Parent Stars of Extrasolar Planets. V. HD 75289
23
arXiv:astro-ph/9909453v1 27 Sep 1999 Accepted by the Astronomical Journal Parent Stars of Extrasolar Planets V: HD 75289 Guillermo Gonzalez and Chris Laws University of Washington, Astronomy Department, Box 351580, Seattle, WA 98195 ABSTRACT The results of a new spectroscopic analysis of HD 75289, recently reported to harbor a Jovian-mass planet, are presented. From high-resolution, high-S/N ratio spectra, we derive [Fe/H] = +0.28 ± 0.05 for this star, in agreement with the spectroscopic study of Gratton et al., published 10 years ago. In addition, we present a re-analysis of the spectra of υ And and τ Boo; our new parameters for these two stars are now in better agreement with photometrically-derived values and with the recent spectroscopic analyses of Fuhrmann et al. We also report on extended abundance analyses of 14 Her, HD 187123, HD 210277, and ρ 1 Cnc. If we include the recent spectroscopic analyses of HD 217107 by Randich et al. and Sadakane et al., who both reported [Fe/H] ∼ +0.30 for this star, we can state that all the ”hot-Jupiter” systems studied to date have metal-rich parent stars. We find that the mean [C/Fe] and [Na/Fe] values among the stars-with-planets sample are smaller than the corresponding quantities among field stars of the same [Fe/H]. Subject headings: planetary systems – stars: individual HD 75289 1. Introduction In our continuing series on the parent stars of extrasolar planets (Gonzalez 1997, Paper I; Gonzalez 1998, Paper II; Gonzalez & Vanture 1998, Paper III; and Gonzalez et al. 1999, Paper IV), we have reported on the results of our spectroscopic analyses of these stars. Other similar studies include Fuhrmann et al. (1997, 1998) and Sadakane et al. (1999). The most significant finding so far has been the high mean metallicity of these stars, as a group, compared to the metallicity distribution of nearby solar-type stars. Additional extrasolar planet candidates continue to be announced by planet hunting groups using
-
Upload
independent -
Category
Documents
-
view
6 -
download
0
Transcript of Parent Stars of Extrasolar Planets. V. HD 75289

arX
iv:a
stro
-ph/
9909
453v
1 2
7 Se
p 19
99
Accepted by the Astronomical Journal
Parent Stars of Extrasolar Planets V: HD 75289
Guillermo Gonzalez and Chris Laws
University of Washington, Astronomy Department, Box 351580, Seattle, WA 98195
ABSTRACT
The results of a new spectroscopic analysis of HD 75289, recently reported
to harbor a Jovian-mass planet, are presented. From high-resolution, high-S/N
ratio spectra, we derive [Fe/H] = +0.28 ± 0.05 for this star, in agreement with
the spectroscopic study of Gratton et al., published 10 years ago. In addition,
we present a re-analysis of the spectra of υ And and τ Boo; our new parameters
for these two stars are now in better agreement with photometrically-derived
values and with the recent spectroscopic analyses of Fuhrmann et al. We also
report on extended abundance analyses of 14Her, HD 187123, HD 210277, and
ρ1 Cnc.
If we include the recent spectroscopic analyses of HD 217107 by Randich et
al. and Sadakane et al., who both reported [Fe/H] ∼ +0.30 for this star, we
can state that all the ”hot-Jupiter” systems studied to date have metal-rich
parent stars. We find that the mean [C/Fe] and [Na/Fe] values among the
stars-with-planets sample are smaller than the corresponding quantities among
field stars of the same [Fe/H].
Subject headings: planetary systems – stars: individual HD 75289
1. Introduction
In our continuing series on the parent stars of extrasolar planets (Gonzalez 1997, Paper
I; Gonzalez 1998, Paper II; Gonzalez & Vanture 1998, Paper III; and Gonzalez et al. 1999,
Paper IV), we have reported on the results of our spectroscopic analyses of these stars.
Other similar studies include Fuhrmann et al. (1997, 1998) and Sadakane et al. (1999).
The most significant finding so far has been the high mean metallicity of these stars, as
a group, compared to the metallicity distribution of nearby solar-type stars. Additional
extrasolar planet candidates continue to be announced by planet hunting groups using

– 2 –
the Doppler method. Herein, we report on a Local Thermodynamic Equilibrium (LTE)
abundance analysis of HD 75289, which was announced on 1 February 1999 (Udry et al.
1999) to harbor a low-mass object with a 3.5 day nearly-circular orbit.
In addition to the new candidate listed above, we also present new analyses of the
spectra of υ And and τ Boo, which had been the subject of Paper I. The basic stellar
parameters and abundances of these two stars were not well-detemined in that study, due
to their relatively broad lines, which resulted in a short linelist. We will improve on that
study by adding several Fe I,II lines carefully chosen to better constrain the solutions. Also,
we report on extended spectroscopic analyses of the following parent stars: HD 187123,
HD 210277, 14Her, and ρ1 Cnc. These stars were discussed in Papers III and IV, but we
had not performed a general abundance analysis from their spectra (note, we had included
ρ1 Cnc in Paper II, but that study was superceded by Paper III). We close with a summary
of the abundance patterns among stars with planets and compare them with those of nearby
F and G dwarfs without (known) planets.
2. Observations
High-resolution, high S/N ratio spectra were obtained with the 2dcoude echelle
spectrograph (described in Tull et al. 1995) at the McDonald observatory 2.7 m telescope.
This is the same instrument employed in Papers I to III (in Paper IV, we analyzed
spectra obtained by G. Marcy with HIRES on the Keck I). The spectral resolving power
(determined from the FWHM of the Th-Ar lines in the comparison lamp spectrum) is
about 65,000, and the S/N ratio is about 450-500. The spectral coverage ranges from 3700
to 10,000 A, with gaps between orders beyond about 5500 A. The data reduction methods
are the same as those employed in Papers I to III. Two spectra of HD 75289 were obtained,
for a total exposure time of 20 minutes. Spectra of a hot star with a high v sin i value were
also obtained in order to divide out telluric lines (with the IRAF program, telluric).
We derived a heliocentric radial velocity of +9.9 ± 0.5 km s−1 (formal error) from
our spectra of HD 75289 obtained on HJD = 2451215.784; this estimate is based on four
clean Fe I lines with laboratory wavelengths adopted from Gratton et al.’s (1989) study.
Note that while we did not observe a radial velocity standard, the stability of the 2dcoude
spectrograph should result in systematic velocity errors of no more than about 0.5 km s−1.
Our velocity estimate differs significantly from Gratton et al.’s radial velocity of +1 km s−1,
which is the mean of six observations they made over a two week period. Based on a
comparison with other published velocity estimates for this star, they concluded that
HD 75289 is a radial velocity variable (with an amplitude of a few km s−1). However, Udry

– 3 –
et al. report a systemic velocity of 9.26 km s−1, which is consistent with our single velocity
estimate. In addition, they obtain a very good fit with a simple Keplerian model, implying
that the velocity is not variable at the few km s−1 level.
3. Analysis
3.1. Spectroscopic analysis
The present method of analysis is the same as that employed in Paper III for ρ1 Cnc.
Briefly, it makes use of the line analysis code, MOOG (Sneden 1973, updated version),
the Kurucz (1993) LTE plane parallel model atmospheres, and Fe I, II equivalent width
(EW) measurements to determine the following atmospheric parameters: Teff , log g, ξt, and
[Fe/H], where the symbols have their usual meanings. The Fe linelist was put together
from Table 1 of Paper I, Table 2 of Paper II, and Table 1 of Paper IV. Lines of elements
other than Fe were selected from Table 1 of Paper 1 and Table 2 of Paper II. We have also
added additional lines to both lists. Their gf -values were calculated from an inverted solar
analysis using the Kurucz et al. (1984) Solar Flux Atlas or our spectrum of Vesta. The
final linelist, along with the EW values, is listed in Tables 1 and 2. The number of lines
employed for each star varies somewhat due to the variations in intrinsic line width and
temperature from one star to another; for example, low excitation lines are weaker in hot
star spectra, and weak lines are more difficult to measure in spectra with relatively high
v sin i, i.e., υ And and τ Boo, and in cool stars with strong-lined spectra due to crowding,
i.e., 14Her and ρ1 Cnc.
The abundances of Li and Al were determined via comparison of synthesized spectra
with the observed spectra. The method employed to determine the Li abundance is
described in our previous papers. Our estimate of the Al abundance is based on the Al I
pair at 6696 and 6698 A; they are sufficiently close to the Li I line at 6708 A that we were
able to determine the Li and Al abundances with the same synthesized spectral region.
This is a change from our previous studies, where we had relied primarily on the 7835 and
8772 A pairs. Unfortunately, the spectrograph setup was such that the 6696 and 6698 A Al
pair fell just outside the order containing the Li I line in our spectrum of HD 75289, so we
do not quote an Al abundance for this star.
The results of the analyses are presented in Tables 2 to 5. The calculations of the
uncertainties and the contribution from systematic errors are the same as those discussed in
Paper III; systematic errors should be negligible in the present study, since these stars are
similar to the Sun. We argued in Paper III that our LTE analysis of ρ1 Cnc, which is about

– 4 –
500 K cooler than the Sun, probably does not suffer from significant systematic errors. As
in Paper III, we refrain from quoting formal uncertainties in [Fe/H] less than 0.05 dex.
3.2. Derived parameters
We have determined the masses and ages in the same way as in Paper II. Using the
Hipparcos parallaxes (ESA 1997) and the stellar evolutionary isochrones of Schaller et al.
(1992) and Schaerer et al. (1993), along with our spectroscopic Teff estimates, we have
estimated the masses and ages for υ And, τ Boo, and HD 75289. Due to the large parallaxes
and hence small distances, neither the Lutz & Kelker (1973) nor extinction corrections were
applied. We list the results in Table 4. The corresponding theoretical surface gravities
are: log g = 4.10 ± 0.04, 4.25 ± 0.03, and 4.33 ± 0.02 for υ And, τ Boo, and HD 75289,
respectively. The close agreement between the observed and theoretical surface gravities
for all three stars supports the assumptions that went into the calculation of the stellar
evolutionary isochrones and the LTE abundance analyses.
4. Discussion
4.1. υ And and τ Boo
The present spectroscopic analyses of υ And and τ Boo are a significant improvement
over those reported in Paper I, both as evidenced by the reduction in the uncertainties of
the derived physical parameters and the closer agreement with the spectroscopic analyses
of Fuhrmann et al. (1998) and photometrically-derived parameters. While our new Teff
estimates are significantly smaller than those in Paper I - υ And is less by 110 K and τ Boo
is less by 180 K - the [Fe/H] values are similar; this is due to the fact that we derived
a complete new set of atmosphere parameters for each star, not just a new Teff . As a
result, the basic conclusions of Gonzalez (1999a), which is a study of the chemo-dynamical
properties of stars-with-planets, are not altered. In particular, the conclusion that τ Boo
possesses an anomalously high [Fe/H] value for its age and Galactocentric distance still
holds. Finally, we note that the value of ξt we obtain for τ Boo is unusually small compared
to the other hot stars we analyzed; its ξt value should be larger, given its higher Teff value.

– 5 –
4.2. HD75289
The Bright Star Catalog (Hoffleit 1982) designates HD 75289 as G0Ia-0:, which is
clearly incorrect. Gratton et al. included HD 75289 in their spectroscopic abundance study
of G and K supergiants (their work confirmed that HD 75289 was in fact a metal-rich dwarf
and not a supergiant). Of the EW measurements reported in their paper and ours, there
are 15 spectral lines in common, with an average difference of only +1.5 mA between them.
They went on to derive the atmospheric parameters based on a total of 35 Fe I and 5 Fe
II lines, and obtained the following results: Teff = 6000 K, log g = 3.8, ξt = 1.3 km s−1,
and [A/H] = 0.2. We note that the present work, which uses a similar method of analysis
and a larger number of Fe lines to better constrain these same stellar parameters, is in
close agreement with their results. The only exception to this statement is log g, where
our derived value of 4.47 differs considerably. The stellar evolutionary log g value tends to
support our estimate.
Gonzalez (1999a) compared the [Fe/H] estimates of the parent stars to the mean trends
of [Fe/H] with age and mean Galactocentric distance, Rm, among field stars. Among the
young stars (age ≤ 2 Gyr), not only is τ Boo too metal-rich for its value of Rm, but so is
HD 75289. They are both metal-rich relative to the typical field star of the same Rm by
+0.26 dex.
Henry et al. (1996) reported a log R′
HK value of −5.00 for HD 75289 from a single
measurement; we confirm the low chromospheric activity level of this star from examination
of the Ca II H and K lines in our spectra. This measure places it among the low-activity
stars of the roughly 800 stars observed by them. Employing the activity-age relation of
Donahue (1993)1 we derive an age of 5.6 Gyr, nearly a factor of three greater than the age
derived from its position on the HR diagram. None of the other parent stars displays such
a large activity age relative to the evolutionary age2. Further, Udry et al. reported a v sin i
value of 4.37 km s−1 - about half the v sin i value of υ And, itself 3.5 Gyr old according to
its location on the HR diagram.
Hence, according to its chromospheric activity level and rotation, HD 75289 is older
than the Sun, while it is younger according to stellar evolution. A possible way out of this
dilemma may be to invoke a phenomenon that spun-down HD 75289 faster than is typical
for stars of its spectral type.
1As reported in Henry et al. (1996).
270Vir has an evolutionary age nearly four times its activity age, but this discrepancy is likely due to its
more evolved state than the other parent stars.

– 6 –
4.3. Abundance Trends
To search for subtle abundance anomalies among the star-with-planets sample, we will
compare our results to high-quality abundance analyses of the general field population. The
best sources of data on abundances of field stars are Edvardsson et al. (1993), Tomkin et
al. (1997), Feltzing & Gustafsson (1998), and Gustafsson et al. (1999). All four studies
are based on the Uppsala Astronomical Observatory group analysis techniques, and, hence,
should be consistent with each other. In addition to these, we will make use of several
studies of Li abundances among field and open cluster stars. In the following, for most
elements, we will compare abundances relative to Fe (as [X/Fe]), since such a quantity is
less sensitive to systematic differences among various studies.
Among the elements measured in the stars-with-planets sample, Li has the potential to
give us the greatest insight into the process of planet formation. Its abundance in a stellar
atmosphere is affected by a number of physical processes, some of which are possibly related
to the presence of planets (see discussion in Paper II). Among the stellar parameters found
to correlate with Li abundance are Teff , age, and metallicity (Pasquini, Liu, & Pallavicini
1994). What’s more, the Li abundance on the surface of an F star might be enhanced as
a result of the accretion of rocky material (see Alexander 1967 and Paper II). Following
Pasquini et al., we have derived an equation relating log ǫ(Li) to Teff , the chromospheric
emission measure (R′
HK), and [Fe/H]:
log ǫ(Li) = −80.246 + 0.806[Fe/H] + 0.431 logR′
HK + 22.436 logTeff (1)
The stars used to calibrate this equation are from Pasquini et al., Favata et al. (1997),
and Randich et al. (1999) with the R′
HK values from Henry et al. (1996). The range
of applicability of the parameters are: −0.61 ≤ [Fe/H] ≤ +0.22, 5458 ≤ Teff ≤ 6180 K,
−5.24 ≤ log R′
HK ≤ −4.34, and +0.83 ≤ log ǫ(Li) ≤ +2.92. Note, some of our stars are
outside the metallicity range of equation 1. All the stars-with-planets but one have observed
Li abundances less than the values calculated from equation 1 (Figure 2). The largest
deviation on this plot is τ Boo; there are two points to note about it: its Teff value is beyond
the range for which equation 1 is calibrated, and it is within the so-called ”Li dip” seen
among open cluster stars (Balachandran 1995). It is also important to note that many stars
of the same temperature, age, and metallicity range as those used to determine equation 1
do not have detectable Li; an example of this is the large spread in Li among single stars of
the same colors in M67 (Jones, Fischer, & Soderblom 1999). The Li abundance of HD 75289
is not unusual compared to the field star sample, but it might be slightly high with respect
to its evolutionary age.

– 7 –
The study of Gustafsson et al. is probably the most accurate study of C abundances
among F and G disk to date. They employed the [C I] line at 8727 A. The [C/Fe] values
display remarkably small scatter about a mean trend with respect to [Fe/H] (see Figure
4 of Gustafsson et al.). In Figure 1 we present the [C/Fe] estimates from Gustafsson et
al. and Tomkin et al. (who did not employ the [C I] line) for field stars as well as the
stars-with-planets. A small trend of [C/Fe] with Galactocentric distance has been removed
from the individual data points (amounting to −0.015 dex per kpc). Some of the Tomkin
et al. stars and all but one of the stars-with-planets fall below the mean trend line; τ Boo
displays the largest negative deviation. The [C/Fe] estimate for HD 217107 is from Sadakane
et al.’s two measurements: the [C I] and 5380 A lines; the estimate for 51Peg is the average
from Paper II and Tomkin et al. It is always possible that there is a systematic offset
between our [C/Fe] estimates and those of Gustafsson et al. due to the different lines used,
but it is not likely to be significant since both studies are differential relative to the Sun.
The deviation of the Sun’s [C/Fe] value from the mean trend in Figure 1 is also notable;
while it may not seem like a large difference, the error bars on the data point corresponding
to the Sun are effectively zero, since Gustafsson et al.’s study is differential with respect to
the Sun (for additional discussion on this point see Gustafsson et al. and Gonzalez 1999b).
Feltzing & Gustafsson examined abundance trends (as [X/Fe] versus [Fe/H]) among
metal-rich disk stars. For most elements, there are no significant deviations from the solar
ratios, but they did find a significant upturn in [Na/Fe] for stars with [Fe/H] > 0.00,
reaching [Na/Fe] ∼ 0.20 for the most metal-rich stars. Among the stars-with-planets
sample, the mean [Na/Fe] value is −0.02; ρ1 Cnc, HD 75289, and HD 210277 have the
smallest [Na/Fe]. They used the same two Na I lines we employed in our study. The mean
values of [X/Fe] for the other elements among our sample stars do not appear to differ
significantly from the trends seen among disk stars.
The most obvious abundance trend among the stars-with-planets studied so far is
their high mean metallicity compared to the general field population. Our estimate for
the [Fe/H] value of HD 75289, +0.28, is close to the mean of the so-called ”hot Jupiter”
systems. Another recently announced system, HD 217107, was studied spectroscopically by
Randich et al. and Sadakane et al., who obtained [Fe/H] = +0.30 and +0.31, respectively.
5. Conclusions
The results of our analysis of high-resolution spectra of HD75289 confirm that it is a
metal-rich star, with [Fe/H] = +0.28. Its evolutionary age, 2.1 Gyr, is much less than the
age derived from its chromospheric emission measure, R′
HK.

– 8 –
Compared, as a group, to nearby F and G dwarfs, the stars-with-planets sample display
the following peculiarities:
• The latest additions to this group, HD 75289 and HD 217107, continue the trend, first
noted in Paper I, that stars-with-planets are metal-rich relative to the nearby field
star population.
• The stars, τ Boo, ρ1 Cnc, 14Her, HD 75289, and HD 217107, are much more metal-rich
than F and G dwarfs of similar ages and mean Galactocentric distances.
• Compared to field stars with detectable Li, stars-with-planets tend to have smaller Li
abundances when corrected for differences in Teff , [Fe/H], and R′
HK.
• The [Na/Fe] and [C/Fe] values of stars-with-planets are, on average, smaller than the
corresponding quantities among field stars of the same [Fe/H].
In summary, while the numbers are still small, the data on stars-with-planets are
beginning to indicate ways in which they differ from the general field star population. These
abundance anomalies might be useful in constraining future searches for extrasolar planets,
and they will be very helpful in theoretical studies of planet formation.
The authors are grateful to David Lambert for obtaining spectra of HD 75289 at our
request. Thanks also go to Robert Kurucz for his model atmospheres and Chris Sneden
for use of his code, MOOG. This research has made use of the Simbad database, operated
at CDS, Strasbourg, France. The research has been supported in part by the Kennilworth
Fund of the New York Community Trust.

– 9 –
REFERENCES
Alexander, J. B. 1967, Observatory, 87, 238
Balachandran, S. 1995, ApJ, 446, 203
Butler, R. P., Marcy, G. W., Vogt, S. S., & Apps, K. 1998, PASP, 110, 1389
Donahue, R. A. 1993, Ph. D. thesis, New Mexico State University
Edvardsson, B., Andersen, J., Gustafsson, B., Lambert, D. L., & Nissen, P. E. et al. 1993,
A&A, 275, 101
ESA 1997, The Hipparcos and Tycho Catalogue, ESA SP-1200
Favata, F., Micela, G., & Sciortino, S. 1997, A&A, 322, 131
Feltzing, S. & Gustafsson, B. 1998, A&AS, 129, 237
Fuhrmann, K. 1998, A&A, 338, 161
Fuhrmann, K., Pfeiffer, M. J., & Bernkopf, J. 1997, A&A, 326, 1081
Fuhrmann, K., Pfeiffer, M. J., & Bernkopf, J. 1998, A&A, 336, 942
Gonzalez, G. 1997, MNRAS, 285, 403 (Paper I)
Gonzalez, G. 1998, A&A, 334, 221 (Paper II)
Gonzalez, G. 1999a, MNRAS, 308, 447
Gonzalez, G. 1999b, A&G, in press
Gonzalez, G. & Vanture, A. D. 1998, A&A, 339, L29 (Paper III)
Gonzalez, G., Wallerstein, G, & Saar, S. H. 1999, ApJ, 511, L111 (Paper IV)
Gratton, R. G., Focardi, P., & Bandiera, R. 1985, MNRAS, 237, 1085
Gustafsson, B., Karlsson, T, Olsson, E., Edvardsson, B, & Ryde, N. 1999, A&A, 342, 426
Henry, T. J., Soderblom, D. R., Donahue, R. A., & Baliunas, S. L. 1996, AJ, 111, 439
Henry, G. W., Baliunas, S. L., Donahue, R. A., Soon, W. H., & Saar, S. H. 1997, ApJ, 474,
503
Hoffleit, D. 1982, Bright Star Catalog, 4th edn, Yale University Observatory
Jones, B. F., Fischer, D., & Soderblom, D. R. 1999, ApJ, 117, 330
Kurucz, R. L., Furenlid, I., Brault, J., Testerman, L. 1984, Solar Flux Atlas from 296 to
1300 nm, National Solar Observatory
Kurucz, R. L. 1993, ATLAS9 Stellar Atmosphere Programs and 2km/s Grid CDROM Vol.
13, Smithsonian Astrophysical Observatory
Lutz, T. E. & Kelker, D. H. 1973, PASP, 85, 573
Pasquini, L., Liu, Q., & Pallavicini, R. 1994, A&A, 287, 191
Randich, S., Gratton, R., Pallavicini, R., Pasquini, L., & Carretta, E. 1999, A&A, 348, 487

– 10 –
Sadakane K., Honda, S., Kawanomoto, S., Takeda, Y., & Takada-Hidai, M. 1999, PASJ, in
press
Schaerer, D., Charbonnel, C., Meynet, G., Maeder, A., & Schaller, G. 1993, A&AS, 102,
339
Schaller, G., Schaerer, D., Meynet, G., & Maeder, A. 1992, A&AS, 96, 269
Smith, M. A. & Giampapa, M. S. 1987, in Cool Stars, Stellar Systems, and the Sun, eds. J.
Linsky & R. Stencel (Berlin: Springer), 477
Sneden, C. 1973, Ph.D. thesis, University of Texas
Tomkin, J., Edvardsson, B., Lambert, D. L., & Gustafsson, B. 1997, A&A, 327, 587
Tull, R. G., MacQueen, P. J., Sneden, C., &, Lambert, D. L. 1995, PASP, 107, 251
Udry, S., Mayor, M., Naef, D., Santos, N., & Queloz, D. et al. 1999, A&A, in preparation
This preprint was prepared with the AAS LATEX macros v4.0.
– 11 –
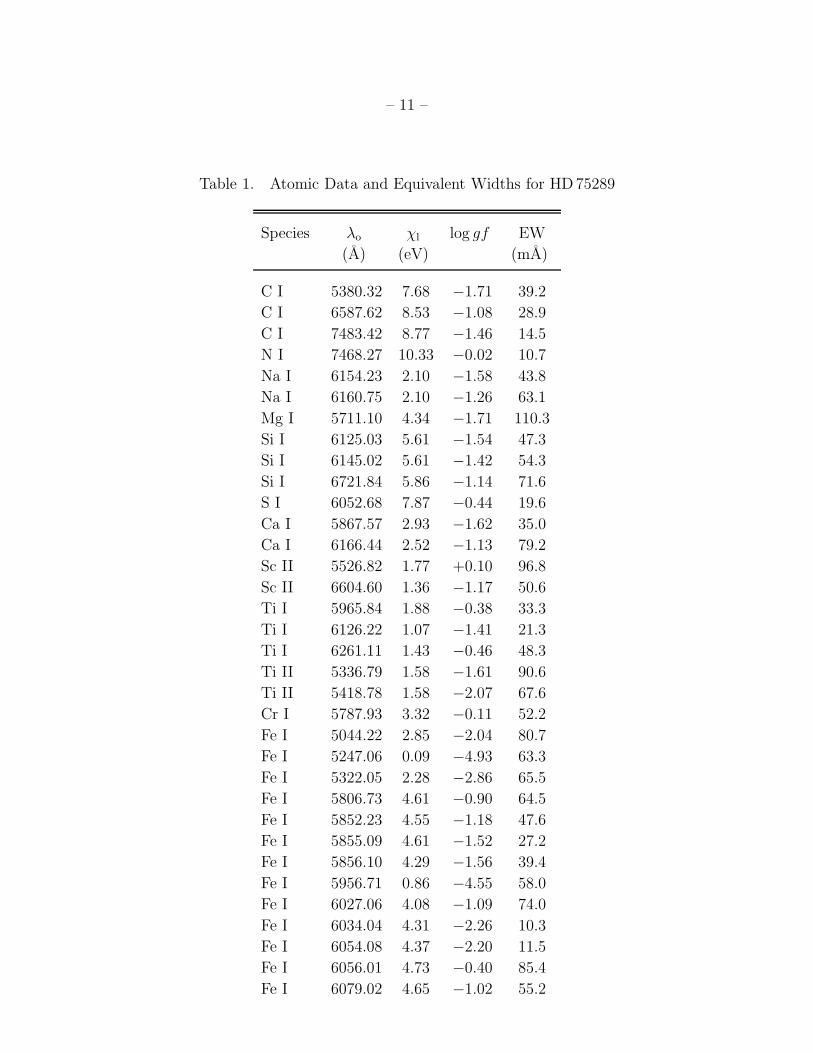
Table 1. Atomic Data and Equivalent Widths for HD 75289
Species λo χl log gf EW
(A) (eV) (mA)
C I 5380.32 7.68 −1.71 39.2
C I 6587.62 8.53 −1.08 28.9
C I 7483.42 8.77 −1.46 14.5
N I 7468.27 10.33 −0.02 10.7
Na I 6154.23 2.10 −1.58 43.8
Na I 6160.75 2.10 −1.26 63.1
Mg I 5711.10 4.34 −1.71 110.3
Si I 6125.03 5.61 −1.54 47.3
Si I 6145.02 5.61 −1.42 54.3
Si I 6721.84 5.86 −1.14 71.6
S I 6052.68 7.87 −0.44 19.6
Ca I 5867.57 2.93 −1.62 35.0
Ca I 6166.44 2.52 −1.13 79.2
Sc II 5526.82 1.77 +0.10 96.8
Sc II 6604.60 1.36 −1.17 50.6
Ti I 5965.84 1.88 −0.38 33.3
Ti I 6126.22 1.07 −1.41 21.3
Ti I 6261.11 1.43 −0.46 48.3
Ti II 5336.79 1.58 −1.61 90.6
Ti II 5418.78 1.58 −2.07 67.6
Cr I 5787.93 3.32 −0.11 52.2
Fe I 5044.22 2.85 −2.04 80.7
Fe I 5247.06 0.09 −4.93 63.3
Fe I 5322.05 2.28 −2.86 65.5
Fe I 5806.73 4.61 −0.90 64.5
Fe I 5852.23 4.55 −1.18 47.6
Fe I 5855.09 4.61 −1.52 27.2
Fe I 5856.10 4.29 −1.56 39.4
Fe I 5956.71 0.86 −4.55 58.0
Fe I 6027.06 4.08 −1.09 74.0
Fe I 6034.04 4.31 −2.26 10.3
Fe I 6054.08 4.37 −2.20 11.5
Fe I 6056.01 4.73 −0.40 85.4
Fe I 6079.02 4.65 −1.02 55.2

– 12 –
Table 1—Continued
Species λo χl log gf EW
(A) (eV) (mA)
Fe I 6089.57 5.02 −0.86 38.3
Fe I 6151.62 2.18 −3.29 50.4
Fe I 6157.73 4.07 −1.25 75.0
Fe I 6159.38 4.61 −1.87 16.3
Fe I 6165.36 4.14 −1.47 53.7
Fe I 6180.21 2.73 −2.61 65.4
Fe I 6187.99 3.94 −1.61 52.3
Fe I 6200.32 2.61 −2.44 83.6
Fe I 6226.74 3.88 −2.03 35.8
Fe I 6229.23 2.84 −2.82 42.8
Fe I 6240.65 2.22 −3.32 51.8
Fe I 6265.14 2.18 −2.57 91.0
Fe I 6270.23 2.86 −2.57 59.4
Fe I 6303.46 4.32 −2.55 6.2
Fe I 6380.75 4.19 −1.32 60.1
Fe I 6385.73 4.73 −1.82 15.1
Fe I 6392.54 2.28 −4.01 19.5
Fe I 6498.95 0.96 −4.62 44.6
Fe I 6581.22 1.48 −4.66 17.6
Fe I 6591.33 4.59 −1.98 14.2
Fe I 6608.04 2.28 −4.00 16.9
Fe I 6627.56 4.55 −1.44 34.9
Fe I 6646.97 2.61 −3.85 9.8
Fe I 6653.91 4.15 −2.41 13.8
Fe I 6703.58 2.76 −3.01 38.7
Fe I 6710.32 1.48 −4.80 14.3
Fe I 6725.36 4.10 −2.18 20.3
Fe I 6726.67 4.61 −1.04 53.6
Fe I 6733.15 4.64 −1.45 31.9
Fe I 6739.52 1.56 −4.90 10.7
Fe I 6745.11 4.58 −2.06 10.0
Fe I 6745.98 4.07 −2.68 7.9
Fe I 6746.98 2.61 −4.41 2.6
Fe I 6750.16 2.42 −2.62 76.4

– 13 –
Table 1—Continued
Species λo χl log gf EW
(A) (eV) (mA)
Fe I 6752.72 4.64 −1.20 45.0
Fe I 6786.86 4.19 −1.95 35.3
Fe I 6839.84 2.56 −3.36 34.8
Fe I 6855.72 4.61 −1.73 25.1
Fe I 6861.95 2.42 −3.80 19.5
Fe I 6862.50 4.56 −1.35 35.3
Fe I 6864.32 4.56 −2.30 9.7
Fe I 7498.54 4.14 −2.09 23.8
Fe I 7507.27 4.41 −1.05 67.6
Fe II 5234.63 3.22 −2.20 109.5
Fe II 6084.11 3.20 −3.75 36.3
Fe II 6149.25 3.89 −2.70 60.9
Fe II 6247.56 3.89 −2.30 78.6
Fe II 6369.46 2.89 −4.11 33.0
Fe II 6416.93 3.89 −2.60 61.9
Fe II 6432.68 2.89 −3.29 65.6
Fe II 7515.84 3.90 −3.36 27.4
Ni I 6767.78 1.83 −2.09 84.6
Zn I 4722.16 4.03 −0.26 75.7

– 14 –
Table 2. Equivalent Widths for υ And, τ Boo, and ρ1 Cnc
Species λo(A) υ And τ Boo ρ1 Cnc
C I 5380.32 46.4 35.0 21.0
C I 6587.62 35.6 48.5 · · ·
C I 7108.92 13.7 22.8 · · ·
C I 7115.17 40.7 53.0 · · ·
C I 7116.96 · · · 52.6 · · ·
C I 7483.42 18.3 24.5 · · ·
N I 7468.27 9.2 16.7 · · ·
Na I 6154.23 32.8 34.6 96.0
Na I 6160.75 53.6 58.2 109.2
Mg I 5711.10 96.8 98.8 · · ·
Si I 5793.08 49.2 56.8 63.0
Si I 6125.03 36.0 43.5 52.2
Si I 6145.02 45.9 49.1 58.0
Si I 6721.84 51.8 64.6 · · ·
S I 6052.68 25.0 38.2 · · ·
Ca I 5867.57 23.5 21.6 57.9
Ca I 6166.44 64.2 64.6 111.9
Sc II 5526.82 · · · · · · 86.9
Sc II 6604.60 46.5 44.8 56.0
Ti I 5965.84 22.1 19.8 · · ·
Ti I 6126.22 14.3 13.4 67.0
Ti I 6261.11 36.9 42.1 · · ·
Ti II 5336.79 92.2 97.0 79.5
Ti II 5418.78 65.1 78.1 57.8
Cr I 5787.93 41.3 48.8 84.4
Fe I 5044.22 70.8 67.1 · · ·
Fe I 5247.06 · · · · · · 100.0
Fe I 5806.73 51.0 56.4 · · ·
Fe I 5852.23 44.7 38.3 71.5
Fe I 5855.09 21.1 20.7 46.0
Fe I 5856.10 27.6 31.4 60.5
Fe I 5956.71 36.5 29.6 84.5
Fe I 6027.06 63.2 68.1 · · ·
Fe I 6034.04 · · · · · · 23.6

– 15 –
Table 2—Continued
Species λo(A) υ And τ Boo ρ1 Cnc
Fe I 6054.08 · · · · · · 28.6
Fe I 6056.01 73.5 76.0 · · ·
Fe I 6065.48 111.0 110.1 · · ·
Fe I 6079.02 · · · · · · 79.0
Fe I 6089.57 32.5 37.9 60.6
Fe I 6093.65 · · · · · · 56.1
Fe I 6096.67 · · · · · · 69.8
Fe I 6098.25 · · · · · · 38.5
Fe I 6151.62 37.6 33.6 81.2
Fe I 6157.73 · · · · · · 98.0
Fe I 6159.38 · · · · · · 35.1
Fe I 6165.36 43.0 42.2 67.0
Fe I 6180.21 · · · · · · 94.7
Fe I 6187.99 · · · · · · 83.5
Fe I 6200.32 68.5 64.9 · · ·
Fe I 6226.74 · · · · · · 58.2
Fe I 6229.23 · · · · · · 80.6
Fe I 6240.65 · · · · · · 81.6
Fe I 6270.23 · · · · · · 86.3
Fe I 6303.46 · · · · · · 14.7
Fe I 6380.75 50.0 53.7 85.9
Fe I 6385.73 · · · · · · 28.6
Fe I 6392.59 · · · · · · 49.9
Fe I 6498.95 34.8 28.5 91.3
Fe I 6581.22 · · · · · · 61.3
Fe I 6591.33 8.9 8.5 27.2
Fe I 6608.04 13.3 14.4 49.6
Fe I 6627.56 · · · · · · 56.8
Fe I 6646.97 · · · · · · 33.6
Fe I 6653.91 · · · · · · 29.7
Fe I 6703.58 28.7 26.0 70.8
Fe I 6710.32 · · · · · · 56.7
Fe I 6725.36 · · · · · · 43.8
Fe I 6726.67 · · · · · · 77.9

– 16 –
Table 2—Continued
Species λo(A) υ And τ Boo ρ1 Cnc
Fe I 6733.15 · · · · · · 52.6
Fe I 6739.52 6.4 7.3 40.6
Fe I 6745.11 · · · · · · 24.7
Fe I 6745.98 · · · · · · 29.1
Fe I 6746.98 · · · · · · 18.7
Fe I 6750.16 68.5 63.6 · · ·
Fe I 6752.72 33.8 33.0 69.7
Fe I 6786.86 · · · · · · 52.9
Fe I 6820.37 36.2 39.6 71.3
Fe I 6833.25 8.6 10.1 · · ·
Fe I 6839.84 32.4 31.4 · · ·
Fe I 6855.72 · · · · · · 42.3
Fe I 6861.95 · · · · · · 56.5
Fe I 6862.50 · · · · · · 59.5
Fe I 6864.32 · · · · · · 19.7
Fe I 7498.54 15.8 17.2 · · ·
Fe I 7507.27 53.3 55.0 · · ·
Fe I 7583.80 78.2 76.4 · · ·
Fe I 7586.03 111.3 114.8 · · ·
Fe II 5234.63 · · · · · · 85.5
Fe II 5991.38 50.3 59.3 32.9
Fe II 6084.11 · · · · · · 22.0
Fe II 6149.25 57.3 64.9 33.4
Fe II 6247.56 · · · · · · 44.0
Fe II 6369.46 31.8 34.8 18.6
Fe II 6416.93 · · · · · · 49.3
Fe II 6432.68 · · · · · · 40.1
Fe II 6442.95 · · · · · · 7.2
Fe II 6446.40 · · · · · · 3.7
Fe II 7515.84 25.9 35.4 · · ·
Ni I 6767.78 72.8 69.9 115.8
Zn I 4722.16 80.4 76.6 · · ·

– 17 –
Table 3. Equivalent Widths for HD 187123, HD 210277, and 14Her
Species λo(A) HD 187123 HD 210277 14Her
C I 5380.32 26.6 25.3 23.9
Na I 6154.23 45.9 65.1 99.5
Na I 6160.75 62.6 81.4 114.6
Mg I 5711.10 113.0 138.0 179.6
Si I 6125.03 39.0 46.2 55.9
Si I 6145.02 46.2 54.5 60.1
Si I 6721.84 57.4 64.1 80.5
S I 6052.68 15.0 17.2 · · ·
Ca I 6166.44 77.5 94.1 116.6
Sc II 6604.60 40.5 45.4 54.7
Ti I 6126.22 25.8 47.0 69.2
Ti II 5336.79 79.4 87.5 69.2
Ti II 5418.78 54.1 55.9 58.9
Cr I 5787.93 50.3 64.8 84.0
Ni I 6767.78 81.7 95.6 120.6

– 18 –
Table 4. Spectroscopically-Determined Physical Parameters of υ And, τ Boo, and
HD 75289
Star Teff log g ξt [Fe/H] MVa Ageb Massb
(K) (km s−1) (Gyr) (M⊙)
υ And 6140 ± 60 4.12 ± 0.11 1.35 ± 0.10 0.12 ± 0.05 3.45 ± 0.03 3.3 ± 0.5 1.28 ± 0.02
τ Boo 6420 ± 80 4.18 ± 0.08 1.25 ± 0.11 0.32 ± 0.06 3.53 ± 0.03 1.5 ± 0.5 1.34 ± 0.02
HD 75289 6140 ± 50 4.47 ± 0.24 1.48 ± 0.10 0.28 ± 0.05 4.04 ± 0.04 2.1+0.70−0.60 1.22 ± 0.02
aCalculated from the Hipparcos parallaxes.
bDerived from Schaller et al. (1992) and Schaerer et al. (1993) stellar evolutionary isochrones.

– 19 –
Table 5. [X/H] values for υ And, τ Boo, ρ1 Cnc, and HD 75289
Element log ǫ⊙ υ And τ Boo ρ1 Cnca HD 75289
Li 1.06 +1.20 ± 0.07 +0.62 ± 0.25 < −0.60 ± 0.15 +1.70 ± 0.05
C 8.56 +0.06 ± 0.11 +0.06 ± 0.09 +0.33 ± 0.10 +0.16 ± 0.10
N 8.05 −0.10 ± 0.09 +0.04 ± 0.10 +0.71 ± 0.14 +0.05 ± 0.10
Na 6.33 +0.09 ± 0.07 +0.27 ± 0.09 +0.34 ± 0.09 +0.20 ± 0.05
Mg 7.58 +0.04 ± 0.08 +0.24 ± 0.09 · · · +0.13 ± 0.09
Al 6.47 +0.02 ± 0.06 +0.15 ± 0.10 +0.50 ± 0.06 · · ·
Si 7.55 +0.16 ± 0.02 +0.38 ± 0.04 +0.39 ± 0.02 +0.33 ± 0.04
S 7.21 +0.11 ± 0.08 +0.29 ± 0.08 · · · +0.04 ± 0.09
Ca 6.36 +0.14 ± 0.08 +0.28 ± 0.09 +0.31 ± 0.10 +0.33 ± 0.08
Sc 3.10 +0.07 ± 0.08 +0.15 ± 0.09 +0.56 ± 0.09 +0.32 ± 0.10
Ti I 4.99 +0.06 ± 0.06 +0.30 ± 0.08 +0.33 ± 0.11 +0.26 ± 0.05
Ti II 4.99 +0.16 ± 0.09 +0.47 ± 0.10 +0.40 ± 0.10 +0.29 ± 0.10
Cr 5.67 +0.10 ± 0.08 +0.42 ± 0.09 +0.34 ± 0.10 +0.25 ± 0.07
Fe 7.47 +0.12 ± 0.05 +0.32 ± 0.06 +0.45 ± 0.05 +0.28 ± 0.05
Ni 6.25 +0.02 ± 0.09 +0.24 ± 0.11 +0.44 ± 0.09 +0.16 ± 0.09
Zn 4.60 +0.10 ± 0.09 +0.22 ± 0.11 · · · −0.02 ± 0.08
aThe values of [Li/H], [C/H], and [N/H] for ρ1 Cnc are from Paper III. The [C/H]
value listed here is based on the C I line at 5380 A.

– 20 –
Table 6. [X/H] values for 14Her, HD 187123, and HD 210277
Element 14Her HD 187123 HD 210277
Li < −0.36 +0.14 ± 0.20 < −0.26
C +0.36 ± 0.12 +0.10 ± 0.05 +0.24 ± 0.08
Na +0.46 ± 0.11 +0.08 ± 0.04 +0.18 ± 0.07
Mg +0.52 ± 0.11 +0.06 ± 0.05 +0.20 ± 0.08
Al +0.43 ± 0.07 +0.17 ± 0.06 +0.38 ± 0.07
Si +0.47 ± 0.06 +0.14 ± 0.02 +0.24 ± 0.02
S · · · +0.04 ± 0.04 +0.27 ± 0.07
Ca +0.43 ± 0.12 +0.14 ± 0.05 +0.24 ± 0.08
Sc +0.53 ± 0.10 +0.10 ± 0.05 +0.25 ± 0.07
Ti I +0.44 ± 0.13 +0.13 ± 0.05 +0.27 ± 0.09
Ti II +0.49 ± 0.10 +0.13 ± 0.05 +0.31 ± 0.07
Cr +0.40 ± 0.12 +0.09 ± 0.05 +0.19 ± 0.08
Fe +0.50 ± 0.05 +0.16 ± 0.05 +0.24 ± 0.05
Ni +0.54 ± 0.11 +0.05 ± 0.06 +0.17 ± 0.08

– 21 –
FIGURE CAPTIONS
Fig. 1.— The [C/Fe] values are shown as dots for 73 single F and G dwarfs from Gustafsson
et al. (1999) and 8 single F and G dwarfs from Tomkin et al. (1997), with 2 stars in common
between the two studies. The Sun is shown as an open circle and the stars-with-planets as
plus signs. The points have been corrected to a common galactocentric distance of 8.8 kpc by
removal of a small trend with galactocentric distance. A least-squares fit to the Gustafsson
et al. sample stars is shown as a dashed line.
Fig. 2.— Difference between observed and calculated (with equation 1) Li abundances for
field stars from Pasquini et al., Favata et al., and Randich et al. (dots). The stars-with-
planets are shown as plus signs.

-0.4
-0.2
0.0
0.2
0.4[C
/Fe]
-1.0 -0.5 0.0 0.5
[Fe/H]

-2
-1
0
1lo
g ε
(Li)
obs -
log
ε (L
i)ca
lc
3.02.52.01.51.00.5log ε (Li)obs