Drilling of Early Cretaceous Oceanic Anoxic Event 1a in Southern France
68
Reports on Deep Earth Sampling and Monitoring Published by the Integrated Ocean Drilling Program with the International Continental Scientific Drilling Program LAKE EL´GYGYTGYN D1 315 m 517 m 0 m 140 m brecciated bedrock breccia 275 m Reports on Deep Earth Sampling and Monitoring No. 9, April 2010 Scientific Drilling ISSN: 1816-8957 Pacific Equatorial Transect 4 Borehole Observatories at Juan de Fuca Ridge 16 Early Cretaceous Oceanic Anoxic Event 20 The Paleoproterozoic Oxidation Event 23 Technical Developments 30 Workshop Reports 45
-
Upload
independent -
Category
Documents
-
view
1 -
download
0
Transcript of Drilling of Early Cretaceous Oceanic Anoxic Event 1a in Southern France
Reports on Deep Earth Sampling and Monitoring
NU
MB
ER
1,
20
05
Published by the Integrated Ocean Drilling Program with the International Continental Scientific Drilling Program
LAKE EL´GYGYTGYN
D1
D3
NW SE
315 m
517 m
0 m
140 m
brecciatedbedrock
brecciasupposed
talik/permafrostborder
Faults associated
with central ring
275 m
141 m
Reports on Deep Earth Sampling and Monitoring
No
. 9
, A
pri
l 2
01
0
Scientific DrillingISSN: 1816-8957
Pacific Equatorial Transect 4
Borehole Observatories at Juan de Fuca Ridge 16
Early Cretaceous Oceanic Anoxic Event 20
The Paleoproterozoic Oxidation Event 23
Technical Developments 30
Workshop Reports 45
Editorial Preface Dear Reader:
Hans Christian LarsenEditor-in-Chief
Ulrich HarmsEditor
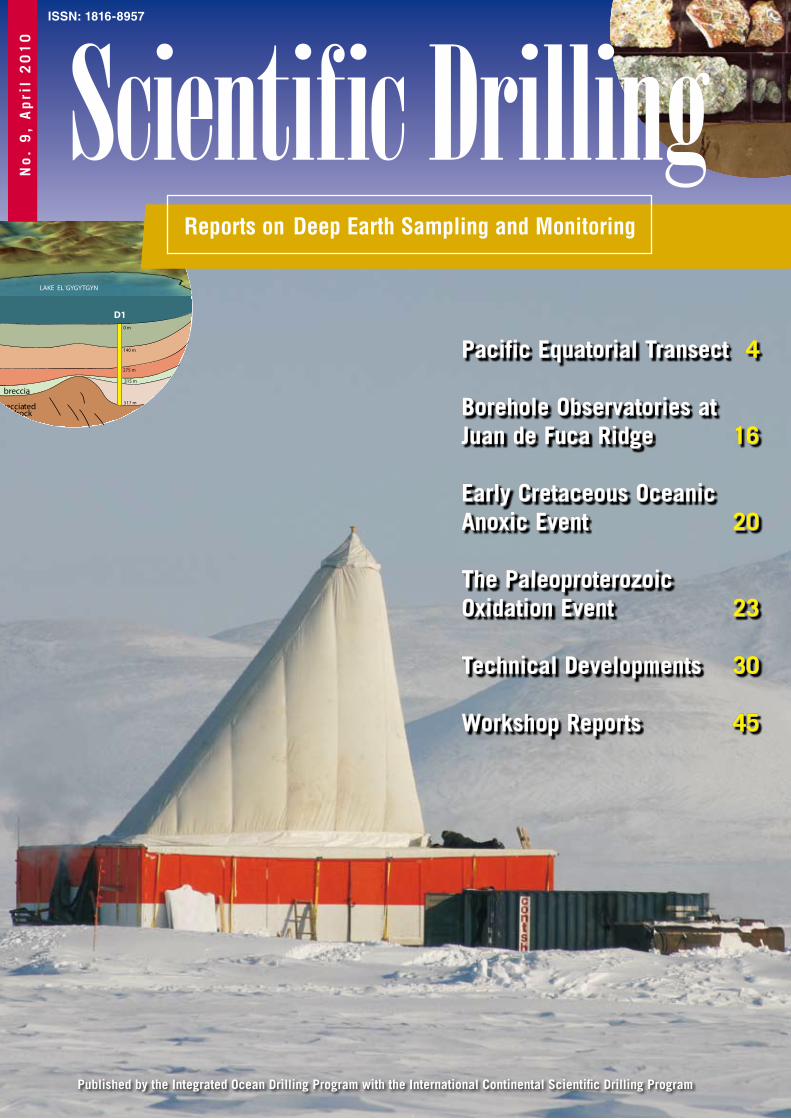
Front Cover: ICDP drilling at the frozen El´gygytgyn (local name in Chukchi language [чукчи ] meaning “White Lake”) addressing past climate history at extreme northeastern Siberia and the impact of an extraterrestrial bolide that generated the 12-km-wide lake basin 3.6 Ma ago.Left inset: Preliminary geological model of sequence drilled in the Russian Arctic.
A strong Northern Hemisphere 2010 winter might have shifted attention away from the issue of climate change, but climate change is about more than just annual weather patterns. Research must focus on broader impacts, such as the effect of changes in the oceans’ water masses on global climate. The refurbished ocean drilling vessel JOIDES Resolution ( JR) made its ‘maiden voyage’ in the equatorial Pacific Ocean in 2009. This area absorbs solar radiation into a giant warm water pool and is the source of the inter-annual El Niño Southern Oscillation phenomenon (ENSO) affecting the climate of the entire circum-Pacific and beyond. A drilling transect by the JR from the northwestern to southeastern equatorial Pacific took advantage of lithospheric plate motion to recover high-resolution sedimentary equatorial sections from most of the Cenozoic era (p. 4); this will enable a much better understanding of the global climate control exerted by this ocean.
The JR proved her reputation as the workhorse of ocean drilling, provid-ing remarkable core recovery to greater depths than ever before; results from these cores can underpin unprecedented detailed analyses of ocean and climate history. Understanding climate and sea-level change of the past is the only real benchmark test for assessing the impact of anthropogenic greenhouse gasses on the global environment. Naturally, as we prepare for a new ten-year program of scientific ocean drilling, societally important fields such as environmental changes, earthquakes and other geohazards are in focus along with principal research themes directed at the funda-mental dynamic behavior of our planet. A major milestone of future science planning was achieved with the recent INVEST conference soliciting ideas from across the Earth and life science community for the scientific themes of the new program (summary report on p. 54).
Environmental change is no threat to continued life on Earth, only to the success of specific species (e.g., humans). A milestone study of the ICDP addresses the profound change of the conditions for life on Earth when the atmosphere went from oxygen-poor to oxygen-rich more than two billion years ago. These remarkable ICDP drill cores (p. 23) from western Russia throw new light on this most fundamental change in Earth’s exterior environment.
So, dear reader, please take a deep breath (of oxygen) and enjoy the ride through Earth’s history and how scientific drilling helps us to understand it!
Scientific DrillingISSN 1816-8957 (printed version) 1816-3459 (electronic version)
Scientific Drilling is a semiannual journal published by the Integrated Ocean Drilling Program ( IODP) with the Internat ional Cont inental Scient i f ic Dri l l ing Program (ICDP). The editors welcome contributions on any aspect of scientific drilling, including borehole instruments, observatories, and monitor ing exper iments. T he journal is produced and distributed by the Integrated Ocea n Dr i l l i ng P rog r a m Ma na gement International (IODP-MI) for the IODP under the sponsorship of the U.S. National Science Foundat ion, the Minist r y of Educat ion, Culture, Sports, Science and Technology of Japan, and other participating countries. T he j ou r na l ’s c ont ent i s p a r t l y ba s e d upon research supported under Contract OCE- 0432224 from the National Science Foundation.
Electronic versions of this publication and informat ion for authors can be found at ht tp://www.iodp.org/scient i f ic -dr i l l ing/ and http://www.icdp-online.org/scientific-drilling/. Printed copies can be requested from the publication office.
IODP is an international marine research dril l ing program dedicated to advancing scient i f ic understanding of the Earth by mon i t or i ng a nd s a mpl i ng subs ea f loor environments. Through mult iple dril l ing p l a t fo r m s , IODP s c ient i s t s ex p lore t he prog r a m ’s p r i nc ip a l t he me s : t he de e p biosphere, environmental change, and solid Earth cycles.
ICDP is a multi-national program designed to promote and coordinate continental drilling projects with a variety of scientific targets at drilling sites of global significance.
Publication Office IODP-MI, Tokyo University of Marine Science and Technology, Office of Liaison and Cooperative Research 3rd Floor,2-1-6, Etchujima, Koto-ku, Tokyo 135-8533, JAPAN Tel: +81-3-6701-3180Fax: +81-3-6701-3189 e-mail: [email protected]: www.iodp.org/scientific-drilling/
Editorial BoardEditor-in-Chief Hans Christian LarsenEditor Ulrich Harms
Send comments to:[email protected]
Editorial Review BoardGilbert Camoin, Keir Becker, Hiroyuki Yamamoto, Naohiko Ohkouchi, Steve Hickman, Christian Koeberl, Julie Brigham-Grette, and Maarten DeWit
Copy Editing Glen Hill, Obihiro, Japan.
Layout, Production and Printing Mika Saido and Renata Szarek (IODP-MI), andSOHOKKAI, Co. Ltd., Sapporo, Japan.
IODP-MI Tokyo, Japanwww.iodp.org
Program Contact: Jamus [email protected]
ICDPGerman Research Center for Geosciences – GFZwww.icdp-online.org
Program Contact: Ulrich [email protected]
All figures and photographs courtesy of the IODP or ICDP, unless otherwise specified.
2 Scientific Drilling, No. 9, April 2010
Scientific Drilling, No. 9, April 2010 3
The Pacific Equatorial Age Transect, IODP Expeditions 320 and 321: Building a 50-Million-Year-Long Environmental Record of the Equatorial Pacific Oceanby Mitchell Lyle, Heiko Pälike, Hiroshi Nishi, Isabella Raffi,
Kusali Gamage, Adam Klaus, and the IODP Expeditions
320/321 Scientific Party
4
16 IODP Expedition 321T: Cementing Operations at Holes U1301A and U1301B, Eastern Flank of the Juan de Fuca Ridge
20 Drilling of Early Cretaceous Oceanic Anoxic Event 1a in Southern France
23 The Great Oxidation Event Recorded in Paleoproterozoic Rocks from Fennoscandia
Technical Developments
30 New Integrated Data Analyses Software Components
32 Automatic Slide-Loader Fluorescence Microscope for Discriminative Enumeration of Subseafloor Life
37 High-Precision Orientation of Three-Component Magnetic Downhole Logs
41 Seismic Prediction While Drilling (SPWD): Looking Ahead of the Drill Bit by Application of Phased Array Technology
45 Arctic Ocean Scientific Drilling: The Next Frontier50 IODP Drilling of the “Shackleton Sites” on the
Iberian Margin: A Plio-Pleistocene Marine Reference Section of Millennial-Scale Climate Change
52 Workshop on Pliocene Climate54 IODP New Ventures in Exploring Scientific
Targets (INVEST): Defining the New Goals of an International Drilling Program
News and Views
65 News and Views
Schedules
back cover IODP and ICDP Expedition Schedules
Science Report
Workshop ReportsProgress Reports
by Mitchell Lyle, Heiko Pälike, Hiroshi Nishi, Isabella Raffi, Kusali Gamage, Adam Klaus, and the IODP Expeditions 320/321 Scientific Party
The Pacific Equatorial Age Transect, IODP Expeditions 320 and 321: Building a 50-Million-Year-Long Environmental Record of the Equatorial Pacific Ocean
doi:10.2204/iodp.sd.9.01.2010
4 Scientific Drilling, No. 9, April 2010
Science Reports Science Reports
Introduction
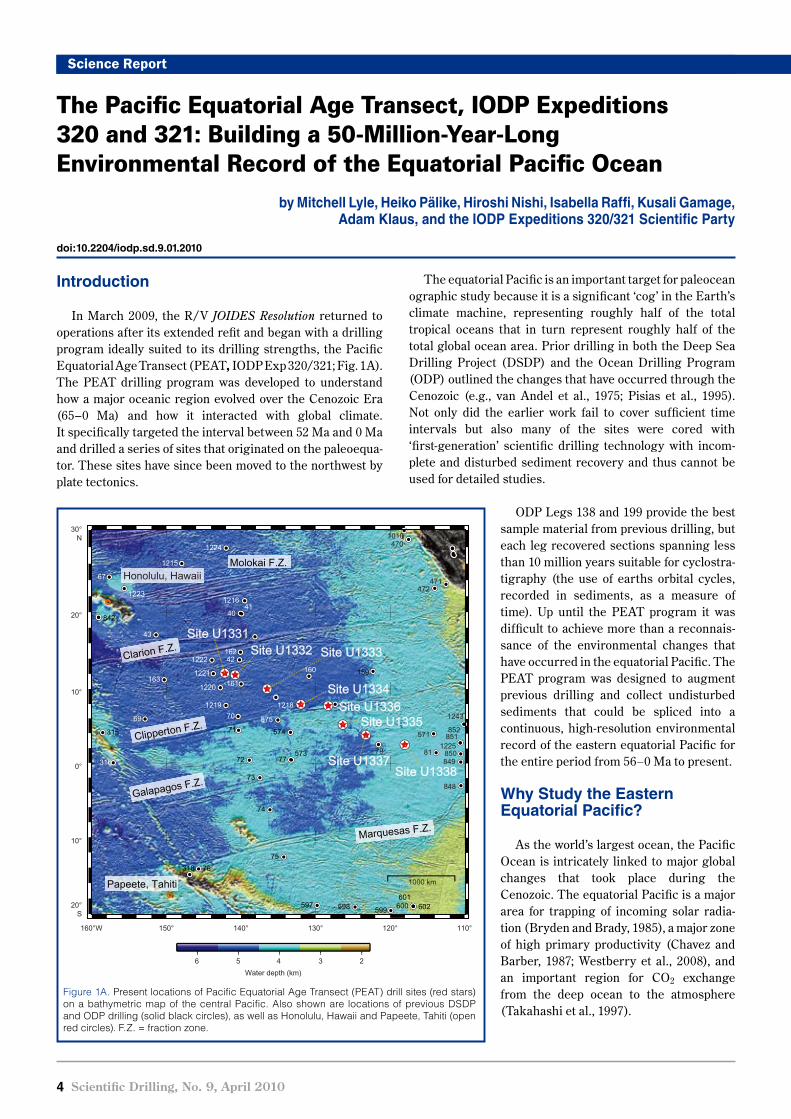
In March 2009, the R/V JOIDES Resolution returned to operations after its extended refit and began with a drilling program ideally suited to its drilling strengths, the Pacific Equatorial Age Transect (PEAT, IODP Exp 320/321; Fig. 1A). The PEAT drilling program was developed to understand how a major oceanic region evolved over the Cenozoic Era (65–0 Ma) and how it interacted with global climate. It specifically targeted the interval between 52 Ma and 0 Ma and drilled a series of sites that originated on the paleoequa-tor. These sites have since been moved to the northwest by plate tectonics.
The equatorial Pacific is an important target for paleocean ographic study because it is a significant ‘cog’ in the Earth’s climate machine, representing roughly half of the total tropical oceans that in turn represent roughly half of the total global ocean area. Prior drilling in both the Deep Sea Drilling Project (DSDP) and the Ocean Drilling Program (ODP) outlined the changes that have occurred through the Cenozoic (e.g., van Andel et al., 1975; Pisias et al., 1995). Not only did the earlier work fail to cover sufficient time intervals but also many of the sites were cored with ‘first-generation’ scientific drilling technology with incom-plete and disturbed sediment recovery and thus cannot be used for detailed studies.
ODP Legs 138 and 199 provide the best sample material from previous drilling, but each leg recovered sections spanning less than 10 million years suitable for cyclostra-tigraphy (the use of earths orbital cycles, recorded in sediments, as a measure of time). Up until the PEAT program it was difficult to achieve more than a reconnais-sance of the environmental changes that have occurred in the equatorial Pacific. The PEAT program was designed to augment previous drilling and collect undisturbed sediments that could be spliced into a continuous, high-resolution environmental record of the eastern equatorial Pacific for the entire period from 56–0 Ma to present.
Why Study the Eastern Equatorial Pacific?
As the world’s largest ocean, the Pacific Ocean is intricately linked to major global changes that took place during the Cenozoic. The equatorial Pacific is a major area for trapping of incoming solar radia-tion (Bryden and Brady, 1985), a major zone of high primary productivity (Chavez and Barber, 1987; Westberry et al., 2008), and an important region for CO2 exchange from the deep ocean to the atmosphere (Takahashi et al., 1997).
Science Report
Figure 1A. Present locations of Pacific Equatorial Age Transect (PEAT) drill sites (red stars) on a bathymetric map of the central Pacific. Also shown are locations of previous DSDP and ODP drilling (solid black circles), as well as Honolulu, Hawaii and Papeete, Tahiti (open red circles). F.Z. = fraction zone.
160°W 150° 140° 130° 120° 110°
20°S
10°
0°
10°
20°
30°N
1000 km
6 5 4 3 2Water depth (km)
4041
42
43
67
69 70
71
72
73
74
7576
77
78
79 81
159160
161
162
163
315
316
318
470
471472
477478479480481
571
573
574
575
597 598 599 600601
602
8423
848
849850
851852
1010
1215
1216
1217
1219
1220
1221
1222
1223
1224
1225
12431218
Honolulu, HawaiiMolokai F.Z.
Clarion F.Z.
Clipperton F.Z.
Galapagos F.Z.
Marquesas F.Z.
Site U1331Site U1332 Site U1333
Site U1338Site U1337
Site U1336Site U1335
Site U1334
Papeete, Tahiti
Scientific Drilling, No. 9, April 2010 5
is linked to the strength of the trade winds, which are in turn strongly tied to the global climate system. Variations in glo-bal climate, inter-hemispheric differences in temperature gradients, and marked changes in the ocean boundaries are all imprinted on the biogenic-rich sediments accumulating in the equatorial zone.
Finally, the equatorial Pacific may have responded to the closing of Tethys gateways, potentially a significant Cenozoic climate driver. Closure of the Panama gateway and the con-striction of the Indonesian Passage should both have affected the Pacific, and indeed, evidence for oceanographic change associated with these gateway restrictions are recorded in
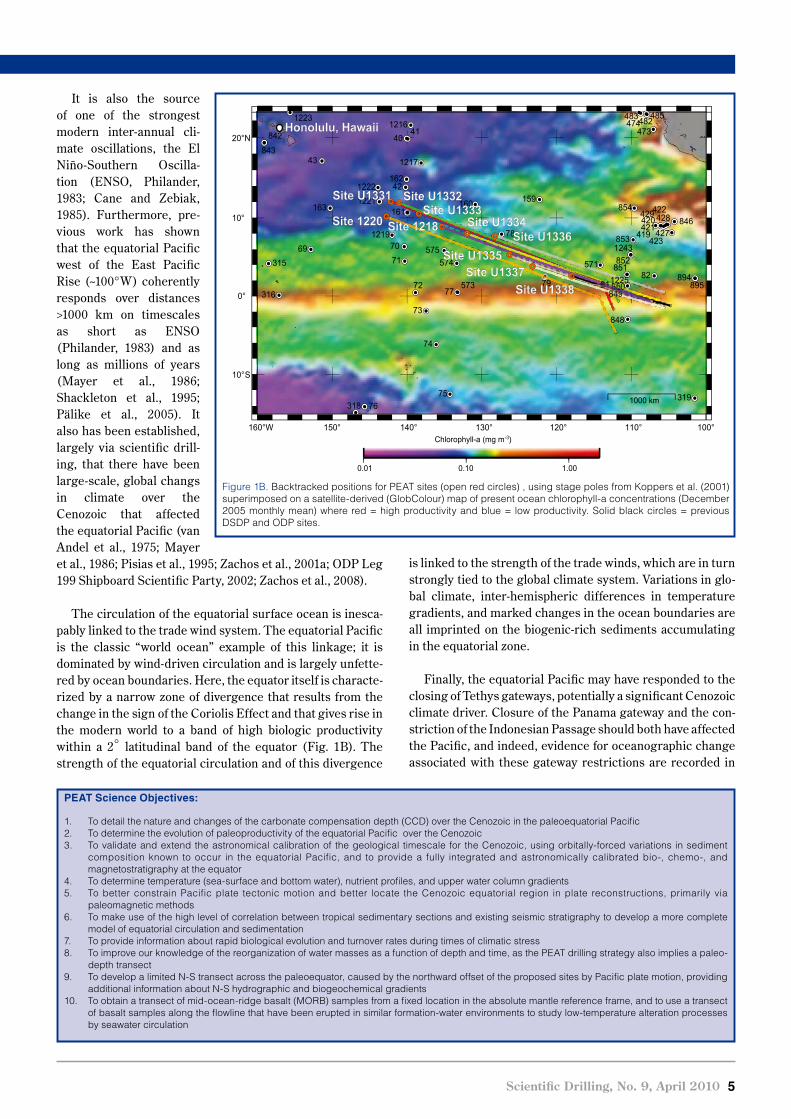
It is also the source of one of the strongest modern inter-annual cli-mate oscillations, the El Niño-Southern Oscilla-tion (ENSO, Philander, 1983; Cane and Zebiak, 1985). Furthermore, pre-vious work has shown that the equatorial Pacific west of the East Pacific Rise (~100°W) coherently responds over distances >1000 km on timescales as short as ENSO (Philander, 1983) and as long as millions of years (Mayer et al., 1986; Shackleton et al., 1995; Pälike et al., 2005). It also has been established, largely via scientific drill- ing, that there have been large-scale, global changs in climate over the Cenozoic that affected the equatorial Pacific (van Andel et al., 1975; Mayer et al., 1986; Pisias et al., 1995; Zachos et al., 2001a; ODP Leg 199 Shipboard Scientific Party, 2002; Zachos et al., 2008).
The circulation of the equatorial surface ocean is inesca-pably linked to the trade wind system. The equatorial Pacific is the classic “world ocean” example of this linkage; it is dominated by wind-driven circulation and is largely unfette-red by ocean boundaries. Here, the equator itself is characte-rized by a narrow zone of divergence that results from the change in the sign of the Coriolis Effect and that gives rise in the modern world to a band of high biologic productivity within a 2° latitudinal band of the equator (Fig. 1B). The strength of the equatorial circulation and of this divergence
Figure 1B. Backtracked positions for PEAT sites (open red circles) , using stage poles from Koppers et al. (2001) superimposed on a satellite-derived (GlobColour) map of present ocean chlorophyll-a concentrations (December 2005 monthly mean) where red = high productivity and blue = low productivity. Solid black circles = previous DSDP and ODP sites.
160°W
10°S
0°
10°
20°N
1000 km
4041
42
43
69 7071
72
73
74
7576
77
78
79 8182
159160161
162
163
315
316
318319
419420421
422
423427
428429
473474482483 485
571
573
574575
842
843
848
849850
851852
853
854846
894895
1216
1217
1219
12211222
1223
1225
1243
Honolulu, Hawaii
Site 1220
Site U1338Site U1337
Site U1335Site U1336
Site U1334Site U1333
Site 1218
Site U1332Site U1331
Chlorophyll-a (mg m )
00.101.010.0
150° 140° 130° 120° 110° 100°-3
PEAT Science Objectives:
To detail the nature and changes of the carbonate compensation depth (CCD) over the Cenozoic in the paleoequatorial Pacific1. To determine the evolution of paleoproductivity of the equatorial Pacific over the Cenozoic2. To validate and extend the astronomical calibration of the geological timescale for the Cenozoic, using orbitally-forced variations in sediment 3. composition known to occur in the equatorial Pacific, and to provide a fully integrated and astronomically calibrated bio-, chemo-, and magnetostratigraphy at the equatorTo determine temperature (sea-surface and bottom water), nutrient profiles, and upper water column gradients4. To better constrain Pacific plate tectonic motion and better locate the Cenozoic equatorial region in plate reconstructions, primarily via 5. paleomagnetic methodsTo make use of the high level of correlation between tropical sedimentary sections and existing seismic stratigraphy to develop a more complete 6. model of equatorial circulation and sedimentationTo provide information about rapid biological evolution and turnover rates during times of climatic stress7. To improve our knowledge of the reorganization of water masses as a function of depth and time, as the PEAT drilling strategy also implies a paleo-8. depth transectTo develop a limited N-S transect across the paleoequator, caused by the northward offset of the proposed sites by Pacific plate motion, providing 9. additional information about N-S hydrographic and biogeochemical gradientsTo obtain a transect of mid-ocean-ridge basalt (MORB) samples from a fixed location in the absolute mantle reference frame, and to use a transect 10. of basalt samples along the flowline that have been erupted in similar formation-water environments to study low-temperature alteration processes by seawater circulation

6 Scientific Drilling, No. 9, April 2010
Science Report
Neogene equatorial Pacific and Caribbean sediments (Keigwin, 1982; Romine and Lombari, 1985; Lyle et al., 1995; Haug and Tiedemann, 1998; Roth et al., 2000; Cane and Molnar, 2001; Lyle et al., 2008).
Design of the PEAT Drilling Program
The primary design cri-terion of PEAT drilling was to recover sediments deposited in the equatorial zone during different time slices of the Cenozoic and assemble them into an equatorial Pacific ‘megasplice’ covering the inter-val from 56 Ma to present. The sedimentary records from “off-splice” latitudes are not ignored, but they give impor-tant insight into the strength of winds, currents, upwelling, productivity, and changes in carbonate compensation depth (CCD) once the chronostratigraphy is properly calibrated (Hovan, 1995; Lyle, 2003; Moore et al., 2004). The off-equatorial sediments are also important for calibration of paleomagnetic stratigraphy with well-developed equatorial Pacific biostratigraphy (Schneider, 1995; Lanci et al., 2005). Text box on the previous page provides the scientific objectives for the PEAT program.
Tectonic motions of the Pacific plate help to make the equatorial Pacific an attractive target for recovery of environ-mental records. The Pacific plate has moved with a north-ward latitudinal component of around 0.25° m.y.-1 for the last 43 million years, and it moved slightly faster to the north prior to that time (Koppers et al., 2001). The north-west movement of the Pacific plate transports the equatorial sedi-ments gradually out from under the zone of highest primary productivity at the equator, resulting in a broad mound of biogenic sediments (Fig. 1B). The transport of crust away from this equatorial zone of rapid sedimentation into regions with lower sedimentation rates keeps older equatorial sedi-ment sections from being buried deeply beneath younger sediments. However, this tectonic movement requires that a complete environmental record of the equatorial region must be spliced together from different drill sites. Assem-bling a complete equatorial record requires periodic shifts to new drill site locations that contain sediments of the appro-priate age deposited within the equatorial zone (Fig. 1).
While the tectonic transport of each drill site complicates reconstruction, the diminished overburden resulting from
transport out of the relatively fast sedimentation regime near the equator also minimizes potential burial diagenesis and allows for good preservation of biogenic sediments. In addi-tion, because of the shallow overburden, most of the sedi-ment column can be cored by the advanced piston coring technique to recover sediments with minimal drilling distur-bance. The northward rate of tectonic displacement, however, is not so large that a traverse of the equatorial zone (within two degrees latitude of the equator) was too rapid to record a reasonable period of equatorial ocean history. Typically drill sites remain within the equatorial zone for 10–20 m.y. before passing beyond the northern edge of high biogenic sedimen-tation.
The Flow Line Strategy and Equatorial Carbonate Compensation Depth
The PEAT drilling program pursued a “flow line” rather than the “timeline” strategy pursued by previous ODP drilling legs for two reasons. A latitudinal transect (timeline) best resolves the structure of the equatorial current system, but for only a limited time window. Ocean crust cools and sinks as it ages, and the sea-floor on which the sedi-ments are deposited approaches the lysocline and CCD within a few million years, especially during the Paleo- gene when the CCD was shallow. Thus, the best preserved part of sections recovered in such timeline transects is restricted by the depth at which carbonate dissolution significantly increases, as well as by the northward move- ment of sediment sections out of the region of high equa-
Ridge crest2.75 km
Wat
er D
epth
(km
)
Age (Ma)
2.5
0 10 20 30 40 50 60 70
3.0
3.5
4.0
4.5
5.0
Site U1338
Site U1337 Site U1335Site U1336 Site U1334
Site U1333Site U1332
Site U1331
Below CCD,estimate prior to drilling
CCD - 100 m
Figure 2. Targeting drill sites prior to coring based on calcium carbonate compensation depth (CCD) history (van Andel, 1975), with additional data from Leg 199. Colored boxes = critical time interval targeted for each site. Colored subsidence lines are critical time intervals where we also expected carbonate to be deposited (i.e., when site is above CCD). Subsidence curves use a subsidence parameter calculated from estimated basement age of PEAT sites and their present-day depth (k = ~0.35). Additional subsidence due to sediment loading was not modeled.
Science Report
Scientific Drilling, No. 9, April 2010 7
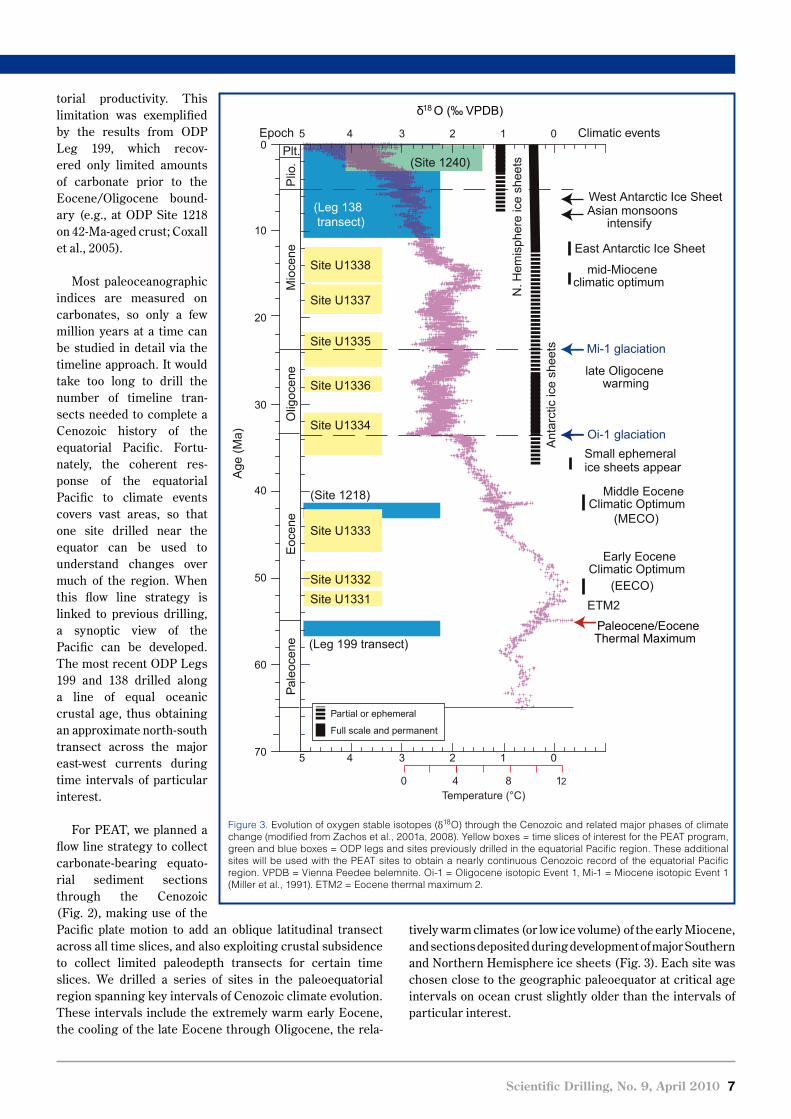
tively warm climates (or low ice volume) of the early Miocene, and sections deposited during development of major Southern and Northern Hemisphere ice sheets (Fig. 3). Each site was chosen close to the geographic paleoequator at critical age intervals on ocean crust slightly older than the intervals of particular interest.
torial productivity. This limitation was exemplified by the results from ODP Leg 199, which recov- ered only limited amounts of carbonate prior to the Eocene/Oligocene bound- ary (e.g., at ODP Site 1218 on 42-Ma-aged crust; Coxall et al., 2005).
Most paleoceanographic indices are measured on carbonates, so only a few million years at a time can be studied in detail via the timeline approach. It would take too long to drill the number of timeline tran-sects needed to complete a Cenozoic history of the equatorial Pacific. Fortu- nately, the coherent res-ponse of the equatorial Pacific to climate events covers vast areas, so that one site drilled near the equator can be used to understand changes over much of the region. When this flow line strategy is linked to previous drilling, a synoptic view of the Pacific can be developed. The most recent ODP Legs 199 and 138 drilled along a line of equal oceanic crustal age, thus obtaining an approximate north-south transect across the major east-west currents during time intervals of particular interest.
For PEAT, we planned a flow line strategy to collect carbonate-bearing equato-rial sediment sections through the Cenozoic (Fig. 2), making use of the Pacific plate motion to add an oblique latitudinal transect across all time slices, and also exploiting crustal subsidence to collect limited paleodepth transects for certain time slices. We drilled a series of sites in the paleoequatorial region spanning key intervals of Cenozoic climate evolution. These intervals include the extremely warm early Eocene, the cooling of the late Eocene through Oligocene, the rela-
Figure 3. Evolution of oxygen stable isotopes (δ18O) through the Cenozoic and related major phases of climate change (modified from Zachos et al., 2001a, 2008). Yellow boxes = time slices of interest for the PEAT program, green and blue boxes = ODP legs and sites previously drilled in the equatorial Pacific region. These additional sites will be used with the PEAT sites to obtain a nearly continuous Cenozoic record of the equatorial Pacific region. VPDB = Vienna Peedee belemnite. Oi-1 = Oligocene isotopic Event 1, Mi-1 = Miocene isotopic Event 1 (Miller et al., 1991). ETM2 = Eocene thermal maximum 2.
0123450
10
20
30
40
50
60
70
Mio
cene
Olig
ocen
eE
ocen
ePa
leoc
ene
Plio
.
Plt.
Age
(Ma)
δ18 O (‰ VPDB)
4 2180Temperature (°C)
Small ephemeralice sheets appear
Paleocene/EoceneThermal Maximum
Oi-1 glaciation
Mi-1 glaciation
Early EoceneClimatic Optimum
ETM2
late Oligocenewarming
mid-Mioceneclimatic optimum
Asian monsoonsintensify
West Antarctic Ice Sheet
East Antarctic Ice Sheet
Middle EoceneClimatic Optimum
(MECO)
(EECO)
Climatic events
(Site 1218)
(Site 1240)
(Leg 138 transect)
(Leg 199 transect)
Full scale and permanent
Partial or ephemeral
Site U1331Site U1332
Site U1336
Site U1333
Site U1334
Site U1338
Site U1337
Site U1335
Epoch
N. H
emis
pher
e ic
e sh
eets
Ant
arct
ic ic
e sh
eets
012345

8 Scientific Drilling, No. 9, April 2010
Science Report
Fig
ure
4. S
tratig
rap
hic
sum
mar
y p
lot f
or P
EA
T d
rill s
ites
and
OD
P S
ite 1
218.
For
eac
h si
te th
e st
ratig
rap
hic
colu
mn
and
litho
log
y ar
e p
lotte
d ag
ains
t dril
led
dep
th, t
oget
her
with
the
mag
neto
stra
tigra
phy
and
bi
ostra
tigra
phi
c zo
natio
n sc
hem
es. T
he E
ocen
e in
terv
als
are
shad
ed in
gre
en, O
ligoc
ene
in li
ght
blu
e, M
ioce
ne in
dar
k an
d lig
ht s
had
es o
f yel
low
, and
Plio
cene
-Ple
isto
cene
in p
ink.
C2r
Late Neo
Depth CSF-A (m)
0 20 40 60 80 100
120
140
160
180
200
I IV V
RP1
6
RP2
1
RP1
9
RP1
8
RP1
7
RP1
5
RP1
4
RP1
3
RP1
2
RP1
1
RP2
0
RP9
RP8
Barre
n
RP1
0
CalcareousNannofossils
NP
22
NP
21
NP
14
NP
15
NP
17
NP
16
NP
23 NN18-20
NP
12
Barre
n
Barre
n
Barre
n
Barre
nC
10r
C12
r
C13
r
C18
r
C19
n
C19
r
C20
n
C20
r
C21
n
C21
r
C23
n.1r
C23
n.2n
C18
n.2n
C18
n.1n
C17
n.1n
C16
n.2n
C13
n
early Eocenemiddle Eocenelate EoceneearlyOligocene
CalcareousNannofossils
Radiolarians
Lithology
Lithologic Units/Subunits
Series
Magnetic Stratigraphy
NN
1
NP
25
NP2
2
NP2
3
NP2
1
NP
18-2
0
NP1
4
NP1
5
NP1
7
NP1
6
NN
1-2
NP
24
Lithology
Lithologic Units/Subunits
Series
Series
Series
I II IIIa
IIIb
IV V
Depth CSF-A (m)
0 20 40 60 80 100
120
140
160
180
200
late Oligocene early Miocene early Oligocene late Eocene middle Eocene
IIa IIb IIc IIIa
IIIb IIIc
VII II III
IVa
IVb
IVc
V
NP18
-2
0
RP19
Barre
n
early Miocene
C18n
.1n
C19r
C18r
C18n
.2n
C17n
.1n
C16n
.2n
C13r
C13n
C12r
C13n
C12r
C12n
C11r
C11n
.2n
C11n
.1n
C10r
C9r
C9n
C8n.
2nC8
r
C6Br
C1r.2
rC2
r.2r
C19n
0 20 40 60 80 100
120
140
160
180
200
RP1
6
RP2
1
RP1
8R
P17
RP1
5
RP1
4
RP1
3
RP2
0
RP2
2
middle Eocenelate Eoceneearly Oligocenelate Oligocene
NP
22
NP
21
NP
15
NP
17
NP
16
NP
23
Bar
ren
Bar
ren
Bar
ren
Bar
ren
NP
14
NN
1
CalcareousNannofossils
Radiolarians
Lithology
Lithologic Units/Subunits
Series
Magnetic Stratigraphy
RN
1
RN
1
Radiolarians
Magnetic Stratigraphy
CalcareousNannofossils
Lithology
Lithologic Units/Subunits
Depth CSF-A (m)
Radiolarians
Forams
Magnetic Stratigraphy
Series
CalcareousNannofossils
Lithology
Lithologic Units/Subunits
Depth CSF-A (m)
Radiolarians
Forams
Magnetic Stratigraphy
Series
CalcareousNannofossils
Lithology
Lithologic Units/Subunits
Depth CSF-A (m)
Radiolarians
Forams
Magnetic Stratigraphy
Series
CalcareousNannofossils
Lithology
Lithologic Units/Subunits
Depth CSF-A (m)
Radiolarians
Forams
Diatoms
Magnetic Stratigraphy
Series
CalcareousNannofossils
Lithology
Lithologic Units/Subunits
Depth CSF-A (m)
Radiolarians
Forams
Diatoms
Magnetic Stratigraphy
Lithology
Lithologic Units/Subunits
Depth (mbsf)
Radiolarians
Magnetic Stratigraphy
RP1
6
RP2
1
RP1
8R
P17
RP1
5
RP1
4
RP1
3
RP2
0
RP2
2
RN
2
RN
1
RP1
9
Barre
n
C6n
C6Ar
C6AA
r.1r
C6Br
C6Cr
C8n.
2nC8
r
C9r
C9n
C10n
.1n
C10r
C12r
C12n
C11r
C11n
.2n
C11n
.1n
C13n
C13r
C16n
.2n
C17n
.1n
C18n
.1n
C18r
C18n
.2n
C19r
C20r
C20n
(5)
Cla
y w
ith c
hert
Cal
care
ous
Nan
nofo
ssil
ooze
Cla
y/cl
ayst
one
Cal
care
ous
ooze
Rad
iola
rian
nann
ofos
sil
ooze
Rad
iola
rian
clay
Cla
yey
nann
ofos
sil o
oze
Nan
nofo
ssil
chal
k
Cla
yey
nann
ofos
sil
chal
k
Fora
min
ifer o
oze
Silic
icla
stic
s
Silic
eous Cla
yey
Rad
iola
rite
Rad
iola
rian
ooze
Dia
tom
ooz
e
Dia
tom
-rad
iola
rian
ooze
Nan
nofo
ssil
radi
olar
ian
ooze
Porc
ella
nite
Rad
iola
rite
Cla
yey
radi
olar
ian
ooze
Dia
tom
ite
Che
rt
Bas
alt
(1) P
lioce
ne/M
ioce
ne (
1.81
Ma)
(2) l
ate/
mid
dle
Mio
cene
(11
.61
Ma)
(3) m
iddl
e/ea
rly M
ioce
ne (
15.9
7 M
a)(4
) Olig
ocen
e/M
ioce
ne (
23.0
3 M
a)(5
) Eoc
ene/
Olig
ocen
e (3
3.8
Ma)
gree
nish
gra
y co
lor
Lith
olog
ic k
ey
Bou
ndar
ies
Nan
nofo
ssil
chal
k w
ith
incr
easi
ng d
iato
ms
190.
6 D
SF (m
)
184.
1 D
SF (m
)
152.
4 D
SF (m
)
Depth CSF-A (m)
CalcareousNannofossils
Radiolarians
Lithology
Lithologic Units/Subunits
Series
Magnetic Stratigraphy
Site
U13
33(4
854
m w
ater
dep
th)
Site
121
8(4
828
m w
ater
dep
th)
Site
U13
34(4
788
m w
ater
dep
th)
Site
U13
36(4
286
m w
ater
dep
th)
Site
U13
35(4
327
m w
ater
dep
th)
Site
U13
37(4
463
m w
ater
dep
th)
Site
U13
38(4
200
m w
ater
dep
th)
Site
U13
32(4
924
m w
ater
dep
th)
Site
U13
31(5
116
m w
ater
dep
th)
V (b
asal
t)
120
140
100
160
180
220
240
260
200
20 40 60 80
0
lower Oligocene middle Eoceneupp. Eoc.upper Oligocene
III IVB
Pleisto-cene u. Mio. m. Mio. lower Miocene
IVAI II
RP2
2
RN
1
RN
2
RN
3R
N4
RN
5R
N6
RN
7
RN
15R
N14 Mixed
RP1
9R
P18
RP2
1
RP2
0
RP1
5
RP1
5/
RP1
4
RP1
6
RP1
7
Bar
ren
C3A
n.1n
C3A
n.2n
C4n
C5nC3n
.1n
C3n
.4n
C3B
nC
4An
C5A
Dn
C5A
Cn
C5A
n.1n
C5A
AnC
5ABn
C5A
n.2n
C5B
n
C5C
nC
5Dn
C5E
nC
6nC
6An.
1nC
6An.
2nC
6AAn
C6A
Ar.1
nC
6AAr
.2n
C6B
n.1n
C6B
n.2n
C6C
n.1n
C6C
n.3n
C6C
n.2n
C7n
.2n
C7n
.1n
C7A
nC
8n.1
nC
8n.2
n
C9n
C10
n.1n
C10
n.2n
C11
n.2n
C12
n
C11
n.1n
300
120
140
100
160
180
220
240
260
200
20 40 60 80
0
280
I II IIIa
IIIb
IVupper Eocene lower Oligocene m. Eocene lower Miocene upper Oligocene middle Miocene
O4-
O5
O6
O3
Barre
n
M2
M6-
N12
M5-
M6
M1a
M1b
O1-
O2
E13
-E16
NN
4
NP2
5
NP2
2
NP2
3
NP2
1
NP1
9
-20
NP1
7
NN
4-5
NP2
4
Barre
n
NN
6
NN
3-N
N4
NN
2
NN
1
NP1
8
O2
RP2
2
RP2
1
RP1
9
RP1
8
RP1
7
RP2
0
Barre
n
RN
3
RN
1
RN
5
RN
4
RN
2
RN
6R
N7
mix
ed
C11
n.2n
C1n
C2n
C3n
.4n
C3A
n.1n
C3B
r.1n
C4A
r.1n
C4A
r.2n
C5r
.1n
C5A
n.1n
C5A
n.2n
C5A
AnC
5ABn
C5A
Cn
C5A
Dn
C5B
n.1n
C5B
n.2n
C5C
n.1n
C5D
nC
5En
C6n
C6A
n.1n
C6A
n.2n
C6A
AnC
6AAr
.1n
C6A
Ar.2
nC
6Bn.
1nC
6Bn.
2nC
6Cn.
1nC
6Cn.
2nC
6Cn.
3n
C7n
.1n
C7n
.2n
C7A
nC
8n.1
nC
8n.2
n
C9n
C10
n.1n
C10
n.2n
C11
n.1n
II
lower Miocene upper Oligocene middle Miocene upper Miocene
120
140
100
160
180
220
240
260
200
20 40 60 80
0
280
300
320
340
360
380
400
420
Pliocene
NN
18
NN
13-1
5
NN
4
NP2
5
NN
19-2
1
NN
6
NN
3
NN
2
NN
1
NN
4-5
NN
16
NN
12
NN
11
NN
10
NN
9
NN
7
RP2
1
Barre
n
RN
1
RP2
2
RN
5
RN
4
RN
3
RN
2
RN
14
RN
10
RN
9
RN
8
RN
7
RN
6
RN
11R
N12
RN
13PL
6
PL1a
M14
M13
a
-M
12 M11
N12 N11
N10
M5-
M6
M4
M2-
M3
M1b
M1a
O6
PT1
a
PL4
-PL5
PL1
-3
M10
M13
b
I II III
Chert
lower Oligocene lower Miocene upper Oligocene middle Miocene
I II III
NN
4
NP2
5
NN
6
NN
1
NN
2
NP2
4
NN
4-5
NP2
3
NP2
2
Bar
ren
RN
1
RP
22
RN
5
RN
4
RN
3
RN
2
RN
6
C7A
n
C7n
.2n
C6C
rC6Cr through C6n?
C6n
C5E
n
C5D
nC
6Cr
C5B
r
C5A
r.1r
C5A
Cn
C5A
Bn
C5A
n.2n
C5D
r
300
120
140
100
160
180
220
240
260
200
20 40 60 80
0
280
M1a
O6
N12
N11
M6-
N10
M5
M3-
M4
M2
M1b O5
O4
O3
O1-
O2
285.
5 D
SF (m
)
421.
1 D
SF (m
)
302.
9DSF
(m)
276.
8 m
bsf
C1n
C1r
.2r
C2A
r
C3r
C3A
r
C4r
.2r
C4A
n
C4A
n
C5n
1n/2
n
C5A
AnC
5AAr
C5A
BnC
5ABr
C5A
Cn
C5A
Dn
C5A
Dr
C5B
n.1n
C5B
n.2n
C5B
n.1r
C5B
r
C5C
n.1n
C5C
rC
5Dn
C5D
rC
5Dr
C5E
nC
5Er
lower Miocene middle Miocene upper Miocene
120
140
100
160
180
220
240
260
200
20 40 60 80
0
280
300
320
340
360
380
400
420
Pliocene
NN
1
RN
3
RN
1
RN
4
RN
5
RN
6
RN
2
M13
a
M5b M4
M1b
-M
2
M5a O6
I II IV
(1)
(2)
(3)
C1n
C2A
r
C3B
r
C4n
C5n
440
Pleistocene
Pleist.
NN
18
NN
15/
NN
14/
NN
13
NN
20-2
1
NN
16
NN
12
NN
19
NN
17
NN
11
RN
10
RN
9
RN
8
RN
7
RN
16/
RN
17R
N14
RN
13
RN
12
RN
11B
RN
11A
NN
6
NN
7
NN
8
NN
10
NN
9
NN
5
NN
4
NN
2
NN
3
M14
-M
13b
M6
M2- M3
M1a
Olig
.Ba
rren
Barre
n
Barre
n
Barre
n
PL1b
-PL
1a
PL2
PT1a
PL5
PL3
PT1b
PL6
M11
M10
N12 N11
N10
F.do
liolu
s
N.re
inho
ldii
R.
prae
berg
onii
T. c
onve
xa
N. j
ouse
ae
T. y
abei
N. m
ioce
nica
C.n
icob
aric
a
C.le
wis
ianu
s
N. p
orte
ri
C.g
igas
v.di
oram
a
C.
cosc
inod
iscu
s
C.p
eplu
m
A.
mor
onen
sis
T. p
ileus
C. e
lega
ns
C5A
An
C5A
Bn
C5A
Cn
C5A
Dn
C5B
n.2n
C5B
r
C2A
n.1n
C2A
n.2n
C1r
.1n
C1r
.2r
C3n
.3n
C3n
.4n
C3A
n.1n
C3n
.2n
C3n
.1n
C3A
n.2n
C3A
r
C4A
n
C4r
lower Miocene middle Miocene upper Miocene
120
140
100
160
180
220
240
260
200
20 40 60 80
0
280
300
320
340
360
380
400
420
Pliocene
RN
3
RN
4
RN
5
RN
6
M13
a
M5b
M3-
M4
M5a
I II IV
Pleistoc.
NN
18
NN
15/
NN
14/
NN
13
NN
20-2
1
NN
16
NN
12
NN
19
NN
17
NN
11
RN
10
RN
9
RN
8
RN
7
RN
16/
RN
17R
N14
RN
13
RN
12
RN
11B
RN
11A
NN
6
NN
7
NN
8
NN
10
NN
9
NN
5
M14
Barre
n
Barre
n
PL1b
-PL
1a
PL2
PT1a
PL5
PL3
PT1b
PL6
M11
-M13
a
M10
N12 N11
N10
F.do
liolu
s
N.re
inho
ldii
R.
prae
berg
onii
T. c
onve
xa
N. j
ouse
ae
T. y
abei
N. m
ioce
nica
C.le
wis
ianu
s
N. p
orte
ri
C.g
igas
v.di
oram
a
C.
cosc
inod
iscu
s
C.p
eplu
m
A.
mor
onen
sis
III
C1n C2A
r
C5n
C2A
n.1n
C1r
.1n
C2r C4A
n
M13
b
M13
a
M11
NN
4-5
M2
M2-
M3
Rar
e-Ba
rren
NN
4
(4)
Pliocene
C2r
449.
8 D
SF (m
)
416.
1 D
SF (m
)
NW
SE
low
er E
ocen
e
mid
dle
and
uppe
r Eoc
ene
Olig
ocen
e
low
er M
ioce
ne
mid
dle
Mio
cene
uppe
r Mio
cene
Plio
cene
-Ple
isto
cene
Stra
tigra
phic
key

Science Report
Scientific Drilling, No. 9, April 2010 9
the PEAT transect (U1334 and U1336) and thins in both directions, marking the Oligocene equatorial zone.
The study of paleoceanographic processes—and the variations and evolution over time of mass accumulation rates across the PEAT transect—depend on a detailed knowledge of sedimentation rates. The integrated bio- and magnetostratigraphies obtained for all expedition sites are the starting point to allow us to fully exploit and understand the complex interplay of productivity, dissolution, and spatial biogenic sedimentation patterns. The sedimentation rates vary from site to site over time depending on crustal sub-sidence, crustal age, and the length of time spent in the equa-torial region (Fig. 5).
Our results reveal the change of linear sedimentation rate in both the latitudinal and age transect components of the PEAT program. The comparison between sites reveals that the highest sedimentation rates occur within the Oligocene and Miocene equatorial zones (Sites U1334 to U1338), with sedimentation patterns similar to the modern equatorial region (highest deposition at the equator). However, sedi-mentation rates within the Eocene equatorial zone were not significantly higher than those outside of the equatorial zone. This result will be confirmed with revised estimates post-cruise of Pacific plate motion vectors.
In this way we were able to track the paleoceano-graphic conditions at the paleoequator in the best preserved sediments obtai-nable. We can also make use of the high level of cor-relation between tropical sediment sections and seis-mic stratigraphy to develop a more complete model of equatorial productivity and sedimentation.
Drilling Results
Detailed descriptions of PEAT drilling can be found in the Exp 320 and Exp 321 Preliminary Reports (see Related Web Links), and in the Exp 320/321 Initial Reports (in press). Eight sites (U1331 to U1338) were drilled; their basement ages span from 52 Ma to 18 Ma. PEAT shipboard science has determined that the sediments recov-ered fill gaps from previous drill-ing and can be used to create a high-resolution megasplice of equatorial Pacific sedimentation. Cross-calibration of magneto-, bio-, and ultimately orbital stratigraphy will significantly improve chronological estimates of sedimentation and ages of significant events. The study of fluxes of different sediment components will then add a new dimension of information about biogeo-chemical cycling.
The PEAT program recovered sediments similar in lithol-ogy to previous DSDP and ODP expeditions to the central equatorial Pacific region (Lyle et al., 2002). Figure 4 summa-rizes the lithostratigraphy of the northwest—southeast transect of sites drilled during Expedition 320/321 together with the sedimentary sequence from ODP Site 1218, which is also included in the PEAT flow line strategy. As expected due to the decreasing age of crust toward the southeast, the Eocene sequence (Fig. 4, green shading) thins from northwest to southeast, pinching out east of Site U1334, the last site drilled on Eocene crust. In contrast, the Miocene sequence (Fig. 4, yellow shading) thickens substantially from northwest to southeast. The Miocene section is thickest at Site U1337, which targeted crust of latest Oligocene age, and thus is the drill site that spent the most time within the Miocene equatorial zone. The Oligocene sequence (Fig. 4, blue shading) is thickest in the middle of
Figure 5. Summary of chronostratigraphic datum levels identified at PEAT sites plotted versus corrected composite depth (spliced depth compacted back to depth measured by the drill string). A steeper slope corresponds to a higher sedimentation rate. Yellow boxes mark approximate times when each drill site was within the equatorial zone (±2° N or S of the equator) based on estimated absolute motion of the Pacific tectonic plate.
0
50
100
150
200
250
300
350
400
0 10 20 30 40 50
Dep
th c
orre
cted
CC
SF-
A (m
)
Age (Ma)
EoceneMiocenelate middle earlylate earlyearlymiddlelate
450
Pleist./Plioc.
Sedimentation rates (m m.y. )
5
10
2040
Site U1331
Site U1332
Site U1333
Site U1334
Site U1335
Site U1336
Site U1337
Site U1338
Oligocene
-1
sites in equatorial zone (±2° N,S)

10 Scientific Drilling, No. 9, April 2010
Science Report
Time-dependent changes in sediment production and preservation strongly affected the Eocene sedimentary record. The linear sedimentation rates of the middle Eocene were high for the pelagic realm, frequently over 10 m m.y.-1, with a maximum of 18 m m.y.-1 at Site U1331. Rates for the middle Eocene at Sites U1332 and 1333 were similar (6–8 m m.y.-1). The sedimentation rates during the late Eocene decreased to 3.5–6 m m.y.-1 at Sites U1331 through U1333. Sediment-ation rates were highest (>20 m m.y.-1) during the early to late Oligocene at Sites U1333 and 1334, and in the early and middle Miocene at Sites U1337 and U1338.
All sites have either a hiatus or reduced sedimentation rates for the youngest sediments because they have moved out of the Neogene equatorial zone and into regions with low modern deposition rates. The data from the PEAT sites,—when combined with available data from ODP Leg 138 for 0–10 Ma and ODP Leg 199 for intervals between 32 Ma and 42 Ma (Site 1218) and >52 Ma (Sites 1219 to 1221),—will produce a continuous history of sedimentation rates in the equatorial Pacific region for the past 56 m.y.
The combined results of ODP Leg 199 and the PEAT program provide the ability to study important intervals of climate change during the Cenozoic within the equatorial Pacific, and significant post-cruise research is aimed at these intervals. Important climate intervals include the early Eocene climatic optimum (EECO, Zachos et al., 2001a; Lyle et al., 2002; Sites U1331 and U1332), the middle Eocene climatic optimum (MECO; Bohaty and Zachos, 2003; Bohaty et al., 2009; Site U1333), the middle through late Eocene
carbonate accumulation events (Lyle et al., 2005; Sites U1333 and U1334), the Eocene-Oligocene (EO) transition (Coxall et al., 2005; Site U1334), the late Oligocene warming (Pälike et al., 2006a; Site U1336), the Oligocene-Miocene (OM) tran-sition (Zachos et al., 2001b; Pälike et al., 2006b; Sites U1335, U1336, and U1337), and the middle Miocene glaciation inten-sification event (Holbourn et al., 2005; Sites U1337 and U1338).
Initial Results and Future Directions
The highest shipboard priorities for a paleoceanographic drilling program are the development of a detailed sediment stratigraphy and the identification of a continuous sediment section that can be spliced together from multiple holes drilled at each site. In contrast, most of the scientific insight comes after drilling ceases and the scientific party has a chance to analyze samples collected from the cores along the spliced sedimentary sections. The sediment sampling was completed at the end of October 2009, and the analyses are just beginning. Nevertheless, broad-scale patterns can be discerned, and initial data have provided tantalizing indications of future results.
Because of the drilling design, the PEAT program was successful in collecting carbonate sediments of the late Eocene age and crossing the Eocene-Oligocene boundary. Carbonate sediments were also recovered for significant parts of the Eocene where it had been impossible from previous equatorial Pacific drilling to study the proxy climate information stored in carbonates. In addition, the Neogene PEAT sites are the first essentially complete Miocene sedi-
ment sections from the equa-torial Pacific. These Miocene sediment sections will pro-vide the first high-resolution studies of this poorly under-stood Cenozoic interval. Stable isotope studies on all the new sedimentary sequences will provide the backbone of in- formation to understand the interrelationships between development of polar ice and equatorial circulation.
We also expect to re- cover important data about sea-surface temperature. Reconnaissance studies of alkenones (C. Beltran, unpublished) show a 4°C cooling of the equatorial Pacific since the middle Miocene. Most of the PEAT sediment splices are now being scanned using X-ray
Figure 6. CaCO3% vs. depth and age from initial analysis of PEAT results. The carbonate compensation depth (CCD) through the Cenozoic is shown to be very dynamic during the Eocene, with many excursions of ~500 m. The Neogene has generally a deeper CCD and milder excursions.
CAE-3
E/O
CAE-4
CAE-2
20
40
60
80
100
CaCO 3 (%)
U1331U1332U1333U1334U1335U1336U1337U133812181220
Wat
er D
epth
(m)
3000
3500
4000
4500
5000
5500
Age (Ma)0 5 10 15 20 25 30 35 40 45 50 55
Carbonate Concentrations
Science Report
Scientific Drilling, No. 9, April 2010 11
2003). The PEAT cores allow us to refine our knowledge of temporal and spatial variation in sediment accumulation rates resulting from plate movement, varying biologic productivity at the equatorial divergence, and carbonate preservation (Fig. 6). The shipboard determinations of CaCO3 concentrations reveal the carbonate accumulation events of Lyle et al. (2005) as sharp carbonate concentration fluctuations at ~44 Ma, 41 Ma, 39 Ma, and 36 Ma across Sites U1331 through U1334 and ODP Site 1218, followed by a sharp transition into much higher carbonate accumulation rates from the Eocene into the Oligocene. PEAT shipboard results reveal a complex Eocene latitudinal pattern, where Sites U1331, U1332, and U1334 track the equatorial CCD that well matches the signal observed from ODP Site 1218. On the other hand, Site U1333, which is slightly to the north of the equatorial zone during the E-O transition, shows significantly more carbonate accumulation.
The early Eocene equatorial CCD was much shallower than previously thought. Site U1332, drilled on 50-Ma crust, recovered very little carbonate in the basal sediment section, in contrast to Site U1331 that is just ~two million years older. The estimated equatorial Pacific CCD at ~49 Ma is <3000 m paleodepth. Surprisingly, the late Oligocene (23–27 Ma) CCD was also found to be 300 m shallower than previously estimated. This shallower CCD, at a paleodepth of approxi-mately 4.5 km, along with associated reduced carbonate
Fluorescence (XRF) to collect high-resolution profiles of chemical data for much of the time interval. Furthermore, quantitative studies of micro-fossil assemblages will give new insights into the changes in the equatorial Pacific eco- system, including the devel-opment of a diatom-based ecology in the late middle Miocene, with significant monospecific diatom intervals during the transition (Kemp and Baldauf, 1993). Finally, downhole logging will enable refinement of the equatorial seismic stratigraphy devel-oped by Mayer et al. (1985) from Deep Sea Drilling Project Leg 85.
One of the key achieve-ments of the shipboard scien-tific program was better constraint of Cenozoic strati- graphy, showing the potential to achieve detailed bio-, magneto-, and chemostrati-graphies for the Cenozoic from the early Eocene to the present, within an astronomically tuned age model. Shipboard results indicate that we can achieve this objective based on the observation that even decimeter-scale features in the sedimentary record from the drilled sites can be correlated over large distances across the Pacific sea-floor (Pälike et al., 2005). The PEAT program will leave a lasting legacy through detailed correlation of all major fossil groups, a detailed magnetostratigraphy with over 800 dated reversals, and sedimentary cycles that can be correlated across large distances in the Pacific Ocean.
One of the primary objectives of the PEAT program is to detail the nature and changes of the CCD throughout the Cenozoic in the paleoequatorial Pacific (see text box on page 5), with potential links to organic matter deposition (Olivarez Lyle and Lyle, 2006). The choice of drilling loca-tions, specifically targeting positions on the palaeoequator—to track carbonate preservation during crustal subsidence through time (Fig. 2)—followed the initial work on DSDP sites by van Andel et al. (1975). The first PEAT reconstruc-tion of the Cenozoic CCD (Fig. 6) was augmented by addi-tional results from ODP Leg 199 (Lyle et al., 2005; Rea and Lyle, 2005). One of the very significant contributions of Leg 199 drilling was the latitudinal mapping of CCD varia-tions with time. During the Eocene, a generally shallow CCD appeared to be deeper outside a zone ±4º from the equator, opposite the pattern established during the Neogene (Lyle,
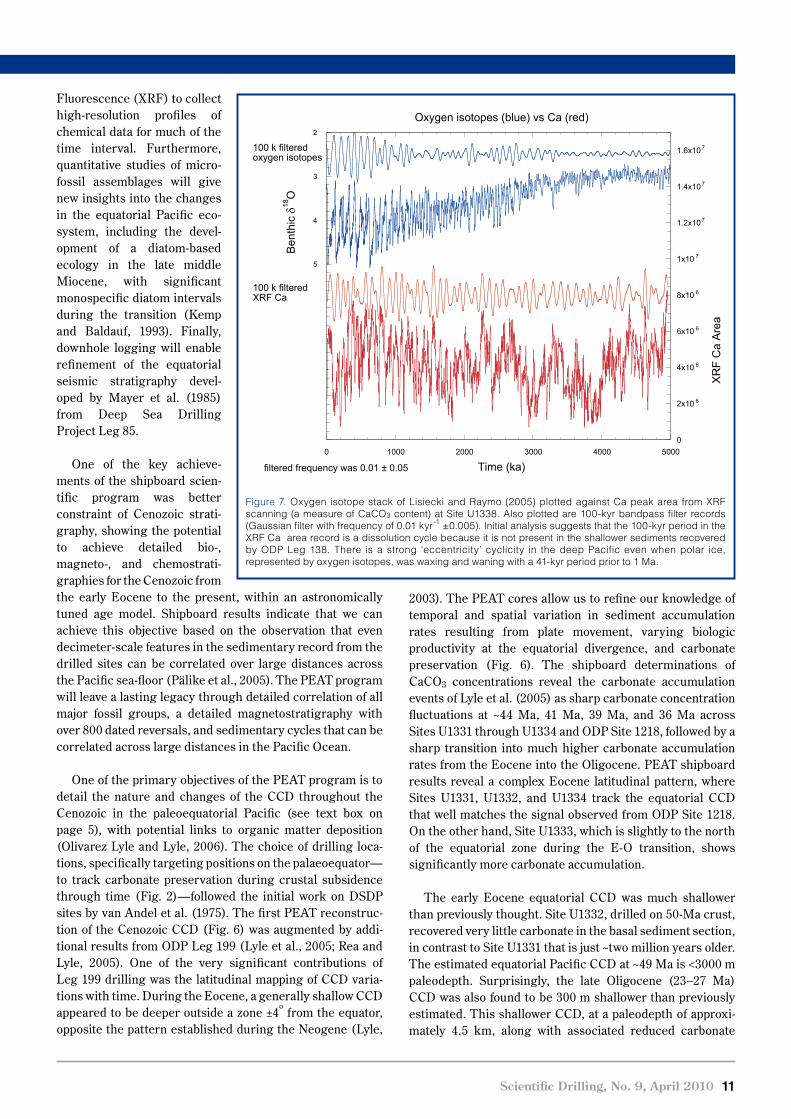
Figure 7. Oxygen isotope stack of Lisiecki and Raymo (2005) plotted against Ca peak area from XRF scanning (a measure of CaCO3 content) at Site U1338. Also plotted are 100-kyr bandpass filter records (Gaussian filter with frequency of 0.01 kyr -1 ±0.005). Initial analysis suggests that the 100-kyr period in the XRF Ca area record is a dissolution cycle because it is not present in the shallower sediments recovered by ODP Leg 138. There is a strong ‘eccentricity’ cyclicity in the deep Pacific even when polar ice, represented by oxygen isotopes, was waxing and waning with a 41-kyr period prior to 1 Ma.
2
3
4
5
0
2x10 6
4x10 6
6x10 6
8x10 6
1x10 7
1.2x10⁷
1.4x10⁷
1.6x10⁷
0 1000 2000 3000 4000 5000
Oxygen isotopes (blue) vs Ca (red)
Ben
thic
δ 18
O
XR
F C
a A
rea
Time (ka)filtered frequency was 0.01 ± 0.05
100 k filtered oxygen isotopes
100 k filtered XRF Ca

12 Scientific Drilling, No. 9, April 2010
Science Report
fluxes to the sea-floor, may be linked to a late Oligocene warming before the O/M boundary. The O/M boundary interval was first fully recovered in the equatorial Pacific at ODP Site 1218 (Fig. 3; see also suppl. Fig. 3 in Pälike et al., 2006a). Neogene carbonate minima are well documented in the Neogene PEAT sites, including a CCD minimum bet-ween 17 Ma and 18 Ma, a ‘carbonate crash’ interval around 10 Ma, and a newly delineated CCD minimum at about 4 Ma that occurs concurrently with enhanced deposition of diato-maceous sediments. The design of our drilling locations in combination with existing data will allow us to generate a three-dimensional view of Cenozoic CCD evolution during post-cruise research and to explore the linkage between Cenozoic changes in atmospheric CO2 and global warmth.
Post-cruise research will undoubtedly enhance our under-standing of the strength and timing of the CCD events and how they relate to other globally important Earth systems. These studies are intended in part to develop the tie between these events and orbital insolation changes. Reaching a sample resolution high enough to detect orbital insolation variations is an important PEAT objective, necessary to improve the Cenozoic age model and to confirm that events across the equatorial Pacific are synchronous.
Initial XRF scanning results from the Neogene (Lyle et al., unpublished) using the new Texas A&M XRF scanner at the IODP Gulf Coast Repository demonstrate how important information will result from detailed studies of the PEAT sediment (Fig. 7). Shown is a comparison between the 0–5 Ma XRF Ca peak area in Site U1338 and the Lisiecki and Raymo (2005) LR04 benthic oxygen isotope stack. The Ca peak area is correlated to the CaCO3 content in the U1338 sediments. The age model used in this example for U1338 is the linear shipboard age model, which has not been further tuned.
The benthic isotope record clearly shows a progression from low amplitude 41-kyr obliquity cycles to higher ampli-tude 41-kyr cycles at 2.7 Ma, and finally to the dominance of 100-kyr eccentricity cycles by 1 Ma. The development of the 100-kyr power within the oxygen isotope record is most easily observed in the 100-kyr bandpass filtered isotope record. For the oxygen isotope record older than 1 Ma, the spectral power in the 100-kyr band is only about 0.2 times that of the 41-kyr band. The evolution of the benthic isotope record may be caused by the development of Northern Hemisphere ice sheets or at least increased sensitivity to
Figure 8. Correlation between the seismic reflection records from DSDP Leg 85 Site 574, IODP Expedition 321 Site U1337 (line 4 of the AMAT-03 site survey in the PEAT-7 area), and logging data from Hole U1337A. Correlations between the seismic profile at Site U1337 and the logs are based on velocities from VSP experiments and those measured by the velocity log, as well as the correlations to the age of sediments associated with the sediment physical property anomalies. The seismic horizons are associated with major fluctuations of carbonate; they appear to be chronostratigraphic, as originally suggested by Mayer et al. (1986).
0 Ma (seafloor)4.2 Ma7.6-8 Ma8.3-10.5 Ma13.7-14.0 Ma17.1 Ma18.0-21.6 Ma
Site 574
1755
Site U1337
Shotpoint175017601765
5.8
5.9
6.0
6.1
6.2
6.3
6.4
6.5
6.6
6.7
Dep
th W
MS
F (m
)
0 25(gAPI)Gamma ray (p2)0 20(inch)
Bit size0 20(inch)
Hole diameter(p2)
1 2(g cm-3)Density (p2)
1 2(g cm-3 )Density (p1)
1 2(g cm-3)
MAD
0.3 2(Ωm)SFLU (p2)
0.3 2(Ωm)IMPH (p2)
0
50
100
150
200
250
300
350
400
450
1.4 2.4(km s )P-velocity (VSP)1.4 2.4(km s )P-velocity (p2)
1.4 (km s )P-velocity (p1)
Two-
way
trave
ltim
e (s
)
Site U1337
2.4-1
-1
-1

Science Report
Scientific Drilling, No. 9, April 2010 13
high latitude insolation prior to the late Pleistocene (Lisiecki and Raymo, 2005).
In contrast, the U1338 Ca record retains spectral power in the 100-kyr band throughout the five-million-year record, suggesting that there is a linkage between carbonate burial and eccentricity (Pälike et al., 2006a). For the interval older than 1 Ma, the 100-kyr power in the Ca record is roughly six times greater than the 41-kyr power. It is interesting to note that records for 0–6 Ma from ODP Leg 138 eastern Pacific sites did not record high 100-kyr power (Hagelberg et al., 1995), but they do find high variability associated with obliquity (41 kyr) and precession (23 kyr and 19 kyr). The significant level of 100-kyr power in the older, deeper PEAT site suggests that dissolution (changes in CO2 storage) may play a significant role in the development of the ~100-kyr CaCO3 cycle in the central Pacific. Furthermore, it leads to the speculation that the abyssal carbon cycle played a role in ‘looking in’ the glacial cycles to a ~100-kyr rhythm.
Another major objective of PEAT drilling was to ground-truth the equatorial Pacific seismic stratigraphy so that seis-mic reflection records can be used to connect the sediment column described at each drill site to form a regional model. The PEAT expeditions have collected important new physi-cal property data so that we can confirm the Mayer et al. (1985) seismic stratigraphy and also tie the eastern Pacific seismic stratigraphy with that of the central Pacific.
The equatorial Pacific is a classic ‘binary’ sediment system, with variable amounts of biogenic calcium carbonate and biosiliceous sediment components but very little clay. It is also well known that carbonate contents of equatorial Pacific sediments can be estimated from the bulk density, because carbonates have lower porosity and higher grain density than biosiliceous sediments (Mayer, 1991). Consequently, physical properties records contain meter-scale cyclicity that will ultimately be useful for orbital-tuning time scales, which is one of the PEAT objectives. Mayer et al. (1985) developed a seismic strati-graphy for the central Pacific at Site 574 on DSDP Leg 85. They noted that major seismic horizons were caused by density variations associated with low carbonate intervals. They proposed that the seismic horizons were isochrons because they were caused by paleoceanographic changes in deposition and/or dissolution of calcium carbonate.
Mayer et al. (1985) did not have logs to measure in situ velocities in support of their interpretation. One of the impor-tant PEAT experiments therefore was to use a combination of downhole measurements (vertical seismic profile (VSP) and standard logs) with physical properties measurements on core. We were able to run the VSP log at Site U1337 (Fig. 8) and Site U1338. Figure 8 is an initial comparison between the Site 574 seismic stratigraphy of Mayer et al. (1985) and the shipboard results for Site U1337. The events correlate in age, as would be predicted by Mayer et al. (1985). Site 574 is
at essentially the same latitude as Site U1337 but is located more than 1000 km to the west. The extent of the correlat-able seismic horizons across the Pacific helps to define the magnitude of the paleoceanographic events that caused them. Post-cruise studies will focus upon better defining the seismic strati-graphy at both Sites U1337 and U1338, allowing new tie points for seismic stratigraphic study of the equatorial Pacific sediment bulge (Mitchell et al., 2003).
Outlook for the Future
The initial results from PEAT drilling illustrate the funda-mental thrusts of the post-cruise science and provide a taste of new scientific insights to be reported in the next few years. We expect these insights to include a fundamental improve-ment of the Cenozoic time scale, an exploration of the unstable Eocene CCD and its relation to atmospheric CO2, a much better understanding of the interactions between the carbon cycle and climate, and a better understanding of the history of major pelagic nutrient cycles and productivity. All of these studies will give important insights on how diffe-rent Earth systems have interacted in the past and may respond in the near future.
Acknowledgements
We thank the ship’s crew and drilling crew on the JOIDES Resolution, and the technical staff of the U.S. Implementing Organization who made it possible to translate our plans into recovered core. M. Lyle also acknowledges support from the U.S. Science Advisory Committee for his participation and for NSF grant OCE-07253011.
References
Bohaty, S.M., and Zachos, J.C., 2003. Significant Southern Ocean warming event in the late middle Eocene. Geology, 31(11):1017–1020, doi:10.1130/G19800.1.
Bohaty, S.M., Zachos, J.C., Florindo, F., and Delaney, M.L., 2009. Coupled greenhouse warming and deep-sea acidification in the middle Eocene. Paleoceanogr., 24: PA2207, doi:10.1029/ 2008PA001676, 16 pp.
Bryden, H.L., and Brady, E.C., 1985. Diagnostic model of the three-dimensional circulation in the upper equatorial Pacific Ocean. J. Phys. Oceanogr., 15:1255–1273, doi:10.1175/1520-0485(1985)015<1255:DMOTTD>2.0.CO;2.
Cane, M.A., and Molnar, P., 2001. Closing of the Indonesian Seaway as a precursor to east African aridification around 3-4 million years ago. Nature, 411:157–162, doi:10.1038/35075500.
Cane, M.A., and Zebiak, S.E., 1985. A theory for El Niño and the Southern Oscillation. Science, 228:1085–1087、doi:10.1126/science.228.4703.1085.
Chavez, F.P., and Barber, R.T., 1987. An estimate of new production in the equatorial Pacific. Deep Sea Res., 34:1229–1243, doi:10.1016/0198-0149(87)90073-2.
Coxall, H.K., Wilson, P.A., Pälike, H., Lear, C., and Backman, J., 2005. Rapid stepwise onset of Antarctic glaciation and deeper
14 Scientific Drilling, No. 9, April 2010
Science Report
calcite compensation in the Pacific Ocean. Nature, 433:53–57, doi:10.1038/nature03135.
Hagelberg, T.K., Pisias, N.G., Mayer, L.A., Shackleton, N.J., and Mix, A.C., 1995. Spatial and temporal variability of late Neogene equatorial Pacific carbonate, Leg 138. In Pisias, N.G., Mayer, L.A., Janecek, T.R., Palmer-Julson, A., and van Andel, T.H. (Eds.), Proc. ODP, Sci. Results, 138, College Station, Texas (Ocean Drilling Program), 321–336.
Haug, G.H., and Tiedemann, R., 1998. Effect of the formation of the Isthmus of Panama on Atlantic Ocean thermohaline circulation. Nature, 393:673–676, doi:10.1038/31447.
Holbourn, A., Kuhnt, W., Schulz, M., and Erlenkeuser, H., 2005. Impacts of orbital forcing and atmospheric carbon dioxide on Miocene ice-sheet expansion. Nature, 438(7067):483–487, doi:10.1038/nature04123.
Hovan, S.A., 1995. Late Cenozoic atmosphere circulation intensity and climatic history recorded by eolian deposition in the eastern equatorial Pacific Ocean, Leg 138. In Pisias, N.G., Mayer, L.A., Janecek, T.R., Palmer-Julson, A., and van Andel, T.H. (Eds.), Proc. ODP, Sci. Results, 138, College Station, Texas (Ocean Drilling Program), 615–626.
Keigwin, L.D., 1982. Isotopic paleoceanography of the Caribbean and East Pacific: role of Panama uplift in Late Neogene time. Science, 217(4557):350–353, doi:10.1126/science.217.4557. 350.
Kemp, A.E., and Baldauf, J.G., 1993. Vast Neogene laminated diatom mat deposits from the eastern equatorial Pacific Ocean. Nature, 362:141–143, doi:10.1038/362141a0.
Koppers, A.A.P., Morgan, J.P., Morgan, J.W., and Staudigel, H., 2001. Testing the fixed hotspot hypothesis using Ar-40/Ar-39 age progressions along seamount trails. Earth Planet. Sci. Lett., 185(3-4):237–252, doi:10.1016/S0012-821X(00)00387-3.
Lanci, L., Pares, J.M., Channell, J.E.T., and Kent, D.V., 2005. Oligocene magneto-stratigraphy from Equatorial Pacific sediments (ODP Sites 1218 and 1219, Leg 199). Earth Planet. Sci. Lett., 237:617–634, doi:10.1016/j.epsl.2005.07.004.
Lisiecki, L.E., and Raymo, M.E., 2005. A Pliocene-Pleistocene stack of 57 globally distributed benthic δ18O records. Paleoceanogr., 21:PA1003, doi:1010.1029/2004PA001071, 17 pp.
Lyle, M., 2003. Neogene carbonate burial in the Pacific Ocean. Paleoceanogr., 18(3):1059, doi:10.1029/2002PA000777.
Lyle, M., Barron, J., Bralower, T.J., Huber, M., Olivarez Lyle, A., Ravelo, A.C., Rea, D.K., and Wilson, P.A., 2008. The Pacific Ocean and Cenozoic evolution of climate. Rev. Geophys., 46:RG2002, doi:10.1029/2005RG000190.
Lyle, M., Dadey, K., and Farrell, J., 1995. The Late Miocene (11-8 Ma) eastern Pacific carbonate crash: evidence for reorganiza-tion of deep water circulation by the closure of the Panama Gateway. In Pisias, N.G., Mayer, L.A., Janecek, T.R., Palmer-Julson, A., and van Andel, T.H. (Eds.), Proc. ODP, Sci. Results, 138, College Station, Texas (Ocean Drilling Program), 821–837.
Lyle, M.W., Olivarez Lyle, A., Backman, J., and Tripati, A., 2005. Biogenic sedimentation in the Eocene equatorial Pacific: the stuttering greenhouse and Eocene carbonate compen-sation depth. In Lyle, M., Wilson, P., Janecek, T.R., and Firth, J. (Eds.), Proc. ODP, Sci. Results, 199, College Station, Texas (Ocean Drilling Program), 35 pp.
Lyle, M., Wilson, P.A., Janecek, T.R., and the ODP Leg 199 Shipboard Scientific Party, 2002. Proc. ODP Init. Repts., 199, College Station, Texas (Ocean Drilling Program).
Mayer, L.A., 1991. Extraction of high-resolution carbonate data for palaeoclimate reconstruction. Nature, 352:148–50, doi:10.1038/352148a0.
Mayer, L.A., Shipley, T.H., Theyer, F., Wilkens, R.H., Winterer, E.L., Seismic modeling and paleoceanography at Deep Sea Drilling Project Site 574. In: Mayer, L.A., Theyer, F., Thomas, E., et al., Init. Repts. DSDP 85: Washington, U.S. Govt. Printing Office, 947–970, 1985.
Mayer, L.A., Shipley, T.H., and Winterer, E.L., 1986. Equatorial Pacific seismic reflectors as indicators of global oceano-graphic events. Science, 233:761–764, doi:10.1126/science. 233.4765.761.
Miller, K.G., Wright, J.D., and Fairbanks, R.G., 1991. Unlocking the Ice House, Oligocene-Miocene oxygen isotopes, eustasy, and margin erosion. J. Geophys. Res., 96(B4):6829–6848, doi:10.1029/90JB02015.
Mitchell, N.C., Lyle, M.W., Knappenberger, M.B., and Liberty, L.M., 2003. The lower Miocene to present stratigraphy of the equatorial Pacific sediment bulge and carbonate dissolution anomalies. Paleoceanogr., 18:1038, doi:10.1029/2002PA 000828.
Moore, T.C., Backman, J., Raffi, I., Nigrini, C., Sanfilippo, A., Pälike, H., and Lyle, M., 2004. The Paleogene tropical Pacific: clues to circulation, productivity, and plate motion. Paleoceanogr., 19:PA3013, doi:10.1029/2003PA000998.
ODP Leg 199 Shipboard Scientific Party, 2002. Leg 199 Summary. In Lyle, M.W., Wilson, P.A., Janecek, T.R. (Eds.), Proc. ODP, Init Repts., 199, College Station, Texas (Ocean Drilling Program), 1–87.
Olivarez Lyle, A., and Lyle, M.W., 2006. Missing organic carbon in Eocene marine sediments: is metabolism the biological feedback that maintains end-member climates? Paleoceanogr., 21:PA2007, doi:10.1029/2005PA001230.
Pälike, H., Moore, T., Backman, J., Raffi, I., Lanci, L., Parés, J.M., and Janecek, T., 2005. Integrated stratigraphic correlation and improved composite depth scales for ODP Sites 1218 and 1219. In Wilson, P.A., Lyle, M., and Firth, J.V. (Eds.), Proc. ODP, Sci. Results, 199, College Station, Texas (Ocean Drilling Program), 42 pp.
Pälike, H., Norris, R.D., Herrle, J.O., Wilson, P.A., Coxall, H.K., Lear, C.H., Shackleton, N.J., Tripati, A.K., and Wade, B.S., 2006a. The heartbeat of the Oligocene climate system. Science, 314(5807):1894–1898, doi:10.1126/science.1133822.
Pälike, H., Frazier, J., and Zachos, J.C., 2006b. Extended orbitally forced palaeoclimatic records from the equatorial Atlantic Ceara Rise. Quat. Sci. Rev., 25:3138–3149. doi:10.1016/j.quascirev.2006.02.011.
Philander, S.G.H., 1983. El Niño Southern Oscillation phenomena. Nature, 302:295–301, doi:10.1038/302295a0.
Pisias, N.G., Mayer, L.A., and Mix, A.C., 1995. Paleoceanography of the eastern equatorial Pacific during the Neogene: synthe-sis of Leg 138 drilling results. In Pisias, N.G., Mayer, L.A., Janecek, T.R., Palmer-Julson, A., and van Andel, T.H. (Eds.), Proc. ODP, Sci. Results, 138, College Station, Texas (Ocean Drilling Program), 5–21. doi:10.2973/odp.proc.sr.138.101. 1995.

Science Report
Scientific Drilling, No. 9, April 2010 15
Rea, D.K., and Lyle, M., 2005. Paleogene calcite compensation depth in the eastern subtropical Pacific: answers and questions. Paleoceanogr., 20:PA1012, doi:10.1029/2004PA001064, 9 pp.
Romine, K., and Lombari, G., 1985. Evolution of Pacific circulation in the Miocene: radiolarian evidence from DSDP Site 289. In Kennett, J.P. (Ed.), The Miocene Ocean: Paleoceanography and Biogeography, GSA Memoir 163, Boulder, Colo. (Geological Society of America), 273–291.
Roth, J.M., Droxler, A.W., and Kameo, K., 2000. The Caribbean car-bonate crash at the middle to late Miocene transition: linkage to the establishment of the modern global ocean conveyor. In Leckie, R.M., Sigurdsson, H., Acton, G.D., and Draper, G. (Eds.), Proc. ODP, Sci. Results, 165, College Station, Texas (Ocean Drilling Program), 249–273, doi:10.2973/odp.proc.sr.165.013.2000.
Schneider, D.A., 1995. Paleomagnetism of some Leg 138 sediments: detailing Miocene magnetostratigraphy. In Pisias, N.G., Mayer, L.A., Janecek, T.R., Palmer-Julson, A., and van Andel, T.H. (Eds.), Proc. ODP, Sci. Results, 138, College Station, Texas (Ocean Drilling Program), 59–72.
Shackleton, N.J., Crowhurst, S., Hagelberg, T., Pisias, N.G., and Schneider, D.A., 1995. A new late Neogene time scale: application to Leg 138 Sites. In Pisias, N.G., Mayer, L.A., Janecek, T.R., Palmer-Julson, A., and van Andel, T.H. (Eds.), Proc. ODP, Sci. Results, 138, College Station, Texas (Ocean Drilling Program), 73–101.
Takahashi, T., Feely, R.A., Weiss, R.F., Wanninkhof, R.H., Chipman, D.W., Sutherland, S.C., and Takahashi, T.T., 1997. Global air-sea flux of CO2: an estimate based on measurements of sea-air pCO2 difference. Proc. Natl. Acad. Sci., 94:8292–8299, doi:10.1073/pnas.94.16.8292.
van Andel, T.H., 1975. Mesozoic/Cenozoic calcite compensation depth and global distribution of calcareous sediments. Earth Planet. Sci. Lett., 26:187–194, doi:10.1016/0012-821X(75)90086-2.
van Andel, T.H., Heath, G.R., and Moore, T.C., 1975. Cenozoic History and Paleoceanography of the Central Equatorial Pacific Ocean. A Regional Synthesis of Deep Sea Drilling Project Data. The Geological Society of America, Memoir 143, 134 pp.
Westberry, T.M., Behrenfeld, J., Siegel, D.A., and Boss, E., 2008. Carbon-based primary productivity modeling with verti-cally resolved photo-acclimation. Glob. Biogeochem. Cycles, 22:GB2024, doi:10.1029/2007GB003078.
Zachos, J.C., Dickens, G.R., and Zeebe, R.E., 2008. An early Cenozoic perspective on greenhouse warming and carbon-cycle dynamics. Nature, 451:279–283, doi:10.1038/nature06588.
Zachos, J.C., Pagani, M., Sloan, L., Thomas, E., and Billups, K., 2001a. Trends, rhythms, and aberrations in global climate 65 Ma to present. Science, 292:686–693, doi:10.1126/science. 1059412.
Zachos, J.C., Shackleton, N.J., Revenaugh, J.S., Pälike, H., and Flower, B.P., 2001b. Climate response to orbital forcing across the Oligocene-Miocene boundary. Science, 292(5515), 274–278, doi:10.1126/science.1058288.
AuthorsMitchell Lyle, Department of Oceanography, Texas A&M University, TAMU 3146, College Station, TX 77840-3146, U.S.A., e-mail: [email protected] Pälike, School of Ocean and Earth Science, National Oceanography Centre, European Way, Southampton, SO14 3ZH, U.K., e-mail: [email protected] Nishi, Department of Natural History Sciences, Hokkaido University, Kita 10, Nishi 8, Kita-ku, Sapporo, 060-0810, Japan, e-mail: [email protected] Raffi, Dipartimento di Geotecnologie per l’Ambiente e il Territorio–DiGAT, Universitá “G. D’Annunzio”, Campus Universitario, via dei Vestini 31, 66013 Chieti Scalo, Italy, e-mail: [email protected] Gamage, Integrated Ocean Drilling Program, Texas A&M University, 1000 Discovery Drive, College Station, TX 77845-9547, U.S.A., e-mail: [email protected] Klaus, Integrated Ocean Drilling Program, Texas A&M University, 1000 Discovery Drive, College Station, TX 77845-9547, U.S.A., e-mail: [email protected].
IODP PEAT (Exp. 320/321) Scientific Party
Expedition 320: Heiko Pälike (co-chief scientist), Hiroshi Nishi (co-chief scientist), Adam Klaus (staff scientist), Gary Acton, Paul Bown, Margaret Delaney, Tom Dunkley Jones, Kirsty Edgar, Helen Evans, Peter Fitch, Nikolaus Gussone, Jens Herrle, Kiseong Hyeong, Shin-ichi Kamikuri, Junichiro Kuroda, Lizette Leon-Rodriguez, Theodore Moore Jr., Brandon Murphy, Hideto Nakamura, Christian Ohneiser, Carl Richter, Rebecca Robinson, Ken Sawada, Howie Scher, Hiroyuki Takata, Thomas Westerhold, Trevor Williams, Paul Wilson, and Yuhji Yamamoto. Expedition 321: Mitchell Lyle (co-chief scientist), Isabella Raffi (co-chief scientist), Kusali Gamage (staff scientist), Louise Anderson, Jan Backman, Catherine Beltran, William Busch, James Channell, Pawan Dewangan, Hitoshi Hasegawa, Ed Hathorne, Hiroki Hayashi, Ann Holbourn, Steven Hovan, Koichi Iijima, Takashi Ito, Katsumori Kimoto, Alberto Malinverno, Daniel Murphy, Kaoru Ogane, Oscar Romero, Leah Schneider, Appy Sluijs, Jun Tian, Akira Tsujimoto, Bridget Wade, Roy Wilkens, Shinya Yamamoto, and Toshitsugu Yamazaki.
Related Web Links
http://iodp.tamu.edu/scienceops/expeditions/equatorial_pacific.htmlhttp://www.iodp.org/Pacif ic -Equatorial-Age-Transect-PEAT-1-2-Media-Kit/
IODP Expedition 321T: Cementing Operations at Holes U1301A and U1301B, Eastern Flank of the Juan de Fuca Ridge
by Andrew T. Fisher, and IODP Expedition 321T Scientific Party
doi:10.2204/iodp.sd.9.02.2010
16 Scientific Drilling, No. 9, April 2010
Progress ReportsProgress Reports
Introduction
IODP Expedition 301 (Fisher et al., 2005a) was part of a series of expeditions and experiments to quantify hydro- geologic, lithologic, biogeochemical, and microbiological properties, processes, and linkages on the eastern flank of the Juan de Fuca Ridge, North Pacific (Fig. 1). Operations during Expedition 301 included replacement of one existing subseafloor borehole observatory (“CORK”, Hole 1026B), drilling two basement holes and installing two new long-term observatories (Holes U1301A and U1301B), coring the upper ~300 m of basement and shallow sediments above basement, and collection of in situ hydrogeologic and geophysical data from basement. Subsequent expeditions using a remotely operated vehicle (ROV) and submersible have serviced borehole observatories, collected pressure and temperature data and fluid and microbiological samples, and replaced components as needed to maintain these systems for future use. Another drilling expedition is planned for 2010 (see backcover for schedule) to emplace three more borehole observatories and initiate cross-hole tests, and additional ROV and submersible ex-peditions will conduct long-term experiments and recover subseafloor data and samples.
Borehole observatories installed during IODP Expedition 301 were designed (i) to seal open holes so that thermal, pressure, and chemical conditions could equilibrate following the dissipation of the drilling disturbance; (ii) to facilitate collection of fluid and microbiological samples and temperature and pressure data using autonomous samplers and data logging systems; and (iii) to serve as long-term monitoring points for large-scale crustal testing (Fisher et al., 2005b). Unfortunately, the CORKs installed in Holes U1301A and U1301B were not sealed as intended (Fisher et al., 2005a). Initially, both holes were drawing cold bottom seawater into basement, but as described below, conditions in these holes are dynamic, and flow conditions have changed over time. The primary objective of Expedition 321T was to seal these observatories by pumping cement into the reentry cones surrounding the CORK wellheads, allowing the re-maining components of the full experimental program to be completed during subsequent drilling and submersible ex-peditions.
Background
Ocean Drilling Program (ODP) Leg 168 completed a drill-ing transect of eight sites across 0.9–3.6 Ma seafloor east of the Juan de Fuca Ridge. It resulted in collection of sediment, rock, and fluid samples; determination of thermal, geochemi-cal, and hydrogeologic conditions in basement; and installa-tion of a series of CORK observatories in the upper crust (Davis et al., 1997). Two of the Leg 168 observatories were placed in 3.5–3.6 Ma seafloor near the eastern end of the drilling transect, in Holes 1026B and 1027C (Fig. 1). IODP Expedition 301 returned to this area and drilled deeper into basement, sampled additional sediment, basalt, and micro-biological materials, replaced the borehole observatory in Hole 1026B, and established two multilevel observatories at Site U1301 for use in long-term, three-dimensional hydro-geologic experiments.
Hole 1026B was drilled to 295 meters below seafloor (mbsf), cased across the sediment/basement interface, and extended to 48 meters sub-basement (msb) during ODP Leg 168 (Davis et al., 1997). The original CORK installed in Hole 1026B included a data logger, pressure sensors, therm-istors at multiple depths, and a fluid sampler, all of which (except the fluid sampler) were recovered in 1999. The Hole 1026B CORK was incompletely sealed after being installed in 1996, and because basement fluids are overpressured in this location with respect to ambient hydrostatic conditions (Davis, et al., 1997), this hole discharged fluid for years until it was replaced during IODP Expedition 301. As of the start of Expedition 301, warm (~64°C) altered basement fluid vented freely through the top of the wellhead. The original ODP Leg 168 CORK installed in Hole 1026B was replaced successfully during IODP Expedition 301.
IODP Site U1301 was positioned 1 km south-southwest of ODP Site 1026, where sediment thickness is 260–265 m above a buried basement high (Fig. 1). Hole U1301A was drilled without coring to 370 mbsf (107 msb). The casing was extended into the upper 15 m of basement, but poor hole con-ditions prevented installation of longer casing, coring, or deeper drilling. A depth check prior to CORK deployment in Hole U1301A revealed that much of the lower part of the hole had filled in with rocks from the rubbly formation around the hole.
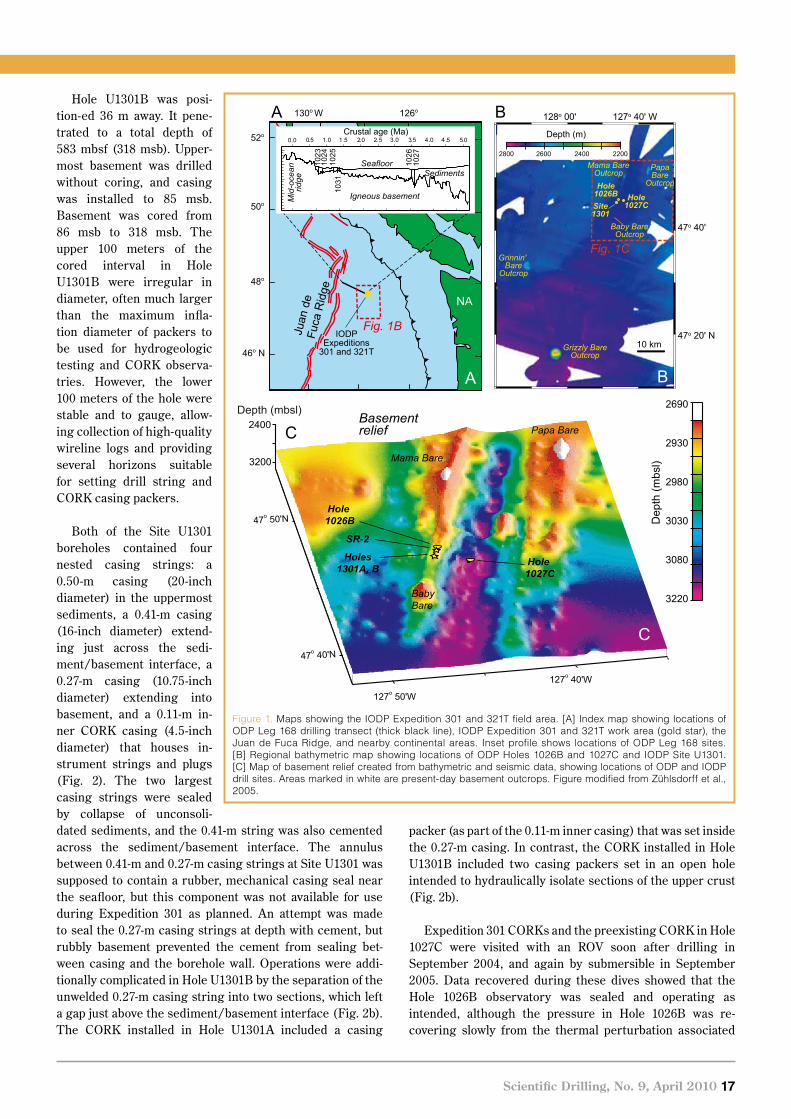
Scientific Drilling, No. 9, April 2010 17
packer (as part of the 0.11-m inner casing) that was set inside the 0.27-m casing. In contrast, the CORK installed in Hole U1301B included two casing packers set in an open hole intended to hydraulically isolate sections of the upper crust (Fig. 2b).
Expedition 301 CORKs and the preexisting CORK in Hole 1027C were visited with an ROV soon after drilling in September 2004, and again by submersible in September 2005. Data recovered during these dives showed that the Hole 1026B observatory was sealed and operating as intended, although the pressure in Hole 1026B was re-covering slowly from the thermal perturbation associated
Hole U1301B was posi-tion-ed 36 m away. It pene- trated to a total depth of 583 mbsf (318 msb). Upper-most basement was drilled without coring, and casing was installed to 85 msb. Basement was cored from 86 msb to 318 msb. The upper 100 meters of the cored interval in Hole U1301B were irregular in diameter, often much larger than the maximum infla- tion diameter of packers to be used for hydrogeologic testing and CORK observa- tries. However, the lower 100 meters of the hole were stable and to gauge, allow-ing collection of high-quality wireline logs and providing several horizons suitable for setting drill string and CORK casing packers.
Both of the Site U1301 boreholes contained four nested casing strings: a 0.50-m casing (20-inch diameter) in the uppermost sediments, a 0.41-m casing (16-inch diameter) extend-ing just across the sedi-ment/basement interface, a 0.27-m casing (10.75-inch diameter) extending into basement, and a 0.11-m in-ner CORK casing (4.5-inch diameter) that houses in-strument strings and plugs (Fig. 2). The two largest casing strings were sealed by collapse of unconsoli-dated sediments, and the 0.41-m string was also cemented across the sediment/basement interface. The annulus between 0.41-m and 0.27-m casing strings at Site U1301 was supposed to contain a rubber, mechanical casing seal near the seafloor, but this component was not available for use during Expedition 301 as planned. An attempt was made to seal the 0.27-m casing strings at depth with cement, but rubbly basement prevented the cement from sealing bet-ween casing and the borehole wall. Operations were addi-tionally complicated in Hole U1301B by the separation of the unwelded 0.27-m casing string into two sections, which left a gap just above the sediment/basement interface (Fig. 2b). The CORK installed in Hole U1301A included a casing
Figure 1. Maps showing the IODP Expedition 301 and 321T field area. [A] Index map showing locations of ODP Leg 168 drilling transect (thick black line), IODP Expedition 301 and 321T work area (gold star), the Juan de Fuca Ridge, and nearby continental areas. Inset profile shows locations of ODP Leg 168 sites. [B] Regional bathymetric map showing locations of ODP Holes 1026B and 1027C and IODP Site U1301. [C] Map of basement relief created from bathymetric and seismic data, showing locations of ODP and IODP drill sites. Areas marked in white are present-day basement outcrops. Figure modified from Zühlsdorff et al., 2005.
Juan
de
Fuca
Rid
ge
Canada
130o W 126o
46o N
48o
50o
52o
Fig. 1B
A
47o 40'
47o 20' N
128o 00' 127o 40' W
Hole1026B
10 km
Baby BareOutcrop
Grizzly BareOutcrop
Grinnin' Bare
Outcrop
B
NA
Depth (m)
2800 2600 2400 2200
Hole1027C
ODPLeg168
IODPExpeditions
301 and 321T
Mama BareOutcrop
PapaBare
Outcrop
Site1301
127o 50'W
127o 40'W
47o 40'N
47o 50'N
Depth (mbsl)2400
3200
C
Papa Bare
Mama Bare
BabyBare
Hole 1026B
Hole 1027C
Holes1301A, B
SR-2
Basementrelief
3220
3080
3030
2980
2930
2690
Dep
th (m
bsl)
Fig. 1C
0.5 1.0 1 .5 2.0 2. 5 3.0 3.5 4.0 4 .5 5.0Crustal age (Ma)
1031
1026
Mid
-oce
anrid
ge
Sediments
Igneous basement
1027
0.0
1023
1024
1025
Seafloor
A B
C
18 Scientific Drilling, No. 9, April 2010
Progress Reports
with eight years of upflow of warm formation fluid. The CORKs in Holes U1301A and U1301B were incompletely sealed, allowing cold ocean-bottom water to flow into the formation following CORK installation. The flow of this water into the crust at Site U1301 caused a measurable pressure perturbation at Site 1027, 2.4 km away, comprising an un-intended (but scientifically useful) cross-hole test (Fisher et al., 2008).
Attempts to seal Hole U1301B using a cement delivery system with the submersible Alvin in summers 2006 and 2007 were unsuccessful, as the submersible could not deliver a sufficient quantity of cement to the cone. Shimmering fluid was observed discharging from Hole U1301A during and after summer 2007 dive operations. No such evidence for upflow from the borehole was observed during earlier visits, suggesting that Hole U1301A had “turned around” sometime between 2006 and 2007 servicing operations. In fact, downhole temperature loggers recovered from Hole U1301A in summer 2008 provide a detailed record of this flow reversal. Remarkably, Hole U1301B continued to draw fluid rapidly into basement as of summer 2008, even though it is located just 36 m from Hole U1301A, which was vigo-rously discharging warm formation fluid to the ocean. Additional research will be needed to understand the pressure and thermal interactions between Holes U1301A
and U1301B as well as the implications for local and regional crustal hydrogeology.
The CORK landing platform installed at Hole U1301A included a solid surface that was perforated by eight 25-cm-diameter holes. Screens were welded below these holes prior to deployment so that instrumentation being deployed or manipulated by a submersible or ROV would not fall through the holes. In contrast, the landing platform at Hole U1301B has a series of radial support arms covered by the same screen material as was welded to the bottom of the platform at Hole U1301A. By the time the landing platform was deployed at Hole U1301B during Expedition 301, shipboard personnel realized that later cementing would be necessary, and a slot was cut through the platform screen to facilitate this operation.
Operations and Results
A special formulation of cement, including “Cello-Flake” lost circulation material (LCM) was loaded onto the JOIDES Resolution during a brief port call prior to Expedition 321T. The use of cement with LCM is common in industry drilling and borehole installations, particularly in fractured rock, but this technology had not been used previously in scientific ocean drilling. In addition, a special bottom hole assembly
Figure 2. Summary of basement and borehole observatory characteristics i n H o les U13 01B and U13 01A (modified from Fisher et al., 2008). [A] Basement recovery, primary lithology, borehole size, and bulk density from Hole U1301B (Fisher et al., 2005a). Basement cores were collected from ~355 mbsf to 575 mbsf (~100 –320 msb), with recovery indicated by black intervals next to depth column. Bulk density log (blue line) and analyses of pieces of rock (diamonds) show evidence for considerable porosity in uppermost basement and a layered basement structure, especially below 470 mbsf (220 msb), with alternating more and less dense intervals. Horizontal bands indicate depths where CORK casing packers and the drill string packer used for hydrogeologic t e s t i n g w e r e s e t a g a i n s t t h e borehole wall. [B] Casing and CORK configurations in Holes U1301B and U1301A. Observatories in both holes lack a critical seal between 0.27-m and 0.41-m casing, which are needed to prevent the flow of cold bottom water into shallow basement or the flow of warm formation fluid out into the ocean. TD = total depth.
Hole diam.(m)
Bulk density(kg m-3)
0.25 0.35 1500
Depth (m
sb)Dep
th (m
bsf)
380
400
420
440
460
480
500
520
540
560
Rec
over
y
250090
110
130
150
170
190
210
230
250
270
290
310
Hole U1301B
CORKpacker
Plug
Casinggap
Nocement
Nocasingseal
Cement
TD = 582 mbsf(318 msb)
0.27-mcasing
CORKpacker
Lith
olog
y
Massive basaltPillow basalt Basalt lava
Basalt-hyaloclastite breccia
H
H
H
C
C
HC
Packer for hydrogeologic testingPacker for CORK casing
0.11-mcasing
0.41-mcasing
0.50-mcasing
Hole U1301A
Fill
0.50-mcasing
TD = 370 mbsf(108 msb)
Slottedcasing
0.11-mcasing
CORKpacker
CementPlug
0.41-mcasing
0.27-mcasing
Nocasingseal
36 m
Sed
imen
tsB
asem
ent
A B
Progress Reports
Scientific Drilling, No. 9, April 2010 19
(BHA) was designed for Expedition 321T cementing operations, including a cementing “stinger” with a beveled edge that could be used to push through one of eight 25-cm-diameter holes in the landing platform in Hole U1301A.
Cementing operations occurred first at Hole U1301B, where reentry was easier because of the preexisting hole in the landing platform in the cone. Once pipe was run, reentry required 2.25 hrs, after which 60 barrels (bbls) of cement blended with LCM was pumped into the reentry cone. Seafloor operations were observed with the shipboard television camera system, and the cone was visibly filled with cement. The ship was offset to Hole U1301A, where the cement stinger was maneuvered to push through a screened hole in the CORK landing platform. This second reentry was accomplished in 2.75 hrs, after which 114 bbls of cement blended with LCM was pumped into the reentry cone. The ship was offset back to Hole U1301B, the hole was reentered again, and another 70 bbls of cement and LCM was pumped into the cone. Both reentry cones were inspected and found to be filled with cement surrounding the CORK observatory wellheads. Additional cement was observed to have poured over the edges of the cones and into the depressions in the seafloor around the cones. Cementing operations during 321T were completed more quickly, and with greater ease, than anticipated because of a combination of careful plan-ning and preparation, the skill of the shipboard personnel in managing delicate operations, and fortuitous weather and sea conditions.
A scientific group returned to Holes U1301A and U1301B by submersible three weeks after Expedition 321T, downloaded pressure data, and evaluated the success of cementing efforts. As of summer 2009, both holes U1301A and U1301B had “turned around” and returned to overpressured conditions. Hole 1301A continued to leak fluid, as some of the cement pumped into the cone during Expedition 321T drained down into the annular gap between 0.41-m and 0.27-m casings. Additional cementing will be attempted during summer 2010 drilling operations, with a more aggressive use of LCM, to seal hole U1301A more completely. In contrast, Hole U1301B appears to be sealed between 0.41-m and 0.27-m casing, but the fluid overpressure in basement is greater than anticipated, and the top CORK plug was lifted by this pressure. Dive weights were placed on top of the plug during summer 2009 submersible operations, and additional pressure data will be collected from this system during summer 2010 servicing, which will allow a more complete evaluation of the state of this borehole obser-vatory system.
References
Davis, E.E., Fisher, A.T., Firth, J.V., Andersson, E.M., Aoike, K.,Becker, K., Brown, K.A., Buatier, M.D., Constantin, M., Elderfield, H., Gonçalves, C.A., Grigel, J.S., Hunter, A.G.,
Inoue, A., Lawrence, R.M., Macdonald, R.D., Marescotti, P., Martin, J.T., Monnin, Ch., Mottl, M.J., Pribnow, D.F.C., Stein, J.S., Su, X., Sun, Y., Underwood, M.B., Vanko, D.A., Wheat, G., 1997. Proc. ODP, Init. Repts., 168: College Station, TX (Ocean Drilling Program), doi:10.2973/odp.proc.ir.168.1997.
Fisher, A.T., Davis, E.E., and Becker, K., 2008. Borehole-to-borehole hydrologic response across 2.4 km in the upper oceanic crust: implications for crustal-scale properties. J. Geophys. Res., 113(B7):B07106, doi:10.1029/2007JB005447.
Fisher, A.T., Urabe, T., Klaus, A., and the Expedition 301 Scientists, 2005a. Proc. IODP, 301. College Station, Texas (Integrated Ocean Drilling Program Management International, Inc.), doi:10.2204/iodp.proc.301.2005.
Fisher, A.T., Wheat, C.G., Becker, K., Davis, E.E., Jannasch, H., Schroeder, D., Dixon, R., Pettigrew, T.L., Meldrum, R., Macdonald, R., Nielsen, M., Fisk, M., Cowen, J., Bach, W., and Edwards, K., 2005b. Scientific and technical design and deployment of long-term, subseafloor observatories for hydrogeologic and related experiments, IODP Expedition 301, eastern flank of Juan de Fuca Ridge. In Fisher, A.T., Urabe, T., and Klaus, A. (Eds.) Proc. IODP, 301. College Station, Texas (Integrated Ocean Drilling Program), doi:10.2204/iodp.proc.2301.2103.2005.
Zühlsdorff, L., Hutnak, M., Fisher, A.T., Spiess, V., Davis, E.E., Nedimovic, M., Carbotte, S., Villinger, H., and Becker, K., 2005. Site surveys related to IODP Expedition 301: ImageFlux (S149) and RetroFlux (TN116) expeditions and earlier studies. In Fisher, A.T., Urabe, T., Klaus, A., and the Expedition 301 Scientists, Proc. IODP, 301. College Station, Texas (Integrated Ocean Drilling Program Management International, Inc.), doi:10.2204/iodp.proc.301.102.2005.
Author
Andrew T. Fisher, University of California Santa Cruz, Earth and Planetary Sciences Department and Instsitute for Geophysics and Planetary Physics, 1156 High Street, E&MS A232, Santa Cruz, CA 95064, U.S.A., e-mail: [email protected] IODP Expedition 321T Scientific Party
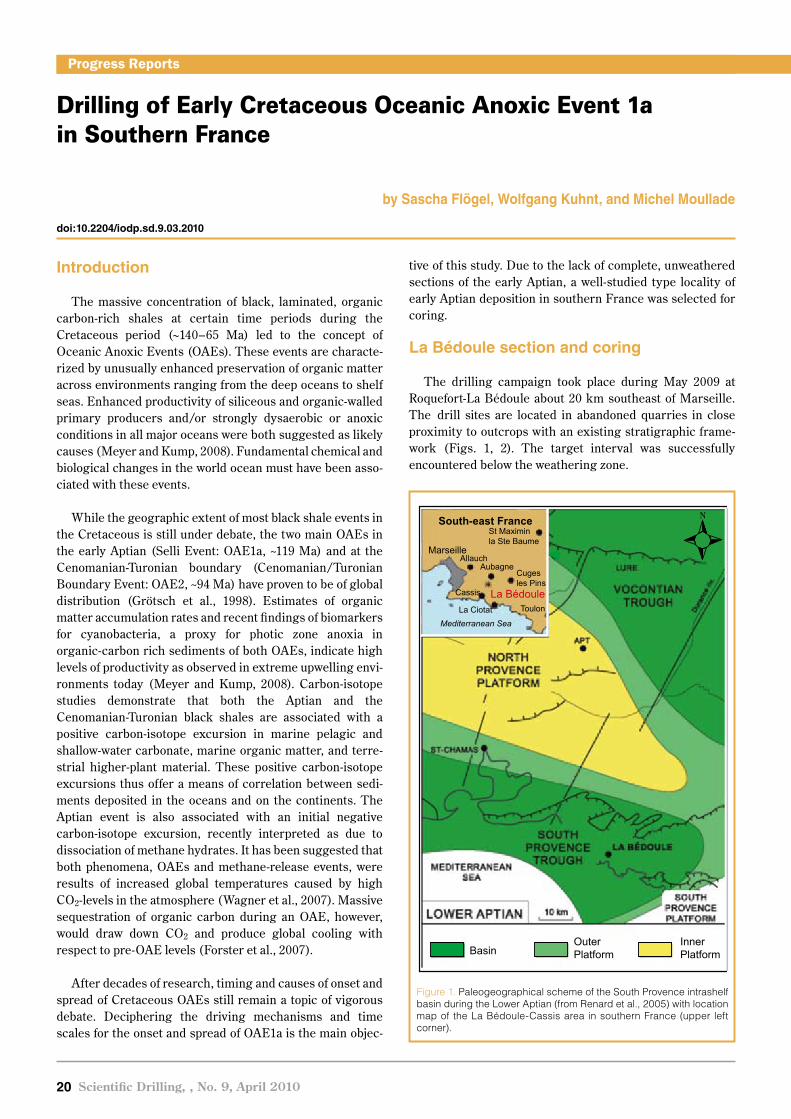
Drilling of Early Cretaceous Oceanic Anoxic Event 1a in Southern France
by Sascha Flögel, Wolfgang Kuhnt, and Michel Moullade
doi:10.2204/iodp.sd.9.03.2010
20 Scientific Drilling, , No. 9, April 2010
Progress ReportsProgress Reports
Introduction
The massive concentration of black, laminated, organic carbon-rich shales at certain time periods during the Cretaceous period (∼140–65 Ma) led to the concept of Oceanic Anoxic Events (OAEs). These events are characte-rized by unusually enhanced preservation of organic matter across environments ranging from the deep oceans to shelf seas. Enhanced productivity of siliceous and organic-walled primary producers and/or strongly dysaerobic or anoxic conditions in all major oceans were both suggested as likely causes (Meyer and Kump, 2008). Fundamental chemical and biological changes in the world ocean must have been asso-ciated with these events.
While the geographic extent of most black shale events in the Cretaceous is still under debate, the two main OAEs in the early Aptian (Selli Event: OAE1a, ~119 Ma) and at the Cenomanian-Turonian boundary (Cenomanian/Turonian Boundary Event: OAE2, ~94 Ma) have proven to be of global distribution (Grötsch et al., 1998). Estimates of organic matter accumulation rates and recent findings of biomarkers for cyanobacteria, a proxy for photic zone anoxia in organic-carbon rich sediments of both OAEs, indicate high levels of productivity as observed in extreme upwelling envi-ronments today (Meyer and Kump, 2008). Carbon-isotope studies demonstrate that both the Aptian and the Cenomanian-Turonian black shales are associated with a positive carbon-isotope excursion in marine pelagic and shallow-water carbonate, marine organic matter, and terre-strial higher-plant material. These positive carbon-isotope excursions thus offer a means of correlation between sedi-ments deposited in the oceans and on the continents. The Aptian event is also associated with an initial negative carbon-isotope excursion, recently interpreted as due to dissociation of methane hydrates. It has been suggested that both phenomena, OAEs and methane-release events, were results of increased global temperatures caused by high CO2-levels in the atmosphere (Wagner et al., 2007). Massive sequestration of organic carbon during an OAE, however, would draw down CO2 and produce global cooling with respect to pre-OAE levels (Forster et al., 2007).
After decades of research, timing and causes of onset and spread of Cretaceous OAEs still remain a topic of vigorous debate. Deciphering the driving mechanisms and time scales for the onset and spread of OAE1a is the main objec-
tive of this study. Due to the lack of complete, unweathered sections of the early Aptian, a well-studied type locality of early Aptian deposition in southern France was selected for coring.
La Bédoule section and coring
The drilling campaign took place during May 2009 at Roquefort-La Bédoule about 20 km southeast of Marseille. The drill sites are located in abandoned quarries in close proximity to outcrops with an existing stratigraphic frame-work (Figs. 1, 2). The target interval was successfully encountered below the weathering zone.
Figure 1. Paleogeographical scheme of the South Provence intrashelf basin during the Lower Aptian (from Renard et al., 2005) with location map of the La Bédoule-Cassis area in southern France (upper left corner).
Mediterranean Sea
South-east France
MarseilleAllauch
Aubagne
La Ciotat
Cassis
ToulonLa Bédoule
BasinOuter Platform
Inner Platform
Cuges les Pins
St Maximin la Ste Baume
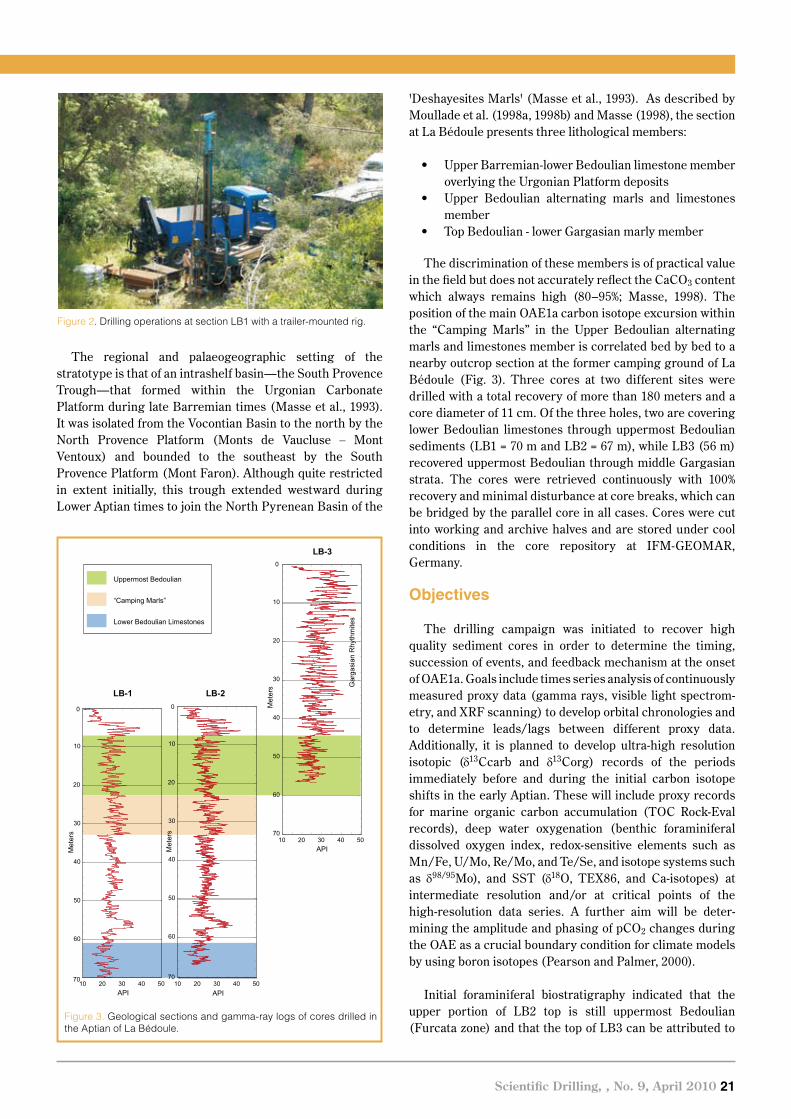
Scientific Drilling, , No. 9, April 2010 21
The regional and palaeogeographic setting of the stratotype is that of an intrashelf basin—the South Provence Trough—that formed within the Urgonian Carbonate Platform during late Barremian times (Masse et al., 1993). It was isolated from the Vocontian Basin to the north by the North Provence Platform (Monts de Vaucluse – Mont Ventoux) and bounded to the southeast by the South Provence Platform (Mont Faron). Although quite restricted in extent initially, this trough extended westward during Lower Aptian times to join the North Pyrenean Basin of the
'Deshayesites Marls' (Masse et al., 1993). As described by Moullade et al. (1998a, 1998b) and Masse (1998), the section at La Bédoule presents three lithological members:
Upper Barremian-lower Bedoulian limestone member •overlying the Urgonian Platform depositsUpper Bedoulian alternating marls and limestones •memberTop Bedoulian - lower Gargasian marly member•
The discrimination of these members is of practical value in the field but does not accurately reflect the CaCO3 content which always remains high (80–95%; Masse, 1998). The position of the main OAE1a carbon isotope excursion within the “Camping Marls” in the Upper Bedoulian alternating marls and limestones member is correlated bed by bed to a nearby outcrop section at the former camping ground of La Bédoule (Fig. 3). Three cores at two different sites were drilled with a total recovery of more than 180 meters and a core diameter of 11 cm. Of the three holes, two are covering lower Bedoulian limestones through uppermost Bedoulian sediments (LB1 = 70 m and LB2 = 67 m), while LB3 (56 m) recovered uppermost Bedoulian through middle Gargasian strata. The cores were retrieved continuously with 100% recovery and minimal disturbance at core breaks, which can be bridged by the parallel core in all cases. Cores were cut into working and archive halves and are stored under cool conditions in the core repository at IFM-GEOMAR, Germany.
Objectives
The drilling campaign was initiated to recover high quality sediment cores in order to determine the timing, succession of events, and feedback mechanism at the onset of OAE1a. Goals include times series analysis of continuously measured proxy data (gamma rays, visible light spectrom-etry, and XRF scanning) to develop orbital chronologies and to determine leads/lags between different proxy data. Additionally, it is planned to develop ultra-high resolution isotopic (δ13Ccarb and δ13Corg) records of the periods immediately before and during the initial carbon isotope shifts in the early Aptian. These will include proxy records for marine organic carbon accumulation (TOC Rock-Eval records), deep water oxygenation (benthic foraminiferal dissolved oxygen index, redox-sensitive elements such as Mn/Fe, U/Mo, Re/Mo, and Te/Se, and isotope systems such as δ98/95Mo), and SST (δ18O, TEX86, and Ca-isotopes) at intermediate resolution and/or at critical points of the high-resolution data series. A further aim will be deter-mining the amplitude and phasing of pCO2 changes during the OAE as a crucial boundary condition for climate models by using boron isotopes (Pearson and Palmer, 2000).
Initial foraminiferal biostratigraphy indicated that the upper portion of LB2 top is still uppermost Bedoulian (Furcata zone) and that the top of LB3 can be attributed to
Figure 2. Drilling operations at section LB1 with a trailer-mounted rig.
Figure 3. Geological sections and gamma-ray logs of cores drilled in the Aptian of La Bédoule.
0
10
20
30
40
50
60
70
Met
ers
0
10
20
30
40
50
60
7010 20 30 40 50
Met
ers
API
LB-2
LB-3
Lower Bedoulian Limestones
“Camping Marls”
Uppermost Bedoulian
Gar
gasi
an R
hyth
mite
s
LB-1
API10 20 30 40 50 10 20 30 40 50
API
Met
ers
0
10
20
30
40
50
60
70
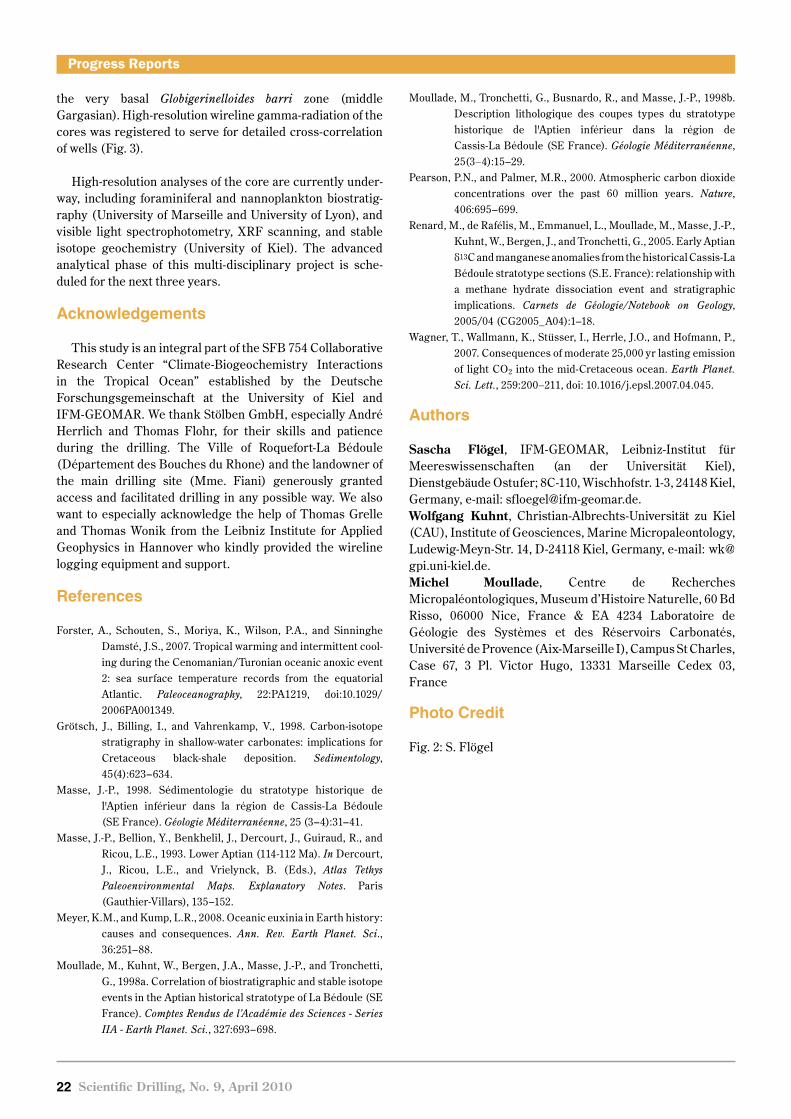
22 Scientific Drilling, No. 9, April 2010
Progress Reports
the very basal Globigerinelloides barri zone (middle Gargasian). High-resolution wireline gamma-radiation of the cores was registered to serve for detailed cross-correlation of wells (Fig. 3).
High-resolution analyses of the core are currently under-way, including foraminiferal and nannoplankton biostratig-raphy (University of Marseille and University of Lyon), and visible light spectrophotometry, XRF scanning, and stable isotope geochemistry (University of Kiel). The advanced analytical phase of this multi-disciplinary project is sche-duled for the next three years.
Acknowledgements
This study is an integral part of the SFB 754 Collaborative Research Center “Climate-Biogeochemistry Interactions in the Tropical Ocean” established by the Deutsche Forschungsgemeinschaft at the University of Kiel and IFM-GEOMAR. We thank Stölben GmbH, especially André Herrlich and Thomas Flohr, for their skills and patience during the drilling. The Ville of Roquefort-La Bédoule (Département des Bouches du Rhone) and the landowner of the main drilling site (Mme. Fiani) generously granted access and facilitated drilling in any possible way. We also want to especially acknowledge the help of Thomas Grelle and Thomas Wonik from the Leibniz Institute for Applied Geophysics in Hannover who kindly provided the wireline logging equipment and support.
References
Forster, A., Schouten, S., Moriya, K., Wilson, P.A., and Sinninghe Damsté, J.S., 2007. Tropical warming and intermittent cool-ing during the Cenomanian/Turonian oceanic anoxic event 2: sea surface temperature records from the equatorial Atlantic. Paleoceanography, 22:PA1219, doi:10.1029/ 2006PA001349.
Grötsch, J., Billing, I., and Vahrenkamp, V., 1998. Carbon-isotope stratigraphy in shallow-water carbonates: implications for Cretaceous black-shale deposition. Sedimentology, 45(4):623–634.
Masse, J.-P., 1998. Sédimentologie du stratotype historique de l'Aptien inférieur dans la région de Cassis-La Bédoule (SE France). Géologie Méditerranéenne, 25 (3–4):31–41.
Masse, J.-P., Bellion, Y., Benkhelil, J., Dercourt, J., Guiraud, R., and Ricou, L.E., 1993. Lower Aptian (114-112 Ma). In Dercourt, J., Ricou, L.E., and Vrielynck, B. (Eds.), Atlas Tethys Paleoenvironmental Maps. Explanatory Notes. Paris (Gauthier-Villars), 135–152.
Meyer, K.M., and Kump, L.R., 2008. Oceanic euxinia in Earth history: causes and consequences. Ann. Rev. Earth Planet. Sci., 36:251–88.
Moullade, M., Kuhnt, W., Bergen, J.A., Masse, J.-P., and Tronchetti, G., 1998a. Correlation of biostratigraphic and stable isotope events in the Aptian historical stratotype of La Bédoule (SE France). Comptes Rendus de l’Académie des Sciences - Series IIA - Earth Planet. Sci., 327:693–698.
Moullade, M., Tronchetti, G., Busnardo, R., and Masse, J.-P., 1998b. Description lithologique des coupes types du stratotype historique de l'Aptien inférieur dans la région de Cassis-La Bédoule (SE France). Géologie Méditerranéenne, 25(3–4):15–29.
Pearson, P.N., and Palmer, M.R., 2000. Atmospheric carbon dioxide concentrations over the past 60 million years. Nature, 406:695–699.
Renard, M., de Rafélis, M., Emmanuel, L., Moullade, M., Masse, J.-P., Kuhnt, W., Bergen, J., and Tronchetti, G., 2005. Early Aptian δ13C and manganese anomalies from the historical Cassis-La Bédoule stratotype sections (S.E. France): relationship with a methane hydrate dissociation event and stratigraphic implications. Carnets de Géologie/Notebook on Geology, 2005/04 (CG2005_A04):1–18.
Wagner, T., Wallmann, K., Stüsser, I., Herrle, J.O., and Hofmann, P., 2007. Consequences of moderate 25,000 yr lasting emission of light CO2 into the mid-Cretaceous ocean. Earth Planet. Sci. Lett., 259:200–211, doi: 10.1016/j.epsl.2007.04.045.
Authors
Sascha Flögel, IFM-GEOMAR, Leibniz-Institut für Meereswissenschaften (an der Universität Kiel), Dienstgebäude Ostufer; 8C-110, Wischhofstr. 1-3, 24148 Kiel, Germany, e-mail: [email protected] Kuhnt, Christian-Albrechts-Universität zu Kiel (CAU), Institute of Geosciences, Marine Micropaleontology, Ludewig-Meyn-Str. 14, D-24118 Kiel, Germany, e-mail: [email protected] Moullade, Centre de Recherches Micropaléontologiques, Museum d’Histoire Naturelle, 60 Bd Risso, 06000 Nice, France & EA 4234 Laboratoire de Géologie des Systèmes et des Réservoirs Carbonatés, Université de Provence (Aix-Marseille I), Campus St Charles, Case 67, 3 Pl. Victor Hugo, 13331 Marseille Cedex 03, France
Photo Credit
Fig. 2: S. Flögel
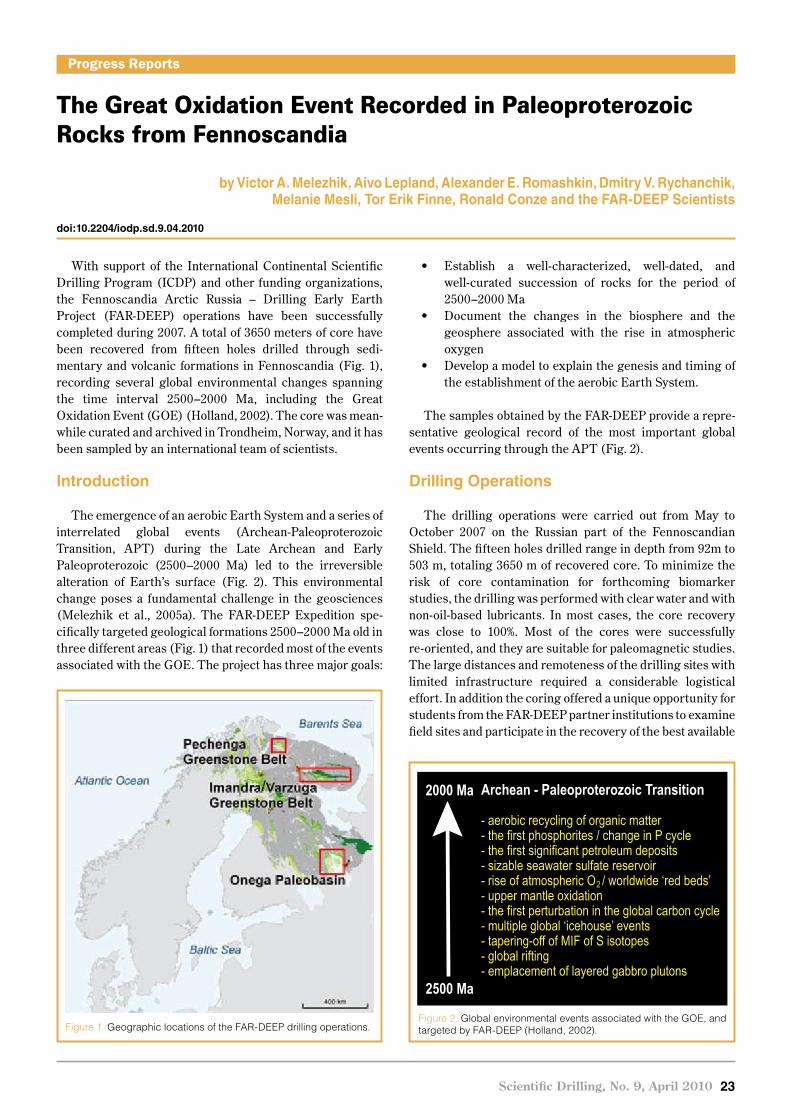
The Great Oxidation Event Recorded in Paleoproterozoic Rocks from Fennoscandia
Scientific Drilling, No. 9, April 2010 23
doi:10.2204/iodp.sd.9.04.2010
Progress Reports
With support of the International Continental Scientific Drilling Program (ICDP) and other funding organizations, the Fennoscandia Arctic Russia – Drilling Early Earth Project (FAR-DEEP) operations have been successfully completed during 2007. A total of 3650 meters of core have been recovered from fifteen holes drilled through sedi- mentary and volcanic formations in Fennoscandia (Fig. 1), recording several global environmental changes spanning the time interval 2500–2000 Ma, including the Great Oxidation Event (GOE) (Holland, 2002). The core was mean-while curated and archived in Trondheim, Norway, and it has been sampled by an international team of scientists.
Introduction
The emergence of an aerobic Earth System and a series of interrelated global events (Archean-Paleoproterozoic Transition, APT) during the Late Archean and Early Paleoproterozoic (2500–2000 Ma) led to the irreversible alteration of Earth’s surface (Fig. 2). This environmental change poses a fundamental challenge in the geosciences (Melezhik et al., 2005a). The FAR-DEEP Expedition spe-cifically targeted geological formations 2500–2000 Ma old in three different areas (Fig. 1) that recorded most of the events associated with the GOE. The project has three major goals:
Establish a well-characterized, well-dated, and •well-curated succession of rocks for the period of 2500–2000 MaDocument the changes in the biosphere and the •geosphere associated with the rise in atmospheric oxygenDevelop a model to explain the genesis and timing of •the establishment of the aerobic Earth System.
The samples obtained by the FAR-DEEP provide a repre-sentative geological record of the most important global events occurring through the APT (Fig. 2).
Drilling Operations
The drilling operations were carried out from May to October 2007 on the Russian part of the Fennoscandian Shield. The fifteen holes drilled range in depth from 92m to 503 m, totaling 3650 m of recovered core. To minimize the risk of core contamination for forthcoming biomarker studies, the drilling was performed with clear water and with non-oil-based lubricants. In most cases, the core recovery was close to 100%. Most of the cores were successfully re-oriented, and they are suitable for paleomagnetic studies. The large distances and remoteness of the drilling sites with limited infrastructure required a considerable logistical effort. In addition the coring offered a unique opportunity for students from the FAR-DEEP partner institutions to examine field sites and participate in the recovery of the best available
Figure 1. Geographic locations of the FAR-DEEP drilling operations.
by Victor A. Melezhik, Aivo Lepland, Alexander E. Romashkin, Dmitry V. Rychanchik, Melanie Mesli, Tor Erik Finne, Ronald Conze and the FAR-DEEP Scientists
Figure 2. Global environmental events associated with the GOE, and targeted by FAR-DEEP (Holland, 2002).
Archean - Paleoproterozoic Transition
- aerobic recycling of organic matter- the first phosphorites / change in P cycle- the first significant petroleum deposits- sizable seawater sulfate reservoir- rise of atmospheric O / worldwide ‘red beds’- upper mantle oxidation- the first perturbation in the global carbon cycle- multiple global ‘icehouse’ events- tapering-off of MIF of S isotopes- global rifting- emplacement of layered gabbro plutons
2500 Ma
2000 Ma
2

24 Scientific Drilling, No. 9, April 2010
Progress Reports
succession of volcanic-sedimentary rocks recording the time of emergence of an aerobic world.
Core Archive and Drilling Information System (DIS)
All cores were transported to the Geological Survey of Norway (NGU) in Trondheim for curation and archiving. All technical and geological data gathered during the drilling operations and through the archiving process have been catalogued using the Drilling Information System (DIS, see Web Links) developed by ICDP. During the project, the func-tions of this software have been continuously updated to meet the specific FAR-DEEP needs. The archive process began in March and was completed by December 2008.
At the NGU’s core repository the archive process included (1) high-resolution photography of core in boxes, in dry and wet conditions, (2) magnetic susceptibility measurements of full core at ~20-cm intervals, (3) core splitting by sawing, (4) image scanning and photography of split core, (5) detailed lithological description, (6) and routine sampling with ~7-m spacing for general geochemical and petrographic characte-rizations of the rocks. The archive sample set consists of 554 specimens that have been analyzed for whole-rock major and trace elements, carbonate composition, abundance of C and S, and thin sections have been made from them at the NGU laboratory. Selected specimens from the archive set have been analyzed for S isotopes of sulfides, C- and N-isotopes of the organic matter, and C-, O-, and Sr-isotopes of carbonates by the FAR-DEEP international team of researchers. All documentation obtained during the archiving process and general geochemical profiles of cores (Fig. 3) were made available for the FAR-DEEP partners on the Internet prior to core sampling in Trondheim from March to April 2009.
“Coring” through Major Paleoproterozoic Events and Paleoproterozoic Reference Sections
The FAR-DEEP cores of sedimentary and volcanic formations in the stratotype areas of the Pechenga and Imandra/Varzuga Greenstone Belts and the Onega Basin (Fig. 1) record the global events of the APT (Figs. 4 and 5).
Change in fractionation of sulfur isotopes. Several lines of evidence imply Earth’s earliest atmosphere shifted from being anoxic to oxic between 2500 Ma and 2000 Ma (GOE, Fig. 2). The processes driving this shift, as well as their timing and duration, remain enigmatic. Appearance of ‘red beds’ and sulfates in the stratigraphic record is among the most compelling evidence reflecting the change to oxic conditions. Additional support for the oxygenation has been gained from recent work on S-isotopes that have shown the presence of mass-independently fractionated (MIF) S-isotopes in rocks older than 2360 Ma and disap-pearance of such a signature thereafter (Bekker et al., 2004; Hannah et al., 2004; Guo et al., 2009). The disappearance of MIF S-isotopes has been typically attributed to the oxygenation of the atmosphere and related change in photochemical reactions, but other processes have also been proposed (Watanabe et al., 2009). FAR-DEEP’s drillhole 1A intersected a sequence of marine shales (Fig. 6A) and sandstones deposited prior to 2442 Ma (Fig. 4). These 2442-Ma rocks show a transition from MIF to mass-dependently fractionated sulfur isotopes (Reuschel et al., 2008); thus, they offer new constraints on the S-isotope cycle at the dawn of the GOE. Moreover, isotope geochemi-stry of marine carbonate rocks interbedded with shales may represent a robust proxy for the global carbon cycle prior to the Huronian-age glaciation (Young et al., 2001).Figure 3. Example of a drillhole log with position of archive samples
(red squares) and their numbers. Magnetic susceptibility data are plotted alongside.
Susceptibility low(gray)
Susceptibility high (black)
0.01
0.1 1 10 100
1000
1000
1000
0
10000
1000
00
100000
FAR-DEEP6A
60
50
40
30
20
10
31061563106164
3106182
3106148
3106146
3106128
3106124
3106118
Dacite
AndesiteDacite lava breccia
Sandstone-silstone
Andesite
Conglomerate
Conglomerate
ConglomerateGritstone
Sandstone
Siltstone
Sandstone - siltstone
Siltstone
Conglomerate
Tuff
Basalt
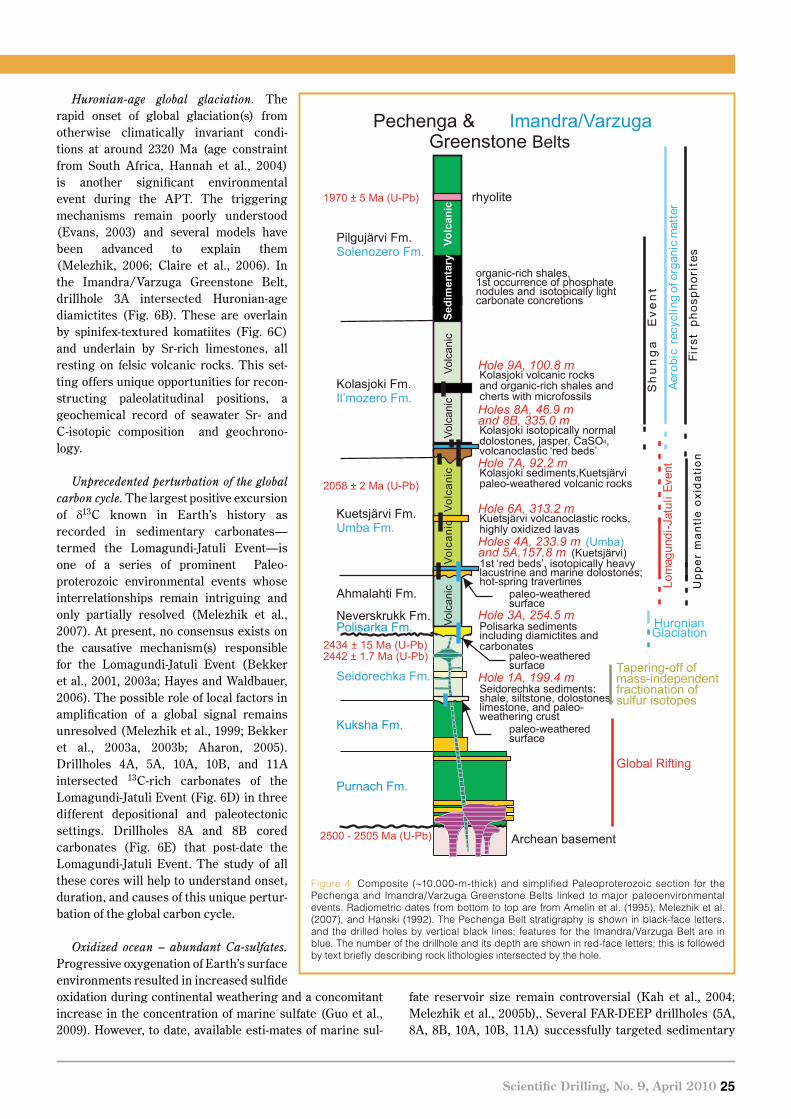
Progress Reports
Scientific Drilling, No. 9, April 2010 25
Huronian-age global glaciation. The rapid onset of global glaciation(s) from otherwise climatically invariant condi-tions at around 2320 Ma (age constraint from South Africa, Hannah et al., 2004) is another significant environmental event during the APT. The triggering mechanisms remain poorly understood (Evans, 2003) and several models have been advanced to explain them (Melezhik, 2006; Claire et al., 2006). In the Imandra/Varzuga Greenstone Belt, drillhole 3A intersected Huronian-age diamictites (Fig. 6B). These are overlain by spinifex-textured komatiites (Fig. 6C) and underlain by Sr-rich limestones, all resting on felsic volcanic rocks. This set-ting offers unique opportunities for recon-structing paleolatitudinal positions, a geochemical record of seawater Sr- and C-isotopic composition and geochrono-logy.
Unprecedented perturbation of the global carbon cycle. The largest positive excursion of δ13C known in Earth’s history as recorded in sedimentary carbonates— termed the Lomagundi-Jatuli Event—is one of a series of prominent Paleo-proterozoic environmental events whose interrelationships remain intriguing and only partially resolved (Melezhik et al., 2007). At present, no consensus exists on the causative mechanism(s) responsible for the Lomagundi-Jatuli Event (Bekker et al., 2001, 2003a; Hayes and Waldbauer, 2006). The possible role of local factors in amplification of a global signal remains unresolved (Melezhik et al., 1999; Bekker et al., 2003a, 2003b; Aharon, 2005). Drillholes 4A, 5A, 10A, 10B, and 11A intersected 13C-rich carbonates of the Lomagundi-Jatuli Event (Fig. 6D) in three different depositional and paleotectonic settings. Drillholes 8A and 8B cored carbonates (Fig. 6E) that post-date the Lomagundi-Jatuli Event. The study of all these cores will help to understand onset, duration, and causes of this unique pertur-bation of the global carbon cycle.
Oxidized ocean – abundant Ca-sulfates. Progressive oxygenation of Earth’s surface environments resulted in increased sulfide oxidation during continental weathering and a concomitant increase in the concentration of marine sulfate (Guo et al., 2009). However, to date, available esti-mates of marine sul-
fate reservoir size remain controversial (Kah et al., 2004; Melezhik et al., 2005b),. Several FAR-DEEP drillholes (5A, 8A, 8B, 10A, 10B, 11A) successfully targeted sedimentary
Figure 4. Composite (~10,000-m-thick) and simplified Paleoproterozoic section for the Pechenga and Imandra/Varzuga Greenstone Belts linked to major paleoenvironmental events. Radiometric dates from bottom to top are from Amelin et al. (1995), Melezhik et al. (2007), and Hanski (1992). The Pechenga Belt stratigraphy is shown in black-face letters, and the drilled holes by vertical black lines; features for the Imandra/Varzuga Belt are in blue. The number of the drillhole and its depth are shown in red-face letters; this is followed by text briefly describing rock lithologies intersected by the hole.
Pechenga &Greenstone Belts
Imandra/Varzuga
1970 ± 5 Ma (U-Pb)
2058 ± 2 Ma (U-Pb)
Sedi
men
tary
Volc
anic
Neverskrukk Fm.Polisarka Fm.
Ahmalahti Fm.
organic-rich shales,1st occurrence of
isotopically lightcarbonate concretions
phosphatenodules and
Volc
anic
Volc
anic
Hole 6A, 313.2 mKuetsjärvi volcanoclastic rocks,highly oxidized lavasHoles 4A, 233.9 mand 5A,157.8 m
(Umba)(Kuetsjärvi)
1st ‘red beds’, isotopically heavylacustrine and marine dolostones;hot-spring travertines
Holes 8A, 46.9 m and 8B, 335.0 mKolasjoki isotopically normaldolostones, jasper, CaSO ,volcanoclastic ‘red beds’
4
Hole 9A, 100.8 mKolasjoki volcanic rocksand organic-rich shales andcherts with microfossils
Hole 7A, 92.2 mKolasjoki sediments,Kuetsjärvipaleo-weathered volcanic rocks
Archean basement
Purnach Fm.
Kuksha Fm.
2434 ± 15 Ma (U-Pb)2442 ± 1.7 Ma (U-Pb)
2500 - 2505 Ma (U-Pb)
Hole 1A, 199.4 mSeidorechka sediments:shale, siltstone, dolostones,limestone, and paleo-weathering crust
Hole 3A, 254.5 mPolisarka sedimentsincluding diamictites andcarbonates
Pilgujärvi Fm.Solenozero Fm.
Kolasjoki Fm.Il’mozero Fm.
Kuetsjärvi Fm.Umba Fm.
Seidorechka Fm.
Volc
anic
Volc
anic
Volc
anic
rhyolite
tnevEilutaJ-idnugamoL
rettam cinagro fo gnilcycer ciboreA
HuronianGlaciation
t n e v E a g n u h S
setirohpsohp tsriF
Global Rifting
Tapering-off ofmass-independentfractionation ofsulfur isotopes
paleo-weatheredsurface
paleo-weatheredsurface
paleo-weatheredsurface
Upp
er m
antl
e ox
idat
ion

26 Scientific Drilling, No. 9, April 2010
Progress Reports
formations that contain seawater sulfates. Pseudomorphs after gypsum and anhydrite, with relicts of primary mine-rals, have been documented in great abundance (Fig. 6F, 6G). Detailed mineralogical and isotopic studies to decipher their environmental significance are in progress and will help constrain the oxygenation history.
Ferric iron-rich volcanic rocks: upper mantle oxidizing event vs. secondary overprint by oxidized groundwaters. Was the rise of atmospheric oxygen levels related to increased dioxygen
due to evolution of oxygen-producing organisms, or was it controlled by a decrease in oxygen sinks (Kump, 2008)? One hypothesis is that a predominant sink for oxygen in the Archean era was abruptly and permanently diminished during the APT (Kump and Barley, 2007), but the overall cause of the GOE remains unresolved. Approximately 2060-Ma-old volcanic rocks (Fig. 6H, 6I) in the Pechenga Greenstone Belt have high Fe3+/Fetotal ratios (average=0.37) which are in sharp contrast to the majority of underlying and overlying volcanic units. The FAR-DEEP drillholes 4A and
6A recovered more than 300 meters of such highly oxidized lavas (Fig. 6I). This anomaly may represent evidence either for relatively oxidized mantle material (e.g., recycled ban-ded iron formations) or a large-scale altera-tion of Earth’s surface by oxidized meteoric and/or groundwaters.
Subaerial and subaqueous hydrothermal systems. Two types of compositionally dif- ferent hydrothermal products have been documented in the FAR-DEEP drillcores. The first type is represented by iron oxide-silica-dominated rocks (jasper). This appears in a large variety of occurrences in the FAR-DEEP cores, including numer- ous amygdales (Fig. 6I), veinlets and veins in volcanic rocks (Fig. 6J), siltstone- and dolostone-hosted layers, beds, and feeder-veinlets in dolostones and silici- clastic sediments (Fig. 6K), and redeposited clasts in fluvial, deltaic and marine sedi-ments. The occurrences of jasper thus re-present a complex history of fluid migration and redox alteration in a suite of processes linked to the GOE.
The second type of hydrothermal products is travertine (Fig. 6L), occurring in great abundance as thin crusts and feeder-veinlets in 13C-rich lacustrine dolostones (Fig. 4, Kuetsjärvi Fm). These oldest ever documen-ted travertines may signify a radical change in Earth surface environment to one allowing the precipitation of hydrothermal carbonates in subaerial conditions. Drillcores from holes 5A, 6A, 7A, 8A, and 8B provide excellent material for studying the complex ‘iron story’ around the GOE, as well as the earliest known travertine-precipitating hydrothermal systems.
Revolution in biological cycling of phosphorous and organic matter. Post-Lomagundi-Jatuli deposits (2000 Ma) record the first known appearance (if sider-ite in banded iron formations is excluded) of
Figure 5. Composite (~5000-m-thick) and simplified Paleoproterozoic section for the Onega Basin linked to major paleoenvironmental events. Radiometric dates from bottom to top are from Ovchinnikova et al. (2007) and Pukhtel et al. (1992). Vertical red lines show the position of the drillholes. The number of the drillhole and its depth are shown in red-face letters; this is followed by text briefly describing rock lithologies intersected by the hole.
Onega Basin
1980 ± 27 Ma (Sm-Nd)
2090 ± 70 Ma(Pb-Pb on carbonate)
Jangozero Fm.
Medvezhegora Fm.
Suisari Fm.
Kondopoga Fm.
Palozero Fm.
‘red beds’, isotopicallyheavy carbonates
clastic pybitumen,petrified oil seeps inlacustrine turbiditicgraywackes
paleo-weatheredsurface
diamictites, polymictconglomerates
paleo-weatheredsurface
paleo-weatheredsurface
Basal regolithArchean basement
Hole 13A, 239.3 mHole 12A,99.6 mHole 12B, 503.4 morganic rich shales,petrified oil reservoir,
isotopically light carbonateconcretions, organo-siliceous rocks, maficlavas, gabbro sills
organic rich shales
organic rich shales
gabbro sill
Hole 11A, 435.6 mHole 10A, 431.4 mHole 10B, 277.5 misotopically heavycarbonates, ‘red beds’,Ca-sulfate
Tulomozero Fm.
Zaonega Fm.
t n e v E i l u t a J - i d n u g a m o L
Upp
er m
antle
oxi
datio
n
r e t t a m c i n a g r o f o g n i l c y c e r c i b o r e A
t n e v E a g n u h S
setaflus eniram tsriF
HuronianGlaciation
vein-trapped, migrated,petrified oil
Volc
anic
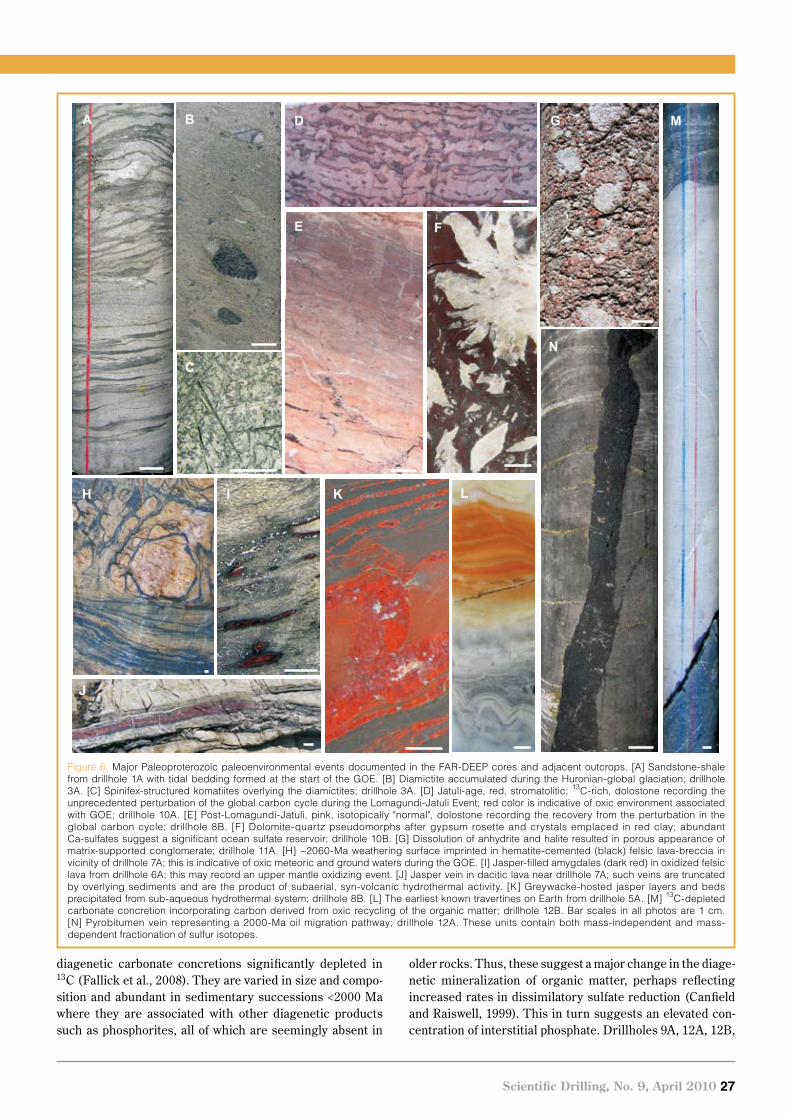
Progress Reports
Scientific Drilling, No. 9, April 2010 27
diagenetic carbonate concretions significantly depleted in 13C (Fallick et al., 2008). They are varied in size and compo-sition and abundant in sedimentary successions <2000 Ma where they are associated with other diagenetic products such as phosphorites, all of which are seemingly absent in
older rocks. Thus, these suggest a major change in the diage-netic mineralization of organic matter, perhaps reflecting increased rates in dissimilatory sulfate reduction (Canfield and Raiswell, 1999). This in turn suggests an elevated con-centration of interstitial phosphate. Drillholes 9A, 12A, 12B,
A B
C
D
E F
G
H I
J
K L
M
N
Figure 6. Major Paleoproterozoic paleoenvironmental events documented in the FAR-DEEP cores and adjacent outcrops. [A] Sandstone-shale from drillhole 1A with tidal bedding formed at the start of the GOE. [B] Diamictite accumulated during the Huronian-global glaciation; drillhole 3A. [C] Spinifex-structured komatiites overlying the diamictites; drillhole 3A. [D] Jatuli-age, red, stromatolitic, 13C-rich, dolostone recording the unprecedented perturbation of the global carbon cycle during the Lomagundi-Jatuli Event; red color is indicative of oxic environment associated with GOE; drillhole 10A. [E] Post-Lomagundi-Jatuli, pink, isotopically "normal", dolostone recording the recovery from the perturbation in the global carbon cycle; drillhole 8B. [F] Dolomite-quartz pseudomorphs after gypsum rosette and crystals emplaced in red clay; abundant Ca-sulfates suggest a significant ocean sulfate reservoir; drillhole 10B. [G] Dissolution of anhydrite and halite resulted in porous appearance of matrix-supported conglomerate; drillhole 11A. [H] ~2060-Ma weathering surface imprinted in hematite-cemented (black) felsic lava-breccia in vicinity of drillhole 7A; this is indicative of oxic meteoric and ground waters during the GOE. [I] Jasper-filled amygdales (dark red) in oxidized felsic lava from drillhole 6A; this may record an upper mantle oxidizing event. [J] Jasper vein in dacitic lava near drillhole 7A; such veins are truncated by overlying sediments and are the product of subaerial, syn-volcanic hydrothermal activity. [K] Greywacke-hosted jasper layers and beds precipitated from sub-aqueous hydrothermal system; drillhole 8B. [L] The earliest known travertines on Earth from drillhole 5A. [M] 13C-depleted carbonate concretion incorporating carbon derived from oxic recycling of the organic matter; drillhole 12B. Bar scales in all photos are 1 cm. [N] Pyrobitumen vein representing a 2000-Ma oil migration pathway; drillhole 12A. These units contain both mass-independent and mass-dependent fractionation of sulfur isotopes.
28 Scientific Drilling, No. 9, April 2010
Progress Reports
and 13A recovered hundreds of meters of cores con- taining abundant carbonate nodules (Fig. 6M) and carbonate-associated phosphorites, which allow us to address the causes of the emergence of ‘modern-style’ re-cycling of organic matter, are and the factors that control the formation of the oldest known phosphorites.
Supergiant petroleum deposits. The most remarkable accumulation of organic-matter-rich sediments and genera-tion of petroleum in the Precambrian took place at around 2000 Ma ago in the aftermath of the Lomagundi-Jatuli Event (Melezhik et al., 2009). This is known as the Shunga Event. The causes (e.g., high productivity or anoma-lous preservation) of such unprecedented global accumu-lation of organic-matter and pervasive oil generation remain unknown. In the type area at Shunga, three FAR-DEEP drillholes (12A, 12B, 13A) intersected several hundred meters of organic matter-rich source rocks, a uni-quely preserved oil migration pathway (Fig. 6N), a petrified supergiant oilfield, and several bodies of enigmatic organo-siliceous rocks containing up to 40 wt% organic car-bon. More than 100 archive samples have already been analyzed for major and trace elements as well as for S- and C-isotopes of sulfides, organic matter and associated carbonates, and they indicate a complex geochemical evolu-tionary pattern. These data, together with the results of forthcoming studies on biomarkers and structural, isotopic, and trace element characteristics of organic matter, will enable several fundamental problems associated with the Shunga Event to be addressed.
International Sampling and Acknowledgements
The drilling operations were carried out by a Finnish operator, whereas all logistical support was provided by the Russian State Company “Mineral” from St. Petersburg, Russia. Selected specimens from the archive set have been analyzed by partners at the Westfälische Wilhelms-Universität, Münster, Germany (H. Strauss), the Scottish Universities Environmental Research Center, Glasgow, Scotland (A.E. Fallick), the Pennsylvania State University, U.S.A. (L.R. Kump), and the Institute of Precambrian Geology and Geochronology, St. Petersburg, Russia (I.M. Gorokhov). The NGU, Center of Excellence in Geobiology at the University of Bergen in Norway, and the Institute of Geology at the Karelian Research Center in Petrozavodsk, Russia provided resources for the archiving work. In March–April 2009, the NGU provided its facilities and logistical support for an international sampling campaign. Samples have been collected either directly by scientists who have examined the core in Trondheim or by the NGU’s staff upon sample requests submitted by FAR-DEEP part-ners. More than 5500 samples have been collected from cores, and they are being prepared for various analyses and experiments. Scientists from thirteen countries have applied for research grants from various funding agencies to com-
plete studies of the FAR-DEEP cores. Currently, five PhD students from Finland, Germany, and Norway are involved in the FAR-DEEP research program. Four postdoctoral proj-ects in Finland, Great Britain, and Norway have been finan-ced by national funding agencies. A large group of scientists from the U.S.A. has received support from the U.S. National Science Foundation and NASA. Several research groups from Australia, Belgium, Czech Republic, Estonia, and Russia have also been successful in obtaining research grants.
References
Aharon, P., 2005. Redox stratification and anoxia of the early Precambrian oceans: Implications for carbon isotope excur-sions and oxidation events. Precam. Res., 137:207–222.
Amelin, Yu.V., Heaman, L.M., and Semenov, V.S., 1995. U-Pb geo-chronology of layered mafic intrusions in the eastern Baltic Shield: Implications for the timing and duration of Palaeoproterozoic continental rifting. Precam. Res., 75:31–46, doi:10.1016/0301-9268(95)00015-W.
Bekker, A., Holland, H.D., Wang, P.L., Rumble III, D., Stein, H.J., Hannah, J.L., Coetzee, L.L., and Beukes, N.J., 2004. Dating the rise of atmospheric oxygen. Nature, 427:117–120, doi:10.1038/nature02260.
Bekker, A., Karhu, J.A., Eriksson, K.A. and Kaufman, A.J., 2003a. Chemostratigraphy of Paleoproterozoic carbonate succes-sions of the Wyoming Craton: Tectonic forcing of biogeo-chemical change? Precam. Res., 120:279–325, doi:10.1016/S0301-9268(02)00164-X.
Bekker, A., Kaufman, A.J., Karhu, J.A., Beukes, N.J., Swart, Q.D., Coetzee, L.L., and Eriksson, K.A., 2001. Chemostratigraphy of the Paleoproterozoic Duitschland Formation, South Africa: Implications for coupled climate change and carbon cycling. Am. J. Sci., 301:261–285, doi:10.2475/ajs.301.3.261.
Bekker, A., Sial, A.N., Karhu, J.A., Ferreira, V.P., Noce, C.M., Kaufman, A.J., Romano, A.W., and Pimentel, M.M., 2003b. Chemostratigraphy of carbonates from the Minas Supergroup, Quadrilátero ferrífero (Iron Quadrangle), Brazil: a stratigraphic record of Early Proterozoic atmo-spheric, biogeochemical and climatic change. Am. J. Sci., 303:865–904, doi:10.2475/ajs.303.10.865.
Canfield, D.E., and Raiswell, R., 1999. The evolution of the sulfur cycle. Am. J. Sci., 299: 97–723, doi:10.2475/ajs.299.7-9.697.
Claire, M.W., Catling, D.C., and Zahnle, K.J., 2006. Biogeochemical modelling of the rise in atmospheric oxygen. Geobiology, 4:239–269, doi:10.1111/j.1472-4669.2006.00084.x.
Evans, D.A.D., 2003. A fundamental Precambrian-Phanerozoic shift in Earth’s glacial style? Tectonophysics, 375:353–385, doi:10.1016/S0040-1951(03)00345-7.
Fallick, A.E., Melezhik, V.A., and Simonson, B., 2008. The ancient anoxic biosphere was not as we know it. In Dobretsov, N., Kolchanov, N., Rozanov, A., and Zavarzin, G. (Eds.) Biosphere Origin and Evolution. New York (Springer Science + Business Media), 169–188.
Guo, Q., Strauss, H., Kaufman, A.J., Schröder, S., Gutzmer, J., Wing, B., Baker, M.A., Bekker, A., Kim, S.-T., Jin, Q., and Farquhar,

Pukhtel, I.S., Zhuravlev, D.Z., Ashikhmina, N.A., Kulikov, V.S., and Kulikova, V.V., 1992. Sm-Nd age of the Suisarian suite on the Baltic Shield. Trans. Russian Acad. Sci., 326:706–711. (in Russian).
Reuschel, M., Strauss, H., Fallick, A.E., and Melezhik, V., 2008. FAR-DEEP: Sulphur biogeochemistry in deep time. 33rd International Geological Congress, Oslo, 6–14 August 2008.
Watanabe, Y., Farquhar, J., and Ohmoto, H., 2009. Anomalous fractionations of sulfur isotopes during thermochemical reduction. Science, 324:370–373, doi:10.1126/science. 1169289.
Young, G.M., Long, D.G.F, Fedo, C.M., and Nesbitt, H.W., 2001. Paleoproterozoic Huronian basin: Product of a Wilson cycle punctuated by glaciations and a meteorite impact. Sed. Geol., 141/142:233–254, doi:10.1016/S0037-0738(01) 00076-8.
Authors
Victor A. Melezhik, Geological Survey of Norway, N-4791, Trondheim, Norway; Centre for Geobiology, University of Bergen, N-5020, Bergen, Norway, e-mail: [email protected] Lepland, Melanie Mesli, Tor Erik Finne, Geological Survey of Norway, N-4791, Trondheim, Norway.Alexander E. Romashkin and Dmitry V. Rychanchik, Institute of Geology of Karelian Research Centre, 185610, Petrozavodsk, Russia. Ronald Conze, Operational Support Group ICDP, GFZ German Research Center for Geosciences (GeoForschungsZentrum Potsdam), D-14473 Potsdam, Germany.and the FAR-DEEP Scientists
Web Links
http://far-deep.icdp-online.org (Internal Data FARDEEP)http://www.icdp-online.org/front_content.php?idart=1962
Scientific Drilling, No. 9, April 2010 29
J., 2009. Reconstructing Earth’s surface oxidation across the Archean-Proterozoic transition. Geology, 37:399–402, doi:10.1130/G25423A.1.
Hannah, J.L., Bekker, A., Stein, H.J., Markey, R.J., and Holland, H.D., 2004. Primitive Os and 2316 Ma age for marine shale: Implications for Paleoproterozoic glacial events and the rise of atmospheric oxygen. Earth Planet. Sci. Lett., 225:43–52, doi:10.1016/j.epsl.2004.06.013.
Hanski, E.J., 1992. Petrology of the Pechenga ferropicrites and coge-netic, Ni-bearing gabbro-wehrlite intrusions, Kola Peninsula, Russia. Geol. Survey Finland Bull., 367, 191 pp.
Hayes, J.M., and Waldbauer, J.R., 2006. The carbon cycle and associ-ated redox processes through time. Philos. Trans. R. Soc.
Lond. B Biol. Sci., 361:931–950.Holland, H.D., 2002. Volcanic gases, black smokers, and the great oxi-
dation event. Geochim. Cosmochim. Acta, 66:3811–3826, doi:10.1016/S0016-7037(02)00950-X.
Kah, L.C., Lyons, T.W., and Frank, T.D., 2004. Low marine sulfate and protracted oxygenation of the Proterozoic biosphere. Nature, 431:834–838, doi:10.1038/nature02974.
Kump, L.R., 2008. The rise of atmospheric oxygen. Nature, 451:277–278, doi:10.1038/nature06587.
Kump, L.R., and Barley, M.E., 2007. Increased subaerial volcanism and the rise of atmospheric oxygen 2.5 billion years ago. Nature, 448:1033–1036, doi:10.1038/nature06058.
Melezhik, V.A., 2006. Multiple causes of Earth’s earliest global glacia-tion. Terra Nova, 18:130–137, doi:10.1111/j.1365-3121. 2006.00672.x.
Melezhik, V.A., Fallick, A.E., Filippov, M.M., Lepland, A., Rychanchik, D.V., Deines, Y.E., Medvedev, P.V., Romashkin, A.E., and Strauss, H., 2009. Petroleum surface oil seeps from Palaeoproterozoic petrified giant oilfield. Terra Nova, 21:119–126, doi:10.1111/j.1365-3121.2009.00864.x.
Melezhik, V.A., Fallick, A.E., Hanski, E.J., Kump, L.R., Lepland, A., Prave, A.R., and Strauss, H., 2005a. Emergence of the aero-bic biosphere during the Archean-Proterozoic transition: Challenges of future research. Geol. Soc. Am. Today, 15:4–11.
Melezhik, V.A., Fallick, A.E., Medvedev, P.V., and Makarikhin, V.V., 1999. Extreme 13Ccarb enrichment in ca. 2.0 Ga magnesite-stromatolite-dolomite-‘red beds’ association in a global context: a case for the world-wide signal enhanced by a local environment. Earth Sci. Rev., 48:71–120, doi:10.1016/S0012-8252(99)00044-6.
Melezhik, V.A., Fallick, A.E., Rychanchik, D.V., and Kuznetsov, A.B., 2005b. Palaeoproterozoic evaporites in Fennoscandia: Implications for seawater sulfate, δ13C excursions and the rise of atmospheric oxygen. Terra Nova, 17:141–148, doi:10.1111/j.1365-3121.2005.00600.x.
Melezhik, V.A., Huhma, H., Condon, D.J., Fallick, A.E., and Whitehouse, M.J., 2007. Temporal constraints on the Paleoproterozoic Lomagundi-Jatuli carbon isotopic event. Geology, 35:655–658, doi:10.1130/G23764A.1.
Ovchinnikova, G.V., Kusnetzov, A.B., Melezhik, V.A., Gorokhov, I.M., Vasil’eva, I.M., and Gorokhovskii, B.M., 2007. Pb-Pb age of Jatulian carbonate rocks: the Tulomozero Formation of southeast Karelia. Strat. Geol. Correl., 15(4):359–372.

New Integrated Data Analyses Software Components
by Ronald Conze, Frank Krysiak, Josh Reed, Yu-Chung Chen, Hans-Joachim Wallrabe-Adams, Colin Graham and the New Jersey Shallow Shelf Science Team,
Volker Wennrich and the Lake El’gygytgyn Science Team
doi:10.2204/iodp.sd.9.08.2010
30 Scientific Drilling, No. 9, April 2010
Technical Developments
Introduction
Data management in scientific drilling programs such as the Integrated Ocean Drilling Program (IODP), the International Continental Scientific Drilling Program (ICDP), and the Antarctic Drilling Program (ANDRILL) performs two functions: firstly, the capture of drilling and scientific data during an expedition, and secondly, the long-term storage and dissemination of these data. Here we describe the progress in linking data management with stand-alone data capture and visualization applications. This provides a two-way flow of data between the database and the applications, and a more integrated data environment for scientists. The new system has been tested, so far, with cores from the IODP Expedition 313 New Jersey Shallow Shelf and the ICDP Lake El’gygytgyn Drilling Project.
The Components
The Expedition Drilling Information System 1. (ExpeditionDIS) is used for ICDP lake drilling pro- jects and IODP-MSP expeditions in a two-phase data capture process, at the drill site during the drilling operation and in one or more laboratories during the post-drilling phase (Conze et al., 2007). It is based on a relational database using mainly digital forms for the data input.PSICAT, the Paleontological Strati-2. graphic Interval Construction and Analysis Tool, is a stand-alone, Java-based graphical editing tool for creating and viewing core description diagrams (http://dev.psicat.org/) that can be used in the field as well as in a laboratory environment.Corelyzer as part of CoreWall (3. http://www.corewall.org/) is a scalable, ex- tensible visualization tool, developed to enhance the study of geological cores. The strength of Corelyzer is the ability to display large sets of core imagery, with multi-sensor logs and annotations. Plugins can be developed to provide additional data visualization functionality.Correlator, another CoreWall product, 4. is an interactive workstation software
product for displaying and depth-shifting/merging data from multiple cores and/or downhole geophysical logging data.
The Concept
The idea is to combine the advantages of all these stand-alone tools into an interoperable configuration.
The link between the ExpeditionDIS, PSICAT, and Corelyzer is realized by a Common Exchange Format (Fig. 1) using XML notation. The general workflow starts with the export of all relevant primary data for core recovered from a drill hole from the ExpeditionDIS in the Common Ex- change Format, which can then subsequently be imported by PSICAT and/or Corelyzer. A Common Exchange Format file contains the corresponding driller depths and file paths for core section images as well as any existing lithological visual core description data for each core section, and other corresponding data sets such as petrophysical (e.g., from Multi Sensor Core Logging, MSCL) data.
By importing the ExpeditionDIS data as Common 1. Exchange Format, PSICAT generates a visual core description (VCD) form for each core section. Exist-ing VCD data can be modified, and new data can be added using the graphical functionality of PSICAT. The new or modified data can be written back to the
Technical Developments
Expedition
DIS
CORRELATOR
PSICAT CORELYZER
Common
Exchange
Format
exports core section data,scanned images, existinglithological descriptions,and image annotations
re-imports modified and/ornew lithological descriptions
Start
exports modifiedand/or newlithological descriptions
exports imageannotations
Figure 1. Conceptual diagram showing data exchange between the components (Figure credit by R. Conze).

Scientific Drilling, No. 9, April 2010 31
ExpeditionDIS via the Common Exchange Format file. Upon selecting a subset of core sections or all core sections for a drill hole, a non-editable, continuous sequence, scaled to the driller depth, is displayed.By importing a Common Exchange Format file, 2. Corelyzer reads in all core images and corresponding optional logging data (Fig. 2). The utilization of an existing PSICAT plugin will allow visualization of the lithological units graphically beside these scanned images and log data. The user can add annotations to the images, which are added to the Common Exchange Format file and then exported for use by the other tools.By re-importing the Common Exchange Format 3. data generated by PSICAT, and Corelyzer, the ExpeditionDIS can store all modified or new lithological data. By connecting Correlator, Corelyzer can control 4. visualization and core depth adjustments in runtime using socket commands. It will allow users to utilize rich features in high-resolution core images to generate composite and spliced depth scales. This feature allows more fine-grained interactive strati-graphic correlations.
Benefits and Outlook
The two test beds demonstrated that the synergetic integration of ExpeditionDIS, PSICAT and Corelyzer is beneficial and enhances the capabilities of the individual stand-alone systems. The ExpeditionDIS and its relational database provide the full documentation of all recovered cores and sections including consistent driller depths and the corresponding scanned images in different grades of resolution. Neither PSICAT nor Corelyzer provides any tools to capture these important primary data, but both need these data as input for generating lithological visual core descrip-tions and visualization of the scanned images of the core sections and related logging data. In conjunction with
Correlator it will be possible to import the depth adjustment tables by ExpeditionDIS using the same Common Exchange Format so that any data can be output on the same composite or spliced depth scales.
Upcoming scientific drilling expeditions of ICDP and ECORD/IODP will provide further test beds for consolida-tion and development of such features.
Acknowledgements
This work has been made possible through bilateral memoranda of understanding between ICDP and IODP, ANDRILL, and LacCore as well as the GeoSciNET initiative composed of CoreWall, Geoinformatics for Geochemistry (GfG), System for Earth Sample Registration (SESAR), PaleoStrat, and ICDP.
ReferencesConze, R., Wallrabe-Adams, H.J., Graham, C., Krysiak, F., 2007. Joint
Data Management on ICDP projects and IODP mission spe-cific platform expeditions. Sci. Drill. 4:32–34. doi:10.2204/iodp.sd.4.07.2007
Authors
Ronald Conze, Operational Support Group ICDP, GFZ German Research Centre for Geosciences, Telegrafenberg, D-14473 Potsdam, Germany, e-mail:[email protected] Krysiak, smartcube GmbH Berlin, Puschkinallee 48, D-12435 Berlin, Germany. Josh Reed, Andrill Science Management Office, 126 Bessey Hall, Lincoln, University of Nebraska-Lincoln, P.O. Box 880851, Loncoln, NE 68588-0341, U.S.A. Yu-Chung Chen, University of Illinois at Chicago, Electronic Visualization Laboratory, U.S.A. Hans-Joachim Wallrabe-Adams, MARUM, University of Bremen, Leobener Str., D-28359 Bremen, Germany. Colin Graham, British Geological Survey Edinburgh, ESO – ECORD Science Operator, Murchison House, West Mains Road, Edinburgh EH9 3LA, Scotland, U.K. Volker Wennrich, University of Cologne, Institute of Geology and Mineralogy, Zuelpicher Str. 49a, D-50674 Koeln, Germany.
Related Web Links
http://www.icdp-online.org http://www.iodp.org http://www.ecord.org http://www.andrill.org http://lrc.geo.umn.edu http://www.corewall.org http://www.geoinfogeochem.org http://www.geosamples.org http://www.scientificdrilling.org http://www.smartcube.dehttp://www.wdc-mare.org
Figure 3. Corelyzer station at the IODP Exp. 313 New Jersey Shallow Shelf onshore science party at MARUM (University of Bremen). This station was fed continuously with scanned images and MSCL data of new core sections as they were added to the ExpeditionDIS. In conjunction with Correlator, this station was used for correlation between sites using lithological features and/or logging data. (Photo by H. Ando, Ibaraki University)
Automatic Slide-Loader Fluorescence Microscope for Discriminative Enumeration of Subseafloor Life
by Yuki Morono and Fumio Inagaki
doi:10.2204/iodp.sd.9.05.2010
32 Scientific Drilling, No. 9, April 2010
Technical Developments
Introduction
The marine subsurface environment is considered the potentially largest ecosystem on Earth, harboring one-tenth of all living biota (Whitman et al., 1998) and comprising diverse microbial components (Inagaki et al., 2003, 2006; Teske, 2006; Inagaki and Nakagawa, 2008). In deep marine sediments, the discrimination of life is significantly more difficult than in surface sediments and terrestrial soils because buried cells generally have extremely low metabolic activities (D’Hondt et al., 2002, 2004), and a highly consoli-dated sediment matrix produces auto-fluorescence from diatomaceous spicules and other mineral particles (Kallmeyer et al., 2008). The cell abundance in marine subsurface sediments has conventionally been evaluated by acridine orange direct count (AODC; Cragg et al., 1995; Parkes et al., 2000) down to 1613 meters below the seafloor (mbsf) (Roussel et al., 2008). Since the cell-derived AO signals often fade out in a short exposure time, recognizing and counting cells require special training. Hence, such efforts to enumerate AO-stained cells from the subseafloor on photographic images have been difficult, and a verifica-tion of counts by other methods has been impossible. In addition, providing mean statistical values from low biomass sedimentary habitats has been complicated by physical and time limitations, yet these habitats are considered critical for understanding the Earth’s biosphere close to the limits of habitable zones (Hoehler, 2004; D’Hondt et al., 2007).
Here we report recent developments on the automatic cell count system based on our recently published new cell detec-tion and enumeration method that discriminates the SYBR Green I(SYBR I)-stained cells from the background fluo-rescent signals, called SYBR-SPAM (SYBR-Stainable PArticulated Matter; Morono et al., 2009). We integrated an automatic slide loader and an LED light-camera monitoring system for high-throughput and high-resolution counting operation.
Principle of Discriminative Detection
SYBR-I or SYBR-II has been considered a more effective fluorescent dye for cell enumeration in sediments than AO due to its higher fluorescent intensity and sensitivity to nucleic acids (Weinbauer et al., 1998; Lunau et al., 2005;
Engelen et al., 2008). However, we found non-autofluorescent SYBR-I-stainable particulate matter (SYBR-SPAM) in heat-sterilized control sediments treated at 450°C for 3 hours (Morono et al., 2009). We also found that when SYBR-I bound to SYBR-SPAM the SYBR-I spectra shifted to longer wavelengths (Fig. 1A), and that the spectra can be distin-guished from cell-derived green fluorescence under the observation of a long-pass filter of cut-off wavelength 510 nm (Fig. 1B). To discriminate the cell-derived fluorescent signal more precisely, we obtained microscopic images using band-pass filters at 528/38 and 617/73 nm (center wavelength/bandwidth) that separated the green and red components of SYBR-I fluorescence (Fig. 1C, D). We divided the fluorescent intensity of green by that of the red images to obtain relative intensity profiles of green/red fluorescence, in which cell-derived fluorescence was successfully discrim-inated as bright signals, whereas SYBR-SPAM and other background signals were entirely eliminated (Fig. 1E).
Sample Preparation Protocol
A standard sample preparation scheme is shown in Fig. 2. Fifty microliters of sediment slurry (10% [v/v] sediment in ethanol-PBS solution) fixed in 2% paraformaldehyde is mixed with 850 μL of 3% [wt/v] NaCl solution and sonicated at 20 W for 1 min on ice using an ultrasonic homogenizer (Model UH-50, SMT Co. Ltd., Tokyo). The sonicate is then mixed with 100 μL of 10% [wt/v] hydrofluoric acid (HF) and incubated for 20 min at room temperature. This HF treat-ment has been shown to effectively decrease the number of SYBR-SPAM especially in shallow subseafloor sediments, while intracellular DNA is negligibly affected (Morono et al., 2009). Then, up to 700 μL of the mixture is directly filtered through a 0.22 μm-pore size black polycarbonate membrane without centrifugation. The final sediment volumes on the filter are up to 3.5 x 10⁻³ cm3. To eliminate potential carbo-nate particles and/or precipitates, the membrane is treated with 1 mL of 0.1 M HCl for 5 min on the filtration device. The membrane is then washed with 5 mL of TE buffer (10 mM Tris-HCl, 1.0 mM EDTA, pH 8.0), and roughly 2 x 10⁸ fluo-rescence microsphere beads (Fluoresbrite Bright Blue Carboxylate Microspheres [BB beads], 0.5 μm, Polysciences, Inc., Warrington, Pa.) are used for focus adjustment (Morono et al., 2009). After air drying, one-fourth of the membrane is placed on the filtration device again, then stained with SYBR-I staining solution (1/40 [v/v] SYBR-I in TE buffer). The stained filter is finally mounted on a glass microscope
32 Scientific Drilling, No. 9, April 2010
Technical DevelopmentsTechnical DevelopmentsTechnical Developments

Scientific Drilling, No. 9, April 2010 33
slide with 3–5 μL of mounting solution (1:2 mixture of VECTASHIELD mounting medium H-1000 and TE buffer).
The Slide Handler-Equipped Automatic Fluorescence Microscope System
The images are automatically acquired with a fluorescent microscope system (Fig. 3A) that consists of a basic micro-scope (BX-51, Olympus), an automatic slide handler (LEP Slide Handler System, Ludl Electric Products, Ltd.), illumi-nation with LED Array Modules (LAMs) of 400 nm and 490 nm (precisExcite, CoolLED, Ltd.), an emission filter wheel (Ludl Electric Products, Ltd.), and a cooled CCD
camera (ORCA-AG, Hamamatsu Photonics K.K.) All units are software controlled (MetaMorph 7.5, Molecular Devices). Up to 50 slides of samples can be set in two magazines of the slide handler (Fig. 3B). To keep the sample in good condition for a long time (depending on the scanning area but at least 30 min per sample, i.e., 25 h duration to process all 50 slides), the whole system is put in a dark cooled (15°C) chamber. In addition, we also installed a digital camera to monitor the system without opening the door of the chamber (Fig. 3C, D). LED illumination allows for (i) an instant on/off switch and wavelength change without damage to the lamp source, (ii) a prolonged lifetime in comparison to mercury lamps, and (iii) negligible heating during operation.
Figure 1. Difference of SYBR-I fluorescence spectrum with intracellular DNA or SYBR-SPAM, and discrimination of cell-derived SYBR Green I fluorescence from background signals using image analysis. [A] Spectrum patterns show “red shift” of SYBR-I fluorescence. When SYBR-I binds to SYBR-SPAM (red line), fluorescence spectra shift to longer wavelengths than SYBR-DNA complex (green line). Green and orange shaded areas show the wavelength range of 525/36 and 605/52 (nm of center wavelength/bandwidth) band-pass filters, respectively. [B] Examples of fluorescence-producing cellular and non-cellular objects stained with SYBR-I. Red arrows, yellowish SYBR-SPAM. White arrows, green E. coli cells. The image was obtained using a long-pass filter of cut-off wavelength 510 nm. [C to E] Image analysis to distinguish cell-derived SYBR-I signals from SYBR-SPAM in natural marine sediments (core 1H-1 of Site C0006 Hole E in the Integrated Ocean Drilling Program Exp. 316). Fluorescence microscopic images taken using band-pass filters of 525/36 [C] and 605/52 [D]. Relative intensity profiles of green/red fluorescence [E] show only cell-derived fluorescence signals without background fluorescence. Bars: 10 μm.
500 550 600 650 700Fluorescence wavelength (nm)
0
0.4
0.8
1.0
Rel
ativ
e in
tens
ity SYBR-SPAM
SYBR+DNA
BP 525/36 nm BP 605/52 nm BA
C D E
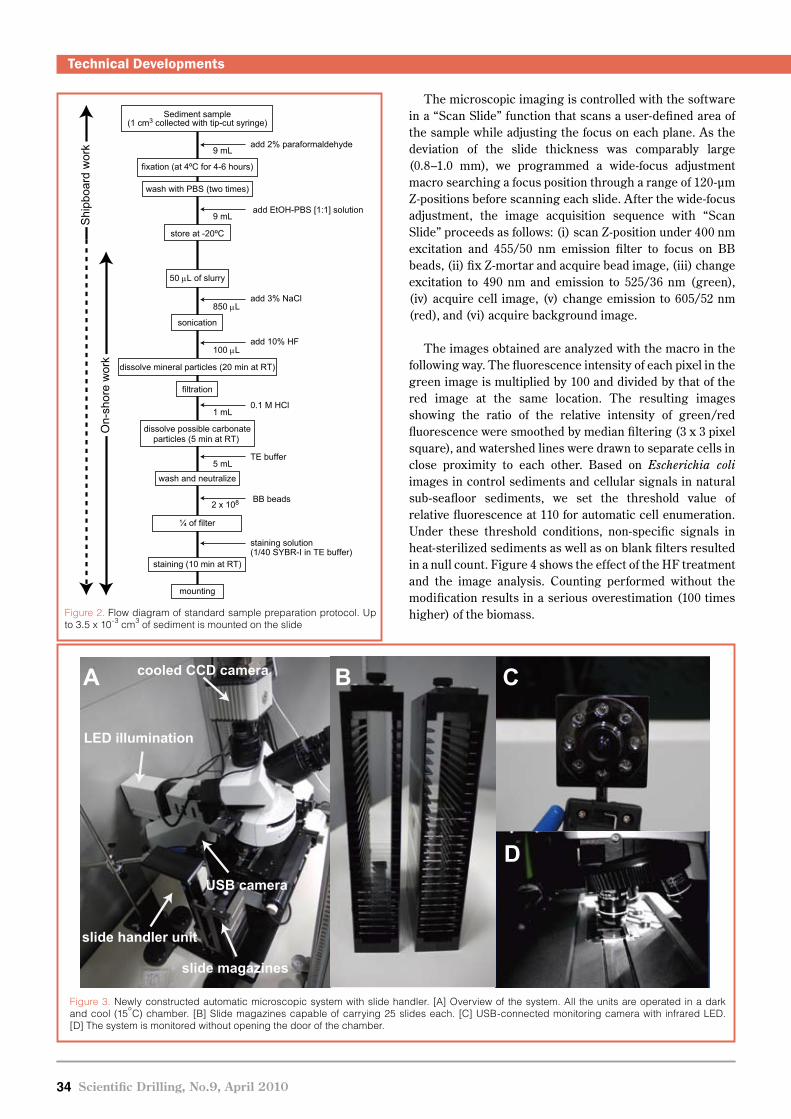
34 Scientific Drilling, No.9, April 2010
Technical Developments
The microscopic imaging is controlled with the software in a “Scan Slide” function that scans a user-defined area of the sample while adjusting the focus on each plane. As the deviation of the slide thickness was comparably large (0.8–1.0 mm), we programmed a wide-focus adjustment macro searching a focus position through a range of 120-μm Z-positions before scanning each slide. After the wide-focus adjustment, the image acquisition sequence with “Scan Slide” proceeds as follows: (i) scan Z-position under 400 nm excitation and 455/50 nm emission filter to focus on BB beads, (ii) fix Z-mortar and acquire bead image, (iii) change excitation to 490 nm and emission to 525/36 nm (green), (iv) acquire cell image, (v) change emission to 605/52 nm (red), and (vi) acquire background image.
The images obtained are analyzed with the macro in the following way. The fluorescence intensity of each pixel in the green image is multiplied by 100 and divided by that of the red image at the same location. The resulting images showing the ratio of the relative intensity of green/red fluorescence were smoothed by median filtering (3 x 3 pixel square), and watershed lines were drawn to separate cells in close proximity to each other. Based on Escherichia coli images in control sediments and cellular signals in natural sub-seafloor sediments, we set the threshold value of relative fluorescence at 110 for automatic cell enumeration. Under these threshold conditions, non-specific signals in heat-sterilized sediments as well as on blank filters resulted in a null count. Figure 4 shows the effect of the HF treatment and the image analysis. Counting performed without the modification results in a serious overestimation (100 times higher) of the biomass.
slide handler unit
slide magazines
LED illumination
USB camera
cooled CCD cameraA B C
D
Figure 3. Newly constructed automatic microscopic system with slide handler. [A] Overview of the system. All the units are operated in a dark and cool (15°C) chamber. [B] Slide magazines capable of carrying 25 slides each. [C] USB-connected monitoring camera with infrared LED. [D] The system is monitored without opening the door of the chamber.
Figure 2. Flow diagram of standard sample preparation protocol. Up to 3.5 x 10⁻³ cm3 of sediment is mounted on the slide
add 3% NaCl
add 10% HF
0.1 M HCl
TE buffer
BB beads
add EtOH-PBS [1:1] solution
add 2% paraformaldehyde 9 mL
9 mL
850 µL
100 µL
1 mL
5 mL
2 x 10⁸
Sediment sample(1 cm3 collected with tip-cut syringe)
fixation (at 4ºC for 4-6 hours)
wash with PBS (two times)
store at -20ºC
sonication
dissolve mineral particles (20 min at RT)
filtration
¼ of filter
staining (10 min at RT)
dissolve possible carbonateparticles (5 min at RT)
wash and neutralize
50 µL of slurry
mounting
staining solution(1/40 SYBR-I in TE buffer)
On-
shor
e w
ork
Shi
pboa
rd w
ork
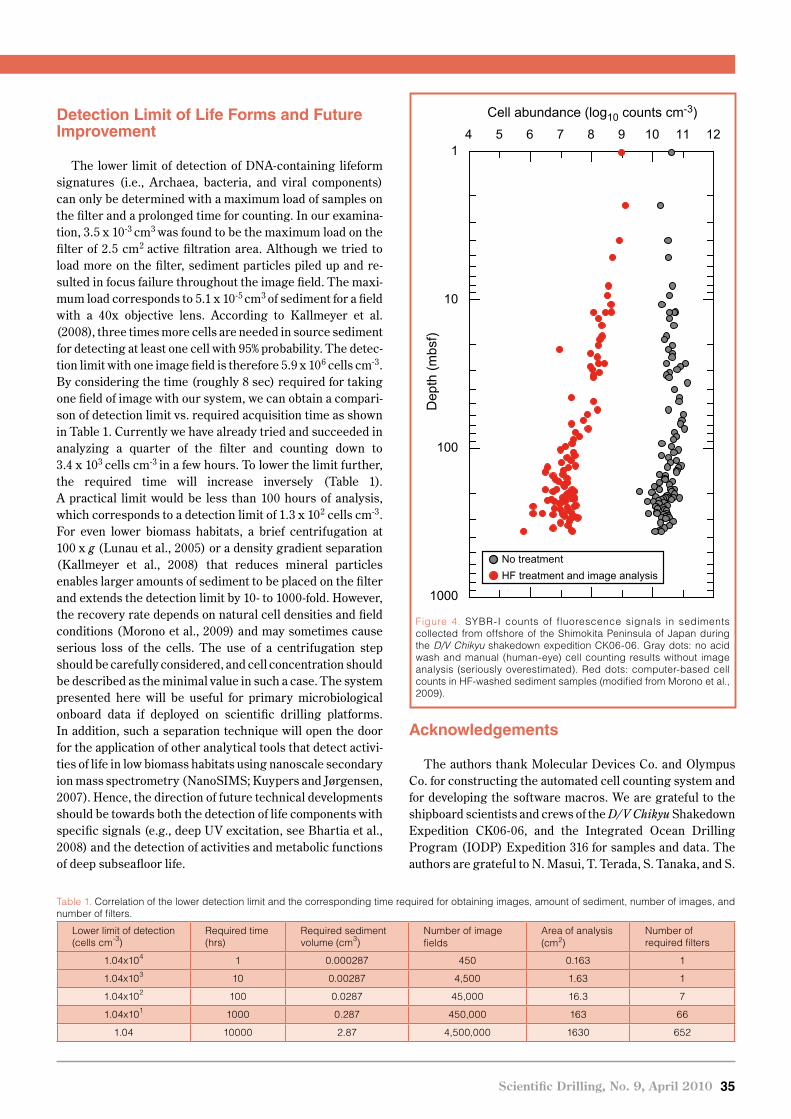
Technical Developments
Scientific Drilling, No. 9, April 2010 35
Detection Limit of Life Forms and Future Improvement
The lower limit of detection of DNA-containing lifeform signatures (i.e., Archaea, bacteria, and viral components) can only be determined with a maximum load of samples on the filter and a prolonged time for counting. In our examina-tion, 3.5 x 10⁻³ cm3 was found to be the maximum load on the filter of 2.5 cm2 active filtration area. Although we tried to load more on the filter, sediment particles piled up and re-sulted in focus failure throughout the image field. The maxi-mum load corresponds to 5.1 x 10⁻⁵ cm3 of sediment for a field with a 40x objective lens. According to Kallmeyer et al. (2008), three times more cells are needed in source sediment for detecting at least one cell with 95% probability. The detec-tion limit with one image field is therefore 5.9 x 10⁶ cells cm-3. By considering the time (roughly 8 sec) required for taking one field of image with our system, we can obtain a compari-son of detection limit vs. required acquisition time as shown in Table 1. Currently we have already tried and succeeded in analyzing a quarter of the filter and counting down to 3.4 x 10³ cells cm-3 in a few hours. To lower the limit further, the required time will increase inversely (Table 1). A practical limit would be less than 100 hours of analysis, which corresponds to a detection limit of 1.3 x 10² cells cm-3. For even lower biomass habitats, a brief centrifugation at 100 x g (Lunau et al., 2005) or a density gradient separation (Kallmeyer et al., 2008) that reduces mineral particles enables larger amounts of sediment to be placed on the filter and extends the detection limit by 10- to 1000-fold. However, the recovery rate depends on natural cell densities and field conditions (Morono et al., 2009) and may sometimes cause serious loss of the cells. The use of a centrifugation step should be carefully considered, and cell concentration should be described as the minimal value in such a case. The system presented here will be useful for primary microbiological onboard data if deployed on scientific drilling platforms. In addition, such a separation technique will open the door for the application of other analytical tools that detect activi-ties of life in low biomass habitats using nanoscale secondary ion mass spectrometry (NanoSIMS; Kuypers and Jørgensen, 2007). Hence, the direction of future technical developments should be towards both the detection of life components with specific signals (e.g., deep UV excitation, see Bhartia et al., 2008) and the detection of activities and metabolic functions of deep subseafloor life.
Acknowledgements
The authors thank Molecular Devices Co. and Olympus Co. for constructing the automated cell counting system and for developing the software macros. We are grateful to the shipboard scientists and crews of the D/V Chikyu Shakedown Expedition CK06-06, and the Integrated Ocean Drilling Program (IODP) Expedition 316 for samples and data. The authors are grateful to N. Masui, T. Terada, S. Tanaka, and S.
1
10
100
1000
Dep
th (m
bsf)
4 5 6 7 8 9 10 11 12
Cell abundance (log10 counts cm-3)
HF treatment and image analysisNo treatment
Figure 4. SYBR-I counts of fluorescence signals in sediments collected from offshore of the Shimokita Peninsula of Japan during the D/V Chikyu shakedown expedition CK06-06. Gray dots: no acid wash and manual (human-eye) cell counting results without image analysis (seriously overestimated). Red dots: computer-based cell counts in HF-washed sediment samples (modified from Morono et al., 2009).
Table 1. Correlation of the lower detection limit and the corresponding time required for obtaining images, amount of sediment, number of images, and number of filters.
Lower limit of detection (cells cm-3)
Required time (hrs)
Required sediment volume (cm3)
Number of image fields
Area of analysis (cm2)
Number of required filters
1.04x10⁴ 1 0.000287 450 0.163 1
1.04x10³ 10 0.00287 4,500 1.63 1
1.04x10² 100 0.0287 45,000 16.3 7
1.04x101 1000 0.287 450,000 163 66
1.04 10000 2.87 4,500,000 1630 652
36 Scientific Drilling, No.9, April 2010
Technical Developments
Fukunaga for filter preparation and technical supports. This study was supported in part by JAMSTEC Multidisciplinary Research Promotion Award 2008 (to YM and FI).
References
Bhartia, R., Hug, W.F., Salas, E.C., Reid, R.D., Sijapati, K.K., Tsapin, A., Abbey, W., Nealson, K.H., Lane, A.L., and Conrad, P.G., 2008. Classification of organic and biological materials with deep ultraviolet excitation. Appl. Spect., 62:1070–1077, doi:10.1366/000370208786049123.
Cragg, B.A., Parkes, R.J., Fry, J.C., Weightman, A.J., Maxwell, J.R., Kastner, M., Hovland, M., Whiticar, M.J., Sample, J.C., and Stein, R., 1995. Bacterial profiles in deep sediments of the Santa Barbara Basin, Site 893. Proc. ODP Sci. Res., 146 (Part 2):139–144.
D’Hondt, S., Inagaki, F., Ferdelman, T., Jørgensen, B.B., Kato, K., Kemp, P., Sobecky, P., Sogin, M., and Takai, K., 2007. Exploring subseafloor life with the Integrated Ocean Drilling Program. Sci. Drill., 5:26–37, doi:10.2204/iodp.sd.5.03.2007.
D’Hondt, S., Jørgensen, B.B., Miller, D.J., Batzke, A., Blake, R., Cragg, B.A., Cypionka, H., Dickens, G.R., Ferdelman, T., Hinrichs, K.-U., Holm, N.G., Mitterer, R., Spivack, A., Wang, G., Bekins, B., Engelen, B., Ford, K., Gettemy, G., Rutherford, S.D., Sass, H., Skilbeck, C.G., Aiello, I.W., Guerin, G., House, C.H., Inagaki, F., Meister, P., Naehr, T., Niitsuma, S., Parkes, R.J., Schippers, A., Smith, D.C., Teske, A., Wiegel, J., Naranjo Padillo, C., and Solis Acosta, J.L., 2004. Distributions of microbial activities in deep subseafloor sediments. Science, 306:2216–2221, doi:10.1126/science.1101155.
D’Hondt, S., Rutherford, S., and Spivack, A.J., 2002. Metabolic activ-ity of subsurface life in deep-sea sediments. Science, 295:2067–2070, doi:10.1126/science.1064878.
Engelen, B., Ziegelmüller, K., Wolf, L., Köpke, B., Gittel, A., Cypionka, H., Treude, T., Nakagawa, S., Inagaki, F., Lever, M.A., and Steinsbu, B.O., 2008. Fluids from the oceanic crust support microbial activities within the deep biosphere. Geomicrobiol.
J., 25:56–66, doi:10.1080/01490450701829006. Hoehler, T.M., 2004. Biological energy requirements as quantitative
boundary conditions for life in the subsurface. Geobiology, 2:205–215, doi:10.1111/j.1472-4677.2004.00033.x.
Inagaki, F., and Nakagawa, S., 2008. Spatial distribution of the sub-seafloor life: Diversity and biogeography. In Dilek, Y., Furnes, H., and Muehlenbachs, K. (Eds.), Links Between
Geographical Processes, Microbial Activities and Evolution of
Life. New York (Springer Verlag), 135–158. Inagaki, F., Nunoura, T., Nakagawa, S., Teske, A., Lever, M., Lauer,
A., Suzuki, M., Takai, K., Delwiche, M., Colwell, F.S., Nealson, K.H., Horikoshi, K., D'Hondt, S., and Jørgensen, B.B., 2006. Biogeographical distribution and diversity of microbes in methane hydrate-bearing deep marine sedi-ments on the Pacific Ocean Margin. Proc. Natl. Acad. Sci.
U.S.A., 103:2815–2820, doi:10.1073/pnas.0511033103.Inagaki, F., Suzuki, M., Takai, K., Oida, H., Sakamoto, T., Aoki, K.,
Nealson, K.H., and Horikoshi, K., 2003. Microbial commu-nities associated with geological horizons in coastal sub-
seafloor sediments from the Sea of Okhotsk. Appl. Environ.
Microbiol., 69:7224–7235, doi:10.1128/AEM.69.12.7224-7235.2003.
Kallmeyer, J., Smith, D.C., Spivack, A.J., and D’Hondt, S., 2008. New cell extraction procedure applied to deep subsurface sedi-ments. Limnol. Oceanogr. Methods, 6:236–245.
Kuypers, M.M.M., and Jørgensen, B.B., 2007. The future of single-cell environmental microbiology. Environ. Microbiol., 9:6–7, doi:10.1111/j.1462-2920.2006.01222_5.x.
Lunau, M., Lemke, A., Walther, K., Martens-Habbena, W., and Simon, M., 2005. An improved method for counting bacteria from sediments and turbid environments by epifluorescence microscopy. Environ. Microbiol., 7:961–968, doi:10.1111/ j.1462-2920.2005.00767.x.
Morono, Y., Terada, T., Masui, N., and Inagaki, F., 2009. Discriminative detection and enumeration of microbial life in marine sub-surface sediments. ISME J., 3:503–511, doi:10.1038/ismej.2009.1.
Parkes, R.J., Cragg, B.A., and Wellsbury, P., 2000. Recent studies on bacterial populations and processes in subseafloor sedi-ments: A review. Hydrogeol. J., 8:11–28, doi:10.1007/PL 00010971.
Roussel, E.G., Bonavita, M.C., Querellou, J., Cragg, B.A., Webster, G., Prieur, D., and Parkes, R.J., 2008. Extending the sub-sea-floor biosphere. Science, 320:1046, doi:10.1126/science. 1154545.
Teske, A.P., 2006. Microbial communities of deep marine subsurface sediments: Molecular and cultivation surveys. Geomicrobiol.
J., 23:357–368, doi:10.1080/01490450600875613. Weinbauer, M.G., Beckmann, C., and Höfle, M.G., 1998. Utility of
green fluorescent nucleic acid dyes and aluminum oxide membrane filters for rapid epifluorescence enumeration of soil and sediment bacteria. Appl. Environ. Microbiol., 64:5000–5003.
Whitman, W.B., Coleman, D.C., and Wiebe, W.J., 1998. Prokaryotes: The unseen majority. Proc. Natl. Acad. Sci. U.S.A., 95:6578–6583, doi:10.1073/pnas.95.12.6578.
Authors
Yuki Morono and Fumio Inagaki, Geomicrobiology Group, Kochi Institute for Core Sample Research (KOCHI), Japan Agency for Marine-Earth Science and Technology (JAMSTEC), Monobe B200, Nankoku, Kochi 783-8502, Japan, e-mail: [email protected].
Photo Credits
Fig. 1 and 3: Yuki Morono, JAMSTEC
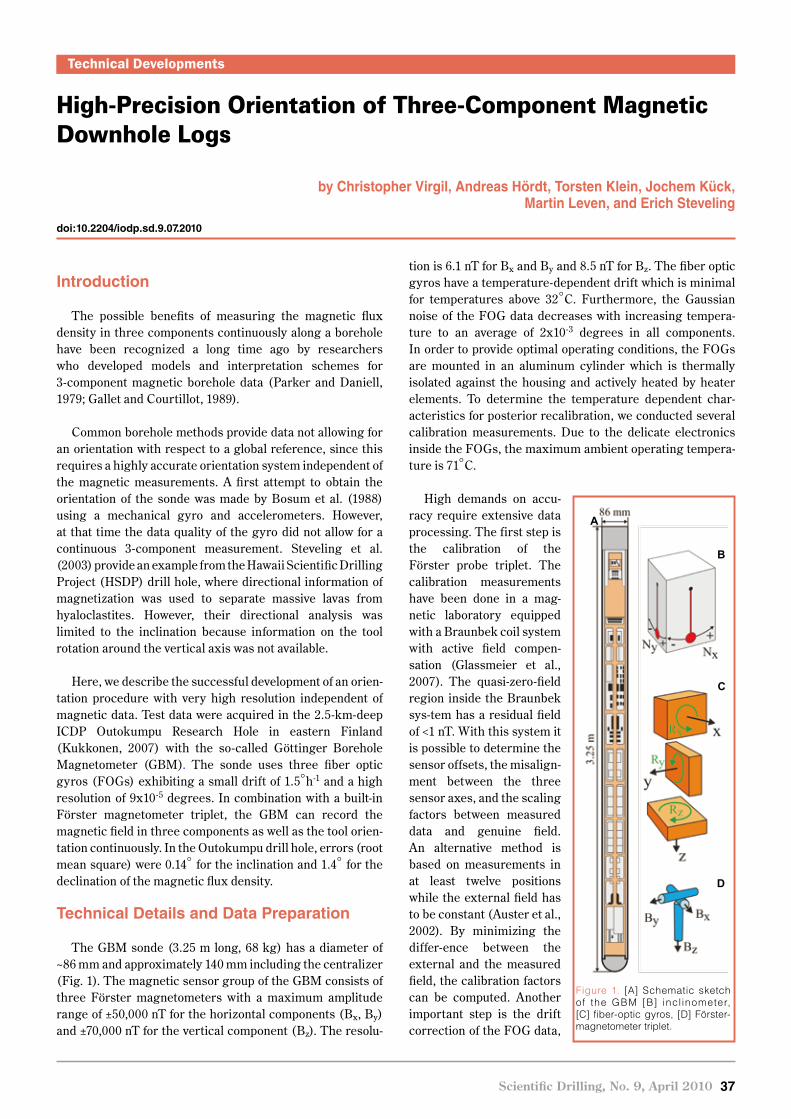
Scientific Drilling, No. 9, April 2010 37
High-Precision Orientation of Three-Component Magnetic Downhole Logs
by Christopher Virgil, Andreas Hördt, Torsten Klein, Jochem Kück, Martin Leven, and Erich Steveling
doi:10.2204/iodp.sd.9.07.2010
Technical Developments
Introduction
The possible benefits of measuring the magnetic flux density in three components continuously along a borehole have been recognized a long time ago by researchers who developed models and interpretation schemes for 3-component magnetic borehole data (Parker and Daniell, 1979; Gallet and Courtillot, 1989).
Common borehole methods provide data not allowing for an orientation with respect to a global reference, since this requires a highly accurate orienta tion system independent of the magnetic measurements. A first attempt to obtain the orientation of the sonde was made by Bosum et al. (1988) using a mechanical gyro and accelerometers. However, at that time the data quality of the gyro did not allow for a continuous 3-component measurement. Steveling et al. (2003) provide an example from the Hawaii Scientific Drilling Project (HSDP) drill hole, where directional information of magnetization was used to separate massive lavas from hyaloclastites. However, their directional analysis was limited to the inclination because information on the tool rotation around the vertical axis was not available.
Here, we describe the successful development of an orien-tation procedure with very high resolution independent of magnetic data. Test data were acquired in the 2.5-km-deep ICDP Outokumpu Research Hole in eastern Finland (Kukkonen, 2007) with the so-called Göttinger Borehole Magnetometer (GBM). The sonde uses three fiber optic gyros (FOGs) exhibiting a small drift of 1.5°h-1 and a high resolution of 9x10⁻⁵ degrees. In combination with a built-in Förster magnetometer triplet, the GBM can record the magnetic field in three components as well as the tool orien-tation continuously. In the Outokumpu drill hole, errors (root mean square) were 0.14° for the inclination and 1.4° for the declination of the magnetic flux density.
Technical Details and Data Preparation
The GBM sonde (3.25 m long, 68 kg) has a diameter of ~86 mm and approximately 140 mm including the centralizer (Fig. 1). The magnetic sensor group of the GBM consists of three Förster magnetometers with a maximum amplitude range of ±50,000 nT for the horizontal components (Bx, By) and ±70,000 nT for the vertical component (Bz). The resolu-
tion is 6.1 nT for Bx and By and 8.5 nT for Bz. The fiber optic gyros have a temperature-dependent drift which is minimal for temperatures above 32°C. Furthermore, the Gaussian noise of the FOG data decreases with increasing tempera-ture to an average of 2x10⁻³ degrees in all components. In order to provide optimal operating conditions, the FOGs are mounted in an aluminum cylinder which is thermally isolated against the housing and actively heated by heater elements. To determine the temperature dependent char- acteristics for posterior recalibration, we conducted several calibration measurements. Due to the delicate electronics inside the FOGs, the maximum ambient operating tempera-ture is 71°C.
High demands on accu-racy require extensive data processing. The first step is the calibration of the Förster probe triplet. The calibration measurements have been done in a mag-netic laboratory equipped with a Braunbek coil system with active field compen-sation (Glassmeier et al., 2007). The quasi-zero-field region inside the Braunbek sys-tem has a residual field of <1 nT. With this system it is possible to determine the sensor offsets, the misalign-ment between the three sensor axes, and the scaling factors between measured data and genuine field. An alternative method is based on measurements in at least twelve positions while the external field has to be constant (Auster et al., 2002). By minimizing the differ-ence between the external and the measured field, the calibration factors can be computed. Another important step is the drift correction of the FOG data,
Technical Developments
Figure 1. [A] Schematic sketch of the GBM [B] incl inometer, [C] fiber-optic gyros, [D] Förster-magnetometer triplet.
B
C
D
A

38 Scientific Drilling, No.9, April 2010
Technical Developments
rotations, can be observed. A possible explanation is that they are caused by borehole wall outbreaks. The cable ten-sion built up by the use of non-rotating centralizers may be released in such breakout sections. This hypothesis is sup-ported by an observed co-occurrence between sections of rapid tool rotation and increasing caliper.
For the reorientation procedure, the magnetic data from the internal tool coordinate system xyz are projected onto the geographical system North, East, and Vertical (down-wards). Each magnetic data triplet is multiplied by a rotation matrix computed from the FOG’s data. Furthermore, other effects have to be considered, one of which is the Earth’s rotation. The fiber optic gyros measure rotation depending on their orientation with respect to Earth’s rotational axis, in addition to the tool rotation. Therefore, the Earth’s rotational vector has to be projected into the tool system and sub- tracted from the FOG data in all three components for each depth.
The next processing corrects the misalignment of the FOG system. If the three axes of this system are not exactly perpendicular to each other, rotation around the z-axis will cause a spurious signal in the x- and y-gyros, which would be mistaken for a real rotation. Due to the torque in the cable, the rotation around the z-axis dominates. Thus, we consider only the misalignment between the x- and z-axis, as well as y- and z-axis, which were determined by calibration measurements to be 0.19° and 0.02°, respectively.
Another challenge is the computation of the rotation matrix itself. During the sampling period of 0.5 seconds, rotation occurs continuously around all three axes. However, when computing the rotation matrix, one has to assume rotation in a specific order—for instance, in roll-yaw-pitch convention. Instead of using only one rotation matrix per step, the movement is smoothed by dividing the period into fifty steps. Each matrix corresponds to a rotation by only 1/50 of the measured rotation angles. This reduces the error particularly in regions where fast rotations in all three axes exist.
The final correction takes the tool orientation above ground into account. Before actually starting the logging, the tool is set up in a vertical position above the borehole and is aligned to a north marker by a sighting telescope mounted on the housing. This defines the start orientation in the FOG data with an accuracy of 5x10⁻² degrees. Having finished the uplog this procedure is repeated, so that the orientation at these two time points can be ensured. If the reorientation procedure works perfectly, the two orientations should match exactly after processing. Nevertheless, differences of a few degrees are usually observed in all three components. Based on these deviations, additional drift corrections are computed and applied to the FOG data to minimize the orien-tation differences. In Figs. 3D–3F, the example logs are shown after the complete reorientation procedure.
using the temperature-dependent calibration factors pre-viously determined in the laboratory. Finally, the actual re-orientation procedure is carried out, which transforms the magnetic data from tool to geographical coordinates using the orientation information provided by the FOGs.
Case Study from the Outokumpu Deep Drillhole
The GBM sonde was utilized in a logging campaign in the Outokumpu research borehole in eastern Finland (Fig. 2) in September 2008. This 2516-m-deep well was drilled from 2004 to 2005 and is maintained by the Geological Survey of Finland as a deep geolaboratory. It offers ideal conditions for magnetic measurements as it cuts through a highly magnetized 200-m-thick Cu-Co-Zn bearing ophiolitic layer (1300–1500 m) at moderate temperatures below 40°C (Kukkonen, 2007).
Figure 3 shows a comparison of downlog and uplog data of sample measurements before and after reorientation. The mean difference between downlog and uplog in the total field (Fig. 3A) is on the order of 30 nT. The horizontal components after recalibration, but before reorientation, are depicted in Figs.3B and 3C. The large variations of ±11,200 nT are due to the rotation around the vertical axis. Depth regions with rapid changes (e.g., at 800 m), which are produced by sudden
Figure 2. Borehole scheme of the Outokumpu well with simplified lithological units (Kukkonen, 2007).
Lithologies of Outokumpu borehole
Drilling started 6 Apr. 2004
Drilling completed 31 Jan. 2005
Mica schistblack schist interlayers,fracture zones
Outokumpu - rock type assemblage:• Serpentinite• Skarn rock• Quartz rock• Black schist
Pegmatitic granite
33 m
1314 m
1515 m
2013 m
2516 m
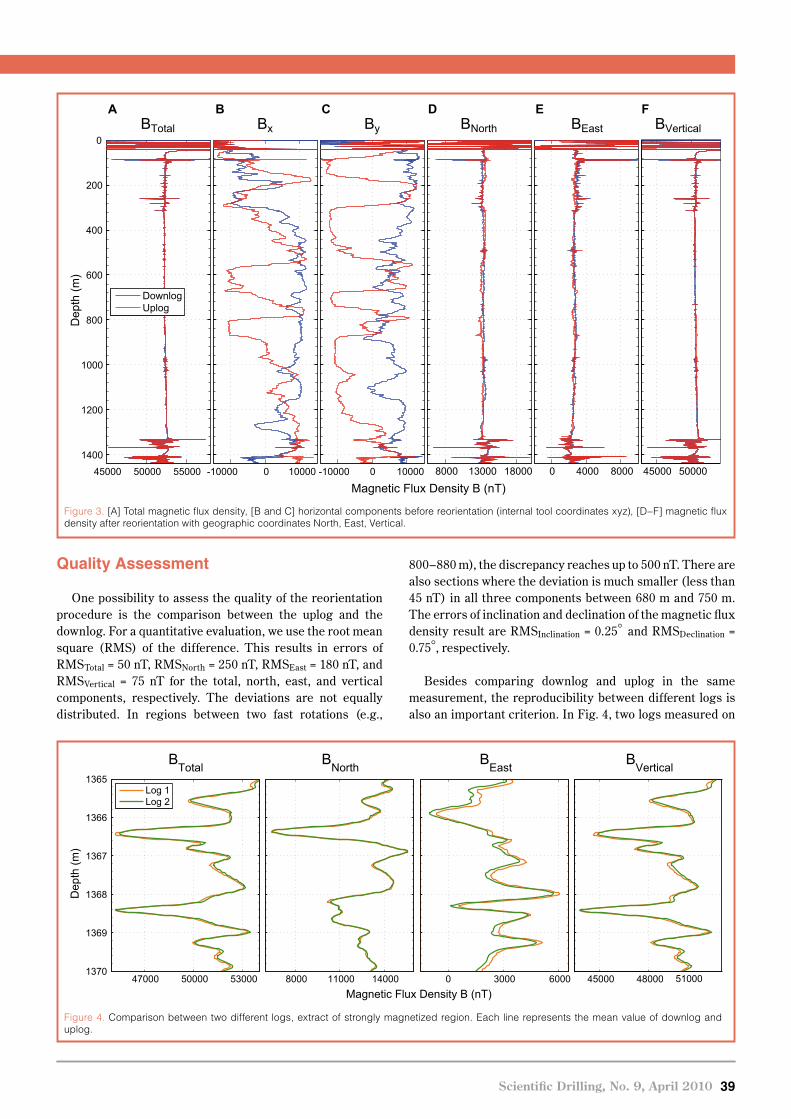
Technical Developments
Scientific Drilling, No. 9, April 2010 39
Quality Assessment
One possibility to assess the quality of the reorientation procedure is the comparison between the uplog and the downlog. For a quantitative evaluation, we use the root mean square (RMS) of the difference. This results in errors of RMSTotal = 50 nT, RMSNorth = 250 nT, RMSEast = 180 nT, and RMSVertical = 75 nT for the total, north, east, and vertical components, respectively. The deviations are not equally distributed. In regions between two fast rotations (e.g.,
800–880 m), the discrepancy reaches up to 500 nT. There are also sections where the deviation is much smaller (less than 45 nT) in all three components between 680 m and 750 m. The errors of inclination and declination of the magnetic flux density result are RMSInclination = 0.25° and RMSDeclination = 0.75°, respectively.
Besides comparing downlog and uplog in the same measurement, the reproducibility between different logs is also an important criterion. In Fig. 4, two logs measured on
Figure 4. Comparison between two different logs, extract of strongly magnetized region. Each line represents the mean value of downlog and uplog.
47000 50000 53000
1365
1366
1367
1368
1369
1370
BTotal
Dep
th (m
)
Log 1Log 2
8000 11000 14000
BNorth
0 3000 6000
BEast
45000 48000
BVertical
Magnetic Flux Density B (nT)51000
Figure 3. [A] Total magnetic flux density, [B and C] horizontal components before reorientation (internal tool coordinates xyz), [D–F] magnetic flux density after reorientation with geographic coordinates North, East, Vertical.
45000 50000 55000
0
200
400
600
800
1000
1200
1400
BTotal
Dep
th (m
)
DownlogUplog
Bx By
8000 13000 18000
BNorth
0 4000 8000
BEast
45000 50000
BVertical
Magnetic Flux Density B (nT)-10000 100000 -10000 100000
A B C D E F
Magnetic Flux Density B (nT)
40 Scientific Drilling, No.9, April 2010
Technical Developments
two consecutive days under identical conditions are shown. Each log consists of the average value of the corresponding downlog and uplog. To illustrate the spatial resolution, a section of the strongly magnetized Outokumpu rock assemblage is shown in detail (Fig. 4). All features are reproduced very well. The average amplitude deviations between the two logs are 170 nT in the total and vertical com-ponents, 10 nT in the east component, and 330 nT in the north component. The deviations in orientation are RMSInclination = 0.14° and RMSDeclination = 1.4°.
Outlook
The logging results from the Outokumpu drill hole are used to calculate the rock magnetization, based on a model developed by Bosum et al. (1988). Existing susceptibility measurements are used to separate remanent from induced magnetization. Preliminary results indicate that the direc-tion of remanent magnetization is inhomogeneous and scat-tered. From a statistical analysis we were able to identify two preferred directions of remanent magnetization which might be related to the genesis of the Outokumpu rock assemblage in the depth region of 1300–1440 m. The results of the ongoing detailed analysis including magnetic laboratory measurements will be reported elsewhere. Based on the comparison of our in situ direction of remanent magnetiza-tion with direction measured in the laboratory, we might also be able to carry out a reorientation of core samples from this section.
We will continue to improve the accuracy of the reorienta-tion procedure. Presently, the main source of error is the fast rotation of up to 10° around the z-axis during the sample period of 0.5 seconds. Since the sampling period is limited by the data transfer rate to the base station, an upgrade of the tool hardware is desirable. We plan to implement a flash memory, which will enable us to increase the sampling fre-quency by twenty-fold. This will also enhance the spatial resolution of the tool using the same logging speed. Furthermore, we intend to carry out extended calibration measurements to obtain the misalignment angles between all three FOG axes and their scaling factors. We will also re-measure the calibration factors of the magnetic sensors, considering possible temperature dependence. We aim for errors less than 0.1° for both inclination and declination of the magnetic flux density.
Acknowledgements
Ilmo T. Kukkonen (GTK, Finland) provided extensive organizational support. Christian Carnein and Martin Töpfer (Operational Support Group OSG/ICDP, GFZ, Germany) helped during the measurements. Johannes Stoll (Metronix, Germany) is thanked for fruitful discussions and advice. This project was supported by the German Science Foundation (DFG, Ho 1506/16-1).
References
Auster, H.U., Fornacon, K.H., Georgescu, E., Glassmeier, K.H., and Motschmann, U., 2002. Calibration of flux-gate magnetom-eters using relative motion. Meas. Sci. Technol., 13:1124–1131, doi:10.1088/0957-0233/13/7/321.
Bosum, W., Eberle, D., and Rehli, H.J., 1988. A gyro-orientated 3-com-ponent borehole magnetometer for mineral prospecting, with examples of its application. Geophys. Prospect., 36:933–961, doi:10.1111/j.1365-2478.1988.tb02201.x.
Gallet, Y., and Courtillot, V., 1989. Modeling magetostratigraphy in a borehole. Geophysics, 54(8):973–983, doi:10.1190/1. 1442740.
Glassmeier, K.H., Richter, I., Diedrich, A., Musmann, G., Auster, U., Motschmann, U., Balogh, A., Carr, C., Cupido, E., Coates, A., Rother, M., Schwingenschuh, K., Szegö, K., and Tsurutani, B., 2007. RPC-MAG The fluxgate magnetometer in the ROSETTA plasma consortium. Space Sci. Rev., 128:649–670, doi:10.1007/s11214-006-9114-x.
Kukkonen, I.T., 2007. Outokumpu Deep Drilling Project, Second International Workshop. Programme and Extended Abstracts,
Espoo, Finland, 21–22 May 2007.Parker, R.L., and Daniell, G.J., 1979. Interpretation of borehole
magnetometer data. J. Geophys. Res., 84:5467–5479, doi:10.1029/JB084iB10p05467.
Steveling, E., Stoll, J. B., and Leven, M., 2003. Quasi-continuous depth profiles of rock magnetization from magnetic logs in the HSDP-2 borehole, Island of Hawaii. Geochem. Geophs.
Geosyst., 4(4), 8708, doi:10.1029/2002GC000330.
Authors
Christopher Virgil, Andreas Hördt, and Torsten Klein, Institut für Geophysik und extraterrestrische Physik, Technische Universität Braunschweig, Mendelssohnstrass 3, D-38106 Braunschweig, Germany, e-mail: [email protected] Kück, GFZ – German Research Centre for Geosciences, Telegrafenberg, D-14473, Potsdam, Germany.Martin Leven and Erich Steveling, Institut für Geophysik, Georg-August-Universität Göttingen, Friedrich-Hund-Platz 1, D-37077, Göttingen, Germany.
Related Web Link
http://www.gsf.fi/projects/o_k_deepdrilling/

Scientific Drilling, No. 9, April 2010 41
Seismic Prediction While Drilling (SPWD): Looking Ahead of the Drill Bit by Application of Phased Array Technology
by Katrin Jaksch, Rüdiger Giese, Matthias Kopf, Andreas Jurczyk, Stefan Mikulla, Stefan Weisheit, Marco Groh, and Kay Krüger
doi:
Technical Developments
doi:10.2204/iodp.sd.9.07.2010
Technical DevelopmentsTechnical Developments
Introduction
Geophysical exploration is indispensable for planning deep drilling. Usually 2D- or 3D-seismics investigations are applied and, depending on the resulting geologic model for the underground, the drill site and drilling path are deter-mined. In recent years the focus of exploration has shifted towards small-scale geological structures such as local layers and faults. Depending on the source frequencies and the target depth, 2D- or 3D-seismics from surface cannot always resolve such structures in particular at larger depths. In general, signal frequencies of about 30–70 Hz are typical for surface seismic methods. The deeper and smaller the sought-after structures are, the worse will be the resolution. Therefore, borehole seismic measurements like Vertical Seismic Profile (VSP) or Seismic While Drilling (SWD) have been developed (Fig. 1). For the VSP method geophones are normally integrated in the borehole, while the seismic source generates seismic waves at the surface. The SWD method uses the drill bit as the seismic source. Hence, the quality of the seismic signals is highly dependent on the drilled rock and the type of drill bit, but even well-suited rock conditions and adequate drilling may not provide sufficient data quality.
Compared to 2D- and 3D-seismics, the distances between source and receiver to the target are shorter for VSP, and for SWD in particular. Signal frequencies up to about 100 Hz are observed yielding a slightly better resolution compared to surface seismics. However, subtle yet important features (e.g., fault zone) often cannot be identified with certainty. Accordingly, a method or tool that would improve the resolu-tion is of high importance since this would allow adjusting the drilling path to minimize risks and costs of drilling.
A device combining source and receiver immediately behind the drill bit would allow seismic exploration of a range of about 50–100 m ahead of the drill bit with a resolution of one meter. The first prototype of such a Seismic Prediction While Drilling (SPWD) device has been designed and manufactured within this project (Wenke et al., 2010). The tool uses signal frequencies between 500 Hz and 5000 Hz, which are significantly higher than the usual VSP and SWD applications.
A Laboratory Prototype for Seismic Prediction in Boreholes
A SPWD prototype was designed for laboratory condi-tions without the impact of borehole fluids, high tempera-
tures, and pressures and only for tests in horizontal boreholes. It consists of different units for seismic sources, receivers, and data logger. Figure 2 and Table 1 provide details of the instrumentation and dimen-sions. Four standard magnetostrictive actuators (AK1 to AK4; Fig. 2) are aligned along the borehole axis to serve as a cascading source and act as seismic sources. Every single actuator unit can be rotated in steps of 15° around the longi-tudinal axis of the prototype to allow for a variety of source configurations trials.
Technical Developments
Figure 1. Comparison of the different seismic borehole exploration methods VSP, SWD, and SPWD
Source
Receiver
Receiver
ReceiverSource
VSP SWD SPWD
SourceTable 1. Parameters of the prototype
Length 1.81 m
Diameter 20–23.5 cm
Weight ~60 kg
Pressing pneumatic, 6–8 bar
Contact pressure:
actuators ~ 2 kN
geophones ~ 200 N

42 Scientific Drilling, No. 9, April 2010
Technical Developments
Several guide rollers are mounted at the top and the end to move the prototype slightly in the borehole. In order to take measurements, the actuators and geophones must be pressured radially to the borehole wall. The prototype is automatically centered in the borehole. The actuators are decoupled from the prototype body so that all seismic energy is initiated exclusively in the borehole wall.
The actuators are controlled in amplitude and phase. Acceleration sensors are integrated in the front stamps of the actuators to measure the emitted seismic signals. With respect to a specific radiation pattern, the signal for each actuator is calculated based on the local coupling conditions at the borehole wall and then applied.
Test Environment
A test site in the education and research mine “Reiche Zeche” in Freiberg, Germany (Wenke et al., 2010) has been constructed to ensure con-stant environmental condi-tions. Surrounded by three galleries, the site comprises a block of homogeneous high-grade gneisses of almost 50 m x 200 m. Previously used as a test site for seismic sources and receivers of an integrated seismic imaging system (Giese et al., 2006), the site has been expanded. Over thirty 3-component geophone anchors one or two meters long are installed around the area about 4–9 m apart (Fig. 3).
The receivers used are four 3-component geophones integrated in two geophone units (GK1/2 and GK3/4; Fig. 2) with each 3-component geophone mounted in opposite alignment. Again, the geophone units can be rotated in 15° increments perpendicular to the borehole axis. This allows receiving the seismic response from the surrounding rock in defined space directions adjusted to the actuator positions.
The data logger unit (KK; Fig. 2) includes the interface with the external feed cables and the data logger which is used for source activation, triggering, and seismic data acquisition. Additionally, a sensor for inclination, a compass, and an odometer are integrated to determine the position and orientation of the SPWD device in the borehole. An infrared camera at the top monitors the borehole wall.
Figure 2. The first prototype developed by the GFZ with the separated units AK1 to AK4 (actuator components), GK1 to GK4 (geophone components), and KK (interface box).
R1R15
R30
R24
Source
Richtstrecke
Wilhelm Stehender Süd
Underground Test Site “Reiche Zeche”
30 m
Figure 3. The test site of the GFZ at the education and research mine “Reiche Zeche” in plain view with the three surrounding galleries (green), the boreholes (red), and the geophone anchors (R1-R30, black). The lower horizontal gallery is named Richtstrecke; the upper gallery is called Wilhelm Stehender Süd.
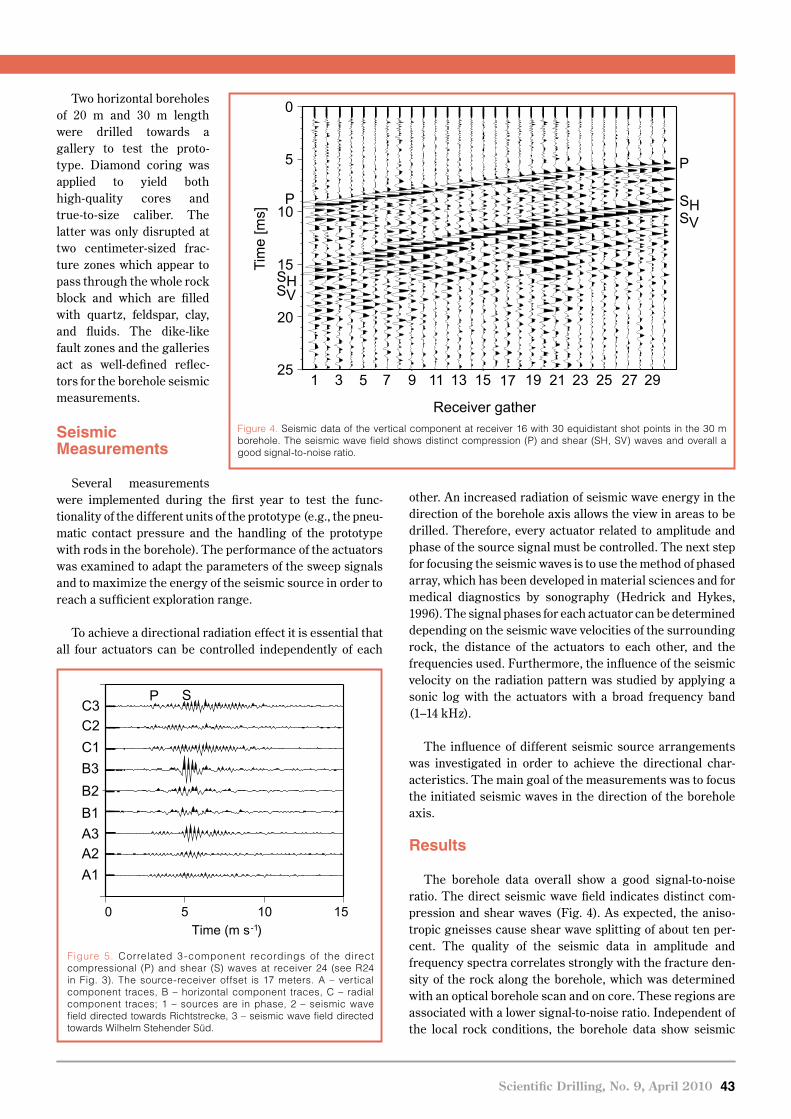
Technical Developments
Scientific Drilling, No. 9, April 2010 43
Two horizontal boreholes of 20 m and 30 m length were drilled towards a gallery to test the proto-type. Diamond coring was applied to yield both high-quality cores and true-to-size caliber. The latter was only disrupted at two centimeter-sized frac-ture zones which appear to pass through the whole rock block and which are filled with quartz, feldspar, clay, and fluids. The dike-like fault zones and the galleries act as well-defined reflec-tors for the borehole seismic measurements.
Seismic Measurements
Several measurements were implemented during the first year to test the func- tionality of the different units of the prototype (e.g., the pneu-matic contact pressure and the handling of the prototype with rods in the borehole). The performance of the actuators was examined to adapt the parameters of the sweep signals and to maximize the energy of the seismic source in order to reach a sufficient exploration range.
To achieve a directional radiation effect it is essential that all four actuators can be controlled independently of each
other. An increased radiation of seismic wave energy in the direction of the borehole axis allows the view in areas to be drilled. Therefore, every actuator related to amplitude and phase of the source signal must be controlled. The next step for focusing the seismic waves is to use the method of phased array, which has been developed in material sciences and for medical diagnostics by sonography (Hedrick and Hykes, 1996). The signal phases for each actuator can be determined depending on the seismic wave velocities of the surrounding rock, the distance of the actuators to each other, and the frequencies used. Furthermore, the influence of the seismic velocity on the radiation pattern was studied by applying a sonic log with the actuators with a broad frequency band (1–14 kHz).
The influence of different seismic source arrangements was investigated in order to achieve the directional char-acteristics. The main goal of the measurements was to focus the initiated seismic waves in the direction of the borehole axis.
Results
The borehole data overall show a good signal-to-noise ratio. The direct seismic wave field indicates distinct com-pression and shear waves (Fig. 4). As expected, the aniso- tropic gneisses cause shear wave splitting of about ten per-cent. The quality of the seismic data in amplitude and frequency spectra correlates strongly with the fracture den-sity of the rock along the borehole, which was determined with an optical borehole scan and on core. These regions are associated with a lower signal-to-noise ratio. Independent of the local rock conditions, the borehole data show seismic
0 5 10 15Time (m s )
A1A2A3
B2B3C1C2C3
B1
P S
-1
Figure 5. Correlated 3-component recordings of the direct compressional (P) and shear (S) waves at receiver 24 (see R24 in Fig. 3). The source-receiver offset is 17 meters. A – vertical component traces, B – horizontal component traces, C – radial component traces; 1 – sources are in phase, 2 – seismic wave field directed towards Richtstrecke, 3 – seismic wave field directed towards Wilhelm Stehender Süd.
Figure 4. Seismic data of the vertical component at receiver 16 with 30 equidistant shot points in the 30 m borehole. The seismic wave field shows distinct compression (P) and shear (SH, SV) waves and overall a good signal-to-noise ratio.
0
5
10
15
20
25
Tim
e [m
s]
P
Receiver gather
1 3 5 7 9 11 13 15 17 19 21 23 25 27 29
SHSV
P
SHSV
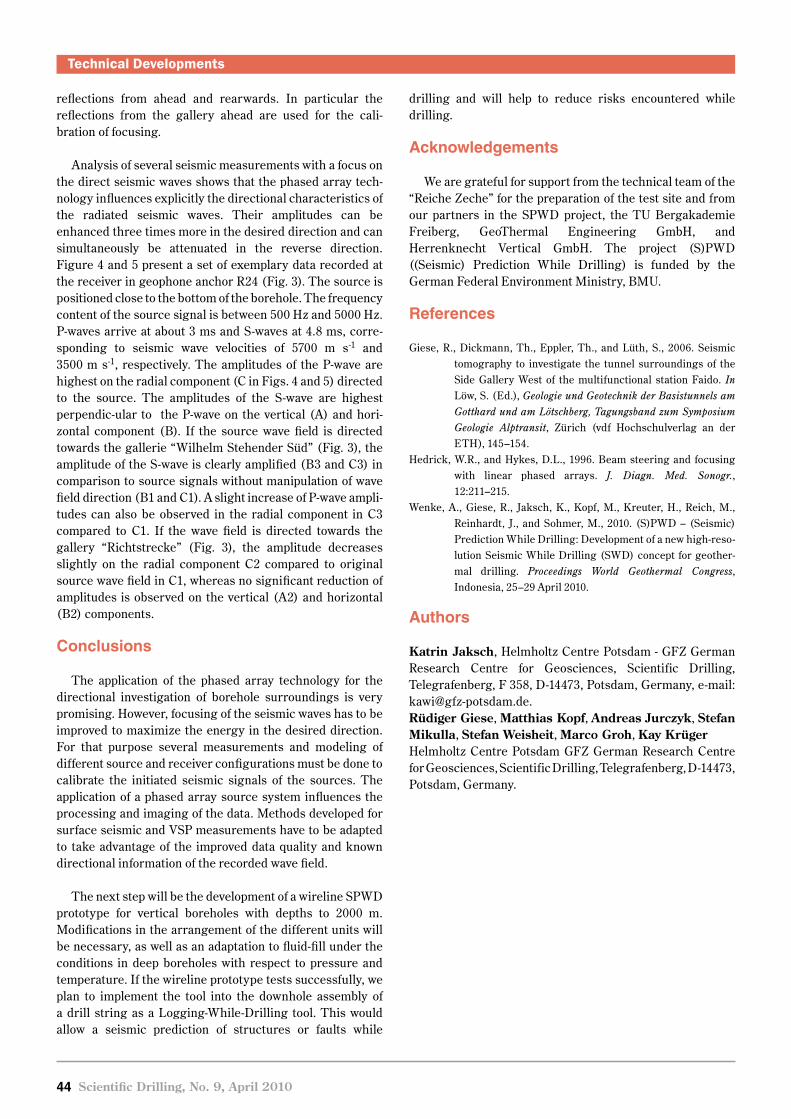
44 Scientific Drilling, No. 9, April 2010
Technical Developments
reflections from ahead and rearwards. In particular the reflections from the gallery ahead are used for the cali- bration of focusing.
Analysis of several seismic measurements with a focus on the direct seismic waves shows that the phased array tech-nology influences explicitly the directional characteristics of the radiated seismic waves. Their amplitudes can be enhanced three times more in the desired direction and can simultaneously be attenuated in the reverse direction. Figure 4 and 5 present a set of exemplary data recorded at the receiver in geophone anchor R24 (Fig. 3). The source is positioned close to the bottom of the borehole. The frequency content of the source signal is between 500 Hz and 5000 Hz. P-waves arrive at about 3 ms and S-waves at 4.8 ms, corre-sponding to seismic wave velocities of 5700 m s-1 and 3500 m s-1, respectively. The amplitudes of the P-wave are highest on the radial component (C in Figs. 4 and 5) directed to the source. The amplitudes of the S-wave are highest perpendic-ular to the P-wave on the vertical (A) and hori-zontal component (B). If the source wave field is directed towards the gallerie “Wilhelm Stehender Süd” (Fig. 3), the amplitude of the S-wave is clearly amplified (B3 and C3) in comparison to source signals without manipulation of wave field direction (B1 and C1). A slight increase of P-wave ampli-tudes can also be observed in the radial component in C3 compared to C1. If the wave field is directed towards the gallery “Richtstrecke” (Fig. 3), the amplitude decreases slightly on the radial component C2 compared to original source wave field in C1, whereas no significant reduction of amplitudes is observed on the vertical (A2) and horizontal (B2) components.
Conclusions
The application of the phased array technology for the directional investigation of borehole surroundings is very promising. However, focusing of the seismic waves has to be improved to maximize the energy in the desired direction. For that purpose several measurements and modeling of different source and receiver configurations must be done to calibrate the initiated seismic signals of the sources. The application of a phased array source system influences the processing and imaging of the data. Methods developed for surface seismic and VSP measurements have to be adapted to take advantage of the improved data quality and known directional information of the recorded wave field.
The next step will be the development of a wireline SPWD prototype for vertical boreholes with depths to 2000 m. Modifications in the arrangement of the different units will be necessary, as well as an adaptation to fluid-fill under the conditions in deep boreholes with respect to pressure and temperature. If the wireline prototype tests successfully, we plan to implement the tool into the downhole assembly of a drill string as a Logging-While-Drilling tool. This would allow a seismic prediction of structures or faults while
drilling and will help to reduce risks encountered while drilling.
Acknowledgements
We are grateful for support from the technical team of the “Reiche Zeche” for the preparation of the test site and from our partners in the SPWD project, the TU Bergakademie Freiberg, GeoThermal Engineering GmbH, and Herrenknecht Vertical GmbH. The project (S)PWD ((Seismic) Prediction While Drilling) is funded by the German Federal Environment Ministry, BMU.
References
Giese, R., Dickmann, Th., Eppler, Th., and Lüth, S., 2006. Seismic tomography to investigate the tunnel surroundings of the Side Gallery West of the multifunctional station Faido. In Löw, S. (Ed.), Geologie und Geotechnik der Basistunnels am Gotthard und am Lötschberg, Tagungsband zum Symposium Geologie Alptransit, Zürich (vdf Hochschulverlag an der ETH), 145–154.
Hedrick, W.R., and Hykes, D.L., 1996. Beam steering and focusing with linear phased arrays. J. Diagn. Med. Sonogr., 12:211–215.
Wenke, A., Giese, R., Jaksch, K., Kopf, M., Kreuter, H., Reich, M., Reinhardt, J., and Sohmer, M., 2010. (S)PWD – (Seismic) Prediction While Drilling: Development of a new high-reso-lution Seismic While Drilling (SWD) concept for geother-mal drilling. Proceedings World Geothermal Congress, Indonesia, 25–29 April 2010.
Authors
Katrin Jaksch, Helmholtz Centre Potsdam - GFZ German Research Centre for Geosciences, Scientific Drilling, Telegrafenberg, F 358, D-14473, Potsdam, Germany, e-mail: [email protected]üdiger Giese, Matthias Kopf, Andreas Jurczyk, Stefan Mikulla, Stefan Weisheit, Marco Groh, Kay KrügerHelmholtz Centre Potsdam GFZ German Research Centre for Geosciences, Scientific Drilling, Telegrafenberg, D-14473, Potsdam, Germany.
Scientific Drilling, No. 9, April 2010 45
Arctic Ocean Scientific Drilling: The Next Frontier
by Bernard Coakley and Ruediger Stein
doi:10.2204/iodp.sd.9.09.2010
Workshop Reports
Introduction
The modern Arctic Ocean appears to be changing faster than any other region on Earth. To understand the potential extent of high latitude climate change, it is necessary to sam-ple the history stored in the sediments filling the basins and covering the ridges of the Arctic Ocean. These sediments have been imaged with seismic reflection data, but except for the superficial record, which has been piston cored, they have been sampled only on the Lomonosov Ridge in 2004 during the Arctic Coring Expedition (ACEX-IODP Leg 302; Backman et al., 2006) and in 1993 in the ice-free waters in the Fram Strait/Yermak Plateau area (ODP Leg 151; Thiede et al., 1996).
Although major progress in Arctic Ocean research has been made during the last few decades, the short- and long-term paleoceanographic and paleoclimatic history as well as its plate-tectonic evolution are poorly known com-pared to the other oceans. Despite the importance of the Arctic in the climate system, the database we have from this area is still very weak. Large segments of geologic time have not been sampled in sedimentary sections. The question of regional variations cannot be addressed.
Prior to 2004, the geological sampling in the Arctic Ocean was restricted to obtaining near-surface sediments, i.e., only the upper about 5–15 m could be sampled by means of grav-ity and piston coring. Thus, more or less, all studies were restricted to the Quaternary, with one exception (Fig. 1; e.g., Clark et al., 1980, 1986; Thiede et al., 1990). In four short sediment cores from Alpha Ridge, upper Cretaceous and lower Tertiary sediments were sampled by gravity coring from ice island T-3. Until recently (Stein, 2008), the absence of technological and logistic solutions for reaching and oper-ating in a permanently ice-covered region thwarted further study of the Arctic Ocean; thus, we have been unable to retrieve long and undisturbed sediment cores.
With the successful completion of IODP Expedition 302 (“Arctic Coring Expedition”, ACEX)—the first Mission Specific Platform (MSP) expedition within the Integrated Ocean Drilling Program (IODP)—a new era in Arctic research has begun. For the first time, scientific drilling in the permanently ice-covered Arctic Ocean was carried out, penetrating about 430 m of Quaternary, Neogene, Paleogene,
and Campanian sediments on the crest of Lomonosov Ridge close to the North Pole (Backman et al., 2006, 2008; Moran et al., 2006).
ACEX was an outstanding success for two reasons. First, ACEX has proven that with an intensive ice-management strategy (i.e., a three-ship approach with two icebreakers Sovetskiy Soyuz and Oden protecting the drillship Vidar Viking by breaking upstream ice floes into small pieces), suc-cessful scientific drilling in the permanently ice-covered central Arctic Ocean is possible. Second, the first scientific results brought new and unexpected insights into the Arctic Ocean climate history and its global significance (Backman and Moran, 2008, and further references therein).
Despite the success of IODP Expedition 302, major ques-tions related to the climate history of the Arctic Ocean and its long- and short-term variability during Mesozoic-Cenozoic times cannot be answered from the ACEX record due to the poor core recovery and, especially, a major mid-Cenozoic hiatus. This hiatus spans the critical time of the transition from the early Cenozoic Greenhouse world to the late Cenozoic Icehouse world (Miller et al., 1987, 1991; Lear et al., 2000; Pearson and Palmer, 2000; Zachos et al., 2001). Nevertheless, the success of ACEX has certainly opened the door for further scientific drilling in the Arctic Ocean. The ACEX results will frame the next round of questions to be answered from new drill holes to be taken by a series of drill-ing legs during the next decades.
Workshop on “Arctic Ocean History: From Speculation to Reality”
In order to discuss and plan the future of scientific drilling in the Arctic Ocean, an international workshop was held at the Alfred Wegener Institute in Bremerhaven, Germany, on 3–5 November 2008 (Coakley and Stein, 2008). The coauthors of this article convened that workshop. About ninety-five scientists from Europe, the U.S.A., Canada, Russia, Japan, and Korea as well as observers from oil com-panies participated in the workshop. All participants were invited to submit abstracts about their experiences, ideas and/or plans of Arctic Ocean research with special emphasis on drilling.
The major targets of the workshop were as follows: (1) to bring together an international group of Arctic scientists,

46 Scientific Drilling, No 9, April 2010
Workshop ReportsWorkshop Reports
young scientists, and ocean drilling scien-tists to learn and exchange ideas, experi-ence, and enthusiasm about the Arctic Ocean; (2) to develop a scientific drilling strategy to investigate the tectonic and paleoceanographic history of the Arctic Ocean and its role in influencing the global climate system; (3) to summarize the tech-nical needs, opportunities, and limitations of drilling in the Arctic; and (4) to define scientific and drilling targets for specific IODP-type campaigns in Arctic Ocean key areas to be finalized in the development of drilling proposals.
The first day of the workshop focused on presentations about the history of the Arctic Ocean, the legacy of high latitude ocean drilling, the existing site survey data-base, the possibilities of collaboration with industry, and the process of developing ocean-drilling legs through IODP. The next day and a half was spent in thematic and regional break-out groups discussing the particular questions to be addressed by drilling and the particular targets for Arctic scientific drilling. Within the work-ing groups, key scientific questions, site surveys (available and needed), and strate-gies for reaching the overall goals were dis-cussed, and—as one of the main results—core groups for further developing drilling proposals were formed.
Based on discussions at this meeting, a number of new proposals will be submitted to IODP in 2009/2010, a critical time both for the future of Arctic Ocean science and the future of scientific ocean drilling. As of October 2009, eight active Arctic-related proposals are listed in the IODP system (Table 1). Major themes (hypotheses to be tested by drill-ing) identified by the workshop participants may be summa-rized as follows:
Paleoceanography:
Cyclicity between oxic, sub-oxic, and/or •euxinic/anxoic conditions during the Cretaceous and Paleocene-EoceneGreenhouse vs. icehouse climate •Polar amplification of greenhouse warming•Hydrological cycle during greenhouse warming•Onset of Eocene cooling•Impact of Eocene-Oligocene transition in global pCO• 2 and sea level on the ArcticOnset and variability of sea-ice cover (seasonal vs. •perennial ice cover)Circum-Arctic ice-sheet/ice-shelf history and •dynamics
Opening of Bering Strait/Fram Strait and its pale-•oceanographic consequencesCauses of extended mid-Cenozoic unconformities•Nature of the Arctic environment during periods of •extreme events (warm/cold)Bipolar synchronous vs. asynchronous climate •variability?
The varied sedimentary environments of the Arctic Ocean (Stein, 2008) enable two types of studies. Sampling on the tops of the ridges that segment the basin make it possible to collect records that span long intervals of geologic time. Focusing on the shelves and near-shelf areas make it possi-ble to collect expanded, high-resolution records suitable for detailed paleo studies. At the workshop there was little inter-est in drilling into basinal sediments, given the expectation that these records are largely composed of turbidites and other mass-wasted sediments.
In order to study the long-term Mesozoic-Cenozoic evolu-tion of the Arctic Ocean, we need to obtain undisturbed and complete sedimentary sequences to be drilled along depth transects across the major ocean ridge systems, i.e., the Lomonosov Ridge, the Alpha-Mendeleev Ridge, and the Chukchi Plateau/Northwind Ridge (Fig. 1). High-resolution records will enable detailed studies of climate variability on Milankovich and millennial to sub-millennial time scales. Appropriate sediments can be drilled along the circum-Arctic
.
180° 160°E 140°E
120°E
100°E
80°E
60°E
40°E20°E0°20°W40°W
60°W
80°W
100°W
120°W
W°061W°041
N°08
N°07
N°06
BeringStrait
ChukchiSea
BarentsSea
KaraSea
LaptevSea
YermakPlateau
Gakke
l Rid
ge
Lomonosov Ridge
MacKenzieDelta
Alpha
Ridge
MendeleevRidge
ChukchiBorderland
MorrisJessup
Rise
LaptevShelf
Figure 1. The proposed drilling regions for the Arctic are primarily ridge tops, which will have condensed sections, making it possible to sample relatively long intervals without deep penetration of the seabed. There is also a desire for expanded, high resolution, sections, which can be recovered from the continental shelves. (Background map is from IBCAO, Jakobsson et al., 2008)
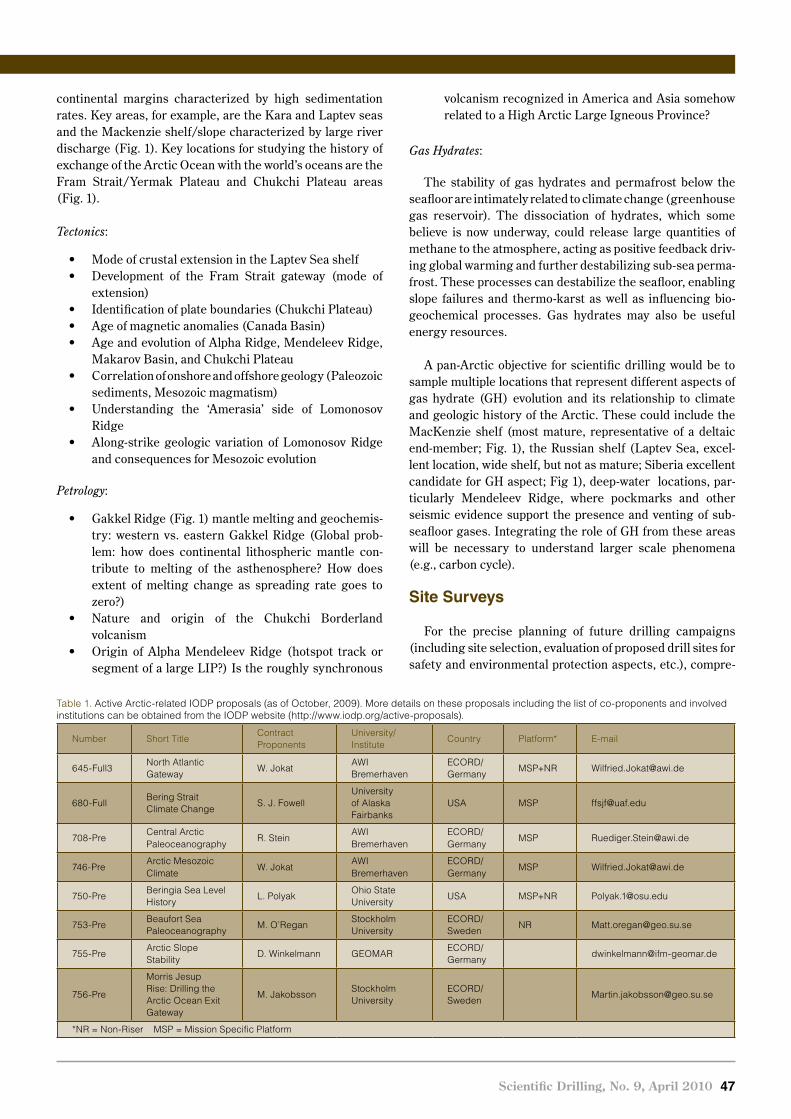
Workshop Reports
Scientific Drilling, No. 9, April 2010 47
Workshop Reports
continental margins characterized by high sedimentation rates. Key areas, for example, are the Kara and Laptev seas and the Mackenzie shelf/slope characterized by large river discharge (Fig. 1). Key locations for studying the history of exchange of the Arctic Ocean with the world’s oceans are the Fram Strait/Yermak Plateau and Chukchi Plateau areas (Fig. 1).
Tectonics:
Mode of crustal extension in the Laptev Sea shelf•Development of the Fram Strait gateway (mode of •extension) Identification of plate boundaries (Chukchi Plateau) •Age of magnetic anomalies (Canada Basin) •Age and evolution of Alpha Ridge, Mendeleev Ridge, •Makarov Basin, and Chukchi Plateau Correlation of onshore and offshore geology (Paleozoic •sediments, Mesozoic magmatism) Understanding the ‘Amerasia’ side of Lomonosov •Ridge Along-strike geologic variation of Lomonosov Ridge •and consequences for Mesozoic evolution
Petrology:
Gakkel Ridge (Fig. 1) mantle melting and geochemis-•try: western vs. eastern Gakkel Ridge (Global prob-lem: how does continental lithospheric mantle con-tribute to melting of the asthenosphere? How does extent of melting change as spreading rate goes to zero?) Nature and origin of the Chukchi Borderland •volcanismOrigin of Alpha Mendeleev Ridge (hotspot track or •segment of a large LIP?) Is the roughly synchronous
volcanism recognized in America and Asia somehow related to a High Arctic Large Igneous Province?
Gas Hydrates:
The stability of gas hydrates and permafrost below the seafloor are intimately related to climate change (greenhouse gas reservoir). The dissociation of hydrates, which some believe is now underway, could release large quantities of methane to the atmosphere, acting as positive feedback driv-ing global warming and further destabilizing sub-sea perma-frost. These processes can destabilize the seafloor, enabling slope failures and thermo-karst as well as influencing bio-geochemical processes. Gas hydrates may also be useful energy resources.
A pan-Arctic objective for scientific drilling would be to sample multiple locations that represent different aspects of gas hydrate (GH) evolution and its relationship to climate and geologic history of the Arctic. These could include the MacKenzie shelf (most mature, representative of a deltaic end-member; Fig. 1), the Russian shelf (Laptev Sea, excel-lent location, wide shelf, but not as mature; Siberia excellent candidate for GH aspect; Fig 1), deep-water locations, par-ticularly Mendeleev Ridge, where pockmarks and other seismic evidence support the presence and venting of sub-seafloor gases. Integrating the role of GH from these areas will be necessary to understand larger scale phenomena (e.g., carbon cycle).
Site Surveys
For the precise planning of future drilling campaigns (including site selection, evaluation of proposed drill sites for safety and environmental protection aspects, etc.), compre-
Table 1. Active Arctic-related IODP proposals (as of October, 2009). More details on these proposals including the list of co-proponents and involved institutions can be obtained from the IODP website (http://www.iodp.org/active-proposals).
Number Short TitleContract Proponents
University/Institute
Country Platform* E-mail
645-Full3North Atlantic Gateway
W. JokatAWI Bremerhaven
ECORD/Germany
MSP+NR [email protected]
680-FullBering Strait Climate Change
S. J. FowellUniversity of Alaska Fairbanks
USA MSP [email protected]
708-PreCentral Arctic Paleoceanography
R. SteinAWI Bremerhaven
ECORD/Germany
746-PreArctic Mesozoic Climate
W. JokatAWI Bremerhaven
ECORD/Germany
750-PreBeringia Sea Level History
L. PolyakOhio State University
USA MSP+NR [email protected]
753-PreBeaufort Sea Paleoceanography
M. O’ReganStockholm University
ECORD/Sweden
755-PreArctic Slope Stability
D. Winkelmann GEOMARECORD/Germany
756-Pre
Morris Jesup Rise: Drilling the Arctic Ocean Exit Gateway
M. JakobssonStockholm University
ECORD/Sweden
*NR = Non-Riser MSP = Mission Specific Platform

48 Scientific Drilling, No 9, April 2010
Workshop ReportsWorkshop ReportsWorkshop Reports
hensive site survey data are needed. The lack of good site survey data and age control for existing seismic reflection records is one of the biggest limitations on the development of Arctic Ocean scientific drilling (see the JEODI Report of Kristoffersen and Mikkelsen, 2004).
For some of the potential study areas, the site survey data base is already quite good. For example, from the Lomonosov Ridge, a large number of deep penetration reflection seismic profiles were acquired on icebreaker-based expeditions in 1991, 1996, 1998, and 2005 (Fütterer, 1992; Kristoffersen et al., 1997; Darby et al., 2005; Jokat, 2005 and further refer-ences therein). An intensive PARASOUND survey (in com-bination with coring) was carried out in 1995 and 1998 (Rachor, 1997; Jokat et al., 1999), and the first high-resolution chirp profiles were collected in 1996 (Jakobsson, 1999). In 1999, the SCICEX program collected high-resolution chirp sub-bottom profiler data, swath bathymetry and side-scan sonar backscatter data on Lomonosov Ridge from an American nuclear submarine (Edwards and Coakley, 2003), contributing significantly to the much improved bathymetric chart of the Arctic Ocean (Jakobsson, 2002; Jakobsson et al., 2008). During the 1995, 1996, and 1998 expeditions, a large number of sediment cores were taken by piston, gravity, and Kastenlot corers in the Lomonosov Ridge area (Backman et al., 1997; Rachor, 1997; Jokat et al., 1999; Stein et al., 2001). That means, in combination with the results from the ACEX drilling campaign (Backman et al., 2006, 2008), future drill areas/sites on Lomonosov Ridge can be identified more accurately. On the other hand, in other key areas for future drilling (e.g., the Alpha-Mendeleev Ridge), site survey expe-ditions still have to be carried out before a detailed planning and drill site selection can start.
Outlook
While sampling in the Arctic Ocean is called out as a pri-ority in many of the sections of the IODP Science Plan, these priorities have yet to be realized in a sampling program of commensurate scope and urgency. Concerning the short- and long-term evolution of the Arctic Ocean and its impor-tance for the understanding of the global climate history, most of the key questions mentioned above, as well as the key areas for scientific drilling in the Arctic Ocean, were already identified on several workshops during the last two decades and published in upcoming reports. Several, especially Thiede and the NAD Science Committee (1992), NAD (1997), Hovland (2001), Bowden et al. (2007), and Coakley and Stein (2009), have to be mentioned here. Over the years, however, scientific drilling in the ice-covered Arctic Ocean remained a dream. The ACEX drilling in 2004 (Backman, et al., 2006) was the first major step to transform this dream into reality. Now, further drilling campaigns are needed to follow up in the future. The construction of a new large icebreaker with deep-water drilling capability will certainly be the next milestone in Arctic Ocean research. Such a vessel would guarantee a commitment to Arctic deep drilling, and
in combination with a continuous drilling program, could be a potential contribution to the IODP and succeeding pro-grams, as already outlined in the APPG Report (Hovland, 2001). Plans for the development of Aurora Borealis, an icebreaker with deep-water drilling capability (Thiede and Egerton, 2004), are pushed forward over the last few years, and it seems possible that it will be completed and available for the international research community within the next decade. Operation of the Aurora Borealis would open a new dimension in multidisciplinary Arctic Ocean research.
References
Backman, J., and Moran, K., 2008. Introduction to special section on Cenozoic Paleoceanography of the Central Arctic Ocean. Paleoceanogr., 23:PA1S01, doi:10.1029/2007PA001516.
Backman, J., Jakobsson, M., Frank, M., Sangiorgi, F., Brinkhuis, H., Stickley, C., O'Regan, M., Løvlie, R., Pälike, H., Spofforth, D., Gattacecca, J., Moran, K., King, J., and Heil, C., 2008. Age model and core-seismic integration for the Cenozoic ACEX sediments from the Lomonosov Ridge. Paleoceanogr., 23:PA1S03, doi:10.1029/2007PA001476.
Backman, J., Jakobsson, M., Knies, J., Knudsen, J., Kristoffersen, Y., Lif, A., Musatov, E., and Stein, R., 1997. Geological coring and high-resolution chirp sonar profiling. In Grönlund, E. (Ed.), Cruise report, Polarforskningssekretaariatets arsbok 1995/96, Stockholm, 64–66.
Backman, J., Moran, K., Mayer, L.A., McInroy, D.B., and the Expedition 302 Scientists, 2006. Proc. IODP, 302, College Station, Texas (Integrated Ocean Drilling Program Management International, Inc.), doi:10.2204/iodp.proc.302.104.2006.
Bowden, S., Corell, R.W., Hassol, S.J., and Symon, C. (Eds.), 2007. Arctic Research: A global responsibility. ICARP-II (2nd International Conference on Arctic Research Planning), Copenhagen, Denmark, 10–12 November 2005, Canada (McCallum Printing Group Inc.), 36 pp. and CD-ROM.
Clark, D.L., Byers, C.W., and Pratt, L.M., 1986. Cretaceous black mud from the central Arctic Ocean. Paleoceanogr., 1:265–271, doi:10.1029/PA001i003p00265.
Clark, D.L., Whitman, R.R., Morgan, K.A., and Mackey, S.D., 1980. Stratigraphy and glacial marine sediments of the Amerasian Basin, central Arctic Ocean. Geol. Soc. Am. Spec. Pap., 181, 57 pp.
Coakley, B.J., and Stein, R., 2008. Workshop on “Arctic Ocean History: From Speculation to Reality”, Alfred Wegener Institute, Bremerhaven, Germany, 3–5 November 2008. Agenda and Abstract Book, 52 pp., http://www.essac.ecord.org/index.php?mod=workshop&page=workshop.
Coakley, B.J., and Stein, R., 2009. Arctic Ocean History: From Speculation to Reality. Alfred Wegener Institute, Bremerhaven, Germany, 3–5 November 2008. Workshop Report, ECORD Newsletter, 12:12 pp.
Darby, D.A., Jakobsson, M., and Polyak, L., 2005. Icebreaker expedi-tion collects key Arctic seafloor and ice data. EOS, Trans. Am. Geophys. Union, 86(52):549–552, doi:10.1029/ 2005EO520001.
Edwards, M.H., and Coakley, B.J., 2003. SCICEX investigations of the Arctic Ocean system. Chemie der Erde, 63:281–392,

Workshop Reports
Scientific Drilling, No. 9, April 2010 49
Workshop Reports
doi:10.1078/0009-2819-00039.Fütterer, D.K. (Ed.), 1992. ARCTIC ´91: The Expedition ARK-VIII/3
of RV "Polarstern" in 1991. Rep. Polar Res., 107:1–267.Hovland, M. (Ed.), 2001. The High-Arctic Drilling Challenge. Final
Report of the Arctic´s Role in Global Change Program Planning Group (APPG), Ocean Drilling Program, 38 pp.
Jakobsson, M., 1999. First high-resolution chirp sonar profiles for the central Arctic Ocean reveal erosion of Lomonosov Ridge sediments. Mar. Geol., 158:111–123, doi:10.1016/S0025-3227(98)00186-8.
Jakobsson, M., 2002. Hypsometry and volume of the Arctic Ocean and its constituent seas. Geochem., Geophys., Geosyst., 3:1–18, doi:10.1029/2001GC000302.
Jakobsson, M., Macnab, R., Mayer, L., Anderson, R., Edwards, M., Hatzky, J., Schenke, H.W., and Johnson, P., 2008. An improved bathymetric portrayal of the Arctic Ocean: Implications for ocean modeling and geological, geophysi-cal and oceanographic analyses. Geophys. Res. Lett., 35:L07602, doi:10.1029/2008GL033520.
Jokat, W., 2005. The sedimentary structure of the Lomonosov Ridge between 88°N and 80°N: Consequences for tectonic and glacial processes. Geophys. J. Int., 163:698–726, doi:10.1111/j.1365-246X.2005.02786.x.
Jokat, W., Stein, R., Rachor, E., and Schewe, I., 1999. Expedition gives fresh view of central Arctic geology. EOS, Trans. Am. Geophys. Union, 80(40):465, 472–473.
Kristoffersen, Y., and Mikkelsen, N. (Eds.), 2004. Scientific drilling in the Arctic Ocean and the site survey challenge: Tectonic, paleoceanographic and climatic evolution of the Polar Basin. Geological Survey of Greenland special publication, JEODI Workshop Report, Copenhagen, Denmark, 13–14 January 2003, http://www.ecord.org/about/j/wp5-wkshp.pdf.
Kristoffersen, Y., Buravtsev, V., Jokat, W., and Poselov, V., 1997. Seismic reflection surveys during Arctic Ocean-96. In Grönlund, E. (Ed.), Cruise report, Polarforskningssekretaariatets arsbok 1995/96, Stockholm, 75–77.
Lear, C.H., Elderfield, P.A., and Wilson, P.A., 2000. Cenozoic deep-sea temperatures and global ice volumes from Mg/Ca in benthic foraminiferal calcite. Science, 287:269–272, doi:10.1126/science.287.5451.269.
Miller, K.G., Fairbanks, R.G., and Mountain, G.S., 1987. Tertiary oxy-gen isotope synthesis, sea level history, and continental margin erosion. Paleoceanogr., 2:1–19, doi:10.1029/PA002i001p00001.
Miller, K.G., Wright, J.D., and Fairbanks, R.G., 1991. Unlocking the ice house: Oligocene-Miocene oxygen isotopes, eustasy, and margin erosion. J. Geophys. Res., 96(B4):6829–6848, doi:10.1029/90JB02015.
Moran, K., Backman, J., Brinkhuis, H., Clemens, S.C., Cronin, T., Dickens, G.R., Eynaud, F., Gattacceca, J., Jakobsson, M., Jordan, R.W., Kaminski, M., King, J., Koc, N., Krylov, A., Martinez, N., Matthiessen, J., McInroy, D., Moore, T.C., Onodera, J., O’Regan, A.M., Pälike, H., Rea, B., Rio, D., Sakamoto, T., Smith, D.C., Stein, R., St. John, K., Suto, I., Suzuki, N., Takahashi, K., Watanabe, M., Yamamoto, M., Frank, M., Jokat, W., and Kristoffersen, Y., 2006. The Cenozoic palaeoenvironment of the Arctic Ocean. Nature, 441:601–605, doi:10.1038/nature04800.
NAD, 1997. Nansen Arctic Drilling Implementation Plan. Report of “Nansen Arctic Drilling Program Implementation Plan Workshop”, Arctic and Antarctic Research Institute, St. Petersburg, Russia, 14–15 October 1996, Joint Oceanographic Institutions, Washington, DC, 50 pp.
Pearson, P.N., and Palmer, M.R., 2000. Atmospheric carbon dioxide concentrations over the past 60 million years. Nature, 406:695–699, doi:10.1038/35021000.
Rachor, E. (Ed.), 1997. Scientific cruise report of the Arctic Expedition ARK-XI/1 of RV “Polarstern” in 1995. Rep. Polar Res., 226:1–157.
Stein, R., 2008. Arctic Ocean Sediments: Processes, Proxies, and Paleoenvironment. Developments in Marine Geology, 2, Amsterdam (Elsevier), 587 pp.
Stein, R., Boucsein, B., Fahl, K., Garcia de Oteyza, T., Knies, J., and Niessen, F., 2001. Accumulation of particulate organic carbon at the Eurasian continental margin during late Quaternary times: Controlling mechanisms and paleoenvironmental significance. Glob. Plan. Change, 31(1–4):87–104, doi:10.1016/S0921-8181(01)00114-X.
Thiede, J., and Egerton, P., 2004. AURORA BOREALIS: A Long-Term European Science Perspective for Deep Arctic Ocean Research 2006-2016. Strasbourg Cedex, France (European Science Foundation), 80 pp.
Thiede, J., and NAD Science Committee, 1992. The Arctic Ocean record: Key to global change (initial science plan). Polarforschung, 61(1):1–102.
Thiede, J., Clark, D.L., and Hermann, Y., 1990. Late Mesozoic and Cenozoic paleoceanography of the northern polar oceans. In Grantz, A., Johnson, L., and Sweeney, J.F. (Eds.), The Geology of North America, Vol. L, The Arctic Ocean Region, Boulder, Colo. (Geol. Soc. Am.), 427–458.
Thiede, J., Myhre, A.M., Firth, J.V., Johnson, G.L., and Ruddiman, W.F. (Eds.), 1996. Proc. ODP, Sci. Results, 151. College Station, Texas (Ocean Drilling Program), 685 pp.
Zachos, J., Pagani, M., Sloan, L., Thomas, E., and Billups, K., 2001. Trends, rhythms, and aberrations in global climate 65 Ma to present. Science, 292:868–693, doi:10.1126/science. 1059412.
Authors
Bernard Coakley, Geophysical Institute, University of Alaska, Fairbanks, AL, U.S.A.; e-mail: [email protected] Stein, Alfred Wegener Institute for Polar and Marine Research, Bremerhaven, Germany; e-mail: [email protected].
Related Web Link
http://www.ngdc.noaa.gov/mgg/bathymetry/arctic/arctic.html
Workshop Reports

IODP Drilling of the “Shackleton Sites” on the Iberian Margin: A Plio-Pleistocene Marine Reference Section of Millennial-Scale Climate Change
by Fatima Abrantes, David Hodell, Gabriella Carrara, Luis Batista, and Henrique Duarte
doi:10.2204/iodp.sd.9.10.2010
50 Scientific Drilling, No. 9, April 2010
Workshop Reports
Few marine sediment cores have played such a pivotal role in paleoclimate research as those recovered from the Portuguese Margin, including MD95-2039 to MD95-2042 (hereafter referred to as the “Shackleton sites”) (Fig. 1). These cores preserve a high-fidelity record of millennial-scale climate variability for the last several glacial cycles and can be readily correlated to Greenland ice cores. Moreover, the narrow continental shelf and prox-imity of the Tagus River results in rapid delivery of terres-trial material to the deep-sea environment, thereby permit-ting correlation of marine and ice-core records to European terrestrial sequences. Few places exist in the world’s ocean where such marine-ice-terrestrial linkages are possible. Consequently, the Iberian Margin cores have become de facto reference sections for the study of abrupt climate change.
The seminal importance of these sections warrants investment by IODP to ensure that the entire Plio-Pleistocene record is continuously cored and properly recovered with multiple holes at several locations. To this end, we held a drilling workshop (“IODP Drilling of the ‘Shackleton sites’ on the Iberian Margin: In Search of a Plio-Pleistocene Marine Reference Section”) in Lisbon on 9–10 November 2009, sponsored by the European Science Foundation Workshops on Marine Research Drilling - MAGELLAN WORKSHOP SERIES, to formulate a drilling proposal to extend these remarkable sediment archives by drilling with the R/V JOIDES Resolution ( JR). The objectives of the workshop were to assemble researchers who have worked on the Portuguese Margin, especially on the Shackleton sites, to provide a forum for invitees to summarize past work, to present new ideas and data, to identify unanswered key questions, and to discuss the best drilling strategy for reaching the overall goals.
We originally envisioned that the workshop would focus solely on paleoceanography, but during its organization
Portuguese and Italian colleagues of the tectonics commu-nity approached us. Their interest is to establish a borehole observatory (i.e., CORKed and instrumented hole) in the region of the fault, which is believed to have caused the dev-astating 1755 Lisbon earthquake and tsunami. Given the societal relevance and importance of these geohazards, we invited seven scientists with tectonic interests to attend the workshop and provide input for potential collaborative drill-ing to achieve both paleoceanographic and tectonic objectives.
Key paleoceanographic questions that emerged from the workshop including the following. (1) Was the bipolar seesaw a persistent feature of Earth’s climate system, or did interhemispheric coupling differ for previous glacial periods? (2) How did millennial-scale variability “evolve” as glacial and orbital boundary conditions changed during the Pleistocene? (3) Did millennial-scale climate variability change in frequency or amplitude across the mid-Pleistocene transition (~920 ka and 640 ka), when the average climate state evolved toward generally colder conditions with larger ice sheets, and the spectral character of climate variability shifted from dominantly 41 kyr to 100 kyr? (4) How do millennial and orbital bands of climate variability interact? (5) What role do millennial-scale events play in triggering glacial terminations? Only by integrating marine and ice-core stratigraphies can we begin to address mechanisms of the coupled ocean-atmosphere system, including the causes of Dansgaard-Oeschger variability, glacial-interglacial cycles, and atmospheric CO2 variation.
In an effort to address the paleoceanographic questions in a meaningful way, workshop participants discussed the sug-gestion by Alley (2003) that “paleoceanographers should consider following the ice-core community’s lead and orga-nize a research effort to generate a few internationally coor-dinated, multiply replicated, multiparameter, high time resolution-type sections of oceanic change.” The group
50 Scientific Drilling, No. 9, April 2010
Workshop ReportsWorkshop Reports
Table 1. Location of proposed drilling site locations.
Site Lat (N) Long (W) Depth (m) Distance to land (km) Objectives
1A 37°52,1 10°12,6 2978 123.4 Plio- Quaternary Sequence with ±700 m
2A 37°48,45 9°50,35 2266 91 Plio-Quaternary Sequence with 750–1000 m
3A 37°45,5 10°02,0 2619 108 Plio-Quaternary Sequence with 400–700 m
4A 37°33,1 10°08,8 2658 118 Plio-Quaternary Sequence with 400–800 m
5A 37°32,8 10°22,2 3559 140 Plio-Quaternary Sequence with 400–800 m
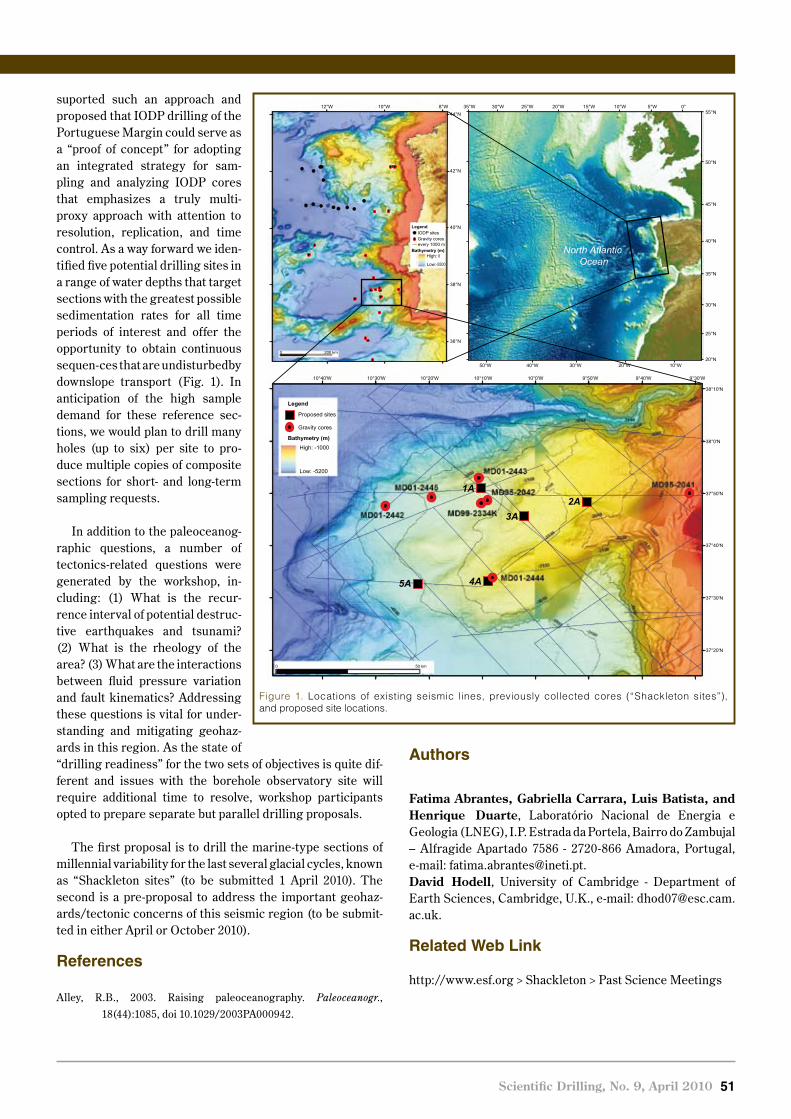
Authors
Fatima Abrantes, Gabriella Carrara, Luis Batista, and Henrique Duarte, Laboratório Nacional de Energia e Geologia (LNEG), I.P. Estrada da Portela, Bairro do Zambujal – Alfragide Apartado 7586 - 2720-866 Amadora, Portugal, e-mail: [email protected] Hodell, University of Cambridge - Department of Earth Sciences, Cambridge, U.K., e-mail: [email protected].
Related Web Link
http://www.esf.org > Shackleton > Past Science Meetings
suported such an approach and proposed that IODP drilling of the Portuguese Margin could serve as a “proof of concept” for adopting an integrated strategy for sam-pling and analyzing IODP cores that emphasizes a truly multi-proxy approach with attention to resolution, replication, and time control. As a way forward we iden-tified five potential drilling sites in a range of water depths that target sections with the greatest possible sedimentation rates for all time periods of interest and offer the opportunity to obtain continuous sequen-ces that are undisturbedby downslope transport (Fig. 1). In anticipation of the high sample demand for these reference sec-tions, we would plan to drill many holes (up to six) per site to pro-duce multiple copies of composite sections for short- and long-term sampling requests.
In addition to the paleoceanog-raphic questions, a number of tectonics-related questions were generated by the workshop, in-cluding: (1) What is the recur-rence interval of potential destruc-tive earthquakes and tsunami? (2) What is the rheology of the area? (3) What are the interactions between fluid pressure variation and fault kinematics? Addressing these questions is vital for under-standing and mitigating geohaz-ards in this region. As the state of “drilling readiness” for the two sets of objectives is quite dif-ferent and issues with the borehole observatory site will require additional time to resolve, workshop participants opted to prepare separate but parallel drilling proposals.
The first proposal is to drill the marine-type sections of millennial variability for the last several glacial cycles, known as “Shackleton sites” (to be submitted 1 April 2010). The second is a pre-proposal to address the important geohaz-ards/tectonic concerns of this seismic region (to be submit-ted in either April or October 2010).
References
Alley, R.B., 2003. Raising paleoceanography. Paleoceanogr., 18(44):1085, doi 10.1029/2003PA000942.
Scientific Drilling, No. 9, April 2010 51
Workshop Reports
High: 0
Low:-5500
0 200 km
12°W 10°W 8°W44°N
42°N
40°N
38°N
36°N
10°40'W 10°30'W 10°20'W 10°10'W 10°0'W 9°50'W 9°40'W 9°30'W
38°0'N
37°50'N
37°40'N
37°30'N
37°20'N
38°10'N
Bathymetry (m)High: -1000
Low: -5200
Gravity cores
Proposed sites
0 50 km
Legend
Bathymetry (m)
LegendIODP sitesGravity cores every 1000 m
2A
4A
1A
3A
5A
55°N
45°N
40°N
35°N
30°N
50°N
25°N
20°N
35°W 25°W 15°W30°W 20°W 10°W 5°W 0°
North Atlantic Ocean
30°W 20°W 10°W40°W50°W
Figure 1. Locations of existing seismic lines, previously collected cores (“Shackleton sites”), and proposed site locations.
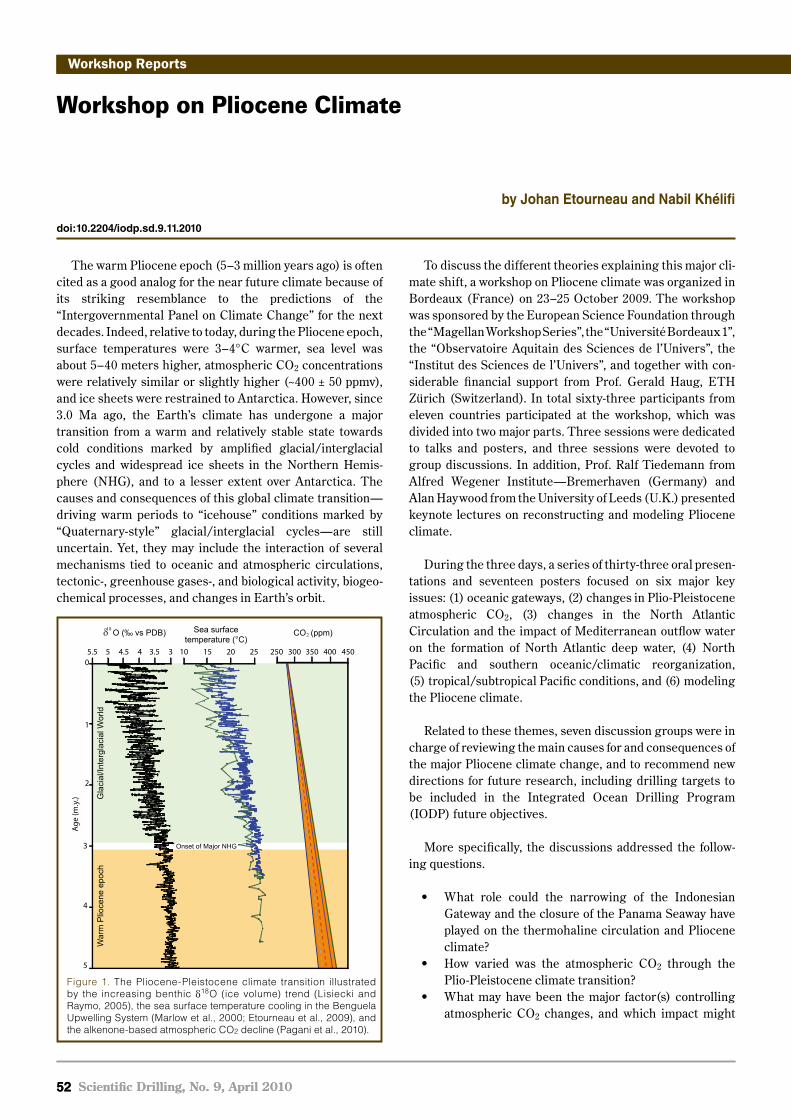
Workshop on Pliocene Climate
by Johan Etourneau and Nabil Khélifi
doi:10.2204/iodp.sd.9.11.2010
52 Scientific Drilling, No. 9, April 2010
Workshop Reports
The warm Pliocene epoch (5–3 million years ago) is often cited as a good analog for the near future climate because of its striking resemblance to the predictions of the “Intergovernmental Panel on Climate Change” for the next decades. Indeed, relative to today, during the Pliocene epoch, surface temperatures were 3–4°C warmer, sea level was about 5–40 meters higher, atmospheric CO2 concentrations were relatively similar or slightly higher (~400 ± 50 ppmv), and ice sheets were restrained to Antarctica. However, since 3.0 Ma ago, the Earth’s climate has undergone a major transition from a warm and relatively stable state towards cold conditions marked by amplified glacial/interglacial cycles and widespread ice sheets in the Northern Hemis-phere (NHG), and to a lesser extent over Antarctica. The causes and consequences of this global climate transition—driving warm periods to “icehouse” conditions marked by “Quaternary-style” glacial/interglacial cycles—are still uncertain. Yet, they may include the interaction of several mechanisms tied to oceanic and atmospheric circulations, tectonic-, greenhouse gases-, and biological activity, biogeo-chemical processes, and changes in Earth’s orbit.
To discuss the different theories explaining this major cli-mate shift, a workshop on Pliocene climate was organized in Bordeaux (France) on 23–25 October 2009. The workshop was sponsored by the European Science Foundation through the “Magellan Workshop Series”, the “Université Bordeaux 1”, the “Observatoire Aquitain des Sciences de l’Univers”, the “Institut des Sciences de l’Univers”, and together with con-siderable financial support from Prof. Gerald Haug, ETH Zürich (Switzerland). In total sixty-three participants from eleven countries participated at the workshop, which was divided into two major parts. Three sessions were dedicated to talks and posters, and three sessions were devoted to group discussions. In addition, Prof. Ralf Tiedemann from Alfred Wegener Institute—Bremerhaven (Germany) and Alan Haywood from the University of Leeds (U.K.) presented keynote lectures on reconstructing and modeling Pliocene climate.
During the three days, a series of thirty-three oral presen-tations and seventeen posters focused on six major key issues: (1) oceanic gateways, (2) changes in Plio-Pleistocene atmospheric CO2, (3) changes in the North Atlantic Circulation and the impact of Mediterranean outflow water on the formation of North Atlantic deep water, (4) North Pacific and southern oceanic/climatic reorganization, (5) tropical/subtropical Pacific conditions, and (6) modeling the Pliocene climate.
Related to these themes, seven discussion groups were in charge of reviewing the main causes for and consequences of the major Pliocene climate change, and to recommend new directions for future research, including drilling targets to be included in the Integrated Ocean Drilling Program (IODP) future objectives.
More specifically, the discussions addressed the follow-ing questions.
What role could the narrowing of the Indonesian •Gateway and the closure of the Panama Seaway have played on the thermohaline circulation and Pliocene climate?How varied was the atmospheric CO• 2 through the Plio-Pleistocene climate transition?What may have been the major factor(s) controlling •atmospheric CO2 changes, and which impact might
52 Scientific Drilling, No. 9, April 2010
Workshop ReportsWorkshop Reports
Figure 1. The Pliocene-Pleistocene climate transition illustrated by the increasing benthic δ18O (ice volume) trend (Lisiecki and Raymo, 2005), the sea surface temperature cooling in the Benguela Upwelling System (Marlow et al., 2000; Etourneau et al., 2009), and the alkenone-based atmospheric CO2 decline (Pagani et al., 2010).
0
1
2
3
4
5
45 33.54.55.5 2515 2010 400300 450350250
Age
(m.y
.)
δ O (‰ vs PDB)18 Sea surface temperature (°C)
CO (ppm)2
Onset of Major NHG
War
m P
lioce
ne e
poch
Gla
cial
/Inte
rgla
cial
Wor
ld

the latter have had on global climate and ice sheet extension?Did biogeochemical cycles change in high and low •latitudes during the transition from the Pliocene to Pleistocene time, and to what extent might they have impacted on greenhouse gas levels?How did the reorganization of the atmospheric •circulation affect monsoon system variability and tropical/subtropical/polar precipitation rates over the last 4.0 Ma?How can we improve on the currently used models for •reconstructing Pliocene climate?
The discussions gave rise to a unanimous consensus: the data spanning the Pliocene are missing in several key sec-tors of the world ocean, and such data are absolutely needed to further investigate what caused the climate to dramati-cally cool and generate widespread glaciations in the Northern Hemisphere over the Plio-Pleistocene transition.
A group was specifically tasked with collecting proposi-tions from all participants to define near-future drilling tar-gets. It is clear that the lack of several proxy records from key locations (e. g., bottom and sea surface temperatures, water mass origin, productivity, ocean mixing, CO2 levels, and most importantly a reliable sea-level record covering the last 5.0 Ma) prevents the scientific community involved in Pliocene studies to further explore the causes and conse-quences of this climate shift. For instance, only one IODP site 806 in the western equatorial Pacific is available to con-strain Plio-Pleistocene changes in the entire warm pool con-ditions. Also, well dated, located, and preserved ocean records for reconstructing African and South Asian climates are too scarce. Oceanic sedimentary archives from East Africa are particularly crucial for a better understanding of the links between hominid evolution and the African climate during the Pliocene.
Scientific Drilling, No. 9, April 2010 53
Workshop Reports
Figure 2. Wind-eroded landforms in the Yadan National Geological Park, Gansu Province, China, resulting from the dryness of a paleolake over the Pliocene-Pleistocene climate transition. Decreasing regional rainfalls are supposed to be closely tied to the Himalayan uplift associated to changes in the atmospheric pattern.
Another challenge is the poor knowledge of the extent of ice sheets in the northern high latitudes during the Pliocene. Future IODP drilling campaigns need to be planned in the Arctic Ocean. Given the importance of oceanic gateways in controlling the global thermohaline circulation system, it was also concluded that drilling north of the Bering Strait and offshore Indonesia and Panama is also needed. In addition, to better understand the role of the northern and southern polar oceans in the Pliocene cooling, future IODP drilling should be expanded into the Pacific and Indian parts of the Southern Ocean as well, particularly around and within the polar front system.
After three days of discussions, several participants suggested that workshops on Pliocene climate become a regular event (every three years?) addressing, among other issues, the interactions between data and modeling. The workshop also strongly encouraged participants to submit proposals for future IODP expeditions targeting critical loca-tions to understand Pliocene climate changes.
Further information about the program, talks and posters can be obtained from the workshop homepage: http://www.plioclimworkshop.com.
References
Etourneau, J., Martinez, P., Blanz, T., and Schneider, R., 2009. Pliocene–Pleistocene variability of upwelling activity, pro-ductivity, and nutrient cycling in the Benguela region. Geology, 37:871–874.
Lisiecki, L.E., and Raymo, M.E., 2005. A Pliocene-Pleistocene stack of 57 globally distributed benthic δ18O records. Paleoceanogr., 20:PA1003, doi:10.1029/2004PA001071.
Marlow, J.R., Lange, C.B., Wefer, G., and Rosell-Melé, A., 2000. Upwelling intensification as part of the Pliocene-Pleistocene climate transition. Science, 290:2288–2291.
Pagani, M., Liu, Z., LaRiviere, J., and Ravelo, A.C., 2010. High Earth-system climate sensitivity determined from Pliocene carbon dioxide concentrations. Nature Geosci., 3:27–30, doi:10.1038/NGEO724.
Authors
Johan Etourneau, Christian-Albrechts-Universität zu Kiel/Université Bordeaux 1, 24118 Kiel/ 33405 Talence, Germany/France, e-mail: [email protected] Khélifi, Christian-Albrechts-Universität zu Kiel, 24118 Kiel, Germany, e-mail: [email protected].
Photo Credit
Fig. 2: J. Etourneau

Workshop Reports
IODP New Ventures in Exploring Scientific Targets (INVEST): Defining the New Goals of an International Drilling Program
Wolfgang Bach, Christina Ravelo, Jan Behrmann, Gilbert Camoin, Robert Duncan, Katrina Edwards, Sean Gulick, Fumio Inagaki, Heiko Pälike, and Ryuji Tada
doi:10.2204/iodp.sd.9.12.2010
54 Scientific Drilling, No. 9, April 2010
Workshop Reports
Introduction
The INVEST conference, an international meeting to define the scientific goals and required technology for a new ocean drilling program, was held at the University of Bremen on 22–25 September 2009. Based on the large attendance and vigorous engagement of scientists in the discussion of new science/technology ideas, INVEST was extremely suc-cessful. Initially 400 participants were expected, but the INVEST steering and organization committees were thrilled to see a much larger number of scientists flock to Bremen to demonstrate their support and enthusiasm for the continua-tion of an international scientific ocean drilling program. In all, 584 participants, including sixty-four students, from twenty-one nations and >200 institutions and agencies attended the INVEST conference. Contributions to INVEST included 103 submitted white papers that were posted on the INVEST webpage (http://www.marum.de/iodp-invest.html), and breakout discussions in fifty working groups that focused on a range of topics during the course of the confer-ence. In addition, students and early career scientists, as well as national funding agency managers and platform provid-ers, presented a total of eighty-six posters. Interspersed with the working group and plenary sessions were twelve keynote lectures, chosen to highlight overarching themes and new directions in research and technology.
The conference was sponsored by IODP-MI, the Deutsche Forschungsgemeinschaft (DFG) and the MARUM research center. Using input from national workshops that took place in the year prior to the INVEST conference and that provided initial ideas for scientific directions and themes, the INVEST working group sessions were organized within six conference themes: 1) Co-evolution of Life and Planet, 2) Earth’s Interior, Crust and Surface Interactions, 3) Climate Change – Records of the Past, Lessons for the Future, 4) Earth System Dynamics, Reservoirs and Fluxes, 5) Earth-Human-Earth Interactions, and 6) Science Implementation.
Each meeting attendee was given the opportunity to par-ticipate in three working groups: one within conference themes one through three, one within conference themes four and five, and one within conference theme six. Up to
eighteen working groups met in parallel sessions. All work-ing groups within one conference theme met to report to each other the results of the individual working group dis-cussions. The conference theme co-chairs then met with the working group chairs and scribes to prepare a plenary pre-sentation of the conference theme.
The steering committee, with the help of some confer-ence session chairs, used the working group notes and ple-nary session presentation materials to write the INVEST conference report. The main chapters of the report are “Climate Change Impacts”, “The Lithospheric Membrane: The Key Interface and Processing Zone”, “Co-evolution of Life and the Planet”, and “Earth-Human-Earth Interactions”. In addition, several “Cross-disciplinary Research Frontiers” were identified as being important new ocean drilling themes and were highlighted in a separate section of the report. Implementation and outreach aspects are summarized in the chapters “Technology Needs and Developments” and “Outreach, Education, and Branding”. “Recommendations for the New Ocean Drilling Program” is the final chapter of the INVEST report and pertains to what the community con-siders desirable program architecture and science advisory structure. A brief synopsis of each of these chapters is pre-sented below. More details on the INVEST meeting struc-ture, white papers, background material, and the complete report can be found at the INVEST website.
Climate Change Impacts
Earth’s climate results from complex interactions among Earth system components, including the atmosphere, hydro-sphere, cryosphere, lithosphere, and biosphere. Variations in these systems over short and long timescales, including the way material cycles among them (e.g., carbon cycle, hydrologic cycle), result in changes to Earth’s climate. Understanding how climate has changed in the past and how it will change in the future requires understanding of how the Earth system behaves over a range of conditions. Instrumental records, collected over the last century or so, are insufficient by themselves to study long-term climate change. On the other hand, ocean drilling of sediments and corals provides a unique opportunity to acquire the high-resolution records of past change needed to examine and understand the baseline of natural climate variability against
Workshop Reports

Scientific Drilling, No. 9, April 2010 55
Workshop Reports
across some or all components, allowing interconnected processes to be examined and understood. Extreme and rapid events stand out in noisy sediment-derived proxy records and are thus easy to quantify. This allows investi-gation of dynamic system behavior, such as tipping points and thresholds. Ocean drilling remains the only means to reconstruct, at medium to high temporal resolution, the global climate evolution of the Earth system throughout the Cenozoic. Large amplitude perturbations often mark epoch boundaries and provide one of the main avenues to investi-gate large-scale events, including those that involve extreme climates, ecosystem turnover, and biodiversity evolution. Drilling is also the only means to study how rapid cli- mate phenomena that occur on seasonal to millennial timescales, such as the El Niño Southern Oscillation or Dansgaard-Oeschger cycles, behave under different bound-ary conditions.
Only ocean drilling can provide the geologic perspective necessary to understand ice-sheet dynamics and the result-ing impacts to sea level and shorelines. Over the past 100 m.y., sea-level change reflects global climate evolution from a time characterized by ephemeral Antarctic ice sheets (100 Ma to 33 Ma), to a time when large ice sheets occurred primarily in Antarctica (33 Ma to 2.5 Ma), and finally to a world with large Antarctic and Northern Hemisphere ice sheets (2.5 Ma to present). Over the last ~800 kyr, the cyclic growth and decay of continental ice sheets induced rapid sea-level change with maximum amplitudes of 120–140 m at intervals of ~100 kyr. Ice volume fluctuations can be inferred from eustatic
which current climate change can be compared. These records will also allow study of the behavior of the Earth system during different climate states and major climate transitions throughout the Cenozoic, as well as the origin of and mechanisms that lead to abrupt, seasonal- to millennial-scale climate changes.
Fundamental climate change questions that can be addressed by ocean drilling are outlined throughout the INVEST report. This section on “Climate Change Impacts” focuses on scientific questions that, when answered, will underpin our understanding of climate change. It explores the behavior of the climate during abrupt and extreme events, the stability of ice sheets and their relationship to sea level and coastal/shoreline processes, and the impact of regional and global climate on the hydrologic cycle. In the “Earth-Human-Earth Interactions” section, climate change questions are framed in anticipation of future conditions associated with increasing levels of atmospheric carbon dioxide. Climate change questions related to tectonics and hominin evolution are explored in the “Cross-disciplinary Research Frontiers” section.
Ocean drilling can provide unprecedented insight into cli-matic and oceanic processes through investigation of past rapid and extreme climate events (Fig. 1). These globally sig-nificant events represent major deviations from the natural variability of Earth’s climate. Extreme events originate from perturbations in a specific component of the Earth system and typically propagate through complicated feedbacks
Figure 1. Compilation of potential drilling sites proposed by workshop participants to address the scientific themes ‘Warm intervals through time’, ‘Ocean-continent interactions’, ‘Biogeochemical cycles’, ‘Ecosystem change’, and ‘Climate modes’; from Thurow et al., (2009). Site numbers are linked to information that can be found in Appendix 1 at http://high-resolution.icdp-online.org.
60º
0º
60º
180º 0º 180º
1
2 3
4-5
6
7
8
9-11
12
13
14
1516 17 18
19-20
21-24
25
26
27-31
32-33
3435
36
373839
40
41
42
43
44 4546
47
48
49-50 51
52
53
54
5556
57
58
59
60
61
6263
6465
66
67
68
69
70
71
7273
74 75
warm intervals
biogeochemical cycles
ecosystem change
ocean-continent interactions
climate modes
marine ‘reference’ section
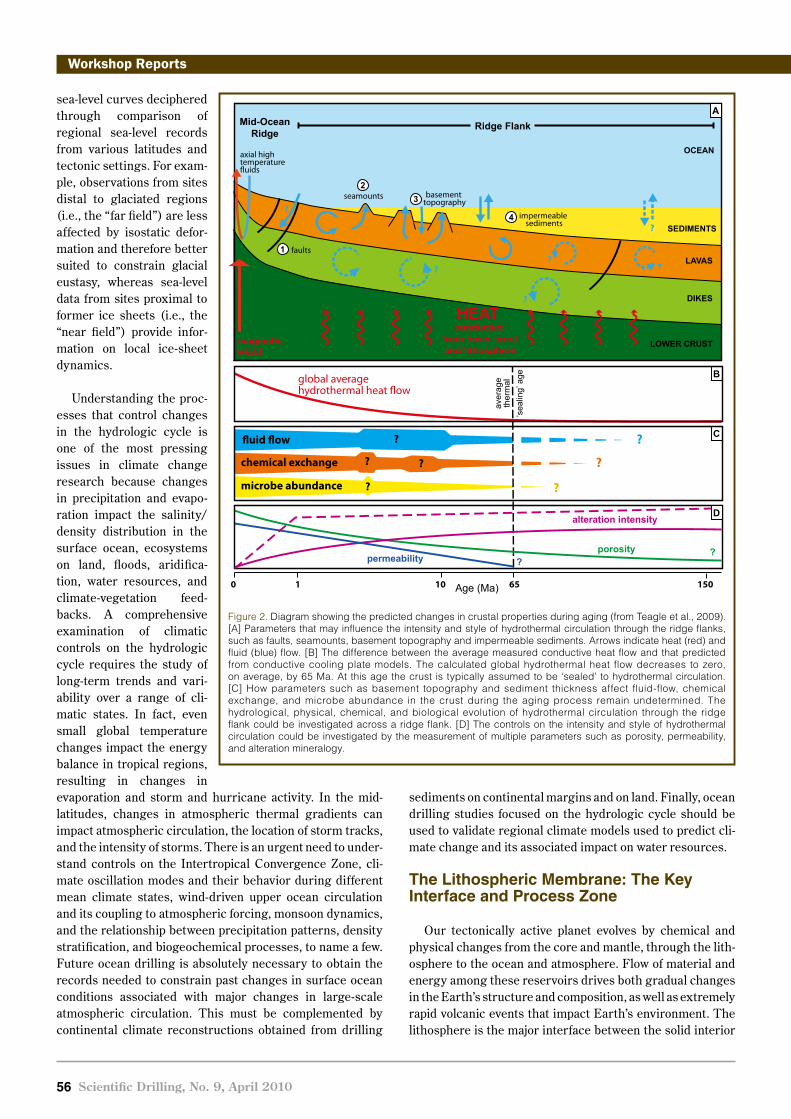
56 Scientific Drilling, No. 9, April 2010
Workshop ReportsWorkshop Reports
sea-level curves deciphered through comparison of regional sea-level records from various latitudes and tectonic settings. For exam-ple, observations from sites distal to glaciated regions (i.e., the “far field”) are less affected by isostatic defor-mation and therefore better suited to constrain glacial eustasy, whereas sea-level data from sites proximal to former ice sheets (i.e., the “near field”) provide infor-mation on local ice-sheet dynamics.
Understanding the proc-esses that control changes in the hydrologic cycle is one of the most pressing issues in climate change research because changes in precipitation and evapo- ration impact the salinity/density distribution in the surface ocean, ecosystems on land, floods, aridifica-tion, water resources, and climate-vegetation feed-backs. A comprehensive examination of climatic controls on the hydrologic cycle requires the study of long-term trends and vari-ability over a range of cli-matic states. In fact, even small global temperature changes impact the energy balance in tropical regions, resulting in changes in evaporation and storm and hurricane activity. In the mid-latitudes, changes in atmospheric thermal gradients can impact atmospheric circulation, the location of storm tracks, and the intensity of storms. There is an urgent need to under-stand controls on the Intertropical Convergence Zone, cli-mate oscillation modes and their behavior during different mean climate states, wind-driven upper ocean circulation and its coupling to atmospheric forcing, monsoon dynamics, and the relationship between precipitation patterns, density stratification, and biogeochemical processes, to name a few. Future ocean drilling is absolutely necessary to obtain the records needed to constrain past changes in surface ocean conditions associated with major changes in large-scale atmospheric circulation. This must be complemented by continental climate reconstructions obtained from drilling
sediments on continental margins and on land. Finally, ocean drilling studies focused on the hydrologic cycle should be used to validate regional climate models used to predict cli-mate change and its associated impact on water resources.
The Lithospheric Membrane: The Key Interface and Process Zone
Our tectonically active planet evolves by chemical and physical changes from the core and mantle, through the lith-osphere to the ocean and atmosphere. Flow of material and energy among these reservoirs drives both gradual changes in the Earth’s structure and composition, as well as extremely rapid volcanic events that impact Earth’s environment. The lithosphere is the major interface between the solid interior
Figure 2. Diagram showing the predicted changes in crustal properties during aging (from Teagle et al., 2009). [A] Parameters that may influence the intensity and style of hydrothermal circulation through the ridge flanks, such as faults, seamounts, basement topography and impermeable sediments. Arrows indicate heat (red) and fluid (blue) flow. [B] The difference between the average measured conductive heat flow and that predicted from conductive cooling plate models. The calculated global hydrothermal heat flow decreases to zero, on average, by 65 Ma. At this age the crust is typically assumed to be ‘sealed’ to hydrothermal circulation. [C] How parameters such as basement topography and sediment thickness affect fluid-flow, chemical exchange, and microbe abundance in the crust during the aging process remain undetermined. The hydrological, physical, chemical, and biological evolution of hydrothermal circulation through the ridge flank could be investigated across a ridge flank. [D] The controls on the intensity and style of hydrothermal circulation could be investigated by the measurement of multiple parameters such as porosity, permeability, and alteration mineralogy.
?
?
?
OCEAN
SEDIMENTS
HEAT conducted
from lower crustand lithosphere
Mid-OceanRidge
Ridge Flank
LAVAS
DIKES
LOWER CRUST
global average hydrothermal heat ow
?
?
uid ow
chemical exchange
microbe abundance
magmatic HEAT
basement topography
faults
impermeable sediments
1
23
4
seamounts
axial hightemperatureuids
?
?
?
?
??
0 1 10 65 150Age (Ma)
‘sea
ling’
age
A
B
C
permeability ?porosity
alteration intensity
aver
age
ther
mal
?
?
D
?

Workshop Reports
Scientific Drilling, No. 9, April 2010 57
Workshop Reports
of the Earth and the exterior hydrosphere/atmosphere/ biosphere (Fig. 2). Quantifying the fluxes mediated by the lithospheric processing zone is crucial for understanding the state and evolution of our planet, and ocean drilling provides a key tool in this endeavor.
From direct sampling we can examine the fundamental steady-state processes of ocean crust accretion, plate aging, and recycling, as well as intermittent events such as erup-tions of large igneous provinces and rifting of continents. These processes affect the presence and state of resources that society depends upon—including sources of energy, fresh water, and nutrients—but they also create deleterious effects on society through earthquakes, tsunamis, and volca-nic eruptions.
It is timely to stress that many of the things to be learned about the “lithospheric membrane” of the Earth are of great societal relevance. Understanding initiation of plate bound-aries and evolution of plates is fundamental to learning how the Earth works and how the continents we live upon were formed and evolve. Plate boundary formation and related vol-canism have impacted past climate and may yield informa-tion about agents of climate change. Rifted continental mar-gins host major hydrocarbon reservoirs that are an essential energy resource. Subduction zone hydration-dehydration cycling affects earthquakes and volcanic hazards. Hydrothermal systems form polymetallic sulfide deposits of potential economic interest and also host microorganisms that may be useful for bioengineering. Finally, the ocean crust provides vast opportunities for CO2 capture and storage.
Understanding hydrothermal transfers of heat and mass between the lithosphere and hydrosphere/atmosphere on a global scale has been identified as a high-priority overarch-ing research question. Seawater circulation facilitates micro-bial growth within the ocean floor and is critical to the trans-port and distribution of microorganisms; however, the size, activity, and connectivity of the intracrustal oceanic bio-sphere and its influence on global geochemical and biogeo-chemical cycles are unknown. Investigation of the coupling between hydrogeological, geochemical, thermal, mechani-cal, and biological processes and their relationship to the architecture and physical nature of oceanic lithosphere is essential. Of primary importance is addressing the nature of the Mohoroviĉić discontinuity (Moho), a first-order geo-physical interface within our planet, which is uncertain in slow-spreading mid-ocean ridge environments. It could be an igneous boundary or a serpentinization front—a differ-ence with profound consequences for the chemical and rheo-logical properties of the lithosphere. As much as one-quarter of the seafloor exposed at slow-spreading mid-ocean ridges is a heterogeneous assemblage of peridotite and gabbroic lithologies, which is hydrothermally more reactive and undergoes greater changes in physical properties than layered basaltic crust. To understand ocean-crust composi-
tion, structure, and evolution, it is essential to drill a com-plete crustal section across the Moho and into the shallow mantle at a fast-spreading ridge. Complete sampling is also necessary to provide in situ confirmation of geophysical imaging of the ocean crust.
When oceanic lithosphere is recycled during subduction and plate collision, sediments may be scraped off, and ocean crust can be accreted to a continent or island arc. Deep in subduction zones, dehydration reactions and melting of sub-ducting sediments and occasionally the upper crust produce continental or oceanic volcanic arcs. Both of these processes can effectively transfer crustal material, fluids, and volatiles from the geologically transient oceanic lithosphere to more permanent continental crust. Ocean drilling is a critical tool necessary to investigate the relative roles of these processes and the magnitudes of element fluxes. Of crucial importance in determination of input fluxes are reliable estimates of the chemical and mineralogical state of the subducting ocean crust. Additionally, subduction zones produce some of the most significant geologic hazards to society including the highest magnitude earthquakes, the greatest tsunamis, and the most explosive eruptions.
Formation, hydrothermal alteration, and subduction of ocean crust generate secular chemical and physical changes throughout the crust and mantle, as well as in the ocean-atmosphere system. Large igneous provinces and hot spot trails are profound examples of massive mantle-crust exchanges and how these vary in time and space. At inter-mittent intervals, the emplacement of oceanic plateaus and formation of volcanic rifted margins produce significant chemical effects in the ocean and atmosphere. Particularly intense periods of volcanic activity appear to correlate with long-term changes in geodynamic behavior, which could involve interactions between the core and the deep mantle.
Many questions still need to be answered for us to better understand the Earth system. To address these we need to quantify fluxes and interplay within the mantle-crust-ocean system (physical, chemical, and biological) and monitor fault-driven processes. We also need to obtain a better under-standing of the components of a subduction zone system that control seismic behavior, which in turn affects the level of hazard posed by the plate boundary. Ocean drilling will con-tinue to significantly contribute to our understanding of these processes.
Co-Evolution of Life and the Planet
Scientific ocean drilling is poised to offer transformative advances to disciplines within the life sciences and provide insight into how life operates and interacts with Earth proc-esses at and below the seafloor, both today and in the past. In particular, the study of paleoenvironmental controls on marine paleoecosystems through the Cenozoic and of extant

58 Scientific Drilling, No. 9, April 2010
Workshop ReportsWorkshop Reports
life in rock and sediments can best be studied through ocean drilling.
Exploration of deeply seated microbial populations has revealed active, extant populations of microbes down to 1.6 km depth. These sedimentary and crustal habitats are vast in scale, physically and chemi-cally diverse, and together represent the largest biome on Earth. A major challenge in the study of subseafloor life is the need to develop a more comprehensive under-standing of the microbes that live there. Future research should reveal the biodiversity of the deep bio-sphere (Fig. 3), as well as the degree to which it is con-nected to surface biomes. Metagenomics, observato-ries, and other emerging technologies will play a sig-nificant role in the advance-ment of our understanding of the function and form of extant life in the subsurface. Advances in our knowledge of subsurface life from past ocean drilling have principally arisen as opportunistic ven-tures, where a microbiologist would sail on an expedition focused on other scientific objectives. This has resulted in a significantly skewed data set. This view can be changed in the future by utilizing both opportunistic and targeted drill-ing expeditions for deep biosphere research. A legacy sam-pling program would also fill critical gaps and lead to a more comprehensive understanding of the largest biome on Earth.
New approaches and dedicated expeditions will also reveal the physiological function and activity of the deep bio-sphere and provide a quantitative first-order understanding of the rates and magnitude of the biogeochemical processes that occur there. How these processes impact elemental cycles of carbon, nitrogen, iron, sulfur, etc. are generally not known. This presents an enormous challenge to understand-ing, at a very basic level, the global implications of the pres-ence of deep ecosystems. Does this biosphere impact Earth processes such as energy and carbon cycling, and can a better understanding of its function help solve global redox and carbon budgets? To meet these challenges new drilling and sampling are required to obtain high-quality fresh sam-ples critical for microbiological and biogeochemical study.
Research on the deep subseafloor biosphere has the poten-tial to address urgent questions about energy creation, cli-mate change, and the nature of evolution of life on Earth over geologic time.
Important emerging fields within paleontology are the study of systems ecology and biotic response to major envi-ronmental forcing (such as climate change). Drilling is needed to better understand how ecosystems influence and respond to their environment on different timescales in order to predict how populations will respond to present and future global change. High temporal resolution records across paleogeographic gradients and through time can thus be used to study the processes that generate and destroy biodiversity.
Human-Earth-Human Interactions
Geohazards
A top priority for the new drilling program should be the study of geologic hazards. Geology touches society directly through earthquakes, tsunamis, and landslides, and drilling can provide key constraints. Ocean drilling can be combined with other onshore and offshore national and international
Figure 3. Phylogenetic tree of Archaea and Bacteria based on 16S rRNA gene sequences (from Inagaki, 2010). The red and blue branches represent archaeal and bacterial phyla, respectively, and include sequences frequently detected from the deep subseafloor biosphere.
Spirochaetes
DSAG (M
BG−B
) MCG
DHVEGMethanobacteriales
SAGMEG
Thermoplasmatales
Methanosarcinales and ANME-2Methanomicrobiales
Methanococcales
WS1
OP10
OD1−OP11−WS6−TM7−KFS1
Chloroflexi
ActinobacteriaFirm
icutes
OP8
JS1
Cald
ithrix
-like
mar
ine
sedi
men
t bac
teria
l gro
up
Plan
ctom
ycet
es
WS3
Uncu
lture
d m
arin
e se
dim
ent b
acte
rial g
roup
Bacteroidetes
Uncultured methane−rich se
diment bacterial group
Betaproteobacteria
Gamm
aproteobacteria−1
Gammaproteobacteria−2
Alphaproteobacteria
Deltaproteobacteria
OP8
OP1
Eukarya
Bacteria
Archaea
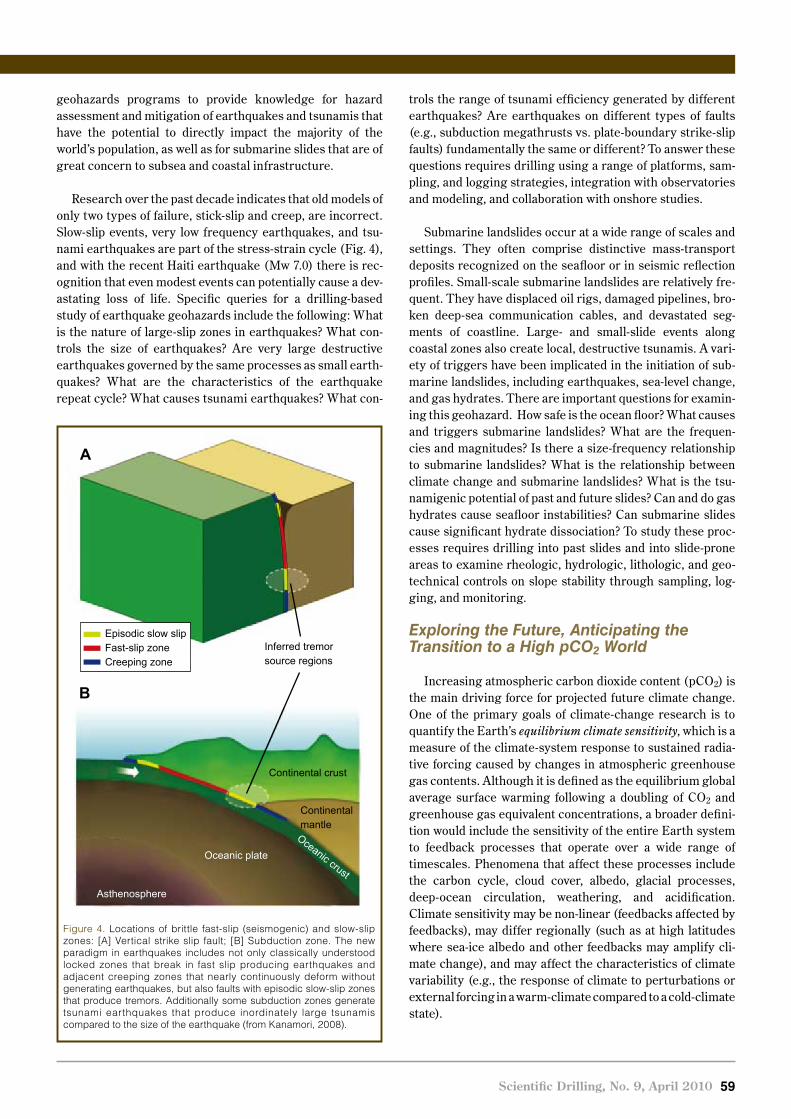
Workshop Reports
Scientific Drilling, No. 9, April 2010 59
Workshop Reports
geohazards programs to provide knowledge for hazard assessment and mitigation of earthquakes and tsunamis that have the potential to directly impact the majority of the world’s population, as well as for submarine slides that are of great concern to subsea and coastal infrastructure.
Research over the past decade indicates that old models of only two types of failure, stick-slip and creep, are incorrect. Slow-slip events, very low frequency earthquakes, and tsu-nami earthquakes are part of the stress-strain cycle (Fig. 4), and with the recent Haiti earthquake (Mw 7.0) there is rec-ognition that even modest events can potentially cause a dev-astating loss of life. Specific queries for a drilling-based study of earthquake geohazards include the following: What is the nature of large-slip zones in earthquakes? What con-trols the size of earthquakes? Are very large destructive earthquakes governed by the same processes as small earth-quakes? What are the characteristics of the earthquake repeat cycle? What causes tsunami earthquakes? What con-
trols the range of tsunami efficiency generated by different earthquakes? Are earthquakes on different types of faults (e.g., subduction megathrusts vs. plate-boundary strike-slip faults) fundamentally the same or different? To answer these questions requires drilling using a range of platforms, sam-pling, and logging strategies, integration with observatories and modeling, and collaboration with onshore studies.
Submarine landslides occur at a wide range of scales and settings. They often comprise distinctive mass-transport deposits recognized on the seafloor or in seismic reflection profiles. Small-scale submarine landslides are relatively fre-quent. They have displaced oil rigs, damaged pipelines, bro-ken deep-sea communication cables, and devastated seg-ments of coastline. Large- and small-slide events along coastal zones also create local, destructive tsunamis. A vari-ety of triggers have been implicated in the initiation of sub-marine landslides, including earthquakes, sea-level change, and gas hydrates. There are important questions for examin-ing this geohazard. How safe is the ocean floor? What causes and triggers submarine landslides? What are the frequen-cies and magnitudes? Is there a size-frequency relationship to submarine landslides? What is the relationship between climate change and submarine landslides? What is the tsu-namigenic potential of past and future slides? Can and do gas hydrates cause seafloor instabilities? Can submarine slides cause significant hydrate dissociation? To study these proc-esses requires drilling into past slides and into slide-prone areas to examine rheologic, hydrologic, lithologic, and geo-technical controls on slope stability through sampling, log-ging, and monitoring.
Exploring the Future, Anticipating the Transition to a High pCO2 World
Increasing atmospheric carbon dioxide content (pCO2) is the main driving force for projected future climate change. One of the primary goals of climate-change research is to quantify the Earth’s equilibrium climate sensitivity, which is a measure of the climate-system response to sustained radia-tive forcing caused by changes in atmospheric greenhouse gas contents. Although it is defined as the equilibrium global average surface warming following a doubling of CO2 and greenhouse gas equivalent concentrations, a broader defini-tion would include the sensitivity of the entire Earth system to feedback processes that operate over a wide range of timescales. Phenomena that affect these processes include the carbon cycle, cloud cover, albedo, glacial processes, deep-ocean circulation, weathering, and acidification. Climate sensitivity may be non-linear (feedbacks affected by feedbacks), may differ regionally (such as at high latitudes where sea-ice albedo and other feedbacks may amplify cli-mate change), and may affect the characteristics of climate variability (e.g., the response of climate to perturbations or external forcing in a warm-climate compared to a cold-climate state).
Figure 4. Locations of brittle fast-slip (seismogenic) and slow-slip zones: [A] Vertical strike slip fault; [B] Subduction zone. The new paradigm in earthquakes includes not only classically understood locked zones that break in fast slip producing earthquakes and adjacent creeping zones that nearly continuously deform without generating earthquakes, but also faults with episodic slow-slip zones that produce tremors. Additionally some subduction zones generate tsunami earthquakes that produce inordinately large tsunamis compared to the size of the earthquake (from Kanamori, 2008).
Episodic slow slipFast-slip zoneCreeping zone
Inferred tremorsource regions
Continental crust
Continentalmantle
Oceanic crust
Oceanic plate
Asthenosphere
A
B
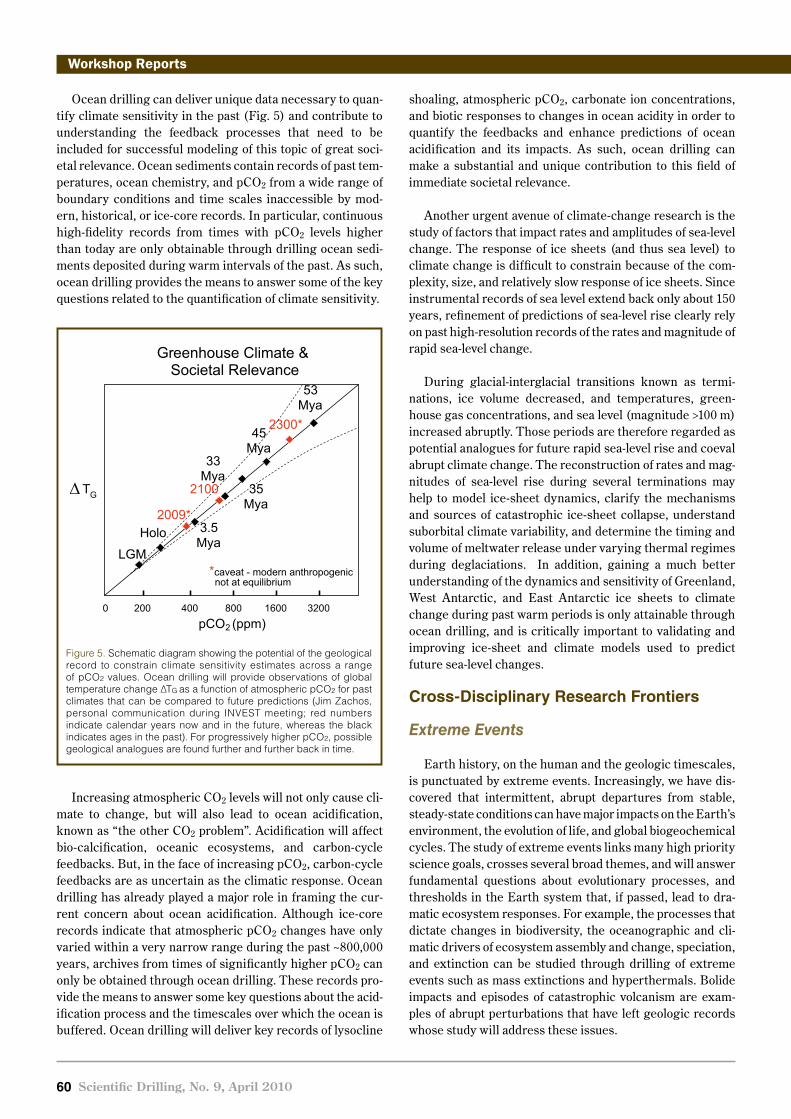
60 Scientific Drilling, No. 9, April 2010
Workshop ReportsWorkshop Reports
Ocean drilling can deliver unique data necessary to quan-tify climate sensitivity in the past (Fig. 5) and contribute to understanding the feedback processes that need to be included for successful modeling of this topic of great soci-etal relevance. Ocean sediments contain records of past tem-peratures, ocean chemistry, and pCO2 from a wide range of boundary conditions and time scales inaccessible by mod-ern, historical, or ice-core records. In particular, continuous high-fidelity records from times with pCO2 levels higher than today are only obtainable through drilling ocean sedi-ments deposited during warm intervals of the past. As such, ocean drilling provides the means to answer some of the key questions related to the quantification of climate sensitivity.
Increasing atmospheric CO2 levels will not only cause cli-mate to change, but will also lead to ocean acidification, known as “the other CO2 problem”. Acidification will affect bio-calcification, oceanic ecosystems, and carbon-cycle feedbacks. But, in the face of increasing pCO2, carbon-cycle feedbacks are as uncertain as the climatic response. Ocean drilling has already played a major role in framing the cur-rent concern about ocean acidification. Although ice-core records indicate that atmospheric pCO2 changes have only varied within a very narrow range during the past ~800,000 years, archives from times of significantly higher pCO2 can only be obtained through ocean drilling. These records pro-vide the means to answer some key questions about the acid-ification process and the timescales over which the ocean is buffered. Ocean drilling will deliver key records of lysocline
shoaling, atmospheric pCO2, carbonate ion concentrations, and biotic responses to changes in ocean acidity in order to quantify the feedbacks and enhance predictions of ocean acidification and its impacts. As such, ocean drilling can make a substantial and unique contribution to this field of immediate societal relevance.
Another urgent avenue of climate-change research is the study of factors that impact rates and amplitudes of sea-level change. The response of ice sheets (and thus sea level) to climate change is difficult to constrain because of the com-plexity, size, and relatively slow response of ice sheets. Since instrumental records of sea level extend back only about 150 years, refinement of predictions of sea-level rise clearly rely on past high-resolution records of the rates and magnitude of rapid sea-level change.
During glacial-interglacial transitions known as termi-nations, ice volume decreased, and temperatures, green-house gas concentrations, and sea level (magnitude >100 m) increased abruptly. Those periods are therefore regarded as potential analogues for future rapid sea-level rise and coeval abrupt climate change. The reconstruction of rates and mag-nitudes of sea-level rise during several terminations may help to model ice-sheet dynamics, clarify the mechanisms and sources of catastrophic ice-sheet collapse, understand suborbital climate variability, and determine the timing and volume of meltwater release under varying thermal regimes during deglaciations. In addition, gaining a much better understanding of the dynamics and sensitivity of Greenland, West Antarctic, and East Antarctic ice sheets to climate change during past warm periods is only attainable through ocean drilling, and is critically important to validating and improving ice-sheet and climate models used to predict future sea-level changes.
Cross-Disciplinary Research Frontiers
Extreme Events
Earth history, on the human and the geologic timescales, is punctuated by extreme events. Increasingly, we have dis-covered that intermittent, abrupt departures from stable, steady-state conditions can have major impacts on the Earth’s environment, the evolution of life, and global biogeochemical cycles. The study of extreme events links many high priority science goals, crosses several broad themes, and will answer fundamental questions about evolutionary processes, and thresholds in the Earth system that, if passed, lead to dra-matic ecosystem responses. For example, the processes that dictate changes in biodiversity, the oceanographic and cli-matic drivers of ecosystem assembly and change, speciation, and extinction can be studied through drilling of extreme events such as mass extinctions and hyperthermals. Bolide impacts and episodes of catastrophic volcanism are exam-ples of abrupt perturbations that have left geologic records whose study will address these issues.
Figure 5. Schematic diagram showing the potential of the geological record to constrain climate sensitivity estimates across a range of pCO2 values. Ocean drilling will provide observations of global temperature change ∆TG as a function of atmospheric pCO2 for past climates that can be compared to future predictions (Jim Zachos, personal communication during INVEST meeting; red numbers indicate calendar years now and in the future, whereas the black indicates ages in the past). For progressively higher pCO2, possible geological analogues are found further and further back in time.
Greenhouse Climate & Societal Relevance
pCO2 (ppm)0 200 400 800 1600 3200
LGM
Holo2009*
3.5 Mya
33Mya
35Mya
45Mya
53Mya
2100
2300*
∆TG
*caveat - modern anthropogenic not at equilibrium

Workshop Reports
Scientific Drilling, No. 9, April 2010 61
Workshop Reports
tation or speciation pressures that resulted in genetic selec-tion and innovation. Where hypotheses differ is in the pro-posed role of climate change in natural selection. The Savannah Hypothesis states that the evolution of African mammalian fauna, including early hominins, was primarily linked to the progressive expansion of more open grassland conditions. The Turnover Pulse Hypothesis is the variant of this idea that focuses on bursts of biotic change initiated by progressive shifts toward greater African aridity at approxi-mately 2.8 Ma and 1.8 Ma. The Variability Selection Hypothesis suggests that changes in the amplitudes of orbitally controlled African climate variability, linked to the eccentricity modulation of precessional monsoonal cycles, may have been an important genetic selection criterion. To test these hypotheses, fundamental questions concerning the timing, nature, and causes of African climate variability must be answered. Drilling targets are margin sediments that reflect the subtropical African geographic domain where hominin fossils are found, including South Africa, Tanzania, Kenya, and Ethiopia. Ocean drilling to obtain records from these regions will likely revolutionize our understanding of the timing and causes of African climate changes and allow us to test the hypothesized role of past climate changes in shaping the course of human evolution.
Climate-Tectonic Linkages and Feedbacks
Climate and plate tectonics are two forces that shape the Earth in concert; examining the interplay between climatic and tectonic processes will advance our understanding of
Future drilling can play a vital role in improving our understanding of impacts and their role in Earth’s history, particularly through compari-son of impacts that caused mass extinction events (e.g., the 65.5 Ma Chicxulub impact) to other large impacts that only caused minor perturbations (e.g., the 35 Ma Chesapeake Bay impact). Identifying the critical factors that lead to global environmental devasta-tion (e.g., the energy of impact, the chemistry of the target rocks, additional environmen-tal stresses, or the vulner- ability of life at the time of impact) is possible through ocean drilling of the impact structures and the sediments containing critical fossil and environmental-proxy evidence.
A fundamental process within the solid Earth is inter-mittent whole-mantle overturn that results in periods of eruption of large igneous provinces (LIPs) (Fig. 6), high seafloor spreading and associated arc collisions, and sea-level highstands. This mode was last prominent during the Cretaceous to early Tertiary Periods (135–55 Ma) when extraordinary eruption rates produced large igneous systems on both continents and in ocean basins. The rate, volume, and duration of these events need to be constrained to under-stand the geodynamic mechanisms for their origin and their potential environmental impacts, including mass extinc-tions, rapid global warming, ocean acidification, and oceanic anoxic events. LIPs are extreme mantle-melting and volcanic events that can be studied to answer questions about geodynamic models whose critical distinctions are magma flux through time, geochemical variability, and internal architecture—all of which are best addressed by drilling to obtain direct volcanic samples and far-field, high-resolution marine sedimentary sections.
Hominin Evolution
Scientific ocean drilling can transform our understanding of how African climate change affected early human evolu-tion. Key evolutionary events occurred near 3.0–2.5 Ma and 2.0–1.5 Ma that effectively shaped the characteristics that define us as human: bipedalism, exceptionally large brains, and the construction of increasingly sophisticated stone tools. Environmental hypotheses for early human evolution suggest that changing African climate altered the ecological composition of a landscape, which led to specific faunal adap-
Figure 6. Proposed interconnections between reservoirs and fluxes within the Earth system during extreme volcanic events (Naohiko Ohkouchi, personal communication during INVEST meeting). The emplacement of large igneous provinces (LIPs), an expression of the Earth's interior behavior, could explain episodes of enhanced greenhouse gas input to the atmosphere and subsequent climatic and ocean circulation changes that lead to Oceanic Anoxic Events (OAEs). OAEs are extreme oceanic events marked by enhanced organic carbon burial and related biological impacts.
Greenhouse effect
Mass extinction
LIPs
Super plume
Petroleum
Black shale
OAE
Ocean circulationchange
Climatic shift
Magnetic field
Moderncivilization
Atmosphere
Ocean
Crust
Mantle
Core
62 Scientific Drilling, No. 9, April 2010
Workshop ReportsWorkshop Reports
both. Fundamental questions regarding tectonic-climate linkages can be answered by ocean drilling in conjunction with continental studies. Future studies should focus on how the changing configuration and topography/bathymetry of the continents and oceans influence ocean and atmo-spheric circulations and biogeochemical cycles, as well as how orogens respond to significant climate shifts such as the onset of Northern Hemisphere glaciation, the Mid-Pleistocene Transition, and the development of the Indian monsoon. Other avenues of research should investi-gate how tectonics influences discharge of freshwater, nutri-ents, and sediment from the continents to the ocean and how these affect the biota and biogeochemical cycles on conti-nental margins and in marginal seas. The potential impact of small rivers, groundwater, and eolian transport on global freshwater, nutrient, and sediment budgets also needs to be quantified. Future ocean drilling should focus on capturing a complementary array of continental margin and fan records, including Arctic and Antarctic deposystems; exhumation history; terrestrial climate/vegetation changes; sediment, nutrients, and carbon budgets; and freshwater discharges for the areas of the Earth with the highest fluxes. Such a strategy will undoubtedly advance our understanding of the feedbacks between tectonics and climate and their combined influences on the Earth’s surface.
Technological Needs and Development
To achieve novel scientific ocean drilling objectives will depend on improved drilling capabilities such as enhancing depth penetration, improving core recovery and quality, cor-ing in high-temperature and high-pressure environments, coring in shallow water margins, coral reefs, and sea-ice covered regions (e.g., such as with the planned Research Icebreaker Aurora Borealis), and preventing magnetic, chemical, and microbiological contaminations. Overall, the next phase of the scientific drilling program will require sig-nificant and even more coordinated engineering efforts.
One of the most significant technological requirements is the measurement of the intrinsic and/or ephemeral proper-ties of cores and boreholes. In situ measurements of redox state, chemical compositions, physical parameters, pH, and microbial populations and their activities are absolutely necessary. Newly developed (or improved) logging sensor tools, in situ sampling/monitoring devices, and in situ micro-bial colonization systems will be needed to achieve multidis-ciplinary scientific objectives through borehole observato-ries and experiments. Real-time hydrocarbon gas monitoring systems that include stable isotope measurements should also be deployed in platform laboratories. Novel and/or improved analytical technologies for quick, high-resolution measurements of temperature-, redox-, and oxygen-sensitive chemical and microbiological components must be devel-oped for use on recently acquired cores, since exploration of high-temperature hydrothermal systems and the deep, hot biosphere has great potential to increase our understanding
of the co-evolution of life and the planet. In addition, onboard measurements of physical, chemical, and biological proper-ties of cores are extremely useful for real-time decisions necessary to meet drilling goals.
The development of a high-pressure- (and -temperature) coring system is required for various geochemical and bio-logical reactions because the pressure limit of the currently available high-pressure-coring system is up to 25 MPa, which is not enough for high-pressure gas fields or deep coring (>2500 meters below the sea surface). Furthermore, once core under high pressure and temperature reaches the surface, an onboard high-pressure core transfer system equipped with multiple (micro-) sensors, gas and fluid ex-traction ports, tracer injection systems, and a mini-core sub-sampling system is needed.
Subseafloor microbes proliferate in narrow niches and vary over local fluid-flow pathways used to transport energy and nutrients, hence high-resolution microbiological sam-pling is necessary. We need to develop onboard sub-sampling strategies for quick identification of microbially interesting zones and high-resolution sampling capabilities while monitoring and minimizing contamination. Furthermore, the non-destructive identification of core quality and struc-tures (through X-ray CT scanning) is a high priority for future microbiology/biogeochemistry-dedicated drilling expeditions. For high-throughput and high-resolution onboard analyses, computer automated systems, such as the auto-extractor and the automated cell-counting microscope system using fluorescent image analysis, should be deployed.
Penetration through a complete ocean-crust section, the so-called project “Mohole”, will require advances in drilling capabilities that include riser drilling capability in 4000 m or more water depth, deep penetration and recovery of crustal rocks of all lithologies, and borehole and drill bit cooling technology for high temperature (>250 °C) environ-ments. Technological issues include improvement of riser-pipe quality and casing strings, the blowout preventer, and the mud-circulation/recovery system.
The newly developed Riserless Mud Recovery (RMR) system has great potential for use in various environments in future drilling, especially for borehole controls (i.e., stability and cooling). Combining the dual-gradient technology with RMR enables environmentally friendly drilling (i.e., clean without mud pollutants to seawater) access to deeper envi-ronments and areas previously not drillable by riserless drill-ing. The RMR technology is directly applicable to all IODP platforms.
Improving core recovery and quality is the fundamental challenge for all drilling environments. Core recovery and quality depend on factors such as depth, temperature, fluid pressure, and lithology, as well as the design and perfor-
Workshop Reports
Scientific Drilling, No. 9, April 2010 63
Workshop Reports
mance of drilling and coring tools. In previous drilling ex-periences, poor core recovery has plagued (a) chert and/or shales, (b) sand and gravel layers, (c) hydrothermal depos-its, (d) rubble basalts and sheeted dyke complexes, and (e) fault and fracture zones. Anticipated improvements include more accurate compensation of drill bit motion, torque, and type of cutting shoe, and operational technol-ogies such as a feedback system of real-time drilling parameters. Other strategies, such as cuttings and side-wall coring, will increase sampling of unrecovered intervals. Borehole management (i.e., stability) requires cuttings removal and compensation of lithostatic and pumping pres-sures in both riser and riserless drilling modes. In addition, large diameter pipes may provide more opportunities to con-duct various geophysical measurements such as pore pres-sures and resistivity.
Monitoring while drilling using downhole logging tools has greatly expanded our understanding of in situ pressure and stress conditions in the borehole. The use of logging tools during drilling or in CORKed boreholes is likely to expand in the new drilling program. Multiple-hole experi-ments are recommended, including injection tests and cross-borehole communication studies. Broadband and high-sensitivity sensors such as fiber-optic seismo-sensors combined with continuous data recovery should be devel-oped and installed in active subseafloor environments. To study in situ conditions of high-temperature and/or high-pressure environments, the durability of logging sys-tems to high temperature and pressure must be improved. Development of new slim-line multi-logging tools and borehole equipment is needed for all platforms. Current shipboard computational and dissemination capabilities should be more effectively integrated between software pro-grams, database mining, and accessibility and be easily interfaced among the multiple drilling platforms and core repositories.
Outreach and Education, and Branding
Outreach refers to activities that target the general public and funding agencies. Education and educational outreach are aimed at students in primary, secondary, undergraduate, and graduate school realms. Continued coordination through IODP-MI or its successor organization is essential to achieve the best results in the arena of public outreach. A successful branding campaign will be vital to ensure ongoing public recognition of the scientific discoveries and technological achievements of scientific ocean drilling.
Branding the science and accomplishments of ocean drill-ing should elucidate the linkages to broader objectives or themes, and not necessarily focus on individual expeditions. As visual impression is the key for branding, web sites across the program must have a common layout to promote the impression of a truly integrated program to the scientific community and the public, and to facilitate access to infor-
mation. A series of bold, clear key messages should be an important element in any branding campaign. For example, the main messages of the drilling program should empha-size the following:
The program investigates a dynamic Earth; it is a •changing, not static, planet.Basic science is always valuable to society.•Scientific ocean drilling is particularly relevant to •society, providing knowledge about geohazards and climate change.Scientific ocean drilling is on the edge of the science •frontier. By exploring Earth through scientific ocean drilling, we make novel and fundamental discoveries.
Outreach and education are vital in raising the profile of the future drilling program. The program needs to employ a full-time science “translator” (scientist or science educator with requisite skills) that can effectively communicate drill-ing science to non-scientists. Because many ocean drilling scientists are also geoscience educators, there should be mechanisms for them to be closely involved in framing the science to be easily accessible to students and the general public. Consideration should be given to expanding success-ful current programs to include all international partners and to serve all audiences (undergraduates, graduates, faculty, young scientists, science teachers, etc.). Specific recommendations are (a) the development and dissemina-tion of an archive of basic images documenting the history and goals of the drilling program; (b) admitting science educators, in addition to school teachers, on expeditions; (c) providing communications training for younger scientists on board; (d) offering early career workshops sponsored by the new ocean drilling program; and (e) developing a men-toring plan for young career scientists who go to sea on expe-ditions and site survey cruises. Generally, the ocean drilling program should make greater use of Google Ocean and GeoMapApp to provide the public with images and video for education and outreach. Finally, in planning the new drilling program, there should be a workshop dedicated to formulat-ing a plan that employs innovative cutting-edge methods of science education, communication, and outreach.
Recommendations for the Architecture of a New Program
Scientific planning in the new ocean drilling program should be driven from the ”bottom up”, with scientists play-ing key roles in defining specific scientific short- and long-term goals and in advising and working directly with management, ship operators, and engineering development to execute the drilling program. The direct involvement of world-class students and scientists will keep the interna-tional ocean drilling program fresh and focused on emerg-ing transformative topics that define the frontiers of life and earth sciences. As such, a strong science advisory structure should be a central component of the new program architec-
64 Scientific Drilling, No. 9, April 2010
Workshop Reports
ture. Furthermore, transformative science is often born from cross-disciplinary perspectives, and the drilling program must have multiple mechanisms to proactively engage scien-tists and students from disciplines outside of the traditional drilling community, from both academia and industry.
Because of the complex nature of an international drilling program with multiple operators and stakeholders, effective management should focus on fostering stronger interna-tional partnerships, well-integrated collaborations with other large geosciences programs, effective fundraising, and cre-ative and efficient coordination amongst the national offices and implementation/ship operators. By working with the science advisory committees and scientific community, management should facilitate the formulation of visionary and innovative scientific goals through the life of the program.
Meeting the scientific goals of the drilling program will require flexibility. Multi-expedition, long-term missions will be required to achieve these ambitious goals. At the same time, many of the highest impact ocean drilling projects may be unanticipated and/or concise and focused. Thus, there must be mechanisms by which the new ocean drilling pro-gram can quickly respond to, nurture, and execute brilliant new ideas (identified through a peer-review system) that require ocean drilling. To implement the projects necessary to achieve transformative science will require a new ocean drilling program architecture that, by design, will have the flexibility to react quickly to new opportunities, but also to make decisive commitments to long-term complex, techni-cally challenging projects.
ReferencesInagaki, F., 2010. Deep subseafloor microbial communities. In
Encyclopedia of Life Sciences, Chichester (John Wiley & Sons, Ltd.), doi:10.1002/9780470015902.a0021894.
Kanamori, H., 2008. Earthquake physics and real-time seismology. Nature, 451:271–273, doi:10.1038/nature06585.
Teagle, D., Abe, N., Bach, W., Blackman, D., Coggon, R., Dick, H., Edwards, K., and Ildefonse, B., 2009. Melting, magma, flu-ids and life: Challenges for the next generation of scientific ocean drilling into the oceanic lithosphere, Workshop Report, 27–29 July 2009. National Oceanography Centre, Southampton, University of Southampton, U.K., 85 pp.
Thurow, J., Peterson, L.C., Harms, U., Hodell, D.A., Cheshire, H., Brumsack, H.J., Irino, T., Schulz, M., Masson-Delmotte, V., and Tada, R., 2009. Acquiring high to ultra-high resolution geological records of past climate change by scientific drill-ing. Sci. Drill., 8:46–56, doi:10.2204/iodp.sd.8.08.2009.
Authors and Steering Committee Members
Wolfgang Bach (co-chair), Department of Geosciences, University of Bremen, Klagenfurter Strasse, D-28359 Bremen, Germany.Christina Ravelo (co-chair), Ocean Sciences Department, University of California Santa Cruz, CA 95064, U.S.A., e-mail: [email protected] (corresponding author).Jan Behrmann, Leibniz-Institut für Meereswissenschaften, IFM-GEOMAR, Gebäude Ostufer, Wischhofstrasse 1-3, 24148 Kiel, Germany.Gilbert Camoin, National Center for Scientific Research (CNRS), CEREGE UMR 6635, CNRS, Europôle Méditerranéen de l’Arbois, BP 80, F-13545 Aix-en-Provence cedex 4, Aix-en-Provence, France.Robert Duncan, College of Oceanic and Atmospheric Sciences, Oregon State University, 104 COAS Administration Building, Corvallis, OR 97331-5503, U.S.A.Katrina Edwards, Department of Biological Sciences, Hancock Auditorium and Museum (AHF) 107F, University of Southern California, Los Angeles, CA 90089-0371, U.S.A.Sean Gulick, The University of Texas at Austin, Department of Geological Sciences, Geology Building 2. 106, 23rd Street at San Jacinto Boulevard., Austin, TX 78705, U.S.A.Fumio Inagaki, Kochi Core Center, JAMSTEC, 200 Monobe Otsu, Nankoku City, Kochi Prefecture, 783-8502, Japan.Heiko Pälike, National Oceanography Centre Southampton, University of Southampton and Natural Environment Research Council, Southampton, University of Southampton Waterfront Campus, European Way, Southampton, SO14 3ZH, U.K.Ryuji Tada, Department of Earth and Planetary Science, University of Tokyo, Sci. Bldg. No.1-734, Hongou 7-3-1, Bunkyo-ku, Tokyo, 113-0033, Japan.
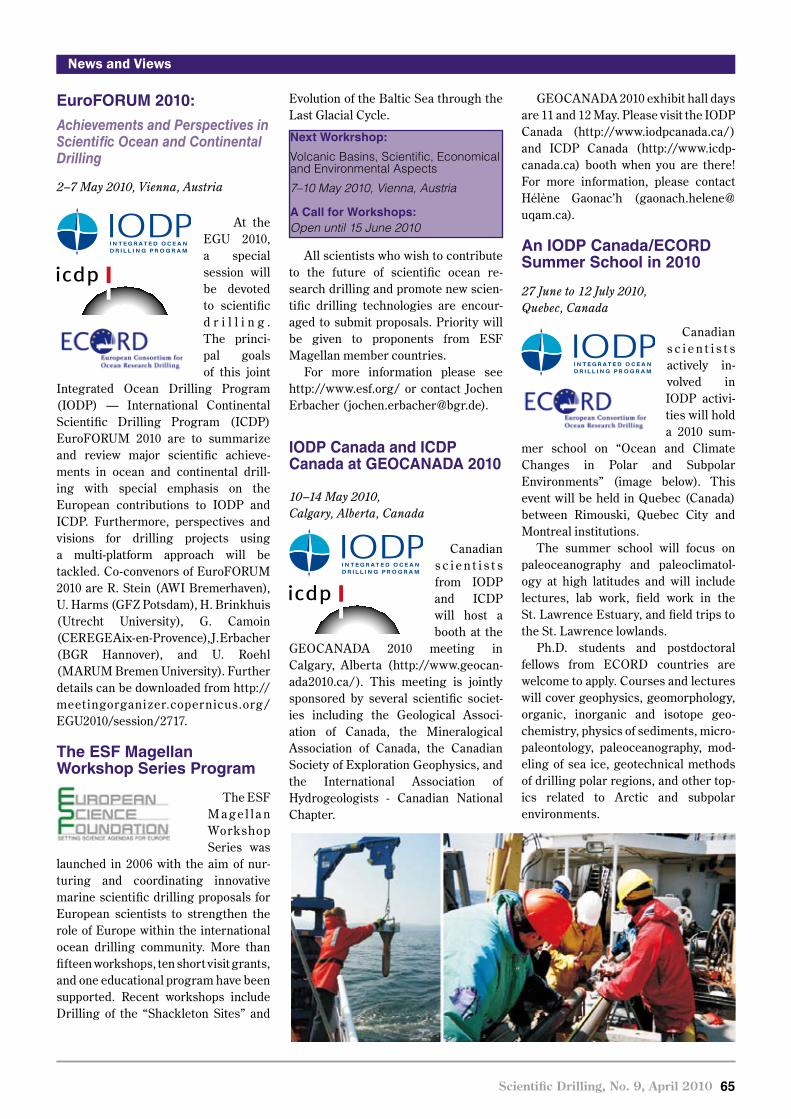
EuroFORUM 2010:
Achievements and Perspectives in Scientific Ocean and Continental Drilling
2–7 May 2010, Vienna, Austria
At the EGU 2010, a special session will be devoted to scientific d r i l l i n g . The princi-pal goals of this joint
Integrated Ocean Drilling Program (IODP) — International Continental Scientific Drilling Program (ICDP) EuroFORUM 2010 are to summarize and review major scientific achieve-ments in ocean and continental drill- ing with special emphasis on the European contributions to IODP and ICDP. Furthermore, perspectives and visions for drilling projects using a multi-platform approach will be tackled. Co-convenors of EuroFORUM 2010 are R. Stein (AWI Bremerhaven), U. Harms (GFZ Potsdam), H. Brinkhuis (Utrecht University), G. Camoin (CEREGE Aix-en-Provence), J. Erbacher (BGR Hannover), and U. Roehl (MARUM Bremen University). Further details can be downloaded from http://meet ingorganizer.copernicus.org/EGU2010/session/2717.
The ESF Magellan Workshop Series Program
The ESF M a g e l l a n Workshop Series was
launched in 2006 with the aim of nur-turing and coordinating innovative marine scientific drilling proposals for European scientists to strengthen the role of Europe within the international ocean drilling community. More than fifteen workshops, ten short visit grants, and one educational program have been supported. Recent workshops include Drilling of the “Shackleton Sites” and
Evolution of the Baltic Sea through the Last Glacial Cycle.
All scientists who wish to contribute to the future of scientific ocean re-search drilling and promote new scien-tific drilling technologies are encour-aged to submit proposals. Priority will be given to proponents from ESF Magellan member countries.
For more information please see http://www.esf.org/ or contact Jochen Erbacher ([email protected]).
IODP Canada and ICDP Canada at GEOCANADA 2010
10–14 May 2010, Calgary, Alberta, Canada
Canadian s c i e n t i s t s from IODP and ICDP will host a booth at the
GEOCANADA 2010 meeting in Calgary, Alberta (http://www.geocan-ada2010.ca/). This meeting is jointly sponsored by several scientific societ-ies including the Geological Associ-ation of Canada, the Mineralogical Association of Canada, the Canadian Society of Exploration Geophysics, and the International Association of Hydrogeologists - Canadian National Chapter.
GEOCANADA 2010 exhibit hall days are 11 and 12 May. Please visit the IODP Canada (http://www.iodpcanada.ca/) and ICDP Canada (http://www.icdp-canada.ca) booth when you are there! For more information, please contact Hélène Gaonac’h ([email protected]).
An IODP Canada/ECORD Summer School in 2010
27 June to 12 July 2010,Quebec, Canada
Canadian s c i e n t i s t s actively in- volved in IODP activi-ties will hold a 2010 sum-
mer school on “Ocean and Climate Changes in Polar and Subpolar Environments” (image below). This event will be held in Quebec (Canada) between Rimouski, Quebec City and Montreal institutions.
The summer school will focus on paleoceanography and paleoclimatol-ogy at high latitudes and will include lectures, lab work, field work in the St. Lawrence Estuary, and field trips to the St. Lawrence lowlands.
Ph.D. students and postdoctoral fellows from ECORD countries are welcome to apply. Courses and lectures will cover geophysics, geomorphology, organic, inorganic and isotope geo- chemistry, physics of sediments, micro-paleontology, paleoceanography, mod-eling of sea ice, geotechnical methods of drilling polar regions, and other top-ics related to Arctic and subpolar environments.
Scientific Drilling, No. 9, April 2010 65
News and ViewsNews and Views
Next Workrshop:
Volcanic Basins, Scientific, Economical and Environmental Aspects
7–10 May 2010, Vienna, Austria
A Call for Workshops:Open until 15 June 2010
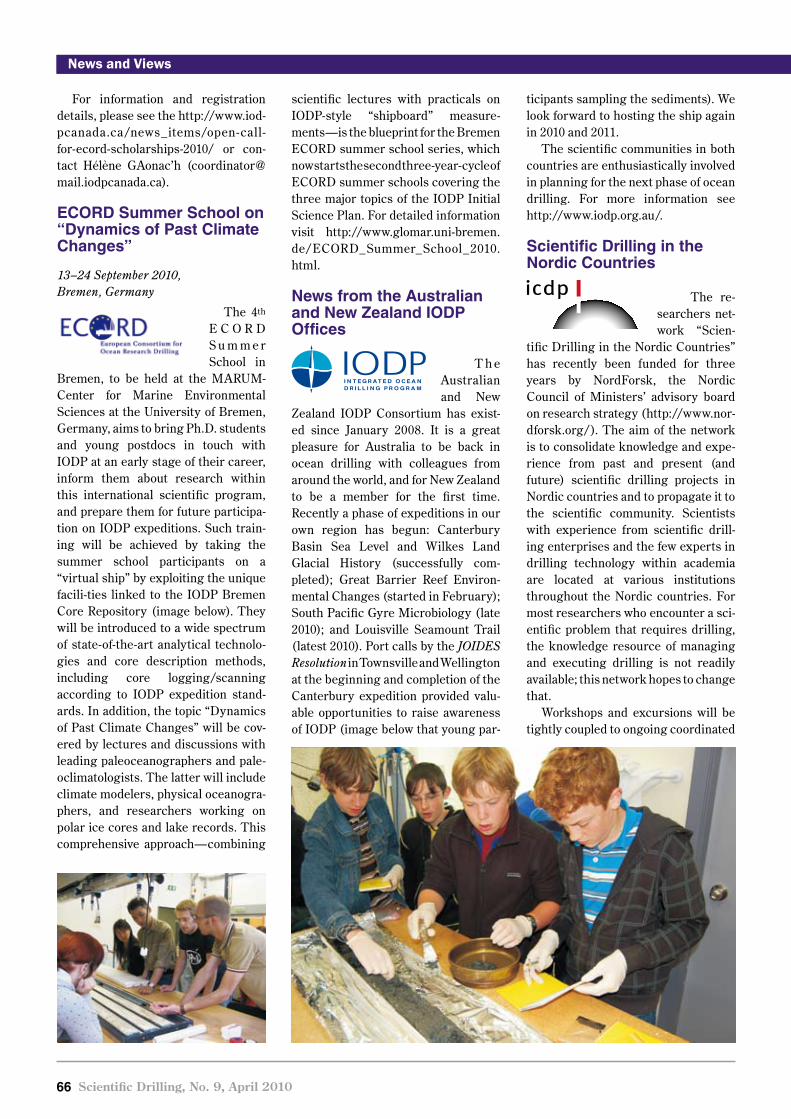
66 Scientific Drilling, No. 9, April 2010
News and ViewsNews and Views
For information and registration details, please see the http://www.iod-pcanada.ca/news_items/open-call -for-ecord-scholarships-2010/ or con-tact Hélène GAonac’h ([email protected]).
ECORD Summer School on “Dynamics of Past Climate Changes”
13–24 September 2010, Bremen, Germany
The 4th E C O R D S u m m e r School in
Bremen, to be held at the MARUM-Center for Marine Environmental Sciences at the University of Bremen, Germany, aims to bring Ph.D. students and young postdocs in touch with IODP at an early stage of their career, inform them about research within this international scientific program, and prepare them for future participa-tion on IODP expeditions. Such train-ing will be achieved by taking the summer school participants on a “virtual ship” by exploiting the unique facili-ties linked to the IODP Bremen Core Repository (image below). They will be introduced to a wide spectrum of state-of-the-art analytical technolo-gies and core description methods, including core logging/scanning according to IODP expedition stand-ards. In addition, the topic “Dynamics of Past Climate Changes” will be cov-ered by lectures and discussions with leading paleoceanographers and pale-oclimatologists. The latter will include climate modelers, physical oceanogra-phers, and researchers working on polar ice cores and lake records. This comprehensive approach—combining
ticipants sampling the sediments). We look forward to hosting the ship again in 2010 and 2011.
The scientific communities in both countries are enthusiastically involved in planning for the next phase of ocean drilling. For more information see http://www.iodp.org.au/.
Scientific Drilling in the Nordic Countries
The re-searchers net-work “Scien-
tific Drilling in the Nordic Countries” has recently been funded for three years by NordForsk, the Nordic Council of Ministers’ advisory board on research strategy (http://www.nor-dforsk.org/). The aim of the network is to consolidate knowledge and expe-rience from past and present (and future) scientific drilling projects in Nordic countries and to propagate it to the scientific community. Scientists with experience from scientific drill-ing enterprises and the few experts in drilling technology within academia are located at various institutions throughout the Nordic countries. For most researchers who encounter a sci-entific problem that requires drilling, the knowledge resource of managing and executing drilling is not readily available; this network hopes to change that.
Workshops and excursions will be tightly coupled to ongoing coordinated
scientific lectures with practicals on IODP-style “shipboard” measure-ments—is the blueprint for the Bremen ECORD summer school series, which now starts the second three-year-cycle of ECORD summer schools covering the three major topics of the IODP Initial Science Plan. For detailed information visit http://www.glomar.uni-bremen.de/ECORD_Summer_School_2010.html.
News from the Australian and New Zealand IODP Offices
T h e Australian and New
Zealand IODP Consortium has exist-ed since January 2008. It is a great pleasure for Australia to be back in ocean drilling with colleagues from around the world, and for New Zealand to be a member for the first time. Recently a phase of expeditions in our own region has begun: Canterbury Basin Sea Level and Wilkes Land Glacial History (successfully com-pleted); Great Barrier Reef Environ-mental Changes (started in February); South Pacific Gyre Microbiology (late 2010); and Louisville Seamount Trail (latest 2010). Port calls by the JOIDES Resolution in Townsville and Wellington at the beginning and completion of the Canterbury expedition provided valu-able opportunities to raise awareness of IODP (image below that young par-

News and ViewsNews and Views
serve as manager of the newly formed Technical and Analytical Services Department, which is composed of the majority of the shipboard technical support staff.
ESSAC Office Moves from France to Germany
On 1 O c t ober 2009, the
European Consortium for Ocean Research Drilling Science Support and Advisory Committee (ESSAC) office moved from Aix-en-Provence, France to Bremerhaven, Germany. The new office, established at the Alfred Wegener Institute (AWI) for Polar and Marine Research, is headed by Ruediger (Rudy) Stein as the new ESSAC Chair. Jeannette (Jenny) Lezius is the new Science Coordinator. More information about ESSAC and its activities is available at http://www.essac.ecord.org/.
IODP-MI Office in Tokyo
T h e Integrated O c e a n
Drilling Program Management International, Inc. (IODP-MI) is integ-rating most of its activities into one single location. On 1 March 2010 the former Sapporo office moved to new IODP-MI office located at Tokyo University of Marine Science and Technology, Etchujima Campus. A small office of finances and contracts office is maintained in Washington, D.C. Following a few additional staff hires, the planned restructuring of IODP-MI has been completed. The new office structure and contact details can be found at: www.iodp.org.
jects. As it will be capable of drilling to depths of 2000–3000 m, this rig will complement the traditional deep-drilling platform InnovaRig of the GFZ German Research Centre for Geosciences.
U.S. Implementing Organization Adds New Talent, Restructures
The U.S. Implementing Organization of the Integrated
Ocean Drilling Program (USIO) has restructured and added new talent to its team. The USIO operates the JOIDES Resolution and consists of the Consortium for Ocean Leadership, Lamont-Doherty Earth Observatory (LDEO) of Columbia University, and Texas A&M University (TAMU).
Ocean Leadership hired Greg Myers as the new Senior Technical Expert (Engineering and Develop-ment) and Doug Fils as the new Data Management Technical Expert. Myers will oversee USIO engineering development efforts and coordinate non-IODP funding activities. Fils will interact with IODP-Management International and the USIO to develop and implement approaches to data management needs.
At LDEO, former Scientific Ocean Drilling Vessel project manager Gerardo Iturrino is now the Manager of Engineering Services and will oversee engineering development and maintenance of shipboard and shore-based logging systems. Eric Meissner takes on the newly-created position of Senior Engineering Pro-ject Manager. Alberto Malinverno will now super-vise the Science Services group while remaining in his role of Principal Scientist.
Jim Rosser has joined IODP-TAMU as the Manager of Development, Information Technology, and Data-bases. Rosser brings experience as a U.S. naval commander to oversee the shipboard and shorebased IT infra-structure and the acquisition and management of data collected by the JOIDES Resolution. Jay Miller will
scientific projects and bring together experts, experienced scientists, and novices for knowledge exchange and transfer. For more information visit the network’s website at http://www.sdnc.eu/ or contact Henning Lorenz ([email protected]).
Canada is Back in ICDP
In 2009 the Natural Sciences and
Engineering Research Council of Canada (NSERC) committed itself to supporting Canadian membership in the ICDP for the next five years, giving Canadian scientists the opportunity to continue their involvement in ICDP activities and scientific planning.
ICDP Canadian scientists currently coordinate their activities through the Canadian Continental Drilling Program (CCDP). CCDP is also sup-ported by INRS-ETE and has its co-ordination office at UQÀM jointly with CCOD, the coordination body for Canadian activities linked to IODP (http://www.iodpcanada.ca/). CCDP is presently chaired by Pierre Francus from INRS-ETE. Further information is available at http://www.icdp-canada.ca/.
New Scientific Drilling Infrastructure in Sweden
T w o years ago, the Swedish
geoscientific community established a national program for scientific drilling, the Swedish Deep Drilling Program (SDDP). SDDP was able to successfully promote Swedish mem-bership in ICDP. Furthermore, the Swedish Research Council decided to support an application for a drilling rig. The envisaged drilling platform will be capable of core drilling to at least 2500 m depth in different litholo-gies. The Department of Engineering Geology at Lund University will orga-nize the management of this infra-structure. The rig is intended primar-ily for use in SDDP drilling projects but will be rented out to other pro-
Scientific Drilling, No. 9, April 2010 67
United States Implementing OrganizationIntegrated Ocean Drilling Program
IODP•USIO

90º 120º 150º 180º 210º 240º 270º 300º 330º 0º 30º
-60º
-30º
0º
30º
60º
51
-60º
-30º
0º
30º
60º
90º 120º 150º 180º 210º 240º 270º 300º 330º 0º 30º
ICDP
IODP
1
6 5
67
4
23
4
23
ESO Operations * Platform Dates Port of Origin
325 - Great Barrier Reef Environmental Changes MSP 11 Feb.–late Mar. 2010 Townsville, QLD, Australia
327 - Juan de Fuca Hydrogeology JOIDES Resolution 05 Jul. – 04 Sep. 2010 Victoria, BC, Canada
328 - Cascadia CORK JOIDES Resolution 04 Sep. – 18 Sep. 2010 Victoria, BC, Canada
329 - South Pacific Gyre Microbiology JOIDES Resolution 08 Oct. – 12 Dec. 2010 Papeete, Tahiti
330 - Louisville Seamount Trail JOIDES Resolution 12 Dec. 2010 – 11 Feb. 2011 Auckland, New Zealand
JOIDES Resolution
326 - NanTroSEIZE Stage 2 Chikyu TBD TBD
ICDP - Project Schedule http://www.icdp-online.org/projects/
IODP - Expedition Schedule http://www.iodp.org/expeditions/
4
1
Schedules
2
3
5
USIO Operations ** Platform Dates Port of Origin
CDEX Operations *** Platform Dates Port of Origin
ICDP Projects Drilling Dates Location
1 Lake Van Jul. 2010–Sep. 2010 Anatolia, Turkey
Snake River Plain Jul. 2010–Sep. 2011 Idaho, U.S.A.
Songliao Basin Jul. 2010–Sep. 2011 NW China
Barberton Greenstone Belt Oct.–Nov. 2010 South Africa
Dead Sea Dec. 2010–Jan. 2011 Israel/Jordan
Campi Flegrei May–Aug. 2011 Italy
Lake Ohrid Jul.–Aug. 2011 Macedonia/Albania
123
65
4
7
6
MSP = Mission Specific Platform TBD = to be determined* Exact dates in this time frame dependent upon final platform tender.** Sailing dates may change slightly. Staffing updates for all expeditions to be issued soon.*** CDEX schedule subject to OTF and SAS approval.