The Cenomanian – Turonian of the Wunstorf section – (North Germany): global stratigraphic...
25
Newsletters on Stratigraphy © Gebrüder Borntraeger 2008 Vol. 43/1: 65–89, June 2008 The Cenomanian – Turonian of the Wunstorf section – (North Germany): global stratigraphic reference section and new orbital time scale for Oceanic Anoxic Event 2 Silke Voigt 1 , Jochen Erbacher 2 , Jörg Mutterlose 3 , Wolfgang Weiss 2 , Thomas Westerhold 4 , Frank Wiese 5 , Markus Wilmsen 6 , Thomas Wonik 7 With 11 figures and 1 table Abstract. The Cenomanian–Turonian Boundary Event (CTBE) is reflected by one of the most extreme car- bon cycle perturbations in Earth’s history and is characterized by the widespread occurrence of sediments in- dicating oxygen deficiency in oceanic waters (Oceanic Anoxic Event 2 = OAE 2). At Wunstorf (northern Ger- many) the CTBE is represented by a 26.5 m thick sedimentary succession consisting of rhythmically bedded laminated black shales, dark organic-rich marls and marly limestones yielding abundant micro- and macrofos- sils, making the locality particularly well suited to serve as an international standard reference section for the CTBE. In 2006 a newly drilled continuous core recovered 76 m of middle Cenomanian to middle Turonian sed- iments. A high-resolution carbonate d 13 C curve derived from core samples resolves all known features of the positive d 13 C anomaly of OAE 2 with high accuracy. Throughout the middle Cenomanian – middle Turonian succession, the d 13 C curve shows numerous small-scaled positive excursions, which appear to be cyclic. High- resolution borehole geophysics and XRF core scanning were performed to generate two time series of gamma- ray data and Ti concentrations for the CTBE black shale succession. Hierarchical bundling of sedimentary cy- cles as well as spectral analysis and Gaussian filtering of dominant frequencies reveal cycle frequency ratios characteristic for short eccentricity modulated precession (100 kyr, 21 kyr). This new orbital time scale pro- vides a time estimate of 430–445 kyr for the duration of OAE 2 and refines the existing orbital age models de- veloped at localities in the English Chalk, the Western Interior Basin and the Tarfaya Basin. Based on the new age model and high-resolution carbon isotope correlation, our data allow for the first time a precise basin-wide reconstruction of the palaeoceanographic modifications within the European shelf sea during OAE 2. Key words. Carbon isotope stratigraphy, OAE 2, CTBE, Cretaceous, orbital time scale DOI: 10.1127/0078-0421/2008/0043-0065 0078-0421/08/0043-0001 $ 6.25 © 2008 Gebrüder Borntraeger, D-14129 Berlin · D-70176 Stuttgart Authorsʼ addresses 1 Leibniz Institute of Marine Sciences (IFM-Geomar), Wischhofstraße 1–3, 24184 Kiel, Germany, E-Mail: svoigt@ifm- geomar.de 2 Federal Institute for Geosciences and Natural Resources (BGR), Stilleweg 2, 30655 Hannover, Germany, E-Mail: [email protected] 3 Institute of Geology, Mineralogy and Geophysics, Ruhr-University Bochum, Universitätsstraße 150, 44801 Bochum, Ger- many, E-Mail: [email protected] 4 Center for Marine Environmental Sciences (Marum), University of Bremen, Leobener Straße, 28359 Bremen, Germany, E-Mail: [email protected] 5 Institute of Palaeontology, FU Berlin, Malteser Straße 74–100, Haus D, 12249 Berlin, Germany, E-Mail: frwiese@sna- fu.de 6 GeoZentrum Nordbayern, Fachgruppe Paläoumwelt, FAU Erlangen-Nürnberg, Loewenichstraße 28, 91054 Erlangen, E-Mail: [email protected] 7 Leibniz Institute for Applied Geosciences, Stilleweg 2, 30655 Hannover, E-Mail: [email protected]
-
Upload
independent -
Category
Documents
-
view
1 -
download
0
Transcript of The Cenomanian – Turonian of the Wunstorf section – (North Germany): global stratigraphic...
Newsletters on Stratigraphy © Gebrüder Borntraeger 2008Vol. 43/1: 65–89, June 2008
The Cenomanian – Turonian of the Wunstorfsection – (North Germany): global stratigraphic reference section and new orbital time scale for Oceanic Anoxic Event 2
Silke Voigt1, Jochen Erbacher2, Jörg Mutterlose3, Wolfgang Weiss2,Thomas Westerhold4, Frank Wiese5, Markus Wilmsen6, Thomas Wonik7
With 11 figures and 1 table
Abstract. The Cenomanian–Turonian Boundary Event (CTBE) is reflected by one of the most extreme car-bon cycle perturbations in Earth’s history and is characterized by the widespread occurrence of sediments in-dicating oxygen deficiency in oceanic waters (Oceanic Anoxic Event 2 = OAE 2). At Wunstorf (northern Ger-many) the CTBE is represented by a 26.5 m thick sedimentary succession consisting of rhythmically beddedlaminated black shales, dark organic-rich marls and marly limestones yielding abundant micro- and macrofos-sils, making the locality particularly well suited to serve as an international standard reference section for theCTBE. In 2006 a newly drilled continuous core recovered 76 m of middle Cenomanian to middle Turonian sed-iments. A high-resolution carbonate d13C curve derived from core samples resolves all known features of thepositive d13C anomaly of OAE 2 with high accuracy. Throughout the middle Cenomanian – middle Turoniansuccession, the d13C curve shows numerous small-scaled positive excursions, which appear to be cyclic. High-resolution borehole geophysics and XRF core scanning were performed to generate two time series of gamma-ray data and Ti concentrations for the CTBE black shale succession. Hierarchical bundling of sedimentary cy-cles as well as spectral analysis and Gaussian filtering of dominant frequencies reveal cycle frequency ratioscharacteristic for short eccentricity modulated precession (100 kyr, 21 kyr). This new orbital time scale pro-vides a time estimate of 430–445 kyr for the duration of OAE 2 and refines the existing orbital age models de-veloped at localities in the English Chalk, the Western Interior Basin and the Tarfaya Basin. Based on the newage model and high-resolution carbon isotope correlation, our data allow for the first time a precise basin-widereconstruction of the palaeoceanographic modifications within the European shelf sea during OAE 2.
Key words. Carbon isotope stratigraphy, OAE 2, CTBE, Cretaceous, orbital time scale
DOI: 10.1127/0078-0421/2008/0043-0065 0078-0421/08/0043-0001 $ 6.25© 2008 Gebrüder Borntraeger, D-14129 Berlin · D-70176 Stuttgart
Authorsʼ addresses1 Leibniz Institute of Marine Sciences (IFM-Geomar), Wischhofstraße 1–3, 24184 Kiel, Germany, E-Mail: [email protected] Federal Institute for Geosciences and Natural Resources (BGR), Stilleweg 2, 30655 Hannover, Germany, E-Mail:[email protected] Institute of Geology, Mineralogy and Geophysics, Ruhr-University Bochum, Universitätsstraße 150, 44801 Bochum, Ger-many, E-Mail: [email protected] Center for Marine Environmental Sciences (Marum), University of Bremen, Leobener Straße, 28359 Bremen, Germany,E-Mail: [email protected] Institute of Palaeontology, FU Berlin, Malteser Straße 74–100, Haus D, 12249 Berlin, Germany, E-Mail: [email protected] GeoZentrum Nordbayern, Fachgruppe Paläoumwelt, FAU Erlangen-Nürnberg, Loewenichstraße 28, 91054 Erlangen, E-Mail: [email protected] Leibniz Institute for Applied Geosciences, Stilleweg 2, 30655 Hannover, E-Mail: [email protected]

1. Introduction
The Cenomanian – Turonian Boundary Event (CTBE)is reflected by one of the most extreme carbon cycleperturbations in Earth’s history. Increased rates of or-ganic carbon were buried in marine sediments at theheight of the mid-Cretaceous greenhouse. The CTBEis characterised globally by a major positive carbonisotope excursion (CIE) in carbonates and organic mat-ter (e. g. Arthur et al. 1985, Gale et al. 1993, Jenkyns etal. 1994, Tsikos et al. 2004, Sageman et al. 2006). It isaccompanied by a rapid and profound warming of sur-face and shallow waters (Huber et al. 1999, Voigt et al.2004, Forster et al. 2007), fast rising sea level (Uličnýet al. 1997, Voigt et al. 2006), as well as the widespreadoccurrence of sediments indicating oxygen deficiencyin the oceans (Oceanic Anoxic Event 2 = OAE 2;Schlanger and Jenkyns 1976, Arthur et al. 1990). Theoccurrence of oceanic anoxia was controlled by localpalaeoceanographic conditions and was either relatedto an extended oxygen minimum zone in the tropicaloceans (Kuypers et al. 2002, Friedrich et al. 2006) or toincreased water column stratification in epicontinentalintrashelf basins (Crumiére 1989, Johnson and Lott1993, van Buchem et al. 2002, Lüning et al. 2004). Ithas been shown that oxygen deficiency did not occurcontemporaneously, and a chemostratigraphic delimi-tation of OAE 2 with carbon isotopes is considered tobe a more reliable method of defining the stratigraphicextent of the event than the distribution of organic-richsediments (Tsikos et al. 2004).
The positive OAE 2 – CIE has a magnitude of 2–3‰ in the inorganic carbon reservoir and shows diag-nostic features which have been recognised in ex-panded sections such as the international stratotype ofthe base of the Turonian stage at Pueblo, Colorado orthe European reference section at Eastbourne (Pratt1985, Gale et al. 1993, Paul et al. 1999, Tsikos et al.2004, Jarvis et al. 2006, Sageman et al. 2006). Themost distinct features are 1) the onset of the excursion,2) a rise towards a first maximum (labelled “A” byPratt 1985, Gale et al. 1993), 3) a trough interval fol-lowed by a rise towards a second maximum (“B”), 4)a plateau of maximum d13C values, and 5) a less dis-tinctive third maximum (“C”). The identification, dat-ing and correlation of these small-scale carbon isotopefeatures at a high-resolution scale remain difficult, andoften only the onset (1) and the plateau (4) of the CIEcan be identified (Kuypers et al. 2002, Tsikos et al.,2004, Erbacher et al. 2005, Kuhnt et al. 2005). Hiatus-es, reduced rates of sedimentation, poor microfossil
preservation, and/or the absence of carbonate com-monly lead to insufficient stratigraphic control of OAE2.
The OAE 2 has been studied from a variety of shal-low-marine to deep-sea sections. A precise estimate ofits length is however limited because of stratigraphichiatuses and the lack of correlatable datum levels thatdefine the termination of the event (e. g. Gale et al.1993, Tsikos et al. 2004, Erbacher et al. 2005). Orbitaltime control has the potential to improve stratigraphicresolution which helps to monitor environmentalchanges during oceanic anoxic events. The recentlydeveloped astronomical timescale for the Cenoman-ian-Turonian Boundary stratotype section at Pueblosuggests a duration of 572–601 kyr for the OAE 2(Sageman et al. 2006). It differs however substantiallyfrom earlier cyclostratigraphic estimates which pro-vide durations of 197 to 400 kyr for the OAE 2 (Kuhntet al. 1997, 2005, Caron et al. 1999, Prokoph et al.2001). The considerable offset between these time es-timates is mainly caused by the different interpreta-tions of cycle lengths or problems in defining the ter-mination of OAE 2. One approach to overcome thesedifferences is the construction of orbital timescales atdifferent sites and in different depositional settings toprovide global high-resolution correlation of thisevent.
At Wunstorf (northern Germany), OAE 2 is repre-sented by a 26.5 m thick sedimentary succession con-sisting of laminated black shales, dark organic-richmarls and marly limestones. These TOC-rich beds al-low the geochemical analyses of both organic matterand carbonates. In addition, the Wunstorf quarry sec-tion yields abundant micro- and macrofossils. Thesetwo prerequisite make the Wunstorf section an idealcandidate to serve as an international standard for theOAE 2. In 2006 a newly drilled continuous core re-covered 76 m of middle Cenomanian to middle Turon-ian sediments. These consist of rhythmically beddedmarls and limestones in the lower part, marls, blackshales and limestones in the middle part, and nodularand marly limestones in the upper part (Erbacher et al.2007).
This study presents a new, biostratigraphically cali-brated, high-resolution carbon isotope curve for themiddle Cenomanian to middle Turonian of the Wun-storf core covering a period of 3.5 Myr. The OAE 2 –CIE is being correlated from mid-shelf environmentsdominated by pelagic carbonates, over an intrashelfbasin with locally occurring shelf-sea anoxia to silici-clastics offshore to lower shoreface sediments of the
66 Silke Voigt et al.
inner shelf. An orbital timescale for the OAE 2 inter-val has been generated based on the depositional cy-cles at Wunstorf and is compared with the astronomi-cal timescales developed elsewhere (Gale et al. 1999,Kuhnt et al. 2005, Sageman et al. 2006). Finally, theregional and global pattern of the OAE 2 d13C anom-aly will be discussed in order to evaluate the mecha-nisms for the formation of shelf-sea anoxia.
2. Material and Methods
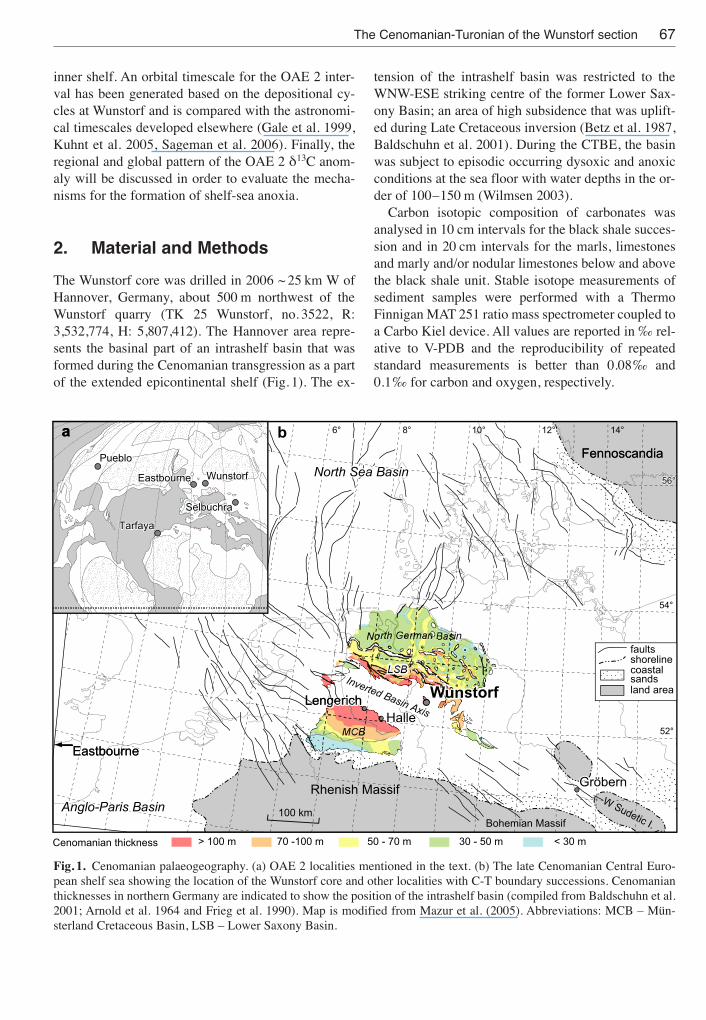
The Wunstorf core was drilled in 2006 ~ 25 km W ofHannover, Germany, about 500 m northwest of theWunstorf quarry (TK 25 Wunstorf, no. 3522, R:3,532,774, H: 5,807,412). The Hannover area repre-sents the basinal part of an intrashelf basin that wasformed during the Cenomanian transgression as a partof the extended epicontinental shelf (Fig. 1). The ex-
tension of the intrashelf basin was restricted to theWNW-ESE striking centre of the former Lower Sax-ony Basin; an area of high subsidence that was uplift-ed during Late Cretaceous inversion (Betz et al. 1987,Baldschuhn et al. 2001). During the CTBE, the basinwas subject to episodic occurring dysoxic and anoxicconditions at the sea floor with water depths in the or-der of 100–150 m (Wilmsen 2003).
Carbon isotopic composition of carbonates wasanalysed in 10 cm intervals for the black shale succes-sion and in 20 cm intervals for the marls, limestonesand marly and/or nodular limestones below and abovethe black shale unit. Stable isotope measurements ofsediment samples were performed with a ThermoFinnigan MAT 251 ratio mass spectrometer coupled toa Carbo Kiel device. All values are reported in ‰ rel-ative to V-PDB and the reproducibility of repeatedstandard measurements is better than 0.08‰ and0.1‰ for carbon and oxygen, respectively.
67The Cenomanian-Turonian of the Wunstorf section
10°
..
B..
Cenomanian thickness > 100 m 70 -100 m 50 - 70 m 30 - 50 m < 30 m
100 km
WunstorfWunstorfWunstorf
North German Basin
54°
6°4°2°0° 8° 10° 12° 14°
52°
56°56°
sixAnisaBdetrevnI
sixAnisaBdetrevnI
North Sea BasinNorth Sea Basin
b
MCB
LSBLSB
Rhenish Massif Rhenish MassifRhenish Massif
Bohemian Massif Bohemian Massif .IciteduSW
.IciteduSW
PuebloPueblo
aa
EastbourneEastbourne
TarfayaTarfaya
WunstorfWunstorf
SelbuchraSelbuchra
shorelinecoastalsandsland area
faults
HalleHalleLengerichLengerich
GröbernGröbernGröbern
EastbourneEastbourne
Anglo-Paris BasinAnglo-Paris BasinAnglo-Paris Basin
FennoscandiaFennoscandia
Fig. 1. Cenomanian palaeogeography. (a) OAE 2 localities mentioned in the text. (b) The late Cenomanian Central Euro-pean shelf sea showing the location of the Wunstorf core and other localities with C-T boundary successions. Cenomanianthicknesses in northern Germany are indicated to show the position of the intrashelf basin (compiled from Baldschuhn et al.2001; Arnold et al. 1964 and Frieg et al. 1990). Map is modified from Mazur et al. (2005). Abbreviations: MCB – Mün-sterland Cretaceous Basin, LSB – Lower Saxony Basin.

68 Silke Voigt et al.
Bad
deck
enst
edt
mFkcebrethcor
BmFlatlesse
HmF
edlhöS
nainamone
Celddi
Mnaina
moneCrepp
UnainoruTre
woLnainoruT
elddiM
inamhsuc
aropilatoR
sisnenrohneergaropilato
R-inamhsuc
aropilatoR
aecatercoeahcraallenietih
Wacitevleh
anacnurtobolgotevleH
ienworbsekuj.
Airegnareug).
P(sarecocyla
Ciidduj.
Nde
vone
nse
sareconitaW
sediosodonseti
mma
Miraglloo
wsarecinongillo
Cmunainilseg.
Mesnega
motohr.A
(C.w.)
(M.n.)
(W.)
C.g.
A.j.
Pycnodonte
Amphidonte Event
FC
Fischschiefer
Watinoceras Bed
Mytiloides Event
PlenusChondrites E.
Bed
MCEUOB
EventJukes-Browne Event
Amphidonte Bed Event
a2
b2
Monument Event
b1
a1
(m)5
10
15
20
25
30
35
40
45
50
55
60
65
70
75
80
2.0 3.0 4.0 5.0
A
B
C
D
Tu 1 (Holywell Event)
Tu 2 (c1)
Tu 3 (c2)
Tu 4
Tu 5 (Lulworth Event)
Tu 6 (d1)
T
Tu 8 (Round Down Event)
u 7 (d2)
δ 13C ‰ VPDB
EIC-
2E
AO
drocernoisrucxe-erp
drocernoisrucxe-tsop
.z .S
.z .S
.Z.Z
(M.g.)
Fig. 2. Carbon isotope stratigraphy and biozonation of the Wunstorf core succession. First occurrences of ammonites inbrackets are correlated from outcrop sections in Westfalen. For legend to lithologies see Fig. 3. Abbreviations: A. j. – Acan-thoceras jukesbrownei, C. g. – Calycoceras gu er angeri, M. g. – Metoicoceras geslinianum, W. – Watino ceras sp., M.n. –Mammites nodosoides, C. w. – Collignoniceras woollgari, MCE – Mid-Cenomanian Event of Ernst et al. (1983), UOB – Up-per Orbirhynchia band of Jeans (1980), FC – Facies Change.

Natural gamma ray activity was recorded with adownhole spectral gamma ray tool and depends on theconcentration of radioisotopes of potassium, uraniumand thorium in the formation. These isotopes occurnaturally in relatively high abundances in clay miner-als, making it possible to distinguish between sand andclay layers and to estimate the clay content. This isdone with a scintillation detector made from bismuth-germanium oxide. The vertical resolution of the gam-ma ray log depends on the length of the scintillationcrystal (25 cm) and the data sampling rate (10 cm).The lateral distance of detection (normally 15–20 cm)is influenced by the density of the rock. Ninety percentof the measured gamma-radiation is from this verti-cally and horizontally limited space.
The elemental composition of sediments from theblack shale succession of the Wunstorf core was meas-ured using the X-ray Fluorescence (XRF) Core Scan-ner II located at MARUM (Bremen University). XRFcore scanning allows a high-resolution, nearly contin-uous, non-destructive determination of major and mi-nor elements at the core surface. The data collectionwas performed every 2 cm over a 1 cm2 area using a30s count time. The record of XRF Ti concentrationsreflects relative changes in the amount of terrigeneoussupply and displays a high signal-to-noise ratio, whichmakes it useful for time series analysis. Ti is essential-ly not affected by biological and diagenetic processesin nearshore environments. The XRF Ti intensityrecord was used for spectral analysis to construct anorbital timescale for the Cenomanian-Turonian bound-ary interval.
3. Lithology
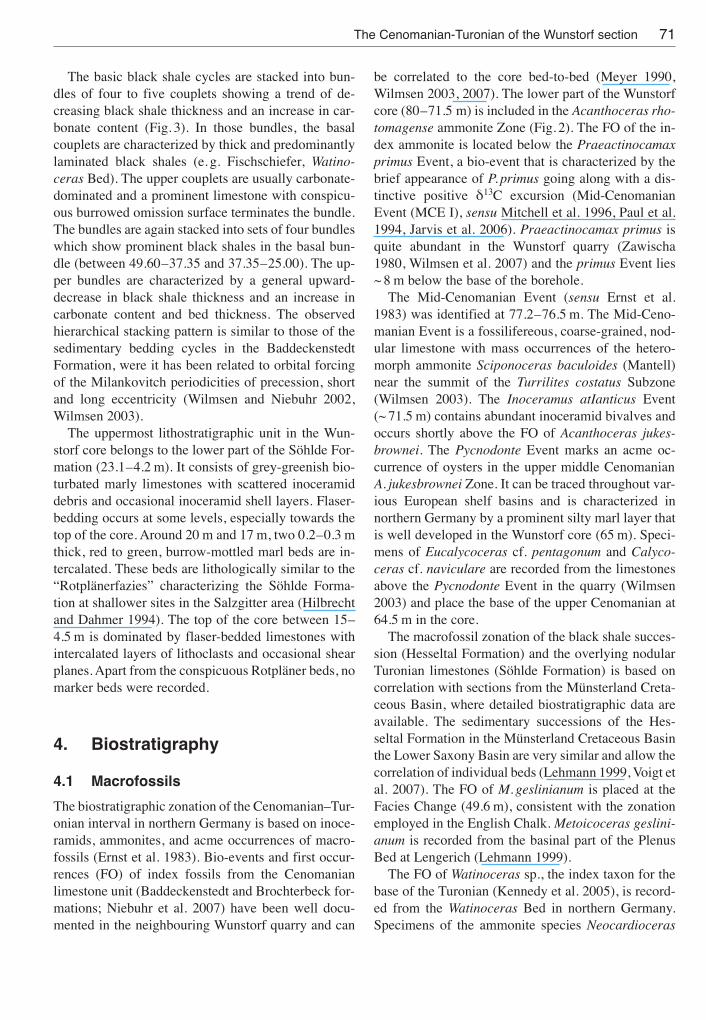
The Wunstorf core section consists of four lithostrati-graphic units which represent, from base to top, partsof the Baddeckenstedt Formation, the BrochterbeckFormation, the Hesseltal Formation and parts of theSöhlde Formation (Fig. 2). These lithostratigraphicunits (Niebuhr et al. 2007) can be easily assigned to thechronostratigraphic schemes using the well-estab-lished event stratigraphic framework of the lower Up-per Cretaceous (Ernst et al. 1983, 1996; Wiese et al.2004).
The Baddeckenstedt Formation (80–71.5 m) ischaracterized by fossiliferous and strongly bioturbatedmarl-limestone alternations stacked in distinct bed-ding couplets with well-developed marls. The coupletsare asymmetrical and become increasingly carbonate-
rich towards the top. In the core, only the upper part ofthe Baddeckenstedt Formation was penetrated. A con-spicuous marl bed with rhynchonellid brachiopods isoverlain by a strong limestone at 77.0 m. The marl cor-responds to the “Upper Orbirhynchia band” of Jeans(1980), while the limestone marks the Mid-Cenoman-ian Event of Ernst et al. (1983). According to correla-tions with the nearby quarry section, the interregionalmarker of the Praeactinocamax primus Event lies~ 8 m below the base of the borehole (Wilmsen 2007,Wilmsen et al. 2007).
The Brochterbeck Formation (71.5–49.6 m) is fullyexposed in the core and consists of 21.9 m of poorlydefined bedding couplets of white limestones andlight-grey marly limestones as well as of up to � 2 mthick units of flaser-bedded white limestones. Phacoidlayers and internal shear planes are common. Macro-fossils are scarce and bioturbation is less conspicuousin comparison to the Baddeckenstedt Formation. Awell-developed marl bed with abundant pycnodon-teine oysters around 65 m equates with the latest mid-dle Cenomanian Pycnodonte Event, while a thin marlbed at 61 m corresponds to the early late CenomanianAmphidonte Event (Ernst et al. 1983; Wilmsen andVoigt 2006). The Brochterbeck Formation is terminat-ed by the Facies Change (“Fazieswechsel” of Ernst etal. 1983), an interregional sequence boundary (SB CeV) approximating to the transition from the Calyco-ceras guerangeri to the Metoicoceras geslinianumZone (Robaszynski et al. 1998, Wilmsen 2003).
The Hesseltal Formation (49.6–23.1 m) comprise a26.5 m thick succession of alternating black shales,grey to green marls, marly limestones as well as light-grey limestones (Fig. 2). Other than in less expandedsections, where the Facies Change is represented by awell developed erosional surface (e. g. Hilbrecht andDahmer 1994), the facies turnover towards the Hes-seltal Formation is gradual and marked by a prominentdecrease in carbonate content. In the lower part of theHesseltal Formation, 20–30 cm of the core are sup-pressed by two small-scale normal faults, but this minor gap can easily be closed by the exposure in theWunstorf limestone quarry. The Hesseltal Formation ischaracterized by prominent black shale beds which oc-cur in three major packages (between 48.7–47.4 m,44.1–41.6 m and 37.3–35.0 m). The black shales are upto 2 m thick and are typical marker beds of the basinalblack shale facies (Hilbrecht and Dahmer 1994,Lehmann 1999). The lower black shale horizon com-prises an alternation of four black shale beds with in-tercalated light marly limestones and yields the basin-
69The Cenomanian-Turonian of the Wunstorf section
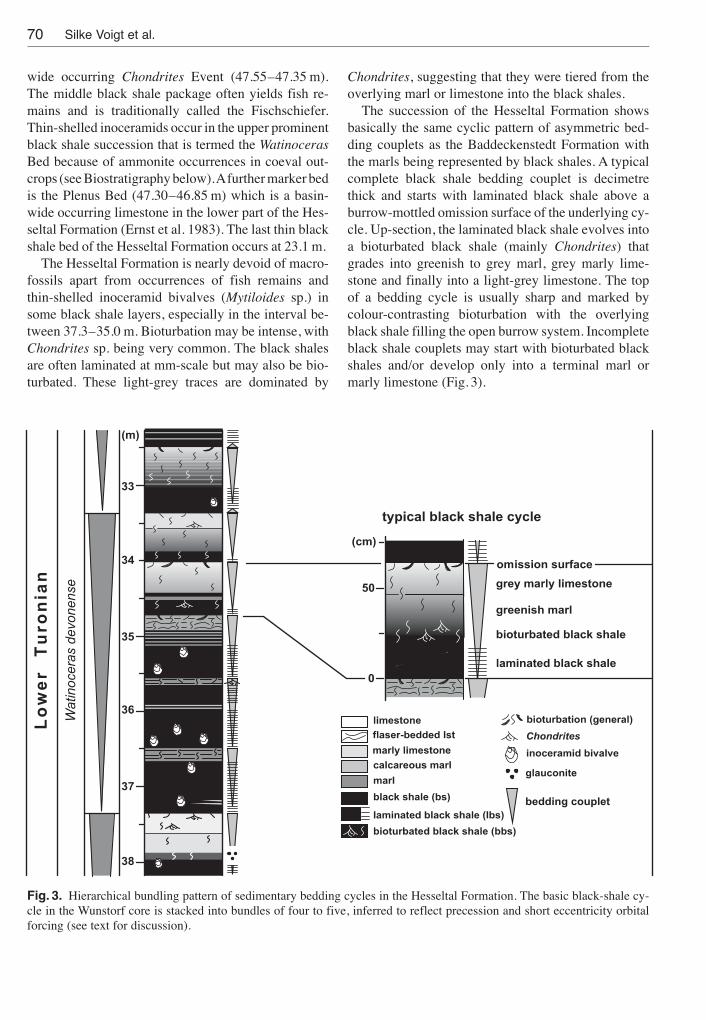
wide occurring Chondrites Event (47.55–47.35 m).The middle black shale package often yields fish re-mains and is traditionally called the Fischschiefer.Thin-shelled inoceramids occur in the upper prominentblack shale succession that is termed the WatinocerasBed because of ammonite occurrences in coeval out-crops (see Biostratigraphy below). A further marker bedis the Plenus Bed (47.30–46.85 m) which is a basin-wide occurring limestone in the lower part of the Hes-seltal Formation (Ernst et al. 1983). The last thin blackshale bed of the Hesseltal Formation occurs at 23.1 m.
The Hesseltal Formation is nearly devoid of macro-fossils apart from occurrences of fish remains andthin-shelled inoceramid bivalves (Mytiloides sp.) insome black shale layers, especially in the interval be-tween 37.3–35.0 m. Bioturbation may be intense, withChondrites sp. being very common. The black shalesare often laminated at mm-scale but may also be bio-turbated. These light-grey traces are dominated by
Chondrites, suggesting that they were tiered from theoverlying marl or limestone into the black shales.
The succession of the Hesseltal Formation showsbasically the same cyclic pattern of asymmetric bed-ding couplets as the Baddeckenstedt Formation withthe marls being represented by black shales. A typicalcomplete black shale bedding couplet is decimetrethick and starts with laminated black shale above aburrow-mottled omission surface of the underlying cy-cle. Up-section, the laminated black shale evolves intoa bioturbated black shale (mainly Chondrites) thatgrades into greenish to grey marl, grey marly lime-stone and finally into a light-grey limestone. The topof a bedding cycle is usually sharp and marked bycolour-contrasting bioturbation with the overlyingblack shale filling the open burrow system. Incompleteblack shale couplets may start with bioturbated blackshales and/or develop only into a terminal marl ormarly limestone (Fig. 3).
70 Silke Voigt et al.
bedding couplet
Wat
inoc
eras
dev
onen
se
Fig. 3. Hierarchical bundling pattern of sedimentary bedding cycles in the Hesseltal Formation. The basic black-shale cy-cle in the Wunstorf core is stacked into bundles of four to five, inferred to reflect precession and short eccentricity orbitalforcing (see text for discussion).
The basic black shale cycles are stacked into bun-dles of four to five couplets showing a trend of de-creasing black shale thickness and an increase in car-bonate content (Fig. 3). In those bundles, the basalcouplets are characterized by thick and predominantlylaminated black shales (e. g. Fischschiefer, Watin o -ceras Bed). The upper couplets are usually carbonate-dominated and a prominent limestone with conspicu-ous burrowed omission surface terminates the bundle.The bundles are again stacked into sets of four bundleswhich show prominent black shales in the basal bun-dle (between 49.60–37.35 and 37.35–25.00). The up-per bundles are characterized by a general upward-decrease in black shale thickness and an increase incarbonate content and bed thickness. The observed hierarchical stacking pattern is similar to those of thesedimentary bedding cycles in the BaddeckenstedtFormation, were it has been related to orbital forcingof the Milankovitch periodicities of precession, shortand long eccentricity (Wilmsen and Niebuhr 2002,Wilmsen 2003).
The uppermost lithostratigraphic unit in the Wun-storf core belongs to the lower part of the Söhlde For-mation (23.1–4.2 m). It consists of grey-greenish bio-turbated marly limestones with scattered inoceramiddebris and occasional inoceramid shell layers. Flaser-bedding occurs at some levels, especially towards thetop of the core. Around 20 m and 17 m, two 0.2–0.3 mthick, red to green, burrow-mottled marl beds are in-tercalated. These beds are lithologically similar to the“Rotplänerfazies” characterizing the Söhlde Forma-tion at shallower sites in the Salzgitter area (Hilbrechtand Dahmer 1994). The top of the core between 15–4.5 m is dominated by flaser-bedded limestones withintercalated layers of lithoclasts and occasional shearplanes. Apart from the conspicuous Rotpläner beds, nomarker beds were recorded.
4. Biostratigraphy
4.1 Macrofossils
The biostratigraphic zonation of the Cenomanian–Tur-onian interval in northern Germany is based on inoce-ramids, ammonites, and acme occurrences of macro-fossils (Ernst et al. 1983). Bio-events and first occur-rences (FO) of index fossils from the Cenomanianlimestone unit (Baddeckenstedt and Brochterbeck for-mations; Niebuhr et al. 2007) have been well docu-mented in the neighbouring Wunstorf quarry and can
be correlated to the core bed-to-bed (Meyer 1990,Wilmsen 2003, 2007). The lower part of the Wunstorfcore (80–71.5 m) is included in the Acanthoceras rho-tomagense ammonite Zone (Fig. 2). The FO of the in-dex ammonite is located below the Praeactinocamaxprimus Event, a bio-event that is characterized by thebrief appearance of P. primus going along with a dis-tinctive positive d13C excursion (Mid-CenomanianEvent (MCE I), sensu Mitchell et al. 1996, Paul et al.1994, Jarvis et al. 2006). Praeactinocamax primus isquite abundant in the Wunstorf quarry (Zawischa1980, Wilmsen et al. 2007) and the primus Event lies~ 8 m below the base of the borehole.
The Mid-Cenomanian Event (sensu Ernst et al.1983) was identified at 77.2–76.5 m. The Mid-Ceno-manian Event is a fossilifereous, coarse-grained, nod -ular limestone with mass occurrences of the hetero-morph ammonite Sciponoceras baculoides (Mantell)near the summit of the Turrilites costatus Subzone(Wilmsen 2003). The Inoceramus atIanticus Event(~ 71.5 m) contains abundant inoceramid bivalves andoccurs shortly above the FO of Acanthoceras jukes-brownei. The Pycnodonte Event marks an acme oc-currence of oysters in the upper middle CenomanianA. jukesbrownei Zone. It can be traced throughout var-ious European shelf basins and is characterized innorthern Germany by a prominent silty marl layer thatis well developed in the Wunstorf core (65 m). Speci-mens of Eucalycoceras cf. pentagonum and Calyco-ceras cf. naviculare are recorded from the limestonesabove the Pycnodonte Event in the quarry (Wilmsen2003) and place the base of the upper Cenomanian at64.5 m in the core.
The macrofossil zonation of the black shale succes-sion (Hesseltal Formation) and the overlying nodularTuronian limestones (Söhlde Formation) is based oncorrelation with sections from the Münsterland Creta-ceous Basin, where detailed biostratigraphic data areavailable. The sedimentary successions of the Hes-seltal Formation in the Münsterland Cretaceous Basinthe Lower Saxony Basin are very similar and allow thecorrelation of individual beds (Lehmann 1999, Voigt etal. 2007). The FO of M. geslinianum is placed at theFacies Change (49.6 m), consistent with the zonationemployed in the English Chalk. Metoicoceras geslini-anum is recorded from the basinal part of the PlenusBed at Lengerich (Lehmann 1999).
The FO of Watinoceras sp., the index taxon for thebase of the Turonian (Kennedy et al. 2005), is record-ed from the Watinoceras Bed in northern Germany.Specimens of the ammonite species Neocardioceras
71The Cenomanian-Turonian of the Wunstorf section

juddii were described from this bed at Lengerich andMisburg (Ernst et al. 1983, Ernst et al. 1984, Kaplan etal. 1998), and later assigned to the genus Watinocerasby Lehmann (1999). In the Wunstorf core, theWatinoceras Bed marks the upper end of the ‘plateau’phase of the OAE 2 – CIE. The Cenomanian–Turon-ian (C-T) Boundary is located 1 m beneath the top ofthe d13C plateau at Eastbourne, UK (Meads Marls 3–4, couplet E15; Gale et al. 2000) and above the d13Cplateau at the global stratotype Pueblo, Colorado (baseof Bed 86, Kennedy et al. 2005, Caron et al. 2005,Sageman et al. 2006). The FO of Watinoceras in north-ern Germany is in a similar position relative to carbonisotope stratigraphy, and the C-T Boundary at Wun-storf is placed at 37.5 �1 m.
The Mytiloides Event (Mytiloides Event 1 of Ernstet al. 1983, Mytiloides Event s. str. of Kaplan 1992)marks a first mass occurrence of the inoceramid bi-valves Mytiloides labiatus and M. mytiloides and ap-proximates the level of the FO of the lower Turonianammonite Mammites nodosoides (Lehmann 1999).The Mytiloides Event lies beneath the uppermost twoblack shales of the Hesseltal Formation and can be lo-cated in the Wunstorf core at 24 m.
The base of the Middle Turonian is defined by theFO of the ammonite Collignoniceras woollgari(Kennedy et al. 2005). The FO of C. woollgari isrecorded from Lengerich, and corresponds to a signif-icant negative event in the Turonian d13C record (Lul-worth Event of Jarvis et al. 2006, Tu5 of Voigt et al.2007). Based on carbon isotope correlation (see Car-bon isotope stratigraphy below), the base of the mid-dle Turonian is placed at 16 �1 m.
4.2 Planktonic foraminifera
The planktonic foraminiferal zonation of the Wunstorfcore is based on samples from the core and additionalsamples from the quarry (Weiss 1982 and unpublisheddata). The following zones of the classical planktonicforaminiferal zonation (Caron 1995) were recognized.The Rotalipora cushmani Zone is defined as the inter-val from the FO of R. cushmani to the last occurrence(LO) of rotaliporids at the base of the Plenus Bed(47.30 m). The FO of R. cushmani at the base of thecore (80 m) is within the A. rhotomagense ammonitezone (middle Cenomanian, lower part, Fig. 2). Basedon the FO of R. greenhornensis in the Wunstorf core,the R. cushmani Zone is subdivided in 2 subzones: theR. cushmani Subzone (80–69 m), defined by the FO ofR. cushmani to the FO of R. greenhornensis (69 m),
corresponds to the lower part of the R. cushmani Zoneof Caron (1995). The R. cushmani – R. greenhornensisSubzone, above, is defined as the interval where bothspecies occur together. The FO of R. greenhornensis at69 m core depth is slightly above the base of theA. jukesbrownei ammonite zone (middle Cenomanian,upper part). The R. cushmani – R. greenhornensis Sub-zone corresponds to the upper part of the R. cushmaniZone of Caron (1995).
The Whiteinella archaeocretacea Zone is defined asthe interval between the extinction level of rotaliporidsand the FO of Helvetoglobotruncana helvetica. Itranges from the base of the Plenus Bed at a core depthof 47.30 m up to 31.24 m. The base of the Helve-toglobotruncana helvetica Zone at 31.24 m was rec-ognized by several specimens. Higher up in section,H. helvetica is found sporadically. The FO of H. hel-vetica at Wunstorf lies 5–6 m below the MytiloidesEvent and the correlative level of the FO of M. no-dosoides in Westphalia, which is similar to its FO inthe Tethys, but distinctly predates its FO in other bo-real sucessions such as the Pueblo section (Caron et al.2005).
5. Carbon isotope stratigraphy
The long- and short-term trends of the Wunstorf car-bon isotope curve can be divided into three parts(Fig. 2); 1) the prominent OAE 2 – CIE (49.6–36 m),2) a pre-excursion d13C record in the Cenomanian(80–49.6 m) and 3) a post-excursion d13C record in theTuronian (36–5 m). The pre-excursion d13C recorddisplays rising values (2.4–2.9‰) in the middle Ceno-manian (80–65 m) and stable values (~ 3.1‰) in thelower upper Cenomanian succession (65–49.6 m) inits long-term trend with little variations on shortertime-scales. The d13C record of the OAE 2 – CIE liesbetween 49.6 and 36.0 m. The post-excursion d13Crecord shows a slight increase of values from 2.9‰ to3.5‰ in its long-term trend and distinct short-termvariability of higher magnitude.
5.1 Short-term variations in theCenomanian pre-OAE 2-d13C record
Detailed short-term features of the Cenomanian d13Crecord were first described from Speeton, Norfolk, UK(Mitchell et al. 1996). Recently, numerous carbon iso-tope events were defined from a Cenomanian-Santon-ian d13C reference curve of the English Chalk (Jarvis
72 Silke Voigt et al.
et al. 2006). The middle and upper Cenomanian eventsfrom the English Chalk are also evident in the Wun-storf d13C curve if related biostratigraphic informationis used (Figs. 2, 4). The positive excursions of theJukes-Browne and the Amphidonte Bed events of Jar -vis et al. (2006) occur in the lowermost upper Ceno-manian (64.5–63.3 m and 61.5–60.5 m) between thehorizons of abundant occurrences of oysters of thegenera Pycnodonte and Amphidonte. The Jukes-Browne Event, furthermore, marks the inflection in thelong-term d13C trend from rising to stable values. Twosubsidiary isotope events (a1, a2), which were sug-gested to occur between MCE I and the Jukes-BrowneEvent (Jarvis et al. 2006), can be identified in the Wun-storf d13C curve at equivalent stratigraphic levels(77.7–76.0 m and 69.4–65.5 m). The MonumentEvent (56–55.5 m) describes a weak negative inflec-tion within the C. guerangeri zone and is underlain bythe two positive subsidiary events b1 and b2 (58.5–59.5 m and 57.2–57.9 m). All of these features areweakly developed at Wunstorf and appear to be of lowsignificance. They occur however in the correct strati-graphic position in relation to the macrofossil bios-tratigraphy, can be correlated to the English Chalk ref-erence curve, and are resolved in a high temporal res-olution.
5.2 Short-term variations of the OAE 2 – CIE
The isotope stratigraphy of the OAE 2 – CIE and as-sociated biostratigraphy has been studied in various re-gions and different depositional settings. The mainfeatures of the OAE 2 – CIE in Europe can also beidentified at Wunstorf and include 1) an initial smallrise in d13C above the Facies Change terminated by asmall negative inflection 2) a major rise towards thefirst maximum (A), 3) a trough interval followed by arise towards a second maximum (B), 4) a ‘plateau’phase yielding an intermittent positive inflection (C)and 5) a final fourth maximum (D) (Figs. 2, 4, 5; Jarviset al. 2006; Voigt et al. 2007).
At Wunstorf, the main d13C increase of the OAE 2 –CIE commences above the thick black shale yieldingthe Chrondrites Event (47.8 m). The A-maximum oc-curs above the Plenusbank (46.4–46.9 m), and the Bmaximum lies beneath the Fischschiefer (43.5–44.0 m). The C peak is located below the massive lime-stone in the uppermost Cenomanian (39.0–39.6 m) andthe D-inflection lies in the lower Watinoceras Bed(36.2–37.1 m; Figs. 2, 5). Although all the positive ex-
cursions identified in the Wunstorf d13C record arecommon features of the OAE 2 – CIE, the overallshape of the d13C anomaly shows some peculiarities.The initial d13C rise above the Facies Change is inter-rupted by sudden large-scale negative excursions, andthe B maximum that usually shows the highest d13Cvalues is only weakly developed. The ‘plateau’ phaseis suppressed and appears as an intermittent negativeexcursion. All maxima form double spikes with neg-ative inflections in between. These negative devia-tions from the general pattern of the CIE are alwayslinked to marl and black shale lithologies. They simi-larly occur in other black-shale successions, e. g. inHalle and Lägerdorf in Westphalia (Lehmann 1999,Voigt et al. 2007) but were not recorded from shal-lower sites (Schlanger et al. 1987, Hilbrecht et al.1992, Lehmann 1999). It appears that the negatived13C deviations are locally restricted to the sedimen-tary facies and/or the oceanographic conditions with-in the intrashelf basin. Pronounced oxidation of or-ganic matter or increased stratification within the intrashelf basin likely resulted in the increased liber-ation of isotopic light carbon.
The D-maximum is not considered as a part of theOAE 2 – CIE in many studies, because it often lies onthe declining part of the d13C curve in carbonates. Acomparison of d13C curves from carbonates and or-ganic matter in Westphalia (Germany) has shown theD-maximum to be a part of the d13C anomaly inrecords derived from organic matter (Voigt et al.2007). Different shapes of the decline of the OAE 2 –CIE documented from sections worldwide (Tsikos etal. 2004) illustrate that it was influenced by local fac-tors which makes the certain identification of the finald13C maximum difficult. The distinctive small-scaledpositive features observed at Wunstorf can be used forthe correlation of different shelf settings in Europe (seebelow), but they probably cannot be identified inoceanic areas, where the development of an extendedoxygen-minimum zone provided different localboundary conditions.
5.3 Short-term variations in the Turonianpost-OAE 2 d13C record
Jarvis et al. (2006) recognised three significant carbonisotope events (Holywell, Lulworth and Round Downevents) in the Lower and lowest Middle Turonian ofthe English Chalk. This chemostratigraphic frame-work was refined by the identification of additionalcarbon isotope events (Tu1 to Tu8) in the Münsterland
73The Cenomanian-Turonian of the Wunstorf section

74 Silke Voigt et al.
Halle - Oerlinghausen English Chalk Wunstorf
Jukes-Browne Event
Amphidonte Bed Event
OAE 2 - CIE
a2
b2
Monument Event Monument Event
b1
a1
esnegamotohr.
A.bj.
Airegnareug.
C.g.
Mud
dii
j.N
W. d
evon
ense
.sodon.M
iraglloow.
C nainoruT elddi
M nainoruT re
woL naina
moneC elddi
M
m10
0
A
Holywell Event
Lulworth EventLulworth Event
d2
d1
c2
c1
B
CD
Tu 1
Tu 2
Tu 3Tu 4Tu 5Tu 5Tu 6
Tu 7Tu 8
δ13C ‰ VPDB2 3 4 5
δ13C ‰ VPDB2 3 4 5
δ13C ‰ VPDB
2 3 4 5
Fig. 4. Correlation of middle Cenomanian to middle Turonian carbon isotope stratigraphies between the North German basinal successions at Wunstorf (this study) and Halle/ Oerlinghausen (Voigt et al. 2007) and the English Chalk referencecurve of Jarvis et al. (2006).

Cretaceous Basin and their correlation to high-resolu-tion d13C curves in the Umbria-Marche Basin, Italy(Voigt et al. 2007). Each of these small-scale excur-sions is also evident in the d13C curve from the Wun-storf core (Figs. 2, 4).
The Holywell Event (= Tu1) is a distinct 0.5‰ pos-itive excursion associated to a prominent black shale–limestone couplet in the W. coloradoense Zone be-neath the FO of H. helvetica (31.4–32.4 m). Tu2 is another 0.5‰ positive excursion that occurs in theshell-detrital limestones of the Mytiloides Event (24.5–26.0 m). It is underlain and overlain by the last pairs ofblack shales of the black shale succession. Tu3 andTu4 are positive inflections at 21.0–22.4 m and 18.5–19.5 m in the M. nodosoides Zone. Together with Tu2,they form three cycles of similar thickness and magni-tude.
The Lulworth Event (= Tu5) is defined as an inflec-tion in the long-term trend from falling to rising d13Cvalues and occurs close to the Lulworth Marl in Eng-land (Jarvis et al. 2006). The long-term d13C trend dif-fers in the Wunstorf d13C record, were such an inflec-
tion cannot be recognised. Here, Tu5 (17.0 m) appearsas a last short-termed negative inflection below therise towards the positive excursion above (Tu6, 14.9–15.6 m). Tu5 is associated with a distinct reddish marlwith abundant lithoclasts. Tu6 and Tu7 (11.5–12.5 m)are small positive excursions in grey marly bioturbat-ed limestones with higher maximum d13C values thenthe isotope events beneath. Above Tu7 the overall sed-iment colour changes from grey to reddish indicatingcondensation and a shallower depositional setting.
6. Orbital age model
In the moment it is impossible to directly anchor geo-logical data to current orbital solutions beyond~ 42 Ma due to the chaotic diffusion in the solar sys-tem (Laskar et al. 2004). However, orbital cycles canbe identified even in Cretaceous sedimentary succes-sions by their diagnostic characteristics i. e. the ratiobetween cycle periodicities. Especially the long(405 kyr) orbital eccentricity is thought to have re-
75The Cenomanian-Turonian of the Wunstorf section
Holywell Event
A
FC
A
B
B C
C
D
D
3.0 4.0 5.0
2.0 3.0 4.0 5.0
δ13C ‰ VPDB
δ13C ‰ VPDBδ13C ‰ VPDB
Halle
Eastbourne
Wunstorf
Tu1
Gröbern
2.0 3.0 4.0 5.0
δ13C ‰ VPDB
δ13Corg ‰ VPDB
-26.0 -25.0 -24.0 -23.0
3.0 4.0 5.05 m
CT
CT
CT
EIC-
2E
AO
Fig. 5. Correlation of the OAE 2 – CIE along a shelf transect from the siliciclastic inner shelf (Gröbern; Voigt et al. 2006)over the black-shale dominated intra-shelf basin (Wunstorf and Halle; Voigt et al. 2007) to the open pelagic mid-shelf suc-cession at Eastbourne (Paul et al. 1999). All successions are plotted against the same depth scale.
76 Silke Voigt et al.
10 100
-2 0 2
Gamma ray (gAPI)naina
moneC
elddiM
nainamone
CreppU
nainoruTrewoL
nainoruTelddi
Mesnega
motohr.A
ienworbsekuj.
Airegnareug).
P(srecocyla
C.nainilseg.
Miidduj.
Nde
vone
nse
sareconitaW
sediosodonseti
mma
Miraglloo
wsarecinongillo
C
(C. w.)
(M. n.)
(W.)
(M. g.)
C. g.
A. j.
(m)5
10
15
20
25
30
35
40
45
50
55
60
65
70
75
80
Gamma(detrended, normalized)
Filter output
2
3
4
5
6
7
8
9
1
log Ti Area normalized, detrended
-4 0 4
-2 0Filter output
2
1
2
3
44
5
6
7
8
9
81
A
B
C
D
Tu1
Tu2
-2 0 2
1
2
3log Ti Area (19.9 - 46.6 m)
Bwrewo
P
P
0 0.4 0.8Cycles/m
rewo
P
1.2 1.6 2.00
1
2
3
4
5 E1
O
P
E2
E1
Gamma (5.0 - 78.4 m)
Bw
92.1
aM
egA
)4002ST
G(
92.7
93.55
94.2
94.8
95.1
EIC-
2E
AO
13
45
910
1114
158116
1718
2122
2326
2730
3132
3435
3841
4243
2
a
b
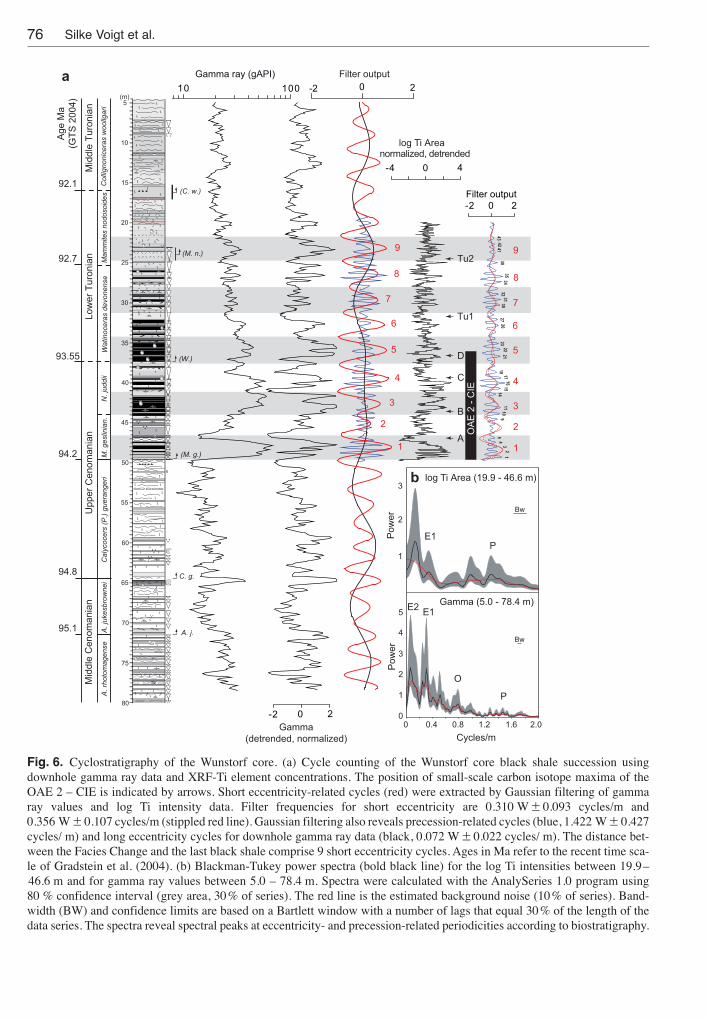
Fig. 6. Cyclostratigraphy of the Wunstorf core. (a) Cycle counting of the Wunstorf core black shale succession usingdownhole gamma ray data and XRF-Ti ele ment concentrations. The position of small-scale carbon isotope maxima of theOAE 2 – CIE is indicated by arrows. Short eccentricity-related cycles (red) were extracted by Gaussian filtering of gammaray values and log Ti intensity data. Filter frequencies for short eccentricity are 0.310 W � 0.093 cycles/m and0.356 W � 0.107 cycles/m (stippled red line). Gaussian filtering also reveals precession-related cycles (blue, 1.422 W � 0.427cycles/ m) and long eccentricity cycles for downhole gamma ray data (black, 0.072 W � 0.022 cycles/ m). The distance bet-ween the Facies Change and the last black shale comprise 9 short eccentricity cycles. Ages in Ma refer to the recent time sca-le of Gradstein et al. (2004). (b) Blackman-Tukey power spectra (bold black line) for the log Ti intensities between 19.9–46.6 m and for gamma ray values between 5.0 – 78.4 m. Spectra were calculated with the AnalySeries 1.0 program using80 % confidence interval (grey area, 30% of series). The red line is the estimated background noise (10% of series). Band-width (BW) and confidence limits are based on a Bartlett window with a number of lags that equal 30% of the length of thedata series. The spectra reveal spectral peaks at eccentricity- and precession-related periodicities according to biostratigraphy.

mained very stable over several hundreds of millionsof years (Laskar et al. 2004) and has been observed innumerous studies in the geological record (e. g. Gale etal. 1999, Hillgärtner and Strasser 2003, Westerhold etal. 2007, 2008). Evidence for hierarchical bundling ofsedimentary cycles indicates the common presence ofthe low and high frequencies of precession as well asshort and long eccentricity (Fig. 3).
6.1 Spectral Analysis
The cored interval of the Wunstorf core comprisesabout 3.5 Myr according to the identified ammonitezones and their age on the GTS2004 timescale (Grad-stein et al. 2004). The downhole gamma ray data aswell as the XRF Ti concentrations exhibit a distinctcyclicity that shows a high correlation in the blackshale unit (cycles 1–9, Fig. 6a). Both parameters canbe attributed to varying contents of clay minerals, andthus reflecting changes in the relative amount of ter-rigenous supply or carbonate production. The XRF Tiintensity record is of higher resolution and shows a superimposed high-frequency cyclicity that is alsoweakly resolved by the downhole gamma ray record.
In order to investigate a possible orbital forcing ofthe observed cyclicity, time-series analysis was per-formed on both records following the method of Wee-don (2003). The calculation of evolutionary spectra inthe depth domain enables the identification of domi-nant cycle periods and possible changes in the sedi-mentation rate. Wavelet analysis of downhole gammaray data shows a distinct cyclicity in the black shaleunit between 20 m and 50 m with a stable frequencyband at ~ 3.3 m/cycle (Fig. 7a). Cyclicity with stablefrequency bands are less well developed in the under-and overlying limestone units and possibly indicatechanges in the sedimentation rate. In addition, thehigh-resolution XRF Ti record displays cyclicity at0.6–0.7 m/cycle with a 3.0–3.5 m spacing of highspectral power (Fig. 7b).
A raw estimation of sedimentation rates in theCenomanian and Turonian limestone units can be per-formed based on the duration of ammonite zones ac-cording to the GTS2004 (1.6–2.3 cm/kyr). Using thesevalues as a starting point, the expected thickness ofpossible precession cycles would be in the order of30–40 cm. To be sure to identify true signals which arenot affected by aliasing (Priestly 1981), a minimum of4–5 points per oscillation is desired representing asample density of � 0.06 m at Wunstorf (Weedon2003). This criterion is not fulfilled by the downhole
gamma ray data, wherefore the intervals with datapoints from the Cenomanian and Turonian limestoneunits were not interpreted for their dominant frequen-cies.
Spectral analyses were performed on downholegamma ray data (black shale interval and the completeborehole for higher frequency resolution) and XRF-Ticoncentrations (black shale unit only) of the Wunstorfcore in order to identify dominant cycle lengths. Thethickness of the studied black shale unit is not suffi-cient to identify the frequency of long eccentricity.Therefore, we aimed for the detection of dominant fre-quencies which can be related to the signals of preces-sion and their modulation by short eccentricity. Priorto the algorithm, the downhole gamma ray record wasdetrended by subtraction of long-term variations de-tected by locally weighted least squares regression.The data set was evenly sampled every 10 cm by lin-ear interpolation. The XRF Ti concentration recordwas plotted on a logarithmic scale to achieve variancestabilization and evenly spaced sampled each 2 cm.Blackman-Tukey power spectra were calculated forboth records with the AnalySeries program (Paillard etal. 1996) using a 80% confidence interval.
The downhole gamma ray record (whole borehole)shows dominant cycles at 13.9, 3.2–3.3, 1.26 and0.68 m/cycle (Fig. 6b). These cycle lengths do not dif-fer significant from those identified in the black shaleunit (3.29, 1.29 and 0.68 m/cycle) indicating that thespectral signal in the whole core is dominated by thecyclicity in the black shale unit. The observed fre-quency ratio of 1:4.2–4.3:20.4 is close to the 1:4:20frequency ratio diagnostic for the long (405 kyr) andshort eccentricity (100 kyr) and the mean precession(21 kyr) cycle (Herbert et al. 1995). In addition, the1.26 m cycle provides some indication for the presenceof an obliquity signal in the record. The dominant cy-cles in the log Ti concentration record occur at cyclelengths of 7.58, 3.0–2.81, 1.0 and 0.78–0.70 m. Thesecycle lengths differ somewhat in comparison to thegamma ray data, however the 0.78–0.70 m and the3.0–2.81 m cycles are close to the signals of preces-sion and short eccentricity. These discrepancies in thelength of dominant cycles may arise from small offsetsbetween the depth scales used for borehole geophysicsand the measured core.
The cycle length of the precession signal (0.6–0.7 m) is higher than it was assumed by the raw esti-mation based on the duration of ammonite zones ac-cording to the GTS2004. This observation can only beexplained by a significant increase of the sedimenta-
77The Cenomanian-Turonian of the Wunstorf section

78 Silke Voigt et al.
−2−10123dezila
mronaer
AiT
Depth (m)
)elcyc/m(
doireP
20 25 30 35 40 45
0.06250.1250.250.51248
high
low
rewoplartceps
b
−2−10123
a no
rmal
ized
mma
G
Depth (m)
)elcyc/m(
doireP
10 20 30 40 50 60 70
0.250.5
1
2
4
8
16
32
high
low
rewoplartceps
a
0.70-0.78 m cycle0.70-0.78 m cycle0.70-0.78 m cycle
3.3 m cycle3.3 m cycle3.3 m cycle
3.3 m cycle3.3 m cycle3.3 m cycle
Fig. 7. Evolutionary wavelet power spectra for (a) Gamma and (b) Ti intensity data from the Wunstorf Core in the depthdomain. The shaded contours in the evolutionary wavelet power spectra are normalized linear variances with blue repre-senting low spectral power, and red representing high spectral power. The black contour lines enclose regions of greater than95% confidence. Cross-hatched regions on either end indicate the cone of influence where edge effects become important.Note the distinct bands that run across the spectra which indicate the dominance of Milankovitch related periods.

tion rate within the black shale unit which is in the or-der of factor 2.
6.2 Cyclostratigraphy
The dominant cycle frequencies of precession andshort eccentricity were used for Gaussian band-passfiltering in order to construct a cyclostratigraphy forthe black shale unit of the Wunstorf core (Fig. 6a). TheFacies Change (base of M. geslinianum Zone, onset ofOAE 2 – CIE) was used as a starting point for cyclecounting. The carbon isotope event Tu2 (~ base ofM. nodosoides Zone), proven to be at least a European-wide stratigraphic marker horizon (Voigt et al. 2007),was chosen as upper limit. Both records the downholegamma ray data and the XRF-Ti intensities, showeight short eccentricity cycles within this interval. 36precession cycles were counted from the filter outputof gamma ray data and 38 precession cycles were de-tected from XRF-Ti intensities. The discrepancy is de-rived from two suppressed cycles in the lower resolu-tion gamma ray record at the end of the 4th and 6th shorteccentricity cycle. Each short eccentricity cycle com-prises 4.5 to 4.75 precession-related cycles. Further-more, both precession-related filters reveal a pattern ofamplitude modulation that confirm the bundling ofblack shale – limestone couplets, and is especially ev-ident for the short eccentricity cycles 1, and 3–8(Figs. 6a, 7b). This observation provides further evi-dence that the dominant cycle frequencies are relatedto the orbital signals of precession and short eccentric-ity.
According to the metronomic approach of Herbertet al. (1995), the duration of each cycle is equal to themean period of the orbital parameter that forced its for-mation. A short eccentricity cycle has a mean period of~ 100 kyr, whilst 21 kyr is a good estimate for themean of modern precession cycle counts (see also Hin-nov et al. 2007). The mean periods of obliquity andprecession are considered to diminish back throughtime due to tidal dissipation (Berger et al. 1992, Laskar1999, Hinnov 2000), and the estimated mean length ofprecession cycles in the Late Cretaceous is about20.5 kyr (Berger et al. 1992). Notwithstanding, weused the modern precessional cycle length of 21 kyr todevelop an orbital age model because this value agreesbetter with our observed cycle frequency ratio and theestimated duration based on eccentricity cycle counts.According to the precession-related cycle count for theWunstorf core, the black shale unit represents 756–798 kyr of time (Facies Change to Tu2; 49.6–25.0 m).
This time estimate would be lowered by 18–19 kyr ifa mean precession cycle duration of 20.5 kyr is as-sumed.
6.3 What was the duration of OAE 2?
Estimations of the duration of OAE 2 depend on thedefinition of its onset and termination. The comparisonof different European OAE 2 – CIEs (Fig. 5) has clear-ly shown that the shape of the d13C anomaly as well asthe presence and magnitude of small positive d13Cevents can substantially differ among basinal succes-sions in relation to their prevailing lithology and de-positional setting. The OAE 2 – CIE commenced withthe initial small increase (above the Facies Change inwestern Europe), and its termination is defined withthe last d13C-plateau maximum close to the C-Tboundary (Tsikos et al. 2004). However, the precisedefinition of this last maximum is not unequivocal andvaries among different depositional settings in de-pendence of completeness, state of preservation of or-ganic matter and carbonate as well as the resolution ofthe d13C excursion. Using the D-maximum as upperlimit, as was done for the Eastbourne section (Tsikoset al. 2004, Jarvis et al. 2006), the equivalent OAE 2-interval at Wunstorf encompass 4.3 short eccentricityor 21.2 precession cycles. The corresponding time es-timate would be 430–445 kyr.
6.4 Justification of the orbital age model
The robustness of the orbital cycle interpretation can beevaluated by comparing the sedimentation rate estimat-ed from inferred orbital cycles with those determined us-ing independent techniques such as biostratigraphy.Three different age models can be used for comparison(Fig. 8), the recent geological timescale GTS 2004(Gradstein et al. 2004) and two independently devel-oped orbital time scales which are both tied to ammonitezonations (Gale et al. 1999; Sageman et al. 2006).
One of the orbital timescales is based on precession-controlled bedding cycle counts in middle to upperCenomanian shelf sections in Europe (Gale 1995, Galeet al. 1999). Spectral analysis of long time series ofgrey scale reflectance data in conjunction with cross-correlation of two distant sections (Folkestone, UKand Selbuchra, Crimea, Ukraine) reveals distinct mod-ulation of precession-related cyclicity by the frequen-cy of short eccentricity and allows the detection ofmissing cycles associated to sequence boundaries(Gale et al. 1999). Accordingly, the A. rhotomagense,A. jukesbrownei, C. guerangeri, M. geslinianum and
79The Cenomanian-Turonian of the Wunstorf section

N. juddii ammonite zones comprise 44, 17, 37, 12, and6 precession cycles, respectively. Altogether they en-compass a time span of 2.44 Myr. The counting of bed-ding cycles in the English Chalk is extended into thelower Turonian (37 precession cycles) covering a timespan of 0.78 Myr (Gale 1996). This orbital time scaleis calibrated against FO ages of index ammonites.
The second astronomical time scale covers the C-TBoundary interval and is based on multi-taper evolu-tionary harmonic spectral analysis (EHA) of opticaldensitometry data (grey values) in the Portland core,Colorado, Western Interior Basin (Meyers et al. 2001,Meyers and Sageman 2004). Here, the identified dom-inant cycle frequency was assigned to the 95 kyr sig-nal of short eccentricity and frequency variations ofthis signal in the depth domain were interpreted to ac-count for changes in sediment accumulation rates. Theorbital age model of the Portland core was calibrated
against FO ages of ammonites and 40Ar/39Ar ages ofbentonites from the Pueblo section, the global GSSPfor the C-T Boundary, and time spans for the length ofthe individual ammonite zones were provided (Sage-man et al. 2006).
In order to compare these age models with the or-bital cycle interpretation at Wunstorf, the C-T Bound-ary age of 93.55 Ma (GTS2004) is used as a tie point(Fig. 8). The duration of ammonite zones for each agemodel (in kyr) is plotted versus their depth in the Wun-storf core. One additional depth-age data point is in-cluded in the orbital age model of Wunstorf at the lev-el of isotope event Tu5 below the FO of C. woollgari.Voigt et al. (2007) found the Tu2 and Tu5, carbon iso-tope events (approximating to the length of the M. no-dosoides Zone) to be one 405 kyr long eccentricity cy-cle apart. We have added this time span to the intervalbetween 24.7 m and 17.0 m.
80 Silke Voigt et al.
Age model Wunstorf96
95
94
93
92
0 10 20 30 40 50 60 70 80 90 100
Depth (m)
)aM(
Age
GTS 2004
Sageman et al. 2006Gale 1996, Gale et al. 1999Orbital age modelFO C. w.
FO M. n.
FO W. c.
FO M. g.
FO C. g.
FO A. jb.
FO A. r.
tiepointC-T Boundary at 93.55 Ma
OAE 2 - CIE
Fig. 8. Comparison of different age models for the Wunstorf core. FO ages of index ammonites according to the GTS 2004and two orbital age models (Gale et al. 1999, Sageman et al. 2006) are plotted versus their FO depth at Wunstorf. The ageof the C-T Boundary is fixed to 93.55 Ma (Gradstein et al. 2004). The orbital age model of this study is based on short ec-centricity cycle counts from the Gaussian filter (red line) and fixed to the Facies Change (equals base of M. geslinianumZone). The Wunstorf core age model agrees well with the Gale et al. (1999) age model and with the model by Sageman etal. (2006) for the Turonian part. It differs from the GTS 2004 by assuming an increased sedimentation rate in the black shalesuccession.

Using the GTS2004 ages, the calculated sedimenta-tion rates decline from 2.3–2.5 cm/kyr in the Ceno-manian limestone unit, to 1.8 cm/kyr in the blackshales, and to 1.4–1.5 cm/kyr in the Turonian lime-stones. This pattern is not confirmed by the orbital agemodels, which all demonstrate a rise of sedimentationrate in the black shale unit (Fig. 8). According to agemodel of Gale et al. (1999) the sedimentation rate was1.9–2.0 cm/kyr in the jukesbrownei and guerangerizones and increased to 3.2 cm/kyr in the geslinianumand juddii zones. The Sageman et al. (2006) age mod-el shows somewhat lower rates (2.2–2.3 cm/kyr) in thelatest Cenomanian but similar high values (3.4 cm/kyr) in the earliest Turonian.
Using our orbital cycle interpretation, the sedimen-tation rate in the black shale succession was 2.5–3.5 cm/kyr. The good agreement of this value with theindependently developed orbital age models for cen-tral Colorado and the UK justifies the assignment ofdominant cycle lengths at Wunstorf to the orbital fre-quencies of precession and short eccentricity.
7. Comparison of orbital age models for different C-T boundary successions
7.1 Wunstorf – Eastbourne
Accuracy of orbital age models depends on the preci-sion of identification and correlation of distinct strati-graphic features among distant sections (base of bio-zones, carbon isotope events). The orbital age modelsfor Wunstorf and the English Chalk (Gale et al. 1999)show a high degree of consistency with respect to car-bon isotope stratigraphy in the late Cenomanian(Fig. 9). Both models count 21 precession-controlledbedding cycles from the Facies Change to the D-Max-imum of the OAE 2 – CIE, and all other carbon isotopeevents (A, B, and C) occur at similar positions, with amaximum error of one precession cycle (Fig. 9). Inter-estingly, the first record of the ammonite genusWatinoceras occurs 2.5 precessional cycles earlier inEastbourne then at Wunstorf, resulting in an apparenttemporal offset of the C-T Boundary of about 50 kyr.
7.2 Wunstorf – central Colorado
The orbital age model for the Portland core is not basedon orbital cycle counts. In order to compare the Wun-storf age model with Colorado, we generated age-scaled
plots of carbon isotope stratigraphies of both localitiesusing the corresponding age models. The organic d13Crecord of the Portland core was smoothed with a 2 pointmoving average. The d13C curve from the interval� 1 m from the base of Bed 63 is of low resolution andno data are available from limestone Bed 63. This partof the d13C curve was therefore substituted by d13C datameasured on organic matter at the railway outcrop sec-tion, Pueblo (Gale et al. 2005). The new Pueblo/Portlandcomposite curve shows a better resolved signal of theOAE 2 – CIE (Fig. 10). The age-scaled d13C records ofWunstorf and Colorado were fitted by using the com-mencement of the CIE as a tie point. This feature isprominent in all OAE–2 carbon isotope excursions andis therefore least likely to be influenced by local effectsrelated to the depositional setting.
The relative length of both orbital age modelsagrees well in the early Turonian (Fig. 10). The timespan between the FO ages of W. coloradoense andC. woollgari encompass 785 kyr in Colorado and808 kyr in northern Germany, and thus differ by lessthen two precession cycles. The base of the M. no-dosoides Zone occurs also at similar horizons in bothsuccessions. The resulting duration of the W. colora-doense to V. birchbyi zones in Colorado and the W. col-oradoense Zone in northern Germany is 362 kyr and386 kyr, respectively. However, a larger discrepancyexists in the late Cenomanian affecting also the esti-mated length of the OAE 2 – CIE.
81The Cenomanian-Turonian of the Wunstorf section
1
E19E20
E10E11E12E13E14E15E16E17E18
E1E2E3
E4
E5
E6E7E8E9
No. of precession cycles Wunstorf
Eastbourne
No.
of p
rece
ssio
n cy
cles
3 5 7 9 11 13 15 17 19 21
1
3
5
7
9
11
13
15
17
19
21
AA
BB
CC
DD
DDCCBBAAFCFCFC
C-T BdyC-T BdyC-T BdyC
-T B
dyC
-TB
dyC
-T B
dy
Fig. 9. Cross-plot of the precession cycle counts for thesuccessions at Wunstorf and Eastbourne. The positions ofdistinct features of the OAE 2 – CIE (see text) and the C-TBoundary are shown relative to the number of precession cy-cles.

The best correlation of the OAE 2 – CIE at Wunstorfand Colorado can be achieved if the longer OAE 2 def-inition at Wunstorf (Facies Change to D) is used,which is also confirmed by the similar relative positionof the FO of Watinoceras. In Colorado, the OAE 2 –CIE starts 50 cm beneath Bed 63 and ends at the baseof Bed 86 (C-T Boundary). The corresponding timespan is 516–554 kyr long (Sageman et al. 2006). Thistime estimate is about 100–150 kyr longer then the es-timated duration of the equivalent horizon (~ 403 kyr)at Wunstorf (Fig. 10).
There are several possibilities to explain this differ-ence:
(1) Some strata are missing at Wunstorf betweenthe B and D isotope maxima, comprising at least oneshort eccentricity cycle. However, the hierarchicalbundling of bedding couplets as well as the increasedsedimentation rate argues against a hiatus at this level.In addition, the precise correlation of the CIE to East-bourne suggests that a complete succession is devel-oped at Wunstorf (Fig. 9).
(2) The termination of the compared time intervalsis not identical and the FO age of Watinoceras is di-
achronous. The carbon isotope curves are difficult tocompare between the two sections because the end ofthe plateau phase and the D maximum are not unam-biguously constrained in Colorado. According to ourcorrelation to Eastbourne there is some potential for atemporal offset in the FO age of Watinoceras. How -ever, the temporal discrepancy between Wunstorf andColorado would increase by another 50 kyr if the ear-lier FO age at Eastbourne is correlated to Wunstorf.
(3) The assigned orbital frequency to the dominantcycle length is overestimated between Beds 79 and 86in central Colorado. Meyers et al. (2001) observed ashift towards lower frequencies in the EHA time-fre-quency plot for this interval (between 3–5 m in theirFig. 7). In addition, the diagnostic frequency ratios ofeccentricity, obliquity and precession disappear at thislevel and allow an alternative assignment of orbitalfrequencies. A reinterpretation of the dominant cyclefrequency (1.1–1.2 cycle/m) as obliquity cycle wouldaccount for a ~ 100 kyr shorter period of time andcould explain the discrepancy between both age mod-els. This new interpretation involves an increase in thesedimentation rate between beds 78 and 86 by a factor
82 Silke Voigt et al.
Fig. 10. Comparison of d13C stratigraphies of the Wunstorf core, North Germany (this study) and the Pueblo/Portland com-posite section, central Colorado (Gale et al. 2005, Sageman et al. 2006) plotted versus their corresponding astronomical timescales. The x-axis shows relative ages with the onset of the CIE (– 40 kyr) used as tie point for both time series. Light greybars mark the positions of small-scale carbon isotope events at Wunstorf. Open circles indicate the part of the d13C curvefrom the Pueblo section. Numbers refer to the bed numbers of Cobban and Scott (1972). Lines with arrows mark the basesof ammonite zones in both basins. Note the temporal discrepancy in the duration of the N. juddii Zone, while the other am-monite zones encompass similar time spans.

of two which is in good agreement with the increasedaccumulation of detrital clays in the interval.
7.3 Wunstorf-Tarfaya
Another cyclostratigraphic analysis of the C-T bound-ary interval exists for the Tarfaya Basin, Moroccobased on sedimentary cycles resolved by density logs(Kuhnt et al. 1997, 2005). The OAE 2 – CIE is record-ed in organic matter at several sites and biostrati-graphically dated by planktonic foraminifera and cal-careous nannoplankton (Tsikos et al. 2004, Kolonic etal. 2005). The bedding cycles reflect changes in thecontent of organic matter and pelagic carbonate andare assigned to the frequency of obliquity. Kuhnt et al.(2005) counted 11 obliquity cycles for the OAE 2 –CIE with a total duration of 440 kyr. However, the def-inition of the CIE is different from that used in thisstudy. Using the definition of Tsikos et al. (2004) theCIE would comprise only 4.5–5 obliquity cycles (bed-ding cycles –2 to +3 of Kuhnt et al. 2005). The corre-sponding time span of 176–197 kyr is distinctly short-er then the estimates from Eastbourne, Colorado andWunstorf. The cross-plot of the main features of theCIE recorded from three sites (S13, S57, and S75) withthose from the Wunstorf core shows that the numberof obliquity cycles in the Tarfaya Basin coincides withthe number of short eccentricity cycles in northernGermany (Fig. 11). The length of the CIE encompass-es ~ 4.5 cycles in both areas and the error in the posi-tion of intermittent carbon isotope events (A, B, and Cpeaks) is lower then 0.5 cycles. Based on the goodagreement of the Wunstorf age model with those fromthe UK and central Colorado, we therefore suggest thatthe sedimentary cycles in the Tarfaya Basin related tothe OAE 2 – CIE were probably forced by the signalof short eccentricity and not obliquity as previouslyproposed.
In summary, we can state that the basic deposition-al cycles (the black shale – limestone bedding cou-plets) at Wunstorf are dominated by short eccentricitymodulated precession cycles. The OAE 2 – CIE oc-curred within the same number of precession cycles atWunstorf and Eastbourne, which is a good justificationof our orbital age model. There is also a good agree-ment of the Wunstorf age model with the astronomicaltimescale developed in central Colorado. Discrepan-cies in the late Cenomanian can be minimized if thedominant cycle length in the N. juddii zone in Col-orado is assigned to the frequency of obliquity. A sim-ilar number of sedimentary cycles encompass the OAE
2 – CIE in the Tarfaya Basin and at Wunstorf. Both cy-clostratigraphies propose an orbital trigger mechanismclosely related to short eccentricity.
8. High-resolution correlation of palaeoceanographic eventsduring the CTBE
During the Cenomanian, a variety of sedimentary suc-cessions were deposited in subsiding areas of the Eu-ropean shelf sea. The sections at Eastbourne (Sussex),Wunstorf (Lower Saxony), Halle (Westphalia) andGröbern (Saxony) represent different shelf settingsreaching from the calcareous mid-shelf and the in-trashelf basin to the siliciclastic inner shelf, respec-tively (Fig. 1). Each of them exposes an extended sed-imentary record of OAE 2 that is resolved by high-res-olution d13C curves (Paul et al. 1999, Tsikos et al.2004, Voigt et al. 2006, 2007). The detailed correlationof the OAE 2 – CIE with the Wunstorf d13C curve isin addition supported by litho- and biostratigraphicdata. The carbon isotope maxima A to D and the peak
83The Cenomanian-Turonian of the Wunstorf section
1
-2
-1
0
+1
+2
+3
No. of eccentricity cycles Wunstorf
Tarfaya
‘obl
iqut
iy’ c
ycle
sfo.o
N
2 3 4 5
1
2
3
4
5
6
AA
BB
CC
DD
DDCCBBAA
C-T BdyC-T Bdy
ydB
T-C
ydB
T-C
S75S57S13
Fig. 11. Cross-plot of the distinct features of the OAE 2 –CIE and the C-T Boundary against the number of eccentric-ity cycles at Wunstorf (this study) and supposed obliquitycycles in the Tarfaya Basin, Morocco (Kuhnt et al. 1997,2005). The features of the CIE in Morocco are derived fromthe boreholes S75, S57, and S13 (Kolonic et al. 2005). Theirrelative position varies slightly within the individual cycles(grey shaded area).

Tu1 can be identified in all sections, which allow a pre-cise correlation of the different depositional settings(Fig. 5) and in combination with the orbital age modelthe comparison of thicknesses and sedimentation rates.Whilst the sedimentation was dominated by pelagiccarbonates and marls at Eastbourne and in addition byrepeated occurring black shales at Halle and Wunstorf,the Gröbern core is dominated by calcareous silici-clastics representing an expanded relatively nearshoresuccession. The correlation of the Gröbern core withcoastal sections provide an estimate of the magnitudeof eustatic sea level change associated to OAE 2 (Voigtet al. 2006).
The Facies Change is a marked feature of mid-shelfand intrashelf basinal environments. It is related to aeustatic sea-level fall that resulted in the shelf-wide re-duction of pelagic carbonate production and the re-es-tablishment of a shelf-break frontal system. The col-lapse of the shelf-break front which separates openoceanic waters from coastal waters today was sug-gested to cause the spread of pelagic carbonates inCretaceous marginal seas (Hay 1995, Gale et al. 2000,Wilmsen 2003). Shelf-sea sediments representing theinitial phase of OAE 2 are lowstand deposits (Robas -zynski et al. 1998). The basinal progradation of detri-tal clays and marls is indicated by increased sedimen-tation rates in the successions at Gröbern, Eastbourne,and Wunstorf (Table 1). This pattern is not observedfor the Halle section, which was situated at the slopeof the intrashelf basin in shallower depths. Within thisinterval, nutrients were released by lowland erosionsupporting an increased productivity and the deposi-tion of the first black shales at Wunstorf.
The subsequent occurring eustatic sea-level rise hasa magnitude of ~ 25 m and is associated to the fastd13C rise towards the A maximum and the interval be-tween isotope events A and B (Voigt et al. 2006). The
newly generated accommodation space supported theaccumulation of more clay-rich sediments in basinalstructures with closer distance to the shores such asGröbern and Eastbourne. The sedimentary thickness isreduced in the more distant intrashelf basin and thesedimentation rate decreased because the main depo-sitional centre was shifted towards nearshore settings.
The A-B interval also represents the period when thespread of the boreal belemnite Praeactinocamax ple nusoccurred, interpreted to represent a brief cooling phase(Gale and Christensen 1996) and the climate responseto the reduction of atmospheric CO2 by enhanced se-questration of organic carbon (Voigt et al. 2006). A briefperiod of intensified sea-floor oxygenation and inter-mittent surface-water cooling is also documented fromthe tropical proto-North Atlantic Ocean indicating thisphase to have been of ocean wide significance (Fried -rich et al. 2006; Forster et al. 2007). At Wunstorf, the A-B interval corresponds to the only short eccentricitycycle that is free of black shales. The green marls de-veloped at Wunstorf grade into reddish marls at theshallower site at Halle, which is in general typical forshallower and well-ventilated parts of the shelf in north-ern Germany (Hilbrecht and Dahmer 1994). In combi-nation with the data from the tropical proto-North Atlantic Ocean, more vigorous ventilation and surfacewater cooling occurred in the open ocean and its mar-ginal seas, suggesting a brief period of intensified cir-culation during the maximum rate of transgression.
The rate of sea-level rise decreased during theplateau phase of the CIE (B – C maxima) and almostequal sedimentation rates prevailed in all basinal suc-cessions (~ 3 cm/kyr). At Gröbern and Eastbourne, thisrate represents a shift towards lower values indicatinga starved sedimentation system, as is typical for max-imum flooding zones in basinal settings (e. g. Emeryand Myers 1997). The subsequent initial progradation
84 Silke Voigt et al.
Table 1 Sedimentation rates of basinal successions during OAE 2.
Interval Sedimentation rate (cm/kyr)
Gröbern Eastbourne Wunstorf Halle/Westfalenmarginal
inner shelf mid shelf intrashelf basin intrashelf basin
C. guerangeri Zone 2.2 2.7 1.9 2.3Facies change to d13C event A 4.6 4.5 2.9 2d13C events A to B 9.5 4.9 2.6 2d13C events B to C 3 3.2 3 2.2d13C events C to D 3.8 3.4 2.1 1.7
of highstand sediments (Interval C–D) is indicated bya tendency towards higher sedimentation rates on theinner shelf and, depending on the rate of basin subsi-dence, the progressive loss of accommodation space inmid-shelf environments.
While sedimentation at Gröbern was still dominat-ed by siliciclastics in the latest Cenomanian, the depo-sition of nodular chalks at Eastbourne demonstratesthe re-establishment of pelagic carbonate productionin mid-shelf environments. The transition from marlsto pure coccolith chalks occurred everywhere in theAnglo-Paris Basin and has been related to the disap-pearance of shelf-break fronts (Gale et al. 2000). Co-eval to the spread of coccolith-dominated chalks,anoxic conditions became established in the intrashelfbasin with the deposition of the Fischschiefer (B max-imum of the CIE). The Fischschiefer is the strati-graphic equivalent of the Black Band in northern Eng-land and the North Sea, where it especially prevailedin basinal structures such as the Central Graben (John-son and Lott 1993; Surlyk et al. 2003).
In general, it can be stated that the deposition ofblack shales during OAE 2 in European shelf seas isspatially limited to basinal settings. This localized dis-tribution suggests that restricted conditions may haveprevailed in intrashelf basins and caused the formationof a stratified water column with stagnant and oxygen-poor bottom waters. On the other hand, black shaledeposition was also triggered by precession and itsmodulation by short eccentricity, suggesting forcingby climate change that influenced primary productivi-ty. Pronounced black shale deposition (e. g. Fisch -schiefer) was initiated when no or only weak shelf-break fronts were developed, allowing for the spreadof oceanic mixed surface waters. This occurred duringtimes of maximum flooding corresponding to theplateau phase of the OAE 2 – CIE. Cyclic black shaledeposition during OAE 2 is also recorded from thenorthern proto-North Atlantic Ocean, where dark clay-stones alternate with green clays (Kuypers et al. 2004).Here, the black shales are interpreted to reflect a pro-ductivity-related increase of the organic particle fluxthat cannot be mineralized by deep ocean circulation,causing oxygen deficiency in the water column thatreach up into the photic zone. The spread of such fer-tile oceanic surface waters from the proto-North At-lantic into marginal shelf seas, as proposed by Jarvis etal. (1988), in combination with a stratified water col-umn in the deeper parts of the shelf-sea basins mayhave formed a favourable boundary condition for thedeposition of black shales.
9. Conclusions
The Wunstorf core recovers a unique sedimentaryrecord of middle Cenomanian to middle Turonian sed-iments with a thick CTBE succession of hierarchicalbundled black shale – limestone bedding couplets.Their deposition in a subsiding intrashelf basin result-ed in an extended and complete sedimentary record ofOAE 2. A new high-resolution carbon isotope stratig-raphy of the Wunstorf core resolves detailed Ceno-manian-Turonian carbon cycle variations in relation tothe macro- and microfossil zonation and confirms thelarge potential of carbon isotope stratigraphy for high-resolution long-range correlation (Gale et al. 1993,Jenkyns et al. 1994, Jarvis et al. 2006, Voigt et al.2007). The positive d13C anomaly of OAE 2 can becorrelated with high accuracy across the Europeanshelf sea and among different depositional settings.
Our detailed cyclostratigraphic analysis of theCTBE black shale succession at Wunstorf allows thedevelopment of a new orbital time scale for latestCenomanian to early Turonian time. Results of spec-tral analysis show the black shale-limestone beddingcycles to be climatically induced by short eccentricitymodulated precession. For the first time it is possibleto identify the common presence of the low- and highfrequencies of precession and short eccentricity bytheir diagnostic cycle periodicity ratio in one sectionthrough the entire OAE 2 interval.
A comparison of the orbital age model at Wunstorfwith astronomically forced stratigraphies at East-bourne, Pueblo and the Tarfaya Basin provides an op-portunity to improve earlier developed astronomicaltimescales for OAE 2. The correlation of cyclostrati-graphies in different depositional settings reduces theerror of wrong assignment of orbital frequencies to thedominant sedimentary cycles inherent in the interpre-tation of single sections because of changes in the sed-imentation rate. As result of our correlation, we con-sider the new estimate of 430–445 kyr for the durationof OAE 2 as the most reliable value to date.
The combined usage of high-resolution carbon iso-tope stratigraphy, biostratigraphy and the new astro-nomical time scale allows the regional considerationof sedimentary processes in relation to eustasy and cir-culation changes in the proto-North Atlantic Ocean.The sedimentary response to OAE 2 in shelf-sea envi-ronments was strongly triggered by orbital forcing.Two prominent oceanographic events are related toshort eccentricity cycles. A period of intensified circu-lation and shelf-sea cooling (short eccentricity cycle 2)
85The Cenomanian-Turonian of the Wunstorf section

corresponds to the maximum rate of transgression andenhanced ventilation of the deep proto-North AtlanticOcean (Kuypers et al. 2004, Friedrich et al. 2006),whereas widespread basinal black shale deposition(i. e. Fischschiefer, short eccentricity cycle 3) corre-sponds to high sea level and the spread of partly anox-ic oceanic surface waters. The close relationship be-tween eustatic sea-level change and the signal of shorteccentricity confirms the suggestion of orbital forcingas a driving mechanism for eustasy in periods ofgreenhouse climate conditions (Gale et al. 2002, Hill-gärtner and Strasser 2003).
Acknowledgements: This work was funded by researchgrants of the Deutsche Forschungsgemeinschaft (Er 226/4,Vo 687/7, Ro 1113/4 MU 667/32-1). The insightful reviewsby O. Friedrich and I. Jarvis are highly acknowledged.
10. References
Arnold, H., 1964. Fazies und Mächtigkeit der Kreidestufenim Münsterländer Oberkreidegebiet. Fortschritte in derGeologie von Rheinland und Westfalen 7, 599–609.
Arthur, M. A., Dean, W. E., Schlanger, S. O., 1985. Variationsin the global carbon cycle during the Cretaceous related toclimate, volcanism, and changes in atmospheric CO2. In:Sundquist, E. T. S., Broecker, W. S. (Eds.), The carbon cy-cle and atmospheric CO2: Natural variations Archaen toPresent. Geophysical Monographs 32, p. 504–529.
Arthur, M. A., Jenkyns, H. C., Brumsack, H.-J., Schlanger,S. O., 1990. Stratigraphy, geochemistry, and paleoceano -graphy of organic carbon-rich Cretaceous sequences. In:Ginsburg, R. N., Beaudoin, B. (Eds.), Cretaceous Re-sources, Events and Rhythms. Kluwer Academic Publish-ers, Dordrecht, p. 75–119.
Baldschuhn, R., Binot, F., Fleig, S., Kockel, F., 2001. Geo -tektonischer Atlas von Nordwest-Deutschland und demdeutschen Nordsee-Sektor – Strukturen, Strukturent wick -lung, Paläogeographie. Geologisches Jahrbuch Reihe A,Band A 153, Schweizerbart, Stuttgart, 88 p.
Berger, A., Loutre, M. F., Laskar, J., 1992. Stability of the astronomical frequencies over the Earth’s history for pa-leoclimate studies. Science 255, 560–566.
Betz, D., Führer, F., Greiner, G., Plein, E., 1987. Evolutionof the Lower Saxony Basin. Tectonophysics 13, 127–170.
Caron, M., Dall’Agnolo, S., Accarie, H., Barrera, E., Kauff-man, E. G., Amédro, F., Robaszynski, F., 2006. High-res-olution stratigraphy of the Cenomanian-Turonian bound-ary interval at Pueblo (USA) and wadi Bahloul (Tunisia):stable isotope and bio-event correlation. Géobios 39,171–200.
Caron, M. F., Robaszynski, F., Amédro, F., Baudin, F., De-coninck, J. F., Hochuli, P., von Salis-Perch Nielsen, K.,Tribovillard, N., 1999. Estimation de la dureé de l’événe-
ment anoxique global au passage Cénomanien/Turonien.Approche cyclostratigraphique dans la formation Bahloulen Tunisie centrale. Bulletin de la Société géologique deFrance 170, 145–160.
Cobban, W. A., Scott, G. R., 1972. Stratigraphy and am-monite fauna of the Graneros Shale and Greenhorn Lime-stone near Pueblo, Colorado. U. S. Geological Survey,Professional Paper 645, 108 p.
Crumiére, J.-P., 1989. Crise anoxique à la limit Ceno-manien-Turonien dans le bassin subalpin oriental (sud-estde la France). Relation avec l’eustatisme. Géobios, Mé-moire spécial no. 11, 189–203.
Emery, D., Myers, K. J., 1997. Sequence Stratigraphy.Blackwell Science, Oxford, 297 p.
Erbacher, J., Friedrich, O., Wilson, P. A., Birch, H., Mutter-lose, J., 2005. Stable organic carbon isotope stratigraphyacross Oceanic Anoxic Event 2 of Demerara Rise, west-ern tropical Atlantic. Geochemistry Geophysics Geosys-tems 6, Q06010, doi:10.1029/2004GC000850.
Erbacher, J., Mutterlose, J., Wilmsen, M., Wonik, T., Wun-storf Drilling Scientific Party, 2007. The WunstorfDrilling Project: Coring a global stratigraphic referencesection of the Oceanic Anoxic Event 2. Scientific Drilling4, 19–21, doi:10.2204/Iodp.sd. 4. 05.2007.
Ernst, G., Niebuhr, B., Wiese, F., Wilmsen, M., 1996. Faciesdevelopment, basin dynamics, event correlation and sed-imentary cycles in the Upper Cretaceous of selected areasof Germany and Spain. Göttinger Arbeiten zur Geologieund Paläontologie Sb3, 87–100.
Ernst, G., Schmid, F., Seibertz, E., Wood, C. J., 1983. Event-Stratigraphie im Cenoman und Turon NW-Deutschlands.Zitteliana 10, 531–554.
Ernst, G., Wood, C. J., Hilbrecht, H., 1984. The Cenoman-ian-Turonian boundary problem in NW-Germany withcomments on the north-south correlation to the Regens-burg area. Bulletin of the Geological Society of Denmark33, 103–113.
Forster, A., Schouten, S., Moriya, K., Wilson, P. A., Sin-ninghe Damsté, J. S., 2007. Tropical warming and inter-mittent cooling during the Cenomanian/Turonian ocean-ic anoxic event 2: Sea surface temperature records fromthe equatorial Atlantic. Paleoceanography 22, PA 1219,doi:10.1029/2006PA001349.
Friedrich, O., Erbacher, J., Mutterlose, J., 2006. Paleoenvi-ronmental changes across the Cenomanian/TuronianBoundary Event (Oceanic Anoxic Event 2) as indicatedby benthic foraminifera from the Demerara Rise (ODPLeg 207). Revue de Micropaléontologie 49, 121–139.
Frieg, C., Hiss, M., Kaever, M., 1990. Alb und Cenoman imzentralen und südlichen Münsterland (NW Deutsch-land) – Stratigraphie, Fazies, Paläogeographie. NeuesJahrbuch für Geologie und Paläontologie, Abhandlungen181, 325–363.
Gale, A. S., 1996. Turonian correlation and sequence stratig-raphy of the Chalk in southern England. In: Hesselbo,S. P., Parkinson, D. N. (Eds.), Sequence Stratigraphy inBritish Geology. Geological Society Special PublicationNo. 103, p. 177–195.
86 Silke Voigt et al.

Gale, A. S., 1995. Cyclostratigraphy and correlation of theCenomanian stage in western Europe. In: House, M. R.,Gale, A. S. (Eds.), Orbital Forcing Timescales and Cy-clostratigraphy. Geological Society Special Publications85, p. 177–197.
Gale, A. S., Christensen, W. K., 1996. Occurrence of thebelemnite Actinocamax plenus in the Cenomanian of SEFrance and its significance. Bulletin of the Geological So-ciety of Denmark 43, 68–77.
Gale, A. S., Jenkyns, H. C., Kennedy, W. J., Corfield, R. M.,1993. Chemostratigraphy versus biostratigraphy: Datafrom around the Cenomanian-Turonian boundary. Jour-nal of the Geological Society 150, 29–32.
Gale, A. S., Kennedy, W. J., Voigt, S., Walaszczyk, I., 2005.Stratigraphy of the Late Cenomanian-Early TuronianChalk succession at Eastbourne, Sussex, UK: ammonites,inoceramid bivalves and stable carbon isotopes. Creta-ceous Research 26, 460–487.
Gale, A. S., Smith, A. B., Monks, N. E. A., Young, J. A.,Howard, A., Wray, D. S., Huggett, J. M., 2000. Marinebiodiversity through the Late Cenomanian-Early Turon-ian: palaeoceanographic controls and sequence strati-graphic biases. Journal of the Geological Society 157,745–757.
Gale, A. S., Young, J. R., Shackleton, N. J., Crowthurst, S. J.,Wray, D. S., 1999. Orbital tuning of Cenomanian marlychalk successions: towards a Milankovitch time-scale forthe Late Cretaceous. Philosophical Transactions RoyalSociety London, A 357, 1815–1829.
Gradstein, F., Ogg, J., Smith, A., 2004. A Geologic TimeScale. Cambridge University Press, Cambridge, 589 p.
Hardenbol, J., Thierry, J., Farley, M. B., Jaquin, T., Gracian-sky, P.-C., Vail, P., 1998. Mesozoic and Cenozoic se-quence chronostratigraphic framework of Europeanbasins. In: Graciansky, P.-C., Hardenbol, J., Jacquin, T.,Vail, P. (Eds.), Mesozoic and Cenozic sequence stratigra-phy of European basins. SEPM Special PublicationNo. 60, SEPM, p. 3–13.
Hay, W. W., 1995. A comparison of modern and Cretaceouspaleoceanography. Geologica Carpathica 46, 257–266.
Herbert, T. D., Premoli-Silva, I., Erba, E., Fischer, A. G.,1995. Orbital chronology of Cretaceous-Paleocene ma-rine sediments. In: Berggren, W.A. (Ed.), Geochronolo-gy, Time Scales and Global Stratigraphic Correlation.Special Publication SEPM Sedimentary Geology 54,p. 81–93.
Hilbrecht, H., Dahmer, D.-D., 1994. Sediment dynamicsduring the Cenomanian-Turonian (Cretaceous) OceanicAnoxic Event in northwestern Germany. Facies 30, 63–84.
Hilbrecht, H., Hubberten, H.-W., Oberhänsli, H., 1992. Bio-geography of planctonic foraminifera and regional car-bon isotope variation: productivity and water masses inLate Cretaceous Europe. Palaeogeography, Palaeoclima-tology, Palaeoecology 92, 407–421.
Hillgärtner, H., Strasser, A., 2003. Quantification of high-frequency sea-level fluctuations in the shallow-water car-bonates: an example from the Berriasian-Valanginian
(French Jura). Palaeogeography, Palaeoclimatology,Palaeoecology 200, 43–63.
Hinnov, L. A., 2000. New perspectives on orbitally-forcedstratigraphy. Annual Reviews of Earth and Planetary Sci-ences 28, 419–475.
Hinnov, L. A., Ogg, J. G., 2007. Cyclostratigraphy and theastronomical time scale. Stratigraphy 4, 239–251.
Huber, B. T., Leckie, R. M., Norris, R. D., Brawlower, T. J.,CoBabe, E., 1999. Foraminiferal assemblage and stableisotopic change across the Cenomanian-Turonian bound-ary in the subtropical North Atlantic. Journal of Fo ra -miniferal Research 29, 392–417.
Jarvis, I., Carson, G. A., Cooper, M. K. E., Hart, M. B.,Leary, P. N., Tocher, B. A., Horne, D., Rosenfeld, A.,1988. Microfossil Assemblages and the Cenomanian-Turonian (late Cretaceous) Oceanic Anoxic Event. Creta-ceous Research 9, 3–103.
Jarvis, I., Gale, A. S., Jenkyns, H. C., Pearce, M., 2006. Secularvariations in Late Cretaceous carbon isotopes: a new d13Ccarbonate reference curve for the Cenomanian-Campanian(99.6–70.6 Ma). Geological Magazine 143, 561–608.
Jeans, C. V., 1980. Early submarine lithification in the RedChalk and Lower Chalk of eastern England: a bacterialcontrol model and its implications. Proceedings of theYorkshire Geological Society 43, 81–157.
Jenkyns, H. C., Gale, A. S., Corfield, R. M., 1994. Carbon-and oxygen isotope stratigraphy of the English chalk andItalian Scaglia and its palaeoclimate significance. Geo-logical Magazine 131, 1–34.
Johnson, H., Lott, G. K., 1993. Cretaceous of the Central andNorthern North Sea. In: Knox, R.W.O’B., Cordey, W.G.(Eds.), Lithostratigraphic nomenclature of the UK NorthSea 2. British Geological Survey, Nottingham, 169pp.
Kaplan, U., 1992. Die Oberkreide-Aufschlüsse im RaumLengerich/Westfalen. Geologie und Paläontologie inWestfalen 21, 7–37.
Kennedy, W. J., Walaszczyk, I., Cobban, W. A., 2005. TheGlobal Boundary Stratotype Section and Point for thebase of the Turonian Stage of the Cretaceous: Pueblo,Colorado, U. S. A. Episodes 28, 93–104.
Kolonic, S., Wagner, T., Forster, A., Sinninghe Damsté, J. S.,Walsworth-Bell, B., Turgeon, S., Brumsack, H.-J., Kuhnt,W., Tsikos, H., Kuypers, M. M., 2005. Mechanisms ofblack shale deposition at the NW African Shelf during theCenomanian-Turonian Oceanic Anoxic Event: Implica-tions for climate coupling and global organic carbon bur-ial. Paleoceanography 20, doi: 10.1012/2003/PA000950.
Kuhnt, W., Luderer, F., Nederbragt, S., Thurow, J., Wagner,T., 2005. Orbital-scale record of the late Cenomanian-Turonian oceanic anoxic event (OAE 2) in the TarfayaBasin (Morocco). International Journal of Earth Sciences(Geologische Rundschau) 94, 147–159.
Kuhnt, W., Nederbragt, A., Leine, L., 1997. Cyclicity ofCenomanian-Turonian organic-carbon-rich sediments inthe Tarfaya Atlantic Coastal Basin (Morocco). Creta-ceous Research 18, 587–601.
Kuypers, M. M. M., Lourens, L. J., Rijpstra, W. I. C., Pan-cost, R. D., Nijenhuis, I. A., Sinninghe Damsté, J. S.,
87The Cenomanian-Turonian of the Wunstorf section
2004. Orbital forcing of organic burial in the proto-NorthAtlantic during oceanic anoxic event 2. Earth and Plane-tary Science Letters 228, 465–482.
Kuypers, M. M. M., Pancost, R. D., Nijenhuis, I. A., Sin-ninghe Damsté, J. S., 2002. Enhanced productivity led toincreased organic carbon burial in the euxinic North At-lantic basin during the late Cenomanian oceanic anoxicevent. Paleoceanography 17, 1051, doi: 10.1029/2000/PA000659.
Laskar, J., 1999. The limits of orbital calculations for geo-logical timescale use. Philosophical Transactions RoyalSociety London, series A 357, 1735–1759.
Laskar, J., Robutel, P., Joutel, F., Gastineau, M., Correia,A. C. M., Levrard, B., 2004. A long-term numerical solu-tion for the insolation quantities of the Earth. Astronomyand Astrophysics 428, 261–285.
Lehmann, J., 1999. Integrated stratigraphy and palaeoenvi-ronment of the Cenomanian-Lower Turonian (Upper Cre-taceous) of Northern Westphalia, North Germany. Facies40, 25–70.
Lüning, S., Kolonic, S., Belhadj, E. M., Belhadj, Z., Cota,L., Baríc, G., Wagner, T., 2004. Integrated depositionalmodel for the Cenomanian-Turonian organic rich strata inNorth Africa. Earth-Science Reviews 64, 51–117.
Mazur, S., Scheck-Wenderoth, M., Krzywiec, P., 2005. Dif-ferent modes of the Late Cretaceous-Early Tertiary inver-sion in the North German and Polish basins. Internation-al Journal of Earth Sciences (Geologische Rundschau)94, 782–798.
Meyer, T., 1990. Biostratigraphische und sedimentologischeUntersuchungen in der Plänerfazies des Cenomans vonNordwestdeutschland. Mitteilungen des GeologischenInstitutes der Universität Hannover 30, Hannover, 114 p.
Meyers, S. R., Sageman, B. B., 2004. Detection, quantifica-tion, and significance of hiatuses in pelagic andhemipelagic strata. Earth and Planetary Science Letters224, 55–72.
Meyers, S. R., Sageman, B. B., Hinnov, L. A., 2001. Inte-grated quantitative stratigraphy of the Cenomanian-Tur-onian Bridge Creek Limestone Member using evolutiveharmonic analysis and stratigraphic modelling. Journal ofSedimentary Research 71, 628–644.
Mitchell, S. F., Paul, C. R. C., Gale, A. S., 1996. Carbon iso-topes and sequence stratigraphy. In: Howell, J. A., Aitken,J. F. (Eds.), High Resolution Sequence Stratigraphy: In-novations and Applications. Geological Society SpecialPublication No. 104, p. 11–24.
Niebuhr, B., Hiss, M., Kaplan, U., Tröger, K.-A., Voigt, S.,Voigt, T., Wiese, F., Wilmsen, M., 2007. Beitrag zurStratigraphie von Deutschland: Lithostratigraphie dernorddeutschen Oberkreide. Schriftenreihe der DeutschenGesellschaft für Geowissenschaften 55, 1–136.
Paillard, D., Labeyrie, L., Yiou, P., 1996. Macintosh pro-gram performs time-series analysis. EOS TransactionsAmerican Geophysical Union 77, 379.
Paul, C. R. C., Lamolda, M. A., Mitchell, S. F., Vaziri, M. R.,Gorostidi, A., Marshall, J. D., 1999. The Cenomanian-Turonian boundary at Eastbourne (Sussex, UK): a pro-
posed European reference section. Palaeogeography,Palaeoclimatology, Palaeoecology 150, 83–121.
Paul, C. R. C., Mitchell, S. F., Marshall, J. D., Leary, P. N.,Gale, A. S., Duane, A. M., Ditchfield, P. W., 1994. Palaeo-ceanographic events in the Middle Cenomanian of North-west Europe. Cretaceous Research 15, 707–738.
Pratt, L. M., 1985. Isotopic studies of organic matter and car-bonate in rocks of the Greenhorn marine cycle. In: Pratt,L. M., Kauffman, E. G., Zelt, F. B. (Eds.), Fine-grained De-posits and Biofacies of the Cretaceous Western InteriorSeaway: Evidence of Cyclic Sedimentary Processes. Soci-ety for Sedimentary Geology (SEPM), Tulsa, p. 38–48.
Priestly, M. B., 1981. Spectral Analysis and Time Series. Academic Press, London, 890 p.
Prokoph, A., Villeneuve, M., Agterberg, F. P., Rachold, V.,2001. Geochronology and calibration of global Milan -kovitch cyclicity at the Cenomanian-Turonian boundary.Geology 29, 523–526.
Robaszynski, F., Gale, A. S., Juignet, P., Amédro, F., Hard-enbol, J., 1998. Sequence stratigraphy in the Upper Cre-taceous series of the Anglo-Paris Basin: exemplified bythe Cenomanian stage. In: Graciansky, P. C., Hardenbol,J., Jacquin, T., Vail, P. (Eds.), Mesozoic and Cenozoic se-quence stratigraphy of European Basins. SEPM SpecialPublication No. 60, SEPM (Society for Sedimentary Ge-ology), Tulsa, p. 363–386.
Sageman, B. B., Meyers, S. R., Arthur, M. A., 2006. Orbitaltime scale and new C-isotope record for Cenomanian-Turonian boundary stratotype. Geology 34, 125–128.
Schlanger, S. O., Arthur, M. A., Jenkyns, H. C., Scholle,P. A., 1987. The Cenomanian-Turonian Oceanic AnoxicEvent, I. Stratigraphy and distribution of organic carbon-rich beds and the marine d13C excursion. In: Brooks, J.,Fleet, A. (Eds.), Marine Petroleum Source Rocks. Geo-logical Society Special Publication 26, Blackwell, Ox-ford, p. 371–399.
Schlanger, S. O., Jenkyns, H. C., 1976. Cretaceous oceanicanoxic events: causes and consequences. Geologie en Mijnbouw 55, 179–184.
Surlyk, F., Dons, T., Clausen, C. K., Higham, J., 2003. Up-per Cretaceous. In: Evans, D., Graham, C., Armour, A.,Bathurst, P. (Eds.), The Millennium Atlas: Petroleum Ge-ology of the Central and Northern North Sea. GeologicalSociety of London, London, p. 213–233.
Tsikos, H., Jenkyns, H. C., Walsworth-Bell, B., Petrizzo,M. R., Forster, A., Kolonic, S., Erba, E., Premoli Silva, I.,Baas, M., Wagner, T., Sinninghe Damsté, J. S., 2004. Car-bon isotope stratigraphy recorded by the Cenomanian-Turonian Oceanic Anoxic Event: correlation and impli-cations based on three key localities. Journal of the Geo-logical Society 161, 711–719.
Uličný, D., Hladíková, J., Attrep Jr, M. J., Čech, S., Hrad -ecká, L., Svobodová, M., 1997. Sea-level changes andgeochemical anomalies across the Cenomanian-Turonianboundary: Pecínov quarry, Bohemia. Palaeogeography,Palaeoclimatology, Palaeoecology 132, 265–285.
van Buchem, F. S. P., Razin, P., Homewood, P. W., Oter-doom, W. H., Philip, J., 2002. Stratigraphic organization
88 Silke Voigt et al.

of carbonate ramps and organic-rich intrashelf basins:Natih Formation (middle Cretaceous) of northern Oman.The American Association of Petroleum Geologists Bul-letin 86, 21–53.
Voigt, S., Aurag, A., Leis, F., Kaplan, U., 2007. Late Ceno-manian to Middle Turonian high-resolution carbon iso-tope stratigraphy: New data from the Münsterland Creta-ceous Basin, Germany. Earth and Planetary Science Letters 253, 196–210.
Voigt, S., Flögel, S., Gale, A. S., 2004. Midlatitude shelf seasin the Cenomanian-Turonian greenhouse world: Temper-ature evolution and North Atlantic circulation. Paleo-ceanography 19, doi:10.1029/2004PA001015.
Voigt, S., Gale, A. S., Voigt, T., 2006. Sea level change,carbon cycling and palaeoclimate during the LateCenomanian of northwest Europe; an integrated pa -laeo environmental analysis. Cretaceous Research 27,836–858.
Weedon, G., 2003. Time-series Analysis and Cyclostratigra-phy. Cambridge University Press, Cambridge, 259 p.
Weiss, W., 1982. Planktonische Foraminiferen aus demCenoman und Turon von Nordwest- und Süddeutschland.Palaeontographica A, 178, 49–108.
Westerhold, T., Röhl, U., Laskar, J., Raffi, I., Bowles, J.,Lourens, L. J., Zachos, J. C., 2007. On the duration ofmagnetochrons C24r and C25n and the timing of earlyEocene global warming events: Implications from theOcean Drilling Program Leg 208 Walvis Ridge depthtransect. Paleoceanography 22, PA2201, doi:10.1029/2006PA001322.
Westerhold, T., Röhl, U., Raffi, I., Fornaciari, E., Monechi,S., Reale, V., Bowles, J., Evenas, H. F., 2008. Astronom-
ical calibration of the Paleocene time. Palaeogeography,Palaeoclimatology, Palaeoecology 257, 377–403.
Wiese, F., Wood, C. J., Kaplan, U., 2004. 20 years of eventstratigraphy in NW Germany; advances and open ques-tions. Acta Geologica Polonica 54, 639–656.
Wilmsen, M., 2007. Integrated stratigraphy of the upper Low-er – lower Middle Cenomanian of northern Germany andsouthern England. Acta Geologica Polonica 57, 263–279.
Wilmsen, M., 2003. Sequence stratigraphy and palaeo-ceanography of the Cenomanian Stage in northern Ger-many. Cretaceous Research 24, 525–568.
Wilmsen, M., Niebuhr, B., 2002. Stratigraphic revision of theupper Lower and Middle Cenomanian in the Lower Sax-ony Basin (northern Germany) with special references tothe Salzgitter area. Cretaceous Research 23, 445–460.
Wilmsen, M., Niebuhr, B., Hiss, M., 2005. The Cenomanianof northern Germany: facies analysis of a transgressivebiosedimentary system. Facies 51, 242–263.
Wilmsen, M., Niebuhr, B., Wood, C. J., Zawischa, D., 2007. Fau-na and palaeoecology of the Middle Cenomanian Prae-actinocamax primusEvent at the type locality, Wunstorf quar-ry, northern Germany. Cretaceous Research 28, 428–460.
Wilmsen, M., Voigt, T., 2006. The Middle-Upper Cenoman-ian of Zilly (Sachsen-Anhalt, northern Germany) with re-marks on the Pycnodonte Event. Acta Geologica Poloni-ca 56, 17–31.
Zawischa, D., 1980. Die Fauna des Cenomans von Wun-storf. Arbeitskreis für Paläontologie Hannover 5/6, 1–34.
Manuscript received: March 6, 2008, rev. version received:March 30, 2008, accepted for print: April 1, 2008.
89The Cenomanian-Turonian of the Wunstorf section