Influence of nitrogen enrichment on size-fractionated in vitro carboxylase activities of...
43
Journal of Experimental Marine Biology and Ecology AUGUST 2002; 275(2) : 147-171 http://dx.doi.org/10.1016/S0022-0981(02)00235-6 Copyright © 2002 Elsevier Science B.V. All rights reserved Archimer http://www.ifremer.fr/docelec/ Archive Institutionnelle de l’Ifremer Influence of nitrogen enrichment on size-fractionated in vitro carboxylase activities of phytoplankton from Thau Lagoon (Coastal Mediterranean Lagoon, France) Eric Fouilland a, *, Chantal Descolas-Gros a , Yves Collos a , André Vaquer a , Philippe Souchu b , Anne Gasc b , Bertrand Bibent a and Virginie Pons a a Laboratoire d'Hydrobiologie Marine et Continentale, UMR 5556 CNRS, Université Montpellier II, Case 093, 34095, Montpellier Cedex 05, France b Laboratoire Ecologie, station IFREMER, 1 rue Jean Vilar, 34200 Sète, France *: Corresponding author : Present address: The Scottish Association For Marine Science (SAMS), Dunstaffnage Marine Laboratory, Dunbeg, , Oban, Argyll, PA37 1QA, , UK. Tel.: +44-1631-559323; fax: +44-1631-559001; email: [email protected] Abstract: The influence of dissolved inorganic and organic nitrogen (DIN and DON) enrichments on pools of enzymes responsible for CO 2 fixation by the Calvin–Benson (Rubisco) and β-carboxylation pathways (β-carboxylases) were studied in a natural plankton assemblage. The plankton community from a coastal Mediterranean lagoon were incubated in situ for 24 h with initially ammonium, nitrate and DON (taurine) enrichments and compared to a control without any enrichment. An increase of small picophytoplankton and diatom biomass was observed in the enriched inorganic nitrogen treatments 7– 10 h after the initial enrichment. Phytoplankton biomass decreased in the control and under taurine enrichment suggesting an inorganic nitrogen limitation of phytoplankton growth. Nevertheless, the ratio of particulate carbon (C) versus chlorophyll a concentrations decreased throughout the experiment, pointing out the increasing importance of the autotroph community in all the carboys. The pool of Rubisco enzyme per biomass generally decreased in all the incubation carboys. In contrast, an increase in the pool of β-carboxylase enzymes normalised to the particulate carbon, chlorophyll and cell concentrations was observed at the end of the experiment under inorganic N-deficient conditions, in the control and with the addition of taurine. Under these latter conditions, the anaplerotic carbon fixation by β-carboxylation may potentially exceed photosynthetic carbon fixation by Rubisco in phytoplankton cells. A shift towards heterotrophy for natural phytoplankton cells using organic sources of nitrogen is proposed to explain the increase of the enzymatic pool of the β-carboxylation pathway. Keywords: Carboxylase activities; Size-fractionated phytoplankton; Nitrogen enrichments; Autotrophy; Heterotrophy 1
Transcript of Influence of nitrogen enrichment on size-fractionated in vitro carboxylase activities of...

Journal of Experimental Marine Biology and Ecology AUGUST 2002 275(2) 147-171 httpdxdoiorg101016S0022-0981(02)00235-6 Copyright copy 2002 Elsevier Science BV All rights reserved
Archimer httpwwwifremerfrdocelecArchive Institutionnelle de lrsquoIfremer
Influence of nitrogen enrichment on size-fractionated in vitro carboxylase activities of phytoplankton from Thau Lagoon (Coastal
Mediterranean Lagoon France)
Eric Fouillanda Chantal Descolas-Grosa Yves Collosa Andreacute Vaquera Philippe Souchub Anne Gascb Bertrand Bibenta and Virginie Ponsa
a Laboratoire dHydrobiologie Marine et Continentale UMR 5556 CNRS Universiteacute Montpellier II Case 093 34095 Montpellier Cedex 05 France b Laboratoire Ecologie station IFREMER 1 rue Jean Vilar 34200 Segravete France Corresponding author Present address The Scottish Association For Marine Science (SAMS) Dunstaffnage Marine Laboratory Dunbeg Oban Argyll PA37 1QA UK Tel +44-1631-559323 fax +44-1631-559001 email erfodmlacuk
Abstract The influence of dissolved inorganic and organic nitrogen (DIN and DON) enrichments on pools of enzymes responsible for CO2 fixation by the CalvinndashBenson (Rubisco) and β-carboxylation pathways (β-carboxylases) were studied in a natural plankton assemblage The plankton community from a coastal Mediterranean lagoon were incubated in situ for 24 h with initially ammonium nitrate and DON (taurine) enrichments and compared to a control without any enrichment An increase of small picophytoplankton and diatom biomass was observed in the enriched inorganic nitrogen treatments 7ndash10 h after the initial enrichment Phytoplankton biomass decreased in the control and under taurine enrichment suggesting an inorganic nitrogen limitation of phytoplankton growth Nevertheless the ratio of particulate carbon (C) versus chlorophyll a concentrations decreased throughout the experiment pointing out the increasing importance of the autotroph community in all the carboys The pool of Rubisco enzyme per biomass generally decreased in all the incubation carboys In contrast an increase in the pool of β-carboxylase enzymes normalised to the particulate carbon chlorophyll and cell concentrations was observed at the end of the experiment under inorganic N-deficient conditions in the control and with the addition of taurine Under these latter conditions the anaplerotic carbon fixation by β-carboxylation may potentially exceed photosynthetic carbon fixation by Rubisco in phytoplankton cells A shift towards heterotrophy for natural phytoplankton cells using organic sources of nitrogen is proposed to explain the increase of the enzymatic pool of the β-carboxylation pathway Keywords Carboxylase activities Size-fractionated phytoplankton Nitrogen enrichments Autotrophy Heterotrophy
1
2
Introduction
The nature of the interaction between nutrient assimilation and photosynthetic carbon
fixation is of major importance in understanding phytoplankton growth in fluctuating
environments The metabolic pathways of carbon (C) and nitrogen (N) are linked because they
must share organic C and energy They are supplied directly from photosynthetic electron
transport and CO2 fixation or from respiration of fixed C via glycolysis the TCA cycle and
mitochondrial electron transport chain (Turpin 1991 Huppe and Turpin 1994) Modifications of
photosynthesis due to variations in N supply have been largely ascribed to changes in the content
or specific activity of the primary CO2 fixing enzyme Rubisco ( Osborne and Geider 1986
references therein) Phytoplankton fix dissolved inorganic carbon via β-carboxylation to
replenish intermediates in the tricarboxylic acid cycle and the replacements or anaplerotic
carboxylations to provide essential compounds for phytoplankton growth that cannot be
produced from the Calvin-Benson cycle (Falkowski and Raven 1997) This pathway leads to
protein synthesis a process using phosphenolpyruvate carboxylase (PEPC)
phosphoenolpyruvate carboxykinase (PECK) or pyruvate carboxylase (PYRC) influenced by
ammonium availability among others factors (Mortain-Bertrand et al 1988) The β-
carboxylation pathway is mainly driven by phosphoenolpyruvate (PEP) which originates from
intermediates of Calvin-Benson cycle or in darkness from polysaccharides (Appleby et al
1980 Mortain-Bertrand et al 1987a b)
The nature of N source has been demonstrated to affect the phytoplankton physiology
(Levasseur et al 1993 Fidalgo et al 1995) such as the C fixation pathway It has been reported
that C fixation in darkness (via szlig-carboxylation pathway) was enhanced by addition of NH4+ to
3
N limited phytoplankton (Morris et al 1971 Slawyk and Collos 1982 Elrifi and Turpin 1986
Dodds and Priscu 1991 Vanlerberghe et al 1990 1992) Under steady-state conditions the
fraction of anaplerotic carbon fixation required to sustain the flux of aspartate glutamate and
their derivatives theoretically accounts for 5 of the fixed carbon in the organism (Falkowski
and Raven 1997 references therein) Nevertherless Guy et al (1989) using carbon isotope
discrimination showed that transient N assimilation by N-limited Selenastrum minutum causes a
major shift in carbon fixation from Rubisco to PEPC at high irradiance suggesting that PEPC
accounted for 70 to 87 of carbon fixation
Though the role of β-carboxylation in the phytoplankton cells is well known as supporting
the synthesis of amino acids derived from aspartate and glutamate the origin of PEP for β-
carboxylation is not clearly defined A higher β-carboxylase activity than Rubisco activity under
high irradiance as observed by Guy et al (1989) and Descolas-Gros and Oriol (1992) for
different phytoplanktonic species in culture suggested metabolites synthesised by other pathways
in the cell or from the external medium act as carbon acceptors for β-carboxylation pathway
Thus relative to the Rubisco activity a high β-carboxylase activity sustained by a mixotrophic
activity of the phytoplanktonic cells under N limiting conditions is assumed
During the present study the Calvin-Benson cycle and β-carboxylation pathways were
both examined over 24 hours by measuring the pool of carboxylase enzymes in a natural
plankton community from Thau Lagoon under different N conditions The initial addition of
ammonium and nitrate were compared to a control without enrichment The heterotrophic
capability of phytoplankton N nutrition was studied by enrichment with taurine which is an
important organic N compound released from oyster culture and has been shown to be a good
organic N source for phytoplankton in such ecosystems (Vincendeau 1987) Small
4
phytoplankton (lt2 microm) in Thau lagoon have been shown to be important in the phytoplankton
biomass and in primary production averaging about 30 of total chlorophyll a concentration and
about 40 of the total annual primary production (Courties et al 1994 Vaquer et al 1996)
This phytoplankton fraction is mainly constituted by the picoeukaryote Ostreococcus tauri with
cell size less of 1 microm diameter and described by Chreacutetiennot-Dinet et al (1995) We have thus
size-fractionated (1 microm) the plankton community to study the influence of the addition of these
different N sources on the unknown CO2 metabolism of the lt1 microm cells
Material and methods
Study area
Thau lagoon (Fig 1) is a Mediterranean coastal lagoon (France 43deg24 N - 3deg36 E)
shallow (depth average of 45 m) without tide exposed both to continental exports and oceanic
influence via the Rhocircne river plume (Souchu et al 1997) Thau lagoon is one of the most
important shellfish areas in Europe with an estimated standing stock of 40 000 tons of oysters
(Crassostrea gigas) which takes up 15th of the total area (7 000 ha) Salinities and temperatures
vary from 24 to 38 PSU and from 4 to 27oC respectively with a pH of 82 Little information is
available regarding the physical characteristics of Thau Lagoon Seawater turbidity is limited
with a Secchi depth ranging from 25 m to 77 m without any seasonal variation (Bacher et al
1995) The light attenuation coefficient is about 035 m-1 (outside the shellfish farming areas)
Hydrodynamics in the Thau Lagoon are linked with the wind regime and most of the exchanges
between the lagoon and the sea occur through the Canaux de Sete (Fig 1) The lagoon is able to
5
renew 12 of its water mass within 3 days owing to wind and barometric effects (Millet 1989)
In summer in spite of the low concentration of dissolved inorganic nitrogen (DIN) the shellfish
production is generally highest in the lagoon This suggests a high regenerated production
increased by enhanced benthic nutrient fluxes (Souchu et al 20001) and mainly based on
dissolved organic matter which represents the greatest stock of C and N (Gasc 1997)
In Thau Lagoon loricate ciliates such as tintinnids are abundant Tintinnids and rotifers
represented between 26 and 45 of the net collected microzooplankton biomass (Lam-Hoai et
al 1997) However at the shellfish culture area the occurrence of oysters and of epibiotic fauna
resulted in a drastic biomass reduction of the microzooplankton The oyster cultures contributed
to the picophytoplanktonic dominance in these waters by the preferential grazing of the larger
phytoplankton and zooplankton (Le Gall et al 1997 Dupuy et al 2000) From grazing
experiments Dupuy et al (2000) demonstrated that small picophytoplankton were not retained
by the oysters gills Nevertheless the picoeukaryote community constituted the most abundant
primary food resource for hetero-mixotrophic flagellates dinoflagellates and ciliates The whole
daily picophytoplankton production can be consumed by heterotrophic planktonic grazers
(Dupuy et al 2000) Phytoplankton from this oyster farming area showed higher annual Rubisco
activity normalised to chlorophyll a than phytoplankton from outside oyster farming and
offshore areas (Fouilland et al 1995) A marked effect of the oyster farming zone on bacterial
activities has been shown at the water-sediment interface with strong reductive processes
contributing to high ammonium concentrations in the farming areas (Gilbert et al 1997) A
higher average ambient ammonium concentration in this area than outside was suggested to
explain the strong autotrophic activity (Fouilland et al 1995)
6
Experimental set-up
The present experiment was conducted at Station ZA (85 m depth) located inside the
eastern shellfish-farming zone previously described in Souchu et al (1997) Two hundred litres
of seawater were taken from a 1 m depth in the middle of the Northern oyster rearing area (Fig
1) early in the morning Bulk water was filtered through a 200 microm mesh nylon net to remove
large particles and macrozooplankton grazers before distribution in incubation carboys The
water was subdivided into eight 20 L polycarbonate carboys two carboys per treatment being
used to increase the volume of incubated seawater 40 litres each for control ammonium nitrate
and taurine enrichments One carboy of each series was sampled during the first 10 hours of the
experiment (carboy A) and the second one during the last 14 hours (carboy B) The
reproducibility for a pair of carboys has been tested on chlorophyll (a+b+c) concentrations under
all N treatments and in the control during the experiment The equation of the linear regression
obtained between the Chl concentrations measured from all the carboys A and B is (Chl carboy
A) = 095 (Chl carboy B) +002 with a regression coefficient R2= 0988 indicating that
chlorophyll concentrations in a pair of carboys were very similar Polycarbonate carboys giving
an average of 95 light transmission were preferred to glass All incubated carboys (except
control) were enriched in different nitrogen sources with nitrate (10 microM NaNO3 final
enhancement) ammonium (10 microM NH4Cl final enhancement) and taurine (10 microM final
enhancement) Carboys were incubated at in situ temperature and irradiance at 1 m depth in the
middle of the oyster rearing area The experiment began on 22 June 1995 at 1000 (local time)
(T0) until 23 June 1995 at 1000 (T24) The sub-samplings occurred for each incubated carboys at
T0 T2 (1200) T4 (1400) T7 (1700) T10 (2000) T13 (2300) T17 (300) T21 (700) and T24
7
Physical and chemical variables
Surface photosynthetic available radiation (PAR) was measured with a LI-COR (Model
LI-190SA) quantum sensor and a LI-1000 data logger Underwater irradiance was measured
every 50 cm with a LI-COR (Model 193SA) spherical quantum sensor The visible light
extinction coefficient was calculated from linear regressions of irradiance vs depth
Samples for ammonium (NH4+) determination were immediately fixed and measured at
the laboratory using the method of Koroleff (1976) For the other nutrients samples were brought
to the field laboratory stored in acid precleaned polycarbonate carboys Filtrations and storage of
samples were performed within one hour after sampling in an all glass filtering system through a
precombusted (450degC for 6 h) Whatman GFF filter (vacuum lt10 cm Hg) Filtrates were
immediately frozen in precombusted Pyrex flasks for later analysis of Soluble Reactive
Phosphorus (SRP) nitrate (NO3-) and nitrite (NO2-) and silicate with a segmented flow analyser
(Treacuteguer and Le Corre 1975) The determination of dissolved organic nitrogen concentration
(DON) was performed using the photo-oxidation method (Armstrong and Tibbits 1968)
Determinations of particulate organic carbon (POC) were performed on Whatman 25 mm GFF
filters with a Perkin-Elmer Model 2400 CHN analyzer
Size fractionated filtrations
For each sampling time 1050 ml was used for size fractions following a protocol
described in Fouilland et al (2001) This protocol allows
1) study of the effect of N treatment on in vitro carboxylase activities for lt1 μm and gt 1μm
plankton cells 2) expression of the in vitro carboxylase activities per unit cell for lt1 μm
picophytoplankton 3) a check for potential filtration artefacts Two successive filtrations on
8
Nuclepore filter (1 microm size pore) and on GFF glass fiber Whatman filter (07 microm size pore) with
a vacuum lt 23 cm Hg to minimise cell damage were performed Subsamples for cell
enumeration were taken before and after filtrations on 1 microm Nuclepore and GFF Whatman
filters Both filters for in vitro carboxylase activities and chlorophyll measurements as well as
subsamples fixed previously by 2 (final concentration) formaldehyde for cell enumeration
(Troussellier et al 1995) were all stored in liquid nitrogen
Chlorophyll concentration measurements
Filters were ground in 90 acetone and extracted for 24 h in the dark at 4oC Chlorophyll
(a+b+c) concentrations (Chl) were determined by spectrofluorimetry (Neveux and Lantoine
1993)
Planktonic cell enumeration and diatoms taxonomy
Subsamples (20 ml) were fixed with 2 ml of 40 formaldehyde The samples were kept
in the dark at 4degC Fixed samples for bacteria and flagellates enumeration were filtered on black
polycarbonate Nuclepore membranes (022 μm porosity) Five minutes before filtration one drop
of DAPI (4 6-diamidino-2-phenylindole) was added to samples (Porter and Feig 1980)
Autotrophic and heterotrophic flagellates were discriminated by the red fluorescence of
chlorophyll a containing organisms under ultra-violet light using epifluorescence microscopy
Counting was done by examination of 10 equatorial bands (100x objective and band surface
168000 μm2) over the whole membrane length For bacteria 20 to 30 microscope fields were
counted in order to have a minimum count of 300 bacteria (100x objective field surface 256
9
μm2) Enumeration and identification of large phytoplankton was made by optical microscopy
after sedimentation (Utermohl 1958)
Flow cytometry analyses
Flow cytometry (FCM) analyses were run with an ACR 1000 cytometer Phytoplanktonic
cells were detected according to their light scatter (related to cell size and structure) their orange
and red fluorescence emissions (due to phycoerythrin and chlorophyll pigments) collected
through 58542 nm band pass and 650 nm long pass optical filters respectively One microm beads
(Polysciences Warrington PA) used as internal standard were systematically added to analyse
samples in order to normalise and compare the different phytoplanktonic groups Flow cytometry
allowed us to discriminate phytoplankton with size range between 05 microm and 50 microm (FCM
injector size)
In vitro carboxylase activities
The pool of potentially active enzymes responsible for CO2 fixation in plankton
community was measured as the in vitro carboxylases activity by incorporation of radioactive
bicarbonate into stable products following Descolas-Gros and Oriol (1992) This allowed us to
quantify the in vitro Rubisco activity and szlig-carboxylase activity (sum of the activities of
phosphenolpyruvate carboxylase PEPC phosphoenolpyruvate carboxykinase PEPCK and
pyruvate carboxylase PYRC) present in planktonic community (Appleby et al 1980 Glover
1989) All carboxylase assays were made on the same extract Extraction was carried out at 0 oC
and pH 8 following the protocol described in Descolas-Gros and De Billy (1987) For the
Rubisco assay the reaction mixture contained 50 mM Tricine buffer (pH 8) 5 mM dithiothreitol
10
(DTT) 10 mM MgCl2 20 mM NaH14CO3 and 100 μl of the crude extract For the other three
assays the reaction mixture contained 50 mM Pipes buffer (pH 68) instead of the Tricine buffer
Moreover 5 mM MnCl2 and 5 mM ADP were added for PEPCK assays and for PYRC assays 5
mM MgCl2 and 5 mM ATP were added All reactions were initiated after a pre-incubation period
of 10 min by adding substrates 2 mM RuBP for Rubisco assay 5 mM PEP for PEPC and
PEPCK assays and 5 mM pyruvate for PYRC assay All mixtures were incubated at 25 oC for 20
min The reactions were stopped by the addition of 6 N HCl More details on the protocol are
given in Descolas-Gros and Fontugne (1985) Descolas-Gros and De Billy (1987) and Descolas-
Gros and Oriol (1992) Every carboxylase assay was carried out in triplicate with an assay error
lt15 and was automated with a Gilson auto-analyser (222 Autosampler Injector interfaced with
a Dilutor 401) Carboxylase activity is expressed in nmol CO2 L-1 h-1 in pmol CO2 μg C-1 h-1 and
in nmol CO2 μg Chla-1 h-1 in order to take into account the variation of the particulate carbon and
phytoplanktonic biomass during the experiment and in fmol CO2 cell-1 h-1 when possible The szlig-
carboxylasesRubisco ratio (βCR expressed in ) allowed us to quantify the relative importance
of the two pathways
Experiment reproducibility
In order to estimate the precision of the biological parameters discussed in this study the
coefficient of variation (CV) has been calculated for each parameter using four values measured
at T0 and is presented in Table 1 The CV of the biological parameters was generally less than
25 except for the carboxylases activity per cell for diatom cell and for the β-carboxylase per
cell for lt1 μm cells with values between 33 and 44 (Table 1)
11
Statistical analyses
In order to compare the effect of N treatments relative to the control and between the N
treatments non-parametric Wilcoxon signed-Rank analyses have been applied on cell numbers
chlorophyll concentrations and carboxylase activities and reported in Table 2
Results
Nutrient concentrations and physical variables
All chemical data are reported in Table 3 Water temperature varied between 220 and
238oC at a depth of 15 m At this depth the attenuation of the incident light with a maximum
value of 1800 μE m-1 s-1 was about 50 The initial chemical conditions were characterised by
very low concentrations in nitrate (lt015 microM) nitrite (lt01 microM) and by ammonium
concentrations averaging 04 microM and high DON concentrations averaging 24 microM These values
were close to those reported in June 1993 in the same area (Collos et al 1997) The phosphate
values averaged 022 microM in all carboys throughout the experiment (data not shown) The molar
ratio of silicateDIN varied from 17 to 110 in the control and enriched taurine carboys while the
ratio was close to 1 (between 08 and 25) throughout the experiment under enriched NH4+ and
NO3- treatments (data not shown) This suggested that DIN was the limiting nutrient in the
control and enriched taurine carboy during the experiment The ammonium concentrations
decreased from 04 to 006 microM (T10) in the control and under NO3- treatment and to 017 microM
(T10) under taurine treatment and varied between 007 to 023 microM afterwards The ammonium
concentrations decreased from 686 microM (T0) to 032 microM (T24) under NH4+ treatment The nitrate
12
remained undetectable throughout most of the experiment in the control NH4+ and taurine
treatments and decreased from 931 microM (T0) to 242 microM (T24) under NO3- treatment The DON
concentrations remained quite constant in the control and under DIN treatments varying from
218 to 268 microM and decreased from 376 microM (T0) to 303 microM (T24) under the taurine treatment
Size fractionation accuracy
Using the chlorophyll parameter (red fluorescence) from flow cytometry analysis on
samples before and after 1 μm nuclepore filtration and compared to the lt1 μm chlorophyll a
concentrations measured by spectrofluorimetry the accuracy of size-fractionation protocol was
assessed The red fluorescence for each cell group in the lt1μm fraction was summed and
compared with the lt1μm chlorophyll a concentrations A positive linear regression was obtained
(R2=074 n=22) The total red fluorescence of cells after 1 μm filtration detected by flow
cytometry was thus directly correlated with chlorophyll a pigment concentration measured in this
lt1 μm fraction This indicates that the potential filtration artefacts (eg breakdown of small cells)
were reduced during the experiment
Small picoplanktonic cells
In the lt1 μm filtrate a population of small picoeukaryotes was identified and exhibited
the same flow cytometric characteristics as the eukaryotic Ostreococcus tauri This picoeukaryote
contributed 95 of total lt1 μm cell numbers Larger picoeukaryote cells with a relative red
fluorescence and apparent size close to those of 1 μm beads were also detected in this fraction
No cyanobacteria cells were detected by either flow cytometry or epifluorescence microscopy
during this study The variation of lt1 microm cell numbers detected by flow cytometry is reported in
13
Table 4 The abundance of small picoeukaryote cells measured during this experiment was in the
same range of values as previously observed in the same area between 1991 and 1994 averaging
30x106 cell L-1 (Vaquer et al 1996) Compared to the control no effect of taurine treatment was
detected on the lt1 microm cell concentrations (Table 2) The lt1 microm cell numbers increased in all
carboys T0 to T7 and afterwards decreased in the control and under taurine treatment From T10 a
strong significant increase of lt1 microm cell numbers reaching 50 106 cell L-1 was observed under
DIN treatments (Table 4)
From previous filtration experiments with plankton community from Thau Lagoon 67 to
74 of total bacteria cells can be retained on GFF filters (unpubl data) Bacterial cell numbers
varied slightly during the experiment (Table 3) As compared to the control the different N
treatments did not influence the cell concentrations Retention on GFF filter of 70 of total
bacterial cell was assumed Thus the contribution of bacteria cells was always greater than 95
of the total lt1 μm plankton cell numbers retained on GFF filters
Larger plankton cells community
At the beginning of the experiment nano- and microplankton species were dominated by
autotrophic flagellates and diatoms mainly composed of Chaetoceros spp Skeletonema spp and
Pseudo-nitzschia spp (Table 5) At the end of the experiment heterotrophic and autotrophic
flagellate abundance did not vary whereas diatom cells reached 19 106 cells L-1 in the control and
under taurine treatment mainly due to an increase of Pseudo-nitzschia spp cells On the last day
of the experiment higher diatom cell abundance was measured under DIN treatments mainly
due to the increase of Skeletonema spp cells (Table 5) Using a Ccell conversion factors for
each group from Dupuy et al (2000) the contribution of gt1 μm picophytoplankton and diatom
14
cells to the total gt1μm planktonic organic carbon was estimated to be less than 01 and greater
than 95 respectively during the experiment
Chlorophyll pigment concentrations and in vitro carboxylases activity
The chlorophyll pigment concentrations and the pool of Rubisco per litre for both size
fractions were not significantly different between the control and the taurine treatment
throughout the experiment (Table 2) Compared to the control a significant increase of
chlorophyll concentration occurred after 7 incubation hours under DIN treatments reaching 109
and 08 microgL-1 for gt1 μm and lt1 μm phytoplankton cells respectively (Fig 2A amp 2B Table 1)
Similarly to the chlorophyll concentrations after 7 incubation hours the pool of Rubisco per litre
for both size fractions was significantly greater under DIN treatments than in the control (Table 2
and 6) The pool of β-carboxylase activity per litre for both size fractions varied slightly during
the 24 hours incubation (Table 7) and no significant different between the N treatments and the
control was reported (Table 2) The values of the total carboxylases activity (ie sum of two size
fractions) were normalised per carbon using the particulate organic carbon concentration (POC)
and reported in Figure 3 In the carboys without DIN enrichments the total β-carboxylase
activity per carbon increased during the night period while the total Rubisco activity per carbon
decreased (Fig 3A) A coupling between the total Rubisco and β-carboxylase activity per carbon
was generally observed in the carboys with DIN enrichments (Fig 3B) The ratio between POC
and chlorophyll a concentrations (POCChla) decreased from about 700 to 200 μgC μgChla-1
overall the experiment in all the carboys The carboxylases activity was normalised to
chlorophyll a concentrations for each size fraction in order to take into account the
phytoplankton biomass variation between the N treatments during the present experiment The
15
Rubisco activity per Chla generally decreased in all N treatments for both size fractions during
the experiment (Fig 4) and no significant difference between these N treatments was measured
(Table 2) The β-carboxylase activity per Chla for both sized fractions generally decreased
during the 10 first hours of the experiment in all N treatments (Fig 5) Nevertheless a significant
increase of the β-carboxylase activity per Chla for both size fractions occurred under DIN
treatments afterwards while this activity per Chla remained very low in the control and the
taurine treatment (Fig 5 and Table 2)
β-carboxylation pathway
β-carboxylase activity (PEPC+PEPCK+PYRC) for the plankton community expressed as
a percentage of Rubisco activity (βCR ratio) reached values greater than 50 after 10 incubation
hours in the control and under taurine treatment (Fig 6) Under DIN treatments the βCR ratio
for both size fractions was significantly lower than measured in the control with values less than
40 throughout the study (Table 2) Phosphenolpyruvate carboxylase (PEPC) enzyme
contributed to about 50 of the total β-carboxylase enzymes in both size fractions (data not
shown)
Cellular pool of carboxylase enzymes
A strong decrease of the Rubisco pool per unit cell was measured in small phytoplankton
in all carboys during the experiment and no significant influence of N treatments was observed
(Table 2 and 8) As diatom cells contributed for the most part of carbon biomass in gt1 μm
plankton community the in vitro Rubisco activity for gt1 μm fraction is expressed on the basis of
16
diatom cell number Similarly to the small cells a decrease of the Rubisco pool per unit cell is
also observed for larger cells after 24 incubation hours in the carboys (Table 5)
For the small size fraction the enzymatic pool of PEPC is expressed per unit cell of small
picoeukaryotes and reported in the Table 8 This cellular pool tended to be significantly different
between the DIN treatments and the control (p=005 and 008 Table 2) This pool decreased
during the experiment under DIN treatments while the highest values in the control and under
taurine treatment were recorded close to the end of the experiment (Table 8) The pool of PEPCK
is expressed by unit of diatom cells as this enzyme is present in the dominant diatom species
observed during this study (Descolas-Gros and Oriol 1992) and these species contributed to 95
of the total gt1 μm carbon biomass Similarly to the PEPC in small cells the cellular pool of
PEPCK in larger cells was significantly very low under DIN treatments relative to the control and
to the carboy with an addition of taurine at the end of the experiment (Table 5)
Discussion
After 10 hours of incubation the very low available dissolved inorganic nitrogen (DIN)
concentrations probably limited the growth of phytoplankton in the control and under taurine
treatment This explains the decrease of the small picophytoplankton cells and the low net growth
rate of diatoms in these carboys Nevertheless bacterial cells and heterotrophic flagellates
submitted to these different nutrient conditions did not show a net growth rate In contrast the net
growth rate of picophytoplankton and diatom was about 15 and 3 divday respectively in the
samples enriched with DIN
17
Even though phytoplankton growth was positively influenced by DIN enrichments the
cellular pool of potentially active Rubisco enzyme for picophytoplankton and diatom cells
decreased throughout the study in all the carboys This suggests a degradation of the cellular
enzymatic pool in phytoplankton cells during the study The rapid degradation of the nitrogen
fraction in phytoplankton cells under high irradiance has been shown in a shallow environment
with photosynthetically available radiation levels above 600 to 1000 μE m-2 s-1 (Collos et al
1992) Rubisco enzyme can act as a nitrogen reservoir that is more easily mobilised than the rest
of the protein pool during environmental changes (Ekman et al 1989) Thus cellular Rubisco
pool degradation during this present study may result from the light conditions in incubation
carboys held at fixed positions near the surface where phytoplankton cannot avoid high
irradiance levels during the day time reaching about 900 μE m-2 s-1 at the incubation depth
As compared to the Rubisco pathway the potential use of β-carboxylation pathway by the
plankton community as shown by the carboxylases activity normalised to the particulate carbon
chlorophyll a and cell and by the ratio βCR increased after 10 incubation hours in the carboys
without DIN enrichments only The values of the βCR ratio were higher than 100 at which
time the phytoplankton biomass started to decrease in the control and under taurine treatment In
contrast β-carboxylase activity seemed strongly coupled to the Rubisco activity under DIN
treatments This daily co-variation was already reported for natural phytoplankton in
Mediterranean Sea under favourable environmental conditions (Fouilland et al 2001) showing
the strong interdependence of these two C assimilation pathways (falkowski and Raven 1997)
The βCR ratio under DIN treatments remained less than 40 which is a characteristic of
autotrophic cells (Descolas-Gros and Oriol 1992) A βCR ratio higher than 100 suggests that
the β-carboxylation pathway can prevail on the Calvin-Benson pathway As β-carboxylation in
18
the light occurs using a substrate (PEP) derived from the Calvin-Benson cycle a ratio greater
than 100 has been associated with the occurrence of heterotrophic organisms such as
dinoflagellates (Descolas-Gros and Oriol 1992) For such cells the origin of
phosphoenolpyruvate is uncertain and Descolas-Gros and Oriol (1992) suggested that it could be
supplied by the incorporation of external organic substances
The increase of β-carboxylase pathway observed in the present study cannot be explained
by the increase of heterotrophic biomass relative to the autotrophic biomass in the control or with
addition of taurine The POCChla ratio decreased throughout the experiment suggesting a shift
towards an autotrophic community in all the carboys For the small size fraction bacterial cells
which are partially retained by filters could have significantly contributed to the total β-
carboxylase activity as suggested by results from dark fixation of 14C from natural plankton (Li et
al 1993 Markager 1999) Nevertheless the regulation of β-carboxylation pathway and enzyme
structure is different in bacterial and phytoplankton cells (Rivoal et al 1998) The occurrence of
carboxylation of PEP by PEPC is well known in bacterial cells Nevertheless this carboxylase
does not act unless acetyl-coenzyme A is present perhaps to facilitate a continued supply of
oxaloacetate for the TCA cycle fuelling (Baumerg 1973 Overbeck 1984) Such regulation does
not occur in phytoplankton cells (Turpin et al 1991) As no acetyl-coenzyme A is added to the
reaction mixture the strong variation of the activity of major β-carboxylase enzymes (PEPC) is
assumed to be directly related to the β-carboxylation pathway of the small picoeukaryote cells
Moreover the bacterial cells contributed a very large fraction to the total lt1 μm picoplankton
abundance and no significant difference in the bacterial abundance was noticed between carboys
(Table 4) Thus any increase of βCR ratio for the lt1 μm fraction observed after 10 hours of
incubation cannot be due to the bacterial growth relative to the decrease of small
19
picophytoplankton abundance which contributed to less than 5 of total cell numbers over the
experiment in all carboys The importance of bacterial activity (free or attached bacteria cells) is
assessed relatively to the ammonium uptake Data from Table 3 show that ammonium uptake was
at least twice as high during the day than at night in NH4+ treatment indicating autotrophic
driven processes In the control ammonium actually increased at night (Table 3) so it can be
safely assumed that bacterial populations produced rather than consumed ammonium in these
series of experiment This suggests that the heterotroph bacterial activity was not influenced by
the N treatments Moreover using values for the carbon content in plankton species in Thau
Lagoon calculated by Dupuy et al (2000) the heterotroph flagellates contributing to the total gt1
microm plankton biomass was estimated to be less than 1 in the control and under all N treatments
at the end of the experiment Thus the variation of the β-carboxylation enzyme pool relative to
the Rubisco was mainly due to the enzyme activities from the autotrophic plankton in both size
fractions
Anaplerotic carbon fixation by PEPC in the light exceeding photosynthetic carbon
fixation has already been measured in an N-limited green alga using stable carbon isotope
discrimination (Guy et al 1989) These authors showed that under transient situations the
contribution of βminuscarboxylation to the total C fixation can be as high as 70 ie a βCR ratio of
230 which is higher than our maximum value for a natural plankton assemblage (160) The
significant increase of both βCR ratio and the β-carboxylase activity normalised to the
chlorophyll and carbon biomass reported during the present study suggests a potential increase
of cellular β-carboxylase enzymes The pool of PEPC and PEPCK expressed per unit cell for the
small picoeukaryotes and diatoms tended to increase at the end of the experiment in the control
and under taurine treatment This increase of the activity of β-carboxylase enzymes combined
20
with the decrease of the Rubisco activity under inorganic N-deficient conditions suggests that β-
carboxylation pathway is more active when phytoplankton growth is limited by inorganic
nutrients A higher photosynthetic carbon fixation by β-carboxylation than by Rubisco in
autotrophic phytoplankton cells is surprising especially in regards to the source of the substrate
for β-carboxylation The dissimilation of reserve carbohydrate providing PEP for this pathway
as usually observed in the dark for microalgae (Mortain-Bertrand et al 1988) is unlikely This is
because phytoplankton growth was very low under N-deficient conditions implying low C
storage in cells
The increase of the enzymatic pool for β-carboxylation in phytoplankton may be due to a
shift from autotrophic to heterotrophic activity induced by a DIN deficiency as in the control and
DON (taurine) treatment There is indirect evidence that taurine was taken up during the day
Data from Table 2 shows that DON decreased in the carboys enriched with taurine while it
remained constant in the others This decrease roughly corresponds to the taurine addition but
taurine was taken up during the day only and not at night which indicates that phytoplankton
not bacteria were responsible for this uptake Nevertheless this uptake does not result in
increased phytoplankton biomass as observed in enriched ammonium or nitrate carboys
Possibly the time lag involved between uptake and growth is longer than the time scale used in
the present study as observed elsewhere (Antia et al 1975 Bonin and Maestrini 1981) Thus
increases in cell numbers could not be observed within a 24-hour time frame following the
taurine addition Interestingly in the study of Vincendeau (1987) S costatum took up DON once
DIN was exhausted Thus the similarity between the control and the taurine treatment could have
a common explanation heterotrophy is induced by DIN limitation The increase of β-
carboxylation pathway under limiting N conditions is coupled to the uptake of dissolved nitrogen
21
compounds by phytoplankton resulting in the activation of respiration for the biosynthetic
processes This causes the back-regulation of anaplerotic reactions as previously described by
Vanlerberghe et al (1990 1992) for NH4+ uptake A stimulation of respiration after the addition
of acetate has also been observed in Chlamydomonas reinhardtii cultured photoautotrophically
(Fett and Coleman 1994 Endo and Asada 1996) Moreover under similar conditions Heifetz et
al (2000) showed a decrease of photosynthetic carbon fixation in cells grown in acetate with
saturating light and CO2 These results suggest an increase of the β-carboxylation pathway for the
replenishment of TCA cycle intermediates in order to sustain the growth rate of C reinhardtii
growing heterotrophically using acetate as source of carbon This is in accordance with the
increase of cellular β-carboxylase pool during a shift toward heterotrophy in natural
phytoplankton cells suggested in this study Even though the evidence of this heterotrophy was
observed with the taurine enrichment only the importance of the β-carboxylation pathway in
natural phytoplankton under very low nutrient conditions is clearly highlighted in this study In
order to gain further insight into the phytoplankton heterotrophy the relationship between the
CO2 assimilation pathways and the capacity of phytoplankton to use organic sources of nitrogen
andor carbon should be investigated using axenic cultures of phytoplankton submitted to
different nutritional conditions for instance
Acknowledgements
This work was supported by CNRS University Montpellier II IFREMER (URM 5) We
thank J-M Deslous-Paoli and C Leboulanger for their assistance during the fieldwork T Sime-
22
Ngando for providing bacteria and flagellates data and 2 anonymous referees for insightful
comments on the manuscript This paper represents a portion of a thesis of the University Paris
VI of Eric Fouilland who received a BDI fellowship from CNRS and IFREMER This is the
XXX ISEM contribution for Chantal Descolas-Gros
23
References
Appleby G Colbeck J Holdsworth ES Wadman H 1980 szligcarboxylation enzymes in
marine phytoplankton and isolation and purification of pyruvate carboxylase from
Amphidinium carterae (Dinophyceae) J Phycol 16 290-295
Antia NJ Berland BR Bonin DJ Maestrini SY 1975 Comparative evaluation of certain
organic and inorganic sources of nitrogen for phototrophic growth of marine microalgae J
Mar Biol AssU K 55 519-539
Armstrong FAJ Tibbits S 1968 Photochemical combustion of organic matter in sea
water for nitrogen phosphorus and carbon determination J Mar Biol Ass U K 48
143-152
Bacher C Millet B Vaquer A 1997 Modeacutelisation de lrsquoimpact des mollusques cultiveacutes
sur la biomasse phytoplanctonique de lrsquoeacutetang de Thau (France) C R Acad Sci Paris
320 73-81
Baumberg S 1973 Co-ordination of metabolism In Mandelstam J McQuillen K (eds)
Biochemistry of bacterial growth Second edition Blackwell 423-493
Bonin DJ Maestrini SY 1981 Importance of organic nutrients for phytoplankton growth in
natural environments implications for algal species successionPhysiological bases of
phytoplankton ecology Platt T (Ed) Can Bull Fish Aquat Sci 210 279-291
Chreacutetiennot-Dinet M-J Courties C Vaquer A Neveux J Claustre H Lautier J
Machado MC 1995 A new marine picoeukaryote Ostreococcus tauri gen et sp nov
(Chlorophyta Prasinophyceae) Phycologia 34 85-292
24
Collos Y Descolas-Gros C Fontugne M Mortain-Bertrand A Chretiennot-Dinet MJ
Frikha MG 1992 Carbon and nitrogen dynamics during growth and degradation of
phytoplankton under natural surface irradiance Mar Biol 112 491-496
Collos Y Descolas-Gros C Fontugne M Mortain-Bertrand A Chreacutetionnot-Dinet M-J
Frikha MG 1993 Chemical isotopic and enzymatic monitoring of free and enclosed
seawater implications for primary production estimates in incubation carboys Mar Ecol
Prog Ser 93 49-54
Collos Y Vaquer A Bibent B Slawyk G Garcia N Souchu P 1997 Variability in nitrate
uptake kinetics of phytoplankton communities in a Mediterranean coastal lagoon Estuar
Coast Shelf S 44 369-375
Courties C Vaquer A Troussellier M Lautier J Chreacutetiennot-Dinet M-J Neveux J
Machado C Claustre H 1994 Smallest eukaryotic organism Nature 370 255
Descolas-Gros C Fontugne M 1985 Carbon fixation in marine phytoplankton carboxylase
activities and stable carbon-isotope ratios physiological and paleoclimatological aspects
Mar Biol 87 1-6
Descolas-Gros C De Billy G 1987 Temperature adaptation of RuBP caboxylase kinetic
properties in marine Antarctic diatoms J Exp Mar Biol Ecol 108 147-158
Descolas-Gros C Oriol L 1992 Variations in carboxylase activity in marine phytoplankton
cultures szligcarboxylation in carbon flux studies Mar Ecol Prog Ser 85 163-169
Dodds WK Priscu JC 1991 Ammonium stimulation of dark carbon fixation as an indicator
of nitrogen deficiency in phytoplankton potential errors caused by ammonium-oxidizing
bacteria J Phycol 27 79-82
25
Dupuy C Vaquer A Lam-Hoai T Rougier C Mazouni N Lautier J Collos Y Le Gall
S 2000 Feeding rate of the oyster Crassostera gigas in a natural planktonic community of
Mediterranean Thau Lagoon Mar Ecol Prog Ser 205 171-184
Ekman P Lignell A Pedersen M 1989 Localization of ribulose-15-bisphosphate
carboxylaseoxygenase in Gracilaria secundata (Rhodophyta) and its role as a nitrogen
storage pool Botanica Mar 32 527-534
Elrifi IR Turpin DH 1986 Nitrate and ammonium induced photosynthetic suppression in N-
limited Selenastrum minutum Plant Physiol 81 273-279
Endo T Asada K 1996 Dark induction of the non-photochemical quenching of chlorophyll
fluorescence by acetate in Chlamidomonas reinhardtii Plant Cell Physiol 37 551-555
Falkowski PG Raven JA 1997 Aquatic photosynthesis Blackwell Science publisher
Fett JP Coleman JR 1994 Regulation of periplasmic carbonic anhydrase expression in
Chlamidomonas reinhardtii by acetate and pH Plant Physiol 106 103-108
Fidalgo JP Cid A Abalde J Herrero C 1995 Culture of the marine diatom Phaedactylum
tricornutum with different nitrogen sources Growth nutrient conversion and biochemical
composition Cah Biol Mar 36 165-173
Fouilland E Vaquer A Descolas-Gros C 1995 Annual variations in CO2 assimilation and
primary production measurements in a mediterranean lagoon (Thau lagoon France)
Photosynthesis from Light to Biosphere Mathis P (Ed) Elvesier 5 873-876
Fouilland E Courties C Descolas-Gros C 2001 Size-fractionated carboxylase activities
during a 32 h cycle at 30 m depth in the Northwestern Mediterranean Sea after an episodic
wind event J Plankton Res 23 623-632
26
Gasc A 1997 Etude de la production primaire reacutegeacuteneacutereacutee dans un eacutecosystegraveme conchylicole le
bassin de Thau Ph D Univ Sciences et Techniques du Languedoc Montpellier France
Gilbert F Souchu P Bianchi M Bonin P 1997 Influence of shellfish farming activities on
nitrification nitrate reduction to ammonium and denitrification at the water-sediment
interface of the Thau lagoon France Mar Ecol Prog Ser 151 143-153
Glover HE 1989 Ribulosebisphosphate carboxylaseoxygenase in marine organisms Int Rev
Cytol 115 67-137
Guy RD Vanlerberghe GC Turpin DH 1989 Significance of phosphoenolpyruvate
carboxylase during ammonium assimilation Carbon isotope discrimination in
photosynthesis and respiration by the N-limited green alga Selenastrum minutum Plant
Physiol 89 1150-1157
Heifetz PB Forster B Osmond CB Giles LJ Boynton JE 2000 Effects on facultative
autotrophy in Chlamydomonas reihardtii assessed by photosynthetic measurements and
stable isotope analyses Plant Physiol 122 1439-1445
Huppe HC Turpin DH 1994 Integration of carbon and nitrogen metabolism in plant and
algal cells Annu Rev Physiol Plant Mol Biol 45 577-607
Koroleff F 1976 Determination of nutrients Methods of Seawater analysis Grasshoff K
(Ed) Verlag Chemie 117-182
Lam-Hoai T Rougier C Lasserre G 1997 Tintinnids and rotifers in a northern
Mediterranean coastal lagoon Structural diversity and function through biomass
estimations Mar Ecol Prog Ser 152 13-25
27
Le Gall S Hassen MB Le Gall PB 1997 Ingestion of a bacterivorous ciliate by oyster
Crassostera gigas protozoa as a trophic link between picoplankton and benthic suspension-
feeders Mar Ecol Prog Ser 152 301-306
Levasseur M Thompson PA Harrison PJ 1993 Physiological acclimation of marine
phytoplankton to different nitrogen sources J Phycol 29 587-595
Millet B 1989 Fonctionnement hydrodynamique du bassin de Thau Validation drsquoun modegravele
numeacuterique de circulation (programme Ecothau) Oceanol Acta 12 37-46
Morris I Yentsch CM Yentsch CS 1971 The physiological state with respect to nitrogen
of phytoplankton from low-nutrient subtropical water as measured by the effect of
ammonium ion on dark carbon dioxide fixation Limnol Oceanogr 16 859-868
Mortain-Bertrand A Descolas-Gros C Jupin H 1987a Short-term 14C incorporation in
Skeletonema costatum (Greville) Cleve (Bacillariophyceae) as a function of light regime
Phycologia 16 262-269
Mortain-Bertrand A Descolas-Gros C Jupin H 1987b Stimulating effect of transitions from
light to dark on carbon assimilation by a marine diatom J Exp Mar Biol Ecol 112 11-
26
Mortain-Bertrand A Descolas-Gros C Jupin H 1988 Pathway of dark inorganic carbon
fixation in two species of diatoms influence of light regime and regulator factors on diel
variations J Plankton Res 10 199-217
Neveux J Lantoine F 1993 Spectrofluorometric assay of chlorophylls and phaeopigments
using the least squares approximation technique Deep-Sea Res 40 1747-1765
28
Osborne BA Geider RJ 1986 Effect of nitrate-nitrogen limitation on photosynthesis of the
diatom Phaeodactylum tricornutum Bohlin (Bacillariphyceae) Plant Cell Environ 9 617-
625
Overbeck J 1984 Application of TCA cycle metabolism for growth estimates of heterotrophic
bacterioplankton Arch Hydrobiol Beih 19 23-36
Porter K Feig YS 1980 The use of DAPI for identifying and counting aquatic microflora
Limnol Oceanogr 25 943-948
Slawyk G Collos Y 1982 13C and 15N uptake by marine phytoplankton 2 Results from a
tropical area Rapp P-v Reacuteun Cons int Explor Mer 180 209-213
Souchu P Gasc A Cahet G Vaquer A Collos Y Deslous-Paoli JM 1997
Biogeochemical composition of Mediterranean waters outside the Thau lagoon Estuar
Coast Shelf S 44 275-284
Souchu P Vaquer A Collos Y Lamdrein S Deslous-Paoli J-M Bibent B 2001
Influence of shellfish farming activities on the biogeochemical composition of the water
column in Thau Lagoon Mar Ecol Prog Ser 218 141-152
Treacuteguer P Le Corre P 1975 Manuel danalyse des sels nutritifs dans leau de mer
Utilisation de lAutoAnalyseur II Technicon LOC Universiteacute de Bretagne Occidentale
Brest France
Troussellier M Courties C Zettelmaier S 1995 Flow cytometric analysis of coastal lagoon
bacterioplankton and picophytoplankton fixation and storage effects Estuar Coast Shelf
S 40 621-633
Turpin DH 1991 Effects of inorganic N availability on algal photosynthesis and carbon
metabolism J Phycol 27 14-20
29
Turpin DH Vanlerberghe GC Amory AM Guy RD 1991 The inorganic requirements
for nitrogen assimilation Can J Bot 69 1139-1145
Utermoumlhl H 1958 Zur Vervollkommnung der quantitativen Phytoplankton-Methodik Mitt int
Ver theor angew Limnol 9 1-38
Vanlerberghe GC Schuller KA Smith RG Feil R Plaxton WC Turpin DH 1990
Relationship between NH4+ assimilation rate and in vivo phosphoenolpyruvate carboxylase
activity Regulation of anapleurotic carbon flow in the green alga Selenastrum minutum
Plant Physiol 94 284-290
Vanlerberghe GC Huppe HC Vlossak KDM Turpin DH 1992 Activation of
respiration to support dark NO3- and NH4
+ assimilation in the green alga Selenastrum
minutum Plant Physiol 99 495-500
Vaquer A Troussellier M Courties C Bibent B 1996 Standing stock and dynamics of
picophytoplankton in the Thau Lagoon (northwest Mediterranean coast) Limnol
Oceanogr 41 1821-1828
Vincendeau ML 1987 Etude expeacuterimentale de la fertiliteacute des eaux des milieux conchylicoles
influence de lrsquoexcreacutetion des huitres et des palourdes sur la production des diatomeacutees
dominantes Ph D Univ Paris 6 Paris France
Table 1 Coefficient of variation (in percent) of the different biological
parameters calculated using four measurements observed at T0 Calculation based on cell numbers of diatom dominant species
gt1 microm lt1 micromCell numbers 22 6
Chlorophyll a concentrations 6 10Rubisco activity per liter 20 17szlig-Carboxylases per liter 23 12
Rubisco activity per chlorophyll a unit 17 24szlig-Carboxylases activity per chlorophyll a unit 19 12
βCR ratio 23 24Rubisco activity per cell 35 18 β-carboxylase per cell 44 33
Table 2 Statistical results from non parametric Wilcoxon signed-Rank analyses between N enriched treatments and control 001le p lt005 p le001 NS non significant (p ge01)
Cell numbers
Rubisco activity per cell
PEPC activity per cell
lt1 microm gt1 microm lt1 microm gt1 microm lt1 microm gt1 microm lt1 microm gt1 microm lt1 microm gt1 microm lt1 microm gt1 microm lt1 microm lt1 microm lt1 microm
+NH4+ Control 009 NS NS NS NS NS 005
+NO3- Control NS NS NS NS NS NS 008
+taurine Control NS NS NS NS NS NS NS NS NS NS NS NS NS NS NS
βCR ratioChla concentrations
Rubisco activity per litre
β-carboxylase activity per litre
Rubisco activity per Chla
β-carboxylase activity per Chla
Table 3 Concentrations of ammonium nitrate and dissolved organic nitrogen (DON) measured in the control NH4+
(+NH4+) NO3
- (+NO3-) and taurine (+taurine) enriched treatments during the experiment
nd no data data in bold denote a period of darkness
Control + NH4+ + NO3
- + taurine Control + NH4+ + NO3
- + taurine Control + NH4+ + NO3
- + taurineT0 039 686 04 047 013 005 931 003 226 268 218 376T2 nd nd 026 nd 006 000 896 000 224 nd 222 ndT4 045 582 024 037 000 000 85 000 224 255 236 369T7 011 352 022 029 000 000 746 000 247 266 245 332T10 006 362 006 017 001 000 615 000 265 256 236 329T13 011 384 015 023 000 000 633 000 249 258 251 312
T17 018 327 012 015 000 008 586 001 218 249 221 315
T21 007 261 009 022 000 000 468 000 233 260 223 317T24 017 032 019 020 000 000 242 000 244 260 218 303
Ammonium concentrations (microM) Nitrate concentrations (microM) Dissolved organic nitrogen (DON) concentrations (microM)
Table 4 Small picophytoplankton and bacteria cell numbers during the experiment in
the control and N enriched treatments
nd no data data in bold denote a period of darkness
Control +NH4+ +NO3
- +taurine Control +NH4+ +NO3
- +taurineT0 196 195 219 208 936 nd nd ndT2 182 208 182 130 nd nd nd ndT4 309 252 279 257 nd nd nd ndT7 304 333 312 286 1220 1220 1200 1360T10 260 415 406 221 nd nd nd ndT13 258 482 484 230 1500 1500 1190 1330
T17 198 516 409 219 nd nd nd nd
T21 208 nd 500 177 1510 1220 884 1170T24 135 nd 457 184 1120 967 832 1160
lt1 microm phytoplankton cell numbers (x106 cells L-1)
Bacteria cell numbers (x106 cells L-1)
Table 5 Plankton cell numbers and carboxylases (Rubisco and PEPCK) activity per
carbon unit of diatom cell within the gt1 microm fraction at T0 in the control and T24 in the
control and N enriched treatments nd no data
Control +NH4+ +NO3
- +taurinePicophytoplankton (x106 cells L-1) 27 149 nd 20 72
Heterotroph flagellates (x106 cells L-1) 06 05 03 02 05Autotroph flagellates (x106 cells L-1) 07 11 06 05 07
Diatoms (x106 cells L-1) 08 19 91 50 19Rubisco activity (fmol CO2 cell-1 h-1) 117 57 83 112 60PEPCK activity (fmol CO2 cell-1 h-1) 90 26 006 046 75
T24T0
Table 6 The in vitro Rubisco activity per litre of gt1 microm and lt1microm fractions in the control and
enriched N treatments
nd no data data in bold denote a period of darkness
Control +NH4+ +NO3
- +taurine Control +NH4+ +NO3
- +taurineT0 1088 664 844 939 519 459 498 349T2 1215 1322 1147 1535 289 434 428 347T4 1427 1802 nd 975 449 nd 746 599T7 552 1029 1064 441 520 842 732 361T10 478 1667 1640 396 162 647 532 351T13 213 2006 1724 239 185 577 609 164T17 129 1485 1264 171 134 453 400 159T21 366 2324 843 371 180 669 657 232T24 1093 7606 5625 1186 120 329 395 155
gt1 microm Rubisco activity (nmol CO2 L
-1 h-1)lt1 microm Rubisco activity
(nmol CO2 L-1 h-1)
Table 7 The in vitro β-carboxylase activity (PEPC+PEPCK+PYRC) of gt1 microm and lt1microm
fractions in the control and enriched N treatments
nd no data data in bold denote a period of darkness
Control +NH4+ +NO3
- +taurine Control +NH4+ +NO3
- +taurineT0 104 91 138 151 156 142 118 147T2 211 178 154 178 264 125 288 161T4 201 86 nd 95 116 nd 235 121T7 169 140 149 70 151 150 168 121T10 99 223 133 128 182 235 170 67T13 195 320 nd 150 113 114 155 123T17 203 231 118 111 132 82 109 255T21 227 392 257 289 208 161 228 113T24 117 120 265 190 59 61 71 65
gt1 microm β-carboxylase activity (nmol CO2 L
-1 h-1)lt1 microm β-carbxylase activity
(nmol CO2 L-1 h-1)
Table 8 The cellular pool of Rubisco and PEPC enzymes of lt 1microm picophytoplankton in the
control and N enriched treatments
nd no data data in bold denote a period of darkness
Control +NH4+ +NO3
- +taurine Control +NH4+ +NO3
- +taurineT0 265 235 228 168 038 035 017 041T2 159 208 235 268 020 023 052 030T4 145 nd 267 233 027 nd 011 014T7 171 253 234 126 050 022 037 023T10 062 156 131 158 037 024 021 024T13 072 120 126 071 032 019 028 017
T17 068 088 098 073 038 011 021 027
T21 086 nd 131 131 055 nd 011 047T24 088 nd 086 084 020 nd 010 005
Rubisco activity per cell (fmol CO2 cell-1 h-1)
PEPC activity per cell (fmol CO2 cell-1 h-1)
Sampling area
Fig 1 Map of sampling area in Thau lagoon Grey and black areas denote the shellfish cultivation area and towns respectively
Mediterranean Sea
NIGHTC
hlor
ophy
llco
ncen
trat io
n(micro
g c h
l L-1
)
0
2
4
6
8
10
12
00
02
04
06
08
10NIGHT
Control+ NH4
+
+ NO3-
+ Taurine
A) gt1 microm phytoplankton
B) lt1 microm phytoplankton
Chl
orop
hyll
conc
entra
t ion
(microg
c hl L
-1)
Local time
1000 1600 2200 10000400
Fig 2 Chlorophyll (a+b+c) concentrations of (A) gt1 microm phytoplankton and of (B) lt1 microm phytoplankton in the control and enriched N treatments during the incubation experiment
Rub
isco
activ
ity(p
mol
CO
2 microg
C-1
h-1
)A) Without DIN enrichments
Local time
1000 1600 2200 10000400
0
200
400
600
800
1000
0
40
80
120
160
200
0
200
400
600
800
1000
0
40
80
120
160
200
NIGHT
NIGHT
B) With DIN enrichments
Control Control+ Taurine+ Taurine
+ NH4+
+ NO3-
+ NH4+
+ NO3-
β-ca
rbox
ylas
eac
tivity
(pm
olC
O2 micro
g C
-1 h
-1)
Rub
isco
activ
ity(p
mol
CO
2 microg
C-1
h-1
)
β-ca
rbox
ylas
eac
tivity
(pm
olC
O2 micro
g C
-1 h
-1)
Fig 3 Total Rubisco and β-carboxylase activity expressed per particulate carbon for (A) the control and enriched taurine carboy and for (B) the ammonium and nitrate enrichments during the incubation experiment
NIGHT
Rub
isco
activ
ity(n
mol
CO
2 microg
chla
-1 h
-1) NIGHT
Control+ NH4
+
+ NO3-
+ Taurine
A) gt1 microm phytoplankton
B) lt1 microm phytoplankton
Fig 4 Rubisco activity normalised per chlorophyll a concentration of (A) gt1 microm phytoplankton and of (B) lt1 microm phytoplankton in the control and enriched N treatments during the incubation experiment
Rub
isco
activ
ity(n
mol
CO
2 microg
chla
-1 h
-1)
0
200
400
600
0
200
400
600
Local time
1000 1600 2200 10000400
NIGHT
β-ca
rbox
ylas
eac
tivity
(nm
olC
O2 micro
g ch
la-1
h-1
)
A) gt1 microm phytoplankton
B) lt1 microm phytoplankton
NIGHTControl+ NH4
+
+ NO3-
+ Taurine
0
40
80
120
160
200
β-ca
rbox
ylas
eac
tivity
(nm
olC
O2 micro
g ch
la-1
h-1
)
0
20
40
60
Local time
1000 1600 2200 10000400
Fig 5 β-carboxylase activity normalised per chlorophyll a concentrations of (A) gt1 microm phytoplankton and of (B) lt1 microm phytoplankton in the control and enriched N treatments during the incubation experiment
NIGHT
β-ca
rbox
y las
e R
ubi s
cora
tio (
)
NIGHT
Control+ NH4
+
+ NO3-
+ Taurine
A) gt1 microm phytoplankton
B) lt1 microm phytoplankton
0
30
60
90
120
150
180
0
30
60
90
120
150
180
1000 1600
β-ca
rbox
y las
e R
ubi s
cora
tio (
)
Local time
2200 10000400
Fig 6 Ratio of β-carboxylase activity (PEPC+PEPCK+PYRC) to Rubisco activity expressed as percents measured in the control and enriched N treatments during the incubation experiment
2
Introduction
The nature of the interaction between nutrient assimilation and photosynthetic carbon
fixation is of major importance in understanding phytoplankton growth in fluctuating
environments The metabolic pathways of carbon (C) and nitrogen (N) are linked because they
must share organic C and energy They are supplied directly from photosynthetic electron
transport and CO2 fixation or from respiration of fixed C via glycolysis the TCA cycle and
mitochondrial electron transport chain (Turpin 1991 Huppe and Turpin 1994) Modifications of
photosynthesis due to variations in N supply have been largely ascribed to changes in the content
or specific activity of the primary CO2 fixing enzyme Rubisco ( Osborne and Geider 1986
references therein) Phytoplankton fix dissolved inorganic carbon via β-carboxylation to
replenish intermediates in the tricarboxylic acid cycle and the replacements or anaplerotic
carboxylations to provide essential compounds for phytoplankton growth that cannot be
produced from the Calvin-Benson cycle (Falkowski and Raven 1997) This pathway leads to
protein synthesis a process using phosphenolpyruvate carboxylase (PEPC)
phosphoenolpyruvate carboxykinase (PECK) or pyruvate carboxylase (PYRC) influenced by
ammonium availability among others factors (Mortain-Bertrand et al 1988) The β-
carboxylation pathway is mainly driven by phosphoenolpyruvate (PEP) which originates from
intermediates of Calvin-Benson cycle or in darkness from polysaccharides (Appleby et al
1980 Mortain-Bertrand et al 1987a b)
The nature of N source has been demonstrated to affect the phytoplankton physiology
(Levasseur et al 1993 Fidalgo et al 1995) such as the C fixation pathway It has been reported
that C fixation in darkness (via szlig-carboxylation pathway) was enhanced by addition of NH4+ to
3
N limited phytoplankton (Morris et al 1971 Slawyk and Collos 1982 Elrifi and Turpin 1986
Dodds and Priscu 1991 Vanlerberghe et al 1990 1992) Under steady-state conditions the
fraction of anaplerotic carbon fixation required to sustain the flux of aspartate glutamate and
their derivatives theoretically accounts for 5 of the fixed carbon in the organism (Falkowski
and Raven 1997 references therein) Nevertherless Guy et al (1989) using carbon isotope
discrimination showed that transient N assimilation by N-limited Selenastrum minutum causes a
major shift in carbon fixation from Rubisco to PEPC at high irradiance suggesting that PEPC
accounted for 70 to 87 of carbon fixation
Though the role of β-carboxylation in the phytoplankton cells is well known as supporting
the synthesis of amino acids derived from aspartate and glutamate the origin of PEP for β-
carboxylation is not clearly defined A higher β-carboxylase activity than Rubisco activity under
high irradiance as observed by Guy et al (1989) and Descolas-Gros and Oriol (1992) for
different phytoplanktonic species in culture suggested metabolites synthesised by other pathways
in the cell or from the external medium act as carbon acceptors for β-carboxylation pathway
Thus relative to the Rubisco activity a high β-carboxylase activity sustained by a mixotrophic
activity of the phytoplanktonic cells under N limiting conditions is assumed
During the present study the Calvin-Benson cycle and β-carboxylation pathways were
both examined over 24 hours by measuring the pool of carboxylase enzymes in a natural
plankton community from Thau Lagoon under different N conditions The initial addition of
ammonium and nitrate were compared to a control without enrichment The heterotrophic
capability of phytoplankton N nutrition was studied by enrichment with taurine which is an
important organic N compound released from oyster culture and has been shown to be a good
organic N source for phytoplankton in such ecosystems (Vincendeau 1987) Small
4
phytoplankton (lt2 microm) in Thau lagoon have been shown to be important in the phytoplankton
biomass and in primary production averaging about 30 of total chlorophyll a concentration and
about 40 of the total annual primary production (Courties et al 1994 Vaquer et al 1996)
This phytoplankton fraction is mainly constituted by the picoeukaryote Ostreococcus tauri with
cell size less of 1 microm diameter and described by Chreacutetiennot-Dinet et al (1995) We have thus
size-fractionated (1 microm) the plankton community to study the influence of the addition of these
different N sources on the unknown CO2 metabolism of the lt1 microm cells
Material and methods
Study area
Thau lagoon (Fig 1) is a Mediterranean coastal lagoon (France 43deg24 N - 3deg36 E)
shallow (depth average of 45 m) without tide exposed both to continental exports and oceanic
influence via the Rhocircne river plume (Souchu et al 1997) Thau lagoon is one of the most
important shellfish areas in Europe with an estimated standing stock of 40 000 tons of oysters
(Crassostrea gigas) which takes up 15th of the total area (7 000 ha) Salinities and temperatures
vary from 24 to 38 PSU and from 4 to 27oC respectively with a pH of 82 Little information is
available regarding the physical characteristics of Thau Lagoon Seawater turbidity is limited
with a Secchi depth ranging from 25 m to 77 m without any seasonal variation (Bacher et al
1995) The light attenuation coefficient is about 035 m-1 (outside the shellfish farming areas)
Hydrodynamics in the Thau Lagoon are linked with the wind regime and most of the exchanges
between the lagoon and the sea occur through the Canaux de Sete (Fig 1) The lagoon is able to
5
renew 12 of its water mass within 3 days owing to wind and barometric effects (Millet 1989)
In summer in spite of the low concentration of dissolved inorganic nitrogen (DIN) the shellfish
production is generally highest in the lagoon This suggests a high regenerated production
increased by enhanced benthic nutrient fluxes (Souchu et al 20001) and mainly based on
dissolved organic matter which represents the greatest stock of C and N (Gasc 1997)
In Thau Lagoon loricate ciliates such as tintinnids are abundant Tintinnids and rotifers
represented between 26 and 45 of the net collected microzooplankton biomass (Lam-Hoai et
al 1997) However at the shellfish culture area the occurrence of oysters and of epibiotic fauna
resulted in a drastic biomass reduction of the microzooplankton The oyster cultures contributed
to the picophytoplanktonic dominance in these waters by the preferential grazing of the larger
phytoplankton and zooplankton (Le Gall et al 1997 Dupuy et al 2000) From grazing
experiments Dupuy et al (2000) demonstrated that small picophytoplankton were not retained
by the oysters gills Nevertheless the picoeukaryote community constituted the most abundant
primary food resource for hetero-mixotrophic flagellates dinoflagellates and ciliates The whole
daily picophytoplankton production can be consumed by heterotrophic planktonic grazers
(Dupuy et al 2000) Phytoplankton from this oyster farming area showed higher annual Rubisco
activity normalised to chlorophyll a than phytoplankton from outside oyster farming and
offshore areas (Fouilland et al 1995) A marked effect of the oyster farming zone on bacterial
activities has been shown at the water-sediment interface with strong reductive processes
contributing to high ammonium concentrations in the farming areas (Gilbert et al 1997) A
higher average ambient ammonium concentration in this area than outside was suggested to
explain the strong autotrophic activity (Fouilland et al 1995)
6
Experimental set-up
The present experiment was conducted at Station ZA (85 m depth) located inside the
eastern shellfish-farming zone previously described in Souchu et al (1997) Two hundred litres
of seawater were taken from a 1 m depth in the middle of the Northern oyster rearing area (Fig
1) early in the morning Bulk water was filtered through a 200 microm mesh nylon net to remove
large particles and macrozooplankton grazers before distribution in incubation carboys The
water was subdivided into eight 20 L polycarbonate carboys two carboys per treatment being
used to increase the volume of incubated seawater 40 litres each for control ammonium nitrate
and taurine enrichments One carboy of each series was sampled during the first 10 hours of the
experiment (carboy A) and the second one during the last 14 hours (carboy B) The
reproducibility for a pair of carboys has been tested on chlorophyll (a+b+c) concentrations under
all N treatments and in the control during the experiment The equation of the linear regression
obtained between the Chl concentrations measured from all the carboys A and B is (Chl carboy
A) = 095 (Chl carboy B) +002 with a regression coefficient R2= 0988 indicating that
chlorophyll concentrations in a pair of carboys were very similar Polycarbonate carboys giving
an average of 95 light transmission were preferred to glass All incubated carboys (except
control) were enriched in different nitrogen sources with nitrate (10 microM NaNO3 final
enhancement) ammonium (10 microM NH4Cl final enhancement) and taurine (10 microM final
enhancement) Carboys were incubated at in situ temperature and irradiance at 1 m depth in the
middle of the oyster rearing area The experiment began on 22 June 1995 at 1000 (local time)
(T0) until 23 June 1995 at 1000 (T24) The sub-samplings occurred for each incubated carboys at
T0 T2 (1200) T4 (1400) T7 (1700) T10 (2000) T13 (2300) T17 (300) T21 (700) and T24
7
Physical and chemical variables
Surface photosynthetic available radiation (PAR) was measured with a LI-COR (Model
LI-190SA) quantum sensor and a LI-1000 data logger Underwater irradiance was measured
every 50 cm with a LI-COR (Model 193SA) spherical quantum sensor The visible light
extinction coefficient was calculated from linear regressions of irradiance vs depth
Samples for ammonium (NH4+) determination were immediately fixed and measured at
the laboratory using the method of Koroleff (1976) For the other nutrients samples were brought
to the field laboratory stored in acid precleaned polycarbonate carboys Filtrations and storage of
samples were performed within one hour after sampling in an all glass filtering system through a
precombusted (450degC for 6 h) Whatman GFF filter (vacuum lt10 cm Hg) Filtrates were
immediately frozen in precombusted Pyrex flasks for later analysis of Soluble Reactive
Phosphorus (SRP) nitrate (NO3-) and nitrite (NO2-) and silicate with a segmented flow analyser
(Treacuteguer and Le Corre 1975) The determination of dissolved organic nitrogen concentration
(DON) was performed using the photo-oxidation method (Armstrong and Tibbits 1968)
Determinations of particulate organic carbon (POC) were performed on Whatman 25 mm GFF
filters with a Perkin-Elmer Model 2400 CHN analyzer
Size fractionated filtrations
For each sampling time 1050 ml was used for size fractions following a protocol
described in Fouilland et al (2001) This protocol allows
1) study of the effect of N treatment on in vitro carboxylase activities for lt1 μm and gt 1μm
plankton cells 2) expression of the in vitro carboxylase activities per unit cell for lt1 μm
picophytoplankton 3) a check for potential filtration artefacts Two successive filtrations on
8
Nuclepore filter (1 microm size pore) and on GFF glass fiber Whatman filter (07 microm size pore) with
a vacuum lt 23 cm Hg to minimise cell damage were performed Subsamples for cell
enumeration were taken before and after filtrations on 1 microm Nuclepore and GFF Whatman
filters Both filters for in vitro carboxylase activities and chlorophyll measurements as well as
subsamples fixed previously by 2 (final concentration) formaldehyde for cell enumeration
(Troussellier et al 1995) were all stored in liquid nitrogen
Chlorophyll concentration measurements
Filters were ground in 90 acetone and extracted for 24 h in the dark at 4oC Chlorophyll
(a+b+c) concentrations (Chl) were determined by spectrofluorimetry (Neveux and Lantoine
1993)
Planktonic cell enumeration and diatoms taxonomy
Subsamples (20 ml) were fixed with 2 ml of 40 formaldehyde The samples were kept
in the dark at 4degC Fixed samples for bacteria and flagellates enumeration were filtered on black
polycarbonate Nuclepore membranes (022 μm porosity) Five minutes before filtration one drop
of DAPI (4 6-diamidino-2-phenylindole) was added to samples (Porter and Feig 1980)
Autotrophic and heterotrophic flagellates were discriminated by the red fluorescence of
chlorophyll a containing organisms under ultra-violet light using epifluorescence microscopy
Counting was done by examination of 10 equatorial bands (100x objective and band surface
168000 μm2) over the whole membrane length For bacteria 20 to 30 microscope fields were
counted in order to have a minimum count of 300 bacteria (100x objective field surface 256
9
μm2) Enumeration and identification of large phytoplankton was made by optical microscopy
after sedimentation (Utermohl 1958)
Flow cytometry analyses
Flow cytometry (FCM) analyses were run with an ACR 1000 cytometer Phytoplanktonic
cells were detected according to their light scatter (related to cell size and structure) their orange
and red fluorescence emissions (due to phycoerythrin and chlorophyll pigments) collected
through 58542 nm band pass and 650 nm long pass optical filters respectively One microm beads
(Polysciences Warrington PA) used as internal standard were systematically added to analyse
samples in order to normalise and compare the different phytoplanktonic groups Flow cytometry
allowed us to discriminate phytoplankton with size range between 05 microm and 50 microm (FCM
injector size)
In vitro carboxylase activities
The pool of potentially active enzymes responsible for CO2 fixation in plankton
community was measured as the in vitro carboxylases activity by incorporation of radioactive
bicarbonate into stable products following Descolas-Gros and Oriol (1992) This allowed us to
quantify the in vitro Rubisco activity and szlig-carboxylase activity (sum of the activities of
phosphenolpyruvate carboxylase PEPC phosphoenolpyruvate carboxykinase PEPCK and
pyruvate carboxylase PYRC) present in planktonic community (Appleby et al 1980 Glover
1989) All carboxylase assays were made on the same extract Extraction was carried out at 0 oC
and pH 8 following the protocol described in Descolas-Gros and De Billy (1987) For the
Rubisco assay the reaction mixture contained 50 mM Tricine buffer (pH 8) 5 mM dithiothreitol
10
(DTT) 10 mM MgCl2 20 mM NaH14CO3 and 100 μl of the crude extract For the other three
assays the reaction mixture contained 50 mM Pipes buffer (pH 68) instead of the Tricine buffer
Moreover 5 mM MnCl2 and 5 mM ADP were added for PEPCK assays and for PYRC assays 5
mM MgCl2 and 5 mM ATP were added All reactions were initiated after a pre-incubation period
of 10 min by adding substrates 2 mM RuBP for Rubisco assay 5 mM PEP for PEPC and
PEPCK assays and 5 mM pyruvate for PYRC assay All mixtures were incubated at 25 oC for 20
min The reactions were stopped by the addition of 6 N HCl More details on the protocol are
given in Descolas-Gros and Fontugne (1985) Descolas-Gros and De Billy (1987) and Descolas-
Gros and Oriol (1992) Every carboxylase assay was carried out in triplicate with an assay error
lt15 and was automated with a Gilson auto-analyser (222 Autosampler Injector interfaced with
a Dilutor 401) Carboxylase activity is expressed in nmol CO2 L-1 h-1 in pmol CO2 μg C-1 h-1 and
in nmol CO2 μg Chla-1 h-1 in order to take into account the variation of the particulate carbon and
phytoplanktonic biomass during the experiment and in fmol CO2 cell-1 h-1 when possible The szlig-
carboxylasesRubisco ratio (βCR expressed in ) allowed us to quantify the relative importance
of the two pathways
Experiment reproducibility
In order to estimate the precision of the biological parameters discussed in this study the
coefficient of variation (CV) has been calculated for each parameter using four values measured
at T0 and is presented in Table 1 The CV of the biological parameters was generally less than
25 except for the carboxylases activity per cell for diatom cell and for the β-carboxylase per
cell for lt1 μm cells with values between 33 and 44 (Table 1)
11
Statistical analyses
In order to compare the effect of N treatments relative to the control and between the N
treatments non-parametric Wilcoxon signed-Rank analyses have been applied on cell numbers
chlorophyll concentrations and carboxylase activities and reported in Table 2
Results
Nutrient concentrations and physical variables
All chemical data are reported in Table 3 Water temperature varied between 220 and
238oC at a depth of 15 m At this depth the attenuation of the incident light with a maximum
value of 1800 μE m-1 s-1 was about 50 The initial chemical conditions were characterised by
very low concentrations in nitrate (lt015 microM) nitrite (lt01 microM) and by ammonium
concentrations averaging 04 microM and high DON concentrations averaging 24 microM These values
were close to those reported in June 1993 in the same area (Collos et al 1997) The phosphate
values averaged 022 microM in all carboys throughout the experiment (data not shown) The molar
ratio of silicateDIN varied from 17 to 110 in the control and enriched taurine carboys while the
ratio was close to 1 (between 08 and 25) throughout the experiment under enriched NH4+ and
NO3- treatments (data not shown) This suggested that DIN was the limiting nutrient in the
control and enriched taurine carboy during the experiment The ammonium concentrations
decreased from 04 to 006 microM (T10) in the control and under NO3- treatment and to 017 microM
(T10) under taurine treatment and varied between 007 to 023 microM afterwards The ammonium
concentrations decreased from 686 microM (T0) to 032 microM (T24) under NH4+ treatment The nitrate
12
remained undetectable throughout most of the experiment in the control NH4+ and taurine
treatments and decreased from 931 microM (T0) to 242 microM (T24) under NO3- treatment The DON
concentrations remained quite constant in the control and under DIN treatments varying from
218 to 268 microM and decreased from 376 microM (T0) to 303 microM (T24) under the taurine treatment
Size fractionation accuracy
Using the chlorophyll parameter (red fluorescence) from flow cytometry analysis on
samples before and after 1 μm nuclepore filtration and compared to the lt1 μm chlorophyll a
concentrations measured by spectrofluorimetry the accuracy of size-fractionation protocol was
assessed The red fluorescence for each cell group in the lt1μm fraction was summed and
compared with the lt1μm chlorophyll a concentrations A positive linear regression was obtained
(R2=074 n=22) The total red fluorescence of cells after 1 μm filtration detected by flow
cytometry was thus directly correlated with chlorophyll a pigment concentration measured in this
lt1 μm fraction This indicates that the potential filtration artefacts (eg breakdown of small cells)
were reduced during the experiment
Small picoplanktonic cells
In the lt1 μm filtrate a population of small picoeukaryotes was identified and exhibited
the same flow cytometric characteristics as the eukaryotic Ostreococcus tauri This picoeukaryote
contributed 95 of total lt1 μm cell numbers Larger picoeukaryote cells with a relative red
fluorescence and apparent size close to those of 1 μm beads were also detected in this fraction
No cyanobacteria cells were detected by either flow cytometry or epifluorescence microscopy
during this study The variation of lt1 microm cell numbers detected by flow cytometry is reported in
13
Table 4 The abundance of small picoeukaryote cells measured during this experiment was in the
same range of values as previously observed in the same area between 1991 and 1994 averaging
30x106 cell L-1 (Vaquer et al 1996) Compared to the control no effect of taurine treatment was
detected on the lt1 microm cell concentrations (Table 2) The lt1 microm cell numbers increased in all
carboys T0 to T7 and afterwards decreased in the control and under taurine treatment From T10 a
strong significant increase of lt1 microm cell numbers reaching 50 106 cell L-1 was observed under
DIN treatments (Table 4)
From previous filtration experiments with plankton community from Thau Lagoon 67 to
74 of total bacteria cells can be retained on GFF filters (unpubl data) Bacterial cell numbers
varied slightly during the experiment (Table 3) As compared to the control the different N
treatments did not influence the cell concentrations Retention on GFF filter of 70 of total
bacterial cell was assumed Thus the contribution of bacteria cells was always greater than 95
of the total lt1 μm plankton cell numbers retained on GFF filters
Larger plankton cells community
At the beginning of the experiment nano- and microplankton species were dominated by
autotrophic flagellates and diatoms mainly composed of Chaetoceros spp Skeletonema spp and
Pseudo-nitzschia spp (Table 5) At the end of the experiment heterotrophic and autotrophic
flagellate abundance did not vary whereas diatom cells reached 19 106 cells L-1 in the control and
under taurine treatment mainly due to an increase of Pseudo-nitzschia spp cells On the last day
of the experiment higher diatom cell abundance was measured under DIN treatments mainly
due to the increase of Skeletonema spp cells (Table 5) Using a Ccell conversion factors for
each group from Dupuy et al (2000) the contribution of gt1 μm picophytoplankton and diatom
14
cells to the total gt1μm planktonic organic carbon was estimated to be less than 01 and greater
than 95 respectively during the experiment
Chlorophyll pigment concentrations and in vitro carboxylases activity
The chlorophyll pigment concentrations and the pool of Rubisco per litre for both size
fractions were not significantly different between the control and the taurine treatment
throughout the experiment (Table 2) Compared to the control a significant increase of
chlorophyll concentration occurred after 7 incubation hours under DIN treatments reaching 109
and 08 microgL-1 for gt1 μm and lt1 μm phytoplankton cells respectively (Fig 2A amp 2B Table 1)
Similarly to the chlorophyll concentrations after 7 incubation hours the pool of Rubisco per litre
for both size fractions was significantly greater under DIN treatments than in the control (Table 2
and 6) The pool of β-carboxylase activity per litre for both size fractions varied slightly during
the 24 hours incubation (Table 7) and no significant different between the N treatments and the
control was reported (Table 2) The values of the total carboxylases activity (ie sum of two size
fractions) were normalised per carbon using the particulate organic carbon concentration (POC)
and reported in Figure 3 In the carboys without DIN enrichments the total β-carboxylase
activity per carbon increased during the night period while the total Rubisco activity per carbon
decreased (Fig 3A) A coupling between the total Rubisco and β-carboxylase activity per carbon
was generally observed in the carboys with DIN enrichments (Fig 3B) The ratio between POC
and chlorophyll a concentrations (POCChla) decreased from about 700 to 200 μgC μgChla-1
overall the experiment in all the carboys The carboxylases activity was normalised to
chlorophyll a concentrations for each size fraction in order to take into account the
phytoplankton biomass variation between the N treatments during the present experiment The
15
Rubisco activity per Chla generally decreased in all N treatments for both size fractions during
the experiment (Fig 4) and no significant difference between these N treatments was measured
(Table 2) The β-carboxylase activity per Chla for both sized fractions generally decreased
during the 10 first hours of the experiment in all N treatments (Fig 5) Nevertheless a significant
increase of the β-carboxylase activity per Chla for both size fractions occurred under DIN
treatments afterwards while this activity per Chla remained very low in the control and the
taurine treatment (Fig 5 and Table 2)
β-carboxylation pathway
β-carboxylase activity (PEPC+PEPCK+PYRC) for the plankton community expressed as
a percentage of Rubisco activity (βCR ratio) reached values greater than 50 after 10 incubation
hours in the control and under taurine treatment (Fig 6) Under DIN treatments the βCR ratio
for both size fractions was significantly lower than measured in the control with values less than
40 throughout the study (Table 2) Phosphenolpyruvate carboxylase (PEPC) enzyme
contributed to about 50 of the total β-carboxylase enzymes in both size fractions (data not
shown)
Cellular pool of carboxylase enzymes
A strong decrease of the Rubisco pool per unit cell was measured in small phytoplankton
in all carboys during the experiment and no significant influence of N treatments was observed
(Table 2 and 8) As diatom cells contributed for the most part of carbon biomass in gt1 μm
plankton community the in vitro Rubisco activity for gt1 μm fraction is expressed on the basis of
16
diatom cell number Similarly to the small cells a decrease of the Rubisco pool per unit cell is
also observed for larger cells after 24 incubation hours in the carboys (Table 5)
For the small size fraction the enzymatic pool of PEPC is expressed per unit cell of small
picoeukaryotes and reported in the Table 8 This cellular pool tended to be significantly different
between the DIN treatments and the control (p=005 and 008 Table 2) This pool decreased
during the experiment under DIN treatments while the highest values in the control and under
taurine treatment were recorded close to the end of the experiment (Table 8) The pool of PEPCK
is expressed by unit of diatom cells as this enzyme is present in the dominant diatom species
observed during this study (Descolas-Gros and Oriol 1992) and these species contributed to 95
of the total gt1 μm carbon biomass Similarly to the PEPC in small cells the cellular pool of
PEPCK in larger cells was significantly very low under DIN treatments relative to the control and
to the carboy with an addition of taurine at the end of the experiment (Table 5)
Discussion
After 10 hours of incubation the very low available dissolved inorganic nitrogen (DIN)
concentrations probably limited the growth of phytoplankton in the control and under taurine
treatment This explains the decrease of the small picophytoplankton cells and the low net growth
rate of diatoms in these carboys Nevertheless bacterial cells and heterotrophic flagellates
submitted to these different nutrient conditions did not show a net growth rate In contrast the net
growth rate of picophytoplankton and diatom was about 15 and 3 divday respectively in the
samples enriched with DIN
17
Even though phytoplankton growth was positively influenced by DIN enrichments the
cellular pool of potentially active Rubisco enzyme for picophytoplankton and diatom cells
decreased throughout the study in all the carboys This suggests a degradation of the cellular
enzymatic pool in phytoplankton cells during the study The rapid degradation of the nitrogen
fraction in phytoplankton cells under high irradiance has been shown in a shallow environment
with photosynthetically available radiation levels above 600 to 1000 μE m-2 s-1 (Collos et al
1992) Rubisco enzyme can act as a nitrogen reservoir that is more easily mobilised than the rest
of the protein pool during environmental changes (Ekman et al 1989) Thus cellular Rubisco
pool degradation during this present study may result from the light conditions in incubation
carboys held at fixed positions near the surface where phytoplankton cannot avoid high
irradiance levels during the day time reaching about 900 μE m-2 s-1 at the incubation depth
As compared to the Rubisco pathway the potential use of β-carboxylation pathway by the
plankton community as shown by the carboxylases activity normalised to the particulate carbon
chlorophyll a and cell and by the ratio βCR increased after 10 incubation hours in the carboys
without DIN enrichments only The values of the βCR ratio were higher than 100 at which
time the phytoplankton biomass started to decrease in the control and under taurine treatment In
contrast β-carboxylase activity seemed strongly coupled to the Rubisco activity under DIN
treatments This daily co-variation was already reported for natural phytoplankton in
Mediterranean Sea under favourable environmental conditions (Fouilland et al 2001) showing
the strong interdependence of these two C assimilation pathways (falkowski and Raven 1997)
The βCR ratio under DIN treatments remained less than 40 which is a characteristic of
autotrophic cells (Descolas-Gros and Oriol 1992) A βCR ratio higher than 100 suggests that
the β-carboxylation pathway can prevail on the Calvin-Benson pathway As β-carboxylation in
18
the light occurs using a substrate (PEP) derived from the Calvin-Benson cycle a ratio greater
than 100 has been associated with the occurrence of heterotrophic organisms such as
dinoflagellates (Descolas-Gros and Oriol 1992) For such cells the origin of
phosphoenolpyruvate is uncertain and Descolas-Gros and Oriol (1992) suggested that it could be
supplied by the incorporation of external organic substances
The increase of β-carboxylase pathway observed in the present study cannot be explained
by the increase of heterotrophic biomass relative to the autotrophic biomass in the control or with
addition of taurine The POCChla ratio decreased throughout the experiment suggesting a shift
towards an autotrophic community in all the carboys For the small size fraction bacterial cells
which are partially retained by filters could have significantly contributed to the total β-
carboxylase activity as suggested by results from dark fixation of 14C from natural plankton (Li et
al 1993 Markager 1999) Nevertheless the regulation of β-carboxylation pathway and enzyme
structure is different in bacterial and phytoplankton cells (Rivoal et al 1998) The occurrence of
carboxylation of PEP by PEPC is well known in bacterial cells Nevertheless this carboxylase
does not act unless acetyl-coenzyme A is present perhaps to facilitate a continued supply of
oxaloacetate for the TCA cycle fuelling (Baumerg 1973 Overbeck 1984) Such regulation does
not occur in phytoplankton cells (Turpin et al 1991) As no acetyl-coenzyme A is added to the
reaction mixture the strong variation of the activity of major β-carboxylase enzymes (PEPC) is
assumed to be directly related to the β-carboxylation pathway of the small picoeukaryote cells
Moreover the bacterial cells contributed a very large fraction to the total lt1 μm picoplankton
abundance and no significant difference in the bacterial abundance was noticed between carboys
(Table 4) Thus any increase of βCR ratio for the lt1 μm fraction observed after 10 hours of
incubation cannot be due to the bacterial growth relative to the decrease of small
19
picophytoplankton abundance which contributed to less than 5 of total cell numbers over the
experiment in all carboys The importance of bacterial activity (free or attached bacteria cells) is
assessed relatively to the ammonium uptake Data from Table 3 show that ammonium uptake was
at least twice as high during the day than at night in NH4+ treatment indicating autotrophic
driven processes In the control ammonium actually increased at night (Table 3) so it can be
safely assumed that bacterial populations produced rather than consumed ammonium in these
series of experiment This suggests that the heterotroph bacterial activity was not influenced by
the N treatments Moreover using values for the carbon content in plankton species in Thau
Lagoon calculated by Dupuy et al (2000) the heterotroph flagellates contributing to the total gt1
microm plankton biomass was estimated to be less than 1 in the control and under all N treatments
at the end of the experiment Thus the variation of the β-carboxylation enzyme pool relative to
the Rubisco was mainly due to the enzyme activities from the autotrophic plankton in both size
fractions
Anaplerotic carbon fixation by PEPC in the light exceeding photosynthetic carbon
fixation has already been measured in an N-limited green alga using stable carbon isotope
discrimination (Guy et al 1989) These authors showed that under transient situations the
contribution of βminuscarboxylation to the total C fixation can be as high as 70 ie a βCR ratio of
230 which is higher than our maximum value for a natural plankton assemblage (160) The
significant increase of both βCR ratio and the β-carboxylase activity normalised to the
chlorophyll and carbon biomass reported during the present study suggests a potential increase
of cellular β-carboxylase enzymes The pool of PEPC and PEPCK expressed per unit cell for the
small picoeukaryotes and diatoms tended to increase at the end of the experiment in the control
and under taurine treatment This increase of the activity of β-carboxylase enzymes combined
20
with the decrease of the Rubisco activity under inorganic N-deficient conditions suggests that β-
carboxylation pathway is more active when phytoplankton growth is limited by inorganic
nutrients A higher photosynthetic carbon fixation by β-carboxylation than by Rubisco in
autotrophic phytoplankton cells is surprising especially in regards to the source of the substrate
for β-carboxylation The dissimilation of reserve carbohydrate providing PEP for this pathway
as usually observed in the dark for microalgae (Mortain-Bertrand et al 1988) is unlikely This is
because phytoplankton growth was very low under N-deficient conditions implying low C
storage in cells
The increase of the enzymatic pool for β-carboxylation in phytoplankton may be due to a
shift from autotrophic to heterotrophic activity induced by a DIN deficiency as in the control and
DON (taurine) treatment There is indirect evidence that taurine was taken up during the day
Data from Table 2 shows that DON decreased in the carboys enriched with taurine while it
remained constant in the others This decrease roughly corresponds to the taurine addition but
taurine was taken up during the day only and not at night which indicates that phytoplankton
not bacteria were responsible for this uptake Nevertheless this uptake does not result in
increased phytoplankton biomass as observed in enriched ammonium or nitrate carboys
Possibly the time lag involved between uptake and growth is longer than the time scale used in
the present study as observed elsewhere (Antia et al 1975 Bonin and Maestrini 1981) Thus
increases in cell numbers could not be observed within a 24-hour time frame following the
taurine addition Interestingly in the study of Vincendeau (1987) S costatum took up DON once
DIN was exhausted Thus the similarity between the control and the taurine treatment could have
a common explanation heterotrophy is induced by DIN limitation The increase of β-
carboxylation pathway under limiting N conditions is coupled to the uptake of dissolved nitrogen
21
compounds by phytoplankton resulting in the activation of respiration for the biosynthetic
processes This causes the back-regulation of anaplerotic reactions as previously described by
Vanlerberghe et al (1990 1992) for NH4+ uptake A stimulation of respiration after the addition
of acetate has also been observed in Chlamydomonas reinhardtii cultured photoautotrophically
(Fett and Coleman 1994 Endo and Asada 1996) Moreover under similar conditions Heifetz et
al (2000) showed a decrease of photosynthetic carbon fixation in cells grown in acetate with
saturating light and CO2 These results suggest an increase of the β-carboxylation pathway for the
replenishment of TCA cycle intermediates in order to sustain the growth rate of C reinhardtii
growing heterotrophically using acetate as source of carbon This is in accordance with the
increase of cellular β-carboxylase pool during a shift toward heterotrophy in natural
phytoplankton cells suggested in this study Even though the evidence of this heterotrophy was
observed with the taurine enrichment only the importance of the β-carboxylation pathway in
natural phytoplankton under very low nutrient conditions is clearly highlighted in this study In
order to gain further insight into the phytoplankton heterotrophy the relationship between the
CO2 assimilation pathways and the capacity of phytoplankton to use organic sources of nitrogen
andor carbon should be investigated using axenic cultures of phytoplankton submitted to
different nutritional conditions for instance
Acknowledgements
This work was supported by CNRS University Montpellier II IFREMER (URM 5) We
thank J-M Deslous-Paoli and C Leboulanger for their assistance during the fieldwork T Sime-
22
Ngando for providing bacteria and flagellates data and 2 anonymous referees for insightful
comments on the manuscript This paper represents a portion of a thesis of the University Paris
VI of Eric Fouilland who received a BDI fellowship from CNRS and IFREMER This is the
XXX ISEM contribution for Chantal Descolas-Gros
23
References
Appleby G Colbeck J Holdsworth ES Wadman H 1980 szligcarboxylation enzymes in
marine phytoplankton and isolation and purification of pyruvate carboxylase from
Amphidinium carterae (Dinophyceae) J Phycol 16 290-295
Antia NJ Berland BR Bonin DJ Maestrini SY 1975 Comparative evaluation of certain
organic and inorganic sources of nitrogen for phototrophic growth of marine microalgae J
Mar Biol AssU K 55 519-539
Armstrong FAJ Tibbits S 1968 Photochemical combustion of organic matter in sea
water for nitrogen phosphorus and carbon determination J Mar Biol Ass U K 48
143-152
Bacher C Millet B Vaquer A 1997 Modeacutelisation de lrsquoimpact des mollusques cultiveacutes
sur la biomasse phytoplanctonique de lrsquoeacutetang de Thau (France) C R Acad Sci Paris
320 73-81
Baumberg S 1973 Co-ordination of metabolism In Mandelstam J McQuillen K (eds)
Biochemistry of bacterial growth Second edition Blackwell 423-493
Bonin DJ Maestrini SY 1981 Importance of organic nutrients for phytoplankton growth in
natural environments implications for algal species successionPhysiological bases of
phytoplankton ecology Platt T (Ed) Can Bull Fish Aquat Sci 210 279-291
Chreacutetiennot-Dinet M-J Courties C Vaquer A Neveux J Claustre H Lautier J
Machado MC 1995 A new marine picoeukaryote Ostreococcus tauri gen et sp nov
(Chlorophyta Prasinophyceae) Phycologia 34 85-292
24
Collos Y Descolas-Gros C Fontugne M Mortain-Bertrand A Chretiennot-Dinet MJ
Frikha MG 1992 Carbon and nitrogen dynamics during growth and degradation of
phytoplankton under natural surface irradiance Mar Biol 112 491-496
Collos Y Descolas-Gros C Fontugne M Mortain-Bertrand A Chreacutetionnot-Dinet M-J
Frikha MG 1993 Chemical isotopic and enzymatic monitoring of free and enclosed
seawater implications for primary production estimates in incubation carboys Mar Ecol
Prog Ser 93 49-54
Collos Y Vaquer A Bibent B Slawyk G Garcia N Souchu P 1997 Variability in nitrate
uptake kinetics of phytoplankton communities in a Mediterranean coastal lagoon Estuar
Coast Shelf S 44 369-375
Courties C Vaquer A Troussellier M Lautier J Chreacutetiennot-Dinet M-J Neveux J
Machado C Claustre H 1994 Smallest eukaryotic organism Nature 370 255
Descolas-Gros C Fontugne M 1985 Carbon fixation in marine phytoplankton carboxylase
activities and stable carbon-isotope ratios physiological and paleoclimatological aspects
Mar Biol 87 1-6
Descolas-Gros C De Billy G 1987 Temperature adaptation of RuBP caboxylase kinetic
properties in marine Antarctic diatoms J Exp Mar Biol Ecol 108 147-158
Descolas-Gros C Oriol L 1992 Variations in carboxylase activity in marine phytoplankton
cultures szligcarboxylation in carbon flux studies Mar Ecol Prog Ser 85 163-169
Dodds WK Priscu JC 1991 Ammonium stimulation of dark carbon fixation as an indicator
of nitrogen deficiency in phytoplankton potential errors caused by ammonium-oxidizing
bacteria J Phycol 27 79-82
25
Dupuy C Vaquer A Lam-Hoai T Rougier C Mazouni N Lautier J Collos Y Le Gall
S 2000 Feeding rate of the oyster Crassostera gigas in a natural planktonic community of
Mediterranean Thau Lagoon Mar Ecol Prog Ser 205 171-184
Ekman P Lignell A Pedersen M 1989 Localization of ribulose-15-bisphosphate
carboxylaseoxygenase in Gracilaria secundata (Rhodophyta) and its role as a nitrogen
storage pool Botanica Mar 32 527-534
Elrifi IR Turpin DH 1986 Nitrate and ammonium induced photosynthetic suppression in N-
limited Selenastrum minutum Plant Physiol 81 273-279
Endo T Asada K 1996 Dark induction of the non-photochemical quenching of chlorophyll
fluorescence by acetate in Chlamidomonas reinhardtii Plant Cell Physiol 37 551-555
Falkowski PG Raven JA 1997 Aquatic photosynthesis Blackwell Science publisher
Fett JP Coleman JR 1994 Regulation of periplasmic carbonic anhydrase expression in
Chlamidomonas reinhardtii by acetate and pH Plant Physiol 106 103-108
Fidalgo JP Cid A Abalde J Herrero C 1995 Culture of the marine diatom Phaedactylum
tricornutum with different nitrogen sources Growth nutrient conversion and biochemical
composition Cah Biol Mar 36 165-173
Fouilland E Vaquer A Descolas-Gros C 1995 Annual variations in CO2 assimilation and
primary production measurements in a mediterranean lagoon (Thau lagoon France)
Photosynthesis from Light to Biosphere Mathis P (Ed) Elvesier 5 873-876
Fouilland E Courties C Descolas-Gros C 2001 Size-fractionated carboxylase activities
during a 32 h cycle at 30 m depth in the Northwestern Mediterranean Sea after an episodic
wind event J Plankton Res 23 623-632
26
Gasc A 1997 Etude de la production primaire reacutegeacuteneacutereacutee dans un eacutecosystegraveme conchylicole le
bassin de Thau Ph D Univ Sciences et Techniques du Languedoc Montpellier France
Gilbert F Souchu P Bianchi M Bonin P 1997 Influence of shellfish farming activities on
nitrification nitrate reduction to ammonium and denitrification at the water-sediment
interface of the Thau lagoon France Mar Ecol Prog Ser 151 143-153
Glover HE 1989 Ribulosebisphosphate carboxylaseoxygenase in marine organisms Int Rev
Cytol 115 67-137
Guy RD Vanlerberghe GC Turpin DH 1989 Significance of phosphoenolpyruvate
carboxylase during ammonium assimilation Carbon isotope discrimination in
photosynthesis and respiration by the N-limited green alga Selenastrum minutum Plant
Physiol 89 1150-1157
Heifetz PB Forster B Osmond CB Giles LJ Boynton JE 2000 Effects on facultative
autotrophy in Chlamydomonas reihardtii assessed by photosynthetic measurements and
stable isotope analyses Plant Physiol 122 1439-1445
Huppe HC Turpin DH 1994 Integration of carbon and nitrogen metabolism in plant and
algal cells Annu Rev Physiol Plant Mol Biol 45 577-607
Koroleff F 1976 Determination of nutrients Methods of Seawater analysis Grasshoff K
(Ed) Verlag Chemie 117-182
Lam-Hoai T Rougier C Lasserre G 1997 Tintinnids and rotifers in a northern
Mediterranean coastal lagoon Structural diversity and function through biomass
estimations Mar Ecol Prog Ser 152 13-25
27
Le Gall S Hassen MB Le Gall PB 1997 Ingestion of a bacterivorous ciliate by oyster
Crassostera gigas protozoa as a trophic link between picoplankton and benthic suspension-
feeders Mar Ecol Prog Ser 152 301-306
Levasseur M Thompson PA Harrison PJ 1993 Physiological acclimation of marine
phytoplankton to different nitrogen sources J Phycol 29 587-595
Millet B 1989 Fonctionnement hydrodynamique du bassin de Thau Validation drsquoun modegravele
numeacuterique de circulation (programme Ecothau) Oceanol Acta 12 37-46
Morris I Yentsch CM Yentsch CS 1971 The physiological state with respect to nitrogen
of phytoplankton from low-nutrient subtropical water as measured by the effect of
ammonium ion on dark carbon dioxide fixation Limnol Oceanogr 16 859-868
Mortain-Bertrand A Descolas-Gros C Jupin H 1987a Short-term 14C incorporation in
Skeletonema costatum (Greville) Cleve (Bacillariophyceae) as a function of light regime
Phycologia 16 262-269
Mortain-Bertrand A Descolas-Gros C Jupin H 1987b Stimulating effect of transitions from
light to dark on carbon assimilation by a marine diatom J Exp Mar Biol Ecol 112 11-
26
Mortain-Bertrand A Descolas-Gros C Jupin H 1988 Pathway of dark inorganic carbon
fixation in two species of diatoms influence of light regime and regulator factors on diel
variations J Plankton Res 10 199-217
Neveux J Lantoine F 1993 Spectrofluorometric assay of chlorophylls and phaeopigments
using the least squares approximation technique Deep-Sea Res 40 1747-1765
28
Osborne BA Geider RJ 1986 Effect of nitrate-nitrogen limitation on photosynthesis of the
diatom Phaeodactylum tricornutum Bohlin (Bacillariphyceae) Plant Cell Environ 9 617-
625
Overbeck J 1984 Application of TCA cycle metabolism for growth estimates of heterotrophic
bacterioplankton Arch Hydrobiol Beih 19 23-36
Porter K Feig YS 1980 The use of DAPI for identifying and counting aquatic microflora
Limnol Oceanogr 25 943-948
Slawyk G Collos Y 1982 13C and 15N uptake by marine phytoplankton 2 Results from a
tropical area Rapp P-v Reacuteun Cons int Explor Mer 180 209-213
Souchu P Gasc A Cahet G Vaquer A Collos Y Deslous-Paoli JM 1997
Biogeochemical composition of Mediterranean waters outside the Thau lagoon Estuar
Coast Shelf S 44 275-284
Souchu P Vaquer A Collos Y Lamdrein S Deslous-Paoli J-M Bibent B 2001
Influence of shellfish farming activities on the biogeochemical composition of the water
column in Thau Lagoon Mar Ecol Prog Ser 218 141-152
Treacuteguer P Le Corre P 1975 Manuel danalyse des sels nutritifs dans leau de mer
Utilisation de lAutoAnalyseur II Technicon LOC Universiteacute de Bretagne Occidentale
Brest France
Troussellier M Courties C Zettelmaier S 1995 Flow cytometric analysis of coastal lagoon
bacterioplankton and picophytoplankton fixation and storage effects Estuar Coast Shelf
S 40 621-633
Turpin DH 1991 Effects of inorganic N availability on algal photosynthesis and carbon
metabolism J Phycol 27 14-20
29
Turpin DH Vanlerberghe GC Amory AM Guy RD 1991 The inorganic requirements
for nitrogen assimilation Can J Bot 69 1139-1145
Utermoumlhl H 1958 Zur Vervollkommnung der quantitativen Phytoplankton-Methodik Mitt int
Ver theor angew Limnol 9 1-38
Vanlerberghe GC Schuller KA Smith RG Feil R Plaxton WC Turpin DH 1990
Relationship between NH4+ assimilation rate and in vivo phosphoenolpyruvate carboxylase
activity Regulation of anapleurotic carbon flow in the green alga Selenastrum minutum
Plant Physiol 94 284-290
Vanlerberghe GC Huppe HC Vlossak KDM Turpin DH 1992 Activation of
respiration to support dark NO3- and NH4
+ assimilation in the green alga Selenastrum
minutum Plant Physiol 99 495-500
Vaquer A Troussellier M Courties C Bibent B 1996 Standing stock and dynamics of
picophytoplankton in the Thau Lagoon (northwest Mediterranean coast) Limnol
Oceanogr 41 1821-1828
Vincendeau ML 1987 Etude expeacuterimentale de la fertiliteacute des eaux des milieux conchylicoles
influence de lrsquoexcreacutetion des huitres et des palourdes sur la production des diatomeacutees
dominantes Ph D Univ Paris 6 Paris France
Table 1 Coefficient of variation (in percent) of the different biological
parameters calculated using four measurements observed at T0 Calculation based on cell numbers of diatom dominant species
gt1 microm lt1 micromCell numbers 22 6
Chlorophyll a concentrations 6 10Rubisco activity per liter 20 17szlig-Carboxylases per liter 23 12
Rubisco activity per chlorophyll a unit 17 24szlig-Carboxylases activity per chlorophyll a unit 19 12
βCR ratio 23 24Rubisco activity per cell 35 18 β-carboxylase per cell 44 33
Table 2 Statistical results from non parametric Wilcoxon signed-Rank analyses between N enriched treatments and control 001le p lt005 p le001 NS non significant (p ge01)
Cell numbers
Rubisco activity per cell
PEPC activity per cell
lt1 microm gt1 microm lt1 microm gt1 microm lt1 microm gt1 microm lt1 microm gt1 microm lt1 microm gt1 microm lt1 microm gt1 microm lt1 microm lt1 microm lt1 microm
+NH4+ Control 009 NS NS NS NS NS 005
+NO3- Control NS NS NS NS NS NS 008
+taurine Control NS NS NS NS NS NS NS NS NS NS NS NS NS NS NS
βCR ratioChla concentrations
Rubisco activity per litre
β-carboxylase activity per litre
Rubisco activity per Chla
β-carboxylase activity per Chla
Table 3 Concentrations of ammonium nitrate and dissolved organic nitrogen (DON) measured in the control NH4+
(+NH4+) NO3
- (+NO3-) and taurine (+taurine) enriched treatments during the experiment
nd no data data in bold denote a period of darkness
Control + NH4+ + NO3
- + taurine Control + NH4+ + NO3
- + taurine Control + NH4+ + NO3
- + taurineT0 039 686 04 047 013 005 931 003 226 268 218 376T2 nd nd 026 nd 006 000 896 000 224 nd 222 ndT4 045 582 024 037 000 000 85 000 224 255 236 369T7 011 352 022 029 000 000 746 000 247 266 245 332T10 006 362 006 017 001 000 615 000 265 256 236 329T13 011 384 015 023 000 000 633 000 249 258 251 312
T17 018 327 012 015 000 008 586 001 218 249 221 315
T21 007 261 009 022 000 000 468 000 233 260 223 317T24 017 032 019 020 000 000 242 000 244 260 218 303
Ammonium concentrations (microM) Nitrate concentrations (microM) Dissolved organic nitrogen (DON) concentrations (microM)
Table 4 Small picophytoplankton and bacteria cell numbers during the experiment in
the control and N enriched treatments
nd no data data in bold denote a period of darkness
Control +NH4+ +NO3
- +taurine Control +NH4+ +NO3
- +taurineT0 196 195 219 208 936 nd nd ndT2 182 208 182 130 nd nd nd ndT4 309 252 279 257 nd nd nd ndT7 304 333 312 286 1220 1220 1200 1360T10 260 415 406 221 nd nd nd ndT13 258 482 484 230 1500 1500 1190 1330
T17 198 516 409 219 nd nd nd nd
T21 208 nd 500 177 1510 1220 884 1170T24 135 nd 457 184 1120 967 832 1160
lt1 microm phytoplankton cell numbers (x106 cells L-1)
Bacteria cell numbers (x106 cells L-1)
Table 5 Plankton cell numbers and carboxylases (Rubisco and PEPCK) activity per
carbon unit of diatom cell within the gt1 microm fraction at T0 in the control and T24 in the
control and N enriched treatments nd no data
Control +NH4+ +NO3
- +taurinePicophytoplankton (x106 cells L-1) 27 149 nd 20 72
Heterotroph flagellates (x106 cells L-1) 06 05 03 02 05Autotroph flagellates (x106 cells L-1) 07 11 06 05 07
Diatoms (x106 cells L-1) 08 19 91 50 19Rubisco activity (fmol CO2 cell-1 h-1) 117 57 83 112 60PEPCK activity (fmol CO2 cell-1 h-1) 90 26 006 046 75
T24T0
Table 6 The in vitro Rubisco activity per litre of gt1 microm and lt1microm fractions in the control and
enriched N treatments
nd no data data in bold denote a period of darkness
Control +NH4+ +NO3
- +taurine Control +NH4+ +NO3
- +taurineT0 1088 664 844 939 519 459 498 349T2 1215 1322 1147 1535 289 434 428 347T4 1427 1802 nd 975 449 nd 746 599T7 552 1029 1064 441 520 842 732 361T10 478 1667 1640 396 162 647 532 351T13 213 2006 1724 239 185 577 609 164T17 129 1485 1264 171 134 453 400 159T21 366 2324 843 371 180 669 657 232T24 1093 7606 5625 1186 120 329 395 155
gt1 microm Rubisco activity (nmol CO2 L
-1 h-1)lt1 microm Rubisco activity
(nmol CO2 L-1 h-1)
Table 7 The in vitro β-carboxylase activity (PEPC+PEPCK+PYRC) of gt1 microm and lt1microm
fractions in the control and enriched N treatments
nd no data data in bold denote a period of darkness
Control +NH4+ +NO3
- +taurine Control +NH4+ +NO3
- +taurineT0 104 91 138 151 156 142 118 147T2 211 178 154 178 264 125 288 161T4 201 86 nd 95 116 nd 235 121T7 169 140 149 70 151 150 168 121T10 99 223 133 128 182 235 170 67T13 195 320 nd 150 113 114 155 123T17 203 231 118 111 132 82 109 255T21 227 392 257 289 208 161 228 113T24 117 120 265 190 59 61 71 65
gt1 microm β-carboxylase activity (nmol CO2 L
-1 h-1)lt1 microm β-carbxylase activity
(nmol CO2 L-1 h-1)
Table 8 The cellular pool of Rubisco and PEPC enzymes of lt 1microm picophytoplankton in the
control and N enriched treatments
nd no data data in bold denote a period of darkness
Control +NH4+ +NO3
- +taurine Control +NH4+ +NO3
- +taurineT0 265 235 228 168 038 035 017 041T2 159 208 235 268 020 023 052 030T4 145 nd 267 233 027 nd 011 014T7 171 253 234 126 050 022 037 023T10 062 156 131 158 037 024 021 024T13 072 120 126 071 032 019 028 017
T17 068 088 098 073 038 011 021 027
T21 086 nd 131 131 055 nd 011 047T24 088 nd 086 084 020 nd 010 005
Rubisco activity per cell (fmol CO2 cell-1 h-1)
PEPC activity per cell (fmol CO2 cell-1 h-1)
Sampling area
Fig 1 Map of sampling area in Thau lagoon Grey and black areas denote the shellfish cultivation area and towns respectively
Mediterranean Sea
NIGHTC
hlor
ophy
llco
ncen
trat io
n(micro
g c h
l L-1
)
0
2
4
6
8
10
12
00
02
04
06
08
10NIGHT
Control+ NH4
+
+ NO3-
+ Taurine
A) gt1 microm phytoplankton
B) lt1 microm phytoplankton
Chl
orop
hyll
conc
entra
t ion
(microg
c hl L
-1)
Local time
1000 1600 2200 10000400
Fig 2 Chlorophyll (a+b+c) concentrations of (A) gt1 microm phytoplankton and of (B) lt1 microm phytoplankton in the control and enriched N treatments during the incubation experiment
Rub
isco
activ
ity(p
mol
CO
2 microg
C-1
h-1
)A) Without DIN enrichments
Local time
1000 1600 2200 10000400
0
200
400
600
800
1000
0
40
80
120
160
200
0
200
400
600
800
1000
0
40
80
120
160
200
NIGHT
NIGHT
B) With DIN enrichments
Control Control+ Taurine+ Taurine
+ NH4+
+ NO3-
+ NH4+
+ NO3-
β-ca
rbox
ylas
eac
tivity
(pm
olC
O2 micro
g C
-1 h
-1)
Rub
isco
activ
ity(p
mol
CO
2 microg
C-1
h-1
)
β-ca
rbox
ylas
eac
tivity
(pm
olC
O2 micro
g C
-1 h
-1)
Fig 3 Total Rubisco and β-carboxylase activity expressed per particulate carbon for (A) the control and enriched taurine carboy and for (B) the ammonium and nitrate enrichments during the incubation experiment
NIGHT
Rub
isco
activ
ity(n
mol
CO
2 microg
chla
-1 h
-1) NIGHT
Control+ NH4
+
+ NO3-
+ Taurine
A) gt1 microm phytoplankton
B) lt1 microm phytoplankton
Fig 4 Rubisco activity normalised per chlorophyll a concentration of (A) gt1 microm phytoplankton and of (B) lt1 microm phytoplankton in the control and enriched N treatments during the incubation experiment
Rub
isco
activ
ity(n
mol
CO
2 microg
chla
-1 h
-1)
0
200
400
600
0
200
400
600
Local time
1000 1600 2200 10000400
NIGHT
β-ca
rbox
ylas
eac
tivity
(nm
olC
O2 micro
g ch
la-1
h-1
)
A) gt1 microm phytoplankton
B) lt1 microm phytoplankton
NIGHTControl+ NH4
+
+ NO3-
+ Taurine
0
40
80
120
160
200
β-ca
rbox
ylas
eac
tivity
(nm
olC
O2 micro
g ch
la-1
h-1
)
0
20
40
60
Local time
1000 1600 2200 10000400
Fig 5 β-carboxylase activity normalised per chlorophyll a concentrations of (A) gt1 microm phytoplankton and of (B) lt1 microm phytoplankton in the control and enriched N treatments during the incubation experiment
NIGHT
β-ca
rbox
y las
e R
ubi s
cora
tio (
)
NIGHT
Control+ NH4
+
+ NO3-
+ Taurine
A) gt1 microm phytoplankton
B) lt1 microm phytoplankton
0
30
60
90
120
150
180
0
30
60
90
120
150
180
1000 1600
β-ca
rbox
y las
e R
ubi s
cora
tio (
)
Local time
2200 10000400
Fig 6 Ratio of β-carboxylase activity (PEPC+PEPCK+PYRC) to Rubisco activity expressed as percents measured in the control and enriched N treatments during the incubation experiment

4
phytoplankton (lt2 microm) in Thau lagoon have been shown to be important in the phytoplankton
biomass and in primary production averaging about 30 of total chlorophyll a concentration and
about 40 of the total annual primary production (Courties et al 1994 Vaquer et al 1996)
This phytoplankton fraction is mainly constituted by the picoeukaryote Ostreococcus tauri with
cell size less of 1 microm diameter and described by Chreacutetiennot-Dinet et al (1995) We have thus
size-fractionated (1 microm) the plankton community to study the influence of the addition of these
different N sources on the unknown CO2 metabolism of the lt1 microm cells
Material and methods
Study area
Thau lagoon (Fig 1) is a Mediterranean coastal lagoon (France 43deg24 N - 3deg36 E)
shallow (depth average of 45 m) without tide exposed both to continental exports and oceanic
influence via the Rhocircne river plume (Souchu et al 1997) Thau lagoon is one of the most
important shellfish areas in Europe with an estimated standing stock of 40 000 tons of oysters
(Crassostrea gigas) which takes up 15th of the total area (7 000 ha) Salinities and temperatures
vary from 24 to 38 PSU and from 4 to 27oC respectively with a pH of 82 Little information is
available regarding the physical characteristics of Thau Lagoon Seawater turbidity is limited
with a Secchi depth ranging from 25 m to 77 m without any seasonal variation (Bacher et al
1995) The light attenuation coefficient is about 035 m-1 (outside the shellfish farming areas)
Hydrodynamics in the Thau Lagoon are linked with the wind regime and most of the exchanges
between the lagoon and the sea occur through the Canaux de Sete (Fig 1) The lagoon is able to
5
renew 12 of its water mass within 3 days owing to wind and barometric effects (Millet 1989)
In summer in spite of the low concentration of dissolved inorganic nitrogen (DIN) the shellfish
production is generally highest in the lagoon This suggests a high regenerated production
increased by enhanced benthic nutrient fluxes (Souchu et al 20001) and mainly based on
dissolved organic matter which represents the greatest stock of C and N (Gasc 1997)
In Thau Lagoon loricate ciliates such as tintinnids are abundant Tintinnids and rotifers
represented between 26 and 45 of the net collected microzooplankton biomass (Lam-Hoai et
al 1997) However at the shellfish culture area the occurrence of oysters and of epibiotic fauna
resulted in a drastic biomass reduction of the microzooplankton The oyster cultures contributed
to the picophytoplanktonic dominance in these waters by the preferential grazing of the larger
phytoplankton and zooplankton (Le Gall et al 1997 Dupuy et al 2000) From grazing
experiments Dupuy et al (2000) demonstrated that small picophytoplankton were not retained
by the oysters gills Nevertheless the picoeukaryote community constituted the most abundant
primary food resource for hetero-mixotrophic flagellates dinoflagellates and ciliates The whole
daily picophytoplankton production can be consumed by heterotrophic planktonic grazers
(Dupuy et al 2000) Phytoplankton from this oyster farming area showed higher annual Rubisco
activity normalised to chlorophyll a than phytoplankton from outside oyster farming and
offshore areas (Fouilland et al 1995) A marked effect of the oyster farming zone on bacterial
activities has been shown at the water-sediment interface with strong reductive processes
contributing to high ammonium concentrations in the farming areas (Gilbert et al 1997) A
higher average ambient ammonium concentration in this area than outside was suggested to
explain the strong autotrophic activity (Fouilland et al 1995)
6
Experimental set-up
The present experiment was conducted at Station ZA (85 m depth) located inside the
eastern shellfish-farming zone previously described in Souchu et al (1997) Two hundred litres
of seawater were taken from a 1 m depth in the middle of the Northern oyster rearing area (Fig
1) early in the morning Bulk water was filtered through a 200 microm mesh nylon net to remove
large particles and macrozooplankton grazers before distribution in incubation carboys The
water was subdivided into eight 20 L polycarbonate carboys two carboys per treatment being
used to increase the volume of incubated seawater 40 litres each for control ammonium nitrate
and taurine enrichments One carboy of each series was sampled during the first 10 hours of the
experiment (carboy A) and the second one during the last 14 hours (carboy B) The
reproducibility for a pair of carboys has been tested on chlorophyll (a+b+c) concentrations under
all N treatments and in the control during the experiment The equation of the linear regression
obtained between the Chl concentrations measured from all the carboys A and B is (Chl carboy
A) = 095 (Chl carboy B) +002 with a regression coefficient R2= 0988 indicating that
chlorophyll concentrations in a pair of carboys were very similar Polycarbonate carboys giving
an average of 95 light transmission were preferred to glass All incubated carboys (except
control) were enriched in different nitrogen sources with nitrate (10 microM NaNO3 final
enhancement) ammonium (10 microM NH4Cl final enhancement) and taurine (10 microM final
enhancement) Carboys were incubated at in situ temperature and irradiance at 1 m depth in the
middle of the oyster rearing area The experiment began on 22 June 1995 at 1000 (local time)
(T0) until 23 June 1995 at 1000 (T24) The sub-samplings occurred for each incubated carboys at
T0 T2 (1200) T4 (1400) T7 (1700) T10 (2000) T13 (2300) T17 (300) T21 (700) and T24
7
Physical and chemical variables
Surface photosynthetic available radiation (PAR) was measured with a LI-COR (Model
LI-190SA) quantum sensor and a LI-1000 data logger Underwater irradiance was measured
every 50 cm with a LI-COR (Model 193SA) spherical quantum sensor The visible light
extinction coefficient was calculated from linear regressions of irradiance vs depth
Samples for ammonium (NH4+) determination were immediately fixed and measured at
the laboratory using the method of Koroleff (1976) For the other nutrients samples were brought
to the field laboratory stored in acid precleaned polycarbonate carboys Filtrations and storage of
samples were performed within one hour after sampling in an all glass filtering system through a
precombusted (450degC for 6 h) Whatman GFF filter (vacuum lt10 cm Hg) Filtrates were
immediately frozen in precombusted Pyrex flasks for later analysis of Soluble Reactive
Phosphorus (SRP) nitrate (NO3-) and nitrite (NO2-) and silicate with a segmented flow analyser
(Treacuteguer and Le Corre 1975) The determination of dissolved organic nitrogen concentration
(DON) was performed using the photo-oxidation method (Armstrong and Tibbits 1968)
Determinations of particulate organic carbon (POC) were performed on Whatman 25 mm GFF
filters with a Perkin-Elmer Model 2400 CHN analyzer
Size fractionated filtrations
For each sampling time 1050 ml was used for size fractions following a protocol
described in Fouilland et al (2001) This protocol allows
1) study of the effect of N treatment on in vitro carboxylase activities for lt1 μm and gt 1μm
plankton cells 2) expression of the in vitro carboxylase activities per unit cell for lt1 μm
picophytoplankton 3) a check for potential filtration artefacts Two successive filtrations on
8
Nuclepore filter (1 microm size pore) and on GFF glass fiber Whatman filter (07 microm size pore) with
a vacuum lt 23 cm Hg to minimise cell damage were performed Subsamples for cell
enumeration were taken before and after filtrations on 1 microm Nuclepore and GFF Whatman
filters Both filters for in vitro carboxylase activities and chlorophyll measurements as well as
subsamples fixed previously by 2 (final concentration) formaldehyde for cell enumeration
(Troussellier et al 1995) were all stored in liquid nitrogen
Chlorophyll concentration measurements
Filters were ground in 90 acetone and extracted for 24 h in the dark at 4oC Chlorophyll
(a+b+c) concentrations (Chl) were determined by spectrofluorimetry (Neveux and Lantoine
1993)
Planktonic cell enumeration and diatoms taxonomy
Subsamples (20 ml) were fixed with 2 ml of 40 formaldehyde The samples were kept
in the dark at 4degC Fixed samples for bacteria and flagellates enumeration were filtered on black
polycarbonate Nuclepore membranes (022 μm porosity) Five minutes before filtration one drop
of DAPI (4 6-diamidino-2-phenylindole) was added to samples (Porter and Feig 1980)
Autotrophic and heterotrophic flagellates were discriminated by the red fluorescence of
chlorophyll a containing organisms under ultra-violet light using epifluorescence microscopy
Counting was done by examination of 10 equatorial bands (100x objective and band surface
168000 μm2) over the whole membrane length For bacteria 20 to 30 microscope fields were
counted in order to have a minimum count of 300 bacteria (100x objective field surface 256
9
μm2) Enumeration and identification of large phytoplankton was made by optical microscopy
after sedimentation (Utermohl 1958)
Flow cytometry analyses
Flow cytometry (FCM) analyses were run with an ACR 1000 cytometer Phytoplanktonic
cells were detected according to their light scatter (related to cell size and structure) their orange
and red fluorescence emissions (due to phycoerythrin and chlorophyll pigments) collected
through 58542 nm band pass and 650 nm long pass optical filters respectively One microm beads
(Polysciences Warrington PA) used as internal standard were systematically added to analyse
samples in order to normalise and compare the different phytoplanktonic groups Flow cytometry
allowed us to discriminate phytoplankton with size range between 05 microm and 50 microm (FCM
injector size)
In vitro carboxylase activities
The pool of potentially active enzymes responsible for CO2 fixation in plankton
community was measured as the in vitro carboxylases activity by incorporation of radioactive
bicarbonate into stable products following Descolas-Gros and Oriol (1992) This allowed us to
quantify the in vitro Rubisco activity and szlig-carboxylase activity (sum of the activities of
phosphenolpyruvate carboxylase PEPC phosphoenolpyruvate carboxykinase PEPCK and
pyruvate carboxylase PYRC) present in planktonic community (Appleby et al 1980 Glover
1989) All carboxylase assays were made on the same extract Extraction was carried out at 0 oC
and pH 8 following the protocol described in Descolas-Gros and De Billy (1987) For the
Rubisco assay the reaction mixture contained 50 mM Tricine buffer (pH 8) 5 mM dithiothreitol
10
(DTT) 10 mM MgCl2 20 mM NaH14CO3 and 100 μl of the crude extract For the other three
assays the reaction mixture contained 50 mM Pipes buffer (pH 68) instead of the Tricine buffer
Moreover 5 mM MnCl2 and 5 mM ADP were added for PEPCK assays and for PYRC assays 5
mM MgCl2 and 5 mM ATP were added All reactions were initiated after a pre-incubation period
of 10 min by adding substrates 2 mM RuBP for Rubisco assay 5 mM PEP for PEPC and
PEPCK assays and 5 mM pyruvate for PYRC assay All mixtures were incubated at 25 oC for 20
min The reactions were stopped by the addition of 6 N HCl More details on the protocol are
given in Descolas-Gros and Fontugne (1985) Descolas-Gros and De Billy (1987) and Descolas-
Gros and Oriol (1992) Every carboxylase assay was carried out in triplicate with an assay error
lt15 and was automated with a Gilson auto-analyser (222 Autosampler Injector interfaced with
a Dilutor 401) Carboxylase activity is expressed in nmol CO2 L-1 h-1 in pmol CO2 μg C-1 h-1 and
in nmol CO2 μg Chla-1 h-1 in order to take into account the variation of the particulate carbon and
phytoplanktonic biomass during the experiment and in fmol CO2 cell-1 h-1 when possible The szlig-
carboxylasesRubisco ratio (βCR expressed in ) allowed us to quantify the relative importance
of the two pathways
Experiment reproducibility
In order to estimate the precision of the biological parameters discussed in this study the
coefficient of variation (CV) has been calculated for each parameter using four values measured
at T0 and is presented in Table 1 The CV of the biological parameters was generally less than
25 except for the carboxylases activity per cell for diatom cell and for the β-carboxylase per
cell for lt1 μm cells with values between 33 and 44 (Table 1)
11
Statistical analyses
In order to compare the effect of N treatments relative to the control and between the N
treatments non-parametric Wilcoxon signed-Rank analyses have been applied on cell numbers
chlorophyll concentrations and carboxylase activities and reported in Table 2
Results
Nutrient concentrations and physical variables
All chemical data are reported in Table 3 Water temperature varied between 220 and
238oC at a depth of 15 m At this depth the attenuation of the incident light with a maximum
value of 1800 μE m-1 s-1 was about 50 The initial chemical conditions were characterised by
very low concentrations in nitrate (lt015 microM) nitrite (lt01 microM) and by ammonium
concentrations averaging 04 microM and high DON concentrations averaging 24 microM These values
were close to those reported in June 1993 in the same area (Collos et al 1997) The phosphate
values averaged 022 microM in all carboys throughout the experiment (data not shown) The molar
ratio of silicateDIN varied from 17 to 110 in the control and enriched taurine carboys while the
ratio was close to 1 (between 08 and 25) throughout the experiment under enriched NH4+ and
NO3- treatments (data not shown) This suggested that DIN was the limiting nutrient in the
control and enriched taurine carboy during the experiment The ammonium concentrations
decreased from 04 to 006 microM (T10) in the control and under NO3- treatment and to 017 microM
(T10) under taurine treatment and varied between 007 to 023 microM afterwards The ammonium
concentrations decreased from 686 microM (T0) to 032 microM (T24) under NH4+ treatment The nitrate
12
remained undetectable throughout most of the experiment in the control NH4+ and taurine
treatments and decreased from 931 microM (T0) to 242 microM (T24) under NO3- treatment The DON
concentrations remained quite constant in the control and under DIN treatments varying from
218 to 268 microM and decreased from 376 microM (T0) to 303 microM (T24) under the taurine treatment
Size fractionation accuracy
Using the chlorophyll parameter (red fluorescence) from flow cytometry analysis on
samples before and after 1 μm nuclepore filtration and compared to the lt1 μm chlorophyll a
concentrations measured by spectrofluorimetry the accuracy of size-fractionation protocol was
assessed The red fluorescence for each cell group in the lt1μm fraction was summed and
compared with the lt1μm chlorophyll a concentrations A positive linear regression was obtained
(R2=074 n=22) The total red fluorescence of cells after 1 μm filtration detected by flow
cytometry was thus directly correlated with chlorophyll a pigment concentration measured in this
lt1 μm fraction This indicates that the potential filtration artefacts (eg breakdown of small cells)
were reduced during the experiment
Small picoplanktonic cells
In the lt1 μm filtrate a population of small picoeukaryotes was identified and exhibited
the same flow cytometric characteristics as the eukaryotic Ostreococcus tauri This picoeukaryote
contributed 95 of total lt1 μm cell numbers Larger picoeukaryote cells with a relative red
fluorescence and apparent size close to those of 1 μm beads were also detected in this fraction
No cyanobacteria cells were detected by either flow cytometry or epifluorescence microscopy
during this study The variation of lt1 microm cell numbers detected by flow cytometry is reported in
13
Table 4 The abundance of small picoeukaryote cells measured during this experiment was in the
same range of values as previously observed in the same area between 1991 and 1994 averaging
30x106 cell L-1 (Vaquer et al 1996) Compared to the control no effect of taurine treatment was
detected on the lt1 microm cell concentrations (Table 2) The lt1 microm cell numbers increased in all
carboys T0 to T7 and afterwards decreased in the control and under taurine treatment From T10 a
strong significant increase of lt1 microm cell numbers reaching 50 106 cell L-1 was observed under
DIN treatments (Table 4)
From previous filtration experiments with plankton community from Thau Lagoon 67 to
74 of total bacteria cells can be retained on GFF filters (unpubl data) Bacterial cell numbers
varied slightly during the experiment (Table 3) As compared to the control the different N
treatments did not influence the cell concentrations Retention on GFF filter of 70 of total
bacterial cell was assumed Thus the contribution of bacteria cells was always greater than 95
of the total lt1 μm plankton cell numbers retained on GFF filters
Larger plankton cells community
At the beginning of the experiment nano- and microplankton species were dominated by
autotrophic flagellates and diatoms mainly composed of Chaetoceros spp Skeletonema spp and
Pseudo-nitzschia spp (Table 5) At the end of the experiment heterotrophic and autotrophic
flagellate abundance did not vary whereas diatom cells reached 19 106 cells L-1 in the control and
under taurine treatment mainly due to an increase of Pseudo-nitzschia spp cells On the last day
of the experiment higher diatom cell abundance was measured under DIN treatments mainly
due to the increase of Skeletonema spp cells (Table 5) Using a Ccell conversion factors for
each group from Dupuy et al (2000) the contribution of gt1 μm picophytoplankton and diatom
14
cells to the total gt1μm planktonic organic carbon was estimated to be less than 01 and greater
than 95 respectively during the experiment
Chlorophyll pigment concentrations and in vitro carboxylases activity
The chlorophyll pigment concentrations and the pool of Rubisco per litre for both size
fractions were not significantly different between the control and the taurine treatment
throughout the experiment (Table 2) Compared to the control a significant increase of
chlorophyll concentration occurred after 7 incubation hours under DIN treatments reaching 109
and 08 microgL-1 for gt1 μm and lt1 μm phytoplankton cells respectively (Fig 2A amp 2B Table 1)
Similarly to the chlorophyll concentrations after 7 incubation hours the pool of Rubisco per litre
for both size fractions was significantly greater under DIN treatments than in the control (Table 2
and 6) The pool of β-carboxylase activity per litre for both size fractions varied slightly during
the 24 hours incubation (Table 7) and no significant different between the N treatments and the
control was reported (Table 2) The values of the total carboxylases activity (ie sum of two size
fractions) were normalised per carbon using the particulate organic carbon concentration (POC)
and reported in Figure 3 In the carboys without DIN enrichments the total β-carboxylase
activity per carbon increased during the night period while the total Rubisco activity per carbon
decreased (Fig 3A) A coupling between the total Rubisco and β-carboxylase activity per carbon
was generally observed in the carboys with DIN enrichments (Fig 3B) The ratio between POC
and chlorophyll a concentrations (POCChla) decreased from about 700 to 200 μgC μgChla-1
overall the experiment in all the carboys The carboxylases activity was normalised to
chlorophyll a concentrations for each size fraction in order to take into account the
phytoplankton biomass variation between the N treatments during the present experiment The
15
Rubisco activity per Chla generally decreased in all N treatments for both size fractions during
the experiment (Fig 4) and no significant difference between these N treatments was measured
(Table 2) The β-carboxylase activity per Chla for both sized fractions generally decreased
during the 10 first hours of the experiment in all N treatments (Fig 5) Nevertheless a significant
increase of the β-carboxylase activity per Chla for both size fractions occurred under DIN
treatments afterwards while this activity per Chla remained very low in the control and the
taurine treatment (Fig 5 and Table 2)
β-carboxylation pathway
β-carboxylase activity (PEPC+PEPCK+PYRC) for the plankton community expressed as
a percentage of Rubisco activity (βCR ratio) reached values greater than 50 after 10 incubation
hours in the control and under taurine treatment (Fig 6) Under DIN treatments the βCR ratio
for both size fractions was significantly lower than measured in the control with values less than
40 throughout the study (Table 2) Phosphenolpyruvate carboxylase (PEPC) enzyme
contributed to about 50 of the total β-carboxylase enzymes in both size fractions (data not
shown)
Cellular pool of carboxylase enzymes
A strong decrease of the Rubisco pool per unit cell was measured in small phytoplankton
in all carboys during the experiment and no significant influence of N treatments was observed
(Table 2 and 8) As diatom cells contributed for the most part of carbon biomass in gt1 μm
plankton community the in vitro Rubisco activity for gt1 μm fraction is expressed on the basis of
16
diatom cell number Similarly to the small cells a decrease of the Rubisco pool per unit cell is
also observed for larger cells after 24 incubation hours in the carboys (Table 5)
For the small size fraction the enzymatic pool of PEPC is expressed per unit cell of small
picoeukaryotes and reported in the Table 8 This cellular pool tended to be significantly different
between the DIN treatments and the control (p=005 and 008 Table 2) This pool decreased
during the experiment under DIN treatments while the highest values in the control and under
taurine treatment were recorded close to the end of the experiment (Table 8) The pool of PEPCK
is expressed by unit of diatom cells as this enzyme is present in the dominant diatom species
observed during this study (Descolas-Gros and Oriol 1992) and these species contributed to 95
of the total gt1 μm carbon biomass Similarly to the PEPC in small cells the cellular pool of
PEPCK in larger cells was significantly very low under DIN treatments relative to the control and
to the carboy with an addition of taurine at the end of the experiment (Table 5)
Discussion
After 10 hours of incubation the very low available dissolved inorganic nitrogen (DIN)
concentrations probably limited the growth of phytoplankton in the control and under taurine
treatment This explains the decrease of the small picophytoplankton cells and the low net growth
rate of diatoms in these carboys Nevertheless bacterial cells and heterotrophic flagellates
submitted to these different nutrient conditions did not show a net growth rate In contrast the net
growth rate of picophytoplankton and diatom was about 15 and 3 divday respectively in the
samples enriched with DIN
17
Even though phytoplankton growth was positively influenced by DIN enrichments the
cellular pool of potentially active Rubisco enzyme for picophytoplankton and diatom cells
decreased throughout the study in all the carboys This suggests a degradation of the cellular
enzymatic pool in phytoplankton cells during the study The rapid degradation of the nitrogen
fraction in phytoplankton cells under high irradiance has been shown in a shallow environment
with photosynthetically available radiation levels above 600 to 1000 μE m-2 s-1 (Collos et al
1992) Rubisco enzyme can act as a nitrogen reservoir that is more easily mobilised than the rest
of the protein pool during environmental changes (Ekman et al 1989) Thus cellular Rubisco
pool degradation during this present study may result from the light conditions in incubation
carboys held at fixed positions near the surface where phytoplankton cannot avoid high
irradiance levels during the day time reaching about 900 μE m-2 s-1 at the incubation depth
As compared to the Rubisco pathway the potential use of β-carboxylation pathway by the
plankton community as shown by the carboxylases activity normalised to the particulate carbon
chlorophyll a and cell and by the ratio βCR increased after 10 incubation hours in the carboys
without DIN enrichments only The values of the βCR ratio were higher than 100 at which
time the phytoplankton biomass started to decrease in the control and under taurine treatment In
contrast β-carboxylase activity seemed strongly coupled to the Rubisco activity under DIN
treatments This daily co-variation was already reported for natural phytoplankton in
Mediterranean Sea under favourable environmental conditions (Fouilland et al 2001) showing
the strong interdependence of these two C assimilation pathways (falkowski and Raven 1997)
The βCR ratio under DIN treatments remained less than 40 which is a characteristic of
autotrophic cells (Descolas-Gros and Oriol 1992) A βCR ratio higher than 100 suggests that
the β-carboxylation pathway can prevail on the Calvin-Benson pathway As β-carboxylation in
18
the light occurs using a substrate (PEP) derived from the Calvin-Benson cycle a ratio greater
than 100 has been associated with the occurrence of heterotrophic organisms such as
dinoflagellates (Descolas-Gros and Oriol 1992) For such cells the origin of
phosphoenolpyruvate is uncertain and Descolas-Gros and Oriol (1992) suggested that it could be
supplied by the incorporation of external organic substances
The increase of β-carboxylase pathway observed in the present study cannot be explained
by the increase of heterotrophic biomass relative to the autotrophic biomass in the control or with
addition of taurine The POCChla ratio decreased throughout the experiment suggesting a shift
towards an autotrophic community in all the carboys For the small size fraction bacterial cells
which are partially retained by filters could have significantly contributed to the total β-
carboxylase activity as suggested by results from dark fixation of 14C from natural plankton (Li et
al 1993 Markager 1999) Nevertheless the regulation of β-carboxylation pathway and enzyme
structure is different in bacterial and phytoplankton cells (Rivoal et al 1998) The occurrence of
carboxylation of PEP by PEPC is well known in bacterial cells Nevertheless this carboxylase
does not act unless acetyl-coenzyme A is present perhaps to facilitate a continued supply of
oxaloacetate for the TCA cycle fuelling (Baumerg 1973 Overbeck 1984) Such regulation does
not occur in phytoplankton cells (Turpin et al 1991) As no acetyl-coenzyme A is added to the
reaction mixture the strong variation of the activity of major β-carboxylase enzymes (PEPC) is
assumed to be directly related to the β-carboxylation pathway of the small picoeukaryote cells
Moreover the bacterial cells contributed a very large fraction to the total lt1 μm picoplankton
abundance and no significant difference in the bacterial abundance was noticed between carboys
(Table 4) Thus any increase of βCR ratio for the lt1 μm fraction observed after 10 hours of
incubation cannot be due to the bacterial growth relative to the decrease of small
19
picophytoplankton abundance which contributed to less than 5 of total cell numbers over the
experiment in all carboys The importance of bacterial activity (free or attached bacteria cells) is
assessed relatively to the ammonium uptake Data from Table 3 show that ammonium uptake was
at least twice as high during the day than at night in NH4+ treatment indicating autotrophic
driven processes In the control ammonium actually increased at night (Table 3) so it can be
safely assumed that bacterial populations produced rather than consumed ammonium in these
series of experiment This suggests that the heterotroph bacterial activity was not influenced by
the N treatments Moreover using values for the carbon content in plankton species in Thau
Lagoon calculated by Dupuy et al (2000) the heterotroph flagellates contributing to the total gt1
microm plankton biomass was estimated to be less than 1 in the control and under all N treatments
at the end of the experiment Thus the variation of the β-carboxylation enzyme pool relative to
the Rubisco was mainly due to the enzyme activities from the autotrophic plankton in both size
fractions
Anaplerotic carbon fixation by PEPC in the light exceeding photosynthetic carbon
fixation has already been measured in an N-limited green alga using stable carbon isotope
discrimination (Guy et al 1989) These authors showed that under transient situations the
contribution of βminuscarboxylation to the total C fixation can be as high as 70 ie a βCR ratio of
230 which is higher than our maximum value for a natural plankton assemblage (160) The
significant increase of both βCR ratio and the β-carboxylase activity normalised to the
chlorophyll and carbon biomass reported during the present study suggests a potential increase
of cellular β-carboxylase enzymes The pool of PEPC and PEPCK expressed per unit cell for the
small picoeukaryotes and diatoms tended to increase at the end of the experiment in the control
and under taurine treatment This increase of the activity of β-carboxylase enzymes combined
20
with the decrease of the Rubisco activity under inorganic N-deficient conditions suggests that β-
carboxylation pathway is more active when phytoplankton growth is limited by inorganic
nutrients A higher photosynthetic carbon fixation by β-carboxylation than by Rubisco in
autotrophic phytoplankton cells is surprising especially in regards to the source of the substrate
for β-carboxylation The dissimilation of reserve carbohydrate providing PEP for this pathway
as usually observed in the dark for microalgae (Mortain-Bertrand et al 1988) is unlikely This is
because phytoplankton growth was very low under N-deficient conditions implying low C
storage in cells
The increase of the enzymatic pool for β-carboxylation in phytoplankton may be due to a
shift from autotrophic to heterotrophic activity induced by a DIN deficiency as in the control and
DON (taurine) treatment There is indirect evidence that taurine was taken up during the day
Data from Table 2 shows that DON decreased in the carboys enriched with taurine while it
remained constant in the others This decrease roughly corresponds to the taurine addition but
taurine was taken up during the day only and not at night which indicates that phytoplankton
not bacteria were responsible for this uptake Nevertheless this uptake does not result in
increased phytoplankton biomass as observed in enriched ammonium or nitrate carboys
Possibly the time lag involved between uptake and growth is longer than the time scale used in
the present study as observed elsewhere (Antia et al 1975 Bonin and Maestrini 1981) Thus
increases in cell numbers could not be observed within a 24-hour time frame following the
taurine addition Interestingly in the study of Vincendeau (1987) S costatum took up DON once
DIN was exhausted Thus the similarity between the control and the taurine treatment could have
a common explanation heterotrophy is induced by DIN limitation The increase of β-
carboxylation pathway under limiting N conditions is coupled to the uptake of dissolved nitrogen
21
compounds by phytoplankton resulting in the activation of respiration for the biosynthetic
processes This causes the back-regulation of anaplerotic reactions as previously described by
Vanlerberghe et al (1990 1992) for NH4+ uptake A stimulation of respiration after the addition
of acetate has also been observed in Chlamydomonas reinhardtii cultured photoautotrophically
(Fett and Coleman 1994 Endo and Asada 1996) Moreover under similar conditions Heifetz et
al (2000) showed a decrease of photosynthetic carbon fixation in cells grown in acetate with
saturating light and CO2 These results suggest an increase of the β-carboxylation pathway for the
replenishment of TCA cycle intermediates in order to sustain the growth rate of C reinhardtii
growing heterotrophically using acetate as source of carbon This is in accordance with the
increase of cellular β-carboxylase pool during a shift toward heterotrophy in natural
phytoplankton cells suggested in this study Even though the evidence of this heterotrophy was
observed with the taurine enrichment only the importance of the β-carboxylation pathway in
natural phytoplankton under very low nutrient conditions is clearly highlighted in this study In
order to gain further insight into the phytoplankton heterotrophy the relationship between the
CO2 assimilation pathways and the capacity of phytoplankton to use organic sources of nitrogen
andor carbon should be investigated using axenic cultures of phytoplankton submitted to
different nutritional conditions for instance
Acknowledgements
This work was supported by CNRS University Montpellier II IFREMER (URM 5) We
thank J-M Deslous-Paoli and C Leboulanger for their assistance during the fieldwork T Sime-
22
Ngando for providing bacteria and flagellates data and 2 anonymous referees for insightful
comments on the manuscript This paper represents a portion of a thesis of the University Paris
VI of Eric Fouilland who received a BDI fellowship from CNRS and IFREMER This is the
XXX ISEM contribution for Chantal Descolas-Gros
23
References
Appleby G Colbeck J Holdsworth ES Wadman H 1980 szligcarboxylation enzymes in
marine phytoplankton and isolation and purification of pyruvate carboxylase from
Amphidinium carterae (Dinophyceae) J Phycol 16 290-295
Antia NJ Berland BR Bonin DJ Maestrini SY 1975 Comparative evaluation of certain
organic and inorganic sources of nitrogen for phototrophic growth of marine microalgae J
Mar Biol AssU K 55 519-539
Armstrong FAJ Tibbits S 1968 Photochemical combustion of organic matter in sea
water for nitrogen phosphorus and carbon determination J Mar Biol Ass U K 48
143-152
Bacher C Millet B Vaquer A 1997 Modeacutelisation de lrsquoimpact des mollusques cultiveacutes
sur la biomasse phytoplanctonique de lrsquoeacutetang de Thau (France) C R Acad Sci Paris
320 73-81
Baumberg S 1973 Co-ordination of metabolism In Mandelstam J McQuillen K (eds)
Biochemistry of bacterial growth Second edition Blackwell 423-493
Bonin DJ Maestrini SY 1981 Importance of organic nutrients for phytoplankton growth in
natural environments implications for algal species successionPhysiological bases of
phytoplankton ecology Platt T (Ed) Can Bull Fish Aquat Sci 210 279-291
Chreacutetiennot-Dinet M-J Courties C Vaquer A Neveux J Claustre H Lautier J
Machado MC 1995 A new marine picoeukaryote Ostreococcus tauri gen et sp nov
(Chlorophyta Prasinophyceae) Phycologia 34 85-292
24
Collos Y Descolas-Gros C Fontugne M Mortain-Bertrand A Chretiennot-Dinet MJ
Frikha MG 1992 Carbon and nitrogen dynamics during growth and degradation of
phytoplankton under natural surface irradiance Mar Biol 112 491-496
Collos Y Descolas-Gros C Fontugne M Mortain-Bertrand A Chreacutetionnot-Dinet M-J
Frikha MG 1993 Chemical isotopic and enzymatic monitoring of free and enclosed
seawater implications for primary production estimates in incubation carboys Mar Ecol
Prog Ser 93 49-54
Collos Y Vaquer A Bibent B Slawyk G Garcia N Souchu P 1997 Variability in nitrate
uptake kinetics of phytoplankton communities in a Mediterranean coastal lagoon Estuar
Coast Shelf S 44 369-375
Courties C Vaquer A Troussellier M Lautier J Chreacutetiennot-Dinet M-J Neveux J
Machado C Claustre H 1994 Smallest eukaryotic organism Nature 370 255
Descolas-Gros C Fontugne M 1985 Carbon fixation in marine phytoplankton carboxylase
activities and stable carbon-isotope ratios physiological and paleoclimatological aspects
Mar Biol 87 1-6
Descolas-Gros C De Billy G 1987 Temperature adaptation of RuBP caboxylase kinetic
properties in marine Antarctic diatoms J Exp Mar Biol Ecol 108 147-158
Descolas-Gros C Oriol L 1992 Variations in carboxylase activity in marine phytoplankton
cultures szligcarboxylation in carbon flux studies Mar Ecol Prog Ser 85 163-169
Dodds WK Priscu JC 1991 Ammonium stimulation of dark carbon fixation as an indicator
of nitrogen deficiency in phytoplankton potential errors caused by ammonium-oxidizing
bacteria J Phycol 27 79-82
25
Dupuy C Vaquer A Lam-Hoai T Rougier C Mazouni N Lautier J Collos Y Le Gall
S 2000 Feeding rate of the oyster Crassostera gigas in a natural planktonic community of
Mediterranean Thau Lagoon Mar Ecol Prog Ser 205 171-184
Ekman P Lignell A Pedersen M 1989 Localization of ribulose-15-bisphosphate
carboxylaseoxygenase in Gracilaria secundata (Rhodophyta) and its role as a nitrogen
storage pool Botanica Mar 32 527-534
Elrifi IR Turpin DH 1986 Nitrate and ammonium induced photosynthetic suppression in N-
limited Selenastrum minutum Plant Physiol 81 273-279
Endo T Asada K 1996 Dark induction of the non-photochemical quenching of chlorophyll
fluorescence by acetate in Chlamidomonas reinhardtii Plant Cell Physiol 37 551-555
Falkowski PG Raven JA 1997 Aquatic photosynthesis Blackwell Science publisher
Fett JP Coleman JR 1994 Regulation of periplasmic carbonic anhydrase expression in
Chlamidomonas reinhardtii by acetate and pH Plant Physiol 106 103-108
Fidalgo JP Cid A Abalde J Herrero C 1995 Culture of the marine diatom Phaedactylum
tricornutum with different nitrogen sources Growth nutrient conversion and biochemical
composition Cah Biol Mar 36 165-173
Fouilland E Vaquer A Descolas-Gros C 1995 Annual variations in CO2 assimilation and
primary production measurements in a mediterranean lagoon (Thau lagoon France)
Photosynthesis from Light to Biosphere Mathis P (Ed) Elvesier 5 873-876
Fouilland E Courties C Descolas-Gros C 2001 Size-fractionated carboxylase activities
during a 32 h cycle at 30 m depth in the Northwestern Mediterranean Sea after an episodic
wind event J Plankton Res 23 623-632
26
Gasc A 1997 Etude de la production primaire reacutegeacuteneacutereacutee dans un eacutecosystegraveme conchylicole le
bassin de Thau Ph D Univ Sciences et Techniques du Languedoc Montpellier France
Gilbert F Souchu P Bianchi M Bonin P 1997 Influence of shellfish farming activities on
nitrification nitrate reduction to ammonium and denitrification at the water-sediment
interface of the Thau lagoon France Mar Ecol Prog Ser 151 143-153
Glover HE 1989 Ribulosebisphosphate carboxylaseoxygenase in marine organisms Int Rev
Cytol 115 67-137
Guy RD Vanlerberghe GC Turpin DH 1989 Significance of phosphoenolpyruvate
carboxylase during ammonium assimilation Carbon isotope discrimination in
photosynthesis and respiration by the N-limited green alga Selenastrum minutum Plant
Physiol 89 1150-1157
Heifetz PB Forster B Osmond CB Giles LJ Boynton JE 2000 Effects on facultative
autotrophy in Chlamydomonas reihardtii assessed by photosynthetic measurements and
stable isotope analyses Plant Physiol 122 1439-1445
Huppe HC Turpin DH 1994 Integration of carbon and nitrogen metabolism in plant and
algal cells Annu Rev Physiol Plant Mol Biol 45 577-607
Koroleff F 1976 Determination of nutrients Methods of Seawater analysis Grasshoff K
(Ed) Verlag Chemie 117-182
Lam-Hoai T Rougier C Lasserre G 1997 Tintinnids and rotifers in a northern
Mediterranean coastal lagoon Structural diversity and function through biomass
estimations Mar Ecol Prog Ser 152 13-25
27
Le Gall S Hassen MB Le Gall PB 1997 Ingestion of a bacterivorous ciliate by oyster
Crassostera gigas protozoa as a trophic link between picoplankton and benthic suspension-
feeders Mar Ecol Prog Ser 152 301-306
Levasseur M Thompson PA Harrison PJ 1993 Physiological acclimation of marine
phytoplankton to different nitrogen sources J Phycol 29 587-595
Millet B 1989 Fonctionnement hydrodynamique du bassin de Thau Validation drsquoun modegravele
numeacuterique de circulation (programme Ecothau) Oceanol Acta 12 37-46
Morris I Yentsch CM Yentsch CS 1971 The physiological state with respect to nitrogen
of phytoplankton from low-nutrient subtropical water as measured by the effect of
ammonium ion on dark carbon dioxide fixation Limnol Oceanogr 16 859-868
Mortain-Bertrand A Descolas-Gros C Jupin H 1987a Short-term 14C incorporation in
Skeletonema costatum (Greville) Cleve (Bacillariophyceae) as a function of light regime
Phycologia 16 262-269
Mortain-Bertrand A Descolas-Gros C Jupin H 1987b Stimulating effect of transitions from
light to dark on carbon assimilation by a marine diatom J Exp Mar Biol Ecol 112 11-
26
Mortain-Bertrand A Descolas-Gros C Jupin H 1988 Pathway of dark inorganic carbon
fixation in two species of diatoms influence of light regime and regulator factors on diel
variations J Plankton Res 10 199-217
Neveux J Lantoine F 1993 Spectrofluorometric assay of chlorophylls and phaeopigments
using the least squares approximation technique Deep-Sea Res 40 1747-1765
28
Osborne BA Geider RJ 1986 Effect of nitrate-nitrogen limitation on photosynthesis of the
diatom Phaeodactylum tricornutum Bohlin (Bacillariphyceae) Plant Cell Environ 9 617-
625
Overbeck J 1984 Application of TCA cycle metabolism for growth estimates of heterotrophic
bacterioplankton Arch Hydrobiol Beih 19 23-36
Porter K Feig YS 1980 The use of DAPI for identifying and counting aquatic microflora
Limnol Oceanogr 25 943-948
Slawyk G Collos Y 1982 13C and 15N uptake by marine phytoplankton 2 Results from a
tropical area Rapp P-v Reacuteun Cons int Explor Mer 180 209-213
Souchu P Gasc A Cahet G Vaquer A Collos Y Deslous-Paoli JM 1997
Biogeochemical composition of Mediterranean waters outside the Thau lagoon Estuar
Coast Shelf S 44 275-284
Souchu P Vaquer A Collos Y Lamdrein S Deslous-Paoli J-M Bibent B 2001
Influence of shellfish farming activities on the biogeochemical composition of the water
column in Thau Lagoon Mar Ecol Prog Ser 218 141-152
Treacuteguer P Le Corre P 1975 Manuel danalyse des sels nutritifs dans leau de mer
Utilisation de lAutoAnalyseur II Technicon LOC Universiteacute de Bretagne Occidentale
Brest France
Troussellier M Courties C Zettelmaier S 1995 Flow cytometric analysis of coastal lagoon
bacterioplankton and picophytoplankton fixation and storage effects Estuar Coast Shelf
S 40 621-633
Turpin DH 1991 Effects of inorganic N availability on algal photosynthesis and carbon
metabolism J Phycol 27 14-20
29
Turpin DH Vanlerberghe GC Amory AM Guy RD 1991 The inorganic requirements
for nitrogen assimilation Can J Bot 69 1139-1145
Utermoumlhl H 1958 Zur Vervollkommnung der quantitativen Phytoplankton-Methodik Mitt int
Ver theor angew Limnol 9 1-38
Vanlerberghe GC Schuller KA Smith RG Feil R Plaxton WC Turpin DH 1990
Relationship between NH4+ assimilation rate and in vivo phosphoenolpyruvate carboxylase
activity Regulation of anapleurotic carbon flow in the green alga Selenastrum minutum
Plant Physiol 94 284-290
Vanlerberghe GC Huppe HC Vlossak KDM Turpin DH 1992 Activation of
respiration to support dark NO3- and NH4
+ assimilation in the green alga Selenastrum
minutum Plant Physiol 99 495-500
Vaquer A Troussellier M Courties C Bibent B 1996 Standing stock and dynamics of
picophytoplankton in the Thau Lagoon (northwest Mediterranean coast) Limnol
Oceanogr 41 1821-1828
Vincendeau ML 1987 Etude expeacuterimentale de la fertiliteacute des eaux des milieux conchylicoles
influence de lrsquoexcreacutetion des huitres et des palourdes sur la production des diatomeacutees
dominantes Ph D Univ Paris 6 Paris France
Table 1 Coefficient of variation (in percent) of the different biological
parameters calculated using four measurements observed at T0 Calculation based on cell numbers of diatom dominant species
gt1 microm lt1 micromCell numbers 22 6
Chlorophyll a concentrations 6 10Rubisco activity per liter 20 17szlig-Carboxylases per liter 23 12
Rubisco activity per chlorophyll a unit 17 24szlig-Carboxylases activity per chlorophyll a unit 19 12
βCR ratio 23 24Rubisco activity per cell 35 18 β-carboxylase per cell 44 33
Table 2 Statistical results from non parametric Wilcoxon signed-Rank analyses between N enriched treatments and control 001le p lt005 p le001 NS non significant (p ge01)
Cell numbers
Rubisco activity per cell
PEPC activity per cell
lt1 microm gt1 microm lt1 microm gt1 microm lt1 microm gt1 microm lt1 microm gt1 microm lt1 microm gt1 microm lt1 microm gt1 microm lt1 microm lt1 microm lt1 microm
+NH4+ Control 009 NS NS NS NS NS 005
+NO3- Control NS NS NS NS NS NS 008
+taurine Control NS NS NS NS NS NS NS NS NS NS NS NS NS NS NS
βCR ratioChla concentrations
Rubisco activity per litre
β-carboxylase activity per litre
Rubisco activity per Chla
β-carboxylase activity per Chla
Table 3 Concentrations of ammonium nitrate and dissolved organic nitrogen (DON) measured in the control NH4+
(+NH4+) NO3
- (+NO3-) and taurine (+taurine) enriched treatments during the experiment
nd no data data in bold denote a period of darkness
Control + NH4+ + NO3
- + taurine Control + NH4+ + NO3
- + taurine Control + NH4+ + NO3
- + taurineT0 039 686 04 047 013 005 931 003 226 268 218 376T2 nd nd 026 nd 006 000 896 000 224 nd 222 ndT4 045 582 024 037 000 000 85 000 224 255 236 369T7 011 352 022 029 000 000 746 000 247 266 245 332T10 006 362 006 017 001 000 615 000 265 256 236 329T13 011 384 015 023 000 000 633 000 249 258 251 312
T17 018 327 012 015 000 008 586 001 218 249 221 315
T21 007 261 009 022 000 000 468 000 233 260 223 317T24 017 032 019 020 000 000 242 000 244 260 218 303
Ammonium concentrations (microM) Nitrate concentrations (microM) Dissolved organic nitrogen (DON) concentrations (microM)
Table 4 Small picophytoplankton and bacteria cell numbers during the experiment in
the control and N enriched treatments
nd no data data in bold denote a period of darkness
Control +NH4+ +NO3
- +taurine Control +NH4+ +NO3
- +taurineT0 196 195 219 208 936 nd nd ndT2 182 208 182 130 nd nd nd ndT4 309 252 279 257 nd nd nd ndT7 304 333 312 286 1220 1220 1200 1360T10 260 415 406 221 nd nd nd ndT13 258 482 484 230 1500 1500 1190 1330
T17 198 516 409 219 nd nd nd nd
T21 208 nd 500 177 1510 1220 884 1170T24 135 nd 457 184 1120 967 832 1160
lt1 microm phytoplankton cell numbers (x106 cells L-1)
Bacteria cell numbers (x106 cells L-1)
Table 5 Plankton cell numbers and carboxylases (Rubisco and PEPCK) activity per
carbon unit of diatom cell within the gt1 microm fraction at T0 in the control and T24 in the
control and N enriched treatments nd no data
Control +NH4+ +NO3
- +taurinePicophytoplankton (x106 cells L-1) 27 149 nd 20 72
Heterotroph flagellates (x106 cells L-1) 06 05 03 02 05Autotroph flagellates (x106 cells L-1) 07 11 06 05 07
Diatoms (x106 cells L-1) 08 19 91 50 19Rubisco activity (fmol CO2 cell-1 h-1) 117 57 83 112 60PEPCK activity (fmol CO2 cell-1 h-1) 90 26 006 046 75
T24T0
Table 6 The in vitro Rubisco activity per litre of gt1 microm and lt1microm fractions in the control and
enriched N treatments
nd no data data in bold denote a period of darkness
Control +NH4+ +NO3
- +taurine Control +NH4+ +NO3
- +taurineT0 1088 664 844 939 519 459 498 349T2 1215 1322 1147 1535 289 434 428 347T4 1427 1802 nd 975 449 nd 746 599T7 552 1029 1064 441 520 842 732 361T10 478 1667 1640 396 162 647 532 351T13 213 2006 1724 239 185 577 609 164T17 129 1485 1264 171 134 453 400 159T21 366 2324 843 371 180 669 657 232T24 1093 7606 5625 1186 120 329 395 155
gt1 microm Rubisco activity (nmol CO2 L
-1 h-1)lt1 microm Rubisco activity
(nmol CO2 L-1 h-1)
Table 7 The in vitro β-carboxylase activity (PEPC+PEPCK+PYRC) of gt1 microm and lt1microm
fractions in the control and enriched N treatments
nd no data data in bold denote a period of darkness
Control +NH4+ +NO3
- +taurine Control +NH4+ +NO3
- +taurineT0 104 91 138 151 156 142 118 147T2 211 178 154 178 264 125 288 161T4 201 86 nd 95 116 nd 235 121T7 169 140 149 70 151 150 168 121T10 99 223 133 128 182 235 170 67T13 195 320 nd 150 113 114 155 123T17 203 231 118 111 132 82 109 255T21 227 392 257 289 208 161 228 113T24 117 120 265 190 59 61 71 65
gt1 microm β-carboxylase activity (nmol CO2 L
-1 h-1)lt1 microm β-carbxylase activity
(nmol CO2 L-1 h-1)
Table 8 The cellular pool of Rubisco and PEPC enzymes of lt 1microm picophytoplankton in the
control and N enriched treatments
nd no data data in bold denote a period of darkness
Control +NH4+ +NO3
- +taurine Control +NH4+ +NO3
- +taurineT0 265 235 228 168 038 035 017 041T2 159 208 235 268 020 023 052 030T4 145 nd 267 233 027 nd 011 014T7 171 253 234 126 050 022 037 023T10 062 156 131 158 037 024 021 024T13 072 120 126 071 032 019 028 017
T17 068 088 098 073 038 011 021 027
T21 086 nd 131 131 055 nd 011 047T24 088 nd 086 084 020 nd 010 005
Rubisco activity per cell (fmol CO2 cell-1 h-1)
PEPC activity per cell (fmol CO2 cell-1 h-1)
Sampling area
Fig 1 Map of sampling area in Thau lagoon Grey and black areas denote the shellfish cultivation area and towns respectively
Mediterranean Sea
NIGHTC
hlor
ophy
llco
ncen
trat io
n(micro
g c h
l L-1
)
0
2
4
6
8
10
12
00
02
04
06
08
10NIGHT
Control+ NH4
+
+ NO3-
+ Taurine
A) gt1 microm phytoplankton
B) lt1 microm phytoplankton
Chl
orop
hyll
conc
entra
t ion
(microg
c hl L
-1)
Local time
1000 1600 2200 10000400
Fig 2 Chlorophyll (a+b+c) concentrations of (A) gt1 microm phytoplankton and of (B) lt1 microm phytoplankton in the control and enriched N treatments during the incubation experiment
Rub
isco
activ
ity(p
mol
CO
2 microg
C-1
h-1
)A) Without DIN enrichments
Local time
1000 1600 2200 10000400
0
200
400
600
800
1000
0
40
80
120
160
200
0
200
400
600
800
1000
0
40
80
120
160
200
NIGHT
NIGHT
B) With DIN enrichments
Control Control+ Taurine+ Taurine
+ NH4+
+ NO3-
+ NH4+
+ NO3-
β-ca
rbox
ylas
eac
tivity
(pm
olC
O2 micro
g C
-1 h
-1)
Rub
isco
activ
ity(p
mol
CO
2 microg
C-1
h-1
)
β-ca
rbox
ylas
eac
tivity
(pm
olC
O2 micro
g C
-1 h
-1)
Fig 3 Total Rubisco and β-carboxylase activity expressed per particulate carbon for (A) the control and enriched taurine carboy and for (B) the ammonium and nitrate enrichments during the incubation experiment
NIGHT
Rub
isco
activ
ity(n
mol
CO
2 microg
chla
-1 h
-1) NIGHT
Control+ NH4
+
+ NO3-
+ Taurine
A) gt1 microm phytoplankton
B) lt1 microm phytoplankton
Fig 4 Rubisco activity normalised per chlorophyll a concentration of (A) gt1 microm phytoplankton and of (B) lt1 microm phytoplankton in the control and enriched N treatments during the incubation experiment
Rub
isco
activ
ity(n
mol
CO
2 microg
chla
-1 h
-1)
0
200
400
600
0
200
400
600
Local time
1000 1600 2200 10000400
NIGHT
β-ca
rbox
ylas
eac
tivity
(nm
olC
O2 micro
g ch
la-1
h-1
)
A) gt1 microm phytoplankton
B) lt1 microm phytoplankton
NIGHTControl+ NH4
+
+ NO3-
+ Taurine
0
40
80
120
160
200
β-ca
rbox
ylas
eac
tivity
(nm
olC
O2 micro
g ch
la-1
h-1
)
0
20
40
60
Local time
1000 1600 2200 10000400
Fig 5 β-carboxylase activity normalised per chlorophyll a concentrations of (A) gt1 microm phytoplankton and of (B) lt1 microm phytoplankton in the control and enriched N treatments during the incubation experiment
NIGHT
β-ca
rbox
y las
e R
ubi s
cora
tio (
)
NIGHT
Control+ NH4
+
+ NO3-
+ Taurine
A) gt1 microm phytoplankton
B) lt1 microm phytoplankton
0
30
60
90
120
150
180
0
30
60
90
120
150
180
1000 1600
β-ca
rbox
y las
e R
ubi s
cora
tio (
)
Local time
2200 10000400
Fig 6 Ratio of β-carboxylase activity (PEPC+PEPCK+PYRC) to Rubisco activity expressed as percents measured in the control and enriched N treatments during the incubation experiment
6
Experimental set-up
The present experiment was conducted at Station ZA (85 m depth) located inside the
eastern shellfish-farming zone previously described in Souchu et al (1997) Two hundred litres
of seawater were taken from a 1 m depth in the middle of the Northern oyster rearing area (Fig
1) early in the morning Bulk water was filtered through a 200 microm mesh nylon net to remove
large particles and macrozooplankton grazers before distribution in incubation carboys The
water was subdivided into eight 20 L polycarbonate carboys two carboys per treatment being
used to increase the volume of incubated seawater 40 litres each for control ammonium nitrate
and taurine enrichments One carboy of each series was sampled during the first 10 hours of the
experiment (carboy A) and the second one during the last 14 hours (carboy B) The
reproducibility for a pair of carboys has been tested on chlorophyll (a+b+c) concentrations under
all N treatments and in the control during the experiment The equation of the linear regression
obtained between the Chl concentrations measured from all the carboys A and B is (Chl carboy
A) = 095 (Chl carboy B) +002 with a regression coefficient R2= 0988 indicating that
chlorophyll concentrations in a pair of carboys were very similar Polycarbonate carboys giving
an average of 95 light transmission were preferred to glass All incubated carboys (except
control) were enriched in different nitrogen sources with nitrate (10 microM NaNO3 final
enhancement) ammonium (10 microM NH4Cl final enhancement) and taurine (10 microM final
enhancement) Carboys were incubated at in situ temperature and irradiance at 1 m depth in the
middle of the oyster rearing area The experiment began on 22 June 1995 at 1000 (local time)
(T0) until 23 June 1995 at 1000 (T24) The sub-samplings occurred for each incubated carboys at
T0 T2 (1200) T4 (1400) T7 (1700) T10 (2000) T13 (2300) T17 (300) T21 (700) and T24
7
Physical and chemical variables
Surface photosynthetic available radiation (PAR) was measured with a LI-COR (Model
LI-190SA) quantum sensor and a LI-1000 data logger Underwater irradiance was measured
every 50 cm with a LI-COR (Model 193SA) spherical quantum sensor The visible light
extinction coefficient was calculated from linear regressions of irradiance vs depth
Samples for ammonium (NH4+) determination were immediately fixed and measured at
the laboratory using the method of Koroleff (1976) For the other nutrients samples were brought
to the field laboratory stored in acid precleaned polycarbonate carboys Filtrations and storage of
samples were performed within one hour after sampling in an all glass filtering system through a
precombusted (450degC for 6 h) Whatman GFF filter (vacuum lt10 cm Hg) Filtrates were
immediately frozen in precombusted Pyrex flasks for later analysis of Soluble Reactive
Phosphorus (SRP) nitrate (NO3-) and nitrite (NO2-) and silicate with a segmented flow analyser
(Treacuteguer and Le Corre 1975) The determination of dissolved organic nitrogen concentration
(DON) was performed using the photo-oxidation method (Armstrong and Tibbits 1968)
Determinations of particulate organic carbon (POC) were performed on Whatman 25 mm GFF
filters with a Perkin-Elmer Model 2400 CHN analyzer
Size fractionated filtrations
For each sampling time 1050 ml was used for size fractions following a protocol
described in Fouilland et al (2001) This protocol allows
1) study of the effect of N treatment on in vitro carboxylase activities for lt1 μm and gt 1μm
plankton cells 2) expression of the in vitro carboxylase activities per unit cell for lt1 μm
picophytoplankton 3) a check for potential filtration artefacts Two successive filtrations on
8
Nuclepore filter (1 microm size pore) and on GFF glass fiber Whatman filter (07 microm size pore) with
a vacuum lt 23 cm Hg to minimise cell damage were performed Subsamples for cell
enumeration were taken before and after filtrations on 1 microm Nuclepore and GFF Whatman
filters Both filters for in vitro carboxylase activities and chlorophyll measurements as well as
subsamples fixed previously by 2 (final concentration) formaldehyde for cell enumeration
(Troussellier et al 1995) were all stored in liquid nitrogen
Chlorophyll concentration measurements
Filters were ground in 90 acetone and extracted for 24 h in the dark at 4oC Chlorophyll
(a+b+c) concentrations (Chl) were determined by spectrofluorimetry (Neveux and Lantoine
1993)
Planktonic cell enumeration and diatoms taxonomy
Subsamples (20 ml) were fixed with 2 ml of 40 formaldehyde The samples were kept
in the dark at 4degC Fixed samples for bacteria and flagellates enumeration were filtered on black
polycarbonate Nuclepore membranes (022 μm porosity) Five minutes before filtration one drop
of DAPI (4 6-diamidino-2-phenylindole) was added to samples (Porter and Feig 1980)
Autotrophic and heterotrophic flagellates were discriminated by the red fluorescence of
chlorophyll a containing organisms under ultra-violet light using epifluorescence microscopy
Counting was done by examination of 10 equatorial bands (100x objective and band surface
168000 μm2) over the whole membrane length For bacteria 20 to 30 microscope fields were
counted in order to have a minimum count of 300 bacteria (100x objective field surface 256
9
μm2) Enumeration and identification of large phytoplankton was made by optical microscopy
after sedimentation (Utermohl 1958)
Flow cytometry analyses
Flow cytometry (FCM) analyses were run with an ACR 1000 cytometer Phytoplanktonic
cells were detected according to their light scatter (related to cell size and structure) their orange
and red fluorescence emissions (due to phycoerythrin and chlorophyll pigments) collected
through 58542 nm band pass and 650 nm long pass optical filters respectively One microm beads
(Polysciences Warrington PA) used as internal standard were systematically added to analyse
samples in order to normalise and compare the different phytoplanktonic groups Flow cytometry
allowed us to discriminate phytoplankton with size range between 05 microm and 50 microm (FCM
injector size)
In vitro carboxylase activities
The pool of potentially active enzymes responsible for CO2 fixation in plankton
community was measured as the in vitro carboxylases activity by incorporation of radioactive
bicarbonate into stable products following Descolas-Gros and Oriol (1992) This allowed us to
quantify the in vitro Rubisco activity and szlig-carboxylase activity (sum of the activities of
phosphenolpyruvate carboxylase PEPC phosphoenolpyruvate carboxykinase PEPCK and
pyruvate carboxylase PYRC) present in planktonic community (Appleby et al 1980 Glover
1989) All carboxylase assays were made on the same extract Extraction was carried out at 0 oC
and pH 8 following the protocol described in Descolas-Gros and De Billy (1987) For the
Rubisco assay the reaction mixture contained 50 mM Tricine buffer (pH 8) 5 mM dithiothreitol
10
(DTT) 10 mM MgCl2 20 mM NaH14CO3 and 100 μl of the crude extract For the other three
assays the reaction mixture contained 50 mM Pipes buffer (pH 68) instead of the Tricine buffer
Moreover 5 mM MnCl2 and 5 mM ADP were added for PEPCK assays and for PYRC assays 5
mM MgCl2 and 5 mM ATP were added All reactions were initiated after a pre-incubation period
of 10 min by adding substrates 2 mM RuBP for Rubisco assay 5 mM PEP for PEPC and
PEPCK assays and 5 mM pyruvate for PYRC assay All mixtures were incubated at 25 oC for 20
min The reactions were stopped by the addition of 6 N HCl More details on the protocol are
given in Descolas-Gros and Fontugne (1985) Descolas-Gros and De Billy (1987) and Descolas-
Gros and Oriol (1992) Every carboxylase assay was carried out in triplicate with an assay error
lt15 and was automated with a Gilson auto-analyser (222 Autosampler Injector interfaced with
a Dilutor 401) Carboxylase activity is expressed in nmol CO2 L-1 h-1 in pmol CO2 μg C-1 h-1 and
in nmol CO2 μg Chla-1 h-1 in order to take into account the variation of the particulate carbon and
phytoplanktonic biomass during the experiment and in fmol CO2 cell-1 h-1 when possible The szlig-
carboxylasesRubisco ratio (βCR expressed in ) allowed us to quantify the relative importance
of the two pathways
Experiment reproducibility
In order to estimate the precision of the biological parameters discussed in this study the
coefficient of variation (CV) has been calculated for each parameter using four values measured
at T0 and is presented in Table 1 The CV of the biological parameters was generally less than
25 except for the carboxylases activity per cell for diatom cell and for the β-carboxylase per
cell for lt1 μm cells with values between 33 and 44 (Table 1)
11
Statistical analyses
In order to compare the effect of N treatments relative to the control and between the N
treatments non-parametric Wilcoxon signed-Rank analyses have been applied on cell numbers
chlorophyll concentrations and carboxylase activities and reported in Table 2
Results
Nutrient concentrations and physical variables
All chemical data are reported in Table 3 Water temperature varied between 220 and
238oC at a depth of 15 m At this depth the attenuation of the incident light with a maximum
value of 1800 μE m-1 s-1 was about 50 The initial chemical conditions were characterised by
very low concentrations in nitrate (lt015 microM) nitrite (lt01 microM) and by ammonium
concentrations averaging 04 microM and high DON concentrations averaging 24 microM These values
were close to those reported in June 1993 in the same area (Collos et al 1997) The phosphate
values averaged 022 microM in all carboys throughout the experiment (data not shown) The molar
ratio of silicateDIN varied from 17 to 110 in the control and enriched taurine carboys while the
ratio was close to 1 (between 08 and 25) throughout the experiment under enriched NH4+ and
NO3- treatments (data not shown) This suggested that DIN was the limiting nutrient in the
control and enriched taurine carboy during the experiment The ammonium concentrations
decreased from 04 to 006 microM (T10) in the control and under NO3- treatment and to 017 microM
(T10) under taurine treatment and varied between 007 to 023 microM afterwards The ammonium
concentrations decreased from 686 microM (T0) to 032 microM (T24) under NH4+ treatment The nitrate
12
remained undetectable throughout most of the experiment in the control NH4+ and taurine
treatments and decreased from 931 microM (T0) to 242 microM (T24) under NO3- treatment The DON
concentrations remained quite constant in the control and under DIN treatments varying from
218 to 268 microM and decreased from 376 microM (T0) to 303 microM (T24) under the taurine treatment
Size fractionation accuracy
Using the chlorophyll parameter (red fluorescence) from flow cytometry analysis on
samples before and after 1 μm nuclepore filtration and compared to the lt1 μm chlorophyll a
concentrations measured by spectrofluorimetry the accuracy of size-fractionation protocol was
assessed The red fluorescence for each cell group in the lt1μm fraction was summed and
compared with the lt1μm chlorophyll a concentrations A positive linear regression was obtained
(R2=074 n=22) The total red fluorescence of cells after 1 μm filtration detected by flow
cytometry was thus directly correlated with chlorophyll a pigment concentration measured in this
lt1 μm fraction This indicates that the potential filtration artefacts (eg breakdown of small cells)
were reduced during the experiment
Small picoplanktonic cells
In the lt1 μm filtrate a population of small picoeukaryotes was identified and exhibited
the same flow cytometric characteristics as the eukaryotic Ostreococcus tauri This picoeukaryote
contributed 95 of total lt1 μm cell numbers Larger picoeukaryote cells with a relative red
fluorescence and apparent size close to those of 1 μm beads were also detected in this fraction
No cyanobacteria cells were detected by either flow cytometry or epifluorescence microscopy
during this study The variation of lt1 microm cell numbers detected by flow cytometry is reported in
13
Table 4 The abundance of small picoeukaryote cells measured during this experiment was in the
same range of values as previously observed in the same area between 1991 and 1994 averaging
30x106 cell L-1 (Vaquer et al 1996) Compared to the control no effect of taurine treatment was
detected on the lt1 microm cell concentrations (Table 2) The lt1 microm cell numbers increased in all
carboys T0 to T7 and afterwards decreased in the control and under taurine treatment From T10 a
strong significant increase of lt1 microm cell numbers reaching 50 106 cell L-1 was observed under
DIN treatments (Table 4)
From previous filtration experiments with plankton community from Thau Lagoon 67 to
74 of total bacteria cells can be retained on GFF filters (unpubl data) Bacterial cell numbers
varied slightly during the experiment (Table 3) As compared to the control the different N
treatments did not influence the cell concentrations Retention on GFF filter of 70 of total
bacterial cell was assumed Thus the contribution of bacteria cells was always greater than 95
of the total lt1 μm plankton cell numbers retained on GFF filters
Larger plankton cells community
At the beginning of the experiment nano- and microplankton species were dominated by
autotrophic flagellates and diatoms mainly composed of Chaetoceros spp Skeletonema spp and
Pseudo-nitzschia spp (Table 5) At the end of the experiment heterotrophic and autotrophic
flagellate abundance did not vary whereas diatom cells reached 19 106 cells L-1 in the control and
under taurine treatment mainly due to an increase of Pseudo-nitzschia spp cells On the last day
of the experiment higher diatom cell abundance was measured under DIN treatments mainly
due to the increase of Skeletonema spp cells (Table 5) Using a Ccell conversion factors for
each group from Dupuy et al (2000) the contribution of gt1 μm picophytoplankton and diatom
14
cells to the total gt1μm planktonic organic carbon was estimated to be less than 01 and greater
than 95 respectively during the experiment
Chlorophyll pigment concentrations and in vitro carboxylases activity
The chlorophyll pigment concentrations and the pool of Rubisco per litre for both size
fractions were not significantly different between the control and the taurine treatment
throughout the experiment (Table 2) Compared to the control a significant increase of
chlorophyll concentration occurred after 7 incubation hours under DIN treatments reaching 109
and 08 microgL-1 for gt1 μm and lt1 μm phytoplankton cells respectively (Fig 2A amp 2B Table 1)
Similarly to the chlorophyll concentrations after 7 incubation hours the pool of Rubisco per litre
for both size fractions was significantly greater under DIN treatments than in the control (Table 2
and 6) The pool of β-carboxylase activity per litre for both size fractions varied slightly during
the 24 hours incubation (Table 7) and no significant different between the N treatments and the
control was reported (Table 2) The values of the total carboxylases activity (ie sum of two size
fractions) were normalised per carbon using the particulate organic carbon concentration (POC)
and reported in Figure 3 In the carboys without DIN enrichments the total β-carboxylase
activity per carbon increased during the night period while the total Rubisco activity per carbon
decreased (Fig 3A) A coupling between the total Rubisco and β-carboxylase activity per carbon
was generally observed in the carboys with DIN enrichments (Fig 3B) The ratio between POC
and chlorophyll a concentrations (POCChla) decreased from about 700 to 200 μgC μgChla-1
overall the experiment in all the carboys The carboxylases activity was normalised to
chlorophyll a concentrations for each size fraction in order to take into account the
phytoplankton biomass variation between the N treatments during the present experiment The
15
Rubisco activity per Chla generally decreased in all N treatments for both size fractions during
the experiment (Fig 4) and no significant difference between these N treatments was measured
(Table 2) The β-carboxylase activity per Chla for both sized fractions generally decreased
during the 10 first hours of the experiment in all N treatments (Fig 5) Nevertheless a significant
increase of the β-carboxylase activity per Chla for both size fractions occurred under DIN
treatments afterwards while this activity per Chla remained very low in the control and the
taurine treatment (Fig 5 and Table 2)
β-carboxylation pathway
β-carboxylase activity (PEPC+PEPCK+PYRC) for the plankton community expressed as
a percentage of Rubisco activity (βCR ratio) reached values greater than 50 after 10 incubation
hours in the control and under taurine treatment (Fig 6) Under DIN treatments the βCR ratio
for both size fractions was significantly lower than measured in the control with values less than
40 throughout the study (Table 2) Phosphenolpyruvate carboxylase (PEPC) enzyme
contributed to about 50 of the total β-carboxylase enzymes in both size fractions (data not
shown)
Cellular pool of carboxylase enzymes
A strong decrease of the Rubisco pool per unit cell was measured in small phytoplankton
in all carboys during the experiment and no significant influence of N treatments was observed
(Table 2 and 8) As diatom cells contributed for the most part of carbon biomass in gt1 μm
plankton community the in vitro Rubisco activity for gt1 μm fraction is expressed on the basis of
16
diatom cell number Similarly to the small cells a decrease of the Rubisco pool per unit cell is
also observed for larger cells after 24 incubation hours in the carboys (Table 5)
For the small size fraction the enzymatic pool of PEPC is expressed per unit cell of small
picoeukaryotes and reported in the Table 8 This cellular pool tended to be significantly different
between the DIN treatments and the control (p=005 and 008 Table 2) This pool decreased
during the experiment under DIN treatments while the highest values in the control and under
taurine treatment were recorded close to the end of the experiment (Table 8) The pool of PEPCK
is expressed by unit of diatom cells as this enzyme is present in the dominant diatom species
observed during this study (Descolas-Gros and Oriol 1992) and these species contributed to 95
of the total gt1 μm carbon biomass Similarly to the PEPC in small cells the cellular pool of
PEPCK in larger cells was significantly very low under DIN treatments relative to the control and
to the carboy with an addition of taurine at the end of the experiment (Table 5)
Discussion
After 10 hours of incubation the very low available dissolved inorganic nitrogen (DIN)
concentrations probably limited the growth of phytoplankton in the control and under taurine
treatment This explains the decrease of the small picophytoplankton cells and the low net growth
rate of diatoms in these carboys Nevertheless bacterial cells and heterotrophic flagellates
submitted to these different nutrient conditions did not show a net growth rate In contrast the net
growth rate of picophytoplankton and diatom was about 15 and 3 divday respectively in the
samples enriched with DIN
17
Even though phytoplankton growth was positively influenced by DIN enrichments the
cellular pool of potentially active Rubisco enzyme for picophytoplankton and diatom cells
decreased throughout the study in all the carboys This suggests a degradation of the cellular
enzymatic pool in phytoplankton cells during the study The rapid degradation of the nitrogen
fraction in phytoplankton cells under high irradiance has been shown in a shallow environment
with photosynthetically available radiation levels above 600 to 1000 μE m-2 s-1 (Collos et al
1992) Rubisco enzyme can act as a nitrogen reservoir that is more easily mobilised than the rest
of the protein pool during environmental changes (Ekman et al 1989) Thus cellular Rubisco
pool degradation during this present study may result from the light conditions in incubation
carboys held at fixed positions near the surface where phytoplankton cannot avoid high
irradiance levels during the day time reaching about 900 μE m-2 s-1 at the incubation depth
As compared to the Rubisco pathway the potential use of β-carboxylation pathway by the
plankton community as shown by the carboxylases activity normalised to the particulate carbon
chlorophyll a and cell and by the ratio βCR increased after 10 incubation hours in the carboys
without DIN enrichments only The values of the βCR ratio were higher than 100 at which
time the phytoplankton biomass started to decrease in the control and under taurine treatment In
contrast β-carboxylase activity seemed strongly coupled to the Rubisco activity under DIN
treatments This daily co-variation was already reported for natural phytoplankton in
Mediterranean Sea under favourable environmental conditions (Fouilland et al 2001) showing
the strong interdependence of these two C assimilation pathways (falkowski and Raven 1997)
The βCR ratio under DIN treatments remained less than 40 which is a characteristic of
autotrophic cells (Descolas-Gros and Oriol 1992) A βCR ratio higher than 100 suggests that
the β-carboxylation pathway can prevail on the Calvin-Benson pathway As β-carboxylation in
18
the light occurs using a substrate (PEP) derived from the Calvin-Benson cycle a ratio greater
than 100 has been associated with the occurrence of heterotrophic organisms such as
dinoflagellates (Descolas-Gros and Oriol 1992) For such cells the origin of
phosphoenolpyruvate is uncertain and Descolas-Gros and Oriol (1992) suggested that it could be
supplied by the incorporation of external organic substances
The increase of β-carboxylase pathway observed in the present study cannot be explained
by the increase of heterotrophic biomass relative to the autotrophic biomass in the control or with
addition of taurine The POCChla ratio decreased throughout the experiment suggesting a shift
towards an autotrophic community in all the carboys For the small size fraction bacterial cells
which are partially retained by filters could have significantly contributed to the total β-
carboxylase activity as suggested by results from dark fixation of 14C from natural plankton (Li et
al 1993 Markager 1999) Nevertheless the regulation of β-carboxylation pathway and enzyme
structure is different in bacterial and phytoplankton cells (Rivoal et al 1998) The occurrence of
carboxylation of PEP by PEPC is well known in bacterial cells Nevertheless this carboxylase
does not act unless acetyl-coenzyme A is present perhaps to facilitate a continued supply of
oxaloacetate for the TCA cycle fuelling (Baumerg 1973 Overbeck 1984) Such regulation does
not occur in phytoplankton cells (Turpin et al 1991) As no acetyl-coenzyme A is added to the
reaction mixture the strong variation of the activity of major β-carboxylase enzymes (PEPC) is
assumed to be directly related to the β-carboxylation pathway of the small picoeukaryote cells
Moreover the bacterial cells contributed a very large fraction to the total lt1 μm picoplankton
abundance and no significant difference in the bacterial abundance was noticed between carboys
(Table 4) Thus any increase of βCR ratio for the lt1 μm fraction observed after 10 hours of
incubation cannot be due to the bacterial growth relative to the decrease of small
19
picophytoplankton abundance which contributed to less than 5 of total cell numbers over the
experiment in all carboys The importance of bacterial activity (free or attached bacteria cells) is
assessed relatively to the ammonium uptake Data from Table 3 show that ammonium uptake was
at least twice as high during the day than at night in NH4+ treatment indicating autotrophic
driven processes In the control ammonium actually increased at night (Table 3) so it can be
safely assumed that bacterial populations produced rather than consumed ammonium in these
series of experiment This suggests that the heterotroph bacterial activity was not influenced by
the N treatments Moreover using values for the carbon content in plankton species in Thau
Lagoon calculated by Dupuy et al (2000) the heterotroph flagellates contributing to the total gt1
microm plankton biomass was estimated to be less than 1 in the control and under all N treatments
at the end of the experiment Thus the variation of the β-carboxylation enzyme pool relative to
the Rubisco was mainly due to the enzyme activities from the autotrophic plankton in both size
fractions
Anaplerotic carbon fixation by PEPC in the light exceeding photosynthetic carbon
fixation has already been measured in an N-limited green alga using stable carbon isotope
discrimination (Guy et al 1989) These authors showed that under transient situations the
contribution of βminuscarboxylation to the total C fixation can be as high as 70 ie a βCR ratio of
230 which is higher than our maximum value for a natural plankton assemblage (160) The
significant increase of both βCR ratio and the β-carboxylase activity normalised to the
chlorophyll and carbon biomass reported during the present study suggests a potential increase
of cellular β-carboxylase enzymes The pool of PEPC and PEPCK expressed per unit cell for the
small picoeukaryotes and diatoms tended to increase at the end of the experiment in the control
and under taurine treatment This increase of the activity of β-carboxylase enzymes combined
20
with the decrease of the Rubisco activity under inorganic N-deficient conditions suggests that β-
carboxylation pathway is more active when phytoplankton growth is limited by inorganic
nutrients A higher photosynthetic carbon fixation by β-carboxylation than by Rubisco in
autotrophic phytoplankton cells is surprising especially in regards to the source of the substrate
for β-carboxylation The dissimilation of reserve carbohydrate providing PEP for this pathway
as usually observed in the dark for microalgae (Mortain-Bertrand et al 1988) is unlikely This is
because phytoplankton growth was very low under N-deficient conditions implying low C
storage in cells
The increase of the enzymatic pool for β-carboxylation in phytoplankton may be due to a
shift from autotrophic to heterotrophic activity induced by a DIN deficiency as in the control and
DON (taurine) treatment There is indirect evidence that taurine was taken up during the day
Data from Table 2 shows that DON decreased in the carboys enriched with taurine while it
remained constant in the others This decrease roughly corresponds to the taurine addition but
taurine was taken up during the day only and not at night which indicates that phytoplankton
not bacteria were responsible for this uptake Nevertheless this uptake does not result in
increased phytoplankton biomass as observed in enriched ammonium or nitrate carboys
Possibly the time lag involved between uptake and growth is longer than the time scale used in
the present study as observed elsewhere (Antia et al 1975 Bonin and Maestrini 1981) Thus
increases in cell numbers could not be observed within a 24-hour time frame following the
taurine addition Interestingly in the study of Vincendeau (1987) S costatum took up DON once
DIN was exhausted Thus the similarity between the control and the taurine treatment could have
a common explanation heterotrophy is induced by DIN limitation The increase of β-
carboxylation pathway under limiting N conditions is coupled to the uptake of dissolved nitrogen
21
compounds by phytoplankton resulting in the activation of respiration for the biosynthetic
processes This causes the back-regulation of anaplerotic reactions as previously described by
Vanlerberghe et al (1990 1992) for NH4+ uptake A stimulation of respiration after the addition
of acetate has also been observed in Chlamydomonas reinhardtii cultured photoautotrophically
(Fett and Coleman 1994 Endo and Asada 1996) Moreover under similar conditions Heifetz et
al (2000) showed a decrease of photosynthetic carbon fixation in cells grown in acetate with
saturating light and CO2 These results suggest an increase of the β-carboxylation pathway for the
replenishment of TCA cycle intermediates in order to sustain the growth rate of C reinhardtii
growing heterotrophically using acetate as source of carbon This is in accordance with the
increase of cellular β-carboxylase pool during a shift toward heterotrophy in natural
phytoplankton cells suggested in this study Even though the evidence of this heterotrophy was
observed with the taurine enrichment only the importance of the β-carboxylation pathway in
natural phytoplankton under very low nutrient conditions is clearly highlighted in this study In
order to gain further insight into the phytoplankton heterotrophy the relationship between the
CO2 assimilation pathways and the capacity of phytoplankton to use organic sources of nitrogen
andor carbon should be investigated using axenic cultures of phytoplankton submitted to
different nutritional conditions for instance
Acknowledgements
This work was supported by CNRS University Montpellier II IFREMER (URM 5) We
thank J-M Deslous-Paoli and C Leboulanger for their assistance during the fieldwork T Sime-
22
Ngando for providing bacteria and flagellates data and 2 anonymous referees for insightful
comments on the manuscript This paper represents a portion of a thesis of the University Paris
VI of Eric Fouilland who received a BDI fellowship from CNRS and IFREMER This is the
XXX ISEM contribution for Chantal Descolas-Gros
23
References
Appleby G Colbeck J Holdsworth ES Wadman H 1980 szligcarboxylation enzymes in
marine phytoplankton and isolation and purification of pyruvate carboxylase from
Amphidinium carterae (Dinophyceae) J Phycol 16 290-295
Antia NJ Berland BR Bonin DJ Maestrini SY 1975 Comparative evaluation of certain
organic and inorganic sources of nitrogen for phototrophic growth of marine microalgae J
Mar Biol AssU K 55 519-539
Armstrong FAJ Tibbits S 1968 Photochemical combustion of organic matter in sea
water for nitrogen phosphorus and carbon determination J Mar Biol Ass U K 48
143-152
Bacher C Millet B Vaquer A 1997 Modeacutelisation de lrsquoimpact des mollusques cultiveacutes
sur la biomasse phytoplanctonique de lrsquoeacutetang de Thau (France) C R Acad Sci Paris
320 73-81
Baumberg S 1973 Co-ordination of metabolism In Mandelstam J McQuillen K (eds)
Biochemistry of bacterial growth Second edition Blackwell 423-493
Bonin DJ Maestrini SY 1981 Importance of organic nutrients for phytoplankton growth in
natural environments implications for algal species successionPhysiological bases of
phytoplankton ecology Platt T (Ed) Can Bull Fish Aquat Sci 210 279-291
Chreacutetiennot-Dinet M-J Courties C Vaquer A Neveux J Claustre H Lautier J
Machado MC 1995 A new marine picoeukaryote Ostreococcus tauri gen et sp nov
(Chlorophyta Prasinophyceae) Phycologia 34 85-292
24
Collos Y Descolas-Gros C Fontugne M Mortain-Bertrand A Chretiennot-Dinet MJ
Frikha MG 1992 Carbon and nitrogen dynamics during growth and degradation of
phytoplankton under natural surface irradiance Mar Biol 112 491-496
Collos Y Descolas-Gros C Fontugne M Mortain-Bertrand A Chreacutetionnot-Dinet M-J
Frikha MG 1993 Chemical isotopic and enzymatic monitoring of free and enclosed
seawater implications for primary production estimates in incubation carboys Mar Ecol
Prog Ser 93 49-54
Collos Y Vaquer A Bibent B Slawyk G Garcia N Souchu P 1997 Variability in nitrate
uptake kinetics of phytoplankton communities in a Mediterranean coastal lagoon Estuar
Coast Shelf S 44 369-375
Courties C Vaquer A Troussellier M Lautier J Chreacutetiennot-Dinet M-J Neveux J
Machado C Claustre H 1994 Smallest eukaryotic organism Nature 370 255
Descolas-Gros C Fontugne M 1985 Carbon fixation in marine phytoplankton carboxylase
activities and stable carbon-isotope ratios physiological and paleoclimatological aspects
Mar Biol 87 1-6
Descolas-Gros C De Billy G 1987 Temperature adaptation of RuBP caboxylase kinetic
properties in marine Antarctic diatoms J Exp Mar Biol Ecol 108 147-158
Descolas-Gros C Oriol L 1992 Variations in carboxylase activity in marine phytoplankton
cultures szligcarboxylation in carbon flux studies Mar Ecol Prog Ser 85 163-169
Dodds WK Priscu JC 1991 Ammonium stimulation of dark carbon fixation as an indicator
of nitrogen deficiency in phytoplankton potential errors caused by ammonium-oxidizing
bacteria J Phycol 27 79-82
25
Dupuy C Vaquer A Lam-Hoai T Rougier C Mazouni N Lautier J Collos Y Le Gall
S 2000 Feeding rate of the oyster Crassostera gigas in a natural planktonic community of
Mediterranean Thau Lagoon Mar Ecol Prog Ser 205 171-184
Ekman P Lignell A Pedersen M 1989 Localization of ribulose-15-bisphosphate
carboxylaseoxygenase in Gracilaria secundata (Rhodophyta) and its role as a nitrogen
storage pool Botanica Mar 32 527-534
Elrifi IR Turpin DH 1986 Nitrate and ammonium induced photosynthetic suppression in N-
limited Selenastrum minutum Plant Physiol 81 273-279
Endo T Asada K 1996 Dark induction of the non-photochemical quenching of chlorophyll
fluorescence by acetate in Chlamidomonas reinhardtii Plant Cell Physiol 37 551-555
Falkowski PG Raven JA 1997 Aquatic photosynthesis Blackwell Science publisher
Fett JP Coleman JR 1994 Regulation of periplasmic carbonic anhydrase expression in
Chlamidomonas reinhardtii by acetate and pH Plant Physiol 106 103-108
Fidalgo JP Cid A Abalde J Herrero C 1995 Culture of the marine diatom Phaedactylum
tricornutum with different nitrogen sources Growth nutrient conversion and biochemical
composition Cah Biol Mar 36 165-173
Fouilland E Vaquer A Descolas-Gros C 1995 Annual variations in CO2 assimilation and
primary production measurements in a mediterranean lagoon (Thau lagoon France)
Photosynthesis from Light to Biosphere Mathis P (Ed) Elvesier 5 873-876
Fouilland E Courties C Descolas-Gros C 2001 Size-fractionated carboxylase activities
during a 32 h cycle at 30 m depth in the Northwestern Mediterranean Sea after an episodic
wind event J Plankton Res 23 623-632
26
Gasc A 1997 Etude de la production primaire reacutegeacuteneacutereacutee dans un eacutecosystegraveme conchylicole le
bassin de Thau Ph D Univ Sciences et Techniques du Languedoc Montpellier France
Gilbert F Souchu P Bianchi M Bonin P 1997 Influence of shellfish farming activities on
nitrification nitrate reduction to ammonium and denitrification at the water-sediment
interface of the Thau lagoon France Mar Ecol Prog Ser 151 143-153
Glover HE 1989 Ribulosebisphosphate carboxylaseoxygenase in marine organisms Int Rev
Cytol 115 67-137
Guy RD Vanlerberghe GC Turpin DH 1989 Significance of phosphoenolpyruvate
carboxylase during ammonium assimilation Carbon isotope discrimination in
photosynthesis and respiration by the N-limited green alga Selenastrum minutum Plant
Physiol 89 1150-1157
Heifetz PB Forster B Osmond CB Giles LJ Boynton JE 2000 Effects on facultative
autotrophy in Chlamydomonas reihardtii assessed by photosynthetic measurements and
stable isotope analyses Plant Physiol 122 1439-1445
Huppe HC Turpin DH 1994 Integration of carbon and nitrogen metabolism in plant and
algal cells Annu Rev Physiol Plant Mol Biol 45 577-607
Koroleff F 1976 Determination of nutrients Methods of Seawater analysis Grasshoff K
(Ed) Verlag Chemie 117-182
Lam-Hoai T Rougier C Lasserre G 1997 Tintinnids and rotifers in a northern
Mediterranean coastal lagoon Structural diversity and function through biomass
estimations Mar Ecol Prog Ser 152 13-25
27
Le Gall S Hassen MB Le Gall PB 1997 Ingestion of a bacterivorous ciliate by oyster
Crassostera gigas protozoa as a trophic link between picoplankton and benthic suspension-
feeders Mar Ecol Prog Ser 152 301-306
Levasseur M Thompson PA Harrison PJ 1993 Physiological acclimation of marine
phytoplankton to different nitrogen sources J Phycol 29 587-595
Millet B 1989 Fonctionnement hydrodynamique du bassin de Thau Validation drsquoun modegravele
numeacuterique de circulation (programme Ecothau) Oceanol Acta 12 37-46
Morris I Yentsch CM Yentsch CS 1971 The physiological state with respect to nitrogen
of phytoplankton from low-nutrient subtropical water as measured by the effect of
ammonium ion on dark carbon dioxide fixation Limnol Oceanogr 16 859-868
Mortain-Bertrand A Descolas-Gros C Jupin H 1987a Short-term 14C incorporation in
Skeletonema costatum (Greville) Cleve (Bacillariophyceae) as a function of light regime
Phycologia 16 262-269
Mortain-Bertrand A Descolas-Gros C Jupin H 1987b Stimulating effect of transitions from
light to dark on carbon assimilation by a marine diatom J Exp Mar Biol Ecol 112 11-
26
Mortain-Bertrand A Descolas-Gros C Jupin H 1988 Pathway of dark inorganic carbon
fixation in two species of diatoms influence of light regime and regulator factors on diel
variations J Plankton Res 10 199-217
Neveux J Lantoine F 1993 Spectrofluorometric assay of chlorophylls and phaeopigments
using the least squares approximation technique Deep-Sea Res 40 1747-1765
28
Osborne BA Geider RJ 1986 Effect of nitrate-nitrogen limitation on photosynthesis of the
diatom Phaeodactylum tricornutum Bohlin (Bacillariphyceae) Plant Cell Environ 9 617-
625
Overbeck J 1984 Application of TCA cycle metabolism for growth estimates of heterotrophic
bacterioplankton Arch Hydrobiol Beih 19 23-36
Porter K Feig YS 1980 The use of DAPI for identifying and counting aquatic microflora
Limnol Oceanogr 25 943-948
Slawyk G Collos Y 1982 13C and 15N uptake by marine phytoplankton 2 Results from a
tropical area Rapp P-v Reacuteun Cons int Explor Mer 180 209-213
Souchu P Gasc A Cahet G Vaquer A Collos Y Deslous-Paoli JM 1997
Biogeochemical composition of Mediterranean waters outside the Thau lagoon Estuar
Coast Shelf S 44 275-284
Souchu P Vaquer A Collos Y Lamdrein S Deslous-Paoli J-M Bibent B 2001
Influence of shellfish farming activities on the biogeochemical composition of the water
column in Thau Lagoon Mar Ecol Prog Ser 218 141-152
Treacuteguer P Le Corre P 1975 Manuel danalyse des sels nutritifs dans leau de mer
Utilisation de lAutoAnalyseur II Technicon LOC Universiteacute de Bretagne Occidentale
Brest France
Troussellier M Courties C Zettelmaier S 1995 Flow cytometric analysis of coastal lagoon
bacterioplankton and picophytoplankton fixation and storage effects Estuar Coast Shelf
S 40 621-633
Turpin DH 1991 Effects of inorganic N availability on algal photosynthesis and carbon
metabolism J Phycol 27 14-20
29
Turpin DH Vanlerberghe GC Amory AM Guy RD 1991 The inorganic requirements
for nitrogen assimilation Can J Bot 69 1139-1145
Utermoumlhl H 1958 Zur Vervollkommnung der quantitativen Phytoplankton-Methodik Mitt int
Ver theor angew Limnol 9 1-38
Vanlerberghe GC Schuller KA Smith RG Feil R Plaxton WC Turpin DH 1990
Relationship between NH4+ assimilation rate and in vivo phosphoenolpyruvate carboxylase
activity Regulation of anapleurotic carbon flow in the green alga Selenastrum minutum
Plant Physiol 94 284-290
Vanlerberghe GC Huppe HC Vlossak KDM Turpin DH 1992 Activation of
respiration to support dark NO3- and NH4
+ assimilation in the green alga Selenastrum
minutum Plant Physiol 99 495-500
Vaquer A Troussellier M Courties C Bibent B 1996 Standing stock and dynamics of
picophytoplankton in the Thau Lagoon (northwest Mediterranean coast) Limnol
Oceanogr 41 1821-1828
Vincendeau ML 1987 Etude expeacuterimentale de la fertiliteacute des eaux des milieux conchylicoles
influence de lrsquoexcreacutetion des huitres et des palourdes sur la production des diatomeacutees
dominantes Ph D Univ Paris 6 Paris France
Table 1 Coefficient of variation (in percent) of the different biological
parameters calculated using four measurements observed at T0 Calculation based on cell numbers of diatom dominant species
gt1 microm lt1 micromCell numbers 22 6
Chlorophyll a concentrations 6 10Rubisco activity per liter 20 17szlig-Carboxylases per liter 23 12
Rubisco activity per chlorophyll a unit 17 24szlig-Carboxylases activity per chlorophyll a unit 19 12
βCR ratio 23 24Rubisco activity per cell 35 18 β-carboxylase per cell 44 33
Table 2 Statistical results from non parametric Wilcoxon signed-Rank analyses between N enriched treatments and control 001le p lt005 p le001 NS non significant (p ge01)
Cell numbers
Rubisco activity per cell
PEPC activity per cell
lt1 microm gt1 microm lt1 microm gt1 microm lt1 microm gt1 microm lt1 microm gt1 microm lt1 microm gt1 microm lt1 microm gt1 microm lt1 microm lt1 microm lt1 microm
+NH4+ Control 009 NS NS NS NS NS 005
+NO3- Control NS NS NS NS NS NS 008
+taurine Control NS NS NS NS NS NS NS NS NS NS NS NS NS NS NS
βCR ratioChla concentrations
Rubisco activity per litre
β-carboxylase activity per litre
Rubisco activity per Chla
β-carboxylase activity per Chla
Table 3 Concentrations of ammonium nitrate and dissolved organic nitrogen (DON) measured in the control NH4+
(+NH4+) NO3
- (+NO3-) and taurine (+taurine) enriched treatments during the experiment
nd no data data in bold denote a period of darkness
Control + NH4+ + NO3
- + taurine Control + NH4+ + NO3
- + taurine Control + NH4+ + NO3
- + taurineT0 039 686 04 047 013 005 931 003 226 268 218 376T2 nd nd 026 nd 006 000 896 000 224 nd 222 ndT4 045 582 024 037 000 000 85 000 224 255 236 369T7 011 352 022 029 000 000 746 000 247 266 245 332T10 006 362 006 017 001 000 615 000 265 256 236 329T13 011 384 015 023 000 000 633 000 249 258 251 312
T17 018 327 012 015 000 008 586 001 218 249 221 315
T21 007 261 009 022 000 000 468 000 233 260 223 317T24 017 032 019 020 000 000 242 000 244 260 218 303
Ammonium concentrations (microM) Nitrate concentrations (microM) Dissolved organic nitrogen (DON) concentrations (microM)
Table 4 Small picophytoplankton and bacteria cell numbers during the experiment in
the control and N enriched treatments
nd no data data in bold denote a period of darkness
Control +NH4+ +NO3
- +taurine Control +NH4+ +NO3
- +taurineT0 196 195 219 208 936 nd nd ndT2 182 208 182 130 nd nd nd ndT4 309 252 279 257 nd nd nd ndT7 304 333 312 286 1220 1220 1200 1360T10 260 415 406 221 nd nd nd ndT13 258 482 484 230 1500 1500 1190 1330
T17 198 516 409 219 nd nd nd nd
T21 208 nd 500 177 1510 1220 884 1170T24 135 nd 457 184 1120 967 832 1160
lt1 microm phytoplankton cell numbers (x106 cells L-1)
Bacteria cell numbers (x106 cells L-1)
Table 5 Plankton cell numbers and carboxylases (Rubisco and PEPCK) activity per
carbon unit of diatom cell within the gt1 microm fraction at T0 in the control and T24 in the
control and N enriched treatments nd no data
Control +NH4+ +NO3
- +taurinePicophytoplankton (x106 cells L-1) 27 149 nd 20 72
Heterotroph flagellates (x106 cells L-1) 06 05 03 02 05Autotroph flagellates (x106 cells L-1) 07 11 06 05 07
Diatoms (x106 cells L-1) 08 19 91 50 19Rubisco activity (fmol CO2 cell-1 h-1) 117 57 83 112 60PEPCK activity (fmol CO2 cell-1 h-1) 90 26 006 046 75
T24T0
Table 6 The in vitro Rubisco activity per litre of gt1 microm and lt1microm fractions in the control and
enriched N treatments
nd no data data in bold denote a period of darkness
Control +NH4+ +NO3
- +taurine Control +NH4+ +NO3
- +taurineT0 1088 664 844 939 519 459 498 349T2 1215 1322 1147 1535 289 434 428 347T4 1427 1802 nd 975 449 nd 746 599T7 552 1029 1064 441 520 842 732 361T10 478 1667 1640 396 162 647 532 351T13 213 2006 1724 239 185 577 609 164T17 129 1485 1264 171 134 453 400 159T21 366 2324 843 371 180 669 657 232T24 1093 7606 5625 1186 120 329 395 155
gt1 microm Rubisco activity (nmol CO2 L
-1 h-1)lt1 microm Rubisco activity
(nmol CO2 L-1 h-1)
Table 7 The in vitro β-carboxylase activity (PEPC+PEPCK+PYRC) of gt1 microm and lt1microm
fractions in the control and enriched N treatments
nd no data data in bold denote a period of darkness
Control +NH4+ +NO3
- +taurine Control +NH4+ +NO3
- +taurineT0 104 91 138 151 156 142 118 147T2 211 178 154 178 264 125 288 161T4 201 86 nd 95 116 nd 235 121T7 169 140 149 70 151 150 168 121T10 99 223 133 128 182 235 170 67T13 195 320 nd 150 113 114 155 123T17 203 231 118 111 132 82 109 255T21 227 392 257 289 208 161 228 113T24 117 120 265 190 59 61 71 65
gt1 microm β-carboxylase activity (nmol CO2 L
-1 h-1)lt1 microm β-carbxylase activity
(nmol CO2 L-1 h-1)
Table 8 The cellular pool of Rubisco and PEPC enzymes of lt 1microm picophytoplankton in the
control and N enriched treatments
nd no data data in bold denote a period of darkness
Control +NH4+ +NO3
- +taurine Control +NH4+ +NO3
- +taurineT0 265 235 228 168 038 035 017 041T2 159 208 235 268 020 023 052 030T4 145 nd 267 233 027 nd 011 014T7 171 253 234 126 050 022 037 023T10 062 156 131 158 037 024 021 024T13 072 120 126 071 032 019 028 017
T17 068 088 098 073 038 011 021 027
T21 086 nd 131 131 055 nd 011 047T24 088 nd 086 084 020 nd 010 005
Rubisco activity per cell (fmol CO2 cell-1 h-1)
PEPC activity per cell (fmol CO2 cell-1 h-1)
Sampling area
Fig 1 Map of sampling area in Thau lagoon Grey and black areas denote the shellfish cultivation area and towns respectively
Mediterranean Sea
NIGHTC
hlor
ophy
llco
ncen
trat io
n(micro
g c h
l L-1
)
0
2
4
6
8
10
12
00
02
04
06
08
10NIGHT
Control+ NH4
+
+ NO3-
+ Taurine
A) gt1 microm phytoplankton
B) lt1 microm phytoplankton
Chl
orop
hyll
conc
entra
t ion
(microg
c hl L
-1)
Local time
1000 1600 2200 10000400
Fig 2 Chlorophyll (a+b+c) concentrations of (A) gt1 microm phytoplankton and of (B) lt1 microm phytoplankton in the control and enriched N treatments during the incubation experiment
Rub
isco
activ
ity(p
mol
CO
2 microg
C-1
h-1
)A) Without DIN enrichments
Local time
1000 1600 2200 10000400
0
200
400
600
800
1000
0
40
80
120
160
200
0
200
400
600
800
1000
0
40
80
120
160
200
NIGHT
NIGHT
B) With DIN enrichments
Control Control+ Taurine+ Taurine
+ NH4+
+ NO3-
+ NH4+
+ NO3-
β-ca
rbox
ylas
eac
tivity
(pm
olC
O2 micro
g C
-1 h
-1)
Rub
isco
activ
ity(p
mol
CO
2 microg
C-1
h-1
)
β-ca
rbox
ylas
eac
tivity
(pm
olC
O2 micro
g C
-1 h
-1)
Fig 3 Total Rubisco and β-carboxylase activity expressed per particulate carbon for (A) the control and enriched taurine carboy and for (B) the ammonium and nitrate enrichments during the incubation experiment
NIGHT
Rub
isco
activ
ity(n
mol
CO
2 microg
chla
-1 h
-1) NIGHT
Control+ NH4
+
+ NO3-
+ Taurine
A) gt1 microm phytoplankton
B) lt1 microm phytoplankton
Fig 4 Rubisco activity normalised per chlorophyll a concentration of (A) gt1 microm phytoplankton and of (B) lt1 microm phytoplankton in the control and enriched N treatments during the incubation experiment
Rub
isco
activ
ity(n
mol
CO
2 microg
chla
-1 h
-1)
0
200
400
600
0
200
400
600
Local time
1000 1600 2200 10000400
NIGHT
β-ca
rbox
ylas
eac
tivity
(nm
olC
O2 micro
g ch
la-1
h-1
)
A) gt1 microm phytoplankton
B) lt1 microm phytoplankton
NIGHTControl+ NH4
+
+ NO3-
+ Taurine
0
40
80
120
160
200
β-ca
rbox
ylas
eac
tivity
(nm
olC
O2 micro
g ch
la-1
h-1
)
0
20
40
60
Local time
1000 1600 2200 10000400
Fig 5 β-carboxylase activity normalised per chlorophyll a concentrations of (A) gt1 microm phytoplankton and of (B) lt1 microm phytoplankton in the control and enriched N treatments during the incubation experiment
NIGHT
β-ca
rbox
y las
e R
ubi s
cora
tio (
)
NIGHT
Control+ NH4
+
+ NO3-
+ Taurine
A) gt1 microm phytoplankton
B) lt1 microm phytoplankton
0
30
60
90
120
150
180
0
30
60
90
120
150
180
1000 1600
β-ca
rbox
y las
e R
ubi s
cora
tio (
)
Local time
2200 10000400
Fig 6 Ratio of β-carboxylase activity (PEPC+PEPCK+PYRC) to Rubisco activity expressed as percents measured in the control and enriched N treatments during the incubation experiment

8
Nuclepore filter (1 microm size pore) and on GFF glass fiber Whatman filter (07 microm size pore) with
a vacuum lt 23 cm Hg to minimise cell damage were performed Subsamples for cell
enumeration were taken before and after filtrations on 1 microm Nuclepore and GFF Whatman
filters Both filters for in vitro carboxylase activities and chlorophyll measurements as well as
subsamples fixed previously by 2 (final concentration) formaldehyde for cell enumeration
(Troussellier et al 1995) were all stored in liquid nitrogen
Chlorophyll concentration measurements
Filters were ground in 90 acetone and extracted for 24 h in the dark at 4oC Chlorophyll
(a+b+c) concentrations (Chl) were determined by spectrofluorimetry (Neveux and Lantoine
1993)
Planktonic cell enumeration and diatoms taxonomy
Subsamples (20 ml) were fixed with 2 ml of 40 formaldehyde The samples were kept
in the dark at 4degC Fixed samples for bacteria and flagellates enumeration were filtered on black
polycarbonate Nuclepore membranes (022 μm porosity) Five minutes before filtration one drop
of DAPI (4 6-diamidino-2-phenylindole) was added to samples (Porter and Feig 1980)
Autotrophic and heterotrophic flagellates were discriminated by the red fluorescence of
chlorophyll a containing organisms under ultra-violet light using epifluorescence microscopy
Counting was done by examination of 10 equatorial bands (100x objective and band surface
168000 μm2) over the whole membrane length For bacteria 20 to 30 microscope fields were
counted in order to have a minimum count of 300 bacteria (100x objective field surface 256
9
μm2) Enumeration and identification of large phytoplankton was made by optical microscopy
after sedimentation (Utermohl 1958)
Flow cytometry analyses
Flow cytometry (FCM) analyses were run with an ACR 1000 cytometer Phytoplanktonic
cells were detected according to their light scatter (related to cell size and structure) their orange
and red fluorescence emissions (due to phycoerythrin and chlorophyll pigments) collected
through 58542 nm band pass and 650 nm long pass optical filters respectively One microm beads
(Polysciences Warrington PA) used as internal standard were systematically added to analyse
samples in order to normalise and compare the different phytoplanktonic groups Flow cytometry
allowed us to discriminate phytoplankton with size range between 05 microm and 50 microm (FCM
injector size)
In vitro carboxylase activities
The pool of potentially active enzymes responsible for CO2 fixation in plankton
community was measured as the in vitro carboxylases activity by incorporation of radioactive
bicarbonate into stable products following Descolas-Gros and Oriol (1992) This allowed us to
quantify the in vitro Rubisco activity and szlig-carboxylase activity (sum of the activities of
phosphenolpyruvate carboxylase PEPC phosphoenolpyruvate carboxykinase PEPCK and
pyruvate carboxylase PYRC) present in planktonic community (Appleby et al 1980 Glover
1989) All carboxylase assays were made on the same extract Extraction was carried out at 0 oC
and pH 8 following the protocol described in Descolas-Gros and De Billy (1987) For the
Rubisco assay the reaction mixture contained 50 mM Tricine buffer (pH 8) 5 mM dithiothreitol
10
(DTT) 10 mM MgCl2 20 mM NaH14CO3 and 100 μl of the crude extract For the other three
assays the reaction mixture contained 50 mM Pipes buffer (pH 68) instead of the Tricine buffer
Moreover 5 mM MnCl2 and 5 mM ADP were added for PEPCK assays and for PYRC assays 5
mM MgCl2 and 5 mM ATP were added All reactions were initiated after a pre-incubation period
of 10 min by adding substrates 2 mM RuBP for Rubisco assay 5 mM PEP for PEPC and
PEPCK assays and 5 mM pyruvate for PYRC assay All mixtures were incubated at 25 oC for 20
min The reactions were stopped by the addition of 6 N HCl More details on the protocol are
given in Descolas-Gros and Fontugne (1985) Descolas-Gros and De Billy (1987) and Descolas-
Gros and Oriol (1992) Every carboxylase assay was carried out in triplicate with an assay error
lt15 and was automated with a Gilson auto-analyser (222 Autosampler Injector interfaced with
a Dilutor 401) Carboxylase activity is expressed in nmol CO2 L-1 h-1 in pmol CO2 μg C-1 h-1 and
in nmol CO2 μg Chla-1 h-1 in order to take into account the variation of the particulate carbon and
phytoplanktonic biomass during the experiment and in fmol CO2 cell-1 h-1 when possible The szlig-
carboxylasesRubisco ratio (βCR expressed in ) allowed us to quantify the relative importance
of the two pathways
Experiment reproducibility
In order to estimate the precision of the biological parameters discussed in this study the
coefficient of variation (CV) has been calculated for each parameter using four values measured
at T0 and is presented in Table 1 The CV of the biological parameters was generally less than
25 except for the carboxylases activity per cell for diatom cell and for the β-carboxylase per
cell for lt1 μm cells with values between 33 and 44 (Table 1)
11
Statistical analyses
In order to compare the effect of N treatments relative to the control and between the N
treatments non-parametric Wilcoxon signed-Rank analyses have been applied on cell numbers
chlorophyll concentrations and carboxylase activities and reported in Table 2
Results
Nutrient concentrations and physical variables
All chemical data are reported in Table 3 Water temperature varied between 220 and
238oC at a depth of 15 m At this depth the attenuation of the incident light with a maximum
value of 1800 μE m-1 s-1 was about 50 The initial chemical conditions were characterised by
very low concentrations in nitrate (lt015 microM) nitrite (lt01 microM) and by ammonium
concentrations averaging 04 microM and high DON concentrations averaging 24 microM These values
were close to those reported in June 1993 in the same area (Collos et al 1997) The phosphate
values averaged 022 microM in all carboys throughout the experiment (data not shown) The molar
ratio of silicateDIN varied from 17 to 110 in the control and enriched taurine carboys while the
ratio was close to 1 (between 08 and 25) throughout the experiment under enriched NH4+ and
NO3- treatments (data not shown) This suggested that DIN was the limiting nutrient in the
control and enriched taurine carboy during the experiment The ammonium concentrations
decreased from 04 to 006 microM (T10) in the control and under NO3- treatment and to 017 microM
(T10) under taurine treatment and varied between 007 to 023 microM afterwards The ammonium
concentrations decreased from 686 microM (T0) to 032 microM (T24) under NH4+ treatment The nitrate
12
remained undetectable throughout most of the experiment in the control NH4+ and taurine
treatments and decreased from 931 microM (T0) to 242 microM (T24) under NO3- treatment The DON
concentrations remained quite constant in the control and under DIN treatments varying from
218 to 268 microM and decreased from 376 microM (T0) to 303 microM (T24) under the taurine treatment
Size fractionation accuracy
Using the chlorophyll parameter (red fluorescence) from flow cytometry analysis on
samples before and after 1 μm nuclepore filtration and compared to the lt1 μm chlorophyll a
concentrations measured by spectrofluorimetry the accuracy of size-fractionation protocol was
assessed The red fluorescence for each cell group in the lt1μm fraction was summed and
compared with the lt1μm chlorophyll a concentrations A positive linear regression was obtained
(R2=074 n=22) The total red fluorescence of cells after 1 μm filtration detected by flow
cytometry was thus directly correlated with chlorophyll a pigment concentration measured in this
lt1 μm fraction This indicates that the potential filtration artefacts (eg breakdown of small cells)
were reduced during the experiment
Small picoplanktonic cells
In the lt1 μm filtrate a population of small picoeukaryotes was identified and exhibited
the same flow cytometric characteristics as the eukaryotic Ostreococcus tauri This picoeukaryote
contributed 95 of total lt1 μm cell numbers Larger picoeukaryote cells with a relative red
fluorescence and apparent size close to those of 1 μm beads were also detected in this fraction
No cyanobacteria cells were detected by either flow cytometry or epifluorescence microscopy
during this study The variation of lt1 microm cell numbers detected by flow cytometry is reported in
13
Table 4 The abundance of small picoeukaryote cells measured during this experiment was in the
same range of values as previously observed in the same area between 1991 and 1994 averaging
30x106 cell L-1 (Vaquer et al 1996) Compared to the control no effect of taurine treatment was
detected on the lt1 microm cell concentrations (Table 2) The lt1 microm cell numbers increased in all
carboys T0 to T7 and afterwards decreased in the control and under taurine treatment From T10 a
strong significant increase of lt1 microm cell numbers reaching 50 106 cell L-1 was observed under
DIN treatments (Table 4)
From previous filtration experiments with plankton community from Thau Lagoon 67 to
74 of total bacteria cells can be retained on GFF filters (unpubl data) Bacterial cell numbers
varied slightly during the experiment (Table 3) As compared to the control the different N
treatments did not influence the cell concentrations Retention on GFF filter of 70 of total
bacterial cell was assumed Thus the contribution of bacteria cells was always greater than 95
of the total lt1 μm plankton cell numbers retained on GFF filters
Larger plankton cells community
At the beginning of the experiment nano- and microplankton species were dominated by
autotrophic flagellates and diatoms mainly composed of Chaetoceros spp Skeletonema spp and
Pseudo-nitzschia spp (Table 5) At the end of the experiment heterotrophic and autotrophic
flagellate abundance did not vary whereas diatom cells reached 19 106 cells L-1 in the control and
under taurine treatment mainly due to an increase of Pseudo-nitzschia spp cells On the last day
of the experiment higher diatom cell abundance was measured under DIN treatments mainly
due to the increase of Skeletonema spp cells (Table 5) Using a Ccell conversion factors for
each group from Dupuy et al (2000) the contribution of gt1 μm picophytoplankton and diatom
14
cells to the total gt1μm planktonic organic carbon was estimated to be less than 01 and greater
than 95 respectively during the experiment
Chlorophyll pigment concentrations and in vitro carboxylases activity
The chlorophyll pigment concentrations and the pool of Rubisco per litre for both size
fractions were not significantly different between the control and the taurine treatment
throughout the experiment (Table 2) Compared to the control a significant increase of
chlorophyll concentration occurred after 7 incubation hours under DIN treatments reaching 109
and 08 microgL-1 for gt1 μm and lt1 μm phytoplankton cells respectively (Fig 2A amp 2B Table 1)
Similarly to the chlorophyll concentrations after 7 incubation hours the pool of Rubisco per litre
for both size fractions was significantly greater under DIN treatments than in the control (Table 2
and 6) The pool of β-carboxylase activity per litre for both size fractions varied slightly during
the 24 hours incubation (Table 7) and no significant different between the N treatments and the
control was reported (Table 2) The values of the total carboxylases activity (ie sum of two size
fractions) were normalised per carbon using the particulate organic carbon concentration (POC)
and reported in Figure 3 In the carboys without DIN enrichments the total β-carboxylase
activity per carbon increased during the night period while the total Rubisco activity per carbon
decreased (Fig 3A) A coupling between the total Rubisco and β-carboxylase activity per carbon
was generally observed in the carboys with DIN enrichments (Fig 3B) The ratio between POC
and chlorophyll a concentrations (POCChla) decreased from about 700 to 200 μgC μgChla-1
overall the experiment in all the carboys The carboxylases activity was normalised to
chlorophyll a concentrations for each size fraction in order to take into account the
phytoplankton biomass variation between the N treatments during the present experiment The
15
Rubisco activity per Chla generally decreased in all N treatments for both size fractions during
the experiment (Fig 4) and no significant difference between these N treatments was measured
(Table 2) The β-carboxylase activity per Chla for both sized fractions generally decreased
during the 10 first hours of the experiment in all N treatments (Fig 5) Nevertheless a significant
increase of the β-carboxylase activity per Chla for both size fractions occurred under DIN
treatments afterwards while this activity per Chla remained very low in the control and the
taurine treatment (Fig 5 and Table 2)
β-carboxylation pathway
β-carboxylase activity (PEPC+PEPCK+PYRC) for the plankton community expressed as
a percentage of Rubisco activity (βCR ratio) reached values greater than 50 after 10 incubation
hours in the control and under taurine treatment (Fig 6) Under DIN treatments the βCR ratio
for both size fractions was significantly lower than measured in the control with values less than
40 throughout the study (Table 2) Phosphenolpyruvate carboxylase (PEPC) enzyme
contributed to about 50 of the total β-carboxylase enzymes in both size fractions (data not
shown)
Cellular pool of carboxylase enzymes
A strong decrease of the Rubisco pool per unit cell was measured in small phytoplankton
in all carboys during the experiment and no significant influence of N treatments was observed
(Table 2 and 8) As diatom cells contributed for the most part of carbon biomass in gt1 μm
plankton community the in vitro Rubisco activity for gt1 μm fraction is expressed on the basis of
16
diatom cell number Similarly to the small cells a decrease of the Rubisco pool per unit cell is
also observed for larger cells after 24 incubation hours in the carboys (Table 5)
For the small size fraction the enzymatic pool of PEPC is expressed per unit cell of small
picoeukaryotes and reported in the Table 8 This cellular pool tended to be significantly different
between the DIN treatments and the control (p=005 and 008 Table 2) This pool decreased
during the experiment under DIN treatments while the highest values in the control and under
taurine treatment were recorded close to the end of the experiment (Table 8) The pool of PEPCK
is expressed by unit of diatom cells as this enzyme is present in the dominant diatom species
observed during this study (Descolas-Gros and Oriol 1992) and these species contributed to 95
of the total gt1 μm carbon biomass Similarly to the PEPC in small cells the cellular pool of
PEPCK in larger cells was significantly very low under DIN treatments relative to the control and
to the carboy with an addition of taurine at the end of the experiment (Table 5)
Discussion
After 10 hours of incubation the very low available dissolved inorganic nitrogen (DIN)
concentrations probably limited the growth of phytoplankton in the control and under taurine
treatment This explains the decrease of the small picophytoplankton cells and the low net growth
rate of diatoms in these carboys Nevertheless bacterial cells and heterotrophic flagellates
submitted to these different nutrient conditions did not show a net growth rate In contrast the net
growth rate of picophytoplankton and diatom was about 15 and 3 divday respectively in the
samples enriched with DIN
17
Even though phytoplankton growth was positively influenced by DIN enrichments the
cellular pool of potentially active Rubisco enzyme for picophytoplankton and diatom cells
decreased throughout the study in all the carboys This suggests a degradation of the cellular
enzymatic pool in phytoplankton cells during the study The rapid degradation of the nitrogen
fraction in phytoplankton cells under high irradiance has been shown in a shallow environment
with photosynthetically available radiation levels above 600 to 1000 μE m-2 s-1 (Collos et al
1992) Rubisco enzyme can act as a nitrogen reservoir that is more easily mobilised than the rest
of the protein pool during environmental changes (Ekman et al 1989) Thus cellular Rubisco
pool degradation during this present study may result from the light conditions in incubation
carboys held at fixed positions near the surface where phytoplankton cannot avoid high
irradiance levels during the day time reaching about 900 μE m-2 s-1 at the incubation depth
As compared to the Rubisco pathway the potential use of β-carboxylation pathway by the
plankton community as shown by the carboxylases activity normalised to the particulate carbon
chlorophyll a and cell and by the ratio βCR increased after 10 incubation hours in the carboys
without DIN enrichments only The values of the βCR ratio were higher than 100 at which
time the phytoplankton biomass started to decrease in the control and under taurine treatment In
contrast β-carboxylase activity seemed strongly coupled to the Rubisco activity under DIN
treatments This daily co-variation was already reported for natural phytoplankton in
Mediterranean Sea under favourable environmental conditions (Fouilland et al 2001) showing
the strong interdependence of these two C assimilation pathways (falkowski and Raven 1997)
The βCR ratio under DIN treatments remained less than 40 which is a characteristic of
autotrophic cells (Descolas-Gros and Oriol 1992) A βCR ratio higher than 100 suggests that
the β-carboxylation pathway can prevail on the Calvin-Benson pathway As β-carboxylation in
18
the light occurs using a substrate (PEP) derived from the Calvin-Benson cycle a ratio greater
than 100 has been associated with the occurrence of heterotrophic organisms such as
dinoflagellates (Descolas-Gros and Oriol 1992) For such cells the origin of
phosphoenolpyruvate is uncertain and Descolas-Gros and Oriol (1992) suggested that it could be
supplied by the incorporation of external organic substances
The increase of β-carboxylase pathway observed in the present study cannot be explained
by the increase of heterotrophic biomass relative to the autotrophic biomass in the control or with
addition of taurine The POCChla ratio decreased throughout the experiment suggesting a shift
towards an autotrophic community in all the carboys For the small size fraction bacterial cells
which are partially retained by filters could have significantly contributed to the total β-
carboxylase activity as suggested by results from dark fixation of 14C from natural plankton (Li et
al 1993 Markager 1999) Nevertheless the regulation of β-carboxylation pathway and enzyme
structure is different in bacterial and phytoplankton cells (Rivoal et al 1998) The occurrence of
carboxylation of PEP by PEPC is well known in bacterial cells Nevertheless this carboxylase
does not act unless acetyl-coenzyme A is present perhaps to facilitate a continued supply of
oxaloacetate for the TCA cycle fuelling (Baumerg 1973 Overbeck 1984) Such regulation does
not occur in phytoplankton cells (Turpin et al 1991) As no acetyl-coenzyme A is added to the
reaction mixture the strong variation of the activity of major β-carboxylase enzymes (PEPC) is
assumed to be directly related to the β-carboxylation pathway of the small picoeukaryote cells
Moreover the bacterial cells contributed a very large fraction to the total lt1 μm picoplankton
abundance and no significant difference in the bacterial abundance was noticed between carboys
(Table 4) Thus any increase of βCR ratio for the lt1 μm fraction observed after 10 hours of
incubation cannot be due to the bacterial growth relative to the decrease of small
19
picophytoplankton abundance which contributed to less than 5 of total cell numbers over the
experiment in all carboys The importance of bacterial activity (free or attached bacteria cells) is
assessed relatively to the ammonium uptake Data from Table 3 show that ammonium uptake was
at least twice as high during the day than at night in NH4+ treatment indicating autotrophic
driven processes In the control ammonium actually increased at night (Table 3) so it can be
safely assumed that bacterial populations produced rather than consumed ammonium in these
series of experiment This suggests that the heterotroph bacterial activity was not influenced by
the N treatments Moreover using values for the carbon content in plankton species in Thau
Lagoon calculated by Dupuy et al (2000) the heterotroph flagellates contributing to the total gt1
microm plankton biomass was estimated to be less than 1 in the control and under all N treatments
at the end of the experiment Thus the variation of the β-carboxylation enzyme pool relative to
the Rubisco was mainly due to the enzyme activities from the autotrophic plankton in both size
fractions
Anaplerotic carbon fixation by PEPC in the light exceeding photosynthetic carbon
fixation has already been measured in an N-limited green alga using stable carbon isotope
discrimination (Guy et al 1989) These authors showed that under transient situations the
contribution of βminuscarboxylation to the total C fixation can be as high as 70 ie a βCR ratio of
230 which is higher than our maximum value for a natural plankton assemblage (160) The
significant increase of both βCR ratio and the β-carboxylase activity normalised to the
chlorophyll and carbon biomass reported during the present study suggests a potential increase
of cellular β-carboxylase enzymes The pool of PEPC and PEPCK expressed per unit cell for the
small picoeukaryotes and diatoms tended to increase at the end of the experiment in the control
and under taurine treatment This increase of the activity of β-carboxylase enzymes combined
20
with the decrease of the Rubisco activity under inorganic N-deficient conditions suggests that β-
carboxylation pathway is more active when phytoplankton growth is limited by inorganic
nutrients A higher photosynthetic carbon fixation by β-carboxylation than by Rubisco in
autotrophic phytoplankton cells is surprising especially in regards to the source of the substrate
for β-carboxylation The dissimilation of reserve carbohydrate providing PEP for this pathway
as usually observed in the dark for microalgae (Mortain-Bertrand et al 1988) is unlikely This is
because phytoplankton growth was very low under N-deficient conditions implying low C
storage in cells
The increase of the enzymatic pool for β-carboxylation in phytoplankton may be due to a
shift from autotrophic to heterotrophic activity induced by a DIN deficiency as in the control and
DON (taurine) treatment There is indirect evidence that taurine was taken up during the day
Data from Table 2 shows that DON decreased in the carboys enriched with taurine while it
remained constant in the others This decrease roughly corresponds to the taurine addition but
taurine was taken up during the day only and not at night which indicates that phytoplankton
not bacteria were responsible for this uptake Nevertheless this uptake does not result in
increased phytoplankton biomass as observed in enriched ammonium or nitrate carboys
Possibly the time lag involved between uptake and growth is longer than the time scale used in
the present study as observed elsewhere (Antia et al 1975 Bonin and Maestrini 1981) Thus
increases in cell numbers could not be observed within a 24-hour time frame following the
taurine addition Interestingly in the study of Vincendeau (1987) S costatum took up DON once
DIN was exhausted Thus the similarity between the control and the taurine treatment could have
a common explanation heterotrophy is induced by DIN limitation The increase of β-
carboxylation pathway under limiting N conditions is coupled to the uptake of dissolved nitrogen
21
compounds by phytoplankton resulting in the activation of respiration for the biosynthetic
processes This causes the back-regulation of anaplerotic reactions as previously described by
Vanlerberghe et al (1990 1992) for NH4+ uptake A stimulation of respiration after the addition
of acetate has also been observed in Chlamydomonas reinhardtii cultured photoautotrophically
(Fett and Coleman 1994 Endo and Asada 1996) Moreover under similar conditions Heifetz et
al (2000) showed a decrease of photosynthetic carbon fixation in cells grown in acetate with
saturating light and CO2 These results suggest an increase of the β-carboxylation pathway for the
replenishment of TCA cycle intermediates in order to sustain the growth rate of C reinhardtii
growing heterotrophically using acetate as source of carbon This is in accordance with the
increase of cellular β-carboxylase pool during a shift toward heterotrophy in natural
phytoplankton cells suggested in this study Even though the evidence of this heterotrophy was
observed with the taurine enrichment only the importance of the β-carboxylation pathway in
natural phytoplankton under very low nutrient conditions is clearly highlighted in this study In
order to gain further insight into the phytoplankton heterotrophy the relationship between the
CO2 assimilation pathways and the capacity of phytoplankton to use organic sources of nitrogen
andor carbon should be investigated using axenic cultures of phytoplankton submitted to
different nutritional conditions for instance
Acknowledgements
This work was supported by CNRS University Montpellier II IFREMER (URM 5) We
thank J-M Deslous-Paoli and C Leboulanger for their assistance during the fieldwork T Sime-
22
Ngando for providing bacteria and flagellates data and 2 anonymous referees for insightful
comments on the manuscript This paper represents a portion of a thesis of the University Paris
VI of Eric Fouilland who received a BDI fellowship from CNRS and IFREMER This is the
XXX ISEM contribution for Chantal Descolas-Gros
23
References
Appleby G Colbeck J Holdsworth ES Wadman H 1980 szligcarboxylation enzymes in
marine phytoplankton and isolation and purification of pyruvate carboxylase from
Amphidinium carterae (Dinophyceae) J Phycol 16 290-295
Antia NJ Berland BR Bonin DJ Maestrini SY 1975 Comparative evaluation of certain
organic and inorganic sources of nitrogen for phototrophic growth of marine microalgae J
Mar Biol AssU K 55 519-539
Armstrong FAJ Tibbits S 1968 Photochemical combustion of organic matter in sea
water for nitrogen phosphorus and carbon determination J Mar Biol Ass U K 48
143-152
Bacher C Millet B Vaquer A 1997 Modeacutelisation de lrsquoimpact des mollusques cultiveacutes
sur la biomasse phytoplanctonique de lrsquoeacutetang de Thau (France) C R Acad Sci Paris
320 73-81
Baumberg S 1973 Co-ordination of metabolism In Mandelstam J McQuillen K (eds)
Biochemistry of bacterial growth Second edition Blackwell 423-493
Bonin DJ Maestrini SY 1981 Importance of organic nutrients for phytoplankton growth in
natural environments implications for algal species successionPhysiological bases of
phytoplankton ecology Platt T (Ed) Can Bull Fish Aquat Sci 210 279-291
Chreacutetiennot-Dinet M-J Courties C Vaquer A Neveux J Claustre H Lautier J
Machado MC 1995 A new marine picoeukaryote Ostreococcus tauri gen et sp nov
(Chlorophyta Prasinophyceae) Phycologia 34 85-292
24
Collos Y Descolas-Gros C Fontugne M Mortain-Bertrand A Chretiennot-Dinet MJ
Frikha MG 1992 Carbon and nitrogen dynamics during growth and degradation of
phytoplankton under natural surface irradiance Mar Biol 112 491-496
Collos Y Descolas-Gros C Fontugne M Mortain-Bertrand A Chreacutetionnot-Dinet M-J
Frikha MG 1993 Chemical isotopic and enzymatic monitoring of free and enclosed
seawater implications for primary production estimates in incubation carboys Mar Ecol
Prog Ser 93 49-54
Collos Y Vaquer A Bibent B Slawyk G Garcia N Souchu P 1997 Variability in nitrate
uptake kinetics of phytoplankton communities in a Mediterranean coastal lagoon Estuar
Coast Shelf S 44 369-375
Courties C Vaquer A Troussellier M Lautier J Chreacutetiennot-Dinet M-J Neveux J
Machado C Claustre H 1994 Smallest eukaryotic organism Nature 370 255
Descolas-Gros C Fontugne M 1985 Carbon fixation in marine phytoplankton carboxylase
activities and stable carbon-isotope ratios physiological and paleoclimatological aspects
Mar Biol 87 1-6
Descolas-Gros C De Billy G 1987 Temperature adaptation of RuBP caboxylase kinetic
properties in marine Antarctic diatoms J Exp Mar Biol Ecol 108 147-158
Descolas-Gros C Oriol L 1992 Variations in carboxylase activity in marine phytoplankton
cultures szligcarboxylation in carbon flux studies Mar Ecol Prog Ser 85 163-169
Dodds WK Priscu JC 1991 Ammonium stimulation of dark carbon fixation as an indicator
of nitrogen deficiency in phytoplankton potential errors caused by ammonium-oxidizing
bacteria J Phycol 27 79-82
25
Dupuy C Vaquer A Lam-Hoai T Rougier C Mazouni N Lautier J Collos Y Le Gall
S 2000 Feeding rate of the oyster Crassostera gigas in a natural planktonic community of
Mediterranean Thau Lagoon Mar Ecol Prog Ser 205 171-184
Ekman P Lignell A Pedersen M 1989 Localization of ribulose-15-bisphosphate
carboxylaseoxygenase in Gracilaria secundata (Rhodophyta) and its role as a nitrogen
storage pool Botanica Mar 32 527-534
Elrifi IR Turpin DH 1986 Nitrate and ammonium induced photosynthetic suppression in N-
limited Selenastrum minutum Plant Physiol 81 273-279
Endo T Asada K 1996 Dark induction of the non-photochemical quenching of chlorophyll
fluorescence by acetate in Chlamidomonas reinhardtii Plant Cell Physiol 37 551-555
Falkowski PG Raven JA 1997 Aquatic photosynthesis Blackwell Science publisher
Fett JP Coleman JR 1994 Regulation of periplasmic carbonic anhydrase expression in
Chlamidomonas reinhardtii by acetate and pH Plant Physiol 106 103-108
Fidalgo JP Cid A Abalde J Herrero C 1995 Culture of the marine diatom Phaedactylum
tricornutum with different nitrogen sources Growth nutrient conversion and biochemical
composition Cah Biol Mar 36 165-173
Fouilland E Vaquer A Descolas-Gros C 1995 Annual variations in CO2 assimilation and
primary production measurements in a mediterranean lagoon (Thau lagoon France)
Photosynthesis from Light to Biosphere Mathis P (Ed) Elvesier 5 873-876
Fouilland E Courties C Descolas-Gros C 2001 Size-fractionated carboxylase activities
during a 32 h cycle at 30 m depth in the Northwestern Mediterranean Sea after an episodic
wind event J Plankton Res 23 623-632
26
Gasc A 1997 Etude de la production primaire reacutegeacuteneacutereacutee dans un eacutecosystegraveme conchylicole le
bassin de Thau Ph D Univ Sciences et Techniques du Languedoc Montpellier France
Gilbert F Souchu P Bianchi M Bonin P 1997 Influence of shellfish farming activities on
nitrification nitrate reduction to ammonium and denitrification at the water-sediment
interface of the Thau lagoon France Mar Ecol Prog Ser 151 143-153
Glover HE 1989 Ribulosebisphosphate carboxylaseoxygenase in marine organisms Int Rev
Cytol 115 67-137
Guy RD Vanlerberghe GC Turpin DH 1989 Significance of phosphoenolpyruvate
carboxylase during ammonium assimilation Carbon isotope discrimination in
photosynthesis and respiration by the N-limited green alga Selenastrum minutum Plant
Physiol 89 1150-1157
Heifetz PB Forster B Osmond CB Giles LJ Boynton JE 2000 Effects on facultative
autotrophy in Chlamydomonas reihardtii assessed by photosynthetic measurements and
stable isotope analyses Plant Physiol 122 1439-1445
Huppe HC Turpin DH 1994 Integration of carbon and nitrogen metabolism in plant and
algal cells Annu Rev Physiol Plant Mol Biol 45 577-607
Koroleff F 1976 Determination of nutrients Methods of Seawater analysis Grasshoff K
(Ed) Verlag Chemie 117-182
Lam-Hoai T Rougier C Lasserre G 1997 Tintinnids and rotifers in a northern
Mediterranean coastal lagoon Structural diversity and function through biomass
estimations Mar Ecol Prog Ser 152 13-25
27
Le Gall S Hassen MB Le Gall PB 1997 Ingestion of a bacterivorous ciliate by oyster
Crassostera gigas protozoa as a trophic link between picoplankton and benthic suspension-
feeders Mar Ecol Prog Ser 152 301-306
Levasseur M Thompson PA Harrison PJ 1993 Physiological acclimation of marine
phytoplankton to different nitrogen sources J Phycol 29 587-595
Millet B 1989 Fonctionnement hydrodynamique du bassin de Thau Validation drsquoun modegravele
numeacuterique de circulation (programme Ecothau) Oceanol Acta 12 37-46
Morris I Yentsch CM Yentsch CS 1971 The physiological state with respect to nitrogen
of phytoplankton from low-nutrient subtropical water as measured by the effect of
ammonium ion on dark carbon dioxide fixation Limnol Oceanogr 16 859-868
Mortain-Bertrand A Descolas-Gros C Jupin H 1987a Short-term 14C incorporation in
Skeletonema costatum (Greville) Cleve (Bacillariophyceae) as a function of light regime
Phycologia 16 262-269
Mortain-Bertrand A Descolas-Gros C Jupin H 1987b Stimulating effect of transitions from
light to dark on carbon assimilation by a marine diatom J Exp Mar Biol Ecol 112 11-
26
Mortain-Bertrand A Descolas-Gros C Jupin H 1988 Pathway of dark inorganic carbon
fixation in two species of diatoms influence of light regime and regulator factors on diel
variations J Plankton Res 10 199-217
Neveux J Lantoine F 1993 Spectrofluorometric assay of chlorophylls and phaeopigments
using the least squares approximation technique Deep-Sea Res 40 1747-1765
28
Osborne BA Geider RJ 1986 Effect of nitrate-nitrogen limitation on photosynthesis of the
diatom Phaeodactylum tricornutum Bohlin (Bacillariphyceae) Plant Cell Environ 9 617-
625
Overbeck J 1984 Application of TCA cycle metabolism for growth estimates of heterotrophic
bacterioplankton Arch Hydrobiol Beih 19 23-36
Porter K Feig YS 1980 The use of DAPI for identifying and counting aquatic microflora
Limnol Oceanogr 25 943-948
Slawyk G Collos Y 1982 13C and 15N uptake by marine phytoplankton 2 Results from a
tropical area Rapp P-v Reacuteun Cons int Explor Mer 180 209-213
Souchu P Gasc A Cahet G Vaquer A Collos Y Deslous-Paoli JM 1997
Biogeochemical composition of Mediterranean waters outside the Thau lagoon Estuar
Coast Shelf S 44 275-284
Souchu P Vaquer A Collos Y Lamdrein S Deslous-Paoli J-M Bibent B 2001
Influence of shellfish farming activities on the biogeochemical composition of the water
column in Thau Lagoon Mar Ecol Prog Ser 218 141-152
Treacuteguer P Le Corre P 1975 Manuel danalyse des sels nutritifs dans leau de mer
Utilisation de lAutoAnalyseur II Technicon LOC Universiteacute de Bretagne Occidentale
Brest France
Troussellier M Courties C Zettelmaier S 1995 Flow cytometric analysis of coastal lagoon
bacterioplankton and picophytoplankton fixation and storage effects Estuar Coast Shelf
S 40 621-633
Turpin DH 1991 Effects of inorganic N availability on algal photosynthesis and carbon
metabolism J Phycol 27 14-20
29
Turpin DH Vanlerberghe GC Amory AM Guy RD 1991 The inorganic requirements
for nitrogen assimilation Can J Bot 69 1139-1145
Utermoumlhl H 1958 Zur Vervollkommnung der quantitativen Phytoplankton-Methodik Mitt int
Ver theor angew Limnol 9 1-38
Vanlerberghe GC Schuller KA Smith RG Feil R Plaxton WC Turpin DH 1990
Relationship between NH4+ assimilation rate and in vivo phosphoenolpyruvate carboxylase
activity Regulation of anapleurotic carbon flow in the green alga Selenastrum minutum
Plant Physiol 94 284-290
Vanlerberghe GC Huppe HC Vlossak KDM Turpin DH 1992 Activation of
respiration to support dark NO3- and NH4
+ assimilation in the green alga Selenastrum
minutum Plant Physiol 99 495-500
Vaquer A Troussellier M Courties C Bibent B 1996 Standing stock and dynamics of
picophytoplankton in the Thau Lagoon (northwest Mediterranean coast) Limnol
Oceanogr 41 1821-1828
Vincendeau ML 1987 Etude expeacuterimentale de la fertiliteacute des eaux des milieux conchylicoles
influence de lrsquoexcreacutetion des huitres et des palourdes sur la production des diatomeacutees
dominantes Ph D Univ Paris 6 Paris France
Table 1 Coefficient of variation (in percent) of the different biological
parameters calculated using four measurements observed at T0 Calculation based on cell numbers of diatom dominant species
gt1 microm lt1 micromCell numbers 22 6
Chlorophyll a concentrations 6 10Rubisco activity per liter 20 17szlig-Carboxylases per liter 23 12
Rubisco activity per chlorophyll a unit 17 24szlig-Carboxylases activity per chlorophyll a unit 19 12
βCR ratio 23 24Rubisco activity per cell 35 18 β-carboxylase per cell 44 33
Table 2 Statistical results from non parametric Wilcoxon signed-Rank analyses between N enriched treatments and control 001le p lt005 p le001 NS non significant (p ge01)
Cell numbers
Rubisco activity per cell
PEPC activity per cell
lt1 microm gt1 microm lt1 microm gt1 microm lt1 microm gt1 microm lt1 microm gt1 microm lt1 microm gt1 microm lt1 microm gt1 microm lt1 microm lt1 microm lt1 microm
+NH4+ Control 009 NS NS NS NS NS 005
+NO3- Control NS NS NS NS NS NS 008
+taurine Control NS NS NS NS NS NS NS NS NS NS NS NS NS NS NS
βCR ratioChla concentrations
Rubisco activity per litre
β-carboxylase activity per litre
Rubisco activity per Chla
β-carboxylase activity per Chla
Table 3 Concentrations of ammonium nitrate and dissolved organic nitrogen (DON) measured in the control NH4+
(+NH4+) NO3
- (+NO3-) and taurine (+taurine) enriched treatments during the experiment
nd no data data in bold denote a period of darkness
Control + NH4+ + NO3
- + taurine Control + NH4+ + NO3
- + taurine Control + NH4+ + NO3
- + taurineT0 039 686 04 047 013 005 931 003 226 268 218 376T2 nd nd 026 nd 006 000 896 000 224 nd 222 ndT4 045 582 024 037 000 000 85 000 224 255 236 369T7 011 352 022 029 000 000 746 000 247 266 245 332T10 006 362 006 017 001 000 615 000 265 256 236 329T13 011 384 015 023 000 000 633 000 249 258 251 312
T17 018 327 012 015 000 008 586 001 218 249 221 315
T21 007 261 009 022 000 000 468 000 233 260 223 317T24 017 032 019 020 000 000 242 000 244 260 218 303
Ammonium concentrations (microM) Nitrate concentrations (microM) Dissolved organic nitrogen (DON) concentrations (microM)
Table 4 Small picophytoplankton and bacteria cell numbers during the experiment in
the control and N enriched treatments
nd no data data in bold denote a period of darkness
Control +NH4+ +NO3
- +taurine Control +NH4+ +NO3
- +taurineT0 196 195 219 208 936 nd nd ndT2 182 208 182 130 nd nd nd ndT4 309 252 279 257 nd nd nd ndT7 304 333 312 286 1220 1220 1200 1360T10 260 415 406 221 nd nd nd ndT13 258 482 484 230 1500 1500 1190 1330
T17 198 516 409 219 nd nd nd nd
T21 208 nd 500 177 1510 1220 884 1170T24 135 nd 457 184 1120 967 832 1160
lt1 microm phytoplankton cell numbers (x106 cells L-1)
Bacteria cell numbers (x106 cells L-1)
Table 5 Plankton cell numbers and carboxylases (Rubisco and PEPCK) activity per
carbon unit of diatom cell within the gt1 microm fraction at T0 in the control and T24 in the
control and N enriched treatments nd no data
Control +NH4+ +NO3
- +taurinePicophytoplankton (x106 cells L-1) 27 149 nd 20 72
Heterotroph flagellates (x106 cells L-1) 06 05 03 02 05Autotroph flagellates (x106 cells L-1) 07 11 06 05 07
Diatoms (x106 cells L-1) 08 19 91 50 19Rubisco activity (fmol CO2 cell-1 h-1) 117 57 83 112 60PEPCK activity (fmol CO2 cell-1 h-1) 90 26 006 046 75
T24T0
Table 6 The in vitro Rubisco activity per litre of gt1 microm and lt1microm fractions in the control and
enriched N treatments
nd no data data in bold denote a period of darkness
Control +NH4+ +NO3
- +taurine Control +NH4+ +NO3
- +taurineT0 1088 664 844 939 519 459 498 349T2 1215 1322 1147 1535 289 434 428 347T4 1427 1802 nd 975 449 nd 746 599T7 552 1029 1064 441 520 842 732 361T10 478 1667 1640 396 162 647 532 351T13 213 2006 1724 239 185 577 609 164T17 129 1485 1264 171 134 453 400 159T21 366 2324 843 371 180 669 657 232T24 1093 7606 5625 1186 120 329 395 155
gt1 microm Rubisco activity (nmol CO2 L
-1 h-1)lt1 microm Rubisco activity
(nmol CO2 L-1 h-1)
Table 7 The in vitro β-carboxylase activity (PEPC+PEPCK+PYRC) of gt1 microm and lt1microm
fractions in the control and enriched N treatments
nd no data data in bold denote a period of darkness
Control +NH4+ +NO3
- +taurine Control +NH4+ +NO3
- +taurineT0 104 91 138 151 156 142 118 147T2 211 178 154 178 264 125 288 161T4 201 86 nd 95 116 nd 235 121T7 169 140 149 70 151 150 168 121T10 99 223 133 128 182 235 170 67T13 195 320 nd 150 113 114 155 123T17 203 231 118 111 132 82 109 255T21 227 392 257 289 208 161 228 113T24 117 120 265 190 59 61 71 65
gt1 microm β-carboxylase activity (nmol CO2 L
-1 h-1)lt1 microm β-carbxylase activity
(nmol CO2 L-1 h-1)
Table 8 The cellular pool of Rubisco and PEPC enzymes of lt 1microm picophytoplankton in the
control and N enriched treatments
nd no data data in bold denote a period of darkness
Control +NH4+ +NO3
- +taurine Control +NH4+ +NO3
- +taurineT0 265 235 228 168 038 035 017 041T2 159 208 235 268 020 023 052 030T4 145 nd 267 233 027 nd 011 014T7 171 253 234 126 050 022 037 023T10 062 156 131 158 037 024 021 024T13 072 120 126 071 032 019 028 017
T17 068 088 098 073 038 011 021 027
T21 086 nd 131 131 055 nd 011 047T24 088 nd 086 084 020 nd 010 005
Rubisco activity per cell (fmol CO2 cell-1 h-1)
PEPC activity per cell (fmol CO2 cell-1 h-1)
Sampling area
Fig 1 Map of sampling area in Thau lagoon Grey and black areas denote the shellfish cultivation area and towns respectively
Mediterranean Sea
NIGHTC
hlor
ophy
llco
ncen
trat io
n(micro
g c h
l L-1
)
0
2
4
6
8
10
12
00
02
04
06
08
10NIGHT
Control+ NH4
+
+ NO3-
+ Taurine
A) gt1 microm phytoplankton
B) lt1 microm phytoplankton
Chl
orop
hyll
conc
entra
t ion
(microg
c hl L
-1)
Local time
1000 1600 2200 10000400
Fig 2 Chlorophyll (a+b+c) concentrations of (A) gt1 microm phytoplankton and of (B) lt1 microm phytoplankton in the control and enriched N treatments during the incubation experiment
Rub
isco
activ
ity(p
mol
CO
2 microg
C-1
h-1
)A) Without DIN enrichments
Local time
1000 1600 2200 10000400
0
200
400
600
800
1000
0
40
80
120
160
200
0
200
400
600
800
1000
0
40
80
120
160
200
NIGHT
NIGHT
B) With DIN enrichments
Control Control+ Taurine+ Taurine
+ NH4+
+ NO3-
+ NH4+
+ NO3-
β-ca
rbox
ylas
eac
tivity
(pm
olC
O2 micro
g C
-1 h
-1)
Rub
isco
activ
ity(p
mol
CO
2 microg
C-1
h-1
)
β-ca
rbox
ylas
eac
tivity
(pm
olC
O2 micro
g C
-1 h
-1)
Fig 3 Total Rubisco and β-carboxylase activity expressed per particulate carbon for (A) the control and enriched taurine carboy and for (B) the ammonium and nitrate enrichments during the incubation experiment
NIGHT
Rub
isco
activ
ity(n
mol
CO
2 microg
chla
-1 h
-1) NIGHT
Control+ NH4
+
+ NO3-
+ Taurine
A) gt1 microm phytoplankton
B) lt1 microm phytoplankton
Fig 4 Rubisco activity normalised per chlorophyll a concentration of (A) gt1 microm phytoplankton and of (B) lt1 microm phytoplankton in the control and enriched N treatments during the incubation experiment
Rub
isco
activ
ity(n
mol
CO
2 microg
chla
-1 h
-1)
0
200
400
600
0
200
400
600
Local time
1000 1600 2200 10000400
NIGHT
β-ca
rbox
ylas
eac
tivity
(nm
olC
O2 micro
g ch
la-1
h-1
)
A) gt1 microm phytoplankton
B) lt1 microm phytoplankton
NIGHTControl+ NH4
+
+ NO3-
+ Taurine
0
40
80
120
160
200
β-ca
rbox
ylas
eac
tivity
(nm
olC
O2 micro
g ch
la-1
h-1
)
0
20
40
60
Local time
1000 1600 2200 10000400
Fig 5 β-carboxylase activity normalised per chlorophyll a concentrations of (A) gt1 microm phytoplankton and of (B) lt1 microm phytoplankton in the control and enriched N treatments during the incubation experiment
NIGHT
β-ca
rbox
y las
e R
ubi s
cora
tio (
)
NIGHT
Control+ NH4
+
+ NO3-
+ Taurine
A) gt1 microm phytoplankton
B) lt1 microm phytoplankton
0
30
60
90
120
150
180
0
30
60
90
120
150
180
1000 1600
β-ca
rbox
y las
e R
ubi s
cora
tio (
)
Local time
2200 10000400
Fig 6 Ratio of β-carboxylase activity (PEPC+PEPCK+PYRC) to Rubisco activity expressed as percents measured in the control and enriched N treatments during the incubation experiment

10
(DTT) 10 mM MgCl2 20 mM NaH14CO3 and 100 μl of the crude extract For the other three
assays the reaction mixture contained 50 mM Pipes buffer (pH 68) instead of the Tricine buffer
Moreover 5 mM MnCl2 and 5 mM ADP were added for PEPCK assays and for PYRC assays 5
mM MgCl2 and 5 mM ATP were added All reactions were initiated after a pre-incubation period
of 10 min by adding substrates 2 mM RuBP for Rubisco assay 5 mM PEP for PEPC and
PEPCK assays and 5 mM pyruvate for PYRC assay All mixtures were incubated at 25 oC for 20
min The reactions were stopped by the addition of 6 N HCl More details on the protocol are
given in Descolas-Gros and Fontugne (1985) Descolas-Gros and De Billy (1987) and Descolas-
Gros and Oriol (1992) Every carboxylase assay was carried out in triplicate with an assay error
lt15 and was automated with a Gilson auto-analyser (222 Autosampler Injector interfaced with
a Dilutor 401) Carboxylase activity is expressed in nmol CO2 L-1 h-1 in pmol CO2 μg C-1 h-1 and
in nmol CO2 μg Chla-1 h-1 in order to take into account the variation of the particulate carbon and
phytoplanktonic biomass during the experiment and in fmol CO2 cell-1 h-1 when possible The szlig-
carboxylasesRubisco ratio (βCR expressed in ) allowed us to quantify the relative importance
of the two pathways
Experiment reproducibility
In order to estimate the precision of the biological parameters discussed in this study the
coefficient of variation (CV) has been calculated for each parameter using four values measured
at T0 and is presented in Table 1 The CV of the biological parameters was generally less than
25 except for the carboxylases activity per cell for diatom cell and for the β-carboxylase per
cell for lt1 μm cells with values between 33 and 44 (Table 1)
11
Statistical analyses
In order to compare the effect of N treatments relative to the control and between the N
treatments non-parametric Wilcoxon signed-Rank analyses have been applied on cell numbers
chlorophyll concentrations and carboxylase activities and reported in Table 2
Results
Nutrient concentrations and physical variables
All chemical data are reported in Table 3 Water temperature varied between 220 and
238oC at a depth of 15 m At this depth the attenuation of the incident light with a maximum
value of 1800 μE m-1 s-1 was about 50 The initial chemical conditions were characterised by
very low concentrations in nitrate (lt015 microM) nitrite (lt01 microM) and by ammonium
concentrations averaging 04 microM and high DON concentrations averaging 24 microM These values
were close to those reported in June 1993 in the same area (Collos et al 1997) The phosphate
values averaged 022 microM in all carboys throughout the experiment (data not shown) The molar
ratio of silicateDIN varied from 17 to 110 in the control and enriched taurine carboys while the
ratio was close to 1 (between 08 and 25) throughout the experiment under enriched NH4+ and
NO3- treatments (data not shown) This suggested that DIN was the limiting nutrient in the
control and enriched taurine carboy during the experiment The ammonium concentrations
decreased from 04 to 006 microM (T10) in the control and under NO3- treatment and to 017 microM
(T10) under taurine treatment and varied between 007 to 023 microM afterwards The ammonium
concentrations decreased from 686 microM (T0) to 032 microM (T24) under NH4+ treatment The nitrate
12
remained undetectable throughout most of the experiment in the control NH4+ and taurine
treatments and decreased from 931 microM (T0) to 242 microM (T24) under NO3- treatment The DON
concentrations remained quite constant in the control and under DIN treatments varying from
218 to 268 microM and decreased from 376 microM (T0) to 303 microM (T24) under the taurine treatment
Size fractionation accuracy
Using the chlorophyll parameter (red fluorescence) from flow cytometry analysis on
samples before and after 1 μm nuclepore filtration and compared to the lt1 μm chlorophyll a
concentrations measured by spectrofluorimetry the accuracy of size-fractionation protocol was
assessed The red fluorescence for each cell group in the lt1μm fraction was summed and
compared with the lt1μm chlorophyll a concentrations A positive linear regression was obtained
(R2=074 n=22) The total red fluorescence of cells after 1 μm filtration detected by flow
cytometry was thus directly correlated with chlorophyll a pigment concentration measured in this
lt1 μm fraction This indicates that the potential filtration artefacts (eg breakdown of small cells)
were reduced during the experiment
Small picoplanktonic cells
In the lt1 μm filtrate a population of small picoeukaryotes was identified and exhibited
the same flow cytometric characteristics as the eukaryotic Ostreococcus tauri This picoeukaryote
contributed 95 of total lt1 μm cell numbers Larger picoeukaryote cells with a relative red
fluorescence and apparent size close to those of 1 μm beads were also detected in this fraction
No cyanobacteria cells were detected by either flow cytometry or epifluorescence microscopy
during this study The variation of lt1 microm cell numbers detected by flow cytometry is reported in
13
Table 4 The abundance of small picoeukaryote cells measured during this experiment was in the
same range of values as previously observed in the same area between 1991 and 1994 averaging
30x106 cell L-1 (Vaquer et al 1996) Compared to the control no effect of taurine treatment was
detected on the lt1 microm cell concentrations (Table 2) The lt1 microm cell numbers increased in all
carboys T0 to T7 and afterwards decreased in the control and under taurine treatment From T10 a
strong significant increase of lt1 microm cell numbers reaching 50 106 cell L-1 was observed under
DIN treatments (Table 4)
From previous filtration experiments with plankton community from Thau Lagoon 67 to
74 of total bacteria cells can be retained on GFF filters (unpubl data) Bacterial cell numbers
varied slightly during the experiment (Table 3) As compared to the control the different N
treatments did not influence the cell concentrations Retention on GFF filter of 70 of total
bacterial cell was assumed Thus the contribution of bacteria cells was always greater than 95
of the total lt1 μm plankton cell numbers retained on GFF filters
Larger plankton cells community
At the beginning of the experiment nano- and microplankton species were dominated by
autotrophic flagellates and diatoms mainly composed of Chaetoceros spp Skeletonema spp and
Pseudo-nitzschia spp (Table 5) At the end of the experiment heterotrophic and autotrophic
flagellate abundance did not vary whereas diatom cells reached 19 106 cells L-1 in the control and
under taurine treatment mainly due to an increase of Pseudo-nitzschia spp cells On the last day
of the experiment higher diatom cell abundance was measured under DIN treatments mainly
due to the increase of Skeletonema spp cells (Table 5) Using a Ccell conversion factors for
each group from Dupuy et al (2000) the contribution of gt1 μm picophytoplankton and diatom
14
cells to the total gt1μm planktonic organic carbon was estimated to be less than 01 and greater
than 95 respectively during the experiment
Chlorophyll pigment concentrations and in vitro carboxylases activity
The chlorophyll pigment concentrations and the pool of Rubisco per litre for both size
fractions were not significantly different between the control and the taurine treatment
throughout the experiment (Table 2) Compared to the control a significant increase of
chlorophyll concentration occurred after 7 incubation hours under DIN treatments reaching 109
and 08 microgL-1 for gt1 μm and lt1 μm phytoplankton cells respectively (Fig 2A amp 2B Table 1)
Similarly to the chlorophyll concentrations after 7 incubation hours the pool of Rubisco per litre
for both size fractions was significantly greater under DIN treatments than in the control (Table 2
and 6) The pool of β-carboxylase activity per litre for both size fractions varied slightly during
the 24 hours incubation (Table 7) and no significant different between the N treatments and the
control was reported (Table 2) The values of the total carboxylases activity (ie sum of two size
fractions) were normalised per carbon using the particulate organic carbon concentration (POC)
and reported in Figure 3 In the carboys without DIN enrichments the total β-carboxylase
activity per carbon increased during the night period while the total Rubisco activity per carbon
decreased (Fig 3A) A coupling between the total Rubisco and β-carboxylase activity per carbon
was generally observed in the carboys with DIN enrichments (Fig 3B) The ratio between POC
and chlorophyll a concentrations (POCChla) decreased from about 700 to 200 μgC μgChla-1
overall the experiment in all the carboys The carboxylases activity was normalised to
chlorophyll a concentrations for each size fraction in order to take into account the
phytoplankton biomass variation between the N treatments during the present experiment The
15
Rubisco activity per Chla generally decreased in all N treatments for both size fractions during
the experiment (Fig 4) and no significant difference between these N treatments was measured
(Table 2) The β-carboxylase activity per Chla for both sized fractions generally decreased
during the 10 first hours of the experiment in all N treatments (Fig 5) Nevertheless a significant
increase of the β-carboxylase activity per Chla for both size fractions occurred under DIN
treatments afterwards while this activity per Chla remained very low in the control and the
taurine treatment (Fig 5 and Table 2)
β-carboxylation pathway
β-carboxylase activity (PEPC+PEPCK+PYRC) for the plankton community expressed as
a percentage of Rubisco activity (βCR ratio) reached values greater than 50 after 10 incubation
hours in the control and under taurine treatment (Fig 6) Under DIN treatments the βCR ratio
for both size fractions was significantly lower than measured in the control with values less than
40 throughout the study (Table 2) Phosphenolpyruvate carboxylase (PEPC) enzyme
contributed to about 50 of the total β-carboxylase enzymes in both size fractions (data not
shown)
Cellular pool of carboxylase enzymes
A strong decrease of the Rubisco pool per unit cell was measured in small phytoplankton
in all carboys during the experiment and no significant influence of N treatments was observed
(Table 2 and 8) As diatom cells contributed for the most part of carbon biomass in gt1 μm
plankton community the in vitro Rubisco activity for gt1 μm fraction is expressed on the basis of
16
diatom cell number Similarly to the small cells a decrease of the Rubisco pool per unit cell is
also observed for larger cells after 24 incubation hours in the carboys (Table 5)
For the small size fraction the enzymatic pool of PEPC is expressed per unit cell of small
picoeukaryotes and reported in the Table 8 This cellular pool tended to be significantly different
between the DIN treatments and the control (p=005 and 008 Table 2) This pool decreased
during the experiment under DIN treatments while the highest values in the control and under
taurine treatment were recorded close to the end of the experiment (Table 8) The pool of PEPCK
is expressed by unit of diatom cells as this enzyme is present in the dominant diatom species
observed during this study (Descolas-Gros and Oriol 1992) and these species contributed to 95
of the total gt1 μm carbon biomass Similarly to the PEPC in small cells the cellular pool of
PEPCK in larger cells was significantly very low under DIN treatments relative to the control and
to the carboy with an addition of taurine at the end of the experiment (Table 5)
Discussion
After 10 hours of incubation the very low available dissolved inorganic nitrogen (DIN)
concentrations probably limited the growth of phytoplankton in the control and under taurine
treatment This explains the decrease of the small picophytoplankton cells and the low net growth
rate of diatoms in these carboys Nevertheless bacterial cells and heterotrophic flagellates
submitted to these different nutrient conditions did not show a net growth rate In contrast the net
growth rate of picophytoplankton and diatom was about 15 and 3 divday respectively in the
samples enriched with DIN
17
Even though phytoplankton growth was positively influenced by DIN enrichments the
cellular pool of potentially active Rubisco enzyme for picophytoplankton and diatom cells
decreased throughout the study in all the carboys This suggests a degradation of the cellular
enzymatic pool in phytoplankton cells during the study The rapid degradation of the nitrogen
fraction in phytoplankton cells under high irradiance has been shown in a shallow environment
with photosynthetically available radiation levels above 600 to 1000 μE m-2 s-1 (Collos et al
1992) Rubisco enzyme can act as a nitrogen reservoir that is more easily mobilised than the rest
of the protein pool during environmental changes (Ekman et al 1989) Thus cellular Rubisco
pool degradation during this present study may result from the light conditions in incubation
carboys held at fixed positions near the surface where phytoplankton cannot avoid high
irradiance levels during the day time reaching about 900 μE m-2 s-1 at the incubation depth
As compared to the Rubisco pathway the potential use of β-carboxylation pathway by the
plankton community as shown by the carboxylases activity normalised to the particulate carbon
chlorophyll a and cell and by the ratio βCR increased after 10 incubation hours in the carboys
without DIN enrichments only The values of the βCR ratio were higher than 100 at which
time the phytoplankton biomass started to decrease in the control and under taurine treatment In
contrast β-carboxylase activity seemed strongly coupled to the Rubisco activity under DIN
treatments This daily co-variation was already reported for natural phytoplankton in
Mediterranean Sea under favourable environmental conditions (Fouilland et al 2001) showing
the strong interdependence of these two C assimilation pathways (falkowski and Raven 1997)
The βCR ratio under DIN treatments remained less than 40 which is a characteristic of
autotrophic cells (Descolas-Gros and Oriol 1992) A βCR ratio higher than 100 suggests that
the β-carboxylation pathway can prevail on the Calvin-Benson pathway As β-carboxylation in
18
the light occurs using a substrate (PEP) derived from the Calvin-Benson cycle a ratio greater
than 100 has been associated with the occurrence of heterotrophic organisms such as
dinoflagellates (Descolas-Gros and Oriol 1992) For such cells the origin of
phosphoenolpyruvate is uncertain and Descolas-Gros and Oriol (1992) suggested that it could be
supplied by the incorporation of external organic substances
The increase of β-carboxylase pathway observed in the present study cannot be explained
by the increase of heterotrophic biomass relative to the autotrophic biomass in the control or with
addition of taurine The POCChla ratio decreased throughout the experiment suggesting a shift
towards an autotrophic community in all the carboys For the small size fraction bacterial cells
which are partially retained by filters could have significantly contributed to the total β-
carboxylase activity as suggested by results from dark fixation of 14C from natural plankton (Li et
al 1993 Markager 1999) Nevertheless the regulation of β-carboxylation pathway and enzyme
structure is different in bacterial and phytoplankton cells (Rivoal et al 1998) The occurrence of
carboxylation of PEP by PEPC is well known in bacterial cells Nevertheless this carboxylase
does not act unless acetyl-coenzyme A is present perhaps to facilitate a continued supply of
oxaloacetate for the TCA cycle fuelling (Baumerg 1973 Overbeck 1984) Such regulation does
not occur in phytoplankton cells (Turpin et al 1991) As no acetyl-coenzyme A is added to the
reaction mixture the strong variation of the activity of major β-carboxylase enzymes (PEPC) is
assumed to be directly related to the β-carboxylation pathway of the small picoeukaryote cells
Moreover the bacterial cells contributed a very large fraction to the total lt1 μm picoplankton
abundance and no significant difference in the bacterial abundance was noticed between carboys
(Table 4) Thus any increase of βCR ratio for the lt1 μm fraction observed after 10 hours of
incubation cannot be due to the bacterial growth relative to the decrease of small
19
picophytoplankton abundance which contributed to less than 5 of total cell numbers over the
experiment in all carboys The importance of bacterial activity (free or attached bacteria cells) is
assessed relatively to the ammonium uptake Data from Table 3 show that ammonium uptake was
at least twice as high during the day than at night in NH4+ treatment indicating autotrophic
driven processes In the control ammonium actually increased at night (Table 3) so it can be
safely assumed that bacterial populations produced rather than consumed ammonium in these
series of experiment This suggests that the heterotroph bacterial activity was not influenced by
the N treatments Moreover using values for the carbon content in plankton species in Thau
Lagoon calculated by Dupuy et al (2000) the heterotroph flagellates contributing to the total gt1
microm plankton biomass was estimated to be less than 1 in the control and under all N treatments
at the end of the experiment Thus the variation of the β-carboxylation enzyme pool relative to
the Rubisco was mainly due to the enzyme activities from the autotrophic plankton in both size
fractions
Anaplerotic carbon fixation by PEPC in the light exceeding photosynthetic carbon
fixation has already been measured in an N-limited green alga using stable carbon isotope
discrimination (Guy et al 1989) These authors showed that under transient situations the
contribution of βminuscarboxylation to the total C fixation can be as high as 70 ie a βCR ratio of
230 which is higher than our maximum value for a natural plankton assemblage (160) The
significant increase of both βCR ratio and the β-carboxylase activity normalised to the
chlorophyll and carbon biomass reported during the present study suggests a potential increase
of cellular β-carboxylase enzymes The pool of PEPC and PEPCK expressed per unit cell for the
small picoeukaryotes and diatoms tended to increase at the end of the experiment in the control
and under taurine treatment This increase of the activity of β-carboxylase enzymes combined
20
with the decrease of the Rubisco activity under inorganic N-deficient conditions suggests that β-
carboxylation pathway is more active when phytoplankton growth is limited by inorganic
nutrients A higher photosynthetic carbon fixation by β-carboxylation than by Rubisco in
autotrophic phytoplankton cells is surprising especially in regards to the source of the substrate
for β-carboxylation The dissimilation of reserve carbohydrate providing PEP for this pathway
as usually observed in the dark for microalgae (Mortain-Bertrand et al 1988) is unlikely This is
because phytoplankton growth was very low under N-deficient conditions implying low C
storage in cells
The increase of the enzymatic pool for β-carboxylation in phytoplankton may be due to a
shift from autotrophic to heterotrophic activity induced by a DIN deficiency as in the control and
DON (taurine) treatment There is indirect evidence that taurine was taken up during the day
Data from Table 2 shows that DON decreased in the carboys enriched with taurine while it
remained constant in the others This decrease roughly corresponds to the taurine addition but
taurine was taken up during the day only and not at night which indicates that phytoplankton
not bacteria were responsible for this uptake Nevertheless this uptake does not result in
increased phytoplankton biomass as observed in enriched ammonium or nitrate carboys
Possibly the time lag involved between uptake and growth is longer than the time scale used in
the present study as observed elsewhere (Antia et al 1975 Bonin and Maestrini 1981) Thus
increases in cell numbers could not be observed within a 24-hour time frame following the
taurine addition Interestingly in the study of Vincendeau (1987) S costatum took up DON once
DIN was exhausted Thus the similarity between the control and the taurine treatment could have
a common explanation heterotrophy is induced by DIN limitation The increase of β-
carboxylation pathway under limiting N conditions is coupled to the uptake of dissolved nitrogen
21
compounds by phytoplankton resulting in the activation of respiration for the biosynthetic
processes This causes the back-regulation of anaplerotic reactions as previously described by
Vanlerberghe et al (1990 1992) for NH4+ uptake A stimulation of respiration after the addition
of acetate has also been observed in Chlamydomonas reinhardtii cultured photoautotrophically
(Fett and Coleman 1994 Endo and Asada 1996) Moreover under similar conditions Heifetz et
al (2000) showed a decrease of photosynthetic carbon fixation in cells grown in acetate with
saturating light and CO2 These results suggest an increase of the β-carboxylation pathway for the
replenishment of TCA cycle intermediates in order to sustain the growth rate of C reinhardtii
growing heterotrophically using acetate as source of carbon This is in accordance with the
increase of cellular β-carboxylase pool during a shift toward heterotrophy in natural
phytoplankton cells suggested in this study Even though the evidence of this heterotrophy was
observed with the taurine enrichment only the importance of the β-carboxylation pathway in
natural phytoplankton under very low nutrient conditions is clearly highlighted in this study In
order to gain further insight into the phytoplankton heterotrophy the relationship between the
CO2 assimilation pathways and the capacity of phytoplankton to use organic sources of nitrogen
andor carbon should be investigated using axenic cultures of phytoplankton submitted to
different nutritional conditions for instance
Acknowledgements
This work was supported by CNRS University Montpellier II IFREMER (URM 5) We
thank J-M Deslous-Paoli and C Leboulanger for their assistance during the fieldwork T Sime-
22
Ngando for providing bacteria and flagellates data and 2 anonymous referees for insightful
comments on the manuscript This paper represents a portion of a thesis of the University Paris
VI of Eric Fouilland who received a BDI fellowship from CNRS and IFREMER This is the
XXX ISEM contribution for Chantal Descolas-Gros
23
References
Appleby G Colbeck J Holdsworth ES Wadman H 1980 szligcarboxylation enzymes in
marine phytoplankton and isolation and purification of pyruvate carboxylase from
Amphidinium carterae (Dinophyceae) J Phycol 16 290-295
Antia NJ Berland BR Bonin DJ Maestrini SY 1975 Comparative evaluation of certain
organic and inorganic sources of nitrogen for phototrophic growth of marine microalgae J
Mar Biol AssU K 55 519-539
Armstrong FAJ Tibbits S 1968 Photochemical combustion of organic matter in sea
water for nitrogen phosphorus and carbon determination J Mar Biol Ass U K 48
143-152
Bacher C Millet B Vaquer A 1997 Modeacutelisation de lrsquoimpact des mollusques cultiveacutes
sur la biomasse phytoplanctonique de lrsquoeacutetang de Thau (France) C R Acad Sci Paris
320 73-81
Baumberg S 1973 Co-ordination of metabolism In Mandelstam J McQuillen K (eds)
Biochemistry of bacterial growth Second edition Blackwell 423-493
Bonin DJ Maestrini SY 1981 Importance of organic nutrients for phytoplankton growth in
natural environments implications for algal species successionPhysiological bases of
phytoplankton ecology Platt T (Ed) Can Bull Fish Aquat Sci 210 279-291
Chreacutetiennot-Dinet M-J Courties C Vaquer A Neveux J Claustre H Lautier J
Machado MC 1995 A new marine picoeukaryote Ostreococcus tauri gen et sp nov
(Chlorophyta Prasinophyceae) Phycologia 34 85-292
24
Collos Y Descolas-Gros C Fontugne M Mortain-Bertrand A Chretiennot-Dinet MJ
Frikha MG 1992 Carbon and nitrogen dynamics during growth and degradation of
phytoplankton under natural surface irradiance Mar Biol 112 491-496
Collos Y Descolas-Gros C Fontugne M Mortain-Bertrand A Chreacutetionnot-Dinet M-J
Frikha MG 1993 Chemical isotopic and enzymatic monitoring of free and enclosed
seawater implications for primary production estimates in incubation carboys Mar Ecol
Prog Ser 93 49-54
Collos Y Vaquer A Bibent B Slawyk G Garcia N Souchu P 1997 Variability in nitrate
uptake kinetics of phytoplankton communities in a Mediterranean coastal lagoon Estuar
Coast Shelf S 44 369-375
Courties C Vaquer A Troussellier M Lautier J Chreacutetiennot-Dinet M-J Neveux J
Machado C Claustre H 1994 Smallest eukaryotic organism Nature 370 255
Descolas-Gros C Fontugne M 1985 Carbon fixation in marine phytoplankton carboxylase
activities and stable carbon-isotope ratios physiological and paleoclimatological aspects
Mar Biol 87 1-6
Descolas-Gros C De Billy G 1987 Temperature adaptation of RuBP caboxylase kinetic
properties in marine Antarctic diatoms J Exp Mar Biol Ecol 108 147-158
Descolas-Gros C Oriol L 1992 Variations in carboxylase activity in marine phytoplankton
cultures szligcarboxylation in carbon flux studies Mar Ecol Prog Ser 85 163-169
Dodds WK Priscu JC 1991 Ammonium stimulation of dark carbon fixation as an indicator
of nitrogen deficiency in phytoplankton potential errors caused by ammonium-oxidizing
bacteria J Phycol 27 79-82
25
Dupuy C Vaquer A Lam-Hoai T Rougier C Mazouni N Lautier J Collos Y Le Gall
S 2000 Feeding rate of the oyster Crassostera gigas in a natural planktonic community of
Mediterranean Thau Lagoon Mar Ecol Prog Ser 205 171-184
Ekman P Lignell A Pedersen M 1989 Localization of ribulose-15-bisphosphate
carboxylaseoxygenase in Gracilaria secundata (Rhodophyta) and its role as a nitrogen
storage pool Botanica Mar 32 527-534
Elrifi IR Turpin DH 1986 Nitrate and ammonium induced photosynthetic suppression in N-
limited Selenastrum minutum Plant Physiol 81 273-279
Endo T Asada K 1996 Dark induction of the non-photochemical quenching of chlorophyll
fluorescence by acetate in Chlamidomonas reinhardtii Plant Cell Physiol 37 551-555
Falkowski PG Raven JA 1997 Aquatic photosynthesis Blackwell Science publisher
Fett JP Coleman JR 1994 Regulation of periplasmic carbonic anhydrase expression in
Chlamidomonas reinhardtii by acetate and pH Plant Physiol 106 103-108
Fidalgo JP Cid A Abalde J Herrero C 1995 Culture of the marine diatom Phaedactylum
tricornutum with different nitrogen sources Growth nutrient conversion and biochemical
composition Cah Biol Mar 36 165-173
Fouilland E Vaquer A Descolas-Gros C 1995 Annual variations in CO2 assimilation and
primary production measurements in a mediterranean lagoon (Thau lagoon France)
Photosynthesis from Light to Biosphere Mathis P (Ed) Elvesier 5 873-876
Fouilland E Courties C Descolas-Gros C 2001 Size-fractionated carboxylase activities
during a 32 h cycle at 30 m depth in the Northwestern Mediterranean Sea after an episodic
wind event J Plankton Res 23 623-632
26
Gasc A 1997 Etude de la production primaire reacutegeacuteneacutereacutee dans un eacutecosystegraveme conchylicole le
bassin de Thau Ph D Univ Sciences et Techniques du Languedoc Montpellier France
Gilbert F Souchu P Bianchi M Bonin P 1997 Influence of shellfish farming activities on
nitrification nitrate reduction to ammonium and denitrification at the water-sediment
interface of the Thau lagoon France Mar Ecol Prog Ser 151 143-153
Glover HE 1989 Ribulosebisphosphate carboxylaseoxygenase in marine organisms Int Rev
Cytol 115 67-137
Guy RD Vanlerberghe GC Turpin DH 1989 Significance of phosphoenolpyruvate
carboxylase during ammonium assimilation Carbon isotope discrimination in
photosynthesis and respiration by the N-limited green alga Selenastrum minutum Plant
Physiol 89 1150-1157
Heifetz PB Forster B Osmond CB Giles LJ Boynton JE 2000 Effects on facultative
autotrophy in Chlamydomonas reihardtii assessed by photosynthetic measurements and
stable isotope analyses Plant Physiol 122 1439-1445
Huppe HC Turpin DH 1994 Integration of carbon and nitrogen metabolism in plant and
algal cells Annu Rev Physiol Plant Mol Biol 45 577-607
Koroleff F 1976 Determination of nutrients Methods of Seawater analysis Grasshoff K
(Ed) Verlag Chemie 117-182
Lam-Hoai T Rougier C Lasserre G 1997 Tintinnids and rotifers in a northern
Mediterranean coastal lagoon Structural diversity and function through biomass
estimations Mar Ecol Prog Ser 152 13-25
27
Le Gall S Hassen MB Le Gall PB 1997 Ingestion of a bacterivorous ciliate by oyster
Crassostera gigas protozoa as a trophic link between picoplankton and benthic suspension-
feeders Mar Ecol Prog Ser 152 301-306
Levasseur M Thompson PA Harrison PJ 1993 Physiological acclimation of marine
phytoplankton to different nitrogen sources J Phycol 29 587-595
Millet B 1989 Fonctionnement hydrodynamique du bassin de Thau Validation drsquoun modegravele
numeacuterique de circulation (programme Ecothau) Oceanol Acta 12 37-46
Morris I Yentsch CM Yentsch CS 1971 The physiological state with respect to nitrogen
of phytoplankton from low-nutrient subtropical water as measured by the effect of
ammonium ion on dark carbon dioxide fixation Limnol Oceanogr 16 859-868
Mortain-Bertrand A Descolas-Gros C Jupin H 1987a Short-term 14C incorporation in
Skeletonema costatum (Greville) Cleve (Bacillariophyceae) as a function of light regime
Phycologia 16 262-269
Mortain-Bertrand A Descolas-Gros C Jupin H 1987b Stimulating effect of transitions from
light to dark on carbon assimilation by a marine diatom J Exp Mar Biol Ecol 112 11-
26
Mortain-Bertrand A Descolas-Gros C Jupin H 1988 Pathway of dark inorganic carbon
fixation in two species of diatoms influence of light regime and regulator factors on diel
variations J Plankton Res 10 199-217
Neveux J Lantoine F 1993 Spectrofluorometric assay of chlorophylls and phaeopigments
using the least squares approximation technique Deep-Sea Res 40 1747-1765
28
Osborne BA Geider RJ 1986 Effect of nitrate-nitrogen limitation on photosynthesis of the
diatom Phaeodactylum tricornutum Bohlin (Bacillariphyceae) Plant Cell Environ 9 617-
625
Overbeck J 1984 Application of TCA cycle metabolism for growth estimates of heterotrophic
bacterioplankton Arch Hydrobiol Beih 19 23-36
Porter K Feig YS 1980 The use of DAPI for identifying and counting aquatic microflora
Limnol Oceanogr 25 943-948
Slawyk G Collos Y 1982 13C and 15N uptake by marine phytoplankton 2 Results from a
tropical area Rapp P-v Reacuteun Cons int Explor Mer 180 209-213
Souchu P Gasc A Cahet G Vaquer A Collos Y Deslous-Paoli JM 1997
Biogeochemical composition of Mediterranean waters outside the Thau lagoon Estuar
Coast Shelf S 44 275-284
Souchu P Vaquer A Collos Y Lamdrein S Deslous-Paoli J-M Bibent B 2001
Influence of shellfish farming activities on the biogeochemical composition of the water
column in Thau Lagoon Mar Ecol Prog Ser 218 141-152
Treacuteguer P Le Corre P 1975 Manuel danalyse des sels nutritifs dans leau de mer
Utilisation de lAutoAnalyseur II Technicon LOC Universiteacute de Bretagne Occidentale
Brest France
Troussellier M Courties C Zettelmaier S 1995 Flow cytometric analysis of coastal lagoon
bacterioplankton and picophytoplankton fixation and storage effects Estuar Coast Shelf
S 40 621-633
Turpin DH 1991 Effects of inorganic N availability on algal photosynthesis and carbon
metabolism J Phycol 27 14-20
29
Turpin DH Vanlerberghe GC Amory AM Guy RD 1991 The inorganic requirements
for nitrogen assimilation Can J Bot 69 1139-1145
Utermoumlhl H 1958 Zur Vervollkommnung der quantitativen Phytoplankton-Methodik Mitt int
Ver theor angew Limnol 9 1-38
Vanlerberghe GC Schuller KA Smith RG Feil R Plaxton WC Turpin DH 1990
Relationship between NH4+ assimilation rate and in vivo phosphoenolpyruvate carboxylase
activity Regulation of anapleurotic carbon flow in the green alga Selenastrum minutum
Plant Physiol 94 284-290
Vanlerberghe GC Huppe HC Vlossak KDM Turpin DH 1992 Activation of
respiration to support dark NO3- and NH4
+ assimilation in the green alga Selenastrum
minutum Plant Physiol 99 495-500
Vaquer A Troussellier M Courties C Bibent B 1996 Standing stock and dynamics of
picophytoplankton in the Thau Lagoon (northwest Mediterranean coast) Limnol
Oceanogr 41 1821-1828
Vincendeau ML 1987 Etude expeacuterimentale de la fertiliteacute des eaux des milieux conchylicoles
influence de lrsquoexcreacutetion des huitres et des palourdes sur la production des diatomeacutees
dominantes Ph D Univ Paris 6 Paris France
Table 1 Coefficient of variation (in percent) of the different biological
parameters calculated using four measurements observed at T0 Calculation based on cell numbers of diatom dominant species
gt1 microm lt1 micromCell numbers 22 6
Chlorophyll a concentrations 6 10Rubisco activity per liter 20 17szlig-Carboxylases per liter 23 12
Rubisco activity per chlorophyll a unit 17 24szlig-Carboxylases activity per chlorophyll a unit 19 12
βCR ratio 23 24Rubisco activity per cell 35 18 β-carboxylase per cell 44 33
Table 2 Statistical results from non parametric Wilcoxon signed-Rank analyses between N enriched treatments and control 001le p lt005 p le001 NS non significant (p ge01)
Cell numbers
Rubisco activity per cell
PEPC activity per cell
lt1 microm gt1 microm lt1 microm gt1 microm lt1 microm gt1 microm lt1 microm gt1 microm lt1 microm gt1 microm lt1 microm gt1 microm lt1 microm lt1 microm lt1 microm
+NH4+ Control 009 NS NS NS NS NS 005
+NO3- Control NS NS NS NS NS NS 008
+taurine Control NS NS NS NS NS NS NS NS NS NS NS NS NS NS NS
βCR ratioChla concentrations
Rubisco activity per litre
β-carboxylase activity per litre
Rubisco activity per Chla
β-carboxylase activity per Chla
Table 3 Concentrations of ammonium nitrate and dissolved organic nitrogen (DON) measured in the control NH4+
(+NH4+) NO3
- (+NO3-) and taurine (+taurine) enriched treatments during the experiment
nd no data data in bold denote a period of darkness
Control + NH4+ + NO3
- + taurine Control + NH4+ + NO3
- + taurine Control + NH4+ + NO3
- + taurineT0 039 686 04 047 013 005 931 003 226 268 218 376T2 nd nd 026 nd 006 000 896 000 224 nd 222 ndT4 045 582 024 037 000 000 85 000 224 255 236 369T7 011 352 022 029 000 000 746 000 247 266 245 332T10 006 362 006 017 001 000 615 000 265 256 236 329T13 011 384 015 023 000 000 633 000 249 258 251 312
T17 018 327 012 015 000 008 586 001 218 249 221 315
T21 007 261 009 022 000 000 468 000 233 260 223 317T24 017 032 019 020 000 000 242 000 244 260 218 303
Ammonium concentrations (microM) Nitrate concentrations (microM) Dissolved organic nitrogen (DON) concentrations (microM)
Table 4 Small picophytoplankton and bacteria cell numbers during the experiment in
the control and N enriched treatments
nd no data data in bold denote a period of darkness
Control +NH4+ +NO3
- +taurine Control +NH4+ +NO3
- +taurineT0 196 195 219 208 936 nd nd ndT2 182 208 182 130 nd nd nd ndT4 309 252 279 257 nd nd nd ndT7 304 333 312 286 1220 1220 1200 1360T10 260 415 406 221 nd nd nd ndT13 258 482 484 230 1500 1500 1190 1330
T17 198 516 409 219 nd nd nd nd
T21 208 nd 500 177 1510 1220 884 1170T24 135 nd 457 184 1120 967 832 1160
lt1 microm phytoplankton cell numbers (x106 cells L-1)
Bacteria cell numbers (x106 cells L-1)
Table 5 Plankton cell numbers and carboxylases (Rubisco and PEPCK) activity per
carbon unit of diatom cell within the gt1 microm fraction at T0 in the control and T24 in the
control and N enriched treatments nd no data
Control +NH4+ +NO3
- +taurinePicophytoplankton (x106 cells L-1) 27 149 nd 20 72
Heterotroph flagellates (x106 cells L-1) 06 05 03 02 05Autotroph flagellates (x106 cells L-1) 07 11 06 05 07
Diatoms (x106 cells L-1) 08 19 91 50 19Rubisco activity (fmol CO2 cell-1 h-1) 117 57 83 112 60PEPCK activity (fmol CO2 cell-1 h-1) 90 26 006 046 75
T24T0
Table 6 The in vitro Rubisco activity per litre of gt1 microm and lt1microm fractions in the control and
enriched N treatments
nd no data data in bold denote a period of darkness
Control +NH4+ +NO3
- +taurine Control +NH4+ +NO3
- +taurineT0 1088 664 844 939 519 459 498 349T2 1215 1322 1147 1535 289 434 428 347T4 1427 1802 nd 975 449 nd 746 599T7 552 1029 1064 441 520 842 732 361T10 478 1667 1640 396 162 647 532 351T13 213 2006 1724 239 185 577 609 164T17 129 1485 1264 171 134 453 400 159T21 366 2324 843 371 180 669 657 232T24 1093 7606 5625 1186 120 329 395 155
gt1 microm Rubisco activity (nmol CO2 L
-1 h-1)lt1 microm Rubisco activity
(nmol CO2 L-1 h-1)
Table 7 The in vitro β-carboxylase activity (PEPC+PEPCK+PYRC) of gt1 microm and lt1microm
fractions in the control and enriched N treatments
nd no data data in bold denote a period of darkness
Control +NH4+ +NO3
- +taurine Control +NH4+ +NO3
- +taurineT0 104 91 138 151 156 142 118 147T2 211 178 154 178 264 125 288 161T4 201 86 nd 95 116 nd 235 121T7 169 140 149 70 151 150 168 121T10 99 223 133 128 182 235 170 67T13 195 320 nd 150 113 114 155 123T17 203 231 118 111 132 82 109 255T21 227 392 257 289 208 161 228 113T24 117 120 265 190 59 61 71 65
gt1 microm β-carboxylase activity (nmol CO2 L
-1 h-1)lt1 microm β-carbxylase activity
(nmol CO2 L-1 h-1)
Table 8 The cellular pool of Rubisco and PEPC enzymes of lt 1microm picophytoplankton in the
control and N enriched treatments
nd no data data in bold denote a period of darkness
Control +NH4+ +NO3
- +taurine Control +NH4+ +NO3
- +taurineT0 265 235 228 168 038 035 017 041T2 159 208 235 268 020 023 052 030T4 145 nd 267 233 027 nd 011 014T7 171 253 234 126 050 022 037 023T10 062 156 131 158 037 024 021 024T13 072 120 126 071 032 019 028 017
T17 068 088 098 073 038 011 021 027
T21 086 nd 131 131 055 nd 011 047T24 088 nd 086 084 020 nd 010 005
Rubisco activity per cell (fmol CO2 cell-1 h-1)
PEPC activity per cell (fmol CO2 cell-1 h-1)
Sampling area
Fig 1 Map of sampling area in Thau lagoon Grey and black areas denote the shellfish cultivation area and towns respectively
Mediterranean Sea
NIGHTC
hlor
ophy
llco
ncen
trat io
n(micro
g c h
l L-1
)
0
2
4
6
8
10
12
00
02
04
06
08
10NIGHT
Control+ NH4
+
+ NO3-
+ Taurine
A) gt1 microm phytoplankton
B) lt1 microm phytoplankton
Chl
orop
hyll
conc
entra
t ion
(microg
c hl L
-1)
Local time
1000 1600 2200 10000400
Fig 2 Chlorophyll (a+b+c) concentrations of (A) gt1 microm phytoplankton and of (B) lt1 microm phytoplankton in the control and enriched N treatments during the incubation experiment
Rub
isco
activ
ity(p
mol
CO
2 microg
C-1
h-1
)A) Without DIN enrichments
Local time
1000 1600 2200 10000400
0
200
400
600
800
1000
0
40
80
120
160
200
0
200
400
600
800
1000
0
40
80
120
160
200
NIGHT
NIGHT
B) With DIN enrichments
Control Control+ Taurine+ Taurine
+ NH4+
+ NO3-
+ NH4+
+ NO3-
β-ca
rbox
ylas
eac
tivity
(pm
olC
O2 micro
g C
-1 h
-1)
Rub
isco
activ
ity(p
mol
CO
2 microg
C-1
h-1
)
β-ca
rbox
ylas
eac
tivity
(pm
olC
O2 micro
g C
-1 h
-1)
Fig 3 Total Rubisco and β-carboxylase activity expressed per particulate carbon for (A) the control and enriched taurine carboy and for (B) the ammonium and nitrate enrichments during the incubation experiment
NIGHT
Rub
isco
activ
ity(n
mol
CO
2 microg
chla
-1 h
-1) NIGHT
Control+ NH4
+
+ NO3-
+ Taurine
A) gt1 microm phytoplankton
B) lt1 microm phytoplankton
Fig 4 Rubisco activity normalised per chlorophyll a concentration of (A) gt1 microm phytoplankton and of (B) lt1 microm phytoplankton in the control and enriched N treatments during the incubation experiment
Rub
isco
activ
ity(n
mol
CO
2 microg
chla
-1 h
-1)
0
200
400
600
0
200
400
600
Local time
1000 1600 2200 10000400
NIGHT
β-ca
rbox
ylas
eac
tivity
(nm
olC
O2 micro
g ch
la-1
h-1
)
A) gt1 microm phytoplankton
B) lt1 microm phytoplankton
NIGHTControl+ NH4
+
+ NO3-
+ Taurine
0
40
80
120
160
200
β-ca
rbox
ylas
eac
tivity
(nm
olC
O2 micro
g ch
la-1
h-1
)
0
20
40
60
Local time
1000 1600 2200 10000400
Fig 5 β-carboxylase activity normalised per chlorophyll a concentrations of (A) gt1 microm phytoplankton and of (B) lt1 microm phytoplankton in the control and enriched N treatments during the incubation experiment
NIGHT
β-ca
rbox
y las
e R
ubi s
cora
tio (
)
NIGHT
Control+ NH4
+
+ NO3-
+ Taurine
A) gt1 microm phytoplankton
B) lt1 microm phytoplankton
0
30
60
90
120
150
180
0
30
60
90
120
150
180
1000 1600
β-ca
rbox
y las
e R
ubi s
cora
tio (
)
Local time
2200 10000400
Fig 6 Ratio of β-carboxylase activity (PEPC+PEPCK+PYRC) to Rubisco activity expressed as percents measured in the control and enriched N treatments during the incubation experiment

12
remained undetectable throughout most of the experiment in the control NH4+ and taurine
treatments and decreased from 931 microM (T0) to 242 microM (T24) under NO3- treatment The DON
concentrations remained quite constant in the control and under DIN treatments varying from
218 to 268 microM and decreased from 376 microM (T0) to 303 microM (T24) under the taurine treatment
Size fractionation accuracy
Using the chlorophyll parameter (red fluorescence) from flow cytometry analysis on
samples before and after 1 μm nuclepore filtration and compared to the lt1 μm chlorophyll a
concentrations measured by spectrofluorimetry the accuracy of size-fractionation protocol was
assessed The red fluorescence for each cell group in the lt1μm fraction was summed and
compared with the lt1μm chlorophyll a concentrations A positive linear regression was obtained
(R2=074 n=22) The total red fluorescence of cells after 1 μm filtration detected by flow
cytometry was thus directly correlated with chlorophyll a pigment concentration measured in this
lt1 μm fraction This indicates that the potential filtration artefacts (eg breakdown of small cells)
were reduced during the experiment
Small picoplanktonic cells
In the lt1 μm filtrate a population of small picoeukaryotes was identified and exhibited
the same flow cytometric characteristics as the eukaryotic Ostreococcus tauri This picoeukaryote
contributed 95 of total lt1 μm cell numbers Larger picoeukaryote cells with a relative red
fluorescence and apparent size close to those of 1 μm beads were also detected in this fraction
No cyanobacteria cells were detected by either flow cytometry or epifluorescence microscopy
during this study The variation of lt1 microm cell numbers detected by flow cytometry is reported in
13
Table 4 The abundance of small picoeukaryote cells measured during this experiment was in the
same range of values as previously observed in the same area between 1991 and 1994 averaging
30x106 cell L-1 (Vaquer et al 1996) Compared to the control no effect of taurine treatment was
detected on the lt1 microm cell concentrations (Table 2) The lt1 microm cell numbers increased in all
carboys T0 to T7 and afterwards decreased in the control and under taurine treatment From T10 a
strong significant increase of lt1 microm cell numbers reaching 50 106 cell L-1 was observed under
DIN treatments (Table 4)
From previous filtration experiments with plankton community from Thau Lagoon 67 to
74 of total bacteria cells can be retained on GFF filters (unpubl data) Bacterial cell numbers
varied slightly during the experiment (Table 3) As compared to the control the different N
treatments did not influence the cell concentrations Retention on GFF filter of 70 of total
bacterial cell was assumed Thus the contribution of bacteria cells was always greater than 95
of the total lt1 μm plankton cell numbers retained on GFF filters
Larger plankton cells community
At the beginning of the experiment nano- and microplankton species were dominated by
autotrophic flagellates and diatoms mainly composed of Chaetoceros spp Skeletonema spp and
Pseudo-nitzschia spp (Table 5) At the end of the experiment heterotrophic and autotrophic
flagellate abundance did not vary whereas diatom cells reached 19 106 cells L-1 in the control and
under taurine treatment mainly due to an increase of Pseudo-nitzschia spp cells On the last day
of the experiment higher diatom cell abundance was measured under DIN treatments mainly
due to the increase of Skeletonema spp cells (Table 5) Using a Ccell conversion factors for
each group from Dupuy et al (2000) the contribution of gt1 μm picophytoplankton and diatom
14
cells to the total gt1μm planktonic organic carbon was estimated to be less than 01 and greater
than 95 respectively during the experiment
Chlorophyll pigment concentrations and in vitro carboxylases activity
The chlorophyll pigment concentrations and the pool of Rubisco per litre for both size
fractions were not significantly different between the control and the taurine treatment
throughout the experiment (Table 2) Compared to the control a significant increase of
chlorophyll concentration occurred after 7 incubation hours under DIN treatments reaching 109
and 08 microgL-1 for gt1 μm and lt1 μm phytoplankton cells respectively (Fig 2A amp 2B Table 1)
Similarly to the chlorophyll concentrations after 7 incubation hours the pool of Rubisco per litre
for both size fractions was significantly greater under DIN treatments than in the control (Table 2
and 6) The pool of β-carboxylase activity per litre for both size fractions varied slightly during
the 24 hours incubation (Table 7) and no significant different between the N treatments and the
control was reported (Table 2) The values of the total carboxylases activity (ie sum of two size
fractions) were normalised per carbon using the particulate organic carbon concentration (POC)
and reported in Figure 3 In the carboys without DIN enrichments the total β-carboxylase
activity per carbon increased during the night period while the total Rubisco activity per carbon
decreased (Fig 3A) A coupling between the total Rubisco and β-carboxylase activity per carbon
was generally observed in the carboys with DIN enrichments (Fig 3B) The ratio between POC
and chlorophyll a concentrations (POCChla) decreased from about 700 to 200 μgC μgChla-1
overall the experiment in all the carboys The carboxylases activity was normalised to
chlorophyll a concentrations for each size fraction in order to take into account the
phytoplankton biomass variation between the N treatments during the present experiment The
15
Rubisco activity per Chla generally decreased in all N treatments for both size fractions during
the experiment (Fig 4) and no significant difference between these N treatments was measured
(Table 2) The β-carboxylase activity per Chla for both sized fractions generally decreased
during the 10 first hours of the experiment in all N treatments (Fig 5) Nevertheless a significant
increase of the β-carboxylase activity per Chla for both size fractions occurred under DIN
treatments afterwards while this activity per Chla remained very low in the control and the
taurine treatment (Fig 5 and Table 2)
β-carboxylation pathway
β-carboxylase activity (PEPC+PEPCK+PYRC) for the plankton community expressed as
a percentage of Rubisco activity (βCR ratio) reached values greater than 50 after 10 incubation
hours in the control and under taurine treatment (Fig 6) Under DIN treatments the βCR ratio
for both size fractions was significantly lower than measured in the control with values less than
40 throughout the study (Table 2) Phosphenolpyruvate carboxylase (PEPC) enzyme
contributed to about 50 of the total β-carboxylase enzymes in both size fractions (data not
shown)
Cellular pool of carboxylase enzymes
A strong decrease of the Rubisco pool per unit cell was measured in small phytoplankton
in all carboys during the experiment and no significant influence of N treatments was observed
(Table 2 and 8) As diatom cells contributed for the most part of carbon biomass in gt1 μm
plankton community the in vitro Rubisco activity for gt1 μm fraction is expressed on the basis of
16
diatom cell number Similarly to the small cells a decrease of the Rubisco pool per unit cell is
also observed for larger cells after 24 incubation hours in the carboys (Table 5)
For the small size fraction the enzymatic pool of PEPC is expressed per unit cell of small
picoeukaryotes and reported in the Table 8 This cellular pool tended to be significantly different
between the DIN treatments and the control (p=005 and 008 Table 2) This pool decreased
during the experiment under DIN treatments while the highest values in the control and under
taurine treatment were recorded close to the end of the experiment (Table 8) The pool of PEPCK
is expressed by unit of diatom cells as this enzyme is present in the dominant diatom species
observed during this study (Descolas-Gros and Oriol 1992) and these species contributed to 95
of the total gt1 μm carbon biomass Similarly to the PEPC in small cells the cellular pool of
PEPCK in larger cells was significantly very low under DIN treatments relative to the control and
to the carboy with an addition of taurine at the end of the experiment (Table 5)
Discussion
After 10 hours of incubation the very low available dissolved inorganic nitrogen (DIN)
concentrations probably limited the growth of phytoplankton in the control and under taurine
treatment This explains the decrease of the small picophytoplankton cells and the low net growth
rate of diatoms in these carboys Nevertheless bacterial cells and heterotrophic flagellates
submitted to these different nutrient conditions did not show a net growth rate In contrast the net
growth rate of picophytoplankton and diatom was about 15 and 3 divday respectively in the
samples enriched with DIN
17
Even though phytoplankton growth was positively influenced by DIN enrichments the
cellular pool of potentially active Rubisco enzyme for picophytoplankton and diatom cells
decreased throughout the study in all the carboys This suggests a degradation of the cellular
enzymatic pool in phytoplankton cells during the study The rapid degradation of the nitrogen
fraction in phytoplankton cells under high irradiance has been shown in a shallow environment
with photosynthetically available radiation levels above 600 to 1000 μE m-2 s-1 (Collos et al
1992) Rubisco enzyme can act as a nitrogen reservoir that is more easily mobilised than the rest
of the protein pool during environmental changes (Ekman et al 1989) Thus cellular Rubisco
pool degradation during this present study may result from the light conditions in incubation
carboys held at fixed positions near the surface where phytoplankton cannot avoid high
irradiance levels during the day time reaching about 900 μE m-2 s-1 at the incubation depth
As compared to the Rubisco pathway the potential use of β-carboxylation pathway by the
plankton community as shown by the carboxylases activity normalised to the particulate carbon
chlorophyll a and cell and by the ratio βCR increased after 10 incubation hours in the carboys
without DIN enrichments only The values of the βCR ratio were higher than 100 at which
time the phytoplankton biomass started to decrease in the control and under taurine treatment In
contrast β-carboxylase activity seemed strongly coupled to the Rubisco activity under DIN
treatments This daily co-variation was already reported for natural phytoplankton in
Mediterranean Sea under favourable environmental conditions (Fouilland et al 2001) showing
the strong interdependence of these two C assimilation pathways (falkowski and Raven 1997)
The βCR ratio under DIN treatments remained less than 40 which is a characteristic of
autotrophic cells (Descolas-Gros and Oriol 1992) A βCR ratio higher than 100 suggests that
the β-carboxylation pathway can prevail on the Calvin-Benson pathway As β-carboxylation in
18
the light occurs using a substrate (PEP) derived from the Calvin-Benson cycle a ratio greater
than 100 has been associated with the occurrence of heterotrophic organisms such as
dinoflagellates (Descolas-Gros and Oriol 1992) For such cells the origin of
phosphoenolpyruvate is uncertain and Descolas-Gros and Oriol (1992) suggested that it could be
supplied by the incorporation of external organic substances
The increase of β-carboxylase pathway observed in the present study cannot be explained
by the increase of heterotrophic biomass relative to the autotrophic biomass in the control or with
addition of taurine The POCChla ratio decreased throughout the experiment suggesting a shift
towards an autotrophic community in all the carboys For the small size fraction bacterial cells
which are partially retained by filters could have significantly contributed to the total β-
carboxylase activity as suggested by results from dark fixation of 14C from natural plankton (Li et
al 1993 Markager 1999) Nevertheless the regulation of β-carboxylation pathway and enzyme
structure is different in bacterial and phytoplankton cells (Rivoal et al 1998) The occurrence of
carboxylation of PEP by PEPC is well known in bacterial cells Nevertheless this carboxylase
does not act unless acetyl-coenzyme A is present perhaps to facilitate a continued supply of
oxaloacetate for the TCA cycle fuelling (Baumerg 1973 Overbeck 1984) Such regulation does
not occur in phytoplankton cells (Turpin et al 1991) As no acetyl-coenzyme A is added to the
reaction mixture the strong variation of the activity of major β-carboxylase enzymes (PEPC) is
assumed to be directly related to the β-carboxylation pathway of the small picoeukaryote cells
Moreover the bacterial cells contributed a very large fraction to the total lt1 μm picoplankton
abundance and no significant difference in the bacterial abundance was noticed between carboys
(Table 4) Thus any increase of βCR ratio for the lt1 μm fraction observed after 10 hours of
incubation cannot be due to the bacterial growth relative to the decrease of small
19
picophytoplankton abundance which contributed to less than 5 of total cell numbers over the
experiment in all carboys The importance of bacterial activity (free or attached bacteria cells) is
assessed relatively to the ammonium uptake Data from Table 3 show that ammonium uptake was
at least twice as high during the day than at night in NH4+ treatment indicating autotrophic
driven processes In the control ammonium actually increased at night (Table 3) so it can be
safely assumed that bacterial populations produced rather than consumed ammonium in these
series of experiment This suggests that the heterotroph bacterial activity was not influenced by
the N treatments Moreover using values for the carbon content in plankton species in Thau
Lagoon calculated by Dupuy et al (2000) the heterotroph flagellates contributing to the total gt1
microm plankton biomass was estimated to be less than 1 in the control and under all N treatments
at the end of the experiment Thus the variation of the β-carboxylation enzyme pool relative to
the Rubisco was mainly due to the enzyme activities from the autotrophic plankton in both size
fractions
Anaplerotic carbon fixation by PEPC in the light exceeding photosynthetic carbon
fixation has already been measured in an N-limited green alga using stable carbon isotope
discrimination (Guy et al 1989) These authors showed that under transient situations the
contribution of βminuscarboxylation to the total C fixation can be as high as 70 ie a βCR ratio of
230 which is higher than our maximum value for a natural plankton assemblage (160) The
significant increase of both βCR ratio and the β-carboxylase activity normalised to the
chlorophyll and carbon biomass reported during the present study suggests a potential increase
of cellular β-carboxylase enzymes The pool of PEPC and PEPCK expressed per unit cell for the
small picoeukaryotes and diatoms tended to increase at the end of the experiment in the control
and under taurine treatment This increase of the activity of β-carboxylase enzymes combined
20
with the decrease of the Rubisco activity under inorganic N-deficient conditions suggests that β-
carboxylation pathway is more active when phytoplankton growth is limited by inorganic
nutrients A higher photosynthetic carbon fixation by β-carboxylation than by Rubisco in
autotrophic phytoplankton cells is surprising especially in regards to the source of the substrate
for β-carboxylation The dissimilation of reserve carbohydrate providing PEP for this pathway
as usually observed in the dark for microalgae (Mortain-Bertrand et al 1988) is unlikely This is
because phytoplankton growth was very low under N-deficient conditions implying low C
storage in cells
The increase of the enzymatic pool for β-carboxylation in phytoplankton may be due to a
shift from autotrophic to heterotrophic activity induced by a DIN deficiency as in the control and
DON (taurine) treatment There is indirect evidence that taurine was taken up during the day
Data from Table 2 shows that DON decreased in the carboys enriched with taurine while it
remained constant in the others This decrease roughly corresponds to the taurine addition but
taurine was taken up during the day only and not at night which indicates that phytoplankton
not bacteria were responsible for this uptake Nevertheless this uptake does not result in
increased phytoplankton biomass as observed in enriched ammonium or nitrate carboys
Possibly the time lag involved between uptake and growth is longer than the time scale used in
the present study as observed elsewhere (Antia et al 1975 Bonin and Maestrini 1981) Thus
increases in cell numbers could not be observed within a 24-hour time frame following the
taurine addition Interestingly in the study of Vincendeau (1987) S costatum took up DON once
DIN was exhausted Thus the similarity between the control and the taurine treatment could have
a common explanation heterotrophy is induced by DIN limitation The increase of β-
carboxylation pathway under limiting N conditions is coupled to the uptake of dissolved nitrogen
21
compounds by phytoplankton resulting in the activation of respiration for the biosynthetic
processes This causes the back-regulation of anaplerotic reactions as previously described by
Vanlerberghe et al (1990 1992) for NH4+ uptake A stimulation of respiration after the addition
of acetate has also been observed in Chlamydomonas reinhardtii cultured photoautotrophically
(Fett and Coleman 1994 Endo and Asada 1996) Moreover under similar conditions Heifetz et
al (2000) showed a decrease of photosynthetic carbon fixation in cells grown in acetate with
saturating light and CO2 These results suggest an increase of the β-carboxylation pathway for the
replenishment of TCA cycle intermediates in order to sustain the growth rate of C reinhardtii
growing heterotrophically using acetate as source of carbon This is in accordance with the
increase of cellular β-carboxylase pool during a shift toward heterotrophy in natural
phytoplankton cells suggested in this study Even though the evidence of this heterotrophy was
observed with the taurine enrichment only the importance of the β-carboxylation pathway in
natural phytoplankton under very low nutrient conditions is clearly highlighted in this study In
order to gain further insight into the phytoplankton heterotrophy the relationship between the
CO2 assimilation pathways and the capacity of phytoplankton to use organic sources of nitrogen
andor carbon should be investigated using axenic cultures of phytoplankton submitted to
different nutritional conditions for instance
Acknowledgements
This work was supported by CNRS University Montpellier II IFREMER (URM 5) We
thank J-M Deslous-Paoli and C Leboulanger for their assistance during the fieldwork T Sime-
22
Ngando for providing bacteria and flagellates data and 2 anonymous referees for insightful
comments on the manuscript This paper represents a portion of a thesis of the University Paris
VI of Eric Fouilland who received a BDI fellowship from CNRS and IFREMER This is the
XXX ISEM contribution for Chantal Descolas-Gros
23
References
Appleby G Colbeck J Holdsworth ES Wadman H 1980 szligcarboxylation enzymes in
marine phytoplankton and isolation and purification of pyruvate carboxylase from
Amphidinium carterae (Dinophyceae) J Phycol 16 290-295
Antia NJ Berland BR Bonin DJ Maestrini SY 1975 Comparative evaluation of certain
organic and inorganic sources of nitrogen for phototrophic growth of marine microalgae J
Mar Biol AssU K 55 519-539
Armstrong FAJ Tibbits S 1968 Photochemical combustion of organic matter in sea
water for nitrogen phosphorus and carbon determination J Mar Biol Ass U K 48
143-152
Bacher C Millet B Vaquer A 1997 Modeacutelisation de lrsquoimpact des mollusques cultiveacutes
sur la biomasse phytoplanctonique de lrsquoeacutetang de Thau (France) C R Acad Sci Paris
320 73-81
Baumberg S 1973 Co-ordination of metabolism In Mandelstam J McQuillen K (eds)
Biochemistry of bacterial growth Second edition Blackwell 423-493
Bonin DJ Maestrini SY 1981 Importance of organic nutrients for phytoplankton growth in
natural environments implications for algal species successionPhysiological bases of
phytoplankton ecology Platt T (Ed) Can Bull Fish Aquat Sci 210 279-291
Chreacutetiennot-Dinet M-J Courties C Vaquer A Neveux J Claustre H Lautier J
Machado MC 1995 A new marine picoeukaryote Ostreococcus tauri gen et sp nov
(Chlorophyta Prasinophyceae) Phycologia 34 85-292
24
Collos Y Descolas-Gros C Fontugne M Mortain-Bertrand A Chretiennot-Dinet MJ
Frikha MG 1992 Carbon and nitrogen dynamics during growth and degradation of
phytoplankton under natural surface irradiance Mar Biol 112 491-496
Collos Y Descolas-Gros C Fontugne M Mortain-Bertrand A Chreacutetionnot-Dinet M-J
Frikha MG 1993 Chemical isotopic and enzymatic monitoring of free and enclosed
seawater implications for primary production estimates in incubation carboys Mar Ecol
Prog Ser 93 49-54
Collos Y Vaquer A Bibent B Slawyk G Garcia N Souchu P 1997 Variability in nitrate
uptake kinetics of phytoplankton communities in a Mediterranean coastal lagoon Estuar
Coast Shelf S 44 369-375
Courties C Vaquer A Troussellier M Lautier J Chreacutetiennot-Dinet M-J Neveux J
Machado C Claustre H 1994 Smallest eukaryotic organism Nature 370 255
Descolas-Gros C Fontugne M 1985 Carbon fixation in marine phytoplankton carboxylase
activities and stable carbon-isotope ratios physiological and paleoclimatological aspects
Mar Biol 87 1-6
Descolas-Gros C De Billy G 1987 Temperature adaptation of RuBP caboxylase kinetic
properties in marine Antarctic diatoms J Exp Mar Biol Ecol 108 147-158
Descolas-Gros C Oriol L 1992 Variations in carboxylase activity in marine phytoplankton
cultures szligcarboxylation in carbon flux studies Mar Ecol Prog Ser 85 163-169
Dodds WK Priscu JC 1991 Ammonium stimulation of dark carbon fixation as an indicator
of nitrogen deficiency in phytoplankton potential errors caused by ammonium-oxidizing
bacteria J Phycol 27 79-82
25
Dupuy C Vaquer A Lam-Hoai T Rougier C Mazouni N Lautier J Collos Y Le Gall
S 2000 Feeding rate of the oyster Crassostera gigas in a natural planktonic community of
Mediterranean Thau Lagoon Mar Ecol Prog Ser 205 171-184
Ekman P Lignell A Pedersen M 1989 Localization of ribulose-15-bisphosphate
carboxylaseoxygenase in Gracilaria secundata (Rhodophyta) and its role as a nitrogen
storage pool Botanica Mar 32 527-534
Elrifi IR Turpin DH 1986 Nitrate and ammonium induced photosynthetic suppression in N-
limited Selenastrum minutum Plant Physiol 81 273-279
Endo T Asada K 1996 Dark induction of the non-photochemical quenching of chlorophyll
fluorescence by acetate in Chlamidomonas reinhardtii Plant Cell Physiol 37 551-555
Falkowski PG Raven JA 1997 Aquatic photosynthesis Blackwell Science publisher
Fett JP Coleman JR 1994 Regulation of periplasmic carbonic anhydrase expression in
Chlamidomonas reinhardtii by acetate and pH Plant Physiol 106 103-108
Fidalgo JP Cid A Abalde J Herrero C 1995 Culture of the marine diatom Phaedactylum
tricornutum with different nitrogen sources Growth nutrient conversion and biochemical
composition Cah Biol Mar 36 165-173
Fouilland E Vaquer A Descolas-Gros C 1995 Annual variations in CO2 assimilation and
primary production measurements in a mediterranean lagoon (Thau lagoon France)
Photosynthesis from Light to Biosphere Mathis P (Ed) Elvesier 5 873-876
Fouilland E Courties C Descolas-Gros C 2001 Size-fractionated carboxylase activities
during a 32 h cycle at 30 m depth in the Northwestern Mediterranean Sea after an episodic
wind event J Plankton Res 23 623-632
26
Gasc A 1997 Etude de la production primaire reacutegeacuteneacutereacutee dans un eacutecosystegraveme conchylicole le
bassin de Thau Ph D Univ Sciences et Techniques du Languedoc Montpellier France
Gilbert F Souchu P Bianchi M Bonin P 1997 Influence of shellfish farming activities on
nitrification nitrate reduction to ammonium and denitrification at the water-sediment
interface of the Thau lagoon France Mar Ecol Prog Ser 151 143-153
Glover HE 1989 Ribulosebisphosphate carboxylaseoxygenase in marine organisms Int Rev
Cytol 115 67-137
Guy RD Vanlerberghe GC Turpin DH 1989 Significance of phosphoenolpyruvate
carboxylase during ammonium assimilation Carbon isotope discrimination in
photosynthesis and respiration by the N-limited green alga Selenastrum minutum Plant
Physiol 89 1150-1157
Heifetz PB Forster B Osmond CB Giles LJ Boynton JE 2000 Effects on facultative
autotrophy in Chlamydomonas reihardtii assessed by photosynthetic measurements and
stable isotope analyses Plant Physiol 122 1439-1445
Huppe HC Turpin DH 1994 Integration of carbon and nitrogen metabolism in plant and
algal cells Annu Rev Physiol Plant Mol Biol 45 577-607
Koroleff F 1976 Determination of nutrients Methods of Seawater analysis Grasshoff K
(Ed) Verlag Chemie 117-182
Lam-Hoai T Rougier C Lasserre G 1997 Tintinnids and rotifers in a northern
Mediterranean coastal lagoon Structural diversity and function through biomass
estimations Mar Ecol Prog Ser 152 13-25
27
Le Gall S Hassen MB Le Gall PB 1997 Ingestion of a bacterivorous ciliate by oyster
Crassostera gigas protozoa as a trophic link between picoplankton and benthic suspension-
feeders Mar Ecol Prog Ser 152 301-306
Levasseur M Thompson PA Harrison PJ 1993 Physiological acclimation of marine
phytoplankton to different nitrogen sources J Phycol 29 587-595
Millet B 1989 Fonctionnement hydrodynamique du bassin de Thau Validation drsquoun modegravele
numeacuterique de circulation (programme Ecothau) Oceanol Acta 12 37-46
Morris I Yentsch CM Yentsch CS 1971 The physiological state with respect to nitrogen
of phytoplankton from low-nutrient subtropical water as measured by the effect of
ammonium ion on dark carbon dioxide fixation Limnol Oceanogr 16 859-868
Mortain-Bertrand A Descolas-Gros C Jupin H 1987a Short-term 14C incorporation in
Skeletonema costatum (Greville) Cleve (Bacillariophyceae) as a function of light regime
Phycologia 16 262-269
Mortain-Bertrand A Descolas-Gros C Jupin H 1987b Stimulating effect of transitions from
light to dark on carbon assimilation by a marine diatom J Exp Mar Biol Ecol 112 11-
26
Mortain-Bertrand A Descolas-Gros C Jupin H 1988 Pathway of dark inorganic carbon
fixation in two species of diatoms influence of light regime and regulator factors on diel
variations J Plankton Res 10 199-217
Neveux J Lantoine F 1993 Spectrofluorometric assay of chlorophylls and phaeopigments
using the least squares approximation technique Deep-Sea Res 40 1747-1765
28
Osborne BA Geider RJ 1986 Effect of nitrate-nitrogen limitation on photosynthesis of the
diatom Phaeodactylum tricornutum Bohlin (Bacillariphyceae) Plant Cell Environ 9 617-
625
Overbeck J 1984 Application of TCA cycle metabolism for growth estimates of heterotrophic
bacterioplankton Arch Hydrobiol Beih 19 23-36
Porter K Feig YS 1980 The use of DAPI for identifying and counting aquatic microflora
Limnol Oceanogr 25 943-948
Slawyk G Collos Y 1982 13C and 15N uptake by marine phytoplankton 2 Results from a
tropical area Rapp P-v Reacuteun Cons int Explor Mer 180 209-213
Souchu P Gasc A Cahet G Vaquer A Collos Y Deslous-Paoli JM 1997
Biogeochemical composition of Mediterranean waters outside the Thau lagoon Estuar
Coast Shelf S 44 275-284
Souchu P Vaquer A Collos Y Lamdrein S Deslous-Paoli J-M Bibent B 2001
Influence of shellfish farming activities on the biogeochemical composition of the water
column in Thau Lagoon Mar Ecol Prog Ser 218 141-152
Treacuteguer P Le Corre P 1975 Manuel danalyse des sels nutritifs dans leau de mer
Utilisation de lAutoAnalyseur II Technicon LOC Universiteacute de Bretagne Occidentale
Brest France
Troussellier M Courties C Zettelmaier S 1995 Flow cytometric analysis of coastal lagoon
bacterioplankton and picophytoplankton fixation and storage effects Estuar Coast Shelf
S 40 621-633
Turpin DH 1991 Effects of inorganic N availability on algal photosynthesis and carbon
metabolism J Phycol 27 14-20
29
Turpin DH Vanlerberghe GC Amory AM Guy RD 1991 The inorganic requirements
for nitrogen assimilation Can J Bot 69 1139-1145
Utermoumlhl H 1958 Zur Vervollkommnung der quantitativen Phytoplankton-Methodik Mitt int
Ver theor angew Limnol 9 1-38
Vanlerberghe GC Schuller KA Smith RG Feil R Plaxton WC Turpin DH 1990
Relationship between NH4+ assimilation rate and in vivo phosphoenolpyruvate carboxylase
activity Regulation of anapleurotic carbon flow in the green alga Selenastrum minutum
Plant Physiol 94 284-290
Vanlerberghe GC Huppe HC Vlossak KDM Turpin DH 1992 Activation of
respiration to support dark NO3- and NH4
+ assimilation in the green alga Selenastrum
minutum Plant Physiol 99 495-500
Vaquer A Troussellier M Courties C Bibent B 1996 Standing stock and dynamics of
picophytoplankton in the Thau Lagoon (northwest Mediterranean coast) Limnol
Oceanogr 41 1821-1828
Vincendeau ML 1987 Etude expeacuterimentale de la fertiliteacute des eaux des milieux conchylicoles
influence de lrsquoexcreacutetion des huitres et des palourdes sur la production des diatomeacutees
dominantes Ph D Univ Paris 6 Paris France
Table 1 Coefficient of variation (in percent) of the different biological
parameters calculated using four measurements observed at T0 Calculation based on cell numbers of diatom dominant species
gt1 microm lt1 micromCell numbers 22 6
Chlorophyll a concentrations 6 10Rubisco activity per liter 20 17szlig-Carboxylases per liter 23 12
Rubisco activity per chlorophyll a unit 17 24szlig-Carboxylases activity per chlorophyll a unit 19 12
βCR ratio 23 24Rubisco activity per cell 35 18 β-carboxylase per cell 44 33
Table 2 Statistical results from non parametric Wilcoxon signed-Rank analyses between N enriched treatments and control 001le p lt005 p le001 NS non significant (p ge01)
Cell numbers
Rubisco activity per cell
PEPC activity per cell
lt1 microm gt1 microm lt1 microm gt1 microm lt1 microm gt1 microm lt1 microm gt1 microm lt1 microm gt1 microm lt1 microm gt1 microm lt1 microm lt1 microm lt1 microm
+NH4+ Control 009 NS NS NS NS NS 005
+NO3- Control NS NS NS NS NS NS 008
+taurine Control NS NS NS NS NS NS NS NS NS NS NS NS NS NS NS
βCR ratioChla concentrations
Rubisco activity per litre
β-carboxylase activity per litre
Rubisco activity per Chla
β-carboxylase activity per Chla
Table 3 Concentrations of ammonium nitrate and dissolved organic nitrogen (DON) measured in the control NH4+
(+NH4+) NO3
- (+NO3-) and taurine (+taurine) enriched treatments during the experiment
nd no data data in bold denote a period of darkness
Control + NH4+ + NO3
- + taurine Control + NH4+ + NO3
- + taurine Control + NH4+ + NO3
- + taurineT0 039 686 04 047 013 005 931 003 226 268 218 376T2 nd nd 026 nd 006 000 896 000 224 nd 222 ndT4 045 582 024 037 000 000 85 000 224 255 236 369T7 011 352 022 029 000 000 746 000 247 266 245 332T10 006 362 006 017 001 000 615 000 265 256 236 329T13 011 384 015 023 000 000 633 000 249 258 251 312
T17 018 327 012 015 000 008 586 001 218 249 221 315
T21 007 261 009 022 000 000 468 000 233 260 223 317T24 017 032 019 020 000 000 242 000 244 260 218 303
Ammonium concentrations (microM) Nitrate concentrations (microM) Dissolved organic nitrogen (DON) concentrations (microM)
Table 4 Small picophytoplankton and bacteria cell numbers during the experiment in
the control and N enriched treatments
nd no data data in bold denote a period of darkness
Control +NH4+ +NO3
- +taurine Control +NH4+ +NO3
- +taurineT0 196 195 219 208 936 nd nd ndT2 182 208 182 130 nd nd nd ndT4 309 252 279 257 nd nd nd ndT7 304 333 312 286 1220 1220 1200 1360T10 260 415 406 221 nd nd nd ndT13 258 482 484 230 1500 1500 1190 1330
T17 198 516 409 219 nd nd nd nd
T21 208 nd 500 177 1510 1220 884 1170T24 135 nd 457 184 1120 967 832 1160
lt1 microm phytoplankton cell numbers (x106 cells L-1)
Bacteria cell numbers (x106 cells L-1)
Table 5 Plankton cell numbers and carboxylases (Rubisco and PEPCK) activity per
carbon unit of diatom cell within the gt1 microm fraction at T0 in the control and T24 in the
control and N enriched treatments nd no data
Control +NH4+ +NO3
- +taurinePicophytoplankton (x106 cells L-1) 27 149 nd 20 72
Heterotroph flagellates (x106 cells L-1) 06 05 03 02 05Autotroph flagellates (x106 cells L-1) 07 11 06 05 07
Diatoms (x106 cells L-1) 08 19 91 50 19Rubisco activity (fmol CO2 cell-1 h-1) 117 57 83 112 60PEPCK activity (fmol CO2 cell-1 h-1) 90 26 006 046 75
T24T0
Table 6 The in vitro Rubisco activity per litre of gt1 microm and lt1microm fractions in the control and
enriched N treatments
nd no data data in bold denote a period of darkness
Control +NH4+ +NO3
- +taurine Control +NH4+ +NO3
- +taurineT0 1088 664 844 939 519 459 498 349T2 1215 1322 1147 1535 289 434 428 347T4 1427 1802 nd 975 449 nd 746 599T7 552 1029 1064 441 520 842 732 361T10 478 1667 1640 396 162 647 532 351T13 213 2006 1724 239 185 577 609 164T17 129 1485 1264 171 134 453 400 159T21 366 2324 843 371 180 669 657 232T24 1093 7606 5625 1186 120 329 395 155
gt1 microm Rubisco activity (nmol CO2 L
-1 h-1)lt1 microm Rubisco activity
(nmol CO2 L-1 h-1)
Table 7 The in vitro β-carboxylase activity (PEPC+PEPCK+PYRC) of gt1 microm and lt1microm
fractions in the control and enriched N treatments
nd no data data in bold denote a period of darkness
Control +NH4+ +NO3
- +taurine Control +NH4+ +NO3
- +taurineT0 104 91 138 151 156 142 118 147T2 211 178 154 178 264 125 288 161T4 201 86 nd 95 116 nd 235 121T7 169 140 149 70 151 150 168 121T10 99 223 133 128 182 235 170 67T13 195 320 nd 150 113 114 155 123T17 203 231 118 111 132 82 109 255T21 227 392 257 289 208 161 228 113T24 117 120 265 190 59 61 71 65
gt1 microm β-carboxylase activity (nmol CO2 L
-1 h-1)lt1 microm β-carbxylase activity
(nmol CO2 L-1 h-1)
Table 8 The cellular pool of Rubisco and PEPC enzymes of lt 1microm picophytoplankton in the
control and N enriched treatments
nd no data data in bold denote a period of darkness
Control +NH4+ +NO3
- +taurine Control +NH4+ +NO3
- +taurineT0 265 235 228 168 038 035 017 041T2 159 208 235 268 020 023 052 030T4 145 nd 267 233 027 nd 011 014T7 171 253 234 126 050 022 037 023T10 062 156 131 158 037 024 021 024T13 072 120 126 071 032 019 028 017
T17 068 088 098 073 038 011 021 027
T21 086 nd 131 131 055 nd 011 047T24 088 nd 086 084 020 nd 010 005
Rubisco activity per cell (fmol CO2 cell-1 h-1)
PEPC activity per cell (fmol CO2 cell-1 h-1)
Sampling area
Fig 1 Map of sampling area in Thau lagoon Grey and black areas denote the shellfish cultivation area and towns respectively
Mediterranean Sea
NIGHTC
hlor
ophy
llco
ncen
trat io
n(micro
g c h
l L-1
)
0
2
4
6
8
10
12
00
02
04
06
08
10NIGHT
Control+ NH4
+
+ NO3-
+ Taurine
A) gt1 microm phytoplankton
B) lt1 microm phytoplankton
Chl
orop
hyll
conc
entra
t ion
(microg
c hl L
-1)
Local time
1000 1600 2200 10000400
Fig 2 Chlorophyll (a+b+c) concentrations of (A) gt1 microm phytoplankton and of (B) lt1 microm phytoplankton in the control and enriched N treatments during the incubation experiment
Rub
isco
activ
ity(p
mol
CO
2 microg
C-1
h-1
)A) Without DIN enrichments
Local time
1000 1600 2200 10000400
0
200
400
600
800
1000
0
40
80
120
160
200
0
200
400
600
800
1000
0
40
80
120
160
200
NIGHT
NIGHT
B) With DIN enrichments
Control Control+ Taurine+ Taurine
+ NH4+
+ NO3-
+ NH4+
+ NO3-
β-ca
rbox
ylas
eac
tivity
(pm
olC
O2 micro
g C
-1 h
-1)
Rub
isco
activ
ity(p
mol
CO
2 microg
C-1
h-1
)
β-ca
rbox
ylas
eac
tivity
(pm
olC
O2 micro
g C
-1 h
-1)
Fig 3 Total Rubisco and β-carboxylase activity expressed per particulate carbon for (A) the control and enriched taurine carboy and for (B) the ammonium and nitrate enrichments during the incubation experiment
NIGHT
Rub
isco
activ
ity(n
mol
CO
2 microg
chla
-1 h
-1) NIGHT
Control+ NH4
+
+ NO3-
+ Taurine
A) gt1 microm phytoplankton
B) lt1 microm phytoplankton
Fig 4 Rubisco activity normalised per chlorophyll a concentration of (A) gt1 microm phytoplankton and of (B) lt1 microm phytoplankton in the control and enriched N treatments during the incubation experiment
Rub
isco
activ
ity(n
mol
CO
2 microg
chla
-1 h
-1)
0
200
400
600
0
200
400
600
Local time
1000 1600 2200 10000400
NIGHT
β-ca
rbox
ylas
eac
tivity
(nm
olC
O2 micro
g ch
la-1
h-1
)
A) gt1 microm phytoplankton
B) lt1 microm phytoplankton
NIGHTControl+ NH4
+
+ NO3-
+ Taurine
0
40
80
120
160
200
β-ca
rbox
ylas
eac
tivity
(nm
olC
O2 micro
g ch
la-1
h-1
)
0
20
40
60
Local time
1000 1600 2200 10000400
Fig 5 β-carboxylase activity normalised per chlorophyll a concentrations of (A) gt1 microm phytoplankton and of (B) lt1 microm phytoplankton in the control and enriched N treatments during the incubation experiment
NIGHT
β-ca
rbox
y las
e R
ubi s
cora
tio (
)
NIGHT
Control+ NH4
+
+ NO3-
+ Taurine
A) gt1 microm phytoplankton
B) lt1 microm phytoplankton
0
30
60
90
120
150
180
0
30
60
90
120
150
180
1000 1600
β-ca
rbox
y las
e R
ubi s
cora
tio (
)
Local time
2200 10000400
Fig 6 Ratio of β-carboxylase activity (PEPC+PEPCK+PYRC) to Rubisco activity expressed as percents measured in the control and enriched N treatments during the incubation experiment

20
with the decrease of the Rubisco activity under inorganic N-deficient conditions suggests that β-
carboxylation pathway is more active when phytoplankton growth is limited by inorganic
nutrients A higher photosynthetic carbon fixation by β-carboxylation than by Rubisco in
autotrophic phytoplankton cells is surprising especially in regards to the source of the substrate
for β-carboxylation The dissimilation of reserve carbohydrate providing PEP for this pathway
as usually observed in the dark for microalgae (Mortain-Bertrand et al 1988) is unlikely This is
because phytoplankton growth was very low under N-deficient conditions implying low C
storage in cells
The increase of the enzymatic pool for β-carboxylation in phytoplankton may be due to a
shift from autotrophic to heterotrophic activity induced by a DIN deficiency as in the control and
DON (taurine) treatment There is indirect evidence that taurine was taken up during the day
Data from Table 2 shows that DON decreased in the carboys enriched with taurine while it
remained constant in the others This decrease roughly corresponds to the taurine addition but
taurine was taken up during the day only and not at night which indicates that phytoplankton
not bacteria were responsible for this uptake Nevertheless this uptake does not result in
increased phytoplankton biomass as observed in enriched ammonium or nitrate carboys
Possibly the time lag involved between uptake and growth is longer than the time scale used in
the present study as observed elsewhere (Antia et al 1975 Bonin and Maestrini 1981) Thus
increases in cell numbers could not be observed within a 24-hour time frame following the
taurine addition Interestingly in the study of Vincendeau (1987) S costatum took up DON once
DIN was exhausted Thus the similarity between the control and the taurine treatment could have
a common explanation heterotrophy is induced by DIN limitation The increase of β-
carboxylation pathway under limiting N conditions is coupled to the uptake of dissolved nitrogen
21
compounds by phytoplankton resulting in the activation of respiration for the biosynthetic
processes This causes the back-regulation of anaplerotic reactions as previously described by
Vanlerberghe et al (1990 1992) for NH4+ uptake A stimulation of respiration after the addition
of acetate has also been observed in Chlamydomonas reinhardtii cultured photoautotrophically
(Fett and Coleman 1994 Endo and Asada 1996) Moreover under similar conditions Heifetz et
al (2000) showed a decrease of photosynthetic carbon fixation in cells grown in acetate with
saturating light and CO2 These results suggest an increase of the β-carboxylation pathway for the
replenishment of TCA cycle intermediates in order to sustain the growth rate of C reinhardtii
growing heterotrophically using acetate as source of carbon This is in accordance with the
increase of cellular β-carboxylase pool during a shift toward heterotrophy in natural
phytoplankton cells suggested in this study Even though the evidence of this heterotrophy was
observed with the taurine enrichment only the importance of the β-carboxylation pathway in
natural phytoplankton under very low nutrient conditions is clearly highlighted in this study In
order to gain further insight into the phytoplankton heterotrophy the relationship between the
CO2 assimilation pathways and the capacity of phytoplankton to use organic sources of nitrogen
andor carbon should be investigated using axenic cultures of phytoplankton submitted to
different nutritional conditions for instance
Acknowledgements
This work was supported by CNRS University Montpellier II IFREMER (URM 5) We
thank J-M Deslous-Paoli and C Leboulanger for their assistance during the fieldwork T Sime-
22
Ngando for providing bacteria and flagellates data and 2 anonymous referees for insightful
comments on the manuscript This paper represents a portion of a thesis of the University Paris
VI of Eric Fouilland who received a BDI fellowship from CNRS and IFREMER This is the
XXX ISEM contribution for Chantal Descolas-Gros
23
References
Appleby G Colbeck J Holdsworth ES Wadman H 1980 szligcarboxylation enzymes in
marine phytoplankton and isolation and purification of pyruvate carboxylase from
Amphidinium carterae (Dinophyceae) J Phycol 16 290-295
Antia NJ Berland BR Bonin DJ Maestrini SY 1975 Comparative evaluation of certain
organic and inorganic sources of nitrogen for phototrophic growth of marine microalgae J
Mar Biol AssU K 55 519-539
Armstrong FAJ Tibbits S 1968 Photochemical combustion of organic matter in sea
water for nitrogen phosphorus and carbon determination J Mar Biol Ass U K 48
143-152
Bacher C Millet B Vaquer A 1997 Modeacutelisation de lrsquoimpact des mollusques cultiveacutes
sur la biomasse phytoplanctonique de lrsquoeacutetang de Thau (France) C R Acad Sci Paris
320 73-81
Baumberg S 1973 Co-ordination of metabolism In Mandelstam J McQuillen K (eds)
Biochemistry of bacterial growth Second edition Blackwell 423-493
Bonin DJ Maestrini SY 1981 Importance of organic nutrients for phytoplankton growth in
natural environments implications for algal species successionPhysiological bases of
phytoplankton ecology Platt T (Ed) Can Bull Fish Aquat Sci 210 279-291
Chreacutetiennot-Dinet M-J Courties C Vaquer A Neveux J Claustre H Lautier J
Machado MC 1995 A new marine picoeukaryote Ostreococcus tauri gen et sp nov
(Chlorophyta Prasinophyceae) Phycologia 34 85-292
24
Collos Y Descolas-Gros C Fontugne M Mortain-Bertrand A Chretiennot-Dinet MJ
Frikha MG 1992 Carbon and nitrogen dynamics during growth and degradation of
phytoplankton under natural surface irradiance Mar Biol 112 491-496
Collos Y Descolas-Gros C Fontugne M Mortain-Bertrand A Chreacutetionnot-Dinet M-J
Frikha MG 1993 Chemical isotopic and enzymatic monitoring of free and enclosed
seawater implications for primary production estimates in incubation carboys Mar Ecol
Prog Ser 93 49-54
Collos Y Vaquer A Bibent B Slawyk G Garcia N Souchu P 1997 Variability in nitrate
uptake kinetics of phytoplankton communities in a Mediterranean coastal lagoon Estuar
Coast Shelf S 44 369-375
Courties C Vaquer A Troussellier M Lautier J Chreacutetiennot-Dinet M-J Neveux J
Machado C Claustre H 1994 Smallest eukaryotic organism Nature 370 255
Descolas-Gros C Fontugne M 1985 Carbon fixation in marine phytoplankton carboxylase
activities and stable carbon-isotope ratios physiological and paleoclimatological aspects
Mar Biol 87 1-6
Descolas-Gros C De Billy G 1987 Temperature adaptation of RuBP caboxylase kinetic
properties in marine Antarctic diatoms J Exp Mar Biol Ecol 108 147-158
Descolas-Gros C Oriol L 1992 Variations in carboxylase activity in marine phytoplankton
cultures szligcarboxylation in carbon flux studies Mar Ecol Prog Ser 85 163-169
Dodds WK Priscu JC 1991 Ammonium stimulation of dark carbon fixation as an indicator
of nitrogen deficiency in phytoplankton potential errors caused by ammonium-oxidizing
bacteria J Phycol 27 79-82
25
Dupuy C Vaquer A Lam-Hoai T Rougier C Mazouni N Lautier J Collos Y Le Gall
S 2000 Feeding rate of the oyster Crassostera gigas in a natural planktonic community of
Mediterranean Thau Lagoon Mar Ecol Prog Ser 205 171-184
Ekman P Lignell A Pedersen M 1989 Localization of ribulose-15-bisphosphate
carboxylaseoxygenase in Gracilaria secundata (Rhodophyta) and its role as a nitrogen
storage pool Botanica Mar 32 527-534
Elrifi IR Turpin DH 1986 Nitrate and ammonium induced photosynthetic suppression in N-
limited Selenastrum minutum Plant Physiol 81 273-279
Endo T Asada K 1996 Dark induction of the non-photochemical quenching of chlorophyll
fluorescence by acetate in Chlamidomonas reinhardtii Plant Cell Physiol 37 551-555
Falkowski PG Raven JA 1997 Aquatic photosynthesis Blackwell Science publisher
Fett JP Coleman JR 1994 Regulation of periplasmic carbonic anhydrase expression in
Chlamidomonas reinhardtii by acetate and pH Plant Physiol 106 103-108
Fidalgo JP Cid A Abalde J Herrero C 1995 Culture of the marine diatom Phaedactylum
tricornutum with different nitrogen sources Growth nutrient conversion and biochemical
composition Cah Biol Mar 36 165-173
Fouilland E Vaquer A Descolas-Gros C 1995 Annual variations in CO2 assimilation and
primary production measurements in a mediterranean lagoon (Thau lagoon France)
Photosynthesis from Light to Biosphere Mathis P (Ed) Elvesier 5 873-876
Fouilland E Courties C Descolas-Gros C 2001 Size-fractionated carboxylase activities
during a 32 h cycle at 30 m depth in the Northwestern Mediterranean Sea after an episodic
wind event J Plankton Res 23 623-632
26
Gasc A 1997 Etude de la production primaire reacutegeacuteneacutereacutee dans un eacutecosystegraveme conchylicole le
bassin de Thau Ph D Univ Sciences et Techniques du Languedoc Montpellier France
Gilbert F Souchu P Bianchi M Bonin P 1997 Influence of shellfish farming activities on
nitrification nitrate reduction to ammonium and denitrification at the water-sediment
interface of the Thau lagoon France Mar Ecol Prog Ser 151 143-153
Glover HE 1989 Ribulosebisphosphate carboxylaseoxygenase in marine organisms Int Rev
Cytol 115 67-137
Guy RD Vanlerberghe GC Turpin DH 1989 Significance of phosphoenolpyruvate
carboxylase during ammonium assimilation Carbon isotope discrimination in
photosynthesis and respiration by the N-limited green alga Selenastrum minutum Plant
Physiol 89 1150-1157
Heifetz PB Forster B Osmond CB Giles LJ Boynton JE 2000 Effects on facultative
autotrophy in Chlamydomonas reihardtii assessed by photosynthetic measurements and
stable isotope analyses Plant Physiol 122 1439-1445
Huppe HC Turpin DH 1994 Integration of carbon and nitrogen metabolism in plant and
algal cells Annu Rev Physiol Plant Mol Biol 45 577-607
Koroleff F 1976 Determination of nutrients Methods of Seawater analysis Grasshoff K
(Ed) Verlag Chemie 117-182
Lam-Hoai T Rougier C Lasserre G 1997 Tintinnids and rotifers in a northern
Mediterranean coastal lagoon Structural diversity and function through biomass
estimations Mar Ecol Prog Ser 152 13-25
27
Le Gall S Hassen MB Le Gall PB 1997 Ingestion of a bacterivorous ciliate by oyster
Crassostera gigas protozoa as a trophic link between picoplankton and benthic suspension-
feeders Mar Ecol Prog Ser 152 301-306
Levasseur M Thompson PA Harrison PJ 1993 Physiological acclimation of marine
phytoplankton to different nitrogen sources J Phycol 29 587-595
Millet B 1989 Fonctionnement hydrodynamique du bassin de Thau Validation drsquoun modegravele
numeacuterique de circulation (programme Ecothau) Oceanol Acta 12 37-46
Morris I Yentsch CM Yentsch CS 1971 The physiological state with respect to nitrogen
of phytoplankton from low-nutrient subtropical water as measured by the effect of
ammonium ion on dark carbon dioxide fixation Limnol Oceanogr 16 859-868
Mortain-Bertrand A Descolas-Gros C Jupin H 1987a Short-term 14C incorporation in
Skeletonema costatum (Greville) Cleve (Bacillariophyceae) as a function of light regime
Phycologia 16 262-269
Mortain-Bertrand A Descolas-Gros C Jupin H 1987b Stimulating effect of transitions from
light to dark on carbon assimilation by a marine diatom J Exp Mar Biol Ecol 112 11-
26
Mortain-Bertrand A Descolas-Gros C Jupin H 1988 Pathway of dark inorganic carbon
fixation in two species of diatoms influence of light regime and regulator factors on diel
variations J Plankton Res 10 199-217
Neveux J Lantoine F 1993 Spectrofluorometric assay of chlorophylls and phaeopigments
using the least squares approximation technique Deep-Sea Res 40 1747-1765
28
Osborne BA Geider RJ 1986 Effect of nitrate-nitrogen limitation on photosynthesis of the
diatom Phaeodactylum tricornutum Bohlin (Bacillariphyceae) Plant Cell Environ 9 617-
625
Overbeck J 1984 Application of TCA cycle metabolism for growth estimates of heterotrophic
bacterioplankton Arch Hydrobiol Beih 19 23-36
Porter K Feig YS 1980 The use of DAPI for identifying and counting aquatic microflora
Limnol Oceanogr 25 943-948
Slawyk G Collos Y 1982 13C and 15N uptake by marine phytoplankton 2 Results from a
tropical area Rapp P-v Reacuteun Cons int Explor Mer 180 209-213
Souchu P Gasc A Cahet G Vaquer A Collos Y Deslous-Paoli JM 1997
Biogeochemical composition of Mediterranean waters outside the Thau lagoon Estuar
Coast Shelf S 44 275-284
Souchu P Vaquer A Collos Y Lamdrein S Deslous-Paoli J-M Bibent B 2001
Influence of shellfish farming activities on the biogeochemical composition of the water
column in Thau Lagoon Mar Ecol Prog Ser 218 141-152
Treacuteguer P Le Corre P 1975 Manuel danalyse des sels nutritifs dans leau de mer
Utilisation de lAutoAnalyseur II Technicon LOC Universiteacute de Bretagne Occidentale
Brest France
Troussellier M Courties C Zettelmaier S 1995 Flow cytometric analysis of coastal lagoon
bacterioplankton and picophytoplankton fixation and storage effects Estuar Coast Shelf
S 40 621-633
Turpin DH 1991 Effects of inorganic N availability on algal photosynthesis and carbon
metabolism J Phycol 27 14-20
29
Turpin DH Vanlerberghe GC Amory AM Guy RD 1991 The inorganic requirements
for nitrogen assimilation Can J Bot 69 1139-1145
Utermoumlhl H 1958 Zur Vervollkommnung der quantitativen Phytoplankton-Methodik Mitt int
Ver theor angew Limnol 9 1-38
Vanlerberghe GC Schuller KA Smith RG Feil R Plaxton WC Turpin DH 1990
Relationship between NH4+ assimilation rate and in vivo phosphoenolpyruvate carboxylase
activity Regulation of anapleurotic carbon flow in the green alga Selenastrum minutum
Plant Physiol 94 284-290
Vanlerberghe GC Huppe HC Vlossak KDM Turpin DH 1992 Activation of
respiration to support dark NO3- and NH4
+ assimilation in the green alga Selenastrum
minutum Plant Physiol 99 495-500
Vaquer A Troussellier M Courties C Bibent B 1996 Standing stock and dynamics of
picophytoplankton in the Thau Lagoon (northwest Mediterranean coast) Limnol
Oceanogr 41 1821-1828
Vincendeau ML 1987 Etude expeacuterimentale de la fertiliteacute des eaux des milieux conchylicoles
influence de lrsquoexcreacutetion des huitres et des palourdes sur la production des diatomeacutees
dominantes Ph D Univ Paris 6 Paris France
Table 1 Coefficient of variation (in percent) of the different biological
parameters calculated using four measurements observed at T0 Calculation based on cell numbers of diatom dominant species
gt1 microm lt1 micromCell numbers 22 6
Chlorophyll a concentrations 6 10Rubisco activity per liter 20 17szlig-Carboxylases per liter 23 12
Rubisco activity per chlorophyll a unit 17 24szlig-Carboxylases activity per chlorophyll a unit 19 12
βCR ratio 23 24Rubisco activity per cell 35 18 β-carboxylase per cell 44 33
Table 2 Statistical results from non parametric Wilcoxon signed-Rank analyses between N enriched treatments and control 001le p lt005 p le001 NS non significant (p ge01)
Cell numbers
Rubisco activity per cell
PEPC activity per cell
lt1 microm gt1 microm lt1 microm gt1 microm lt1 microm gt1 microm lt1 microm gt1 microm lt1 microm gt1 microm lt1 microm gt1 microm lt1 microm lt1 microm lt1 microm
+NH4+ Control 009 NS NS NS NS NS 005
+NO3- Control NS NS NS NS NS NS 008
+taurine Control NS NS NS NS NS NS NS NS NS NS NS NS NS NS NS
βCR ratioChla concentrations
Rubisco activity per litre
β-carboxylase activity per litre
Rubisco activity per Chla
β-carboxylase activity per Chla
Table 3 Concentrations of ammonium nitrate and dissolved organic nitrogen (DON) measured in the control NH4+
(+NH4+) NO3
- (+NO3-) and taurine (+taurine) enriched treatments during the experiment
nd no data data in bold denote a period of darkness
Control + NH4+ + NO3
- + taurine Control + NH4+ + NO3
- + taurine Control + NH4+ + NO3
- + taurineT0 039 686 04 047 013 005 931 003 226 268 218 376T2 nd nd 026 nd 006 000 896 000 224 nd 222 ndT4 045 582 024 037 000 000 85 000 224 255 236 369T7 011 352 022 029 000 000 746 000 247 266 245 332T10 006 362 006 017 001 000 615 000 265 256 236 329T13 011 384 015 023 000 000 633 000 249 258 251 312
T17 018 327 012 015 000 008 586 001 218 249 221 315
T21 007 261 009 022 000 000 468 000 233 260 223 317T24 017 032 019 020 000 000 242 000 244 260 218 303
Ammonium concentrations (microM) Nitrate concentrations (microM) Dissolved organic nitrogen (DON) concentrations (microM)
Table 4 Small picophytoplankton and bacteria cell numbers during the experiment in
the control and N enriched treatments
nd no data data in bold denote a period of darkness
Control +NH4+ +NO3
- +taurine Control +NH4+ +NO3
- +taurineT0 196 195 219 208 936 nd nd ndT2 182 208 182 130 nd nd nd ndT4 309 252 279 257 nd nd nd ndT7 304 333 312 286 1220 1220 1200 1360T10 260 415 406 221 nd nd nd ndT13 258 482 484 230 1500 1500 1190 1330
T17 198 516 409 219 nd nd nd nd
T21 208 nd 500 177 1510 1220 884 1170T24 135 nd 457 184 1120 967 832 1160
lt1 microm phytoplankton cell numbers (x106 cells L-1)
Bacteria cell numbers (x106 cells L-1)
Table 5 Plankton cell numbers and carboxylases (Rubisco and PEPCK) activity per
carbon unit of diatom cell within the gt1 microm fraction at T0 in the control and T24 in the
control and N enriched treatments nd no data
Control +NH4+ +NO3
- +taurinePicophytoplankton (x106 cells L-1) 27 149 nd 20 72
Heterotroph flagellates (x106 cells L-1) 06 05 03 02 05Autotroph flagellates (x106 cells L-1) 07 11 06 05 07
Diatoms (x106 cells L-1) 08 19 91 50 19Rubisco activity (fmol CO2 cell-1 h-1) 117 57 83 112 60PEPCK activity (fmol CO2 cell-1 h-1) 90 26 006 046 75
T24T0
Table 6 The in vitro Rubisco activity per litre of gt1 microm and lt1microm fractions in the control and
enriched N treatments
nd no data data in bold denote a period of darkness
Control +NH4+ +NO3
- +taurine Control +NH4+ +NO3
- +taurineT0 1088 664 844 939 519 459 498 349T2 1215 1322 1147 1535 289 434 428 347T4 1427 1802 nd 975 449 nd 746 599T7 552 1029 1064 441 520 842 732 361T10 478 1667 1640 396 162 647 532 351T13 213 2006 1724 239 185 577 609 164T17 129 1485 1264 171 134 453 400 159T21 366 2324 843 371 180 669 657 232T24 1093 7606 5625 1186 120 329 395 155
gt1 microm Rubisco activity (nmol CO2 L
-1 h-1)lt1 microm Rubisco activity
(nmol CO2 L-1 h-1)
Table 7 The in vitro β-carboxylase activity (PEPC+PEPCK+PYRC) of gt1 microm and lt1microm
fractions in the control and enriched N treatments
nd no data data in bold denote a period of darkness
Control +NH4+ +NO3
- +taurine Control +NH4+ +NO3
- +taurineT0 104 91 138 151 156 142 118 147T2 211 178 154 178 264 125 288 161T4 201 86 nd 95 116 nd 235 121T7 169 140 149 70 151 150 168 121T10 99 223 133 128 182 235 170 67T13 195 320 nd 150 113 114 155 123T17 203 231 118 111 132 82 109 255T21 227 392 257 289 208 161 228 113T24 117 120 265 190 59 61 71 65
gt1 microm β-carboxylase activity (nmol CO2 L
-1 h-1)lt1 microm β-carbxylase activity
(nmol CO2 L-1 h-1)
Table 8 The cellular pool of Rubisco and PEPC enzymes of lt 1microm picophytoplankton in the
control and N enriched treatments
nd no data data in bold denote a period of darkness
Control +NH4+ +NO3
- +taurine Control +NH4+ +NO3
- +taurineT0 265 235 228 168 038 035 017 041T2 159 208 235 268 020 023 052 030T4 145 nd 267 233 027 nd 011 014T7 171 253 234 126 050 022 037 023T10 062 156 131 158 037 024 021 024T13 072 120 126 071 032 019 028 017
T17 068 088 098 073 038 011 021 027
T21 086 nd 131 131 055 nd 011 047T24 088 nd 086 084 020 nd 010 005
Rubisco activity per cell (fmol CO2 cell-1 h-1)
PEPC activity per cell (fmol CO2 cell-1 h-1)
Sampling area
Fig 1 Map of sampling area in Thau lagoon Grey and black areas denote the shellfish cultivation area and towns respectively
Mediterranean Sea
NIGHTC
hlor
ophy
llco
ncen
trat io
n(micro
g c h
l L-1
)
0
2
4
6
8
10
12
00
02
04
06
08
10NIGHT
Control+ NH4
+
+ NO3-
+ Taurine
A) gt1 microm phytoplankton
B) lt1 microm phytoplankton
Chl
orop
hyll
conc
entra
t ion
(microg
c hl L
-1)
Local time
1000 1600 2200 10000400
Fig 2 Chlorophyll (a+b+c) concentrations of (A) gt1 microm phytoplankton and of (B) lt1 microm phytoplankton in the control and enriched N treatments during the incubation experiment
Rub
isco
activ
ity(p
mol
CO
2 microg
C-1
h-1
)A) Without DIN enrichments
Local time
1000 1600 2200 10000400
0
200
400
600
800
1000
0
40
80
120
160
200
0
200
400
600
800
1000
0
40
80
120
160
200
NIGHT
NIGHT
B) With DIN enrichments
Control Control+ Taurine+ Taurine
+ NH4+
+ NO3-
+ NH4+
+ NO3-
β-ca
rbox
ylas
eac
tivity
(pm
olC
O2 micro
g C
-1 h
-1)
Rub
isco
activ
ity(p
mol
CO
2 microg
C-1
h-1
)
β-ca
rbox
ylas
eac
tivity
(pm
olC
O2 micro
g C
-1 h
-1)
Fig 3 Total Rubisco and β-carboxylase activity expressed per particulate carbon for (A) the control and enriched taurine carboy and for (B) the ammonium and nitrate enrichments during the incubation experiment
NIGHT
Rub
isco
activ
ity(n
mol
CO
2 microg
chla
-1 h
-1) NIGHT
Control+ NH4
+
+ NO3-
+ Taurine
A) gt1 microm phytoplankton
B) lt1 microm phytoplankton
Fig 4 Rubisco activity normalised per chlorophyll a concentration of (A) gt1 microm phytoplankton and of (B) lt1 microm phytoplankton in the control and enriched N treatments during the incubation experiment
Rub
isco
activ
ity(n
mol
CO
2 microg
chla
-1 h
-1)
0
200
400
600
0
200
400
600
Local time
1000 1600 2200 10000400
NIGHT
β-ca
rbox
ylas
eac
tivity
(nm
olC
O2 micro
g ch
la-1
h-1
)
A) gt1 microm phytoplankton
B) lt1 microm phytoplankton
NIGHTControl+ NH4
+
+ NO3-
+ Taurine
0
40
80
120
160
200
β-ca
rbox
ylas
eac
tivity
(nm
olC
O2 micro
g ch
la-1
h-1
)
0
20
40
60
Local time
1000 1600 2200 10000400
Fig 5 β-carboxylase activity normalised per chlorophyll a concentrations of (A) gt1 microm phytoplankton and of (B) lt1 microm phytoplankton in the control and enriched N treatments during the incubation experiment
NIGHT
β-ca
rbox
y las
e R
ubi s
cora
tio (
)
NIGHT
Control+ NH4
+
+ NO3-
+ Taurine
A) gt1 microm phytoplankton
B) lt1 microm phytoplankton
0
30
60
90
120
150
180
0
30
60
90
120
150
180
1000 1600
β-ca
rbox
y las
e R
ubi s
cora
tio (
)
Local time
2200 10000400
Fig 6 Ratio of β-carboxylase activity (PEPC+PEPCK+PYRC) to Rubisco activity expressed as percents measured in the control and enriched N treatments during the incubation experiment

26
Gasc A 1997 Etude de la production primaire reacutegeacuteneacutereacutee dans un eacutecosystegraveme conchylicole le
bassin de Thau Ph D Univ Sciences et Techniques du Languedoc Montpellier France
Gilbert F Souchu P Bianchi M Bonin P 1997 Influence of shellfish farming activities on
nitrification nitrate reduction to ammonium and denitrification at the water-sediment
interface of the Thau lagoon France Mar Ecol Prog Ser 151 143-153
Glover HE 1989 Ribulosebisphosphate carboxylaseoxygenase in marine organisms Int Rev
Cytol 115 67-137
Guy RD Vanlerberghe GC Turpin DH 1989 Significance of phosphoenolpyruvate
carboxylase during ammonium assimilation Carbon isotope discrimination in
photosynthesis and respiration by the N-limited green alga Selenastrum minutum Plant
Physiol 89 1150-1157
Heifetz PB Forster B Osmond CB Giles LJ Boynton JE 2000 Effects on facultative
autotrophy in Chlamydomonas reihardtii assessed by photosynthetic measurements and
stable isotope analyses Plant Physiol 122 1439-1445
Huppe HC Turpin DH 1994 Integration of carbon and nitrogen metabolism in plant and
algal cells Annu Rev Physiol Plant Mol Biol 45 577-607
Koroleff F 1976 Determination of nutrients Methods of Seawater analysis Grasshoff K
(Ed) Verlag Chemie 117-182
Lam-Hoai T Rougier C Lasserre G 1997 Tintinnids and rotifers in a northern
Mediterranean coastal lagoon Structural diversity and function through biomass
estimations Mar Ecol Prog Ser 152 13-25
27
Le Gall S Hassen MB Le Gall PB 1997 Ingestion of a bacterivorous ciliate by oyster
Crassostera gigas protozoa as a trophic link between picoplankton and benthic suspension-
feeders Mar Ecol Prog Ser 152 301-306
Levasseur M Thompson PA Harrison PJ 1993 Physiological acclimation of marine
phytoplankton to different nitrogen sources J Phycol 29 587-595
Millet B 1989 Fonctionnement hydrodynamique du bassin de Thau Validation drsquoun modegravele
numeacuterique de circulation (programme Ecothau) Oceanol Acta 12 37-46
Morris I Yentsch CM Yentsch CS 1971 The physiological state with respect to nitrogen
of phytoplankton from low-nutrient subtropical water as measured by the effect of
ammonium ion on dark carbon dioxide fixation Limnol Oceanogr 16 859-868
Mortain-Bertrand A Descolas-Gros C Jupin H 1987a Short-term 14C incorporation in
Skeletonema costatum (Greville) Cleve (Bacillariophyceae) as a function of light regime
Phycologia 16 262-269
Mortain-Bertrand A Descolas-Gros C Jupin H 1987b Stimulating effect of transitions from
light to dark on carbon assimilation by a marine diatom J Exp Mar Biol Ecol 112 11-
26
Mortain-Bertrand A Descolas-Gros C Jupin H 1988 Pathway of dark inorganic carbon
fixation in two species of diatoms influence of light regime and regulator factors on diel
variations J Plankton Res 10 199-217
Neveux J Lantoine F 1993 Spectrofluorometric assay of chlorophylls and phaeopigments
using the least squares approximation technique Deep-Sea Res 40 1747-1765
28
Osborne BA Geider RJ 1986 Effect of nitrate-nitrogen limitation on photosynthesis of the
diatom Phaeodactylum tricornutum Bohlin (Bacillariphyceae) Plant Cell Environ 9 617-
625
Overbeck J 1984 Application of TCA cycle metabolism for growth estimates of heterotrophic
bacterioplankton Arch Hydrobiol Beih 19 23-36
Porter K Feig YS 1980 The use of DAPI for identifying and counting aquatic microflora
Limnol Oceanogr 25 943-948
Slawyk G Collos Y 1982 13C and 15N uptake by marine phytoplankton 2 Results from a
tropical area Rapp P-v Reacuteun Cons int Explor Mer 180 209-213
Souchu P Gasc A Cahet G Vaquer A Collos Y Deslous-Paoli JM 1997
Biogeochemical composition of Mediterranean waters outside the Thau lagoon Estuar
Coast Shelf S 44 275-284
Souchu P Vaquer A Collos Y Lamdrein S Deslous-Paoli J-M Bibent B 2001
Influence of shellfish farming activities on the biogeochemical composition of the water
column in Thau Lagoon Mar Ecol Prog Ser 218 141-152
Treacuteguer P Le Corre P 1975 Manuel danalyse des sels nutritifs dans leau de mer
Utilisation de lAutoAnalyseur II Technicon LOC Universiteacute de Bretagne Occidentale
Brest France
Troussellier M Courties C Zettelmaier S 1995 Flow cytometric analysis of coastal lagoon
bacterioplankton and picophytoplankton fixation and storage effects Estuar Coast Shelf
S 40 621-633
Turpin DH 1991 Effects of inorganic N availability on algal photosynthesis and carbon
metabolism J Phycol 27 14-20
29
Turpin DH Vanlerberghe GC Amory AM Guy RD 1991 The inorganic requirements
for nitrogen assimilation Can J Bot 69 1139-1145
Utermoumlhl H 1958 Zur Vervollkommnung der quantitativen Phytoplankton-Methodik Mitt int
Ver theor angew Limnol 9 1-38
Vanlerberghe GC Schuller KA Smith RG Feil R Plaxton WC Turpin DH 1990
Relationship between NH4+ assimilation rate and in vivo phosphoenolpyruvate carboxylase
activity Regulation of anapleurotic carbon flow in the green alga Selenastrum minutum
Plant Physiol 94 284-290
Vanlerberghe GC Huppe HC Vlossak KDM Turpin DH 1992 Activation of
respiration to support dark NO3- and NH4
+ assimilation in the green alga Selenastrum
minutum Plant Physiol 99 495-500
Vaquer A Troussellier M Courties C Bibent B 1996 Standing stock and dynamics of
picophytoplankton in the Thau Lagoon (northwest Mediterranean coast) Limnol
Oceanogr 41 1821-1828
Vincendeau ML 1987 Etude expeacuterimentale de la fertiliteacute des eaux des milieux conchylicoles
influence de lrsquoexcreacutetion des huitres et des palourdes sur la production des diatomeacutees
dominantes Ph D Univ Paris 6 Paris France
Table 1 Coefficient of variation (in percent) of the different biological
parameters calculated using four measurements observed at T0 Calculation based on cell numbers of diatom dominant species
gt1 microm lt1 micromCell numbers 22 6
Chlorophyll a concentrations 6 10Rubisco activity per liter 20 17szlig-Carboxylases per liter 23 12
Rubisco activity per chlorophyll a unit 17 24szlig-Carboxylases activity per chlorophyll a unit 19 12
βCR ratio 23 24Rubisco activity per cell 35 18 β-carboxylase per cell 44 33
Table 2 Statistical results from non parametric Wilcoxon signed-Rank analyses between N enriched treatments and control 001le p lt005 p le001 NS non significant (p ge01)
Cell numbers
Rubisco activity per cell
PEPC activity per cell
lt1 microm gt1 microm lt1 microm gt1 microm lt1 microm gt1 microm lt1 microm gt1 microm lt1 microm gt1 microm lt1 microm gt1 microm lt1 microm lt1 microm lt1 microm
+NH4+ Control 009 NS NS NS NS NS 005
+NO3- Control NS NS NS NS NS NS 008
+taurine Control NS NS NS NS NS NS NS NS NS NS NS NS NS NS NS
βCR ratioChla concentrations
Rubisco activity per litre
β-carboxylase activity per litre
Rubisco activity per Chla
β-carboxylase activity per Chla
Table 3 Concentrations of ammonium nitrate and dissolved organic nitrogen (DON) measured in the control NH4+
(+NH4+) NO3
- (+NO3-) and taurine (+taurine) enriched treatments during the experiment
nd no data data in bold denote a period of darkness
Control + NH4+ + NO3
- + taurine Control + NH4+ + NO3
- + taurine Control + NH4+ + NO3
- + taurineT0 039 686 04 047 013 005 931 003 226 268 218 376T2 nd nd 026 nd 006 000 896 000 224 nd 222 ndT4 045 582 024 037 000 000 85 000 224 255 236 369T7 011 352 022 029 000 000 746 000 247 266 245 332T10 006 362 006 017 001 000 615 000 265 256 236 329T13 011 384 015 023 000 000 633 000 249 258 251 312
T17 018 327 012 015 000 008 586 001 218 249 221 315
T21 007 261 009 022 000 000 468 000 233 260 223 317T24 017 032 019 020 000 000 242 000 244 260 218 303
Ammonium concentrations (microM) Nitrate concentrations (microM) Dissolved organic nitrogen (DON) concentrations (microM)
Table 4 Small picophytoplankton and bacteria cell numbers during the experiment in
the control and N enriched treatments
nd no data data in bold denote a period of darkness
Control +NH4+ +NO3
- +taurine Control +NH4+ +NO3
- +taurineT0 196 195 219 208 936 nd nd ndT2 182 208 182 130 nd nd nd ndT4 309 252 279 257 nd nd nd ndT7 304 333 312 286 1220 1220 1200 1360T10 260 415 406 221 nd nd nd ndT13 258 482 484 230 1500 1500 1190 1330
T17 198 516 409 219 nd nd nd nd
T21 208 nd 500 177 1510 1220 884 1170T24 135 nd 457 184 1120 967 832 1160
lt1 microm phytoplankton cell numbers (x106 cells L-1)
Bacteria cell numbers (x106 cells L-1)
Table 5 Plankton cell numbers and carboxylases (Rubisco and PEPCK) activity per
carbon unit of diatom cell within the gt1 microm fraction at T0 in the control and T24 in the
control and N enriched treatments nd no data
Control +NH4+ +NO3
- +taurinePicophytoplankton (x106 cells L-1) 27 149 nd 20 72
Heterotroph flagellates (x106 cells L-1) 06 05 03 02 05Autotroph flagellates (x106 cells L-1) 07 11 06 05 07
Diatoms (x106 cells L-1) 08 19 91 50 19Rubisco activity (fmol CO2 cell-1 h-1) 117 57 83 112 60PEPCK activity (fmol CO2 cell-1 h-1) 90 26 006 046 75
T24T0
Table 6 The in vitro Rubisco activity per litre of gt1 microm and lt1microm fractions in the control and
enriched N treatments
nd no data data in bold denote a period of darkness
Control +NH4+ +NO3
- +taurine Control +NH4+ +NO3
- +taurineT0 1088 664 844 939 519 459 498 349T2 1215 1322 1147 1535 289 434 428 347T4 1427 1802 nd 975 449 nd 746 599T7 552 1029 1064 441 520 842 732 361T10 478 1667 1640 396 162 647 532 351T13 213 2006 1724 239 185 577 609 164T17 129 1485 1264 171 134 453 400 159T21 366 2324 843 371 180 669 657 232T24 1093 7606 5625 1186 120 329 395 155
gt1 microm Rubisco activity (nmol CO2 L
-1 h-1)lt1 microm Rubisco activity
(nmol CO2 L-1 h-1)
Table 7 The in vitro β-carboxylase activity (PEPC+PEPCK+PYRC) of gt1 microm and lt1microm
fractions in the control and enriched N treatments
nd no data data in bold denote a period of darkness
Control +NH4+ +NO3
- +taurine Control +NH4+ +NO3
- +taurineT0 104 91 138 151 156 142 118 147T2 211 178 154 178 264 125 288 161T4 201 86 nd 95 116 nd 235 121T7 169 140 149 70 151 150 168 121T10 99 223 133 128 182 235 170 67T13 195 320 nd 150 113 114 155 123T17 203 231 118 111 132 82 109 255T21 227 392 257 289 208 161 228 113T24 117 120 265 190 59 61 71 65
gt1 microm β-carboxylase activity (nmol CO2 L
-1 h-1)lt1 microm β-carbxylase activity
(nmol CO2 L-1 h-1)
Table 8 The cellular pool of Rubisco and PEPC enzymes of lt 1microm picophytoplankton in the
control and N enriched treatments
nd no data data in bold denote a period of darkness
Control +NH4+ +NO3
- +taurine Control +NH4+ +NO3
- +taurineT0 265 235 228 168 038 035 017 041T2 159 208 235 268 020 023 052 030T4 145 nd 267 233 027 nd 011 014T7 171 253 234 126 050 022 037 023T10 062 156 131 158 037 024 021 024T13 072 120 126 071 032 019 028 017
T17 068 088 098 073 038 011 021 027
T21 086 nd 131 131 055 nd 011 047T24 088 nd 086 084 020 nd 010 005
Rubisco activity per cell (fmol CO2 cell-1 h-1)
PEPC activity per cell (fmol CO2 cell-1 h-1)
Sampling area
Fig 1 Map of sampling area in Thau lagoon Grey and black areas denote the shellfish cultivation area and towns respectively
Mediterranean Sea
NIGHTC
hlor
ophy
llco
ncen
trat io
n(micro
g c h
l L-1
)
0
2
4
6
8
10
12
00
02
04
06
08
10NIGHT
Control+ NH4
+
+ NO3-
+ Taurine
A) gt1 microm phytoplankton
B) lt1 microm phytoplankton
Chl
orop
hyll
conc
entra
t ion
(microg
c hl L
-1)
Local time
1000 1600 2200 10000400
Fig 2 Chlorophyll (a+b+c) concentrations of (A) gt1 microm phytoplankton and of (B) lt1 microm phytoplankton in the control and enriched N treatments during the incubation experiment
Rub
isco
activ
ity(p
mol
CO
2 microg
C-1
h-1
)A) Without DIN enrichments
Local time
1000 1600 2200 10000400
0
200
400
600
800
1000
0
40
80
120
160
200
0
200
400
600
800
1000
0
40
80
120
160
200
NIGHT
NIGHT
B) With DIN enrichments
Control Control+ Taurine+ Taurine
+ NH4+
+ NO3-
+ NH4+
+ NO3-
β-ca
rbox
ylas
eac
tivity
(pm
olC
O2 micro
g C
-1 h
-1)
Rub
isco
activ
ity(p
mol
CO
2 microg
C-1
h-1
)
β-ca
rbox
ylas
eac
tivity
(pm
olC
O2 micro
g C
-1 h
-1)
Fig 3 Total Rubisco and β-carboxylase activity expressed per particulate carbon for (A) the control and enriched taurine carboy and for (B) the ammonium and nitrate enrichments during the incubation experiment
NIGHT
Rub
isco
activ
ity(n
mol
CO
2 microg
chla
-1 h
-1) NIGHT
Control+ NH4
+
+ NO3-
+ Taurine
A) gt1 microm phytoplankton
B) lt1 microm phytoplankton
Fig 4 Rubisco activity normalised per chlorophyll a concentration of (A) gt1 microm phytoplankton and of (B) lt1 microm phytoplankton in the control and enriched N treatments during the incubation experiment
Rub
isco
activ
ity(n
mol
CO
2 microg
chla
-1 h
-1)
0
200
400
600
0
200
400
600
Local time
1000 1600 2200 10000400
NIGHT
β-ca
rbox
ylas
eac
tivity
(nm
olC
O2 micro
g ch
la-1
h-1
)
A) gt1 microm phytoplankton
B) lt1 microm phytoplankton
NIGHTControl+ NH4
+
+ NO3-
+ Taurine
0
40
80
120
160
200
β-ca
rbox
ylas
eac
tivity
(nm
olC
O2 micro
g ch
la-1
h-1
)
0
20
40
60
Local time
1000 1600 2200 10000400
Fig 5 β-carboxylase activity normalised per chlorophyll a concentrations of (A) gt1 microm phytoplankton and of (B) lt1 microm phytoplankton in the control and enriched N treatments during the incubation experiment
NIGHT
β-ca
rbox
y las
e R
ubi s
cora
tio (
)
NIGHT
Control+ NH4
+
+ NO3-
+ Taurine
A) gt1 microm phytoplankton
B) lt1 microm phytoplankton
0
30
60
90
120
150
180
0
30
60
90
120
150
180
1000 1600
β-ca
rbox
y las
e R
ubi s
cora
tio (
)
Local time
2200 10000400
Fig 6 Ratio of β-carboxylase activity (PEPC+PEPCK+PYRC) to Rubisco activity expressed as percents measured in the control and enriched N treatments during the incubation experiment
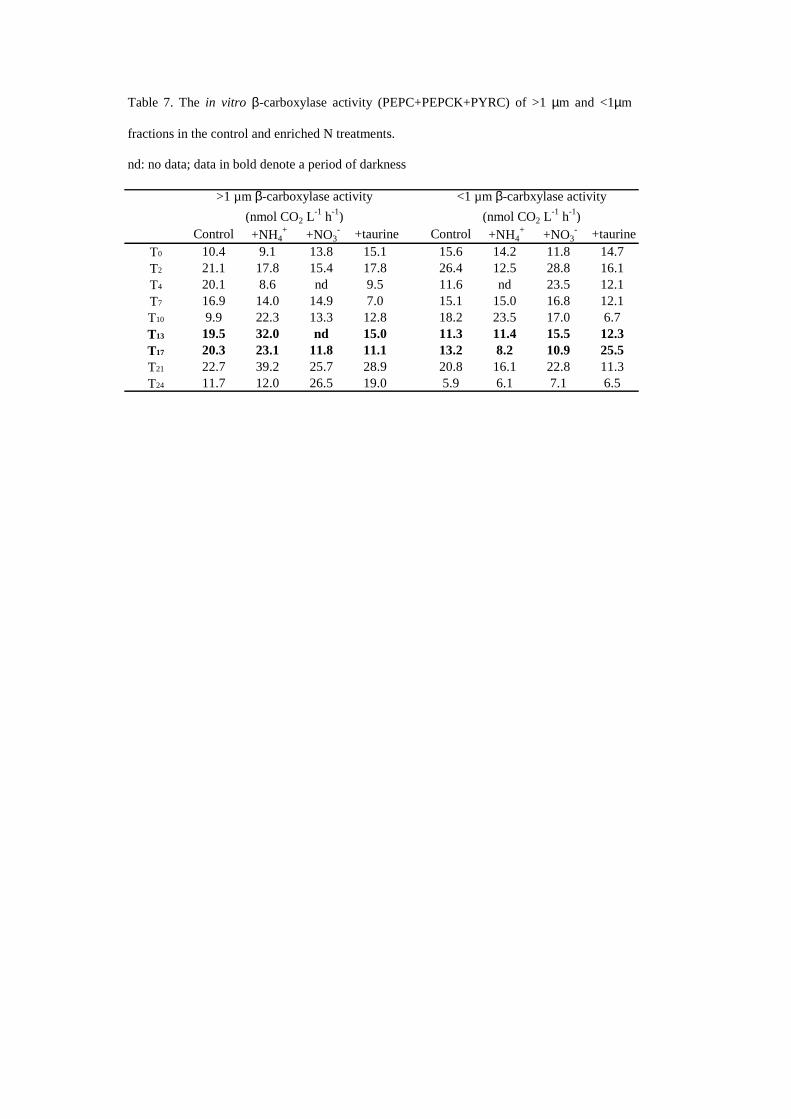

Rub
isco
activ
ity(p
mol
CO
2 microg
C-1
h-1
)A) Without DIN enrichments
Local time
1000 1600 2200 10000400
0
200
400
600
800
1000
0
40
80
120
160
200
0
200
400
600
800
1000
0
40
80
120
160
200
NIGHT
NIGHT
B) With DIN enrichments
Control Control+ Taurine+ Taurine
+ NH4+
+ NO3-
+ NH4+
+ NO3-
β-ca
rbox
ylas
eac
tivity
(pm
olC
O2 micro
g C
-1 h
-1)
Rub
isco
activ
ity(p
mol
CO
2 microg
C-1
h-1
)
β-ca
rbox
ylas
eac
tivity
(pm
olC
O2 micro
g C
-1 h
-1)
Fig 3 Total Rubisco and β-carboxylase activity expressed per particulate carbon for (A) the control and enriched taurine carboy and for (B) the ammonium and nitrate enrichments during the incubation experiment
NIGHT
Rub
isco
activ
ity(n
mol
CO
2 microg
chla
-1 h
-1) NIGHT
Control+ NH4
+
+ NO3-
+ Taurine
A) gt1 microm phytoplankton
B) lt1 microm phytoplankton
Fig 4 Rubisco activity normalised per chlorophyll a concentration of (A) gt1 microm phytoplankton and of (B) lt1 microm phytoplankton in the control and enriched N treatments during the incubation experiment
Rub
isco
activ
ity(n
mol
CO
2 microg
chla
-1 h
-1)
0
200
400
600
0
200
400
600
Local time
1000 1600 2200 10000400
NIGHT
β-ca
rbox
ylas
eac
tivity
(nm
olC
O2 micro
g ch
la-1
h-1
)
A) gt1 microm phytoplankton
B) lt1 microm phytoplankton
NIGHTControl+ NH4
+
+ NO3-
+ Taurine
0
40
80
120
160
200
β-ca
rbox
ylas
eac
tivity
(nm
olC
O2 micro
g ch
la-1
h-1
)
0
20
40
60
Local time
1000 1600 2200 10000400
Fig 5 β-carboxylase activity normalised per chlorophyll a concentrations of (A) gt1 microm phytoplankton and of (B) lt1 microm phytoplankton in the control and enriched N treatments during the incubation experiment
NIGHT
β-ca
rbox
y las
e R
ubi s
cora
tio (
)
NIGHT
Control+ NH4
+
+ NO3-
+ Taurine
A) gt1 microm phytoplankton
B) lt1 microm phytoplankton
0
30
60
90
120
150
180
0
30
60
90
120
150
180
1000 1600
β-ca
rbox
y las
e R
ubi s
cora
tio (
)
Local time
2200 10000400
Fig 6 Ratio of β-carboxylase activity (PEPC+PEPCK+PYRC) to Rubisco activity expressed as percents measured in the control and enriched N treatments during the incubation experiment

NIGHT
Rub
isco
activ
ity(n
mol
CO
2 microg
chla
-1 h
-1) NIGHT
Control+ NH4
+
+ NO3-
+ Taurine
A) gt1 microm phytoplankton
B) lt1 microm phytoplankton
Fig 4 Rubisco activity normalised per chlorophyll a concentration of (A) gt1 microm phytoplankton and of (B) lt1 microm phytoplankton in the control and enriched N treatments during the incubation experiment
Rub
isco
activ
ity(n
mol
CO
2 microg
chla
-1 h
-1)
0
200
400
600
0
200
400
600
Local time
1000 1600 2200 10000400
NIGHT
β-ca
rbox
ylas
eac
tivity
(nm
olC
O2 micro
g ch
la-1
h-1
)
A) gt1 microm phytoplankton
B) lt1 microm phytoplankton
NIGHTControl+ NH4
+
+ NO3-
+ Taurine
0
40
80
120
160
200
β-ca
rbox
ylas
eac
tivity
(nm
olC
O2 micro
g ch
la-1
h-1
)
0
20
40
60
Local time
1000 1600 2200 10000400
Fig 5 β-carboxylase activity normalised per chlorophyll a concentrations of (A) gt1 microm phytoplankton and of (B) lt1 microm phytoplankton in the control and enriched N treatments during the incubation experiment
NIGHT
β-ca
rbox
y las
e R
ubi s
cora
tio (
)
NIGHT
Control+ NH4
+
+ NO3-
+ Taurine
A) gt1 microm phytoplankton
B) lt1 microm phytoplankton
0
30
60
90
120
150
180
0
30
60
90
120
150
180
1000 1600
β-ca
rbox
y las
e R
ubi s
cora
tio (
)
Local time
2200 10000400
Fig 6 Ratio of β-carboxylase activity (PEPC+PEPCK+PYRC) to Rubisco activity expressed as percents measured in the control and enriched N treatments during the incubation experiment
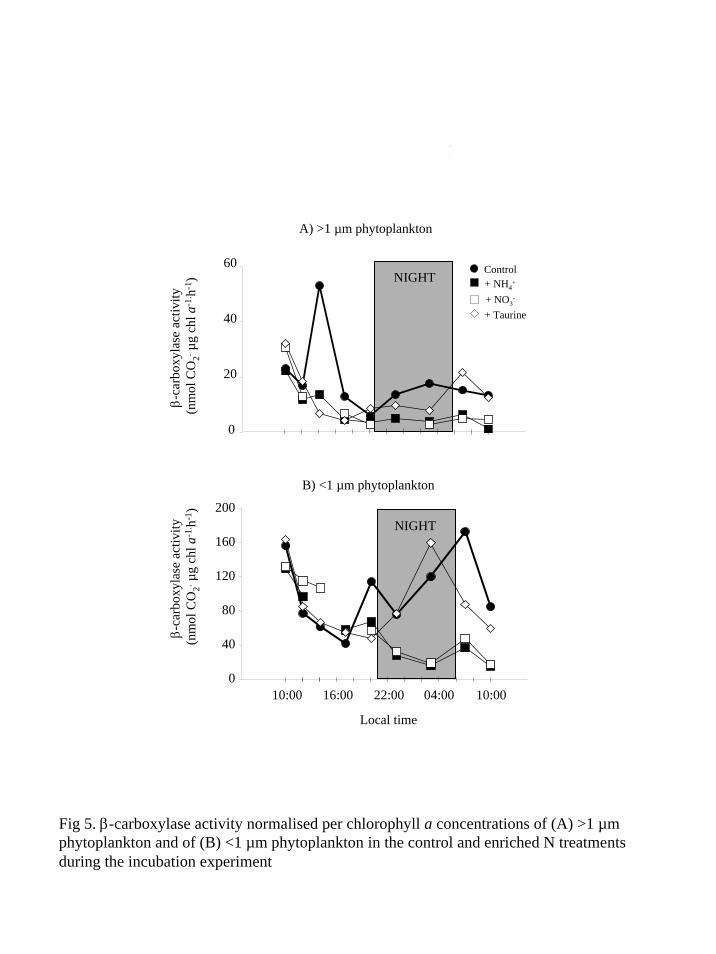
NIGHT
β-ca
rbox
ylas
eac
tivity
(nm
olC
O2 micro
g ch
la-1
h-1
)
A) gt1 microm phytoplankton
B) lt1 microm phytoplankton
NIGHTControl+ NH4
+
+ NO3-
+ Taurine
0
40
80
120
160
200
β-ca
rbox
ylas
eac
tivity
(nm
olC
O2 micro
g ch
la-1
h-1
)
0
20
40
60
Local time
1000 1600 2200 10000400
Fig 5 β-carboxylase activity normalised per chlorophyll a concentrations of (A) gt1 microm phytoplankton and of (B) lt1 microm phytoplankton in the control and enriched N treatments during the incubation experiment
NIGHT
β-ca
rbox
y las
e R
ubi s
cora
tio (
)
NIGHT
Control+ NH4
+
+ NO3-
+ Taurine
A) gt1 microm phytoplankton
B) lt1 microm phytoplankton
0
30
60
90
120
150
180
0
30
60
90
120
150
180
1000 1600
β-ca
rbox
y las
e R
ubi s
cora
tio (
)
Local time
2200 10000400
Fig 6 Ratio of β-carboxylase activity (PEPC+PEPCK+PYRC) to Rubisco activity expressed as percents measured in the control and enriched N treatments during the incubation experiment

NIGHT
β-ca
rbox
y las
e R
ubi s
cora
tio (
)
NIGHT
Control+ NH4
+
+ NO3-
+ Taurine
A) gt1 microm phytoplankton
B) lt1 microm phytoplankton
0
30
60
90
120
150
180
0
30
60
90
120
150
180
1000 1600
β-ca
rbox
y las
e R
ubi s
cora
tio (
)
Local time
2200 10000400
Fig 6 Ratio of β-carboxylase activity (PEPC+PEPCK+PYRC) to Rubisco activity expressed as percents measured in the control and enriched N treatments during the incubation experiment