19 Unified Compresion Model for Venice Lagoon Silts
11
Unified Compression Model for Venice Lagoon Natural Silts Giovanna Biscontin, M.ASCE 1 ; Simonetta Cola 2 ; Juan M. Pestana, P.E., M.ASCE 3 ; and Paolo Simonini 4 Abstract: Over the last 50 years, the city of Venice, Italy, has observed a significant increase in the frequency of flooding. Numerous engineering solutions have been proposed, including the use of movable gates located at the three lagoon inlets. A key element in the prediction of performance is the estimation of settlements of the foundation system of the gates. The soils of Venice Lagoon are characterized by very erratic depositional patterns of clayey silts, resulting in an extremely heterogeneous stratigraphy with discontinuous layering. The soils are also characterized by varying contents of coarse and fine-grained particles. In contrast, the mineralogical compo- sition of these deposits is quite uniform, which allows us to separate the influence of mineralogy from that of grain size distribution. A comprehensive geotechnical testing program was performed to assess the one-dimensional compression of Venice soils and examine the factors affecting the response in the transition from one material type to another. The compressibility of these natural silty clayey soils can be described by a single set of constitutive laws incorporating the relative fraction of granular to cohesive material. DOI: 10.1061/ASCE1090-02412007133:8932 CE Database subject headings: Soil compression; Soil settlement; Soil properties; Geotechnical models; Model verification; Silts. Introduction The historical city of Venice, Italy, is a collection of hundreds of islands in a large lagoon connected to the Adriatic Sea by three inlets i.e., Malamocco, Lido, and Chioggia, Fig. 1. Venice La- goon is suffering a rapid deterioration, including dramatic changes in the water and sediment balance in the basin, which is severely affecting both the natural environment and human activi- ties in the area. The problem dates back to the early 1300s when the Venetians started to divert the three major rivers flowing into the lagoon to protect against silting of the basin and therefore avoid the loss of their prosperous harbor. More recently, the development of an industrial area adjacent to the port after World War II increased the demand for fresh groundwater. Groundwater extraction resulted in an accelerated rate of land subsidence between 1945 and the late 1970s and was eventually stopped Butterfield et al. 2003. During the same period, the city of Venice observed an increase in the frequency of flooding with a record tidal level of nearly 2 m measured in November of 1966. Other factors compounding the problem include the deepening of the inlets to allow for larger ships required by the increased port activity in Venice and sea level rise Harleman et al. 2000. Numerous engineering solutions have been proposed, includ- ing the use of tilting flap gates located at the three Lagoon inlets to prevent flooding from exceptionally high tides. To design the foundation of these movable gates, an extensive study on the characterization of foundation soils has been undertaken. Within these studies, a test site has been selected at the Malamocco Test Site MTS which is considered representative of the whole la- goon area. Preliminary data documenting laboratory investiga- tions and the applicability of some in situ testing methods have already been published e.g., Simonini and Cola 2000; Biscontin et al. 2001; Cola and Simonini 1999, 2002; Simonini 2004. This paper presents a new set of constitutive laws accounting for the ratio of granular to cohesive material to describe the behavior of “transitional” soils with similar mineralogy in one-dimensional compression based on the framework proposed for cohesionless soils Pestana and Whittle 1995; Pestana 2002. Basic Properties of Venice Lagoon Soils The sediments of the Quaternary Basin comprising the whole Venetian Lagoon area, reach depths of approximately 800 m, and were deposited over the past 2 10 6 years. The subsurface soils of the Venice Lagoon down to 50–60 m are characterized by a complex system of interbedded sands, silts, and silty clays depos- ited during the last glacial period of Pleistocene Würm when the rivers transported fluvial material from the Alpine ice fields. The Holocene is only responsible for the shallowest lagoon deposits, about 5 – 15 m thick. The depositional patterns of these sediments are rather complex due to the combined effects of geological his- tory and human action, which modified significantly the morphol- ogy of the lagoon, inlets and channels over the past several centuries. Fig. 2 summarizes gradation and index properties from all samples collected from ground level approximately 10.5 m below mean sea level MSL at MTS down to a depth of 56 m below MSL. For classification purposes, the soil types in the 1 Assistant Professor, Dept. of Civil Engineering, Texas A&M Univ., 3136 TAMU, College Station, TX 77843-3136 corresponding author. E-mail: [email protected] 2 Assistant Professor, Dept. IMAGE, Univ. of Padova, via Ognissanti, 29, 35129 Padova, Italy. E-mail: [email protected] 3 Associate Professor, Dept. of Civil and Environmental Engineering, Univ. of California, Berkeley, 420 Davis Hall, Berkeley CA 94720-1710. E-mail: [email protected] 4 Professor, Dept. IMAGE, Univ. of Padova, via Ognissanti, 29, 35129 Padova, Italy. E-mail: [email protected] Note. Discussion open until January 1, 2008. Separate discussions must be submitted for individual papers. To extend the closing date by one month, a written request must be filed with the ASCE Managing Editor. The manuscript for this paper was submitted for review and pos- sible publication on February 13, 2006; approved on September 11, 2006. This paper is part of the Journal of Geotechnical and Geoenvironmental Engineering, Vol. 133, No. 8, August 1, 2007. ©ASCE, ISSN 1090- 0241/2007/8-932–942/$25.00. 932 / JOURNAL OF GEOTECHNICAL AND GEOENVIRONMENTAL ENGINEERING © ASCE / AUGUST 2007
Transcript of 19 Unified Compresion Model for Venice Lagoon Silts
Unified Compression Model for Venice Lagoon Natural SiltsGiovanna Biscontin, M.ASCE1; Simonetta Cola2; Juan M. Pestana, P.E., M.ASCE3; and Paolo Simonini4
Abstract: Over the last 50 years, the city of Venice, Italy, has observed a significant increase in the frequency of flooding. Numerousengineering solutions have been proposed, including the use of movable gates located at the three lagoon inlets. A key element in theprediction of performance is the estimation of settlements of the foundation system of the gates. The soils of Venice Lagoon arecharacterized by very erratic depositional patterns of clayey silts, resulting in an extremely heterogeneous stratigraphy with discontinuouslayering. The soils are also characterized by varying contents of coarse and fine-grained particles. In contrast, the mineralogical compo-sition of these deposits is quite uniform, which allows us to separate the influence of mineralogy from that of grain size distribution. Acomprehensive geotechnical testing program was performed to assess the one-dimensional compression of Venice soils and examine thefactors affecting the response in the transition from one material type to another. The compressibility of these natural silty clayey soils canbe described by a single set of constitutive laws incorporating the relative fraction of granular to cohesive material.
DOI: 10.1061/�ASCE�1090-0241�2007�133:8�932�
CE Database subject headings: Soil compression; Soil settlement; Soil properties; Geotechnical models; Model verification; Silts.
Introduction
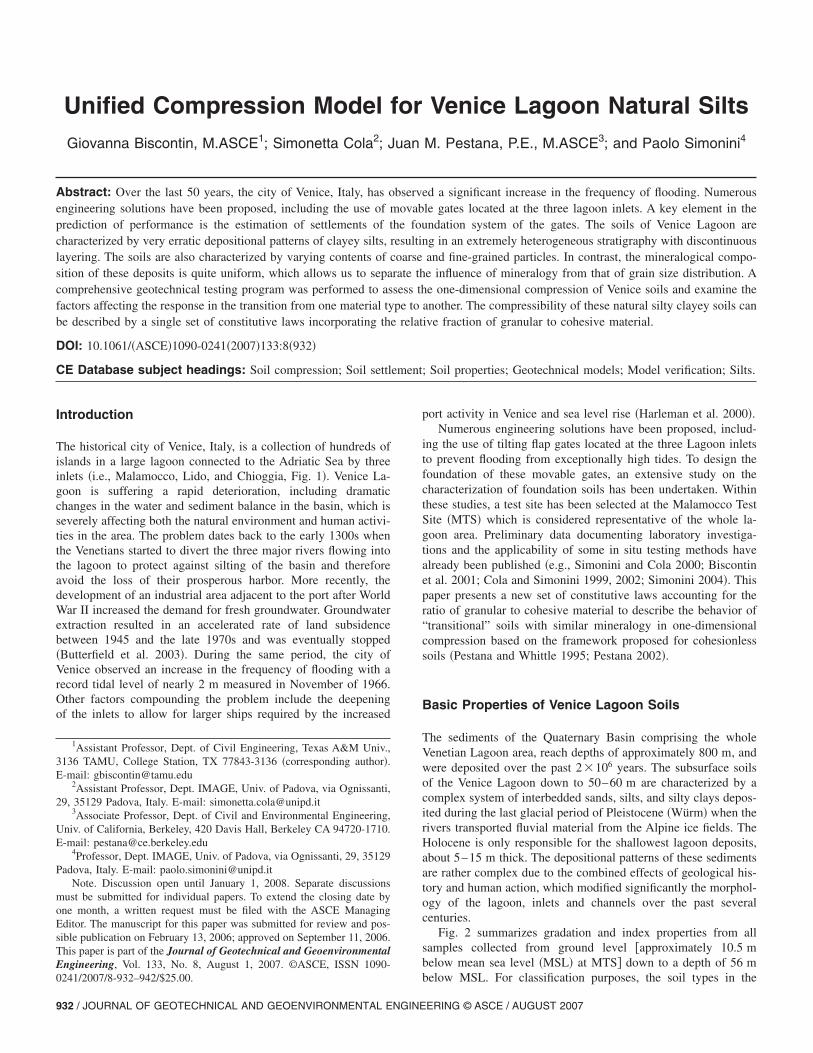
The historical city of Venice, Italy, is a collection of hundreds ofislands in a large lagoon connected to the Adriatic Sea by threeinlets �i.e., Malamocco, Lido, and Chioggia, Fig. 1�. Venice La-goon is suffering a rapid deterioration, including dramaticchanges in the water and sediment balance in the basin, which isseverely affecting both the natural environment and human activi-ties in the area. The problem dates back to the early 1300s whenthe Venetians started to divert the three major rivers flowing intothe lagoon to protect against silting of the basin and thereforeavoid the loss of their prosperous harbor. More recently, thedevelopment of an industrial area adjacent to the port after WorldWar II increased the demand for fresh groundwater. Groundwaterextraction resulted in an accelerated rate of land subsidencebetween 1945 and the late 1970s and was eventually stopped�Butterfield et al. 2003�. During the same period, the city ofVenice observed an increase in the frequency of flooding with arecord tidal level of nearly 2 m measured in November of 1966.Other factors compounding the problem include the deepeningof the inlets to allow for larger ships required by the increased
1Assistant Professor, Dept. of Civil Engineering, Texas A&M Univ.,3136 TAMU, College Station, TX 77843-3136 �corresponding author�.E-mail: [email protected]
2Assistant Professor, Dept. IMAGE, Univ. of Padova, via Ognissanti,29, 35129 Padova, Italy. E-mail: [email protected]
3Associate Professor, Dept. of Civil and Environmental Engineering,Univ. of California, Berkeley, 420 Davis Hall, Berkeley CA 94720-1710.E-mail: [email protected]
4Professor, Dept. IMAGE, Univ. of Padova, via Ognissanti, 29, 35129Padova, Italy. E-mail: [email protected]
Note. Discussion open until January 1, 2008. Separate discussionsmust be submitted for individual papers. To extend the closing date byone month, a written request must be filed with the ASCE ManagingEditor. The manuscript for this paper was submitted for review and pos-sible publication on February 13, 2006; approved on September 11, 2006.This paper is part of the Journal of Geotechnical and GeoenvironmentalEngineering, Vol. 133, No. 8, August 1, 2007. ©ASCE, ISSN 1090-
0241/2007/8-932–942/$25.00.932 / JOURNAL OF GEOTECHNICAL AND GEOENVIRONMENTAL ENGINE
port activity in Venice and sea level rise �Harleman et al. 2000�.Numerous engineering solutions have been proposed, includ-
ing the use of tilting flap gates located at the three Lagoon inletsto prevent flooding from exceptionally high tides. To design thefoundation of these movable gates, an extensive study on thecharacterization of foundation soils has been undertaken. Withinthese studies, a test site has been selected at the Malamocco TestSite �MTS� which is considered representative of the whole la-goon area. Preliminary data documenting laboratory investiga-tions and the applicability of some in situ testing methods havealready been published �e.g., Simonini and Cola 2000; Biscontinet al. 2001; Cola and Simonini 1999, 2002; Simonini 2004�. Thispaper presents a new set of constitutive laws accounting for theratio of granular to cohesive material to describe the behavior of“transitional” soils with similar mineralogy in one-dimensionalcompression based on the framework proposed for cohesionlesssoils �Pestana and Whittle 1995; Pestana 2002�.
Basic Properties of Venice Lagoon Soils
The sediments of the Quaternary Basin comprising the wholeVenetian Lagoon area, reach depths of approximately 800 m, andwere deposited over the past 2�106 years. The subsurface soilsof the Venice Lagoon down to 50–60 m are characterized by acomplex system of interbedded sands, silts, and silty clays depos-ited during the last glacial period of Pleistocene �Würm� when therivers transported fluvial material from the Alpine ice fields. TheHolocene is only responsible for the shallowest lagoon deposits,about 5–15 m thick. The depositional patterns of these sedimentsare rather complex due to the combined effects of geological his-tory and human action, which modified significantly the morphol-ogy of the lagoon, inlets and channels over the past severalcenturies.
Fig. 2 summarizes gradation and index properties from allsamples collected from ground level �approximately 10.5 mbelow mean sea level �MSL� at MTS� down to a depth of 56 m
below MSL. For classification purposes, the soil types in theERING © ASCE / AUGUST 2007
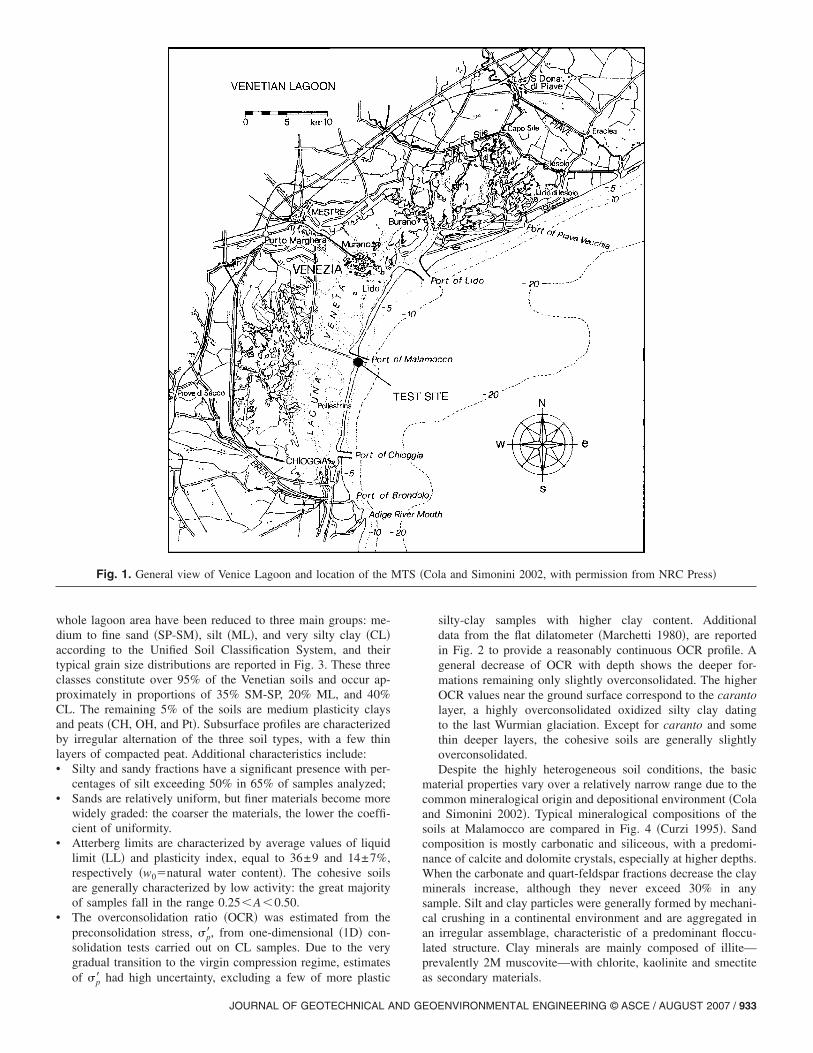
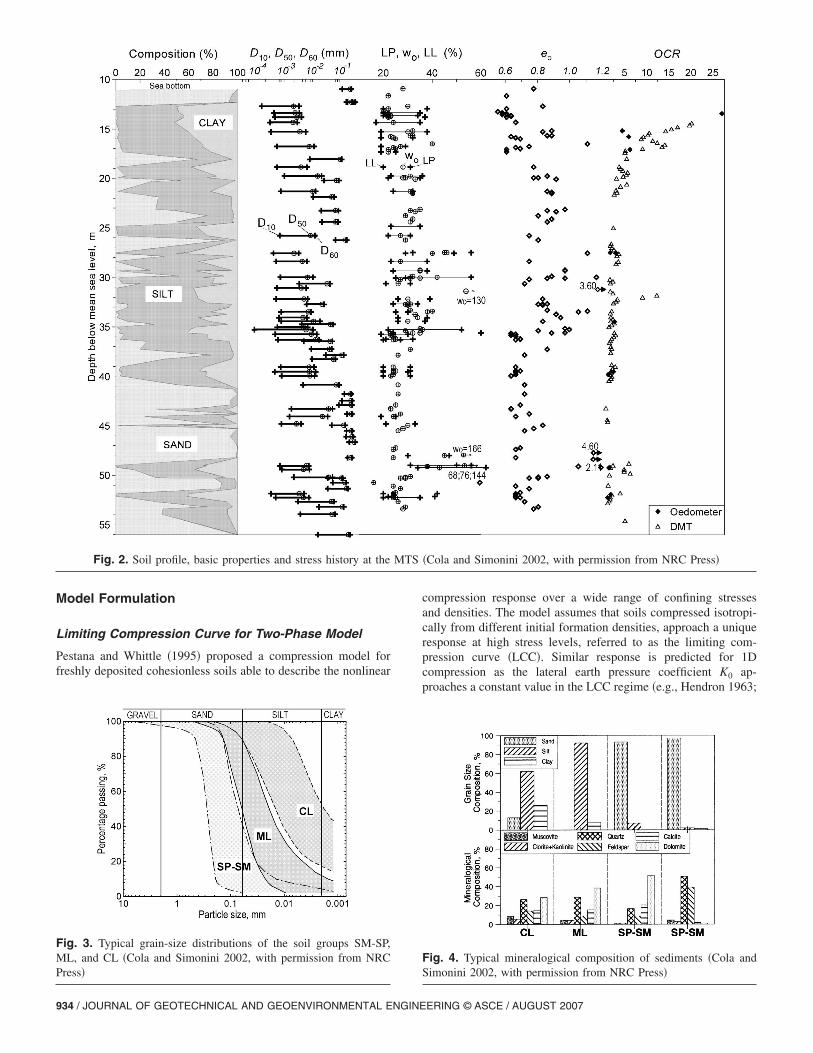
whole lagoon area have been reduced to three main groups: me-dium to fine sand �SP-SM�, silt �ML�, and very silty clay �CL�according to the Unified Soil Classification System, and theirtypical grain size distributions are reported in Fig. 3. These threeclasses constitute over 95% of the Venetian soils and occur ap-proximately in proportions of 35% SM-SP, 20% ML, and 40%CL. The remaining 5% of the soils are medium plasticity claysand peats �CH, OH, and Pt�. Subsurface profiles are characterizedby irregular alternation of the three soil types, with a few thinlayers of compacted peat. Additional characteristics include:• Silty and sandy fractions have a significant presence with per-
centages of silt exceeding 50% in 65% of samples analyzed;• Sands are relatively uniform, but finer materials become more
widely graded: the coarser the materials, the lower the coeffi-cient of uniformity.
• Atterberg limits are characterized by average values of liquidlimit �LL� and plasticity index, equal to 36±9 and 14±7%,respectively �w0�natural water content�. The cohesive soilsare generally characterized by low activity: the great majorityof samples fall in the range 0.25�A�0.50.
• The overconsolidation ratio �OCR� was estimated from thepreconsolidation stress, �p�, from one-dimensional �1D� con-solidation tests carried out on CL samples. Due to the verygradual transition to the virgin compression regime, estimates
Fig. 1. General view of Venice Lagoon and location of the
of �p� had high uncertainty, excluding a few of more plastic
JOURNAL OF GEOTECHNICAL AND G
silty-clay samples with higher clay content. Additionaldata from the flat dilatometer �Marchetti 1980�, are reportedin Fig. 2 to provide a reasonably continuous OCR profile. Ageneral decrease of OCR with depth shows the deeper for-mations remaining only slightly overconsolidated. The higherOCR values near the ground surface correspond to the carantolayer, a highly overconsolidated oxidized silty clay datingto the last Wurmian glaciation. Except for caranto and somethin deeper layers, the cohesive soils are generally slightlyoverconsolidated.Despite the highly heterogeneous soil conditions, the basic
material properties vary over a relatively narrow range due to thecommon mineralogical origin and depositional environment �Colaand Simonini 2002�. Typical mineralogical compositions of thesoils at Malamocco are compared in Fig. 4 �Curzi 1995�. Sandcomposition is mostly carbonatic and siliceous, with a predomi-nance of calcite and dolomite crystals, especially at higher depths.When the carbonate and quart-feldspar fractions decrease the clayminerals increase, although they never exceed 30% in anysample. Silt and clay particles were generally formed by mechani-cal crushing in a continental environment and are aggregated inan irregular assemblage, characteristic of a predominant floccu-lated structure. Clay minerals are mainly composed of illite—prevalently 2M muscovite—with chlorite, kaolinite and smectite
Cola and Simonini 2002, with permission from NRC Press�
MTS �as secondary materials.
EOENVIRONMENTAL ENGINEERING © ASCE / AUGUST 2007 / 933
Model Formulation
Limiting Compression Curve for Two-Phase Model
Pestana and Whittle �1995� proposed a compression model forfreshly deposited cohesionless soils able to describe the nonlinear
Fig. 2. Soil profile, basic properties and stress history at the
Fig. 3. Typical grain-size distributions of the soil groups SM-SP,ML, and CL �Cola and Simonini 2002, with permission from NRCPress�
934 / JOURNAL OF GEOTECHNICAL AND GEOENVIRONMENTAL ENGINE
compression response over a wide range of confining stressesand densities. The model assumes that soils compressed isotropi-cally from different initial formation densities, approach a uniqueresponse at high stress levels, referred to as the limiting com-pression curve �LCC�. Similar response is predicted for 1Dcompression as the lateral earth pressure coefficient K0 ap-proaches a constant value in the LCC regime �e.g., Hendron 1963;
�Cola and Simonini 2002, with permission from NRC Press�
Fig. 4. Typical mineralogical composition of sediments �Cola andSimonini 2002, with permission from NRC Press�
MTS
ERING © ASCE / AUGUST 2007
Coop and Lee 1993�. More recently, the model was revised toinclude a better description of the elastic stiffness and the transi-tional regime �Pestana 2002� and has been used to model theshear stiffness of granular materials for dynamic analyses�Pestana and Salvati 2006�.
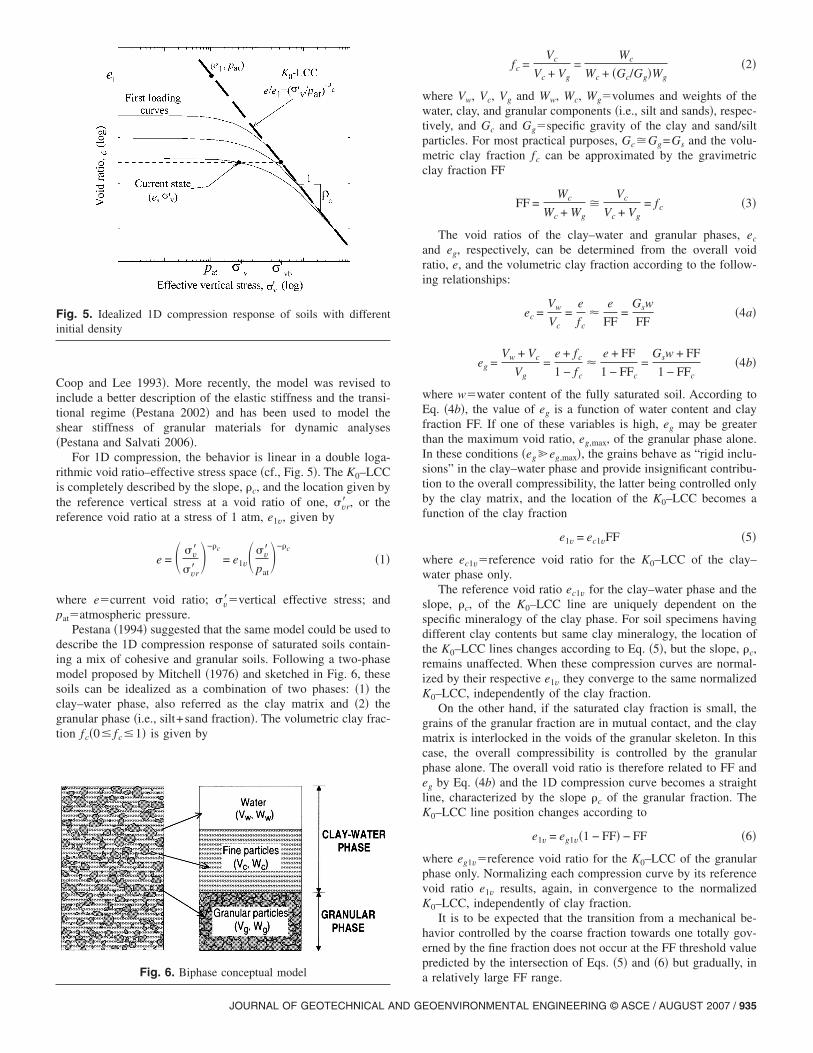
For 1D compression, the behavior is linear in a double loga-rithmic void ratio–effective stress space �cf., Fig. 5�. The K0–LCCis completely described by the slope, �c, and the location given bythe reference vertical stress at a void ratio of one, �vr� , or thereference void ratio at a stress of 1 atm, e1v, given by
e = � �v�
�vr��−�c
= e1v��v�
pat�−�c
�1�
where e�current void ratio; �v��vertical effective stress; andpat�atmospheric pressure.
Pestana �1994� suggested that the same model could be used todescribe the 1D compression response of saturated soils contain-ing a mix of cohesive and granular soils. Following a two-phasemodel proposed by Mitchell �1976� and sketched in Fig. 6, thesesoils can be idealized as a combination of two phases: �1� theclay–water phase, also referred as the clay matrix and �2� thegranular phase �i.e., silt+sand fraction�. The volumetric clay frac-tion fc�0� fc�1� is given by
Fig. 5. Idealized 1D compression response of soils with differentinitial density
Fig. 6. Biphase conceptual model
JOURNAL OF GEOTECHNICAL AND G
fc =Vc
Vc + Vg=
Wc
Wc + �Gc/Gg�Wg�2�
where Vw, Vc, Vg and Ww, Wc, Wg�volumes and weights of thewater, clay, and granular components �i.e., silt and sands�, respec-tively, and Gc and Gg�specific gravity of the clay and sand/siltparticles. For most practical purposes, Gc�Gg=Gs and the volu-metric clay fraction fc can be approximated by the gravimetricclay fraction FF
FF =Wc
Wc + Wg�
Vc
Vc + Vg= fc �3�
The void ratios of the clay–water and granular phases, ec
and eg, respectively, can be determined from the overall voidratio, e, and the volumetric clay fraction according to the follow-ing relationships:
ec =Vw
Vc=
e
fc�
e
FF=
Gsw
FF�4a�
eg =Vw + Vc
Vg=
e + fc
1 − fc�
e + FF
1 − FFc=
Gsw + FF
1 − FFc�4b�
where w�water content of the fully saturated soil. According toEq. �4b�, the value of eg is a function of water content and clayfraction FF. If one of these variables is high, eg may be greaterthan the maximum void ratio, eg,max, of the granular phase alone.In these conditions �eg�eg,max�, the grains behave as “rigid inclu-sions” in the clay–water phase and provide insignificant contribu-tion to the overall compressibility, the latter being controlled onlyby the clay matrix, and the location of the K0–LCC becomes afunction of the clay fraction
e1v = ec1vFF �5�
where ec1v�reference void ratio for the K0–LCC of the clay–water phase only.
The reference void ratio ec1v for the clay–water phase and theslope, �c, of the K0–LCC line are uniquely dependent on thespecific mineralogy of the clay phase. For soil specimens havingdifferent clay contents but same clay mineralogy, the location ofthe K0–LCC lines changes according to Eq. �5�, but the slope, �c,remains unaffected. When these compression curves are normal-ized by their respective e1v they converge to the same normalizedK0–LCC, independently of the clay fraction.
On the other hand, if the saturated clay fraction is small, thegrains of the granular fraction are in mutual contact, and the claymatrix is interlocked in the voids of the granular skeleton. In thiscase, the overall compressibility is controlled by the granularphase alone. The overall void ratio is therefore related to FF andeg by Eq. �4b� and the 1D compression curve becomes a straightline, characterized by the slope �c of the granular fraction. TheK0–LCC line position changes according to
e1v = eg1v�1 − FF� − FF �6�
where eg1v�reference void ratio for the K0–LCC of the granularphase only. Normalizing each compression curve by its referencevoid ratio e1v results, again, in convergence to the normalizedK0–LCC, independently of clay fraction.
It is to be expected that the transition from a mechanical be-havior controlled by the coarse fraction towards one totally gov-erned by the fine fraction does not occur at the FF threshold valuepredicted by the intersection of Eqs. �5� and �6� but gradually, in
a relatively large FF range.EOENVIRONMENTAL ENGINEERING © ASCE / AUGUST 2007 / 935
One-Dimensional Compression Response
During the 1D compression process, the change of the volumetricstrain d�p can be decomposed into the elastic d�p
e and plasticd�p
p components. The elastic component d�pe may be determined
from
d�pe =
dp�
Ke =3�1 − 2�
�1 + �1
Ge�1 + 2K0
3�d�v� �7�
where p� and �v��mean and vertical effective stresses;K0�coefficient of lateral earth pressure at rest; Ke and Ge�elasticbulk and shear modulus; and �elastic Poisson’s ratio.
The elastic shear stiffness, also referred to as Gmax, can bedescribed by the following relationship �Jamiolkowski et al.1994�:
Gmax
pat=
Gb
e1.1� p�
pat�n
�8�
where Gb�material constant, and the exponent n may vary be-tween 0.4 and 0.8. Plastic deformation is controlled by the prox-imity of the current stress �v� to the corresponding vertical stress�vb� on the K0–LCC at the same void ratio:
d�pp =
e
1 + e�c�1 − b
��d�v�
�v��9a�
b = 1 − �v�/�vb� , 0 � b � 1 �9b�
�vb�
pat= � e1v
e�1/�c
�9c�
where ��model parameter controlling the curvature of thecompression curve. If we ignore, momentarily, the elastic contri-bution during the compression loading and substituting Eq. �9c�into Eqs. �9b� and �9a�, we obtain
d�p = −de
1 + e�
e
1 + e�c�1 − �1 −
�v�
pat� e
e1v�1/�c�d�v�
�v�
�10a�
This equation can be rearranged to read
de
e=
de/e1v
e/e1v� − �c�1 − �1 − ��v�
pat�� e
e1v�1/�c�d�v�
�v�
�10b�
Eq. �10b� implies that normalized curves will converge to thesame K0–LCC �for the same �c�, and that the transitional regimecan be approximately described with a unique parameter � forvalues of vertical effective stress above the initial vertical effec-tive stress �i.e., the equation assumes that the soils are freshlydeposited�.
On the basis of the previous equations the model is completelydefined by six independent parameters, namely three parametersfor the elastic strain component, Gb, n, , and three for the plasticone, e1v, �c, �. However, for a group of samples sharing the samemineralogy, and consequently the same �c, the values of e1vcan also be related to the position of the K0–LCC for the pureclay �ec1v� and/or the pure granular soil �eg1v� depending on FF.For example, using the assumption of rigid granular inclusions
�i.e., large eg and large FF� and Eqs. �4a� and �5�, we obtain that936 / JOURNAL OF GEOTECHNICAL AND GEOENVIRONMENTAL ENGINE
the change in normalized void ratio �de /e� is only a function ofthe clay water phase. Hence, still ignoring the elastic component,we have
de
e=
dec
ec� − �c�1 − �1 −
�v�
pat� e
FFec1v�1/�c�d�v�
�v��11�
Therefore, to describe a whole class of soils with the samemineralogy, but different grain size distribution, parameter e1vmay be estimated from the clay fraction FF.
The proposed formulation assumes that the Venetian soils ex-hibiting very low OCRs can be described by the formulation forfreshly deposited soils above the value of the current effectivestress. Similarly to sands, for these silty-clayey soils the compres-sion in the transitional regime �i.e., before the LCC� is relativelyinsensitive to the elastic response and it is difficult to assess thevalue of the preconsolidation pressure by visual inspection of thevoid ratio vs. vertical effective stress curve. As a result, the com-pression curve can be described with reasonable accuracy by as-suming “freshly deposited” material response above the currentvertical stress up to the LCC. The transition to the LCC is notnecessarily related to the preconsolidation pressure as it is thecase for high clay content materials. Although further research isrequired to fully ascertain this fact, preliminary results indicatethat for clay contents larger than 25–30% the “break” in the com-pression curve represents the preconsolidation pressure, but thismay be a function of clay mineralogy �i.e., activity�.
Calibration and Validation of the Model
In order to evaluate the proposed model ability to capture theone-dimensional compression of Venetian soils, experimental re-sults from an existing database and from a new laboratory inves-tigation have been considered.
Parameter Calibration
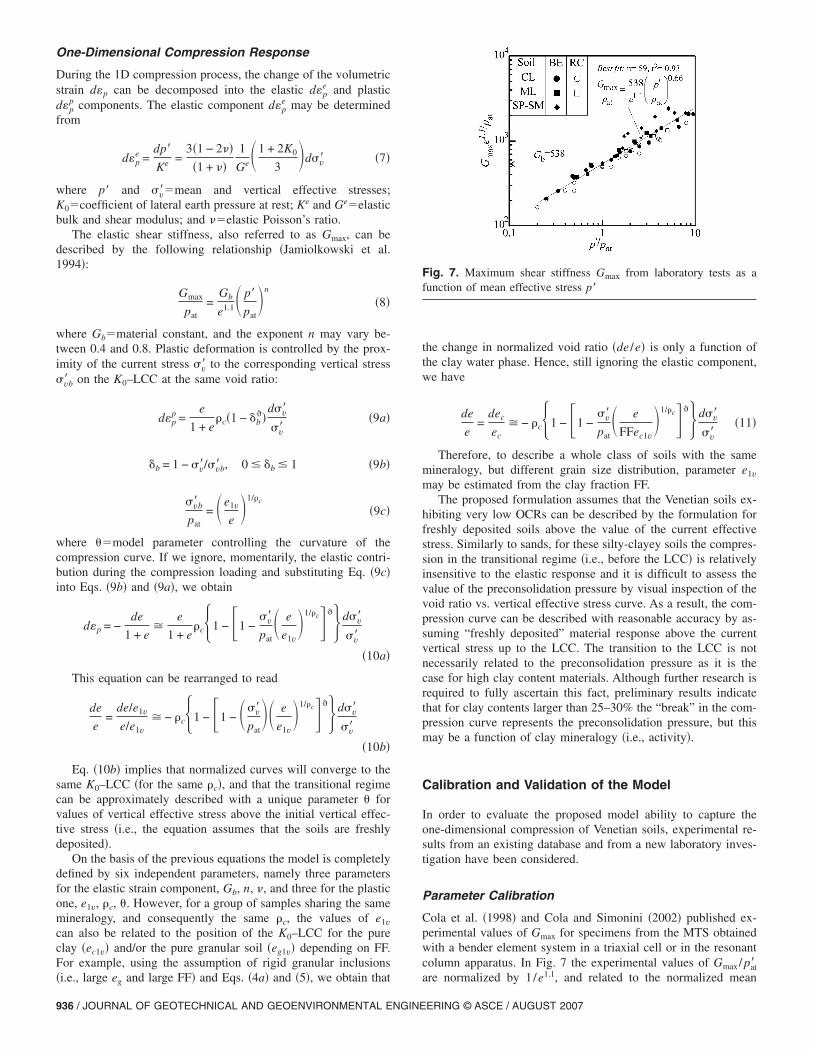
Cola et al. �1998� and Cola and Simonini �2002� published ex-perimental values of Gmax for specimens from the MTS obtainedwith a bender element system in a triaxial cell or in the resonantcolumn apparatus. In Fig. 7 the experimental values of Gmax/ pat�
1.1
Fig. 7. Maximum shear stiffness Gmax from laboratory tests as afunction of mean effective stress p�
are normalized by 1/e , and related to the normalized mean
ERING © ASCE / AUGUST 2007
effective stress p� / pat. The data, grouped by class of material andtest type, show a relatively large scatter. However, a constantGb=538 with an exponent n=0.66 can be reasonably assumed asrepresentative of the trend for all data.
Given the difficulty in obtaining experimental measures ofPoisson’s ratio, a unique value =0.15 was assumed for all theVenetian materials. Variations in Poisson ratio have a minor effecton the predicted response.
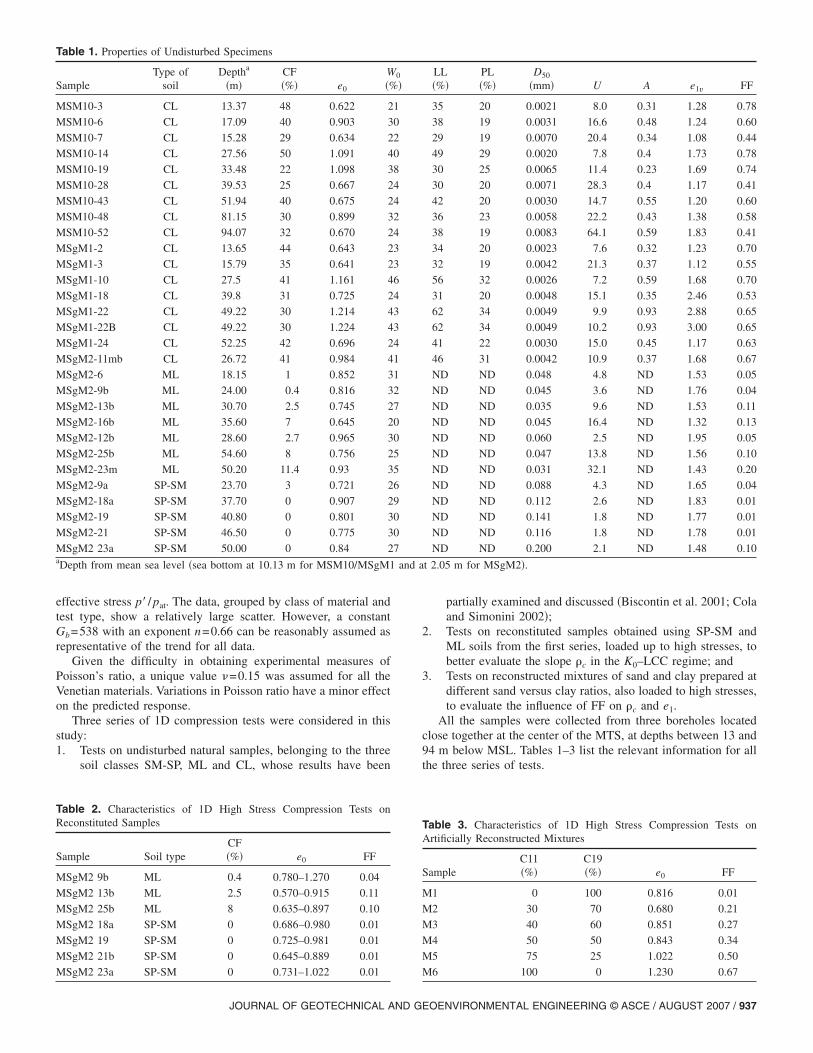
Three series of 1D compression tests were considered in thisstudy:1. Tests on undisturbed natural samples, belonging to the three
soil classes SM-SP, ML and CL, whose results have been
Table 1. Properties of Undisturbed Specimens
SampleType of
soilDeptha
�m�CF�%� e0
W�%
MSM10-3 CL 13.37 48 0.622 2
MSM10-6 CL 17.09 40 0.903 3
MSM10-7 CL 15.28 29 0.634 2
MSM10-14 CL 27.56 50 1.091 4
MSM10-19 CL 33.48 22 1.098 3
MSM10-28 CL 39.53 25 0.667 2
MSM10-43 CL 51.94 40 0.675 2
MSM10-48 CL 81.15 30 0.899 3
MSM10-52 CL 94.07 32 0.670 2
MSgM1-2 CL 13.65 44 0.643 2
MSgM1-3 CL 15.79 35 0.641 2
MSgM1-10 CL 27.5 41 1.161 4
MSgM1-18 CL 39.8 31 0.725 2
MSgM1-22 CL 49.22 30 1.214 4
MSgM1-22B CL 49.22 30 1.224 4
MSgM1-24 CL 52.25 42 0.696 2
MSgM2-11mb CL 26.72 41 0.984 4
MSgM2-6 ML 18.15 1 0.852 3
MSgM2-9b ML 24.00 0.4 0.816 3
MSgM2-13b ML 30.70 2.5 0.745 2
MSgM2-16b ML 35.60 7 0.645 2
MSgM2-12b ML 28.60 2.7 0.965 3
MSgM2-25b ML 54.60 8 0.756 2
MSgM2-23m ML 50.20 11.4 0.93 3
MSgM2-9a SP-SM 23.70 3 0.721 2
MSgM2-18a SP-SM 37.70 0 0.907 2
MSgM2-19 SP-SM 40.80 0 0.801 3
MSgM2-21 SP-SM 46.50 0 0.775 3
MSgM2 23a SP-SM 50.00 0 0.84 2aDepth from mean sea level �sea bottom at 10.13 m for MSM10/MSgM1
Table 2. Characteristics of 1D High Stress Compression Tests onReconstituted Samples
Sample Soil typeCF�%� e0 FF
MSgM2 9b ML 0.4 0.780–1.270 0.04
MSgM2 13b ML 2.5 0.570–0.915 0.11
MSgM2 25b ML 8 0.635–0.897 0.10
MSgM2 18a SP-SM 0 0.686–0.980 0.01
MSgM2 19 SP-SM 0 0.725–0.981 0.01
MSgM2 21b SP-SM 0 0.645–0.889 0.01
MSgM2 23a SP-SM 0 0.731–1.022 0.01
JOURNAL OF GEOTECHNICAL AND G
partially examined and discussed �Biscontin et al. 2001; Colaand Simonini 2002�;
2. Tests on reconstituted samples obtained using SP-SM andML soils from the first series, loaded up to high stresses, tobetter evaluate the slope �c in the K0–LCC regime; and
3. Tests on reconstructed mixtures of sand and clay prepared atdifferent sand versus clay ratios, also loaded to high stresses,to evaluate the influence of FF on �c and e1.
All the samples were collected from three boreholes locatedclose together at the center of the MTS, at depths between 13 and94 m below MSL. Tables 1–3 list the relevant information for allthe three series of tests.
LL�%�
PL�%�
D50
�mm� U A e1v FF
35 20 0.0021 8.0 0.31 1.28 0.78
38 19 0.0031 16.6 0.48 1.24 0.60
29 19 0.0070 20.4 0.34 1.08 0.44
49 29 0.0020 7.8 0.4 1.73 0.78
30 25 0.0065 11.4 0.23 1.69 0.74
30 20 0.0071 28.3 0.4 1.17 0.41
42 20 0.0030 14.7 0.55 1.20 0.60
36 23 0.0058 22.2 0.43 1.38 0.58
38 19 0.0083 64.1 0.59 1.83 0.41
34 20 0.0023 7.6 0.32 1.23 0.70
32 19 0.0042 21.3 0.37 1.12 0.55
56 32 0.0026 7.2 0.59 1.68 0.70
31 20 0.0048 15.1 0.35 2.46 0.53
62 34 0.0049 9.9 0.93 2.88 0.65
62 34 0.0049 10.2 0.93 3.00 0.65
41 22 0.0030 15.0 0.45 1.17 0.63
46 31 0.0042 10.9 0.37 1.68 0.67
ND ND 0.048 4.8 ND 1.53 0.05
ND ND 0.045 3.6 ND 1.76 0.04
ND ND 0.035 9.6 ND 1.53 0.11
ND ND 0.045 16.4 ND 1.32 0.13
ND ND 0.060 2.5 ND 1.95 0.05
ND ND 0.047 13.8 ND 1.56 0.10
ND ND 0.031 32.1 ND 1.43 0.20
ND ND 0.088 4.3 ND 1.65 0.04
ND ND 0.112 2.6 ND 1.83 0.01
ND ND 0.141 1.8 ND 1.77 0.01
ND ND 0.116 1.8 ND 1.78 0.01
ND ND 0.200 2.1 ND 1.48 0.10
t 2.05 m for MSgM2�.
Table 3. Characteristics of 1D High Stress Compression Tests onArtificially Reconstructed Mixtures
SampleC11�%�
C19�%� e0 FF
M1 0 100 0.816 0.01
M2 30 70 0.680 0.21
M3 40 60 0.851 0.27
M4 50 50 0.843 0.34
M5 75 25 1.022 0.50
M6 100 0 1.230 0.67
0
�
1
0
2
0
8
4
4
2
4
3
3
6
4
3
3
4
1
1
2
7
0
0
5
5
6
9
0
0
7
and a
EOENVIRONMENTAL ENGINEERING © ASCE / AUGUST 2007 / 937
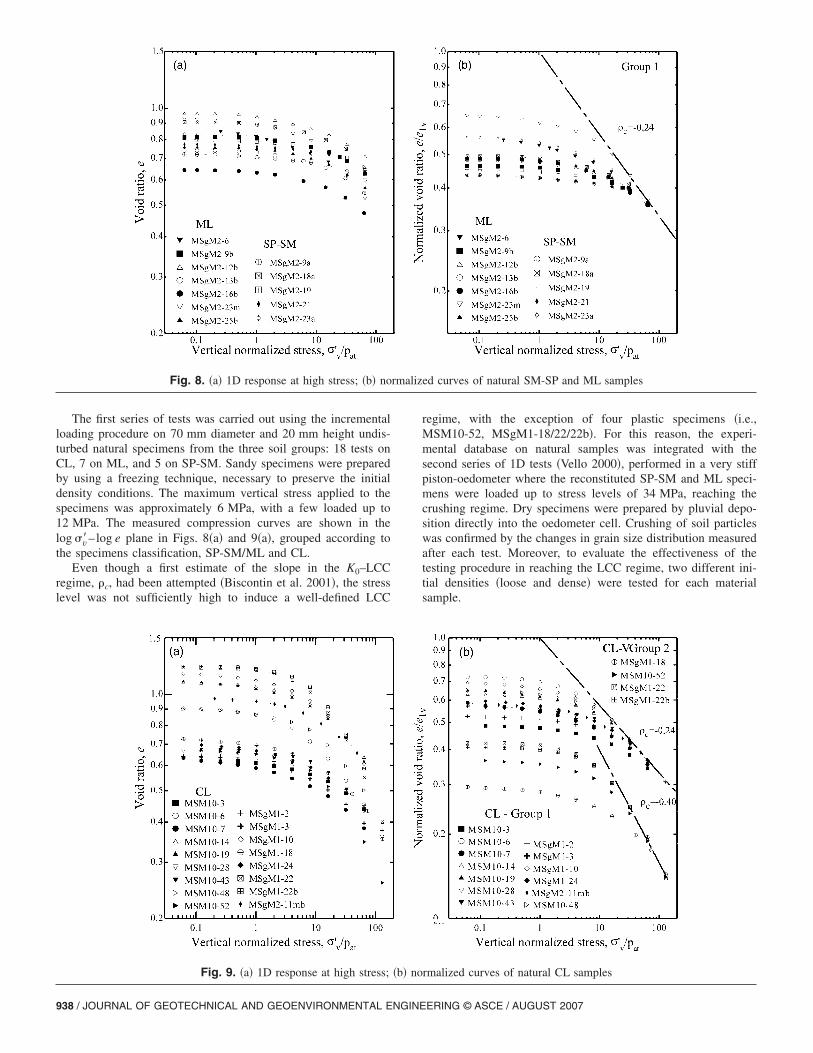
The first series of tests was carried out using the incrementalloading procedure on 70 mm diameter and 20 mm height undis-turbed natural specimens from the three soil groups: 18 tests onCL, 7 on ML, and 5 on SP-SM. Sandy specimens were preparedby using a freezing technique, necessary to preserve the initialdensity conditions. The maximum vertical stress applied to thespecimens was approximately 6 MPa, with a few loaded up to12 MPa. The measured compression curves are shown in thelog �v�–log e plane in Figs. 8�a� and 9�a�, grouped according tothe specimens classification, SP-SM/ML and CL.
Even though a first estimate of the slope in the K0–LCCregime, �c, had been attempted �Biscontin et al. 2001�, the stresslevel was not sufficiently high to induce a well-defined LCC
Fig. 8. �a� 1D response at high stress; �b� no
Fig. 9. �a� 1D response at high stress;
938 / JOURNAL OF GEOTECHNICAL AND GEOENVIRONMENTAL ENGINE
regime, with the exception of four plastic specimens �i.e.,MSM10-52, MSgM1-18/22/22b�. For this reason, the experi-mental database on natural samples was integrated with thesecond series of 1D tests �Vello 2000�, performed in a very stiffpiston-oedometer where the reconstituted SP-SM and ML speci-mens were loaded up to stress levels of 34 MPa, reaching thecrushing regime. Dry specimens were prepared by pluvial depo-sition directly into the oedometer cell. Crushing of soil particleswas confirmed by the changes in grain size distribution measuredafter each test. Moreover, to evaluate the effectiveness of thetesting procedure in reaching the LCC regime, two different ini-tial densities �loose and dense� were tested for each materialsample.
ed curves of natural SM-SP and ML samples
rmalized curves of natural CL samples
rmaliz
�b� no
ERING © ASCE / AUGUST 2007
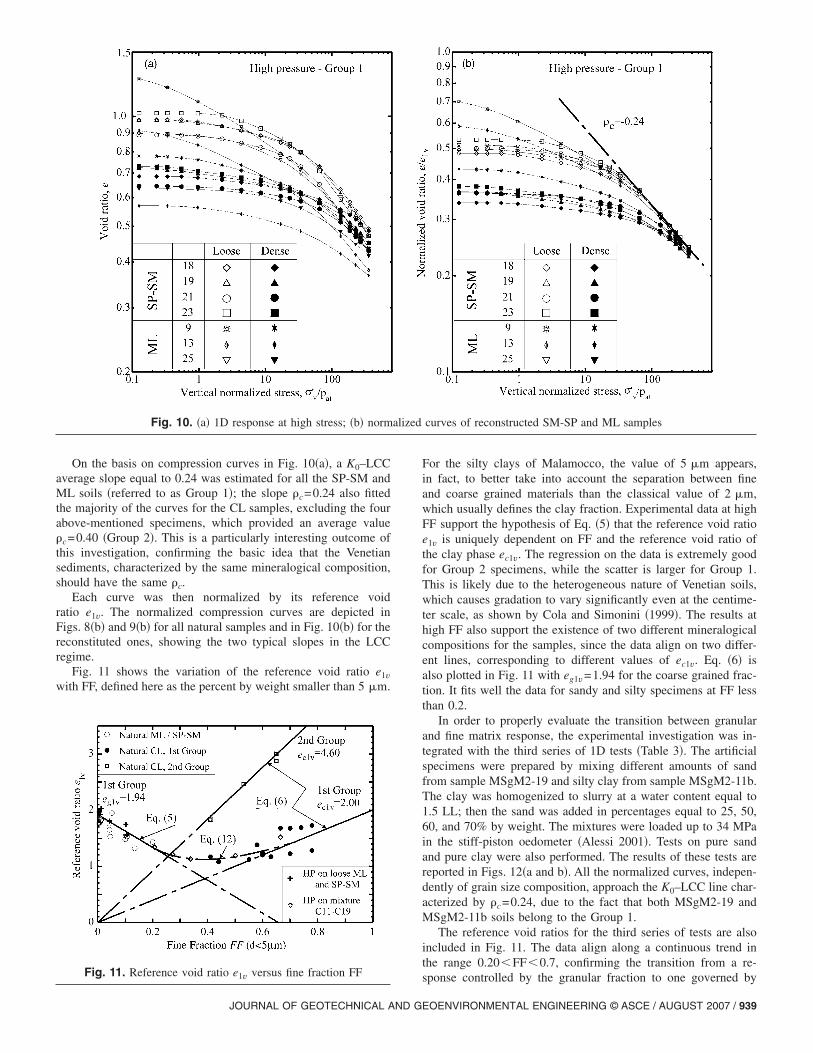
On the basis on compression curves in Fig. 10�a�, a K0–LCCaverage slope equal to 0.24 was estimated for all the SP-SM andML soils �referred to as Group 1�; the slope �c=0.24 also fittedthe majority of the curves for the CL samples, excluding the fourabove-mentioned specimens, which provided an average value�c=0.40 �Group 2�. This is a particularly interesting outcome ofthis investigation, confirming the basic idea that the Venetiansediments, characterized by the same mineralogical composition,should have the same �c.
Each curve was then normalized by its reference voidratio e1v. The normalized compression curves are depicted inFigs. 8�b� and 9�b� for all natural samples and in Fig. 10�b� for thereconstituted ones, showing the two typical slopes in the LCCregime.
Fig. 11 shows the variation of the reference void ratio e1vwith FF, defined here as the percent by weight smaller than 5 m.
Fig. 10. �a� 1D response at high stress; �b� norm
Fig. 11. Reference void ratio e1v versus fine fraction FF
JOURNAL OF GEOTECHNICAL AND G
For the silty clays of Malamocco, the value of 5 m appears,in fact, to better take into account the separation between fineand coarse grained materials than the classical value of 2 m,which usually defines the clay fraction. Experimental data at highFF support the hypothesis of Eq. �5� that the reference void ratioe1v is uniquely dependent on FF and the reference void ratio ofthe clay phase ec1v. The regression on the data is extremely goodfor Group 2 specimens, while the scatter is larger for Group 1.This is likely due to the heterogeneous nature of Venetian soils,which causes gradation to vary significantly even at the centime-ter scale, as shown by Cola and Simonini �1999�. The results athigh FF also support the existence of two different mineralogicalcompositions for the samples, since the data align on two differ-ent lines, corresponding to different values of ec1v. Eq. �6� isalso plotted in Fig. 11 with eg1v=1.94 for the coarse grained frac-tion. It fits well the data for sandy and silty specimens at FF lessthan 0.2.
In order to properly evaluate the transition between granularand fine matrix response, the experimental investigation was in-tegrated with the third series of 1D tests �Table 3�. The artificialspecimens were prepared by mixing different amounts of sandfrom sample MSgM2-19 and silty clay from sample MSgM2-11b.The clay was homogenized to slurry at a water content equal to1.5 LL; then the sand was added in percentages equal to 25, 50,60, and 70% by weight. The mixtures were loaded up to 34 MPain the stiff-piston oedometer �Alessi 2001�. Tests on pure sandand pure clay were also performed. The results of these tests arereported in Figs. 12�a and b�. All the normalized curves, indepen-dently of grain size composition, approach the K0–LCC line char-acterized by �c=0.24, due to the fact that both MSgM2-19 andMSgM2-11b soils belong to the Group 1.
The reference void ratios for the third series of tests are alsoincluded in Fig. 11. The data align along a continuous trend inthe range 0.20�FF�0.7, confirming the transition from a re-
curves of reconstructed SM-SP and ML samples
alizedsponse controlled by the granular fraction to one governed by
EOENVIRONMENTAL ENGINEERING © ASCE / AUGUST 2007 / 939
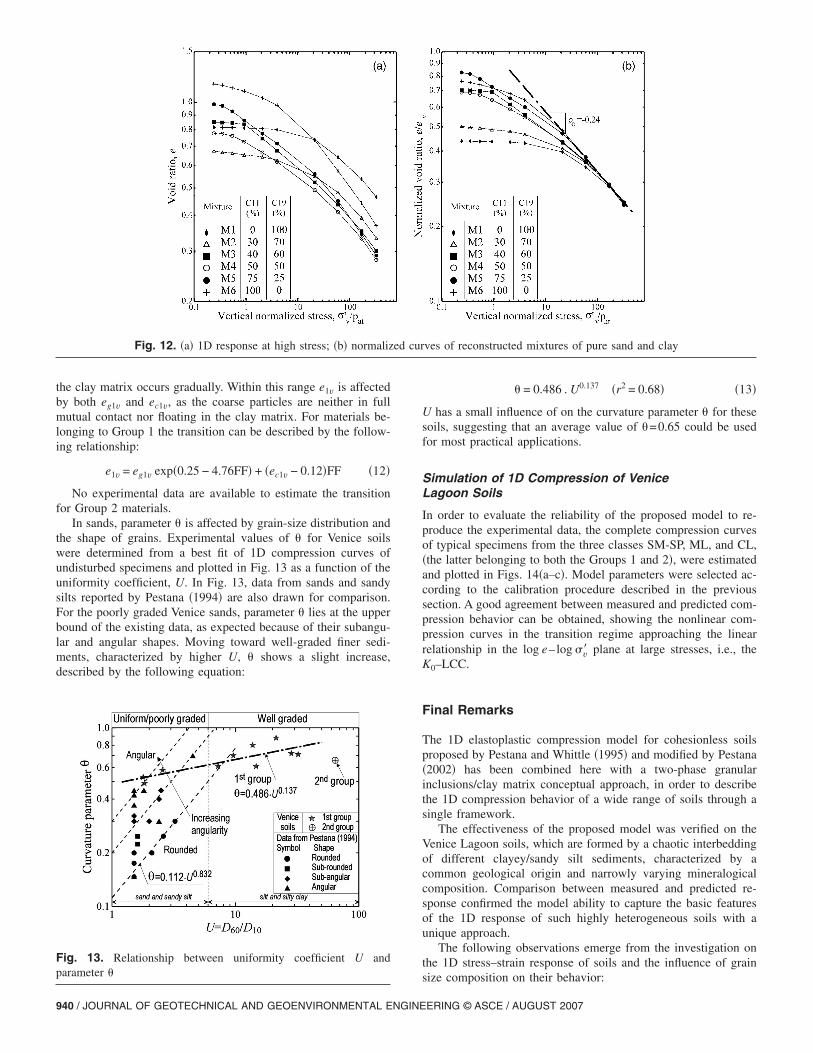
the clay matrix occurs gradually. Within this range e1v is affectedby both eg1v and ec1v, as the coarse particles are neither in fullmutual contact nor floating in the clay matrix. For materials be-longing to Group 1 the transition can be described by the follow-ing relationship:
e1v = eg1v exp�0.25 − 4.76FF� + �ec1v − 0.12�FF �12�
No experimental data are available to estimate the transitionfor Group 2 materials.
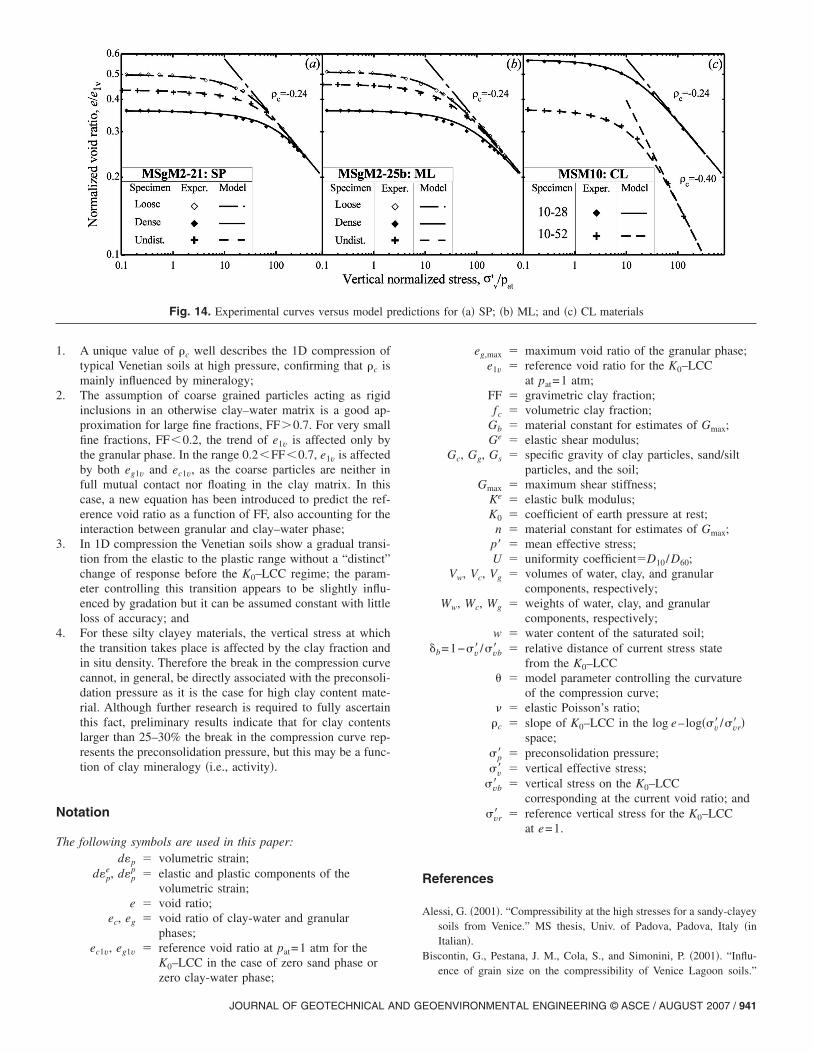
In sands, parameter � is affected by grain-size distribution andthe shape of grains. Experimental values of � for Venice soilswere determined from a best fit of 1D compression curves ofundisturbed specimens and plotted in Fig. 13 as a function of theuniformity coefficient, U. In Fig. 13, data from sands and sandysilts reported by Pestana �1994� are also drawn for comparison.For the poorly graded Venice sands, parameter � lies at the upperbound of the existing data, as expected because of their subangu-lar and angular shapes. Moving toward well-graded finer sedi-ments, characterized by higher U, � shows a slight increase,described by the following equation:
Fig. 12. �a� 1D response at high stress; �b� normaliz
Fig. 13. Relationship between uniformity coefficient U andparameter �
940 / JOURNAL OF GEOTECHNICAL AND GEOENVIRONMENTAL ENGINE
� = 0.486 . U0.137 �r2 = 0.68� �13�
U has a small influence of on the curvature parameter � for thesesoils, suggesting that an average value of �=0.65 could be usedfor most practical applications.
Simulation of 1D Compression of VeniceLagoon Soils
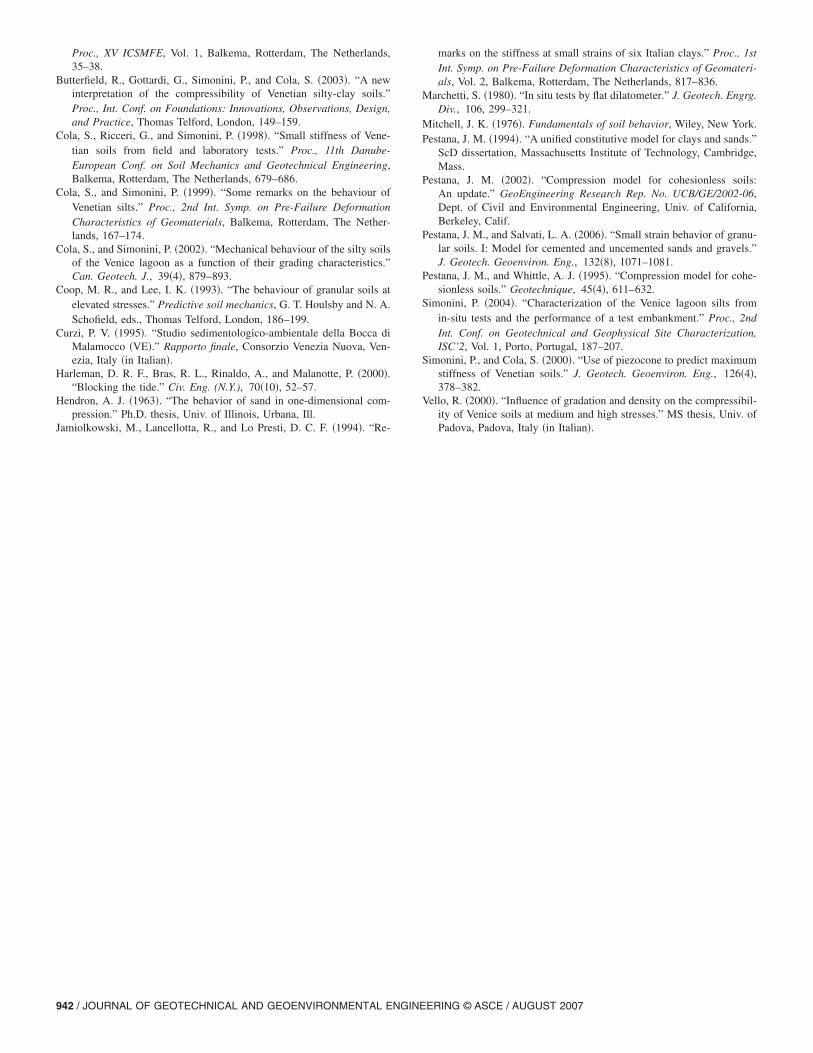
In order to evaluate the reliability of the proposed model to re-produce the experimental data, the complete compression curvesof typical specimens from the three classes SM-SP, ML, and CL,�the latter belonging to both the Groups 1 and 2�, were estimatedand plotted in Figs. 14�a–c�. Model parameters were selected ac-cording to the calibration procedure described in the previoussection. A good agreement between measured and predicted com-pression behavior can be obtained, showing the nonlinear com-pression curves in the transition regime approaching the linearrelationship in the log e–log �v� plane at large stresses, i.e., theK0–LCC.
Final Remarks
The 1D elastoplastic compression model for cohesionless soilsproposed by Pestana and Whittle �1995� and modified by Pestana�2002� has been combined here with a two-phase granularinclusions/clay matrix conceptual approach, in order to describethe 1D compression behavior of a wide range of soils through asingle framework.
The effectiveness of the proposed model was verified on theVenice Lagoon soils, which are formed by a chaotic interbeddingof different clayey/sandy silt sediments, characterized by acommon geological origin and narrowly varying mineralogicalcomposition. Comparison between measured and predicted re-sponse confirmed the model ability to capture the basic featuresof the 1D response of such highly heterogeneous soils with aunique approach.
The following observations emerge from the investigation onthe 1D stress–strain response of soils and the influence of grain
ves of reconstructed mixtures of pure sand and clay
ed cursize composition on their behavior:
ERING © ASCE / AUGUST 2007
1. A unique value of �c well describes the 1D compression oftypical Venetian soils at high pressure, confirming that �c ismainly influenced by mineralogy;
2. The assumption of coarse grained particles acting as rigidinclusions in an otherwise clay–water matrix is a good ap-proximation for large fine fractions, FF�0.7. For very smallfine fractions, FF�0.2, the trend of e1v is affected only bythe granular phase. In the range 0.2�FF�0.7, e1v is affectedby both eg1v and ec1v, as the coarse particles are neither infull mutual contact nor floating in the clay matrix. In thiscase, a new equation has been introduced to predict the ref-erence void ratio as a function of FF, also accounting for theinteraction between granular and clay–water phase;
3. In 1D compression the Venetian soils show a gradual transi-tion from the elastic to the plastic range without a “distinct”change of response before the K0–LCC regime; the param-eter controlling this transition appears to be slightly influ-enced by gradation but it can be assumed constant with littleloss of accuracy; and
4. For these silty clayey materials, the vertical stress at whichthe transition takes place is affected by the clay fraction andin situ density. Therefore the break in the compression curvecannot, in general, be directly associated with the preconsoli-dation pressure as it is the case for high clay content mate-rial. Although further research is required to fully ascertainthis fact, preliminary results indicate that for clay contentslarger than 25–30% the break in the compression curve rep-resents the preconsolidation pressure, but this may be a func-tion of clay mineralogy �i.e., activity�.
Notation
The following symbols are used in this paper:d�p � volumetric strain;
d�pe, d�p
p � elastic and plastic components of thevolumetric strain;
e � void ratio;ec, eg � void ratio of clay-water and granular
phases;ec1v, eg1v � reference void ratio at pat=1 atm for the
K0–LCC in the case of zero sand phase or
Fig. 14. Experimental curves versus model p
zero clay-water phase;
JOURNAL OF GEOTECHNICAL AND G
eg,max � maximum void ratio of the granular phase;e1v � reference void ratio for the K0–LCC
at pat=1 atm;FF � gravimetric clay fraction;fc � volumetric clay fraction;
Gb � material constant for estimates of Gmax;Ge � elastic shear modulus;
Gc, Gg, Gs � specific gravity of clay particles, sand/siltparticles, and the soil;
Gmax � maximum shear stiffness;Ke � elastic bulk modulus;K0 � coefficient of earth pressure at rest;
n � material constant for estimates of Gmax;p� � mean effective stress;U � uniformity coefficient�D10/D60;
Vw, Vc, Vg � volumes of water, clay, and granularcomponents, respectively;
Ww, Wc, Wg � weights of water, clay, and granularcomponents, respectively;
w � water content of the saturated soil;b=1−�v� /�vb� � relative distance of current stress state
from the K0–LCC� � model parameter controlling the curvature
of the compression curve; � elastic Poisson’s ratio;
�c � slope of K0–LCC in the log e–log��v� /�vr� �space;
�p� � preconsolidation pressure;�v� � vertical effective stress;
�vb� � vertical stress on the K0–LCCcorresponding at the current void ratio; and
�vr� � reference vertical stress for the K0–LCCat e=1.
References
Alessi, G. �2001�. “Compressibility at the high stresses for a sandy-clayeysoils from Venice.” MS thesis, Univ. of Padova, Padova, Italy �inItalian�.
Biscontin, G., Pestana, J. M., Cola, S., and Simonini, P. �2001�. “Influ-ence of grain size on the compressibility of Venice Lagoon soils.”
ons for �a� SP; �b� ML; and �c� CL materials
redictiEOENVIRONMENTAL ENGINEERING © ASCE / AUGUST 2007 / 941
Proc., XV ICSMFE, Vol. 1, Balkema, Rotterdam, The Netherlands,35–38.
Butterfield, R., Gottardi, G., Simonini, P., and Cola, S. �2003�. “A newinterpretation of the compressibility of Venetian silty-clay soils.”Proc., Int. Conf. on Foundations: Innovations, Observations, Design,and Practice, Thomas Telford, London, 149–159.
Cola, S., Ricceri, G., and Simonini, P. �1998�. “Small stiffness of Vene-tian soils from field and laboratory tests.” Proc., 11th Danube-European Conf. on Soil Mechanics and Geotechnical Engineering,Balkema, Rotterdam, The Netherlands, 679–686.
Cola, S., and Simonini, P. �1999�. “Some remarks on the behaviour ofVenetian silts.” Proc., 2nd Int. Symp. on Pre-Failure DeformationCharacteristics of Geomaterials, Balkema, Rotterdam, The Nether-lands, 167–174.
Cola, S., and Simonini, P. �2002�. “Mechanical behaviour of the silty soilsof the Venice lagoon as a function of their grading characteristics.”Can. Geotech. J., 39�4�, 879–893.
Coop, M. R., and Lee, I. K. �1993�. “The behaviour of granular soils atelevated stresses.” Predictive soil mechanics, G. T. Houlsby and N. A.Schofield, eds., Thomas Telford, London, 186–199.
Curzi, P. V. �1995�. “Studio sedimentologico-ambientale della Bocca diMalamocco �VE�.” Rapporto finale, Consorzio Venezia Nuova, Ven-ezia, Italy �in Italian�.
Harleman, D. R. F., Bras, R. L., Rinaldo, A., and Malanotte, P. �2000�.“Blocking the tide.” Civ. Eng. (N.Y.), 70�10�, 52–57.
Hendron, A. J. �1963�. “The behavior of sand in one-dimensional com-pression.” Ph.D. thesis, Univ. of Illinois, Urbana, Ill.
Jamiolkowski, M., Lancellotta, R., and Lo Presti, D. C. F. �1994�. “Re-
942 / JOURNAL OF GEOTECHNICAL AND GEOENVIRONMENTAL ENGINE
marks on the stiffness at small strains of six Italian clays.” Proc., 1stInt. Symp. on Pre-Failure Deformation Characteristics of Geomateri-als, Vol. 2, Balkema, Rotterdam, The Netherlands, 817–836.
Marchetti, S. �1980�. “In situ tests by flat dilatometer.” J. Geotech. Engrg.Div., 106, 299–321.
Mitchell, J. K. �1976�. Fundamentals of soil behavior, Wiley, New York.Pestana, J. M. �1994�. “A unified constitutive model for clays and sands.”
ScD dissertation, Massachusetts Institute of Technology, Cambridge,Mass.
Pestana, J. M. �2002�. “Compression model for cohesionless soils:An update.” GeoEngineering Research Rep. No. UCB/GE/2002-06,Dept. of Civil and Environmental Engineering, Univ. of California,Berkeley, Calif.
Pestana, J. M., and Salvati, L. A. �2006�. “Small strain behavior of granu-lar soils. I: Model for cemented and uncemented sands and gravels.”J. Geotech. Geoenviron. Eng., 132�8�, 1071–1081.
Pestana, J. M., and Whittle, A. J. �1995�. “Compression model for cohe-sionless soils.” Geotechnique, 45�4�, 611–632.
Simonini, P. �2004�. “Characterization of the Venice lagoon silts fromin-situ tests and the performance of a test embankment.” Proc., 2ndInt. Conf. on Geotechnical and Geophysical Site Characterization,ISC’2, Vol. 1, Porto, Portugal, 187–207.
Simonini, P., and Cola, S. �2000�. “Use of piezocone to predict maximumstiffness of Venetian soils.” J. Geotech. Geoenviron. Eng., 126�4�,378–382.
Vello, R. �2000�. “Influence of gradation and density on the compressibil-ity of Venice soils at medium and high stresses.” MS thesis, Univ. ofPadova, Padova, Italy �in Italian�.
ERING © ASCE / AUGUST 2007