Soil Accretionary Dynamics, Sea-Level Rise and the Survival of Wetlands in Venice Lagoon: A Field...
22
Estuarine, Coastal and Shelf Science (1999) 49, 607–628 Article No. ecss.1999.0522, available online at http://www.idealibrary.com on Soil Accretionary Dynamics, Sea-Level Rise and the Survival of Wetlands in Venice Lagoon: A Field and Modelling Approach J. W. Day Jr a , J. Rybczyk a,d , F. Scarton b , A. Rismondo b , D. Are b and G. Cecconi c a Coastal Ecology Institute and Department of Oceanography and Coastal Sciences, Louisiana State University, Baton Rouge, LA 70803, U.S.A. b SELC Inc., Viale Garibaldi 50, 30173 Venezia-Mestre, Italy c Consorzio Venezia Nuova, San Marco 2803, 30124 Venezia, Italy d Present address: Department of Biological and Environmental Sciences, California University, Box 45, California, PA 15419, U.S.A. Received 28 December 1998 and accepted in revised form 11 June 1999 Over the past century, Venice Lagoon (Italy) has experienced a high rate of wetland loss. To gain an understanding of the factors leading to this loss, from March 1993 until May 1996 the soil accretionary dynamics of these wetlands were studied. Vertical accretion, short term sedimentation, soil vertical elevation change and horizontal shoreline change were measured at several sites with varying sediment availability and wave energy. Short term sedimentation averaged 3–7 g dry m "2 day "1 per site with a maximum of 76 g m "2 day "1 . The highest values were measured during strong pulsing events, such as storms and river floods, that mobilized and transported suspended sediments. Accretion ranged from 2–23 mm yr "1 and soil elevation change ranged from "32 to 13·8 mm yr "1 . The sites with highest accretion were near a river mouth and in an area where strong wave energy resuspended bottom sediments that were deposited on the marsh surface. A marsh created with dredged spoil had a high rate of elevation loss, probably due mainly to compaction. Shoreline retreat and expansion of tidal channels also occurred at several sites due to high wave energy and a greater tidal prism. The current rate of elevation gain at some sites was not sufficient to offset relative sea-level rise. The results suggest that reduction of wave energy and increasing sediment availability are needed to offset wetland loss in different areas of the lagoon. Using the data collected as part of this project, we developed a wetland elevation model designed to predict the effect of increasing rates of eustatic sea-level rise on wetland sustainability. The advantage of this model, in conjunction with measured short-term rates of soil elevation change, to determine sustainability is that the model integrates the effects of long term processes (e.g. compaction and decomposition) and takes into account feedback mechanisms that affect elevation. Specifically, changes in elevation can result in changes in allogenic sediment deposition, decomposition and autogenic primary production. Model results revealed that, given the Intergovernmental Panel on Climate Change (IPCC) ‘ best estimate ’ eustatic sea-level rise scenario of 48 cm in the next 100 years, only one site could maintain its elevation relative to sea level over the next century. Under the IPCC ‘ current conditions’ scenario of 15 cm in the next 100 years, four of seven sites remained stable. This work demonstrates that more accurate predictions of the future of coastal wetlands with rising sea level will be obtained with a combination of short-term measurements of accretion and soil elevation change and long-term modelling. ? 1999 Academic Press Keywords: sedimentation; Venice Lagoon; sea-level rise; modelling; IPCC Introduction Coastal wetlands exist in a dynamic equilibrium, in both horizontal and vertical planes, between forces which lead to their establishment and maintenance, and forces which lead to deterioration. In the vertical plane, of the most important processes currently affecting coastal wetlands is rising sea level. If marshes are to survive rising water levels, they must be able to accrete at a rate such that surface elevation gain is sufficient to offset the rate of water level rise (Cahoon et al., 1995b). A number of studies have shown that coastal marshes are able to accrete at a rate equal to the historical rate of eustatic sea-level rise (1–2 mm yr "1 , Gornitz et al., 1982) and survive for long periods of time (Redfield, 1972; McCaffrey & Thompson, 1980; Orson et al., 1987). It is likely, however, that the rate of sea-level rise will accelerate over the coming 100 years by 4–6 mm yr "1 (Raper et al., 1996). In addition, subsidence has caused relative sea-level rise (RSLR) to be much greater than the eustatic rate in a number 0272–7714/99/110607+22 $30.00/0 ? 1999 Academic Press
-
Upload
independent -
Category
Documents
-
view
4 -
download
0
Transcript of Soil Accretionary Dynamics, Sea-Level Rise and the Survival of Wetlands in Venice Lagoon: A Field...

Estuarine, Coastal and Shelf Science (1999) 49, 607–628Article No. ecss.1999.0522, available online at http://www.idealibrary.com on
Soil Accretionary Dynamics, Sea-Level Rise and theSurvival of Wetlands in Venice Lagoon: A Field andModelling Approach
J. W. Day Jra, J. Rybczyka,d, F. Scartonb, A. Rismondob, D. Areb and G. Cecconic
aCoastal Ecology Institute and Department of Oceanography and Coastal Sciences, Louisiana State University,Baton Rouge, LA 70803, U.S.A.bSELC Inc., Viale Garibaldi 50, 30173 Venezia-Mestre, ItalycConsorzio Venezia Nuova, San Marco 2803, 30124 Venezia, ItalydPresent address: Department of Biological and Environmental Sciences, California University, Box 45, California,PA 15419, U.S.A.
Received 28 December 1998 and accepted in revised form 11 June 1999
Over the past century, Venice Lagoon (Italy) has experienced a high rate of wetland loss. To gain an understanding of thefactors leading to this loss, from March 1993 until May 1996 the soil accretionary dynamics of these wetlands werestudied. Vertical accretion, short term sedimentation, soil vertical elevation change and horizontal shoreline changewere measured at several sites with varying sediment availability and wave energy. Short term sedimentation averaged3–7 g dry m"2 day"1 per site with a maximum of 76 g m"2 day"1. The highest values were measured during strongpulsing events, such as storms and river floods, that mobilized and transported suspended sediments. Accretion rangedfrom 2–23 mm yr"1 and soil elevation change ranged from "32 to 13·8 mm yr"1. The sites with highest accretion werenear a river mouth and in an area where strong wave energy resuspended bottom sediments that were deposited on themarsh surface. A marsh created with dredged spoil had a high rate of elevation loss, probably due mainly to compaction.Shoreline retreat and expansion of tidal channels also occurred at several sites due to high wave energy and a greater tidalprism. The current rate of elevation gain at some sites was not sufficient to offset relative sea-level rise. The results suggestthat reduction of wave energy and increasing sediment availability are needed to offset wetland loss in different areas ofthe lagoon. Using the data collected as part of this project, we developed a wetland elevation model designed to predictthe effect of increasing rates of eustatic sea-level rise on wetland sustainability. The advantage of this model, inconjunction with measured short-term rates of soil elevation change, to determine sustainability is that the modelintegrates the effects of long term processes (e.g. compaction and decomposition) and takes into account feedbackmechanisms that affect elevation. Specifically, changes in elevation can result in changes in allogenic sediment deposition,decomposition and autogenic primary production. Model results revealed that, given the Intergovernmental Panel onClimate Change (IPCC) ‘ best estimate ’ eustatic sea-level rise scenario of 48 cm in the next 100 years, only one site couldmaintain its elevation relative to sea level over the next century. Under the IPCC ‘ current conditions’ scenario of 15 cmin the next 100 years, four of seven sites remained stable. This work demonstrates that more accurate predictions of thefuture of coastal wetlands with rising sea level will be obtained with a combination of short-term measurements ofaccretion and soil elevation change and long-term modelling. ? 1999 Academic Press
Keywords: sedimentation; Venice Lagoon; sea-level rise; modelling; IPCC
Introduction
Coastal wetlands exist in a dynamic equilibrium, inboth horizontal and vertical planes, between forceswhich lead to their establishment and maintenance,and forces which lead to deterioration. In the verticalplane, of the most important processes currentlyaffecting coastal wetlands is rising sea level. If marshesare to survive rising water levels, they must be able toaccrete at a rate such that surface elevation gain issufficient to offset the rate of water level rise (Cahoon
0272–7714/99/110607+22 $30.00/0
et al., 1995b). A number of studies have shown thatcoastal marshes are able to accrete at a rate equalto the historical rate of eustatic sea-level rise(1–2 mm yr"1, Gornitz et al., 1982) and survive forlong periods of time (Redfield, 1972; McCaffrey &Thompson, 1980; Orson et al., 1987).
It is likely, however, that the rate of sea-level risewill accelerate over the coming 100 years by4–6 mm yr"1 (Raper et al., 1996). In addition,subsidence has caused relative sea-level rise (RSLR)to be much greater than the eustatic rate in a number
? 1999 Academic Press

608 J. W. Day Jr et al.
of coastal systems. For example, in the Mississippidelta, RSLR is 10–12 mm yr"1, primarily due toregional subsidence (Penland & Ramsey, 1990) andfor the Nile Delta, the rate of subsidence is as high as5 mm yr"1 (Stanley, 1988). The rate of backgroundgeologic subsidence in Venice Lagoon during the20th century is 1·2–1·5 mm yr"1 (Pirazzoli, 1987;Carbognin et al., 1996) resulting in a RSLR between2·4 and 3·0 mm yr"1 (Albani et al., 1983; Rusconiet al., 1993). Groundwater withdrawal in the Venicearea from the 1940s to the late 1960s led to RSLR ashigh as 8 mm yr"1 (Sestini, 1996). Marshes, how-ever, can survive such high rates of RSLR if sedimentinput and in situ organic soil formation are sufficient.In the Mississippi Delta, for example, tidal creekstreamside levee marshes and those near sources ofriverine sediments are able to accrete vertically at rateshigher than RSLR while back marshes generallyhave accretion rates less than RSLR (Baumann et al.,1984; Hatton et al., 1983). In Venice Lagoon,however, practically all riverine sediment input hasbeen stopped (Bendoricchio et al., 1993) and thereis a strong net loss of sediments from the lagoon(Bettinetti et al., 1995).
To determine if wetlands are growing vertically at arate sufficient to offset water level rise, measurementsof soil vertical accretion alone are insufficient.Measurements must also be made of the rate of soilelevation change because shallow subsidence mayoccur in the upper soil profile. Shallow subsidence isdefined as the difference between vertical accretionand net surface elevation change (Cahoon et al.,1995b). It provides an estimate of the degree ofconsolidation and compaction in the upper soilcolumn, primarily the root zone, and is differentiatedfrom deep subsidence such as is measured by longterm tide gauge records.
In the horizontal plane, high wave energy onexposed marsh shores can lead to shoreline retreat,enlargement of interior marsh ponds and, at times,scour of the marsh surface (Stevenson et al., 1985;Pethick, 1992). An increased tidal prism due toincreased water depths resulting from bottom scour orsea-level rise leads to the deepening and widening oftidal channels (Pethick, 1992, 1993). In VeniceLagoon, marsh retreat is occurring in a number ofareas. By analysing maps, Cavazzoni and Gottardo(1983) calculated that between 1933 and 1970 theedge of exposed marshes in the south-eastern lagoonretreated at rates of 0·8–2·7 m yr"1. The lagoon hasdeepened by up to 30 cm due both to RSLR andlonger fetch resulting from marsh retreat. Therehas been an expansion of the tidal network over thepast several decades due to an increasing tidal prism
(Consorzio Venezia Nuova, 1993). This is a syner-gistic process because as the marsh disappears, bothfetch and the mean depth of the lagoon increasefurther. Thus, Venice Lagoon marshes are beingaffected by rising water levels, lower sediment inputand increasing hydrodynamic energy. The purpose ofthis project was to study the soil dynamics and geo-morphic response of wetlands in Venice Lagoon to acombination of sea-level rise and human alterations ofthe lagoon and to predict the future of these marsheswith accelerated sea-level rise. In order to do this,measurements were made of a number of vertical andhorizontal soil accretionary processes affecting the wet-lands of Venice Lagoon and a wetland elevation modelwas developed to predict their long-term survival.
The objectives of the field study were: (a) tomeasure short-term sedimentation, vertical accretion,soil elevation change and shoreline change on varyingtime scales in different wetlands of Venice Lagoon; (b)to compare rates of accretion and soil elevationchange with relative sea-level rise (RSLR) to deter-mine if current rates of vertical growth are sufficient tooffset present and predicted future rates of RSLR; (c)to evaluate the impacts of different human alterationson wetland sustainability.
It was also recognized that the direct comparison ofshort-term rates of accretion and soil elevation changeto rates of RSLR, in order to predict wetland sustain-ability, can be misleading. This is because short termfield measurements of accretion and shallow subsid-ence of one to several years do not fully integrate longterm processes, such as compaction and decompo-sition, that affect wetland elevation. Additionally, suchdirect comparisons do not take into account elevationfeedback mechanisms on the processes themselves.Specifically, processes which change with elevationinclude allogenic sediment deposition (French, 1993),decomposition (Webster & Bedfield, 1986) andautogenic primary production (Randerson, 1979).Therefore an integrated wetland elevation model wasused, which can be simulated for decades and incor-porates elevation feed back mechanisms, for predict-ing long term wetland sustainability in the face ofincreased RSLR and for evaluating the outcome ofvarious mineral management scenarios in the wet-lands of the Venice Lagoon. The model is a modifiedversion of previous wetland elevation modelsdeveloped by Callaway et al. (1996); and Rybczyket al. (1998).
Area description
The Lagoon of Venice, the largest Italian lagoon andone of the largest of the Mediterranean, is located in

Venice Lagoon wetland accretion 609
Torson
Punta Cane
Laghi
Tessera
Dese
S. Felice
45° 25'
12° 19'
N
50 10 km
F 1. Map of Venice Lagoon showing the location of the study sites. Grey areas are marshes and black areas are islandswithin the lagoon. All sites were established in March 1993 with the exception of Torson and Punta Cane 2 (October 1993)and Tessera 2 and 4 (June 1994). See text for more detailed descriptions of the sites.
north-eastern Italy and has an area of approximately550 km2 (Figure 1). It exchanges water with the seathrough three large inlets. Over the past five centuries,sediment dynamics of the lagoon have been greatlyaltered (Gatto & Carbognin, 1981). Three rivers, theBrenta, Sile, and Piave, which originally dischargedinto the lagoon, were diverted from the lagoon to thesea beginning in the 16th century. Presently, only afew small rivers (total discharge about 30 m3 s"1)discharge into the lagoon (Bendoricchio et al., 1993).
Thus, riverine sediment input to the lagoon has beenalmost completely eliminated. The import of coarsemarine sediments into the lagoon has been greatlyreduced because of the construction of long jetties inthe inlets at the end of the last century. Nowadays,there is a net export of about one million m3 yr"1 ofsediments from the lagoon system (Bettinetti et al.,1995).
Most of the lagoon is occupied by a large centralwaterbody (about 370 km2) and extensive intertidal

610 J. W. Day Jr et al.
salt marshes (about 40 km2). The mean depth of thelagoon is 1·1 m and the tide range is 0·6–1 m, thusextensive tidal flats (about 50 km2) are exposed at lowtide. The subtidal areas are partially vegetated bymacroalgae and seagrasses (such as Zostera marina, Z.noltii and Cymodocea nodosa). The dominant saltmarsh species include Limonium serotinum, Puccinelliapalustris, Arthrocnemum fruticosum and Spartina mar-itima (a listing of plant species of the lagoon is given byGehu et al., 1984). Species composition varies withelevation and Pignatti (1966) described vegetativeassociations correlated with elevation and other fac-tors for Venice Lagoon wetlands. For the elevationrange for our sites, Pignatti described four vegetationassociations: a Puccinellia–Arthrocnemum associationfrom 25 to 40 cm msl (above mean sea-level), aLimonium–Puccinellia association from 15–30 cm msl,a Limonium–Spartina association from 5–20 cmmsl, and a Salicornia spp. association from 5–10 cmmsl. The species associations at our sampling sitesrelative to elevation are similar to those described byPignatti and are discussed in the sections on sitedescription and soil elevation change and vegetativesuccession. The Venice Lagoon marshes are import-ant in Europe due to their aerial extent, high produc-tivity, and habitat value (Dijkema, 1984). Salt marsharea in the lagoon, has fallen from about 12 000 ha atthe beginning of the century to about 4000 ha atpresent due to reclamation, erosion, pollution, andnatural and human-induced subsidence (Favero,1992; Runca et al., 1993).
The marshes of Venice Lagoon occur in a highlyvariable environment with respect to salinity, sedi-ment availability and hydrodynamic forces. In order todetermine the effects of this variability on accretionand erosion processes, we selected sites in a number ofrepresentative marsh areas of the lagoon and stationswere established in each of these in 1993 and 1994(Figure 1). The elevation of the sites was determinedusing DGPS technology with an accuracy of &3 cm.
Site descriptions
San Felice. This salt marsh is located near the Lidoinlet. Before the construction of jetties, this marsh islikely to have received inputs of coarser sedimentsfrom the near-shore Adriatic Sea (Albani et al., 1983).Salt marshes in this area currently exist mainly asrelatively narrow fringes along tidal creeks whileinterior zones between creeks are shallow ponds,which formed over the last several decades due to thedisappearance of interior marsh. The study area islocated between a tidal creek and a shallow pond.Sites were set up in each of two vegetation zones, a
higher A. fruticosum–L. serotinum–P. palustris domi-nated marsh nearer the tidal creek (S. Felice 1,elevation 0·35 m msl) and a lower marsh dominatedby S. maritima about 20 cm in height with a muchlesser occurrence of L. serotinum (S. Felice 2, evalu-ation 0·29 m msl). Although the marshes at this siteare relatively high, the soils have a high clay contentand do not drain well.
Isola dei Laghi. This salt marsh is intermediatebetween the mouth of the Dese River and San Felice,and probably receives sediments from both the seaand river. Wetland vegetation is dominated by Juncusmaritimus, with much lower occurrence of S. maritimaand L. serotinum. A site was established in the marshadjacent to a small tidal creek at 0·29 m msl.
Dese. This tidal freshwater marsh located near themouth of the Dese River receives sediment input fromthe river and is composed of nearly pure stands ofPhragmites australis. Two sites were established, oneon the edge of a tidal creek about 300 m from the river(Dese 1, 0·29 m msl) and a second on the edge of theriver (Dese 2, 0·36 m msl).
Tessera. This salt marsh is located on the western edgeof the lagoon adjacent to Marco Polo airport and isexperiencing edge erosion due to wave attack. Thevegetation in the area is composed of A. fruticosum, P.palustris and L. serotinum. Two sites were establishedin this area at 0·38 m msl (Tessera 1 and 3).
Torson di Sotto. This site is in a constructed wetland inthe southeastern lagoon formed when dredged spoilwas pumped into a confined area in 1992. By 1995,the area was sparsely covered with A. fruticosum.Sites were established in the constructed wetland(Torson 2, 0·40 m msl) and in an adjacent naturalwetland dominated by P. palustris, L. serotinum andA. fruticosum (Torson 1, 0·39 m msl).
Punta Cane. This area is an eroding wetland in thesouthern part of the lagoon in an old delta of theBrenta River where there has been rapid wave erosionand expansion of the tidal channel network during thiscentury. Wetland vegetation includes A. fruticosum, P.palustris and L. serotinum. The marsh edge is beingeroded by wind waves (Day et al., 1998) and two smalltidal channels about 10 m long are cutting into themarsh. A site was established in the marsh within30 m of the eroding marsh edge at an elevation of0·44 m msl. Soil elevation change stations were estab-lished about 4 m in front of the marsh where erosion istaking place (at about "0·35 m msl). Because of the

Venice Lagoon wetland accretion 611
high rate of shoreline erosion, a number of markerstakes were placed along the vegetation edge to deter-mine horizontal erosion rates of the marsh edge andthe enlargement of the tidal channels.
Methods
At each study area, a 50#50 m site was marked off ina representative area of the marsh, and duplicate,randomly-placed 4#4 m plots were establishedwithin the site for measurement of short-term sedi-mentation patterns, vertical accretion, and change insoil surface elevation. Short-term sedimentation wasmeasured from March 1993 to May 1996 as theaccumulation of material on 9 cm Whatman ashlessfilters placed on the marsh surface as described byReed (1992). Three pre-weighed, numbered filterswere placed in each plot at various times throughoutthe study period and left in place for 2–4 weeks. Aftercollection, the filter pads were dried at 60 )C for 48 hand weighed to obtain total sedimentation. Whenparts of filters were lost, the percentage area lost wasestimated and corrected for this. The filters were thencombusted at 550 )C and re-weighed. The loss oncombustion was considered organic matter and thematerial remaining was inorganic. Because measure-ments were made on a short-term basis and theperiods of collection were chosen to encompass therange of events that affect sediment mobilization anddeposition on the marsh surface, the effect of theseevents (such as storms, high river flow, rainfall, as wellas calm periods) could be determined (Reed, 1992).
The short-term sedimentation study represents acompletely randomized block design, with time(sampling periods) as the blocking factor, considereda fixed effect. The study comprised 10 sites and 13sampling periods for a total of 580 observations.The analysis was conducted using SAS Proc Mixed(SAS, 1990) to handle the unbalanced data andnested error structure. A log transformationde-emphasized near-zero observations and the influ-ence of infrequent high observations (which representvery important phenomena in the sedimentationbudget). Post hoc contrasts compared marginal meansof sites (protected at the 0·05 family-wise Type I errorrate by a Bonferonni adjustment). For those samplingperiods that showed significant differences betweensites, contrasts were made comparing those in high-energy environments (decided a priori, Dese 1 and 2,Laghi and Punta Cane) with the others (also protectedby Bonferonni adjustment).
Vertical accretion was measured as the accumula-tion of material over 0·25 m2 artificial marker horizonslaid down on the marsh surface as described by
Cahoon and Turner (1989). Three horizons wererandomly laid down in each plot for a total of sixmarkers. The markers were set up in March 1993 andsampled by coring every six months until April 1996.The markers in the constructed wetland had erodedaway after three months, so no further measurementswere taken. Soil elevation changes were measuredusing a sedimentation-erosion table (SET) developedfor high precision measurements (&2 mm) of surfaceelevation in wetlands (Boumans & Day, 1993). OneSET station was established in each marsh plot(Figure 1) and surface elevation was measured atapproximately three month intervals until April 1996.SET stations were also established (February 1994)on the eroding marsh front at Punta Cane which hadbeen denuded of vegetation. Soil organic content wasevaluated by ignition loss from three soil cores (upper5 cm) taken from each station. Bulk density wasdetermined from three to five small cores (2 cmdiameter) 5 cm deep taken at each site. The data fromthe cores were ln transformed because they were notnormally distributed and differences between siteswere tested with a two-way ANOVA.
The sedimentation-erosion study followed arepeated measures design with a nested error struc-ture. Elevation was measured at 11 time intervals(approximately every three months) over three yearsat each of 10 sites and resulted in 720 observations.Two SET pipes were established at each site, whichrepresents a low sample size. Analysis of varianceconducted within the repeated measures design testedif the variance between SET pipes at each site wasequal to the variance between orientations (n=4)within a SET pipe (SAS Proc GLM; SAS, 1990). Thedesign of the SET is such that for each pipe, elevationis measured with nine pins on an arm which is placedin four different orientations (see Boumans & Day,1993 for a detailed description). An assumption of theanalysis was that the measurements at each level (pins,orientations and SET pipes) were independent. Theresults showed that for all sites, the variance com-ponents were not significantly different at P>0·14.Because of this, we pooled the two set pipes at eachsite, resulting in an effective sample size of eight (eightorientations). The repeated measures model waschanged to reflect this conceptual design change.Since the test for parallel trends among all sites overtime was significant (non-parallel), univariate analyseswere conducted on each time period and pairwisecomparisons were made between sites, using aBonferonni family-wise error rate.
The analysis of accretion over marker horizons wasalso conducted as a repeated measures model witha nested error structure, since the same sediment

612 J. W. Day Jr et al.
surface was sampled in each of six sampling datesspread over a period of 35 months. The data setcomprised 392 observations. Since the test for paralleltrends among sites was significant, univariate analyseswere conducted on each time period and pairwisecomparisons were made between sites, using aBonferonni-adjusted family-wise error rate.
The sediment elevation measurements, averagedper site, were regressed on corresponding accretion toestimate the percentage of variation in total soil eleva-tion change that could be explained by a linear trendin accretion (Proc GLM; SAS, 1990). The analysiswas limited to dates and sites held in common:May–June 1994, January 1995, June–August 1995and January–February 1996; Dese 1 and 2, Laghi,Punta Cane 1, San Felice 1 and 3, Tessera 1 and 3and Torson 1.
Shallow subsidence was calculated for each plotfollowing the approach of Cahoon et al. (1995b).Because of shallow subsidence, net soil elevationchange measured by the SET rather than verticalaccretion as measured by marker horizons must beused to determine the rate of vertical growth. There-
fore, current soil elevation change was comparedwith the present (2·4 mm yr"1) and predicted(5·0 mm yr"1) rates of RSLR for Venice Lagoon (asdocumented in the introduction) to determine hownet elevation change compared to RSLR. If there is anelevation deficit (surface elevation gain <RSLR), thesite will become progressively more waterlogged andvegetation increasingly stressed. The time course ofelevation at each site was investigated further usingthe wetland elevation model described in the nextsection.
Modelling
Sediment cohort 2
Sediment cohort n
Above andbelowground
primaryproduction
-labile organic matter-refractory organic matter-live roots-mineral matter-pore space
Sediment cohort 1Temp.
Mineralmatter
Relativewetlandelevation
ESLRand
deep subsidence
Decomposition
Compaction
F 2. Conceptual model diagram showing the three sub-models, forcing functions and field data inputs. Modified fromRybczyk et al. (1998).
Model development
The integrated model consists of three linked sub-models or sectors: (a) primary productivity; (b) sedi-ment dynamics and (c) relative soil elevation (Figure2). Numerous field measurements (Day et al., 1995a;Scarton & Rismondo, 1996), were used for modelinitialization, calibration and validation. Specifically,measurements of annual above and belowground
Venice Lagoon wetland accretion 613
production and turnover were used to calibrate andinitialize the production submodel, decompositionexperiments and soil core analyses were used to cali-brate the sediment dynamics submodel and markerhorizons were used to estimate mineral inputs. Weprogrammed the model using STELLA> icono-graphic modelling software. An Euler numerical inte-gration method, with a Ät=1 week, was used to solvethe finite difference equations generated by theSTELLA software. State variable differential equa-tions are described in Table 1. A full description of thegeneric model, including validation and calibrationexercises and sensitivity analyses, are provided byRybczyk et al. (1998). A brief description of the modeland modifications to the published model areprovided in the following sections.
Primary productivity submodel. In situ organic matter(o.m.) production is simulated in this submodel as afunction of wetland elevation. The simulated o.m. isallocated to the sediment dynamics sub-model, eitheron the surface, as litter, or within the soil column asroot biomass. There are two state variables in thissubmodel, leaf (aboveground biomass) and root(belowground biomass) (Table 1). These state vari-ables are a function of five rates: (a) net primaryproduction (maxnet), (b) leaf litter production duringthe growing season (llitrateg), (c) leaf litter productionat the end of the growing season/beginning of thedormant season (llitrated), (d) root litter production(rlitrate) and, (e) root to shoot ratio (rootmult). Below-ground production is a function of aboveground bio-mass. Litter production for both state variables arecalibrated to reflect field measurements (Scarton &Rismondo, 1996).
Because there is no linked hydrology or salt conser-vation model, elevation acts as a surrogate for salt andhydrologic stress on vegetation production in thewetland elevation model. In Venice Lagoon saltmarshes, certain plant species associations have beenshown to be characteristic of given elevation ranges(Pignatti, 1966—see Area Description, Table 2). Forall but the Dese site we ascribed four plant communityassociations to the elevation ranges 0 to 10, 10 to 20,20 to 30, and 30 to 40 cm, respectively, each withspecific net primary production, litter production andturnover characteristics (Table 2). Changes in thesecharacteristics are triggered and simulated by makingthe five rates, described in the previous paragraph, aninstant step function of elevation. In reality, vegetationshifts occur more gradually over several years, but it isbelieved that this does not introduce serious errors inthe model which has a simulation time of 100 years.This issue is addressed in more detail in the discus-
sion. In general, simulated above and belowgroundproduction, as well as mean standing crop, decreasewith decreasing elevation. Additionally, at the lowestelevations, the dominant plant species are annualinstead of perennial, therefore, there is no live over-wintering belowground biomass. At the Dese site,strong freshwater riverine inputs maintain a near-freshwater plant community dominated by P. australis.For this reason, it is assumed that this communitywill persist and that there will be a simple decreasein primary production as elevation decreases to zero.
Sediment dynamics submodel. The sediment dynamicssubmodel has four state variables representing labileo.m., refractory o.m., mineral matter and live rootbiomass distributed among a number of sedimentlayers or cohorts (Table 1). Sediment state variablesare passed from cohort to cohort according to thefollowing simulated yearly time sequence; 1 (surfacecohort), 1, 5, 5, 5, 5, 10, 10, 10, 10, 10, 10, 10, 10,10, 20, 20 and 20+ (deepest cohort) years. Thus shortterm sediment processes, most of which occur nearthe sediment surface, are simulated within the cohortswith the shortest retention period. This allows forprecise calibration and resolution of output. Deepsediment process, which for the most part occur atdecades-long time scales, are simulated within thecohorts with the longest retention time.
Maximum mineral inputs are the only forcing func-tions in this submodel, as other inputs are modelgenerated. This submodel simulates decomposition ofo.m., inputs of mineral matter, the distribution of rootbiomass, sediment compaction, and the transfer ofmaterial from cohort to cohort. Output includes thefollowing sediment characteristics with depth: bulkdensity, sediment height, organic and mineral mattermass and volume, pore space and live root mass.
Changes within each sediment cohort, due todecomposition and belowground production, whichare both a function of model-generated depth, arecalculated on a weekly basis. Sediment compaction,also calculated weekly, is a function of the mass ofmaterial above a particular cohort. This sector isparticularly powerful, because the measurementsobtained from a few soil cores (bulk density, and %organic and mineral matter) along with measurementsof accretion rates, (e.g. 210Pb and marker horizons)provide a comprehensive set of data which can beused to calibrate the submodel at several points.Critical algorithms for this submodel are describedbelow.
Decomposition: The model separates all o.m. intolabile and refractory pools, each with its own timedependent decay rate. Additionally, the labile o.m.

614 J. W. Day Jr et al.
T 1. State variables and differential equations for the Integrated Wetland Elevation Model
Labile organic matter sediment cohorts , lab_belown
d(lab_belown)/dt= (litter# leaf_lab_frac)+(rlitn#rlab%)+(tranln"1# lab_belown"1)"lab_belown#klab)"(tranln# lab_belown)
where:lab_belown labile organic matter in cohort n (g C cm"2)litter aboveground leaf litter inputs to surface cohort (g C cm"2 week"1)leaf_lab_frac labile fraction of aboveground biomass (unitless)rlitn root litter inputs to cohort n (g C cm"2 week"1)rlab% labile fraction of root litter (unitless)tranln"1 transfer rate of labile o.m. from overlying cohort (g C cm"2 yr"1)lab_belown"1 labile o.m. in overlying cohort (g C cm"2)klab decomposition rate of labile organic matter (week"1)tranln transfer rate of labile o.m. to underlying cohort (g C cm"2 yr"1)
Refractory organic matter sediment cohorts, ref_belown
d(ref_belown)/dt= (litter#(1" leaf_lab_frac))+(rlitn#(1"rlab%))+(tranrn"1#ref_belown"1)"(ref_belown#kref)"(tranrn#ref_belown)
where:ref_belown refractory o.m. in cohort n (g C cm"2)tranrn"1 transfer rate of refractory o.m. from overlying cohort (g C cm"2 yr"1)ref_belown"1 refractory o.m. in overlying cohort (g C cm"2)kref decomposition rate of refractory organic matter (week"1)tranrn transfer rate of refractory o.m. to underlying cohort (g C cm"2 yr"1)
Mineral matter in sediment cohorts, mineraln
d(mineraln)/dt= (max_min_in#minelvfunc)+(tranmn"1#mineraln"1)"(tranmn#mineraln)where:
mineraln mineral matter in cohort n (g cm"2)max_min_in maximum mineral input as a function of elevation (unitless)tranmn"1 transfer rate of mineral matter from overlying cohort (g cm"2 yr"1)mineraln"1 mineral matter in overlying cohort (g cm"2)tranmn transfer rate of mineral matter to underlying cohort (g cm"2 yr"1)
Live roots in sediment cohorts, rootn
d(rootn)/dt= rootinn"(rlitrate#rootn)where:
rootn live root biomass in cohort n (g C cm"2)rootinn fraction of total root production (root) distributed to cohort n (g C cm"2)rlitrate rate of root litter production (week"1)
Aboveground macrophyte biomass, Leaf
d(leaf)/dt= maxnet"(leaf# llitrateg)"(leaf# litrated)where:
leaf aboveground biomass (g C m"2)maxnet maximum net primary productivity (g C m"2 week"1)llitrateg leaf litter production rate during the growing season (week"1)llitrated leaf litter production rate during the dormant season (week"1)
Belowground macrophyte biomass, Root
d(root)/dt= rootprod"(root#rlitrate)where:
root belowground live root biomass (g C m"2)rootprod root production rater (g C m"2 week"1)rlitrate root litter production rate (week"1)
Venice Lagoon wetland accretion 615
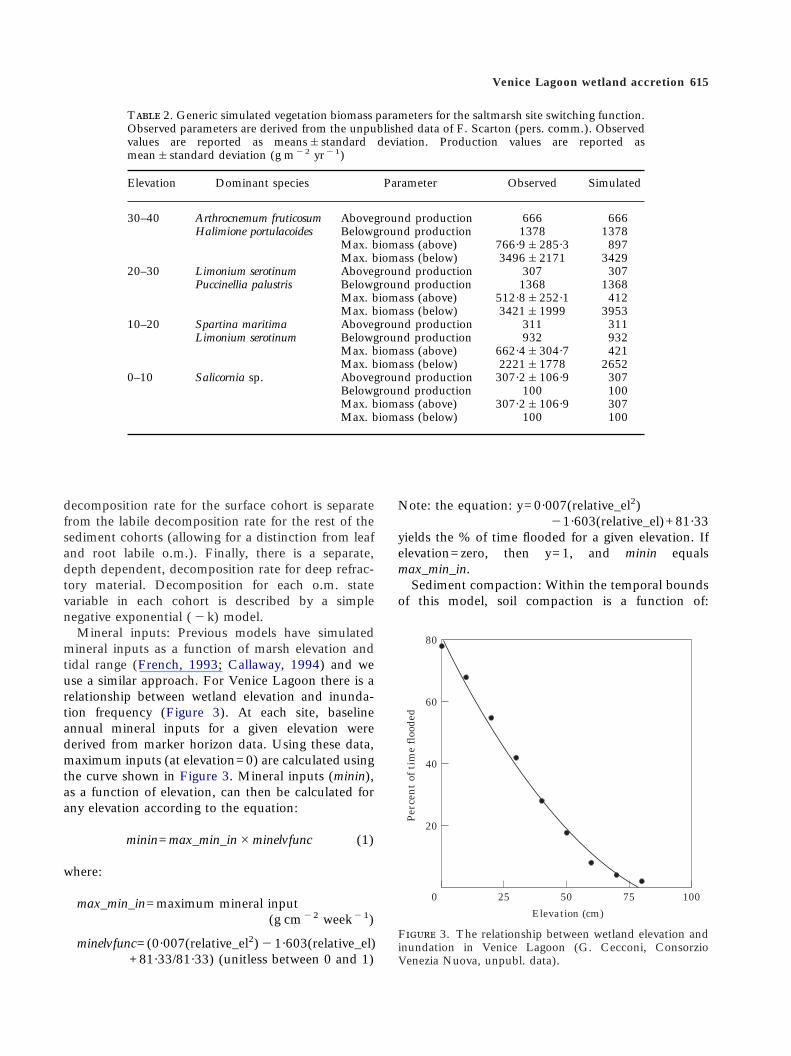
T 2. Generic simulated vegetation biomass parameters for the saltmarsh site switching function.Observed parameters are derived from the unpublished data of F. Scarton (pers. comm.). Observedvalues are reported as means&standard deviation. Production values are reported asmean&standard deviation (g m"2 yr"1)
Elevation Dominant species Parameter Observed Simulated
30–40 Arthrocnemum fruticosum Aboveground production 666 666Halimione portulacoides Belowground production 1378 1378
Max. biomass (above) 766·9&285·3 897Max. biomass (below) 3496&2171 3429
20–30 Limonium serotinum Aboveground production 307 307Puccinellia palustris Belowground production 1368 1368
Max. biomass (above) 512·8&252·1 412Max. biomass (below) 3421&1999 3953
10–20 Spartina maritima Aboveground production 311 311Limonium serotinum Belowground production 932 932
Max. biomass (above) 662·4&304·7 421Max. biomass (below) 2221&1778 2652
0–10 Salicornia sp. Aboveground production 307·2&106·9 307Belowground production 100 100Max. biomass (above) 307·2&106·9 307Max. biomass (below) 100 100
100
80
Elevation (cm)
Per
cen
t of
tim
e fl
oode
d
50
60
40
20
25 750
F 3. The relationship between wetland elevation andinundation in Venice Lagoon (G. Cecconi, ConsorzioVenezia Nuova, unpubl. data).
decomposition rate for the surface cohort is separatefrom the labile decomposition rate for the rest of thesediment cohorts (allowing for a distinction from leafand root labile o.m.). Finally, there is a separate,depth dependent, decomposition rate for deep refrac-tory material. Decomposition for each o.m. statevariable in each cohort is described by a simplenegative exponential ("k) model.
Mineral inputs: Previous models have simulatedmineral inputs as a function of marsh elevation andtidal range (French, 1993; Callaway, 1994) and weuse a similar approach. For Venice Lagoon there is arelationship between wetland elevation and inunda-tion frequency (Figure 3). At each site, baselineannual mineral inputs for a given elevation werederived from marker horizon data. Using these data,maximum inputs (at elevation=0) are calculated usingthe curve shown in Figure 3. Mineral inputs (minin),as a function of elevation, can then be calculated forany elevation according to the equation:
minin=max_min_in#minelvfunc (1)
where:
max_min_in=maximum mineral input(g cm"2 week"1)
minelvfunc=(0·007(relative_el2)"1·603(relative_el)+81·33/81·33) (unitless between 0 and 1)
Note: the equation: y=0·007(relative_el2)"1·603(relative_el)+81·33
yields the % of time flooded for a given elevation. Ifelevation=zero, then y=1, and minin equalsmax_min_in.
Sediment compaction: Within the temporal boundsof this model, soil compaction is a function of:

616 J. W. Day Jr et al.
(a) o.m. decomposition, simulated separately and, (b)the reduction of sediment pore space (primary con-solidation) (Penland & Ramsey, 1990). Callaway et al.(1996) simulated the compaction of pore space as anasymptotic decrease with depth, bounded by pre-setminimum and maximum pore space values. We use amodified version of Callaway’s algorithm, where thedecrease in pore space for a given cohort (pore_spacen)is a function of the mass of material above it:
porespacen
=poremin+(poremax"poremin)#compactn). (2)
where:
pore_spacen=pore space of cohort n (%)poremin=minimum pore space for the entire
sediment column (%)poremax=maximum pore space for the entire
sedimentation column (%)compactn=1"(tmassi /(compk+tmassi) (unitless)
The parameter, compactn describes a Michaelis–Menten type reduction in pore space where:
tmassi=mass of sediment overlying cohort n(g cm"2)
compk=half saturation compaction constant (unit-less)
Poremin, poremax and compk values are derivedfrom site specific soil cores collected to a depth ofapproximately 40 cm.
Relative elevation sub-model. Wetland elevation, rela-tive to sea level, is simulated as the balance betweeneustatic sea-level rise (ESLR), deep subsidence, shal-low subsidence and the accretion of organic andinorganic material. The accretion of mineral matter ismodelled explicitly with the minin function describedin the sediment dynamics submodel. Inputs of o.m.are simulated in the primary productivity submodel.Shallow subsidence is modelled explicitly with separ-ate decomposition and pore space compaction func-tions. The remaining two parameters that affectsimulated relative elevation, deep subsidence andESLR, are entered into the model as forcing functions.
Initialization and calibration: data required formodel initialization are shown in Table 3. It is criticalto note that the only data required for model calibra-tion include annual accretion and, most critically,sediment bulk density, % organic matter, % mineralmatter and pore space with depth. Calibration proce-dures are described in detail by Rybczyk et al. (1998).
Simulation scenarios: for all sites we first ran themodel for 200–300 simulated years, to allow themodel to generate a stable simulated soil column.Output from this ‘ pre-simulation ’ was then used toinitialize the sediment column state variables forfuture simulations. To simulate and predict wetlandsustainability over the next 100 years at all sites, weused as forcing functions, estimates of deep subsid-ence from Carbognin et al. (1996) and two IPCCeustatic sea-level rise scenarios over the next 100years: (a) ‘ current trends ’ of 15 cm and, (2) ‘ bestestimate ’ of 48 cm (Gornitz, 1995). Additionally, bysystematically varying simulated mineral inputs toeach site, it was possible to estimate the amount ofadditional mineral sediments required to maintainwetland elevation under both IPCC scenarios.
Results
Short term sedimentation on the filter pads at thedifferent sites was highly variable, ranging from 0·1 to73 g m"2 day"1 (Figure 4). This high variabilityreflected the importance of high energy events, such asstrong storms and river floods, in mobilizing andtransporting sediments. Significant differencesbetween sites existed for all sampling periods exceptMay 1993, August 1994 and April 1995. The contrastbetween high energy sites and low energy sites wassignificant only in October and November 1993,November 1994 and January and November 1995.These sampling periods occur in the late autumn-early winter, a period characterized by strong windsand high river discharge. For example, the highestsedimentation (73·3 g m"2 day"1) at Punta Cane inOctober 1993 was associated with sustained Sciroccowinds of 60 kph and the highest tides recorded in thelast 10 years. The material deposited in the filters was27·7–32·4% organic matter. High sedimentation ratesassociated with storms also occurred at Tessera andLaghi; and at Dese associated with river floods prior tothe November 93 and May 94 samplings (Figure 4).The lowest mean values (1·7 and 2·2 g m"2 day"1)occurred at San Felice. Short term sedimentation wasuniformly low at this site (always less than 5 g m"2
day"1) suggesting that high energy events do notpromote sediment input to this area (Figure 4). Thisis likely partially the result of the jetties in the Lidoinlet which restrict the input of sediments from thenear shore Adriatic. Thus, this deteriorating saltmarsh has very low sediment input.
Soil elevation change showed significant differencesamong sites over all sampling periods. As with shortterm sedimentation, high variability resulted in a lack

T 3. Initialization para
SymbolSan Felice
1San Felice
2Torson
1 Punta Cane DeseTessara
1
init_elev initial wetla 33 30 39 43 29 39min_in current min 0·0020 0·0017 0·0015 0·0074 0·0031 0·0023max_min_in maximum m 0·0125 0·0088 0·0142 0·09974 0·0149 0·0212surate local deep s 0·15 0·15 0·05 0·125 0·075 0·025poremax max. fractio 73 78 0·80 86 82 80poremin mini. fractio 43 39 78 79 76 63comp_k soil compac 8 1 50 3 2 8kdeep decomp. ra 0·005 0·0003 0·0004 0·0001 0·0005 0·0003klab decomp. ra 0·05 0·015 0·05 0·05 0·046 0·05klabsurf decomp. ra 0·05 0·031 0·05 0·05 0·046 0·05krefr decomp. ra 0·002 0·0015 0·0025 0·0015 0·0015 0·0025leaf_lab_frac labile % of 50 50 60 60 33 60maxnet max. net ab 10·6 10·6 10·6 10·6 10·6 16·9rlab% labile % of 50 20 30 20 20 30root_k root distribu 0·20 0·08 0·06 0·05 0·08 0·05
Ven
iceL
agoonw
etland
accretion617
meters for Integrated Elevation Model
Description Units Laghi
nd elevation cm 29eral inputs g cm"2 week"1 0·0025ineral input g cm"2 week"1 0·0122
ubsidence rate cm yr"1 0·075n of pore space % 79n of pore space % 55tion half. sat. g cm"2 10te of deep refractory o.m. week"1 0·0005te of labile o.m. week"1 0·05te of surface labile o.m. week"1 0·05te of refractory o.m. week"1 0·0025aboveground biomass % 60oveground production g C m"2 week"1 4·7live roots % 30tion constant cm"1 0·11

618 J. W. Day Jr et al.
30
0
g m
–2 d
ay–1
25Dese
20
15
10
5
30
0
g m
–2 d
ay–1
25Laghi
20
15
10
5
10
0
g m
–2 d
ay–1
S. Felice 18
6
4
2
10
0
g m
–2 d
ay–1
S. Felice 28
6
4
2
60
0
g m
–2 d
ay–1
55Tessera
20
15
10
5
30
0
g m
–2 d
ay–1
25Torson 1
20
15
10
5
10
0
g m
–2 d
ay–1
Torson 28
6
4
2
75
0
g m
–2 d
ay–1
70Punta Cane 1
20
15
10
5
Apr
-93
May
-93
Oct
-93
Nov
-93
Feb
-94
May
-94
Au
g-94
Nov
-94
Jan
-95
Apr
-95
May
-95
Nov
-95
Apr
-96
May
-94
Au
g-94
Nov
-94
Jan
-95
Apr
-95
May
-95
Nov
-95
Apr
-96
Apr
-93
May
-93
Oct
-93
Nov
-93
Feb
-94
Date Date
F 4. Short-term sedimentation rates at the different sites. Results for Dese 1 and 2 and for Tessera 1 and 3 arecombined. Vertical lines are &one standard error. Note different scales for San Felice 1 and 2 and Torson 2.
of consistent trends over time (Figure 5). No signifi-cant differences existed between the high energy sitesand the low energy sites as groups. The only trendswere with individual sites; Punta Cane 2 and Torson2. Torson 2 (the constructed wetland) and PuntaCane 2 (the eroding mudflat in front of the marsh)had consistent elevation loss, always greater than theother sites (adjusted P<0·05). Punta Cane 1 had thehighest soil elevation change at the end of three years(5·88 cm). At the end of two years, the high energysites averaged 0·89&0·29 cm yr"1 (&1 standarderror), 0·61&0·09 cm yr"1 not considering PuntaCane 1. The remaining sites (not including PuntaCane 2 or Torson 2) averaged 0·36&0·06 cm yr"1.
Vertical accretion at the high energy sites (Dese,Laghi and Punta Cane 1) was always greater than atthe other sites (San Felice, Tessera, and Torson 1)throughout the study period (P<0·0037) (Figure 5).After 35 months, the high energy sites averaged0·99&0·0·4 cm yr"1, compared to 0·38&0·06 cmyr"1 for the other sites. These results compare verywell to those of sediment elevation. Generally, trendsare more apparent in accretion than in sedimentelevation, since the latter is a combination of otherfactors which each contribute to the overall variance ofthe measurements. The difference between the highenergy sites and the others was mainly attributed toPunta Cane 1, which showed significantly greater

Venice Lagoon wetland accretion 619
2
–1
Mar
-93
Dese 2 (fresh marsh)
cm
0
1.5
–0.5
0.5
1
Oct
-93
Jun
-94
Feb
-95
Oct
-95
Jun
-96
2
–1
Mar
-93
Laghi (salt marsh)
cm
0
1.5
–0.5
0.5
1
Oct
-93
Jun
-94
Feb
-95
Oct
-95
Jun
-96
2
–1
Mar
-93
S. Felice 1 (salt marsh)
cm
0
1.5
–0.5
0.5
1
Oct
-93
Jun
-94
Feb
-95
Oct
-95
Jun
-96
2
–1
Mar
-93
S. Felice 2 (salt marsh)
cm
0
1.5
–0.5
0.5
1
Oct
-93
Jun
-94
Feb
-95
Oct
-95
Jun
-96
2
–1
Mar
-93
Tessera 1 (salt marsh)
cm
0
1.5
–0.5
0.5
1
Oct
-93
Jun
-94
Feb
-95
Oct
-95
Jun
-96
2
–1
Jun
-94
Tessera 4 (tidal flat)
cm
0
1.5
–0.5
0.5
1O
ct-9
4
Jan
-95
May
-95
Jan
-96
May
-96
2
–1
Mar
-93
Torson 1 (salt marsh)
cm
0
1.5
–0.5
0.5
1
Oct
-93
Jun
-94
Feb
-95
Oct
-95
Jun
-96
0
–10
Mar
-93
Torson 2 (artificial marsh)
cm
–8
–2
–6
–4
Oct
-93
Jun
-94
Feb
-95
Oct
-95
Jun
-96
7
0
Mar
-93
Punta Cane 1 (salt marsh)
cm
2
5
1
34
Oct
-93
Jun
-94
Feb
-95
Oct
-95
Jun
-96
0
–10
Mar
-93
Punta Cane 2 (tidal flat)
cm
–8
–2
–6
–4
Oct
-93
Jun
-94
Feb
-95
Oct
-95
Jun
-96
Sep
-95
6
F 5. Vertical accretion (bars) and soil elevation change (line with solid squares) for the different sites (results for Dese1 and Tessera 3 are not shown but are very similar to the data presented). O elevation is the beginning elevation at each site.Tessera 4 and Punta Cane 2 are intertidal mudflats. Torson 2 is a marsh constructed from dredge spoil material. Markerhorizons to measure accretion at this site were eroded away by waves after three months. Vertical lines are &one standarderror.

620 J. W. Day Jr et al.
2.00
–2.50D1
D1 = Dese 1, D2 = Dese 2, L = Laghi, SF1 = S. Felice 1, SF2 = S. Felice 2, T1 = Tessera 1,T2 = Tessera 2, To1 = Torson 1, To2 = Torson 2, PC1 = Punta Cane 1
cm y
r–1
Sedimentation erosion table
0.00
1.50
1.00
0.50
–0.50
–1.00
–1.50
–2.00MarkersShallow subsidence
D2 L SF1 SF2 T1 T3 To1 To2 PC1
RSLR 1996
RSLR 2050
F 6. A comparison of soil elevation change, vertical accretion, and shallow subsidence at each of the sites. The dottedhorizontal line is the current rate of relative sea-level rise (RSLR) and the darker, dashed horizontal line is the estimated rateof RSLR for 2050 based on the later IPCC estimates.
accretion than the other sites for most time periodsacross the 35-month study. Only Dese 2 andTessera 1 had similarly high accretion in the June1994 sampling, over the same time in whichPunta Cane had significant erosion. The strength ofthe linear relationship between total soil elevationchange and total accretion generally increased overtime. After four months, only 17·4% of the totalvariation in sediment elevation could be explained bythe linear regression. After two years, the R2 rose to0·86.
At the end of three years, surface elevation increasewas in all cases less than vertical accretion, indicatingthat accreted material was compacting and consolidat-ing due to shallow subsidence (Figure 6). The presentrates of elevation gain at San Felice 1, Tessera, andthe natural Torson site are less than present rates ofRSLR. The rate at San Felice 2, 0·24 cm yr"1, isslightly higher than the present rate of RSLR. Thepresent rates of elevation gain at Laghi, Dese andPunta Cane are higher than RSLR predicted for 50years. The marsh at Punta Cane has a very high rate ofsurface elevation gain which is greater than the upperlimits predicted by the IPCC. This site, however, iseroding rapidly and the study plots will be erodedwithin 15–25 years.
The edge of the marsh at Punta Cane is experienc-ing a rapid retreat due to wave induced erosion.
The vegetation edge retreated at a rate of 1·2–2·2 m yr"1. The two tidal channels are lengtheningby 0·2 and 0·6 m yr"1 and widening by 0·48 and0·26 m yr"1, respectively. We observed distinctdepositional layers in the exposed vertical erosionalsurface on the edge of the tidal channel. Material ofrelatively recent origin such as plastic sheeting wasburied 30–50 cm indicating that this marsh formedrapidly over the past several decades by verticalaccretion.
The results of the soil analysis show a clear differ-ence between the natural marshes and the constructedone, which had a higher fresh weight (2·1 vs 1·25 to1·49 g cm"3 for the natural marshes), lower watercontent (25·4 vs 47·6 to 72%), lower organicmatter (10·8 vs 18·3 to 26·6%) and higher bulkdensity (1·6 vs 0·36 to 0·8 g cm"3). Among thenatural marshes, there was no difference in freshweight (F6,38=2·00, NS) whereas there was a highlysignificant difference in organic matter (F6,38=16·77,P<0·001) and bulk density (F6,38=6·00, P<0·001).Overall, the riverine site with P. australis had higherwater content (72·0%) and lower bulk density(0·33 g cm"3) than the salt marsh sites. Of the naturalsalt marshes, the higher site at San Felice (site 1)had the highest bulk density (0·50 g cm"3) andthe lowest water (47·6%) and organic matter (24%)content.

Venice Lagoon wetland accretion 621
Model output
Eustatic sea-level rise scenarios
Given the IPCC ‘ best estimate ’ (BE) ESLR scenarioof 48 cm in the next 100 years, only Puna Cane couldmaintain its elevation relative to sea level. Under theIPCC ‘ current conditions ’ (CC) ESLR scenario of15 cm in the next 100 years, the elevation at four sitesremained above sea level for the entire simulationperiod; Tessera 1, Torson 1, Punta Cane and Dese.Simulation results from each site are discussedseparately below.
Under CC, simulated wetland elevation at Laghideclines relative to sea level over 100 years, but doesnot fall below 0 cm MSL during that time period.Under BE, simulated wetland elevation falls below sealevel in 82 years (Table 4 and Figure 7). This site isespecially vulnerable to loss because the initial elev-ation is already low relative to other wetlands inthe Lagoon, subsidence is moderately high, andmineral inputs and organic matter production areintermediate to low compared to other sites (Table 3).
At both San Felice 1 and 2, simulated wetlandelevation under CC declines relative to sea level over100 years, but does not fall below 0 cm MSL duringthat time period. Under BE, simulated wetland eleva-tion falls below sea level in 75 years for San Felice 1and in 63 years for San Felice 2 (Table 4 and Figure7). The model indicates that both sites are vulnerabledue to low mineral inputs and high rates of subsidence(Table 3).
At Tessera 1, simulated wetland elevation at thissite is stable over 100 years under the CC scenario.Under BE, simulated wetland elevation declines rela-tive to sea level over 100 years, but does not fall below0 cm MSL during that time period (Table 4 andFigure 7). Although mineral inputs are low at this site
(Table 3), the initial elevation is high and subsidencerates are also low, thus countering a marginalaccretion environment.
Under CC, simulated wetland elevation at Torson 1is stable over 100 years. Under BE, simulated wetlandelevation declines relative to sea level over 100 years,but does not fall below 0 cm MSL during that timeperiod (Table 4 and Figure 7). Mineral inputs are lowat this site, but are balanced by low rates of subsidenceand a high initial elevation (Table 3).
At Punta Cane simulations indicate that wetlandelevation would be stable over the next 100 yearsgiven either CC or BE scenarios (Table 4 and Figure7). Mineral and organic matter inputs are quite highat this site, balancing both ESLR and subsidence(Table 3). However, it should be noted that this sitehas a high rate of shoreline erosion, a process notsimulated during these exercises. Thus, even thoughthis is the only site which is stable vertically, it willmost likely erode completely within a few decades.
Finally, under CC, simulated wetland elevation atDese is stable over 100 years. Under BE, simulatedwetland elevation declines relative to sea level over100 years, but does not fall below 0 cm MSL duringthat time period (Table 4 and Figure 7). This site ismoderately stable due to high initial elevationand high rates of mineral inputs which balanceintermediate rates of subsidence (Table 3).
T 4. Number of years to wetland submergence (wetland elevation relative to sea level=0), givena 100 year simulation, under various IPCC ESLR scenarios. ‘ Declining ’ indicates that althoughwetland elevation is decreasing, elevation does not reach zero within a 100 year time frame
Site
Number of years to submergence
IPCC‘ Current conditions ’
IPCC‘ Best estimate ’
Laghi Declining 82San Felice 1 Declining 75San Felice 2 Declining 63Tessera 1 Relative elevation is stable DecliningTorson 1 Relative elevation is stable DecliningPunta Cane Relative elevation is stable Relative elevation is stableDese Relative elevation is stable Declining
Estimates of mineral inputs required for marsh survival
Only one site, Punta Cane, required no additionalmineral inputs for both ESLR scenarios. Three othersites required no further inputs under the CC scen-ario; Tessera 1, Torson 1 and Dese (Table 5). Underthe CC scenario, the amount of additional mineralsediment required to maintain elevation in the

622 J. W. Day Jr et al.
2090
60
–202000
Ele
vato
in (
cm)
2050
40
20
0
2010 2020 2030 2040 2060 2070 2080
(a) Laghi
2090
60
–202000
Ele
vati
on (
cm)
2050
40
20
0
2010 2020 2030 2040 2060 2070 2080
(b) San Felice 1
2090
60
–202000
Ele
vati
on (
cm)
2050
40
20
0
2010 2020 2030 2040 2060 2070 2080
(c) San Felice 2
2090
60
–202000
Ele
vati
on (
cm)
2050
40
20
0
2010 2020 2030 2040 2060 2070 2080
(d) Tessera 1
2090
60
–202000
Ele
vati
on (
cm)
2050
40
20
0
2010 2020 2030 2040 2060 2070 2080
(e) Torson 1
2090
60
–202000
Ele
vati
on (
cm)
2050
40
20
0
2010 2020 2030 2040 2060 2070 2080
(f) Punta Cane
2090
60
–202000
Ele
vati
on (
cm)
2050
40
20
0
2010 2020 2030 2040 2060 2070 2080
(g) Dese
Relative wetland elevation given the 'current conditions' scenarioRelative wetland elevation given the 'best estimate' scenarioSea level
F 7. Wetland elevation relative to sea level in the next 100 years for two IPCC eustatic sea-level rise scenarios: (1)Current conditions=15 cm sea level rise (solid line) and, (2) best estimate=48 cm sea level rise (dashed line). Wetlandelevation is plotted relative to sea level, therefore sea level appears constant (shown as dashed and dotted line).

Venice Lagoon wetland accretion 623
non-stable sites ranged from 2·5 to 7·9 times thecurrent inputs. Under the BE scenario, additionalmineral sediments required to maintain elevationranged from 3·2 to 22·6 times the current inputs.
T 5. Predicted mineral inputs required over the next 100 years to maintain wetland elevationunder two IPCC ESLR scenarios. All units are g dry wt. m"2 yr"1
WetlandActual mineral inputs
(1993–1996)
Mineral inputs required to maintainelevation under various ESLR scenarios
IPCCCurrent conditionsa
IPCCBest estimateb
Laghi 1318 3325 10 985San Felice 1 1052 7035 16 727San Felice 2 905 6749 20 527Tessera 1 1202 No additions required 6806Torson 1 800 No additions required 6352Punta Cane 3838 No additions required No additions requiredDese 1611 No additions required 5162
aCurrent conditions: 15 cm ESLR in the next 100 years.bBest estimate: 48 cm ESLR in the next 100 years.
Discussion
The patterns of soil accretionary dynamics in VeniceLagoon reflect variability in sediment supply, hydro-dynamic energy, sediment consolidation and relativesea-level rise and are consistent with trends observedin other areas. During this century there has been arelative increase in water level due to eustatic sealevel rise, subsidence, and deepening of the lagoon(Cavazzoni & Gottardo, 1983; Sestini, 1992). Thishad led to both greater wave energy and a larger tidalprism, both of which have affected the sedimentdynamics and geomorphology of wetlands.
Short-term sedimentation patterns were highly vari-able with peak rates over an order of magnitudegreater than the lowest ones. This high variabilityresulted because most sediment deposition on themarsh surface was associated with high energy eventssuch as storms or river floods, as has been reported forthe Mississippi delta, the Rhone delta, south-eastEngland and other areas (Stumpf, 1983; Baumannet al., 1984; Reed, 1989; Pethick, 1992; Day et al.,1995b). The highest short-term sedimentation ratesoccurred at Punta Cane during strong storms whilethe lowest rates occurred at San Felice. Our rates werecomparable to values reported elsewhere. In theMississippi delta, mean rates ranged from 0 to40 g m"2 day"1 (Reed, 1989, 1992; Boumans &Day, 1994) where the highest rates occurred near thecoast and during frontal passage and the lowest rates
occurred in impounded marshes. Short term sedimen-tation associated with Hurricane Andrew was as highas 130 g m"2 day"1 in the Mississippi delta (Cahoonet al., 1995b). In the Rhone delta, short term sedimen-tation ranged from <1·0 to 95 g m"2 day"1 with thehighest values associated with a major Rhone Riverflood and high winds (Day et al., 1995b; Hensel et al.,1998, 1999).
The results for most sites also showed very dynamicmarsh surfaces with increases in elevation and accre-tion followed by decreases, sometimes by more than acm during one sampling interval. Similar findingshave been reported from the Mississippi delta(Baumann et al., 1984; Reed, 1992; Boumans & Day,1994), Delaware (Stumpf, 1983) and south-eastEngland (Pethick, 1992). Pethick (1992) reportedthat the surface of saltmarshes in south-easternEngland increased by 1·4 cm yr"1 and the mudflat infront of the marsh eroded by a similar amount; erosionof the marsh surface was as high as 0·5 cm duringstrong storms. Hartnall (1986) reported seasonalchanges in the surface elevation of a salt marsh atLincolnshire, U.K., of up to 3·0 cm yr"1 withincreases in the summer and decreases in the winter.These changes were attributed to seasonal growth anddecay of marsh vegetation as well as to sediment inputand the highest rates of elevation gain were in areaswith a high density of tidal channels. Baumann et al.(1984) also reported erosion of the marsh surface inthe Mississippi delta. SET results from other areasalmost always show both increases and decreases inmarsh surface elevation, sometimes greater than1·0 cm over several months (Childers et al., 1993;Cahoon et al., 1995a,b Hensel et al., 1999). Thesechanges have been attributed to storm deposition,consolidation of deposited material, seasonal patterns

624 J. W. Day Jr et al.
of root growth and decomposition and shrinking andswelling of the soil under different inundationpatterns. At Punta Cane, storm deposition followedby decomposition is clearly taking place but the otherfactors may be important at several of the sites.
The overall average rate of vertical accretion at thedifferent sites, which ranged from 0·3–1·9 cm yr"1,is similar to values reported for other coastal wetlands.The highest rates are similar to those from theMississippi delta where there is a high rate of geologi-cal subsidence. Cahoon (1994) reported that verticalaccretion in the Mississippi delta was 0·3 cm yr"1 ina brackish marsh far from the coast and about1·0 cm yr"1 in a marsh near the coast. Cahoon andReed (1995) found accretion strongly related toduration of flooding in a Louisiana salt marsh, whereduring a stormy, high water period, accretion was3·6 cm yr"1 compared to 1·08 cm yr"1 during anormal period. For the Rhone delta, Hensel et al.(1999) reported rates of vertical accretion of0–2·5 cm yr"1 and in the Ebro delta, accretion rangedwas 0–0·04 cm yr"1 (Ibanez et al., 1997). In both ofthese cases, the highest accretion occurred at tidalriverine sites. Roman et al. (1997) reported thataccretion in a New England back barrier salt marshadjacent to a tidal inlet was highest during periodswith major coastal storms.
In two of the sites, Punta Cane and Tessera, therewas rapid shoreline erosion due to wave attack, whichis common for exposed marshes (Wells, 1995). Inaddition, new tidal channels are forming at PuntaCane. Our measurements of shoreline retreat at PuntaCane of 1·2–2·2 m yr"1 compare favourably with thelonger term retreat rate of 0·8–2·7 m yr"1 measuredfor marshes in the southern Lagoon between 1933and 1970 (Cavazzoni & Gottardo, 1983). This reduc-tion in marsh area is consistent with changes in thehydrodynamics and morphology of the lagoon (seeDay et al., 1998 for a more detailed discussion of thePunta Cane site). The lagoon has deepened due toRSLR and scour and, as a result, wave energy and thetidal prism have increased. Pethick (1992) hasdescribed a similar situation for marshes of theNorfolk coast in south-east England. Accelerated sea-level rise will likely lead to more rapid deterioration ofthe marshes at Punta Cane, Tessera and similarexposed areas in Venice Lagoon (e.g. Pethick, 1993;Wells, 1995).
Comparisons of observed and modelled results
Short-term measurements of accretion are usefulbecause they provide critical information concerningthe depositional characteristics of a given wetland
(e.g. % mineral and organic matter of the depositedmaterials, rates of mineral deposition and the timingand magnitude of depositional events). For example,the high rates of accretion and soil elevation changemeasured at Dese and Punta Cane suggest that thesesites have the potential for maintaining elevation assea levels increase. However, the use of such measure-ments to predict long-term wetland sustainability inthe face of RSLR is limited because short-termmeasurements of accretion do not fully integrate thelong-term processes such as primary compaction andorganic matter decomposition (shallow subsidence),that tend to reduce sediment volume over time(Cahoon et al., 1995b). In contrast, sedimenterosion tables, that integrate the sediment processesthat contribute to shallow subsidence (Boumans &Day, 1993; Cahoon et al., 1995b), yield measure-ments over time (absolute change in elevation) thatcan be directly compared to estimates rates ofRSLR (deep subsidence plus ESLR) to determine ifwetland elevation is currently stable, decreasing orincreasing.
In Venice Lagoon, rates of soil elevation changemeasured with the SET were less than rates of accre-tion measured with feldspar horizon markers for all ofthe wetland sites reflecting the effects of compactionand decomposition. Comparisons of SET measure-ments to current rates of RSLR (Figure 6) indicatethat only three wetlands, Laghi, Punta Cane andDese are currently maintaining elevation relative tosea level. However, as noted previously, these typesof direct comparisons do not take into accountpossible mechanisms that feedback on elevation pro-cesses over the long term (e.g. allogenic sedimentdeposition, decomposition and autogenic primaryproduction).
The wetland elevation model, which does considerfeedback mechanisms, indicates that given currentRSLR conditions, the elevation at four wetlands;Tessera 1, Torson 1, Punta Cane and Dese willremain stable over the next 100 years and elevationwill decline at Laghi, San Felice 1 and San Felice 2(Figure 7). Why does the model predict that elevationat Tessera 1 and Torson 1 will remain stable eventhough current SET vs RSLR comparisons suggestthe opposite (Figure 6). Initial elevation is relativelyhigh at both of these sites and, consequently, mineralinputs are low, as reflected by both the accretion andSET data (Figure 5). Since material inputs are afunction of elevation, as elevation decreases, simu-lated mineral inputs increase enough to compensatefor RLSR.
In contrast to the Tessera and Torson sites, themodel predicted that elevation will decrease relative to
Venice Lagoon wetland accretion 625
sea level at Laghi while direct comparisons of SET vsRSLR suggested the opposite. In this case, althoughcurrent mineral inputs are higher at Laghi than ateither Tessera 1 or Torson 2, the potential maximummineral inputs are higher at Torson and Tesserabecause the initial elevation at Laghi is lower. Mineralinputs are currently much closer to maximum atLaghi, than at Torson and Tessera.
Soil elevation change and vegetation succession
As the marsh surface elevation at the different sitesdeclines relative to sea level, the vegetation associ-ations at these sites will undergo a series of changesbefore the marsh converts to a mudflat due to vegeta-tion death (Pignatti, 1966, see Area description andTable 2). Although there is some elevation overlapamong these associations at our sites, the vegetationshifts towards more flood tolerant plants as marshelevation decreases. The following indicates the veg-etation changes which will likely occur under thedifferent model predictions.
The Tessera site, at 38 cm, has characteristics of thetwo higher elevation associations with A. fruticosum, P.palustris and L. serotinum. The site does not loseelevation under IPCC current conditions (CC) butdeclines to about 21 cm in 100 years under the IPCCbest estimate (BE). Under the latter scenario, A.fruticosum would probably disappear, P. palustris willlose importance and L. serotinum will gain and S.martima will likely begin to invade. The natural marshat Torson, at 39 cm, also has characteristics of the twohigher elevation associations and is dominated by L.serotinum and A. fruticosum. Elevation remains con-stant under CC and falls to 17 cm under BE. Arthroc-nemum fruticosum will probably disappear, P. palustrismay invade and gain then lose importance and L.serotinum will gain. Spartina maritima will likely beginto invade.
The higher site at San Felice 1 has an elevation of35 cm and the lower at San Felice 2 is at 29 cm.However, because of poor drainage, the vegetationassociations are mixed, but the higher site has A.fruticosum, L. serotinum and P. palustris while the lowersite is dominated by S. maritima and P. palustris. ForSan Felice 1, elevation falls to 17 cm in 100 yearsunder CC and reaches sea level in about 75 years withBE. For the same conditions at San Felice 2, elevationis 14 cm in 100 years and sea level in 65 years. SanFelice 1 will likely change to L. serotinum and S.maritima under CC and disappear in 75 years withBE. San Felice 2 will probably convert to a S. mar-itima and Salicornia association with CC anddisappear within 65 years with BE.
Laghi, at 29 cm, will decrease to about 15–16 cm in100 years under CC and decrease to sea level in about85 years with BE. Presently, J. maritimus dominates. Itwill likely shift to a marsh dominated by S. maritimaunder CC and disappear in about 75 years with BE.Dese will not change in elevation under CC but willdecrease to about 10 cm under BE. Under bothconditions, it will remain a freshwater marsh so longas there is strong riverine influence. Punta Cane at43 cm is the highest site studied and has vegetation ofthe highest elevation association. There will likely belittle change in vegetation due to soil elevationchanges which increase under both scenarios. But dueto shoreline retreat, the measurement plots will beeroded away in 15–25 years. The high elevationcommunity may maintain itself by migrating back atthe same rate as shoreline retreat until the islandfragments and disappears.
These shifts in vegetation associations have import-ant implications for organic soil formation and totalaccretion. Although there is little difference betweenthe three lower vegetation associations in above-ground production and maximum standing crop,there is a marked decrease in belowground productionand peak standing crop (Table 2). For example,belowground production is about 100 gm"2 yr"1 andbelowground biomass is 100 g m"2 for the lowestSalicornia vegetation association, while the otherassociations characteristic of higher elevations havevalues an order of magnitude higher. Thus, thebelowground vegetative contribution to soil formationwill decrease significantly as wetland elevationdeclines due to the positive feedback mechanismwhere decreasing elevation leads to rapidly decreasingorganic soil formation.
The projected trends of succession with rising sea-levels may not occur exactly as described. Roozen andWesthoff (1985) studied trends in salt marsh succes-sion over a 27 year period in a Dutch salt marsh whereelevation was increasing. They found that ‘ succes-sional trends are clearly directional, mainly in thelower parts of the salt marsh, where the effects ofthe tides is regular and predictable. In the higher partsthe trends get somewhat obscured by the variousinterconnected but convergent pathways ’. Thus, it isbelieved that the predicted trends for the Venice saltmarshes are likely to occur, but there may be somedifferences in the structure of the plant communitiesover the period when the marshes are submerging. Itis assumed that relative water-level changes aregradual enough so that vegetation change occurswithout the marsh becoming devoid of vegetation.The results of Pignatti and the vegetation compositionat our sites indicate that this is the case.

626 J. W. Day Jr et al.
The future of Venice Lagoon marshes
Compared to marshes in areas with low sea-level riseand continued sediment input, changes in the marshesof Venice Lagoon are rapid. In some coastal areas,there has been a slow but sustained vertical adjust-ment to eustatic sea-level rise for several thousandyears (Redfield, 1972; McCaffrey & Thompson,1980; Orson et al., 1987). By comparison, a numberof the marshes that have been studied have muchhigher rates of accretion and resulting elevationincrease (Laghi, Dese and Punta Cane). At PuntaCane, for example, the upper half metre of marsh hasformed over 30–40 years which is consistent with aRSLR of about 30 cm or more since 1930 (Sestini,1992; Bondesan et al., 1995). Despite the relativelyhigh rate of elevation gain at some of the sites,however, model results predict that only Punta Canehas a high enough accretion rate to maintain elevationwith predicted acceleration of sea-level rise.
Based on these results, the future of Venice Lagoonmarshes looks bleak. If no action is taken to prevent it,the marshes at Punta Cane, Tessera, San Felice andLaghi will continue to erode due to wave attack andincreasing tidal energy, perhaps at an accelerating rateas RSLR and lagoon deepening continue to increase.All marshes except Punta Cane will lose elevation ifsea-level rise accelerates. The forces which have led toand continue to lead to their degradation are likely tocontinue in the future. There is a need to balance thestrong net loss of sediments from the lagoon withsediment inputs. However, all major rivers have beendiverted from the lagoon and the presence of thejetties in the inlets restricts sediment input from thenearshore zone. Frontal erosion due to wave attack isoccurring for many of the lagoon marshes. As fetchincreases, the strength of wave attack will increase.RSLR and wave scour will continue to deepen thelagoon leading to further export of sediments. Theincreasing tidal prism will lead to increased tidalenergy which will continue to cause expansion of thetidal creek network and further sediment loss. The netsediment loss and lack of riverine sediment input iscausing low sedimentation on marsh surfaces andmost marshes are failing to keep apace of sea-levelrise. When these marshes subside to a point wherevegetation death occurs, sediment loss will beincreased even further.
If these trends of wetland loss are to be reversed,new management approaches must be adapted. Oneapproach is the diversion of river flow back into thelagoon. This would result in new sediment input andwetland expansion as happened when the BrentaRiver was diverted back into the southern lagoon from
1840–1896 to relieve flooding in agricultural landalong the diversion canal. During this period about2300 ha of coastal marsh were created in a ‘ largefluvial delta ’ (Zunica, 1974). This is equivalent toabout one third of the total wetland loss during the20th century. A practicable way to reverse waveerosion of marshes is to reduce wave energy along themarsh edge using permeable breakwaters or wave-stilling devices. Because they are permeable, theywould not reduce sediment delivery to the marshsurface and would probably enhance accretion andrevegetation in front of the marsh. Such breakwatershave been used successfully to establish marshes inThe Netherlands and the Mississippi delta (Schoot &de Jong, 1982; Boumans et al., 1997). It is possiblethat placement of such structures could be done in away that waves are reduced and accretion is enhancedin both the immediate vicinity of the structure but alsoat some distance away in adjacent areas. Such man-agement actions should be taken as part of a holisticmanagement strategy for the entire lagoon. A numberof additional elements of such an approach have beenproposed including construction of salt marshes andtidal flats with dredge material, vegetative plantings,and use of wetlands to reduce nutrient levels. Holisticmanagement approaches have been proposed for thesouth-eastern coast of the U.K. (Pethick, 1993) andfor the Mississippi delta (Day & Templet, 1989; Dayet al., 1997).
Predicting long-term marsh elevation response to relativesea-level rise
The accurate determination of the ability of anyparticular coastal wetland to survive sea-level rise iscrucial if appropriate management actions are to betaken to ensure its survival. For many years, verticalaccretion was used as a measure of the vertical growthof a wetland surface (e.g. Baumann et al., 1984;Stevenson et al., 1985; Reed & Cahoon, 1993).Vertical accretion was compared directly to local ratesof RSLR and if accretion was less than RSLR, then an‘ accretion deficit ’ existed and the wetland wouldsubmerge. As indicated in the Introduction, however,accretion alone is insufficient to determine if a wetlandis growing vertically at a rate sufficient to offsetwater-level rise. Cahoon et al. (1995b) showed that therate of soil elevation change must also be measuredbecause of shallow subsidence occurring in the uppersoil profile. Soil elevation change measurements allowa short-term comparison of the change of a wetlandsurface relative to water level changes but, alone, areinsufficient to determine long-term survival.

Venice Lagoon wetland accretion 627
As emphasized earlier, short-term field measure-ments do not fully integrate long term processes, suchas compaction and decomposition, that affect wetlandelevation and do not take into account possible elev-ation feedback mechanisms. Specifically, changes insoil elevation can result in changes in sediment depo-sition, decomposition and primary production. There-fore, it is believed that the accurate prediction ofwhether a coastal wetland will survive requires bothfield measurements of accretion and soil elevationchange and modelling, which takes into accountthese long term processes and elevation feedbackmechanisms.
Acknowledgements
This work was supported by the State WaterAuthority of Venice, the Magistrato alle Acque diVenezia, through the Consorzio Venezia Nuova.Additional support was provided by The CoastalEcology Institute and the Department of Oceanogra-phy and Coastal Sciences at LSU. We thank DrsGlenn Garson and Philippe Hensel for help withstatistical analysis, Betty Schmitt for assistancewith manuscript preparation, and two anonymousreviewers for helpful comments.
References
Albani, A. D., Favero, V. & Serandrei Barbero, R 1983 Apparatiintertidali della laguna di Venezia. Atti del convegno Laguna,fiumi, lidi; cinque secoli di gestione delle acque nelle Venezie. Venice,10–12 June, 1983.
Baumann, R., Day, J. & Miller, C. 1984 Mississippi deltaic wetlandsurvival: sedimentation versus coastal submergence. Science 224,1093–1095.
Bendoricchio, G., Di Luzio, M., Baschieri, P. & Capodaglio, A.1993 Diffuse pollution in the lagoon of Venice. Water, Science andTechnology 28, 69–78.
Bettinetti, A., Mattarolo, F. & Silva, P. 1995 Reconstruction ofsaltmarshes in the Venice Lagoon, pp. 921–935. In Proceedings ofthe MEDCOAST 94 Conference (Ozhan, E., ed.). 22–27 October1995, Tarragona, Spain.
Bondesan, M., Castiglioni, G., Elmi, C., Gabbianelli, G., Marocco,R., Pirazzoli, P. & Tomasin, A. 1995 Coastal areas at risk fromstorm surges and sea-level rise in Northeastern Italy. Journal ofCoastal Research 11, 1354–1379.
Boumans, R. & Day, J. 1993 High precision measurements ofsediment elevation in shallow coastal areas using a sedimentation-erosion table. Estuaries 16, 375–380.
Boumans, R. & Day, J. 1994 Effects of two Louisiana marshmanagement plans on water and material flux and short termsedimentation. Wetlands 14, 247–261.
Boumans, R., Day, J., Kemp, P., & Kilgen, K. 1997 The effect ofintertidal sediment fences on wetland surface elevation, waveenergy and vegetation establishment in two Louisiana coastalmarshes. Ecological Engineering 9, 37–50.
Cahoon, D. 1994 Recent accretion in two managed marsh im-poundments in coastal Louisiana. Ecological Applications 4, 166–176.
Cahoon, D. & Turner, R. 1989 Accretion and canal impacts in arapidly subsiding wetland II. Feldsparmarker horizon technique.Estuaries 12, 260–268.
Cahoon, D. & Reed, D. 1995 Relationships among marsh surfacetopography, hydroperiod, and soil accretion in a deterioratingLouisiana salt marsh. Journal of Coastal Research 11, 357–369.
Cahoon, D., Reed, D., Day, J., Steyer, G., Boumans, R., Lynch, J.,McNally, D. & Latif, N. 1995a The influence of HurricaneAndrew on sediment distribution in Louisiana coastal marshes.Journal of Coastal Research 18, 280–294.
Cahoon, D., Reed, D. & Day, J. 1995b Estimating shallow subsid-ence in microtidal salt marshes of the southeastern United States:Kaye and Barghoorn revisited. Marine Geology 128, 1–9.
Callaway, J. C. 1994 Sedimentation processes in selected coastalwetlands from the Gulf of Mexico and Northern Europe. Ph.D.Dissertation. Louisiana State University, 209 p.
Callaway, J. C., Nyman, J. & DeLaune, R. 1996 Sediment accretionin coastal wetlands: a review and a simulation model of processes.Current Topics in Wetland Biogeochemistry 2, 2–23.
Carbognin, L., Gambolati, G., Marabini, F., Taroni, G., Teatini,P. & Tosi, L. 1996 Analisi del processo di subsidenza nell’areaVeneziana e sua simulazione con un modello tridimensionalenon lineare. Progetto Sistema Lagunare Veneziano. Ministerodell’Universita e della Ricerca Scientifica e Technologica.
Cavazzoni, S. & Gottardo, D. 1983 Processi evolutivi e morfologicinella laguna di Venezia. In Ministero dei Lavori Pubblici, Atti delConvegno ‘ Laguna, fiumi, lidi: cinque secoli di gestione delle acquenelle Venezie ’, Venice, 10–12 June, 1983, pp. 2–18.
Childers, D., Sklar, F., Drake, B. & Jordan, T. 1993 Seasonalmeasurements of sediment elevation in three Mid-Atlantic estu-aries. Journal of Coastal Research 9, 986–1003.
Consorzio Venezia Nuova. 1993 Il Recupero Morfologico della Lagunadi Venezia. Supplemento dei Quaderni Trimestrali, May, 1993.Consorzio Venezia Nuova, San Marco 2488, 30124 Venice, Italy,24 pp.
Day, J., Are, D., Rismondo, A., Scarton, F. & Cecconi, G. 1995aRelative sea level rise and Venice lagoon wetlands. Proceedings ofthe MEDCOAST 95 Conference, Tarragona 24–27 October 1995,pp. 793–807.
Day, J., Pont, D. & Hensel, P. & Ibanez, C. 1995b Impacts of sealevel rise on deltas in the Gulf of Mexico and the Mediterranean:the importance of pulsing events to sustainability. Estuaries 18,636–647.
Day, J. & Templet, P. 1989 Consequences of sea level rise:Implications from the Mississippi Delta. Coastal Management 17,241–257.
Day, J., Cardoch, L. & Templet, P. 1997 System functioning asbasis for sustainable management of deltaic ecosystems. CoastalManagement 25, 115–153–
Day, J., Scarton, F., Rismondo, A. & Are, D. 1998 Rapid deterio-ration of a salt marsh in Venice Lagoon, Italy. Journal of CoastalResearch 14, 583–590.
Dijkema, K. S. (ed.) 1984 Salt marshes in Europe. Council ofEurope. Nature and Environment Series 30, Strousbourg, 178 pp.
Favero, V. 1992 Evoluzione morfologica e trasformazioni ambien-tali dalla conterminazione lagunare al nostro secolo. In Contermi-nazione Lagunare: Storia Ingegneria, Politica e Diritto nella Lagunadi Venezia. Atti del Convegno di Studio nel Bicentenario dellaConterminazione Lagunare. Istituto Veneto di Science, Lettere edArti, Venice, 14–16 March, 1991, pp. 165–184.
Favero, V., Parolini, R. & Scattolin, M. 1988 Morfologia Storica dellaLaguna di Venezia. Arsenale Editrice, Venice, 79 pp.
French, J. 1993 Numerical simulation of vertical marsh growth andadjustment to accelerated sea-level rise, North Norfolk, U.K.Earth Surface Processes and Landforms 18, 63–81.
Gatto, P. & Carbognin, L. 1981 The lagoon of Venice: naturalenvironmental trend and man-induced modification. HydrologicalScience Bulletin 26, 379–391.
Gehu, J., Scoppola, A., Caniglia, G., Marchiori, S. & Gehu-Franck,J. 1984 Les sistemes vegetaux de la cote nord-adriatique

628 J. W. Day Jr et al.
italienne, leur originalite a l’echelle europeenne. DocumentsPhytosociologiques 8, 485–558.
Gornitz, V., Lebedeff, S. & Hansen, J. 1982 Global sea level trendin the past century. Science 215, 1611–1614.
Gornitz, V. 1995 Sea-level rise: a review of recent past andnear-future trends. Earth Surface and Landforms 20, 7–20.
Hartnall, T. J. 1986 Salt-marsh vegetation and micro-relief devel-opment on the New Marsh at Gibraltar Point, Lincolnshire InCoastal Research: U.K. Perspectives (Clark, M. W., ed.), GeoBooks Norwich, England, pp. 37–58.
Hatton, R., DeLaune, R. & Patrick, W. 1983 Sedimentation,accretion, and subsidence in marshes of Barataria Basin,Louisiana. Limnology and Oceanography 28, 494–502.
Hensel, P., Day, J. W., Pont, D. & Day, J. N. 1998 Short-termsedimentation dynamics in the Rhone River delta, France: Theimportance of riverine pulsing. Estuaries 21, 52–65.
Hensel, P., Day, J. & Pont, D. 1999 Wetland vertical accretion andsoil elevation in the Rhone River delta, France: The importanceof riverine pulsing. Journal of Coastal Research 15, 668–681.
Ibanez, C., Canicio, A., Day, J. & Curco, A. 1997 Morphologicdevelopment, relative sea level rise and sustainable managementof water and sediment in the Ebre delta, Spain. Journal of CoastalConservation 3, 191–202.
McCaffrey, R. & Thompson, J. 1980 A record of the accumulationof sediment and trace metals in a Connecticut salt marsh. InEstuarine Physics and Chemistry. Studies in Long Island Sound(Saltzmann, B., ed.), Academic Press, New York, pp. 165–236.
Orson, R., Warren, R. & Niering, W. 1987 Development of a tidalmarsh in a New England River Valley. Estuaries 10, 20–27.
Penland, S. & Ramsey, K. 1990 Relative sea-level rise in Louisianaand the Gulf of Mexico, 1908–1988. Journal of Coastal Research 6,323–342.
Pethick, J. S. 1992 Saltmarsh geomorphology. In Saltmarshes.Morphodynamics, Conservation, and Engineering Significance(Allen, J. & Pye, K., eds). Cambridge University Press,Cambridge, pp. 41–62.
Pethick, J. S. 1993 Shoreline adjustments and coastal management:physical and biological processes under accelerated sea-level rise.The Geographical Journal 159, 162–168.
Pignatti, S. 1966 La vegetazione alofila della Laguna Veneta.Memorie Istituto Veneto di Soienze, Letere ed Arti 33, 1–74.
Pirazzoli, P. 1987 Recent sea-level changes and related engineeringproblems in the Lagoon of Venice, Italy. Progress in Oceanography18, 323–346.
Randerson, P. F. 1979 A simulation model of salt-marsh develop-ment and march ecology. In Estuarine and Coastal Reclamationand Water Storage (Knight, B. & Philips, A. J., eds). EBSA, SaxonHouse, London.
Raper, S., Wigley, T. & Warrick, R. 1996 Global sea-level rise: pastand future. In Sea-Level Rise and Coastal Subsidence (Milliman, J.& Haq, B., eds). Kluwer Academic Publishers, Dordrecht, TheNetherlands, pp. 11–45.
Redfield, A. 1972 Development of a New England salt marsh.Ecological Monographs 42, 201–237.
Reed, D. 1989 Patterns of sediment deposition in subsiding coastalmarshes, Terrebonne Bay, Louisiana: The role of winter storms.Estuaries 12, 222–227.
Reed, D. 1992 Effect of weirs on sediment deposition in Louisianacoastal marshes. Environmental Management 16, 55–65.
Reed, D. & Cahoon, D. 1993 Marsh submergence vs marshaccretion: interpreting accretion deficit data in coastal Louisiana.
In Proc. 8th Symp. Coastal and Ocean Management, Coastal Zone’93 (Magoon, O. T., Wilson, W. S., Converse, H. & Tobin,L. T., eds). (New Orleans, LA). ASCE, New York, NY,pp. 243–257.
Roman, C., Peck, J., Allen, J., King, J. & Appleby, P. 1997Accretion of a New England (U.S.A.) salt marsh in response toinlet migration, storms and sea-level rise. Estuarine, Coastal andShelf Science 45, 717–727.
Roozen, J. M. & Westhoff, V. 1985 Study on long-term salt-marshsuccession using permanent plots. Vegetatio 61/62, 45–424.
Runca, E., Bernstein, A., Postma, L. & DiSilvio, G. 1993 Controlof macroalgae blooms in the Lagoon of Venice, pp. 421–435.Proceedings of the MEDCOAST 93 Conference, November 2–5,1993, Antalya, Turkey.
Rusconi, A., Ferla, M. & Filippi, M. 1993 Tidal observations in theVenice lagoon: the variations in sea level observed in the last 120years. Proceedings of Sea Change 93, The Hague, Netherlands,April 19–23, 1993.
Rybczyk, J. M. 1997 The use of secondarily treated wastewatereffluent for forested wetland restoration in a subsiding coastalzone. Ph.D. Dissertation, Louisiana State University, BatonRouge, Louisiana, 228 pp.
Rybczyk, J. M., Calloway, J. & Day, J. 1998 A relative elevationmodel (REM) for a subsiding forested wetland receiving waste-water effluent. Ecological Modeling 112, 23–44.
SAS Institute Inc. 1990 SAS Procedures Guide Version 6, ThirdEdition. SAS Institute, Inc., Cary, North Carolina.
Scarton, F. & Rismondo, A. 1996 Primary production and decom-position in the Po Delta. Report to E.C. and MEDDELT.Impact of Climate Change on Northwestern MediterraneanDeltas. Final Report to the European Community, Contract EV5V-CT94-0465. Tecnomare S.p.A., San Marco n. 3584, 30124Venice, Italy, pp. 6.37–6.53.
Schoot, P. M. & de Jong, J. 1982 Sedimentatie en erosie metingenmet behulp van de Sedi-Eros-tafel (Set). Rijkswaterstaat. TheHague, Netherlands. Notitie. DDMI-82, 401.
Sestini, G. 1992 Implications of climatic changes for the Po deltaand Venice lagoon. In Climatic Change and the Mediterranean(Jeftic, L., Milliman, J. & Sestini, G., eds). Edward Arnold,London.
Sestini, G. 1996 Land subsidence and sea-level rise: The case of thePo delta region. In Sea-Level Rise and Coastal Subsidence(Milliman, J. & Haq, B., eds). Kluwer Academic Publishers,Dordrecht, The Netherlands.
Stanley, D. 1988 Subsidence in the northeastern Nile delta: rapidrates, possible causes, and consequences. Science 240, 497–500.
Stevenson, J. C., Kearney, M. & Pendleton, E. 1985 Sedimentationand erosion in a Chesapeake Bay brackish marsh system. MarineGeology 67, 213–235.
Stumpf, R. 1983 The process of sedimentation on the surface of asaltmarsh. Estuarine and Coastal Marine Science 17, 495–508.
Webster, J. R. & Benfield, E. 1986 Vascular plant breakdown infreshwater ecosystems. Annual Review of Ecology and Systematics17, 567–594.
Wells, J. 1995 Effects of sea level rise on coastal sedimentation anderosion. In Climate Change Impact on Coastal Habitation (Eisma,D., ed.). Lewis Publishers, London.
Zunica, M. 1974 La bonifica Delta Brenta. Rivista GeograficaItaliana 81, 346–399.


![The Orthodoxy in Venice [In Russian: Православие в Венеции]](https://static.fdokumen.com/doc/165x107/63212d80f2b35f3bd10fc259/the-orthodoxy-in-venice-in-russian-pravoslavie-v-venetsii.jpg)