Phytoplankton growth and microzooplankton grazing rates in a restricted Mediterranean lagoon...
16
MARINE ECOLOGY PROGRESS SERIES Mar Ecol Prog Ser Vol. 500: 67–82, 2014 doi: 10.3354/meps10706 Published March 17 INTRODUCTION Greenlandic fjords support rich and diverse wildlife communities and are highly valuable ecosystems for commercial as well as cultural fishing (Hamilton et al. 2000). Climate models for the Arctic predict significant increases in temperatures, declines in the sea ice cover and acceleration of glacial melting (Stroeve et al. 2007, Comiso et al. 2008, Holland et al. 2008, Motyka et al. 2011). The Greenland fjords are major outlets of glacial runoff, and thus climate changes are likely to affect the hydrography, and possibly the food web structures, within these ecosystems (Mortensen et al. 2011). Therefore, baseline studies of the key plankton components in these areas are essential to understand climate-mediated changes in pelagic food web structure and productivity. The Godthåbsfjord is a subarctic fjord system located next to Nuuk, the capital of Greenland. It is one of the largest fjord systems in Greenland, harbouring large populations of capelin and Atlantic cod (Smidt 1979, Storr-Paulsen et al. 2004, Bergstrøm & Vilhjalmsson 2008). The copepod community is numerically dominated by Pseudocalanus spp., © Inter-Research 2014 · www.int-res.com *Corresponding author: [email protected] Trophic role and top-down control of a subarctic protozooplankton community Karen Riisgaard 1 , Rasmus Swalethorp 1 , Sanne Kjellerup 1,2 , Thomas Juul-Pedersen 2 , Torkel Gissel Nielsen 1,2, * 1 National Institute of Aquatic Resources, DTU Aqua, Section for Oceanography and Climate, Kavalergården 6, 2920 Charlottenlund, Denmark 2 Greenland Climate Research Centre, Greenland Institute of Natural Resources, PO Box 570, 3900 Nuuk, Greenland ABSTRACT: Plankton succession was investigated in the subarctic Godthåbsfjord, Western Greenland, from March to August 2010. The trophic role of protozooplankton (ciliates and hetero- trophic dinoflagellates) was evaluated with emphasis on their seasonal succession and as prey for the copepod community. The integrated protozooplankton biomass ranged between 0.1 and 4.0 g C m -2 , and was dominated by ciliates. Over the 6 mo study period, maximum potential ingestion rates of the protozooplankton ranged from 0.02 to 1.2 g C m -2 d -1 , corresponding to 30 to 194% of primary production d -1 or 0.5 to 37% of phytoplankton biomass d -1 . The highest copepod biomass (24 g C m -2 ) occurred in spring, with Metridia longa alone contributing up to 92% of the biomass. A grazing experiment with M. longa feeding on a natural plankton assemblage confirmed that this species cleared cells in the size range 10 to 60 μm with an average clearance rate of 2.4 ml μg C -1 d -1 . The copepod community, dominated by the genera Calanus, Metridia, Pseudocalanus, Oithona, Microsetella and Triconia/Oncaea, accounted for 72 to 93% of the copepod biomass in the spring. After the large calanoid copepod species left the surface layer, the protozooplankton increased numerically and were the most important grazers for some weeks until a late summer copepod community, dominated by cyclopoids Oithona spp., controlled the protist community. Our study indicated that protozooplankton succession is regulated by copepod grazing during most of the season, and that these protists provide an essential source of nutrition for the copepod populations. KEY WORDS: Protozooplankton · Subarctic · Grazing · Metridia longa Resale or republication not permitted without written consent of the publisher
Transcript of Phytoplankton growth and microzooplankton grazing rates in a restricted Mediterranean lagoon...

MARINE ECOLOGY PROGRESS SERIESMar Ecol Prog Ser
Vol. 500: 67–82, 2014doi: 10.3354/meps10706
Published March 17
INTRODUCTION
Greenlandic fjords support rich and diverse wild lifecommunities and are highly valuable ecosystems forcommercial as well as cultural fishing (Hamilton et al.2000). Climate models for the Arctic predict significantincreases in temperatures, declines in the sea icecover and acceleration of glacial melting (Stroeve etal. 2007, Comiso et al. 2008, Holland et al. 2008, Motyka et al. 2011). The Greenland fjords are majoroutlets of glacial runoff, and thus climate changes arelikely to affect the hydrography, and possibly the food
web structures, within these ecosystems (Mortensenet al. 2011). Therefore, baseline studies of the keyplankton components in these areas are essential tounderstand climate-mediated changes in pelagic foodweb structure and productivity.
The Godthåbsfjord is a subarctic fjord systemlocated next to Nuuk, the capital of Greenland. It isone of the largest fjord systems in Greenland, harbouring large populations of capelin and Atlanticcod (Smidt 1979, Storr-Paulsen et al. 2004, Bergstrøm& Vilhjalmsson 2008). The copepod community isnumerically dominated by Pseudocalanus spp.,
© Inter-Research 2014 · www.int-res.com*Corresponding author: [email protected]
Trophic role and top-down control of a subarcticprotozooplankton community
Karen Riisgaard1, Rasmus Swalethorp1, Sanne Kjellerup1,2, Thomas Juul-Pedersen2, Torkel Gissel Nielsen1,2,*
1National Institute of Aquatic Resources, DTU Aqua, Section for Oceanography and Climate, Kavalergården 6, 2920 Charlottenlund, Denmark
2Greenland Climate Research Centre, Greenland Institute of Natural Resources, PO Box 570, 3900 Nuuk, Greenland
ABSTRACT: Plankton succession was investigated in the subarctic Godthåbsfjord, WesternGreenland, from March to August 2010. The trophic role of protozooplankton (ciliates and hetero-trophic dinoflagellates) was evaluated with emphasis on their seasonal succession and as prey forthe copepod community. The integrated protozooplankton biomass ranged between 0.1 and 4.0 gC m−2, and was dominated by ciliates. Over the 6 mo study period, maximum potential ingestionrates of the protozooplankton ranged from 0.02 to 1.2 g C m−2 d−1, corresponding to 30 to 194% ofprimary production d−1 or 0.5 to 37% of phytoplankton biomass d−1. The highest copepod biomass(24 g C m−2) occurred in spring, with Metridia longa alone contributing up to 92% of the biomass.A grazing experiment with M. longa feeding on a natural plankton assemblage confirmed that thisspecies cleared cells in the size range 10 to 60 µm with an average clearance rate of 2.4 ml µgC−1 d−1. The copepod community, dominated by the genera Calanus, Metridia, Pseudocalanus,Oithona, Microsetella and Triconia/Oncaea, accounted for 72 to 93% of the copepod biomass inthe spring. After the large calanoid copepod species left the surface layer, the protozooplanktonincreased numerically and were the most important grazers for some weeks until a late summercopepod community, dominated by cyclopoids Oithona spp., controlled the protist community.Our study indicated that protozooplankton succession is regulated by copepod grazing duringmost of the season, and that these protists provide an essential source of nutrition for the copepodpopulations.
KEY WORDS: Protozooplankton · Subarctic · Grazing · Metridia longa
Resale or republication not permitted without written consent of the publisher
Mar Ecol Prog Ser 500: 67–82, 2014
Micro setella spp., Oithona spp. and Metridia longa(Arendt et al. 2010, 2012, Tang et al. 2011), which isin contrast to most other Arctic regions where cope-pods of the genus Calanus are the most numerousspecies (Digby 1953, Nielsen and Hansen 1995, Rys-gaard et al. 1999, Seuthe et al. 2011).
Metridia longa has not previously been recognizedas an important component in the Arctic food web(e.g. Madsen et al. 2001), principally because sam-pling has often been conducted during the daytime,when M. longa is absent from the upper portion ofthe water column (Hays 1995, Falkenhaug et al.1997, Daase et al. 2008). Recent studies show that M.longa is highly abundant during the productive sea-son in the Godthåbsfjord (Arendt et al. 2010, 2012,Tang et al. 2011), where its high lipid content (Hop-kins et al. 1984) makes this species a high qualityprey item for planktivores (Pedersen & Fossheim2008). M. longa is considered an omnivore, feedingselectively on protozooplankton and zooplankton inthe size range 5 to 300 µm (Haq 1967), even whenphytoplankton within this size range are available(Campbell et al. 2009).
We investigated seasonal plankton dy -na mics in a side branch of the Godthåbs-fjord, Kapisigdlit Fjord, with emphasis onthe role of protozooplankton in the foodweb, and the interaction between the pro-tozooplankton and the copepod commu-nity. The latter was evaluated from maxi-mum potential production and clearancerates given in Hansen et al. (1997) andMøller et al. (2006). Estimates of maximumpotential clearance rates by Metridialonga were supported by a grazing exper-iment with M. longa feeding on a natu ralplankton assemblage.
MATERIALS AND METHODS
Locality and sampling
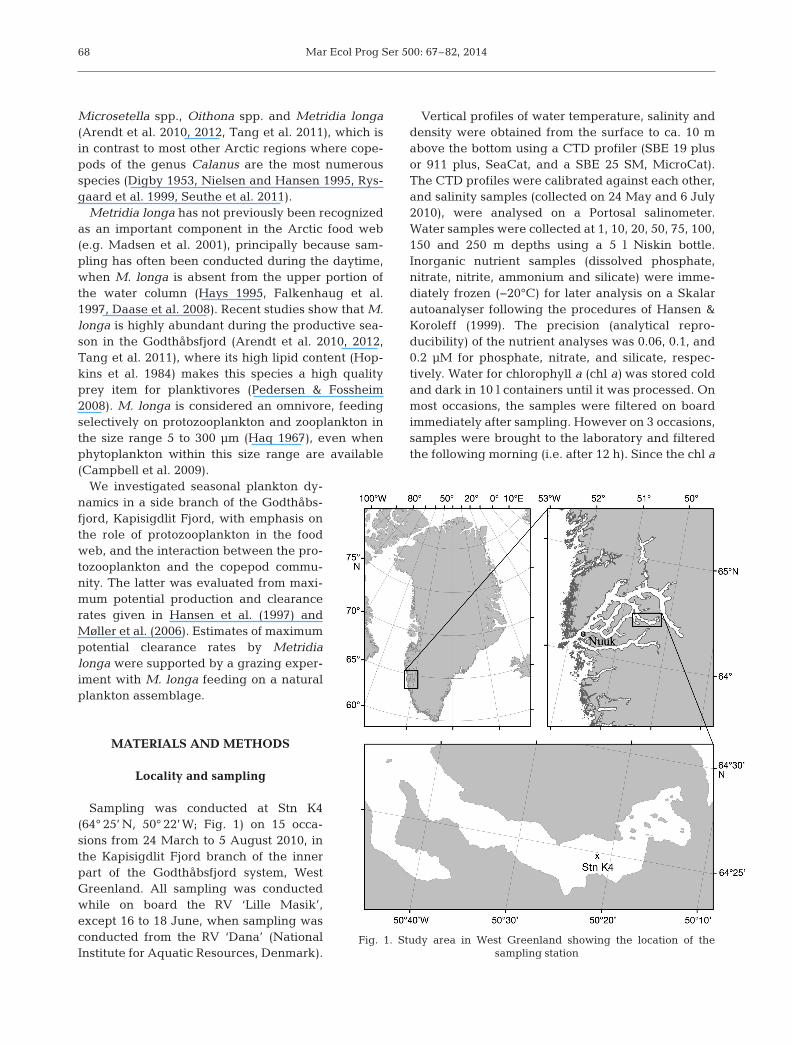
Sampling was conducted at Stn K4(64° 25’ N, 50° 22’W; Fig. 1) on 15 occa-sions from 24 March to 5 August 2010, inthe Kapisigdlit Fjord branch of the innerpart of the Godthåbsfjord system, WestGreenland. All sampling was conductedwhile on board the RV ‘Lille Masik’,except 16 to 18 June, when sampling wasconducted from the RV ‘Dana’ (NationalInstitute for Aquatic Re sources, Denmark).
Vertical profiles of water temperature, salinity anddensity were obtained from the surface to ca. 10 mabove the bottom using a CTD profiler (SBE 19 plusor 911 plus, SeaCat, and a SBE 25 SM, MicroCat).The CTD profiles were calibrated against each other,and salinity samples (collected on 24 May and 6 July2010), were analysed on a Portosal salinometer.Water samples were collected at 1, 10, 20, 50, 75, 100,150 and 250 m depths using a 5 l Niskin bottle. In organic nutrient samples (dissolved phosphate, ni trate, nitrite, ammonium and silicate) were imme-diately frozen (−20°C) for later analysis on a Skalarautoanalyser following the procedures of Hansen &Koroleff (1999). The precision (analytical repro-ducibility) of the nutrient analyses was 0.06, 0.1, and0.2 µM for phosphate, nitrate, and silicate, respec-tively. Water for chlorophyll a (chl a) was stored coldand dark in 10 l containers until it was processed. Onmost occasions, the samples were filtered on boardimmediately after sampling. However on 3 occasions,samples were brought to the laboratory and filteredthe following morning (i.e. after 12 h). Since the chl a
68
Fig. 1. Study area in West Greenland showing the location of the sampling station
Riisgaard et al.: Subarctic protozooplankton
concentration was relatively stable between sam-pling events (i.e. the average chl a concentration inthe upper 10 m across all samplings was 0.9 ± 0.3 mgl−1), we assume that this storage did not impact thechl a concentration.
Phytoplankton
Chl a concentration was determined from triplicatesubsamples of 100 to 500 ml seawater, and size frac-tionated on Whatman GF/F filters (0.7 µm pore size,total phytoplankton biomass) and 10 µm mesh filters(from 1, 10, 20, 50 and 100 m depths). Filters wereextracted in 96% ethanol for 12 to 24 h (Jespersen &Christoffersen 1987), and then either analyzed imme-diately or stored at −20°C for a maximum of 2 mo.Chl a was measured on a TD-700 Turner fluorometercalibrated against a chl a standard before and afteracidification (Yentsch & Menzel 1963) and convertedinto µg C using a conversion factor of 42.7 (Juul- Pedersen et al. 2006).
Primary production was measured on 6 occasionsusing the 14C incubation method (Steemann-Nielsen1958) with a free-drifting array. Water samples from 5,10, 20, 30 and 40 m depths were incubated at in situdepths for ca. 4 h during the day in 100 ml Wink lerglass bottles (1 dark and 2 light bottles at each depth);following incubation, 200 µl NaH14CO3 (20 µCi ml−1;DHI Denmark) was added to each of the bottles. Afterrecovery, the samples were kept completely darkuntil filtration on Whatman GF/C filters. The filterswere then treated with 100 µl 1M HCl, and left to fu-migate for ca. 12 h to remove any remaining 14C onthe filter. Scintillation liquid (PerkinElmer UltimaGold) was added and the sample was mixed and leftfor ca. 24 h before analyses on a TriCarb 2800 TR liq-uid scintillation analyzer (PerkinElmer). In situ dis-solved inorganic carbon (DIC) concentrations, meas-ured with a CM5012 CO2 Coulometer according toRysgaard & Glud (2004), were applied for the calcula-tion of primary production using thespecific activity of each 14C batch(DHI Denmark). The dark bottle valuefrom each depth was subtrac ted fromthe light bottle value in or der to cor-rect for uptake of 14C in the dark. Insitu incoming irradiance, as photo-synthetically active radiation (PAR;supplied by ASIAQ) during the de-ployment versus the entire day, wasused to calculate the daily primaryproduction. Primary production was
integra ted vertically from 0 to 45 m, covering the eu-photic zone. The in fluence of the different filter typesused, i.e. chl a (GF/F) and primary production (GF/C),has previously been examined in the Godthåbsfjord,and no significant difference was detected betweenthese filter types (T. Juul-Pedersen unpubl. data).
Protozooplankton
Biomass, abundance and taxonomic composition ofprotozooplankton were determined at 5 depths: 1, 10,20, 50/60 and 100 m. Water samples of 250 to 300 mlwere collected with a 5 l Niskin bottle at each depth,gently decanted through a silicon tube into brownglass bottles and fixed in acidic Lugol’s solution (finalconcentration of 2%). Samples were kept cool anddark until analyses (max. of 6 mo). Depending on thecell concentration, 50 to 100 ml subsamples wereallowed to settle for 24 h in sedimentation chambers.All (or a minimum of 300) cells were counted usingan inverted microscope (Nikon K18). Protozooplank-ton depth profiles were determined 9 times duringthe investigated period.
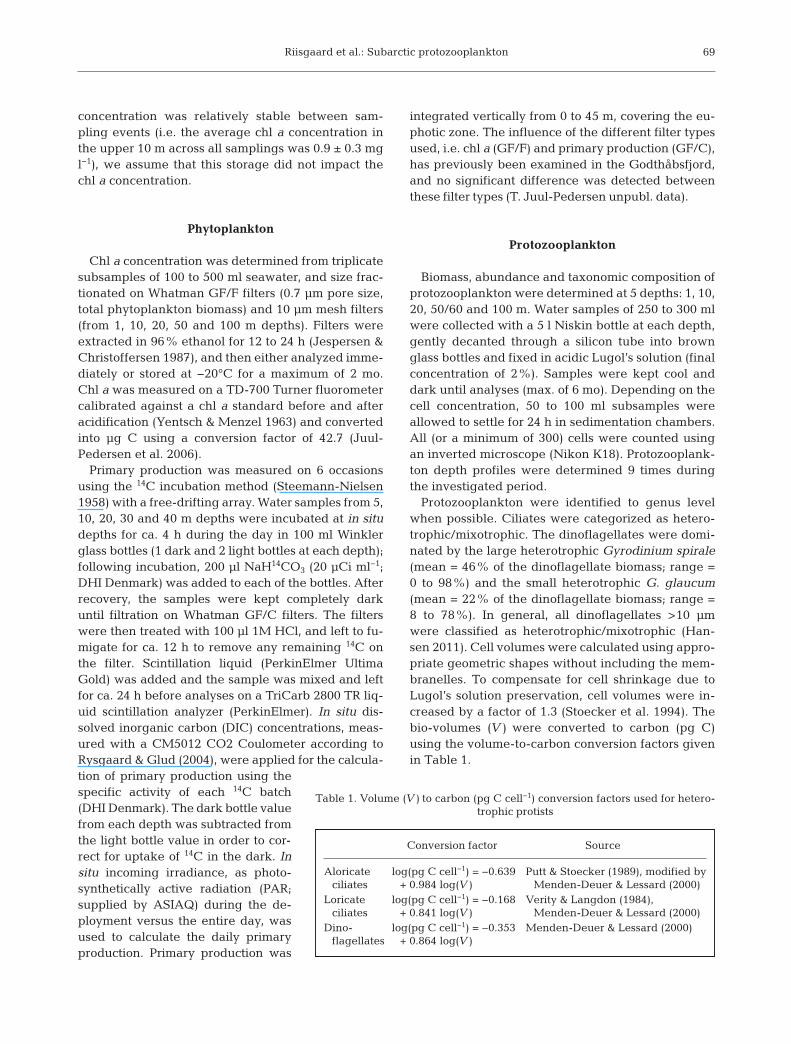
Protozooplankton were identified to genus levelwhen possible. Ciliates were categorized as hetero-trophic/mixotrophic. The dinoflagellates were domi-nated by the large heterotrophic Gyrodinium spirale(mean = 46% of the dinoflagellate biomass; range =0 to 98%) and the small heterotrophic G. glaucum(mean = 22% of the dinoflagellate biomass; range =8 to 78%). In general, all dinoflagellates >10 µmwere classified as heterotrophic/mixotrophic (Han -sen 2011). Cell volumes were calculated using appro-priate geometric shapes without including the mem-branelles. To compensate for cell shrinkage due toLugol’s solution preservation, cell volumes were in -creased by a factor of 1.3 (Stoecker et al. 1994). Thebio-volumes (V) were converted to carbon (pg C)using the volume-to-carbon conversion factors givenin Table 1.
69
Conversion factor Source
Aloricate log(pg C cell−1) = −0.639 Putt & Stoecker (1989), modified by ciliates + 0.984 log(V) Menden-Deuer & Lessard (2000)
Loricate log(pg C cell−1) = −0.168 Verity & Langdon (1984), ciliates + 0.841 log(V) Menden-Deuer & Lessard (2000)
Dino- log(pg C cell−1) = −0.353 Menden-Deuer & Lessard (2000)flagellates + 0.864 log(V)
Table 1. Volume (V) to carbon (pg C cell−1) conversion factors used for hetero-trophic protists

Mar Ecol Prog Ser 500: 67–82, 2014
Identification of ciliates and dinoflagellates to spe-cies, genus or morphotypes was based on Nielsen &Hansen (1999). During enumeration, ciliates anddinoflagellates were identified to lowest taxonomiclevel possible and divided into size classes covering10 µm ranges of equatorial spherical diameter (ESD)starting with 10 to 20 µm. ESD and cell volume arerelated by: cell volume = π /6 × ESD3.
Rates of protozooplankton maximum potentialclearance rates were calculated according to theequation in Hansen et al. (1997) for ciliates:
log(Cmax) = 1.491 – 0.23log(Pvol) (1)
and for heterotrophic dinoflagellates:
log(Cmax) = 0.851 – 0.23log(Pvol) (2)
where Cmax is the maximum potential clearance rate,and Pvol is the cell volume in µm3. Cmax was nor -malized to in situ temperatures (ranging between 0.5and 13°C) by using a Q10 factor of 2.8 (reviewed inHansen et al. 1997). Maximum potential ingestionrate, I (µg C cell−1 d−1) was calculated from size- specific maximum potential clearance rates and thein situ chl a concentration:
I = Cmax × d (3)
where d (µg C l−1) is the phytoplankton density. Ciliates were assumed to graze on the chl a fraction<10 µm, while heterotrophic dinoflagellates wereassumed to graze on the chl a fraction >10 µm(Jakobsen & Hansen 1997). Production (µg C l−1 d−1
or g C m−2 d−1) of ciliates and dinoflagellates was esti-mated from I using an average gross growth effi-ciency of 0.33 (Hansen et al. 1997, 2000).
Copepod biomass
Copepods were collected in 5 depth strata (0 to50, 50 to 100, 100 to 150, 150 to 200, and 200 to235 m) with a Multinet (50 µm mesh, Hydrobiostype mini). The nets were hauled at a speed of 0.2 to0.3 m s−1, and samples were immediately preservedin buf fered formalin (4% final concentration). Sam-pling was conducted around 18:00 h local time.Samples containing high numbers of copepods weresplit by volumes into subsamples. In each sampleand subsample, all nauplii and copepodite stageswere identified to species or genus level, and lengthwas measured for up to 10 individuals of each stage.Biomass of the different copepod species was calcu-lated based on measurements of prosome length,and length/carbon relationships from the literature(Table 2).
Metridia longa grazing experiment
Seawater was collected on 28 July 2010 from 20 mdepth with a 30 l Niskin bottle and transferred gentlyvia a silicon tube into a 25 l dark carboy. The carboywas stirred gently, nutrients were added (15 µM
70
Taxon a b Source Stage Units (L)
Acartia spp.a 1.11× 10⁻¹¹ 2.92 Berggreen et al. (1988) C1−C6 µmCalanus finmarchicua 4.8 × 10⁻³ 3.5687 Madsen et al. (2001) C1−C6 mmCalanus glacialisa 4.8 × 10⁻³ 3.5687 Madsen et al. (2001) C1−C6 mmCalanus hyperboreusa 1.4 × 10⁻³ 3.3899 Hirche & Mumm (1992) C1−C6 mmCentropages spp.b 1.78 × 10⁻² 2.45 Klein Breteler et al. (1982) C1−C6 mmCentropages spp.b 1.45 × 10⁻² 2.24 Klein Breteler et al. (1982) N1−N6 mmMetridia spp.a 6.05 × 10⁻³ 3.0167 Hirche & Mumm (1992) C1−C6 mmMicrocalanus spp.a 9.47 × 10⁻¹⁰ 2.16 Sabatini & Kiørboe (1994) C1−C6 µmMicrosetella spp.a 2.65 × 10⁻⁹ 1.95 Uye et al. (2002) N1−C6 µmOithona spp.a 9.47 × 10⁻¹⁰ 2.16 Sabatini & Kiørboe (1994) C1−C6 µmOithona spp.a 5.545 × 10⁻¹¹ 2.71 Sabatini & Kiørboe (1994) N1−N6 µmOncaea spp.a 2.51 × 10⁻¹¹ 2.9 Satapoomin (1999) C1−C6 µmParaeuchaeta spp.c 3.1107 1.8633 K. Tönnesson unpubl. data N1−C6 mmPseudocalanus spp.a 6.12 × 10⁻¹¹ 2.7302 Klein Breteler et al. (1982) C1−C6 µmCalanus spp. and Metridia spp.a 4.29 × 10⁻⁹ 2.05 Hygum et al. (2000) N1−N6 µmOther naupliia 3.18 × 10⁻¹² 3.31 Berggreen et al. (1988) N1−N6 µmaCalculated from the following equation: a × Lb
bCalculated from the following equation: a × Lb, multiplied with 0.45 to convert into carboncCalculated ash free dry weight from the following equation: 10(a × Log(L) −b), multiplied with 0.45 to convert into carbon
Table 2. Length (L) to carbon (mg C) conversion factors used for copepod nauplii (N1−N6) and copepodites (C1−C6)

Riisgaard et al.: Subarctic protozooplankton
NH4Cl and 1 µM Na2HPO4), and seawater was in -verse filtered via a silicon tube through 200 µm meshto remove mesozooplankton, and to fill 42 transpar-ent 600 ml polycarbonate bottles.
Metridia longa were collected using a 200 µm WP2net. One actively swimming adult female M. longawas added to each of the 28 polycarbonate bottles.Fourteen additional bottles without copepods wereused as controls. To ensure that copepods cleared onaverage <30% of the prey, half of the experimentaland control bottles were incubated for 12 h, and theother half for 24 h. Bottles were incubated in dark-ness at 5°C (in situ temperature was 3.2°C) and rot -ated by hand every 6 h. Dark incubation was chosensince M. longa undergo diel vertical migrations andfeed during the night (Hays 1995). As soon as theexperiment was terminated, triplicate subsamples of100 ml were removed from the bottles for determi -nation of chl a concentration. For protozooplanktonanalyses, 100 ml subsamples were fixed in acidicLugol’s solution in a final concentration of 2%.
Metridia longa clearance rates (ml µg C−1 d−1) werecalculated from Frost (1972) when prey growth ratesdiffered significantly from the controls (t-test, p <0.05). Clearance rate on protozooplankton was calcu-lated for 4 size classes of ciliates, 1 size class of dino-flagellates and 2 size classes of nanoflagellates(Table 3). A minimum of 450 cells were measured foreach size class. Clearance rate on phytoplankton wascalculated using chl a as a proxy. Clearance rateswere converted to in situ temperatures by using a Q10
factor of 2.8 (Hansen et al. 1997, 2000).
Copepod community grazing
Clearance capacity of the copepod community wasestimated from maximum specific clearance rates,assuming that the copepod population was not food-
saturated. Maximum specific clearance rate (F) ofMetridia longa was estimated according to Hansen etal. (1997, 2000):
log(F ) × 105 = log(1.5753) – 0.23log(V ) (4)
where V is the copepod body volume in µm3. SinceM. longa undertake pronounced diel vertical migra-tion and only visit the surface at night, M. longamaxi mum potential clearance capacity is only real-ized in the upper 50 m for 6 h per day, i.e. aroundmidnight (S. Kjellerup unpubl. data). Maximum po -tential clearance was converted to in situ tempera-tures in the upper 50 m of the water column using aQ10 factor of 2.8 (Hansen et al. 1997, 2000).
Protozooplankton
The maximum potential clearance rates of Calanusspp. and other copepods (i.e. Pseudocalanus, Oitho -na, Centropages and Microcalanus) were estimatedaccording to Møller et al. (2006):
log(F ) = 1.16 − 0.45 log(W ), r2 = 0.73 (5)
where W is the copepod biomass (µg C), assumingthat they were distributed evenly throughout thewater column. Maximum potential clearance rateswere converted to in situ temperatures using a Q10
factor of 2.8 (Hansen et al. 1997, 2000). From Marchuntil breakup of ice in the Kapisigdlit River around20 June 2010, Q10 was calculated in the 0 to 100 mdepth stratum. Thereafter, Calanus spp. and othercopepods were distributed below the warm and freshsurface water and thus Q10 was calculated in the 20 to100 m depth stratum. The small copepods Micro -setella spp. and Triconia/Oncaea spp. were not in -cluded in the grazing estimates since they both havemorphologies and feeding strategies suited for solidsubstrata such as marine snow (Koski et al. 2007).
RESULTS
Hydrography
Sampling was initiated in March when the watercolumn was well-mixed with cold, saline, nutrient-rich water throughout the euphotic zone (Fig. 2,Table 4). The chl a concentration was low (0.5 to1 µg l−1) and evenly distributed in the upper 40 m(Fig. 2C). In late April, a weak halocline was estab-lished (Fig. 2B) and additional heat was trapped inthe surface layer (Fig. 2A). The stratification stimu-
71
Average ESD range SD nESD (µm) (µm) (µm)
Ciliates 11.7 7−15 1.8 197521.2 15−30 4.4 237534.9 30−40 2.8 63450.3 40−60 5.7 917
Dinoflagellates 33.3 25−50 5.6 865
Nanoflagellates 3.5 3−4 0.4 4555.4 5−6 0.2 483
Table 3. Average equatorial spherical diameter (ESD; µm),range, standard deviation (SD) and number of cells (n)measured within the different size classes of the grazing
experiment

Mar Ecol Prog Ser 500: 67–82, 2014
lated phytoplankton growth, which thenquickly depleted the nitrate to below 0.5µM in association with the peak of the firstphytoplankton bloom of 3 µg chl a l−1 (Fig.2C).
In May, melt water was added to the sur-face layer as runoff from land, and culmi-nated in the seasonal pulse of fresh waterfollowing the breakup of ice in theKapisigdlit River around 20 June 2010.Thereafter, the surface salinity rapidlydecreased from 31 to 16 by the beginningof August. The melt water established astrong halocline, strengthened by a ther-mocline due to warming of the freshwatersurface plume to above 13°C on the lastsampling day (5 August 2010). After thedepletion of nitrate above the pycnocline, asubsurface bloom developed with a peakvalue of 12 µg chl a l−1 on 26 June 2010(Fig. 2).
Nutrients
High concentrations of nutrients (i.e.phosphorus, nitrate and silicate) weremeasured in the upper 100 m of the watercolumn at the initiation of the investigation(data not shown). During the first part ofthe investigation, the average nitrate con-centration in the upper 50 m stratumdecreased from 6.8 ± 0.3 µM to 0.5 ± 0.3µM as a result of increased stratificationand the developing phytoplankton bloom(Fig. 2C). The overall phosphorus and sili-cate dis tributions (Table 4) and successionmirrored that illustrated by nitrate (Fig.2C), but were not fully depleted in theeuphotic zone. In association with thebreakup of ice in the Kapisigdlit River, a
72
Strata (n) NO3 SiO PO4 NO2 NH3
Plume (20) BD 5.09 ± 0.36 0.038 ± 0.003 BD 0.20 ± 0.0020−50 m (47) 1.70 ± 0.05 2.07 ± 0.03 0.22 ± 0.01 0.03 ± 0.001 1.12 ± 0.0250−100 m (30) 4.67 ± 0.10 3.15 ± 0.07 0.47 ± 0.01 0.129 ± 0.003 1.28 ± 0.03100−150 m (16) 5.92± 1.50 5.92 ± 0.99 0.56 ± 0.08 0.18 ± 0.08 1.36 ± 0.50150−200 m (17) 7.21 ± 1.25 4.43 ± 0.98 0.65 ± 0.08 0.24 ± 0.05 2.02 ± 1.16>200 m (18) 11.47 ± 1.23 7.31 ± 0.58 0.94 ± 0.14 0.05 ± 0.03 0.68 ± 0.39
Table 4. Concentrations (µM) of nutrients (mean ± SE), in the freshwater plume (1 to 5 m depth) after the breakup of ice in the Kapisigdlit River (20 June), and in subsequent 50 m strata; n = number of samples, BD = below detection level
Fig. 2. Water column characteristics over the investigation period. (A)Temperature (°C), (B) salinity and (C) density (kg m−3) overlaid withchl a concentrations (µg l−1, green shading) and concentrations of thelimiting nutrient, nitrate (µM), displayed as red isolines (detectionlimit 0.5 µM, red dashed line). Points represent sampling depths. The
vertical black line indicates breakup of the ice in the fjord

Riisgaard et al.: Subarctic protozooplankton
freshwater plume overlaid the fjord water, character-ized by a very high concentration of silicate (Table 4).
Comparisons of the major nutrient types (Fig. 3A−C) suggest nitrate limitation of the primary produc-ers, since nitrate concentration in the upper 50 mbecame depleted relative to the Redfield-Brzezinskinutrient ratios with respect to phosphorus (Fig. 3A)and silicate (Fig. 3B).
Phytoplankton
The integrated phytoplankton biomass averaged3.0 ± 2.4 g C m−2 over the study period with peak values of 3.5 and 11.4 g C m−2 during the spring andsummer blooms, respectively (Fig. 4). The phyto-plankton spring bloom was initially composed ofsmall phytoplankton cells (<10 µm), which progres sedinto a phase dominated by larger cells (>10 µm).Within a few weeks, nitrate was depleted in the eu-photic zone, and the total phytoplankton biomass andrelative proportion of large phytoplankton cells de-creased. As the ice in the Kapisigdlit River broke up inmid-June, a freshwater plume resulted in a temporaryupwelling of nutrients into the euphotic zone (Fig. 2),causing a summer bloom to form and the relative pro-portion of large cells to increase. Nutrients once againbecame depleted in the stra tified water column andthe relative proportion of small cells increased (Fig. 4).
Average integrated primary production (PP) for theinvestigated period was 0.11 g C m−2 d−1 (n = 6) witha maximum of 0.21 g C m−2 d−1 in early spring (Fig. 4).The phytoplankton community was dominated bychain-forming diatoms (mainly Thalassiosira spp.)du ring the 2 blooms. In the non-bloom periods, thephytoplankton biomass was mostly composed ofsmall (<10 µm) un identified flagellates, primarilycryptophytes and solitary haptophytes (probablyPhaeocystis).
Protozooplankton
At the onset of the investigation, the abundanceof protozooplankton was low (<103 cells l−1), butthroughout June and July a diverse protozooplank-ton community developed in the upper 50 m, withcell concentrations as high as 3 × 10⁴ cells l−1
73
Fig. 3. Relationship between (A) phosphorus and nitrate, (B) silicate and nitrate and (C) phosphorus and silicate. l =samples taken below the euphotic zone (i.e. deeper than50 m); = surface samples taken above 50 m. Data from thefreshwater plume after the breakup of ice in the river is notincluded, but shown in Table 4. Lines indicate the Redfield-
Brzezinski ratios of the nutrients
Fig. 4. Seasonal succession in phytoplankton. Bars = inte-grated biomass, phytoplankton (g C m−2); l = integrated pri-mary production, PP (g C m−2 d−1). Integration depth: 250 m
for phytoplankton and 45 m for PP

Mar Ecol Prog Ser 500: 67–82, 2014
(Fig. 5A,B). Ciliates dominated the protozooplanktoncommunity (Fig. 5A), while dinoflagellates were lessabundant (Fig. 5B). The protozooplankton biomassmirrored the phytoplankton biomass with maximumbiomass associated with the chl a maximum at adepth of 19 ± 3 m (mean ± SD). Protozooplankton bio-mass peaked on July 6 at 155 µg C l−1 (Fig. 5C,D).
The main contributors to the protozooplankton bio-mass were Strombidium spp. and Gyrodinium spiraleduring spring, while Mesodinium spp., Strobilidiumspp., Strombidium spp., Laboea strobila and G. spi-rale dominated during the summer (Fig. 6). Numeri-cally, small (<20 µm) ciliates dominated the proto-zooplankton community (Fig. 6).
The integrated biomass of protozooplankton ran -ged between 0.1 and 4.0 g C m−2 (Figs. 7A,B & 8A).Initially, and by the termination of the investigatedperiod, the protozooplankton community was com-posed of small ciliates and dinoflagellates. However,during the bloom period, the relative amount of largecells increased. Thus, in June, 45 to 98% of the inte-grated protozooplankton biomass was composed oflarge (>40 µm) specimens (mainly ciliates; Fig. 7A).
The estimated protozooplankton production ran -ged between 0.01 and 0.42 g C m−2 d−1 (Fig. 7C,D).For ciliates, the seasonal variation mirrored the inte-grated biomass, with small ciliates being the most
productive during spring and large ciliates beingmost productive during the summer (Fig. 7C).
Assuming that ciliates only feed on phytoplankton<10 µm, and dinoflagellates only feed on phyto-plankton >10 µm (Hansen et al. 1994), the protozoo-plankton maximum potential ingestion rates rangedbetween 0.01 and 1.2 g C m−2 d−1, corresponding to26 to 196% of the primary production d−1 (data notshown) or 0.5 to 50% of phytoplankton biomass d−1
(Fig. 7E,F). The highest maximum potential ingestionrates were achieved in the summer after the dis -appearance of the copepod Metridia longa.
Copepod succession
The copepod community was dominated by thegenera Calanus, Pseudocalanus, Oithona, Micro -setella and Triconia/Oncaea. Metridia longa ac coun -ted for 72 to 93% of the copepod biomass in thespring. The integrated biomass of copepods showeda maximum of 24 g C m−2 in early March (Fig. 8B),but decreased after 3 June when the communitychanged towards dominance by smaller species suchas Pseudocalanus spp., Microsetella norvegica andOithona similis. The copepod biomass remained low(<6 g C m−2) throughout the rest of the study period.
74
Fig. 5. Seasonal development in the abundance (cells l−1) of (A) ciliates and (B) heterotrophic dinoflagellates superimposedon the chl a concentration (green shading, µg l–1) and (C,D) seasonal succession in the biomass (µg C l−1) of (C) ciliates and
(D) heterotrophic dinoflagellates. Points represent sampling depths

Riisgaard et al.: Subarctic protozooplankton
A pairwise correlation between the integratedproto zooplankton biomass and the grazing part ofthe copepod biomass (i.e. Acartia spp., Calanus spp.,Metridia longa, Microcalanus spp., Oithona spp. andPseudocalanus spp.) revealed a significant relation-ship between the 2 zooplankton groups, with proto-zooplankton biomass being inversely proportional tocopepod biomass (r2 = 0.89, p <0.01; Fig. 9). A similartrend was found be tween chl a and copepod biomass(r2 = 0.22, p = 0.08; Fig. 9). No significant correlationwas found between protozooplankton biomass andchl a.
Grazing impact by Metridia longa
The Metridia longa grazing experiment was initi-ated with a phytoplankton biomass of 22 µg C l−1.Phytoplankton cells in the small size fraction (0.7 to
10 µm) contributed 95% of the total phytoplanktonbiomass. M. longa clearance rate on the large chl afraction (>10 µm) was estimated at 2.1 ± 0.5 ml µg C−1
d−1 (mean ± SE, n = 23), while there was negativeclearance (−1.5 ± 0.6 ml µg C−1 d−1, mean ± SE, n =23) on the small chl a fraction (<10 µm). The lowerthreshold of clearance was corroborated from theLugol’s sample counts, where no significant clear-ance was found on particles in the size range 3 to6 µm (Fig. 10; t-test, p > 0.05). We cannot concludewhether M. longa in fact consumed these small sizedprey items or if the non-significant clearance rates onsmall sized particles are due to a bottle-generatedcascade effect caused by removal of protozooplank-ton in the experimental bottles. This condition mayhave caused a significant underestimation of thegrazing rates (Nejstgaard et al. 1997, 2001). On aglobal average, copepod grazing on phytoplankton isunderestimated by 20 to 30% in this kind of grazing
75
Fig. 6. Seasonal development in selected protozooplankton specimens. Bars = integrated biomass (g C m−2); l = abundance (cells l−1). Integration depth: 100 m. Note different y-axis scales

Mar Ecol Prog Ser 500: 67–82, 2014
experiment (Saiz & Calbet 2011). The protozooplank-ton concentration in the experimental bottles was21 ± 5 × 10³ l−1, corresponding to an average biomassof 14 ± 2 µg C l−1. The protozooplankton communitywas dominated by Mesodinium spp., Strombidiumspp., Gyrodinium spirale, Laboea strobila and Strobi-lidium oviformis. M. longa cleared cells in the sizerange of 10 to 60 µm, with an average clearance rateof 2.4 ± 0.2 ml µg C−1 d−1 (mean ± SE, n = 26)(Fig. 10A). While clearance rate was positively corre-lated to prey size (r2 = 0.90, p = 0.06), no clear rela-tionship was found between biomass of the prey sizeclasses and the clearance rate (Fig. 10B).
Copepod community grazing
The maximum potential grazing rates of the cope-pod community was highest from March to late May,when the copepod community cleared 16 ± 7% of thewater column per day. Metridia longa alone ac -counted for >90% of the maximum potential cope-pod community clearance (Fig. 11A).
As the Metridia longa population disappearedfrom the water column, the maximum potentialclearance capacity was reduced, and remained low(7 ± 2% water column d−1) throughout the summerperiod (Fig. 11A). Generally, our maximum poten-
76
Fig. 7. (A,B) Integrated biomass (g C m−2), (C,D) estimated production (g C m−2 d−1) calculated from (E,F) estimated maximalpotential ingestion rates (g C m−2 d−1) of ciliates and heterotrophic dinoflagellates. The color codes represent the fraction ofeach protozooplankton size class. Size is given in equatorial spherical diameter (ESD). (E,F) l = phytoplankton biomass
ingested per day (% d−1). Integration depth: 100 m. Note different y-axis scales

Riisgaard et al.: Subarctic protozooplankton
tial grazing estimates suggest that M. longa wasable to control the protozooplankton communityduring spring, grazing >100% of the protozoo-plankton production every day (Fig. 11B). FromJune to August, the predation pressure declinedand there was an intense buildup of protozooplank-ton biomass in response to the reduction in M.longa grazing pressure.
DISCUSSION
Hydrography and plankton characteristics
Fjords are important environments of the coastalzone of Greenland. They are the first components ofthe marine regime to be impacted by increased meltwater from land, and are therefore suitable proxies todetermine how open marine environments may re-spond in a warmer future. In this sense, the fresh-water-impacted Kapisigdlit Fjord branch representsan ideal test site to develop an understanding of thepotential impact of increased freshwater input andwater- column stratification on the pelagic community.
The Kapisigdlit Fjord is a seasonally oligotrophic,stratified subarctic ecosystem controlled by nitrateduring the productive season. The fjord shows strongseasonality in chl a concentrations, but is character-
77
Fig. 8. (A) Integrated protozooplankton biomass (g C m−2),(B) integrated copepod biomass (g C m−2). Integration depth:100 m for protozooplankton and 250 m for copepod biomass
Fig. 9. Relationship between integrated copepod biomassand integrated phytoplankton and protozooplankton bio-mass. White dots indicate regression between copepods andphytoplankton (r2 = 0.22, p = 0.08). Black dots indicate re-gression between copepods and protozooplankton (r2 = 0.89,
p < 0.01)
Fig. 10. Metridia longa. Specific clearance rate (ml µg C−1 d−1) at 3°C of different (A) size classes and (B) biomass classes of ciliates,dinoflagellates, nanoflagellates and phytoplankton. ESD: equatorial spherical diameter. Error bars indicate mean ± SE (n = 23)

Mar Ecol Prog Ser 500: 67–82, 2014
ized by lower concentrations than reported fromother subarctic and Arctic regions, where the surfacechl a generally exceeds 1.5 µg l−1 during the produc-tive season (Pabi et al. 2008). The freshwater runoffin the Kapisigdlit Fjord creates a more stratifiedwater column—which prevents mixing of nutrientsupward into the euphotic zone, as shown by the lowchl a concentrations, the low primary productionrates and the high proportions of nanophytoplanktonand protozooplankton.
Few attempts have been made to investigate therole of protozooplankton in subarctic and Arctic eco-systems, and most studies have focused on the high-productive regions dominated by diatoms andCalanus spp. (Verity et al. 2002, Sherr & Sherr 2007,Seuthe et al. 2011). This research documented thatsubarctic fjords may support rich and diverse proto-zooplankton communities, and that their abundancesare comparable to levels found in temperate waters(Sherr & Sherr 2007, Saiz & Calbet 2011).
Compared to existing data from subarctic and Arctic regions, the protozooplankton biomass in the
Godthåbsfjord (including Kapisigdlit Fjord) is re -markably high (Poulsen & Reuss 2002, Arendt et al.2010, this study). Maximum integrated protozoo-plankton biomasses in coastal Arctic and subarcticwaters such as Kongsfjorden (Svalbard), Disko Bay(West Greenland), Young Sound (Northeast Green-land), Fyllas Banke (off West Greenland), the BarentsSea and the subarctic Pacific Ocean have been re -ported in the range 0.2 to 1.7 g C m−2 (Strom et al.1993, Rysgaard et al. 1999, Levinsen et al. 2000,Rat’kova & Wassmann 2002, Seuthe et al. 2011). Incomparison, the maximum integrated protozooplank-ton biomass in the Kapisigdlit Fjord was 4.0 g C m−2.
In contrast to studies at Fyllas Banke, Kongsfjorden,Disko Bay and Young Sound, where dinoflagellatesdominated the protozooplankton community (Levin-sen & Nielsen 2002, Poulsen & Reuss 2002, Sherr et al.2009, Seuthe et al. 2011), ciliates contributed 82% ofthe total protozooplankton biomass in our study. Asimilar community structure has been observed in theBarents Sea (Rat’kova & Wassmann 2002) and in thesubarctic Pacific Ocean (Strom et al. 1993). The dif-ference in the relative composition of the protozoo-plankton community can be explained by the differ-ent feeding strategies of ciliates and dinoflagellates.While ciliates generally prefer small particles (~2 to10 µm), heterotrophic dinoflagellates feed on diatomsand other large particles (>10 µm) (Hansen et al.1994). The Kapisigdlit Fjord represents a seasonallystratified and oligotrophic ecosystem supporting aphytoplankton community of small flagellates, andaccordingly, ciliates as the dominant proto zoo -plankton grazers. Ciliates feeding on nanoflagellatescould not be distinguished from potential predatoryciliates feeding on other ciliates and dinoflagellates.However, predatory ciliates such as Didinium spp. orFavella ehrenbergii (Berger 1980, Stoecker et al.1981) were rare in the samples, and thus predatoryciliates were not considered important for the trophicrole of the protozooplankton community.
The estimated maximum potential grazing impactof protozooplankton on phytoplankton was highlyvariable, but generally exceeded 100% of the pri-mary production during the summer months. Thishigh grazing impact of protozooplankton is consis-tent with data from Calbet et al. (2011) who, based ondilution experiments, estimated grazing rates corre-sponding to 128% of the primary production con-sumed per day in June. In comparison, grazing ratesestimated from dilution experiments in other regionsof Arctic seas have been in the range of 26 to 77% ofthe primary production per day (Verity et al. 2002,Sherr et al. 2009). Although the maximum potential
78
Fig. 11. Seasonal development in copepod grazing impact.(A) Water column cleared for cells in the size range 10 to60 µm by the copepod community (% d−1); (B) bars = inte-grated protozooplankton production (g C m−2 d−1) and l =fraction of protozooplankton production cleared by thecopepod community (% d−1). ‘Others’ represent copepodsdo minated by Pseudocalanus spp., Oithona spp., Centro-
pages spp. and Microcalanus spp.

Riisgaard et al.: Subarctic protozooplankton
grazing impact may be slightly overestimated due toinclusion of mixotrophic species such as Mesodiniumrubrum, Laboea strobila and Strombidium cornicum,the results emphasize the need to consider protozoo-plankton as key grazers in high latitude ecosystems.
Protozooplankton as prey for copepods
It is well documented that Calanus can exploit pro -to zooplankton (Ohman & Runge 1994, Levinsen et al.2000, Turner et al. 2001). Knowledge of Metri dia feed-ing biology indicates this species consumes diatoms,nauplii and copepod eggs (Haq 1967, Sell et al. 2001,Campbell et al. 2009, Kjellerup & Kiørboe 2012). Incontrast to typical suspension-feeding copepods (e.g.Calanus) which generate a feeding current to captureprey, Metridia longa feeds by cruising through thewater, capturing prey by remote detection (Kjellerup& Kiørboe 2012). The cruising behavior of Metridiamay be an advantage in environments in which preyconcentrations are low, or when the prey tries to es-cape the feeding current (e.g. ciliates such as Meso-dinium rubrum; Jonsson & Tiselius 1990, Fenchel &Hansen 2006). Haq (1967) demonstrated that M. lon -ga was able to capture prey in the size range 5 to 300µm, with clearance rates in the range of 3 to 7 ml ind.−1
d−1. Our study indicates that particles <60 µm are effi-ciently consumed by adult M. longa females, but incomparison to Haq (1967), the average clearance ratewas higher: 222 ± 36 ml ind.−1 d−1 (mean ± SE, n = 26)for protozooplankton in the size range 10 to 60 µm.The estimated grazing rates obtained from the graz -ing experiment are close to maximum potential clear-ance rates estimated from empirical relations in Han -sen et al. (1997, 2000) and Møller et al. (2006) (Fig. 12).The low clearance rates presented in Haq (1967)could be explained by the limited variability inoffered prey, since M. longa was only exposed tophytoplankton cells, small flagellates and Artemianauplii. Our data suggest that M. longa has a high af -finity for protozooplankton prey. Similarly, Haq (1967)demonstrated that M. longa feed more rapidly on ani-mal prey than on phytoplankton. Due to the size com-position of the plankton community and the possiblecascading effects within the phytoplankton commu-nity in the grazing experiment, we did not find upperand lower prey size thresholds for M. longa. However,the relative optimal size range of prey for copepods issurprisingly constant between species, suggestingthat adult copepods of similar size to M. longa have anoptimal prey size range of ~10 to 70 µm (Berggreen etal. 1988, Hansen et al. 1994, Levinsen et al. 2000).
Since the in situ size composition of the phyto-plankton in the Kapisigdlit Fjord was dominated bysmall cells (<10 µm), we presume that only a smallfraction of the phytoplankton community is availableto adult Metridia longa, and that survival of this species to a large extent is dependent on prey itemssuch as microzooplankton. During the study period,ciliates and dinoflagellates accounted for 55%(10–81%) and 10% (2–25%) respectively, of the car-bon available for the copepods, assuming that cope-pods primarily feed on phytoplankton and protozoo-plankton >10 µm. This proportion is within the samemagni tude as found in global oligotrophic eco -systems (<50 µg C l−1), where ciliates and dinoflagel-lates on average account for 43 and 19% of the cope-pod carbon consumption, respectively (Saiz & Calbet2011). Although M. longa is known to consume nau-plii (Haq 1967, Kjellerup & Kiørboe 2012), naupliionly contributed 11% (1–40%) of the microzoo-plankton biomass (calculated as the sum of ciliate,dinoflagellate and nauplii biomass). Prey preferenceand clearance rate will likely vary depending on thecopepod community composition and prey availabil-ity. However, throughout the study period, adultfemales and copepodites in the CV stage constituted78 ± 9% (55–89%) of the entire M. longa biomass(i.e. all copepod stages including nauplii, cope-podites and males), indicating that the rates esti-mated from our grazing experiment are within a rea -listic range. Thus, the present study indicates thatprotozooplankton, especially ciliates, are an essentialsource of food for the copepod community in sub -arctic oligotrophic systems, such as the KapisigdlitFjord.
79
Fig. 12. Water column cleared for cells in the size range 10 to60 µm by Metridia longa (% d−1). Values are estimated usingmaximum potential clearance rates from Hansen et al.(1997) and Møller et al. (2006), or by using the average clear-ance rate generated from the grazing experiment with M.
longa (present study)

Mar Ecol Prog Ser 500: 67–82, 2014
Correcting grazing impact to in situ temperatureusing Q10
The in situ temperature throughout the studyperiod ranged between 0.5 and 13°C. Literature Q10
values for maximum potential clearance, ingestionand production rates of protozooplankton and cope-pods (reviewed in Hansen et al. 1997) range between1.5 and 4.0 (average 2.8) within the temperaturerange 5 to 25°C. Since there are no consistent differ-ences in Q10 between temperatures, a universal Q10
of 2.8 was applied to all temperatures when estimat-ing maximum grazing potential. By using Q10 withinthe range of 1.5 to 4.0, the overall conclusions of thestudy would be unchanged. For example, using a Q10
of 4.0 at temperatures <5°C, maximum potentialclearance, ingestion and production rates for proto-zooplankton would have been 28% lower than whenusing a Q10 of 2.8 for all temperatures.
Regulation of protozooplankton
The late summer peak of protozooplankton ob -served in the Kapisigdlit Fjord is a result of the dis -appearance of large copepods, a condition that re -duces the grazing pressure on the protozooplanktoncommunity. A similar seasonal succession has beenobserved in Disko Bay (Levinsen & Nielsen 2002),where a ‘regulation window’ is created by the phyto-plankton spring bloom. During the spring bloom,Calanus becomes food-saturated and thereby de -creases the grazing pressure on the protozooplankton.In Disko Bay, a second ‘window’ is created when theadult Calanus leave the surface layer in the late sum-mer. In the Kapisigdlit Fjord, the ‘regulation window’is established as the predation pressure from Metridialonga is reduced when leaving the surface layer. This‘regulation window’ stays ‘open’ a few weeks duringthe summer period until a high grazing pressure is re-established by a late summer community of smallcopepods; mainly Oithona spp. (Figs. 8 & 11). In high- Arctic regions such as Young Sound, ‘regulation windows’ are usually absent due to the brief open wa-ter period. In these systems, copepods are able to con-sume most of the primary production, meaning thatcopepods control both the phytoplankton and proto-zooplankton during the entire productive season(Rysgaard et al. 1999, Nielsen et al. 2007).
Climate changes are probably the largest ecologi-cal threats facing the Arctic marine environment inthe future. More detailed knowledge about trophicdynamics in subarctic marine ecosystems will pro-
vide a basis for predicting the consequences of re -gime shifts in high latitudes. In some areas of theArctic, increased temperatures may reduce the sea-ice cover and expand the productive season (Trem-blay & Gagnon 2009, Slagstad et al. 2011), allowingmore complex plankton communities to develop(Rysgaard et al. 1999). Intensified precipitation andglacial melting may strengthen water column stratifi-cation, which would favor the development of small-sized phytoplankton populations (Ar dyna et al. 2011)and position ciliates as key grazers. According to thisscenario, the zooplankton community would changefrom dominance by copepods towards a morebimodal grazer succession, with a peak of largecalanoid copepods in the spring succeeded by a latesummer peak of protozooplankton and small cope-pod species, as illustrated in Disko Bay (Levinsen &Nielsen 2002) and the present study.
Acknowledgements. The research leading to these resultswas funded by the European Commission FP7 EURO-BASIN (Grant Agreement: 264 933) and the Greenland Climate Research Centre (Project 6505). We acknowledgethe marine sub-program of the Greenland Ecosystem Moni-toring program for assistance in equipment and primaryproduction estimates. We thank the captains and crew forexcellent help during sampling on RVs ‘Lille Masik’ and‘Dana’. We also thank S. Zamora-Terol, B. Søborg, T. Krogh,K. Kreutzmann, H. Philipsen and J. Mortensen for help withlogistics and equipment.
LITERATURE CITED
Ardyna M, Gosselin M, Michel C, Poulin M, Tremblay J(2011) Environmental forcing of phytoplankton commu-nity structure and function in the Canadian High Arctic: contrasting oligotrophic and eutrophic regions. Mar EcolProg Ser 442: 37−57
Arendt KE, Nielsen TG, Rysgaard S, Tönnesson K (2010)Differences in plankton community structure along theGodthåbsfjord, from the Greenland Ice Sheet to offshorewaters. Mar Ecol Prog Ser 401: 49−62
Arendt KE, Juul-Pedersen T, Mortensen J, Blicher ME, Rys-gaard S (2012) A 5-year study of seasonal patterns inmesozooplankton community structure in a sub-Arcticfjord reveals dominance of Microsetellanorvegica (Crus-tacea, Copepoda). J Plankton Res 35: 105−120
Berger J (1980) Feeding-behavior of Didinium nasutum onParamecium bursaria with normal or apochlorotic zoo-chlorellae. J Gen Microbiol 118: 397−404
Berggreen U, Hansen B, Kiørboe T (1988) Food size spectra,ingestion and growth of the copepod Acartia tonsa dur-ing development: implications for determination of cope-pod production. Mar Biol 99: 341−352
Bergstrøm B, Vilhajalmsson H (2008) Cruise report and pre-liminary results of the acoustic/pelagic trawl survey offWest Greenland for capelin and polar cod 2005. Techni-cal Report No. 66, Greenland Institute of Natural Re -sources, Nuuk
80

Riisgaard et al.: Subarctic protozooplankton
Calbet A, Riisgaard K, Saiz E, Zamora S, Stedmon C,Nielsen TG (2011) Phytoplankton growth and microzoo-plankton grazing along a sub-Arctic fjord (Godthåbs-fjord, west Greenland). Mar Ecol Prog Ser 442: 11−22
Campbell RG, Sherr EB, Ashjian CJ, Plourde S, Sherr BF,Hill V, Stockwell DA (2009) Mesozooplankton prey pref-erence and grazing impact in the Western Arctic Ocean.Deep-Sea Res II 56: 1274−1289
Comiso JC, Parkinson CL, Gersten R, Stock L (2008) Accel-erated decline in the Arctic sea ice cover. Geophys ResLett 35: L01703, doi: 10.1029/2007GL031972
Daase M, Eiane K, Aksnes DL, Vogedes D (2008) Verticaldistribution of Calanus spp. and Metridia longa at fourArctic locations. Mar Biol Res 4: 193−207
Digby PSB (1953) Plankton production in Scoresby Sound,East Greenland. J Anim Ecol 22: 289−322
Falkenhaug T, Tande KS, Semenova T (1997) Diel, seasonaland ontogenetic variations in the vertical distributions offour marine copepods. Mar Ecol Prog Ser 149: 105−119
Fenchel T, Hansen PJ (2006) Motile behaviour of the bloom-forming ciliate Mesodinium rubrum. Mar Biol Res 2: 33−40
Frost BW (1972) Effects of size and concentration of foodparticles on feeding behavior of marine planktonic cope-pod Calanus pacificus. Limnol Oceanogr 17: 805−815
Hamilton L, Lyster P, Otterstad O (2000) Social change, ecology and climate in 20th-century Greenland. ClimChange 47: 193−211
Hansen PJ (2011) The role of photosynthesis and fooduptake for the growth of marine mixotrophic dinoflagel-lates. J Eukaryot Microbiol 58: 203−214
Hansen H, Koroleff F (1999) Determination of nutrients. In: Grasshoff K, Kremling K, Ehrhardt M (eds) Methods ofseawater analysis, 3rd edn. Wiley-VCH, Weinheim,p 159−228
Hansen B, Bjørnsen PK, Hansen PJ (1994) The size ratiobetween planktonic predators and their prey. LimnolOceanogr 39: 395−403
Hansen PJ, Bjørnsen PK, Hansen BW (1997) Zooplanktongrazing and growth: scaling within the 2–2000-µm bodysize range. Limnol Oceanogr 42: 687−704
Hansen PJ, Bjørnsen PK, Hansen BW (2000) Zooplanktongrazing and growth: Scaling within the 2–2000-µm bodysize range. Limnol Oceanogr 45: 1891 [Erratum to LimnolOceanogr 42: 687−704]
Haq SM (1967) Nutritional physiology of Metridia lucensand M. longa from Gulf of Maine. Limnol Oceanogr 12: 40−51
Hays GC (1995) Ontogenetic and seasonal variation in thediel vertical migration of the copepods Metridia lucensand Metridia longa. Limnol Oceanogr 40: 1461−1465
Hirche HJ, Mumm N (1992) Distribution of dominant cope-pods in the Nansen Basin, Arctic-Ocean, in summer.Deep-Sea Res A 39: S485−S505
Holland DM, Thomas RH, De Young B, Ribergaard MH,Lyberth B (2008) Acceleration of Jakobshavn Isbræ triggered by warm subsurface ocean waters. Nat Geosci1: 659−664
Hopkins CCE, Tande KS, Grønvik S, Sargent JR (1984) Eco-logical investigations of the zooplankton community ofBalsfjorden, Northern Norway: an analysis of growth andoverwintering tactics in relation to niche and environ-ment in Metridia longa (Lubbock), Calanus finmarchicus(Gunnerus), Thysanoessa inermis (Krøyer) and Thysa-noessa raschi (M. Sars). J Exp Mar Biol Ecol 82: 77−99
Hygum BH, Rey C, Hansen BW, Tande K (2000) Importanceof food quantity to structural growth rate and neutrallipid reserves accumulated in Calanus finmarchicus. MarBiol 136:1057–1073
Jakobsen HH, Hansen PJ (1997) Prey size selection, grazingand growth response of the small heterotrophic dino -flagellate Gymnodinium sp. and the ciliate Balanioncomatum — a comparative study. Mar Ecol Prog Ser 158: 75−86
Jespersen AM, Christoffersen K (1987) Measurements ofchlorophyll-a from phytoplankton using ethanol as ex -traction solvent. Arch Hydrobiol 109: 445−454
Jonsson PR, Tiselius P (1990) Feeding-behavior, prey detec-tion and capture efficiency of the copepod Acartia tonsafeeding on planktonic ciliates. Mar Ecol Prog Ser 60: 35−44
Juul-Pedersen T, Nielsen TG, Michel C, Møller EF and oth-ers (2006) Sedimentation following the spring bloom inDisko Bay, West Greenland, with special emphasis onthe role of copepods. Mar Ecol Prog Ser 314: 239−255
Kjellerup S, Kiørboe T (2012) Prey detection in a cruisingcopepod. Biol Lett 8: 438−441
Klein Breteler WCM, Fransz HG, Gonzalez SR (1982)Growth and development of four calanoid copepod spe-cies under experimental and natural conditions. Neth JSea Res 16:195–207
Koski M, Møller EF, Maar M, Visser AW (2007) The fate ofdiscarded appendicularian houses: degradation by thecopepod, Microsetella norvegica, and other agents.J Plankton Res 29: 641−654
Levinsen H, Nielsen TG (2002) The trophic role of marinepelagic ciliates and heterotrophic dinoflagellates in arc-tic and temperate coastal ecosystems: a cross-latitudecomparison. Limnol Oceanogr 47: 427−439
Levinsen H, Turner JT, Nielsen TG, Hansen BW (2000) Onthe trophic coupling between protists and copepods inarctic marine ecosystems. Mar Ecol Prog Ser 204: 65−77
Madsen SD, Nielsen TG, Hansen BW (2001) Annual popu -lation development and production by Calanus fin-marchicus, C. glacialis and C. hyperboreus in Disko Bay,western Greenland. Mar Biol 139: 75−93
Menden-Deuer S, Lessard EJ (2000) Carbon to volume rela-tionships for dinoflagellates, diatoms, and other protistplankton. Limnol Oceanogr 45: 569−579
Møller EF, Nielsen TG, Richardson K (2006) The zooplank-ton community in the Greenland Sea: composition androle in carbon turnover. Deep-Sea Res I 53: 76−93
Mortensen J, Lennert K, Bendtsen J, Rysgaard S (2011) Heatsources for glacial melt in a sub-Arctic fjord (Godthåbs-fjord) in contact with the Greenland Ice Sheet. J GeophysRes 116: C01013, doi: 10.1029/2010JC006528
Motyka RJ, Truffer M, Fahnestock M, Mortensen J, Rys-gaard S (2011) Submarine melting of the 1985 Jakob-shavn Isbræ floating tongue and the triggering of thecurrent retreat. J Geophys Res 116: F01007, doi: 10.1029/2009JF001632
Nejstgaard JC, Gismervik I, Solberg PT (1997) Feeding andreproduction by Calanus finmarchicus, and microzoo-plankton grazing during mesocosm blooms of diatomsand the coccolithophore Emiliania huxleyi. Mar EcolProg Ser 147: 197−217
Nejstgaard JC, Naustvoll JL, Sazhin A (2001) Correcting forunderestimation of microzooplankton grazing in bottleincubation experiments with mesozooplankton. Mar EcolProg Ser 221: 59−75
81

Mar Ecol Prog Ser 500: 67–82, 2014
Nielsen TG, Hansen B (1995) Plankton community structureand carbon cycling on the western coast of Greenlandduring and after the sedimentation of a diatom bloom.Mar Ecol Prog Ser 125: 239−257
Nielsen TG, Hansen PJ (1999) Dyreplankton i danske far-vande. Danmarks Miljøundersøgelser. TEMA-rapport fraDMU, Miljø- og Energiministeriet, No. 28/1999, Roskilde
Nielsen TG, Ottosen LD, Hansen BW (2007). Structure andfunction of the pelagic ecosystem in an ice covered arcticfjord. In: Rysgaard S, Glud RN (Eds.) Carbon cycling inArctic marine ecosystems: case study Young Sound.Meddr Greenland, Bioscience Special Issue p 88–107
Ohman MD, Runge JA (1994) Sustained fecundity whenphytoplankton resources are in short supply: omnivoryby Calanus finmarchicus in the Gulf of St. Lawrence.Limnol Oceanogr 39: 21−36
Pabi S, van Dijken GL, Arrigo KR (2008) Primary productionin the Arctic Ocean, 1998-2006. J Geophys Res 113: C08005, doi: 10.1029/2007JC004578
Pedersen T, Fossheim M (2008) Diet of 0-group stages ofcapelin (Mallotus villosus), herring (Clupea harengus)and cod (Gadus morhua) during spring and summer inthe Barents Sea. Mar Biol 153:1037–1046
Poulsen LK, Reuss N (2002) The plankton community onSukkertop and Fylla Banks off West Greenland during aspring bloom and post-bloom period: hydrography,phytoplankton and protozooplankton. Ophelia 56: 69−85
Putt M, Stoecker DK (1989) An experimentally determinedcarbon-volume ratio for marine oligotrichous ciliatesfrom estuarine and coastal waters. Limnol Oceanogr 34: 1097−1103
Rat’kova TN, Wassmann P (2002) Seasonal variation andspatial distribution of phyto- and protozooplankton in thecentral Barents Sea. J Mar Syst 38: 47−75
Rysgaard S, Glud RN (2004) Anaerobic N2 production inArctic sea ice. Limnol Oceangr 49(1):86–94
Rysgaard S, Nielsen TG, Hansen BW (1999) Seasonal varia-tion in nutrients, pelagic primary production and grazingin a high-Arctic coastal marine ecosystem, Young Sound,Northeast Greenland. Mar Ecol Prog Ser 179: 13−25
Sabatini M, Kiørboe T (1994) Egg production, growth anddevelopment of cyclopoid copepod Oithona similis.J Plankton Res 16: 1329–1351
Saiz E, Calbet A (2011) Copepod feeding in the ocean: scal-ing patterns, composition of their diet and the bias ofestimates due to microzooplankton grazing during incu-bations. Hydrobiologia 666: 181−196
Satapoomin S (1999) Carbon content of some common tro -pical Andaman Sea copepods. J Plankton Res 21:2117–2123
Sell AF, van Keuren D, Madin LP (2001) Predation by omnivorous copepods on early developmental stages ofCala nus finmarchicus and Pseudocalanus spp. LimnolOcea nogr 46: 953−959
Seuthe L, Iversen KR, Narcy F (2011) Microbial processes ina high-latitude fjord (Kongsfjorden, Svalbard): II. Ciliatesand dinoflagellates. Polar Biol 34: 751−766
Sherr EB, Sherr BF (2007) Heterotrophic dinoflagellates: asignificant component of microzooplankton biomass andmajor grazers of diatoms in the sea. Mar Ecol Prog Ser352: 187−197
Sherr EB, Sherr BF, Hartz AJ (2009) Microzooplankton graz-ing impact in the western Arctic Ocean. Deep-Sea Res II56: 1264−1273
Slagstad D, Ellingsen IH, Wassmann P (2011) Evaluatingprimary and secondary production in an Arctic Oceanvoid of summer sea ice: an experimental simulationapproach. Prog Oceanogr 90: 117−131
Smidt ELB (1979) Annual cycles of primary production andof zooplankton at southwest Greenland. Greenl Biosci1:1−56
Steemann-Nielsen E (1958) A survey of recent Danish meas-urements of the organic productivity in the sea. RappCons Int Explor Mer 144: 92−95
Stoecker D, Guillard RRL, Kavee RM (1981) Selective preda-tion by Favella ehrenbergii (Tintinnia) on and amongdinoflagellates. Biol Bull 160: 136−145
Stoecker DK, Gifford DJ, Putt M (1994) Preservation of mar-ine planktonic ciliates: losses and cell shrinkage duringfixation. Mar Ecol Prog Ser 110: 293−299
Storr-Paulsen M, Wieland K, Hovgard H, Ratz HJ (2004)Stock structure of Atlantic cod (Gadus morhua) in WestGreenland waters: implications of transport and migra-tion. ICES J Mar Sci 61: 972−982
Stroeve J, Holland MM, Meier W, Scambos T, Serreze M(2007) Arctic sea ice decline: faster than forecast. Geo-phys Res Lett 34: L09501, doi: 10.1029/2007GL029703
Strom SL, Postel JR, Booth BC (1993) Abundance, variabil-ity, and potential grazing impact of planktonic ciliates inthe open sub-Arctic Pacific Ocean. Prog Oceanogr 32: 185−203
Tang KW, Nielsen TG, Munk P, Mortensen J and others(2011) Metazooplankton community structure, feedingrate estimates, and hydrography in a meltwater-influ-enced Greenlandic fjord. Mar Ecol Prog Ser 434: 77−90
Tremblay JE, Gagnon J (2009) The effects of irradiance andnutrient supply on the productivity of Arctic waters: aperspective on climate change. In: Nihoul JCJ, KostianoyAG (eds) Influence of climate change on the changingArctic and Sub-Arctic conditions. NATO Science forPeace and Security Series C: Environmental Security.Springer, Houten, p 73−93
Turner J, Levinsen H, Nielsen TG, Hansen BW (2001) Zoo-plankton feeding ecology: grazing on phytoplankton andpredation on protozoans by copepod and barnacle nau-plii in Disko Bay, West Greenland. Mar Ecol Prog Ser221: 209−219
Uye S, Aoto I, Onbé T (2002) Seasonal population dynamicsand production of Microsetella norvegica, a widely dis-tributed but little-studied marine planktonic harpacticoidcopepod. J Plankt Res 24:143–153
Verity PG Langdon C (1984) Relationships between loricavolume, carbon, nitrogen, and ATP content of tintinnidsin Narragansett Bay. J Plankton Res 6:859–868
Verity PG, Wassmann P, Frischer ME, Howard-Jones MH,Allen AE (2002) Grazing of phytoplankton by microzoo-plankton in the Barents Sea during early summer. J MarSyst 38: 109−123
Yentsch CS, Menzel DW (1963) A method for the determina-tion of phytoplankton chlorophyll and phaeophytin byfluorescence. Deep-Sea Res 10: 221−231
82
Editorial responsibility: Marsh Youngbluth, Fort Pierce, Florida, USA
Submitted: September 26, 2012; Accepted: December 17, 2013Proofs received from author(s): February 26, 2014