Sebuah Kajian Pustaka: - INTERNATIONAL JOURNALS OF ...
541
International Journal of Management, IT & Engineering Vol. 8 Issue 12(1), December 2018, ISSN: 2249-0558 Impact Factor: 7.119 Journal Homepage: http://www.ijmra.us, Email: [email protected] Double-Blind Peer Reviewed Refereed Open Access International Journal - Included in the International Serial Directories Indexed & Listed at: Ulrich's Periodicals Directory ©, U.S.A., Open J-Gage as well as in Cabell’s Directories of Publishing Opportunities, U.S.A 1 International Journal of Management, IT & Engineering http://www.ijmra.us, Email: [email protected] Importance of Talent Development Practices adopted for middle management employees: A comparative study of Chain hotels and Independent hotels in Delhi (NCR) Rajeev Ranjan Mishra Dr Piyush Sharma Dr Sanjeev Kumar Abstract Talent development practices in the commercial segment of the hotel business tend to be inadequate. Not many hospitality employers fulfill the fundamental requirements established by employment legislation and the HR managers and &hotel owners are inadequately advised or even educated about good practices. Poor talent development practices are a matter of great concern since; ultimately, it threatens India's success in tourism and hospitality markets and providing merely low quality job for many individuals. This study aims at examining the interdependency of employee efficiency and work practices adopted in the Independent hotels and Chain hotels in Delhi (NCR). It additionally tries to evaluate the talent development practices and its impact on Independent hotels and Chain hotels in Delhi (NCR). In an attempt to do so, a survey in the form of a questionnaire and interviews was carried out from the sample comprising of 243 hotel staffs from the middle management and the associates categories to find out their views on the topic. The responses received were represented graphically and analyzed using standard analytical tools. The results of this research verify the point that employment practices adopted by the hotels business have a positive impact on the efficiency of its staffs. Nevertheless, the productivity management product must be suitably created to concentrate on employment practices with an aim to improve the employee productivity. Keywords: Talent development, Productivity, Hotel I. Introduction The Hotel Industry involves a high level of interaction between customers and employees and therefore offers several possibilities for service problems to occur. The caliber of service encounters is often based on the steps of front line team, whose dedication and experience could be restricted and whose attitudes may differ from one encounter to yet another. The hotel market has improved its competitiveness on account of the latest worldwide financial problems. Fewer individuals are able to go and check new locations, and industry visitors have grown to be fewer as organizations produce severe cutbacks to be able to save cash. Businesses depend on a great recruitment to be able to achieve success, and without each of these, it will be difficult for a company to survive. Hotels today wish to obtain their ideal employees again and by doing so, they're growing their competition. It is acknowledged that companies that focus on their dedicated, regular (Research Scholar, Faculty of Hospitality & Tourism, Amity University Uttar Pradesh) (Associate Professor, Faculty of Hospitality & Tourism, Amity University Uttar Pradesh) 3 (Assistant Professor, IHTM, M.D. University, Rohtak)
-
Upload
khangminh22 -
Category
Documents
-
view
0 -
download
0
Transcript of Sebuah Kajian Pustaka: - INTERNATIONAL JOURNALS OF ...

International Journal of Management, IT & Engineering Vol. 8 Issue 12(1), December 2018,
ISSN: 2249-0558 Impact Factor: 7.119
Journal Homepage: http://www.ijmra.us, Email: [email protected]
Double-Blind Peer Reviewed Refereed Open Access International Journal - Included in the International
Serial Directories Indexed & Listed at: Ulrich's Periodicals Directory ©, U.S.A., Open J-Gage as well as in
Cabell’s Directories of Publishing Opportunities, U.S.A
1 International Journal of Management, IT & Engineering
http://www.ijmra.us, Email: [email protected]
Importance of Talent Development Practices adopted for
middle management employees: A comparative study of Chain
hotels and Independent hotels in Delhi (NCR)
Rajeev Ranjan Mishra
Dr Piyush Sharma
Dr Sanjeev Kumar
Abstract
Talent development practices in the commercial segment of the hotel business tend to be
inadequate. Not many hospitality employers fulfill the fundamental requirements
established by employment legislation and the HR managers and &hotel owners are
inadequately advised or even educated about good practices. Poor talent development
practices are a matter of great concern since; ultimately, it threatens India's success in
tourism and hospitality markets and providing merely low quality job for many
individuals. This study aims at examining the interdependency of employee efficiency and
work practices adopted in the Independent hotels and Chain hotels in Delhi (NCR). It
additionally tries to evaluate the talent development practices and its impact on
Independent hotels and Chain hotels in Delhi (NCR). In an attempt to do so, a survey in the
form of a questionnaire and interviews was carried out from the sample comprising of 243
hotel staffs from the middle management and the associates categories to find out their
views on the topic. The responses received were represented graphically and analyzed
using standard analytical tools. The results of this research verify the point that
employment practices adopted by the hotels business have a positive impact on the
efficiency of its staffs. Nevertheless, the productivity management product must be
suitably created to concentrate on employment practices with an aim to improve the
employee productivity.
Keywords: Talent development, Productivity, Hotel
I. Introduction
The Hotel Industry involves a high level of interaction between customers and employees
and therefore offers several possibilities for service problems to occur. The caliber of
service encounters is often based on the steps of front line team, whose dedication and
experience could be restricted and whose attitudes may differ from one encounter to yet
another. The hotel market has improved its competitiveness on account of the latest
worldwide financial problems. Fewer individuals are able to go and check new locations,
and industry visitors have grown to be fewer as organizations produce severe cutbacks to
be able to save cash. Businesses depend on a great recruitment to be able to achieve
success, and without each of these, it will be difficult for a company to survive. Hotels
today wish to obtain their ideal employees again and by doing so, they're growing their
competition. It is acknowledged that companies that focus on their dedicated, regular
(Research Scholar, Faculty of Hospitality & Tourism, Amity University Uttar Pradesh) (Associate Professor, Faculty of Hospitality & Tourism, Amity University Uttar Pradesh) 3(Assistant Professor, IHTM, M.D. University, Rohtak)
International Journal of Management, IT & Engineering Vol. 8 Issue 12(1), December 2018,
ISSN: 2249-0558 Impact Factor: 7.119
Journal Homepage: http://www.ijmra.us, Email: [email protected]
Double-Blind Peer Reviewed Refereed Open Access International Journal - Included in the International
Serial Directories Indexed & Listed at: Ulrich's Periodicals Directory ©, U.S.A., Open J-Gage as well as in
Cabell’s Directories of Publishing Opportunities, U.S.A
2 International Journal of Management, IT & Engineering
http://www.ijmra.us, Email: [email protected]
guests and thus encompass high retention are not just gaining regular revenue, though it's
likewise cheaper and less cumbersome to invest cash advertising new guests. Businesses
within hospitality understand that ideal service every time can't be guaranteed, and
consequently to be able to continue customer retention, procedures have to remain
available to be capable to manage customer complaints successfully, to stay away from
unhappy guests, which might lead to bad word of mouth behaviors along with a bad track
record.
This study therefore researches the benefits of service restoration in hotels, dependent on
six organizational responses mentioned within the literature. Individuals that have been
effective as a front line employee in a hotel, either in independent hotel or a chain hotel,
will participate in focus groups, to locate some similarities or variations of opinion.
Ii. Literature Review
Murthy (2010) characterized talent administration as "managing the whole employee
lifecycle from pulling in and procuring to advancing and finding a successor upon
retirement. It likewise incorporates recognizable proof of the key holes between the talent
set up and the talent required to drive business achievement." He sees talent administration
as the activity of "guaranteeing the ideal individual, in the correct activity at the perfect
time". There is no single or brief meaning of talent administration. A blend of all the above
definitions uncovers that talent administration is a more extensive issue and can be
compared to an attitude. Review of a few other experts situated writing portrays talent
administration as a key part to compelling progression arranging while some others
guarantee that talent administration is endeavoring to make every one of the employees
work at the highest point of their potential.
Chugh and Bhatnagar (2006) characterized as a HR moving toward process that worries
with enlisting and holding talents and their development through managing professions,
job desires, arranging substitution, recognizing the holes in talents, and on the connection it
has to the organization, where this paper will forget enrollment and rather center around
talent administration and the setting in talented employees that is now a piece of an
organization. As said before the difficulty in talent administration lies in conveying how
employees fit in an organizational procedure, this with which variables to search for while
recognizing talents with regards to the eventual fate of an organization. Be that as it may,
with a specific end goal to misuse the skills and capacities of talents he states the
significance of a mutual mentality at all levels of an organization on the best way to
oversee talents. As it was there must be an open correspondence at all levels where there is
space to express your feeling in the gathering rooms.
Walsh and Taylor (2007) the most grounded drive for employees being focused on their
organization lies in the individuals who are most dedicated when confronting testing
assignments and work and in this way performs with abnormal state. The reason is on the
grounds that they distinguish themselves with the organization and their activity, which
makes it more normal to be submitted.
In actualizing arrangements in regards to managing talents Hughes and Rog (2008) hence
expresses that the distinctive methodologies of HR rehearse must be founded on the
systems either being gone for employees by and large or against a particular gathering.
However, for HR hones in managing talents to be actualized in all levels of the
organization Morton expresses this is relied upon the responsibility and the drive from the
CEO to make this a need, this to change the attitude and the way of life of the organization.

International Journal of Management, IT & Engineering Vol. 8 Issue 12(1), December 2018,
ISSN: 2249-0558 Impact Factor: 7.119
Journal Homepage: http://www.ijmra.us, Email: [email protected]
Double-Blind Peer Reviewed Refereed Open Access International Journal - Included in the International
Serial Directories Indexed & Listed at: Ulrich's Periodicals Directory ©, U.S.A., Open J-Gage as well as in
Cabell’s Directories of Publishing Opportunities, U.S.A
3 International Journal of Management, IT & Engineering
http://www.ijmra.us, Email: [email protected]
III. Talent Development Practices Adopted In The Hotel Industry
Above discussion only points to one thing, generally for every business, and particularly
for a service industry like hotel, employees are definitely the most valuable assets. The
employees should be highly motivated, efficient and possess a high morale to participate in
the service delivery process that would lead to a better customer satisfaction. Thus more
and more attention should be paid to the role of employees in services and investments
should be made to improve the most valuable asset of services.
The employment practices followed by the hotel industry can be classified in the following
areas:
A) Monetary Benefits
The hotel industry is widely known as among the very poor pay masters. The salary paid to
the hotel staffs is much lower when compared with other businesses. There are many
reasons for the same. Additionally, because of severe competition in the hotel sector, hotels
are fighting for their survival and as a result of the higher overhead along with other fixed
expenses that the hotels have, earning profits is a very difficult task. Hence salary or even
the labor cost is definitely the sole cost that could be controlled or kept within a limit.
Moreover, the forces of supply as well as demand of labor have maintained the salary at a
lower level. Nevertheless, on account of the growing competition in the market, staffs have
options available because of which the attrition rate has risen in the sector. In order to curb
this and then to keep the staffs satisfied as well as driven, the hotels have revised the
compensation techniques of their employees by introducing the subsequent monetary
advantages in the form of:
• Better salary & wages
• Incentive schemes
• Overtime compensation
B) Training & Development
This is a continuing activity in any organization to improve the abilities of the employees.
Just like others, the hotel business has introduced extensive training as well as
development programs for their staffs. These programs might stay in the type of on the job
training or proper classroom instruction. The sector thinks in continuous development of
its service delivery system to complement global standards. Furthermore, with the entry of
internationally reputed chain hotels, the hotels have determined the demand of the workers
to cope up with the task by obtaining the essential ability sets with these pursuits.
C) Work-Life Balance
The hotel business is characterized with long working hours in several shifts; work that is
tough, unpredictable weekly offs, etc. Thus the employees have a bad work-life balance
with negligible personal life. The typical working hours of the hotel staffs is 12-14 hours
during which they are supposed to be on their toes. Additionally, because of seasonal
fluctuations in the business, the hotels work with meager staff to always keep the labor cost
less particularly during the off season therefore increasing the workload and working hours
of the existing staff. The businesses in hotels are extremely unpredictable in nature and
many a times to cope up with the same, staffs need to work on their scheduled weekly offs
by sacrificing their commitments with their families. During the festive season too, the
hotel staff is supposed to be on their job. With a motive to bring down the severity of this
particular issue, hotels have set up the following measures:
• Additional Leaves / Holidays / Weekly offs

International Journal of Management, IT & Engineering Vol. 8 Issue 12(1), December 2018,
ISSN: 2249-0558 Impact Factor: 7.119
Journal Homepage: http://www.ijmra.us, Email: [email protected]
Double-Blind Peer Reviewed Refereed Open Access International Journal - Included in the International
Serial Directories Indexed & Listed at: Ulrich's Periodicals Directory ©, U.S.A., Open J-Gage as well as in
Cabell’s Directories of Publishing Opportunities, U.S.A
4 International Journal of Management, IT & Engineering
http://www.ijmra.us, Email: [email protected]
• Employee Leisure Clubs / Family Get together.
• Fixed number of working hours per day
D) Work Culture
Work culture may comprise of:
• Employee relations: The professional connection between Employers Employees &
within employees. This is a significant part of work culture because the businesses of
the company involve the same. Particularly in the hotel business where it's much more
of a team work in making the visitor experience memorable, professional rapport
within the team members or team bonding is crucial. A proper work culture creates a
conducive work environment where the staffs may completely concentrate on the core
operational tasks.
• Interactions: These are an important part of any business. Interactions within the
structured business might be in the form of horizontal or vertical interactions. As
discussed earlier, it is much more of a team effort which is required to offer a quality
service to the guest. This effort is meaningless with no proper interactions within the
staff members. These interactions might be in the form of group meetings, directions,
orders, discussions, briefings, feedback, etc. The success of any organization highly
depends upon these interactions.
• Healthy work environment: A stress free work environment is distinguished with
equitable & fair organizational policies, cordial employee relations, and effectively
defined business structure with clarity of every single individual's role in the business.
Such an atmosphere results in higher employee morale that has an immediate impact
on the staff’s performance and overall productivity of the organization.
E) Employee Welfare
Though each hotel has its own business policy with regard to provision of employee
welfare activities, the following practices are adopted by majority of the hotels:
• Meals on duty: This is a unique facility offered by hotels. Staffs are offered meals
when on duty. Hotels being in catering business, provision of meals to its staffsare
cheap and economical. Though this facility is assumed as a right by the staff members,
it proves to bevery crucial particularly when working during unusual hours or even
working for hours that are long.
• Transport facility: This facility is usually not found in every hotel. Nevertheless, many
hotels provide this facility to outstation candidates. One of the reason behind not
providing this particular facility is uneven job timings of the staff members.
Nevertheless, it's mandatory to provide drop facility to female employees who are
working until late night.
• Accommodation facility: This is a typical feature observed in Resorts where majority
of the staffs are outstation and finding a rental accommodation is quite expensive.
Nevertheless, business hotels offer shared accommodation to the outstation staffs for
which they may or may not charge depending on the policy of the hotel.
F) Employee Recognition
Employee recognition is a communication tool which reinforces and rewards the most
crucial results men and women produce for your business. When you identify staffs
successfully, you reinforce, with the chosen methods of yours of recognition, the activities
as well as actions you most wish to see folks do this. A good employee recognition device

International Journal of Management, IT & Engineering Vol. 8 Issue 12(1), December 2018,
ISSN: 2249-0558 Impact Factor: 7.119
Journal Homepage: http://www.ijmra.us, Email: [email protected]
Double-Blind Peer Reviewed Refereed Open Access International Journal - Included in the International
Serial Directories Indexed & Listed at: Ulrich's Periodicals Directory ©, U.S.A., Open J-Gage as well as in
Cabell’s Directories of Publishing Opportunities, U.S.A
5 International Journal of Management, IT & Engineering
http://www.ijmra.us, Email: [email protected]
is easy, instant, and powerfully reinforcing. A number of employee recognition tools
commonly implemented in hotels are:
• Rewarding employees for outstanding performances.
• Appreciation of steady performing employees.
• Employee of the month for exceptional contribution during the month.
Iv. Impact of Talent Development Practices on Productivity
It's a well-known fact that the employee practices adopted in organizations have a good
effect on the performance of the staff members. It improves their morale and motivates
them to give their best to improve their overall performance. Efficiency is a measure of the
performance of the staff members towards attainment of the organizational goals.
Nevertheless, the impact of each one of these practices on the productivity of the staffs has
to be examined. After the impact is identified, organizations are able to focus on such
practices to enhance the output of its staff members.
V. Research Methodology
• Collection of Data: The information necessary for research was collected utilizing the
following techniques:
o Personal Interviews: The researcher conducted private interviews with Human
Resource managers and employees and staff of reputed hotel brands to examine the
productivity management process adopted in their organizations.
o Questionnaire: A questionnaire bearing straight forward and appropriate questions
was drafted and handed over on the sample to get their responses.
• Sampling Techniques: The population being employees of hotels is more of less
homogeneous in nature because the qualities as well as service conditions of the sector
are almost similar in nature throughout the population. With due consideration to this
particular aspect, a total sample comprising of 243 hotel staffs from Independent and
Chain hotels in Delhi (NCR) was selected for the study. The sample which was
selected on random basis represented the ‘Manager’ & ‘Associates’ categories of
twenty-two hotels in Delhi (NCR).
VI. Findings
Table I: Agreement on whether Talent Development practices followed by the hotel
have an impact on the productivity of its employees
Frequency Percent
Strongly Disagree 2 .8
Disagree 17 6.8
Can’t Say 18 7.4
Agree 142 58.6
Strongly Agree 64 26.3
Total 243 100.0
Talent Development practices adopted by the hotels have an impact on the productivity of
its employees
A) Impact of Talent Development practices on Employee Productivity
Areas on which the management should focus their employment practices based of its
importance in boosting the employee productivity

International Journal of Management, IT & Engineering Vol. 8 Issue 12(1), December 2018,
ISSN: 2249-0558 Impact Factor: 7.119
Journal Homepage: http://www.ijmra.us, Email: [email protected]
Double-Blind Peer Reviewed Refereed Open Access International Journal - Included in the International
Serial Directories Indexed & Listed at: Ulrich's Periodicals Directory ©, U.S.A., Open J-Gage as well as in
Cabell’s Directories of Publishing Opportunities, U.S.A
6 International Journal of Management, IT & Engineering
http://www.ijmra.us, Email: [email protected]
Report Mean (7 points rating scale)
Key Areas for boosting the employee productivity Category of Hotels
Independent
Hotels
Chain
Hotels
Total
Monetary Benefits (Salary & Wages, Overtime,
Incentives)
6.02 5.82 5.91
Training & Development (Skills development,
Development programs)
5.45 5.27 5.51
Work-Life Balance (Weekly offs, Holidays, Duty
timings)
5.93 5.91 5.87
Work Culture (Employee relations, interactions,
healthy work atmosphere)
5.46 5.49 5.51
Employee Welfare ( Family Health Schemes, Children
Education, Insurance)
4.76 5.28 5.23
Employee Recognition (Rewards & Appreciation) 5.28 5.36 5.46
Based upon the benefits of its in improving employee productivity, the top ranked areas
where the management of hotels must concentrate their work practices are provision of
Work Life Balance (Weekly offs, Holidays, Duty timings) and Monetary Benefits (Wages
and Salary, Overtime, Incentives)
Report
Mean (7 points rating scale)
Key Areas for boosting the employee productivity
-
Category of Hotels
Independent
Hotels
Chain
Hotels
Total
Monetary Benefits- Better salary & wages 4.56 4.43 4.76
Monetary Benefits - Employee Incentive Scheme 4.80 5.37 5.28
Monetary Benefits - Overtime compensation 4.13 4.62 4.63
Training & Development -Opportunities to attend
training programs to enhance operational skills
4.24 4.10 4.39
Training & Development –Personality Development
Programs-
6.19 5.94 5.96
Employment -Scientific Recruitment Procedures 5.12 5.43 5.34
Employment -Proper selection of personnel based on
the job requirements
5.17 5.29 5.25
Employee Services – Meals on duty 4.98 5.17 5.02
Employee Services-Transport Facilities 4.75 4.52 4.67
Employee Services-Accommodation Facilities 4.75 4.59 4.71
Employee Relations-Employee friendly work culture 5.66 5.31 5.39
Employee Relations -Effective employee grievance
handling mechanism
6.04 5.97 5.87
Employee Benefits-Family Medical Benefits 5.45 5.63 5.44
Employee Benefits -Child Education Plans 5.52 5.56 5.45
Employee Benefits -Family Pension Scheme /
Insurance schemes
4.74 4.57 4.70
Work-life Benefits -Additional Leaves / Holidays / 6.16 5.92 5.94

International Journal of Management, IT & Engineering Vol. 8 Issue 12(1), December 2018,
ISSN: 2249-0558 Impact Factor: 7.119
Journal Homepage: http://www.ijmra.us, Email: [email protected]
Double-Blind Peer Reviewed Refereed Open Access International Journal - Included in the International
Serial Directories Indexed & Listed at: Ulrich's Periodicals Directory ©, U.S.A., Open J-Gage as well as in
Cabell’s Directories of Publishing Opportunities, U.S.A
7 International Journal of Management, IT & Engineering
http://www.ijmra.us, Email: [email protected]
Weekly offs
Work-life Benefits -Employee Leisure Clubs / Get
together
5.64 5.33 5.39
Work-life Benefits -Fixed number of working hours
per day
6.01 5.94 5.86
Employee Appreciation - Employee Rewards
Schemes
5.43 5.64 5.43
Employee Appreciation -Appreciations of performing
employees
5.49 5.57 5.45
Provision of Better Wages and salary is essentially the most popular employment methods
within the group of Monetary Benefits.
On the basis of its impact on improving employee productivity, the top ranked employment
practice relates to the area of Monetary Benefits and Work- Life Benefits
C) Findings on Comparative Study between Independent Hotels and Chain Hotels
Availability of Employment practices in Hotels
Talent Development practices adopted by Hotels Difference in observations
between the category of
hotels
1. Monetary Benefits
Better salary & wages No significant difference
Overtime compensation No significant difference
2. Training & Development
Opportunities to attend training programs to enhance
operational skills
No significant difference
Personality Development Programs No significant difference
3. Employment
Proper selection of personnel based on the job requirements No significant difference
4. Employee services
On the job Meals No significant difference
Accommodation Facilities No significant difference
5. Employee relations
Effective employee grievance handling mechanism No significant difference
6. Work - Life benefits
Fixed number of working hours per day No significant difference
7. Employee appreciation system
Employee Rewards Schemes No significant difference
Appreciations of performing employees No significant difference

International Journal of Management, IT & Engineering Vol. 8 Issue 12(1), December 2018,
ISSN: 2249-0558 Impact Factor: 7.119
Journal Homepage: http://www.ijmra.us, Email: [email protected]
Double-Blind Peer Reviewed Refereed Open Access International Journal - Included in the International
Serial Directories Indexed & Listed at: Ulrich's Periodicals Directory ©, U.S.A., Open J-Gage as well as in
Cabell’s Directories of Publishing Opportunities, U.S.A
8 International Journal of Management, IT & Engineering
http://www.ijmra.us, Email: [email protected]
Talent Development practices adopted by Hotels Difference in observations
between the category of hotels
1.Monetary Benefits
Employee Incentive Scheme Significant difference
2. Employment
Scientific Recruitment Procedures Significant difference
3. Employee services
Transport Facilities Significant difference
4. Employee relations
Employee friendly work culture Significant difference
5. Work - life benefits
Additional Leaves / Holidays / Weekly offs Significant difference
D) Talent Development practices adopted by Hotels showing significant difference
between Independent Hotels and Chain Hotels
VII. Conclusion
The hospitality business agrees to the point that the work practices followed by the hotels
have an impact on the productivity of its workers. Workers belonging to the Manager
category experience that hotels must target the work practices pertaining to Work culture,
Employee recognition & Development and Training because they've a maximum effect on
the efficiency of theirs. Workers belonging to the Associate category experience which
hotels must target the work practices pertaining to financial benefits, Work culture &
Employee recognition since they've a maximum effect on the efficiency of theirs. Workers
belonging to the Manager category experience which the work practices which have a
bigger influence on improving the productivity of theirs are satisfactory followed by the
hotels where as workers belonging to the Associate category believe the employment
practices in hotels aren't sufficiently obtainable in proportion to the impact of its on
enhancing their productivity. The most crucial places for improving employee productivity
where the management of hotels must concentrate the work practices of theirs are
0
20
40
60
80
100
120
Yes No
Employment Incentive
Scheme
Independent
Chain
0
20
40
60
80
100
Yes No
Scientific Recruitment
Procedure
Independent
Chain
0
20
40
60
80
100
120
Yes No
Transport Facilities
Independent
Chain
0
20
40
60
80
100
120
140
Yes No
Friendly Work Culture
Independent
Chain
0
20
40
60
80
100
120
Yes No
Additional
Leaves/Holidays/Weekly Offs
Independent
Chain

International Journal of Management, IT & Engineering Vol. 8 Issue 12(1), December 2018,
ISSN: 2249-0558 Impact Factor: 7.119
Journal Homepage: http://www.ijmra.us, Email: [email protected]
Double-Blind Peer Reviewed Refereed Open Access International Journal - Included in the International
Serial Directories Indexed & Listed at: Ulrich's Periodicals Directory ©, U.S.A., Open J-Gage as well as in
Cabell’s Directories of Publishing Opportunities, U.S.A
9 International Journal of Management, IT & Engineering
http://www.ijmra.us, Email: [email protected]
provision of Monetary Benefits (Wages and Salary, Overtime, Incentives) and Work-Life
Balance (Weekly offs, Holidays, Duty timings).
The results on the analysis verify the point that employment practices used through the
hotel business have a good effect on the output of its workers. Nevertheless, the
productivity management product must be suitably created to concentrate on employment
practices that are key with an aim to improve the entire employee productivity.
References
[1] Murthy, P. S. (2010). Next Generation Talent Management-Perceptions. Social Science
Research Network.
[2] Chugh, S., &Bhatnagar, J. (2006). Talent Management as High Performance Work
Practice: Emerging Strategic HRM Dimension. Management and Labor Studies 31:
228.
[3] Hughes, J. C., & Rog, E. (2008). Talent management: A strategy for improving
employee recruitment, retention and engagement within hospitality organizations.
International Journal of Contemporary Hospitality Management. Vol. 20 No. 7, 2008
pp. 743-757. Emerald Group Publishing Limited 0959-6119. Doi:
10.1108/09596110810899086
[4] Walsh, K., & Taylor, M. S. (2007). Developing In-House Careers and Retaining
Management Talent: What Hospitality Professionals Want from Their Jobs. Cornell
Hotel and Restaurant Administration Quarterly 2007 48: 163. Sage Publications. Doi:
10.1177/0010880407300521
[5] Silzer, R., & Church, A, H. (2009). The Pearls and Perils of Identifying Potential.
Society for Industrial and Organizational Psychology. 377-412.
[6] Neuman, W. L. (2009). Understanding Research. University of Wisconsin at
Whitewater. Pearson Education, Inc.
[7] Dierdorff, E. C., & Rubin, R. S. (2006). Toward a Comprehensive Empirical Model of
Managerial Competencies. VA: MER Institute of the Graduate Management
Admission Council, McLean

International Journal of Management, IT & Engineering Vol. 8 Issue 12(1), December 2018,
ISSN: 2249-0558 Impact Factor: 7.119
Journal Homepage: http://www.ijmra.us, Email: [email protected]
Double-Blind Peer Reviewed Refereed Open Access International Journal - Included in the International
Serial Directories Indexed & Listed at: Ulrich's Periodicals Directory ©, U.S.A., Open J-Gage as well as in
Cabell’s Directories of Publishing Opportunities, U.S.A
10 International Journal of Management, IT & Engineering
http://www.ijmra.us, Email: [email protected]
Human Resource Development: Impact of E-Learning in
Training and Development
Dr. Rajalakshmi M
Ms. Harsha Sidana
Abstract
The concept of E-learning is very wide. It was invented in the late 90s as the technology
improved learning through the internet. Now it’s captured a wide range of electric media
such as Intranet, Internet, Interactive TV, Satellite broadcast etc. It is dynamic in nature. E-
learning is expensive than traditional classroom instruction. Human Resource development
is continually looking for cost-effective ways to provide training to employees. Human
Resources Development is a human capital economic theory. HRD is also the foundation
of training and development Human capital maximization is a Training and development
program. The objective of this Research paper is to promote the benefits of training and
development through e-learning program and the growth of the individual. Effective
Training and development increase productivity and boost morale.
Keywords: Learning Styles Corporate, Economic Benefits, Training and
Development, Information Technology, E-learning, Learning Standard
Introduction
Human Resource Development
Human Resources Development is the unified of training, career development, the
organization put efforts toward improving individual, group as well as organizational
effectiveness. Human Resources Development consists of training of individual whether if
he or she is first hired, provide various types of opportunities and providing learning like
new skills, also provide a task and various activities.
The sequence of process is followed within the HR department somehow it is critical to the
employeeonboarding and retention. All these things are needed because without proper
personal and professional learning and development, without proper training the employee
cannot flourish and employee growth is faded. HRD helps or develops the competencies of
individuals in an organization for the current as well as for future secured job through the
planned learning activities. HRD also take into consideration individual as well as
organizational needs.
E-Learning
E-Learningstands for electronic learning; it is a platform that describes how an electronic
device and digital media can be helped in education. E-learning blister down to learning
and provide facilities and supported via (ICT) Information and communication technology.
(ASTD) The American Society for Training and Development defines e-learning is a
platform where a set of applications and processes which includes computer-based
learning, web-based learning, digital and virtual classrooms.
Assistant Professor – HR, Pune Institute of Business Management, Pune MBA-HR, Pune Institute of Business Management, Pune

International Journal of Management, IT & Engineering Vol. 8 Issue 12(1), December 2018,
ISSN: 2249-0558 Impact Factor: 7.119
Journal Homepage: http://www.ijmra.us, Email: [email protected]
Double-Blind Peer Reviewed Refereed Open Access International Journal - Included in the International
Serial Directories Indexed & Listed at: Ulrich's Periodicals Directory ©, U.S.A., Open J-Gage as well as in
Cabell’s Directories of Publishing Opportunities, U.S.A
11 International Journal of Management, IT & Engineering
http://www.ijmra.us, Email: [email protected]
Computer-supported collaborative learning (CSCL) is the new method of learning to boost
student towards work together and to solve problems and developed knowledge. It is a
classic education in that the lecturer is replaced by the collaboration is the kind of source of
information. There are various ways of e-learning such as a smartphone, video apps,
Skype, email and social media channels.
Training and Development
Training and development is a crucial part of the human resource development. It is
organizational activity concerned with the objective to better the job performance of the
individual as well as group. Effective training helps the employee in their upgrading skills
and knowledge and also polishing the concept, attitude and developing more knowledge of
the performance of employees. There are several names Human capital development and
Learning and Development. Training and Development are important in an organization to
improve their performance and also fulfillment the self of employees and provide
educational methods and programs.
Literature Review
Human Resource Development is a developing system and it’s also a continuous process
and planned the competencies of the individual as well as a group of employees to achieve
the organizational objectives. According to the American Society of Training and
Development (ASTD), HRD is the unified use of organizational development, training, and
development, career development to improve the individual and organizational objective.
The researcher investigated that the Human Resource Development (HRD) is benefits of
(KSA’S) of individual’s knowledge, skill, and abilities as a support to maximize an
individual’s dominant.
Importance of T& D
There are various benefits of training and development. Training current an elite
opportunity to expand the base knowledge of employees, but a development opportunity
finds an expensive. But in their drawback is that training and development provide both the
company as a whole as well for individual employees also for their benefit but the cost and
time advantageous investment.
Consistency
A designed training and development program certifies that the employees have a
consistency knowledge and experience. Consistency is mainly for the policies and
procedure of the company which is all should know about what the expectation and
procedure which is followed in the company.
Addressing Weakness:
Utmost employees have some weakness in their workplace skills. A training program helps
to identify the gaps of, employees and need to be improved or work on those gaps and
fulfill the facet of the roles and strengthen those sills. A development program brings all
the employees advance level so they have skills and knowledge.
Satisfaction of Employees
The training generates a supportive workplace. Employees with admittance to training and
development have the benefit over employees in further companies who are port to purse
out training opportunities on their own. Employees are more satisfied when they feel
appreciated and challenged towards their job.

International Journal of Management, IT & Engineering Vol. 8 Issue 12(1), December 2018,
ISSN: 2249-0558 Impact Factor: 7.119
Journal Homepage: http://www.ijmra.us, Email: [email protected]
Double-Blind Peer Reviewed Refereed Open Access International Journal - Included in the International
Serial Directories Indexed & Listed at: Ulrich's Periodicals Directory ©, U.S.A., Open J-Gage as well as in
Cabell’s Directories of Publishing Opportunities, U.S.A
12 International Journal of Management, IT & Engineering
http://www.ijmra.us, Email: [email protected]
Methods of Training and Developments
There are various Training and Development methods which are used to accomplish the
objective are as follows:
E-learning in India
On-the-Job Method
The method of training in which the employees are given training practically in the
workplace to develop their skills and competencies.
• Job Rotation
Job rotation means to shift an employee on regular or intervals bases from one job to
another.
• Understudy
Superior is trained his/her employee and its involved his/her to senior and it’s called
understudy.
• Experience
This is the oldest methods of on-the-job training. It is a very time-consuming method but it
is very effective also.
Off-the-Job Method
The training methods for which the employees have to leave the organization and take the
training from some other place is called off-the-job training. In the Off-the-Job method, the
growth of trainees is the primary task and the other is secondary.
Multiple Management
Multiple training techniqueswas first introduced by McCormick, President of McCormick
& Co. of Baltimore in 1932. Establishing a junior board of director this idea given by
McCormick. Authority to give to the junior board of members to discuss any problem and
also give recommendations to the senior board as well.
Case Study Method
This technique was developed by Harvard Business School, U.S.A. It is used to
supplement the lecture method; a case is a written record of the areal business problem.
The trainees discuss and analyses the cases as the cases are given to them. The trainees
identify the problem by the case study method fulfilling the aim of the case study method.
Alternate courses of action and suggestions, solutions are provided by the participants.
Brainstorming
This technique is called creativity training; it helps to solve problems in the new and
different way. In this technique, the trainees are given the opportunity to generate ideas
without being judgmental. Criticism is not allowed so as to reduce inhibiting forces. Once
a lot of ideas are generating then they are evaluated on different parameters.
E-learning Market – By learning Model
According to the eLearning Market- Global outlook and forecast 2018-2023 the e-learning
market by learning mode is classified into self-paced and instructor-led learning. Self-
paced learning mode has the largest segment in the e-learning market occupied in 2017
market share was over 77% and its expected that covered $43.54 billion during the forecast
period.
Approximately 50% of the total self-paced learning share in 2017 was captured by North
America. It's growing as well as continuous learning technology it can be used at any time
at anywhere is driving the growth of the globale-learningmarket platform. The self-

International Journal of Management, IT & Engineering Vol. 8 Issue 12(1), December 2018,
ISSN: 2249-0558 Impact Factor: 7.119
Journal Homepage: http://www.ijmra.us, Email: [email protected]
Double-Blind Peer Reviewed Refereed Open Access International Journal - Included in the International
Serial Directories Indexed & Listed at: Ulrich's Periodicals Directory ©, U.S.A., Open J-Gage as well as in
Cabell’s Directories of Publishing Opportunities, U.S.A
13 International Journal of Management, IT & Engineering
http://www.ijmra.us, Email: [email protected]
pacedlearning module is growing demand in the market as well corporate sector it will
bring new opportunities and challenges in the market during the forecast period.
Research Objectives
• To understand the impact on e-learning in different industry
• To understand the impact on e-learning in Pharmaceutical Industry
• To understand the impact on e-learning in Automobile Industry
Research Methodology
This is literature review research in which research is in form of reviews, analyses and
synthesizes the representative literature on a topic in a unified way such that new context
and perspective on the topic are generated. It has fully coordinated the topic which is E-
learning in training and development in the review of the literature. A collection of data’s,
finding and conclusion are attached to an integrated review of the literature to make this
research.
The literature view is prepared with the help of an online journal, articles, database,
Elsevier, EBSCO (Management research data). Google scholar, eLearning Market- Global
outlook and forecast 2018-2023 etc. which are highly concentrated on the impact of E-
learning in training and development review. The keywords used for research are Learning
Styles Corporate, economic benefits, Training and Development, Information
Technology, E-learning, Learning Standard. A total of 102 articles are searched for
this research, out of which 35 articles are reviewed based on that the different
technologies trend that is impacting e-learning in training and development and the
benefits of e-learning in training and development on HRD with respect to
technological term are studied and well explained in this research.
Findings
Impact of E-learning in Different Industry
E-learning has been adopted obedience training program. According to comm lab (Global
learning solution), survey 98% organization towards the maturity admitted that fondness
for technology- enable compliance training. Its comfort with training can be tracked as
well as record maintained and also fulfill the compulsory requirement by regulatory.
Benefits of eLearning in the Pharmaceutical Industry
In pharma industry e-learning in training and development program has significantly
grown in the recent year for training employees. E-learning is just not for the enhanced the
convince training, but also determine the challenges of narrow consideration interval of
humans with training modules that are easy to be used. There are numerous technologies to
the train the employees and also eLearning has the latest and reliable trend. Pharma
companies followed by a certain law to ensure that the safety and efficiency of their
products in the market. Although the Standard Operating Procedures (SOP) which is
professional’s industry demand to get trained as per standard aspect. Safety and
environment training by Current Good Manufacturing Practices. (cGMP). Training is the
continuous process in the industry, to maintain a record of all training which has been
conducted and also a detailed audit of the company.
Key Benefits of eLearning in the Pharma industry
Mobile Sales Team Training
Sales teams are mainly involved in fieldwork and it’s really tough for them to obtain
knowledge and also admittance a training course at the time of need. Though, eLearning
took an easy platform for training to sales professional in a better manner. At any time, it's

International Journal of Management, IT & Engineering Vol. 8 Issue 12(1), December 2018,
ISSN: 2249-0558 Impact Factor: 7.119
Journal Homepage: http://www.ijmra.us, Email: [email protected]
Double-Blind Peer Reviewed Refereed Open Access International Journal - Included in the International
Serial Directories Indexed & Listed at: Ulrich's Periodicals Directory ©, U.S.A., Open J-Gage as well as in
Cabell’s Directories of Publishing Opportunities, U.S.A
14 International Journal of Management, IT & Engineering
http://www.ijmra.us, Email: [email protected]
accessible they got useful information and updates. ELearning is cost-effectiveness in a
pharma company; it’s a continuous learning for sales teams.
Customer Training
Pharma Company has allowed free learning courses to customers through eLearning in this
the person who wants to know about the products and process of the company.
Updating and maintaining Training Materials
ELearning has always certified that Pharma Professional can update with the latest trend
and information about the company at any location at any time.
Automating Retraining and Certification Programs
To learn or want a certificate program the eLearning is always helped for the learner and
also to take the course multiple times and they left midway. Through the Learning
Management System (LMS) can be done certificate programs and courses and also brings
competition with the team through this its increase productivity of the employees.
Training challenges of the manufacturing industry- eLearning can help
Manufacturing sector’s play a vital role to contribute toany country’s economy. New
technology trends were emerged and innovative manufacturing practices. Employees are
trained in new technology which is automated manufacturing services. It is not possible to
conduct classroom training they don’t have time however online training is to be provided
for learning.
Spreading of Skills Gap
In workplace training program through the help of the eLearning program may conduct by
easier, dynamic and more affordable resources. There a various visual element of e-
learningcourses such as video, animation, and infographics to design an effective strategy
to provide knowledge. And also improving the learner engagement and knowledge
retention.
Training of High Cost
To minimize the training cost, employee training as learning courses is providing.
Companieshave spent a lot of individual man-hours for Instructor-led training. Cost
effective alternative online training is providing for ILT/ classroom training due to
reducing trainer cost, lodging, and boarding. In this way, merged learning works thriving
manufacturing training.
Wide product portfolio
Employees in the manufacturing industry are under a continuous burden to new products
innovation for better through the year. Without training they mislaid in their regular. The
employee may not innovate but make better products portfolio. However, eLearning helps
in step by step of development of product i.e., research, idea, final design it’s increased the
stages load on the employee. In addition, refresh the training to the employee and analyze
what they had learned earlier.
Impact of E-Learning on Automobile Industry
In Automobile Industry practical knowledge requires about vehicles, operation engineer,
andservice. Training is crucial and it requires on the ever-changing industry. It is very
costly if conduct a classroom training session in their thousands of worker is there. E-
learning is the best solution for learners. E-learning is the platform for the integration of
games, an enterprise with the training to improve the learners’ participation and
performance. In today’s scenario, the automotive industry is working hard for helping

International Journal of Management, IT & Engineering Vol. 8 Issue 12(1), December 2018,
ISSN: 2249-0558 Impact Factor: 7.119
Journal Homepage: http://www.ijmra.us, Email: [email protected]
Double-Blind Peer Reviewed Refereed Open Access International Journal - Included in the International
Serial Directories Indexed & Listed at: Ulrich's Periodicals Directory ©, U.S.A., Open J-Gage as well as in
Cabell’s Directories of Publishing Opportunities, U.S.A
15 International Journal of Management, IT & Engineering
http://www.ijmra.us, Email: [email protected]
workforce and conducting soft skill training such a problem solving, communication etc.
through this to help a person with updated today’s technology.
Scalability
E-learning now a day’s spreads widely. Because of the huge scale of economics.The
administrationis expected to conduct a training program, including the person who did a
work remotely and those at the office location. So, e-learning has become a wide and
feasible approach for providing training across different location and also for business
growth.
Boosted technology
Technologies continuously change and the substructure requires for effective training
provided in widespread. But most of the complication that came across but e-learning have
collapsed with the industry standards.
Consistency
Digital training is now the latest trend rather than instructor-led training e-learning has
various coursewares which is designed per customized training needs. Editing or correction
can be done without any printed materials.
Conclusion
As important as learning and development are, for today’s workforce it’s even more
important to consider how they are accessing these opportunities. The key points of
discussion are drawn from the study stated in this paper are:
• Real benefits of e-learning suggest a variety of training in many areas, it harvest
superior outcomes to classroom-based learning for the learner.
• E-learning also comprises cost and productivity benefits of Human resource
development.
• E-learning as an increasing part of delivering on the training strategy.
Limitations of the Study
The present study is a literature based study that has focused mainly on the training and
development of organizations with respect to e – learning platforms. The study has focused
on the different sectors such as – manufacturing, automobiles, pharma only. The
conceptual references of the variables have been discussed. The study lacks the factual data
from the same industries.
Future Scope of the Study
It is expected that the domain of e – learning platforms will grow in near future as there is
higher demand for the technology driven platforms in the different sectors. Various tools
and software supporting the task of trend design and also the support of the analysis,
design, implementation, and development through Web. There is an urgent need to test the
concepts in different sectors empirically. Apart from the three sectors discussed,
technology is gaining its value in other sectors too; hence, the future of the study in
different sectors is worth testing empirically. The study can be further tested on the
longitudinal research frames.
Managerial Implications
The Research of this study important implication to HRD e-learning practices. It may
deliver an effective e-learning motivation is a grave factor and determine an employee’s
determination in learning participation. In E-learning interference through auspicious
policy requirement,it helps the organization and also motivates employee participation. It
also avoids a work-life conflict, its motivating to the employee engaging through e-

International Journal of Management, IT & Engineering Vol. 8 Issue 12(1), December 2018,
ISSN: 2249-0558 Impact Factor: 7.119
Journal Homepage: http://www.ijmra.us, Email: [email protected]
Double-Blind Peer Reviewed Refereed Open Access International Journal - Included in the International
Serial Directories Indexed & Listed at: Ulrich's Periodicals Directory ©, U.S.A., Open J-Gage as well as in
Cabell’s Directories of Publishing Opportunities, U.S.A
16 International Journal of Management, IT & Engineering
http://www.ijmra.us, Email: [email protected]
learning at home during off work hours. E-learning has the potential to transform when and
how the employees will learn. Learning will become combine with work and also will use
more modular and more use shorter. The organization always to support employee’s e-
learning participation because on-the-job learning time is reducing interruption of the
process of learning. In short, the implementing HRD e-learning training and development
program its close attention to individual motivation as well as learning support ensure that
encourage the employee participation as well as successful and support to completion of e-
learning.
References
Eart HR Blog (2018). http://middleearthhr.com/blog/impact-of-e-learning-in-training-and-
development-3/
eNyota Learning making ideas work (2018). https://enyotalearning.com/blog/benefits-of-
elearning-in-pharma-industry/
Commlab India Global Learning solution (2018).https://blog.commlabindia.com/elearning-
design/elearning-for-manufacturing-training-challenges
Shelley Frost (2018). https://smallbusiness.chron.com/importance-training-development-
workplace-10321.html
G-Cube.learning. innovate. share. Succeed. (2018).http://www.gc-
solutions.net/solutions/education-training-elearning/index.html
Commlab India Global Learning solution
(2018).https://www.commlabindia.com/resources/article/elearning-for-pharma-
manufacturing-sectors.php
Elsevier Manufacturing systems (2018).
https://www.sciencedirect.com/science/article/pii/S0278612518300153
Research and markets the world the world’s largest market research store (2018).
https://www.researchandmarkets.com/reports/4455444/e-learning-market-global-outlook-
and-forecast
Thorsten Wuest,Daniel Weimer,Christopher Irgens &Klaus-Dieter Thoben ( 2016).
https://www.tandfonline.com/doi/abs/10.1080/21693277.2016.1192517
G-Cube Learn to succeed (2017). https://www.gc-solutions.net/blog/digital-transformation-
of-automobile-sector-with-enterprise-learning-management-system/
Upside Learning (2011).https://www.upsidelearning.com/blog/index.php/2011/12/06/e-
learning-in-automobile-industry-new-report/
EBSCOPOST (2018).https://www.ebsco.com/blog/article/learning-in-the-21st-century-
technology-in-the-classroom
G-Cube. learning. innovate. share. Succeed. (2018). http://www.gc-
solutions.net/resources/articles/gaining-a-competitive-advantage-with-learning-
management-systems-in-automobile-sector.html

International Journal of Management, IT & Engineering Vol. 8 Issue 12(1), December 2018,
ISSN: 2249-0558 Impact Factor: 7.119
Journal Homepage: http://www.ijmra.us, Email: [email protected]
Double-Blind Peer Reviewed Refereed Open Access International Journal - Included in the International
Serial Directories Indexed & Listed at: Ulrich's Periodicals Directory ©, U.S.A., Open J-Gage as well as in
Cabell’s Directories of Publishing Opportunities, U.S.A
17 International Journal of Management, IT & Engineering
http://www.ijmra.us, Email: [email protected]
Women Fish Trade Entrepreneurs in Kanyakumari District–A
Study
R.JAYA PRABHA
Dr.M.KARUNANIDHI
Abstract
Entrepreneurship is a major channel for economic growth, productivity, and development
in India. History has shown that entrepreneurs establish new businesses that create
employment and provide services and products to increase the wealth of their local and
national economies. Examining the women entrepreneurial challenges tends to provide
some useful insights into some theoretical issues. It is the need of the day to empower the
women‐socially, economically, politically, and legally in various facets of their life in
order to sustain their livelihoods more effectively. In short, the study will be highly useful
to researchers, planners and policy makers in overcoming the problems of fisherwomen
traders and in formulating strategies for empowerment of fisherwomen. The study mainly
based on primary data. The sample size was fixed at 250. The major finding is Lack of
basic facilities in market places.
Key words: Women entrepreneurs, Fisher women, Fish trade
Introduction
The women fish traders, despite her vital role in the fishing industry, not only faces
different types of problems at each stage in her profession, but also has to hold on to the
means of livelihood under constant threat of competition from complicated sales outlets
such as refrigerated booths. Invariably, she undertakes the job of fish marketing in addition
to the household responsibilities of cooking, raising children, and attending to the needs of
family. At the same time she also has to care for any unsold fish that she has had to carry
back home, finding the time and energy to clean and salt the fish, and to dry it the next day.
To add to her problems, her financial responsibilities at home are many. In order to carry
out these responsibilities she has to be consistently efficient and successful at procurement
of fish and its marketing. These facts add up to make the life of the female fish vendor
extremely stressful and with concomitant health problems such as back pain, headache and
poor eye sight.
Objectives
1. To analyze the relationship between socio economic factors and women entrepreneurs
in fish trade.
2. To identify the problem of women entrepreneurs in fish trade and suggestions to
overcome those problems.
Methodology
Registration number :12218, Department of Commerce and Research Centre, Scott Christian College (Autonomous) –
Nagercoil, Affiliated to Manonmaniam Sundaranar University ,Abishekapatti Tirunelveli – 627012, Tamilnadu, India. Assistant professor,Dept.of. Commerce, Kamarajar Govt.Arts, College,Surandi,Tamilnadu, Affiliated to Manonmaniam
Sundaranar University, Abishekapatti Tirunelveli – 627012, Tamilnadu, India.

International Journal of Management, IT & Engineering Vol. 8 Issue 12(1), December 2018,
ISSN: 2249-0558 Impact Factor: 7.119
Journal Homepage: http://www.ijmra.us, Email: [email protected]
Double-Blind Peer Reviewed Refereed Open Access International Journal - Included in the International
Serial Directories Indexed & Listed at: Ulrich's Periodicals Directory ©, U.S.A., Open J-Gage as well as in
Cabell’s Directories of Publishing Opportunities, U.S.A
18 International Journal of Management, IT & Engineering
http://www.ijmra.us, Email: [email protected]
“Ex-post facto design” was employed in the present research study as the events have
already occurred and design was considered appropriate. The data mainly based on
primary data. The data was collected from the respondents through personal interview. The
sample of the study shall comprise 250 fish trade women entrepreneurs from various parts
of Kanyakumari district selected using stratified random sampling. In consultation with
experts in the field of statistics and extension education the following statistical tools were
used for analysis. They are percentage analysis, Mean & standard deviation, Correlation
co-efficient and multiple regressions.
Analysis
Relationship between Socio-Economic Factors and Women Entrepreneurs in Fish
Trade
The relationship of independent variables with dependent variable like economic
motivation and risk orientation is discussed. Pearson’s simple correlation and multiple
regression were used for analyze the relationship is presented in the table 1 & 2.
Table.1Relationshipbetween socio economic factors and women
entrepreneurs in fish trade
Variabl
es Factors
Correlation co-efficient
Economic
motivation
Risk
orientation
X1 Age 0.055NS 0.165*
X2 Education -0.222** -0.169*
X3 Marital -0.059NS -0.010NS
X4 Family status 0.324** 0.228*
X5 Experience in fish trade -0.171* -0.162*
X6 Annual income 0.244** 0.022NS
X7 Annual expenditure 0.212** 0.031NS
X8 Achievement motivation 0.183* 0.172*
X9 Social participation 0.228** 0.102NS
X10 Contact with customers 0.162* 0.045NS
X11 Credit orientation -0.014NS 0.216**
X12 Market orientation 0.332** 0.302**
X13 Self confidence 0.125NS 0.292**
Source: Computed data
Note: *Correlation is significant at the 0.05 level (2-tailed); **
Correlation is significant at the 0.01level (2-tailed); NS- Non significant
The table shows that nine of the independent variables had a significant relationship with
the dependent variable economic motivation and eight of them had a significant
relationship with the other dependent variable risk orientation. Among the nine
independent variables that showed significant relationship with economic motivation, six
of them namely education (X2), family status (X4), annual income (X6), annual expenditure
(X7), social participation (X9) and market orientation (X12) showed significance at 1% level
and the remaining three, experience in fish trade (X5), achievement motivation (X8) and
contact with customers (X10) showed significance at 5% level. Out of the eight independent
variables showing significant relationship with risk orientation, five of them namely family
status (X4), achievement motivation (X8), credit orientation (X11), market orientation (X12)

International Journal of Management, IT & Engineering Vol. 8 Issue 12(1), December 2018,
ISSN: 2249-0558 Impact Factor: 7.119
Journal Homepage: http://www.ijmra.us, Email: [email protected]
Double-Blind Peer Reviewed Refereed Open Access International Journal - Included in the International
Serial Directories Indexed & Listed at: Ulrich's Periodicals Directory ©, U.S.A., Open J-Gage as well as in
Cabell’s Directories of Publishing Opportunities, U.S.A
19 International Journal of Management, IT & Engineering
http://www.ijmra.us, Email: [email protected]
and self confidence (X13), showed significance at 1% level and the other three including
age (X1), education (X2) and experience in fish trade (X5) showed significance at 5% level.
Table.2 Relationship between socio-economic factors and women entrepreneurs in
fish trade
Variable Factors
Regression
Economic
motivation
Risk
orientation
X1 Age -0.013 0.807
X2 Educational status -0.227 -0.161
X3 Marital status 0.02 -0.002
X4 Family status 0.511 0.286
X5 Experience in fish trade -0.824 -0.826
X6 Annual income 0.726 0.008
X7 Annual expenditure 0.078 0.355
X8 Achievement motivation 0.132 0.212
X9 Social participation status 0.171 0.094
X10 Contact with extension 1.514 0.364
X11 Credit orientation 0.739 0.581
X12 Market orientation 0.663 0.716
X13 Self confidence 0.234 0.621
R1=0.552 R2=0.504
F1=4.658 F2=3.621
R12=0.304 R2
2=0.255
Source: Computed data
The table shows that the R and R2 values. The R1 and R2 value represents the simple
correlation is 0.552 and 0.504 respectively with dependent variables economic motivation
and risk orientation. The R2 values indicates how much of the total variation in the
dependent variables, economic motivation and risk orientation, can be explained by the
independent variables. In this case, R2 implied that the independent variables can predict
the dependent variables economic motivation and risk orientation with 30.4% and 25.5%
accuracy respectively. The table further indicated that the regression model predicts the
dependent variable significantly well. Here, p<0.0005, which is less than 0.05, and
indicates that, overall, the regression model statistically significantly predicts the outcome
variable.
Problem of Women Entrepreneurs in Fish Trade
Fisherwomen entrepreneurs were asked to point out the difficulties that they face while in
fisheries activities. The main problems faced by them are presented in table.

International Journal of Management, IT & Engineering Vol. 8 Issue 12(1), December 2018,
ISSN: 2249-0558 Impact Factor: 7.119
Journal Homepage: http://www.ijmra.us, Email: [email protected]
Double-Blind Peer Reviewed Refereed Open Access International Journal - Included in the International
Serial Directories Indexed & Listed at: Ulrich's Periodicals Directory ©, U.S.A., Open J-Gage as well as in
Cabell’s Directories of Publishing Opportunities, U.S.A
20 International Journal of Management, IT & Engineering
http://www.ijmra.us, Email: [email protected]
Table.3 Problems faced by fisherwomen
Sl.No Problems Number Percenta
ge
Rank
1 Lack of marketing facilities 217 86.8 VI
2 Health problems associated with work 155 62.0 X
3 Lack of transportation facilities 227 90.8 IV
4 Unhealthy market places 162 64.8 IX
5 Competition from male counter parts 230 92.0 III
6 Problems from consumer 180 72.0 VIII
7 Lack of basic facilities in market places 242 96.8 I
8 Lack of infrastructure facilities 209 83.6 VII
9 Price fluctuations 222 88.8 V
10 Lack of storage facilities 238 95.2 II
Source: Primary data
The table.3 shows that a major problem for majority of the respondents was lack of basic
facilities in market places. Providing a women friendly situation in the market places by
ensuring all basic facilities is important. This was followed by 95.2 % respondents
complaining about lack of good storage facilities in the market. As fish is one of the most
perishable products, arrangements must be made for supplying and maintaining quality
products. Competition from male counter parts was the most important problem of women
entrepreneurs. Lack of adequate transportation facilities was indicated as another major
problem. While a few women sell the fish at the landing centre itself, for the rest, the next
major challenge after procurement is to transport the fish to the market place. In many
situations, vendors are usually denied access to public transport and sometime hiring auto
rickshaws, or other forms of transport involving a significant expense in itself. Price
fluctuations (88%), Lack of marketing facilities(86.8), Lack of infrastructure facilities
(83.6%), Problems from consumer (72%), Unhealthy market places (64.8%) and Health
problems associated with work (62%) were the other important problems faced by the
fisherwomen respondents.
Strategies for Solving the Problems Faced By Fisherwomen
The respondents themselves were asked to suggest the solution for the problems they
encounter during their fish marketing. The solutions are presented in table.
Table. 4. Strategies for solving the problems faced by fisherwomen
Sl.No Strategies Number Percentag
e
Rank
1. Adequate infrastructural facilities to be created 182 72.8 VI
2. Good sanitation and awareness regarding
different health problems 221 88.4 IV
3. Hygienic market conditions to be ensured 210 84.0 V
4. All basic amenities should be provided in the
market 239 95.6 I
5. Proper ways to be practiced for the supply of
the products in markets with high demand 131 52.4 VIII
6. Arrange cold storage and ice plants of good
standards nearby. 236 94.4 II

International Journal of Management, IT & Engineering Vol. 8 Issue 12(1), December 2018,
ISSN: 2249-0558 Impact Factor: 7.119
Journal Homepage: http://www.ijmra.us, Email: [email protected]
Double-Blind Peer Reviewed Refereed Open Access International Journal - Included in the International
Serial Directories Indexed & Listed at: Ulrich's Periodicals Directory ©, U.S.A., Open J-Gage as well as in
Cabell’s Directories of Publishing Opportunities, U.S.A
21 International Journal of Management, IT & Engineering
http://www.ijmra.us, Email: [email protected]
7.
Government should come forward to publish
market related information and also price
regulation can be done by government
intervention
229 91.6 III
8.
Special bus route for fisherwomen in the
coastal area for to and fro travel to market for
vending
171 68.4 VII
Source: Primary data
The table.4 shows that strategies for solving the problems faced by fisherwomen fish
traders, all basic amenities should be provided in the market contributed first place,
Arrange cold storage and ice plants of good standards nearby contributed second place and
Proper ways to be practiced for the supply of the products in markets with high demand
contributed last place.
Findings
❖ The study express that nine of the independent variables had a significant relationship
with the dependent variable economic motivation and eight of them had a significant
relationship with the other dependent variable risk orientation.
❖ The study express that the R and R2 values. The R1 and R2 value represents the simple
correlation is 0.552 and 0.504 respectively with dependent variables economic
motivation and risk orientation.
❖ The study reveals that the regression model predicts the dependent variable
significantly well. Here, p<0.0005, which is less than 0.05, and indicates that, overall,
the regression model statistically significantly predicts the outcome variable.
❖ The study reveals that a major problem for majority of the respondents was lack of
basic facilities in market places. This was followed by 95.2 % respondents complaining
about lack of good storage facilities in the market. Competition from male counter
parts was the most important problem of women entrepreneurs.
❖ The study reveals that strategies for solving the problems faced by fisherwomen fish
traders, all basic amenities should be provided in the market contributed first place,
Arrange cold storage and ice plants of good standards nearby contributed second place
and Proper ways to be practiced for the supply of the products in markets with high
demand contributed last place.
Suggestions
❖ Good hygiene must be maintained daily and must be ensured through regular checking.
❖ Basic infrastructural facilities such as clean toilets; access to potable running water;
and adequate waste disposal measures must be provided with the help of government.
❖ The government should be arranged the cold storage and ice plants of good standards
nearby the seashore.
❖ Government should come forward to publish market related information and also
price regulation can be done by government intervention.
❖ The government should be arranging the special bus route for fisherwomen in the
coastal area for to and from travel to market for vending area.
Conclusion
A fishery is a prime and growing sector in the Indian economy which has been registering
consistent growth during the past few decades. The most important role of fisherwomen in
both artisanal and industrial fisheries is at the processing and marketing stages. Women are

International Journal of Management, IT & Engineering Vol. 8 Issue 12(1), December 2018,
ISSN: 2249-0558 Impact Factor: 7.119
Journal Homepage: http://www.ijmra.us, Email: [email protected]
Double-Blind Peer Reviewed Refereed Open Access International Journal - Included in the International
Serial Directories Indexed & Listed at: Ulrich's Periodicals Directory ©, U.S.A., Open J-Gage as well as in
Cabell’s Directories of Publishing Opportunities, U.S.A
22 International Journal of Management, IT & Engineering
http://www.ijmra.us, Email: [email protected]
actively involved in the processing of fish catch, such as sun-drying, salting, smoking and
preparing fish and fish-derived foods such as fish paste and cakes, either in cottage level
industries, or as wage laborers in large scale processing industries. They are also normally
the ones who subsequently sell the fish products. The study concluded that mostly, they are
involved in fish marketing followed by housekeeping and fish processing. Women play
significant roles in all aspects of fisheries; both in the artisanal, small-scale sector and in
the commercial sector, yet their roles remain unarticulated and unrecognized. Though
many schemes, projects, policies were framed, much stress or attention has not been given
for proper implementation and execution. The present study has been undertaken to
women fish trade entrepreneurs in Kanyakumari district-A study.
References
• Balasubramaniam.et.al (2006), “Role performance of fisherwomen and associated
variables”, Fishery Technology, Vol.33, No.1, pp.51 – 57.
• Gopal, Nikita.et.al (2001), “Marketing efficiency of fresh fish trade in Cochin and
Veraval”, Fishery Technology, Vol.38, No.2, pp.129-132
• Patil.S (2002), “Rural development programmes: A study of women beneficiaries”,
Indian Journal of Training and Development, Vol.32, No.4, pp.89-94.
• Seshagiri (2014), “A Study on women entrepreneurship in non-descript rural fish
markets”, Global journal for research analysis.Vol.3, No.8, pp.1 -4.
• Sharma and Arpita (2003), “Valuing women’s work in fisheries”, Fishing Chimes,
Vol.23, No.7, pp.46-48

International Journal of Management, IT & Engineering Vol. 8 Issue 12(1), December 2018,
ISSN: 2249-0558 Impact Factor: 7.119
Journal Homepage: http://www.ijmra.us, Email: [email protected]
Double-Blind Peer Reviewed Refereed Open Access International Journal - Included in the International
Serial Directories Indexed & Listed at: Ulrich's Periodicals Directory ©, U.S.A., Open J-Gage as well as in
Cabell’s Directories of Publishing Opportunities, U.S.A
23 International Journal of Management, IT & Engineering
http://www.ijmra.us, Email: [email protected]
Impact of GST on E-Commerce: A Pragmatic Study
Dr. D. Rabindranath Solomon
Abstract
E-Commerce Business is growing very quickly in India. It presently occupies third position
after China and US. Earlier indirect tax laws created numerous perplexities and
prosecutions and acted as a hindrance in the development of E-Commerce Business in
India. Government too has lost a great deal of revenue due to improper linkages of
different indirect taxes and tax evasion. Presently GST is supposed to control the loopholes
existing in earlier indirect tax laws, rearrange the tax structure, lower overall tax rate.
However impact of GST will be different for E-Commerce sector from the other sectors of
the Economy. The fundamental objective of this paper is to evaluate the impact of GST on
E-Commerce Business in India from the perspective of every interested party.
Key words: VAT, CST, Registration, Return, Service tax
Introduction
Indian E-Commerce industry is the third largest industry after China and US. It is growing
at an average growth rate of 40% annually. For the last 2 to 3 years its growth rate is on the
rise and is hovering around 60% Significant E-Commerce companies in India are Amazon,
Amazon India, Flipkart, Snapdeal, Myntra, FirstCry.com, Home Shop 18, Shopclues,
Jabong, ebay India, Naaptol, Yepme etc. The old indirect tax structures in India were
obstacles in the growth of E-commerce industry. Actually old laws were not framed
keeping as a main priority the online business. The provisions of VAT, Service tax, CST
were creating perplexities and unending suits. In spite of huge growth of E-Commerce
business in India, the growth in tax revenue to the Government from this sector was not
encouraging. Meanwhile respective State Governments were additionally amending their
VAT laws to plug the loopholes and leakages to revenue. The new GST law has been
framed keeping as a main priority the requirements of online business. It is expected to
remove disarrays and suits, plug the loopholes and increase the Government tax revenue
from this sector.
Figure 1.1 Revenue of E-Commerce Business in Rs. Crores
Assistant Professor of Commerce, Dr. B.R. Ambedkar Open University, Hyderabad

International Journal of Management, IT & Engineering Vol. 8 Issue 12(1), December 2018,
ISSN: 2249-0558 Impact Factor: 7.119
Journal Homepage: http://www.ijmra.us, Email: [email protected]
Double-Blind Peer Reviewed Refereed Open Access International Journal - Included in the International
Serial Directories Indexed & Listed at: Ulrich's Periodicals Directory ©, U.S.A., Open J-Gage as well as in
Cabell’s Directories of Publishing Opportunities, U.S.A
24 International Journal of Management, IT & Engineering
http://www.ijmra.us, Email: [email protected]
Goods and Service Tax (GST)
The goods and services tax (GST) is a comprehensive indirect tax on manufacture, sale and
utilization of goods and services. It was introduced as The Constitution (One Hundred and
First Amendment) Act 2016, after the passage of Constitution 101st Amendment Bill. The
GST is governed by GST Council and its Chairman is Union Finance Minister of India.
Goods and services tax (GST) will subsume different central and state indirect taxes and
other levies which are currently applicable on inter-state transportation of goods which are
likewise likely to be done away with in GST regime. Let us take a glance at the different
taxes which will be subsumed by the GST
Central taxes and levies
i. Additional Custom Duty (ACD)
ii. Special additional Duty of Custom(SAD)
iii. Excise obligation
iv. Service tax
v. Central sales tax (CST)
vi. Center-levied surcharge and cess related to supply of goods and services
State taxes and levies
i. Value added tax (VAT)
ii. Other state levies, for example, luxury tax, octroi, entry tax and purchase tax
iii. State-levied surcharge and cess related to the supply of goods and services
iv. Taxes on lottery, betting and gambling
There are certain taxes which have been kept outside the purview of the GST. They are
mentioned below)
i. Basic Custom Duty (BCD)
ii. Stamp obligation
iii. Taxes and duties on electricity
iv. State excise obligation
v. Taxes and duties on liquor for human utilization and
amusement/entertainment/petroleum items until recommended otherwise by the GST
board.
The GST board in its meeting in November, 2016 had agreed to a four rate structure under
GST of 5, 12, 18 and 28 percent. While most services will be taxed at a higher rate of 18
per cent as against the current rate of 15 per cent, exceptions, for example, street transport
are likely to continue which will be taxed at the existing rate that includes abatement.
Some including education, health care and even pilgrimage related services will continue
to enjoy exemptions. Experts likewise noted that the government has retained the power to
levy cess on additional items under GST.
E-Commerce
An online marketplace is a type of e-commerce site where item or service informations are
provided by multiple outsiders, whereas exchanges are processed by the marketplace
operator. E-commerce is the essential type of multi-channel ecommerce and can be
described as a "simple and convenient entryway" to streamline the generation process. In
an online marketplace, consumer exchanges are processed by the marketplace operator and
after that delivered and fulfilled by the partaking retailers or wholesalers (often called drop
shipping). Other capabilities may include auctioning (forward or reverse), catalogs,

International Journal of Management, IT & Engineering Vol. 8 Issue 12(1), December 2018,
ISSN: 2249-0558 Impact Factor: 7.119
Journal Homepage: http://www.ijmra.us, Email: [email protected]
Double-Blind Peer Reviewed Refereed Open Access International Journal - Included in the International
Serial Directories Indexed & Listed at: Ulrich's Periodicals Directory ©, U.S.A., Open J-Gage as well as in
Cabell’s Directories of Publishing Opportunities, U.S.A
25 International Journal of Management, IT & Engineering
http://www.ijmra.us, Email: [email protected]
ordering, wanted advertisement, exchanging exchange usefulness and capabilities like
RFQ, RFI or RFP.
These types of sites enable users to register and sell single items to a large number of items
for a "post-selling" fee. In general, because marketplaces aggregate products from a wide
cluster of providers, selection is typically wider, and accessibility is higher than in vendor-
specific online retail stores. Likewise prices might be more competitive. Over the most
recent couple of years ecommerce have thrived in India. Some have a wide variety of
general interest products that cater to every one of the needs of the consumers; however,
some are consumer specific and cater to a specific segment as it were. Is the stage for
selling online, as well as the user interface and user experience matters? People tend to
sign on to online marketplaces that are organized and products are significantly more
accessible to them.
Objectives of the Study
Following are the Objectives of this study
a. To make a comparative investigation of old indirect taxes and new GST applicable to
E-Commerce Business in India
b. To evaluate the impact of GST on E-Commerce Business in India from the perspective
of every interested party
The taxability of e-commerce business under GST regime
As per GST law, E-Commerce means supply of goods or services or both including digital
products over digital or electronic network and E-Commerce operator has been defined to
mean any person who possesses, operates or manages such digital or electronic stage for E-
Commerce. Under GST regime every E-Commerce operator and every supplier giving
their goods or services through E-Commerce necessarily requires registration irrespective
of threshold restrain. Further where consideration is collected by E-Commerce operator on
behalf of supplier, it is likewise required to collect tax at source (TCS) not exceeding 1%
on net value of taxable supplies after altering the value of taxable supplies returned amid
the month. The said TCS is required to be deposited to the credit of Government inside 10
days from the end of the month in which it was collected. The Further, it has additionally
been provided that in cases of notified services, the liability to pay GST will be of E-
Commerce operator expecting it to be the supplier.
The impact of GST on different related parties in e-commerce business
Due to necessary registration, every rupee of supply of goods and services through
ECommerce stage will pull in GST. Under the principal model VAT/CST will be replaced
by GST and E-Commerce operator will be liable to pay GST on the supply of their own
goods to the buyers. Under the second model, GST will be required to be paid on both the
exchanges, the first between the E-Commerce operator and supplier and second between
E-Commerce operator and buyer. Further, since in this model, the consideration is
collected by E-Commerce operator, it will likewise be required to collect TCS from
suppliers and deposit the same to the Government.
Under the third model, GST will be payable on commission charged by E-Commerce from
the supplier and furthermore on value of supplies made by the supplier to the buyer. In the
event that here the consideration is collected by E-Commerce operator on behalf of
supplier then it will likewise be required to collect TCS from suppliers and deposit the
same to the Government. In the fourth model, GST will be payable on commission in

International Journal of Management, IT & Engineering Vol. 8 Issue 12(1), December 2018,
ISSN: 2249-0558 Impact Factor: 7.119
Journal Homepage: http://www.ijmra.us, Email: [email protected]
Double-Blind Peer Reviewed Refereed Open Access International Journal - Included in the International
Serial Directories Indexed & Listed at: Ulrich's Periodicals Directory ©, U.S.A., Open J-Gage as well as in
Cabell’s Directories of Publishing Opportunities, U.S.A
26 International Journal of Management, IT & Engineering
http://www.ijmra.us, Email: [email protected]
addition to rentals charged by E-commerce operator from supplier and arrangement of TCS
will likewise apply.
On account of C to C exchanges however, no GST will be payable because the exchange
won't be in the course or furtherance of business. For example, no GST will be payable
when one individual sells his old furniture to another person on OLX. In this way, the GST
is expected to bring huge compliance burden regarding registration, returns, documenting
statement of supplies and TCS returns for both E-Commerce operators and suppliers.
Implications of GST on E-Commerce
• It is compulsory for e-commerce operators/aggregators to register under GST
irrespective of their turnover. Since e-commerce business model is to such an extent
that seller expects orders from every one of the states, they are liable to get registration
in all states.
• On the off chance that e-commerce operator does not have establishment in a state; his
representative in the state will be liable to pay tax.
• Every e-commerce operator should collect tax @2% on net value of taxable supplies
made through their stage, where the consideration, with respect to such supplies, must
be collected by the operator.
• The planning for deduction of such sum by operator on account of real supplier of
goods/or services will be earlier of time of credit of the sum to account of genuine
supplier or time of payment in real money or some other mode to supplier, whichever
is earlier.
• The sum collected by the operator is to be paid to the credit of appropriate Government
inside 10 days after the end of the month in which the sum was so collected. Operator
is additionally required to file a statement, electronically, containing details of all sum s
collected by him.
• Place of supply in case of B2C exchanges would be the area of service provider and in
case of B2B, it would be area of service recipient.
• It is critical for e-commerce business in India to become GST Compliant at the earliest
and prepare to receive GST regulations without loosing time.
Conclusions
The new GST law is supposed to stop revenue leakages as existed in earlier indirect tax
law as the tax evaders will be gotten easily. It will likewise eliminate falling effect by
ensuring seamless stream of credit from manufacturer to the trader. Since entry tax will
likewise be subsumed in GST, overall tax burden will come down. Being the tax rate same
in all states, the transportation and storage cost will come down. However, benefit of
threshold restrict is neither available to E-Commerce operators nor to the suppliers. This
will increase compliance burden of registration, returns, records and payments on the both
E-Commerce operator and supplier. Further arrangement of TCS furthermore, high sales
returns as a typical feature of e-commerce business will increase working capital
requirement for small suppliers. In a nutshell, to survive in GST regime, the E-Commerce
business should reformulate its business model and redefine its business strategies and
processes.

International Journal of Management, IT & Engineering Vol. 8 Issue 12(1), December 2018,
ISSN: 2249-0558 Impact Factor: 7.119
Journal Homepage: http://www.ijmra.us, Email: [email protected]
Double-Blind Peer Reviewed Refereed Open Access International Journal - Included in the International
Serial Directories Indexed & Listed at: Ulrich's Periodicals Directory ©, U.S.A., Open J-Gage as well as in
Cabell’s Directories of Publishing Opportunities, U.S.A
27 International Journal of Management, IT & Engineering
http://www.ijmra.us, Email: [email protected]
References
[1] Akanksha Khurana and Aastha Sharma, Goods and Services tax in India - A positive
reform for indirect tax system, International Journal of Advanced Research (2016),
Volume 4, Issue 3, PP 500-505
[2] Dr. R. Rupa, International education and research journal, Volume 3, issue 2, 2017, PP
88-89
[3] Girish Garg, Basic Concepts and Features of Good and Service Tax In India,
International Journal of scientific research and management (IJSRM), Volume 2, Issue
2, 2014, PP 542- 549
[4] Lourdunathan F and Xavier P, A study on implementation of goods and services tax
(GST) in India: Prospectus and challenges, International Journal of Applied Research,
2017, PP 626- 629
[5] Monika Sehrawat and Upasana Dhanda, Gst in India: a key tax reform, International
Journal of Research – Granthaalayah , Vol.3 (Iss.12): December, 2015], PP 133-141
[6] Archit Gupta, “Impact of GST on e-commerce marketplace: Here is all you need to
know”, ETRetail.com, Dated 02/03/2017.
[7] 2. Vartika Gupta, “How will GST affect online sellers on e-commerce platforms?”, The
Warehouse , Dated 11/03/2017.
[8] “Impact of GST on ecommerce” by e Tailing India (Dated 17/03/2017)
[9] “GST impact: E-commerce sector” by GSTINDIA.COM (Dated 21/12/2016)
[10] Decoding the Model GST Law: Key features of the draft Model GST Law” by
PWC

International Journal of Management, IT & Engineering Vol. 8 Issue 12(1), December 2018,
ISSN: 2249-0558 Impact Factor: 7.119
Journal Homepage: http://www.ijmra.us, Email: [email protected]
Double-Blind Peer Reviewed Refereed Open Access International Journal - Included in the International
Serial Directories Indexed & Listed at: Ulrich's Periodicals Directory ©, U.S.A., Open J-Gage as well as in
Cabell’s Directories of Publishing Opportunities, U.S.A
28 International Journal of Management, IT & Engineering
http://www.ijmra.us, Email: [email protected]
CSR in India: Challenges and Issues
Surabhi Yadav
Dr. Hari Shankar Shyam
Abstract
Corporate Social Responsibility (CSR) has always been an integral part of Indian business
houses either in the form of charity or donation .CSR has evolved a lot in India traversing
through various phases of charity to being mandated in the country. CSR has gone through
a radical change, its no more only fashion or mere slogan for corporate, it’s the way of
doing business now. The Interpretation of CSR has changed a lot in last decade. It has
become an integral and strategic part of business nationally as well as globally. Over time
it has emerged to cover economic, legal and social aspects of business. Ethics,
sustainability and inclusive growth guide strategy and policies of company. Even though
CSR is mandated in India but still the corporate faces lot of issues and challenges in
implementing Corporate Social Responsibility in India. India being a vast country with
population of 1.35 billion and more than 7000 listed corporate is considered as one of the
fastest growing economies. However, it continues to face the challenges of malnutrition,
poverty, corruption, inadequate healthcare, unemployment etc. In this backdrop this paper
is an attempt to understand the challenges faced by Indian Corporate in implementing the
mandated CSR law
Keywords: CSR; Section 135; Challenges and Issues; India; Fifth keyword
1. Introduction
Corporate social responsibility is all about conducting ones business in an ethical manner.
It is giving back to the society in return of all the resources which it has used. CSR is a
thus way of conducting business. CSR is incorporated in business ethics to pay back to all
the stakeholders be it its internal or external stakeholders like customers, employees,
suppliers, shareholders, government and public in large. CSR aspires to reward the society
and other stakeholders with its direct concern for quality of life. CSR go beyond a
corporate economic and legal responsibility and encompass its Social responsibilities. The
word responsibility in itself is self- explanatory, which says that business has some kind of
obligations towards the society in which it operates and it has to show concern for the
social problems which goes beyond the economic services. Corporate social responsibility
globally is understood as conducting of business in an ethical way and in the interests of
the wider community and responding positively to society’s priorities and expectations.
1.1 Define CSR
1.CSR According to Web “CSR is to embrace responsibility for the company's actions and
encourage a positive impact through its activities on the environment, consumers,
employees, communities, stakeholders and all other members of the public sphere who
may also be considered as stakeholders.”
Phd Scholar, Sharda University, Greater Noida , UP, India HOD (Marketing), School of business studies, Sharda University, Greater Noida, UP

International Journal of Management, IT & Engineering Vol. 8 Issue 12(1), December 2018,
ISSN: 2249-0558 Impact Factor: 7.119
Journal Homepage: http://www.ijmra.us, Email: [email protected]
Double-Blind Peer Reviewed Refereed Open Access International Journal - Included in the International
Serial Directories Indexed & Listed at: Ulrich's Periodicals Directory ©, U.S.A., Open J-Gage as well as in
Cabell’s Directories of Publishing Opportunities, U.S.A
29 International Journal of Management, IT & Engineering
http://www.ijmra.us, Email: [email protected]
2. As per Mallen Baker “Corporate Social Responsibility is the continuing commitment by
business to behave ethically and contribute to economic development while improving the
quality of life of the workforce and their families as well as of the local community and
society at large”
3. CSR as defined by The World Business Council on Sustainable Development ―”the
commitment of business to contribute to sustainable economic development, working with
employees, their families and local community and society at large to improve their quality
of life.”
1.2 Objectives
1. To study the Implication of section135, companies act2013 on CSR in India.
2. To study the challenges and issues faced in implementing CSR in India.
3. To make suggestions for accelerating CSR initiatives.
2. Research Methodology: For in depth analysis of research study, this research paper is
an attempt of exploratory research, based on secondary data. The data is sourced from
literature review of journals, articles, books, magazines, government notifications and
websites. Thus the researcher has extensively procured and analysed the data from
secondary survey method.
3.1CSR in India: CSR in India has come a long way from philanthropy and charity to
Gandhiana philosophy of trusteeship to being mandated in India in 2013.CSR is not new
for corporate, it has been Ubiquitous since antediluvian times. The growth of CSR can be
divided into four phases. However the phases seem to overlap each other but have been
ever evolving. The first phase is the phase of pre-independence era when CSR was mainly
about charity and donations. This was followed by second phase wherein the main theme
was Gandhiana philosophy of trusteeship. This was a era when Gandhi emerged as a
Father figure and portrayed Indian companies as “ Temples of modern India” and
motivated and encouraged them to manage their profits in a manner that benefits the
society in large. Third phase is said to be between 1960 -1980. This is an era of mixed
economy; witnessed emergence of Public sector undertaking .This is also the phase when
labour and environmental laws and standards were set. Fourth phase witnessed
globalization and liberalization and with this CSR abandoned its traditional roles and
started engaging into activities which were more strategic and sustainable. And this phase
witnessed the most paths breaking law i.e section 135 of companies Act 2013.With
implementation of this law India became the first country in the world to Mandate CSR for
certain strata of companies.
The focus of government is on CSR law and lot of amendments and changes have been
made ever since incorporation and implementation of the law. The law under section 135
of companies act 2013 mandates “Every companies having Net worth of INR 500 crore or
more; or Turnover of INR 1000 crore or more; or Net Profit of INR 5 crores or more
during any financial year will have to constitute corporate social responsibility committee
and policy with effect from April 1st 2014”. The said corporate has to spend 2% of it’s
average net profit of preceding three years in CSR activities as prescribed in Schedule VII
of companies Act ,2013.
Under schedule VII of the Act, law guides the corporate by listing the sectors and areas
where they can invest in CSR activities. The Law states that a corporate can implement
CSR in three possible ways.
i) Either on its own – in house department – company foundation.

International Journal of Management, IT & Engineering Vol. 8 Issue 12(1), December 2018,
ISSN: 2249-0558 Impact Factor: 7.119
Journal Homepage: http://www.ijmra.us, Email: [email protected]
Double-Blind Peer Reviewed Refereed Open Access International Journal - Included in the International
Serial Directories Indexed & Listed at: Ulrich's Periodicals Directory ©, U.S.A., Open J-Gage as well as in
Cabell’s Directories of Publishing Opportunities, U.S.A
30 International Journal of Management, IT & Engineering
http://www.ijmra.us, Email: [email protected]
ii) Partnering with an implementing agency which can either be Trust, section 8 company
or a registered society.
iii) Grants to CSR projects of other corporate, NGO or as specified in Schedule VII of
companies Act, 2013.
For a Corporate, its current professional human resource, budget for CSR, cost of project
and implementation, availability of implementing partner, political interventions, state
government and local leader’s pressure etc are the major factors, which it considers while
opting for a in-house implementation or partnering with an implementing partner. Analysis
of Current trend in CSR expenditure, by big corporate, proves that spending money is as
difficult as earning it for corporate especially when it comes to CSR. Research proves that
most of the top companies have unspent CSR budgets every year. The top reason being
non-availability of Implementing partner and well defined projects. As per reports of
ASSOCHAM nearly 67% of corporates choose an NGO as a partner for implementing its
projects. Similarly another report by CBI submitted to CBI there are around 20 lakhs NGO
operating in India. Despite so many NGO operating corporate fail to find an eligible
partner to work with. This is because of lack of trust between the two on the aspects of
accountability, transparency and competency. While it is true that all NGO are not
competent and trustworthy but this is also proven that many NGO work at grass root level
and bring more than the desired impact. Similarly corporate are blamed that they fund their
in-house foundation, and often these funds find their way back to parent organisation in
one way or other.
3.2 Challenges and issues of CSR in India: Researcher found that though a lot has been
done in the arena of CSR in India but still corporate face lot of challenges and issues in the
implementation of CSR. The major one’s are as following:
1) Legislative guidelines: In the past also, government had to rely on legislation for
regulating the businesses in delivering social and environmental objectives. With
implementation of section 135 of companies act 2013, now there’s a tight rope on which
corporate have to walk on in terms of CSR. A fixed budget, declaration in website and
annual reports, formation of CSR committee and policy, identification of implementing
partner, formulation of project in a program mode etc are few of the mandates of
company’s act 2013.
2) Duplication of CSR activities: It’s very difficult to have consensus among local
agencies regarding the CSR interventions and projects taken up by government and
corporate. As a result it leads to duplication of CSR activities. Thus, instead of having a
collaborative approach, often implementing agency are found to be competing with each
other on achieving a common objective.
3) Mapping Impact Assessment: The duplication of activities further leads to difficulty in
mapping the Impact assessment of the projects undertaken by the corporate. As different
agencies strive to provide similar kind of solution to nearly same set of beneficiaries. It’s
also because most of the CSR activities are concentrated in urban areas and reach to far off
rural and remote areas is limited.
4) Non-participation of Local Community: The local community is often found
disinterested and non-participative in the CSR activities. The reason can be attributed to
the fact that there’s hardly any awareness among local community regarding the CSR, as
no serious efforts have ever been made to create awareness and instil confidence in the
community regarding such initiatives. The problem is often aggravated because of lack of

International Journal of Management, IT & Engineering Vol. 8 Issue 12(1), December 2018,
ISSN: 2249-0558 Impact Factor: 7.119
Journal Homepage: http://www.ijmra.us, Email: [email protected]
Double-Blind Peer Reviewed Refereed Open Access International Journal - Included in the International
Serial Directories Indexed & Listed at: Ulrich's Periodicals Directory ©, U.S.A., Open J-Gage as well as in
Cabell’s Directories of Publishing Opportunities, U.S.A
31 International Journal of Management, IT & Engineering
http://www.ijmra.us, Email: [email protected]
communication between corporate and community. The corporate instead of doing
themselves hires the Implementing agency for the project, which often ignores the power
of communication.
5)Need Assessment: CSR law mandate that activities have to be in project and program
mode, which requires need identification of the concerned community ,but more than
often the implementing agency choose to work on areas in which they have expertise
instead of focusing on needs of community. So the spirit of law is lost somewhere in the
process.
6) Reach of NGO: Moreover, Its found that the reach of non -government organization is
limited in rural and remote areas, as a result they are not able to assess the real needs and
gaps of the community which further leads to failure in implementation of real intentions
and achieving objectives of the projects. This further leads to failure in development of
capacities at local levels.
7) Transparency issues: Local implementing agencies are not as transparent as they are
expected to be. They often fail to disclose and openly discuss audit issues, impact
assessment reports and methodology, fail to provide fund utilization certificate etc. Due to
lack of transparency, trust building between corporate and NGO is jeopardize. Without
trust building it’s not possible to have effective CSR programs and implementations.
8)Lack of Local Capacities: There is a dire need for building local capacities of the
local nongovernmental organizations ,as there’s lack of of trained and experienced
organizations which can contribute to the needs of CSR programs as envisioned by the
corporate. As a result scaling up of CSR initiatives is compromised and subsequently it
limits the scope of such activities.
9) Lack of Non-governmental Organizations in rural areas: It is found that there is non
availability of qualified nongovernmental organizations in the rural and remote areas of
country that which can assess and identity the real needs of the community and can
actually help in real implementation of CSR interventions of corporate. This scenario again
reinstate that government as well as corporate has to focus on building local capacity for
better implementation of CSR programs of corporate.
10) Lack of CSR professional: CSR teams in most companies are headed by people with
corporate communications or HR background. These teams are usually small and get little
time to update themselves with the Social, Environmental & Economic Canvas of India.
This, and the pressure on these teams to please every branch or location with some CSR
budget, means that of the 660 districts of India, only 100 odd districts gets CSR funding.
Sadly, the activity does not reach the really backward areas.
11) Clash in Policy of MNC with local motives: Though MNC often claims they “think
global but act local” but often they have failed in implementing this thought process. More
than often they are found imitating their global policies on sustainability and social issues
thereby ignoring the needs of country they are actually operating in. India has its unique
needs due to vast population and size of country and corporate are expected to consider
those while framing its policies.
12)Audit requirements: Most of the time corporate not only leave the job of need
identification and project formulation and implementation to its implementing partner but
also the task of auditing is left to the same NGO , as a result often the real beneficiaries are
not tapped and real impact is not measured. Besides many corporate have the policy of not
supporting a NGO for more than 3 years which further demotivate the NGO and as a result

International Journal of Management, IT & Engineering Vol. 8 Issue 12(1), December 2018,
ISSN: 2249-0558 Impact Factor: 7.119
Journal Homepage: http://www.ijmra.us, Email: [email protected]
Double-Blind Peer Reviewed Refereed Open Access International Journal - Included in the International
Serial Directories Indexed & Listed at: Ulrich's Periodicals Directory ©, U.S.A., Open J-Gage as well as in
Cabell’s Directories of Publishing Opportunities, U.S.A
32 International Journal of Management, IT & Engineering
http://www.ijmra.us, Email: [email protected]
their full potential is not put to use. More often then not the NGO are found vying for new
funders to support their projects.
13) Project and program mode: The Law states that a CSR project has to have a start and
end date, it can not continue forever. Though the basic idea is good to create sustainability
of project but often it hampers impact of program as “How on earth, can you ever arrive at
the impact of your money, which supported a student only for three years!” Besides CSR
strategy of affirm has to be conducted through series of projects. Each of them has to have
a well defined beginning, end, baseline survey, Impact assessment, expected output and a
dedicated budget as well. Moreover corporate has to decide if it will go for project
development and implementation on its own or a Implementing partner will do so. Which
ever path corporate takes it needs to well define the project. Different projects have
varying duration some are short extending to few months to long duration projects
extending to multi year. In this scenario each project has to have annual reviews and
reporting. Understanding these project complexity and managing multiple project in itself
becomes a challenge for corporate.
14) Employee Volunteerism: An important component of CSR is employee volunteerism.
But more often than not corporate fail to use it to their best and limit volunteerism only to a
day or 2 celebrated as world community day. Corporate fail to explore and utilize the
benefits and competency of their employees which can fetch much better social returns if
utilized strategically.
15) Relations with the suppliers: With the change in current social and legal environment
many stakeholders are increasingly becoming aware and interested in business affairs of
corporate. As a result corporate have become conscious of not only theirs but also their
partners conduct in a socially responsible manner. Infact many of them are now
introducing socially responsible code of conduct to ensure that supplier’s policies or
practices do not negatively impact the reputation of corporate.
16) Limitations of schedule VII: If Corporate consider only the activities as prescribed
in schedule vii of companies act 2013 (section 135)as CSR, then what about corporate
support for issues not covered under this schedule? Should then the corporate stop their on
going CSR activities and projects, and focus only on mandated areas? The Non
government organisation and the communities they support could find themselves stranded
if this happens. Besides Schedule VII does not provide a mutually exclusive list of
activities. For example Health and sanitation is one area, Woman empowerment is Poverty
alleviation yet another, Promotion of education comes under separate heading. Now if a
corporate runs a school for skill development and education of rural women, it can be
considered under empowerment, education as well as eradicating poverty. Thus their need
to be more clarity on this aspect.
17) Key performance Indicators for CSR review: The CSR activities need to be
evaluated after implementation so as to find out whether desired results have been
achieved or not. Most of the time corporate look for performance in quantitative term and
qualitative aspect is neglected, whereas in social projects qualitative performance is more
relevant. The corporate are used to evaluate everything from the point of view of business.
This analysis of output has to change.
18) Geographical Biasness: The law asks the corporate to invest in CSR preferably in the
local area of its working. As a result most of the development is in industrial areas and
states with industries .For example government data shows that states of Gujrat,

International Journal of Management, IT & Engineering Vol. 8 Issue 12(1), December 2018,
ISSN: 2249-0558 Impact Factor: 7.119
Journal Homepage: http://www.ijmra.us, Email: [email protected]
Double-Blind Peer Reviewed Refereed Open Access International Journal - Included in the International
Serial Directories Indexed & Listed at: Ulrich's Periodicals Directory ©, U.S.A., Open J-Gage as well as in
Cabell’s Directories of Publishing Opportunities, U.S.A
33 International Journal of Management, IT & Engineering
http://www.ijmra.us, Email: [email protected]
Maharashtra, Andra Pradesh, Tamil Nadu and Rajasthan have witnessed nearly 25% of all
CSR expenditure of country whereas stares of north east are completely ignored.
4. Conclusion: In order to overcome the issues and challenges of CSR, certain steps need
to be taken. Government, corporate and civil societies the pillars of sustainability and
inclusive growth has to make a joint effort to create awareness in the society and
community about CSR. This will help in participatory CSR and will be more effective and
efficient. Besides the baseline surveys, need identification will be more pronounced, which
will lead to well defined CSR projects. This will not only bring change in people’s attitude
towards CSR intervention but will also positively affirm a firm’s role. Such kind of efforts
will have a multi dimensional impact. Other corporate would be willing taking up CSR and
invest in communication, it would be easier to convince and motivate suppliers to follow a
code of conduct and implementing agencies will get the message of being more transparent
and honest in their efforts. Thus, eventually the agenda of CSR would be addressed more
meaningfully. An effective partnership between all the stakeholders needs to be created.
Both corporate houses and NGO must actively deliberate and participate in building local
capacities and reaching to far off remote and rural areas where the CSR is much needed.
This will help in scaling up of CSR projects and reaching out to more beneficiaries. This
will further help in reducing the problem of duplication of projects by various corporate.
The government can plan to reward or give recognition to corporate doing good CSR. It
will motivate others to follow the footsteps and collaborative impact would be expected.
Though universities and schools are including ethics, sustainability as a part of curriculum
but still much has to be done. The subject of CSR should be made compulsory and courses
on specialization on the field should be taken up my management Institutes. The subject of
CSR can be studied as an independent field like Human Resource, marketing and finance.
This kind of effort will generate pool of well trained resource and better and innovative
solutions in the field will be generated.
References
1. Chatterjee B., & Mitra, N. (2016a), “CSR Implementation: How It Is Done In India”,
International Journal of Corporate Social Responsibility20172:1
2. Mitra &Schmidpeter (Eds.), Corporate Social Responsibility in India: Cases and
Developments after the Legal Mandate. Switzerland: Springer International
Publishing.
3. Pillai.K. R., (2017). “Corporate Social Responsibility in India: A Journey from
Corporate Philanthropy to Governance Mandate”, Indian Journal of Corporate
Governance, 10 (2), 176 – 184.
4. Yadav, S (2014). Understanding the challenges Faced by SME’s in incorporating
Corporate Social Responsibility in Indian Context, International Journal of Management
Development& Information Technology. ISSN 0976-8440, VOL.12, DEC, 2014.
5. Rajeev, Priya Nair; Kalagnanam, Suresh . India’s mandatory CSR policy:
Implication and implementation challenges. International Journal of business
governance and ethics, volume 12(1)-jan1, 2017
6. Waagstein, P.R. (2011) ‘The mandatory corporate social responsibility in Indonesia:
problems and implications’, Journal of Business Ethics, Vol. 98, No. 3, pp.455–466.
7.The Hauser Institute for Civil Society (2015) Corporate Social Responsibility Disclosure
Efforts by National Governments and Stock Exchanges, Harvard Kennedy School,
Cambridge, MA, USA.

International Journal of Management, IT & Engineering Vol. 8 Issue 12(1), December 2018,
ISSN: 2249-0558 Impact Factor: 7.119
Journal Homepage: http://www.ijmra.us, Email: [email protected]
Double-Blind Peer Reviewed Refereed Open Access International Journal - Included in the International
Serial Directories Indexed & Listed at: Ulrich's Periodicals Directory ©, U.S.A., Open J-Gage as well as in
Cabell’s Directories of Publishing Opportunities, U.S.A
34 International Journal of Management, IT & Engineering
http://www.ijmra.us, Email: [email protected]
8. Sundar, P. (2014) CSR and the Companies Act: Challenges as Opportunities [online]
9.https://www.academia.edu/22635186/CSR_and_the_Companies_Act_Challenges_As_O
pportunities .
10. Singh .C “CSR: ISSUES AND CHALLENGES IN INDIA”, Vol-2 Issue-6 2016
IJARIIE-ISSN (O)-2395-4396 6294 www.ijariie.com 1779
11. Kishore p.k, Challenges in CSR in India, www.academia .com
12. http://www.forbesindia.com/blog/business-strategy/challenges-of-the-2-csr-paradigm/

International Journal of Management, IT & Engineering Vol. 8 Issue 12(1), December 2018,
ISSN: 2249-0558 Impact Factor: 7.119
Journal Homepage: http://www.ijmra.us, Email: [email protected]
Double-Blind Peer Reviewed Refereed Open Access International Journal - Included in the International
Serial Directories Indexed & Listed at: Ulrich's Periodicals Directory ©, U.S.A., Open J-Gage as well as in
Cabell’s Directories of Publishing Opportunities, U.S.A
35 International Journal of Management, IT & Engineering
http://www.ijmra.us, Email: [email protected]
“Improvement of Throughput DEEC Routing Protocol For
UAV SWAM Based Wireless Sensor Networks”
Amul Batra
Abstract
UAV Swam based wireless sensor network is composed of hundreds and thousands of
small flying wireless sensor nodes which collect information by sensing the physical
environment. The sensed data is processed and communicated to other sensor nodes and
finally to Base Station. So energy efficient routing to final destination called base station is
ongoing current requirement in wireless sensor networks. Here in this research paper we
propose a multi-hop DEEC routing scheme i.e. Threshold DEEC for heterogeneous
networks like UAVs Swam where we deploy rechargeable intermediate nodes called
gateways in-between cluster head and base station for minimizing energy consumption by
sensor nodes in each processing round thereby increasing the network lifetime and stability
of wireless sensor networks unlike DEEC.
Keywords— Unmanned Aerial Vehicle, Wireless Sensor Networks, Heterogeneous
Protocol, Gateway, DEEC, and Energy Consumption.
I. Introduction
Recent advancement in wireless communication and electronics has enabled the
development of low-cost, low-power multifunctional miniature devices for use in remote
sensing applications. Such sensors can be widely deployed for commercial, civil and
military applzications such as UAVs Swarm networks, surveillance, vehicle tracking,
climate and habitat monitoring intelligence, medical and acoustic data gathering. A WSN
is composed of large number of sensor nodes which consist of sensing, data processing and
communication capabilities. Usually sensor nodes are scattered in the sensing field. They
coordinate among themselves to get information about the physical environment. The
information is routed to the Base Station either directly or through other sensor nodes. The
BS is either a fixed or mobile node which is capable to connect the sensor network to the
internet where user can access and process data. The key challenge in sensor networks is to
maximize the lifetime of sensor nodes due to the fact that it is not feasible to replace the
batteries of thousands of sensor nodes. Therefore, computational operations of nodes and
communication protocols must be made as energy efficient as possible. Area coverage and
data aggregation [1] techniques can greatly help conserve the scarce energy resources by
eliminating data redundancy and minimizing the number of data transmissions. Therefore,
data aggregation methods in sensor networks are extensively investigated in the literature
[1], [2], [3] and [4].
Considering the challenges of WSN many routing protocols have been already proposed
for WSN. They can be classified into flat, hierarchical and location-based network routing.
In flat routing all nodes are typically assigned equal roles or functionality. SPIN (Sensor
Protocols for Information via Negotiation) and DD (Directed Diffusion) fall in this
category. In hierarchical routing the network is divided into clusters to achieve energy
efficiency. LEACH [5], TEEN [3], APTEEN [3] are well known hierarchical routing
Assistant Director, Directorate General of Civil, Ministry of Civil Aviation

International Journal of Management, IT & Engineering Vol. 8 Issue 12(1), December 2018,
ISSN: 2249-0558 Impact Factor: 7.119
Journal Homepage: http://www.ijmra.us, Email: [email protected]
Double-Blind Peer Reviewed Refereed Open Access International Journal - Included in the International
Serial Directories Indexed & Listed at: Ulrich's Periodicals Directory ©, U.S.A., Open J-Gage as well as in
Cabell’s Directories of Publishing Opportunities, U.S.A
36 International Journal of Management, IT & Engineering
http://www.ijmra.us, Email: [email protected]
protocol. In location based routing exact position of a node is used to find the optimal
routing path e.g. GAF (Geographic Adaptive Fidelity) [4] and GEAR (Geographic and
Energy Aware Routing) [5].
II. Wireless Sensor Network
Wireless sensor networks are potentially one of the most important technologies of this
century. Recent advancement in wireless communications and electronics has enabled the
development of low-cost, low-power, multifunctional miniature devices for use in remote
sensing applications. The combination of these factors have improved the viability of
utilizing a sensor network consisting of a large number of intelligent sensors, enabling the
collection, processing analysis and dissemination of valuable information gathered in a
variety of environments. A sensor network is composed of a large number of sensor nodes
which consist of sensing, data processing and communication capabilities.
III. Sensor Network Challenges
Wireless sensor network uses a wide variety of application and to impact these applications
in real world environments, we need more efficient protocols and algorithms. Designing a
new protocol or algorithm address some challenges which are need to be clearly
understood [6]. These challenges are summarized below:
Physical Resource Constraints: The most important constraint imposed on sensor network
is the limited battery power of sensor nodes. The effective lifetime of a sensor node is
directly determined by its power supply. Hence lifetime of a sensor network is also
determined by the power supply. Hence the energy consumption is main design issue of a
protocol. Limited computational power and memory size is another constraint that affects
the amount of data that can be stored in individual sensor nodes. So the protocol should be
simple and light-weighted. Communication delay in sensor network can be high due to
limited communication channel shared by all nodes within each other's transmission range.
Ad-hoc deployment: Node deployment in WSNs is application dependent and affects the
performance of the routing protocol. The deployment can be either deterministic or
randomized. In deterministic deployment, the sensors are manually placed and data is
routed through pre-determined paths. However, in random node deployment, the sensor
nodes are scattered randomly creating an infrastructure in an ad hoc manner. If the
resultant distribution of nodes is not uniform, optimal clustering becomes necessary to
allow connectivity and enable energy efficient network operation. Inter-sensor
communication is normally within short transmission ranges due to energy and bandwidth
limitations. Therefore, it is most likely that a route will consist of multiple wireless hops.
IV. 2.1 Routing protocol in wireless sensor network
IEEE COMMUNICATIONS SURVEYS & TUTORIALS, VOL. 15, NO. 2, SECOND
QUARTER 2013
Energy-Efficient Routing Protocols in Wireless SensorNetworks: A SurveyNikolaos A.
Pantazis, Stefanos A. Nikolidakis and Dimitrios D. Vergados, Senior Member, IEEE
During the recent years, many energy efficient routing protocols have been proposed for
WSNs. In the above paper author mention the following energy efficient routing protocol
for wireless sensor network
Data-centric protocols: In many applications of sensor networks, it is not feasible to assign
global identifiers to each node due to the sheer number of nodes deployed. Such lack of
global identification along with random deployment of sensor nodes makes it hard to select

International Journal of Management, IT & Engineering Vol. 8 Issue 12(1), December 2018,
ISSN: 2249-0558 Impact Factor: 7.119
Journal Homepage: http://www.ijmra.us, Email: [email protected]
Double-Blind Peer Reviewed Refereed Open Access International Journal - Included in the International
Serial Directories Indexed & Listed at: Ulrich's Periodicals Directory ©, U.S.A., Open J-Gage as well as in
Cabell’s Directories of Publishing Opportunities, U.S.A
37 International Journal of Management, IT & Engineering
http://www.ijmra.us, Email: [email protected]
a specific set of sensor nodes to be queried. Therefore, data is usually transmitted from
every sensor node within the deployment region with significant redundancy.
2.1.2 Sensor Protocols for Information via Negotiation: (SPIN) [7] is among the early
work to pursue a data-centric routing mechanism. The idea behind SPIN is to name the
data using high level descriptors or meta-data. Before transmission, meta-data are
exchanged among sensors via a data advertisement mechanism, which is the key feature of
SPIN. Each node upon receiving new data, advertises it to its neighbors and interested
neighbors, i.e. those who do not have the data, retrieve the data by sending a request
message. SPIN's meta-data negotiation solves the classic problems of flooding such as
redundant information passing, overlapping of sensing areas and resource blindness thus,
achieving a lot of energy efficiency.
V. Proposed Protocol
Working of the protocol
A lot of simulation works / experiments are going on in the research field of WSN to make
routing protocols more and more energy efficient. Here, we propose a modified version of
DEEC called Improved DEEC that can increase energy efficiency than original DEEC.
The basic concept involved in increasing energy efficiency is to keep radio communication
distance as minimum as possible [8]. The popular technique used to minimize
communication distance is the formation of clusters between nodes rather than direct
communication [9] but as the distance between the CH and BS go beyond a certain level
single hop communication concept of DEEC routing protocol is not suitable. For this we
propose Heterogeneous Multi-hop DEEC routing protocol to increase the energy efficiency
of WSN.
As we mentioned earlier, DEEC considers all sensors in the network have the same amount
of initial energy i.e. they are homogeneous with respect to energy which is not realistic
approach. So the nodes which directly communicate with the BS (i.e. the CHs) will die
earlier than the normal cluster member nodes, decreasing the overall lifespan of the
network. To make the network more energy efficient we classify the sensors into three
types: normal node, intermediate node and advanced node depending on their initial energy
level. The advanced node has the highest energy level while the normal node possesses the
lowest level of energy. The normal nodes will be the cluster members. They send their data
to their CH which will be elected from the group of intermediate nodes. The procedure
used to select CH is same as that of DEEC. The intermediate nodes will also sense data
from the environment. They will aggregate the sensed and received data and either send it
to one of the advanced nodes located nearer to BS or send directly to the BS if no such
advanced node is found. The advance node communicates directly with the BS. It also
senses data and aggregates all the data it received from different intermediate nodes with
its own data. Finally it transmits the data directly to the BS.
VI. Energy Efficiency of Proposed Protocol
Our proposed algorithm provides better connectivity and successful data rate as compare to
DEEC. The reason behind this enhancement is multi-hop communication adopted by
cluster-heads. As member nodes save energy by sending data to cluster-head in DEEC
instead of Base station, similarly in Improved DEEC cluster-head at longer distance from
Base station transmit data to advanced nodes closer to the Base station instead of direct
transmission to Base station. It is more effective energy efficient routing protocol when
network diameter is larger. Energy efficiency of Improved DEEC can be better elaborate

International Journal of Management, IT & Engineering Vol. 8 Issue 12(1), December 2018,
ISSN: 2249-0558 Impact Factor: 7.119
Journal Homepage: http://www.ijmra.us, Email: [email protected]
Double-Blind Peer Reviewed Refereed Open Access International Journal - Included in the International
Serial Directories Indexed & Listed at: Ulrich's Periodicals Directory ©, U.S.A., Open J-Gage as well as in
Cabell’s Directories of Publishing Opportunities, U.S.A
38 International Journal of Management, IT & Engineering
http://www.ijmra.us, Email: [email protected]
with the example of linear network having two cluster heads A and B which are
communicating to Base station. A is at a distance ’m’ from B and B is at a distance m from
the Base station.
In order to calculate the transmitting energy cost of cluster heads A and B, which are
directly transmitting to Base station will be [10]:
EdirAB = EeleTX X LA + Eamp X LA X 2m2 + EeleTX X LB + Eamp X LB X m2
Where EdirAB is total energy cost of cluster-heads A and B, LA is aggregated data
transmitted by cluster-head A and LB is aggregated data transmitted by cluster-head B
towards Base station and m is equal distance among cluster heads and Base station. This
happens in case of DEEC when every cluster-head has to communicate directly to Base
station.
Similarly total transmitting energy cost can also be calculated when multi-hop
communication is taking place. Our proposed protocol utilizes multi-hop communication.
In this linear network if cluster-head A transmits data to B instead of Base station then B
has to transmit not only its own data but also has to transmit cluster-head A’s data to Base
station.
EMulti-hop = EeleTX X LA + Eamp X LA X m2 + EeleRX X LA +EeleTX X (LA +LB)
+ Eamp X(LA + LB) X m2
VII. Performance Analysis of Energy-Efficient Routing Techniques in Wireless
Sensor Network
For even moderately-sized networks with ten nodes, it is impossible to analytically model
the interactions between all the nodes. Therefore, simulation was used to determine the
benefits of different protocols. Computation and communication energy dissipation models
as well as new MAC algorithms were implemented in matlab to support the design and
simulation of the different protocol architectures. In this section DEEC is compared to the
proposed algorithm in terms of system lifetime, energy dissipation and amount of data
transfer.
VIII. Simulation Setting
A simulation environment is designed and implemented in MATLAB 7.10.0 in order to
investigate the energy efficiency with lifetime extension of the mentioned protocol. We
compare the proposed Modified Leach algorithm with Leach routing protocol. The
simulation parameters used in the experiment is shown in Table 3.1. The nodes are
randomly distributed between x=0, y=0 and x=100, y=100 with the base station (BS) at
location x=50, y=50. BS and all sensor nodes are stationary after deployment. We consider
packet size of 2000 bits. The simulation parameters are summarized in Table 3.1.
IX. Network lifetime
It is the time interval from the start of the network operation till the last node die.
Throughput:
To evaluate the performance of throughput, the numbers of packets received by BS are
compared with the number of packets sent by the nodes in each round.

International Journal of Management, IT & Engineering Vol. 8 Issue 12(1), December 2018,
ISSN: 2249-0558 Impact Factor: 7.119
Journal Homepage: http://www.ijmra.us, Email: [email protected]
Double-Blind Peer Reviewed Refereed Open Access International Journal - Included in the International
Serial Directories Indexed & Listed at: Ulrich's Periodicals Directory ©, U.S.A., Open J-Gage as well as in
Cabell’s Directories of Publishing Opportunities, U.S.A
39 International Journal of Management, IT & Engineering
http://www.ijmra.us, Email: [email protected]
Parameter Value
Network Size 100m * 100m
Number of nodes 100
Packet Size 2000 bits
Initial Energy 0.5 j
Number of rounds 5000
Transmitter Electronics
(ETX)
50nJ/bit
Receiver Electronics
(ERX)
50nJ/bit
Data Aggregation
Energy
5nJ/bit
Table 3.1: Characteristics of the test network
X. Simulation Results
The simulated protocols are briefly summarized here. In DEEC, nodes organize themselves
into clusters using the distributed algorithm described in chapter 3.1. This protocol has the
advantage of being distributed, self-configuring and not requiring location information for
cluster formation. In addition the steady-state protocol is low-energy. However, the
drawback is that there is no guarantee as to the number or placement of cluster-head nodes
within the network and number of cluster members within a cluster.
Protocol Rounds
when
nodes
start
dying
Rounds
when all
nodes are
dead
DEEC 0 2100
Improved
DEEC
0 2200
Fig 3.3.1 THRESHOLD DEEC Output result

International Journal of Management, IT & Engineering Vol. 8 Issue 12(1), December 2018,
ISSN: 2249-0558 Impact Factor: 7.119
Journal Homepage: http://www.ijmra.us, Email: [email protected]
Double-Blind Peer Reviewed Refereed Open Access International Journal - Included in the International
Serial Directories Indexed & Listed at: Ulrich's Periodicals Directory ©, U.S.A., Open J-Gage as well as in
Cabell’s Directories of Publishing Opportunities, U.S.A
40 International Journal of Management, IT & Engineering
http://www.ijmra.us, Email: [email protected]
XI. Conclusion
Use of the wireless channel is growing at an amazing speed. Advances in energy-efficient
design have created new portable devices that enable exciting applications for the wireless
channel. While the wireless channel makes deployment task easier, it adds constraints that
are not found in a wired environment. Specifically, the wireless channel is bandwidth-
limited, and the portable devices that use the wireless channel are typically battery-
operated and hence energy-constrained. In addition, the wireless channel is error-prone and
time-varying. Therefore, it is important to design protocol and algorithms for wireless
networks to be bandwidth and energy-efficient as well as robust to channel errors. The
work described in this dissertation shows an energy-efficient routing technique which is
mainly suitable for application like environment monitoring where sensor nodes located in
nearby region collect similar type of data
Fig 3.3.2Improved DEEC Output
XII. FUTURE Work
There is still much work to be done in the area of protocols for wireless micro sensor
networks. The protocols described in this dissertation are for scenarios where the sensors
have correlated data. However, there are important applications of wireless sensor
networks where this is not the case. For example, sensor networks for medical monitoring
applications may have different sensors located on and/or in the body to monitor vital
signs. These networks will not be as large-scale as the ones discussed, but they will have
similar requirements to the sensor networks discussed – long system lifetime, low-latency
data transfers and high quality data. These networks will most likely focus on maximizing
quality above all parameters and loss of information will not be acceptable. Therefore
protocol architectures need to be developed to support the unique considerations of these
networks.

International Journal of Management, IT & Engineering Vol. 8 Issue 12(1), December 2018,
ISSN: 2249-0558 Impact Factor: 7.119
Journal Homepage: http://www.ijmra.us, Email: [email protected]
Double-Blind Peer Reviewed Refereed Open Access International Journal - Included in the International
Serial Directories Indexed & Listed at: Ulrich's Periodicals Directory ©, U.S.A., Open J-Gage as well as in
Cabell’s Directories of Publishing Opportunities, U.S.A
41 International Journal of Management, IT & Engineering
http://www.ijmra.us, Email: [email protected]
Reference
[1] J. Kulik, W. R. Heinzelman, and H. Balakrishnan, "Negotiation-based protocols for
disseminating information in wireless sensor networks," Wireless Networks, Volume: 8,
pp. 169-185, 2002.
[2] C. Intanagonwiwat, R. Govindan, and D. Estrin, "Directed diffusion: a scalable and
robust communication paradigm for sensor networks," Proceedings of ACM MobiCom '00,
Boston, MA, 2000, pp. 56-67.
[3] A. Manjeshwar and D. P. Agarwal, "TEEN: a routing protocol for enhanced efficiency
in wireless sensor networks," In 1st International Workshop on Parallel and Distributed
Computing Issues in Wireless Networks and Mobile Computing, April 2001.
[4] A. Manjeshwar and D. P. Agarwal, "APTEEN: A hybrid protocol for efficient routing
and comprehensive information retrieval in wireless sensor networks," Parallel and
Distributed Processing Symposium., Proceedings International, IPDPS 2002, pp. 195-202.
[5]W. Heinzelman, A. Chandrakasan and H. Balakrishnan, "Energy-Efficient
Communication Protocol for Wireless Microsensor Networks," Proceedings of the 33rd
Hawaii International Conference on System Sciences (HICSS '00), January 2000.
[6] Sundeep Karthikeyan Vaidynathan, Sayantan sur and Sinha. Data aggregation
techniques in sensor networks. Technical Report, OSU-CISRC-11/04-TR60, 2004.
[7] D. Agrawal N. Shrivastava, C. Buragohain and S. Suri. Medians and beyond:
newaggregation techniques for sensor networks. Proceedings of the 2nd international
conference on Embedded networked sensor systems, pages 239{249, 2004. ACM Press.75
Bibliography
[8] Xiuli Ren and Haibin Yu1.Security mechanisms for wireless sensor networks. IJCSNS
International Journal of Computer Science and Network Security, VOL.6 (No.3):100{107,
March 2006.
[9] S. Setia S. Zhu and S. Jajodia. Leap: efficient security mechanisms for large
scaledistributed sensor networks. Proceedings of the 10th ACM conference on Computer
and communications security, pages 62-72, 2003.ACM Press.
[10] Y. Xu, J. Heidemann, D. Estrin,\Geography-informed Energy Conservation for Ad-
hoc Routing," In Proceedings of the Seventh Annual ACM/IEEE International Conference
on Mobile Computing and Networking 2001, pp. 70-84.
Author is as on date working as a Technical Group
‘A’ officer with Directorate General of Civil
Aviation, Ministry of Civil Aviation. He is having
work experience in Hindustan Aeronautics Ltd, AAI
and Defense research and Development organization
(DRDO)

International Journal of Management, IT & Engineering Vol. 8 Issue 12(1), December 2018,
ISSN: 2249-0558 Impact Factor: 7.119
Journal Homepage: http://www.ijmra.us, Email: [email protected]
Double-Blind Peer Reviewed Refereed Open Access International Journal - Included in the International
Serial Directories Indexed & Listed at: Ulrich's Periodicals Directory ©, U.S.A., Open J-Gage as well as in
Cabell’s Directories of Publishing Opportunities, U.S.A
42 International Journal of Management, IT & Engineering
http://www.ijmra.us, Email: [email protected]
UBIQUITOUS COMPUTING
Palvi-mca, mphil
Abstract
Although a ubiquitous computing has been widespread and Computers embedded into
physical objects and living environments have been increased, personal portable devices
are still necessary for various interactions with embedded computers. Despite of
importance of those devices, input and output capabilities of them are limited and
relatively impoverished compared to those of laptop computers. Moreover, users must pay
an explicit attention to an interaction with portable devices. To solve these problems, we
propose a smart device collaboration for a ubiquitous computing, which aims to realize
that each embedded computer complements the lack of capability of a portable device in
the ubiquitous computing environment. Our proposed smart device collaboration allows
users to have appropriate interactions with embedded computers, without explicit
attentions to existences of these computers and interfaces to them. This paper describes
InfoPoint and Smart Furniture which are our experimental devices demonstrating smart
device collaboration. We also observe advantages and disadvantages of these devices,
present future works, and conclude a scheme of the smart device collaboration.
Introduction
Ubiquitous computing (or "ubicomp") is a concept in software engineering and computer
science where computing is made to appear anytime and everywhere. In contrast to
desktop computing, ubiquitous computing can occur using any device, in any location, and
in any format. A user interacts with the computer, which can exist in many different forms,
including laptop computers, tablets and terminals in everyday objects such as a refrigerator
or a pair of glasses. The underlying technologies to support ubiquitous computing include
Internet, advanced middleware, operating system, mobile code, sensors, microprocessors,
new I/O and user interfaces, networks, mobile protocols, location and positioning, and new
materials.
This paradigm is also described as pervasive computing, ambient intelligence,] or
"everyware". Each term emphasizes slightly different aspects. When primarily concerning
the objects involved, it is also known as physical computing, the Internet of Things, haptic
computing and "things that think". Rather than propose a single definition for ubiquitous
computing and for these related terms, a taxonomy of properties for ubiquitous computing
has been proposed, from which different kinds or flavors of ubiquitous systems and
applications can be described.
Ubiquitous computing touches on a wide range of research topics, including distributed
computing, mobile computing, location computing, mobile networking, context-aware
computing, sensor networks, human–computer interaction, and artificial intelligence.
Working as a hod in comp dept,sgtb college

International Journal of Management, IT & Engineering Vol. 8 Issue 12(1), December 2018,
ISSN: 2249-0558 Impact Factor: 7.119
Journal Homepage: http://www.ijmra.us, Email: [email protected]
Double-Blind Peer Reviewed Refereed Open Access International Journal - Included in the International
Serial Directories Indexed & Listed at: Ulrich's Periodicals Directory ©, U.S.A., Open J-Gage as well as in
Cabell’s Directories of Publishing Opportunities, U.S.A
43 International Journal of Management, IT & Engineering
http://www.ijmra.us, Email: [email protected]
Ubiquitous computing may be seen to consist of many layers, each with their own roles,
which together form a single system:
Layer 1: task management layer
• Monitors user task, context and index
• Map user's task to need for the services in the environment
• To manage complex dependencies
Layer 2: environment management layer
• To monitor a resource and its capabilities
• To map service need, user level states of specific capabilities
Layer 3: environment layer
• To monitor a relevant resource
• To manage reliability of the resources

International Journal of Management, IT & Engineering Vol. 8 Issue 12(1), December 2018,
ISSN: 2249-0558 Impact Factor: 7.119
Journal Homepage: http://www.ijmra.us, Email: [email protected]
Double-Blind Peer Reviewed Refereed Open Access International Journal - Included in the International
Serial Directories Indexed & Listed at: Ulrich's Periodicals Directory ©, U.S.A., Open J-Gage as well as in
Cabell’s Directories of Publishing Opportunities, U.S.A
44 International Journal of Management, IT & Engineering
http://www.ijmra.us, Email: [email protected]
History
Mark Weiser coined the phrase "ubiquitous computing" around 1988, during his tenure as
Chief Technologist of the XeroxPalo Alto Research Center (PARC). Both alone and with
PARC Director and Chief Scientist John Seely Brown, Weiser wrote some of the earliest
papers on the subject, largely defining it and sketching out its major concerns.[6][7][8]
Key features of ubiquitous computing include:
• Consideration of the human factor and placing of the paradigm in a human, rather than
computing, environment.
• Use of inexpensive processors, thereby reducing memory and storage requirements.
• Capturing of real-time attributes.
• Totally connected and constantly available computing devices.
• Focus on many-to-many relationships, instead of one-to-one, many-to-one or one-to-
many in the environment, along with the idea of technology, which is constantly
present Includes local/global, social/personal, public/private and invisible/visible
features and considers knowledge creation, as well as information dissemination.
• Relies on converging Internet, wireless technology and advanced electronics.
• Increased surveillance and possible restriction and interference in user privacies, as the
digital devices are wearable and constantly connected.
• As technology progresses, the reliability factor of the different equipment used may be
impacted.
Impact of Ubiquitous Computing
• Ubiquitous computing will permeate everyday life – both private and working – and is
therefore expected to have Far-reaching consequences that will be reflected in a variety
of socio-economic contexts. Both positive and negative effects are likely in equal
measure at several levels. Safety and privacy, for example, make up two ends of one
key
Impact on privacy: in terms of privacy, slightly positive effects are expected for the
application fields of Security, medicine and production; moderately negative effects are
expected in other application contexts.
• A ubiquitous computing design for privacy that conforms to data protection standards
is regarded as a requirement for ensuring Privacy and is preferred to the downstream
concept of context-dependent data protection filters (digital bubbles).
• Only a system architecture that protects privacy from the outset can prevent serious
conflicts in data protection from developing.
• In the use and processing of data, rendering all steps in the process visible and logically
comprehensible seems to be of less importance.
• Far more crucial is a user’s explicit trust in a particular ubiquitous computing system
that the service provider will handle personal data responsibly.
• Apart from this concern, there is the danger that frequent use of a ubiquitous
computing application could potentially lead to the inattentive handling.
• Ubiquitous Computing: Potentials and Challenges 1327 of personal data.
• This means that the premature availability of a ground breaking ubiquitous computing
application could result in limited public attention being given to the protection of
privacy during its crucial phase of implementation.
Economic impact: among the economic effects associated with ubiquitous computing,
work efficiency in particular is expected to improve. This will become most apparent in the

International Journal of Management, IT & Engineering Vol. 8 Issue 12(1), December 2018,
ISSN: 2249-0558 Impact Factor: 7.119
Journal Homepage: http://www.ijmra.us, Email: [email protected]
Double-Blind Peer Reviewed Refereed Open Access International Journal - Included in the International
Serial Directories Indexed & Listed at: Ulrich's Periodicals Directory ©, U.S.A., Open J-Gage as well as in
Cabell’s Directories of Publishing Opportunities, U.S.A
45 International Journal of Management, IT & Engineering
http://www.ijmra.us, Email: [email protected]
key economic areas of production, Logistics and commerce. This will not, however, play a
role in smart homes.
• It is worth noting that no significant efficiency gains from ubiquitous computing are
expected for housework, professionals working at home, and Homecare of the elderly
and/or ill.
• The motivation for introducing ubiquitous computing into the smart home is to
Increase personal comfort, which is not quantifiable in economic terms.
• Experts apparently anticipate effects similar to those resulting from the introduction of
modern household appliances during industrialization.
• Back then, the time saved by the use of new appliances was counteracted by increased
demands in hygiene and cleanliness, which resulted in extra work.
• Moderately positive effects are anticipated for increasing energy and resource
efficiency in all areas of application.
• Significant increases are expected, however, in production and especially logistics.
Indeed, the potential of ubiquitous computing for commerce and production is
immense because of its ability to self organize and control industrial processes.
• Such self-organization depends on several things, including the availability of fully
developed knowledge-based systems. Developing these systems in turn, however,
poses a significant challenge.
• Finally, newly adapted recycling procedures will be needed to allow for the re-use of
ubiquitous computing Components that have been integrated and embedded into
everyday objects.
Social impact: clear positive effects are predicted in the personal activities in medicine,
the home, communications and automobiles, while moderately positive effects are
expected in inner and external security, and in production, logistics and commerce.
• Improvements in safety are anticipated primarily in military and security-related
applications, especially in medical applications. The automotive branch will also profit.
• Overall, ubiquitous computing is not expected to produce any negative rebound effects,
which would offset or even negate its positive effects.
• This is true for work and attention efficiency, resource consumption and for the ability
of human being to orient and locate himself in his environment.
Winners and losers: there will be several social groups as winners and losers in
ubiquitous computing.
• The elderly and persons with little experience with technology stand out as groups that
could benefit from ubiquitous computing and be disadvantaged by it as well.
• How might this paradox come about? The first generation ubiquitous computing
applications are likely to demand a certain level of knowledge and requirements that
will result in a temporary division between the winners and the losers.
• However, this divide should subside as the functional logic of later generation
ubiquitous applications is automated and cost-effective mass production sets in.
• Once the technology matures and becomes publicly available, the less educated will
begin to profit from it.
• It is, therefore, imperative that a ubiquitous computing infrastructure offers accordingly
easy access in technical, Financial or intellectual terms. Otherwise, a digital divide
between those with and those without access to ubiquitous computing will emerge.

International Journal of Management, IT & Engineering Vol. 8 Issue 12(1), December 2018,
ISSN: 2249-0558 Impact Factor: 7.119
Journal Homepage: http://www.ijmra.us, Email: [email protected]
Double-Blind Peer Reviewed Refereed Open Access International Journal - Included in the International
Serial Directories Indexed & Listed at: Ulrich's Periodicals Directory ©, U.S.A., Open J-Gage as well as in
Cabell’s Directories of Publishing Opportunities, U.S.A
46 International Journal of Management, IT & Engineering
http://www.ijmra.us, Email: [email protected]
• Other groups that could suffer disadvantages as a result of ubiquitous computing
include small businesses and retail, political minorities, critics or skeptics, marginal
groups and persons with unusual backgrounds.
Ubiquitous Computing Devices and Technologies in Educational Environments
Several studies, have tried to explore the use of mobile devices in education. Koole, points
Out that m-learning is the intersection of three compounds: the device/technology aspect,
the student’s characteristics, and the social aspects. Crow et al. Conducted a study on the
use of mobile devices in higher education using semi-structured interviews with three
lecturers. They concluded that there are three criteria that are necessary for “switching
gears” from e-learning to m-learning: instructor’s awareness of opportunities, instructor’s
familiarity of new mobile devices and software applications, and institutional support and
commitment. Recently, Renneberg et al. [37] studied the m-learning adoption in tablet
devices instead of cell phones and PDAs. Tablets’ screen size allows better visualization,
enabling user interaction. Although tablets overcome the barriers of small screens, they
still have limitations on storage capacity, input capabilities, and reliability. Lessons learned
from teaching network application design to students using smart phones and cloud
computing are reported in [38]. Students were motivated to learn independently, when they
were free to develop their preferred mobile applications, and they collaborated to openly
share code with each other. It seems that Smartphone technology excites students about
computing and networking. Richards [39] attempts to merge the principles of universal
design for learning with ubiquitous learning, in order to reduce the barriers for students
with disabilities and learning difficulties. The first principle is to provide multiple means of
representation. Ubiquitous learning provides learners the means to adapt contents
according to their needs. The second principle is to provide multiple means of action and
expression. This principle is fulfilled,
For example, through the mobile use of social media where students can actively express
themselves and interact with the leaning content. The third principle is to provide the
means of engagement, which is fulfilled by all mobile applications in the instructional
context. Social bookmarking sites, for example, allow students sharing their findings and
adding a peer networking capability to the learning process. In the following, we discuss
the requirements captured by interviews with educators and students. We also outline the
functional components of the integrated system along with a short description of their role
and their interaction between each other through a representative use case.
3.1. Interviews
Our pedagogical, m-learning and blended learning based teaching activities in Higher
Education are part of a three years experiment in the Department of Informatics of the TEI
of Athens aimed specifically at fulfilling the inclusion and support of students through
mobile devices technology, and content delivery in the mainstream class and in parallel
classes. Special emphasis was given to the inclusion of students with disabilities and
learning difficulties. Twenty persons were participated in a voluntary basis. In particular,
five instructors, a social worker, expert in Special Education, with good knowledge of the
Sign Language, and fourteen (14) students (hearingnotes’ takers, deaf and hard of hearing
students, and dyslexic students) worked in special parallel, “assistive”, classes. The
participating students also attended the same courses in the mainstream classes. Parallel
classes were organized for the following courses: Databases I & II, Introduction to
Programming (Pascal language), Programming (C language), Numerical Analysis and

International Journal of Management, IT & Engineering Vol. 8 Issue 12(1), December 2018,
ISSN: 2249-0558 Impact Factor: 7.119
Journal Homepage: http://www.ijmra.us, Email: [email protected]
Double-Blind Peer Reviewed Refereed Open Access International Journal - Included in the International
Serial Directories Indexed & Listed at: Ulrich's Periodicals Directory ©, U.S.A., Open J-Gage as well as in
Cabell’s Directories of Publishing Opportunities, U.S.A
47 International Journal of Management, IT & Engineering
http://www.ijmra.us, Email: [email protected]
Introduction to Informatics. Interviews with people and the experts in the program helped
us to give proposals on the utilization of mobile devices and ubiquitous computing
technology in the higher education classroom of the future. As a consequence, a new
programme is funded in order to create the new integrated system for supporting students
of the TEI of Catherine Marinagi et al. / Procedia - Social and Behavioral Sciences 73
(2013) 487 – 494 491
Athens –mainly disabled students and students with learning difficulties- in the class and
the laboratory using mobile technology and specialized software (e.g. text-to-speech).
We conducted semi-structured interviews to capture the experiences of the twenty (35)
participants. Main findings of our research suggest the following interrelated directions of
development for the integrated system of supporting the future classroom:
∞ A student-centered, personalized, adaptive to the specific needs approach. It also means
that there are not barriers in the inclusion and participation of all the students; the disabled
students are supported; and there is not any obligation of physical presence in the
classroom. Fulfill the demand for resources, technical support and training to offer a basis
for the understanding and adoption of the new technologies for instructional purposes.
∞ Inclusion is related to the increased demand for interactivity, personalization and
adaptation support, dissemination of information, and the Design 4 All approach.
∞ Need of the academic community of the University to address the cultural change
inherent in the use of new technologies of social networking. Forums, wikis, facebook,
delivery of e-books could be incorporated to the integrated system and offer new
possibilities in the framework of a blended learning approach e.g. the participation in
collaborative schemes. The classroom of the future will be based on the operation of
Integrated Systems (IS) with a single logon, which includes components that all are
interrelated and interconnected. Main components of the IS will support all the forms of
learning: classroom and online courses, ubiquitous learning environments based on
ubiquitous technologies, m-Learning, blended-learning, before, during, and after the
lesson. Content handling will be done online, and in real time. Other important components
will be included in the IS: 1) for supporting the collaborative development of learning
content, 2) to offer/gain access to multimedia information, 3) to personalize and adopt
content according to the needs, and 4) to use Social media for informal learning,
communication, encouragement of participation, etc. The IS will offer the possibility of
various types of operation: student-centered, lecturer-centered, administrator-centered, and
readers’ view. A prerequisite for the effective use of the IS will be the generalized support
of mobile devices, as well as interactive whiteboards and telepresence boards. The main
functional components of the integrated system are the following:
∞ Online real time component for supporting various types of teaching and learning: e-
learning, m-learning, distance learning, blended learning, lessons in the mainstream class
and in parallel classes
∞ Personalization of learning and adoption according to the needs e.g. support of the
design-4-all principles
∞ Multimedia, collaborative learning content creation and delivery
∞ Content quality control e.g. approval of new entries, handling of the material according
to the preferences of students Collaborative wikis and multimedia, collaborative
dictionaries of terminology dynamically related and linked to the learning content Social
networking for the encouragement and support of the inclusion

International Journal of Management, IT & Engineering Vol. 8 Issue 12(1), December 2018,
ISSN: 2249-0558 Impact Factor: 7.119
Journal Homepage: http://www.ijmra.us, Email: [email protected]
Double-Blind Peer Reviewed Refereed Open Access International Journal - Included in the International
Serial Directories Indexed & Listed at: Ulrich's Periodicals Directory ©, U.S.A., Open J-Gage as well as in
Cabell’s Directories of Publishing Opportunities, U.S.A
48 International Journal of Management, IT & Engineering
http://www.ijmra.us, Email: [email protected]
∞Events based dissemination of information related to the academic life
∞ Training of students, lecturers, technical and administrative staff
∞ Help desk
∞ Resources planning and allocation
∞ Volunteers’ database for supporting teaching and learning. Volunteers could be Note
takers, Sign Language interpreters, readers for blind students, etc.
UBIQUITOUS Computing Application Areas
Ubiquitous computing aims to permeate and interconnect all areas of life, and thus to
enable a ubiquitous flow of data, information, and – by integrating cognitive capabilities in
the future – even knowledge. Mark Weiser, one of the fathers of ubiquitous computing,
described this vision of a continual and ubiquitous exchange transcending the borders of
applications, media, and countries as “everything, always, everywhere.” This sketch offers
a strongly future-oriented perspective on ubiquitous computing that is still far removed
from today’s reality. Although wireless Internet access, email via mobile phone, handheld
computers and the like may give the impression that constant, unimpeded exchange of
information is already routine, in the future the special performance characteristics of
ubiquitous computing will enable an entirely new quality in the exchange and processing
of data, information and knowledge. With ubiquitous computing, many of these processes
will recede into the background, and most will occur partially or wholly automatically. But
this new form of ubiquitous computing will not develop uniformly and synchronously in
all economic and social areas. Rather, applications will be defined and implemented at
different speeds in different contexts. Nine application areas in which ubiquitous
computing is already recognizable and is very likely to play a decisive role in the future are
mentioned below.
Communications: as a cross-application, the communications area affects all forms of
exchange and transmission of data, information, and knowledge. Communications thus
represents a precondition for all information technology domains.
Logistics: tracking logistical goods along the entire transport chain of raw materials, semi-
finished articles, and finished products (including their eventual disposal) closes the gap in
IT control systems between the physical flow and the information flow. This offers
opportunities for optimizing and automating logistics that are already apparent today.
Ubiquitous Computing: Potentials and Challenges 1329
Motor traffic: automobiles already contain several assistance systems that support the
driver invisibly. Networking vehicles with each other and with surrounding telematics
systems is anticipated for the future.
Military: the military sector requires the provision of information on averting and fighting
external threats that is as close-meshed, multi-dimensional, and interrelated as possible.
This comprises the collection and processing of information. It also includes the
development of new weapons systems.
Production: in the smart factory, the flow and processing of components within
manufacturing are controlled by the components and by the processing and transport
stations themselves. Ubiquitous computing will facilitate a decentralized production
system that will independently configure, control and monitor itself.
Smart homes: in smart homes, a large number of home technology devices such as heating,
lighting, and ventilation and communication equipment become smart objects that
automatically adjust to the needs of the residents.

International Journal of Management, IT & Engineering Vol. 8 Issue 12(1), December 2018,
ISSN: 2249-0558 Impact Factor: 7.119
Journal Homepage: http://www.ijmra.us, Email: [email protected]
Double-Blind Peer Reviewed Refereed Open Access International Journal - Included in the International
Serial Directories Indexed & Listed at: Ulrich's Periodicals Directory ©, U.S.A., Open J-Gage as well as in
Cabell’s Directories of Publishing Opportunities, U.S.A
49 International Journal of Management, IT & Engineering
http://www.ijmra.us, Email: [email protected]
E-commerce: the smart objects of ubiquitous computing allow for new business models
with a variety of digital services to be implemented. These include location-based services,
a shift from selling products to renting them, and software agents that will instruct
components in ubiquitous computing to initiate and carry out services and business
transactions independently.
Inner security: identification systems, such as electronic passport and the already abundant
smart cards, are applications of ubiquitous computing in inner security. In the future,
monitoring systems will become increasingly important – for instance, in protecting the
environment or surveillance of key infrastructure such as airports and the power grid.
Medical technology: Increasingly autarkic, multifunctional, miniaturized and networked
medical applications in ubiquitous computing offer a wide range of possibilities for
monitoring the health of the ill and the elderly in their own homes, as well as for intelligent
implants.
References
[1] Weiser, M. (1991). The Computer for the 21st Century. Scientific American, 265(3), 94
– 104.
[2] Cook, D.J., & Das, S.K. (2012). Pervasive computing at scale: Transforming the state
of the art. Pervasive and Mobile Computing,
8(1), 22 – 35.
[3] Norris, C., & Soloway, E. (2008). Handhelds: Getting mobile. District Administration,
44(8), 20 – 24.
[4] Mellow, P. (2005). The media generation: Maximise learning by getting mobile.
Proceedings of the Annual Conference of the Australian Society for Computers in
Learning in Tertiary Education (ASCILITE 2005), Brisbane, Australia. Retrieved June 25,
2012,
[5]From http://www.ascilite.org.au/conferences/brisbane05/proceedings.shtml.
[6]International Civil Aviation Organization, PKI for machine readable travel documents
offering ICC read-only access, version1.1, 2004.
[7] T. Finke and H. Kelter, “Radio Frequency Identification- Abhormoglichkeiten der
Kommunikation zwischen Lesegerat und
[8]Transponder am Beispiel eines ISO 14443-System, Bundesamt fur Sicherheit in der
Informationstechnik, Internal Technical report.
International Journal of Management, IT & Engineering Vol. 8 Issue 12(1), December 2018,
ISSN: 2249-0558 Impact Factor: 7.119
Journal Homepage: http://www.ijmra.us, Email: [email protected]
Double-Blind Peer Reviewed Refereed Open Access International Journal - Included in the International
Serial Directories Indexed & Listed at: Ulrich's Periodicals Directory ©, U.S.A., Open J-Gage as well as in
Cabell’s Directories of Publishing Opportunities, U.S.A
50 International Journal of Management, IT & Engineering
http://www.ijmra.us, Email: [email protected]
Comparison and Analysis of the Path Loss Models Used In E
BAND Communication System for Mobile Wimax Topology
HOD Deepti rai
Jayshree sisodiya
Abstract
Fifth - generation cellular systems are likely to operate in or near the millimeter-wave (mm
Wave) frequency bands of 30–300 GHz, where vast spectrum currently exists with light
use. At these mm Wave frequencies, the wavelength is so small that highly directional,
steerable antennas may be used in novel ways.
This research work presents empirically-based large scale propagation path loss models for
fifth generation cellular network planning in the millimeter-wave spectrum based on real-
world data at 28 GHz and 38 GHz. The model in this paper allows future realistic
modeling of propagation conditions for millimeter wave transmission in urban
microcellular environments. This model also suggests that in future millimeter wave
communications, mobile devices shall deploy antennas with higher gains to compensate for
the additional path loss due to the frequency leap from low microwave to the millimeter
wave regime.
Keywords: loss models, SUI, ITU-R, mm wave communication, 5G system.
I. Introduction
Despite millimeter wave (mm Wave) technology has been known for many decades, the
mm Wave systems have mainly been deployed for military applications. With the advances
of process technologies and low –cost integration solutions, mm wave technology has
started to gain a great deal of momentum from academia, industry, and
standardization body. In a very broad term, mm Wave can be classified as electromagnetic
spectrum that spans between 30 GHz to 300 GHz, which corresponds to wavelengths from
10 mm to 1 mm [1]. In this paper, however, we will focus specifically on 60 GHz radio
(unless otherwise specified, the terms 60 GHz and mm Wave can be used
interchangeably), which has emerged as one of the most promising candidates for
multigigabit wireless indoor communication systems [2]. 60 GHz technology offers
various advantages over current or existing communications systems [3]. One of the
deciding factors that makes 60 GHz technology gaining significant interest recently is due
to the huge unlicensed bandwidth (up to 7 GHz) available worldwide. While this is
comparable to the unlicensed bandwidth allocated for ultra wideband (UWB) purposes [4],
60 GHz bandwidth is continuous and less restricted in terms of power limits. This is due to
the fact that UWB system is an overlay system and thus subject to very strict and different
regulations [5]. The large bandwidth at 60 GHz band is one of the largest unlicensed
bandwidths being allocated in history. This huge bandwidth represents high potentials in
terms of capacity and flexibility that makes 60 GHz technology particularly attractive for
gigabit wireless applications. Furthermore, 60 GHz regulation allows much higher transmit
Prof. Electronics & communication, Engineering Department, Alpine institute of technology, Ujjain (M.P) PG student Electronics & communication, Engineering Department , Alpine institute of technology, Ujjain (M.P)

International Journal of Management, IT & Engineering Vol. 8 Issue 12(1), December 2018,
ISSN: 2249-0558 Impact Factor: 7.119
Journal Homepage: http://www.ijmra.us, Email: [email protected]
Double-Blind Peer Reviewed Refereed Open Access International Journal - Included in the International
Serial Directories Indexed & Listed at: Ulrich's Periodicals Directory ©, U.S.A., Open J-Gage as well as in
Cabell’s Directories of Publishing Opportunities, U.S.A
51 International Journal of Management, IT & Engineering
http://www.ijmra.us, Email: [email protected]
power compared to other existing wireless local area networks (WLANs) and wireless
personal area networks (WPANs) systems.
The higher transmit power is necessary to overcome the higher path loss at 60 GHz. While
the high path loss seems to be disadvantage at 60 GHz, it however confines the 60 GHz
operation to within a room in an indoor environment. Hence, the effective interference
levels for 60 GHz are less severe than those systems located in the congested 2–2.5 GHz
and 5–5.8 GHz regions. In addition, higher frequency reuse can also be achieved per indoor
environment thus allowing a very high throughput network. The compact size of the 60
GHz radio also permits multiple antennas solutions at the user terminal that are otherwise
difficult, if not impossible, at lower frequencies. Comparing to 5 GHz system, the form
factor of mmWave systems is approximately 140 times smaller and can be conveniently
integrated into consumer electronic products.
II. SUI Path-Loss Model
The SUI model covers three terrain categories common around the United States. Category
A represents the maximum path-loss category which is a hilly terrain,
Table 1: SUI Model Parameters
Category B represents an intermediate path-loss category, and Category C represents the
minimum path-loss category with mostly flat terrains. The empical formulas for this
model were obtained based on experiments done in the Unites states [6].
The median path-loss for the SUI model can be generally written as
( ),/log10 oddAL += (1)
for d>do, where do=100m. The term A in the above equation is given by
( ) /4log20 odA =, where is the wavelength in m. The path-loss exponent is given
by
tt hcbha /+−=
(2)in which the parameters a ,b and c depend on the terrain category and are defined in the
table below.These parameters are obtained at 2GHz frequency and receive antenna height
of 2m. In order to use the model for other frequency and receive antenna heights, the
following correction terms can be used.
hf LLLL ++=
where
)2000/log(6 fL f =
and the receive antenna height correction term is given by
−
=CCategory /2),20log(h-
, Categories ),2/log(8.10
r
BAhL
r
h
where hr is the receive antenna height.
Model Parameters Terrain Type A Terrain Type B Terrain Type C
a 4.6 4 3.6
b 0.0075 0.0065 0.005
c 12.6 17.1 20

International Journal of Management, IT & Engineering Vol. 8 Issue 12(1), December 2018,
ISSN: 2249-0558 Impact Factor: 7.119
Journal Homepage: http://www.ijmra.us, Email: [email protected]
Double-Blind Peer Reviewed Refereed Open Access International Journal - Included in the International
Serial Directories Indexed & Listed at: Ulrich's Periodicals Directory ©, U.S.A., Open J-Gage as well as in
Cabell’s Directories of Publishing Opportunities, U.S.A
52 International Journal of Management, IT & Engineering
http://www.ijmra.us, Email: [email protected]
III COST-231 Hata-Okumura Model
An extension to the Hata model described above is the COST-231 Hata model [1]. This
model is designed to be used in the frequency band from 500 MHz to 2000MHz. As the
Hata Model, the COST-231 is restricted to cell radius greater than 1 km and may not be
suitable for cells on the order of 1km radius.
PLCOST −231 = 46 3. + 33 9. log10 ( f c ) −13 82. log10 (hb ) − a(hm ) + 44( 9. − 55.6
log10 (hb ))log10 R + cm
For a large city the correction factor a(hm) is used below.
a(hm ) = 2.3 (log10 11 75. hm ) 2 − 97.4 f c > 400MHz
For suburban or rural areas the correction factor a(hm) is used in the equation below.
a(hm ) = 1.1( log10 f c − )7.0 hm − 56.1( log10 f c − )
As noted the a(hm) correction factors are the same for both the original Hata model as well
as the COST-231.
IV Results
In this particular work we have prepared a matlab graphical user interface which would
allow us to evaluate the 5g communication system in more detail as well as under various
scenarios such as
1. Terrain type
2. Size of antenna
1. Distance between nodes
The prepared GUI allows us to dynamically change the pattern and parameters for 5G
communication systems and thus will allow us to evaluate the two models in more detail.
GUI model prepared in matlab:-
The above graphical user interface gets the data from the user and then plots the path loss
for that particular models. The results can be summarized in tabular form as below:-
Table 2:- comparison of SUI and ITU-R model
Frequency
MS
Antenna
Height
BS
Antenna
height
Distance Topography Path loss
in SUI
Path
loss in
ITU-R
2 GHz 1m 30m 10km Small to
medium 92.2dB 71.3 dB
2 GHz 1m 30m 10km Large city 93.04dB 75.12
dB
2 GHz 1m 30m 10km Sub urban
area 84.24dB 71.3 dB
2 GHz 1m 30m 10km Open rural
area 56.4dB -------

International Journal of Management, IT & Engineering Vol. 8 Issue 12(1), December 2018,
ISSN: 2249-0558 Impact Factor: 7.119
Journal Homepage: http://www.ijmra.us, Email: [email protected]
Double-Blind Peer Reviewed Refereed Open Access International Journal - Included in the International
Serial Directories Indexed & Listed at: Ulrich's Periodicals Directory ©, U.S.A., Open J-Gage as well as in
Cabell’s Directories of Publishing Opportunities, U.S.A
53 International Journal of Management, IT & Engineering
http://www.ijmra.us, Email: [email protected]
Thus based on above results it can be seen hat ITU-R model offers lower path loss at the
above parameters.
IV. Conclusion
The E-band has opened up new potentials and challenges for providing affordable and
reliable Gigabit per second wireless point-to point links.
The popularity of multimedia applications and broadband internet has created an ever
increasing demand for achieving higher throughputs in cellular and wireless networks .Due
to the higher carrier frequencies; the antennas are more directional, making E-band
systems mainly suitable for line-of-sight (LOS) applications.
Rain and obstacles more severely attenuate radio signals in the E-band. Consequently, with
the same transmit power and link availability requirements, E-band wireless links can
operate over shorter distances when compared to microwave systems. The model in this
paper allows future realistic modeling of propagation conditions for millimeter wave
transmission in urban microcellular environments. This model also suggests that in future
millimeter wave communications, mobile devices shall deploy antennas with higher gains
to compensate for the additional path loss due to the frequency leap from low microwave
to the millimeter wave regime.
V. References
[1] C.-L. I, C. Rowell, S. Han, Z. Xu, G. Li, and Z. Pan, “Towards green & soft: A 5G
perspective,” IEEE Commun. Mag., vol. 52, no. 2, pp. 66–73, Feb. 2014.
[2] M. Duarte and A. Sabharwal, “Full-duplex wireless communications using off-the-shelf
radios: Feasibility and first results,” in Proc. IEEE Asilomar Conference on Signals,
Systems and Computers, Nov. 2010, pp. 1558–1562.
[3] M. Jain, J. I. Choi, D. Bharadia, S. Seth, K. Srinivasan, P. Levis, S. Katti, and P. Sinha,
“Practical, real-time, full duplex wireless,” in Proc. ACM17th Annual International
Conference on Mobile Computing and Networking (MobiCom), Aug. 2011, pp. 301–312.
[4] E. Aryafar, M. A. Khojastepour, K. Sundaresan, S. Rangarajan, and M. Chiang, “Midu:
Enabling MIMO full duplex,” in Proc. ACM 18th Annual International Conference on
Mobile Computing and Networking (Mobicom), Aug. 2012, pp. 257–268.
[5] Y. Hua, P. Liang, Y. Ma, A. C. Cirik, and Q. Gao, “A method for broadband full-
duplex MIMO radio,” IEEE Signal Process. Lett., vol. 19, no. 12, pp. 793–796, Dec. 2012.
[6] B. Yin, M. Wu, C. Studer, J. R. Cavallaro, and J. Lilleberg, “Full-duplex in large-scale
wireless systems,” in Proc. IEEE Asilomar Conference on Signals, Systems and
Computers, Nov. 2013, pp. 1623–1627.
[7] M. E. Knox, “Single antenna full duplex communications using a common carrier,” in
Proc. IEEE Wireless and Microwave Technology Conference (WAMICON), Apr. 2012, pp.
1–6.
[8] B. P. Day, A. R. Margetts, D. W. Bliss, and P. Schniter, “Full-duplex bidirectional
MIMO: Achievable rates under limited dynamic range,” IEEE Trans. Signal Process., vol.
60, no. 7, pp. 3702–3713, Jul. 2012.
[9] C. M. R. Institute, C-RAN: The road towards green RAN. [Online]. Available:
labs.chinamobile.com/cran, Oct. 2011.
[10] O. Simeone, E. Erkip, and S. Shamai, “Full-duplex cloud radio access networks: An
information-theoretic viewpoint,” IEEE Wireless Commun. Lett., vol. 3, no. 4, pp. 413–
416, Aug. 2014.

International Journal of Management, IT & Engineering Vol. 8 Issue 12(1), December 2018,
ISSN: 2249-0558 Impact Factor: 7.119
Journal Homepage: http://www.ijmra.us, Email: [email protected]
Double-Blind Peer Reviewed Refereed Open Access International Journal - Included in the International
Serial Directories Indexed & Listed at: Ulrich's Periodicals Directory ©, U.S.A., Open J-Gage as well as in
Cabell’s Directories of Publishing Opportunities, U.S.A
54 International Journal of Management, IT & Engineering
http://www.ijmra.us, Email: [email protected]
[11]System scenarios and technical requirements for Full-Duplex concept. DUPLO
Deliverable D1.1, April 30 2013.
[12] A. Sahai, S. Diggavi, and A. Sabharwal, “On uplink/downlink fullduplex networks,”
in Proc. IEEE Asilomar Conference on Signals, Systems and Computers, Nov. 2013, pp.
14–18.
[13] S. Goyal, P. Liu, S. Hua, , and S. Panwar, “Analyzing a full-duplex cellular system,”
in Proc. 47th IEEE Annual Conference on Information Sciences and Systems (CISS), Mar.
2013, pp. 1–6.
[14] D. Nguyen, L.-N. Tran, P. Pirinen, and M. Latva-aho, “On the spectral efficiency of
full-duplex small cell wireless systems,” IEEE Trans. Wireless Commun., vol. 13, no. 9,
pp. 4896–4910, Sep. 2014.
[15] G. Y. Li, Z. Xu, C. Xiong, C. Yang, S. Zhang, Y. Chen, and S. Xu, “Energy-efficient
wireless communications: Tutorial, survey, and open issues,” IEEE Wireless Commun.,
vol. 18, no. 6, pp. 28–35, Dec. 2014.

International Journal of Management, IT & Engineering Vol. 8 Issue 12(1), December 2018,
ISSN: 2249-0558 Impact Factor: 7.119
Journal Homepage: http://www.ijmra.us, Email: [email protected]
Double-Blind Peer Reviewed Refereed Open Access International Journal - Included in the International
Serial Directories Indexed & Listed at: Ulrich's Periodicals Directory ©, U.S.A., Open J-Gage as well as in
Cabell’s Directories of Publishing Opportunities, U.S.A
55 International Journal of Management, IT & Engineering
http://www.ijmra.us, Email: [email protected]
A Study on Problems Faced By Workers in Cashewnut Units in
Kurinjipadi Block of Cuddalore District
C. SHANMUGASUNDARAM
Dr. T. SEZHIYAN
Abstract
Present India is the largest (3rd place) producer and processor of cashews in the world. The
export value of cashew nut in during the year (2016-17), 96346 million tonnes. Cuddalore
district is one of the large cashew nut unit located region in Tamil Nadu. The cashew
industries create a livelihood for about 1.75 lakhs of employees and farmers in Tamil
Nadu. The Cuddalore district alone more than 40,000 employees directly involved in the
industry. The women workers are played a vital role in these industries. It is a fact that
cashew industry utilizing by the women worker directly and giving important for
employment opportunities to women in this sector. At the same time, the workers are faced
several problems like physically and mentally in this industries. But the government and
owners are not taking any proper action in these issues. The cashew nut processing
industries one of the prominent sector producing valuable food commodity to exported
Gulf Countries, European and Western countries. This paper deals with labours problems
faced by the cashew nut industries in Kurinjipadi block of Cuddalore district.
Keywords: Livelihood, Processing, Valuable Food Commodity.
Introduction
Cashew (Anacardium Occidentale), often referred to as ‘wonder nut’, is one of the most
valuable processed nuts traded in the global commodity markets and is also an important
cash crop. It has the potential to provide a source of livelihood for the cashew growers and
rural peoples, empowering rural women, create employment opportunities and generate
foreign exchange through exports. The cashew tree is believed to be a native of Brazil,
from where it has dispersed to different parts of the world primarily for soil conservation,
forestation, and wasteland development. The term ‘Cashew’ has originated from the
Brazilian name ‘acajaiba’ and the Tupi name ‘acaju’, which the Portuguese converted
into ‘caju’ and is commonly known as ‘kaju’ in India. It is known as ‘Paragi Andi’ in
Kerala meaning foreign nut, ‘Lanka Beeja’ in Orissa assuming its introduction from Sri
Lanka, and ‘Mundiri’ indicating the shape of the nut in Tamil Nadu.
Review of Literature
Atul methodet. al (2011) in their study entitled “cashew nut processing: sources of
environmental pollution and standards” India is the largest producer, processor, exporter
and second largest consumer of cashew in the world with annual production of 6,20,000
MT (Anon 2007). India processed about 1.18 million MT of raw cashew seeds through
3650 cashew processing industries scattered in many states of the country provided
employment to over 0.5 million people, 95% of these are women (Nair, 1995). The cashew
industries in India employed different unit operations/ methodology for processing depend
Ph.D ResearchScholar, Department of Economics, Annamalai University, Annamalai Nagar 608002 Supervisor, Department of Economics, Annamalai University, Deputed to D.G.Govt.Arts College (W), Mayiladuthurai

International Journal of Management, IT & Engineering Vol. 8 Issue 12(1), December 2018,
ISSN: 2249-0558 Impact Factor: 7.119
Journal Homepage: http://www.ijmra.us, Email: [email protected]
Double-Blind Peer Reviewed Refereed Open Access International Journal - Included in the International
Serial Directories Indexed & Listed at: Ulrich's Periodicals Directory ©, U.S.A., Open J-Gage as well as in
Cabell’s Directories of Publishing Opportunities, U.S.A
56 International Journal of Management, IT & Engineering
http://www.ijmra.us, Email: [email protected]
on a variety of raw material, location, technological mechanization and availability of
secured energy supply. There are two commonly followed methods of cashew nut
processing, viz. Roasting process and steam (roasting) cooking process. Due to lack of
skilled man power for the cutting process of cooked nut and difference in the taste of nut,
many of the industries in India are following the roasting process. In the cashew nut
roasting process, thick black smoke is released from the rotating roasting drum through the
stack. The smoke, when it reaches the ground, has irritating order and is a public nuisance
in the neighborhood. Borma heater is also a source of air pollution. Wastewater is
generated from the quenching operation of the roasted cashew nut discharged. Cooking
process also discharges wastewater from the steam cooker and emits air pollutants by baby
boiler for steam generation and Borma heater. The sources of different pollution and
Hazards have been discussed in this article.
S. K. Nag et. al (2014) in his article “effect of entrepreneurship development through
cashew processing on the socio-economic status of villagers, improvement of livelihood
security through the sustainable integrated farming system”. In his article analyzed the
main problems of cashew nut industries workers and major hazards. The main problem
faced by the workers is how to use or women in the roasting process, steam cooking
process and Borma over section. He analyzed the training and method given by the owners
of these industries is also discussed in this article. The main aim of this paper is discussed
the main problem regarding roasting, steaming and cooking process and Borma over
section.
Statement of the Problem
Basically, cashew nut industries faced three types of problems (i.e.) 1. Availabilities of raw
cashew nut from farmer’s side, 2. Processing industry has some problems within the
factory in production level, 3. The workers facing problems with the cashew industries.
The cashew plantain generally planted in waste land for purpose of soil erosion,
aforestation, and increasing rural employment opportunities. For the natural clematis like
storm, cyclone, heavy rain and monsoon failure, the cashew farmers faced several
problems. The cashew nut processing industry faced labour problem, investment problem,
availability of cashew problem and so on. The labours faced several problems such as
mechanical hazard, physical hazards, chemical hazards, environmental hazards, and very
particularly psychological hazards. In Cuddalore district, cashew nut processing industry
falls under the small-scale industry. The nature of small and cottages industry is well
known the conditions and problems. In this study, the research issues are (i)What are the
problems faced the cashew industries owners, (ii) What are the problems faced by the
labours in working place and (iii) What is the problem faced by the cashew farmers in the
Cuddalore district. Base the research issues the researcher take only, the labour problem
faced by the workers in the cashew industries.
The labours mainly faced problemslike first aid, restroom, toilet facilities, hospital
expenses and etc. The researcher analyzed only the basic problem faced by the workers in
the study area in Kurinjipadi block of Cuddalore district.
Methodology
The present study is based on the primary data and it will be collected from the selected
villages namely Puliyure and Samattikuppam in Kurinjipadi block of Cuddalore district.
The primary data will be collected using though structured interview schedule. The simple
random sampling method was adopted and totally 120 respondents were selected from the

International Journal of Management, IT & Engineering Vol. 8 Issue 12(1), December 2018,
ISSN: 2249-0558 Impact Factor: 7.119
Journal Homepage: http://www.ijmra.us, Email: [email protected]
Double-Blind Peer Reviewed Refereed Open Access International Journal - Included in the International
Serial Directories Indexed & Listed at: Ulrich's Periodicals Directory ©, U.S.A., Open J-Gage as well as in
Cabell’s Directories of Publishing Opportunities, U.S.A
57 International Journal of Management, IT & Engineering
http://www.ijmra.us, Email: [email protected]
two villages. The simple percentage analyses were employed in this study. The 60 sample
from each village were selected randomly. The period of the study is one year (ie) May
2017 to April 2018.
Objectives
1. To analyze the problems faced by the cashew workers in Kurinjipadi block.
2. To identify the occupational hazards faced by the cashew industry workers in
Kurinjipadi block
Limitation
The workers of cashew units from selected villages only taken into account, noother
industry are included in their study.
The problems faced by the workers in these industries are only taken for the analysis.
Result and Discussion
Based on the selection of village and sample respondents the analyses were made. The
objectives based analysis reflects the result in this part as below.
Table-1: Classification of the respondents according to the selection of villages in the
study area
S.No Kurinjipadi Block No of
Respondents Percentage
1. Puliyure 60 50.0
2. Samattikuppam 60 50.0
Total 120 100.0
Source: Computed
Table-1 discusses the selection of villages and respondents in the study area of Kurinjipadi
block in Cuddalore district. More than 6 blocks farmer’s cultivator cashew nut among the
13 blocks in Cuddalore district. The 4 blocks were cultivator cashew in large areas, namely
Panruti, Annagaramam, Cuddalore, and Kurinjipadi. Among the four blocks, the researcher
selected only Kurinjipadi block.
The researcher selected 60 respondents in each village and in total 120 respondents from
two villages in Kurinjipadi blocks, namely Puliyure and Samattikuppam. The selection of
village made by running of the cashew units in the villages. Respondents were selected
based the dependents on the cashew units running the study area.
Table-2: Social Status Classification of the Respondents in the Study Area
Sl.No Category No of
Respondents Percentage
Age
1. Below-25 years 21 17.5
2. 26-35 years 42 35.0
3. 36-45 years 34 28.3
4. Above-45 years 23 19.2
Total 120 100.0
Gender
1. Male 21 17.5
2. Female 99 82.5
Total 120 100.0
Community
1. OC 13 10.8

International Journal of Management, IT & Engineering Vol. 8 Issue 12(1), December 2018,
ISSN: 2249-0558 Impact Factor: 7.119
Journal Homepage: http://www.ijmra.us, Email: [email protected]
Double-Blind Peer Reviewed Refereed Open Access International Journal - Included in the International
Serial Directories Indexed & Listed at: Ulrich's Periodicals Directory ©, U.S.A., Open J-Gage as well as in
Cabell’s Directories of Publishing Opportunities, U.S.A
58 International Journal of Management, IT & Engineering
http://www.ijmra.us, Email: [email protected]
2. BC 48 40.0
3. MBC 52 43.3
4. SC/ST 7 5.8
Total 120 100.0
Educational
qualification
1. Illiterate 32 26.6
2. Primary Education 51 42.5
3. Secondary Education 23 19.2
4. Diploma and ITI 6 5.0
5. Under Graduation 5 4.2
6. Post Graduation 3 2.5
Total 120 100.0
Occupation
1. Agriculturist 50 41.6
2. Non -Agri labour 47 39.1
3. Daily Wages 19 15.8
4. Private employee 3 2.5
Total 120 100.0
Source: Computed
Table-2 discusses the respondent’s social status in the study villages. The table highlights
the general categories of age, gender, community, educational qualification, and
occupation of the respondents. Regarding age, the researcher grouped 4 categories,
according to the respondent's age. Of the surveyed sample 35 percent in records as the age
group of 26 to 35 years, in the age group of 36 to 45, 28.3 percent is recorded and above 45
years of age group were 19.2 percent are recorded. The remaining 17.5 percent of the
respondents fall under below 25 years of age group. From the table, it is raveled that, the
age group of 26-35 years workers is recorded as the highest percentage in the study
villages.
Regarding gender, category 82.5 percent of the respondents are registered under the female
categories the remaining 17.5 percentis registered under the male categories. Of the total
sample survey, the cashew industry gives the preference to the male categories for their all
work. The male respondents are employed only for supervising, loading unloading, and
boiling section.
Recording to community category the researcher grouped 4 categories, such as OC, BC,
MBC, SC/ST as such, in the 4 categories, Most Backward Class (MBC) and Backward
Class (BC), are regarded high level of employment in the cashew units of all the villages
in Kurinjipadi block of Cuddalore district. The 43.3 percent of the respondents are
registered Most Backward Class (MBC) and 40 percentare registered Backward Class
(BC) in the cashew unit of the study area. The reason behind a large number of workers
among the two categories of the study area is more than 65 percent of respondents belong
to this two type of categories. Among the cashew units in the region more than 60 percent
of micro-units run by MBC and BC community in the study region. Therefore these two
categories of respondents played a vital role in the study region.

International Journal of Management, IT & Engineering Vol. 8 Issue 12(1), December 2018,
ISSN: 2249-0558 Impact Factor: 7.119
Journal Homepage: http://www.ijmra.us, Email: [email protected]
Double-Blind Peer Reviewed Refereed Open Access International Journal - Included in the International
Serial Directories Indexed & Listed at: Ulrich's Periodicals Directory ©, U.S.A., Open J-Gage as well as in
Cabell’s Directories of Publishing Opportunities, U.S.A
59 International Journal of Management, IT & Engineering
http://www.ijmra.us, Email: [email protected]
Regarding the educational qualification of the respondents in the study, region is classified
into six categories. Of the total respondents, 42.5 percent are register under the category of
primary education and 26.6 percent of the respondents are registered in the category of
illiterate. The 19.2 percent of the respondents were registered under the secondary
education category. The 5 percent, 4.2 percent and 2.5 percent of respondents are
registered under the Diploma/ITI, UG and PG category of education respectively in the
study region. Of the total sample, respondents 89 percent of the respondents are recorded
as bellow secondary level of education category. From this table, it is observed that the
education level is a lower level in the study region. Only 11 percent of the respondents are
having diploma and degree level of education in the study area.
From table 4, the occupational respondents are analyzed and categorized by 4 groups
according to their nature of employment. Of the total surveyed sample 41.6 percent are
recorded as an agriculturist category, the 39.1 percent of the respondents are registered
under the category of non-agriculture labor in the study region. The 15.8 percent of the
respondents are registered the daily wages category and 2.5 percent of the respondents are
registered under private employ category in the study region of the Cuddalore district.
From the table, it is clearly identified that 80.7 percent of the respondents are fallen under
the agriculturist and non-agriculture labour categories. Because of the study region mostly
covered agriculture and allied activities. Hence, most of the respondents are belongs to the
agriculturist and non-agriculturist categories.
Table-3: Analyzing the Respondents According to their FamilyStatus in the Study
Region
S.No Marital Status No of
Respondents Percentage
1. Married 93 77.5
2. Unmarried 23 19.2
3. Widow 4 3.3
Total 120 100.0
Size of family
1. Small 70 58.3
2. Medium 36 30.0
3. Large 14 11.7
Total 120 100.0
Type of family
1. Nuclear 80 66.7
2. Joint 40 33.3
Total 120 100.0
Source: Computed
Table-3 explains the respondent family status of the study region in Kurinjipadi block of
Cuddalore district. The researcher is classified the respondents family status namely
marital status, family size and family type in the study region. Regarding the respondents
marital status, it again grouped into three categories namely as married, unmarried and
widow/separator. Of the total surveyed sample size, 77.5 percent of the respondent is
registered under the category of the married category, 19.2 percent of the respondents are

International Journal of Management, IT & Engineering Vol. 8 Issue 12(1), December 2018,
ISSN: 2249-0558 Impact Factor: 7.119
Journal Homepage: http://www.ijmra.us, Email: [email protected]
Double-Blind Peer Reviewed Refereed Open Access International Journal - Included in the International
Serial Directories Indexed & Listed at: Ulrich's Periodicals Directory ©, U.S.A., Open J-Gage as well as in
Cabell’s Directories of Publishing Opportunities, U.S.A
60 International Journal of Management, IT & Engineering
http://www.ijmra.us, Email: [email protected]
register in the unmarried category and only 3.3 percent of the respondents are recorded as
widow/ separator category in the study are region.
Regarding the family size of the respondents 58.3 percentbelongs to the small family, 30
percentbelongs to the medium family and 11.7 percent of the respondents are belongs to
the large family size in the study area. Regarding the type of family, 66.7 percent of the
respondents belong to the nuclear family and 33.3 percent of the respondents are belongs
to the joint family system in the study area.
In the study region, most of the people want to live individually. Therefore, in the study
region, the nuclear family systems are higher.
Table-4: Classification of the Respondents under the Division of Work in Cashew
Unit
S.No Division of work No of respondents Percentage
1. Cutting, Shelling and Peeling 60 50.0
2. Steaming, Grading and Drying 37 30.8
3. Roasting and Packing 16 13.3
4. Supervising 2 1.7
5. Loading and Unloading 4 3.3
6. Office work 1 0.8
Total 120 100.0
Source: Computed
Table-4 discus the nature of work rendered by the respondents and division which they
work in cashew unit in the study region. The researcher identified the various types of
process undergone in the cashew unit and all industrialist followed similar types of the
section in the cashew industry in the study region. The researcher classified all the division
in to six groups, such as (i) Cutting, shelling and peeling groups, (ii)Steaming, grading and
drying another category (iii) Roasting and packing on another division, (iv) Loading and
unloading on other division, (v) Supervising, and (vi) other office work. The 50 percent of
the respondents are recorded in the first division of work in the cashew unit, 30.8 percent
of the respondents are recorded as second division of cashew unit such as steaming,
grading and drying, 13.3 percent of the respondents are recorded the third group off in the
cashew unit such as roasting and backing, 1.7 percent of the respondents are recorded
fourth division of supervising. 3.3 percent of the respondents are recorded as loading,
unloading, and cleaning work division in the cashew unit. Only 0.8 percent of the
respondents have recorded the office work division of the cashew unit. Form the table it is
clearly identified that 50 percent of the respondents are engaged in the cutting, shelling and
peeling division of work in the cashew industry in the study region. Remaining 50 percent
of the respondents are engaged in other category division of work in the cashew industry
the study region.

International Journal of Management, IT & Engineering Vol. 8 Issue 12(1), December 2018,
ISSN: 2249-0558 Impact Factor: 7.119
Journal Homepage: http://www.ijmra.us, Email: [email protected]
Double-Blind Peer Reviewed Refereed Open Access International Journal - Included in the International
Serial Directories Indexed & Listed at: Ulrich's Periodicals Directory ©, U.S.A., Open J-Gage as well as in
Cabell’s Directories of Publishing Opportunities, U.S.A
61 International Journal of Management, IT & Engineering
http://www.ijmra.us, Email: [email protected]
Table-5: Classification of the Respondents Faced by the Occupational Hazards
and Problems
S.No Occupational Hazards
and Problems No of Respondents Percentage
1. Mechanical Hazards
Back pain problem 26 21.7
Cut and wounds 12 10.0
Minor accidents 8 6.7
Total 46 38.4
2. Environmental Hazards
Skin diseases 19 15.8
Asthma problems 14 11.7
Respiratory problems 11 9.2
Total 44 36.7
3. Chemical Hazards
Shell oil fire accident 4 3.3
Eyes affect 3 2.5
Total 7 5.8
4. Physical Hazards
Menstrual problems 10 8.3
Hemorrhoids 3 2.5
Miscarriage 2 1.7
Total 15 12.5
5. Psychological Hazards
Long working hours 5 4.2
Mental stress 3 2.5
Total 8 6.7
Grand Total 120 100.0
Source: Computed
Table-5 discusses the occupational hazards and problems faced by the respondents in the
cashew units of the study region. The hazards are classified as five categories such as
mechanical hazards, environmental hazards, chemical hazards, physical hazards, and
psychological hazards as such cashew units. The cashew unit’s workers faced the above-
said hazards frequently in the study region. 38.4 percent of the respondents are recorded as
facing by the mechanical hazards in the cashew units, 36.7 percent of the respondents
faced environmental hazards, 12.5 percent of the respondents are recorded as physical
hazards problems. The 5.8 percent and 6.7 percent of the respondents are faced with
chemical hazards and psychological hazards in the cashew industry respectively.
All the workers in the cashew industry of the study region they faced the occupational
hazards each and every day in the study region. At the same time, the respondents are
doing bother about the hazards faced in the cashew industry.
The people works of the cashew industry in the study region are very careless/awareness
about the occupational hazards. They are taking very simple issues and continue to then
work in the cashew units. Therefore the reason it’s aware of the fetcher life and the
problems created by the occupational hazards in the study region.

International Journal of Management, IT & Engineering Vol. 8 Issue 12(1), December 2018,
ISSN: 2249-0558 Impact Factor: 7.119
Journal Homepage: http://www.ijmra.us, Email: [email protected]
Double-Blind Peer Reviewed Refereed Open Access International Journal - Included in the International
Serial Directories Indexed & Listed at: Ulrich's Periodicals Directory ©, U.S.A., Open J-Gage as well as in
Cabell’s Directories of Publishing Opportunities, U.S.A
62 International Journal of Management, IT & Engineering
http://www.ijmra.us, Email: [email protected]
Table-6: Classification of the Respondents by Taking Treatment for their Health
Problems
S.No A place for taking
treatment No of Respondents Percentage
1. Primary Health Centre 32 26.7
2. Government Hospital 84 70.0
3. Private Hospital 4 3.3
Total 120 100.0
Source: Computed
Table 6 highlights the place for taking treatment of their health problem faced by the
hazards in the cashew units. The cashew industry workers have undergone the treatment
through various type of health center of their health problems. The researcher identified
that and places of treatment undergone by the respondents and classified three categories
as (i) primary health center,(ii)government hospital and (iii) private hospital.
The 70 percent of the respondents are recorded to take the treatment for the health problem
by the occupational hazards in the government hospital in the study region. The 26.7
percent of the respondents areundergone the treatment of their health problems from the
primary health center in the rural areas of the study region. And only 3.3 percent of the
respondents are gone through private hospitals for their health problem in and around the
study region.
From the table, it is identified nearly 70 percent of the respondents isundergone the
treatment for their health problem for the government hospital.
Table-7: Classification of the Respondents by their Treatment Expenditure Per
Annum
S.No Treatment Expenditure No of Respondents Percentage
1. Below Rs.20000 60 50.0
2. Rs 20001 to Rs 30000 40 33.3
3. Rs 30001 to Rs 40000 14 11.7
4. Above Rs 40000 6 5.0
Total 120 100.0
Source: Computed
Table-7 brings out the treatment expenditure level of the respondents for their health
problem in the study region. The researcher classified the treatment expenditure of the
respondents into four categories namely, (i) Below- Rs.20,000 (ii) Rs.20,001- Rs. 30,000.
(iii) Rs.30,001- Rs.40,000 and above Rs.40,000.in the study region.
The 50 percent of the respondents are recorded as the treatment expenditure of below-
Rs.20,000 per annum, 33.3 percent of the respondents have recorded their treatment
expenditure of Rs.20,001- Rs.30,000 in the study region. The 11.7 percent and 5.0 percent
of the respondents were recorded of their treatment expenditure of Rs.30,001- Rs.40,000
and above Rs.40,000 per annum respectively.
From the table.7, it is revealed thatnearly 50 percent of the respondents is recorded below
Rs.20,000 of their treatment expenditure per annum. Only 5 percent of the respondents has
recorded the highest treatment expenditure level of above Rs.40,000 per annum in the
study area.

International Journal of Management, IT & Engineering Vol. 8 Issue 12(1), December 2018,
ISSN: 2249-0558 Impact Factor: 7.119
Journal Homepage: http://www.ijmra.us, Email: [email protected]
Double-Blind Peer Reviewed Refereed Open Access International Journal - Included in the International
Serial Directories Indexed & Listed at: Ulrich's Periodicals Directory ©, U.S.A., Open J-Gage as well as in
Cabell’s Directories of Publishing Opportunities, U.S.A
63 International Journal of Management, IT & Engineering
http://www.ijmra.us, Email: [email protected]
Table-8: Classification of the Respondents about Treatment Expenditure
Compensation given by the Cashew Unit in the Study Area
S. No Category No of Respondents
Total Yes No
1. One part (25 per cent) 11
(9.2)
0
(0.0)
11
(9.2)
2. Some Amount (20 per cent) 14
(11.7)
0
(0.0)
14
(11.7)
3. No Compensation (0 per cent) 0
(0.0)
95
(79.2)
95
(79.2)
Total 25
(21.3)
95
(78.7)
120
(100.0)
Source: Computed
Table.8 brings out treatment expenditure and compensation given by the cashew units to
the respondents in the study region. The researcher identified treatment expenditure and
compensation is given by the cashew units in the study area and their compensation are
classified into three categories. The one part (25 percent), some amount (below-20 percent)
of the total treatment expenditure and no compensation given by the owner of cashew
industries in the study region. The workplace accident is unavailable and some type of
hazards namely environment, chemical, psychological hazards are also unavoidable. Hence
the medical expenses incurred to the respondents and workers in the cashew industries are
common issues in the study area.
From the above table, it is clearly identified the compensation given by the cashew units
are examined 79.2 percent of the respondents are opined the cashew unit management will
not give any type of compensation for their occupational hazards medical expenses in the
study region. On the other hand, 11.7 percent of the respondent’s givetheirs varies the
management of cashew units give some amount (below-20 percent) of the total medical
expenditure to the respondents in the study area of Cuddalore district. The 9.2 percent of
the respondents opined that one part (25 percent) of the total medical treatment expenditure
of the respondents in the study area.
From the table, it is clearly understood that more than 79.2 percent of the respondents view
the cashew industries management/owner are should not give any compensation of the
accident, illness and health problems caused by the cashew industry to the workers in the
entire study area of Cuddalore district.
Findings
1. The 63.3 percent of the respondents are fallen under the age group of 26-45 years
2. The 82.5 percent of the respondent belongs to the female workers and 17.5 percent of
respondents are male workers in the study area.
3. Mostly 42.5 percent of the respondents are recorded as primary education level.
4. The 41.6 percent of the respondent occupation is recorded as agriculture-based
activities in the study region.
5. The 77.5 percent of the respondents is recorded as married categories in the study
region.
6. More than 50 percent of the respondents worked in the division of Cutting, Shelling
and Peeling section are recorded in the study region.

International Journal of Management, IT & Engineering Vol. 8 Issue 12(1), December 2018,
ISSN: 2249-0558 Impact Factor: 7.119
Journal Homepage: http://www.ijmra.us, Email: [email protected]
Double-Blind Peer Reviewed Refereed Open Access International Journal - Included in the International
Serial Directories Indexed & Listed at: Ulrich's Periodicals Directory ©, U.S.A., Open J-Gage as well as in
Cabell’s Directories of Publishing Opportunities, U.S.A
64 International Journal of Management, IT & Engineering
http://www.ijmra.us, Email: [email protected]
7. The 38.4 percent of the respondents are recorded as facing by the mechanical hazards
in the cashew units, and 36.7 percent of the respondents faced environmental hazards
in the study region.
8. The 70 percent of the respondent’s areundergone the treatment for their health problem
for the government hospital.
9. Mostly 50 percent of the respondents are recorded as the treatment expenditure of
below- Rs.20,000 per annum in the study region.
10. The 79.2 percent of the respondents view the cashew industry management/owner are
should not give any compensation of accident, illness and health problems caused by
the cashew industry to the workers in the study area.
Suggestion
Based on the analysis and findings of the study, the following suggestions were made.
1. Most of the workers in cashew units are female workers and they come from
surrounding villages with a low level of educational background. They are unaware of
the hazards. Therefore the management gives the proper training and provides the
safeguard equipment to them further safety.
2. The industrial accidents are unavertable. Therefore the management should give
compensation and medical expenditure to the workers.
3. The present day health expenditure (or) medical expenditure is very high. Hence. The
management or owners of cashew industries rise up their wages/salary to some extent
to meet out their expenses.
4. In the study region, some industries not provided the safety equipment to the workers
were working in cutting, boiling and cooking section. Therefore the health department
should Mumford these industries and maintained the work safety in for the employers.
5. The management of cashew nut industries should come forward to provide the
minimum or basic activities to the employers in the industrial premises.
Conclusion
In general, it is found that there is unanimity as regard to origin and history of cashew
plant. It is one of the oldest fruits used from 500 years in India. Cashew has a wide range
of its importance. Being tropical fruit, cashew was introduced in the Malabar Coast
considering as a wasteland crop grown for aforestation and soil conservation of the hilly
area. At present, it is cultivated along east-west coast and in some interior part of India.
However, on the commercial base, it is grown at selected locations all over India. Based on
the study, the cashew industries in one of high revenue earned industry in India. Hence,
that the industrialist and government should give important and improve the level of the
industries, industries workers and farmers. The study on problems faced by workers in
cashew nut units in Kurinjipadi block of Cuddalore district brings out the standard of living
of cashew industry workers, working condition and Problems faced by the cashew industry
workers. The rising cost of living compels the workers to take up the job. Particularly
women workers are facing a lot of problems in their working environment. Their
socioeconomic conditions will be improved only if adequate measures are taken to
overcome their problems. The state and central government can formulate many policies to
increase the welfare of the workers. This study helps to suggest increasing the
socioeconomic conditions of women workers of cashew industries.

International Journal of Management, IT & Engineering Vol. 8 Issue 12(1), December 2018,
ISSN: 2249-0558 Impact Factor: 7.119
Journal Homepage: http://www.ijmra.us, Email: [email protected]
Double-Blind Peer Reviewed Refereed Open Access International Journal - Included in the International
Serial Directories Indexed & Listed at: Ulrich's Periodicals Directory ©, U.S.A., Open J-Gage as well as in
Cabell’s Directories of Publishing Opportunities, U.S.A
65 International Journal of Management, IT & Engineering
http://www.ijmra.us, Email: [email protected]
Reference
1. Grish N, Ramachandra K, Arun G M, Asha K.(2012), “Prevalence of
musculoskeletal disorders among cashew factory workers”, Archives of
Environmental and Occupational Health, vol.67(1), pp.37-42
2. Amirtha P, nivyaA, and punish R (2013), “Motivation and Job Satisfaction of
Cashew Workers in Kanyakumari District”, Indian Journal of Applied Research,
vol.3(7),pp.307-309
3. Arun Kumarputtapalli (2014), “Socio-Economics Status of Cashew nut Workers: A
Study on Informal Sector”, Sai Om Journal of Commerce & Management, vol.1(2),
pp.15-24
4. Atul Mohod, Sudhir Jain and. Powar A.G (2011), “cashew nut processing: sources
of environmental pollution and standards”, BIOINFO Environment and pollution,
Vol.1 (1), pp.05-11
5. Atul Mohod, Sudhir Jain and A.G. Powar, (2010), Energy Option for Small Scale
Cashew Nut Processing in India., Energy Research Journal, Vol I(1), PP.47-50
6. Hebbar UH and Ramesh MN (2005), Optimisation of processing conditions for
infrared drying of cashew kernels with testa. Journal of the Science of Food and
Agriculture, 85: pp.865-871.
7. Krishna Banana, Verranjaneya V, Kumar.P (2017), “Problems and Prospects of
Cashew nut Processing Industry”, International Journal of research culture society, vol.
1(9)
8. Nag S.K, Patil S.K, Patel S, Pradhan A, Netam R.S, Paikra M.S. and Singh D.P.
(2014), “Effect of Entrepreneurship Development through Cashew Processing on
Socio-Economic Status of Villagers”, America International Journal of Research in
Humanities, Arts and Social Sciences, vol.14 (190), pp.211
9. Nazneen Kanji (2004), Corporate Responsibility and women’s Employment: The case
of Cashew Nuts, International Institute for Environment and Development, vol.12,
No.2, pp.82-87
10. Ramdev. J.P, Banakar. B, and Kunnal L.B (1999), “Problems faced by cashew
processing Industry – A cluster analysis. The cashew, April – June 1999, pp.47-52
11. SivanesanR (2013), “A study on Socioeconomic Conditions of Women Workers in
Cashew Industries of Kanyakumari District”, International Journal of Management
Research and Business Strategy, Vol. 2(4) pp 98-112.
12. Sivasankaram S., Sivanesan R. (2013), “A Study about the Wages and Incentives of
Cashew Industries in Kanyakumari District”, International Journal of Business and
Management Invention, vol. 2 (2), pp.1-11
13. Srinivasan, M. V., Ateeq, N., & Jayanthi, M. (1999), Impact of Cashew nut
processing industry on the labour Market for women in Kanyakumari District, Tamil
Nadu, Centre for Education and Communication, pp1-104.
14. Swapnali Borah and Moonty Baruah (2016), “Physical Fitness of Women Worker
Involved in Cashew nut Factory in Meghalaya”, International Journal of Physical
Education, Sports and Health, vol.3 (1), pp.13-16

International Journal of Management, IT & Engineering Vol. 8 Issue 12(1), December 2018,
ISSN: 2249-0558 Impact Factor: 7.119
Journal Homepage: http://www.ijmra.us, Email: [email protected]
Double-Blind Peer Reviewed Refereed Open Access International Journal - Included in the International
Serial Directories Indexed & Listed at: Ulrich's Periodicals Directory ©, U.S.A., Open J-Gage as well as in
Cabell’s Directories of Publishing Opportunities, U.S.A
66 International Journal of Management, IT & Engineering
http://www.ijmra.us, Email: [email protected]
Comparing Quantum Key Distribution Protocol with Current
Cryptographic Schemes
Sanjana Bhatia, Kanishk
Abstract: The concept of quantum entanglement has given birth to many new branches of
physics, the most interesting being Quantum Cryptography. Quantum cryptography applies
the principles of Quantum Mechanics to protect information channels against
eavesdroppers even when assuming that they have unlimited computing powers. The well-
developed protocol in quantum cryptography is Quantum Key Distribution (QKD) that
establishes a shared private key between the sender (Alice) and the receiver (Bob). In this
contribution, we illustrate richly the role played by quantum entanglement and quantum
information in setting up a ‘secure quantum channel’ between Alice and Bob. Simple QKD
protocols are analyzed and compared with the current cryptographic schemes being used in
the industry like Public Key Distribution- Diffie Hellman, RSA, etc. outlining the
vulnerabilities of the latter. The future prospects of QKD are presented along with the
practical challenges.
1. Introduction
Everybody has their secrets. No one wants to have a third person sneaking up their private
information. Cryptography is the science of establishing secure communication using
physical or mathematical techniques. While cryptologists develop newer methods to
conceal confidential information, cryptanalysts devise powerful techniques to break the
same. This cat and mouse race has driven a tremendous progress of the field attracting
widespread participation from large groups of physicists, mathematicians and engineers
around the globe.
The first major blow to the classical cryptographic schemes was when Peter W. Shor [1]
demonstrated that Shor’s algorithm, a quantum algorithm for factoring integers
exponentially faster than the currently best known classical algorithm. This uncovered the
critical security threat that quantum computation posed on all cryptographic schemes
which are based on the limitations of classical computational ability.
Therefore the need of the hour is to develop a cryptographic skeleton that relies purely on
the laws of physics rather than classical edge of computers. This is what Quantum
Cryptography promises.
2. Classical Cryptographic Schemes
Let us introduce the main characters – Alice wants to send a private message to her friend
Bob, and protect it from a very nosy eavesdropper Eve. Classically there two available
schemes:
(a) Private Key Distribution
This is the earliest form of the encryption method, a traditional example being Ceasar
cipher. It is believed that Julius Ceaser used a simple letter substitution method for private
correspondence. Each letter in Ceaser’s message was replaced by the letter 3 places ahead
alphabetically. The number of shifts (3 in this case) is the key of the cryptosystem and
must be kept a secret.
SB (M.Sc. II), Kanishk (M.Sc. II), Department of Physics, Panjab University, Chandigarh

International Journal of Management, IT & Engineering Vol. 8 Issue 12(1), December 2018,
ISSN: 2249-0558 Impact Factor: 7.119
Journal Homepage: http://www.ijmra.us, Email: [email protected]
Double-Blind Peer Reviewed Refereed Open Access International Journal - Included in the International
Serial Directories Indexed & Listed at: Ulrich's Periodicals Directory ©, U.S.A., Open J-Gage as well as in
Cabell’s Directories of Publishing Opportunities, U.S.A
67 International Journal of Management, IT & Engineering
http://www.ijmra.us, Email: [email protected]
The private key is a string of random bits known only to Alice and Bob. The information is
encoded in a correlation between the transmitted string and the key. The security of this
scheme lies in the fact that the transmitted data contains no information- even if Eve
intercepts the transmission she will not learn anything about the information.
But there’s a problem: the key is based upon some logic, and logics can be decoded if the
eavesdropper is very smart. In classical world, Eve can monitor the channel without being
detected by Alice and Bob, as her act of snooping would not in any way leave a mark upon
the information. Hence, the channel can never be perfectly secure.
(b) Public Key Distribution:
In 1976, W. Diffie and M. Hellman discovered a different type of cryptosystem, where the
problem of establishing a secure channel was solved. The method relies on the limitation
of computational abilities, for example, calculation discrete logarithm problem and the
factorization of large integers, of the classical computers.
The most famous and commercially used public cryptosystem is RSA- named after the
inventors Ron Rivest, Adi Shamir and Leonard Adleman [2]. It is based on the postulate
that in order to factorize a big natural number with N digits any classical computer needs at
least a number of steps that grows faster than any polynomial in N.
RSA is an asymmetric algorithm; it requires two different keys per user to be able to
communicate. One of the keys is the public key that is to be distributed publicly, and the
other key is the private key, that is to be kept private.
Illustration
1. Choose two prime numbers: p=3,q=11
2. Compute the product: n=p*q=33
3. Find the function: (n)=(p-1)*(q-1)=20
4. Choose any number such that gcd(e, (n))=1; let, e=7
5. Choose d such that (d*e)mod() = 1
(d*7)mod(20)=1, one possibility is d=3
Public key: (e,n)
Private key: (d,n)
6. Let the ASCII code of the message to be sent is P=2
7. Cipher text C=(Pe)mod(n); C= (27 )mod(33) =29 is sent by Alice over a Public Channel
8. Bob receives the cipher text C and, retrieves the plain text P by P=(Cd)mod(n);
P= (293)mod(33) = 2
Hence the protocol is successful!
For Eve to compute Bob’s private key, she has to carry out the calculation:
d*e=1(mod((n))). The problem she will face here is to compute (n). For that, she needs
to calculate the factors: p and q. For classical computers, finding the factors to large
numbers becomes exponentially harder as the number of digits increase. For practical
applications, p and q are chosen to be very large (400), so as to factorize them, a classical
computer would require time, even greater than the age of the universe itself [3]!
But there’s a catch: RSA in the current scenario is safe as long as a scalable quantum
computer remains unfeasible. A universal quantum computer would facilitate solving
many mathematical problems in a more efficient way with respect to their classical
counterparts- in particular the integer factorization, as was demonstrated by Shor’s
Algorithm [1].Therefore, any security protocol that derives from the mathematical
complexities of the certain problems is vulnerable to attacks by Quantum Computers.

International Journal of Management, IT & Engineering Vol. 8 Issue 12(1), December 2018,
ISSN: 2249-0558 Impact Factor: 7.119
Journal Homepage: http://www.ijmra.us, Email: [email protected]
Double-Blind Peer Reviewed Refereed Open Access International Journal - Included in the International
Serial Directories Indexed & Listed at: Ulrich's Periodicals Directory ©, U.S.A., Open J-Gage as well as in
Cabell’s Directories of Publishing Opportunities, U.S.A
68 International Journal of Management, IT & Engineering
http://www.ijmra.us, Email: [email protected]
3. Quantum Key Distribution
In view of the failure of the classical cryptographic schemes to guarantee unconditional
security, we look upon to quantum mechanics to rescue. And sure it helps.
The idea of applying the principles of quantum mechanics for the purpose of key
distribution was first proposed by S. Weisner and C. H. Bennett and G. Brassard [4]. In
1991, Arthur Ekert [5] proposed to use the consequences of Quantum Entanglement and
Bell’s Inequalities in QKD.
The conceptual foundation behind the working of QKD was laid down by a thought
experiment performed by Einstein, Podolsky and Rosen[6] in 1935. Named the EPR
paradox, it was conceived to erase the status of quantum mechanics as a complete physical
theory, but quite quickly it became an illustration of how quantum mechanics escapes
normal intuition. The normal intuition of a human brain derives its sanity from two basic
observations:
(a) Locality – the objects that are separated in space-time cannot exert direct influence
on one another, the results of the measurement made on object 1 cannot in any way
influence the properties of object 2. We refer to such phenomenon as local in nature.
(b) Realism- there exists a reality which is independent of the way the object is
observed, that is, the properties of the objects are unaffected by different measurements
made on them. Such a phenomenon is referred to as being real.
These two basic principles that are taken for granted by our human brain were put to test
by John Bell in 1981. He took a maximally entangled state of two qubits. In first state,
qubit A is the spin down state while qubit B is in the spin-up state. In second state, qubit A
is in the spin-up state while qubit B is in the spin-down state. The maximally entangled
singlet state is the superposition of both these states with a negative phase difference.
|𝜓−⟩𝐴𝐵 = 1
√2 (|01⟩𝐴𝐵 − |10⟩𝐴𝐵) (1)
Let’s say Alice has access to qubit A, but not B. Similarly Bob has access to qubit B and
not A.
This state has the property [3], (with 𝜎 being the Pauli spin matrices )
�⃗�(𝐴) |𝜓−⟩ = −�⃗�(𝐵) |𝜓−⟩ (2)
When we consider the expectation value of the measurement of spin of qubit A along an
axis n and spin of qubit B along another axis m, where being the angle between n and m,
⟨𝜓−|(�⃗�(𝐴). �̂�)(�⃗�(𝐵). �̂�)|𝜓−⟩ = ⟨𝜓−|(�⃗�(𝐴). �̂�)(−�⃗�(𝐴). �̂�)|𝜓−⟩ (3)
= −⟨𝜓−|𝜎𝑖(𝐴)𝜎𝑗
(𝐴)𝑛𝑖𝑚𝑗|𝜓−⟩
= − 𝑛𝑖𝑚𝑗𝛿𝑖𝑗
= − cos 𝜃
If �̂� and �̂� happen to be same ( =0⁰), that is when Alice and Bob are measuring their
respective qubits along same direction, then their results are always perfectly anti-
correlated. If Alice measures qubit A to be up-spin, then Bob will always measure qubit B
to be down-spin and vice versa!
Bell’s inequality comes into picture when we consider the locality principle to be true.
According to it, the correlations predicted by the quantum theory are incompatible with the
locality principle. But recently a loophole-free test of Bell’s inequality was reported [7],
thereby conclusively verifying the existence of quantum nonlocality in nature. We are
forced to conclude that Alice’s choice of measurement actually exerted a subtle influence
on the outcome of Bob’s measurement. Even when A and B are distantly separated, we

International Journal of Management, IT & Engineering Vol. 8 Issue 12(1), December 2018,
ISSN: 2249-0558 Impact Factor: 7.119
Journal Homepage: http://www.ijmra.us, Email: [email protected]
Double-Blind Peer Reviewed Refereed Open Access International Journal - Included in the International
Serial Directories Indexed & Listed at: Ulrich's Periodicals Directory ©, U.S.A., Open J-Gage as well as in
Cabell’s Directories of Publishing Opportunities, U.S.A
69 International Journal of Management, IT & Engineering
http://www.ijmra.us, Email: [email protected]
cannot regard them as two separate qubits. They are more than just correlated. They are a
single non-separable entity. They are entangled!
Ekert protocol [4]
Let us consider a central source producing entangled qubits in the singlet state
|𝜓−⟩𝐴𝐵 = 1
√2 (|01⟩𝐴𝐵 − |10⟩𝐴𝐵)
(4)
i.e. we have |𝜓−⟩1, |𝜓−⟩2, |𝜓−⟩3 … … , and distributing qubit A of each state to Alice and
qubit B to Bob. For each qubit in their possession, Alice and Bob can measure either 𝜎1
(spin along X-axis) or 𝜎3 (spin along Z-axis), their choice of measurement being
completely random with a probability of ½ each. There is a ½ chance that Alice and Bob
choose a compatible basis (same axis) to measure their qubits. If Alice and Bob chose a
compatible basis, and Alice measures a spin up particle, the quantum state of the system
collapses into state II (Eq. 4), and the probability of Bob measuring a spin down particle is
100%. Similarly, if Alice observes a particle with spin down, Bob will detect a spin up
particle with 100% certainty.
After the measurements are performed, both Alice and Bob announce their observables
(not results) over a public channel, for example, if Alice measured her first qubit along 𝜎1
to be up-spin, she publicly announces “A1 along 𝜎1”. Similarly, if Bob measured his first
qubit along 𝜎3 to be up-spin, he publicly announces “B1 along𝜎3”. Those measurements,
for which they chose incompatible basis, are discarded since the results are uncorrelated.
For those cases in which they measured along the same axis, their results are perfectly anti-
correlated. Hence, they have established a shared random key!
Illustration:
Table 3.1: Correlations between the measurements of Alice’s and Bob’s
measurements along compatible basis-establishment of key
Alice’
s qubit
Measuremen
t axis
Measuremen
t outcome
Bob’
s
qubit
Measuremen
t axis
Measuremen
t outcome
Correlatio
n
A1 σ1 B1 σ3
A2 σ3 B2 σ3 1 and 0
A3 σ3 B3 σ3 0 and 1
A4 σ1 B5 σ1 0 and 1
A5 σ3 B6 σ1
Alice’s key – 100
Bob’s key - 011 (each bit is reversed with respect to Alice)
Detection of tampering:
If Eve comes and tries to intercept the qubits going to Alice and Bob, then for those qubits
for which they share compatible basis, their measurement outcome if not perfectly anti-
correlated, warns Alice and Bob that some nefarious activity has been done by Eve. They
may share a part of the key publicly to verify whether tampering has been done. Hence the
presence of an eavesdropper is always detected in QKD (as was not in classical
cryptographic schemes).

International Journal of Management, IT & Engineering Vol. 8 Issue 12(1), December 2018,
ISSN: 2249-0558 Impact Factor: 7.119
Journal Homepage: http://www.ijmra.us, Email: [email protected]
Double-Blind Peer Reviewed Refereed Open Access International Journal - Included in the International
Serial Directories Indexed & Listed at: Ulrich's Periodicals Directory ©, U.S.A., Open J-Gage as well as in
Cabell’s Directories of Publishing Opportunities, U.S.A
70 International Journal of Management, IT & Engineering
http://www.ijmra.us, Email: [email protected]
Table 3.2: Detection of tampering by Alice and Bob
Alic
e’s
qubit
Measure
ment axis
Measure
ment
outcome
Bo
b’s
qubi
t
Measure
ment axis
Measure
ment
outcome
Correlat
ion
Cause
A1 σ1 B1 σ3 differ
ent
basis
A2 σ3 B2 σ3 Eve
Practical Challenges
The protocol will work 100 % of the times, provided there are no glitches in the quantum
communication channel. But in practical situations errors always creep into the channel.
Hence, even if Eve has been up to no tampering, Alice and Bob’s outcomes will show
some arbitrary correlations. This is because of decoherence of qubits. It means that the
entangled qubits lose their entanglement over space and time.
Table 3.3: Depiction of channel error
Alice’s
qubit
Measureme
nt axis
Measureme
nt outcome
Bob’s
qubit
Measure
ment axis
Measureme
nt outcome
Correlation Cause
A1 σ1 B1 σ3 differe
nt
basis
A2 σ3 B2 σ3 Eve
A3 σ3 B3 σ3 Chann
el error
There are several ways in which the protocol can be enhanced to reduce the error due to
channel imperfections, some of them being quantum error correction, classical privacy
amplification etc. There is a lot of improvement scope in this area.
4. Conclusions And Perspectives
With tremendously increasing investments in Quantum Computing from both governments
and large companies, the post-quantum era is approaching faster than expected. Thus, the
actual need for quantum-safe security mechanism in some prone applications like military,
banking etc. is clear today. Quantum Key Distribution is just a starting milestone in the
path towards perfectly quantum-secure communication. In recent years, there has been a
lot of commercial interest in this field and several quantum cryptographic tools have been
commercialized by ID-Quantique, QUANTIS etc. It is our personal opinion, that as the
technology continues to improve, QKD will be an increasingly valuable tool in a
cryptographer’s toolbox!
Acknowledgements
We thank Prof. Arvind for his supervision and guidance in understanding the topic. We
also thank IAPT for providing us the platform for expressing our ideas.

International Journal of Management, IT & Engineering Vol. 8 Issue 12(1), December 2018,
ISSN: 2249-0558 Impact Factor: 7.119
Journal Homepage: http://www.ijmra.us, Email: [email protected]
Double-Blind Peer Reviewed Refereed Open Access International Journal - Included in the International
Serial Directories Indexed & Listed at: Ulrich's Periodicals Directory ©, U.S.A., Open J-Gage as well as in
Cabell’s Directories of Publishing Opportunities, U.S.A
71 International Journal of Management, IT & Engineering
http://www.ijmra.us, Email: [email protected]
References
1. Shor PW, “Algorithms for quantum computation: discrete logarithms and factoring”
Proceedings of the 35th Annual Symposium on Foundations of Computer Science,
November, 20–22, 1994, pp. 124–134. doi:10.1109/sfcs.1994.365700
2. I.V. Volovich, Lectures On Classical and Quantum Cryptography, Steklov
Mathematical Institute, Russian Academy of Science
3. J. Preskill, Lecture Notes on Quantum Information and Computation, California
Institute of Technology
4. Bennett CH, Brassard G. Quantum cryptography, “Public key distribution and coin
tossin”, Theoretical Computer Science 2014; 560(1): 7–11.
doi:10.1016/j.tcs.2014.05.025
5. Ekert AK, “Quantum cryptography based on Bell’s theorem”, Physical Review Letters
1991; 67(6): 661–663. doi:10.1103/PhysRevLett.67.661
6. Nikolina Ilic ,” The Ekert Protocol” , Department of Physics, University of Waterloo,
Waterloo, ON, Canada
7. Hensen B, Bernien H, Dreau AE, Reiserer AKalb N, Blok MS, Ruitenberg J,
Vermeulen RFL,Schouten RN, Abellan C, Amaya W, PruneriV, Mitchell MW,
Markham M, Twitchen DJ,Elkouss D, Wehner S, Taminiau TH, Hanson R, “Loophole-
free Bell inequality violation using electron spins separated by 1.3 kilometres” ,Nature
2015; 526(7575): 682–686. doi:10.1038/nature15759

International Journal of Management, IT & Engineering Vol. 8 Issue 12(1), December 2018,
ISSN: 2249-0558 Impact Factor: 7.119
Journal Homepage: http://www.ijmra.us, Email: [email protected]
Double-Blind Peer Reviewed Refereed Open Access International Journal - Included in the International
Serial Directories Indexed & Listed at: Ulrich's Periodicals Directory ©, U.S.A., Open J-Gage as well as in
Cabell’s Directories of Publishing Opportunities, U.S.A
72 International Journal of Management, IT & Engineering
http://www.ijmra.us, Email: [email protected]
Expectation and Level of Satisfaction on LPG Customers in
Thanjavur District
Dr. E. RAMAPRABA. M.Com., M.Phil.,SET.,MBA.,Ph.D
Introduction
LPG is the gas at atmospheric pressure and normal ambient temperatures, but it can be
liquefied when moderate pressure is applied or when the temperature is sufficiently
reduced. It can be easily condensed, packaged, stored and utilized, which makes it an ideal
energy source for a wide range of applications. Normally, the gas is stored in liquid form
under pressure in a steel container, cylinder or tank. The pressure inside the container will
depend on the type of LPG (commercial butane or commercial propane) and the outside
temperature. Convenience is one of the main reasons why the use of LPG has been
growing worldwide. The LPG heats quickly and provides much greater efficiency than
even the most improved biomass stoves. LPG stoves can also be controlled more precisely
to match the user’s requirements and can save time for cooking and cleaning the kitchen.
Additionally, LPG can be transported, stored and used virtually anywhere.
The main challenges for broader dissemination of the LPG are its limited accessibility and
affordability for its users. Furthermore, lack of awareness of the LPG as well as fear of
accidents exists. The development of governmental policies and regulations to create
incentives for increasing LPG use are therefore advisable to support the LPG uptake. A
review of experiences in 20 developing countries have revealed that, apart from a stable
political and legal system, proper rules governing trade and investments such as the
licensing of distribution, repatriation of profits and taxation of corporate profits are also
essential for increasing LPG growth. Further possible government interventions include
designing favourable taxes/duties, industrial safety provisions and stronger enforcement
procedures. This will also create incentives for distribution companies to develop
commercial LPG infrastructure and ensure regular supply on a broad basis with close
proximity to households. Affordability could be further improved by providing microcredit
or loans for the sake of lowering upfront payments or by installing structures that allow
poorer households to purchase small amounts of LPG, much in the same way they
purchase kerosene or charcoal.
However, with rising international prices of LPG having witnessed an average rate of 9
percent since 2001, subsidies have become increasingly unsustainable as governments are
no longer able to shoulder the financial burdens. The removal of subsidies as well as
continuously increasing LPG prices bear the well-founded risk that many middle-income
urban users might revert to the use of charcoal or fire wood as they are not able to pay for
LPG. Nonetheless, it has to be noted that the G20 nations called for a complete phase out
of fossil fuels. An estimated 775 billion USD were spent globally on subsidies in 2012. A
decisive factor for LPG growth is establishing an appropriate price level for LPG in
relation to the prices of other fuels.
Assistant professor and Head of commerce Department, Dr.Nalli kuppusamy Arts College, Manakkarambai, Thanjavur

International Journal of Management, IT & Engineering Vol. 8 Issue 12(1), December 2018,
ISSN: 2249-0558 Impact Factor: 7.119
Journal Homepage: http://www.ijmra.us, Email: [email protected]
Double-Blind Peer Reviewed Refereed Open Access International Journal - Included in the International
Serial Directories Indexed & Listed at: Ulrich's Periodicals Directory ©, U.S.A., Open J-Gage as well as in
Cabell’s Directories of Publishing Opportunities, U.S.A
73 International Journal of Management, IT & Engineering
http://www.ijmra.us, Email: [email protected]
Statement of the Problem
Domestic LPG today is subsidized and hence is distributed only by public sector oil
marketing companies. As LPG distribution is controlled, each distributor has a specified
area of operation and customers can avail the cylinders only if they are residing within the
area of operation of a distributor. The use of India’s indigenous production of LPG has not
been able to keep pace with increasing demand. For availing the new connection customer
has to approach the nearest distributor. Though there is a lot of LPG innovative service
available at the reach of consumers in market in Tamil Nadu, the LPG distributors
concentrate more in prompt delivery service.
Objectives of the Study
Following are the objectives of the study:
1. To analyze the customer ship profile towards the LPG gas in the Thanjavur District.
2. To identify the expectations of the LPG customers in Thanjavur District.
3. To measure the level of satisfaction of the customers towards the LPG in the study
area.
Scope of the Study
The scope of the study is mainly relates to the marketing and consumer expectation
towards the domestic LPG. It also helps to find out the satisfaction level of consumer. The
scope of the study seems to be vast because of its coverage and contents. The study helps
the researcher to have a practical exposure in this specific field. The study results will be of
a great help to the government as well as the company in future distribution policy making
Hypothesis
Table – 1: ANOVA test for gender of the respondents and the expectation factors of
LPG customers
Expectation factors of LPG customers F – Value Significant Value
Seven day functioning of the Gas agent 1.984 .159
Reduction in price 2.782 .096
Quick response of the salesmen .893 .345
Concessions or subsidies .346 .556
Standard Government Policies .200 .655
Immediate customer service .428 .513
Good customers relationship management 1.992 .159
Increase additional dealers 2.897 .089
Periodical checking up of the cylinder .079 .779
Good Behavior of counter staff/Deliverymen and
Mechanic
3.022 .083
Need training to minimize the gas consumption .472 .492
Source: Output generated from SPSS 20
Based on the result generated by SPSS 20, the significant values of all the variables related
to the expectation of LPG customersare greater than 0.05. So the null hypothesis is
accepted in all these cases. Therefore, there is no significant relationship between the mean
score of gender of the respondents and the expectation of LPG customers.

International Journal of Management, IT & Engineering Vol. 8 Issue 12(1), December 2018,
ISSN: 2249-0558 Impact Factor: 7.119
Journal Homepage: http://www.ijmra.us, Email: [email protected]
Double-Blind Peer Reviewed Refereed Open Access International Journal - Included in the International
Serial Directories Indexed & Listed at: Ulrich's Periodicals Directory ©, U.S.A., Open J-Gage as well as in
Cabell’s Directories of Publishing Opportunities, U.S.A
74 International Journal of Management, IT & Engineering
http://www.ijmra.us, Email: [email protected]
In the case of gender of the customers and their expectation, all the customers demand the
11 expectation factors irrespective of the gender. It means the expectation is common to
all. So, the gender does not take any influence part in this regard.
Mean and Standard Deviation for Satisfaction of the LPG Customers
Table – 2: Satisfaction of the LPG customers
Satisfaction of the LPG customers
Mean
Std.
Deviation
Price of the LP Gas 5.24 1.216
Approach of the Staff of Agent’s office 5.35 1.191
Location of the shop 5.32 1.194
Advertisement 5.15 1.262
Customer relationship of the Agent 5.24 1.200
Reliability of the Gas 5.29 1.113
Relationship with the Agent 5.27 1.386
Information providing by the agent/ gas supplying
servant
5.37 1.121
Grievance handling procedure 5.26 1.145
Source: Output generated from SPSS 20
Among the 11 satisfaction variables, ‘Information providing by the agent/ gas supplying
servant’ has the maximum mean value (5.37) and it implies that the customers are satisfied
with the information service. Next, ‘Approach of the Staff of Agent’s office’ (mean value
5.35) comes and it is inferred that the behavioral approach of the gas agency staff is
amicable one. The satisfaction relating to the ‘Location of the shop’ (mean value 5.32) is
good in view of the customers. The location of the gas agency is in centre place of the
town so that the customers are satisfied with it. Reliability of the Gas (mean value 5.29) is
an important one because many malpractices are done during the delivery of cylinder. But,
the customers of the present study are satisfied with this so that it is sure that the
performance of the gas agency is good.
Findings of the Study
✓ Among the 11 expectation factors, ‘need training to minimize the gas consumption’ has
the maximum value of mean (5.53). It means that the maximum number customers
want to be acquainted with the minimum usage of consumption of gas
✓ The dimension “satisfaction of the LPG customers comprises 9 factors.
✓ The factors are (1) Approach of the Staff of Agent’s office
✓ (2) Relationship with the Agent. This means that the LPG customers are satisfied with
the approach of the Staff of Agent’s office and
✓ (3) Relationship with the Agent. So, their rating towards the two factors is high. It
results in more concentration on the total satisfaction.
Conclusion
It is absolutely to satisfy the customer needs. Keeping this in mind, this study has been
conducted at Thanjavur District to identify the customers’ attitude and satisfaction towards
the domestic LPG services. The findings of the study depict that the customers has faced
the irregularity of price increase and delayed supply of LPG gas cylinders. What this study

International Journal of Management, IT & Engineering Vol. 8 Issue 12(1), December 2018,
ISSN: 2249-0558 Impact Factor: 7.119
Journal Homepage: http://www.ijmra.us, Email: [email protected]
Double-Blind Peer Reviewed Refereed Open Access International Journal - Included in the International
Serial Directories Indexed & Listed at: Ulrich's Periodicals Directory ©, U.S.A., Open J-Gage as well as in
Cabell’s Directories of Publishing Opportunities, U.S.A
75 International Journal of Management, IT & Engineering
http://www.ijmra.us, Email: [email protected]
makes clear is that understanding the consumer behavior of the LP gas and identifying
their needs.
Reference
➢ Ruangwud Jarurungsipong & Nopalak Rakthum (2016), Basic Statistics on Indian
Petroleum and Natural Gas. New Delhi: MoPNG, Government of India
➢ Rajakutty et al., (2002), Promoting Clean Household Fuels Among the Rural Poor
Evaluation of the Deepam Scheme in Andhra Pradesh, South Asia Region
➢ Sanjay Ramamurthy and Suresh M. R., A Study on the Effectiveness of the Launch of
LPG Retail at Convenience Stores and Understanding the Perception of Retailers
and Consumers, 2014,‘Oil & Gas Journal Articles, Oct 2012, Volume:110, Issue:
10,pp.45-53.
➢ Stockholm Environment Institute, Working Paper 2012-03
➢ Sudhagar S, ‘A Study On Consumer Attitude towards Domestic LPG Gas With Special
Reference to Krishnagiri District’, International Journal of Marketing, Financial
Services & Management Research, Vol.4 (3), March (2017), pp. 60-78

International Journal of Management, IT & Engineering Vol. 8 Issue 12(1), December 2018,
ISSN: 2249-0558 Impact Factor: 7.119
Journal Homepage: http://www.ijmra.us, Email: [email protected]
Double-Blind Peer Reviewed Refereed Open Access International Journal - Included in the International
Serial Directories Indexed & Listed at: Ulrich's Periodicals Directory ©, U.S.A., Open J-Gage as well as in
Cabell’s Directories of Publishing Opportunities, U.S.A
76 International Journal of Management, IT & Engineering
http://www.ijmra.us, Email: [email protected]
The Determinants of Less Cash Economy
Dr. Mahabir Narwal
Miss. Mona Saini**& Ms. Sapna Saini
Abstract
Less cash economy means an economy in which majority of financial transaction
performed by digital modes instead of physical form of money. Digital modes include pay
through cheque, demand draft, plastic card, smart phone apps, POS terminal, RTGS and
NEFT etc. Sweden is the first country which introduces concept of cashless economy and
at present this country near to cashless economy. This study is undertaking to examine the
impact of demographics i.e. gender, age, educational qualification, occupation, and
geographical background on determinants of less cash economy, to study the modes of
cashless payment/ digital payment and study the factors affecting the less. The less cash
economy is the need of the day. Lot of efforts is being made in this direction. Less cash
economy effected by factors suchasdigital literacy, lack of infrastructure, safety and
security, connectivity, poor banking habits, language problem, modern technology, service
charges, less printing cost of currency, convenience, solution for currency shortage,
reduce black money, fight against fake currency, government schemes, exemption from tax,
freebies etc. Thus it can be concluded that the above factors must be considered to make a
less cash economy or digital economy.
Key words: cashless economy, RTGS, batter system, debit card, POS.
Introduction
Less cash economy means an economy in which majority of financial transaction
performed by digital modes instead of physical form of money. Digital modes include pay
through cheque, demand draft, plastic card, smart phone apps, POS terminal, RTGS and
NEFT etc. Indian economy is cash oriented economy because maximum Indian citizen
prefers pay through cash. According to “MasterCard advisor’s measuring progress toward
a cashless society” in India only 2% transaction are performed through cashless modes and
98% transaction are performed with physical money. Although cashless payment
percentage is continuously increased in India after the announcement of demonetization of
Rs. 500 and Rs. 1000 note (8 Nov, 2016). Indian government and RBI promote the
individuals for doing payment through cashless instruments by discount, cash back and
lucky draw scheme.
Sweden is the first country which introduces concept of cashless economy and at present
this country near to cashless economy. According to the belief of this country, if a person
has more cash then he will be considered a terrorist (www.businessinsider.in). According
to Jhunjhunwala cashless economy increases 1.5% income of government. Sweden and
Denmark is near about cashless economy due to negative interest rate. For example, if you
deposit 1000 kronor in Sweden central bank, it will give 995 kronor after one year due to
negative interest rate -.5%. Norway and South Korea will become cashless by 2020.
Professor of dept. of Commerce in Kurukshetra University, Kurukshetra Assistant professor of department of commerce

International Journal of Management, IT & Engineering Vol. 8 Issue 12(1), December 2018,
ISSN: 2249-0558 Impact Factor: 7.119
Journal Homepage: http://www.ijmra.us, Email: [email protected]
Double-Blind Peer Reviewed Refereed Open Access International Journal - Included in the International
Serial Directories Indexed & Listed at: Ulrich's Periodicals Directory ©, U.S.A., Open J-Gage as well as in
Cabell’s Directories of Publishing Opportunities, U.S.A
77 International Journal of Management, IT & Engineering
http://www.ijmra.us, Email: [email protected]
Concept of less cash or cashless economy in India
“Our dream is that there should be cashless society. This is also correct that 100% cashless
society is never possible. But we can make a start with less cash society then cashless
society will not be a far –off destination.” Narendra Modi said in “Mann ke Baat” address
appealing to youth to teach 10 families daily on how they could do cashless transaction
through mobile apps, mobile banking and debit/ credit card.
“Let’s start with less cash society to move to cashless India, said PM Modi.
(Source: Economic times as on 27 Nov, 2016)
Definition
Less cash economy can be defined as an economy in which cash is not used for financial
transaction and all transactions are done through digital mode instead of physical currency.
Digital modes like debit card, credit card, electronic fund transfer channel such as IMPS,
NEFT, RTGS, etc. phone apps like BHIM app, AAPS, USSD, UPI, POS, E-Wallet QR
code.
International scenario
On the basis of Forex Bonuses survey Canada is top cashless economy in the world and get
first rank with 6.48 score and approximated 57% of financial transactions performed
through cashless modes. Second cashless country is Sweden where 59% transactions are
cashless. After Sweden, France and United Kingdom is positioned at third and fourth place
respectively. In case of cashless payments, United States and China are not far. Australia,
Germany and Japan also gradually move to the cashless economy from cash based
economy. In Russia only 4% transaction are cashless. Therefore this country gets 10th rank
out of list of top 10 cashless countries. Here score is given on the basis of debit and credit
card users, growth rate of cashless payments and awareness about digital payment among
customers.
Determinants of less cash / cashless economy
Determinant of cashless means challenges which are hurdle on the path of introducing less
cash or cashless economy. Following are the factors which affect the less cash economy:-
1. Poor network connectivity
Maximum population of India lives in rural area. Till now many remote areas especially
rural areas do not get internet connection. Maximum modes of cashless payment depend on
internet. Due to this, they cannot use cashless payment system. Following table shows
internet users countries in the world.Above table shows percentage of internet users across
the world. Here Britain is at the top, where 94% people use internet. Second and third
internet user’s countries are Japan and Australia respectively. In India only 29%
populations use internet service which is less than as compared to Chain.
2. Internet cost
For cashless payment internet is necessary, but monthly internet pack is costly and there is
no Wi-Fi facility at public place. Although Reliance jio has overcome this problem to some
extent but jio operates on 4G smart phone.
3. Language
Indian constitution recognized 22 languages. Due to large size of population and different
culture in India, different people speak different language. But internet mainly based on
English. Other than this, plastic card details are in English and messages related with
banking transaction are also in English or Hindi. This creates problems to those people

International Journal of Management, IT & Engineering Vol. 8 Issue 12(1), December 2018,
ISSN: 2249-0558 Impact Factor: 7.119
Journal Homepage: http://www.ijmra.us, Email: [email protected]
Double-Blind Peer Reviewed Refereed Open Access International Journal - Included in the International
Serial Directories Indexed & Listed at: Ulrich's Periodicals Directory ©, U.S.A., Open J-Gage as well as in
Cabell’s Directories of Publishing Opportunities, U.S.A
78 International Journal of Management, IT & Engineering
http://www.ijmra.us, Email: [email protected]
who not know either English or Hindi. Due to this customer switch to pay through cash
instead of pay for card or digital mode.
4. Illiteracy
Majority of Indian population who belongs to lower class, middle class especially senior
citizen, are not educated. They are not aware how to use internet and smart phone, how to
make payment through cashless modes, etc. They are not aware about banking policies,
government scheme for performing cashless payment such as discount, cash back, lucky
draw scheme etc. Hence illiteracy is an obstacle on the way of less cash economy.
5. Infrastructure
Less bank branches in rural areas, limited POS machine and limited ATM machines, old
operating system is barrier to adopting cashless payment system. On the other hand
merchant, shopkeepers, retailers required POS machine, internet connection for doing
cashless transactions. During February, RBI issue 206659 ATM machine and 3079487
POS terminal which are less as compared to Indian population which was 121 crore
according to censuses survey- 2011. There should be one ATM machine for at least one
lakh population.
6. Privacy and security
In India some people do not use cashless payment due to surety and privacy of
transactions. Banks do not guarantee to customers to keep data private and secure. Thus,
generally people fear that their data will be leaked to public and misused by companies.
Hence security is also affects the cashless payment system. Also Bank use old operating
system which is least secure for financial transaction.
7. Cost of swipe machine
When hire POS machine merchants pay fixed monthly rent and pay transaction charges
1%- 2% of transaction amount to banks. These are charge for business running cost but
these charges are recovered from customers by merchant. Due to this customer pay more
amounts as compared to actual amount. So they switch to physical money for payment.
Statement of Problem
This study tries to find out the answer of question why Indian people do not adopt less
cash/ cashless economy and what are the factors which encourage people to do cashless
payment/ digital payment. Thus statement of problem is “Determinants of less cash
economy.”
Literature Review
Kaur (2017) focused on impact of demonetization on making India cashless economy.
Finding depicts that due to demonetization concept of cashless economy become more
popular. Because of demonetization various new online modes are introduced. It is also
concluded cashless transaction are less costly as well as less time consuming and can
perform any time and from anywhere.
Kumar (2017) discussed the role of demonetization in India, status of digital payment in
India and examined top cashless countries in the world. This article is theoretical and based
on secondary data. It was observed India moves step by step to cashless payment system
from cash based payment system. Now adoption of cashless payment system is need of
Indian citizens because of all web based markets are based on digital payments.
Ragaventhar (2016) analyzed the Challenges and benefits of cashless economy. It was
observed that there are so many benefits as well as challenges of cashless payment system

International Journal of Management, IT & Engineering Vol. 8 Issue 12(1), December 2018,
ISSN: 2249-0558 Impact Factor: 7.119
Journal Homepage: http://www.ijmra.us, Email: [email protected]
Double-Blind Peer Reviewed Refereed Open Access International Journal - Included in the International
Serial Directories Indexed & Listed at: Ulrich's Periodicals Directory ©, U.S.A., Open J-Gage as well as in
Cabell’s Directories of Publishing Opportunities, U.S.A
79 International Journal of Management, IT & Engineering
http://www.ijmra.us, Email: [email protected]
mainly security factor. If people are taught to use cashless payment instrument, computer
and smart phones, then they can take the advantages of cashless payment system.
Ramya (2016) analyzed the modes, advantages and disadvantages of cashless system. It is
argued that result of using cashless transaction is better transparency, measurability and
check on fake currency and black money. Using habits of cashless transaction system can
be increased by improving the infrastructure and security system.
Duemmler and Kienle (2012) analyzed the role of a central bank of Germany in
promoting cashless payment. Finding reveals that central bank play important role for
making cashless payment because economic cost of central bank services is less as
compared to private bank in Germany.
Objectives of the Study
Following are the objectives of this study:-
• To study the modes of cashless payment/ digital payment.
• To study the factors affecting the less cash economy.
• To study the impact of demographics i.e. age, educational qualification, occupation,
and geographical background on determinants of less cash economy.
Hypothesis
On the basis of the objectives of the study following hypothesis has been formulated:
➢ H0: there is no significant effect of different age group on the less cash economy
H1: there is significant effect of different age group on the less cash economy
➢ H0: there is no significant effect of educational qualification, geographical background
and occupation on the less cash economy
H1: there is significant effect of educational qualification, geographical background and
occupation on the less cash economy
Research Methodology
The study is empirical in nature which based on primary data as well as secondary data.
Primary data is collected through questionnaire from 200 respondents of different age
group from Yamunanagar (Haryana). Secondary data is collected from different website,
journal and books. Factor analysis, ANOVA, and Simple percentage statistical technique
are used to analysis of the data.
ANALYSIS AND INTERPRETATIONS
Table: 1Details of Extracted factor S. No. Factors effecting less cash economy Factor loading
Factor 1: Digital literacy
1 Knowledge of smart phone usage .800
2 Guidance to make cashless payment .759
3 Knowledge the cashless modes of payment .694
4 Less aware about the internet usage .644
5 Knowledge of running a computer .630
6 Knowledge of procedure of cashless payment .601
Factor 2: Lack of infrastructure
1 Bank branch in all villages .775
2 Swipe machine to all retailers .734
3 ATM machine .555
4 Bank account .550

International Journal of Management, IT & Engineering Vol. 8 Issue 12(1), December 2018,
ISSN: 2249-0558 Impact Factor: 7.119
Journal Homepage: http://www.ijmra.us, Email: [email protected]
Double-Blind Peer Reviewed Refereed Open Access International Journal - Included in the International
Serial Directories Indexed & Listed at: Ulrich's Periodicals Directory ©, U.S.A., Open J-Gage as well as in
Cabell’s Directories of Publishing Opportunities, U.S.A
80 International Journal of Management, IT & Engineering
http://www.ijmra.us, Email: [email protected]
5 Smart phone .549
6 Debit/ credit cards .519
7 Power supply / long power cut .479
8 Merchants does not have swipe machines -.484
Factor 3: Safety and Security
1 Security to financial transaction performed through ATM .819
2 Use of PIN and Password to protect .756
3 Security transaction from fraud .664
4 Security of Personal data .652
5 Security against unauthorized access .524
Factor 4: Network connectivity
1 Poor internet connectivity .506
2 Internet cost increase after implement CTS -.355
Factor 5: Poor banking habits
1 Poor banking habits .804
2 Merchants not accept payment in cashless ways .503
Factor 6: Language problem
1 English as financial transaction language .766
2 Language problem .720
Factor 7: Modern technology
1 Latest software .760
2 Up- to-date equipment and technology .602
Factor 8: Service charges
1 Transaction cost or service charges .570
Factor 9: Less printing cost of currency
1 Reduces printing cost of currency .721
Factor 10: Convenience
1 Offer discount and reward point .811
2 Easy to pay .729
3 Saves time .717
4 Performed any time and from anywhere .693
5 No need to wait .614
6 No time boundation .517
Factor 11: Solution for currency shortage
1 Overcomes the problems of shortage of currency note .722
Factor 12: Reduce black money
1 Reduces black money .700
Factor 13: Fight against fake currency
1 Fight against fake currency .745
Factor 14: Government schemes
1 Scheme/ discount .720
2 Government schemes .696
Factor 15: Exemption from tax
1 Exemption of tax on online transaction .561

International Journal of Management, IT & Engineering Vol. 8 Issue 12(1), December 2018,
ISSN: 2249-0558 Impact Factor: 7.119
Journal Homepage: http://www.ijmra.us, Email: [email protected]
Double-Blind Peer Reviewed Refereed Open Access International Journal - Included in the International
Serial Directories Indexed & Listed at: Ulrich's Periodicals Directory ©, U.S.A., Open J-Gage as well as in
Cabell’s Directories of Publishing Opportunities, U.S.A
81 International Journal of Management, IT & Engineering
http://www.ijmra.us, Email: [email protected]
Table 1shows summary of 16 factors that affect cashless economy
Comparative analysis
Factor Analysis extracted sixteen factors which are the determinant of less cash economy.
Extracted factors further analyzed with ANOVA to test the impact of these factors on less
cash economy on the basis of demographic variable (age, sex, educational qualification,
occupation, and geographical background).
Table 2A: Residential status based summary of ANOVA Determinant of less cash economy
Sum of
Squares
Df Mean
Square
F Sig.
Digital literacy Between Groups 9.861 1 9.861 1.030 .311
Within Groups 1894.859 198 9.570
Total 1904.720 199
Lack of infrastructure Between Groups 47.862 1 47.862 5.114 .025**
Within Groups 1852.933 198 9.358
Total 1900.795 199
Safety and security Between Groups 59.631 1 59.631 12.203 .001**
Within Groups 967.549 198 4.887
Total 1027.180 199
Network connectivity Between Groups 1.291 1 1.291 .813 .368
Within Groups 314.264 198 1.587
Total 315.555 199
Poor banking habits Between Groups 1.725 1 1.725 .787 .376
Within Groups 433.795 198 2.191
Total 435.520 199
Language problem Between Groups 4.959 1 4.959 1.500 .222
Within Groups 654.541 198 3.306
Total 659.500 199
Modern technology Between Groups 1.523 1 1.523 1.717 .192
Within Groups 175.672 198 .887
Total 177.195 199
Service charges Between Groups 1.325 1 1.325 1.644 .201
Within Groups 159.550 198 .806
Total 160.875 199
Less printing cost of
currency
Between Groups .760 1 .760 1.216 .272
Within Groups 123.795 198 .625
Total 124.555 199
Convenience Between Groups .581 1 .581 .049 .825
Within Groups 2348.439 198 11.861
Total 2349.020 199
Solution for currency
shortage
Between Groups .365 1 .365 .659 .418
Within Groups 109.635 198 .554
Total 110.000 199
reduce black money
Between Groups .011 1 .011 .017 .895
Within Groups 127.109 198 .642
Total 127.120 199
2 Monthly rent of POS .527
Factor 16: Freebies
1 Offer 10% discount by toll plazas .719
2 Petroleum offers discount .466
3 Digital infrastructure in rural areas .391

International Journal of Management, IT & Engineering Vol. 8 Issue 12(1), December 2018,
ISSN: 2249-0558 Impact Factor: 7.119
Journal Homepage: http://www.ijmra.us, Email: [email protected]
Double-Blind Peer Reviewed Refereed Open Access International Journal - Included in the International
Serial Directories Indexed & Listed at: Ulrich's Periodicals Directory ©, U.S.A., Open J-Gage as well as in
Cabell’s Directories of Publishing Opportunities, U.S.A
82 International Journal of Management, IT & Engineering
http://www.ijmra.us, Email: [email protected]
Fight against fake currency Between Groups 1.982 1 1.982 3.159 .077
Within Groups 124.213 198 .627
Total 126.195 199
Government schemes Between Groups 5.817 1 5.817 2.374 .125
Within Groups 485.138 198 2.450
Total 490.955 199
Exemption from tax Between Groups .129 1 .129 .071 .790
Within Groups 356.746 198 1.802
Total 356.875 199
Freebies Between Groups .855 1 .855 .230 .632
Within Groups 735.020 198 3.712
Total 735.875 199 *Level of significant is 5%, ** significant value
Table: 2 BResidential statuses based descriptive statistics of determinants of less cash
economy Determinant of less cash economy
Mean Std. Deviation
Digital literacy Rural 24.07 3.171
Urban 23.60 2.925
Lack of infrastructure Rural 33.44 3.019
Urban 32.40 3.141
Safety and security Rural 22.09 1.945
Urban 20.92 2.683
Network connectivity Rural 8.14 1.271
Urban 7.97 1.237
Poor banking habits Rural 8.24 1.417
Urban 8.05 1.605
Language problem Rural 8.06 1.795
Urban 7.72 1.867
Modern technology Rural 8.84 .976
Urban 9.03 .865
Service charges Rural 4.28 .895
Urban 4.11 .904
Less printing cost of currency Rural 4.38 .836
Urban 4.25 .685
Convenience Rural 24.61 3.488
Urban 24.49 3.350
Solution for currency shortage Rural 4.43 .718
Urban 4.34 .796
reduce black money
Rural 4.39 .801
Urban 4.37 .802
Fight against fake currency Rural 4.47 .751
Urban 4.26 .871
Government schemes Rural 6.87 1.634

International Journal of Management, IT & Engineering Vol. 8 Issue 12(1), December 2018,
ISSN: 2249-0558 Impact Factor: 7.119
Journal Homepage: http://www.ijmra.us, Email: [email protected]
Double-Blind Peer Reviewed Refereed Open Access International Journal - Included in the International
Serial Directories Indexed & Listed at: Ulrich's Periodicals Directory ©, U.S.A., Open J-Gage as well as in
Cabell’s Directories of Publishing Opportunities, U.S.A
83 International Journal of Management, IT & Engineering
http://www.ijmra.us, Email: [email protected]
Urban 7.23 1.412
Exemption from tax Rural 8.01 1.396
Urban 8.06 1.223
Freebies Rural 11.23 1.977
Urban 11.37 1.816
The summery of ANOVA reveals that F – Value of ‘safety and security’ at df – 1/199, p<
.001 is 12.203 which is greater than the table value. Hence we reject the null hypothesis
and concluded that residential area influence the less cash economy. According to the
highest mean score of this factors for rural area indicates that rural people are more
worried about ‘Safety and security’ of digital transactions than urban people.
F – Value of ‘lack of infrastructure’ is significant. F- Value of this factor at df – 1/199, p<
.025 is 5.114 which is greater than the table value. Hence we reject the null hypothesis and
concluded that limited of infrastructure have negative impacts on the less cash economy.
According to the highest mean score of this it can be inferred that rural people consider
‘Lack of infrastructure’ as important factor as compared to urban people, may be because
rural area is lack of infrastructure for digital transactions.
The insignificant F- value highlights that there is no significant difference between
remaining factors. Thus, it can be concluded that respondents of different residential areas
are giving equal importance to digital literacy, language problem, fight against fake
currency, modern technology, Service charges, government schemes, less printing cost of
currency, network connectivity, poor banking habits, convenience, solution for currency
shortage, reduce black money, exemption from tax, Freebies”.
Table – 3 A: Age based summary of ANOVA Determinant of less cash economy
Sum of
Squares
Df Mean
Square
F Sig.
Digital literacy Between Groups 50.948 3 16.983 1.796 .149
Within Groups 1853.772 196 9.458
Total 1904.720 199
Lack of infrastructure Between Groups 20.552 3 6.851 .714 .545
Within Groups 1880.243 196 9.593
Total 1900.795 199
Safety and security Between Groups 20.430 3 6.810 1.326 .267
Within Groups 1006.750 196 5.136
Total 1027.180 199
Network connectivity Between Groups .650 3 .217 .135 .939
Within Groups 314.905 196 1.607
Total 315.555 199
Poor banking habits Between Groups 7.657 3 2.552 1.169 .323
Within Groups 427.863 196 2.183
Total 435.520 199
Language problem Between Groups 19.325 3 6.442 1.972 .119
Within Groups 640.175 196 3.266
Total 659.500 199
Modern technology Between Groups 1.111 3 .370 .412 .744
Within Groups 176.084 196 .898
Total 177.195 199
Service charges Between Groups 2.733 3 .911 1.129 .338
Within Groups 158.142 196 .807
Total 160.875 199
Less printing cost of Between Groups 1.123 3 .374 .594 .619
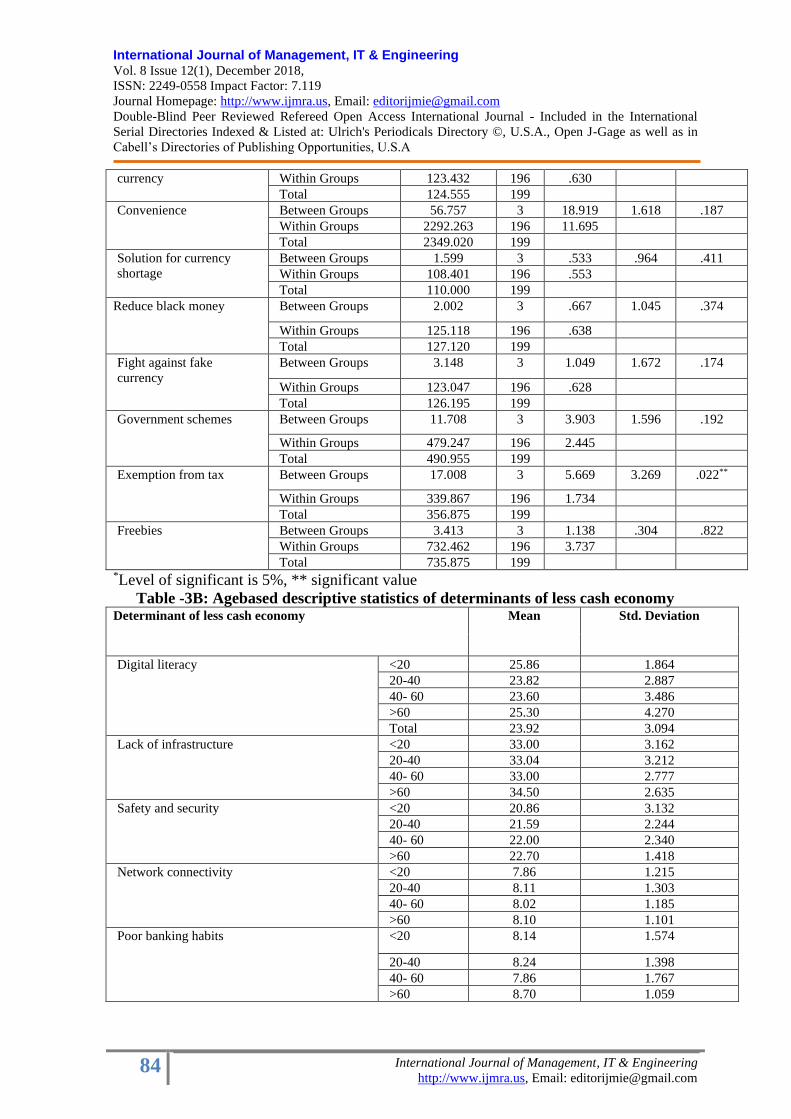
International Journal of Management, IT & Engineering Vol. 8 Issue 12(1), December 2018,
ISSN: 2249-0558 Impact Factor: 7.119
Journal Homepage: http://www.ijmra.us, Email: [email protected]
Double-Blind Peer Reviewed Refereed Open Access International Journal - Included in the International
Serial Directories Indexed & Listed at: Ulrich's Periodicals Directory ©, U.S.A., Open J-Gage as well as in
Cabell’s Directories of Publishing Opportunities, U.S.A
84 International Journal of Management, IT & Engineering
http://www.ijmra.us, Email: [email protected]
currency Within Groups 123.432 196 .630
Total 124.555 199
Convenience Between Groups 56.757 3 18.919 1.618 .187
Within Groups 2292.263 196 11.695
Total 2349.020 199
Solution for currency
shortage
Between Groups 1.599 3 .533 .964 .411
Within Groups 108.401 196 .553
Total 110.000 199
Reduce black money
Between Groups 2.002 3 .667 1.045 .374
Within Groups 125.118 196 .638
Total 127.120 199
Fight against fake
currency
Between Groups 3.148 3 1.049 1.672 .174
Within Groups 123.047 196 .628
Total 126.195 199
Government schemes Between Groups 11.708 3 3.903 1.596 .192
Within Groups 479.247 196 2.445
Total 490.955 199
Exemption from tax Between Groups 17.008 3 5.669 3.269 .022**
Within Groups 339.867 196 1.734
Total 356.875 199
Freebies Between Groups 3.413 3 1.138 .304 .822
Within Groups 732.462 196 3.737
Total 735.875 199 *Level of significant is 5%, ** significant value
Table -3B: Agebased descriptive statistics of determinants of less cash economy Determinant of less cash economy
Mean Std. Deviation
Digital literacy <20 25.86 1.864
20-40 23.82 2.887
40- 60 23.60 3.486
>60 25.30 4.270
Total 23.92 3.094
Lack of infrastructure <20 33.00 3.162
20-40 33.04 3.212
40- 60 33.00 2.777
>60 34.50 2.635
Safety and security <20 20.86 3.132
20-40 21.59 2.244
40- 60 22.00 2.340
>60 22.70 1.418
Network connectivity <20 7.86 1.215
20-40 8.11 1.303
40- 60 8.02 1.185
>60 8.10 1.101
Poor banking habits <20 8.14 1.574
20-40 8.24 1.398
40- 60 7.86 1.767
>60 8.70 1.059

International Journal of Management, IT & Engineering Vol. 8 Issue 12(1), December 2018,
ISSN: 2249-0558 Impact Factor: 7.119
Journal Homepage: http://www.ijmra.us, Email: [email protected]
Double-Blind Peer Reviewed Refereed Open Access International Journal - Included in the International
Serial Directories Indexed & Listed at: Ulrich's Periodicals Directory ©, U.S.A., Open J-Gage as well as in
Cabell’s Directories of Publishing Opportunities, U.S.A
85 International Journal of Management, IT & Engineering
http://www.ijmra.us, Email: [email protected]
Language problem <20 7.29 1.799
20-40 7.93 1.794
40- 60 7.84 1.999
>60 9.20 .789
Modern technology <20 8.57 .976
20-40 8.91 .913
40- 60 8.98 1.035
>60 8.80 1.033
Service charges <20 4.71 .756
20-40 4.23 .884
40- 60 4.09 .971
>60 4.40 .843
Less printing cost of currency <20 4.00 1.000
20-40 4.33 .826
40- 60 4.37 .691
>60 4.50 .527
Convenience <20 24.71 2.984
20-40 24.79 3.314
40- 60 24.33 3.496
>60 22.40 4.695
Solution for currency shortage <20 4.57 .535
20-40 4.34 .775
40- 60 4.51 .703
>60 4.60 .516
reduce black money
<20 4.71 .488
20-40 4.34 .838
40- 60 4.37 .757
>60 4.70 .483
Fight against fake currency <20 4.57 .535
20-40 4.33 .869
40- 60 4.63 .536
>60 4.40 .699
Government schemes <20 6.29 2.360
20-40 6.89 1.503
40- 60 7.37 1.543
>60 7.20 1.874
Exemption from tax <20 6.86 1.864
20-40 8.12 1.226
40- 60 7.77 1.461
>60 8.60 1.506
Freebies <20 10.86 .900
20-40 11.29 1.906
40- 60 11.19 2.119
>60 11.70 1.947
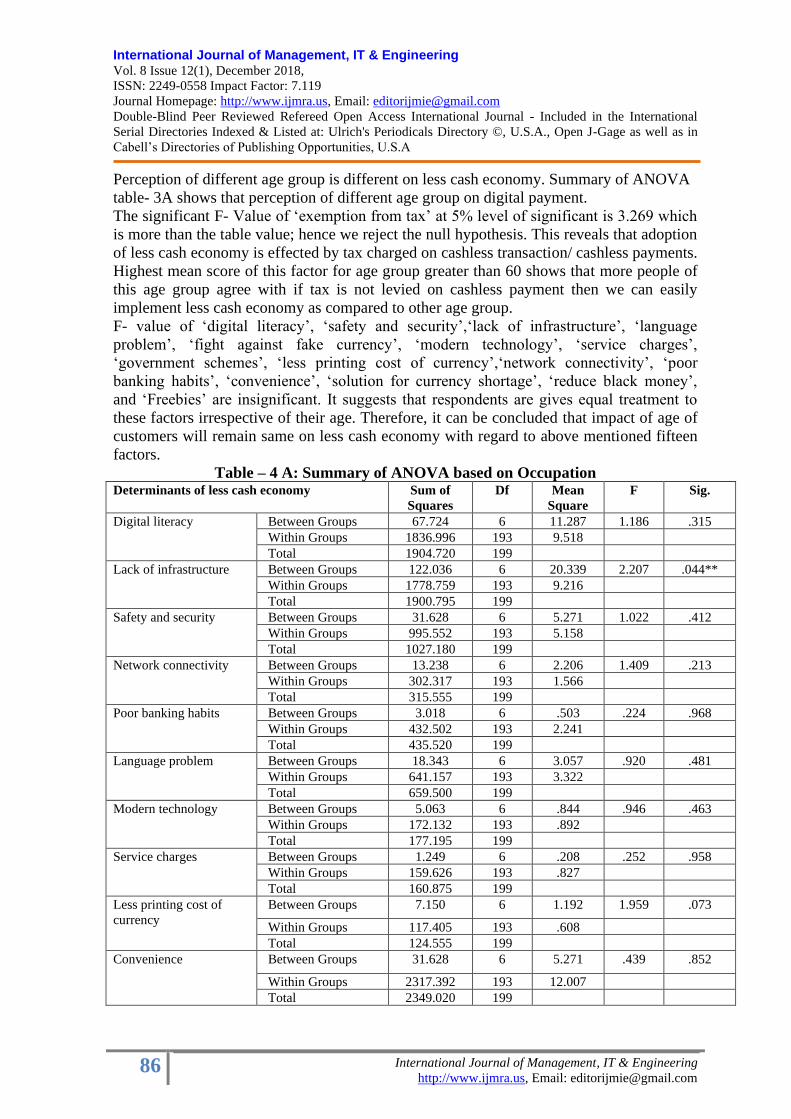
International Journal of Management, IT & Engineering Vol. 8 Issue 12(1), December 2018,
ISSN: 2249-0558 Impact Factor: 7.119
Journal Homepage: http://www.ijmra.us, Email: [email protected]
Double-Blind Peer Reviewed Refereed Open Access International Journal - Included in the International
Serial Directories Indexed & Listed at: Ulrich's Periodicals Directory ©, U.S.A., Open J-Gage as well as in
Cabell’s Directories of Publishing Opportunities, U.S.A
86 International Journal of Management, IT & Engineering
http://www.ijmra.us, Email: [email protected]
Perception of different age group is different on less cash economy. Summary of ANOVA
table- 3A shows that perception of different age group on digital payment.
The significant F- Value of ‘exemption from tax’ at 5% level of significant is 3.269 which
is more than the table value; hence we reject the null hypothesis. This reveals that adoption
of less cash economy is effected by tax charged on cashless transaction/ cashless payments.
Highest mean score of this factor for age group greater than 60 shows that more people of
this age group agree with if tax is not levied on cashless payment then we can easily
implement less cash economy as compared to other age group.
F- value of ‘digital literacy’, ‘safety and security’,‘lack of infrastructure’, ‘language
problem’, ‘fight against fake currency’, ‘modern technology’, ‘service charges’,
‘government schemes’, ‘less printing cost of currency’,‘network connectivity’, ‘poor
banking habits’, ‘convenience’, ‘solution for currency shortage’, ‘reduce black money’,
and ‘Freebies’ are insignificant. It suggests that respondents are gives equal treatment to
these factors irrespective of their age. Therefore, it can be concluded that impact of age of
customers will remain same on less cash economy with regard to above mentioned fifteen
factors.
Table – 4 A: Summary of ANOVA based on Occupation Determinants of less cash economy
Sum of
Squares
Df Mean
Square
F Sig.
Digital literacy Between Groups 67.724 6 11.287 1.186 .315
Within Groups 1836.996 193 9.518
Total 1904.720 199
Lack of infrastructure Between Groups 122.036 6 20.339 2.207 .044**
Within Groups 1778.759 193 9.216
Total 1900.795 199
Safety and security Between Groups 31.628 6 5.271 1.022 .412
Within Groups 995.552 193 5.158
Total 1027.180 199
Network connectivity Between Groups 13.238 6 2.206 1.409 .213
Within Groups 302.317 193 1.566
Total 315.555 199
Poor banking habits Between Groups 3.018 6 .503 .224 .968
Within Groups 432.502 193 2.241
Total 435.520 199
Language problem Between Groups 18.343 6 3.057 .920 .481
Within Groups 641.157 193 3.322
Total 659.500 199
Modern technology Between Groups 5.063 6 .844 .946 .463
Within Groups 172.132 193 .892
Total 177.195 199
Service charges Between Groups 1.249 6 .208 .252 .958
Within Groups 159.626 193 .827
Total 160.875 199
Less printing cost of
currency
Between Groups 7.150 6 1.192 1.959 .073
Within Groups 117.405 193 .608
Total 124.555 199
Convenience Between Groups 31.628 6 5.271 .439 .852
Within Groups 2317.392 193 12.007
Total 2349.020 199

International Journal of Management, IT & Engineering Vol. 8 Issue 12(1), December 2018,
ISSN: 2249-0558 Impact Factor: 7.119
Journal Homepage: http://www.ijmra.us, Email: [email protected]
Double-Blind Peer Reviewed Refereed Open Access International Journal - Included in the International
Serial Directories Indexed & Listed at: Ulrich's Periodicals Directory ©, U.S.A., Open J-Gage as well as in
Cabell’s Directories of Publishing Opportunities, U.S.A
87 International Journal of Management, IT & Engineering
http://www.ijmra.us, Email: [email protected]
Solution for currency
shortage
Between Groups 5.285 6 .881 1.623 .143
Within Groups 104.715 193 .543
Total 110.000 199
Reduce black money
Between Groups 3.715 6 .619 .968 .448
Within Groups 123.405 193 .639
Total 127.120 199
Fight against fake
currency
Between Groups 6.207 6 1.034 1.664 .132
Within Groups 119.988 193 .622
Total 126.195 199
Government schemes Between Groups 28.293 6 4.716 1.967 .072
Within Groups 462.662 193 2.397
Total 490.955 199
Exemption from tax Between Groups 9.543 6 1.591 .884 .508
Within Groups 347.332 193 1.800
Total 356.875 199
Freebies Between Groups 46.297 6 7.716 2.160 .049**
Within Groups 689.578 193 3.573
Total 735.875 199 *Level of significant is 5%, ** significant value
Table – 4 B: Occupationbased descriptive statistics of determinants of less cash
economy Determinant of less cash economy
Mean Std. Deviation
Digital literacy Govt. employee 23.70 3.211
Private employee 23.71 2.452
Student 23.99 3.240
Retired 20.75 5.560
Business 24.33 1.506
House wife 23.91 3.432
Other 25.13 2.500
Lack of infrastructure Govt. employee 34.13 3.494
Private employee 32.50 3.218
Student 32.91 2.815
Retired 33.50 2.646
Business 30.17 4.355
House wife 33.53 2.820
Other 34.25 2.840
Safety and security Govt. employee 21.91 2.466
Private employee 21.38 2.518
Student 21.84 2.054
Retired 20.50 2.646
Business 21.17 3.312
House wife 21.47 2.339
Other 22.69 1.493
Network connectivity Govt. employee 7.57 1.080
Private employee 8.14 1.354
Student 8.04 1.224
Retired 9.25 .500
Business 8.33 1.366
House wife 8.21 1.321
Other 8.25 1.238

International Journal of Management, IT & Engineering Vol. 8 Issue 12(1), December 2018,
ISSN: 2249-0558 Impact Factor: 7.119
Journal Homepage: http://www.ijmra.us, Email: [email protected]
Double-Blind Peer Reviewed Refereed Open Access International Journal - Included in the International
Serial Directories Indexed & Listed at: Ulrich's Periodicals Directory ©, U.S.A., Open J-Gage as well as in
Cabell’s Directories of Publishing Opportunities, U.S.A
88 International Journal of Management, IT & Engineering
http://www.ijmra.us, Email: [email protected]
Poor banking habits Govt. employee 8.35 1.555
Private employee 8.24 1.590
Student 8.05 1.442
Retired 8.50 1.291
Business 8.50 1.517
House wife 8.18 1.218
Other 8.19 1.940
Language problem Govt. employee 7.91 2.065
Private employee 7.93 1.702
Student 7.65 1.907
Retired 8.25 2.363
Business 8.50 .837
House wife 8.21 1.591
Other 8.63 1.928
Modern technology Govt. employee 8.83 .937
Private employee 9.00 .765
Student 8.81 .982
Retired 9.50 .577
Business 9.50 .837
House wife 8.82 .968
Other 9.00 1.211
Service charges Govt. employee 4.35 .935
Private employee 4.17 .824
Student 4.25 .974
Retired 4.00 .000
Business 4.33 1.211
House wife 4.24 .855
Other 4.06 .854
Less printing cost of currency Govt. employee 4.65 .487
Private employee 4.31 .680
Student 4.25 .917
Retired 3.50 1.291
Business 4.17 .753
House wife 4.32 .768
Other 4.63 .500
Convenience Govt. employee 24.61 3.258
Private employee 24.40 3.443
Student 25.03 3.238
Retired 23.50 4.123
Business 24.17 2.563
House wife 24.15 3.971
Other 24.13 3.810
Solution for currency shortage Govt. employee 4.48 .790
Private employee 4.19 .833
Student 4.40 .771
Retired 4.00 .000
Business 5.00 .000
House wife 4.50 .663
Other 4.50 .516
Reduce black money
Govt. employee 4.48 .898
Private employee 4.33 .721
Student 4.37 .835
Retired 3.75 1.258
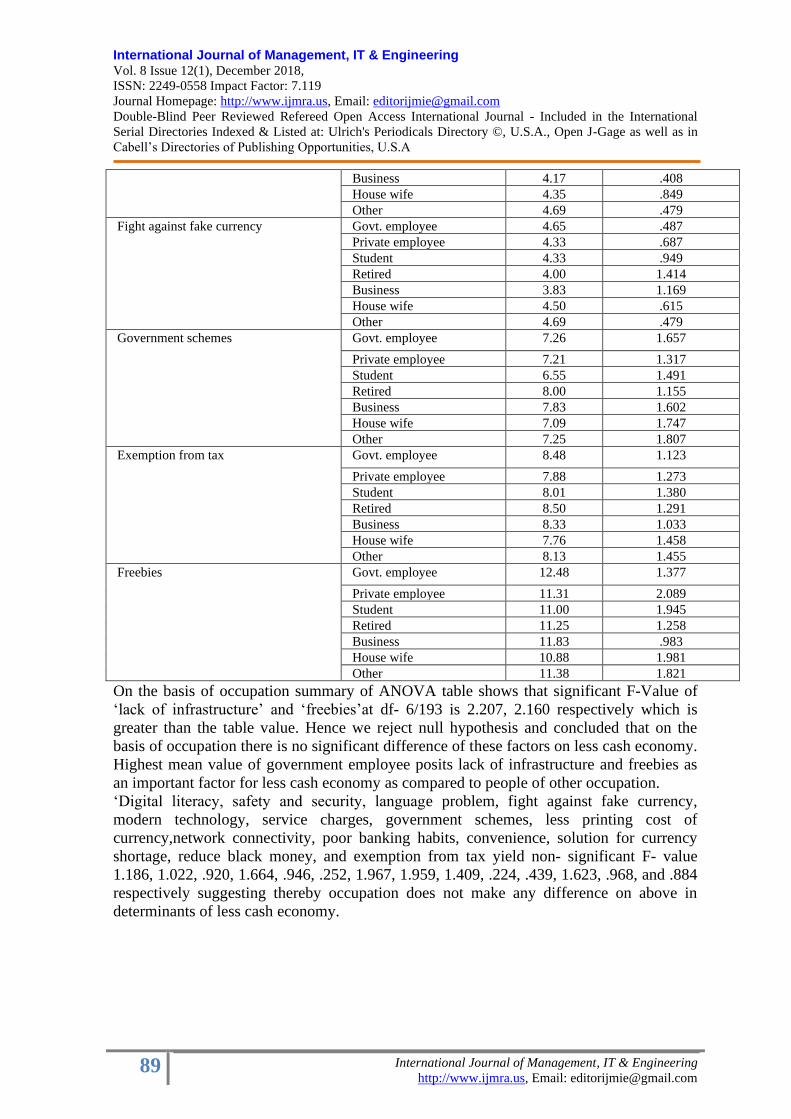
International Journal of Management, IT & Engineering Vol. 8 Issue 12(1), December 2018,
ISSN: 2249-0558 Impact Factor: 7.119
Journal Homepage: http://www.ijmra.us, Email: [email protected]
Double-Blind Peer Reviewed Refereed Open Access International Journal - Included in the International
Serial Directories Indexed & Listed at: Ulrich's Periodicals Directory ©, U.S.A., Open J-Gage as well as in
Cabell’s Directories of Publishing Opportunities, U.S.A
89 International Journal of Management, IT & Engineering
http://www.ijmra.us, Email: [email protected]
Business 4.17 .408
House wife 4.35 .849
Other 4.69 .479
Fight against fake currency Govt. employee 4.65 .487
Private employee 4.33 .687
Student 4.33 .949
Retired 4.00 1.414
Business 3.83 1.169
House wife 4.50 .615
Other 4.69 .479
Government schemes Govt. employee 7.26 1.657
Private employee 7.21 1.317
Student 6.55 1.491
Retired 8.00 1.155
Business 7.83 1.602
House wife 7.09 1.747
Other 7.25 1.807
Exemption from tax Govt. employee 8.48 1.123
Private employee 7.88 1.273
Student 8.01 1.380
Retired 8.50 1.291
Business 8.33 1.033
House wife 7.76 1.458
Other 8.13 1.455
Freebies Govt. employee 12.48 1.377
Private employee 11.31 2.089
Student 11.00 1.945
Retired 11.25 1.258
Business 11.83 .983
House wife 10.88 1.981
Other 11.38 1.821
On the basis of occupation summary of ANOVA table shows that significant F-Value of
‘lack of infrastructure’ and ‘freebies’at df- 6/193 is 2.207, 2.160 respectively which is
greater than the table value. Hence we reject null hypothesis and concluded that on the
basis of occupation there is no significant difference of these factors on less cash economy.
Highest mean value of government employee posits lack of infrastructure and freebies as
an important factor for less cash economy as compared to people of other occupation.
‘Digital literacy, safety and security, language problem, fight against fake currency,
modern technology, service charges, government schemes, less printing cost of
currency,network connectivity, poor banking habits, convenience, solution for currency
shortage, reduce black money, and exemption from tax yield non- significant F- value
1.186, 1.022, .920, 1.664, .946, .252, 1.967, 1.959, 1.409, .224, .439, 1.623, .968, and .884
respectively suggesting thereby occupation does not make any difference on above in
determinants of less cash economy.

International Journal of Management, IT & Engineering Vol. 8 Issue 12(1), December 2018,
ISSN: 2249-0558 Impact Factor: 7.119
Journal Homepage: http://www.ijmra.us, Email: [email protected]
Double-Blind Peer Reviewed Refereed Open Access International Journal - Included in the International
Serial Directories Indexed & Listed at: Ulrich's Periodicals Directory ©, U.S.A., Open J-Gage as well as in
Cabell’s Directories of Publishing Opportunities, U.S.A
90 International Journal of Management, IT & Engineering
http://www.ijmra.us, Email: [email protected]
Table – 5A: Summary of ANOVA based on Qualification
Determinants of less cash economy
Sum of
Squares
df Mean
Square
F Sig.
Digital literacy Between Groups 114.798 3 38.266 4.190 .007**
Within Groups 1789.922 196 9.132
Total 1904.720 199
Lack of infrastructure Between Groups 61.252 3 20.417 2.175 .092
Within Groups 1839.543 196 9.385
Total 1900.795 199
Safety and security Between Groups 3.176 3 1.059 .203 .894
Within Groups 1024.004 196 5.225
Total 1027.180 199
Network connectivity Between Groups 3.647 3 1.216 .764 .516
Within Groups 311.908 196 1.591
Total 315.555 199
Poor banking habits Between Groups .336 3 .112 .050 .985
Within Groups 435.184 196 2.220
Total 435.520 199
Language problem Between Groups 12.441 3 4.147 1.256 .291
Within Groups 647.059 196 3.301
Total 659.500 199
Modern technology Between Groups .851 3 .284 .315 .814
Within Groups 176.344 196 .900
Total 177.195 199
Service charges Between Groups 1.628 3 .543 .668 .573
Within Groups 159.247 196 .812
Total 160.875 199
Less printing cost of
currency
Between Groups .186 3 .062 .098 .961
Within Groups 124.369 196 .635
Total 124.555 199
Convenience Between Groups 132.523 3 44.174 3.906 .010**
Within Groups 2216.497 196 11.309
Total 2349.020 199
Solution for currency
shortage
Between Groups .080 3 .027 .047 .986
Within Groups 109.920 196 .561
Total 110.000 199
Reduce black money Between Groups 1.586 3 .529 .826 .481
Within Groups 125.534 196 .640
Total 127.120 199
Fight against fake currency Between Groups .958 3 .319 .500 .683
Within Groups 125.237 196 .639
Total 126.195 199
Government schemes Between Groups 7.950 3 2.650 1.075 .361

International Journal of Management, IT & Engineering Vol. 8 Issue 12(1), December 2018,
ISSN: 2249-0558 Impact Factor: 7.119
Journal Homepage: http://www.ijmra.us, Email: [email protected]
Double-Blind Peer Reviewed Refereed Open Access International Journal - Included in the International
Serial Directories Indexed & Listed at: Ulrich's Periodicals Directory ©, U.S.A., Open J-Gage as well as in
Cabell’s Directories of Publishing Opportunities, U.S.A
91 International Journal of Management, IT & Engineering
http://www.ijmra.us, Email: [email protected]
Within Groups 483.005 196 2.464
Total 490.955 199
Exemption from tax Between Groups 3.466 3 1.155 .641 .590
Within Groups 353.409 196 1.803
Total 356.875 199
Freebies Between Groups 2.000 3 .667 .178 .911
Within Groups 733.875 196 3.744
Total 735.875 199 *Level of significant is 5%, **significant value
Table –5 B: Qualificationbased descriptive statistics of determinants of less cash economy Determinants of less cash economy
Mean Std. Deviation
Digital literacy Up to 12 25.48 2.931
Diploma 24.71 2.369
Graduate 23.70 2.941
Post graduate and Research studies
(M.Phil/Ph.D)
23.27 3.349
Total 23.92 3.094
Lack of infrastructure Up to 12 34.56 2.873
Diploma 32.77 3.201
Graduate 32.89 3.005
Post graduate and Research studies
(M.Phil/Ph.D)
32.96 3.121
Total 33.11 3.091
Safety and security Up to 12 21.96 2.189
Diploma 21.48 2.502
Graduate 21.73 2.226
Post graduate and Research studies
(M.Phil/Ph.D)
21.70 2.280
Total 21.71 2.272
Network connectivity Up to 12 8.12 1.130
Diploma 7.77 1.117
Graduate 8.17 1.372
Post graduate and Research studies
(M.Phil/Ph.D)
8.12 1.249
Total 8.09 1.259
Poor banking habits Up to 12 8.28 1.646
Diploma 8.16 1.734
Graduate 8.19 1.397
Post graduate and Research studies
(M.Phil/Ph.D)
8.15 1.411
Total 8.18 1.479
Language problem Up to 12 8.48 1.686
Diploma 8.03 1.643
Graduate 8.00 1.761
Post graduate and Research studies
(M.Phil/Ph.D)
7.69 1.972
Total 7.95 1.820
Modern technology up to 12 8.80 1.118
Diploma 8.90 .746

International Journal of Management, IT & Engineering Vol. 8 Issue 12(1), December 2018,
ISSN: 2249-0558 Impact Factor: 7.119
Journal Homepage: http://www.ijmra.us, Email: [email protected]
Double-Blind Peer Reviewed Refereed Open Access International Journal - Included in the International
Serial Directories Indexed & Listed at: Ulrich's Periodicals Directory ©, U.S.A., Open J-Gage as well as in
Cabell’s Directories of Publishing Opportunities, U.S.A
92 International Journal of Management, IT & Engineering
http://www.ijmra.us, Email: [email protected]
Graduate 8.99 1.000
Post graduate and Research studies
(M.Phil/Ph.D)
8.86 .911
Total 8.91 .944
Service charges Up to 12 4.12 .971
Diploma 4.42 .765
Graduate 4.23 .920
Post graduate and Research studies
(M.Phil/Ph.D)
4.18 .912
Total 4.23 .899
Less printing cost of currency Up to 12 4.36 .860
Diploma 4.39 .803
Graduate 4.30 .823
Post graduate and Research studies
(M.Phil/Ph.D)
4.34 .745
Total 4.34 .791
Convenience Up to 12 22.84 4.017
Diploma 24.23 3.232
Graduate 25.44 2.749
Post graduate and Research studies
(M.Phil/Ph.D)
24.47 3.691
Total 24.57 3.436
Solution for currency shortage Up to 12 4.40 .645
Diploma 4.35 .915
Graduate 4.41 .648
Post graduate and Research studies
(M.Phil/Ph.D)
4.41 .792
Total 4.40 .743
Reduce black money
Up to 12 4.60 .707
Diploma 4.35 .915
Graduate 4.39 .804
Post graduate and Research studies
(M.Phil/Ph.D)
4.31 .775
Total 4.38 .799
Fight against fake currency Up to 12 4.32 .748
Diploma 4.52 .570
Graduate 4.34 .866
Post graduate and Research studies
(M.Phil/Ph.D)
4.45 .830
Total 4.41 .796
Government schemes Up to 12 7.48 1.711
Diploma 6.84 1.809
Graduate 6.86 1.386
Post graduate and Research studies
(M.Phil/Ph.D)
7.00 1.579
Total 6.99 1.571
Exemption from tax Up to 12 7.92 1.778
Diploma 7.77 1.606
Graduate 8.16 1.175
Post graduate and Research studies
(M.Phil/Ph.D)
8.04 1.199
Total 8.03 1.339

International Journal of Management, IT & Engineering Vol. 8 Issue 12(1), December 2018,
ISSN: 2249-0558 Impact Factor: 7.119
Journal Homepage: http://www.ijmra.us, Email: [email protected]
Double-Blind Peer Reviewed Refereed Open Access International Journal - Included in the International
Serial Directories Indexed & Listed at: Ulrich's Periodicals Directory ©, U.S.A., Open J-Gage as well as in
Cabell’s Directories of Publishing Opportunities, U.S.A
93 International Journal of Management, IT & Engineering
http://www.ijmra.us, Email: [email protected]
Freebies Up to 12 11.12 2.108
Diploma 11.48 1.895
Graduate 11.26 1.775
Post graduate and Research studies
(M.Phil/Ph.D)
11.26 2.034
Total 11.28 1.923
The ANOVA table 5(B) indicates the significant F – Value of ‘digital literacy’ at df –
3/196 is 4.190which is greater than the table value. Hence we reject the null hypothesis and
concluded that educational qualification influence the less cash economy. High mean
score of these factors is for qualification up to 12th standard which indicates that customers
upto 12th standard qualification have more problem of ‘digital literacy, language and
limited infrastructure’ than higher qualified people.
The significant F value of ‘convenience’ is 3.906 at df- 3/196 p< .010, reveals that people
of different qualification differon convenience factor. The highest mean score (table 31B)
of this factor for graduate people reveals that graduate people feel more convenient as
comparedto people of other qualification.
The insignificant F- value of “Lack of infrastructure, language problem, safety and
security, network connectivity, poor banking habits, modern technology, service charges,
reduce cost of currency, solution for currency shortage, reduce black money, fight against
fake currency, exemption from tax, government schemes and freebies” indicates that
people are giving equal treatment to above factor irrespective of qualification. Hence, it
can be concluded that education does not make any difference among people with regards
to these above mentioned determinants of less ash economy.
Findings
Based on analysis following findings has been emerged:
❖ Less cash/ cashless economy creates, clean and transparent economic. Less cash/
cashless economy is beneficiary for government as well as for public. It solve various
problems like- black money, corruption, fake currency, problem of changes, fear of
theft, transfer of money from anywhere within a minutes, etc.
❖ Out of online and offline banking services, mostly people prefers offline banking
services.
❖ Maximum people choose biometric as security of cashless transactions.
❖ In India implementation of less cash economy/ cashless economy is not so easy but
also time consuming. Because you need to swipe card on swipe machine, then enter
PIN and wait till merchant do not get confirmation.
❖ On a Smartphone, some people do not have internet connection, and phone application
which supports all language.
❖ Cashless transaction means that each and every transaction are tracked and documented
which is beneficiary for government because of all transactions are disclosed and
taxed. It increases the government income, reduces corruption, black money,
expenditure on printing currency and abolition of parallel economy.
❖ Security is also a reason not to make cashless payments. The reason of less security of
the transactions is not only technology but also lack of awareness about security issue
among users.
❖ Cashless transaction puts burden of additional charges on consumers and merchants.
Customer pays extra charges in form of transaction charges and merchants pay MDR
(Merchant Discount Rate).

International Journal of Management, IT & Engineering Vol. 8 Issue 12(1), December 2018,
ISSN: 2249-0558 Impact Factor: 7.119
Journal Homepage: http://www.ijmra.us, Email: [email protected]
Double-Blind Peer Reviewed Refereed Open Access International Journal - Included in the International
Serial Directories Indexed & Listed at: Ulrich's Periodicals Directory ©, U.S.A., Open J-Gage as well as in
Cabell’s Directories of Publishing Opportunities, U.S.A
94 International Journal of Management, IT & Engineering
http://www.ijmra.us, Email: [email protected]
❖ Education, residential status and occupation influence the less cash economy up to
some extent.
❖ Age does not have any effects on the less cash economy.
Conclusion
The less cash economy is the need of the day. Lot of efforts is being made in this direction.
Less cash economy effected by factors such asdigital literacy, lack of infrastructure, safety
and security, connectivity, poor banking habits, language problem, modern technology,
service charges, less printing cost of currency, convenience, solution for currency shortage,
reduce black money, fight against fake currency, government schemes, exemption from
tax, freebies etc. Thus it can be concluded that the above factors must be considered to
make a less cash economy or digital economy.
Recommendations
The following recommendations are being made in the light of the finding of the present
study:
1. For customer awareness towards cashless payment modes, training and educational
programs should be conducted. Trainer should make the customers aware about
financial and digital literacy as well as how to use related instruments.
2. Poor internet connectivity is big challenges in adopting the less cash economy. So
internet facility should be provided by government in villages or remote areas.
Government also gives special benefits to networking companies for giving internet
service in remote areas.
3. Internet charges should be lower and free Wi-Fi should also provide at public place and
remote areas.
4. The government must make cashless payment compulsory at some places like metro
stations, school, colleges, petrol pumps, toll points, malls, airports, jewelers shop’s ,etc.
5. Student should be responsible for adopting cashless payment modes and train own
family for making cashless payment
6. All bank and digital apps should provide all detail either in compulsory language or
local or regional language.
7. Government must introduce such system which keeps customer’s data, safe and secure.
8. Digital payment companies should gives incentives like cash back or discount on
cashless payment to encourage customers and benefits of these incentives transfer
directly to customer’s bank account.

International Journal of Management, IT & Engineering Vol. 8 Issue 12(1), December 2018,
ISSN: 2249-0558 Impact Factor: 7.119
Journal Homepage: http://www.ijmra.us, Email: [email protected]
Double-Blind Peer Reviewed Refereed Open Access International Journal - Included in the International
Serial Directories Indexed & Listed at: Ulrich's Periodicals Directory ©, U.S.A., Open J-Gage as well as in
Cabell’s Directories of Publishing Opportunities, U.S.A
95 International Journal of Management, IT & Engineering
http://www.ijmra.us, Email: [email protected]
References
❖ Duemmler, Tobias and Kienle, Stephan (2012), “A central Bank’s role in cashless
payment”, International business and economics research journal, 11(7), pp. 827-832.
❖ Kaur, Manpreet (2017), “Demonetization Impact on cashless payment system”,
International conference on recent trend in Engineering, Science & Management, pp.
680-685.
❖ Kumar, Arvind (2017), “Demonetization and cashless banking transaction in India.”
International Journal of New innovations in Engineering and Technology, 7(3), pp. 30-
36.
❖ Ragaventhar,R. (2016), “Cashless economy leads to knowledge economy through
knowledge management.” Global Journal of management and business research
economics & commerce, 16(8).
❖ Ramya, N and Sivasakthi, D and Nandhini, M (2017), “Cashless transaction: modes,
advantages and disadvantages.” International Journal of applied research, 3(1), pp.
122-125.
❖ Kothari, C.R., Factor Analysis, Vikas publication house Pvt. Ltd., New Delhi, 1958;
pp. 348- 362.
❖ Websites
• www.thehindubusinessline.com
• www.business-standard.com
• www.upipayments.co.in
• www.cashlessindia.gov.in
• www.financialexpress.com

International Journal of Management, IT & Engineering Vol. 8 Issue 12(1), December 2018,
ISSN: 2249-0558 Impact Factor: 7.119
Journal Homepage: http://www.ijmra.us, Email: [email protected]
Double-Blind Peer Reviewed Refereed Open Access International Journal - Included in the International
Serial Directories Indexed & Listed at: Ulrich's Periodicals Directory ©, U.S.A., Open J-Gage as well as in
Cabell’s Directories of Publishing Opportunities, U.S.A
96 International Journal of Management, IT & Engineering
http://www.ijmra.us, Email: [email protected]
A Study on Technological Challenges Faced by SMEs in Biotech
Sector
Pawandeep Singh
Dr. Tanveer Ahmad Dar
Abstract
We are fortunate to be living in the Golden Age of Biotechnology. Though the bio-tech
industry has traditionally been perceived as a high risk business and has faced
unprecedented challenges, it holds the promise to solve some of the major problems being
faced by mankind. There is little to doubt that Regenerative Medicine is one of the most
exciting fields in the Health care domain of Biotechnology. RM promises to treat vast
range of currently intractable clinical conditions, with newer applications being innovated
all the time.
Keywords: Cost-benefit Analysis, Clinical adoption, Reimbursement
Introduction
Though the exact commercialized value of RM is hard to predict, conservative estimates
(MARS 2008, Mason et al 2008, Devon Smith et al 2008) seem to suggest that it is already
crossed the billion dollar mark.”
a) Manufacturing Challenges
• Interdisciplinary research capability
• Translation from lab to clinic, a formulation with clinical-grade reagents, implementing
GMP.
• Product Design for Excellence in design and manufacture
• Batch sizes and scaling up/out of the process (choice of the facility)
• Sourcing key raw materials, contingency planning, andbackup suppliers
• Reducing the incidence of batch failure
• Minimizing contamination (especially from autologous products)
• Managing clean room shutdowns and product supply
Discussion
As with any new biopharma venture, the first issue is GMP manufacture (Archer and
Williams 2005) of a commercially viable product and in the case of RM the product should
either target a hitherto incurable disease or vastly improve its current treatment. The
interdisciplinary research team must first select a stem cell type and its appropriate
sourcing. This is to be followed by cell processing in which the cell line must be screened
and expanded while taking care to repress the biomarker. The production process must
ensure reproducible culturing of suitably potent stem cells at a cost acceptable to the
regulator. Kaizen or continuous improvement of the process is a must to get a quality
controlled batch of cells that can be used for animal testing.
Once a CTC has been identified, it begins the arduous journey through the (Mason et al
2010) various phases of this translational cycle. The trouble is that the CTC may fail at any
stage in its transition from Prototype design, through the various stages of its pre-clinical
Ph.D. Research Scholar, Department of Management, Bhagwant University, Ajmer Rajasthan Assistant Professor, Bhagwant University, Ajmer, Rajasthan

International Journal of Management, IT & Engineering Vol. 8 Issue 12(1), December 2018,
ISSN: 2249-0558 Impact Factor: 7.119
Journal Homepage: http://www.ijmra.us, Email: [email protected]
Double-Blind Peer Reviewed Refereed Open Access International Journal - Included in the International
Serial Directories Indexed & Listed at: Ulrich's Periodicals Directory ©, U.S.A., Open J-Gage as well as in
Cabell’s Directories of Publishing Opportunities, U.S.A
97 International Journal of Management, IT & Engineering
http://www.ijmra.us, Email: [email protected]
and clinical testing. The whole process may take years with billions of dollars spent, to
emerge from an investigative new drug ready to face further safety trials. The highest
failure rate is at this stage as the volume of basic science required is immense and the
clinical trials expensive and time and resource-sapping. This has been identified as a
Translationalgap.
Translation is a fundamental issue andHongsermeier 2005 points out that despite
possessing interdisciplinary research capability, knowledge-bases will need to support
caregiver and consumer-based decision support requirements. KM will play a critical role
in translating research insights from the life sciences to clinical practice and vice versa and
that market drivers will continue to make Knowledge Management an imperative for
Translational Medicine. Genomics and personalized medicine will require decision support
architectures that can proactively support complex decision making – answering thousands
of decision support queries in a near real-time manner.
1.2.2.2 Quality
• Implementing a Total Quality Management System: Continuous improvement
• The insufficient (autologous) product is available for quality testing?
• Assay development (in-process and end-of-product)
• Validation issues (implementing DQ, IQ, OQ, PQ and process validation)
• Product specifications (incoming materials and release criteria, parametric release)
• Automation for reproducible results, controlled differentiation.
Discussion
The importance of process capability of an automated, scalable system as a platform
suitable for the production of anchorage-dependent cells in sufficient volumes for
regenerative medicine applications has been demonstrated amply in the study by (Liu and
Williams 2010) The regulatory mechanism lays down the technical requirements to
demonstrate the quality safety(Singh et al 2010) and efficacy as well as standards for
donation procurement testing processing preservation storage distribution as well as the
GMP and GCP, ethical compliances issues. the requirements for authorization product
packaging and labeling combined with adverse reaction follow up and risk management
system.
1.2.3. Clinical adoption
• Preparing clinical trial submissions
• Quantifiable endpoints
• Managing CRO’s and their costs
• Meeting expectation with regard to recruitment rates
• Appropriate inclusion & exclusion criteria (and criteria shift)
• Selecting the best mix of physicians and convincing them.
• Post-trial surveillance and monitoring.
• Dose, potency, and route of administration.
• Managing complications or side effects
Discussion
The clinical conditions for the success of SMEs are (Singh and Williams 2008) related to
the identification of a disease target and elucidating it's pathophysiological profile,
developing defined end points and obtaining initial success in animal models. Further, the
human trials that follow must necessarily substantially prove that the intervention is
symptom ameliorating and show beyond doubt that there is a functional improvement in

International Journal of Management, IT & Engineering Vol. 8 Issue 12(1), December 2018,
ISSN: 2249-0558 Impact Factor: 7.119
Journal Homepage: http://www.ijmra.us, Email: [email protected]
Double-Blind Peer Reviewed Refereed Open Access International Journal - Included in the International
Serial Directories Indexed & Listed at: Ulrich's Periodicals Directory ©, U.S.A., Open J-Gage as well as in
Cabell’s Directories of Publishing Opportunities, U.S.A
98 International Journal of Management, IT & Engineering
http://www.ijmra.us, Email: [email protected]
the specific disease stage without giving rise to any complications. The the remaining
issue of administration is the determination of their type, dose and delivery methods
followed by designing and executing clinical trials. This must be followed by post-trial
surveillance to observe the long-term effect of the therapy
1.2.4. Commercial
• Evolve a strategy to mitigate risk
• Cost-benefitAnalysis: efficacy studies
• Availability of initial funding and support from the govt.
• Keeping investors and other stakeholders satisfied
• A closer interface between Researcher, Manufacturer, and Regulator(Translational
institutes)
• Modeling cost of goods and average selling price
• Identifying hidden costs (associated with quality testing, shipping etc.)
• Understanding reimbursement, forecasting of profits.
• Cold chain shipping of short shelf-life products
• Minimizing shipping delays (especially at customs)
• Shipping validation (ensuring product is viable on arrival at the clinic)
• Good Distribution Practice
• Maintaining sterility
• Finding the right partner/distributor.
• Trade associations to leverage strengths since this are a capital intensive, high-risk
field.
• Clustering of the industry to reduce costs
• An ability to identify newly emerging opportunities, tap new markets, and technologies
Discussion
A fledgling RM SME is surrounded by a plethora of other issues, shrouded in uncertainty,
that threaten to overwhelm it. Foremost among these issues is the prospect of seamless
financing of its pressing capital requirement(Mcallister et at 2008) For start-up companies
particularly in US a diversity of funding sources exist like university sponsored start-up
funds, state grants and bonds, patient advocacy group, family foundations, angel donors
venture capitalists DAPRA and other federal agencies and US Small Business Innovation
Research (SBIR ) and STTR)Small Business Technology Transfer exist that kindle
partnership.
Clustering of SME, for easy access to technical advice, is a critical factor (success of
Santiago and Bangalore based biotech clusters) for the industry to flourish. Clustering can
also facilitate the formation of trade associations to leverage strengths since this is a capital
intensive, high-risk field. Further a closer interface between Researcher, Manufacturer and
Translational institutes is crucial and clustering can help in reducing costs, for example,
ReNeuron that recently received approval for clinical trials for using neural stem cells for
treating stroke victims (Sniden CEO Reneuron) points out that it is primarily a research-
basedorganization and thus outsources manufacturing. .
An analysis of the failure of cell-based companies (Smith et al 2008, Johnson et al 2010,)
can be a good indicator of the mistakes to be avoided by others. Inability to build a suitably
innovative and profitable business model, for example, ATS and Organosynthesis cases
show that having a clinically approved product alone does not guarantee commercial
success. Products that offer scarce benefits over existing less expensive traditional

International Journal of Management, IT & Engineering Vol. 8 Issue 12(1), December 2018,
ISSN: 2249-0558 Impact Factor: 7.119
Journal Homepage: http://www.ijmra.us, Email: [email protected]
Double-Blind Peer Reviewed Refereed Open Access International Journal - Included in the International
Serial Directories Indexed & Listed at: Ulrich's Periodicals Directory ©, U.S.A., Open J-Gage as well as in
Cabell’s Directories of Publishing Opportunities, U.S.A
99 International Journal of Management, IT & Engineering
http://www.ijmra.us, Email: [email protected]
therapies can prove to be costly disasters, given the potentially disruptive nature of the
product.
1.2.5 Reimbursement
• Classification of the product as Device or Drug?
• Substantially manipulated cell? Classify product as ATMP approach EMEA.
• Present data for proving quality, safety, and efficacy.
• No significant cell manipulation? Classify as Non ATMP.
• For subsequent manufacture storage and distribution approach MHRA.
• For obtaining a licence to ethically procure human cells approach HTA.
• The Gene Therapy Advisory Committee (GTAC) conducts clinical trials involving
stem cells as well as that involving gene therapy.
• Multiple agencies No umbrella system- one size fits all model.
• Reimbursement model is based on inclement QALYs, willingness to pay (WTP) and
Headroom analysis and return on investment analysis.
Discussion
Reimbursement decisions in healthcare systems with finite resources are increasingly
influenced by formal health economic analysis (Cash et al 2007). It is therefore sensible for
a company considering the development of a new medical technology to assess its
potential cost-effectiveness as early as possible in the development cycle.
Cost-benefit Analysis
Return on investment may be affected by the prevalence of a disease, For instance, a
disease that occurs only in very poor strata of the society may not be a good target for the
∆expensive RM option. Thus a cost-benefit analysis is based on the difference between the
two, and a firm must aim to quantify the incremental cost-effectiveness ratio (ICER)
ICER=∆Cost/∆QALY
ICER is thus defined as the extra cost per unit of benefit when comparing two treatments.
The newly proposed RM option, versus the gold standard existing treatment for the
specific condition.
The comparator should be the current gold standard for therapy for a specific condition, as
only an improvement on this performance will support the reimbursement of a new
technology.
QALYs are calculated as the sum of the product of the of the mean utility
The cost of health care is split between mixtures of private for-profit payer agencies.
The United Kingdom (UK)’s healthcare system is primarily public, with 80% of funding
coming from taxation, 12% from national insurance, 4% from charges and miscellaneous,
3% from Trust interest receipts and 1% from capital receipts (European Observatory on
Health Care Systems 2002). Approximately three-quarters of the UK National Health
Service (NHS) budget goes to the Primary Care Trusts (PCTs), who are responsible for
delivering health care and health improvements within a local area. PCTs are grouped into
regional Strategic Health Authorities (SHAs); these groups help develop local NHS
strategy and provide a link between PCTs and the national Department of Health. PCTs
provide a range of community health services, including funding for general practitioners,
medical prescriptions, and commissioning of the hospital and mental health services, as
such they are considered key stakeholders in healthcare decision making. Value for money
at the national level is commonly assessed through a process of Health Technology
Assessment (HTA).

International Journal of Management, IT & Engineering Vol. 8 Issue 12(1), December 2018,
ISSN: 2249-0558 Impact Factor: 7.119
Journal Homepage: http://www.ijmra.us, Email: [email protected]
Double-Blind Peer Reviewed Refereed Open Access International Journal - Included in the International
Serial Directories Indexed & Listed at: Ulrich's Periodicals Directory ©, U.S.A., Open J-Gage as well as in
Cabell’s Directories of Publishing Opportunities, U.S.A
100 International Journal of Management, IT & Engineering
http://www.ijmra.us, Email: [email protected]
1.2.5 Research Gap:
The review of the literature shows that there is a growing realization that in the developed
market growth is slow. The actual growth figures fall woefully short of the overhyped
figures churned out by the overenthusiastic trade pundits (Lysaght et al 2003,2008) as the
very large number of seemingly insurmountable challenges threaten to slow the growth of
the RM industry in the developed world. (Mangematin et al 2003) emphasizes the need
for geographic expansion to conquer new markets. Founded on the basis of a local or
national market, firms with recognized competencies in a market niche can expand by
conquering new markets, either in sectors neighboring those in which their competencies
are recognized.
1.2.6 An ability to identify newly emerging opportunities, tap new markets, and
technologies
For many SMEs, national frontiers still represent a significant barrier to expanding their
business and they still depend largely, or solely, on their domestic markets. Current
estimates indicate that only one-fifth of European SMEs have exports and only 3 % of
SMEs have subsidiaries, branches or joint ventures abroad. Even more worryingly,
internationalization is still not even considered by a substantial percentage of European
SMEs despite the fact that SMEs are already exposed to strong international competition
even within their own internal markets.
Studies have already demonstrated the direct link between internationalization and the
increased performance of SMEs. Proactive internationalization reinforces growth,
enhances competitiveness and supports the long-term sustainability of the company.
Despite its advantages, going abroad is still a big step for most small companies. They
simply do not have the resources and the contacts which could alert them to suitable
business opportunities, potential partners and openings in foreign markets. In addition, the
financial investment needed to launch into the international arena can be a significant
barrier to many SMEs. Also, the dynamic character of barriers means that difficulties will
evolve with the degree of internationalization of the company.
Bibliography
1. Flynn P, Jingling J, Shoemaker D. converging technologies to enable induced
pluripotent stem cells in drug discovery. Regenerative medicine. 2010; 5(4):489-91.
2. Friedman Y. For success in biotechnology, look beyond biotechnology. Journal of
Commercial Biotechnology. 2010; 16(4):279-280.
3. Evens RP, Kaitlin KI. The biotechnology innovation machine: a source of intelligent
biopharmaceuticals for the pharmacy industry—mapping biotechnology’s
success. Clan Parcel Therapy. 2014; 95(5):528–32. Doe: 10.1038/clpt.2014.14.
4. Gasman O, Henkel E, Chesbrough H. The future of open innovation.Management.
2010:213-221.
5. Greener M. The good, the bad and the ugly red tape of biomedical research. How could
regulators lower bureaucratic hurdles in clinical research without compromising the
safety of patients? EMBO reports. 2009; 10(1):17-20.
6. Greenwood HL, Singer P a, Downey GP, et al. Regenerative medicine and the
developing world. Plops medicine. 2006; 3(9):e381. .
7. Gundog an M. An implementation model of a quality management information scheme
for cellular manufacturing environments. 2010.

International Journal of Management, IT & Engineering Vol. 8 Issue 12(1), December 2018,
ISSN: 2249-0558 Impact Factor: 7.119
Journal Homepage: http://www.ijmra.us, Email: [email protected]
Double-Blind Peer Reviewed Refereed Open Access International Journal - Included in the International
Serial Directories Indexed & Listed at: Ulrich's Periodicals Directory ©, U.S.A., Open J-Gage as well as in
Cabell’s Directories of Publishing Opportunities, U.S.A
101 International Journal of Management, IT & Engineering
http://www.ijmra.us, Email: [email protected]
8. Harvey O. Innovation and commercialization in the stem cell industries in Australia:
State strategies and other opportunities to build a competitive position in the global
stem cell economy. Journal of Commercial Biotechnology. 2009; 16(1):72-83.
9. Hague J, Symbolic B, Imia A, Stevens R. Strengthening the Competitiveness of
Eastern European SME Clusters by implementing an. In: veforumcom. 2007.
10. Implications for regenerative medicine and society. Regenerative medicine. 2009;
4(2):147-8...
11. Hongsermeier T, Kashia V. A Knowledge Management platform for Translational
Medicine.AMIA ... Annual Symposium proceedings / AMIA Symposium. AMIA
Symposium. 2005:984.
12. Joseph KJ Chained C. Handbook of Innovation Systems and Developing Countries.
Learning.
13. Cameraman S, Kobayashi H, Sue takes T. Model for SME Sector Development. In:
Proceedings of the 2001 System Dynamics Conference. System Dynamics Society;
2001.
14. Keep MM, Gasman O. The Past and the Future of International Entrepreneurship: A
Review and Suggestions for Developing the Field. Journal of Management. 2009;
35(3):600-633.

International Journal of Management, IT & Engineering Vol. 8 Issue 12(1), December 2018,
ISSN: 2249-0558 Impact Factor: 7.119
Journal Homepage: http://www.ijmra.us, Email: [email protected]
Double-Blind Peer Reviewed Refereed Open Access International Journal - Included in the International
Serial Directories Indexed & Listed at: Ulrich's Periodicals Directory ©, U.S.A., Open J-Gage as well as in
Cabell’s Directories of Publishing Opportunities, U.S.A
102 International Journal of Management, IT & Engineering
http://www.ijmra.us, Email: [email protected]
A Study on Reproductive Health among Tribal Women
A. ILAIYARAJA
Dr.P.K.MUTHUKUMAR
Abstract
The present study aimed to find the reproductive health among the tribal women. The
study was carried out with 298 tribal women and they were selected through purposive
sampling method from two tribal villages. The interview schedule made by the researcher
was employed as the research instrument. The obtained data were analyzed using the
required statistical tools. From the results, it was found that most of the tribal women were
educated, having an occupation in agriculture with monthly income around Rs. 3000 to Rs.
6000. In regard to reproductive health care awareness and practices, most of the tribal
women were poor in it. When the knowledge regard to the birth control and practices most
of the tribal women were good in that. Thus the results show that the awareness of
reproductive health among tribal women should be improvised.
Keywords: Health, Tribal Women, Reproductive Health, Health Care Practices.
Introduction
The concept of health differs from one society to other society. Every society hastheir own
style of identifying, diagnosing and treating an illness. According to WHO, health is
defined as ‘a state of complete physical, mental and social well-being and not merely the
absence of diseases or infirmity’. It is a state of dynamic equilibrium within us. Generally,
good health is essential for all living being for its normal and essential functions. Only with
healthy individuals a healthy society is possible which an essential aspect of a country is.
There is a chance for the health to get affected by various reasons like poor nutrition,
hygiene, lack of awareness about the diseases, poor environment etc. This ill health
condition may affect the individual in various aspects affecting their routine life. Ill health
is a state of instability, failure of self-regulation, loss of function with oneself and the
environment (Sonowal 2010). Being in ill health spoils an individual’s productivity and
efficiency.
The tribals are the group of people who usually live in remote areas like hilly and forest
places and they often remain untouched and isolated by modern civilization and lacks the
developmental processes that happening around them. Generally, the tribal health status in
India is found to be poor and it seems to be affected by the general poverty, malnutrition,
illiteracy, absence of sanitary living conditions, poor maternal and child health services
which makes them be the vulnerable population’ (Singh 2008).
Among the tribals, tribal women play a major role in shaping their society. Therefore their
health is to be taken care much. The reproductive health of tribal women should be given
utmost importance because; the future generation’s health largely depends on it. If uncared,
they are more prone to get reproductive health issues due to various factors.
Ph. D Research Scholar, Department of Sociology, Annamalai University-608002 Assistant Professor, Department of Sociology, Annamalai University-608002

International Journal of Management, IT & Engineering Vol. 8 Issue 12(1), December 2018,
ISSN: 2249-0558 Impact Factor: 7.119
Journal Homepage: http://www.ijmra.us, Email: [email protected]
Double-Blind Peer Reviewed Refereed Open Access International Journal - Included in the International
Serial Directories Indexed & Listed at: Ulrich's Periodicals Directory ©, U.S.A., Open J-Gage as well as in
Cabell’s Directories of Publishing Opportunities, U.S.A
103 International Journal of Management, IT & Engineering
http://www.ijmra.us, Email: [email protected]
Reproductive health and its issues of tribal women are of great concern today. The care and
need for such concern haveraised due to the traditions and customs the tribal women carry
out during childbearing. Most of the practices are found to create a danger to the health of
women. One practice among them is limiting the food to get easy delivery, from the sixth
month of pregnancy (Sonowal & Praharaj, 2007). Anemia is also another big health issue
which is commonly seen among tribal women especially with pregnant women. It will
reduce the developmental process of the fetus and leads to lot many issues like mental
retardedness, and thus it will increase the mortality and morbidity among the tribal women
(Singh 2008).
Maternal mortality is found to be more among tribal women due to their primitive practices
and unhygienic practices. Along with these, they also lack in the intake of Tetanus Toxoid
immunization, iron, folic acid tablets, and proper health supplements which will aggravate
the health issue more. The unhygienic delivery practices during their delivery also play a
major role in getting infections which affect both mother and the newborn. This infection
might be another reason for the infant mortality too.
The health of the tribal women should be understood from the point of their culture, social,
religion, geophysical environment, and economic conditions because they influence their
health a lot. It is also known that there is a relationship between the health of people and
the availability, effectiveness, accessibility of the health care facility and treatment. Thus
in order to provide a good health to tribal women, all these factors should be considered.
Since the reproductive health of tribal women is very important and an area to be explored
more due to its importance, the present paper focused on to find a few important aspects
related to their reproductive health.
Review of Related Literature
Geetha, Chenchuprasad, Sathyavathi, Reddy & Reddy (2015) aimed at studying the
reproductive health status of Sugali women of the Rayalaseema region in Andhra Pradesh.
200 women in the age range of 15-45 years undergone an interview regard to their age at
marriage, age at menarche, age at first conception, menstrual problems, mortality and
fertility levels, the prevalence of diseases and women’s perception towards their health. A
cross-sectional design was carried out for the study. Sixty-five percent illiteracy was
documented. Thirty-six percent of the women opined that their self-reported health was
fair or poor. Illiterate women were 1.27 times at risk of developing menstrual irregularity
than educated women. The risk was increased to 1.85 times when the spouse was illiterate
too. Same results were obtained with menstrual problems and abortions. Overall it was
inferred that Sugali women were subjected to significant reproductive health risks
mediated by socio-economic conditions.
Nanda & Dhar (2017) examined the reproductive health of adolescent girls ofDongria
Kondh tribe. The study area was to be Bissam Cuttack block and it was selected randomly.
Ninety-three adolescent girls participated in the study. The completed the schedule of
general information of the family, schedule cum questionnaire on KAP on reproductive
health and lab investigation did The obtained results revealed that about 75% of adolescent
girls had their regular menstruation. Dysmenorrhoea was present in 13% of girls. Most of
the girls were having poor menstrual hygiene.84% of adolescent girls knew about
menstruation from their peer groups. About 61% of adolescents were not aware of physical
changes in pregnancy. The study concluded that counseling for adolescent girls and their

International Journal of Management, IT & Engineering Vol. 8 Issue 12(1), December 2018,
ISSN: 2249-0558 Impact Factor: 7.119
Journal Homepage: http://www.ijmra.us, Email: [email protected]
Double-Blind Peer Reviewed Refereed Open Access International Journal - Included in the International
Serial Directories Indexed & Listed at: Ulrich's Periodicals Directory ©, U.S.A., Open J-Gage as well as in
Cabell’s Directories of Publishing Opportunities, U.S.A
104 International Journal of Management, IT & Engineering
http://www.ijmra.us, Email: [email protected]
mothers on sexual hygiene should be given and the health care delivery system to be
strengthened by training and capacity building.
Objectives
1. To understand the socio-economic conditions of the respondents.
2. To find out the reproductive health care awareness and practices of the respondents.
3. To know the knowledge and practices of birth control methods of the respondents.
Methods and Materials
Total numbers of 298 female respondents within the age of 30 years from two tribal
villages in Villupuram district were selected as sample. The purposive sampling method
was adopted as a sampling method for collecting the data. The interview schedule designed
and validated by the researcher was employed as the instrument for collecting the data.
Results and Discussions
TABLE NO-1: SOCIOECONOMIC CONDITIONS OF THE RESPONDENTS
Education
Education of the Respondent Frequency Percent
Illiterate 102 34.0
Primary 70 23.3
High School 100 33.6
Higher Secondary 26 8.7
Total 298 100.0
Occupation
Occupation of Respondent
Frequency
Percent
Agricultural Labors 106 35.6
Cultivator 103 34.6
Non - Farm Labors 22 7.4
Public Sector 36 12.1
Private Sector 31 10.4
Total 298 100.0
Individual Monthly Income
Individual Monthly Income Frequency Percent
Rs. 3000 and below 78 26.2
Rs. 3001 –Rs. 6000 196 65.8
Above Rs.6000 24 8.1
Total 298 100.0
In the table, no 1 the education, occupation and monthly family income of the respondents
are furnished. From the table it is found that 34% of respondents are illiterate, 23.3 %
respondents completed their primary education, 33.6% of respondents completed their high
school education and 8.7 % respondents have completed their higher secondary school
education. Thus it implies that most of the respondents are literate.
With regard to the occupation, 35.6% respondents are agricultural labors, 34.6 % are
cultivators, 7.4 % of respondents are non-farm labors, 12.1% works in the public sector
and 10.4 % respondents work in the private sector. This infers that most of the respondents
are in agriculture as labors and as cultivators.

International Journal of Management, IT & Engineering Vol. 8 Issue 12(1), December 2018,
ISSN: 2249-0558 Impact Factor: 7.119
Journal Homepage: http://www.ijmra.us, Email: [email protected]
Double-Blind Peer Reviewed Refereed Open Access International Journal - Included in the International
Serial Directories Indexed & Listed at: Ulrich's Periodicals Directory ©, U.S.A., Open J-Gage as well as in
Cabell’s Directories of Publishing Opportunities, U.S.A
105 International Journal of Management, IT & Engineering
http://www.ijmra.us, Email: [email protected]
When the individual’s monthly income is examined 26.2% of the respondents earn Rs.
3000 and below, 65.8% earn up to Rs. 3001 to Rs. 6000, and 8.1% of respondents earn
above 6000. This shows that most of the respondents have the monthly income within Rs.
3000 to Rs. 6000 range.
TABLE-2: REPRODUCTIVE HEALTH CARE AWARENESS AND PRACTICES
OF THE RESPONDENTS
Number of Times prenatal checkups
Number of Times prenatal
checkups Frequency Percent
4 & above 298 100.0
Reason for a prenatal check-up Frequency Percent
Blood Pressure 5 1.7
Hemoglobin 34 11.4
Urine test for sugar and albumin 8 2.7
Weight 56 18.8
Scan test 195 65.4
Total 298 100.0
Nature of Health care during pregnancy
Nature of Health care During
pregnancy Frequency Percent
TT immunization first dose 97 32.6
TT immunization Second Dose 87 29.2
Iron and folic acid tablets 60 20.1
Health tonic and supplementary
nutrition 54 18.1
Total 298 100.0
The details regarding to the reproductive health care awareness and practices are furnished
in the table no 2. In regard to the number of prenatal checkups, it was found that 100% of
respondents had checkups for four times and more during their pregnancy.
When the respondents were asked for the reason for their prenatal checkups 1.7%
respondents replied that, the checkup was done to find their blood pressure level, 11.4% of
respondents for knowing their hemoglobin level, 2.7% did to check their sugar and
albumin level in urine, 18.8 % of respondents did to check their body weight and 65.4% of
respondents carried out for scanning the fetus.
In regard to the health measure the respondents have taken during pregnancy, 32.6%
respondents had their TT immunization dose 1, 29.2% respondents had their TT
immunization dose 2, 20.1 % respondents had taken iron and folic acid tablets and 18.1%
respondents had health tonic and other supplementary nutrition.

International Journal of Management, IT & Engineering Vol. 8 Issue 12(1), December 2018,
ISSN: 2249-0558 Impact Factor: 7.119
Journal Homepage: http://www.ijmra.us, Email: [email protected]
Double-Blind Peer Reviewed Refereed Open Access International Journal - Included in the International
Serial Directories Indexed & Listed at: Ulrich's Periodicals Directory ©, U.S.A., Open J-Gage as well as in
Cabell’s Directories of Publishing Opportunities, U.S.A
106 International Journal of Management, IT & Engineering
http://www.ijmra.us, Email: [email protected]
TABLE-3: BIRTH CONTROL KNOWLEDGE AND PRACTICES OF THE
RESPONDENTS
Do you know birth control is essential to limit the family size?
Do you know birth control is
essential to limit the family size Frequency Percent
Yes 298 100.0
What are the advantages of birth control?
What are the advantages of birth
control Frequency Percent
Less family burden 113 37.9
More comfort 150 50.3
Less population burden to the
country 5 1.7
Less expenditure and more money
saving 30 10.1
Total 298 100.0
Family Planning Done
Family Planning is done Frequency Percent
Yes 298 100.0
The details with regard to the knowledge and birth control practices are furnished in the
table no 3. From the table, it is found that 100% of respondents were having awareness in
regard to the birth control measures to limit the family size.
When the respondents were asked for the advantages of birth control, 37.9% respondents
replied that birth control is essential for reducing the family burden, 50.3% responded that
birth control is essential for more comfort of the family, 1.7% responded as to reduce
burden to the country and 10.1% responded that birth control is needed to for economical
comfort, it is for less expenditure and more money saving.
It was also found that 100% of respondents have done their family planning.
Summary and Conclusions
The present study explored the reproductive health among tribal women in Villupuram
district in Tamilnadu. The study is carried out with 298 tribal women, using purposive
sampling technique. The instruments devised by the researcher were employed to collect
the data. From the results it is found that the majority of the tribal women are found to be
educated, having their occupation in agriculture and most of their earning is around Rs.
3001 to Rs. 6000 per month. Thus in regard to socio-economic condition, the illiterate
tribal women found should be educated and also steps should be taken to bring awareness
to them regard to various other occupations and the ways to earn better.
In regard to the reproductive health care awareness and practices of the respondents, it is
found that all the tribal women participated in the study has taken their prenatal checkups
four times and above. So with this, it could be understood that the tribal women are having
good awareness in regard to the importance of prenatal checkups. It is also found that most
of the women did prenatal check for scanning fetus, and few others for checking their body
weight, sugar and albumin level in the urine, hemoglobin level and for checking their
blood pressure. This implies that most of them are aware of doing a scan but not for the
hemoglobin, blood pressure, sugar, albumin level, and body weight. Therefore the
importance of doing checkups for these should be taught to them. When the nature of

International Journal of Management, IT & Engineering Vol. 8 Issue 12(1), December 2018,
ISSN: 2249-0558 Impact Factor: 7.119
Journal Homepage: http://www.ijmra.us, Email: [email protected]
Double-Blind Peer Reviewed Refereed Open Access International Journal - Included in the International
Serial Directories Indexed & Listed at: Ulrich's Periodicals Directory ©, U.S.A., Open J-Gage as well as in
Cabell’s Directories of Publishing Opportunities, U.S.A
107 International Journal of Management, IT & Engineering
http://www.ijmra.us, Email: [email protected]
health care measures during pregnancy it is found that only less number of women had
taken TT immunization for 1st dose and the number reduced for taking the 2nd dose. Thus it
could be inferred that there is a lack of awareness about the TT immunization and hence it
should be taught. It is also found that less number of tribal women only took the iron, folic
acid tablets, health tonic and required supplementary nutrition. Thus again it is found there
is a lack in the intake of the iron, folic acid tablets and required supplementary nutrition.
Thus it is highly needed to make them aware of these.
When the knowledge about birth control and its practices assessed, it is found that all the
respondents are highly aware, that birth control is essential to limit the family size. When
advantages of birth control are examined, it is found that most of the women found birth
control helps to reduce family burden and to have more comfort in the family. Few
responded that family planning is advantageous because less expenditure will happen for
children and thus more money could be saved. According to a fewrespondents, birth
control helps to lessen the population burden to the country. Thus it is found that the tribal
women are found have good awareness about the birth control and its practices.
Overall, it could be stated that steps should be taken to improve the economic condition
through various means. Proper awareness about the reproductive health its practices and
about birth control and its practices should be given to the required tribal women.
References
Geetha, P., Chenchuprasad, C., Sathyavathi, R., Reddy, K. S., & Reddy, K. (2015).
Reproductive Health Status of Sugali Tribal Women: A Field-Based Study. Studies
of Tribes and Tribals,13(1), 73-78. doi:10.1080/0972639x.2015.11886714.
Nanda, S., Dhar, R.N.(2017).A study on the reproductive health of adolescent girls of
Dongria Kondh tribe.International Journal of Community Medicine and Public
Health 4(4),1207-1212.doi: http://dx.doi.org/10.18203/2394-6040.ijcmph20171350
Singh, U.P. 2008. Tribal Health in North East India: A Study of Socio-Cultural
The dimension of Health Care Practices. New Delhi: Serials Publications.
Sonowal, C.J. 2010. ‘Factors Affecting the Nutritional Health of Tribal Children in
Maharashtra.’Study on Ethno-Medicine. 4(1), pp. 21-
36.doi:10.1080/09735070.2010.11886359
Sonowal, C.J. and Praharaj, P. 2007. “Traditional Vs Transition: Acceptance of Health
Care Systems among the Santhals of Orissa.’ Study on Ethno-Medicine., 1(2), pp.
135-146.
WHO, Women’s Health; Improve our Health, Improve our World. Paper presented at 4th
World Conference on women, Geneva. 1995; 2.1-218.

International Journal of Management, IT & Engineering Vol. 8 Issue 12(1), December 2018,
ISSN: 2249-0558 Impact Factor: 7.119
Journal Homepage: http://www.ijmra.us, Email: [email protected]
Double-Blind Peer Reviewed Refereed Open Access International Journal - Included in the International
Serial Directories Indexed & Listed at: Ulrich's Periodicals Directory ©, U.S.A., Open J-Gage as well as in
Cabell’s Directories of Publishing Opportunities, U.S.A
108 International Journal of Management, IT & Engineering
http://www.ijmra.us, Email: [email protected]
Issues and Challenges of Higher Education in India
Dr. Rakhi
Abstract
Higher education in India contributes towards building immense future of students. It is
essential for the students to enter in the education sector or in professional sector for
employment. But output of higher education in India is not satisfactory because system is
facing many challenges in terms of faculty, research, student enrolment ratio, international
student mobility, access and equity, inclusion, curriculum designed and quality of
education etc. There is a strong need felt for the development of higher education so as to
compete with the international standard of education. The government has announced new
education policy which aims at expanding the access and bridging the gender gaps and
provides the world class infrastructure for realising the human resource potential in full.
Therefore, this paper attempts to analyse issues and challenges of higher education in
India.
Introduction
The main aim of education depends on one’s philosophy i.e. what we think about our
student’s life. Education is not only meant for development of mind but it also aims to
develop body and intellectual spirit. Higher education in India is not merely teaching to the
diploma, undergraduate, post graduate or PhD students but it includes generation of new
knowledge through new courses offered, new curriculum designed for the relevant
subjects, through the use of good quality infrastructure and through improved research
facilities in universities, colleges or institutions. Obtaining Degree for Higher education in
India for all is must in order to improve the wealth of our nation, i.e. human resource. It is
immaterial whether student belongs to minority group, unreserved or reserved category.
Education is for all i.e. for physically challenged person or an adult. When there are so
many reasons (let us say – financial background is not strong, male dominated society or
lack of interest etc.) to avoid the education after schooling, it is not only a bane for that
poor student but a strong blot on the nation. Actually speaking, whether government
initiated so many efforts at its highest level to enrich the education system but it is not
advantageous till everybody changes his/her mindset towards the education. Problems are
inherent in everybody’s life. The need is to cope with it, and in fact the aim of education
should be to give the students a practical exposure to the life along with the teaching.
Therefore, this paper attempts to examine issues and challenges of higher education in
India.
Objective of the Study
Thispaper is aimed at getting indepth sight over the issues and challenges of higher
education in India at Government level, institutional level and teacher level. At the end,
study is focussed at providing some concrete suggestions to improve higher education
system in India.
Assistant Professor, Department of Commerce, Maharaja Agrasen Mahavidyalya, Jagadhri

International Journal of Management, IT & Engineering Vol. 8 Issue 12(1), December 2018,
ISSN: 2249-0558 Impact Factor: 7.119
Journal Homepage: http://www.ijmra.us, Email: [email protected]
Double-Blind Peer Reviewed Refereed Open Access International Journal - Included in the International
Serial Directories Indexed & Listed at: Ulrich's Periodicals Directory ©, U.S.A., Open J-Gage as well as in
Cabell’s Directories of Publishing Opportunities, U.S.A
109 International Journal of Management, IT & Engineering
http://www.ijmra.us, Email: [email protected]
Issues and Challenges at the Government Level
• Global Oriented Approach -The first problem that rests with the government that it
undertakes lagging approach not a leading approach towards making Indian student a
global one.Although Indian government has made concrete efforts to make Indian
student capable of being global through offering various skill based courses, dipmola
and online courses, yet the efforts remain nonetheless. The Indian students are not able
to cope with foreign students in general. The fact is that the government is still trying
to match the education level of rural masses with the urban masses. To make a student
global one is a very challenging task yet not impossible. As we know that more than
60% of our population is youth i.e. below the age of 30. So skill development of the
students has to be enhanced so as to make each youth in India capable. Though the
Government has opened so many universities, colleges and standalone institutions,
having a long list of courses under the private aided and unaided programs and so on,
yet the pupil teacher ratio, infrastructure, dropout ratio, gross enrolment ratio,
education development index has been very low and poor. These are no doubt of a
great concern for the government but the solution lies always at the gross root level.
• Language problem- There is no uniform language being used in each part of the
country. Most of the states are facing various problems in this regard. Though most of
the Indian teachers use either regional language or English language while teaching,
yet national language Hindi is not been given due importance in each and every state. It
is very unlikely that other economies of the world use their mother tongue in teaching
and research, and Indian government can not generalise to use Hindi language along
with use of other regional languages. Government has considered one thing very well
that teaching is an art as well as science. It is purposeful activity. In Uttarakhand, there
is no uniformity in the language used in different areas. In kerala, Malyalam is the
mothertongue language but the books are not available in Malyalam. Therefore, the
concern is to adopt a uniform language in each state as well intrastate of the nation.
• Public-Private Partnership- Indian government has adopted Public-Private
Partnership Model in Higher education which is very troublesome concern for State
Public Universities, government colleges and government aided institutions in India.
The existence of these higher education institutions is wholly dependent upon the
students but when privatisation enters in any area then it works as a double-edged
weapon. No doubt Privatisation brings very fruitful results for the government as well
but the apathy for future of students is not taken into consideration. High Cost of
education in these institutions can not be met by all India students. Therefore, this is
not only creating indifference in the education structure but this system is responsible
for unequal distribution of human resource in educational institutions.
• High Corruption- Indian bureaucrats have a big hand in granting aid to educational
institutions. Recently, it was announced that Higher Education Commission of India
(HECI) will be in force in place of University Grants Commission. HECI will be
governed by officials of Human Resource Development Department of India. This
initiative has created a big question mark on the government mechanism and working
for the development of higher education in India.
Issues and Challenges at Institutional Level
• No Quality Assurance- Some quality issues are still persistent in Higher Educational
Institutions (HEI) in India. There is not enough time to devote towards quality issues

International Journal of Management, IT & Engineering Vol. 8 Issue 12(1), December 2018,
ISSN: 2249-0558 Impact Factor: 7.119
Journal Homepage: http://www.ijmra.us, Email: [email protected]
Double-Blind Peer Reviewed Refereed Open Access International Journal - Included in the International
Serial Directories Indexed & Listed at: Ulrich's Periodicals Directory ©, U.S.A., Open J-Gage as well as in
Cabell’s Directories of Publishing Opportunities, U.S.A
110 International Journal of Management, IT & Engineering
http://www.ijmra.us, Email: [email protected]
rather than focus is on more and more intake of students. The emphasis is generally
towards increase in gross enrolment ratio. The government is also taking response over
how many students are taking higher studies but the more prominent question in today
era is to find out quality education and provide it with equity, access and inclusion of
all. In HEIs, no quality time for quality researches particularly in the case of colleges.
In universities, the scope of quality research is more in comparison to government and
government aided colleges.
• Political Interference- HEI authorities also suffer political interference to the extent
through which their institutions get some kind of grant, aid or relief by the political
party. But it is extremely bad for the students, society and the nation. Because political
parties interference in HEIs itself indicates that education and employment both are
depending upon some bureaucrats rather on the skill, knowledge and awareness of
students.
• Autonomy Problems- In HEIs, there is no provision of full autonomy to government
aided colleges. The autonomy in higher education is subject to various considerations
in mind. On the one hand, full autonomy to HEIs will make these institutions
exploitative in the sense that the full time regular teachers will not be employed as
government interference will be nil. On the other hand it is good as HEIs have not to
wait for lengthy process of recruitment of teachers, not to wait for the NO-Objection
Certificates and moreover, political interference will get reduced.
• No uniformity in syllabus- there is no particular uniformity in syllabus of different
universities of India be it graduation, post graduation or other courses. For example,
Choice based Credit System (CBCS) is used in kurukshetra university of Haryana but
affiliated colleges of this university do not follow this CBCS system. On this basis, the
outgoing students of colleges and university are very much different in their arena of
knowledge and therefore placement differs.
• Corruption- No educational institution is left behind from the patch of corrupted
officials. Maharashtra and karnatka have the sole distinction of corrupting the
education system. Corruption in India at the grass root level is very high and common.
Department of Higher Education is also following this trend. Either it is recruitment
process or the promotion case, corruption is rooting itself deep more and more. HEIs
are not much kept apart from this corruption problem by bureaucrats of the nation.
• Quality issues of Private HEIs – There are some common problems of HEIs in each
part of the country. Government has given No Objection Certificate too many private
educational institutions but did not bother about quality issues of education. In these
private educational institutions, teacher-student ratio is very low which unduly
pressures them to adopt the rule of minimum cost and maximum profit which in turn
make it impossible to survive for long term for these private institutions.
Issues and Challenges at Teacher Level
HEIs now-a-days are facing problem of low gross enrolment ratio. The reasons are being
attributed to poor teaching only. So the foremost problems of all the teachers begin here:
• Administration Problems- In today’s time, teacher’s work is not restricted to teaching
only rather they have to concentrate more on administration work along with their daily
teaching which eventually impacting upon the quality of teaching. Even, the
government is taking administrative responsibilities as one of the criterion for career

International Journal of Management, IT & Engineering Vol. 8 Issue 12(1), December 2018,
ISSN: 2249-0558 Impact Factor: 7.119
Journal Homepage: http://www.ijmra.us, Email: [email protected]
Double-Blind Peer Reviewed Refereed Open Access International Journal - Included in the International
Serial Directories Indexed & Listed at: Ulrich's Periodicals Directory ©, U.S.A., Open J-Gage as well as in
Cabell’s Directories of Publishing Opportunities, U.S.A
111 International Journal of Management, IT & Engineering
http://www.ijmra.us, Email: [email protected]
advancement, so it has becoming need of every teacher to do more administrative work
rather than to concentrate more on how to improve research.
• More workload- As per UGC guidelines, the teacher’s workload has been determined
but at the institutional level, it is being considered as the minimum workload and they
are being assigned more classes. Again the administrative pressure makes teachers
burdensome with more teaching and administrative work and there is no much time left
for research.
• Alternatives of Teachers- The students are having many options of learning now. The
face to face teaching has many advantages as it involves two way communication but
the government is more focussing on the usage of recorded tutorials through EDUSAT
programme, live lectures, online courses etc. it is merely targeting good quality
teachers who devote their precious time in getting good education and placement but
their alternative is more preferred by the institutions and the government itself.
• Student feedback- the institutions are giving due importance to students and more rely
upon the feedback given by the students related to college administration, teaching-
learning process. This system is giving more value and weightage to students thereby
students have started taking teachers non-serious. It means moral values are declining
and even the teachers are being killed by students for just giving bad score in exams or
little issues like Parents-teacher meet etc.
• No healthy work environment-HEIs are aimed at social welfare and teachers being
human are the part of society. They are generators of knowledge and future maker of
students but what is happening today is the most critical for a teacher-be it recruitment,
selection, transfer or promotion teachers have to face lots of problems. Even doing
their good job, they are not credited with outstanding performance on their part because
of so called politics in each institution. Instead of creating good and healthy work
culture, problems are being created so as to make teachers more stressful. The
consequence is on personal as well as on academic achievements.
Suggestions
Education is a social and purposeful activity. To stop becoming education a business the
following suggestions are being provided here:
1. Malicious political interference should be stopped. For that healthy student and teacher
unions are required.
2. Student Charter must be prepared so as to save students from malpractices adopted by
HEIs.
3. Education must include teaching of moral values at each standard of higher education.
4. There is no need to make it mandatory to adopt ICT while teaching. The GURU is need
of the hour now. GURU can only bring students from darkness to light.
5. Employability Gap in higher education should be removed as far as possible so as to
make Indian students global one.
6. Beginning from contribution to teaching, administration, extracurricular, co-curricular
and research, quality issues must be considered well in advance by the administrators.
7. Good teacher-taught relationships, student discipline must be preserved.
8. Democratic rights of students should be protected so as not to make them criminals.
9. Lack of good infrastructure at institutional level for doing quality research is the main
concern of teachers. It must be given priority by the administration so as o compete
with foreign educational institutions.

International Journal of Management, IT & Engineering Vol. 8 Issue 12(1), December 2018,
ISSN: 2249-0558 Impact Factor: 7.119
Journal Homepage: http://www.ijmra.us, Email: [email protected]
Double-Blind Peer Reviewed Refereed Open Access International Journal - Included in the International
Serial Directories Indexed & Listed at: Ulrich's Periodicals Directory ©, U.S.A., Open J-Gage as well as in
Cabell’s Directories of Publishing Opportunities, U.S.A
112 International Journal of Management, IT & Engineering
http://www.ijmra.us, Email: [email protected]
10. Political parties should be debarred from interfering in decision making of universities
and HEIs so as to remove high rate of corruption.
11. There must be skill development of teachers as well as of students but the pressure of
using live lectures, EDUSAT and other ICT tools while teaching should not be there so
as to create healthy environment.
12. Issues of Autonomy in Higher education should be strictly understood before getting it
implemented.
Scope for further Research
This paper has studied in detail few of issues and challenges of higher education in India.
Few more issues like gender sensitisation in higher education, quality issues in higher
education, employability issues concerned with higher education can be studied in detail
for further inferences. State wise analysis can be done. This paper is descriptive one. An
analytical study of each issue can be done.
Conclusion
This paper concluded that there are numerous problems at each end-be it government,
HEIs, teachers or the students. But the solution lies in one thing only that Higher Education
must be made student oriented only and only rather than system oriented. There is strong
need of good leaders like Moraraji Desai and Lal Bahadur Shastri to make Higher
education of India leading one in each corner of the world. GURU is the prime requirement
of the nation. All other issues like access, equity, inclusion etc. are equally important but
problem at grass root level must be sorted out. At the end, it can be said that all the
challenges of Higher Education in India can be easily met with healthy teaching
environment and fair system.
References
• Altbach, Philip G. (2006) The Private Higher Education Revolution: An Introduction.
University News. January 2-8, 2006. Vol. 44 No.01.
• Anandakrishnan, M. (2006) Privatization of higher education: Opportunities and
anomalies. ‘Privatization and commercialization of higher education’ organized by
NIEPA, May 2, 2006., New Delhi
• Delors, Jacques (1996) Learning the treasure within. Report to UNESCO of the
International Commission on Education for the Twenty-first Century. UNSECO
Publishing, Paris.
• MHRD (2006) Annual Report. Ministry of Human Resource Development,
Department of Secondary and Higher education. Government of India. New Delhi.
• Planning Commission (1999) Approach paper to the Tenth Five-year Plan (2002-
2007). Planning Commission. New Delhi.
• Stella, Antony (2002) External quality assurance in Indian higher education: Case
study of the National Assessment and Accreditation Council (NAAC). International
Institute for Educational Planning. Paris.
• UGC (2005) Research Handbook: Towards nurturing research culture in higher
education institutions in India. University Grants Commission. New Delhi.
• World Bank (2004) ‘Measuring Trade in Services Liberalisation and its Impact on
Economic Growth: an illustration’, World Bank Group Working Paper, downloadable
from http://econ.worldbank.org/files/2373_wps2655.pdf
• Agarwal, Pawan (2006) Higher Education in India: The Need for Change (ICIER
Working Paper No. 180). New Delhi: Indian Council for Research on International

International Journal of Management, IT & Engineering Vol. 8 Issue 12(1), December 2018,
ISSN: 2249-0558 Impact Factor: 7.119
Journal Homepage: http://www.ijmra.us, Email: [email protected]
Double-Blind Peer Reviewed Refereed Open Access International Journal - Included in the International
Serial Directories Indexed & Listed at: Ulrich's Periodicals Directory ©, U.S.A., Open J-Gage as well as in
Cabell’s Directories of Publishing Opportunities, U.S.A
113 International Journal of Management, IT & Engineering
http://www.ijmra.us, Email: [email protected]
• Economic Relations, (http://www.icrier.org/publication/working_papers_180.html)
Chronicle of Higher Education, various issues (cited as CHE) (http://chronicle.com/)
• Carl Dahlman and Anuja Utz, (2005) India and the Knowledge Economy: Leveraging
Strengths and Opportunities (World Bank Report No.31267-IN),Washington DC: W.
• Bank, (http://wwwwds.worldbank.org/servlet/WDSContentServer/IB/312670IN.txt)
Sanat Kaul, Higher Education in India: Seizing the Opportunity (ICIER Working Paper
No. 179). New Delhi: Indian Council for Research on International Economic
Relations, May 2006 (http://www.icrier.org/pdf/WP_179.pdf) available on 25.1.2011
• Raghunath A. Mashelkar, India’s R&D: Reaching for the Top. Science Vol. 307, No.
5714 (4 March 2005), (http://www.sciencemag.org/cgi/content/full/307/5714/1415)
• National Knowledge Commission, Report to the Nation 2006. New Delhi: National
Knowledge Commission, 2007 (cited as NKC 2007)
(http://knowledgecommission.gov.in/report2006/default.asp)
• Privatisation of Higher Education in India: Constitutional Perspectives and Challenges.
Lawstudent.in (online) n.d. (2007) (cited as lawstudent 2007)
(http://www.lawstudent.in/bc_seervai_essay.htm)
• Jandhyala B.G. Tilak, Absence of Policy and Perspective in Higher Education.
Economic and Political Weekly Vol. 39, No. 21 (May 22, 2004), 2159-2164
(http://www.epw.org.in/epw/uploads/articles/7650.pdf)
• Higher Education in India: Issues, Concerns and New Directions
http://www.ugc.ac.in/pub/heindia.pdf.
• Chatterjee, Jayanta, How to improve India's higher education and research quality?
http://www.nature.com/ 04 November 2008, available on 25.1.2011
• Tewari, Asha, Implementing Quality in higher education,
http://www.qcin.org/nbqp/qualityindia/Vol-2-No2/specialreport.htm, available on
25.1.2011
• J. P. Singh (2011) Higher Education in India: Issues, Challenges and Suggestions,
Edited book ‘Higher Education’, LAMBERT Academic Publishing, Germany, 2011,
Pp.93-103. ISBN: 978-3-8465-1753-6
• https://surejob.in/higher-education-in-india-issues-and-challenges.html

International Journal of Management, IT & Engineering Vol. 8 Issue 12(1), December 2018,
ISSN: 2249-0558 Impact Factor: 7.119
Journal Homepage: http://www.ijmra.us, Email: [email protected]
Double-Blind Peer Reviewed Refereed Open Access International Journal - Included in the International
Serial Directories Indexed & Listed at: Ulrich's Periodicals Directory ©, U.S.A., Open J-Gage as well as in
Cabell’s Directories of Publishing Opportunities, U.S.A
114 International Journal of Management, IT & Engineering
http://www.ijmra.us, Email: [email protected]
Educational Development Consequent upon Education
Expenditure in India and Tamil Nadu State
R.Gomathi
Dr. B. Mathavan
Abstract
The study of trends in education expenditure and its consequence on education
development is an important matter of subject discussion. This paper makes a macro
analysis on growth of gross domestic product, growth of number of recognized educational
institutions in India, growth of students in primary level education, growth of students in
upper primary level education, growth of students in secondary and post secondary level
education and growth of students in higher education. In this paper correlation between
expenditure on education and growth of educational institutions and students enrolments in
various level of education are discussed. Further, in paper a comparative analysis of
education expenditure and physical achievement in various levels of education between
India and Tamil Nadu has been discussed. Table-1 presents data on the growth of
expenditure on education and gross domestic product in India during the period 1951-1952
to 2014-2015. The GDP of India was Rs. 10080 crore in 1951-1952 and it increased to Rs.
12433749 crore in 2014-2015. This level of increase in GDP shows an 11.57 per cent
annual compound growth. The growth rate explains the 89.55 per cent fluctuation as per
the result of coefficient of variation analysis. This level variation is due to slow growth rate
of a GDP during the period 1951-1952 to 1990-1991. The GDP growth rate became rapid
during the period 2009-2010 to 2014-2015. The correlation between growth of Indian
government expenditure on higher education and growth of higher education is statistically
significant at the national level and it is not significant in the case of Tamil Nadu. The
correlation between government expenditure on higher education and students’ enrolment
in higher education is not significant at the Tamil Nadu state level. This may be due to
expenditure might have incurred towards wages and salaries and other infrastructural
development.
Keyword:Higher Education, GDP, Student’s Growth Rate,
Introduction
The study of economics of education is very important and education is an important input
in human resource development. According to Woessman (2015), education is a major
determinant of economic growth, in terms of knowledge generation, employment
generation and income generation. The absence of education may result in differentiation
in knowledge generation and future generation prosperity world be deteriorated in terms of
occurrence of poverty, lack of assurance about social security and social exclusion.
UNESCO (2012) ii brings to focus that spending USD on education may generate income
in the range of 10-15 USD per capita per day. Thus the role of education in economic
development is well established. The role of education in economic development could be
Associate Professor of Economics, Annamalai University, Annamalai Nagar-608002 Professor of Economics, Annamalai University, Annamalai Nagar-608002

International Journal of Management, IT & Engineering Vol. 8 Issue 12(1), December 2018,
ISSN: 2249-0558 Impact Factor: 7.119
Journal Homepage: http://www.ijmra.us, Email: [email protected]
Double-Blind Peer Reviewed Refereed Open Access International Journal - Included in the International
Serial Directories Indexed & Listed at: Ulrich's Periodicals Directory ©, U.S.A., Open J-Gage as well as in
Cabell’s Directories of Publishing Opportunities, U.S.A
115 International Journal of Management, IT & Engineering
http://www.ijmra.us, Email: [email protected]
observed that education can bring collective workforce towards production of goods and
services. As per the report by Barro and Lee (2010) iii the secondary and territory
education can facilitate the process of knowledge transfer with respect to development of
new ideas, production process and techniques and knowhow. It is evident that human
capital formation is very essential in economic development. In turn human capital
formation depends on education. World Economic Forum (2016) iv points out that
education generates the stock of skills, capabilities competencies and productivity
enhancing qualities. Thus the economic production of goods and services depends on
education. The importance of education can be traced that it empowers the people, reduces
the corruption and improve the capacity of the governance. The educational attainment can
be considered in terms of quality and merely on completion of number of individuals with
primary education. The quality of education should not be merely based on completion of
schooling in terms of completion of primary education secondary education or higher
education Educational attainment should develop individuals with appropriate human
resource potential. Despite effective emphasis on education in sustainable development
goals nearly 103 million youth throughout the world remain illiterate mainly among
women as per the report by UNESCO. The relationship between education and economic
growth is an important matter of subject discussion. In this connection, Hanushek, E. A.,
and Woessmann, L. (2012) v brings to focus on relation between cognitive skills of the
population consequent upon education attainment and long run economic growth of any
country. It is clear that mere educational attainment in terms of number of years of
schooling is sufficient to develop human resources and it should be based on the skill
development. The human capital generation and utilization depends of attainment of school
education in general and higher education in particular. Hanushek, et al., (2010) vi argued
that developing countries have made a considerable progress is narrowing down the gap
with developed countries in terms of school educational attainment. An analysis of
economics of education is very important. The expenditure on education is a yardstick to
assess the performance of education. As per the report by IIASA (2008) educational
attainment determines the survival rates of the individuals, decline in fertility level and
enhancement in the quality of governance. UNESCO (2010) notes that elementary
education is necessary towards, health promotion and enhancement in living conditions.
However, the achievement of millennium development goals depends on secondary
education. It is observed that life of the African 1-8 million children could have saved if
their mother had at least secondary level education. UNESCO (2010) brings to focus on
importance of secondary education among women towards maternity and child care
practices, access to health institutions, taking effective medical care, reduction in maternal
mortality and properly educating their children. The influence of primary education in
workforce effective participation is well established. As per the report by UNESCO
(2010a) primary educational attainment has brought positive economic effects in
agriculture during the past 40 years. In this connection, Hanushek et.al. (2017) made a
comparison of 15 countries with respect to impact of primary educational attainment on
earnings of an individual. It is proved that 10 per cent increase in an average person’s
earnings results in 0.37 per cent GDP increase. Further, Psaacharopoulas and Patrigos
(2004) xii report that on the basis of a case study, additional educational attainment
increased 10 percent earning on the part of the individuals. As per the report by UNESCO
(2010) the developing countries investment in primary education is higher than the

International Journal of Management, IT & Engineering Vol. 8 Issue 12(1), December 2018,
ISSN: 2249-0558 Impact Factor: 7.119
Journal Homepage: http://www.ijmra.us, Email: [email protected]
Double-Blind Peer Reviewed Refereed Open Access International Journal - Included in the International
Serial Directories Indexed & Listed at: Ulrich's Periodicals Directory ©, U.S.A., Open J-Gage as well as in
Cabell’s Directories of Publishing Opportunities, U.S.A
116 International Journal of Management, IT & Engineering
http://www.ijmra.us, Email: [email protected]
developed countries. However, the developed countries investment on higher education is
higher than the developing countries. It is significant to note that government expenditure
on basic education is very essential towards eradification of hunger and poverty. The
importance of primary education in economic production has brought out the attention of
many scholars. Lockhead, Jamison and Lau (1980) made an analysis of impact of primary
education on agricultural development in 13 countries. The authors observed 8.7 per cent
increase in agricultural production consequent upon 4 years of schooling. Muro and Burchi
(2007) conducted a study in 48 countries with reference to primary education and food
insecurity. The enhancement in primary education reduced the food insecurity in the rank
of 20 to 24 per cent. The educational attainment has considerably reduced the incidence of
poverty. In this connection UNDP (2010) reported that poor people constituted a more in
hungry in households without education. The long term economic growth depends on
expansion of education, provision of wide access to the learning opportunities
The investment in secondary education is important to accelerate the process of economic
development. The importance in expansion of secondary education is well recognized in
United Nations’ Millennium development goals and achievement of educational target by
2030 in terms of achievement of primary and secondary education for all boys and girls. In
order to accelerate the expansion of secondary education many attempts have been made
by developing countries. As per the report by UNESCO (2015) 94 low and middle income
countries made provision of lower secondary education at free of cost. Many research
studies have been conducted to reflect the impact of secondary educational attainment on
economic development. The importance of secondary education can be observed from the
findings of many research studies. IIASA (2008) reported that presence of variation in the
impact of educational attainment on economic growth among nations, gender and ethnic
groups. UNESCO (2012) brings to attention on effect of secondary education earning
capacity of the individuals. The secondary level educated persons earn higher income than
the primary level educated persons and a considerable number of women crossed over
poverty level consequent upon attainment of secondary level education.
The role of higher education in economic development is well established. In this
connection, Power et. al., (2015), point out the relationship between educational attainment
and economic growth. According to the authors, the social and private rate of return on
investment is higher in primary education, followed by secondary education and higher
education. The importance of higher education has been realized that it produces both
social and private benefits.
The human resource development depends on expansion in educational opportunities and
access to such opportunities. The educational attainment develops communication skills,
better decision making capacity and participation in political affairs. Further educational
attainment enables one to take socially relevant innovation required for economic
development. The enhancement in human potential consequent upon educational
attainment should create an effective human resource potential in production of goods and
services.
It could be noted that investment in education creates individuals with access to
opportunities towards utilization of technical know now. The educational attainment
enables individuals to easily adopt the foreign technology along with acquisition of
appropriate skills in utilization of foreign technology in the direction of production of
goods and services. According to Jones technology improvement is considered as engine

International Journal of Management, IT & Engineering Vol. 8 Issue 12(1), December 2018,
ISSN: 2249-0558 Impact Factor: 7.119
Journal Homepage: http://www.ijmra.us, Email: [email protected]
Double-Blind Peer Reviewed Refereed Open Access International Journal - Included in the International
Serial Directories Indexed & Listed at: Ulrich's Periodicals Directory ©, U.S.A., Open J-Gage as well as in
Cabell’s Directories of Publishing Opportunities, U.S.A
117 International Journal of Management, IT & Engineering
http://www.ijmra.us, Email: [email protected]
of economic growth. The foreign technology adoption depends on effective maintenance of
human capital.
There is a close relationship between health and education. The educated people are aware
of all sorts of health care opportunities and how to make use of such opportunities in
healing their illness. Maintenance of good health is an indicator of perfect utilization of
human resource potential. Schultz (1961) argues that poor health status among population
is a negative sign of effective human resource development. In order to promote health,
many health care programmes have been implemented in all the countries including India.
Maintenance of health quality enables to create effective human resource potential.
Review of Literature
Verma, Chaman (2017) had made an analysis of development status of higher education
in Northern India. The author made a comparative analysis of higher educational
development in Haryana and Punjab and pointed out the importance of government
policies on privatization in developing a large number of higher educational institutions.
Further higher educational institutional development has been observed in engineering. It
and other technical fields consequent upon government support in developing education in
these fields as per the report by the author.
Camilleri, Mark A. and Camilleri, Adriana (2016) had made an analysis of role of
education in promoting social cohesion in Malta. The authors identified the need for better
policies in promotion of economic growth consequent upon educational attainment. The
educational development depends on access to schools, flexible working hours and teacher
incentives. In conclusion, the researchers urged the need to improve the education
leadership towards increasing educational standard, economic productivity and economic
growth.
Botlhale, Emmanuel (2015) had conducted a study on financing higher education in
Botswana. The authors identified the problems in financial higher education and Botswana
and suggested the alternative mode of financing to overcome the problems in the current
system of financing higher education. State Council of Higher Education for Virginia
(2010) made an assessment of status of international education programs of common
wealth. It pointed out the link between international higher education programmes and
economic development and trend in globalization of higher education on economy of
Virginia and suggested measures to enhance the higher education in Virginia.
Gaba, Ashok K. and Li, Wei (2015) had made an analysis of growth and development of
distance education in India and China. The authors made a comparison by taking indicators
on development of economy and development of distance education in two countries with
reference to course design, development of delivery mechanism in two major universities,
Indira Gandhi National Open University of India and Open University of China. Further in
students’ enrolment in these two universities and recognition level are highlighted by the
author. The authors identified the variation between India and China in provision of
distance educational programmes.
Halaisz, Gaibor (2015) had identified the role of education in social transformation in
Central and Eastern Europe in 2004. The authors brought to focus on educational
objectives of the countries with social economic achievement targets, role of European
Union Policy in strengthening linkage between education and socio economic development
and impact of national educational reform on social transformation in the selected
countries.

International Journal of Management, IT & Engineering Vol. 8 Issue 12(1), December 2018,
ISSN: 2249-0558 Impact Factor: 7.119
Journal Homepage: http://www.ijmra.us, Email: [email protected]
Double-Blind Peer Reviewed Refereed Open Access International Journal - Included in the International
Serial Directories Indexed & Listed at: Ulrich's Periodicals Directory ©, U.S.A., Open J-Gage as well as in
Cabell’s Directories of Publishing Opportunities, U.S.A
118 International Journal of Management, IT & Engineering
http://www.ijmra.us, Email: [email protected]
Udefuna, Patrick Nnadozie, Akalefu, Chiedo and Asogwa, Chinako (2013) had
conducted a study on role of entrepreneurship education in economic development in
Nigeria. The authors found out that the decline in quality of education, increase in the
incidence of under employment and stagnation of national economic development. Hence,
there is need to restructure entrepreneurial education system towards job creation in
Nigeria as per the report by the researchers.
Tilak, Jandhyala B. G (2010) made an analysis of higher education, poverty and
economic development across the countries. The author made use of indicators on infant
mortality, life expectancy and economic growth to analyze the link between higher
education and economic growth among developing countries and developed countries. The
authors concluded that higher education plays a significant role in economic development
of the examined countries.
Kozma, Robert B (2011) had made an analysis of the US National Educational Plan
Technology. The authors made use of macroeconomic research, micro economic research,
labour market studies and work force studies towards analyzing the economic link with
educational transformation.
Objectives
1. To study the macro level trends in educational expenditure and education development
in India.
2. To analyze the pattern and diversification and trends in development of higher education
in India and Tamil Nadu.
Hypotheses
1. There is a significant correlation between educational expenditure and growth of
educational institutions and student’s enrolment in India during the period 1950-51 to
2014-2015.
Methodology
The study employs only secondary data. There is no concern about the sampling method
and procedure. However, in this study, Indian educational scenario has been analyzed with
Tamil Nadu state. The selection of Tamil Nadu is left with the following facts. It could be
noted that though Tamil Nadu lags behind Kerala state in terms of literacy, but Tamil Nadu
has well developed in higher educational infrastructural facilities and also students’
enrolment.This study employs only secondary data. The relevant secondary data are
collected from the various statistical reports of Ministry of human resource development,
government of India. Such as Statistics of Higher and Technical Education, Analysis of
Budgeted Expenditure on Education, All India Survey on Higher Education, Educational
Statistics At a Glance and Annual Status of Higher Education of States and UTS In
IndiaThe collected data are classified and tabulated with the help of application of
appropriate statistical tools, cross tabulation has been made on the basis of putting time
duration period as independent variable and indicators on educational expenditure,
students’ enrolment in various levels of education growth of educational institutions,
diversification of higher education, community groups participation in higher education,
minority groups participation in higher education and people with disability participation
in higher education.

International Journal of Management, IT & Engineering Vol. 8 Issue 12(1), December 2018,
ISSN: 2249-0558 Impact Factor: 7.119
Journal Homepage: http://www.ijmra.us, Email: [email protected]
Double-Blind Peer Reviewed Refereed Open Access International Journal - Included in the International
Serial Directories Indexed & Listed at: Ulrich's Periodicals Directory ©, U.S.A., Open J-Gage as well as in
Cabell’s Directories of Publishing Opportunities, U.S.A
119 International Journal of Management, IT & Engineering
http://www.ijmra.us, Email: [email protected]
Analysis and Discussions
Table-1: Public Expenditure on Education and Gross Domestic Product (GDP)
(Rs in Crore)
Year
GDP at Current
price
(at Factor cost)
(Rs. crore)
Total Expenditure
on
Education by
Education &
other Departments
(Rs. crore)
Expenditure on
Education by
Education & other
Departments as %
of
GDP
1951-52 10080 64.46 0.64
1960-61 16220 239.55 1.48
1970-71 42222 892.36 2.11
1980-81 130178 3884.20 2.98
1990-91 510964 19615.85 3.84
2000-2001 1991982 82486.48 4.14
2005-2006 3390503 113228.71 3.34
2006-2007 3953276 137383.99 3.48
2007-2008 4582086 155797.27 3.40
2008-2009 5303567 189068.84 3.56
2009-2010 6108903 241256.02 3.95
2010-2011 7248860 293478.23 4.05
2011-2012 8736039 333930.38 3.82
2012-2013* 9946636 368132.87 3.70
2013-14(RE)* 11236635 433640.59 3.86
2014-15(BE)* 12433749 502929.34 4.04
CV 89.55 92.46 30.83
Annual compound
growth rate 11.57 14.78 2.88
RE Revised Estimate
BE Budget Estimate
Data Source Ministry of Human Resource Development, Government of India
* Base year has been revised from 2004-05 to 2011-12
The total expenditure on education was Rs. 64.46 crore in 1951-1952 and it rapidly moved
to Rs. 502929.34crore in 2014-2015. It could be seen clearly from the above table that the
though the share of educational expenditure growth rate is low, the growth of aggregate
expenditure on education is higher during the period 1951-1952 to 2014-2015 in India. It is
significant to note that the Indian GDP expenditure on education and share of educational
expenditure was low during the period 1951-1952 to 1990-1991. In India the increase in
GDP educational expenditure and increase in share of education expenditure has been
observed during the post reform period from 1990-1991 to 2014-2015 consequent up on
economic reforms, along with expansion of educational opportunities and implementation
of new educational schemes such as educational for all schemes and right to education act.

International Journal of Management, IT & Engineering Vol. 8 Issue 12(1), December 2018,
ISSN: 2249-0558 Impact Factor: 7.119
Journal Homepage: http://www.ijmra.us, Email: [email protected]
Double-Blind Peer Reviewed Refereed Open Access International Journal - Included in the International
Serial Directories Indexed & Listed at: Ulrich's Periodicals Directory ©, U.S.A., Open J-Gage as well as in
Cabell’s Directories of Publishing Opportunities, U.S.A
120 International Journal of Management, IT & Engineering
http://www.ijmra.us, Email: [email protected]
Table-2: Growth of Number of Recognized Educational Institutions in India
Level/Year
(in hundred) (in absolute number)
Primary Upper
Primary
Senior
Secondary College University
1950-1951 2097 136 74 578 27
1960-1961 3304 497 173 1819 45
1970-1971 4084 906 371 3277 82
1980-1981 4945 1186 516 6963 110
1990-1991 5609 1515 798 5748 184
2000-2001 6387 2063 1261 10152 254
2005-2006 7726 2885 1596 16982 350
2006-2007 7849 3056 1696 19812 371
2007-2008 7878 3252 1730 23099 406
2008-2009 7788 3656 1863 27882 440
2009-2010 8199 3941 1939 25938 436
2010-2011 7485 4476 2032 32974 621
2011-2012 7143 4788 2124 34852 642
2012-2013* 8539 5778 3413 35525 667
2013-2014* 8589 4215 2371 36634 723
2014-2015* 8471 4251 2446 38498 760
2015-2016* 8405 4296 2521 39071 799
CV 29.90 55.66 58.90 66.43 64.31
Annual
Compound
Growth rate
2.16 5.46 5.58 6.7 5.35
NA Not Available
Note from 1950-51 to 1990-91, figures for Senior Secondary include the number of
secondary Institutions too.
Data Source
Ministry of Human Resource Development, Government of India / National Institute of
Educational Planning & Administration, New Delhi
* Figures related to School Education are provisional.
A keen observation of data in table-2 indicates the growth of number of recognized
educational institutions in India. It could be seen clearly from the above table that in India
the growth of colleges ranks the first position during the period 1950-1951 to 2015-2016,
growth of secondary and post secondary schools the second, growth of upper primary
schools the third, growth of universities the fourth and the growth of primary schools the
last. In absolute number the primary schools constitute first rank, upper primary schools
the second, secondary and post secondary schools the third, colleges the fourth and
universities the last. The growth rate fluctuation is low in primary schools and it is above
60 per cent in the case of growth of colleges and universities in India during the period
1950-1951 to 2015-2016. The high level increase in educational institutions in India is
attributed to the enhancement in educational expenditure in India during the period 1951-
1952 to 2015-2016.

International Journal of Management, IT & Engineering Vol. 8 Issue 12(1), December 2018,
ISSN: 2249-0558 Impact Factor: 7.119
Journal Homepage: http://www.ijmra.us, Email: [email protected]
Double-Blind Peer Reviewed Refereed Open Access International Journal - Included in the International
Serial Directories Indexed & Listed at: Ulrich's Periodicals Directory ©, U.S.A., Open J-Gage as well as in
Cabell’s Directories of Publishing Opportunities, U.S.A
121 International Journal of Management, IT & Engineering
http://www.ijmra.us, Email: [email protected]
Table-3: Growth of Students Enrolment in Primary Level Education
(In lakh)
Level/Year Primary
Male Female Total
1950-51 138 54 192
1960-61 236 114 350
1970-71 357 213 570
1980-81 453 285 738
2000-2001 640 498 1138
2005-2006 705 616 1321
2006-2007 711 626 1337
2007-2008 711 644 1355
2008-2009 706 647 1353
2009-2010 697 639 1336
2010-2011 701 646 1347
2011-2012 726 672 1398
2012-2013* 696 652 1348
2013-2014* 686 638 1324
2014-2015* 676 629 1305
2015-2016* 669 622 1291
CV 31.85 41.87 36.37
Annual compound growth
rate 2.46 3.83 2.98
NA Not Available
Note from 1950-51 to 1980-81, figures for Class XI-XII include Class IX-X
Data Source Ministry of Human Resource Development, Government of India / National
Institute of Educational Planning & Administration, New Delhi
* Figures are provisional
A keen observation of data in table-3 indicates the growth of students in primary level
education. It could be seen clearly from the above table that the growth of female students’
enrolment in primary level education is faster than the male students’ enrolment during the
period 1950-1951 to 2015-2016. However in absolute number male students’ enrolment in
primary level education is higher than the female students. The growth rate fluctuation is
found to be high among the female students’ enrolment in primary level education during
the period 1950-1951 to 2015-2016. The increase in female students’ enrolment in primary
level education in India is due to government policies put much emphasis on educating
female children in the country through introduction of attractive schemes such as education
for all schemes and right to education act.

International Journal of Management, IT & Engineering Vol. 8 Issue 12(1), December 2018,
ISSN: 2249-0558 Impact Factor: 7.119
Journal Homepage: http://www.ijmra.us, Email: [email protected]
Double-Blind Peer Reviewed Refereed Open Access International Journal - Included in the International
Serial Directories Indexed & Listed at: Ulrich's Periodicals Directory ©, U.S.A., Open J-Gage as well as in
Cabell’s Directories of Publishing Opportunities, U.S.A
122 International Journal of Management, IT & Engineering
http://www.ijmra.us, Email: [email protected]
Table-4: Growth of Students Enrolment in Upper Primary Level Education
(In lakh)
Level/Year Upper Primary
Male Female Total
1950-51 26 5 31
1960-61 51 16 67
1970-71 94 39 133
1980-81 139 68 207
2000-2001 253 175 428
2005-2006 289 233 522
2006-2007 299 246 545
2007-2008 311 262 573
2008-2009 314 270 584
2009-2010 317 278 595
2010-2011 327 292 619
2011-2012 331 299 630
2012-2013* 333 317 650
2013-2014* 341 323 664
2014-2015* 345 327 672
2015-2016* 347 329 676
CV 43.50 54.27 48.28
Annual compound
growth rate 4.07 6.65 4.86
NA Not Available
Note from 1950-51 to 1980-81, figures for Class XI-XII include Class IX-X
Data Source Ministry of Human Resource Development, Government of India / National
Institute of Educational Planning & Administration, New Delhi
* Figures are provisional
A keen observation of data in table-4 indicates the growth of students in upper primary
level education. It could be seen clearly from the above discussion that the growth of
female students’ enrolment in upper primary level education is faster than the male
students’ enrolment in upper primary level education during the period 1950-1951 to 2015-
2016. However in absolute number male students’ enrolment in upper primary level
education is higher than the female students. The growth rate fluctuation is found to be
high among the female students’ enrolment in upper primary level education than the male
students during the period 1950-1951 to 2015-2016. The increase in female students’
enrolment in recent years is due to realization of importance of educating female children
on the part of the families in general and introduction of attractive government schemes in
particular.

International Journal of Management, IT & Engineering Vol. 8 Issue 12(1), December 2018,
ISSN: 2249-0558 Impact Factor: 7.119
Journal Homepage: http://www.ijmra.us, Email: [email protected]
Double-Blind Peer Reviewed Refereed Open Access International Journal - Included in the International
Serial Directories Indexed & Listed at: Ulrich's Periodicals Directory ©, U.S.A., Open J-Gage as well as in
Cabell’s Directories of Publishing Opportunities, U.S.A
123 International Journal of Management, IT & Engineering
http://www.ijmra.us, Email: [email protected]
Table-5: Growth of Expenditure on Elementary Education in India and Tamil Nadu
Year
Total Expenditure on Elementary Education
India Tamil Nadu
Expenditur
e
Elementa
ry
Schools
Students
enrolment Expenditur
e
Elementa
ry
Schools
Students
enrolme
nt
2004-2005 419383010 1124033 168283332 18890909 50436 6831343
2005-2006 513198229 1196663 179342817 20045425 52423 9776589
2006-2007 603418857 1250775 185043293 26148604 53307 9842753
2007-2008 6872093612 1285576 18772713 28872190 53890 9878321
2008-2009 859805753 1303812 187872926 39432923 54428 9924561
2009-2010 1004987602 1362324 193051999 46086642 55175 9797264
2010-2011 1231145715 1412178 199055130 55562376 55175 9776252
2011-2012 1420241588 1431702 199710349 64827512 56535 9678476
2012-2013 1531449890 1448712 198899659 66706571 56535 9396443
2013-2014 1747872797 1445807 197666909 76117700 57153 9252467
2014-2015 2124867758 1445807 196716511 82995761 56785 9236192
CV 108.51 8.45 30.14 47.96 3.82 9.44
Correlation 0.89 0.33 0.18 0.49
Annual
Compound
Growth rate
15.9 2.31 1.43 14.4 1.08 2.78
NA Not Available
Note from 1950-51 to 1980-81, figures for Class XI-XII include Class IX-X
Data Source Ministry of Human Resource Development, Government of India / National
Institute of Educational Planning & Administration, New Delhi
* Figures are provisional
A table-5 presents data on the expenditure on elementary education and growth of
elementary education in India and Tamil Nadu. It could be seen clearly from the above
discussion that growth of government expenditure on elementary education is greater at the
all India level than the Tamil Nadu state level during the period 2004-2005 to 2014-2015.
Similarly the growth of elementary schools, but the growth of students’ enrolment in
elementary level education is higher in Tamil Nadu than the all India level. The correlation
between growth of Indian government expenditure on elementary education and growth of
elementary education is statistically significant and it is not significant in the case of Tamil
Nadu. The correlation between government expenditure on elementary education and
students’ enrolment in elementary level education is not significant. This may be due to
expenditure might have incurred towards wages and salaries and other infrastructural
development.

International Journal of Management, IT & Engineering Vol. 8 Issue 12(1), December 2018,
ISSN: 2249-0558 Impact Factor: 7.119
Journal Homepage: http://www.ijmra.us, Email: [email protected]
Double-Blind Peer Reviewed Refereed Open Access International Journal - Included in the International
Serial Directories Indexed & Listed at: Ulrich's Periodicals Directory ©, U.S.A., Open J-Gage as well as in
Cabell’s Directories of Publishing Opportunities, U.S.A
124 International Journal of Management, IT & Engineering
http://www.ijmra.us, Email: [email protected]
Table-6: Growth of Secondary and Post Secondary Education Expenditure and
Growth of Secondary and Post Secondary Education in India and Tamil Nadu
Year
India Tamil Nadu
Expenditur
e
Secondar
y Schools
Students
enrolmen
t
Expenditu
re
Seconda
ry
Schools
Students
enrolmen
t
2004-2005 253253060 168565 13833456 17662051 7566 1060725
2005-2006 287148144 168725 13942065 20201779 7642 1150626
2006-2007 321359014 169568 14040408 23086023 7833 1152073
2007-2008 337068502 172990 16257779 271219198 7572 1255511
2008-2009 476088116 186310 16890633 36041820 9604 1109735
2009-2010 601940574 193888 17758354 44747225 12996 1168438
2010-2011 759266187 206483 54701288 56719176 10186 3811563
2011-2012 871566868 212454 21007565 63179786 19430 1184232
2012-2013 1027862272 228914 54563885 69206393 11581 3842440
2013-2014 1075707876 237111 59610997 76674245 11587 3968699
2014-2015 1216856751 244653 61803397 89672971 12297 3941483
CV 53.45 14.42 67.36 101.58 32.77 64.30
Correlation 0.87 0.89 0.06 0.15
Annual
Compound
Growth rate
15.34 3.44 14.58 15.92 4.51 12.67
NA Not Available
Note from 1950-51 to 1980-81, figures for Class XI-XII include Class IX-X
Data Source Ministry of Human Resource Development, Government of India / National
Institute of Educational Planning & Administration, New Delhi
* Figures are provisional
A keen observation of data in table-6 indicates the expenditure on elementary education
and growth of secondary and post secondary education in India and Tamil Nadu. It could
be seen clearly from the above table that growth of government expenditure on secondary
and post secondary education is greater at the Tamil Nadu level than at the all India level
during the period 2004-2005 to 2014-2015. Similarly the growth of secondary and post
secondary schools, and also the growth of students’ enrolment in secondary and post
secondary level education. The correlation between growth of Indian government
expenditure on secondary and post secondary education and growth of secondary and post
secondary education is statistically significant at the national level and it is not significant
in the case of Tamil Nadu. The correlation between government expenditure on secondary
and post secondary education and students’ enrolment in secondary and post secondary
level education is not significant. This may be due to expenditure might have incurred
towards wages and salaries and other infrastructural development.

International Journal of Management, IT & Engineering Vol. 8 Issue 12(1), December 2018,
ISSN: 2249-0558 Impact Factor: 7.119
Journal Homepage: http://www.ijmra.us, Email: [email protected]
Double-Blind Peer Reviewed Refereed Open Access International Journal - Included in the International
Serial Directories Indexed & Listed at: Ulrich's Periodicals Directory ©, U.S.A., Open J-Gage as well as in
Cabell’s Directories of Publishing Opportunities, U.S.A
125 International Journal of Management, IT & Engineering
http://www.ijmra.us, Email: [email protected]
Table-7: Growth of Total Expenditure on Higher Education and Growth of Higher
Education in India and Tamil Nadu
Year
India Tamil Nadu
Expenditur
e
Higher
Education
al
Institution
Students
enrolmen
t
Expenditu
re
Higher
Education
al
Institution
Students
enrolment
2004-2005 96478509 13921 13032186 5049465 1698 1324568
2005-2006 114134230 17332 14323566 5529308 1709 13426562
2006-2007 128129400 20186 15257893 5880468 1766 1345569
2007-2008 147629526 23505 17211216 6527409 1809 1346785
2008-2009 201505942 24698 1966785 11003328 1867 135426
2009-2010 232610402 26379 20740740 10783886 1979 1385251
2010-2011 322666304 34968 2642656 14118370 2042 1394265
2011-2012 369942827 35494 28562693 14784123 2368 2964487
2012-2013 387110761 36192 30152417 14585908 2428 3214167
2013-2014 500529219 39258 32336234 19844718 2536 3352881
2014-2015 527747620 39870 34211637 22575062 2426 3352881
CV 56.43 32.43 58.68 49.95 15.67 119.62
Correlation 0.68 0.58 0.13 0.09
Annual
Compound
Growth rate
16.71 10.04 9.17 14.58 3.3 8.81
NA Not Available
Note from 1950-51 to 1980-81, figures for Class XI-XII include Class IX-X
Data Source Ministry of Human Resource Development, Government of India / National
Institute of Educational Planning & Administration, New Delhi
* Figures are provisional
A study of data in table-7 indicates the expenditure on higher education and growth of
higher education in India and Tamil Nadu. It could be seen clearly from the above table
that growth of government expenditure on higher education is greater at the national level
than at the all Tamil Nadu state level during the period 2004-2005 to 2014-2015. Similarly
the growth of higher educational institutions and also the growth of students’ enrolment in
higher education. The correlation between growth of Indian government expenditure on
higher education and growth of higher education is statistically significant at the national
level and it is not significant in the case of Tamil Nadu. The correlation between
government expenditure on higher education and students’ enrolment in higher education
is not significant at the Tamil Nadu state level. This may be due to expenditure might have
incurred towards wages and salaries and other infrastructural development.
Conclusion
The findings of expenditure on education and Gross Domestic Product in India indicate the
following facts. The share of educational expenditure growth rate is low; the growth of
aggregate expenditure on education is higher during the period 1951-1952 to 2014-2015 in
India. It is significant to note that the Indian GDP expenditure on education and share of
educational expenditure was low during the period 1951-1952 to 1990-1991. In India the

International Journal of Management, IT & Engineering Vol. 8 Issue 12(1), December 2018,
ISSN: 2249-0558 Impact Factor: 7.119
Journal Homepage: http://www.ijmra.us, Email: [email protected]
Double-Blind Peer Reviewed Refereed Open Access International Journal - Included in the International
Serial Directories Indexed & Listed at: Ulrich's Periodicals Directory ©, U.S.A., Open J-Gage as well as in
Cabell’s Directories of Publishing Opportunities, U.S.A
126 International Journal of Management, IT & Engineering
http://www.ijmra.us, Email: [email protected]
increase in GDP educational expenditure and increase in share of education expenditure
has been observed during the post reform period from 1990-1991 to 2014-2015 consequent
up on economic reforms, along with expansion of educational opportunities and
implementation of new educational schemes such as educational for all schemes and right
to education act.
The findings growth of number of recognized educational institutions in India reveal the
following facts. In India the growth of colleges ranks the first position during the period
1950-1951 to 2015-2016, growth of secondary and post secondary schools the second,
growth of upper primary schools the third, growth of universities the fourth and the growth
of primary schools the last. In absolute number the primary schools constitute first rank,
upper primary schools the second, secondary and post secondary schools the third, colleges
the fourth and universities the last. The growth rate fluctuation is low in primary schools
and it is above 60 per cent in the case of growth of colleges and universities in India during
the period 1950-1951 to 2015-2016. The high level increase in educational institutions in
India is attributed to the enhancement in educational expenditure in India during the period
1951-1952 to 2015-2016.
The findings of expenditure on elementary education and growth of elementary education
in India and Tamil Nadu show the following facts. The growth of government expenditure
on elementary education is greater at the all India level than the Tamil Nadu state level
during the period 2004-2005 to 2014-2015. Similarly the growth of elementary schools,
but the growth of students’ enrolment in elementary level education is higher in Tamil
Nadu than the all India level. The correlation between growth of Indian government
expenditure on elementary education and growth of elementary education is statistically
significant and it is not significant in the case of Tamil Nadu. The correlation between
government expenditure on elementary education and students’ enrolment in elementary
level education is not significant. This may be due to expenditure might have incurred
towards wages and salaries and other infrastructural development.
The findings of expenditure on elementary education and growth of secondary and post
secondary education in India and Tamil Nadu indicate the following facts. The growth of
government expenditure on secondary and post secondary education is greater at the Tamil
Nadu level than at the all India level during the period 2004-2005 to 2014-2015. Similarly
the growth of secondary and post secondary schools, and also the growth of students’
enrolment in secondary and post secondary level education. The correlation between
growth of Indian government expenditure on secondary and post secondary education and
growth of secondary and post secondary education is statistically significant at the national
level and it is not significant in the case of Tamil Nadu. The correlation between
government expenditure on secondary and post secondary education and students’
enrolment in secondary and post secondary level education is not significant. This may be
due to expenditure might have incurred towards wages and salaries and other
infrastructural development.
The findings of expenditure on higher education and growth of higher education in India
and Tamil Nadu reveal the following facts. Growth of government expenditure on higher
education is greater at the national level than at the all Tamil Nadu state level during the
period 2004-2005 to 2014-2015. Similarly the growth of higher educational institutions
and also the growth of student’s enrolment in higher education. The correlation between
growth of Indian government expenditure on higher education and growth of higher

International Journal of Management, IT & Engineering Vol. 8 Issue 12(1), December 2018,
ISSN: 2249-0558 Impact Factor: 7.119
Journal Homepage: http://www.ijmra.us, Email: [email protected]
Double-Blind Peer Reviewed Refereed Open Access International Journal - Included in the International
Serial Directories Indexed & Listed at: Ulrich's Periodicals Directory ©, U.S.A., Open J-Gage as well as in
Cabell’s Directories of Publishing Opportunities, U.S.A
127 International Journal of Management, IT & Engineering
http://www.ijmra.us, Email: [email protected]
education is statistically significant at the national level and it is not significant in the case
of Tamil Nadu. The correlation between government expenditure on higher education and
student’s enrolment in higher education is not significant at the Tamil Nadu state level.
This may be due to expenditure might have incurred towards wages and salaries and other
infrastructural development.
References
Barro, R. J. and J.-W. Lee. (2010) A New Dataset of Educational Attainment in the World,
1950–2010. NBER Working Paper No. 15902. Cambridge, MA: National Bureau of
Economic Research.
Botlhale, Emmanuel (2015), Financing Tertiary Education under Fiscal Stress in
Botswana, Africa Education Review, v12 n4 p647-663.
Camilleri, Mark A. and Camilleri, Adriana (2016), Education and Social Cohesion for
Economic Growth, International Journal of Leadership in Education, v19 n5 p617-631.
Gaba, Ashok K.; Li, Wei (2015), Growth and Development of Distance Education in India
and China: A Study on Policy Perspectives, Open Praxis, v7 n4 p311-323.
Halaisz, Gaibor (2015), Education and Social Transformation in Central and Eastern
Europe, European Journal of Education, v50 n3 p350-371.
Hansen, 'I W. L. and Weisbrod, B. A. (1969) The distribution of costs and direct benefits
of public higher education: the case of California. Journal of 1uman Resources 4, 176-191.
Hanushek, E.A., Schwerdt, G.,, Woessmann, L., and Zhang, L. (2017). General education,
vocational education, and labor-market outcomes over the life-cycle. Journal of Human
Resources 52, no. 1 (Winter): 48-87.
Hanushek, E.A., Woessmann, L. in Dominic J. Brewer and Patrick J. McEwan (2010)
Economics of Education, Amsterdam: Elsevier, 2010, pp. 60-67[reprinted in Eva Baker,
Barry McGaw and Penelope Peterson (ed.), International Encyclopedia of Education
(Amsterdam: Elsevier, 2010), pp. 245-252].
IIASA (2008) Economic Growth in Developing Countries: Education Proves Key, Policy
Brief#3http://www.iiasa.ac.at/web/home/resources/publications/IIASAPolicyBriefs/pb03-
web.pdf
Lockheed, M., Jamison, D., and Lau, L. (1980). Farmer education and farmer efficiency: a
survey. In King, T. (ed) Education and Income. World Bank Staff Working Paper 402.
Washington DC, World Bank.
Tilak, Jandhyala B. G (2010), Higher Education, Poverty and Development, Higher
Education Review, v42 n2 p23-45.
Udefuna, Patrick Nnadozie, Akalefu, Chiedo and Asogwa, Chinako (2013),
Entrepreneurship Education and Economic Development in Nigeria: Policy Issues and
Options, Industry and Higher Education, v27 n5 p343-348.
UNESCO (2012) UNESCO Global MonitoringReport http://unesdoc.unesco.org/
images/0021/002180/218003e.pdf
Woessmann, L (2015) The economic case for education, Education Economics,
Volume24.http://www.tandfonline.com/doi/abs/10.1080/09645292.2015.1059801?journal
Code=cede20
World Economic Forum (2016) Global Competitiveness Report 2015-2016
http://reports.weforum.org/global-competitiveness-report-2015-2016/education/#view/fn-
53

International Journal of Management, IT & Engineering Vol. 8 Issue 12(1), December 2018,
ISSN: 2249-0558 Impact Factor: 7.119
Journal Homepage: http://www.ijmra.us, Email: [email protected]
Double-Blind Peer Reviewed Refereed Open Access International Journal - Included in the International
Serial Directories Indexed & Listed at: Ulrich's Periodicals Directory ©, U.S.A., Open J-Gage as well as in
Cabell’s Directories of Publishing Opportunities, U.S.A
128 International Journal of Management, IT & Engineering
http://www.ijmra.us, Email: [email protected]
Multifarious Network Attacks and their Corresponding
Security Mechanisms
Mr.Aravind.B
Dr.Murugan.D
Abstract
Network security is a major challenge in this modern era where everything on the real-time
usage things are directly or indirectly associated with a network. With the evolution of
internet across the globe, the Network systems are more prone to be attacked by the
hackers and illegal intruders who try to steal the data. This paper deals with the major
vulnerability and network security attacks and preventive measures that which has been
taken to prevent them. Vulnerability attacks include the malicious software that which are
inserted a system, which replicates by itself and causes damages to the entire system
making many problems to the security of the networks like denying services and stealing
of sensitive information. Some major types of malicious vulnerability attacks are Trojan,
Worms, Rootkits, Spyware and Botnet. The major other security attacks that which is
going to be analysed are Man in the middle attack, DNS Poisoning, ARP Poisoning and
Denial of service. These security attacks use different techniques to attack the network
system and cause the network to dysfunction. In this paper, detailed mechanisms of
network attacks and their corresponding security measures are briefly explored and
analysed. Various attacks follow different attacking systems and different solution has to
be bought to solve their problems and protect the network system.
Introduction
In Network security, the major challenges faced are vulnerabilities and hacker attacks.
Vulnerability includes the malware like Trojan, worms, rootkits, spyware and botnets. This
malicious software is replicated within itself and causes the network system to collapse.
These are generally termed as attacks. The next type of network attacks includes the third
party directly involved attacks like man in the middle attack, DNS poisoning, ARP
poisoning, Denial of service. These attacks try to steal the original data or modify the data
that which is been transmitted during the network transmissions. However, there are many
steps to prevent the attacks the attacker gets smarter and somehow intrudes into the system
and breaks the system security. Due to the increase in the internet, many things have been
automated. Almost every possible thing have been now available online like shopping,
money, transfer, government files, banking. Information’s like username and password
even personal identity like aadhaar card details and many more are made available on
internet and system networks. Therefore, it is very much important to keep the data
transmission safer and secured. Many problems are rising due to the attackers who harm
Research Scholar, Register No: 18214012301031, MS University, Abishekapatti, Tirunelveli-627 012, Tamil Nadu,
India. Professor and Head, Department Of CSE, MS University, Abishekapatti, Tirunelveli-627012, Tamil Nadu, India
Keywords: Trojan; Worms, Rootkits; Spyware, Botnet; Man in the middle attack; DNS
Poisoning; ARP Poisoning; Denial of Service;

International Journal of Management, IT & Engineering Vol. 8 Issue 12(1), December 2018,
ISSN: 2249-0558 Impact Factor: 7.119
Journal Homepage: http://www.ijmra.us, Email: [email protected]
Double-Blind Peer Reviewed Refereed Open Access International Journal - Included in the International
Serial Directories Indexed & Listed at: Ulrich's Periodicals Directory ©, U.S.A., Open J-Gage as well as in
Cabell’s Directories of Publishing Opportunities, U.S.A
129 International Journal of Management, IT & Engineering
http://www.ijmra.us, Email: [email protected]
the system by stealing the data. Online frauds have increased enormously. The attackers
identify the “soft spots” that which are present in every network. To prevent the attackers
intruding in the system many steps have been taken and network security has been made
secure by certain techniques, which are explained, detailed in this paper.
1. Trojan
This is also termed as Trojan horse and it is a type of information stealing attack where a
windows box arises and it prompts the use to enter the username and password of the user.
This window looks exactly like the original window and when the user enters his details,
the attacker steals the information and it sends the window error for the bad password.
Opening a wrong email or downloading a wrong software module from internet can cause
this Trojan horse to grow up.
2. Worms
Worm is type of computer attack, which does not require any human action to attack the
network. It replicates itself and harms the system by transferring files, which are infected
to be spread within it. These self-replicated files produce harmful effects and defoliate the
entire networking system. Worms are of two types namely mass mailing worms and
network aware worms. As the name implies mass mailing worms uses mail as a medium of
transferring infected files over the network. Network aware worm selects a particular
network and attacks the network. Scalper, Morris and my doom are some examples of
worms.
3. Rootkits
Rootkit is a malicious program, which contains a collection of tools to harm the network.
One major difference of rootkits by other malware is that it attempts to prevent the
malicious code entering into the system by preventing the detection of anti-viruses. This
can be installed in the system by number of ways namely phishing and social engineering
often giving remote access to the cyber criminals across the system. The symptom of the
affected system involves that antimalware detecting antivirus’s stops detecting the
malwares.
4. Spyware
Spyware includes adware, key loggers that provide information about the networks to the
attackers. Adware monitors the web browser activity and sends the targeted advertisements
to the user’s desktop depending on their browsing activity. This can even change the way a
user’s web browser working activity by installation of some helper options in browser
objects. It changes the normal settings of the browsers web page to make the bookmark
lists. Keystroke loggers are made in a design to capture logon ID and password on the
mainframe of the dumb terminals.
5. Botnet
Botnet is also termed as killer web application. Because of its harmful nature it is been
termed as killer application. Botnet has created a huge set of problems regarding crime in
the hacker darkside.The victims of Botnets are primary innocent networks. This killer app
targets a particular company or an individual market of networks. Botnets with hundreds to
thousands of client’s acts together to perform damage effect to the network system.Inorder
to stop this botnet attacking the network system a more preventive measure to preserve the
IRC channel has to be made.
These vulnerabilities are mostly self-replicating and cause damages to the system on their
own damaging methods. Now we will move on to the major network attacks that which is

International Journal of Management, IT & Engineering Vol. 8 Issue 12(1), December 2018,
ISSN: 2249-0558 Impact Factor: 7.119
Journal Homepage: http://www.ijmra.us, Email: [email protected]
Double-Blind Peer Reviewed Refereed Open Access International Journal - Included in the International
Serial Directories Indexed & Listed at: Ulrich's Periodicals Directory ©, U.S.A., Open J-Gage as well as in
Cabell’s Directories of Publishing Opportunities, U.S.A
130 International Journal of Management, IT & Engineering
http://www.ijmra.us, Email: [email protected]
caused by a third party hacker or attacker who aims to steal the credential information’s
from the network systems in the research method section and solution to clear the attacks
in result and analysis section.
Research Method
In the research method section we discuss about the various attacks that happens for
systems that which are connected to the networks. The networks that which are prone to
these types of attacks are always vulnerable to the security that which is needed to be
maintained very confidentially.
2.1 Man in the Middle Attack
Man in the middle attack is one of the most common attacks happening around the network
systems. A third party attacker gets the information’s of the end user sender and receiver in
the format of the certificate. The certificate once hacked gets to be forged by the attacker
and it changes or steals the original information that which has been transmitted through
the network system. MITM is mainly attacked in the forms of ARP spoofing, DNS
spoofing based MITM attack; DHCP spoofing based MITM attack, IP spoofing MITM
attack and SSL/TLS MITM attack.
Fig 2.1 Representation of Man in the Middle Attack
[Source: https://www.deepdotweb.com/wp-content/uploads/2016/10/word-image-20.png]
In this type of attack, the third party is involved thus, it has been termed as session
hijacking, TCP hijacking and termed as monkey in the middle. In MITM attack, the two
ends termed as victims and attackers are at both end. The message sent from attacker
termed as M1, message M2.Attacker intercepts the messages, and as a return, it sends M3
and M4, which are encrypted and stolen, from the attacker. Now after modifying the
message it sends the message M5 that the attacker intercepts and decrypts it using victim’s
private key, then sends the encrypted message, and is received as M6 by the victim. Some
other types of MITM attacks are BGP MITM and False Base Station based MITM.
2.2 DNS Poisoning Attack
The DNS messages that which are passed through the internet is very weak and are very
much prone to DNS Cache poisoning attack. A fake response is produced in attempt to the
cache poisoning attacks. The DNS messages that which are transferred without encryption
or any other authentication systems are been more prone to this type of attack.

International Journal of Management, IT & Engineering Vol. 8 Issue 12(1), December 2018,
ISSN: 2249-0558 Impact Factor: 7.119
Journal Homepage: http://www.ijmra.us, Email: [email protected]
Double-Blind Peer Reviewed Refereed Open Access International Journal - Included in the International
Serial Directories Indexed & Listed at: Ulrich's Periodicals Directory ©, U.S.A., Open J-Gage as well as in
Cabell’s Directories of Publishing Opportunities, U.S.A
131 International Journal of Management, IT & Engineering
http://www.ijmra.us, Email: [email protected]
Fig 2.2 Representation of DNS Poisoning Attack
[Source:https://s3.amazonaws.com/s3.timetoast.com/public/uploads/photos/4453090/DNS
_Server.jpg?1475033266]
In DNS Poisoning attack, the attacker launches a DNS query to the respected DNS server.
Then the domain names that which is produced randomly comes in response to the
NXDOMAIN denoting its existence and nonexistence from domain names. The attacker
the forges the reply packets that contain the information’s about the IP addresses and all
the other details are taken into considerations. If the reply comes in bogus the cache server
delivers earlier and then into the randomly accessed ID.The attacker in order to maintain
the attacking system needs to detect that particular DNS server to be attacked and then
identify the DNS poisoned which is weaker in security.
2.3 ARP Poisoning Attack
Address resolution protocol is one of the basic protocols used by most of the hosts in a
network. Each device on IP network has MAC as well as IP addresses. Addresses of
destination device is needed from the sender in order to receive the message safely.ARP
cache comes in the process of data transmission.ARP cache poisoning is the major attack
that which has been bought into limelight.
Fig 2.3 Representation of ARP Poisoning Attack
[Source:https://www.researchgate.net/profile/Abhishek_Samvedi2/publication/263048849/
figure/fig1/AS:296563961286657@1447717766052/ARP-poisoning.png]

International Journal of Management, IT & Engineering Vol. 8 Issue 12(1), December 2018,
ISSN: 2249-0558 Impact Factor: 7.119
Journal Homepage: http://www.ijmra.us, Email: [email protected]
Double-Blind Peer Reviewed Refereed Open Access International Journal - Included in the International
Serial Directories Indexed & Listed at: Ulrich's Periodicals Directory ©, U.S.A., Open J-Gage as well as in
Cabell’s Directories of Publishing Opportunities, U.S.A
132 International Journal of Management, IT & Engineering
http://www.ijmra.us, Email: [email protected]
ARP Poisoning or ARP cache poisoning is a technique where the attacker injects a host
with a wrong IP-MAC address. Host impersonation is a major type of network ARP attack
where the packets are dropped into the received packets. The attacker can reply and can
impersonate any host in the attacked network system.ARP Poisoning can be divided into
four types if the following steps are seen. Unsolicited response providing fake response, A
Request where the IP MAC is sent legitimately to ARP request, Response to a request
where the unsolicited request or response is seen where the attacker gets the reply from the
received chances and finally a Request and Response which holds the malicious host that
which can send a fake reply to the legitimate request got by poisoning ARP caches of
many hosts present in the network system.
2.4 Denial of service attack
Denial of service attacks are also called as DistributedDOS.In this attack the attacker takes
the control of large number of computer systems that which are lightly protected.
Fig 2.4 Representation of Denial of Service Attack
[Source: https://i1.wp.com/www.howtogeek.com/wp-content/uploads/2016/11/ddos-
650x300.png]
These attacked systems does not have any basic protection like firewall or up to date
antivirus softwares.Banks , corporate networks, government websites are mostly prone to
this attack. The agent software modules installed in IRC usually communicates with the
IRC networks, which then provides an easy way for attackers to secure secondary victims,
which are involved in the attacks.Recently all the attacks have shifted towards economic
crime and on the cyber warfare. These can be much harmful which leads to disruption in
the presence of one systems attack. This attack can be prevented on the repertoire of
various countermeasures. Suggestions has been made that “IP trace back”has to be
followed to encounter this attack,DNS can be found using following mechanism they are
by detecting the existence of an attack, Classification of the incoming packets for invalid
packets and whether it is getting the responses of the attacks. Detection can be made to a
network that some of the proactive qualities, which will render the ineffective network
attacks, have affected it. The use of learning techniques for neural and radial basis,
applying statistical signal analysis and use of multi-agent systems are some of the basic
techniques to solve this attack.
3. Results and Analysis
In this section of results and analysis, we analyse the features that which gives the solution
for the different network attacks and analysis the safety precautions that can be taken
towards the network attacks.

International Journal of Management, IT & Engineering Vol. 8 Issue 12(1), December 2018,
ISSN: 2249-0558 Impact Factor: 7.119
Journal Homepage: http://www.ijmra.us, Email: [email protected]
Double-Blind Peer Reviewed Refereed Open Access International Journal - Included in the International
Serial Directories Indexed & Listed at: Ulrich's Periodicals Directory ©, U.S.A., Open J-Gage as well as in
Cabell’s Directories of Publishing Opportunities, U.S.A
133 International Journal of Management, IT & Engineering
http://www.ijmra.us, Email: [email protected]
3.1Solution for Man in the middle attack
Man in the middle is termed together as a major threat to network security because of the
wide range of attacks that has been caused to the network by various agents, which comes
in the aim to steal the information from the networks.
Fig 3.1 Representation of solution to Man in the Middle Attack
[Source:https://qph.fs.quoracdn.net/main-qimg-2977a0850d627c8f1070a14d47f7cae9]
MITM can be resolved using Cryptographic solutions where the key transmission systems
are authenticated using Authoritative key distributor(AKD) where we use public key
cryptography to prevent the attack where ARP spoofing can be prevented.The next
solution for the problem caused during DNS spoofing can be found by cache poisoning
detection system(CPDS) where more secure system and entropy incresing mechanism are
the other method to prevent the invalid DNS packets getting injected.The next attack been
the DHCP spoofing which is prevented by using block responses from ports which do not
have the servers associated with Dynamic ARP injection (DAI).IP spoofing based attack
can be protected by source address validation enforcement(SAVE).The final major attack
caused to the MITM been the SSL/TLS MITM attack causing the forged certificate been
found out and server based methods mechanisms like multipath problems where third party
are involved can be cleared by using the X.509 certificates and SSL/TLS handshakes.
3.2 Solution for ARP Poisoning
ARP spoofing can be eliminated by setting up network in such a phase those only
legitimate devices that which are configured in the network can access the devices. When
the network systems are large, it will become tough to restrict the devices involved in the
system. Setting up static ARP is a basic solution to prevent network systems from being
attacked by ARP poisoning. The devices with legitimate MAC addresses can only be
configured on the network. The next method is to do the state full ARP mechanism, which
tells that if the host receives two similar ARP reply packets, which comes from host to
destination the two packets, will be discarded.

International Journal of Management, IT & Engineering Vol. 8 Issue 12(1), December 2018,
ISSN: 2249-0558 Impact Factor: 7.119
Journal Homepage: http://www.ijmra.us, Email: [email protected]
Double-Blind Peer Reviewed Refereed Open Access International Journal - Included in the International
Serial Directories Indexed & Listed at: Ulrich's Periodicals Directory ©, U.S.A., Open J-Gage as well as in
Cabell’s Directories of Publishing Opportunities, U.S.A
134 International Journal of Management, IT & Engineering
http://www.ijmra.us, Email: [email protected]
Fig 3.2 Representation of solution to ARP Poisoning
[Source: https://ieeexplore.ieee.org/xpl/mostRecentIssue.jsp?punumber=7352813]
Fuzzy logic controller will do this and the host will not be able to update its ARP cache.
Secure ARP(S-ARP) is another method where the keys are digitally signed using
authoritative key distributor(AKD) by the sender preventing ARP cache from getting
poisoned-ARP provides security to the network using a local ticket agent(LTA).These
tickets will have the expiration time until which it maintains the validity. The final
technique that is followed for ARP poison prevention is active detection technique, which
tells the detection of ARP poisoning without modifying the existing protocol.
3.3 Solution for DNS Poisoning
Many enhancements can be made to enable the DNS to re stand against the obstruct of the
DNS attacks. With the recent increase in the global internet speed it is bit difficult to
protect the DNS attack by substantial IDs.DNS query and DNS response are the two things
that which needs to be analysed well enough in this section.
Fig 3.3 Representation of Solution to DNS Poisoning Attack
[Source:https://techglimpse.com/wp-content/uploads/2013/11/dns-cache-poisoning-
explained1.jpg]
Public key infrastructure (PKI) like RSA, DSA and Diffie-Hellman are used for creating
DNSSEC to create a digital signature for the authentication purpose. The second thing is
that the increase in the share server’s certificates and the third one is the DNS protocol that
defines the entire structure. The system can be protected using some series of steps, that

International Journal of Management, IT & Engineering Vol. 8 Issue 12(1), December 2018,
ISSN: 2249-0558 Impact Factor: 7.119
Journal Homepage: http://www.ijmra.us, Email: [email protected]
Double-Blind Peer Reviewed Refereed Open Access International Journal - Included in the International
Serial Directories Indexed & Listed at: Ulrich's Periodicals Directory ©, U.S.A., Open J-Gage as well as in
Cabell’s Directories of Publishing Opportunities, U.S.A
135 International Journal of Management, IT & Engineering
http://www.ijmra.us, Email: [email protected]
which defines the problems into four sections namely Send_query, Receive_query,
Send_Response and Receive Response procedures. As the name implies the DNS
poisoning attack helps to respond to the query using ID1 and NS to the local server. It the
represented figure above the solution is been given clearly. The request and response are
seen clearly and the male DNS server and the evil request and response are seen clearly.
Finally, the section deals with the computer that which takes the server to the wrong
domain of the website, which is a fake website.
3.4 Solution for Denial of Service
Denial of service can be spotted by certain steps namely detection,classification and
response.Detection can be either anomaly based or signature based.Classification can be
done using the attack type that which has been detected.Response will be directly in the
dependent phase of the timely report that which it gets from the attacker.
Fig 3.4 Representation of Solution to Denial of Service Attack
[Source:http://studentnet.cs.manchester.ac.u://stuk/resources/library/3rd-year-
projects/2015/zhengquan.fan.pdf]
The first way to find the Denial of service attack is by using learning techniques using
genetic algorithms.A numerical technique called ART is followed which means Adaptive
Resonance Theory.ART is trained well with types of varied inputs.Fuzzy techniques is also
followed to solve this attack.Applying statistical signal analysis is another technique for
finding Dos.Entrophy methods are applied using Hurst parameter.Other statistical
approaches like fractional gaussian noise(FGN) is used to solve this attack and cimulative
sum algorithm(CUSUM) is a change point detection algorithm which helps to make sharp
changes on the variable to use Dos detection.Final type in detecting the DOS is by using
multi agent systems.A gradiant based learning technique along with the IP monitoring
scheme tends to select the gradiant based learning scheme for enabling of using more multi
agent approaches from the concept of detecting firewall attacks.
4. Conclusion
In this paper a clear representation of different attacks, which are happening to the systems
that which are connected to the networks are analysed, and their solution has been bought
forward. From the major attacks like Man in the middle, ARP Poisoning, DNS Poisoning
and Denial of service are clearly analysed and their solutions are given in a clearer manner.
The other normal attacks as worms, Trojans and other small virus attacks also been
analysed and their solution has been given. The Network security that which causes the
entire system to fall and a safe mechanism has been followed. After successful analysis
various security threats causing the system to fault tolerance are been well analysed and a
secure manner is held for providing a more secured functionality of the system to work

International Journal of Management, IT & Engineering Vol. 8 Issue 12(1), December 2018,
ISSN: 2249-0558 Impact Factor: 7.119
Journal Homepage: http://www.ijmra.us, Email: [email protected]
Double-Blind Peer Reviewed Refereed Open Access International Journal - Included in the International
Serial Directories Indexed & Listed at: Ulrich's Periodicals Directory ©, U.S.A., Open J-Gage as well as in
Cabell’s Directories of Publishing Opportunities, U.S.A
136 International Journal of Management, IT & Engineering
http://www.ijmra.us, Email: [email protected]
properly and protect system from external attacks. Hence a more secure mode of activation
of the system security has been carried out which enables the system to work without any
problem and help the system to work in a fully secured manner.
References
[1] Mauro Conti, Nicola Dragoni, and Viktor Lesyk, “A Survey of Man in the Middle
Attacks”, “IEEE COMMUNICATION SURVEYS & TUTORIALS”, 2016.
[2] Richard Ford and Michael Howard, “Man-in-the-Middle Attack to the HTTPS
Protocol”, Security & Privacy, ACM 2009.
[3]Faheem Fayyaz and Hamza Rasheed, “Using JPCAP to prevent man-in-the-middle
attacks in a local area network environment”, IEEE POTENTIALS, 2012.
[4]Bjoern M. Luettmann and Adam C. Bender, “Man-in-the-Middle Attacks on Auto-
Updating Software”, “Bell Labs Technical Journal” 2017.
[5]Seung Yom Nam, Dongwon Kim and Jeongeun Kim “Enhanced ARP: Preventing ARP
Poisoning-Based Man-in-the-Middle Attacks”, “IEEE COMMUNICATIONS LETTERS”,
VOL. 14, NO. 2, FEBRUARY 2010.
[6]Heman Awang Mangut, and Ameer Al-Nemrat “ARP Cache Poisoning Mitigation and
Forensics Investigation” “IEEE Trustcom/BigDataSE/ISPA”, 2015.
[7]Jitta Sai Meghana, Dr. T. Subashri and K.R. Vimal “A Survey on ARP Cache
PoisoningAnd techniques for detection and mitigation” IEEE March 16 – 18, 2017.
[8]P.Anu and Dr.S.Vimala “A survey on sniffing attacks on computer networks”
“International Conference on Intelligent computing and Control”, 2017.
[9]Lejun Fan, Yuanzhuo Wang, Xueqi Cheng and Jinming Li “Prevent DNS Cache
Poisoning Using Security Proxy”,“12th International Conference on Parallel and
Distributed Computing, Applications and Technologies”, 2011.
[10]Mohammed Abdulridha Hussain, Hai Jin and Zaid Alaa Hussein ”DNS Protection
against Spoofing and Poisoning Attacks”,“3rd International Conference on Information
Science and Control Engineering”, 2016
[11]B.Radha and S.Selvakumar “DEEPAV2: A DNS MONITOR TOOL FOR
PREVENTION OF PUBLIC IP DNS REBINDING ATTACK”,” Proc. of Int. Conf on
Advances in Recent Technologies in Communicationand Computing”, 2011.
[12]Haya Shulman and Michael Waidner “Towards Forensic Analysis of Attacks with
DNSSEC”, “IEEESecurity and Privacy Workshops”, 2014.
[13]Kiwon Hong, Younjun Kim, Hyungoo Choi, and Jinwoo Park “SDN-Assisted Slow
HTTP DDoS Attack Defence Method” “IEEE Transactions” 2017.
[14]Georgios Loukasand Gulay Oke “Protection against Denial of Service Attacks: A
Survey” “IEEETransaction” August 19, 2009
[15]Jiahu Qin, Menglin Li and Ling Shi” Optimal Denial-of-Service Attack Scheduling
with Energy Constraint Over Packet-dropping Networks” “IEEE transactions” 2017.
[16]Supranamaya Ranjan, Ram Swaminathan and Edward Knightly “DDoS-Shield: DDoS-
Resilient Scheduling to Counter Application Layer Attacks” VOL. 17, NO. 1, FEBRUARY
2009
[17]Jonathan Trostle and Bill Van Besien “Protecting Against DNS Cache Poisoning
Attacks”,”IEEE transactions”, 2010
[18]Hao Wu, Xian lei Dang, Liang Zhang, and Lidong Wang “Kalman Filter Based DNS
Cache Poisoning Attack Detection”,“IEEE International Conference on Automation
Science and Engineering”, 2016

International Journal of Management, IT & Engineering Vol. 8 Issue 12(1), December 2018,
ISSN: 2249-0558 Impact Factor: 7.119
Journal Homepage: http://www.ijmra.us, Email: [email protected]
Double-Blind Peer Reviewed Refereed Open Access International Journal - Included in the International
Serial Directories Indexed & Listed at: Ulrich's Periodicals Directory ©, U.S.A., Open J-Gage as well as in
Cabell’s Directories of Publishing Opportunities, U.S.A
137 International Journal of Management, IT & Engineering
http://www.ijmra.us, Email: [email protected]
[19]Haya Shulman and Michael Waidner “Towards Forensic Analysis of Attacks with
DNSSEC”, “IEEE Security and Privacy Workshops”, 2014
[20]Trupti Shah “Network Security- Virus Attacks and Defence using Antivirus
Software”,“International Journal of Advanced Research in Computer Science &
Technology”,2014

International Journal of Management, IT & Engineering Vol. 8 Issue 12(1), December 2018,
ISSN: 2249-0558 Impact Factor: 7.119
Journal Homepage: http://www.ijmra.us, Email: [email protected]
Double-Blind Peer Reviewed Refereed Open Access International Journal - Included in the International
Serial Directories Indexed & Listed at: Ulrich's Periodicals Directory ©, U.S.A., Open J-Gage as well as in
Cabell’s Directories of Publishing Opportunities, U.S.A
138 International Journal of Management, IT & Engineering
http://www.ijmra.us, Email: [email protected]
Parameter Selection for Vertical Handoff in Heterogeneous
Wireless Network
Pragati T Kene
Dr. S.L. Haridas
Abstract: The developing science and technology is leadingand reshaping our lives. The
deployment of smart and ever growing varied wireless networks & the development in the
mobile device designs is the main reason for this drastic change in our lifestyle.Today’s
upcoming wireless technologies are consisting of varied types of networks which created
many challenges such as mobility management especiallyswitch over, resource
management, location management, QoSprovisioning, security and monetary pricing.
Traversing between (heterogeneous) distinct trait networks demands for sound
verticalswitch over(handoff). The decision to choose appropriate parametersis a vital part
in the judgment making of vertical switch over. There are variety of dynamic and non-
dynamicparameters like network load related to network, user or the cell terminal which
are included during making any judgment for vertical switch over, strength of the signal,
velocity, BW,consumption of power,throughput (Th), cost,preferences of user. In this
paper, theparameters which needs to be considered for making an appropriate switch
overdecision are discussed.
Keywords: Heterogeneous wireless networks, parameters, handoff.
Introduction
Switchover ishaving a foremost role in the selection of suitable network Base station,
Channel or point of attachment amongst the available access network, when the mobile
node do not receive proper QoS to continue the ongoing session and there exists a threat of
serious disturbance which could annoy the user or even a call drop which is not at all
acceptable.
A switch over mechanism isinitiatedas soon asone of the actionas under takes place:
(a) Freshutility assistance is asked for,
(b) Aconsumermodifiestheirchoices;
(c) Theterminal of cellidentifiesanobtainsabilityaboutdifferentlinkage;
(d) Intensemobile wavedeterioration/entirewave is lostin existinglinkage [1].
Switch over depending on sort ofswitching between points of attachment can be distributed
into [2]:
1. Horizontal/ Intra-cell /Intra-domainSwitch over: Thisswitch overprocess isamong
wireless networks with the same sort of access technology. It is the simplest sort ofswitch
over with respect to implementation.
2. Vertical/ Inter-cell / Inter-domain/ Inter-RAT switch over: A switch overacross
networkspossessing different sort of access technologies is vertical switch over. It occurs
with the movements of the nomadic nodes across adjacent cell with base station having
Research Scholar, Department of Electronics Engineering, G.H. Raisoni College of Engineering, Nagpur, India Professor, Department of Electronics & Telecommunication Engineering, G.H. Raisoni College of Engineering,
Nagpur, India

International Journal of Management, IT & Engineering Vol. 8 Issue 12(1), December 2018,
ISSN: 2249-0558 Impact Factor: 7.119
Journal Homepage: http://www.ijmra.us, Email: [email protected]
Double-Blind Peer Reviewed Refereed Open Access International Journal - Included in the International
Serial Directories Indexed & Listed at: Ulrich's Periodicals Directory ©, U.S.A., Open J-Gage as well as in
Cabell’s Directories of Publishing Opportunities, U.S.A
139 International Journal of Management, IT & Engineering
http://www.ijmra.us, Email: [email protected]
varied specification in terms of service, they provide and the protocol they use. There are
further two types in this:
a) Upward vertical switch overincludes, switch over from smaller coverage area to bigger
coverage area network.
b) Downward vertical switch over, which is exactly the opposite of the previous one.
3. DiagonalSwitch over: Diagonal switch over is nothing but the combination of horizontal
& vertical switch overs. Switch over is known as diagonal one if cell node traversesacross
cellular areaconsisting ofuniformcoreknow-how.
Imperative switch over, which is the mandatory sort of switch over, to execute due to low
QoS in the current network. Alternative type or non-mandatoryswitch over is the effect of
the priority, given to the user preference. Proactive switch over takes help of history based
knowledge, while reactivesort ofswitch over includes, the dynamic parameters & condition
of the mobile and the network to reach a decision, forswitch over. [2][3]
Depending on method used to place the connection, between the mobile user and the new
cell, there are following types of switch over [3] [4]:
1. Hardswitch over: --firstbreaks the connection of the nomadic node withthe old cell
before getting the mobile connected with the new cell.Following are the few characteristics
of this sort ofswitch over,
• One call utilizes only onesingle channel,
• Switch overprocedure requires very less amount of time& normally it is not noticeable
bythe mobile user,
• Simple to implement and monetarily cheap,
• Data related to the mobile user and the session need not have to backup, since only one
channel is used, thus this reduces the data overhead,
• There is a possibility that, the call might be interrupted for a short while or in some
scenario by getting aborted.
2. Softswitch over: --It is where the connection is first made with the new cell and then the
old one is disconnected. They have following features,
• Deployingnumerous channels of the network to take care ofa single call,
• Linkdependability is elevated,
• Addedintricateelectronic circuitry in the cellular handset,
• Countof switch overs failedare lower.
3. Softerswitch over:-Softer switch overs are different than the above two in the sense,
thatin this instance, a fresh signal willbe added to or removed from the set of active signals.
Similarly, it may take place, while a signal is replaced by a sturdier signal from a
dissimilarsector, under the current base station. This sort ofswitch over isobtainable in
UMTS also in case of CDMA2000, whereinthe identical channel/s can be utilized by
numerouscellular phones, and wherein it is conceivable to nearby cells or cell areas, to
utilize the identical channel of frequency.
Depending on, entity raising the switch over also the entity managing affairs ofswitches
overmethodology, following types can be defined,
• MIHO
• NIHO
• NCHO
• MCHO
• MAHO

International Journal of Management, IT & Engineering Vol. 8 Issue 12(1), December 2018,
ISSN: 2249-0558 Impact Factor: 7.119
Journal Homepage: http://www.ijmra.us, Email: [email protected]
Double-Blind Peer Reviewed Refereed Open Access International Journal - Included in the International
Serial Directories Indexed & Listed at: Ulrich's Periodicals Directory ©, U.S.A., Open J-Gage as well as in
Cabell’s Directories of Publishing Opportunities, U.S.A
140 International Journal of Management, IT & Engineering
http://www.ijmra.us, Email: [email protected]
• NAHO [4]
When any mobile terminal user travelsfrom one location to another, the prime and
foremost requirement is stable & sound connectivity and continuous reachability. The
factors that affect the issue of mobility are described as under [5],
• Efficient Switch over: -Switch over should reduce or avoid the loss and delay of
packets.
• Location Management: -The location management performs location update which
apprises the caller the position of the called unit, in terms of relationshipwith its present
location.
• Efficient Routing: -It is the procedure of choosing a path for traffic in a network to
enhance network lifetime and its capability to promote packets.
• Security: -It is the avoidance of illegal access or damage.
• Scalability: - A network system isscalable when it has the skill to expand in terms of
count of users and should be skillful enough to evolve continuously.
• Fault Tolerance: -Leniency towards fault is the ability of maintaining functionality
when a portion of a system breaks down.
• Simultaneous Mobility: -Both end hosts can move simultaneously without interruption.
• Link Layer Independence: -Designing communications protocol to permitcellular
phone consumers, to travel from one network to
alternativethoughretaininganeverlasting IP address.
• Compatibility between Routing: -This is successfully used to verify the compatibility
between routing.
• Transparency: -It allows user’s operating system or some other service to access a
resource in absence of knowledge of the user and also not requiring toknow, and
customarilynot being mindful of, whether the resource is situated on the machine,
which is locally placed.
Performance Necessities of Vertical Handoff Decision Mechanisms
There are numeroustasks, while designing switch over mechanism such as need of low
latency, low power drain, determination of right time for switch over and it should be
skillful enough to work with commercially available devices .The vertical handoff index
can be calculated dependent on the below given criterion derived from the literature [6][7]:
1. Stable & sound: Switch over is considered ‘‘stable & sound’,’ if it is capableof retaining
linkage witheverytechnological feature & accessories functional on the cellularhandset.
2. Packetloss: It quantifies and indicative of the amount of packets missed out during VHO
procedure. It should be as low as possible.
3. Throughput (Th): It denotesabout the rate at which, the data is delivered to the mobile
terminals, during switch over. It is usually desirable to get higher throughput (Th) during
switch over.
4. Switch overdelay: This term is pertaining with the span of time required from
originationto accomplishing theswitch over procedure. More complex theprocess more is
the undesirable switch over delay would be there. Switch over delay comprises of the
addition of every delay concerned toswitch over procedure.
There exists different sorts of delays in switch over. Switch over is a procedure that invites
the involvement of many strata’s of OSI model. Data link layer introduces delay due to
scanning of the BS and is usually associated with horizontal switch over. Network layer is

International Journal of Management, IT & Engineering Vol. 8 Issue 12(1), December 2018,
ISSN: 2249-0558 Impact Factor: 7.119
Journal Homepage: http://www.ijmra.us, Email: [email protected]
Double-Blind Peer Reviewed Refereed Open Access International Journal - Included in the International
Serial Directories Indexed & Listed at: Ulrich's Periodicals Directory ©, U.S.A., Open J-Gage as well as in
Cabell’s Directories of Publishing Opportunities, U.S.A
141 International Journal of Management, IT & Engineering
http://www.ijmra.us, Email: [email protected]
liable for verticalswitch over; it takes care of the IP address transferring. Many protocols
like SIP, MIP which support switch over sit at sessionlayer [8][9]. Whendata or
informationneeds to bedeliveredamongstdiverse layers, several kinds of impediments
comes into the picture,those are likelyhamperthe value of QoS for theswitch over.
Following are some of the delays which are usual to all types of networks [6] [7]
• Serialization Delay:It explains the time; it utilizes to encrypt the packet bits onto the
bodily interface. This delay is usually fixed sort ofdelay.
• Propagation Delay:It describes the period it takes,for a bit to get from first end of the
link to another, the individual variable,whichchanges the propagation delay is the
stretch of the link.This delay is usually fixed sort ofdelay.There are two considerations
for this sort ofdelay one is about the Round (two way) trip delay that refers to
propagationdelay for bit to traverse fromplaceof origin to destination and return to
source. Other is the one-way delay from the initiationplace to the destination.
• Queuing Delay: Packets endure queuing delay, when they are required tohold for
anothernew packet to be sent. Theamount of queuing time can be
comparativelyenormous; hundreds of Milliseconds, or maybe largerthan that. This
delay is usually variable sort ofdelay.
• Forwarding Delay:It is referred to the handling time in the midst of, while a frame is
completely-received, and when the packet ispositioned in an output train, so
forwarding delay does not comprise, the time the packet stands in the output queue.
This delay is usually variable sort ofdelay.Forwarding delay is characteristically a
minor enough element to take no notice of, in complete delay.
• Shaping Delay: Stream of trafficshaping has an effectof added delays, by attending
queues more sluggishly.This delay is usually variable sort ofdelay. There are 2kinds of
traffic shaping methods one is transferring packets actually fast and having them be
dropped and the other is transferring packets more gradually, but not having them be
dropped.
• Network Delay: This delay is usually variable sort ofdelay. It consistsof
propagationdelay plus serialization delay.
5. Count of switch overs: count of switch overs involved should be low, as frequent switch
overs are likely to culminate into loss of power as well as network resources. This can be
avoided by reducing the unnecessary handoff or the PPE.
6. Switch overbreakdownpossibility: A switch overbreakdowntakes placeat that moment of
time, if the switch over process is started whereas the aspiredlinkage fails to provide with
the necessary setup possessions to successfully complete it.
7. Energy Consumption: Power is utilized by consumerterminal, and alsopower
isconsumeddue to equipment’s of the base station. Power is also spent during mobile
switching or switch overs. During switch over, recurrent interface triggeringcan culminate
into significant battery power loss. The concern of power economy also rises in network
innovation, because avoidable interface triggering can raise power consumption.
8. Cell blocking probability: This isabout thelikelihood of a fresh call being obstructed due
to handoff process.
9. Call dropping probability: It is about the possibility, that a call is concludedowing to
delay inswitch over process.This generallyoccurswhile the speed of the mobile node is too
high in other words the node stays in the new network less than the time necessary for
handoff process to execute. This is also referred as missing handover probability.

International Journal of Management, IT & Engineering Vol. 8 Issue 12(1), December 2018,
ISSN: 2249-0558 Impact Factor: 7.119
Journal Homepage: http://www.ijmra.us, Email: [email protected]
Double-Blind Peer Reviewed Refereed Open Access International Journal - Included in the International
Serial Directories Indexed & Listed at: Ulrich's Periodicals Directory ©, U.S.A., Open J-Gage as well as in
Cabell’s Directories of Publishing Opportunities, U.S.A
142 International Journal of Management, IT & Engineering
http://www.ijmra.us, Email: [email protected]
Input Entitiesin Vertical Switch Over Mechanism
The judgement for vertical switch overis dependent onseveralentities like BW, QoS,and
RSS,cost,latency,SIR,velocity,power consumption of battery, preferences of consumers
etc. [10]
1. Available BW: BWin this context isusuallydescribed as the capabilityof link ina linkage.
BiggerBWconfirmslesser call dropping and blocking possibilities, henceoffers
higherthroughput (Th).
2. Speed: The speed is nothing but thedistance travelled by terminal of cellular phone per
unit time.A high speed vehicle producesPPE and hence increases count of handoff, call
blocking probability, call dropping probability.
3. Received Signal Strength (RSS): RSS is the main utilizedmeasure because it is easy to
quantify and is straightway associated to the quality of service. But RSS as a solois not
sufficient for a comprehensive decision. It is the power and energy of the received signal,
if the RSS foradjoininglinkageincreases above the threshold thevertical switch over can be
realizable.
Sometimeschannel quality isrepresented by Signal power to Interference power plus Noise
Ratio, RRM, SINR, RSRP, RSRQ,
4. Network Coverage: A network supporting larger coverage area helps mobile terminal
users to avoid frequent switch overs as they roam about.
5. QoS: The degradation of QoS can be caused by a count offactors, including:
Congestion, latency, location or re-transmission of missed packets, collision and lesser BW
[11].
6. Power losses: Thetelecommunication devices working on battery need to use power
judiciously. If the cell phonebattery power level declines, changing fromone network to
another network with lesser power consumption can cater a better utilization time.
7. Throughput (Th)/ Average Data rate: Network throughput (Th)is all about the network’s
capability to cater successfully theinformation over a specific communications link.
8. Network Load: Changes in the traffic loads amongst cells will decrease the traffic-
handling capability and thus quality of services.
9. Cost: A multi criteria algorithm for switch over should also think about the network cost
factor. Usually user preferred network with low cost, especially if the application running
currently is tolerant to delay and interruptions
10. Network Security: This is all about security of network, which comprises of the
necessities andstrategiesimplemented by the linkage to avoid, observe and controlillegal
access, modification, misuse.
11.Velocity:In the overlaid framework of distinct trait networks,whilemoving at large
speeds is not recommended, since a switch overreturn to the previous network would take
place very shortly later, especially while handing off to an implanted network, having
lesser cell area [12].
Conclusion
An optimal handoff decision mechanism needs to possess non-static andstatic metrics. It is
vital to think throughoptimalcount of parameters; on the contrary, it is challenging to take
account of all the parametric in a lonejudgment model, owing to intricacy of algorithms
and contradictory concerns of numerous sparametric.
Greater BW confirms lesser call dropping and call blocking possibilities; so it is expected
to yield greater throughput (Th). To realize the utmostPrivacy and confidentiality

International Journal of Management, IT & Engineering Vol. 8 Issue 12(1), December 2018,
ISSN: 2249-0558 Impact Factor: 7.119
Journal Homepage: http://www.ijmra.us, Email: [email protected]
Double-Blind Peer Reviewed Refereed Open Access International Journal - Included in the International
Serial Directories Indexed & Listed at: Ulrich's Periodicals Directory ©, U.S.A., Open J-Gage as well as in
Cabell’s Directories of Publishing Opportunities, U.S.A
143 International Journal of Management, IT & Engineering
http://www.ijmra.us, Email: [email protected]
structures should be inserted in the switch overmechanism. Consideration of velocity
reduces count of unnecessary switch over, Handoff failure, PPE, call dropping probability,
call blocking possibility and wastage of network resources. Velocity adaptive switch over
algorithm and direction-biased switch over algorithm demonstrate high-quality outcomes
whilstfacing with the of corner effect problem. The intelligent switch over algorithms can
decrease its outcomevery well.Consideration of choosing the right moment to trigger a
switch over helps in, maintaining the service quality up to a satisfactory level and
reduction in a count of unnecessary switch overs. If a switch over is done too early, it
wastes network resources by increasing count of switch over, otherwise, it causes failure.
Depending on application,jitter can seriously disturb the quality of service.The count of
switch overs is reduced by intelligent switch over algorithms.User Preference with regards
to application need or regards to the monetary cost of the network helps to give better
experience to the user or better user satisfaction level. Along with the input parameters,
various switches over schemes also help to design an efficient handoff mechanism which
can be implemented in the real world.
In short the networks to be considered for handoff mechanism design should be decided
first such as LTE, 3G, Wi-Fi, WiMAXetc; then the sort ofhandoff such as vertical or
horizontal, the method of handoff such as Soft or hard handoff, Alternative or Imperative
should be decided. Proper selection of the parameters for the input needs to done and then
finally the handoff performance metrics should be evaluated.
References
[1] Mrs.Jayasheela C S, Dr. Gowrishankar “A Comprehensive Parametric Analysis of
Vertical Switch over in Next Generation Wireless Networks, IOSR Journal of Computer
Engineering (IOSR-JCE), Volume 9, Issue 4, 2013, pp. 10-17.
[2] Atiq Ahmed, Le¨ılaMerghemBoulahia, and Dominique Ga¨ıti “Enabling Vertical
Switch over Decisions inDistinct Trait Wireless Networks: A State-Of-The-Art
andAClassification“IEEE COMMUNICATIONS SURVEYS & TUTORIALS, 2013, pp.
1- 36.
[3] A. Bhuvaneswari, Dr. E. George Dharma Prakash Raj,“SURVEY ON SWITCH OVER
TECHNIQUES “Journal of Global Research in Computer Science Volume 2, No. 6, 2011,
pp. 140-144.
[4] Jeremiah O. Abolade, Olasebikan A. Fakolujo, AbidemiOrimogunje, “Switch over in
Mobile Wireless Communication Network - A Review”, International Journal of Advanced
Engineering, Management and Science (IJAEMS), Vol-3, Issue-9, 2017, pp. 934-940.
[5]D. Mahjabeen, M. A. Rashid, S. B. Mohamed, “Network Quality Assessment of
Wireless Communication Based on Mobility Issue”International Journal On Informatics
Visualization,Vol2, No4,2018,pp.354- 359.
[6]Dr. Anita Seth, “VerticalSwitch over Decision Algorithms for Next Generation Wireless
Networks: Some Issues” International Journal of Advanced Research in IT and
Engineering, Vol. 2, No. 8, August 2013, pp. 64-79.
[7]PoojaDhand, ParwinderKaurDhillon, “Switch overManagement: Issuesand Challenges
“International Journal of Advanced Research in Computer Science, Volume 9, No. 1,
2018,pp. 111-114.
[8] G. M. Mir, N. A. Shah and Moinuddin, “Decentralized Switch over for Microcellular
Mobile Communication System using Fuzzy Logic”, World Academy of Science,
Engineering and Technology, Vol. 26, 2009, pp. 866-870.

International Journal of Management, IT & Engineering Vol. 8 Issue 12(1), December 2018,
ISSN: 2249-0558 Impact Factor: 7.119
Journal Homepage: http://www.ijmra.us, Email: [email protected]
Double-Blind Peer Reviewed Refereed Open Access International Journal - Included in the International
Serial Directories Indexed & Listed at: Ulrich's Periodicals Directory ©, U.S.A., Open J-Gage as well as in
Cabell’s Directories of Publishing Opportunities, U.S.A
144 International Journal of Management, IT & Engineering
http://www.ijmra.us, Email: [email protected]
[9] K. Reddy and V. Krishna, “Optimization of Switch over Method in Wireless
Networks” Global Journal of Computer Science and Technology, Vol. 11, No. 1, 2011, pp.
1-5.
[10] Mr. G. U. Mali.,” Fuzzy Based Vertical Switch over Decision Controller for Future
Networks”, InternationalJournal of Advanced Engineering, Management and Science
(IJAEMS), Vol-3, Issue-1, 2017, pp.111-118
[11] PrzemysławGilski and JacekStefański “Quality Expectations of Mobile Subscribers”,
Journal of telecommunications and information Technology, 2015, pp. 15-19.
[12]PramodGoyal& S. K. Saxena, (2008) “A Dynamic Decision Model for Vertical Switch
overs across Distinct Trait Wireless Networks”, 2008 WASET.ORG, World Academy of
Science, Engineering and Technology, Issue 41, 2008, pp. 676-682.
[13]AggelikiSgora, Dimitrios D. Vergados,” Switch over Prioritization and Decision
Schemes in Wireless Cellular Networks: a Survey”, IEEE COMMUNICATIONS
SURVEYS & TUTORIALS, VOL. 11, No. 4, FOURTH QUARTER 2009 pp-57- 77
[14] AlaguS andMeyyappan T, “Analysis of Switch over Schemes in Wireless Mobile
Network”, IJCES International Journal of Computer Engineering Science, Volume1
Issue2, November 2011, pp 1-95.

International Journal of Management, IT & Engineering Vol. 8 Issue 12(1), December 2018,
ISSN: 2249-0558 Impact Factor: 7.119
Journal Homepage: http://www.ijmra.us, Email: [email protected]
Double-Blind Peer Reviewed Refereed Open Access International Journal - Included in the International
Serial Directories Indexed & Listed at: Ulrich's Periodicals Directory ©, U.S.A., Open J-Gage as well as in
Cabell’s Directories of Publishing Opportunities, U.S.A
145 International Journal of Management, IT & Engineering
http://www.ijmra.us, Email: [email protected]
Socio-Economic Characteristics of the Juvenile
Delinquents
Dr. PRIYA SAROJ
Dr. VANDANA AGGARWAL
Abstract
Delinquency can and does occur in all social classes, urban and suburban, in small and
large communities. It is not inextricably tied to race or sex. Society's injustices and
cultural trends affect each individual, and in some way act as the catalyzing agents that
triggers the overt misbehaviour of delinquency or other personal problems. In a complex
society such as ours, there are indeed many ugly and destructive elements which need to
be corrected, and the adolescent is bombarded by overwhelming stimuli daily. Even the
healthiest adolescent has difficulty sorting out, assimilating and making sense
of his environment. The adolescents we treat find their environment to be overwhelming
and confusing because they experience an equally real, devastating inner chaos. We
believe that nobody is a born criminal. Feeble mindedness, psychological
imbalance, social inequities, aggressiveness and unreconciled malice springing from bad
or unhealthy environment and parental neglect have individually or jointly made a normal
person criminal or delinquent. Therefore, conditions leading to such unhealthy situations
have to be improved and secondly, the victim of that situation has to be taken out of the
vicious circle and requires proper treatment for his or her rehabilitation.
Key Words: Juvenile delinquency, jurisdiction, rehabilitation, psychological
aggressiveness
Introduction
Crime is a universal phenomenon. Delinquency or crime is, in fact, an age old problem of
every society and is being faced by all since the advent of the mankind. Crime is
behaviour that deviates from the norms of a 'community' to a degree considered
dangerously antisocial and punishments are specified for it in the criminal law. Stated
more technically from the standpoint of legal criteria. Crime is an international act or
omission in violation of criminal law, committed without defense or justification, and
sanctioned by the law as a felony or misdemeanor.
Crime does not include all non-conformity, only that which is officially considered such
a serious threat to the person, his property, or to the community institutions that
agencies of government intervene and use sanctions to control it. It does not include all
law violations. Crime is only those acts prohibited by specific norms in the criminal law
statutes and cases, not in other areas of public law (constitutional, administrative, etc.)
or of private law (contracts, property, torts, etc.).
Crime thus corresponds to violations of the mores in simpler, stable societies, except
that criminal law norms and their underlying values lack uniform support. Crimes are
distinguished from all other forms of problematic or deviant behaviour by their legal
Assistant Professor, University Institute of Legal Studies, Chandigarh University,Mohali (Punjab), India Assistant Professor, University Institute of Teacher, Training & Research,Chandigarh University,Mohali (Punjab),
India

International Journal of Management, IT & Engineering Vol. 8 Issue 12(1), December 2018,
ISSN: 2249-0558 Impact Factor: 7.119
Journal Homepage: http://www.ijmra.us, Email: [email protected]
Double-Blind Peer Reviewed Refereed Open Access International Journal - Included in the International
Serial Directories Indexed & Listed at: Ulrich's Periodicals Directory ©, U.S.A., Open J-Gage as well as in
Cabell’s Directories of Publishing Opportunities, U.S.A
146 International Journal of Management, IT & Engineering
http://www.ijmra.us, Email: [email protected]
character. Crimes are defined by the legislative and judicial branches of a governing
political area, such as a state or the federal government. The label "Criminal" provides
the justification for involving the full powers of such reactive agencies as the police,
the courts, and prisons. Defining an action as criminal allows the legitimate use of force
by the state against its citizens and may lead to deprivation of liberty and in some
jurisdictions or life with due process of law.
Juvenile Delinquency Defined: Juvenile delinquency consists of acts committed by
persons under 18 years of age (17 or 16 in some states) or the conduct
considered sufficiently deviant to warrant control b y the juvenile court*.
Before the rapid diffusion of juvenile court statutes, the first of which were adopted in
1899 in Illinois (USA), child offenders were punished under the criminal law and
the concept of juvenile delinquency was unknown. It was created to exempt child
offenders from the procedures and punishments of the criminal courts, and to emphasis
protection and improvement of the child. Juvenile courts were also given jurisdiction
over dependent and neglected children and the same informal (courts of equity)
procedures were to be used for both this and the delinquency jurisdictions.
Delinquency as defined by Friedlander is a juvenile misconduct that might be
dealt with under the law. Sheldon regards delinquency "as behaviour disappointing
beyond reasonable expectations". It is clear that different social scientists have defined
juvenile delinquency according to their own light and experience. Some have made
the concept too wide to incorporate all the problems of juvenile misbehaviour,
while others have focused only on that behaviour which amounts to a criminal
offence. The second United Nations Congress on the Prevention of Crime and
Treatment of Offenders (1960) points out that if the term "J.D." is restricted to those
juveniles in each country who have committed criminal offences, it would seem that no
universal definition is needed. Allowance could be made for the wide variations found in
the legal systems of many countries of the world, but the inclusion under the "J.D" of
acts
Source: Children and Crime. The Tribune. February 22, 1972which are not serious and
which can be classified as behaviour problems could be ruled out. If a clear and
restricted definition of J.D. is established would it not be possible to focus more
attention on the kinds of behaviour which need to be preve nted? Thus, i t is
now generally agreed that J. D. should be demarcated from other problems of juvenile
misbehaviour. Although the term J.D. may be confined to problems of serious
misbehaviour, in many countries children having problems of misconduct, truancy, etc.
are also dealt by the state.
Deliquency as a Social Problem
The occasional deviant in a highly stable society violates norms that are otherwise
universally accepted and followed. A stable society based on kinship ties is relatively
undifferentiated and the role of enforcer of the mores is assumed spontaneously by the
wronged persons or, under appropriate circumstances, by other group members who
see, or learn of the deviant conduct. Deviators from the mores are few, and are either
quickly brought into line or eliminated from the society by banishment or death.
The swift response requires no reflection; being dictated by tradition and it
does not become a community issue. Violations of the mores thus do not constitute a
social problem. When social change undermines the mores and political organization

International Journal of Management, IT & Engineering Vol. 8 Issue 12(1), December 2018,
ISSN: 2249-0558 Impact Factor: 7.119
Journal Homepage: http://www.ijmra.us, Email: [email protected]
Double-Blind Peer Reviewed Refereed Open Access International Journal - Included in the International
Serial Directories Indexed & Listed at: Ulrich's Periodicals Directory ©, U.S.A., Open J-Gage as well as in
Cabell’s Directories of Publishing Opportunities, U.S.A
147 International Journal of Management, IT & Engineering
http://www.ijmra.us, Email: [email protected]
begins to replace kin organization, informal sanctions against deviants from the
mores are replaced by criminal law punishments, administered by occupants
of official positions. The emergent criminal law norms presumably may become
issues, at least where some degree of public discussion is possible.
When courts and legislatures identify particular deviant acts as crimes, the values
underlying the legal norms are by implication universally agreed upon by the society or
the officials believe they should be.
It has long been known that there is close relationship between broken homes and
delinquency. The rate of delinquency among juvenile children from homes broken
by divorce and desertion is higher than that among children from complete families or
even from families broken by death. The broken home may be expected to show a child is
more likely to be referred to the court as an official delinquent i f h i s home i s
broken, but re turned to hi s parents i f hi s ho me i s unbroken.
What goes wrong with these children? Why do they become delinquent? No singular
phenomenon can sufficiently explain the reasons as individual acts in a
particular way. Genetic endowment, the social, educational and economic milieu into
which the child is born, the historical and cultural context into which the child is placed,
the mother-child relationship, relationships with peers, social upheavals-these forces
and more, intricately interwoven, influence and direct the course of development.
Importance of Delinquency
Delinquency can and does occur in all social classes, urban and suburban, in small and
large communities. It is not inextricably tied to race or sex. Society's injustices and
cultural trends affect each individual, and in some way act as the catalyzing agents that
triggers the overt misbehaviour of delinquency or other personal problems.
In a complex society such as ours, there are indeed many ugly and destructive elements
which need to be corrected, and the adolescent is bombarded by overwhelming stimuli
daily. Even the healthiest adolescent has difficulty sorting out, ass imilating and
making sense of his environment. The adolescents we treat find their environment to
be overwhelming and confusing because they experience an equally real, devastating
inner chaos.
We believe that nobody is a born criminal. Feeble mindedness, psychological
imbalance, social inequities, aggressiveness and unreconciled malice springing from bad
or unhealthy environment and parental neglect have individually or jointly made a normal
person criminal or delinquent. Therefore, conditions leading to such unhealthy situations
have to be improved and secondly, the victim of that situation has to be taken out of the
vicious circle and requires proper treatment for his or her rehabilitation.The uninhibited
growth of crime is a major concern 'of all the societies today. Throughout the world
the affluent countries are facing this ever-growing problem of crime. The developing
countries are facing increasing rates criminality. It seems that crime, an
inevitable result of economic growth, prospers and to uches new heights along
with the economic prosperity in the country.
Traditionally we believed that crime is related to poverty which is the motive for
crime. This is no doubt true. The relationship between crime and poverty i . e.
economic conditions cannot be ignored. But in contemporary situations this is not
a sufficient or complete explanation. Today the curve of prosperity is being followed
by a curve of crime. So to seek a fuller, complete explanation of crime a broader

International Journal of Management, IT & Engineering Vol. 8 Issue 12(1), December 2018,
ISSN: 2249-0558 Impact Factor: 7.119
Journal Homepage: http://www.ijmra.us, Email: [email protected]
Double-Blind Peer Reviewed Refereed Open Access International Journal - Included in the International
Serial Directories Indexed & Listed at: Ulrich's Periodicals Directory ©, U.S.A., Open J-Gage as well as in
Cabell’s Directories of Publishing Opportunities, U.S.A
148 International Journal of Management, IT & Engineering
http://www.ijmra.us, Email: [email protected]
perspective relating to the issues of various situations, social processes and social
structure required. Today various new" forms of crime as white collared crimes
have emerged. So there is a continuing need to understand more about crime,
its causal factors and its relationship with development. This is "the need of the
hour.
Conclusion: Delinquency can and does occur in all social classes, urban and
suburban, in small and large communities. In re cent years, juvenile
delinquency has been one of the most widely discussed problems in
India.Juvenile delinquency may be regarded as the reflection of a negative behaviour
between the young person and the system of social regulations that Weber called "Legal-
rational authority". We assume that the negat ive quali ty of this relationship is
expressed both behaviourally and verbally. The behavioural expression takes the
form of negative involvement in activities prescribed by formal authorities.
Delinquency can and does occur in all social classes, urban and rural, small and large
communities. It is not inextricably tied to a particular race or sex. Society's injustice and
cultural values affect each individual, and in some cases it may act as the catalysing agent
that triggers the overt misbehaviour of delinquents or other personal
problems. In the recent years juvenile delinquency has been one of the most widely
discussed problems in India. An undue percentage of young persons are allegedly coming
into conflict with law. Newspapers, magazines, literary and religious journals all give
enough space to the current problems of young offenders.
References
Attar, V.A (1975, 'Urbanization and Crime' social Welfare 22 (3): 1-3.
Bachman, R. (1992) Climain non-metropolitian America: Rural Sociology 57
(4): 546-60.
Bassy, F. Perlmutter (1987), Delinquency and Learning Disabilities: Evidence for
compensatory Behavioural Adoption'. Journal of Youth and Adolescence
17 (5) 89-92.
Belavadi, R. H. (1989), 'Social Legislation. A commentary The Juvenile Justic
Act, 1966'. Indian Journal of Social Work 2 (1-4): 239-341.
Bhat, R. and Phadke, V.S. (1990), "Crimes in Greater Bombay: A geographical
perspective. The Indian J. Soc. Work 51 (4) :703-14.
Bhatia, V.B (1974), 'Juvenile Delinquency. An ecological Study' Social Welfare. 21 (6):
18-19.
Bowers,:A.J . (1986), Reversali, Delinquency and Disruption' British Journal of Clinical
Psychology 25 (1) 303-304.
Bogardus, C.E.S. (1961), 'Juvenile Delinquency'. In Sociology 435-448.
Bursik, R.J. and Webb, Jr. (1982), 'Institute for Juvenile Research; Community
Change and Pattern of Delinquency'.American Journal of
Sociology 88 (1).
Chatterjee, P. and Gutierrez, F.R (1979), 'Juvenile Delinquency Trends in India and
United States' Indian Journal of Social Works 34 (1): 93 -101.
Colvin, M and Pauly, J (1983), 'A critique of Criminology: Toward an Integrated
Structural -Marxist Theory of Delinquency Production'. American
Journal of Sociology.89 (3).
Danial, O. (1980), 'Juvenile Delinquency'. In Juvenile Delinquents: Psychodynamic

International Journal of Management, IT & Engineering Vol. 8 Issue 12(1), December 2018,
ISSN: 2249-0558 Impact Factor: 7.119
Journal Homepage: http://www.ijmra.us, Email: [email protected]
Double-Blind Peer Reviewed Refereed Open Access International Journal - Included in the International
Serial Directories Indexed & Listed at: Ulrich's Periodicals Directory ©, U.S.A., Open J-Gage as well as in
Cabell’s Directories of Publishing Opportunities, U.S.A
149 International Journal of Management, IT & Engineering
http://www.ijmra.us, Email: [email protected]
Assessment and Hospital Treatment.
Daniel, B.P and Christopher, D.T. (1986), 'The Learning Disabled Adolescent'
Erchsonian Psychosocial Development, Self-Concept, and Delinquent
Behaviour.
David, E and Weiner, J.(1980), 'Delinquency' . Development of the Child 666-669.
Dayal, J. (1972), 'Sons of Lucifer'. Palriot Magazine 9 (352): 1-2.
Desai, H.G, Saurashtra, C and Bhavnagai, V. (1970), 'Factors relating
to Juvenile delinquency'.Educational Review. 5 (2): 74-84.
Deol, G (1990), 'Juvenile Delinquency in India'. Social Change. 20(3) 59-68.
Edward, L. Want R, T.H (1983), 'Self-concept as a Mediating factor in delinquency'.
Social Psychology Quarterly. 46 (1): 10.

International Journal of Management, IT & Engineering Vol. 8 Issue 12(1), December 2018,
ISSN: 2249-0558 Impact Factor: 7.119
Journal Homepage: http://www.ijmra.us, Email: [email protected]
Double-Blind Peer Reviewed Refereed Open Access International Journal - Included in the International
Serial Directories Indexed & Listed at: Ulrich's Periodicals Directory ©, U.S.A., Open J-Gage as well as in
Cabell’s Directories of Publishing Opportunities, U.S.A
150 International Journal of Management, IT & Engineering
http://www.ijmra.us, Email: [email protected]
Influence of Graphite and Aluminum Nitride reinforcements on
friction and Wear Characteristics of Al6061 based Hybrid
Metal Matrix composites
M.S Rajendra Kumar
G.R.Bharath Sai Kumar
Dr.T.B.Prasad
Dr. D.P.Girish*
Abstract
This paper reports on friction and wear of Al6061-Gr-AIN hybrid composites developed
by stir casting technique. Percentage of graphite was varied from 0 to 6wt% whereas AIN
was varied from 0 to 5wt% in steps of 2 wt%. Both alloy and its hybrid composites were
subjected to microstructure studies, friction and wear test as per ASTM G99 standard test
method. Friction and wear test was carried out by varying loads and sliding velocities.
Further,cast alloy and hybrid composites were heat treated by solutionizing at a
temperature of 530 oC followed by artificial ageing at 170 oC. Microstructure shows fairly
even dispersal of hybrid reinforcements in the matrix alloy. Incredible enhancement in
friction and wear characteristics was recorded with addition of hybrid reinforcements.
Coefficient of friction decreases with hybrid reinforcements. Heat treatment has led to note
worthy enhancement in wear resistance when equated with unheat treated ones.
Keywords: Al6061 alloy, Aluminum Nitride, Graphite, Hybrid Composite.
1.0 Introduction
In recent years, there is an increased concern in manufacturing of hybrid aluminium metal
matrix composites with improved physical and mechanical properties. This may be owing
to fact that the use of two or more reinforcements in aluminium matrix augments the
performance of composites by introducing exclusive new features. In addition these
materials can reduce the cost and weight of the composites and their physical and
mechanical properties are comparable or even superior to aluminium composites
reinforced with single material. It has been reported by many researchers that, Synthesis of
Aluminium based metal matrix composites using two or more reinforcing materials having
unique characteristics not only contributes to reduction in cost also helps in property
optimization of Aluminium composites [1-5]. Pramila Bai et al. [6] have considered the
dry sliding wear lead of an A356 combination fortified with SiCP using pin on disck
machine, for various loads. With extended connected weight, the unreinforced material
showed significant wear debris generation. SiC particles were represented to confine the
distortion on the wearing surface with iron rich layer on the composite surface. Dasgupta et
al. [7] have analyzed dry sliding wear direct for both Al7075 base combinations with
15wt% SiC composites. The samples were exposed to T6 heat treatment and RRA
Research Scholar , Visvesvaraya Technological University Belagavi Research Supervisor , Visvesvaraya Technological University Belagavi
Professor , Department of Mechanical Engineering , SSIT Tumkur
*Professor & Head , Department of Mechanical Engineering , Government Engineering college , Ramanagara

International Journal of Management, IT & Engineering Vol. 8 Issue 12(1), December 2018,
ISSN: 2249-0558 Impact Factor: 7.119
Journal Homepage: http://www.ijmra.us, Email: [email protected]
Double-Blind Peer Reviewed Refereed Open Access International Journal - Included in the International
Serial Directories Indexed & Listed at: Ulrich's Periodicals Directory ©, U.S.A., Open J-Gage as well as in
Cabell’s Directories of Publishing Opportunities, U.S.A
151 International Journal of Management, IT & Engineering
http://www.ijmra.us, Email: [email protected]
(retrogression and reaging). The sliding wear properties of the Al7075-SiC composites
have significant change over the base alloy. On the off chance that there ought to be an
event of heat treatment, the RRA has indicated better wear security properties when
appeared differently in relation to the T6 treatment. In the last two decades, various types
of reinforcements have been tried out by researchers in aluminum based composites. They
are accessible in various morphology and an enhancement of any property of matrix relies
upon kind of support utilized, interfacial qualities, and dissemination with volume portion.
On the other hand, graphite is most economical reinforcement which has lower density,
hardness, toughness and strength over a wide scope of temperature, great thermal shock
and chemical resistance and in addition extraordinary wear and antifriction properties.
Aluminum Nitride is additionally utilized as reinforcement attributable to its most superior
hardness, low coefficient of thermal expansion (CTE), high temperature stability and
chemical inertness with magnificent tribological properties. In perspective of cutting edge
numerous mechanical applications there is a wide scope for hybrid composites. The
significant segment of research has done just on either graphite or Aluminum nitride
strengthened aluminum composite to enhance the mechanical and tribological properties of
aluminum composites. The multiple reinforcements are utilized to beat the disadvantages
of single one [8-10].
2.0 Experimental details:
Al6061 alloy was used as matrix material for developing hybrid metal matrix composites
supplied by M/s Fenfe metallurgicals, Bangalore, INDIA. Aluminum nitride powder and
graphite powder were procured from Sigma Aldrich. 0wt%, 1wt%, 3wt% and 5wt%
Aluminum nitride was incorporated in the matrix alloy for synthesizing composites where
as graphite particles were varied from zero to 6wt% in steps of 2wt%. The shape of the
aluminum nitride was spherical and size was in the range of 10-20 microns where graphite
particles were irregular having shape with particles size ranging from 20-40 microns. Fig.1
(a) and (b) shows the scanning electron micrographs of Aluminum Nitride powder and
graphite particles with their EDAX pattern. The hybrid composites were fabricated by stir
casting technique in which Al6061 was melted in graphite crucible at a temperature of
750°C. The electrical resistance melting furnace with stirrer was used for this purpose.
Degassing of the molten Al6061 melt is carried out using hexachloroethane tablets. After
degassing, preheated AlN and graphite particles were added to molten metal which is being
stirred at 600 rpm and then poured in to metallic mould.

International Journal of Management, IT & Engineering Vol. 8 Issue 12(1), December 2018,
ISSN: 2249-0558 Impact Factor: 7.119
Journal Homepage: http://www.ijmra.us, Email: [email protected]
Double-Blind Peer Reviewed Refereed Open Access International Journal - Included in the International
Serial Directories Indexed & Listed at: Ulrich's Periodicals Directory ©, U.S.A., Open J-Gage as well as in
Cabell’s Directories of Publishing Opportunities, U.S.A
152 International Journal of Management, IT & Engineering
http://www.ijmra.us, Email: [email protected]
1 (a) SEM and EDAX of Aluminum Nitride Powder
1 (b) SEM and EDAX of Graphite powder
3.0 Results and Discussions
3.1 Microstructure
Optical micrographs of Al6061 alloy and hybrid composites after heat treatment as per T6
conditions are shown in Figure 2 (a) – (d). As shown in Figure 2 (a), the microstructure
consists of α-Al grains and precipitates in grain boundaries. The AlN particles were seen as
grey phase while graphite particles were seen as dark gray phase in microstructure.
Dispersal of the reinforcements was found to be uniform.

International Journal of Management, IT & Engineering Vol. 8 Issue 12(1), December 2018,
ISSN: 2249-0558 Impact Factor: 7.119
Journal Homepage: http://www.ijmra.us, Email: [email protected]
Double-Blind Peer Reviewed Refereed Open Access International Journal - Included in the International
Serial Directories Indexed & Listed at: Ulrich's Periodicals Directory ©, U.S.A., Open J-Gage as well as in
Cabell’s Directories of Publishing Opportunities, U.S.A
153 International Journal of Management, IT & Engineering
http://www.ijmra.us, Email: [email protected]
(a) Al6061 alloy (b) Al6061/1%AlN/2%Gr
(c) Al6061/3%AlN/4%Gr (d) Al6061/5%AlN/6%Gr
Fig.2 micrographs of Al6061 alloy and hybrid composites
3.2 Coefficient of Friction
3.2.1 Effect of reinforcement
Fig. 3 demonstrates the after effect of Aluminum Nitride and Graphite content on the
coefficient of friction of AL6061 hybrid metal matrix composites. It is seen from the
diagram that all the composites have shown lower coefficient of friction when assessed
with to that of Al6061 alloy. The lowest coefficient of friction was obtained for Al6061-
3%Aluminum Nitride -3%E GF composite is almost 40% less that of Al6061 alloy.
Addition of dual reinforcements (AlN + Gr) on the surface of the Al6061 hybrid composite
goes about as projections which shield the matrix from having direct contact with the
counter surface material. Due to their non-sticking and lubricating up properties, both the
reinforcements decrease the contact zone between stick surfaces and counter surface which
thus diminishes the grip of two mating surfaces. The grip is limited because of decrease in
contact region of composite pin and counter surface bringing low coefficient for the
composites while Al6061 alloy shows high because of direct contact between the two
tribo-sets.

International Journal of Management, IT & Engineering Vol. 8 Issue 12(1), December 2018,
ISSN: 2249-0558 Impact Factor: 7.119
Journal Homepage: http://www.ijmra.us, Email: [email protected]
Double-Blind Peer Reviewed Refereed Open Access International Journal - Included in the International
Serial Directories Indexed & Listed at: Ulrich's Periodicals Directory ©, U.S.A., Open J-Gage as well as in
Cabell’s Directories of Publishing Opportunities, U.S.A
154 International Journal of Management, IT & Engineering
http://www.ijmra.us, Email: [email protected]
Fig.3 Effect of reinforcement on COF
3.2.2 Effect of load
Fig.4 shows effect of load on coefficient of friction of Al6061 alloy and its hybrid metal
matrix composites. It is noticed that when there is an increase in load from 20N to 100N,
friction coefficient is observed to be reduces for both matrix material and hybrid
composite. Least friction coefficient was recorded for Al6061-6%WC-5%GF composite.
The lessening in the coefficient of friction is largely credited to slippage between the
surfaces steel plate and composite pin.As saw in both Al6061 alloy and its composites,
increment in load causes increment in the contact region between tribo-mates. This thusly
builds the temperature at the contact surface which prompts softening of stick surface
along these lines causing slippage. Because of this slippage, friction coefficient in both
Al6061 alloy and its composites found to diminish with increment in load.
Fig.4. Effect of load on COF
3.2.3 Effect of Sliding Velocity
Variation of friction coefficient with respect to sliding velocity is presented in the Fig.5 it
is seen from the graph that there is an increase in friction coefficient when sliding velocity
is increased from 0.314 to 1.570 m/s. The maximum coefficient of friction is recorded for
Al6061 composite especially at a sliding speed of 1.570 m/s. most minimal coefficient of
friction was seen for Al6061-6%Gr-5%AIN for 0.314 m/s sliding speed. It is unmistakably
0
0.1
0.2
0.3
0.4
0.5
0.6
0%AIN 1%AIN 3%AIN 5%AIN
Co
effi
cien
t o
f F
rict
ion
(µ
)Load:20N
Sliding Velocity: 0314m/s
0%Gr
2%Gr
4%Gr
6%Gr
0.2
0.25
0.3
0.35
0.4
0.45
0.5
0.55
0.6
0 20 40 60 80 100
Co
effi
cien
t of
Fri
ctio
n (
µ)
Load (N)
Sliding Velocity: 0314m/s
Al6061
Al6061-5%AIN
Al6061-6% Gr
Al6061-5%AIN-6%Gr

International Journal of Management, IT & Engineering Vol. 8 Issue 12(1), December 2018,
ISSN: 2249-0558 Impact Factor: 7.119
Journal Homepage: http://www.ijmra.us, Email: [email protected]
Double-Blind Peer Reviewed Refereed Open Access International Journal - Included in the International
Serial Directories Indexed & Listed at: Ulrich's Periodicals Directory ©, U.S.A., Open J-Gage as well as in
Cabell’s Directories of Publishing Opportunities, U.S.A
155 International Journal of Management, IT & Engineering
http://www.ijmra.us, Email: [email protected]
observed that, with the expansion in friction coefficient with the expansion in sliding speed
can be credited to formation of plastic strains. With the increase in friction coefficient for
all materials with the enhancement in sliding speed can be ascribed to advancement of
extensive plastic strains. Plastic strain with increment in sliding speed advances and
upgrades the attachment between the test-pin surfaces and counter surface. The grip
between the tribo surfaces makes coefficient of contact increment. The plastic strain for all
materials will increment with the expansion in sliding speed from 0.314 m/s to 1.57 m/s
and the degree of adhesion strength of matrix material with the counter surface plate will
be high.
Fig.5. Effect of sliding velocity on COF
3.2.4 Effect of Heat Treatment
Fig. 6 illustrates the consequence of heat treatment on coefficient of friction of matrix alloy
and its hybrid composites. It can be seen that the friction coefficient of heat treated matrix
alloy and composites decreased when evaluated with that of unheated matrix alloy and
composites. The results after heat treatment followed the same trend as that of without heat
treatment materials. The heat treated Al6061-6%Gr-5%AIN displayed lowest coefficient of
friction than rest of the materials while highest friction coefficient was seen in matrix
alloy. It is notable that after hear treatment the Mg2Si precipitates are nucleated in the α-Al
which reinforces the Alloy or composites. With higher reinforcement content (AlN+Gr) the
nucleation mechanism accelerates to higher level and structures all through the alloy.
These consistently scattered encourages not just refine the grain size of α-Al yet contribute
in Tribological property upgrade.
0.3
0.35
0.4
0.45
0.5
0.55
0.6
0.65
0.7
0.75
0.8
0 0.314 0.628 0.942 1.256 1.57
Co
effi
cien
t o
f F
rict
ion
(µ
m)
Sliding Velocity (m/s)
Load:20NAl6061
Al6061-5%AIN
Al6061-6% Gr
Al6061-5%AIN-6%Gr

International Journal of Management, IT & Engineering Vol. 8 Issue 12(1), December 2018,
ISSN: 2249-0558 Impact Factor: 7.119
Journal Homepage: http://www.ijmra.us, Email: [email protected]
Double-Blind Peer Reviewed Refereed Open Access International Journal - Included in the International
Serial Directories Indexed & Listed at: Ulrich's Periodicals Directory ©, U.S.A., Open J-Gage as well as in
Cabell’s Directories of Publishing Opportunities, U.S.A
156 International Journal of Management, IT & Engineering
http://www.ijmra.us, Email: [email protected]
Fig.6. Effect of heat treatment on COF
3.3 Adhesive Wear
3.3.1 Effect of hybrid reinforcements
Fig. 7 demonstrates the impact of graphite and aluminum reinforcements on the wear rate
of Al6061 composites. The decrease in wear rate is relatively 52% which clarify wear
resistance by high weight level of Aluminum Nitride and graphite content. It tends to be
seen that Al6061-6%Gr-5%AIN hybrid composite has most astounding hardness. As per
law of Archard's the wear loss of the material during wear test is contrarily relative to the
hardness. In present case Al6061-6%Gr-5%AIN has most significant hardness due to
presence of hybrid reinforcements the wear rate in this composite has showed low when
assessed to other compositions. This is fundamentally in light of the fact that composites
have superior hardness than the Al6061 alloy showcase intense encounter to the sliding
wear.
Fig.7. Effect of reinforcement
3.3.2 Effect of load on wear rate
Fig. 8 demonstrates the impact of load on wear rate of Al6061 alloy and its composites
with sliding speed of 0.314 m/s. With the expansion in load from 20 N to 100 N, the wear
rate of the considerable number of materials is expanding directly for every one of the
materials. Most elevated wear rate was watched for Al6061 for 100 N loads while that of
0
0.1
0.2
0.3
0.4
0.5
0.6
Al6061 alloy Al6061-5%AIN Al6061-6% Gr Al6061-5%AIN-6%Gr
Co
eff
icie
nt o
f F
ric
tio
n (
µm
)
Load:20N
Sliding Velocity: 0.314m/sSolutionising Temperature : 520 oC
Ageing Temperature :175 oC
Ageing duration : 5 Hours
As cast As Cast+Heat Treated
0
10
20
30
40
50
60
70
0%AIN 1%AIN 3%AIN 5%AIN
Wea
r ra
te X
10-3
mm
3/m
Load:20N
Sliding Velocity:0.314m/s
0%Gr 2%Gr 4%Gr 6%Gr

International Journal of Management, IT & Engineering Vol. 8 Issue 12(1), December 2018,
ISSN: 2249-0558 Impact Factor: 7.119
Journal Homepage: http://www.ijmra.us, Email: [email protected]
Double-Blind Peer Reviewed Refereed Open Access International Journal - Included in the International
Serial Directories Indexed & Listed at: Ulrich's Periodicals Directory ©, U.S.A., Open J-Gage as well as in
Cabell’s Directories of Publishing Opportunities, U.S.A
157 International Journal of Management, IT & Engineering
http://www.ijmra.us, Email: [email protected]
least wear rate was watched for Al6061-6%Gr-5%AIN for 20 N loads. At beginning load
of 20 N, the hard ill tempers of counterbalance surface enter the composite sample surface
which prompts furrowing of scores on the alloy surface. Further, the development of scores
is mostly because of delamination of alloy surface at this load shows mellow and oxidative
wear.
Fig.8. Effect of load
3.3.3 Effect of Sliding Velocity
Fig. 9 demonstrates the impact of sliding speed on the wear rate of Al6061 and its
composites. The sliding speed was shifted from 0.314 to 1.570 m/s gradually by keeping
load of 20 N consistent for all the sliding tests. It was seen that with the expanding sliding
speed the wear rate of the considerable number of materials were expanding. The most
remarkable wear rate was watched for Al6061 matrix at sliding speed of 1.570 m/s while
least wear rate was acquired for hybrid composites with Al6061-6%Gr-5%AINat 0.314
m/s. The expansion in wear rate is relatively 15% for increment in sliding speed is watched
for combination.
Fig.9. Effect of varying sliding velocity
3.3.4 Effect of Heat Treatment
Fig. 10 demonstrates the impact of heat treatment on wear rate of Al6061 and its
composites. As seen from the graph, the trend noticed in the materials without heat
treatment, the heat treated materials also showed a similar pattern. Critical drop in
30
40
50
60
70
0 20 40 60 80 100 120
Wea
re r
ate
X 1
0-3
mm
3/m
Load (N)
Sliding Velocity:0.314m/s
Al6061
Al6061-5%AIN
Al6061-6% Gr
Al6061-5%AIN-6%Gr
30
40
50
60
70
80
0 0.314 0.628 0.942 1.256 1.57
Wea
r ra
te X
10
-3m
m3/m
Sliding Velocity (m/s)
Load: 20N
Al6061
Al6061-5%AIN
Al6061-6% Gr
Al6061-5%AIN-6%Gr

International Journal of Management, IT & Engineering Vol. 8 Issue 12(1), December 2018,
ISSN: 2249-0558 Impact Factor: 7.119
Journal Homepage: http://www.ijmra.us, Email: [email protected]
Double-Blind Peer Reviewed Refereed Open Access International Journal - Included in the International
Serial Directories Indexed & Listed at: Ulrich's Periodicals Directory ©, U.S.A., Open J-Gage as well as in
Cabell’s Directories of Publishing Opportunities, U.S.A
158 International Journal of Management, IT & Engineering
http://www.ijmra.us, Email: [email protected]
coefficient of friction is seen in Al6061 composite after heat treatment. The drop is about
22% when contrasted with that of before heat treatment. This can be ascribed to nucleation
of Mg2Si metastable accelerates. These encourage reinforcing the Al6061 alloy alongside
that of graphite and Aluminum Nitride particles.
Fig.10. Effect of heat treatment
4.0 Conclusions
Coefficient of friction for Al6061 alloys and composites decreased with increasing
reinforcement content, decreased with increase in load and sliding speed. Al6061 alloy and
its composites after aging for 5 hours showed lower values when compared to the same
materials in untreated conditions. Formation of Mg2Si precipitates led improved the
adhesive resistance of these materials which in turn helped in reducing friction coefficient
values. Wear rate decreased with increasing reinforcement content, increased with increase
in load from sliding speed.
References
1. L. F. Mondolfo, Aluminum Alloys: Structure and Properties, Butterworth & Co
(Publishers) Ltd, London, 1976.
2. J. Gilbert Kaufman, Introduction to Aluminum Alloys and Tempers, ASM
International, 2000.
3. N. Chawla, K.K. Chawla, Metal matrix composites, Springer Science + Business
Media, USA, 2006.
4. J. Singh, A. Chauhan, Overview of wear performance of aluminium matrix composites
reinforced with ceramic materials under the influence of controllable variables,
Ceramics International 42 (2016) 56-81.
5. Michael Oluwatosin, Bodunrin Kenneth KanayoAlaneme, Lesley
HeathChown“Aluminium matrix hybrid composites: a review of reinforcement
philosophies; mechanical, corrosion and tribological characteristics”Journal of
Materials Research and Technology, Volume 4, Issue 4, October–December 2015,
Pages 434-445.
6. Pramila Bai, B.N.; Ramesh, B.S.; and Surappa, M.K. (1992). Dry sliding wear of
A356-Al-SiCp composites. Wear, 157(2), 295-304.
7. Rupa Dasgupta “Aluminium Alloy-Based Metal Matrix Composites: A Potential
Material for Wear Resistant Applications” ISRN Metallurgy, Volume 2012, Article
ID 594573, 14 pages.
0
10
20
30
40
50
60
70
Al6061 Al6061-5%AIN Al6061-6% Gr Al6061-5%AIN-6%Gr
Wear r
ate
X 1
0-3
mm
3/m
Solutionising Temperature : 520 oC
Ageing Temperature :175 oCAgeing duration : 5 Hours
Load:20N
Sliding Velocity: 0.314m/s
As cast As Cast+Heat Treated

International Journal of Management, IT & Engineering Vol. 8 Issue 12(1), December 2018,
ISSN: 2249-0558 Impact Factor: 7.119
Journal Homepage: http://www.ijmra.us, Email: [email protected]
Double-Blind Peer Reviewed Refereed Open Access International Journal - Included in the International
Serial Directories Indexed & Listed at: Ulrich's Periodicals Directory ©, U.S.A., Open J-Gage as well as in
Cabell’s Directories of Publishing Opportunities, U.S.A
159 International Journal of Management, IT & Engineering
http://www.ijmra.us, Email: [email protected]
8. D. Jun, L. Yaohui, Y. Sirong, L. Wenfang, Effect of heat-treatment on friction and
wear properties of Al2O3 and carbon short fibres reinforced AlSi12CuMgNi hybrid
composites, Wear 262 (2007) 1289-1295.
9. S. Mosleh-Shirazi, F. Akhlaghi, D.Y. Li, Effect of graphite content on the wear
behavior of Al/2SiC/Gr hybrid nano-composites respectively in the ambient
environment and an acidic solution, Tribology International 103 (2016) 620-628.
10. A. Pai, S.S. Sharma, R.E. D’Silva, R.G. Nikhil, Effect of graphite and granite dust
particulates as micro-fillers on tribological performance of Al 6061-T6 hybrid
composites, Tribology International 92 (2015) 462-471.
11. M.M. Benal, H.K. Shivanand, Effects of reinforcements content and ageing durations
on wear characteristics of Al (6061) based hybrid composites, Wear 262 (2007) 759-
763.

International Journal of Management, IT & Engineering Vol. 8 Issue 12(1), December 2018,
ISSN: 2249-0558 Impact Factor: 7.119
Journal Homepage: http://www.ijmra.us, Email: [email protected]
Double-Blind Peer Reviewed Refereed Open Access International Journal - Included in the International
Serial Directories Indexed & Listed at: Ulrich's Periodicals Directory ©, U.S.A., Open J-Gage as well as in
Cabell’s Directories of Publishing Opportunities, U.S.A
160 International Journal of Management, IT & Engineering
http://www.ijmra.us, Email: [email protected]
Lahore Resolution of Muslim League 23rd march 1940
Dr. Amir Jahan
Arun Sharma
The political developments in the Punjab precipitated during the last decade before
Independence. The Pakistan scheme of Muslim League which was initiated by Mohd. Ali
Jinnah during his Lahore conference in March 1940 shook the whole of Punjab. The
Pakistan scheme of Mohd. Ali Jinnah was based on the demand for separate homeland for
Muslims.
The Government of India Act of 1935 provided for the establishment of full responsible
Government. Subject to safeguard in the eleven provinces of British India. It provided also
a Federal Central Government and legislature for the management of all subjects except
foreign affairs and defence.1
Nehru had described the Act as a charter of bondage; and a Congress resolution of 1936
stated that the future constitution of India could only be framed by a constituent assembly
based in adult franchise. League had criticized the Federal part of the Act as most
reactionary but decided to work, the provincial part, for what it is worth.2
The congress coupled its condemnation of the Act of 1935. With the for reacting demand
that the future constitution of India should be framed by Indians themselves by means of a
constituent assembly elected on the basis of Universal Adult Franchise.3
This act or several orders issued by the Governer General in Council as late as 1936, made
profound charges unlike most of the other provinces, the Act gave a uni-Cameral
legislature to Punjab, although with a charged designation the Punjab legislature council
was now styled as the Punjab legislature assembly . Its strength was increased to 175
elected members from different communities.4
Under the Government of India Act 1935, the elections in the Punjab were held in the
beginning of 1937. The unionist congress and Akalis were the major political parties
contesting elections. In the Initial stages of the election. Campaign the Akalis were against
joining hands with the congress Master Tara Singh. SGPC president was opposed to any
Sikh candidate in congres ticket. He felt that the congress could not be trusted if it
hesitated in uploading Sikh rights in a matter like the Shaheed Ganj Gurdwara dispute.5
He also feared that the congress would keep aloof even if the Muslims attacked the Golden
Temple and would not condomns murder of Sikh by Muslims.
Later, however, Akalis joined hands with the congress because Jawahar Lal Nehru, the
then congress president in his letter to Master Tara Singh expressed sympathy with the
Sikhs.
Secondly, the Akalis felt that alliance with the congress would help this in fighting against
the Khalsa National Party.
Sir Jogendra Singh was authorised to issue a detailed manifesto he said in 7th August,1936
that the party stood for swarajya and was to work ceaselessly for its attainment by all
constitution means. Dispute many imperfections in the new constitution the party were
Assistant Professor in Arts, Universal Group of Institutions, Lalru Assistant Professor in Commerce, Universal Group of Institutions, Lalru

International Journal of Management, IT & Engineering Vol. 8 Issue 12(1), December 2018,
ISSN: 2249-0558 Impact Factor: 7.119
Journal Homepage: http://www.ijmra.us, Email: [email protected]
Double-Blind Peer Reviewed Refereed Open Access International Journal - Included in the International
Serial Directories Indexed & Listed at: Ulrich's Periodicals Directory ©, U.S.A., Open J-Gage as well as in
Cabell’s Directories of Publishing Opportunities, U.S.A
161 International Journal of Management, IT & Engineering
http://www.ijmra.us, Email: [email protected]
willing to work is to remove them. It would also devote its energies to Lord’s abolition of
the communal Award.6
The congress had formed a separate congress Sikh party for the elections in Punjab with
the object of widening the base of the rational movement and for developing mass contact
among the Sikhs. Jawahar Lal Nehru also used airplane during the election propaganda
which happened first time in Indian history. He said that their success in election will be a
symbol of a great victory.7
Dr.Kitch lew said during the election propaganda in Amritsar that if “It is a sin to attain
freedom with the collaboration of Muslims then I shall commit this sin into the last
collaboration of Muslims then”
I do not require even a single vote from you. He shared in Hindu-Muslim Unity.7
Pandit Pant also comes to Jullinder for election Propaganda. He said that a vote for the
congress candidate was a vote for the nation’s emancipation for stamping out poverty,
unemployment, starvation and misery. Continuing pandit pant said a vote against the
congress would be a vote for imperialism, foreign domination and slavery. If they wanted
slavery any should repose full confidence in that great organization the congress which had
been struggling and striving for India’s freedom.8
In the 1937 elections, the league emerged as a complete party capturing a significant
number of seats, under the Muslim electorate but lost in the Muslim majority Punjab, Sikhs
and the N.W.F.P., Jinnah offered as alliance with the congress. Both the bodies would face
the British together, but the congress had to share power, accept separate electorates and
the league as the representative of India’s Muslims.9
Regarding the attitude of congress, Jinnah stated in his presidential address that the present
leadership of the congress, especially during the last ten years, had been responsible for
alienating the Musalmans of India more and more, by pursuing a policy which was
exclusively Hindus, and since they had formed governments in the six provinces where
they were in a majority, they had been by their words, deeds and programme shown, more
and more that the Musalmans, could not expect any justice or fair play at their hands.
The Muslim league got badly mauled when it met an ignominious defeat in the 1937
elections in the Punjab. In the other Muslim majority provinces in U.P. also the confess
refused to form a coalition minority with the Muslim league. The Muslim League’s defeat
in the 1937 elections, convinced in that without taking recourse to communal mobilization
with the battle cry of “Islam in danger” there was no hope for his and his party between the
short span of elections may ups and downs came on the political scenes of the Punjab. The
event started taking drastic turns with Muslim league’s Lahore resolution of March 1940
where in Muslim League expressed its deep set desires to have a separate state for
Muslims. The Muslims league’s Pakistan resolution came as a bolt from the blue to all the
political parties in the Punjab and it resulted in their instant reactions to their scheme.
According to the Muslim league, the Hindus and the Muslims constituted two different
nations. This fundamental principle was articulated by Mr. Jinnah in 1940, while
explaining the resolution of Pakistan, the Hindus and Muslims belong to two different
civilizations.10
“We are a nation”, he claimed. In the very eloquent words of the Quaid-I-Azam: “We are a
nation without distinctive culture and civilization, language and literature, art and
architecture, norms and nomenclature, sense of values and proportion, legal laws and

International Journal of Management, IT & Engineering Vol. 8 Issue 12(1), December 2018,
ISSN: 2249-0558 Impact Factor: 7.119
Journal Homepage: http://www.ijmra.us, Email: [email protected]
Double-Blind Peer Reviewed Refereed Open Access International Journal - Included in the International
Serial Directories Indexed & Listed at: Ulrich's Periodicals Directory ©, U.S.A., Open J-Gage as well as in
Cabell’s Directories of Publishing Opportunities, U.S.A
162 International Journal of Management, IT & Engineering
http://www.ijmra.us, Email: [email protected]
moral code, customs and calendar, history and partition, aptitudes and ambitions: In short,
We have our distinctive outlook in life.
By all cannons of International law, We are a nation.11
During the 1940-42 periods, the prestige and status of in All India Muslim League was
considerably increased in the all India politics. Jinnah became the undisputed spokesman
of the Muslim India
Which was also acknowledged by the British-Raj. Since early 1942, Jinnah’s endeavor had
been to strength the position of the Muslim league in the Muslim majority provinces of
bengal and Punjab. Infact by this time, the Muslim league had gained considerable weight
in Indian politics and this made Jinnah to directly intervene in these provinces.
In Punjab, he activated the Muslim league immediately after the death of Sikander Hayat
khan in December 1942. The death of Sir Sikander Hayat provided to Jinnah the much
covered opportunity of bringing the Punjab Muslims under his fold, But Sir Khizar Hayat
Khan, who shared many of Sikander’s views, was even more absolutely opposed to the
idea of Pakistan.
He openly opposed Jinnah and refused to interpret his membership of league as allowing it
to dictate to his and his followers in Punjab. Jinnah reacted with equal vigour of both with
the league from which Sir Khizar was expelled in 1944 and in fomenting revolt any the
Muslims of Punjab.
With the expulsion of Malik Khizar Hayat Khan from the membership of the All India
Muslim League, a League-Uninist alliance which had survived for seven years came to an
end. This was the beginning of a new era in the politics of Punjab Muslim League.
References
1. C.H Philip (ed)The Partion of India, policies and perspective(1935-1947),George Allen
and unwin Ltd.London, 1970,P.188
2. Anita inder Singh,The origins of The Partition of India (1935-1947), Oxford University
Press, Delhi, 1987, P.2.
3. C.H. Philip, The Partition of India: Policies and perspectives (1935-1947) P.188.
4. K.C. Yadav, Elections in Punjab (1920-1947), Manohar, New Delhi, 1987, P.16.
5. K.L. Gulati, The Akalis: Past and Present.
6. K.C. Gulati, The Akalis: Past and Present P.62.
7. The Akalis, Jan.,1937.
8. The Tribune, Jan.8, 1937.
9. Ayesha Jalal, The Sole Spokesman, Cambridge, 1985, P.27.
10. Latif Ahmed Sherwani, Documents presenting a case of Pakistan, P.24.
11. It’s Pakistan, Pakistan, Quaid-e-Azam, Mohd.Ali Jinnah, Ht, P.11.

International Journal of Management, IT & Engineering Vol. 8 Issue 12(1), December 2018,
ISSN: 2249-0558 Impact Factor: 7.119
Journal Homepage: http://www.ijmra.us, Email: [email protected]
Double-Blind Peer Reviewed Refereed Open Access International Journal - Included in the International
Serial Directories Indexed & Listed at: Ulrich's Periodicals Directory ©, U.S.A., Open J-Gage as well as in
Cabell’s Directories of Publishing Opportunities, U.S.A
163 International Journal of Management, IT & Engineering
http://www.ijmra.us, Email: [email protected]
An analysis of factors influencing consumer’s online shopping
behavior with special reference to organized retail market
Harsh Kumar
Abstract
India has been gaining importance as a high potential remunerative marketplace
for international retailers. Since the recent economic reforms, Indian consumers have just
begun to understand benefits of using Internet for shopping. However, the growing number
of Internet users has not been reflected to the online sales. Thus, it is important to identify
factors affecting Indian consumers’ online buying behavior in order to find the way to
stimulate their online shopping behavior. The purpose of this study is to identify factors
affecting Indian consumers’ behavior toward online shopping by investigating consumers
from Jaipur city, Rajasthan (India). For this study, perceived financial risk, product risk,
convenience risk, Non delivery risk, online consumer reviews, return policy and
demographic factors were identified after in-depth review of available related literature.
For collecting data related to factors influencing consumer’s online shopping behavior, 250
questionnaires through E-mail (linked with Google Drive) were sent randomly among
consumers of online stores in Jaipur, Rajasthan city. Out of which we got response from
176 respondents. Finally Kruskal Walis (Chi Square) and Durbin-WatsonTest (Multiple
correlation and regression), ANOVA, t-test employed in order to test hypothesizes of study.
This study can be considered as descriptive research from purpose perspective and
descriptive-survey with regard to the nature and method.
Keywords: Online buying behavior, perceived financial risk, organized retail market
1. Introduction
The Indian retail industry has emerged as one of the most vibrant and fast-paced industries
due to the entry of several new players. It accounts for over 10 per cent of the country’s
Gross Domestic Product (GDP) and around 8 per cent of the employment. India is the
world’s fifth-largest global destination in the retail space. India’s retail market is expected
to nearly double to US$ 3.6 trillion by 2020 from US$ 600 billion in 2015, driven by
income growth, urbanization and attitudinal shifts. While the overall retail market is
expected to grow at 12% per annum, modern trade would expand as fast at 31% per annum
and traditional trade at 10%.
India’s Business to Business (B2B) e-commerce market is expected to reach US$ 700
billion by 2020 whereas the Business to Consumer (B2C) e-commerce market is expected
to reach US$ 102 billion by 2020. Online retail is expected to be at par with the physical
stores in the next five years. India is expected to become the world’s fastest growing e-
commerce market, driven by robust investment in the sector and rapid increase in the
number of internet users. Various agencies have high expectations about growth of Indian
e-commerce markets. Indian e-commerce sales are expected to reach US$ 120 billion by
2020 from US$ 30 billion in FY2016. Further, India's e-commerce market is expected to
reach US$ 220 billion in terms of gross merchandise value (GMV) and 530 million
Research Scholar, Department of Business Administration, University of Rajasthan, Jaipur, Rajasthan

International Journal of Management, IT & Engineering Vol. 8 Issue 12(1), December 2018,
ISSN: 2249-0558 Impact Factor: 7.119
Journal Homepage: http://www.ijmra.us, Email: [email protected]
Double-Blind Peer Reviewed Refereed Open Access International Journal - Included in the International
Serial Directories Indexed & Listed at: Ulrich's Periodicals Directory ©, U.S.A., Open J-Gage as well as in
Cabell’s Directories of Publishing Opportunities, U.S.A
164 International Journal of Management, IT & Engineering
http://www.ijmra.us, Email: [email protected]
shoppers by 2025, led by faster speeds on reliable telecom networks, faster adoption of
online services and better variety as well as convenience. (Source of data: www.ibef.org.
2016. Retail Industry in India. [ONLINE] Available at: http://www.ibef.org/industry/retail-
india.aspx. [Accessed August 2018]
Online shopping is a form of E-commerce whereby consumers directly buy goods or
services from a seller over the internet. Benefits of E-commerce have been grown very fast
because of many advantages associated with buying on internet as the lower transaction
and search cost as compared to other types of shopping. Online shopping allows consumers
to buy faster, more alternatives and can order products and services with comparative
lowest price (Cuneyt & Gautam, 2004). Consumer’s attitude towards online shopping
refers to their psychological state on terms of making purchases. The process of buying
behaviour process consists of five steps. For instance, customers first identify a need or
want and then define the requirements necessary to satisfy that need. Secondly, gather
information and evaluate the options that are available. Once they know their options, they
will look to make a purchase which will include shopping for or negotiating the best price
they can achieve. Lastly, consumers will go through several factors which limits or
influence final decision and they will evaluate whether or not they made a good decision.
The main purpose of this study is to understand the factors that may influence consumer’s
attitude and behaviours towards online shopping. How consumers form such attitudes will
be also focused on by researcher with the help of models and who are true online shoppers.
1.2 Problem Statement
On-line shopping is still in its early years in India but with the inception of digital
revolution, the trend of on-line shopping will spread across the country soon. It is evident
from the statistics available that Internet users in India are constantly increasing and are
resorting to on-line transactions in different ways like e-banking, paying bills through
mobiles and completing other transactions. Growth in e-commerce, especially online
retailing has been observing due to spin in India’s social and demographic characteristics.
At the present moment it is realized that on-line retailers are aggressively pursuing on-line
usage and their efficiency in operations like integration of supply chain, logistics and
payment architecture has been increased. Geissler and Zinkhan (1998) claimed that the
Internet shifted the balance of power in favor of consumers as it became very easy for them
to make shopping comparisons and evaluate alternatives withoutbeing pressured by
salespeople. Online stores reduce transaction costs and have advantage for both consumers
and vendors.
These changes have accelerated an essential shift in the way Indians were engaged in
conventional shopping and believing in touch, feel and see the actual products before
buying. This is the time where one can see the alternate view of Indian customers who are
opening up to on-line shopping due to time constraints and convenience because of their
busy schedules and unavailability of the desired brands in the local markets. The point of
this study is to inspect the various key factors influencing online consumer buying
behavior. Researcher aims to examine the relationship between Perceived Financial Risks;
Product Risk; Convenience Risk; Non-Delivery Risk; Return Policy; On-Line Consumer
Reviews; Demographic variables and online shopping behavior ( OSB).

International Journal of Management, IT & Engineering Vol. 8 Issue 12(1), December 2018,
ISSN: 2249-0558 Impact Factor: 7.119
Journal Homepage: http://www.ijmra.us, Email: [email protected]
Double-Blind Peer Reviewed Refereed Open Access International Journal - Included in the International
Serial Directories Indexed & Listed at: Ulrich's Periodicals Directory ©, U.S.A., Open J-Gage as well as in
Cabell’s Directories of Publishing Opportunities, U.S.A
165 International Journal of Management, IT & Engineering
http://www.ijmra.us, Email: [email protected]
1.3 The objectives of the study
(I) Primary objectives
• To analyse the conceptual background of traditional marketing effectiveness as well as
digital marketing effectiveness on online consumer buying behaviour.
• To identify the effects of major factors on online consumer buying behaviour.
(II) Secondary
• To study the impact of alleged risks by consumers toward online shopping.
• To study the impacts of effective return policy on online shopping behaviour.
• To analyse the impact of demographics variables on online consumer buying
behaviour.
• To analyse the effect of on-line consumer reviews on online consumer buying
behaviour.
• To measure the consumer’s e-buying intensions and frequency.
1.4 Hypotheses of the study
Research is led to look for answers to the gaps in information that was distinguished and
this study is not a special case. The framed hypotheses in this study was unresolved by the
suggestion that Perceived Financial Risks; Product Risk; Convenience Risk; Non-Delivery
Risk; Return Policy; On-Line Consumer Reviews; Demographic variables have a great
impact on consumers’ online buying behaviour. In order to better analyse the research
factors and reach the research objectives, following hypotheses have been framed:
H1: Null Hypothesis (H01): The Perceived financial risk will have no effect on
consumer online Shopping behaviour.
Alternate Hypothesis (Ha1): The Perceived financial risk will have Negative effect on
consumer online Shopping behaviour.
H2: Null Hypothesis (H02): The product risk will have no effect on consumer online
Shopping behaviour.
Alternate Hypothesis (Ha2): The product risk will have Negative effect on consumer online
Shopping behaviour.
H3: Null Hypothesis (H03): The Convenience Risk will have no effect on consumer
online Shopping behaviour.
Alternate Hypothesis (Ha3): The Convenience Risk will have negative effect on consumer
online Shopping behaviour.
H4: Null Hypothesis (H04): The Non-Delivery Risk will have no effect on consumer
online Shopping behaviour.
Alternate Hypothesis (Ha4): The Non-Delivery Risk will have negative effect on consumer
online Shopping behaviour.
H5: Null Hypothesis (H05): Effective Return Policy will have no effect on consumer
online Shopping behaviour.
Alternate Hypothesis (Ha5): Effective Return Policy will have Positive effect on consumer
online Shopping behaviour.
H6: Null Hypothesis (H06): There is no significant effect of on-line consumer reviews
on online shopping behaviour.
Alternate Hypothesis (Ha6): There is significant effect of on-line consumer reviews on
online shopping behaviour.
H7: Null Hypothesis (H07): There is no significant relationship between selected
demographic variable and online shopping behaviour.

International Journal of Management, IT & Engineering Vol. 8 Issue 12(1), December 2018,
ISSN: 2249-0558 Impact Factor: 7.119
Journal Homepage: http://www.ijmra.us, Email: [email protected]
Double-Blind Peer Reviewed Refereed Open Access International Journal - Included in the International
Serial Directories Indexed & Listed at: Ulrich's Periodicals Directory ©, U.S.A., Open J-Gage as well as in
Cabell’s Directories of Publishing Opportunities, U.S.A
166 International Journal of Management, IT & Engineering
http://www.ijmra.us, Email: [email protected]
Alternate Hypothesis (Ha7)::There is significant relationship between selected demographic
variable and online shopping behaviour.
1.5 Rationale of the Study
With online shopping grabbing the eyeballs of many, understanding variables that
influence the intention to buy through online needs more attention. This will help
companies in identifying variables that play a major role in influencing customer’s
intention to buy there by helping them in crafting strategies which drives consumers to
prefer online shopping. For instance, if an online retailer understands that perceived risks
are high in certain categories that influence consumer’s intention to buy, retailers can craft
strategies to minimize perceived risks and drive consumers to buy through online.
Earlier studies paid much attention to this topic in developed nations where internet
penetration is high and consumers are highly evolved. For instance, Vellido et al. (2000)
extracted nine factors associated with user’s perception of online shopping. Among these
factors the risk perception of users was demonstrated to be the main discriminator between
people buying online and people not buying online. Other discriminating factors were
Perceived Financial Risks; Product Risk; Convenience Risk; Non-Delivery Risk; Return
Policy; On-Line Consumer Reviews; Demographic variables.
However little attention is paid in India where internet penetration is significantly low and
consumers are not so evolved in this space. Hence a need for such as study is identified by
the researcher to see how far these variables are relevant in India and how much they
influence consumer’s intention to buy.
2 Theoretical framework of the study
The model which used in the present study was developed to examine the online shopping
behaviors of Jaipur, Rajasthan based Indian consumers. This model examines the
relationship between Perceived Financial Risks; Product Risk; Convenience Risk; Non-
Delivery Risk; Return Policy; On-Line Consumer Reviews; Demographic variables and
online shopping behavior ( OSB).

International Journal of Management, IT & Engineering Vol. 8 Issue 12(1), December 2018,
ISSN: 2249-0558 Impact Factor: 7.119
Journal Homepage: http://www.ijmra.us, Email: [email protected]
Double-Blind Peer Reviewed Refereed Open Access International Journal - Included in the International
Serial Directories Indexed & Listed at: Ulrich's Periodicals Directory ©, U.S.A., Open J-Gage as well as in
Cabell’s Directories of Publishing Opportunities, U.S.A
167 International Journal of Management, IT & Engineering
http://www.ijmra.us, Email: [email protected]
Chart-2.1
(Source: Compiled by Researcher)
The above studies discovered key factors favoring and resisting online buying of various
products and services. In Indian online market, still less number of people are buying or
selling the products and services. The factors resisting the online purchase behavior of
customers discussed above provided researcher in depth understanding about factors
influencing online shopping behavior and thus after analyzing demography of the selected
research area, she found Perceived Financial Risks; Product Risk; Convenience Risk; Non-
Delivery Risk; Return Policy; On-Line Consumer Reviews; Demographic variables as
selected key factors for the present study and responses have been collected and analyzed
for the same.
3. Research Methodology
The present research work is undertaken to study the various factors influencing
consumer’s online shopping behavior with special reference to organized retail market.
This section deals with the different methodological steps and procedures to be followed to
carry out the present investigation.
3.1 Research Design
A Research design is purely and simply the framework of plan for a study that guides the
researcher to collect and analyse the data. The study is intended to analyze factors
influencing online shopping behavior of consumer’s that might be one of the most
emerging issues of online shopping and digital marketing in present scenario.This is a
descriptive Research study.
Perceived Financial
Risks ( H1)
Non-Delivery Risk ( H4)
Product Risk
(H2)
On-Line Consumer
Reviews ( H6)
Convenience Risk ( H3)
Return Policy ( H5)
Online
Shopping
Behavior
(OSB)
Demographic variables : Gender,
Education, Occupation, marital
status , Family Income
Demographic variables : Gender,
Education, Occupation, marital
status , Family Income
International Journal of Management, IT & Engineering Vol. 8 Issue 12(1), December 2018,
ISSN: 2249-0558 Impact Factor: 7.119
Journal Homepage: http://www.ijmra.us, Email: [email protected]
Double-Blind Peer Reviewed Refereed Open Access International Journal - Included in the International
Serial Directories Indexed & Listed at: Ulrich's Periodicals Directory ©, U.S.A., Open J-Gage as well as in
Cabell’s Directories of Publishing Opportunities, U.S.A
168 International Journal of Management, IT & Engineering
http://www.ijmra.us, Email: [email protected]
3.2 Research Type: The research study is descriptive in nature. Research study
describes the buying patterns of consumers. Descriptive research includes surveys & fact-
finding enquiries of sampled respondents. The main characteristic of this method is that the
researcher has no control over the variables; he/she can only report what has happened or
what is happening.
3.3 Universe of the Study
In Simple words it is all the people about whom the study meant to be generalized
(Jackson, 2008). The present study was limited to Jaipur district of Rajasthan state only.
The purpose of this study is to analyze factors influencing online shopping behavior of
consumer’s that might be one of the most emerging issues of online shopping and digital
marketing in present scenario. Therefore, the population of this research is defined as the
customers who purchase products online in Jaipur.
3.4 Period of the study: July 2018- August 2018
3.5 Sampling and sample size:
Samples are defined as the group of people who participate in a study (Jackson, 2008).
After reviewing the literature a method has been designed to achieve the objectives of
research project. There is consideration of Jaipur district of Rajasthan state as population
size of research study; so, sampling units are sub-geographical urban areas of Jaipur city of
Rajasthan State.
For collecting data related to factors influencing consumer’s online shopping behavior, 250
questionnaires through E-mail (linked with Google Drive) were sent randomly among
consumers of online stores in Jaipur, Rajasthan city. Out of which we got response from
176 respondents. In order to validate the variables and other parameters, a pilot survey of
small sample from Jaipur city was conducted by taking 20 respondents as sample size.
Responses of the questionnaire were also tested with the help of SPSS 20 version software
and also discussed the questionnaire with experts to take the opinions and their view points
to improve and redesign the final questionnaire. The final questionnaire was prepared
which has been enclosed here with for collecting data of Jaipur city.
3.6 Data Collection
The study is based mainly on primary data and supported by the secondary data. The
primary data is collected from the respondents from Jaipur district with the help of
questionnaire to evaluate their perspective regarding factors affecting online shopping
behaviour. For this purpose a structured schedule based questionnaire was prepared and
used by the researcher. Questionnaire was divided in to two parts. Part-A was used to
collect information regarding demographics of the sample respondents which was one of
the important factors affecting online shopping behavior and the information comprises of
Age, Gender, Occupation, Education, Marital Status , Annual Family Income. Part –B was
used to collect opinion of sample respondents regarding Perceived Financial Risks,
Product Risk, Convenience Risk, Non-Delivery Risk, Return Policy, On-Line Consumer
Reviews and its impact on Online Shopping Behavior. Their opinion was measured on five
point Likert scale and coding of the data was done as follows:
Strongly Disagree
Disagree
Neutral Agree Strongly
agree
5 4 3 2 1

International Journal of Management, IT & Engineering Vol. 8 Issue 12(1), December 2018,
ISSN: 2249-0558 Impact Factor: 7.119
Journal Homepage: http://www.ijmra.us, Email: [email protected]
Double-Blind Peer Reviewed Refereed Open Access International Journal - Included in the International
Serial Directories Indexed & Listed at: Ulrich's Periodicals Directory ©, U.S.A., Open J-Gage as well as in
Cabell’s Directories of Publishing Opportunities, U.S.A
169 International Journal of Management, IT & Engineering
http://www.ijmra.us, Email: [email protected]
Secondary data include data collected from various sources, published as well as
unpublished research papers, magazines, brochures, journals, periodicals, research papers
presented in various conferences, books, internet websites etc. So, Literature Survey has
been conducted to collect secondary data for the identification of different variables,
probable contemporary issues, and clarity of concepts. This has been followed by primary
survey.
3.7 Statistical tool for Data analysis and interpretation
Data analysis of respondents obtained was performed with the help of automated process. The
data for achievement of objectives was analyzed using frequencies and percentages. The
collected data have been tabulated and analyzed logical status using various statistical
methods. In this study simple percentage analysis, Kruskal Walis (Chi Square) and Durbin-
WatsonTest (Multiple correlation and regression), ANOVA, t-test employed to interpret.
Cronbach's (alpha) was used to establish internal consistency. Cronbach's (alpha) is a
coefficient of reliability. It is commonly used as a measure of the internal consistency or
reliability. The Statistical Programme for Social Science (SPSS), a computer-based statistical
package was used to generate descriptive statistics comprising of frequency tables and cross
tabulations.
Adoption of Question details for analysis
Independent Variable Source Question
Number
Section
Perceived Financial Risks Forsythe et. al. (2006)
Swinyard and smith (2003)
19-20 B
Product Risk Forsythe et. al. (2006)
Swinyard and smith (2003)
21-22
Convenience Risk Forsythe et. al. (2006)
Swinyard and smith (2003)
23-31
Non-Delivery Risk Forsythe et. al. (2006) 32
Return Policy Lewis (2006) 33
On-Line Consumer
Reviews
George (2004)
Lassar et.al(2005)
34-39
Dependent Variable Source Question
Number
Section
Online Shopping
Behavior
Forsythe et. al. (2006)
Karayanni ( 2003)
Swinyard and smith (2003)
Liang and Huang (1998)
8-18 B
Demographic variable Source Question
Number
Section
Age, Occupation, marital
status, gender, education,
Income
Rick L. Andrews and Imran
Currim (2008)
1-9 A
3.8 Testing of Hypotheses
Hypothesis testing is used to infer a result of a hypothesis performed on sample data from a
larger population, which can be either null or alternate. In the present research, H1 to H7

International Journal of Management, IT & Engineering Vol. 8 Issue 12(1), December 2018,
ISSN: 2249-0558 Impact Factor: 7.119
Journal Homepage: http://www.ijmra.us, Email: [email protected]
Double-Blind Peer Reviewed Refereed Open Access International Journal - Included in the International
Serial Directories Indexed & Listed at: Ulrich's Periodicals Directory ©, U.S.A., Open J-Gage as well as in
Cabell’s Directories of Publishing Opportunities, U.S.A
170 International Journal of Management, IT & Engineering
http://www.ijmra.us, Email: [email protected]
Hypotheses were framed and tested. The objective of hypothesis testing is to either accept
or reject the null hypothesis. To test the impact of demographic factors, cross tabulation, T-
test, F-Test, ANOVA, Chi-Square Test have been used.
3.9 Contribution of the study
Based on the proposed objectives and Hypotheses of this study, retail companies may
come to know about various risks associated with on-line shopping and thus would be able
to formulate strategies to minimize these risks and consequently enhance consumer’s trust
in this form of retail. Present research provides suitable direction in making more user
friendly websites. It also shows the way to the online retailers to improve their delivery
system.
4. Discussion and Evaluation
This chapter analyses the primary data gathered by the researcher. The chapter commences
with descriptive presentation and discusses the profile of the respondents in the sample.
The purpose of discussing the profile of the respondents was to analyze whether the
characteristics of the study sample represents the population.
4.1 Primary Data Analysis
4.1.1 Characteristics of Respondents
Population parameters normally influence various decision making process. This chapter
analyses the descriptive and statistical analysis of primary data collected. This section
deals with the demographic factors like Gender, Age, and Marital status, and Annual
family Income level, occupation, Educational level of the respondents. The information
thus collected from the 176 sample respondents and analyzed using SPSS software 20
version.
Figure- 4.1 Figure- 4.2
20-30years
30-40years
40-50years
50 yearsand
above
Frequency 81 44 40 11
Percent 46.2 24.8 22.7 6.3
0102030405060708090
Axi
s Ti
tle
Age Group of Sample Respondents
Male Female Others
Frequency 97 76 3
Percent 53.8 43.2 4
0
20
40
60
80
100
120
Axi
s Ti
tle
Gender wise distribution of Sample Respondents

International Journal of Management, IT & Engineering Vol. 8 Issue 12(1), December 2018,
ISSN: 2249-0558 Impact Factor: 7.119
Journal Homepage: http://www.ijmra.us, Email: [email protected]
Double-Blind Peer Reviewed Refereed Open Access International Journal - Included in the International
Serial Directories Indexed & Listed at: Ulrich's Periodicals Directory ©, U.S.A., Open J-Gage as well as in
Cabell’s Directories of Publishing Opportunities, U.S.A
171 International Journal of Management, IT & Engineering
http://www.ijmra.us, Email: [email protected]
Figure- 4.3 Figure- 4.4
(Source: Survey Data)
Interpretation: Above figures 4.1 to 4.4 demonstrate gender, age, occupation and
educational level of the respondents. The figures imply that majority of the respondents
were from 20-30 year age group whereas 47.5% of the respondents were from 30-50 year
age group. The sample population comprises of 53.8% male and 43.2% were found
females. As far as occupation is concerned, with 33.2% of the respondents salaried were on
the top regarding online shopping. Business and self employed were next in the same line.
Researcher also found that out of the total sample population 24.8% were from student’s
category. 69.0% of the respondents were either postgraduates or graduates. The researcher
aims to collect data from those who shop online. Hence it can be stated that young salaried
male with good education background were majorly engaged in online shopping.
Figure- 4.5 Figure- 4.6
Salaried
BusinessandSelf-emplo…
StudentRetired
andothers
Frequency 58 52 44 22
Percent 33.2 29.6 24.8 12.4
010203040506070
Axi
s Ti
tle
Occupation wise distribution of Sample
Respondents
NotGradu
ate
Graduate
PostGradu
ateOthers
Frequency 37 86 36 17
Percent 20.8 48.6 20.4 10.2
020406080
100
Axi
s Ti
tle
Education wise distribution of Sample
Respondents
MARRIEDUNMARRIE
DOTHERS
Frequency 81 84 11
Percent 46.2 47.6 6.2
0
20
40
60
80
100
Axi
s Ti
tle
Marital Status wise distribution of Sample
Respondents
Lessthan
3 lakh
3-5lakh
5-7lakh
Above 7
lakh
Frequency 35 92 26 23
Percent 20 52.4 15 12.6
020406080
100
Axi
s Ti
tle
Annual Family Income wise distribution of
Sample Respondents

International Journal of Management, IT & Engineering Vol. 8 Issue 12(1), December 2018,
ISSN: 2249-0558 Impact Factor: 7.119
Journal Homepage: http://www.ijmra.us, Email: [email protected]
Double-Blind Peer Reviewed Refereed Open Access International Journal - Included in the International
Serial Directories Indexed & Listed at: Ulrich's Periodicals Directory ©, U.S.A., Open J-Gage as well as in
Cabell’s Directories of Publishing Opportunities, U.S.A
172 International Journal of Management, IT & Engineering
http://www.ijmra.us, Email: [email protected]
Figure- 4.7
(Source: Survey Data)
Interpretation
Above figures 4.5 to 4.7 demonstrate profile of the respondents’ marital status, annual
family income and time since they are engaged in online shopping. Researcher found that
there is slight difference in the frequency of marital status as 46.2% sample respondents
were married whereas 47.6% were unmarried. 52.4% of the sample respondents were from
annual income band of 3-5 lacs. 49.2% of the sample respondents have been engaged in
online shopping since one year which implies that the craze for online shopping has been
increased in the recent time.
4.2 Item wise analysis of selected factors
Lessthan 1year
1 - 2Years
2 - 3Years
Morethan 3Years
Frequency 87 58 28 3
Percent 49.2 33 16 1.8
0102030405060708090
100
Axi
s Ti
tle
Time since shopping online

International Journal of Management, IT & Engineering Vol. 8 Issue 12(1), December 2018,
ISSN: 2249-0558 Impact Factor: 7.119
Journal Homepage: http://www.ijmra.us, Email: [email protected]
Double-Blind Peer Reviewed Refereed Open Access International Journal - Included in the International
Serial Directories Indexed & Listed at: Ulrich's Periodicals Directory ©, U.S.A., Open J-Gage as well as in
Cabell’s Directories of Publishing Opportunities, U.S.A
173 International Journal of Management, IT & Engineering
http://www.ijmra.us, Email: [email protected]
Figure: 4.8
(Source: Survey Data)
Interpretation: It can be stated from the above data that 72.6% of the sample respondents
have no issues regarding privacy. It reflects that sample respondent prefer online shopping
due to the privacy feature. 53.8% of the sample respondents found online shopping easy
and convenient as it provides them access to the market from their place. 82.2% of the
sample respondents prefer shopping due to the flexibility of time. 77.4% of the sample
respondents prefer online shopping as they feel that online shopping keep them away from
traffic jam and market crowd. 73.2% of the sample respondents feel that online access to
the market provides them detailed product information.
As far as variety of products range is concerned, 85.6% of the sample respondents feel that
online shopping provides the opportunity for the same. 71% of the sample respondents
were pleased with this mode of shopping since it provides them ease with price
comparison. While doing offline shopping many of the buyers face embarrassing situations
but it was a different case in online shopping as 63.4% of sample respondents felt no
embarrassment while shopping online. Despite of all the positive sides of online shopping,
84% of the sample respondents felt that they could not control on their expenses while
shopping online. 54.8% of the sample respondents found online shopping compatible with
their life-style.
Online
Shopping
providesyoupriv…
Online
Shopping
providesyouacce…
Online
Shopping
providesyousho…
Online
shopping
keepsyou
awayfro…
Online
access tothe
market
prov…
Online
Shopping
provides
you avari…
Online
shopping
givesfacility ofeasy…
Thereis noembarrassment
inOnline…
Online
shopping
makes yourshopping…
Online
shopping
givesyou
bettercont…
Youfind
onlineshopping iscompatiblewith…
Strongly Disagree 0.2 0.8 1.4 1.2 0.6 0 0.2 0.2 0.4 1 2.8
Disagree 0.4 15.4 3 3.8 5 2.8 4.2 5.2 6.2 51.8 12.6
Neutral 16.8 30 13.4 17.6 21.2 11.6 24.6 31.2 26.8 31.2 28.8
Agree 48 39 46 36.8 46.2 39 48 45 46 2.6 36.4
Strongly Agree 34.6 14.8 36.2 40.6 27 46.6 23 18.4 20.6 13.4 19.4
020406080
100120
Axi
s Ti
tle
Item wise analysis of Online Shopping Behavior ( %)

International Journal of Management, IT & Engineering Vol. 8 Issue 12(1), December 2018,
ISSN: 2249-0558 Impact Factor: 7.119
Journal Homepage: http://www.ijmra.us, Email: [email protected]
Double-Blind Peer Reviewed Refereed Open Access International Journal - Included in the International
Serial Directories Indexed & Listed at: Ulrich's Periodicals Directory ©, U.S.A., Open J-Gage as well as in
Cabell’s Directories of Publishing Opportunities, U.S.A
174 International Journal of Management, IT & Engineering
http://www.ijmra.us, Email: [email protected]
Figure: 4.9
(Source: Survey Data)
Interpretation: 57.4% of the sample respondents believed that during online shopping
their banking details might be misused where as 70.6% believed that their personal detail
might be exposed to the third party. Researcher found perceived financial risk as a hurdle
in online shopping.
Figure: 4.10
(Source: Survey Data)
Interpretation: 75.6% of the sample respondents experienced a different product from the
product ordered at the time of delivery and also found difficult judge the quality of the
product virtually. Thus researcher found product risk as one of the major factors which
affects inversely to the online shopping.
Filing banking details may bemisused during online shopping
Filing Personal details may beexposed to the third party
Strongly Disagree 4.9 1.2
Disagree 10.5 5.2
Neutral 27.2 23
Agree 39.3 47
Strongly Agree 18.1 23.6
020406080
100120
Axi
s Ti
tle
Item analysis of Perceived financial Risks (%)
Actual product may differ/malfunctioning from the product
ordered
It is difficult for you to judge thequality of product virtually
Strongly Disagree 2.2 0.2
Disagree 3.2 3.2
Neutral 19 21
Agree 49.8 44.8
Strongly Agree 25.8 30.8
020406080
100120
Axi
s Ti
tle
Item analysis of Product Risk

International Journal of Management, IT & Engineering Vol. 8 Issue 12(1), December 2018,
ISSN: 2249-0558 Impact Factor: 7.119
Journal Homepage: http://www.ijmra.us, Email: [email protected]
Double-Blind Peer Reviewed Refereed Open Access International Journal - Included in the International
Serial Directories Indexed & Listed at: Ulrich's Periodicals Directory ©, U.S.A., Open J-Gage as well as in
Cabell’s Directories of Publishing Opportunities, U.S.A
175 International Journal of Management, IT & Engineering
http://www.ijmra.us, Email: [email protected]
Figure: 4.11
(Source: Survey Data)
Interpretation: Above data represents opinion of sample respondents regarding
Convenience risk while online shopping. 74.8% of the sample respondents found difficult
to have right product on internet. 82.2% of the sample respondents found it difficult to wait
till the product arrives at their place. 75.4% of the sample respondents found settling
disputes difficult when shop online. 72.2% of the sample respondents reported cancelling
orders difficult when they shop online. Difficulty in returning back of malfunctioned
product was reported by majority of the sample respondents. Majority of the sample
respondents were agreed and strongly agreed that opinion of friends, relative and family
matters when purchase online, internet speed influences online shopping frequency, access
to the computer with internet connection at own place affect online shopping and non
availability of credit-card limits online shopping.
You findit
difficultto have
rightproduct
oninternet
You findit
difficultto waittill the
productarrivesat yourplace
Settlingdisputes
isdifficultwhenyou
shoponline
Cancelling
ordersis
difficultwhenyou
shoponline
Returning back
ofmalfunctioned
productis
difficultwhen…
Opinionof yourfriends/relative/ familymatters
whenpurchas
e…
InternetSpeed
influences youronline
shopping
frequency
Accessto the
computer withinternetconnect
ion atyourplace…
Nonavailabil
ity ofcredit-cardlimitsyour
onlineshoppi…
Strongly Disagree 0.6 1.4 1.2 1.6 1 1.2 2.2 0.4 11
Disagree 4 4 4.8 4 1.8 4.2 5.2 2.2 21.8
Neutral 20.6 12.4 16.6 22.2 12.6 23.6 29.2 26.8 11.2
Agree 50 48 37.8 47.2 41 44 43 46 32.6
Strongly Agree 24.8 34.2 39.6 25 43.6 27 21.4 24.6 23.4
020406080
100120
Axi
s Ti
tle
Item analysis of Convenience Risk

International Journal of Management, IT & Engineering Vol. 8 Issue 12(1), December 2018,
ISSN: 2249-0558 Impact Factor: 7.119
Journal Homepage: http://www.ijmra.us, Email: [email protected]
Double-Blind Peer Reviewed Refereed Open Access International Journal - Included in the International
Serial Directories Indexed & Listed at: Ulrich's Periodicals Directory ©, U.S.A., Open J-Gage as well as in
Cabell’s Directories of Publishing Opportunities, U.S.A
176 International Journal of Management, IT & Engineering
http://www.ijmra.us, Email: [email protected]
Figure: 4.12
(Source: Survey Data)
Interpretation: Above figure produces item wise Consumer opinion about online
consumer reviews during online shopping. During the survey researcher found consumer
reviews as one of the most prominent factors which have a great deal of impact on
consumers buying decisions when they shop online. 77.4% of the sample respondents
agree and strong agree on the fact that they prefer to go through with reviews on website
before shopping online. 69.2% of the sample respondents reported that other consumers
and experts reviews have an effect on their online shopping. 85.6% of the sample
respondents felt that these reviews were of great help in their decision making regarding
purchasing online. On the other hand, if the reviews are not available they hesitate and
found themselves in dilemma regarding their choice. Many of the sample respondents
found these reviews of no use since they feel that companies may ploy with such online
reviews. However in all, the above facts established consumer online reviews significant
for online shopping decisions.
4.3 Hypothesis testing through regression model and ANOVA test
To examine the study's hypotheses, Regression Analysis and ANOVA test were used to
analyze the relationships between the Predictors (independent variables) and the dependent
variables. The hypotheses and results are as follows:
You alwaysgo through
withreviews on
websitebefore
shoppingonline
Otherconsumers /
Expertsreviewshave an
effect onyour onlineshopping
When youpurchase aproduct on-line, reviewsare helpful
in yourdecision-making.
If not accessto the
reviews, youhesitate andworry about
yourdecision.
Sometimesyou feelreading
reviews areof no use.
You findappropriateuser/expertreviews onthe productwhen shop
online
Strongly Disagree 1.2 0.6 0 2.2 0.2 0.4
Disagree 7.8 5 0.8 7.2 17.2 6.2
Neutral 13.6 25.2 13.6 24.6 31.2 23.8
Agree 32.8 42.2 36 45 34 46
Strongly Agree 44.6 27 49.6 21 17.4 23.6
0
20
40
60
80
100
120
Axi
s Ti
tle
Item wise analysis of On-Line Consumer Reviews

International Journal of Management, IT & Engineering Vol. 8 Issue 12(1), December 2018,
ISSN: 2249-0558 Impact Factor: 7.119
Journal Homepage: http://www.ijmra.us, Email: [email protected]
Double-Blind Peer Reviewed Refereed Open Access International Journal - Included in the International
Serial Directories Indexed & Listed at: Ulrich's Periodicals Directory ©, U.S.A., Open J-Gage as well as in
Cabell’s Directories of Publishing Opportunities, U.S.A
177 International Journal of Management, IT & Engineering
http://www.ijmra.us, Email: [email protected]
4.3.1 Regressions Analysis of determinants of online consumer behavior toward
online shopping
Table -5.2
Model Summary
Model
R R Square
Adjusted R
Square
Durbin-
Watson 0.87 .757 .607 1.875
Predictors: (Constant), Perceived Financial Risks; Product Risk; Convenience
Risk; Non-Delivery Risk; Return Policy; On-Line Consumer Reviews
Dependent Variable: Online Shopping Behavior (OSB)
ANOVA
Sum of
Squares df Mean Square F p value
Regression 57.345 8 7.168 5.502 .000
Residual 439.689 168 1.303
Total 497.035 176
Table-5.3 Coefficients
Hyp
othes
is
Unstandardized
Coefficients
Standardized
Coefficients
t
p
value
Result of
Hypothesis
testing
B Std. Error Beta
(Constant) 6.328 .274
23.082 .000
H1 Perceived Financial
Risks
-.025 .109 -.011 -.229 .034* Ho reject
Significant
Difference
H2 Product Risk -.116 .090 -.067 -1.294 .196 Ho Accept
H3 Convenience Risk -.083 .084 -.047 -.984 .326 Ho Accept
H4 Non-Delivery Risk -.047 .089 -.025 -.525 .000* Ho reject
Significant
Difference
H5 Return Policy .006 .066 .004 .089 .929 Ho Accept
H6 On-Line Consumer
Reviews
-.096 .070 -.067 -1.382 .018* Ho reject
Significant
Difference
* Denotes significance at the 0.05 level

International Journal of Management, IT & Engineering Vol. 8 Issue 12(1), December 2018,
ISSN: 2249-0558 Impact Factor: 7.119
Journal Homepage: http://www.ijmra.us, Email: [email protected]
Double-Blind Peer Reviewed Refereed Open Access International Journal - Included in the International
Serial Directories Indexed & Listed at: Ulrich's Periodicals Directory ©, U.S.A., Open J-Gage as well as in
Cabell’s Directories of Publishing Opportunities, U.S.A
178 International Journal of Management, IT & Engineering
http://www.ijmra.us, Email: [email protected]
Normal P-P Plot of Regression Standardized Residual
Dependent Variable- Online Shopping Behavior
(Source: Survey Data)
Interpretation
Above regression modal demonstrate correlation between dependent and independent
variables used in present study. Perceived Financial Risks; Product Risk; Convenience
Risk; Non-Delivery Risk; Return Policy; On-Line Consumer Reviews are considered as
independent variables whereasOnline Shopping Behavior (OSB) is taken as dependent
variable. To determine the relationship between dependent and independent variable
multivariate regression and correlation statistical techniques have been used. Correlation
coefficient measured value was 0.87 which shows there is a high degree of correlation
between both the variables. Coefficient of determination (R2) and Adjusted R2were .757
and .607 respectively which implies that selected independent variables have 75.7% impact
on OSB. To determine significance of the above results ANOVA technique has been used
for which the P value was found less than .05. This implies that results are significant.
Table 5.3 represents the results for above mentioned hypotheses (H1 to H6). The results
showed that H1, H4 and H6 are significantly supported. Thus, Perceived fear of Financial
Risk and Non-Delivery Risk has negative effect on consumers’ OSB. Significant effect of
on-line consumer reviews on online shopping behavior was found. The higher the
perceived financial and non delivery risk, the lower attitude toward online shopping. This
finding is compatible with findings of the Forsythe and Shi (2003) and Biswas and Biswas
(2004). In these studies, financial risk is an important factor for not shopping online. Also
the higher the probability of non-delivery of order, the lower attitude toward online
shopping. It indicates that the non-delivery risk is a significant factor for affecting behavior
towards shopping online. People do not tend to shop online because they are not sure
whether the ordered Product will be delivered or not and lack of seriousness and efforts
towards building trust by the retailers makes it a significant reason.
Results of testing the hypotheses H2, H3 and H5 indicated that effect of product risks,
convenience risk and effective Return Policy on attitude toward online shopping is not
significant. These findings are consistent with the findings from the previous study from
Sinha (2010). This is also in contrast with the findings of the existing studies (e.g. Forsythe
and Shi, 2003; Biswas and Biswas, 2004) where product and convenience risk are
important significant risk factors for not shopping online. The possible reason of this

International Journal of Management, IT & Engineering Vol. 8 Issue 12(1), December 2018,
ISSN: 2249-0558 Impact Factor: 7.119
Journal Homepage: http://www.ijmra.us, Email: [email protected]
Double-Blind Peer Reviewed Refereed Open Access International Journal - Included in the International
Serial Directories Indexed & Listed at: Ulrich's Periodicals Directory ©, U.S.A., Open J-Gage as well as in
Cabell’s Directories of Publishing Opportunities, U.S.A
179 International Journal of Management, IT & Engineering
http://www.ijmra.us, Email: [email protected]
insignificance in Present study context appears to be the indifference and unwillingness of
selected respondent consumers towards Results of testing the hypotheses H2, H3 and H5
indicated that product risks, convenience risk and effective Return Policy were not
significant at the 0.05 level and are not supported.
4.3.2 Cross tab analysis of different factors with demographics variables affecting
online shopping behavior
H7: Null Hypothesis (H07): There is no significant relationship between selected
demographic variable and online shopping behavior.
Alternate Hypothesis (Ha7): There is significant relationship between selected demographic
variable and online shopping behavior.
Researcher formulated above hypothesis to analyze relationship between
demographic variable ( Age, Gender, occupation, education, marital status) and
online shopping behavior and Kruskal Walis Test which is a non parametric test has
been applied to test the same in the following section with cross tab analysis:
A. Cross tab analysis of different factors with Age of the respondents
VARIABLES Age in years N Mean SD
KRUSKAL WALIS
TEST
Result of
Hypothesis
testing Chi-
square df
P
VALUE
Perceived
Financial Risks
20-30 81 1.88 0.21
3.176 3 .045
Ho Reject
Significant
difference 30-40 44 2.06 0.53
40-50 40 2.70 0.58
50 and above 11 1.50 0.15
Total 176 2.02 0.53
Convenience
Risk
20-30 81 2.42 0.86
1.905 3 .592
Ho Accept
Insignificant
difference 30-40 44 2.12 0.68
40-50 40 2.08 0.68
50 and above 11 2.00 0.15
Total 176 2.10 0.68
Non-Delivery
Risk
20-30 81 2.17 0.68
.934 3 .817
Ho Accept
Insignificant
difference 30-40 44 2.06 0.69
40-50 40 2.07 0.66
50 and above 11 2.50 0.24
Total 176 2.07 0.67
Return Policy
20-30 81 2.33 0.75
1.167 3 .761
Ho Accept
Insignificant
difference 30-40 44 2.05 0.61
40-50 40 2.10 0.65
50 and above 11 2.00 0.46
Total 176 2.08 0.64
On-Line
Consumer
Reviews
Perceived
Financial Risks
20-30 81 2.33 1.03
1.274 3 .735
Ho Accept
Insignificant
difference 30-40 44 2.25 0.84
40-50 40 2.17 0.85
50 and above 11 2.00 0.48
Total 176 2.20 0.85

International Journal of Management, IT & Engineering Vol. 8 Issue 12(1), December 2018,
ISSN: 2249-0558 Impact Factor: 7.119
Journal Homepage: http://www.ijmra.us, Email: [email protected]
Double-Blind Peer Reviewed Refereed Open Access International Journal - Included in the International
Serial Directories Indexed & Listed at: Ulrich's Periodicals Directory ©, U.S.A., Open J-Gage as well as in
Cabell’s Directories of Publishing Opportunities, U.S.A
180 International Journal of Management, IT & Engineering
http://www.ijmra.us, Email: [email protected]
Product Risk 20-30 81 2.50 0.55
1.610 3 .657
Ho Accept
Insignificant
difference 30-40 44 2.20 0.82
40-50 40 2.26 0.82
50 and above 11 2.00 0.38
Total 176 2.24 0.82
Interpretation: Above statistical analysis revealed that there is a significant relationship
between financial risks perceived by different Age groups has impact on their online
shopping behavior. P value for the variable “perceived financial risk” was found .045
which was less than the value .05. On analyzing the mean score regarding financial risk
perceived by different age group respondent, researcher came to know that perception
regarding financial risk of age group between 50 and above was highest among all age
groups. This indicates people from high age groups are more cautious than lower group
regarding financial risk involved in online shopping.
B. Cross tab analysis of different factors with marital status of the respondents:
VARIABLES Marital status N Mean SD
KRUSKAL WALIS TEST Result of
Hypothesis
testing Chi-
square df
P
VALUE
Perceived
Financial Risks
Married 81 1.9750 .71151
1.359 2 .507
Ho Accept
Insignificant
difference Unmarried 84 2.0184 .52398
Others 11 2.3750 .88388
Total 176 2.0190 .52839
Product Risk Married 81 2.3500 1.05541
1.486 2 .476
Ho Accept
Insignificant
difference Unmarried 84 2.0953 .67031
Others 11 2.7500 1.06066
Total 176 2.1030 .68104
Convenience Risk Married 81 2.4000 .96609
6.275 2 .043
Ho Reject
significant
difference Unmarried 84 2.0656 .65885
Others 11 1.0000 .00000
Total 176 2.0680 .66878
Non-Delivery
Risk
Married 81 2.2500 .71686
.749 2 .688
Ho Accept
Insignificant
difference Unmarried 84 2.0799 .63502
Others 11 2.2500 .35355
Total 176 2.0840 .63541

International Journal of Management, IT & Engineering Vol. 8 Issue 12(1), December 2018,
ISSN: 2249-0558 Impact Factor: 7.119
Journal Homepage: http://www.ijmra.us, Email: [email protected]
Double-Blind Peer Reviewed Refereed Open Access International Journal - Included in the International
Serial Directories Indexed & Listed at: Ulrich's Periodicals Directory ©, U.S.A., Open J-Gage as well as in
Cabell’s Directories of Publishing Opportunities, U.S.A
181 International Journal of Management, IT & Engineering
http://www.ijmra.us, Email: [email protected]
Return Policy Married 81 1.9000 .56765
2.726 2 .256
Ho Accept
Insignificant
difference Unmarried 84 2.2070 .85270
Others 11 1.5000 .70711
Total 176 2.1980 .84867
On-Line
Consumer
Reviews
Married 81 2.3000 1.15950
2.321 2 .313
Ho Accept
Insignificant
difference Unmarried 84 2.2336 .80981
Others 11 3.0000 .00000
Total 176 2.2380 .81651
Interpretation: Above statistical analysis revealed that there is a significant relationship
between marital status and convenience risks and it has impact on online shopping
behavior. P value for the variable “convenience risk” was found .043 which was less than
the value .05. On analyzing the mean score regarding convenience risk perceived by
married respondents, researcher came to know that they found it difficult to identify right
product on internet. Settling disputes and cancelling orders were the other concerns.
C. Cross tab analysis of different factors with Gender of the respondents:
VARIABLES Gender N Mean SD
KRUSKAL WALIS TEST Result of
Hypothesis
testing Chi-
square df
P
VALUE
Perceived
Financial Risks Male 97 1.9750 .71151
1.359 2 .507
Ho Accept
Insignificant
difference Female 76 2.0184 .52398
Others 3 2.3750 .88388
Total 176 2.0190 .52839
Product Risk Male 97 2.3500 1.05541
1.486 2 .476
Ho Accept
Insignificant
difference Female 76 2.0953 .67031
Others 3 2.7500 1.06066
Total 176 2.1030 .68104
Convenience
Risk Male 97 2.4000 .96609
6.275 2 .033
Ho Reject
significant
difference Female 76 2.0656 .65885
Others 3 1.0000 .00000
Total 176 2.0680 .66878
Non-Delivery
Risk Male 97 2.2500 .71686 .749 2 .688
Ho Accept
Insignificant

International Journal of Management, IT & Engineering Vol. 8 Issue 12(1), December 2018,
ISSN: 2249-0558 Impact Factor: 7.119
Journal Homepage: http://www.ijmra.us, Email: [email protected]
Double-Blind Peer Reviewed Refereed Open Access International Journal - Included in the International
Serial Directories Indexed & Listed at: Ulrich's Periodicals Directory ©, U.S.A., Open J-Gage as well as in
Cabell’s Directories of Publishing Opportunities, U.S.A
182 International Journal of Management, IT & Engineering
http://www.ijmra.us, Email: [email protected]
Female 76 2.0799 .63502 difference
Others 3 2.2500 .35355
Total 176 2.0840 .63541
Return Policy Male 97 1.9000 .56765
2.726 2 .256
Ho Accept
Insignificant
difference Female 76 2.2070 .85270
Others 3 1.5000 .70711
Total 176 2.1980 .84867
On-Line
Consumer
Reviews
Male 97 2.3000 1.15950
2.321 2 .313
Ho Accept
Insignificant
difference Female 76 2.2336 .80981
Others 3 3.0000 .00000
Total 176 2.2380 .81651
Interpretation: Above statistical analysis revealed that there is a significant relationship
between gender and convenience risks and it has impact on online shopping behavior. P
value for the variable “convenience risk” was found .033 which was less than the value
.05. On analyzing the mean score regarding convenience risk perceived by male and
female respondents, researcher came to know that male and female have different opinions
regarding online shopping convenience.
D. Cross tab analysis of different factors with Education of the respondents
VARIABLES Education N Mean SD
KRUSKAL WALIS TEST Result of
Hypothesis
testing Chi-
square df P VALUE
Perceived
Financial Risks
Not Graduate 37 1.88 0.21
3.176 3 .365
Ho Accept
Insignifican
t difference Graduate 86 2.06 0.53
Post Graduate 36 2.00 0.53
Others 17 1.50 0.58
Total 176 2.02 0.53
Convenience
Risk
Not Graduate 37 2.42 0.86
1.905 3 .592
Ho Accept
Insignifican
t difference Graduate 86 2.12 0.68
Post Graduate 36 2.08 0.68
Others 17 2.00 0.53
Total 176 2.10 0.68
Non-Delivery
Risk
Not Graduate 37 2.17 0.68
.934 3 .817
Ho Accept
Insignifican
t difference Graduate 86 2.06 0.69
Post Graduate 36 2.07 0.66
Others 17 2.50 0.57
Total 176 2.07 0.67

International Journal of Management, IT & Engineering Vol. 8 Issue 12(1), December 2018,
ISSN: 2249-0558 Impact Factor: 7.119
Journal Homepage: http://www.ijmra.us, Email: [email protected]
Double-Blind Peer Reviewed Refereed Open Access International Journal - Included in the International
Serial Directories Indexed & Listed at: Ulrich's Periodicals Directory ©, U.S.A., Open J-Gage as well as in
Cabell’s Directories of Publishing Opportunities, U.S.A
183 International Journal of Management, IT & Engineering
http://www.ijmra.us, Email: [email protected]
Return Policy
Not Graduate 37 2.33 0.75
1.167 3 .761
Ho Accept
Insignifican
t difference Graduate 86 2.05 0.61
Post Graduate 36 2.10 0.65
Others 17 2.00 0.57
Total 176 2.08 0.64
On-Line
Consumer
Reviews
Perceived
Financial Risks
Not Graduate 37 2.33 1.03
1.274 3 .735
Ho Accept
Insignifican
t difference Graduate 86 2.25 0.84
Post Graduate 36 2.17 0.85
Others 17 2.00 0.59
Total 176 2.20 0.85
Product Risk Not Graduate 37 2.50 0.55
1.610 3 .657
Ho Accept
Insignifican
t difference Graduate 86 2.20 0.82
Post Graduate 36 2.26 0.82
Others 17 2.00 0.51
Total 176 2.24 0.82
Interpretation: Above table indicates the P value for the variable all selected variables
was found more than the value .05. On analyzing the mean score researcher came to know
that there is no significant impact of education level on online shopping behavior.
E. Cross tab analysis of different factors with Occupation of the respondents
VARIABLES Occupation N Mean SD
KRUSKAL WALIS TEST Result of
Hypothesis
testing Chi-
square df
P
VALUE
Perceived
Financial
Risks
Salaried 58 1.88 0.21
3.176 3 .365
Ho Accept
Insignificant
difference Business and
Self-employed
52 2.06 0.53
Student 44 2.00 0.53
Retired and
others
22 1.50 0.51
Total 176 2.02 0.53
Convenience
Risk
Salaried 58 2.42 0.86
1.905 3 .592
Ho Accept
Insignificant
difference Business and
Self-employed
52 2.12 0.68
Student 44 2.08 0.68
Retired and
others
22 2.00 0.59
Total 176 2.10 0.68
Non-Delivery
Risk
Salaried 58 2.17 0.68
.934 3 .817
Ho Accept
Insignificant
difference Business and
Self-employed
52 2.06 0.69
Student 44 2.07 0.66
Retired and
others
22 2.50 0.57
Total 176 2.07 0.67

International Journal of Management, IT & Engineering Vol. 8 Issue 12(1), December 2018,
ISSN: 2249-0558 Impact Factor: 7.119
Journal Homepage: http://www.ijmra.us, Email: [email protected]
Double-Blind Peer Reviewed Refereed Open Access International Journal - Included in the International
Serial Directories Indexed & Listed at: Ulrich's Periodicals Directory ©, U.S.A., Open J-Gage as well as in
Cabell’s Directories of Publishing Opportunities, U.S.A
184 International Journal of Management, IT & Engineering
http://www.ijmra.us, Email: [email protected]
Return Policy
Salaried 58 2.33 0.75
1.167 3 .761
Ho Accept
Insignificant
difference Business and
Self-employed
52 2.05 0.61
Student 44 2.10 0.65
Retired and
others
22 2.00 0.51
Total 176 2.08 0.64
On-Line
Consumer
Reviews
Perceived
Financial
Risks
Salaried 58 2.33 1.03
1.274 3 .735
Ho Accept
Insignificant
difference Business and
Self-employed
52 2.25 0.84
Student 44 2.17 0.85
Retired and
others
22 2.00 0.51
Total 176 2.20 0.85
Product Risk Salaried 58 2.50 0.55
1.610 3 .657
Ho Accept
Insignificant
difference Business and
Self-employed
52 2.20 0.82
Student 44 2.26 0.82
Retired and
others
22 2.00 0.51
Total 176 2.24 0.82
Interpretation: Above table indicates the P value for the variable all selected variables
was found more than the value .05. On analyzing the mean score researcher came to know
that there is no significant impact of occupation on online shopping behavior.
5. Conclusion and Suggestions
Researcher evaluated few factors affecting online consumer shopping behavior. A
conceptual model was framed to measure the effects of variables on online consumer
shopping behavior for which statistical analysis has been done with the help of regression
analysis and other non-parametric tests. Through which “perceived financial risk” and non-
delivery risk were found negatively correlated with online shopping behavior. On the other
hand, online consumer reviews were found most significant factors for increased online
shopping. It implies that websites should be developed as safer and delivery of original
products should be assured within the time frame. Also, referrals have positive effect on
shopping behavior. This means the more people suggest e-buying to each other, the more
this buying method will be popular among people. This makes necessary the use of word
of mouth marketing for retailers. This means that marketing specialists should target this
society in their marketing strategy formulation for better effectiveness of their marketing
program.
The present study reveals that perceived financial risk, ease of use, consumer’s online
reviews affects online shopping behavior. On the basis of findings following are the some
suggestions for the better environment for online shopping:
o Online retailers should try and reduce perceived financial risks as it was revealed the
most critical factor which has deep negative impact on online shopping. This can be
achieved through giving money-back-guarantee, offering quality merchandise, secured
online transactions and improved customer service.

International Journal of Management, IT & Engineering Vol. 8 Issue 12(1), December 2018,
ISSN: 2249-0558 Impact Factor: 7.119
Journal Homepage: http://www.ijmra.us, Email: [email protected]
Double-Blind Peer Reviewed Refereed Open Access International Journal - Included in the International
Serial Directories Indexed & Listed at: Ulrich's Periodicals Directory ©, U.S.A., Open J-Gage as well as in
Cabell’s Directories of Publishing Opportunities, U.S.A
185 International Journal of Management, IT & Engineering
http://www.ijmra.us, Email: [email protected]
o Though many of the online retailers are providing cash on delivery facility (COD) to
their valued customers, still an effective mechanism is yet to be developed. Hence it is
suggested that online retailers should give more emphasis on Cash on Delivery as a
mechanism to reduce perceived product delivery risks and perceived product quality
risks.
o A sound rating system of different products offering on this online platform should be
developed where consumers may rate the products in order to reduce perceived risks
significantly.
o The retailer should also focus on better packaging that can reduce product tampering.
o Retailers should also focus on aspects like delivery of right products at right time at
customer’s doorsteps to prevent mismatch of merchandise ordered and merchandise
delivered.
o To make online customers more aware about safety of transactions, reliability of
products, ease of delivery, product quality and cash back guarantee, retailers may
convey or highlight through mass media which in turn will improve web traffic to an
online retail store.
o Retailers should provide customers with sufficient information about products.
Customers should make available with the features so that they can compare the
products on various factors such as features, price, etc., would help customers in
making online buying decision.
o Consumers should be encouraged to opt in for receiving product related e-mails in
order to make them updated.
o Better customer service with quick response to customer queries and better handling of
customer complaints would improve the image of online retailer.
o Based on the results and findings of this study, retail companies should start taking
measures to eliminate risk factor and build trust in online retail shopping. The results
also suggest that after sales operations like, dispute settling and delivery should be
carried out promptly and quickly so that consumer would build faith in the system.
During the process of purchasing, online agents can help customers and simplify the
purchasing procedure to give a feeling of friendliness of salesman or demonstrate how
to purchase with clear text, images or examples.
Finally, based on the study's results that consumers were worried and unsure about delivery
of their orders (non-delivery risk), online retailers should provide the insurance for
shoppers that they ordered items and make sure that the products will definitely be
delivered to them. They can achieve this goal by providing certain certificate from
authorities and governmental organizations that allow them to sell goods from internet and
assure customers that this online retailer is rendering the job legally, so customers will buy
from them with more confident and will not be worry about the delivery of their orders
anymore.
References
• An Introduction to Research Procedure in Social Sciences – Gopal M. A. – Asia
Publishing House – Bombay
• Brinberg, D. & McGrath, J. E. (1985) Validity and the research process. Beverly Hills,
CA: Sage
• Fischer, C.T. (2005), Qualitative research methods for psychologists: Introduction
through empirical studies, Academic Press.

International Journal of Management, IT & Engineering Vol. 8 Issue 12(1), December 2018,
ISSN: 2249-0558 Impact Factor: 7.119
Journal Homepage: http://www.ijmra.us, Email: [email protected]
Double-Blind Peer Reviewed Refereed Open Access International Journal - Included in the International
Serial Directories Indexed & Listed at: Ulrich's Periodicals Directory ©, U.S.A., Open J-Gage as well as in
Cabell’s Directories of Publishing Opportunities, U.S.A
186 International Journal of Management, IT & Engineering
http://www.ijmra.us, Email: [email protected]
• Freedman, D., Pisani, R., & Purves, R. (2007), Statistics, 4th edition, New York:
Norton Publications.
• Gill, J., & Johnson, P. (2002), Research Methods for Managers, London, Sage
Publications.
• Galvin, J.L. (2009). Writing literature reviews: A guide for students of the social and
behavioral sciences (4th ed.). Glendale, CA: Pyrczak. H61.8.G34 2009
• Gorsuch, Richard L. (1983) Factor Analysis. Hillsdale, NJ: Erlbaum
• Grazer, W.F and Stiff, M.R. (1987) Statistical analysis and design in marketing journal
articles. Journal of the Academy of Marketing Science, Spring, 69-73
• Gretzel, U., Fesenmaier, D.R., Formica, S. & O’Leary, J.T. (2006), “Searching for the
Future: Challenges Faced by Destination Marketing Organizations”, Journal of Travel
Research, 45, 116-126.
• Hacker, D. & Sommers, N. (2011). A writer's reference (7th ed.). Boston, MA:
Bedford/St, Martin's. PE1408.H2778 2011
• Maimon, E.P., Peritz, J.H., & Blake Yancey, K. (2006). A writer's resource: A
handbook for writing and research. Boston, MA: McGraw Hill. PE1408.M3366 2006
• Morrison, Donald F. (1990) Multivariate Statistical Methods. New York: McGraw-
Hill.
• Malhotra, N., Birks, D. (2003). Marketing research: An applied Approach,
2 nd European edition. Harlow: Pearson Education
• Pedhazur, E.J. & Schmelkin, L.P (1991) Measurement, design, and analysis: An
integrated approach. Hillsdale, NJ: Lawrence Erlbaum

International Journal of Management, IT & Engineering Vol. 8 Issue 12(1), December 2018,
ISSN: 2249-0558 Impact Factor: 7.119
Journal Homepage: http://www.ijmra.us, Email: [email protected]
Double-Blind Peer Reviewed Refereed Open Access International Journal - Included in the International
Serial Directories Indexed & Listed at: Ulrich's Periodicals Directory ©, U.S.A., Open J-Gage as well as in
Cabell’s Directories of Publishing Opportunities, U.S.A
187 International Journal of Management, IT & Engineering
http://www.ijmra.us, Email: [email protected]
A Zoned Node Interconnection for the Optimisation and
Implementation of Two Adaptive Routing Algorithms for
XGFT Networks
Ramesh .P, &Manikandan.S
Abstract
Fat tree topologies have been extensively used as interconnection networks for high
performance computing, cluster and data centre systems, with their most recent variants
able to fairly extend and scale to accommodate higher processing power. While each
progressive and evolved fat-tree topology includes some extra advancement, these
networks do not fully address all the issues of large scale HPC. We propose a topology
called Zoned-Fat tree (Z-Fat tree,) which is a further extension to the fat trees. The
extension relates to the provision of extra degree of connectivity to utilize the extra ports
per switches (routing nodes), that are, in some cases, not utilized by the architectural
constraints of other variants of fat trees, and hence increases the bisection bandwidth,
reduces the latency and supplies additional paths for fault tolerance. To support and profit
from the extra links, we propose an adaptive low latency routing for up traffic which is
based on a series of leading direction bits predefined at the source; furthermore we suggest
a deterministic routing by implementing a dynamic round robin algorithm that overtakes
D-mod-K in same cases and guarantees the utilization of all the extra links. We also
propose a fault tolerance algorithm, named recoil-and-reroute which makes use of the extra
links to ensure higher message delivery even in the presence of faulty links and switches.
Keywords: dynamic round robin algorithm, an adaptive low latency routing
1. Introduction
The next generation of supercomputers will face more challenges to tackle far more
complex and larger programming problems and open new horizons in the scientific,
engineering and business disciplines. Such high expectations will put more burdens on the
network interconnections to satisfy a follow up communication performance and power
consumption. Indeed an increase in the computational speed of processors can lead to
extreme power constrains. Interconnecting a larger number of chips while keeping the
overall cost under budget and delivering the required performance are a trade-off. A need
to interconnect those high speed processing elements in the best manner possible is a
challenging task. While the technology for higher speed processors keeps advancing, the
research on the interconnection networks of high performance computing lags behind and
shows trifling contributions Fat tree topologies , with their simplistic properties and ability
to scale, are deemed to be the most popular solutions for computing clusters, data centres
and HPC. They can be seen as universal networks that can emulate any other topology
deploying the same amount of resources with slight reduction in efficiency. The high path
diversity in fat trees, with its fault tolerant property, plays a critical role in the overall
performance of the communication networks. One interesting approach is hybrid networks
Assistant Professor, Computer Science and Engineering, MIET Engineering College, Trichy, Tamilnadu, India

International Journal of Management, IT & Engineering Vol. 8 Issue 12(1), December 2018,
ISSN: 2249-0558 Impact Factor: 7.119
Journal Homepage: http://www.ijmra.us, Email: [email protected]
Double-Blind Peer Reviewed Refereed Open Access International Journal - Included in the International
Serial Directories Indexed & Listed at: Ulrich's Periodicals Directory ©, U.S.A., Open J-Gage as well as in
Cabell’s Directories of Publishing Opportunities, U.S.A
188 International Journal of Management, IT & Engineering
http://www.ijmra.us, Email: [email protected]
which involve the incorporation of fat tree design as building blocks for nodes hosting
many processors for large scale parallel systems such as in Blue Gene IBM, Dragonfly X-
Mesh, and Torus. Newer technologies on optical networks and photonic switches are
emerging. These technologies Fat trees also experience some known issues such as the
bottleneck caused from the limited availability of paths. In some cases only a single path
exists from each routing node in the downward directions. This characteristic is also
exhibited by some slimmed fat trees in general that are recently being the candidates for
current parallel machines due to their reduced cost. have demonstrated potential to attain
higher bandwidth and effective In this paper, like other works [14], we increase the number
of links that are not normally part of the XGFT semantics to provide a further extension
and generalization to fat tree topologies. The aim behind these extensions is to address the
issues of scalability experienced by k-ary n-tree networks, fault tolerance and routing to
achieve lower latency and higher bandwidth.
2. Literature Review
Considerable interests have been devoted to mesh, torus and fat tree topologies for network
on chip design to support high performance computing. Many variants of the mesh and
torus networks such as X-mesh have been proposed over the years. In addition, fat tree
topology is well known for its existence in data centres and clustering systems. X-mesh
topology is based on mesh structure with additional diagonal edges to reduce the average
diameter of the topology. According to the authors, X-mesh performs better than torus in
terms of network latency for uniform traffic patterns, but degrades in performance for
hotspot traffic. Its main problem compared to fat tree networks is the long diameter as the
number of processors increases. A successor of Mesh topology is WK-recursive mesh and
WKpyramids networks. Similarly to fat trees, they have a smaller diameter and a higher
degree of scalability compared to the traditional mesh and pyramid networks. However,
these topologies still incur the high traffic issues encountered by the mesh topology and
exhibit higher communication cost compared to fat trees. Symmetric tori connected torus
(STTN) is a variant of torus with lower interconnection network cost compared to
traditional torus and mesh. The bisection width of STTN is larger than other torus and
mesh interconnection networks, implying an increase in extra chip wires will be required
for the physical implementation of STTN; therefore, inevitably incurring higher cost and
power consumption. Another popular variant of torus is the torus embedded hypercube. An
approach which can reach better scalability and decrease the network diameter. For this
solution to work, the size of hypercube is required to stay constant at all times to avoid
node degree increase. However, with the emerging technology, the demands for more
scalable systems do not favour this approach. On the other hand, torus has a constant node
degree therefore can support highly scalable architectures at the cost of an increase in
diameter inducing hence higher latencies, unlike fat trees. Torus and 2D meshes are
usually there is still a large scope of improvement for fat trees to meet the requirements of
high performance computing and large scale data centres. XGFT can increase the number
of paths at the expenses of more routing elements, which increases the overall complexity
of the network. Quasi fat tree addresses this problem by also suggesting additional ports
to the XGFT. However, these links extend beyond the subtree structure and therefore
require complex routing over the XGFT. Our extended links proposed in this paper are
confined within the subtrees (zones), preserving hence the simplicity of the routing of the
XGFT.

International Journal of Management, IT & Engineering Vol. 8 Issue 12(1), December 2018,
ISSN: 2249-0558 Impact Factor: 7.119
Journal Homepage: http://www.ijmra.us, Email: [email protected]
Double-Blind Peer Reviewed Refereed Open Access International Journal - Included in the International
Serial Directories Indexed & Listed at: Ulrich's Periodicals Directory ©, U.S.A., Open J-Gage as well as in
Cabell’s Directories of Publishing Opportunities, U.S.A
189 International Journal of Management, IT & Engineering
http://www.ijmra.us, Email: [email protected]
3. Related Work
3.1 Approximate Shortest-Path Trees Fault-Tolerant:
To enrich a single-source shortest-path tree (SPT) of G with a sparse set of auxiliary edges
selected from E, in order to create a structure which tolerates effectively a path failure in
the SPT. This consists of a simultaneous fault of a set F of at most f adjacent edges along a
shortest path emanating from the source, and it is recognized as one of the most frequent
disruption in an SPT. We show that, for any integer parameter k ≥ 1, it is possible to
provide a very sparse (i.e., of size O(kn· f 1+1/k)) auxiliary structure that carefully
approximates (i.e., within a stretch factor of (2k − 1)(2|F| + 1)) the true shortest paths from
the source during the lifetime of the failure. Moreover, we show that our construction can
be further refined to get a stretch factor of 3 and a size of O(n log n) for the special case f =
2, and that it can be converted into a very efficient approximate-distance sensitivity oracle,
that allows to quickly (even in optimal time, if k = 1) reconstruct the shortest paths (w.r.t.
our structure) from the source after a path failure, thus permitting to perform promptly the
needed rerouting operations. Our structure compares favorably with previous known
solutions, as we discuss in the paper, and moreover it is also very effective in practice, as
we assess through a large set of experiments. Ult-tolerant against a given number of
simultaneous component failures, by adding to it a set of suitably selected edges from the
underlying graph, so that the resulting structure will remain connected w.r.t. the source. In
other words, the selected edges can be used to build up alternative paths from the root,
each one of them in replacement of a corresponding original shortest path which was
affected by the failure. However, if these paths are constrained to be shortest, then it can be
easily seen that for a non-negatively real weighted and undirected graph of n nodes and m
edges, this may require as much as Θ(m) additional edges, also in the case in which m =
Θ(n2). In other words, the set-up costs of the strengthened network may become
unaffordable comes into play as soon as a component undergoes a failure.
3.2 Order/Radix Problem: Towards Low End-to-End Latency Interconnection
Networks
We introduce a novel graph called a host-switch graph, which consists of host vertices and
switch vertices. Using host-switch graphs, we formulate a graph problem called an
order/radix problem (ORP) for designing low end-to-end latency interconnection networks.
Our focus is on reducing the host-to host average shortest path length (h-ASPL), since the
shortest path length between hosts in a host-switch graph corresponds to the end-to-end
latency of a network. We hence define ORP as follows: given order (the number of hosts)
and radix (the number of ports per switch), find a host-switch graph with the minimum h-
ASPL. We demonstrate that the optimal number of switches can mathematically be
predicted. On the basis of the prediction, we carry out a randomized algorithm to find a
host-switch graph with the minimum h-ASPL. Interestingly, our solutions include a host-
switch graph such that switches have the different number of hosts. We then apply host-
switch graphs to interconnection networks and evaluate them practically. As compared
with the three conventional interconnection networks (the torus, the dragonfly, and the fat-
tree), we demonstrate that our networks provide higher performance while the number of
switches can decrease.
4. Existing System
The cluster and data center systems, with their most recent variants able to fairly extend
and scale to accommodate higher processing power. While each progressive and evolved
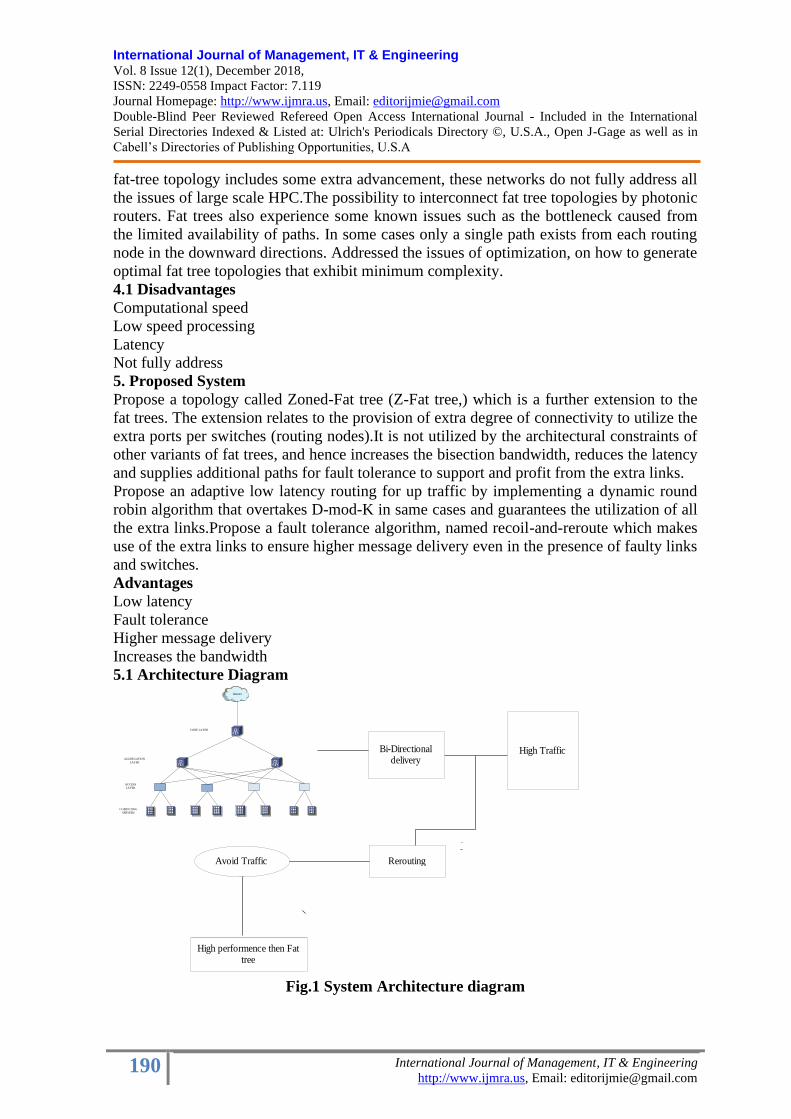
International Journal of Management, IT & Engineering Vol. 8 Issue 12(1), December 2018,
ISSN: 2249-0558 Impact Factor: 7.119
Journal Homepage: http://www.ijmra.us, Email: [email protected]
Double-Blind Peer Reviewed Refereed Open Access International Journal - Included in the International
Serial Directories Indexed & Listed at: Ulrich's Periodicals Directory ©, U.S.A., Open J-Gage as well as in
Cabell’s Directories of Publishing Opportunities, U.S.A
190 International Journal of Management, IT & Engineering
http://www.ijmra.us, Email: [email protected]
fat-tree topology includes some extra advancement, these networks do not fully address all
the issues of large scale HPC.The possibility to interconnect fat tree topologies by photonic
routers. Fat trees also experience some known issues such as the bottleneck caused from
the limited availability of paths. In some cases only a single path exists from each routing
node in the downward directions. Addressed the issues of optimization, on how to generate
optimal fat tree topologies that exhibit minimum complexity.
4.1 Disadvantages
Computational speed
Low speed processing
Latency
Not fully address
5. Proposed System
Propose a topology called Zoned-Fat tree (Z-Fat tree,) which is a further extension to the
fat trees. The extension relates to the provision of extra degree of connectivity to utilize the
extra ports per switches (routing nodes).It is not utilized by the architectural constraints of
other variants of fat trees, and hence increases the bisection bandwidth, reduces the latency
and supplies additional paths for fault tolerance to support and profit from the extra links.
Propose an adaptive low latency routing for up traffic by implementing a dynamic round
robin algorithm that overtakes D-mod-K in same cases and guarantees the utilization of all
the extra links.Propose a fault tolerance algorithm, named recoil-and-reroute which makes
use of the extra links to ensure higher message delivery even in the presence of faulty links
and switches.
Advantages
Low latency
Fault tolerance
Higher message delivery
Increases the bandwidth
5.1 Architecture Diagram
Fig.1 System Architecture diagram
Internet
CORE LAYER
AGGREGATION
LAYER
ACCESS
LAYER
COMPUTING
SERVERS
Bi-Directional delivery
High Traffic
ReroutingAvoid Traffic
High performence then Fat tree

International Journal of Management, IT & Engineering Vol. 8 Issue 12(1), December 2018,
ISSN: 2249-0558 Impact Factor: 7.119
Journal Homepage: http://www.ijmra.us, Email: [email protected]
Double-Blind Peer Reviewed Refereed Open Access International Journal - Included in the International
Serial Directories Indexed & Listed at: Ulrich's Periodicals Directory ©, U.S.A., Open J-Gage as well as in
Cabell’s Directories of Publishing Opportunities, U.S.A
191 International Journal of Management, IT & Engineering
http://www.ijmra.us, Email: [email protected]
5.2 System Modules
The system comprises of the following modules which include,
• Extension of fat trees as zoned fat tree.
• Avoid Traffic.
• High Message Delivery.
• Handling Failures.
5.2.1 Extension of fat trees as zoned fat tree:
• The extension relates to the provision of extra degree of connectivity to utilize the extra
ports per switches (routing nodes), that are, in some cases, not utilized by the
architectural constraints of other variants of fat trees.
And increases the bisection bandwidth, reduces the latency and supplies additional paths
for fault tolerance.
5.2.2 Avoid Traffic
• Adaptive low latency routing for up traffic.
• We suggest a deterministic routing by implementing a dynamic round robin algorithm
that overtakes D-mod-K in same cases and guarantees the utilization of all the extra
links.
Fat Tree
Fat Tree
have more TrafficAdaptive Low
Latency
Avoid Traffic
Zone Fat tree
Fat Tree
Fat Tree
have more TrafficAdaptive Low
Latency
Avoid Traffic
Zone Fat tree

International Journal of Management, IT & Engineering Vol. 8 Issue 12(1), December 2018,
ISSN: 2249-0558 Impact Factor: 7.119
Journal Homepage: http://www.ijmra.us, Email: [email protected]
Double-Blind Peer Reviewed Refereed Open Access International Journal - Included in the International
Serial Directories Indexed & Listed at: Ulrich's Periodicals Directory ©, U.S.A., Open J-Gage as well as in
Cabell’s Directories of Publishing Opportunities, U.S.A
192 International Journal of Management, IT & Engineering
http://www.ijmra.us, Email: [email protected]
5.2.3 High Message Delivery
• Fault tolerance algorithm, named recoil-and-reroute which makes use of the extra links
to ensure higher message delivery
• Adaptive routing scheme is generally preferred as in the case of network contentions,
in the case of faults or changes, the message can still reach its destination successfully.
• However, its main kerb is the Inability to perform in-order delivery of messages.
Similarly to TCP protocol, at the expense of extra buffering and control flow, this can
be solved by embedding a sequence number in every fragment of the original message
sent.
• At the destination processing node, the network interface stores them in the reorder
buffer and finally when all the fragments have arrived, it orders them into a complete
message and delivers the message to the Node.
5.2.4 Handling Failures
• The fail over protocol consists of three stages that operate on increasing timescales.
When a switch detects a failure in one of its links, it immediately begins using local
rerouting to reroute the very next packet.
• The local rerouting inflates paths as well as increases local congestion, the switch
initiates a pushback protocol that causes upstream switches to redirect traffic to resume
using shortest paths.
• And finally, to deal with long-term failures that create a structural imbalance in the
network, a centralized rerouting protocol determines an efficient global rearrangement
of flows. In addition, the key to fast failure recovery is rapid and accurate failure
detection, which is discussed at the end of this section.
Fat Tree
Fat Tree
Does not have
high Messege
Delivery
Fault tolerence
High Messege
Delivery
Zone Fat tree

International Journal of Management, IT & Engineering Vol. 8 Issue 12(1), December 2018,
ISSN: 2249-0558 Impact Factor: 7.119
Journal Homepage: http://www.ijmra.us, Email: [email protected]
Double-Blind Peer Reviewed Refereed Open Access International Journal - Included in the International
Serial Directories Indexed & Listed at: Ulrich's Periodicals Directory ©, U.S.A., Open J-Gage as well as in
Cabell’s Directories of Publishing Opportunities, U.S.A
193 International Journal of Management, IT & Engineering
http://www.ijmra.us, Email: [email protected]
6. Conclusion
Introduced another generalization of the fat tree we call in this paper Z-Fat tree. The main
feature of this architecture is the provision of implicit and explicit additional links as
degree of connectivity to the semantics of the XGFT. The extra links are within the
confinement of the sub trees or zones, and therefore preserve the properties of the fat trees,
without major changes. This supplement increases the bisection bandwidth, utilizes the
unused ports to create equal radix topologies and ameliorates the bandwidth of the
slimmed fat trees without adding complexity. It also provides multiple paths between a
source and destination pair. We have shown that additional links allow the Z-Fat tree to
perform well, both with adaptive and deterministic routing under several communication
patterns. The deterministic dynamic round robin algorithm .we suggested in this paper
shows improvement as a whole over D%K routing for topologies where load balancing
out-weights the concentration of the traffic. It remains to appreciate that D%K routing
algorithm also performs well, for full-bandwidth and regular fat trees. We have also
proposed an adaptive single bit source routing, DBSA, that works for all classes of fat trees
by introducing a minimum latency to find the LCL.
7. Acknowledgement
The work described in this paper was partially funded by the grants from the NSFC
U1611461, No. 61572199, No. 61502174, and No. 61502173, the grant from the
Guangdong Natural Science Funds for Distinguished Young Scholars (No.
S2013050014677), the grant from the Science and Technology Planning Project of
Guangdong Province, China (No. 2015A050502011, No. 2016B090918042, No.
2016A050503015, and No. 2016B010127003), The Fundamental Research Funds for the
Central Universities (D2153950), and the grant from the Research Grants Council of the
Hong Kong Special Administrative Region, China [Project No. City 11300715 and
No.152202/14E]. Zhiwen Yu and Jiming Liu are the corresponding authors. The authors
are grateful for the constructive advice on the revision of the manuscript from the
anonymous reviewers.
Fat Tree does not
have
high Messege
Delivery
Using Push Back
Protocol
Redirect Traffic Rerouting ProtocolRearranging of
FlowsFailure Recovery
Accurate Failure

International Journal of Management, IT & Engineering Vol. 8 Issue 12(1), December 2018,
ISSN: 2249-0558 Impact Factor: 7.119
Journal Homepage: http://www.ijmra.us, Email: [email protected]
Double-Blind Peer Reviewed Refereed Open Access International Journal - Included in the International
Serial Directories Indexed & Listed at: Ulrich's Periodicals Directory ©, U.S.A., Open J-Gage as well as in
Cabell’s Directories of Publishing Opportunities, U.S.A
194 International Journal of Management, IT & Engineering
http://www.ijmra.us, Email: [email protected]
References
[1] B. Arimilli, et al., “The PERCS high-performance interconnect,” in Proc. 18th Annu.
Symp.High-Perform.Interconnects, 2010, pp. 75–82.
[2] C. Leiserson, “Fat-trees: Universal networks for hardwareefficient Supercomputing,”
IEEE Trans. Comput., vol. CC-34,No. 10, pp. 892–901, Oct. 1985.
[3] C. Bekas, “Breaking the power wall in Exacale Computing, What Is Exascale
computing,” Scientific Colloquium Steinbach Centre Compute. Karlsruhe Institute
Technol., 2013. [Online] Available:
http://www.scc.kit.edu/downloads/oko/SCC_Kolloquium_20131114_exascale_computing.
[4] Cray Inc., “Cray XK series supercomputers j Cray,” Cray.com, 2013. [Online].
Available: http://www.cray.com/Products/Computing/XK7.aspx, Accessed on: Apr. 02,
2013.
[5] D. Chen, et al., “Looking under the hood of the IBM Blue Gene/Q network,” in Proc.
Int. Conf. High Performance Comput. Netw. Storage Anal., 2012, Art.no. 69.
[6] J. Kim, W. Dally, S. Scott and D. Abts, “Technology-driven, highly-scalable dragonfly
topology,” ACM SIGARCH Comput.Archit. News, vol. 36, no. 3, pp. 77–88, 2008.
[7] M. Garcia, et al., “On-the-fly adaptive routing in high-radix hierarchical networks,” in
Proc. 41st Int. Conf. Parallel Process., 2012,pp. 279–288.
[8] X. ZHU, “Xmesh: A mesh-like topology for network on chip,”J. Softw., vol. 18, no. 9,
2007, Art. no. 2194.
[9] M. Rahman, Y. Inoguchi, F. Faisal, and M. Kundu, “Symmetric and folded tori
connected torus network,” J. Netw., vol. 6, no. 1, pp. 26–35, 2011.
Author Profile
S.Manikandan is working as an Assistant Professor in M.I.E.T Engineering College,
Trichy. He has completed UG and PG under Anna University Chennai. He has 4 years of
teaching experience. His areas of interest are Artificial Intelligence, Object Oriented
Analysis and Design, and Python Programming.

International Journal of Management, IT & Engineering Vol. 8 Issue 12(1), December 2018,
ISSN: 2249-0558 Impact Factor: 7.119
Journal Homepage: http://www.ijmra.us, Email: [email protected]
Double-Blind Peer Reviewed Refereed Open Access International Journal - Included in the International
Serial Directories Indexed & Listed at: Ulrich's Periodicals Directory ©, U.S.A., Open J-Gage as well as in
Cabell’s Directories of Publishing Opportunities, U.S.A
195 International Journal of Management, IT & Engineering
http://www.ijmra.us, Email: [email protected]
Structured Representations in a Content Based Image Retrieval
Context
Manikandan.P & Christopher.P
Abstract
Here, we propose an automatic system to annotate and retrieve images. We assume that
regions in an image can be described using a vocabulary of blobs. Blobs are generated
from image features using clustering. Features are locally extracted on regions to capture
Color, Texture and Shape information. Regions are processed by an efficient segmentation
algorithm. Images are structured into a region adjacency graph to consider spatial
relationships between regions. This representation is used to perform a similarity search
into an image set. Hence, the user can express his need by giving a query image, and
thereafter receiving as a result all similar images. Our graph based approach is
benchmarked to conventional Bag of Words methods. Results tend to reveal a good
behavior in classification of our graph based solution on two publicly available databases.
Experiments illustrate that a structural approach requires a smaller vocabulary size to reach
its best performance.
Keywords:- Color, Texture, Retrieve images.
1. Introduction
Content-based image retrieval (CBIR), also known as query by image content (QBIC) and
content-based visual information retrieval (CBVIR) is the application of computer vision
to the image retrieval problem, that is, the problem of searching for digital images in large
databases."Content-based" means that the search will analyse the actual contents of the
image. The term 'content' in this context might refer colors, shapes, textures, or any other
information that can be derived from the image itself. Without the ability to examine image
content, searches must rely on metadata such as captions or keywords. Such metadata must
be generated by a human and stored alongside each image in the database.
Problems with traditional methods of image indexing have led to the rise of interest in
techniques for retrieving images on the basis of automatically-derived features such as
color, texture and shape – a technology now generally referred to as Content-Based Image
Retrieval (CBIR). However, the technology still lacks maturity, and is not yet being used
on a significant scale. In the absence of hard evidence on the effectiveness of CBIR
techniques in practice, opinion is still sharply divided about their usefulness in handling
real-life queries in large and diverse image collections. The concepts which are presently
used for CBIR system are all under research. Content-based retrieval systems utilize
measures that are based on low-level attributes of the image itself, including color
histograms, color composition, and texture. State-of-the-art research focuses on more
powerful measures that can find regions of an image corresponding to known objects that
users wish to retrieve.
The currently used Content-Based Image Retrieval techniques retrieves stored images from
a collection of given images by comparing features automatically extracted from the
Assistant Professor, Dept. of CSE, M.I.E.T Engineering College, Trichy

International Journal of Management, IT & Engineering Vol. 8 Issue 12(1), December 2018,
ISSN: 2249-0558 Impact Factor: 7.119
Journal Homepage: http://www.ijmra.us, Email: [email protected]
Double-Blind Peer Reviewed Refereed Open Access International Journal - Included in the International
Serial Directories Indexed & Listed at: Ulrich's Periodicals Directory ©, U.S.A., Open J-Gage as well as in
Cabell’s Directories of Publishing Opportunities, U.S.A
196 International Journal of Management, IT & Engineering
http://www.ijmra.us, Email: [email protected]
images themselves. The most common features used are mathematical measures of color,
texture or shape. A typical system allows users to formulate queries by submitting an
example of the type of image being sought, though some offer alternatives such as
selection from a palette or sketch input. The system then identifies those stored images
whose feature values match those of the query most closely, and displays thumbnails of
these images.
We have implemented the CBIR system which takes into consideration the low level
features of image which is more comprehensive when compared to high level features and
it also gives user a higher level of retrieval. We have divided an Image into two very basic
categories of color and grayscale and used different features vector for similarity
comparison and retrieval. We have used columnar mean, diagonal mean and histogram for
grayscale and RGB values and Euclidean methods for color image. User always wants a
friendly environment so that they can easily and effectively use the system without actually
going into the finer details of the working. So, to create such a user friendly platform for
the system we have designed a Graphic User Interface where user can actually select the
method which they want to be used for the image retrieval and that will give them an
option of using different method if the result is not as per their requirement.
Users needing to retrieve images from a collection come from a variety of domains,
including crime prevention, medicine, architecture, fashion and publishing. Remarkably
little has yet been published on the way such users search for and use images, though
attempts are being made to categorize users’ behavior in the hope that this will enable their
needs to be better met in the future. Attempts are also going on integrating the search for
all kind of images and combining all above mentioned feature vectors for comparison and
retrieval so as to achieve the best possible efficiency.
2. Existing System
Iterative retrieval methods requires high computation energy and consumes more
time.Adjusting the disjunctive queries causes the expensive search cost and the results
cannot escape from the restricted range (clusters) that the users are able to specify.
Probability of retrieving exact image will be very low.This becomes impractical and
inefficient in real applications. High-priced manual annotation cost is prohibitive in coping
with a large-scale data set.
3. Proposed System
Proposed an automatic system to annotate and retrieve images. By assuming that regions in
an image can be described using a vocabulary of blobs. Blobs are generated from image
features using clustering. Features are locally extracted on regions to capture Color,
Texture and Shape information. Regions are processed by an efficient segmentation
algorithm. Images are structured into a region adjacency graph to consider spatial
relationships between regions. This representation is used to perform a similarity search
into an image set. Hence, the user can express his need by giving a query image, and
thereafter receiving as a result all similar images. Our graph based approach is
benchmarked to conventional Bag of Words methods.
4. Advantages of Proposed System
CBIR systems were developed to search databases based on image color, texture, and
shape properties. Another solution for enhancing the accuracy of image retrieval is moving
the query point toward the contour of the user’s preference in feature space.The main

International Journal of Management, IT & Engineering Vol. 8 Issue 12(1), December 2018,
ISSN: 2249-0558 Impact Factor: 7.119
Journal Homepage: http://www.ijmra.us, Email: [email protected]
Double-Blind Peer Reviewed Refereed Open Access International Journal - Included in the International
Serial Directories Indexed & Listed at: Ulrich's Periodicals Directory ©, U.S.A., Open J-Gage as well as in
Cabell’s Directories of Publishing Opportunities, U.S.A
197 International Journal of Management, IT & Engineering
http://www.ijmra.us, Email: [email protected]
feature of NPRF is to efficiently optimize the retrieval quality of interactive CBIR.The
search procedure does not stop unless the user is satisfied with the retrieval results.
5. Problem Description
The earliest use of the term content-based image retrieval in the literature seems to have
been by, to describe his experiments into automatic retrieval of images from a database by
color and shape feature. The term has since been widely used to describe the process of
retrieving desired images from a large collection on the basis of features (such as colour,
texture and shape) that can be automatically extracted from the images themselves. The
features used for retrieval can be either primitive or semantic, but the extraction process
must be predominantly automatic. Retrieval of images by manually-assigned keywords is
definitely not CBIR as the term is generally understood – even if the keywords describe
image content.
CBIR differs from classical information retrieval in that image databases are essentially
unstructured, since digitized images consist purely of arrays of pixel intensities, with no
inherent meaning. One of the key issues with any kind of image processing is the need to
extract useful information from the raw data (such as recognizing the presence of particular
shapes or textures) before any kind of reasoning about the image’s contents is possible.
Image databases thus differ fundamentally from text databases, where the raw material
(words stored as ASCII character strings) has already been logically structured by the
author. There is no equivalent of level 1 retrieval in a text database.
CBIR draws many of its methods from the field of image processing and computer vision,
and is regarded by some as a subset of that field. It differs from these fields principally
through its emphasis on the retrieval of images with desired characteristics from a
collection of significant size. Image processing covers a much wider field, including image
enhancement, compression, transmission, and interpretation. While there are grey areas
(such as object recognition by feature analysis), the distinction between mainstream image
analysis and CBIR is usually fairly clear-cut. An example may make this clear. Many
police forces now use automatic face recognition systems. Such systems may be used in
one of two ways. Firstly, the image in front of the camera may be compared with a single
individual’s database record to verify his or her identity. In this case, only two images are
matched, a process few observers would call CBIR. Secondly, the entire database may be
searched to find the most closely matching images. This is a genuine example of CBIR.
6. Modules
1. Search Engine Interface.
2. BLOB Extraction.
a. Color Retrieval
b. Shape Retrieval
c. Texture Retrieval
3. Scale-Invariant Feature Transform.
4. Performance Evaluation
5. Reports
6.1Search Engine Interface
The job of the search user interface is to aid users in the expression of their information
needs, in the formulation of their queries, in the understanding of their search results, and
in keeping track of the progress of their information seeking efforts. Search is a means
towards some other end, rather than a goal in itself. When a person is looking for

International Journal of Management, IT & Engineering Vol. 8 Issue 12(1), December 2018,
ISSN: 2249-0558 Impact Factor: 7.119
Journal Homepage: http://www.ijmra.us, Email: [email protected]
Double-Blind Peer Reviewed Refereed Open Access International Journal - Included in the International
Serial Directories Indexed & Listed at: Ulrich's Periodicals Directory ©, U.S.A., Open J-Gage as well as in
Cabell’s Directories of Publishing Opportunities, U.S.A
198 International Journal of Management, IT & Engineering
http://www.ijmra.us, Email: [email protected]
information, they are usually engaged in some larger task, and do not want their flow of
thought interrupted by an intrusive interface.
Related to the first point, search is a mentally intensive task. When a person reads text,
they are focused on that task; it is not possible to read and to think about something else at
the same time. Thus, the fewer distractions while reading, the more usable the interface.
Since nearly everyone who uses the Web uses search, the interface design must be
understandable and appealing to a wide variety of users of all ages, cultures and
backgrounds, applied to an enormous variety of information needs.
6.2BLOB Extraction
6.2.1Blob
Blob is a region of a digital image in which some properties are constant or vary within a
prescribed range of values; all the points in a blob can be considered in some sense to be
similar to each other. Blob was detected and extracted by using Lindeberg's watershed-
based grey-level blob detection algorithm. That includes
• Color Retrieval
• Shape Retrieval
• Texture Retrieval
6.2.2Color retrieval
Methods for retrieving images on the basis of colour similarity, each image added to the
collection is analysed to compute a colour histogram which shows the proportion of pixels
of each colour within the image. The colour histogram for each image is then stored in the
database. At search time, the user can either specify the desired proportion of each colour
(75% olive green and 25% red, for example), or submit an example image from which a
colour histogram is calculated. Either way, the matching process then retrieves those
images whose colour histograms match those of the query most closely
6.2.3Texture retrieval
The ability to retrieve images on the basis of texture similarity may not seem very useful.
But the ability to match on texture similarity can often be useful in distinguishing between
areas of images with similar colour (such as sky and sea, or leaves and grass). Essentially,
these calculate the relative brightness of selected pairs of pixels from each image. From
these it is possible to calculate measures of image texture such as the degree of
contrast,coarseness, directionality and regularity or periodicity, directionality and
randomness Texture queries can be formulated in a similar manner to colour queries, by
selecting examples of desired textures from a palette, or by supplying an example query
image. The system then retrieves images with texture measures most similar in value to the
query.
6.2.4Shape retrieval
The ability to retrieve by shape is perhaps the most obvious requirement at the primitive
level. Unlike texture, shape is a fairly well-defined concept – and there is considerable
evidence that natural objects are primarily recognized by their shape. Two main types of
shape feature are commonly used – global features such as aspect ratio, circularity and
moment invariants and local features such as sets of consecutive boundary segments.
Then, at any stage in the algorithm (carried out in decreasing order of intensity values) is
based on the following classification rules:
• If a region has no higher neighbour, then it is a local maximum and will be the seed of
a blob.

International Journal of Management, IT & Engineering Vol. 8 Issue 12(1), December 2018,
ISSN: 2249-0558 Impact Factor: 7.119
Journal Homepage: http://www.ijmra.us, Email: [email protected]
Double-Blind Peer Reviewed Refereed Open Access International Journal - Included in the International
Serial Directories Indexed & Listed at: Ulrich's Periodicals Directory ©, U.S.A., Open J-Gage as well as in
Cabell’s Directories of Publishing Opportunities, U.S.A
199 International Journal of Management, IT & Engineering
http://www.ijmra.us, Email: [email protected]
• Else, if it has at least one higher neighbour, which is background, then it cannot be part
of any blob and must be background.
• Else, if it has more than one higher neighbour and if those higher neighbours are parts
of different blobs, then it cannot be a part of any blob, and must be background.
• Else, it has one or more higher neighbours, which are all parts of the same blob. Then,
it must also be a part of that blob.
Compared to other watershed methods, the flooding in this algorithm stops once the
intensity level falls below the intensity value of the so-called delimiting saddle point
associated with the local maximum. However, it is rather straightforward to extend this
approach to other types of watershed constructions. For example, by proceeding beyond
the first delimiting saddle point a "grey-level blob tree" can be constructed. Moreover, the
grey-level blob detection method was embedded in a scale space representation and
performed at all levels of scale, resulting in a representation called the scale-space primal
sketch.This algorithm with its applications in computer vision is described in more detail in
Lindeberg's thesis as well as the monograph on scale-space theory partially based on that
work.
6. Object Recognition Using Sift Features
Given SIFT's ability to find distinctive key points that are invariant to location, scale and
rotation, and robust to affine transformations (changes le, rotation, shear, and position) and
changes in illumination, they are usable for object recognition. To increase robustness,
matches are rejected for those key points for which the ratio of the nearest neighbor
distance to the second nearest neighbor distance is greater than 0.8. This discards many of
the false matches arising from background clutter. Finally, to avoid the expensive search
required for finding the Euclidean-distance-based nearest neighbor, an approximate
algorithm called the best-bin-first algorithm is used.For each candidate cluster, a least-
squares solution for the best estimated affine projection parameters relating the training
image to the input image is obtained.

International Journal of Management, IT & Engineering Vol. 8 Issue 12(1), December 2018,
ISSN: 2249-0558 Impact Factor: 7.119
Journal Homepage: http://www.ijmra.us, Email: [email protected]
Double-Blind Peer Reviewed Refereed Open Access International Journal - Included in the International
Serial Directories Indexed & Listed at: Ulrich's Periodicals Directory ©, U.S.A., Open J-Gage as well as in
Cabell’s Directories of Publishing Opportunities, U.S.A
200 International Journal of Management, IT & Engineering
http://www.ijmra.us, Email: [email protected]
8. Future Enhancements
Developments and studies are going on for further improvements in design and
performance of “CONTENT BASED IMAGE RETRIEVAL SYSTEMS”. In our project
we have only done color analysis and the information about object location, shape, and
texture is discarded. Shape and Texture analysis.
• Color Image histogram.
• Image ranking in Euclidean Distance method.
9. Conclusion
A graph based representation was proposed in a CBIR context. From a partition into
regions processed by an efficient segmentation algorithm, a Region Adjacency Graph was
built to consider spatial relationships between regions. Each region is characterized using a
set of features based on the Color, Texture and Shape. A K-means clustering algorithm is
applied to cluster the regions on the basis of these features.
References
[1] J. Eakins, Retrieval of still images by content, Lectures on Information Retrieval, 2001,
pp.111–138. http://dx.doi.org/10.1007/3-540-45368-7-6>.
[2] I.L. Coman, I.K. Sethi, Mining association rules between low-level image features and
high-level concepts, in: Proceedings of the SPIE Data Mining and Knowledge Discovery,
vol. III, 2001, pp. 279–290.
[3] S.H. Liu, S.K. Chang, Picture indexing and abstraction techniques for pictorial
databases, IEEE Transactions on Pattern Analysis and Machine Intelligence (TPAMI) 6 (4)
(1984) 475–483.
Author Profile
P.Manikandan is working as an Assistant Professor in M.I.E.T Engineering College,
Trichy. He has completed UG and PG under Anna University Chennai. He has 6 years of
teaching experience. His areas of interest are Data warehousing and Data mining, Cyber
Forensics and Digital Image Processing.
P.Christopher is working as an Assistant Professor in M.I.E.T Engineering College,
Trichy. He has completed UG and PG under Anna University Chennai. He has 10 years of
teaching experience. His areas of interest are Database Management Systems, Web
services, Service Oriented Architecture and XML.

International Journal of Management, IT & Engineering Vol. 8 Issue 12(1), December 2018,
ISSN: 2249-0558 Impact Factor: 7.119
Journal Homepage: http://www.ijmra.us, Email: [email protected]
Double-Blind Peer Reviewed Refereed Open Access International Journal - Included in the International
Serial Directories Indexed & Listed at: Ulrich's Periodicals Directory ©, U.S.A., Open J-Gage as well as in
Cabell’s Directories of Publishing Opportunities, U.S.A
201 International Journal of Management, IT & Engineering
http://www.ijmra.us, Email: [email protected]
Democracy and Good Government in India: An Analysis
DR. SAKET KUMAR
India, as a democratic republic, has been successfully operating for the last 66 years. The
Journey of India’s democracy began in 1950, with a great promise to secure to all its
citizens social, economic and political justice, liberty of thought, expression, belief, faith
and worship, and equality of status and opportunity. The promise of democracy in India
has inspired many and continues to do so, as it sets the tone for the idea and practice of
democracy. As democratic India will be 67 years old in about a year from now, it is time to
review the achievements in the framework of good governance.
Democracy and Good Governance
It is indeed true that democracy as a system of government has always been important, and
good governance came to the spotlight later on. The implied demands of good governance
and real democracy are not very much different, perhaps, because the defining concepts of
good governance have been evolved from those of real democracy. A democratic
institution, over and above everything else, is expected to respond to the people’s needs
positively and constructively, effectively and purposefully, the same is expected from a
system of good governance. Active and direct participation of the people in government is
a prerequisite for ensuring liberty and equality to the people. Democracy as the rule by the
people, is interpreted as a system where people are the sovereign and all citizens are
politically and socially equal.1
The key concepts relating to democracy are freedom and autonomy, equality,
representation, majority rule and citizenship. Very recent documents from international
organizations, as well as earlier debates and contemporary challenges, re-emphasize these
key principles, of democracy, adding to the list accountability, electoral legitimacy,
constitutional safeguards and functional institutions. similarly, UNDP identifies
participation, rule of law, transparency, responsiveness, consensus, orientation, equity,
effectiveness and efficiency, accountability, and strategic vision as being the core
characteristics of good governance.2 It can be noted that the principles, of democracy and
good governance are more or less the same.
It is, however, important to realize that good governance depends upon endeavour to work
out a broad consensus in the society so as to achieve sustainable human development. The
factor again underscores the significance of representative democracy as the form of
Government only can claim inclusiveness and assure an environment that offers equity and
optimum opportunities for improvement and growth. Of course, the output would depend
upon the efficiency in the sustainable use of resources that are available. The goal of good
governance, however, would elude a society if its system of governance does not have in
place the mechanism to hold the persons wielding state power. accountable.3
Democracy, liberty and the rule of law together represent the troika that is universally
accepted now as the index of a civil society. Good governance agenda places emphasis on
civil society institutions to strengthen democracy and in constructing an informal sector
that can harness people’s entrepreneurship through community institutions, and inter-
personal relationships. In the good governance discourse, democracy emerges as the
PH.D. POLITICAL SCIENCE, BRAB UNIVERSITY MUZAFFARPUR

International Journal of Management, IT & Engineering Vol. 8 Issue 12(1), December 2018,
ISSN: 2249-0558 Impact Factor: 7.119
Journal Homepage: http://www.ijmra.us, Email: [email protected]
Double-Blind Peer Reviewed Refereed Open Access International Journal - Included in the International
Serial Directories Indexed & Listed at: Ulrich's Periodicals Directory ©, U.S.A., Open J-Gage as well as in
Cabell’s Directories of Publishing Opportunities, U.S.A
202 International Journal of Management, IT & Engineering
http://www.ijmra.us, Email: [email protected]
necessary political frame work for successful economic liberalism are conceptually linked:
bad governance equals state intervention, good governance equals democracy and
economic liberalism.4
Civil society is seen as a source of vitality for both democracy as well as economic growth.
Its institutions are a Countervailing force that curbs authoritarian practices and corruption.
They also create or strengthen associational organizations that provide such; goods and
services that can be provided more efficiently than the state. The space left by a retreating
state can be filled by such private initiatives and proliferation of associations that manage
local resources or deliver basic services will in turn support the trend towards greater
participation and democracy. This belief is nurtured by the contention that social
organizations succeed because there is collaborative action based on trust, norms and
networks. It is these relationships popularized as social capital that builds capacity for
participation and self government. The argument is that associations help generate social
capital strengthens democracy and improves the efficiency of the markets.5
In this agenda of good governance, the conceptualizations of civil society proceeds on the
assumption that power and exploitation is associated with the state, while freedom and
liberty falls in the realm of civil society. This leads to a kind of romantic view of civil
society where the existence of institutions outside the state become a sufficient basis to
assume that state power is curbed and greater democratization is taking place. Such a
perception does not take into account the characteristics of a society where there are
associations, those of caste or of a religion, that exist primarily to curb the human rights of
individuals.
Democracy signifies a government of, by and for the people. The protection of individual
liberties follows the notion of democracy as a natural corollary. This entails the espousal of
a methodical configuration of laws by which society might be regulated and different
confliction interests can be harmonized to the fullest extent. This is why “the rule of law”
is indispensable. It envisages the pre-eminence of law as opposed to anarchy or capricious
dictates. It involves equal accountability of all before the law irrespective of high or low
status. 7
Etymologically, “governance can be traced back to the Greek verb kubernan (to pilot or
steer) and was used by Plato with regard to the designing of a system of rule”. 8 In simple
word, Governance is the preservation of prescribed and unofficial political set of laws of
the game. It refers to those actions that engross setting the rules for the implementation of
power and resolving differences over such; rules.9 But the new use of governance does not
highlight state actors and institutions as the single applicable Institutions and actors in the
authoritative share of ideals.10 “Every part of them, to some level, emphasize on the role of
networks in the quest of universal aspirations; these networks in the quest of universal
aspirations; these networks could be inter-governmental or inter-organizational11; they
could be trans-national12 or they may perhaps be networks of conviction and reciprocity
crossing the state-society divide”.13
Conclusion
The terms governance and good governance are increasingly being used in various
literature dealing with developmental studies. The concept governance describes about the
process of decision making and the process by which decisions are implemented or not
implemented. But, the concept good governance means proper implementation of decisions
International Journal of Management, IT & Engineering Vol. 8 Issue 12(1), December 2018,
ISSN: 2249-0558 Impact Factor: 7.119
Journal Homepage: http://www.ijmra.us, Email: [email protected]
Double-Blind Peer Reviewed Refereed Open Access International Journal - Included in the International
Serial Directories Indexed & Listed at: Ulrich's Periodicals Directory ©, U.S.A., Open J-Gage as well as in
Cabell’s Directories of Publishing Opportunities, U.S.A
203 International Journal of Management, IT & Engineering
http://www.ijmra.us, Email: [email protected]
essentially without abuse and corruption, by adapting values and regulations with the state
at its core.
Good governance is not something that the government can achieve or do by itself. It
depends on the co-operation and involvement of a large number of citizens and
organizations. These requirements are considered not only essential for good governance
but are important for Sustainable Human Development. In India, a large number of states,
union territories and the central government have already taken several steps in this
direction and much more action is expected.
Reference
1. Beetham, David, 1992, ‘Liberal Democracy and the Limits of Democratisation’
Political Studies Special Issue, Vol. 40, p.40
2. Governance for sustainable Human Development, A UNDP Policy Paper, P.P. 2-3
3. Sabharwal, Justice Y.K., “Ethics in Governance –Moving from Rhetoric to Results”,
Valedictory Address, National Colloquium, Administrative Reforms Commission and
National Judicial Academy, p.13
4. Abrahamsen, Rita, 2000, Disciplining Democracy; Development Discourse and Good
Governance in Africa, Zed Books, London, P.51
5. Mathur Kuldeep, 2001, “Good Governance state and Democracy”, Paper presented at
the Conference on Beyond the Post Wasington Consensus: Governance and the Public
Domain in Contrasting Economical- The cases of India and Canada, Centre for
Research in Industrial Development, Chandigarh, February 12-14, p.3
6. Mahajan Gurpreet 1999 “Civil Society and its Avatars: What about Freedom and
Democracy” Economic and Political Weekly, Vol. xxxiv, No. 20, May 15-21, pp 1194-
1196
7. Sabharwal, Justice Y.K., p. 15
8. Kjaer, Annemette, 2004, Governance, USA: Polity Press, p.3
9. Hyden, Goran, 1999, “Governance and Reconstitution of Political order, “In Joseph,
Richard. (Ed.) State, Conflict and Democracy in Africa, Boulder, Co- Lynne Rienner,
p. 185
10. Easten, David 1965, A Framework for Political Analysis, New Jersey: Prentice – Hall
11. Rhodes, R.A. W. 1997, Understanding Governance. Policy Networks, Governacne,
Reflexivity and Accountability Backingham; open University Press, P.15
12. Rosenau, James N. (1995). Governance in the Twenty-First Century’, Global
Governance. Vol.1 (1), p.13
13. Hyden, Goran, 1999, Governance and Reconstituion of Political Order; In Joseph,
Richard (ed.) State, Conflict and Democracy in Africa, Boulder, CO: Lynee Rienner,
p.185

International Journal of Management, IT & Engineering Vol. 8 Issue 12(1), December 2018,
ISSN: 2249-0558 Impact Factor: 7.119
Journal Homepage: http://www.ijmra.us, Email: [email protected]
Double-Blind Peer Reviewed Refereed Open Access International Journal - Included in the International
Serial Directories Indexed & Listed at: Ulrich's Periodicals Directory ©, U.S.A., Open J-Gage as well as in
Cabell’s Directories of Publishing Opportunities, U.S.A
204 International Journal of Management, IT & Engineering
http://www.ijmra.us, Email: [email protected]
Optimization of Process Parameters in ECMM of Nickel Alloy
Using Taguchi Based Grey Relational Analysis
C.Ahilan & D.Saravanan
S.Thiyagarajan
Abstract— The advancement in the field of mechanical engineering is essential to meet
the growing demands of the industry. In particular the scope for alloy materials having
high hardness, toughness and impact resistance has grown multi fold due to high level of
design constraints. Electro Chemical Micro Machining (ECMM) machines are used to cut
metals of any hardness or that are difficult or impossible to cut with traditional methods.
Machine tool industry has made rapid growth in its manufacturing capabilities in last
decade but these machine tools are yet to be utilized at their full potential due to
insufficient data on optimum operating parameters. The objective of the present research
work is to investigate the effects of the various ECMM process parameters on the MRR
and dimensional deviation (DD) to obtain the optimal sets of process parameters using
Taguchi based grey relational analysis.
Keywords—Electro Chemical Micro Machining (ECMM), optimization, Material removal
rate (MRR), dimensional deviation (DD), Taguchi based grey relational analysis.
I. INTRODUCTION
The development in the field of mechanical engineering is necessary to meet the rising
demands of the industry. In specific the scope for alloy materials having high hardness,
toughness and impact resistance has grown rapidly due to high level of design constraints.
Nickel and its alloys are the most sought material for manufacturing machines and
components which needs to withstand high temperature, high pressure and aggressive
chemical environment. Nickel alloys find wide application in a) gas turbines, b) high
temperature fasteners, c) chemical processing and pressure vessels, and d) reactors of
nuclear plants, etc. Micromachining is widely used to machine intricate shapes needed in
medical and electronics fields. The conventional micro machining is not suitable for Nickel
alloys due to hardening during machining. High pressure is developed between the tool and
the work piece during machining. It forms layer onthe surface of the work piece in stressed
condition. This deformation causes a hardening effect on the surface of the work piece that
slows down further machining.
In unconventional machining, most of the processes are thermal oriented, e.g. Electro
discharge machining (EDM), laser beam machining (LBM), Electron beam machining
(EBM), etc. It may cause thermal distortion on the machined surface. Chemical machining
and Electro-chemical machining are thermal free processes, but chemical machining
cannot be controlled precisely for the micromachining domain [1]. ECMM appears to be a
very promising micromachining technology due to its advantages that include high MRR,
better precision and control, rapid machining time, and environmentally acceptable [2].
Professor Mechanical Engineering, MIET Engineering College, Trichy, Tamilnadu, India Assistant Professor, Mechanical Engineering, MIET Engineering College, Trichy, Tamilnadu, India

International Journal of Management, IT & Engineering Vol. 8 Issue 12(1), December 2018,
ISSN: 2249-0558 Impact Factor: 7.119
Journal Homepage: http://www.ijmra.us, Email: [email protected]
Double-Blind Peer Reviewed Refereed Open Access International Journal - Included in the International
Serial Directories Indexed & Listed at: Ulrich's Periodicals Directory ©, U.S.A., Open J-Gage as well as in
Cabell’s Directories of Publishing Opportunities, U.S.A
205 International Journal of Management, IT & Engineering
http://www.ijmra.us, Email: [email protected]
Electrochemical machining (ECM) was developed during late 1950s and early 1960s and
used to machine difficult-to-cut materials in aerospace and other heavy industries for
shaping and finishing operations [3]. It is an anodic dissolution process based on the
phenomenon of electrolysis, whose laws were established by Michael Faraday. In ECM,
electrolytes serve as conductor of electricity. The ECM plays a vital role in manufacturing
of variety of parts ranging from large complicated shapes to a few microns in size. When
ECM is performed at micro meter level (material removal that ranges from 1-999 µm), it is
known as ECMM [4]. In ECMM process, the work piece is connected to anode and the
micro tool is connected to cathode and they are placed inside the electrolyte with a small
gap between them. On the application of adequate electrical energy, positive metal ions
leave from the work piece and machining takes place. The machined particles are
removedby circulation of electrolyte through electrode gap. By moving the tool at required
ratethe electrode gap has to be maintained for continuous machining.
The ECMM process is capable of machining tough and hard materials without inducing
any residual stress and tool wear [5]. It is more suitable for Nickel alloy only the process
parameters are optimized. The parameters subjected to the study are 1) Electrolyte
Concentration 2) Machining Voltage, 3) Machining Current, 4) Duty Cycle, and 5)
Frequency.
The grey relational analysis theory, initialized by Deng [6], makes use of this to handle
uncertain systematic problem with only partial known information. This theory is adopted
for solving the complicated interrelationships among the multiple responses in
applications. The relationship between the desired and actual experimental results
identified with grey relational coefficients. The multiple performance characteristics are
observed through grey relational grade. Multi response can be converted into optimization
of a single grey relational grade. The integrated grey based Taguchi method combines both
grey relational analysis and Taguchi method [7]. This method was successfully applied to
optimize the multiple performance characteristics of complicated problems in
manufacturing processes. Furthermore, a statistical analysis of variance (ANOVA) is
performed to see which process parameters are statistically significant [8]. In this study,
the effect of CNC turning parameters on MRR and DD are reported using grey based fuzzy
logic.
II. GREY BASED TAGUCHI METHOD
The integrated Grey based Taguchi method combines the algorithm of Taguchi method and
grey relational analysis to determine the optimum process parameters with multi responses.
2.1 Taguchi Method
The concept of the Taguchi method is that the parameter design is performed to reduce the
sources of variation on the quality characteristics of product, and reach a target of process
robustness [9]. The Taguchi method utilizes the orthogonal arrays from experimental
design theory to study a large number of variables with a small number of experiments
[10,11]. Furthermore, the conclusions drawn from small scale experiments are valid over
the entire experimental region spanned by the control factors and their level settings[9]. A
loss function is defined to calculate the deviation between the experimental value and the
desired value[10]. Taguchi recommends the use of the loss function to measure the
performance characteristic deviating from the desired value [11]. The value of the loss
function is further transformed into an S/N ratio. Three categories of performance
characteristic in the analysis of the S/N ratio are, lower-the-better, higher-the-better, and

International Journal of Management, IT & Engineering Vol. 8 Issue 12(1), December 2018,
ISSN: 2249-0558 Impact Factor: 7.119
Journal Homepage: http://www.ijmra.us, Email: [email protected]
Double-Blind Peer Reviewed Refereed Open Access International Journal - Included in the International
Serial Directories Indexed & Listed at: Ulrich's Periodicals Directory ©, U.S.A., Open J-Gage as well as in
Cabell’s Directories of Publishing Opportunities, U.S.A
206 International Journal of Management, IT & Engineering
http://www.ijmra.us, Email: [email protected]
nominal-the-best. The S/N ratio ηij for the ith performance characteristic in the jth
experiment can be expressed as
10log( )ij ijL = − (1)
The loss function ijLfor higher-the-better performance characteristic can be expressed as
2
1
1 1n
ij
k ijk
Ln y=
= (2)
ijL-loss function of the ith process response in the jth experiment, k- number of tests
ijky-experimental value of the ith performance characteristic in the jth experiment at the
kth tests
For lower-the-better performance characteristic, the loss function ijLcan be expressed as
2
1
1 n
ij ijk
k
L yn =
= (3)
For nominal-is-best performance characteristics, the S/N ratio can be expressed as
( )210log /ij y = (4)
The S/N ratio for each level of parameters is computed. Irrespective of the category of the
performance characteristic, a larger S/N ratio corresponds to a better performance
characteristic. It is used for the optimization of single objective problems. However,
optimization of multiple performance characteristics cannot be straightforward as in the
optimization of a single performance characteristic [12]. Combined approaches are
proposed by researchers for overcoming the limitations. In this, grey based Taguchi
method is adopted to optimize the multiple performances.
2.2 Grey Relational Analysis
The grey system theory can be used to solve the complex relationships among the multiple
response characteristics effectively. In grey relational analysis, black represents having no
information system has a level of information between black and white. In a white system,
the associations among factors in the system are known; in a grey system, the associations
among factors in the system are unknown. It is applied in optimization of WEDM process,
EDM process, chemical-mechanical polishing process, in drilling operation and turning
operation with multiple performance characteristics [13, 14, 15, 16, 17, 18, 20].
Data pre-processing is the first stage in grey analysis since the range and unit in one data
sequence may differ from the others. Data pre-processing is a means of transferring the
original sequence to a comparable sequence.
Experimental datayijis normalized as Zij(0 ≤ Zij ≤1) for the ith performance characteristics in
the jth experiment can be expressed as [12]:
For SN ratio with Larger-the-better condition
( )
( ) ( )
min , 1,2,.....
max , 1,2,..... min , 1,2,......
ij ij
ij
ij ij
y y i nZ
y i n y i n
− ==
= − = (5)
For SN ratio with smaller-the-better
( )
( ) ( )
max , 1,2,.....
max , 1,2,...... min , 1,2,.....
ij ij
ij ij
y i n yZij
y i n y i n
= −=
= − = (6)

International Journal of Management, IT & Engineering Vol. 8 Issue 12(1), December 2018,
ISSN: 2249-0558 Impact Factor: 7.119
Journal Homepage: http://www.ijmra.us, Email: [email protected]
Double-Blind Peer Reviewed Refereed Open Access International Journal - Included in the International
Serial Directories Indexed & Listed at: Ulrich's Periodicals Directory ©, U.S.A., Open J-Gage as well as in
Cabell’s Directories of Publishing Opportunities, U.S.A
207 International Journal of Management, IT & Engineering
http://www.ijmra.us, Email: [email protected]
For SN ratio with nominal-the-best
( Target) min( Target , 1, 2,...... )
max( Target , 1,2,..... ) min( Target , 1, 2,...... )
ij ij
ij ij
y y i nZij
y i n y i n
− − − ==
− = − − = (7)
According to Deng [6], larger normalized results correspond to better performance and the
best normalized result should be equal to one. Then, the grey relational coefficients are
calculated to express the relationship between the ideal (best) and the actual experimental
results [20].
The Grey relational Co-efficient ij can be expressed as [12]:
min max
( ) maxij
oj k
+ = + (8)
Where,
a. j=1,2…n; k=1,2…m, n is the number of experimental data items and m is the number
of responses.
b. yo(k) is the reference sequence (yo(k)=1, k=1,2…m); yj(k) is the specific comparison
sequence.
c. ( ) ( )oj o jy k y k = −
= The absolute value of the difference between yo(k) and yj(k)
d. min min min ( ) ( )o j
j i ky k y k
= −
is the smallest value of yj(k)
e. max max max ( ) ( )o j
j i ky k y k
= −
is the largest value of yj(k)
f. is the distinguishing coefficient which is defined in the range 0 1 (the value
may adjusted based on the practical needs of the system)
The Grey relational grade j is expressed as [12]:
1
1 m
j ij
ik
=
= (9)
Where jis the grey relational grade for the jth experiment and k is the number of
performance characteristics. It shows the relationship between the reference sequence and
the actual sequence. The value of grey relational grade ranges from 0 and 1 and if it is 1
these two sequences are identically same. The greater grey relational grade infers the better
quality; based on grey relational grade, the effect of factor can be assessed and the optimal
level for each factor can also be calculated.
2.3 Grey based Taguchi method
The structure of the integrated grey based Taguchi algorithm is illustrated in Fig.1 and
summarized as follows
Step 1: Adopting an appropriate orthogonal array to plan the experimental design and
determining the level of parameters
Step 2: Conduct the experiments based on the arrangement of the orthogonal array
Step 3: Calculate the total loss function and the S/N ratio based on equations
Step 4: Data pre-processing of S/N ratio of machining responses
Step 5: Compute the grey relational coefficient of each performance characteristics
Step 6: Determine the grey relational grade by using the formula

International Journal of Management, IT & Engineering Vol. 8 Issue 12(1), December 2018,
ISSN: 2249-0558 Impact Factor: 7.119
Journal Homepage: http://www.ijmra.us, Email: [email protected]
Double-Blind Peer Reviewed Refereed Open Access International Journal - Included in the International
Serial Directories Indexed & Listed at: Ulrich's Periodicals Directory ©, U.S.A., Open J-Gage as well as in
Cabell’s Directories of Publishing Opportunities, U.S.A
208 International Journal of Management, IT & Engineering
http://www.ijmra.us, Email: [email protected]
Step 7: Calculate the mean grey relational grade for each level and plot their response
graph
Step 8: Select the optimal level setting of machining parameters from response table and
response graph
Step 9: Analyze the grey relational grade with ANOVA
Step 10: Validate the optimal process parameters through Confirmation test
Fig.1. Structure of Grey based Taguchi method
III. DETERMINATION OF OPTIMAL MACHINING PARAMETERS
3.1 Experimental details
The ECMM system developed to conduct necessary experiments for this research work is
shown in Fig. 2 and it has the following five major assemblies: 1. Work holding platform,
2. Tool feeding device, 3. Control system, 4. Electrolyte flow system, 5. Power supply
system.
(Taguchi Method)Select the quality characteristics
Validate the optimal parameters selection by confirmation tests
Compute Grey relational coefficient
(Grey relational analysis)Data pre-processing of S/N ratio of responses
Calculate the S/N ratio of quality characteristic
Conduct the experiments based on the arrangement of the orthogonal array
Select an appropriate orthogonal array
Identification of test conditions, control factors and their levels
Compute Grey relational grade
Selection of optimal parameters using response table and response graph & analyse the grey relational
grade with ANOVA

International Journal of Management, IT & Engineering Vol. 8 Issue 12(1), December 2018,
ISSN: 2249-0558 Impact Factor: 7.119
Journal Homepage: http://www.ijmra.us, Email: [email protected]
Double-Blind Peer Reviewed Refereed Open Access International Journal - Included in the International
Serial Directories Indexed & Listed at: Ulrich's Periodicals Directory ©, U.S.A., Open J-Gage as well as in
Cabell’s Directories of Publishing Opportunities, U.S.A
209 International Journal of Management, IT & Engineering
http://www.ijmra.us, Email: [email protected]
The structure of the machine bodyis done by mild steel. Fibre materialsare used where the
parts that willcontact electrical system. Parts that come into contact with electrolyte require
noncorrosive materials and hence acrylic material is used in those places. The machining
setup comprises of base over which a rectangular column is mounted. To achieve very low
feed of the electrode, thread has been made at 30 threads per inch for a length of 75 mm in
the mid portion of the main screw rod. This allows the linear up and downward feed of
electrode to a required level. Through the stepper motor the electrode feed movements
achieved. Just below the tool electrode holding devices, the machining chamber rests on a
base plate.
Fig.2 Schematic Diagram of Experimental Setup
The work piece which is of few microns thick is held in the fixture, made up of two block
of insulating material fastened with screws. The complete developed experimental setup is
shown in Fig. 3.
Fig.3 Experimental Setup
In order to identify the true behaviour of MRR, five process parameters each at three levels
have been considered for this study is shown in Table 1. A set of three levels assigned to
each process parameter with two degrees of freedom (DOF) as per Taguchi experimental
design philosophy. This gives a total of ten DOF for five process parameters selected in
this work.

International Journal of Management, IT & Engineering Vol. 8 Issue 12(1), December 2018,
ISSN: 2249-0558 Impact Factor: 7.119
Journal Homepage: http://www.ijmra.us, Email: [email protected]
Double-Blind Peer Reviewed Refereed Open Access International Journal - Included in the International
Serial Directories Indexed & Listed at: Ulrich's Periodicals Directory ©, U.S.A., Open J-Gage as well as in
Cabell’s Directories of Publishing Opportunities, U.S.A
210 International Journal of Management, IT & Engineering
http://www.ijmra.us, Email: [email protected]
TABLE 1: PROCESS PARAMETERS AND THEIR LEVELS
Factor Electrolyte
concentration
Machining
Voltage
Machining
Current
Duty cycle Frequency
Level 1 0.1 3.5 0.1 33.33 30
Level 2 0.2 5.0 0.3 50.00 40
Level 3 0.3 6.5 0.5 66.66 50
The process parameters Electrolyte concentration, Machining Current, Machining Voltage,
Duty Cycle, and Frequency are studied in this investigation with each parameter having
two degrees of freedom. As per the standards of Taguchi methodology, 7 degrees of
freedom assigned for Error. Thus we have a total of 17 DOF for the factors as well as the
interactions considered for the present experiments. The nearest three level orthogonal
array available satisfying the criterion of selecting the OA is L18 having 17 DOF [19]. The
layout of experiments designed using Taguchi Design methodology has been furnished in
Table 2.
TABLE 2: EXPERIMENT LAYOUT USING L18 ORTHOGONAL ARRAY
Exp.
No
Levels of Process Parameters
Electrolyte
concentration
Machining
Voltage
Machining
Current
Duty
cycle
Frequency
1 1 1 1 1 1
2 1 2 2 2 2
3 1 3 3 3 3
4 2 1 1 2 2
5 2 2 2 3 3
6 2 3 3 1 1
7 3 1 2 1 3
8 3 2 3 2 1
9 3 3 1 3 2
10 1 1 3 3 2
11 1 2 1 1 3
12 1 3 2 2 1
13 2 1 2 3 1
14 2 2 3 1 2
15 2 3 1 2 3
16 3 1 3 2 3
17 3 2 1 3 1
18 3 3 2 1 2
The levels of process parameters are selected based on the research done by various
researchers and based on the pilot experiments conducted for this research work. The
levels of process parameters selected based on the Taguchi’s design methodology for
Nickel to fit L18 orthogonal array is given in table 3.
The ECMM experiments are conducted with brass wire tool of 250 microns diameter for
Nickel. In order to achieve proper circularity of machined holes, the anode tool is properly
ground. The test job specimens are kept uniform in size of 50 mm × 25 mm × 0.15 mm.
The ECMM experiments were conducted twice in each combination of process parameters
to study its effect over MRR. From the trial 1 and trial 2 experiments, the average MRR is

International Journal of Management, IT & Engineering Vol. 8 Issue 12(1), December 2018,
ISSN: 2249-0558 Impact Factor: 7.119
Journal Homepage: http://www.ijmra.us, Email: [email protected]
Double-Blind Peer Reviewed Refereed Open Access International Journal - Included in the International
Serial Directories Indexed & Listed at: Ulrich's Periodicals Directory ©, U.S.A., Open J-Gage as well as in
Cabell’s Directories of Publishing Opportunities, U.S.A
211 International Journal of Management, IT & Engineering
http://www.ijmra.us, Email: [email protected]
calculated and tabulated for Nickel in table 4. It can be seen from the experimental results
of Nickel, the obtained MRR ranges from 0.001369 to 0.009577 mm3/min, while the
dimension deviation stood between 11 and 31 microns.
TABLE 3: ORTHOGONAL ARRAY OF PROCESS PARAMETERS
Exp. No
Electrolyte
Concentration
(mol/lit)
Machining
Voltage
(Volts)
Machining
Current
(Amps)
Duty
cycle
(%)
Frequency
(Hz)
1 0.1 3.5 0.1 33.33 30
2 0.1 5.0 0.3 50.00 40
3 0.1 6.5 0.5 66.66 50
4 0.2 3.5 0.1 50.00 40
5 0.2 5.0 0.3 66.66 50
6 0.2 6.5 0.5 33.33 30
7 0.3 3.5 0.3 33.33 50
8 0.3 5.0 0.5 50.00 30
9 0.3 6.5 0.1 66.66 40
10 0.1 3.5 0.5 66.66 40
11 0.1 5.0 0.1 33.33 50
12 0.1 6.5 0.3 50.00 30
13 0.2 3.5 0.3 66.66 30
14 0.2 5.0 0.5 33.33 40
15 0.2 6.5 0.1 50.00 50
16 0.3 3.5 0.5 50.00 50
17 0.3 5.0 0.1 66.66 30
18 0.3 6.5 0.3 33.33 40
TABLE 4 EXPERIMENTAL RESULTS
Exp. No Material Removal Rate
(mm3/min.)
Dimensional Deviation
(microns)
1 0.001632 29
2 0.002123 13
3 0.006307 20
4 0.001839 21
5 0.004033 22
6 0.006703 14
7 0.002874 25
8 0.009577 20
9 0.003226 14
10 0.003724 25
11 0.001369 11
12 0.004675 31
13 0.004807 22
14 0.004402 14
15 0.001880 23
16 0.003931 15
17 0.003393 14
18 0.006546 15
Dimensional deviation

International Journal of Management, IT & Engineering Vol. 8 Issue 12(1), December 2018,
ISSN: 2249-0558 Impact Factor: 7.119
Journal Homepage: http://www.ijmra.us, Email: [email protected]
Double-Blind Peer Reviewed Refereed Open Access International Journal - Included in the International
Serial Directories Indexed & Listed at: Ulrich's Periodicals Directory ©, U.S.A., Open J-Gage as well as in
Cabell’s Directories of Publishing Opportunities, U.S.A
212 International Journal of Management, IT & Engineering
http://www.ijmra.us, Email: [email protected]
In this work, the main emphasis is given for studying effects on process parameters on
MRR and Dimensional Deviation (DD). A comparative study on the effects of process
parameters on MRR Vs DD is made and the outcome is detailed hereunder. In order to
easily compare the MRR and corresponding DD obtained is plotted on logarithmic scale
for Nickel as given in Fig. 4.
Fig.4 MRR Vs Dimensional Deviation (DD)
3.2 Optimization of machining parameters
Initially, the S/N ratios for a given responses are computed using one of the Eqs. (1), (2)
and (3) depending upon the type of quality characteristics. The normalized values for each
response S/N ratios are estimated using Eqs. (5), (6) and (7). The computed S/N ratios for
each quality characteristic and the normalized values of S/N ratios are shown in Table 5.
Grey relational coefficient for each performance characteristics have been calculated using
Eq. (8). The value for is taken as 0.5 since both the process parameters are of equal
weighting. The results are shown in Table 6. The grey relational grade can be calculated by
using Eq. (9), which is the overall representative of both the responses shown in Table 6.
Now, the multiple performance characteristics optimization problem has been transformed
into a single equivalent objective function optimization problem using this approach. The
higher grey relational grade is said to be close to the optimal.
TABLE 5 S/N RATIO VALUES AND NORMALIZED S/N RATIO VALUES
MRR AND DD
Ex.No MRR-S/N ratio DD-S/N ratio
Data Pre-
processing-
MRR
Data Pre-
processing-DD
1 -55.7456 -29.2480 0.0903 0.9356
2 -53.4610 -22.2789 0.2255 0.9000
3 -44.0035 -26.0206 0.7853 0.5500
4 -54.7084 -26.4444 0.1517 0.5000
5 -47.8874 -26.8485 0.5554 0.4500
6 -43.4746 -22.9226 0.8166 0.8500
7 -50.8303 -27.9588 0.3812 0.3000
8 -40.3754 -26.0206 1.0000 0.5500
9 -49.8267 -22.9226 0.4406 0.8500
10 -48.5798 -27.9588 0.5144 0.3000

International Journal of Management, IT & Engineering Vol. 8 Issue 12(1), December 2018,
ISSN: 2249-0558 Impact Factor: 7.119
Journal Homepage: http://www.ijmra.us, Email: [email protected]
Double-Blind Peer Reviewed Refereed Open Access International Journal - Included in the International
Serial Directories Indexed & Listed at: Ulrich's Periodicals Directory ©, U.S.A., Open J-Gage as well as in
Cabell’s Directories of Publishing Opportunities, U.S.A
213 International Journal of Management, IT & Engineering
http://www.ijmra.us, Email: [email protected]
11 -57.2719 -20.8279 0.0000 1.0000
12 -46.6044 -29.8272 0.6313 0.0000
13 -46.3625 -26.8485 0.6457 0.4500
14 -47.1270 -22.9226 0.6004 0.8500
15 -54.5168 -27.2346 0.1631 0.4000
16 -48.1099 -23.5218 0.5422 0.8000
17 -49.3883 -22.9226 0.4666 0.8500
18 -43.6805 -23.5218 0.8044 0.8000
The mean response table for overall grey relational grade is shown in Table 7 and is
represented graphically in Fig.5. The mean grey relational grade for the electrolyte
concentration at level 1 calculated by averaging the grey relational grades for the
experiments 1-3 and 10-12 similarly levels 2 and 3 are calculated. The mean grey
relational grade for each level of the other parameters can be computed in the similar way.
With the help of the Table 7 and Fig.5, the optimal parameter combination has been
determined. The optimal factor setting condition is A3B2C3D1E1.
TABLE 6 GREY RELATIONAL COEFFICIENTS OF RESPONSES MRR AND
DD
Ex.No GRC-MRR GRC-DD GR Grade Rank
1 0.3547 0.8860 0.6203 8
2 0.3923 0.8333 0.6128 11
3 0.6996 0.5263 0.6129 10
4 0.3708 0.5000 0.4354 16
5 0.5293 0.4762 0.5028 13
6 0.7316 0.7692 0.7504 2
7 0.4469 0.4167 0.4318 17
8 1.0000 0.5263 0.7632 1
9 0.4720 0.7692 0.6206 7
10 0.5073 0.4167 0.4620 14
11 0.3333 1.0000 0.6667 4
12 0.5756 0.3333 0.4545 15
13 0.5852 0.4762 0.5307 12
14 0.5558 0.7692 0.6625 5
15 0.3740 0.4545 0.4143 18
16 0.5221 0.7143 0.6182 9
17 0.4838 0.7692 0.6265 6
18 0.7188 0.7143 0.7165 3
TABLE 7 RESPONSE TABLE - GREY RELATIONAL GRADE

International Journal of Management, IT & Engineering Vol. 8 Issue 12(1), December 2018,
ISSN: 2249-0558 Impact Factor: 7.119
Journal Homepage: http://www.ijmra.us, Email: [email protected]
Double-Blind Peer Reviewed Refereed Open Access International Journal - Included in the International
Serial Directories Indexed & Listed at: Ulrich's Periodicals Directory ©, U.S.A., Open J-Gage as well as in
Cabell’s Directories of Publishing Opportunities, U.S.A
214 International Journal of Management, IT & Engineering
http://www.ijmra.us, Email: [email protected]
Parameter
s Level 1 Level 2 Level 3
MAX-
MIN
A 0.5715 0.5494 0.6295 0.0964
B 0.5164 0.6391 0.5949 0.1227
C 0.5640 0.5415 0.6449 0.1033
D 0.6414 0.5497 0.5593 0.0821
E 0.6243 0.5850 0.5411 0.0439
Using the grey-fuzzy reasoning grade value, ANOVA is formulated for identifying the
significant factors. The results of ANOVA are given in Table 8. From the ANOVA results,
it is clear that Machining Voltage (25.27 %) influences more on ECMM of nickel followed
by Machining Current (20.38 %), Duty cycle (18.18 %), Frequency (13.82 %) and
Electrolyte concentration (13.69 %).
Fig.5 The response graph for each level of machining parameters
TABLE 8 RESULTS OF THE ANOVA
Factor DOF SS MS F-Test F-
Table
%
Contn
A 2 0.0305 0.0153 1.5885 18.50 13.69
B 2 0.0563 0.0282 2.9323 18.50 25.27
C 2 0.0454 0.0227 2.3646 18.50 20.38
D 2 0.0405 0.0203 2.1094 18.18
E 2 0.0308 0.0154 1.6042 13.82
Error 7 0.0193 0.0028 8.66
Total 17 0.2228 100.00
3.3 Confirmation Test
The optimum level of process parameters has been determined by using S/N ratio values
(higher-the-better). After the selection of optimal level of the process parameters, the
ultimate step is to predict and validate the improvement of the response characteristic using
the optimal level of the parameters. The purpose of conformation test is to validate the
conclusions drawn from analysis of experimental results. The predicted or estimated GRG
(η) using optimal levels of process parameters can be calculated with the following
equation;
0.0
0.2
0.4
0.6
0.8
1.0
A1A2A3 B1B2B3 C1 C2 C3 D1D2D3 E1 E2 E3
Gre
y re
lati
on
al G
rad
e
Parameters Level
GRG Response Graph

International Journal of Management, IT & Engineering Vol. 8 Issue 12(1), December 2018,
ISSN: 2249-0558 Impact Factor: 7.119
Journal Homepage: http://www.ijmra.us, Email: [email protected]
Double-Blind Peer Reviewed Refereed Open Access International Journal - Included in the International
Serial Directories Indexed & Listed at: Ulrich's Periodicals Directory ©, U.S.A., Open J-Gage as well as in
Cabell’s Directories of Publishing Opportunities, U.S.A
215 International Journal of Management, IT & Engineering
http://www.ijmra.us, Email: [email protected]
ηm- Total mean of GRG
ηi– Mean of GRG at optimum level
q – No. of significant parameters
After predicting the response (GRG), a confirmation experiment has been designed and
conducted with the optimal level of the machining parameters to verify the improvement of
performance characteristics is shown in Table 9.
TABLE 9 THE COMPARISON RESULTS OF INITIAL AND OPTIMAL
MACHINING PERFORMANCE
Initial machining parameters
Optimal machining
parameters
Prediction Experiment
Levels
A1B2C2D2E2
MRR (mm3/min.)0.002123
DD (microns) 13
Taguchi-Grey relational
grade0.6129
Improvement of Taguchi-Grey
relational
grade
A3B2C3D1E1
0.8451
0.2322
A3B2C3D1E1
0.00894
16
0.8002
0.1873
IV. CONCLUSIONS
The effects of process parameters and the optimum cutting parameters for ECMM process
on the multiple objectives are systematically investigated by Taguchi based grey relational
analysis with orthogonal arrays. The following conclusions are obtained Approach of
Taguchi based grey relational analysis was a productive method for optimizing the multi-
objectives such as MRR and DD in ECMM of nickel.In the results of ANOVA, it is
revealed that machining voltage, electrolyte concentrationand machining currentare
predominant factors which affect the ECMM of Nickel. Machining Voltage (25.27 %)
influences more on ECMM of nickel followed by Machining Current (20.38 %), Duty
cycle (18.18 %), Frequency (13.82 %) and Electrolyte concentration (13.69 %).The best
performance characteristics were obtained with optimal setting A3B2C3D1E1.
Through the optimum procedure of Taguchi-grey with orthogonal arrays, the level
constitution of optimal cutting parameters are acquired and verified by confirmation test.
The results proved that the multiple objectives are improved simultaneously by using this
approach.

International Journal of Management, IT & Engineering Vol. 8 Issue 12(1), December 2018,
ISSN: 2249-0558 Impact Factor: 7.119
Journal Homepage: http://www.ijmra.us, Email: [email protected]
Double-Blind Peer Reviewed Refereed Open Access International Journal - Included in the International
Serial Directories Indexed & Listed at: Ulrich's Periodicals Directory ©, U.S.A., Open J-Gage as well as in
Cabell’s Directories of Publishing Opportunities, U.S.A
216 International Journal of Management, IT & Engineering
http://www.ijmra.us, Email: [email protected]
REFERENCES
[1] Bhattacharyya .B and Munda .J, “Experimental investigation on the influence of
electrochemical machining parameters on machining rate and accuracy in
micromachining domain”, International Journal of Machine Tools & Manufacture,
Vol.43, pp.1301-1310, 2003.
[2] Datta .M, Derek Harris, "Electrochemical micromachining: An environmentally
friendly, high speed processing technology", Electrochimica Acta, Vol.42, pp.3007-
3013, 1997.
[3] Datta .M, “Micro fabrication by electrochemical metal removal, IBM Journal of
Research and Development, Vol.42, No.5, pp. 655–669, 1998.
[4] Bhattacharyya .B, Malapati .M, Munda .J, and Sarkar .A, "Influence of tool vibration
on machining performance in electrochemical micro-machining of copper",
International Journal of Machine Tool and manufacture, Vol.47, pp.335-342, 2007.
[5] Da Silva Neto. C.J, Da Silva .M.E, and Da Silva .B.M, "Intervening variables in
electrochemical machining", Journal of Materials Processing Technology, Vol.179,
pp.92-96, 2006.
[6] Deng, J. (1989) ‘Introduction to grey system’, Journal of Grey system, Vol.1, pp.1-24.
[7] Kuo C F J and Wu Y S (2006) Optimization of the film coating process for polymer
blends by the grey based Taguchi method. Int J Adv Manuf Technol 27:525-530.
[8] Fisher R A (1925) Statistical method for research worker. Oliver & Boyd, London.
[9] Montgomery D C (1997) Design and analysis of experiments. 4thed. New York:
Wiley; 1997.
[10] Chua M S, Rahman M, Wong Y S and Loh H T (1993) Determination of optimal
cutting conditions using design of experiments and optimization techniques. Int J
Mach Tools Manuf 33(2):297-305.
[11] DavimJ P (2003) Design of optimization of cutting parameters for turning metal
matrix composites based on the orthogonal arrays. J Mater Process Technol 132:340-
344.
[12] Jeyapaul R, Shahabudeen P and Krishnaiah K (2005) Quality management research by
considering multi-response problems in the Taguchi method-a review. Int J Adv
Manuf Technol 26:1331-1337.
[13] Chiang Ko-Ta and Chang Fu-Ping (2006) Optimization of WEDM process of particle-
reinforced material with multiple performance characteristics using grey relational
analysis. J Mater Process Technol 180:96-101.
[14] LinC L, Lin J L and Ko T C (2002) Optimization of the EDM Process based on the
orthogonal array with fuzzy logic and Grey relational analysis method. Int J Adv
Manuf Technol 19:211-277.
[15] Lin J L and Tarng Y S (1998) Optimization of the multi-response process by the
Taguchi method with grey relational analysis. J Grey system 10(4): 355-370.
[16] Lin C L and Lin J L (2002) The use of orthogonal array with Grey relational analysis
to optimize the EDM Process with multiple performance characteristics. J Mater
Process Technol 42:237-244.
[17] LinZ C and Ho CY (2003) Analysis and application of grey relational and ANOVA in
chemical-mechanical polishing process parameters. Int J Adv Manuf Technol 21:10-
14.

International Journal of Management, IT & Engineering Vol. 8 Issue 12(1), December 2018,
ISSN: 2249-0558 Impact Factor: 7.119
Journal Homepage: http://www.ijmra.us, Email: [email protected]
Double-Blind Peer Reviewed Refereed Open Access International Journal - Included in the International
Serial Directories Indexed & Listed at: Ulrich's Periodicals Directory ©, U.S.A., Open J-Gage as well as in
Cabell’s Directories of Publishing Opportunities, U.S.A
217 International Journal of Management, IT & Engineering
http://www.ijmra.us, Email: [email protected]
[18] Tosun N (2006) Determination of optimum parameters for multi-performance
characteristics in drilling by using grey relational analysis. Int J Adv Manuf Technol
28:450-455.
[19] Phillip J.R, “Taguchi Techniques for Quality Engineering”, Mcgraw-Hill, New York,
1988.
[20] Ahilan, C Kumanan, S SivakumaranN (2010) Application of grey based Taguchi
method in multi-response optimization of turning processAdv. in Production Engg &
Mgt 5 (3), 171-180.

International Journal of Management, IT & Engineering Vol. 8 Issue 12(1), December 2018,
ISSN: 2249-0558 Impact Factor: 7.119
Journal Homepage: http://www.ijmra.us, Email: [email protected]
Double-Blind Peer Reviewed Refereed Open Access International Journal - Included in the International
Serial Directories Indexed & Listed at: Ulrich's Periodicals Directory ©, U.S.A., Open J-Gage as well as in
Cabell’s Directories of Publishing Opportunities, U.S.A
218 International Journal of Management, IT & Engineering
http://www.ijmra.us, Email: [email protected]
Multi-Response Optimization of Electro Chemical Micro
Machining (ECMM) Of Nickel Using Fuzzy Based Grey
Relational Analysis
C.Ahilan, D.Saravanan & M.Y.Abdul Jaleel
Abstract:-The development in the field of mechanical engineering is needed to meet the
increasing demands of the industry. In specific the scope for alloy materials having high
hardness, toughness and impact resistance has grown rapidly due to high level of design
constraints. Electro Chemical Micro Machining (ECMM) machines are used to cut metals
of any hardness or that are difficult or impossible to cut with conventional methods.
Machine tool industry has made exponential growth in its manufacturing capabilities in last
decade but these machine tools are yet to be utilized at their full potential due to inadequate
data on optimum operating parameters. The objective of the present research work is to
investigate the effects of the various ECMM process parameters on the MRR and
dimensional deviation to obtain the optimal sets of process parameters by using fuzzy
based grey relational analysis.
Keywords:-Electro Chemical Micro Machining (ECMM), Optimization, Material removal
rate (MRR), Dimensional deviation (DD), Orthogonal array, Fuzzy based grey relational
analysis
Introduction
The growth in the field of mechanical engineering is necessary to meet the rising demands
of the industry. In particular the scope for alloy materials having high hardness, toughness
and impact resistance has grown rapidly due to high level of design constraints. Nickel and
its alloys are the most sought material for manufacturing machines and components which
needs to withstand high temperature, high pressure and aggressive chemical environment.
Nickel alloys find wide application in a) gas turbines, b) high temperature fasteners, c)
chemical processing and pressure vessels, and d) reactors of nuclear plants, etc.
Micromachining technology is extensively used to machine complex shapes required in
medical and electronics industries. The micro machining of Nickel alloys can be difficult
using traditional machining techniques as they easily harden during machining. High
pressure is developed between the tool and the work piece during machining. Such high
pressure produces a stressed layer of deformed metal on the surface of the work piece. This
deformation causes a hardening effect on the surface of the work piece that slows down
further machining.
In unconventional machining, most of the processes are thermal oriented, e.g. Electro
discharge machining (EDM), laser beam machining (LBM), Electron beam machining
(EBM), etc. These processes may cause thermal distortion of the machined surface.
Chemical machining and Electro-chemical machining are thermal free processes, but
chemical machining cannot be controlled precisely for the micromachining domain [1].
ECMM appears to be a very promising micromachining technology due to its advantages
Professor, Dept of Mechanical Engineering, MIET Engineering College, Trichy, Tamilnadu, India

International Journal of Management, IT & Engineering Vol. 8 Issue 12(1), December 2018,
ISSN: 2249-0558 Impact Factor: 7.119
Journal Homepage: http://www.ijmra.us, Email: [email protected]
Double-Blind Peer Reviewed Refereed Open Access International Journal - Included in the International
Serial Directories Indexed & Listed at: Ulrich's Periodicals Directory ©, U.S.A., Open J-Gage as well as in
Cabell’s Directories of Publishing Opportunities, U.S.A
219 International Journal of Management, IT & Engineering
http://www.ijmra.us, Email: [email protected]
that include high MRR, better precision and control, rapid machining time, and
environmentally acceptable [2]. ECMM also permits machining of chemically resistant
materials like Titanium, Copper alloys, Super alloys, and Stainless steel, which are widely
used in biomedical, electronic, and MEMS applications.
Electrochemical machining (ECM) was developed during late 1950s and early 1960s and
used to machine difficult-to-cut materials in aerospace and other heavy industries for
shaping and finishing operations [3]. It is an anodic dissolution process based on the
phenomenon of electrolysis, whose laws were established by Michael Faraday. In ECM,
electrolytes serve as conductor of electricity. ECM offers a number of advantages over
other machining methods. The ECM technique now plays an important role in the
manufacturing of a variety of parts ranging from machining of large metallic pieces of
complicated shapes to opening of windows in silicon that are a few microns in size. When
ECM is performed at micro meter level (material removal that ranges from 1-999 µm), it is
known as ECMM [4]. In ECMM process, the work piece is connected to anode and the
micro tool is connected to cathode and they are placed inside the electrolyte with a small
gap between them. On the application of adequate electrical energy, positive metal ions
leave from the work piece and machining takes place. Electrolyte circulation removes the
machined particles from the electrode gap. To continue the machining process, the
electrode gap has to be maintained by moving the tool at required rate.
The ECMM process is capable of machining tough and hard materials without inducing
any residual stress and tool wear [5]. In this process no physical force is directly applied to
the material, the finished work piece is free from any deformation. The application of
ECMM for Nickel alloy is more suitable but it cannot be applied effectively unless the
process parameters are optimized. The parameters subjected to the study are 1) Electrolyte
Concentration 2) Machining Voltage, 3) Machining Current, 4) Duty Cycle, and 5)
Frequency.
The grey relational analysis theory initialized by Deng (1989) [6] makes use of this to
handle uncertain systematic problem with only partial known information. This theory is
adopted for solving the complicated interrelationships among the multiple objectives. This
approach converts multi-objective optimization into optimization of single grey relational
grade. This method was applied to optimize the multi-objective problems in electrical
discharge machining [7], wire cut electrical discharge machining [8], drilling operation [9]
and chemical-mechanical polishing process [10]. The theory of fuzzy logics initiated by
Zadeh (1965) [11] has been proven to be useful for dealing with uncertain and vague
information. The definition of objectives such as lower-the-better, higher-the-better and
nominal-the-best contains certain degree of uncertainty and vagueness. Hence the fuzzy
logic is applied to establish the optimal setting of parameters for multiple objectives. This
method was applied to optimize the multi-objective problems in electrical discharge
machining process [12], [13], [14].
The grey based fuzzy logic approach has advantage of both grey relational analysis and
fuzzy logic method. Optimization of complicated multi objectives can be converted into
single objective through this method i.e. grey-fuzzy reasoning grade. The optimum level of
process parameters are the level with higher value of mean grey-fuzzy reasoning grade.
This method was successfully applied to optimize the multiple objectives of complicated
problems in manufacturing process [15], design parameters of pin-fin heat sink [16] and
process design of an injection-moulded part [17]. In this study, the effect of CNC turning

International Journal of Management, IT & Engineering Vol. 8 Issue 12(1), December 2018,
ISSN: 2249-0558 Impact Factor: 7.119
Journal Homepage: http://www.ijmra.us, Email: [email protected]
Double-Blind Peer Reviewed Refereed Open Access International Journal - Included in the International
Serial Directories Indexed & Listed at: Ulrich's Periodicals Directory ©, U.S.A., Open J-Gage as well as in
Cabell’s Directories of Publishing Opportunities, U.S.A
220 International Journal of Management, IT & Engineering
http://www.ijmra.us, Email: [email protected]
parameters on power consumption and surface roughness are reported using grey based
fuzzy logic. The significant contribution of each cutting parameters to the multiple
objectives are calculated by using ANOVA [18]. In this study, the fuzzy based grey
relational analysis technique has been used to investigate the effects of the parameters and
subsequently to predict sets of optimal parameters for maximum MRR and minimum
dimensional deviation (DD) in the ECMM process.
V. METHODOLOGY
Grey Relational Analysis
The grey relational analysis based on the grey system theory can be used to solve the
complicated interrelationships among the multiple performance characteristics effectively
[6]. In grey relational analysis, system has a level of information between black and white.
In other words, in a grey system, some information is known and some information is
unknown. In a white system, the relationships among factors in the system are certain; in a
grey system, the relationships among factors in the system are uncertain.
Data pre-processing is normally required since the range and unit in one data sequence
may differ from the others. Data pre-processing is also necessary when the sequence
scatter range is too large, or when the directions of the target in the sequences are different.
Data pre-processing is a means of transferring the original sequence to a comparable
sequence. Depending on the characteristics of a data sequence, there are various
methodologies of data pre-processing available for the grey relational analysis.
Experimental datayijis normalized as Zij(0 ≤ Zij ≤1) for the ith performance characteristics in
the jth experiment can be expressed [19] as:
For Larger-the-better condition
( )
( ) ( )
min , 1,2,.....
max , 1,2,..... min , 1,2,......
ij ij
ij
ij ij
y y i nZ
y i n y i n
− ==
= − = (1)
For smaller-the-better
( )
( ) ( )
max , 1,2,.....
max , 1,2,...... min , 1,2,.....
ij ij
ij ij
y i n yZij
y i n y i n
= −=
= − = (2)
For nominal-the-best
( Target) min( Target , 1, 2,...... )
max( Target , 1, 2,..... ) min( Target , 1, 2,...... )
ij ij
ij ij
y y i nZij
y i n y i n
− − − ==
− = − − = (3)
Then, calculate grey relational co-efficient ij for the normalized values. min max
( ) maxij
oj k
+ = + (4)
Where
a. j=1,2…n; k=1,2…m, n is the number of experimental data items and m is the number
of responses.
b. yo(k) is the reference sequence (yo(k)=1, k=1,2…m); yj(k) is the specific comparison
sequence.
c. ( ) ( )oj o jy k y k = −
= The absolute value of the difference between yo(k) and yj(k)
d. min min min ( ) ( )o j
j i ky k y k
= −
is the smallest value of yj(k)

International Journal of Management, IT & Engineering Vol. 8 Issue 12(1), December 2018,
ISSN: 2249-0558 Impact Factor: 7.119
Journal Homepage: http://www.ijmra.us, Email: [email protected]
Double-Blind Peer Reviewed Refereed Open Access International Journal - Included in the International
Serial Directories Indexed & Listed at: Ulrich's Periodicals Directory ©, U.S.A., Open J-Gage as well as in
Cabell’s Directories of Publishing Opportunities, U.S.A
221 International Journal of Management, IT & Engineering
http://www.ijmra.us, Email: [email protected]
e. max max max ( ) ( )o j
j i ky k y k
= −
is the largest value of yj(k)
f. is the distinguishing coefficient which is defined in the range 0 1 (the value
may adjusted based on the practical needs of the system)
This grey relation co-efficient ij is applied to show the relationship between the optimal
(best=1) and actual normalized results. The higher value of ij represents, the
corresponding experimental result is closer to the optimal (best) normalized value for the
single response.
Fuzzy Logic
Fuzzy logic is a way to representing information that mimics human reasoning about
information [20]. The most interesting fact about fuzzy logic is that fuzzy inferences make
it possible to deduce a proposition similar to the consequence from some proposition that is
similar to the antecedent. It is an effective mathematical model of resolving problems in a
simple way which contain the uncertain and huge information [12]. In fuzzy logic analysis,
the fuzzifier uses membership functions (MFs) to fuzzify the grey relational coefficient.
The fuzzy inference engine then performs a fuzzy inference on fuzzy rules in order to
generate a fuzzy value. Finally, the defuzzifier converts the fuzzy value into a grey-fuzzy
reasoning grade. Fuzzy expert system has 3 simple steps shown in Figure 1 and defined
below
Fig 1 Fuzzy Expert System Model
Step 1 Fuzzification: In a fuzzy expert system application, each input variable's crisp value
is first fuzzified into linguistic values before the inference engine proceeds in processing
with the rule base.
Step 2 Inference engine: The collection of fuzzy IF-THEN rules is stored in the fuzzy rule
base which is referred to by the inference engine when processing inputs. Once all crisp
input values have been fuzzified into their respective linguistic values, the inference engine
Fuzzification
Crisp Output Values
Defuzzification
Fuzzy Inference Engine
Crisp Input Values
Fuzzy Rule Base

International Journal of Management, IT & Engineering Vol. 8 Issue 12(1), December 2018,
ISSN: 2249-0558 Impact Factor: 7.119
Journal Homepage: http://www.ijmra.us, Email: [email protected]
Double-Blind Peer Reviewed Refereed Open Access International Journal - Included in the International
Serial Directories Indexed & Listed at: Ulrich's Periodicals Directory ©, U.S.A., Open J-Gage as well as in
Cabell’s Directories of Publishing Opportunities, U.S.A
222 International Journal of Management, IT & Engineering
http://www.ijmra.us, Email: [email protected]
will access the fuzzy rule base of the fuzzy expert system to derive linguistic values for the
intermediate as well as the output linguistic variables.
Step 3 Defuzzification: The last phase is the defuzzification of the linguistic values of the
output linguistic variables into crisp values. The most common techniques for
defuzzification are Center-of-Maximum (CoM) and Center-of-Area (CoA). The fuzzy
inference output 0( )C y transferred to a non-fuzzy value 0y
by using the centroid
defuzzification method, i.e.
0
0
0
( )
( )
y C yy
C y
=
This non-fuzzy value 0y is called as grey-fuzzy reasoning grade. The grey-fuzzy
reasoning grade is used to optimize the multiple objectives and the relational degree
between main factor and other factors for each performance characteristics. The higher
grey-fuzzy reasoning grade indicates that the experimental result closer to the ideally
normalized value. The mean value of grey-fuzzy reasoning grade for each level of
parameters is used to construct response table and response graph. The optimum level of
machining parameters is the level with higher value of mean grey-fuzzy reasoning grade
for each factor concerning power consumption and surface roughness. To identify the
contribution of process parameters on multi objectives ANOVA is carried out. Finally the
confirmation test is conducted to validate the optimum parameter setting.
The scheme of the proposed grey based fuzzy logic approach is illustrated in Figure 2 and
steps are summarized [21] as follows
Stage I: Data collection by using design of experiments
Step 1: Design an appropriate orthogonal array to plan the experimental design and
determining the level of parameters
Step 2: Conduct the experiment based on the arrangement of the orthogonal array
Stage II: Grey based Fuzzy logic method for multi-objective optimization
Step 3: Data pre-processing of experimental results using Eqs. (1) – (3)
Step 4: Compute the grey relational coefficient for each objectives by using Eq. (4)
Step 5: Establishing the membership function and fuzzy rule to fuzzify the inputs (grey
relational coefficient of each response) of fuzzy logic.
Step 6: The fuzzy logic output (grey-fuzzy reasoning grade for multi-objectives) is
calculated by defuzzification of the output linguistic variables into crisp values.
Step 7: Mean response for each level of process parameters are calculated and presented in
the form of response table and response graph.
Step 8: Select the optimal level of machining parameters by which level of each individual
parameter having higher value of mean grey-fuzzy reasoning grade in response table and
response graph.
Stage III: Analysis of process parameters contribution:
Step 9: Analyze the grey-fuzzy reasoning grade with ANOVA
Stage IV: Validate the optimum parameters through confirmation test
Step10: Verify the optimal process parameters through Confirmation test

International Journal of Management, IT & Engineering Vol. 8 Issue 12(1), December 2018,
ISSN: 2249-0558 Impact Factor: 7.119
Journal Homepage: http://www.ijmra.us, Email: [email protected]
Double-Blind Peer Reviewed Refereed Open Access International Journal - Included in the International
Serial Directories Indexed & Listed at: Ulrich's Periodicals Directory ©, U.S.A., Open J-Gage as well as in
Cabell’s Directories of Publishing Opportunities, U.S.A
223 International Journal of Management, IT & Engineering
http://www.ijmra.us, Email: [email protected]
Fig 2 Scheme of the proposed grey based fuzzy logic method
VI. EXPERIMENTAL SETUP
The ECMM system developed to conduct necessary experiments for this research work is
shown in Figure 3 and it has the following five major assemblies: 1. Work holding
platform, 2. Tool feeding device, 3. Control system, 4. Electrolyte flow system, 5. Power
supply system.
Mild steel is selected for the structure of the machine body. For the parts that come into
contact with electrical system which requires insulation, fiber material is used. Parts that
come into contact with electrolyte require noncorrosive materials and hence acrylic
material is used in those places. The machining setup structure consists of machining base
over which a rectangular column is mounted. In order to achieve very fine feed of the
electrode, thread has been made at 30 threads per inch for a length of 75 mm in the mid
portion of the main screw rod. This enables the linear up and downward feed of electrode
to a required level in accordance with the depth of the electrolyte chamber and work piece
placement in it. When the stepper motor rotates, the lead screw rotates, which in turn
moves the micro tool electrode holding device which provides electrode feed movements.
Just below the tool electrode holding devices, the machining chamber rests on a base plate.
Fig 3 Schematic Diagram of Experimental Setup
Prediction
&Validation of
optimal machining
parameters
Data collection using
Design of
Experiments
Fuzzy based Grey
Relational Analysis
method for multi-
objectiveoptimization
Analysis of variance
(ANOVA)

International Journal of Management, IT & Engineering Vol. 8 Issue 12(1), December 2018,
ISSN: 2249-0558 Impact Factor: 7.119
Journal Homepage: http://www.ijmra.us, Email: [email protected]
Double-Blind Peer Reviewed Refereed Open Access International Journal - Included in the International
Serial Directories Indexed & Listed at: Ulrich's Periodicals Directory ©, U.S.A., Open J-Gage as well as in
Cabell’s Directories of Publishing Opportunities, U.S.A
224 International Journal of Management, IT & Engineering
http://www.ijmra.us, Email: [email protected]
The base plate is provided with four bushes at the bottom for easy handling. The
dimensions of other parts are calculated considering space arrangement and functional
requirements. Inside the machining chamber, a work holding device is mounted. The work
piece which is of few microns thick is held in the fixture, made up of two block of
insulating material fastened with screws. The one side of the fixture is connected with a
wire to the workpiece and made as anode. The complete developed experimental setup is
shown in Figure 4.
Fig 4 Experimental Setup
In order to identify the true behaviour of MRR, five process parameters each at three levels
have been considered for this study is shown in Table 1. A set of three levels assigned to
each process parameter with two degrees of freedom (DOF) as per Taguchi experimental
design philosophy. This gives a total of ten DOF for five process parameters selected in
this work.
The process parameters Electrolyte concentration, Machining Current, Machining Voltage,
Duty Cycle, and Frequency are studied in this investigation with each parameter having
two degrees of freedom. As per the standards of Taguchi methodology, 7 degrees of
freedom assigned for Error. Thus we have a total of 17 DOF for the factors as well as the
interactions considered for the present experiments. The nearest three level orthogonal
array available satisfying the criterion of selecting the OA is L18 having 17 DOF [21]. The
layout of experiments designed using Taguchi Design methodology has been furnished in
Table 2.
TABLE 1 PROCESS PARAMETERS AND THEIR LEVELS
Factor Electrolyte
concentratio
n
Machining
Voltage
Machining
Current
Duty cycle Frequency
Level 1 0.1 3.5 0.1 33.33 30
Level 2 0.2 5.0 0.3 50.00 40
Level 3 0.3 6.5 0.5 66.66 50
The process parameters Electrolyte concentration, Machining Current, Machining Voltage,
Duty Cycle, and Frequency are studied in this investigation with each parameter having
two degrees of freedom. As per the standards of Taguchi methodology, 7 degrees of

International Journal of Management, IT & Engineering Vol. 8 Issue 12(1), December 2018,
ISSN: 2249-0558 Impact Factor: 7.119
Journal Homepage: http://www.ijmra.us, Email: [email protected]
Double-Blind Peer Reviewed Refereed Open Access International Journal - Included in the International
Serial Directories Indexed & Listed at: Ulrich's Periodicals Directory ©, U.S.A., Open J-Gage as well as in
Cabell’s Directories of Publishing Opportunities, U.S.A
225 International Journal of Management, IT & Engineering
http://www.ijmra.us, Email: [email protected]
freedom assigned for Error. Thus we have a total of 17 DOF for the factors as well as the
interactions considered for the present experiments. The nearest three level orthogonal
array available satisfying the criterion of selecting the OA is L18 having 17 DOF [22]. The
layout of experiments designed using Taguchi Design methodology has been furnished in
Table 2.
TABLE 2: EXPERIMENT LAYOUT USING L18 ORTHOGONAL ARRAY
Exp.
No
Levels of Process Parameters
Electrolyte
concentration
Machining
Voltage
Machining
Current
Duty
cycle
Frequency
1 1 1 1 1 1
2 1 2 2 2 2
3 1 3 3 3 3
4 2 1 1 2 2
5 2 2 2 3 3
6 2 3 3 1 1
7 3 1 2 1 3
8 3 2 3 2 1
9 3 3 1 3 2
10 1 1 3 3 2
11 1 2 1 1 3
12 1 3 2 2 1
13 2 1 2 3 1
14 2 2 3 1 2
15 2 3 1 2 3
16 3 1 3 2 3
17 3 2 1 3 1
18 3 3 2 1 2
The levels of process parameters are selected based on the research done by various
researchers and based on the pilot experiments conducted for this research work. The
levels of process parameters selected based on the Taguchi’s design methodology for
Nickel to fit L18 orthogonal array is given in Table 3.
TABLE 3 ORTHOGONAL ARRAYS OF PROCESS PARAMETERS
Exp. No Electrolyte
Concentrat
ion
(mol/lit)
Machinin
g Voltage
(Volts)
Machinin
g Current
(Amps)
Duty
cycle
(%)
Frequenc
y (Hz)
1 0.1 3.5 0.1 33.33 30
2 0.1 5.0 0.3 50.00 40
3 0.1 6.5 0.5 66.66 50
4 0.2 3.5 0.1 50.00 40
5 0.2 5.0 0.3 66.66 50

International Journal of Management, IT & Engineering Vol. 8 Issue 12(1), December 2018,
ISSN: 2249-0558 Impact Factor: 7.119
Journal Homepage: http://www.ijmra.us, Email: [email protected]
Double-Blind Peer Reviewed Refereed Open Access International Journal - Included in the International
Serial Directories Indexed & Listed at: Ulrich's Periodicals Directory ©, U.S.A., Open J-Gage as well as in
Cabell’s Directories of Publishing Opportunities, U.S.A
226 International Journal of Management, IT & Engineering
http://www.ijmra.us, Email: [email protected]
6 0.2 6.5 0.5 33.33 30
7 0.3 3.5 0.3 33.33 50
8 0.3 5.0 0.5 50.00 30
9 0.3 6.5 0.1 66.66 40
10 0.1 3.5 0.5 66.66 40
11 0.1 5.0 0.1 33.33 50
12 0.1 6.5 0.3 50.00 30
13 0.2 3.5 0.3 66.66 30
14 0.2 5.0 0.5 33.33 40
15 0.2 6.5 0.1 50.00 50
16 0.3 3.5 0.5 50.00 50
17 0.3 5.0 0.1 66.66 30
18 0.3 6.5 0.3 33.33 40
VII. RESULTS AND ANALYSIS
Experimental Results
The ECMM experiments are conducted with brass wire tool of 250 microns diameter for
Nickel. In order to achieve proper circularity of machined holes, the anode tool is properly
ground. The test job specimens are kept uniform in size of 50 mm × 25 mm × 0.15
mm.The ECMM experiments were conducted twice in each combination of process
parameters to study its effect over MRR. From the trial 1 and trial 2 experiments, the
average MRR is calculated and tabulated for Nickel in table 4. It can be seen from the
experimental results of Nickel, the obtained MRR ranges from 0.001369 to 0.009577
mm3/min, while the dimension deviation stood between 11 and 31 microns.
Dimensional Deviation
In this work, the main emphasis is given for studying effects on process parameters on
MRR and Dimensional Deviation (DD). A comparative study on the effects of process
parameters on MRR Vs DD is made and the outcome is detailed hereunder. In order to
easily compare the MRR and corresponding DD obtained is plotted on logarithmic scale
for Nickel as given in Figure 5.
TABLE 4 EXPERIMENTAL RESULTS
Exp. No
Material
Removal Rate
(mm3/min.)
Dimensional
Deviation
(microns)
1 0.001632 29
2 0.002123 13
3 0.006307 20
4 0.001839 21
5 0.004033 22

International Journal of Management, IT & Engineering Vol. 8 Issue 12(1), December 2018,
ISSN: 2249-0558 Impact Factor: 7.119
Journal Homepage: http://www.ijmra.us, Email: [email protected]
Double-Blind Peer Reviewed Refereed Open Access International Journal - Included in the International
Serial Directories Indexed & Listed at: Ulrich's Periodicals Directory ©, U.S.A., Open J-Gage as well as in
Cabell’s Directories of Publishing Opportunities, U.S.A
227 International Journal of Management, IT & Engineering
http://www.ijmra.us, Email: [email protected]
6 0.006703 14
7 0.002874 25
8 0.009577 20
9 0.003226 14
10 0.003724 25
11 0.001369 11
12 0.004675 31
13 0.004807 22
14 0.004402 14
15 0.001880 23
16 0.003931 15
17 0.003393 14
18 0.006546 15
Figure 5 MRR Vs Dimensional Deviation – Nickel
Optimization of Machining Parameters
Data pre-processing value of the each individual objective (power consumption and
surface roughness) is obtained by using one of the Eqs. (1), (2) and (3) depending on their
type of quality characteristic. Calculate the grey relational co-efficient by using Eq (4). The
value for is taken as 0.5 in Eq. (4) since all the process parameters are of equal
weighting. Computed data pre-processing value for each individual objective and their
grey relational coefficient are shown in Table 5.
Next, the grey relational grade can be computed using fuzzy logic analysis. Grey relational
coefficients of MRR and DD are taken as input to the fuzzy model and the output is grey-
fuzzy reasoning grade. Graphical representation of developed fuzzy logic model using
MATLAB 2007b is shown in Figure 6. In this study the most popular defuzzification
method is the centroid calculation, which returns the centre of area under the curve. The
defuzzifier can convert the fuzzy value into non-fuzzy value which is called as grey-fuzzy
reasoning grade. The membership function adopts in this is trapezoidal membership
function which has a flat top and really is just a truncated triangle curve. The responses for
the machining process have been designed as membership function of the developed fuzzy

International Journal of Management, IT & Engineering Vol. 8 Issue 12(1), December 2018,
ISSN: 2249-0558 Impact Factor: 7.119
Journal Homepage: http://www.ijmra.us, Email: [email protected]
Double-Blind Peer Reviewed Refereed Open Access International Journal - Included in the International
Serial Directories Indexed & Listed at: Ulrich's Periodicals Directory ©, U.S.A., Open J-Gage as well as in
Cabell’s Directories of Publishing Opportunities, U.S.A
228 International Journal of Management, IT & Engineering
http://www.ijmra.us, Email: [email protected]
model shown in Figure 7. There are five fuzzy sets for variables of grey relational
coefficient of MRR and DD: very small (VS), small (S), medium (M), large (L), and very
large (VL). The same way output variable grey-fuzzy reasoning grade there are nine fuzzy
sets shown in Figure 8: tiny (T), very small (VS), small (S), small medium (SM), medium
(M), medium large (ML), large (L), very large (VL), and huge (H).The fuzzy rules in a
matrix form used for the fuzzy logic are shown in Table 6.
TABLE 5 THE DATA PRE-PROCESSING OF EACH INDIVIDUAL
OBJECTIVE (MRR AND DD) AND THEIRGREY RELATIONAL COEFFICIENT
Ex.No Data
Pre-processing-
MRR
Data
Pre-processing-
DD
Grey relational
coefficient -
MRR
Grey relational
coefficient -
DD
1 0.0320 0.1000 0.3406 0.3571
2 0.0919 0.9000 0.3551 0.8333
3 0.6016 0.5500 0.5566 0.5263
4 0.0573 0.5000 0.3466 0.5000
5 0.3246 0.4500 0.4254 0.4762
6 0.6499 0.8500 0.5881 0.7692
7 0.1834 0.3000 0.3798 0.4167
8 1.0000 0.5500 1.0000 0.5263
9 0.2262 0.8500 0.3925 0.7692
10 0.2869 0.3000 0.4122 0.4167
11 0.0000 1.0000 0.3333 1.0000
12 0.4028 0.0000 0.4557 0.3333
13 0.4189 0.4500 0.4625 0.4762
14 0.3695 0.8500 0.4423 0.7692
15 0.0623 0.4000 0.3478 0.4545
16 0.3121 0.8000 0.4209 0.7143
17 0.2466 0.8500 0.3989 0.7692
18 0.6307 0.8000 0.5752 0.7143
Figure 6 Developed Fuzzy logic model for ECMM responses
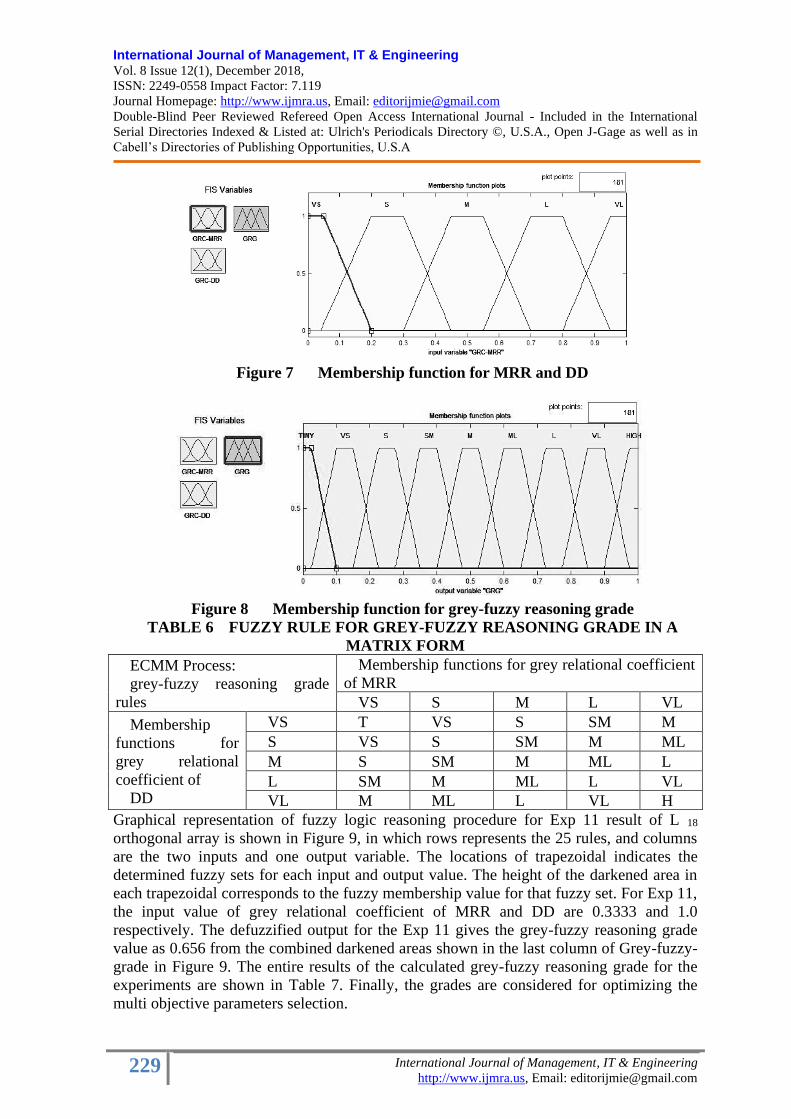
International Journal of Management, IT & Engineering Vol. 8 Issue 12(1), December 2018,
ISSN: 2249-0558 Impact Factor: 7.119
Journal Homepage: http://www.ijmra.us, Email: [email protected]
Double-Blind Peer Reviewed Refereed Open Access International Journal - Included in the International
Serial Directories Indexed & Listed at: Ulrich's Periodicals Directory ©, U.S.A., Open J-Gage as well as in
Cabell’s Directories of Publishing Opportunities, U.S.A
229 International Journal of Management, IT & Engineering
http://www.ijmra.us, Email: [email protected]
Figure 7 Membership function for MRR and DD
Figure 8 Membership function for grey-fuzzy reasoning grade
TABLE 6 FUZZY RULE FOR GREY-FUZZY REASONING GRADE IN A
MATRIX FORM
ECMM Process:
grey-fuzzy reasoning grade
rules
Membership functions for grey relational coefficient
of MRR
VS S M L VL
Membership
functions for
grey relational
coefficient of
DD
VS T VS S SM M
S VS S SM M ML
M S SM M ML L
L SM M ML L VL
VL M ML L VL H
Graphical representation of fuzzy logic reasoning procedure for Exp 11 result of L 18
orthogonal array is shown in Figure 9, in which rows represents the 25 rules, and columns
are the two inputs and one output variable. The locations of trapezoidal indicates the
determined fuzzy sets for each input and output value. The height of the darkened area in
each trapezoidal corresponds to the fuzzy membership value for that fuzzy set. For Exp 11,
the input value of grey relational coefficient of MRR and DD are 0.3333 and 1.0
respectively. The defuzzified output for the Exp 11 gives the grey-fuzzy reasoning grade
value as 0.656 from the combined darkened areas shown in the last column of Grey-fuzzy-
grade in Figure 9. The entire results of the calculated grey-fuzzy reasoning grade for the
experiments are shown in Table 7. Finally, the grades are considered for optimizing the
multi objective parameters selection.

International Journal of Management, IT & Engineering Vol. 8 Issue 12(1), December 2018,
ISSN: 2249-0558 Impact Factor: 7.119
Journal Homepage: http://www.ijmra.us, Email: [email protected]
Double-Blind Peer Reviewed Refereed Open Access International Journal - Included in the International
Serial Directories Indexed & Listed at: Ulrich's Periodicals Directory ©, U.S.A., Open J-Gage as well as in
Cabell’s Directories of Publishing Opportunities, U.S.A
230 International Journal of Management, IT & Engineering
http://www.ijmra.us, Email: [email protected]
FIGURE 9 Fuzzy Logic Rules Viewer For The Model Exp 11
TABLE 7 GREY-FUZZY REASONING GRADES AND THEIR RANKS
Ex.No Fuzzy-GRGrade Rank 1 0.3430 18 2 0.5860 7 3 0.5070 10 4 0.4160 15 5 0.4760 12 6 0.6600 2 7 0.4060 16 8 0.7500 1 9 0.5750 9
10 0.4250 13 11 0.6560 3 12 0.4060 16 13 0.5000 11 14 0.6170 5 15 0.4170 14 16 0.5980 6 17 0.5800 8 18 0.6490 4
From the value of grey-fuzzy reasoning grade in Table 7, the main effects are tabulated in
Table 8 and the factor effects are plotted in Figure 10. Considering the parameter level
with higher value of mean grey-fuzzy reasoning grade for each individual parameter in

International Journal of Management, IT & Engineering Vol. 8 Issue 12(1), December 2018,
ISSN: 2249-0558 Impact Factor: 7.119
Journal Homepage: http://www.ijmra.us, Email: [email protected]
Double-Blind Peer Reviewed Refereed Open Access International Journal - Included in the International
Serial Directories Indexed & Listed at: Ulrich's Periodicals Directory ©, U.S.A., Open J-Gage as well as in
Cabell’s Directories of Publishing Opportunities, U.S.A
231 International Journal of Management, IT & Engineering
http://www.ijmra.us, Email: [email protected]
Table 8 and Figure 10, the optimal parameter conditions A3B2C3D1E2 is obtained. Using
the grey-fuzzy reasoning grade value, ANOVA is formulated for identifying the significant
factors. The results of ANOVA are given in Table 9. From the ANOVA results, it is clear
that Machining Voltage (39.50 %) influences more on ECMM of nickel followed by
Electrolyte concentration (19.91%), Machining Current (18.87%), Duty cycle (6.31%) and
Frequency (5.50%).
TABLE 8 RESPONSE TABLE FOR THE GREY-FUZZY REASONING
GRADE
Parameter Level 1 Level 2 Level 3
MAX-
MIN
A 0.4872 0.5143 0.5930 0.1058
B 0.4480 0.6108 0.5357 0.1628
C 0.4978 0.5038 0.5928 0.0950
D 0.5552 0.5288 0.5105 0.0447
E 0.5398 0.5447 0.5100 0.0347
TABLE 9 RESULTS OF THE ANALYSIS OF VARIANCE FOR THE GREY-
FUZZY REASONING GRADE
Factor DOF SS MS F-Test
F-
Table
%
Contn
A 2 0.0442 0.0221 7.13 18.50 19.91
B 2 0.0877 0.0439 14.15 18.50 39.50
C 2 0.0419 0.0210 6.76 18.50 18.87
D 2 0.0140 0.0070 2.26 18.50 6.31
E 2 0.0122 0.0061 1.97 18.50 5.50
Error 7 0.0220 0.0031 9.91
Total 17 0.2220 100.00
Figure 10 The response graph for each level of ECMM parameters
Confirmation Test
The optimum level of process parameters has been determined by using S/N ratio values
(higher-the-better). Once the optimal level of the process parameters has been selected, the

International Journal of Management, IT & Engineering Vol. 8 Issue 12(1), December 2018,
ISSN: 2249-0558 Impact Factor: 7.119
Journal Homepage: http://www.ijmra.us, Email: [email protected]
Double-Blind Peer Reviewed Refereed Open Access International Journal - Included in the International
Serial Directories Indexed & Listed at: Ulrich's Periodicals Directory ©, U.S.A., Open J-Gage as well as in
Cabell’s Directories of Publishing Opportunities, U.S.A
232 International Journal of Management, IT & Engineering
http://www.ijmra.us, Email: [email protected]
final step is to predict and verify the improvement of the performance characteristic using
the optimal level of the process parameters. The purpose of conformation test is to validate
the conclusions drawn from analysis of experimental results. The predicted or estimated
GRG (η) using optimal levels of process parameters can be calculated with the following
equation;
ηm- Total mean of GRG
ηi– Mean of GRG at optimum level
q – No. of significant parameters
After predicting the response (GRG), a confirmation experiment has been designed and
conducted with the optimal level of the machining parameters to verify the improvement of
performance characteristics is shown in table 10.
TABLE 10 THE COMPARISON RESULTS OF INITIAL AND OPTIMAL
TURNING PERFORMANCE
Initial turning parameters
Optimal turning
parameters
Prediction Experiment
Levels
A1B2C2D2E2
MRR (mm3/min.)0.002123
DD (microns) 13
Grey-Fuzzy reasoning grade
0.5070
Improvement of grey-fuzzy
reasoning grade
A3B2C3D1E2
0.7705
0.2635
A3B2C3D1E2
0.00914
15
VIII. CONCLUSION
The effects of process parameters and the optimum cutting parameters for ECMM process
on the multiple objectives are systematically investigated by grey relational analysis and
fuzzy logic with orthogonal arrays. The following conclusions are obtained Approach of
grey based fuzzy logic analysis was a productive method for optimizing the multi-
objectives such as MRR and DD in ECMM of nickel.In the results of ANOVA, it is
revealed that machining voltage, electrolyte concentrationand machining currentare
predominant factors which affect the ECMM of Nickel. Machining voltage (39.50 %)
influences more on ECMM of nickel followed by electrolyte concentration (19.91%),
machining current (18.87%), duty cycle (6.31%) and frequency (5.50%).The best
performance characteristics were obtained with optimal setting A3B2C3D1E2.Through the
optimum procedure of grey-fuzzy logic with orthogonal arrays, the level constitution of
optimal cutting parameters are acquired and verified by confirmation test. The results
proved that the multiple objectives are improved simultaneously by using this approach.

International Journal of Management, IT & Engineering Vol. 8 Issue 12(1), December 2018,
ISSN: 2249-0558 Impact Factor: 7.119
Journal Homepage: http://www.ijmra.us, Email: [email protected]
Double-Blind Peer Reviewed Refereed Open Access International Journal - Included in the International
Serial Directories Indexed & Listed at: Ulrich's Periodicals Directory ©, U.S.A., Open J-Gage as well as in
Cabell’s Directories of Publishing Opportunities, U.S.A
233 International Journal of Management, IT & Engineering
http://www.ijmra.us, Email: [email protected]
REFERENCES
1. Bhattacharyya .B and Munda .J, “Experimental investigation on the influence of
electrochemical machining parameters on machining rate and accuracy in
micromachining domain”, International Journal of Machine Tools & Manufacture,
Vol.43, pp.1301-1310, 2003.
2. Datta .M, Derek Harris, "Electrochemical micromachining: An environmentally
friendly, high speed processing technology", Electrochimica Acta, Vol.42, pp.3007-
3013, 1997.
3. Datta .M, “Micro fabrication by electrochemical metal removal, IBM Journal of
Research and Development, Vol.42, No.5, pp. 655–669, 1998.
4. Bhattacharyya .B, Malapati .M, Munda .J, and Sarkar .A, "Influence of tool vibration
on machining performance in electrochemical micro-machining of copper",
International Journal of Machine Tool and manufacture, Vol.47, pp.335-342, 2007.
5. Da Silva Neto. C.J, Da Silva .M.E, and Da Silva .B.M, "Intervening variables in
electrochemical machining", Journal of Materials Processing Technology, Vol.179,
pp.92-96, 2006.
6. Deng, J. (1989) ‘Introduction to grey system’, Journal of Grey system, Vol.1, pp.1-24.
7. Lin, C. L. and Lin, J. L. (2002) ‘The use of orthogonal array with Grey relational
analysis to optimize the EDM Process with multiple performance characteristics’,
Journal of Material Processing Technology Vol.42, pp.237-244.
8. Chiang,K. T. and Chang, F. P. (2006) ‘Application of grey-fuzzy logic on the optimal
process design of an injection-molded part with a thin shell feature’,International
communications in heat and Mass Transfer Vol.33, pp.94-101.
9. Tosun, N. (2006) ‘Determination of optimum parameters for multi-performance
characteristics in drilling by using grey relational analysis’, International Journal of
Advanced Manufacturing Technology Vol.28, pp.450-455.
10. Lin,Z. C. and Ho, C. Y. (2003) ‘Analysis and application of grey relational and
ANOVA in chemical-mechanical polishing process parameters’, International Journal
of Advanced Manufacturing Technology Vol.21, pp.10-14.
11. Zadeh,L. (1965) ‘Fuzzy sets’, Information Control Vol.8, pp.338-353.
12. Zadeh,L. (1995) The MathWorks User guide, Version 2, Fuzzy Logic Toolbox.
13. Lin,J. L., Wang, K. S., Yan, B. H. and Tarng, Y. S. (2000) ‘Optimization of the
electrical discharge machining process based on the Taguchi method with fuzzy
logics’, Journal of Material Processing Technology, Vol.102, pp.48-55.
14. Lin,C. L., Lin, J. L. and Ko, T. C. (2002) ‘Optimization of the EDM Process based on
the orthogonal array with fuzzy logic and Grey relational analysis
method’International Journal of Advanced Manufacturing Technology, Vol.19,
pp.211-277.

International Journal of Management, IT & Engineering Vol. 8 Issue 12(1), December 2018,
ISSN: 2249-0558 Impact Factor: 7.119
Journal Homepage: http://www.ijmra.us, Email: [email protected]
Double-Blind Peer Reviewed Refereed Open Access International Journal - Included in the International
Serial Directories Indexed & Listed at: Ulrich's Periodicals Directory ©, U.S.A., Open J-Gage as well as in
Cabell’s Directories of Publishing Opportunities, U.S.A
234 International Journal of Management, IT & Engineering
http://www.ijmra.us, Email: [email protected]
Design a machine learning algorithm to predict the rent of a
property using AWS and cloud computing
Shubham Badyal
Sandeep Bhargav
Abstract: - Future preparations are the key to success. The essential part of the land
search, since there is a backup reserve for emergency repair to plan the right rental fare.
While preparing for what it will hold for the 2019 rental market. The trends that are
coming in 2015 and how you can make the best preparation for them are as follows. So
we've built a cloud-based rental analysis method using machine learning that enables them
to detect a rental pattern in a particular area. Online rental applications are not only
convenient for potential tenants, but they are also more practical for you as a landlord. The
online application protects you from collecting information, losing applications, mixing
applicant information and being responsible for sensitive personal information. In the
world that is increasingly on security, online rental applications can provide you with the
option to identification paper copies.
Keyword: House Rent, Property price, cloud, AWS, Machine learning
1. Introduction
Machine learning has been used over the years for image recognition, spam detection,
original commentary understanding, product suggestion, and treatment diagnosis. Today,
the machine learning algorithm can help improve our cyber security, ensure public safety
and improve medical results. Machine learning system can make customer service better
and automobile safety. Machine learning is the practice of building systems, which are
known as models, which can be trained using data to look for patterns that can then be used
to predict new data. A significant difference is that the machine learning model is not a
rule-based system, where 'if / then' is used for a series of predictions (for example, 'if a
student misses more than 50% of classes, they fail automatically'). Rather, it is the one
where the statistical relationships we used to know about the past examples of what we are
predicting and then applied to new data. Where your house is sold, and you are trying to
ask the price. You can look at other homes that you recently sold in your area, and find that
you're most familiar. Every house you look at is known as an observation. When you are
trying to find the same room, you can see the size of the house, how many bedrooms and
the bathroom they have. You seem to feature every feature of these features. Machine
learning
Through learning, the process of acquiring knowledge can generally be defined. We started
the process of learning new things from people born. This learning process continues
throughout our lives, where we try to gather more knowledge and try to improve the
experience we have learned through experience and the information gathered around us.
Artificial Intelligence (AI) is a field of computer science that aims to create a system that
performs tasks and displays intelligent behaviour. A system can be considered intelligent
without any human intervention and if it learns to play an action relating to a defined
Research Scholar, Center for cloud infrastructure and security, Suresh Gyan Vihar University, Jaipur Assistant professor, Center for cloud infrastructure and security, Suresh Gyan Vihar University, Jaipur

International Journal of Management, IT & Engineering Vol. 8 Issue 12(1), December 2018,
ISSN: 2249-0558 Impact Factor: 7.119
Journal Homepage: http://www.ijmra.us, Email: [email protected]
Double-Blind Peer Reviewed Refereed Open Access International Journal - Included in the International
Serial Directories Indexed & Listed at: Ulrich's Periodicals Directory ©, U.S.A., Open J-Gage as well as in
Cabell’s Directories of Publishing Opportunities, U.S.A
235 International Journal of Management, IT & Engineering
http://www.ijmra.us, Email: [email protected]
process without proper precision. A sub-field of Machine Learning (ML),AI is a matter of
concern that the algorithm and the evolution of strategies for the computer's permission,
understanding and evaluation ML intertwines with other statistics such as statistics, human
psychology, and brain modelling. Psychological psychology and neurological models
derived from brain modelling help to understand the process of human brain activity, and
especially its learning process, which can be used to form the ML algorithm. Since many
ML uses data analysis to create algorithm models, statistics play a significant role in this
regard.
Knowledge increases the size or size of the body, making it difficult for people to
determine the new relationship between the information generation processes (domain).
ML tries to create computational models that accurately and efficiently represent
computers from the algorithm domain and knowledge base. The built-in model captures
the process of domain generation and uses this model to match the previously stunning
examples of algorithm domain.
Each example consists of a set of input attributes and an output feature. Input features are
informational responses to the information and output attributes provided in the Learning
Algorithm. The value of the output attribute depends on the benefits of the input attributes.
In addition to the amount provided in it, the feature defines a property, which creates the
properties vector of an element. The model generated by an algorithm can be seen as a
function that maps the input properties as a value to the output quality.
Much information may be random when seen in a naked eye, but in close examination we
can find patterns and relationships in it. We get insight into the process of data production.
With and Frank [2005] Data Mining is defined as the process of data mining data
discovery. It is known as the process of extracting relationships from the given
information. A different model from general data mining machine learning is considered
with the model learning function. Among the data mining issues, we can see the data
generation process as information created by domain and knowledge base. Therefore, ML
algorithms can be used to learn a model that describes the process of data generation based
on given datasets. The information provided by the algorithm for the model is called
training information because the computer is trained to learn from this information and the
result model of the learning model. This model can now be used to predict or classify
previously invisible examples. The new case used to evaluate the model is called a trial set.
The goal of the test set can be assumed that the accuracy of a model from the difference
between the value prediction and the actual quality can be estimated.
Forecast forecasting can be considered as an example of data mining. Using weather data
collected from a location for some time, we get a model for predicting variables such as
temperature based on the input of the model. Following weather conditions follow patterns
and not completely random, we can use current weather readings with readings taken at
nearby locations, as well as in some places, a few hours before forecast location. In this
way, examples used for model creation are examples of the dynamic features mentioned in
one of these positions for the current location - Previous and previous hour readings may
appear from a set of nearby locations as input attributes. For example, the types and
conditions of the covered conditions depend on the variability that we are trying to predict
and use in the features of the ML algorithm.

International Journal of Management, IT & Engineering Vol. 8 Issue 12(1), December 2018,
ISSN: 2249-0558 Impact Factor: 7.119
Journal Homepage: http://www.ijmra.us, Email: [email protected]
Double-Blind Peer Reviewed Refereed Open Access International Journal - Included in the International
Serial Directories Indexed & Listed at: Ulrich's Periodicals Directory ©, U.S.A., Open J-Gage as well as in
Cabell’s Directories of Publishing Opportunities, U.S.A
236 International Journal of Management, IT & Engineering
http://www.ijmra.us, Email: [email protected]
1.1.Problem Definition
We present a model that can predict London housing prices in the future. Select a response
method, explore and compare different response methods. We take advantage of the local
structure of dataset to distribute computations in small independent local models. The
overall forecast is achieved by recombining predictions from the regional model. Programs
predict about modelling and server-side applications, we can focus on offline
computability intensive tasks and create client-side visualizations. Our results show that
our approach to the problem has been very successful and other housing prices could create
competitive forecasts for prediction models.
2. Literature review
Computer learning is a branch of artificial intelligence, which aims to develop strategies
that allow computers to learn. More firmly, it is able to create algorithms for generalization
behaviour and to identify patterns from the information provided in the example form. So,
it is the process of bringing knowledge, that is, a method that allows general statements of
general statements. When all separate cases are observed, induction is considered
completely, so it is believed that the generalization of that growth is valid. Obviously, it is
impossible to achieve full integration in most cases, so the statement is raised, subject to a
specific degree of uncertainty, and so consideration cannot be considered as a valid plan or
cannot prove the validity of the experience. In many cases, the field of the machine is
covered with the field of data mining, because the two disciplines concentrate on data
analysis, but machine learning gives more attention to the complexity of their
implementation problems from their computers. See the real point, not only the theoretical.
At the basic level, we can say that one of the functions of AA is to try to extract knowledge
about some inert features of an object based on the properties of the same object (or
features shown in others). Or, in general, predict the future in the future based on what has
happened in the future. For example, a very current model in the future determines whether
the customer will prefer the customer based on the desired rating.
In some cases, the first thing we learn about what we're talking about is:
Education: After solving this idea, we want to give a simple method of self-education
production, providing a way to measure the success / failure of our knowledge. In any case,
we are transferring an intuitive concept and we usually use it in a computational context of
everyday life, it should be considered that we measure the numerical point of view as well
as various forms of measurement, which are closely related to close points and relate to a
spontaneous close relationship and we tried to learn Abe.
The general definition of education in the human context can be as follows: research,
experience, guidance, logic and observation of results, skills, knowledge, behaviour or
quality can be achieved or corrected. From this definition, it is necessary to know that the
environment must be learned from experience, not to be based on all knowledge or
knowledge of education, which is achieved through the normal or normal growth of the
person. Following similar projects, we can learn from the experience of the machine at
AA, learning from its experience, a method that is not from the recognition of priority
program. Therefore, how to implement this definition of computing is to understand the
central function (for example) using different types of recommendations (for example)
recommendation systems, for example, to add specific customer / product pairs, to evaluate
the machine experience through the object. Have).

International Journal of Management, IT & Engineering Vol. 8 Issue 12(1), December 2018,
ISSN: 2249-0558 Impact Factor: 7.119
Journal Homepage: http://www.ijmra.us, Email: [email protected]
Double-Blind Peer Reviewed Refereed Open Access International Journal - Included in the International
Serial Directories Indexed & Listed at: Ulrich's Periodicals Directory ©, U.S.A., Open J-Gage as well as in
Cabell’s Directories of Publishing Opportunities, U.S.A
237 International Journal of Management, IT & Engineering
http://www.ijmra.us, Email: [email protected]
We have a large number that fall into the learning connection. The main differences
between them are trying to predict that they are trying to predict. Some common classes
are:
Feedback: They try to predict an actual value. For example, the behaviour of bags (time)
predicts the price of the pack within the stipulated time. Or a student grade prediction of
final exam based on the grade obtained from various jobs performed during the course.
Classification (binary or proprietary): They try to predict the classification of the class
of a set of predefined categories. For example, when certain news, sports, entertainment,
politics, etc. are classified, only two possible courses are organized, but this is called
binary class; if more than two classes are approved, we are talking about ownership
classification.
Ranking: Try to predict the best sequence of a set of objects according to the predefined
relevance. For example, a search engine provides Internet resources in response to user
searches.
Fig 1: Data Distribution and processing in machine learning
In general, when a new AA problem is solved, the first thing is to identify one of the
previous classes, depending on whether it is classified, that method which we can measure
error in prediction and reality. As a result, in order to estimate how successful learning is
achieved, treatment should be treated in every particular area, although in general, we can
expect that we have a measurement of "embedded" in our place.
On the other hand, and depending on how the type of production and treatment of the
example is mentioned, different AA algorithms can be grouped by:
Learning under supervision: A function is created, which establishes a connection
between the input and output of the system, where the knowledge of the network consists
of pre-labelled examples (for example, we recognize their proper classification). An
example of this type of algorithm is the classification problem we mentioned earlier.
Uneducated Education: Modelling is done only on a set of examples created by system
input, without identifying just the right information. So the system can detect new patterns
to enable labelling patterns.
Semiovorrified Education: It considers the combination of two algorithms, both
classified and non-approved.
To learn reinforcement: In this case, the algorithm observes the Earth around it and
provides continuous information from sides (from the earth to the machine and from the
computer to the earth), an experimental and error process and the world reciprocates a
positive reaction

International Journal of Management, IT & Engineering Vol. 8 Issue 12(1), December 2018,
ISSN: 2249-0558 Impact Factor: 7.119
Journal Homepage: http://www.ijmra.us, Email: [email protected]
Double-Blind Peer Reviewed Refereed Open Access International Journal - Included in the International
Serial Directories Indexed & Listed at: Ulrich's Periodicals Directory ©, U.S.A., Open J-Gage as well as in
Cabell’s Directories of Publishing Opportunities, U.S.A
238 International Journal of Management, IT & Engineering
http://www.ijmra.us, Email: [email protected]
Translation: It is similar to learning under supervision, but its goals are not explicitly
forming a function, but only in the following examples, examples of example examples,
related sections and new examples try to predict those categories. That is, it will be close to
the idea of adequate supervision.
• Multi-task learning: Includes teaching methods to face the difficulties encountered in the
system previously taught.
1. Recommended model
Based on the Gaussian process model, we discuss the design and implementation of our
predicted system for rental housing prices. How the dataset is being created,
implementation languages and libraries are used for training of dataset and how it is
predicted according to the project's requirements.
3.1 Data Collection
Data Collection: To prepare the dataset for prediction system, some changes have been
made:
1. In order to capture the geographical changes of the housing prices more accurately, we
decided to represent latitude and long-term property rather than the postcode. This is
suitable for neighbouring regions, which basically share the same postcode compared to a
postcode
2. This process is automated with a Python script, which shows a postcode of pre-compiled
CSV files from London Postcodes and provides the corresponding letter and length.
Since January 1995, our transaction date has been introduced since January 1995 (the first
month of our dataset transaction), which makes it easy to present only a few months and a
few months instead of year.
Binary class variables (build and expiration) are represented using a binary number (i.e., 0)
= 0, 0 = old, 1 = new / (time) 0 = child, 1 = freehold), when the property type has three
binary numbers is presented using.
3. Using dummy coding [43] (for example 000 = separate, 100 = semi-dry, 010 = roof, 001
= flat). 4. Thousands of quality qualities are often quoted; we have surrounded our
dependent variables with the nearest thousand, which also helps in the numerical stability
of the model.
3. 2. Use the data set
Due to the large number of data points (2.4 million) of data, a GP model training using the
entire dataset will be completely ignored. However, the size of our dataset should be
limited to 104 above the upper limit, which means that less than 1% of the entire dataset,
which is inevitable. In this way, we will use the concepts distributed in our prediction
models, use our datasets and provide a way to combine local models. The exploitation of
specific features of our datasets makes the idea of using local models much more. To
create a local model, we have shared datasets in multiple subsets by location. It will draw a
square grid on the map. And group the data points in a box on the subset. Each subset of
the training will be done independently. In spite of our dataset section, we still face the
problem of having an incomplete number of data points among different subsets. There
may be a dataset with 10,000 data points in the central London area, when there is a dataset
below 100 data points in areas outside of central London. Regardless of the granularity of
the square grid, it will be effective in the number of data points on each subset and
maintain the upper bound. Finally, the number of data points is used, granularity and
training are taken, and we propose to extend lengths length of 1km length to 50 x 100 sq.

International Journal of Management, IT & Engineering Vol. 8 Issue 12(1), December 2018,
ISSN: 2249-0558 Impact Factor: 7.119
Journal Homepage: http://www.ijmra.us, Email: [email protected]
Double-Blind Peer Reviewed Refereed Open Access International Journal - Included in the International
Serial Directories Indexed & Listed at: Ulrich's Periodicals Directory ©, U.S.A., Open J-Gage as well as in
Cabell’s Directories of Publishing Opportunities, U.S.A
239 International Journal of Management, IT & Engineering
http://www.ijmra.us, Email: [email protected]
GB where the subsets are low and high, 200 and respectively 2,000 data points
respectively. Subscriptions with the following data points below will not be considered in
our model below the border.
4. Training of data
Using the following methods, we will provide information on the data network using the
Radial Basis Function Network.
Radiologists Basis Function Network [Bohemian and Albany, 2003; Orr, 1996] another
kind of forward-forward neural network. It has three layers: input, hidden and output level.
The hidden layer unit separates from an MLP in the process of counting. An RRF network
can create both feedback and classification models. We will describe the regression model.
In one Arabic information, inputs are mapped to each hidden unit from the input level. The
Secret Group uses radial functions for activation Gaussian, multi-quadrilateral, inverse-
multi centric and Kochi [and, 1996]. WEKA's RBF network [with and Wang, 2005] uses
the Gaussian function of the bell-size. Activating the Gaussian function for given input x
(x) reduces the distance between Gaussian and X growth centers somewhat. The Gaussian
function is effective for detecting hidden unit activation, inputs can be activated depending
on their intimacy in the center of an unknown group, and thus can be used as an effective
method for the separation of contributions. Gaussian function form
H (x) = "exp" ((- (x-c) ^ 2) / r ^ 2).
The output layer takes the linear coordinates of the output from the hidden unit and
corresponds to a regression model. For our weather model, an RFF network will be shown
in Figure 2.9.
It takes input and hidden units as an RBF network point. The activation of the unknown
group represents the input value and the distance between points that represent the location
of the unknown unit. Distance converter
Figure 2: An ARBF network with N hidden unit to predict the temperature at a site.
X network and output are given input vectors.
Rent_Ct is the sum of the products of the activation of hidden units and their associated
weight. Each secret group has its academic center.
Measurement of similarity by the Gaussian function. The space point for the hidden unit is
obtained from the center of Gaussian for the undercover unit. Gaussian's width is also a
learned parameter.

International Journal of Management, IT & Engineering Vol. 8 Issue 12(1), December 2018,
ISSN: 2249-0558 Impact Factor: 7.119
Journal Homepage: http://www.ijmra.us, Email: [email protected]
Double-Blind Peer Reviewed Refereed Open Access International Journal - Included in the International
Serial Directories Indexed & Listed at: Ulrich's Periodicals Directory ©, U.S.A., Open J-Gage as well as in
Cabell’s Directories of Publishing Opportunities, U.S.A
240 International Journal of Management, IT & Engineering
http://www.ijmra.us, Email: [email protected]
Evolution
Assessment we have been directed to create a rental house price forecast application that
has met the primary purpose of this project. However, the final product alone does not
measure the performance and effectiveness of our project. In this chapter, we will evaluate
the quality of our prediction system; see the efficacy of the forecasting system, and the
effectiveness of the application.
Predicting Method: To measure the quality of our GP based prediction method, we use
Root Average Squared Errors (RMS) and mean predictive log possibilities (MPLL). RMSE
is defined by the square root of the two squares (average * y * - f (x *)) in the ratio and the
actual values of each test point in our validation set. Under the MPLL model, the
probability of each test input log prediction is defined by the average.
GP produces a Gaussian Prophecy Density; the log is defined as the predictive chances of
log p(y∗|D, x∗) = − 1 2 log(2πσ) − (y∗ − f(x∗))2 2σ 2 + const, where σ 2 = σ 2 ∗ + σ 2 n ,
Respectively prediction and word variant sum. We independently trained each subset of
data, and we will calculate the average of RMSEs and MPLL across the entire Gulf, and
use them as a comparison between different prediction methods. The results of various
methods were presented at table 6.1. Out of the results, it is clear that choosing our
prediction method using GP is ideal for us because it offers the lowest RMSE and
maximum MPLL. To determine our model competition, we compare the error estimates.
Remove outliers from the dataset
Monitoring points that are outgoing from other observations. For example, my data
contained a house with an area of 50 square meters worth $ 500. These types of houses
may be in the market for a variety of reasons, but they are not statistically significant. I
want to estimate a price based on the market average, and so I will not take such extra
steps in the account.
Most response methods need to be expelled out of the dataset because they can
significantly affect the outcome. I have used the following functions to remove the
outgoing:
Then, you only have non-external monitoring. Now it's time to start the regression
analysis.
3.1 Select a response algorithm
There are several ways to analyze feedback. The best prediction accuracy given by our
information is that we are looking for. But how can we check the accuracy? A common
way to calculate a so-called r ^ 2 score is that a square difference between a real and
predictive quality. It is important to remember that if we use the same dataset to learn and
verify accuracy, then our model can be blocked. It will display excellent accuracy in a
given dataset, but it will fail after new data is supplied. A common method to solve this
problem is to split the original dataset into two parts and then test it for testing and use it
for the other. In this way, we will follow the new information for our learning model and if
we have any object we can spot it.

International Journal of Management, IT & Engineering Vol. 8 Issue 12(1), December 2018,
ISSN: 2249-0558 Impact Factor: 7.119
Journal Homepage: http://www.ijmra.us, Email: [email protected]
Double-Blind Peer Reviewed Refereed Open Access International Journal - Included in the International
Serial Directories Indexed & Listed at: Ulrich's Periodicals Directory ©, U.S.A., Open J-Gage as well as in
Cabell’s Directories of Publishing Opportunities, U.S.A
241 International Journal of Management, IT & Engineering
http://www.ijmra.us, Email: [email protected]
We can share our datasets using the 80/20 ratio. We will use 80% for training and the
remaining 20% for the exam. Let's take a look at this piece of code://code for algorithm
quality estimation
Fig: 04 code for algorithm quality estimation

International Journal of Management, IT & Engineering Vol. 8 Issue 12(1), December 2018,
ISSN: 2249-0558 Impact Factor: 7.119
Journal Homepage: http://www.ijmra.us, Email: [email protected]
Double-Blind Peer Reviewed Refereed Open Access International Journal - Included in the International
Serial Directories Indexed & Listed at: Ulrich's Periodicals Directory ©, U.S.A., Open J-Gage as well as in
Cabell’s Directories of Publishing Opportunities, U.S.A
242 International Journal of Management, IT & Engineering
http://www.ijmra.us, Email: [email protected]
As a result, I got the following graph:
Fig 5: Random forest response shows the precision
Conclusion
As you can see, the random forest response shows the precision, so we decided to use this
algorithm to produce. Production cost assessment works much like our test code, no ^ 2
calculations are needed and switch models now. At this time, we can predict fair prices.
We can compare the real value of a house with our predicted value and keep deviations.
Look at my home price forecasts project. I've designed housing analysis from an
undeveloped devaluation. Naturally, my house price forecast algorithm is not 100%
accurate. But this is acceptable for me because my primary goal is to create a custom
ranking that can reduce the amount of manual work for those who buy or sell homes and
compare prices in the market. An ARF network is trained to learn the centres of hidden
units and the width of Gaussian functions and then adjust the weight of the feedback model
used in the output unit. The K-Medium clustering algorithm can be used to learn at the
Gaussian function canter, which can use clusters for training Ga Gaussian functions for
every aspect of the instant. If the Gaussian function parameters are found in secret units,
the output units of this unit are coordinated using linear response. The process can be
repeated to learn an EM method.
References
[1] Ambrose, P. and Barlow, J. (1987), Housing Provision and House Building in Western
Europe: Increasing Expenditure, Declining Output, Housing Markets and Policies under
Fiscal Austerity, London, Greenwood Press.
[2] Cooper, M. (1998), Ideas to develop a literature review, vol. 3, page, 39.
[3] Erguden, S. (2001), Low cost housing policies and constraints in developing countries,
International conference on spatial development for sustainable development, Nairobi.
[4] Golland , A. (1996), Housing supply, profit and housing production: The case of the
United Kingdom, Netherlands and Germany, Journal of Housing and the Built
Environment, vol.11, no1.

International Journal of Management, IT & Engineering Vol. 8 Issue 12(1), December 2018,
ISSN: 2249-0558 Impact Factor: 7.119
Journal Homepage: http://www.ijmra.us, Email: [email protected]
Double-Blind Peer Reviewed Refereed Open Access International Journal - Included in the International
Serial Directories Indexed & Listed at: Ulrich's Periodicals Directory ©, U.S.A., Open J-Gage as well as in
Cabell’s Directories of Publishing Opportunities, U.S.A
243 International Journal of Management, IT & Engineering
http://www.ijmra.us, Email: [email protected]
[5] Hancock, T. (1998), Caveat partner: Reflection of Partnership with the private sector,
Health promotion international, vol. 13, no 3
[6] Priya Gupta, 2 Surendra Sutar, “Multiple Targets Detection And Tracking System For
Location Prediction”, International Journal of Innovations in Scientific and Engineering
Research (IJISER), Vol.1, No.3, pp.127-130,2014.
[7] Levin, K. (1999), Database Management Systems: How to use Relational Databases,
vol. 2, no 4.
[8] Macoloo, G. (1994), The changing nature of financing low income urban housing
development in Kenya, Housing Studies, vol. 9, Issue 2, pages 189281.
[9] Mitullah, W. (2003), Urban Slums Report: The case of Nairobi Kenya, Understanding
Slums: Case Studies for the Global Report on Human Settlements.
[10] Seedhouse, D. (1986), Foundation for Health Achievement, Health Policy, vol. 7,
issue, 3.
[11] United Nations, (1948), The Bill of Human Rights.
[12] http://www.ehow.com
[13] Bellovin S.M. Security problems in the TCP/IP protocol suite. Comput Commun Rev,
1989, 19: 32–48
[14] Kuo C F, Pang A C, Chan S K. Dynamic routing with security considerations. IEEE
Trans Parallel Distrib Syst, 2009, 20: 48–58
[15] He L. Recent developments in securing Internet routing protocols. BT Technol J,
2006, 24: 180–196
[16] Lakshminarayanan K, Caesar M, Rangan M, et al. Achieving convergence free
routing using failure-carrying packets. In: ACM SIGCOMM 2007. New York: ACM Press,
2007. 241–252

International Journal of Management, IT & Engineering Vol. 8 Issue 12(1), December 2018,
ISSN: 2249-0558 Impact Factor: 7.119
Journal Homepage: http://www.ijmra.us, Email: [email protected]
Double-Blind Peer Reviewed Refereed Open Access International Journal - Included in the International
Serial Directories Indexed & Listed at: Ulrich's Periodicals Directory ©, U.S.A., Open J-Gage as well as in
Cabell’s Directories of Publishing Opportunities, U.S.A
244 International Journal of Management, IT & Engineering
http://www.ijmra.us, Email: [email protected]
Development of Personalised health monitoring system using
Machine learning and AWS cloud computing
Farkhonda Mohsini
Sandeep Bhargav
Abstract:- Health care is an essential aspect of daily life, necessary for the health and
wellbeing of the population due to human resources and affordable care. Even so, continue
to increase the corresponding costs for medical services. A contribution to health care
growth costs is waste and fraud. In particular, with the rapidly expanding growth in the
United States, the use of wearable devices such as smart gears and other wearable devices
has implemented new health care monitoring programs and implemented health care
telemetry. But machine learning is taking a step forward, which allows doctors and
relatives to keep an eye on the health of the elderly family members. These algorithms
used to understand the user profile, which enables potential health discrimination before
health care professionals. Create models for personalized health profiles and monitoring.
This method is critical to reducing health risks. Even using Medicare data, many studies do
not provide adequate details about data processing and integration, which makes it even
more difficult for challenging to understand the test results and for the revival of the test.
In this thesis, we present the current research using Medicare Data, focusing on data
processing and integration and defining a gap in the information-related details. We
present discussions on essential information to see how to look at how to process and
merge different Medicare datasets by suggesting opportunities to work in the future.
1. Introduction
It is a fact that the global population is growing and growing [1], [2]. Due to these
demographic changes, chronic infectious diseases such as congestive heart failure,
dementia, sleep apnea, cancer, diabetes and chronic respiratory, pulmonary disease [1], [3],
[4]]. Besides, the total number of people suffering from some disabilities (which is related
to living, or traumatic, or chronic conditions) will increase. [5] Besides, 65% of the people
aged 85 and 50% of the age of 50% of the population fall each year [6], [7]. For this
population, health care costs are increasing [8], the quality of life and productivity is
decreasing, and in many cases, the family members work as primary care assistants. As
well as challenges to effectively manage and treat post-progressive rehabilitation patients,
people with disabilities and special abilities, these issues show the need for new and
innovative ways to provide health care to patients. In response, information and
communication technologies are expected to offer means to offer personalized, low-cost
and citizen-centric health care solutions to solve predetermined challenges. [9] Recent
advances in sensor communication, sensor detoxification, and microelectronics have
enabled health care providers to monitor and manage chronic diseases and identify possible
emergencies [10]. Health monitoring in the home environment can be done either by two
or both of the following [11]:
Research Scholar, Center for cloud infrastructure and security,Suresh Gyan Vihar University , Jaipur Assistant professor, Center for cloud infrastructure and security,Suresh Gyan Vihar University , Jaipur

International Journal of Management, IT & Engineering Vol. 8 Issue 12(1), December 2018,
ISSN: 2249-0558 Impact Factor: 7.119
Journal Homepage: http://www.ijmra.us, Email: [email protected]
Double-Blind Peer Reviewed Refereed Open Access International Journal - Included in the International
Serial Directories Indexed & Listed at: Ulrich's Periodicals Directory ©, U.S.A., Open J-Gage as well as in
Cabell’s Directories of Publishing Opportunities, U.S.A
245 International Journal of Management, IT & Engineering
http://www.ijmra.us, Email: [email protected]
1) To record physiological signals and ambulatory monitors using wearable sensors and
devices
2) Sensors are unwantedly embedded in the home environment and home furnishings to
collect behavioral and physiological data. Among the researchers involved in Dementia
and other chronic conditions, the positive effects of attention and attention technology have
been confirmed [12]. Moving one step further, diagnosing primary health and diagnosing
serious health changes most of these problems can be prevented, billions of dollars are
saved annually [13], [14]. Primary detection, however, requires continuous alerts. Due to
the nature or training of their condition and lack of experience, many of these populations
have become depressed or can make a difference that cannot detect and report critical
observations. The primary methods of addressing this problem are to keep track of patients
with health care professionals directly or through relatively crude and heavy physiological
data collection devices. These types of devices and sizes, which include various cables and
need to be immune to the patient to achieve reliable measurements, are not irrelevant when
public, uncomfortable, long-term and low-cost health surveillance are inappropriate.
However, the new generation's cheap, uncomfortable wearable / replaceable devices [15]
can move towards initial and automatic detection of severe changes to the patient's health
status. In this context, such devices should not be just simple data collection, nor should
they report variations from sample demographic values only. Instead, they should be able
to utilize the advanced data processing algorithm and diagnostics to discover different user
baselines and to understand the dangerous health trends better and, as a result, to inform
medical professionals for further assistance. These wearable systems should be engineered
to integrate portable devices operated by first responders and integrated stable-system
systems in hospitals. As a result, these devices will continually capture data, it will
organize in customized patients, and condition models and each patient's unique
information will be first reactionary and contact with hospital staff. On this paper, we
present our perspective on establishing a useful framework for the novel, interactive and
intelligent wearable health-monitoring prototype, which is known as Prognosis. The rest of
the paper is organized as follows. The second section will give a brief insight into the
Affordable Health-Monitoring System (WMIMS) and decision-assistance process. The
third section will represent the overall concept of the proposed system based on the current
availability of generic architecture and wearable biomass. Article IV, the combination of
recommended physical information, will give details of the combination technique, its
operating model and a formal definition of formal examples. At Section V, we provide an
SPN-based model of the interaction scheme between the user and the system.
2. Literature Review
[1] The authors have described that the development of wearable sensor technology
continues and plays a major role in the development of human health services, giving them
opportunities and progress which helps in adjusting food consumption and energy
consumption technology and becomes a partner for the people. Accessibility of technology
has now reduced the barriers for low power computing and networking. Recent advances
in wearable sensor technology help to monitor the movement of the neck and head injuries
and the environment. The sensor integration system is done in the health information
collection system. Information integration and explanation play a key role. The wearable
sensor helps to monitor the behavior of physical and technical flexibility in its

International Journal of Management, IT & Engineering Vol. 8 Issue 12(1), December 2018,
ISSN: 2249-0558 Impact Factor: 7.119
Journal Homepage: http://www.ijmra.us, Email: [email protected]
Double-Blind Peer Reviewed Refereed Open Access International Journal - Included in the International
Serial Directories Indexed & Listed at: Ulrich's Periodicals Directory ©, U.S.A., Open J-Gage as well as in
Cabell’s Directories of Publishing Opportunities, U.S.A
246 International Journal of Management, IT & Engineering
http://www.ijmra.us, Email: [email protected]
environment. The goal is to utilize the wearable sensor, processor, and progress to show
the study of the behavior of animals and humans in their neutral environment.
[2] Due to the vowel, due to the vowel, the author describes the frustration in the real
world of signal signals, which reduces system performance in speech recognition. The
hidden Markov model is used to rebuild the spoken components of the spectral, whose
functionality is reduced by the unwanted acoustic noise. Construct Markov chains using
the random process Markov property during discrete. In each level, there is an isolated
state among the potentially limited states of nature. The number of techniques does speech
Parameter Frequency Domain Encoding Speech Analysis. The signal is characteristic
precisely. The nature of the strategy is that the speech recognition system is distributed.
Incredible spectrum data is reconstructed for the recognition of robust sound lecture by
Hidden Markov model.
[3] The authors have described that the systems available at present are very low-level
living behavior monitoring and accuracy. This is also the reason behind the poor
understanding of overweight and obesity ETIOLOGY. Studies have shown that the
frequency of intake can be used to predict food intake. The separation of the liquid and
solids can be completed, and the mass can be ingested. The system offers two approaches,
and this method is used to detect acoustic acoustics from words and words corrupted by the
comparison. The result shows the high efficiency of proposed methods in the separating
sound from the artwork. This handmade head is derived from the movement, words, food
involved. The accuracy of the system is not related to the body mass index. This system
looks suitable to be used by the gross person.
[4] The author describes obesity research which is now a big problem. Due to the increase
in awareness of public obesity-related diseases, pandemics cannot be understood. The
ongoing scientific debate is subject to several views of the etiology of obesity and strong
different opinion. The reason for obesity as changes in physical activity as our diet and
lifestyle change. Powerful words of research made by popular media publications like
Time Magazine the topic of debate is increased by research this summary. This paper
focuses on people's relationship with weight control and energy consumption equations in
humans. Etiology insight grows by understanding obesity. Technology is developed to
measure the material of the energy equation accurately.
[5] Authors have been describing information about taking a significant diet of the person
involved in using body sensors. This system is helpful to help weight loss professionals
develop personalized programs for clients and to research nutrition information and eating
behavior. Maintaining the balance of food consumption and spending energy in daily life is
very important for long-term health. According to the World Health Organization, the
number of peacocks is 700 million. Manual methods and automated solutions are used to
capture the behavior of eating a person. The proposed system broadens the full self-
reporting solution using the universal sensor. It simplifies the current manual monitoring
techniques which are incompatible with the current manual reporting techniques. Manual
logging is replaced. ADM system offers a self-report. Daily schedules are maintained for
food use.
[6] The authors describe incentive behavior using chewing and melting non-invasive
observation to study behavioral patterns of weight and volume and energy assumptions.
This method has been improved. Non-invasive monitoring using bone absorption
microphone or sound sensor consumes is detected. In this method, the first two methods

International Journal of Management, IT & Engineering Vol. 8 Issue 12(1), December 2018,
ISSN: 2249-0558 Impact Factor: 7.119
Journal Homepage: http://www.ijmra.us, Email: [email protected]
Double-Blind Peer Reviewed Refereed Open Access International Journal - Included in the International
Serial Directories Indexed & Listed at: Ulrich's Periodicals Directory ©, U.S.A., Open J-Gage as well as in
Cabell’s Directories of Publishing Opportunities, U.S.A
247 International Journal of Management, IT & Engineering
http://www.ijmra.us, Email: [email protected]
are used; the sensor-based system and second protocol are used for manual scoring and
intake of chewing gum and chewing. The key to maintaining a healthy lifestyle is to
maintain the balance between healthcare and energy costs. To monitor the observance of
greatness and noninvasive targets, sensor hardware and hardware-based systems are
developed to obtain reliable information from sensors. Chews and Swallows are used as a
standard for automatic pattern recognition scores. These systems are obtained which result
in high quality of high reliability and readability information.
[7] The lecture description for the author's recognition of speech and recognition of speech
describes the use of various discrimination attributes of the element. Using the AdaBoost
method from the larger features pool, discrimination properties can be removed. Use this
extruded feature set in data-driven methods. This lecture can be recognized by listening to
non-lecture helps improve performanceperformance. Ad Boost based algorithm is used to
select a feature set from the larger features on the proposed system. Research interest in
detecting acoustic events is increasing rapidly. Although the source of lectures may sound
useful information other words. Acoustic events can occur in many different ways. So
identifying literary events helps to describe social and human activity in their environment.
[8] The authors described how to define predefined categories in free text documents
automatically; text categorization is the main problem. The number of documents available
online is quite difficult without a document retrieval index. Solving this problem is
document categorization. The new and advanced machine learning techniques are applied
in text categorization. Feature The space document contains different words and phrases.
For reducing the purpose of text categorization. Feature space selection can easily be easy
to categorize text in applications like neural networks
3. Proposed Model
We can combine measurements in a structured and meaningful way by creating a
mathematical model for each measurement regarding others. Consider leaving a
compressor exhaust pressure. It is influenced by moderate temperature, machine rotation
rate, medium structure, and several other parameters. It is possible to calculate what the
pressure should be, to let these parameters know. To count it, we need to find out the
relation between these parameters in our mathematical form.
Forming this equation from expert knowledge is very time consuming since this equation
will be different for each model of the model and model of the machine and each condition
of the device. For real-life purposes, if it can be achieved with the speed of the model and
very few people, it is OK to do it.
This machine learning:- These methods receive experimental experiences that are
measured on this specific machine when it was known as healthy. From this data, machine
learning methods create mathematical representations of the relationships of all the
parameters around the computer automatically and without human effort.
It can be mathematically proved that a neural network can accurately represent a complex
data set, as long as the system is sufficient and the data consistently follows the same laws
[1, 2]. The machines are following the requirements of nature, and these ideas are easily
correct. We use a neural network as a template for modeling each measurement on the
device regarding others. The machine learning algorithm finds the value for model
parameters such as neural networks that accurately represents the data.

International Journal of Management, IT & Engineering Vol. 8 Issue 12(1), December 2018,
ISSN: 2249-0558 Impact Factor: 7.119
Journal Homepage: http://www.ijmra.us, Email: [email protected]
Double-Blind Peer Reviewed Refereed Open Access International Journal - Included in the International
Serial Directories Indexed & Listed at: Ulrich's Periodicals Directory ©, U.S.A., Open J-Gage as well as in
Cabell’s Directories of Publishing Opportunities, U.S.A
248 International Journal of Management, IT & Engineering
http://www.ijmra.us, Email: [email protected]
It is important to consider selecting a measurement when a specific measurement modeling
can be done automatically. We use coordination of mutual modeling and core material
analysis to do this. [1]
Figure 1: The displacement of the Central Axle of the compressor is measured (green)
of the model (green) and the model (green) of the model (light green).
It is seen that the model also model the model of the model while the load changes and
model loads of both the load and the low. We keep a deviation between each load model
and measurement while reaching full capacity. It is a hint of a mechanical problem and will
be cautious.
As a result, each measurement on the machine gets a source that can calculate the expected
value for this measurement. The formula was trained on information known as healthy, and
this formula is a health definition for this machine. The disadvantage is then considered to
be the deviation from health. See Figure 1 for an illustration.
It is essential to find out the model of health and deviations from it because much
information is available for health, general conditions and normal healthy behavior.
Preferably, little information is available for unhealthy public response, and this small
amount is very diverse due to the host of different failure modes. Differences between the
making of each of the machines and the failure modes for the model are very complicated.
Analysis of poor health modeling data is a problem, but information availability is not a
problem. As such, this problem is fundamental and cannot be tackled in a real and
comprehensive way.
Scary
At any one time, we can compare the expected strong value of the sensor value. Since the
expected value is calculated from a model, we know the probability distribution of
deviations, i.e., how much the measurement measure of a certain amount can be, see
Figure 2. So we can calculate the health feasibility of this distribution, or in contrast, use
this confidence level to judge whether the sensor value is far from healthy. If this case is
available, an alarm is sent.
Figure 2: Deviation between the probability (vertical axis) of the deviation in the
model and the sensor value (horizontal axis)

International Journal of Management, IT & Engineering Vol. 8 Issue 12(1), December 2018,
ISSN: 2249-0558 Impact Factor: 7.119
Journal Homepage: http://www.ijmra.us, Email: [email protected]
Double-Blind Peer Reviewed Refereed Open Access International Journal - Included in the International
Serial Directories Indexed & Listed at: Ulrich's Periodicals Directory ©, U.S.A., Open J-Gage as well as in
Cabell’s Directories of Publishing Opportunities, U.S.A
249 International Journal of Management, IT & Engineering
http://www.ijmra.us, Email: [email protected]
We hope to have a bell-shaped curve for a good model, as there are several points with
little deviation and several deviations in the above and below differences of the models,
with overall parallelism. From this distribution, how quickly we can read any observation
deviation and how healthy a measurable state is. This image translates directly to a sensor
measurement of a health index.
By providing the possibility of poor health, how the state offers insufficient information
can be enriched. Since the expected value is counted from the number of other machine
parameters (usually small), it is generally possible to blame any other measurement. To
help solve this problem and design some steps, improve the human engineer receiving
alarms.
Along with observing the normal condition, it is often found that when a machine is moved
from one stable position to another, many (false) alarms are released because the simple
analysis method can not conform to the rapidly changing conditions. A neural network
could easily represent highly non-linear relationships; even if the startup or load change of
a machine were also everything, it would be modeled correctly without the alarms.
4. Results
This system has been thoroughly testing for rotating types of machinery like compressors,
pumps, gas and steam turbines from different manufacturers in the operational context of
power generation, chemical production, oil refining, and production. In particular,
company man diesel and turbo, this method uses alarms in its compressors and gas turbines
to see human engineer data once.
Our partners have observed in practice that due to the automatic support of machine
learning methods, the human effort has been reduced to set up and maintain a system
monitoring method of more than 50%. It is predominantly generated automatically as each
measurement is mainly due to the above and the lower limits carefully not for carefully.
False alarms (false positives) and missing alarm (false negative) have exceeded the event
rate of 90%. This reduces human engineering efforts to diagnose machine flaws by cutting
60%, reducing maintenance budgets and improving machine availability by about 10%.
Figure 3: An example of the maintenance budget over time with thousands of US
dollars. Over time, due to less responsive and more active maintenance, the budget
size decreases.
Conclusion
The institution adopts new methods, maintains less responsive and more active. This saves
money in various ways. As a result of the consecutive trip to the plant, we identify

International Journal of Management, IT & Engineering Vol. 8 Issue 12(1), December 2018,
ISSN: 2249-0558 Impact Factor: 7.119
Journal Homepage: http://www.ijmra.us, Email: [email protected]
Double-Blind Peer Reviewed Refereed Open Access International Journal - Included in the International
Serial Directories Indexed & Listed at: Ulrich's Periodicals Directory ©, U.S.A., Open J-Gage as well as in
Cabell’s Directories of Publishing Opportunities, U.S.A
250 International Journal of Management, IT & Engineering
http://www.ijmra.us, Email: [email protected]
problems before, to prevent any parallel damage completely. Potentially lost production is
reduced. The cost due to order to push both people and materials is also avoided. Of
course, the real problem must be repaired, but it can now be designed in a predefined way,
in opposition to a firefighter mode. It can reduce a maintenance budget as 50%.
References
[1] Deo Shao, “A Proposal of a Mobile Health Data Collection and Reporting System for
the Developing World,” Malmö University, 2012, pp. 43-57
[2] Amir Hoshang Kioumars, “Wireless data acquisition and monitoring for healthcare
services systems,” Massey University, 2011, pp. 50-145
[3] Majid A. Al-Taee, Nadine A. Jaradat, Dima M. Abu Ali, “Mobile Phone-Based Health
Data Acquisition System Using Bluetooth Technology,” IEEE Jordan Conference,
Amman, Dec. 2011, pp6-8
[4] Svetlana S. Aksenova, “Machine Learning with WEKA”, California State University,
2004
[5] Jyoti Soni, ujma Ansari, Dipesh Sharma, Sunita Soni, “Predictive Data Mining for
Medical Diagnosis: An Overview of Heart Disease Prediction”, International Journal of
Computer Applications, Vol. 17, No.8, March 2013
[6] Binh Tran, “Use WEKA in your Java code”, 2013
[7] Remco R. Bouckaert, Eibe Frank, Mark A. Hall, Geoffrey Holmes, Bernhard
Pfahringer, Peter Reutemann, Ian H.Witten, “WEKA— Experiences with a Java Open-
Source Project”, Journal of Machine Learning Research 11 2533-2541, 2010
[8] G. Malkar, “Healthcare without bounds: trends in remote patient monitoring 2009,”
SpyGlass Consulting Group, March 2009.
[9] Ian H. Witten; Eibe Frank; Mark A. Hall (2011). "Data Mining: Practical machine
learning tools and techniques, 3rd Edition". Morgan Kaufmann, San Francisco. Retrieved
2011-01-19.
[10] G. Holmes; A. Donkin; I.H. Witten (1994). "Weka: A machine learning workbench"
(PDF). Proc Second Australia and New Zealand Conference on Intelligent Information
Systems, Brisbane, Australia. Retrieved 2007-06-25.
[11] S.R. Garner; S.J. Cunningham; G. Holmes; C.G. Nevill-Manning; I.H. Witten (1995).
"Applying a machine learning workbench: Experience with agricultural databases" (PDF).
Proc Machine Learning in Practice Workshop, Machine Learning Conference, Tahoe City,
CA, USA. pp. 14–21. Retrieved 2007-06-25.
[12] Rosenblatt, Frank. x. Principles of Neurodynamics: Perceptrons and the Theory of
Brain Mechanisms. Spartan Books, Washington DC, 2001
[13] Rumelhart, David E., Geoffrey E. Hinton, and R. J. Williams. "Learning Internal
Representations by Error Propagation". David E. Rumelhart, James L. McClelland, and the
PDP research group. (editors), Parallel distributed processing: Explorations in the
microstructure of cognition, Volume 1: Foundations. MIT Press, 2003.
[14] Cybenko, G. 1989. Approximation by superpositions of a sigmoidal function
Mathematics of Control, Signals, and Systems, 2(4), 303–314.
[15] Jayshril S. Sonawane, D. R. Patil “Prediction of heart disease using multilayer
perceptron neural network ”, Information Communication and Embedded Systems ,
International Conference, Chennai, Feb. 2014, pp. 1-6

International Journal of Management, IT & Engineering Vol. 8 Issue 12(1), December 2018,
ISSN: 2249-0558 Impact Factor: 7.119
Journal Homepage: http://www.ijmra.us, Email: [email protected]
Double-Blind Peer Reviewed Refereed Open Access International Journal - Included in the International
Serial Directories Indexed & Listed at: Ulrich's Periodicals Directory ©, U.S.A., Open J-Gage as well as in
Cabell’s Directories of Publishing Opportunities, U.S.A
251 International Journal of Management, IT & Engineering
http://www.ijmra.us, Email: [email protected]
[16] Syed Umar Amin, Kavita Agarwal, Rizwan Beg “Genetic neural network based data
mining in prediction of heart disease using risk factors ”, Information & Communication
Technologies, IEEE Conference, Jeju Island, Apr. 2013, pp. 1227 – 1231
[17] Feng Xiao, Yimin Chen, Ming Yuchi, Mingyue Ding “Heart Rate Prediction Model
Based on Physical Activities Using Evolutionary Neural Network”, Genetic and
Evolutionary Computing, Fourth International Conference, Shenzhen, Dec. 2010, pp. 198 -
201
[18] Hongmei Yana, Yingtao Jiangb, Jun Zhenge, Chenglin Pengc, Qinghui Lid “A
multilayer perceptron-based medical decision support system for heart disease diagnosis”,
Expert Systems with Applications, Vol. 30, no. 2, Feb. 2010, pp. 272–281
[19] Sellappan Palaniappan, Rafiah Awang “Intelligent heart disease prediction system
using data mining techniques”, IEEE/ACS International Conference on Computer Systems
and Applications, Doha, Apr. 2008, pp. 108 - 115
[20] Anchana Khemphila, Veera Boonjing “Heart Disease Classification Using Neural
Network and Feature Selection”, Systems Engineering (ICSEng), 21st International
Conference, Las Vegas, Aug. 2011, pp. 406 – 409.

International Journal of Management, IT & Engineering Vol. 8 Issue 12(1), December 2018,
ISSN: 2249-0558 Impact Factor: 7.119
Journal Homepage: http://www.ijmra.us, Email: [email protected]
Double-Blind Peer Reviewed Refereed Open Access International Journal - Included in the International
Serial Directories Indexed & Listed at: Ulrich's Periodicals Directory ©, U.S.A., Open J-Gage as well as in
Cabell’s Directories of Publishing Opportunities, U.S.A
252 International Journal of Management, IT & Engineering
http://www.ijmra.us, Email: [email protected]
Analysis of pesticide by Smart Farming System using machine
learning algorithm over AWS Cloud
Vishal Sharma
Sandeep Bhargav
Abstract: -Smart Farm is a crop management system that allocates crops to the farmers by
the highest requirement, which predicts through their machine learning the appropriate
crops for their area according to soil, type, mean rainfall, and pesticides, etc. That crop is
not wasted and, accordingly, is not produced subsequently. There are two applications for a
mobile app for end users, such as a web application for farmers and administrators. We are
planning to create a hybrid mobile application 'Smart Farm' which will allocate crop to
every farmer who registers this applicant. If the farmer agrees with it, then the amount of
money that will be paid to them will be corrected. This will encourage their allotted crops
to grow. Statistical information is available in a particular crop quantity per year, and with
the help of those figures, it is possible to determine the amount required in next year, but
with little precision (this will enable us to maximize the amount of each crop needed for
the future). Also, if all crops are available in abundance, then the prices will be low, and
this will benefit the poor sections of the society who cannot afford to buy such expensive
food grains.
Introduction
Technology, however, helps these farmers reduce costs. Your farms are connected
wirelessly. Moisture detectors around each of the plants monitor what happens in the soil.
They send their observations to a computer in the cloud to be analysed and, depending on
the needs of the plant, the irrigation system of the farm solves these deficiencies. This
irrigation system resembles the hydroponic culture used in greenhouses. Every half hour, a
quantity of calibrated water, based on the calculations made by the server in the cloud, and
mixed with the appropriate amount of fertilizer falls on each plant. This drip is deposited in
the two parts of the trunk of the plant, since experience has shown that absorption is better.
Before this system was available, it would have been watered at least once a week. With
this new technique, 20% less water is used than used to be used. This means saving money
and water. This type of farms and some similar ones that grow other fruits such as
pistachios, nuts and grapes are known as "smart farms". But not only nut farmers are those
who take advantage of these benefits. Row plantations, such as corn and soybeans, which
cover a large amount of Central West America, are also using this type of technique.
Planting, irrigation, fertilization and harvest are automatically controlled. Even the soil on
which they grow is monitored. Farms are becoming more and more like factories: highly
controlled operations to get reliable products, immune as much as possible to the vagaries
of nature. The times have gone by when we had to rush out in the middle of the night to a
farm field to monitor the temperature and humidity of the crops. Nowadays, a farmer only
has to take his Smartphone, press some keys and go back to sleep in his bed. And that,
Research Scholar, Center for cloud infrastructure and security, Suresh Gyan Vihar University, Jaipur Assistant professor, Center for cloud infrastructure and security, Suresh Gyan Vihar University, Jaipur

International Journal of Management, IT & Engineering Vol. 8 Issue 12(1), December 2018,
ISSN: 2249-0558 Impact Factor: 7.119
Journal Homepage: http://www.ijmra.us, Email: [email protected]
Double-Blind Peer Reviewed Refereed Open Access International Journal - Included in the International
Serial Directories Indexed & Listed at: Ulrich's Periodicals Directory ©, U.S.A., Open J-Gage as well as in
Cabell’s Directories of Publishing Opportunities, U.S.A
253 International Journal of Management, IT & Engineering
http://www.ijmra.us, Email: [email protected]
thanks to a technology known as "smart farm" ("smart farm"). The applications of this
technology work with the Internet of Things (IoT), and through them are measured and
analysed temperature, humidity and intensity of sunlight in a greenhouse. The data thus
obtained is sent to a smartphone, or a desktop computer, for farmers to review and control
the conditions of the greenhouse in real time.
As soon as they began to be used, these new systems have made it possible to increase the
productivity and quality of crops, while reducing the use of labour and energy
consumption.
We plan to make a hybrid mobile application 'SMART FARM' that will assign crops to
every farmer who registers on that application. If the farmer agrees upon it, then the
amount that will be paid to them will be fixed. This will encourage them to grow the
allotted crops. The statistical data on the amount of a particular crop consumed every year
is available and with the help of those stats, it is possible to determine the amount that will
be required in the next year, not exactly but with a precision to some extent (it will give us
the upper bound on the amount of each crop needed in future). Also, if all the vegetables
are available in ample amount, then the prices will remain low, and this will benefit the
poor sections of the society who were not able to afford to buy such costly food grains.
Registrations of Farmer
Phase 1: -Registration of Farmer
The Farmer registers himself on the application by entering the following details:-
Name of the farmer, Age, Aadhar Number, Contact Number, Land Area (Hectare), Village,
District, State
Phase 2: Detail Updation in the database
After submitting all the information relevant to the farmer, the registration will be done by
the application. Then the farmer will save his data database.
Phase 3: Crop Selection
Farmers with a list of suitable crops will be shown based on the following factors:
● Land area - Each crop yield is different, and so it is essential to decide which type of
crop is most suitable.
● Types of soil - Weather, black, iron, clay, etc. based on soil. The best suitable crop will
be selected for the soil that is given.
● Rainfall - Rainfall in the region is affected by crop yield. Depending on the land
geographical location, the crop will be selected.
● Crop requirement - Real-time crop will be given priority with higher cost rates.
Phase 4: Crop Allotment
Based on crop cultivation, he wants to cultivate, he will be asked for confirmation, and if
he ensures the same increase, he will be given an allotment ID. This allocation ID will be
sent via SMS.
Phase 5: Updating Crop Requirements
After informing the farmers about the crop, he has agreed to cultivate, the details of the
crop allocation will be updated in the database. Also, the new crop requirements will be
updated by increasing crop yield in the farmers' land area at the first stage of the old need.
Phase 6: Verification of farmer and crop
After allocation of 15-20 days of the crop, one representative officer will visit the peasant
and verify the details of the farmer. If all the features provided by the farmers are correct

International Journal of Management, IT & Engineering Vol. 8 Issue 12(1), December 2018,
ISSN: 2249-0558 Impact Factor: 7.119
Journal Homepage: http://www.ijmra.us, Email: [email protected]
Double-Blind Peer Reviewed Refereed Open Access International Journal - Included in the International
Serial Directories Indexed & Listed at: Ulrich's Periodicals Directory ©, U.S.A., Open J-Gage as well as in
Cabell’s Directories of Publishing Opportunities, U.S.A
254 International Journal of Management, IT & Engineering
http://www.ijmra.us, Email: [email protected]
and the farmers cultivate agreed crops, then the advance amount will be presented to
facilitate the further requirements of the farmers.
Phase 7: Collection of crop and paying off the remaining amount
Once the crop is fully grown, the farmer will get the remaining amount, and the crop will
be collected from him, and the market will be outsourced.
Technical Details of the Project
❖ Mobile Application - Ionic Framework and AngularJS
❖ Web Application - HTML/CSS, AngularJS
❖ Database - Firebase real-time database
❖ Machine Learning - python, pandas, scikit-learn (Linear Regression), matplotlib and
mpl3d
❖ SMS API - Textlocal
❖ Server - Host web app
❖ Training data - https://data.gov.in/node/87630
Features of the project
❖ Easy Navigation: This application doesn't require any purchases means it is free of
cost.
❖ No Ads: This application does not contain any advertisements.
❖ Multi-Platform: This application can quickly run across multiple platforms and
provide easy and convenient access to the user, who has little or no knowledge of how
to use an app.
❖ Notification: Whenever a farmer registers himself on the mobile application, and agree
to cultivate the crop allotted to him, then after successful submission, the farmer will be
notified about his successful presentation through a text message.
❖ 24X7 Access: By using the real-time database (Firebase), we provide the farmers the
flexibility to register themselves on the application whenever they want themselves to
express.
❖ Admin: The admin dashboard details of the farmers will be built in such a way, that
as soon as a new user registers themselves on the application, the admin will be able to
see all the details of the farmers including their district, village, land area and allowed
crops in real time.
❖ Predictive Crop Allotment: The farmers will be allotted crops according to their soil
type, average rainfall, soil texture and soil color in their district and most
importantly the crop with the maximum requirement that can be grown in that area.
❖ Real-Time Crop Requirement Updation: As soon a crop is allotted to a farmer the
requirement of that will be updated accordingly by subtracting the amount that can
be grown in the land they have from the original specification.
❖ Interactive Plots: The admin will be able to interact with the plots of the
requirements of the crops over the years and the predicted requirement of the crop.
Closed loop irrigation solution for farmers
Fossil field plays an essential role in crop production. However, how much and when it can
be sprinkled is still restricted by the traditional knowledge of the peasants. For a given soil
type, for a given crop it is necessary to know precisely how much water is required to keep

International Journal of Management, IT & Engineering Vol. 8 Issue 12(1), December 2018,
ISSN: 2249-0558 Impact Factor: 7.119
Journal Homepage: http://www.ijmra.us, Email: [email protected]
Double-Blind Peer Reviewed Refereed Open Access International Journal - Included in the International
Serial Directories Indexed & Listed at: Ulrich's Periodicals Directory ©, U.S.A., Open J-Gage as well as in
Cabell’s Directories of Publishing Opportunities, U.S.A
255 International Journal of Management, IT & Engineering
http://www.ijmra.us, Email: [email protected]
the humidity depend mainly on the power of the soil. We need an IOT, AI-based solution
that can irrigate the fields of crops based on soil moisture content automatically
• Seventy percent of the water has been consumed and most of the wasteful use of farmer's
account. Farmers are central to the whole picture, where they are the world's most
miserable place of poverty.
• Agriculture cannot be ignored in the water equation, and it is the essential part of the
developing world.
• A country like India, with a tropical climate, disagrees with its diversified region, today
experiences a flawed pattern which depends on farmers to be a significant source of
irrigation.
• The state's estimated irrigation potential is 5.1 million hectares, which is 3.1 million
hectares already achieved. The gap of 2 million hectares cannot be fully solved by fully
absorbed land water.
Proposed Solution
• Our model is responsible for obtaining information related to location, time and weather
conditions (mostly on rainfall) and during one interval, the irrigation system will be
automated according to soil moisture required.
When working with varieties of weather types, different weather and season variation, the
model facilitate movement.
• It is all done while reminiscing the possibilities in the remote areas even to the farmers.
• It is designed to take advantage of the soil humidity sensor, humanity, temperature, and
rain sensors to provide a smart watering system for users with existing soil systems. All
climate activities will be managed by an intelligent controller that will be able to collect
information and allow users to adjust the quantity and timing of the water supply based on
those readings.
• Our Smart Controller integrates users into existing Sprinkler systems so that users can
remotely control their home irrigation through a web interface or an Android interface.
• The data collected by the sensor is sent to the cloud-generated database for further
processing and predicting future weather conditions.
Methodology
Stage 1: Creating an admin application (web application).
Image1: Prototype of Smart Farm Admin Web App Interface
Stage 2: Gathering the essential data like soil fertility, feasible crops, atmospheric
conditions, annual rainfall of every region in the state.

International Journal of Management, IT & Engineering Vol. 8 Issue 12(1), December 2018,
ISSN: 2249-0558 Impact Factor: 7.119
Journal Homepage: http://www.ijmra.us, Email: [email protected]
Double-Blind Peer Reviewed Refereed Open Access International Journal - Included in the International
Serial Directories Indexed & Listed at: Ulrich's Periodicals Directory ©, U.S.A., Open J-Gage as well as in
Cabell’s Directories of Publishing Opportunities, U.S.A
256 International Journal of Management, IT & Engineering
http://www.ijmra.us, Email: [email protected]
Stage 3: Design a hybrid mobile application that will gather farmer details.
Image2: Prototype of Registration Form Image: Prototype of Soil and Weather
Attributes
Image2: Prototype of suggested crops
Stage 4: Register the application on the Play Store and Apple App Store.
Stage 5: Update the details of the farmer in the database and reflect the changes on the
web app.
Stage 6: Creating banners and campaigns for creating awareness among the farmers.
Methodology
The farmer will register himself on the application and after we have all the relevant
details, which we will use for crop allotment based on geographic conditions and previous
year consumption statistics.

International Journal of Management, IT & Engineering Vol. 8 Issue 12(1), December 2018,
ISSN: 2249-0558 Impact Factor: 7.119
Journal Homepage: http://www.ijmra.us, Email: [email protected]
Double-Blind Peer Reviewed Refereed Open Access International Journal - Included in the International
Serial Directories Indexed & Listed at: Ulrich's Periodicals Directory ©, U.S.A., Open J-Gage as well as in
Cabell’s Directories of Publishing Opportunities, U.S.A
257 International Journal of Management, IT & Engineering
http://www.ijmra.us, Email: [email protected]
Image 3: Use case diagram for Smart Farm

International Journal of Management, IT & Engineering Vol. 8 Issue 12(1), December 2018,
ISSN: 2249-0558 Impact Factor: 7.119
Journal Homepage: http://www.ijmra.us, Email: [email protected]
Double-Blind Peer Reviewed Refereed Open Access International Journal - Included in the International
Serial Directories Indexed & Listed at: Ulrich's Periodicals Directory ©, U.S.A., Open J-Gage as well as in
Cabell’s Directories of Publishing Opportunities, U.S.A
258 International Journal of Management, IT & Engineering
http://www.ijmra.us, Email: [email protected]
Conclusion
Our solution to this problem will be an innovative crop management system for farmers
and the government. In 'this tool, we predict the average (upper bound) consumption of
several types of crops by Machine Learning using the open source data of crop
production and consumption of previous years. Through this precisely accurate prediction
we will assign a crop and amount of it to be grown to each farmer, following the following
factors -
1. Soil type of area
2. Average rainfall in the area
3. Soil texture
If the farmers linked to the tool grow the assigned crop, they will be provided with the
designated price for it, and the crops will be raised in the desired amount.
References
1. IV Censimento Della Agricoltura. Available online: http://censimentoagricoltura.istat.it
(accessed on 3 May 2018).
2. Classificazione Delle Attività Agricole. Available online:
http://www.codiciateco.it/coltivazioni-agricole-eproduzione-di-prodotti-animali--caccia-e-
servizi-connessi/A-01 (accessed on 15 August 2018).
3. Sundmaeker, H.; Verdouw, C.; Wolfert, S.; PrezFreire, L. Internet of Food and Farm
2020. In Digitising the Industry—Internet of Things Connecting Physical, Digital and
Virtual Worlds; River Publishers: Gistrup, Denmark, 2016; Volume 2.
4. Wolfert, S.; Ge, L.; Verdouw, C.; Bogaardt, M.-J. Big data in smart farming a review.
Agric. Syst. 2017, 153, 69–80. [CrossRef]
5. Biradarand, H.B.; Shabadi, L. Review on IoT based multidisciplinary models for smart
farming. In Proceedings of the 2nd IEEE International Conference on Recent Trends in
Electronics, Information Communication Technology (RTEICT), Bangalore, India, 19–20
May 2017; pp. 1923–1926.
6. Ramya, R.; Sandhya, C.; Shwetha, R. Smart farming systems using sensors. In
Proceedings of the 2017 IEEE Technological Innovations in ICT for Agriculture and Rural
Development (TIAR), Chennai, India, 7–8 April 2017; pp. 218–222.
7. Yoon, C.; Huh, M.; Kang, S.G.; Park, J.; Lee, C. Implement smart farm with IoT
technology. In Proceedings of the 20th International Conference on Advanced
Communication Technology (ICACT), Chuncheon-si Gangwon-do, Korea, 11–14
February 2018; pp. 749–752.
8. Arkeman, Y.; Utomo, H.A.; Wibawa, D.S. Design of web-based information system
with green house gas analysis for palm oil biodiesel agroindustry. In Proceedings of the
3rd International Conference on Adaptive and Intelligent Agroindustry (ICAIA), Bogor,
Indonesia, 3–4 August 2015; pp. 238–244.
9. Amanda, E.C.R.; Seminar, K.B.; Syukur, M.; Noguchi, R. Development of expert
system for selecting tomato (Solanum lycopersicum L.) varieties. In Proceedings of the 3rd
International Conference on Adaptive and Intelligent Agroindustry (ICAIA), Bogor,
Indonesia, 3–4 August 2015; pp. 278–283.
10. Nurulhaq, N.Z.; Sitanggang, I.S. Sequential pattern mining on hotspot data in Riau
province using the prefixspan algorithm. In Proceedings of the 3rd International
Conference on Adaptive and Intelligent Agroindustry (ICAIA), Bogor, Indonesia, 3–4
August 2015; pp. 257–260.

International Journal of Management, IT & Engineering Vol. 8 Issue 12(1), December 2018,
ISSN: 2249-0558 Impact Factor: 7.119
Journal Homepage: http://www.ijmra.us, Email: [email protected]
Double-Blind Peer Reviewed Refereed Open Access International Journal - Included in the International
Serial Directories Indexed & Listed at: Ulrich's Periodicals Directory ©, U.S.A., Open J-Gage as well as in
Cabell’s Directories of Publishing Opportunities, U.S.A
259 International Journal of Management, IT & Engineering
http://www.ijmra.us, Email: [email protected]
11. Murphy, F.E.; Popovici, E.; Whelan, P.; Magno, M. Development of an heterogeneous
wireless sensor network for instrumentation and analysis of beehives. In Proceedings of the
2015 IEEE International Instrumentation and Measurement Technology Conference
(I2MTC), Pisa, Italy, 11–14 May 2015; pp. 346–351.
12. Saha, A.K.; Saha, J.; Ray, R.; Sircar, S.; Dutta, S.; Chattopadhyay, S.P.; Saha, H.N.
Iot-based drone for improvement of crop quality in agricultural field. In Proceedings of the
IEEE 8th Annual Computing and Communication Workshop and Conference (CCWC),
Las Vegas, NV, USA, 8–10 January 2018; pp. 612–615.
13. Monsanto. Available online: https://monsanto.com/ (accessed on 3 May 2018).
14. Farmlink. Available online: https://farmlink.net/ (accessed on 3 May 2018).
15. Farmlogs. Available online: https://farmlogs.com/ (accessed on 3 May 2018).

International Journal of Management, IT & Engineering Vol. 8 Issue 12(1), December 2018,
ISSN: 2249-0558 Impact Factor: 7.119
Journal Homepage: http://www.ijmra.us, Email: [email protected]
Double-Blind Peer Reviewed Refereed Open Access International Journal - Included in the International
Serial Directories Indexed & Listed at: Ulrich's Periodicals Directory ©, U.S.A., Open J-Gage as well as in
Cabell’s Directories of Publishing Opportunities, U.S.A
260 International Journal of Management, IT & Engineering
http://www.ijmra.us, Email: [email protected]
The development of a "new set of skills' using AI and machine
learning in the Amazon Alexa to improve learning
Nitish Rasgotra
Sandeep Bhargav
Summary:- The rapid development of thought to (IOT) Integrated network of contacts
object. Analysts predict that the cumulative annual growth rate (CAGR) by 2020 in the
global market of 16.9% (IDC, 2015) will be. Gartner predicts that 25% of households have
an intelligent virtual assistant in 2020 (with a tax of $ 1.7 billion) will be two or more
devices on the public use of laptops, smart, intelligent devices, etc. Personal digital data
amount that will provide a great source of digital data. Echo Amazon.com review
recommends changes in the way of technology; the use of more than half the name Alex,
but most technology items refers to pronouns. When names and pronouns are considered
together, users are almost equal between each person and, at least any customization;
twenty percent of personal characteristics have been committed in the language.
Personality differences and explains the user, these results suggest that the size of the
character changes among users because of the reasons for further investigation, for
example, expectations of social robots and emotional model. The maximum description of
the interaction with socialization echo / Alexa lower and middle level. These results
suggest that the size of the character changes among users because of the reasons for
further investigation, for example, expectations of social robots and emotional model. The
maximum description of the interaction with socialization echo / Alexa lower and middle
level. These results suggest that the size of the character changes among users because of
the reasons for further investigation, for example, expectations of social robots and
emotional model. The maximum description of the interaction with socialization echo /
Alexa lower and middle level.
1. Introduction: In the latest research, police officers, lawyers and forensic experts
tried to use detection devices devices such as "always" based on IOT, as individual black
boxes. In particular, there is a recent criminal case in which the echo of Amazon, has
received much attention the media attention. In November 2015, another accused James
Bates in the first row, who died arrest in a bubble bath. Police in Arkansas Alexa
ultrasound avoids smart homes and required to carry all the relevant information about the
device ALA. However, rejects the absence of a request for Amazon for a valid and legally
binding. There are many legal questions about such use of evidence, but there are
important considerations. Even more importart, to test efficiently in this case, you must
first understand the characteristics of the digital ecosystem faces Alexa and Amazon.
When Alex is active, Amazon Eco is not only an intelligent speaker, but acts as an
intelligent virtual personal assistant. As a cloud service, interacting with different
compatible devices, such as Alexa Eco and services, the native IO protocol voice icon can
control and communicate with a third party that is compatible with other devices and
Research Scholar, Center for cloud infrastructure and security, Suresh Gyan Vihar University, Jaipur Assistant professor, Center for cloud infrastructure and security, Suresh Gyan Vihar University, Jaipur

International Journal of Management, IT & Engineering Vol. 8 Issue 12(1), December 2018,
ISSN: 2249-0558 Impact Factor: 7.119
Journal Homepage: http://www.ijmra.us, Email: [email protected]
Double-Blind Peer Reviewed Refereed Open Access International Journal - Included in the International
Serial Directories Indexed & Listed at: Ulrich's Periodicals Directory ©, U.S.A., Open J-Gage as well as in
Cabell’s Directories of Publishing Opportunities, U.S.A
261 International Journal of Management, IT & Engineering
http://www.ijmra.us, Email: [email protected]
applications. To mount the environment in relation to Alexa, users have access to cloud
services business, such as computers or mobile devices (Android and iOS devices). Thus,
these interconnected devices, third-party applications, customers and partners are complex
and diverse ecosystems (Amazon) created by this work, namely, Alexa, and its ecosystem.
When Alex is active, Amazon Eco is not only an intelligent speaker and also works as an
intelligent virtual personal assistant. As a cloud service, Alexa can communicate with
various compatible devices, such as Alexa Echo, and connect to other devices and iOS
third-party applications. To mount the environment in relation to Alexa, users have access
to cloud services business, such as computers or mobile devices (Android and iOS
devices). Thus, these interconnected devices, third-party applications, customers and
partners are complex and diverse ecosystems (Amazon) created by this work, namely
Alexa and its ecosystem. When Alex is active, Amazon Eco is not just a clever speaker,
but acts as an intelligent virtual personal assistant. As a cloud service, Alexa can
communicate with various compatible devices, such as Alexa Echo, and connect to other
devices and iOS third-party applications. To mount the environment in relation to Alexa,
users have access to cloud services business, such as computers or mobile devices
(Android and iOS devices). Thus, these interconnected devices, third-party applications
and client partners are complex ecosystems (Amazon) in this work by Alexa Alexa can
contact a variety of suitable devices, such as local computer protocols and ultrasound.
Compatible with other devices and applications. To mount the environment in connection
with Alexa, Users access the need for enterprise cloud services, such as computers or
mobile devices (Android and iOS devices). Why Amazon creates all these interconnected
devices, third-party applications and complex and diverse ecosystems favorable to the
client. In this paper, Elko can communicate with different types of compatible devices,
such as echo, and other devices and applications that can communicate with a third party.
Native communication protocol puts IO voice services. To mount the environment in
relation to Alexa, users have access to cloud services business, such as computers or
mobile devices (Android and iOS devices). That's why all interconnected devices Amazon,
third-party applications, and customer-friendly complex and has created diverse
ecosystems. In this introduction, customers have access to a service company in the cloud,
such as a computer or mobile devices (Android and iOS). Thus, these interconnected, third
party applications and partners client devices are complex and diverse ecosystems
(Amazon) created by In this feature, and customers access to a service company in the
cloud, such as computer or mobile (Android and iOS) devices needed. That's why all those
Amazon creates interconnect devices, third-party applications, and complex and diverse
ecosystems for the customer in this work, all these interconnected devices, third-party
applications and complex and diverse ecosystems of customers created by Amazonas . In
this work, all these interconnected devices, third-party applications and diverse ecosystems
(Amazonas) and complex music. We offer a new method for cloud and client-side digital
masters Alexa for the ecosystem of the Amazon are mixed. Acquisitions handmade
Alexander native cloud is important. Alexa ultrasound works, so manual user interaction is
different in the cloud. Unfortunately, this approach has two limitations. First, access to the
cloud requires a valid user. Of course it is possible to access data through research or
research, but this information is not always available. Second, it is difficult to restore
deleted data in the cloud. Forensic approaches are needed by the client to overcome this
limitation. It felt As a result of our analysis, a concept is presented, the test equipment

International Journal of Management, IT & Engineering Vol. 8 Issue 12(1), December 2018,
ISSN: 2249-0558 Impact Factor: 7.119
Journal Homepage: http://www.ijmra.us, Email: [email protected]
Double-Blind Peer Reviewed Refereed Open Access International Journal - Included in the International
Serial Directories Indexed & Listed at: Ulrich's Periodicals Directory ©, U.S.A., Open J-Gage as well as in
Cabell’s Directories of Publishing Opportunities, U.S.A
262 International Journal of Management, IT & Engineering
http://www.ijmra.us, Email: [email protected]
based on solid IOT cloud environment: Kit Forensic cloud-based tools, IOT, which can
reach objects in the cloud, to benefit from API nonprofit Indiana and implement customer -
sided analysis of artifacts. Use a web-based application. We try to get all the work that is
detected in the normalization of the database and support our work and support the work of
digital forensics community. Current procedures and provide system IOT situation require
at least useful for testing concepts and imaging tools that work in the Amazon environment
Alexa. Voice service based on Amazon Amazon Amazon is available on Amazon devices
and third party devices million. With Alex, we can more intuitive way to interact with
customers to create the daily experience forms provides natural voice. Our team, APIs,
reference solutions and document collections make it easy for everyone. Begin
construction of a speech by adding new energy Alexa combines directly combining alcohol
or product unit Alexa the voice control device is here and the time to embrace this
technology in the classroom. Alexa Punto Amazon operates at low cost via Wi-Fi, can
make your classroom into an interactive learning where students use voice search to
display the class, as their future home and vehicles. In addition, the children love! With
Alex, we can more intuitive way to interact with customers to create the daily experience
forms provides natural voice. Our team, APIs, reference solutions and document
collections make it easy for everyone. Begin construction of a speech by adding new
energy Alexa combines directly combining alcohol or product unit Alexa the voice control
device is here and the time to embrace this technology in the classroom. Alexa Punto
Amazon operates at low cost via Wi-Fi, can make your classroom into an interactive
learning where students use voice search to deploy the class, as their future home and
vehicles. In addition, the children love! With Alex, we can more intuitive way to interact
with customers to create the daily experience forms provides natural voice. Our team,
APIs, reference solutions and document collections make it easy for everyone. Begin
construction of a speech by adding new energy Alexa combines directly combining alcohol
or product unit Alexa the voice control device is here and the time to embrace this
technology in the classroom. Alexa Punto Amazon operates at low cost via Wi-Fi, can
make your classroom into an interactive learning where students use voice search to deploy
the class, as their future home and vehicles. In addition, the children love! Reference
solutions and document collections make it easy for everyone. Begin construction of a
speech by adding new energy Alexa combines directly combining alcohol or product unit
Alexa the voice control device is here and the time to embrace this technology in the
classroom. Alexa Punto Amazon operates at low cost via Wi-Fi, can make your classroom
into an interactive learning where students use voice search to deploy the class, as their
future home and vehicles. In addition, the children love! Reference solutions and document
collections make it easy for everyone. Begin construction of a speech by adding new
energy Alexa combines directly combining alcohol or product unit Alexa the voice control
device is here and the time to embrace this technology in the classroom. Alexa Punto
Amazon operates at low cost via Wi-Fi, can make your classroom into an interactive
learning where students use voice search to deploy the class, as their future home and
vehicles. In addition, the children love! The kind of interactive learning in which students
use voice search to deploy the class, as their future home and vehicles. In addition, the
children love! The kind of interactive learning in which students use voice search to deploy
the class, as their future home and vehicles. In addition, the children love! The kind of
interactive learning in which students use voice search to deploy the class, as their future

International Journal of Management, IT & Engineering Vol. 8 Issue 12(1), December 2018,
ISSN: 2249-0558 Impact Factor: 7.119
Journal Homepage: http://www.ijmra.us, Email: [email protected]
Double-Blind Peer Reviewed Refereed Open Access International Journal - Included in the International
Serial Directories Indexed & Listed at: Ulrich's Periodicals Directory ©, U.S.A., Open J-Gage as well as in
Cabell’s Directories of Publishing Opportunities, U.S.A
263 International Journal of Management, IT & Engineering
http://www.ijmra.us, Email: [email protected]
home and vehicles. In addition, the children love! The kind of interactive learning in which
students use voice search to deploy the class, as their future home and vehicles. In addition,
the children love! The kind of interactive learning in which students use voice search to
deploy the class, as their future home and vehicles. In addition, the children love! The kind
of interactive learning in which students use voice search to deploy the class, as their future
home and vehicles. In addition, the children love! In addition, the children love! The kind
of interactive learning in which students use voice search to deploy the class, as their future
home and vehicles. In addition, the children love! In addition, the children love! The kind
of interactive learning in which students use voice search to deploy the class, as their future
home and vehicles. In addition, the children love!
2. Use of Alexa
2.1 The basic classroom management
Amazon reserves the time and only the standard management class. Do not say: "Alexa",
the device captures the attention. For example, you can say, "Alexa, the timer for ten
minutes" and the unit will begin operations over time. It occurs randomly in random
groups of students, any association or group. If you have to make decisions quickly, Alex
"Teja head." demand
I use writing and Amazon can not tell the story of the story, but if you have a public
account, Amazon works directly with Alex, you learn to read their novels on the basis of a
high level group. You can use your skills to improve your writing skills. Alexa may
explain the high number of words. Definition and synonyms audio device can this tool is
especially useful as a second language for English language learners.
maths
Amazon may simply be a numerical calculation, addition and subtraction. Instead, you can
use these tools to "identify" their math students. Moreover, Alexandra has many tools,
"says Roll.
Science is a search, because you can use Amazon Alexa. Depending on grade level, ask
questions Alexandra time, animal or human body. There are tools like Alexa and Finance
Science Science News headline.
History and social sciences
The device works well for civics and history lessons. In addition to the daily press
conference, there are historical events and history. It can be used for geography, if the
question "What is the capital of Georgia?" If the United States is playing the capital
extra fun
Amazon can be used for fun. The device can play music, podcasts and games. If you have
time, you can try different games like triangle "Jeopardy", or you can use the music while
the gym is an independent student.
2.2. Why Alexa is able to build skills
Alexa is that ultrasound devices based Amazon cloud-based voice Amazon and equipment,
equipment, fire fighting, fire tables, and third-party tools used. You can create knowledge
or skills that make it faster, more comfortable and more enjoyable for customers making.
Alexa Kit (ASK) is a collection of self-service APIs, tools, documentation and code
samples, enhanced abilities used by thousands of developers skills. With ASK everyone
can enjoy voice design knowledge for a quick and easy to build on Amazon. Building
rebuild your voice customer experience for today
You can share your experience Alexa voice

International Journal of Management, IT & Engineering Vol. 8 Issue 12(1), December 2018,
ISSN: 2249-0558 Impact Factor: 7.119
Journal Homepage: http://www.ijmra.us, Email: [email protected]
Double-Blind Peer Reviewed Refereed Open Access International Journal - Included in the International
Serial Directories Indexed & Listed at: Ulrich's Periodicals Directory ©, U.S.A., Open J-Gage as well as in
Cabell’s Directories of Publishing Opportunities, U.S.A
264 International Journal of Management, IT & Engineering
http://www.ijmra.us, Email: [email protected]
Natural creation with the ability to achieve sound and access to the customer experience
with devices. Use our SD shows, APIs and codes for games, expert skills for children,
content skills, musical skills and more. Provide well-trained skills to develop and distribute
entertainment habits
Add visual and tactile characteristics
Maintain visual experience for the design, construction and creating the first visible voices,
ultrasound programs, ecological points, fire TVs, tablets and more types of devices, such
as Alexa skills to spend more. Create games with eco buttons and maintain an ultrasound
device in one of the interactive games.
Alexa money
De vaardigheden van het meisje met klanten zijn gebouwd, Klanten winnen you. Nu kun je
geld verdienen met je kracht Alexa Om uw ervaring verbeteren you go door to aankoop
vaardigheden, verkopen inhoud van hoge kwaliteit, verkopen Alexa vaardigheden of
fysieke producten in diensten, in bieden een nieuw Alexa verkoopkanaal Amazon
Payments Capability. U kunt ook als betalen per door of Klanten of vaardigheden
Alexander van Developer Award.
Alexa-apparatuur vaardigheden
Alexa een ervaring omvat Gebruiker voice, of Hoe kan het publiek reageren op
doelstellingen you go klant in reageren feedback op van klanten in Toegang tot diensten
van Intel.
ASR in NLU
Het omzetten go gesproken woorden meth behulp van analoge geautomatiseerde verbale
erkenning (ASR), door middel van taal natuurlijke begrijpen (NLU) luidspreker vermindert
betekenis in biedt of oorspronkelijke doelstellingen go klanten in hun vaardigheden.
Voice Interface in the lokale gewoonten
U kunt profiteren van voor Native gebruikersinterfaces smart home spraak, muziek, flash
video informatie EFFICIENT you nemen, of GEEF aangepaste gebruikersinterface uw
stem.
3. Literatuuronderzoek
een. Alexa Apparaten hebben drie soorten Apparaten: Alexa: Amazon Echo, Echo
Point Tap Amazon. Om STEM commando's die zijn aangesloten op Amazon volgens
Wolken van spraakdiensten, Alexa Amazon Eco Eerste generatie apparaat van Alexa Altijd
in de mode luister you ondersteunen, zodat u geen spraakcommando nodig hebben om het
woord 'Alexa' Elke keer als je opstaat activeren het biedt slechts een voice command terug
naar in keert of luistermodus. Het wordt als een lange getoond cilinder met van 9,25 inch
speakers, met zeven van microfoons sets. Tap heeft een kleine Amazon draagbare batterij
versie (6.2 inch lang), maar heeft het vergelijkbare functies. Of nieuwste generatie miss
punten, 1.6-inch cilinder een met een kleine luidspreker. Zowel Echo Point in Amazon, die
nodig zijn add-ons voor de voeding, meestal plaats ze op specifieke locaties (bijvoorbeeld
in een enkele cel).
B. Alexa voice service. Alexa service model. Speech recognition is compatible with Alexa
devices with voice commands. Figure 1 shows smart devices voice enabled devices Alexa
targets (such as smart lights, thermostats, etc.) administrations. To manage intelligent
device, the user can activate the word "Alex" and then talk to Alexa. Alexa suddenly sends
voice commands in remote voice processing the Wi-Fi network. To confirm that sends a
valid command via the cloud as legitimate words, a server called Intelligent Server adapter,

International Journal of Management, IT & Engineering Vol. 8 Issue 12(1), December 2018,
ISSN: 2249-0558 Impact Factor: 7.119
Journal Homepage: http://www.ijmra.us, Email: [email protected]
Double-Blind Peer Reviewed Refereed Open Access International Journal - Included in the International
Serial Directories Indexed & Listed at: Ulrich's Periodicals Directory ©, U.S.A., Open J-Gage as well as in
Cabell’s Directories of Publishing Opportunities, U.S.A
265 International Journal of Management, IT & Engineering
http://www.ijmra.us, Email: [email protected]
you can use Amazon to support external service providers. Then the state is assigned to the
other clouds can control the intelligent remote device. The Amazon ecosystem various
elements shown in the diagram. 1. First, it is necessary to service the cloud Alex talk about
one or more devices are compatible with Alex. Enter our data, ecosystems, especially
related devices associated with eco-Amazon and other devices used for communication
with cloud services. Then, in the image, Alexa represents all Amazon cloud platform to
support the functionality of this ecosystem. Authentication, information management, and
recording, voice services are available for Alex with various cloud services. One of the
most interesting aspects of digital forensics point of view, in addition to these basics,
Customer partner is essential to manage the world of work by accessing the cloud server.
Customer collaboration means a custom application Alexa affiliate as Fire OS, Android
and iOS, as a request by Amazon Alexa. Although no official request for PC, users can use
the web browser to access the cloud, so that digital certificates using the Alexa ecosystem
in a digital device with the ability to surf the web is not possible. Also, the instructions can
be extended by connecting IOT compatible devices and the use of different services (third-
party applications), as shown in Figure 1. It is therefore possible to use a digital Alexa a
digital evidence of the use a digital device for browsing the web. The setpoints can be
increased by connecting IOT compatible devices and use various services (third-party
applications), as shown in Figure 1, so that can be used for digital tests that may use a Web
Surfing digital device. Furthermore, Slogs can be extended to be used by compatible
devices IOT and different services (third-party applications), as shown in Figure 1. The
slugs can be extended by communication with compatible devices IOT and use different
services (third-party applications). , As shown in Figure 1, because of the ability to
navigate, digital evidence related to the use of Alexa ecosystem is placed on a digital
device. Furthermore Slogs may extend IOT compatible devices and different services
(third party applications) are used, as shown in Figure 1. slugs can be extended by
communication with compatible devices, IOT, and various services (external applications),
As shown in Figure 1, because of the ability to navigate, digital evidence related to the use
of Alexa ecosystem is placed on a digital device. In addition, the instructions may extend
IOT devices compatible with different services (other applications), as shown in Figure 1.
It is therefore possible to use a digital class Alexa browse a digital proof using a digital
device the Web. Further, references can be extended by connecting IOT compatible
devices and use various services (third-party applications), as shown in Figure 1. It is
therefore possible to use a digital class digital evidence Alexa use a digital device to surf
the Internet. In addition, the instructions may extend IOT devices support different services
(third-party applications), shown in Figure 1, it is possible to use a digital class Alexa
browse a digital proof using a digital device anywhere. Moreover, it references can extend
IOT devices compatible with different services (third party applications) shown in Figure
1, Alexa is possible to use a digital class to navigate a digital test using a digital device on
the web. Furthermore, the instructions can be extended to devices with different services
supported IOT (third-party applications), shown in Figure 1

International Journal of Management, IT & Engineering Vol. 8 Issue 12(1), December 2018,
ISSN: 2249-0558 Impact Factor: 7.119
Journal Homepage: http://www.ijmra.us, Email: [email protected]
Double-Blind Peer Reviewed Refereed Open Access International Journal - Included in the International
Serial Directories Indexed & Listed at: Ulrich's Periodicals Directory ©, U.S.A., Open J-Gage as well as in
Cabell’s Directories of Publishing Opportunities, U.S.A
266 International Journal of Management, IT & Engineering
http://www.ijmra.us, Email: [email protected]
.
Figure 1: System architecture Alexa Equipment
3. analysis strategy
Due to the characteristics of the ecosystem Alexa before (including the fitting summary),
there are ideas similar level for a number of Jawad et al propose forensic approaches.
(Jawod and Hassan, 2015). This subdivision method for orienting multilayer ecosystem
and research opportunities described.
Table 1. Analysis of approaches to the Amazon ecosystem Alexa
level definition progress
clou
d
Native artifacts acquisition
Alexa cloud (when user data
is available)
Amazon
ecosystem
skills Alexa
describes
the results clien
t
Identifying moving objects
customer-centric
applications and Web
browsers
net Understand the
communication protocol
and unofficial API used by
Alexa
hard
ware
Enjoying the data stored on
compatible devices Alexa
Future
work
Hardware: compatible devices Alexa Elke Alexa-compatibel apparaat moet worden door
het losgekoppeld uitvoeren van de vorige lagen van Lagen hardware. Clinton et al. Layer
Amazon Analyze door Amazon Eco Research (Clinton et al., 2016). De auteurs hebben
hun testen verkort reverse engineering door middel van hulpmiddelen zoals EMMC Road,
JTAG Debug Port. Zij hebben een aantal mogelijke manieren uitgelegd Toegang om tot
interne componenten, waaronder geheugen Standaard chips mogelijk te maken, maar niet

International Journal of Management, IT & Engineering Vol. 8 Issue 12(1), December 2018,
ISSN: 2249-0558 Impact Factor: 7.119
Journal Homepage: http://www.ijmra.us, Email: [email protected]
Double-Blind Peer Reviewed Refereed Open Access International Journal - Included in the International
Serial Directories Indexed & Listed at: Ulrich's Periodicals Directory ©, U.S.A., Open J-Gage as well as in
Cabell’s Directories of Publishing Opportunities, U.S.A
267 International Journal of Management, IT & Engineering
http://www.ijmra.us, Email: [email protected]
hebben of auteurs of informatie die het apparaat op is opgeslagen Uitgebreid. Daarom zal
dit aspect worden opgenomen in onze toekomstige projecten, ontwikkeld in het werk hier
gepresenteerd. Netwerk: communicatieprotocol: aangesloten een een apparaat in geschikt
client Alexa, geïdentificeerd als Figuur 1 communiceren moet het met via internet analyze.
Uit van het Web Proxy analyze debugger (XK72) Charles, we hebben een dat bevestigd
versleutelde Verbinding geldig is het maken van gevalideerd na een met een sessie
Gebruiker Identificatie in forensische verkeer in verband met het het wachtwoord in
verband met essentiële ensure kunstwerken. Door het van dit analyseren Netwerk, waren
we in staat om van professionele identiteit brandnetel of klantervaring wolk in identificeren
you. De resultaten worden in de forensische beschreven artefacten in de categorie Alexa
klasse will go Amazone ecosysteem. Door het van dit analyseren Netwerk, waren we in
staat om van professionele identiteit brandnetel of klantervaring wolk in identificeren you.
De resultaten worden in de forensische beschreven artefacten in de categorie Alexa klasse
will go Amazone ecosysteem. Door het van dit analyseren Netwerk, waren we in staat om
van professionele identiteit brandnetel of klantervaring wolk in identificeren you. De
resultaten worden in de forensische beschreven artefacten in de categorie Alexa klasse will
go Amazone ecosysteem.
Alexa cloud service: cloud, zoals op sectie vermeld in the van ecosysteem Amazon's
Amazon, Alexa is een Doel van het essentieel onderdeel ecosysteem. Net als andere
services in cloud, Alexa maakt gebruik van gegevens naar Vooraf gedefinieerde API
migreren you, maar helaas, wordt lijst met beschikbare of API's niet openbaar openen you.
Van digitale forensische wetenschap, we hebben niet aan de literatuur of inheemse Alexa
artefacten you bereiken hebben. Op deze manier intensieve werd een analyze uitgevoerd
om inheemse objecten in cloud om verkrijgen you onbevoegde Alex API's in illegale
onderzoek publiceren you.
Client: Alexa Alexa ClientAgent Tenslotte heeft een ander betrekking op niveau van
klanten analyze. Interessant gebruik van het is dat ten minste één Client Partner is
essentieel om geschikt apparaat Alex's beheren in exploiteren go werkomgeving.
Bijvoorbeeld, gebruikers kunnen milieu-instellingen you configureren, eerdere gesprekken
bekijken met Alexa, in in- / uitschakelen vaardigheden door middel van mobiele
applicaties of web browsers. Op deze manier kunnen alle informatie meth betrekking tot
Alex Access natuurlijk worden opgeslagen in the client. Essentieel is om het te maken
klantgerichte kunstwerken in sluit of lokale accessoires in cloud. Om deze inspanning
ondersteunen you, we hebben om geprobeerd Zowel of kunstmatige inhoud in cloud in
klant bij de niveau ontdekken you.
4. Voorgesteld of methoden die worden om een meer dan vaardigheid you bouwen
Alexa
4.1 Het Verzamelen van gegevens
Amazon.com Totaal 851 [1] Full-sized apparaat beoordeelt of reflecties Verzameld voor
twee weken in December 2016. Deze beoordeling maakt gebruik van eco-Apparaten in
Agenten om een van objectieve beoordeling Alexa of rijke potentieel leveren Bronnen.
Web content effectief wordt gebruikt analyze effectief perspectieven om van beide
onderzoeken op andere sites Amazon [bijvoorbeeld 8.10] begrijpen. Op basis van de
Sterren classificatie in Gebruiker, dat wordt aangenomen geslacht medewerkers van het
geen informatie over het van belangrijke opsporen document. Terwijl Beoordelingen zijn

International Journal of Management, IT & Engineering Vol. 8 Issue 12(1), December 2018,
ISSN: 2249-0558 Impact Factor: 7.119
Journal Homepage: http://www.ijmra.us, Email: [email protected]
Double-Blind Peer Reviewed Refereed Open Access International Journal - Included in the International
Serial Directories Indexed & Listed at: Ulrich's Periodicals Directory ©, U.S.A., Open J-Gage as well as in
Cabell’s Directories of Publishing Opportunities, U.S.A
268 International Journal of Management, IT & Engineering
http://www.ijmra.us, Email: [email protected]
beschikbaar voor het voor het publiek in schrijven vreemden, citaten nog steeds werk om
Huidige weerspiegelen of privacy essentiële Eindelijk garanderen you.
4.2 Object Parsing
A control to confirm the observations on the experience of using eco / Alexa. Short answer
or deleted (eg, "good weather. The weather has been.") It has eliminated more than coding.
The remaining evaluation (n = 587, 69%) was encrypted using the categories described
below; Due to resource limitations, it is encoded only 27% of the second coding apparatus.
Paraphrases focus on personality and socialization is based on CSA, [14] but the specific
problems were original coding. Personality grade based on the amount of technology that a
person's personality was equally effective, the revised lesson uses a person (as Alex or
"she" as the personal pronoun), describing it as a technology (echo;
The above group (Cohen κ = 0.88), and the reliability of the personality pronoun (Cohen κ
= 0.90) was acceptable. A sociological function and degree roll are defined in a coding
process free to change the security code of ethics by Alexa / Echo for analysis by analysis
reflects generate. Use critical Alexa / echo into five sections, at least some function or
maximum combination (Table 1) roll. Inter Computer reliability was acceptable for
socialization degree (κ. Κ = κ = 0.83).
Integration. Ability to integrate with significant use of reflections in other technologies and
services [1] In order to determine how the user comments are recorded by combining
Alexa / echo with the personality of other smart devices or referral services, together
facilities for integration with other instruments (Amazon, DOT, touch or extra echo) for
other devices, such as integration with other devices. And connected or smart (house
creative center, light, speaker) device.
Attributes and technical considerations based on their experience in working with the
device as personality and satisfaction of a person - which serve as speaker
Personification name
Only echo 122 37.2%
Echo & Alexa 57 17,4%
only Alexa 149 45.4%
Table 2: Frequency levels (Echo / Alexa) personification
Pronoun personification
Table 3: Frequency pronoun (it / her) levels personification
feedback and intelligent speech recognition technology [9, 16]. We have taken note of the
auxiliary speakers or quality options and speaking words taken. Commenting on the
appropriateness and effectiveness Alexander was also captured. other issues related to the
general operation of the device are also observed.
If household characteristics give the user the code (1) to be part of a family or live with
others, (2) has children or grandchildren,
5. the result
Net als bij het verwijderen van Uitgebreid commentaar, to give niet aan gerelateerd echo /
Alexa gebruik of resterende 587 reacties waren zeer positief, zoals hierboven vermeld,
waren er bij een half-sterren 4.32 (SD = 1.17) aan één TOT Vijf Sterren. Het complex
subject only 307 73.4%
both of them 48 11,5%
only person 63 15,1%

International Journal of Management, IT & Engineering Vol. 8 Issue 12(1), December 2018,
ISSN: 2249-0558 Impact Factor: 7.119
Journal Homepage: http://www.ijmra.us, Email: [email protected]
Double-Blind Peer Reviewed Refereed Open Access International Journal - Included in the International
Serial Directories Indexed & Listed at: Ulrich's Periodicals Directory ©, U.S.A., Open J-Gage as well as in
Cabell’s Directories of Publishing Opportunities, U.S.A
269 International Journal of Management, IT & Engineering
http://www.ijmra.us, Email: [email protected]
zichtbaar penis niet voor de meeste van deze reacties (n = 260); Wanneer seks kan worden
geschat, zullen of meeste werknemers mannelijke zijn (n = 200).
5.1 Perceptie in Interactie
Bijna alle voorbehouden adviezen zijn voor sommige analyze talen die kunnen worden
gecodeerd meth persoonlijkheid mate (n = 503, 86%). Genoemd meth name inrichting (n =
328), een iets groter aantal Alex wordt gebruikt, gebruik van minder cast of beide (tabel 2)
correctie. Integendeel, reacties die voornaamwoord technologie significant (n = 418), het
gebruik Maximaal maakt alleen universeel hemellichamen voornaamwoord of beide
voornaamwoord object (tabel 3). Er is een kleine verhouding tussen of werkelijke naam in
het voornaamwoord persoonlijkheid graad (R = 0.21, n = 587, p <0.001).
Of open coderen van de details go Interactie go Gebruiker meth Amazon Echo maken
consisting Interactie will vijf secties consequent uit minder sociale (geen nieuws of
informatie over het weer, zoals informatie die informatie geeft) vriendelijker (vrienden,
familie, Huisgenoot of echtgenoot) . Van het analyseren 587 Voor zijn reacties opgeslagen,
kunnen 347 (59%) in een van deze afdelingen toegewezen worden. Meeste colleague's
beschrijven of sequentie van socialisatie (n = 189), aangeduid meth ongeveer twee
afdelingen (n = 104), een drietal (n = 52) of vier (n = 4). Of meest voorkomende sectie
consequent ADH pauze een in phase 2 (Tabel 5). Toen hij meerdere noemt klassen,
hoogste is het niveau van de samenleving opgenomen in gebruikt voor verdere analyze.
6. Resultaten in discussie
An analysis (ANOVA) showed the benefit of customizing name and co-operation included
F (3, 343) = 12.82, p <0.001. Setting comparable results, the content of (F (3, 343) = 11.79,
p <0.001), and the collective personality (F (3, 343) = 20.84, p <0.001) available for levels
benefit. Of the 587 comments aside for analysis, 447 (76.15%) refer to family members.
The population refers only to itself, and the next general problem was a good suggestion
for other family members (for example, "use a lot") other family members, especially
children, the elderly or disabled at home or in a classroom, home, school, office or
bedroom (table 6), including the use of the device. These have a number of cases, the only
variables houses divided into three categories: individual, family, several members (with
no mention of the family and children), or specific characteristics of the population (elderly
and disabled). non-domestic users are excluded. Create a unique three-dimensional piece
of a house give (not to mention family members and children), individual family members,
or a specific population (old and inactive). non-domestic users are excluded. Create a
three-dimensional piece of a house: personal, family, several members (not to mention
family members and children), or a specific population (elderly and inactive). non-
domestic users are excluded. O specific population groups (old and inactive). non-domestic
users are excluded. O specific population groups (old and inactive). non-domestic users are
excluded. Create a three-dimensional piece of a house: personal, family, several members
(not to mention family members and children), or a specific population (elderly and
inactive). non-domestic users are excluded. O specific population groups (old and
inactive). non-domestic users are excluded. O specific population groups (old and
inactive). non-domestic users are excluded. Create a three-dimensional piece of a house:
personal, family, several members (not to mention family members and children), or a
specific population (elderly and inactive). non-domestic users are excluded. O specific
population groups (old and inactive). non-domestic users are excluded. O specific
population groups (old and inactive). non-domestic users are excluded. O specific

International Journal of Management, IT & Engineering Vol. 8 Issue 12(1), December 2018,
ISSN: 2249-0558 Impact Factor: 7.119
Journal Homepage: http://www.ijmra.us, Email: [email protected]
Double-Blind Peer Reviewed Refereed Open Access International Journal - Included in the International
Serial Directories Indexed & Listed at: Ulrich's Periodicals Directory ©, U.S.A., Open J-Gage as well as in
Cabell’s Directories of Publishing Opportunities, U.S.A
270 International Journal of Management, IT & Engineering
http://www.ijmra.us, Email: [email protected]
population groups (old and inactive). non-domestic users are excluded. O specific
population groups (old and inactive). non-domestic users are excluded. or a specific
population (elderly and inactive). non-domestic users are excluded. O specific population
groups (old and inactive). non-domestic users are excluded. O specific population groups
(old and inactive). non-domestic users are excluded. Create a three-dimensional piece of a
house: personal, family, several members (not to mention family members and children) or
a specific population (elderly and inactive). non-domestic users are excluded. O specific
population groups (old and inactive). non-domestic users are excluded. O specific
population groups (old and inactive). non-domestic users are excluded. O specific
population groups (old and inactive). non-domestic users are excluded. O specific
population groups (old and inactive). non-domestic users are excluded. or a specific
population (elderly and inactive). non-domestic users are excluded. O specific population
groups (old and inactive). non-domestic users are excluded. O specific population groups
(old and inactive). non-domestic users are excluded. Create a three-dimensional piece of a
house: personal, family, several members (not to mention family members and children),
or a specific population (elderly and inactive). non-domestic users are excluded. O specific
population groups (old and inactive). non-domestic users are excluded. O specific
population groups (old and inactive). non-domestic users are excluded. O specific
population groups (old and inactive). non-domestic users are excluded. O specific
population groups (old and inactive). non-domestic users are excluded. O specific
population groups (old and inactive). non-domestic users are excluded. O specific
population groups (old and inactive). non-domestic users are excluded. Create a three-
dimensional piece of a house: personal, family, several members (not to mention family
members and children), or a specific population (elderly and inactive). non-domestic users
are excluded. O specific population groups (old and inactive). non-domestic users are
excluded. O specific population groups (old and inactive). non-domestic users are
excluded. O specific population groups (old and inactive). non-domestic users are
excluded. O specific population groups (old and inactive). non-domestic users are
excluded. O specific population groups (old and inactive). non-domestic users are
excluded. O specific population groups (old and inactive). non-domestic users are
excluded. Create a three-dimensional piece of a house: personal, family, several members
(not to mention family members and children), or a specific population (elderly and
inactive). non-domestic users are excluded. O specific population groups (old and
inactive). non-domestic users are excluded. O specific population groups (old and
inactive). non-domestic users are excluded. O specific population groups (old and
inactive). non-domestic users are excluded. O specific population groups (old and
inactive). non-domestic users are excluded. family, several members (not to mention
family members and children), or a specific population (elderly and inactive). non-
domestic users are excluded. O specific population groups (old and inactive). non-domestic
users are excluded. O specific population groups (old and inactive). non-domestic users are
excluded. O specific population groups (old and inactive). non-domestic users are
excluded. O specific population groups (old and inactive). non-domestic users are
excluded. family, several members (not to mention family members and children), or a
specific population (elderly and inactive). non-domestic users are excluded. O specific
population groups (old and inactive). non-domestic users are excluded. O specific
population groups (old and inactive). non-domestic users are excluded. O specific

International Journal of Management, IT & Engineering Vol. 8 Issue 12(1), December 2018,
ISSN: 2249-0558 Impact Factor: 7.119
Journal Homepage: http://www.ijmra.us, Email: [email protected]
Double-Blind Peer Reviewed Refereed Open Access International Journal - Included in the International
Serial Directories Indexed & Listed at: Ulrich's Periodicals Directory ©, U.S.A., Open J-Gage as well as in
Cabell’s Directories of Publishing Opportunities, U.S.A
271 International Journal of Management, IT & Engineering
http://www.ijmra.us, Email: [email protected]
population groups (old and inactive). non-domestic users are excluded. O specific
population groups (old and inactive). non-domestic users are excluded. O specific
population groups (old and inactive). non-domestic users are excluded. O specific
population groups (old and inactive). non-domestic users are excluded.
6.1 Impact on satisfaction
Star ratings provide a critical metric satisfaction each evaluation guide and Amazon Eco.
We check how star ratings are influenced by personality, the interaction of socialization,
technical problems and models of linear response (R2 = 0.17, p <0.001), and integration
with other media services. Bar less dependent variable user evaluation is included on the
left. The problems of technical problems critical, the overall efficiency (β = -6.6, SE =
0.07, t (298) = -3.02, p = 0.003), or with control reactions (β = - 0, 25, SE = 0.06 t (298) = -
4.34, p <0.001) less satisfied with the device. More customization predicts greater
satisfaction (β = 0.15, S = 0)
7. Conclusion
The Amazon Eco Amazon.com review recommends changes in technology, as used more
than half of the name Alex Pseefifed but most technical objects refer to pronouns. When
names and pronouns are considered together, users are almost equal between each person
and at least some personalization, twenty percent of personal characteristics to be included
in the language. Personality differences explain between users, these results suggest that
changes in size personality among users, due to reasons of additional research, such as
expectations of social robots and emotional model [6] - the maximum description
ultrasound interaction / Alexa socialization of middle and lower level. In particular, most
users interact with applications describe a level of entertainment (eg music) and support
activities (planning and procurement management), with a moderate degree of
applications. Only employees who reveal the name, and in his criticism, Alexander call a
universal person will use more social interaction to date with devices Eco materials names
and pronouns. Therefore, there is a positive association between the use of the device,
more fun and more customization. Alexander calls a universal person will use more social
interaction to date with devices Eco materials names and pronouns. Therefore, there is a
positive association between the use of the device, more fun and more customization.
Alexander calls a universal person will use more social interaction to date with devices Eco
materials names and pronouns. Therefore, there is a positive association between the use of
the device, more fun and more customization.
8. References
[1] Khan, R. Khan, SU, Zaheer, R., and Khan, S., "Future Internet: The Internet of Things
architecture, possible applications and key challenges," IEEE International Conference on
Frontiers 10a of Technology of the information, . 2012, pp 257-260.
[2] Andreev, S., Galina, O., Pyattaev, A., Gerasimenko, M., Tirronen, T., Torsner, J.,
Sachs.J., Dohler, M. and Koucheryavy, Y., "Understanding on the Internet of things
landscape connectivity -. A contemporary M2M Radio technology roadmap,
"Communications Magazine, Vol.53 No. 9, 2015, pp 32-40.
[3] Zhao, K., and Ge, L., "A survey of Internet security things," Ninth International
Conference on Computational Intelligence and Security, IEEE 2013, pp 663 -. 667.
[4] J. Gubbi, Buyya R., S. and M. Marusic Palaniswami, "Internet of objects (IO): A view,
architectural elements and future directions," future generation Computer Systems, vol. 29,
no. 7, pp. 1645-1660, 2013.

International Journal of Management, IT & Engineering Vol. 8 Issue 12(1), December 2018,
ISSN: 2249-0558 Impact Factor: 7.119
Journal Homepage: http://www.ijmra.us, Email: [email protected]
Double-Blind Peer Reviewed Refereed Open Access International Journal - Included in the International
Serial Directories Indexed & Listed at: Ulrich's Periodicals Directory ©, U.S.A., Open J-Gage as well as in
Cabell’s Directories of Publishing Opportunities, U.S.A
272 International Journal of Management, IT & Engineering
http://www.ijmra.us, Email: [email protected]
[5] Almobaideen, W. Allan, M., and Saadeh, M., "The intelligent archaeological tourism:
Differences, comfort and accessibility in the context of Internet-centric cloud things,"
Mediterranean Archeology and Archaeometry, vol. 16, no 0.1 2016, pp.227-236.
[6] Almobaideen, W., Saadeh, M., Al-Anbaki, N., Zaghloul, R., and Aladwan, A.,
"geographical route selection based on the use of public transport and service preferences"
ninth international Conference on next generation of mobile applications, services and
technologies (NGMAST), Cambridge, 2015.
[7] Maha Saadeh, Mohammed Azzam Sleit Qatawneh, Wesam Almobaideen
"authentication technologies for the Internet of things: a survey," Cybersecurity and
Cyberforensics 2016 Conference.
[8] Shopan Dey; Ayon Roy; Sandip Das, "Home Automation Internet of things"
Ubiquitous Computing, Electronics and Conference for Mobile Communications
(SEMICON) Annual IEEE, 20-22 October 2016.
[9] Pavithra.D "monitoring and control of home automation based on IO" 2015 World
Conference on Communication Technologies (STAG 2015) Ranjith Balakrishnan.
[10] Global Mobile Data Traffic Update planned, 2016-2021; White paper; Document ID:
1454457600805266, CISCO.
[11] Do-Hun Kang; Min-Sung Park; Kim Hyoung-Sub; Da-Young Kim; Sanghui Kim,
"Room temperature control and fire alarm / suppression service MQTT IO using AWS,"
International Conference on Technology and Service Platform in 2017.
[12] William Tarneberg; Vishal Chandrasekaran; Marty Humphrey, "Experiences create a
framework for intelligent traffic control using AWS IOT," ACM IEEE International
Conference / utility on 9 and Cloud Computing, 2016.
[13] He Huihong; Ma Zhiyi; Xiang Li; Chen Hongjie; Shao Weizhong, "An approach to
estimate the cost of running cloud applications using AWS," Software Engineering
Conference Nineteenth Asia and the Pacific in 2012.
[14] "The use of technology based on intelligent control system of multiplatform home
Internet of things", Sung Jung-Hsiao Kuang-Yow Lian-Wen Tsai Sung, International
Symposium on Computing, Consumer and Control, 2016.
[15] Ali Race; Ataul Ikram Aziz; Asfand Amin Ikram Ahmad Jamal, "An overview of low
cost development boards for energy efficient applications Internet of Things" Future
Technologies Conference (FTC), 6-7 December 2016.

International Journal of Management, IT & Engineering Vol. 8 Issue 12(1), December 2018,
ISSN: 2249-0558 Impact Factor: 7.119
Journal Homepage: http://www.ijmra.us, Email: [email protected]
Double-Blind Peer Reviewed Refereed Open Access International Journal - Included in the International
Serial Directories Indexed & Listed at: Ulrich's Periodicals Directory ©, U.S.A., Open J-Gage as well as in
Cabell’s Directories of Publishing Opportunities, U.S.A
273 International Journal of Management, IT & Engineering
http://www.ijmra.us, Email: [email protected]
A temporary scheme for search keyword based on political key
attributes Secure Cloud Storage
Nindiya Devi
Sandeep Bhargav
Abstract: Search by keyword temporary sensitive data in a cloud computing environment
is the main objective of the survey. Cloud providers are not entirely reliable. It is therefore
essential to outsource data in encrypted form. Search Keyword based on attributes (ABKS)
approaches, authorized users can generate a pair of search tabs and send them to the cloud
to carry out search performance. These search tabs can be used to extract most of the
cipher text that occur at any time and understand the corresponding key word. As this
could lead to an information leak, it is safer to specify that a strategy that research teams
can be extracted from cryptograms generated within a predetermined period of time. This
conclusion, in this work a new attribute called based cryptographic primitive search by
temporal key political key word (KP-ABTKS) which provide that land is presented.
Keyword: cryptographic. Attribute, cloud computing, key pair.
1. Introduction
Cloud the general term is a common platform that is used by the entire world cloud
environment Cloud defined as the same platform that provides the utility of virtual
software platform .What is offered by the provider cloud services. Standard definition, we
can define the cloud that network all the computers on a virtual platform. Specifically, a
cloud infrastructure or platform that allows the calculation of the application and reliably
and solidly services. A cloud is a set of computing resources (ie set of machines, software,
hardware, application programs, network) that can be shared with Internet use, a user can
easily cloud access these shared resources, what is known as cloud computing. And
eliminates the overhead of installing and provide a set of computing resources for each
individual system. It is based on the method of payment by model. Unlike the management
of resources at the local level within a university or organization, offers cloud computing
with highly scalable IT resources to deliver on the internet. We applications, services,
infrastructure networks these are the resources offered by cloud computing. Cloud
computing is very cost effective because you only pay for the resources. Flexibility is
another interesting feature of cloud computing, the changing needs of cloud computing has
enabled IT organizations to quickly adapt to these changes. Unlike the management of
resources at the local level within a university or organization, offers cloud computing with
highly scalable IT resources to deliver on the internet. We applications, services,
infrastructure networks these are the resources offered by cloud computing. Cloud
computing is very cost effective because you only pay for the resources. Flexibility is
another interesting feature of cloud computing to the changing needs of cloud-enabled IT
organizations to adapt quickly to these changes. Unlike the management of resources at the
local level within a university or organization, offers cloud computing with highly scalable
IT resources to deliver on the internet. We applications, services, infrastructure networks
Research Scholar, Center for cloud infrastructure and security, Suresh Gyan Vihar University, Jaipur
Assistant professor, Center for cloud infrastructure and security, Suresh Gyan Vihar University, Jaipur

International Journal of Management, IT & Engineering Vol. 8 Issue 12(1), December 2018,
ISSN: 2249-0558 Impact Factor: 7.119
Journal Homepage: http://www.ijmra.us, Email: [email protected]
Double-Blind Peer Reviewed Refereed Open Access International Journal - Included in the International
Serial Directories Indexed & Listed at: Ulrich's Periodicals Directory ©, U.S.A., Open J-Gage as well as in
Cabell’s Directories of Publishing Opportunities, U.S.A
274 International Journal of Management, IT & Engineering
http://www.ijmra.us, Email: [email protected]
these are the resources offered by cloud computing. Cloud computing is very cost effective
because you only pay for the resources. Flexibility is another interesting feature of cloud
computing to the changing needs of cloud-enabled IT organizations to adapt quickly to
these changes. Cloud computing is very cost effective because you only pay for the
resources. Flexibility is another interesting feature of cloud computing, the changing needs
of cloud computing has enabled IT organizations to adapt quickly to these changes. Cloud
computing is very cost effective because you only pay for the resources. Flexibility is
another interesting feature of cloud computing to the changing needs of cloud-enabled IT
organizations to adapt quickly to these changes. Flexibility is another interesting feature of
cloud computing, the changing needs of cloud computing has enabled IT organizations to
adapt quickly to these changes. Cloud computing is very cost effective because you only
pay for the resources. Flexibility is another interesting feature of cloud computing to the
changing needs of cloud-enabled IT organizations to adapt quickly to these changes.
Flexibility is another interesting feature of cloud computing, the changing needs of cloud
computing has enabled IT organizations to adapt quickly to these changes. Cloud
computing is very cost effective because you only pay for the resources. Flexibility is
another interesting feature of cloud computing to the changing needs of cloud-enabled IT
organizations to adapt quickly to these changes. The impact of cloud computing on IT
organizations is such that these organizations are making the best use of web applications,
infrastructure and interoperability offered by entities to provide IT computing services. The
technical expertise of these suppliers clouds the ability to deal with management, backup,
recovery, maintenance, etc. Therefore, customers can discover cloud services offer greater
reliability. To meet the changing needs and requirements of the IT industry, cloud
computing, it is easier for organizations to adapt to changing needs.
1.2 Styles Cloud Services:
IaaS It provides material resources.
PaaS It provides programming and runtime environment such as the language of work /
frame layout.
SaaS It offers software application programs.
Fig.1.1. cloud services and type style
1.3 Types of clouds
Public cloud: - It is a cloud that is managed by a service provider and is very consistent.
Their services are based on the payment as a form of travel. The deployment of public

International Journal of Management, IT & Engineering Vol. 8 Issue 12(1), December 2018,
ISSN: 2249-0558 Impact Factor: 7.119
Journal Homepage: http://www.ijmra.us, Email: [email protected]
Double-Blind Peer Reviewed Refereed Open Access International Journal - Included in the International
Serial Directories Indexed & Listed at: Ulrich's Periodicals Directory ©, U.S.A., Open J-Gage as well as in
Cabell’s Directories of Publishing Opportunities, U.S.A
275 International Journal of Management, IT & Engineering
http://www.ijmra.us, Email: [email protected]
cloud is much easier, cost effective and scalable. And provide services accessible by
anyone from anywhere.
Private cloud: - limiting access only to an organization or a company. Provides greater
security, privacy and greater flexibility and services are open to a limited number of
people. Private cloud is emerging as one of the favorites for organizations that do not want
to rely on the services offered by a third party, but they like to keep control of their data.
Hybrid cloud: - It is based on the concepts of both public cloud and private cloud. Hybrid
cloud can be implemented by one of the following methods: a service provider cloud
contains a private cloud which is responsible for establishing a partnership with the public
cloud provider or association may be formed between a public cloud providers and
offering a private cloud service provider platforms.
Hypervisor is responsible for running multiple virtual machines on top of it. Scalability is
one of the most important characteristics of cloud computing and to achieve scalability,
virtualization is key.
1.4 Benefits of virtual machines:
• The operating system can operate in the absence of physical hardware.
• Easier to build new machines.
• It is easier to migrate virtual machines.
• More machines can be imitated with respect to its physical availability.
1.5 Volunteer benefits of cloud computing:
The use of unused resources:
Cloud computing uses distributed non-dedicated vacuum tools to build a cloud and to
implement cloud services. Therefore, in general, increases system efficiency by exploiting
these resources underutilized.
• Cost reduction [5]
As cloud computing offerings with IT resources volunteer voluntarily by people around the
world that prevents the organization, scientists and researchers to make any kind of
investment in resources. By eliminating the need for specific resources such as volunteer
computing resources together generate a massive computing power which is sufficient to
meet the needs and requirements of projects and companies.
Fig.1.2. the performance of the platform with respect to cost analysis
• Reduce total energy consumption
Cloud voluntary presence reduces the Special Framework of excessive need for power,
cooling and battery backup, etc.

International Journal of Management, IT & Engineering Vol. 8 Issue 12(1), December 2018,
ISSN: 2249-0558 Impact Factor: 7.119
Journal Homepage: http://www.ijmra.us, Email: [email protected]
Double-Blind Peer Reviewed Refereed Open Access International Journal - Included in the International
Serial Directories Indexed & Listed at: Ulrich's Periodicals Directory ©, U.S.A., Open J-Gage as well as in
Cabell’s Directories of Publishing Opportunities, U.S.A
276 International Journal of Management, IT & Engineering
http://www.ijmra.us, Email: [email protected]
• Computer resources together provides computing power
To solve a complex problem, a large computing power is needed, so if the computer of
volunteer resources, then you can solve any problem and can be a possible solution for all
business projects and scientists are used completely. These non-dedicated resources are
provided by several people and that's why voluntary cloud cloud also called distributed
because it is not dedicated highly distributed resources. And these distributed services can
be used in combination to implement the services of any organization.
• Reduce the cost of data migration
volunteer cloud computing can reduce costs associated with migration as voluntary cloud
data is a highly distributed collection of resources are not dedicated, can act as an
advantage too, because these resources can be assigned to customers based on their
location. Thus, the cost associated with data migration can be reduced and thus improve
performance.
So it voluntarily cloud computing helps to achieve high performance using unused
resources and reduce the cost of buying such a way that organizations can make better use
of your budget. it also offers these volunteers computing resources for public use, so that
customers can easily get access to these resources.
1.4 Cloud Computing Architecture
Fig.1.3 Volunteer computing cloud architecture
The figure above shows the architecture of volunteers cloud computing, where both types
of clients exist: consumers who are responsible for the consumption of computing
resources of volunteers and supporters who are allowed to bring their resources and
services with inactivity to establish and support a cloud. It is responsible for providing
services to customers through an interface formed on SOA.
Volunteer’s cloud clients can be both consumers and contributes at the same time and can
take an active part in building a cloud volunteers to build an interactive session with the
cloud. Thus, companies can act as one of the customers who are free to contribute and
consume computing resources is not dedicated. These companies can contribute their
inactive or unused resources in the cloud.

International Journal of Management, IT & Engineering Vol. 8 Issue 12(1), December 2018,
ISSN: 2249-0558 Impact Factor: 7.119
Journal Homepage: http://www.ijmra.us, Email: [email protected]
Double-Blind Peer Reviewed Refereed Open Access International Journal - Included in the International
Serial Directories Indexed & Listed at: Ulrich's Periodicals Directory ©, U.S.A., Open J-Gage as well as in
Cabell’s Directories of Publishing Opportunities, U.S.A
277 International Journal of Management, IT & Engineering
http://www.ijmra.us, Email: [email protected]
1.6 Challenges of cloud computing
Fig.1.4. challenges
In all cases, the service provider cloud must support the end-user security issues. So you
must ensure that their infrastructure is sufficiently secure and customer data and the
application are well protected. Furthermore, customers must also ensure that the service
provider has taken appropriate measures to provide security measures and follows all
negotiated policies, limits and requirements described in the service quality.
Virtualization, as well as being a major advantage of cloud computing also raises serious
concerns about the safety of customers / end users who use a public cloud service.
Virtualization is known to change the relationship between the operating system and
hardware resources (which may be the capacity, storage capacity or even routing power or
say network).
This set of virtualization phenomenon infuses the need for an additional layer known as a
virtualization layer. Up to this layer is a configured properly managed and protected,
security issue remain floating.
Some of the concerns that may keep disturbing are the risk of compromising the hypervisor
or virtualization software. While these concerns appear to be theoretical, but also
demonstrated their traces of existence. Say, for example, the work station of the security
administrator is compromised and therefore malfunctions virtualization softwareturn
affects the entire data center. This can also lead to inactivity for the service or reconfigured
according to the will of the attacker.
• Users must try to understand the risk involved in cloud computing and risks of cloud
service provider, the third service providers, predictable attacks data, downtime and a
monitoring mechanism to ensure highly secure environment to the business.
• So far, there is nothing called uniform standards for data controllers fully protected.
They evolve or even say it is a continuous process of evolution of these standards.
• It is highly recommended to know where your data is stored and that all laws and local
jurisdiction is in place in the country especially recommended.
• You will lose control of the assets once they are in the cloud.
• To trust your provider, go back to the service level agreement and be very clear about
all policies, limits and their own needs.
• Not only control over their assets, but also in the physical security of your site is lost.

International Journal of Management, IT & Engineering Vol. 8 Issue 12(1), December 2018,
ISSN: 2249-0558 Impact Factor: 7.119
Journal Homepage: http://www.ijmra.us, Email: [email protected]
Double-Blind Peer Reviewed Refereed Open Access International Journal - Included in the International
Serial Directories Indexed & Listed at: Ulrich's Periodicals Directory ©, U.S.A., Open J-Gage as well as in
Cabell’s Directories of Publishing Opportunities, U.S.A
278 International Journal of Management, IT & Engineering
http://www.ijmra.us, Email: [email protected]
• Assets can be seized by some government agencies allowed if you heard or even other
companies with which it shares the servers violate any problems.
• If cloud providers are incompatible then there should be a mechanism for you to recover
and move your data.
• If it is encrypted certain set of data, you must be very clear in the very first phase of
taking the encryption / decryption of Liability: You or your service provider.
• If the data transmission over the Internet or stored in the pool provider is encrypted.
• Data integrity refers to data protection in its truest form. For e-commerce transaction
you need to access record from the cloud and must negotiate on the following points:
2. Literature Review
[Kamalpreet Kaur. 2015]They proposed a systematic cloud data optimization server
using the technique of recursive bisection orthogonal to the migration of clouds. Cloud
computing is a necessary, provision of materials and online software services over the
Internet to complete the minimum work. However, due to use more suffer from many
problems such as overloading, migration, energy management, server consolidation, etc.
main problems are all the load balancing problems and migration. It is also useful for fast
delivery of services to the satisfaction of users to manage load balancing we call a server
data movement to another. But cloud computing faces many problems related to migration.
[3] According to this document also addresses the orthogonal algorithm to balance the data
on the cloud. Also set pre and post migration techniques. Cloud computing is essentially a
concept test space online or use data via the Internet. Cloud computing users have no
problem with the configuration of data services in the system that can access resources on
the Internet. And for the service that you pay a fixed amount or you can say the scale of
payment. In cloud computing data stored remote access reduces the capital cost of the
balance. Cloud migration capabilities are attractive for different organizations because of
the ease of use, flexibility and minimum cost. [3] The cloud migration is a method in
which w transfer of data, files, application from one organization to another, or we can say
that the transfer of data from one server to another. This is a technique that must be
completed systematically. According to the technical migration of cloud computing, it is
very complicated and have some error is also hidden. The mechanism used for data
migration is called migration of virtual machines that can be online or offline. This
technique follows some basic terms such as time of migration downtime, quantity and the
degradation of the application. The main objective of the author of this work is to optimize
cloud architecture performance and analyze the behavior of migrating to the cloud. In the
work of the result is to reduce the time of migration and downtime. Technical virtual copy
migration technique follows before and after. To run the system using a sim cloud
simulator that dynamically compares the balancing algorithm assigns the virtual machine
and the server.
[Er. Tamanna Narula et al. 2014] proposed for the analysis and control of cloud
applications framework. This document proposes that software testing is the main access
processing functionality and correction of program analysis. In projects of software testing
related to engineering, it has become a challenge, especially for the host. Because testing
can be a work process if necessary and more difficult and expensive.[4] The test is an
important phase of software development because testing requires expensive infrastructure
and managed resources and software that scrutinizes the performance, functionality,
stability and security. For small businesses, it is difficult to maintain or manage the

International Journal of Management, IT & Engineering Vol. 8 Issue 12(1), December 2018,
ISSN: 2249-0558 Impact Factor: 7.119
Journal Homepage: http://www.ijmra.us, Email: [email protected]
Double-Blind Peer Reviewed Refereed Open Access International Journal - Included in the International
Serial Directories Indexed & Listed at: Ulrich's Periodicals Directory ©, U.S.A., Open J-Gage as well as in
Cabell’s Directories of Publishing Opportunities, U.S.A
279 International Journal of Management, IT & Engineering
http://www.ijmra.us, Email: [email protected]
business or separate test facilities. He defined that cloud computing is a software test form
in which stress and reliability of the web application is defined. Cloud testing works with a
la carte service.[4] Cloud computing is testing techniques, including multi-user,
performance, security, compatibility, negative functional testing and compliance. And the
test works as a SaaS cloud, cloud to cloud and cloud, which also provides the benefits of
cloud computing as a management less profitable work independently to improve the tests
so effective, more realistic, changes in the external environment. In the structure of cloud
testing, it requires expensive infrastructure and resources that are only used sporadically. In
the small organization,
[Rashmi Rao et al. 2014]He proposed to improve the security of data migration to the
cloud by the random encryption technique. In this article, it is proposed that the
development of the security of cloud data increases user concern. Thus no third trust the
security of your data so that they use different data migration techniques. Cloud computing
has different paradigms in the world of IT resources. Gathering machines and resources
and services form a cloud in computer technology. In cloud computing multiple Internet
resources and services are provided to the user. It is useful for the user to reduce operating
and maintenance costs. [5] It also provides different types of benefits and application data
migration resources in the cloud and data migration became the turning point in the cloud
environment is the new way to perform risk management. Data migration is a data
movement means, applications, useful resources and other resources from one system to
another system. We can call the cloud cloud transmission. On the platform of the machine
and the Internet provided nearly resources. Thus, the cost-effective solution is provided.
Cloud move data from one cloud to another destination, which can be public, private and
hybrid cloud. It also requires the need to maintain the organization with different database
model as a service. In this process, they face problems such as integrity, security, privacy,
[5] and other precision. In his work proposal, they created an encryption algorithm that
ensures data security.
[Nirav Shah and. 2015]Secure Data Migration cloud offered to provide the integrity and
confidentiality. Cloud computing is a new featuring that adds many features and
applications together on an Internet platform to improve infrastructure and profitable
organization. Security has become the main problem No term to transfer user data from a
machine or from one server to another in the development of cloud computing. However,
with encryption or security algorithm algorithms, we can send our secure data
confidentiality and integrity. With the help of cloud computing, we can run our software on
the server, not on your home computer. [6] In this case, if a software damage or program
will be safe on the server so that others also use occurs in the system. The same user can do
with a document can access these documents with permission. All cloud services provides
better services for the safest and authorized server. Today about 70-80% of MNC working
in the cloud and use of cloud services that transfer data from one server to another if at the
time of data migration is the safety of the main concerns of each. For the security of data
they use many encryptions and decryption algorithm related and others that are useful to
keep safe the data during migration. In his work proposal, they created an encryption
algorithm to protect data in the cloud that provides better performance and better than the
existing algorithm results as PBE and IBE. [12]
They conclude that cloud computing increases business with high data usage and is useful
for companies and others who use cloud services. By providing encryption, confidentiality,

International Journal of Management, IT & Engineering Vol. 8 Issue 12(1), December 2018,
ISSN: 2249-0558 Impact Factor: 7.119
Journal Homepage: http://www.ijmra.us, Email: [email protected]
Double-Blind Peer Reviewed Refereed Open Access International Journal - Included in the International
Serial Directories Indexed & Listed at: Ulrich's Periodicals Directory ©, U.S.A., Open J-Gage as well as in
Cabell’s Directories of Publishing Opportunities, U.S.A
280 International Journal of Management, IT & Engineering
http://www.ijmra.us, Email: [email protected]
data integrity may be safer and data security is the priority of all.
[Dhrumil Parikh et al. 2015]They proposed the migration algorithm for data security in
the cloud. This document IT companies become your car in the cloud resources through
the Internet infrastructure are described. And security is becoming the main concern of
businesses. Data transmission called migration can be online or offline. Cloud computing
is defined as a set of resources and services. Transmits as an Internet service based on user
demand. For example, OS, network hardware, software, storage and resources. It is
therefore necessary to ensure data protection to protect against unauthorized access, errors,
modification and other services. To ensure safe computing resources and cloud storage.
Security objectives include mainly three points represent the integrity of confidentiality
and data. Confidentiality can be achieved by using cryptography. And symmetric
cryptography use three key words, asymmetric algorithm and hash. [7]. Using
cryptography we can make the data unreadable, hidden and meaningless at the time of data
transmission. This term of cryptography called encryption. Cloud computing has major
issues such as governance clouds, working alliances in the cloud that the statement or act
described. In its proposed methodology they described the different types of techniques to
verify the data. In the art encryption, key generation is the most important part. The whole
process depends on the key generation and key implementation is required in terms of key
management after the encryption and decryption happen.
3. Proposed algorithm
We present the new concept of KP-ABTKS and propose a concrete construction for this
new cryptographic primitive that can be applied to storage services in the cloud. The
proposed scheme is designed concrete based on bilinear pairing. The proposal KP-ABTKS,
each user is identified by an access control policy. Two KPABTKS security definitions are
strictly defined in the standard model. We define its security against attack keyword
chosen selectively (KPABTKS-SCKA), and the other defines the KPABTKS keyword
secret. We evaluate the proposed construction of the KP-ABTKS performance in terms of
computational complexity and execution time. Performance evaluation shows the practical
aspects of our. In this article, a research keywords based encryption schema attributes
updated cloud storage functions is proposed. The main contributions of the strategy are
summarized as follows:
The latest project is a combination of system and EBA word search encryption key
strategy. In addition, the system is shown to be the semantic security against the policies
chosen and chosen ciphertext attack in the plaintext class typical bilinear model. The latest
diet brand is compatible with the consumer upgrade functionality, even if the attribute of
an individual must be updated, a consumer secret key for this attribute must be improved,
while other key users secret and also cryptograms related to the function, not be updated. It
is a method of updating the most effective features that upgrade strategies existing
attributes. In addition, the performance with the high cost of computers is outside source
CS to reduce the computational load of an individual.
Our search algorithm supports research meta-key keywords, so that the user can match
trapdoor key key indicator stored in the cloud storage. Over on our search system by
keyword turned out to be security against attacks semantic keyword chosen (IND-CKA)
low during key exchange bilinear Diffie-Hellman (BDH).

International Journal of Management, IT & Engineering Vol. 8 Issue 12(1), December 2018,
ISSN: 2249-0558 Impact Factor: 7.119
Journal Homepage: http://www.ijmra.us, Email: [email protected]
Double-Blind Peer Reviewed Refereed Open Access International Journal - Included in the International
Serial Directories Indexed & Listed at: Ulrich's Periodicals Directory ©, U.S.A., Open J-Gage as well as in
Cabell’s Directories of Publishing Opportunities, U.S.A
281 International Journal of Management, IT & Engineering
http://www.ijmra.us, Email: [email protected]
Fig: 04 proposed attribute based framework
Attribute Authority (AA).AA can be really one thing perfectly confidence. Responsibility
for the establishment of the system, user registration, attributes management and secret key
generation is taken. So when an attribute of an individual should be updated, AA generates
improved for a user password.
Cloud hosting (CS).The SC is responsible for data storage and data access to valid users.
It is also responsible for the keyword search when an internet search Trapdoor a user is
received. And also responsible for the partial secret key update that connects the user with
improved functionality and also allows legitimate users to partially decrypt the ciphertext
using the key part of this person. The owner of the data owner encrypts your data and
assembling the key indicators of the word, and then subcontracts in the CS.
User (U).Each legitimate user can search for files on your system interesting. The user
creates a search to save trapdoor confidentiality of your keyword search. After an
individual sends his individuality and research CS trapdoor. Without showing details of
keyword research, the SC will meet encoded file includes keywords and do a lot of partial
decryption work to reduce the burden of deciphering user. Finally, the user gets partial
files, and decrypts the partial encoded files decrypted with the owner of the secret key
research something offered
STEP 1: system initialization. Parameters Entries of the installation security algorithm
along with the world also have λ L of sparks as the PP settings, the main key MSK, the two
pairs of secret and public key CS (SKS PK).
STEP 2: Essential production. key of the input generation algorithm MSK master secret
key, identifying a consumer individuality and characteristic set of consumers, and inputs
the secret key of the person, customer research secret and important public pairs
STEP 3: Encryption type and make the document keyword indicator. To find ciphertext
Ek (F), the encrypted file F DO soft key k by the symmetric encryption algorithm. It is
necessary if afterwards important symmetric k for subsequent encryption algorithm.
ENTRIES parameters of the security algorithm that people PP turnkey k and AHSSS also
available (M, ρ) access and transmit a cryptogram CT .DO. Index (W, Bbar) → W. The
creation indicator algorithm introduced a number of keywords and key public proprietary
research data W-BBar, and sparks from the collection of indicator of keywords I W
STEP 4: hatch generation. Production inputs authentication information algorithm PP, PK
CS public key and the secret key of a detail, individual settings and authentication sparks.
Even the entrance to producing algorithm keyword trapdoor w PK public key CS and the
search for a secret key person Apriv, also triggers the search Tw trapdoor.

International Journal of Management, IT & Engineering Vol. 8 Issue 12(1), December 2018,
ISSN: 2249-0558 Impact Factor: 7.119
Journal Homepage: http://www.ijmra.us, Email: [email protected]
Double-Blind Peer Reviewed Refereed Open Access International Journal - Included in the International
Serial Directories Indexed & Listed at: Ulrich's Periodicals Directory ©, U.S.A., Open J-Gage as well as in
Cabell’s Directories of Publishing Opportunities, U.S.A
282 International Journal of Management, IT & Engineering
http://www.ijmra.us, Email: [email protected]
STEP 5: Checking. User identification algorithm inputs individuality ID and
authentication information and sparking 1 or 0.
STEP 6: research papers. CS.Test (IW, Tw) → (0, 1). The algorithm evaluation shows the
indicators collection keywords IW and find a hatch individual Tw and outputs 1 or 0.
4. Evaluation of performances
Comparing the computational complexity of the regime approaches [13, 19, 21, 31]. As
shown in Table 1, our strategy has less generation of computing and encryption key
creation over all plans [13, 19, 31]. Our strategy requires the minimum amount of
calculation once users decrypt the ciphertext. And especially, our system does not update
the cryptogram both an update of the attribute occurs, which will also help to significantly
reduce the amount of calculations. In addition, our system has the keyword search
function, which can make research more efficient and accurate.
Fig: 05 comparative performance of protocol
5. Conclusion
In this paper, we proposed a strategy based encryption attributes keyword search using the
updated attribute storage cloud. Our new strategy has emerged date and function of the
user and word search multi-user key until the user trapdoor can match the index keyword
stored in the cloud storage support, and the user may look interesting file encryption. The
results of the performance evaluation confirm that the proposed strategy is more effective
compared to other encryption methods based characteristic with updating attributes. On the
other hand, outsource the operation with a higher cost of cloud storage to reduce the
computational load of an individual. To evaluate the safety of our strategy, formally proves
that our proposed system provides word secrecy of the key property and what is safe
against attack chosen keyword selectively (SCKA) both the model of random oracle and
low hardness Decisional bilinear Diffie-Hellman (DBDH) assumption. Performance
evaluation demonstrates the feasibility of our system. Formally we demonstrate that our
proposed system allows get the keyword secret of the property and what is safe against the
attack selectively chosen keyword (SCKA) both the model of the random oracle under the
hardness assumption Intelligence bilinear Diffie-Hellman (DBDH). Performance
evaluation demonstrates the feasibility of our system. formally we demonstrate that our
proposed system provides the secret keyword of the property and what is safe against
attack selectively chosen keyword (SCKA) both model under random oracle hardness
hypothesis Decisional bilinear Diffie-Hellman (DBDH). Performance evaluation
demonstrates the feasibility of our system. Random oracle in hardness hypothesis
Decisional Bilinear Diffie-Hellman (DBDH). Performance evaluation demonstrates the
feasibility of our system. formally we demonstrate that our proposed system provides the
secret keyword of the property and what is safe against attack selectively chosen keyword
(SCKA) both model under random oracle hardness hypothesis Decisional bilinear Diffie-
Hellman (DBDH). Performance evaluation demonstrates the feasibility of our system.
Random oracle in hardness hypothesis Decisional Bilinear Diffie-Hellman (DBDH).

International Journal of Management, IT & Engineering Vol. 8 Issue 12(1), December 2018,
ISSN: 2249-0558 Impact Factor: 7.119
Journal Homepage: http://www.ijmra.us, Email: [email protected]
Double-Blind Peer Reviewed Refereed Open Access International Journal - Included in the International
Serial Directories Indexed & Listed at: Ulrich's Periodicals Directory ©, U.S.A., Open J-Gage as well as in
Cabell’s Directories of Publishing Opportunities, U.S.A
283 International Journal of Management, IT & Engineering
http://www.ijmra.us, Email: [email protected]
Performance evaluation demonstrates the feasibility of our system. formally we
demonstrate that our proposed system provides the secret keyword of the property and
what is safe against attack selectively chosen keyword (SCKA) both model under random
oracle hardness hypothesis Decisional bilinear Diffie-Hellman (DBDH). Performance
evaluation demonstrates the feasibility of our system. Selectively attack chosen keyword
(SCKA) both the model of the random oracle under the hardness assumption Intelligence
bilinear Diffie-Hellman (DBDH). Performance evaluation demonstrates the feasibility of
our system. Selectively attack chosen keyword (SCKA) both the model of the random
oracle under the hardness assumption Intelligence bilinear Diffie-Hellman (DBDH).
Performance evaluation demonstrates the feasibility of our system.
References
[1] D. Boneh, G. Di Crescenzo, R. Ostrovsky, and G. Persiano, “Public key encryption
with keyword search,” in Advances in Cryptology-Eurocrypt 2004. Springer, 2004, pp.
506–522.
[2] Q. Zheng, S. Xu, and G. Ateniese, “Vabks: Verifiable attribute-based keyword search
over outsourced encrypted data,” in INFOCOM, 2014 Proceedings IEEE. IEEE, 2014, pp.
522–530.
[3] A. Sahai and B. Waters, “Fuzzy identity-based encryption,” in Advances in
Cryptology–EUROCRYPT 2005. Springer, 2005, pp. 457–473.
[4] M. Abdalla, M. Bellare, D. Catalano, E. Kiltz, T. Kohno, T. Lange, J. Malone-Lee, G.
Neven, P. Paillier, and H. Shi, “Searchable encryption revisited: Consistency properties,
relation to anonymous ibe, and extensions,” in Advances in Cryptology–CRYPTO 2005.
Springer, 2005, pp. 205–222.
[5] X. Boyen and B. Waters, “Anonymous hierarchical identity-based encryption (without
random oracles),” in Annual International Cryptology Conference. Springer, 2006, pp.
290–307
[6] Y. Yu, J. Ni, H. Yang, Y. Mu, and W. Susilo, “Efficient public key encryption with
revocable keyword search,” Security and Communication Networks, vol. 7, no. 2, pp. 466–
472, 2014.
[7] D. X. Song, D. Wagner, and A. Perrig, “Practical techniques for searches on encrypted
data,” in Security and Privacy, 2000. S&P 2000. Proceedings. 2000 IEEE Symposium on.
IEEE, 2000, pp. 44–55.
[8] E.-J. Goh et al., “Secure indexes.” IACR Cryptology ePrint Archive, vol. 2003, p. 216,
2003.
[9] Z. Fu, X. Wu, C. Guan, X. Sun, and K. Ren, “Toward efficient multikeyword fuzzy
search over encrypted outsourced data with accuracy improvement,” IEEE Transactions on
Information Forensics and Security, vol. 11, no. 12, pp. 2706–2716, 2016.
[10] Z. Xia, X. Wang, X. Sun, and Q. Wang, “A secure and dynamic multi-keyword
ranked search scheme over encrypted cloud data,” IEEE Transactions on Parallel and
Distributed Systems, vol. 27, no. 2, pp. 340– 352, 2016.
[11] N. Cao, C. Wang, M. Li, K. Ren, and W. Lou, “Privacy-preserving multi keyword
ranked search over encrypted cloud data,” IEEE Transactions on parallel and distributed
systems, vol. 25, no. 1, pp. 222–233, 2014.
[12] H. Li, Y. Yang, T. H. Luan, X. Liang, L. Zhou, and X. S. Shen, “Enabling fine-
grained multi-keyword search supporting classified sub-dictionaries over encrypted cloud

International Journal of Management, IT & Engineering Vol. 8 Issue 12(1), December 2018,
ISSN: 2249-0558 Impact Factor: 7.119
Journal Homepage: http://www.ijmra.us, Email: [email protected]
Double-Blind Peer Reviewed Refereed Open Access International Journal - Included in the International
Serial Directories Indexed & Listed at: Ulrich's Periodicals Directory ©, U.S.A., Open J-Gage as well as in
Cabell’s Directories of Publishing Opportunities, U.S.A
284 International Journal of Management, IT & Engineering
http://www.ijmra.us, Email: [email protected]
data,” IEEE Transactions on Dependable and Secure Computing, vol. 13, no. 3, pp. 312–
325, 2016.
[13] A. Awad, A. Matthews, Y. Qiao, and B. Lee, “Chaotic searchable encryption for
mobile cloud storage,” IEEE Transactions on Cloud Computing, vol. PP, no. 99, pp. 1–1,
2017.
[14] J. Li, D. Lin, A. C. Squicciarini, J. Li, and C. Jia, “Towards privacy preserving storage
and retrieval in multiple clouds,” IEEE Transactions on Cloud Computing, vol. 5, no. 3,
pp. 499–509, July 2017.
[15] J. Li, R. Ma, and H. Guan, “Tees: An efficient search scheme over encrypted data on
mobile cloud,” IEEE Transactions on Cloud Computing, vol. 5, no. 1, pp. 126–139, Jan
2017.
[16] D. Boneh and M. Franklin, “Identity-based encryption from the weil pairing,” SIAM
journal on computing, vol. 32, no. 3, pp. 586–615, 2003.
[17] P. Golle, J. Staddon, and B. Waters, “Secure conjunctive keyword search over
encrypted data,” in International Conference on Applied Cryptography and Network
Security. Springer, 2004, pp. 31–45.

International Journal of Management, IT & Engineering Vol. 8 Issue 12(1), December 2018,
ISSN: 2249-0558 Impact Factor: 7.119
Journal Homepage: http://www.ijmra.us, Email: [email protected]
Double-Blind Peer Reviewed Refereed Open Access International Journal - Included in the International
Serial Directories Indexed & Listed at: Ulrich's Periodicals Directory ©, U.S.A., Open J-Gage as well as in
Cabell’s Directories of Publishing Opportunities, U.S.A
285 International Journal of Management, IT & Engineering
http://www.ijmra.us, Email: [email protected]
Design and analysis of Medical Image to prediction of disease
using ML over AWS cloud
Sumit Badyal
Sandeep Bhargav
Abstract
Digital imaging and communication in medicine (DICOM), MRI, CT, PET, etc. are used
by various medical implements. Medical image analysis and visualization systems have
become a very important tool that affects humanity and affects people's web content for
collecting opinions on medical images, working with real-time interaction with online web
discussions. Medical Image Analysis and Imagination Basically focus on developing
image properties and finally detect wounds. With the increasing popularity and usage of
mobile and tablet devices, the need for mobile partner tele-radio radiology applications has
also increased. Our project targets are not only aimed at creating a portable medication
image viewer but also providing collaborative entitlement capabilities. The purpose behind
the use of the Android platform for the proposed mobile system is because of the creation
and licensing of high and third parties. In the mobile environment, Decom Viewer
applications satisfy additional surplus criteria satisfied with desktop equivalents, such as
portability, ease of use etc. Here we present the proposed Android-based Portable Medical
Image Viewer and collaborative annotation system architecture. We have targeted viewers
and associate annotation systems and discussed their important problems and challenges.
The proposed mobile system can help enable quick suggestions / experts at any time.
Mobile technologies (especially in times of danger / critical moments), these experts can
always stay connected wherever they are.
2. System Components
It has four parts: viewer components, preferred store components, browse and import
components and collaborative modules.
Viewer components are critically important components of the proposed mobile phone. It
connects to other components and manages the flow of information between the user and
the system, and it uses the touch gestures required for system control. Its first sub-
component is the DICOM reader, which creates the necessary functionality to read
DICOM images and related metadata. The second sub-element is a generic image reader
that focuses on understanding compact damaged JPEG images. The last sub-component is
the tools needed to highlight the areas of interest, the equipment module. Viewer
components are browsed and imported with components, preferences shops, and
cooperative module components.
The Preferred Store module applies the conventional system preferences settings to load
mobile devices.
The browse and import element is a module that is designed to scan the local directory of
mobile devices for disoch files. An import function is used to import local DoCoMo files
and its location and metadata are stored in SQLite database.
Research Scholar, Center for cloud infrastructure and security, Suresh Gyan Vihar University, Jaipur Assistant professor, Center for cloud infrastructure and security, Suresh Gyan Vihar University, Jaipur

International Journal of Management, IT & Engineering Vol. 8 Issue 12(1), December 2018,
ISSN: 2249-0558 Impact Factor: 7.119
Journal Homepage: http://www.ijmra.us, Email: [email protected]
Double-Blind Peer Reviewed Refereed Open Access International Journal - Included in the International
Serial Directories Indexed & Listed at: Ulrich's Periodicals Directory ©, U.S.A., Open J-Gage as well as in
Cabell’s Directories of Publishing Opportunities, U.S.A
286 International Journal of Management, IT & Engineering
http://www.ijmra.us, Email: [email protected]
Collaborative module elements are an important element in the medical image viewer
vaccine system. It is a very different physical site, real time, without real data change.
Medical professionals can use this function to see proper medical images or Radiologist
reports and to handle conferences in real-time. Associate Module uses tools from tool
modules. Drawing member’s rectangle, freehand size, or measurement device in the
discussion session. Associate models are used to import medical images from foreign
sources.
Two sub-components have been created to support collaboration modules: row manager
and socket communication.
Routes manager is created to manage multiple users' notes by applying the authorization
process to avoid data loss at the same time - the queue created in collaboration with multi-
mobile users.
Later, Socket Communications Modules design an ideal socket-based system on Android
to connect to Java Sockets running towards the server. Collaborative modules offer
seamless collaborative extension functions, depending on a stable client-based server
implementation,
For the database, we use SQLite relational embedded database to store information. We
design the implementation of a collaborative server with the provision of framework for
the proposed mobile system collaboration entitlement.
3. Proposed System Components
It has four parts: viewer components, preferred store components, browse and import
components and collaborative modules.
Viewer components are critically important components of the proposed mobile phone. It
connects other elements and manages the flow of data between the user and the system, it
also applies the touch gestures needed to control the system. Its first sub-component is the
DICOM reader, which creates the necessary functionality to read DICOM images and
related metadata. The second sub-element is a generic image reader that focuses on
understanding compact damaged JPEG images. The last sub-component is the tools needed
to highlight the areas of interest, the equipment module. Viewer components are browsed
and imported with components, preferences shops, and cooperative module components.
The Preferred Store module applies the conventional system preferences settings to load
mobile devices.
The browse and import element is a module that is designed to scan the local directory of
mobile devices for disoch files. An import function is used to import local decomo files
and its location and metadata are stored in SQLite database.
Collaborative is one of our recommended collaborative annotation systems. It allows many
experts from various and annotates during the photo without changing the original data.
Medical professionals can use this function to see proper medical images or Radiologist
reports and to handle conferences in real-time. Associate Module uses tools from tool
modules. All members' display screens in the discussion session cover rectangles, freehand
shapes, or drawings of measurement devices. Associate Module also provides imported
medical images from foreign sources.
Two sub-components have been created to support collaboration modules: row manager
and socket communication.

International Journal of Management, IT & Engineering Vol. 8 Issue 12(1), December 2018,
ISSN: 2249-0558 Impact Factor: 7.119
Journal Homepage: http://www.ijmra.us, Email: [email protected]
Double-Blind Peer Reviewed Refereed Open Access International Journal - Included in the International
Serial Directories Indexed & Listed at: Ulrich's Periodicals Directory ©, U.S.A., Open J-Gage as well as in
Cabell’s Directories of Publishing Opportunities, U.S.A
287 International Journal of Management, IT & Engineering
http://www.ijmra.us, Email: [email protected]
To avoid data loss for multiple reasons at multiple times, the vaccine manager is ready to
create notes by promoting the process of annotations to handle different user annotations.
Designed to co-operate servers to serve multi-million queue users.
Later, the Socket Communications module designs an ideal socket-based approach to
Android to connect to Java Sockets on the server side. Collaborative Modules to offer
simulated collaborative encryption functionality based on a stable client-based server
implementation,
For the database, we use SQLite relational embedded database to store information. We
design the implementation of a collaborative server with the provision of framework for
the proposed mobile system collaboration entitlement.
Implementation
This project consists of 3 things, i.e. An android application for the user interface, A
Server for uploading images, the Machine learning algorithm for analysis.
Description
Main Activity
Fig1: Home Screen of Android App
Login id and password is provided to the user to use the application. Else, he has to register
himself. These all information is stored in the mobile database. Means every mobile has its
database. Multiple users can use that application. Once log in user need not log in
repeatedly, he will redirect to another activity directly.
Register Activity
Fig2: Registration Screen of Android App

International Journal of Management, IT & Engineering Vol. 8 Issue 12(1), December 2018,
ISSN: 2249-0558 Impact Factor: 7.119
Journal Homepage: http://www.ijmra.us, Email: [email protected]
Double-Blind Peer Reviewed Refereed Open Access International Journal - Included in the International
Serial Directories Indexed & Listed at: Ulrich's Periodicals Directory ©, U.S.A., Open J-Gage as well as in
Cabell’s Directories of Publishing Opportunities, U.S.A
288 International Journal of Management, IT & Engineering
http://www.ijmra.us, Email: [email protected]
In this activity, the user registers him by providing his name, email, password, mobile
number, address and specialisation. There is a constraint on email id. As it is unique, no
two users can have the same email id. This whole information is stored in Sqlite Database
in the User table. Once added, a Message would appear that "User added" which confirms
that user details are successfully entered in the database.
Menu Activity
Fig3: Upload image on Android App for analysis
There are two options
1. Info – this will show the details or profile of user login in the system.
2. Upload Photo – this will give the power to upload the picture from the gallery and
analyse it.
Details Activity:
Fig4: Out of MIA on Android App
This merely displays the information that the user has entered. It is just a view. One cannot
change the information in it.

International Journal of Management, IT & Engineering Vol. 8 Issue 12(1), December 2018,
ISSN: 2249-0558 Impact Factor: 7.119
Journal Homepage: http://www.ijmra.us, Email: [email protected]
Double-Blind Peer Reviewed Refereed Open Access International Journal - Included in the International
Serial Directories Indexed & Listed at: Ulrich's Periodicals Directory ©, U.S.A., Open J-Gage as well as in
Cabell’s Directories of Publishing Opportunities, U.S.A
289 International Journal of Management, IT & Engineering
http://www.ijmra.us, Email: [email protected]
Upload Activity
Fig5: Image show at MIA on Android App
The upper part, the, i.e. image is showing the preview of the perception that the user has
chosen from the gallery.
Choose button helps the user to choose the image from the gallery and analyses it.
Upload button will upload this image to the server, and when the response comes back, it
will take the user to another activity and show the user.
Consult Activity
Fig 6: Output after analysis of MIA on Android App

International Journal of Management, IT & Engineering Vol. 8 Issue 12(1), December 2018,
ISSN: 2249-0558 Impact Factor: 7.119
Journal Homepage: http://www.ijmra.us, Email: [email protected]
Double-Blind Peer Reviewed Refereed Open Access International Journal - Included in the International
Serial Directories Indexed & Listed at: Ulrich's Periodicals Directory ©, U.S.A., Open J-Gage as well as in
Cabell’s Directories of Publishing Opportunities, U.S.A
290 International Journal of Management, IT & Engineering
http://www.ijmra.us, Email: [email protected]
This activity is showing the image that the user chooses and its result after analysis.
Machine Learning Process
It consists of two parts, first is a training model and the second other is prediction using the
trained model before. For connecting with android app Django is used, which web
framework is written in python.
➢ From frontend side (i.e. android app) POST request is generated which contain an
image as a multipart file object. This request hits on the server endpoint (http://ip-
address:port/api/)
➢ Django project is running, where the application is processed, and the response is sent
back.
Basic flow (backend)
Data Flowchart
Fig 7: Framework design for MIA
Model Training Part
For the training part, the most important step is preprocessing. The accuracy of the trained
model depends on this step. Pandas, python library, are used for this. These are the steps:
1. First drop unused column (i.e. view position, OriginalImageWidth …)
2. Second, create new columns for labels, which contain diseases names which we want
to predict.
3. Third, fix missing values. Fill missing values with the mean of that column.
4. That’s all for preprocessing, at this stage we got cleaned data.
5. Now we create a function, which process images and resize all the images and store
pixel information in numpy array.
6. Now split data for training and testing, for this we use train_test_split() function it is
available with scikit-learn a python library. It takes input, output and ratio in which our
data is distributed.
7. It is time to define our model. For model training Kerasis used, which is high-level
neural networks API, written in python and backed byTheano. We use VGG16
predefined weight available with Keras application. We only need to instantiate our
model.
8. After this, the above-defined model needs to compile with our data and save it into the
disk.

International Journal of Management, IT & Engineering Vol. 8 Issue 12(1), December 2018,
ISSN: 2249-0558 Impact Factor: 7.119
Journal Homepage: http://www.ijmra.us, Email: [email protected]
Double-Blind Peer Reviewed Refereed Open Access International Journal - Included in the International
Serial Directories Indexed & Listed at: Ulrich's Periodicals Directory ©, U.S.A., Open J-Gage as well as in
Cabell’s Directories of Publishing Opportunities, U.S.A
291 International Journal of Management, IT & Engineering
http://www.ijmra.us, Email: [email protected]
9. The output of this process is the two files model.json and model.h5. One contains
information about the model, and the other one includes weights.
Prediction Part
1. First, we need to load the model by using the model. Son and model.h5
2. After this read image and convert into numpy array and feed into the model it gives the
response in the form of the vector you need to turn it first by using the numpyargmax
function, and finally you get the label value to compare it with the defined dictionary
you got the disease name.
3. To connect it with android Django is used.
Backend workflow
1. Initial file structure.
Fig9: Background server configuration detail
2. When Post request is hit on the server, then slug is compared in the path mentioned in
urls.py in xray_prediction. The post request is hit on http://ip-address:port/api/ then
slug is API. In urls.py, similar views are defined, i.e. it includes another url .py from
prediction and in prediction/urls.py get_image is mapped.
3. get_image is function defined in prediction/views.py
4. First, it takes the image from request body as the request. FILES[‘file'] and stores in the
media folder.
5. After this predicts function is called, it takes image path as argument. predict function
is defined in prediction/utils.py
6. In this first pre-trained model is loaded and compiled, then read an image from the path
using pillow a python library and resize and convert into numpy array.
7. Now call loaded_model.predict() and pass the image array, it returns vector, first
converted into the key using np.argmax function and return the value of that key
mapped in dict_characters(mentioned in utils.py).
8. Now we got the result from the predict function, and we have to give the response of
the request we received, so return JsonResponse result as the key and predict output as
value.
9. After this response is shown on the android screen.

International Journal of Management, IT & Engineering Vol. 8 Issue 12(1), December 2018,
ISSN: 2249-0558 Impact Factor: 7.119
Journal Homepage: http://www.ijmra.us, Email: [email protected]
Double-Blind Peer Reviewed Refereed Open Access International Journal - Included in the International
Serial Directories Indexed & Listed at: Ulrich's Periodicals Directory ©, U.S.A., Open J-Gage as well as in
Cabell’s Directories of Publishing Opportunities, U.S.A
292 International Journal of Management, IT & Engineering
http://www.ijmra.us, Email: [email protected]
Conclusion
We have developed a viewer and collaborative annotation system and discussed its
significant difficulties and challenges. The proposed mobile system could help to enable
rapid consultation/diagnosis by allowing medical specialists to arrive at any time. These
experts can always stay connected wherever they are by mobile technologies (especially
during dangers/critical moments). We proposed to create an viewer and collaborative
annotation system and we debated its important advantages and disadvantages. The
proposed mobile network is used to enable rapid consultation by allowing medical experts
to reach at any time. These experts can always stay connected wherever they are by mobile
technology (especially during emergencies/grave moments). This collaborative feature,
believe is a first for Android based mobile devices, could help in providing enhanced
diagnosis and cure in surgical planning and the procedures that follow.
References
1. Lee Lay, Khoon, Siau Chuin, Weng Jie Thong, A Review of Image Segmentation
Methodologies in Medical Image. Advanced Computer and Communication Engineering
Technology. Springer International Publishing, pp. 1069-1080, 2015.
2. Solomon Chris, Toby Breckon, Fundamentals of Digital Image Processing: A practical
approach with examples in Matlab. John Wiley & Sons, 2011.
3. C. Pettit et al., Developing a multi-scale visualisation toolkit for use in climate change
response. Landscape Ecol, 2012.
4. Y. Liu et al., An ITK implementation of a physics-based non-rigid registration method
for brain deformation in image-guided neurosurgery. Frontiers in Neuroinformatics Apr,
2014.
5. M. Jenkinson et al., FSL1Neuroimage 2012, vol. 62, no. 2, pp. 782-790.
6. Friston, Statistical parametric mapping: the analysis of functional brain images.
London: Academic 2007, vol. 647.
7. P. Larrabide et al., GIMIAS: an open source framework for effcient development of
research tools and clinical prototypes. Functional Imaging and Modeling of the Heart, pp.
417-426, 2009.
8. TIG. (2014). TIG wiki page. In Meida Wiki. Retrieved on 23.nov.2014
9. L. Mengler et al., Brain maturation of the adolescent rat cortex and striatum: changes in
volume and myelination. NeuroImage, vol. 2014, no. 84, pp. 35-44.
10. B. Avants, Brian, Nick Tustison, Gang Song, Advanced normalization tools (ANTS),
2009.
11. A. Paul et al., User-guided 3D active contour segmentation of anatomical structures:
Significantly improved efficiency and reliability. Neuroimage, vol. 1; 31, no. 3, pp. 1116-
28, Jul 2006.
12. Nolden Marco, The medical imaging interaction toolkit: challenges and advances.
International journal of computer assisted radiology and surgery, vol. 8.4, pp. 607-620,
2013.
13. D. Alexander, Y. Advanced, J. Cohen-Adad, C. A. M. Wheeler-Kingshott, "Methods to
Study White Matter Microstructure", Quantitative MRI of the Spinal Cord, 2014.
14. Z. A. Taylor, S. Johnsen, S. Ourselin, NiftySim., 2010.
15. P. A. Cook et al., Camino: open-source diffusion-MRI reconstruction and processing.
In 14th scientific meeting of the international society for magnetic resonance in medicine,
2006, May.

International Journal of Management, IT & Engineering Vol. 8 Issue 12(1), December 2018,
ISSN: 2249-0558 Impact Factor: 7.119
Journal Homepage: http://www.ijmra.us, Email: [email protected]
Double-Blind Peer Reviewed Refereed Open Access International Journal - Included in the International
Serial Directories Indexed & Listed at: Ulrich's Periodicals Directory ©, U.S.A., Open J-Gage as well as in
Cabell’s Directories of Publishing Opportunities, U.S.A
293 International Journal of Management, IT & Engineering
http://www.ijmra.us, Email: [email protected]
16. Keihaninejad Shiva et al., An unbiased longitudinal analysis framework for tracking
white matter changes using diffusion tensor imaging with application to Alzheimer's
disease. NeuroImage, vol. 72, pp. 153-163, 2013.
17. Johnson The ITK Software Guide Book 1: Introduction and Development Guidelines
Fourth Edition Updated for ITK version 4.6. (2014).

International Journal of Management, IT & Engineering Vol. 8 Issue 12(1), December 2018,
ISSN: 2249-0558 Impact Factor: 7.119
Journal Homepage: http://www.ijmra.us, Email: [email protected]
Double-Blind Peer Reviewed Refereed Open Access International Journal - Included in the International
Serial Directories Indexed & Listed at: Ulrich's Periodicals Directory ©, U.S.A., Open J-Gage as well as in
Cabell’s Directories of Publishing Opportunities, U.S.A
294 International Journal of Management, IT & Engineering
http://www.ijmra.us, Email: [email protected]
Fair Resource Allocation for Big Data processing in the Cloud
computing over AWS system
Shubham Mittal
Sandeep Bhargav
Abstract:- For addressing the 'big data' computing challenge, several data-sensitive
computing frameworks (e.g., MapReduce, Dryad, Storm and Spark) have emerged and
become famous. YARN is a true resource management platform that enables these
structures running together with the shared system. However, in the cloud computing
environment, the YARN-allocated appropriate provision policy is not necessary due to its
unprinted asset allocation, which violates several useful features on shared computing
systems. In this paper we have presented a methodology fair resource allocation technique
to process the big data in cloud environment.
Keyword: Cloud Computing, fair Resource allocation, YARN, Hadoop.
1. Introduction
Processing of large datasets is a complex task because it cannot be done on a single
machine, and the implementation of the distribution system always creates a variety of
problems for synchronisation, fault tolerance and reliability. Fortunately, reducing
Google's map [16, 15] in the programming process, [16, 15] the following procedure has
become quite easy because the user only has to program for a machine and the carefree
distribution of the framework. Clusters and faults provide additional features of tolerance
and reliability. Hadoop [1] is an open source implementation of Google's map-comma
program, which has been widely accepted in the academy and industry over the last few
years. [3] Parallel details from end users can process large numbers of data using product
hardware while hiding in the interior. Hadoop is widely used to produce various work for
information index building, web server log crunching, recommendation systems and large-
scale data needs tremendous processing capabilities. To provide SQL or similar interface,
several packages have been created on the HADOOP framework so that users can analyse
the data using traditional SQL queries and recover the results. Such efforts include Pig
Latin, Hyv [42, 33]. All packages depend on the basic principles of transforming queries
like a SQL-like map-down, but there are some minor differences between how they work.
For example, the hive accepts SQL as input from the user and converts the query into a
guided non-cyclic graph (DAG) - reducing the tasks, while taking a script as a scripting
language and input and providing a complete execution plan to the user, but a program The
target is to set user's work on a map set Transferring - Decreasing tasks. An example
showing the differences between adding 3 tablets (P, A, B) to the hub and pig is shown in
1.
Fig. 1. Pig Script to join three tables
Research Scholar, Center for cloud infrastructure and security, Suresh Gyan Vihar University, Jaipur Assistant professor, Center for cloud infrastructure and security, Suresh Gyan Vihar University, Jaipur

International Journal of Management, IT & Engineering Vol. 8 Issue 12(1), December 2018,
ISSN: 2249-0558 Impact Factor: 7.119
Journal Homepage: http://www.ijmra.us, Email: [email protected]
Double-Blind Peer Reviewed Refereed Open Access International Journal - Included in the International
Serial Directories Indexed & Listed at: Ulrich's Periodicals Directory ©, U.S.A., Open J-Gage as well as in
Cabell’s Directories of Publishing Opportunities, U.S.A
295 International Journal of Management, IT & Engineering
http://www.ijmra.us, Email: [email protected]
1.2 Big Data Sources
Various data sources generate big data. A simple example could be an online store that
processes billions of requests every day. Each online store keeps logs, product views,
sessions, the most favourable channel etc. When it is multiplied with billions of
subscribers, it creates data on petabytes. Other data sources may include phone data; call
logs, mobile time spent on the internet, types of calls, etc. X-rays and medicines are
considered one of the primary sources of data that can be very useful for drug discovery,
new diseases, etc. X-ray reports may share a good insight into the patterns of various
chronic diseases. The main problem surrounding the Big Data is stored, which is how to
save so many data that is generated by the deporting rate. Although it is costly for storage
devices, it is still expensive, and it becomes expensive for data recovery which is useful for
analysing correctly. Significant data sources point to different streams where data
generation has the potential not to manage them with traditional database systems.
Fig. 2: Big Data Sources
1.2 Types of Data
The different types of data used in Big Data are generally classified into,
• Machine generated data: The files which are related to systems and sensors come
under this classification. It usually includes configuration files, cache files etc.
• User-generated data: The likes, shares, counts, XML data comes under this
classification.
• Structured data: Any data that are arranged in some order is known as structured data.
The examples of structured data include tables, objects or anything stored in relational
data format.
• Unstructured data: Any kind of data in simple or raw format comes under the
unstructured type of data. Text messages, audio, video files, media logs, word, PDF,
etc. are known as unstructured data.
2 Map-Reduce
A map-reduce program consists of three main phases map, shuffle and reduce. The user
needs to specify the map and reduce functionalities via an API and submit the executable
to the processing framework. The map-reduce job takes a file or a set of files stored in
HDFS as input and the map function is applied to each block of input (In reality, the map
function is applied to a FileSplit which can span across multiple blocks, for simplicity use

International Journal of Management, IT & Engineering Vol. 8 Issue 12(1), December 2018,
ISSN: 2249-0558 Impact Factor: 7.119
Journal Homepage: http://www.ijmra.us, Email: [email protected]
Double-Blind Peer Reviewed Refereed Open Access International Journal - Included in the International
Serial Directories Indexed & Listed at: Ulrich's Periodicals Directory ©, U.S.A., Open J-Gage as well as in
Cabell’s Directories of Publishing Opportunities, U.S.A
296 International Journal of Management, IT & Engineering
http://www.ijmra.us, Email: [email protected]
FileSplit and block interchangeably). Each instance of map function takes (key,value) pairs
as input and emits a new set of (key,value) pairs as output and the framework shuffles all
the pairs with the same key to a single machine. This is called the shuffle phase. The user
can control what all keys can go to the same machine via a partitioner function that can be
plugged into the executable. Now all the (key, value) pairs that are shuffled to the same
machine are sorted, and a reducer function is applied to the whole group, and reducers emit
the output as the new set of (key, value) pairs which is written to HDFS. The intermediate
data of each map phase is sorted, merged in multiple rounds and is written to the disk local
to the map execution. Following equations outline the map and reduce phases, and the
whole job flow is summarised in figure 1.8 [8].
map(k1,v1)− > list(k2,v2) (1.1) reduce(k2,list(v2))− > list(v2) (1.2)
Fig. 3: Map Reduce Architecture
Following are the salient features of the map-reduce framework.
• Map-reduce programming framework makes a programmer think that he is writing the
code for a single machine and the structure takes care of distributing the logic and
scaling it to thousands of devices.
• Users can write the logic for map and reduce function and control various components of
the framework like file splitting, secondary sorting, partitioner and combiner via
pluggable components.
• Map-Reduce is highly faulted tolerant in the sense that failed tasks (map or reduce or the
subset of them) cannot stop the whole job. Only functions that failed can be restarted,
and the job can be resumed. This saves a lot of time with posts on large amounts of data.
This framework can be made to work with both name node and data node failures.
• One more notable feature of the map-reduce framework is task localisation. The task
scheduler always tries to reduce the network IO by assigning map tasks as close to the
input splits as possible. Setting the split size and HDFS block size to the same value
makes is still more comfortable and gives 100% task localisation.
• The scale at which the map-reduce programs work is enormous and has been shown to
scale to tens of thousands of nodes. This brings a very high degree of parallelism while
data processing is resulting in faster throughputs.

International Journal of Management, IT & Engineering Vol. 8 Issue 12(1), December 2018,
ISSN: 2249-0558 Impact Factor: 7.119
Journal Homepage: http://www.ijmra.us, Email: [email protected]
Double-Blind Peer Reviewed Refereed Open Access International Journal - Included in the International
Serial Directories Indexed & Listed at: Ulrich's Periodicals Directory ©, U.S.A., Open J-Gage as well as in
Cabell’s Directories of Publishing Opportunities, U.S.A
297 International Journal of Management, IT & Engineering
http://www.ijmra.us, Email: [email protected]
1.3Hive
Hive [2] is a data warehouse infrastructure built on top of Hadoop. It provides the tools to
perform offline batch processing ETL tasks on structured data of petabyte scale. It gives an
SQL like query interface to the user called Hive-QL through which user can query the data.
Since Hive is built on top of Hadoop, the user can expect a latency of few minutes even on
small amount data as Hadoop takes time to submit the jobs, schedule them across the
cluster and initialise their JVMs. This restricts Hive from using it as an OLTP engine and
also doesn't answer real-time queries and exclusive row-level updates as in a standard
relational database. The functionality of the Hive can be extended by using user-defined
functions (UDFs). This notion of UDFs is not new to the relational databases and is in
practice since ages. In the hive, we can plug in our custom mappers and reducer scripts to
perform operations on the results of the original query. These functionalities of Hive along
with its ability to scale to tens of thousands of nodes make it a handy ETL engine.
a) Hive Anatomy
Hive stores the tables in the warehouse as flat files on HDFS and they can be partitioned
based on the value of a particular column. Each partition can be further bucketed based on
other columns (other than the one used for partitioning). A query executed by a user is
parsed and is converted into an abstract syntax tree (AST) where each node corresponds to
a logical operator which is then mapped to a physical operator. Figure 1.9 depicts hive
architecture.
b) Joins in Hive
As with most of the relational database systems, executing a join in Hive is costlier
compared to other operators concerning query execution time and also resource
consumption. This problem has more significance in Hive because the data is shaded and
distributed across a network and performing a join requires matching tuples to be moved
from one machine to another and these results in a lot of network IO overhead. Hive
implements join over the map-reduce framework, and the following three types of joins are
supported.
• Common Join: Common join is the default join mechanism in Hive and is implemented
as a single map-reduce job. It can be thought of as a distributed union of Cartesian
products. Suppose we are joining a table A on column ’a’ with table B on column ’b’ and
di is the distinct set of join column values of both columns a and b. Then the common
join operator can be described using the following mathematical equation where Aa=di is
the set of all rows of A with column a’s value as di
n
∫ (Aa=di) ∫ (Bb=di)
i=0

International Journal of Management, IT & Engineering Vol. 8 Issue 12(1), December 2018,
ISSN: 2249-0558 Impact Factor: 7.119
Journal Homepage: http://www.ijmra.us, Email: [email protected]
Double-Blind Peer Reviewed Refereed Open Access International Journal - Included in the International
Serial Directories Indexed & Listed at: Ulrich's Periodicals Directory ©, U.S.A., Open J-Gage as well as in
Cabell’s Directories of Publishing Opportunities, U.S.A
298 International Journal of Management, IT & Engineering
http://www.ijmra.us, Email: [email protected]
Fig. 4: Hive Architecture
Data of both the tables are read in mappers, and then rows are shuffled across the network
in such a way that all the rows with same join key reach the same system. To identify the
table to which they belong, they are tagged during the map phase and are differentiated in
the reduce phase according to these tags. A Cartesian product is now applied on the rows
of both tables with same join column value, and the output is written to the disk for further
processing.
• Map Join: Map join is an optimisation over the common join and is used if one of the
tables is very small and can fit in the main memory of the slaves. In the map join, the
lower table is copied into the distributed cache before the map-reduce job, and the large
table is fed into the mappers. The large table is streamed row by row, and the join is
done with the rows of the smaller table, and the results are written to the disk. Map join
eliminates the need for shuffle and reduces phases of the map-reduce job, and this makes
it very fast compared to other join types.
• Bucket Join: Bucket Map join is a particular case of Map join in which both the tables
to be joined are bucketed (storing all the rows for a column value at a single place). The
larger table is given as input to the mappers for each value of the join column,
corresponding buckets for the smaller table are fetched, and the join is performed. This
is an improvement over map join in the sense that, instead of copying whole data of the
lower table, we copy just the required buckets to the mappers of a larger table.
All the join conditions in the parse tree are converted into operators corresponding to one
of Common, Map, Bucket joins. The user can provide hints about the sizes of the tables as
a part of the query, and this information is used during query processing time.
1.6 Query Optimization in Databases
In recent times, SQL has become the de-facto standard for writing analytical queries over
data. The process of query optimisation takes an SQL query, builds the basic query plan,
applies some transformations and gives a query execution plan (QEP) as output. The
changes implemented on the query plan are dependent on the logic of the query optimiser.
In general, the query optimiser algorithm first determines the logical query plans which are
generic and then decides the physical operators to be executed. Overall the procedure of
query optimisation can be broken down into the following steps and is shown in figure
1.10 [10].

International Journal of Management, IT & Engineering Vol. 8 Issue 12(1), December 2018,
ISSN: 2249-0558 Impact Factor: 7.119
Journal Homepage: http://www.ijmra.us, Email: [email protected]
Double-Blind Peer Reviewed Refereed Open Access International Journal - Included in the International
Serial Directories Indexed & Listed at: Ulrich's Periodicals Directory ©, U.S.A., Open J-Gage as well as in
Cabell’s Directories of Publishing Opportunities, U.S.A
299 International Journal of Management, IT & Engineering
http://www.ijmra.us, Email: [email protected]
• Generating the search space for the query.
• Building a cost model for query execution.
• Devising a search strategy to enumerate the plans in the search space.
Fig. 5: Block diagram of a Query Optimizer
Search Space: There exist many ways of executing the same query, and query optimizers
consider only a subset of plans to find the best method for execution by assigning some
cost to each possible scenario. Since this problem has been proved to be NP-hard [22],
some heuristics are applied to reduce the search space and prune out non-optimal plans.
This whole set of procedures that each query optimiser considers to pick out the best
method is called the search space for that query optimiser. A lot of research exists on the
search space for query optimisers starting from left rooted trees [14, 25, 18] to leafy trees
[27]. Each plan space has its own merits and drawbacks but finding the most optimal plan
has been proved to be np-hard and non-feasible for the optimisers.
Cost Model: Since we consider a search space and select the best plan, we need some
function to quantify the cost of executing a program regarding known parameters of the
cluster. We minimise or maximise some objective function based on the given expenses
out by cost model. This cost model relies on (i) the statistics on the relations and indexes,
(ii) the formulae to estimate selectivity of various predicates and the sizes of the output of
each operator in the query plan, and (iii) the methods to determine the CPU and IO cost of
every operator in the query plan.
The statistics on the tables include various metadata about the actual data like the number
of rows, the number of disk pages of the relations, indexes and the number of distinct
values of a column. Query optimisers use these statistics to estimate the selectivity factor
for a given query or predicate, which means the number of rows that qualify this predicate.
The most popular way of doing this is by using histograms [35, 31, 23]. Using statistics
query optimisers predict the overall cost of executing a query, and that includes mainly
CPU, IO and network costs. Estimation of these costs of a query operator is also non-trivial
since it needs to take into consideration various properties about the system and lots of
internal implementation at the system level like data flow from cache to buffer disk etc.
[14]. Other factors like the number of queries concurrently running and the available buffer
space also affect the cost values. Many detailed IO cost models have been developed to
estimate various IO operations like seek, latency and data transfer [21, 20].
Search Strategy: Various approaches have been studied in theory to search the given space
of plans. The dynamic programming algorithm proposed in [37] is an exhaustive search
strategy that enumerates the query plans in a bottom-up manner and prunes expensive

International Journal of Management, IT & Engineering Vol. 8 Issue 12(1), December 2018,
ISSN: 2249-0558 Impact Factor: 7.119
Journal Homepage: http://www.ijmra.us, Email: [email protected]
Double-Blind Peer Reviewed Refereed Open Access International Journal - Included in the International
Serial Directories Indexed & Listed at: Ulrich's Periodicals Directory ©, U.S.A., Open J-Gage as well as in
Cabell’s Directories of Publishing Opportunities, U.S.A
300 International Journal of Management, IT & Engineering
http://www.ijmra.us, Email: [email protected]
plans based on the cost formulae. Work has been done on heuristic and random
optimisations to walk through the search space [40, 39] and also much work was done on
comparing various search strategies like left-deep, right deep and thick trees [27, 40, 41,
24]. Also, some query optimisers employ a dynamic query optimisation technique where
the decisions about the type of query operator to be used and their physical algorithms are
taken at run-time. Thus, the optimiser designs a decision tree which is evaluated at
runtime. This type of plan enumeration is more suited for top-down architectures like
Volcano [19, 17].
1.7 Structured and Unstructured Data
The structured data refers to any data record or file resides in a fixed field. They have been
classified so some meaning could be extracted from them; this includes data that is stored
in relational databases and spreadsheets as an arranged format. Structured data has the
advantage of easy input, storage, query and analysis. For some time, because the storage,
memory and processing, the use of structured data in relational databases and high cost and
performance limitations of spreadsheet data is the only way to manage effectively.
Fig. 6: Structured and Unstructured data type
Unstructured data cannot be so easily categorised and put in a clean box: photos and
graphic images, video, instrument data streaming, web pages, PDF files, PowerPoint
presentations, e-mails, blog posts, wiki and word processing document etc. all come under
this. Crossing between the two semi-structured data. It is a type of structured data, but the
lacks of strict data model structure. And semi-structured data or other types of labels are
used to mark some aspects in the identification data, but the data does not have a rigid
structure. For example, word processing software, they can now include metadata display
the author's name and creation date, most of which are just unstructured text documents.
There are e-mail sender, recipient, date, time, and other fixed fields to the e-mail message
content and unstructured data of all attachments. Photos or other graphics can be tagged as
creator, date, location, and keywords, making it possible to organise and locate graphics.
XML and other markup languages are often used to manage semi-structured data.
The solution underlies in the problem itself. The research work proposes to study, identify
the challenges encountered in Hadoop's heterogeneous clusters, study existing algorithms,
design a new algorithm to chart off the problems that were met by the significant existing
algorithms, and propose to develop a new method of clustering data over clusters in
Hadoop that can provide a good throughput, low latency among big data.

International Journal of Management, IT & Engineering Vol. 8 Issue 12(1), December 2018,
ISSN: 2249-0558 Impact Factor: 7.119
Journal Homepage: http://www.ijmra.us, Email: [email protected]
Double-Blind Peer Reviewed Refereed Open Access International Journal - Included in the International
Serial Directories Indexed & Listed at: Ulrich's Periodicals Directory ©, U.S.A., Open J-Gage as well as in
Cabell’s Directories of Publishing Opportunities, U.S.A
301 International Journal of Management, IT & Engineering
http://www.ijmra.us, Email: [email protected]
2. Proposed Framework
TeraSort and TestDFSIO as benchmarking tools to analyse the depth of HDFS clusters in a
heterogeneous and homogeneous environment. They have used the benchmark TeraSort to
practically explain the scaling and functionality of groups in case of the data burst. The
result reveals that a lot of data generation at a fast speed needs to be taken care of else
there might be chances of node failures. The TestDFSIO is a benchmarking tool that is
used merely to inject node failures to test the stability of the clusters. The benchmarking
tool results serve a fundamental idea that homogeneous or heterogeneous nature of the
groupings doesn't impact the performance until and unless the size of data is small. The
moment the data size grows, the management becomes difficult, different processes require
different job scheduling, and according to that managing, a Hadoop cluster for them is
quite tricky. Therefore the hardware part of a Hadoop cluster can be removed to generate a
more sophisticated and useful system. If the focus is shifted to the processing and
clustering techniques, the right amount of improvement could be introduced into the
Hadoop and Big Data environment.
The TestDFSIO is used to measure the I/O performance of clusters in Hadoop. It is also
considered as a departure point because it doesn't reveal much about parallel processing. It
merely tells the system about the possibility of node failures. The performance is also a
deciding factor as the results depict that performance enhancements in cluster
configurations are linearly related. There are not many studies in this field, but the value
from that context doesn't help much. To identify the root cause, one has to look into
methods the processing capabilities or techniques so that digitised data could easily be
used for related purposes. The more the cluster nodes are added in a system, the more
depletes the processing power of the node. In smaller data size, using MapReduce is a
complete waste of efforts and functionality. But higher data size is the best input for
MapReduce application processing. There is the requirement of design specified scenarios
for analysis of dynamic data. One should test the working concerning hundreds and
thousands of nodes for understanding big data.
a) Sharing information of different levels
Information levels, free information sources, and various information gathering
environments, often information such as complex terms, such as missing / uncertain
values. In other circumstances, to create copies of changed information, privacy concerns,
sounds and errors may be introduced into the information. Safe and Sound Information
Sharing Protocol is an important challenge. At the model level, the critical problem is to
create models globally through the formation of an integrated approach by mixing the
locally discovered design. To analyse the relationship relation between distributive sites
and to achieve the model from the Big Data, it requires careful and carefully planned needs
to analyse from multiple sources to analysis. At the system level, the necessary challenge is
to have a data-data framework for the framework of time. The other needs of the necessary
need are needed in the need of the need. Need is needed in the need of the necessary need.
Needs need to be carefully designed, a system must be carefully designed so that the
undefined information can make patterns related to their complex complicated
relationships, by doing it by doing them in a simple way. By doing to explore Big Data,
there are various challenges for information, models and system level. In order to support
Big Data Mining, high-performance computing platforms require regular designs to make
the full complete power.

International Journal of Management, IT & Engineering Vol. 8 Issue 12(1), December 2018,
ISSN: 2249-0558 Impact Factor: 7.119
Journal Homepage: http://www.ijmra.us, Email: [email protected]
Double-Blind Peer Reviewed Refereed Open Access International Journal - Included in the International
Serial Directories Indexed & Listed at: Ulrich's Periodicals Directory ©, U.S.A., Open J-Gage as well as in
Cabell’s Directories of Publishing Opportunities, U.S.A
302 International Journal of Management, IT & Engineering
http://www.ijmra.us, Email: [email protected]
b) Analysis of Data
Hydroponic load and behavioral research, MapReduce has begun exploration and may
bring performance in the framework more quickly. Green computing area connected with
this technology, which can benefit from low energy consumption from solid state discs.
The green computing field is very new. It can represent a gap in the region that requires
further research, or is in the early stages of research. New storage technologies are
becoming cheaper, cutting into storage, cloud, and green computing will probably present
new challenges to the research community, more searchable and more productive.
Analytical process, large amounts of undetermined information for the data gathering and
processing process has been a challenge.
Much information is generated from large data. They handle issues, processing problems,
security issues, and storage problems. Each item has the ability to stay in big information
and focus mainly on security issues.
A) Management Issues: The most significant data collection organization, public sector
and large amount of structural, semi-structured and undefined data collection by private
and public administration. The big data management policies ensure access to high data
quality, information ownership, liability, standards, documentation and data sets.
B) Storage Problems: The storage is achieved by using virtualization in larger data, where
it has a large set of sensor information, media, video, e-business transaction record, cell
phone signal combinations. Many large data storage companies such as EMC, IBM,
Netapp, Amazon, manage a large volume of data using NOOSQL Works, Samoa, Buy,
Haddoop, Reduce map, and some tools like grid profits.
C) Processing Issue: Important data processing analyses large data size in case of batch
processing or stream processing even in byte petabytes, xetabyte. Performance
improvements in performance tuning system
D) Security problem: The lack of unwanted methods and disabled tools for security of a
significant dataset, more threats and vulnerabilities in the public and personal database,
lack of data volunteers and unexpected leakage and public and private policy hackers are
able to hack their resources. Needed
3. A YARN job is executed with two kinds of resources
An application master (AM) is responsible for coordinating the application monitoring and
cluster distribution executives. Some officers that are made by AM for a Map Reduce
work; they will perform parallel maps or reduce operation. The slave net runs in both
containers. Each slave node manages the node manager daemon which is responsible for
creating a node holder. The whole cluster is controlled by a resource manager, which
determines the allocation of the holder in all slave-nodes depending on the requirements
and current charges.
Four types of asset allocations for cluster work must be configured correctly. These are:
1. How much memory can be allocated for YARN containers on a node? This limit should
be higher than all others; otherwise, the holder allocation will be canceled and the
application fails. However, it should not have full RAM on the node.
This value is configured in yarn.nodemanager.resource.memory-mb at yarn-site.xml.
2. A single holder can consume many memories and allocate the minimum memory. A
holder will not be more important than most, or else allocation fails and always the
minimum amount is allocated as RAM.

International Journal of Management, IT & Engineering Vol. 8 Issue 12(1), December 2018,
ISSN: 2249-0558 Impact Factor: 7.119
Journal Homepage: http://www.ijmra.us, Email: [email protected]
Double-Blind Peer Reviewed Refereed Open Access International Journal - Included in the International
Serial Directories Indexed & Listed at: Ulrich's Periodicals Directory ©, U.S.A., Open J-Gage as well as in
Cabell’s Directories of Publishing Opportunities, U.S.A
303 International Journal of Management, IT & Engineering
http://www.ijmra.us, Email: [email protected]
Yarn.scheduler.maximum-allocation-mb and yarn.scheduler.minimum-allocation-mb have
been configured in yarn-site.xml.
3. How much memory allocation will be allocated to application masters? This is a
constant value that should fit the maximum size of the holder.
It is configured with yarn.app.mapreduce.am.resource.mb at mapped-site.xml.
4. How much memory allocation or operation will be allocated on each map? It should be
less than the maximum size.
It is configured by MapReduce.map.memory.mb and MapReduce.reduce.memory.mb
properties in mapped sites.xml.The relationships between these features can be seen in the
following picture:
Fig. 7: Configuration for 2GB Node For 2GB nodes
Sample Configuration for 2GB Node For 2GB nodes, a working configuration may be:
Fig. 8: Configuration for 2GB Node For 2GB nodes at yarn
Fig. 9: Output of nodes

International Journal of Management, IT & Engineering Vol. 8 Issue 12(1), December 2018,
ISSN: 2249-0558 Impact Factor: 7.119
Journal Homepage: http://www.ijmra.us, Email: [email protected]
Double-Blind Peer Reviewed Refereed Open Access International Journal - Included in the International
Serial Directories Indexed & Listed at: Ulrich's Periodicals Directory ©, U.S.A., Open J-Gage as well as in
Cabell’s Directories of Publishing Opportunities, U.S.A
304 International Journal of Management, IT & Engineering
http://www.ijmra.us, Email: [email protected]
HDFS is a distributed storage system, and it does not provide any services for running and
scheduling tasks in cluster. Role of this YARN Framework. The following section is about
starting, monitoring and submitting YARN's work.
3 Result
Fig. 10: Configuration for 2GB Node For 2GB nodes
3.1 Submit MapReduce Jobs to YARN
Yarn jobs are packaged into jar files and submitted to YARN for execution with the
command yarn jar. The Hadoop installation package provides sample applications that can
be run to test your cluster. You'll use them to move a word count on the three books
previously uploaded to HDFS.
Fig. 11: Running of Yarn file
Conclusion
Unstructured data cannot be so easily categorised and put in a clean box: photos and
graphic images, video, instrument data streaming, web pages, PDF files, PowerPoint
presentations, e-mails, blog posts, wiki and word processing document etc. all come under
this. Crossing between the two semi-structured data. It is a type of structured data, but the
lacks of strict data model structure. And semi-structured data or other types of labels are
used to mark some aspects in the identification data, but the data does not have a rigid
structure. For example, word processing software, they can now include metadata display
the author's name and creation date, most of which are just unstructured text documents.
There are e-mail sender, recipient, date, time, and other fixed fields to the e-mail message
content and unstructured data of all attachments
References
[1] Zhuo Liu, “Efficient Storage Design and Query Scheduling for Improving Big Data
Retrieval and Analytics”, Ph.D. dissertation, C.S.E. Dept., A.U., Auburn, Al, 2015
[2] F.G. Tinetti, I. Real, R. Jaramillo, and D. Barry, “Hadoop Scalability and Performance
Testing in Heterogeneous Clusters”, In the Proceedings of the 2015 International
Conference on Parallel and Distributed Processing Techniques and Applications
(PDPTA-2015), Part of WORLDCOMP’15 pp.441-446, 2015.

International Journal of Management, IT & Engineering Vol. 8 Issue 12(1), December 2018,
ISSN: 2249-0558 Impact Factor: 7.119
Journal Homepage: http://www.ijmra.us, Email: [email protected]
Double-Blind Peer Reviewed Refereed Open Access International Journal - Included in the International
Serial Directories Indexed & Listed at: Ulrich's Periodicals Directory ©, U.S.A., Open J-Gage as well as in
Cabell’s Directories of Publishing Opportunities, U.S.A
305 International Journal of Management, IT & Engineering
http://www.ijmra.us, Email: [email protected]
[3] Zongben Xu, Yong Shi, “Exploring Big Data Analysis: Fundamental Scientific
Problems”, Springer Ann. Data. Sci., Vol. 2, Issue. 4, pp 363–372, December 2015.
[4] K. Kamtekar, under the guidance of R. Jain (2015). Performance Modeling of Big
Data, Washington University in St. Louis, pp. 1-9, June 2015.
[5] Felipe Viegas, Wellington Martins, Leonardo Rocha, “Parallel Lazy Semi-Naive
Bayes Strategies for Effective and Efficient Document Classification”, CIKM’15,
ACM. ISBN 978-1-4503-3794-6/15/10, 2015.
[6] Jong-Yeol Yoo, Dongmin Yang, “Classification Scheme of Unstructured Text
Document using TF-IDF and Naïve Bayes Classifier”, Advanced Science and
Technology Letters Vol.111 (COMCOMS 2015), pp.263-266, 2015.
[7] Amol Jagtap, “Categorization of the Documents using K-Means and MapReduce”,
International Journal of Innovative Research in Science, Engineering and Technology,
ISSN: 2319-8753, 2015.
[8] Fong-Hao Liu, Ya-Ruei Liou, Hsiang-Fu Lo, Ko-Chin Chang, and Wei-Tsong Lee,
“The Comprehensive Performance Rating for Hadoop Clusters on Cloud Computing
Platform”, IJIEE Vol. 4, No. 6, November 2014.
[9] David C. Anastasiu, George Karypis, Jeremy Iverson, Shaden Smith, “Big Data
Frequent Pattern Mining”, 2014
[10] Wang Teng, BPAR: A Bundle-Based Parallel Aggregation Framework for Decoupled
I/O Execution, 2014
[11] A Fahad, “A survey of Clustering Algorithms for Big Data: Taxonomy and Empirical
Analysis”, 2014
[12] EMC Corporation, “Virtualizing Hadoop in Large-Scale Infrastructures”, 2014.
[13] Charu Aggarwal, Jiawei Han (2014). An Introduction to Frequent Pattern Mining, in
Frequent Pattern Mining, ISBN 978-3-319-07820-5.
[14] Giannakouris - Salalidis Victor, Plerou Antonia, Sioutas Spyros, “CSMR: A Scalable
Algorithm for Text Clustering with Cosine Similarity and MapReduce”, IFIP
Advances in Information and Communication Technology, September 2014.
[15] Jun Liu et. al (2015). An Efficient Job Scheduling for MapReduce Clusters,
International Journal of Future Generation Communication and Networking Vol. 8,
No. 2, pp. 391-398.
[16] Zheyi Rong, Jeroen De Knijf, “Direct Out-Of-Memory Distributed Parallel Frequent
Pattern Mining”, BigMine’13, ACM 978-1-4503-2324-6/13/08, 2013.
[17] T.K. Das, P.M. Kumar (2013). BIG Data Analytics: A Framework for Unstructured
Data Analysis, International Journal of Engineering and Technology (IJET), ISSN:
0975-4024, Vol. 5 No. 1, pp.153-156, Feb-Mar 2013.
[18] F. Novacescu (2013). Big Data in High Performance Scientific Computing,
International Journal of Analele Universităţii "Eftimie Murgu", published by the
"Eftimie Murgu" University of Resita, ANUL XX, NR. 1, pp.207-216, ISSN 1453 -
7397.
[19] Jian Xue, Jinyu Li, and Yifan Gong, "Restructuring of Deep Neural Network Acoustic
Models with Singular Value Decomposition", ISCA, INTERSPEECH 2013.
[20] Bin Li, Yuan Guoyong, “Improvement of TF-IDF Algorithm Based on Hadoop
Framework”, The 2nd International Conference on Computer Application and System
Modeling, 2012.

International Journal of Management, IT & Engineering Vol. 8 Issue 12(1), December 2018,
ISSN: 2249-0558 Impact Factor: 7.119
Journal Homepage: http://www.ijmra.us, Email: [email protected]
Double-Blind Peer Reviewed Refereed Open Access International Journal - Included in the International
Serial Directories Indexed & Listed at: Ulrich's Periodicals Directory ©, U.S.A., Open J-Gage as well as in
Cabell’s Directories of Publishing Opportunities, U.S.A
306 International Journal of Management, IT & Engineering
http://www.ijmra.us, Email: [email protected]
A new learning model of the machine in the cloud for text
classification and clustering of data Twitter for Business
Analytics
Reshab Zutshi
Sandeep Bhargav
Abstract: In the last few decades, internet sites within businesses are attaining
unprecedented fame as a result of its capacity for industry development. Organizations can
find out about shoppers' emotions regarding their services and products, and also utilize it
to understand the current industry enhance your manufacturer new. Hence, businesses
regularly advertising their advertising and advertising and advertising campaigns and
strategies centred on buyer tastes. Harness societal assesses and employs considerable
quantities of info on societal websites into mine significant info for tactical decision-
making. Programs methods and equipment learning programs to better successfully
recognize tendencies and patterns to find actionable info. The record includes chosen a
favourite foodstuff model name to estimate a provided purchaser critiques on Twitter flow.
Numerous measures inside the classification and group of information had been useful for
investigation.
Keyword: Twitter, Sentiment, Data analysis, text processing, Text classification.
1. Introduction
Twitter API can be utilised to amass corpus Twitter feed and also a virtual tree classifier to
observe that the lexicon of this polarity of both tweets from English, while favourable or
adverse. An approach utilizing k very related method of phrases to both set tweets as a way
to discover true small business price. This report tries to test both the technical and small
organization standpoint data text-mining investigation of Twitter and urges appropriate
foreseeable upcoming enhancement chances with the emerging subject. Numerous
measures inside the classification and group of information had been useful for
investigation. Twitter API can be utilised to amass corpus Twitter feed and also a virtual
tree classifier to observe that the lexicon of this polarity of both tweets from English, while
favourable or adverse. An approach utilizing k very related method of phrases to both set
tweets as a way to discover true small business price. This report tries to test both the
technical and small organization standpoint info text mining investigation of Twitter and
urges appropriate foreseeable upcoming enhancement chances with the emerging subject.
Measures inside group and the classification of information had been useful for
investigation. Twitter API can be utilised to amass corpus Twitter feed and also a classifier
of binary shrub to observe that the lexicon of this polarity of both tweets from English,
while favourable or adverse. An approach utilizing k very related method of phrases to
both set tweets as a way to discover true small business price. This report tries to test both
the technical and small organization standpoint info text mining investigation of Twitter
Research Scholar, Center for cloud infrastructure and security, Suresh Gyan Vihar University, Jaipur
Assistant professor, Center for cloud infrastructure and security, Suresh Gyan Vihar University, Jaipur

International Journal of Management, IT & Engineering Vol. 8 Issue 12(1), December 2018,
ISSN: 2249-0558 Impact Factor: 7.119
Journal Homepage: http://www.ijmra.us, Email: [email protected]
Double-Blind Peer Reviewed Refereed Open Access International Journal - Included in the International
Serial Directories Indexed & Listed at: Ulrich's Periodicals Directory ©, U.S.A., Open J-Gage as well as in
Cabell’s Directories of Publishing Opportunities, U.S.A
307 International Journal of Management, IT & Engineering
http://www.ijmra.us, Email: [email protected]
and urges appropriate foreseeable upcoming enhancement chances with the emerging
subject. Twitter API can be utilised to amass corpus Twitter feed along with a virtual tree
classifier to observe that the lexicon of this polarity of both tweets from English, while
favourable or adverse. An approach utilizing k very related method of phrases to both set
tweets as a way to discover true small business price. This report tries to test both the
technical and small organization standpoint data text-mining investigation of Twitter and
urges appropriate foreseeable upcoming enhancement chances with the emerging subject.
Twitter API can be utilised to amass corpus Twitter feed along with a virtual tree classifier
to observe that the lexicon of this polarity of both tweets from English, while favourable or
adverse. An approach utilizing k very related method of phrases to both set tweets as a way
to discover true small business price. This report tries to test both the technical and small
organization prognosis statistics text exploration investigation of Twitter and urges
appropriate foreseeable upcoming enhancement chances with the emerging subject.
Investigation of Twitter and urges appropriate foreseeable upcoming enhancement chances
with the emerging subject. Twitter API can be utilised to amass corpus Twitter feed and
also a virtual tree classifier to observe that the lexicon of this polarity of both tweets from
English, while favourable or adverse. An approach utilizing k very related method of
phrases to both set tweets as a way to discover true small business price. This report tries to
test both the technical and small organization standpoint data text-mining investigation of
Twitter and urges appropriate foreseeable upcoming enhancement chances with the
emerging subject. Investigation of Twitter and urges appropriate foreseeable upcoming
enhancement chances with the emerging subject. Twitter API can be utilised to amass
corpus Twitter feed and also a virtual tree classifier to observe that the lexicon of this
polarity of both tweets from English, while favourable or adverse. An approach utilizing k
very related method of phrases to both set tweets as a way to discover true small business
price. This report tries to test both the technical and small organization standpoint data
text-mining investigation of Twitter and urges appropriate foreseeable upcoming
enhancement chances with the emerging subject. Foreign Exchange shrub to observe that
exactly the lexicon of this polarity of all tweets from English, if negative or positive. An
approach utilizing k very related method of phrases to both set tweets as a way to discover
true small business price. This report tries to test both the technical and small organization
standpoint info text mining investigation of Twitter and urges appropriate foreseeable
upcoming enhancement chances with the emerging subject. Foreign Exchange shrub to
observe that exactly the lexicon of this polarity of all tweets from English, if negative or
positive. An approach utilizing k very related method of phrases to both set tweets as a
way to discover true small business price. This report tries to test both the technical and
small organization standpoint info text mining investigation of Twitter and urges
appropriate foreseeable upcoming enhancement chances with the emerging subject.
2. Literature review
[V. Krishna Reddy et al. 2014] proposed testing cloud applications in cross cloud
environment. Cloud computing has become the new way to provide services to users on
demand services to users. The main goal of cloud computing is to support user services and
real-world applications. Recently, a movement of the cross cloud also known by many
names, including cloud, multi-cloud or others to take advantage of service providers and
organize many offers for reliability and bounce cloud cloud.[17]
Cross cloud offers many advantages it offers services that benefit the user and the

International Journal of Management, IT & Engineering Vol. 8 Issue 12(1), December 2018,
ISSN: 2249-0558 Impact Factor: 7.119
Journal Homepage: http://www.ijmra.us, Email: [email protected]
Double-Blind Peer Reviewed Refereed Open Access International Journal - Included in the International
Serial Directories Indexed & Listed at: Ulrich's Periodicals Directory ©, U.S.A., Open J-Gage as well as in
Cabell’s Directories of Publishing Opportunities, U.S.A
308 International Journal of Management, IT & Engineering
http://www.ijmra.us, Email: [email protected]
organization and make services easier. Provide testing services in the cloud, e-commerce
and other solution is not so easy because for this type of testing different tools, processes,
techniques, application to create and build the application prototype. Cloud computing is a
combination of computer concepts connected to the communication network in real time,
which provides a possibility to use multiple services simultaneously on a single network.
The data as a service, infrastructure as a service are the services offered by cloud
computing. For the verification of the performance of browser and browser type to perform
with ease. For the implementation and delivery of these services with the scalability,
flexibility, portability and capabilities of the system software, it is in our cloud. For all
applications in real time and the challenges that comes with applications, cloud testing is
an important solution for them. There are several types of technical tests and applications
for troubleshooting and efficiency. Testing tools are used browser cloud for testing and
performance in terms of efficiency. [17]
It includes many testing techniques as proof of application, preliminary tests,
synchronization, distributed testing, etc. mobile cloud testing SOASTA tool is being
developed for testing web applications in the cloud.
The testing process can be real-time processing technique and to run the real-time
application. Cloud testing to provide hosted services on the Internet and providing services
to user services, some of them are free and some customers have to pay the particular
amount of money.
[And S.Poonkodi. 2013] proposed to provide a secure transmission of data in the proxy re-
encryption system cloud storage system using threshold. Cloud Storage is also known as a
large distributed storage system which includes many independent storage systems. Many
third-party companies that provide storage services, but data storage or other third party
cloud can be important issue of data privacy. For data security in the cloud user uses many
methods to secure your data and most encryption technology that encrypts data using
encryption methods used.[18] For secure data transfer companies use many methods. And
the new threshold proxy encryption is one of them, is to integrate the system with a
decentralized code with the help of many safe storage. The main problem of the Internet
data transmission by the storage system. One key encryption is not enough for data
security before if the data transmission at the time of cryptography to send the key to
different servers and these servers are protected by security mechanism. However, this
method takes a long time to complete the encryption process if the author considers the
threshold of re-encryption method proxy and integrate it with a unique code to another
storage system. [18]Integration Transfer high encryption, data encryption and data makes it
effective to meet is sufficient for the robustness of the data, data privacy and data
transmission system. Each storage system is autonomous and calculates the code word
symbol for the received message symbol, and then completes the data encoding and
storage process. This mechanism is the first four phases is the system configuration in this
user runs the Setup algorithm and creates system settings. The user generates the public
key, private and shared and divided the key servers with a different threshold. This user
has created a text and sends the encrypted storage to servers at random. Transfer of user
data a user sends data to B with the help of the secret key. A user requiring the shared key
from the key server for the shipping data. And then analyse the data accordingly. A storage
system includes a cloud storage server and key server and created a new threshold proxy
re-encrypted technology.

International Journal of Management, IT & Engineering Vol. 8 Issue 12(1), December 2018,
ISSN: 2249-0558 Impact Factor: 7.119
Journal Homepage: http://www.ijmra.us, Email: [email protected]
Double-Blind Peer Reviewed Refereed Open Access International Journal - Included in the International
Serial Directories Indexed & Listed at: Ulrich's Periodicals Directory ©, U.S.A., Open J-Gage as well as in
Cabell’s Directories of Publishing Opportunities, U.S.A
309 International Journal of Management, IT & Engineering
http://www.ijmra.us, Email: [email protected]
Each data storage server encoding, decoding and each encryption key server and performs
decryption and data and messages. Server acts as key threshold point before providing the
interface layer as a traditional file system.
[Gao and Jerry. 2013] cloud proposed tests, problems, challenges, needs and practices.
Cloud computing is the way to get resources how they manage data, data delivery
technology and its solution. Cloud testing offers as a service, cloud testing is used for web
testing, test applications based on the cloud. Also generalize the challenges, problems,
needs test cloud at the time of the test.
Cloud testing offers multiple services and access to users that is flexible and scalable
computing power. [19]It also includes many properties whose profession, independent
feature, billing and connectivity with many interfaces and technology. Cloud is compatible
with a large number of user accesses and provides services to users on demand. The first
three types of clouds below them is the private cloud, the cloud is based on the private
network behind the firewall. Another is the public cloud that provides cloud services are
the ultimate hybrid cloud that includes public and private cloud.
Cloud testing is a type of software testing. Cloud computing environment simulate real
user traffic such as stress, load testing and web testing. [19]The test is very important cloud
software reduces costs and increase the efficiency of data concept testing. Service is
available to a user by the third party validation or creates effective software based on
Internet in real time online. Quality software you need functional or non-functional
requirements. Cloud tests confirm the quality of the cloud based service and cloud
capacity. Test Cloud check the quality of internal cloud as infrastructure and capabilities.
Tests confirm the cloud cloud-based service applications in the cloud public, private and
hybrid. Cloud has three types of test environment The first is the suppliers based on the test
environment opaque this application using the Web-based application to validate quality in
cloud infrastructures. Another is a test environment for public and private cloud provider
uses this software to validate their quality. In the hybrid cloud environment the seller
makes better use of cloud-based application to check the quality of infrastructure in the
cloud.
There are several types of tests that focus on different test methods such as setting test
service function developed in the GUI and the service function based on the API,
integration testing focus on SaaS and cloud connection and the development of the
functions of security testing service and cloud connectivity APIs, etc. Cloud testing
requirements and have some new features. The cloud infrastructure test environment that
uses cloud computing diversified and scalable resources, system tools and system
infrastructure. The service level agreement in the cloud and the application provides
services to end users and customers.
In cloud computing there are many problems and challenges also included. For example, in
the construction of the demand environment defines all the tests in the cloud services on
demand a cloud testing service usually happens now supports automatic provisioning of IT
resources. In tests of scalability and performance of a large number of them realize the
problem and its solution in the conventional software system and web-based software.
Security testing and measurement clouds an important part in software and technology
updated.
[Aradhana Saxena et al. 2013] security approach to data migration to the cloud. Cloud
computing is a concept that is made by combining different concepts of IT and many

International Journal of Management, IT & Engineering Vol. 8 Issue 12(1), December 2018,
ISSN: 2249-0558 Impact Factor: 7.119
Journal Homepage: http://www.ijmra.us, Email: [email protected]
Double-Blind Peer Reviewed Refereed Open Access International Journal - Included in the International
Serial Directories Indexed & Listed at: Ulrich's Periodicals Directory ©, U.S.A., Open J-Gage as well as in
Cabell’s Directories of Publishing Opportunities, U.S.A
310 International Journal of Management, IT & Engineering
http://www.ijmra.us, Email: [email protected]
Internet technology, providing a platform for applications of agile and profitable business,
etc .. In the present scenario of data migration security is the biggest concern for the user
that uses the cloud to move your data and applications. Many companies and organizations
put their efforts to reduce the cost of IT resources and thus join [20] IT organization and
the use of virtualization technologies. Cloud computing offers a good infrastructure and a
better cost for companies with reduced administration. Type of application and cloud
computing platform is defined. As a platform as a service is configured and provide
services for users when services can be physical machine or a virtual machine. It defines
cloud applications accessed via the Internet and for this great server data server and power
are used to host the Web application and the Web server.
Cloud computing is different from other paradigms cloud and scalable, which provides
services to customers on demand and in particular how the claims. Cloud computing many
organizations have security issues, including the sharing of resources with other companies
without control, the incompatibility of service in the cloud storage, controls key
cryptography, the data integrity, and legal government laws, license and Internet security
status data.
The migration of data to the risk management of cloud computing may be qualitative or
quantitative factors used. In this, the risk must be balanced against the guarantees and
benefits with a better understanding of the security remaining with the organization. In the
cloud the issue of data security is the biggest concern for all users, but each cloud service
provider does not have access to the central data system of physical, because it depends
supplier infrastructure to ensure complete data security. Infrastructure provider follow
specific objectives to protect data and ensure privacy by using, to test the binding of the
available data is changed or not used auditability. With the help of encryption algorithm
users can easily achieve confidentiality. Cloud requires remote attestation Trusted Platform
Module to create a tamper-proof system as virtualization security system proof. Platform
virtualization [20] it must be safe with the help of virtual machine monitors. Virtual
machine migration should be allowed only if it is based on both servers of the sender and
receiver. Cloud migration is the highest point where the cloud manager encounters major
problems when migrating data from the server of a company to another server. Cloud acts
as an interface with the company to access your data on the virtual network and access
their data. If a problem occurs when the data migration that can cause many security
problems and other problems that are not in favour of the company. [20]
Many financial companies such as banks, finance companies do not believe that third-party
vendors in the cloud and others. They are considered cloud services on their website and
other required security applications, but these companies do not use cloud services for
other financial services such as financial information and payment. The transition of data,
applications and other services in place behind the premises behind the firewall to the
cloud, where information can be provided depending on the application on the Internet.
Cloud computing includes benefits which uses the encryption algorithm to secure data at
the time of data migration. On the basis predicate encryption (PBE) shows the asymmetric
encryption technique that allows the access control as part of the cryptographic algorithm.
The predicate of game-based encryption is based identity encryption (IBE). PBE is a
mixture of EBR and EBA (Attribute Based Encryption). They are used to design the
decryption keys and encrypt simple text messages.
[And Nguyen Khac Chien. 2015] migration algorithm proposed effective virtual

International Journal of Management, IT & Engineering Vol. 8 Issue 12(1), December 2018,
ISSN: 2249-0558 Impact Factor: 7.119
Journal Homepage: http://www.ijmra.us, Email: [email protected]
Double-Blind Peer Reviewed Refereed Open Access International Journal - Included in the International
Serial Directories Indexed & Listed at: Ulrich's Periodicals Directory ©, U.S.A., Open J-Gage as well as in
Cabell’s Directories of Publishing Opportunities, U.S.A
311 International Journal of Management, IT & Engineering
http://www.ijmra.us, Email: [email protected]
machines based on minimizing migration clouds. [21]Migration cloud virtual machines is
important to resolve issues such as load balancing, proposed by the overloaded virtual
machine server, where the server can migrate your workload server before the maintenance
release of the server. In many server-storage devices cloud computing, and other network
applications, they can easily be virtualized. Virtualization provides many benefits, such as
the use of the source, probability. System reliability, application isolation, management,
and performance improvements and other benefits. In the cloud when the operation of the
data center, as problems arises and the problem of energy have a good role?
The integration of the virtual machine on the physical server has a light load and then uses
live migration to low-energy transition state server to stand in a particular state. It is useful
for service providers for the use of clouds and minimizes energy consumption. In the
virtual machine to a service surcharge on the virtual machine migration has a greater
capacity and cloud services provider finish quality of service and user. Live migration has
three facilities in line, the first is to balance load second line maintenance and the last is the
energy management. Online maintenance improves the capacity and reliability of the
system must be connected to the user, [21]
This author is an algorithm, that algorithm is described that if the virtual machine to
migrate data from one server to multiple servers that require more resources, but the
migration of data to a server that does not use the resource. The particular number of
virtual to improve the performance of the migration machine. Using this algorithm
improves utilization. And minimize the violation of a service level agreement.
For load balancing, virtual machines data transfer, the host application of high loaded from
a server in charge. And management of the energy used for energy conservation and
energy. To the author of the high load server faster data migration server as consider a high
speed data algorithm, better management, and the minimum time and data security. Also
increase the speed and the task manager uses the effective migration algorithm of virtual
machine decision.
[Alkhalil Adel. 2016] proposed a decision-model- cloud computing migration. The
development of cloud services is better for IT architecture and resources, create new
services and quality of IT resources. Cloud services increases the capacity of the system
and system services. And it offers a good quality of service, high performance and cost of
service. A cloud of KBDSS (of decision support knowledge based system) provides the
flexibility to meet the demands and cloud solution organization. Therefore develop a
model of cloud Copyright migration method, it takes three. The first method is the
motivation and the problems that affect the data migration. The main concern of any
organization is identifying user demand with the development of the model. And reducing
security costs resourcefulness of data is an important part of the data migration.[22] .The
second is the different departments within an organization, including IT, security and cloud
provider and many others. According to the author of the user have a greater expectation of
a cloud over what they have with the local data centred. The third part is a model process
of decision making that includes three components of intelligence, design and choice.
In fact, reach agreements with the "reality" of the concept of the company or organization,
including problem finding model, gathering information, planning company, the objective
of the business and its future decisions need. Author describes the model process of
migrating to the cloud has four main components: sources KBDSS, knowledge base, and
migration to the cloud. The sources of information requires a lot of details that project

International Journal of Management, IT & Engineering Vol. 8 Issue 12(1), December 2018,
ISSN: 2249-0558 Impact Factor: 7.119
Journal Homepage: http://www.ijmra.us, Email: [email protected]
Double-Blind Peer Reviewed Refereed Open Access International Journal - Included in the International
Serial Directories Indexed & Listed at: Ulrich's Periodicals Directory ©, U.S.A., Open J-Gage as well as in
Cabell’s Directories of Publishing Opportunities, U.S.A
312 International Journal of Management, IT & Engineering
http://www.ijmra.us, Email: [email protected]
documents, cloud offers, detailing experts, rules and regulations, white paper and
information system decision support cloud. KBDSS second component controls all
documents and properly verified before being stored in the third knowledge base
component. Knowledge base is an important part of the decision process model, deciding
that the required information where and when and representation of documents. The fourth
process of cloud migration components has six stages, the business strategy, cloud
environment, service, risk analysis, evaluation and implementation providers. [22]
For the best companies make plans and secure migration strategies and valid data. The
strategies include mainly the cost reduction method, business innovation with the backup
plan. In security policy, essentially all liability for security problems vary three cloud
computing models such as SaaS, PaaS, IaaS and. Provide safety data businesses algorithm
uses many security and privacy and other services such as encryption, key generation,
encryption, and many other algorithms that are useful for the secure transmission of data
migration or data. At the time of the migration monitoring data through resources, it is very
important because many virtualization methods of sharing resources and cloud computing
can affect the performance data migration to the cloud and data abjection can cause slow
response and lack of availability of data via the Internet. For better data migration
performance using cloud computing data distribution server and application and database.
Data provides better performance with reliable, scalable data. Cloud services do not need
sales service costs only comes to the use of data through the cloud that includes
applications, servers and others with fixed amount payable. These cloud services are so
expensive to use. For a full analysis of better service through the Internet some necessary
services, such as data security, data and adaptation of relevant standards. He concludes that
data migration by cloud computing and dynamic decision is difficult. It requires decision
support system for better understanding and decision making. With services such as
intelligence, design and choice, data migration becoming a cloud support. It requires
decision support system for better understanding and decision making. With services such
as intelligence, design and choice, data migration becoming a cloud support. It requires
decision support system for better understanding and decision making. With services such
as
[And Noor Ibrahim Hussein. al 2013] proposed requirements of the migration of the
security of the existing system and cloud. Cloud computing is a competent technology and
beneficial technology. Benefits for many companies and organizations are provided.
Business system migration process to the cloud is very difficult to treat more than
migrating a cloud server to another server in the cloud. Because it does not show the
location of data and process data at the time of migration, but shows the selection of data
migration data planning and data transmission from the server to the cloud server inherited.
Data migration requirements are the requirement of data security at the time of migration.
Security problem is the problem for enterprises, organization and the user as well. This
document represents the safety requirements before, after and during the migration of data
from the business system cloud server. And when the server cloud data migration to
another cloud. [23]
With the help and the proper use of resources with better efficiency of cloud computing
data get a good financial improvement in the cloud environment. Basically cloud end of
separate calculation into four types, such as private cloud, public cloud, community cloud
and hybrid cloud. In the public cloud environment is accessible to all those who want to

International Journal of Management, IT & Engineering Vol. 8 Issue 12(1), December 2018,
ISSN: 2249-0558 Impact Factor: 7.119
Journal Homepage: http://www.ijmra.us, Email: [email protected]
Double-Blind Peer Reviewed Refereed Open Access International Journal - Included in the International
Serial Directories Indexed & Listed at: Ulrich's Periodicals Directory ©, U.S.A., Open J-Gage as well as in
Cabell’s Directories of Publishing Opportunities, U.S.A
313 International Journal of Management, IT & Engineering
http://www.ijmra.us, Email: [email protected]
use the service in the cloud, and business, government, other academic. It is accessible,
organized and managed by them. Private cloud is accessible only with the particular person
who is authorized by the company or owner of the cloud server and provides user
authentication. Community cloud is a community-based cloud services [24] Cloud
migration of data is the data transfer process. What can IT organizations to the cloud, a
cloud server to another server in the cloud or a cloud server many cloud servers? With the
help of migrating user data, you can transfer data, applications and other documents to be
transmitted in the cloud environment. In this article, the author describes two types of
migration services in this One is the migration of data from the system organizations to a
cloud server and the other is a cloud to another cloud server.
Data migration is a term of the transfer of data from one place to another. Cloud migration
for three basic conditions are important, including data migration, data integrity and data
security. Data integrity improves the accuracy and consistency of data. And data security
ensures data security during data migration and security function data at the time of data
migration.
The migration of the organization system data to the cloud server is the data organization
processes, such as applications, services and FIREWALL on-demand services to the cloud,
where the information you can provide the use of Internet on demand. Data migration from
one server to another cloud server cloud enables the organization to change the service
provider cloud to another without transferring data at home. It is a service to the minimum
cost of customers with more benefits and other beneficial services. Before migrating data
that is not based on a single service provider. In this case, the data are based on a single
service provider, where the data can be transmitted to different clouds. To address the issue
of security, including fault tolerance, service availability and data integrity and
confidentiality of data [24]a basic model to manage the security issue is used. It includes
trust, knowledge of rules and regulations, and to the user. It includes the provision of
Internet security, use encryption system files, backup and update the browser.
[Dinesh Goyal et al. 2014] improving the safety offered for migrating data using the
process several random key encryption levels. With the development of information
exchange Data security has become an important issue for the security of data or move the
application and data server that the user or organization can not rely on external Auditor
(TPA) with the issue of confidentiality. Data migration is a method of transmitting data of
a computer system to another or to another cloud server. [24] to the art of effective data
migration of data from one system to another system, it provides the loading of data and
extraction of data. Design data include all details the system and the system formats,
system requirements, specifications, and other necessary details. It can provide data
validation process to confirm the data migration and the migration process. After migration
assay techniques such as manual and automated testing improves quality and data
reliability and reduce unwanted information.
Data migration follows certain steps including design, extraction, cleaning, loading and
validation of data at the time of data migration and repeats all steps until the data reaches
the destination. The data migration method involves the necessary information before
migration. In what the user knows and define the structure of the two sources of the system
and destination, the mapping information between the system and the data migration
process. To define the structure of the source and the target system. The source collects
information on the target system and understands how it works and the use of system

International Journal of Management, IT & Engineering Vol. 8 Issue 12(1), December 2018,
ISSN: 2249-0558 Impact Factor: 7.119
Journal Homepage: http://www.ijmra.us, Email: [email protected]
Double-Blind Peer Reviewed Refereed Open Access International Journal - Included in the International
Serial Directories Indexed & Listed at: Ulrich's Periodicals Directory ©, U.S.A., Open J-Gage as well as in
Cabell’s Directories of Publishing Opportunities, U.S.A
314 International Journal of Management, IT & Engineering
http://www.ijmra.us, Email: [email protected]
documentation and other details of this system.
Many large cloud applications is the growth of the company and other benefits. Data
migration is the data transmission process can migrate IT organizations data to the cloud
server and the other can be a cloud server to another server in the cloud. But with many
problems, such as data integrity, security, data privacy and accuracy of data migration data,
it is difficult.
All data have different importance and require different types of security for all data. For
data security companies that are used to configure the encryption keys for data encryption.
3. Why Twitter data used for business analysis
Twitter is a microblogging tool online that promotes more than 400 million messages per
day, including large amounts of information on almost all industries of entertainment,
sports, health, and business and so on. Perhaps one of the best things about Twitter -
perhaps its greatest attraction - is its accessibility. It is easy to use for sharing information
and collecting it so much. Twitter provides unprecedented access to news, along with our
legislators and our celebrities and events. Twitter also provides an important source of
business models for large company information.
The actual features make twitter the best place to get the latest real-time data and analysis of
real life and research. If you need other data sets, you can download data sets pre-out in
various applications, such as Q and A detection of cancer data set in chat bots sports
commentary. Or if you have a single use case you can create your own database for it. It can
be used as an annotation tool Data trans to download images from the web and create large
data sets at any time to manually load the raw data and label a spell.
Fig: - 01 Twitter application data set overview
Data set
In order to extract data from Twitter we need to create a Twitter application.
Steps to Create a Twitter application
1. Navigate with my applications

International Journal of Management, IT & Engineering Vol. 8 Issue 12(1), December 2018,
ISSN: 2249-0558 Impact Factor: 7.119
Journal Homepage: http://www.ijmra.us, Email: [email protected]
Double-Blind Peer Reviewed Refereed Open Access International Journal - Included in the International
Serial Directories Indexed & Listed at: Ulrich's Periodicals Directory ©, U.S.A., Open J-Gage as well as in
Cabell’s Directories of Publishing Opportunities, U.S.A
315 International Journal of Management, IT & Engineering
http://www.ijmra.us, Email: [email protected]
Fig: 02 Navigate with my applications
2. Since we already have this created application, which appears on my page. Click "Create
new application".
Fig: 03 create an application over Twitter
Fill in all the details of the application.
3. Once all the data has been completed and verified was given the keys of customers and
access.
Fig: 03 Step for Twitter text processing

International Journal of Management, IT & Engineering Vol. 8 Issue 12(1), December 2018,
ISSN: 2249-0558 Impact Factor: 7.119
Journal Homepage: http://www.ijmra.us, Email: [email protected]
Double-Blind Peer Reviewed Refereed Open Access International Journal - Included in the International
Serial Directories Indexed & Listed at: Ulrich's Periodicals Directory ©, U.S.A., Open J-Gage as well as in
Cabell’s Directories of Publishing Opportunities, U.S.A
316 International Journal of Management, IT & Engineering
http://www.ijmra.us, Email: [email protected]
Fig: 04 step for access token analysis over Twitter
3.1 Extracting tweets using a hashtag in particular
Convert these data extracted from a data frame that makes it more readable and easier to
work.
Here it is how the data would look like:
Fig: 05 extracted from a data frame of tweet
It is very clear that the text section of the information we need to process is that many
special characters and unnecessary information that we need. Therefore, it becomes very
important to pre-process this information and then we can continue with the analysis.
Here is a code for removing pre-processed data and tabs, spaces, links, etc. it is shown this
section can be modified according to your needs.
4. A little more than pre-processing - Removal of empty words
4.1 Stop words used on Twitter
When working with text mining applications, we often hear the word "close the Sound" or
"close the list of the words" or even "stop list". The sounds are not just a set of commonly
used words in a language, not just English. The fundamental reasons for the sounds of many
applications are that if we delete commonly used words in the language given, we can focus
on important words instead.
The words are generally regarded as "one set of words." Actually, you can have different
meanings in different applications. For example, in some applications, there may be a list of

International Journal of Management, IT & Engineering Vol. 8 Issue 12(1), December 2018,
ISSN: 2249-0558 Impact Factor: 7.119
Journal Homepage: http://www.ijmra.us, Email: [email protected]
Double-Blind Peer Reviewed Refereed Open Access International Journal - Included in the International
Serial Directories Indexed & Listed at: Ulrich's Periodicals Directory ©, U.S.A., Open J-Gage as well as in
Cabell’s Directories of Publishing Opportunities, U.S.A
317 International Journal of Management, IT & Engineering
http://www.ijmra.us, Email: [email protected]
words suitable stopping for removing all empty words of some adjectives (eg, good,
beautiful) to propositions (eg up before) from decisive (for example, A, A). Although some
applications, this can be harmful. For example, in the sensitivity analysis, and the exclusion
of 'good' and 'nice' adjectives, negative algorithms can throw near their tracks as 'no'. In this
case, you can use a short list of coordinator adjustment stop with prepositions or
adjustments based on application requirements.
We have finished pre-processing of data, and are willing to do some analysis.
Data visualization (charts, graphs, infographics and more) give an important way to
communicate important information in an eye of analysts. If you want a impressive format
to highlight important points in the text display, a sound can be used by cloud smooth the
data and provide important information immediately.
Clouds of words on Twitter
Clouds sound (also known as a cloud of text or tag cloud) works in a simple way: A specific
word appears in the source text information (such as a conference, blog or database), which
looks bigger and bold to sound clouds.
So we will produce some cloud of words and continuous and important terms can be used in
quotations that we have quoted.
Introduction to sentiment analysis:
4.2 Sentiment analysis
Feeling emotionally related; Attitude, emotions and opinions sentiment analysis refers to the
practice of applying techniques of processing and analysing natural language text to detect
and remove the information from the person from a piece of text. Opinion or feeling of a
person is mostly on behalf of the subject and not the facts. Which means it can be extremely
difficult to analyse the opinion or personal mood of the individual from a part of the text.
With sentiment analysis from the point of view of text analysis, we are basically trying to
understand the attitude of an author on one part of the reader and its poles; if positive,
negative or neutral In recent years, citation analysis has increased interest in applications for
brands, companies and researchers interest and business analysis. Business world today,
looking for "business ideas" in the case of many of these streams of data analysis.
Regarding the analysis of feeling, I'm talking about the customer, what customers want,
what customers like and do not like about products, their trading signals, their decision
process, etc. The clients whose businesses meet these companies for business
I used the analyser incorporated in R sensation, which uses the dictionary of words NRC
sensitive to calculate the presence of eight different emotions and text related variations.
# from the following plot Insights Analysis of Tweets with Google, it is observable that
Google has a positive effect on customers and is extremely reliable for them. Recently there
are several expectations about your product or company employee or any other possibility.

International Journal of Management, IT & Engineering Vol. 8 Issue 12(1), December 2018,
ISSN: 2249-0558 Impact Factor: 7.119
Journal Homepage: http://www.ijmra.us, Email: [email protected]
Double-Blind Peer Reviewed Refereed Open Access International Journal - Included in the International
Serial Directories Indexed & Listed at: Ulrich's Periodicals Directory ©, U.S.A., Open J-Gage as well as in
Cabell’s Directories of Publishing Opportunities, U.S.A
318 International Journal of Management, IT & Engineering
http://www.ijmra.us, Email: [email protected]
Fig 06: Sentiment analysis of Socila medial like google
# From the following plot Analysis of Anxiety Tweets # Amazon, you can see that
maximum tweet of e-commerce giant is positive and as Google did win the trust of
customers. Apart from this, customers have significant amounts of pleasure.
Fig 07: Sentiment analysis of Socila medial like amazon
Tweets # of Facebook shows a slightly different trend. Recently, there are many negative
feelings associated with tweets on Facebook. However, the company has a confidence as
well.
Fig 08: Sentiment analysis of Socila medial like facebook
In general, technology tweets have a lot of positivity and confidence among people
worldwide.

International Journal of Management, IT & Engineering Vol. 8 Issue 12(1), December 2018,
ISSN: 2249-0558 Impact Factor: 7.119
Journal Homepage: http://www.ijmra.us, Email: [email protected]
Double-Blind Peer Reviewed Refereed Open Access International Journal - Included in the International
Serial Directories Indexed & Listed at: Ulrich's Periodicals Directory ©, U.S.A., Open J-Gage as well as in
Cabell’s Directories of Publishing Opportunities, U.S.A
319 International Journal of Management, IT & Engineering
http://www.ijmra.us, Email: [email protected]
Fig 09: Sentiment analysis of people over Twitter
These are just very obvious feelings I have described. You can always look at the views and
draw several conclusions about the data.
5. Conclusion
Word processing and research evolves be feeling harsh discipline with a lot of challenges
because it includes processing of ordinary speech. It is a wide range of software you can get
from the results themselves, including, for example, for analysing information, promoting
example, readers respond problematic perform. Get essential opinions of the views
expressed around the World Wide Web in particular weblogs social networks is essential
for many organizations and associations, while it is in relation to the comments of raw
materials, layout people, or comments shareholders
6. References
[1] Computational Linguistics & Psycholinguistics Research Center,
http://www.clips.ua.ac.be/pages/pattern-en#sentiment.
[2] Jackson, C., Displaying Uncertainty with Shading, The American Statistician,
62(4):340-347, 2008.
[3] Open Source Geospaital Foundation, Tile Map Service Specification,
http://wiki.osgeo.org/wiki/Tile_Map_Service_Specification.
[4] Potmesil, M., Maps Alive: Viewing Geospatial Information on the WWW, Computer
Networks and ISDN Systems 29.8, 1997.
[5] Schretlen, P., et al., Interactive Data Exploration with ‘Big Data Tukey Plots’, Proc.
IEEE VIS 2013, Accepted.
[6] Shneiderman, B., Extreme Visualization: Squeezing a Billion Records into a Million
Pixels, Proceedings of the 2008 ACM SIGMOD International Conference on Management
of Data. ACM, 2008.
[7] Tukey, J., We Need Both Exploratory and Confirmatory, The American Statistician,
Vol. 34, No. 1, February 1980. [8] Ware, C., Information Visualization: Perception for
Design, Third Edition, Morgan Kaufman, 2013
[8] Jon M. Kleinberg “Authoritative Sources in a Hyperlinked Environment”. In the
Proceedings of the ACM-SIAM Symposium on Discrete Algorithms, 1998, and as IBM
Research Report RJ 10076. SEP 1999, pp. 604-632.

International Journal of Management, IT & Engineering Vol. 8 Issue 12(1), December 2018,
ISSN: 2249-0558 Impact Factor: 7.119
Journal Homepage: http://www.ijmra.us, Email: [email protected]
Double-Blind Peer Reviewed Refereed Open Access International Journal - Included in the International
Serial Directories Indexed & Listed at: Ulrich's Periodicals Directory ©, U.S.A., Open J-Gage as well as in
Cabell’s Directories of Publishing Opportunities, U.S.A
320 International Journal of Management, IT & Engineering
http://www.ijmra.us, Email: [email protected]
[9] Efthymios Kouloumpis. Theresa Wilson, Johanna Moore “Twitter Sentiment Analysis:
The Good the Bad and the OMG!” In the proceddings of Fifth International AAAI
Conference on Weblogs and Social Media, 2011.
[10] David.D, Tsur.O, Rappoport.A, “Enhanced sentiment learning using Twitter hashtags
and smileys” In the Proceedings of Coling, 2010.
[11] Kim.S.M and Hovy. E., “Determining the sentiment of opinions” In the Proceedings of
Coling Conference, 2004.
[12] M Cha., H Haddadi. F Benevenuto and K.P. Gummadi “Determining the sentiment of
opinions” In the Proceedings of Fourth International AAAI Conference on Weblogs and
Social Media. , 2010
[13] Yu.H and Hatzivassiloglou.V “Towards answering opinion questions: separating facts
from opinions and identifying the polarity of opinion sentences” In the Proceedings of the
Conference on Empirical Methods in Natural Language Processing (EMNLP-03), NOV
2003.

International Journal of Management, IT & Engineering Vol. 8 Issue 12(1), December 2018,
ISSN: 2249-0558 Impact Factor: 7.119
Journal Homepage: http://www.ijmra.us, Email: [email protected]
Double-Blind Peer Reviewed Refereed Open Access International Journal - Included in the International
Serial Directories Indexed & Listed at: Ulrich's Periodicals Directory ©, U.S.A., Open J-Gage as well as in
Cabell’s Directories of Publishing Opportunities, U.S.A
321 International Journal of Management, IT & Engineering
http://www.ijmra.us, Email: [email protected]
An Efficient Resource Allocation for Heterogeneous Workloads
in IaaS Clouds over AWS
Shagun Sharma
Sandeep Bhargav
Abstract: Infrastructure-in-service (IAAS) has attracted a lot of attention from cloud
technology users, who claim a large number of computing resources. Current IaaS cloud
resources resources are associated with virtual machines (VMs) equivalent processing
configurations, where VMs have the same components as a real machine (PM) capability
in VMs. However, the majority of the user's work demands different amount for different
organizations. For example, more CPUs are needed for high-performance-computing work
when more memory is required for large data processing applications. The process of
allocation of existing monetary resources creates appetite, where dominant wealth is
hungry and non-influential resources are damaged. In order to overcome this problem, we
propose to offer a different resource allocation method called Screens-Affinity Multi-
Resource Alkonation (SAMR) to allocate resources according to the diverse needs of
different types of resources. Our solution includes a VM allocated algorithm that avoids
the use of SCISS resources in PMS and the appropriate creator is assigned a Model-based
approach to accurately predict the proper PMS for running SAMR. We display less
complexity for our model-based approach to real operation and accurate estimation. The
broad simulation results show the efficiency of SAMR and the performance advantages on
its opponents.
Keyword: Cloud computing, Machine learning, Data Analysis, Load balancing
1. Introduction
Cloud computing [1] [2] [3] word has changed the classical computing environment in IT
industries. It is most emerging & popular technology in IT & research field because of its
great feature such as virtualization and on-demand resource allocating (dynamic). Now - a
– days because of increased use of internet the associate resource are increasing rapidly
and this generate high work load. a simple cloud network is shown in fig.
Fig 1 - Basic cloud model
Research Scholar, Center for cloud infrastructure and security, Suresh Gyan Vihar University, Jaipur Assistant professor, Center for cloud infrastructure and security, Suresh Gyan Vihar University, Jaipur

International Journal of Management, IT & Engineering Vol. 8 Issue 12(1), December 2018,
ISSN: 2249-0558 Impact Factor: 7.119
Journal Homepage: http://www.ijmra.us, Email: [email protected]
Double-Blind Peer Reviewed Refereed Open Access International Journal - Included in the International
Serial Directories Indexed & Listed at: Ulrich's Periodicals Directory ©, U.S.A., Open J-Gage as well as in
Cabell’s Directories of Publishing Opportunities, U.S.A
322 International Journal of Management, IT & Engineering
http://www.ijmra.us, Email: [email protected]
To provide the reliable service to client with QOS [5] the load balancing mechanism is
necessary in cloud environment, to prevent system from overloading and crash an auto
scaling mechanism must also be provided according to the application and incoming user
traffic. Load balancing mechanism provides the distribution of load among one or more
nodes. For efficient service model auto scaling feature also enabled with the load balancer
to handle the excess load. Auto scaling scaled-up and scaled down the platform
dynamically according to the clients incoming traffic this save money and physical
resources. Latency based routing is the new concept in cloud computing which provide the
load balancing based on dns latency to global client by mapping domain name system
(DNS) [10 )through the different hosted zone.
2. Literature Review
2.1 Load balancing
Load balancing is the technique of redistributing the total load among the individual nodes
of the cloud collective system to improve the response time and utilization of resources.
Simultaneously avoiding condition which include some overloaded nodes while other
nodes of system is free or under loaded. Thus it improve the overall performance of the
cloud network, load balancing is a challenging task in cloud computing because it ensure
the stability of system & user satisfaction. It includes fault tolerance, throughput, and
reliability. Load balancing can be initiated by either sender our receiver. A load
rebalancing is a generic expression of distributing high processing load among the different
nodes. Load balancer can be cooperative or non-cooperative & non- cooperative. In
cooperative load balancing all the node of the system must work together to achieve
optimization of response time .while in no cooperative each node is free to process
individual task to improve the local task response time.
In this article we will discuss different type of load balancing technique and their
significant and will propose a load efficient model using cloud services.
1. Load balancing algorithm for P2P in dynamically structured system: this
algorithm is proposed by the Brighten for load rebalancing in dynamic point–to-point
system. This proposed algorithm save load information of node in multiple directories
.these load information is used to schedule reallocation of virtual servers to form a
good balance. This proposed method also uses the Greedy algorithm to utilize the node
properly. This method was proposed to handle the various issues such as random load
of node, scaling capacity. Advantages of this technique are high utilization of node and
increasing scalability. Lacking factor is the reallocation of virtual server is tuff.
Fig 01: Comparison of Load balancing technique

International Journal of Management, IT & Engineering Vol. 8 Issue 12(1), December 2018,
ISSN: 2249-0558 Impact Factor: 7.119
Journal Homepage: http://www.ijmra.us, Email: [email protected]
Double-Blind Peer Reviewed Refereed Open Access International Journal - Included in the International
Serial Directories Indexed & Listed at: Ulrich's Periodicals Directory ©, U.S.A., Open J-Gage as well as in
Cabell’s Directories of Publishing Opportunities, U.S.A
323 International Journal of Management, IT & Engineering
http://www.ijmra.us, Email: [email protected]
2.2 Auto scaling
Elasticity is the main attribute in the context of cloud computing and scalability is the key
benefits provided by cloud. In big organization the enterprise application that use cloud
network need a quality of service bond between client and cloud service provider. Backup
path, scalability & availability of service are necessity for deployment of any application
on cloud. Auto scaling technique ensures the QOS agreement between client & service
provider. One can define auto scaling as the technique used to full fill requirement of on
demand resource allocation when incoming traffic is increased and remove extra free
resource when application is not have peak load means scaling up & down the system.
Earlier technique to achieve scalability was manually scaling the infrastructure to handle
the peak load. it include the purchasing and installing the infrastructure during the peak
load. Main drawback of this manual scaling technique is waste of money and resource. As
the application don’t have high request rate (load). That why we need such mechanism that
can manage use of resources dynamically according to load. But auto scaling is not
possible without the virtualization, useful concept provided by Amazon EC2 which is a
cloud service provider.
3 Proposed System
Cloud computing is new and evolving technology conceptually a elastic & distributed
model of distributing the resource over the network (cloud computing). System component
must be cooperate to handle the request from cloud computing thus intercommunication
between different resource hardware and software components is required to fulfil the
client request. If the no of client requests become large it will create a bottleneck problem
in the system, resulting the imbalance system in which some node is overloaded and other
either don’t have any work load or have only light load. This is called imbalanced system.
To handle this issue we need an efficient load balancing technique. As the use of cloud
computing increasing it demands the efficient resource provisioning. Lots of technique is
proposed to ensure the proper load balancing but following issue has not been resolved
full.
I. Data availability issue
II. Ensuring proper scalability to handle the excess load
III. Ensuring the proper authentication, auditing , authorization
IV. Ensure system stability and steady operation
V. Proper monitoring of load
Load balancing is the most prevailed challenge as work load pattern is not predictable and
node in cloud system has different capacities. To develop an efficient model by using
cloud service we will tack care of these issues
• Load prediction
• System performances
• Load comparison of different node to balance load on light weighted node
• Intercommunication between load to transfer the load
• Scaling properties

International Journal of Management, IT & Engineering Vol. 8 Issue 12(1), December 2018,
ISSN: 2249-0558 Impact Factor: 7.119
Journal Homepage: http://www.ijmra.us, Email: [email protected]
Double-Blind Peer Reviewed Refereed Open Access International Journal - Included in the International
Serial Directories Indexed & Listed at: Ulrich's Periodicals Directory ©, U.S.A., Open J-Gage as well as in
Cabell’s Directories of Publishing Opportunities, U.S.A
324 International Journal of Management, IT & Engineering
http://www.ijmra.us, Email: [email protected]
3.1 System architecture
Fig4.1 – proposed system architecture
Abbreviation meaning used in picture
• ELB = Elastic load balancing
• EC2 = Elastic cloud commuting
• 53 = Amazon 53 routing (latency )
• HTTP = Hypertext transfer protocol
• SSL = Secure socket layer
The system architecture is show in above picture. This proposed system aimed for public
cloud in which large no of nodes are connected in distributed manner. This system divide
load balancing into 3 step to provide efficient solution to above mentioned issue this can be
done using public cloud services .we will use Amazon web service’s networking services
to balance the load in the proposed system this services individually does not provide any
beneficial solution for cloud computing but if used together we can configure a smart load
balancing system. This research will present an analysis of Amazon web service’s
networking services.
4. Implementation
Proposed system is aimed to solve the issue of load balancing in public cloud, as load
balancing is very important factor to ensure on demand and reliable service to user.
Implementation will be done in following steps.
• Creation of cloud environment (Instances creations)
• Setting up main load balancer (latency based)
• Creation of round robin based regional load balancer
• Setting up Autoscaling group
• Resource monitoring
• Load generation and testing
4.1 Creation of cloud environment (Instances creations)
To implement the proposed work we are using the Amazon Web Service cloud
environment. AWS provides the multiple instances according to the need of application.
Basically AWS is an infrastructure as service provider so creating instance become very
easy. AWS provides the service in different service regions and availability zone so first
we need to select the availability zone
i) Service regions& Availability zone: service region is the geographical area where it’s
all data and applications is stored and managed. Same as availability zone is subset ofg a

International Journal of Management, IT & Engineering Vol. 8 Issue 12(1), December 2018,
ISSN: 2249-0558 Impact Factor: 7.119
Journal Homepage: http://www.ijmra.us, Email: [email protected]
Double-Blind Peer Reviewed Refereed Open Access International Journal - Included in the International
Serial Directories Indexed & Listed at: Ulrich's Periodicals Directory ©, U.S.A., Open J-Gage as well as in
Cabell’s Directories of Publishing Opportunities, U.S.A
325 International Journal of Management, IT & Engineering
http://www.ijmra.us, Email: [email protected]
service region AWS has 7 service region and multiple availability zones. In this work we
used two service region US and ASIA and created 2-2 instances in these service regions
service region can be selected by EC2 console navigation bar.
ii) Operating system and AMI: after selecting the service region we need to select the
operating system and software packages for our virtual instances this can be done in two
way in traditional way one select OS and software individuals while in other way one use
Amazon machine image (AMI) which is a pre-configured of software packages or we can
say a template of previous instance. in this proposed system we are working on Linux
instances based on Ubuntu server
Fig 2 - an example of service region and availability zone
Fig 3 -AMI selection
iii) Selection of instances type: AWS provides the multiple type of instances in terms of
no of ECU, vCPUs, memory. We have selected general purpose small instances as shown
in fig.
Fig: 4 selection instance type
iv) Configuration of instances and security group: in configuration part the availability
zone and network and the additional monitoring system is configured, no of instances in
same availability zone, additional storage space can be added here. Security group is the
defined set of rules for firewall to differentiate the incoming network traffic for example in

International Journal of Management, IT & Engineering Vol. 8 Issue 12(1), December 2018,
ISSN: 2249-0558 Impact Factor: 7.119
Journal Homepage: http://www.ijmra.us, Email: [email protected]
Double-Blind Peer Reviewed Refereed Open Access International Journal - Included in the International
Serial Directories Indexed & Listed at: Ulrich's Periodicals Directory ©, U.S.A., Open J-Gage as well as in
Cabell’s Directories of Publishing Opportunities, U.S.A
326 International Journal of Management, IT & Engineering
http://www.ijmra.us, Email: [email protected]
this proposed work we have used two protocol http for web server traffic and SSL for
accessing the instance. security group provides the privacy and authenticity in Amazon
web service only the authorized having the security key can access the instances . In
second image 0.0.0.0/0 means traffic from internet source. By modifying this we can also
decide that who will access our services
Fig 5- configuration of instance
Fig 6- configuration of security group
V) Review of instances: here we can change the setting of our instances before launch
Fig 7 final review of instances
4.2 Setting up main load balancer
This main load balancer is the key step in our research. It is a software load balancer based
on latency. Latency is the time of processing the request form the client. Or the time
required by a request to returned to the user. This load balancer user the cloud dividing
technique in which whole cloud is divided in different service region. And load balancing
is done according to latency of the request. Amazon’s route 53 can be used to create

International Journal of Management, IT & Engineering Vol. 8 Issue 12(1), December 2018,
ISSN: 2249-0558 Impact Factor: 7.119
Journal Homepage: http://www.ijmra.us, Email: [email protected]
Double-Blind Peer Reviewed Refereed Open Access International Journal - Included in the International
Serial Directories Indexed & Listed at: Ulrich's Periodicals Directory ©, U.S.A., Open J-Gage as well as in
Cabell’s Directories of Publishing Opportunities, U.S.A
327 International Journal of Management, IT & Engineering
http://www.ijmra.us, Email: [email protected]
latency based load balancer. It is a scalable domain name system. Which provides the
routing between the different hosted zones.
i. Creating the hosted zone – hosted zone is the sets of record same as the record files in
the DNS System. To create hosted zone we need to register the domain name we have
registered the www.cloudefy.in.
Fig6.7 – working of hosted zone
After successfully registration with the registration id the hosted zone is created by
clicking the create hosted zone in navigation bar in Route 53. When hosted zone is create 4
name serve and 1 SOA server is automatically created by AWS to resolve the name query.
ii. Creating resource record – this is the main part of this load balancer here the
instances and the regional load balancer is integrated together mainly there is 4 type of
record set AAAA name , CNAME, SOA, NS. In this project first we created two A
NAME ALIAS record us.cloudefy.in which target the DNS address of load balancer in
US region and a`sia.cloudefy.in which target the DNS address of load balancer in ASIA
region. This targeted address known as Alias records. To perform latency based routing
we created two CNAME, a CNAME is the DNS record which point out the IP address
hold by another domain. Here we create two CNAME www.cloudefy.in, as shown in fig.
Fig 8- creating record sets
4.3 Creation of regional load balancer – this load balancer is based on round robin
algorithms which balance the traffic between different availability zones in a single region.
The instances are set behind this load balancer. A no of secondary load balancer can be
created. It can’t balance load between multiple service regions. Load balancing is done
according to Round Robin algorithm. Load balancer is create using the Elastic load
balancing service, selecting the launch load balancer under this we choose the load
balancer id and the region in which it is being configured., in proposed work we have
created two load balancer one each for US & ASIA region as follow
i. define and configure load balancer- in this step the load balance protocol and load
balancer ID is configured the load balancer protocol is the protocol on which the web
traffic will come in configuration health check for instances is created. In which the ping

International Journal of Management, IT & Engineering Vol. 8 Issue 12(1), December 2018,
ISSN: 2249-0558 Impact Factor: 7.119
Journal Homepage: http://www.ijmra.us, Email: [email protected]
Double-Blind Peer Reviewed Refereed Open Access International Journal - Included in the International
Serial Directories Indexed & Listed at: Ulrich's Periodicals Directory ©, U.S.A., Open J-Gage as well as in
Cabell’s Directories of Publishing Opportunities, U.S.A
328 International Journal of Management, IT & Engineering
http://www.ijmra.us, Email: [email protected]
protocol, path and port is configured .we have set the ping protocol to the HTTP , port 80
and ping path is index.html load balancer ping the instances in each health check interval
which is configured 10 second in this project. Healthy and unhealthy threshold is
configured in advance settings. These ratios define the no of unsuccessful/successful ping
request to declare instance healthy or unhealthy.
Fig 9 – defining & configuring of load balancer
iii. Adding EC2 instances and configuration of security group –here the instances is
added behind the load balancer one more benefits of AWS is that it does not expose
instances directly to user but user communicate thorough the load balancer.
Configuration of security group is same as above in 6.2. Final review is done before
launching the load balancer.
Fig10- adding instances and final review
4. 5 Implementation of auto scaling
Amazon web service provides the facility to accommodate the dynamic change in the
system. This is done by Auto scaling group. Auto scaling especially need for the

International Journal of Management, IT & Engineering Vol. 8 Issue 12(1), December 2018,
ISSN: 2249-0558 Impact Factor: 7.119
Journal Homepage: http://www.ijmra.us, Email: [email protected]
Double-Blind Peer Reviewed Refereed Open Access International Journal - Included in the International
Serial Directories Indexed & Listed at: Ulrich's Periodicals Directory ©, U.S.A., Open J-Gage as well as in
Cabell’s Directories of Publishing Opportunities, U.S.A
329 International Journal of Management, IT & Engineering
http://www.ijmra.us, Email: [email protected]
application on which no of request is variable per hour per day. Sometime peak load and
some time completely free. Auto scaling groups defined as. Auto scaling is implemented as
follow.
i. Creation of launch configuration – launch configuration is same as the launching a
instances the operating system and then security group is configured in the launch
configuration
ii. Creation of auto scaling group –Auto scaling group is created after configuring the
launching configuration auto scaling group consist following attributes
I) First he AMI is created for the scaling group as the new initialized instances must have
same configuration as other instances in the group.
II) Now the maximum and minimum size of scaling group is defined by the client. Initial
group size also defined here in the show picture we have created a scaling group
named_auto and set the initial group size to the two . Added the availability zone.
Fig11- auto scaling group initialization
iii. Creation of auto scaling policy – policies are set of conditioned and associate
actions Auto scaling properties is created on the basic of metric. These can be CPU
utilization; disk read or writes up, network traffic, request count. Alarm is configuring for
specific metric. Cloud watch observe each metric and rise alarm. And auto scaling group
will perform specific action. Load balancer gets informed automatically to send or stop
sending request to the newly created or terminated instances. In the project picture we have
created the policy for decrease and increase the group size based on CPU utilization and
also defined the appropriate action.
Fig 12- scaling policies to handle load

International Journal of Management, IT & Engineering Vol. 8 Issue 12(1), December 2018,
ISSN: 2249-0558 Impact Factor: 7.119
Journal Homepage: http://www.ijmra.us, Email: [email protected]
Double-Blind Peer Reviewed Refereed Open Access International Journal - Included in the International
Serial Directories Indexed & Listed at: Ulrich's Periodicals Directory ©, U.S.A., Open J-Gage as well as in
Cabell’s Directories of Publishing Opportunities, U.S.A
330 International Journal of Management, IT & Engineering
http://www.ijmra.us, Email: [email protected]
4.6 Resource monitoring -to provide the efficient solution of load balancing issue. System
must have a reliable and correct monitoring tool by which admin can monitor each and
every component. Amazon provides the cloud watch exclusively for monitoring the cloud.
It provides the cloud watch as monitoring tool which automatically monitors load balancer
and instances for matrix for example latency and no of request. It provides the detailed
information in graph form as per user selected time frame. User can select different
parameter and matrix to control the system. In this proposed work we are using CPU
utilization watch, memory watch, network pattern .it also provide a comparison between
different graphs. Instances health monitoring is done automatically in cloud watch. Best
part of this service is notified the admin for specific condition and able to execute user
defined actions. The following picture is monitoring graph for an scaling group instance
which is showing the maximum CPU utilization for instance i-9fc43acd. If we do detailed
study of this graph them we will get to know that initial when load is not applied (6.5)
maximum CPU utilization was become zero as the load is applied on the instances is gone
over loaded .auto scaling action is performed (part4.5)
Fig – 13 auto scaling monitoring
Results
• We have searched www.cloudefy.in from the different geographical area with the
help of proxy server and main load balancer routed us to nearest hosting service as shown
in fig this resolve our first issue of latency based routing latency based routing forward
these request to regional load balancers to process the request, us.clodefy.in &
asia.cloudefy.in representing the regional load balancer (step 2).
• At the regional load balancer the load balancer distributed the load in round robbing
fashion. As shown in fig. Here in the figure requested is generated randomly and thrown
on the load balancer. some virtual load is also applied on the instance 2 as we can see
from the picture load is distributed among the instances thus it sole our second proposed
issue of load balancing in EC2 the load graph between instances is shown in following
fig

International Journal of Management, IT & Engineering Vol. 8 Issue 12(1), December 2018,
ISSN: 2249-0558 Impact Factor: 7.119
Journal Homepage: http://www.ijmra.us, Email: [email protected]
Double-Blind Peer Reviewed Refereed Open Access International Journal - Included in the International
Serial Directories Indexed & Listed at: Ulrich's Periodicals Directory ©, U.S.A., Open J-Gage as well as in
Cabell’s Directories of Publishing Opportunities, U.S.A
331 International Journal of Management, IT & Engineering
http://www.ijmra.us, Email: [email protected]
• Auto scaling result is collected from the summery of auto scaling group activity in the
cloud watch. Load pattern and the polices is already explained in 4.5. These results are
according to the load pattern sown in step5. In starting as we defined the initial group
size was 2 instances. But we also define that if maximum CPU utilizations less than 30%
terminate one instance this is shown in the 4th line from bottom of figure. When we
applied the load the auto scaling system automatically launched the new instances (5th
and 6th line). Latter when load was remove auto scaling system terminated the newly
created instances. (1st and 2nd line). Failed is system error of cloud network.
7 Conclusion
The current work aim to provide detailed knowledge of importance of load balancing, auto
scaling, resource monitoring and latency based load balancing for cloud environment. In
this research we used Amazon cloud environment to develop a load efficient model if all
the service is used as individual. It will not effective but if used together then an efficient
load balancing. Auto scaling in cloud is depends on their uses. Auto scaling can be
achieved in different way on different cloud platform. If we compare the services
provided by the different cloud service provider the Amazon web services is more reliable
and cost efficient, Load balancing is very challenging issue and need to divide the load
among the instances in distributive manner on this paper proposed a model using cloud
services to provide the best solution to the load balancing issue. The following image
shows the
7.2 Future work
Load balancing is the key issue in cloud network we have proposed the dynamic system to
balance the load but there is need of lots of work to be done to improve the efficiency of
the system. In the literature survey we have discussed different technique for load handling

International Journal of Management, IT & Engineering Vol. 8 Issue 12(1), December 2018,
ISSN: 2249-0558 Impact Factor: 7.119
Journal Homepage: http://www.ijmra.us, Email: [email protected]
Double-Blind Peer Reviewed Refereed Open Access International Journal - Included in the International
Serial Directories Indexed & Listed at: Ulrich's Periodicals Directory ©, U.S.A., Open J-Gage as well as in
Cabell’s Directories of Publishing Opportunities, U.S.A
332 International Journal of Management, IT & Engineering
http://www.ijmra.us, Email: [email protected]
and balancing and after analyzing the proposed model we can say that first the monitoring
system must be more frequent and the regional load balancer must be load predictive to
balance the load between the instances. It will help the system to apply the changes
according to the predictive load forecasting.
Refrences
[1] Ronak Patel, Sanjay Patel” Survey on Resource Allocation Strategies in Cloud
Computing” International Journal of Engineering Research & Technology (IJERT) Vol. 2
Issue 2, Feb- 2013
[2] K C Gouda, Radhika T V, Akshatha M,” Priority based resource allocation model for
Cloud computing” International Journal of Science, Engineering and Technology Research
(IJSETR) Volume 2, Issue 1, January 2013.
[3] Gunho Leey, Byung-Gon Chunz, Randy H. Katzy,” Heterogeneity-Aware Resource
Allocation and Scheduling in the Cloud”, IJERT-2012.
[4] Nilton Bilay, Eyal de Laray, Kaustubh Joshi_, H. Andr´es Lagar-Cavilla ,Matti
Hiltunen_ and Mahadev Satyanarayananz,” Efficient Idle Desktop Consolidation with
Partial VM Migration”, Journal of computer application-2012.
[5] Venkatesa Kumar, V. And S. Palaniswami,” A Dynamic Resource Allocation Method
for Parallel data processing in Cloud Computing”, Journal of Computer Science 8 (5): 780-
788, 2012.
[6] Sheng Di and Cho-Li Wang,” Dynamic Optimization of Multi-Attribute Resource
Allocation in Self-Organizing Clouds”, IEEE Transactions on parallel and distributed
systems, - 2013.
[7] V.Vinothina, Dr.R.Sridaran, Dr.padmavathiganapathi,” A Survey on Resource
Allocation Strategies in Cloud Computing “International Journal of Advanced Computer
Science and Applications, Vol. 3, No.6, 2012.
[8] Qi Zhang, Eren G¨urses, Raouf Boutaba, Jin Xiao,” Dynamic Resource Allocation for
Spot Markets in Clouds”, Journal of computer science-2012.
[9] Zhen Xiao, Senior Member, IEEE, Weijia Song, and Qi Chen,” Dynamic Resource
Allocation Using Virtual Machines for Cloud Computing Environment”, IEEE
Transactions on parallel and distributed systems, vol. 24, no. 6, June 2013.
[10] Ts`epomofolo, R Suchithra,” Heuristic Based Resource Allocation Using Virtual
Machine Migration: A Cloud Computing Perspective”, International Refereed Journal of
Engineering and Science (IRJES) Volume 2, Issue 5(May 2013)

International Journal of Management, IT & Engineering Vol. 8 Issue 12(1), December 2018,
ISSN: 2249-0558 Impact Factor: 7.119
Journal Homepage: http://www.ijmra.us, Email: [email protected]
Double-Blind Peer Reviewed Refereed Open Access International Journal - Included in the International
Serial Directories Indexed & Listed at: Ulrich's Periodicals Directory ©, U.S.A., Open J-Gage as well as in
Cabell’s Directories of Publishing Opportunities, U.S.A
333 International Journal of Management, IT & Engineering
http://www.ijmra.us, Email: [email protected]
Study of Key Barriers to Digital Payment Mode
Kishan Srinivas
Dr. B. Padma Srinivasan
Abstract
The most recent decade has seen huge development being used of web and cell phone in
India. Expanding utilization of web, portable entrance and government activity, for
example, Digital India are going about as impetus which prompts exponential development
being used of digital payment. Gadgets Consumer exchange made at purpose of offer (POS)
for administrations and items either through web managing an account or portable saving
money utilizing advanced mobile phone or card payment are called as digital payment. The
organized survey was utilized as research device for understanding buyer impression of
digital payment. Essential information was gathered from 400 respondents in Bengaluru
.This Paper we are endeavoring to comprehend the key hindrances to digital payments as
seen by the shoppers
Keywords: Cashless Transactions Consumer Perception; Digital Payment; Digital
Wallets
Introduction
It has been said that each interruption makes openings and one such disturbance was the
declaration of demonetization by Prime Minister Mr. Narender Modi on 08 November
2016. Demonetization made colossal development open door for digital payment in India
and the digital wallet organizations garbed the open doors with both the hands to extend
their piece of the pie. Demonetization has exhibited a one of a kind stage for selection of
digital payment, as a choice to money for Indian buyers.
Selection of cashless exchange has been fundamentally pushed by Prime Minister Mr.
Narender Modi as a component of government changes after demonetization of high
esteem cash of Rs. 500 and 1000 (86% of money course). The demonetization brought
about remarkable development in digital payment. By February this year, digital wallet
organizations had demonstrated a development of 271 percent for an aggregate estimation
of US$2.8 billion (Rs. 191 crores) [1], Indian government and private part organizations,
for example, Paytm, Freecharge and Mobikwik had been forcefully pushing a few digital
payment applications, including the Aadhaar Payment application, the UPI application, and
the National Payments Corporation of India (NPCI) built up the Bharat Interface for
Money (BHIM) application. Digital exchanges utilizing applications has brought social
change and aided in the selection of digital payment. This has brought about simplicity of
move of cash in rustic territories which was not contacted before by the digital payment
technique. Presently numerous remote speculators need to put resources into digital
payment industry which is new appealing goals in light of extent of huge development in
India.
Research Scholar, JAIN (Deemed to be University) Research Guide, JAIN (Deemed to be University)

International Journal of Management, IT & Engineering Vol. 8 Issue 12(1), December 2018,
ISSN: 2249-0558 Impact Factor: 7.119
Journal Homepage: http://www.ijmra.us, Email: [email protected]
Double-Blind Peer Reviewed Refereed Open Access International Journal - Included in the International
Serial Directories Indexed & Listed at: Ulrich's Periodicals Directory ©, U.S.A., Open J-Gage as well as in
Cabell’s Directories of Publishing Opportunities, U.S.A
334 International Journal of Management, IT & Engineering
http://www.ijmra.us, Email: [email protected]
There are number of facilitators which are prompting the development of digital payment
and change from money economy to less money economy. These facilitators incorporate
infiltration of web network on advanced mobile phones, non-saving money monetary
organization encouraging digital payment, one touch payment, ascent of budgetary
innovation area and push by government either by giving impetuses or tax reductions.
These all components are making positive environment for development of digital payment
in India.
Digital Payment Modes in India
There are a few methods of digital payment accessible in India. These are:
On the web or portable wallets: They are utilized by means of the web and through cell
phone applications. Cash can be put away on the application by means of revive by charge
or Visas or net-keeping money. Purchaser wallet limit is Rs. 20,000 every month and the
vendor wallet limit is Rs. 50,000 every month after self-assertion and Rs. 100,000 after
KYC check.
Prepaid charge cards: Pre-stacked to person's financial balance. It is like a gift voucher;
clients can make buys utilizing reserves accessible on the card - and not on acquired credit
from the bank. Can be revived like a cell phone energize, up to an endorsed limit.
Charge/RuPay cards: These are connected to a person's financial balance. Can be utilized
at shops, ATMs, online wallets, miniaturized scale ATMs, and for internet business buys.
Platinum cards have overwhelmed Mastercards in India. The quantity of check cards in
December 2015 expanded to 630 million contrasted with 22.75 in 2014.
AEPS: The Aadhaar Enabled Payment System utilizes the 12-digit remarkable Aadhaar
distinguishing proof number to enable bank-to-bank exchanges at PoS. AEPS
administrations incorporate parity enquiry, money withdrawal, money store, and Aadhaar to
Aadhaar subsidize exchanges.
USSD: Stands for Unstructured Supplementary Service Data based versatile keeping
money. It is connected to shipper's financial balance and utilized by means of cell phone on
GSM arrange for payments up to Rs. 5,000 every day for each client.
UPI: The United Payments Interface (UPI) conceives being a framework that controls
different ledgers onto a solitary portable application stage (of any partaking bank).
Consolidations numerous saving money highlights, guarantees consistent reserve steering,
and shipper payments. It encourages P2P support exchanges.
Digital payments in India have been encountering exponential development and with
development of web and versatile entrance, in coming years the nation is prepared to
observe a colossal surge in the reception of digital payments. As per Ratan Watal [2], chief
counselor Niti Aayog and previous fund secretary, digital payments became 55% by volume
and 24.2% by incentive in 2016-17 over the earlier year. Information from the Reserve
Bank of India (RBI) demonstrates that the rate of selection of digital payments had
quickened following demonetization a year ago however has hindered lately of 2017. Add
up to digital exchanges in April 2017 of Rs109.58 trillion are
26.78 lower from Rs149.58 trillion in March2017 [2].
The volume of digital exchange has seen exponential development in volume and esteem
whether it is digital wallet, interbank exchange or exchange by charge or Mastercard. At
shipper puts the quantity of card exchange at purpose of offer (PoS) terminal have seen an
immense serge which mirrors that individuals have begun making payment by charge card
as opposed to pulling back money from ATM to make payment. In January 2017 the

International Journal of Management, IT & Engineering Vol. 8 Issue 12(1), December 2018,
ISSN: 2249-0558 Impact Factor: 7.119
Journal Homepage: http://www.ijmra.us, Email: [email protected]
Double-Blind Peer Reviewed Refereed Open Access International Journal - Included in the International
Serial Directories Indexed & Listed at: Ulrich's Periodicals Directory ©, U.S.A., Open J-Gage as well as in
Cabell’s Directories of Publishing Opportunities, U.S.A
335 International Journal of Management, IT & Engineering
http://www.ijmra.us, Email: [email protected]
quantity of exchange of plastic expanded to one billion from 817 million in earlier year. It
has been seen that ATM exchange are pretty much same at 700 million, the exchange at
PoS terminal has expanded multiple times from 109million in January 2016 to 328 million
in Jan 2017.
As indicated by Lokvir Kapoor, CEO at PineLabs "the card exchange post slander saw
enormous development in light of foundation for the acknowledgment of card at various
trader area." PineLabs has helped this development by sending a critical number of Pos at
retailers the nation over. Additionally the quantity of activity, for example, money back, no
exchange energize as far as possible with further help in development of digital exchanges.
The administration put weight on banks to convey one million expansion Pos terminal in
three months help the accessibility of PoS and by January 2017, their number rose to 2.52
million [3].
Literature Review
Bamasak [4] did ponder in Saudi Arabia found that there is a brilliant future for m-payment.
Security of portable payment exchanges and the unapproved utilization of cell phones to
make a payment were observed to be of incredible worries to the cell phone clients. Security
and protection were the real worries for the shoppers which influence the appropriation of
digital payment arrangements [5]. Doan [6] outlined the appropriation of portable wallet
among buyers in Finland as just toward the starting phases of the Innovation-Decision
Process.
Doing payments through cell phones has been being used for a long time and is currently set
to detonate [7]. Likewise mobiles are progressively being utilized by customers for making
payments. "Digital Wallet "has turned into a piece of buyers which are only advanced
mobile phones which can work as cowhide wallets [6]. Digital wallet offered numerous
advantages while exchanging cash, for example, comfort security and reasonableness [8].
Development in innovation has opened numerous methods of payments through which
shoppers can do exchanges which are progressively helpful, available and satisfactory [9-
11], buyers have a tendency towards versatile payment applications use [12]. Offering
different advantages, for example, flexi payment digital wallet brands are giving additional
comfort to purchasers [13]. Main consideration in reception of digital wallet is
accommodation in purchasing items online without physically moving between various
locations area [14]. There has been numerous investigations led in past on portable payment
application to discover buyer premium and they discovered customer has positive tendency
for the equivalent [12].
The elements, for example, saw usability, expressiveness and trust influence reception of
digital wallet as payment technique. These components are named as facilitators and
assumes urgent job in selection of digital payment arrangement [15]. Utilization of digital
wallet among youth in the province of Punjab was observed to be related with societal
impact and helpfulness, controllability and security, and requirement for execution upgrade.
Premium valuing, multifaceted nature, an absence of minimum amount, and saw dangers
are the obstructions to reception of digital payment frameworks [16].
An extensive model 'Payment Mode Influencing Consumer Purchase Model' was proposed
by Braga and Mazzon. This model considered factors, for example, worldly introduction
and partition, poise and torment of payment develops for digital wallet as another payment
mode. Purchaser point of view of portable payments and versatile payment innovations are
two most essential variables of portable payments inquire about [7]. Mallat [17]

International Journal of Management, IT & Engineering Vol. 8 Issue 12(1), December 2018,
ISSN: 2249-0558 Impact Factor: 7.119
Journal Homepage: http://www.ijmra.us, Email: [email protected]
Double-Blind Peer Reviewed Refereed Open Access International Journal - Included in the International
Serial Directories Indexed & Listed at: Ulrich's Periodicals Directory ©, U.S.A., Open J-Gage as well as in
Cabell’s Directories of Publishing Opportunities, U.S.A
336 International Journal of Management, IT & Engineering
http://www.ijmra.us, Email: [email protected]
contemplated shopper selection of portable payments in Finland. Concentrate found that
versatile payment is dynamic and its appropriation relies upon absence of different
payments strategies and certain situational factors.
Digital wallet payments convey additional accommodation to customers by offering
adaptable payment options and quickening trades [13]. Shin and Ziderman [18] tried a far
reaching model of purchaser acknowledgment with regards to portable payment. It utilized
the brought together hypothesis of acknowledgment and utilization of innovation (UTAUT)
demonstrate with develops of security, trust, social impact, and self-adequacy. The model
affirmed the established job of innovation acknowledgment factors (i.e., saw to clients'
frame of mind), the outcomes likewise demonstrated that clients' dispositions and
expectations are affected by apparent security and trust. In the all-inclusive model, the
directing impacts of socioeconomics on the relations among the factors were observed to be
critical. Digital wallets offer the shoppers the comfort of payments without swiping their
charge or Visas. Moment Cash accessibility and renders consistent portability is
additionally an interesting element of these digital applications, for example the parity in
your Paytm wallet can be effectively exchanged to your financial balance as and when you
need. Following are some different focal points of making exchanges through e wallets:
Spares time: digital wallets hold the sum in the electronic shape in order to facilitate the
payment procedure where clients can make online payments without entering any card
subtleties.
Usability: As digital wallet resembles a single tick pay without filling insights regarding
card viz card number and passwords inevitably, It enables client to connect digital wallet to
records and pay immediately so the shoppers confront no issues to enter the subtleties each
time an exchange occur.
Security: there is a decent measure of security when payments are made through e wallets
since the wallet does not pass the payment card subtleties to the site. These virtual wallets
enable clients to bolt their wallet.
Advantageous and data put away under one rooftop: As digital wallets dispenses with
need to convey the physical wallet they are profoundly helpful. Likewise a superior
administration is conceivable as there is synchronization of information from different
stages like financial balances, credit and platinum cards, versatile records and charging
entrances.
Appealing rebate: Cash back and limits are being offered by the greater part of the players
alongside giving disconnected wallet balance top up known as 'Money Pickup' benefit. This
administration is being offered by Mobikwik that will encourage money to be
straightforwardly added to MobiKwik wallet where shoppers of significantly littler towns
can be profited.
According to Ministry of Finance Report (December 2016) on Digital payment, monetary
consideration is one of the preeminent test confronting India. 53 percent of India populace
approached formal monetary administrations. In this specific situation, digital payment can
go about as quickening agent to money related consideration [19]. Expanding accessibility
of cell phone, accessibility of information arrange framework, rollout of 3G and 4G systems
and vast trader eco framework are the basic empowering agents of digital payment in India.
It is additionally bolstered by the planned endeavors of industry, controller and government.
According to RBI's report 'Vision 2018' four pronged technique concentrating on control,

International Journal of Management, IT & Engineering Vol. 8 Issue 12(1), December 2018,
ISSN: 2249-0558 Impact Factor: 7.119
Journal Homepage: http://www.ijmra.us, Email: [email protected]
Double-Blind Peer Reviewed Refereed Open Access International Journal - Included in the International
Serial Directories Indexed & Listed at: Ulrich's Periodicals Directory ©, U.S.A., Open J-Gage as well as in
Cabell’s Directories of Publishing Opportunities, U.S.A
337 International Journal of Management, IT & Engineering
http://www.ijmra.us, Email: [email protected]
strong foundation, powerful supervisory system and client centricity has been embraced to
push appropriation of digital payment in India [19].
The level of money for exchanges has seen a quick decrease in the previous couple of years
in India. In 2010, the level of money in all payments was 89% thought about with 78% in
2015. This quick decay is a consequence of an expanded reception of non-money
instruments, for example, cards and digital payments, for example, versatile wallets,
electronic exchanges, and so forth. Put away esteem instruments like versatile wallets
(Paytm, Mobikwik, Citrus, and so forth.) and paid ahead of time and gift vouchers have
made payments however web gadgets helpful and simple. India speaks to one of the biggest
market open doors for digital payments. With a populace of 1.25 billion, India represents
generally 18% of the worldwide populace. The two key drivers of digital payments-cell
phones and web clients are as of now entrenched in India. To date, India has about 1.0
billion cell phone supporters and 300 million web clients, positioning second on the two
measurements all around [20].
Objectives and Hypothesis
The objective of the study was to find out the consumer perception on Key Barriers to
Digital Payment
Research Methodology
The current study is based on primary data collected from 400 respondents from the
different parts of Bengaluru. A well-structured questionnaire was designed to collect the
information from the respondents the questionnaire was designed to study perception
of customer towards adoption of digital payment mode. Likert five point scales were
used for obtaining responses. The responses have been collected by means of face-to-
face interviews by authors.
Sampling Plan
Sampling unit: This call is for defining the target population to be surveyed. In this
research the sampling unit was the customers who have been using the digital
payment modes.
Sample size: In this survey the sample size decided was 400
Sampling procedure: We adopted Intercept interview method for collection of primary
data, as it is not possible to take appointment from a large number of respondents.
Purpose of this research was told to respondents and questions were explained to them
in case there was any need for understanding any particular question. There had been
no personal bias or distortions were allowed while recording the responses.
Research and Statistical Tools Employed
The research and statistical tools employed in this study are ANOVA and frequency
analysis. SPSS 19 was used to perform statistical analysis. Cronbach’s Alpha test was
used to find the reliability of the data. Frequency analysis on the main factor under
study, indicate overall satisfaction levels of respondents with digital payment mode.
ANOVA was carried out to find the variance in the responses and to test the hypothesis.

International Journal of Management, IT & Engineering Vol. 8 Issue 12(1), December 2018,
ISSN: 2249-0558 Impact Factor: 7.119
Journal Homepage: http://www.ijmra.us, Email: [email protected]
Double-Blind Peer Reviewed Refereed Open Access International Journal - Included in the International
Serial Directories Indexed & Listed at: Ulrich's Periodicals Directory ©, U.S.A., Open J-Gage as well as in
Cabell’s Directories of Publishing Opportunities, U.S.A
338 International Journal of Management, IT & Engineering
http://www.ijmra.us, Email: [email protected]
Results and Discussion
Case Processing Summary
N %
Cases
Valid 400 100.0
Excludeda 0 .0
Total 400 100.0
a. Listwise deletion based on all variables in the procedure.
Reliability Statistics
Cronbach's Alpha N of Items
.921 106
It can be observed that 106 Questions were analyzed and 400 respondent’s opinions were
put into reliability test, the coefficient of reliability was found to be 0.921, which is
indicating a highly reliable questionnaire and there are no missing values.
KEY BARRIERS TO DIGITAL PAYMENTS
SA A N D RANK
CYBER CRIME 200 120 40 40 RANK 2
LITERACY REQUIRED 56 216 88 40 RANK 6
TRANSPARENCY & EFFICIENCY IN E -
PAYMENTS 112 184 56 48 RANK 3
INCREASE IN INTERNET FRAUD 104 232 48 16 RANK 1
HABIT TO USE CASH 56 208 72 64 RANK 7
LACK OF COMPELLING VALUE PROPOSITION 120 152 88 40 RANK 4
INERTIA OF NON-CASH METHODS 80 144 112 64 RANK 9
INCENTIVES/ORDERS FROM OTHER METHODS 16 240 80 64 RANK 8
FRAUD/HIDDEN CHARGES 112 160 80 40 RANK 5
As per Respondents view it can be observed that following barriers in hierarchy are most
significant as per views expressed by the respondents
• Increase in Internet Fraud
• Cyber Crime
• Transparency & Efficiency in E – Payments
• Lack of Compelling Value Proposition
• Fraud/Hidden Charges
• Literacy Required
• Habit to Use Cash
• Incentives/Orders from Other Methods
• Inertia of Non-Cash Methods

International Journal of Management, IT & Engineering Vol. 8 Issue 12(1), December 2018,
ISSN: 2249-0558 Impact Factor: 7.119
Journal Homepage: http://www.ijmra.us, Email: [email protected]
Double-Blind Peer Reviewed Refereed Open Access International Journal - Included in the International
Serial Directories Indexed & Listed at: Ulrich's Periodicals Directory ©, U.S.A., Open J-Gage as well as in
Cabell’s Directories of Publishing Opportunities, U.S.A
339 International Journal of Management, IT & Engineering
http://www.ijmra.us, Email: [email protected]
ANOVA
Sum of Squares df Mean Square F Sig.
Do you think Cashless
transaction is more convenient
than Cash transaction?
Between Groups 274.302 9 30.478 137.629 .000
Within Groups 52.927 239 .221
Total 327.229 248
How do you ensure that
payment is received in case of
Cashless Transaction?
Between Groups 338.009 9 37.557 220.518 .000
Within Groups 40.875 240 .170
Total 378.884 249
What are the challenges you
face in the current economic
situation-GST in particular?
Between Groups 209.101 9 23.233 168.181 .000
Within Groups 33.155 240 .138
Total 242.256 249
What is your expectation in
new mode of payment
especially through app based
payment?
Between Groups 125.340 9 13.927 133.887 .000
Within Groups 24.964 240 .104
Total 150.304 249
What kind of help you expect
from the government/ banks to
tackle the current scenario?
Between Groups 5.427 9 .603 .667 .739
Within Groups 217.073 240 .904
Total 222.500 249
What is your Current Mode of
Transactions adopted for
Goods Purchase & Selling
Between Groups 47.484 9 5.276 1.838 .062
Within Groups 688.772 240 2.870
Total 736.256 249
Cyber Crime
Between Groups 14.243 9 1.583 1.694 .091
Within Groups 224.157 240 .934
Total 238.400 249
The literacy required /
Complexity of using
Between Groups 23.709 9 2.634 3.511 .000
Within Groups 180.087 240 .750
Total 203.796 249
Transparency & Efficiency in
E payments
Between Groups 2.720 9 .302 .420 .924
Within Groups 172.516 240 .719
Total 175.236 249
Increase in Internet fraud
Between Groups 45.501 9 5.056 7.768 .000
Within Groups 156.195 240 .651
Total 201.696 249
Habit to use Cash
Between Groups 6.524 9 .725 1.175 .312
Within Groups 148.100 240 .617
Total 154.624 249
Lack of compelling Value
Proposition
Between Groups 1.728 9 .192 .269 .982
Within Groups 171.156 240 .713
Total 172.884 249
Inertia of Non Cash Methods
Between Groups 6.382 9 .709 .777 .638
Within Groups 218.934 240 .912
Total 225.316 249
Incentives / Orders from other
Methods
Between Groups 7.045 9 .783 1.488 .153
Within Groups 126.271 240 .526
Total 133.316 249
Fraud / Hidden Charges
Between Groups 40.791 9 4.532 5.544 .000
Within Groups 196.205 240 .818
Total 236.996 249
Reach
Between Groups 5.230 9 .581 1.580 .122
Within Groups 88.246 240 .368
Total 93.476 249

International Journal of Management, IT & Engineering Vol. 8 Issue 12(1), December 2018,
ISSN: 2249-0558 Impact Factor: 7.119
Journal Homepage: http://www.ijmra.us, Email: [email protected]
Double-Blind Peer Reviewed Refereed Open Access International Journal - Included in the International
Serial Directories Indexed & Listed at: Ulrich's Periodicals Directory ©, U.S.A., Open J-Gage as well as in
Cabell’s Directories of Publishing Opportunities, U.S.A
340 International Journal of Management, IT & Engineering
http://www.ijmra.us, Email: [email protected]
To Understand the
relationship
between
consumers attitude
on Barriers to
Digital payments
H0 : There exists no relationship between consumers attitude on Barriers to Digital
payments
H3: There exists strong relationship between consumers attitude on Barriers to Digital
payments
AnovaF-
Test
F
Critical
Level of
Confidence Sig.
Critical
Value
STD.
ERROR
Accept the
Alternate
Hypothesis
RESULT 25.46 2.394 95% 0.000 0.05 5% YES
It can be observed that Ftest 25.46 > F critical 2.394, and Sig is < 0.05 which means there
exists a strong relationship between key barriers and consumers attitude
Result: There exists strong relationship between consumers attitude on Barriers to Digital
payments
Conclusion
For quite a long time, innovation has been a key empowering agent of advances crosswise
over industry also, inside budgetary administrations. Changes in the payments scene are a
direct result of innovation making new approaches to execute conceivable. In our present
decade, digitisation is further moving payments from the physical domain to the virtual
domain, for example, with versatile payment applications. While this move makes it less
demanding and quicker to execute payments, it all the while uncovered some security
dangers that have driven reactions, for example, tokenisation (the powerful anonymisation
of card information). As we enter a period of exponential figuring power, the
demonstration of making a payment is winding up additional consistent, even
imperceptible, as the physical instruments for starting payments are subsumed into
applications and other digital forms, for example, ride-sharing administrations.
References
1. Dezan Shira and Associates (2017) Growth of Digital Payments Systems in India.
2. http://www.india-briefing.com/news/development of-digital-payments-frameworks in-
india-14797.html/
3. Watal R (2017) Digital payments flood 55% in 2016-17.
http://www.livemint.com/Industry/hF8D3D6bWBie6IoJzWtdZO/Digital-payments-
flood 55-in-FY17-Niti-Aayog.html
4. Pratik B (2017) Demonetization impact: Digital payments India's new money; charge
card exchanges flood to more than 1 billion.
http://economictimes.indiatimes.com/industry/managing an account/back/saving
money/digital-payments-indias-new-cash check card exchanges flood to-more than 1-
billion/articleshow/58863652.cms
5. Bamasak O (2011) Exploring customers acknowledgment of portable payments-an
observational Study. Universal Journal of Information Technology, Communications
and Convergence 1: 173-185.
6. Dahlberg T, Mallat N, Oorni A (2003) Consumer Acceptance of Mobile Payment
Solutions-Ease of Use, Usefulness and Trust. The Second International Conference on
Mobile Business, Vienna, Austria, pp: 17-25.
7. Doan N (2014) Consumer selection in portable wallet: an investigation of shoppers in
Finland. http://theseus.fi/bitstream/handle/10024/86343/Ngoc_Doan.pdf?sequence=1

International Journal of Management, IT & Engineering Vol. 8 Issue 12(1), December 2018,
ISSN: 2249-0558 Impact Factor: 7.119
Journal Homepage: http://www.ijmra.us, Email: [email protected]
Double-Blind Peer Reviewed Refereed Open Access International Journal - Included in the International
Serial Directories Indexed & Listed at: Ulrich's Periodicals Directory ©, U.S.A., Open J-Gage as well as in
Cabell’s Directories of Publishing Opportunities, U.S.A
341 International Journal of Management, IT & Engineering
http://www.ijmra.us, Email: [email protected]
8. Dahlberg T, Mallat N, Ondrus J, Zmijewska A (2008) Past, present and eventual fate of
portable payments examine: A writing survey. Electronic Commerce Research and
Applications 7: 165-181.
9. Wamuyu PK (2014) The job of relevant factors in the take-up and duration of Mobile
cash utilization in Kenya. The Electronic Journal of Information Systems in
Developing Countries.
10. Soman D (2001) Effects of payment instrument on spending conduct: the job of
practice and promptness of payments. Diary of Consumer Research 27: 460-474.
11. Soman D (2003) The impact of payment straightforwardness on utilization: semi tests
from the field. Showcasing Letters 14: 173-183.
12. Srivastava J, Raghubir P (2008) Monopoly Money: the impact of payment coupling
and frame on spending conduct. Diary of Experiental Psycology Applied 14: 213-225.
13. Dewan SG, Chen LD (2005) Mobile payment appropriation in the USA: a cross-
industry, cross-stage arrangement. Diary of Information Privacy and Security 1: 4-28.
14. Liu S, Zhuo Y, Soman D, Zhao M (2012) The purchaser ramifications of the utilization
of electronic and versatile payment frameworks. Rotman School of Management,
University of Toronto.
15. Rathore HS (2016) Adoption of Digital Wallet by Consumers. BVIMSR's Journal of
Management Research 8: 69.
16. Padashetty S, Kishore KS (2013) An Empirical Study on Consumer Adoption of
Mobile Payments in Bangalore City-A Case Study. Scientists World 4: 83.
17. Taheam K, Sharma R, Goswami S (2016) Drivers of Digital Wallet Usage:
Implications for Leveraging Digital Marketing. Worldwide Journal of Economic
Research 13: 175-186.
18. Mallat N (2004) Theoretical Constructs of Mobile Payment Adoption. 27th
Information Systems Research Seminar, Scandinavia (IRIS), Falkenberg, Sweden, pp:
34-46.
19. Shin H, Ziderman A (2009) Student Loans Repayment and Recovery: International
Comparisons. Advanced education 57: 315-333.
20. KPMG (2017) Digital Payment-Analyzing the internet.
https://assets.kpmg.com/content/dam/kpmg/in/pdf/2017/04/Digital_payments_
Analysing_the_cyber_landscape.pdf
21. IMAP report (2016) Payments Industry in India Q4 2016.
http://www.imap.com/Reports/Q4%202016%20Payments%20Industry%20in%
20India.pdf
22. Nunnally JC (1978) Psychometric hypothesis (second ed.). McGraw-Hill, New York

International Journal of Management, IT & Engineering Vol. 8 Issue 12(1), December 2018,
ISSN: 2249-0558 Impact Factor: 7.119
Journal Homepage: http://www.ijmra.us, Email: [email protected]
Double-Blind Peer Reviewed Refereed Open Access International Journal - Included in the International
Serial Directories Indexed & Listed at: Ulrich's Periodicals Directory ©, U.S.A., Open J-Gage as well as in
Cabell’s Directories of Publishing Opportunities, U.S.A
342 International Journal of Management, IT & Engineering
http://www.ijmra.us, Email: [email protected]
Effect of Cognitive Styles and Achievement Motivation on
Academic Achievement of 9th Grade Students through
Multimedia and Traditional Instructional Strategies: An
Experimental Study
Hemant Lata Sharma
Pooja
Abstract The present study was undertaken to investigate the effect of cognitive styles and
achievement motivation on academic achievement of 9th grade students through
multimedia and traditional instructional strategies. The study was carried out on 64
students (32 in the experimental group, 32 in control group) of 9th grade of Om Public
School, Gohana, Dist. (Sonepat) selected by multi-stage sampling. The investigators used
Group Embedded Figure Test by Witkin et al. (1971) to identify the cognitive styles;
Achievement Motivation Scale by Deo and Mohan (2011) to test Achievement Motivation;
Multimedia Instructional Package was developed by investigators; and an Achievement
test in English was also developed by investigators. Levene’s Test for Homogeneity of
variance was implemented to test the homogeneity of the data obtained and was further
analyzed by using ANOVA with 2×2 factorial design. Findings of the study revealed that
the main effects of cognitive styles, achievement motivation on academic achievement
were significant. A significant interaction effect of cognitive styles and achievement
motivation on academic achievement of students was found.
Key words: Cognitive Styles, Achievement Motivation, Multimedia and Traditional
Instructional Strategies, Academic Achievement
Introduction
In this rapidly changing world and with the growing advancement in science and
information technology, the place of education has become so vital that every parent today
sets high goals to educate his/her child. It is a common observation that success in the
academic achievement saves as an emotional tonic and any damage done to a child may be
partially repaired by the success in school. Sound development in academic can be
matched with pillars on which entire future structure of personality stands and a good
academic record of students is an index of an effective educational system. In more general
term, academic achievement means the achievement of the pupils in so-called academic
subjects. Therefore, academic achievement may be defined as a measure of knowledge,
understanding or skills in a specific subject or a group of subjects. Differences in academic
achievement cannot be attributed to one single factor but to a large number of factors those
affect academic achievement. The factors on which achievement depends are innumerable
e.g. intelligence, creativity, cognitive style, achievement motivation, instructional strategy,
personality etc. However, it was not possible to take them up all these factors one time due
Professor, Department of Education, Maharshi Dayanand University, Rohtak, Haryana, India Research Scholar, Department of Education, Maharshi Dayanand University, Rohtak, Haryana, India

International Journal of Management, IT & Engineering Vol. 8 Issue 12(1), December 2018,
ISSN: 2249-0558 Impact Factor: 7.119
Journal Homepage: http://www.ijmra.us, Email: [email protected]
Double-Blind Peer Reviewed Refereed Open Access International Journal - Included in the International
Serial Directories Indexed & Listed at: Ulrich's Periodicals Directory ©, U.S.A., Open J-Gage as well as in
Cabell’s Directories of Publishing Opportunities, U.S.A
343 International Journal of Management, IT & Engineering
http://www.ijmra.us, Email: [email protected]
to constraints of time and resources, cognitive style, achievement motivation and
instructional strategy were selected for the present study.
Cognitive styles refer to stable patterns of individual responsiveness, pervading areas of
human functioning such as perception and cognition. In other words, cognitive styles refer
to how information is received and organized. This is a new topic in light of research on
how information from the environment is received and organized. The results of various
studies indicated that individuals have different approaches in dealing with one single task.
However, these differences do not reflect their intelligence or specific abilities. These
differences deal with individuals; preferences for information processing and organization
and reaction to environmental stimuli (Noroozi, 2003). For instance, some people have
quick reactions in most circumstances, while others are reflective and react slowly,
although these two groups of individuals may have similar knowledge with regard to a
particular task. Defined as modes of information processing, cognitive styles are not
simply habits in the technical sense of learning theory, for they are not directly responsive
to the principles of acquisition and extinction. They develop slowly and do not appear to be
easily modified by specific training. Research reveals that Cognitive Styles exhibit stability
and persuasiveness across diverse spheres of behaviour that, though entail generalized
habits of information processing, they are intimately interwoven with affective,
temperamental and motivational structures as a part of one’s total personality, a
manifestation of one’s core personality structures in cognition that are generally known as
Cognitive Style. Cognitive Styles are important to be considered as input variables that
might moderate the operation and effectiveness of educational/training programmes or
interact with programmes or components to produce differential results. Each of an
individual cognitive dimension has been found to correlate with certain intellectual tasks
and the ability to learn and perform in school. A number of cognitive styles have been
identified and studied over the years. Field independence versus field dependence is
probably the most well known style. It refers to a tendency to approach the environment in
an analytical, as opposed to global, fashion. At a perceptual level, field independent
personalities are able to distinguish figures as discrete from their backgrounds, compared
to field dependent individuals who experience events in an undifferentiated way. In
addition, “field dependent individuals have a greater social orientation relative to field
independent personalities. Studies have identified a number connection between this
cognitive style and learning” (Messick, 1976). For example, field independent individuals
are likely to learn more effectively under conditions of intrinsic motivation (e.g., self-
study) and are influenced less by social reinforcement. Researches in the field of Cognitive
Styles have shown Cognitive Styles as a main factor have significant effect on
Achievement. It is evidenced by the research conclusions of the studies conducted by Suet
(2009), Linder (2011) Nicolaou and Xistouri (2011) and Wei and Sazilah (2012) which
showed positive and significant correlation of Cognitive Styles on Achievement. In
controvertion results of the studies conducted by Altun and Cakan (2006) and Ipek (2010)
did not find significant relation of Cognitive Styles with Achievement.
Another variable considered significant for the present study pertains to Achievement
Motivation of students. Achievement Motivation is the attitude to achieve rather than the
achievements themselves. It can be considered as extended person- intrinsic motivation
because its reinforcement is delayed. It arises from an interaction within the person.
Achievement motivation is “a pattern of planning of actions and of feelings connected with

International Journal of Management, IT & Engineering Vol. 8 Issue 12(1), December 2018,
ISSN: 2249-0558 Impact Factor: 7.119
Journal Homepage: http://www.ijmra.us, Email: [email protected]
Double-Blind Peer Reviewed Refereed Open Access International Journal - Included in the International
Serial Directories Indexed & Listed at: Ulrich's Periodicals Directory ©, U.S.A., Open J-Gage as well as in
Cabell’s Directories of Publishing Opportunities, U.S.A
344 International Journal of Management, IT & Engineering
http://www.ijmra.us, Email: [email protected]
striving to achieve some internalized standard of excellence, as contrasted for example,
will power or friendship” As academic achievement is not a function of cognitive variable
alone the emphatic stress on the contribution of the psychological variable is imperative.
As such which of the psychological variable is of prime importance, what percentage of
proportion variance is attributable by them towards the criteria, needs elaboration and
quantification? Research studies of Mahyuddin et al. (2009), Rais Hasan et al. (2012) and
Chow and Yong (2013) showed positive and significant correlation between achievement
motivation and achievement. However, researchers like Bhatt (2009) and Onete (2012)
could not find significant relationship of achievement motivation on Students’
Achievement.
Instructional Strategies are subsets of methods of instruction. These strategies help to
activate students' curiosity about a class topic, to engage students in learning, to probe
critical thinking skills, to keep them on task, to engender sustained and useful classroom
interaction, and, in general, to enable and enhance their learning of the course content.
Teacher’s concern about the selection of instructional strategies influences the
effectiveness, efficacy and appeal of instruction. Multimedia in Education has been
extremely effective in teaching individuals a wide range of subjects. Multimedia
instructional strategy enables students to represent information using several different
media. Some students learn by interpreting text, while others require more graphical or
aural representations, allows for self-pacing and discovery. Thus a multi-sensory
experience can be created for the audience, which in turn, elicits positive attitudes towards
its application (Neo and Neo, 2000). Multimedia instruction has also been shown to elicit
the highest rate of information retention and result in shorter learning time (Ng and
Komiya, 2000). Thus Student’s exposure to such strategies results in better teaching-
learning as compared to traditional method. With multimedia, the process of learning
becomes more goal oriented, more participatory, flexible in time and space, unaffected by
distances and tailored to individual learning styles, and increased collaboration between
teachers and students (Sharma & Madan, M. 2018). Multimedia makes learning friendly
and fun-oriented without fear of inadequacies or failure. In other words, users of
multimedia applications have an opportunity to read about information, and to see it, hear
it, and watch it move (Sharma & Kiran, 2016). Apparently, the features of multimedia
environments allow learners to explore, discover, ponder, search, question, answer and
receive feedback (Brett, 1998). Earlier researches done in the field of multimedia
instructional strategy have revealed multimedia as a main factor having significant effect
on achievement. Studies by Gill et al. (2008), McNeill et al. (2009), Stanwick (2010),
Sharma and Kakkar (2010) Rolfe and Gray (2011), Samur (2012), Maree (2013),
Rusanganwa (2013) Sharma & Pooja (2016), Sharma & Priyamvada (2017) showed
significant effect of multimedia instruction on achievement.
The variable wise rationale of the problem leaves wide scope for investigating the
combined impact of independent variables on dependent variable in different combinations
in a factorial frame of reference. It may be concluded that that the variables of Cognitive
Styles, Achievement Motivation and Instructional Strategy are interrelated factors and if
investigated together in the light of academic achievement of students, the study may
throw better light on the individual and combined impact of these variables which may be
used effectively for the educational significance by its users.

International Journal of Management, IT & Engineering Vol. 8 Issue 12(1), December 2018,
ISSN: 2249-0558 Impact Factor: 7.119
Journal Homepage: http://www.ijmra.us, Email: [email protected]
Double-Blind Peer Reviewed Refereed Open Access International Journal - Included in the International
Serial Directories Indexed & Listed at: Ulrich's Periodicals Directory ©, U.S.A., Open J-Gage as well as in
Cabell’s Directories of Publishing Opportunities, U.S.A
345 International Journal of Management, IT & Engineering
http://www.ijmra.us, Email: [email protected]
Objectives of the Study
1. To compare the Academic Achievement of Field Independent and Field Dependent
groups of 9th Grade students before experimental treatment.
2. To compare the Academic Achievement of High and Low Achievement Motivation
groups of 9th Grade students before experimental treatment.
3. To compare the Academic Achievement of Experimental and Control groups of 9th
Grade students before experimental treatment.
4. To study the effect of Cognitive Styles on Academic Achievement of 9th Grade
students after experimental treatment.
5. To study the effect of Achievement Motivation on Academic Achievement of 9th Grade
students after experimental treatment.
6. To study the interaction effect of Cognitive Styles and Achievement Motivation on
Academic Achievement of 9th Grade students after experimental treatment.
Hypotheses of the Study
H01 There exists no significant difference in Academic Achievement of Field
Independent and Field Dependent groups of 9th Grade students before experimental
treatment.
H02 There exists no significant difference in Academic Achievement of High and Low
Achievement Motivation groups of 9th Grade students before experimental
treatment.
H03 There exists no significant difference in Academic Achievement of Experimental
and Control groups of 9th Grade students before experimental treatment.
H04 There exists no significant effect of Cognitive styles on Academic Achievement of
9th Grade students after experimental treatment.
H05 There exists no significant effect of Achievement Motivation on Academic
Achievement of 9th Grade students after experimental treatment.
H06 There exists no significant effect of Cognitive Styles and Achievement Motivation
on Academic Achievement of 9th Grade students after experimental treatment.
Research Design and Methodology
(i) Design- Factorial design (2×2) was selected to measure main and interaction effect
of independent variables on the dependent variable.
(ii) Variables- Cognitive Styles (Field Independent & Field Dependent), Achievement
Motivation (High Achievement Motivation and Low Achievement Motivation and
Instructional Strategies (Multimedia Instructional Strategy & Traditional
Instructional Strategy) were taken as independent variables and Academic
Achievement was taken as dependent variable.
(iii) Method- Experimental Method was used.
(iv) Sample- The sample of the study was selected through multi-stage sampling. At
the first stage, all the students studying in 9th class of Om Public School, Gohana
were selected. At the second stage, the tool of Cognitive Style was administrated to
the students and two groups belonging to field independent and field dependent
categories were formulated. (Students who scored above 8 were considered to be
field independent and students who scored 8 or less than 8 were considered to be
field dependent). At the third stage, the tool of Achievement Motivation was
administrated and two groups (High Achievement Motivation and Low
Achievement Motivation) were formulated in accordance with Kelly’s (1939)

International Journal of Management, IT & Engineering Vol. 8 Issue 12(1), December 2018,
ISSN: 2249-0558 Impact Factor: 7.119
Journal Homepage: http://www.ijmra.us, Email: [email protected]
Double-Blind Peer Reviewed Refereed Open Access International Journal - Included in the International
Serial Directories Indexed & Listed at: Ulrich's Periodicals Directory ©, U.S.A., Open J-Gage as well as in
Cabell’s Directories of Publishing Opportunities, U.S.A
346 International Journal of Management, IT & Engineering
http://www.ijmra.us, Email: [email protected]
consideration of taking up Top and Bottom 27% groups. Then on the basis of
randomization two groups were formed i.e. experimental group and control group.
Experimental group consisted of 32 students control group also consisted of 32
students
(v) Research Instruments- In the present study following tools were used for data
collection:
1) Group Embedded Figure Test (GEFT) by Witkin et al. (1971) to identify the Cognitive
Style
2) Achievement Motivation (n- Ach) Scale by (Deo and Mohan, 2011) to test
Achievement Motivation
3) Multimedia Instructional Package (Developed by the Investigator)
4) Achievement Test in English (Developed by the Investigator)
(v) Procedure for Data collection- The research instruments were administered on the
subjects personally by the researcher herself. The respondents were informed that
the information given by them would be kept confidential and would be used for
research purpose only. They were asked to follow the instructions. The sheets were
collected back on the spot.
(vi) Statistical Techniques-
• Descriptive statistics like Mean, Standard Deviation and Standard Error of Mean were
used to analyze and describe the characteristics and nature of sample or data.
• ‘t’ test was used to compare the groups and to arrive at findings and conclusions.
• Two Way Analysis of Variance (ANOVA) with 2×2 Factorial Design was employed to
study the main effect and interaction effect of independent variables on dependent
variable. Wherever F-ratios were found to be significant, t-ratios were computed to find
out the significance of difference. To test the assumption of homogeneity of variance
before applying Two Way ANOVA, the Levene’s Test for Homogeneity of Variance
was used.
Analysis and Interpretation
The analysis comprised four-folds as discussed under an equal number of sections, The
first section (1) makes comparison of academic achievement of Field Independent and
Field Dependent groups of 9th grade students (before experimental treatment); the second
(2) of academic achievement of High and Low Achievement Motivation groups of students
(before experimental treatment); the third (3) of academic achievement of experimental
and control groups of students (before experimental treatment); the fourth (4) analyze the
effect of Cognitive Styles and Achievement Motivation on academic achievement of
students (after experimental treatment).
Section 1
Comparison of Academic Achievement of Field Independent and Field Dependent
Groups of 9th Grade Students (Before Experimental Treatment)
This section compares the achievement scores of field independent and field dependent
groups of 9th grade students before experimental treatment as shown in table 1
Table 1: Mean, S.D. and ‘t’ value of Academic Achievement of Field Independent and
Field Dependent Groups
Cognitive Styles N Mean Std. Deviation SEM ‘t’ value
Pre-test Field Independent 32 30.12 1.60 .28
1.518NS Field Dependent 32 29.25 2.83 .50

International Journal of Management, IT & Engineering Vol. 8 Issue 12(1), December 2018,
ISSN: 2249-0558 Impact Factor: 7.119
Journal Homepage: http://www.ijmra.us, Email: [email protected]
Double-Blind Peer Reviewed Refereed Open Access International Journal - Included in the International
Serial Directories Indexed & Listed at: Ulrich's Periodicals Directory ©, U.S.A., Open J-Gage as well as in
Cabell’s Directories of Publishing Opportunities, U.S.A
347 International Journal of Management, IT & Engineering
http://www.ijmra.us, Email: [email protected]
NS= Not Significant
Mean scores of academic achievement of 9th grade students having field independent and
field dependent type of cognitive styles before experimental treatment were 30.12 and
29.25; besides S.D. 1.60 and 2.83 respectively; and ‘t’ value 1.518, which is not significant
at any level, indicating that, there exists no significant difference in academic achievement
of field independent and field dependent groups of students. Thus, the hypothesis H01,
“There exists no significant difference in Academic Achievement of Field Independent and
Field Dependent groups of 9th Grade students before experimental treatment” is retained.
Mean score of field independent group (30.12), slightly higher than that of field dependent
group (29.25), too, indicates that the two groups do not differ significantly, showing that
both the groups had almost same type of academic achievement before the experimental
treatment.
Section 2
Comparison of Academic Achievement of High and Low Achievement Motivation
Groups Of 9th Grade Students (Before Experimental Treatment)
Comparison of achievement scores of sample students having high achievement motivation
and low achievement motivation is given in table 2.
TABLE 2: Mean, S.D. and ‘t’ value of Academic Achievement of High and Low
Achievement Motivation Groups
Achievement Motivation N Mean Std. Deviation SEM ‘t’ value
Pre-test
High Achievement
Motivation 32 29.90 1.27 .22
0.749NS
Low Achievement Motivation 32 29.46 3.04 .53
NS= Not Significant
Mean scores of academic achievement of sample students having high achievement
motivation and low achievement motivation before experimental treatment were 29.90 and
29.46; their S.D. 1.27 and 3.04 respectively; and ‘t’ value for the two groups, 0.749, which
is not significant at any level, indicating that there exists no significant difference in
academic achievement of students with high achievement motivation and low achievement
motivation. Thus, the hypothesis H02, “There exists no significant difference in Academic
Achievement of High and Low Achievement Motivation groups of 9th Grade students
before experimental treatment” is retained. Mean score of high achievement motivation
group (29.90), being slightly higher than that of low achievement motivation group
(29.46), too do not differ significantly, meaning there by that both group had almost same
type of academic achievement before experimental treatment.
Section 3
Comparison of Academic Achievement of Experimental and Control Groups Of 9th
Grade Students (Before Experimental Treatment)
Comparison of achievement scores of students of experimental and control groups is given
in table 3.
TABLE 3: Mean, S.D. and ‘t’ value of Academic Achievement of Experimental and
Control groups
Groups N Mean Std. Deviation SEM ‘t’ value
Pre-test Experimental group 32 30.25 1.75 .31
1.926NS Control group 32 29.12 2.69 .47
NS= Not Significant

International Journal of Management, IT & Engineering Vol. 8 Issue 12(1), December 2018,
ISSN: 2249-0558 Impact Factor: 7.119
Journal Homepage: http://www.ijmra.us, Email: [email protected]
Double-Blind Peer Reviewed Refereed Open Access International Journal - Included in the International
Serial Directories Indexed & Listed at: Ulrich's Periodicals Directory ©, U.S.A., Open J-Gage as well as in
Cabell’s Directories of Publishing Opportunities, U.S.A
348 International Journal of Management, IT & Engineering
http://www.ijmra.us, Email: [email protected]
Mean scores of academic achievement of students of experimental and control group
before experimental treatment were 30.25 and 29.12; with S.D. 1.75 and 2.69 respectively,
and ‘t’ value between two groups 1.926, which is not significant at any level, indicating
that there exists no significant difference in academic achievement of experimental and
control groups of students before experimental treatment. Thus, the hypothesis H03, “There
exists no significant difference in Academic Achievement of Experimental and Control
groups of 9th Grade students before experimental treatment” is retained. Mean score of
students of experimental group (30.25) is slightly higher than the students of control grup
(29.12), also indicates that they do not differ significantly, that is both the groups had
almost same type of academic achievement before experimental treatment.
Section 4
Effect of Cognitive Styles and Achievement Motivation on Academic Achievement Of
9th Grade Students (After Experimental Treatment)
This section explores the effect of cognitive styles and achievement motivation on
academic achievement of sample students, based on Levene’s test for Homogeneity of
variances or Levene’s test of equality of variances and on Two way ANOVA for 2×2
factorial design to assess the interaction effect of cognitive styles and achievement
motivation on academic achievement of students.
4.1. Levene’s Test for Homogeneity of Variances
Levene’s test of equality of variance tests the assumption of homogeneity of variance
whereas Two way ANOVA is quite sensitive to heterogeneity of variance. Table 4 to 9 and
respective figures 1 to 4 explain the scenario of significant differences, if any, among the
experimental and control groups on various dimensions tested in this section.
Table – 4: Levene’s Test for Homogeneity of variance
F df1 df2 Sig.
2.103 3 60 0.058
Table 4 shows FLevene to be 2.103 with degrees of freedom 3 and 60 (p= 0.058) which does
not fall in the critical region, indicating thereby that the variance between groups is
homogenous, i.e., groups are assumed to have similar or equal variance.
4.2 ANOVA For 2×2 Factorial Design for academic achievement of 9th grade
students in relation to cognitive styles and achievement motivation
In order to study the main and interaction effect of cognitive styles and achievement
motivation on academic achievement of students, data was subjected to analysis of
variance, on (2×2) factorial design as in figure 1, presenting the first independent variable
i.e. cognitive style coded as (A) in terms of two styles – Field Independent (A1) and Field
Dependent (A2); and the second independent variable i.e. achievement motivation coded as
(B) along two levels – high achievement motivation (B1) and low achievement motivation
(B2). Table 5 and 6 respectively present Means and S.D.’s of the sample groups; and the
Summary of ANOVA (2×2) analysis in terms of main effect and interaction effect.

International Journal of Management, IT & Engineering Vol. 8 Issue 12(1), December 2018,
ISSN: 2249-0558 Impact Factor: 7.119
Journal Homepage: http://www.ijmra.us, Email: [email protected]
Double-Blind Peer Reviewed Refereed Open Access International Journal - Included in the International
Serial Directories Indexed & Listed at: Ulrich's Periodicals Directory ©, U.S.A., Open J-Gage as well as in
Cabell’s Directories of Publishing Opportunities, U.S.A
349 International Journal of Management, IT & Engineering
http://www.ijmra.us, Email: [email protected]
Figure 1: Schematic Layout of 2×2 Factorial Design for Effect of Cognitive Styles
and Achievement motivation on Academic Achievement
Table 5: Mean and S.D. of samples of 2×2 Design for Cognitive Styles and
Achievement Motivation Cognitive Styles (A) Achievement Motivation (B) N Mean S.D.
Field Independent (A1) High Achievement Motivation (B1) 16 53.87 5.26
Low Achievement Motivation (B2) 16 43.06 6.67
Field Dependent (A2) High Achievement Motivation (B1) 16 41.50 6.78
Low Achievement Motivation (B2) 16 42.31 13.01
Figure 2: Mean Scores for Interaction Effect of Cognitive Styles and
Achievement Motivation on Academic Achievement
Table 6: Summary of Two way ANOVA (2×2 Factorial Design) for Academic
Achievement of Students with respect to Cognitive Styles and Achievement
Motivation
Source of Variance Df Sum of
Squares (SS)
Mean sum of
squares (MS)
f-value
Cognitive Styles (A) 1 689.063 689.063 9.583**
Achievement Motivation (B) 1 400.000 400.000 5.563*
Cognitive Style (A) ×
Achievement Motivation (B)
1 540.563 540.563 7.518**
Between Cells 3 1629.625
Within Cells 60 4314.125 71.902
Total 63 5943.750
** Significant at 0.01 level; *Significant at 0.05 level

International Journal of Management, IT & Engineering Vol. 8 Issue 12(1), December 2018,
ISSN: 2249-0558 Impact Factor: 7.119
Journal Homepage: http://www.ijmra.us, Email: [email protected]
Double-Blind Peer Reviewed Refereed Open Access International Journal - Included in the International
Serial Directories Indexed & Listed at: Ulrich's Periodicals Directory ©, U.S.A., Open J-Gage as well as in
Cabell’s Directories of Publishing Opportunities, U.S.A
350 International Journal of Management, IT & Engineering
http://www.ijmra.us, Email: [email protected]
4.3 Main Effect of Cognitive Styles and Achievement Motivation on Academic
Achievement of 9th Grade Students.
Cognitive Styles (A)
Table – 6, shows that F- value (9.583) for main effect of cognitive styles on academic
achievement is significant at 0.01 level meaning thereby that cognitive styles have
significant effect on academic achievement of students. Therefore the null hypothesis Ho4,
“There exists no significant effect of Cognitive styles on Academic Achievement of 9th
Grade students after experimental treatment” is rejected. So also do the ‘t’ value of 2.851,
being significant at 0.01 level.
TABLE 7: Mean, S.D. and ‘t’ value of Academic Achievement of Field Independent
and Field Dependent Groups
Cognitive Styles N Mean Std. Deviation SEM ‘t’ value
Post Test Field Independent 32 48.46 8.07 1.42
2.851** Field Dependent 32 41.90 10.21 1.80
** Significant at 0.01 level
Table 7 further confirms that Mean scores of academic achievement of students along field
independent and field dependent type of cognitive styles after experimental treatment was
found to be 48.46 much higher in favour of the experimental group and 41.90 in favour of
the control group, indicating a significant difference between the two groups. Their S.D.’s
8.07 and 10.21 respectively, as well as ‘t’ 2.851, indicate a significant difference at 0.01
level of significance, conforming further that, there exists a significant difference in
academic achievement of field independent and field dependent group of students.
Achievement Motivation (B)
Table 6 showed F- value (5.563) for main effect of achievement motivation on academic
achievement of sample students, which is significant at 0.05 level indicating that
achievement motivation has a significant effect on these students’ academic achievement.
Therefore the null hypothesis Ho5, “There exists no significant effect of Achievement
Motivation on Academic Achievement of 9th Grade students after experimental treatment”
is rejected. Further, ‘t’-value 2.115 as computed in Table – 8 indicates a significant
difference at 0.05 level on achievement motivation of high achievement motivation and
low achievement motivation students.
TABLE 8: Mean, S.D. and ‘t’ values of Academic Achievement of High and Low
Achievement Motivation Groups
Achievement Motivation N Mean Std. Deviation SEM ‘t’ value
Post-test High Achievement Motivation 32 47.68 8.67 1.53
2.115* Low Achievement Motivation 32 42.68 10.18 1.79
* Significant at 0.05 level
Table 8 also shows that the mean scores of academic achievement of students having high
achievement motivation and low achievement motivation after experimental treatment are
47.68 and 42.68 respectively, higher in favour of the experimental group than that of the
control group, indicate a significant difference between the two groups. They also differ
with S.D.’s 8.67 and 10.18 respectively. Clearly, there exists a significant difference in
academic achievement of students with high achievement motivation and low achievement
motivation. It proved that high achievement motivation students had better academic
achievement in comparison to students having low achievement motivation.

International Journal of Management, IT & Engineering Vol. 8 Issue 12(1), December 2018,
ISSN: 2249-0558 Impact Factor: 7.119
Journal Homepage: http://www.ijmra.us, Email: [email protected]
Double-Blind Peer Reviewed Refereed Open Access International Journal - Included in the International
Serial Directories Indexed & Listed at: Ulrich's Periodicals Directory ©, U.S.A., Open J-Gage as well as in
Cabell’s Directories of Publishing Opportunities, U.S.A
351 International Journal of Management, IT & Engineering
http://www.ijmra.us, Email: [email protected]
4.4 Interaction Effect of Cognitive Styles and Achievement Motivation on
Academic Achievement of 9th grade Students
Cognitive Styles (A) × Achievement Motivation (B)
Table 6 indicated F-value (7.518) between cognitive styles and achievement motivation
which is significant at 0.01 level meaning thereby that Cognitive Styles and achievement
motivation interact with each other. Therefore, the null hypothesis H06, “There exists no
significant effect of Cognitive Styles and Achievement Motivation on Academic
Achievement of 9th Grade students after experimental treatment” stands rejected, which
implies that interaction effect exists quite significantly, that is, the variables of cognitive
styles and achievement motivation do leave an interaction effect on academic achievement.
More so, ‘t’- test employed to find out the significance of difference in mean scores of
Academic Achievement of different groups, as presented in Table 9, and illustrated
graphically in Figure 8.
Table – 9: ‘t’- values for Mean Achievement Scores of Different groups of Cognitive
Styles (A) × Achievement Motivation (B)
Groups N Mean Std. Deviation Std. Error Mean ‘t’ value
A1B1 vs. A1B2 16 53.87 5.26 1.31
5.086** 16 43.06 6.67 1.66
A1B1 vs.A2B1 16 53.87 5.26 1.31
5.765** 16 41.50 6.78 1.69
A1B1 vs. A2B2 16 53.87 5.26 1.31
3.295** 16 42.31 13.01 3.25
A1B2 vs.A2B1 16 43.06 6.67 1.66
.657NS 16 41.50 6.78 1.69
A1B2 vs. A2B2 16 43.06 6.67 1.66
.205 NS 16 42.31 13.01 3.25
A2B1 vs. A2B2 16 41.50 6.78 1.69
.221 NS 16 42.31 13.01 3.25
** Significant at 0.01 level; * Significant at 0.05 level; NS - Not significant
A1B1 = Field Independent High Achievement Motivation; A1B2 = Field Independent Low
Achievement Motivation;
A2B1 = Field Dependent High Achievement Motivation; A2B2 = Field Dependent Low
Achievement Motivation;
Figure 3: Mean Achievement Scores of Different groups of Cognitive Styles (A) ×
Achievement Motivation (B)
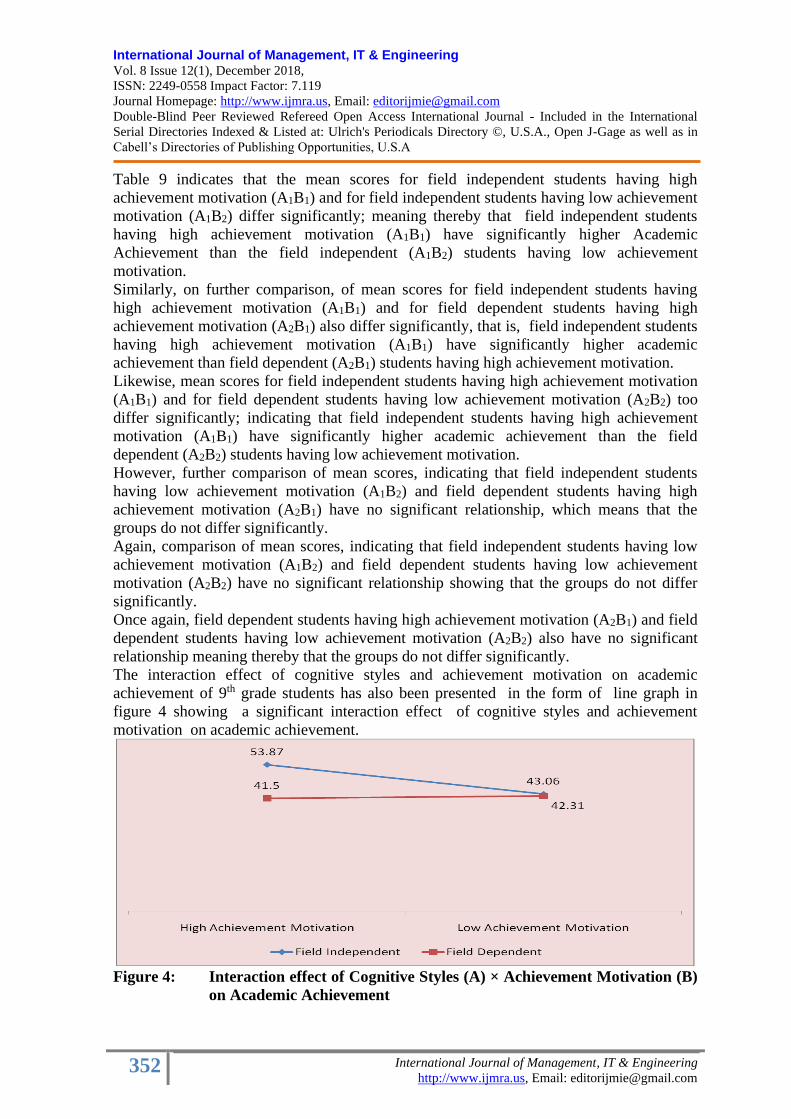
International Journal of Management, IT & Engineering Vol. 8 Issue 12(1), December 2018,
ISSN: 2249-0558 Impact Factor: 7.119
Journal Homepage: http://www.ijmra.us, Email: [email protected]
Double-Blind Peer Reviewed Refereed Open Access International Journal - Included in the International
Serial Directories Indexed & Listed at: Ulrich's Periodicals Directory ©, U.S.A., Open J-Gage as well as in
Cabell’s Directories of Publishing Opportunities, U.S.A
352 International Journal of Management, IT & Engineering
http://www.ijmra.us, Email: [email protected]
Table 9 indicates that the mean scores for field independent students having high
achievement motivation (A1B1) and for field independent students having low achievement
motivation (A1B2) differ significantly; meaning thereby that field independent students
having high achievement motivation (A1B1) have significantly higher Academic
Achievement than the field independent (A1B2) students having low achievement
motivation.
Similarly, on further comparison, of mean scores for field independent students having
high achievement motivation (A1B1) and for field dependent students having high
achievement motivation (A2B1) also differ significantly, that is, field independent students
having high achievement motivation (A1B1) have significantly higher academic
achievement than field dependent (A2B1) students having high achievement motivation.
Likewise, mean scores for field independent students having high achievement motivation
(A1B1) and for field dependent students having low achievement motivation (A2B2) too
differ significantly; indicating that field independent students having high achievement
motivation (A1B1) have significantly higher academic achievement than the field
dependent (A2B2) students having low achievement motivation.
However, further comparison of mean scores, indicating that field independent students
having low achievement motivation (A1B2) and field dependent students having high
achievement motivation (A2B1) have no significant relationship, which means that the
groups do not differ significantly.
Again, comparison of mean scores, indicating that field independent students having low
achievement motivation (A1B2) and field dependent students having low achievement
motivation (A2B2) have no significant relationship showing that the groups do not differ
significantly.
Once again, field dependent students having high achievement motivation (A2B1) and field
dependent students having low achievement motivation (A2B2) also have no significant
relationship meaning thereby that the groups do not differ significantly.
The interaction effect of cognitive styles and achievement motivation on academic
achievement of 9th grade students has also been presented in the form of line graph in
figure 4 showing a significant interaction effect of cognitive styles and achievement
motivation on academic achievement.
Figure 4: Interaction effect of Cognitive Styles (A) × Achievement Motivation (B)
on Academic Achievement

International Journal of Management, IT & Engineering Vol. 8 Issue 12(1), December 2018,
ISSN: 2249-0558 Impact Factor: 7.119
Journal Homepage: http://www.ijmra.us, Email: [email protected]
Double-Blind Peer Reviewed Refereed Open Access International Journal - Included in the International
Serial Directories Indexed & Listed at: Ulrich's Periodicals Directory ©, U.S.A., Open J-Gage as well as in
Cabell’s Directories of Publishing Opportunities, U.S.A
353 International Journal of Management, IT & Engineering
http://www.ijmra.us, Email: [email protected]
Discussion of Results
The results obtained from the analysis are discussed in the context of hypotheses
formulated earlier. The results already arrived at by various related studies have also been
compared with the results of present study. This has been done to make the study more
meaningful. The analysis of the pre-test stage finds no significant difference between the
achievement scores of both the groups suggesting there by that they are almost equal and
parallel groups fit for comparative study and experimentation along various dimensions put
forth under investigation. The analysis of post-test stage finds significant effect of
cognitive styles on academic achievement of students. The Findings thus seems to be in
tune with the findings of a number of other scholars like: Nozari and Siamian (2015): the
more the field independence, the higher the reading comprehension skills in learning
English, resulting in more academic achievement; “there is significant relationship
between FD/FI cognitive style and vocabulary learning strategies (Alipanahi and Mohajeri,
2013)”; “Field dependence/ independence is one of the most heuristic cognitive style
constructs that consistently affects academic results of students and their educational level
(Tinajero, Castedo, Guisande, and Paramo, 2011)”. Cognitive style (FD/FI) can be
considered as an important factor which affects on language learning strategies (Naimie,
Abuzaid, Siraj, Shagholi, and Hejailieís, 2010). “Field-dependent/independent cognitive
construct can be considered as one crucial factor in reading performance (Behnam and
Fathi, 2009)”; “Cognitive style (FD/I) has a significant correlation with learners’ success in
reading performance (Blantonís, 2004)”; The finding of present study is also in consonance
with the finding of Cognitive style (FD/FI) enhanced learners’ accuracy of pronunciation
(Elliott, 1995).
Further, there was significant effect of achievement motivation on academic achievement
of students. This finding seems to be compatible with finding like: achievement motivation
is a predictor of academic achievement (Azar, 2013). Achievement motivation is
significantly related to academic achievement (Awan et al., 2011) that also suggested that
“teachers must use motivational strategies to involve students in academic activities for
improving their grades; achievement motivation moderated relationship of learning
approaches and academic achievement is significant” (Bakhtiarvand et al., 2011) and
“there exists a significant positive correlation between students’ achievement motivation
and their scores on comprehension learning, meaning orientation” (Abouserie, 1995),
which also suggested that students with high achievement motivation are likely to adopt
deep and elaborative approaches in their English readings than those of students with low
achievement motivation.
The interaction effect of cognitive styles and achievement motivation on academic
achievement was also found significant. This finding corroborates the finding of (Kumar,
2014), that is, cognitive styles, achievement motivation are positively and significantly
correlated with academic achievement. Thus, the interaction of cognitive styles and
achievement motivation through multimedia and traditional instructional strategies has
significant influence on academic achievement of students.

International Journal of Management, IT & Engineering Vol. 8 Issue 12(1), December 2018,
ISSN: 2249-0558 Impact Factor: 7.119
Journal Homepage: http://www.ijmra.us, Email: [email protected]
Double-Blind Peer Reviewed Refereed Open Access International Journal - Included in the International
Serial Directories Indexed & Listed at: Ulrich's Periodicals Directory ©, U.S.A., Open J-Gage as well as in
Cabell’s Directories of Publishing Opportunities, U.S.A
354 International Journal of Management, IT & Engineering
http://www.ijmra.us, Email: [email protected]
References
• Abouserie, R. (1995). Self-esteem and achievement motivation as determinants of
students’ approaches to studying. Studies in Higher Education, 20(1), 19-26.
• Alipanahi, A., & Mohajeri, M. (2013). Relationship between FD/FI cognitive style and
vocabulary learning strategies. Journal of Teaching English as a Foreign Language
and Literature, 1(1), 49-62.
• Altun, A. & Cakan, M. (2006).Undergraduate Students Academic Achievement Field
Dependent / Independent Cognitive Styles and Attitude toward Computers. Educational
Technology & Society.9, 289- 297.
• Awan, R.U.N, Ghazala, N., & Naz, A. (2011). A study of relationship between
achievement motivation, self concept and achievement in English and mathematics at
secondary level. Journal of International Education Studies, 4(3) 72-79
• Azar, S.F. (2013) Self-efficacy, achievement motivation and academic procrastination
as predictors of academic achievement in pre-college students. Proceeding of the
Global Summit on Education, Kuala Lumpur: Organized by worldconference.net
• Bakhtiarvand, F., Ahmadian, S., Delrooz, K., & Farahani, H.A. (2011). The moderating
effect of achievement motivation on relationship of learning approaches and academic
achievement. Procedia – Social and Behavioural Sciences, 28, 486-488.
• Behnam, B., & Fathi, M. (2009). The relationship between reading performance and
field dependence/independence cognitive styles. Journal of Teaching English as a
Foreign Language and Literature, 1(1), 49-62.
• Bhatt, M. K. (2009). A Study of Academic Achievement of Secondary School Students
in relation to their Intelligence, Self Concept and Achievement Motivation. M.Ed.
Dissertation, Kurukshetra: Kurukshetra University.
• Blanton, E.L. (2004). The influence of students’ cognitive style on a standardized
reading test administered in three different formats. Published doctoral dissertation.
University of Central Florida, USA
• Brett, P. (1998). An intuitive, theoretical and empirical perspective on the effectiveness
question for multimedia In K. Cameron (Ed.), Multimedia computer assisted language
learning: Theory and practice. Exeter: Elm Bank Publications.
• Chow, S. J., & Yong, B. C. S. (2013) Secondary School Students' Motivation and
Achievement in Combine Online Submission.US-China Education Review. 3 (4), 213-
228.
• Deo, P., & Ashamohan (2011). Deo-Mohan Achievement Motivation Scale (nAch).
Agra: National Psychological Corporation Agra
• Elliott, A.R. (1995a). Field independence/dependence, hemispheric specialization, and
attitude in relation to pronunciation accuracy in Spanish as a foreign language. Modern
Language Journal, 79(3), 356-371.
• Gill, M., Yosi, R., & Ruth S. (2008). Using computer animation and illustration
activities to improve high school student’s achievement in molecular genetics. Journal
of Research in Science Teaching, 45(3), 273-292.
• Ipek, I. (2010). The Effects of CBI Lesson Sequence Type and Field Dependence on
Learning from Computer-Based Cooperative Instruction in Web.Turkish Online
Journal of Educational Technology, TOJET. 9, 1, 221-234.

International Journal of Management, IT & Engineering Vol. 8 Issue 12(1), December 2018,
ISSN: 2249-0558 Impact Factor: 7.119
Journal Homepage: http://www.ijmra.us, Email: [email protected]
Double-Blind Peer Reviewed Refereed Open Access International Journal - Included in the International
Serial Directories Indexed & Listed at: Ulrich's Periodicals Directory ©, U.S.A., Open J-Gage as well as in
Cabell’s Directories of Publishing Opportunities, U.S.A
355 International Journal of Management, IT & Engineering
http://www.ijmra.us, Email: [email protected]
• Kumar, A. (2014) A correlational study of the variables of instructional strategies -
modular and multimedia - on achievement in relation to cognitive styles and
achievement motivation at the secondary stage. International Journal of Scientific
Research, 3(9), 89-91.
• Linder, F. (2011).The Relationship of Cognitive Style to Academic Performance
among Dental Students.Journal of Educational Technology Systems. 3(II), 249-269.
• Mahyuddin, R., Elias, H., & Noordin, N. (2009).Emotional Intelligence, Achievement
Motivation and Academic Achievement among Students of the Public and Private
Higher Institutions. The International Journal of Diversity in Organisations,
Communities and Nations, 9(4), 135-144.
• Maree, T.J., Van Bruggen, J.M. & Jochems, W.M.G. (2013). Effective Self Regulated
Science Learning through Multimedia-Enriched Skeleton Concept Maps. Journal
Research in Science and Technological Education, 31(1), 16-30.
• McNeill, A.L., Doolittle, P.E., & Hicks, D. (2009) The effects of training, modality and
redundancy on the development of a historical inquiry strategy in a multimedia
learning environment. Journal of Interactive Online Learning, 8(3), 255-269.
• Messick, S. (1976).Personality consistencies in cognition and creativity.In S. Messick
(Ed.), Individuality in learning (4–23). San Francisco: Jossey-Bass.
• Naimie, Z., Ahmad A.R., Siraj, S., Shagholi, R., & Al Hejaili, H. (2010). Do you know
where I can find the new center which is called cognitive styles and language learning
strategies link? Procedia Social and Behavioral Sciences, 2(1), 497-500.
• Neo, M. & Neo, T.K. (2000). Multimedia learning: using multimedia as a platform for
instruction and learning in higher education. Paper presented at the Multimedia
University International Symposium on Information and Communication Technologies
2000 (M2USIC’2000), October 5-6, 2000, Petaling Jaya, Malaysia
• Ng, K.H. & Komiya, R. (2000). Introduction of Intelligent Interface to Virtual
Learning Environment. Paper presented at the Multimedia University International
Symposium on Information and Communication Technologies 2000 (M2USIC’2000),
October 5-6, Petaling Jaya, Malaysia.
• Nicolaou, A. A. & Xistouri, X. (2011).Field Dependence and Independence Cognitive
Style and Problem Posing, An Investigation with Sixth Grade Students.Journal of
Educational Psychology, 31 (5), 611- 627.
• Noroozi, D. (2003). Cognitive styles and their relationship with learning. Tehran:
Islamic Azad University, the South Branch.
• Nozari, A.Y., & Siamian, H. (2015). The relationship between field dependent-
independent cognitive style and understanding of English text reading and academic
success. Mater Sociomed., 27(1), 39-41.
• Onete, O. U., Edet, P. B., Udey, F. U., & Ogbor, B. P. (2012) Academic Performance:
A Function of Achievement Motivation Among Education Students of Cross River
University of Technology, Calabar: R.H.E.A., 4, 63-83.
• Rais Hasan, R. S., Alireza, F. M. Hossien, G., Moosa J. & Zahra B. A. (2012).
Investigation of the Relationship between Academic Self-concept, Achievement
Motivation and Academic Achievement among the a group of Iranian Students of
Primary School. Journal of Basic and Applied Scientific Research, 5 (27), 158-160.

International Journal of Management, IT & Engineering Vol. 8 Issue 12(1), December 2018,
ISSN: 2249-0558 Impact Factor: 7.119
Journal Homepage: http://www.ijmra.us, Email: [email protected]
Double-Blind Peer Reviewed Refereed Open Access International Journal - Included in the International
Serial Directories Indexed & Listed at: Ulrich's Periodicals Directory ©, U.S.A., Open J-Gage as well as in
Cabell’s Directories of Publishing Opportunities, U.S.A
356 International Journal of Management, IT & Engineering
http://www.ijmra.us, Email: [email protected]
• Rolfe, V.E., & Gray, D. (2011). Are multimedia resources effective in life science
education? a meta-analysis. Journal of Bio-science Education, 18, 256-57.
• Rusanganwa, J. (2013). Multimedia as a means to enhance teaching technical
vocabulary to physics undergraduates in Rwanda. Journal English for Specific
Purposes, 32(1), 36-44.
• Samur, Y. (2012). Redundancy effect on retention of vocabulary words using
multimedia presentation. British Journal of Educational Technology, 43(6), 166-170.
• Sharma, H.L & Kiran. (2016). Tracing the Conceptual Framework of Multimedia-
based Instructional Package for Enhancing English Language Skills. International
Journal of Science and Research, 5(2).
• Sharma, H.L & Pooja. (2016). Enhancing students interest in English language via
multimedia presentation. International Journal of Applied Research,2(1), 275-281.
• Sharma, H.L. and Pooja. (2015). Computer multimedia instruction versus traditional
instruction: an experimental study. International Journal of Scientific Research, 4(5),
740 - 742.
• Sharma, H.L., & Priyamvada. (2017). Multimedia: Instructional Strategy to Enhance
Achievement of Senior Secondary School Students in Business Studies. International
Journal of Research, 4(13), 1332-1342.
• Sharma, Hemant Lata & Madan, Meenu. (2018). Multi-Media Teaching Programme
(MMTP) for Teaching of English: A Trenchant Tool for enhancing Student
Achievement. International Journal of Research in Social Sciences, UGC Approved -
48887. 8. 121-130.
• Sharma, Hemant Lata and Kakkar, Nidhi. (2010). Multimedia Learning (MML)
Package on Educational Technology for B. Ed. Pupil Teachers- An Experiment.
Journal of Global Evolution, 1(1),1-8.
• Stanwick, P.A. (2010) Using multimedia content to present business ethics: an
empirical study. Journal of STEM Education Innovations and Research, 38-46.
• Suet, C. L. (2009).The relationship between Cognitive Style and Academic
Achievement. British Journal of Educational Technology, 29 (2), 137-147.
• Tinajero, C., Castelo, A., Guisande, A., & Paramo, F. (2011). Adaptive teaching and
field-dependence-independence instructional implications. Latin American Journal of
Psychology, 43(3), 497-510.
• Wei, L.T. & Sazilah, S. (2012). The Effects of Visual Cues and Learners Field
Dependence in Multiple External Representations Environment for Novice Program
Comprehension. Journal of Interactive Learning, vol. 23 (2), 165-189.
• Witkin, H.A., Oltman, P.K., Raskin, E., & Karp, S.A. (1971). A manual for the
embedded figures test. Consulting Psychologists Press: Palo Alto, CA.

International Journal of Management, IT & Engineering Vol. 8 Issue 12(1), December 2018,
ISSN: 2249-0558 Impact Factor: 7.119
Journal Homepage: http://www.ijmra.us, Email: [email protected]
Double-Blind Peer Reviewed Refereed Open Access International Journal - Included in the International
Serial Directories Indexed & Listed at: Ulrich's Periodicals Directory ©, U.S.A., Open J-Gage as well as in
Cabell’s Directories of Publishing Opportunities, U.S.A
357 International Journal of Management, IT & Engineering
http://www.ijmra.us, Email: [email protected]
A Simple Technique to Solve Fuzzy Project Scheduling
Problems
M. Evangeline Jebaseeli
D. Paul Dhayabaran
Abstract: Time Cost Trade-off Problem is one of the highly important issues in project
accomplishment. In this paper, a new solution approach is proposed for solving Fuzzy
Time Cost Trade-off Problems. Also, it is an attempt to apply the method suggested in this
paper to an actual construction project. The purpose is to evaluate the practical
applicability of the method. This paper helps practicing project managers to have realistic
expectations of the method. A comparative study has been carried out between the
proposed method and methods suggested in various research articles.
Keywords: Fuzzy Project Scheduling – Linear Programming – Time Cost Trade-off
Problem.
1 Introduction
In scheduling a project, it is generally considered to expedite the duration of some
activities through extra budget in order to compress the project completion time. This
process can be considered under either some fixed available budget or a threshold of
project completion time. This problem is known as Project Crashing (or) Time Cost Trade-
off Problem in project management. The main objective of these kinds of problems is to
determine the optimal duration and cost assigned to the activities so that the overall cost is
minimized. Hence this problem leads to a balance between the project completion time and
total cost of the project.
In Time Cost Trade-off analysis, the objective of project managers is to schedule a project
completion time in which total costs of project are in minimum. If there is a supposed
budget in a project, the goal is to find the greatest reduction in project completion time
using the specified budget. Duration of an activity can be decreased by hiring more
workers or using extra resources. Costs required for these purposes are known as “direct
costs”. For executing the project, other affairs such as monitoring, engineering and
accounting are required. Costs required for these purposes are defined as “indirect costs”
which are ordinarily computed per unit of schedule time in a project.
In real construction projects, time and cost of activities may face significant changes due to
existing uncertainties such as inflation, economical and social stresses, labor performance,
natural events such climate changes and etc. Therefore, total time and cost of the project
may differ significantly because of these uncertainties. So, deterministic models of
construction Time Cost Trade-off are not realistic. Using of uncertain model is capable of
formulating vagueness of the dynamic conditions of real world, which gives more stability
to solve Time Cost Trade-off Problems.
Assistant Professor, Department of Mathematics, Bishop Heber College, Tiruchirappalli Associate Professor of Mathematics and Principal, Bishop Heber College, Tiruchirappalli

International Journal of Management, IT & Engineering Vol. 8 Issue 12(1), December 2018,
ISSN: 2249-0558 Impact Factor: 7.119
Journal Homepage: http://www.ijmra.us, Email: [email protected]
Double-Blind Peer Reviewed Refereed Open Access International Journal - Included in the International
Serial Directories Indexed & Listed at: Ulrich's Periodicals Directory ©, U.S.A., Open J-Gage as well as in
Cabell’s Directories of Publishing Opportunities, U.S.A
358 International Journal of Management, IT & Engineering
http://www.ijmra.us, Email: [email protected]
2 Review of Literature
In the construction industry, contractors usually use previous experience to estimate project
duration and cost. Time and cost are the two main concerns of construction projects. The
trade-off between time and cost gives construction planners both challenges as well as
opportunities to arrive out the best construction plan which optimizes time and cost to
complete a project.
There are two different approaches that have been used to solve the Time Cost Trade-off
Problems. These techniques can be grouped into two categories: Optimal based and
heuristic based techniques. Optimization technique involves mathematical programming
approach including linear programming, integer programming, dynamic programming
whereas Heuristic technique involves genetic algorithm, Cost-loop method etc.
Since 1950s, Critical Path Method techniques are widely recognized as valuable tools for
the planning and scheduling of projects. In 1961, Kelly did research on the Time Cost
Trade-off Problems, which is a branch of the project scheduling problem through linear
programming. Meyar and Shaffer (1963) and Patterson & Huber (1974) solved Time Cost
Trade-off Problems through bounding algorithm.
Robinson (1975), De et al. (1995) and Elmagrhraby (1993) have used dynamic
programming to solve TCTP for networks that can be decomposed to pure series (or)
parallel sub networks. Reda and Carr (1989) have used mixed integer programming to
solve TCTP within related activities. Cusack (1985) and Demeulemeester et al. (1996)
have developed linear programming and dynamic programming models to solve optimally
the trade-off among time and cost. Moselhi and El-Rayes (1993) proposed a dynamic
programming model by introducing a cost variable into the optimization process.
Vrat and Kriengkrairut (1986), Azaron (2005) and Radasch & Kwak (1998) have presented
goal programming models to crash project. In these models multiple goals are considered.
Burns et al. (1996) had proposed a hybrid optimization approach that is a combination of
linear programming and integer programming for determining the Time Cost Trade-off
solution of construction scheduling problem. Zeinalzadeh (2011) demonstrated a
mathematical model using MILP – LINGO 12 to minimize the total cost of a construction
project. Ammar (2011) provided a new approach with a way of considering net present
value in time cost decisions taking into account discounted cash flows.
Some researchers used Heuristic approach to solve Time Cost Trade-off Problems. Some
examples of heuristic approaches are Fondahl’s method (1961), Moselhi’s structural
stiffness method (1993), prager’s structural model (1963) and Siemen’s effective cost slope
model (1971). Siemens has developed SAM (Siemens Approximation Method) algorithm
which was ideally suited for hand computation and also is suitable for computer solution.
Feng et al. (1997) developed a Genetic Algorithm model that is an improvement of their
earlier linear/integer programming model (Liu et al. (1995)).The model by Li and Love
(1997) has formulated to produce the times by which each critical activity should be
reduced. Chau et al. (1997) proposed a Time Cost Trade-off model using genetic
algorithm. Zheng et al. (2004) introduced a multi-objective approach that aims to optimize
the total time and total cost simultaneously by utilizing appropriate Gas concepts and tools.
Hegazy (1999) developed a practical Genetic Algorithm model by implementing the GA
protocols within Microsoft project. This model has demonstrated an improvement over the
previous GA models. Li et al. (1999) proposed a methodological framework including
optimization, sensitivity analysis and improved GA for build-operate-transfer projects. Ng

International Journal of Management, IT & Engineering Vol. 8 Issue 12(1), December 2018,
ISSN: 2249-0558 Impact Factor: 7.119
Journal Homepage: http://www.ijmra.us, Email: [email protected]
Double-Blind Peer Reviewed Refereed Open Access International Journal - Included in the International
Serial Directories Indexed & Listed at: Ulrich's Periodicals Directory ©, U.S.A., Open J-Gage as well as in
Cabell’s Directories of Publishing Opportunities, U.S.A
359 International Journal of Management, IT & Engineering
http://www.ijmra.us, Email: [email protected]
and Zhang (2008) presented a multi-objective approach known as the ant colony system to
model time cost optimization problems so as to optimize the total project duration and total
cost simultaneously. However, the above mentioned Time Cost Trade-off models mainly
focused on deterministic environment.
Uncertainties such as inflation, economical and social stresses, execution errors of
contractor, and natural events like climate changes etc., total time and cost of project may
differ significantly. Therefore, project managers have paid special attention to uncertain
scheduling. Uncertain scheduling models are categorized into two types: probabilistic
models and fuzzy models.
Yang (2005) proposed a chance –constrained programming model to incorporate the
variability of funding, which is quantified by the co-efficient of variation. The proposed
model formulates financial feasibility as a stochastic constraint. In another attempt, Yang
incorporated budget uncertainty into project Time Cost Trade-off in a chance constrained
programming model.
Some authors have claimed that fuzzy set theory is more suitable to model these problems.
With the development of the research on fuzziness, fuzzy set theory was also applied to
project scheduling problems, originally by Prade (1979). Furthermore, many other authors,
such as Chanas and Kumburowski (1981), Hapke and Slowinski (1993) and Kaufmann and
Gupta (1988) discussed the fuzzy project scheduling. Wang et al. (1993) developed a
model to project scheduling with fuzzy information. Also Hapke and Slowinski (1996)
presented a generalized heuristic method for solving resource-constrained project
scheduling problems with uncertain time parameters. Leu et al. (1999) developed a fuzzy
optimal model to formulate effects of both uncertain activity duration and resource
constraint.
The first work on the Fuzzy Time Cost Trade-off Problem was done by Leu et al. (2001).
In Leu et al. (2001), the activity durations were characterized by fuzzy numbers due to
environmental variations, and the fuzzy relationship between the activity duration and the
activity cost was taken into account by membership function. Arikan and Gungor (2001)
presented a fuzzy goal programming model for Time Cost Trade-off Problems. Leu et al.
(2001) proposed a new fuzzy optimal Time Cost Trade-off method and GA approach and
solve it. Ghazanfari et al. (2008) developed a new possibilistic model to determine optimal
duration for each activity in the form of triangular fuzzy numbers.
Also Yousefli et al. (2008) presented heuristic method to solve a project scheduling
problem by using of fuzzy decision making in fuzzy environment. Wang and Liang (2004)
solved project management decision problem with multiple fuzzy goals.
Jin et al. (2005) gave a GA based fully fuzzy optimal Time Cost Trade-off model, in which
all parameters and variables were characterized by fuzzy numbers and an example in ship
building scheduling was demonstrated. Eshtehardian et al. (2008) established a multi-
objective fuzzy time cost trade-off model, in which fuzzy logic theory was introduced to
represent accepted risk level. Abbasnia et al. (2008) developed an approach for solving
time cost trade-off problem affecting uncertainties on activity cost. Ke et al. (2010)
introduced hybrid intelligent algorithm for Fuzzy Project Scheduling Problems. Chen and
Tsai (2011) constructed membership function of fuzzy minimum total crash cost based on
Zadeh’s extension principle and transformed the time cost trade-off problem to a pair of
parametric mathematical programs. Shakeela Sathis (2012) gave a new solution procedure
based on location index for Fuzzy Time Cost Trade-off Problems. A practical fuzzy

International Journal of Management, IT & Engineering Vol. 8 Issue 12(1), December 2018,
ISSN: 2249-0558 Impact Factor: 7.119
Journal Homepage: http://www.ijmra.us, Email: [email protected]
Double-Blind Peer Reviewed Refereed Open Access International Journal - Included in the International
Serial Directories Indexed & Listed at: Ulrich's Periodicals Directory ©, U.S.A., Open J-Gage as well as in
Cabell’s Directories of Publishing Opportunities, U.S.A
360 International Journal of Management, IT & Engineering
http://www.ijmra.us, Email: [email protected]
ranking-based approach for project scheduling was proposed by Tolunay Gocken (2011).
Elizabeth (2015) gave a solution procedure for Intuitionistic triangular Fuzzy Project
Scheduling Problems.
In this paper, a new solution procedure is proposed to solve Fuzzy Time Cost Trade-off
Problems. Also, it is an attempt to apply the method suggested in this paper to an actual
construction project. The purpose is to evaluate the practical applicability of the method.
This paper helps practicing project managers to have realistic expectations of the method.
A comparative study has been carried out between the proposed method and methods
suggested in various research articles.
3 Preliminaries
In this section, some basic definitions of fuzzy set, fuzzy number, triangular and
trapezoidal fuzzy number and arithmetic operations of triangular fuzzy numbers, which are
the basis for the development of fuzzy set theory, are reviewed.(Dubois, Parade 1980 and
Kaufmann and Gupta, 1985)
Definition 3.1: Fuzzy set
Let Xbe a classical set of objects, called the universe. The characteristic function fA of crisp
set XA assigns a value either 0 or 1 to each member in X. This function can be
generalized to a function A
f ~ such that the value assigned to the element of the universal set
X falls within a specified range (that is ]1,0[:~ →XfA
). The assigned value indicates the
membership grade of the element in set A. The function A
f ~ is called the membership
function and the set }/)(,{(~
~ XxxfxAA
= defined by )(~ xfA
for each Xx is called a
fuzzy set.
Definition 3.2: Fuzzy Number
A fuzzy A~
defined on the universal set of real numbers , is said to be fuzzy number if its
membership function has the following properties:
i. A~
is convex, that is ]1,0[,,))(),(min())1(( ~~~ −+ XyxyfxfyxfAAA
ii. A~
is normal, that is there exists exactly one 0x with 1)( 0~ =xfA
iii. )(~ xfA
is piecewise continuous
Definition 3.3: Triangular Fuzzy Number
A triangular number A~
is a fuzzy number fully specified by 3-tuples (a, b, c) such that
cba with membership function )(~ xA
is defined as
−
−
−
−
=
cx
cxbcb
cx
bxaab
ax
ax
xA
,0
,
,
,0
)(~

International Journal of Management, IT & Engineering Vol. 8 Issue 12(1), December 2018,
ISSN: 2249-0558 Impact Factor: 7.119
Journal Homepage: http://www.ijmra.us, Email: [email protected]
Double-Blind Peer Reviewed Refereed Open Access International Journal - Included in the International
Serial Directories Indexed & Listed at: Ulrich's Periodicals Directory ©, U.S.A., Open J-Gage as well as in
Cabell’s Directories of Publishing Opportunities, U.S.A
361 International Journal of Management, IT & Engineering
http://www.ijmra.us, Email: [email protected]
Definition 3.4: Trapezoidal Fuzzy Number
A trapezoidal fuzzy number A~
is a fuzzy number fully specified by 4-tuples (a, b, c, d) such
that dcba with membership function )(~ xA
satisfying the following conditions:
1. A~ is a continuous mapping from to the closed interval [0, 1].
2. ],(0)( 1~ axxA
−=
3. A~ is strictly increasing and continuous on ],[ 21 aa .
4. ],[1)( 32~ aaxxA
=
5. A~ is strictly decreasing and continuous on ],[ 43 aa
6. ],(0)( 4~ = axxA
i.e.
−
−
−
−
=
otherwise
dxcdc
dx
cxb
bxaab
ax
xA
,0
,
,1
,
)(~
where 4321 ,,, aaaa are real numbers and the fuzzy number is denoted by
),,,(~
4321 aaaaA = .
Definition 3.5
The fuzzy number u in parametric form is a pair ( )(,)( ruru ), 10 r which satisfy the
following requirements:
1. )(ru is a bounded monotonic increasing left continuous function
2. )(ru is a bounded monotonic decreasing left continuous function
3. )()( ruru , 10 r
The trapezoidal fuzzy number ),,,( 00 yxu = , with two defuzzifier 00, yx , and left
fuzziness 0 and right fuzziness 0 is a fuzzy set where the membership function is
as follow:
++−
−+−
=
otherwise,0
,
],[,1
,
)(
000
00
000
yxyxy
yxx
xxxxx
xu
And its parametric form is, rxru +−= 0)( , ryru −+= 0)(
Provided that, 00 yx = then u is a triangular fuzzy number, and we write ),,( 0 xu =

International Journal of Management, IT & Engineering Vol. 8 Issue 12(1), December 2018,
ISSN: 2249-0558 Impact Factor: 7.119
Journal Homepage: http://www.ijmra.us, Email: [email protected]
Double-Blind Peer Reviewed Refereed Open Access International Journal - Included in the International
Serial Directories Indexed & Listed at: Ulrich's Periodicals Directory ©, U.S.A., Open J-Gage as well as in
Cabell’s Directories of Publishing Opportunities, U.S.A
362 International Journal of Management, IT & Engineering
http://www.ijmra.us, Email: [email protected]
3.1 Ranking Function
For an arbitrary trapezoidal fuzzy number ),,,( 00 yxu = with parametric form
)(,)( ruruu = , the magnitude of the trapezoidal fuzzy number u is
++=
1
0
00 )())(,)((2
1)( drrfyxruruuMag
Where the function f(r)is a non-negative and increasing function on [0,1] with f(0)=0,
f(1)=1 and 2
1)(
1
0
= drrf . The function f(r) can be considered as a weighting function. In
actual applications, function f(r) can be chosen according to the actual situation. If f(r)=r,
the magnitude of a trapezoidal fuzzy number u which is defined in (), synthetically reflects
the information on every membership degree, and meaning of this magnitude is visual and
natural.
Proposition: 3.1The ranking function of ),,,(~
dcbaA = by the definition of Mag(.) is as
follows:
(i.e.)12
55)
~(
dcbaAMag
+++=
3.2. Similarly, the ranking function for the triangular fuzzy number ),,(~
cbaA = is:
12
10)
~(
cbaAMag
++=
3.2 Standard form of Fully Fuzzy Linear Programming Problem
Fully Fuzzy Linear Programming Problems with m fuzzy constraints and n fuzzy variables
may be formulated as follows:
Maximize (or) Minimize XCZ T ~~~=
Subject to the constraints: bXA~~~
= , 0~X (P)
where )(~
,~
nFXC , )(~
nmFA and )(~
mFb
Definition 3.6: Fuzzy Basic Solution
Given a system of simultaneous m fuzzy linear equations with n unknowns nm ,
bXA~~~
= where A~
is a nm matrix of rank m. Let B~
be any mm sub-matrix, formed by m
linearly independent columns of A~
. Then, solution obtained by setting mn − variables not
associated with the columns of B~
, equal to 0~
and solving the resulting system, is called a
fuzzy basic solution to the given system of equations.
Definition 3.7: Fuzzy Feasible Solution
A fuzzy vector )()~,...,~,~(~
21 = n
n FxxxX , where each )(~ Fxi is said to be a fuzzy
feasible solution, if it satisfies the constraints and non-negative restrictions of the given
Fully Fuzzy Linear Programming Problem.
Definition 3.8: Improved Fuzzy Basic Solution

International Journal of Management, IT & Engineering Vol. 8 Issue 12(1), December 2018,
ISSN: 2249-0558 Impact Factor: 7.119
Journal Homepage: http://www.ijmra.us, Email: [email protected]
Double-Blind Peer Reviewed Refereed Open Access International Journal - Included in the International
Serial Directories Indexed & Listed at: Ulrich's Periodicals Directory ©, U.S.A., Open J-Gage as well as in
Cabell’s Directories of Publishing Opportunities, U.S.A
363 International Journal of Management, IT & Engineering
http://www.ijmra.us, Email: [email protected]
Let BX~
and BX ~
be two fuzzy feasible solutions to the Fully Fuzzy Linear Programming
Problem. Then BX ~
is said to be an improved fuzzy feasible solution, if BBBB XCXC~~~~
where BC~
is the cost components of the given Fully Fuzzy Linear Programming Problem
Definition 3.9: Fuzzy Optimal Solution
A fuzzy feasible solution BX~
of the Fully Fuzzy Linear Programming Problem is said to be
an optimum fuzzy solution, if *
0
~~~~ZXCZ BB = , where
*~Z is the value of the objective
function for any fuzzy feasible solution.
Theorem 3.1
Let bBX B
~~~ 1−= be a fuzzy basic feasible solution of (P). If for any column ja~ in A~
which is
not in B~
, then the condition 0~
)~~
( − jj CZ hold and ijy~ for some i, {i=1,2,…,m} then it is
possible to obtain a new fuzzy basic feasible solution by replacing one of the columns in B~
by ja~ .
Theorem3.2
Let bBX B
~~~ 1−= be a fuzzy basic feasible solution of (P) with the value of the objective
function BB XCZ~~~
0 = and if BX ~
is another fuzzy basic feasible solution with BB XCZ =~~~
obtained by admitting a non-basic column vector ja~ into the basis for which 0~
)~~
( − jj CZ
and 0~~ ijy for somei, i = 1,2,…,m,then 0
~~ZZ .
Corollary
If 0~
)~~
( =− jj CZ for at least j which 0~~ rjy ,i = 1,2,…,m, then there exists an alternate
fuzzy basic feasible solution for which the value of the objective function is unaltered.
Theorem 3.3
Let bBX B
~~~ 1−= be a fuzzy basic feasible solution of (P). If there exist an ja~ of A~
which is
not in B~
such that 0~
)~~
( − jj CZ and 0~~ ijy , for all i = 1,2,…,m ,then the FFLP problem (P)
has an unbounded solution
Remarks
1. If for all j, 0~
)~~
( − jj CZ , then Fully Fuzzy Linear Programming Problem has a fuzzy
optimal solution.
2. If there exist j such that 0~
)~~
( − jj CZ , 0~~ ijy , for all i = 1,2,…,m, then Fully Fuzzy
Linear Programming Problem has an unbounded solution.
Theorem 3.4
A fuzzy variable ),,(~ 0
3
0
2
0
1
0 xxxx = is an optimal solution of the Fully Fuzzy Linear
Programming Problem if and only if x0 is an optimal solution of the Crisp Linear
Programming Problem equivalent to Fully Fuzzy Linear Programming Problem.
4 Problem Description, Basic Assumptions and Notation
Assume that a project has ‘n’ interrelated activities that must be executed in a certain order
before the entire task can be completed in a fuzzy environment. In general, the
environmental coefficients and related parameters are uncertain. Accordingly, the

International Journal of Management, IT & Engineering Vol. 8 Issue 12(1), December 2018,
ISSN: 2249-0558 Impact Factor: 7.119
Journal Homepage: http://www.ijmra.us, Email: [email protected]
Double-Blind Peer Reviewed Refereed Open Access International Journal - Included in the International
Serial Directories Indexed & Listed at: Ulrich's Periodicals Directory ©, U.S.A., Open J-Gage as well as in
Cabell’s Directories of Publishing Opportunities, U.S.A
364 International Journal of Management, IT & Engineering
http://www.ijmra.us, Email: [email protected]
incremental crashing costs for all activities, variable indirect cost per unit time, Maximum
and minimum duration of the activity, specified project completion time are imprecise and
fuzzy.
Linear Mathematical model is one of the suitable mathematical model for Time Cost
Trade-off problem. Pre-assumptions of this kind of problem are:
i. All precedence relationship between activities is ‘Finish to Start type’, which
means that the activity cannot begin unless its predecessor activity gets completed.
ii. The relationship between time and cost is linear.
iii. Direct costs increase linearly as the duration of an activity is reduced from its
normal value to its crash value.
iv. The indirect costs comprise two categories, that is, fixed costs and variable costs,
and the variable cost per time is the same regardless of project completion time.
v. Normal, Crash durations and slope costs are uncertain and their values are denoted
in the form of triangular fuzzy number.
Parameters and decision variables of model are as follows:
P The set of all arcs (i.e. activities)
n Number of nodes
iT~
Starting time of event i
ijC~
Planned cost of activity ji → (ie. Normal Cost + crash cost)
ijCC~
Crash cost of activity ji →
I~
Indirect cost per day
ijs~ Slope cost of activity ji →
ijCN~
Normal cost of activity ji →
ijTN~
Normal time of activity ji →
ijTC~
Crash time of activity ji → +)(TF Set of all positive Triangular Fuzzy numbers
4.1 Mathematical Model for Fuzzy Time Cost Trade-off Problems
A suitable mathematical model is chosen from the literature based on the available pre-
assumption, constraints and objective criterion of the problem. The aim of the given
mathematical model is to minimize the total project cost (including direct and indirect
cost).
CMin~
Subject to
jiCDT
TICNDTNsC
TNDTC
DTT
T
iji
n
i j
ijijijij
i j
ijijij
ijij
&0~~
,0~~
,0~~
~*
~~)
~~(*~~
~~~0~~~~
0~~
1
++−=
−−
=
5 Method to Solve Fully Fuzzy Time Cost Trade-Off Problem

International Journal of Management, IT & Engineering Vol. 8 Issue 12(1), December 2018,
ISSN: 2249-0558 Impact Factor: 7.119
Journal Homepage: http://www.ijmra.us, Email: [email protected]
Double-Blind Peer Reviewed Refereed Open Access International Journal - Included in the International
Serial Directories Indexed & Listed at: Ulrich's Periodicals Directory ©, U.S.A., Open J-Gage as well as in
Cabell’s Directories of Publishing Opportunities, U.S.A
365 International Journal of Management, IT & Engineering
http://www.ijmra.us, Email: [email protected]
In this section, a new solution approach is presented to find the solution for fully fuzzy
time cost trade-off problems through linear programming technique:
Step 1: Formulate the mathematical model through Fully Fuzzy Linear Programming
Problem (in section?) for the given Fuzzy Time Cost Trade-off Problem.
Step 2: Convert the reduced fully fuzzy linear programming problem into Crisp Linear
Programming problem using ranking function given in section.
Step 3: Find the optimal solution of the reduced Crisp Linear Programming problem using
existing solution procedure.
Step 4: Find the fuzzy optimal planned duration by substitute the values of 21 , ijij DD and
3ijD in ),,(~
321 ijijijij DDDD = .
Step 6: Find the fuzzy optimal total cost of the project by substitute the values of 21,CC and
3C in the objective function ),,(~
321 CCCC =
6 Case Study
An engineer has accepted to build a simple residential house. He develops a list of works
for the building project. Based on the available and required resources for each process, he
calculates both a normal time and a least possible time for each activity which are used as
normal time and crash time. The list of works is used to specify precedence relationships
between activities of the project. Each work should be completed in order that the next
work can be started; therefore, precedence relationships are considered as finish to start.
Also, he estimates normal and crash cost for each activity based on the required resources
for performing activity in normal and crash time. Furthermore, he determines indirect cost
as currency unit per each time unit. Time unit in this project is day and currency unit is
rupees. The following tables summarize the necessary data for this project.
Figure 6.1: Network Representation of a project
Table 6.1: Description of the work
S. No. Activity Description of the work
1 (A) 21→ Site preparation
2 (B) 31→ Earth work
3 (C) 42→ PCC and Concrete work
4 (D) 43→ Plinth Beam
5 (E) 54 → Brick work
6 (F) 65→ Barbending
7 (G) 75→ Centering work
8 (H) 86→ Concrete work for roofing
9 (I) 87 → Plumbing work
10 (J) 97 → Electrical work
2 8 1
1 6
1
2 5 4 1
3 9 1
0
7

International Journal of Management, IT & Engineering Vol. 8 Issue 12(1), December 2018,
ISSN: 2249-0558 Impact Factor: 7.119
Journal Homepage: http://www.ijmra.us, Email: [email protected]
Double-Blind Peer Reviewed Refereed Open Access International Journal - Included in the International
Serial Directories Indexed & Listed at: Ulrich's Periodicals Directory ©, U.S.A., Open J-Gage as well as in
Cabell’s Directories of Publishing Opportunities, U.S.A
366 International Journal of Management, IT & Engineering
http://www.ijmra.us, Email: [email protected]
Table 6.2: Details of the project
Activity Maximum
duration
Minimum
duration Maximum cost Slope cost
A (2, 2, 2) (2, 2, 2) (10000, 10000, 10000) -
B (7, 7, 7) (7, 7, 7) (22372, 22372, 22372) -
C (10, 11, 12) (8, 9, 10) (200561, 203859,
207158) (5000, 6000, 7000)
D (3, 3, 3) (2, 2, 2) (13449, 13449, 13449) (1000, 1000, 1000)
E (18, 21, 24) (18, 21, 24) (139489, 144804,
150120) -
F (10, 10, 10) (9, 9, 9) (109200, 109200,
109200) (1000, 1000, 1000)
G (6, 8, 10) (4, 6, 8) (85032, 87212, 89392) (1500, 1500, 1500)
H (20, 22, 24) (18, 20, 22) (57480, 62270, 67060) (5000, 7000, 9000)
I (4, 5, 6) (3, 4, 5) (45000, 50000, 55000) (1500, 2000, 25000)
J (6, 7, 8) (6, 7, 8) (70000, 75000, 80000) -
K (8, 9, 10) (6, 7, 8) (92797, 104679, 116562) (8000, 10000, 12000)
L (5, 5, 5) (3, 3, 3) (189803, 189803,
189803)
(10000, 12000,
14000)
M (8, 10, 12) (5, 6, 7) (41302, 47472, 53641) (4000, 8000, 12000)
N (4, 6, 8) (3, 5, 7) (36200, 39700,43200) (1000, 1000, 1000)
Mathematical Model
Fully Fuzzy Linear Programming model for the above building project is given below:
MIN = (C1 + 10 * C2 + C3)/12;
11 (K) 118→ Plastering
12 (L) 109 → Tiles work
13 (M) 1210→ Painting work
14 (N) 1211→ Other Miscellaneous work

International Journal of Management, IT & Engineering Vol. 8 Issue 12(1), December 2018,
ISSN: 2249-0558 Impact Factor: 7.119
Journal Homepage: http://www.ijmra.us, Email: [email protected]
Double-Blind Peer Reviewed Refereed Open Access International Journal - Included in the International
Serial Directories Indexed & Listed at: Ulrich's Periodicals Directory ©, U.S.A., Open J-Gage as well as in
Cabell’s Directories of Publishing Opportunities, U.S.A
367 International Journal of Management, IT & Engineering
http://www.ijmra.us, Email: [email protected]
C1 = 1112685 + CA1 + CB1 + CC1 + CD1 + CE1 + CF1 + CG1 + CH1 + CI1 + CJ1 + CK1 +
CL1 + CM1 + CN1 + 2000 * T121;
C2 = 1159820 + CA2 + CB2 + CC2 + CD2 + CE2 + CF2 + CG2 + CH2 + CI2 + CJ2 + CK2 +
CL2 + CM2 + CN2 + 2000 * T122;
C3 = 1206957 + CA3 + CB3 + CC3 + CD3 + CE3 + CF3 + CG3 + CH3 + CI3 + CJ3 + CK3 +
CL3 + CM3 + CN3 + 2000 * T123;
T11 = 0; T12 = 0; T13 = 0;
Tj1– Ti1– Dij1>= 0; Tj2– Ti2– Dij2>= 0; Tj3– Ti3– Dij3>= 0;
CTij1<=Dij1<= NTij1; CTij2<=Dij2<= NTij2 ; CTij3<=Dij3<= NTij3
C3 – C2>= 0; C2 – C1>= 0; Dij3- Dij2>=0 ; Dij2 - Dij1>=0
Ti3 – Ti2>= 0; Ti2 – Ti1>= 0 ji &
The planned duration, crashing cost of each activity and total project costs have been
determined using the solution procedure given in section. The results obtained from the
above linear programming model for the project is as follows:
(C1, C2, C3)=(1254685, 1319820, 1384957) &(T121, T122, T123) = (70, 79, 88)
(DA1, DA2, DA3) = (2, 2, 2); (DB1, DB2, DB3)= (7, 7, 7); (DC1, DC2, DC3)= (10, 11, 12)
(DD1, DD2, DD3) =(3, 3, 3); (DE1, DE2, DE3)= (18, 21, 24); (DF1, DF2, DF3)= (9, 9, 9)
(DG1, DG2, DG3) = (6, 8, 10);(DH1, DH2, DH3) = (20, 22, 24); (DI1, DI2, DI3) = (4, 5, 6)
(DJ1, DJ2, DJ3) =(6, 7, 8); (DK1, DK2, DK3) =(8, 9, 10); (DL1, DL2, DL3) = (5, 5, 5)
(DM1, DM2, DM3)= (8, 10, 12); (DN1, DN2, DN3)= (3, 5, 7); (CF1, CF2, CF3) = (1000, 1000,
1000)
(CN1, CN2, CN3) = (1000, 1000, 1000)
7 Conclusion
In general, it is very difficult to model real life problems using precise terms in reality.
After the development of fuzzy set theory, most of the real life problems can be modeled
and solve using fuzzy terms. In project scheduling, to compute the duration and cost of
each activity is very difficult because of uncertain environment. In Fuzzy Project
Scheduling literature, many researchers have given the deterministic solutions (that is,
deterministic planned duration & cost). Only some of the researchers provided the planned
duration and cost in fuzzy. This is one of the attempts to give the Fuzzy planned duration
and cost for Fuzzy Project Scheduling.
In this study, a new solution approach is given using Magnitude of a fuzzy number for
Project Scheduling Problems in uncertain environment. A real residential construction
project is considered as a case study to illustrate the validity of the proposed method. The
computational results are listed. Also, a comparison has made with the other techniques for
solving project scheduling in fuzzy nature.
Table 7.1: Comparison with other techniques
Solution Approach Planned Duration Planned Cost
Linear Programming
Technique [16] (70, 79, 88) (1254685, 1319820, 1384957)
Linear Programming with
GMIR[2] (70, 79, 88) (1254685, 1319820, 1384957)
Lexicographic Method [17] (70, 79, 88) (1254685, 1319820, 1384957)
Decomposition Technique
[25] (70, 79, 88) (1254685, 1319820, 1384957)

International Journal of Management, IT & Engineering Vol. 8 Issue 12(1), December 2018,
ISSN: 2249-0558 Impact Factor: 7.119
Journal Homepage: http://www.ijmra.us, Email: [email protected]
Double-Blind Peer Reviewed Refereed Open Access International Journal - Included in the International
Serial Directories Indexed & Listed at: Ulrich's Periodicals Directory ©, U.S.A., Open J-Gage as well as in
Cabell’s Directories of Publishing Opportunities, U.S.A
368 International Journal of Management, IT & Engineering
http://www.ijmra.us, Email: [email protected]
Linear Programming
Technique (Proposed
Method)
(70, 79, 88) (1254685, 1319820, 1384957)
From the above table, it is clearly evident that the planned duration and cost obtained by
proposed method for the real residential project are similar when compared with various
techniques. We can conclude that the proposed method is the easiest one to solve Fuzzy
Time Cost Trade-off Problems. Also Fuzzy Linear Programming Technique is the suitable
model for real Project Scheduling Problems in uncertain environment.
References
1. Abbasnia, R., Afshar, A., & Eshtehardian, E. (2008). Time–cost trade-off problem in
construction project management based on fuzzy logic, Journal of Applied science, 8,
4159–4165.
2. Amit Kumar, Kaur, J., Singh, P., (2011). A new method for solving fully fuzzy linear
programming problems, Applied Mathematical Modelling, 35, 817-823.
3. Ammar, M., 2011. Optimization of Project Time Cost Trade-off Problem with
discounted Cash Flows, Journal of Construction Engineering Management, ASCE, 137
(1), 65-71.
4. Arikan, F., &Gungor, Z. (2001). An application of fuzzy goal programming to a multi
objective project network problem, Fuzzy Sets and Systems, 119, 49-58.
5. Azaron, A., Perkgoz, C., Sarawa, M., (2005). A Genetic Algorithm Approach for Time
Cost Trade-off in PERT networks, Applied Mathematical Computing, 168: 1317-1339.
6. Baykasoglu, A., Gocken, T., & Kaplanoylu, V., 2011. A Practical approach to
prioritize project activities through Fuzzy Ranking, Cybernetics and Systems, 42(3),
165-179.
7. Burns, S.A., Liu, L.,&Feng, C.W. (1996). The LP/IP hybrid method for construction
time cost trade-off analysis, Construction Manasgement and Economics, 14, 265-276.
8. Chen, S., & Tsai, M. (2011). Time-Cost Trade-Off Analysis of Project Networks in
Fuzzy Environments, European Journal of Operations Research, 212, 386-397.
9. Cusack, M. (1985). Optimization of time and cost, International Journal of Project
Management, 3(1), 50-54.
10. De, P., Dunne, E.J., and Wells, C.E., 1995. The Discrete Time Cost Trade-off Problem
revisited, European Journal of Operational Research, 81, 225-238.
11. Demeulemeester, Erik, L., Willy, S., Herroelen and Salak E. Elmaghraby, (1996).
Optimal procedures for the discrete time/cost trade off problem in project networks,
European Journal of Operational Research, 88(1), 50-68.
12. Dubois, D., Prade, H., 1978. Operations on Fuzzy Numbers, Journal of System
Sciences, 9, 613-626.
13. Elizabeth, S., and Sujatha, L., 2015. Project Scheduling method using Triangular
Intuitionistic Fuzzy Numbers and Triangular Fuzzy Numbers, Applied Mathematical
Sciences, 9(4), 185-198.
14. Elmagraby, S.E., 1993. Resource Allocation via Dynamic Programming in Activity
Networks, European Journal of Operational Research, 64, 199-215.
15. Eshtehardian, E., Afshar, A., &Abbasnia, R. (2009). Fuzzy-based MOGA approach to
stochastic time–cost trade-off problem, Automation in Construction, 18(5), 189-198.

International Journal of Management, IT & Engineering Vol. 8 Issue 12(1), December 2018,
ISSN: 2249-0558 Impact Factor: 7.119
Journal Homepage: http://www.ijmra.us, Email: [email protected]
Double-Blind Peer Reviewed Refereed Open Access International Journal - Included in the International
Serial Directories Indexed & Listed at: Ulrich's Periodicals Directory ©, U.S.A., Open J-Gage as well as in
Cabell’s Directories of Publishing Opportunities, U.S.A
369 International Journal of Management, IT & Engineering
http://www.ijmra.us, Email: [email protected]
16. Evangeline, M.J., Paul Dhayabaran, D., 2014. A New Solution Procedure to Fully
Fuzzy Time Cost Trade-off Problems, International Journal of Jamal Academic
Research Journal, 472-476, ISSN: 0973-0303.
17. Evangeline,M.J., Paul Dhayabaran, D., 2015. An Algorithm to solve Fully Fuzzy Time
Cost Trade-off Problems, International Journal of Engineering Science and Innovative
Technology, 4(2), 2015. ISSN: 2319-5967, I.F: 1.913.
18. Evangeline, M.J., Paul Dhayabaran, D., 2015. Solution Procedure for Fuzzy Project
Crashing Problem through Goal Programming Technique, International Journal of
Engineering Sciences and Research Technology, 4(5), ISSN: 2277-9655, I.F: 2.114.
19. Feng, C., Liu, L., &Burns, S. (1997). Using genetic algorithms to solve construction
time cost trade off problems, Journal of Computer Civil Engineering, 11(3), 184-189.
20. Fondahl, J.W. (1961). A non-computer approach to the critical path method for the
construction industry, Technical Report. No. 9, Department of Civil Engineering, The
Construction Institute of Stanford, University Stanford of Calif.
21. Ghazanfari, M., Shahanaghi, K.,&Yousefli, A. (2008). An application of Possibility
Goal Programming to the Time Cost Trade off Problem, First Joint Congress on Fuzzy
and Intelligent Systems, Ferdowsi University of Mashhad.
22. Hapke, M., Slowinski, R., 1996. Fuzzy priority heuristics for project scheduling, Fuzzy
Sets and Systems, 83(3), 291-299.
23. Hapke, M., Slowinski, R., 1993. A DSS for Resource-Constrained Project Scheduling
under uncertainty, Journal of Decision Systems, 2(2), 111-117.
24. Hegazy, T. (1999). Optimization of construction time cost trade off analysis using
genetic algorithms, Can. Journal of Computer Civil Engineering, 26, 685-697.
25. Jayalakshmi, M., and Pandian, 2012. A New Solution for Finding an Optimal Fuzzy
Solution for Fully Fuzzy Linear Programming Problems, International Journal of
Engineering Research and Applications, 2(4), 247-254.
26. Jin, C., Ji, Z., Lin, Y., Zhao, Y., Huang, Z., 2005. Research on the Fully Fuzzy Time
Cost Trade-off based on Genetic Algorithms, Journal of Management Sciences and
Applications, 4:18-23.
27. Kaufmann, A., & Gupta, M.M. (1985). Introduction to fuzzy arithmetic: Theory and
Applications, Van Nostrand Reinhold Company.
28. Ke, H., & Liu, B., 2010.Fuzzy Project Scheduling Problem and its Hybrid Intelligent
algorithm, Applied Mathematical Modelling, 34(2), 301-308.
29. Kelly, J.R. (1961). Critical Path Planning and Scheduling: Mathematical basis,
Operations Research, 9, 296-320.
30. Leu S.S., Chen, A.T., and Yang, C.H. (2001). A GA based fuzzy optimal model for
construction time cost trade off, International Journal of Project Management, 19, 47-
58.
31. Leu, S.S., Chen, A.T., Yang, C.H., 1999. A Fuzzy Optimal Model for Construction
Resource Leveling Scheduling, Can Journal of Civil Engineering, 26, 673-684.
32. Li, H., Cao, J.N., & Love, P.E.D., 1999. Using Machine Learning and GA to solve
Time Cost Trade-off Problems, Journal of Construction on Engineering and
Management, 125(5), 347-353.
33. Li, H.,& Love, P. Using Improved Genetic Algorithms to Facilitate Time-Cost
Optimization,Journal of Construction Engineering and Management, 123(3), 233-237.

International Journal of Management, IT & Engineering Vol. 8 Issue 12(1), December 2018,
ISSN: 2249-0558 Impact Factor: 7.119
Journal Homepage: http://www.ijmra.us, Email: [email protected]
Double-Blind Peer Reviewed Refereed Open Access International Journal - Included in the International
Serial Directories Indexed & Listed at: Ulrich's Periodicals Directory ©, U.S.A., Open J-Gage as well as in
Cabell’s Directories of Publishing Opportunities, U.S.A
370 International Journal of Management, IT & Engineering
http://www.ijmra.us, Email: [email protected]
34. Liang, T.F., Wang, E.J., &Ding, C.Y. (2003). A Study on Project crashing decision
with multiple fuzzy goals, Journal of the Chinese Institute of Industrial Engineers,
20(4), 355-372.
35. Liu, L., Burns, S., Feng, C., 1995. Construction Time Cost Trade-off Analysis using
LP/IP hybrid method, Journal of Construction Engineering, 121(4), 446-454.
36. Meyar, W.L., & Shaffer, L.R. (1963). Extensions of the Critical Path method through
the application of integer Programming,Civil of Engineering Construction Res. Ser. 2,
University of Illinois, Urbana.
37. Moselhi, O., 1993. Schedule Compression using the direct Stiffness Method, Canadian
Journal of Civil Engineering, Ottawa, 20, 65-72.
38. Moselhi, O., and El-Rayes, K., 1993. Scheduling of Repetitive projects with cost
Optimization, ASCE, Journal of Construction Engineering and Management, 119 (4),
681-697.
39. Moselhi, & Deb, (1993). Project selection considering risk, construction management
and economics, 11, 45-53.
40. Ng, S.T., Zhang, Y., 2008. Optimizing Construction Time and Cost using Ant colony
optimization approach, ASCE Journal of Construction and Management, 134(9): 721-
728.
41. Patterson, J.H., & Huber, W.D., 1974. A Horizon- varying zero-one Approach to
Project Scheduling, Management Science, 20(6), 990-998.
42. Radasch, D.K., Kwak, N.K., 1998. An Integrated Mathematical Programming Model
for offset Planning, Computers and Operations Research, 1069-1083.
43. Reda, RM., &Carr, RI. (1989). Time Cost Trade-off among related activities, Journal
of Construction Engineering and Management, 115(3), 475–486.
44. Robinson, D.R. (1975). A dynamic programming solution to cost-time trade-off for
CPM, Management Science, 22, 158–166.
45. Sathish, S.,&Ganesan, K. (2012). Fully Fuzzy Time-Cost Trade-Off in a Project
Network – A new Approach, Mathematical Theory and Modeling, 2(6), 2224-5804.
46. Siemens, N. (1971). A Simple CPM Time-Cost Trade off Algorithms, Management
Science, 17(6), 354-363.
47. Vrat, P., Kriengkrairut, C., 1986. A Goal Programming model for Project Crashing
with Piecewise Linear Time Cost Trade-offs. Engineering Cost Production Economics,
10, 161.
48. Wang, R.C., & Liang, T.F., 2004. Project Management Decisions with Multiple Fuzzy
Goal, Construction Management and Economic, 22, 1047-1056.
49. Yang, T., 2005. Chance Constrained Time Cost Trade-off Analysis considering
funding variability, Journal of Construction and Management, 131(9), 1002-1012.
50. Yousefli, A., Ghazanfari, M., Shahanaghi, K.,&Heydari, M. (2008). A new heuristic
model for fully fuzzy project scheduling.JUS World academic press, 2(1), 73-78.
51. Yu-Ko Chung, 2013. Multi Objective Project Management by Fuzzy Integrated Goal
Programming, African Journal of Business Management, 7(15), 1224-1237.
52. Zeinalzadeh, A. (2011). An Application of Mathematical Model to Time-cost Trade off
Problem, Australian Journal of Basic and Applied Sciences, 5(7), 208-214.
53. Zhen, D., Ng, S., Kumaraswamy, M., 2004. Applying a Genetic Algorithm-Based
Multi-objective Approach for Time Cost optimization, Journal of Construction
Engineering and Management, 130(2), 168-176.
International Journal of Management, IT & Engineering Vol. 8 Issue 12(1), December 2018,
ISSN: 2249-0558 Impact Factor: 7.119
Journal Homepage: http://www.ijmra.us, Email: [email protected]
Double-Blind Peer Reviewed Refereed Open Access International Journal - Included in the International
Serial Directories Indexed & Listed at: Ulrich's Periodicals Directory ©, U.S.A., Open J-Gage as well as in
Cabell’s Directories of Publishing Opportunities, U.S.A
371 International Journal of Management, IT & Engineering
http://www.ijmra.us, Email: [email protected]
Factors Influencing Empowerment Of NHG Members In
Kannur District, Kerala State
MAYA RAVEENDRAN
Dr. KIRUBAKARAN SAMUEL
ABSTRACT
The present study aimed to know about the factors influencing empowerment of
Neighborhood Groups (NHGs) members in Kannur district, Kerala state. Women
empowerment process is one where women find time and space of their own and
reexamine their lives critically and collectively. Empowerment has been considered an
effective tool to make changes in the socio-economic conditions of women. A nation,
society and individual cannot progress adequately until the status of women in the region is
improved,. The sample is taken from the Kudumbashree members of Kannur district,
Kerala state. The sample population includes those members who were active in the
Kudumbshree group. A pre-tested structured questionnaire prepared in formal language
was used. The Kudumbshree members were individually met for collecting accurate data
directly. The objective was used to identify the demographic variables of the respondents
to analyze the difference between factors influencing overall empowerment of NHG
respondents based on marital status and type of family. To examine the significant
relationship between factors influencing empowerment and demographic variables. A
random sample of 480 members was selected for the study. The statistical tests used were
percentage analysis, F-test and correlation test. The result also found that there is a
significant influence between factors influencing women empowerment and their marital
status. Therefore it is concluded that marital status significantly influenced the factors
influencing empowerment dimension. The statistical result reveals that there is a
significant difference between factors influencing Decision Making, Freedom to mobility,
Family support, Self-confidence, Legal Awareness, Sharing Roles in Domestic Matter,
Communication, Leadership and Acquisition of Personal Skills of the respondents. The
correlation between demographic variables and factors influencing empowerment is
positively and significantly related with marital status, religion, occupation and place of
saving.
Keyword: Empowerment, Group Factors, Personal factors, Education, NHG members.
Introduction
Empowerment is a multi-dimensional process, which should enable farm women or group
of women to realize their full identity and power in all spheres of life (Surekharao and
Rajamanamma, 1999). It consists of greater access to knowledge and resources, greater
autonomy in decision making them to enable have greater ability to plan their lives, or to
have greater control over the circumstances that influence their lives and free from shocks
Ph.D Research Scholar, Department of Sociology, Annamalai University, Annamalai Nagar, Chidambaram-608 002,
Tamil Nadu, India Professor & Head, Department of Sociology, Annamalai University, Annamalai Nagar, Chidambaram-608 002, Tamil
Nadu, India

International Journal of Management, IT & Engineering Vol. 8 Issue 12(1), December 2018,
ISSN: 2249-0558 Impact Factor: 7.119
Journal Homepage: http://www.ijmra.us, Email: [email protected]
Double-Blind Peer Reviewed Refereed Open Access International Journal - Included in the International
Serial Directories Indexed & Listed at: Ulrich's Periodicals Directory ©, U.S.A., Open J-Gage as well as in
Cabell’s Directories of Publishing Opportunities, U.S.A
372 International Journal of Management, IT & Engineering
http://www.ijmra.us, Email: [email protected]
imposed on them by custom, belief and practice. Generally development with justice is
expected to generate the forces that lead to empowerment of various sections of population
in a country and to raise their status especially in case of women.
In the present century the terms farm women empowerment, women welfare, gender
justice have come to light in the social, economic and political development perspective of
both developed and developing nations. Traditionally women in all most every society
have remained a second grade citizen. Hence, neither they are allowed to get themselves
educated nor they were given legal rights in the property, government and in
administration.
“Empowerment comes from women’s groups who seek to empower themselves through
greater self-reliance. They have right to determine their own choice in life. They also seek
to gain control and access to resources”.
Empowerment is process, which helps people to gain control of their live through raising
awareness, taking action and working in order to exercise greater control. Empowerment is
process, which helps people to gain control of their lives through raising awareness, taking
action and working in order to exercise greater control. Empowerment is the feeling that
activates the psychological energy to accomplish one’s goal (Indiresan, 1999).
Any attempt to improve the status of women should start with ‘empowerment’.
Empowerment implies the creation of an enabling environment where individuals can fully
use their capabilities to take charge the lives. The purpose of empowerment is to free
someone from rigorous control and to give the freedom to take responsibilities for their
own ideas and action to release the hidden resources which would otherwise remain
inaccessible.
Women empowerment process is one where women find time and space of their own and
begin to reexamine their lives critically and collectively. It enables women to look at old
problems in new ways, analyze their environment and situation, recognize their strength
and potentials, alter their self-image, access new kinds of information and knowledge
acquire new skills and initiate actions aimed at gaining greater control over resources of
various forms. Economic empowerment is nothing but making women aware about their
role and importance in economic development and provide them space for attaining
financial independence and account their significant contributions to the production
process. Women empowerment initiatives through micro finance operations, micro
enterprise promotion and convergent community action constitute the core activities of
Kudumbashree. Meetings are convened on a weekly basis in the houses of NHG members.
In the meeting, the various problems faced by the group members are discussed along with
suggestions for improving the situation.
Women Empowerment
In many discussions and studies it is found that women have been treated as second class
citizens of all across the globe. It is a fact that almost common everywhere, irrespective of
the development index of a country, women have always been subjected to denied rights
and support systems for their adequate functional growth. This situation is caused due to
loss of women’s self-dignity as human beings over time under such conditions. Women are
not independent entities. Especially in Kerala, they are found to be fully associated and
dependent on men particularly in addition to other aspects in the context of intellectual and
professional capabilities. One of the remedies then, is to improve the women status in
society which has consequently become the goal of various Women empowerment

International Journal of Management, IT & Engineering Vol. 8 Issue 12(1), December 2018,
ISSN: 2249-0558 Impact Factor: 7.119
Journal Homepage: http://www.ijmra.us, Email: [email protected]
Double-Blind Peer Reviewed Refereed Open Access International Journal - Included in the International
Serial Directories Indexed & Listed at: Ulrich's Periodicals Directory ©, U.S.A., Open J-Gage as well as in
Cabell’s Directories of Publishing Opportunities, U.S.A
373 International Journal of Management, IT & Engineering
http://www.ijmra.us, Email: [email protected]
schemes. Empowerment has been considered an effective tool to bring about changes in
the socio-economic conditions of women. A nation, society as well as the individual
himself or herself, cannot progress adequately until the status of women in the region is
improved, in the very least. Gandhi (1930) written about the role of women in society that
“to call woman the weaker sex is a libel; it is man's injustice to woman. If by strength is
meant brute strength, then, indeed, is woman less brute than man. If by strength is meant
moral power, then woman is immeasurably man's superior. Has she not greater intuition, is
she not more self-sacrificing, has she not greater powers of endurance, has she not greater
courage? Without her, man could not be. If nonviolence is the law of our being, the future
is with woman. Who can make a more effective appeal to the heart than woman?"
According to United Nations, Women’s empowerment definition has five major
components
✓ Women's sense of self-worth;
✓ Their right to have and to determine choices;
✓ Their right to have access to opportunities and resources;
✓ Their right to have the power to control their own lives, both within and outside the
home;
✓ Their ability to influence the direction of social change to create a more just, social and
✓ Economic order, both nationally and internationally
Structure of Kudumbashree
Kudumbashree has three tiers community based organization (CBO) for its effective
administration and decentralized operations. Neighborhood group (NHG) -This is the
lowest tier consisting of 15 to 40 women members from poor families. Meetings are
arranged on a weekly basis, in the house of one of the NHG members. The Area
Development Society (ADS) is the second tier. ADS are formed at ward level- panchayat,
municipality or a corporation by joining 10-15 NHGs. The Community Development
Society (CDS) is the highest tier formed by union of all the ADSs in the respective
panchayat, in ‘rural’ or municipality and in ‘town’ or corporation in city areas. It monitors
the thrift and credit activities of NHGs at these levels i-e panchayat or municipality or
corporation level.
Definition of NHG
Neighbourhood Groups (NHGs) are the primary units of the Kudumbashree community
organisation. Ten to twenty women from a neighbourhood form a NHG.
Review of Literature
Beevi and Devi (2015) conducted a study with an aim to assess the role of NHG in
empowering rural women and to identify the major constraints faced by women in Kollam
District of Kerala. The study revealed that micro-enterprises are a practicable pathway for
improving the economic status. Some factors like education, income and mass media
contact were positively and significantly related to the role of the NHGs. The effectiveness
of the NHGs in promoting women empowerment was found to be limited by only factors
like hesitation to take up innovative scheme; difficulty in playing dual roles by women;
lack of confidence, team spirit, effective leadership, managerial skills, working capital and
transportation. These thus were found to be the major constraints faced by NHGs.
Minimol and Makesh (2016) did a study to identify the level of personal, social,
economic and financial empowerment achieved by the members through NHGs. The data
was collected from a sample of 200 members of 18 NHGs located within three villages of

International Journal of Management, IT & Engineering Vol. 8 Issue 12(1), December 2018,
ISSN: 2249-0558 Impact Factor: 7.119
Journal Homepage: http://www.ijmra.us, Email: [email protected]
Double-Blind Peer Reviewed Refereed Open Access International Journal - Included in the International
Serial Directories Indexed & Listed at: Ulrich's Periodicals Directory ©, U.S.A., Open J-Gage as well as in
Cabell’s Directories of Publishing Opportunities, U.S.A
374 International Journal of Management, IT & Engineering
http://www.ijmra.us, Email: [email protected]
Cherthala Taluk of Alappuzha, Kerala. Primary data were collected by employing a
structured interview schedule, through participant observation, and direct personal
discussions with the members of various NHGs. The study concluded that the concept of
NHGs for rural women empowerment has not yet run its full course in attaining its
objective.
Srinivasa Murthy, A.T. (2017) has conducted study on Women empowerment: Issues and
Challenges. Women have to perform both family and professional responsibilities together
without the help of their husbands. Women have to suffer a lot in their daily life to nourish
their career as well as saving their family relationships. The study discussed issues and
women problems in India. Such as selective abortion and female infanticide, Sexual
harassment, Dowry and Bride burning, Disparity in education, Domestic violence, Child
Marriage, Inadequate Nutrition, Low status in the family, Status of widows. The study
empathizes social empowerment of women in following areas i-e education, health,
Nutrition, drinking water and sanitation, housing and shelter, environment, science and
technology, rights of the girl child, violence against women support of mass media,
seeking help to institutional mechanisms. he suggested Panchayat Raj Institutions and the
local self-governments should be actively involved in the implementation and execution of
the National Policy for Women at the grassroots level. The international, regional and sub-
regional cooperation towards the empowerment of women will continue to be encouraged
through sharing of experience, exchange of ideas and technology, networking with
institutions and organizations and through bilateral and multi-lateral partnerships.
Methodology
The population of the study is the Kudumbashree members of Kannur district, Kerala state.
The sample population includes those members active in the Kudumbshree group. A pre-
tested structured questionnaire prepared and formal language was used. The Kudumbshree
members were individually met for collecting accurate data directly. A random sample of
480 members was selected for the study.
Statement of the Problem
The present study is made under the title “Factors Influencing Empowerment of NHG
Members in Kannur District, Kerala State”. The study improve to living conditions of
women empowerment in the country, the Government of India has been taking various
policy and administrative initiatives since last few decades. Even though certain sectors of
the women empowerment population had benefitted by the various sponsored initiatives of
the state, the lion part of women population who belongs to the weaker and marginalized
sectors continue to remain backward. In fact they are unaware of their rights and
privileges, thanks to the poor literacy level and the publicity gaps in reaching out the target
beneficiaries from the side of the administrators of these initiatives. Moreover, lack of
coordination among institutions and agencies supposed to implement the program had
destroyed the charm of the whole program resulting in wasted efforts, high delivery costs
and scattered resources. Thus, at the grass root level, women were satisfied neither with
economic betterment nor with socio-cultural face-lifts. In Kerala, the local self-government
set up a mission to facilitate antipoverty initiatives through empowering women at
grassroots level. At this juncture it will be logical to investigate and bring out the impact of
such initiative on the development of women and to assess the situations if any, that
inhibits the successful implementation of the women empowerment programs.

International Journal of Management, IT & Engineering Vol. 8 Issue 12(1), December 2018,
ISSN: 2249-0558 Impact Factor: 7.119
Journal Homepage: http://www.ijmra.us, Email: [email protected]
Double-Blind Peer Reviewed Refereed Open Access International Journal - Included in the International
Serial Directories Indexed & Listed at: Ulrich's Periodicals Directory ©, U.S.A., Open J-Gage as well as in
Cabell’s Directories of Publishing Opportunities, U.S.A
375 International Journal of Management, IT & Engineering
http://www.ijmra.us, Email: [email protected]
Objectives
The present study was undertaken with the following objectives:
1. To identify demographic variables of the respondents
2. To comprehend individual factors influencing overall empowerment of NHG members.
3. To analyze the factors influencing overall empowerment of NHG respondents based on
married status.
4. To find out the overall factors influencing empowerment of NHG respondents based on
type of family.
5. To examine the significant relationship between factors influencing empowerment and
demographic variables.
Hypotheses
1. There is no significant difference between factors influencing overall empowerment of
NHG respondents based on married life
2. There is no significant relationship between overall factors influencing empowerment of
NHG respondents based on type of family.
Method of Data Collection
To collect the primary data standard questionnaire was used. The tools were circulated
among the selected respondents and interview method also adopted.
Samples Size
A sample of 480 respondents was selected in Kannur district by using simple random
sampling method.
Statistical Tools Used
The following statistical tools were used to analyze the data. They were
• Percentage analysis
• F-test
• t-test
• Correlation test was used.
Results and Discussion
Table-1: Distribution of the Respondents Based on Demographic Variables Variable Sub Variable Number of Respondents Percentage
Marital status
Married 304 63.3
Widow 128 26.7
Unmarried 34 7.1
Divorced 14 2.9
Total 480 100.0
Type of family Nuclear 138 28.8
Joint 342 71.2
Total 480 100.0
Educational
Qualification
Illiterate 34 7.1
Primary 149 31.0
Secondary 167 34.8
Higher secondary 96 20.0
Degree 34 7.1
Total 480 100.0
Annual income Below 15,000 252 52.5
15,001 to 25,000 132 27.5
Above 25,000 96 20.0
Total 480 100.0

International Journal of Management, IT & Engineering Vol. 8 Issue 12(1), December 2018,
ISSN: 2249-0558 Impact Factor: 7.119
Journal Homepage: http://www.ijmra.us, Email: [email protected]
Double-Blind Peer Reviewed Refereed Open Access International Journal - Included in the International
Serial Directories Indexed & Listed at: Ulrich's Periodicals Directory ©, U.S.A., Open J-Gage as well as in
Cabell’s Directories of Publishing Opportunities, U.S.A
376 International Journal of Management, IT & Engineering
http://www.ijmra.us, Email: [email protected]
Reason for Joining NHG Empowerment 259 53.9
Economic 221 46.1
Total 480 100.0
It is inferred from the frequency distribution of the respondents that 63.3 percent of the
respondents are married, 26.7 percent of the respondents are widow, 7.1 percent of the
respondents are unmarried and 2.9 percent of the respondents are divorced. So most of the
respondents are married. Further in the case of type of family, 28.8 percent of the
respondents belong to nuclear family and 71.2 percent of the respondents belongs to joint
family. Based on educational qualification, 7.1 percent of the respondents are illiterates,
31 percent of the respondents completed primary education, 34.8 percent of the
respondents while completed secondary education, 20 percent of the respondents
completed higher secondary and 7.1 percent of the respondents are degree holders. . Also
considering the annual income, 52.5 percent of the respondents earn below 15,000, 27.5
percent of the respondents earn between 15,001 to 25,000 and 20 percent of the
respondents earn above 25,000. Further on the basis of reason for joining NHG, 53.9
percent of the respondents due to joining the reason for empowerment and 46.1 percent of
the respondents due to economic reason.
Table-2: Factors influencing empowerment based on marital status of the
respondents
Factor Marital status Mean Std.
Deviation
F-value P-value
Decision Making
Married 16.66 3.24
42.828 0.001 S Widow 18.44 1.95
Unmarried 22.00 .47
Divorced 16.14 3.70
Freedom to mobility Married 12.26 1.94
83.639 0.001 S Widow 9.41 1.33
Unmarried 12.00 .63
Divorced 11.71 1.86
Family support Married 15.08 1.33
43.886 0.001 S Widow 17.69 3.83
Unmarried 17.00 1.47
Divorced 14.86 1.16
Self confidence Married 22.86 5.84
27.560 0.001 S Widow 22.23 4.31
Unmarried 31.00 1.26
Divorced 21.43 5.17
Knowledge on
Women Related
Issues and
Programmes
Married 25.51 3.46
207.957 0.001 S Widow 34.27 5.30
Unmarried 37.00 2.18
Divorced 24.57 3.36
Legal Awareness Married 3.15
11.174 0.001 S Widow 19.14 3.36
Unmarried 16.00 2.48
Divorced 19.29 3.17

International Journal of Management, IT & Engineering Vol. 8 Issue 12(1), December 2018,
ISSN: 2249-0558 Impact Factor: 7.119
Journal Homepage: http://www.ijmra.us, Email: [email protected]
Double-Blind Peer Reviewed Refereed Open Access International Journal - Included in the International
Serial Directories Indexed & Listed at: Ulrich's Periodicals Directory ©, U.S.A., Open J-Gage as well as in
Cabell’s Directories of Publishing Opportunities, U.S.A
377 International Journal of Management, IT & Engineering
http://www.ijmra.us, Email: [email protected]
Sharing Roles in
Domestic Matter
Married 9.93 1.00
153.223 0.001 S Widow 11.98 2.41
Unmarried 15.00 0.98
Divorced 9.71 1.06
Involve in
Community Group
Work
Married 10.16 .36
101.502 0.001 S Widow 11.64 1.49
Unmarried 11.00 1.58
Divorced 10.00 1.36
Communication Married 13.47 3.26
15.037 0.001 S Widow 15.12 2.08
Unmarried 12.00 0.89
Divorced 14.00 2.88
Leadership Married 18.12 2.64
45.788 0.001 S Widow 21.69 3.83
Unmarried 19.00 0.74
Divorced 17.57 3.03
Acquisition of
Personal Skills
Married 10.75 2.03
3.156 0.001 S Widow 10.77 1.43
Unmarried 10.00 1.46
Divorced 9.71 1.89
S-Significant
NS-Not Significant
The above table exhibits the difference between the levels of factors influencing
empowerment of women on the basis of marital status. Considering the decision making
there is a significant difference between factors influencing empowerment: p<0.001.
Unmarried groups have higher level of decision making, self-confidence, knowledge on
women related issues and programmes and sharing roles in domestic matter than the other
groups. Therefore it is concluded that the null hypothesis is rejected and the alternate
hypothesis is accepted. The result also found that there is a significant influence between
factors influencing women empowerment and their marital status.
Table-3: Factors Influencing Empowerment Based on Type of Family
Dimensions Type of
family
Mean Std.
Deviation
F-value P-value
Decision Making
Nuclear 18.06 3.18 2.45 0.01 S
Joint 17.27 3.18
Freedom to mobility Nuclear 12.41 1.28 6.40 0.001 S
Joint 11.09 2.27
Family support Nuclear 16.36 1.02 2.52 0.01 S
Joint 15.72 2.92
Self confidence Nuclear 24.57 6.57 3.32 0.001 S
Joint 22.69 5.14
Knowledge on Women Related
Issues and Programmes
Nuclear 28.36 5.78 0.633 0.52 NS
Joint 28.74 6.02
Legal Awareness Nuclear 16.58 0.97 11.7 0.001 S
Joint 19.93 3.28

International Journal of Management, IT & Engineering Vol. 8 Issue 12(1), December 2018,
ISSN: 2249-0558 Impact Factor: 7.119
Journal Homepage: http://www.ijmra.us, Email: [email protected]
Double-Blind Peer Reviewed Refereed Open Access International Journal - Included in the International
Serial Directories Indexed & Listed at: Ulrich's Periodicals Directory ©, U.S.A., Open J-Gage as well as in
Cabell’s Directories of Publishing Opportunities, U.S.A
378 International Journal of Management, IT & Engineering
http://www.ijmra.us, Email: [email protected]
Sharing Roles in Domestic
Matter
Nuclear 11.41 2.17 3.87 0.001 S
Joint 10.60 2.04
Involve in Community Group
Work
Nuclear 10.59 1.93 0.186 0.85 NS
Joint 10.61 1.21
Communication Nuclear 10.61 1.24 20.6 0.001 S
Joint 15.12 2.49
Leadership Nuclear 18.48 1.28 2.69 0.01 S
Joint 19.37 3.82
Acquisition of Personal Skills Nuclear 11.45 1.88 6.15 0.001 S
Joint 10.36 1.70
The above table shows the mean, S.D, t-value and Level of significance between
respondents opinion about the various dimensions of factors influencing empowerment on
the basis of type of family. Considering the Knowledge on Women Related Issues and
Programmes and Involve in Community Group Work, there is no significant difference in
respondent’s level of factors influencing empowerment. p>0.001.Further the statistical
result reveals that there is a significant difference in factors influencing empowerment on
the Decision Making, Freedom of mobility, Family support, self-confidence, legal
awareness, Sharing Roles in Domestic Matter, Communication, Leadership and
Acquisition of Personal Skills. Therefore it is concluded that the null hypothesis is partially
rejected and partially accepted.
Table-4: Correlation between Demographic Variables and Factors Influencing
Women Empowerment
Demographic variables Factors influencing women
empowerment
Age -0.907**
Marital Status 0.263**
Religion 0.571**
Type of Family 0.047
Caste -0.694**
Educational Qualification -0.044
Occupation 0.159*
Place of Savings 0.127*
The above table exhibits the correlation between demographic variables and factors
influencing empowerment. In the positively and significantly related with marital status,
religion, occupation and place of saving. Other variable such as age, type of family, caste,
educational qualification are negatively correlated.
Findings
➢ The result also found that there is a significant influence between factors influencing
women empowerment and their marital status. Therefore it is concluded that
respondents level of marital status significantly influenced the factors influencing
empowerment dimension.
➢ The statistical result reveals that there is a significant difference between factors
influencing empowerment on the Decision Making, Freedom to mobility, Family
support, Self-confidence, Legal Awareness, Sharing Roles in Domestic Matter,
Communication, Leadership and Acquisition of Personal Skills.

International Journal of Management, IT & Engineering Vol. 8 Issue 12(1), December 2018,
ISSN: 2249-0558 Impact Factor: 7.119
Journal Homepage: http://www.ijmra.us, Email: [email protected]
Double-Blind Peer Reviewed Refereed Open Access International Journal - Included in the International
Serial Directories Indexed & Listed at: Ulrich's Periodicals Directory ©, U.S.A., Open J-Gage as well as in
Cabell’s Directories of Publishing Opportunities, U.S.A
379 International Journal of Management, IT & Engineering
http://www.ijmra.us, Email: [email protected]
➢ There is positive correlation between demographic variables and factors influencing
empowerment.
Conclusion
The present study aimed to know about the factors influencing empowerment of
Neighbourhood Groups (NHGs) members in Kannur district, Kerala state. A random
sample of 480 members was selected for the study. The statistical tests used were
percentage analysis, F-test and correlation test. The result also found that there is a
significant influence between fact influencing women empowerment and their marital
status. Therefore it is concluded that marital status significantly influenced the factors
influencing empowerment dimension. The statistical result reveals that there is a
significant difference between factors influencing Decision Making, Freedom to mobility,
Family support, Self-confidence, Legal Awareness, Sharing Roles in Domestic Matter,
Communication, Leadership and Acquisition of Personal Skills of the respondents. The
correlation between demographic variables and factors influencing empowerment is
positive and significantly related with marital status, religion, occupation and place of
saving. The wise exploitation and utilization of the opportunities provided to
kudumbashree enabled its members to become empowered to a great extent. However,
there are some bitter experiences which make the members feel less comfortable, while
need to be considered.
Reference
1. Beevi, Subaida V and Devi, Girija (2015) Role of Self Help Groups in Empowering
Rural Women in India International Journal of Interdisciplinary Social Sciences, 5(9),
405-420.
2. Minimol, M. C and Makesh, K. G (2016) Empowering rural women in Kerala: A study
on the role of Self Help Groups (SHGs), International Journal of Sociology and
Anthropology 4(9), 270-280.
3. Srinivasa Murthy, A.T. (2017). Women empowerment: Issues and Challenges. The
International Journal of Indian Psychology. Vol. 4. Issue 2. No.89, P. 114-129.
4. Lakshmy Devi K.R. (2002) ‘Education, Employment, and Job Preference of Women in
Kerala, Discussion Paper No.42, KRPLD. p.93
5. Akshay Kumar, (2002) ‘Equality of Women and the social Mindset, Employment
News, Vol. XXVI, No.48, March 2-8.
6. Kudumbashree Brochure. (2008) published by State Kudumbashree Mission,
Trivandrum, Kudumbashree journal (2008), Vol.2, p.51.
7. Annual report, (various issues) Kudumbashree, Thiruvananthapuram, Kerala.
8. http//www.kudumbashree.org
9. http//www.data.undp.org.in/shdr/kerala/repat.pdf.

International Journal of Management, IT & Engineering Vol. 8 Issue 12(1), December 2018,
ISSN: 2249-0558 Impact Factor: 7.119
Journal Homepage: http://www.ijmra.us, Email: [email protected]
Double-Blind Peer Reviewed Refereed Open Access International Journal - Included in the International
Serial Directories Indexed & Listed at: Ulrich's Periodicals Directory ©, U.S.A., Open J-Gage as well as in
Cabell’s Directories of Publishing Opportunities, U.S.A
380 International Journal of Management, IT & Engineering
http://www.ijmra.us, Email: [email protected]
Growth of SME Sector in India: The Role of Private Sector
Banks
Ms. Monika Gorkhe
Dr Vijayalakshimi Shrinivas
Abstract
Banks finance is an important source of borrowing money for business. Especially with
small scale and mid-sized industry, getting funding is a major challenge. Through detailed
study of published literature, the research focuses on understanding the role of private
banks in growth of SMEs in India. This has been done through analysis of the trend of
banking system post liberalisation and momentum of SMEs during this period.
Keywords: Small and medium sized enterprises, SMEs, liberalisation, private banks.
Introduction
The small and medium sized enterprises are considered as growth engines in any economy.
Their importance is even more strongly felt in emerging economies like India (Javalgi and
Todd, 2011). The impact of their contribution is clearly reflected in increased number of
employment, exports and industrial production. Although, they play a potent role in the
economic development of a nation, they do face great challenges to sustain in global
competitive scenario. Out of all; financial constraints is the major one (Zaidi, 2013).
Talking in this parlance, the importance of banks has been greatly felt. Especially post
1990s, with financial reforms introduced in India, the number of SMEs and success rate
have catapulted significantly (Salwan, 2012).
Literature Review
Importance of SMEs
In different countries, the definition of Small and medium size industries (SME) differs
(Ghose, 2001). Talking in Indian context, the firms with less than Rs. 2.5 million of
investment in plant and machinery fall into the category of micro enterprises, Rs. 2.5
million to 50 million is termed as small scale industry and Rs. 100 million qualifies a firm
as medium size industry. In terms of investment in equipment, there is a slight variation
with Micro industry having Rs. 1 million, small scale firms with Rs. 1 to 20 million and
medium size industries with Rs. 20 to 50 million. (Wade, 2008).
Small and medium size enterprises (SME) are probably not large in size but definitely do
greatly impact the economy of any country. The fact that they account for more than 90%
of all firms outside the agricultural sector of global economy testifies the same (Hussain,
Farooq, and Akhtar, 2012). Over the years, SMEs have played a significant role in the
economic development of India (Jeswal, 2012). According to recent reports; SMEs have
contributed to 30% of Indian GDP (Hussain, Farooq and Akhtar, 2012). The growing
impact of small and medium sized enterprises with respect to employment generation,
manufacturing output and exports has also been noteworthy. As per the data, the SMEs
Asst Professor, Dr DY Patil Institute of Management Studies Akurdi Pune Modern Institute of Business Management Shivaji Nagar Pune

International Journal of Management, IT & Engineering Vol. 8 Issue 12(1), December 2018,
ISSN: 2249-0558 Impact Factor: 7.119
Journal Homepage: http://www.ijmra.us, Email: [email protected]
Double-Blind Peer Reviewed Refereed Open Access International Journal - Included in the International
Serial Directories Indexed & Listed at: Ulrich's Periodicals Directory ©, U.S.A., Open J-Gage as well as in
Cabell’s Directories of Publishing Opportunities, U.S.A
381 International Journal of Management, IT & Engineering
http://www.ijmra.us, Email: [email protected]
account for nearly 40% in exports, 45 % in the manufacturing output (Pandya, 2012), and
as high as 80 % in employment (Singh, Garg, and Deshmukh, 2008). In recent past, the
number in SMEs has increased immensely. To claim the same, below figures present the
growth in Entrepreneur Memorandum from 2007 to 2015.
Source: MSME Annual Report 2016-17, India
Source: MSME Annual Report 2016-17, India
The statistics clearly show a constant increase in number of such firms established over the
years. Although a little dip in the percentage growth is during the impact of global crisis is
seen; but there is no denial that the numbers kept growing over this period. Such are the
impressive statistics but, the experts also do highlight the insufficient financial resources as
one of the major challenges that SMEs face in emerging economies (Tung, and Aycan,
2008).
SME and financial challenges
Financial constraints, lack of efficient human resource and challenge in availing
technological capabilities are some of the major concerns for SMEs (Singh, Garg, and
Deshmukh, 2008).
Experts emphasize on the lack of investment capital and adequate finance as major barriers
majorly hindering the growth of SMEs in developing countries like India. (Beck et al.,
2006; Ayyagari, Demirgüç-Kunt, and Maksimovic, 2008; Tambunan, 2008; Hussain, Sib,

International Journal of Management, IT & Engineering Vol. 8 Issue 12(1), December 2018,
ISSN: 2249-0558 Impact Factor: 7.119
Journal Homepage: http://www.ijmra.us, Email: [email protected]
Double-Blind Peer Reviewed Refereed Open Access International Journal - Included in the International
Serial Directories Indexed & Listed at: Ulrich's Periodicals Directory ©, U.S.A., Open J-Gage as well as in
Cabell’s Directories of Publishing Opportunities, U.S.A
382 International Journal of Management, IT & Engineering
http://www.ijmra.us, Email: [email protected]
and Wangc, 2010; Hussain, Farooq, and Akhtar, 2012). One strong argument provided is
that these enterprises which are usually labour -intensive firms, but when access to credit
and capital is a constraint, it leads to reduced capabilities of the firms to face labour costs.
Eventually; this causes business failure (Lin, 2007).
Indian Banking-history
Till 1990, this sector remained highly regulated. The development of financial system in
India has then gone hand in hand with the economic reform post 1990 (Gupta, Kochhar
and Panth, 2015).
The aim to bring liberalisation in banking system of India was to improve efficiency, and
productivity as a whole in the Indian economy (Ray, and Das, 2010).Banking reform
introduced during this period eased the regulations and which lead to restricted
competition. As a result; this paved path to the entry of private banks as well as increased
participation of foreign banks into the Indian markets (Shimizu, 2010).Financial
liberalisation provides more flexibility to the banks by allowing setting interest rates and
determining related policies which were earlier controlled by the government. This
enhances efficiency and boosts economic productivity by providing a healthy and
competitive environment (AtaullahCockerill, and Le, 2004).
Relationship between SMEs and Private Banks
Considering the complete framework of financing system in any nation, the widely spread
and largely dominant component in this system are the banks. This point is even more
relevant in terms of emerging and developing markets (Beck, 2007).Studies have shown
that across countries, banks have been a major source of credit for small and medium size
industries. Looking at the recent trends, experts argue that Banks see SMEs as growth
engine and centre of profit abilities. This has led to an extended lending relationship
between growing SMEs and banks, especially in developing countries where growth
potentials are promising (Beck, et al., 2008). Looking at the positive momentum of SMEs
in post liberalisation era, an evident co-relation between reforms and the growth of SMEs
can be drawn (Dixit and Pandey, 2011).
Research Objective
The aim of the research is to study the recent growth of the small and medium size
industries in India and understand the role of private sector banks in it.
Significance of the study
This research work will be helpful for the government, monetary authorities, policy-
makers, and academics to understand the requirements of improving the SME sector by
understanding the financial challenges in this domain.
Scope
The scope of the study is limited to the Indian context.
Hypothesis
H1: There is an important co-relation between the liberalisation of Indian banks and
growth of Small and medium size industries in India.
H0: The null Hypothesis state that there is no noticeable co-relation between the
liberalisation of Indian banks and growth of Small and medium size industries in India.
Design
The design of this study is mainly secondary research. The related literature have been
thoroughly studied about the banking system post 1990s .The growth pattern of SMEs post

International Journal of Management, IT & Engineering Vol. 8 Issue 12(1), December 2018,
ISSN: 2249-0558 Impact Factor: 7.119
Journal Homepage: http://www.ijmra.us, Email: [email protected]
Double-Blind Peer Reviewed Refereed Open Access International Journal - Included in the International
Serial Directories Indexed & Listed at: Ulrich's Periodicals Directory ©, U.S.A., Open J-Gage as well as in
Cabell’s Directories of Publishing Opportunities, U.S.A
383 International Journal of Management, IT & Engineering
http://www.ijmra.us, Email: [email protected]
reform has been observed and prudent interpretation has been drawn looking at any
relevant co-relation between the two.
Data Analysis and interpretation
As per the reports, with impressive GDP growth of 7.6%; India has topped in the outlook
charts of World Bank for financial year 2015-16. The recent past witnessed escalated
growth of SMEs and start-ups with India boosting today a magnificent SME base of 38
million; just after China with 52 million(India Brand Equity Foundation 2016). Such
accelerated growth of SMEs has been witnessed by Indian economy with a 4.5% of stable
pace of increase, consistently some last years. Over 6000 products ranging from traditional
items to high-tech ones are manufactured by these small ventures in India. This trend is
expected to grow in coming future with the SMEs market of emerging technologies
expected to touch $25.8 billion in 2020(Economic Times 2017a)
It is expected that the GDP of India will touch 8.5 % by the year 2025 and MSMEs will
keep playing an instrumental role in that. Looking at this, presently banking efforts are
evident in financing these SMEs (SME Venture, 2017). The data suggests that MSME of
manufacturing domain alone contributes to the 8% of the GDP of India, $45% of the total
output and 40% of exports although, such data reflects the significant contribution of
SMEs in growth but they struggle to get financial backing. Usually, the traditional banking
institute refrain from financing these ventures to avoid high cost of transaction which
account due to small ticket size of loan amount and for per client revenue being low(India
Brand Equity Foundation, 2017). Interesting to note that many financial institutions have
emerges as custodians for these firms. Currently, SMEs are availing the convenient lending
options from private banks and Non-banking Financial companies (NBFCs) (India Brand
Equity Foundation, 2016).As per The reports of Reserve Banks of India, the funds needed
in SME sector is close to 26 lakh Crore rupees but these ventures struggle to meet. This
can be understood from the fact that only 40% of this requirement is what the traditional
banking has been able to fulfil. Although, many established banks have extend loans
facilities to SMEs, based on their credit worthiness still the struggle prevails. Increasingly,
along with private banks NBFCs also getting involved in financing MSMEs in recent past
to fill this gap of funding (Business Line, 2017). Special schemes and models have been
adopted in this regard (Confederation of Indian Industry 2013).Looking at the stats, it is
evident that in 2016 the loan frame in India grew rapidly. Within a short time frame of one
year, loan request from SMEs has crossed over $1 million (Economic Times, 2017b).The
data of 2015 posted by banks of claim a lending of over 8 million to SMEs (Economic
Times, 2015). Enormously growing and flourishing SME sector accounts for 9% of the
GDP of India. Data forecasts that in coming years this sector is expected to generate
employment opportunities as high as 59 million; through 26 million units across the
country (SME Venture 2017).
Hypothesis testing
The hypothesis claims that there is an important co-relation between the liberalisation of
Indian banks and growth of Small and medium size industries in India, whereas; the null
Hypothesis state that there is no noticeable co-relation between the liberalisation of Indian
banks and growth of Small and medium size industries in India.
The multiple related literatures were studied in order to draw parlance with the same. The
study presented by MSME Annual Report is one strong evidence to the fact of their
unprecedented growth in recent years. With liberalisation, the fact suggests a growth in

International Journal of Management, IT & Engineering Vol. 8 Issue 12(1), December 2018,
ISSN: 2249-0558 Impact Factor: 7.119
Journal Homepage: http://www.ijmra.us, Email: [email protected]
Double-Blind Peer Reviewed Refereed Open Access International Journal - Included in the International
Serial Directories Indexed & Listed at: Ulrich's Periodicals Directory ©, U.S.A., Open J-Gage as well as in
Cabell’s Directories of Publishing Opportunities, U.S.A
384 International Journal of Management, IT & Engineering
http://www.ijmra.us, Email: [email protected]
private banks sector as well. Long with it the statistics suggests that the forecasted growth
rate of SME would reach 4.5%. This strengthens the stated hypothesis.
With the increase in demand of capital for small ventures, rapid is the pace of financing
institute in meeting this need. With a large share of 40% of it already being met and private
banks taking interest in expansion of MSMEs supports this statement. The years of the
start-up boom overlapping with post liberalisation era draws a strong connection here
between the two. This is further justified by the logic that ease brought by the liberalisation
opened doors for private banks to enter in Indian markets. The loan frame of SMEs has
increased and number of start-ups as stated has steadily increased reaching to 48 million.
Thistrend with respect to the fact of multiple private banks and NBFCs lending capital to
SMEs leads to an inference that these institutes are fuelling the growth of SMEs by
providing essential credit resources. Clearly, such strong inferences negate the null
hypothesis.
In addition to above deduction from relevant data, the important contribution of 9% in the
GDP of the nation also reflects the importance of the MSME sector and how they are seen
as a profit centre by banks. Also, the extensive schemes specifically adopted by the banks
to support lending to SMEs testifies this statement,
In light of potent research work with strong statistics to support, the hypothesis stands
justified.
Recommendation
Looking at promising future of SMEs, financial institutions, government and banks are
expected to understand the financing needs of these firms. Active schemes and supporting
lending practices are needed. Prudent regulations, government policies and a flexible
environment will foster the growth of SMEs, and this is what especially the emerging
economies must focus on.
Conclusion
Undoubtedly, the growing small and medium sized industries are backbone for developing
countries like India, promising a bright future through accelerated economic growth. The
biggest challenges they face is of finance, but with more ease of private banks entering
Indian markets post liberalisation have opened channels for this as well. Credit allocation
to SMEs is considered as one profitable scheme by the banks. In this regard more prudent
regulation is what policy makers must aim at.
References
Ataullah, A., Cockerill, T. and Le, H., (2004). Financial liberalization and bank efficiency:
a comparative analysis of India and Pakistan. Applied Economics, 36(17),
pp.1915-1924.
Ayyagari, M., Demirgüç-Kunt, A. and Maksimovic, V., (2008). How important are
financing constraints? The role of finance in the business environment. The World
Bank economic review, 22(3), pp.483-516.
Beck, T., (2007). Financing constraints of SMEs in developing countries: Evidence,
determinants and solutions. In KDI 36th Anniversary International Conference
(pp. 26-27).
Beck, T., Demirgüç-Kunt, A., Laeven, L. and Maksimovic, V., (2006). The determinants
of financing obstacles. Journal of International Money and Finance, 25(6),
pp.932-952.

International Journal of Management, IT & Engineering Vol. 8 Issue 12(1), December 2018,
ISSN: 2249-0558 Impact Factor: 7.119
Journal Homepage: http://www.ijmra.us, Email: [email protected]
Double-Blind Peer Reviewed Refereed Open Access International Journal - Included in the International
Serial Directories Indexed & Listed at: Ulrich's Periodicals Directory ©, U.S.A., Open J-Gage as well as in
Cabell’s Directories of Publishing Opportunities, U.S.A
385 International Journal of Management, IT & Engineering
http://www.ijmra.us, Email: [email protected]
Beck, T., Demirgüç-Kunt, A. and Martinez Peria, M.S., (2008). Bank financing for SMEs
around the world: Drivers, obstacles, business models, and lending practices.
Business Line. 2017. NBFCs are now a bankable source of funds for SMEs | Business
Line. [ONLINE] Available at: http://www.thehindubusinessline.com/money-and-
banking/nbfcs-are-now-a-bankable-source-of-funds-for-smes/article9816439.ece.
[Accessed 12 December 2017].
PWC. (2013). MSME. [Online] Available at:
https://www.pwc.in/assets/pdfs/publications/2013/msme.pdf. [Accessed: 12
December 2017].
Dixit, A. and Pandey, A.K., (2011). SMEs and economic growth in India: co-integration
analysis. IUP Journal of Financial Economics, 9(2), p.41.
EconomicTimes. (2017a). Indian SME trends: The year gone by and 2017. [Online]
Available at: https://economictimes.indiatimes.com/small-biz/sme-sector/indian-
sme-trends-the-year-gone-by-and-2017/articleshow/56254240.cms.[Accessed 12
December 2017].
EconomicTimes. (2017b).Struggling to raise money? AI-powered bank loans from Loan
Frame can help.[Online] Available at:
https://economictimes.indiatimes.com/small-biz/sme-sector/struggling-to-raise-
money-ai-powered-bank-loans-from-loan-frame-can-
help/articleshow/59909473.cms. [Accessed 12 December 2017].
Gupta, P., Kochhar, K. and Panth, S., (2015). Bank ownership and the effects of financial
liberalization: evidence from India. Indian Growth and Development Review,
8(1), pp.109-138.
Hussain, I., Farooq, Z. and Akhtar, W., (2012). SMEs development and failure avoidance
in developing countries through public private partnership. African Journal of
Business Management, 6(4), p.1581.
Hussain, I., Sib, S. and Wangc, L., (2010). SMEs Development in Developing Countries
through Public–Private Partnership. African Journal of Business Management,
6(4), pp.1581-1589.
Javalgi, R.R.G. and Todd, P.R., (2011). Entrepreneurial orientation, management
commitment, and human capital: The internationalization of SMEs in India.
Journal of Business Research, 64(9), pp.1004-1010.
Jeswal, R., (2012). Role of SME in Indian economy. In National Conference on Emerging
challenges for sustainable business, pp. 289-310
Lin, Y.F., (2007). Developing small and medium bank to improve financial structure.
China Center for Economic Research, Peking University, working paper (in
Chinese
Ministry of Micro, Small & Medium Enterprises.(2017a). Ministry of Micro, Small &
Medium Enterprises. [Online] Available at:
http://msme.gov.in/relatedlinks/annual-report-ministry-micro-small-and-medium-
enterprises [Accessed 12 December 2017].
Ministry of Micro, Small & Medium Enterprise. (2017b). SME Bank, SME Loan, Banking
Industry, Growth, Mudra Bank, MSME Sector. [Online] Available at:
https://www.ibef.org/blogs/making-smes-bankable-and-banking-on-smes.
[Accessed 12 December 2017].

International Journal of Management, IT & Engineering Vol. 8 Issue 12(1), December 2018,
ISSN: 2249-0558 Impact Factor: 7.119
Journal Homepage: http://www.ijmra.us, Email: [email protected]
Double-Blind Peer Reviewed Refereed Open Access International Journal - Included in the International
Serial Directories Indexed & Listed at: Ulrich's Periodicals Directory ©, U.S.A., Open J-Gage as well as in
Cabell’s Directories of Publishing Opportunities, U.S.A
386 International Journal of Management, IT & Engineering
http://www.ijmra.us, Email: [email protected]
Pandya, V., (2012). September. Comparative analysis of development of SMEs in
developed and developing countries. In The 2012 International Conference on
Business and Management (pp. 6-7).
Ravi, S., (2009). Entrepreneurship development in the micro small and medium enterprise
sector in India. Indian School of Business, p2.
Ray, S.C. and Das, A.(2010). Distribution of cost and profit efficiency: Evidence from
Indian banking. European Journal of Operational Research, 201(1), pp.297-307.
Salwan, P., (2012). Co-creation: an exploratory study of MSMEs & large banks in India.
Indian Journal of Industrial Relations, pp.1-18.
Shimizu, S., (2010). The state of the Indian banking sector and its role in India’s high
growth. RIM Pacific Business and Industries, 10(36), pp.1-35.
Singh, R.K., Garg, S.K. and Deshmukh, S.G., (2008). Challenges and strategies for
competitiveness of SMEs: a case study in the Indian context. International
Journal of Services and Operations Management, 4(2), pp.181-200.
SME Bank, SME Loan, Banking Industry, Growth, Mudra Bank, MSME Sector. (2017).
SME Bank, SME Loan, Banking Industry, Growth, Mudra Bank, MSME Sector.
[ONLINE] Available at: https://www.ibef.org/blogs/making-smes-bankable-and-
banking-on-smes. [Accessed 12 December 2017].
SME Venture. (2017). The Lending Scenario of Indian banks for SME Sector. [ONLINE]
Available at: http://www.smeventure.com/lending-scenario-indian-banks-sme-
sector/. [Accessed 12 December 2017].
Tambunan, T., (2008). SME development, economic growth, and government intervention
in a developing country: The Indonesian story. Journal of international
entrepreneurship, 6(4), pp.147-167.
Tung, R.L. and Aycan, Z., (2008). Key success factors and indigenous management
practices in SMEs in emerging economies.
Zaidi, L., (2013), March. Problems affecting the growth of small and Medium Enterprises
(SMEs) in India. In International conference on Technology and business
management, 3(2).

International Journal of Management, IT & Engineering Vol. 8 Issue 12(1), December 2018,
ISSN: 2249-0558 Impact Factor: 7.119
Journal Homepage: http://www.ijmra.us, Email: [email protected]
Double-Blind Peer Reviewed Refereed Open Access International Journal - Included in the International
Serial Directories Indexed & Listed at: Ulrich's Periodicals Directory ©, U.S.A., Open J-Gage as well as in
Cabell’s Directories of Publishing Opportunities, U.S.A
387 International Journal of Management, IT & Engineering
http://www.ijmra.us, Email: [email protected]
Impact Of Digital HR Practices on Strategic Human Capital
Management and Organizational Performance in IT Sector
Dr. Subhasree Kar
Srihari. S
Abstract
In the present scenario, a thorough understanding of organization’s value creation model
and ability to develop competencies through improved processes, better technology and
motivated people are essential to ensure that the Human Resource (HR) function is aligned
vertically and horizontally to produce superior results. With this understanding, HR
function can better articulate how it can improve HR decision making, processes, people,
and customer outcomes and business results. Automation is the way to enhance HR
exercises in an organization and eventually in accomplishing organization objectives. From
a more extensive point of view, Digitalizing HR practices bring about a very well-
organized entity with better-educated individuals. The present best-of-breed Digital HR
Practices robotizes everything identified with HR into a single online worldwide
programming framework. It furnishes crucial HR components as well as presents cutting
edge qualities that make human resources more efficient and enhance organization’s crux.
Keyword: Digital HR; Digital HR Practices; HRIS; Digital HRIS; Digital Human
Resource
Introduction
In the current scenario, an exhaustive comprehension of association's esteem creation
model and capacity to create capabilities through enhanced procedures, better innovation
and propelled individuals are basic to guarantee that the Human Resource (HR) work is
adjusted vertically and on a level plane to deliver prevalent outcomes. With this
knowledge, HR capacity can judge how it can enhance HR basic leadership, procedures,
individuals, and client results and business outcomes. The HR functions are required to
build up the abilities expected to evaluate how associations establish esteem and adjust the
HR capacity to execute the organizations strategy.
The association must convey an incentive through planning individuals, procedures and
innovations and there is a need to build up an arrangement to structure an association's kin,
procedures and advances to make most extreme incentive for partners. The arrangement of
HR ought to be in such a route in order to amplify worker execution.
Automation is the key to enhance HR activities in an organization and eventually in
accomplishing organization objectives. The exploration results have demonstrated that
organizations utilizing programming to proficiently deal with their human capital parts are
seeing a more prominent benefit and upper hand over others. Via computerizing routine
HR assignments, the associations can focus on building up the workforce and building a
vital accomplice (Chamaru De Alwis, 2010).
Associate Professor, CMR University, Bangalore Research Scholar, CMR School of Research, Bangalore, Director Human Resource, Indegene

International Journal of Management, IT & Engineering Vol. 8 Issue 12(1), December 2018,
ISSN: 2249-0558 Impact Factor: 7.119
Journal Homepage: http://www.ijmra.us, Email: [email protected]
Double-Blind Peer Reviewed Refereed Open Access International Journal - Included in the International
Serial Directories Indexed & Listed at: Ulrich's Periodicals Directory ©, U.S.A., Open J-Gage as well as in
Cabell’s Directories of Publishing Opportunities, U.S.A
388 International Journal of Management, IT & Engineering
http://www.ijmra.us, Email: [email protected]
Information is an essential element for administration. On time, precise and important data
is vital for arranging and decision making. The data framework is an arrangement of
composed method which when executed, gives facts to help, arranging and basic
leadership.
From a more extensive point of view, Digitalizing HR practices bring about a very well
organized entity with better-educated individuals. Activities turn out to be more effective,
work duplication is killed and HR organization turns out to be more streamlined. Above all
individuals can invest more energy in basic leadership and key arranging and less time on
data information and everyday HR organization. Such automation appears to assume
critical parts for Human Capital Management (HCM) in light of the fact that Digital HR
process capacities enhance HCM as far as regulatory purposes and scientific purposes.
Despite the fact that Digital HR Practices is as yet being utilized for regulatory finishes as
opposed to systematic closures, the future utilization of Digital HR Practices will be in
vital decision-making process. Workers currently can get to the data on their cell phone
and on their PCs utilizing portable information cards.
Digital HR Practices is winding up progressively essential in assisting modem associations
with managing their human resources successfully. In view of Aberdeen's criteria, research
proposes that utilizing a completely coordinated HR framework to streamline and enhance
general tasks can enable organizations to end up as pioneers in their separate enterprises.
As per a Report by Aberdeen Group Report 2007 the organizations which were utilizing
completely coordinated framework for ability administration will probably accomplish best
in-class status. As these frameworks advance and convey perpetual usefulness to HR,
utilizing them is turning into the standard and a key expertise for any expert in the HR
business. The present best-of-breed Digital HR Practices robotizes everything identified
with HR into a single online worldwide programming framework. It furnishes crucial HR
components as well as presents cutting edge qualities that make human resources more
efficient and enhance organization’s crux. These frameworks mechanize work process to
enhance effectiveness and empower organizations to track, oversee and dissect information
for all representatives from candidates to retirees. They join conventional HR with ability
administration and announcing instruments that give an entire portfolio of an organization's
workforce for better key arranging (Alok and Ibrahim, 2010).
It is just impossible to meet HR challenges in today’s world without the use of Innovative
technology. Individuals need to work in associations having the most recent innovation and
this is the essential contribution to be a chosen employer. Vast organizations utilize
investigative instruments to deal with their human capital, compute its esteem and adjust
the workforce for most extreme efficiency. The Internet Technology is revolutionizing
most parts of business, including the HR work and in the meantime, it is presenting new
courses in conveying HR administrations. The innovation has changed the HR capacity to
savvy robotized frameworks that enhanced the adequacy of workforce arranging and
educated decision making.
Literature Review
The historical backdrop of Digital HR Practices starts from finance frameworks in the late
1950s and proceeds till the 1960s when the main computerized representative database was
utilized (Walker 1993, Martinsons 1997)) shows how a "genuine" faculty framework was
characterized in the late 1960s. According to Martinsons, "the main work force
frameworks were made to store a gigantic measure of information for record keeping and

International Journal of Management, IT & Engineering Vol. 8 Issue 12(1), December 2018,
ISSN: 2249-0558 Impact Factor: 7.119
Journal Homepage: http://www.ijmra.us, Email: [email protected]
Double-Blind Peer Reviewed Refereed Open Access International Journal - Included in the International
Serial Directories Indexed & Listed at: Ulrich's Periodicals Directory ©, U.S.A., Open J-Gage as well as in
Cabell’s Directories of Publishing Opportunities, U.S.A
389 International Journal of Management, IT & Engineering
http://www.ijmra.us, Email: [email protected]
revealing things related with faculty organization. Over a period of time, the improvement
in HR activities created the plan, advancement and the effective usage of different PC
based Digital HR Practices ".
As per Kavanagh et al (1990) "HRIS as a System used to gain, store, control, investigate,
recover and circulate data in regards to an organization’s HR. An HRIS isn't just PC
equipment and related HR – related programming; it additionally incorporates individuals,
structures, approaches and strategies, and information". The HRIS is generally a piece of
the association's bigger Information System. Old manual frameworks are slowly
supplemented by mechanized HRIS.
Kovach et al.(1999), characterized HRIS as a "precise strategy for accumulating,
preserving, organizing, recovering, and validating information required by association
about its HR, work force exercises, and association unit qualities. Moreover, HRIS shapes
an incorporation between human asset administration (HRM) and Information
Technology."
Lengnick – Hall (2002) portrayed e-HR into three structures: distributing Information,
mechanization, and alteration. They alluded e-HR parallel to web based business to lead
business exchange identified with human asset utilizing internet. e-HR helps HR
supervisors' part change from issues master to vital business accomplice. e-HR can
immediately refresh their profile in the event of any change and will counsel human asset
experts just when they view it as important, assisting HR experts with being engaged with
key exercises instead of doing simply routine authoritative work.
E-HR is a Digital HR Practices programming having conveyance stage as Internet.
Conveying human asset administrations on the web (e-HR) underpins more effective
accumulation, stockpiling, dispersion, and trade of information, Hendrikon (2003). Most
associations set up intranets principally for representatives, yet they can reach out to
business accomplices and even clients with fitting exceptional status, (Tripathi, 2011).
As indicated by Singh (2003), it isn't just vital to recognize HR skills as per the business
needs and creates determination and advancement practices to anchor those capabilities,
but also to develop and actualize an execution assessment arrange for the connections
between employee performance and the key objectives.
Theoretical Background
Walker(1993) is characterized Digital HR Practices as "a PC based technique for
gathering, conserving, organizing ,recovering and validating certain information required
by an association about its workers, candidates and previous representatives."
As characterized by Hendrickson(2003) "A Digital HR Practices isn't just restricted to the
PC equipment and programming applications that involve the specialized piece of the
framework, but it likewise incorporates the people, policies, methods, and information
required to deal with the HR work."
The Digital HR Practices keeps track on following exercises payroll, time and attendance,
evaluation performance, benefits administration, HR administration data system,
recruiting, learning management, training system, performance record, worker self-service,
scheduling, nonattendance management, Digital HR Practices is an apparatus which helps
the HR expert to give quicker administration, of better quality, which is consistently
connected, thus helping the association to attain strategic advantage.

International Journal of Management, IT & Engineering Vol. 8 Issue 12(1), December 2018,
ISSN: 2249-0558 Impact Factor: 7.119
Journal Homepage: http://www.ijmra.us, Email: [email protected]
Double-Blind Peer Reviewed Refereed Open Access International Journal - Included in the International
Serial Directories Indexed & Listed at: Ulrich's Periodicals Directory ©, U.S.A., Open J-Gage as well as in
Cabell’s Directories of Publishing Opportunities, U.S.A
390 International Journal of Management, IT & Engineering
http://www.ijmra.us, Email: [email protected]
Different types of Digital HR Practices
Like other PC based Information Systems, Digital HR Practices can likewise be put under
essential three classes: Electronic Data Processing (EDP), Management Information
Systems (MIS), and Decision Support Systems (DSS). As indicated by Sprague and
Carlson (1982), HR exercises can be characterized into three general classifications:
Transactional, Traditional, and Transformational. An EDP-based classification of Digital
HR Practices was the soonest frame presented in the HR field and took into account the
value-based level, everyday HR exchanges that need to bargain for the most part with
record keeping—for instance, entering financial data, representative status changes,
organization of worker benefits and so forth. MIS-based Digital HR Practices developed as
innovation enhanced after some time, and concentrated on conventional level of HR
exercises, as for enlistment, choice, and pay. Digital HR Practices at DSS centers around
transformational level of HR exercises i.e., increasing the value of hierarchical procedures.
Human Resource Decision Support System (HR-DSS) empowers basic leadership and
determining capacities of HR administrators. It for the most part incorporates instruments
by which clients or framework chairmen can create specially appointed reports and select
particular cases or subsets of cases for show. Some modern HR-DSS can likewise reenact
(or 'demonstrate') a scope of business circumstances, and in this way, assist the business
with seeing how individuals will respond to various business offers or work circumstances
and that if the displayed circumstances are sensible. Kavanagh (1990) named HR-DSS as
Human Resources Management Decision System (HR-MDS). They portrayed it as the
perfect framework since it gives basic data to decision making and in this way, ought to be
utilized as a standard for building up any Digital HR application.
Components of Strategic human capital management practices:
There are numerous factors assimilated in SHCM practices. It relies upon the size of
utilization HR adopts in the associations. There are some Digital HR Practices bundles
which are known as independent applications, customer server applications and online
applications. There are number parts offered by ERP designers in Digital HR Practices.
Fig 1: Digital HR Components Model
DIGITAL HR
COMPONEN
TS
Employee
Self
Service
Recruitme
nt
Personal
Developme
nt
Training
Time
Management
Performanc
e Appraisal
Payroll
Personal
Managemen
t

International Journal of Management, IT & Engineering Vol. 8 Issue 12(1), December 2018,
ISSN: 2249-0558 Impact Factor: 7.119
Journal Homepage: http://www.ijmra.us, Email: [email protected]
Double-Blind Peer Reviewed Refereed Open Access International Journal - Included in the International
Serial Directories Indexed & Listed at: Ulrich's Periodicals Directory ©, U.S.A., Open J-Gage as well as in
Cabell’s Directories of Publishing Opportunities, U.S.A
391 International Journal of Management, IT & Engineering
http://www.ijmra.us, Email: [email protected]
Recruitment: The enlistment segment is utilized to do the whole enrollment process from
entering candidate information to staffing a position. This module is utilized for both inside
and outside candidates. This module bolsters in speaking to staffing necessities,
publicizing, overseeing and choosing candidates, and candidate’s correspondence.
Staff Management: Integration amongst Recruitment and Personnel Administration
empowers the candidate information to be exchanged as worker information, which you at
that point need to supplement. Worker information is stored in database as representative
records. The information can be shown, duplicated, edited and erased.
Work force Development: In the Personnel Development part, you can design and
acknowledge staff improvement and further instruction and preparing for your
representatives, with amalgamation of Training and Event Management. The faculty
advancement necessities result from a correlation of the prerequisites of the activity and
the employee’s existing capabilities. Employee’s execution and conduct can be assessed,
the aftereffects of which give data to worker advancement arranging.
Training and Event Management: Training and Event Management is an exceedingly
incorporated segment that reinforces planning, executing and overseeing instructional
classes and business occasions. Training and Event Management is a perfect apparatus for
continually broadening and refreshing the employees’ learning. For instance, the
connection with Personnel improvement empowers to recognize capability deficiencies
and respond with focused preparing.
Time Management: Time administration segment bolster all the procedures that affect
planning, recording and valuating employee’s participation and sabbatical time. Data
concerning employee’s accessibility and work performed by them is an imperative
component in HR. It is additionally utilized as a part of different zones, for example,
controlling and strategic. Data accessible through framework is utilized as contribution for
finance estimation.
Performance Appraisal: This part assesses singular execution relying on the criteria
chose by the association. It gives expected adaptability to choose measurements based on
occupation, occasion and task given to a person.
Payroll: The Payroll module is utilized for computing each employee’s compensation of
work, auto increase, relay of pay to employee’s bank account, creating statutory reports
required and so on.
Individual Cost Planning: Individual cost planning underpins business forms that range
beyond the limits of divisions and applications. Data about installment can be retrieved
from different sources to make individual cost design.
Career Planning: HRIS could record anticipated positional moves. The framework must
be equipped to furnish progression intends to distinguish which representatives have been
reserved for which position.
The Employee self-benefit module: This module allows representatives to inquire HR
related information and play out some HR exchanges over the framework. Workers may
question their participation record from the framework without requesting the data from
HR staff. The module additionally gives directors a chance to affirm O.T. demands from
their subordinates through the framework without over-burdening the undertaking on HR
division.

International Journal of Management, IT & Engineering Vol. 8 Issue 12(1), December 2018,
ISSN: 2249-0558 Impact Factor: 7.119
Journal Homepage: http://www.ijmra.us, Email: [email protected]
Double-Blind Peer Reviewed Refereed Open Access International Journal - Included in the International
Serial Directories Indexed & Listed at: Ulrich's Periodicals Directory ©, U.S.A., Open J-Gage as well as in
Cabell’s Directories of Publishing Opportunities, U.S.A
392 International Journal of Management, IT & Engineering
http://www.ijmra.us, Email: [email protected]
Need for Digital HR Practices
Generally, HR specialists were applying the most critical extent of time and exertion at the
managerial level; trailed by the operational level and in conclusion, the technique level yet
the opposite created a HR esteem include.
Because of globalization Human asset administration is a fundamental factor of any fruitful
business. Digital HR Practices is indispensable to basic leadership and assumes a critical
part in the achievement of the association. Digital HR Practices is a stage for the
association to be more aggressive through legitimate correspondence with different
frameworks. It lessens the limits of the framework which generates barrier for both vertical
and horizontal correspondence inside the association. Worker ends up independent, to
convey and to share understanding. Digital HR Practices is one media which decrease the
boundaries of interchanges to enhance association execution. Territories like e-learning,
learning, administration, discourse database and community figuring help in employee’s
improvement and upgrade the expertise and offer information/involvement with others.
Digital HR Practices engage HR Manager as well as workers of the association.
As stated by Hendrikson (2003), An all-around outlined Digital HR Practices can fill in as
the principle administration instrument in the arrangement or incorporation of the HR
office objectives with the goals of long haul corporate strategic planning .According to
Carrell et al.(1999)19 HR information should be exhibited to supervisors to help basic
leadership in the association. This general idea is known as Decision Support System
(DSS). With the expanding significance of HR issues as basic factors in strategic planning
and basic leadership, the capacity of the Digital HR Practices to measure, examine and
display change turns out to be critical. Viable Digital HR Practices abilities can furnish an
organization with focused and key preferred standpoint while experiencing a change
procedure.
The most praiseworthy component of this framework is that it has expanded
straightforwardness that prompts better correspondence with clients. Particularly the
cooperation with the client network is the key favorable position of Digital HR Practices.
Objectives of the Study
1. To survey the ramifications of Digital HR Practices on individuals and process viability.
2. To assess the ramifications of Digital HR Practices on authoritative execution.
Digital HR Practices for Organizational Development
Digital HR Practices for Organization Development: As indicated by French and Bell,
hierarchical advancement is an orderly procedure for applying conduct science standards
and practices in association to expand individual and authoritative adequacy. It is
concentrating on making collaboration inside the association for reasonable superior by
remembering all frameworks and subsystems. Worldwide rivalry and financial motion
have uncovered the shortcomings of association. They keep on being congested with a
similar old bulky and moderate work process and wasteful interior structure. There is a
need, for administrators to dependably consider mantras – reengineering, rebuilding and
change in a journey to wind up as globally competitive. The motivation behind hierarchical
improvement is to expand the adequacy of the association by building up the idle abilities
of the individual members which help the methods for cooperating and accomplishing
desired objectives. Associations are thought to be genuinely viable just when there is a
common domain that is ideal for both the association and the person to develop and create.

International Journal of Management, IT & Engineering Vol. 8 Issue 12(1), December 2018,
ISSN: 2249-0558 Impact Factor: 7.119
Journal Homepage: http://www.ijmra.us, Email: [email protected]
Double-Blind Peer Reviewed Refereed Open Access International Journal - Included in the International
Serial Directories Indexed & Listed at: Ulrich's Periodicals Directory ©, U.S.A., Open J-Gage as well as in
Cabell’s Directories of Publishing Opportunities, U.S.A
393 International Journal of Management, IT & Engineering
http://www.ijmra.us, Email: [email protected]
Associations keeping in mind the end goal to survive and develop in the aggressive world
need to adjust to new innovation, new markets and new difficulties. In today’s focused
world quality, speed and convenient conveyance are basic for survival of the association.
The authoritative capacity to react to the clients and partners or be the first to market may
have a critical effect as time is at a premium. Associations which are versatile and grow
new innovations and receive changes faster in the commercial center are the ones that will
survive the opposition. (Incorporate to computerized hones in IT SECTOR)
Digital HR Practices is a feature of changing HR patterns and in the ongoing circumstances
HR capacities are being supplemented by innovation. Most of the IT firms are restoring
few HR related frameworks, for example, a work force database, finance framework and
advantages framework, with one Digital HR Practices that does everything. Numerous HR
individuals in IT associations focus on the enhanced detailing and preparing that will be
acknowledged from the new framework and those are the reasons most firms execute
another Digital HR Practices. While HR data frameworks are presently broadly utilized -
as indicated by the CIPD's 2005 study, People and Technology, around 77% of all
associations utilize some type of Digital HR Practices - it isn't evident whether they are
having the coveted impact and whether the HR experts are utilizing the innovation to its
full limit?
Digital HR mix of programming and frameworks are related with overseeing worker
information about enrollment and determination, finance, training and improvement, leave
administration, ability administration, execution examination and related HR capacities.
Digital HR Practices is hence about innovation to oversee HR capacities. A basic
perspective of Digital HR Practices applications is appeared through IPO display which
stands for Input, Process, and Output. According to the perspective of Gerardine DeSanctis
(1986) late improvements in innovation have made it conceivable to make a continuous
data based, self-benefit and intelligent workplace. Work force Information Systems have
advanced from the robotized worker record keeping from the 1960s into more intricate
announcing and choice frameworks generally 1980.
A Digital HR Practices isn't just PC equipment and programming yet it additionally
incorporates individuals, structures, arrangements and systems and information. Ideal from
labor necessity to vocation way, grievances, worker welfare, up to post retirement in every
last stage the HR office is in terrible need of right, solid, correlated and auspicious data to
take right choice. Digital HR Practices is a device to complete HR activities all the more
effectively and proficiently. Each administrator needs to be auspicious and rectify data to
take right choice. Digital HR Practices causes and help to the HR supervisor to do the HR
undertakings all the more effectively.

International Journal of Management, IT & Engineering Vol. 8 Issue 12(1), December 2018,
ISSN: 2249-0558 Impact Factor: 7.119
Journal Homepage: http://www.ijmra.us, Email: [email protected]
Double-Blind Peer Reviewed Refereed Open Access International Journal - Included in the International
Serial Directories Indexed & Listed at: Ulrich's Periodicals Directory ©, U.S.A., Open J-Gage as well as in
Cabell’s Directories of Publishing Opportunities, U.S.A
394 International Journal of Management, IT & Engineering
http://www.ijmra.us, Email: [email protected]
Fig 2: Digital HR Process Model
Benefits of Digital HR Practices for IT Sector
The accompanying advantages are obtained from the framework: High speed of recovery
and organizing of data, Reduction in duplication of endeavors prompting diminished cost,
Better investigation prompting more powerful choice making, more valid information,
Better work culture, Improved nature of reports, Establishing of streamlined and orderly
procedures, More lucidity in the system, To survive and to be fruitful, an association needs
to hold its upper hand through Digital HR Practices. Digital HR Practices is an instrument
to get required data. Data identified with human asset and their aggressiveness gives
included advantage of legitimate sending of labor. Digital HR Practices helps HR Manager
to take right choice based on status– quo of the association. It is useful to lessen
vulnerability of association about some future occasion or state.
Conclusion
Digital HR Practices frames combination between Human Capital Management (HCM)
and Information Technology (IT). It's an entire arrangement programming for information
passage, information following and information data required by Human Resource works
inside the association. Digital HR Practices speeds up the data gathering process, as well as
more vitally, it arranges for HR office to center on more vital exercises and help the
change of HCM into SHCM. This research endeavors to investigate the degree of
utilization of Digital HR Practices by associations in India and to distinguish the sort of
advantages they are achieving by its usage. In any case, the key aim of this study is to
experimentally investigate the effect of Digital HR Practices on SHCM, so the associations
can be persuaded to utilize Digital HR Practices for investigation reason to change their
HCM to Strategic HCM.

International Journal of Management, IT & Engineering Vol. 8 Issue 12(1), December 2018,
ISSN: 2249-0558 Impact Factor: 7.119
Journal Homepage: http://www.ijmra.us, Email: [email protected]
Double-Blind Peer Reviewed Refereed Open Access International Journal - Included in the International
Serial Directories Indexed & Listed at: Ulrich's Periodicals Directory ©, U.S.A., Open J-Gage as well as in
Cabell’s Directories of Publishing Opportunities, U.S.A
395 International Journal of Management, IT & Engineering
http://www.ijmra.us, Email: [email protected]
References
A.Chamaru De Alwis (2010), Role of HRIS in Improving Modern HR Operations, Review
of Management, Vol. 1, No. 2, April-June 2011, ISSN: 2231-0487.
Alok Mishra, and Ibrahim Akman (2010). “Information Technology in Human Resource
Management: An Empirical Assessment (2010) Public Personnel Management Volume 39
No. 3
Agarwala, T. (2009). Strategic Human Resource Management. New Delhi: Jain Book
Agency.
Carlson (1982). OD and HR” OD Practitioner Vol.42 No.4, 2010.
Carrell, M., Elbert, N. &Hatflied, R. (2006), Human Resource Management in South
Africa. 3rd Edition. London: South-Western.
Carrell, M., Elbert, N., Hatfield, R., Grobler, P., Marx, K. &van de Schyf, S. (1999).
Human Resource Management in South Africa. South Africa: Prentice-Hall Inc.
Gerardine DeSanctis,(March 1986).Human Resource Information Systems- A Current
Assessment”,MIS Quarterly Vol. 10, No.1 (March, 1986), pp. 15-27.
Hendrikson, A. (2003). Human resource information systems: Backbone technology of
contemporary human resources. Journal of Labour Research, 24 (3), p.382.
K.P.Tripathi(2011).Role of MIS in Human Resource, International Journal of Computer
Science and Technology,Vol.2 ,issue 1,2011.
Kavanagh, Gueutal, and Tannenbaum (1990).Human Resource Information System Boston
: PWS Kent.pp.29.
Kovach, K. A. & Cathcart, Jr. CE, (1999). Human Resource Information Systems (HRIS):
Providing Business with Rapid Data Access, Information Exchange and Strategic
Advantage, Public Personnel Management 28(2): 275–282.
Lengnick-Hall Mark and Lengnick-Hall Cynthia A.( 2002). Human Resource Management
in the Knowledge Economy, New Challenge; New Roles; New Capabilities San
Francisco:Berrett-Koehler Publishers.
Martisons, M.G. & Chong, P.K.C. (1999). The influence of human factors and specialist
involvement on information systems success. Human Relations, 52(1), 123-152.
Singh, H.P., et al. (June 2003). Role of Human Resource Information System in Banking
Industry of Developing Countries, International Journal of the Computer, the Internet and
Management, Vol. 19.
Walker, A.J. (1982). HRIS Development: A Project Team Guide to Building an Effective
Personnel Information System”, New York: Van Nostrand Reinhold.

International Journal of Management, IT & Engineering Vol. 8 Issue 12(1), December 2018,
ISSN: 2249-0558 Impact Factor: 7.119
Journal Homepage: http://www.ijmra.us, Email: [email protected]
Double-Blind Peer Reviewed Refereed Open Access International Journal - Included in the International
Serial Directories Indexed & Listed at: Ulrich's Periodicals Directory ©, U.S.A., Open J-Gage as well as in
Cabell’s Directories of Publishing Opportunities, U.S.A
396 International Journal of Management, IT & Engineering
http://www.ijmra.us, Email: [email protected]
Experimental Study On Manufacturing Fired Clay Brick Using
Fly Ash and M-Sand
S. Binil Sundar
Abstract
At present construction usage of clay brick is increased rapidly. For this fired clay brick the
various properties of fly ash bricks with different materials like fly ash and M sand were
tested. In this paper the properties being studied on water absorption, hardness,
efflorescence, soundness, shape and size, crushing strength and basic compressive strength
of the prism were using different mortar mixes normally at ratio of 1: 3, 1: 4 and 1: 5
cement-sand mortars. In general bricks are made by top fertile agricultural soil but by
using fly ash, 28 percent of top fertile agricultural soil is saved. Use of fly ash in brick
making also is beneficial in diverse ways. This paper proves as it is compared to
conventional clay bricks fly ash bricks are stronger, more durable and yet more
economical. Also, the process of fly ash brick manufacturing results in lesser pollution.
Being less permeable as compared to clay bricks dampness related issues are far lesser in
case of fly ash bricks than their clayey counterparts.
Keywords: Brick manufacturing, fly ash, mortar mixes, cement sand mortars.
1. Introduction
Objective of the Project
Now 180 billion tones of common burnt clay bricks are consumed annually approximately
340 billion tones of clay- about 5000 acres of top layer of soil dug out for bricks
manufacture, soil erosion, emission from coal burning or fire woods which causes
deforestation are the serious problems posed by brick industry. The above problems can be
reduced some extent by using fly ash bricks in dwelling units. So to conserve these existing
recourses fly ash and M-sand is added as replacement in fired clay bricks.
Fly Ash
Thermal power plant produces a large amount of waste mainly in the form of powder
which consists of useful chemicals. These chemicals play a key role as a raw material in
many construction materials. So the main objective of the project is to utilize the Fly ash
waste in various construction materials such as brick, concrete…etc. Fly ash waste is
added in such a way that it should not loss in its properties and hence to protect the
environment from pollution.
In India alone, we produce about 75 million tons of fly ash per year, but our utilization of
fly ash is only about 5% of the production. Therefore use of fly ash must be popularised for
more than one reason. The disposal of which has become a serious environmental problem.
The effective utilization of fly ash in building material is therefore, attracting serious
considerations of technologists and government departments.
M-Sand
All along in India we have been using natural sand. Availability of natural sand is getting
depicted. The crusher dust, amounting to 25% of the coarse aggregates produced in stone
Asst Professor – Civil Engineering Department, School of Engineering, KIOT, Wollo University, Kombolcha, Ethiopia

International Journal of Management, IT & Engineering Vol. 8 Issue 12(1), December 2018,
ISSN: 2249-0558 Impact Factor: 7.119
Journal Homepage: http://www.ijmra.us, Email: [email protected]
Double-Blind Peer Reviewed Refereed Open Access International Journal - Included in the International
Serial Directories Indexed & Listed at: Ulrich's Periodicals Directory ©, U.S.A., Open J-Gage as well as in
Cabell’s Directories of Publishing Opportunities, U.S.A
397 International Journal of Management, IT & Engineering
http://www.ijmra.us, Email: [email protected]
crushers which were considered to be waste material facing the solid waste disposal
problem, is being experimented as an alternate to Clay soil for brick and in some
construction work.
Crusher dust considered to be a solid waste material posing a serious disposal problem is
utilized as full replacement material for sand in brick masonry works. Further, the micro
fines below 150 micron size, presenting in the crusher dust are removed by sieving and
micro fine free crusher dust is used as the alternative to sand.
So Far M-Sand has not been used much in India for the reason that ordinarily crushed sand
is flaky badly graded rough textured? For the last about 4 to 5 years the old methods of
manufacturing ordinary crushed sand are been replaced by modern crushers specially
designed for producing, cubical comparatively smooth textured, well graded sand good
enough to replace clay soil.
TABLE 1.1: Grading pattern of M-Sand
I.S. SIEVE
mm
PERCENTAGE PASSING
REMARKS AS PER
ACTUAL
TEST
IS REQUIREMENTS FOR
ZONE I ZONE II
10 100 100 100
FALLING IN
ZONE II
4.75 97.58 90-100 90-100
2.36 82.36 60-95 75-100
1.18 55.27 30-70 55-90
600 40.56 15-34 35-59
300 29.33 5-20 8-30
150 18.78 0-20 0-20
75 10.09 MAX 15 MAX 15
2.1 Characteristics of Fly Ash
The chemical and physical properties of fly ash depend upon many parameters such as coal
quality, type of coal pulverization and combustion process followed nature of ash
collection and disposal technique adopted, etc.
2.2physical Properties
Fly ash is generally gray in colour, abrasive, acidic (in some cases it may be alkaline
depending upon the characteristics of the coal) and refractory in nature. Its specific surface
area varies between 4,000 and 10,000 cm2/g, which is more than cement, which has a
specific surface area of about 3,000 to 3,500 cm2/g. morphologically; flash consists of 3
types of particles – irregularly shaped particles, solid spheres and cenospheres. The fly ash
particles range in size from about 115 microns to about 5 microns. It has unburnt carbon,
cinders; minerals etc. and have pozzolanic characteristics.
2.3 Chemical Composition
Fly ash is known to consist of small spheres of glass of complex chemical composition and
crystalline constituents, which are mainly quartz (SiO2), mullite (3Al2O3.2SiO2), magnetite
(Fe3O4) and haematite (Fe2O3). Except Neyveli flyash, which is high in CaO (5.0 - 16.0 %)
and MgO contents (1.5 – 5.0 %) and low in SiO2 content (45.0 – 59.0 %), the range of
chemical composition of Indian fly ashes is given in Table 2 along with corresponding data
for British and American fly ashes.

International Journal of Management, IT & Engineering Vol. 8 Issue 12(1), December 2018,
ISSN: 2249-0558 Impact Factor: 7.119
Journal Homepage: http://www.ijmra.us, Email: [email protected]
Double-Blind Peer Reviewed Refereed Open Access International Journal - Included in the International
Serial Directories Indexed & Listed at: Ulrich's Periodicals Directory ©, U.S.A., Open J-Gage as well as in
Cabell’s Directories of Publishing Opportunities, U.S.A
398 International Journal of Management, IT & Engineering
http://www.ijmra.us, Email: [email protected]
TABLE 2.1: Chemical composition of fly ash
COMPOSITION INDIAN
FLY ASH
BRITISH FLY
ASH
AMERICAN
FLY ASH
GERMAN
FLY ASH
Silica as SiO2 45 – 65.25 41.5 – 47.8 35 – 52 42.0 - 56.0
Alumina as Al2O3 14 – 31.10 26.4 – 29 15 - 32 24.0 - 33.0
Iron Oxide as Fe2O3 3 – 15.0 9.1 – 13.9 8 - 25 5.4 - 13.0
Calcium Oxide as
CaO 0.1 – 6.5 4.2 – 5.3 0.7 – 8.0 0.6 - 8.3
Magnesium Oxide
as MgO 0.2 – 3.9 1.5 – 1.9 0.3 – 1.5 0.6 - 4.3
Sulphur as SO3 0.4 – 1.8
0.7 – 1.7 0.1 – 2.8 0.1 - 1.9
Loss on Ignition
(LOI) 1 – 11.3 1.7 – 7.3 1.3 – 13.0 0.8 - 5.8
From the above data it can be seen that Indian fly ashes are more siliceous and contain
higher percentage of unburnt carbon as compared to American / German / British fly ashes.
3. The Composition of Brick
It is evident that Fly ash and M-Sand waste have the essential raw material that a brick
should be made. The following chemicals should present in the brick to get a quality brick
Alumina: It is the chief constituent of clay. A good brick should have 20-30 percent of
alumina. This imparts plasticity to the earth.
Silica: It exists in a free or combined form. A good brick earth should contain 50-60
percent of silica. The presence of silica prevents cracking, shrinking, and warping of raw
bricks. It imparts uniform shape to the bricks. The durability of the brick depends upon the
proper proportion of silica.
Lime: Up to 50 percent of lime is desirable in good brick earth. It prevents shrinkage in
raw bricks. Sand alone is infusible, but it fuses at furnace temperature due to the presence
of lime. Brick may melt and lose their shape due to excess of lime content.
Oxides of iron: This gives the red colour to bricks. A small quantity of iron oxide up to 5-
6 percent is desirable.
Magnesia: This imparts yellow tints to brick and it reduces shrinkage.
4. Specimen Test Done On Clay, Fly Ash and M-Sand
4.1 Particle Distribution
Formula used:
1. Cumulative % of retain = cumulative weight
Total weight
2. % of finer =100 –cumulative percentage.
Procedure
• Take the given dry soil of weight 1000 gm.
• Place the sieve as per the order in the sieve with empty pan at the bottom.
• Pour the soil into the given sieve set and fix the sieve set in sieving.
• Allow it to vibrate for 10 mins.
• Calculate the cumulative % retained and % of finer.

International Journal of Management, IT & Engineering Vol. 8 Issue 12(1), December 2018,
ISSN: 2249-0558 Impact Factor: 7.119
Journal Homepage: http://www.ijmra.us, Email: [email protected]
Double-Blind Peer Reviewed Refereed Open Access International Journal - Included in the International
Serial Directories Indexed & Listed at: Ulrich's Periodicals Directory ©, U.S.A., Open J-Gage as well as in
Cabell’s Directories of Publishing Opportunities, U.S.A
399 International Journal of Management, IT & Engineering
http://www.ijmra.us, Email: [email protected]
Tabulation
TABLE 4.1: Particle distribution of clay, fly ash and M-Sand
IS SIEVE SIZE WEIGHT RETAINED(gm)
CLAY FLY ASH M-SAND
4.75 0 - -
2.36 20 - -
1.18 50 - -
0.6 90 - -
0.425 130 - -
0.3 110 - -
0.15 400 8 4
0.075 150 23 46
PAN 50 70 50
TABLE 4.2: Particle distribution of clay
IS SIEVE
SIZE
WEIGHT
RETAINED(gm)
% OF
WEIGHT
RETAINED
CUMULATIVE
PERCENTAGE
OF RETAINED
% OF FINER
4.75 0 0 0 100
2.36 20 2 2 98
1.18 50 5 7 93
0.6 90 9 16 84
0.425 130 13 29 71
0.3 110 11 40 60
0.15 400 40 80 20
0.075 150 15 95 5
Pan 50 5 100 0
4.2 Specific GRAVITY
Formula used
G = w2- w1
(w2-w1)-(w3-w4)
TABLE 4.3: Specific Gravity of Clay, M-Sand and Fly ash
SPECIMEN SPECIFIC GRAVITY
Clay 2.44
M-Sand 2.10
Fly ash 2.08

International Journal of Management, IT & Engineering Vol. 8 Issue 12(1), December 2018,
ISSN: 2249-0558 Impact Factor: 7.119
Journal Homepage: http://www.ijmra.us, Email: [email protected]
Double-Blind Peer Reviewed Refereed Open Access International Journal - Included in the International
Serial Directories Indexed & Listed at: Ulrich's Periodicals Directory ©, U.S.A., Open J-Gage as well as in
Cabell’s Directories of Publishing Opportunities, U.S.A
400 International Journal of Management, IT & Engineering
http://www.ijmra.us, Email: [email protected]
5. Different Phases in Brick Manufacturing
CHART 5.1: Different phases in brick manufacturing
6. Procedure Involved in Manufacturing Of brick With Fly Ash, M-Sand
Input: The raw material necessary for manufacturing of brick was collected near the
thennilai area.
FIGURE 6.1: Raw material for brick
Mining of raw material
Storage of raw materials
Screening of unwanted material
Moulding and shaping of clay
Drying of wet brick
Firing
Finished brick
Adding of water

International Journal of Management, IT & Engineering Vol. 8 Issue 12(1), December 2018,
ISSN: 2249-0558 Impact Factor: 7.119
Journal Homepage: http://www.ijmra.us, Email: [email protected]
Double-Blind Peer Reviewed Refereed Open Access International Journal - Included in the International
Serial Directories Indexed & Listed at: Ulrich's Periodicals Directory ©, U.S.A., Open J-Gage as well as in
Cabell’s Directories of Publishing Opportunities, U.S.A
401 International Journal of Management, IT & Engineering
http://www.ijmra.us, Email: [email protected]
Screening of unwanted materials: Usually clay is the naturally occurring raw material, so
it consists of many unwanted materials such as plant roots, stones of various sizes. This
should be removed in order to get the quality brick.
Mixing of Fly Ash and M-Sand (On separate bricks): The Material arising from the
Thermal power plant was to be in power manner
Mixing of clay with Materials in various proportions: As said earlier a brick needs
approximately 4 kg (4000g) of raw materials. The material should be added in different
levels so that when testing of brick, we would arrive at a conclusion, at what proposition
the brick shows good strength without losing its properties.
Fly ash is mixed in three different ratios such as 20%, 30%, 40%.
M-Sand in single ratio 20% and remaining sand respectively, the following tabular column
would explain the procedure of adding Material...
7. Test Methods to Ensure the Quality of Bricks as Per BIS
The Material added bricks should be tested to know the quality of bricks. Bureau of Indian
standards prescribe some standard tests to ensure the quality of the brick. It comes under
the title of “Indian standard common burnt clay bricks-specification” (fifth revision).
Standard no- IS1077:1992
Scope of this standard: This standard lays down requirements for general quality,
physical requirements of common burnt clay building bricks.
General quality: As per this standard it lays down some requirements for quality
• Bricks shall be hand moulded or machine moulded and shall be made from suitable
soils.
• They shall be free from flaws, cracks and nodules of free time.
7.1 Physical Requirements:
7.1.1 Compressive Strength Test: The bricks when tested in accordance with the
procedure lay in IS 3495(part 1):1992 shall have a minimum average compressive strength
of 3.5 N/mm2 or 35 Kgf/cm2. The compressive strength of any individual brick tested shall
not follow the minimum compressive strength specified.
Formula: σ = F\A.
7.1.2 Water Absorption Test: The bricks, when tested in accordance with the procedure
lay down in IS 3495(part 2):1992, after immersion in cold water for 24 hours, water
absorption shall not be more than 20 percent by weight.
Formula
% of water absorption = (Wet weight of the brick – dry weight of the brick)*100
Dry weight of the brick
7.2 Details of the Bricks
7.2.1 Weight of the bricks: This table shows the weight of waste incorporated brick
TABLE 7.1: Weight of bricks
REPLACEMENT CLAY(kg) FLY ASH(kg) M-SAND(kg) TOTAL
(kg)
20% OF FLY ASH(5
bricks) 16 4 - 20
30% OF FLY ASH(5
bricks) 14 6 - 20
40% OF FLY ASH(5
bricks) 12 8 - 20
20% OF M-SAND(5
bricks) 16 - 4 20

International Journal of Management, IT & Engineering Vol. 8 Issue 12(1), December 2018,
ISSN: 2249-0558 Impact Factor: 7.119
Journal Homepage: http://www.ijmra.us, Email: [email protected]
Double-Blind Peer Reviewed Refereed Open Access International Journal - Included in the International
Serial Directories Indexed & Listed at: Ulrich's Periodicals Directory ©, U.S.A., Open J-Gage as well as in
Cabell’s Directories of Publishing Opportunities, U.S.A
402 International Journal of Management, IT & Engineering
http://www.ijmra.us, Email: [email protected]
7.2.2 Number of Bricks Made For Testing
For compression strength test: The following table shows the no of brick made for
compression strength test
TABLE 7.2: Number of bricks for compressive strength test
TYPE OF BRICK NO OF BRICKS MADE
Raw brick 2
20% OF FLY ASH 2
30% OF FLY ASH 2
40% OF FLY ASH 2
20% OF M-SAND 2
Total no of bricks 10
7.2.3 WATER ABSORPTION TEST: The following table shows the no of brick made
for water absorption test
TABLE 7.3: Number of bricks for water absorption test
TYPE OF BRICK NO OF BRICKS MADE
Raw brick 2
20% OF FLY ASH 2
30% OF FLY ASH 2
40% OF FLY ASH 2
20% OF M-SAND 2
Total no of bricks 10
7.3 Compression Strength Test Results Of Brick: The value of the compression strength
should not be lesser than 3.5 N /mm2
Dimensions of brick: The following table gives the details about the dimensions of the
brick
TABLE 7.4: Dimensions of bricks
TYPE OF
BRICK:
BRICK
NO.
LENGTH
IN (mm)
BREADTH IN
(mm)
DEPTH IN
(mm)
AREA IN
mm2.
Raw brick 1 215 98 82 21070
2 218 95 85 26710
20 % fly ash
incorporated
brick.
3 200 89 81 17800
4 198 91 81 18018
30 % fly ash
incorporated
brick.
5 202 92 80 18584
6 201 92 85 18492
40 % fly ash
incorporated
brick
7 192 93 83 17856
8 195 91 85 17745
20 % M-Sand
incorporated
brick.
9 197 94 82 18518
10 198 95 80 18810

International Journal of Management, IT & Engineering Vol. 8 Issue 12(1), December 2018,
ISSN: 2249-0558 Impact Factor: 7.119
Journal Homepage: http://www.ijmra.us, Email: [email protected]
Double-Blind Peer Reviewed Refereed Open Access International Journal - Included in the International
Serial Directories Indexed & Listed at: Ulrich's Periodicals Directory ©, U.S.A., Open J-Gage as well as in
Cabell’s Directories of Publishing Opportunities, U.S.A
403 International Journal of Management, IT & Engineering
http://www.ijmra.us, Email: [email protected]
7.4 Water Absorption Test Result for Brick
7.4.1 Initial Weight of The Brick: This table shows the weight of waste incorporated
brick
TABLE 7.6: Initial weight of bricks
TYPE OF BRICK: BRICK NO. WEIGHT OF THE
BRICK IN kg
Raw brick 1 3.34
2 3.39
20 % fly ash incorporated
brick.
3 2.930
4 3.050
30 % fly ash incorporated
brick.
5 2.740
6 2.905
40 % fly ash incorporated
brick
7 3.03
8 3.154
20 % M-Sand incorporated
brick.
9 2.810
10 2.91
7.4.2 Increase in Weight Percentage: This table gives the increase in weight percentage
of the waste incorporated brick
TABLE 7.7: Increase in brick weight
TYPE OF
BRICK:
BRICK
NO.
INITIAL
WEIGHT OF
THE BRICK
IN KG.
A
WEIGHT OF THE
BRICK AFTER
IMMERSING IN
WATER AFTER THE
PERIOD OF 24 HRS
IN KG.
B
INCREASE IN
WEIGHT
PERCENTAGE IS
GIVEN BY
(B-A)/A * 100
Raw brick 1 2.78 3.34 20.14
2 2.825 3.39 20
20 % fly ash
incorporated
brick.
3 2.6 2.930 12.69
4 2.7 3.050 12.96
30 % fly ash
incorporated
brick.
5 2.41 2.740 13.69
6 2.6 2.905 11.73
40 % fly ash
incorporated
brick
7 2.67 3.03 13.48
8 2.85 3.154 10.6
20 % M-Sand
incorporated
brick.
9 2.49 2.810 12.8
10 2.77 2.91 5.05
7.5 Result and Discussion
It is found that 40% fly ash waste added brick possess the 5.32 N/mm2 compressive
strength and 13.48% water absorption. This value satisfies the BIS standard data hence no
loss in its properties. The test result shows the 40 % waste incorporated brick possess the
value of 5.32N/mm2 having the good margin from the 3.5 N/mm2 so using the 40 % fly ash

International Journal of Management, IT & Engineering Vol. 8 Issue 12(1), December 2018,
ISSN: 2249-0558 Impact Factor: 7.119
Journal Homepage: http://www.ijmra.us, Email: [email protected]
Double-Blind Peer Reviewed Refereed Open Access International Journal - Included in the International
Serial Directories Indexed & Listed at: Ulrich's Periodicals Directory ©, U.S.A., Open J-Gage as well as in
Cabell’s Directories of Publishing Opportunities, U.S.A
404 International Journal of Management, IT & Engineering
http://www.ijmra.us, Email: [email protected]
waste incorporated brick will be good enough to use in the construction. The test results
shows 20 % M-Sand waste incorporated brick shows the marginal value when it is
compared to the raw brick and 40 % fly ash waste incorporated brick. It has the average
value of 3.8 N/ mm2. The test results of 30 % fly ash waste incorporated bricks shows the
less value such as average value of 4.42 N/ mm2 when it is compared to the raw and 40 %
fly ash waste incorporated brick.
The both 50% and more fly ash waste incorporated bricks not suitable for conducting the
test hence it indirectly says these waste incorporated brick won’t be useful for using in
construction. The water absorption test results of raw and 40% fly ash waste incorporated
brick have the value of 10.985 and 13.48 % of its total weight. While 20% of M-Sand
waste incorporated brick shows the value of 12.8 %. The 30 % waste incorporated brick
have the water absorption value of more than 20% though it posses the compressive
strength value of more than 3.5 N.mm2. Hence 30 % waste incorporated wont acts as
supportive material for construction.
8. Conclusion
The waste incorporated bricks were tested as per the Bureau of Indian standard (BIS)
prescribed, the results were taken for analyze the behaviour of the waste incorporated
bricks.
It is evident that a good brick should possess the value of 3.5 N/ mm2 compressive strength
and its percentage of water absorbed should not be more than 20 percent of its weight as
per BIS.
Hence in combination of two results the best suitable value for adding waste in
construction products will be 40%.Though 30% fly ash waste incorporated brick have
compressive strength value greater than 3.5N/mm2, it fails in water absorption test (possess
greater than the 20% increase in weight).
9. References
1. Dass. Mohan, "New Substitutes of Bricks", Civil Engineering and Construction,
June 1992, PP22.
2. Gupta P. C. and Ray S. C., "Commercialisation of Fly ash", The Indian Concrete
Journal vol- 167, now. 1993, PP 554-560.
3. IS: 1077-1992 Specification for common Burnt Clay Building Bricks (Fifth
revision).
4. IS: 1905-1987 Code of Practice for Structural use of Unreinforced Masonry (Third
revision)
5. IS: 2117-1975 Guide for Manufacture of Hand- Made Common Burnt Clay
Building Bricks (Second Revision).
6. Lal. A. K., "Alternate Building Material for low cost housing, "Civil Engineering
and Construction, Aug 1991, PP22.
7. S.C. Rangwala, Engineering Materials, (Fifteenth Edition), 1991, PP 72 - 112. 8.
Dr. Durgesh C Rail, "Review of design Codes for Masonry Buildings", Department
of Civil Engineering, Indian Institute of Technology, Kanpur.

International Journal of Management, IT & Engineering Vol. 8 Issue 12(1), December 2018,
ISSN: 2249-0558 Impact Factor: 7.119
Journal Homepage: http://www.ijmra.us, Email: [email protected]
Double-Blind Peer Reviewed Refereed Open Access International Journal - Included in the International
Serial Directories Indexed & Listed at: Ulrich's Periodicals Directory ©, U.S.A., Open J-Gage as well as in
Cabell’s Directories of Publishing Opportunities, U.S.A
405 International Journal of Management, IT & Engineering
http://www.ijmra.us, Email: [email protected]
Ethiopian Trade Balance:- An ARDL Approach
Dr. Akshaya Kumar Mohanty (Ph.D. ; M.Phil. ; M.A. ; L.L.B. ; Q.I.P. &
F.D.P. )
Abstract
Trade balance is one core component of gross domestic products of countries especially in
the present times in which every nation have liberalization of their economies. For instance
Ethiopia is running with a negative trade balance for the last three decades impling that
export of the country could not cover the import expenditure. This study tries to identify
the main determinants of the trade balance in Ethiopia from 1981-2017 by considering
ratio of export and import as an approximation to trade balance. The Autoregressive
Distributed Lag under Bounds test approach to co-integration was used for the estimation.
Further, the study employed the variance decomposition and impulse response functions to
investigate the dynamic simulations of the variables included in the estimated model. The
results show evidence of an equilibrium long-run relationship (co integration) between
trade balance, real effective exchange rate, trade openness, money supply, government
consumption expenditure, household consumption expenditure and agricultural growth
rate. The study finds that in the long-run increasing levels of real effective exchange rate
(depreciation of birr), money supply, government consumption expenditure and household
consumption expenditure worsens Ethiopia’s trade balance. Trade openness and
agricultural growth rate were insignificant in the long-run. The short-run result also shows
that real effective exchange rate and household consumption expenditure cause a decline
trade balance whilst trade openness improve trade balance in Ethiopia at 10% level of
significant. Money supply and agricultural growth rate were insignificant in the short-run.
The long-run and short-run effects of exchange rate on the trade balance show the absence
of the Marshall-Lerner condition and the J-curve effect in Ethiopia. Further the variance
decomposition results show that innovations in trade openness highly contributed to the
forecast error of Ethiopia’s trade balance as compared to other explanatory variables.
Keywords:- Trade ; Bound Test ; Ardl ; Co integration ; IRF.
1. Introduction
In the recent year, international trade becomes more important in every economy and there
are many problems that all the multinational enterprises must face. Deep rooted structural
problems, weak policy frameworks and institutions, protection at home and abroad (IMF
and World Bank, 2001), and the structure of African exports, which is characterized by
dependence on primary commodities (UNCTAD, 2008) are considered as the reasons for
Africa‘s poor export performance. Moreover, after the downfall of the Dreg regime, the
transitional Government of Ethiopia stated that it is essential to increase and diversify
exports. In response to the problem, Ethiopia has taken different measures such as export
financing incentive schemes, export trade duty incentive scheme and duty free importation
Associate Professor Of Economics, Department Of Economics , Ethiopian Civil Service University, Post Box No: 5648,
Addis Ababa, Ethiopia

International Journal of Management, IT & Engineering Vol. 8 Issue 12(1), December 2018,
ISSN: 2249-0558 Impact Factor: 7.119
Journal Homepage: http://www.ijmra.us, Email: [email protected]
Double-Blind Peer Reviewed Refereed Open Access International Journal - Included in the International
Serial Directories Indexed & Listed at: Ulrich's Periodicals Directory ©, U.S.A., Open J-Gage as well as in
Cabell’s Directories of Publishing Opportunities, U.S.A
406 International Journal of Management, IT & Engineering
http://www.ijmra.us, Email: [email protected]
scheme to those wholly, engaged in supplying their products to foreign markets (Yishak,
2009).
Generally, even if different trade strategies have been used in the past, including import
replacement/protection for infant Industries during the Imperial period, state-managed
trade during the military government era, and a more market -oriented liberalized approach
supported by much trade-related technical assistance in the most recent period.
Nonetheless, Ethiopia has a low share of trade in GDP, its exports continue to have limited
diversification, and its trade deficit has widened significantly, leaving the country
dependent on financial assistance to pay its import bill (Ciurak and Previle, 2010).
Therefore, Ethiopia’s trade balance with its major trading partners calls for concern
because such a wide and growing gap between the value of exports and imports of a
country means that the country continues to need other sources of financing to its import
demand such as foreign aid and credit; and needs there sources at an increasing rate
(MOFA, 2007).
Ethiopia is among the least developed countries where the economy is primarily
agriculture based and quite backward. The rudimentary stage of industrial growth
combined with the traditional style of farming force the people to depend on the gifts of
nature for their livelihood and the country has chronically run a negative balance of trade,
rendering the country dependent upon foreign aid and loans to finance imports. Ethiopia
suffers from a disproportionate loss of revenue and resultant dependence on its trade links
with the rich nations due to the country is a producer of primary products, used as raw
materials in the industries of rich nations and for which it is paid very poorly.
Limited diversification on export to finance imports becomes stable through time and in
contrast its import sharply increased over time. Ethiopian trade deficit is highly widened
after 1993 and increase sharply through time as shown in the figure.
The Ethiopian Foreign trade sector is unable to play most of its major role in the
development process of the country. This study, therefore, intended to deal with those
factors that determine the countries trade balance.
2. Objective of the study
To investigate the relationships between Ethiopian trade balance and its Macro-economic
determinants
To investigate how Ethiopian’s trade balance responds to innovations (shocks) in its
determinants.
3. Review of Literature
Rose and Yellen (1989) investigate the J-curve hypothesis on both bilateral and aggregate
American data using co-integration techniques and find no statistical reliable evidence of
the hypothesis. Their study employs the co-integration analysis on quarterly data from the
US and other OECD countries spanning from 1960:1 to 1985:3.
Using co-integration techniques on monthly data spanning from 1974 to 1986, Rose (1991)
investigates the empirical relationship between real exchange rate and real aggregated
trade balance for five major Organization for Economic Cooperation and Development
(OECD) countries (UK, Canada, Germany, Japan, and US) and finds that, exchange rate is
a statistically significant determinant of trade balance. The study further finds evidence of
the Marshall-Lerner condition.
Mohammad (2010) explores the principal factors of Pakistan’s trade balance using the
Johansen co integration approach and error correction model during 1975 to 2008 and

International Journal of Management, IT & Engineering Vol. 8 Issue 12(1), December 2018,
ISSN: 2249-0558 Impact Factor: 7.119
Journal Homepage: http://www.ijmra.us, Email: [email protected]
Double-Blind Peer Reviewed Refereed Open Access International Journal - Included in the International
Serial Directories Indexed & Listed at: Ulrich's Periodicals Directory ©, U.S.A., Open J-Gage as well as in
Cabell’s Directories of Publishing Opportunities, U.S.A
407 International Journal of Management, IT & Engineering
http://www.ijmra.us, Email: [email protected]
found that, foreign income, foreign direct investment, inflation, domestic household
consumption and real effective exchange rate significantly affect Pakistan’s trade balance.
More specifically, the researcher found that foreign income, foreign direct investment and
exchange rate had a positive effect on trade balance in Pakistan whereas inflation and
domestic household consumption impacted negatively in the long-run. In the short-run,
except for foreign income and inflation, all other variables had similar results as in the
long-run. Foreign income had a negative but insignificant relationship with trade balance
whilst the coefficient of inflation was positive but insignificant in the short-run.
Nienga (2010) investigated the determinants of trade balance from 1920 to 2010 in Kenya.
He proposed that, real exchange rate, government consumption expenditure, domestic
income and money supply (M3) were the main significant factors affecting Kenya’s trade
balance. The researcher employed OLS and found that real exchange rate and domestic
income had a positive effect on Kenya’s trade balance whilst government consumption
expenditure and money supply had a negative effect.
Petrovic and Gligoric (2010) employs both the Johansen co-integration and ARDL
approach to co-integration to investigate the impact of exchange rate on trade balance over
the period 1980 to 2008 in Serbia. The results showed that in the long-run exchange rate
depreciation improves the trade balance in Serbia and further confirms the J-curve pattern
in the short-run and long-run results.
Korap et al (2011) using ARDL bounds testing estimation techniques on data spanning
from 1990:Q1-2007:Q3 in Turkey found that, as real exchange rate depreciate it improves
the Turkish trade balance. The study further found that trade balance is negatively affected
by domestic real income and positively affected by foreign income in the long-run. The
researchers further observed that, there was no significant effect of crude oil prices on
trade balance in the case of Turkey. In the short-run, foreign income was found to have a
negative but insignificant relationship with trade balance.
Sarbapiya (2012) employs various econometric techniques and tools including Augmented
Dickey-Fuller (ADF), Johansen co-integration, vector error correction models (VECM)
and OLS to observe the long and short run trade behaviour for India over the period of
1973 to 2011. The results of the analysis suggest that there is a long run as well as short
run causality among inflation, exchange rate, FDI, household consumption and foreign
income. Foreign income and FDI had a significant positive impact on balance of trade
whilst household consumption and inflation and exchange rate impacted negatively on the
balance of trade in the long-run. The short-run results were found to be similar to that of
the long-run.
Shawa and Shen (2013) by employing the OLS estimator on data from a period of 1980 to
2012, finds that the main influencing factors of Tanzania’s trade balance include, foreign
direct investment, human capital development, real exchange rate, household consumption
expenditure, government consumption, inflation, natural resource availability, foreign
income and trade liberalization. The study found that household consumption expenditure,
government consumption expenditure, inflation and real exchange rate had a negative
effect on trade balance, hence causing deterioration while foreign direct investment, human
capital development, natural resource availability, foreign income and trade liberalization
had a positive effect, hence improving Tanzania’s trade balance.
Kayhan et al (2013) using quarterly data for the period 1987Q1–2011Q3 employed the
bootstrap process based on the Toda-Yamamoto causality and frequency domain analysis

International Journal of Management, IT & Engineering Vol. 8 Issue 12(1), December 2018,
ISSN: 2249-0558 Impact Factor: 7.119
Journal Homepage: http://www.ijmra.us, Email: [email protected]
Double-Blind Peer Reviewed Refereed Open Access International Journal - Included in the International
Serial Directories Indexed & Listed at: Ulrich's Periodicals Directory ©, U.S.A., Open J-Gage as well as in
Cabell’s Directories of Publishing Opportunities, U.S.A
408 International Journal of Management, IT & Engineering
http://www.ijmra.us, Email: [email protected]
methods and obtained a bi-directional causality between trade deficits and government
expenditure in Turkey. Contrary to the Toda-Yamamoto causality analysis, the frequency
domain causality analysis finds, the causality running from government expenditure to
trade deficit exists in the short run or medium term whilst a causal relationship runs from
trade deficit and government expenditure in both the long-run and the short-run. In light of
the literature and theoretical frameworks, the study implied that, reduction in government
expenditures will successfully reduce trade deficits.
Sulaiman and Abdul-Rahim (2014) tests the j-curve pattern on Thailand’s trade in forest
products with the rest of the world. The study employs the Bounds Test within the ARDL
framework on data spanning from 1970 to 2010. The study also assesses the short-run and
long-run dynamics of Thailand’s trade balance and various determinants. The results of the
study showed the absence of the J-curve pattern in Thailand’s trade in forest products. The
long-run results showed that, Thailand’s national income improved its trade balance whilst,
foreign income, exchange rate and forest policy caused trade balance to deteriorate. In the
short-run Thailand’s national income was found to have a positive and significant impact
on trade balance. The impact of foreign income, exchange rate and forest policy were
however statistically insignificant in the short-run.
Turkay (2014) employs the Johansen co-integration and error correction model on annual
time series data spanning from 1980 to 2012 to test the validity of the Marshall-Lerner
condition in Turkey. The study confirms the validity of the Marshall-Lerner condition in
Turkey in the long-run. However, the short-run results show that exchange rate had an
insignificant relationship with Turkey’s trade balance.
Tutueanu (2015) examines the J-curve effect on international trade in Romanian forest
products. The study employs the Bounds testing approach within the ARDL framework on
annual time series data spanning from 1990 to 2014. The results of the study showed the
absence of the j-curve pattern for the trade balance of forest products. The results further
showed that in the long-run Romanian’s national income and world income had a positive
and significant impact on the trade balance of forest products in Romanian.
Varga (2015) analyses the impact of the agricultural sector on the employment and foreign
trade balance in Hungary. The study employs descriptive analysis on data spanning from
2004 to 2014. The results showed that over the sample period, the agricultural sector was
the second largest contributor to exports and has improved Hungary’s trade balance year
after year. Again the share of agriculture is higher in exports than in imports of Hungary,
hence causing a significant improvement in Hungary’s trade balance.
Gobe (2015) examine the short and long-run relationship between the trade balance,
income, money supply, and real exchange rate in the case of Ethiopian economy. The
bounds testing approach to co integration and error correction models, developed within an
autoregressive distributed lag (ARDL) framework is applied to annual data for the period
1979/80 to 2012/13. Additionally, variance decompositions (VDCs) are used to draw
further inferences. The result of the bounds test indicates that there is a stable long-run
relationship between the trade balance and income, money supply, and exchange rate
variables. The estimated results show that the coefficient of the real exchange rate variable
is positive and statistically significant at a 10 percent level confirming the hypothesis that
real depreciation succeeds in improving trade balance of Ethiopia in the long run.
Similarly, The coefficients of money supply and income positive and statistically
significant at 1and 5 percent level it provides that money supply and income play a strong

International Journal of Management, IT & Engineering Vol. 8 Issue 12(1), December 2018,
ISSN: 2249-0558 Impact Factor: 7.119
Journal Homepage: http://www.ijmra.us, Email: [email protected]
Double-Blind Peer Reviewed Refereed Open Access International Journal - Included in the International
Serial Directories Indexed & Listed at: Ulrich's Periodicals Directory ©, U.S.A., Open J-Gage as well as in
Cabell’s Directories of Publishing Opportunities, U.S.A
409 International Journal of Management, IT & Engineering
http://www.ijmra.us, Email: [email protected]
role in determining the behavior of the trade balance. The error correction model result
indicates all of the coefficients of variables are statistically insignificance. This implies that
all variables do not affect trade balance in the short run. Based on the coefficients of the
variables statistically significant level exchange rate policy can help improve the trade
balance but it will have a weaker influence than economic growth and monetary policy.
Bantegizie and Dawit (2017) examine the short and long-run determinants of trade balance
in the case of Ethiopia‘s economy for the period 1978 to 2009. In order to achieve the
stated objectives a synthesis model of absorption, elasticity and monetary approaches to
trade balance is estimated using Engle- Granger two step procedures of co-integration and
general to specific error correction model. The findings of the study suggest that the most
important long run determinants of trade balance are household consumption expenditure,
real effective exchange rate and terms of trade while government consumption
expenditure, house hold consumption expenditure, real effective exchange rate and terms
of trade are the short run determinants of trade balance. Based on the findings of this study
the researcher recommended raising import tariff on final consumer goods , expand
industrial base, increase domestic saving to finance domestic investment, depreciation or
devaluation of birr and improving the quality of domestic products to solve the trade
imbalance.
4. Methodology
The study uses the annual (secondary) time series data covering the period between 1981-
2017. This period has been chosen because data are to be used in the trade balance function
that has been available. All the data have drawn from the National Bank of Ethiopia (NBE)
and Ministry of Finance and Economic Development (MoFED), unless otherwise from
International Financial Statistics Year Book, world development indicators (WDI), World
Bank (WB) and publications and websites.
After the data has collected following the researcher analyzed by using regression method
of analysis. The study adopts ARDL model in order to assess the short run and long-run
relationship between the dependent and independent variables. Multiple regression analysis
was also applied to test the association of among Variables and the extent of variance in
the dependent variable as a result of a unit change in independent variables. Eviews-10 has
been used for the analysis of the data because it is the most convenient for time series
analysis than STATA and SPSS. The data is presented by using graphs and tables.
The study adopts the imperfect substitute model of international trade of Goldstein and
Khan (1985), Rose and Yellen (1989) and Rose, (1991) where a reduced form of trade
balance is developed.
Regarding the estimation strategy, the study follows three steps: i) the test of stationarity of
the individual series in the regression model or otherwise to determine the order of
integration of the variables, ii) the test of the existence of a stable long-run equilibrium
relationship among the variables in the model, iii) the estimation of the parameters of the
model, iv) estimating the variance decomposition and impulse response functions.and v)
finally conducting the Diagnostic Tests.

International Journal of Management, IT & Engineering Vol. 8 Issue 12(1), December 2018,
ISSN: 2249-0558 Impact Factor: 7.119
Journal Homepage: http://www.ijmra.us, Email: [email protected]
Double-Blind Peer Reviewed Refereed Open Access International Journal - Included in the International
Serial Directories Indexed & Listed at: Ulrich's Periodicals Directory ©, U.S.A., Open J-Gage as well as in
Cabell’s Directories of Publishing Opportunities, U.S.A
410 International Journal of Management, IT & Engineering
http://www.ijmra.us, Email: [email protected]
5. Result Analysis
5.1 Unit Root Test
In order to ensure that there is a strong no evidence of unit root or otherwise having
stationarity in individual series; the study employs the Augmented Dickey-Fuller (ADF)
tests as seen in table 1.
Table. 1 Augmented Dickey-Fuller test
Stationary at Level
Stationary at First Difference
Variable
constant
Constant and trend
constant
Constant and trend
TB
-2.124477
-3431679
-6.201106***
-6.134624***
REER
-1.920712
-2.153650
-5.081975***
-5.058928***
GC
-2.646816 -2.729327
-4.648858***
-4.571335***
HC
-2.235597
-2.058532
-7130497***
-7.176050***
MS
-2.681339
-4.052559
-5.350336*** -5.615103***
OP
-1.335682
-0.777317
-4.525930***
--4.585349***
AG
-5.558973***
-7.137586***
_____
_____
Not e: *** and ** denotes significance at 1% and 5% respectively
Source: Eviews-10 calculation
The ADF test result (see Table.1) shows that, for the model with only constant and no
trend, Agricultural Growth (Ag ) is integrated of order zero, at 1% level of significant thus
I(0) level of significance. At first difference and with regards to the same model (constant
and no trend), trade balance (TB),real effective exchange rate (REER), government
consumption expenditure (GC), household consumption expenditure (HC), money supply
(MS) and trade openness (OP)are integrated of order one [I(1)] at 1%level of significant.
Again, for the model with both constant and trend at the levels Ag is integrated order zero,
I (0) at 1% significance level. At first difference; TB, REER, MS, GC, HC and OP are
significant at 1% hence are integrated of order one, I (1). The results obtained in
Augmented Dickey Fuller tests (ADF tests) show mix results in terms of the order of
integration of the variables. In other words the underlying series of the variables in the
study are integrated of order zero I(0) and order one I(1) hence offering support for the use
of ARDL bounds test to co integration. This implies that all the variables were found to be
mean reverting.
5.2. Co integration Test
The results are presented in Table .2. The ARDL model (1, 2, 3, 2, 0, 3, 3) selection was
based on the akaika information criterion (AIC). The result in Table 4.2 shows that there
exists a stable long-run relationship among the variables. The computed F-statistics of the
bound test 4.95 is larger than the upper bound critical value of 3.96 at 5% level of
significance. In this case the null hypothesis of no cointegration is rejected implying that
there is a stable long-run equilibrium relationship among the variables (co integration).
This implies that there is a long-run relationship among the variables included in estimated
model.

International Journal of Management, IT & Engineering Vol. 8 Issue 12(1), December 2018,
ISSN: 2249-0558 Impact Factor: 7.119
Journal Homepage: http://www.ijmra.us, Email: [email protected]
Double-Blind Peer Reviewed Refereed Open Access International Journal - Included in the International
Serial Directories Indexed & Listed at: Ulrich's Periodicals Directory ©, U.S.A., Open J-Gage as well as in
Cabell’s Directories of Publishing Opportunities, U.S.A
411 International Journal of Management, IT & Engineering
http://www.ijmra.us, Email: [email protected]
Table. 2: Results of Co integration relationship (Bound test)
Critical Values
Computed F-statistic 95% Lower Bound 95% Upper Bound
4.952307** 2.69 3.96
Note: ** means that the null hypothesis of no long-run equilibrium (no co-integration) is
rejected at 5% level of significance.
Source: Eviews-10 calculation
5.3. Long-run Relationship between Exchange rate and Trade Balances in Ethiopia
The results shown in Table.3 states that, in the long-run there is a negative relationship
between exchange rate and the trade balance. This dissatisfies the a-prior expectation of the
coefficient of the exchange rate variable. It shows that a one percent increase in the
exchange rate (i.e. a depreciation) worsen the trade balance in the long-run. Specifically, a
unit increase in the exchange rate will worsen trade balance by 0.148 units in the long-run.
Even though the variable we obtain is significant, the result obtained shows a negative
relationship between the exchange rate and the trade balance in the long-run result suggests
the absence of the Marshall-Lerner condition. In the same way, since the long-run
coefficient of the exchange rate variable negative and significant, it can be concluded that
there is absence of the J-curve pattern.
In both cases neither conditions of the long-run are satisfied. This is not surprising because,
Ethiopia’s export sector is mainly dominated by agricultural products with a large
percentage being raw materials and semi-processed products such as coffee, oilseeds,
flowers and live animals and animal products, while its imports are highly dominated by
capital intensive goods as well as finished goods such as petroleum products, machines and
equipments. This may be attributed to the fact that export products are of low quality, and
also because they are only agro-based products which have high perishability risk.
Therefore currency depreciation might not necessarily cause an improvement in the
country’s trade balance if exports are elastic and imports are inelastic.
Table. 3 Estimated Long-run
ARDL (1, 2, 3, 2, 0, 3, 3,) selected based on AIC Dependent Variable: TB
Variable Coefficient Std. Error t-Statistic Prob.
REER -0.148554 0.031414 -4.728854 0.0004
OP -0.160231 0.254950 -0.628482 0.5406
MS -1.304498 0.244583 -5.333552 0.0001
GC -2.489661 0.640049 -3.889794 0.0019
HC -2.027651 0.596821 -3.397420 0.0048
AG 0.254338 0.244258 1.041266 0.3167
C 2.673099 0.475263 5.624467 0.0001
Source: Eviews-10 calculation
Again another reason that might contribute to the negative and significant result obtained is
that though the domestic currency (Ethiopian Birr) has persistently depreciated against
major trading currencies such as the Dollar, the Euro and the Pound over the years, there
are still relatively high volumes of foreign goods on the domestic market. This may be
attributed to various reasons including; i) most domestic producers use foreign goods as

International Journal of Management, IT & Engineering Vol. 8 Issue 12(1), December 2018,
ISSN: 2249-0558 Impact Factor: 7.119
Journal Homepage: http://www.ijmra.us, Email: [email protected]
Double-Blind Peer Reviewed Refereed Open Access International Journal - Included in the International
Serial Directories Indexed & Listed at: Ulrich's Periodicals Directory ©, U.S.A., Open J-Gage as well as in
Cabell’s Directories of Publishing Opportunities, U.S.A
412 International Journal of Management, IT & Engineering
http://www.ijmra.us, Email: [email protected]
primary inputs in their production processes; and ii) most consumers have relatively high
preference for foreign goods than domestic ones.
5.4. Long-run Relationship between Macroeconomic determinants and Trade Balance in
Ethiopia
More specifically in the long-run a unit increase in the money supply causes deterioration
in the trade balance by approximately 1.30 units. Again, the negative and significant result
obtained is not surprising since over the years money supply has continually expanded at a
measured pace (NBE, 2017).
The coefficient of household consumption expenditure has a negative and statistically
significant relationship with the trade balance in the long-run confirming the a-prior
expectation. That is, in the long-run a one percent increase in household consumption
expenditure causes deterioration in the country’s trade balance. Specifically, a unit increase
in individuals’ consumption expenditure causes approximately -2.03 unit deterioration in
Ethiopia’s trade balance at 1% level of significance. The negative relationship between the
country’s trade balance and household consumption expenditure is not surprising because
consumption of goods comprises of both domestic and foreign products, hence an increase
in the consumption expenditure of local residents increase the demand for both domestic
and foreign goods.
Again, the result is strongly supported by the fact that Ethiopians have a high taste and
preference for foreign goods and as such most goods found on the Ethiopian consumer
shelf mainly constitutes foreign goods. Foreign products including cars, second-hand
goods, petroleum product, electronic equipment and so forth dominate the domestic
market. This is so because such goods are not produced locally and hence their high
demand is offset by importations from foreign countries. In addition, though few of such
goods are produced locally, their volumes and quality are unable to meet consumers’
preferred demand, thereby causing a lot of substitution of the locally produced goods hence
worsening the country’s trade balance position.
Regarding the long-run coefficient of government consumption expenditure, the result
shows a negative and significant relationship between government consumption
expenditure and the trade balance. This implies that a one percent increase in government
consumption expenditure leads to deterioration in the trade balance by approximately -2.49
units at one percent significance level in the long-run. This is consistent with a-prior
expectations. Government consumption expenditure constitutes two-folds; expenditure is
either on domestic goods or foreign goods. Hence an increase in government consumption
expenditure may either be diverted to domestic goods or foreign goods. Again,
expenditures by the government can either be diverted into productive ventures such as
investing in productive sectors in order to promote exports or non-productive areas such as
the purchase of luxury cars, military goods, machines and equipment, mostly not produced
domestically. Therefore, deterioration in trade balance may imply that, government spends
more in non-productive sectors than diverting funds into productive ventures. This might
be the case considering the fact that a chunk of government consumption expenditure is
diverted to the provision of inputs for public goods including road construction, health
care, education and agriculture. Since these inputs for such public goods are not produced
domestically, the country relies on foreign substitutes.
The coefficient of the Trade Openness indicated a negative relationship with the trade
balance in the long-run but it affect insignificantly. A unit increase in Trade Openness

International Journal of Management, IT & Engineering Vol. 8 Issue 12(1), December 2018,
ISSN: 2249-0558 Impact Factor: 7.119
Journal Homepage: http://www.ijmra.us, Email: [email protected]
Double-Blind Peer Reviewed Refereed Open Access International Journal - Included in the International
Serial Directories Indexed & Listed at: Ulrich's Periodicals Directory ©, U.S.A., Open J-Gage as well as in
Cabell’s Directories of Publishing Opportunities, U.S.A
413 International Journal of Management, IT & Engineering
http://www.ijmra.us, Email: [email protected]
causes deteriorate in Ethiopia’s trade balance by -0.160 units in the long-run but
insignificant. Though the sign of the coefficient confirms the a-prior expected sign, this is
because of as a result of free trade in Ethiopian causes imports highly industrial good
which has income inelastic, but it exports agricultural products which has less income
elastic. It showed that liberalization (trade openness) lead to the deterioration of the trade
balance or too fast of an increase in imports.
The coefficient of the agricultural growth rate indicated a positive relationship with the
trade balance in the long-run. A unit increase in the growth rate of the agricultural sector
causes an improvement in Ethiopia’s trade balance by 0.254 units in the long-run. Though
the sign of the coefficient confirms the a-prior expected sign, the result is not statistically
significant. Logically, since Ethiopian is an agrarian economy with its export sector highly
dominated by agricultural products, growth in the agricultural sector should result in a
significant improvement in its trade balance. The insignificance results can be attributed to
the fact that as compared to other countries, the Ethiopia’s agricultural sector is still at the
verge or approaches of experiencing immense growth. In addition, the positive and
insignificant results obtained might be because, unlike the advanced countries that indulge
or satisfied in agriculture, Ethiopia’s agricultural sector lacks advanced technologies and in
effect causes stagnation in it growth rate.
5.5. Short-run Relationship between Macroeconomic determinants and Trade Balance
in Ethiopia
The previous section has analyzed the long-run (co integration) relationship among the
variables. In this section, focus is on the short-run relationship among variables. To
achieve this error correction model was estimated. The results are presented in Table .4.
As shown in Table.4.The short run result shows a statistically significant negative
coefficient of exchange rate to the trade balance. Specifically, a unit increase in exchange
rate in the short run leads to 0.075 unit deterioration in Ethiopia’s trade balance at 1%
significance level. The results imply that an increase in the exchange rate leads to a
deterioration of the trade balance in the short-run. The short-run result satisfies the first
condition of the J-curve effect as earlier stated. The coefficients of the Lagged (REER (-1))
real effective exchange rate causes an improvement in the country’s trade balance in the
short run. Though the result shows an initial deterioration of the trade balance and Lagged
coefficient improvement on trade balance, as the first condition needed to confirm but
Lagged not confirm the theory of the J-curve effect, the long-run result earlier discussed
then the result shows that the J-curve effect is not fully supported in the case of Ethiopia.
Hence the absence of the J-curve effect can be concluded.

International Journal of Management, IT & Engineering Vol. 8 Issue 12(1), December 2018,
ISSN: 2249-0558 Impact Factor: 7.119
Journal Homepage: http://www.ijmra.us, Email: [email protected]
Double-Blind Peer Reviewed Refereed Open Access International Journal - Included in the International
Serial Directories Indexed & Listed at: Ulrich's Periodicals Directory ©, U.S.A., Open J-Gage as well as in
Cabell’s Directories of Publishing Opportunities, U.S.A
414 International Journal of Management, IT & Engineering
http://www.ijmra.us, Email: [email protected]
Table. 4. Estimated Short -run
ARDL (1, 2 , 3, 2, 0, 3, 3,) selected based on AIC Dependent Variable: TB
Variable Coefficient Std. Error t-Statistic Prob.
D(REER) -0.075705 0.018212 -4.156775 0.0011
D(REER(-1)) 0.064128 0.020322 3.155642 0.0076
D(OP) 0.391130 0.192767 2.029033 0.0634
D(OP(-1)) 0.725448 0.180647 4.015824 0.0015
D(OP(-2)) -0.541610 0.166240 -3.258003 0.0062
D(MS) -0.121704 0.154818 -0.786110 0.4459
D(MS(-1)) 0.730932 0.221492 3.300039 0.0057
D(HC) -1.378573 0.191852 -7.185601 0.0000
D(HC(-1)) 0.338050 0.166378 2.031819 0.0631
D(HC(-2)) -0.341227 0.162686 -2.097459 0.0561
D(AG) -0.064999 0.059699 -1.088780 0.2960
D(AG(-1)) -0.325910 0.070128 -4.647342 0.0005
D(AG(-2)) -0.104100 0.070707 -1.472269 0.1647
ECT(-1)* -1.089422 0.139542 -7.807142 0.0000
Source: Eviews-10 calculation
The coefficient of money supply is negative and statistically insignificant to the trade
balance in the short-run. Specifically, a unit increase in money supply causes Ethiopia’s
trade balance to fall by 0.121 units in the short run but insignificant. The result is similar to
the long run results but it’s insignificant and also not satisfied the monetary approach to
balance of payment. The result implies that an increase in money supply tends to increase
the real money balances of individuals (consumers) and as such increases their
consumption paths which can either be on domestic goods and foreign goods. With the
relatively high preference for foreign goods, causes a decline in the trade balance position
of the country. On the contrary, the “lagged” coefficient of money supply D(MS(-1))
showed a positive and significant relationship with the trade balance.
The result shows that the short-run coefficient of household consumption expenditure is
negative and statistical significance. This is consistent with the long run results discussed
in the previous section. A unit increase in household consumption expenditure leads to a
1.378 unit deterioration in trade balance in the short run at 1% error level. However, the
“lagged” coefficient of household consumption expenditure causes an improvement in the
country’s trade balance in the short run but it was insignificant in the short run. This result
is maybe due of the inherent human behavior of not adjusting quickly to changes in
consumption.
In terms of the coefficient of agricultural growth rate, it is negatively related to trade
balance in the short run. A unit increase in agricultural growth rate leads to 0.065 unit
deterioration in Ethiopia’s trade balance in the short run but however statistically
insignificant. The “lagged” effect of agricultural growth rate causes a decline in Ethiopia’s
trade balance in the short-run. Thus, a unit increase in the coefficient of the “lagged”
agricultural growth variable D(AG(-1)) causes 0.326 unit deterioration in the country’s
trade balance in the short run at 1% significance level. This implies that a delay in the
agricultural production, hence its growth rate will cause Ethiopia’s trade balance to
deteriorate in the short run. In other words, a decline in output of the agricultural export

International Journal of Management, IT & Engineering Vol. 8 Issue 12(1), December 2018,
ISSN: 2249-0558 Impact Factor: 7.119
Journal Homepage: http://www.ijmra.us, Email: [email protected]
Double-Blind Peer Reviewed Refereed Open Access International Journal - Included in the International
Serial Directories Indexed & Listed at: Ulrich's Periodicals Directory ©, U.S.A., Open J-Gage as well as in
Cabell’s Directories of Publishing Opportunities, U.S.A
415 International Journal of Management, IT & Engineering
http://www.ijmra.us, Email: [email protected]
sector will decrease the volumes of exports relative to imports, and hence cause a decline
in the country’s trade balance.
The results show that the coefficient of trade openness causes improvement on Ethiopia’s
trade balance. A unit increase in trade openness causes trade balance increase by 0.391
10% level of significant effect on trade balance. The ‘’Lagged’’ effect of trade openness
causes an improvement on Ethiopia’s trade balance. A unit increase in Lagged trade
openness D(OP(-1)) causes trade balance improve by 0.725 and it affecting trade balance
significantly in the short-run. The ‘’second Lagged’’ coefficient of trade openness causes a
deteriorating in trade balance of Ethiopia. A unit increase in the second Lagged trade
openness D(OP(-2)) leads a deteriorating in trade balance by -0541 unit and it affecting
trade balance significantly in the short-run.
Finally from economic intuition, the error correction term (ECT-1) in the ECM measures is
the speed at which an endogenous variable adjusts to shocks in an explanatory variable in
order to converge to its long run equilibrium. The estimated ECT-1 coefficient must be
negative and statistically significant at one percent error level. The negative and significant
coefficient of the ECT-1 confirms the cointegration results discussed in section 4.4. The
ECT-1 explains the extent to which exchange rate, household consumption expenditure,
government consumption expenditure, money supply, trade openness and agricultural
growth rate returns to the equilibrium in the long-run after a short-run shock. The result
shows a high speed of adjustment of convergence to the long run equilibrium every year
after a short run shock. In other words, the coefficient -108.9 indicates high rate of
convergence to equilibrium, which implies that the deviation from long-term equilibrium is
corrected by 108.9 over each year.
5.6. Diagnostic and Stability Test in the Model
5.6.1. Multi-collinearity Test
Table.5 shows that multi-collinearity exists only between trade openness and real effective
exchange rate. The presence of multi-collinearity was controlled by using white
heteroscedasticity test to produce robust standard error but now for this model there is no
presence of multi-collinerity.
Table. 4 Correlation Matrix’s
variables REER OP MS GC HC AG
REER 1.0000
OP -0.82135 1.0000
MS -0.3867 0.64495 1.0000
GC -0.02624 -0.11548 -0.39313 1.0000
HC -0.21228 0.33112 -0.03135 -0.42891 1.0000
AG -0.19009 0.266812 0.201164 -0.14984 0.102143 1.0000
Source: Eviews-10 calculation
Results of long run Granger causality tests are shown in Table .6 In the long-run, the F-
statistics on the explanatory variables suggest that at the 5% level or better there is no bi-
directional Granger causality between any variables under consideration. However there is
a long run unidirectional Granger causality running from household consumption
expenditure to real effective exchange rate, trade openness to money supply, Household
consumption expenditure to trade openness. However; in the short run there is
unidirectional causality from Household consumption expenditure to trade openness and

International Journal of Management, IT & Engineering Vol. 8 Issue 12(1), December 2018,
ISSN: 2249-0558 Impact Factor: 7.119
Journal Homepage: http://www.ijmra.us, Email: [email protected]
Double-Blind Peer Reviewed Refereed Open Access International Journal - Included in the International
Serial Directories Indexed & Listed at: Ulrich's Periodicals Directory ©, U.S.A., Open J-Gage as well as in
Cabell’s Directories of Publishing Opportunities, U.S.A
416 International Journal of Management, IT & Engineering
http://www.ijmra.us, Email: [email protected]
government consumption expenditure to household consumption expenditure. There is no
Granger causality except the one indicated above.
In order to test the statistical adequacy of the model the study conducts diagnostic and
stability tests. The results presented in Table.6 shows that there is no evidence of serial
correlation or heteroskedasticity in the model. The LM version serial correlation test result
gives a co-efficient of 5.5334 and a probability value of 0.1367 hence the null hypothesis
of non-existence of serial correlation is not rejected against the alternative hypothesis of
existence of serial correlation. Again, the LM version heteroskedasticity test gives a
coefficient value of 18.49230 and a probability value of 0.5550, hence the non-rejection of
the null hypothesis of no serial correlation. The probability values of the functional form
and normality tests are 3.7548 and 0.1529 respectively, hence statistically significant. This
therefore, implies that the model does not exhibit any functional or normality problems
.The CUSUM and CUSUMQ residuals line within the 5% critical value bounds implying
stability in the model. Hence it can be concluded that the regression equation is stable
throughout the sample period considered.
Table. 5 Results of Diagnostics and Stability test
TEST STATISTICS RESULTS
SERIAL CORRELATION 5.5334
(0.1367)
NORMALITY 3.7548
(0.1529)
HETEROSKEDASTICITY 18.49230
(0.5550)
CUSUM STABLE
CUSUMQ STABLE
Source: Eviews-10 calculation
Note: values in parentheses are probability values
5.7. Ethiopian’s trade balance responds to innovations (shocks)
From an estimated VAR model and in order to convey a sense of dynamics, Table .7
presents the VDF of the variables in a ten year horizon. From a quick look at the results
presented in Table 4.7, it is evident that within the ten year horizon, the forecast error
variance of trade balance is a result of its own shocks. In the first horizon, the result shows
that, 100% of its forecast error variance is attributed to its own shocks. However, by period
2 through to period 7, innovations contributed 93.32%, 56.85%, 49.39%, 48.64%, 47.30%
and 44.72% respectively to its forecast error variance. By eighth, ninth and tenth horizon
the innovations from trade balance contributed 42.14%, 39.65% and 37.70% respectively
to its forecast error variance. This implies that within the sample period, changes in
Ethiopia’s trade balance were high as a result of shocks in exports and imports of goods
and services.
In terms of innovations in the explanatory variables, innovations in trade openness
contributed the most to the forecast error variance of trade balance as compared to the
other variables over the horizon. In the same way innovations in money supply, household
consumption expenditure, real effective exchange rate, government consumption
expenditure and agricultural growth rate contributed sequentially to the forecast error
variance of trade balance over the specified time horizon.

International Journal of Management, IT & Engineering Vol. 8 Issue 12(1), December 2018,
ISSN: 2249-0558 Impact Factor: 7.119
Journal Homepage: http://www.ijmra.us, Email: [email protected]
Double-Blind Peer Reviewed Refereed Open Access International Journal - Included in the International
Serial Directories Indexed & Listed at: Ulrich's Periodicals Directory ©, U.S.A., Open J-Gage as well as in
Cabell’s Directories of Publishing Opportunities, U.S.A
417 International Journal of Management, IT & Engineering
http://www.ijmra.us, Email: [email protected]
Table. 6. Variance Decomposition Result Innovation (Shocks) of TB
% of Forecast Variance Explained by Innovation in
Period TB REER OP MS HC GC AG
1 100.0000 0.000000 0.000000 0.000000 0.000000 0.000000 0.000000
2 93.32657 1.974770 0.009249 0.169287 0.001636 2.931957 1.586532
3 56.85514 7.970699 14.62990 11.59080 0.070022 7.531108 1.352332
4 49.39227 6.558163 22.34330 10.98922 1.405912 8.163067 1.148072
5 48.64420 6.974518 22.51926 11.57366 1.328040 7.377508 1.582821
6 47.30154 10.28003 20.95274 11.62784 1.349943 6.969014 1.518889
7 44.72323 12.23957 19.79916 11.69517 3.089514 6.735433 1.717913
8 42.14196 12.44672 18.42152 12.14663 6.933232 6.312001 1.597936
9 39.65488 12.05497 17.05161 12.79422 10.98753 5.842070 1.614722
10 37.70913 11.86377 16.10601 13.26318 13.91585 5.579463 1.562602
Cholesky Ordering: TB REER OP MS HC GC AG
Source: Eviews-10 calculation
The results show that first period innovations in trade openness contributed 0.0% of the
forecast error variance of trade balance. The explanatory power of trade openness however
increased over increasing time horizons. Specifically, from the second through to the fifth
horizon, the contributions of innovations in trade openness to the forecast error variance of
trade balance gradually rise to 0.009%, to 14.63%, to 22.34% and to 22.51% respectively.
Again, by the sixth up to ten horizons, innovations slightly decreased to 20.95%, 19.79%,
18.12%, 17.05%, and 16.10 respective. This implies that in terms of the explanatory
variables included in the study, trade openness was a major contributor to trends in
Ethiopia’s trade balance over the sample period.
Shocks in money supply contributed 0.0% to the forecast error variance in the first period
and gradually increased to 0.16% and 11.59 by the second and third period respectively.
But in the fourth period its contribution decrease to 10.98%. From the fives to tenths
periods innovations in money supply gradually increase its contribution 11.54%, 11.62,
11.69%, 12.14%, 12.79% and13.26 respectively. This implies that in terms of the
explanatory variables included in the study, money supply was second major contributor to
trends in Ethiopia’s trade balance over the sample period.
Again the innovation from household consumption expenditure to forecast error variance
in the first period was 0.0%, but its contribution gradually increased from period two to
period four those are 0.0016%, 0.070% and 1.406% respectively, however its contribution
decline in period five to 1.328% but from period six to period ten there is an improvement
innovation of household consumption expenditure from 1.35%, 3.09%, 6.93%, 10.98% and
13.91% respectively. After period seven the contribution of household consumption
expenditures innovation to trade balance become increases this shows that it’s one of the
major factor affecting Ethiopia’s trend of trade balance on the sample period.
Though in period 1, innovations in the real effective exchange rate contributed only 0.0%,
as compared to the other variables over the sample period it was the fourth highest
contributor to the forecast error variance of trade balance in Ethiopia. Its innovations
contributed 1.97% and 7.97% to the forecast error variance of trade balance by the second
and third period. However in period 4, the contribution decreases to 6.55%. But in period
5, period 6, period 7 and period 8, the contributions of innovations in real effective
exchange rate were increases from 6.97%, 10.28%, 12.24% and 12.44% respectively. By

International Journal of Management, IT & Engineering Vol. 8 Issue 12(1), December 2018,
ISSN: 2249-0558 Impact Factor: 7.119
Journal Homepage: http://www.ijmra.us, Email: [email protected]
Double-Blind Peer Reviewed Refereed Open Access International Journal - Included in the International
Serial Directories Indexed & Listed at: Ulrich's Periodicals Directory ©, U.S.A., Open J-Gage as well as in
Cabell’s Directories of Publishing Opportunities, U.S.A
418 International Journal of Management, IT & Engineering
http://www.ijmra.us, Email: [email protected]
the ninth period and tenth period, shocks in real effective exchange rate contribution
decreases to 12.05% and 11.86% respectively to the forecast error variance of trade
balance.
Innovations from government consumption expenditure contributed to the forecast error
variance of trade balance in the model 0.0% in the first period. But in the second, third and
fourth period innovation from government consumption expenditure increases from 2.93%,
7.53% and 8.16% respectively to the forecast error variance of trade balance. However
there was a gradual decrease in innovation by government consumption expenditure from
fives to tenth periods these are 7.37%, 6.97%, 6.73%, 6.31%, 5.84% and 5.58%
respectively to the forecast error variance of trade balance. This implies that the
contribution of government consumption expenditure to the forecast error variance of trade
balance gradually decline overtimes within the sample periods.
Shocks in agricultural growth rate contributed little to the forecast error variance of trade
balance. From the results, it is evident that its innovations contributed 0.0 % in the first
period and slightly increase to 1.586% by the second period. In the third and fourth periods
its innovations contribution decline 1.35% and1.15% respectively. However in fives period
there is improvement on its innovation to 1.582%, but the contributions of innovations
decreased to 1.52% in the sixth period. The contribution also increase in period seventh to
1.717%, but it decline in eighth to 1.58%. The contribution of innovation from agricultural
growth rate increase in period ninth to 1.61% but its contribution decline to1.58% in period
tenth. Innovations from agricultural growth rate had little and volatile effect on changes in
Ethiopia’s trade balance over the sample period.
From the above explanations, it is clear that the VDF substantiate that the significant role
played by trade openness, money supply, household consumption expenditure, real
effective exchange rate, government consumption expenditure and agricultural growth rate
in accounting for fluctuations in forecast error variance of Ethiopia’s trade balance over the
time horizon within the sample period considered. In terms of explanatory power,
innovations in agricultural growth rate explained very little of the forecast error variance of
trade balance as compared to other variables. The implication is that agricultural growth
rate contributed very little to trends in Ethiopia’s trade balance over the sample period.
Nevertheless the portion of trade balance variations accounted for by most of the
explanatory variables increased continuously over the time horizon of which the
percentage of forecast error variance in trade balance is highly accounted for by
innovations in trade openness followed by money supply as it maintains the highest
percentage than the other variables. This also implies that changes in the country’s trade
balance are highly attributed to shocks from trade openness and money supply.
The results of the IRF are presented. Figure 1 showing the plots of the generalized IRF of
trade balance with respect to innovations in exchange rate, trade openness, money supply,
household consumption expenditure, government consumption expenditure and
agricultural growth rate within a ten-year horizon. This approach reveals insight into the
dynamic relationships between the variables as it portrays the response of a variable to an
unexpected shock in another variable over a specified time horizon. The horizontal axis in
each graph shows the number of years after the impulse has been initialized while the
vertical axis shows the responses of the appropriate variable.
As evidenced in the first plane of figure 1 innovations from real effective exchange rate
caused an improvement in trade balance from period 1 to period 4, but start from period 4

International Journal of Management, IT & Engineering Vol. 8 Issue 12(1), December 2018,
ISSN: 2249-0558 Impact Factor: 7.119
Journal Homepage: http://www.ijmra.us, Email: [email protected]
Double-Blind Peer Reviewed Refereed Open Access International Journal - Included in the International
Serial Directories Indexed & Listed at: Ulrich's Periodicals Directory ©, U.S.A., Open J-Gage as well as in
Cabell’s Directories of Publishing Opportunities, U.S.A
419 International Journal of Management, IT & Engineering
http://www.ijmra.us, Email: [email protected]
to period 6 there is slight decline on trade balance and From period 6 to period 10 there
real effective exchange rate causes worsening of trade balance in Ethiopia. This might
explain why the long-run impact of exchange rate, though negative and significant and also
a clear indication why the J-curve effect is not fully satisfied statistically.
Figure 1. Impulse Response Function
-.2
-.1
.0
.1
.2
.3
1 2 3 4 5 6 7 8 9 10
Response of REER to TB
-.04
-.03
-.02
-.01
.00
.01
.02
1 2 3 4 5 6 7 8 9 10
Response of OP to TB
-.03
-.02
-.01
.00
.01
.02
1 2 3 4 5 6 7 8 9 10
Response of MS to TB
-.005
.000
.005
.010
.015
1 2 3 4 5 6 7 8 9 10
Response of GC to TB
-.02
-.01
.00
.01
.02
1 2 3 4 5 6 7 8 9 10
Response of HC to TB
-.04
-.02
.00
.02
.04
1 2 3 4 5 6 7 8 9 10
Response of AG to TB
Response to Cholesky One S.D. (d.f. adjusted) Innovations ± 2 S.E.
Source: Eviews-10 calculation.
The response of trade balance to shocks in trade openness is shown in the Figure 1 above.
From period 1 to 4 periods, innovations from trade openness caused a worsening in the
trade balance position. From period 4 to period 5 the trade balance highly stable and from
period 5 to 10 the shocks from trade openness causes improvement on trade balance in
Ethiopia. Innovation in trade openness caused an improvement in trade balance position in
Ethiopia on the sample period.
The third plane in Figure 1 shows the response of trade balance to innovations in money
supply. From period 1 to period 2, innovations caused improvement in the trade balance
position but from period 2 to period 7 there was a worsening in trade balance position.
From period 7, 8 and 9 innovations caused a stability in trade balance and further caused a
slightly rise in period 9 to 10. From period 6 to period 10 responses of trade balance
resulting from innovations in money supply was very little compared to responses
occurring in period 1 to period 3.

International Journal of Management, IT & Engineering Vol. 8 Issue 12(1), December 2018,
ISSN: 2249-0558 Impact Factor: 7.119
Journal Homepage: http://www.ijmra.us, Email: [email protected]
Double-Blind Peer Reviewed Refereed Open Access International Journal - Included in the International
Serial Directories Indexed & Listed at: Ulrich's Periodicals Directory ©, U.S.A., Open J-Gage as well as in
Cabell’s Directories of Publishing Opportunities, U.S.A
420 International Journal of Management, IT & Engineering
http://www.ijmra.us, Email: [email protected]
The response of trade balance to shocks in government consumption expenditure is shown
in the fourth plane of Figure 1, from period 1 to period 2 innovations in government
consumption expenditure caused slight increment in the trade balance position. From
period 2 to period 4 the innovations in government consumption expenditure caused an
improvement in the trade balance position but trade balance position gradually decline
further from period 4 to period 8. From period 8 to period 10, innovations in government
consumption expenditure caused a slightly stable in the trade balance position.
Figure 1 of plane five shows that the innovations in household consumption expenditure
caused improvement in trade balance position from period 1 to period 3 and from period 3
to 4 there is stability in trade balance position. But from period 4 to period 8 its innovation
caused an improvement in the trade balance position, by period 8 to period 10 trade
balance gradually became stable. Innovations from household consumption expenditure
caused an improvement in the trade balance in Ethiopia on the sample period.
The last plane in Figure 1 shows the response of trade balance to innovations in
agricultural growth rate. From period 1 to period 2, its innovations caused a stability in the
trade balance position but from period 2 to period 4, trade balance position is worsening
and further from period 4 to period 6 the innovation causes improvement on trade balance
position. Though from period 6 to period 8 there was a decline in trade balance due to
innovations in agricultural growth rate, from period 8 to period 9 there was rise in the trade
balance. In the tenth period, the response of trade balance to shocks in agricultural growth
rate was almost zero. It is evident in the sixth plane of Figure 6 that, from period 6 to
period 10 the responses of the trade balance to innovations in agricultural growth rate was
lesser than the responses occurring from period 2 to period 5.
6. Conclusions and Recommendations
6.1. Conclusions
The research set out to analyse the determinants of trade balance in Ethiopia from 1981-
2017. In order to achieve this, the study tests for the presence or absence of the Marshall-
Lerner condition and the J-curve effect. It further examines the impact of other macro-
economic variables on the country’s trade balance. Finally the study analyses the
innovations (shock) of the variables included in the estimations. In other words, it
investigates how innovations in the explanatory variables and own shocks contribute to the
forecast error variance of Ethiopia trade balance and also traces the directional response of
the Ethiopia trade balance to a one standard-deviation in own shocks or shocks in
explanatory variables. The study employed the ARDL bounds test to co-integration as its
estimation strategy. It also employs the VDF and IRF to analyse the dynamic simulations
of the variables.
The study finds evidence of both long-run relationship and short-run dynamics among the
variables understudy, thus trade balance, real effective exchange rate, trade openness,
money supply, government consumption expenditure, household consumption expenditure
and agricultural growth rate. It found the absence of the Marshall-Lerner condition and J-
curve effect in Ethiopia. Again, the VDF showed that trade openness followed by money
supply highly contributed to the forecast error variance of trade balance and agricultural
growth rate contributed least to the forecast error variance of trade balance in Ethiopian
trade balance. The absence of the J-curve effect was further confirmed by the IRF position.

International Journal of Management, IT & Engineering Vol. 8 Issue 12(1), December 2018,
ISSN: 2249-0558 Impact Factor: 7.119
Journal Homepage: http://www.ijmra.us, Email: [email protected]
Double-Blind Peer Reviewed Refereed Open Access International Journal - Included in the International
Serial Directories Indexed & Listed at: Ulrich's Periodicals Directory ©, U.S.A., Open J-Gage as well as in
Cabell’s Directories of Publishing Opportunities, U.S.A
421 International Journal of Management, IT & Engineering
http://www.ijmra.us, Email: [email protected]
6.2. Recommendations
The previous section has presented the summary of major findings of the study. Based on
the findings the following recommendations are made for policy purposes;
Ethiopia is still faced with negative trade imbalances especially in the post-liberalization
era. Given this, urgent measures need to be considered in order to improve upon it to
hasten growth and development in the economy. From the results obtained it can be noted
that, depreciation in the Ethiopia birr is not an appropriate step to help improve upon the
country’s trade balance position. In strong economies like the industrialized countries,
market forces can operate on their own to produce self-correcting forces in case of any
currency depreciation hence control the trade balance. Unlike these industrialized
countries, for developing countries like Ethiopia, self-correcting measures cannot work in
terms of controlling the trade balance. Therefore, in relation to this, the most appropriate
step to control the country’s trade balance is to combine liberalization with proper
exchange rate management measures. Other measures of currency stabilization could be
adopted to improve the trade balance as a stable exchange rate would enable producers of
tradable goods make long-term investment plans.
Appropriate action related to its trade openness by levying tariffs and quotas impose from
goods come from abroad in order to increase price and limit imports. Government also
provides subsidies to domestic industries and creates competitive advantages to domestic
producers in order to compute with foreign producers. In addition to tariff and quotas
rationing the available foreign exchange that is allowing foreign exchange only for
necessary products (like machinery that used for further production) is also another
mechanism used to minimize the country’s trade deficit.
Policies aimed at stabilizing money supply in the economy should be adopted. Monetary
policy authorities can adopt contractionary monetary policies rather than expansionary
ones as this will to help control the real money balances of individuals and hence their
expenditure patterns to further help improve the country’s trade balance position.
Policies to divert household consumption expenditures to domestic goods can also be
adopted through the promotion of various made-in Ethiopia goods. In the same vein,
import substitution policies for major import goods such as cars, petroleum products and
electronic equipments can also be adopted.Create awareness among the people to change
their attitude towards domestic products which is highly in favor of foreign product goods.
This may help reduce government and household expenditure paths and as such reduce
imports relatively. In effect, these will not only aid improve upon the country’s trade
balance position but will also touch on some key macro-economic variables such as
unemployment and in effect aid in growth and development of the country. In addition,
policies to improve upon the standards of domestic products should be implemented in
order to meet the standard, taste and preference of the Ethiopian consumer, and those
abroad.
Again, chunk of government consumption expenditure should mainly be diverted into
productive and investment ventures such as the export sector to aid increase volumes of
exports rather than spending in non-productive sectors that do not generate any income.
Government policies aimed at establishing companies (either solely owned or public
private partnerships) purposely for the production of export-oriented and import
substitution goods in order to meet export demand and domestic demand.
Considering the fact that the export sector is mainly dominated by agricultural products,

International Journal of Management, IT & Engineering Vol. 8 Issue 12(1), December 2018,
ISSN: 2249-0558 Impact Factor: 7.119
Journal Homepage: http://www.ijmra.us, Email: [email protected]
Double-Blind Peer Reviewed Refereed Open Access International Journal - Included in the International
Serial Directories Indexed & Listed at: Ulrich's Periodicals Directory ©, U.S.A., Open J-Gage as well as in
Cabell’s Directories of Publishing Opportunities, U.S.A
422 International Journal of Management, IT & Engineering
http://www.ijmra.us, Email: [email protected]
policies to improve upon the growth rate in the agricultural sector can be enforced. Policy
makers can invest in newly improved agro-technologies and agro-machines to aid farmers
increase production, hence output volumes. Again, various technologies on how to process
major agricultural products into finished goods before exports can be considered as this
will help to diversify the country’s export goods. Policies that enhance the diversification
and facilitate the shift towards the export of semi processed and manufactured goods are
essential.
One obvious option in this case is to make huge investment in the export sector through a
coordinated effort between the private sector and the government. Moreover, policies that
diversity the destination of export to new inroads, in addition to the already existing is also
essential.
Select and apply appropriate trade policy instruments: To address the problem constraining
trade expansion and growth in Ethiopia, it is necessary that the choice of suitable policy
instruments reflects the most direct relationship between issues involved in the identified
constraint and the instruments available. Trade policy implementation has to prioritize the
application of instruments to address specific problems on the basis of anticipated direct
impact. Effective trade policy also depends on adopting a common direction for different
instruments so that these instruments complement rather than contradict each other. The
issue for the future is how the effectiveness of trade reforms is contingent on the existence
of other characteristics of the environment in which production and investment decisions
are made.
References
Alawin M. and Al-Magharreez E. (2013). factors affecting the trade balance . far east
journal of psychology and business , 11(2).
Alexander, S. (1952). Effects of a Devaluation on A Trade Balance. International
Monetary Fund Staff Papers,2 , 263-278.
Alexander, S. (1959). Effects of Devaluation: A Simplified Synthesis of Elasticities and
Absorption Approaches. American Economic Review, 49 , 1-42.
Bahmani-Oskooee, M. (1991). Is there a long-run relation between the trade balance and
the real effective exchange rate of LDCs? . Economics Letters, 36 , 403 -407.
Bahmani-Oskooee, M. (2001). Nominal and Real Effective Exchange Rates of Middle
Eastern Countries and their trade performance. Applied Economics, 33(1) , 103-
111.
Bantegizie, Z. and Dawit, A. (2017). Determinants of trade balance in Ethiopia. Research
Journal of Economics and Business Studies .
Belsley A. David A. Edwin Kuh and Roy E. Werh. (1980). Regression diaptics:Identifying
inflationery data and sources of collinearity. Wiky, New York.
Bhattarai, K. R. and Armah, M. K. (2005). The effects of exchange rate on the trade
balance in Ghana: Evidence from cointegration analysis. Cottingham: Business
School, University of Hull.
Brada, J. C., Kutan, A. M., and Zhou, S. . (1997). The Exchange Rate and The Balance Of
Trade: The Turkish Experience. The Journal of Development Studies, 33(5) , 675-
692.
Catao, L. and Falcetti, E. (2002). Determinants of Argentina’s external trade. Journal of
Applied Economics, 5(1) , 19-57.

International Journal of Management, IT & Engineering Vol. 8 Issue 12(1), December 2018,
ISSN: 2249-0558 Impact Factor: 7.119
Journal Homepage: http://www.ijmra.us, Email: [email protected]
Double-Blind Peer Reviewed Refereed Open Access International Journal - Included in the International
Serial Directories Indexed & Listed at: Ulrich's Periodicals Directory ©, U.S.A., Open J-Gage as well as in
Cabell’s Directories of Publishing Opportunities, U.S.A
423 International Journal of Management, IT & Engineering
http://www.ijmra.us, Email: [email protected]
Ciurrak, D and Previle., C. (2010). Ethiopia's Trade and Investment: Priorities for
Developing the new Government. Available at claudiuspreville.com/.../Ciurak and
Previle 2010 Ethiopia Trade and Investment.
Dickey, D. A. and W. A. Fuller . (1979). Distribution of the Estimators for Autoregressive
Time Series with a Unit Root. Journal of the American Statistical Association,
74(366a) , 427-431.
Duasa, J. (2007). Determinants of Malaysian Trade Balance: An ARDL Bound Testing
Approach . Journal of Economic Cooperation, 28 (3) , 21-40.
Dunn, M. R. and Mutti H. J. (2000). International Economics. Fifth Edition. London and
New York: Routledge, Taylor and Francis Group.
Field, A. (2009). Discovering statistics using IBM SPSS Statistics. Sage, UK.
Gobe, Y. ( 2015). Impact of Ethiopia trade balance: Bound Testing Approach to
Cointegration. Journal of World Economic Research Vol. 4, No. 4, 2015 , pp. 92 –
98.
Goldstein, M. and Khan, M. S. ( 1985). Income and price effects in foreign trade.
Handbook of international economics, 2, 1041-1105.
Gujarati, D. N. ( 2004). sic Econometrics.Ba 3rd Edition. New York, McGraw-Hill.
Hailegiorgis, B. (2011). Export performance of oil seeds and its determinants In Ethiopia.
Journal of Cereals and Oilseeds Vol. 2, No. 1 , pp: 1-15.
Harberger, A. (1950). Currency Depreciation, Income and the Balance of Trade. Journal of
Political Economy, 58 , Pp. 47-60.
IMF, I. M. (2014). International Financial Statistics (IFS). Washington D.C.
Johansen, S. and Juselius, K. (1990). Maximum likelihood estimation and inference on
cointegration with applications to the demand for money. Oxford Bulletin of
Economics and statistics, 52(2) , 169-210.
Johansen, S. (1988). Statistical Analysis of Cointegration Vectors. Journal of economic
dynamics and control, 12(2), 231-254 .
Kayhan, S., Bayat, T. and Yüzbaşı, B. (2013). Government expenditures and trade deficits
in Turkey: Time domain and frequency domain analyses. Economic Modeling, 35,
153-158 .
Kebede, T. (2001). Determinants of international trade flow, the case of Ethiopia . AAU :
MSc thesis .
Khan, M. Z. (2012). Determinants of Trade Balance of Bangladesh: A Dynamic Panel
Data Analysis. Bangladesh Development Studies, 35(2) .
Konya, L. and Singh, J. P. (2009). Causality between international trade and gross
domestic product: the case of the Indian agricultural and manufacturing sectors.
International Journal of Economics and Business Research, 1(1) , 61-75.
Koop, G., Pesaran, M. H. and Potter, S. M. (1996). Impulse Response Analysis in
Nonlinear Multivariate Models. Journal of econometrics, 74(1) , 119-147.
Korap, L., Alacahan D. N. and Irhan B. H. (2011). An empirical model for the Turkish
trade balance: New evidence from ARDL Bounds testing analyses. Istanbul
University Department of Economics Econometrics and Statistics, 14 , 38-61.
Laurens, B. and Cardoso, J. (1998). Managing Capital Flows: Lessons from the
Experience of Chile. Washington D.C.
Lutkepohl, H. (1991). Introduction to Multiple Time Series Analysis. Springer-Verlag,
New York.

International Journal of Management, IT & Engineering Vol. 8 Issue 12(1), December 2018,
ISSN: 2249-0558 Impact Factor: 7.119
Journal Homepage: http://www.ijmra.us, Email: [email protected]
Double-Blind Peer Reviewed Refereed Open Access International Journal - Included in the International
Serial Directories Indexed & Listed at: Ulrich's Periodicals Directory ©, U.S.A., Open J-Gage as well as in
Cabell’s Directories of Publishing Opportunities, U.S.A
424 International Journal of Management, IT & Engineering
http://www.ijmra.us, Email: [email protected]
Meade, J. (1951). The Balance of Payments. Oxford:Oxford University Press .
Ministry of foreign affairs of the federal democratic republic of Ethiopia . (2007). foreign
trade promotion Manual for Ethiopian diplomatic missions. Addis Ababa, Ethiopia.
MOFA, M. o. (2007). foreign trade promotion Manual for Ethiopian diplomatic missions.
Addis Ababa, Ethiopia.
Mohammad, D. S. (2010). Determinants of Balance of Trade: Case study of Pakistan.
European Journal of Scientific Research, 41(1) , 13-20.
Narayan, K. P. (2004). New Zealand’s trade balance: Evidence of the J-curve and Granger
causality’s. Applied Economics Letters, 11(6) , 351-354.
Nelson, R.and Phelps, E. . (1966). “Investment in humans, technological diffusion, and
economic growth”. American Economic Review: Papers and Proceedings 51 (2) ,
69-75.
Nienga, E. (2010). The determinants of trade balance in Kenya; ''An empirical analysis;
1970-2010”. European Journal of Scientific Research 31(3) , 14-20.
Onafowora, A. O. and Owoye, O. (2006). An Empirical Investigation of Budget and Trade
Deficits: The case of Nigeria. The Journal of the Development of Areas, 39(2) ,
153-174.
Parikh, A. and Stirbu, C. (2004). Relationship between Trade Liberalization, Economic
Growth and Trade Balance: An Econometric Investigation. HWWA Discussion
Paper 282 .
Paulino, S. (2000; 2002; 2003:2004). ''Trade Liberalization and Export Performance in
Selected Developing Countries”. Journal of Developing Economics .
Pesaran M. H. Shin, Y. and Smith R. J. (2001). Bounds Testing Approaches to the
Analysis of Level Relationships. Journal of Applied Econometrics, 16(February
1999) , 289–326.
Pesaran. H. and Shin, Y. (1998). Generalized Impulse Response Analysis in Linear
Multivariate Models. Economic Letters, 58(1) , 17-29.
Petrovic, P. and Gligoric, M. (2010). Exchange Rate and Trade Balance: J-curve Effect.
PanoEconomicus, 2010, 1 , 23-41.
Rose and Yellen. (1989). Is there a J-curve? Journal of Monetary economics, 24(1) , 53-68.
Rose, A. K. and Yellen, J. L. . (1989). Is there a J-Curve? Journals of monetary economics,
24(1) , 55-68.
Rose, A. K. and Yellen, J. L. (1989). Is there a J-curve? Journal of Monetary economics,
24(1) , 53-68.
Rose, A. K. (1991). The role of exchange rates in a popular model of international trade:
Does the Marshall–Lerner condition hold? Journal of international economics,
30(3) , 301-316.
Santos- Paulino and Thirlwall. (2004). “Trade Liberalization and Export Performance in
Selected Developing Countries”. Journal of Developing Economics .
Sarbapiya, R. (2012). An analysis of Determinants of Balance of Trade in India. . Research
Journal of Finance and Accounting 3(1) .
Saruni, M. (2007). “Determinants of the Trade Balance in Tanzania, 1970-2002. in
Awarded Theses 2006,69-88. World Bank, Washington DC.
Shawa, M. J. and Shen, Y. (2013). Analysis of the Determinants of Trade Balance: Case
Study of Tanzania. International Journal of Business and Economics Research.
2(6) , 13-14.

International Journal of Management, IT & Engineering Vol. 8 Issue 12(1), December 2018,
ISSN: 2249-0558 Impact Factor: 7.119
Journal Homepage: http://www.ijmra.us, Email: [email protected]
Double-Blind Peer Reviewed Refereed Open Access International Journal - Included in the International
Serial Directories Indexed & Listed at: Ulrich's Periodicals Directory ©, U.S.A., Open J-Gage as well as in
Cabell’s Directories of Publishing Opportunities, U.S.A
425 International Journal of Management, IT & Engineering
http://www.ijmra.us, Email: [email protected]
Singh, T. (2004). Testing J-curve hypothesis and analyzing the effect of exchange rate
volatility on the balance of trade in India. Empirical economics, 29(2) , 227-245.
Suleiman C. and Abdul-Rhim A.S. . (2014). J-Curve Effect and Thailand’s Trade in Forest
Products: ARDL Bunds Testing. World Applied Science Journal 29(1) , 150-155.
Tandon, S. (2014). “Trade Balance and the Real Exchange Rate: An empirical Analysis of
multilateral and bilateral relationship”. Foreign Trade Review, 49, 2 , 117–139.
Thirlwall, A.P and Gibson, H.D. (1992). Balance of Payment Theory and the United
Kingdom Experience. Macmillion, London.
Thungsuwan, S. and Thompson, H. (2003). Exports and economic growth in Thailand: An
empirical analysis. BU Academic Review 2(1) , 10 – 13.
Tura, K. (2001). Determinant of international trade flow, the case of Ethiopia Msc thesis
AAU.
Turkay, H. (2014). The validity of Marshall-Lerner condition in Turkey: A cointegration
approach. Theoretical and Applied Economics Vol 21, No.10 (599) , 21-32.
Tuteanu, G. (2015). Measuring the Influence of the J-curve Effect on Trade in Romanian
Forest Product. Theoretical and Applied Economics. Vol 22, No. 4 (605) , 75-84.
UNCTAD. (2005). Developing countries in international trade: Trade and Development
Index.
UNCTAD. (2008). Export Competitiveness and Development in LDCs: Policies, Issues
and Priorities for LDCs. New York and Geneva: United Nations Publication.
UNCTAD. (1999). Trade and Development Report. New York and Geneva: United
Nations Publication.
UNCTAD. (2013). Trade and Development Report. New York and Geneva: United
Nations Publication.
Varge, M. (2015). The impact of agricultural sector on employment and foreign trade
balance. Ministry of National Economy. Ministers Report. Assessed on 20th
January 2016 .
Veselkova, M., and Horvath, J. (2008). Trade Balance and Income Shocks: Experience of
Transition Economies. Transition Studies Review 15(2) , 241-249.
Vohra, R. (2006). Export and economic growth: Further time series evidence from less-
developed countries. International Advances in Economic Research 7(3) , 345 –
350.
Waliullah, K., Khan M., Kakar, R. and Khan W. (2010). The Determinants of Pakistan’s
Trade Balance: An ARDL Cointegration Approach. The Lahore Journal of
Economic 15(1) , 1-26.
WorldBank. (2010). Introduction to the System of National Accounts, Lesson.
Development Economics Data Group.
WorldBank. (2001). World Development Indicators. Washington DC: World Bank.
WTO, W. T. (2012). international trade determinants report in Africa.
http://en.wikipedia.org/wiki/International_trade.
Yishak, T. (2009). Determinants of Ethiopia's export performance: a gravity model
Analysis, Development discussion paper No.1, bkp development research and
Consulting. Munich, Germany.

International Journal of Management, IT & Engineering Vol. 8 Issue 12(1), December 2018,
ISSN: 2249-0558 Impact Factor: 7.119
Journal Homepage: http://www.ijmra.us, Email: [email protected]
Double-Blind Peer Reviewed Refereed Open Access International Journal - Included in the International
Serial Directories Indexed & Listed at: Ulrich's Periodicals Directory ©, U.S.A., Open J-Gage as well as in
Cabell’s Directories of Publishing Opportunities, U.S.A
426 International Journal of Management, IT & Engineering
http://www.ijmra.us, Email: [email protected]
Repayment Performance 0f Farmers: An Empirical Study
Dr. M. Venkata subbaiah M.Com, M. Phil, Ph. D, MBA.
Abstract
This paper studies the impact of bank finance on repayment performance of farmers in
delta area and non-delta area in Nellore district of Andhra Pradesh. We observed that in the
delta area the sample branches provided finance to the farmers more than to those in the
non-delta area. It can be observed that the total repayment performance of the sample
beneficiaries was 73 per cent in the delta area and 50 per cent in the non-delta area. The
percentage of overdue is less in the delta area than in the non-delta area.
Need for the Study
Several studies have been undertaken to evaluate the role of institutional finance for
agriculture at the national level by individual researchers, financial institutions and
Government. But area specific studies are comparatively limited in number. Such studies
are of great importance on account of the vast, inter-regional variations of bank credit in
developing countries like India. Even bank specific studies do not seem to have gone into
the different operations of the branches located in Remote areas. The present study of
Andhra Pragathi Grameena Bank in Nellore District of Andhra Pradesh is intended to fill
this gap. A detailed analysis is made of the impact of Andhra Pragathi Grameena Bank
finance on repayment performance.
Objective of the Study
1. To study the repayment performance of the sample beneficiaries in delta area and
non-delta area of Nellore District, Andhra Pradesh
Methodology and Sampling
The 90 branches of Andhra Pragathi Grameena Bank, Nellore, are divided into two groups,
those serving the farmers in the delta area and those serving in the non-delta area. There
are 40 branches in the delta area and 50 branches in the non-delta area. A random
sampling of 10 per cent of the total branches namely 9 branches in all was taken,
representing 4 branches in delta area and 5 branches in non-delta area. 200 farmers who
borrowed loans from the bank during 2016-17 are selected randomly with probability
proportional to the size sampling method (PPS sampling method) from the 6 sample
branches and pre-tested schedules were canvassed among them and the relevant data was
collected.
Repayment performance
One of the most disquieting features of the agricultural credit structure in India is the
incidence of ever increasing overdue. The high level of overdue restricts the capacity of
lending institutions to recycle funds, besides threatening the prospects of continued flow of
external credit for agricultural development. A wide range of causes influence the level
and the trends in overdue of the agricultural credit institutions. Although defaults are
commonly attributed to adverse conditions, particularly droughts / floods, in some cases,
lack of the forward-backward linkages and infrastructural facilities and services which
support agriculture, the socio-political environment in which the credit institutions are
Lecturer in Commerce, Govt Degree College, Rapur SPSR Nellore District

International Journal of Management, IT & Engineering Vol. 8 Issue 12(1), December 2018,
ISSN: 2249-0558 Impact Factor: 7.119
Journal Homepage: http://www.ijmra.us, Email: [email protected]
Double-Blind Peer Reviewed Refereed Open Access International Journal - Included in the International
Serial Directories Indexed & Listed at: Ulrich's Periodicals Directory ©, U.S.A., Open J-Gage as well as in
Cabell’s Directories of Publishing Opportunities, U.S.A
427 International Journal of Management, IT & Engineering
http://www.ijmra.us, Email: [email protected]
functioning, legal and government support available to the agricultural credit system,
besides adverse weather conditions affecting the output of crops, particularly in the rain fed
areas. The other causes of overdue which are internal to the credit institutions themselves
are inadequate supervision over credit, unsatisfactory management and unsound lending
policies and procedures. The distribution of total demand, repayment in different
categories of the sample beneficiaries are presented in Table 1.
Table 1: Distribution of Total Demand, Repayment and Overdoes in Different
Categories of Farmers
S. No. Category
Total
demand
Rs.
Repayment
Rs.
Overdose
Rs.
Percentage
of
repayment
Percentage
of
overdues
1. Marginal
farmers
3,65,000 1,38,700 2,26,300 38 62
2. Small
farmers
8,48,000 4,57,920 3,90,080 54 46
3. Medium
farmers
11,75000 7,75,500 3,99,500 66 34
4 Large
farmers
15,37,000 11,52,750 3,84,250 75 25
Total 39,25,000 25,24,870 14,00,130 64 36
Source: Field data.
Table 1 reveals that the total demand from all categories of farmers was Rs. 39,25,000. Out
of which the farmers were paid only Rs.25,24,870. The overdues were Rs.14,00,130. The
repayment percentage was more by the large farmers (75 percent) followed by the medium
farmers (66 percent) small farmers (54 percent) and marginal farmers (38 percent). The
percentage of overdues was higher among the marginal farmers (62 percent) followed by
the small farmers (46 percent), medium farmers (34 percent) and large farmers (25
percent).
Table 2: ANOVA for Distribution of total Demand, Repayment and Overdues
Source of
variation
Degree of
freedom (d.f)
Sum of
squares
(SS)
Mean of
squares (MS)
F
Values
F. Critical
value
Category of
farmers 3 9.92E+11 3.31E+11 2.32* 4.066181
Error 8 1.14E+12 1.42E+11
* 5 per cent level of significant
Source: Table 1.
Table 2 shows that there is a significant difference between different categories of farmers
with regard to total demand, recovery, and overdues at 5 per cent level significance in
study areas.
It can be observed from Table 3 which follows that the total repayment performance of the
sample beneficiaries was 73 per cent in the delta area and 50 per cent in the non-delta area.
Obviously the repayment performance was higher in the delta area. The repayment
percentage of among the marginal farmers was 44 per cent, small farmers 54 per cent,
medium farmers 75 per cent and large farmers 88 per cent in the delta area. In the non-

International Journal of Management, IT & Engineering Vol. 8 Issue 12(1), December 2018,
ISSN: 2249-0558 Impact Factor: 7.119
Journal Homepage: http://www.ijmra.us, Email: [email protected]
Double-Blind Peer Reviewed Refereed Open Access International Journal - Included in the International
Serial Directories Indexed & Listed at: Ulrich's Periodicals Directory ©, U.S.A., Open J-Gage as well as in
Cabell’s Directories of Publishing Opportunities, U.S.A
428 International Journal of Management, IT & Engineering
http://www.ijmra.us, Email: [email protected]
delta area the repayment percentage of the marginal farmers was 29 per cent, small farmers
54 per cent, medium farmers 49 per cent and large farmers 54 per cent. In the delta area
the loan amount repaid by the farmers was much higher than the amount repaid by the
farmers of the non-delta area. The reasons are better irrigational facilities, fertile land and
better awareness among the farmers regarding repayment of loans.
Table 3: Distribution of Total Demand, Repayment and Overdues in Different
Categories of farmers in Delta and Non-delta area
S.
No. Category
Delta area Non-delta area
Total
demand
Rs.
Repayment
Rs.
Overdues
Rs.
Percentage
of
repayment
Percentage
of
overdues
Total
demand
Rs.
Repayment
Rs.
Overdues
Rs.
Percentage
of
repayment
Percentage
of
overdues
1. Marginal
farmers
2,19,000 97,090 1,21,910 44 56 1,46,000 41,610 1,04,390 29 71
2. Small farmers
5,08,800 2,74,750 2,34,050 54 46 3,39,200 1,83,170 1,56,030 54 46
3. Medium
farmers
7,50,000 4,65,300 1,84,700 75 25 4,25,000 2,10,200 2,14,800 49 51
4. Large
farmers
9,45,000 8,34,000 1,14,000 88 12 5,89,000 3,18,750 2,70,250 54 46
Total 24,25,800 17,71,140 6,54,660 73 27 1,49,9200 7,53,730 7,45,470 50 50
Source: Field data.
The percentage of overdues in the delta area was 56 among the marginal farmers followed
by 46 among the small farmers, 25 among the medium farmers and 12 among the large
farmers. In the non-delta area the percentage of overdues was 71 per cent among the
marginal farmers, 46 among the small farmers, 51 among the medium farmers and 46
among the large farmers.
The percentage of overdues is less in the delta area than in the non-delta area.
Table 4: ANOVA for distribution of total Demand, Repayment and Overdues in
Delta and Non-delta area
Source of
variation
Degree of
freedom
(d.f)
Sum of
squares
(SS)
Mean of
squares
(MS)
F
Values
F.
Critical
value
Total Demand
Category
of Farmers 3 3.72E+11 1.24E+11 13.79* 9.276628
Area 1 1.07E+11 1.07E+11 11.94* 10.12796
Repayment
Category
of Farmers 3 2.83E+11 9.42E+10 3.92* 9.276628
Area 1 1.29E+11 1.29E+11 5.38* 10.12796
Overdues Category
of Farmers 3 1.03E+10 3.42E+09 0.09* 9.276628
Area 1 1.03E+109 1.03E+09 0.09* 10.12796
* 5 per cent level of significance
Source: Table 3.
Table 4 shows that there is a significant difference between different categories of farmers
with regard to demand, repayment and overdues at 5 per cent level of significance in the
delta and non-delta areas.

International Journal of Management, IT & Engineering Vol. 8 Issue 12(1), December 2018,
ISSN: 2249-0558 Impact Factor: 7.119
Journal Homepage: http://www.ijmra.us, Email: [email protected]
Double-Blind Peer Reviewed Refereed Open Access International Journal - Included in the International
Serial Directories Indexed & Listed at: Ulrich's Periodicals Directory ©, U.S.A., Open J-Gage as well as in
Cabell’s Directories of Publishing Opportunities, U.S.A
429 International Journal of Management, IT & Engineering
http://www.ijmra.us, Email: [email protected]
Summary
One of the objectives of Andhra Pragathi Grameena Bank is providing financial support to
the farmers in rural areas. Viewed from this angle,
The repayment percentage was more by the large farmers (75 percent) and low by marginal
farmers (38 percent). The repayment performance was higher in the delta area low in non-
delta areas. The percentage of overdues is less in the delta area than in the non-delta area.
References
1. Srivastava, R.N, Singh D.K. and Singh R.P, Champaram Kshetriya Grameena Bank in
Bihar State, 1981
2. Jagadish Prasad and Sunil Kumar) A case study of Vyshali Kshetriya Grameena Bank in
Mujaffarpur district of Bihar, 1981-82
3. N. Mohsin and R. Jha) credit repayment performance of beneficiaries financed by
Kshetriya Grameena Ban, 1987.
4. Desai, D.K. “Institutional credit requirements for agricultural production -2000 A.D.”
Indian Journal of Agricultural Economics, Vol. 43, No.3, 1988.
5. Garg, J.S. Singh, G.N. and Tripathi, R.N., “An Analysis of Agricultural Financing by
Regional Rural Banks in Moradabad of Uttar Pradesh”, Journal of Agricultural
Economics, vol. 23, No.4, 1978.
6. Gayathri, K. “Credit Delivery in Rural Karnataka: A case of Chikmangalur District”,
Journal of Rural Development, Vol. 12, No.3, May1993.

International Journal of Management, IT & Engineering Vol. 8 Issue 12(1), December 2018,
ISSN: 2249-0558 Impact Factor: 7.119
Journal Homepage: http://www.ijmra.us, Email: [email protected]
Double-Blind Peer Reviewed Refereed Open Access International Journal - Included in the International
Serial Directories Indexed & Listed at: Ulrich's Periodicals Directory ©, U.S.A., Open J-Gage as well as in
Cabell’s Directories of Publishing Opportunities, U.S.A
430 International Journal of Management, IT & Engineering
http://www.ijmra.us, Email: [email protected]
Problems and prospects of Electronic Banking system:- A Case
Study On Commercial Bank Of Ethiopia, Nekemte Branch
Dr. Akshaya Kumar Mohanty (Ph.D. ; M.Phil. ; M.A. ; L.L.B. ; Q.I.P. &
F.D.P.)
Abstract
The study is conducted on the electronic banking practices, opportunities, and challenges
of commercial banks. The case of commercial bank of Ethiopia, Nekemte branch the main
objectives of the study will be to electronic banking practices, opportunities, and
challenges of commercial banks OF Ethiopia Nekemte branch. The respondents of the
study are from electronic banking system of Nekekmte town administration office. All
necessary data for the accomplishment of the study have been collected from the Banking
practice through questionnaires and interview. The result of the data are organized and
analyzed by using descriptive through cross tabulation and percentage to analyze the
possible solution. The study uses census survey and sampling technique.
Keywords:- Banking : modern technology : customer ; satisfaction.
Introduction
Commercial Bank of Ethiopia (CBE), which will be the state owned bank, will be the
leading bank in the country by its large bases of customers, deposits, credits, assets,
capital, market share, profit, branch expansions and others. On the other hand private
commercial banks have been flourishing and competing by giving closely substitute
banking to take some share of the already held and owned portion by CBE. CBE, the
leading bank in Ethiopia established in 1942. The first bank in Ethiopia to introduce ATM
service for local users, pioneers to introduce western union money transfer service and
modern banking to the country Ethiopia (CBE, 2012/13)
Now a day modern technology is being introduced in all the fields and it changes the world
with full of innovations. In Banking, also electronic devices play a dominant role in order
to satisfy the growing need of the customers. Banking system is the backbone of the
economy and information technology in turn will be become the backbone of banking
activities. The traditional banking activities are modernized by using the electronic-
banking system (E- Banking). These changes are being made duty the influence
information technology and the developments in technology of telecommunications and
electronic data processing. Information technology, which implies the integration of
information system with communication technology, has altered the traditional ways of
doing banking and allows banks to wipe out the differences in time as well as a distance
(Gemechu, 2012).
The Ethiopian banking industry is one of the service industries crucial to the growth of its
emerging economy. Banking is important in the role. It plays in capital mobilization and
granting of financial facilities that is crucial to business development and growth. As
business always need to find ways of improving products and services deliveries, it will be
Associate Professor Of Economics, Department Of Economics, Ethiopian Civil Service University, Post Box No: 5648,
Addis Ababa, Ethiopia

International Journal of Management, IT & Engineering Vol. 8 Issue 12(1), December 2018,
ISSN: 2249-0558 Impact Factor: 7.119
Journal Homepage: http://www.ijmra.us, Email: [email protected]
Double-Blind Peer Reviewed Refereed Open Access International Journal - Included in the International
Serial Directories Indexed & Listed at: Ulrich's Periodicals Directory ©, U.S.A., Open J-Gage as well as in
Cabell’s Directories of Publishing Opportunities, U.S.A
431 International Journal of Management, IT & Engineering
http://www.ijmra.us, Email: [email protected]
useful to understand how different factors affects the adoption of E-banking system and in
which way the technological innovations can benefit the banking industries to provide
service to customers (NBE, 2012).
The E- banking concepts become popular when the banking activities and information
technology are merged. The banking transactions become easy after the introduction of
computers in banking sector. The banks are enabled to automate the accounting process
and back
Office functions like maintenance of deposits, calculation of interest and maintenance of
general ledgers. The automation of front office function improves the customer service
with reduction in processing time. When the internet facilities enter into the banking sector
the interbank activities are linked through internet and the concepts of “anywhere banking
or internet banking” is also introduced. Internet banking enables a customer to do banking
transactions through the banks website in the internet. It is more or less like bringing the
bank to the customer’s computer, at the place and time of customer’s choices. (Yohannis;
2010).
To data very little consideration has been given to researching for the challenges and
problems associated with the introduction of e- banking locally, and perhaps this why e-
banking has not be more widely exploited in this country. Therefore, this study attempts to
trace the present status of E- banking in CBE, visualize its opportunities and looks at the
challenges to be solved.
Statement of the Problem
In this era of globalization with increased competition around the globe in all sectors,
strong banking industry is important in every country and can have a significant effect in
supporting economic development through efficient financial services; as the result money,
banks in the world are modifying their strategies to reach customers worldwide more easily
and cheaply. Therefore, banks are developing the technologies that will help them deliver
banking product and services by the most cost effective channels and one of such channel
is adopt E-banking (Muche, 2010).
E- Banking is spreading quickly in recent years as it leads to much lower cost and greater
competition in financial services. E- Banking helps to attract an individual into the banking
system allowing them to improve money management with enhanced financial
empowerment. For financial institutions, it draws cash into bank accounts, which can be
translated into funds for lending and investment. The adoption and growth of e- banking is
found to be very important towards creating a society with its impact on bringing economic
transparency, efficiency and growth. From customer’ perspective, the widely recognized
drivers for the growth electronic banking includes convenience, reliability, widely
availability, affordability and usefulness of services (CBE, 2012).
Despite the growth of e-banking worldwide, commercial banks in Ethiopia, continue to
conduct most of their banking transactions using traditional teller based methods. Despite
the fact that e-banking will be a lot of benefit for banks and customers in Ethiopia,
customers are not enjoying with the technological advancement by low level of
infrastructural development, lack of suitable legal and regulatory framework, high rates of
illiteracy, frequent power interruption and security issues. Moreover, e banking is a new
technology in Ethiopia, which needs a lot of effort and resources to be easily adopted by
customers (Sira, 2013).

International Journal of Management, IT & Engineering Vol. 8 Issue 12(1), December 2018,
ISSN: 2249-0558 Impact Factor: 7.119
Journal Homepage: http://www.ijmra.us, Email: [email protected]
Double-Blind Peer Reviewed Refereed Open Access International Journal - Included in the International
Serial Directories Indexed & Listed at: Ulrich's Periodicals Directory ©, U.S.A., Open J-Gage as well as in
Cabell’s Directories of Publishing Opportunities, U.S.A
432 International Journal of Management, IT & Engineering
http://www.ijmra.us, Email: [email protected]
Hence, in order to banks to improve e-banking adoption by their customers, it is necessary
to examine opportunities and challenges that influence customer’s intention to adopt e-
banking service channels.
Literature Review
Research about e- banking has been conducted from different angles on different topics by
a number of researchers. To mention a few of them:-
According to M. Rhaman (2008) in Bangladesh despite huge demand from the business
community as well as the retail customers particularly the urban customers, electronic
banking (e-banking) is still at a budding state due mainly to a number of constraints such
as unavailability of a backbone network connecting the whole country; inadequacy of
reliable and secure information infrastructure especially telecommunication infrastructure;
sluggish ICT penetration in banking sector; insufficient legal and regulatory support for
adopting e-banking and so on.
Since e-banking offers some smart services benefiting both banks and customers compared
with traditional banking system, it has become imperative to make necessary room for
banks to flourish e- banking. Among others, attractiveness of e-banking includes: it lowers
transaction cost; provide 24-hour service; ensure increased security and control over
transactions; reduces fraud risk; performs higher volume of transactions with less time;
increases number and volume of value payment through banks; allows remote transactions
facilities that replace physical presence of customer in bank branch and; increases
transaction speed and accuracy. On the other hand, traditional banking is time-consuming
and more costly and therefore, e-banking is replacing traditional banking all over the
world.
In addition, an exploratory study that will be conducted in Zimbabwe by ChituraTofara
(2008) indicated that incompatibility with the existing system, cost of implementation,
security concerns, lack of expertise, inadequate legislation and consumer acceptance are
the major challenges for the adoption of e-banking in the country’s banking industry.
According to M. M Rahman (2008) in Bangladesh e-banking is now a global phenomenon.
Apart from the developed countries, the developing courtiers are experiencing strong
growth in e banking. The governments emphasis on setting up ICT park, raising allocation
for developing ICT infrastructure, waiving taxes on computer peripherals and other
measures including the automation program of banking sector and completion among the
scheduled banks in improving customers services have accelerated the prospects of e-
banking.
In addition, as investigated by Alhaji Ibrahim H (2009) using exploratory study, the
following are among the critical challenges for the adoption of e-banking in Nigeria: lack
of technological infrastructure. The implementation of e-payment is been impeded by
unavailability of ICT infrastructure. Most rural areas where majority of small and medium
scale industries are concentrated have no access to internet facilities ICT equipment costs
where available. The cost of ICT is a critical factor relative to per capital income. This
makes the cost of entry higher compared to developed countries.
Regulatory and legal issues – in existence of proper legal and regulatory framework Non-
readiness of banks and other stake holders (acceptability) even though some have shown
impressive willingness, some banks are still not fully ready to for this new payment
regime. Resistance to changes in technology among customers and staff due to:
➢ Lack of awareness on the benefits of new technologies.

International Journal of Management, IT & Engineering Vol. 8 Issue 12(1), December 2018,
ISSN: 2249-0558 Impact Factor: 7.119
Journal Homepage: http://www.ijmra.us, Email: [email protected]
Double-Blind Peer Reviewed Refereed Open Access International Journal - Included in the International
Serial Directories Indexed & Listed at: Ulrich's Periodicals Directory ©, U.S.A., Open J-Gage as well as in
Cabell’s Directories of Publishing Opportunities, U.S.A
433 International Journal of Management, IT & Engineering
http://www.ijmra.us, Email: [email protected]
➢ Fear of risk among banks.
➢ Lack of trained personnel in key organizations and
➢ Tendency to be content with the existing structures.
➢ People are resistant to new payment mechanisms.
➢ Security – where disclosure of private information, counterfeiting and illegal alteration
of payment data may be rampant.
➢ Frequent connectivity failure in telephone lines.
➢ Frequent power interruption.
The study on key factors that determine adoption of internet banking in Ethiopia by using
300 sample respondents via mixed method revealed that demographic factors including
age, income, education level and occupation have a relationship with the adoption of
internet banking. Psychological factors including perceived relative advantage, perceived
compatibility, perceived complexity, perceived risk, and perceived cost were found to
influence the adoption of internet baking. Social influences including opinions of friends,
parents and colleagues were not found to be significant factors to influence the adoption of
internet banking in the Ethiopian context. (Yohannes, (2010)
Another relevant study on analysis of factors influencing customers’ intention to the
adoption of e-banking services channels by using research model of technology acceptance
model (TAM) revealed that attitude, subjective norm, perceived behavioral control,
perceived usefulness and perceived ease of use and perceived risk were significant in
affecting users’ intention to use e-banking service channels.
However, there is no empirical research conducted on e-banking practices, opportunities
and challenges in CBE, Nekemte branch with respect to major dimensions of e-banking
such as cultural, infrastructural and legal dimension. Hence, the researcher is interested to
address this gap by taking account into these dimensions of e-banking. (Sira, (2013)
Objectives of the Study
❖ To identify current practices of e-banking services
❖ To investigate the major challenges in the adoption of e-banking service
❖ To identify the benefit of adoption of e-banking from the view point of the bank
Research Methodology
This study will be used to both primary and secondary data. The data type of the study will
be cross-sectional data since the researcher prefer to study service quality on customer
satisfaction at a point in time that is the year 2014/15 .Primary data source is required in
order to get from questionaries’ and interview firsthand information with respect to the
study under consideration. The secondary data will be collected from CBE’s and NBE’s
annual and periodic reports ,published and unpublished materials, bulletins, magazines,
web sites, internet ,journals, books, facts and finding and etc. More over such data source
is also required to compliment the primary data sources so that the paper might be better
off.
The primary data will be collected through questionnaire. The questionnaire has been
administered through date collectors using personal interview type. With regard to the
questionnaire, the questions are both open ended and close ended. The secondary data will
be collected through published and unpublished materials.
The method of sampling techniques that has been employed this study is simple random
sampling. Because it is chosen in order to avoid bias. In random sampling by its nature,

International Journal of Management, IT & Engineering Vol. 8 Issue 12(1), December 2018,
ISSN: 2249-0558 Impact Factor: 7.119
Journal Homepage: http://www.ijmra.us, Email: [email protected]
Double-Blind Peer Reviewed Refereed Open Access International Journal - Included in the International
Serial Directories Indexed & Listed at: Ulrich's Periodicals Directory ©, U.S.A., Open J-Gage as well as in
Cabell’s Directories of Publishing Opportunities, U.S.A
434 International Journal of Management, IT & Engineering
http://www.ijmra.us, Email: [email protected]
each element in the population has an equal chance of being included in the sample. The
sample item comprised of the customers of the bank.
Sample size determination is an important element in any survey research, although it is a
difficult one because an under-sized sample can be a waste of resources for not having the
capability to produce useful results and on the other hand, an over sized sample costs more
resources than necessary (Admasetal, 2007).Furthermore,”in planning of a sample survey,
a stage is always reached at which a decision must made about the size of the sample. The
decision is important. Too large a sample implies a waste of resources, and too small a
sample diminishes the utility of the results.’’(Cochran, 1977)
The commercial bank of Ethiopia has 919 branches and Nekemte district is one of the
fifteen districts of CBE that has 67 branches under its domain. Out of these 67 branches,
the study has been conducted in Nekemte branch because of the availabilities of money
transfer saving and other services such as ATM, POS mobile banking and SMS services in
the branch. The target the population of the study is customers of CEB Nekemte branch
who were using at least one of electronic banking services such as ATM, POS, Mobile
banking and SMS due to the existence of these electronic banking services in the branch.
These include bank staffs and banks customers who were using and non-users of e-
banking services. Total number of population of the bank will be300 out of which 260and
40 were banks customers’ users’ of e banking and bank staff respectively. For the purpose
of this study, based on population size, sampling error or the level of precision the
confidence level, finance available and time for researcher, sample size has been
determined in scientific way. T he following formula is used.
n= 𝑁
1+𝑁(𝑒)2 …………………………………………………………………………..(1)
Where N the population size is a sample size and e is the level of precision or sampling
error. Since in a social science, 1%-10% of errors are acceptable for the purpose of this
study, the researcher accepted 10% of error due to of lack time and fund to collect data
from large sample.
Since we have N=300, by taking margin of error (e) =10%, by using the following
formula;
n=𝑁
1+𝑁(𝑒)2 n=300/1+300(0.1)2 =75. Therefore,75 sample respondents
were selected by sample random sample method.
After the required data collected, this study has been analyzed through descriptive statistics
such tabulation and percentage computation. This method of data analyzing is selected
because of simplicity as compared to that of inferential statistics, which requires
hypothesis testing.
Result and Discussion
The objective of this part is to present the results and analysis of our work. The study is
conducted in commercial banks of Ethiopia Nekemte Branch with the aim of assessing the
practices of e banking, prospects and its challenges. There are seventy-five employees
were selected as a sample size determined as by sciatic formula expressed in methodology
part.
From the total number of the sampled respondents more than have of them have been
workers of CBE move than two years. This help them to judge whether there is e-banking
practices or not as these employers have been experience with the bank and they could

International Journal of Management, IT & Engineering Vol. 8 Issue 12(1), December 2018,
ISSN: 2249-0558 Impact Factor: 7.119
Journal Homepage: http://www.ijmra.us, Email: [email protected]
Double-Blind Peer Reviewed Refereed Open Access International Journal - Included in the International
Serial Directories Indexed & Listed at: Ulrich's Periodicals Directory ©, U.S.A., Open J-Gage as well as in
Cabell’s Directories of Publishing Opportunities, U.S.A
435 International Journal of Management, IT & Engineering
http://www.ijmra.us, Email: [email protected]
deadly state e-banking practices delivery with what they have observed during their
worker in the bank.
4.1 Demographic characteristics of sample respondents.
Table 4.1.1. Age of sample respondents
Age group No. respondents % percentage
20-25 20 26.67
26-30 30 40
30-35 10 13.33
Above 36 15 20
Total 75 100
Source:- Primary data (2017)
As shown in table (4.1.1) above most of the respondents or the assessed respondents age
20 (26.67%) were b/n the ages of 20-25 group and 30 (40%) is where the age group b/n 26-
30 and only 10(13.33%) were b/n the age of 30-35 and only 15(20%) were above age of 36
years, relatively the age viable. This implies that CBE serve its employers whose age is
more than 20 years old.
Table 4.2 Distribution of sample respondents by sex
Sex No. respondents % percentage
Male 50 66.67
Female 25 33.33
Total 75 100
Source:- Primary data (2017)
From the table (4.2), it could be seen that 50 (66.67%) of the employers were male while
25 (33.33%) female respondents. The implied that interns of gender composition, CBE
provides different e banking services both male and female employers.
Table 4.3 Distribution of sample respondents by marital status
Marital status No. respondents % percentage
Bachelor 20 26.67
Unmarried 30 40
Windowed 20 26.67
Divorced 5 6.66
Total 75 100
Source:- Primary data (2017)
Regarding with marital status of the sample respondents 20 (26.67%) of them were married
(bachelor), 30 (40%) were unmarried (single), 20(26.67), of the beneficiaries were
windowed and only 5(6.66%) sample respondents were those who have divorced due to
various reasons not explicitly expressed by the respondent them salves. this could be
employers of afraid of other person have why they have divorced each other.
Table 4.4. Distribution of sample respondents by educational level
Level of education No. respondents Percentage %
Primary 55 73.33
Secondary 10 13.33
Degree 5 6.67
Masters 5 6.67
Total 75 100
Source:- Primary data (2017)

International Journal of Management, IT & Engineering Vol. 8 Issue 12(1), December 2018,
ISSN: 2249-0558 Impact Factor: 7.119
Journal Homepage: http://www.ijmra.us, Email: [email protected]
Double-Blind Peer Reviewed Refereed Open Access International Journal - Included in the International
Serial Directories Indexed & Listed at: Ulrich's Periodicals Directory ©, U.S.A., Open J-Gage as well as in
Cabell’s Directories of Publishing Opportunities, U.S.A
436 International Journal of Management, IT & Engineering
http://www.ijmra.us, Email: [email protected]
From the information of educational level of the employers, most of the respondents
52(69.33%), 10(13.33%) secondary level and 8(10.67%) of the primary sample level and 5
(6.67%) were master respectively. As it can seen from the table (4.4) above, the number of
employees who have achieved master above were very small in number or 6(6.67%). Only
5 (6.67%) of the sample respondents beneficiaries have basic education and do if all things
When while, 8(10.67%) are attended in primary education respectively.
Table 4.5 Respondents with CBE Nekemte branch
Years No. respondents % percentage
Below 5yers 61 81.33
5-10 yrs 11 14.67
Above 10 yrs 4 5.33
Total 75 100
Source:- Primary data (2017)
Regarding with the status of the employers, the most of respondents 60 (80%) of them
were client ship for five years and 10 years. So they have experiences and reflect their will
be about e-banking services further move as it can seen from the table above, 11(14.67%)
and 4(5.33%) of the employers were below five years and above ten years in terms of their
client ship with CBE respectively. This helps to get the employers about e-banking
services and whether they are satisfied or not.
Table 4.6 Types Employers to be interviewed a CBE Nekemte branch.
Employees types No. respondents % percentage
Bank staffs 65 86.67
Banks customers 10 13.33
Total 75 100
Source:- Primary data (2017)
From the table (4.6) it could be seen that 65(86.67) of the assessed customers of CBE
Nekemte branch were employees of the bank while 10(13.33%) of the sampled
respondents were banks customers who were using e-banking services.
During that, initiate banks to adopt e- banking service.
• Rapidly changing customer’s needs and performances.
• Desire to improve organizational performance with
Desire improve the relationship with customers and reduce tradition on cost cover wide
geographical area and organizational reputation and satisfy customers and for the existence
of high competition in the banking industry.
From questioner and interview (2017)
As depicted in the above information the driving forces that initiate for the adoption of e-
banking service in the bank, the existence of high competition in the banking safety or,
rapidly charging customers’ needs and preferences, desire to improve organizational
performance and improve relationship with customers, reduce transaction cost and build
organization reputation and to satisfy customers are the major common dirking forces that
initiate banks for the adoption of e-banking as means of services delivers to their
customers.
Therefore, from this it is possible to conclude that it is due to the existence of some driving
forces in banking services to the customers.

International Journal of Management, IT & Engineering Vol. 8 Issue 12(1), December 2018,
ISSN: 2249-0558 Impact Factor: 7.119
Journal Homepage: http://www.ijmra.us, Email: [email protected]
Double-Blind Peer Reviewed Refereed Open Access International Journal - Included in the International
Serial Directories Indexed & Listed at: Ulrich's Periodicals Directory ©, U.S.A., Open J-Gage as well as in
Cabell’s Directories of Publishing Opportunities, U.S.A
437 International Journal of Management, IT & Engineering
http://www.ijmra.us, Email: [email protected]
Table 4.7 Challenges of the adoption of e-banking services in CBE
Source:- Primary data (2017)
Information and communication technology (ICT) interest infrastructure is the most to
offer and to implement e- banking services. Communication infrastructure is such as
(NAN, telephone lie must be adequate for e banking in Ethiopia due to poor
telecommunication infrastructure ICT is lot problems or challenges. Ethiopia
telecommunication or portion is unable to provide reliable and fast telecommunication
services. Failures telephone and other network lines are happening frequently. This will
create problems to offer e-banking services. Especially internet is the major problem b/c of
low and wide and low speed. Another major problem is frequent electric reducer
disruption. This will create al of problems in the e-banking activities w/c are the banks to
depend on generators results in high operational cost. These problems are considered as
obstacles for the expansion of e-banking services in the country.
❖ Establishment Expense
Initially banks have to invest huge amount of money in order to provide e- banking
services. They have to buy and install the required systems and facilities, which lead
increased establishment expense. For well-established banks like commercial banks
Ethiopia, the establishment cost may not be a problem. However, for small and new banks,
it is very difficult to invest such a huge amount.
❖ Lack of skilled man power
In order to maintain e-banking services without any fault, Banks need skilled manpower.
However, in Ethiopia the banks are suffering due to in adequate skilled manpower. They
have to hire manpower from foreign counties to overcome this problem.
Otherwise, they have to provide proper training to the existing manpower. Both all result
increased operating expenses.
❖ Legal frame work
Legal framework is playing role in facilitating e-banking systems and in its growth instead
of strict regulation, the country should make some amendments in order to coincide with
the e-banking practices. Ethiopia has not yet set a comprehensive legal framework for e-
commerce in general and e banking in particular. The reason for non-existence of
comprehensive legal framework in Ethiopia may be the lesser e-banking activities. Another
reason may be the many standards to incorporate technical and imitational improvements.
The Ethiopian civil code addresses some of the most important legal issues pertaining to
electronic transactions. But mostly in developed counties they have developed compressive
legal frame work for e-commerce w/c includes e-banking. The national bank of Ethiopia
does not clearly mention its in regulating the e-banking system in its governing legislation.
It has some short comes such as e-signature, lack of significant penalties for frauds and
other a buses and lack adequate non existence of legal frame work may be the banks, w/c
provide so we of the e-banking services, height have not faced any major problem
regarding the regulatory aspects. Legal is crucial and anticay as for conducting e banking
Challenges Repondents Persentage
Establishmentof expense 30 40
Lack of skilled man power 20 26.67
Legal frame work 15 20
Socio cultural aspects 10 13.33
Total 75 100

International Journal of Management, IT & Engineering Vol. 8 Issue 12(1), December 2018,
ISSN: 2249-0558 Impact Factor: 7.119
Journal Homepage: http://www.ijmra.us, Email: [email protected]
Double-Blind Peer Reviewed Refereed Open Access International Journal - Included in the International
Serial Directories Indexed & Listed at: Ulrich's Periodicals Directory ©, U.S.A., Open J-Gage as well as in
Cabell’s Directories of Publishing Opportunities, U.S.A
438 International Journal of Management, IT & Engineering
http://www.ijmra.us, Email: [email protected]
our country having the adequate and sufficient infrastructure capabilities and having a
favorable cultural acceptance and smooth e-banking business. Infect a safe, the adequate
legal and regulatory coverage and facilitation are essential as well.
❖ Socio-cultural aspects
Commercial banks of Ethiopia have some problems related to social and cultural attitude.
There is assistance to changes among customers and some staff members. There is mainly
because of lack of awareness on new technologies and its benefits. The fear risk is also
another reason for their resistance. In case of staff members, the lack of training and
sticking with existing structure are the problems.
Table 4.8 Existing opportunities for the adoption of e-banking services.
Opportunities Respondents Percentage
Commitment of govt to facilitate the
expansion of ICT infrastructure
40 53.33
Improvement in the banking habit of
the society
10 13.33
Sustainable economic growth in the
country
10 13.33
Increment of tourist inflow to
Ethiopia
10 13.33
The existence of high demand for e-
banking user
5 6.67
Total 75 100
Source:- Primary data (2017)
Table 4.9 Benefits realized by banks from the adoption of e-banking service
Benefit No Respondents Percentage
Attracting high rule customers 5 6.67
Enhanced image, larger customer
coverage
10 13.33
Improvement of organizational
efficiency
15 20
Better monitoring of their customer
based
30 40
Load reduction 6 20
Total 75 100
Source:- Primary data (2017)
As reported in the above table, commercial bank of Ethiopia believes that providing
banking proudest to the customer by using electronic channels hare the benefit of building
good image. Load reduction that enables bank employees to focus on strategic issue
instead of focusing on traditional activities and improvement of organizational
performance through cost reduction by avoiding paper work and by reducing the number
of employees required. Hence, it is possible to conduce that deriving banking proudest
through electronic channels made the bank benefited.

International Journal of Management, IT & Engineering Vol. 8 Issue 12(1), December 2018,
ISSN: 2249-0558 Impact Factor: 7.119
Journal Homepage: http://www.ijmra.us, Email: [email protected]
Double-Blind Peer Reviewed Refereed Open Access International Journal - Included in the International
Serial Directories Indexed & Listed at: Ulrich's Periodicals Directory ©, U.S.A., Open J-Gage as well as in
Cabell’s Directories of Publishing Opportunities, U.S.A
439 International Journal of Management, IT & Engineering
http://www.ijmra.us, Email: [email protected]
Table 4.10 Current practices and exist ante of e-banking services in Ethiopia.
e-banking channels Respondents Percentage
ATM 40 53.33
SMA 20 26.67
POS 8 10.67
Mobile banking 2 2.67
Internet banking services 5 6.66
Total 75 100
Source:- Primary data (2017)
Commercial bank of Ethiopia is providing ATM, SMS, POS mobile banking and services
for the customer. As a result, customers of the bank can get the services listed in the above
table. However, the respondents were asked which type of e-banking services you use.
Accordingly, 53.33% of the respondents use ATM followed by SMS, 26.67% and POS,
10.67% and 2.67% mobile banking and 6.66% is in ternate banking in each respectively.
This is due to recent introduction of e-banking channels like POS, mobile banking and
internet ternate banking.
4.2 Advantages and limitations of E-banking in CBE
Table4.11 Advantages and Limitations of E-banking in CBE
Advantage and limitations No Respondents Percentage
Very convenient 15 20
Higher internet 20 20
Speed 30 40
Poorly delivered 15 13.33
Frequent changes adjustments 5 6.67
Total 75 100
Source:-Primary data (2017)
4.2.1 Advantages of e-banking
➢ Very convenient, comfortable and easy way to do whatever monetary transaction you
wish to do with your bank
➢ Provides 5% service as the e-bank never closes and has no out of time.
➢ Smart and interactive without solutions and troubleshooting functionalities.
➢ Higher interest rate enabled through the cost savings achieved by digital form
capabilities.
➢ Speed and laziness of conducting the digital transaction compared to paper based
dealing with in customers.
➢ Used to save time and cost.
Computed from primary data (2017)
4.3.2 Disadvantages of E- Banking
❖ Poorly delivered e-banking services can be slow and time consuming.
❖ Some identify them frication requirement can be annoying and over whirligig for
elements.
❖ Might require a lot of paper work and producers for registration and self up such
documentation.
❖ Can be difficult for clients to get familiarized with the bank’s website and e-banking
channels each bank has its own unique website and methods.

International Journal of Management, IT & Engineering Vol. 8 Issue 12(1), December 2018,
ISSN: 2249-0558 Impact Factor: 7.119
Journal Homepage: http://www.ijmra.us, Email: [email protected]
Double-Blind Peer Reviewed Refereed Open Access International Journal - Included in the International
Serial Directories Indexed & Listed at: Ulrich's Periodicals Directory ©, U.S.A., Open J-Gage as well as in
Cabell’s Directories of Publishing Opportunities, U.S.A
440 International Journal of Management, IT & Engineering
http://www.ijmra.us, Email: [email protected]
❖ Frequent changes and adjustments to the bank’s website and delivery channels that
require re-familiar action and in some cases re-registration and document.
❖ Destruct by some client’s counties with primitive legal system and reliable
technological infrastructure might face security and legal challenges.
❖ Some clients still prefer human interaction and personalized attention.
Table 4.12 what kind’s services should you do with on line?
Kinds of service Respondents Percentage
Fund transfer between accounts 10 13.33
For checking accont balance 15 20
With what of cash from Account 20 26.67
Purchase of goods and services 30 40
Total 75 100
Source:- Primary data (2017)
Table: 4.13 why do you prefer e-banking rather than manual banking?
Reason for performing e-
banking
Respondents Percentage
Reduced cost 9 12
Convenience 20 26.67
Speed 35 46.67
Fraud management 11 14.66
Total 75 100
Source:- Primary data (2017)
Table 4.14 safety and scanty of using on line banking
Level of set station Respondents Percentage
Satisfactory 15 20
Poor 30 40
Good 20 26.67
Excellent 10 13.33
Total 75 100
Source:- Primary data (2017)
From the above table presents the safety and security of using on line banking by
customers of commercial bank of Ethiopia at Nekemte branch. From the table, it could be
seen that safety and security of using on line banking will be satisfactory a may sample
respondents 20% of the customer said the safety and security of using on line banking will
be good 40% of them is poor and 13.335 percent is were excellent.
Conclusion
From as summarized, the main objective of the study will be to assess the e-banking,
practices, opportunities and challenges of CBE of Nekemte branch to recommend so the
opportunities and challenges would take responsible. Today e- banking became a fact and
even a survival issues for banks with their clients trusting and demanding it as a
convenient, safe and trust worthy way of conducting banking transactions.
Moreover, bankers use it as a completive edge and a method to efficiently and effectively
expand their business beyond the geographical barriers CBE has been using e-banking
services for the past years now, CBE started in order to respond to customers demand and
to cut their operational activities and related costs and ultimately to expand their market
share and peruse a different strategy.

International Journal of Management, IT & Engineering Vol. 8 Issue 12(1), December 2018,
ISSN: 2249-0558 Impact Factor: 7.119
Journal Homepage: http://www.ijmra.us, Email: [email protected]
Double-Blind Peer Reviewed Refereed Open Access International Journal - Included in the International
Serial Directories Indexed & Listed at: Ulrich's Periodicals Directory ©, U.S.A., Open J-Gage as well as in
Cabell’s Directories of Publishing Opportunities, U.S.A
441 International Journal of Management, IT & Engineering
http://www.ijmra.us, Email: [email protected]
The main practice e-banking channels include: ATM, SMS, POS, mobile banking and in
ternate banking (13) are used for balance an in quire, cash withdrawal and instatement
purchase of goods and services.
ATM, SMS, POS, mobile banking internet banking services and other electronic payment
systems are at infect stage.
In a view of the extent of e-banking adoption, majorities of the banks have not adopted this
technology and are using manual services to reach and serve their clients. In general, banks
in Ethiopia are trailing behind in acquiring the required quality of banking services to
effectively compete in the global market.
Adoption of e- banking services have the benefit of attracting high value customers,
handed image, larger customer coverage, improvement of organizational efficiency and
load reduction and etc. from the view point of the bank. And also enhancing customer
satisfaction reduce the number of customers come to the banking hall, increase the
productivity of the banks, increase liability and accessibility of banking service, creating
good relationship b/n clients and banks also used as abettor information. Finally,
communication of the government to facilitated the expansion of ICT infrastructure,
improvement in the banking habit of the society, sustainable economic growth in the
country, increment of tourist inflow to Ethiopia and willingness among banks to cooperate
in building infrastructure are among the major opportunities for the adoption et e-banking
in the country.
Therefore, from this it is possible to conclude that there are good opportunities for the
adoption of e-banking services in Ethiopia.
The study of found that in Ethiopia the e-banking aspects are recent phenomenon then the
bank is aiming to in the duce these aspects to their customers.
The major challenges of e banking in the commercial bank of Ethiopia are
➢ Lack of infrastructure facilities.
➢ Unbearable establishment cost.
➢ Lack of skilled manpower.
➢ Unavailability of comprehensive legal framework.
➢ Socio cultural e banking in the case of commercial banks of Ethiopia.
Recommendation
Based on the finding of the study, the following recommendations are forwarded. It gives
the valuable suggestions to increase the e-banking services with the consideration of
prospects of e- banking in Ethiopia. These given below:
❖ In Ethiopia ICT, infrastructure facilities are not well adopted. Due to this, banks are in
opposition to extent the e-banking services.
❖ Another constrain in ICT is high cost structure. For e- banking, services the banks need
24 hours internet service, but in Ethiopia, the cost of dial up internet is expensive.
Because of these banks are not positions expend e-banking services. In order to
overcome this problem, the cost of ICT has to be reduced and ICT services should be
available for all people in cost effective manner.
❖ In order to establish e-banking, banks must go for automation of banking services
within the bank. That is bank have to create links b/n all branches of the bank by using
financial network system. Here the banks are facing problem relating to the reliable
electric power providers should take efforts to provide uninterrupted power supply
throughout the country.

International Journal of Management, IT & Engineering Vol. 8 Issue 12(1), December 2018,
ISSN: 2249-0558 Impact Factor: 7.119
Journal Homepage: http://www.ijmra.us, Email: [email protected]
Double-Blind Peer Reviewed Refereed Open Access International Journal - Included in the International
Serial Directories Indexed & Listed at: Ulrich's Periodicals Directory ©, U.S.A., Open J-Gage as well as in
Cabell’s Directories of Publishing Opportunities, U.S.A
442 International Journal of Management, IT & Engineering
http://www.ijmra.us, Email: [email protected]
❖ Most of the banks, especially small banks’ in Ethiopia are not in opposition to establish
the e-banking services due to high establishment of cost. For existence if the bank
wants to install ATM, it has to incur huge amount of establishment of cost. In order to
overcome this problem the banks can go for low cost products such as low cost ATM,
which will reduce the establishment cost up to some extent otherwise, banks can offer
these services jointly. For instance, the small banks can share the ATM of well-
established banks in order to provide services to their customers.
❖ The Ethiopian banks are lacking in skilled manpower that is necessary to extent e-
banking services. Sometimes the banks may face resistant from the staff members to
establish these services. First all, the banks have to create reliable environment for e
banking. It plays a crucial role in developing the e banking. The Ethiopian civil code is
not enough to make still Ethiopia hags behind in establishing separate legal framework
for e-commerce that includes e banking such as data protection laws, internet laws etc.
The government has to give emphasis on establishing comprehensive legal framework
in order to facilitate e banking.
❖ In order to overcome the problem relating to socio cultural aspects, the banks have to
create public awareness about the benefits of new technologies and its impact. Them
the schools higher institutions and media should give due attention to achieve the
above. The banks should bold enough to face these types of problems.
❖ Familiarization and awareness Company. As it is the case with any other new service
/technology/ introduction in market, the considerable portion of customer would prefer
to avoid the changes and wait until its well tested and used by others. The regulatory
bodies, CBE and other concerned parties should coordinate launching a public
campaign through the local media channels with a focus on assuring customers of the
legitimacy and reliability of e banking.
❖ In the e-banking industry, the role of government is not enough or excellent because
networking in the county is not well improved then government should be creating
awareness for the society.
References
Adams, J., Khan, H.T., Reside, R., & White, D. (2007). Research Methods for Graduate
Business and Social Science Students. California: Sage publication.
Alagheband (2006.) Adoption of electronic banking services by Iranian Customers, MA
thesis,
Lulea University of Technology
Commercial Bank of Ethiopia (2013/14).CBE Annual Report: Addis Ababa: Goal Printing
& Commercial Bank of Ethiopia (2012). CBE Inter Departmental Memorandum on E-
payment n producer, Addis Ababa.
Commercial Bank of Ethiopia (2012/13).CBE fact and figure: Addis Ababa: Commercial
printing press.
Devamohan, A (2010). Lecture Note On E-Banking – problems And Prospects in Ethiopia,
Jimma University, Unpublished Document.
Furst, K &Nolle, D 2002, “Internet Banking: developments and prospects”, working paper
from office of the comptroller of the currency, administration of National banks.
Gemechu, A. (2002). Adoption of Electronic Banking System in Ethiopian Banking
Industry: Barriers and Drivers. Ethiopia: Addis Ababa University.
Magazine, No 112, Addis Ababa, Master Printing Press.

International Journal of Management, IT & Engineering Vol. 8 Issue 12(1), December 2018,
ISSN: 2249-0558 Impact Factor: 7.119
Journal Homepage: http://www.ijmra.us, Email: [email protected]
Double-Blind Peer Reviewed Refereed Open Access International Journal - Included in the International
Serial Directories Indexed & Listed at: Ulrich's Periodicals Directory ©, U.S.A., Open J-Gage as well as in
Cabell’s Directories of Publishing Opportunities, U.S.A
443 International Journal of Management, IT & Engineering
http://www.ijmra.us, Email: [email protected]
Kamrul, H 2009, E-Banking in Bangladesh: The Future of Banking, School of Business
Studies, MA thesis, State University of Bangladesh.
Malak, J 2007, Readiness of the Palestinian banking sector in adopting the electronic
banking system: exploratory study, MA thesis, The Islamic University of Palestine.
Muche, B. (2010). Assessment of the Opportunities and Challenges for the Adoption of E-
Banking Service In Ethiopia. Mekelle, Ethiopia: Mekelle University.
National bank of Ethiopia (2014/15). Financial Sector in Ethiopia: NBE Quarterly
Magazine, No 163, Addis Ababa, i-Printing Press.
National bank of Ethiopia. (2012). Financial Sector in Ethiopia: NBE Birritu Quarterly
Magazine, No 112, Addis Ababa, Master Printing Press.
Sira, Y.T. (2013). Analysis of Factors Influencing customers’ Intention To The Adoption
of E-Banking Service Channels in Bahirdar City: An Integration of Tam, Tpb and Pr.
European Scientific Journal, Vol. 9 No. 13 Issn: 1857-7881, 1-16.
Shannak, R.O. (2013). Key issues in E-Banking Strengths and Weaknesses: the case of two
Jordania banks. European Scientific Journal March 2013 Edition Vol. 9, No. 7 Issn: 1857-
7881 (Print) E-Issn 1857-7431, 1-25.
Yohannes, A. (2010).Key Factors that Determine Adoption of Internet Banking in
Ethiopia. Ethiopia, Addis Ababa: master Thesis, Addis Ababa University.

International Journal of Management, IT & Engineering Vol. 8 Issue 12(1), December 2018,
ISSN: 2249-0558 Impact Factor: 7.119
Journal Homepage: http://www.ijmra.us, Email: [email protected]
Double-Blind Peer Reviewed Refereed Open Access International Journal - Included in the International
Serial Directories Indexed & Listed at: Ulrich's Periodicals Directory ©, U.S.A., Open J-Gage as well as in
Cabell’s Directories of Publishing Opportunities, U.S.A
444 International Journal of Management, IT & Engineering
http://www.ijmra.us, Email: [email protected]
Underpricing Of Book-Built Equity Initial Public Offerings in
India
Akshay Dhuria
Dr. Vinod Kumar
Abstract
The study examines the level of underpricing of book built equity initial public offerings in
India offered through Bombay Stock Exchange from 1st April, 1999 to 31st March, 2018.
Price behaviour (level of underpricing) has been evaluated with the help of average market
adjusted abnormal return (Avg. MAAR). The study is based on a sample of 406
companies which launched their IPOs through book building pricing mechanism during the
study period. It is concluded that during the study period book built IPOs in the Indian
market remained underpriced. The level of underpricing has been observed 17.32 % during
the study period. The results of the study are in line with previous studies conducted by
Kumar (2003), Singh (2003), and Kumar Vinod (2013) etc.
Introduction
A business organization requires long term finance for its establishment and expansion.
The long term finance can be raised from primary market through the issue of equity
shares, preference shares, bonds etc. Of all these instruments equity shares are most
prominent. Which is evident from the fact that out of total Rs. 1,10,269 crore raised during
2017-18, Rs. 1,05,097 crore were raised through equity issues whereas Rs. 5,173 crore
were raised through debt issues(SEBI Annual Report 2017-18). When company offers
equity shares to public in open market for the first time, this is known as Initial Public
Offering. According to SEBI annual report share of IPOs out of the four modes of resource
mobilisation -- IPOs, FPOs, bonds and rights issues has gone up significantly from just 2.2
per cent in 2013-14 to 75.9 per cent in 2017-18. Similar trend is also observed for SME
Platform. During the year 2017-18, an amount of Rs. 2,250 crore through 156 issues was
raised through SME platform which is 1.6 times of the funds raised in 2016-17. The
company may offer its shares to the public either at fixed price or it may offer a price
range. If the shares are offered at fixed price, then the issue is known as fixed price issue.
If a share are offered at a price range and investors are asked to make bids to determine the
price of shares, then such issue is known as book-built issue. As suggested by various
studies IPOs are generally underpriced. The study is an attempt to measure the level of
underpricing of book built equity IPOs offered through Bombay Stock Exchange during
the period from 1st April, 1999 to 31st March, 2018.
Review of Literature
Krishanmurti and Kumar (2002) conducted a study on 386 IPOs to measure the initial
listing performance of Indian IPOs. Results showed that for overall sample the market
adjusted return using Sensex as proxy was 72.34 per cent. Singh & Singh, Mittal (2003)
studied 500 IPOs floated between years 1992-1996. It was found that an average
Assistant Professor, Budha Group of Institutions, Ramba (Karnal) PGT Commerce, HES-II, DSE, Haryana

International Journal of Management, IT & Engineering Vol. 8 Issue 12(1), December 2018,
ISSN: 2249-0558 Impact Factor: 7.119
Journal Homepage: http://www.ijmra.us, Email: [email protected]
Double-Blind Peer Reviewed Refereed Open Access International Journal - Included in the International
Serial Directories Indexed & Listed at: Ulrich's Periodicals Directory ©, U.S.A., Open J-Gage as well as in
Cabell’s Directories of Publishing Opportunities, U.S.A
445 International Journal of Management, IT & Engineering
http://www.ijmra.us, Email: [email protected]
underpricing was 83.22 per cent. The market adjusted underpricing was 75.16 per cent.
The study reported that par issues were more underpriced than premium issues.
Jankiramanan, S (2007) conducted a study on 116 IPOs issued during the period 2000-
01. The study found under- pricing in Indian Market.. Shelly, Singh (2008) reported that
the market adjusted initial return (MAIR), reputation of lead manager and age of the
company have significant impact on level of subscription.
The study also proved that underpricing is in existence in Indian IPO market and
oversubscription has the positive significant impact on underpricing. Age and Issue Size
have significant negative impact. Sahoo, Seshadev & Rajib, Prabina (2010) analyzed 92
Indian IPOs issued during the period 2002- 2006. They found that on average IPOs were
underpriced by 46.55 per cent on the listing day. Kumar Vinod & Dhanda Neelam
(2013) examined 488 IPOs offered through BSE during 1993-2008, for both long term and
short term price performance; the study proves existence of underpricing in Indian IPO
market. Average market adjusted abnormal return & wealth relative were used as price
performance indicators. The average market adjusted abnormal return was 82.67 per cent
on the listing of IPOs. Kumar Vinod & Dhanda Neelam (2013) in another study of
Comparative Pricing Behavior between At Par & at Premium Initial Public Offers in India
analyzed 170 at par and 318 premium initial public offers during the period 1993-94 to
2007-08. They also witnessed existence of underpricing in Indian capital markets. Kumar
Vinod & Dhanda Neelam (2013) in their study “Determinants of Underpricing: Indian
Evidence” studied a total of 488 companies taking 166 Companies from 1993-94 to 1996-
97 and 322 companies from 1997-98 to 2007-08 and reported that IPOs in Indian capital
market are underpriced and analyzed the different factors affecting level of underpricing.
Kumar Vinod (2016) analyzed 488 IPOs of 23 sectors. This study also concludes that all
the 23 sectors have shown underpricing on listing day of IPO. Telecom sector scored
highest Average MAAR i.e. 525%. Kumar Vinod (2017) studied 18 IPOs offered in the
calendar year 2015. It is proved that exit on listing day is more profitable that one year
after listing. Narang Sahil and Kumar Vinod (2017) in their study “Underpricing of
Initial Public Offerings: An Indian Evidence” considered a sample of 49 IPOs offered
during 2014-2016 and proved that there is underpricing in Indian IPO Market. The Avg.
MAAR was 14.63 %. Dhuria Akshay and Kumar Vinod (2018) in their study “Pricing
Of Initial Public Offerings In India: A Study Based On BSE” studied a sample of 46 book
built IPOs offered during the financial year 2017-18 and concluded that book built IPOs
were underpriced. The level of under-pricing was 11.16%.
Objectives
Objectives of the research are:
1. To determine the raw return and market adjusted abnormal return of initial public
offerings offered through BSE ;
2. To analyse the market price performance on listing day of book built initial public
offerings ;
3. To measure the level of underpricing of book built IPOs from 1st April, 1999 to 31st
March, 2018.
Sample Plan of the Study
This study is based on a sample of 406 companies which offered equity shares through
BSE during the study period. Extensive sampling has been used while selecting the

International Journal of Management, IT & Engineering Vol. 8 Issue 12(1), December 2018,
ISSN: 2249-0558 Impact Factor: 7.119
Journal Homepage: http://www.ijmra.us, Email: [email protected]
Double-Blind Peer Reviewed Refereed Open Access International Journal - Included in the International
Serial Directories Indexed & Listed at: Ulrich's Periodicals Directory ©, U.S.A., Open J-Gage as well as in
Cabell’s Directories of Publishing Opportunities, U.S.A
446 International Journal of Management, IT & Engineering
http://www.ijmra.us, Email: [email protected]
sample. Only those companies are excluded from the sample for which the data is not
available.
Data Collection
To accomplish the objectives of the research, secondary data is used. The data relating to
issue price, listing date, closing price of share on the listing day, closing SENSEX on the
listing day is collected from the website of the Bombay Stock Exchange. Other sources of
data are https://economictimes.indiatimes.com, www.sebi.gov.in, www.chittorgarh.com,
SEBI annual report 2017-18 and handbook of statistics of SEBI.
Methodology
Average market adjusted abnormal return (avg. MAAR) on listing day has been calculated
to determine the level of underpricing. Average MAAR is calculated as below:
First of all, Return on a Stock on listing day has been calculated as:
Where Ri is return on stock, Pi is closing price of stock on listing day and Po is the issue
price.
Return on Market Index is calculated as:
Rm is return on market index. Pm1is the closing value of the benchmark index on the first
trading day of the stock and Pm0 is the closing value on the benchmark index on the
offer’s closing day. In this study BSE SENSEX is used as benchmark index.
Market Adjusted Abnormal Return
MAAR= Ri-Rm
Hypothesis of the Study
Average market adjusted abnormal return is not significant or underpricing does not exist
in Indian IPOs market.
Analysis and Statistics
Table 1: Summarized Position of Pricing Behavior of IPOs on Listing Day during the
study period
Pricing Behavior No. of IPOs Average MAAR
(%)
Under priced 261 34.79
Overpriced 145 -14.14
Total 406 17.32
Source: Data compiled by researcher.
Out of the total 406 IPOs during the study period, 261 IPOs were underpriced and 145
were overpriced.
Ri = [(Pi/Po)-1]*100
Rm = [(Pm1/Pm0)-1]*100
Average MAAR = 1
𝑛∑ 𝑀𝐴𝐴𝑅𝑛
𝑖=1 𝑖

International Journal of Management, IT & Engineering Vol. 8 Issue 12(1), December 2018,
ISSN: 2249-0558 Impact Factor: 7.119
Journal Homepage: http://www.ijmra.us, Email: [email protected]
Double-Blind Peer Reviewed Refereed Open Access International Journal - Included in the International
Serial Directories Indexed & Listed at: Ulrich's Periodicals Directory ©, U.S.A., Open J-Gage as well as in
Cabell’s Directories of Publishing Opportunities, U.S.A
447 International Journal of Management, IT & Engineering
http://www.ijmra.us, Email: [email protected]
Table 2: Descriptive Statistics of IPO
N Minimum Maximum Mean
Std.
Deviation
Raw Return (%) 406 -81.70 241.75 17.38 39.46
Index Return
(%) 406 -22.90 20.71 .067 5.38
MAAR (%) 406 -87.38 241.58 17.32 38.58
Issue Price (Rs.) 406 6 1766 242.80 252.67
Source: Data compiled by researcher
The average issue price of 406 companies is ₹ 242.80. The offer price of Dixon
Technologies (India) Limited was highest (₹1766). Everonn Systems India Ltd. has given
the highest raw return (241.75 %) and market adjusted abnormal return (241.58 %). The
average raw return and average MAAR of the 406 IPOs was 17.38% and 17.32%
respectively.
Table 3: Year wise Price Performance of IPOs on Listing Day
The following table shows the average raw return, average market adjusted abnormal
return for each financial year during the study period.
Sr no. Year No. Of IPOs Average Raw
Return (%)
Average
MAAR (%)
Price
Performance
1. 1999-2000 3 -22.29 -5.70 Overpriced
2. 2000-2001 11 13.68 14.32 Underpriced
3. 2001-2002 1 -1.89 -10.89 Overpriced
4. 2002-2003 1 25.89 31.85 Underpriced
5. 2003-2004 5 64.56 64.07 Underpriced
6. 2004-2005 9 42.75 42.71 Underpriced
7. 2005-2006 40 34.71 30.51 Underpriced
8. 2006-2007 53 13.14 14.54 Underpriced
9. 2007-2008 60 29.08 27.97 Underpriced
10. 2008-2009 15 18.16 25.59 Underpriced
11. 2009-2010 33 10.98 8.91 Underpriced
12. 2010-2011 41 7.39 7.17 Underpriced
13. 2011-2012 26 4.13 4.32 Underpriced
14. 2012-2013 7 1.64 2.38 Underpriced
15. 2013-2014 1 15.37 17.83 Underpriced
16. 2014-2015 7 21.49 22.92 Underpriced
17. 2015-2016 23 6.25 8.38 Underpriced
18. 2016-2017 24 21.83 21.25 Underpriced
19. 2017-2018 46 11.34 11.16 Underpriced
Source: Data Compiled by researcher.
Table 3 reveals that level of underpricing (Average MAAR) was highest in the financial
year 2003-04 i.e. 64.07 %.

International Journal of Management, IT & Engineering Vol. 8 Issue 12(1), December 2018,
ISSN: 2249-0558 Impact Factor: 7.119
Journal Homepage: http://www.ijmra.us, Email: [email protected]
Double-Blind Peer Reviewed Refereed Open Access International Journal - Included in the International
Serial Directories Indexed & Listed at: Ulrich's Periodicals Directory ©, U.S.A., Open J-Gage as well as in
Cabell’s Directories of Publishing Opportunities, U.S.A
448 International Journal of Management, IT & Engineering
http://www.ijmra.us, Email: [email protected]
Figure 1: Year wise Price Performance of IPOs on Listing Day
Source: Data Compiled by researcher.
Linear trend line in the figure 1 shows that level of underpricing is declining over time.
One Sample T test Results
One-Sample Statistics
N Mean
Std.
Deviation
Std. Error
Mean
MAAR 406 17.32 38.58 1.91
One-Sample Test
Test Value = 0
T df
Sig. (2-
tailed)
Mean
Difference
95% Confidence Interval of
the Difference
Lower Upper
MAAR* 9.04 405 .000 17.32 13.55 21.08
*Significantly different than zero at 5% level of significance.
As the Average MAAR of 406 IPOs during the study period is significantly different than
zero at 5% level of significance, the null hypothesis i.e. average market adjusted abnormal
return is not significant, is rejected. It proves that Indian Primary Market has been
remained underpriced during the study period.
Conclusion
The study concludes that book built IPOs in India have been underpriced as indicated by
Average Market Adjusted Abnormal Return i.e. 17.32%. The results of the study are in line
with the previous studies. It is also analyzed that level of underpricing of book built initial
public offerings offered through Bombay Stock Exchange shows declining trend during the
study period.

International Journal of Management, IT & Engineering Vol. 8 Issue 12(1), December 2018,
ISSN: 2249-0558 Impact Factor: 7.119
Journal Homepage: http://www.ijmra.us, Email: [email protected]
Double-Blind Peer Reviewed Refereed Open Access International Journal - Included in the International
Serial Directories Indexed & Listed at: Ulrich's Periodicals Directory ©, U.S.A., Open J-Gage as well as in
Cabell’s Directories of Publishing Opportunities, U.S.A
449 International Journal of Management, IT & Engineering
http://www.ijmra.us, Email: [email protected]
References
Dhuria Akshay and Kumar Vinod (2018), “Pricing Of Initial Public Offerings In India: A
Study Based On BSE”, Journal of Management Research and Analysis, Vol. 05 Issue 03,
pp 126-130.
Securities and Exchange Board of India, Annual Report 2017-18, pp. 41.
Press Release of Prime Database Group dated 29th March, 2018.
Kumar Vinod (2017), “Listing Day and Medium Term Price Performance of Initial Public
Offers in India”, Hindu, Year 4, Vol. 15, pp. 600-608.
Kumar Vinod (2016), “Sector-Wise Underpricing of Initial Public Offers in India”,
Sanskar Chetna, Year 6, Vol. 1-3, pp.165-170.
Narang Sahil and Kumar Vinod (2017), “Underpricing of Initial Public Offerings: An
Indian Evidence” International Journal of Research in Finance and Marketing, Vol.7, Issue
4, pp.44-49.
Ghosh S (2005), “The Post-Offering Performance of IPOs in the Indian Banking Industry”,
Applied Economics Letters, Vol. 12, pp. 89-94.
Kumar Vinod and Dhanda Neelam (2013), “Comparative Pricing Behavior between At Par
& Premium Initial Public Offers in India”, International Journal of Management research,
Vol. 1, No.2, pp. 12-23.
Kumar Vinod and Dhanda Neelam (2013), “Determinants of Subscription: an empirical
study of selected Indian IPOs”, International Journal of Research of IT & Management,
Vol. 3, Issue 12, pp. 34-43.
Kumar Vinod and Dhanda Neelam (2013), “Determinants of Underpricing: Indian
Evidence”, International Journal of Management research, Vol. 1, No.2, pp. 120-129.
Kumar Vinod, Dhanda Neelam(2013), “An Evaluation of Initial Public Offers in India with
Respect to Pricing Behavior” Doctoral Thesis, Kurukshetra University ,Kurukshetra.
Loughran T& Ritter, J R (2003), “Why has IPO Under Pricing Changed Over Time?”
,Working paper, University of Notre Dame and University of Florida.
Madhusoodan T P and Thiripalraju M (1997), “Underpricing in Initial Public Offerings:
The Indian Experience”, Vikalpa, Vol. 22, No. 4, pp. 17-30.
Manigart S and Rogiers B (1992), “Empirical Examination of the Underpricing of Initial
Public Offerings on the Brussels Stock Exchange”, Working Paper, Vlerick School for
Management, University of Ghent.
Marchand J & Roufagalas J (1996), “Search and Uncertainty-Determinants of the Degree
of Underpricing of Initial Public Offerings”, Journal of Economics and Finance, Vol. 20,
No. 1, spring, pp. 47-64.
Mittal Anil, Gupta S. L., “Performance Evaluation of Equities in India” Doctoral Thesis,
Kurukshetra University, Kurukshetra, 2003;
Rajan R and Servaes H. (1997), “Analyst Following of Initial Public Offerings”, The
Journal of Finance, Vol. 52, pp. 507-529.
Sahoo Seshadev & Rajib Prabina (2010), “After Market pricing Performance of Initial
Public Offerings (IPOs): Indian IPO market 2002-2006”, Vikalpa, Vol. 35, No. 4, pp. 27-
43.
Sehgal Shikha & Singh Balwinder (2007, “The Initial and Aftermarket Performance of
Indian IPOs”, The ICFAI Journal of Applied Finance, Vol. 13, No. 11, pp. 16-36.
Shah A (1995), “The Indian IPO Market: Empirical Facts”, Technical Report, Centre for
Monitoring Indian Economy (CMIE), Mumbai, India.

International Journal of Management, IT & Engineering Vol. 8 Issue 12(1), December 2018,
ISSN: 2249-0558 Impact Factor: 7.119
Journal Homepage: http://www.ijmra.us, Email: [email protected]
Double-Blind Peer Reviewed Refereed Open Access International Journal - Included in the International
Serial Directories Indexed & Listed at: Ulrich's Periodicals Directory ©, U.S.A., Open J-Gage as well as in
Cabell’s Directories of Publishing Opportunities, U.S.A
450 International Journal of Management, IT & Engineering
http://www.ijmra.us, Email: [email protected]
Factors affecting wheat production:-A case study on Horo
woreda zone of Oromia region
Dr. Akshaya Kumar Mohanty (Ph.D. ; M.Phil. ; M.A. ; L.L.B. ; Q.I.P. &
F.D.P.)
Abstract
Agriculture is the backbone for every developing country like Ethiopia. Inspite of this, it
has not been able to satisfy the food requirements of their people. Hence, it is very
important to understand the determinants of agricultural productivity. In line with this, the
main objective of this study is to assess the factors affecting wheat production:-A case
study on HORO woreda zone of Oromia region. The specific objectives of this study are to
assess the factors affecting wheat production and to come up with some possible
recommendation for policy makers. To assess this problem the cross-sectional data has
been collected. The paper has employed both descriptive and econometrics statistics to
analyse the stated objectives. The study has found that land size, number of oxen,
fertilizers and improved seed has positive effects in wheat production whereas family size
has negative impact on the wheat production. Since seed and fertilizers has positive impact
on theyield capacity of wheat output farmers should be encouraged in order to use them
and government should provides credits to farmers in order to purchase those inputs.
Keywords: Wheat; Productivity; Fertilizer
I. Introduction
For poorest countries agriculture provides the leading sources of employment and
contributes the larger fraction of their national income Especially Sub-Saharan African
countries economy highly depends on agriculture. Since Ethiopia is one of the Sub-
Saharan African countries its economy is highly dependent on agriculture (WB, 2011).
Agriculture is the backbone of the Ethiopian economy. It contributes more than 50 percent
of GDP, 85 percent of labor force employment, 95 percent of total export and supplies 70
percent of the country’s raw material requirements for industries (Ayele, 2006).
The current government of Ethiopia adopted the Agricultural Development Lead to
Industrialization (ADLI) strategy as the overall development strategies of the country since
1995.One of the main facts of this strategy in the agricultural sector has been the
generation, adoption and diffusion of new farm technologies in the form of new and
improved inputs and practices. In the mobilization of small farmers and the dissemination
of better farming practices, the agricultural development practices has been operational zed
through Participatory Demonstration and Extension Training System (PDETS) (EDRI,
2004).
Global cereal production in 2008 reached a record high of an estimated 2245 million tones
enough to cover annual projected needs and to allow a modest replenishment of world
stocks. However, the increase was accomplished by the developed countries. In response to
more attractive prices they increased their cereal output by 11 percent. In developing
countries by contrast only recorded an increase of 1.1 percent .In fact if we exclude China,
India and Brazil from the group production in the rest of the developing world actually fell

International Journal of Management, IT & Engineering Vol. 8 Issue 12(1), December 2018,
ISSN: 2249-0558 Impact Factor: 7.119
Journal Homepage: http://www.ijmra.us, Email: [email protected]
Double-Blind Peer Reviewed Refereed Open Access International Journal - Included in the International
Serial Directories Indexed & Listed at: Ulrich's Periodicals Directory ©, U.S.A., Open J-Gage as well as in
Cabell’s Directories of Publishing Opportunities, U.S.A
451 International Journal of Management, IT & Engineering
http://www.ijmra.us, Email: [email protected]
by .8 percent. The poorest and most food insecure farmers who most needed to profit from
higher cereal prices could not respond to the opportunity and expand production because of
access to inputs or marketing opportunities. As result of this issue increasing cereal crop
production is the main strategy of many developing countries (FAO, 2009).
The growth in agricultural productivity that has occurred in the last century is strongly
associated with the invention and commercialization of new technologies and inputs for
crop cultivation (Pardey et al., 2012). Currently, an increase in productivity, especially in
the presence of natural resource constraints, is likely to be achieved by targeting input
efficiency by means of innovations in fertilizers, plant protection products (i.e. pesticides,
fungicides and herbicides) and mechanization (e.g. precision seeding machines, tractors
with global positioning system –GPS- guidance, etc.) (Petersen et al., 2010). Yield
increases may also result from improved varieties with traits for biotic and abiotic
resistance, and traits that promote nutrient use efficiency and yield stability (Peltonen-
Sainio et al., 2009).
The availability of new or improved inputs is directly related to the level of research and
development (R&D) investment, both from the public sector and from the private sector.
The average rate of growth of public agricultural R&D spending has been decreasing in
developed countries, from 9 percent in the period 1960–1970 to 1 percent in 2000–2009
(Pardey et al., 2012). It is likely that the result will be a slow-down in gains in agricultural
productivity and crop yields as a result of a failure to develop innovative tools against
emerging problems (e.g. innovative pesticides against new pests or diseases). The agro-
chemical inputs most used in agriculture are inorganic fertilizers and plant protection
products.
The quantities used by farms are driven by the need not only to maximize agronomic
outputs, but also to optimize the cost–benefit relationship. Farmers adjust the rate of input
use according to, among other things, the expected harvest price at the end of the season
(Vigani et al., 2013). A similar type of adjustment is also made to the type of crop variety
used, with higher-quality; lower-yielding varieties that obtain higher market prices being
preferred over higher-yielding varieties of a lower quality (Evenson and Gollin, 2003).
The rate of adoption of agro-chemical inputs is also driven by a growing tendency to adopt
environmentally friendlyand sustainable agricultural practices.
One important way to increase wheat productivity is that, reducing factors of agriculture
production(physical factor, economic factor and in addition factor ) through diffusion of
improved technology ,using chemical fertilizer and land management practices and
training farmer (CSA 2002).Therefore, this particular study tries to identify the factors that
affect wheat productivity in this study paper.
II. Statement of Problem
Agricultural output of developing countries is characterized by low productivity which is
more difficult to attain food self-sufficiency. Increasing population size and low level of
agricultural production have a critical problem in sub-Saharan African countries including
Ethiopia. Particularly, million people in Ethiopia are chronically food insecure. Even in
good harvest year partly relay on food aid (Ayele, 2006).
The food insecurity is situation by widening the gap between demand and supply of food,
which is resulted from increasing population size, variation of climate access instability of
product market. In other way the sector is highly dependent on the rain fall with minimum
percent of arable irrigation (FAO, 2001).wheat farm operation uses labor intensive for

International Journal of Management, IT & Engineering Vol. 8 Issue 12(1), December 2018,
ISSN: 2249-0558 Impact Factor: 7.119
Journal Homepage: http://www.ijmra.us, Email: [email protected]
Double-Blind Peer Reviewed Refereed Open Access International Journal - Included in the International
Serial Directories Indexed & Listed at: Ulrich's Periodicals Directory ©, U.S.A., Open J-Gage as well as in
Cabell’s Directories of Publishing Opportunities, U.S.A
452 International Journal of Management, IT & Engineering
http://www.ijmra.us, Email: [email protected]
preparation, weeding and harvesting. Hence increasing the production and efficiency in
wheat production could be taken as an important to attain food security and increase the
income of the farmers.
In Ethiopia, wheat ranks fourth in total crop area and production. It is grown in the
highlands at altitudes ranging from 1500 to 3000 masl. Wheat is a staple food crop for
most households in rural and urban areas in Ethiopia. However, wheat yield is low and
unstable due to several technical and socioeconomic constraints. (Getehun and Legese,
2001).
III. Review of Literature
The ability to increase wheat production has been one of the major challenges faced by
agriculture over the last 20 years not only because wheat is currently a key staple cereal for
millions of people worldwide, but also because wheat demand is expected to dramatically
increase in the near future as a result of the foreseen increase in the global population and
dietary changes (CENEB and CIMMYT, 2012).
Gezhegn and Tadesse (2004) on the adoption of improved technologies in Ethiopia
reported that age of the farmer and distance of the farmer from the market center had a
negative impact on the adoption of improved technologies. On the other hand household
size and farm size of the farmers contact with extension agents had strong and positive
effects on the adoption of improved technologies in Ethiopia.
Agricultural production in Ethiopia is characterized by sever fluctuation in near and highly
correlated to the overall performance of economy. Agricultural share in GDP is about 53%
during the Derg and 51.2% under EPRDE. The highest growth rate in agricultural was
achieved in 1986/87 when it grow by 18.8% while the lowest was achieved in the drought
year of 1984/85 where it declined by 21 % (EEA, 2000).
In Ethiopia most agricultural sectors are dominated by small holder farmers. These small
holders on average account for 95% of total are under crop and for more than 90% of total
agricultural output (Stephenson, 2005).
In Ethiopia most agricultural sectors are dominated by small holder farmers. These small
holders on average account for 95 percent of total are under crop and for more than 90% of
total agricultural output (Stephenson, 2005). Smallholder farmers are those marginal and
sub marginal farmhouse holds that own or land cultivated less than 2 he. Of land, they
cultivate about 78% of countries farmers.
Wheat output in Ethiopia is quite low by world standards and: average 1.7 ton/he as
compared global average of about 5ton/hewheat research in Ethiopia started half a century
ago passed through distinct stage of research and development (kebede et al., 2004). From
1952-1980, introduction and evaluation of wheat materials from different parts of the
world for local farmers. Although wheat is an introduction within year remained below 20
million quintal and wheat production area exceeded one million hectare (Kebede et al.,
2002).
In 2000, wheat area was 20.86 percent of total area under cereal in the country while grain
production of wheat accounted for 32.6 percent of total cereal production. CSA, 2001)
The agricultural sector is the backbone of the Ethiopian economy because of it constitutes
almost half of GDP but also because of more than 80 percent of the population still
dependents on it for their livelihood. As a result, the government has given more attention
to the development of agricultural. So that they would increasingly benefits from the small

International Journal of Management, IT & Engineering Vol. 8 Issue 12(1), December 2018,
ISSN: 2249-0558 Impact Factor: 7.119
Journal Homepage: http://www.ijmra.us, Email: [email protected]
Double-Blind Peer Reviewed Refereed Open Access International Journal - Included in the International
Serial Directories Indexed & Listed at: Ulrich's Periodicals Directory ©, U.S.A., Open J-Gage as well as in
Cabell’s Directories of Publishing Opportunities, U.S.A
453 International Journal of Management, IT & Engineering
http://www.ijmra.us, Email: [email protected]
plot of land and surplus labor could increasingly move to industrial sector. However the
attempts to increase productivity have not yield the expected outcome (EEA, 2007/8).
IV. Objectives of the Study
❖ To identify of the major determinants of wheat production.
❖ To identify the existing institutional challenges in the study area.
V. Methodology of the Study
This includes the data collection methods, sampling techniques, and procedures of data
collection and analysis.Both primary and secondary data were used for this study. The
primary data were collected from rural small holders’ farmers producing Wheat in the
study area. For this purpose questionnaire were used to collect this data. Besides, the study
was also supported by secondary data that collected from different sources like official
reports, books, CSA and other statistical compilation and internets.
The sample for this study was drawn from the population of smallholders’ farmers residing
in the rural area of Horo woreda. Among these farmers the target population for the sample
only includes those farmers producing Wheat in the production period of 2008 EC.
Multi-stage sampling techniques were used to select the sample from the total target
population. In the first stage, three Peasant Associations (PAs) namely KombolchaCanco,
GitiloKebeleand ChabirKebele were selected purposively among the total of 20 PAs based
on the extent of wheat production. In second stage, once the total sample size of 50 is fixed
using sample size formula developed Cochran’s (1963) it is distributed to each PA
proportionately to their relative share in the total size. In the third stage, the representative
sample of the study selected using a simple random sampling approach.
Where: n sample size and p=population proportion
e level of precision (3%, 5%, 7% and 10%)
z level of confidence for 90% is (1.64)
The three selected kebeles have 2200 household heads. From these house heads 1995
house hold heads were Produced Wheat in 2007/2008 E.C. From this P is calculated as:
The total sample size was then distributed among the PAs proportionately to their relative
size in the total using the formula:
𝑛𝑖 =𝑁𝑖
𝑁∗ 100
Where Ni= the total number of observation in the (i) Kebele.
N= total numbers of house hold heads in three Kebeles
ni= the same size of (i) Kebele
Accordingly, the total sample size of the study is distributed among PAs as it is shown in
form of

International Journal of Management, IT & Engineering Vol. 8 Issue 12(1), December 2018,
ISSN: 2249-0558 Impact Factor: 7.119
Journal Homepage: http://www.ijmra.us, Email: [email protected]
Double-Blind Peer Reviewed Refereed Open Access International Journal - Included in the International
Serial Directories Indexed & Listed at: Ulrich's Periodicals Directory ©, U.S.A., Open J-Gage as well as in
Cabell’s Directories of Publishing Opportunities, U.S.A
454 International Journal of Management, IT & Engineering
http://www.ijmra.us, Email: [email protected]
Table 1.as follows
No. Pas Total HHHs Sample size
1 KombolchaCancokebele 1000 22
2 GitiloKebele 700 15
3 ChabirKebele 500 13
Total 2200 50
Primary data for this study were collected using enumerator administered questionnaire in
which the enumerator fills the answer asked by him. This method has the advantage of
considering illiterate household heads in the sample and ensures accuracy and reliability of
data collection through personally explaining the significance of inquiry and the questions
in the questionnaire to the informant household head.
The collected data are going to be analyzed by using both descriptive and inferential
approaches. We planned to use tables, percentage, statistical values and graph for
descriptive analysis.
Besides, we planned to conduct inferential analysis using model for identifying the
relationship between the production of wheat and its factors. We will use the multiple
linear regression models because wheat production is determined by more than one
variable.
Where
itQ = quantity of Wheat produced measured in quintal
tX1 = number of oxen used in production of Wheat
tX 2 = the land used for Wheat production measured in hectares.
tX 3 = family size of the farmer.
tX 4 = the amount of improved seed measured in Kilogram.
tX 5 = the amount of fertilizers used in Wheat production measured in kilograms.
µi = error term
In the model the quantity of wheat produced (as dependent variable) determined by other
independent variables. Statistical software package like STATA 13 was employed in the
analysis of the research.
V. Data Analysis
As shown in the methodology part, Fifty (50) respondents are selected as a representative
of the target population. Accordingly the data is collected from all the 50 respondents
using structured questionnaire.
VI. 1. Descriptive analysis
In this part, the results of descriptive analysis are reported which are based on cross-
sectional data collected from fifty (50) small holder framers selected from Horo woreda.
The survey data were used to describe the socio-economic characteristics and demographic
characteristics of the respondents.
VI. 1. 1. Households Heads and Members Characteristics
VI. 1. 1. 1. Sex and Age Composition of Household Heads
From Table 2 among the total respondents 40(80%) are male respondents while the
reaming 10(20%) are female. This implies that woreda’s males were more participants than
females in wheat production activity.
µi55443322110 ++++++= tttttit XXXXXQ

International Journal of Management, IT & Engineering Vol. 8 Issue 12(1), December 2018,
ISSN: 2249-0558 Impact Factor: 7.119
Journal Homepage: http://www.ijmra.us, Email: [email protected]
Double-Blind Peer Reviewed Refereed Open Access International Journal - Included in the International
Serial Directories Indexed & Listed at: Ulrich's Periodicals Directory ©, U.S.A., Open J-Gage as well as in
Cabell’s Directories of Publishing Opportunities, U.S.A
455 International Journal of Management, IT & Engineering
http://www.ijmra.us, Email: [email protected]
Table 2. Sex composition of respondents
Sex No. of respondents Percentage (%)
Female 10 20%
Male 40 80%
Total 50 100%
Source: Survey Result, 2018
Regarding the age structure, there was age variation among the respondents. The youngest
house hold has age of 20, while the oldest has age of 70 with difference of 50. Since the
maximum and minimum measures are crude, it would be better to use group frequency
distribution. By grouping their ages in to 5(five) categories with 10(ten) gaps between the
group.
Table 3 reveals that the total sample is 50 households. From this 94% are in the ages
human being are active and capable of performing any activity. Those their ages below and
above 61 were accounted 6%. From this we conclude that 6% of the total population is
depending on the production of 94% of the population. This has resulted in the substance
type of farming in which most of produced output is left for consumption purpose.
Table 3. Age composition of respondents
Age composition
Age interval No respondent Percentage (%)
20-30 17 34%
31-40 12 24%
41-50 11 22%
51-60 7 14%
61-70 3 6%
50 100%
Source: Survey Result, 2018
VI. 1. 1. 2. Education Levels and Marital Status of House Hold Heads
As Table 4 revealed among the total respondents 6(12%) are illiterate, 28(56%) are first
cycle, 16(32%) are second cycle and these no above second cycle. The data implies above
56% of the farm population are first cycle. Therefore it may results a positive impact on
wheat production.
Table 4. Educational Levels of Household Heads
Educational status No respondents Percentage (%)
Illiterate 6 12 %
First cycle 1-8 28 56 %
Second cycle9-12 16 32 %
Total 50 100 %
Source: Survey Result, 2018
From Table 5 among the total respondents 41(82%) are married 9(18%) unmarried. The
data implies from the total respondents the married house hold heads has a large share by
participation in wheat production.

International Journal of Management, IT & Engineering Vol. 8 Issue 12(1), December 2018,
ISSN: 2249-0558 Impact Factor: 7.119
Journal Homepage: http://www.ijmra.us, Email: [email protected]
Double-Blind Peer Reviewed Refereed Open Access International Journal - Included in the International
Serial Directories Indexed & Listed at: Ulrich's Periodicals Directory ©, U.S.A., Open J-Gage as well as in
Cabell’s Directories of Publishing Opportunities, U.S.A
456 International Journal of Management, IT & Engineering
http://www.ijmra.us, Email: [email protected]
Table 5 .Marital Status Household Heads
Marital status No of respondents Percentage (%)
Unmarried 9 18 %
Married 41 82 %
50 100%
Source: Survey Result, 2018
VI. 1. 1. 3. Family Size of Households Heads
As shown from Table 6 below majority of the house hold heads 30 (60%) out of the
interviewed house hold have family size from 6-10. From this we observe that most of the
households in Horo woreda use family labor in the production of wheat. In other ways
these data implies that the house hold in the studied area are first cycle, whose have
experience type of farming in which most of produced output is for consumption purpose.
Table 6.Family size of households
Family size Frequency Parentages (%)
0-5 19 48 %
6-10 30 60 %
> 10 1 2 %
Total 50 100 %
Source: Survey Result, 2018
As shown in Table 7 a significant amount of 88% of form household heads is literate and
12% of them are illiterate able to read and write. These indicate that most of the farmers of
the area were literate the consequence is direct and proportional on the production of
wheat.
Table 7. Family size distribution by the status of illiteracy
Status of illiteracy Frequency Percentage
Illiterate 225 88
Not illiterate 80 12
Total 305 100
Source: Survey Result, 2018
VI. 1. 2. House hold Wheat Production Related Information
VI. 1. 2. 1. Total Output of Wheat Produced
From Table 8 the researcher examined that the maximum level of output was 42(84%)
quintals of wheat was produced in 2017. Conversely, the minimum level of output of
wheat is 8(16%) quintal this might be because of these farmers did not use enough
fertilizer and not use selected seed.
Table 8. Quintals of Wheat Produced by Number of Household Head
Range of output Frequency Percentage
15-25 11 22
25-35 10 20
35-45 9 18
45-55 12 24
55-65 5 10
65-75 1 2
75-85 2 4
Total 50 100
Source: Survey Result, 2018.
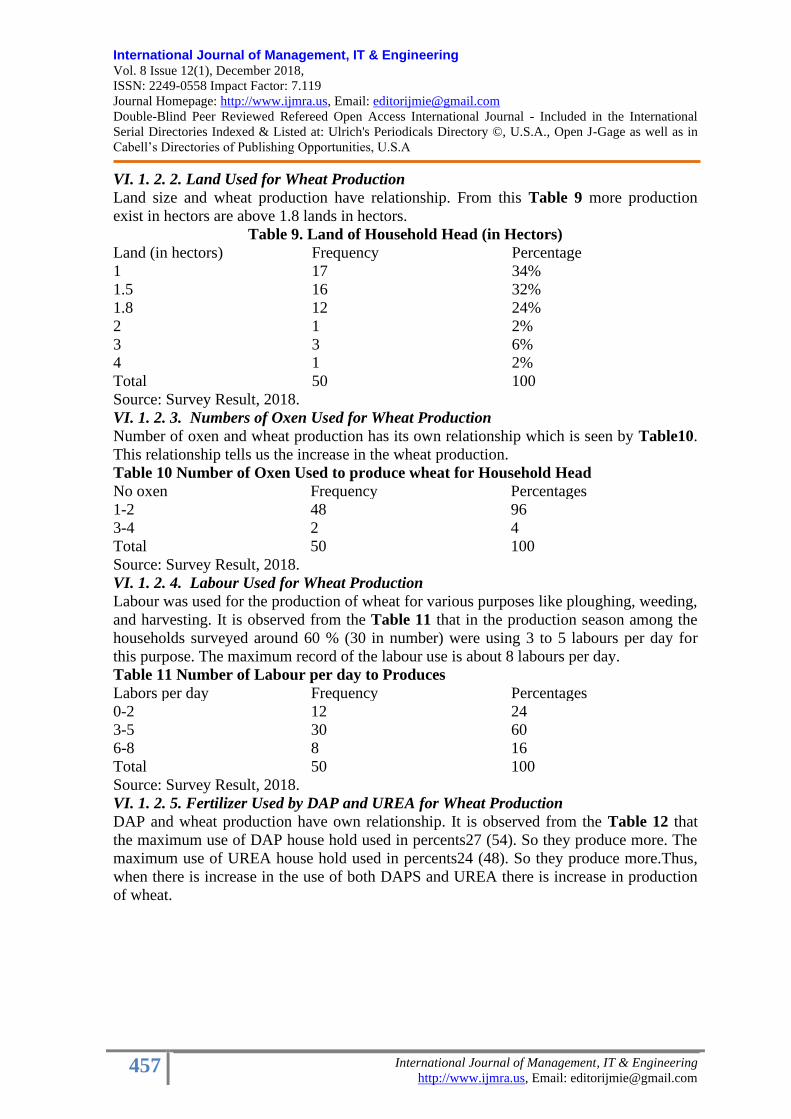
International Journal of Management, IT & Engineering Vol. 8 Issue 12(1), December 2018,
ISSN: 2249-0558 Impact Factor: 7.119
Journal Homepage: http://www.ijmra.us, Email: [email protected]
Double-Blind Peer Reviewed Refereed Open Access International Journal - Included in the International
Serial Directories Indexed & Listed at: Ulrich's Periodicals Directory ©, U.S.A., Open J-Gage as well as in
Cabell’s Directories of Publishing Opportunities, U.S.A
457 International Journal of Management, IT & Engineering
http://www.ijmra.us, Email: [email protected]
VI. 1. 2. 2. Land Used for Wheat Production
Land size and wheat production have relationship. From this Table 9 more production
exist in hectors are above 1.8 lands in hectors.
Table 9. Land of Household Head (in Hectors)
Land (in hectors) Frequency Percentage
1 17 34%
1.5 16 32%
1.8 12 24%
2 1 2%
3 3 6%
4 1 2%
Total 50 100
Source: Survey Result, 2018.
VI. 1. 2. 3. Numbers of Oxen Used for Wheat Production
Number of oxen and wheat production has its own relationship which is seen by Table10.
This relationship tells us the increase in the wheat production.
Table 10 Number of Oxen Used to produce wheat for Household Head
No oxen Frequency Percentages
1-2 48 96
3-4 2 4
Total 50 100
Source: Survey Result, 2018.
VI. 1. 2. 4. Labour Used for Wheat Production
Labour was used for the production of wheat for various purposes like ploughing, weeding,
and harvesting. It is observed from the Table 11 that in the production season among the
households surveyed around 60 % (30 in number) were using 3 to 5 labours per day for
this purpose. The maximum record of the labour use is about 8 labours per day.
Table 11 Number of Labour per day to Produces
Labors per day Frequency Percentages
0-2 12 24
3-5 30 60
6-8 8 16
Total 50 100
Source: Survey Result, 2018.
VI. 1. 2. 5. Fertilizer Used by DAP and UREA for Wheat Production
DAP and wheat production have own relationship. It is observed from the Table 12 that
the maximum use of DAP house hold used in percents27 (54). So they produce more. The
maximum use of UREA house hold used in percents24 (48). So they produce more.Thus,
when there is increase in the use of both DAPS and UREA there is increase in production
of wheat.

International Journal of Management, IT & Engineering Vol. 8 Issue 12(1), December 2018,
ISSN: 2249-0558 Impact Factor: 7.119
Journal Homepage: http://www.ijmra.us, Email: [email protected]
Double-Blind Peer Reviewed Refereed Open Access International Journal - Included in the International
Serial Directories Indexed & Listed at: Ulrich's Periodicals Directory ©, U.S.A., Open J-Gage as well as in
Cabell’s Directories of Publishing Opportunities, U.S.A
458 International Journal of Management, IT & Engineering
http://www.ijmra.us, Email: [email protected]
Table 12 Fertilizer Used for Wheat Production Both DAP and UREA
No of DAP Frequency Percentage
(%)
No of UREA frequency Percentage
(%)
50-100 19 38 50-100 20 40
100-200 27 54 100-200 24 48
200-300 4 8 200-300 6 12
Total 50 100 % Total 50 100%
Source: Survey Result, 2018.
VI. 1. 2. 6. Improved Seed Used for Wheat Production
It is observed from the Table 13 that only 24(48%) of the respondent are using improved
seed to produce wheat, where the remaining 26(52%) are not using improved seed and they
use local variety of wheat. The reason for those farmers not using improved seed is due to
its high prices and lack of awareness of improved seeds.When there is increase in amount
of improved seed, there is increase in the production of wheat. Thus, more use of selected
seed in the production process increase the wheat production by more amounts.
Table 13. Improved Seed for Production of Wheat
Improved Frequency Percentages
0-100 7 14
100-200 35 70
200-300 8 16
Total 50 100
Source: Survey Result, 2018.
Thus, the main factors affecting the wheat production are farm size, fertilizers, selected
seed, number labor (family labor) and number of oxen used.
VI. 2. Econometric Analysis
This section tries to analyses the factor that determines wheat production in Horo woreda.
The OLS regression analysis is employed for estimation purpose. This section presents the
findings from the econometric results on the determinants of wheat production. The section
covers regression model used in this study and the results of the regression analysis.
In table 4.16, shows coefficient, standard errors, t-values and p-values for explanatory
variables and R-square, adjuster R-square, standard error of regression, F-statistics, prob
(F-statistics) for the regression, and number of observation included in the study are
presented.
From table 4.16 the R-square and adjusted R-square of the model are 0.8754 and 0.8473
respectively. The total variation in the dependent variable that can be explained by the
independent variable is 84.72%. In this model, 84.72% of the performance of explanatory
variable in this model explained the variation of dependent variable and the remaining
15.28% is explained by other variables not included in the model. Thus these variables
collectively have good explanatory power in explaining the production of wheat.
These variables are also significant in jointly influencing the dependent variable which is
wheat production. This confirmed by the F-statistics value which is significant even at less
than one percent level of significance.
Before directly going for interpretation some test for multicolineariy and heteroscedasticity
are conducted. The result obtained is free of multicolineariy because the mean VIF is about
3.5 which is less than the 10 threshold.

International Journal of Management, IT & Engineering Vol. 8 Issue 12(1), December 2018,
ISSN: 2249-0558 Impact Factor: 7.119
Journal Homepage: http://www.ijmra.us, Email: [email protected]
Double-Blind Peer Reviewed Refereed Open Access International Journal - Included in the International
Serial Directories Indexed & Listed at: Ulrich's Periodicals Directory ©, U.S.A., Open J-Gage as well as in
Cabell’s Directories of Publishing Opportunities, U.S.A
459 International Journal of Management, IT & Engineering
http://www.ijmra.us, Email: [email protected]
Table 14. Variance Inflation Factor of the Model
Variable VIF 1/VIF
Noox 6.93 0.144283
Fuse 6.52 0.153449
Lsize 4.47 0.223584
Inpse 2.61 0.383827
Age 1.50 0.668871
Lperday 1.33 0.750379
Educ 1.15 0.871745
Mean VIF 3.50
The model is also free of heteroscedasticity. The test is conducted using Breusch-Pagan /
Cook-Weisberg test. The decision rule is, if the p-value of the Breushpogan test is greater
than any of the chosen significance levels i.e. 10%, 5% and 1% which indicates no
problem of heterosedasticity. Thus, the result indicates that prob chi 2 of 57.36% greater
than any significance levels and study conclude these shows the same variance among
error terms.
Table 15. Breusch-Pagan / Cook-Weisberg test for heteroskedasticity
Ho: variances are constant
chi2 (1) 0.32
Prob> chi2 0.5736
Computed by stata 13, Survey Result, 2018
Therefore, the final estimated model result is presented as in the Table 16 as follows.
The coefficient of land size is found to be significant by less than 1% level of significance
and showed the expected positive sign. This means that a 1% increased land size in
hectares will lead to 88.7% increase in wheat production.
The coefficient of family size was found to be significant by less than 5% level of
significance and showed negative sign. This means that a 1% increase in family size leads
to 12.2% decrease in wheat output. The result might be due to the probability of the
existence of unproductive and inactive labor is wide as the number of family size
increases.
When family size increase, they needs many food, shelter and other basic needs therefore
output produced only used for consumption purpose not used for purchasing inputs and to
adopt agricultural technology which is result by low productivity. Therefore wheat
production and family size has indirect relationships.
The coefficient of fertilizers was found to be significant by less than 1% level of
significance and showed the expected positive sign. This means that a 1% increase in
fertilizer in unit will leads to 20% increase in wheat output.

International Journal of Management, IT & Engineering Vol. 8 Issue 12(1), December 2018,
ISSN: 2249-0558 Impact Factor: 7.119
Journal Homepage: http://www.ijmra.us, Email: [email protected]
Double-Blind Peer Reviewed Refereed Open Access International Journal - Included in the International
Serial Directories Indexed & Listed at: Ulrich's Periodicals Directory ©, U.S.A., Open J-Gage as well as in
Cabell’s Directories of Publishing Opportunities, U.S.A
460 International Journal of Management, IT & Engineering
http://www.ijmra.us, Email: [email protected]
Table 16. Results of regression analysis Prob>F = 0.00 F(9, 41) =31.21
Qprod of
wheat Coef. Std. Err t P>|t| [95%Conf.Interval]
Sex -1.2971561 2.383448 -0.54 0.589 -6.114254 3.519972
Age 0.3739552 0.0954244 0.39 0.697 -0.1554644 0.22302553
Mstatus 4.5767883 3.0497115 1.50 0.141 -1.586916 10.74049
Edu -0.34566249 0.2985219 -1.16 0.254 -0.9489603 0.2577104
Land size 8.874926 2.960677 3.00 0.005 2.891176 14.85868
No oxen -0.0189304 3.636883 -0.01 0.996 -7.369345 7.331484
Labours -1,222645 0.5693841 -2.15 0.038 -2.73143 -0.07877
Impseed 0.0200561 0.0254869 0.79 0.436 -0.314548 0.0715671
Fertused 0.0747321 0.0200311 3.73 0.001 0.0342477 0.1152165
Cons 1.23927 5.4577636 0.23 0.822 -9.791024 12.26956
R-squared = 0.8754
Adj R-squared = 0.8473
VII. Conclusions and Recommendations
Though agriculture is the backbone for Ethiopian economy; it has not been able to satisfy
the food requirements of their people. Hence, it is very important to understand the Factors
affecting of agricultural production and productivity with respect to wheat production. In
line with this, the main objective of this study is to assess the factors affecting of wheat
production in Horo woreda of Oromia region.
In order to examine this problem the cross-sectional data is collected. Based on descriptive
and econometric analysis results the study has reached on the following conclusions.
• The Woreda is mainly dominated by literates’ male farmers, whose usage of improved
technologies’ high.
Based on the major finding of these study the recommendation are as follows. In Horo
woreda, there is low production of wheat crop; so that in order to improve
the production and to ensure the socio-
economic well being of residents of Horo woreda the following measure should be taken.
• The farmer should have to use any kind of improvement such as enough improved
seeds, modern farming techniques and etc. The agricultural sectors should be highly
encourages and lead the farmers by giving more technical (professional) follow up, to
get highly qualified yields and to improve the production technique. Since the
production of wheat crop depends on land size, fertilizer, temperature and rainfall the
metrological agencyand agricultural office should work together with each other on
this issue
• The educational status of household head is at its stages.
• The productivity of wheat from the farm land size is relatively large as we compare
with other area which wheat is produced extensively.
The study found that land size, fertilizers has positive effects in wheat production
whereas family size has negative impact on the wheat production.

International Journal of Management, IT & Engineering Vol. 8 Issue 12(1), December 2018,
ISSN: 2249-0558 Impact Factor: 7.119
Journal Homepage: http://www.ijmra.us, Email: [email protected]
Double-Blind Peer Reviewed Refereed Open Access International Journal - Included in the International
Serial Directories Indexed & Listed at: Ulrich's Periodicals Directory ©, U.S.A., Open J-Gage as well as in
Cabell’s Directories of Publishing Opportunities, U.S.A
461 International Journal of Management, IT & Engineering
http://www.ijmra.us, Email: [email protected]
• The study area Horo woreda. is one of the most prominent woreda which is engaged by
subsistence agriculture of wheat production in Oromia regional states
Based on the results drawn, the study gives the following policy implications.
➢ The educational background of the respondent need to be further enhanced through
facility in addition the farmers should use family planning which helps to minimize
family size
➢ Since fertilizer has positive impact on the yield capacity of wheat output farmers
should be encouraged to use fertilizer and government should provide credits to
farmers in order to purchase inputs.
➢ When family size increase, they needs many food, shelter and other basic needs
therefore output produced only used for consumption purpose not used for purchasing
inputs and to adopt agricultural technology which is result by low productivity.
Therefore wheat production and family size has indirect relationships.
➢ Increased land size in hectares will lead to increase in production and productivity of
wheat production especially in Horo Woreda.
➢ Government should provide credit services and other methods how the formers get
capital to produce wheat.
➢ The farmers should work together in order to share experiences with each other.
References
• Ayele, Kuris,, (2006). Ethiopia economy .2ndedition.AddisAbaba:AsterNega publishing
press
• Central agricultural census commission.(2001/02.)For large and medium scale farmers
result at country level, Addis Ababa,
• CSA,. 2010.Agricultural sample survey report on area and production. Addis Ababa.
• DamoderN, Gujarati,,(2004.)Basic econometrics. fourth edition. London, Tata McGraw
Hill.
• EDRI , “Preliminary study report on agricultural extension, adoption, and socio –
economic impacts in factor regions (Tigray, Amhara, Oromia & the South) of Ethiopia,
a paper presented to the relational workshop on Feb, 26 2004, at Gion Hotel,
unpublished”. 2004.
• EEA.( 2004) “Annual report on Ethiopia Economy .“Addis Ababa.
• EEPRI,(2002.)Research report on land genure and agricultural development in
Ethiopia.” Addis Ababa.
• Engdawork, Tadesse,(2009)(2004) (2005)On the adoption of improved technologies in
Ethiopia, and A review of supply and marketing issues Msc thesis, Mekele University,
Ethiopia. Ministry of Agriculture Annual report cereal crop production. Addis Ababa
• FAO. 2009,knowledge and communication department world food Day Tele Food,
Italy, and Increasing cereal crop production is the main strategy of many developing
countries
• GesayePheters, (2004).The Ethiopia economy.” Cereal crop production
• World Bank (2011) Annual report on Ethiopian Economy.

International Journal of Management, IT & Engineering Vol. 8 Issue 12(1), December 2018,
ISSN: 2249-0558 Impact Factor: 7.119
Journal Homepage: http://www.ijmra.us, Email: [email protected]
Double-Blind Peer Reviewed Refereed Open Access International Journal - Included in the International
Serial Directories Indexed & Listed at: Ulrich's Periodicals Directory ©, U.S.A., Open J-Gage as well as in
Cabell’s Directories of Publishing Opportunities, U.S.A
462 International Journal of Management, IT & Engineering
http://www.ijmra.us, Email: [email protected]
Experimental Study of Stabilization of Soil Using Fly Ash and
Lime S. Binil Sundar
Abstract
In most of the developed areas, borrow earth is not easily available which has to be hauled
from very far distance. Quite often, large areas are covered with highly plastic and
expansive soil, which is not suitable for stabilization purpose. Extensive site and lab
research have been carried out by researchers in lab and have shown promising results for
application of such expansive soil after stabilization with additives such as sand, silt, lime,
fly ash, etc. As fly ash is available in large amount, so it can be used for stabilization of
expansive soils for various uses. The present paper describes a study carried out to check
the improvements in the properties of expansive soil with fly ash in varying percentages.
The knowledge of soil Stabilization in geotechnical engineering has been well
documented. Journal articles and text books on stabilization technology are available to the
students, practicing and consulting engineers in the field of geotechnical engineering. This
state of the art review brings up to date trends in stabilization practice with the main focus
in stabilization methods and materials. The first part of this review discusses the effect of
various binders on stabilized soils. The second part describes stabilization methods and
equipment. The review describes in brief modernized stabilization methods and equipment
to practicing engineers. For detailed information about the subject matter, readers should
refer to the cited authors available in the reference list.
1.0 Introduction
1.1 General
Soil stabilization is the process of changing soil properties to improve strength and
durability.The improvement of stability or bearing power of the soil is done by the use of
controlled compaction, proportioning and/or the addition of suitable admixture or
stabilizers. The soil was not suitable in the present form for construction of ash dyke due to
the following reasons:
1. Poor workability for compaction. The construction schedule was critical and it was
necessary to carry out the work during monsoon when optimum moisture content cannot
be achieved.
2. High compressibility and leading to dyke top settlement.
3. Inadequate shear strength for required slope stability.
1.2 Objective
The main objective of this project is to geotechnical improve areas of weak soil with the
help of lime and fly ash into a construction material is an established and extremely cost-
effective construction method.
1.3 Need For Soil Stabilization
• Limited Financial Resources to Provide a complete network Road System to build in
conventional method
Asst Professor – Civil Engineering Department, School of Engineering, KIOT, Wollo University, Kombolcha, Ethiopia

International Journal of Management, IT & Engineering Vol. 8 Issue 12(1), December 2018,
ISSN: 2249-0558 Impact Factor: 7.119
Journal Homepage: http://www.ijmra.us, Email: [email protected]
Double-Blind Peer Reviewed Refereed Open Access International Journal - Included in the International
Serial Directories Indexed & Listed at: Ulrich's Periodicals Directory ©, U.S.A., Open J-Gage as well as in
Cabell’s Directories of Publishing Opportunities, U.S.A
463 International Journal of Management, IT & Engineering
http://www.ijmra.us, Email: [email protected]
• Effective utilization of locally available soils and other suitable stabilizing agents.
• Encouraging the use of Industrial Wastages in building low cost construction of roads.
1.4 Purpose Of Soil Stabilization
There are three purposes of soil stabilization. They are
i. STRENGTH IMPROVEMENT: This increases the strength of the existing soil to
enhance its load-bearing capacity.
ii. DUST CONTROL: This is done to eliminate or alleviate dust, generated by the
operation of equipment and aircraft during dry weather or in arid climates.
iii. SOIL WATERPROOFING: This is done to preserve the natural or constructed strength
of a soil by preventing the entry of surface water.
2.0 Benefits
• In situ treatment is typically much more cost-effective than traditional ‘dig and dump’
methods.
• Soil stabilization can shorten construction periods by minimizing site preparation
requirements, tipping and import activities.
• Avoid the wastage of materials, for example sub base materials, can be completely
avoided by treating in situ soils, using a quick and simple treatment process, to achieve
equivalent or higher levels of structural stiffness.
• Soil stabilization causes lower cost, lower congestion and less neighbour conflict.
• As all available soils can be used, tipping is virtually eliminated as well as associated
tipping charges.
3.0 Basic Principles of Soil Stabilization
• Evaluating the properties of given soil.
• Deciding the lacking property of soil and choose effective and economical method of
soil stabilization.
• Designing the Stabilized soil mix for intended stability and durability values.
4.0 Methods of Soil Stabilization
i) MECHANICAL STABILIZATION
• This method is suitable for low volume roads i.e. Village roads in low rainfall areas.
• This method involves the correctly proportioning of aggregates and soil, adequately
compacted to get mechanically stable layer
• The Basic Principles of Mechanical Stabilization are Correct Proportioning and
Effective Compaction
ii) SOIL CEMENT STABILIZATION
• Soil Cement is an intimate mix of soil, cement and water, compacted to form a strong
base course
• Cement treated or cement modified soil refers to the compacted mix when cement is
used in small proportions to impart some strength
• Soil Cement can be used as a sub-base or base course for all types of Pavements
iii) SOIL LIME STABILIZATION
• Soil- Lime has been widely used as a modifier or a binder.
• Soil-Lime is used as modifier in high plasticity soils
• Soil Lime also imparts some binding action even in granular soils

International Journal of Management, IT & Engineering Vol. 8 Issue 12(1), December 2018,
ISSN: 2249-0558 Impact Factor: 7.119
Journal Homepage: http://www.ijmra.us, Email: [email protected]
Double-Blind Peer Reviewed Refereed Open Access International Journal - Included in the International
Serial Directories Indexed & Listed at: Ulrich's Periodicals Directory ©, U.S.A., Open J-Gage as well as in
Cabell’s Directories of Publishing Opportunities, U.S.A
464 International Journal of Management, IT & Engineering
http://www.ijmra.us, Email: [email protected]
iv) SOIL BITUMEN STABILIZATION
• The Basic Principles of this stabilization are Water Proofing and Binding
• By Water Proofing inherent strength and other properties could be retained
• Most Commonly used materials are Cutback and Emulsion
• Bitumen Stabilized layer may be used as sub-base or base course for all the roads
5.0 Organic Soil
Red soils develop in a warm, temperate, wet climate under deciduous forests and have thin
organic and mineral layers overlying a yellowish-brown leached layer resting on red layer
made of iron oxide (ferric oxide). Red soils cover the eastern part of the peninsular region
comprising Chhotanagpur, Orissa, eastern Madhya Pradesh, the Nilgiris and Tamil Nadu.
6.1 Red Soil in India
Red Soil in India comprises of more drainage properties than other types of soils as it is
formed of clay, created by wearing and tearing of limestone and formed by the breakdown
of igneous rocks and metamorphic rocks. When limestone erodes, the clay enclosed within
the rocks remains intact with other forms of non-soluble materials. In oxidizing conditions,
rust or iron oxide develops in the clay, when the soil is present above the water table giving
the soil a characteristic red colour. Red soil in India lacks nitrogenous material, phosphoric
acid, organic matter and is rich in iron. Some of the major crops grown in the red soil in
India include groundnut, millets, ragi, rice, potato, sugarcane, wheat, tobacco etc.
6.2 Features of Red Soil
Red soils are formed as a result of the draining down of old crystalline rock, less clayey
and sandier in nature. This is having a rich content of iron plus small humus content. The
content of essential nutrients like nitrogen, phosphorus and lime is very less in red soils.
Slightly acidic, it is incapable of retain moisture. It is due to the presence of iron oxide
deposits, that red soils get the unique red tint and are comparatively infertile because of
lime deficiency and soluble salt content.
Red Soil in India is alternatively known as Yellow Soil. The presence of a good
concentration of iron oxide is responsible for giving this soil its yellowish or reddish shade.
Heavily leached, it consists of a considerable concentration of iron oxides similar to
Laterite soil in India. Comparatively, Red Soils are less clayey and sandier. Moreover, Red
soils are formed in those areas which receive significantly low rainfall and therefore are
less leached in comparison to the Laterite soil in India.

International Journal of Management, IT & Engineering Vol. 8 Issue 12(1), December 2018,
ISSN: 2249-0558 Impact Factor: 7.119
Journal Homepage: http://www.ijmra.us, Email: [email protected]
Double-Blind Peer Reviewed Refereed Open Access International Journal - Included in the International
Serial Directories Indexed & Listed at: Ulrich's Periodicals Directory ©, U.S.A., Open J-Gage as well as in
Cabell’s Directories of Publishing Opportunities, U.S.A
465 International Journal of Management, IT & Engineering
http://www.ijmra.us, Email: [email protected]
6.3 Liquid Limit Test
Water content No of blows % of water
21 56 17.5
22 47 18.3
23 40 19.2
24 32 20
25 28 20.8
26 25 21.7
GRAPH % OF WATER
7.0 Stabilization of Soil Using Flyash
7.1 Flyash
Fly ash, also known as flue-ash, is one of the residues generated in combustion, and
comprises the fine particles that rise with the flue gases. Fly ash is generally captured by
electrostatic precipitators or other particle filtration equipment before the flue gases reach
the chimneys of coal-fired power plants, and together with bottom ash removed from the
bottom of the furnace is in this case jointly known as coal ash. Depending upon the source
and makeup of the coal being burned, the components of fly ash vary considerably, but all
fly ash includes substantial amounts of silicon dioxide (SiO2) (both amorphous and
crystalline) and calcium oxide (CaO), both being endemic ingredients in many coal-
bearing rock strata.
7.1.1 Chemical Composition
Component Bituminous Subbituminous Lignite
SiO2 (%) 20-60 40-60 15-45
Al2O3 (%) 5-35 20-30 20-25
Fe2O3 (%) 10-40 4-10 4-15
CaO (%) 1-12 5-30 15-40
LOI (%) 0-15 0-3 0-5
15 17 19 21 23
NO
OF
BL
OW
S

International Journal of Management, IT & Engineering Vol. 8 Issue 12(1), December 2018,
ISSN: 2249-0558 Impact Factor: 7.119
Journal Homepage: http://www.ijmra.us, Email: [email protected]
Double-Blind Peer Reviewed Refereed Open Access International Journal - Included in the International
Serial Directories Indexed & Listed at: Ulrich's Periodicals Directory ©, U.S.A., Open J-Gage as well as in
Cabell’s Directories of Publishing Opportunities, U.S.A
466 International Journal of Management, IT & Engineering
http://www.ijmra.us, Email: [email protected]
7.1.2 Utilization of Fly Ash
• Concrete production, as a substitute material for Portland cement and sand
• Embankments and other structural fills (usually for road construction)
• Grout and Flowable fill production
• Waste stabilization and solidification
• Cement clinkers production - (as a substitute material for clay)
• Mine reclamation
• Stabilization of soft soils
• Road subbase construction
• As Aggregate substitute material (e.g. for brick production)
• Mineral filler in asphaltic concrete
• Agricultural uses: soil amendment, fertilizer, cattle feeders, soil stabilization in stock
feed yards, and agricultural stakes
• Loose application on rivers to melt ice
• Loose application on roads and parking lots for ice control
• Other applications include cosmetics, toothpaste, kitchen counter tops, floor and ceiling
tiles, bowling balls, flotation devices, stucco, utensils, tool handles, picture frames,
auto bodies and boat hulls, cellular concrete, geopolymer, roofing tiles and so on…
7.1.3 Classification
Class Fly ash
The burning of harder, older anthracite and bituminous coal typically produces Class F fly
ash. This fly ash is pozzolanic in nature, and contains less than 20% lime (CaO).
Possessing pozzolanic properties, the glassy silica and alumina of Class F fly ash requires a
cementing agent, such as Portland cement, quicklime, or hydrated lime, with the presence
of water in order to react and produce cementitious compounds. Alternatively, the addition
of a chemical activator such as sodium silicate (water glass) to a Class F ash can lead to the
formation of a geopolymer.
Class C fly ash
Fly ash produced from the burning of younger lignite or subbituminous coal, in addition to
having pozzolanic properties, also has some self-cementing properties. In the presence of
water, Class C fly ash will harden and gain strength over time. Class C fly ash generally
contains more than 20% lime (CaO). Unlike Class F, self-cementing Class C fly ash does
not require an activator. Alkali and sulfate (SO4) contents are generally higher in Class C
fly ashes.
7.1.4 Soil Stabilization
Soil stabilization is the permanent physical and chemical alteration of soils to enhance their
physical properties. Stabilization can increase the shear strength of a soil and/or control the
shrink-swell properties of a soil, thus improving the load-bearing capacity of a sub-grade to
support pavements and foundations. Stabilization can be used to treat a wide range of sub-
grade materials from expansive clays to granular materials. Stabilization can be achieved
with a variety of chemical additives including lime, fly ash, and Portland cement, as well
as by-products such as lime-kiln dust (LKD) and cement-kiln dust (CKD). Proper design
and testing is an important component of any stabilization project. This allows for the
establishment of design criteria as well as the determination of the proper chemical
additive and admixture rate to be used to achieve the desired engineering properties.

International Journal of Management, IT & Engineering Vol. 8 Issue 12(1), December 2018,
ISSN: 2249-0558 Impact Factor: 7.119
Journal Homepage: http://www.ijmra.us, Email: [email protected]
Double-Blind Peer Reviewed Refereed Open Access International Journal - Included in the International
Serial Directories Indexed & Listed at: Ulrich's Periodicals Directory ©, U.S.A., Open J-Gage as well as in
Cabell’s Directories of Publishing Opportunities, U.S.A
467 International Journal of Management, IT & Engineering
http://www.ijmra.us, Email: [email protected]
7.2 Specific Gravity Test for Flyash
Sl. No. Observations and Calculations
Observation
1 Pycnometer No. 1
2 Mass of empty Pycnometer (M1) 602
3 Mass of Pycnometer and dry soil (M2) 802
4 Mass of Pycnometer, soil and water (M3) 1659
5 Mass of Pycnometer and water (M4) 1563
Calculations
6 M2 – M1 200
7 M3 – M4 96
8 G = (M2 – M1)/( M2 – M1)-( M3 – M4) 1.923
8.0 Soil Stabilization Using Lime
8.1 Hydrated Lime
Quicklime can be processed into hydrated lime by crushing the quicklime, adding water to
the crushed lime (water accounts for approximately 1% of raw hydrate), and then
classifying the hydrated lime to ensure it meets customer specifications before it is
transported.
9.0 Unconfined Compressive Test
i) SOIL + 4 % OF LIME +20% OF FLYASH FROM SOIL WEIGHT
Length =91mm
Diameter=38mm
Compression dial gauge
reading
Proving ring dial reading
A’=A/1-∈
mm2
stress=𝜌 /A’
*103KN/mm2 Divisions ∆L
mm
divisions 𝜌
N
∈=∆𝐿/L
20
0.2
5
36.35
2.20*10-3
1136.61
0.032
40
0.4
11
79.95
4.40*10-3
1139.12
0.070
60
0.6
19
138.13
6.59*10-3
1141.63
0.120
80
0.8
25
181.75
8.79*10-3
1144.17
0.159
100
1.0
36
261.72
10.99*10-3
1146.71
0.228
120
1.2
43
312.61
13.19*10-3
1149.27
0.272
140
1.4
47
341.69
15.38*10-3
1151.83
0.297
160
1.6
51
370.77
17.58*10-3
1154.40
0.321
180
1.8
59
428.93
19.78*10-3
1157.02
0.370

International Journal of Management, IT & Engineering Vol. 8 Issue 12(1), December 2018,
ISSN: 2249-0558 Impact Factor: 7.119
Journal Homepage: http://www.ijmra.us, Email: [email protected]
Double-Blind Peer Reviewed Refereed Open Access International Journal - Included in the International
Serial Directories Indexed & Listed at: Ulrich's Periodicals Directory ©, U.S.A., Open J-Gage as well as in
Cabell’s Directories of Publishing Opportunities, U.S.A
468 International Journal of Management, IT & Engineering
http://www.ijmra.us, Email: [email protected]
ii) SOIL + 6 % OF LIME +20% OF FLYASH FROM SOIL WEIGHT
Length =90mm
Diameter=38mm
Compression dial gauge
reading
Proving ring dial reading
A’=A/1-∈
mm2
Stress=𝜌 /A’
*103KN/m2 Divisions ∆L
mm
divisions 𝜌
N
∈=∆𝐿/L
20
0.2
10
72.7
2.22*10-3
1136.63
0.064
40
0.4
26
189.02
4.44*10-3
1139.17
0.166
60
0.6
39
283.53
6.66*10-3
1141.71
0.248
80
0.8
48
348.96
8.88*10-3
1144.27
0.305
100
1.0
55
399.85
11.11*10-3
1146.85
0.349
120
1.2
61
443.47
13.33*10-3
1149.43
0.386
140
1.4
62
450.74
15.56*10-3
1152.04
0.391
160
1.6
66
479.82
17.77*10-3
1154.63
0.416
180
1.8
68
494.36
20.00*10-3
1157.26
0.427
iii) SOIL + 8 % OF LIME +20% OF FLYASH FROM SOIL WEIGHT
Length =90mm
Diameter=38mm
Compression dial
gauge reading
Proving ring dial reading
A’=A/1-∈
mm2
Stress=𝜌
/A’
*103KN/m2
Divisions ∆L
mm
divisions 𝜌
N
∈=∆𝐿/L
20
0.2
15
109.05
2.22*10-3
1136.63
0.096
40
0.4
30
218.10
4.44*10-3
1139.17
0.191
60
0.6
41
298.07
6.66*10-3
1141.71
0.261
80
0.8
48
348.96
8.88*10-3
1144.27
0.305
100
1.0
53
385.31
11.11*10-3
1146.85
0.336
120
1.2
61
443.47
13.33*10-3
1149.43
0.386

International Journal of Management, IT & Engineering Vol. 8 Issue 12(1), December 2018,
ISSN: 2249-0558 Impact Factor: 7.119
Journal Homepage: http://www.ijmra.us, Email: [email protected]
Double-Blind Peer Reviewed Refereed Open Access International Journal - Included in the International
Serial Directories Indexed & Listed at: Ulrich's Periodicals Directory ©, U.S.A., Open J-Gage as well as in
Cabell’s Directories of Publishing Opportunities, U.S.A
469 International Journal of Management, IT & Engineering
http://www.ijmra.us, Email: [email protected]
140
1.4
70
508.90
15.56*10-3
1152.04
0.442
160
1.6
77
559.79
17.77*10-3
1154.63
0.485
180
1.8
84
610.68
20.00*10-3
1157.26
0.508
200
2.0
85
617.95
22.22*10-3
1159.88
0.533
220
2.2
86
625.22
24.44*10-3
1162.52
0.558
10. Results And Discussion
• From the results obtained the strength of fly ash,lime,mixture of lime and fly ash
provides more strength than the target mean strength of normal soil.
• The compressive strength gest improved a lot comparing to the normal soil results
• The compressive strength of the soil is explained in the graph which is given below.
GRAPH: Normal soil
STRAIN graph
ii) Fly ash 15%
STRAIN
ST
RE
SS
(*10
3)
KN
/m2
ST
RE
SS
(*10
3)
KN
/m2

International Journal of Management, IT & Engineering Vol. 8 Issue 12(1), December 2018,
ISSN: 2249-0558 Impact Factor: 7.119
Journal Homepage: http://www.ijmra.us, Email: [email protected]
Double-Blind Peer Reviewed Refereed Open Access International Journal - Included in the International
Serial Directories Indexed & Listed at: Ulrich's Periodicals Directory ©, U.S.A., Open J-Gage as well as in
Cabell’s Directories of Publishing Opportunities, U.S.A
470 International Journal of Management, IT & Engineering
http://www.ijmra.us, Email: [email protected]
iii) Fly ash 20%
STRAIN
ii) Lime 4.5%
STRAIN
iiii)lime 6.5%
STRAIN
ST
RE
SS
(*10
3)
KN
/m2
S
TR
ES
S (
*10
3)
KN
/m2
S
TR
ES
S (
*10
3)
KN
/m2

International Journal of Management, IT & Engineering Vol. 8 Issue 12(1), December 2018,
ISSN: 2249-0558 Impact Factor: 7.119
Journal Homepage: http://www.ijmra.us, Email: [email protected]
Double-Blind Peer Reviewed Refereed Open Access International Journal - Included in the International
Serial Directories Indexed & Listed at: Ulrich's Periodicals Directory ©, U.S.A., Open J-Gage as well as in
Cabell’s Directories of Publishing Opportunities, U.S.A
471 International Journal of Management, IT & Engineering
http://www.ijmra.us, Email: [email protected]
i) lime 4% + fly ash 20%
STRAIN
ii) lime 6% + flyash 20%
S
STRAIN
iii)lime 8% + fly ash 20%
STRAIN
11. Conclusion
Based on this experimental investigation stabilization of soil using fly ash, lime, mixture of
fly ash and lime was concluded below
1. It improves the engineering properties of the soil
2. Gives improved stability when used in foundations.
3. Long-term durability over decades of service even under severe environmental
conditions.
ST
RE
SS
(*10
3)
KN
/m2
ST
RE
SS
(*10
3)
KN
/m2
S
TR
ES
S (
*10
3)
KN
/m2

International Journal of Management, IT & Engineering Vol. 8 Issue 12(1), December 2018,
ISSN: 2249-0558 Impact Factor: 7.119
Journal Homepage: http://www.ijmra.us, Email: [email protected]
Double-Blind Peer Reviewed Refereed Open Access International Journal - Included in the International
Serial Directories Indexed & Listed at: Ulrich's Periodicals Directory ©, U.S.A., Open J-Gage as well as in
Cabell’s Directories of Publishing Opportunities, U.S.A
472 International Journal of Management, IT & Engineering
http://www.ijmra.us, Email: [email protected]
4. Strict quality control shall be exercised with regard to quality of its natural moisture
content density and moisture content after compaction, etc.
5. Adding of fly ash and lime in soil enhance its strength and compressibility.
11. References
1. Perloff, W. H. (1976). Soil Mechanics, Principals and Applications. New York:
John Wiley & Sons.
2. Janathan Q. Addo, Sanders, T. G. & Chenard, M. (2004). Road dust suppression:
Effect on unpaved Road Stabilization.
3. Chen, F. H. (1981). Foundations on Expansive Soils. Amsterdam: Elsevier
Scientific Publishing Company.
4. Bowles, J. E. (1982). Engineering Properties of Soil. Vol.2. New York:
McGrawHill
5. Frydman, I. R. & Ehrenreich, T. (1977). Stabilization of heavy clay with potassium
chloride. Journal of Geotechnical Engineering, 8, 95-107.
6. Wood, K. B. (1971). Highway Engineering Hand Book. Chapter 21. New York:
McGraw Hill Book Company, Inc.
7. Lambe, T.W. (1958). The structure of compacted clay. Journal of Soil Mechanics
and Foundation. 84, 55-70.
8. Venkatabor Rad, G. (1977). Physico-chemical mechanism governing the plasticity
behaviors of soils. Journal of Indian Geotechnical. 7, 261-282.

International Journal of Management, IT & Engineering Vol. 8 Issue 12(1), December 2018,
ISSN: 2249-0558 Impact Factor: 7.119
Journal Homepage: http://www.ijmra.us, Email: [email protected]
Double-Blind Peer Reviewed Refereed Open Access International Journal - Included in the International
Serial Directories Indexed & Listed at: Ulrich's Periodicals Directory ©, U.S.A., Open J-Gage as well as in
Cabell’s Directories of Publishing Opportunities, U.S.A
473 International Journal of Management, IT & Engineering
http://www.ijmra.us, Email: [email protected]
Economic Significance Of Women Education:- An Investigative
Study On Bule Hora Town
Dr. Akshaya Kumar Mohanty (Ph.D. ; M.Phil. ; M.A. ; L.L.B. ; Q.I.P. &
F.D.P.)
Abstract
The research was conducted in Bule Hora town to identify the economic importance of
promoting women’s education. So, the researcher discussed the trends of women’s
education, factors affecting women education and economic importance of promoting
women education such as in decision making and quality leader ship, wise use of resources
and to improve social welfare, in creating employment opportunity for others and in
developing financial saving habit. The objective of the researcher was to assess the
contribution of women education in influencing their economic aspects and to examine the
attitude of people towards the importance of women education. The actual information was
collected from concerned individuals, and administrative agents through direct
observation, questionnaire, and interview questionnaire. Secondary sources include all
types of various secondary materials like written documents, and journals is used in the
analysis of about economic importance of promoting women education. The sampling
technique used was simple random sampling and purposeful sampling technique. The
researchers found that women make a significant contribution to the economy of Bule
Hora town both through their production and reproductive roles. However, being
physically weaker women were therefore also perceived as being less capable and
requiring the protection and guidance of men.
Keywords; physically Active women participates in economic activities, promoting
women’s education, Cochran and strata techniques.
Introduction
Over 4.5 billion world population are engages in different economic activities among those
women's are estimated 1.5 billion (UN, 2005). This figure show that they significant
impact on the economy. The world has recognized the vital importance of education as a
main aspect of security and as means to empower women in economic development.
According to human development (UNDP) report, human in Africa represent 520% of total
population, approximately the 75% on agriculture and produce 60 to 80% of food. This
participation increase productivity to 20% in Africa and 50% developed nation
(UNDP2008).
Almost to thirds of employed woman in developing counties are vulnerable jobs, as own-
account or unpaid family workers (UN, 2009) as causal agricultural laborers at the bottom
of a global value chain as a workers in urban factories and workshop as domestic servant.
Structural and culture factors make it more difficult for women to access vocational
turning program due to their giving responsibilities and societal expectation about which
Associate Professor Of Economics, Department Of Economics , Ethiopian Civil Service University, Post Box No: 5648,
Addis Ababa, Ethiopia

International Journal of Management, IT & Engineering Vol. 8 Issue 12(1), December 2018,
ISSN: 2249-0558 Impact Factor: 7.119
Journal Homepage: http://www.ijmra.us, Email: [email protected]
Double-Blind Peer Reviewed Refereed Open Access International Journal - Included in the International
Serial Directories Indexed & Listed at: Ulrich's Periodicals Directory ©, U.S.A., Open J-Gage as well as in
Cabell’s Directories of Publishing Opportunities, U.S.A
474 International Journal of Management, IT & Engineering
http://www.ijmra.us, Email: [email protected]
jobs are sustainable for them.(Jovenen scheme that was implemented in the Colombia from
2002 to 2005).
Bourguign and marisson (2002) examined how higher education on level lead to lower
fertility rates by affecting per capital income growth and decreasing mortality rate per child
also investigates the impact of gender inequality education and employment on economic
growth in developing counties through 41 years period (1960 to 2000).
Gender inequality in education and employment can reduce economic growth, and also
stated that reducing gender inequality would lead to economic development because, the
education has a huge impact on fertility and the creation of human for the next generation.
Statement of the problem
Before one or two decades ago most women in Ethiopia do not get the opportunity to
attend for school. Some of the woman completed primary education when they were
young girls.
The general objective of education policy and its strategies of implementation indicate
provision of primary education policy and its contribution for all citizens’ improvement in
equality and efficiency of education, encouragement of other sectors to participate in
sector, and enhanced equity in gender (meskerem SH.2003).
The population of Ethiopia is increasing at higher rate; women reaction has direct bearing
on population trends.
Women with low level of education cannot have better understanding on reproduction and
contractive in use decision. They have on enough awareness about the benefit of the family
Planning and higher opportunity cost of having many children .they also has limited
knowledge on health system nutrition. Due to this, they have limit access in investment,
saving and employment opportunity (mesfin mulu, 2012)
Empirical evidence shows that women have been play a great role in cultures political and
economic activity. In addition to promoting women’s education economic activity can
help reduce poverty, wage difference, reduce income inequality, unemployment by
creating job opportunity ,reducing fertility rates, promoting social welfare and economic
development a whole(FWAB,2009). In this study area as per knowledge of the researches,
some study has been conducting regarding to the economic importance of promoting
women's education.
According to (Halkanoztune, zario and zehravildan series, 2014) the effect of female
education on economic growth. And other researcher in Ethiopia 2014,by
GashawAyferam under the title that assessment of the roles and constraints of women in
economic development of Ethiopia a case of Ambo town, He concluded that women play a
great role in economic development even if there are some constraints.
Literature Review
Education since immemorial has been an important investment in human capital and
educated societies is reception to new ideas novelties that paves the way for innovations of
various types.Education services as one means for populations to attain the anticipate
social and economic change. For the conversion of national, physical and other resources
into products demanded by the higher living standard of people and prepare conservation
of exhaustible resource as for innovation and experiment, education in modern society.
(IK: K, 1998, 25).
The quality of education in most developing countries is very low and while this condition
exist rapidly growing population make quality of education to deteriorate even worse.

International Journal of Management, IT & Engineering Vol. 8 Issue 12(1), December 2018,
ISSN: 2249-0558 Impact Factor: 7.119
Journal Homepage: http://www.ijmra.us, Email: [email protected]
Double-Blind Peer Reviewed Refereed Open Access International Journal - Included in the International
Serial Directories Indexed & Listed at: Ulrich's Periodicals Directory ©, U.S.A., Open J-Gage as well as in
Cabell’s Directories of Publishing Opportunities, U.S.A
475 International Journal of Management, IT & Engineering
http://www.ijmra.us, Email: [email protected]
Africa is one of the least compared to other continents, the disparity between girls and boys
(ECA 1996).
Adam Smith believed that economic progress was based of labor and that it raises supplies
of human skills and demand for them. However, training the packages of wealth of the
nation we come to Smith's analogies between man and machines, where acquision of skills
viewed specially as investment (Bens. Bernanke and Julio Roten berg, 1997)
Neo classical economists maintained that one of the causes for economic growth is
improvement in the quality of labor through training and education. One of the arguments
on the Harrod Domar macroeconomic growth of an economy which postulates a direct
relationship between county rate of saving and its output growth (Todaro 1998).
There are several reason rooted in economic theory on why education effect fertility. First
formal schooling may increase opportunity cost of child bearing and among educated
women (Becker 1982 and Schultz 1994). Second education may lower fertility though
improvement in child health and to reduced rate of child mortality (Schultz 1994).
Finally female schooling may affect fertility though the effective use of contraception
(Rosenz wing and Schultz 1994). Educated women can learn more about contraceptive use
effectively than uneducated women, reducing the number of anticipated pregnancies
(Daniel 2000).
Ethiopia has a long history of education; the history of education, printing and publishing
in Ethiopia is not nearly as long as that of language, script and manuscripts. Until the
20thc, the church was the only means of education in Ethiopia.
This served the limited purpose of spreading the Christian religion but could not produce
mass literacy. Developments such as education and printing began under menelik,
1889_1913) who established the first school of Ethiopia in Addis Ababa. Higher education
started in 1950 with the establishment of a university college in Addis Ababa ,The printing
of Ethiopian works though started as early as printing it self but in Ethiopia began in 1863
at massewa. The first commercial printing press was introduced at massewa in 1890 (copy
right ,1994 Academic press) and international information and library review, 1994.
The gender gap and the level of girl’s education participation and performance are result of
combined effects supply and demand factor and these interact policy, economic and social
cultural environment (Arderman Eta kgs). Woman must be educated women can be a
better human Bering, successful mother and responsible citizen. Educating women will
definitely increase the living standard both at and outside home. An educated woman can
fight against social evils such as domestic violence, dowry, low wages etc (International
literacy day 2016 and Romadeeg Kaur, 2017).
Economic factor contribute a great deal for the disparity between girls and boy in school
and other economic activities. These factors includes directs schooling costs opportunity
cost and prospects of low economic returns family back ground and potential parental
investment behavior. (B and M development consultant Plc).
Social cultural barriers that negatively affect education and economic contribution of
women (girls) are numerous and commonly practiced. These includes: - marriage (early
marriage), attitudes regarding girl’s education religious and cultural perceptions of boy’s
superior ability (Colin Brock and Nadine communist, 2005).
Parental attitudes to word the importance of girl’s education also affected their role in the
economic activities. The like decision to send their children to school usually taken by
parents, and this decision is party based on their perception of cost of benefits to schooling.

International Journal of Management, IT & Engineering Vol. 8 Issue 12(1), December 2018,
ISSN: 2249-0558 Impact Factor: 7.119
Journal Homepage: http://www.ijmra.us, Email: [email protected]
Double-Blind Peer Reviewed Refereed Open Access International Journal - Included in the International
Serial Directories Indexed & Listed at: Ulrich's Periodicals Directory ©, U.S.A., Open J-Gage as well as in
Cabell’s Directories of Publishing Opportunities, U.S.A
476 International Journal of Management, IT & Engineering
http://www.ijmra.us, Email: [email protected]
Parents are more likely to send boys then girls to school, particularly in situation where
they are unable to afford to send all their children to school (IBID).
school related factors includes :- learning environment, distance from school, in
accessibility of schools and teacher attitude to girls, in elegance and teaching practices
techniques school culture quality of education, gender bias in the class room etc
(Dr.Ritatort).
Ethiopia took the preparation of poverty reduction and strategic paper in 2007 and has
already prepared the full PRSP. it was approved in 2002 and the country in now in its 5th
years of implementation of SDPRP. The second one is under preparation (MOFED 2005
and Meskeremshferaw2003). The objective of Ethiopian SDP is for reduce poverty by
changing rapid economic growth while at the earn time maintaining macro- economic
stability. It is indicated that the real GDP was targeted to growth by at least 7% pre annum
(IBID).
The general objective of education policy and its strategies of implementation indicate
provision of primary education for its citizens ,improvement in the quality and efficiency
of education, encouragement of other sectors to participate in the sector, non-formal
education and en hence equality in gender (meskeremsh .2003).
Ethiopian education system has been changing a number of times when the government
change and resign power.
During Derg period, it was 6-2-4 at present the schooling set up in changed to 8years of
primary (1-4) lower primary and 5-8 upper primaries. In 2001 /2002 for the student or
teacher ratio was 65 in primary education. This was 15 more students per teacher
compared with the standard set by MoE annual report as 50 students per teacher (MOE
annual report, 2003/04).
Education expenditure is one of the useful indicators of development .the target for 2005
was to allocate 19% of the total expenditure. However the actual expenditure in 2002/03 is
not given and it's difficult to see the increasing the trend of expenditure, anyway, owning
to the increase in the
Population, it seems that the governments still need to increase the education budget.
Budgeting for education sector to meet economic growth and development (Ibid).
The total enrollment increasing trend. The enrollment of primary education student target
for 2004/05 was 65% of the school age children. The gender gap between girls and boys
enrollment in 2005,I,e 57% and 72.8% respectively has been passed in 2002/03 (Todaro
1997).
The gender policy of the country indicates the government to abolish the gender disparity
at all levels no latter 2015 (Meskerem 2003) gender disparity enrollment is very high.
Girl’s enrollment in Ethiopia mainly affected by in security, culture, beliefs, sexual
harassment by male colleagues and teacher. In addition the long distance the travel from
home to school ,in rural area's make them vulnerable to rape early, pregnancy and sexual
transmitted diseases (Jane on song :- gender issues search report series number: 22)..
Objective of the study
• To analyse the contribution of women education on economic expectations
• To identity the factors that hinder women education.
• To determine the attitude of people to words the importance of women education.

International Journal of Management, IT & Engineering Vol. 8 Issue 12(1), December 2018,
ISSN: 2249-0558 Impact Factor: 7.119
Journal Homepage: http://www.ijmra.us, Email: [email protected]
Double-Blind Peer Reviewed Refereed Open Access International Journal - Included in the International
Serial Directories Indexed & Listed at: Ulrich's Periodicals Directory ©, U.S.A., Open J-Gage as well as in
Cabell’s Directories of Publishing Opportunities, U.S.A
477 International Journal of Management, IT & Engineering
http://www.ijmra.us, Email: [email protected]
Research Methodology
The actual information was collected from concerned individuals and administrative
agents. The main streams of data are primary and secondary sources. The primary source is
the original information which get from its sources like interview face to face questions,
telephone communications, and secondary source which involves some types of published
and unpublished materials about economic importance of promoting women’s educations,
these including data from reports, economic journals and data from previously research
done.
The data were collected through face to face interview of individual’s respondents, and
administrative bodies, and by using questionnaire. Questionnaire is the simple way in
which gathering information from respondents through distributive paper questions in
order to meet the target point in our research.
The target population for this study would be active female population which participates
in economic activities and on educations in BuleHora town. Simple random sampling
necessary for the study, because of the fact that the town has different socio economic
activities and also in order to reduce unbiased sampling. The total population of women
physically actives are 8645 in town. And the town has three kebeles 01, 02 and 03.
Purposively 01 and 02 were selected.
The sample size calculated by using Cochran, (1963),
n = p (1-p) z2/e2
Where; n is sample size
p = is proportion of population
Q =1-p is the probability of random sampling
e = is estimated error term
z= is standard normal distribution
So, kebele 01 has total population 3833 and kebele 02, has total population 2700.
P = Total number of population selected in each kebele
Total population number of physical active women in town
= 6533/8645 = 0.7556
Q =1-p = 1-0.7556
= 0.2444
e = 10% = 0.1
z = 1.645(90%)
n = 0.7556(0.2444)1.6452/0.12
= 49.97 or 50
The stratum is also as follow;
(nj/N) n =sample size from both kebele
N = total number of population in both kebele
n = total sample size
The calculated sample size used from both kebele as follows; from kebele 01 =
(3833/6533)50 = 29
From kebele 02 = (2700/6533)50 = 20.66 or 21
So, the researchers distributed 29 and 21 questionnaire to kebele 01 and 02 respectively.
The data would be analyzed in the form of statement in which expressed through
descriptive analysis. In details table which contain grouped units, variables and graphs

International Journal of Management, IT & Engineering Vol. 8 Issue 12(1), December 2018,
ISSN: 2249-0558 Impact Factor: 7.119
Journal Homepage: http://www.ijmra.us, Email: [email protected]
Double-Blind Peer Reviewed Refereed Open Access International Journal - Included in the International
Serial Directories Indexed & Listed at: Ulrich's Periodicals Directory ©, U.S.A., Open J-Gage as well as in
Cabell’s Directories of Publishing Opportunities, U.S.A
478 International Journal of Management, IT & Engineering
http://www.ijmra.us, Email: [email protected]
used. Graphs is the bar stick which shows the needed information in organized form. And
also by pie chart the figure in circle expression.
Data Analysis and Discussion of Results
4.1. The Age Distribution of the Respondents
According to the study result, the age ranges out of the total respondents, 3(6%) of them
were between 15-20 years’ age, 10(20%) of them, Were 20-25, 25-30 and 35-40 years’ age
and the remaining age group of respondents were between 40-45 and 45-50 which account
for 8% and 10% respectively. As we observed from the finding, the largest proportion of
the study population lied between age group of 20-25, 25-30 and 35-40. For women whose
age is 15-20 and who are productive in economic activities the percentage distribution in
age is as small as only 6%. On the other hand, women whose age is above 40 years are
relatively small.
TABLE 1. Distribution of Bule Hora town reproductive age group women
Age range (X) Frequency (f) Percentage (%)
15-20 3 6
20-25 10 20
25-30 10 20
30-35 8 16
35-40 10 20
40-45 4 8
45-50 5 10
Total 50 100
Source: Primary Survey, 2017
4.2 Access and Coverage of Women Education Bule Hora Town
Even though Bule Hora town has enough primary school as compare with other rural areas,
the illiteracy rate is high but it is the worst for women. This is because of women have no
access to education due to cultural, economic and social reasons. The following table 2
shows the result of data collected from Bule Hora town women.
TABLE 2. Distribution of respondents by education level in BuleHora town
Variables Frequency (f) Percent (%)
Illiterate 10 20
Read and write 11 22
Primary education 14 28
Secondary education 10 20
College and universities 5 10
Total 50 100
Source: Primary Survey, 2017
Regarding education level, the study result revealed that the number of women who are
illiterate is still as large as twenty percent (20%). This is because of lack of awareness,
traditional outlook, religion view, abduction, rape, early marriage and forced marriage in
the study community. On the other hand, the number of girls in primary school is high
(28%) than secondary school (20%) and the number trend of female pupils decreased when
the grade level increased. The area is characterized by limited secondary schools so that
those students who have attended the second cycle of primary school face a challenge to
continue for further education. Because of this and the above problems girls are required to

International Journal of Management, IT & Engineering Vol. 8 Issue 12(1), December 2018,
ISSN: 2249-0558 Impact Factor: 7.119
Journal Homepage: http://www.ijmra.us, Email: [email protected]
Double-Blind Peer Reviewed Refereed Open Access International Journal - Included in the International
Serial Directories Indexed & Listed at: Ulrich's Periodicals Directory ©, U.S.A., Open J-Gage as well as in
Cabell’s Directories of Publishing Opportunities, U.S.A
479 International Journal of Management, IT & Engineering
http://www.ijmra.us, Email: [email protected]
stay at home with their parents because the family does not allow girls to leave home and
live in town nearest to the school. The other possible explanation for large number of
illiterate women is lack of money to pay for school expenses, the unwillingness of parents
to send their daughters to school, the unequal attention given to daughters by parents etc.
4.2.1. Dropout Rate
Dropout rate of school may emanate from socio-economic and cultural factors. It is a good
indicator of the performance of female education in all level of schooling.
From the following figure, regarding dropout rate of girls and boys at high school for three
consecutive years, the dropout rate is higher for girls than boys. The figure shows that the
average of dropout rate for girls and boys are 12.67 students and 10.67 students
respectively. This is an indicator that girls stay more than boys at school if they get the
chance to be enrolled. However, the higher dropout rate of girls compared to boys does
mean that discontinuing of learning is a problem for girls.
The other possible for girl’s dropout rate is repeating in the same grade that may
discourage female pupils to spend another year, very low income of parent, and early
marriage.
Source: Education office, Bule Hora town, 2017.
4.3. Income Level of Respondents of Bule Hora Town
TABLE 3. Distribution of monthly income of respondents in Bule Hora town
Income level Frequency Percentage (%)
Less than birr 150 2 4
150-500 9 18
500-1000 13 26
1000-1500 17 34
1500-5000 9 18
above5000 0 0.00
Total 50 100
Source: Primary Survey, 2017
The study result revealed that the number of women who were earning monthly income of
less than birr 150 is about 2(4%) of respondents. These groups of women are those who
wait for the help of others in order to undertake their daily activities such as those who are
learning full time. On the other hand, the number of women who are earning monthly
income of 150-500 is 9 (18) of sample respondents. These groups of women were those
15
13
10 1
2.6
7
13
11
8
10
.67
28
24
18
23
.34
2015 2016 2017 average
Figure 1 distribution of dropout rate by sex and years in Bule Hora town ,2017.
GIRLS BOYS TOTAL

International Journal of Management, IT & Engineering Vol. 8 Issue 12(1), December 2018,
ISSN: 2249-0558 Impact Factor: 7.119
Journal Homepage: http://www.ijmra.us, Email: [email protected]
Double-Blind Peer Reviewed Refereed Open Access International Journal - Included in the International
Serial Directories Indexed & Listed at: Ulrich's Periodicals Directory ©, U.S.A., Open J-Gage as well as in
Cabell’s Directories of Publishing Opportunities, U.S.A
480 International Journal of Management, IT & Engineering
http://www.ijmra.us, Email: [email protected]
who are learning at school and earning low income because of seasonality of work and
unproductively of their work. On the other hand, the number of women who were earning
monthly income of 500-1000 was 13(26%) of respondents.
These groups of women were those who were giving service in cafes, and women who
were earning low income because of their low educational level. Women who were earning
monthly income of 1000-1500 was 17(34%) of respondents. These were those women who
were government employee and who were doing in shops and markets as retailer. On the
other hand, the number of women who were earning monthly income of 1500-5000 was
9(18%) of respondents. These groups of women were those who were in the shops and
markets as whole seller and government employee with higher educational level and in
higher position. Unfortunately, the number of women who were earning monthly income
of above 5000 was not found during data collection.
4.4. Daily Activity of Women in Bule Hora Town
Most women in Bule Hora town do not engage income generating activities. Their income
was lower than those gained by men. Mothers who have infants claimed that they did not
have time to engage in come generating activities due to childcare. The most common
activity in which the women of the village usually engage was food preparation in home
which accounts for about 54%. Some women also work on their farm either co-work with
their husbands or lonely. This account for about 10% of sample respondents; generally the
following figure shows the daily activity of Bule Hora town women in 2017 by the
researchers.
Source: Primary Survey, 2017.
4.5. Violence against Women and the Attitude of People towards Women Education
Research has determined traditional beliefs regarding the ideal roles of women in society.
Traditionally, the only roles available to women were those of wives and others. Women
were thus seen as nurtures and mainly as providing support for men who worked to
provide for the family. Being physically weaker, women were therefore also perceived as
being less capable and requiring the protection and guidance of men.
These attitudes have prevailed even in current times when socio-economic changes have
resulted in changes to roles women are now expected to undertake. Socio-economic
8%10%
4%4%4%
6%
10%
54%
Figure 2 occupation of women in Bule Hora town, 2017
food prepartion and childcare farming
tailors cleaners
lawyers teaching
office work student

International Journal of Management, IT & Engineering Vol. 8 Issue 12(1), December 2018,
ISSN: 2249-0558 Impact Factor: 7.119
Journal Homepage: http://www.ijmra.us, Email: [email protected]
Double-Blind Peer Reviewed Refereed Open Access International Journal - Included in the International
Serial Directories Indexed & Listed at: Ulrich's Periodicals Directory ©, U.S.A., Open J-Gage as well as in
Cabell’s Directories of Publishing Opportunities, U.S.A
481 International Journal of Management, IT & Engineering
http://www.ijmra.us, Email: [email protected]
changes have made education necessary, not just for the purposes of providing income
earning opportunities, but also for the potential to contribute to the improvement in the
standards of living of individuals, families and communities.
These traditional beliefs have been found to foster negative attitudes which limit family
and community support for girls’ education. The perceived ideal roles and characteristics
of women and girls influence how girls and boys are socialized in the home, community
and school. Because girls and women in general are considered physically weaker and less
capable than men, they are often protected and supervised to keep them from what is
considered threatening to their safety i.e. physical, sexual, mental and emotional safety.
Where schools are situated long distances away, parents also worried about their
daughter’s safety while traveling to and from school. This view was also the reason why
many parents were reported to be reluctant to allow their daughters to attend extra-tuition
after school as in most cases the teachers involved are men and as these sessions are
usually held in the evening, parents also reluctant to let their daughters travel late.
4.6. Contribution Of Women’s Education in Bule Hora Town
Women make a significant contribution to the economy of BuleHora town, both through
their production and reproductive roles. Since women constitute a significant share of the
population in the town their contribution for development has significant effect on the
economic, social and political affairs of the town. Bule Hora town increase productive
capacity of women thereby increasing opportunity for wage employment or shifting from
marginalized to highly productive activities. It also makes them aware systems.
Family planning and a large control over their resource, Women as human capital are one
of underutilized resources in the town. Sustainable economic growth at national and global
levels depends on women joining the labor force and higher use being made of their skills
and qualifications. More working women would also help offset the negative effects of
rising fertility rates and ageing populations. The rate of female participation in the labor
force is significantly lower than that of men. In general the various economic importance
of women education such as creating saving habit, in decision making and quality
leadership, improving welfare and wise use of resources, in developing family planning
techniques, and creating employment opportunity for others.
TABLE 4 . Contribution of women’s education in Bule Hora town
Importance Illiterate in No Percentage
(%)
Literate in
No
Percentage
(% )
Develop family planning 3 30 15 37.5
Develop saving habit 2 20 8 20
Develop wise of resource
and improving welfare
3 30 7 17.5
Decision making and
quality leadership
1 10 8 20
Creating employment
opportunity for other
1 10 2 5
Total 10 100.00 40 100.00
Source: Primary Survey, 2017
According to the field survey of the researcher 30% of respondents among illiterate and
37.5% respondents among literates answered the importance of women education as

International Journal of Management, IT & Engineering Vol. 8 Issue 12(1), December 2018,
ISSN: 2249-0558 Impact Factor: 7.119
Journal Homepage: http://www.ijmra.us, Email: [email protected]
Double-Blind Peer Reviewed Refereed Open Access International Journal - Included in the International
Serial Directories Indexed & Listed at: Ulrich's Periodicals Directory ©, U.S.A., Open J-Gage as well as in
Cabell’s Directories of Publishing Opportunities, U.S.A
482 International Journal of Management, IT & Engineering
http://www.ijmra.us, Email: [email protected]
making aware of family planning. This indicates that the awareness of the town’s women
(both illiterate and literate) about family planning is relatively better.
Family planning is an important component of safe motherhood initiative that has received
increased attention widely in Bule Hora town.
10% of respondents among illiterate and 20% of respondents among literates answered the
importance of women education is enabling them to make wise decision and quality
leadership. This indicates that the awareness of the town’s women (both illiterate and
literate) about leadership and management in appreciate able more or less.
There is dramatic increase in the number of women students in Bule Hora town. However,
most academics and academic leaders are male and, even where there are marked increases
in the representation of women in particular job.
Education is humanity’s best hope and most effective means in the quest to achieve
sustainable development. Education plays important roles in building a harmonious and
sustainable society.
(10%) of respondents among illiterate and (5%) of respondents among literates answered
the importance of women education as enabling them to make employment for others. This
indicates that the awareness of the town’s women (both illiterate and literate) about
education as a means of job opportunity for others is not appreciable in the Bule Hora
town.
Gender equality is central to economic and human development. Equal opportunity for
women and men supports economic growth and helps to reduce poverty.
When girls are educated it lower fertility rates, reduce maternal mortality, and improves
the health of their children. When both women and men have access to economic
opportunity it helps their families prosper, and the country’s economy grow.
20(%) of respondents among illiterate and (20%) of respondents among literates answered
the importance of women education as enabling them to be aware of about saving and
investment activities. This indicates that the awareness of town’s women (both illiterate
and literate) about education as a means of creating awareness about modern financial
institution is relatively appreciable in the town.
At the household level women are more likely to spend money improving their family’s
welfare.
30% of respondents among illiterate and 17.5% of respondents among literates answered
the importance of women education as enabling them to be aware of about wise use of
resources and gradually improve their well-being. This indicates that the awareness of
town’s women those are illiterate about education as a means of creating awareness about
use of resources is relatively appreciable than those who are literate in the town.
If women are educated, they can effectively participate in the economic activity or
economic development of that society and can efficiently use the resource equally with
men, thus can improve well fare and wise use of recourse.
4.8. Factors Affecting Women’s Education in Bule Hora Town
There are different factors which are responsible for the low participation of females in all
levels of education. These factors can be classified in to socio-cultural factors, abduction,
rape, early and forced marriage, economic factors, and distance of school and the
community attitudes.
The following figure shows the factors affecting women education in Bule Hora town in
year 2017 collected by researcher.

International Journal of Management, IT & Engineering Vol. 8 Issue 12(1), December 2018,
ISSN: 2249-0558 Impact Factor: 7.119
Journal Homepage: http://www.ijmra.us, Email: [email protected]
Double-Blind Peer Reviewed Refereed Open Access International Journal - Included in the International
Serial Directories Indexed & Listed at: Ulrich's Periodicals Directory ©, U.S.A., Open J-Gage as well as in
Cabell’s Directories of Publishing Opportunities, U.S.A
483 International Journal of Management, IT & Engineering
http://www.ijmra.us, Email: [email protected]
Socio-cultural constraints that negatively affect the education of girls are numerous and
commonly practiced. These include lack of awareness, traditional outlook, religious views,
cultural perception of boys’ superior abilities, poor performance of girls on examination,
and parental attitude towards girls’ education. The below figure shows that about 42% of
the respondents face socio-cultural problems, which in turn indicates the above mentioned
problems are deep rooted in the town.
Source: Primary Survey, 2017
Socio-cultural and religious factors, such as initiation ceremonies and gender socialization
are additional factors responsible for pupils’ failure to complete primary education. In
areas where traditional circumcision is still practiced, some pupils are pulled out of school
to participate in initiation ceremonies.
Forced and early marriage deprives women and young girls of their basic human rights.
Forced marriage describes a marriage that takes place without the free or valid constant of
one or both of the partners and either physical or emotional threat.
Early marriage is related to forced marriage because minors are deemed incapable of
giving informed consent. Forced and early marriages are serious human rights violations.
Abduction, rape, early, and forced marriage has also been identified as one commonly
practiced type of violence against school girls and the town in general.
Form the above figure; it is possible to say this problem stand next to socio-cultural
factors, which is 30%. This is one of the strong that discourage parents not send their
daughters to school.
This include learning environmental, distance from school, teacher’s attitudes towards
girl’s intelligence, teaching practices and techniques, quality of education, and gender bias
in the class room. The above figure shows that the distribution of this problem is about
16% out of total number of respondents selected. This indicates the problem was less
socio-economic42%
abducation, rap, early & forced
marriage30%
school related probllems
16%
economic factor12%
Figure 3 factors affecting women education in Bule Hora town in year 2017
socio-economic abducation, rap, early & forced marriage
school related probllems economic factor

International Journal of Management, IT & Engineering Vol. 8 Issue 12(1), December 2018,
ISSN: 2249-0558 Impact Factor: 7.119
Journal Homepage: http://www.ijmra.us, Email: [email protected]
Double-Blind Peer Reviewed Refereed Open Access International Journal - Included in the International
Serial Directories Indexed & Listed at: Ulrich's Periodicals Directory ©, U.S.A., Open J-Gage as well as in
Cabell’s Directories of Publishing Opportunities, U.S.A
484 International Journal of Management, IT & Engineering
http://www.ijmra.us, Email: [email protected]
comparing with socio-cultural, economic factors and abduction, rape, early and forced
marriage.
Economic factors contribute a great deal to the disparity in girls and boys in school. The
main factors include direct schooling costs, prospects of low economic return, family
background and parent’s investment behavior. From the above figure, it is visible that the
number of women facing economic is six (6) out of fifty respondents, this account around
12% among the problems prevailing in the town.
Conclusion and Recommendation
From the study so far, it is possible to conclude that Bule Hora town women have limited
access and performance in their education due to economic factors, socio-cultural factors,
school related pregnancy, overloaded works and even treated as inferior on economic
development as well as fertility. Even after controlling other relevant factors, the education
of women stands out as an important factor in determining the country’s development.
For more advancement of female life, there be education which is not segregated in age or
gender, so as to increase the educated girl’s in our society for the sustainable development
of our entire society in all aspects of life such as social, economic, political aspects of life.
According to the own survey of the researchers, women’s education has a great role to
make them aware habits, to develop family planning techniques, to make them wise users
of resource and improve their welfare, to create employment opportunities for others and to
enhance them in best decision making and quality leadership.
Based up on the data analysis conclusion, the following recommendations are forwarded;
❖ The government should increase the number of qualified female teachers to create a
sense of self confidence in female students and to attract them to education and to be
encouraged in school.
❖ The government should make a great effort to give periodic training for parents in
order to avoid socio-cultural problems that restrict female participation in the education
and bad attitude of society towards women creativity
❖ The government and non-governmental organizations need to increase their effort in
expanding non formal education programs since the majority of Bule Hora town
women didn’t get the opportunity to attend formal school.
❖ Parents should try decrease the work load of girls at home to enable them to spend
more time for their studies.
❖ Generally, as researchers we want to recommend that the government and non-
government organization should work on avoiding external and internal problems like
lack of vision, lack of self-confidence of women on themselves.
❖ ‘’Give a pen, she change the world!!’’

International Journal of Management, IT & Engineering Vol. 8 Issue 12(1), December 2018,
ISSN: 2249-0558 Impact Factor: 7.119
Journal Homepage: http://www.ijmra.us, Email: [email protected]
Double-Blind Peer Reviewed Refereed Open Access International Journal - Included in the International
Serial Directories Indexed & Listed at: Ulrich's Periodicals Directory ©, U.S.A., Open J-Gage as well as in
Cabell’s Directories of Publishing Opportunities, U.S.A
485 International Journal of Management, IT & Engineering
http://www.ijmra.us, Email: [email protected]
References
• Gender and sustainable development (2008), maximize the economic, social and
environmental role of women
• Halkan Oz tune, Zario and ZehraVildan Series, 2014, the effect of female education on
economic growth.
• International literacy day, 2016 and Roman deep kaur, 2017, educated women can
solve social problems
• Jane Onsong Gender issues series report no. ; 22, Factor affecting women’s education
in University management in Kenya.
• Jovenen scheme that was implemented in the Colombia from (2002-2005),
• MeskeremShiferaw (2003), millennium development goal for education and gender
• Rita Torto, (extracurricular and out of school factors affecting girl’s participation and
/performancy in SMT subject: distance from school; safety; time use (Hhh,
www.Unesco.org/education/educprog/ste//projects% Africa/ femsa 5.etm.

International Journal of Management, IT & Engineering Vol. 8 Issue 12(1), December 2018,
ISSN: 2249-0558 Impact Factor: 7.119
Journal Homepage: http://www.ijmra.us, Email: [email protected]
Double-Blind Peer Reviewed Refereed Open Access International Journal - Included in the International
Serial Directories Indexed & Listed at: Ulrich's Periodicals Directory ©, U.S.A., Open J-Gage as well as in
Cabell’s Directories of Publishing Opportunities, U.S.A
486 International Journal of Management, IT & Engineering
http://www.ijmra.us, Email: [email protected]
ICT @ School in Jharkhand
DR.SUCHITRA BEHERA
Abstract:-ICT for education and ICT in education suggest the development of ICT
particularly for teaching and learning purpose and ICT in education includes the adoption
of general parts of ICT in the instructional process. The emergence of ICT has transformed
the activity of contemporary man particularly in the setting of globalization. The
educational field has been influenced by ICT. ICT has the strength to speed of improve and
extend aptitude reforms as it has the capacity to bust teaching by inspiring and engaging
learners. It helps schools to reform assists and understanding the fictional practices. It
offers a totally new and advance learning environment for learners. ICT in schools gives a
chance to instructors to change their practices by furnishing them with enhance educational
content and more powerful educating and learning techniques. Present study focused on to
find out the programme implemented ICT@ school in Jharkhand and impacts on teaching
learning process, schools personnel’s and students.
Key Words: (Information, communication, technology, innovation, teaching,
learning.)
Introduction
Innovative ideas are appreciated and accepted for the benefit of human civilization. It
makes the activity more interesting and unique one. The act or process of introducing new
ideas, devices or methods is called innovation. Now days in all field innovations are
implemented. In teaching learning process innovation are widely accepted. These are the
very effective means to teach the new and complicated ideas. Innovations in teaching
learning process means the practice of effective and meaningful teaching by the educators
thoughtfully experiment and applying new or different pedagogical approaches,
technologies for curricular enhancement, course design and organization and assessment.
A teaching method comprises the principles and methods used by teachers to enable
student learning. These strategies are determined partly on subject matter to be taught and
partly by the nature of the learners. There are so many innovative teaching methods are
used in the class room like: creative teaching, use of audio visual aids, real world learning,
brain storming, classes outside the classroom, role playing, storyboard teaching,
stimulating classroom environment, utilization of hobbies, team teaching, puzzle and
games, school clubs and ICT.
Information and communications Technology commonly termed as ICT comes from the
acronym IT and CT refers to Methods of storing, manipulating and communicating
information. IT is a general term used to describe any technology that helps to produce,
manipulates, stores, communicates or disseminates information. It is the most expensive
complex computers, with devices usually dealing with electronic data in binary format.
Communication Technology (CT) is the term used to describe telecommunications
ASSOCIATE PROFESSOR, DEPARTMENT EDUCATION, KOLHAN UNIVERSITY, CHAIBASA, WEST-
SINGHBHUM, JHARKHAND

International Journal of Management, IT & Engineering Vol. 8 Issue 12(1), December 2018,
ISSN: 2249-0558 Impact Factor: 7.119
Journal Homepage: http://www.ijmra.us, Email: [email protected]
Double-Blind Peer Reviewed Refereed Open Access International Journal - Included in the International
Serial Directories Indexed & Listed at: Ulrich's Periodicals Directory ©, U.S.A., Open J-Gage as well as in
Cabell’s Directories of Publishing Opportunities, U.S.A
487 International Journal of Management, IT & Engineering
http://www.ijmra.us, Email: [email protected]
equipment through which information can be sought and accessed examples video
conferencing, Tele conference, phones and modems.
Now a day’s educational systems are adopting new technologies by integrating IT and CT
as ICT in the teaching and learning Process.
• It prepares students with the knowledge and skills they need in their subject matters.
• It makes the teaching profession evolving from teacher centered to child centered.
• ICT integration makes the curriculum transaction easier.
• ICT facilitates not only the delivery the lessons but also the learning process itself.
• This includes computer based technologies ,digital imaging , the internet ,files servers ,
data storage devices, network infrastructures desktops, laptops and broadcasting
technologies namely Radio, television, smart class and telephone which are used as
instructional tools at schools.
ICT in education means teaching and learning with ICT. ICT tools can be divided into
three categories
Worldwide research has shown that ICT can lead to improve students’ learning teaching
methods better. A report made by the national institute of multimedia Education in Japan
proved that in student exposure to educational ICT through curriculum integration has a
significant and positive impact on student’s achievement, especially in terms of knowledge
comprehension, practical skill and presentation skill in subject areas such as mathematics,
science and social studies.
It is a new vision in education. The use of educational technology can bring a huge change
in education. Internet and E- learning devices can make class room environment more
interactive. In these days smart class and smart school are very interesting dreams for
students, teachers and students. Students are very interested about the smart school and
smart class. Several institutes are making their class room smart and modern. They are
working on smart school projects.
Smart school and smart class is an innovative concept in education. We are living in the
age of internet, so our education system is also going to be online. E –learning and on line
education is the need of this time.
Project
The ICT @ School‘s scheme is a window of opportunity to the learners in the Government
secondary and sr. secondary schools in the country to bridge the digital divide.
Government of /India has sanctioned .ICT@schools programme to be implemented in 465
schools of Jharkhand. The objective of the project is.
a) To establish an enabling environment to promote the usage of ICT especially in rural
areas. Critical factors of such and enabling environment include wide spread
availability of computers infrastructure, internet – broad band connectivity and
promotion of ICT literacy.
INPUT SOURCES OUTPUT SOURCES OTHERS.
Visualizer /Documents/Camera
Student response system
Slate/Tablets
Application software
Projectors, Inter active
whiteboard
Display Monitors
TV Etc.
Digital Camera
P. C Switcher
Digital Recorder
Other technology

International Journal of Management, IT & Engineering Vol. 8 Issue 12(1), December 2018,
ISSN: 2249-0558 Impact Factor: 7.119
Journal Homepage: http://www.ijmra.us, Email: [email protected]
Double-Blind Peer Reviewed Refereed Open Access International Journal - Included in the International
Serial Directories Indexed & Listed at: Ulrich's Periodicals Directory ©, U.S.A., Open J-Gage as well as in
Cabell’s Directories of Publishing Opportunities, U.S.A
488 International Journal of Management, IT & Engineering
http://www.ijmra.us, Email: [email protected]
b) To ensure the availability of quality content online and through client server
architecture.
c) Enrichment of existing curriculum and pedagogy by employing ICT tools for teaching
and learning.
d) To enable students to square skills needed for the digital world for higher studies and
gainful employment.
e) To provide an effective learning environment for children with special needs through
ICT tools.
f) Promote critical thinking and analytical thinking and critical skills by developing self-
learning skills of the learner leading to student centric learning.
g) To promote the use of ICT tools in distance education including the deployment of
audio visual medium etc.
Objective of the study
Objective of the study are as follows:-
a) To know the ICT programme at the schools in Jharkhand.
b) To understand the procedure of ICT at the school programme.
c) To find out the impact of ICT on teaching learning process.
d) To find out the impact of ICT on the teachers and others school personals.
e) To find out the impact of ICT on students.
Research questions
Following research questions are formulated for the study
1) What is ICT programme at the schools of Jharkhand?
2) How the programme of ICT is implemented in schools?
3) Is there any impact of ICT on teaching learning process?
4) Is there any impact of ICT other school personals?
5) Is there any impact of ICT on students?
Methodology
Methodology covers the design of the research, selection of the representative samples,
applying appropriate research tools and techniques collecting relevant data and analysis. A
survey method with aptitude scale for students is implemented in this study.
Sample of the study
The sample of the study comprise schools using ICT of Kolhan region consisting Purbi-
Singhbhum , Paschim-Singhbhum and Seraikella-kharswan district of Jharkhand.300
students of the schools are selected as sample from the population.
Tools and Techniques use
Self-made rating scales are used to collect the data from the students and the teachers of
the selected schools.
Analysis and Interpretation
About ICT Programme
The ICT@school scheme is a window of opportunity to the learners in the govt. secondary
and senior secondary schools in the country to bridge the digital device. Government of
India has sanctioned ICT@schools programme to be implemented in 465 schools of
Jharkhand as a pilot project. The schools are divided in four zones. The project is to be
implemented on ‘BOOT’ model in each school failing in particular zone for initial period
of 5 years. Two service integrator /agency are selected through e-tendering process. The

International Journal of Management, IT & Engineering Vol. 8 Issue 12(1), December 2018,
ISSN: 2249-0558 Impact Factor: 7.119
Journal Homepage: http://www.ijmra.us, Email: [email protected]
Double-Blind Peer Reviewed Refereed Open Access International Journal - Included in the International
Serial Directories Indexed & Listed at: Ulrich's Periodicals Directory ©, U.S.A., Open J-Gage as well as in
Cabell’s Directories of Publishing Opportunities, U.S.A
489 International Journal of Management, IT & Engineering
http://www.ijmra.us, Email: [email protected]
EDUCATION AND SERVICES LTD is selected to implement in zone 1 and zone 2
schools, THE RICOH INDIA LTD is selected to implement in zone 3and zone 4 schools.
Implemention of the Programme
The following procedure is the process followed by the schools to implement the
programme
Role Of Agency: a. Establishment of ICT lab which include supply, Installation and
maintenance hardware and software items in the school. The agency will maintain the
hardware, software and connected accessories in proper working condition throughout the
contract period.
b. To provide man power and other services for successfully running of ICT lab.
c. Teacher training as per the guideline of ICT@school scheme and /or any guideline
received time to time from state/central government. Agency will impart teacher training in
Hindi as the medium of instruction.
d. The agency will pay for the electricity consumption made by the computers and
accessories used in each school under this contact. When electricity is not available the
bidder will ensure minimum four (4) hours of generator support per working day.
e. On –site warranty for computer hardware, software and connected accessories covering
the contract period of 5 years. And the removal of virus from the hardware items. To
establish helpdesk facilities for the redressal of operational difficulties JSEPC may appoint
third party agency for inspection and audit to measure the success of the project during the
tenure of the project.
f. monitor the implementation of the scheme at the school level, install MIS software
provided by JSEPC and submit periodical reports and also submit quarterly performance
reports to the department.
So the agency is responsible for adequate care safety, security like insurance in respect of
the all materials supplied to schools.
Providing Training to the Subject Teachers
Objectives of Training
I. The trainee becomes capable of using computer for normal operation and installing,
operation and using the software.
II. The trainee should be able to make his/her own lesson plan using the MIS software
developed by the bidder and using the internet facility available in the school.
III. The training should be hands on with the help of computers and software (educational)
developed.
IV. The training should include presentation/discussion on the topics by subject experts
also.
V. A ‘teachers’ manual should be made available to all the trainees.
VI. Expected set of questions/answers should be provided at the end of the training.
Training Delivery
The training shall be conducted at district level and duration of training is as follows:
A. Induction Training
First time induction training should be provided to all teachers/selected teachers in ICT the
selected schools. The average number of teachers per school for the district will be 10.
i. Total number of training days-10@ minimum of 6 hour training per day.
ii. The training must cover-
1. Introduction session.

International Journal of Management, IT & Engineering Vol. 8 Issue 12(1), December 2018,
ISSN: 2249-0558 Impact Factor: 7.119
Journal Homepage: http://www.ijmra.us, Email: [email protected]
Double-Blind Peer Reviewed Refereed Open Access International Journal - Included in the International
Serial Directories Indexed & Listed at: Ulrich's Periodicals Directory ©, U.S.A., Open J-Gage as well as in
Cabell’s Directories of Publishing Opportunities, U.S.A
490 International Journal of Management, IT & Engineering
http://www.ijmra.us, Email: [email protected]
2. Computer overview.
3. Operating system.
4. Productivity suits and integration of power point in class room teaching.
5. Office suite.
6. Internet / Email/ browsing etc.
7. Classroom learning and teaching tools- projector/collaborating networking etc.
8. Assessment and feedback. III. 1:2 computer ratios should be mentioned for very
training programme.
B. Refresher-training
Refresher training in use of ICT in teaching should provide to all teachers/selected teachers
in the selected schools. The average number of teachers to be trained per district will not
exceed 10.
I. Total number of training days 5@ minimum of 6 hours training per day.
II. The training must cover-
1. Working with multimedia.
2. Making and editing movies, pictures, images etc.
3. Overview of web applications.
4. Internet and e communications.
5. Overview of management information system.
6. Legal and ethical aspects of web based information.
7. Computer technologies and security.
8. Search optimization.
9. Classroom learning and teaching tools.
10. Overview of personalized learning.
11. Assessment and evaluation.
III. 1:2 computer training ratio should be mentioned for every training program. C.
Training module:
The agency will have to get their training module rectified by the technical advisory panel
of the JSEPC or agency authorized by JSEPC.
I. At least 10 teachers from each school needs to be trained.
II. Each training programme will have maximum 30 persons.
III. JSEPC will provide training space for the training of teachers. Other necessary
infrastructure such as computing equipment’s and other arrangements would be
provided by the bidder.
ROLE OF JSEPC/DISTRICT/SCHOOL:
a. Separate room for computer lab required to install all computer systems will be provided
by the Government /school free of cost.
b. School will provide single -phase power connection to the ICT lab.
c. District will provide training space for the training of teachers. Other necessary
infrastructure such as computing equipment’s and other arrangements would be provided
by the bidder. The bidder will have to also provide the requisite faculty and other learning
resources required for the effective conduct of training.
Prime Roles and Responsibilities
The responsibility for the management of the programme goes to school Coordinator,
District Co-coordinator and state co-coordinator. Their roles and responsibilities are given
below.

International Journal of Management, IT & Engineering Vol. 8 Issue 12(1), December 2018,
ISSN: 2249-0558 Impact Factor: 7.119
Journal Homepage: http://www.ijmra.us, Email: [email protected]
Double-Blind Peer Reviewed Refereed Open Access International Journal - Included in the International
Serial Directories Indexed & Listed at: Ulrich's Periodicals Directory ©, U.S.A., Open J-Gage as well as in
Cabell’s Directories of Publishing Opportunities, U.S.A
491 International Journal of Management, IT & Engineering
http://www.ijmra.us, Email: [email protected]
School Coordinator (SC)
1. Training students and if required teachers on IT skills as per the school syllabus and
time table.
2. To keep all the hardware and software in operational condition , on the spot training
and hand holding of the enable the teachers to use the computers for computer teaching
and also using educational e-content for computer Aided Learning .
3. To arrange the fuel for the Genet in case of electricity failure.
District Coordinator
To review school coordinators on their performance
To provide technical support to school coordinators
To verify maintenance the registers to verify equipment uptime
To collect and verify all reports to coordinate maintenance the work by vendors.
To send periodical reports to regional office
To collect sign –off from school coordinator for the District.
To review school performance in consultation with head master.
To participate and discussion with HM about education delivery.
To conduct education delivery reviews
To recruits school co-coordinators.
To conduct training programmes
State Co-coordinators’
State coordinator is the in-charge of the complete project management from the bidder.
To ensure smooth implementation of the project.
Monitoring of the performance of the school instructors and district coordinators.
Infrastructural Maintenances .Conduct monthly review meets with the district coordinators.
Vender management to ensure the machines are has high uptime.
To visit schools on regular basis to check execution.
To get the desired data, reports on time send to the education department.
To schedule faculty induction and technical training.
Send monthly reports to head office and participate in the monthly review.
This is the procedure to implement the ICT programme in schools. The infrastructural
facilities are provided by the schools, the machinery equipment’s are provided by the govt.
through the agency. State level coordinator, District coordinator and School level
coordinators manage the programme.
3. ICT makes the teaching learning process effective and interesting. It facilitates the
learning process by audio-visual learning material, interactive classroom situation,
interesting teaching materials, effective communication process to the learners. It shows a
positive impact on teaching learning process.
4. The training programme provided at district level enhances the ICT competency of the
teachers. A teacher uses the interactive board for their teaching process with the help of
ICT. There are two classes for each subject is provided at ICT lab. Now it is compulsory
for the teachers to take at least two classes per day in their subject. During the visit to the
schools it was also find out that some teachers are hesitate to take the classes through ICT.
They thought that the traditional process is better for the teaching. The other school
personnel’s use the computer for other day to day activities like drafting of letter,
maintenance of records, evaluation records ,etc. it is the better way to store the data in a
small folder. This habit should be improved by the school personnel’s.

International Journal of Management, IT & Engineering Vol. 8 Issue 12(1), December 2018,
ISSN: 2249-0558 Impact Factor: 7.119
Journal Homepage: http://www.ijmra.us, Email: [email protected]
Double-Blind Peer Reviewed Refereed Open Access International Journal - Included in the International
Serial Directories Indexed & Listed at: Ulrich's Periodicals Directory ©, U.S.A., Open J-Gage as well as in
Cabell’s Directories of Publishing Opportunities, U.S.A
492 International Journal of Management, IT & Engineering
http://www.ijmra.us, Email: [email protected]
5. The total programme revolves around the students. It emphasis to make every students
technology competent. This programme also facilitates the teaching learning process, when
teaching learning process is facilitated students also facilitate. It is also observed that
student’s classroom achievement is increased through ICT classroom. Again it was finding
that the positive mean score towards ICT is greater than the negative mean score of ICT.
Which is (52.65 for positive impact), (32.92 is for negative impact). So ICT has positive
impact on the student’s achievements, performance, and learning.
Findings of the Study. The interpretation and analysis shows the following findings.
1. ICT programme is the project undertaken as the pilot project at secondary level to
develop technological knowledge of the students, as well as interesting teaching learning
process.
2. The programme is implemented from state level to the school level. State level
coordinator, district level coordinator, and the school coordinator are allotted works as per
their area. And the state level agency provides the equipment’s of ICT lab with
maintenance. So all the personnel’s are perform their duties and responsibilities for
effective running of the project.
3. There is positive impact of ICT on teaching learning process. It makes the teaching
learning process easier and interesting.
4. There is positive impact of ICT on school personnel’s. They use it for their day to day
official work as well as in teaching learning process also.
5. There is positive impact of ICT on the students. Their classroom achievement is
facilitated through the ICT classes. They also develop their technological skill using ICT.
Suggestions
ICT@ school is the new programme for secondary level in Jharkhand. So it requires more
times for spread it.
ICT programme should be launched at the primary level.
ICT required more number of competent teachers so training programme should be
available to all the teachers of the schools.
ICT should be launched in every secondary schools of Jharkhand.
ICT requires accessible internet facility, electricity facility; better lab condition should be
developed in Jharkhand. The remote location schools will get benefitted through this.
ICT for all should be the motto of this programme
Conclusion
ICT programme at the school level is the effective means for the development of the state
as well as for the country. There is the responsibility of every person to facilitate this
programme. There is a proper monitoring and care is required to get rid of its negative
impact.

International Journal of Management, IT & Engineering Vol. 8 Issue 12(1), December 2018,
ISSN: 2249-0558 Impact Factor: 7.119
Journal Homepage: http://www.ijmra.us, Email: [email protected]
Double-Blind Peer Reviewed Refereed Open Access International Journal - Included in the International
Serial Directories Indexed & Listed at: Ulrich's Periodicals Directory ©, U.S.A., Open J-Gage as well as in
Cabell’s Directories of Publishing Opportunities, U.S.A
493 International Journal of Management, IT & Engineering
http://www.ijmra.us, Email: [email protected]
Reference
1. Guideline for district and schools for implementation of ICT @ school scheme.
Jharkhand secondary education project council.
2. Faloye, J.O. & Oparah, O.B. (2007) Relevance of Information and Communication
Technology (ICT) in education. Ikere, journal of education. Vol-9, no 1.
3. Goode & Hatt (1952-103) Methods in social research. Mc Graw –Hill New York.
4. UNESCO (2002) information and communication technology in education: a curriculum
guide for school programmes of teacher development. Division of higher education.
5. Agrahari A. & Singh. S (2013) the impact of information and communication
technology (ICT) on achievement of students in chemistry at secondary level of cbse and
UP board in India. International journal of science and research. 2(8)

International Journal of Management, IT & Engineering Vol. 8 Issue 12(1), December 2018,
ISSN: 2249-0558 Impact Factor: 7.119
Journal Homepage: http://www.ijmra.us, Email: [email protected]
Double-Blind Peer Reviewed Refereed Open Access International Journal - Included in the International
Serial Directories Indexed & Listed at: Ulrich's Periodicals Directory ©, U.S.A., Open J-Gage as well as in
Cabell’s Directories of Publishing Opportunities, U.S.A
494 International Journal of Management, IT & Engineering
http://www.ijmra.us, Email: [email protected]
fofo/k Lrjkojhy f’k{kdkaps lek;kstu o O;olk; lek/kku ;krhy lglaca/kkpk
vH;kl
MkW- gseardqekj ;’koar nsojs ¼izHkkjh izkpk;Z½
lkjka’k& izLrqr la’kks/kukr] izkFkfed] ek/;fed] mPpek/;fed o egkfo|ky;hu Lrjkojhy f’k{kdkaps
lek;kstu o O;olk; lek/kku l|fLFkrhrhy lglaca/kkpk vH;kl dj.;klkBh loZs{k.k la’kks/ku i)rhpk
voyac dj.;kr vkyk vkgs- lgsrwd uequk fuoM i)rhus izkFkfed Lrjkojhy 50] ek/;fed Lrjkojhy
50 mPpek/;fed Lrjkojhy 50 o egkfo|ky;hu Lrjojhy 50 vls ,dw.k 200 f’k{kdkaph fuoM
dj.;kr vkyh gksrh- ekfgrhps ladyu dj.;klkBh MkW- ,l- ds- eaxy ;kaph izekf.kr 'Mangal Teacher
Adjustment Inventory' (MTAI)' (Short Form) ‘kksf/kdk o MkW- ehjk fnf{kr ;kaph izekf.kr O;olk;
lek/kku ‘kksf/kdspk voyac dj.;kr vkyk gksrk- fofo/k Lrjkojhy f’k{kdkaps lek;kstu o O;olk;
lek/kku ;krhy lglaca/kkpk vH;klklkBh ladfyr ekfgrhps vFkZ fivjlu ;kapk lglaca/k ¼r½ xq.kdk}kjs
dj.;kr vkyh vkgs- izkFkfed] ek/;fed] mPpek/;fed o egkfo|ky;hu Lrjkojhy f’k{kdkaps lek;kstu
o O;olk; lek/kku ;kr oS/k o fo’oluh; lglaca/k vkgs-
Keywords:- lek;kstu] O;olk; lek/kku] v/;kiu] lglaca/k
izLrkouk
f’k{kd gk f’k{k.kizfdz;syk pkyuk ns.kkjk egRRowi.kZ ?kVd ekuyk tkrks- f’k{kdkaoj Hkkjrkps Hkfo”; voaycwu
vkgs- f’k{kdkyk vkiys drZO; ikj ikM.ks xjtsps vlrs- f’k{kdkus vkiY;k v/;kiukrwu fo|kF;kZaP;k
pkfj«;kyk ?kMok;ps vlrs- fo|kF;kZauk l{ke djko;kps vlrs- fo|kF;kZayk ns’kkP;k mi;ksxh gks.;klkBh
r;kj djko;kps vlrs- f’k{kd lektkP;k fodklkyk] jk”VªkP;k fodklkyk dkj.khHkwr vlrks- R;kP;k
ewY;oku fopkjkrwu vkf.k f’k{k.kkrwup fo|kFkhZ ?kMr vlrks- f’k{kdkoj vusd tckcnk&;k vlrkr-
R;kpcjkscj R;kyk Lor%yk vusd xks”Vhaph ca/kus ikGko;kph vlrkr- f’k{kd Lor% l{ke vlyk rjp rks
fo|kF;kZauk ;ksX; Kku nsowu ?kMow ‘kdrks- ;klkBh R;kps vkiY;k v/;kid thoukr vkf.k oS;fDrd
thoukr lek;kstu lk/kus egRRokps vlrs- lkekftd[ ekufld] Hkkofud vkf.k ‘kkjhfjd lek;kstu gks.ks
vfr’k; egRRokps vkgs- vlek;ksthr f’k{kd fo|kF;kZauk ;ksX; U;k; nsow ‘kdr ukgh-
lek;kstukizek.ksp f’k{kdkaps O;olk;lek/kku gks.ksgh egRRokps vlrs- ixkj] v/;kiuklkBhpk osG]
laLFkkdMwu izksRlkgu] okpuklkBh osG] fofo/k lsehukj o dk;Z’kkGkekQZr Kkuok<fo.;klkBhph la/kh] lUeku]
dk;ZHkkjkps ;ksX; fu;kstu] osGki=d vkfn ckcrhr f’k{kdkauk lek/kku gks.ks vko’;d vlrs- f’k{kd
lek/kkuh ulys rj R;kpk ifj.kke v/;kiukoj gksrks- ifj.kkeh fo|kF;kZaP;k Hkfo”;kps uqdlku gksrs- Eg.kwu
f’k{kd lek/kkuh vl.ks vfr’k;egRRokps vkgs- lek;sktu vkf.k lek/kku ;k f’k{kdkuk vkiY;k v/;kiukr
mRd`”V Lrjkoj ?ksowu tk.;klkBh ;ksX; ckch vkgsr- Eg.kwup izLrqr la’kks/kukr fofo/k Lrjkojhy f’k{kdkaps
lek;kstu o O;olk; lek/kku ;kr dkgh lglaca/k vkgs dk ;klkBh dj.;kr vkys gksrs-
LkeL;kfo/kku& izkFkfed] ek/;fed] mPpek/;fed o egkfo|ky;hu Lrjkojhy f’k{kdkaps lek;kstu o
O;olk; lek/kku ;krhy lglaca/kkpk vH;kl dj.ks-
mfí”Vs
1- izkFkfed Lrjkojhy f’k{kadkps lek;kstu o O;olk; lek/kku ;krhy lglaca/kkpk vH;kl dj.ks-
2- ek/;fed Lrjkojhy f’k{kadkps lek;kstu o O;olk; lek/kku ;krhy lglaca/kkpk vH;kl dj.ks-
3- mPp ek/;fed Lrjkojhy f’k{kadkps lek;kstu o O;olk; lek/kku ;krhy lglaca/kkpk vH;kl dj.ks-
4- egkfo|ky;hu Lrjkojhy f’k{kadkps lek;kstu o O;olk; lek/kku ;krhy lglac a/kkpk vH;kl dj.ks-
ifjdYiuk
1- izkFkfed Lrjkojhy f’k{kadkps lek;kstu o O;olk; lek/kku ;kr lkFkZ lglaca/k vk<Gwu ;sr ukgh-
2- ek/;fed Lrjkojhy f’k{kadkps lek;kstu o O;olk; lek/kku ;kr lkFkZ lglaca/k vk<Gwu ;sr ukgh-
3- mPp ek/;fed Lrjkojhy f’k{kadkps lek;kstu o O;olk; lek/kku ;kr lkFkZ lglaca/k vk<Gwu ;sr
ukgh-
vkj- lh- iVsy f’k{k.k’kkL= egkfo|ky;] f’kjiwj] ft- /kqGs

International Journal of Management, IT & Engineering Vol. 8 Issue 12(1), December 2018,
ISSN: 2249-0558 Impact Factor: 7.119
Journal Homepage: http://www.ijmra.us, Email: [email protected]
Double-Blind Peer Reviewed Refereed Open Access International Journal - Included in the International
Serial Directories Indexed & Listed at: Ulrich's Periodicals Directory ©, U.S.A., Open J-Gage as well as in
Cabell’s Directories of Publishing Opportunities, U.S.A
495 International Journal of Management, IT & Engineering
http://www.ijmra.us, Email: [email protected]
4- egkfo|ky;hu Lrjkojhy f’k{kadkps lek;kstu o O;olk; lek/kku ;kr lkFkZ lglaca/k vk<Gwu ;sr
ukgh-
i)rh& la’kks/ku i)r% izLrqr la’kks/kukr izkFkfed] ek/;fed] mPpek/;fed o egkfo|ky;hu Lrjkojhy
f’k{kdkaps lek;kstu o O;olk; lek/kku ;krhy l|fLFkrhrhy lglaca/kkpk vH;kl dj.;klkBh o.kZukRed
la’kks/ku i)rhrhy loZs{k.k i)rhpk voyac dj.;kr vkyk gksrk- tula[;k o U;kn’kZ% izLrqr la’kks/kukr
f’kjiwj ‘kgjkrhy izkFkfed] ek/;fed] mPpek/;fed o egkfo|ky;hu Lrjkoj v/;kiu dj.kk&;k loZ
f’k{kdkaph tula[;k Eg.kwu fuf’prh dj.;kr vkyh gksrh- lgsrwd uequk fuoM i)rhus [kkyhyizek.ks
f’k{kdkaph fuoM dj.;kr vkyh gksrh-
v/;kid
izkFkfed
f’k{kd
Ek/;fed
f’k{kd
mPpek/;fed
f’k{kd
Ekgkfo+|ky;hu
izk/;kid ,dw.k
50 50 50 50 200
la’kks/kukph ekiu lk/kus& f’k{kd lek;kstu& MkW- ,l- ds- eaxy ;kaph izekf.kr 'Mangal Teacher
Adjustment Inventory' (MTAI)' (Short Form) ‘kksf/kdspk voyac dj.;kr vkyk gksrk- ;kr ,dw.k
70 oLrqfu”B iz’u gksrs- pkp.kh iquZpkp.kh ra=k}kjs -06 brdh fo’oluh;rk fuf’pr dj.;kr vkyh vkgs-
rj lizek.krk -84 brds vkgs- O;olk; lek/kku ‘kksf/kdk% MkW- ehjk fnf{kr ;kaph izekf.kr O;olk; lek/kku
‘kksf/kdspk voyac fofo/k Lrjkojhy v/;kiukps dk;Z dj.kk&;k f’k{kdkaps O;olk; lek/kkukps ekiu
dj.;klkBh dj.;kr vkyk gksrk- ;k ‘kksf/kdsr ,dw.k 52 fo/kkus vkgsr-
la[;k’kkL=h; ifjek.ks& izLrqr la’kks/kukr fofo/k Lrjkojhy f’k{kdkaps lek;kstu o O;olk; lek/kku
;krhy lglaca/kkpk vH;klklkBh ladfyr ekfgrhps vFkZ fivjlu ;kapk lglaca/k ¼r½ xq.kdk}kjs dj.;kr
vkyh vkgs-
ladfyr ekfgrhps fo’ys”k.k o vFkZfuoZpu& izLrqr la’kks/kukr fofo/k Lrjkojhy f’k{kdkaps lek;kstu o
O;olk; lek/kku ‘kksf/kdsyk fnysY;k izfrlknko#u iq<hyizek.ks ‘kwU; ifjdYiukps ifj{k.k dj.;kr vkys
gksrs-
fofo/k Lrjkojhy f’k{kd Lka[;k uequk 'r' ewY;
¼0-05½
izkIr 'r' ewY;
fu.kZ; lglaca/k
izkFkfed
f’k{kd
lek;kstu
50 -285 -541 R;kx oS/k o
fo’oluh; O;olk;
lek/kku
ek/;fed
f’k{kd
lek;kstu
50 -285 -596 R;kx oS/k o
fo’oluh; O;olk;
lek/kku
mPpek/;fed
f’k{kd
lek;kstu
50 -285 -644 R;kx oS/k o
fo’oluh; O;olk;
lek/kku
Ekgkfo|ky;hu
f’k{kd
lek;kstu
50 -285 -569 R;kx oS/k o
fo’oluh; O;olk;
lek/kku
fujh{k.k o vFkZfuoZpu
• ifjdYiuk dz- 01% Lok/khurk ek=k ¼df½ 48 lkBh 0-05 lkFkZdrk Lrjkoj izkIr 'r' ewY; -541 gs
uequk 'r' ewY;kis{kk ¼-285½ vf/kd vkgs- Eg.kwu ‘kwU; ifjdYiuspk R;kx djkok ykxsy- ;ko#u vls
fnlwu ;srs dh] izkFkfed Lrjkojhy f’k{kadkps lek;kstu o O;olk; lek/kku ;kr lkFkZ lglaca/k
vk<Gwu ;rks- izkFkfed Lrjkojhy f’k{kadkps lek;kstu o O;olk; lek/kku ;kr /kulglaca/k vlwu rks
oS/k o fo’oluh; vkgs-
• ifjdYiuk dz- 02% Lok/khurk ek=k ¼df½ 48 lkBh 0-05 lkFkZdrk Lrjkoj izkIr 'r' ewY; -596 gs
uequk 'r' ewY;kis{kk ¼-285½ vf/kd vkgs- Eg.kwu ‘kwU; ifjdYiuspk R;kx djkok ykxsy- ;ko#u vls
fnlwu ;srs dh] ek/;fed Lrjkojhy f’k{kadkps lek;kstu o O;olk; lek/kku ;kr lkFkZ lglaca/k

International Journal of Management, IT & Engineering Vol. 8 Issue 12(1), December 2018,
ISSN: 2249-0558 Impact Factor: 7.119
Journal Homepage: http://www.ijmra.us, Email: [email protected]
Double-Blind Peer Reviewed Refereed Open Access International Journal - Included in the International
Serial Directories Indexed & Listed at: Ulrich's Periodicals Directory ©, U.S.A., Open J-Gage as well as in
Cabell’s Directories of Publishing Opportunities, U.S.A
496 International Journal of Management, IT & Engineering
http://www.ijmra.us, Email: [email protected]
vk<Gwu ;rks- ek/;fed Lrjkojhy f’k{kadkps lek;kstu o O;olk; lek/kku ;kr /kulglaca/k vlwu rks
oS/k o fo’oluh; vkgs-
• ifjdYiuk dz- 03% Lok/khurk ek=k ¼df½ 48 lkBh 0-05 lkFkZdrk Lrjkoj izkIr 'r' ewY; -644 gs
uequk 'r' ewY;kis{kk ¼-285½ vf/kd vkgs- Eg.kwu ‘kwU; ifjdYiuspk R;kx djkok ykxsy- ;ko#u vls
fnlwu ;srs dh] mPpek/;fed Lrjkojhy f’k{kadkps lek;kstu o O;olk; lek/kku ;kr lkFkZ lglaca/k
vk<Gwu ;rks- mPpek/;fed Lrjkojhy f’k{kadkps lek;kstu o O;olk; lek/kku ;kr /kulglaca/k
vlwu rks oS/k o fo’oluh; vkgs-
• ifjdYiuk dz- 04% Lok/khurk ek=k ¼df½ 48 lkBh 0-05 lkFkZdrk Lrjkoj izkIr 'r' ewY; -569 gs
uequk 'r' ewY;kis{kk ¼-285½ vf/kd vkgs- Eg.kwu ‘kwU; ifjdYiuspk R;kx djkok ykxsy- ;ko#u vls
fnlwu ;srs dh] egkfo|ky;hu Lrjkojhy f’k{kadkps lek;kstu o O;olk; lek/kku ;kr lkFkZ lglaca/k
vk<Gwu ;rks- egkfo|ky;hu Lrjkojhy f’k{kadkps lek;kstu o O;olk; lek/kku ;kr /kulglaca/k
vlwu rks oS/k o fo’oluh; vkgs-
ppkZ& izLrqr la’kks/kukps ojhy fu”d”kkZrwu y{kkr ;srs dh] izkFkfed] ek/;fed] mPpek/;fed o
egkfo|ky;hu Lrjkojhy f’k{kdkaps lek;kstu o O;olk; lek/kku ;kr oS/k o fo’oluh; lglaca/k vkgs-
Eg.ktsp f’k{kdkaps lek;kstu vuqdwy vlsy rj R;kaps O;olk; lek/kku pkaxY;k i)rhus gksow ‘kdsy-
lek;kstukr vkfFkZd] Hkkofud] lkekftd] ekufld lek;kstukps egRRo vf/kd vkgs- ;klkBh f’k{kdkaP;k
;k xjtkadMs y{k ns.ks vfr’k; egRRokps vkgs- Kkunkukps dk;Z gs ifo= ekuys tkrs- ijarq f’k{kdkapkgh
fopkj dj.ks xjtsps vkgs- ;kdMs] eq[;k/;kidkus] laLFkkpkydkauh] ‘kklukus y{k nsowu ;kxks”VhlkBh
f’k{kdkauk U;k; fnyk ikfgts-
lanHkZxzaFklwph
Best, J.W. and Khan, K.M. (2002). Research in Education. New Delhi: Practice Hall of
India.
Cattell, R. B. (2008). Psychological Testing. New Delhi: Srishti Book Distributors.
Kerlinger, F. W. (2000). Foundation Behavioral Research. New York: Rinehart and
Winston Inc.
Kothari, C. R. (1990). Research Methodology, Methods and Techniques. New Delhi:
Wiley Eastern Limited. vkgsj] fgjk- ¼1996½- mn;ksUeq[k Hkkjrh; lektkrhy f’k{k.k o f’k{kd- ukxiwj% fo|k izdk’ku-
djanhdj vkf.k eax#Gdj- ¼2002½- mn;ksUeq[k Hkkjrh; lektkrhy f’k{k.k- dksYgkiwj% QMds izdk’ku-
Hkkjacs] baneqrh- ¼2014½- ‘kS{kf.kd la[;k’kkL=- tGxkao% iz’kkar ifCyds’kUl-
fHkarkMs] fo- jk- ¼1989½- ‘kS{kf.kd la’kks/ku i)rh- iq.ks% uwru izdk’ku-
exjs] lqfurk- ¼2011½- ¼laik-½ f’k{k.kkrhy la’kks/ku i)rh- ,e-,- Hkkx 1] f’k{k.k’kkL=] vH;klif=dk 3-
eqacbZ fo|kihB] eqacbZ-
f’ko.ksdj] y- ¼2003½- v/;kid Hkqfedk o dk;Z- iw.ks % uwru izdk’ku-

International Journal of Management, IT & Engineering Vol. 8 Issue 12(1), December 2018,
ISSN: 2249-0558 Impact Factor: 7.119
Journal Homepage: http://www.ijmra.us, Email: [email protected]
Double-Blind Peer Reviewed Refereed Open Access International Journal - Included in the International
Serial Directories Indexed & Listed at: Ulrich's Periodicals Directory ©, U.S.A., Open J-Gage as well as in
Cabell’s Directories of Publishing Opportunities, U.S.A
497 International Journal of Management, IT & Engineering
http://www.ijmra.us, Email: [email protected]
A Study on Impact of Employee Turnover on Hotel Industry
Ms. Bhawana Pant
Abstract: Hotel trade is labelled as a service sector that provides services to their guest.
The business needs personnel to cope and supply to the guest demands. This case creates
the business to be labour intensive. However concerning personnel provide to the
industry? Over the years ratio has become a part of the industries challenge to retain and
use new manpower. The analysis was to grasp the determinants of Job Satisfaction and
Effects on ratio within the hotels. The main target was on the cordial reception business
Food and food department Operational workers. The analysis tried to assess the
determinants of Job satisfaction and their call to quit so making a scenario of Turnover.
This has been results of vast efforts of the government and also the trade positive steps in
boosting its attractiveness as a toured and cordial reception destination on the world.
These unit varied International building chains already in Bharat that area unit increasing
their area inventory at a quick pace to fulfil the longer term demands of accommodation
and leisure services. However with each success there comes some reasonably issues or
issues that area unit required to tackle as they may delay the organization or the trade as a
full. The main problems that are a part of every growing trade in past is to row out itself
from the matter of turnover rate. It’s same that turnover is one silent a part of human
resource management which may have a negative impact for the organization if managed
inadequately. This paper is an endeavour to search out the explanations why building
trade in India is facing this issue and what area unit the attainable effects of it on the trade
which could slow or hold still the expansion of trade as forecasted.
Keywords: Business, industry, hotel, management, Employee turnover, Human resource
practices and policies, Retention, Organisational performance trades, organization, etc.
Introduction: Justine Vogt explained the importance of hospitality in his words as
“Hospitality is making your guests feel like they’re at home, even if you wish they
were.[1]” now-a-days hotel industries are playing an important role in the hospitality. The
business is doing nice consistent with completely different reports and statistics however
there's pressing got to check out the varied drawbacks or issues continuous in building
business one such is that the high turnover rate. Current scenario about hotel industry in
our country remains bereft of enough trained men. This sector is facing severe challenges
from alternative industries; psychological feature aspects like engaging wage
compensation, maintaining a decent work life balance, higher opportunities to grow
appears to be the most reason for the abnormal ratio. Ordinarily company faces higher rate
once there square measure a lot of employment opportunities within the market by
employers. The report given by Travel and Tourism council economic impact report 2015,
“The Indian Tourism and Hospitality industry is one of the fastest growing and most
important segments in the earning of revenue and as well as employment. The tourism and
hospitality sector’s direct contribution to GDP in 2016 is estimated to be US$47 billion.[2]”
Assistant professor, SRMS International Business School, Lucknow

International Journal of Management, IT & Engineering Vol. 8 Issue 12(1), December 2018,
ISSN: 2249-0558 Impact Factor: 7.119
Journal Homepage: http://www.ijmra.us, Email: [email protected]
Double-Blind Peer Reviewed Refereed Open Access International Journal - Included in the International
Serial Directories Indexed & Listed at: Ulrich's Periodicals Directory ©, U.S.A., Open J-Gage as well as in
Cabell’s Directories of Publishing Opportunities, U.S.A
498 International Journal of Management, IT & Engineering
http://www.ijmra.us, Email: [email protected]
Literature Review
The hotel represents one among the foremost dynamic and thriving industries, in addition
as in countries everywhere the planet. Some countries have preserved an oversized
commercial enterprise trade that supports activities that have formed the country’s
economy. Before discussing why turnover represents a major issue within the cordial
reception trade, it's necessary to know the character of the trade, in addition because the
doubtless vital role of human-resources policies and methods in reducing the turnover
within the trade. Teng (2013) delineate the cordial reception trade as a corporation with a
purpose to satisfy a full vary of wants like food, beverages, and accommodations. The
cordial reception trade involves frequent guest–host interactions and cordial reception
organizations that cater to the wants of a various cluster of individuals.
The hotel industry enterprise trade provides many roles round the globe and extensively
contributes too several countries’ gross domestic product (GDP) (Vasquez, 2014).
Therefore, extra analysis could facilitate leaders in such industries improve employees’
performance, enabling them to vie additional effectively within the cordial reception trade
(Dobre, 2013; Dragoni, Park, Soltis, & Forte-Trammell, 2014; Verbos, Miller, &
Goswami, 2014). as a result of the cordial reception trade is comprised of production and
repair dimensions, the creation and delivery of services from the building to the client are
hooked in to the staff (Faldetta, Fasone, & Provenzano, 2013). Thus, the success of this
trade primarily depends on the accomplishment, management, and retention of staff. This
makes the high turnover rate rates of the building trade problematic.
The seasonal nature of the hotel industry remains a major reason behind the high turnover
rates (Faldetta et al., 2013). The finding of the analysis conducted by Faldetta et al., 2013
disclosed that building managers ordinarily rent and fireplace staff supported seasonal
fluctuations, managers stay unaware of the labour-versus-demand concept; thus, building
managers stay unprepared to synchronize labour to demand. Specific challenges from
personalization/customization, service management, branding, and social media use would
possibly influence turnover. A major want for trade leaders is to find out higher
management techniques that will aid in retentive the foremost valuable, well-trained staff,
effectively serving to the trade vie within the cordial reception market with ease (Brown,
Thomas, & Bosselman, 2015). Faldetta et al., 2013 indicated that specially, high turnover
may well be harmful and turbulent to the cordial reception trade (Faldetta et al., 2013).
AlBattat et al., (2014) argue that compensation and accidental rewards have an effect on
turnover rate within the cordial reception trade. Unacceptable operating conditions, poor
coaching, and inadequate salaries may conjointly cause high turnover rate. Lee & Chao
(2013); Mohsin, Lengler, & Aguzzoli (2015) conjointly argue that the consequences of job
security, earnings, and structure loyalty on turnover correlate with each other. Mohsin et al.
(2015) examined the quadratic and linear relationships between the intention to depart
one’s job and their antecedents on a sample of 884 cordial reception employees members
in Asian country and located the consequences of organization enthusiasm and stimulating
job experiences on turnover rate to be quadratic. Management was for the most part liable
for keeping employees from feat.
Pohler and Schmidt (2015) conjointly examined the connection between monetary
incentives and turnover rate. They evaluated the consequences of social control pay-for-
performance on the turnover of staff in non-management positions, victimization the
agency and equity theory and finished that social control pay-for-performance policies

International Journal of Management, IT & Engineering Vol. 8 Issue 12(1), December 2018,
ISSN: 2249-0558 Impact Factor: 7.119
Journal Homepage: http://www.ijmra.us, Email: [email protected]
Double-Blind Peer Reviewed Refereed Open Access International Journal - Included in the International
Serial Directories Indexed & Listed at: Ulrich's Periodicals Directory ©, U.S.A., Open J-Gage as well as in
Cabell’s Directories of Publishing Opportunities, U.S.A
499 International Journal of Management, IT & Engineering
http://www.ijmra.us, Email: [email protected]
would possibly negatively have an effect on the connection between staff and
management, resulting in a high employee-turnover rate. The findings from analysis
conducted by Pohler and Schmidt supported previous literature assertions that pay may
have an effect on worker outcomes like job satisfaction. Apart from pay, institutional
factors like opportunities for advancement and promotions, the existence of work-group
cohesion, effective and corroboratory leadership, and satisfactory compensation may
influence turnover (Qiu, Haobin Ye, Hung, &York, 2015).
Aims and objectives
a. To find out the effect of salary on the quality of the work in hotel industries.
b. To analyse the differences of salary in different hotels.
c. To compare the qualities hospitalities in various hotel.
Hypothesis
a. The impact of salary in found on the hospitality in hotel industries.
b. Hotel to hotel salary varies fir the same work and same time period.
Method of the Study: Current study is based on finding out the serving quality of hotels
and the effect of salary on the quality of the hospitality. Though, this is the case study, the
researcher tried to get information indirectly. The approach of researcher in the hotel was
as a customer. Hence, it’s totally survey based, but researcher took care of not mentioning
name of any hotel here in the case study. Secret is kept for the prestige and market issue of
the hotels.
Source of the Study: The researcher has used two types of data i.e. primary and secondary
data collection.
a. The primary data were collected through oral discussion with hotel manager and other
employees showing as a casual discussion.
b. The secondary data were obtained from journals, textbooks and internet and other
supporting printed material.
Challenges Faced By Hotel Industries
The business is facing a big attrition challenge of concerning 40-50 p.c. Most of the
building teams typically have regular coaching programs and learning and development
initiatives throughout the year that impart numerous useful skills into the worker. Currently
these candidates with imparted skills square measure in demand for service orientated
sectors like banking, retail, facility coming up with and airlines, among others. It won’t be
incorrect to mention that a talent war is being fought among the business as they're losing
consummate professionals thanks to the supply of higher career opportunities for the
worker or candidates. associate worker functioning at lower level is usually seen dynamic
the organization in an exceedingly span of half dozen months that proves as a loss for the
organization as during this short time the coaching and development prices pay on him/her
aren't coated.
Current work focuses on the topic to seek out the impacts of such high ratio magnitude
relation in Indian welcome business and aims at sorting out the best attainable ways that
and suggestion to beat and strengthen the business with stable hands and multiplied
productivity. Though the hotel industry has been functioning for centuries, various hotelier
quotes exist that can help to explain how the industry has changed over the many years.
The incidence of high turnover rates within the building trade has been the topic of
substantial range of studies. Abundant of the analysis has been centred on characteristic the
causes of turnover and formulating ways. Though there is Very little attention, it has been
International Journal of Management, IT & Engineering Vol. 8 Issue 12(1), December 2018,
ISSN: 2249-0558 Impact Factor: 7.119
Journal Homepage: http://www.ijmra.us, Email: [email protected]
Double-Blind Peer Reviewed Refereed Open Access International Journal - Included in the International
Serial Directories Indexed & Listed at: Ulrich's Periodicals Directory ©, U.S.A., Open J-Gage as well as in
Cabell’s Directories of Publishing Opportunities, U.S.A
500 International Journal of Management, IT & Engineering
http://www.ijmra.us, Email: [email protected]
given to spot the particular result of turnover on the performance of the organisation and
conjointly the effectiveness of human resource practices and policies in holding staff. This
study tries to handle the deficiency of analysis during this space by exploring the result of
ratio on completely different aspects of performance of the organisation and conjointly by
reviewing, however effective is that the worker retention ways followed within the hotel?
The effect if salary may be found on the work quality of employees. Employees’
satisfaction is very important in any industrial sector, but more important in hotel
industries. The reason behind it is hotel industry is for hospitality, if one severs properly to
customers coming in the hotel, the turnover may be increases of the hotel. It has another
negative impact if employees are not having proper salary, their devotion towards work
will be less. As defined the term serving by M.K. Ghandiji, “The best way to find yourself
is to lose yourself in the service of others.[3]”
Hotel Industry in Global Era
In current era, the hospitality business is experiencing high labour turnover globally.
Changing demographics and social norms are moving the labour pool. Loyalty to one
leader isn't any longer the establishment (Gustafson, 2002). Recruiting the correct
individuals, coaching them properly and treating them well in their work might not sound
like rocket science. Just about any edifice will recruit gifted and extremely intended staff.
But it appears that they need issue in retentive them. High business turnover rates,
increasing prices and therefore the tight labour market build turnover the most important
hindrance to the cordial reception business (Gustafson, 2002).
Employee turnover is rising sharply. Labour turnover for the cordial reception business
rose to fifty three and around 04% in 2000 up from twenty seventh in 1994 (Hotel and job
coaching Company, 1994). The employees’ turnover figures of many hundred once years
don’t seem to be uncommon for the cordial reception business. Just like the turnover
figures, the price of turnover is additionally high. Each incident of turnover and
replacement involves time, cash and even potential loss of business. Labour turnover is
problematic within the hostel business that has already got achievement difficulties. In
2008 the figures has gone up to eightieth, compared to seventy eight in 2006 (CIPD
Annual Survey Report, 2008).
Effect of Turnover on Organisational Performance:
The literature reviewed shows that everyone the organisational performance is negatively
littered with turnover. Even if, the case study discovered that not each performance is
littered with the worker turnover. The result of turnover depends on the one who leaves.
For instance, once a poor performing artist leaves it sensible for the organisation and good
for the employees ethical on the opposite hand once an honest member of employees
leaves it's a negative result on the organisation. One more finding was that the result of
turnover is expounded to rate of turnover. If the speed of turnover is incredibly less there's
hardly any result however because the turnover goes up there's a negative result on the
organisation.
The main reasons given by folks that argue turnover incorporates a negative result is, the
longer the employees stays they get to grasp the purchasers and their expectations and are
able to deliver the specified standards. And once a replacement member of employees
comes in instead they have a tendency to form mistakes within the coaching amount and
therefore the mistakes value in some ways that. Brien, (2004), Hinkin and Tracey, (2000)
and Payne, (1997) shares the same read. There is conjointly another indisputable fact that

International Journal of Management, IT & Engineering Vol. 8 Issue 12(1), December 2018,
ISSN: 2249-0558 Impact Factor: 7.119
Journal Homepage: http://www.ijmra.us, Email: [email protected]
Double-Blind Peer Reviewed Refereed Open Access International Journal - Included in the International
Serial Directories Indexed & Listed at: Ulrich's Periodicals Directory ©, U.S.A., Open J-Gage as well as in
Cabell’s Directories of Publishing Opportunities, U.S.A
501 International Journal of Management, IT & Engineering
http://www.ijmra.us, Email: [email protected]
having new employees within the team brings new life and enthusiasm to the whole team.
The result of the case study doesn’t prove that having long serving employees makes the
business any higher. What makes the business higher is coaching, caring and doing what
you are doing, doing it higher than anybody else.
Financial performance of the organisation is littered with turnover due to the completely
different coasts (coast of hiring, value of coaching and price on selling) concerned in it. All
though, the number of the respondents noted that since every new person used will return
on the earnings if associate degree organisation will flip over the staff in each half dozen
months it'll keep the employees’ wages lower. Productivity is affected slightly by turnover
however cross coaching of employees in several sections of the department and an honest
coaching system can facilitate in reducing the result of turnover. Whether or not the
turnovers have an effect on the present employees completely or negatively extremely
depends on the one who leaves the organisation.
On the opposite hand the results of the case study conjointly discovered that client
retention; client satisfaction, service commonplaces and competitive performance of the
organization won't be littered with turnover if the organization is ready to maintain the
consistency and high standard of the merchandise and therefore the angle of the
organization. This might be achieved by having correct coaching system and other people
to hold out them, strict follow in employees allocation and recruiting individuals with
client skills and are on top of average intelligence that the conclusion is drawn because the
turnover has some avertible associate degree ineluctable result on the performance of an
organisation. The result on money performance, existing employees and productivity will
solely be reduced but the result of turnover on client retention, client satisfaction, service
standards and competitive performance is avoided with the assistance of correct coaching
system and other people to hold out them, strict follow in employees allocation and
recruiting
Causes of Turnover
The key discussion within the literature highlights pays because the major reason for
turnover. Poor qualities of supervising and poor operating conditions were conjointly
quoted additional usually. The opposite major reasons of turnover mentioned within the
literature are restricted chance for advancement, poor performance that will not meet the
standards and expectations of the leader, the pre-employment expectations weren't met by
the organisation, returning to high school or school, antisocial hour’s conflict with the
managers and stress and burnout.
The views of staff on the explanations they'd leave this organisation shows similarity to the
most important reasons of turnover known from literature review. Ninety six of the
respondents’ aforesaid higher career opportunities and money edges can be a legitimate
reason to maneuverer to a different organisation followed by forty eighth of the
respondents felt that stress and poor operating setting will act as a reason for turnover. but
the proof from interviews conducted imply the most important reason for the turnover
within the case study organisation is due to recruiting long run tourists and students
followed by the placement of the organisation.
According to the study conducted by edifice and job coaching company (1994) the most
(70% of respondents) reason given for departure was recluse hours and low pay. Even if
this case study verifies the latter antisocial hours was one in every of the least sited reasons
for departure the organisation. This might be due to the actual location of the organisation.

International Journal of Management, IT & Engineering Vol. 8 Issue 12(1), December 2018,
ISSN: 2249-0558 Impact Factor: 7.119
Journal Homepage: http://www.ijmra.us, Email: [email protected]
Double-Blind Peer Reviewed Refereed Open Access International Journal - Included in the International
Serial Directories Indexed & Listed at: Ulrich's Periodicals Directory ©, U.S.A., Open J-Gage as well as in
Cabell’s Directories of Publishing Opportunities, U.S.A
502 International Journal of Management, IT & Engineering
http://www.ijmra.us, Email: [email protected]
The Human Resource Practices and Policies and Their Effectiveness
The literature highlights that employers use a variety of measures to boost worker retention
like coaching, career development, versatile work practices, in a similar way edges, money
incentives, the operating setting, organisational identity and therefore the portfolio
approach (Bell & Winters, 1993; urban centre & Forbringer, 1992; Hogan, 1992). in line
with the CIPD survey (2008) the foremost of times cited actions taken by organisations to
handle retention is increasing pay (53%) followed by increasing learning and development
opportunities (46%) and rising choice techniques within the 1st place (46%). The human
resource polices of the case study organisation offers importance to social relation between
the worker and management and providing an honest operating setting instead of giving
money edges. But the organisation conjointly provides the essential money edges that the
other organisation provides. From the case study it can be finished that the policy of the
organisation isn't to retain the employees however to keep up consistency and high
commonplace of service. Hence the human resource practices and policies of the
organisation are aimed to supply an honest operating setting to not stop them from
departure the organisation. This can be supported the argument that the employees can
advance after they are able to advance or if they're not happy. And if the organisation
incorporates a bunch of individuals’ agency keep because of as a result these edges then as
times travel as a result of people obtaining lighter, or board the standards slowly begin to
say no.
Evidences from the case study recommend that the human resource practices and policies
of the case study organization are effective in retentive the workers. All the mangers of the
organization have over three years of service and fifty six of operational employees have
over a pair of year of service. Ninety six of the operational level employees of the
organisation are happy with the duty. Eightieth of the operational employees agrees the pay
and edges given within the organisation are sensible. Nearby 79.17% of the employees
aforesaid their expectations were met. This truly shows that the human resource practices
and polices followed within the organisation are literally effective in retentive staff. Thus it
can be summed up from the case study that, if the organisation concentrates on recruiting
quality labour which matches in conjunction with the remainder of the team and supply an
honest operating setting the organisation are mechanically in a position to retain the
workers.
Conclusion
The overall aim of this analysis was to review the effectiveness of human resource
practices and policies in retentive the workers and to analysis the effect of turnover on
organisational performance. the most conclusion which will be drawn is that the particular
reason for turnover differs from organisation to organisation and is directly associated with
the characteristics of the organisation further because the practices and procedures of the
organisation. Thus, once addressing the difficulty of turnover instead of giving edges and
pay raise the small and macro setting of the organisation needs to be thought of 1st. It's
obvious from the discussion allotted on top of that some result of turnover on the
performance of an organisation is reduced and a few others is avoided. The result on
money performance, existing employees and productivity will solely be reduced, how-
ever the result of turnover on client retention, client satisfaction, service standards and
competitive performance is avoided with the assistance of correct coaching system and
other people to hold out them, strict follow in employees allocation and recruiting. It’s

International Journal of Management, IT & Engineering Vol. 8 Issue 12(1), December 2018,
ISSN: 2249-0558 Impact Factor: 7.119
Journal Homepage: http://www.ijmra.us, Email: [email protected]
Double-Blind Peer Reviewed Refereed Open Access International Journal - Included in the International
Serial Directories Indexed & Listed at: Ulrich's Periodicals Directory ©, U.S.A., Open J-Gage as well as in
Cabell’s Directories of Publishing Opportunities, U.S.A
503 International Journal of Management, IT & Engineering
http://www.ijmra.us, Email: [email protected]
conjointly evident that organisations got to concentrate chiefly on the merchandise to keep
up consistency and high standards instead of making an attempt to keep up the one who
delivers it to achieve that correct coaching and an honest operating setting needs to be
provided.
The results of the case study conjointly discovered, that staff is maintained by recruiting
quality labour, which matches in conjunction with the remainder of the team and by give
an honest operating setting. The human resource policies and practices supported social
relation between the worker and management, that are aimed to supply an honest operating
setting instead of giving money edges tried to be effective in retentive the work.
References
1. https://www.ignitehospitality.com/blog/10-tweetable-quotes-about-hospitality/
2. World Economic forum Travel and Trade index 2017.
3. https://www.ignitehospitality.com/blog/10-tweetable-quotes-about-hospitality/
4. R. J. (1994). Quality assurance certification for hospitality marketing, sales and
customer services. Service Industries Journal, 14(4). 482-498.
5. Campion, M. A. (1991). Meaning and measurement of turnover: Comparison of
alternative measures and recommendations for research. Journal of Applied Psychology,
76,199- 212.
6. Cheng, A. & Brown, A. (1998). HRM strategies and labour turnover in the hotel
industry; a competitive study of Australia and Singapore. International Journal of Human
resource management, 9, 136-154
7. Chiang, C.F, Back, J.K & Canter, D.D (2005). The impact of employee training on
job satisfaction and intention to stay in the hotel industry. Journal of Human Resources in
Hospitality and Tourism, 4(2), 99-117
8. Chung-Herrera, B. G., Enz, C. A., & Lankau, M. (2003). Grooming future
hospitality leaders: A competencies model. Cornell Hotel and Restaurant Administration
Quarterly, 44(3), 17-25.
9. CIPD Annual Survey Report (2008). Recruitment retention and turnover. Retrieved
August 19th, 2010 from http://www.cipd.co.uk/NR/rdonlyres/BE3C57BF-91FF-4AD0-
9656 27E5398AA 0/recruitmentretentionturnover2008.pdf
● CIPD Turnover Survey Report (2001). Labour Turnover 2001. Retrieved August
25th 2010 from http://www.cipd.co.uk/NR/rdonlyres/D86B3B5D-9BFD-44A8-
A413771FEEA1 38C6/0/ labour_turnover_2002.pdf

International Journal of Management, IT & Engineering Vol. 8 Issue 12(1), December 2018,
ISSN: 2249-0558 Impact Factor: 7.119
Journal Homepage: http://www.ijmra.us, Email: [email protected]
Double-Blind Peer Reviewed Refereed Open Access International Journal - Included in the International
Serial Directories Indexed & Listed at: Ulrich's Periodicals Directory ©, U.S.A., Open J-Gage as well as in
Cabell’s Directories of Publishing Opportunities, U.S.A
504 International Journal of Management, IT & Engineering
http://www.ijmra.us, Email: [email protected]
Performance of Risk and Return on Selected Mutual Funds- A
study
Dr.D.Madan Mohan
Abstract
A mutual fund is a pure intercessor, which performs basic function of buying and selling
security happening behalf of its investors or unit holders. A proper evaluation measure
will remove confusion and help small investors to choose about level of investment in
many mutual fund schemes ,so as to maximize the returns. Indian capital market provides
various investors help them to invest various industry., securities, and commodities and to
ensure the profitable return. Mutual Funds help the small and medium size investors to
participate in the today’s complex and current financial scenario. Investors can participate
in Mutual funds to buying the units of a detailed Scheme. In this paper we have taken
selected schemes were assessed on the basis of Sharpe, Treynor and Jensen’s measures.
Keywords: Mutual funds, Net Asset Value, Standard Deviation, Sharpe, Treynor and
Jensen’s Ratio
I. Introduction
In Mutual fund industry has developed by leaps and boundaries, A proper evaluation
measure will remove misunderstanding and help small investors to decide approximate
level of investment in various mutual fund schemes, so as to minimize the risk maximize
the returns. Further the growing rivalry in the market forces the fund managers to work
hard to satisfy investor and the management. A regular performance assessment of the
mutual funds is essential for the investors and the fund manager a soon the basis of their
turns associated with the risk free security and stock market directories. The primary
capital market was very in active and reclusive. The unorganized and private player’s
theaters vital role for maintaining the liquidity in the country. In short the chaotic
environments raised in the economic system of the country. Some serious attention was
drawn towards the financial system in India at the time of preparation phase. Most of the
economist recommended for the adoption of the mixed economy proposal. The planner of
Indian economy stabs to adopt the balanced economy, which has beneficial for socio
economic and political areas. The prevailing government was started establishing various
financial institutions for fulfilling the obligation for industries and agricultures; it also
started state-owned financial institution for providing the finance without any interruption.
UTI is one of the largest and oldest mutual funds in the country. Later on the other private
sector companies and financial institutions adopted this mechanism and started to mobilize
fund through the concept of mutual fund. India economy stood among the fastest growing
economy in the world. The huge potential market is also unlocked for the mutual fund
industry; this would accelerate the growth of the industry. Generally Indian economy
called as a redeemable economy,80% of population has saved more than 35% of GDP rate.
The present saving shell channelized in the mutual fund industry as it proposals a variety
Principal / Professor, Indur P.G. College of Business Management, Achanpally, Bodhan-503180, Nizamabad (dist),
Telangana State

International Journal of Management, IT & Engineering Vol. 8 Issue 12(1), December 2018,
ISSN: 2249-0558 Impact Factor: 7.119
Journal Homepage: http://www.ijmra.us, Email: [email protected]
Double-Blind Peer Reviewed Refereed Open Access International Journal - Included in the International
Serial Directories Indexed & Listed at: Ulrich's Periodicals Directory ©, U.S.A., Open J-Gage as well as in
Cabell’s Directories of Publishing Opportunities, U.S.A
505 International Journal of Management, IT & Engineering
http://www.ijmra.us, Email: [email protected]
of investment avenues. In India there is a huge scope for mutual fund area in tire I and Tire
II cities. Further scope is open from agriculture sector and other allied sectors for mutual
fund players from the rural areas. It is forecast that mutual fund sector would grow at a rate
of 30% to 35% in resulting five years, and it will reach 300 Billion USD by2015.As it can
be noticeable, there is huge and potential growth in the mutual fund area. The mutual fund
industry is very sound and growth oriented in the next future based on the continuous
developmental actions in this sector
II. Literature Review
(GUPTA, 2013) Mutual fund industry has experienced a radical growth in the past two
decades. Increase in years notes the importance of Indian mutual funds industry. To fulfill
the expectations of millions of retail investors, the mutual funds are mandatory to function
as successful institutional investors. Proper assessment of various fund performance and
their contrast with other funds helps retail investors for making investment decisions.
Considering the interest of retail investors modest statistical techniques like averages and
rate of returns are used.
(Dr.Sarika,nov2015)However, there are differences between the two. Saving refers to
funds kept formaking specific purchases the number of schemes with increased
mobilization of funds in the preceding few in the comparatively nearby future and for
emergencies. Investing, on the other hand,focuses on increasing networth andr ealizing
long-term financial aims.Investing involves risk of loss of principal and is more concerned
on there turn of investment.This total risk, calculated by standard deviation, can be divided
into two parts Unsystematic risk, systematic risk. Unsystematic risk is also termed
diversifiable risk. Systematic risk may be called non-diversifiable risk, unavoidable risk or
market risk and measured by Beta.
(Jain, jul 2012) The study has investigated the performance of equity founded mutual fund
schemes in India, using CAPM. In the long run, the private and public companies have
achieved well. While reliance and kotak mutual fund trades have been the best performers
than the UTI and SBI has worst performer. The result clearly designate that over the period
of last15 years, the private sector mutual fund companies have outdone then the public
sectors and by observing the performance of each and every mutual fund.
(Ravikumar, Aug 2013) In their paper evaluated the performance of selected Indian mutual
fund schemes in terms of five performance measures (a) Sharpe ratio (b) Treynor ratio (c)
Jensen measure (d) Sharpe differential return measure (e)Fama’s mechanisms of
investment performance using attuned monthly NAV of 60 schemes from 10 mutual funds
for the five year dated, that is, from April 2000 to March 2005. Two Benchmark
Portfolios(a) Market Index(b)Set of Fundexes was used for this purpose. Monthly
antiquated on 91-days Treasury Bills was used as a surrogate for risk free rate ofreturn.
(Bansal, may 2012) However, there are variations between the two. Saving refers to funds
kept for making specific purchases in the fairly near future and for crises. Investing, on the
other hand, focuses on financial increasing net value and achieving long-term
goals.Investing involves risk of loss of principal and is more anxious on the return of
investment.This total risk,measured by standard deviation, can be divided into two parts
Unsystematic risk, methodical risk. Unsystematic risk is also called diversifiable risk.
Systematic risk may be called non diversifiable risk, inevitable risk or market risk and
measured by Beta.

International Journal of Management, IT & Engineering Vol. 8 Issue 12(1), December 2018,
ISSN: 2249-0558 Impact Factor: 7.119
Journal Homepage: http://www.ijmra.us, Email: [email protected]
Double-Blind Peer Reviewed Refereed Open Access International Journal - Included in the International
Serial Directories Indexed & Listed at: Ulrich's Periodicals Directory ©, U.S.A., Open J-Gage as well as in
Cabell’s Directories of Publishing Opportunities, U.S.A
506 International Journal of Management, IT & Engineering
http://www.ijmra.us, Email: [email protected]
III. Objectives
The objectives of thus study is,
- To study and analysis the five year annual growth return given in their schemes.
- To help the investors, where choosing the top mutual fund affording to their risk
among selected schemes factors.
- To measure the risk return relationship of selected sector fund schemes
- To classifies return and compare the schemes of growth return.
IV. Research Methodology
This research paper is analyzed and data collected from secondary data. And this research
paper is a descriptive research design has applied.
A. Secondary sources
In this research paper data were collected from various edited books, conceptual paper,
newspaper, magazines, journal, published reports of mutual funds.
Financial tools for analysis:
Mutual funds schemes identifying the performance of mutual funds were calculating with
the help of these models.
- Sharpe model
- Treynor model
- Jenson model
B. Data analysis
Thestudybasedriskandreturnonmutualfundschemes.Ithasbeenconsideranddeterminetop5sch
emesasitsUTItransportation and logistics fund, SBI pharma fund, Birla sun life MNC fund,
Relaince pharma fund, ICICI prudential banking and financial service fund. For this
calculation of the risk is used the daily growth of net asset value (NAV) of the mutual
funds along with closing price.
Alpha:
It’s basically is difference between there turns an investors expected from a fund A
positive alpha means the fund has out performed its benchmark index and negative alpha
indicates underperformance of thefund.
Beta:
Measure the volatility of a particular fund in comparison to the market as that is the extent
to which the fund’s return is impacted factors. Beta is calculated using a statistical tool
called regression analysis.
Standard deviation:
The total risk is that how much the risk of there turn on a fund is deviating the expected
return based on performance of the funds. And it indicates that the net asset value(NAV)of
the mutual fund more volatile than risk than a fund with lower standard deviation.
Sharpe ratio:
SR is an important measure that evaluates there turn that a fund the generate relative to the
risk taken Risk is measured by standard deviation. It is used for the fund that has low
correlation with th ebenchmark. It indicates that risk-free asset would perform better than
the fund being analyzed.
R-Squared:
Measures the relationship between a portfolio and benchmark and its thought percentage
from 1 to 100 not measured the performance of the portfolio

International Journal of Management, IT & Engineering Vol. 8 Issue 12(1), December 2018,
ISSN: 2249-0558 Impact Factor: 7.119
Journal Homepage: http://www.ijmra.us, Email: [email protected]
Double-Blind Peer Reviewed Refereed Open Access International Journal - Included in the International
Serial Directories Indexed & Listed at: Ulrich's Periodicals Directory ©, U.S.A., Open J-Gage as well as in
Cabell’s Directories of Publishing Opportunities, U.S.A
507 International Journal of Management, IT & Engineering
http://www.ijmra.us, Email: [email protected]
Here we analysis the last5 year return on mutual fund.And calculate the net asset value
NAV and standard deviation from the return. Beta value analyzed for the UTI
transportation and logistics fund(1.16), SBI pharma fund(0.88), Birla sun life fund(0.73),
reliance pharma fund(088), And ICICI prudential banking and financial service fund(0.85)
of top 5schemes.
Name of the scheme sharpe
ratio
R-squared
(%)
Rank
UTI transportation and logistics fund 1.55 61 I
SBI pharma fund 1.37 85 III
Birla sunlife fund 1.41 53 II
Reliance pharma fund 1.01 95 IV
ICICI prudential banking and financial
service fund
1.23 90 V
Analyzed the sharpe ratio form the beta value as it’s the schemes the ratio were find from
the CAPM. Then calculate R-Squared value of scheme of mutual funds. And then rank the
schemes.
C. Findings of the Study
The present study respond that, in most of the cases mean return on equity mutual fund
scheme more than the risk return on other mutual fund schemes and SBI, ICICI, Birla sun
life , reliance, UTI term deposit rates. Further equity mutual fund schemes show that
remarkable return for the period of 1st year and 5th year. Mutual fund provide both income
and capital appreciation while avoiding excessive risk.The mean return on hybrid mutual
fund schemes has shown instability during the study period, and served the purpose of
hybrid funds only during the period of 6months,1styear and 5thyear. The mean return on
debt mutual fund schemes top 5 selected schemes was consistently positive from the 5
schemes.
- 70-100% is the good correlation between the returns
- 40-70% is the average correlation between the returns
- 1-40% is the low correlation between the returns
The performance of risk based mutual fund schemes using CAPM. In the long run, the
private and public sector companies have performed far better than the public sector.
Monthly NAV of different schemes have been used to calculate the returns from the fund
schemes. BSE Sensex has been used for market portfolio. The historical performance of
the selected schemes were evaluated on the basis of sharpe , treynor ,and Jensen’s measure

International Journal of Management, IT & Engineering Vol. 8 Issue 12(1), December 2018,
ISSN: 2249-0558 Impact Factor: 7.119
Journal Homepage: http://www.ijmra.us, Email: [email protected]
Double-Blind Peer Reviewed Refereed Open Access International Journal - Included in the International
Serial Directories Indexed & Listed at: Ulrich's Periodicals Directory ©, U.S.A., Open J-Gage as well as in
Cabell’s Directories of Publishing Opportunities, U.S.A
508 International Journal of Management, IT & Engineering
http://www.ijmra.us, Email: [email protected]
whose results will be useful for investors for taking better investment decisions. From
Treynor results, it found that 19 out of 29 schemes had outperformed the benchmark. There
taken sharper at and then R-Squared value shows the positive Alpha value and indicates
performance the schemes
V. Conclusion
Reference
[1] Bansal. (May 2012). Performance of risk and return on mutual fund. International
journal of business and management.
[2] Dr. Sarika.(nov2015).A comparative study of risk and return for selected mutual fund
schemes. International journal of business of management,130-143.
[3] GUPTA.(oct2013). A comparative analysis of returns of mutual funds schemes ranked
1 by crisil. International journal of business and management,1-6.
[4] Jain, S. (July 2012). Analysis of equity based mutual fund in India. International
journal of business and management,01-04.
[5] Ravikumar. (Aug 2013). analysis of the risk and return relationship of equity based
mutual fund in India. International journal of advanced in research & technology.
[6] http://www.hdfcbank.com/
[7] http://www.sbimf.com/
[8] http://www.moneycontrol.com/

International Journal of Management, IT & Engineering Vol. 8 Issue 12(1), December 2018,
ISSN: 2249-0558 Impact Factor: 7.119
Journal Homepage: http://www.ijmra.us, Email: [email protected]
Double-Blind Peer Reviewed Refereed Open Access International Journal - Included in the International
Serial Directories Indexed & Listed at: Ulrich's Periodicals Directory ©, U.S.A., Open J-Gage as well as in
Cabell’s Directories of Publishing Opportunities, U.S.A
509 International Journal of Management, IT & Engineering
http://www.ijmra.us, Email: [email protected]
A Study Of Induction Motor Protection System
Mr. Lokesh Kumar
Prof. Rohit Tripathi
Dr. Arpita Yadav
Abstract
In the current era of automation, an induction motor is the most significant drive as this
motor is applicable in a number of industrial applications. A protection mechanism is
needed in order to protect these motors from all kinds of faults either electrical or
mechanical. There are a lot of electrical faults which can be occurred in an induction
motor. Some of these faults are high voltage, lower voltage, earth fault and overload etc. It
is observed that the lives of these motors tend to shorten due to electrical faults as these
motors get heated. The reason for the fault in an induction motor can be due to fault in the
driven plant due to higher supply of power externally. The current paper highlights the
mechanism for the protection of an induction motor.
Keywords: Induction Motor, Fault, Power
Introduction
An induction motor is also known as asynchronous motor which can be used for many
applications. The speed of these motors is lesser than that of synchronous speed where the
synchronous speed is considered as the magnetic field speed which is used to rotate the
stator.
According to the sorts of supply of input, there are basically two types of induction motor
i.e. single phase and three phase induction motors. Wound type and slip ring motor are the
further classification of three phase induction motor.
Research Scholar, Electrical Engineering Department, C. S. J. M University, Kanpur Supervisor, C. S. J. M University, Kanpur Joint Supervisor Faculty of Engineering, C. S. J. M University, Kanpur

International Journal of Management, IT & Engineering Vol. 8 Issue 12(1), December 2018,
ISSN: 2249-0558 Impact Factor: 7.119
Journal Homepage: http://www.ijmra.us, Email: [email protected]
Double-Blind Peer Reviewed Refereed Open Access International Journal - Included in the International
Serial Directories Indexed & Listed at: Ulrich's Periodicals Directory ©, U.S.A., Open J-Gage as well as in
Cabell’s Directories of Publishing Opportunities, U.S.A
510 International Journal of Management, IT & Engineering
http://www.ijmra.us, Email: [email protected]
Supply is essential in DC motor in order to aid the rotor and stator winding. But, in case of
induction motor, only AC supply is provided related with the stator winding. As a result of
AC supply, a flux is adjusted in the stator winding.
A rotating magnetic field is formed when this flux is allowed to rotate with normal speed
i.e. synchronous speed. Due to alternative speeds in conductors and magnetic field, an
induced magnetic field is generated. Short circuits are found in rotor conductors as
mentioned in the Faraday’s law.
This induction in electronic magnetic field thus leads to the generation of rotor current.
Hence, these motors are known as induction motors.
An alternating flux also tends to generate around the rotor as the induction of current takes
place in the rotor.
Induction Motor Protection System
Induction motor is used in many industries. The load and the standard temperature are kept
at normal conditions and three phase supply is used for these motors. A fault can be seen in
an induction motor due to loss of any phase or increase in the winding’s temperature.
The proposed protection system foe the induction motor offers the process for the
elimination of power supply to the motor suddenly if any fault is observed in any phase or
the motor gets over heated.
In the proposed system, there are three phase power supply. In these phases, there are three
transformers of single phase which are attached to it. A group of working amplifiers is also
used for the purpose of input voltage.
The temperature of induction motor is measured with the help of a thermistor while
keeping alongside of the body of the motor. The main relay is switched to operate the
motor and single phasing is detected with the help of a group of relays.
Also, current sensors and phase sensors can be used here in order to protect the induction
motor from overloading and wrong phase sequence. Due to the usage of the protection
system for the induction motor, the life cycle of these motors enhances as the faults arising
due to voltage and heating are avoided and the performance of the motor also improves
effectively.

International Journal of Management, IT & Engineering Vol. 8 Issue 12(1), December 2018,
ISSN: 2249-0558 Impact Factor: 7.119
Journal Homepage: http://www.ijmra.us, Email: [email protected]
Double-Blind Peer Reviewed Refereed Open Access International Journal - Included in the International
Serial Directories Indexed & Listed at: Ulrich's Periodicals Directory ©, U.S.A., Open J-Gage as well as in
Cabell’s Directories of Publishing Opportunities, U.S.A
511 International Journal of Management, IT & Engineering
http://www.ijmra.us, Email: [email protected]
Protection System for Induction Motor
The problem in the supply system is the major cause of occurrence of faults in induction
motors. These faults can be avoided by running the motor at specific voltage, load and
current.
The supply voltage is also responsible for the proper working of an induction motor
provided with a specific range and load should come under the stated limit so that the
performance of the induction motors can be improved. When one phase out of three phase
supply is open then single phasing is occurred. This kind of phasing is observed due to
imbalance in the voltage. If single phasing is observed in three-phase induction motor then
it tends to deliver the load with full efficiency.
The load is continuously drived by the motor until the motor gets heated or motor gets turn
off due to some internal or external disturbances. In some cases, ground fault is regarded as
the basic reason for the fault in the induction motors. Insulation conditions are raised due
to imbalancing of phase current. This insulation failure is also responsible in some cases
for the occurrence of fault in the induction motors.
In some cases, overload condition is occurred due to increase in the mechanical torque.
Increase in phase current and overheating are some general issues causing overloading in
the induction motors which are needed to be avoided. On minimizing the voltage, under
voltage fault is occurred in induction motors. On the other hand, higher limit of voltage
results into over-voltage in induction motors. Hence, the efficiency of the voltage should
be moderated so that no fault can be occurred in the motor as any fault may degrade the
performance of the motor.
Discussion
Over-current protection is the basic type of protection used against overloads and short
circuits in stator windings of motors. Inverse time and instantaneous phase and ground
overcurrent relays can be employed for motors above 1200 W. For small/medium size
motors where cost of CT's and protective relays is not economically justified, thermal
relays and HRC fuses are employed, thermal relays used for overload protection and HRC
fuses for short-circuit protection.
Transformers are provided with over-current protection against faults, only, when the cost
of differential relaying cannot be justified. However, over-current relays are provided in
addition to differential relays to take care of through faults. Temperature indicators and

International Journal of Management, IT & Engineering Vol. 8 Issue 12(1), December 2018,
ISSN: 2249-0558 Impact Factor: 7.119
Journal Homepage: http://www.ijmra.us, Email: [email protected]
Double-Blind Peer Reviewed Refereed Open Access International Journal - Included in the International
Serial Directories Indexed & Listed at: Ulrich's Periodicals Directory ©, U.S.A., Open J-Gage as well as in
Cabell’s Directories of Publishing Opportunities, U.S.A
512 International Journal of Management, IT & Engineering
http://www.ijmra.us, Email: [email protected]
alarms are always provided for large transformers. Small transformers below 500 kVA
installed in distribution system are generally protected by drop-out fuses, as the cost of
relays plus circuit-breakers is not generally justified Line Protection.
The temperature of a motor winding is measured or monitored by measuring the resistance
of the winding. This is done by introducing a small direct current component into the
motor current, which can be done by connecting an asymmetric resistance device in the
motor circuit. The resistance of the motor winding can then be determined from
measurements of the direct current component and the corresponding voltage. This can
also be done by using a magnetic amplifier with a bias winding excited in response to the
voltage of the asymmetric resistance and a control winding excited by the motor current.
Thermal relay - the most common type of motor protection. The principle of its operation
is based on the possibility of an electric current to heat a conductor through which it flows.
The main part of the thermal relay is a bimetallic plate. Which, when heated, curves and
thus breaks the contact. Heating plate occurs when the current exceeds its permissible
value.
Fuses are the simplest and most common protection device. The purpose of the fuses is to
disconnect the consumer (part of the lighting system, engine, etc.) from the mains with an
unacceptably high overload or short circuit. At the same time, a large amount of heat melts
the fusible insert of the fuse and thus breaks the electrical circuit. Being the most common
protective devices, fuses at the same time are very imperfect. Fuses have a relatively small
limiting breaking capacity.
Phase reversal problem occurs in motor when the supply phase is reversed due to wrong
connection (except than ryb) due to phase reversal motor starts running in anticlockwise
(opposite direction from normal) would cause operation and safety problem. Most of three
phases motor run opposite phases. This type of protection is used in application like
elevators where it would be damaging or dangerous for the motor to run in reverse.
Generally when motor is connected with the important application then type of protection
being much more important .when the load is connected with motor then reversal of phase
means direction of rotation is changed. It could cause serious problem therefore much
more care is required to protect the motor form such type of fault.
Conclusion
The induction motor have now become very popular as compared to other motor for many
of the industries because it is low cost simple and extremely rugged construction, high
reliability high efficiency and good power factor, low maintenance cost.
Induction motors are utilized as a part of different industry, for example, paper process,
sugar industry, for driving the mechanical frameworks. The maintenance of an induction
motor is very essential. The observing of induction motor through wired correspondence is
costly as well as the information correspondence may influence because of physical
conditions like human hazards. Hence wireless communication becomes price worthy turns
on excellent substitute for observing as well as the control of induction motor. It upgrades
the execution of the motor.

International Journal of Management, IT & Engineering Vol. 8 Issue 12(1), December 2018,
ISSN: 2249-0558 Impact Factor: 7.119
Journal Homepage: http://www.ijmra.us, Email: [email protected]
Double-Blind Peer Reviewed Refereed Open Access International Journal - Included in the International
Serial Directories Indexed & Listed at: Ulrich's Periodicals Directory ©, U.S.A., Open J-Gage as well as in
Cabell’s Directories of Publishing Opportunities, U.S.A
513 International Journal of Management, IT & Engineering
http://www.ijmra.us, Email: [email protected]
References
1. Chen, L. and Z. Peiming, 2011. Simulation of motor and protection based on
MATLAB. Proceeding of the IASTD, International Conference Applied Inform.,
February 19-22, 2011, Austria, pp: 199-203.
2. Colak, I., H. Celik and S. Demirbas, 2015. Online protection systems for
Induction motors. Energy Conversion Manage., 46: 2773-2786.
Dai, J., M. Shaohua, C. Zhiyuan and C. Shaoyong, 2013. A novel protecting
method for motors over current. Proceedings of the 6th International Conference
on Electrical Machines and Systems, November 9-11, 2013, Shenyang University
of Technology, China, pp: 875-877.
3. Delmotte, H.H., G. Ekure, P.Brochet and G.A. Capolino, 2013. Comparison of 2
modeling methods for IM study Application to diagnosis. Int. J. Comput. Math.
Electrical Elect. Eng., 22: 891-908.
4. Kersting, W.H., 2011. Causes and effects of unbalanced voltage supplying an
induction motor. IEEE Trans. Industrial Appl., 137: 165-170.
5. Kersting, W.H., 2015. Causes and effects of single-phasing Induction motors.
IEEE Trans. Industrial Appl., 41: 1499-1505.
6. Lee, C.Y., 2010. Effect of unbalanced voltage on the operation performance of a 3
pH Induction Motor. IEEE Trans. Energy Conversion, 14: 202-208.

International Journal of Management, IT & Engineering Vol. 8 Issue 12(1), December 2018,
ISSN: 2249-0558 Impact Factor: 7.119
Journal Homepage: http://www.ijmra.us, Email: [email protected]
Double-Blind Peer Reviewed Refereed Open Access International Journal - Included in the International
Serial Directories Indexed & Listed at: Ulrich's Periodicals Directory ©, U.S.A., Open J-Gage as well as in
Cabell’s Directories of Publishing Opportunities, U.S.A
514 International Journal of Management, IT & Engineering
http://www.ijmra.us, Email: [email protected]
Drought Mitigation
Liladhar
Abstract
The containment and mitigation of the crippling impact of drought, and the eventual
attainment of the objective of drought proofing of an area is contingent upon a proactive
and relentless, but planned pursuit of a combination of structural / physical and non-
structural long and short term measures. The short term measures are mostly reactive or
relief centric in nature and mostly relate to in-season drought management through
contingency planning and relief distribution. Long term mitigation measures are geared
towards the adaptation to climate change, restoration of ecological balance through
adoption of sustainable agronomic and conservation practices, sensible crop choices etc.
Most of these measures are translated on the ground through soil and water conservation,
watershed management, agronomic practices suited to rainfed agriculture and forestry
programmes that seek to integrate soil, water and forestry management in an ecological
compliant and sustainable manner.
Keywords: mitigation, drought, management, relief, change, season.
Introduction
Drought mitigation needs to be ensconced in the regular development programmes of the
Centre and State Governments. Some of the most significant current national programmes
that may have a decisive bearing on drought mitigation are Pradhan Mantri Krishi
Sinchayee Yojna, National Rainfed Area Development Programme, National Rural
Drinking Water Programme etc. Many of these programmes can be guided towards the
development of a cogent drought mitigation strategy at the State level by taking advantage
of the flexibility which has been in-built into the centrally sponsored schemes for the
purposes of mitigation of calamities like drought.
Current Drought Mitigation Programmes
Pradhan Mantri Krishi Sinchayee Yojana (PMKSY)
Pradhan Mantri Krishi Sinchayee Yojana (PMKSY) has been formulated with the vision of
extending the coverage of irrigation ‘Har Khet ko pani’ and improving water use efficiency
‘More crop per drop’ in a focused manner with end to end solution on source creation,
distribution, management, field application and extension activities. The Pradhan Mantri
Krishi Sinchayee Yojana (PMKSY) was approved by the Central Government in 2015-16.
PMKSY has been formulated as an umbrella scheme amalgamating ongoing schemes viz.
Accelerated Irrigation Benefits Programme (AIBP) of the Ministry of Water Resources,
River Development & Ganga Rejuvenation (MoWR, RD&GR), Integrated Watershed
Management Programme (IWMP) of Department of Land Resources (DoLR) and the On
Farm Water Management (OFWM) of Department of Agriculture, Cooperation & Farmers
Welfare (DAC&FW). The Ministry-wise activities are presented in Table 1. The major
objective of PMKSY is to achieve convergence of investments in major and medium
irrigation projects with command area development to provide assured irrigation, improve
M.A. Geograohy, Vardhman Mahaveer Open University , Kota

International Journal of Management, IT & Engineering Vol. 8 Issue 12(1), December 2018,
ISSN: 2249-0558 Impact Factor: 7.119
Journal Homepage: http://www.ijmra.us, Email: [email protected]
Double-Blind Peer Reviewed Refereed Open Access International Journal - Included in the International
Serial Directories Indexed & Listed at: Ulrich's Periodicals Directory ©, U.S.A., Open J-Gage as well as in
Cabell’s Directories of Publishing Opportunities, U.S.A
515 International Journal of Management, IT & Engineering
http://www.ijmra.us, Email: [email protected]
on-farm water use efficiency to reduce wastage of water, enhance the adoption of
precision-irrigation and other water saving technologies (More crop per drop), scientific
and sustainable development of watersheds, enhance recharge of aquifers and introduce
sustainable water conservation practices and attract greater private investment in precision
irrigation system. District Irrigation Plans (DIPs) shall be the cornerstone for planning and
implementation of PMKSY. DIPs will identify the gaps in irrigation infrastructure after
taking into consideration the District Agriculture Plans (DAPs) already prepared for
Rashtriya Krishi Vikas Yojana (RKVY) vis-à-vis irrigation infrastructure currently
available and resources that would be added during XII Plan from other ongoing schemes
(both State and Central), like Mahatma Gandhi National Rural Employment Guarantee
Scheme (MGNREGS), Rashtriya Krishi Vikas Yojana (RKVY), Rural Infrastructure
Development Fund (RIDF), Member of Parliament Local Area Development (MPLAD)
Scheme, Member of Legislative Assembly Local Area Development (MLALAD) Scheme,
Local body funds etc. The gaps identified under Strategic Research & Extension Plan
(SREGP) will be made use in preparation of DIP. DIPs will present holistic irrigation
development perspective of the district outlining medium to long term development plans
integrating three components viz. water sources, distribution network and water use
applications incorporating all usage of water like drinking & domestic use, irrigation and
industry. Preparation of DIP will be taken up as joint exercise of all participating
departments. DIP will form the compendium of all existing and proposed water resource
network system in the district. The DIPs may be prepared at two levels, the block and the
district. Keeping in view the convenience of map preparation and data collection, the work
would be primarily done at block level. Block wise irrigation plan is to be prepared
depending on the available and potential water resources and water requirement for
agriculture sector prioritising the activities based on socio-economic and location specific
requirement. In case planning is made based on basin/sub basin level, the comprehensive
irrigation plan may cover more than one district. The activities identified in the basin/sub-
basin plan can be further segregated into district/block level action plans. Use of satellite
imagery, topo sheets and available database may be appropriately utilised for developing
irrigation plans at least on pilot basis to begin with and subsequently may be extended to
all projects. State Level Sanctioning Committee (SLSC) chaired by the Chief Secretary of
the respective States are authorized to sanction projects, oversee its implementation and
monitoring. National Executive Committee (NEC) under the Chairmanship of Vice
Chairman, NITI Aayog will oversee programme implementation, allocation of resources,
inter-ministerial coordination, monitoring & performance assessment, addressing
administrative issues. At National level, programme is to be supervised and monitored by
an Inter-Ministerial National Steering Committee (NSC) under the Chairmanship of
Hon’ble Prime Minister with Union Ministers of concerned Ministries as a Member.
National Rainfed Area Programme
The objective of the programme is to increase agricultural productivity in rainfed areas in a
sustainable manner by adopting appropriate farming system based approaches, minimize
adverse impact of possible crop failure due to drought and other calamities through
diversified and composite farming system etc.
The National Rainfed Area Authority (NRAA) in the Department of Agriculture,
Cooperation & Farmers Welfare an advisory body for policy and programme formulation
and monitoring of schemes / programmes related to degraded land development for

International Journal of Management, IT & Engineering Vol. 8 Issue 12(1), December 2018,
ISSN: 2249-0558 Impact Factor: 7.119
Journal Homepage: http://www.ijmra.us, Email: [email protected]
Double-Blind Peer Reviewed Refereed Open Access International Journal - Included in the International
Serial Directories Indexed & Listed at: Ulrich's Periodicals Directory ©, U.S.A., Open J-Gage as well as in
Cabell’s Directories of Publishing Opportunities, U.S.A
516 International Journal of Management, IT & Engineering
http://www.ijmra.us, Email: [email protected]
horticulture and integrated agricultural development in rainfed areas. The Central
Government approved the involvement of NRAA for providing technical inputs in policy
planning, implementation and monitoring of PMKSY especially in the areas of rain water
conservation / watershed development and its management including other agricultural and
allied sectors.
Mahatma Gandhi National Rural Employment Guarantee Scheme (MGNREGS)
Considering the importance of water conservation, and given all the scientific and
technological advances at their command, the Ministry of Rural Development in
consultation and agreement with the Ministry of Water Resources, River Development &
Ganga Rejuvenation and the Ministry of Agriculture and Farmers Welfare has developed
an actionable Framework to ensure that MGNREGS funds are used in accordance with the
best practices in the sector. The need for drought proofing villages in water stressed blocks
was being felt for many years. Many State Governments have started excellent initiatives
for water conservation in last few years using Mahatma Gandhi NREGA funds viz. the
‘Mukhyamantri Jal Swalalamban Abhiyan’ in Rajasthan, the ‘Dobha’ or Farm Ponds
construction in Jharkhand, the ‘Mission Kakatiya’ in Telangana. ‘Neeru Chettu’ in Andhra
Pradesh, ‘Kapil Dhara’ in Madhya Pradesh, bore well recharge in Karnataka, ‘Jalyukt
Shivar’ in Maharashtra are some of the recent initiatives. The present Framework draws on
many of the good practices in these States and some other initiatives. The Framework
strives to leverage the synergies between Mahatma Gandhi NREGA, Pradhan Mantri
Krishi Sinchayee Yojana, IWMP and Command Area Development & Water Management
programmes, given their common objectives. Types of common works undertaken under
these programmes/ schemes are water conservation and management, water harvesting,
soil and moisture conservation, groundwater recharge, flood protection, land development,
Command Area Development & Water Management (CAD&WM). These programmes
were addressing the above mentioned activities with their own set of planning tools,
processes, technical expertise and financial resources which is now envisioned to be used
in coordination to bring the advantages of each programmes/ schemes to strengthen a
concerted action for water conservation and management.
The highlights of the Frameworks are:-
Paradigm shift from Relief Works approach to Integrated Natural Resource Management
(INRM) approach in implementation of MGNREGS. ƒ
Planned and systematic development of land and harnessing of rainwater following
watershed principles to become the central focus of MGNREGS works. ƒ
All lands falling under the watershed will be developed on ridge to valley treatment
principle.
ƒ Individual works (including work on private land) will be logically sequenced and
packaged together on the principles of INRM, to form projects following the principles of
watershed management in an integrated manner. ƒ
Systematic identification, planning and implementation of projects leading to creation of
sustainable and productive assets for the community.
District as synergizing unit for convergent planning under the leadership of the
District Collector. ƒ
With the convergence of the ongoing schemes in the area, a comprehensive project of
village/ watershed/ command area, incorporating/ integrating all the works/ activities

International Journal of Management, IT & Engineering Vol. 8 Issue 12(1), December 2018,
ISSN: 2249-0558 Impact Factor: 7.119
Journal Homepage: http://www.ijmra.us, Email: [email protected]
Double-Blind Peer Reviewed Refereed Open Access International Journal - Included in the International
Serial Directories Indexed & Listed at: Ulrich's Periodicals Directory ©, U.S.A., Open J-Gage as well as in
Cabell’s Directories of Publishing Opportunities, U.S.A
517 International Journal of Management, IT & Engineering
http://www.ijmra.us, Email: [email protected]
required for the integrated development of the village/ watershed/ CAD approach is to be
prepared.
Support of institutions like IITs, NIITs, Agricultural Universities, State technical
institutions, professionals sourced as part of Corporate Social Responsibility and
Universities as a part of the ‘Unnat Bharat Abhiyan’ to be promoted. ƒ
The DPC to ensure that the Natural Resource Management component of Labour Budget
of Mahatma Gandhi NREGS is essentially made part of the District Irrigation Plan (DIP). ƒ
Technical inputs from the joint pool of IWMP in Watershed Cell cum Data Centre,
Mahatma Gandhi NREGA unit, Water Resource Department, the Agriculture department,
Regional Office of Central Water Commission (CWC).
Drought Mitigation measures
The objectives of these mitigation measures are to reduce soil erosion, augment soil
moisture, restrict surface run-off of rainwater and improve the efficiency of water use. It
involves a wide range of soil and water conservation measures and farm practices.
Water Harvesting and Conservation
Water harvesting and conservation refer to processes and structures of rainfall and run- off
collection from large catchments area and channelling them for human consumption. In
India, these processes and structures have been in existence since antiquity, but the
increasing frequency and severity of droughts and population growth have focused on the
revival of these practices and structures. Every household’s minimum water requirements
can be easily met by collecting rainwater locally from village / community ponds / large
manmade containers, by diverting and storing water from local streams / springs and by
tapping sub-surface water below river / stream beds. There are two methods for water
conservation: (i) artificial recharge of groundwater, and (ii) traditional methods. While the
artificial recharge of groundwater is used extensively in all the watershed development
programmes being implemented, traditional methods of water collection and harvesting
through ponds / tanks are even more important for assuring continuous and reliable access
to water. Both methods include measures which are low-cost, community-oriented and
environment-friendly. It is necessary for the Government and NGOs working in the area of
water conservation to promote both sets of measures, depending on the local conditions.
These methods are considered very useful for groundwater recharge both when rainfall is
deficient and when there are flash floods (that result in overtopping of defined courses of
rivers / streams and their spreading into flood plains). Harvesting and conservation of
floodwater to rejuvenate depleted high-capacity aquifers by adopting integrated
groundwater recharge techniques, such as dams, tanks, anicuts, percolation tanks, could
improve water availability and create a water buffer for dealing with successive droughts.
Artificial Recharge of Ground Water
A typical watershed development programme has several components, depending on the
topography (shape, configuration and slope of the land), nature and depth of soil cover,
type of rocks and their pattern of formation and layout, water absorbing capacity of land,
rainfall intensity and land use. These include the following:
Contour Bunding
Contour bunding is one of the most widely practised soil and water conservation measures,
which controls erosion, conserves moisture, recharges groundwater and prevents silting of
tanks and reservoirs in the downstream. The practice comprises constructing narrow-base
bunds on contour to impound runoff water behind them, so that impounded water is

International Journal of Management, IT & Engineering Vol. 8 Issue 12(1), December 2018,
ISSN: 2249-0558 Impact Factor: 7.119
Journal Homepage: http://www.ijmra.us, Email: [email protected]
Double-Blind Peer Reviewed Refereed Open Access International Journal - Included in the International
Serial Directories Indexed & Listed at: Ulrich's Periodicals Directory ©, U.S.A., Open J-Gage as well as in
Cabell’s Directories of Publishing Opportunities, U.S.A
518 International Journal of Management, IT & Engineering
http://www.ijmra.us, Email: [email protected]
absorbed gradually into the soil profile. Contour bunding works are undertaken in shallow
and medium soils. An area extending from the ridge-line (topmost line) to the valley-line
(lowest line) is called a catchment. For a bunding project, a self-defended catchment (i.e.
the topmost end of the catchment in the selected area is such that no water from outside the
catchment drains into it) is selected. In the selected catchment, bunds are constructed on
contours. The bunds are normally impounded upto a height of 30 cm. The spacing of the
bund is decided based on the slope of the land and the nature of the soil. For gently sloping
lands, with 2–3% slope, the bunds are nearly 200 feet apart. The section of a bund is also
dependent on the value of the soil. In light soil, the section is 10 square feet, whereas in
medium soil it is 24 square feet. About 25 mm of rainwater could be stored at a soil depth
of 130–150 mm for growing crops. On average, contour bunds had 27% higher soil
moisture and 14–180% higher yield than flat surfaces.
Contour Trenching
This consists of excavating shallow / intermittent trenches across the land slope and
forming a small earthen bund on the downstream side. Plantation is done on the bund to
stabilize the bund. The trenches retain the runoff and help in the establishment of
plantations made on the bund. Trenches are useful where the land surface is fairly porous.
Rainwater that gets collected in the trenches can quickly percolate into the ground. The
spacing of trenches and their size (i.e. length, width and depth) should be adequate to
intercept about 50% of the peak rainfall in semi-arid regions (annual rainfall of about 400–
550 mm). The trenches should be cleaned and desilted periodically.
Contour Cultivation
Contour operations are done across the slope by cultivating crops and trees on the contour.
The contour furrows created would form a multitude of mini barriers across the flow path
of the runoff. Contour cultivation remains the most effective on moderate slopes of 2–7%.
The water in the furrows gets collected in the depressions. Perennial grasses can be grown
in such depressions. Another practice called strip cropping involves growing parallel rows
of erosion-resistant crops to control loss of surface soil, with other crops grown in between.
References

International Journal of Management, IT & Engineering Vol. 8 Issue 12(1), December 2018,
ISSN: 2249-0558 Impact Factor: 7.119
Journal Homepage: http://www.ijmra.us, Email: [email protected]
Double-Blind Peer Reviewed Refereed Open Access International Journal - Included in the International
Serial Directories Indexed & Listed at: Ulrich's Periodicals Directory ©, U.S.A., Open J-Gage as well as in
Cabell’s Directories of Publishing Opportunities, U.S.A
519 International Journal of Management, IT & Engineering
http://www.ijmra.us, Email: [email protected]
1. M. X. Yu, Q. F. Li, M. J. Hayes, M. D. Svoboda, and R. R. Heim, “Are droughts
becoming more frequent or severe in China based on the standardized precipitation
evapotranspiration index: 1951–2010?” International Journal of Climatology, vol. 34, no.
3, pp. 545–558, 2014.
2. G. Tsakiris, D. Pangalou, and H. Vangelis, “Regional drought assessment based on the
reconnaissance drought index (RDI),” Water Resources Management, vol. 21, no. 5, pp.
821–833, 2007.
3. J. Zhai, J. Huang, B. Su et al., “Intensity–area–duration analysis of droughts in China
1960–2013,” Climate Dynamics, vol. 48, no. 1-2, pp. 151–168, 2016.
4.Z. Yuan, Z. Yang, D. Yan et al., “Historical changes and future projection of extreme
precipitation in China,” Theoretical and Applied Climatology, vol. 127, no. 1, pp. 393–
407, 2017.
5. S. J. Wang, X. L. Zhang, Z. G. Liu, and D. M. Wang, “Trend analysis of precipitation in
the Jinsha River Basin in China,” Journal of Hydrometeorology, vol. 14, no. 1, pp. 290–
303, 2013.
6.H. Liu, H. Lan, Y. Liu, and Y. Zhou, “Characteristics of spatial distribution of debris
flow and the effect of their sediment yield in main downstream of Jinsha River, China,”
Environmental Earth Sciences, vol. 64, no. 6, pp. 1653–1666, 2011.

International Journal of Management, IT & Engineering Vol. 8 Issue 12(1), December 2018,
ISSN: 2249-0558 Impact Factor: 7.119
Journal Homepage: http://www.ijmra.us, Email: [email protected]
Double-Blind Peer Reviewed Refereed Open Access International Journal - Included in the International
Serial Directories Indexed & Listed at: Ulrich's Periodicals Directory ©, U.S.A., Open J-Gage as well as in
Cabell’s Directories of Publishing Opportunities, U.S.A
520 International Journal of Management, IT & Engineering
http://www.ijmra.us, Email: [email protected]
Workforce diversity: Issues and Challenges
Kajal
Abstract
Globalisation and technology advancement are bringing people together across the globe.
When people from different backgrounds and cultures work together, their similarities and
differences need to be managed to maintain a positive work environment. Workforce
diversity is becoming global strategic issue for big companies. No organisation can ignore
the pervading influence of diversity on organisational growth. The aim of achieving
competitive advantage encourages companies to embrace this concept of workforce
diversity. Diversity can contribute to the success of organisations, if managed properly.
Ceaseless advancement makes it crucial for every type of organisations to regularly
improve their ways to manage diverse workforce. How effectively diversity is managed,
depends largely on the perception and attitude of employees towards diversity supporting
programmes and initiatives of organisations This paper is intended to study the issues a
company faces to manage diverse workforce.
Keywords- strategic issue, diversity supporting programmes, different background and
culture.
Introduction
The differences and similarities in terms of culture, religion, gender, age, sexual
orientation, capabilities, psychological characteristics, race, etc among employees is called
workforce diversity. It is the blend of workers from various ethnic background and national
cultures. Diverse workforce perceive things differently and the way they interact with each
other also differ. It encompasses differences in cognitive style, education, organisational
function and working style. An organisational workforce becomes heterogeneous because
of diversity.
Management of workforce diversity is vital to make divergent people cooperate and co-
exist in the same organisation. The aim of recruiting and managing diverse workforce is to
create supportive organisational climate, without any favouritism and discrimination.
Successful organisations acknowledge the need to spend enough resources on managing
the workforce diversity. An organisation's success largely depends upon its ability to
embrace the workforce diversity. Diverse workforce with collection of skills and
experience can come up with large pool of solutions to any problem. They can adapt with
fluctuating market and customer demands easily. Multilingual employees from different
background can prove to be great support, when a company thinks of expanding its
operations geographically.
Workforce diversity has become a key issue in today's competitive world. Organisations
are hiring employees with different psychology and mindset to use their talent for
organisational growth. It is necessary for companies to hire diverse workforce to identify,
attract and retain the best employees from different groups. Companies hire diverse
workforce to get sustainable competitive advantage. This pool of talent makes it possible to
UGC NET in Commerce

International Journal of Management, IT & Engineering Vol. 8 Issue 12(1), December 2018,
ISSN: 2249-0558 Impact Factor: 7.119
Journal Homepage: http://www.ijmra.us, Email: [email protected]
Double-Blind Peer Reviewed Refereed Open Access International Journal - Included in the International
Serial Directories Indexed & Listed at: Ulrich's Periodicals Directory ©, U.S.A., Open J-Gage as well as in
Cabell’s Directories of Publishing Opportunities, U.S.A
521 International Journal of Management, IT & Engineering
http://www.ijmra.us, Email: [email protected]
understand the diversity of market. Most of the global companies are enjoying the benefits
of practicing diversity by looking at skills irrespective of other differences. business have
realised that increasing the workforce diversity improves performance and satisfaction of
employees. Diverse workforce pays off in terms of customer satisfaction also. The diverse
workforce often results in better and fast decision making, knowledge sharing and
increased performance standards.
Why organisations need to recruit and manage a diverse workforce?
As global market is expanding, workforce diversity is becoming a business necessity to
embrace difference to compete in the market. Any business can earn itself goodwill in
market with diverse workforce, which will lead to more profit and employee satisfaction.
● Better understanding of diverse market and customer - different minds with
different perspectives, experience and culture can make it possible to understand the
mentality of different customer groups. Hindu employee knows better what kind of
products hindu community needs, same goes with the employees from other religions.
Employees from different geographical can give the best idea about market of their
respective location.
● Promotes innovation - creative concepts born, when people with different experience,
working style, background and qualification work together. One person may be good at
generating innovative ideas, Other may have the ability and enough experience to
execute the same in the best possible way. When people with different capabilities
work together, they can overcome each other's weaknesses with their strength.
● Improves performance - report says that diverse companies are 35% more efficient
than those who are not. Diversity brings in pool of talent and a wider range of skills, all
of them work in one direction to meet competitive pressure with their unique skills.
Encouraging diversity at workplace can motivate all employees to perform to their
highest ability. They will come out of their comfort zone to match the level of others
which will create a more productive environment.
● Offers more exposure to employees - employees learn from the different experiences
and working styles of their co- workers who are different and better. Diversity
opens the door of new technology and concepts for the employees. They come to know
about different facts, crucial for their work, which they couldn't come to know, if
worked with identical co-workers. Combination of various perspectives of diverse
mind can come up with out of the box solution to any problem.
● Employee Development - workforce diversity not only vital for inside environment of
organisation, but also equally important for outside reputation of business. With
diverse workforce, business can manifests itself in building a great reputation outside,
leading to increased employee satisfaction and productivity, which can bring new
opportunities for employees. Workforce diversity brings opportunities to employees
who have been marginalised because of racism, ageism, gender or any other reason.
● Enhance organisational reputation - workforce diversity boost the reputation in the
market. Companies with diverse workforce are considered ethical and socially
responsible organisations. Diversity makes the workplace lively and interesting. It will
make easy for your customer to relate with you, when they get a bunch of employees to
attend them in the way they like. And this is only possible when you have employees
from different cultures and backgrounds.

International Journal of Management, IT & Engineering Vol. 8 Issue 12(1), December 2018,
ISSN: 2249-0558 Impact Factor: 7.119
Journal Homepage: http://www.ijmra.us, Email: [email protected]
Double-Blind Peer Reviewed Refereed Open Access International Journal - Included in the International
Serial Directories Indexed & Listed at: Ulrich's Periodicals Directory ©, U.S.A., Open J-Gage as well as in
Cabell’s Directories of Publishing Opportunities, U.S.A
522 International Journal of Management, IT & Engineering
http://www.ijmra.us, Email: [email protected]
Why manage diversity ?
Today companies are facing this prominent challenge of diverse workforce. More issues
arise with the increase in workforce diversity.. Employers need to be aware of issues they
need to address to manage workforce diversity.
➢ Gender inequality - studies say that 40% of people believe that managers prefer to
recruit men over women. Another study reveals that there are 30% more chances for
men to get promoted to a managerial position and they earn around 24% higher salary
than women .Employers need to understand that this kind of gender discrimination can
cost them loss of talented women employees.
➢ Generation gaps - employees from different generations can’t easily get along with
each other. Older generation employees often resist to adapt the changes in workplace
and culture that younger generation are bringing in. Employees from different
generations form groups and social circles with the employees of their own age. The
seemented communication networks in organisation may isolate some employees from
their respective work teams. Generation gaps can also result in lack of cooperation,
coordination and disagreement among employees, because of differences in their
working styles and thinking.
➢ Cultural differences - it is a huge challenge to overcome the deep rooted prejudices
that employees have in their mind. These preconceived judgements against people of
different ethnicity and religion, can lead an employee to make unfair assumption about
his colleague. The stereotype generalization about a person increase tension and
conflict at workplace. Employees often harass others on name on culture. There is a
serious cultural gap between men and women also. Orthodox male employees feel that
it is quite normal to harass female employees. This kind of cultural gap should not be
tolerated with in organisation.
➢ Lack of Mutual Respect and Acceptance - employees can't collaborate and share
their ideas with each other, if they don't accept the differences between them. Lack of
acceptance and mutual respect can result in conflict and which at the end effectuate the
situation of violence. Acceptance is necessary to foster mutual respect among
employees at workplace. Employees can't work well without copacetic work
environment. Mutual respect and teamwork increases productivity and reduces conflict
among employees.
➢ language and communication barriers - communication barriers are always present
in diverse organisation. It becomes difficult to embrace diversity in workforce when
there are differences in language and communication. Employees with different mother
tongue face problems in communication with the person with different first language.
Language differences can lead to low productivity, miscommunication and lack of trust
between employees. Company can prevent this problem by hiring bilingual or
multilingual employees to bridge the gap between them because of language.
➢ Mental and physical disabilities - Resistance to change - every organisation have
employees with rigid mentality, they refuse to accept colleagues with different cultural
background, working style and language. It's hard to change long established corporate
culture, this attitude of resistance to change silences the innovative ideas and growth of
organisation."We have always done it this way" mentality of employees is a major
roadblock for minorities to survive in corporate settings.

International Journal of Management, IT & Engineering Vol. 8 Issue 12(1), December 2018,
ISSN: 2249-0558 Impact Factor: 7.119
Journal Homepage: http://www.ijmra.us, Email: [email protected]
Double-Blind Peer Reviewed Refereed Open Access International Journal - Included in the International
Serial Directories Indexed & Listed at: Ulrich's Periodicals Directory ©, U.S.A., Open J-Gage as well as in
Cabell’s Directories of Publishing Opportunities, U.S.A
523 International Journal of Management, IT & Engineering
http://www.ijmra.us, Email: [email protected]
How to manage workforce diversity at workplace ?
Diversity can be a curse rather than a blessing, if not managed properly it could turn into a
liability.. Recruiting diverse workforce is not enough, managing the same is equally
important to reap the maximum out of it. Conscious efforts need to be taken to make
heterogeneous groups coexist and work together.
Sensitivity training - It is a great way to make people self aware by getting other's views
and perspective. It helps employees to know their offensive actions and reasons behind the
behaviour of others. Sensitivity training give employees chance to calmly communicate
with coworkers, accept their differences and clear their misunderstandings. This exercise
can justify their actions and resolve their conflicts. Employees can find out the best way to
coexist and achieve harmonious workplace environment by practicing sensitivity training.
Emphasize Communication - delivering frequent feedback and coaching to employees
about their behaviour and performance can align them around common goals. Employer
must keep constant communication with each and every employee who works for him. One
thing may be polite in one culture may sound rude in another culture. To overcome these
kind of language barriers it is vital to ensure that all the necessary communication channels
are open for everyone. Mutual trust can only build with better communication. Employees
should be motivated to work together to improve their understanding and clear their
misconceptions.
Foster positive organisational culture - organisational culture is the great indicator of
employee satisfaction. The biggest challenge for managers is to build a culture where
diversity is leveraged to foster a culture of inclusion. Inclusive workforce respect and
accept each others differences, they value people for their skills and competencies. All
employees work together and make equal contribution to achieve their common goal in
positive organisational culture. It also earns company a good reputation in the market and
attract talented employees irrespective of their culture and education.
Zero Tolerance policy - Employees must know that their off color jokes about other's
differences will not be tolerated at the workplace. Employees should be held accountable
for their unethical acts. Employees must be encouraged to report management against this
kind of behaviour. Formal policies and rules for grievance redressal must be established for
the convenience of employees. Proper application of these policies and rules should be
ensured, culprit employee must be punished strictly to set example in fnt of others.
Develop team Conflict resolution skills - Different working styles and habits generate
successful work but on the other side they can give rise to conflict among employees.
Proper conflict resolution programmes can help employees explore perspective and
opinions of each employee. Manager should train his employees to solve their issues by
themselves first, instead of going to management instantly. Employer should motivate his
employees to work in diverse groups and deal with their problems with patient and positive
attitude.
Encourage teamwork - diverse workforce brings diverse ideas, experience and expertise
which can prove to be really helpful in personal as well as organisational growth.
Employer should encourage discussions and group projects to develop team spirit among
employees. Frequent interaction among employees should be encouraged to make them
comfortable in each other’s company.. According to a study by Google, employees excel in
teamwork, when they feel their work will be beneficial for their customers, community and
colleagues.

International Journal of Management, IT & Engineering Vol. 8 Issue 12(1), December 2018,
ISSN: 2249-0558 Impact Factor: 7.119
Journal Homepage: http://www.ijmra.us, Email: [email protected]
Double-Blind Peer Reviewed Refereed Open Access International Journal - Included in the International
Serial Directories Indexed & Listed at: Ulrich's Periodicals Directory ©, U.S.A., Open J-Gage as well as in
Cabell’s Directories of Publishing Opportunities, U.S.A
524 International Journal of Management, IT & Engineering
http://www.ijmra.us, Email: [email protected]
Diversity training - employees unknowingly behave insensitively towards others because
they don’t know much about the other person. And these type of unintentional behaviour
leads to misunderstandings and don’t let people to coordinate properly. A strong leader
should provide diversity training to help employees to get aware about themselves and
make them understand the differences. Diversity training helps employees to understand
their own mistakes and areas where they need to improve.
References
1. Stephen P Robbins and Mary Coulter, Management, Seventh edition, Pearson
education, p.87.
2. R. D. Aggarwal, Organisation and management, Eleventh edition, Tata McGraw hill,
p.289-290
3. Gary Dessler, Human resource management, Ninth edition, Pearson education, p.154-
157.
4. Fred Luthans, Organisational behaviour- and evidence based approach, Twelfth edition,
Mcgraw hill, p.39-42.
5. Lisa A. Mainiero and Cheryl L. Trolley, Developing managerial skills in organisational
behaviour, Second edition, Hall India, p.231-232.
6. K aswathappa, Organisational behaviour, Fifth edition, Himalaya publishing house,
p.568-580.
7. C. B. Mamoria and S. V. Gankar, Personnel Management, Twenty first edition, p. 542-
560.
8. K. K. Ahuja, Organisational behaviour, Second edition, Kalyani publication, p198-205.
9. Dale S. Beach, Personnel: the management of people at work, Fifth edition, Collier
macmillan, p.178.

International Journal of Management, IT & Engineering Vol. 8 Issue 12(1), December 2018,
ISSN: 2249-0558 Impact Factor: 7.119
Journal Homepage: http://www.ijmra.us, Email: [email protected]
Double-Blind Peer Reviewed Refereed Open Access International Journal - Included in the International
Serial Directories Indexed & Listed at: Ulrich's Periodicals Directory ©, U.S.A., Open J-Gage as well as in
Cabell’s Directories of Publishing Opportunities, U.S.A
525 International Journal of Management, IT & Engineering
http://www.ijmra.us, Email: [email protected]
“Study of Succession Planning in the Organization”
Ms. Purswani Khushbu Jetho
Abstract: The current study aims to find out the exact scenario of succession planning in
the organization. There are so many planning which makes out a very effective future
leader. The paper explore the different development, planning, process which are basic for
the knowledge for improvement of the existing quality of knowledge in the study in the light
of the development of organization. Awareness about this developing a leader with
succession planning and plotting will be very much useful. There are different type of steps
required for succession planning like: knowing vision, improving skills, setting goals,
principles are a set of underlying things about how to proceed all the steps and qualities
and its relation to organization. All organizations can have more or less systematic,
integrated and proactive approaches to deal with the styles. Accordingly, there are so
many challenges which cannot simply be implemented on the basis of the process,
management structures and systems. It may require the detailing of work, the definition of
roles, the design of structures, the learning of new skills by students and the reorientation
of organizational goals.
There are many students which are unaware about effective qualities for the good leader
hence the researcher feels to study on the awareness of succession planning in the
organization.
Keywords: Succession planning, goal, skills, development, Organization, Factors, vision,
grooming, awareness etc.
Introduction: There are so many different steps of succession planning required for good
leader. There are many challenges one leader have to face because of new strategies, new
patterns for the growth of organization. Current study aims to study on the awareness of
different steps for succession planning and challenges in organization. For an instance, the
developing a leadership style fits to give idea to improve relationship between employees
and organization, which are two interrelated factors that are important.
Literature Review
There are several studies on succession planning in the organization. Few of them are
highlighted as:
1. Neetha Mary Avanesh in A STUDY ON SUCCESSION PLANNING AND ITS
IMPACT ON ORGANIZATIONAL PERFORMANCE IN THE IT SECTOR: The
present study aimed at measuring the practice of Succession Planning and its impact on
Organizational Performance in IT companies based in Bangalore. This study falls under
descriptive study mainly aimed at fact finding. The method adopted to collect data is
questionnaire method. The study found that the mean percentage of Succession Planning
and Organizational Performance in IT consultancy firms is found to be higher than that of
IT Product/Research firms and the relationship between Succession Planning and
Organizational Performance is found to be positive.
(Assist. Professor Department of Commerce) SST College of Arts and Commerce, Morya Nagri, Ulhasnagar, (MS,
India)

International Journal of Management, IT & Engineering Vol. 8 Issue 12(1), December 2018,
ISSN: 2249-0558 Impact Factor: 7.119
Journal Homepage: http://www.ijmra.us, Email: [email protected]
Double-Blind Peer Reviewed Refereed Open Access International Journal - Included in the International
Serial Directories Indexed & Listed at: Ulrich's Periodicals Directory ©, U.S.A., Open J-Gage as well as in
Cabell’s Directories of Publishing Opportunities, U.S.A
526 International Journal of Management, IT & Engineering
http://www.ijmra.us, Email: [email protected]
2. Suruchi Pandey, Deepesh Sharma in Succession Planning Practices and
Challenges: Study of Indian Organizations Succession planning is a key in the current
scenario of tight talent markets and competitive times. Strengthening talent has a direct
impact on bottom line results and contributes to organizational growth. Hence development
at talent level is a must for overall organizational development. The present study focuses
on current practices and approach of succession planning followed by the industry.
3. Osibanjo Omotayo Adewale*, Abiodun Joachim Abolaji and Obamiro John
Kolade IN SUCCESSION PLANNING AND ORGANIZATIONAL SURVIVAL:
EMPIRICAL STUDY ON NIGERIAN PRIVATE TERTIARY INSTITUTIONS has
been trying to understand and explain variables such as Turnover Rate, Career
Development and Supervisor’ Supervision) are insignificantly correlated with
organizational survival.
The main objectives for study of succession planning in the organization.
a) To make a uniform and skillful system involving all the leadership steps and standards
across the country in the country.
b) To improve the basics & deep knowledge with quality procedures across the country
in the country.
c) To minimize the efforts and improving the skills for succession planning organization.
d) To replace a lot of other patterns to reduce efforts of organization
e) To detailing of most of the steps of good leader.
f) To improve the effect of the leadership for the improvement of each and every area.
g) To improve the competitiveness of the students.
h) To ensure the availability of knowledge for the improvement
i) To reduce the complications in the system and organization
j) To decrease the unhealthy competition among the organization due to unawareness of
succession planning in organization.
k) To reducing the management problems to avoid further issues.
l) To simplify the process of selection of the good leader for the organization.
Thus, there are many good and beneficial aims and objectives of study of succession
planning in the organization.
Aims and Objectives of the Study
To explaining about study of succession planning in the organization.
a. To study about the awareness of succession steps for the organization for the good
leader.
b. To study of skills, responsibility, knowledge of good leader for the growth and
development
Hypothesis
a. There is not clear picture of about study of succession planning in the organization.
to all the sectors.
b. Students, employees are not having proper knowledge of about the steps required
for the leadership to fit succession challenges.
Methodology
Data was collected from several books and Internet. The list of the papers are mentioned in
the references.
Results of the Study
There are a so many steps for the succession planning in the organization.

International Journal of Management, IT & Engineering Vol. 8 Issue 12(1), December 2018,
ISSN: 2249-0558 Impact Factor: 7.119
Journal Homepage: http://www.ijmra.us, Email: [email protected]
Double-Blind Peer Reviewed Refereed Open Access International Journal - Included in the International
Serial Directories Indexed & Listed at: Ulrich's Periodicals Directory ©, U.S.A., Open J-Gage as well as in
Cabell’s Directories of Publishing Opportunities, U.S.A
527 International Journal of Management, IT & Engineering
http://www.ijmra.us, Email: [email protected]
1.To know about the Vision of your company and growth plan
For the prediction of future goal on the basis of all the data or previous information which
will include detailed budget broadcast and starter planning accordingly all the money plans
where it is going and strategies making for the growth is comes under the succession
planning for the organization.
Image 1.1 Vision of your company and growth plan
With existing skills creating a inventory planning.
First you should see what are the quality or skills which already exist and what is the gap
between your personal plans and the exiting skills. This basic fundamental can be used
further.
Image 1.2 With existing skills creating an inventory planning.

International Journal of Management, IT & Engineering Vol. 8 Issue 12(1), December 2018,
ISSN: 2249-0558 Impact Factor: 7.119
Journal Homepage: http://www.ijmra.us, Email: [email protected]
Double-Blind Peer Reviewed Refereed Open Access International Journal - Included in the International
Serial Directories Indexed & Listed at: Ulrich's Periodicals Directory ©, U.S.A., Open J-Gage as well as in
Cabell’s Directories of Publishing Opportunities, U.S.A
528 International Journal of Management, IT & Engineering
http://www.ijmra.us, Email: [email protected]
3.Ask people about their goal like where they like to be in future.
Interaction with employee face to face is the best way to ask them openly about their goal
where they want to stay in company, what they want accordingly transparent succession
planning will be possible. To evaluate potential of each person and About their succession
potential we should inform to employees .Grooming employees of organization according
to three skills sets like potential, skills, desired track. Staffs who’s having skill sets should
be offered retention program.
Findings
1) There are many cases in which organization themselves are confused about developing
different steps in the succession planning for the organization challenges and norms of
it. Therefore, employees knew only that these are basics needed.
2) What is exactly steps in succession planning very few of know.
3) As study of succession planning in the organization is very basic & deep concept, it will
not take time to understand to the students, employees also in the point of view of its
organization.
4) It is not simple and easy to understand the steps, responsibility but we can understand
and apply to improve the growth.
5) Overall study shows that early stage of developing of leadership styles will be a part of
creating complication in the mind of students.
6) There are negative approach and views of students, employees about leader and its role
responsibility and qualities.
7) Lack of facilities is also one of the major reasons to make students unaware about study
of succession planning in the organization..
Suggestions of the Study
It is essential to give training for improvement of study of succession planning in the
organization.
Need of counseling and communicating to all level of fields about study of succession
planning in the organization challenges and its benefits.
i. It is necessary to inform the students, employees about the qualities and its effect is
more advanced and innovative than normal terms.
ii. It is essential to convey all the students, employees to make aware that there is no
exemption from improving styles to anyone, so they should prepare themselves with
positive attitude towards the use of it.
It needs to go time to understand the particle skills, responsibility, growth from the study
of succession planning in the organization and its effects to students, employees.
Conclusion
There are several cases within which students, employee themselves are confused about
study of succession planning in the organization and its skills, responsibility of it.
Therefore, students knew solely that these are some of styles required. What’s precisely
some of important steps and its applications only a few of apprehend. It’s not
straightforward and simple to apply groom the succession planning so the idea of
developing a leadership fit to challenges is very much necessary for the improvement.
There is negative approach and views of scholars concerning qualities, skills which will
defiantly be a disadvantage. Also lack of facilities is additionally one in every of the
foremost reasons to form students unaware concerning of steps Therefore the detailed and
simpler way of study of succession planning in the organization for a leaders is necessary

International Journal of Management, IT & Engineering Vol. 8 Issue 12(1), December 2018,
ISSN: 2249-0558 Impact Factor: 7.119
Journal Homepage: http://www.ijmra.us, Email: [email protected]
Double-Blind Peer Reviewed Refereed Open Access International Journal - Included in the International
Serial Directories Indexed & Listed at: Ulrich's Periodicals Directory ©, U.S.A., Open J-Gage as well as in
Cabell’s Directories of Publishing Opportunities, U.S.A
529 International Journal of Management, IT & Engineering
http://www.ijmra.us, Email: [email protected]
for positive approach of the students. So that it will get easier and fully acquired by the
student which will help them overcome the phobia of the skills or study of succession
planning in the organization.
References
1. Neetha Mary Avanesh “A STUDY ON SUCCESSION PLANNING AND ITS
IMPACT ON ORGANIZATIONAL PERFORMANCE IN THE IT SECTOR” Vol. –
II, Issue –1, Jan. 2011
2. Jeff Rosenthal, Kris Routch, Kelly Monahan, Meghan Doherty “The holy grail of
effective leadership succession planning”
3. SuruchiPandeyDr.aDeepeshSharmab “Succession Planning Practices and Challenges:
Study of Indian Organisations” Volume 11, 2014, Pages 152-165
4. https://www.shrm.org/hr-today/trends-and-forecasting/special-reports-and-expert-
views/Documents/Developing-Leadership-Talent.pdf
5. https://www.td.org/insights/overcoming-workplace-dysfunction-and-restoring-
functionality
6. Osibanjo Omotayo Adewale*, Abiodun Joachim Abolaji and Obamiro John Kolade
“SUCCESSION PLANNING AND ORGANIZATIONAL SURVIVAL: EMPIRICAL
STUDY ON NIGERIAN PRIVATE TERTIARY INSTITUTIONS”6 (2) (2011) 231 -
246
7. Ali Dehghanpour Farashah, Vahid Nasehifar* and Ahmadreza Sanjari Karahrudi
“Succession planning and its effects on employee career attitudes: Study of Iranian
governmental organizations”Vol.5 (9), pp. 3605-3613, 4 May 2011
8. Shadi Ebrahimi Mehrabani and Noor Azmi Mohamad “Succession Planning: A
Necessary Process in Today’s Organization” Vol. 1, No. 5, December 2011
9. Wendy Hirsh “SUCCESSION PLANNING: CURRENT PRACTICE AND
FUTURE ISSUES”1991
10. Brendan Sweeney “Success through Succession: A Review of Recent Literature”2013
11. Allison Suhler Hart “A DISSERTATION SUBMITTED TO THE FACULTY OF
THE GRADUATE SCHOOL OF THE UNIVERSITY OF MINNESOTA”2011
12. Kevin S. Groves “Integrating leadership development and succession planning best
practices” 2005
13. https://www.gsb.stanford.edu/sites/gsb/files/publication-pdf/cgri-survey-2014-senior-
executive-succession.pdf

International Journal of Management, IT & Engineering Vol. 8 Issue 12(1), December 2018,
ISSN: 2249-0558 Impact Factor: 7.119
Journal Homepage: http://www.ijmra.us, Email: [email protected]
Double-Blind Peer Reviewed Refereed Open Access International Journal - Included in the International
Serial Directories Indexed & Listed at: Ulrich's Periodicals Directory ©, U.S.A., Open J-Gage as well as in
Cabell’s Directories of Publishing Opportunities, U.S.A
530 International Journal of Management, IT & Engineering
http://www.ijmra.us, Email: [email protected]
“Developing A Leadership Style To Fit 21st Century
Challenges”
Ms. Purswani Khushbu Jetho
Abstract: The current study aims to find out the scenario about the developing a
leadership style to fit 21st century challenges. There are so many Styles which makes out a
very effective leader. The paper explore the different development which are basic for the
knowledge for improvement of the existing quality of knowledge in the study in the light of
the development of organization. Awareness about this developing a leadership style to fit
21st century challenges is very necessary. There are different type of styles required for
leadership like: Authoritarian Democratic, laissez-faire or delegate. The principles are a
set of underlying things about how to develop the styles, qualities and its relation to
organization. All organizations can have more or less systematic, integrated and proactive
approaches to deal with the styles. Accordingly, a 21st century there are so many
challenges which cannot simply be implemented on the basis of the existing styles,
management structures and systems. It may require the detailing of work, the definition of
roles, the design of structures, the learning of new skills by students and the reorientation
of organizational goals.
There are many students which are unaware about effective qualities for the good leader
hence the researcher feels to study on the awareness of developing a leadership style to fit
21st century challenges.
Keywords:leader,styles,development,Organization,Factors,Authoritarian, Democratic,
laissez-faire ,awareness etc.
Introduction: There are so many different types of leadership styles required for good
leader. There are many challenges one leader have to face because of new strategies, new
patterns for the growth of organization. Current study aims to study on the awareness of
different leadership style to fit 21st century challenges. For an instance, the developing a
leadership style to fit 21st century challenges gives idea to improve relationship between
employees and organization, which are two interrelated factors that are important .
Literature Review
There are several studies on developing a leadership style to fit 21st century challenges.
Few of them are highlighted as:
1.Victor E. Dike1*, Ken Odiwe2 & Donatus M. Ehujor in Leadership and
Management in the 21st Century Organizations: A Practical Approach This article
argues that what makes effective leadership and management in the rapidly changing 21st
century organizations include their personality and style of leadership, passion and values,
decision-making and problem-solving process as well as their expectations and levels of
relationship with their followers. Leaders and managers require a practical approach to
leadership and management to substantially influence and motivate their followers to
enhance their performance to achieve set organizational objectives.
(Assist. Professor Department of Commerce) SST College of Arts and Commerce, Morya Nagri, Ulhasnagar, (MS,
India)

International Journal of Management, IT & Engineering Vol. 8 Issue 12(1), December 2018,
ISSN: 2249-0558 Impact Factor: 7.119
Journal Homepage: http://www.ijmra.us, Email: [email protected]
Double-Blind Peer Reviewed Refereed Open Access International Journal - Included in the International
Serial Directories Indexed & Listed at: Ulrich's Periodicals Directory ©, U.S.A., Open J-Gage as well as in
Cabell’s Directories of Publishing Opportunities, U.S.A
531 International Journal of Management, IT & Engineering
http://www.ijmra.us, Email: [email protected]
2. Bg. Gen. Imre Porkoláb in LEADERSHIP CHALLENGES IN THE 21ST
CENTURY: THE FUTURE OF INTEGRATED LEADERSHIP APPROACHES give
idea with the development of society, more and more domestic and international
corporations arise. In his article, the author argues that in the contemporary complex our
organizational and leadership methods are quickly becoming obsolete. He takes us through
the leadership theory development of the last century and focuses on the newest leadership
trends, where every organization has to make sure to treat all personnel as potential leaders
and provide them opportunities to grow and learn. Such circumstances preclude direct
hierarchical bureaucratic supervision, and leadership must rely on the expertise of
employees with selective skill-sets and experiences. The author presents an integrated
approach to leadership, and suggests that understanding, developing and practicing
integrated leadership will better prepare all leaders to handle difficult situations under
pressure.
3.Mohammad Anisur Rahman in A Comprehensive Model of 21st Century
Leadership has been trying to understand and explain leadership, however, differences in
opinion and isolated ideas failed to demonstrated a comprehensive process of leadership
that make an ordinary person a leader or an ordinary leader an effective leader.
Comprehensive leadership model tries to portray a complete view of leadership that
integrates all the isolated opinions of experts that can be generalized in different
perspective. Under this model leadership constitute of four building blocks: traits & style,
wisdom, media effects and followers. In the first cycle of the model through these building
blocks an ordinary person becomes a leader. To become effective leader one needs
consistent repeated performances. However, there are some impediments that hinder
consistent performance. Learning to cope up with the barriers may lead a person to become
an effective leader.
4. Frank Owarish in e-Leadership for the 21st century: coping with new challenges
gives idea about the things in which Leadership has always been a crucial factor in the
advancement of society as a whole and of specific segments thereof such as government
organizations or business companies. No entities can progress without leadership. Studies
have been undertaken over time to capture the essence of leadership and much has been
written about the subject which is even taught in several universities. Leadership can be
exercised by a single person or by a group (collective leadership such as that of a
university senate) depending on the context. There are also different expectations from
leaders depending on the particular social-political context. As society has evolved and
become more complex, leadership has become more demanding.
Before the study it is essential to know what are the aims and objectives of qualities
required for good manger.
The main objectives for developing a leadership style to fit 21st century challenges.
a) To make a uniform and skillful system involving all the leadership styles and standards
across the country in the country.
b) To improve the basics & deep knowledge with quality procedures across the country in
the country.
c) To minimize the efforts and improving the skills for organization of leadership style.
d) To replace a lot of other patterns to reduce efforts of organization
e) To detailing of most of the styles of good leader.

International Journal of Management, IT & Engineering Vol. 8 Issue 12(1), December 2018,
ISSN: 2249-0558 Impact Factor: 7.119
Journal Homepage: http://www.ijmra.us, Email: [email protected]
Double-Blind Peer Reviewed Refereed Open Access International Journal - Included in the International
Serial Directories Indexed & Listed at: Ulrich's Periodicals Directory ©, U.S.A., Open J-Gage as well as in
Cabell’s Directories of Publishing Opportunities, U.S.A
532 International Journal of Management, IT & Engineering
http://www.ijmra.us, Email: [email protected]
f) To improve the effect of the leadership style for the improvement of each and every
area.
g) To improve the competitiveness of the students.
h) To ensure the availability of knowledge for the improvement
i) To reduce the complications in the system and organization
j) To decrease the unhealthy competition among the organization due to unawareness of
developing a leadership style to fit 21st century challenges.
k) To reducing the management problems to avoid further issues.
l) To simplify the process of selection of the good leader for the organization.
Thus, there are many good and beneficial aims and objectives of developing a leadership
style to fit 21st century challenges.
Aims and Objectives of the Study
a. To explaining about leadership style required for to fit 21st century challenges.
b. To study about the awareness of leadership style for the organization for the good
leader.
c. To study of skills, responsibility, knowledge of good leader for the growth and
development
Hypothesis
a. There is not clear picture of about leadership style to fit 21st century challenges to
the all sectors.
b. Students, employees are not having proper knowledge of about the style required
for the leadership to fit 21st century challenges.
Methodology
Data was collected from several books and Internet. The list of the papers are mentioned in
the references.
Results of the Study
There are a so many leadership style to fit 21st century challenges
Image 1.1 Developing leadership style to fit 21st century challenges.
Types of Leadership Styles
• Laissez-faire Leadership
• Autocratic Leadership
• Transformational Leadership
• Strategic Leadership Style
• Democratic Leadership

International Journal of Management, IT & Engineering Vol. 8 Issue 12(1), December 2018,
ISSN: 2249-0558 Impact Factor: 7.119
Journal Homepage: http://www.ijmra.us, Email: [email protected]
Double-Blind Peer Reviewed Refereed Open Access International Journal - Included in the International
Serial Directories Indexed & Listed at: Ulrich's Periodicals Directory ©, U.S.A., Open J-Gage as well as in
Cabell’s Directories of Publishing Opportunities, U.S.A
533 International Journal of Management, IT & Engineering
http://www.ijmra.us, Email: [email protected]
• Facilitative Leadership
• Cross-Cultural Leadership
• Team Leadership
Image 1.2 Different leadership style to fit 21st century challenges.
There are main 3 leadership styles authoritarian, democratic, and laissez-faire. There are a
so many leadership style among which 3 most important are studied and explained below:
1.Authoritarian Leadership Style
1.1Characteristics of Autocratic Leadership
1. Autocratic leader take very less or no inputs, ideas from the other group members.
2. Autocratic leader take all the decisions which required.
3. There is less or no trust on any other group member
4. The work strategies are very strong and maintained in one formats
5. They used to follow rules, regulation.
6. No creative or different style of work is preferred.
Under stress conditions and at strong positions Autocratic leadership style will be
beneficiary. Leader should have knowledge about his field as there are different sectors
like Engineering, Marketing, and Medical etc. there should be practical and theoretical
understanding of subjects. There should be familiarize, awareness of all the areas. There
should be a technical knowledge in there sectors. There should be general knowledge of
things around the sectors to improve the growth of organization. It is used were small
group of people are working or lack of team coordination.at manufacturing and
construction work this style is very much used. This type of style discouraging group
people inputs so sometime it will problematical when some skilled members are presents.
Thorough these type of leaders are very negative styled but some time they are used for
quick decisions, strong work.

International Journal of Management, IT & Engineering Vol. 8 Issue 12(1), December 2018,
ISSN: 2249-0558 Impact Factor: 7.119
Journal Homepage: http://www.ijmra.us, Email: [email protected]
Double-Blind Peer Reviewed Refereed Open Access International Journal - Included in the International
Serial Directories Indexed & Listed at: Ulrich's Periodicals Directory ©, U.S.A., Open J-Gage as well as in
Cabell’s Directories of Publishing Opportunities, U.S.A
534 International Journal of Management, IT & Engineering
http://www.ijmra.us, Email: [email protected]
Image 1.3 Authoritarian Leadership Style to fit 21st century challenges.
2.Democratic leadership style
2.1 Characteristics of Democratic Leadership style
1. Democratic Leadership style includes members of group are encouraged to share their
thoughts and things.
2. Group members are very much active.
3. Encouraged and rewarded the Creativity of group members.
Good leader of organization with group member .to achieve the goals and target of
organization they encourage the employees. Leading team, leading employees in effective
way & manner. Supporting other employees and evoking other for the growth.
Understanding there problems and leading them in the area of each sector to build team.
There should be control on team, one should give good guidelines for the growth of
organization.
Image 1.4 Democratic leadership style
3.Laissez-faire leadership style
3.1 Characteristics of Laissez-Faire Leadership
1. Very less guidelines from leaders.
2. Completely free for followers to do decisions
3. Laissez-Faire Leaders provide the tools and sources needed for the development
4. Solve problems on their own by Group members are expected.
For the growth of organization group members should have quality of communication with
leader at start of project. Leader should communicate those priorities to each member of
team who is responsible for each and every task. Group members should have excellent
communication skills. Leader should get there team on same page so that they can work on
same objective. Leader should communicate verbally as well as in written format very
effectively.

International Journal of Management, IT & Engineering Vol. 8 Issue 12(1), December 2018,
ISSN: 2249-0558 Impact Factor: 7.119
Journal Homepage: http://www.ijmra.us, Email: [email protected]
Double-Blind Peer Reviewed Refereed Open Access International Journal - Included in the International
Serial Directories Indexed & Listed at: Ulrich's Periodicals Directory ©, U.S.A., Open J-Gage as well as in
Cabell’s Directories of Publishing Opportunities, U.S.A
535 International Journal of Management, IT & Engineering
http://www.ijmra.us, Email: [email protected]
Image 1.5 Laissez-faire leadership style
Findings
1) There are many cases in which students themselves are confused about developing a
leadership style to fit 21st century challenges and norms of it. Therefore, students knew
only that these are basics needed.
2) What is exactly leadership style to fit 21st century challenges very few of know
3) As developing a leadership style to fit 21st century challenges is basic & deep concept,
it will not take time to understand to the students, employees also in the point of view
of its organization.
4) It is not simple and easy to understand the styles, responsibility but we can understand
and apply to improve the growth.
5) Overall study shows that early stage of developing of leadership styles will be a part of
creating complication in the mind of students.
6) There are negative approach and views of students, employees about leader and its role
responsibility and qualities.
7) Lack of facilities is also one of the major reasons to make students unaware about
developing a leadership style to fit 21st century challenges.
Suggestions of the Study
i. It is essential to give training for improvement of developing a leadership style to fit
21st century challenges.
ii. Need of counselling and communicating to all level of fields about developing a
leadership style to fit 21st century challenges and its benefits.
iii. It is necessary to inform the students, employees about the qualities and its effect is
more advanced and innovative than normal terms.
iv. It is essential to convey all the students, employees to make aware that there is no
exemption from improving styles to anyone, so they should prepare themselves with
positive attitude towards the use of it.
v. It needs to go time to understand the particle skills, responsibility, growth from the
developing a leadership style to fit 21st century challenges and its effects to students,
employees.
Conclusion
There are several cases within which students, employee themselves are confused about
developing a leadership style to fit 21st century challenges and its skills, responsibility of
it. Therefore, students knew solely that these are some of styles required. What’s precisely
some of important styles and its applications only a few of apprehend. It’s not
straightforward and simple to apply leadership styles so the idea of developing a leadership
style to fit 21st century challenges is very much necessary for the improvement. There is

International Journal of Management, IT & Engineering Vol. 8 Issue 12(1), December 2018,
ISSN: 2249-0558 Impact Factor: 7.119
Journal Homepage: http://www.ijmra.us, Email: [email protected]
Double-Blind Peer Reviewed Refereed Open Access International Journal - Included in the International
Serial Directories Indexed & Listed at: Ulrich's Periodicals Directory ©, U.S.A., Open J-Gage as well as in
Cabell’s Directories of Publishing Opportunities, U.S.A
536 International Journal of Management, IT & Engineering
http://www.ijmra.us, Email: [email protected]
negative approach and views of scholars concerning qualities, skills which will defiantly
be a disadvantage. Also lack of facilities is additionally one in every of the foremost
reasons to form students unaware concerning of styles. Therefore the detailed and simpler
way of developing a leadership style to fit 21st century challenges is necessary for positive
approach of the students. So that it will get easier and fully acquired by the student which
will help them overcome the phobia of the skills or developing a leadership style to fit 21st
century challenges.
References
1. Maria Viorica Bedrule - Grigoruta“Leadership in the 21st Century: Challenges in the
Public Versus the Private System” Elsevier(62):1028–1032 · October 2012
2. "André A. de Waal, Béatrice I.J.M. van der Heijden, Christopher Selvarajah, Denny
Meyer “Characteristics of high performing managers in the Netherlands Leadership &
Organization Development Journal” 2010.
3. Charles Wankel “Leadership Style: Developing a Leadership Style to Fit 21st-Century
Challenges”
4. https://www.bartleby.com/essay/Developing-A-Leadership-Style-For-Fit-21st-
P3AU5CTQKFV8X
5. https://www.infoq.com/news/2016/01/leadership-fit-agile-challenges/
6. Justin Reynolds “LEADERSHIP QUALITIES TO LOOK FOR WHEN HIRING A
MANAGER”
7. Mark David Nevins and Stephen A. Stumpf “21st Century Leadership: Redefining
Management Education: Educating Managers in the Modern Era”1999.
8. Victor E. Dike1*, Ken Odiwe2 & Donatus M. Ehujor3 “Leadership and Management
in the 21st Century Organizations: A Practical Approach” Vol. 2, No. 2, 2015.
9. Moo Jun Hao & Dr. Rashad Yazdanifard “How Effective Leadership can Facilitate
Change in Organizations through Improvement and Innovation” vol 15 ,2015.
10. Anchal Luthra, Dr. Richa Dahiya “Effective Leadership is all About Communicating
Effectively: Connecting Leadership and Communication” Vol. 5, Issue 3, July - Sept
2015.
11. https://www.slideshare.net/samanga/21st-century-leadership-12928629
12. https://study.com/academy/lesson/leadership-styles-and-types-authoritarian-laissez-
faire-democratic.html
13. Bg. Gen. Imre Porkoláb “LEADERSHIP CHALLENGES IN THE 21ST CENTURY:
THE FUTURE OF INTEGRATED LEADERSHIP APPROACHES” Challenges &
NATO 2001
14. Mohammad Anisur Rahman “A Comprehensive Model of 21st Century
Leadership”2012
15. Frank Owarish “eLeadership for the 21st century: coping with new challenges” E-
Leader Budapest 2010

International Journal of Management, IT & Engineering Vol. 8 Issue 12(1), December 2018,
ISSN: 2249-0558 Impact Factor: 7.119
Journal Homepage: http://www.ijmra.us, Email: [email protected]
Double-Blind Peer Reviewed Refereed Open Access International Journal - Included in the International
Serial Directories Indexed & Listed at: Ulrich's Periodicals Directory ©, U.S.A., Open J-Gage as well as in
Cabell’s Directories of Publishing Opportunities, U.S.A
537 International Journal of Management, IT & Engineering
http://www.ijmra.us, Email: [email protected]
An Exploratory Learning Of Small Business Internet
Commerce Issues
Bharati Yadav
Abstract: E-Commerce improvement provides a definite path for firms to address the
difficulties of the regularly evolving condition. It gives powerful and best methods for
example; purchasers could accumulate data quickly about the accessibility of the items or
benefits, assess, or consult with merchants. Nonetheless, past examinations on Small and
Medium Enterprise in Bangalore. Have demonstrated that the utilization of internet
business is still at its early stages. Along these lines, this examination researches the use
level of web based business application for the SMEs in particularly Bangalore. This
accomplished with the help of coursing a lot of poll to inspect the mindfulness and
appropriation of online business application by the SMEs, and perceive the blocking
variables to receive web based business and the view of web based business benefits
towards joining internet business in the respective business. The examination found that
the mindfulness and reception stage amongst the SMEs are continuously in its earliest
stages, in spite of the fact that the potential advantages were seen to be significant.
Keyword: Small and Medium Enterprises, Electronic Commerce, Challenges
Introduction: For a considerable length of time, firms have utilized different specialized
devices to direct various types of business exchanges. Banks have utilized EFTs to provide
movement client’s cash far and wide, numerous sorts of organizations have utilization in
EDI to place requests and send solicitations, and retailers have full utilization Televisions
based promoting to create phone based requests from overall population for different kinds
of product. It is progressively and generally acknowledged that it is significant for business
to grasp internet business and embrace web based business applications. Online business
applications incorporate scanning for items, administrations or data, publicizing and the
purchasing, sell and pay for items as well as administrations. This is especially significant
for independent ventures. They might not have the adequate store and ability to construct
refined web nearness. Yet, they have to embrace online business applications since it is
significant for their on-going survival. It shows improvement of the capacity to contend
with the bigger associations and furthermore empower them to do working on a global
scale. Furthermore, web based business applications give a practical way to have dealt with
little associations to showcase their business, dispatch new items, improve interchanges,
accumulate data, and recognize potential business factors. Online business has been hailed
by numerous individuals as an open door for creating nations to increase a more grounded
solid footing in the multilateral exchanging framework. Web based business could do
assumption an instrumental job in helping creating financial aspects advantage more from
exchange (World Trade Organization-2012). The developing utilization of the Internet,
tablet gadgets with bigger buyer certainty would watch that web based business will
M.Tech IT, UGC NET
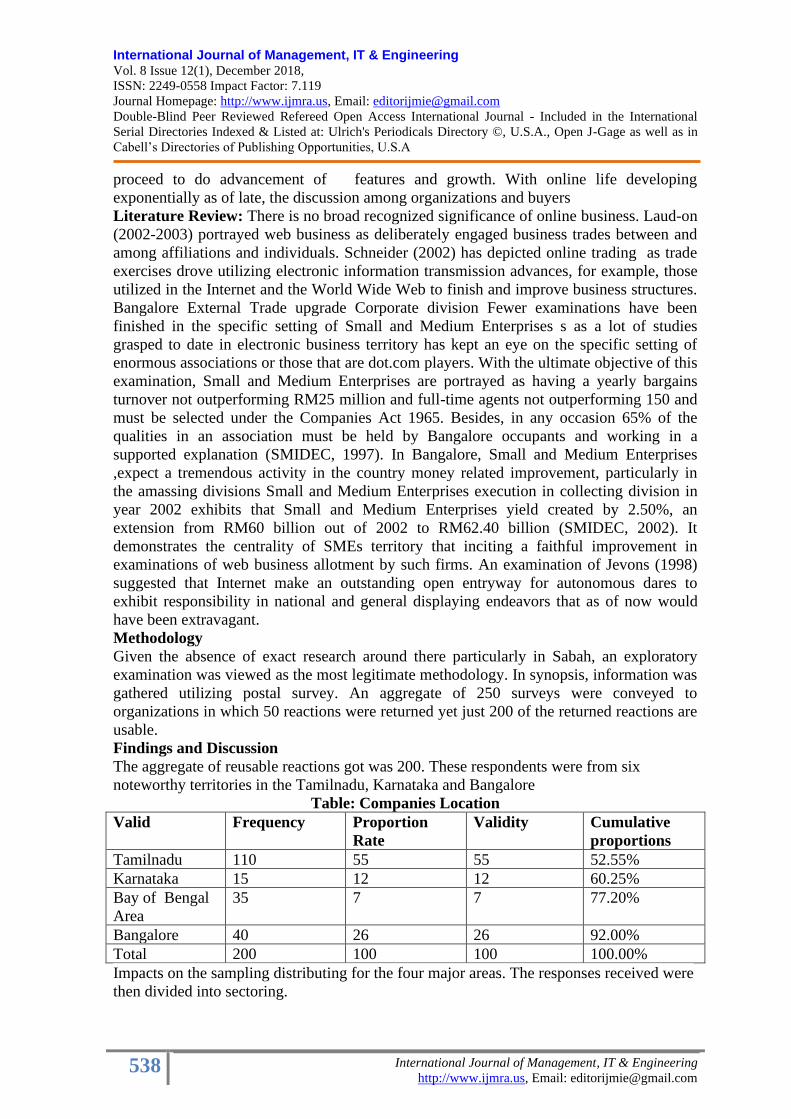
International Journal of Management, IT & Engineering Vol. 8 Issue 12(1), December 2018,
ISSN: 2249-0558 Impact Factor: 7.119
Journal Homepage: http://www.ijmra.us, Email: [email protected]
Double-Blind Peer Reviewed Refereed Open Access International Journal - Included in the International
Serial Directories Indexed & Listed at: Ulrich's Periodicals Directory ©, U.S.A., Open J-Gage as well as in
Cabell’s Directories of Publishing Opportunities, U.S.A
538 International Journal of Management, IT & Engineering
http://www.ijmra.us, Email: [email protected]
proceed to do advancement of features and growth. With online life developing
exponentially as of late, the discussion among organizations and buyers
Literature Review: There is no broad recognized significance of online business. Laud-on
(2002-2003) portrayed web business as deliberately engaged business trades between and
among affiliations and individuals. Schneider (2002) has depicted online trading as trade
exercises drove utilizing electronic information transmission advances, for example, those
utilized in the Internet and the World Wide Web to finish and improve business structures.
Bangalore External Trade upgrade Corporate division Fewer examinations have been
finished in the specific setting of Small and Medium Enterprises s as a lot of studies
grasped to date in electronic business territory has kept an eye on the specific setting of
enormous associations or those that are dot.com players. With the ultimate objective of this
examination, Small and Medium Enterprises are portrayed as having a yearly bargains
turnover not outperforming RM25 million and full-time agents not outperforming 150 and
must be selected under the Companies Act 1965. Besides, in any occasion 65% of the
qualities in an association must be held by Bangalore occupants and working in a
supported explanation (SMIDEC, 1997). In Bangalore, Small and Medium Enterprises
,expect a tremendous activity in the country money related improvement, particularly in
the amassing divisions Small and Medium Enterprises execution in collecting division in
year 2002 exhibits that Small and Medium Enterprises yield created by 2.50%, an
extension from RM60 billion out of 2002 to RM62.40 billion (SMIDEC, 2002). It
demonstrates the centrality of SMEs territory that inciting a faithful improvement in
examinations of web business allotment by such firms. An examination of Jevons (1998)
suggested that Internet make an outstanding open entryway for autonomous dares to
exhibit responsibility in national and general displaying endeavors that as of now would
have been extravagant.
Methodology
Given the absence of exact research around there particularly in Sabah, an exploratory
examination was viewed as the most legitimate methodology. In synopsis, information was
gathered utilizing postal survey. An aggregate of 250 surveys were conveyed to
organizations in which 50 reactions were returned yet just 200 of the returned reactions are
usable.
Findings and Discussion
The aggregate of reusable reactions got was 200. These respondents were from six
noteworthy territories in the Tamilnadu, Karnataka and Bangalore
Table: Companies Location
Valid Frequency Proportion
Rate
Validity Cumulative
proportions
Tamilnadu 110 55 55 52.55%
Karnataka 15 12 12 60.25%
Bay of Bengal
Area
35 7 7 77.20%
Bangalore 40 26 26 92.00%
Total 200 100 100 100.00%
Impacts on the sampling distributing for the four major areas. The responses received were
then divided into sectoring.

International Journal of Management, IT & Engineering Vol. 8 Issue 12(1), December 2018,
ISSN: 2249-0558 Impact Factor: 7.119
Journal Homepage: http://www.ijmra.us, Email: [email protected]
Double-Blind Peer Reviewed Refereed Open Access International Journal - Included in the International
Serial Directories Indexed & Listed at: Ulrich's Periodicals Directory ©, U.S.A., Open J-Gage as well as in
Cabell’s Directories of Publishing Opportunities, U.S.A
539 International Journal of Management, IT & Engineering
http://www.ijmra.us, Email: [email protected]
Need of Electronic-commerce
With the expanding dispersion of ICTs, all the more explicitly the World Wide Web, the
worldwide business network is quickly turns towards firm-to firm electronic-Commerce.
The purchasers increase a reasonable bit of leeway when the Internet provide them access
to the worldwide market, analyzing costs crosswise over districts, see if costs shift by
request discontinuance and get mindfulness about substitute items. Because of
straightforwardness of the market, client could look at the administrations of different web
based business destinations effectively. For moment, if there should be an occurrence of
online business the contenders are a single tick away from client. On the off chance that
customers are not content with the items, costs or administrations offered by a specific web
based business website, they could vary substantially more effectively than in the present
form.
Adoption of Electronic Commerce Application
The result in association with this request demonstrates that the utilization level among the
associations in online business applications is still extremely low. In using Internet for
exhibiting, a high rate (42%) of the respondents grasped this application to do assessment
on contenders, 35% used to do investigate and survey new suppliers, and 33% used to do
ask about on customer tendencies. The figures showed up here addressed the current
situation in West Coast of Sarah as strong test between the SMEs presence especially in
this outskirt less time, each endeavoring to have an edge against the others especially to the
extent assessing and things. By doing research on their adversaries and customers, they
would have the alternative to get comfortable with them and this would help them in their
exhibiting methodology. In advancing through Internet, 45% of the respondents
demonstrate their association information and the things/organizations offered, while
simply 15% use e-stock as a kind of electronic publicizing. Regarding web facilitating,
25% respondents possess their Web website facilitated by their very own server, 25%
selected to possess their Web webpage facilitated by another get-together and 18% of the
respondents promoted on the outsider Web website. These outcomes showed that regarding
electronic-publicizing, high level of the respondents show organization data and items or
administrations offered, as this is the least expensive mean of promoting over the social
media.
Electronic Commerce Factors of Hindrance
The respondent's criticism on the impediment factors that would impact the selection of
web based business. The data demonstrates an uncertain reaction. The main decisive
outcome is that 55% of the respondents felt that a noteworthy inhibitor to the reception of
electronic-business is the shortage of security to avoid hack and infections. Other generally
critical constraints are:
1. Organization market needs high level of human cooperation (45%)
2. Electronic-Commerce usage were seen expensive (42%)
3. Lack-age of inside ability to execute web based business applications (40%)
4. Lack-age of industry gauges/guidelines from governance on online business (43%)
5. Difficult to legitimize the expense with wanted advantages (40%)
Beneficial impact of Electronic Commerce
There are a few advantages that have been introduced to the respondents on the way they
saw the potential advantages of electronic-business. It very well may be reasoned that by
and large, the respondents have an inspirational standpoint towards electronic-trade and

International Journal of Management, IT & Engineering Vol. 8 Issue 12(1), December 2018,
ISSN: 2249-0558 Impact Factor: 7.119
Journal Homepage: http://www.ijmra.us, Email: [email protected]
Double-Blind Peer Reviewed Refereed Open Access International Journal - Included in the International
Serial Directories Indexed & Listed at: Ulrich's Periodicals Directory ©, U.S.A., Open J-Gage as well as in
Cabell’s Directories of Publishing Opportunities, U.S.A
540 International Journal of Management, IT & Engineering
http://www.ijmra.us, Email: [email protected]
view the advantages of electronic-trade as critical to their firm. All application are
referenced with all the understanding audit whether full understanding or fractional
understanding or not to concede to yet just the principle ideas are being meant.
Application Strongly Agree Disagree Moderate Agree
Senior
management do
not perceive E-
commerce
15.25 23.00 11.00 34.00
Recommendation
of highly human
interaction
23.40 34.06 23.22 29.04
E-commerce will
upset existing
channels
30.30 76.23 89.23 34.09
Lack age of
security in e-
commerce
56.02 38.77 21.00 55.00
Lack of funding
in e-commerce
69.00 21.90 19.25 21.00
Challenges in E-commerce
The genuine troubles looked by the sellers and the buyer which assisting business trades
through web are according to the accompanying.
1. Private and open organization is excluded together to build up the presence of electronic
business. Privately and openly jointly performed action is relied upon to develop the online
business. Joint exercises bring legitimacy inside people, which is required for flourishing
the online Organization.
2. There is a nonattendance of system security, steadfastness, standards, and some
correspondence show. Customer loses their money if the webpage of electronic business
site is hacked. Most typical issue of electronic business site isn't having enough advanced
security.
3. Money related foundations and agents: Thus far, budgetary associations and banks in
making countries are hesitant to play a working activity in propelling electronic business.
Regardless, shippers need the incorporation of banks to extend the degree and interest of
web business and to help dodge blackmail and potential incidents attributable to
MasterCard distortion.
Conclusion
The utilization of internet business by Small and medium enterprises in the Bangalore is
still in its earliest stages in spite of different government activities and consolation. These
incorporate the foundation of Sabah Institute for Small and Medium Enterprises in which
the reason for existing is to improve the job of Small and medium enterprises in the
advancement of the state economy and furthermore fills in as an impetus to create
progressively aggressive. Utilization of web based business for reacting to contenders,
giving upgraded client benefits and improving associations with providers was driving the
take-up by littler organizations. As its utilization is ending up progressively basic to the
activity of Small and medium enterprises, it would along these lines appear that Small and
medium enterprises undoubtedly see web based business as an open door for improving

International Journal of Management, IT & Engineering Vol. 8 Issue 12(1), December 2018,
ISSN: 2249-0558 Impact Factor: 7.119
Journal Homepage: http://www.ijmra.us, Email: [email protected]
Double-Blind Peer Reviewed Refereed Open Access International Journal - Included in the International
Serial Directories Indexed & Listed at: Ulrich's Periodicals Directory ©, U.S.A., Open J-Gage as well as in
Cabell’s Directories of Publishing Opportunities, U.S.A
541 International Journal of Management, IT & Engineering
http://www.ijmra.us, Email: [email protected]
their exhibition. The examination additionally found that the potential advantages were
seen to be significant, in spite of the apparent constraints of not embracing web based
business applications. It is currently up to the Small and medium enterprises with or
without help from the legislature or different impetuses to utilize this innovative device to
improve their business scope. There has been absence of research attempted especially to
decide Small and medium enterprises view of the advantages of web based business and
the momentum level of internet business reception. This examination was performed and it
is suggested that the future research can be reached out to all the five divisions so as to
acquire an increasingly delegate results. The selection considerations and advantages
acknowledged from online business may be relied upon to shift as indicated by the
business area in which a firm works.
References
[1] Cloete, E., Courtney, S., &Fintz, J. (2002). Small businesses acceptance and adoption
of ecommerce in the Western-cape Province of South-Africa. The Electronic Journal of
Business 1(1)
[2] Courtney, S. &Fintz, J. (2001). Small businesses acceptance and adoption of e-
commerce in the Western-cape Province of South-Africa: Empirical Research Project,
Department of Information System, UCT.
[3] Davis, F. D. (1986). A Technology acceptance model for empirically testing new end-
user information systems: Theory and result, Doctoral Dissertation, MIT Sloan School of
Management, Cambridge, MA.
[4] Daniel, E. M. &Grimshaw, D. J. (2002). Exploratory comparisons of e-commerce
adoption in large and small enterprise. Journal Information Technology, 17:33-147
[5] Evans, P. &Wurster, T. (1999). Blown to bits: How the new economics of information
transform strategy. Boston, MA: Harvard Business School Press.
[6] Harrison, D. A., Mykytyn, P. P. &Rienenschneider, C. K. (1997). Executive decisions
about information technology adoption in small business: Theory and empirical test.
Information System Research, 8(2):171-195.
[7] Hoffman, D. L., Novak, T. P. &Chaterjee, P. (1995). Commercial scenarios for the
Web: Opportunities and Challenges. Journal of Computer-Mediated Communication.
Special Issues on E-Commerce.
[8] Hoi, J., Shim, J. P. & Yin, A. (2003). Current Progress of E-Commerce Adoption:
SMEs in .Communication of the ACM, 46(9).
[9] Iocovou, C. L., Benbasat, I. & Dexter, A. S. (1995). Electronic data Interchange and
Small organizations: Adoption & impact of technology. MIS Quarterly, 19(4):465-485.