
Seasonality in depressive and anxiety symptoms among primary care patients and in patients with...
18
RESEARCH ARTICLE Open Access Seasonality in depressive and anxiety symptoms among primary care patients and in patients with depressive and anxiety disorders; results from the Netherlands Study of Depression and Anxiety Wim H Winthorst 1* , Wendy J Post 2,3 , Ybe Meesters 1 , Brenda WHJ Penninx 1,4,5 and Willem A Nolen 1 Abstract Background: Little is known about seasonality of specific depressive symptoms and anxiety symptoms in different patient populations. This study aims to assess seasonal variation of depressive and anxiety symptoms in a primary care population and across participants who were classified in diagnostic groups 1) healthy controls 2) patients with a major depressive disorder, 3) patients with any anxiety disorder and 4) patients with a major depression and any anxiety disorder. Methods: Data were used from the Netherlands Study of Depression and Anxiety (NESDA). First, in 5549 patients from the NESDA primary care recruitment population the Kessler-10 screening questionnaire was used and data were analyzed across season in a multilevel linear model. Second, in 1090 subjects classified into four groups according to psychiatric status according to the Composite International Diagnostic Interview, overall depressive symptoms and atypical versus melancholic features were assessed with the Inventory of Depressive Symptoms. Anxiety and fear were assessed with the Beck Anxiety Inventory and the Fear questionnaire. Symptom levels across season were analyzed in a linear regression model. Results: In the primary care population the severity of depressive and anxiety symptoms did not show a seasonal pattern. In the diagnostic groups healthy controls and patients with any anxiety disorder, but not patients with a major depressive disorder, showed a small rise in depressive symptoms in winter. Atypical and melancholic symptoms were both elevated in winter. No seasonal pattern for anxiety symptoms was found. There was a small gender related seasonal effect for fear symptoms. Conclusions: Seasonal differences in severity or type of depressive and anxiety symptoms, as measured with a general screening instrument and symptom questionnaires, were absent or small in effect size in a primary care population and in patient populations with a major depressive disorder and anxiety disorders. Background Epidemiological studies of seasonal variation in the pre- valence of mental disorders have shown diverging results. Seasonal variation in the prevalence of the major mental disorders in general population surveys have rarely been noted, but prevalence rates of mood (affective) disorders with a seasonal pattern have been reported to range from 1% to as much as 12% [1]. The majority of the latter studies reported on seasonal affective disorder (SAD), defined in DSM IV as a recur- rent depressive disorder with a regular temporal rela- tionship between the onset of a major depressive episode and a particular time of the year (mostly fall or winter) and has used specific instruments for its assess- ment [2,3]. The most widely used instrument in those studies is the Seasonal Pattern Assessment Question- naire (SPAQ), a self rating screening questionnaire that * Correspondence: [email protected] 1 Department of Psychiatry, University Medical Centre Groningen, University of Groningen, the Netherlands Full list of author information is available at the end of the article Winthorst et al. BMC Psychiatry 2011, 11:198 http://www.biomedcentral.com/1471-244X/11/198 © 2011 Winthorst et al; licensee BioMed Central Ltd. This is an Open Access article distributed under the terms of the Creative Commons Attribution License (http://creativecommons.org/licenses/by/2.0), which permits unrestricted use, distribution, and reproduction in any medium, provided the original work is properly cited.
-
Upload
independent -
Category
Documents
-
view
4 -
download
0
Transcript of Seasonality in depressive and anxiety symptoms among primary care patients and in patients with...

RESEARCH ARTICLE Open Access
Seasonality in depressive and anxiety symptomsamong primary care patients and in patients withdepressive and anxiety disorders; results from theNetherlands Study of Depression and AnxietyWim H Winthorst1*, Wendy J Post2,3, Ybe Meesters1, Brenda WHJ Penninx1,4,5 and Willem A Nolen1
Abstract
Background: Little is known about seasonality of specific depressive symptoms and anxiety symptoms in differentpatient populations. This study aims to assess seasonal variation of depressive and anxiety symptoms in a primarycare population and across participants who were classified in diagnostic groups 1) healthy controls 2) patientswith a major depressive disorder, 3) patients with any anxiety disorder and 4) patients with a major depression andany anxiety disorder.
Methods: Data were used from the Netherlands Study of Depression and Anxiety (NESDA). First, in 5549 patientsfrom the NESDA primary care recruitment population the Kessler-10 screening questionnaire was used and datawere analyzed across season in a multilevel linear model. Second, in 1090 subjects classified into four groupsaccording to psychiatric status according to the Composite International Diagnostic Interview, overall depressivesymptoms and atypical versus melancholic features were assessed with the Inventory of Depressive Symptoms.Anxiety and fear were assessed with the Beck Anxiety Inventory and the Fear questionnaire. Symptom levels acrossseason were analyzed in a linear regression model.
Results: In the primary care population the severity of depressive and anxiety symptoms did not show a seasonalpattern. In the diagnostic groups healthy controls and patients with any anxiety disorder, but not patients with amajor depressive disorder, showed a small rise in depressive symptoms in winter. Atypical and melancholicsymptoms were both elevated in winter. No seasonal pattern for anxiety symptoms was found. There was a smallgender related seasonal effect for fear symptoms.
Conclusions: Seasonal differences in severity or type of depressive and anxiety symptoms, as measured with ageneral screening instrument and symptom questionnaires, were absent or small in effect size in a primary carepopulation and in patient populations with a major depressive disorder and anxiety disorders.
BackgroundEpidemiological studies of seasonal variation in the pre-valence of mental disorders have shown divergingresults. Seasonal variation in the prevalence of the majormental disorders in general population surveys haverarely been noted, but prevalence rates of mood
(affective) disorders with a seasonal pattern have beenreported to range from 1% to as much as 12% [1].The majority of the latter studies reported on seasonal
affective disorder (SAD), defined in DSM IV as a recur-rent depressive disorder with a regular temporal rela-tionship between the onset of a major depressiveepisode and a particular time of the year (mostly fall orwinter) and has used specific instruments for its assess-ment [2,3]. The most widely used instrument in thosestudies is the Seasonal Pattern Assessment Question-naire (SPAQ), a self rating screening questionnaire that
* Correspondence: [email protected] of Psychiatry, University Medical Centre Groningen, Universityof Groningen, the NetherlandsFull list of author information is available at the end of the article
Winthorst et al. BMC Psychiatry 2011, 11:198http://www.biomedcentral.com/1471-244X/11/198
© 2011 Winthorst et al; licensee BioMed Central Ltd. This is an Open Access article distributed under the terms of the CreativeCommons Attribution License (http://creativecommons.org/licenses/by/2.0), which permits unrestricted use, distribution, andreproduction in any medium, provided the original work is properly cited.

retrospectively measures seasonal variation in mood,social activities and atypical depressive symptoms suchas increased sleep, increased appetite and weight and alowered energy level [4]. Female gender and young agehave been described to be associated with a higher pre-valence of SAD [5,6]. The influence of latitude on theprevalence of SAD has been suggested but could not bedemonstrated [7,8].Absence of seasonal variation in the prevalence of
mental disorders has been reported in studies in whichdata were collected using general structured interviewsor questionnaires on depression in different months ofthe year. For example, in New England (USA) in a studyinvolving 1,500 patients of a psychiatric outpatient prac-tice using the Structured Clinical Interview for DSM-IV(SCID), there were no higher rates of onset of majordepressive disorders in spring and fall, and no higherrates of atypical depression in the winter compared tothe other seasons [9]. In a multicenter study on the cur-rent prevalence of depression in the United Kingdom,Finland, Norway and Spain among 6608 participantsrandomly identified via census registers or primary caredatabases and using the Beck Depression Inventory(BDI), also no evidence of a systematic seasonal patternin depression was found [10]. In Iceland no seasonalmood change could be demonstrated in a cross sectionalstudy using the Hospital Anxiety and Depression Ques-tionnaire in four 1000-person cohorts who received thequestionnaire in either January, April, July or October[11]. Similarly, in a Dutch general population surveyamong 7076 participants (NEMESIS), and using theComposite International Diagnostic Interview (CIDI), noseasonal difference was found in the 1-month prevalenceof the main categories of mood disorders or for thebroad category of anxiety disorders [12]. And finally, ina UK study among 2,255 patients consulting their gen-eral practitioner who were screened over the course of ayear using the General Health Questionnaire (GHQ 30),no significant seasonal variation in GHQ scores wasfound [13].However, other studies also using general structured
interviews or questionnaires to assess depression didreport seasonal variations. In another Dutch generalpopulation study among 5356 participants, a highermean score on the Centre for Epidemiological StudiesDepression Scale (CES-D) was found in the winter com-pared to the summer [14]. In a general population studyin Norway among 11054 participants, modest variationsin the Hospital Anxiety and Depression Scale (HADS)were found, mean sum scores being slightly higher dur-ing November through March compared to the othermonths [15]. In a US study among 1556 men and 314women using the Hopkins Symptom Checklist, womenscored significantly higher in winter on the expanded
mood scale [16]. Finally, in the US National Comorbid-ity Survey among 8,089 participants and using CIDI, alifetime prevalence of major depression with a seasonalpattern of 0.4% was found, and a prevalence of major orminor depression with a seasonal pattern of 1.0%[17].In addition, the studies mentioned above did not mea-
sure seasonality in severity of atypical depressive symp-toms, melancholic depressive symptoms and anxietysymptoms in specific patient groups with depressive andanxiety disorders.The aim of this study was to determine if seasonal
variation exists in the severity and type of depressiveand anxiety symptoms in general and among patientswith a depressive or anxiety disorder. More specificthree questions were formulated: (1) Does a seasonalpattern exist in the severity of depressive and anxietysymptoms among patients visiting their general practi-tioner for any reason?(2) Does a seasonal pattern exist in the severity of
depressive or anxiety symptoms among patients with acurrent depressive disorder, a current anxiety disorder, acurrent depressive and anxiety disorder, and amonghealthy controls; and is there a difference between thesegroups?(3) Does a seasonal pattern exist in type of depressive
symptoms (i.e. atypical or melancholic) among andbetween these groups?
MethodsThe study was conducted using data from the Nether-lands Study of Depression and Anxiety (NESDA, http://www.nesda.nl): (1) the NESDA primary care recruitmentpopulation and (2&3) the NESDA baseline population[18]. NESDA is an ongoing multi-site naturalistic 8-yearlongitudinal cohort study among 2,981 adults (18-65years), aimed at describing the long-term course andconsequences of depressive and anxiety disorders. TheNESDA sample (total n = 2981) is stratified for setting:community, primary care and specialized mental healthcare. The community sample (n = 564) was built on twocohorts that were already available through prior studiesdescribed in detail elsewhere [19]. The primary care par-ticipants (n = 1610) were recruited among 23,750patients from practices of 65 general practitioners (GPs)in the vicinity of three research sites. The specializedmental health patients (n = 807) were recruited fromoutpatient clinics of regional facilities for mental healthcare around the research sites.Across recruitment settings, uniform inclusion and
exclusion criteria were used. The NESDA sampleincluded a range of psychopathology: those with no life-time anxiety or depressive disorders (including healthycontrols), those with a current first or recurrent depres-sive disorder (major depressive disorder or dysthymic
Winthorst et al. BMC Psychiatry 2011, 11:198http://www.biomedcentral.com/1471-244X/11/198
Page 2 of 18

disorder) or anxiety disorder (panic disorder with orwithout agoraphobia, agoraphobia, social phobia or gen-eralized anxiety disorders) and those with earlier epi-sodes, or at risk because of sub threshold symptoms ora positive parental history for depressive or anxiety dis-orders. Excluded were patients with a psychotic disor-der, bipolar disorder, obsessive compulsive disorder, orsevere substance use disorder, and persons not fluent inDutch.
Ethics StatementThe study protocol of NESDA was approved by theEthical Review Board of the VU University MedicalCenter, the Leiden University Medical Center and theUniversity Medical Center Groningen. After full verbaland written information about the study, writteninformed consent was obtained from all participants atthe start of baseline assessment. A full ethics statementof NESDA and detailed information on objectives andmethods of NESDA were published elsewhere [18].
SubjectsThe NESDA primary care recruitment population, towhom the Kessler-10 screening questionnaire was sent,consisted of a random sample of all patients who hadvisited their GP during the previous four months forany reason from January 2004 to February 2007. Thedate the questionnaire was filled out was recorded forparticipants from the research sites in Amsterdam andGroningen (latitude 52,3° and 53,2° respectively). Ques-tionnaires with two or more answers missing wereexcluded.The NESDA baseline population comprised partici-
pants of the NESDA cohort who met the criteria of oneof four groups: 1) Healthy controls (HC), i.e. no lifetimedepressive or anxiety disorder; 2) Major depressive dis-order (MDD) last month; 3) Any anxiety disorder(AAD) last month; 4) Both major depressive disorderand any anxiety disorder (MDD + AAD) last month.Participants with a lifetime MDD or AAD but notwithin the last month, and those not completing the selfreport questionnaires (see below) within 7 days of thebaseline-interview, were left out of the analysis.
MeasuresIn the NESDA primary care recruitment population (n =5,549) the Kessler-10 screening questionnaire (K-10) wasused. The K10 has proven screening qualities for affec-tive disorders based on questions about anxiety anddepressive symptoms that a person has experienced inthe past 4 weeks [20,21].In the NESDA baseline population (n = 1,090) the
CIDI (WHO version 2.1) was used to establish diagnosesof MDD and AAD according to DSM-IV criteria
(American Psychiatric Association, 2001). Within 7 daysprior or after the CIDI interview, all participants com-pleted several self-report questionnaires. Severity ofdepression was assessed with the Inventory of Depres-sive Symptoms, 30 item self-report versions (IDS) [22].Moreover, the IDS was used to assess the presence andseverity of atypical and melancholic features, as the IDSincludes all symptoms of these specifiers. Therefore acontinuous atypical specifier was constructed (At-IDS):a summation of the scores on the items mood reactivity,the highest score of either weight gain or increase inappetite, hypersomnia, leaden paralysis, and interperso-nal rejection sensitivity (score range 0 - 3, total scorerange 0 - 15). The scores of the item mood reactivitywere recoded (reversed) resulting in an item that countsthe presence of the symptom mood reactivity in stead ofits absence. Participants with one or more missing itemswere excluded from the analysis. Also a continuous mel-ancholic specifier was constructed (Mel-IDS): a summa-tion of the scores on the items: loss of pleasure, lack ofreactivity to usually pleasurable stimuli, depressedmood, regularly worse in the morning, early morningawakening, psychomotor retardation or agitation, thehighest score of either anorexia or weight loss, andexcessive or inappropriate guilt (score range 0 - 3, totalscore range 0 - 24). Also for Mel-IDS participants withmissing items were excluded from the analysis.The Beck Anxiety Inventory (BAI), a 21-item self-
report instrument, was used to assess overall severity ofanxiety [23]. Finally the 15-item self-report version ofthe Fear Questionnaire (FQ) was used to measure sever-ity of fear and avoidance [24].
Statistical analysisThe dates were categorized into the four seasons(spring: March 21 - June 20, summer: June 21 - Septem-ber 20, autumn: September 21-December 20, winter:December 21 - March 20). SPSS (SPSS 16.02 inc., 2008)and MLwin (2.02) were used to analyze the data.Descriptive analyses with means and standard errors forquantitative data were calculated. 95% Confidence inter-vals were calculated and a p-value smaller than 0.05(two-sided) was considered to be significant.
Question 1. Seasonality in severity of depressive andanxiety symptoms among primary care patients(recruitment population)As the distribution of the K-10 total score was skewedand the assumption of normality was violated, the logtransformed K-10 score (LnK10) was calculated andused as outcome variable. Taking into account the factthat each GP had several participants, and assumingthat there could be dependency between participantswithin the practices of the GPs, multilevel analysis (by
Winthorst et al. BMC Psychiatry 2011, 11:198http://www.biomedcentral.com/1471-244X/11/198
Page 3 of 18

MLwin) was used to analyze the course over time. Inthis analysis the GP’s were considered to be on thehighest level, and participants on the lowest level. Forthe quantitative outcome measure (LnK10), a linearmodel was specified.Analysis started with the empty model, a model only
including an intercept with random terms. In thismodel, the different sources of variability (within GP’sand between GP’s) were distinguished. Then, differentmodels for the time course were specified, based on thefour seasons, and different combinations of fixed andrandom effects. Differences in deviance determinedwhether the different specifications of the time coursewere significant or not. Additionally, the predictors gen-der, age, and the location of the field site were includedas fixed effects. Interaction terms were explored as well.
Question 2 & 3. Seasonality in severity of depressive andanxiety symptoms and type of depressive symptoms inpatients with a current depressive and/or anxietydisorder and in healthy controlsFor all continuous outcome measures (IDS, At-IDS,Mel-IDS, BAI and FQ), a linear regression model wasspecified with group, season, age and gender as indepen-dent variables. Only significant main effects wereincluded in the model. Analysis started with a modelonly including the four groups of participants. Then, dif-ferent models were specified with the four seasons, ageand gender as predictors. Based on literature anddescriptive statistics, two way interactions between sea-son, gender, age and group were analyzed. Significantinteractions were additionally included in the model.Standardized regression coefficients were calculated andwere used as a measure for the clinical relevance of thefindings.
ResultsQuestion 1. Seasonality in severity of depressive andanxiety symptoms among primary care patients(recruitment population)A total of 23,750 questionnaires was sent out. 10,706 K-10 questionnaires were returned (45%). Those returningthe K-10 (10,706) were more likely to be women (59.3%versus 50.0%, p < .001) and older (44.4 versus 39.0years, p < .001) compared to those not returning thescreener. The date the K-10 was filled out could berecovered for 5,563 participants from the field sites inAmsterdam and Groningen. Because these dates werenot recorded in Leiden the participants from the fieldsite Leiden were excluded from the analysis. Off theremainder 14 K-10 questionnaires had 2 or moreanswers missing; and were excluded as a consequence.The resuming 5,549 participants from 44 GPs wereincluded in the analysis, consisting of 3664 (66%)
women and 1885 (34%) men. The mean age was 43.6years (SE = 0.17).In Figure 1 the observed means and standard errors of
the K-10 score are presented per season. The observedtotal mean K-10 score was 19.2 (SE = 0.11), the medianscore was 17 (range 10-50), the lowest scores wererecorded in summer and the highest scores in autumn.The mean score for women was higher than the meanscore for men. Older participants scored lower thanyounger participants, with younger women scoringhigher than younger men. Amsterdam participants (n =3392) scored higher than Groningen participants (n =2157).In table 1 the results of the multilevel regression ana-
lysis are presented for the log transformed K-10 scores.The second model with the seasons as a predictor (withspring as a reference), explains only little more variabil-ity than the empty model as can be seen in the differ-ence of the deviance (empty model 5086.6; model withseasons 5085.6). In this second model the differencebetween de seasons was not significant (summer -0.014,SE 0.019; autumn -0.002, SE 0.021; winter -0.013, SE0.021).Adding the covariates gender, age and site the final
model showed that these variables contribute signifi-cantly to the explanation of the model (gender 0.065, SE0.011; age 0.002, SE 0.000; site -0.127, SE 0.019) butthere was no significant difference between the seasons(summer -0.015, SE 0.018; autumn -0.022, SE 0.019;winter -0.002, SE 0.019). No significant interactionswere found between the seasons and these covariates,nor between the covariates themselves.Back transformation of the log transformed K-10
scores revealed that women scored 1.07 higher thanmen and participants in Amsterdam scored 1.15 higherthan participants in Groningen. On the highest level,there was a significant difference of 1.01 points betweenthe GP’s.
Question 2 & 3. Seasonality in severity of depressive andanxiety symptoms and type of depressive symptoms inpatients with a current depressive and/or anxietydisorder and in healthy controlsData comprised 1,090 participants (691 women = 63.4%)of the NESDA cohort (2,981 participants) who met thecriteria of one of four groups and completed the IDS:HC (n = 465), MDD (n = 131), AAD (n = 134), MDD +AAD (n = 360). The BAI and the FQ had one partici-pant missing, resulting in 1089 included participants. 16Participants were excluded due to missing items on At-IDS (1.5%) resulting in 1074 participants in the analysisof At-IDS. 57 Participants were excluded due to missingitems on Me-IDS (5.2%) resulting in 1033 participantsin the analysis of Me-IDS.
Winthorst et al. BMC Psychiatry 2011, 11:198http://www.biomedcentral.com/1471-244X/11/198
Page 4 of 18

Figure 1 Kessler-10 screening Questionnaire: mean score per season. Primary care patients (n = 5549). Values are mean scores. Error barsrepresent standard errors of the mean. Seasons: spring (March 21 - June 20), autumn (September 21-December 20), winter (December 21 -March 20). There was no statistical difference between the seasons (defined as p < 0,05).
Table 1 Model of the log transformated scores of the Kessler-10 questionnaire
Empty model1 Seasons2 Full model3
Fixed Effect b (SE) b (SE) b (SE)
Intercept 2.887 (0.013) 2.863 (0.024) 2.984 (0.025)
Spring (reference)
Summer -0.014 (0.019) -0.015 (0.018)
Autumn -0.002 (0.021) 0.022 (0.019)
Winter -0.013 (0.021) -0.002 (0.019)
Men (reference)
Women 0.065 (0.011)*
Age -0.002 (0.000)*
Amsterdam (reference)
Groningen -0.127 (0.019)*
Random Effect
Level two: General practitioner Intercept variance 0.007 (0.002) 0.007 (0.002) 0.002 (0.001)*
Level one: Individual variance 0.144 (0.003) 0.144 (0.003) 0.142 (0.003)
Deviance 5086.6 5085.6 4928.3
b = Beta
SE = standard error
* p < 0.051) Empty model2) Model with seasons3) Full model with seasons and covariates
Winthorst et al. BMC Psychiatry 2011, 11:198http://www.biomedcentral.com/1471-244X/11/198
Page 5 of 18
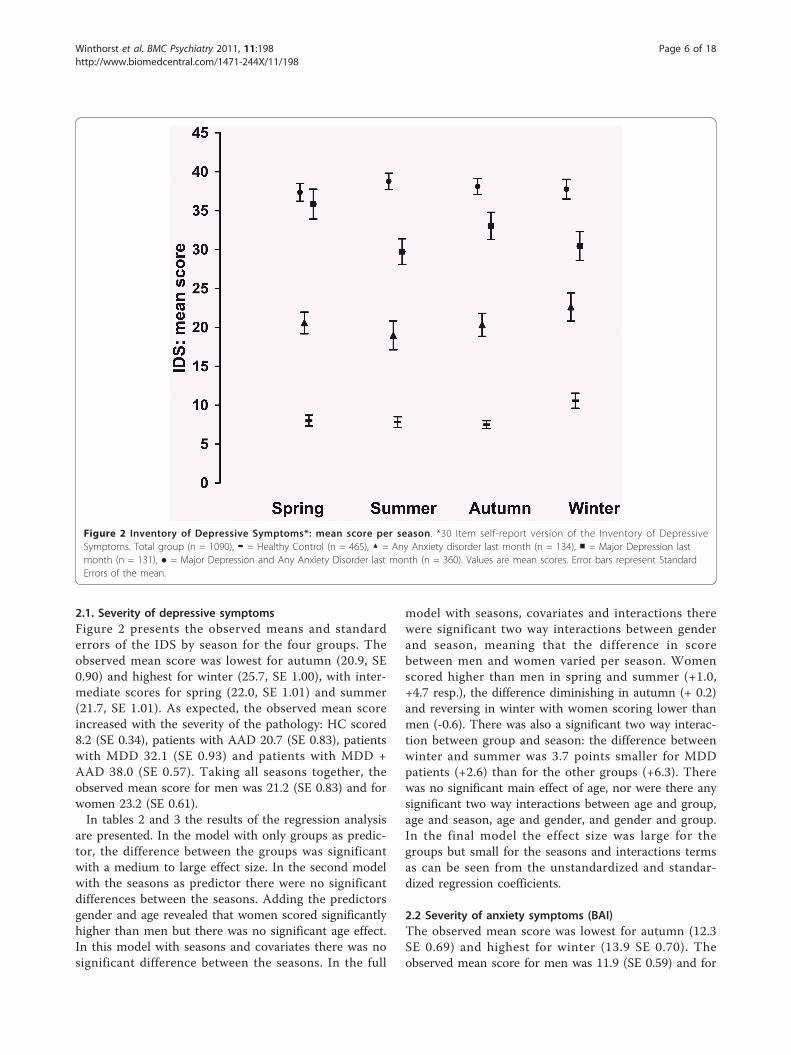
2.1. Severity of depressive symptomsFigure 2 presents the observed means and standarderrors of the IDS by season for the four groups. Theobserved mean score was lowest for autumn (20.9, SE0.90) and highest for winter (25.7, SE 1.00), with inter-mediate scores for spring (22.0, SE 1.01) and summer(21.7, SE 1.01). As expected, the observed mean scoreincreased with the severity of the pathology: HC scored8.2 (SE 0.34), patients with AAD 20.7 (SE 0.83), patientswith MDD 32.1 (SE 0.93) and patients with MDD +AAD 38.0 (SE 0.57). Taking all seasons together, theobserved mean score for men was 21.2 (SE 0.83) and forwomen 23.2 (SE 0.61).In tables 2 and 3 the results of the regression analysis
are presented. In the model with only groups as predic-tor, the difference between the groups was significantwith a medium to large effect size. In the second modelwith the seasons as predictor there were no significantdifferences between the seasons. Adding the predictorsgender and age revealed that women scored significantlyhigher than men but there was no significant age effect.In this model with seasons and covariates there was nosignificant difference between the seasons. In the full
model with seasons, covariates and interactions therewere significant two way interactions between genderand season, meaning that the difference in scorebetween men and women varied per season. Womenscored higher than men in spring and summer (+1.0,+4.7 resp.), the difference diminishing in autumn (+ 0.2)and reversing in winter with women scoring lower thanmen (-0.6). There was also a significant two way interac-tion between group and season: the difference betweenwinter and summer was 3.7 points smaller for MDDpatients (+2.6) than for the other groups (+6.3). Therewas no significant main effect of age, nor were there anysignificant two way interactions between age and group,age and season, age and gender, and gender and group.In the final model the effect size was large for thegroups but small for the seasons and interactions termsas can be seen from the unstandardized and standar-dized regression coefficients.
2.2 Severity of anxiety symptoms (BAI)The observed mean score was lowest for autumn (12.3SE 0.69) and highest for winter (13.9 SE 0.70). Theobserved mean score for men was 11.9 (SE 0.59) and for
Figure 2 Inventory of Depressive Symptoms*: mean score per season. *30 Item self-report version of the Inventory of DepressiveSymptoms. Total group (n = 1090), ▬ = Healthy Control (n = 465), ▲ = Any Anxiety disorder last month (n = 134), ■ = Major Depression lastmonth (n = 131), ● = Major Depression and Any Anxiety Disorder last month (n = 360). Values are mean scores. Error bars represent StandardErrors of the mean.
Winthorst et al. BMC Psychiatry 2011, 11:198http://www.biomedcentral.com/1471-244X/11/198
Page 6 of 18

women 13.6 (SE 0.46). The observed mean score for HCwas 3.9 (SE 0.23), for patients with AAD 15.8 (SE 0.88),for patients with MDD 14.9 (SE 0.90) and for patientswith MDD + AAD 13.0 (SE 0.36). In Figure 3 theobserved means and standard errors of the BAI are pre-sented by season for the four groups.In tables 4 and 5 the results of the regression analysis
are presented. In the model with only groups as predic-tor, the difference between the groups was significantwith a medium to large effect size. In the second modelwith the seasons as predictor there were no significantdifferences between the seasons. Adding the predictorsgender and age revealed that women scored significantlyhigher than men but there was no significant age effect.In this model with seasons and covariates there was stillno significant difference between the seasons. In the fullmodel with seasons, covariates and interactions therewere significant two way interactions between seasonand group: Patients with a MDD scored lower in wintercompared to summer (-2.9) and patients with MDD +AAD scored lower in spring compared to the summer(-2.9). There were significant main effects for thegroups: patients with MDD and AAD scored higherthan HC (+ 11.8). This was reduced in winter forpatients with MDD (+ 8.9). Patients with MDD + AADscored higher than HC (+20.2) which was reduced inwinter (+ 17.3). There was a significant main effect forgender; women scored higher than men (+1.2). Therewas no significant main effect of age and there were no
significant two way interactions between age and gender,age and season, age and group, gender and group orseason and gender. In the final model the effect size waslarge for the groups but small for the seasons and inter-actions terms as can be seen from the unstandardizedand standardized regression coefficients.
2.3 Severity of anxiety symptoms (FQ)The observed mean score was low for autumn (22.9 SE1.2) and spring (23.9 SE 1.20), and high for summer(26.4 SE 1.35) and winter (27.0 SE 1, 23). The observedmean score for men was 21.9 (SE 0.97) and for women26.7 (SE 0.81). In Figure 4 the observed means and stan-dard errors of the FQ are presented by season for thefour groups.In tables 6 and 7 the results of the regression analysis
are presented. In the model with only groups as predic-tor, the difference between the groups was significantwith a small to large effect size. In the second modelwith the seasons as predictor there were no significantdifferences between the seasons. Adding the predictorsgender and age revealed that women scored significantlyhigher than men but there was no significant age effect.In this model with seasons and covariates there was stillno significant difference between the seasons. In the fullmodel with seasons, covariates and interactions therewere significant two way interactions between seasonand gender with women scoring higher in summer andautumn compared tot men (+7.1). The difference
Table 2 IDS total score: regression model with groups and model with seasons
Main Effects B SE LB UB b p B SE LB UB b p
Intercept 8.24 0.43 7.40 9.08 < 0.01* 7.90 0.66 6.60 9.20 < 0.01*
HC (reference)
MDD 23.86 0.92 22.06 25.66 .73 < 0.01* 23.74 0.92 21.94 25.55 .73 < 0.01*
AAD 12.45 0.91 10.67 14.23 .38 < 0.01* 12.34 0.91 10.55 14.14 .38 < 0.01*
MDD + AAD -6.55 1.31 -9.12 -3.98 -.19 < 0.01* -6.41 1.32 -8.99 -3.83 -.19 < 0.01*
Summer (reference)
Autumn 0.14 0.77 -1.38 1.65 .00 0.86
Winter 1.09 0.82 -0.53 2.70 .03 0.19
Spring 0.46 0.82 - 1.16 2.07 .01 0.58
IDS = Inventory of Depressive Symptoms
B = Unstandardized Coefficient
SE = standard error of B
LB = Lower Bound of 95% Confidence Interval for B
UB = Upper Bound of 95% Confidence Interval for B
b = Standardized Coefficient
* p < 0.05
HC = Healthy Control
MDD = Major Depressive Disorder
AAD = Any Anxiety Disorder
MDD + AAD = Major Depressive Disorder + Any Anxiety Disorder
Note: adjusted R2 Model with groups = 0,675
Note: adjusted R2 Model with seasons = 0,674
Winthorst et al. BMC Psychiatry 2011, 11:198http://www.biomedcentral.com/1471-244X/11/198
Page 7 of 18

between women and men was levelled in spring andmarginal in winter (+1). There were significant maineffects for the groups: patients with MDD scored 12points higher than HC, patients with AAD scored 17.1points higher than HC and patients with MDD an AADscored 27.4 points higher than HC. There was no signif-icant main effect of age and there were no significanttwo way interactions between age and gender, age andseason, age and group, gender and group or season andgroup. In the final model the effect size was medium forthe groups but small for the seasons and interactionsterms as can be seen from the unstandardized and stan-dardized regression coefficients.
3.1. Atypical depressive symptomsIn Figure 5 the observed means and standard errors ofthe atypical symptoms are presented by season for thefour groups. The observed mean score was lowest forautumn (5.4, SE 0.13) and highest for winter (6.1 SE0.15), with intermediate scores for spring (5.6 SE 0.14)
and summer (5.5 SE .15). The observed mean score forHC was 4.3 (SE 0.07), for patients with AAD 5.5 (SE0.16), for patients with MDD 6.5 (SE 0.20) and forpatients with MDD + AAD 7.2 (SE 0.12). Taking all sea-sons into account, the observed mean score for men was5.2 (SE 0.11) and 5.9 (SE 0.09) for women.In tables 8 and 9 the results of the regression analysis
are presented. In the model with only groups as predic-tor, the difference between the groups was significantwith a small to large effect size. In the second modelwith the seasons as predictor there were no significantdifferences between the seasons. Adding the predictorsgender and age revealed that women scored significantlyhigher than men and younger participants scored signifi-cantly higher than older participants. In this model withseasons and covariates there was no significant differ-ence between the seasons. In the full model with sea-sons, covariates and interactions there were significanttwo way interactions between gender and season andbetween gender and age. Women scored lower in
Table 3 IDS total score: regression model with groups, seasons, covariates and full model with interactions
Main Effects B SE LB UB b p B SE LB UB b p
Intercept 5.83 1.18 3.50 8.15 < 0.01* 4.60 1.00 2.64 6.56 < 0.01*
HC (reference)
MDD 23.75 0.92 21.95 25.55 .72 < 0.01* 24.80 0.97 22.90 26.69 .76 < 0.01*
AAD 12.37 0.91 10.58 14.16 .38 < 0.01* 12.36 0.91 10.58 14.15 .38 < 0.01*
MDD + AAD -6.51 1.31 -9.09 -3.94 -.19 < 0.01* -6.63 1.31 -9.19 -4.06 -.19 < 0.01*
Summer (reference)
Autumn 0.12 0.77 -1.40 1.63 .00 0.88 2.94 1.25 0.48 5.39 .08 0.02*
Winter 1.08 0.82 -0.53 2.70 .03 0.19 6.28 1.50 3.35 9.21 .16 < 0.01*
Spring 0.45 0.82 -1.16 2.07 .01 0.59 2.72 1.37 0.04 5.40 .07 0.05*
Men (reference)
Women 1.36 0.58 0.21 2.50 .40 0.002* 4.70 1.18 2.38 7.02 .14 < 0.01*
Age 0.03 0.02 -0.01 0.07 .02 0.16
Two way interactions
Winter & MDD -3.74 1.33 -6.35 -1.13 .08 < 0.01*
Autumn & Women -4.53 1.58 -7.64 -1.43 -.11 < 0.01*
Winter & Women -5.34 1.68 -8.63 -2.04 -.12 < 0.01*
Spring & Women -3.72 1.70 -7.07 -0.38 -.08 0.03*
IDS = Inventory of depressive Symptoms
B = Unstandardized Coefficient
SE = standard error of B
LB = Lower Bound of 95% Confidence Interval for B
UB = Upper Bound of 95% Confidence Interval for B
b = Standardized Coefficient
* p < 0.05
HC = Healthy Control
MDD = Major Depressive Disorder
AAD = Any Anxiety Disorder
MDD + AAD = Major Depressive Disorder + Any Anxiety Disorder
Note: adjusted R2 Model with seasons and covariates = 0,675
Note: adjusted R2 Full model with seasons, covariates and interactions = 0,680
Winthorst et al. BMC Psychiatry 2011, 11:198http://www.biomedcentral.com/1471-244X/11/198
Page 8 of 18

Figure 3 Becks Anxiety Inventory*: mean score per season. *21-item self-report version. Total group (n = 1089), ▬ = Healthy Control (n =465), ▲ = Any Anxiety disorder last month (n = 133), ■ = Major Depression last month (n = 131), ● = Major Depression and Any AnxietyDisorder last month (n = 360). Values are mean scores. Error bars are Standard Errors of the mean.
Table 4 Becks Anxiety Inventory: regression model with groups and model with seasons
Main Effects B SE LB UB b p B SE LB UB b p
Intercept 3.94 0.40 3.15 4.72 < 0.01* 3.84 0.62 2.63 5.05 < 0.01*
HC (reference)
MDD 10.92 0.85 9.24 12.60 .46 < 0.01* 11.02 0.86 9.34 12.71 .46 < 0.01*
AAD 11.91 0.85 10.24 13.57 .50 < 0.01* 12.01 0.86 10.33 13.69 .50 < 0.01*
MDD + AAD -3.93 1.22 -6.33 -1.53 -.16 < 0.01* -4.05 1.23 -6.47 -1.64 -.16 < 0.01*
Summer (reference)
Autumn 0.36 0.72 -1.05 1.78 .01 0.61
Winter -0.54 0.77 -2.05 0.97 .02 0.48
Spring 0.26 0.77 -1.24 1.77 .009 0.73
B = Unstandardized Coefficient
SE = standard error of B
LB = Lower Bound of 95% Confidence Interval for B
UB = Upper Bound of 95% Confidence Interval for B
b = Standardized Coefficient
* p < 0.05
HC = Healthy Control
MDD = Major Depressive Disorder
AAD = Any Anxiety Disorder
MDD + AAD = Major Depressive Disorder + Any Anxiety Disorder
Note: adjusted R2 Model with groups = 0,478
Note: adjusted R2 Model with seasons = 0,477
Winthorst et al. BMC Psychiatry 2011, 11:198http://www.biomedcentral.com/1471-244X/11/198
Page 9 of 18

autumn compared to summer (-0.7) and for every addi-tional year of age women scored lower (-0.02), resultingin a 0.9 points diminished score for a 65 year oldwoman and a 0.5 points diminished score for a 43-yearold woman compared to 18-year old woman. There wasa significant main effect for the winter compared tosummer (+0.3). There were significant main effects forthe groups: patients with AAD, MMD and MMD +AAD scored higher than HC (resp. + 1.2, + 2.3, + 2.9).There were no significant two way interactions betweenage and season, age and group, gender and group orseason and group. In the final model the effect size wasmedium to large for the groups but small for the sea-sons and interactions terms as can be seen from theunstandardized and standardized regression coefficients.
3.2 Melancholic depressive symptomsThe observed mean score was lowest for summer andautumn (5.0, SE 0.29) and highest for winter (6.0 SE0.31). The observed mean score for both men andwomen was 5.3 (SE resp. 0.26 and 0.18). The observedmean score for HC was 1.6 (SE 0.10), for patients withAAD 4.5 (SE 0.30), for patients with MDD 8.2 (SE 0.36)and for patients with MDD + AAD 9.4 (SE 0.20). In Fig-ure 6 the observed means and standard errors of the
atypical symptoms are presented by season for the fourgroups.In tables 10 and 11 the results of the regression analy-
sis are presented. In the model with only groups as pre-dictor, the difference between the groups was significantwith a medium to large effect size. In the second modelwith the seasons as predictor there were no significantdifferences between the seasons. Adding the predictorsgender and age revealed that there was no significanteffect for gender or age. In this model with seasons andcovariates there was still no significant differencebetween the seasons. In the full model with seasons,covariates and interactions there was a significant twoway interaction between gender and group: women witha MDD scored lower than men with MDD (-1.1)whereas there was no difference in score between menand women for the other groups. There was also a sig-nificant two way interaction between season and group:patients with MDD scored lower in winter (-0.4) com-pared to the summer whereas the other groups scoredhigher in winter compared to summer (+0.7). Therewere significant main effects for the groups: patientswith AAD scored higher than HC (+2.9) and patientswith MDD + AAD scored 8.8 points higher than HC.Taking the interactions mentioned into account, men
Table 5 Becks Anxiety Inventory: regression model with groups, seasons, covariates and full model with interactions
Main Effects B SE LB UB b p B SE LB UB b p
Intercept 3.09 0.70 1.71 4.46 < 0.01* 2.62 0.72 1.21 4.03 < 0.01*
HC (reference)
MDD 11.07 0.86 9.39 12.75 .46 < 0.01* 11.81 0.91 10.03 13.60 .49 < 0.01*
AAD 12.02 0.85 10.35 13.70 .50 < 0.01* 11.83 0.85 10.15 13.51 .49 < 0.01*
MDD + AAD -4.16 1.23 -6.57 -1.76 -.16 < 0.01* -3.43 1.27 -5.91 -0.95 -.14 < 0.01*
Summer (reference)
Autumn 0.34 0.72 -1.07 1.75 .01 0.64 0.35 0.72 -1.06 1.76 .01 0.63
Winter -0.55 0.77 -2.05 0.96 .02 0.48 0.92 1.01 -1.05 2.89 .03 0.36
Spring 0.20 0.77 -1.30 1.71 .007 0.27 1.13 0.88 -0.60 2.86 .04 0.20
Men (reference)
Women 1.24 0.54 0.17 2.31 .05 0.02* 1.23 0.54 0.16 2.29 .05 0.02*
Two way interactions
Winter & MDD -2.93 1.28 -5.44 -0.42 -.08 0.02*
Spring & MDD + AAD -2.86 1.37 -5.53 -0.18 -.06 0.04*
B = Unstandardized Coefficient
SE = standard error of B
LB = Lower Bound of 95% Confidence Interval for B
UB = Upper Bound of 95% Confidence Interval for B
b = Standardized Coefficient
* p < 0.05
HC = Healthy Control
MDD = Major Depressive Disorder
AAD = Any Anxiety Disorder
MDD + AAD = Major Depressive Disorder + Any Anxiety Disorder
Note: adjusted R2 Model with seasons and covariates = 0,480
Note: adjusted R2 Full model with seasons, covariates and interactions = 0,482
Winthorst et al. BMC Psychiatry 2011, 11:198http://www.biomedcentral.com/1471-244X/11/198
Page 10 of 18
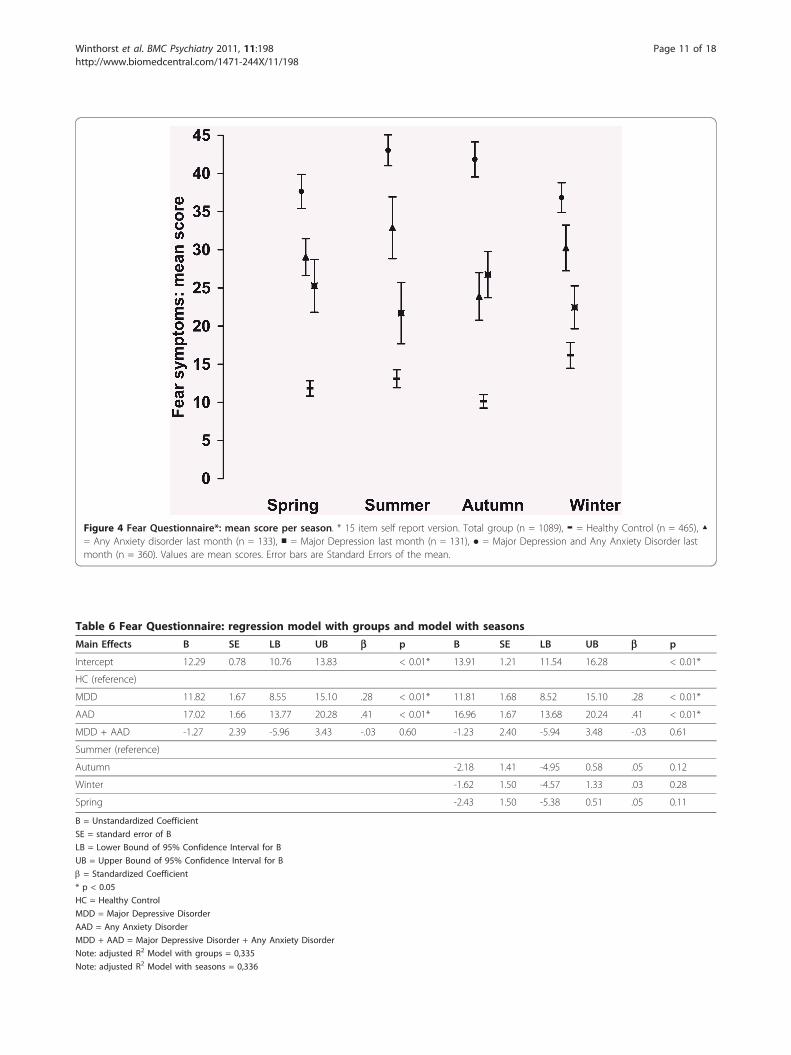
Figure 4 Fear Questionnaire*: mean score per season. * 15 item self report version. Total group (n = 1089), ▬ = Healthy Control (n = 465), ▲= Any Anxiety disorder last month (n = 133), ■ = Major Depression last month (n = 131), ● = Major Depression and Any Anxiety Disorder lastmonth (n = 360). Values are mean scores. Error bars are Standard Errors of the mean.
Table 6 Fear Questionnaire: regression model with groups and model with seasons
Main Effects B SE LB UB b p B SE LB UB b p
Intercept 12.29 0.78 10.76 13.83 < 0.01* 13.91 1.21 11.54 16.28 < 0.01*
HC (reference)
MDD 11.82 1.67 8.55 15.10 .28 < 0.01* 11.81 1.68 8.52 15.10 .28 < 0.01*
AAD 17.02 1.66 13.77 20.28 .41 < 0.01* 16.96 1.67 13.68 20.24 .41 < 0.01*
MDD + AAD -1.27 2.39 -5.96 3.43 -.03 0.60 -1.23 2.40 -5.94 3.48 -.03 0.61
Summer (reference)
Autumn -2.18 1.41 -4.95 0.58 .05 0.12
Winter -1.62 1.50 -4.57 1.33 .03 0.28
Spring -2.43 1.50 -5.38 0.51 .05 0.11
B = Unstandardized Coefficient
SE = standard error of B
LB = Lower Bound of 95% Confidence Interval for B
UB = Upper Bound of 95% Confidence Interval for B
b = Standardized Coefficient
* p < 0.05
HC = Healthy Control
MDD = Major Depressive Disorder
AAD = Any Anxiety Disorder
MDD + AAD = Major Depressive Disorder + Any Anxiety Disorder
Note: adjusted R2 Model with groups = 0,335
Note: adjusted R2 Model with seasons = 0,336
Winthorst et al. BMC Psychiatry 2011, 11:198http://www.biomedcentral.com/1471-244X/11/198
Page 11 of 18

with MDD scored higher than HC (+7.5); this wasreduced to +6.6 points for women (-0.9) and to +5.5(-1.1) points for women in winter. There was no signifi-cant main effect of age and there were no significanttwo way interactions between season and gender, ageand gender, age and season, age and group. In the finalmodel the effect size was medium to large for thegroups but small for the seasons and interactions termsas can be seen from the unstandardized and standar-dized regression coefficients.
DiscussionThe main findings of this study can be summarized asfollows. 1) Using a general screening questionnaire, noseasonal pattern in the severity of depressive and anxietysymptoms among primary care patients visiting theirgeneral practitioner for any reason could be demon-strated. 2) Among the four diagnostic groups of theNESDA baseline population a small rise of depressivesymptoms was found in winter for healthy controls andfor patients with any anxiety disorder but neither forpatients with a major depression nor for patients with amajor depression and an anxiety disorder. Statistical sig-nificant differences between the seasons were accompa-nied by small effect sizes. 3) Both atypical and
melancholic symptoms were slightly higher in winter. Adistinguishing seasonal pattern in type of (i.e. atypical ormelancholic) depressive symptoms could not be demon-strated. For anxiety symptoms (BAI) no seasonal effectcould be demonstrated. For symptoms of fear andavoidance (FQ) a small gender related seasonal effectwas found with more complaints among women in sum-mer and autumn.The finding of no seasonal pattern in the severity of
depressive and anxiety symptoms in a primary carepopulation (question 1) contrasts to the findings ofMersch et al. [14] who did find seasonality in depressivesymptoms as measured with the CES-D scores, and withOyane et al. [15] who found modest seasonal variationsin the depression scores on the Hospital Anxiety andDepression Scale (HADS), both in samples of the gen-eral population. These opposing findings might beexplained by differences in the populations under scru-tiny: general population versus primary care populationwhich could reflect a source of selection bias indepen-dent of season. However the results of our study are inline with studies in the general population that failed todemonstrate seasonal fluctuation in the prevalence ofdepression using general diagnostic instruments like theBDI and the CIDI [10,12]. The results of our study are
Table 7 Fear Questionnaire: regression model with groups, seasons, covariates and full model with interactions
Main Effects B SE LB UB b p B SE LB UB b p
Intercept 11.42 1.36 8.75 14.10 < 0.01* 9.56 1.48 1.21 6.65 < 0.01*
HC (reference)
MDD 11.97 1.67 8.70 15.24 .29 < 0.01* 11.98 1.67 10.03 8.72 .29 < 0.01*
AAD 17.01 1.66 13.75 20.26 .41 < 0.01* 17.07 1.66 10.15 13.82 .41 < 0.01*
MDD + AAD -1.60 2.39 -6.28 3.09 -.04 0.51 -1.68 2.38 -5.91 -6.36 -.04 < 0.48
Summer (reference)
Autumn -2.26 1.40 -5.01 0.49 -.05 0.11 -2.31 1.40 -1.06 -5.05 .05 0.09
Winter -1.63 1.49 -4.56 1.29 .03 0.27 2.17 2.19 -1.05 -2.13 .04 0.32
Spring -2.63 1.49 -5.56 0.30 .05 0.78 1.91 2.28 -0.60 -2.56 .04 0.40
Men (reference)
Women 4.09 1.06 2.01 6.16 .10 < 0.01* 7.10 1.43 0.16 4.29 .17 < 0.01*
Two way interactions
Spring & Women -7.05 2.60 -5.44 -11.24 -.10 0.02*
Winter & Women -6.14 2.65 -5.53 -12.25 -.12 < 0.01*
B = Unstandardized Coefficient
SE = standard error of B
LB = Lower Bound of 95% Confidence Interval for B
UB = Upper Bound of 95% Confidence Interval for B
b = Standardized Coefficient
* p < 0.05
HC = Healthy Control
MDD = Major Depressive Disorder
AAD = Any Anxiety Disorder
MDD + AAD = Major Depressive Disorder + Any Anxiety Disorder
Note: adjusted R2 Model with seasons and covariates = 0,344
Note: adjusted R2 Full model with seasons, covariates and interactions = 0,349
Winthorst et al. BMC Psychiatry 2011, 11:198http://www.biomedcentral.com/1471-244X/11/198
Page 12 of 18
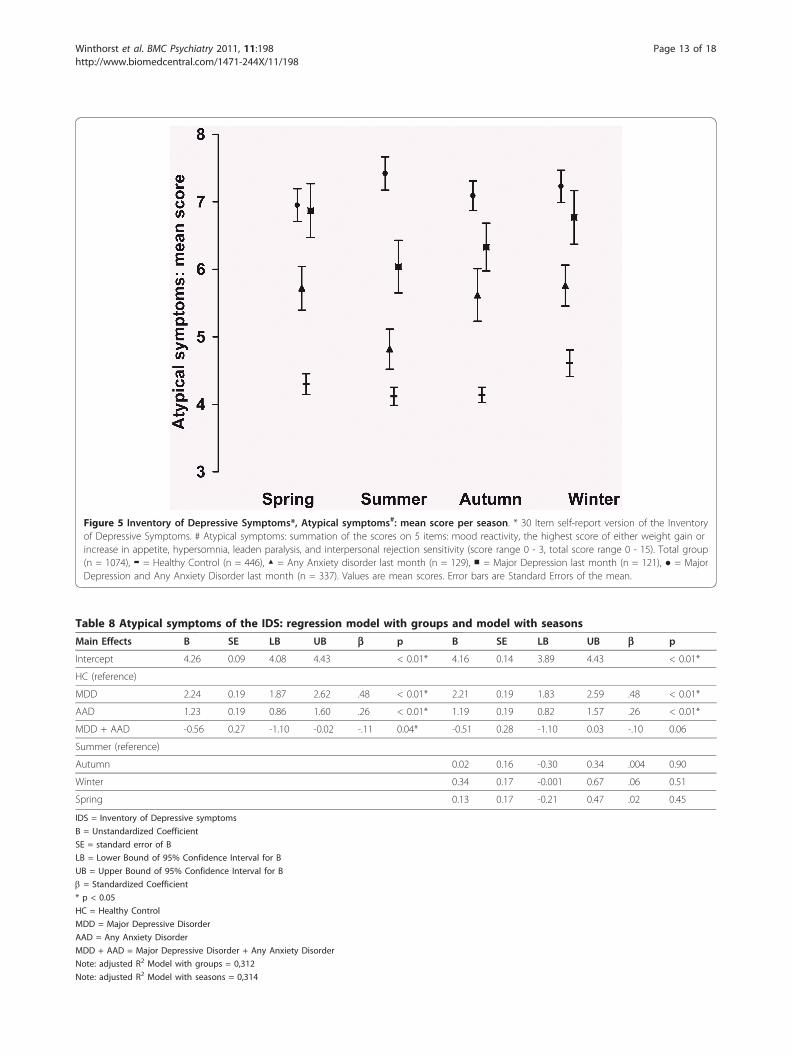
Figure 5 Inventory of Depressive Symptoms*, Atypical symptoms#: mean score per season. * 30 Item self-report version of the Inventoryof Depressive Symptoms. # Atypical symptoms: summation of the scores on 5 items: mood reactivity, the highest score of either weight gain orincrease in appetite, hypersomnia, leaden paralysis, and interpersonal rejection sensitivity (score range 0 - 3, total score range 0 - 15). Total group(n = 1074), ▬ = Healthy Control (n = 446), ▲ = Any Anxiety disorder last month (n = 129), ■ = Major Depression last month (n = 121), ● = MajorDepression and Any Anxiety Disorder last month (n = 337). Values are mean scores. Error bars are Standard Errors of the mean.
Table 8 Atypical symptoms of the IDS: regression model with groups and model with seasons
Main Effects B SE LB UB b p B SE LB UB b p
Intercept 4.26 0.09 4.08 4.43 < 0.01* 4.16 0.14 3.89 4.43 < 0.01*
HC (reference)
MDD 2.24 0.19 1.87 2.62 .48 < 0.01* 2.21 0.19 1.83 2.59 .48 < 0.01*
AAD 1.23 0.19 0.86 1.60 .26 < 0.01* 1.19 0.19 0.82 1.57 .26 < 0.01*
MDD + AAD -0.56 0.27 -1.10 -0.02 -.11 0.04* -0.51 0.28 -1.10 0.03 -.10 0.06
Summer (reference)
Autumn 0.02 0.16 -0.30 0.34 .004 0.90
Winter 0.34 0.17 -0.001 0.67 .06 0.51
Spring 0.13 0.17 -0.21 0.47 .02 0.45
IDS = Inventory of Depressive symptoms
B = Unstandardized Coefficient
SE = standard error of B
LB = Lower Bound of 95% Confidence Interval for B
UB = Upper Bound of 95% Confidence Interval for B
b = Standardized Coefficient
* p < 0.05
HC = Healthy Control
MDD = Major Depressive Disorder
AAD = Any Anxiety Disorder
MDD + AAD = Major Depressive Disorder + Any Anxiety Disorder
Note: adjusted R2 Model with groups = 0,312
Note: adjusted R2 Model with seasons = 0,314
Winthorst et al. BMC Psychiatry 2011, 11:198http://www.biomedcentral.com/1471-244X/11/198
Page 13 of 18

also supported by Magnusson et al. [11] who reportedon the lack of seasonality in anxiety and depression,measured with the HADS, in the Icelandic populationand by Blacker et al. [13], who found no significant sea-sonal variation in General Health Questionnaire scoresin a primary care population. A second explanation maybe found in the difference in data collection. In the stu-dies by Mersch et al. [14], and Oyane et al. [15] season-ality was assessed retrospectively using questionnairesthat assessed fluctuations of symptoms over the year.Like Nayar and Cochrane [25] we think that due torecall bias the retrospective data collection might lead toan overestimation of the seasonal fluctuation in severityand prevalence of affective symptoms. In this study, asin the study by Blacker et al. [13], seasonality wasassessed using data on presence and severity of symp-toms collected in a cross-sectional way over the year.The cross sectional method of sampling in our studymight have introduced a source of selection bias withdifferent groups of patients in different seasons. A thirdexplanation might be that the percentage of patientswith a specific seasonal pattern of their complaints in a
random population of patients visiting their generalpractitioner is too small (ranging from 0.4 - 5.6%) tohave an effect on the mean scores of depression or anxi-ety symptoms in that population, even if the severity oftheir complaints and the health service use of thesepatients is increased in the winter [26]. For example Bla-zer et al. [17] found a prevalence of 0,4% of majordepression with a seasonal pattern and 1% of major orminor depression with a seasonal pattern in a commu-nity based sample, Levitt et al. [27] found a prevalenceof 2,9% of seasonal affective disorder in a communitysample, Eagles et. al. [6] found a prevalence of 5.3% ofseasonal affective disorder during the winter months ina primary care population and Thompson et al. [1]found a prevalence of 5.6% of seasonal affective disor-ders in a primary care population.The finding of minimal seasonal differences in severity
of depressive or anxiety symptoms (question 2) in var-ious clinical groups is in agreement with the study ofPosternak and Zimmerman [9], who did not find higherrates of depressive symptoms in winter in an out-patientpopulation. Seasonal fluctuation of depressive symptoms
Table 9 Atypical symptoms of the IDS: regression model with groups, seasons, covariates and full model withinteractions
B SE LB UB b p B SE LB UB b p
Intercept 4.27 0.24 3.79 4.74 < 0.01* 3.64 0.34 2.97 4.31 < 0.01*
HC (reference)
MDD 2.26 0.19 1.88 2.63 .48 < 0.01* 2.25 0.19 1.88 2.62 .48 < 0.01*
AAD 1.19 0.19 0.82 1.56 .26 < 0.01* 1.20 0.19 0.83 1.56 .26 < 0.01*
MDD + AAD -0.58 0.27 -1.10 -0.05 -.12 0.03* -0.57 0.27 -1.10 -0.04 -.12 0.04*
Summer (reference)
Autumn 0.003 0.16 -0.31 0.32 .001 0.98 0.44 0.23 -0.01 0.89 .09 0.54
Winter 0.33 0.17 0.002 0.67 .06 < 0.05* 0.34 0.17 0.01 0.67 .06 < 0.05*
Spring 0.07 0.17 -0.26 0.40 .01 0.67 0.06 0.17 -0.27 0.39 .01 0.73
Men (reference)
Women 0.65 0.12 0.42 0.89 .14 < 0.01* 1.71 0.40 0.92 2.50 .36 < 0.01*
Age -0.01 0.004 -0.02 0.03 -.07 < 0.01* 0.00 0.01 -0.01 0.01 .002 0.95
Two way interactions
Autumn & Women -0.73 0.26 -1.25 -0.22 -.13 < 0.01*
Age & Women -0.02 0.009 -0.037 -0.002 -.19 0.03*
IDS = Inventory of Depressive Symptoms
B = Unstandardized Coefficient
SE = standard error of B
LB = Lower Bound of 95% Confidence Interval for B
UB = Upper Bound of 95% Confidence Interval for B
b = Standardized Coefficient
* p < 0.05
HC = Healthy Control
MDD = Major Depressive Disorder
AAD = Any Anxiety Disorder
MDD + AAD = Major Depressive Disorder + Any Anxiety Disorder
Note: adjusted R2 Model with seasons and covariates = 0,337
Note: adjusted R2 Full model with seasons, covariates and interactions = 0,344
Winthorst et al. BMC Psychiatry 2011, 11:198http://www.biomedcentral.com/1471-244X/11/198
Page 14 of 18

Figure 6 Inventory of Depressive Symptoms*, Melancholic symptoms#: mean score per season. * 30 Item self-report version of theInventory of Depressive Symptoms. # Melancholic symptoms: summation of the scores on the items loss of pleasure, lack of reactivity to usuallypleasurable stimuli, depressed mood, regularly worse in the morning, early morning awakening, psychomotor retardation or agitation, thehighest score of either anorexia or weight loss, and excessive or inappropriate guilt (score range 0 - 3, total score range 0 - 24). Total group (n =1033), ▬ = Healthy Control (n = 446), ▲ = Any Anxiety disorder last month (n = 129), ■ = Major Depression last month (n = 121), ● = MajorDepression and Any Anxiety Disorder last month (n = 337). Values are mean scores. Error bars are Standard Errors of the mean.
Table 10 Melancholic symptoms of the IDS: regression model with groups and model with seasons
Main Effects B SE LB UB b p B SE LB UB b p
Intercept 1.56 0.15 1.28 1.84 < 0.01* 1.42 0.22 0.98 1.86 < 0.01*
HC (reference)
MDD 6.65 0.31 6.04 7.27 .71 < 0.01* 6.64 0.31 6.03 7.26 .70 < 0.01*
AAD 2.94 0.31 2.34 3.53 .32 < 0.01* 2.94 0.31 2.34 3.54 .31 < 0.01*
MDD + AAD -1.71 0.45 -2.58 -0.84 -.17 < 0.01* -1.71 0.45 -2.58 -0.83 -.17 < 0.01*
Summer (reference)
Autumn 0.19 0.26 -0.33 0.71 .02 0.47
Winter 0.20 0.28 -0.35 0.75 .02 0.48
Spring 0.18 0.28 -0.37 0.72 .02 0.52
IDS = Inventory of Depressive Symptoms
B = Unstandardized Coefficient
SE = standard error of B
LB = Lower Bound of 95% Confidence Interval for B
UB = Upper Bound of 95% Confidence Interval for B
b = Standardized Coefficient
* p < 0.05
HC = Healthy Control
MDD = Major Depressive Disorder
AAD = Any Anxiety Disorder
MDD + AAD = Major Depressive Disorder + Any Anxiety Disorder
Note: adjusted R2 Model with groups = 0,577
Note: adjusted R2 Model with seasons = 0,576
Winthorst et al. BMC Psychiatry 2011, 11:198http://www.biomedcentral.com/1471-244X/11/198
Page 15 of 18
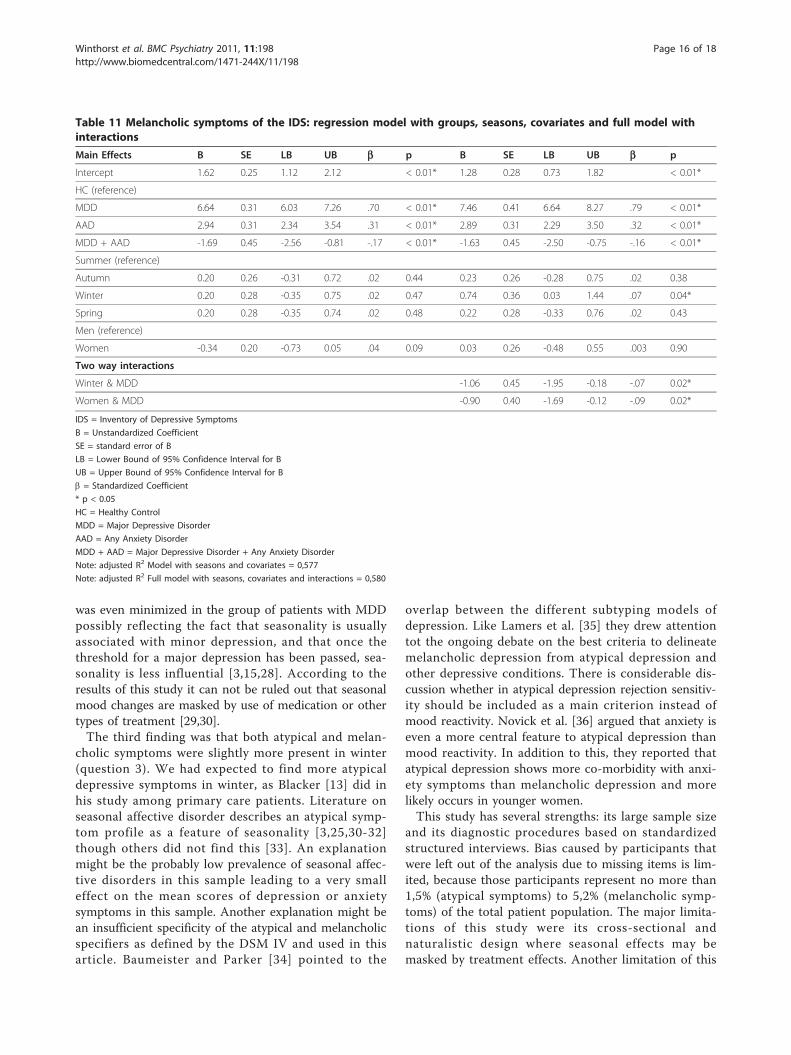
was even minimized in the group of patients with MDDpossibly reflecting the fact that seasonality is usuallyassociated with minor depression, and that once thethreshold for a major depression has been passed, sea-sonality is less influential [3,15,28]. According to theresults of this study it can not be ruled out that seasonalmood changes are masked by use of medication or othertypes of treatment [29,30].The third finding was that both atypical and melan-
cholic symptoms were slightly more present in winter(question 3). We had expected to find more atypicaldepressive symptoms in winter, as Blacker [13] did inhis study among primary care patients. Literature onseasonal affective disorder describes an atypical symp-tom profile as a feature of seasonality [3,25,30-32]though others did not find this [33]. An explanationmight be the probably low prevalence of seasonal affec-tive disorders in this sample leading to a very smalleffect on the mean scores of depression or anxietysymptoms in this sample. Another explanation might bean insufficient specificity of the atypical and melancholicspecifiers as defined by the DSM IV and used in thisarticle. Baumeister and Parker [34] pointed to the
overlap between the different subtyping models ofdepression. Like Lamers et al. [35] they drew attentiontot the ongoing debate on the best criteria to delineatemelancholic depression from atypical depression andother depressive conditions. There is considerable dis-cussion whether in atypical depression rejection sensitiv-ity should be included as a main criterion instead ofmood reactivity. Novick et al. [36] argued that anxiety iseven a more central feature to atypical depression thanmood reactivity. In addition to this, they reported thatatypical depression shows more co-morbidity with anxi-ety symptoms than melancholic depression and morelikely occurs in younger women.This study has several strengths: its large sample size
and its diagnostic procedures based on standardizedstructured interviews. Bias caused by participants thatwere left out of the analysis due to missing items is lim-ited, because those participants represent no more than1,5% (atypical symptoms) to 5,2% (melancholic symp-toms) of the total patient population. The major limita-tions of this study were its cross-sectional andnaturalistic design where seasonal effects may bemasked by treatment effects. Another limitation of this
Table 11 Melancholic symptoms of the IDS: regression model with groups, seasons, covariates and full model withinteractions
Main Effects B SE LB UB b p B SE LB UB b p
Intercept 1.62 0.25 1.12 2.12 < 0.01* 1.28 0.28 0.73 1.82 < 0.01*
HC (reference)
MDD 6.64 0.31 6.03 7.26 .70 < 0.01* 7.46 0.41 6.64 8.27 .79 < 0.01*
AAD 2.94 0.31 2.34 3.54 .31 < 0.01* 2.89 0.31 2.29 3.50 .32 < 0.01*
MDD + AAD -1.69 0.45 -2.56 -0.81 -.17 < 0.01* -1.63 0.45 -2.50 -0.75 -.16 < 0.01*
Summer (reference)
Autumn 0.20 0.26 -0.31 0.72 .02 0.44 0.23 0.26 -0.28 0.75 .02 0.38
Winter 0.20 0.28 -0.35 0.75 .02 0.47 0.74 0.36 0.03 1.44 .07 0.04*
Spring 0.20 0.28 -0.35 0.74 .02 0.48 0.22 0.28 -0.33 0.76 .02 0.43
Men (reference)
Women -0.34 0.20 -0.73 0.05 .04 0.09 0.03 0.26 -0.48 0.55 .003 0.90
Two way interactions
Winter & MDD -1.06 0.45 -1.95 -0.18 -.07 0.02*
Women & MDD -0.90 0.40 -1.69 -0.12 -.09 0.02*
IDS = Inventory of Depressive Symptoms
B = Unstandardized Coefficient
SE = standard error of B
LB = Lower Bound of 95% Confidence Interval for B
UB = Upper Bound of 95% Confidence Interval for B
b = Standardized Coefficient
* p < 0.05
HC = Healthy Control
MDD = Major Depressive Disorder
AAD = Any Anxiety Disorder
MDD + AAD = Major Depressive Disorder + Any Anxiety Disorder
Note: adjusted R2 Model with seasons and covariates = 0,577
Note: adjusted R2 Full model with seasons, covariates and interactions = 0,580
Winthorst et al. BMC Psychiatry 2011, 11:198http://www.biomedcentral.com/1471-244X/11/198
Page 16 of 18
study is the lack of specific instruments, such as theSPAQ, to determine whether the previous course of ill-ness had a seasonal pattern. Finally selection bias cannot be ruled out completely because data were not pri-mary collected to answer this study assignment.
ConclusionsSeasonal differences in severity or type of depressive andanxiety symptoms, as measured with a general screeninginstrument and symptom questionnaires, were absent orsmall in effectsize in a primary care population and inpatient populations with a major depressive disorderand anxiety disorders. For the detection of individualswith a seasonal pattern in depressive episodes more spe-cific questionnaires and a longitudinal approach areneeded. These analyses will be forthcoming in our nextstudy on NESDA data.
AcknowledgementsWe wish to acknowledge Dr P.P. Mersch for his contribution tot the analysisof the data.
Author details1Department of Psychiatry, University Medical Centre Groningen, Universityof Groningen, the Netherlands. 2Department of Epidemiology, UniversityMedical Centre Groningen, University of Groningen, the Netherlands.3Department of Pedagogy & Educational Sciences, University of Groningen,the Netherlands. 4Department of Psychiatry/EMGO Institute/NeuroscienceCampus Amsterdam, VU University Medical Center, Amsterdam, theNetherlands. 5Department of Psychiatry, Leiden University Medical Centre,Leiden, the Netherlands.
Authors’ contributionsWHW is PhD candidate and working as a psychiatrist at the UniversityMedical Centre in Groningen. He was involved in all phases of the study anddrafted the manuscript. WJP supervised the statistical analysis. YMcontributed to the outline of the study and the interpretation of the results.BWHJP, the general principal investigator of the Netherlands Study ofDepression and Anxiety (NESDA), approved of the analysis plan. WAN, seniorinvestigator in Groningen for NESDA, supervised all stages of the study. Allauthors contributed to the manuscript.
Competing interestsThe infrastructure for the NESDA study (http://www.nesda.nl) is fundedthrough the Geestkracht program of the Netherlands Organisation for HealthResearch and Development (ZonMw, grant number 10-000-1002) and issupported by participating universities and mental health care organizations(VU University Medical Center, GGZ inGeest, Arkin, Leiden University MedicalCenter, GGZ Rivierduinen, University Medical Center Groningen, Lentis, GGZFriesland, GGZ Drenthe, IQ Healthcare, Netherlands Institute for HealthServices Research (NIVEL) and Netherlands Institute of Mental Health andAddiction (Trimbos).YM has received research funding and served as a consultant for RoyalPhilips Electronics NV and The Litebook Company Ltd. WAN has receivedgrants from the Netherlands Organization for Health Research andDevelopment, the European Union, the Stanley Medical Research Institute,Astra Zeneca, Eli Lilly, GlaxoSmithKline and Wyeth; has received honoraria/speaker’s fees from Astra Zeneca, Pfizer, Servier and Wyeth; and has servedin advisory boards for Astra Zeneca, Pfizer and Servier. All authors deny anyconflicts of interest or commercial associations in connection with thesubmitted manuscript.
Received: 16 August 2011 Accepted: 19 December 2011Published: 19 December 2011
References1. Thompson C, Thompson S, Smith R: Prevalence of seasonal affective
disorder in primary care; a comparison of the seasonal healthquestionnaire and the seasonal pattern assessment questionnaire. JAffect Disord 2004, 78(3):219-226.
2. Kasper S, Wehr TA, Bartko JJ, Gaist PA, Rosenthal NE: Epidemiologicalfindings of seasonal changes in mood and behavior. A telephone surveyof Montgomery County, Maryland. Arch Gen Psychiatry 1989,46(9):823-833.
3. Michalak EE, Wilkinson C, Hood K, Dowrick C: Seasonal and nonseasonaldepression: how do they differ? Symptom profile, clinical and familyhistory in a general population sample. J Affect Disord 2002, 69(1-3):185-192.
4. Rosenthal NE, Genhart MJ, Sack DA, Skerwer RG, Wehr TA: Seasonalaffective disorder and its relevance for the understanding and treatmentof bulimia. In The psychobiology of bulimia. Edited by: Hudson JI, Pope HG.Washington DC: American Psychiatric Press; 1987:205-228.
5. Magnusson A, Axelsson J: The prevalence of seasonal affective disorder islow among descendants of Icelandic emigrants in Canada. Arch GenPsychiatry 1993, 50(12):947-951.
6. Eagles JM, Wileman SM, Cameron IM, Howie FL, Lawton K, Gray DA,Andrew JE, Naji SA: Seasonal affective disorder among primary careattenders and a community sample in Aberdeen. Br J Psychiatry 1999,175:472-475.
7. Mersch PP, Middendorp HM, Bouhuys AL, Beersma DG, van denHoofdakker RH: Seasonal affective disorder and latitude: a review of theliterature. J Affect Disord 1999, 53(1):35-48.
8. Sohn CH, Lam RW: Update on the biology of seasonal affective disorder.CNS Spectr 2005, 10(8):635-46, quiz 1-14.
9. Posternak MA, Zimmerman M: Lack of association between seasonalityand psychopathology in psychiatric outpatients. Psychiatry Res 2002,112(3):187-194.
10. Michalak EE, Murray G, Wilkinson C, Dowrick C, Lasa L, Lehtinen V,Dalgard OS, Ayuso-Mateos JL, Vazquez-Barquero JL, Casey P, ODIN Group:Estimating depression prevalence from the Beck Depression Inventory:is season of administration a moderator? Psychiatry Res 2004,129(1):99-106.
11. Magnusson A, Axelsson J, Karlsson MM, Oskarsson H: Lack of seasonalmood change in the Icelandic population: results of a cross-sectionalstudy. Am J Psychiatry 2000, 157(2):234-238.
12. de Graaf R, van Dorsselaer S, ten Have M, Schoemaker C, Vollebergh WA:Seasonal variations in mental disorders in the general population of acountry with a maritime climate: findings from the Netherlands mentalhealth survey and incidence study. Am J Epidemiol 2005, 162(7):654-661.
13. Blacker CV, Thomas JM, Thompson C: Seasonality prevalence andincidence of depressive disorder in a general practice sample:identifying differences in timing by caseness. J Affect Disord 1997,43(1):41-52.
14. Mersch PP, Middendorp HM, Bouhuys AL, Beersma DG, van denHoofdakker RH: The prevalence of seasonal affective disorder in TheNetherlands: a prospective and retrospective study of seasonal moodvariation in the general population. Biol Psychiatry 1999, 45(8):1013-1022.
15. Oyane NM, Bjelland I, Pallesen S, Holsten F, Bjorvatn B: Seasonality isassociated with anxiety and depression: the Hordaland health study. JAffect Disord 2008, 105(1-3):147-155.
16. Schlager D, Schwartz JE, Bromet EJ: Seasonal variations of currentsymptoms in a healthy population. Br J Psychiatry 1993, 163:322-326.
17. Blazer DG, Kessler RC, Swartz MS: Epidemiology of recurrent major andminor depression with a seasonal pattern. The National ComorbiditySurvey. Br J Psychiatry 1998, 172:164-167.
18. Penninx BW, Beekman AT, Smit JH, Zitman FG, Nolen WA, Spinhoven P,Cuijpers P, De Jong PJ, Van Marwijk HW, Assendelft WJ, Van Der Meer K,Verhaak P, Wensing M, De Graaf R, Hoogendijk WJ, Ormel J, Van Dyck R,NESDA Research Consortium: The Netherlands Study of Depression andAnxiety (NESDA): rationale, objectives and methods. Int J MethodsPsychiatr Res 2008, 17(3):121-140.
19. Bijl RV, van Zessen G, Ravelli A, de Rijk C, Langendoen Y: The NetherlandsMental Health Survey and Incidence Study (NEMESIS): objectives anddesign. Soc Psychiatry Psychiatr Epidemiol 1998, 33(12):581-586.
20. Furukawa TA, Kessler RC, Slade T, Andrews G: The performance of the K6and K10 screening scales for psychological distress in the Australian
Winthorst et al. BMC Psychiatry 2011, 11:198http://www.biomedcentral.com/1471-244X/11/198
Page 17 of 18

National Survey of Mental Health and Well-Being. Psychol Med 2003,33(2):357-362.
21. Kessler RC, Barker PR, Colpe LJ, Epstein JF, Gfroerer JC, Hiripi E, Howes MJ,Normand SL, Manderscheid RW, Walters EE, Zaslavsky AM: Screening forserious mental illness in the general population. Arch Gen Psychiatry 2003,60(2):184-189.
22. Rush AJ, Gullion CM, Basco MR, Jarrett RB, Trivedi MH: The Inventory ofDepressive Symptomatology (IDS): psychometric properties. Psychol Med1996, 26(3):477-486.
23. Beck AT, Epstein N, Brown G, Steer RA: An inventory for measuring clinicalanxiety: psychometric properties. J Consult Clin Psychol 1988,56(6):893-897.
24. Marks IM, Mathews AM: Brief standard self-rating for phobic patients.Behav Res Ther 1979, 17(3):263-267.
25. Nayyar K, Cochrane R: Seasonal changes in affective state measuredprospectively and retrospectively. Br J Psychiatry 1996, 168(5):627-632.
26. Vigod SN, Levitt AJ: Seasonal severity of depressive symptoms as apredictor of health service use in a community-based sample. J PsychiatrRes 2010.
27. Levitt AJ, Boyle MH, Joffe RT, Baumal Z: Estimated prevalence of theseasonal subtype of major depression in a Canadian community sample.Can J Psychiatry 2000, 45(7):650-654.
28. Steinhausen HC, Gundelfinger R, Winkler Metzke C: Prevalence of self-reported seasonal affective disorders and the validity of the seasonalpattern assessment questionnaire in young adults Findings from a Swisscommunity study. J Affect Disord 2009, 115(3):347-354.
29. Gardarsdottir H, Egberts TC, van Dijk L, Heerdink ER: Seasonal patterns ofinitiating antidepressant therapy in general practice in the Netherlandsduring 2002-2007. J Affect Disord 2010, 122(3):208-212.
30. Sakamoto K, Nakadaira S, Kamo K, Kamo T, Takahashi K: A longitudinalfollow-up study of seasonal affective disorder. Am J Psychiatry 1995,152(6):862-868.
31. Allen JM, Lam RW, Remick RA, Sadovnick AD: Depressive symptoms andfamily history in seasonal and nonseasonal mood disorders. Am JPsychiatry 1993, 150(3):443-448.
32. Garvey MJ, Wesner R, Godes M: Comparison of seasonal and nonseasonalaffective disorders. Am J Psychiatry 1988, 145(1):100-102.
33. Thalen BE, Kjellman BF, Morkrid L, Wetterberg L: Seasonal and non-seasonal depression. A comparison of clinical characteristics in Swedishpatients. Eur Arch Psychiatry Clin Neurosci 1995, 245(2):101-108.
34. Baumeister H, Parker G: Meta-review of depressive subtyping models. JAffect Disord .
35. Lamers F, de Jonge P, Nolen WA, Smit JH, Zitman FG, Beekman AT,Penninx BW: Identifying depressive subtypes in a large cohort study:results from the Netherlands Study of Depression and Anxiety (NESDA).J Clin Psychiatry 2010, 71(12):1582-1589.
36. Novick JS, Stewart JW, Wisniewski SR, Cook IA, Manev R, Nierenberg AA,Rosenbaum JF, Shores-Wilson K, Balasubramani GK, Biggs MM, Zisook S,Rush AJ, STAR*D investigators: Clinical and demographic features ofatypical depression in outpatients with major depressive disorder:preliminary findings from STAR*D. J Clin Psychiatry 2005, 66(8):1002-1011.
Pre-publication historyThe pre-publication history for this paper can be accessed here:http://www.biomedcentral.com/1471-244X/11/198/prepub
doi:10.1186/1471-244X-11-198Cite this article as: Winthorst et al.: Seasonality in depressive andanxiety symptoms among primary care patients and in patients withdepressive and anxiety disorders; results from the Netherlands Study ofDepression and Anxiety. BMC Psychiatry 2011 11:198.
Submit your next manuscript to BioMed Centraland take full advantage of:
• Convenient online submission
• Thorough peer review
• No space constraints or color figure charges
• Immediate publication on acceptance
• Inclusion in PubMed, CAS, Scopus and Google Scholar
• Research which is freely available for redistribution
Submit your manuscript at www.biomedcentral.com/submit
Winthorst et al. BMC Psychiatry 2011, 11:198http://www.biomedcentral.com/1471-244X/11/198
Page 18 of 18