BECK ANXIETY INVENTORY: TRANSLATION AND ...
47
BECK ANXIETY INVENTORY: TRANSLATION AND VALIDATION OF A NORWEGIAN VERSION THOMAS NORDHAGEN 2001
-
Upload
khangminh22 -
Category
Documents
-
view
3 -
download
0
Transcript of BECK ANXIETY INVENTORY: TRANSLATION AND ...

BECK ANXIETY INVENTORY:
TRANSLATION AND VALIDATION OF A NORWEGIAN VERSION
THOMAS NORDHAGEN 2001

The Norwegian version of the BAI
2
Preface
This Master Thesis could not have been completed without help from the following:
my supervisors Inger Hilde Nordhus and Ståle Pallesen, who reqruited me for their translation
project, let me use their data and guided me through the process; Harald Aasen, who worked
with the BDI-II and have been my constant discussion partner in this project; Helle Hagness,
who read through several drafts and Jon Vøllestad; who proof read a final version. The
mistakes otherwise made are mine.

The Norwegian version of the BAI
3
Abstract
This study investigated the psychometric properties of the Norwegian version of the
Beck Anxiety Inventory (BAI) in a community sample of 879 respondents and two student
samples of a total of 408 respondents. Scores on the BAI were compared to the State-trait
Anxiety Inventory, the Beck Depression Inventory-II, three subscales of the SCL-90, the
White Bear Suppression Inventory, the Penn State Worry Questionnaire, and the Fear
Questionnaire. The BAI demonstrated good psychometric properties with high levels of
internal consistency reliability. A moderate test-retest correlation provides support for the
BAI as a state measure. All results obtained on the Norwegian version corresponded to those
reported on the original version. The study supported the use of the Norwegian version of the
BAI. Subsequent confirmatory factor analyses slightly favored a four-factor model initially
reported by Beck and Steer (1990). A post hoc analysis supported loading item 16 �fear of
dying� on the Subjective factor and pointed to some difficulties with the wording of two items
in the Norwegian version.
The Norwegian version of the BAI
4
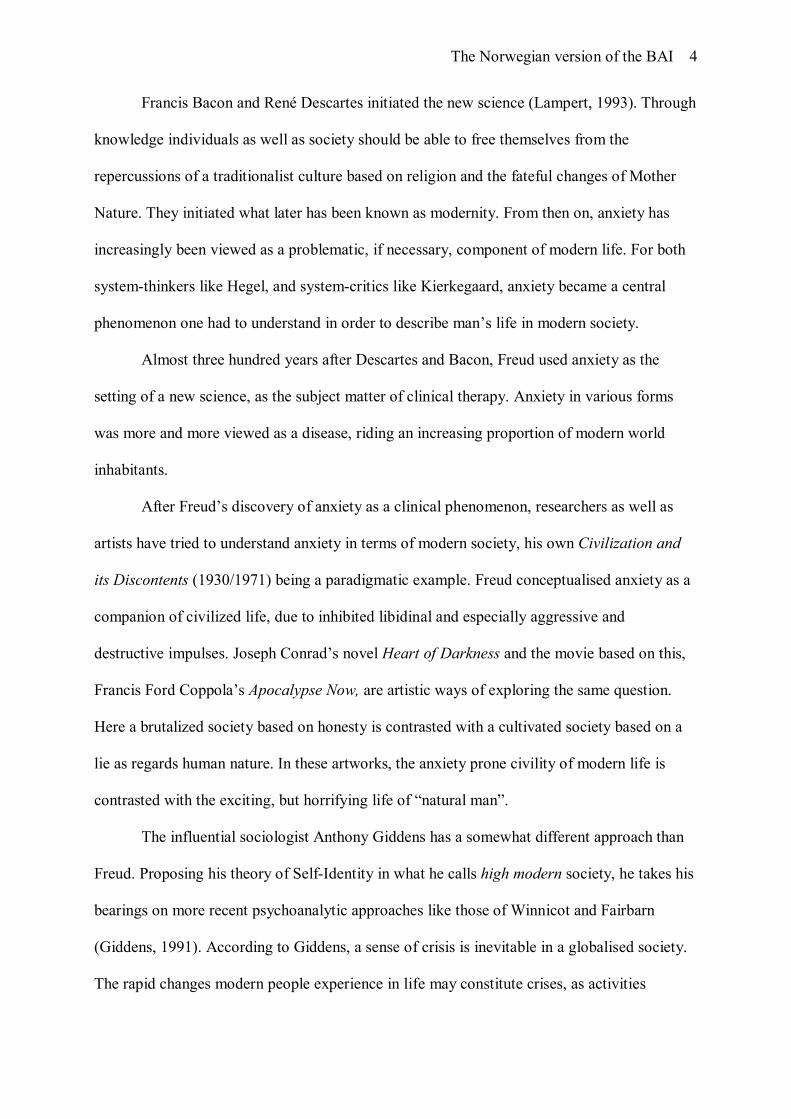
Francis Bacon and René Descartes initiated the new science (Lampert, 1993). Through
knowledge individuals as well as society should be able to free themselves from the
repercussions of a traditionalist culture based on religion and the fateful changes of Mother
Nature. They initiated what later has been known as modernity. From then on, anxiety has
increasingly been viewed as a problematic, if necessary, component of modern life. For both
system-thinkers like Hegel, and system-critics like Kierkegaard, anxiety became a central
phenomenon one had to understand in order to describe man�s life in modern society.
Almost three hundred years after Descartes and Bacon, Freud used anxiety as the
setting of a new science, as the subject matter of clinical therapy. Anxiety in various forms
was more and more viewed as a disease, riding an increasing proportion of modern world
inhabitants.
After Freud�s discovery of anxiety as a clinical phenomenon, researchers as well as
artists have tried to understand anxiety in terms of modern society, his own Civilization and
its Discontents (1930/1971) being a paradigmatic example. Freud conceptualised anxiety as a
companion of civilized life, due to inhibited libidinal and especially aggressive and
destructive impulses. Joseph Conrad�s novel Heart of Darkness and the movie based on this,
Francis Ford Coppola�s Apocalypse Now, are artistic ways of exploring the same question.
Here a brutalized society based on honesty is contrasted with a cultivated society based on a
lie as regards human nature. In these artworks, the anxiety prone civility of modern life is
contrasted with the exciting, but horrifying life of �natural man�.
The influential sociologist Anthony Giddens has a somewhat different approach than
Freud. Proposing his theory of Self-Identity in what he calls high modern society, he takes his
bearings on more recent psychoanalytic approaches like those of Winnicot and Fairbarn
(Giddens, 1991). According to Giddens, a sense of crisis is inevitable in a globalised society.
The rapid changes modern people experience in life may constitute crises, as activities

The Norwegian version of the BAI
5
connected with a person�s or a collective�s goals, suddenly can appear inadequate. And most
of all: Modern society brings our relationships with other people to the fore, as they are not
supported by external (i.e., tradition) factors anymore.
Our basic need for trust and security is in many ways opposed to the experience of a
rapidly changing society. We live in a risk oriented society, both in an economical and
relational way. This creates in each individual disquiet and uneasiness � anxiety � which one
in varying degrees is able to handle. The growth of a knowledge based society, has called for
an increased demand of professional help in all areas of life, and an increasing number of
people turn to psychologists and professional therapists for help.
As a common distinction (e.g., Edelmann, 1992), fear has been understood as
activated in the face of a real or perceived threat, whereas anxiety has been conceptualised as
a sense of uneasiness for which the individual cannot find any immediate reason why he or
she should have. In the early days of psychology, anxiety was one of the more important
phenomena revealed in therapy. The early psychoanalysts understood its existence as a result
of the unconscious battle between the Id and the Super-ego, the frightening sexual desire and
aggressive impulses fighting with the societal restrictions on these desires. The patient could
overcome this anxiety through self-knowledge, through re-enacting in some way those
traumatic experiences where inner drives had been confronted with civilisation, and harshly
rejected.
The existentialists turned anxiety into a question of man�s fear of death. Human
beings, sometimes unconsciously, sometimes consciously, sense that they are dying, doomed
for extinction. In a modern society where the underlying project is to overcome nature, this
awareness creates a feeling of inquietude, or worse, terror. But, by realising and accepting
their destiny, men and women could become individuals or �authentic�, giving anxiety away
for stoic peace (e.g., Yalom, 1980).

The Norwegian version of the BAI
6
Several schools, based on different combinations and varieties of psychoanalysis and
existentialism flourished during the last century, having limited success in their ability to rid
their clients of anxiety and other psychological problems. The therapy schools within the
branch behavioural psychology, perhaps had a clearer aim of adhering to scientific acceptable
measures, but nonetheless with limited success as well. Psychological therapy has to a
growing extent been criticised for its lack of empirically tested validation, Dawes� (1994)
House of cards being one of the renowned statements of this criticism.
The trouble when doing therapy is of course that one in the end will have to find some
way to ensure that therapy actually works. One might want to discuss what both ends, means
and measures should be. As psychologists, our main focus should be the well being of our
clients, but to an increasing extent, the call for effectiveness comes down to money. The cost
of health care has been on the rise for several years (Maruish, 2000), mental health care
making its fair contribution. The payers, be it society, insurance companies, or private persons
would like to know that their investments are worthwhile. Both the accurate detection and
assessment of mental and behavioural disorders, as well as means to examine the
effectiveness of interventions, has become more important over the years.
In this context, the more general concept of anxiety as a free-floating passenger in a
modern self becomes problematic. There seems to be no way to conceptualise the term
�anxiety� as it is used in a sociological or philosophical way, to assert therapeutic
effectiveness in measurable terms. And as everyone has some sense of the word�s meaning,
the concept of anxiety has been used in a variety of ways within the psychological literature.
Even if anxiety was considered a fairly unitary phenomenon, the actual operationalisations
had very little in common (Edelmann, 1992).
One way to remedy this problem was proposed by Lang (1971), who conceptualised
anxiety, as well as all emotions, as comprising three major components. On this view, all
The Norwegian version of the BAI
7
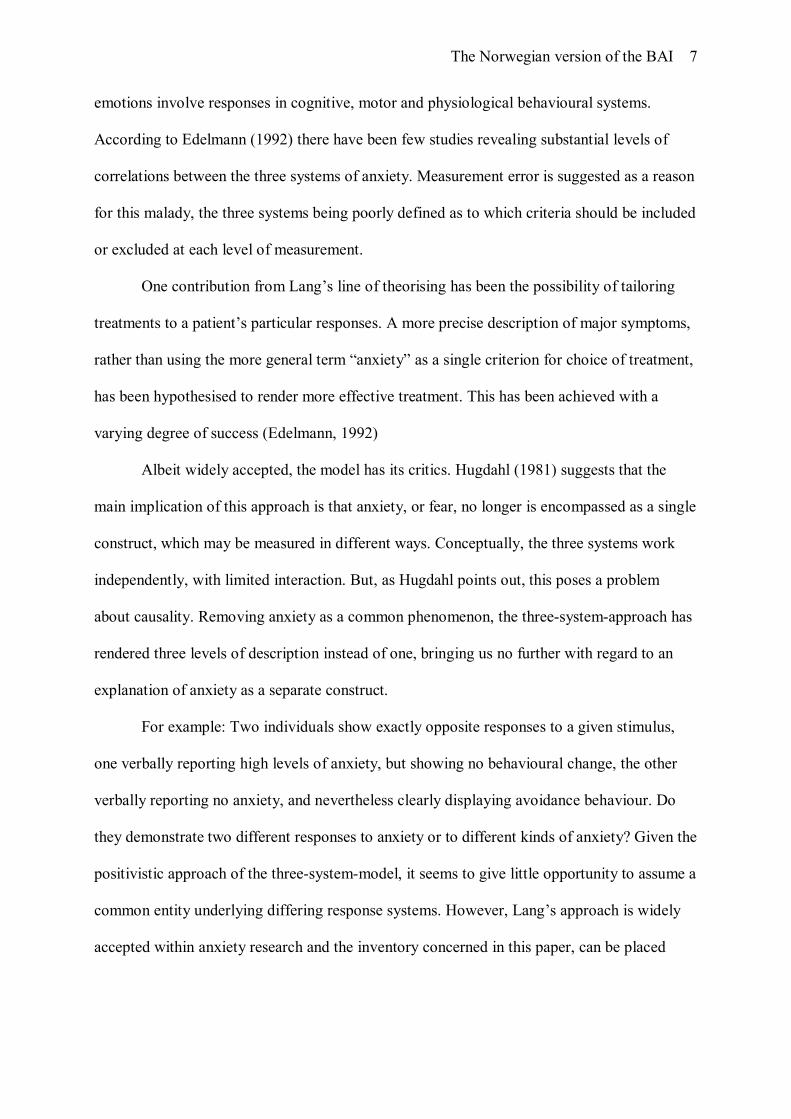
emotions involve responses in cognitive, motor and physiological behavioural systems.
According to Edelmann (1992) there have been few studies revealing substantial levels of
correlations between the three systems of anxiety. Measurement error is suggested as a reason
for this malady, the three systems being poorly defined as to which criteria should be included
or excluded at each level of measurement.
One contribution from Lang�s line of theorising has been the possibility of tailoring
treatments to a patient�s particular responses. A more precise description of major symptoms,
rather than using the more general term �anxiety� as a single criterion for choice of treatment,
has been hypothesised to render more effective treatment. This has been achieved with a
varying degree of success (Edelmann, 1992)
Albeit widely accepted, the model has its critics. Hugdahl (1981) suggests that the
main implication of this approach is that anxiety, or fear, no longer is encompassed as a single
construct, which may be measured in different ways. Conceptually, the three systems work
independently, with limited interaction. But, as Hugdahl points out, this poses a problem
about causality. Removing anxiety as a common phenomenon, the three-system-approach has
rendered three levels of description instead of one, bringing us no further with regard to an
explanation of anxiety as a separate construct.
For example: Two individuals show exactly opposite responses to a given stimulus,
one verbally reporting high levels of anxiety, but showing no behavioural change, the other
verbally reporting no anxiety, and nevertheless clearly displaying avoidance behaviour. Do
they demonstrate two different responses to anxiety or to different kinds of anxiety? Given the
positivistic approach of the three-system-model, it seems to give little opportunity to assume a
common entity underlying differing response systems. However, Lang�s approach is widely
accepted within anxiety research and the inventory concerned in this paper, can be placed

The Norwegian version of the BAI
8
within this theoretical framework (Creamer, Foran, & Bell, 1995). But, to the extent anxiety
can be viewed as an illness, it can also be understood as an emotion.
An emotion is generally understood as a response to the environment, and several
theories have been put forward to explain this connection. The classical ones within
psychology were the James-Lange theory and the Cannon-Bard theory, whereas more recent
theories have been influenced by cognitive psychology (e.g., Schachter, & Singer, 1962), and
Darwin�s (1965) theory of emotions (e.g., Tomkins, 1962; Izard, 1971). Recently there have
been several attempts to look at emotions as multi-component processes, combining the
different approaches adhered earlier (Edelmann, 1992). All the same, one is still in wont of a
clear-cut-definition. In spite of this difficulty, a plethora of instruments have been developed
over the years to assess the level of anxiety. Despite the problem of conceptualising and
measuring anxiety as a unitary phenomenon, its prevelance is estimated to be extensive.
The prevalence of anxiety and its related disorder depression, were in Norway in 1997
estimated to: depression, 4% women, 1% men; panic anxiety/generalised anxiety, 3% women,
1.5% men; phobias 11% women, 6% men. 30% of the Norwegian population will during their
lives have mild psychiatric disorders like depression, anxiety, phobia or somatoform disorder
(Sandanger, Nygård, Brage, & Tellnes, 1997).
Beck Anxiety Inventory
This study is concerned with the translation and validation of the Beck Anxiety
Inventory (BAI; Beck, Epstein, Brown, & Steer, 1988). This is a 21-item Likert scale
questionnaire developed in a clinical population to measure anxiety. Its construction was
based on several instruments developed by Beck and collaborators, like the Anxiety Check
List (ACL; Beck, Steer & Brown, 1985), the PDR Check List (PDR; Beck, 1978) and the
Situational Anxiety Check List (SAC; Beck 1982). The development was based on Jackson�s
(1970) approach and included administering the ACL, the PDR and the SAC to 810
The Norwegian version of the BAI
9
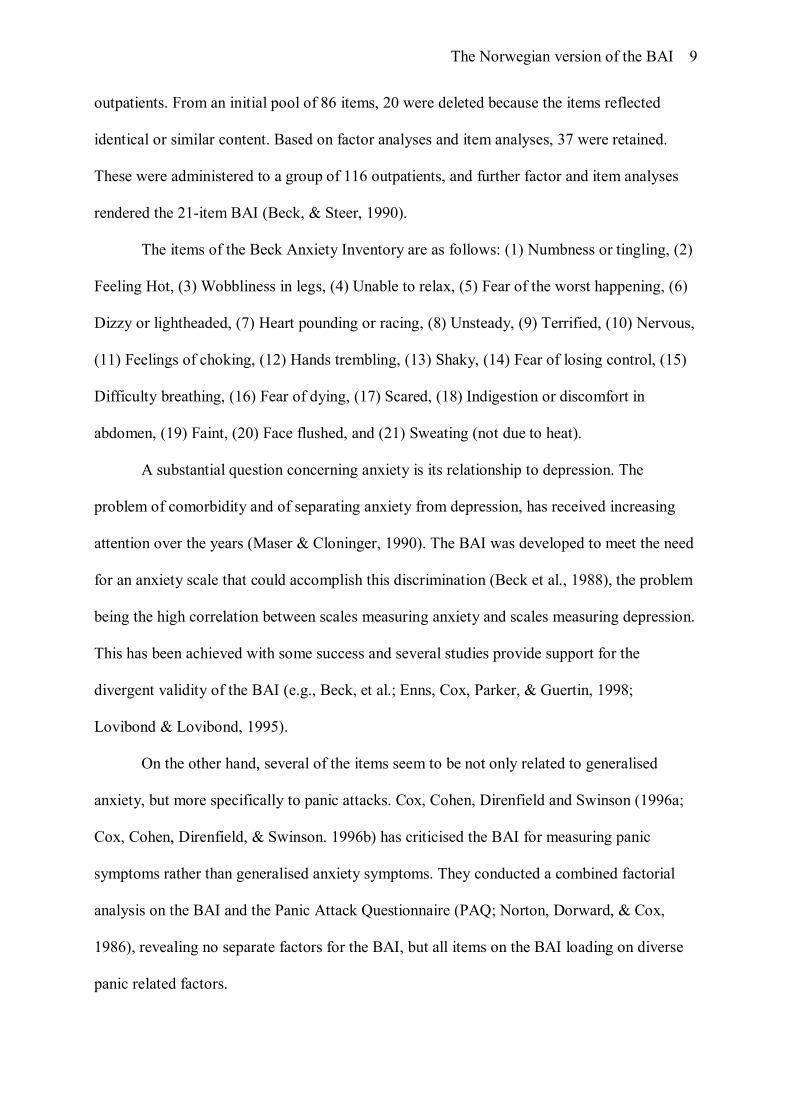
outpatients. From an initial pool of 86 items, 20 were deleted because the items reflected
identical or similar content. Based on factor analyses and item analyses, 37 were retained.
These were administered to a group of 116 outpatients, and further factor and item analyses
rendered the 21-item BAI (Beck, & Steer, 1990).
The items of the Beck Anxiety Inventory are as follows: (1) Numbness or tingling, (2)
Feeling Hot, (3) Wobbliness in legs, (4) Unable to relax, (5) Fear of the worst happening, (6)
Dizzy or lightheaded, (7) Heart pounding or racing, (8) Unsteady, (9) Terrified, (10) Nervous,
(11) Feelings of choking, (12) Hands trembling, (13) Shaky, (14) Fear of losing control, (15)
Difficulty breathing, (16) Fear of dying, (17) Scared, (18) Indigestion or discomfort in
abdomen, (19) Faint, (20) Face flushed, and (21) Sweating (not due to heat).
A substantial question concerning anxiety is its relationship to depression. The
problem of comorbidity and of separating anxiety from depression, has received increasing
attention over the years (Maser & Cloninger, 1990). The BAI was developed to meet the need
for an anxiety scale that could accomplish this discrimination (Beck et al., 1988), the problem
being the high correlation between scales measuring anxiety and scales measuring depression.
This has been achieved with some success and several studies provide support for the
divergent validity of the BAI (e.g., Beck, et al.; Enns, Cox, Parker, & Guertin, 1998;
Lovibond & Lovibond, 1995).
On the other hand, several of the items seem to be not only related to generalised
anxiety, but more specifically to panic attacks. Cox, Cohen, Direnfield and Swinson (1996a;
Cox, Cohen, Direnfield, & Swinson. 1996b) has criticised the BAI for measuring panic
symptoms rather than generalised anxiety symptoms. They conducted a combined factorial
analysis on the BAI and the Panic Attack Questionnaire (PAQ; Norton, Dorward, & Cox,
1986), revealing no separate factors for the BAI, but all items on the BAI loading on diverse
panic related factors.

The Norwegian version of the BAI
10
Steer and Beck (1996) replied that the symptoms of GAD and Panic Disorder in DSM-
III-R (American Psychiatric Association, 1987) had a substantial overlap, this being reflected
in the BAI. They also argued that panic attacks are connected to anxiety, patients having panic
attacks reporting high levels of anxiety. However, Cox et al. (1996b) points out that several of
the overlapping symptoms were deleted from the GAD symptom list in DSM-IV (American
Psychiatric Association, 1994), but retained in the Panic Disorder symptoms list. This
questions the construct validity of the BAI to the extent it is explicitly designed to measure
anxiety. Succeeding in separating anxiety from depression, the BAI perhaps does this at the
expense of convergent validity (Creamer et al., 1995).
With regard to the ICD-10 (WHO, 1992), 16 of the BAI-items correspond directly to
diagnostic criteria for diagnoses F40 Agoraphobia, F40.1 Social Phobia, F41.0 Panic Anxiety
and F41.1 Generalised Anxiety. Three items correspond solely to the Generalised Anxiety
diagnosis; two items to the Social Phobia diagnosis. Three items corresponds to Agoraphobia
and Panic Anxiety, but not to Generalised Anxiety. This indicates that the BAI-items evenly
reflect the different anxiety diagnoses in the ICD-10 (WHO, 1992).
On the other hand, the substantial overlap between diagnostic criteria and the items of
the BAI raises the issue whether the items (or the ICD-10 diagnostic criteria) should be
considered categorical or dimensional. Diagnostic criteria are usually regarded as categorical
(Dobson, & Cheung, 1990). The BAI is constructed as a dimensional measure of anxiety. If
the symptoms of anxiety are dimensional, one should expect them to approximate a normal
distribution in the population. Further, as the BAI is a self-report questionnaire one can still
raise the question whether an underlying phenomena otherwise normally distributed, will be
reported as normally distributed. Theories of various forms of repression are ubiquitous
within the psychological literature.

The Norwegian version of the BAI
11
In constructing the BAI Beck et al. (1988; Beck & Steer, 1990) addressed the problem
that most scales designed to measure anxiety, had been developed on student populations.
Because of this, items more typical of anxiety states in a clinical range may have been
underrepresented in anxiety scales (Fydrich, Dowdall, & Chambless, 1992). To remedy this
the BAI was developed on a clinical sample only. This seems somewhat contrary to Beck�s
theorising on anxiety and depression as general, continually distributed phenomena (e.g.,
Clark & Beck, 1999), but is not mentioned as an issue in the publication (Beck et al.) or the
manual (Beck & Steer). A literature search reveals that most subsequent studies on the BAI
have been conducted on clinical populations, and the non-clinical samples have usually been
drawn from student populations.
Normative data
Connected to the issue of whether or not a given phenomena is categorical or
continually distributed, is the question of how normative data should be collected. There is
only one study in the literature so far reporting data for the BAI from a community population
(Gillis, Haaga, & Ford, 1995). Several researchers have cautioned against using population
data to obtain normative values on scales constructed for identifying psychiatric diagnoses.
The problem is not only that data distributions are skewed, but also that the Standard
Deviation of the data exceeds their Mean, giving a �floor effect� (Kendall, Flannery-Shroeder,
& Ford, 1999).
Nevertheless, Gillis et al. (1995) argues that population data is needed to provide
normative information with which to compare test results after treatment. In the same vein
Hollon & Flick (1988) points out that there are no other meaningful way of establishing
norms if patient improvement should be quantitatively measured on statistical grounds. To
establish comparison groups from psychiatric care settings, for example, one will have to
decide what criterions for exclusion and inclusion should be used. This leaves alternative

The Norwegian version of the BAI
12
routes to obtain norms with which to compare patients improvement much more difficult, lest
say statistically and conceptually problematic, than using population data. Statistic
comparisons become more reliable when comparing larger samples of treatment outcomes
with the �normal distribution� of the actual symptoms. Usually the issue of creating norms is
approached in two ways (Kendall & Sheldrick, 2000):
The first is based on the medical model where normality is viewed as �health�, in the
absence of pathology, which is described as �abnormal�. This view is consistent with
regarding psychiatric disorders as diseases and thus categorical. In order to establish norms
for comparing treatment outcomes, one has to create samples using exclusionary criteria in
the recruitment of normative groups. On the other hand � and this is the approach usually
taken with regard to psychological testing � one can view normality as �average�. This
implies a continuous distribution of individual scores on a trait, forming a bell-shaped curve,
consequently regarding psychiatric symptoms as dimensional.
Kendall & Sheldrick (2000) point out three problems in relation to collecting
normative data based on the medical model. First, the use of exclusionary criteria artificially
alters the mean score of each symptom, making the criteria for comparing treatment outcomes
overly stringent. Second, in normative samples it can make effects more difficult to detect by
altering levels of relevant but unmeasured variables, healthy people being more prone to
suppress symptoms of anxiety or depression than patients in psychiatric care, as an example.
They might experience it, but are reluctant to report it. Third, exclusionary criteria make the
collection and interpretation of data more difficult as problems with how and at what levels
the exclusions should be made, come in to question. These difficulties are comparable to
those mentioned above, using patients in psychiatric care for validation of instruments
designed to measure symptoms of psychopathology.

The Norwegian version of the BAI
13
Kendall & Sheldrick (2000) argues that one should try to establish norms based on
samples being representative of the normal population. The obvious way of solving this
problem is of course to collect community samples. But as pointed out earlier, a normal
distribution of anxiety as a phenomenon does not entail that the self-reporting of anxiety
symptoms, is normally distributed.
In this study a community sample based on a randomised sampling from the total
Norwegian population has been collected. Theoretically, this will give us an approximate
representation of the distribution of anxiety as measured by the BAI in the total population,
and enable the establishing of norms to which treatment outcomes might be compared.
Factor structure
In the BAI manual, Beck and Steer (1990) conducted several factor analyses to sort
out connections between specific response sets on the BAI and diverse anxiety diagnoses.
Contrary to the initial BAI publication study�s (Beck et al., 1988) two-factor solution, the
study employed in the manual yielded four factors. Beck and Steer reported promising results
in using subscales of the BAI to perform specific anxiety diagnostics. Factor analyses have
been conducted on several occasions (e.g., Kabacoff, Segal, Hersen, & Van-Hasselt, 1997;
Osman, Kopper, Barrios, Osman, & Wade, 1997), generally providing two- and four-factor
solutions. By and large, factors reported on the BAI are divided into subjective and
physiological factors, with more sensitivity to the measurement of the physiological
components (Ferguson, 2000). Several studies support the contention that the BAI generally
do not correlate with factors reflecting depressive symptoms (e.g., Enns, Cox, Parker, &
Guertin, 1998; Lovibond & Lovibond, 1995).
Aims of this study
The main aims of this study are: first, to test the internal consistency and test-retest
reliability of the Norwegian version of the BAI; second, investigate concurrent and divergent

The Norwegian version of the BAI
14
validity compared to other self-report measures of anxiety; third, examine the factor structure
of the BAI in a community sample and a student sample, by testing the factor solutions
previously reported in the literature. A more modest aim is that this study may contribute to
the theoretical understanding of the BAI.
Method
Participants
Sampling procedure. The community sample was collecte on a procedure which
included selecting cases randomly from the Norwegian register of phone numbers. This
register includes approximately 98 % of the population. The total number of phone numbers
used was 4738. Using a �last birthday procedure�, those telephoned were first asked whether
or not they would participate in a survey from Opinion Research Institute. The total sample of
respondents asked if they wanted to participate in a survey from the Institute of Clinical
Psychology at the University of Bergen were 2003. Those giving a positive response (N =
1196) received the survey by mail. Those actually filling out the survey and returning it being
N = 879, a response rate of 44 %.
The student samples were based on asking first year psychology and natural science
students in classes whether they would like to participate in a study from the Institiute of
clinical psychology. They were given no compensation for this. The response rate has not
been calculated.
Sample 1. The first sample was designed for collecting normative data for several self-
report questionnaires as part of a translation and validation project at the Institute for Clinical
Psychology at the University of Bergen for Norwegian versions of these scales. The total
sample was composed of 449 (51.1%) women and 430 (48.9%) men. The age ranged from 16
to 86 years with a mean of 45.8 years (SD = 16.8). 611 (71.4%) reported living together with
a partner. As the sample was not evenly distributed with regard to age and sex, a standard

The Norwegian version of the BAI
15
weighting procedure was employed (Kessler et al., 1994). Opinion Research Institute
provided weights based on distribution data of gender and age according to the Norwegian
Statistical Central Bureau (SSB).
Sample 2. The second sample was designed for investigating the validity of the Beck
Depression Inventory-II and conducting a test-rest of both the BDI-II and the BAI. In this
study it is also utilised for assessing the divergent valdidity of the BAI. It included 308 first
year Psychology students. The total sample was composed of 217 (70.5%) women and 91
(29.5%) men. Their age ranged from 18 to 45 years with a mean of 21.2 years (SD = 3.5). Of
these 47 (15.3%) reported living together with a partner. Three weeks later a retest was
conducted from the same sample (N = 127, 41.6% of total sample). A significantly higher
proportion of women than men did the retest (χ2 = 4.8, df = 1, p = 0.028). No other significant
demographic differences between the test and retest sample were found (Age: t (1, 306) = .44,
p > .67; Civil Status: χ2 = .113, df = 1, p = .737.).
Sample 3. The third sample was primarily designed for investigating the validity of the
BAI. It included 120 first year psychology and natural science students. The total sample was
composed of 84 (70.0%) women and 36 (30.0%) men. Their age ranged from 18 to 45 years
with a mean of 21.0 years. Of these 25 (20.8%) reported living together with a partner.
Instruments
Beck Anxiety Inventory. (BAI; Beck et al., 1988). The Norwegian version of the BAI
(Nordhagen, Pallesen, & Nordhus, 2000; Appendix A) is a 21-item Likert scale self-report
questionnaire measuring common symptoms of clinical anxiety, such as nervousness and fear
of losing control. Respondents indicate the degree to which they are bothered by each
symptom. Each symptom is rated on a 4-point scale ranging from 0 (Not at all) to 3 (Severely.
I could barely stand it.). The total scores can range from 0 to 63, with higher scores
corresponding to higher levels of anxiety. The BAI was translated into Norwegian using a

The Norwegian version of the BAI
16
Back Translation Procedure, were a bilingual psychologist translated the initial Norwegian
item translations into English. The back-translated items were then compared to the original
English items for confirmation of the translation.
The Norwegian item translations are as follows: (1) Nummenhet eller kribling, (2)
Hetetokter, (3) Skjelving i bena, (4) Ute av stand til å slappe av, (5) Redd for at det verste
kan/skulle skje, (6) Svimmel eller ør, (7) Bankende eller gallopperende hjerte, (8) Ustø, (9)
Vettskremt, (10) Nervøs, (11) Kvelningsfornemmelser, (12) Skjelving på hender, (13)
Skjelven, (14) Redd for å miste kontrollen, (15) Vansker med å puste/pustevansker, (16) Frykt
for å dø, (17) Skremt, (18) Mage- eller tarmbesvær, (19) Svimling, (20) Ansiktsrødme and
(21) Svetting (som ikke skyldes varme).
Beck Depression Inventory-II. (BDI-II; Beck et al., 1996). The Norwegian version of
the Beck Depression Inventory-II (Aasen, Nordhus, & Pallesen, 2001) is a 21-item Likert
self-report questionnaire, measuring the present severity of depression symptoms in clinical
and non-clinical adults and adolescents more than 13 years old. Similar to the BAI,
respondents indicate the degree to which they are bothered by each symptom, each symptom
being rated on a 4-point scale ranging from 0-3. The total scores can vary from 0 to 63, with
higher scores corresponding to higher levels of depression.
Fear Questionnaire (FQ). (Marks, & Mathews, 1979). The FQ is a 15-item Likert
scale designed to assess severity of specific fears through asking subjects on the severity of
avoidance associated with agoraphobic, social, and blood-injury fears. Responses are rated on
9-point scale ranging from 0 to 8. The total score can vary from 0 to 120 with higher scores
reflecting higher degrees of avoidance behaviour. This measure is used in this study to
establish construct validity for the BAI.
Penn State Worry Questionnaire. (PSWQ; Meyer, Miller, Metzger, & Borkovec,
1990). This is a 16-item Likert scale used to assess an individual�s tendency to worry. Each

The Norwegian version of the BAI
17
item is rated on a 1-5 scale. The resulting scores may range from 16 to 80 were high scores
are related to pathological tendencies to worry.
Symptom Check List-90-R.. (SCL-90-R; Derogatis, 1983) The SCL-90-R is a self-
report clinical rating scale. Originally it consists of 90 questions answered on a 5-point scale,
ranging from 0 (�not at all�) to 4 (�extremely�). For the purposes of this study the subscales
�anxiety� �depression� and �psychoticism� were used as separate measures, with higher
scores on each subscale reflecting higher levels of anxiety, depression and psychoticism,
respectively.
State-Trait Anxiety Inventory. (STAI-Form Y; Spielberger, 1983). The STAI is a
widely used instrument for assessing state anxiety (A-State, 20 items), and trait anxiety (A-
Trait, 20 items). Responses on the A-State are rated on a 4-point scale: 1 (not at all) to 4 (very
much so) to indicate current level of anxiety. The A-Trait uses a 4-point scale ranging from 1
(almost never) to 4 (almost always) to express general level of anxiety. Ten of the A-State
items, and 9 of the A-Trait items are reverse-scored. A raw score is obtained for each scale by
summing the ratings for each scale. The STAI scales have good internal consistency
reliabilities and satisfactory levels of construct, convergent, and discriminant validity. This
measure was used to establish convergent validity for the BAI.
White Bear Suppression Inventory. (WBSI; Wegner, & Zanakos, 1994). This is a 15-
item Likert-scale questionnaire that assesses people�s general tendency to suppress thoughts.
The respondents are requested to indicate their agreement with statements on a 5-point scale
(1 = �Totally agree�; 5 = �Totally disagree�). The resulting score can vary from 15 to 75 with
high scores reflecting chronic thought suppression.
Statistical Procedures
The analyses were carried out in several steps using SPSS 10.1 (SPSS Inc., 2000).
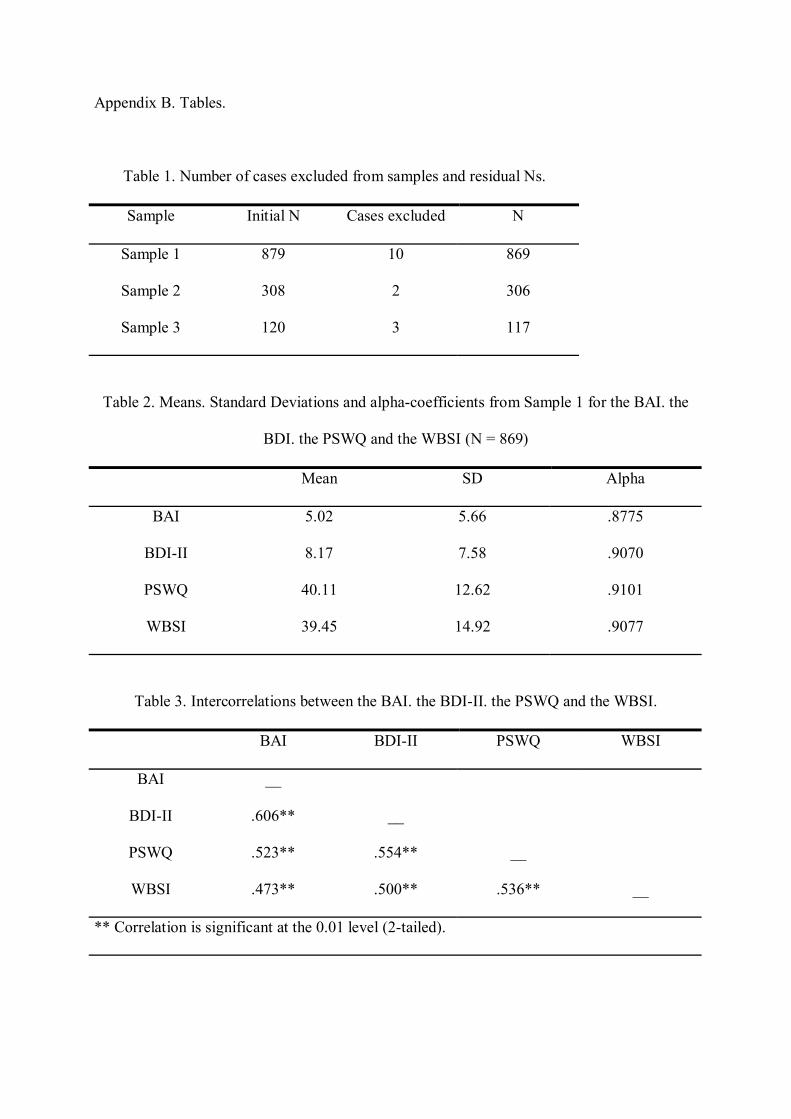
First a missing data analysis was performed. Cases were deleted from samples on the

The Norwegian version of the BAI
18
following criteria: (a) missing demographic data, (b) missing 30% or more of data on all
items, (c) missing 30% or more of data on the BAI-items. For Sample 1 this resulted in 10
cases being deleted; for Sample 2, 2 cases being deleted; for Sample 3, 3 cases being deleted
(Table B1).
--------------------------------------------------------------------------------------------------------
Insert Table B1 about here.
--------------------------------------------------------------------------------------------------------
Prior to creating sum scores for each scale, missing data were replaced by the series
mean-method. Adding up the items on each scale created sum scores. The BAI was then
compared with the other scales on reliability, means and correlations. For sample 2 the test-
retest stability were tested also.
To obtain a larger population for purposes of factorial analyses on the BAI from the
student samples (Sample 2 and Sample3), a new file was created containing the BAI-items
from both samples (N = 423), hereafter labelled Sample 4.
The next step was to test factorial solutions reported in earlier studies through
confirmatory factor analysis, using Structural Equation Modelling (SEM). Due to high levels
of Kurtosis and Skewness on several of the BAI-items this posed some problems, as SEM-
analysis requires data to be normally distributed. I therefore transformed the scores on each
BAI-item using the square root-method, a routine procedure used to obtain a normal
distribution (Schumacker, & Lomax, 1996; Kline, 1998). This resulted in appropriate levels of
Kurtosis and Skewness for most items. Nevertheless, the impact of non-normally distributed
data might have made the estimation of the incremental fit indices for each model more
inaccurate than with normally distributed data.
As mentioned earlier, the BAI-literature most frequently reports two- and four-factor
models for the BAI. I chose three models for confirmatory factor analysis: a two-factor model
The Norwegian version of the BAI
19
presented by Kabacoff et al. (1997); a four-factor model, proposed by Beck & Steer (1990) in
the BAI-manual; and a second-order, four-factor model as presented by Osman et al. (1997).
This last models was included as it is a modification of the Beck & Steer model, with anxiety
as a common factor of the four original factors. The analyses were conducted using AMOS
BASIC and AMOS GRAPHICS (Arbuckle, 1999).
The key index used in comparing the different models was Akaike�s (1987)
Information Criterion as it rewards model parsimony and punishes complexity and can
compare models that are not hierarchical or nested (Schumacker, & Lomax, 1996). A word of
caution: the computation of complexity in the AIC is based on the number of degrees of
freedom (or free parameters) in the models. Due to the high number of sample moments taken
in to the analyses on the BAI, the relative difference in degrees of freedom in each model is
rather small. The inference of this is that the �punishment� for model complexity is less
discriminative than with models containing fewer observed variables. Further, there are two
versions of the AIC in the literature: χ2 � 2DF and χ2 + 2q (were q are number of parameters).
For the purposes of this study, they have equal mathematical properties, but AMOS reports
the latter.
The other criteria being used were the comparative fit index (CFI; Bentler, 1988), and
the root mean square error of approximation (RMSEA; Browne, & Cudeck, 1993). The
traditionally recommended criteria to indicate goodness-of-fit of a particular model are: CFI >
0.90; RMSEA < 0.10 (Arbuckle, 1999).
Subsequent to the confirmatory analyses, I performed a post-hoc analysis of the best-
fitting model using information from the Modification Indices feature in AMOS, exploratory
factor analyses and theoretical deliberations. This is what Joreskog (1993) calls a model-
generating application of the SEM. For some considerations concerning this procedure, see
Byrne (2001).

The Norwegian version of the BAI
20
Analyses
Descriptive data
Sample 1. Means, Standard Deviations and alpha-coefficients from Sample 1 for the
BAI, the BDI-II, the PSWQ and the WBSI are reported in Table B2 (N = 869). For the BAI
the range of scores was 0-37 with a mean of 5.02 (SD = 5.66). The Skewness (1.98) and
Kurtosis (4.91) exceed desired limits. Analyses of internal consistency reliability for the BAI,
revealed a Cronbach�s alpha of .88.
--------------------------------------------------------------------------------------------------------
Insert Table B2 about here.
--------------------------------------------------------------------------------------------------------
The correlations (Table B3) with the PSWQ (.54) and the WBSI (.47) were moderate.
The correlation with the BDI-II was .61. This is comparable to results reported in prior studies
(Ferguson, 2000). Gender differences (F (1, 867) = 5.38, p = .02) and age differences (F (3,
865) = 2.74, p = .04) were significant at the .05 significance level, but not at the .01 level.
There were no interaction effect between gender and age (F (3, 865) = 1.39, p = .25).
--------------------------------------------------------------------------------------------------------
Insert Table B3 about here.
--------------------------------------------------------------------------------------------------------
The item-total correlations ranges from .29 to .63. The item-total correlations (Table
B4) for two of the items (18 Indigestion and 20 Face flushed) relating to autonomic symptoms
as described by Beck & Steer (1990), are low (<. 35). The Skewness and Kurtosis are above
desired levels on almost every item. Items 11 Feelings of choking, 15 Difficulty breathing and
9 Terrified display a more skewed distribution.
--------------------------------------------------------------------------------------------------------
Insert Table B4 about here.

The Norwegian version of the BAI
21
--------------------------------------------------------------------------------------------------------
The total BAI-scores compared to the resulting z-scores from the community
population are presented in Table B5. These entail normative values for total scoring values
on the BAI slightly lower than those obtained in the Gillis-study (1996) and presented by
Ferguson (2000).
--------------------------------------------------------------------------------------------------------
Insert Table B5 about here.
--------------------------------------------------------------------------------------------------------
Sample 2. The BAI correlated .69 with the depression-subscale on the SCL-90, .60
with the psychoticism-subscale on the SCL-90, and .68 with the BDI-II. Test-retest reliability
was estimated by Pearson r correlation coefficient (0,69, p < 0.01, N = 127). This is consistent
with what have been found in earlier studies where correlation coefficients has varied from
.62 to .75 over 7-day and extended periods (Ferguson, 2000).
Sample 3. Means, Standard Deviations and alpha-coefficients from Sample 3 for the
BAI, the BDI, the FQ, the SCL-anxiety the STAI-S and the STAI-T are reported in Table B6.
The Cronbach�s alpha (.87) of the BAI is slightly lower in this sample than in the community
sample. On the other hand, the mean (7.55) is substantially higher in this sample, exceeding
the Standard Deviation (6.56). On total BAI scores, there were no significant gender and age
differences in this sample (Gender: F (1, 115) = .58, p = .45; Age: r = -.54, p = .56)
--------------------------------------------------------------------------------------------------------
Insert Table B6 about here.
--------------------------------------------------------------------------------------------------------
The correlation (Table B7) between the BAI and the BDI-II is .61, similar to the
community sample. The correlation between the BAI and the STAI-S is .54 and the
correlation between the BAI and the STAI-T .60. This is within the range of what have been
The Norwegian version of the BAI
22
reported in non-clinical samples earlier (e.g., Creamer et al., 1995). In this sample the BAI
correlates lower with the BDI-II than do the STAI-S (.75) and STAI-T (.77).
--------------------------------------------------------------------------------------------------------
Insert Table B7 about here.
--------------------------------------------------------------------------------------------------------
Sample 4. The item-total correlations of the BAI-items range from .19 to .67. Several
of the items (2, 11, 15 and 20) reflecting physiological symptoms, and item 16 �fear of dying�
have low (< .35) item-total correlation (Table B8). Albeit the distribution of each item is
closer to normal in this sample, Skewness and Kurtosis are substantial for most of the items.
Especially items 6 Dizzy or lightheaded, 11 Feelings of choking and 15 Difficulty breathing
display substantial deviations from normal distribution.
Confirmative Factor Analyses
Alternative models. I tested three models, the Kabacoff et al. (1997) two-factor model
(Figure C1), the Beck & Steer (1990) four-factor model (Figure C2) and the Osman et al.
(1997) second-order four-factor model (Figure C3). The models are presented with factor
loadings in ascending order in terms of complexity.
--------------------------------------------------------------------------------------------------------
Insert Figure C1, Figure C2 and Figure C3 about here.
--------------------------------------------------------------------------------------------------------
All models approached a good fit to the data considering the RMSEA index, but not
the CFI index. The failure of any of the models to provide fit could be due to several of the
items� distributions being skewed, thus limiting explainable variance (Kline, 1998). The items
displaying the highest levels of Skewness and Kurtosis in the community sample (Table B4)
were item 9 �terrified� loading on the subjective factor in all models, and items 11 �choking�
and 15 �difficulty breathing�, both related to the panic factor in Beck et al.�s (1990) four-
The Norwegian version of the BAI
23
factor model and which are also listed as symptoms of panic attacks in the ICD-10 (WHO,
1992) and DSM-IV (APA, 1994). Unfortunately, Skewness and Kurtosis are not reported in
any of the studies based on non-clinical samples.
The four-factor model proposed by Beck & Steer (1990) achieved better fit than the
other models in both the community sample (Table B9) and the student sample (Table B10).
The results give little reason to favour one model over the other. Nevertheless, on the basis of
the AIC, the four-factor model was retained in order to further examine the factor structure.
Post Hoc analysis. In several explorative factor-analyses the factor labelled
�Subjective� in all models tested during confirmational analyses, seemed fairly robust
regardless of the number of factors being extracted. However, in all these analyses item 16
�fear of dying� had its highest loading on this factor as opposed to what was reported in the
manual (Beck, & Steer, 1990).
Item 16 loading on the subjective factor is congenial with what was originally
expected by Beck et al. (1988). I therefore chose to allow this item to load on the �Subjective�
factor instead of the �Panic� factor in the modified solution. This substantially increased
goodness-of-fit for the model. Additionally, to be able to explain more of the variance, four
further changes were made: The residual errors of items 3 �Wobbliness in legs� and 8
�Unsteady�, items 12 �Hands trembling� and 13 �Shaky�, items 6 �Dizzy or light-headed�
and 19 �Faint� and items 11 �Feelings of choking� and 15 �Difficulty breathing�, were
correlated. All changes had a theoretical rationale, and were supported by the Modification
Indices. Each of these changes made substantial increases in the goodness-of-fit measures.
The resulting model (Figure C4a and Figure C4b) achieved satisfying goodness-of-fit
measures in both samples (Table B9 and Table B10), albeit its fit was slightly better for the
community sample.
--------------------------------------------------------------------------------------------------------

The Norwegian version of the BAI
24
Insert Figure C4a and Figure C4b about here.
--------------------------------------------------------------------------------------------------------
Discussion
Reliability
Internal consistency. The mean and standard deviation is somewhat lower than what
was found (M = 6.66, SD = 8.1) in the community sample by Gillis et al. (1995). The mean
and standard deviations on the PSWQ were, on the other hand, practically identical to those in
the Gillis-study, which would indicate that the samples are comparable. Internal consistency
reliability was somewhat weaker in the Norwegian samples than reported from earlier studies
(Ferguson, 2000), but yet at a satisfactory level. The test-retest reliability was satisfactory and
readily comparable with those obtained in other studies (Ferguson). The Norwegian version of
the BAI displays satisfactory reliability.
Item Analysis. In both the community sample, and especially the student sample,
several of the items demonstrated low correlations with the scale as a whole. Especially, items
related to extreme physiological symptoms � like feelings of choking � had low loadings,
indicating that these symptoms mainly are experienced by people with very high levels of
anxiety. The high levels of Skewness and Kurtosis for most of the items in the community
sample as well as the student sample may also pose some difficulties. Data being severely
skewed has limited variance, thus restricting explanatory value. The results in this study
indicates that the BAI should be used with caution as a research instrument in non-clinical
samples.
Concurrent validity
The correlations with other self-report scales used to measure the severity of anxiety
ranges from low moderate to moderate. The BAI has its highest correlation with the anxiety-

The Norwegian version of the BAI
25
subscale of the SCL-90 and a bit lower with the STAI-Y forms. The results is comparable to
those found in other studies (Fydrich et al., 1992; Creamer et al., 1995) and strengthen the
impression that the Norwegian version is representative of the original version.
The moderate correlations with the other measures in the community sample, indicate
good divergent validity for the BAI in this sample as compared to tendencies to worry
(PSWQ) and chronic thought suppression (WBSI). Nevertheless, the correlation with the
PSWQ is a little lower than might have been expected initially. The PSWQ has showed
evidence of divergent validity with respect to the BDI (Stanley, Novy, Bourland, Beck, &
Averill, 2001), is explicitly related to the Generalized Anxiety Disorder and seen as a trait
measure of pathological tendencies to worry (Meyer, Miller, Metzger, & Borkovec, 1990).
Even though the BAI is a state measure, its desired quality of separating anxiety from
depression, bring about the expectation that it should correlate higher with the PSWQ than
with the STAI-T. However, the divergence is perhaps explained on the hypothesis that worry
is a cognitive aspect of anxiety (Molina, & Borkovec, 1994), whereas the BAI-items
predominantly reflect physiological symptoms of anxiety.
Construct validity
A correlation with BDI-II at .61, is relatively high given the explicit aim of using the
BAI as a tool for separating anxiety from depression (Beck et al., 1988). Even though the
correlation with the BDI-II was higher in the student sample than in the community sample,
the moderate correlations with the two SCL-90 subscales provide further support for the
divergent validity of the BAI. And Beck and Steer (1990) point out, given the high level of
correlation generally found between anxiety and depression over the years, a substantial
correlation between measures of anxiety and depression should be expected. The high
correlation between the Beck anxiety and depression inventories might also be due to elevated
levels of general distress or negative affectivity (NA; Watson & Clark, 1994) The BAI

The Norwegian version of the BAI
26
discriminates better from depression as measured by the BDI-II than does the other anxiety
measures included in this study. The BAI�s superiority over the STAI as a divergent measure,
is supported by this study.
The correlation with other anxiety measures is within the same range as the correlation
with the depression measures. Due to high level of concurrence of anxiety and depression
symptoms, this may not be a problem. However, the emphasis in the BAI on physiological
components as 15 of 21 items relate to physiological symptoms, perhaps facilitates better
discrimination from depression than do other scales, but may be at he expense of convergent
validity (Creamer et al., 1995). The reported studies so far also indicate that the BAI functions
best measuring anxiety disorders having strong physiological components, such as Panic
Disorder (e.g., Beck & Steer, 1990; Cox et al., 1996).
A further indication of construct value of the BAI is the very low correlation between
the BAI and the FQ. The FQ is designed to assess severity of specific fears through querying
about avoidance associated with agoraphobic, social, and blood-injury fears, which according
to the ICD-10 (WHO, 1988) may be experienced with and without present symptoms. To my
knowledge, there are no previous studies reporting correlations between the BAI and the FQ,
but the correlation obtained in this study concurs with what recently have been found
regarding the STAI-Y forms (Stanley et al., 2001). As the findings in this study replicate what
has been found earlier, the impression that the Norwegian version of the BAI reflects the
original version in a satisfactory way is supported.
Factor structure
When Beck and Steer (1990) report factor structure in the BAI Manual, it is for the
specific purposes of enhancing the BAI�s discriminative value within the array of anxiety
diagnoses. Beck & Steer encourage further investigation into this, but to date, most studies
have tested the factor structure of the BAI without linking it to differential psychiatric

The Norwegian version of the BAI
27
diagnosing. As such, the present examination of factor structure is more of a psychometric
investigation of the BAI, than a fine-tuning of the instrument for diagnostic purposes.
However, in this study I found that the four-factor model proposed by Beck & Steer in
the Manual provided the best fit to the data in the community sample as well as in the student
sample. The differences compared to the two-factor and second-order four-factor model were
small, but provide modest support for a four-factor solution. For the Norwegian version of the
BAI, an examination of factor structure based on results from a clinical sample, remains to be
carried out. Of interest here is to what extent the factor structure will differ in the clinical
population as individuals� response sets are altered under higher level of perceived pressure
(Creamer et al., 1995).
To achieve acceptable fit as measured by the CFI-index, some changes were made
modifying the Beck & Steer model. The theoretically most interesting change, was letting
item 16 fear of dying regress on the �Subjective� factor instead of the �Panic� factor. This is
consistent with the two-factor Kabacoff et al. (1997). This concurs with the fact that this is the
only item not reporting physiological symptoms as well. Generally, there seems to be reason
to connect this item to a subjective or cognitive factor, instead of the other factors related to
physiological items.
Due to the difficulties in achieving satisfactory fit on the models examinated,
explorative factor analyses were conducted. Results from these analyses slightly favoured a
four-factor model in the population sample as well as in the student sample, with a solution a
little different from that presented by Beck & Steer (1990). The most robust factor in both
samples, regardless of the number of factors being extracted in the solution, was a factor quite
similar to what Beck & Steer termed the �subjective factor�. Further, the explorative factor
analyses revealed no particular response set in these samples as the items are grouped
independently of their position in the questionnaire.

The Norwegian version of the BAI
28
Overall, the results from confirmatory as well as exploratory factor analyses support
the validity of the Norwegian version of the BAI, as it displays psychometric properties
within reasonable range of what has been obtained on the original version. Thus, the results in
this study sustain the validity of the Norwegian translation. The fact that the BAI displays a
slightly different factor structure in the normal population than what is reported in the
literature in clinical samples, can be due to different response patterns under different levels
of distress (Creamer et al., 1995).
Some possible limitations related to the community sample
The sampling procedure used in this study has several limitations. Albeit no explicit
exclusion criteria were used, there is reason to question whether the sample is representative
of the whole population as there are several implicit excluionary criteria in the sampling
procedure. The first implicit exclusionary criterion is the 2% of the population not registered
either because they don�t want to be listed, or because they do not have a phone. It is also
possible to deny registered phone numbers to be released to marketing companies, which
would include the statistical institute used in this study. Second, an ample proportion of the
initial population could not be reached by phone. Third, some refused to do a survey at all,
and fourth, some refused to do a survey including psychological scales. Fifth, only 67% of
those agreeing to participate actually returned the forms.
One can only speculate as to the reasons why people are selected out this way. But, it
does not seem farfetched to imply that the level of anxiety, or its co-symptom disorder
depression, might have something do with it. There is one explicit criterion though; there are
no psychiatric inpatients in this sample. To remedy this problem, one could have chosen to
stratify the sample by including a representative proportion of psychiatric inpatients in the
sample. Those factors might have contributed to the rather low scoring on the BAI in the
community sample.

The Norwegian version of the BAI
29
The flat floor effect (Kendall et al., 1999) with the Standard Deviation exceeding the
Mean, questions to some extent the conceptualisation of anxiety as normally distributed. If
one should hypothesise that anxiety be normally distributed but not reported overtly, other
instruments will be needed to assess this, the Minnesota Multiphasic Personality Inventory
(MMPI; Hathaway & McKinley, 1943) being one example of an instrument based on this
assumption.
Nevertheless, this investigation takes its bearings on the model of normality as
�average� (Kendall & Sheldrick, 2000). If we had used exclusionary criteria, scanning the
population for levels of anxiety implying psychiatric diagnoses, the resulting norms would
have been more stringent. Studies drawn from populations diagnosed with anxiety and/or
depressive disorders (e.g., Hewitt, & Norton, 1993; Enns et al., 1998) reveal means of the
BAI total score within the second and third standard deviation from the mean in this
community sample. This suggests that even though there are no extremes in this sample, it is
representative of a substantial quantity of the population obtaining total scores on the BAI
connected to psychiatric diagnoses of anxiety.
Bearing these problems, which are inherent in most survey studies in psychology, in
mind, the sample can be regarded as representative and useful for giving normed standards for
the distribution of scores on the BAI in the population. To validate such recommendations for
the Norwegian version of the BAI, though, one will need to compare the results from the
community sample with a sample drawn from patients in psychiatric cares.
Problems with wording in the Norwegian translation
In the post hoc analysis of the four-factor model, several items were allowed to
correlate. This poses problems related to the psychometric properties of the BAI. Ideally, as
much of the variance each item as possible should be explained on account of the factors,
especially if they should be used for differential diagnostics. In the analysis, I let four pairs of

The Norwegian version of the BAI
30
items correlate. All of these were based on face value theoretical considerations as concerns
the content of the items.
Unfortunately, two pairs of items (6 and 19; 12 and 13) are similar not only in content,
but also that similar in wording there is reason to believe this contributes to their high level of
correlation. Although the translation of these items represents the meaning of the English
wording, I believe it is likely they confound the utility of the scale.
Based on these considerations, and contrary to good standards of translation and
validation (Geisinger, 1994), I suggest that the Norwegian wording of item 6 �Svimmel eller
ør� be changed to �Omtåket eller ør� and the wording of item 13 �Skjelven� be changed to
�Oppskaket�. These new translations mirror the original content of the items equally well as
the old. If not procedural correct as regards the validation of the scale, these changes will
possibly enhance the validity of the scale as a whole as well as at the factorial level.
Conclusion
The present study gives reason to accept the Norwegian version of the BAI. The
psychometric properties are satisfactory and coherent with what have been found in studies on
the original versions. A study including a clinical sample is required to confirm the validity of
the Norwegian version and facilitate normative values for the BAI. Nonetheless, some minor
adjustments are recommended, changing the wording of item 6 and item 13. At a theoretical
level, this study supports the original contention that item 16 �fear of death� loads on a
�subjective� factor rather than on more somatic or panic related.

The Norwegian version of the BAI
31
References
Akaike, H. (1987). Factor analysis and AIC. Psychometrika, 52, 317-322.
American Psychiatric Association. (1987). Diagnostic and statistical manual of mental
disorders. (3rd ed.). Washington, DC: American Psychiatric Association.
American Psychiatric Association. (1994). Diagnostic and statistical manual of mental
disorders. (4th ed.). Washington, DC: American Psychiatric Association.
American Psychological Association. (2001). Publication Manual of the American
Psychological Association. Washington, DC: American Psychological Association.
Arbuckle, J. L. (1999). Amos 4.01 [Computer Software]. Chicago: Smallwaters.
Beck, A. T. (1978). PDR Check List. University of Pennsylvania, Center for Cognitive
Therapy, Philadelphia.
Beck, A. T. (1982). Situational Anxiety Check List. University of Pennsylvania, Center for
Cognitive Therapy, Philadelphia.
Beck, A. T., & Steer, R. A. (1990). Manual for the Beck Anxiety Inventory. San Antonio, TX:
Psychological Corporation.
Beck, A. T., Steer, R. A., & Brown, G. (1985). Beck Anxiety Check List. Unpublished
manuscript, University of Pennsylvania, Center for Cognitive Therapy, Philadelphia.
Bentler, P. M. (1988). Comparative fit indices in structural models. Psychological Bulletin,
112, 400-404.
Browne, M., & Cudec, R. (1993). Alternative ways of assessing model fit. In K. A. Bollen &
J. S. Long (Eds.), Testing structural equation models. Newbury Park, CA: Sage.
Byrne, B. M. (2001). Structural Equation Modelling With AMOS. Basic Concepts,
Applications, and Programming. Mahwah, NJ: Lawrence Erlbaum Associates,
Publishers.
The Norwegian version of the BAI
32
Clark, D. A., & Beck, A. T. (1999). Scientific Foundations of Cognitive theory and therapy of
depression. New York: John Wiley & Sons, Inc.
Cox, B. J., Cohen, E., Direnfeld, D. M., & Swinson, R. P. (1996a). Does the Beck Anxiety
Inventory measure anything beyond panic attack symptoms. Behaviour Research and
Therapy, 34(11-12), 949-954.
Cox, B. J., Cohen, E., Direnfeld, D. M., & Swinson, R. P. (1996b). Reply to Steer and Beck:
Panic disorder, generalized anxiety disorder, and quantitative versus qualitative
differences in anxiety assessment. Behaviour Research and Therapy, 34(11-12), 959-
961.
Creamer, M., Foran, J., & Bell, R. (1995). The Beck Anxiety Inventory in a non-clinical
sample. Behaviour research and Therapy, 33(4), 477-485.
Darwin, C. (1965). The Expression of the Emotions in Man and Animals. Chicago: The
University of Chicago Press.
Dawes, R. M. (1994) House of Cards. Psychology and psychotherapy built on myth. New
York: Free Press.
Derogatis, L. R. (1983). SCL-90-R. Administration, scoring and procedures manual.
Baltimore: Clinical Psychometric Research.
Dobson, K. S, & Cheung, E. (1990) Relationship Between Anxiety and Depression:
Conceptual and Methodological Issues. In Maser, J. D., & Cloninger, C. R.,
Comorbidity of Mood and Anxiety Disorders. Washington: American Psychiatric
Press, Inc.
Edelmann, R.J. (1992). Anxiety. Theory, Research and Intervention in Clinical and Health
Psychology. Chichester: John Wiley & Sons Ltd.

The Norwegian version of the BAI
33
Enns, M.W., Cox, B. J., Parker, J. D. A., & Guertin, J. E. (1998). Confirmatory factor analysis
of the Beck Anxiety and Depression Inventory in patients with major depression.
Journal of Affective Disorders, 47 (1-3), 195-200.
Ferguson, G. A., & Takane, I. (1989). Statistical Analysis in Psychology and Education. New
York: McGraw-Hill.
Ferguson, J. R. (2000). Using the Beck Anxiety Inventory in Primary Care. In Maruish, M. I.
(Ed.), Handbook of Psychological Assessment in Primary Care Settings. Mahwah,
New Jersey: Lawrence Erlbaum Associates, Inc., Publishers.
Freud, S. (1961/1930). Civilization and its discontents. In J. Strachey (Ed.) The standard
edition of the complete psychological works of Sigmund Freud, Volume XXI.London:
The Hogarth Press.
Fydrich, T., Dowdall, D., & Chambless, D. L. (1992). Reliability and validity of the Beck
Anxiety Inventory. Journal of Anxiety Disorders, 6(1), 55-61.
Geisinger, K. F. (1994). Cross-Cultural Assessment: Translation and Adaptation Issues
Influencing the Normative Interpretation of Assessment Instruments. Psychological
Assessment, 6 (4), 304-312.
Giddens, A. (1991). Modernity and Self-Identity. Stanford, California: Stanford University
Press.
Gillis, M. M., Haaga, D. A. F., & Ford, G. T. (1995) Normative values for the Beck Anxiety
Inventory, Fear Questionnaire, Penn State Worry Questionnaire, and Social Phobia
and Anxiety Inventory. Psychological Assessment, 7(4), 450-455.
Hathaway, S. R., & McKinley, J. C. (1943). Manual for the Minnesota Multiphasic
Personality Inventory. New York: Psychological Corporation.
Hewitt, P. L., & Norton, G. R. (1993) The Beck Anxiety Inventory: A Psychometric Analysis.
Psychological Assessment, 5 (4), 408-412.

The Norwegian version of the BAI
34
Hugdahl, K. (1981). The Three-Systems-Model of Fear and Emotion � a Critical
Examination. Behaviour Research & Therapy (19), 75-85.
Izard, C. E. (1971). The Face of Emotion. New York: Appleton-Century-Crofts.
Jackson, D. N. (1970). A sequential system for personality scale development. In C. D.
Spielberger (Ed.), Current topics in clinical and community psychology: Vol. II (pp.
61-96). New York: Academic Press.
Joreskog, K. G. (1993). Testing structural equation models. In K. A. Bollen & J. S. Lang
(Eds.), Testing structural equation models (pp. 294-316). Newbury Park, CA: Sage.
Joreskog, K. G., & Sorbom, D. (1986). LISREL VI: Analysis of linear structural relationships
by maximum likelihood, instrumental variables, and least squares methods.
Mooresville, IN: Scientific Software.
Kabacoff, R.I., Segal, D. L., Hersen, M., & Van-Hasselt, V. B. (1997). Psychometric
properties and diagnostic utility of the Beck Anxiety Inventory and the State-Trait
Anxiety Inventory with older adult psychiatric outpatients. Journal of Anxiety
Disorders, 11(1), 33-47.
Kendall, P. C., Flannery-Shroeder, E. C., & Ford, J.D. (1999). Therapy outcome research
methods. In P.C. Kendall, J. N. Butcher, & G. N. Holmbeck (Eds.), Handbook of
research methods in clinical psychology (pp. 330-363). New York: Wiley.
Kendall, P.C., & Sheldrick, R. C. (2000). Normative Data for Normative Comparisons.
Journal of Consulting and Clinical Psychology 68 (5), 767-773.
Kline, R. B. (1998). Principles and Practice of Structural Equation Modeling. New York:
The Guilford Press.
Lampert, L. (1993). Nietzsche and Modern times: a study of Bacon, Descartes and Nietzsche.
New Haven: Yale University Press.

The Norwegian version of the BAI
35
Marks, I. M., & Mathews, A.M. (1979). Brief Standardized self-rating for phobic patients.
Behaviour Research and Therapy, 29, 487-495.
Maruish, M. E. (2000). Introduction. In Maruish, M. E. (Ed.), Handbook of psychological
assessment in primary care settings (pp. 3-41). Mahwah, NJ: Lawrence Erlbaum
Associates, Publishers.
Maser, J. D., & C. R. Cloninger. (1990). Comorbidity of Anxiety and Mood Disorders. In
Maser, J. D., & Cloninger, C. R., Comorbidity of Mood and Anxiety Disorders.
Washington: American Psychiatric Press, Inc.
Meyer, T. J., Miller, M. L., Metzger, R. L., & Borkovec, T. D. (1990). Development and
validation of the Penn State Worry Questionnaire. Behaviour Research and Therapy,
28, 487-495.
Molina, S. & Borkovec, T. D. (1994) The Penn State Worry Questionnaire: psychometric
properties and associated characteristics. In G. C. L. Davey and F. Tallis (Eds.),
Worrying: Perspectives on Theory, Assessment and Treatment. Chichester: John
Wiley & Sons Ltd.
Nordhagen, T., Pallesen, S., & Nordhus, I. H. (2000) Norwegian version of the BAI.
Unpublished manuscript. Institute for clinical psychology, University of Bergen.
Norton, G. R., Dorward, J., & Cox, D. J. (1986). Factors associated with panic attacks in non-
clinical subjects. Behavior Therapy 17, 239-252.
Osman, A., Kopper, B.A., Barrios, F. X., Osman, J. R., & Wade, T. (1997). The Beck Anxiety
Inventory: Re-examination of factor structure and psychometric properties. Journal of
Clinical Psychology 53(1), 7-14.
Sandanger, I., Nygård, J. F., Brage, S., & Tellnes, G. (1997) Forekomst av psykiske problemer
og sykemeldinger med psykiatriske diagnoser i befolkningen, kjønnsforskjeller. Oslo:
Seksjon for trygdemedisin.

The Norwegian version of the BAI
36
Schachter, S., & Singer, J. (1962). Cognitive, social and physiological determinants of
emotional state. Psychological Review, 69, 641-669.
Schumacker, R. E., & Lomax, R. G. (1996). A Beginner�s Guide to Structural Equation
Modelling. Mahawa, New Jersey: Lawrence Erlbaum Associates, Publishers.
SPSS Inc. (2000). SPSS for Windows. SPSS Inc.
Stanley, M. A., Novy, D. M., Bourland, S. L., Beck, J. G., & Averill, P. M. (2001) Assessing
older adults with generalized anxiety: a replication and extension. Behaviour Research
and Therapy 39, 221-235.
Steer, R. A., & Beck, A. T. (1996). Generalized anxiety and panic disorders: Response to
Cox, Cohen, Direnfeld, and Swinson (1996). Behaviour Research and Therapy, 34(11-
12), 955-957.
Tomkins, S. S. (1962). Affect, Imagery, Consciousness, 2 vols. New York: Springer-Verlag.
Watson, D., & Clark, L. A. (1984) Negative affectivity: The disposition to experience
aversive emotional states. Psychological Bulletin, 96, 465-490.
Wegner, D. M., & Zanakos, S. (1994). The White Bear Suppression Inventory. Journal of
Personality, 62, 615-640.
World Health Organization. (1992). The ICD-10 Classification of mental and behavioural
disorders. Geneva: World Health Organization.
Yalom, I. D. (1980). Existential Psychotherapy. New York: Basic Books.

Figure 1. Two-factor model (Kabacoff et al., 1997). Standardized regression weights in community sample included in figure.
somatic
BAI1 er1
,53BAI2 er2
,40BAI3 er3
,48 BAI6 er6,63 BAI7 er7,55
BAI8 er8,52
BAI11 er11,46
BAI12 er12,48
BAI13 er13,59
BAI15 er15
,57
BAI18 er18
,37
BAI19 er19
,63
BAI20 er20
,28
BAI21 er21
,44
subjective
BAI4 er4,61
BAI5 er5,69
BAI9 er9,52
BAI10 er10,72
BAI14 er14,69
BAI16 er16
,47
BAI17 er17
,60
,73

Figure 2. Four-factor model (Beck & Steer, 1990). Standardized correlations and regression weights from community sample included in figure.
Neuro-phys
BAI1 er1,54
BAI3 er3,50
BAI6 er6,67
BAI8 er8,55
BAI12 er12,48
BAI13 er13,58
BAI19 er19
,67
Subjective
BAI4 er4,62
BAI5 er5,68
BAI9 er9,51
BAI10 er10,72
BAI14 er14,70
BAI17 er17,58
Panic
Autonom
BAI7 er7,57
BAI11 er11,51
BAI15 er15,61
BAI16 er16,43
BAI2 er2,63
BAI18 er18,33
BAI20 er20,35
BAI21 er21,74
,67
,75
,56
,55
,54
,86

Figure 3. Second-order four-factor solution (Osman et al., 1997). Standardized regression weights from community sample included in figure.
Neuro-phys
BAI1 er1
,54 BAI3 er3,49
BAI6 er6,67
BAI8 er8,55
BAI12 er12,49
BAI13 er13
,58
BAI19 er19
,67
Subjective
BAI4 er4,62 BAI5 er5,68
BAI9 er9,52
BAI10 er10,72
BAI14 er14,70
BAI17 er17
,58
Panic
Autonom
BAI7 er7,57
BAI11 er11,50
BAI15 er15,61
BAI16 er16
,43
BAI2 er2,63
BAI18 er18,33
BAI20 er20,35
BAI21 er21
,74
Anxiety
,87
,78
,96
,63
res1
res2
res3
res4

Figure 4a. The four-factor model modified. Standard regression weights obtained in the community sample included in figure.
Neuro-phys
BAI1 er1,55
BAI3 er3,48
BAI6 er6,60
BAI8 er8,50
BAI12 er12,46
BAI13 er13,59
BAI19 er19
,58
Subjective
BAI4 er4,61
BAI5 er5,69
BAI9 er9,51
BAI10 er10,72
BAI14 er14,69
BAI17 er17,60
Panic
Autonom
BAI7 er7,57
BAI11 er11,43
BAI15 er15,55
BAI16 er16
BAI2 er2,63
BAI18 er18,33
BAI20 er20,35
BAI21 er21,74
,72
,76
,61
,55
,58
1,00
,47
,43
,25
,31
,29

Figure 4b. The four-factor model modified. Standardized regression weights obtained in the student sample included in model.
Neuro-phys
BAI1 er1,51
BAI3 er3,55
BAI6 er6,53
BAI8 er8,58
BAI12 er12,59
BAI13 er13,72
BAI19 er19
,43
Subjective
BAI4 er4,57
BAI5 er5,66
BAI9 er9,50
BAI10 er10,69
BAI14 er14,58
BAI17 er17,62
Panic
Autonom
BAI7 er7,67
BAI11 er11,26
BAI15 er15,31
BAI16 er16
BAI2 er2,40
BAI18 er18,55
BAI20 er20,29
BAI21 er21,61
,75
,72
,72
,77
,79
1,01
,27
,44
,06
,29
,32
Appendix B. Tables.
Table 1. Number of cases excluded from samples and residual Ns.
Sample Initial N Cases excluded N
Sample 1 879 10 869
Sample 2 308 2 306
Sample 3 120 3 117
Table 2. Means. Standard Deviations and alpha-coefficients from Sample 1 for the BAI. the
BDI. the PSWQ and the WBSI (N = 869)
Mean SD Alpha
BAI 5.02 5.66 .8775
BDI-II 8.17 7.58 .9070
PSWQ 40.11 12.62 .9101
WBSI 39.45 14.92 .9077
Table 3. Intercorrelations between the BAI. the BDI-II. the PSWQ and the WBSI.
BAI BDI-II PSWQ WBSI
BAI __
BDI-II .606** __
PSWQ .523** .554** __
WBSI .473** .500** .536** __
** Correlation is significant at the 0.01 level (2-tailed).

Table 4. Mean. Standard Deviation. Skewness. Kurtosis and Corrected Item-
total correlation for the BAI-items in Sample 1 (N = 869).
Item Mean SD Skewness Kurtosis
Corr. Item-total corr.
BAI1 0.20 0.47 2.42 5.70 0.46
BAI2 0.25 0.49 1.85 2.60 0.36
BAI3 0.11 0.35 3.57 13.86 0.41
BAI4 0.48 0.66 1.23 1.01 0.54
BAI5 0.43 0.65 1.43 1.55 0.56
BAI6 0.31 0.56 1.81 2.91 0.58
BAI7 0.29 0.56 1.99 3.76 0.55
BAI8 0.15 0.41 3.08 10.53 0.42
BAI9 0.07 0.30 4.89 26.04 0.48
BAI10 0.44 0.64 1.35 1.56 0.62
BAI11 0.04 0.24 8.03 79.21 0.44
BAI12 0.17 0.45 2.98 9.42 0.43
BAI13 0.14 0.40 2.99 9.22 0.57
BAI14 0.28 0.54 1.99 3.90 0.63
BAI15 0.12 0.42 4.05 18.84 0.51
BAI16 0.21 0.50 2.76 8.51 0.38
BAI17 0.17 0.42 2.44 5.79 0.54
BAI18 0.41 0.63 1.33 1.05 0.33
BAI19 0.20 0.46 2.50 7.09 0.52
BAI20 0.22 0.49 2.28 5.19 0.29
BAI21 0.34 0.60 1.74 2.69 0.45

Table 5. Normative BAI Values and Percentile Rank Equivalents Based on Community Sample (Sample 1)
BAI Raw Score z-Score (Number of SDs from mean)
Percentile Equivalent
0 -0,89 19 1 -0,73 23 2 -0,57 28 3 -0,40 34 4 -0,24 41 5 -0,07 47 6 0,09 54 7 0,25 60 8 0,42 66 9 0,58 72 10 0,75 77 11 0,91 82 12 1,08 86 13 1,24 89 14 1,40 92 15 1,57 94 16 1,73 96 17 1,90 97 18 2,06 98 19 2,22 99 20 2,39 99+ 21 2,55 99+ 22 2,72 99+ 23 2,88 99+ 24 3,04 99+ - - -
26 3,37 99+ 27 3,54 99+ 28 3,70 99+ 29 3,87 99+ 30 4,03 99+ - - -
32 4,36 99+ 33 4,52 99+ 34 4,69 99+ - - -
37 5.18 99+

Table 6. Means. Standard Deviations and alpha-coefficients from Sample 3 for the BAI, the
BDI, the FQ., the SCL-anxiety, the STAI-S and the STAI-T (N = 117).
Mean SD Alpha
BAI 7.55 6.56 .8706
BDI-II 9.20 7.97 .9127
FQ 21.42 14.12 .8272
SCL-anx. 5.83 6.12 .8801
STAI-S 35.83 10.47 .9340
STAI-T 38.67 11.27 .9336
Table 7. Correlations between the BAI, the BDI-II, the FQ, the SCL-anxiety, the STAI-S and
the STAI-T and the WBSI in sample 3 (N = 117).
BAI BDI-II FQ SCL-anx STAI-S STAI-T
BAI -
BDI-II .612** -
FQ .302** .292** -
SCL-anx .661** .644** .392** -
STAI-S .538** .748** .318** .606** -
STAI-T .599** .774** .404** .717** .808** -
** Correlation is significant at the 0.01 level (2-tailed).

Table 8. Mean. Standard Deviation. Skewness. Kurtosis and Corrected Item-total
correlation for the BAI-items in Sample 4 (N = 423).
Item Mean SD Skewness Kurtosis
Corr. Item-total corr.
BAI1 .24 .49 2.08 4.34 .46
BAI2 .21 .48 2.74 10.78 .31
BAI3 .14 .40 3.22 11.72 .51
BAI4 .56 .71 1.14 0.95 .55
BAI5 .54 .84 3.25 24.45 .56
BAI6 .38 .72 4.90 48.26 .46
BAI7 .29 .61 2.25 4.94 .58
BAI8 .17 .43 2.76 8.35 .48
BAI9 .12 .43 3.81 14.67 .47
BAI10 .64 .69 0.79 0.13 .67
BAI11 .05 .26 5.69 34.46 .26
BAI12 .24 .51 2.35 5.82 .55
BAI13 .20 .46 2.49 6.52 .64
BAI14 .35 .62 1.69 2.11 .51
BAI15 .09 .34 4.92 29.71 .33
BAI16 .11 .41 4.49 22.63 .19
BAI17 .26 .56 2.34 5.54 .51
BAI18 .39 .66 1.73 2.72 .49
BAI19 .24 .51 2.27 5.59 .46
BAI20 .34 .57 1.61 2.37 .20
BAI21 .36 .59 1.56 2.06 .49

Table 9. Fit measures of factorial models in sample 1 (N = 869).
Model χ2 DF AIC CFI RMSEA
Two-factor model (Kabacoff et al.) 1049 188 1136 0.82 0.07
Four-factor model (Beck & Steer) 909 183 1005 0.85 0.07
Second-order, four-factor model 917 185 1009 0.85 0.07
Four-factor model modified 545 179 649 0.92 0.05
Note. AIC = Akaike Information Criterion CFI = Comparative Fit Index. RMSEA = Root
Mean Square Error of Approximation.
Table 10. Fit measures of factorial models in sample 4 (N = 423).
Model χ2 DF AIC CFI RMSEA
Two-factor model (Kabacoff et al.) 574 188 660 0.82 0.07
Four-factor model (Beck & Steer) 555 183 651 0.83 0.07
Second-order, four-factor model 566 185 659 0.83 0.07
Four-factor model modified 383 179 487 0.91 0.05
Note. AIC = Akaike Information Criterion CFI = Comparative Fit Index. RMSEA = Root
Mean Square Error of Approximation.