National Inventory Report - UNFCCC
143
Third Biennial Update Report on Climate Change NATIONAL INVENTORY REPORT Republic of North Macedonia December, 2019
-
Upload
khangminh22 -
Category
Documents
-
view
4 -
download
0
Transcript of National Inventory Report - UNFCCC

Third Biennial Update Report
on Climate Change
NATIONAL INVENTORY REPORT
Republic of North Macedonia
December, 2019

UNFCCC National Focal Point
Dr. Teodora Obradovikj Grncharovska
Project Manager
B.Sc. Pavlina Zdraveva
Chief Techical Advisor
Prof. Dr. Natasa Markovska
GHG INVENTORY TEAM
ICEOR-MANU Team
Acad. Gligor Kanevce,
D.Sc. Verica Taseska-Gjorgievska
D.Sc. Aleksandar Dedinec
Ass. Prof. D.Sc. Aleksandra Dedinec
M.Sc. Vasil Bozhikaliev
B.Sc. Emilija Mihajloska
B.Sc. Lazar Aleksovski
AFOLU TEAM
UKIM - Institute of Agriculture
Prof. Dusko Mukaetov
D-r Hristina Poposka
D-r Dusko Nedelkovski
UKIM – Faculty of Agricultural Science and Food
Prof. D-r. Sretan Andonov
Prof. D-r. Ordan Chukaliev
Prof. D-r Vjekoslav Tanaskovic
UKIM – Faculty of Forestry
Prof. Dr. Ljupco Nestorovski
Prof. Dr. Nikola Nikolov
Prof. Dr. Ivan Mincev
QA Expert
M.Sc. Elena Gavrilova
QC Expert
M.Sc. Marjan Mihajlov
Gender Consultant
Olgica Apostolova

National Inventory Report
Third Biennial Update Report

National Inventory Report
Third Biennial Update Report
i Contents
Contents
Contents ............................................................................................................................................................. i
List of Tables .................................................................................................................................................... iv
List of Figures .................................................................................................................................................. vii
Abbreviations and acronyms ............................................................................................................................ ix
Executive summary ...........................................................................................................................................1
1 Introduction ................................................................................................................................................6
2 Emission trends .........................................................................................................................................8
2.1 Methodologies ...............................................................................................................................8
2.2 Aggregate GHG emissions ............................................................................................................9
2.3 GHG emissions by gas ............................................................................................................... 10
3 Energy .................................................................................................................................................... 12
3.1 Emission trends – Reference approach ..................................................................................... 13
3.2 Emission trends – Sectoral approach ......................................................................................... 13
3.2.1 Energy industries .................................................................................................................... 14
3.2.2 Manufacturing industries and construction ............................................................................. 15
3.2.3 Transport ................................................................................................................................ 17
3.2.4 Other sectors .......................................................................................................................... 17
3.2.5 Non-specified .......................................................................................................................... 18
3.2.6 Fugitive emissions from fuels ................................................................................................. 19
3.2.7 Memo and Infomation Items: International aviation and Biomass combustion for energy production ............................................................................................................................................... 19
3.3 Comparison of Reference and Sectoral approach ..................................................................... 20
3.4 Methodology and emission factors ............................................................................................. 20
3.5 Data sources ............................................................................................................................... 21
4 Industrial processes and product use ..................................................................................................... 22
4.1 Emission trends .......................................................................................................................... 22
4.2 Mineral industry .......................................................................................................................... 24
4.2.1 Cement production ................................................................................................................. 24
4.2.2 Lime production ...................................................................................................................... 24
4.2.3 Glass production ..................................................................................................................... 24
4.2.4 Other process uses of carbonates .......................................................................................... 25
4.3 Metal industry ............................................................................................................................. 25
4.3.1 Iron and steel production ........................................................................................................ 25
4.3.2 Ferroalloys production ............................................................................................................ 25
4.3.3 Aluminum production .............................................................................................................. 26
4.3.4 Lead production ...................................................................................................................... 26
4.3.5 Zinc production ....................................................................................................................... 26
4.4 Product uses as substitutes of ozone depleting substances ...................................................... 26
4.5 Methodology and emission factors ............................................................................................. 26
4.6 Data sources ............................................................................................................................... 27

National Inventory Report
Third Biennial Update Report
ii Contents
5 Agriculture, forestry and other land use.................................................................................................. 28
5.1 Emission trends .......................................................................................................................... 28
5.2 Livestock ..................................................................................................................................... 29
5.2.1 Emissions from livestock activities ......................................................................................... 29
5.3 Land ............................................................................................................................................ 31
5.3.1 Forest land .............................................................................................................................. 31
5.3.2 Cropland ................................................................................................................................. 33
5.3.3 Grassland ............................................................................................................................... 35
5.3.4 Wetland ................................................................................................................................... 37
5.3.5 Settlements ............................................................................................................................. 38
5.3.6 Other land ............................................................................................................................... 39
5.4 Aggregate sources and non-CO2 emissions sources on land .................................................... 40
5.4.1 Urea application ...................................................................................................................... 41
5.4.2 Direct N2O emissions from managed soils ............................................................................. 42
5.4.3 Indirect N2O emissions from managed soils ........................................................................... 42
5.4.4 Indirect N2O emissions from manure management................................................................ 42
5.4.5 Rice cultivation ........................................................................................................................ 43
5.5 Methodology and emission factors ............................................................................................. 43
5.5.1 Livestock ................................................................................................................................. 43
5.5.2 Land ........................................................................................................................................ 43
5.6 Data sources ............................................................................................................................... 45
5.6.1 Livestock ................................................................................................................................. 45
5.6.2 Land ........................................................................................................................................ 45
6 Waste ...................................................................................................................................................... 47
6.1 Emission trends .......................................................................................................................... 47
6.1.1 Solid waste disposal ............................................................................................................... 48
6.1.2 Biological treatment of solid waste ......................................................................................... 49
6.1.3 Incineration and open burning of waste .................................................................................. 50
6.1.4 Wastewater treatment and discharge ..................................................................................... 50
6.2 Methodology and emission factors ............................................................................................. 51
6.3 Data sources ............................................................................................................................... 52
7 Precursors and indirect emissions .......................................................................................................... 53
7.1 Emission trends .......................................................................................................................... 53
7.2 Energy ........................................................................................................................................ 54
7.2.1 Methodology and emission factors ......................................................................................... 57
7.2.2 Data sources ........................................................................................................................... 58
7.3 IPPU ........................................................................................................................................... 58
7.3.1 Methodology and emission factors ......................................................................................... 59
7.3.2 Data sources ........................................................................................................................... 60
7.4 AFOLU ........................................................................................................................................ 60
7.4.1 Methodology and emission factors ......................................................................................... 61
7.4.2 Data sources ........................................................................................................................... 62
7.5 Waste .......................................................................................................................................... 62

National Inventory Report
Third Biennial Update Report
iii Contents
7.5.1 Methodology and emission factors ......................................................................................... 64
7.5.2 Data sources ........................................................................................................................... 64
8 Key category analysis ............................................................................................................................. 65
9 Uncertainty analysis................................................................................................................................ 67
9.1 Input data .................................................................................................................................... 67
9.2 Results ........................................................................................................................................ 69
9.2.1 Error propagation method (Approach 1) ................................................................................. 69
9.2.2 Monte Carlo method (Approach 2) ......................................................................................... 70
9.2.3 Comparison between Error Propagation method (Approach 1) and Monte Carlo method (Approach 2) ........................................................................................................................................... 71
10 QA/QC and Verification Activities ....................................................................................................... 73
10.1 Personnel involved in QA/QC activities ...................................................................................... 73
10.1.1 Chief Technical Advisor (CTA) ............................................................................................... 73
10.1.2 Inventory Development Team (IDT) ....................................................................................... 73
10.1.3 QA team (QAT) ....................................................................................................................... 74
10.2 Quality Control ............................................................................................................................ 75
10.3 Quality Assurance and Verification ............................................................................................. 77
10.4 QA/QC implementation in the current GHG Inventory process .................................................. 78
10.4.1 The process in a nutshell ........................................................................................................ 78
10.4.2 Reporting, documentation and archiving procedures ............................................................. 80
10.4.3 Ensuring sustainability ............................................................................................................ 80
11 Good practices, improvements and recommendations ...................................................................... 81
11.1 Energy ........................................................................................................................................ 81
11.2 IPPU ........................................................................................................................................... 82
11.3 AFOLU ........................................................................................................................................ 82
11.4 Waste .......................................................................................................................................... 84
11.5 Gender aspect ............................................................................................................................ 84
Appendix I Activity data, methodology and emission factors ................................................................... 86
A I.1 Activity data ................................................................................................................................ 86
A I.1.1 Energy..................................................................................................................................... 86
A I.1.2 IPPU........................................................................................................................................ 95
A I.1.3 AFOLU .................................................................................................................................... 95
A I.1.4 Waste ...................................................................................................................................... 97
A I.2 Methods applied ......................................................................................................................... 98
A I.3 Emission factors ....................................................................................................................... 101
A I.3.1 Energy................................................................................................................................... 101
A I.3.2 IPPU...................................................................................................................................... 101
A I.3.3 AFOLU .................................................................................................................................. 102
A I.3.4 Waste .................................................................................................................................... 103
Appendix II Detailed tables of the GHG Inventory ................................................................................... 105
Appendix III Detailed tables of the key category analysis ........................................................................ 126

National Inventory Report
Third Biennial Update Report
iv List of Tables
List of Tables
Table 1. Global warming potential values used in the preparation of the GHG Inventory (100 years time horizon) ..............................................................................................................................................................8
Table 2. GHG emissions and removals by sector (in Gg CO2-eq) ....................................................................9
Table 3. GHG emissions by gas (in CO2-eq).................................................................................................. 10
Table 4. Apparent fuel consumption (in TJ) and CO2 emissions (in Gg) – Reference approach ................... 13
Table 5. GHG emissions in Energy sector, by category (in Gg CO2-eq) ....................................................... 14
Table 6. GHG emissions in Energy Industries, by category and by gas (in Gg CO2-eq) ............................... 15
Table 7. GHG emissions in Manufacturing Industries and Construction, by category and by gas (in Gg CO2-eq) ................................................................................................................................................................... 16
Table 8. GHG emissions in Transport, by category and by gas (in Gg CO2-eq) ............................................ 17
Table 9. GHG emissions in Other Sectors, by category and by gas (in Gg CO2-eq) ..................................... 18
Table 10. Comparison of Sectoral and Reference Approach – total consumption and CO2 emissions for all reported years ................................................................................................................................................. 20
Table 11. Emission factors used for Energy sector ........................................................................................ 21
Table 12. Data sources for Energy sector ...................................................................................................... 21
Table 13. GHG emissions from the IPPU sector, by category (in Gg CO2-eq) ............................................. 23
Table 14. CO2, CH4 and NOx emissions from the IPPU sector, by category (in Gg CO2-eq) ....................... 23
Table 15. HFCs, PFCs and SF6 emissions from the IPPU sector, by category (in Gg CO2-eq) .................... 24
Table 16. Emission factors used for IPPU sector ........................................................................................... 27
Table 17. Data sources for IPPU sector ......................................................................................................... 27
Table 18. GHG emissions and removals from AFOLU sector, by category (in Gg CO2-eq) .......................... 29
Table 19 Emissions of CH4 and N2O (in Gg) due to activities in livestock production ................................... 31
Table 20. Forestland area, ha ........................................................................................................................ 32
Table 21. Cropland, ha ................................................................................................................................... 35
Table 22. Emissions from cropland (CO2-eq) ................................................................................................. 35
Table 23. Grassland area, ha ......................................................................................................................... 36
Table 24. Emissions from grassland (CO2-eq) ............................................................................................... 37
Table 25. Settlements area, ha ...................................................................................................................... 39
Table 26. Emissions from settlements (CO2-eq) ............................................................................................ 39
Table 27. Other land area, ha ......................................................................................................................... 40
Table 28. Emissions from other land (CO2-eq) .............................................................................................. 40
Table 29. GHG emissions from Aggregate sources and non-CO2 emissions sources on land (in Gg CO2-eq) ........................................................................................................................................................................ 41
Table 30. Emissions factors used for GHG emissions inventory in Land ...................................................... 44
Table 31. Data sources for Forestland ........................................................................................................... 45
Table 32. Data sources for Cropland, Grassland, Wetland, Settlement and Other land use, fertilizers and rice ........................................................................................................................................................................ 46
Table 33. GHG emissions from Waste sector, by category (Gg CO2-eq) ...................................................... 47
Table 34. GHG emissions from Waste sector, by category and by gas (in Gg CO2-eq)................................ 48
Table 35. Emission factors used for Waste sector ......................................................................................... 52
Table 36. Data sources for Waste sector ....................................................................................................... 52
Table 37. Emissions of NOx, CO from the Fuel Combustion Activities (in Gg) .............................................. 56
Table 38. Emissions of NMVOC, SO2 and NH3 from the Fuel Combustion Activities (in Gg) ....................... 57
Table 39. Emission factors used for estimation of the emissions of Precursors and Indirect emissions of the Energy sector .................................................................................................................................................. 57
Table 40. Data sources for estimation of the emissions of Precursors and Indirect emissions of the Energy sector .............................................................................................................................................................. 58

National Inventory Report
Third Biennial Update Report
v List of Tables
Table 41. Emission factors used for estimation of the emissions of Precursors and Indirect emissions of the IPPU sector ..................................................................................................................................................... 59
Table 42. Data sources for estimation of the emissions of Precursors and Indirect emissions of the IPPU sector .............................................................................................................................................................. 60
Table 43. Emission factors used for estimation of the emissions of Precursors and Indirect emissions of the AFOLU sector ................................................................................................................................................. 62
Table 44. Data sources for estimation of the emissions of Precursors and Indirect emissions of the IPPU sector .............................................................................................................................................................. 62
Table 45. Emissions of NOx, CO emissions from the Waste sector (in Gg) .................................................. 63
Table 46. Emissions of NMVOC, SO2 and NH3 emissions from the Waste sector (in Gg) ............................ 63
Table 47. Emission factors used for estimation of the emissions of Precursors and Indirect emissions of the Waste sector ................................................................................................................................................... 64
Table 48. Data sources for estimation of the emissions of Precursors and Indirect emissions of the Waste sector .............................................................................................................................................................. 64
Table 49. Summary of key category analysis in 2016 .................................................................................... 66
Table 50. Input data for uncertainty in the IPCC Inventory Software and Monte Carlo method for Energy and Industrial Processes and Product Use sectors (in %) .................................................................................... 68
Table 51. Input data for uncertainty in the Monte Carlo method for AFOLU sector (in %) ............................ 68
Table 52. Input data for uncertainty in the Monte Carlo method for Waste sector (in %) .............................. 69
Table 53. Input data for uncertainty in the IPCC Inventory Software for AFOLU and Waste sectors (in %) . 69
Table 54. 3rd BUR GHG inventory team ......................................................................................................... 74
Table 55. 3rd BUR Tier 1 QC activities and procedures for all sectors ........................................................... 75
Table 56. 3rd BUR QA procedures implemented in the Energy, IPPU and in the Waste sector .................... 77
Table 57. Activity data used in energy sector for 1990 (in TJ) ....................................................................... 86
Table 58. Activity data used in energy sector for 2000 (in TJ) ....................................................................... 87
Table 59. Activity data used in energy sector for 2005 (in TJ) ....................................................................... 89
Table 60. Activity data used in energy sector for 2014 (in TJ) ....................................................................... 90
Table 61. Activity data used in energy sector for 2015 (in TJ) ....................................................................... 92
Table 62. Activity data used in energy sector for 2016 (in TJ) ....................................................................... 93
Table 63. Activity data used in Industrial processes sector ........................................................................... 95
Table 64. Activity data used for Product uses as substitutes for ODS ........................................................... 95
Table 65. Activity data used for GHG emissions inventory in Livestock (number of heads) .......................... 95
Table 66. Activity data used for GHG emissions inventory in Forest land (ha) .............................................. 96
Table 67. Activity data used for GHG emissions inventory in Cropland (ha) ................................................. 96
Table 68. Activity data used for GHG emissions inventory in Grassland (ha) ............................................... 96
Table 69. Activity data used for GHG emissions inventory in Wetlands (ha) ................................................. 96
Table 70. Activity data used for GHG emissions inventory in Settlements (ha) ............................................. 96
Table 71. Activity data used for GHG emissions inventory in Other Land (ha) .............................................. 97
Table 72. Population used for estimation of GHG emission from Municipal Solid Waste and Domestic Wastewater Treatment and Discharge ........................................................................................................... 97
Table 73. Other activity data used for estimation of GHG emission from Municipal Solid Waste ................. 97
Table 74. Composition of waste going to the Municipal solid waste disposal sites ....................................... 97
Table 75. GDP (in $ million) used for estimation of GHG emission from Industrial Waste ............................ 97
Table 76. Other activity data used for estimation of GHG emission from Industrial Waste ........................... 98
Table 77. Total annual amount of solid waste treated by biological treatment facilities (in Gg) .................... 98
Table 78. Activity data for waste incineration ................................................................................................. 98
Table 79. Activity data used for estimation of the GHG emissions from Open burning of waste................... 98
Table 80. Methods and tiers applied in the preparation of the GHG Inventory (for 2016) ............................. 98
Table 81. Emission factors used in Energy sector (in kg/TJ) ....................................................................... 101
Table 82. Emission factors used for IPPU sector ......................................................................................... 101

National Inventory Report
Third Biennial Update Report
vi List of Tables
Table 83. Emission factors used for GHG emissions inventory in livestock activities ................................. 102
Table 84. Methane correction factor and distribution of waste by type of SWDS ........................................ 103
Table 85. Emission factors used for biological treatment of solid waste ...................................................... 103
Table 86. Parameters used for estimation of GHG emissions from Open burning of waste ....................... 104
Table 87. Parameters used for estimation of emissions from Domestic and Industrial Wastewater Treatment and Discharge ............................................................................................................................................... 104
Table 88. Detailed results for 1990............................................................................................................... 105
Table 89. Detailed results for 2000............................................................................................................... 108
Table 90. Detailed results for 2005............................................................................................................... 112
Table 91. Detailed results for 2014............................................................................................................... 115
Table 92. Detailed results for 2015............................................................................................................... 118
Table 93. Detailed results for 2016............................................................................................................... 122
Table 94. Level assessment of key categories in 2016 ............................................................................... 126
Table 95. Trend assessment of key categories (1990, 2016) ...................................................................... 126
National Inventory Report
Third Biennial Update Report
vii List of Figures
List of Figures
Figure 1. GHG emissions and removals by sector (in Gg CO2-eq) ..................................................................2
Figure 2. Total GHG emissions by sector, excluding FOLU sector (in Gg CO2-eq)..........................................2
Figure 3. Total GHG emissions by gas, excluding FOLU (in Gg CO2-eq) ........................................................3
Figure 4. Emissions of NOx, CO, NMVOC, SO2 and NH3 (in Gg) .....................................................................4
Figure 5. National inventory process .................................................................................................................7
Figure 6. GHG emissions and removals by sector (in Gg CO2-eq) ..................................................................9
Figure 7. Total GHG emissions by sector, excluding FOLU sector (in Gg CO2-eq)....................................... 10
Figure 8. Total GHG emissions by gas, excluding FOLU (in Gg CO2-eq) ..................................................... 10
Figure 9. Emissions of F-gasses (in Gg CO2-eq) ........................................................................................... 11
Figure 10. Gross inland consumption (in ktoe) ............................................................................................... 12
Figure 11. Final energy consumption (in ktoe) ............................................................................................... 12
Figure 12. Installed capacity of power plants (only PP that produced electricity in the certain year) (in MW)13
Figure 13. Electricity production and net import (in GWh).............................................................................. 13
Figure 14. GHG emissions in Energy sector, by category (in Gg CO2-eq) .................................................... 14
Figure 15. GHG emissions in Energy sector, by gas (in Gg of CO2-eq) ........................................................ 14
Figure 16. GHG emissions in Energy Industries (in Gg CO2-eq) ................................................................... 15
Figure 17. GHG emissions in Manufacturing Industries and Construction (in Gg CO2-eq) ........................... 16
Figure 18. GHG emissions in Transport (in Gg CO2-eq) ................................................................................ 17
Figure 19. GHG emissions in Other Sectors (in Gg CO2-eq) ......................................................................... 18
Figure 20. GHG emissions in Non-Specified category (in Gg CO2-eq) .......................................................... 18
Figure 21. Fugitive emissions from fuels by gasses (in Gg CO2-eq) ............................................................. 19
Figure 22. GHG emissions from International aviation (in Gg CO2-eq) – Memo Items ................................. 19
Figure 23. CO2 emissions from biomass burning for energy production (Gg) – Information Item ................. 19
Figure 24. GHG emissions from the IPPU sector, (in Gg CO2-eq)................................................................. 22
Figure 25. GHG emissions (and removals) from AFOLU sector (in Gg CO2-eq) ........................................... 29
Figure 26. Emissions of CH4 (in Gg CO2-eq) from Enteric Fermentation and Manure Management ............ 30
Figure 27. Emissions of N2O (in Gg CO2-eq) from Enteric Fermentation and Manure Management ............ 30
Figure 28. GHG emissions and removals from Forest land (in Gg CO2-eq) ................................................. 33
Figure 29. GHG emissions from Cropland (in Gg CO2-eq) ............................................................................ 35
Figure 30. GHG emissions from Grassland (in Gg CO2-eq) .......................................................................... 37
Figure 31. GHG emissions from Settlements (in Gg CO2-eq) ........................................................................ 39
Figure 32. GHG emissions from Other land (in Gg CO2-eq ........................................................................... 40
Figure 33. GHG emissions from Aggregate sources and non-CO2 emissions sources on land (in Gg CO2-eq) ........................................................................................................................................................................ 41
Figure 34. GHG emissions from Waste sector, by category (in Gg CO2-eq) ................................................. 48
Figure 35. GHG emissions form Waste sector, by gas (in Gg CO2-eq) ........................................................ 48
Figure 36. Emissions of CH4 from Solid Waste Disposal (in Gg CO2-eq)..................................................... 49
Figure 37. GHG emissions from Biological Treatment of Solid Waste (in Gg CO2-eq).................................. 49
Figure 38. GHG emissions from Incineration and Open Burning of Waste by gasses (in Gg CO2-eq) ......... 50
Figure 39. GHG emissions from Incineration and Open Burning of Waste by categories(in Gg CO2-eq) ..... 50
Figure 40. GHG emissions from Wastewater Treatment and Discharge (Gg CO2-eq) .................................. 51
Figure 41. Emissions of CH4 from Domestic Wastewater Treatment and Discharge (in Gg CO2-eq) ........... 51
Figure 42. Emissions of NOx, CO, NMVOC, SO2 and NH3 in the period 1990 – 2014 (in Gg)...................... 53
Figure 43. Emissions precursors and indirect GHG emissions (in Gg) and share of by sectors (in %) in the year 2016 ........................................................................................................................................................ 54
Figure 44. Еmissions of NOx, CO, NMVOC, SO2 and NH3 from the Energy sector (in Gg) .......................... 54

National Inventory Report
Third Biennial Update Report
viii List of Figures
Figure 45. SO2 emissions from the Energy sector, by category (in Gg) ........................................................ 55
Figure 46. NOx emissions from the Energy sector, by category, (in Gg) ...................................................... 55
Figure 47. CO emissions from the Energy sector, by category (in Gg) .......................................................... 55
Figure 48. NMVOC emissions from the Energy sector, by category (in Gg).................................................. 55
Figure 49. Emissions of NOx, CO, NMVOC and SO2 from the IPPU sector (in Gg) ...................................... 58
Figure 50. NOx emissions from the IPPU sector, by category (in Gg) ........................................................... 59
Figure 51. SO2 emissions from the IPPU sector, by category (in Gg) ........................................................... 59
Figure 52. NMVOC emissions from the IPPU sector, by category (in Gg)..................................................... 59
Figure 53. CO emissions from the IPPU sector, by category (in Gg) ............................................................. 59
Figure 54. Emissions of NOx, CO, NMVOC, SO2 and NH3 from the AFOLU sector (in Gg) ......................... 60
Figure 55. NOx emissions from the AFOLU sector, by category (in Gg) ....................................................... 61
Figure 56. SO2 emissions from the AFOLU sector, by category (in Gg) ........................................................ 61
Figure 57. NMVOC emissions from the AFOLU sector, by category (in Gg) ................................................. 61
Figure 58. CO emissions from the AFOLU sector, by category (in Gg) ......................................................... 61
Figure 59. NH3 emissions from the AFOLU sector, by category (in Gg) ........................................................ 61
Figure 60. Emissions of NOx, CO, NMVOC and SO2 from the Waste sector (in Gg) .................................... 63
Figure 61. Level assessment of key categories and their contribution in 2016 ............................................. 65
Figure 62. Contribution of key categories to the Trend (1990, 2016) in percentages .................................... 66
Figure 63. Uncertainty for 2014, 2015 and 2016 using Error Propagation method by subcategory .............. 70
Figure 64. Total yearly emissions (and standard deviation) and total uncertainty for 2014, 2015 and 2016 using Error Propagation method ..................................................................................................................... 70
Figure 65. Uncertainty for 2014, 2015 and 2016 using Monte Carlo method by subcategory ....................... 71
Figure 66. Total yearly emissions and total uncertainty for 2014, 2015 and 2016 using Monte Carlo method ........................................................................................................................................................................ 71
Figure 67. Comparison of Monte Carlo and IPCC Inventory Software method by subcategory for 2014 ..... 72
Figure 68. Comparison of the total yearly uncertainty between the Monte Carlo method and IPCC Inventory Software method............................................................................................................................................. 72
Figure 69. Parameters used for methane calculations from Solid Waste Disposal ..................................... 103
National Inventory Report
Third Biennial Update Report
ix Abbreviations and acronyms
Abbreviations and acronyms
AFOLU Agriculture, Forestry and Other Land Use
BUR Biennial Update Report
CC Climate Change
CHPs Combined Heat and Power Plants
CLC CORINE Land Cover
CMC Center for Management of Crises
CRF Common Reporting Format
CS Country Specific
CTA Chief Technical Advisor
DF Default Factor
DOC Degradable Organic Carbon
EC European Commission
EEA European Environment Agency
EFDB Emission Factor Database
EMEP European Monitoring and Evaluation Programme
EO Earth Observation
Eurostat Statistical Office of the European Union
FAOStat Food and Agriculture Organization of the United Nations Statistical Databases
FBUR First Biennial Update Report
FFU Firefighting Union
F-gas Fluorinated gas
FNC First National Communication
FOD First Order Decay
FOLU Forest and Other Land Use
GDP Gross Domestic Product
GEF Global Environment Facility
GHG Greenhouse Gas
GSP Global Support Programme
GWP Global Warming Potential
IDT Inventory Development Team
IE Included elsewhere
IEA International Energy Agency
IPCC Intergovernmental Panel on Climate Change
IPPU Industrial Processes and Product Use
IST Imperial Smelt Technology
LPG Liquefied Petroleum Gas
LU Land Use
LUCF Land-Use Change and Forestry
LULUCF Land Use, Land-Use Change and Forestry
MAFWE Ministry of Agriculture, Forestry and Water Economy
MAKSTAT Database of the State Statistical Office of the Republic of North Macedonia
MANU Macedonian Academy of Sciences and Arts
MCC Macedonian Chambers of Commerce
MKD Macedonian Denar
MMR Monitoring Mechanism Regulation

National Inventory Report
Third Biennial Update Report
x Abbreviations and acronyms
MMU Minimum Mapping Unit
MNAV Macedonian Navigation Agency
МОЕ Ministry of Economy
MOEPP Ministry of Environment and Physical Planning
MRV Measurement, Reporting and Verification
NA Not Applicable
NACE Nomenclature of Economic Activities
NCCC National Communication on Climate Change
NC National Communication
NCV Net calorific value
NE Not estimated
NIR National Inventory Report
NO Not Occurring
ODS Ozone-Depleting Substances
OECD Organization for Economic Cooperation and Development
PV Photovoltaic
QA Quality Assurance
QAT Quality Assurance Team
QC Quality Control
RCESD Research Center for Energy and Sustainable Development
RS Remote Sensing
SAR Second Assessment Report
SBUR Second Biennial Update Report
SNC Second National Communication
SSO State Statistical Office
SWDS Solid Waste Disposal Sites
T1 Tier 1
T2 Tier 2
TNC Third National Communication
TWG Technical Working Group
UN United Nations
UNDP United Nations Development Programme
UNFCCC United Nations Framework Convention on Climate Change
USA United States of America
USD United States Dollar

National Inventory Report
Third Biennial Update Report
xi Abbreviations and acronyms
Chemical symbols
CaCO3 Limestone
CaMgCO3 Dolomite
CH4 Methane
CO(NH2)2 Urea
CO Carbon Monoxide
CO2 Carbon Dioxide
CO2-eq Carbon Dioxide equivalents
HCO3- Bicarbonate
HFCs Hydro Fluorocarbons
N Nitrogen
N2O Nitrous Oxide
Na2CO3 Sodium carbonate
NH3 Ammonia
NH4+2 Ammonium
NMVOC Non-Methane Volatile Organic Compound,
NO3- Nitrate
NOx Nitrogen Oxides
OH- Hydroxyl ion
PFCs Per Fluorocarbons
SF6 Sulphur hexafluoride
SO2 Sulphur Dioxide
SOx Sulphur Oxides
Units and Metric Symbols
UNIT Name Unit for
Metric Symbol Prefix Factor
g gram mass P peta 1015
W watt power T tera 1012
J joule energy G giga 109
m meter length M mega 106
Wh watt hour energy k kilo 103
toe ton of oil equivalent energy h hecto 102
da deca 101
Mass Unit Conversion d deci 10-1
1g
c centi 10-2
1kg = 1 000 g
m milli 10-3
1t = 1 000 kg = 1 Mg μ micro 10-6
1kt = 1 000 t = 1 Gg n nano 10-9
1Mt = 1 000 000 t = 1 Tg p pico 10-12

National Inventory Report
Third Biennial Update Report
1 Executive summary
Executive summary
The Republic of North Macedonia (Macedonia), as a Non-Annex I Party to the UNFCCC, has been developing Inventory of the anthropogenic emissions by sources and removals by sinks of GHGs emitted to or removed from the atmosphere since 2000 as a part of its National Communications on Climate Change and Biennial Update Reports. Up to now, three National Communications (2003, 2008 and 2014) and two Biennial Update Reports (2015 and 2018) have been delivered to the UNFCCC.
The first National GHG Inventory was developed under the First National Communication (FNC) for the period from 1990 – 1998 and under the Second National Communication (SNC), this period was revised and extended to cover the years 1999 – 2002. In the Third National Communication (TNC), the GHG inventory considered the time-frame 2003 – 2009. In these reports, the inventory was developed in accordance with the 1996 Revised IPCC Guidelines for National Greenhouse Gas Inventories and the 2000 IPCC Good Practice Guidance. In the First Biennial Update Report (FBUR), the inventory was compiled using the IPCC Inventory Software, in compliance with the 2006 IPCC Guidelines for National Greenhouse Gas Inventories. The series was updated to consider the period 2010 – 2012 and additionally, the entire previous series of data from 1990 to 2009 were revised according to the requirements of the IPCC Inventory Software. The same approach was used in the Second Biennial Update Report (SBUR) and the emission trend was expanded by developing the GHG inventory for 2013 and 2014.
The inventory activities under the Third Biennial Update Report (3rd BUR ) continue the work done in the previous BURs and include developing the GHG inventory for 2015 and 2016 in line with the IPCC 2006 Guidelines. The latest version of IPCC Inventory Software (version 2.54 – from July 6, 2017) is used in this process.
The inventory covers five main sectors: Energy, Industrial Processes and Product Use (IPPU), Agriculture, Forestry and Other Land Use (AFOLU) and Waste, disaggregated by categories and subcategories. It includes a database for the following GHGs: CO2, CH4, N2O, PFCs and HFCs, as well as precursors and indirect emissions from: CO, NOx, NMVOC, SO2 and NH3. The emission of SF6 is not estimated for Macedonia due to unavailability of activity data.
The national inventory process includes the following key players:
− Ministry of Environment and Physical Planning, responsible for supervising the national inventory process and reporting the emissions to UNFCCC and also for other international reporting;
− GHG Inventory Development Team, composed of MANU team and AFOLU team with experts from University of Ss. Cyril and Methodius (UKIM) - Institute of Agriculture, Faculty of Forestry, Faculty of Agricultural Sciences and Food;
− Data Suppliers, with State Statistical Office being the most important data source;
− Verification Team, which includes experts working on Quality Control, as well as experts working on Quality Assurance. The last is also ensured by multilayer structure involving CTA, NCCC and GSP.
The preparation of the national GHG inventory is project based, supported by Global Environment Facility (GEF) and United Nations Development Program (UNDP). The estimated emissions in the inventory are transparent and publicly available within the national climate change platform www.klimatskipromeni.mk, open data portal (data.gov.mk) and UNFCCC web site. This also contributes to transparency in reporting of climate data required under Article 13 of the Paris Agreement.
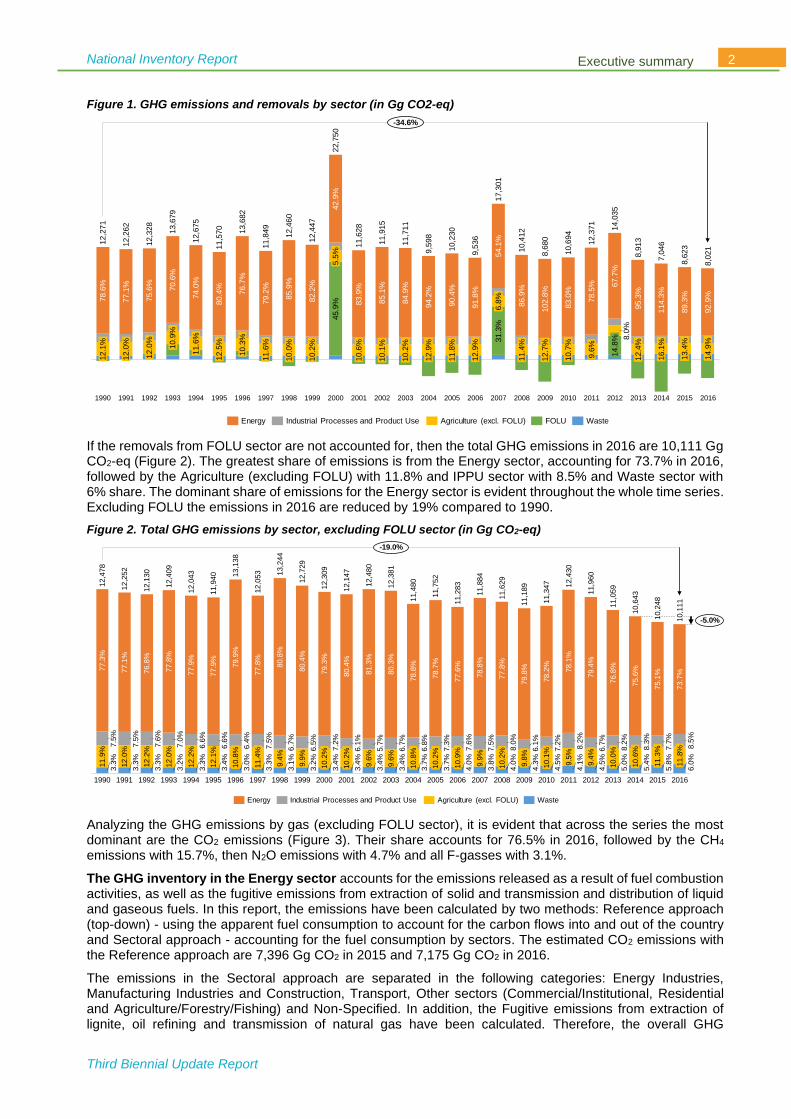
The aggregate GHG emissions and removals (net emissions) in 2016 are estimated to 8,020 Gg CO2-eq (including the FOLU sector) (Figure 1). Figure 1 shows the time–series of emissions and removals, including the net emissions (in CO2-eq), from 1990 to 2016. There are significant fluctuations in the net emissions in 2000, 2007 and 2012, where increased emissions can be noticed in the FOLU sector (instead of removals) as a result of the intensified forest fires/wildfires. The GHG emission in 2016 are reduced by 34.6% compared to 1990. This is mainly results of reduced electricity production from lignite, fuels switch (residual fuel oil for electricity and heat production is replaced with natural gas), and lower industrial production, which is decreasing after 2012.
National Inventory Report
Third Biennial Update Report
2 Executive summary
Figure 1. GHG emissions and removals by sector (in Gg CO2-eq)
If the removals from FOLU sector are not accounted for, then the total GHG emissions in 2016 are 10,111 Gg CO2-eq (Figure 2). The greatest share of emissions is from the Energy sector, accounting for 73.7% in 2016, followed by the Agriculture (excluding FOLU) with 11.8% and IPPU sector with 8.5% and Waste sector with 6% share. The dominant share of emissions for the Energy sector is evident throughout the whole time series. Excluding FOLU the emissions in 2016 are reduced by 19% compared to 1990.
Figure 2. Total GHG emissions by sector, excluding FOLU sector (in Gg CO2-eq)
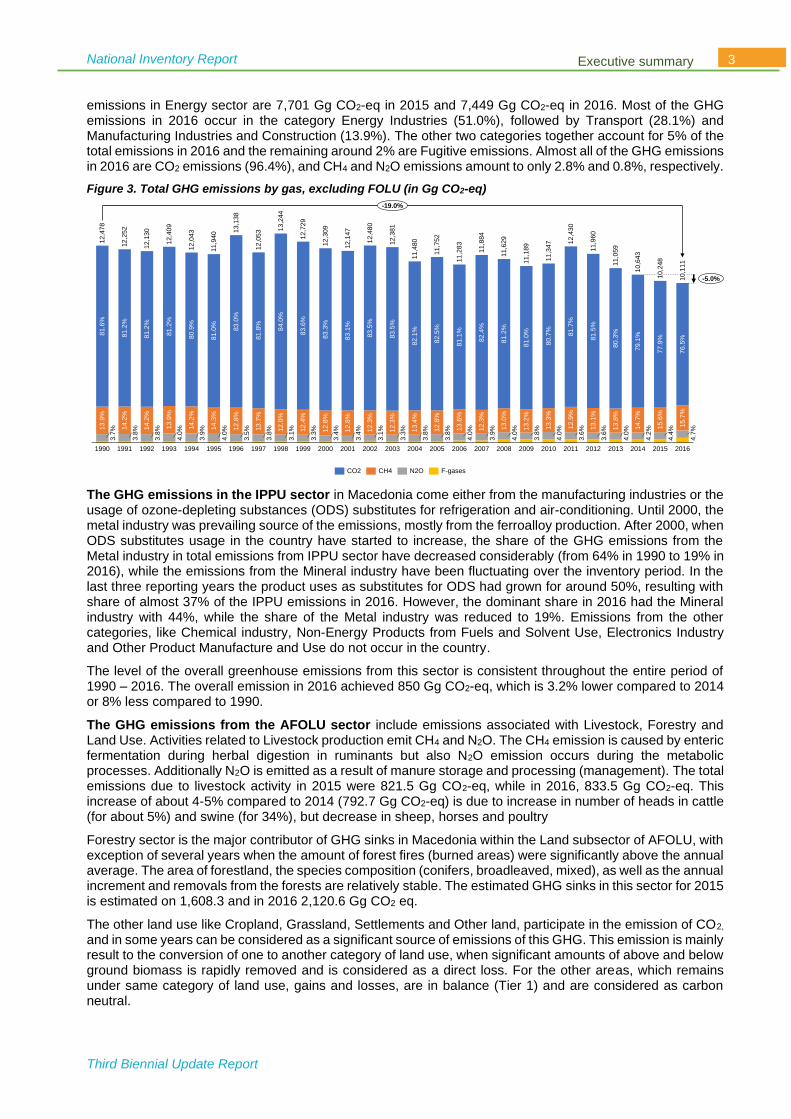
Analyzing the GHG emissions by gas (excluding FOLU sector), it is evident that across the series the most dominant are the CO2 emissions (Figure 3). Their share accounts for 76.5% in 2016, followed by the CH4 emissions with 15.7%, then N2O emissions with 4.7% and all F-gasses with 3.1%.
The GHG inventory in the Energy sector accounts for the emissions released as a result of fuel combustion activities, as well as the fugitive emissions from extraction of solid and transmission and distribution of liquid and gaseous fuels. In this report, the emissions have been calculated by two methods: Reference approach (top-down) - using the apparent fuel consumption to account for the carbon flows into and out of the country and Sectoral approach - accounting for the fuel consumption by sectors. The estimated CO2 emissions with the Reference approach are 7,396 Gg CO2 in 2015 and 7,175 Gg CO2 in 2016.
The emissions in the Sectoral approach are separated in the following categories: Energy Industries, Manufacturing Industries and Construction, Transport, Other sectors (Commercial/Institutional, Residential and Agriculture/Forestry/Fishing) and Non-Specified. In addition, the Fugitive emissions from extraction of lignite, oil refining and transmission of natural gas have been calculated. Therefore, the overall GHG
31.3
%
10.7
%
2006
78.6
%12.1
%
1991
77.1
%12.0
%
75.6
%
1992 20101999
70.6
%
2001 2009
10.9
%
1993
85.9
%
82.2
%
74.0
%
10.2
%
11.6
%
12.9
%
1994
80.4
%12.5
%
10.2
%1995
76.7
%
91.8
%
10.3
%
11.4
%
12,6
75
20051996
79.2
%11.6
%
1997
12,4
60
10.0
%
1998 2002
45.9
%42.9
%5.5
%
85.1
%11,9
15
94.2
%
2000
83.9
%
86.9
%
10.1
%
8,9
13
84.9
%2003 2004
8,0
21
90.4
%
12.9
%
11.8
%
54.1
%6.8
%
2007
9,5
36
2008
102.8
%12.7
%
78.5
%9.6
%
2011
67.7
%
8.0
%
14.8
%
2012
95.3
%12.4
%
2013
114.3
%16.1
%
12,4
47
2014
89.3
%13.4
%
1990
92.9
%14.9
%
2016
83.0
%
12.0
%
10.6
%
12,2
71
12,2
62
12,3
28
13,6
79
11,5
70
13,6
82
2015
22,7
50
11,6
28
11,7
11
9,5
98
10,2
30
8,6
23
17,3
01
10,4
12
8,6
80
10,6
94
12,3
71
14,0
35
7,0
4611,8
49
-34.6%
Agriculture (excl. FOLU)Energy FOLUIndustrial Processes and Product Use Waste
1998
7.0
%
12.0
%
3.2
%
77.8
%
1993
77.9
%
77.9
%
8.2
%
6.6
%
3.3
%
3.7
%
12.2
%
3.3
%
13,2
44
6.4
%
78.8
%
12.1
%
3.4
%
79.9
%
3.0
%
1996
7.5
%
2000
80.3
%
80.8
%
6.7
%
9.4
%
5.4
%
80.4
%
6.5
%
9.9
%
2011
3.2
%
1999
79.3
%
8.5
%
7.2
%
10,6
43
10.2
%
2014
3.4
%
10.2
%
3.4
%
2001
81.3
%
5.7
%
9.6
%
3.4
%
2002
6.7
%
9.6
%
12,1
30
3.4
%
2003
77.3
%
78.8
%
4.0
%
6.8
%
10.8
%
2004
8.2
%
78.7
%
10,1
11
6.0
%
1990
7.3
%
10.2
%
77.1
%
3.7
%
4.3
%
2005
77.6
%
12,4
30
7.6
%
10.9
%
7.5
%
2006
11.9
% 7.5
%
9.9
%
6.6
%
3.8
%
2007
77.8
%
80.4
%
8.0
%
10.2
%
12,3
09
2008
79.8
%
6.1
%
2015
8.3
%
9.8
%
3.3
%
20091997
78.2
%
1994
7.2
%
10.1
%
7.5
%
4.5
%
78.1
%9.5
%
1995
4.1
%
79.4
%
12.0
% 6.7
%
11,4
80
9.4
%
10.8
%
4.5
%
2012
76.8
%
76.8
%
10.0
%
3.3
%
5.0
%
2013
75.6
%
1991
10.6
%
75.1
%
7.6
%
7.7
%
11.3
%
3.1
%
5.8
%
73.7
%
4.0
%
11.8
%
12.2
%
20162010
10,2
48
11.4
%
11,6
29
3.3
%
6.1
%
1992
77.8
%
12,4
78
12,2
52
12,4
09
12,0
43
11,9
40 13,1
38
12,0
53
12,7
29
12,1
47
12,4
80
12,3
81
11,7
52
11,2
83
11,8
84
11,1
89
11,3
47
11,9
60
11,0
59
-5.0%
-19.0%
WasteEnergy Industrial Processes and Product Use Agriculture (excl. FOLU)
National Inventory Report
Third Biennial Update Report
3 Executive summary
emissions in Energy sector are 7,701 Gg CO2-eq in 2015 and 7,449 Gg CO2-eq in 2016. Most of the GHG emissions in 2016 occur in the category Energy Industries (51.0%), followed by Transport (28.1%) and Manufacturing Industries and Construction (13.9%). The other two categories together account for 5% of the total emissions in 2016 and the remaining around 2% are Fugitive emissions. Almost all of the GHG emissions in 2016 are CO2 emissions (96.4%), and CH4 and N2O emissions amount to only 2.8% and 0.8%, respectively.
Figure 3. Total GHG emissions by gas, excluding FOLU (in Gg CO2-eq)
The GHG emissions in the IPPU sector in Macedonia come either from the manufacturing industries or the usage of ozone-depleting substances (ODS) substitutes for refrigeration and air-conditioning. Until 2000, the metal industry was prevailing source of the emissions, mostly from the ferroalloy production. After 2000, when ODS substitutes usage in the country have started to increase, the share of the GHG emissions from the Metal industry in total emissions from IPPU sector have decreased considerably (from 64% in 1990 to 19% in 2016), while the emissions from the Mineral industry have been fluctuating over the inventory period. In the last three reporting years the product uses as substitutes for ODS had grown for around 50%, resulting with share of almost 37% of the IPPU emissions in 2016. However, the dominant share in 2016 had the Mineral industry with 44%, while the share of the Metal industry was reduced to 19%. Emissions from the other categories, like Chemical industry, Non-Energy Products from Fuels and Solvent Use, Electronics Industry and Other Product Manufacture and Use do not occur in the country.
The level of the overall greenhouse emissions from this sector is consistent throughout the entire period of 1990 – 2016. The overall emission in 2016 achieved 850 Gg CO2-eq, which is 3.2% lower compared to 2014 or 8% less compared to 1990.
The GHG emissions from the AFOLU sector include emissions associated with Livestock, Forestry and Land Use. Activities related to Livestock production emit CH4 and N2O. The CH4 emission is caused by enteric fermentation during herbal digestion in ruminants but also N2O emission occurs during the metabolic processes. Additionally N2O is emitted as a result of manure storage and processing (management). The total emissions due to livestock activity in 2015 were 821.5 Gg CO2-eq, while in 2016, 833.5 Gg CO2-eq. This increase of about 4-5% compared to 2014 (792.7 Gg CO2-eq) is due to increase in number of heads in cattle (for about 5%) and swine (for 34%), but decrease in sheep, horses and poultry
Forestry sector is the major contributor of GHG sinks in Macedonia within the Land subsector of AFOLU, with exception of several years when the amount of forest fires (burned areas) were significantly above the annual average. The area of forestland, the species composition (conifers, broadleaved, mixed), as well as the annual increment and removals from the forests are relatively stable. The estimated GHG sinks in this sector for 2015 is estimated on 1,608.3 and in 2016 2,120.6 Gg CO2 eq.
The other land use like Cropland, Grassland, Settlements and Other land, participate in the emission of CO2,
and in some years can be considered as a significant source of emissions of this GHG. This emission is mainly result to the conversion of one to another category of land use, when significant amounts of above and below ground biomass is rapidly removed and is considered as a direct loss. For the other areas, which remains under same category of land use, gains and losses, are in balance (Tier 1) and are considered as carbon neutral.
1999 20092000 2001
12,0
53
2002
11,9
40
2003
12,3
81
2004
3.8
%
2005
12,4
09
2006 2007 2008 2010 2011
11,2
83
2012
3.8
%
2013 2014 2015 2016
4.0
%
12,2
52
11,8
84
12,0
43
12,4
30
12,4
78
12,1
30 13,1
38
13.2
%
12,7
29
3.8
%
12,3
09
12,1
47
11,4
80
11,3
47
13.7
%
11,6
29
11,1
89
11,0
59
10,2
48
10,1
11
83.3
%
81.6
%
14.3
%
83.0
%
13,2
44
81.2
%
79.1
%81.2
%
80.9
%
81.0
%
81.8
%
84.0
%
83.6
%
83.1
%
83.5
%
82.1
%
4.0
%
82.5
%
81.1
%
82.4
%
13.9
%
12.8
%
81.2
%
81.0
%
80.7
%
81.2
%
81.7
%
81.5
%
80.3
%
77.9
%
76.5
%
14.2
%
12
.4%
14.2
%
13.9
%
14.2
%
15.7
%
3.3
% 12
.8%
12.8
%
12.0
%
12.8
%
12.3
%
12.3
%
13.4
%
13.6
%
1991
13.0
%
13.3
%
12.9
%
13.8
%
14.7
%
15.6
%
3.3
%
3.9
%
3.6
%
3.5
%
3.1
%
4.0
%
1993
4.0
%
3.8
%
3.4
%
3.4
%
3.1
%
3.9
%
3.6
%12.3
%
4.2
%
4.4
%
4.7
%
3.7
%
83.5
%
10,6
43
1990
11,9
60
1992 1995
13.1
%
19943.8
%
4.0
%
11,7
52
1996
3.8
%
1997 1998
12,4
80
4.0
%
-5.0%
-19.0%
CO2 CH4 N2O F-gases

National Inventory Report
Third Biennial Update Report
4 Executive summary
For the non-CO2 sources of GHG, it can be concluded that there are numerous management practices and inputs resulting in a significant amount of GHG emissions, which when summed up, differ in a small range of 313.1 Gg CO2-eq in the year 2000 up to 382.3 Gg CO2-eq, in 1990. The managed soils are a major source of non-CO2 emissions, which in 1990 contribute with 55.4% in the total emissions, and up to 62.4 % in 2016.
The categories reported under waste sector are Solid Waste Disposal, Biological Treatment of Solid Waste, Incineration and Open Burning of Waste and Waste Water Treatment and Discharge. The data categorization format is consistent with previous years in order to preserve the existing time series, except in sectors where data was introduced for the first time.
The calculations show that the Waste sector is one of the sectors with an increasing trend of GHG emissions achieving 610 Gg CO2-eq in 2016, which is doubled compared to 1990 or 6.3% more compared to 2014. Out of all the sectors, the emission from Solid Waste Disposal category are most significant participating with 77.5% in the total GHG emission in 2016. Second category with significant amount of GHG emissions is Wastewater Treatment and Discharge participating with around 19% in 2016. Incineration and open burning of waste category contribute with around 4% in the last three reported years. The CH4 and N2O emissions from the Biological Treatment of Solid Waste category do not contribute largely to the overall emissions due to the small amount of reported composted waste. Around 92% of the GHG emissions in the last three years of the reporting period are CH4, while N2O and CO2 participates with 7.2%, 1% respectively.
The Precursors and indirect emissions have been estimated in line with the EMEP/EEA Emission Inventory Guidebook, in a consistent, complete and comparable manner for the entire inventory period 1990 – 2016. The results for precursors and indirect emissions show that they are reduced by 18.5% and 10.5% in 2016 compared to 1990 and 2014 respectively (Figure 4). At average the emission are around 200 Gg/year, but there are peaks in 2000, 2007, 2008, 2011 and 2012 mainly as a results of forest fires. The highest numbers are estimated for 2000, 357 Gg. SO2 participates with around 50% over the entry reporting period, but in the last five years it shares is below 40%, as a result of reduction in electricity production from lignite, as well as fuel change (oil for heat production is replaced with natural gas). CO is the second contributor, participating with around 30%, with peak in the years with more forest fires. NH3 as a new gas that is introduced in this inventory, participate with around 8% during the reporting period.
Figure 4. Emissions of NOx, CO, NMVOC, SO2 and NH3 (in Gg)
The assessment of the sectoral precursors and indirect emissions, shows that during the entire reporting period, Energy sector is the most significant contributor in all of them except in NH3. In 2016, this sector is a source of almost all SO2 and NOx emissions, 99.8 and 95.6%, respectively. At the same time the energy sector participate with 74% in CO and 66% in NMVOC. AFOLU is the second contributor with around 96% share in NH3, 33.4% in NMVOC and 17.6% in CO. Waste participate with 7.7% in CO most as a result of open burning of waste.
The analysis of key categories that contribute the most to the absolute level of national emissions and removals (level assessment) and to the trend of emissions and removals (trend assessment), is conducted using the Approach 1. According to this approach, key categories are identified using a pre-determined
8.1
%
8.7
%12.3
%
6.6
%
20.8
%
1999
7.4
%
20.9
%
41.9
%
10.8
%
48.4
%
8.3
%
48.8
%
187
52.3
%
1990
11.9
%
194
8.9
%
8.7
%
8.8
%49.5
%8.9
%
10.1
%
11.8
%
21.1
%
21.5
%
204
2016
9.9
%
8.7
%49.0
%
8.7
%
10.3
%
9.0
%
11.0
%
1992
5.6
%
10.0
%26.3
%8.9
%
1995
46.3
%
10.9
%
8.5
%
8.8
%
9.4
%
1993
23.3
%10.1
%
41.5
%
24.0
%8.8
%
6.0
%
1994
6.8
%
52.8
%
8.8
%
2004
50.8
%
25.2
%47.3
%
20151996
26.5
%9.0
%46.3
%
1997
6.7
%
8.5
%50.5
%
29.1
%
1998
211
11.1
%21.0
%
50.6
%7.3
%
8.1
%
4.4
%
2000
10.0
%22.0
%8.3
%
209
7.0
%
2001
12.7
%24.4
%8.5
%47.6
%
9.1
%
6.9
%
2002
22.0
%8.2
%52.2
%
36.5
%
2003
10.7
%21.8
%8.7
%
41.8
%
51.3
%
272
7.5
%
10.9
%25.5
%8.2
%49.0
%6.5
%
357
2005
10.9
%
36.0
%
26.2
%8.4
%47.9
%6.7
%
2006
4.6
%
2007
10.2
%31.0
%8.7
%
35.1
%
44.5
%
211
5.6
%
2008
34.3
%
11.0
%26.0
%8.9
%48.1
%6.0
%
2009
10.2
%33.4
%9.0
%
2010
9.0
%39.2
%38.0
%4.8
%
2011
8.8
%8.8
%4.6
%
2012
9.8
%40.6
%
2013
9.7
%
230
31.1
%9.7
%42.6
%6.9
%
2014
9.1
%37.5
%36.8
%
9.6
%10.1
%
9.0
%
7.9
%236
9.3
%
1991
208
7.9
%
197 195204
199
213
161
201208 210
285
201
218
272
202
180187
37.2
%
-10.5%
-18.5%
SO2NOx CO NMVOC NH3

National Inventory Report
Third Biennial Update Report
5 Executive summary
cumulative emissions threshold. Key categories are those that, when summed together in descending order of magnitude, add up to 95% of the total level/trend.
The level assessment is performed for 2016, as the latest analyzed year. The top five categories with the highest values of both emissions and removals (sinks) represented in Gg CO2-eq are: Energy Industries – Solid Fuels (27.4%) (Energy sector), Forest Land Remaining Forest Land (17.5%) (AFOLU sector), Road Transportation (16.6%) (Energy sector), Enteric Fermentation from Livestock (5.3%) (AFOLU sector) and Manufacturing Industries and Construction – Solid Fuels (4.1%) (Energy sector). The Forest land category is relevant for sinks, while the other categories for GHG emissions.
The trend assessment of source categories is also executed, taking 1990 as base year and 2016 as latest inventory year. The purpose of this trend assessment is to emphasize the categories whose trend is significantly different from the trend of the overall inventory, regardless whether the category trend is increasing or decreasing, or is a sink or source. The results in percentages (up to 95%) show that Forest Land Remaining Forest Land category participates with 27.4% (AFOLU sector) , followed by Road Transportation with 22.8% (Energy sector), Energy Industries-solid fuels with 5% (Energy sector), Manufacturing Industries and Construction – Liquid Fuels (Energy sector) with 4.8% and Refrigeration and Air Conditioning with 4.6% (IPPU sector).
The uncertainty analysis is again conducted using both methods, Approach 1 (Error Propagation method) and Approach 2 (which is actually an implementation of the Monte Carlo method), for each sector of the inventory for 2014, 2015 and 2016. IPCC software was used for the first approach, while for the second one, the MATLAB model developed in SBUR was applied.
The Macedonian approach towards QA/QC activities in the national GHG inventory process is based on the in-depth analyses of the current practices of the inventory compilation in the country and the relevant international best practices. The resulting QA/QC plan was presented within the FBUR. It is applied in the same manner over the Inventory process of the SBUR, with an extension of QA activities within the energy sector. This QA/QC plan has proved effective in achieving QA/QC objectives, and as such is planned to be implemented for the inventory processes under forthcoming National Communications on Climate Change and Biennial Update Reports.
The Macedonian inventory process meets the necessary technical conditions for ensuring sustainability, since:
• A strong focus is put on documenting essential information in a concise format;
• Activities and tasks are standardized and clear procedures stipulated;
• Roles and responsibilities of all players are clearly defined.
In this regard, worth mentioning are the training materials on GHG inventory preparation developed by the GHG inventory team. These materials are rather country-specific, and being based on personal experience gathered and lessons learned during the GHG inventory preparation in Macedonian conditions, would provide clear guidance for new comers in the process.
This report also outlines by sector the good practices, improvements and recommendations for future inventories, regarding activity data collection, level of disaggregation, consistency and quality of the activity data, as well as application of more sophisticated methods for emissions estimates.
The national GHG inventory development process incorporated well balanced gender team: 43% women and
57% men. Additional efforts have been made to integrate gender responsive considerations into the GHG
inventory to the extent possible, following the national Action plan on gender and climate change and the
UNDP Gender Responsive National Communications Toolkit. The results of the assessments indicate that at
this time the GHG Inventory cannot reflect the gender dimension, due to the absence of official statistical
gender disaggregated data in the analyzed sectors: Energy, Industrial Processes and Product Use (IPPU),
Agriculture, Forestry and Other Land Use (AFOLU) and Waste, disaggregated by categories and
subcategories on the percentage of female and male participation in the production of the GHG emissions
(more details in Chapter 11).
The official statistical agencies are recommended to start collecting gender disaggregated data in the listed
sectors.

National Inventory Report
Third Biennial Update Report
6 Introduction
1 Introduction
The Republic of North Macedonia (Macedonia), as a Non-Annex I Party to the UNFCCC, has been developing Inventory of the anthropogenic emissions by sources and removals by sinks of GHGs emitted to or removed from the atmosphere since 2000 as a part of its National Communications on Climate Change and Biennial Update Reports. Up to now, three National Communications (2003, 2008 and 2014) and two Biennial Update Reports (2015 and 2018) have been delivered to the UNFCCC.
The first National GHG Inventory was developed under the First National Communication (FNC) for the period from 1990 – 1998 and under the Second National Communication (SNC), this period was revised and extended to cover the years 1999 – 2002. In the Third National Communication (TNC), the GHG inventory considered the time-frame 2003 – 2009. In these reports, the inventory was developed in accordance with the 1996 Revised IPCC Guidelines for National Greenhouse Gas Inventories and the 2000 IPCC Good Practice Guidance. In the First Biennial Update Report (FBUR), the inventory was compiled using the IPCC Inventory Software, in compliance with the 2006 IPCC Guidelines for National Greenhouse Gas Inventories. The series was updated to consider the period 2010 – 2012 and additionally, the entire previous series of data from 1990 to 2009 were revised according to the requirements of the IPCC Inventory Software. The same approach was used in the Second Biennial Update Report (SBUR) and the emission trend was expanded by developing the GHG inventory for 2013 and 2014.
The inventory activities under the Third Biennial Update Report (3rd BUR ) continue the work done in the previous BURs and include developing the GHG inventory for 2015 and 2016 in line with the IPCC 2006 Guidelines. The latest version of IPCC Inventory Software (version 2.54 – from July 6, 2017) is used in this process.
The inventory covers five main sectors: Energy, Industrial Processes and Product Use (IPPU), Agriculture, Forestry and Other Land Use (AFOLU) and Waste, disaggregated by categories and subcategories. It includes a database for the following GHGs: CO2, CH4, N2O, PFCs and HFCs, as well as precursors and indirect emissions from: CO, NOx, NMVOC, SO2 and NH3. The emission of SF6 is not estimated for Macedonia due to unavailability of activity data.
Most of the activity data used for preparation of national inventory are taken from official national documents such as: statistical yearbooks, energy balances, sectoral reports and MAKSTAT database from the State Statistical Office (SSO), various strategies and reports from relevant institutions, such as Ministry of Environment and Physical Planning (MOEPP), Ministry of Agriculture, Forestry and Water Economy (MAFWE) etc. and various international databases such as UN projections for population and GDP and FAOstat.
An overview of the trends of overall GHG emissions and removals by sinks in Macedonia is given in Chapter 2. The GHG emissions and removals for each sector are elaborated in details from Chapter 3 to Chapter 6. The detailed information on precursors and indirect emissions are provided in Chapter 7. The analysis of key categories of emissions and removals (level and trend assessment) was also conducted, and presented in Chapter 8. Both methods, Error Propagation method and the Monte Carlo method for uncertainty analysis were applied for each sector of the inventory for 2014, 2015 and 2016. IPCC software was used for the first approach, while for the second one, the MATLAB model developed in SBUR was applied (Chapter 9).
The Macedonian approach towards QA/QC activities in the national GHG inventory process is based on the in-depth analyses of the current practices of the inventory compilation in the country and the relevant international best practices. The QA/QC plan developed within the FBUR with the extension of QA activities within the energy sector from the SBUR, is applied in the same manner over the Inventory process of the 3rd BUR. Detailed information on the QA/QC procedures is provided in Chapter 10.
The national inventory process (Figure 5) includes the following key players:
− Ministry of Environment and Physical Planning, responsible for supervising the national inventory process and reporting the emissions to UNFCCC and also for other international reporting;
− GHG Inventory Development Team, composed of MANU team and team and AFOLU team with experts from University of Ss. Cyril and Methodius (UKIM) - Institute of Agriculture, Faculty of Forestry, Faculty of Agricultural Sciences and Food;
− Verification Team, which includes experts working on Quality Control, as well as experts working on Quality Assurance. The last is also ensured by multilayer structure involving CTA, NCCC and GSP.
The preparation of the national GHG inventory is project based, supported by Global Environment Facility (GEF) and United Nations Development Programme (UNDP). The estimated emissions in the inventory are

National Inventory Report
Third Biennial Update Report
7 Introduction
publicly available within the national climate change platform www.klimatskipromeni.mk, open data portal (data.gov.mk) and UNFCCC web site. Also, detailed Sectoral MRV schemes the relevant processes are being developed in the framework of 3rd BUR, including the inventory process.
Figure 5. National inventory process
INTERNATIONAL SUPPORT: GEF and UNDP
NATIONAL INVENTORY PROCESS
• National Strategic and
Planning Documents
Other Uses:
STATE STATISTICAL OFFICE (SSO)
DATA SUPPLY
INTERNATIONAL
DATABASES:
UN, FAO,
CORINE LC,
IPCC EF
ENERGY(MANU)
IPPU(MANU)
AFOLU(UKIM – FASF, FF,IA)
WASTE(MANU)
GHG INVENTORY DEVELOPMENT
Precursors and Indirect Emissions(MANU)
Ministry of Environment and
Physical Planning (MOEPP)
• United Nations Framework
Convention on Climate Change
(UNFCCC):- National Communications
- Biennial Update Reports
• European Environment Agency
(EEA)
• European Union Monitoring
Mechanism Regulation (EU MMR)
REPORTINGVERIFICATIONQuality Control (QC)
Macedonian Academy of Sciences and Arts
(MANU) – Verification Team*
External Sectoral
Expert(s)
Quality Assurance (QA)
Global Support
Programme (GSP)
National Committee on
Climate Change (NCCC)External Sectoral
Expert(s) – UNFCCC Certified
Reviewer(s)
Macedonian Academy of Sciences and Arts (MANU) – Verification
Team*
Chief Technical Advisor
(CTA)
*Only for sectors developed by other institutions
Precursors and Indirect Emissions
Ministry of Economy
(MOE)
Macedonian Navigation
Agency (MNAV)
Energy
Joint Stock Company
Macedonian Power Plants (ELEM)
Ministry of Agriculture, Forestry and Water Economy
(MAFWE)
Public Enterprises
( Makedonski shumi ,
PE for Management of
pastures, National
parks)
University of St. Cyril and
Methodious (UKIM) –
Faculty of Agricultural
Sciences and Food
(FASF),
Faculty of Forestry (FF),
Institute of Agriculture
(IA)
Agriculture, Forestry and Other Land Use (AFOLU)
Association of private forest owners Center for
Management of Crisis
(CMC)Firefighting Union
(FFU)
Waste
Municipalities/
Public enterprises
Ministry of Environment and Physical Planning
(MOEPP)
Industrial Process and Product Use (IPPU)
Macedonian Chambers of
Commerce (MCC)
Ministry of Environment and Physical
Planning (MOEPP)
Ministry of Economy
(MOE)

National Inventory Report
Third Biennial Update Report
8 Emission trends
2 Emission trends
This section gives an overview of the trends of the GHG emissions and removals by sinks in Macedonia. The GHG Inventory for the purpose of the FBUR covered the period 1990 – 2012 and in the SBUR the inventory for years 2013 and 2014 has been compiled. In addition, revision and update (where necessary) of the inventory data have been made. In this inventory the GHG emission for 2015 and 2016 are reported. Additionally, the emissions for 1990, 2000, 2005 and 2014 are given, as a years reported in the previous submissions (NCs and BURs) to UNFCCC. More detailed information on the GHG emissions and removals for each sector are provided in the subsequent sections (Chapter 3 to Chapter 6). The inventory covers the GHGs CO2, CH4, N2O, PFCs and HFCs and precursors and indirect emissions of: CO, NOx, NMVOC, SO2 and NH3. The precursors and indirect emissions are separately presented and elaborated by sectors in Chapter 7. The emission of SF6 is not estimated for Macedonia due to unavailability of activity data.
2.1 Methodologies
The Greenhouse gas inventory was prepared following the 2006 IPCC National GHG Inventory Guidelines, using the latest IPCC Inventory Software version available at the time of the preparing the Inventory (version 2.54 – from July 6, 2017). According to the 2006 Guidelines, the GHG emissions and removals estimates are divided into following main sectors:
• Energy • Industrial Processes and Product Use (IPPU) • Agriculture, Forestry and Other Land Use (AFOLU) • Waste • Other (e.g., indirect emissions from nitrogen deposition from non-agriculture sources)
Each sector comprises individual categories and subcategories, so the national inventory was developed at subcategory level.
In the IPCC Guidelines, methods are divided into three tiers: Tier 1 is for the “default method”, which is the simplest and is usually applied when no country-specific emission factors are available; Tier 2 method uses the same procedure as Tier 1 methods, but incorporate emission factors and/or parametric activity data that are specific to the country or at least one of its regions and Tier 3 is reserved for country-specific methods (models, censuses, and others). In the preparation of Macedonia’s National Inventory, the Tier 2 method was applied for CO2 emission factors for lignite, residual fuel oil and natural gas for Fuel combustion activities in Energy sector. Tier 2 was also used in IPPU sector for emission factors in Mineral industry, for cement production and in Metal industry, for Iron and steel production and Ferroalloys production. The Waste sector is another sector with Tier 2 application, through IPCC FOD method and taking into account the country-specific activity data on waste disposal at solid waste disposal sites (SWDS) and the historical data on GDP and population. For the other sectors the default method, Tier 1, was used. The methods applied in the preparation of this national GHG inventory under 3rd BUR, are summarized in A I.2, Table 80.
To facilitate aggregate reporting of GHG values, expressed as carbon dioxide equivalents (CO2-eq) the global warming potentials (GWPs) values provided in the IPCC AR4 (temporal horizon 100 years) were used (see Table 1). According to the Decision 17/CP.8, all non-Annex-I countries should estimate their GHG emissions using GWPs from the IPCC Second Assessment Report, since Macedonia is EU-candidate country, it was decided to use GWPs from IPCC AR4.
Table 1. Global warming potential values used in the preparation of the GHG Inventory (100 years time horizon)
Gas CO2 equivalent Gas CO2 equivalent CO2 1 HFC-125 3,500 CH4 25 HFC-143a 4,470
N2O 298 HFC-134a 1,430
HFC-32 675
HFC-227ea 3,220
CF4 7,390
C2F6 12,200
Source: IPCC Fourth Assessment Report (AR4), 2007

National Inventory Report
Third Biennial Update Report
9 Emission trends
The estimates of precursors and indirect emissions (including indirect NH3 emissions) are based on the EMEP/EEA Emission Inventory Guidebook, 2019. The calculation is performed using the same activity data as for GHG estimations. The tables used for the emission factors are referenced in the subchapters by sectors in Chapter 7. The estimations for all sectors is done using the Tier 1 approach, except for the category Biological treatment of waste – composting in the Waste sector for which Tier 2 emission factors are applied. The higher Tier methodologies require detailed characteristics of the fuels used in combination with onsite measurements or other detailed parameters, which were not available at the time of preparation of the 3rd BUR.
2.2 Aggregate GHG emissions
The aggregate GHG emissions and removals (net emissions) in 2016 are estimated to 8,020 Gg CO2-eq (including the FOLU sector) (Table 2 and Figure 6). Figure 6 shows the time–series of emissions and removals, (in CO2-eq), from 1990 to 2016. There are significant fluctuations in the net emissions in 2000, 2007 and 2012, where increased emissions can be noticed in the FOLU sector (instead of removals) as a result of the intensified forest fires/wildfires. The GHG emissions in 2016 are reduced by 34.6% compared to 1990. This is mainly result of reduced electricity production from lignite, fuels switch (residual fuel oil for electricity and heat production is replaced with natural gas), and lower industrial production, which is decreasing after 2012.
Table 2. GHG emissions and removals by sector (in Gg CO2-eq)
Sector 1990 2000 2005 2014 2015 2016
Energy 9,648.9 9,757.9 9,251.1 8,051.3 7,701.3 7,449.3
Industrial Processes and Product Use 932.2 888.4 861.7 886.2 790.5 858.0
Agriculture (without FOLU) 1,490.4 1,249.6 1,204.1 1,131.5 1,159.4 1,193.2
FOLU* -207.0 10,441.4 -1,522.1 -3597.4 -1,625.4 -2,090.1
Waste 406.7 412.7 435.2 574.3 596.7 610.2
Total (incl. FOLU) – Net emissions 12,271.2 22,749.9 10,230.0 7,045.9 8,622.6 8,020.6
Total (excl. FOLU) 12,478.2 12,308.6 11,752.1 10,643.3 10,247.9 10,110.8
Figure 6. GHG emissions and removals by sector (in Gg CO2-eq)
If the removals from FOLU sector are not accounted for, then the total GHG emissions in 2016 are 10,111 Gg CO2-eq (Figure 7). The greatest share of emissions is from the Energy sector, accounting for 73.7% in 2016, followed by the Agriculture (excluding FOLU) with 11.8% and IPPU sector with 8.5% and Waste sector with 6% share. The dominant share of emissions for the Energy sector is evident throughout the whole time series. Excluding FOLU, the emissions in 2016 are reduced by 19% competed to 1990.
* The value for 1990 does not include the emissions/sinks from land use changes that are reported in the AFOLU chapter (Table 18).
31.3
%
10.7
%
2006
78.6
%12.1
%
1991
77.1
%12.0
%
75.6
%
1992 20101999
70.6
%
2001 2009
10.9
%
1993
85.9
%
82.2
%
74.0
%
10.2
%
11.6
%
12.9
%
1994
80.4
%12.5
%
10.2
%
1995
76.7
%
91.8
%
10.3
%
11.4
%
12,6
75
20051996
79.2
%11.6
%
1997
12,4
60
10.0
%
1998 2002
45.9
%42.9
%5.5
%
85.1
%11,9
15
94.2
%
2000
83.9
%
86.9
%
10.1
%
8,9
13
84.9
%
2003 2004
8,0
21
90.4
%
12.9
%
11.8
%
54.1
%6.8
%
2007
9,5
36
2008
102.8
%12.7
%
78.5
%9.6
%
2011
67.7
%
8.0
%
14.8
%
2012
95.3
%12.4
%
2013
114.3
%16.1
%
12,4
47
2014
89.3
%13.4
%
1990
92.9
%14.9
%
2016
83.0
%
12.0
%
10.6
%
12,2
71
12,2
62
12,3
28
13,6
79
11,5
70
13,6
82
2015
22,7
50
11,6
28
11,7
11
9,5
98
10,2
30
8,6
23
17,3
01
10,4
12
8,6
80
10,6
94
12,3
71
14,0
35
7,0
4611,8
49
-34.6%
Agriculture (excl. FOLU)Energy FOLUIndustrial Processes and Product Use Waste

National Inventory Report
Third Biennial Update Report
10 Emission trends
Figure 7. Total GHG emissions by sector, excluding FOLU sector (in Gg CO2-eq)
2.3 GHG emissions by gas
Analyzing the GHG emissions by gas (excluding FOLU sector), it is evident that across the series the most dominant are the CO2 emissions (Table 3 and Figure 8). Their share accounts for 76.5% in 2016, followed by the CH4 emissions with 15.7%, then N2O emissions with 4.7% and all F-gasses with 3.1%.
Table 3. GHG emissions by gas (in CO2-eq)
Gas 1990 2000 2005 2014 2015 2016
CO2 (incl. FOLU) 9978.1 20697.0 8171.2 4825.0 6355.9 5641.0
CO2 (excl. FOLU) 10185.1 10255.6 9693.3 8422.3 7981.3 7731.1
CH4 1740.3 1571.1 1509.4 1563.3 1595.2 1588.3
N2O 461.1 414.2 446.2 451.0 452.4 475.6
HFCs 0.0 4.8 102.8 206.6 219.1 315.7
PFCs 91.7 62.9 0.3 0.0 0.0 0.0
SF6 0.0 0.0 0.0 0.0 0.0 0.0
Total (incl. FOLU) - Net emissions 12271.2 22749.9 10230.0 7045.9 8622.6 8020.6
Total (excl. FOLU) 12478.2 12308.6 11752.1 10643.3 10247.9 10110.8
Figure 8. Total GHG emissions by gas, excluding FOLU (in Gg CO2-eq)
3.3
%
77.8
%
79.9
%
7.0
%
12.0
%
3.2
%
7.5
%
4.0
%
1993
77.9
%
1998
6.6
%
80.8
%
12.2
%
6.6
%
1994
10.9
%
3.7
%
12,3
81
1995
3.0
%
1996
9.4
%
2008
77
.8%
1997 2009
11,6
2912,7
29
3.1
%
2011
6.7
%
6.8
%
3.2
%
80
.4%
6.5
%
9.9
%
1999
79.3
%
7.2
%
10.2
%
3.4
%
2000
80.4
%
6.1
%
2003
10.2
%
3.4
%
200181.3
%
5.7
%
10.8
%
200219921990
6.7
%
3.3
%
9.6
%
12,1
47
7.5
%
10,6
43
3.4
%
78.8
%77.3
%
10.8
%
5.0
%
3.3
%
3.7
%
20049.6
%
7.3
%
10.2
%
79.4
%
2005
77.6
%
1991
7.6
%
3.4
%2006
78.8
%
11.9
%
11,0
59
7.5
%
9.9
%
3.8
%
2007
77.8
%
77.1
%
8.0
%
10.2
%
12
.1%
4.0
%
79.8
%
10,1
11
6.1
%4.3
%
78.2
%
3.3
%
7.2
%
10.1
%
4.5
%
2010
78.1
%
7.5
%
8.2
%
9.5
%
9.8
%
78.7
%
12.0
% 6.7
%
9.4
%
4.5
%
2012
76.8
%
3.3
%
8.2
%
10.0
%
6.4
%
2013
75.6
%
8.3
%5.4
%
2014
75.1
%
7.7
%
11.3
%
12,0
43
3.4
%
5.8
%
2015
11,8
84
73.7
%77.9
%
8.5
%
11.8
%
4.1
%
2016
10.6
%
76.8
%
80.3
%
7.6
%
12,4
78
12,2
52
12,1
30
12,4
09
11
,94
0 13,1
38
12
,05
3 13,2
44
12,3
09
12,4
80
11,4
80
11,7
52
11,2
83
11,1
89
11,3
47 12,4
30
11,9
60
10,2
48
11.4
%
12.2
%
6.0
%
-5.0%
-19.0%
Industrial Processes and Product UseEnergy Agriculture (excl. FOLU) Waste
1999 20092000 2001
12,0
53
2002
11,9
40
2003
12,3
81
2004
3.8
%
2005
12,4
09
2006 2007 2008 2010 2011
11,2
83
2012
3.8
%
2013 2014 2015 2016
4.0
%
12,2
52
11,8
84
12,0
43
12,4
30
12,4
78
12,1
30 13,1
38
13.2
%
12,7
29
3.8
%
12,3
09
12,1
47
11,4
80
11,3
47
13.7
%
11,6
29
11,1
89
11,0
59
10,2
48
10,1
11
83.3
%
81.6
%
14.3
%
83.0
%
13,2
44
81.2
%
79.1
%81.2
%
80.9
%
81.0
%
81.8
%
84.0
%
83.6
%
83.1
%
83.5
%
82.1
%
4.0
%
82.5
%
81.1
%
82.4
%
13.9
%
12.8
%
81.2
%
81.0
%
80.7
%
81.2
%
81.7
%
81.5
%
80.3
%
77.9
%
76.5
%
14.2
%
12
.4%
14.2
%
13.9
%
14.2
%
15.7
%
3.3
% 12
.8%
12.8
%
12.0
%
12.8
%
12.3
%
12.3
%
13.4
%
13.6
%
1991
13.0
%
13.3
%
12.9
%
13.8
%
14.7
%
15.6
%
3.3
%
3.9
%
3.6
%
3.5
%
3.1
%
4.0
%
1993
4.0
%
3.8
%
3.4
%
3.4
%
3.1
%
3.9
%
3.6
%12.3
%
4.2
%
4.4
%
4.7
%
3.7
%
83.5
%
10,6
43
1990
11,9
60
1992 1995
13.1
%
1994
3.8
%
4.0
%
11,7
52
1996
3.8
%
1997 1998
12,4
80
4.0
%
-5.0%
-19.0%
CO2 CH4 N2O F-gases

National Inventory Report
Third Biennial Update Report
11 Emission trends
In spite of the small share of the F-gases in the total emissions, only HFCs and PFCs are reported in the inventory (Table 3). The SF6 is not estimated for Macedonia due to unavailability of activity data. As can be seen in Figure 9, the emissions of HFCs start in the year 2000 with some fluctuations over the time-series, depending on the activities in the IPPU sector achieving 316 Gg CO2-eq in 2016, while the emissions of the PFCs are considerably decreasing after 2003. The significant growth in import of gases (blends) used for refrigeration and air-conditioning results with increase of HFCs emissions in 2016 compared to 2015.
Figure 9. Emissions of F-gasses (in Gg CO2-eq)
200919991992 1994
105
19981991 1993 1995 1997
100
2000 2001 2002
89
2003 2004 2005 2006 2007 2010 2011
205
110
2012
316
2013 2014
207
124
68
20162015
108
1990 20081996
9197
92
117
89
159
95
149
84 80
103
223
241
225
213207
219
+52.8%
+244.5%
HFCs PFCs SF6

National Inventory Report
Third Biennial Update Report
12 Energy
3 Energy
The gross inland consumption in Macedonia is still dominated by fossil fuels, although their share is decreasing over the reported period, from 92% in 1990 to 79% in 2016 (Figure 10Error! Reference source not found.). At the same time, the share of renewable energy sources has doubled (7.5% in 1990 to around 15% in 2016). The rest of the gross inland consumption is covered by the electricity import, which increased from insignificant 0.2% in 1990 to 6.5% in 2016. The gross inland consumption in total in 2016 is 7% lower compared to the consumption in 1990.
Historically, the most dominant fuel in Macedonia is coal (predominantly lignite) which has accounted for about 45% of the gross inland consumption. The situation is changed in 2016 because the oil products participated with 40%, while share of coal is reduced to 33% (Figure 10).
The final energy consumption does not follow the same trend line as the gross inland consumption (Figure 11). The highest consumption of 1,861 ktoe, in the reported period, is recorded in 2016 which is 7.8% higher compared to the consumption in 1990. In 2016, oil products account for the largest share of final energy consumption (49%), while electricity is next (29%), followed by biomass with 10%, coal with 7% and heat and natural gas with 2% each. The efficiency of the energy system, represented with the ratio of final energy consumption per gross inland consumption, has increased to nearly 70% in 2016 which is 10 percentage points more compared to 1990.
Figure 10. Gross inland consumption (in ktoe) Figure 11. Final energy consumption (in ktoe)
Electricity together with biomass are very important commodities for Macedonia, as domestic resources. In 2016, the electricity available for final energy consumption accounted for 6,191 GWh (532.4 ktoe). Although, in the reported years, the share of electricity in final energy consumption has increased from 23.4% in 1990 up to 32% in 2014, but in the last two years has decreased to 28.6% in 2016, most probably as a result of energy efficiency measures as well as weather conditions.
The installed capacity for electricity production is mainly composed of thermal power plants, 71% in 1990 and 45% in 2016 (Figure 12). They are followed by hydropower plants with 29% in 1990 and 36% in 2016. Technologies such as PV, wind and combined heat and power plants have also been deployed during the reported years and their shares in 2016 were 1%, 2% and 15% of the total installed capacity, respectively. The RES installed capacity in total participate with 39% in 2016 which is 10 percentage points more compare to 1990.
Considering these installed capacities, the electricity is mainly produced in the thermal power plants, i.e. 88% in 1990 and 39% in 2016 (Figure 13), followed by the production from hydropower plants, which is 8% in 1990 and 25% in 2016. Although, 15% of the installed capacity in Macedonia is from CHPs, their production in 2016 accounts for only 7%. Electricity net import has significant share and was about 27% in 2016.
4.4%
50.8%
29.4%
1.9%
6.5%
5.6%
40.4%
33.5%
3.6%
2014
7.1%
33.2%
32.5%
6.5%
4.7%
6.0%
2.1%
-1.9%
6.0%
39.9%
4.1%
3.8%
8.5%
36.3%
8.1%
4.2%
36.2%42.7%
2015
7.2%
2016
7.7%
50.0%53.7%
2,905.8
2,765.0
2,915.2
2,700.4 2,678.2
8.7%
2005
-4.2%
6.1%
2000
1.5%
1990
9.4%
2,692.0
-0.3%
-7.4%
Electricity (Net Import)Biomass
Coal Geothermal
Crude Oil Natural gas
Oil Products
Hydro
Solar
Wind
Biogas
Biodiesel
RES share (%)
11.8% 13.1% 15.3% 14.0%7.5% 11.9%
27.9%
2.5%9.5%
2.8%
2000
42.4%
11.8%
30.6%
2005 2014
5.6%
44.9%
1.9%
13.1%
32.0%
41.8%
1,725.5
1.7%
2.2%
5.5%
46.9%
10.2%
12.3%
49.4%
30.8%
2015
6.8%
10.4%
2.0%
2.5%
8.7% 1,605.7
1,750.11,808.4
52.0%
6.8%
1,860.9
4.1%
23.4%
7.8%
5.7%
1990 2016
12.7%
1,851.0
28.6%
+2.9%
+7.8%
BiomassCoal Natural gas
Oil Products Geothermal Electricity
Heat
12.6% 20.4% 19.6% 19.5% 22.1% 20.3%
RES share (%)
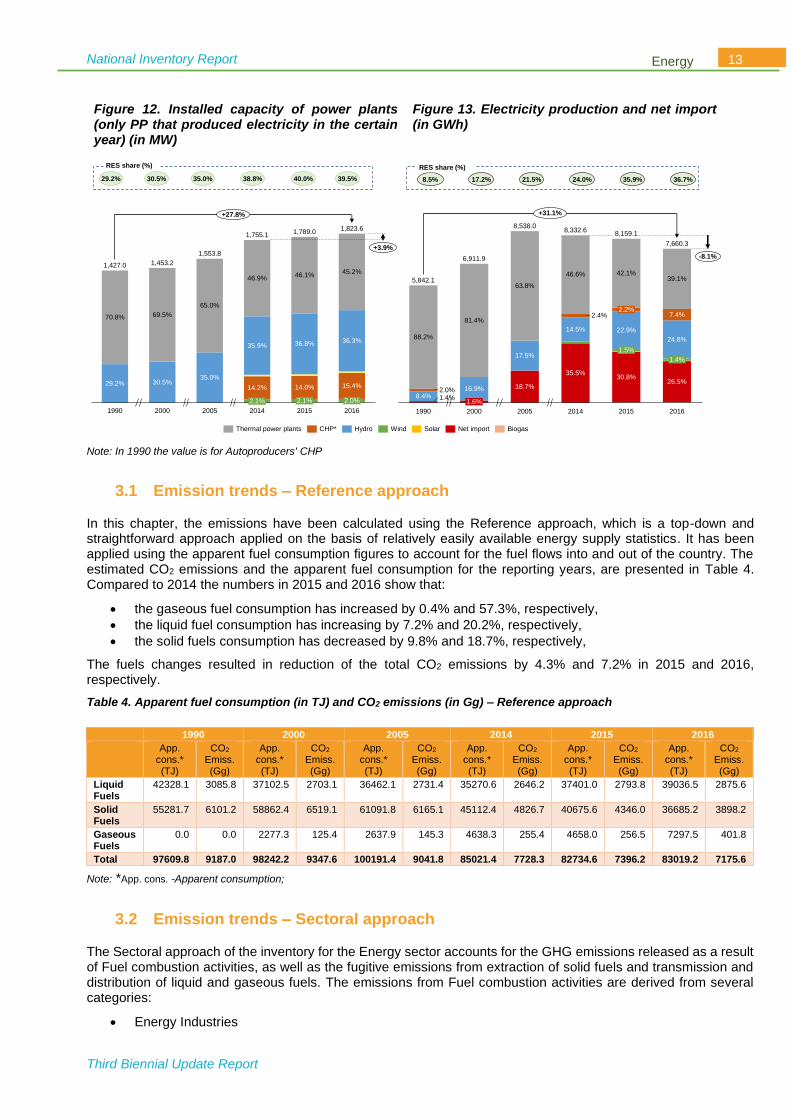
National Inventory Report
Third Biennial Update Report
13 Energy
Figure 12. Installed capacity of power plants (only PP that produced electricity in the certain year) (in MW)
Figure 13. Electricity production and net import (in GWh)
Note: In 1990 the value is for Autoproducers' CHP
3.1 Emission trends – Reference approach
In this chapter, the emissions have been calculated using the Reference approach, which is a top-down and straightforward approach applied on the basis of relatively easily available energy supply statistics. It has been applied using the apparent fuel consumption figures to account for the fuel flows into and out of the country. The estimated CO2 emissions and the apparent fuel consumption for the reporting years, are presented in Table 4. Compared to 2014 the numbers in 2015 and 2016 show that:
• the gaseous fuel consumption has increased by 0.4% and 57.3%, respectively,
• the liquid fuel consumption has increasing by 7.2% and 20.2%, respectively,
• the solid fuels consumption has decreased by 9.8% and 18.7%, respectively,
The fuels changes resulted in reduction of the total CO2 emissions by 4.3% and 7.2% in 2015 and 2016, respectively.
Table 4. Apparent fuel consumption (in TJ) and CO2 emissions (in Gg) – Reference approach
Note: *App. cons. -Apparent consumption;
3.2 Emission trends – Sectoral approach
The Sectoral approach of the inventory for the Energy sector accounts for the GHG emissions released as a result of Fuel combustion activities, as well as the fugitive emissions from extraction of solid fuels and transmission and distribution of liquid and gaseous fuels. The emissions from Fuel combustion activities are derived from several categories:
• Energy Industries
65.0%
2005
46.1%46.9%
2016
35.9%
14.2%
2014
35.0%
36.8%
14.0%
2.1%
2015
45.2%
15.4%
2.0%
29.2%
2.1%
70.8%
1990
1,427.0 1,453.2
1,553.8
36.3%
1,789.0
30.5%
1,823.6
69.5%
2000
1,755.1
+3.9%
+27.8%
29.2% 30.5% 35.0% 38.8% 40.0% 39.5%
18.7%
24.8%
2005
46.6%
30.8%
14.5%
35.5%
2014
42.1%
1.5%
2.2%
81.4%
22.9%
8,332.6
2.4%
26.5%
2015
8,538.0
7.4%
1.4%
88.2%
20161990
2.0%
1.6%1.4%
7,660.3
8.4%
8,159.1
5,842.1
6,911.9
16.9%
2000
39.1%63.8%
17.5%
-8.1%
+31.1%
Thermal power plants WindHydroCHP* Solar Net import Biogas
8.5% 17.2% 21.5% 24.0% 35.9% 36.7%
RES share (%)RES share (%)
1990 2000 2005 2014 2015 2016
App. cons.* (TJ)
CO2 Emiss. (Gg)
App. cons.* (TJ)
CO2 Emiss. (Gg)
App. cons.* (TJ)
CO2 Emiss. (Gg)
App. cons.* (TJ)
CO2 Emiss. (Gg)
App. cons.* (TJ)
CO2 Emiss. (Gg)
App. cons.* (TJ)
CO2 Emiss. (Gg)
Liquid Fuels
42328.1 3085.8 37102.5 2703.1 36462.1 2731.4 35270.6 2646.2 37401.0 2793.8 39036.5 2875.6
Solid Fuels
55281.7 6101.2 58862.4 6519.1 61091.8 6165.1 45112.4 4826.7 40675.6 4346.0 36685.2 3898.2
Gaseous Fuels
0.0 0.0 2277.3 125.4 2637.9 145.3 4638.3 255.4 4658.0 256.5 7297.5 401.8
Total 97609.8 9187.0 98242.2 9347.6 100191.4 9041.8 85021.4 7728.3 82734.6 7396.2 83019.2 7175.6

National Inventory Report
Third Biennial Update Report
14 Energy
• Manufacturing Industries and Construction,
• Transport,
• Other Sectors (Commercial/Institutional, Residential and Agriculture/Forestry/Fishing),
• Non-Specified The entire Energy sector emissions by category can be observed in Figure 14. A decreasing emission trend can be seen due to reduced electricity production from the Energy Industries, replaced mainly with electricity import. Overall, the emissions in 2016 have 7.5% lower values compared with the ones in 2014 and 22.8% compared with 1990.
Most of the GHG emissions in 2016 occur in the category Energy Industries (51.0%), followed by Transport (28.1%) and Manufacturing Industries and Construction (13.9%). The other two categories together account for 5% of the total emissions in 2016 and the remaining around 2% are Fugitive emissions.
Furthermore, the overall GHG emissions in Energy sector by gas (in Gg of CO2-eq) for the reporting years, are given in Figure 15, notably, almost all of the GHG emissions in 2016 are actually CO2 emissions (96.4%), and CH4 and N2O emissions amount to only 2.8% and 0.8%, respectively.
Figure 14. GHG emissions in Energy sector, by category (in Gg CO2-eq)
Figure 15. GHG emissions in Energy sector, by gas (in Gg of CO2-eq)
In Table 5, concrete values of the GHG emissions in Energy sector, by category (in Gg CO2-eq) are presented.
Table 5. GHG emissions in Energy sector, by category (in Gg CO2-eq)
Categories 1990 2000 2005 2014 2015 2016
Energy 9648.9 9757.9 9251.1 8051.3 7701.3 7449.3
Fuel Combustion Activities 9455.5 9549.9 9060.6 7872.4 7537.4 7307.1
Energy Industries 6205.3 6998.3 5940.5 4747.4 4260.6 3801.2
Manufacturing Industries and Construction 1796.5 1080.6 1356.2 1132.8 1067.1 1037.4
Transport 791.1 1006.5 1043.5 1656.4 1837.8 2096.7
Other Sectors 637.3 328.4 302.7 158.7 162.2 149.9
Non-Specified 25.4 136.1 417.8 177.2 209.6 222.0
Fugitive emissions from fuels 193.3 208.0 190.5 178.9 163.9 142.2
Solid Fuels / Цврсти горива 192.6 207.5 189.9 178.9 163.9 142.2
Oil and Natural Gas / Нафта и природен гас
0.7 0.5 0.6 0.0 0.0 0.0
3.2.1 Energy industries
The Energy Industries cover the following subcategories:
• Electricity Generation
• Combined Heat and Power Generation (CHP)
• Heat Plants
• Other Energy Industries
10.3%
4.5%2.1%
2.7%
2000
64.2%
14.7%
3.3%
2.1%
2005
14.1%
20.6%
2.0%
55.3%
2.0%2.2%
2014
1.4%
13.9%
23.9%8.2%
11.3%
2.1%3.4%
64.3%
2.1%
2015
51.0%
13.9%
6.6%
9,648.9
2.0%3.0% 1.9%
2016
9,757.9
9,251.1
28.1%
7,701.37,449.3
18.6%
1990
71.7%
59.0%
11.1%
2.2%
8,051.3
-7.5%
-22.8%
Energy Industries Non-Specified
Manufacturing Industries and Construction
Transport
Other Sectors
Fugitive emissions from solid fuels
Fugitive emissions from oil and natural gas
3.2%
96.5%
2005
3.2%
2014
96.1%
2015
96.1%
2.8%
2016
2.9%
9,757.9
96.8%
2.9%
9,251.1
8,051.37,701.3
7,449.3
96.6%
2000
9,648.9
2.7%
1990
96.4%
CO2 N2OCH4

National Inventory Report
Third Biennial Update Report
15 Energy
The Electricity Generation is the biggest contributor within the category with 91.6% of the emissions in 2016 as well as within the Energy sector as a whole with 46.7% in 2016 (Figure 16). Lignite (as a domestic source) and natural gas are the main energy sources for electricity production in the country. In the previous years, the residual fuel oil was one of the main energy sources used in the Energy Industries, but it was gradually replaced by the natural gas especially for electricity and heat production. As a result of fuel switch and mostly on reduction in electricity production from lignite, the emissions from this category in 2016 are lower by 19.9% compared to 2014 and 38.7% compared to 1990.
Figure 16. GHG emissions in Energy Industries (in Gg CO2-eq)
In Table 6, the GHG emissions in Energy Industries by gas can be found. The emissions of CH4 and N2O in this category are less than 0.5% of the total emissions in Energy Industries.
Table 6. GHG emissions in Energy Industries, by category and by gas (in Gg CO2-eq)
Categories 1990 2000 2005 2014 2015 2016
CO2 CH4 N2O CO2 CH4 N2O CO2 CH4 N2O CO2 CH4 N2O CO2 CH4 N2O CO2 CH4 N2O
Energy Industries 6179.6 1.7 24.0 6969.2 2.5 26.6 5913.4 1.7 25.4 4727.5 1.2 18.7 4242.8 1.1 16.7 3785.8 1.0 14.4
Main Activity Electricity and Heat Production
6179.6 1.7 24.0 6956.5 2.4 26.6 5875.3 1.6 25.3 4713.6 1.2 18.7 4237.7 1.1 16.7 3780.2 1.0 14.4
Electricity Generation 5613.2 1.3 22.5 6259.8 1.6 24.5 5566.9 1.4 24.6 4527.5 1.1 18.5 4054.6 1.0 16.6 3466.3 0.9 14.2
Combined Heat and Power Generation (CHP)
394.4 0.3 1.1 122.4 0.1 0.3 39.5 0.01 0.2 93.5 0.04 0.1 81.0 0.04 0.04 250.9 0.1 0.1
Heat Plants 172.0 0.2 0.4 574.3 0.7 1.7 268.9 0.2 0.6 92.6 0.04 0.1 102.1 0.05 0.1 63.1 0.03 0.03
Manufacture of Solid Fuels and Other Energy Industries
NA NA NA 12.7 0.01 0.03 38.1 0.04 0.1 13.9 0.02 0.04 5.1 0.01 0.01 5.5 0.01 0.01
Other Energy Industries
NA NA NA 12.7 0.01 0.03 38.1 0.04 0.1 13.9 0.02 0.04 5.1 0.01 0.01 5.5 0.01 0.01
Note: NA – Not Applicable
3.2.2 Manufacturing industries and construction
Manufacturing Industries and Construction as an Energy category had a portion of 13.9% in the overall Energy sector emissions in 2016.The fuels used in this category consist of: coking coal, other bituminous coal, lignite, liquefied petroleum gases, residual fuel oil, natural gas, wood/wood waste (biomass and wood wastes, wood briquettes and pellets), sub-bituminous coal, petroleum coke, and gas/diesel oil (road diesel, and heating and other gasoil).
The category itself includes the following subcategories:
• Iron and Steel
• Non-Ferrous Metals
• Chemicals
• Pulp, Paper and Print
• Food Processing, Beverages and Tobacco
• Non-Metallic Minerals
95.8%
8.2%
94.1%
4.5%
2005
2.0%6.4%
4,260.6
5,940.5
2014
95.6%
1.9%2.4%
91.6%
6.6%
90.8%
20161990
6,998.3
3,801.2
2015
6,205.3
2.0%
2000
4,747.4
1.8%
2.8% 1.7%
89.8%
-19.9%
-38.7%
Electricity Generation
Combined Heat and Power Generation (CHP) Other Energy Industries
Heat Plants

National Inventory Report
Third Biennial Update Report
16 Energy
• Machinery
• Mining (excluding fuels) and Quarrying
• Textile and Leather
• Non-specified Industry The total emissions by subcategories are illustrated in Figure 17. The top three most intensive subcategories are: Iron and Steel (51.5% of the emissions in 2016), Non-Metallic Minerals (28.4% of the emissions in 2016) and Food Processing, Beverages and Tobacco (6.3% of the emissions in 2016). If the declining trend of the total category emissions is quantified, one can calculate 2.8% when comparing 2016 with 2015, and 8.4% when comparing 2016 with 2014. The GHG emissions by gas in this category are presented in Table 7.
Figure 17. GHG emissions in Manufacturing Industries and Construction (in Gg CO2-eq)
Note: In 1990 the categories Non-Specified Industry include more industry branches compare to the other years.
In the previous reports (FBUR and SBUR) the total emissions from Manufacturing industries and construction for the period 1990 - 2004 were reported only under the category Non-specified Industries. In this report, using IEA data and SSO energy balances this is corrected, and the subcategory Non-Specified Industry is disaggregated by different subcategories, thus maintaining a consistency with the emissions reported from 2005 to 2016 in the inventory database.
Table 7. GHG emissions in Manufacturing Industries and Construction, by category and by gas (in Gg CO2-eq)
Categories 1990 2000 2005 2014 2015 2016
CO2 CH4 N2O CO2 CH4 N2O CO2 CH4 N2O CO2 CH4 N2O CO2 CH4 N2O CO2 CH4 N2O
Manufacturing Industries and Construction
1788.8 2.6 5.2 1075.6 1.7 3.3 1349.7 2.2 4.2 1127.4 1.8 3.6 1062.0 1.8 3.4 1031.9 1.9 3.6
Iron and Steel 641.9 1.0 1.9 333.2 0.6 1.2 723.1 1.5 2.7 666.9 1.2 2.3 583.2 1.0 2.0 531.5 0.9 1.7
Non-Ferrous Metals 336.4 0.8 1.4 276.0 0.6 1.0 1.7 0.0 0.0 2.4 0.0 0.0 2.8 0.0 0.0 3.4 0.0 0.0
Chemicals 77.5 0.1 0.2 0.0 0.0 0.0 21.4 0.0 0.0 7.1 0.0 0.0 8.8 0.0 0.0 7.9 0.0 0.0
Pulp, Paper and Print 0.0 0.0 0.0 0.0 0.0 0.0 8.4 0.0 0.0 2.3 0.0 0.0 2.9 0.0 0.0 2.2 0.0 0.0
Food Processing, Beverages and Tobacco
54.5 0.1 0.1 122.6 0.1 0.3 99.5 0.1 0.2 61.5 0.2 0.3 64.8 0.2 0.3 65.0 0.2 0.3
Non-Metallic Minerals 133.0 0.1 0.2 330.9 0.3 0.7 380.8 0.3 0.7 269.0 0.2 0.5 276.2 0.3 0.7 293.1 0.6 1.1
Machinery 9.6 0.0 0.0 2.9 0.0 0.0 16.4 0.0 0.0 10.6 0.0 0.0 12.5 0.0 0.0 15.9 0.0 0.0
Mining (excluding fuels) and Quarrying
43.8 0.0 0.1 5.3 0.0 0.0 11.3 0.0 0.0 40.6 0.0 0.1 42.5 0.0 0.1 40.9 0.0 0.1
Textile and Leather 20.7 0.0 0.1 0.7 0.0 0.0 52.8 0.1 0.3 24.8 0.1 0.1 23.5 0.0 0.1 21.2 0.0 0.1
Non-Specified Industry 471.3 0.5 1.1 3.9 0.0 0.1 34.3 0.1 0.2 42.2 0.1 0.1 44.9 0.1 0.1 50.7 0.1 0.2
2.1%
18.9%
28.2%
2.4% 1.2%
1990
26.3%
31.0%
2014
23.8%
11.4%
30.7%
6.3%
2000
59.2%
2005
5.5%
54.9%
3.6%2.2% 2.2%
3.7%
26.0%
4.0%
4.2%
51.5%
25.7%
1.5%4.0%
7.4%
4.9%
1.2%2.6%
6.1%
28.4%
1,796.5
1.2%
35.9%
1,080.6
1,356.2
2016
1,067.1 1,037.4
7.4%
2015
1.6%
4.3%
53.6%
3.0%
3.9%
1,132.8
-8.4%
-42.3%
Iron and Steel Textile and Leather
Non-Ferrous Metals
Food Processing, Beverages and Tobacco
Chemicals
Pulp, Paper and Print
Non-Metallic Minerals
Machinery
Mining (excluding fuels) and Quarrying
Non-Specified Industry

National Inventory Report
Third Biennial Update Report
17 Energy
3.2.3 Transport
Participating with 28.1% in 2016, the transport category is the second biggest contributor in the overall Energy sector emissions. Regarding the fuels, gas/diesel oil (road diesel), motor gasoline, liquefied petroleum gases (LPG), aviation gasoline and natural gas are used.
Three subcategories actively contributing to the emissions: Road Transportation, Railways and Domestic Aviation. Road Transportation releases almost all of the emissions 99.7% in 2016, while emissions from Railways are 0.3% and from the Domestic Aviation are close to zero (Figure 18). Unlike the other categories and Energy sector as a whole, the emissions from the Transport show an increasing trend, 165% and 26.6% more emissions in 2016 compare to 1990 and 2014, respectively (Figure 18). An insight in Transport GHG emissions by categories and by gasses are given in Table 8.
Figure 18. GHG emissions in Transport (in Gg CO2-eq)
Table 8. GHG emissions in Transport, by category and by gas (in Gg CO2-eq)
Categories 1990 2000 2005 2014 2015 2016
CO2 CH4 N2O CO2 CH4 N2O CO2 CH4 N2O CO2 CH4 N2O CO2 CH4 N2O CO2 CH4 N2O
Transport 771.5 6.3 14.4 987.1 6.1 14.3 1021.6 7.0 15.0 1624.4 8.3 23.8 1802.8 9.0 26.2 2057.1 9.7 30.0
Civil Aviation (Domestic)
NA NA NA 1.0 0.0 0.0 0.1 0.0 0.0 0.2 0.0 0.0 0.2 0.0 0.0 0.2 0.0 0.0
Road Transportation
749.2 6.2 11.2 971.7 6.1 14.3 1013.1 6.9 14.0 1615.7 8.3 22.9 1796.5 9.0 25.5 2050.4 9.7 29.2
Railways 22.3 0.0 3.2 13.3 0.0 0.0 8.3 0.01 1.0 8.3 0.0 1.0 6.0 0.0 0.7 6.4 0.0 0.7
Note: NA – Not Applicable
3.2.4 Other sectors
In this category fuels such as: lignite, liquefied petroleum gases, motor gasoline, residual fuel oil, wood/wood waste (biomass and wood wastes, wood briquettes and pellets), gas/diesel oil (road diesel, heating and other gasoil) and natural gas are utilized. Two subcategories, Residential and Agriculture/Forestry/Fishing/Fish Farms contribute in the emissions in the Other sector category, which emitted only 2.0% in the overall Energy sector emissions in 2016. For the second subcategory, only emissions from stationary combustion of fuels are estimated. In 2016, 69.2% of the emissions in this category came from the Residential subcategory and the rest (30.8%) from the Agriculture/Forestry/Fishing/Fish Farms. The GHG emissions in 2016 were 76.5% and 5.5% lower than the emissions reported in 1990 and 2014, respectively. The GHG emissions from Other Sectors in absolute terms are listed in Table 9.
In the previous reports (FBUR and SBUR), for the period 1990 – 2005 the category Other Sector also included the emissions under the subcategory Commercial/Institutional, while after 2005 these emissions were reported under the Non-specified subcategory (in accordance with the SSO energy balances). In this report, based on the IEA and SSO energy balances, the activity data for the period 1990 to 2005 are included within the Non-Specified instead of Commercial/Institutional subcategory. This was done in order to be compatible with the subcategories reported in the Energy Balances from the SSO, thus reporting a consistent time series of emissions for the period 1990 – 2016 under this category.
99.6%
2015
1,837.8
791.1
99.7%
99.1%98.6%
3.1%
96.9%
1990 2005
1,006.5 1,043.5
1,656.4
2,096.7
1.3%
2000
99.4%
2014 2016
+26.6%
+165.0%
Domestic Aviation Road Transportation Railways

National Inventory Report
Third Biennial Update Report
18 Energy
Figure 19. GHG emissions in Other Sectors (in Gg CO2-eq)
Table 9. GHG emissions in Other Sectors, by category and by gas (in Gg CO2-eq)
Categories 1990 2000 2005 2014 2015 2016
CO2 CH4 N2O CO2 CH4 N2O CO2 CH4 N2O CO2 CH4 N2O CO2 CH4 N2O CO2 CH4 N2O
Other Sectors 568.6 58.5 10.2 258.9 59.7 9.7 228.2 64.2 10.3 75.6 71.7 11.4 81.7 69.5 11.1 81.7 58.8 9.4
Residential 427.3 58.1 9.8 126.2 59.2 9.4 147.0 63.6 10.1 33.8 70.8 11.3 36.3 68.6 10.9 36.5 58.0 9.2
Agriculture/Forestry
/Fishing/ Fish Farms
141.3 0.5 0.3 132.7 0.5 0.3 81.2 0.6 0.2 41.7 0.8 0.2 45.3 0.9 0.2 45.2 0.8 0.2
Stationary 141.3 0.5 0.3 132.7 0.5 0.3 81.2 0.6 0.2 41.7 0.8 0.2 45.3 0.9 0.2 45.2 0.8 0.2
3.2.5 Non-specified
The last category from the Fuel Combustion Activities is Non-Specified, having a share of 3.0% of the Energy sector GHG emissions in 2016. The following fuels are being combusted: Lignite, Liquefied Petroleum Gases, Residual Fuel Oil, Natural Gas, Wood/Wood Waste (Biomass), Gas/Diesel Oil (Road Diesel and Heating and Other Gasoil). The GHG emissions are depicted in Figure 20.
The category contributes to the overall Energy sector with increasing trend. In 2016 there is an increasing of 25.3% compared to 2014. The pick year is 2005 achieving 417.8 Gg CO2-eq (two times higher compared to 2016. The reason for such huge difference is higher consumption of Lignite, Residual Fuel Oil and Gas/Diesel Oil in 2005, while in 2016 there is more Electricity consumption.
Figure 20. GHG emissions in Non-Specified category (in Gg CO2-eq)
2005
73.1%
2014
71.4%
26.9%
2015
30.8%
2016
28.6%
302.7
72.9%
328.4
69.2%
59.3%
77.7%
22.3%
637.3
1990
149.9158.7 162.2
40.7%
2000
27.1%
-5.5%
-76.5%
Residential Agriculture/Forestry/Fishing/ Fish Farms
1.3 1.225.2
127.7
412.2
174.6206.7 219.1
1990 2005
7.2 4.4
2000
417.8
2016
2.2
2015
25.4
136.1
177.2
209.6222.0
2.2
2014
2.0
+25.3%
+775.2%
CO2 CH4 N2O

National Inventory Report
Third Biennial Update Report
19 Energy
3.2.6 Fugitive emissions from fuels
In Macedonia, fugitive emissions originate from coal mining and handling within surface mines (mining and post-mining seam gas emissions), oil refining and natural gas venting. Direct GHG emissions arising from fugitive emissions from fuels are dominantly CH4 emissions, with lower share of CO2 emissions that were included in this BUR. The fugitive emissions contributed with 1.9% in the overall Energy sector emissions in 2016. Almost all of them came from solid fuels (coal mining) or 142.2 Gg CO2-eq in 2016, i.e. the fugitive emissions from oil and natural gas are below 0.1 Gg CO2-eq (Figure 21). Over the reported period, the fugitive emissions have decreased by 26.4%, while compare to 2014, in 2016 the emission are lower by 20.5%.
Figure 21. Fugitive emissions from fuels by gasses (in Gg CO2-eq)
3.2.7 Memo and Infomation Items: International aviation and Biomass combustion for energy production
The contributions from the International Aviation are almost insignificant. Jet kerosine is used as fuel. The emissions have increased throughout the period 2014-2016 (27.8% more emission in 2016 compare to 2014) (Error! Reference source not found.). According to the IPCC Guidelines, the CO2 emissions that occur as a result of biomass combustion for energy production are reported as information items. These emissions have increased over the period 1990 – 2016 for 10.5%, but starting from 2014 a decreasing trend can be noticed, resulting in 18% lower emissions in 2016 relative to 2014, (Figure 23)
Figure 22. GHG emissions from International aviation (in Gg CO2-eq) – Memo Items
Figure 23. CO2 emissions from biomass burning for energy production (Gg) – Information Item
187.7201.9
185.0173.7
159.1138.1
2015
4.1
5.6
1990
6.1
2005 20162000
193.3
208.0
190.5178.9
2014
5.55.2
142.2
163.94.8 -20.5%
-26.4%
CO2 CH4 N2O
15.8
88.0
20.2
37.141.6
47.5
20051990 2000 20152014
88.8
2016
15.920.3
37.542.0
47.9
+27.8%
+201.1%
CO2 CH4 N2O
824
997 968
1,1101,071
910
201520001990 2005 20162014
-18.0%
+10.5%
CO2

National Inventory Report
Third Biennial Update Report
20 Energy
3.3 Comparison of Reference and Sectoral approach
It is considered a good practice to compare the results of the two approaches in order to assess possible flaws in the evaluation. Therefore, Table 10 summarizes the total apparent consumption and CO2 emissions estimated using the Reference Approach, the energy consumption and CO2 emissions obtained from the Sectoral Approach, as well as the calculated differences.
The total differences in energy consumption and CO2 emissions are smaller than 2% for all reported years. Furthermore, the differences from 2014 up to 2016 are smaller than 0.02%.
Table 10. Comparison of Sectoral and Reference Approach – total consumption and CO2 emissions for all reported years
Reference Approach Sectoral Approach Differences
Year Apparent consumption
(TJ)
CO2 Emissions
(Gg)
Energy Consumption
(TJ)
CO2 Emissions
(Gg)
Energy Consumption
(%)
CO2 Emissions
(%)
1990 97609.8 9187.0 97641.2 9333.6 -0.032 -1.570
2000 98242.2 9347.6 98065.5 9417.5 0.180 -0.742
2005 100191.8 9041.8 98218.3 8924.9 2.009 1.309
2014 85021.4 7728.3 85027.6 7729.1 -0.007 -0.010
2015 82734.6 7396.2 82722.7 7395.8 0.014 0.005
2016 83019.2 7175.6 83009.6 7175.4 0.011 0.003
3.4 Methodology and emission factors
The choice of Tier for each calculation of the GHG emissions from the Energy sector was determined by the accessibility of the corresponding national data. In this inventory report the following Tiers have been used:
• Tier 1: data on the amount of fuel combusted in the source category; default emissions factor
• Tier 2: data on the amount of fuel combusted in the source category; a country-specific emissions factor for the source category and fuel for CO2 emissions
The CO2 emissions from the combustion of lignite, residual fuel oil and natural gas have been calculated using the Tier 2 methodology. Due to lack of data on the carbon content of lignite since 2013 the country-specific emission factor of lignite calculated for 2012 was used to estimate the CO2 emissions in this BUR as well for the years 2014, 2015 and 2016. Because the quality of natural gas is the same during the reported period, the national emission factor calculated in the FBUR is also applied in this report. The country specific emission factor has also been calculated for residual fuel oil, using the same data on carbon content and the NCV as in the previous BURs.
The State Statistical Office issues annual Energy balances with information on fuel consumption both in natural units and kilotons of oil equivalent (ktoe). These data were used to calculate the NCV of each fuel in a certain year. It should be noted that the variations of fuels’ NCV from one sector to another were taken into account in this inventory.
When compared to the FBUR, the Energy balances used for the SBUR and 3rd BUR have provided a more disaggregated data set. Namely, similar fuels, which in the older issues of the Energy balances had been grouped together, are given separately. This indicates a higher resolution approach of the State Statistical Office, but it also indicates that certain fuels have become significant enough to be reported independently.
The concept of disaggregated data set applies also to the biomass and in the Energy balances issued since 2005, it has been reported in the following three categories:
• Biomass
• Wood wastes, Wood briquettes and Pellets
• Wood of fruit trees and other plant residues In order to take advantage of the disaggregation in this National Inventory Report, the category Biomass is reported in 1000 m3 under Wood/Wood Wastes in the IPCC Inventory Software. Additionally, Wood wastes, Wood briquettes and Pellets are reported in Gg. Wood of fruit trees and other plant residues are also reported as Wood/Wood Wastes (in 1000 m3), with different conversion factor (NCV) from the biomass.
In this BUR the activity data for Energy sector are updated in compliance with the revised Energy Balances for period 2005 – 2016 from the SSO (published in October 2016). In continual collaboration with SSO and as a result of the inconsistencies noted by the GHG Energy Inventory team, latest data was obtained and accordingly

National Inventory Report
Third Biennial Update Report
21 Energy
corrected. The revised Energy Balances have new NCV for biomass used as fuelwood which is implemented in this report.
Regarding the fugitive emissions from fuels, specifically surface mines, the average CO2 emission factor (0.44m3 tonne-1) from the 2019 Refinements to the 2006 IPCC Guidelines was taken in account, while for the CH4 the factor remains the same as in the previous BURs.
The emission factors used to estimate the GHG emissions are given in Table 11.
Table 11. Emission factors used for Energy sector
Emission factor FBUR SBUR 3rd BUR Comment
Energy Industries Manufacturing Industries and Construction Other Sectors Non-Specified
CS, DF CS, DF CS, DF CS same as NIR-FBUR2, NIR-SBUR3 DF from 2006 IPCC Guidelines
Transport DF DF DF DF from 2006 IPCC Guidelines
Fugitive emissions from fuels DF DF DF
DF from 2019 Refinements to the 2006 IPCC Guidelines
Note: DF=Default Factor, CS= Country Specific
3.5 Data sources
The main data sources for the Energy sector are the Energy balances from the State Statistical Office as the most relevant institution for gathering accurate information and the Energy Balances and Statistics from the International Energy Agency (IEA) as a secondary data source. (Table 12)
Table 12. Data sources for Energy sector
Documents Data provider
Energy sector
• MAKSTAT database 2005-2016
• Energy balances, Revised data 2005-2016
• Energy Balances, Final data 1998
• Energy Balances, Final data 1999
• Energy Balances, Final data 2000
• Energy Balances, Final data 2001
• Energy Balances, Final data 2002
• IEA Energy Balances and Statistics (1990-1997;2003,2004)
SSO IEA
2Available at: http://unfccc.org.mk/content/FBUR/National%20Inventory%20Report%20FBUR.pdf 3Available at:
http://unfccc.org.mk/content/Documents/SBUR/3%20Macedonian%20SBUR%20National%20Inventory%20Report.pdf

National Inventory Report
Third Biennial Update Report
22 Industrial processes and product use
4 Industrial processes and product use
The industrial production in Macedonia has slowed down after the economic transition period in the ‘90s. Many industrial plants in the country have either lowered the volume of manufacturing or entirely shut down. However, several industries that continued their production have become the largest contributors of GHG emissions in the Industrial processes and product use (IPPU) sector. Most of the GHG emissions come from the metal industry (from steel and ferroalloys production) and the mineral industry (from production of cement production).
The rest of the greenhouse emissions in the country come from usage of substitutes for ozone-depleting substances (ODS) for refrigeration and air-conditioning. All of the ODS alternatives are imported in the country, either pure or as a blend.
4.1 Emission trends
Over the reported period, the emissions from this sector had slightly changed, with generally decreasing trend, however the participation of different categories had significantly changed. In the 2016, the overall emissions from IPPU sector achieved 858 Gg CO2-eq, which represent a decrease of 8% relative to 1990, or a decrease of 3.2% compared to 2014 (Figure 24).
Until 2000, the metal industry was prevailing source of the emissions, mostly from the ferroalloy production. After 2000, when ODS substitutes usage in the country have started to increase, the share of the GHG emissions from the Metal industry have decreased considerably (from 64% in 1990 to 19% in 2016), while the emissions from the Mineral industry have been fluctuating over the inventory period. In the last three reporting years the product uses as substitutes for ODS had grown for around 50%, resulting with share of almost 37% of the IPPU emissions in 2016. However, the dominant share in 2016 had the Mineral industry with 44%, while the share of the Metal industry was reduced to 19%. Emissions from the other categories, like Chemical industry, Non-Energy Products from Fuels and Solvent Use, Electronics Industry and Other Product Manufacture and Use do not occur in the country (Table 13). In the previous BURs, emissions were reported in the Chemical industry, from Soda Ash production, but during the preparation of this report, all publications from the State Statistical office for the Industry sector were carefully scrutinized and it was concluded that there is only consumption of soda ash in the country (in the industry for production of basic chemical products and in the industry for processing of chemical products). Therefore, the data previously reported under Soda ash production, were now reported as Other Uses of Soda Ash, under subcategory Other Process Uses of Carbonates category in Mineral Industry.
Figure 24. GHG emissions from the IPPU sector, (in Gg CO2-eq)
58.7%
0.5%
2000 2005
32.0%
44.7%
23.3%
2014
35.0%
27.7%
888.4
44.2%
19.0%
36.8%
2016
790.5
42.7%
2015
35.7%
45.4%
37.2%
64.3%
861.7886.2
858.0
932.2
11.9%
1990
40.7%
-3.2%
-8.0%
Chemical Industry
Mineral Industry Metal Industry
Product Uses as Substitutes for ODS
886.2
23.3%
2014 20161990
790.5
2015
36.8%
932.2
9.8%
861.7 858.0
90.0%76.5%
888.4
63.1%
87.8%92.3%
27.7%
72.1%
7.1%
2000
11.9%
2005
-3.2%
-8.0%
CO2 N2OCH4 HFCs PFCs SF6

National Inventory Report
Third Biennial Update Report
23 Industrial processes and product use
Table 13. GHG emissions from the IPPU sector, by category (in Gg CO2-eq)
Categories 1990 2000 2005 2014 2015 2016
Industrial Processes and Product Use 932.2 888.4 758.5 886.2 790.5 858.0
Mineral Industry 333.1 361.8 368.1 283.2 294.4 379.4
Cement production 293.8 348.8 355.3 275.7 288.6 372.9
Lime production 33.7 11.2 11.1 6.4 4.7 5.4
Glass Production 0.3 0.0 0.0 0.0 0.0 0.0
Other Process Uses of Carbonates 5.3 1.9 1.6 1.1 1.1 1.0
Ceramics 2.6 0.4 0.3 0.0 0.0 0.0
Other Uses of Soda Ash 2.7 1.4 1.3 1.1 1.0 1.0
Other 0.0 0.0 0.0 0.0 0.0 0.0
Chemical Industry NO
Metal Industry 599.1 521.8 390.8 396.4 277.0 162.9
Iron and Steel Production 24.7 15.2 58.2 17.0 11.0 15.3
Ferroalloys Production 265.6 196.4 332.2 379.4 264.6 145.3
Aluminium production 100.4 68.9 0.4 NO NO NO
Lead Production 22.1 23.0 NO NO 1.4 2.3
Zinc Production 186.2 218.4 NO NO NO NO
Non-Energy Products from Fuels and Solvent Use NA, NO
Electronics Industry NA, NO
Product Uses as Substitutes for ODS 0.0 4.8 102.8 206.6 219.1 315.7
Refrigeration and Air Conditioning 0.0 4.8 102.8 206.6 219.1 315.7
Refrigeration and Stationary Air Conditioning 0.0 4.8 102.8 206.6 219.1 315.7
Mobile Air Conditioning* IE
Foam Blowing Agents
NA, NE
Fire Protection
Aerosols
Solvents
Other Applications
Other Product Manufacture and Use
Other
Note: *Emissions from Refrigeration and Air Conditioning are calculated based on imported substitute of ODS and all are reported under Stationary Air Conditioning
NO - Not occurring, NA – Not Applicable, NE – Not Estimated, IE – Included Elsewhere
In 2016, the CO2 emissions accounted for 63.1% of the overall greenhouse emissions from IPPU. The HFCs were second highest contributor and accounted for 36.8% of the total emissions. CH4 emissions were negligible and accounted only for 0.1% of the greenhouse emissions from this sector. The emission of SF6 were not estimated due to unavailability of activity data. The emissions segregated by gas are presented in Table 15 and Table 16.
Table 14. CO2, CH4 and NOx emissions from the IPPU sector, by category (in Gg CO2-eq)
Categories 1990 2000 2005 2014 2015 2016
CO2 CH4 N2O CO2 CH4 N2O CO2 CH4 N2O CO2 CH4 N2O CO2 CH4 N2O CO2 CH4 N2O
Industrial Processes and Product Use
839.3 1.3 0.0 819.8 1.0 0.0 756.7 1.8 0.0 677.8 1.8 0.0 570.3 1.2 0.0 541.7 0.6 0.0
Mineral Industry 333.1 NO NO 361.8 NO NO 368.1 NO NO 283.2 NO NO 294.4 NO NO 379.4 NO NO
Chemical Industry NO, NA
Metal Industry 506.2 1.3 NO 457.9 1.0 NO 388.7 1.8 NO 394.6 1.8 NO 275.9 1.2 NO 162.3 0.6 NO
Non-Energy Products from Fuels and Solvent Use
NO, NA
NA NO, NA
NA NO, NA
NA NO, NA
NA NO, NA
NA NO, NA
NA
Electronics Industry NA
Product Uses as Substitutes for ODS
NA
Other Product Manufacture and Use
NA
Other NA
NO - Not occurring, NA – Not Applicable, NE – Not Estimated

National Inventory Report
Third Biennial Update Report
24 Industrial processes and product use
Table 15. HFCs, PFCs and SF6 emissions from the IPPU sector, by category (in Gg CO2-eq)
Categories 1990 2000 2005 2014 2015 2016
HFCs PFCs SF6 HFCs PFCs SF6 HFCs PFCs SF6 HFCs PFCs SF6 HFCs PFCs SF6 HFCs PFCs SF6
Industrial Processes and Product Use
NO 91.7 NO 4.8 62.9 NO 102.8 0.3 NO 206.6 NO NO 219.1 NO NO 315.7 NO NO
Mineral Industry
NA Chemical Industry
Metal Industry
NO 91.7 NO 4.8 62.9 NO 102.8 0.3 NO 206.6 NO NO 219.1 NO NO 315.7 NO NO
Non-Energy Products from Fuels and Solvent Use
NA
Electronics Industry
NA, NO NE, NA
NA, NO NE, NA
NA, NO NE, NA
NA, NO NE, NA
NA, NO NE, NA
NA, NO NE, NA
Product Uses as Substitutes for ODS
NO NO NO 4.8 NO NO 102.8 NO NO 206.6 NO NO 219.1 NO NO 315.7 NO NO
Other Product Manufacture and Use
NA NO, NA NA NO, NA NA NO, NA NA NO, NA NA NO, NA NA NO, NA
Other NA
NO - Not occurring, NA – Not Applicable, NE – Not Estimated
4.2 Mineral industry
4.2.1 Cement production
There is only one cement production factory in the country. Marlstone is used as basic mineral raw material and is obtained from the open-cast mine, located within the factory. Marlstone, as a non-metallic mineral raw material, is a basic component in the production of clinker, i.e., cement. The emissions from the cement production were influenced by the volume of industrial activity and their fluctuation were observed over the inventory period. However, an increasing trend can be seen in the last three years, resulting with 35% higher emissions in 2016 relative to 2014.
In this BUR, some improvements have been made of the activity data for the cement production. Specifically, by taking into account the clinker production and the specific emission of CO2 (per ton clinker) reported in annual reports from the factory “Titan-Usje”, the clinker fraction in cement was calculated for each year in the period 2007 – 2016, and for the previous years (1990 – 2006) the average value of these fractions was used., Also, the annual report for Industry from the SSO were used as a data source for the cement production.
4.2.2 Lime production
According to the SSO’s reports for Industry sector, the lime production in the country include production of quicklime, hydraulic lime and slacked lime, with variation in their production between the years (not all of them are produced in all years). In 2010, 2011 and 2012, there is no evident lime production in the country, and from 2012 until 2016 only production of hydraulic lime is reported.
The emissions from lime production are influenced by the volume of industrial activity and are following generally decreasing trend over the inventory period. Thus, in 2016 the emission are 84% lower compared to 1990, and 14% lower compared to 2014.
4.2.3 Glass production
The glass production in the country is noticeable before 2000, but after that there is no substantial production, although in 2016 a slight increase can be seen. As a result, the overall emissions from this category from 0.33 Gg CO2-eq in 1990 were reduced to 0.05 CO2-eq in 2016.

National Inventory Report
Third Biennial Update Report
25 Industrial processes and product use
4.2.4 Other process uses of carbonates
The other process uses of carbonates in the mineral industry in the country include ceramics production and soda ash use in the chemical industry. The data for different types of clay used in the industry for processing of other non-metallic minerals from the SSO reports, available only until 1998, is used as activity data for ceramic production. To calculate the mass of carbon consumed, a default carbonate content of 10% was used. Since there was evident production of ceramic products (such as bricks and roof tiles, refractory products, expanded clay products, wall and floor tiles, table and ornamental ware, sanitary ware etc.) in the country after 1998, the data for ceramic products were multiplied by a factor of 1.2 in order to continue the trend line for the clay. The factor was calculated as an average of the ratio between the data for clay used in processing industries and the ceramics products produced in the period 1990 – 1998. According to the SSO reports, soda ash is used in the industry for production of basic chemical products and in the industry for processing of chemical products, but data are only available until 1998. The trend of these data was used to extrapolate the series for until 2016.
Therefore, the estimated emissions from other process uses of carbonates followed the decreasing trend of both, ceramic product and soda ash uses.
4.3 Metal industry
4.3.1 Iron and steel production
Steel production in Macedonia mainly relies on electricity. The economic activity in this area covers steel and hot rolled plate production. The basic raw material in the technological process of steel production is scrap iron. Iron ore is not used. The production process takes place in two plants: the production of steel in slabs takes place at the Steel Mill while the production of hot rolled plates takes place at the Rolling Mill for thick plates. The production process of the Steel Mill involves the preparation and processing of scrap iron which is melted in an electric arc furnace, thus producing liquid steel. This liquid steel is then further processed in a ladle furnace (which is an electric furnace) and afterwards continuously cast into slabs. The process in the Rolling Mill for thick plates includes the heating of slabs in pre-heating furnace and the hot rolling of slabs in rolling mills. In the process of the production of slabs, apart from scrap iron as the main input raw material, other materials are used which act as reducing agents, melting agents and electrodes for the electric furnaces (anthracite, coke, lime, dolomite, electrode mass). To calculate the emissions form this category, the data for production of steel middling, steel fragments and slabs were taken into consideration from the SSO reports for Industry, which represent only the steel making process. The MOEPP has started to use Tier 2 approach for calculation of air pollutants from Iron and Steel Industry (for the separate processes) and during the preparation of this report only the data for 2016 and 2017 were available. Once MOEPP will have a consistent series of calculation for each of the Iron and steel processes from 1990 onward, the same activity data should be taken into consideration in the development of the future GHG inventories.
The trend of the CO2 emissions from steel production had significant variations. The fluctuations can be partially described as consequences of financial crises that have occurred in the country and in the region, and for some years even globally. In 2012, the industrial installations in the country were obliged to buy electricity at the open market, therefore their production become highly dependent on the market price of the electricity, which had also reflection on the emissions from this industry. As a result, the emissions in 2016 from this industry were 38% lower compared to 1990, and 10% lower relative to 2014.
4.3.2 Ferroalloys production
In Macedonia, electricity is mainly used for the production of ferro-alloy. In the electric furnaces, heating is realized by passing current through graphite electrodes suspended in a cup-shaped, refractory-lined steel shell. Carbon reduction of the metallic oxides occurs as both coke and graphite electrodes are consumed. This process results in both CO2 and CH4 emissions.
The trend of the GHG emissions from ferroalloy production is fluctuating over the observed period, mainly as a result of the financial crises (locally and globally). In 2016, the GHG emissions amount have decreased for 45% from 1990 level, and for 62% compared to 2014.

National Inventory Report
Third Biennial Update Report
26 Industrial processes and product use
4.3.3 Aluminum production
In Macedonia, there was the largest industrial plant that had a complete process for the production of aluminium alloys, profiles, pipes and structures that was closed. As a result the aluminium production in the country was drastically reduced, and realized by several small production facilities. From 2014 there is no evident production of aluminium. The GHG emissions from this category have significantly reduced after 2003, at level below 1 Gg CO2-eq.
4.3.4 Lead production
Lead production in Macedonia was realized until 2003 in a lead and zinc smelter that used to produce under IST (Imperial Smelt Technology). In 2015 and 2016, the SSO had reported production of crude lead in the country. As the industrial plant has started with operations in 2015, GHG emissions from this category have occurred again in the country, even though at low level, or 1.4 Gg CO2-eq in 2015 and 2.3 Gg CO2-eq in 2016.
4.3.5 Zinc production
The zinc production in Macedonia was performed until 2003 with pyrometallurgical process using Imperial Smelt Technology (IST), which allows for the simultaneous treatment of lead and zinc concentrates. The process results in the simultaneous production of lead and zinc and the release of non-energy CO2 emissions. The GHG emissions from this category occurred until 2003.
4.4 Product uses as substitutes of ozone depleting substances
Hydrofluorocarbons (HFCs) and, to a very limited extent, perfluorocarbons (PFCs), are serving as alternatives to ozone depleting substances (ODS) being phased out under the Montreal Protocol. HFCs and PFCs are not controlled by the Montreal Protocol because they do not contribute to depletion of the stratospheric ozone layer. In Macedonia these gasses are mainly used for refrigeration and air conditioning. The HFCs and their blends are controlled by the Ministry of Environment and Physical Planning since 2000. Data for the period from 2000-2010 are based on issued import permits. Data from 2011-2014 is actual import taken from the EXIM system. All importers since 2011 should apply on-line through the www.exim.gov.mk system to obtain a valid import permit. The EXIM procedure applies for all refrigerants and it is very simple to monitor the real import. The data for 2015 and 2016 were provided by the Ozone Unit of the MOEPP.
In this BUR a correction was made in the F-gases data used as input in the IPCC Software. Namely, for the Assumed lifetime of the equipment, the recommended value of 15 years was entered (according to the IPCC Guidelines), and for the Emission Factor from installed base the value of 15 % was used.
The HFC emissions from this sector followed an increasing trend in the reported years, reaching 317 CO2-eq in 2016, or 53% more compared to 2014.
4.5 Methodology and emission factors
The estimation of the greenhouse gases from all the categories in the IPPU sector was done in accordance to the 2006 IPCC guidelines (Tier 1, Tier 2) and with the usage of the IPCC Inventory Software.
Emission factors and other parameters with background documentation or technical references were derived from the IPCC Emission Factor Database (EFDB), which contains the IPCC default data and the 2006 IPCC Guidelines. The emission factors were compared to those used in the previous biennial report and national communications and are presented in the Table 16. Furthermore, country-specific emission factors were calculated for the subcategories of Cement Production, Steel Production and Ferro-alloy Production. These emission factors are given in the publication entitled ‘National CO2 and non-CO2 emission factors for key sectors under IPCC and CORINAIR methodologies’4.
4 Available at: http://www.unfccc.org.mk/content/Documents/INVENTORY/EFs%20EN.pdf

National Inventory Report
Third Biennial Update Report
27 Industrial processes and product use
Table 16. Emission factors used for IPPU sector
Emission factor FBUR, SBUR, 3rd BUR Comment
Industrial Processes and Product Use CS, DF
Mineral Industry CS, DF
Cement production CS National CO2 and non-CO2 emission factors for key sectors under IPCC and CORINAIR methodologies
Lime production DF DF from 2006 IPCC guidelines
Glass Production DF DF from 2006 IPCC guidelines
Other Process Uses of Carbonates
DF DF from 2006 IPCC guidelines
Ceramics DF DF from 2006 IPCC guidelines
Other Uses of Soda Ash DF DF from 2006 IPCC guidelines
Metal Industry CS, DF
Iron and Steel Production CS National CO2 and non-CO2 emission factors for key sectors under IPCC and CORINAIR methodologies
Ferroalloys Production CS National CO2 and non-CO2 emission factors for key sectors under IPCC and CORINAIR methodologies
Aluminium production DF DF from 2006 IPCC guidelines
Lead Production DF DF from 2006 IPCC guidelines
Zinc Production DF DF from 2006 IPCC guidelines
Product Uses as Substitutes for Ozone Depleting Substances
DF
Refrigeration and Air Conditioning DF DF from 2006 IPCC guidelines
Refrigeration and Stationary Air Conditioning
DF DF from 2006 IPCC guidelines
DF=Default, CS= Country Specific
4.6 Data sources
The data for preparation of the greenhouse gases inventory for the IPPU sector was generally collected from three main sources: the State Statistical Office, the Ministry of Environment and Physical Planning or directly from the industrial plants (Table 17).
Table 17. Data sources for IPPU sector
Documents Data provider
Mineral Industry
Cement production SSO, Industrial production 1989 – 1992, 1993 – 1998, 1996 – 2000 SSO, Industry 2002 SSO, Industry 1999 – 2003 SSO, Industry 2000 – 2005 SSO, Industry 2002 – 2007 SSO, Makstat database 2007 -2015
Usje-Titan – Annual reports; SSO
Lime production SSO
Glass Production SSO
Other Process Uses of Carbonates
SSO
Ceramics SSO
Other Uses of Soda Ash SSO
Other SSO
Metal Industry
Iron and Steel Production SSO, Industrial production 1989 – 1992, 1993 – 1998, 1996 – 2000 SSO, Industry 2002 SSO, Industry 1999 – 2003 SSO, Industry 2000 – 2005 SSO, Industry 2002 – 2007 SSO, Makstat database 2007 -2015
SSO
Ferroalloys Production
Aluminium production
Lead Production
Zinc Production
Product Uses as Substitutes for Ozone Depleting Substances
Refrigeration and Air Conditioning
HCFC Management Phase out Plan- Report Ozone Unit – MOEPP (data for 2015 ad 2016)
MOEPP Refrigeration and Stationary Air Conditioning

National Inventory Report
Third Biennial Update Report
28 Agriculture, forestry and other land use
5 Agriculture, forestry and other land use
Agriculture, Forestry, and Other Land Use (AFOLU) is unique among the sectors considering the numerous processes leading to emissions and removals of greenhouse gases, which can be widely dispersed in space and highly variable in time. The AFOLU Sector has some unique characteristics with respect to developing inventory methods. The factors governing emissions and removals can be both natural and anthropogenic (direct and indirect) and it can be difficult to clearly distinguish between causal factors. For the AFOLU Sector, anthropogenic greenhouse gas emissions and removals by sinks are defined as all those occurring on ‘managed land’. Managed land is land where human interventions and practices have been applied to perform production, ecological or social functions.
The AFOLU sector is covering activates in Livestock production; Land use in particular Forestland, Cropland, Grassland, Wetland, Settlements and other land; Aggregate sources and non-CO2 emissions sources on land; and Other.
Forests and forestland in Macedonia cover around 1.1 mil. ha and are characterized with great species diversity, but low quality and small annual growth. More than 70% of the forests are coppice, 90% are deciduous and almost 90% are state owned. The most dominant species is Beech, and then various oak species. Total wood reserve is estimated on around 70 mil m3, and total annual growth is around 1,7 mil m3. Very large part of the land considered as forest, are Mediterranean type of forest, characterized with small trees and bushes.
5.1 Emission trends
Livestock sector as a one of the main sources of GHG with a total emission of CO2-eq varying in a range of 1,108.11 Gg in 1990, to only 792.68 Gg in 2014 (Figure 25 and Table 18). Cattle are the main source of GHG among the ruminants. The majority of methane emission arouses from enteric fermentation while manure management contribute with only 18% of the total CH4 emissions.
Forestry sector is the major contributor of GHG sinks in Macedonia within the Land subsector of AFOLU, with exception of several years when the amount of forest fires (burned areas) were significantly above the annual average. The area of forestland, the species composition (conifers, broadleaved, mixed), as well as the annual increment and removals from the forests are relatively stable. The estimated GHG sinks in this sector for 2015 is estimated on 1,608.31 and in 2016 2,120.65 Gg CO2 eq.
The other land use like Cropland, Grassland, Settlements and Other land, participate in the emission of CO2,
and in some years can be considered as a significant source of emissions of this GHG. This emission is mainly result to the conversion of one to another category of land use, when significant amounts of above and below ground biomass is rapidly removed and is considered as a direct loss. For the other areas, which remains under same category of land use, gains and losses, are in balance (Tier 1) and are considered as carbon neutral.
For the non-CO2 sources of GHG, it can be concluded that there are a numerous management practices and inputs resulting in significant amount of GHG emissions, which total emission when summed up, differ in a small ranges of 313.11 Gg CO2-eq in year 2000 up to 382.27 Gg CO2-eq, in 1990. As a major source of non-CO2 emissions are managed soils, which contribute with 55.4% in 1990, out of the total emissions in this subsector, up to the 62.4 % in 2016.
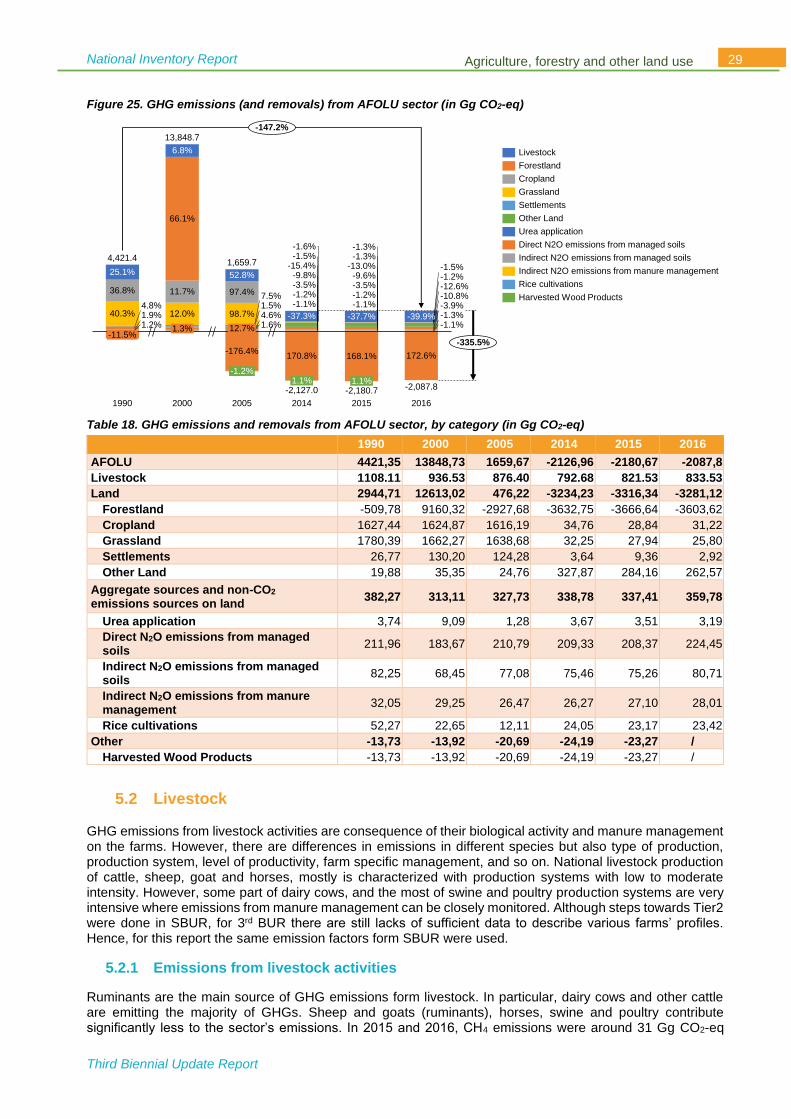
National Inventory Report
Third Biennial Update Report
29 Agriculture, forestry and other land use
Figure 25. GHG emissions (and removals) from AFOLU sector (in Gg CO2-eq)
Table 18. GHG emissions and removals from AFOLU sector, by category (in Gg CO2-eq)
1990 2000 2005 2014 2015 2016
AFOLU 4421,35 13848,73 1659,67 -2126,96 -2180,67 -2087,8
Livestock 1108.11 936.53 876.40 792.68 821.53 833.53
Land 2944,71 12613,02 476,22 -3234,23 -3316,34 -3281,12
Forestland -509,78 9160,32 -2927,68 -3632,75 -3666,64 -3603,62
Cropland 1627,44 1624,87 1616,19 34,76 28,84 31,22
Grassland 1780,39 1662,27 1638,68 32,25 27,94 25,80
Settlements 26,77 130,20 124,28 3,64 9,36 2,92
Other Land 19,88 35,35 24,76 327,87 284,16 262,57
Aggregate sources and non-CO2 emissions sources on land
382,27 313,11 327,73 338,78 337,41 359,78
Urea application 3,74 9,09 1,28 3,67 3,51 3,19
Direct N2O emissions from managed soils
211,96 183,67 210,79 209,33 208,37 224,45
Indirect N2O emissions from managed soils
82,25 68,45 77,08 75,46 75,26 80,71
Indirect N2O emissions from manure management
32,05 29,25 26,47 26,27 27,10 28,01
Rice cultivations 52,27 22,65 12,11 24,05 23,17 23,42
Other -13,73 -13,92 -20,69 -24,19 -23,27 /
Harvested Wood Products -13,73 -13,92 -20,69 -24,19 -23,27 /
5.2 Livestock
GHG emissions from livestock activities are consequence of their biological activity and manure management on the farms. However, there are differences in emissions in different species but also type of production, production system, level of productivity, farm specific management, and so on. National livestock production of cattle, sheep, goat and horses, mostly is characterized with production systems with low to moderate intensity. However, some part of dairy cows, and the most of swine and poultry production systems are very intensive where emissions from manure management can be closely monitored. Although steps towards Tier2 were done in SBUR, for 3rd BUR there are still lacks of sufficient data to describe various farms’ profiles. Hence, for this report the same emission factors form SBUR were used.
5.2.1 Emissions from livestock activities
Ruminants are the main source of GHG emissions form livestock. In particular, dairy cows and other cattle are emitting the majority of GHGs. Sheep and goats (ruminants), horses, swine and poultry contribute significantly less to the sector’s emissions. In 2015 and 2016, CH4 emissions were around 31 Gg CO2-eq
2005
170.8%
-1.6%
1.9%
-3.5%
1.1%
13,848.7
-11.5%
-1.5%
4.8%
-37.7%
25.1%-15.4%
36.8%
168.1%
-13.0%
-1.3%
4.6%
-9.6%
7.5%
2014
-3.5%
40.3%
-1.2%
-1.2%
1.2%
1990
-1.1%
1.1%
2015
-39.9%
6.8%
-1.5%
2016
66.1%
-12.6%-1.2% -10.8%
-3.9%
11.7%
-1.3%
-1.3%
-1.1%
12.0%
-176.4%
1.3%
2000
-9.8%
-37.3%
4,421.41,659.7
-2,127.0 -2,087.8
52.8%
97.4%
-2,180.7
98.7%1.5%
12.7%
172.6%
-1.1%
1.6%
-1.2%
-335.5%
-147.2%
Livestock
Indirect N2O emissions from manure management
Forestland
Cropland
Settlements
Grassland
Harvested Wood Products
Other Land
Urea application
Direct N2O emissions from managed soils
Indirect N2O emissions from managed soils
Rice cultivations

National Inventory Report
Third Biennial Update Report
30 Agriculture, forestry and other land use
(Figure 26). Mainly CH4 emissions are from enteric formation (82%), while manure management is contributing with 18%. The most CH4 is produced by enteric fermentation and manure management in cattle (21 Gg CO2-eq - enteric and 4 Gg CO2-eq manure) accounting for 80% of total methane emission form livestock. Enteric fermentation from all other species (sheep, goat, horses and swine) contributed about 15% in total CH4
emission in the sector. The manure management in all those species contributes for only 5% to CH4 emission from manure management.
N2O emissions were solely due to manure management. The emissions in 2015-16 were 0.14 Gg CO2-eq (Figure 27). The main emitters were again cattle manure with 78%, followed by sheep and swine manure contributing each with 7%. Similarly, to CH4 emissions, dairy cows were the largest contributor with 57% of annual N2O emissions generated in livestock sector.
In the assessment, emissions of CH4 and N2O were transferred into CO2 equivalents (Table 19).The CH4 emissions were 781.03 CO2-eq and 792.17 Gg CO2-eq in 2015 and 2016. The emissions of N2O over the years are rather stable around 41 Gg CO2-eq. The total emissions due to livestock activity in 2015 were 821.53 Gg CO2-eq, while in 2016, 833.53 Gg CO2-eq. This increase of about 4-5% compared to 2014 (792.68 Gg CO2-eq) is due to increase in number of heads in cattle (for about 5%) and swine (for 34%) but decrease in sheep, horses and poultry.
Figure 26. Emissions of CH4 (in Gg CO2-eq) from Enteric Fermentation and Manure Management
Figure 27. Emissions of N2O (in Gg CO2-eq) from Enteric Fermentation and Manure Management
9.6%
2.4%
1.4%
2005
3.4%
2000
46.5%
15.8%
18.6%
9.4%
2.8%
1.2%
51.0%
16.6%
42.4
49.7%
12.3%
7.8%
2.9%
2.6%3.5%
1990
2.8%
2014
18.0%
11.8%
1.1%
50.2%
10.0%10.3%2.8%
2015
17.2%
38.9%
16.6%
1.1%
10.1%
2.7%
1.6%
2016
27.1%
35.7
33.4
30.231.2 31.7
2.1%
2.5%2.5%
11.4%
47.6%
2.5%
15.1%
4.1%
1.4%
17.5%
4.3%
+5.1%
-25.1%
Dairy Cows (Enteric Fermentation )
Goats * (Enteric Fermentation )
Sheep (Enteric Fermentation )
Other Cattle (Enteric Fermentation )
Horses (Enteric Fermentation )
Swine (Enteric Fermentation )
Horses (Manure Management )
Goats * (Manure Management )
Dairy Cows (Manure Management)
Other Cattle (Manure Management )
Sheep (Manure Management )
Swine (Manure Management )
Poultry (Manure Management )
53.8%
23.1%
2005
15.4%
7.7%
58.3%
25.0%
8.3%
0.14
2016
8.3%
0.12
0.13
2014
58.3%
7.7%
25.0%
57.1%
8.3%
2015
61.5%
23.1%
50.0%
6.3%
25.0%
7.7%
18.8%
21.4%
1990
14.3%
0.16
0.13
0.12
8.3%
7.1%
2000
+8.3%
-18.8%
Dairy Cows (Manure Management)
Horses (Manure Management )
Goats * (Manure Management )
Other Cattle (Manure Management )
Sheep (Manure Management )
Swine (Manure Management )
Poultry (Manure Management )

National Inventory Report
Third Biennial Update Report
31 Agriculture, forestry and other land use
Table 19 Emissions of CH4 and N2O (in Gg) due to activities in livestock production
Categories CH4 N2O
1990 2000 2005 2014 2015 2016 1990 2000 2005 2014 2015 2016
Enteric
Fermentation 36.33 29.88 28.23 25.01 25.77 26.06 0.00 0.00 0.00 0.00 0.00 0.00
Cattle 23.47 22.41 20.83 20.39 21.12 21.36
NA
Dairy Cows 16.46 17.00 15.54 15.39 15.51 15.90
Other Cattle 7.01 5.41 5.29 5.00 5.61 5.46
Sheep 11.49 6.25 6.22 3.70 3.67 3.62
Goats * IE IE 0.31 0.41 0.44 0.51
Horses 1.19 1.02 0.71 0.35 0.34 0.35
Swine 0.18 0.20 0.16 0.17 0.20 0.23
Manure
Management 6.03 5.85 5.21 5.14 5.48 5.62 0.16 0.14 0.14 0.13 0.14 0.14
Cattle 4.39 4.27 3.96 3.88 4.00 4.06 0.12 0.11 0.10 0.10 0.11 0.11
Dairy Cows 3.32 3.43 3.14 3.11 3.13 3.21 0.08 0.08 0.07 0.07 0.07 0.08
Other Cattle 1.07 0.84 0.82 0.78 0.87 0.85 0.04 0.03 0.03 0.03 0.03 0.03
Sheep 0.34 0.19 0.19 0.11 0.11 0.11 0.03 0.02 0.02 0.01 0.01 0.01
Goats * IE0 IE 0.01 0.01 0.01 0.02 0.00 0.00 0.00 0.00 0.00 0.00
Horses 0.11 0.09 0.07 0.03 0.03 0.03 0.00 0.00 0.00 0.00 0.00 0.00
Swine 1.07 1.22 0.93 1.06 1.28 1.37 0.01 0.01 0.01 0.01 0.01 0.01
Poultry 0.11 0.07 0.05 0.04 0.03 0.04 0.00 0.00 0.00 0.00 0.00 0.00
Total emissions 42.36 35.74 33.44 30.15 31.24 31.69 0.16 0.14 0.14 0.13 0.14 0.14
Total emissions
(Gg CO2-eq.) 1059.06 893.43 835.98 753.74 781.03 792.17 49.05 43.09 40.42 38.95 40.50 41.36
Note: * Until 2006 the goats are included in the sheep category, IE-Included Elsewhere, NA- Not Applicable
5.3 Land
The category Land contents Forest land, Cropland, Grassland, Settlements and Other land. Nevertheless, some of the categories are significant contributor to GHG emissions, but other like Forest land can be major CO2 sink. For this report need, they were deeply analyzed separately.
5.3.1 Forest land
In this report, the revision of the data from the SBUR report for the forestry sector was made in several levels explained in more details in the following sub-chapters.
5.3.1.1 Total Forest Area
Data for the total forest area were found in the Statistical Yearbooks, from the State Statistical office, Forestry management plans (PE “Makedonski sumi”, other subjects that manage forests, Ministry of Agriculture, forestry and water economy) and Faculty of Forestry (different experts). All those different data were compared between themselves, and they all differ due to their different update year. It is not possible to find difference in this sector on annual level because there is no legal obligation to evident them. Most of the data are collected on 10 year cycle, there is no forest inventory done, and there are really rear data that can be used with modern technology (satellite images) and prompt evidence of the changes. Analyzing the previous series (1990 – 2014) it was found that the forestry area differs in the data of different subject. This is due to the different needs of different subject. For 2010-2016, extended data for forestry land in the State statistical office reports were found. These data were compared with the data from Forestry sector (MAFWE, PE “Makedonski sumi” and other subjects managing other forests) and found out that it slightly differs from satellite images from CORINE land cover (CLC). For the period 2000-2016, State statistical office has not collected data the same way, so there is a lack of such data.
5.3.1.2 Areas by different tree species
The data for tree species composition in the forests was used from State Statistical office, compared with the data from the Forestry management plans from MAFWE, PE “Makedonski sumi” and other subjects that

National Inventory Report
Third Biennial Update Report
32 Agriculture, forestry and other land use
manage the forests. There were significant differences in data, so they were changed from the previous report, from 2000 to 2016.
In the previous reports, the data for those categories of forestland were not taken into consideration. In this report we established new categories in the IPCC software, established their area, growing stock, and used different emission and sink factors from other forest categories. Since data for those categories before 2010 could not be found, the series is only for the last 6 years.
5.3.1.3 Growing stock
Revising the previous reports, it was noticed that used growing stock factors are not compatible with the national ones i.e. they are too high to implement for the country. The growing stock factors were therefore changed for conifer, broadleaved and mixed categories of forests, as well as for the two new categories established in this report, using data from actual Forestry management plans, provided by the experts from UKIM Faculty of Forestry, Department of Forest growth and yield.
5.3.1.4 Land use changes from and to forestry
Since there are no data on annual level for changes in land use, CLC images were used for 2000, 2006, 2012 and 2018. The changes that were acknowledged for 6-year period were interpolated on annual bases and evidenced in the actual land use changes reports. This was continuation of the first try to actually use modern technologies in this sector, initially introduced in the SBUR.
5.3.1.5 Forest for commercial use and firewood
Analyzing previous report, it was noticed that in the worksheet, extraction of firewood was twice counted in
tables Loss of carbon from wood removals and Loss of carbon from fuelwood removals. This was revised,
and the series has been updated.
5.3.1.6 Burned forest area
The data for the category Loss of carbon from disturbances was updated with combined data from the State statistical office, subjects that manage forests, MAFWE and Centre for crisis management. It was found that there are big alterations in some years between the different sources, therefore expert judgment has been used to select the most appropriate ones.
5.3.1.7 Emission trends
Emissions in Macedonia from forestry sector are product of firewood consumption as well as the forest fires. The most constant producer of CO2 emission are households that use firewood for heating. Forest fires are the second emitter of CO2, but they are not constant, and their contribution varies greatly from year to year, depending on their number, and the area that they cover, as well as the species composition in burned areas. There are several years (2000, 2007, and 2012) where due to the big burned area, forestry sector instead of removing, contributed into increase of the GHG emissions in the country.
Methodology used for estimation of the emission is Tier1, since there are no accurate data on annual level, improved using CLC maps to establish annual land use changes. In addition, the annual increment of different types of forests, were changed and national averages were used for different categories of forests, provided by the experts from UKIM Faculty of Forestry, Department of Forest growth and yield. Default emission factors were used from the software. Land use changes from forestry are shown in Table 20. Trend of the emissions from this sector is shown in the time series in Figure 28.
Table 20. Forestland area, ha
1990 2000 2005 2014 2015 2016
Forest remaining forest 970978 957550 955228 1084048 1101265 1102352
Land converted to forest land 21554 15969 14030 233 202 187
Total 992532 973519 969258 1084428 1101467 1102539

National Inventory Report
Third Biennial Update Report
33 Agriculture, forestry and other land use
Figure 28. GHG emissions and removals from Forest land (in Gg CO2-eq)
5.3.2 Cropland
The land use class Cropland covers the area used for cultivation of: field crops, and perennial crops, which mainly includes vineyards, orchards and grasses (meadows and loans). According the methodology of the State Statistical Office (SSO), cropland refers to cultivated land, used for performing agricultural activities for producing of annual yields. The cultivated area consists of arable land and gardens, orchards, vineyards and meadows. Arable land refers to land area where crop production takes place and which is sown with field crops: cereals, industrial crops, vegetables and fodder crops. This category includes fallow and uncultivated arable land.
According the IPCC methodology, GHG emissions and removals are result to the human activities related to land use change, change of management practices and inputs. If no changes occur, the cropland remaining cropland, under annual crops, is considered as system where emissions and removals are in equilibrium (carbon neutral). Significant alteration in carbon pools on cropland, occurs during the conversions of perennial to annual crops (uprooting), since the whole biomass according Tier 1 is considered as immediate emission, and establishing of new plantation where annual sinks occurs due to the bioaccumulation in the growing plants. Significant change of carbon stocks, because of human activates (change of FLU, FMG and FI), occurs in SOC pool.
5.3.2.1 Cropland area
In this report, estimation of cropland areas was done on the base of data available within several sources, like national data published in State Statistical Office (SSO) Year Books for the period 1990-2016, and the special publications of the SSO, “Field crops, orchards and vineyards” and “Macedonia in numbers” (2004-2016) and the digital data base, MakStat (http://makstat.stat.gov.mk/PXWeb/ pxweb/en/MakStat) for the period 2014-2016.
In order to improve the quality and consistency of data for areas under cropland, in this report additional data sources, like CORINE Land Cover (CLC), were used. In previous report, the digital data from CLC was used for calculation of areas under Cropland and were checked against the official state data; while for the period before 2000 (when CLC did not existed); SSO data were used for areas under Cropland. Statistical data from the period of the ’90 does not correspond to the IPCC land use categories and in addition to the forestland and cropland contains data only for grassland and other land. Most probably, for these reasons, the total area under Cropland is reported for more than 620,000 ha, which is much higher than the areas of Cropland after year 2000. In this NIR, additional effort for improvement of the activity data used for land use has been made, i.e. data extrapolation for the years before 2000, based on the period of 18 years (2000-2008) with CLC database.
-509.8
9,409.6
-2,927.7-3,632.8 -3,666.6 -3,603.6
1990 201620052000 2014 2015
-0.8%
+606.9%
National Inventory Report
Third Biennial Update Report
34 Agriculture, forestry and other land use
As a result, the area under Cropland is estimated on 542668 ha, which is in line with the other five years which are reported in this period, where the area under cropland fluctuate in a range of several hundred hectares from year to year.
The analyze of the CLC graphical data set, also enables us to calculate the spatial conversions from other land use category to Cropland, which is of crucial importance for calculation and estimation of the GHG emissions, and implementing of the Approach 3 and higher Tiers in selection of activity data. In addition, the conversions in Cropland were extrapolated until 1990, which enable us to estimate the emissions of CO2, since the post part of emissions is result to the conversions.
In terms of emission factors, in an absence of national emission factors, the global one is used. This is a serious obstacle in accurate estimation of the emissions of GHG, since the emissions factors are the second crucial component in addition to the activity data, for estimation of emissions/removals, hence the use of global data, excludes any possibility for moving towards higher Tier,
Therefore, if the national priority is to implement higher Tier methodology in assessment of the GHG emissions in the crop production subsector, the intensive investing in research related to determination of national emission factors is required.
5.3.2.2 Perennial crops area
Perennial area as a part of Cropland is of significant importance for estimation of the emissions and removals in this category of land use. As previously, mentioned, perennial crops participate in removals o CO2 on yearly base, through its accumulation in the above and below ground biomass. Despite this, when uprooted (clearance) a huge emission of CO2 occurs. For these reasons, accurate estimation of perennial crops is very important. In our country, the land planted with perennial crops is estimated as sum of the land planted with orchards and vine grape planted land. The data source is from several sources, the special publication Field crops, orchards and vineyards, published by State statistical office of the Republic of Macedonia (period 2007-2016) and the Statistical Yearbook of Republic of Macedonia, for the period 1990 – 2006, of total areas. For this report in order to have a better overview of the dynamics of the new established and uprooted perennial plantations, additional data were collected from the regional offices of the Ministry of Agriculture, Forestry and Water Economy and the Agency for Financial Support of Agricultural and Rural Development (Paying agency.)
5.3.2.3 Cropland Area remaining cropland
The cropland area that remain as a cropland in each year was calculated based on the total cropland area and the total land use changes was subtracted from other land use types to the results obtained from the conversion analyses conducted by CLC temporal analyses.
5.3.2.4 Conversion from one to other land use type
The area of converted area is estimated exclusively on the base of CLC data set. For the period 2000-2018, 4 data sets were used covering 3 periods 2000-2006-2012-2018.
Conversions were permed with subtraction of the territory designated as Cropland, from each consecutive data set. New areas are considered as gains while the missing parts are considered as loss. With the special analysis performed in GIS environment, it was possible to determine the origin of the gains and conversion path of losses. On this way, an estimation of areas Cropland remaining Cropland and conversions of each land use category to Cropland and, was enabled.
Out of the data presented in Table 21 it can be noticed that the area of land converted to cropland is significantly variable. This variability is due to the inconsistency of the CLC data set or the country. The total area of converted land in the period 2000-2016 is much higher than for the other 2 periods. It is assumed that the data set from the year 2000, which was the first data set for the country, suffered massive corrections in 2006, when most probably huge areas were converted from one to another category of land use. For the periods 2006-2012 and 2012-2018 datasets, converted area for all land use types is significantly reduced, indicating that the CLC database has been improved.
5.3.2.5 Emission trends
Emission from cropland are manly result to the conversions and changes in perennial plantations. Giving though that the converted areas, as previously explained, significantly differ among the reported years, in a range of over 12 thousand ha in year 2000, to only 155.1 ha in 2016, the quantities of emitted CO2 differ as well from more than 1620 Gg CO2-eq in 2000, to just 31.22 Gg, which is more reliable quantity than the former one.

National Inventory Report
Third Biennial Update Report
35 Agriculture, forestry and other land use
As for the Cropland Remaining Cropland the areas are stable and vary in the range of 542,667.9 in 1990 (extrapolated value), down to 508,399.11 in 2000. In all other years the area is very similar, around 512 to 516 thousand ha. The quantities of emitted CO2 are very low and are mainly due to the changes in perennial crops. In the period 2014-2016 there is a negative trend (removals) of CO2 which is result to the more intensive establishing of perennial plantations (especially orchards), as a result of the policy of subsidizing the establishment of perennial plantations (Table 22 and Figure 29).
Table 21. Cropland, ha
1990 2000 2005 2014 2015 2016
Cropland, area, ha 542,668 508,399 516,312 513,271 512,882 512,303
Cropland Remaining Cropland 525,559 496,170 505,176 513,078 512,714 512,148
Land Converted to Cropland 17,109 12,229 11,136 193 168 155
Table 22. Emissions from cropland (CO2-eq)
1990 2000 2005 2014 2015 2016
Cropland, Gg CO2, 1627.44 1624.87 1616.19 34.76 28.84 31.22
Cropland Remaining Cropland 2.41 2.93 0.00 -5.12 -6.00 -1.38
Land Converted to Cropland 1625.03 1621.95 1616.19 39.88 34.84 32.60
Forest Land converted to Cropland 1538.77 977.08 956.50 27.44 24.06 22.64
Grassland converted to Cropland 86.26 479.09 626.49 12.18 10.56 9.76
Wetlands converted to Cropland 0.00 131.80 4.74 0.00 0.00 0.00
Settlements converted to Cropland 0.00 18.84 16.94 0.03 0.02 0.02
Other Land converted to Cropland 0.00 15.14 11.53 0.23 0.20 0.18
Figure 29. GHG emissions from Cropland (in Gg CO2-eq)
5.3.3 Grassland
Grassland together with the cultivated land represent the total agriculture land. This land use category (according to the CLC that has been used for this analysis) encompasses the following categories: Pastures, Complex cultivation patterns and Natural land with significant areas of natural vegetation. Pastures covers areas on higher altitudes above the forests, called high mountainous pastures, and areas in the lower parts used for grazing of animals during the winter period. The majority of grassland is state owned and managed by the Public Enterprise or Pasture Management, while only small part of grassland is private owned. Grassland is used for grazing of animals on open field predominantly sheep’s, and on small areas a special breed of domestic cattle. Grassland in the past decades has been undermanaged and therefore in many cases grassland degraded and unsuitable for sheep breeding.
Unlike cropland, which is under heavy pressure of the human activities, like unsuitable management practices and inputs, grassland can be threatened just from over grazing, especially in the summer period when grazing of the animals on an open field is particularly intensive. During wither period this pressure is much lower.
In terms of GHG emissions, according to the IPCC methodology, due to the low inputs and management practices for the areas designated as Grassland Remaining Grassland, in Tier 1 approach, grassland is considered as a system in equilibrium in terms of emissions/removals, due to what emissions are not reported. The only inputs on these areas is the urine and excrement deposition from grazing animals.
1.0%
20152005
-14.7%
1990
-4.4%
2.92.41,627.4
2014
35.0%
94.6%
83.4%5.3%
1,624.9
60.1%
36.6%8.1%
28.831.3%
2016
-20.8%
78.9%
29.5%
59.2%
34.8
72.5%1.2%
2000
31.2
38.8%
1,616.2
-100.0%
-98.1%
Cropland Remaining Cropland
Forest Land converted to Cropland
Grassland converted to Cropland
Wetlands converted to Cropland
Settlements converted to Cropland
Other Land converted to Cropland

National Inventory Report
Third Biennial Update Report
36 Agriculture, forestry and other land use
Main sources of GHG emission arouses during the conversion of other land to grassland, especially forest and cropland.
5.3.3.1 Total Grassland
For this report in order to have better overview of the spatial distribution of Grassland and its temporal dynamics, CLC graphical data set was used as a main source of information. In addition several auxiliary national data sources were used as well, like: State Statistic Office Year Books for the period 1990-2016, and the special publications of the SSO, Field crops, orchards and vineyards and Macedonia in numbers (2004-2016) and the digital data base, MakStat (http://makstat.stat.gov.mk/PXWeb/ pxweb/en/MakStat) for the period 2014-2016.
Similarly, like with the Cropland, data obtained with the analysis of CLC, were further interpolated in order to file gap years between two reporting period, while for the period before year 2000, extrapolation has been made based on the four existing data sets, with satisfactory results.
According the results from the analysis, it can be noted that the total area of grassland fluctuates in a very narrow range from slightly above 667 thousand ha in 2000 to around 615 thousand ha for the period 2014-2016 (Table 23).
In an absence of national emission factors, the global one is used, which is a serious obstacle in accurate estimation of the emissions of GHG, and excludes any possibility for moving towards higher Tier. The development of national emission factor as a prerequisite or implementing of higher Tier needs long-term and exact research activities.
5.3.3.2 Grassland remaining grassland
Grassland remaining Grassland, are areas designated as Grassland in at least two consecutive CLC data sets, all other changes are considered as gains and losses and are reported as conversions.
5.3.3.3 Conversion from other land use types to grassland
As in the case of Cropland conversion were calculated through spatial and temporal analysis of CLC data set, by the means of GIS methods. As previously explained, because of the inconsistency o the CLC, the areas under Grassland or the first period 2000-2006 seriously differ from the other 2 periods (2006-2012 and 2012-2018). Still, there are certain trend that should be noted, despite this discrepancy, especially the fact that the majority of conversion to this land use category for all periods arouses from Forest and Croplands to Grassland. As mentioned before, the converted areas to Grassland from other categories, for the period 1990-2000, were calculated with interpolation of CLC data.
5.3.3.4 Emission trends
Emissions from the areas of Grassland Remaining Grassland are not reported since removals and emissions, according Tier 1 approach, are in equilibrium (carbon neutral) in all CO2 pools, like above and below ground biomass, dead wood and SOC. There are certain sources of non-CO2 emissions from burning of Grassland, but due to the absence of exact data of the burned areas, these emissions are not reported. The emission from the grassland is mainly caused by land use changes. Emissions trends from Grassland similarly like the area under this category significantly differ from 1,662.27 Gg CO2-eq in year 2000, to only 25.8 Gg CO2-eq. The values of CO2 emissions, within the period 2014-2016 are very similar, with slight decreasing over time (Table 24 and Figure 30).
In order to bridge this serious obstacle with the CLC database, in the next reports additional efforts will be made in order to increase the estimation accuracy of land use. As planned, other sources of data will be used, like satellite imagery photointerpretation and other existing auxiliary graphical data on a national level.
Still in this moment, our opinion is that the emissions reported for the period 2014-2016 are closer to the real situation in the country.
Table 23. Grassland area, ha
1990 2000 2005 2014 2015 2016
Grassland 637,103 667,146 645,420 616,297 615,980 615,700
Grassland Remaining Grassland 616,821 653,847 632,219 616,082 615,794 615,529
Land Converted to Grassland 20,282 13,299 13,201 214 186 171

National Inventory Report
Third Biennial Update Report
37 Agriculture, forestry and other land use
Table 24. Emissions from grassland (CO2-eq)
1990 2000 2005 2014 2015 2016
Grassland 1,780.39 1,662.27 1,638.68 32.25 27.94 25.80
Grassland Remaining Grassland 0.00 0.00 0.00 0.00 0.00 0.00
Land Converted to Grassland 1780.39 1662.27 1638.68 32.25 27.94 25.80
Forest Land converted to Grassland 1759.48 1181.31 1135.38 14.86 12.87 11.87
Cropland converted to Grassland 30.76 393.01 437.08 15.60 13.52 12.49
Wetlands converted to Grassland -1.89 16.76 9.35 1.79 1.55 1.43
Settlements converted to Grassland -5.60 43.61 35.19 0.00 0.00 0.00
Other Land converted to Grassland -2.36 27.57 21.67 0.00 0.00 0.00
Figure 30. GHG emissions from Grassland (in Gg CO2-eq)
5.3.4 Wetland
Wetlands as a land use category in this report, encompasses several categories of CLC data set, like peat bogs and inland marches. The national Statistic does not report wetlands as a particular type of land use; due to what CLC is the only source of information.
It should be noted that these two land use classes of wetlands according CLC, covers area in the ranges of 15.3 to 15.9 thousand of hectares. According IPCC methodology, wetlands are defined as lands where the water table is artificially changed.
Following this definition, as wetlands in the country can be considered the small areas, which a left as remains of the reclaimed wetlands during the period of 50’s and 60`is of the last century. In that period the big land, reclamation projects for drying the wetlands and drainage of the waterlogged soils were conducted in order to solve malaria problem, to create new fertile land for agriculture or to protect soils from waterlogging during the wet period of the year.
In addition to this, there are two small localities o peatland, which does not cover more than 20 ha and are not used for commercial purposes.
5.3.4.1 Total Wetland
As mentioned above, the total area of Wetland according CLC is estimated of 15.3-15.9 thousand ha. Most
of them are protected by law and serve as natural habitats for various plant and animal species. As most
referent are Katlanovo wetland, Ezerani and Monospitovo. Like in the previous cases, in order to fill the gap
between reporting years of the CLC, linear regression was used to estimate the areas under Wetlands for
years where CLC data are not available.
5.3.4.2 Wetland remaining wetland
For the identification of the areas under Wetland Remaining Wetland category, the exact procedure was followed like in the formerly described cases of Cropland and Grassland.
5.3.4.3 Conversion from other land use types to wetland
Conversion of other land categories to Wetlands were determined with spatial and temporal analysis of CLC data sets the year 2000, year 2006, year 2012 and 2018.
48.4%
98.8%
2015
1.7%
1990
1.0%
23.6%48.4%
5.5%5.6%
46.1%
46.0%
2016
5.5%
2005
1.3%2.1%
71.1%
1,662.3
1,638.7
32.3 27.9
25.8
26.7%
1,780.4
2014
48.4%
69.3%
2000
1.7%
46.1%
2.6%
-100.0%
-98.6%
Forest Land converted to Grassland
Cropland converted to Grassland
Other Land converted to Grassland
Wetlands converted to Grassland
Settlements converted to Grassland

National Inventory Report
Third Biennial Update Report
38 Agriculture, forestry and other land use
For the period 1990-2000 similarly like explained before linear regression model was used or extrapolation of CLC data.
5.3.4.4 Emission trends
Unfortunately, due to problems we faced with the database or software we did not get any emission or sink from the wetlands.
5.3.5 Settlements
Settlement is another category of land use that is not reported within the official national statistics of land use. For this reason, CLC data source was used to estimate the spatial distribution of the area of this category as well as its temporal dynamics. For this NIR, several land use classes relevant to Settlements were used (out of in total 31 class of land use reported in CLC data set): Continuous and Discontinuous urban fabric, Green urban areas and Sport and leisure facilities.
5.3.5.1 Total Settlements
Total area under this category of land use is estimated of approx. over 30 thousand ha, which slightly increase over time from 29,975 ha in 1990 up to 34,638.3 as a result of the intensive urbanization and conversion of other categories of land use into urban areas. This process of conversion is becoming very intensive and is serious problem since very often a fertile agricultural land is lost with soil sealing (Table 25).
Due to the big mapping units of the CLC data set and the large width of the linear objects, numerous villages from desegregated type are probably not considered as urban area. It is evident that the applied methodology is not fitting well to the area covered by infrastructure, but this was the best available data source. This fact increases the need of land use classification on annual basis, conducted by some of the national institutions and applying methodology that will better fit national circumstances as small size of some urban areas, existence of the complex of urban/agricultural land etc. In addition, this will solve problem of obtaining annual data for land use changes, real data instead of estimations based on regression analyses. Such capacities exist in the country and it is matter of mobilization of the experts that can conduct such analyses on regular basis. This is of importance for land degradation convention and can provide reliable data on soil sealing in the country. Therefore, putting high priority on this issue in future is recommended.
5.3.5.2 Settlements Area remaining Settlements
Settlement Remaining Settlements category of land use are areas designated as Grassland in at least two consecutive CLC data sets. All other changes are considered as gains and losses and are reported as conversions.
5.3.5.3 Conversion from one to other land use type
Like in the cases of the other land use categories, conversion was calculated through spatial and temporal analysis of CLC data set, by the means of GIS methods. As previously explained, because of the inconsistency o the CLC, the areas under Grassland or the first period 2000-2006 seriously differ from the other 2 periods (2006-2012 and 2012-2018). In this case, the majority of area converted to settlements arouses from the categories of Cropland and Grassland, which is another prove of an intensive urbanization and soil sealing of fertile agricultural land and pastures. Similarly, like in the other categories of land use, the areas of converted areas to Settlement from other categories, for the period 1990-2000, were calculated with interpolation of CLC data.
5.3.5.4 Emission trends
The emission from the settlements is mainly caused by land use changes. The category of Settlements Remaining Settlements is carbon neutral and some emissions that are quite low in comparison with other sectors are due to conversion of the land use types to settlements.
The land use changes and emission trends are calculated for the converted land or the reporting period. For the estimation of the gap years, between the years to which CLC refers to, interpolation of the data was performed, while for the period before year 2000, extrapolation has been made. Like in the previous cases, there is a huge discrepancy between the first and the other two period of CLC data. From the beginning of the period in 1990 up to year 2005 there high emissions of CO2-eg which rate up to 130.2 Gg (year 200), while in the period beyond 2005, as a result to the small conversion rates, the emission is significantly reduced, to only 2.92 Gg CO2-eq in 2016 (
Table 26 and Figure 31).

National Inventory Report
Third Biennial Update Report
39 Agriculture, forestry and other land use
Table 25. Settlements area, ha
1990 2000 2005 2014 2015 2016
Settlements 29,975 31,785 34275 34,597 34,618 34,638
Settlements Remaining Settlements 28,259 30,610 33158 34,569 34,593 34,615
Land Converted to Settlements 1,716 1,175 1117 28 25 23
Table 26. Emissions from settlements (CO2-eq)
1990 2000 2005 2014 2015 2016
Settlements 26.77 130.20 124.28 3.64 9.36 2.92
Settlements Remaining Settlements 0.00 0.00 0.00 0.00 0.00 0.00
Land Converted to Settlements 26.77 130.20 124.28 3.64 9.36 2.92
Forest Land converted to Settlements 5.26 3.72 3.16 0.55 0.47 0.44
Cropland converted to Settlements 10.85 31.76 34.19 2.46 8.33 1.97
Grassland converted to Settlements 10.66 87.57 80.87 0.64 0.55 0.51
Wetlands converted to Settlements 0.00 2.16 2.34 0.00 0.00 0.00
Other Land converted to Settlements 0.00 5.00 3.71 0.00 0.00 0.00
Figure 31. GHG emissions from Settlements (in Gg CO2-eq)
5.3.6 Other land
The land that is occupied by some other land use type than Forest Land, Cropland, Wetland and Settlements is reported as Other land. Such category does not exist in the documents provided by State Statistical Office, or any other national document. However, there is class other land in CLC, but it is not same other land as needed in this analysis. Therefore, the other land class was calculated as a difference between the total territory of Macedonia and sum of the land use classes Forest Land, Cropland, Wetland and Settlements.
The other land in this report was considered all lend that do not belong to the land use classes: Forest Land,
Cropland, Wetland and Settlements.
5.3.6.1 Total Other land
Data for the total other land was calculated as mathematical difference between territory of the Macedonia and land use classes: Forest Land, Cropland, Wetland and Settlements.
5.3.6.2 Conversion from one to other land use type
The conversions from one land type to settlements was estimated using the same approach as for the other land types (using CLC maps)
40.5%
19.6%
39.8%
2.9%
24.4%
2000
2.5%
2016
67.4%
2005 2014
89.1%
67.3%
67.5%17.5%
26.8
5.9%3.8% 3.0%
15.1%
130.2
1.9%
20151990
1.7%
9.42.917.5%
65.1%
124.3
27.5%
3.7
-20.0%
-89.1%
Forest Land converted to Settlements
Other Land converted to Settlements
Wetlands converted to Settlements
Cropland converted to Settlements
Grassland converted to Settlements

National Inventory Report
Third Biennial Update Report
40 Agriculture, forestry and other land use
5.3.6.3 Other land area remaining other land
The other land area that remain as other land in each year was calculated as a difference of the total other land area and the total land use changes from other land use types, obtained from the conversion analyses conducted by CORINE Land Cover temporal analyses. Land use changes for Other land are shown in Table 27.
Table 27. Other land area, ha
1990 2000 2005 2014 2015 2016
Other land 323,056 335,061 349,940 222,338 205,774 217,211
Other land Remaining Other land 321,306 333,342 348,801 220,254 203,968 215,542
Land Converted to Other land 1,750 1,718 1,139 2,084 1,806 1,669
5.3.6.4 Emission trends
The emission from the other land is mainly caused by land use changes. The other land that remains as other land is carbon neutral and some emissions that are very low in comparison with other sectors are due to conversion of the land use types to other land. The land use changes are estimated for the period from year 2000-2014 and only this period can be analysed. From the beginning of the period up to year 2006 there is reduction of the emissions, while after 2006 the trend is increasing, but with much lower rate that rate of the decreasing in previous period (Table 28 and Figure 32).
Table 28. Emissions from other land (CO2-eq)
1990 2000 2005 2014 2015 2016
Other Land 19.88 35.35 24.76 327.87 284.16 262.57
Other Land Remaining Other Land
Land Converted to Other Land 19.88 35.35 24.76 327.87 284.16 262.57
Forest Land converted to Other Land 20.93 18.54 14.37 318.82 276.32 255.33
Cropland converted to Other Land -0.90 9.26 5.57 5.38 4.66 4.31
Grassland converted to Other Land -0.15 7.55 4.81 3.66 3.17 2.93
Wetlands converted to Other Land 0.00 0.00 0.00 0.00 0.00 0.00
Settlements converted to Other Land 0.00 0.00 0.00 0.00 0.00
Figure 32. GHG emissions from Other land (in Gg CO2-eq
5.4 Aggregate sources and non-CO2 emissions sources on land
Non-CO2 emission refers to the practices in the AFOLU sector, which result in an emission of so-called non-CO2 GHG, like: NOx, CO, CH4. There are many management practices and inputs which a considered as important source of non-CO2 emissions. The emissions considered here are from different sources as biomass burning, liming, urea application, and direct N2O emissions from managed soils, indirect N2O
22.5%
105.3%
2016
19.4%
2005
1.1%1.6%
97.2%
1.6%
97.2%
1.1%
26.2%
201520141990
1.1%1.6%-4.5%
52.4%
97.2%
21.4%
2000
24.8
58.1%
35.4
19.9
327.9
284.2
262.6
-19.9%
+1,220.8%
Forest Land converted to Other land
Cropland converted to Other land
Grassland converted to Other land
Wetlands converted to Other land
Settlements converted to Other land

National Inventory Report
Third Biennial Update Report
41 Agriculture, forestry and other land use
emissions from managed soils, indirect NOx emission from manure management and methane emission from rice cultivation.
• Emission from biomass burning on Land, especially burning of Forest and Pastures, as well as
burning of agricultural by-products,
• N2O direct and indirect emission from managed soils, including indirect N2O emissions arousing from
the inputs of N containing urea and mineral fertilizers, and liming which is a practice used for changing
of soil reaction. In this case significant quantities of lime are used which provokes emission of non-
CO2 gases. Liming is not a common practice in the country. As a result of this and inexistence of data,
liming is not reported.
• NOx emission manure management is another significant source of NOx.
The emissions from of these particular sources, are not very high, except direct N2O emissions from managed soils, but when aggregated they are much higher than direct CO2 emissions from any of the land use classes.
The highest values of non-CO2 emissions has its highest values in 1990, while its lowest values are in the year 2000, when gradually starts to increase up to 2016 with total annual emission of 359,78 Gg of CO2 –eq (Figure 33 and Table 29).
Figure 33. GHG emissions from Aggregate sources and non-CO2 emissions sources on land (in Gg CO2-eq)
Table 29. GHG emissions from Aggregate sources and non-CO2 emissions sources on land (in Gg CO2-eq)
Categories 1990 2000 2005 2014 2015 2016
Aggregate sources and non-CO2 emissions sources on
land 382.27 313.11 327.73 338.78 337.41 359.78
Urea application 3.74 9.09 1.28 3.67 3.51 3.19
Direct N2O emissions from managed soils 211.96 183.67 210.79 209.33 208.37 224.45
Indirect N2O emissions from managed soils 82.25 68.45 77.08 75.46 75.26 80.71
Indirect N2O emissions from manure management 32.05 29.25 26.47 26.27 27.10 28.01
Rice cultivations 52.27 22.65 12.11 24.05 23.17 23.42
5.4.1 Urea application
Urea is an important amendment in common agricultural practices. 46% of Urea is used as fast supplement of N to a growing plant in spring when plants enter intensive growing stages. The N in the urea is in amide form (CO(NH2)2), mining that the release of nitrogen is in close relation to the microbial activities of soil microflora. During this process the urea (CO(NH2)2) is converted into ammonium (NH4
+2), hydroxyl ion (OH-), and bicarbonate (HCO3-), in the presence of water and urease enzymes. Similar to the soil reaction following addition of lime, bicarbonate that is formed evolves into CO2 and water.
Emission of non-CO2 GHG is very low and significantly variable in the period 1990-2005 while in the last 3 year of the reported period is stable in a range of 3.67 Gg-CO2-eq in 2014, to 3.19 Gg-CO2-eq in 2016(Figure 33). The low emission is mostly result to the limited use of urea in agricultural production, mainly on cereals and vegetables, in early spring, in the other phases of vegetation phases a slow release N fertilizer are needed, so the application of urea is quite limited.
75.5
8.1%7.2%
359.8
337.4
2000
64.3%
23.5%
3.7%
2005
1.1%
7.8%
1.0%
21.5%
2014
61.8%
22.3%
8.0%
6.9%
62.4%
22.4%
8.4%
7.8%
6.5%
2016
61.8%
1.0%
55.4%
1990
13.7%
2015
2.9%
7.1%
313.1327.7
338.8
21.9%
58.7%
9.3%
382.3
+6.2%
-5.9%
Urea application
Indirect N2O emissions from managed soils
Direct N2O emissions from managed soils
Indirect N2O emissions from manure management
Rice cultivations

National Inventory Report
Third Biennial Update Report
42 Agriculture, forestry and other land use
5.4.2 Direct N2O emissions from managed soils
Soil is very complex and dynamic media, where a vast number of processes occurs within very narrow time frame, which mostly result to the microbial activates as well to the other parts of the soil biodiversity. To this end, so called nitrogen turnover is a very complex process encompassing several phases that are directly related to the soil properties in certain moment (temperature, aeration, wetness, soil reaction etc.) and its influence on microbial activity. Main processes of nitrogen turnover are nitrification, denitrification, ammonification, immobilization, and mineralization.
Nitrous oxide is produced naturally in soils through the processes of nitrification and de-nitrification. One of the main controlling factors in this reaction is the availability of inorganic N in the soil. An increase in available N through human-induced N additions, or change of land-use and/or management practices that mineralize soil organic N, enhances nitrification and de-nitrification rates which then increase the production of N2O.
For this reason, in estimation of N2O emissions, human-induced net N additions to soils like: synthetic or organic fertilizers, deposited manure, crop residues, or mineralization of N in soil organic matter following cultivation/land-use change on mineral soils are of crucial importance.
Direct N2O emissions from managed sols are mainly caused by the intensive inputs of mineral nitrogen fertilizers, manure and other organic amendments as well as the urine and dung deposits on pastures during grazing of animals on open field. The participation of these three sources of N is variable in the reporting years, hence in 1990 the majority of N2O emissions arouse from organic fertilizers and urine and dung deposits, while in year 2000 the participation of these three sources is almost equal. Starting from year 2005 up to 2016 the emissions arousing rom mineral nitrogen fertilizers is increasing and prevails over the other two sources, reaching more than 105.5 Gg CO2-eq.
As for the trends of the total emission of N2O from managed soils, it can be noticed that except in the year 2000 when emissions has lowest values of only 183.67 Gg CO2-eq, in all other reporting year the quantities of the emitted GHG are varying in very narrow range of 209.33 in 2014 up to 224.45 Gg CO2-eq in 2016 (Figure 33).
5.4.3 Indirect N2O emissions from managed soils
Managed soil can be a serious source of the so-called indirect N2O emissions. In general, there are two main processes related to the indirect emission of N2O: volatisation of N in the atmosphere and leaching/runoff of nitrogen.
In the both cases, the volatilization and leaching of N as NH3 and oxides of N (NOx), is result to the:
• inputs of synthetic N fertilizers; organic N applied as fertilizer; urine and dung N deposited on pasture by
grazing animals,
• N in crop residues and
• mineralization/immobilization associated with loss/gain of soil organic matter resulting from change of
land use or management of mineral soils.
Some of the inorganic N in or on the soil, mainly in the NO3- form, may bypass biological retention mechanisms in the soil/vegetation system by transport in overland water flow (runoff) and/or flow through soil macro pores or pipe drains. Where NO3- is present in the soil in excess of biological demand, e.g., under cattle urine patches, the excess leaches through the soil profile.
The nitrification and de-nitrification processes transform some of the NH4+ and NO3
- to N2O. This may take place in the groundwater below the land to which the N was applied, or in riparian zones receiving drain or runoff water, or in the ditches, streams, rivers and estuaries (and their sediments) into which the land drainage water eventually flows.
From data presented in Figure 33 can be concluded that indirect emissions from managed soil are stable in
all reporting years and vary in the ranges of 68.45 Gg CO2-eq in 2000 up to the 80.71 Gg CO2-eq in 2016.
5.4.4 Indirect N2O emissions from manure management
Manure management can be a serious source of N2O emissions, especially when is not properly managed. The emissions are in form of volatiosation of nitrogen in a form of ammonia NOx.
This portion of N2O emissions is result to the mineralization of the organic nitrogen in animal excretions, and is most intensive in the process of the collection and storage. In case of a improper collection and storage, emissions of nitrogen through volatisation can be significant. For this purpose, appropriate and timely

National Inventory Report
Third Biennial Update Report
43 Agriculture, forestry and other land use
management of these two processes on farm is of crucial importance for reduction of N2O emissions. Nitrogen losses begin at the point of excretion in houses and other animal production areas (e.g., milk parlors) and continue through on-site management in storage and treatment systems (i.e., manure management systems).
Nitrogen is also lost through runoff and leaching into soils in the phase of storage of the manure at outdoor
areas, in feedlots and in pastures where animals are grazing.
The final step of manure management is application and incorporation in soils. If the process of application
and incorporation is not organized in a timely manner, significant losses of N trough volatiosation and leaching
might occur on the field.
As previously mentioned, the N2O emissions from manure management are mainly caused with improper
management in the processes of collection, storage, application and incorporation in soil. The total estimated
emissions of manure management are in the ranges of 26.27 Gg CO2-eq in 2014 up to the 32.05 Gg CO2 in
1990 equivalents. In general, we can say that the indirect N2O emissions from manure management are
stabile by time.
5.4.5 Rice cultivation
Area of rice growing land in this reported is sourced from the special publication Field crops, orchards and vineyards, published by State statistical office of the Republic of Macedonia (period 2007-2014) and the Statistical Yearbook of Republic of Macedonia, for the period 1990 – 2006.
Most part of the rice fields are situated in the vicinity of Kocani on both banks of Bregalnica river. Small portions of rice field are situated in some other parts of the country, in the vicinity of Veles. The sown area of rice fields significantly fluctuates over time, and strongly depends to the weather conditions, especially water supply from Kalimanci dam. The rice growing land fluctuated with strong drop in the middle of nighties from almost 9 thousand hectares in year 1990 to 1296 ha in year 1995. This was result of severe dry period in the nineties and particularly proclamation of the drought as national disaster in year 1993. After this drop, the quick growth in the rice planted land started but this trend finished with the significant drop in year 2001. After that rice was planted on about 2-3000 ha. In last 5-years period, there is evident trend of increase of the land planted with rice and again reached more than 5000 ha in 2014. The rice is important source of the GHG, particularly methane and increase of the area planted with rice is risk for increasing of the GHG emission from crop production within next period.
The trend of the emissions of CH4 from the rice fields follows the trend of the rice planted land change, as described above. Out of the data presented in Table 29, it can be noticed that the emissions of CH4 significantly drops in the period of 1990 to the beginning of 2000, and continue to decrease up to 2005 with only 12,11 Gg of CO2-eq. In the past three reporting years, the emission is dabbled (24-24 Gg-CO2-eq) and stable. This increase is related to the increase of the areas of rice fields in the past three years (Table 29).
5.5 Methodology and emission factors
5.5.1 Livestock
Emission intensities (emissions per unit of animal product) vary greatly between production units, even within similar production systems. This variability is due to different farming practices and supply chain management. In order to be able to distinguish different systems and practice levels deep descriptive data set is needed. Official sources of livestock data publicly available (State Statistical Office, Ministry of Agriculture Forestry and Water Economy) are still not providing sufficient data for higher Tier application than Tier 1. Hence, for this inventory Tier 1 methodology was used, where qualitative improvements were done base done expert judgment. However, in order to meet Tier2 methodology, filed survey was done where small dairy and pig farms were involved. Results of the survey were not able to be implemented in preparation of current report but will be used in 4th NC. Detailed emission factors used for GHG emissions inventory in livestock activities in 3rd BUR, are given in Appendix I, part Emission factors (A I.3.3).
5.5.2 Land
5.5.2.1 Forestland
Emissions in Macedonia from forestry sector are product of firewood consumption as well as the forest fires. The most constant producer of CO2 emission are households that use firewood for heating. Forest fires are the second emitter of CO2, but they are not constant, and their contribution varies greatly from year to year,

National Inventory Report
Third Biennial Update Report
44 Agriculture, forestry and other land use
depending on their number, and the area that they cover, as well as the species composition in burned areas. There are several years (2000, 2007, and 2012) where due to the large burned area, forestry sector instead of removing, contributed into increase of the GHG emissions in the country.
5.5.2.2 Cropland
GHG inventory in AFOLU sector relay on two major segments, activity data that encompasses all activities resulting from human activities, like land use change, management practices and inputs and emission factors which refers to the effect of the human activities on the intensity of the GHG emissions and removals.
Tier1 methodology is used for estimation of the emission from cropland. In the past two NIRs some very
valuable and important efforts have been done in order to move forward to the Tier 2 methodology. To this
end, Land use/Land change data were calculated from a spatial graphical data source (European Space
Agency, CORINE Land Cover), enabling implementation of Approach 3 (Chapter 3) and Tier 2 level in the
segment of land use (land use category remain and land use category converted to other land use category).
CORINE Land Cover is a graphical data set, with mapping scale of 1:100.000 and minimum mapping unit
(MMU) is 25 hectares. The minimum width of linear elements is 100 meters. The standard CLC nomenclature
includes 44 land cover classes, grouped in a three-level hierarchy. In our report, the CORINE LC classes were
grouped into six categories of land use according the IPCC methodology. In this Reports certain
inconsistencies of the CLC data were detected which lead to a significant difference between periods covered
with this data source. Irregularities were detected for lad from one category to another, especially in Cropland,
Grassland and Forestland. For this reason, and in order to improve the temporal and spatial accuracy of land
use data, it was decided in the next period to put some effort in developing of national graphical data source.
Particular attention will be paid to build up the capacities of the institutions responsible for GHG inventory, to
be able to perform photointerpretation and classification of satellite images, for regular updating of the land
use/land database with accurate data.
In an absence of national emission factors, the global emission factors were used, recommended within the IPCC manuals or various category of land use. In Table 30 are indicated the emission factors used for estimation of: biomass carbon stock in perennial crops and conversions, soil organic carbon stock, emissions of methane from rice fields and urea application.
The most important challenge is to develop country specific emission factors for various land use types. Our research showed that there is not any scientific/expert paper on determination of the GHG emission factors from various land use types in the country. The serious efforts and investment in research activities is required in order to develop country specific emission factors associated with different land use types.
Table 30. Emissions factors used for GHG emissions inventory in Land
Emission factor 3rd BUR Comment
1. Cropland remaining cropland
1a. Biomass carbon stock
• 2,1 t/ha biomass accumulation per year in perennial plantations (first 20 years) -
CG,
• 63 t/ha biomass loss with clearance of
perennial plantations - CL
IPCC Guide – Chapter 5, Table 5.1 and 5.3
1.b Dead organic matter In Tier 1 methodology Dead organic matter is not calculated
1.c Soil Organic Carbon
0.9 t/ha for stock exchange factor (land use) 1 t/ha for stock exchange factor FMG (management) 1 t/ha for stock exchange factor FI (input)
IPCC Guide Chapter 5, Table 5.5
1.1. Forest land converted to cropland
120 t/ha biomass loss with clearance during the conversion
IPCC Guide, Chapter 4 Tables 4.7 to 4.12
1.2. Grassland converted to cropland
6,5 t/ha biomass loss biomass loss with clearance during the conversion
IPCC Guide, Chapter 6, Table 6.4
2. Grassland Remaining Grassland
2.a Biomass carbon stock
Grassland where there is no change in either type or intensity of management, biomass will be in an approximate steady-state
2.b Dead organic matter The Tier 1 method assumes that the dead wood and litter stocks are at equilibrium,
2.c. Soil Organic Carbon 1,0 t/ha for stock exchange factor (land use) IPCC Guide Chapter 6, Table 6.2

National Inventory Report
Third Biennial Update Report
45 Agriculture, forestry and other land use
0.95 t/ha for stock exchange factor FMG (management) 1,0 t/ha for stock exchange factor FI (input)
2.1 Forest land converted to grassland
120 t/ha biomass loss with clearance during the conversion
IPCC Guide, Chapter 4 Tables 4.7 to 4.12
2.2 Cropland converted to grassland
10,0 t/ha biomass loss biomass loss with clearance during the conversion
IPCC Guide, Chapter 5, Table 5.1
3. Urea application 0.2 volatisation/leaching factor IPCC Guide, Chapter 11 Table 11.3
3. Rice fields 1.3 Emission factor for CH4 emission from continuously flooded fields
IPCC Guide, Chapter 11 Table 11.3
5.6 Data sources
5.6.1 Livestock
In the inventory of the GHG emission relevant to the livestock activities, the official data from State Statistical Office are used (MakStat database available online on:
http://makstat.stat.gov.mk/PXWeb/pxweb/en/MakStat/MakStat__Zemjodelstvo__DobitocnoProizvodstvo.
The data provided in online database is in fully agreement with FAO-stat and Eurostat. For the reported years in some livestock, species data for different categories was available and it was used in assessment. Data for GHG emissions inventory due to activities in Livestock production are given in Annex I, Table 24. All numbers of heads are taken directly from sources except for broilers and turkey, where the data were corrected for annual cycles (0.1644 for broilers and 0.3856 for turkey).
5.6.2 Land
5.6.2.1 Forestland
Data for the preparation of GHG inventory for the Forestry sector was collected from several main sources: State Statistical office, Ministry of Agriculture, forestry and water economy, Subjects that manage state and private owned forests, UKIM- Faculty of Forestry in Skopje, Centre for management of crises, Firefighting union of Macedonia, expert opinions and other domestic and international sources. The sources of data for different categories are presented in Table 31.
Table 31. Data sources for Forestland
Forestry sector Documents Data provider
Forest area SSO Yearbooks;
Forestry management plans;
SSO;
Subjects that manage forests (PE Makedonski sumi, National parks, Association of private forest owners), MAFWE;
Forest types SSO Yearbooks;
Forestry management plans
SSO;
Subjects that manage forests (PE Makedonski sumi, National parks, Association of private forest owners), MAFWE;
Growing stock Forestry management plans;
Department of Forest growth and yield;
Subjects that manage forests (PE Makedonski sumi, National parks, Association of private forest owners), MAFWE;
Faculty of forestry;
Land use change SSO Yearbooks
CORINE land cover maps (2000, 2006, 2012)
SSO
CORINE land cover;
Removal from forests
SSO Yearbooks;
Monthly and Annual Reports
SSO;
Subjects that manage forests (PE Makedonski sumi, National parks, Association of private forest owners), MAFWE
Burned forest area SSO Yearbooks, Annual reports, internal documents
Subjects that manage forests (PE Makedonski sumi, National parks, Association of private forest owners), MAFWE, Crisis Management Center, Macedonian fire protection unit

National Inventory Report
Third Biennial Update Report
46 Agriculture, forestry and other land use
5.6.2.2 Land, Non-CO2, Aggregate sources and non-CO2 emissions sources on land
Data from several sources were used for preparation of the subsectors Land and the aggregate sources of
non-CO2 emissions. National data sources used were the annual SSO publication, indicated in Table 32, and
the digital database (http://makstat.stat.gov.mk/PXWeb/pxweb/en/MakStat). In addition to this or calculation
of the agricultural areas under perennial crops, data from the MAFWE`s regional offices as well data from the
Paying Agency were used as well.
For the calculation of the spatial and temporal land use/land use change in all IPSS categories of land use,
the ESA product - CORINE LC data sets were used as indicated in Table 32. (https://www.esa.int/Applications
/Observing_the_Earth/Copernicus)
Mineral fertilizers and urea quantities, in the absence of national data were provides from two data sources,
FAO-stat and the International Fertilizer Association Data base - IFA-stat (www.ifastat.org/databases/plant-
nutrition).
Table 32. Data sources for Cropland, Grassland, Wetland, Settlement and Other land use, fertilizers and rice
Documents Data provider
Cropland remain cropland area
Field crops, orchards and vineyards (1990-2016) Statistical Yearbook of Republic of Macedonia (1990-2016) CORINE Land Cover (2000, 2006, 2012, 2018)
State Statistical Office of Republic of Macedonia SENTINEL/ESA
Grassland remain grassland area
Wetlands remain wetlands area
Settlements remain settlements area
Other land remain other land area
Conversions in other category of land use
Processing of CORINE Land Cover (2000, 2006, 2012, 2018) graphical digital data sets
SENTINEL/ESA Expert work
Areas under permanent crops (vineyards and orchards)
Field crops, orchards and vineyards (1990-2016) Statistical Yearbook of Republic of Macedonia (1990-2016) Yearly evidence of Regional Agricultural Offices, Regional Offices Paying Agency
State Statistical Office of Republic of Macedonia Ministry of Agriculture, Forestry and Water Economy,
Rice growing Area
Field crops, orchards and vineyards (1990-2016) Statistical Yearbook of Republic of Macedonia (1990-2016)
State Statistical Office of Republic of Macedonia
Annual crops area
Own calculation based on: Field crops, orchards and vineyards (2007-2014) and Statistical Yearbook of Republic of Macedonia (1990-2006); cropland area minus permanent crop area minus rice growing area
Expert team
Urea application FAO Digital Data Base International Fertilizer Association Data base
FAO-stat IFA-stat

National Inventory Report
Third Biennial Update Report
47 Waste
6 Waste
The categories reported under waste sector are Solid Waste Disposal, Biological Treatment of Solid Waste, Incineration and Open Burning of Waste and Waste Water Treatment and Discharge. The data categorization format is consistent with previous years in order to preserve the existing time series, except in sectors where data was introduced for the first time.
According to the National Waste Management Plan 2009 – 2015, the solid waste generated in Macedonia is mostly disposed on non-compliant landfills. The landfill Drisla, serving the Skopje region, with approximately 590 000 habitants, is the only permitted landfill in Macedonia and it is relatively well managed. At the municipal non-compliant landfills, dumpsites or in rural areas, the wastes are simply dumped by the Communal Enterprises with almost none standard landfilling activities, no operational costs, except some overheads and occasional waste consumption costs for the extinguishing of emerging landfill fires. There are around 50 operational municipal non-compliant landfills. The need for improvement of their waste management practices has been recognized in the national, regional and local waste management strategic documents. Furthermore, there are around 1000 illegal disposal sites which need to be terminated. In accordance with the national legislative, the mayors of municipalities are obliged to provide yearly reports on the municipalities’ management of non-hazardous waste. The hazardous waste generated by Macedonian mining and processing industries faced severe problems during the transition period and many have stopped their activities, with no change of being restarted. Their on-site process waste dumps were abandoned as well, and little or no information is available on the history of these dumpsites.
At the Drisla disposal site, a two-chamber medical waste incinerator has been installed and started operating in the year 2000. Data on incinerated amounts of waste are available and for the first time in this inventory the emissions caused by this activity are reported. In the past, a few facilities for the biological treatment of organic wastes, including biogas and composting installations, have been installed in Macedonia which vary in capacity and operation time. Emissions from Biological Treatment of Solid Waste have been, for the first time, introduced for the period from 2014 to 2016 as a result of data availability.
6.1 Emission trends
The calculations show that the Waste sector is one of the sectors with an increasing trend of GHG emissions achieving 610 Gg CO2-eq in 2016, which is doubled compared to 1990 or 6.3% more compared to 2014. Out of all the sectors, the emission from Solid Waste Disposal category are most significant participating with 77.5% in the total GHG emission in 2016 (Figure 34, Table 33). Second category with significant amount of GHG emissions is Wastewater Treatment and Discharge participating with around 19% in 2016. Incineration and open burning of waste category contribute with around 4% in the last three reported years. The CH4 and N2O emissions from the Biological Treatment of Solid Waste category do not contribute largely to the overall emissions due to the small amount of reported composted waste. Around 92% of the GHG emissions in the last three years of the reporting period are CH4, while N2O and CO2 participates with 7.2%, 1% respectively (Figure 35). Detailed results by gases and categories are reported in Table 34.
Table 33. GHG emissions from Waste sector, by category (Gg CO2-eq)
1990 2000 2005 2014 2015 2016
Waste 406.7 412.7 435.2 574.3 596.7 610.2
Solid Waste Disposal 265.6 299.4 316.0 441.4 457.4 473.2
Biological Treatment of Solid Waste 0.0 0.0 0.0 0.8 1.2 1.0
Incineration and Open Burning of Waste 8.8 9.6 14.1 22.2 23.0 22.7
Wastewater Treatment and Discharge 132.3 103.6 105.1 109.9 115.1 113.4
In this inventory the recommendations from the SBUR were incorporated. Based on it the emissions from Waste category in this inventory are more than 4 time lower compare to the results from the SBUR. There are several factors which contributed to such a big difference in the results. In the SBUR, for industrial waste the default waste generation rate IPCC factor was used. Based on the latest data from the SSO domestic waste generation rate is created. However, at this stage it was very hard to make a distinguish of the data on waste production by industry type, so it was decided to use the data for total waste generated by the manufacturing

National Inventory Report
Third Biennial Update Report
48 Waste
industries. Having this in mind and following the IPCC guideline, Degradable organic carbon factor was revised and 15 was replaced with 1 (Table 2.5 Chapter 2: Waste Generation, Composition and Management Data, IPCC guideline). At the same time, based on the latest national waste management plans, revision of waste composition of municipal solid waste was made. Furthermore, based on SSO data more industrial sectors are introduced in the Industrial wastewater treatment and discharge sub-category. In addition a revision of the overall time series was made.
Figure 34. GHG emissions from Waste sector, by category (in Gg CO2-eq)
Figure 35. GHG emissions form Waste sector, by gas (in Gg CO2-eq)
Table 34. GHG emissions from Waste sector, by category and by gas (in Gg CO2-eq)
Categories 1990 2000 2005 2014 2015 2016
CO2 CH4 N2O CO2 CH4 N2O CO2 CH4 N2O CO2 CH4 N2O CO2 CH4 N2O CO2 CH4 N2O
Waste 2.9 370.8 33.0 3.2 375.0 34.5 4.8 395.1 35.3 6.5 524.9 42.9 6.8 546.7 43.2 6.6 560.5 43.1
Solid Waste Disposal 0.0 265.6 0.0 0.0 299.4 0.0 0.0 316.0 0.0 0.0 441.4 0.0 0.0 457.4 0.0 0.0 473.2 0.0
Managed NE
Unmanaged NE
Uncategorized NE
Biological Treatment of Solid Waste
0.0 0.0 0.0 0.0 0.0 0.0 0.0 0.0 0.0 0.0 0.5 0.3 0.0 0.7 0.5 0.0 0.6 0.4
Incineration and Open Burning of Waste
2.9 5.9 0.0 3.2 6.4 0.0 4.8 9.3 0.0 6.5 12.4 3.3 6.8 12.8 3.4 6.6 12.7 3.4
Waste Incineration NE NE NE 0.1 NE NE 0.3 NE NE 0.5 NE NE 0.7 NE NE 0.5 NE NE
Open Burning of Waste
2.9 5.9 0.0 3.1 6.4 0.0 4.5 9.3 0.0 6.0 12.4 3.3 6.2 12.8 3.4 6.1 12.7 3.4
Wastewater Treatment and Discharge
0.0 99.3 33.0 0.0 69.1 34.5 0.0 69.7 35.3 0.0 70.7 39.2 0.0 75.8 39.3 0.0 74.1 39.3
Domestic 0.0 19.7 33.0 0.0 19.8 34.5 0.0 20.1 35.3 0.0 20.4 39.2 0.0 20.4 39.3 0.0 20.4 39.3
Industrial 0.0 79.6 0.0 0.0 49.4 0.0 0.0 49.7 0.0 0.0 50.3 0.0 0.0 55.4 0.0 0.0 53.6 0.0
Other NO
6.1.1 Solid waste disposal
Treatment and disposal of municipal and industrial solid waste produces significant amounts CH4. A waste by composition approach was applied in the First Order Decay (FOD) calculation. Macedonia is categorized as an Eastern European country, hence, the DOC parameter and methane generation rate constant (k) were assumed to be equal to their corresponding default values provided in the IPCC 2006 Guidelines. As it was mentioned above, based on the latest national waste management plans domestic shares for composition of municipal solid waste are created.
In order to calculate the total municipal solid waste that was created in each year, the time series on population data has been updated for the years 2015 and 2016. The data sources used for the revision are elaborated in detail in the Chapter 6.3. The average municipal solid waste per capita for the period 2014 to 2016 is 375.3 kg/cap/yr. Moreover, the ratio of collected and generated municipal solid waste was 74.5% in 2014, 78.9% in 2015 and 76.7% in 2016. However, having in mind that in SWDS there is a category Uncategorized SWDS
3.9%
25.1%
65.3%
2.3%
2.2%
435.2
1990
32.5%
596.7
19.1%
2000 2014
76.7%
2005
19.3%
406.7
2015
77.5%
3.7%
24.1%
3.2%
610.2
72.6%
76.9%
3.9%
574.3
72.6%
2016
412.7
18.6%
+6.3%
+50.0%
Solid Waste Disposal
Biological Treatment of Solid Waste Wastewater Treatment and Discharge
Incineration and Open Burning of Waste
8.4%
90.9%
1.1%
90.8%
2005
91.4%
7.5% 7.2%
2014 2015
1.1%
91.9%
7.1%
2016
610.2
1.1%
91.2%
8.1%
406.7 412.7
435.2
574.3
91.6%
1.1%
2000
8.1%
1990
596.7+6.3%
+50.0%
CO2 CH4 N2O

National Inventory Report
Third Biennial Update Report
49 Waste
(in the IPCC software), which according to our national methodology are damp site, a recalculation of the overall time series was made and it was found that from the total MSW, 90% is going to SWDS, including the Uncategorized SWDS. The rest 10% of waste is reported in the category Open Burning of Waste. In addition, starting from 2006, annual share of different category of SWDS is made, based on the SSO data.
The results show that the amount of CO2-eq emissions from solid waste disposal have been constantly rising achieving 473 CO2-eq in 2016 Figure 36. Compared to 1990 CO2-eq emissions in 2016 are 78% higher, while compare to 2014 around 7%. Municipal solid waste participates with around 90% over the reporting period.
Figure 36. Emissions of CH4 from Solid Waste Disposal (in Gg CO2-eq)
6.1.2 Biological treatment of solid waste
Biological treatment of solid waste in Macedonia is represented by the composting of waste. The existence of composting facilities has been acknowledged in the past, but it is only recently that data on the amount of composted waste has been reported. Methane is formed in anaerobic section from the compost, but it is oxidized to a large extent in aerobic sections of the compost. Composting can also produce emissions of N2O. As no country-specific emission factors exist, default values have been used.
The emissions from composting have been reported for the years 2014, 2015 and 2016. Observance shows that they are very low, i.e. around 1 Gg CO2-eq. Nevertheless, it may be concluded that the composting practice has become present to the extent that the amount of composted waste is worth reporting, which may be considered as progress. The same cannot be stated for years prior to 2011. The amount of waste composted in 2014 is equal to 1,945 t, while 2,807 t and 2,239 t had been composted in 2015 and 2016, respectively. 58% of the GHG emissions from Biological treatment of solid waste are CH4, while the rest are N2O (Figure 37)
Figure 37. GHG emissions from Biological Treatment of Solid Waste (in Gg CO2-eq)
2015 2016
10.5%
89.5%
315
10.5%
299
10.2%
2005
89.5%
9.6%259 9.7%
1990
90.4%
457440
472
89.6%
90.3%
2000
89.8%
2014
10.4%+7.2%
+82.4%
Industrial waste
Municipal solid waste
58.3%
2005 201620141990 2000
41.7%
41.7%
58.3%
2015
58.3%
41.7%
0.8
1.2
1.0
+15.1%
CH4
N2O

National Inventory Report
Third Biennial Update Report
50 Waste
6.1.3 Incineration and open burning of waste
Waste incineration is defined as the incineration of solid and liquid waste in controlled incineration facilities. The Drisla landfill is the only big landfill that has waste incineration facility and only medical waste is incinerated at this site. The greenhouse gas emissions from incineration of medical waste (since 2000) are taken into account in this report.
Open burning of waste can be defined as the burning of unwanted combustible materials such as paper, wood, plastics, textiles, rubber, waste oils and other debris in nature (open-air) or at non-compliant landfills or dumpsites, where smoke and other emissions are released directly into the air without any emission control activities. Open burning can also include incineration devices that do not control the combustion air to maintain an adequate temperature and do not provide sufficient residence time for complete combustion.
Following the recommendations from the IPCC 2006 Guidelines, the fraction of the population burning waste is assumed to be equal to the fraction of waste not deposited in landfills (including the Uncategorized SWDS). This approach was used for the values over the reporting period. The per capita daily waste generation corresponds to the national statistical data on annual per capita municipal waste.
The emissions of carbon dioxide, methane and nitrous oxide have been estimated for this category. Methane emissions are most significant and represent the majority of the total emissions of the gases emitted through open burning. This emissions participated with around 56% in the last three years, while the share of CO2 and CH4 is 29% and 15%, respectively (Figure 38. Most of the emissions coming from Open Burning of Waste (98%) (Figure 39).
Figure 38. GHG emissions from Incineration and Open Burning of Waste by gasses (in Gg CO2-eq)
Figure 39. GHG emissions from Incineration and Open Burning of Waste by categories(in Gg CO2-eq)
6.1.4 Wastewater treatment and discharge
Wastewater can be a source of CH4 when treated or disposed anaerobically. It can also be a source of N2O emissions. CO2 emissions from wastewater are not considered in the IPCC Guidelines because these are of biogenic origin and should not be included in national total emissions.
Wastewater originates from a variety of domestic, commercial and industrial sources and may be treated on site (uncollected), sewered to a centralized plant (collected) or disposed untreated nearby or via an outfall. Domestic wastewater is defined as wastewater from household water use participating with around 50% in the overall emissions from the Wastewater treatment and discharge sub-category (Figure 40). Industrial wastewater emissions are from industrial practices only.
Domestic wastewater treatment and discharge is not a key source of GHG emissions, so the default parameters and emissions factors have been used. The GHG emissions in this category depend on the population size so the emissions gradually increase achieving around 60 CO2-eq in 2016 (Figure 41). 66% of the emissions are CH4 while the rest are N2O associated with the degradation of nitrogenic components in the wastewater, such as urea, nitrate and protein. It should be noted that the GHG emissions from this category account for just above 50% of the all the emissions in the category Wastewater Treatment and Discharge.
The GHG emissions from industrial wastewater treatment and discharge have been estimated using the industrial production data. The recommendations from the SBUR were incorporated, so based on SSO data
8.8 55.9%
14.9% 14.9%
2014
55.5%
2016
14.1
2015
55.8%
14.8%
65.9%
9.6
34.1%
66.7%
23.0
32.5%
67.4%
1990
33.2%
22.2
29.7%
2000 2005
29.3%29.2%
22.7
+2.3%
+158.6%
CO2 CH4 N2O
3.0%
97.0%
2015
2.4%
97.7%
2016
22.723.022.2
2005
2.3%14.1
100.0%
1990 2000
1.1%8.8
98.9%
97.7%
2.3%
9.6
2014
97.6%
+2.3%
+158.6%
Waste Incineration Open Burning of Waste

National Inventory Report
Third Biennial Update Report
51 Waste
more industrial sectors are introduced in the Industrial wastewater treatment and discharge sub-category. In addition, because of the inconsistence of the data for the reporting period, a revision of the overall time series was made.
The data have been classified in the following industrial sectors: Alcohol Refining, Beer & Malt, Coffee, Dairy Products, Meat & Poultry, Organic Chemicals, Petroleum Refineries, Plastics & Resins, Pulp & Paper (combined), Soap & Detergents, Starch Production, Sugar Refining, Vegetable Oils, Vegetables, Fruits & Juices, Wine & Vinegar. The correlation with the SSO data was made using the NACE codes. Furthermore, it is assumed that the generated wastewater and the chemical oxygen demand parameter correspond to the default values provided in the IPCC 2006 Guidelines.
Methane emissions account for all of the emissions which are the result of industrial wastewater treatment and discharge. Compared to 2014, the emissions in 2016 are 6.7% higher, while compare to 1990 they are for almost 30% lower. The share of emissions from industrial wastewater treatment and discharge out of the total emissions in the category Wastewater Treatment and Discharge are 46% in 2014, 48% in 2015 and 47% in 2016.
Figure 40. GHG emissions from Wastewater Treatment and Discharge (Gg CO2-eq)
Figure 41. Emissions of CH4 from Domestic Wastewater Treatment and Discharge (in Gg CO2-eq)
6.2 Methodology and emission factors
In the inventory prepared in the 3rd BUR framework, the Solid Waste Disposal emissions are estimated in accordance with the IPCC 2006 Guidelines using the IPCC Inventory Software, which impose the First Order Decay (FOD) methodology. It produces a time-dependent emission profile that reflects the true pattern of the degradation process over time. Having in mind that solid waste disposal sites contribute the most to the sector’s emissions, as well as the fact that country specific historic data on the amount of disposed waste are available, Tier 2 methodology has been used. Recent documentation reporting the amount of composted waste has made the relevant data available for the year 2011-2016. Because biological treatment of solid waste is not a widespread practice in Macedonia so country specific emission factors have not been assessed so far. Consequently, Tier 1 was applied for the estimation for the gases emitted from biological treatment of solid waste. Following the IPCC 2006 Guidelines, the Incineration and Open Burning of Waste and the Wastewater Treatment and Discharge are not found to be key sectors, thus, Tier 1 methodologies have also been applied for these sectors.
The emission factors used for the estimation of the GHG emissions of the Waste sector are presented in Table 35. All of them have been assumed to be equal to the default values provided in the IPCC 2006 Guidelines. The default emission factors CH4 and N2O, which have been used to estimate the emissions from composting activities in the SBUR, are used in the 3rd BUR as well.
36.2%
2005
65.8%
2014
34.2%
37.3%
65.8%65.8%
36.4%
2015
34.2%
62.7%
20162000
52.7
1990
55.4
59.7
34.2%
59.7
63.6% 63.8%
54.2
59.6
-0.2%
+13.3%
CH4 N2O
115.1
48.1%
2015
47.3%
2016
105.1
47.3%
2000
109.9
47.6%
60.2%
1990
132.3
2005
103.6
54.2%
45.8%
2014
52.4%
113.4
39.8% 52.7% 51.9% 52.7%
+3.2%
-14.3%
Domestic Wastewaster Treatment and Discharge
Industrial Wastewater Treatment and Discharge

National Inventory Report
Third Biennial Update Report
52 Waste
Table 35. Emission factors used for Waste sector
Emission factor FBUR SBUR, 3rd BUR Comment
Municipal Solid Waste DF DF IPCC 2006 Guidelines National Waste Management Plan 2009 - 2015
Biological Treatment of Solid Waste - DF IPCC 2006 Guidelines
Incineration and Open Burning of Waste
Open Burning of Waste DF DF IPCC 2006 Guidelines
Wastewater Treatment and Discharge
Domestic Wastewater Treatment and Discharge
DF DF IPCC 2006 Guidelines
Industrial Wastewater Treatment and Discharge
DF DF IPCC 2006 Guidelines
6.3 Data sources
In the Solid Waste Disposal sector, the population and GDP data for the period 1990-2014 were revised as a part of SBUR inventory process. In this inventory the population and GDP for 2015 and 2016 were taken from the SSO annual reports.
The State Statistical Office has issued reports on Municipal Waste for the years 2014, 2015 and 2016. It contains information on quantities on generated, collected and waste disposed in waste disposal sites. The Ministry of Environment and Physical Planning releases annual reports on Quality of the Environment which include the amounts of composted waste. The industry product used as input in the category Industrial Wastewater Treatment and Discharge was obtained from the State Statistical Office Yearbook. All other data was used from the IPCC 2006 Guidelines.
Table 36 contains all of the used data sources for the estimation of greenhouse gases in this inventory report.
Table 36. Data sources for Waste sector
Documents Data provider
Municipal Solid Waste Municipal Waste for 2014, 2015, 201 6
Estimation of Population of R. Macedonia
GDP at current prices
SSO
MAKStat database
Biological Treatment of Solid Waste
Annual Report on Quality of Environment 2015-2016 MOEPP
Incineration and Open Burning of Waste
Waste incineration http://www.drisla.mk/page_detail.asp?lID=3&ID=25 Drisla web side
Open Burning of Waste Municipal Waste for 2014, 2015, 201 6 SSO
Wastewater Treatment and Discharge
Domestic Wastewater Treatment and Discharge
Estimation of Population of R. Macedonia
World Population Prospects: The 2017 Revision
MAKStat database
United Nations Population Division
Industrial Wastewater Treatment and Discharge
Online database SSO 2007-2016
Statistical review: Industry and Energy 2002-2007
Statistical review: Industry and Energy 1999-2003
The industry in the Republic of Macedonia 1996-2000
The industry in the Republic of Macedonia 1993-1998
The industry in the Republic of Macedonia 1987-1992
SSO

National Inventory Report
Third Biennial Update Report
53 Precursors and indirect emissions
7 Precursors and indirect emissions
The Decision 17/CP.8, annex, paragraph 16, stipulates that Non-Annex I Parties are encouraged, as appropriate, to report on anthropogenic emissions by sources of indirect GHGs, such as CO, NOx and NMVOC, while in Decision 17/CP.8, annex, paragraph 17, other gases not controlled by the Montreal Protocol, such as SOx, included in the Revised 1996 IPCC Guidelines may be included at the discretion of the Parties.
The most recent 2006 IPCC Guidelines for National Greenhouse Gas Inventories, Chapter 7: Precursors and Indirect Emissions introduces ways to adopt methodologies to calculate the non-GHG emissions, provides a link to relevant methodology chapters in the EMEP/CORINAIR Emission Inventory Guidebook. Some of the methodologies and emission factors in the EMEP/CORINAIR Guidebook are technology-specific and are relevant to conditions and categories in both developed and developing countries.
In the SBUR, the emissions of NOx, CO, NMVOC and SO2 were estimated for the period 1990 – 2014. In this BUR, the emission for 2015 and 2016 year have been estimated, in line with the methodology in the latest EMEP/EEA air pollutant emission inventory guidebook, 2019. In addition review and recalculation for come categories for the period 1990-2014 is done. Also, the NH3 emissions have been included, where applicable.
7.1 Emission trends
The results for precursors and indirect emissions show that they are reduced by 18.5% and 10.5% in 2016 compared to 1990 and 2014 respectively (Figure 42). At average the emissions are around 200 Gg/year, but there are peaks in 2000, 2007, 2008, 2011 and 2012 mainly as a results of forest fires. The highest numbers are estimated for 2000, 357 Gg. SO2 participates with around 50% over the entry reporting period, but in the last five years it shares is below 40%, as a result of reduction in electricity production from lignite, as well as fuel change (oil for heat production is replaced with natural gas). CO is the second contributor, participating with around 30%, with peak in the years with more forest fires. NH3 as a new gas that is introduced in this inventory, participate with around 8% during the reporting period.
Figure 42. Emissions of NOx, CO, NMVOC, SO2 and NH3 in the period 1990 – 2014 (in Gg)
The assessment of the sectoral precursors and indirect emissions, shows that during the entire reporting period, Energy sector is the most significant contributor in all of them except in NH3. In 2016, this sector is a source of almost all SO2 and NOx emissions, 99.8 and 95.6%, respectively (Figure 43). At the same time the energy sector participate with 74% in CO and 66% in NMVOC. AFOLU is the second contributor with around 96% share in NH3, 33.4% in NMVOC and 17.6% in CO. Waste participate with 7.7% in CO most as a result of open burning of waste.
1990 2015
41.9
%
21.8
%
1991
42
.6%
2008
10
.7%
2005
11.0
%
195
4.8
%
20091992
9.0
%
1993 1994
208
4.6
%
1995 1996 2010
8.2
%
1997
25.5
%
20061998 1999 20022000 2001
194
2003
10
.1%
2004
48.1
%
31.0
%
201
44.5
%
2007 20162011 20132012
6.7
%
2014
9.0
%
197204
9.8
%
199
213
230
208
357
209 210204
187
211 211
7.5
%
285
236
201
218
272 272
202
180187
161
26.3
%
9.3
%48.8
%8.7
%
36.8
%
4.6
%
20.8
%
8.1
%
12.3
%
8.9
%49.5
%8.8
%
8.9
%
20.9
%
10.3
%
11.9
%
49.0
%8.7
%21.5
%11.8
%
5.6
%
8.5
%46.3
%
26.0
%
8.9
%10.0
%
8.7
%48.4
%8.8
%2
4.0
%10.1
%
8.9
%50.8
%
9.9
%
8.8
%21.1
%
7.9
%47.3
%8.8
%25.2
%10.9
%
46.3
%26.5
%
6.6
%50.5
%8.5
%23.3
%11.0
%
7.4
%52.3
%8.1
%21.0
%11.1
%
4.4
%29.1
%
22.0
%
8.7
%50.6
%
39.2
%
7.3
%
7.0
%52.8
%8.3
%10.0
%
6.9
%4
7.6
%8.5
%24.4
%12.7
%
6.8
%8.2
%22.0
%1
0.8
%
38.0
%
51.3
%8.7
%
6.5
%49.0
%10.9
%
6.7
%47.9
%8.4
%26.2
%
36.5
%
10.9
%
8.3
%41.5
%9
.1%
5.6
%
9.0
%
8.7
%10.2
%
6.0
%
52.2
%
9.0
%
9.7
%
33
.4%
10
.2%
9.0
%
36.0
%8.8
%41.8
%8.8
%
6.0
%40.6
%9.4
%34.3
%
6.9
%9.7
%31.1
%
37.5
%9.1
%
7.9
%37.2
%10.1
%35.1
%9.6
%
-10.5%
-18.5%
NOx SO2 NH3CO NMVOC

National Inventory Report
Third Biennial Update Report
54 Precursors and indirect emissions
Figure 43. Emissions precursors and indirect GHG emissions (in Gg) and share of by sectors (in %) in the year 2016
7.2 Energy
The SO2 emissions are the dominant form in the combustion emissions at around 50% or greater during the overall reporting period (Figure 44). These emissions are in direct correlation with the combustion of lignite used for electricity generation. On the other hand, as a result of the biomass consumption in the households, CO emissions are the second in dominance, above 30% in 2015 and 2016. Because of the declining trend in electricity generation from lignite, the overall number of precursors and indirect emissions is reduced for 16.4% in 2016 compared to 2014, while compared to 1990 the emissions are reduced by 19.4%.
Figure 44. Еmissions of NOx, CO, NMVOC, SO2 and NH3 from the Energy sector (in Gg)
Electricity production from lignite is the main source of SO2 emissions participating with at least 89% in the reporting period (Figure 45). Furthermore, it is responsible for the majority of NOx emissions (57% in 2016) (Figure 46). With almost 24% in 2015 and 2016, Manufacturing Industries and Construction is the second biggest contributor to NOx, while it participates with 9% and 10% in the share of SOx emissions in 2015 and 2016, respectively. Far behind these two categories are all other. In the share of NOx emissions, the Non-specified category participates with 10%, Transport with 5.2%, and Other Sectors with 4%. On the other hand, the contribution of these three categories in SOx emissions is almost zero. Comparing to 1990, SO2 and NOx emissions are reduced by almost 38% and 39% in 2016, respectively. This is mainly a result of reduced
16.3
95.6%
74.2%
2.7%
66.0%
99.8%
1.6%
NOx
7.7%
17.6%
CO
33.4%
NMVOC SOx
4.3%
95.7%
NH3
15.4
56.4
59.8
12.8
Energy
AFOLU
IPPU
Waste
22.4%
12.1%
58.4%
2000
12.3%
6.5%
56.9%
163.6
2005
10.4%14.1%
11.9%
46.8%
2014
10.2%
31.8%
13.6%
169.7
43.9%43.7%
2015
10.8%
136.7
31.6%
13.5%
56.5%
2016
181.2
23.9%
175.3
30.5%
6.8%
22.4%
6.6%
156.9
1990
-16.4%
-19.4%
NOx
SO2
CO
NMVOC
NH3

National Inventory Report
Third Biennial Update Report
55 Precursors and indirect emissions
electricity production from lignite and an increase in electricity imports. The detailed emissions by categories and subcategories are presented in Table 37.
Figure 45. SO2 emissions from the Energy sector, by category (in Gg)
Figure 46. NOx emissions from the Energy sector, by category, (in Gg)
Note: Transport contains only the emissions of the Railways Transportation and Domestic Aviation
For the CO and NMVOC emissions, the situation is opposite to the previous one (SO2 and NOx). Most of the CO and NMVOC emissions are coming from the category Other Sectors. The share of this category in CO emissions is around 87% and 83%, in 2015 and 2016 respectively (Figure 47,
Table 38), while in NMVOC emissions the share is about 50% in the last two years (Figure 48,
4.5%
62.5%
2000
63.7%
20.8%
11.7%
4.1%
2005
24.0
22.8%
3.9%
3.9%
2014 2015
59.4%
56.3%
22.4%
8.6%
16.0
57.2%
5.5%
4.0%
9.9%
38.3%
23.6%20.0%
3.8%
5.2%
1990
5.2%
4.7%
14.7
21.3
22.4
6.9%
70.8%
17.0
-13.6%
-38.7%
Energy Industries Other Sectors
Manufacturing Industries and Construction
Transport
Non-Specified
Fugitive emissions- Oil and Natural Gas
1990
93.8%
6.2% 5.5% 7.1%
2000
91.9%
10.2%
96.0
2014
88.9%
2015
68.9
9.2%
2016
90.0%
8.5%
90.8%
92.7%
102.4
2005
76.5
103.2
59.8
-21.9%
-37.7%

National Inventory Report
Third Biennial Update Report
56 Precursors and indirect emissions
Table 38). The contribution of the category Manufacturing Industries and Construction is the next one with shares for 2015 and 2016 of 11% and 14% for CO and 6% and 6% for NMVOC. Starting from 2000, NMVOC emissions from the category Fugitive emissions are decreasing due to the lowering of electricity production from lignite. The participation of the other categories is negligible, around 2%.
Figure 47. CO emissions from the Energy sector, by category (in Gg)
Figure 48. NMVOC emissions from the Energy sector, by category (in Gg)
Note: Transport contains only the emissions of the Railways Transportation and Domestic Aviation
The subcategory Road Transportation is also a significant source of the NOx, CO, NMVOC, and SO2 emissions in most of the countries, and furthermore is identified as a key source of GHG emissions in Macedonia. Unfortunately, the emissions of precursors and indirect gases of the subcategory Road transportation of Macedonia have not been estimated due to lack of disaggregated data (which are required by the IPCC 2006 and EEA methodology for estimation of the emissions of precursors and indirect gases of the road transportation). This is the reason why the category Transport contains only the emissions of the Railways and Domestic Aviation and is not identified as a significant source of NOx, CO, NMVOC, and SO2 emissions. The emissions of the subcategory Petroleum Refining are included in the category Other Energy Industries.
Table 37. Emissions of NOx, CO from the Fuel Combustion Activities (in Gg)
Categories NOx CO
1990 2000 2005 2014 2015 2016 1990 2000 2005 2014 2015 2016
Fuel Combustion Activities 24.0 20.4 22.4 16.3 15.2 13.9 38.1 39.2 43.2 45.7 44.3 38.4
Energy Industries 13.5 14.2 14.2 10.6 9.5 8.4 0.5 0.7 0.6 0.5 0.5 0.5
Main Activity Electricity and Heat Production
13.5 14.2 14.2 10.6 9.5 8.4 0.5 0.7 0.6 0.5 0.5 0.5
Electricity Generation 12.4 13.7 13.6 10.3 9.2 7.9 0.4 0.5 0.5 0.4 0.3 0.3
Combined Heat and Power Generation
0.8 0.2 0.1 0.2 0.1 0.4 0.1 0.0 0.0 0.1 0.1 0.2
Heat Plants 0.3 0.2 0.5 0.1 0.2 0.1 0.0 0.2 0.1 0.1 0.1 0.0
Petroleum Refining IE IE IE IE IE IE IE IE IE IE IE IE
Manufacture of Solid Fuels and Other Energy Industries
0.0 0.0 0.1 0.0 0.0 0.0 0.0 0.0 0.0 0.0 0.0 0.0
Manufacture of Solid Fuels NO NO NO NO NO NO NO NO NO NO NO NO
Other Energy Industries 0.0 0.0 0.1 0.0 0.0 0.0 0.0 0.0 0.0 0.0 0.0 0.0
76%
11%
13%
1%
12%
0
1990
84%
2%
0%
1%2%
29
0
2000
2%
2015
11%
0
1%
84%
0
2016
2%
0%
15%
1%
82%
2014
1%
1%
0%
0%
87%
0
83%
1%0
8%
2%
14%
37
31
42
37
2%
2005
7
+21%
+433%
84%
1% 0%
48%
7%
1990
52%
1%
0%
5%
1%
0%
43%
0%
2000
39%
2%
1%
6%
53%
1%5%
1%
36%
56%
2005
0%
39%
12
1%
1%
1%
2014
11
43%
0%
50%
2015
7%
1%
1%
7
2016
12%1%
1010
10 -3%
+46%
Energy Industries
Non-SpecifiedManufacturing Industries and Construction
Transport
Other Sectors
Fugitive emissions - Oil and Natural Gas

National Inventory Report
Third Biennial Update Report
57 Precursors and indirect emissions
Manufacturing Industries and Construction
9.2 4.2 4.7 3.9 3.6 3.5 6.5 6.0 7.9 7.0 6.8 6.6
Transport 0.0 0.0 0.0 0.0 0.0 0.0 0.0 0.0 0.0 0.0 0.0 0.0
Domestic Aviation 0.0 0.0 0.0 0.0 0.0 0.0 0.0 0.0 0.0 0.0 0.0 0.0
Road Transportation NE NE NE NE NE NE NE NE NE NE NE NE
Railways 0.0 0.0 0.0 0.0 0.0 0.0 0.0 0.0 0.0 0.0 0.0 0.0
Other Sectors 1.2 1.0 0.8 0.7 0.7 0.6 30.9 31.8 34.1 37.9 36.7 31.1
Residential 0.7 0.5 0.5 0.5 0.5 0.4 30.7 31.6 34.0 37.8 36.6 30.9
Agriculture/Forestry/Fishing/Fish Farms, Stationary
0.6 0.5 0.3 0.2 0.2 0.2 0.2 0.2 0.1 0.1 0.1 0.1
Non-Specified 0.0 1.0 2.6 1.2 1.4 1.5 0.2 0.6 0.7 0.3 0.3 0.3
Note: NО – Not occurring; NE – Not estimated; IE – Included elsewhere
Table 38. Emissions of NMVOC, SO2 and NH3 from the Fuel Combustion Activities (in Gg)
Categories NMVOC SO2 NH3
1990 2000 2005 2014 2015 2016 1990 2000 2005 2014 2015 2016 1990 2000 2005 2014 2015 2016
Fuel Combustion Activities
5.6 5.8 6.3 6.7 6.5 5.6 96.0 102.4 103.2 76.4 68.8 59.7 0.5 0.6 0.6 0.7 0.7 0.6
Energy Industries
0.1 0.1 0.1 0.1 0.1 0.1 89.0 96.1 94.8 69.5 62.0 53.2 NO NO NO NO NO NO
Main Activity Electricity and Heat Production
0.1 0.1 0.1 0.1 0.1 0.1 89.0 96.1 94.6 69.5 62.0 53.2 NO NO NO NO NO NO
Electricity Generation
0.1 0.1 0.1 0.1 0.1 0.0 84.6 91.5 92.5 69.3 62.0 53.2 NO NO NO NO NO NO
Combined Heat and Power Generation
0.0 0.0 0.0 0.0 0.0 0.0 3.3 1.0 0.6 0.1 0.0 0.0 NO NO NO NO NO NO
Heat Plants 0.0 0.0 0.0 0.0 0.0 0.0 1.1 3.5 1.5 0.0 0.0 0.0 NO NO NO NO NO NO
Petroleum Refining
IE IE IE IE IE IE IE IE IE IE IE IE NO NO NO NO NO NO
Manufacture of Solid Fuels and Other Energy Industries
0.0 0.0 0.0 0.0 0.0 0.0 0.0 0.0 0.2 0.1 0.0 0.0 NO NO NO NO NO NO
Manufacture of Solid Fuels
NO NO NO NO NO NO NO NO NO NO NO NO NO NO NO NO NO NO
Other Energy Industries
0.0 0.0 0.0 0.0 0.0 0.0 0.0 0.0 0.2 0.1 0.0 0.0 NO NO NO NO NO NO
Manufacturing Industries and Construction
0.9 0.7 1.0 0.9 0.8 0.8 6.0 5.6 7.3 6.5 6.4 6.1 0.0 0.0 0.0 0.0 0.0 0.0
Transport 0.0 0.0 0.0 0.0 0.0 0.0 0.0 0.0 0.0 0.0 0.0 0.0 0.0 0.0 0.0 0.0 0.0 0.0
Domestic Aviation
0.0 0.0 0.0 0.0 0.0 0.0 0.0 0.0 0.0 0.0 0.0 0.0 NO NO NO NO NO NO

National Inventory Report
Third Biennial Update Report
58 Precursors and indirect emissions
Road Transportation
NE NE NE NE NE NE NE NE NE NE NE NE NE NE NE NE NE NE
Railways 0.0 0.0 0.0 0.0 0.0 0.0 NO NO NO NO NO NO 0.0 0.0 0.0 0.0 0.0 0.0
Other Sectors 4.6 4.7 5.1 5.7 5.5 4.7 0.8 0.6 0.5 0.2 0.3 0.2 0.5 0.5 0.6 0.7 0.6 0.5
Residential 4.5 4.7 5.0 5.7 5.5 4.6 0.6 0.4 0.4 0.2 0.2 0.2 0.5 0.5 0.6 0.7 0.6 0.5
Agriculture/Forestry/Fishing/Fish Farms, Stationary
0.0 0.0 0.0 0.0 0.0 0.0 0.2 0.2 0.1 0.1 0.1 0.1 NO NO NO NO NO NO
Non-Specified 0.0 0.3 0.2 0.1 0.1 0.1 0.2 0.1 0.5 0.1 0.2 0.2 0.0 0.0 0.0 0.0 0.0 0.0
Note: NО – Not occurring; NE – Not estimated; IE – Included elsewhere
7.2.1 Methodology and emission factors
The IPCC Guidelines contain links to information on methods, used under other agreements and conventions, for the estimation of emissions of tropospheric precursors which may be used to supplement the reporting of emissions and removal of greenhouse gases. Table 7.1 of 2006 IPCC Guidelines for National Greenhouse Gas Inventories, Chapter 7: Precursors and Indirect Emissions provides a link between the IPCC categories and the corresponding methodology chapters in EMEP/CORINAIR guidebook. In this BUR, the latest EMEP/EEA air pollutant emission inventory guidebook from 2019 was used. The estimation of precursors and indirect emissions of the Energy sector is done using the Tier 1 methodology. The reason behind that is that the higher Tier methodologies require detailed characteristics of the fuels used in combination with onsite measurements or other detailed parameters, which were not available in the period of preparation of the 3rd BUR.
Table 39. Emission factors used for estimation of the emissions of Precursors and Indirect emissions of the Energy sector
Emission factor 3rd BUR Comment
Energy sector Tier 1 EF EMEP/EEA air pollutant emission inventory guidebook 2019
Tier 1 methodology applied. Not enough onsite measurement data and detailed parameters for application of higher Tier methodologies.
7.2.2 Data sources
All activity data for the period 1990-1997, as well as 2003 and 2004, are taken from the International Energy Agency database, while the remaining period is covered with data from the national energy balances published by the State Statistical Office (Table 40).
Table 40. Data sources for estimation of the emissions of Precursors and Indirect emissions of the Energy sector
Documents Data provider
Energy sector
IEA Database, (annual databases from 1990-1997, 2003 and 2004) Energy balance, Final data, (1998-2002 publications, 2005-2016 MAKSTAT database)
International Energy Agency SSO
7.3 IPPU
During the preparation, of the IPPU non-GHG emissions part of the inventory it was found that there is a big gap in the emissions for the entire reporting period. Although activity data have been available in the software for the period 1990 – 2001, the non-GHG emissions from Iron and steel were not calculated. In addition, for several categories, different emission factors have been used. Having this in mind, the overall period before 2015 is revised.
The Non-GHG emissions from IPPU are very small compared to the emissions from the Energy industries sector. The peak of the emissions is in 2000 achieving 3.3 Gg, while in 2016 the emissions are 2.5 Gg or 26.4% more compared to 2014 (Figure 49). Most of the emissions are CO, which participates with 52% in 2016, follow by NOx with around 36% and SOx with 11%.
Figure 49. Emissions of NOx, CO, NMVOC and SO2 from the IPPU sector (in Gg)

National Inventory Report
Third Biennial Update Report
59 Precursors and indirect emissions
Mineral and metal industries are the only ones that have created the non-GHG emission in the IPPU category. Almost all NOx and SO2 emissions are produced by the cement production in the Mineral industry, 97% and 93% in 20016 (Figure 50, Figure 51). The share of the Mineral industry is also dominant in the CO and NMVOC emissions participating with around 80%, 61%, respectively (Figure 52, Figure 53). As a result of the higher clinker production in 2016 compared to 2014 the NOx emissions are increased 32.6% during this period, while the SO2 emissions are increased by 36.5%. The peak of the iron and steel production in 2005 led to the highest CO and NMVOC emissions from this sub-category. In that year the share of the Metal industry in CO was 52.8% while in NMVOC was around 72%.
Figure 50. NOx emissions from the IPPU sector, by category (in Gg)
Figure 51. SO2 emissions from the IPPU sector, by category (in Gg)
Figure 52. NMVOC emissions from the IPPU sector, by category (in Gg)
Figure 53. CO emissions from the IPPU sector, by category (in Gg)
20001990 20162005
2.7
2014
11.2%
2015
62.5%
2.6
3.3
2.0 1.9
29.4% 31.7%
27.6%
52.1%
33.9% 35.9%
35.6%
51.0% 47.2%
54.8%
52.4%
18.7% 20.4%8.7% 10.4% 11.2%
2.5
+26.4%
-5.5%
NMVOC
NOx
CO
NH3
SOx
2.6%
1990 20052000
2.5%2.3%3.7%
2014 2015
95.4%
2016
0.8
0.9
0.8
0.9
0.70.7
97.4%
90.8%
4.6%
96.3%
97.5%
97.7%
9.2%
+32.6%
+14.4%
Mineral Metal
44.7%
6.0%
86.6%
55.3%
45.3%
2015
13.4%
54.7%
2000 2005 2014
94.5%
5.5%
94.0%
2016
0.5
93.1%
6.9%
0.5
0.3
0.2 0.2
0.3
1990
+36.5%
-43.3%

National Inventory Report
Third Biennial Update Report
60 Precursors and indirect emissions
7.3.1 Methodology and emission factors
The Tier 1 approach was used to calculate the emissions of precursors and indirect emission from IPPU sector (Table 41).
Table 41. Emission factors used for estimation of the emissions of Precursors and Indirect emissions of the IPPU sector
Emission factor 3rd BUR Comment
Mineral industry EMEP/EEA air pollutant emission inventory guidebook 2019
Table 3.1 Tier 1 emission factors for source category 2.A.1 Cement production.
Table 3-24 Tier 2 emission factors for source category 1.A.2.f.i, Cement production (1.A.2 Manufacturing industries and construction (combustion))
Table 3.1 Tier 1 emission factors for source category 2.A.2 Lime production.
Table 3-23 Tier 2 emission factors for source category 1.A.2.f.i, Lime production (1.A.2 Manufacturing industries and construction (combustion))
Table 3.1 Tier 1 emission factors for source category 2.A.3 Glass production
Metal industry EMEP/EEA air pollutant emission inventory guidebook 2019
Table 3.15 Tier 2 emission factors for source category 2.C.1 Iron and steel production, steel making, electric arc furnace steel plant.
Table 3.1 Tier 1 emission factors for source category 2.C.5 Lead production
7.3.2 Data sources
The activity data used for each industry is production per year (tons/year) as given in five-year data reports on the industrial production in Macedonia from the State Statistical Оffice.
Table 42. Data sources for estimation of the emissions of Precursors and Indirect emissions of the IPPU sector
Documents Data provider
Mineral industry Cement Industry clinker production Industry (1990-1995, 1996-2001, 2002-2006, 2006-2010, 2011-2016), MAKSTAT 2007-2016
MOEPP SSO
Metal industry Industry (1990-1995, 1996-2001, 2002-2006, 2006-2010, 2011-2016), MAKSTAT 2007-2016
SSO
7.4 AFOLU
In the sector AFOLU, the NOx and NMVOC emissions are occurring from the category Agriculture, category Manure management, while in category Forestry and Other Land Use, all emissions are originating from the category Aggregate sources and non-CO2 emissions sources on land: subcategory Biomass burning in Forest land (forest fires).
2000
47.2%
2005
70.3%
29.7%
2014
20.9%
2015
77.9%
22.9%
2016
1.3
34.7%
65.3%
79.1%
1990
52.8%
1.1
77.1%
1.3
2.1
1.0
1.3
22.1%
+20.8%
-3.0%
Mineral Metal
40.1%
2000
71.6%
2005
51.3%
48.7%
0.02
2014
63.0%
28.4%
0.04
2015
0.0243.5%
61.3%
38.7%
59.9%
20161990
56.5%
0.02
0.02
0.02
37.0%
+13.1%
-9.8%

National Inventory Report
Third Biennial Update Report
61 Precursors and indirect emissions
The non-GHG emissions from AFOLU vary during the reporting period, mostly depending on forest fires. The peak of the emissions of 178 Gg is achieved in 2000 (Figure 54), which is а result of the biggest forest fires in the overall reporting period. CO emissions participate with almost 80% in 2000. Compared to 2014 the non-GHG emissions in 2016 are higher for 48%. The second contributor in the overall non-GHG emissions is NH3 from manure management, participating with almost 44% in 2016.
The results by categories shows that:
• During the analysed period emissions of NOx are typically in the range 0.1-0.7 Gg, with exception of the year 2000, where the emissions are 4.7 Gg, due to extensive forest fires and area burned in the country (Figure 55).
• The SO2 emissions are around 0.1 Gg, while in 2000 they reached 0.9 Gg. All SO2 emissions are produced by forest fires (Figure 56).
• NMVOCs are in average 5 Gg/year, while in the year 2000 they are estimated on 19 Gg (Figure 57).
• CO emissions are in range 0.4-17 Gg, but in years 2000 they were 138 Gg, because of the fires (Figure 58).
• All NH3 are results of manure management activities. In 2016 they are lower for 32% compared to 1990, while for 5% higher from 2014 (Figure 59)
Figure 54. Emissions of NOx, CO, NMVOC, SO2 and NH3 from the AFOLU sector (in Gg)
Figure 55. NOx emissions from the AFOLU sector, by category (in Gg)
Figure 56. SO2 emissions from the AFOLU sector, by category (in Gg)
2005
73.4%
0.9%13.7%0.1%
2014
1.8%48.1%
0.3%
2015
1.5%35.4%
2016
77.8%
0.2%
178.42.6%
8.4%
0.5%
0.5%
2000
0.0%
28.018.9
1990
25.01.2%
24.4
36.0
43.6%
25.1%1.8%
0.2%32.9%52.4% 61.5%
+48.3%
+15.1%
NOx
CO
SOx
NMVOC
NH3
53.3%
2014
12.1%
87.9%
2015
71.2% 80.3%
2016
88.2%11.8%
2.1%
1990 2000
0.1
4.7
0.30.7
97.9%
0.428.8%
2005
0.246.7%
19.7%+154.7%
+225.1%
Manure Management Biomass burning
0.0%
100.0%
2005
0.0%100.0%
2014
0.0%
100.0%
2015
100.0%0.0%
2016
0.0
100.0%0.0%
2000
0.0
0.9
0.0
0.1
0.1
1990
0.0% 100.0% +283.8%
+2,117.8%

National Inventory Report
Third Biennial Update Report
62 Precursors and indirect emissions
Figure 57. NMVOC emissions from the AFOLU sector, by category (in Gg)
Figure 58. CO emissions from the AFOLU sector, by category (in Gg)
Figure 59. NH3 emissions from the AFOLU sector, by category (in Gg)
7.4.1 Methodology and emission factors
Emissions of NMVOCs occur from silage, manure in livestock buildings, outside manure storages, field application of manure and from grazing animals. There is a lack of emissions estimates related to feeding with silage, outdoor manure stores, manure application, and grazing animals, due to lack of appropriate activity data.
Emissions of NH3, NO, and NMVOCs arise from the excreta of agricultural livestock that are deposited in and around buildings and collected as liquid slurry, solid manure or litter-based farmyard manure. These emissions occur from buildings housing livestock and outdoor yard areas, from manure storages, after manure land spreading and during grazing.
The subcategory Biomass burning in forests includes emissions from (naturally or man-induced) burning of non-managed and managed forests and other vegetation, excluding agricultural burning of stubble, etc. This includes domestic fires (fuel wood-, crop residue-, dung and charcoal burning) as well as open vegetation fires (forest, shrub-, grass- and cropland burning).
The Tier 1 approach was used to calculate the emissions of precursors and indirect emission from AFOLU sector (Table 43).
Table 43. Emission factors used for estimation of the emissions of Precursors and Indirect emissions of the AFOLU sector
Emission factor 3rd BUR
Manure Management EMEP/EEA pollutant emission inventory Guidebook 2019; 3.B Manure management
2.60.4100.0%
0.0%
2005
0.0%100.0%
0.0% 100.0%
2015
0.0%
138.7
2016
9.9
0.0%
0.0%
2000
100.0%
1990
6.3
17.3
100.0%
100.0%
2014
+283.8%
+2,117.8%
Manure Management Biomass burning
72.8%
1990 2000
11.9%
2016
88.1%
2005
94.3%
5.7%
2014
71.5%
5.30
28.5%
19.05
2015
6.08
81.7%
18.3%
5.43
4.51
99.2%
27.2%
0.8%
5.91 +20.4%
-8.2%
0.0%
12.22
1990
0.0%
100.0%
13.10
100.0%
20142005
100.0%
0.0% 0.0%
2015
100.0%
0.0%
2016
11.81
2000
100.0%
100.0%
0.0%
17.88
14.96
11.64
+5.0%
-31.7%
Manure Management
Biomass burning

National Inventory Report
Third Biennial Update Report
63 Precursors and indirect emissions
Table 3.2. Default Tier 1 EF (EFNH3) for calculation of NH3 emissions from manure management
Table 3.3 Default Tier 1 EFs for NO (as NO2) from stored manure
Table 3.4 Default Tier 1 EFs for NMVOCs
Table 3.5 Default Tier 1 estimates of EF for particle emissions from livestock husbandry (housing)
Emissions from biomass burning
EMEP/EEA pollutant emission inventory Guidebook 2019; 11.B Forest fires
Table 3-1 Tier 1 emission factors for source category 11.B Forest fires
7.4.2 Data sources
The activity data used for manure management are livestock populations provided by SSO. For biomass burning the activity data are the areas burned (forests). Data on forest fires were obtained from MAFWE, State Inspectorate for Forestry and Hunting and the Crisis Management Centre (Table 44).
Table 44. Data sources for estimation of the emissions of Precursors and Indirect emissions of the IPPU sector
Documents Data provider
Livestock-Manure Management
Total number of livestock & poultry in Macedonia
SSO –MAKSTAT database
Biomass burning in forests
SSO Yearbooks, Annual reports, internal documents
Enterprises that manage forests (PE Makedonski sumi, National parks, Association of private forest owners), MAFWE, CMC (Center for Management of Crisis), FFU (Firefighting Union))
7.5 Waste
In the Waste sector, the emissions of NOx, CO, and SO2 are produced by open burning of waste, by the solid waste incineration processes (mainly medical waste), as well as by the incineration of sludge from wastewater treatment. NMVOC emissions can originate from wastewater treatment plants and open burning of waste.
During the preparation of the precursors and indirect emissions from waste, it was found that there are inconsistencies in the data and factors used in the period 1990-2014. Having in mind that better data are available, the revision of the times series was made. For example for Domestic wastewater treatment and discharge, lower factor for waste generation per capita was used. This factor is revised according to the data that SSO is publishing starting from 2016.
In 2016, the amount of precursors and indirect emissions is two times higher compared to 1990, or the average annual growth rate is 3% (Figure 60). The increase is coming from the Open burning of waste at the dump sites. CO is the dominant one with a participation of around 75% during the overall reporting period, while the second one is NMVOC with 21%.
Figure 60. Emissions of NOx, CO, NMVOC and SO2 from the Waste sector (in Gg)
2014
74%
2000
6
4%
20161990
75%
21%
4%
75%
3
21%21%
2005
75%
4%
75%
4%
21%
2015
4%
75%
4%
21%22%
3
4
6 6
2%
+111%
NOx CO NMVOC NH3SO2

National Inventory Report
Third Biennial Update Report
64 Precursors and indirect emissions
Although there is an incinerator at Drisla landfill, the emissions are negligible and almost the overall amount of NOx, CO, and SO2 emissions are generated by the subcategory Open burning of waste at the dumpsites (Table 45). On the other hand, the category Solid waste disposal is contributing with more than 87% in the NMVOC in 2015 and 2016.
Table 45. Emissions of NOx, CO emissions from the Waste sector (in Gg)
Categories
NOX CO
1990 2000 2005 2014 2015 2016 1990 2000 2005 2014 2015 2016
Waste 0.34 0.37 0.53 0.78 0.64 0.71 5.91 6.41 9.29 13.56 11.22 12.46
Solid Waste Disposal NE NE NE NE NE NE NE NE NE NE NE NE
Biological Treatment of Solid Waste NE NE NE NE NE NE 0.00 0.00 0.00 0.00 0.00 0.00
Incineration and Open Burning of Waste 0.17 0.18 0.27 0.39 0.32 0.36 2.96 3.21 4.64 6.78 5.61 6.23
Waste Incineration NO NO 0.00 0.00 0.00 0.00 0.00 0.00 0.00 0.00 0.00 0.00
Open Burning of Waste 0.17 0.18 0.26 0.39 0.32 0.35 2.96 3.21 4.64 6.78 5.61 6.23
Wastewater Treatment and Discharge NE NE NE NE NE NE NE NE NE NE NE NE
Domestic Wastewater NE NE NE NE NE NE NE NE NE NE NE NE
Industrial Wastewater NE NE NE NE NE NE NE NE NE NE NE NE
NE – Not Estimated
Table 46. Emissions of NMVOC, SO2 and NH3 emissions from the Waste sector (in Gg)
Categories NMVOC SO2 NH3
1990 2000 2005 2014 2015 2016 1990 2000 2005 2014 2015 2016 1990 2000 2005 2014 2015 2016
Waste 0.13 0.14 0.21 0.30 1.22 1.21 0.01 0.01 0.02 0.03 0.02 0.03 0.00 0.00 0.00 0.00 0.00 0.00
Solid Waste Disposal
0.00 0.00 0.00 0.00 0.97 0.93 NE NE NE NE NE NE NE NE NE NE NE NE
Biological Treatment of Solid Waste
NE NE NE NE NE NE NE NE NE NE NE NE 0.00 0.00 0.00 0.00 0.00 0.00
Incineration and Open Burning of Waste
0.07 0.07 0.10 0.15 0.12 0.14 0.01 0.01 0.01 0.01 0.01 0.01 NE NE NE NE NE NE
Waste Incineration
0.00 0.00 0.00 0.00 0.00 0.00 0.00 0.00 0.00 0.00 0.00 0.00 NE NE NE NE NE NE
Open Burning of Waste
0.07 0.07 0.10 0.15 0.12 0.14 0.01 0.01 0.01 0.01 0.01 0.01 NE NE NE NE NE NE
Wastewater Treatment and Discharge
0.00 0.00 0.00 0.00 0.00 0.00 NE NE NE NE NE NE NE NE NE NE NE NE
Domestic Wastewater
0.00 0.00 0.00 0.00 0.00 0.00 NE NE NE NE NE NE NE NE NE NE NE NE
Industrial Wastewater
0.00 0.00 0.00 0.00 0.00 0.00 NE NE NE NE NE NE NE NE NE NE NE NE
NE – Not Estimated
7.5.1 Methodology and emission factors
For all categories in the waste sector the default Tier 1 emission factors are used, except for the category Biological treatment of waste – composting for which Tier 2 emission factors are applied.
Regarding wastewater handling, emissions are calculated from both domestic wastewater treatment and industrial wastewater treatment. Starting from 2017, the State Statistical Office is issuing a report on Public water supply and Public sewage. This report contains information about the quantities of total discharged wastewater, non-purified wastewater and purified wastewater, which were used to calculate the share of wastewater treated. On the other hand, the quantities of discharged wastewater from households together with the number of populations, provide information about the domestic wastewater per capita. This information was used to calculate the total amount of domestic wastewater produced and treated in 2015 and 2016. The same methodology is applied for the period before 2015. In addition, for the industrial wastewater treatment, it was noted that in the activity data instead of wastewater generated in m3, the industrial production in tones is used, so it was corrected.
Table 47. Emission factors used for estimation of the emissions of Precursors and Indirect emissions of the Waste sector
Emission factor 3rd BUR Comment

National Inventory Report
Third Biennial Update Report
65 Precursors and indirect emissions
Waste incineration of clinical waste Table 3-1 from EMEP/EEA Air Pollutant Emission Inventory Guidebook 2019, Chapter 5.C.1.b.iii Clinical waste incineration
Open burning of waste Table 3-1 from EMEP/EEA Air Pollutant Emission Inventory Guidebook 2019, Chapter 5.C.2 Open burning of wastes
Wastewater handling Table 3-1 from EMEP/EEA Air Pollutant Emission Inventory Guidebook 2019, Chapter 5.D. Wastewater handling
7.5.2 Data sources
The main data source is the State Statistical Office, as well as relevant reports from the institutions as MOEPP (Table 48).
Table 48. Data sources for estimation of the emissions of Precursors and Indirect emissions of the Waste sector
Documents Data provider
Waste incineration of clinical waste Drisla landfill data on incineration of medical waste
Drisla web site, MOEPP reports on environment 2000-2016
Open burning of waste Report on non-compliant landfilling in the R Macedonia, 2011
Municipal waste
MOEPP,
SSO
Wastewater handling Public water supply and Public sewage,
Utilisation and protection of water against pollution in industry,
Industrial production
SSO

National Inventory Report
Third Biennial Update Report
66 Key category analysis
8 Key category analysis
The analysis of key categories that contribute the most to the absolute level of national emissions and removals (level assessment) and to the trend of emissions and removals (trend assessment), is conducted using the Approach 1. According to this approach, key categories are identified using a pre-determined cumulative emissions threshold. Key categories are those that, when summed together in descending order of magnitude, add up to 95% of the total level/trend.
The level assessment is performed for 1990 as a base year and for 2016, as the latest year. The results in Gg CO2-eq and percentages (up to 95%) for 2016 are depicted in Figure 61. Consequently, the top five categories with the highest values of Gg CO2-eq (both emissions and removals) include: Energy Industries – Solid Fuels (27.4%) (Energy sector), Forest Land Remaining Forest Land (17.5%) (AFOLU sector), Road Transportation (16.6%) (Energy sector), Enteric Fermentation (5.3%) (from Livestock in AFOLU sector) and Manufacturing Industries and Construction – Solid Fuels (4.1%) (Energy sector). The Forest land category is relevant for sinks, while the other categories for GHG emissions. The level assessment of key categories in 1990 and 2016 in details is given in Appendix III.
Figure 61. Level assessment of key categories and their contribution in 2016
The trend assessment of source categories is also executed, taking 1990 as base year and 2016 as latest inventory year. The purpose of this trend assessment is to emphasize the categories whose trend is significantly different from the trend of the overall inventory, regardless whether the category trend is increasing or decreasing, or is a sink or source. The results in percentages (up to 95%) presented on Figure 62 show that Forest Land Remaining Forest Land category participates with 27.4%, follow by Road Transportation with 22.8%, Energy Industries-solid fuels with 5%, Manufacturing Industries and Construction – Liquid Fuels with 4.8% and Refrigeration and Air Conditioning with 4.6%. An overview of the trend assessment relating to 1990 and 2014 is given in Appendix III.
The identified key categories, with both level and trend assessment, for 2016 are summarized in Table 49.
27.4%
17.5%
16.6%
5.3%
4.1%
3.8%
3.6%
3.0%
2.6%
2.5%
1.8%1.6% 1.2%
1.1% 1.1%
0.8%
2016
Energy Industries - Solid Fuels Forest land Remaining Forest land Road Transportation
Enteric Fermentation Manufacturing Industries and Construction - Solid Fuels Solid Waste Disposal
Manufacturing Industries and Construction - Liquid Fuels Cement production Refrigeration and Air Conditioning
Energy Industries - Gaseous Fuels Direct N2O Emissions from managed soils Non-Specified - Liquid Fuels
Ferroalloys Production Manure Management Solid Fuels
Energy Industries - Liquid Fuels
3,3
79
2,1
54
2,0
50
652
508
473
450
373
316
314
224
203
145
141
13
8
93
0.0000
500.0000
1000.0000
1500.0000
2000.0000
2500.0000
3000.0000
3500.0000
4000.0000
Gg
CO
2-e
q
IPCC Category

National Inventory Report
Third Biennial Update Report
67 Key category analysis
Figure 62. Contribution of key categories to the Trend (1990, 2016) in percentages
Table 49. Summary of key category analysis in 2016
IPCC Category code IPCC Category Greenhouse gas
Identification Criteria
Comment
1 1.A.1 Energy Industries - Solid Fuels CO2 L1, T1
2 3.B.1.a Forest land Remaining Forest land CO2 L1, T1
3 1.A.3.b Road Transportation CO2 L1, T1
4 3.A.1 Enteric Fermentation CH4 L1, T1
5 1.A.2 Manufacturing Industries and Construction - Solid Fuels CO2 L1, T1
6 4.A Solid Waste Disposal CH4 L1, T1
7 1.A.2 Manufacturing Industries and Construction - Liquid Fuels CO2 L1, T1
8 2.A.1 Cement production CO2 L1, T1
9 2.F.1 Refrigeration and Air Conditioning HFC L1, T1
10 1.A.1 Energy Industries - Gaseous Fuels CO2 L1, T1
11 3.C.4 Direct N2O Emissions from managed soils N2O L1, T1
12 1.A.5 Non-Specified - Liquid Fuels CO2 L1, T1
13 2.C.2 Ferroalloys Production CO2 L1
14 3.A.2 Manure Management CH4 L1, T1
15 1.B.1 Fugitive emissions - Solid Fuels CH4 L1
16 1.A.1 Energy Industries - Liquid Fuels CO2 L1, T1
17 1.A.4 Other Sectors - Liquid Fuels CO2 T1
18 2.C.6 Zinc Production CO2 T1
19 1.A.2 Manufacturing Industries and Construction - Gaseous Fuels CO2 T1
20 2.C.3 Aluminium production PFCs T1
21 3.B.2.b Land Converted to Cropland CO2 T1
Notation keys: : L = key category according to level assessment; T = key category according to trend assessment; L1 – Level assessment, Approach
1; T1 – Trend assessment, Approach 1 *Non-specified - as a subcategory under the Manufacturing Industries and Construction in Fuel combustion activities in Energy sector **Other sectors – as a category under the Fuel combustion activities in Energy sector, consisted of the subcategories Commercial/Institutional, Residential and Agriculture/Forestry/Fishing/Fish farms
27.4
22.8
5.0 4.84.6 4.6
4.4 4.1 3.2 3.0 2.61.8 1.8 1.3 1.1 0.9 0.8 0.6 0.5
0.0
5.0
10.0
15.0
20.0
25.0
30.0%
Contr
ibution to T
rend
IPCC Categories

National Inventory Report
Third Biennial Update Report
68 Uncertainty analysis
9 Uncertainty analysis
In each analysis, the accuracy of input data is very important because they dictate the precision of the results. The reduction of the uncertainty in the input data may greatly increases the reliability of the result. This is a major reason for making uncertainty analyses, as they are seen as a means to help prioritize national efforts to reduce the uncertainty of inventories in the future. Therefore, the uncertainty analyses are an essential part of the GHG inventory.
There are two basic approaches for determining uncertainty of the inventories: Approach 1 (Error Propagation method) and Approach 2 (which is actually an implementation of the Monte Carlo method). As a well-established practice in the previous inventory reports, both of these methods are implemented for the purpose of this inventory, and also a comparison between them is made.
The Approach 1 is based upon Error Propagation method and it is very easy to use because it is already implemented in the IPCC Inventory Software. This uncertainty tool of the software calculates the uncertainty of the whole inventory for a given year, as well as uncertainty in trend between a year of interest and a base year. Although, the software does not determine disaggregated results at sector level, they can be calculated in spreadsheet software implementing the well-known equations for Approach 1 - Error Propagation method. For the purposes of this inventory, this method was implemented in Excel, so that uncertainty results by sector are calculated.
The second approach according to which the uncertainty can be calculated is the Monte Carlo method. According to this method, random values of the input variables are selected from within their probability density function and the corresponding output is calculated. This procedure is repeated many times or until the mean and the distribution of the output variables do not change. The input variables may include activity data, emission factors, conversion factors etc. and the output variable is the quantity of emissions.
After a review made on a number of recent inventories (including inventories of Annex I countries), it can be concluded that in very few of them Approach 2 is implemented, because it is more complex than Approach 1, and on the other hand requires greater skills to connect the Monte Carlo simulation with the IPCC Inventory Software.
As this approach is not implemented in the IPCC 2006 software, for the inventory in SBUR a separate model was developed in MATLAB. This model directly uses the database of the Inventory (created through the IPCC Inventory Software), calculates random values for each input variable (according to their probability density function) and as a result computes the emissions.
Concerning the uncertainty calculations in the previous national reports, in the Second National Communication uncertainty is done using both methods for the Energy sector for 2000. In the Third National Communication Approach 2 is used for determining the uncertainty in the IPPU sector for the years 2003 to 2009, while in the First Biennial Update Report Approach 1 is used for the inventory for 2012 and for calculating uncertainty in trend for the years 1990 and 2012. In this report both, Approach 1 and Approach 2, are applied for each sector of the inventory for 2014, 2015 and 2016.
9.1 Input data
In order to calculate the uncertainty of the emissions for each sector separately, as well as the uncertainty of the total annual emissions, it is first needed to define uncertainty values for the input data. The IPCC Inventory Software allows input of uncertainty for activity data and emission factors. Based on these data the software automatically calculates uncertainty using the Error Propagation method (Approach 1). The disadvantage of this approach is that in certain sectors where activity data and emission factor is composed of multiple inputs that have different uncertainty, those have to be summarized in just two values for activity data and emission factors. Therefore, this introduces further uncertainty in the calculations. As stated previously, for the Monte Carlo method (Approach 2) a special tool has been created, which allows input of uncertainty for each input data separately.
The input data in the Energy sector, according to the Guidelines, as well as according to the confidentiality of the available resources in Macedonia is the most reliable. Accordingly, the values of the uncertainty for activity data and emission factors are set to 5% in both methods (Table 50). Additionally, in the IPPU sector the same input data for uncertainty are used in both methods (Table 50). In these two sectors, the calculations of the emissions mainly depend only on the two inserted values for activity data and emission factors, therefore it was decided to use uncertainty only for these two variables.

National Inventory Report
Third Biennial Update Report
69 Uncertainty analysis
Table 50. Input data for uncertainty in the IPCC Inventory Software and Monte Carlo method for Energy and Industrial Processes and Product Use sectors (in %)
Activity data uncertainty
Emission factors uncertainty
Energy 5 5
Industrial Processes and Product Use
Mineral Industry
Cement production 10 3
Glass Production 5 30
Other Process Uses of Carbonates
Ceramics 3 5
Other Uses of Soda Ash 3 5
Other 3 5
Chemical Industry
Soda Ash Production 5 5
Metal Industry
Iron and Steel Production 10 5 (CO2)
Ferroalloys Production 5 5 (CO2 and CH4)
Aluminium production 2 10 (CO2) and 50 (PFC)
Product Uses as Substitutes for Ozone Depleting Substances
Refrigeration and Air Conditioning
Refrigeration and Stationary Air Conditioning 5 5 (HFC)
For the other two sectors - AFOLU and Waste, as activity data and emission factors are mainly calculated on the basis of multiple input data, as well as according to the directions given in the Guidelines, in the Monte Carlo method the uncertainty for each input data is entered separately (as presented in Table 51 and Table 52). When entering uncertainty in IPCC Inventory Software for these two sectors, an approximation is made to represent all these values for uncertainty by only two values by subcategory, given in Table 53.
In order to determine the input values for uncertainty in each sector, the corresponding Guidelines were followed.
Table 51. Input data for uncertainty in the Monte Carlo method for AFOLU sector (in %)
Uncertainty
AFOLU
Livestock
Number of animals 5
Emission Factor 30
Land
Forest Land
Wood/firewood removal 20
Area 20
Fraction of biomass lost in disturbance 15
Biomass conversion and expansion factor 5
Ratio of below-ground biomass to above-ground biomass 5
Carbon fraction of dry matter 5
Cropland, Grassland, Settlement and Other Land
Area 10
Annual biomass carbon growth 75
Annual loss of biomass carbon 75
Dead wood/litter stock, under the old land-use category 10
Stock change factor for land-use system 10
Stock change factor for management regime 5
Stock change factor for C input 10

National Inventory Report
Third Biennial Update Report
70 Uncertainty analysis
Table 52. Input data for uncertainty in the Monte Carlo method for Waste sector (in %)
Uncertainty
Waste
Solid Waste Disposal
Total Municipal Solid Waste 30
Fraction of MSWT sent to SWDS 30
Degradable Organic Carbon 20
Fraction of Degradable Organic Carbon Decomposed 20
Methane Correction Factor
= 1.0 10
= 0.8 20
= 0.5 20
= 0.4 30
= 0.6 50
Fraction of CH4 in generated Landfill Gas (F) = 0.5
5
GDP 5
Waste Generation Rate 10
Table 53. Input data for uncertainty in the IPCC Inventory Software for AFOLU and Waste sectors (in %)
Activity data uncertainty
Emission factors uncertainty
AFOLU
Livestock 5 30
Land
Forest land
Forest land remaining Forest land 20 10
Land Converted to Forest land 10 10
Cropland, Grassland, Settlement and Other Land
Land remaining Land 10 50
Land Converted to other Land 10 50
Waste 30 30
For the Monte Carlo method it is assumed that each input variable has normal distribution.
9.2 Results
9.2.1 Error propagation method (Approach 1)
When using the Error Propagation method for calculating the uncertainty for each sector separately, the obtained results indicate that the AFOLU sector has the highest uncertainty (Figure 63). Immediately after this sector is the sector Waste. A characteristic of these two sectors is that uncertainty in certain subcategories reaches over 40% and in 2014 the uncertainty in the sub-category Land to cropland is more than 90%. On the other hand, the sector with the lowest uncertainty is the Energy sector of about 4%. This sector is followed by the IPPU sector, where the Metal Industry has the utmost uncertainty of around 10%.

National Inventory Report
Third Biennial Update Report
71 Uncertainty analysis
Figure 63. Uncertainty for 2014, 2015 and 2016 using Error Propagation method by subcategory
As a result of the different share of the individual subcategories in each analyzed year, the total annual uncertainty is different (Figure 64). The decrease of the share of the AFOLU sector (which have the highest uncertainty) in 2015 and 2016 compared to 2014, contributes to corresponding decrease of the total annual uncertainty in these two years.
The results show that the average deviation from the total annual emissions for 2014 is around ±782 Gg CO2-eq, while for 2015 and 2016 it is around ±483 Gg CO2-eq and ±544 Gg CO2-eq, respectively (Figure 64).
Figure 64. Total yearly emissions (and standard deviation) and total uncertainty for 2014, 2015 and 2016 using Error Propagation method
9.2.2 Monte Carlo method (Approach 2)
The opportunity in the Monte Carlo method to insert uncertainty for each input variable separately, especially in the AFOLU and Waste sectors, changes the obtained results compared to the Error Propagation method. According to this Approach, by far the largest uncertainty is in the Waste sector, which exceeds 29% in all the three analyzed years (Figure 65). This sector is followed by the AFOLU sector, where the greatest uncertainty is in the Livestock subcategories of about 16%. On the other hand, Energy again has the lowest uncertainty, followed by the IPPU sector.
Because uncertainty is calculated as a quotient when dividing the standard deviation to the mean value in each of the subcategories, and because the range of values in the Forestry subcategory contains both positive and negative numbers, this metric does not represent a value for the Forestry subcategory that can be compared with other subcategories, so it is left out of Figure 65. However, this subcategory is included in the total emissions, where the results are positive for each iteration and each year.
0
10
20
30
40
50
60
70
80
90
100
Mineral Industry Metal Industry Product Uses as
Substitutes for
Ozone Depleting
Supstances
Forest Land Cropland Grassland Settlement Other Land
Livestock Land
Energy Industrial Processes and Product Use Agriculture, Forestry and Other Land Use Waste
Unce
rtain
ty [
%]
2014 2015 2016
3000
4000
5000
6000
7000
8000
9000
10000
11000
12000
13000
2014 2015 2016
Gg
CO
2-e
q
Mean + STD
Mean
Mean - STD
7046
8622
8021
0
2
4
6
8
10
12
2014 2015 2016
Unce
rtain
ty [
%}
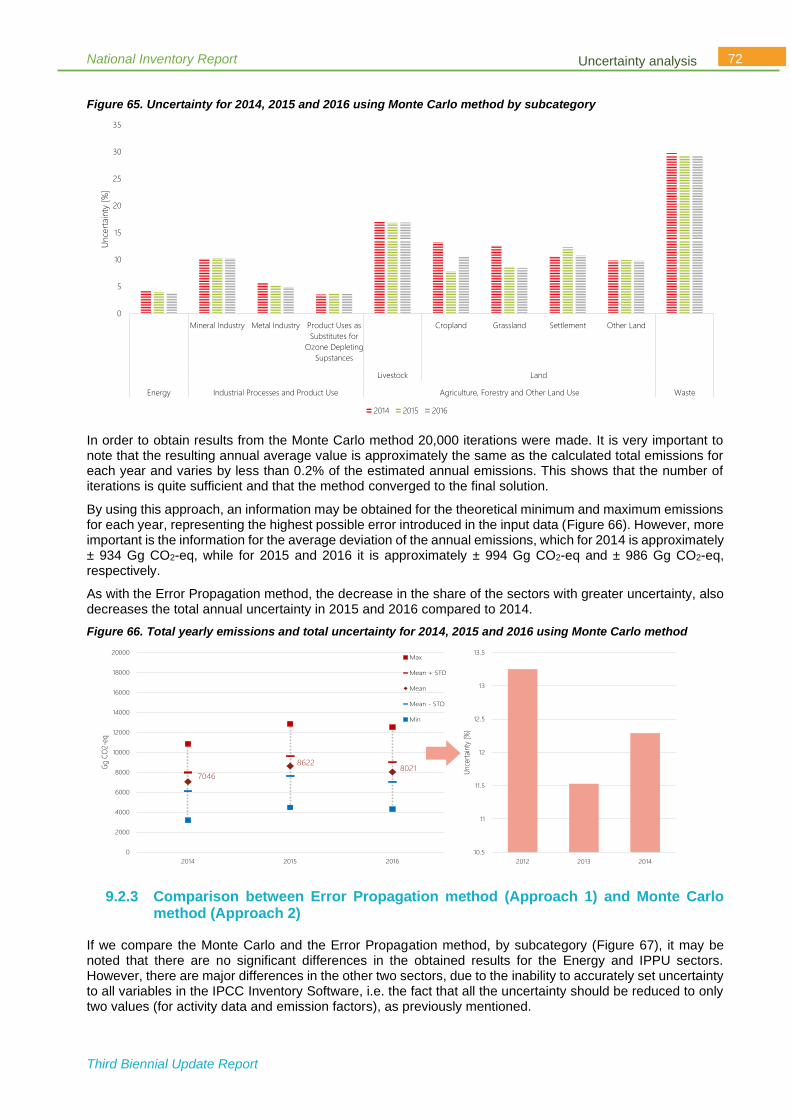
National Inventory Report
Third Biennial Update Report
72 Uncertainty analysis
Figure 65. Uncertainty for 2014, 2015 and 2016 using Monte Carlo method by subcategory
In order to obtain results from the Monte Carlo method 20,000 iterations were made. It is very important to note that the resulting annual average value is approximately the same as the calculated total emissions for each year and varies by less than 0.2% of the estimated annual emissions. This shows that the number of iterations is quite sufficient and that the method converged to the final solution.
By using this approach, an information may be obtained for the theoretical minimum and maximum emissions for each year, representing the highest possible error introduced in the input data (Figure 66). However, more important is the information for the average deviation of the annual emissions, which for 2014 is approximately ± 934 Gg CO2-eq, while for 2015 and 2016 it is approximately ± 994 Gg CO2-eq and ± 986 Gg CO2-eq, respectively.
As with the Error Propagation method, the decrease in the share of the sectors with greater uncertainty, also decreases the total annual uncertainty in 2015 and 2016 compared to 2014.
Figure 66. Total yearly emissions and total uncertainty for 2014, 2015 and 2016 using Monte Carlo method
9.2.3 Comparison between Error Propagation method (Approach 1) and Monte Carlo method (Approach 2)
If we compare the Monte Carlo and the Error Propagation method, by subcategory (Figure 67), it may be noted that there are no significant differences in the obtained results for the Energy and IPPU sectors. However, there are major differences in the other two sectors, due to the inability to accurately set uncertainty to all variables in the IPCC Inventory Software, i.e. the fact that all the uncertainty should be reduced to only two values (for activity data and emission factors), as previously mentioned.
0
5
10
15
20
25
30
35
Mineral Industry Metal Industry Product Uses as
Substitutes for
Ozone Depleting
Supstances
Cropland Grassland Settlement Other Land
Livestock Land
Energy Industrial Processes and Product Use Agriculture, Forestry and Other Land Use Waste
Unce
rtain
ty [
%]
2014 2015 2016
0
2000
4000
6000
8000
10000
12000
14000
16000
18000
20000
2014 2015 2016
Gg
CO
2-eq
Max
Mean + STD
Mean
Mean - STD
Min
7046
86228021
10.5
11
11.5
12
12.5
13
13.5
2012 2013 2014
Unce
rtai
nty
[%
}

National Inventory Report
Third Biennial Update Report
73 Uncertainty analysis
Figure 67. Comparison of Monte Carlo and IPCC Inventory Software method by subcategory for 2014
Obviously, these differences in the emissions by subcategory when using the two approaches leads to different uncertainty in the total annual emissions (Figure 68). However, it can be concluded that the trend of uncertainty by year in the both methods is the same, i.e. increases with the increase of the share of sectors with higher uncertainty.
Figure 68. Comparison of the total yearly uncertainty between the Monte Carlo method and IPCC Inventory Software method
From the finding that the mean emissions from all iterations in the Monte Carlo method is nearly equal to the actual estimates of the emissions and that in this method individual uncertainty for each variable may be used (which is according to the Guidelines), it can be concluded that the results obtained from Approach 2 are much more relevant.
As it is presented, the highest uncertainty is in the Waste sector. This is primarily due to the large number of variables that have uncertainty, such as the total amount of municipal waste, the fraction of that amount sent to SWDS percentage wear landfill, methane correction factor, GPD and waste generation rate.
Furthermore, there is great uncertainty in the Livestock subcategory. Based on the survey conducted in the future, emissions for dairy cattle and pigs will be estimated by applying Tier2 methodology. The results were not available during the preparation of this report. Hence the uncertainty will be reduced in livestock subcategory. In this subcategory default emission factors are used, which according to the Guidelines have great uncertainty associated with them. If, in the future, national emission factors can be calculated, with lower uncertainty, it would significantly reduce the uncertainty in the sector. Following are the remaining subcategories from the AFOLU sector, where the main source of uncertainty are the areas of each type of land, as well as the areas that have been converted to other area type. As stated in the Section 6, due to the inconsistencies in the data related to this subcategories, it is recommended to establish system for continuous monitoring and inventory for each type of land that will also contribute to uncertainty reduction. However, according to the Guidelines there is also high uncertainty in the values for annual biomass carbon growth and annual loss of biomass carbon.
0.0
10.0
20.0
30.0
40.0
50.0
60.0
70.0
80.0
90.0
100.0
Mineral Industry Metal Industry Product Uses as
Substitutes for
Ozone
Depleting
Supstances
Forest Land Cropland Grassland Settlement Other Land
Livestock Land
Energy Industrial Processes and Product Use Agriculture, Forestry and Other Land Use Waste
Unce
rtain
ty [
%]
Monte Carlo Error Propagation
0
2
4
6
8
10
12
14
16
18
20
2014 2015 2016
Unce
rtain
ty [
%]
Monte Carlo Error Propagation
National Inventory Report
Third Biennial Update Report
74 QA/QC and Verification Activities
10 QA/QC and Verification Activities
The implementation of Quality Assurance and Quality Control (QA/QC) procedures is an important part of the development of national GHG inventories. As described in the IPCC Good Practice Guidance and the latest IPCC Guidelines (2006), an adequate QA/QC program ensures
• Continuous improvement
• Transparency,
• Consistency,
• Comparability,
• Completeness,
• Accuracy and
• Timeliness
of the national GHG inventories.
Quality Assurance and Quality Control measures are two distinct types of activities. The IPCC defines each as follows:
• Quality Assurance (QA) – a planned system of review procedures conducted by personnel NOT involved in the inventory development process.
• Quality Control (QC) – a system of routine technical activities implemented by the inventory development team to measure and control the quality of the inventory as it is prepared.
An effective QA/QC plan contains the following elements:
• GHG Inventory team,
• General QC activities and procedures,
• Source-specific QC activities and procedures (optional, as resources allow),
• QA review procedures.
The QA/QC procedures presented in the SBUR are also applied in 3rd BUR. The QA/QC activities of the national GHG inventory process are based on the in-depth analyses of the inventory compilation practices in the country (used in the previous BURs) and the relevant international best practices..
10.1 Personnel involved in QA/QC activities
10.1.1 Chief Technical Advisor (CTA)
The CTA is a national expert who has substantial experience in GHG inventory development and leadership quality. CTA is in charge for the following:
• Supervises the overall inventory process
• Provides advice and approval on the following GHG Inventory elements: o Input data collecting mechanisms, o Time series, o Emission factors, o Methodologies for emission calculation, o Reporting format, o Best practices (key sources analyses, uncertainty management).
• Checks, proposes corrective actions (if any) and approves the National Inventory Report (NIR).
10.1.2 Inventory Development Team (IDT)
At least one IDT member should be responsible for each GHG Inventory sector. At least one IDT member should be assigned a responsibility for compilation of the overall GHG inventory and at least one IDT member for conducting Key Sources analyses and Uncertainty management. IDT members conduct the following:
• Collect input data (activity data and emission factors),
• Calculate sectoral emissions,
• Conduct QC activities and procedures,

National Inventory Report
Third Biennial Update Report
75 QA/QC and Verification Activities
• Re-calculate sectoral emissions implementing the corrective actions proposed by Quality Assurance Team (QAT),
• Conduct Key Sources analyses and Uncertainty management,
• Implement corrective actions proposed by QAT regarding Key Sources analyses and Uncertainty management,
• Compile the overall inventory,
• Implement corrective actions proposed by QAT regarding the overall inventory
• Develop NIR,
• Implement corrective actions proposed by CTA regarding the NIR.
The IDT members that collect input data (i.e. identify/verify data sources and document the input data) and calculate the sectoral emissions are called “Enterer”, while the IDT members that conduct QC activities and procedures are called “Checker”.
10.1.3 QA team (QAT)
The QAT members have previous experience in GHG inventory development (were involved in the preparation of the previous GHG inventories). At least one QAT member should be responsible for each GHG Inventory sector. At least one QAT member should be assigned a responsibility to check and verify the overall GHG inventory and at least one QAT member to check and verify Key Sources analyses and Uncertainty management. QAT members conduct the following:
• Check, propose corrective actions (if any) and verify the sectoral emissions,
• Check, propose corrective actions (if any) and verify the overall GHG inventory,
• Check, propose corrective actions (if any) and verify the Key Sources analyses and Uncertainty management.
Table 54. 3rd BUR GHG inventory team
Expert (contact info) Role Responsibility
Acad. Gligor Kanevce
[email protected] IDT & QAT Leader Leading the overall inventory development
Natasa Markovska
Supervision and Monitoring
Approval of NIR and other reports
QA/QC activities
Verica Taseska-Gjorgievska
IDT Member
QAT Member
Compilation of overall inventory and NIR
Sectors: Energy, Waste, IPPU, Precursors and Indirect emissions (QC, development of the sectoral chapters) Key category analysis
Sectors: AFOLU
Aleksandar Dedinec
IDT Member
QAT Member
Sectors: Energy, Waste, IPPU, Precursors and Indirect emissions (QC, development of the sectoral chapters)
Key category and Uncertainty analysis
Sectors: AFOLU
Aleksandra Dedinec
IDT Member
QAT Member
Sectors: Waste (QC, development of the sectoral chapters)
Uncertainty analysis
Sectors: AFOLU
Emilija Mihajloska
[email protected] IDT Member
Sectors: Energy, Waste, IPPU, Precursors and Indirect emissions (collecting and entering data, development of the sectoral chapters)
Key category analysis
Vasil Bozhikaliev
[email protected] IDT Member
Sectors: Energy, IPPU (collecting and entering data, development of the sectoral chapters)

National Inventory Report
Third Biennial Update Report
76 QA/QC and Verification Activities
Lazar Aleksovski
[email protected] IDT Member Sector: Waste, IPPU (collecting and entering data)
Ljuleta Xhemaili
[email protected] IDT Member Legal document on list of key data providers for GHG inventory
Sreten Andonov
[email protected] IDT Member
Sector: AFOLU (collecting and entering data for Livestock, development of the sectoral chapter)
Ljupco Nestorovski
[email protected] IDT Member
Sector: AFOLU (collecting and entering data for Forestry, development of the sectoral chapter)
Nikola Nikolov
[email protected] IDT Member
Sector: AFOLU (QC for Forestry, development of the sectoral chapter)
Dusko Mukaetov
[email protected] IDT Member
Sector: AFOLU (QC for Land Use, development of the sectoral chapter)
Ordan Cukaliev
[email protected] IDT Member
Sector: AFOLU (QC for Land Use, development of the sectoral chapter)
Hristina Poposka IDT Member Sector: AFOLU (collecting and entering data for Land Use, development of the sectoral chapter)
Dusko Nedelkovski IDT Member Sector: AFOLU (collecting and entering data for Land Use, development of the sectoral chapter)
Vjekoslav Tanskovic IDT Member Sector: AFOLU (collecting and entering data for Land Use, development of the sectoral chapter)
Elena Gavrilova
[email protected] QAT Member
QA activities: Energy, Waste, IPPU and Precursors and Indirect emissions
Marjan Mihajlov
[email protected] QAT Member QA activities: Waste
10.2 Quality Control
Tier 1 approach which requires a minimum set of QC activities and procedures have been implemented by the IDT members for all sectors to ensure that basic standards of quality are met. These standards generally focus on:
• Data gathering, processing, input, and handling,
• Data documentation and archiving,
• Emissions calculation.
Table 55. 3rd BUR Tier 1 QC activities and procedures for all sectors
Data gathering, input, and handling checks
QC Activities Procedures
Check that assumptions and criteria for the selection of activity data and emission factors are documented.
• Cross-check descriptions of activity data and emission factors with information on categories and ensure that these are properly recorded and archived.
Check for transcription errors in data input and reference.
• Confirm that bibliographical data references are properly cited in the internal documentation
• Cross-check a sample of input data from each category (either measurements or parameters used in calculations) for transcription errors.
• Utilize electronic data where possible to minimize transcription errors.
• Use IPCC Inventory Software to minimize user/entry error.
Check that emissions/removals are calculated correctly.
• Reproduce a representative sample of emissions/removals calculations.
• If models are used, selectively mimic complex model calculations with abbreviated calculations to judge relative accuracy.
Check that parameter and emission/removal units are correctly recorded and that appropriate conversion factors are used.
• Check that units are properly labeled in calculation sheets.
• Check that units are correctly carried through from beginning to end of calculations.
• Check that conversion factors are correct.
• Check that temporal and spatial adjustment factors are used correctly.

National Inventory Report
Third Biennial Update Report
77 QA/QC and Verification Activities
Check the integrity of database files. • To extent possible, confirm that the appropriate data processing steps are correctly represented in the database.
• To extent possible, confirm that data relationships are correctly represented in the database.
• Ensure that data fields are properly labeled and have the correct design specifications.
• Ensure that adequate documentation of database and model structure and operation are archived.
Check for consistency in data between categories.
• Identify parameters (e.g., activity data, constants) that are common to multiple categories and confirm that there is consistency in the values used for these parameters in the emissions/removals calculations.
Check that the movement of inventory data among processing steps is correct.
• Check that emissions/removals data are correctly aggregated from lower reporting levels to higher reporting levels when preparing summaries.
• Check that emissions/removals data are correctly transcribed between different intermediate products.
Data documentation
QC Activities Procedures
Review of internal documentation and archiving.
• Check that there is detailed internal documentation to support the estimates and enable duplication of calculations.
• Check that every primary data element has a reference for the source of the data (via cell comments or another system of notation).
• Check that inventory data, supporting data, and inventory records are archived and stored to facilitate detailed review.
• Check that the archive is closed and retained in secure place following completion of the inventory
• Check integrity of any data archiving arrangements of outside organizations involved in inventory preparation.
Calculation checks
QC Activities Procedures
Check methodological and data changes resulting in recalculations.
• Check methodological and data changes resulting in recalculations.
• Check for consistency in the algorithm/method used for calculations throughout the time series.
• Reproduce a representative sample of emission calculations to ensure mathematical correctness.
Check time series consistency • Check for temporal consistency in time series input data for each category.
• Check for consistency in the algorithm/method used for calculations throughout the time series.
• Check that the effects of mitigation activities have been appropriately reflected in time series calculations.
Check completeness • Confirm that estimates are reported for all categories and for all years from the appropriate base year over the period of the current inventory.
• For subcategories, confirm that the entire category is being covered.
• Proved clear definition of ‘Other’ type categories.
• Check that known data gaps that result in incomplete category emissions/removals estimates are documented, including qualitative evaluation of the importance of the estimate in relation to total net emissions (e.g. subcategories classified as ‘not estimated’).
Trend checks • For each category, compare current inventory estimates to previous estimates, if available. If there are significant changes or departures from expected trends, re-check estimates and explain any difference. Significant changes in emissions or removals from previous years may indicate possible input or calculation errors.
• Check value of implied emission factors (aggregate emissions/removals divided by activity data) across time series. Are changes in emissions or removals being captured?
• Check if there any unusual or unexplained trends noticed for activity data or other parameters across the time series.
Source: This list has been adapted from IPCC Good Practice Guidance and the 2006 IPCC Guidelines for National GHG Inventories.

National Inventory Report
Third Biennial Update Report
78 QA/QC and Verification Activities
10.3 Quality Assurance and Verification
The quality assurance (QA) activities are performed at the inventory evaluation stage i.e. after the implementation of QC procedures to the finalized inventory. The GHG inventory quality is assured introducing external expert review conducted by QAT members. They check, and if needed, propose corrective actions and verify the following:
• Adequacy of the selected activity data and emission factors,
• Adequacy of the applied methodologies,
• Accuracy and consistency of the calculated emissions,
• Adequacy of the data documentation,
• Correctness of the conducted Key Sources analysis and Uncertainty Management.
As a final step, the CTA checks the National Inventory Report, if needed proposes corrective actions and verifies the National Inventory Report once the proposed corrective actions are implemented by the IDT members.
According to the IPCC Good Practice Guidance and Uncertainty Management in the National GHG Inventories, the priority in the QA process should be given to the key source categories, as well as source categories where significant changes in methods or data.
An expert peer review was conducted for QA of the national GHG estimates of the sectors Energy, IPPU and Waste.
The table provided bellow this paragraph contains the information of the sector specific data (Energy, IPPU and Waste) reviewed when the QA procedures were carried out.
Table 56. 3rd BUR QA procedures implemented in the Energy, IPPU and in the Waste sector
Data Type QA Activity Remarks / Comments / Examples
Activity Data Check
Check for transcription, typographical error and error transposition.
Compare the national data source with the inventory data contained in the IPCC Inventory Software
Compare with official published data
Compare the national energy related data (the data of the Energy balances published by the SSO and the data published by ESM), the annual data on industrial production (published by SSO) and the national waste related data (the Waste related data published by the SSO and the Regional Waste studies published by MOEPP) with the AD contained in the IPCC Inventory Software
Identify and fix outliers in data inputs (including checking the inclines and spikes in the trend)
Data which don’t fall under the realistic range and are suspected as inaccurate are assessed and if necessary are removed and replaced with data from international sources or derived from expert judgment
Compare with other international data Compare the Energy related data with the data published by the IEA
Check the documentation of all sources, data format and assumptions for easy reference
Keeping records on the data source and assumptions used in each data sheet of the IPCC Inventory Software.
Assure if the Party is able to provide an overview of the overall waste generation and treatment in the country
Assure that an overview of waste generation and treatment is provided and AD on all types of solid waste been collected (MSW, sludge, industrial and other waste)
Ensure that the AD are provided in the appropriate units
Check the background table for each category and ensure the consistency and the accuracy of the AD units
Check if the activity data for estimating of the GHG emissions are equal for the activity data used to estimate the emissions of precursors and indirect emissions
Export the activity data from each worksheet in the IPCC 2006 database and compare with the AD provided in the tables for estimation of the emissions of precursors and indirect emissions
Emission factors
Check the implied emission factors (time series) Ensure consistency check of the use of the EF
Double check in regards to the country specific EF published in the EFDB and compare with the EF of the other countries
Ensure that the country specific EF in use are in the ranges provided by the IPCC guidelines

National Inventory Report
Third Biennial Update Report
79 QA/QC and Verification Activities
Check if the EFs used for estimation of the emissions of precursors and indirect emissions are consistent, comparable and transparently documented
Check if the EFs used for estimation of the emissions of precursors and indirect emissions are in line with the EMEP/CORINAIR Emission Inventory Guidebook.
In case CS EFs are used, check the background materials, the estimation methodology, the EF range and the comparability with other national reports
Calculation by the IPCC Inventory Software
Cross check all steps involved in the calculation Ensure that all steps used for determining, estimating and deriving data are accurate, transparent and internally consistent
Check the documentation of sources and correct use of units
Check if the documentation template records are appropriately fulfilled
Check completeness of the data coverage Ensuring that all relevant gases for all the activities were covered
Check if the excluded other non-energy use of fuels from activity data in energy sector is reported under the IPPU sector (in case emissions occurs from these non-energy uses)
Ensuring that the excluded from the Energy sector is accounted in the sector IPPU
Results (emissions)
Check the differences between the recalculated estimates and verify if proper justifications for the recalculated estimates are provided
Identification of changes, revisions and reallocations in order to improve accuracy and the transparency of the emission estimates
Identify and fix outliers in the results Checking for inconsistency of the emission trends and levels
Check the difference between the sectorial and the reference approach in the Energy Sector
Ensure consistency between the emission estimates and the allocation of carbon in the sectoral and in the reference approach
Check the completeness, use of notation keys and confidential information
Check if complete estimates are provided and if notation keys are used where no estimates are provided
Creativeness of the use of the notation keys Check if the appropriate notation keys are in use
Verify the assumptions, corrections, data and sources
Ensure consistency, transparency, facilitate repeatability and easy retrieval
Documentation Check the improvement list, recommendations and encouragements provided (internal and external)
Check if the recommendations and the encouragements of the technical assessments / reviews have been taken into consideration and implemented
Four steps quality verification process of the GHG inventory has been introduced:
• Two steps on national level (inventory team and a national UNFCCC certified reviewer – procedures described above)
• Two steps on international level (by the Global Support Programme (for the 3rd BUR NIR) and technical analysis as part of the UNFCCC international consultation and analysis process for non-Annex I countries (for the 3rd BUR )).
Recommendations provided by the Global Support Programme and the Technical Analysis of the UNFCCC ICA Process have been implemented in the GHG development process and in the NIR to the extent possible. However, some of the recommendations for improvement shall be included in subsequent national BURs.
10.4 QA/QC implementation in the current GHG Inventory process
10.4.1 The process in a nutshell
Step 1: Allocation of roles (CTA, IDT members, QAT members)
Step 2: Defining the GHG Inventory components
For each sector, the corresponding IDT member, in consultation with CTA, Project manager and MOEPP decides upon:
• Input data collecting mechanisms
• Time series

National Inventory Report
Third Biennial Update Report
80 QA/QC and Verification Activities
• Emission factors (National/IPCC defaults)
• Methodologies for emission calculation
The following is taken into account: Current practices of the inventory compilation in the country, country specifics and relevant international best practices
Step 3: Activity data collection
For each sector, the corresponding IDT member collects data from the official publications and reports and/or contacts the identified institutions (data sources) for obtaining data. The IDT members should reference the inventory data sources and describe procedures and arrangements undertaken to collect and archive data for the preparation of national GHG inventories.
Step 4: Data input, documenting and calculating of emissions (Tier 1 QC procedures undertaken in parallel)
The IDT members use IPCC Inventory Software for National Greenhouse Gas Inventories to enter activity data and emission factors, document data and calculate emissions. This IPCC tool enables all-inclusive documentation of data, as well as includes functionalities for detailed Quality Check. In parallel, the IDT members implement all Tier 1 QC activities and procedures, as described previously.
Step 5: QA at sectoral level
QAT members check, and if needed, propose corrective actions and verify the adequacy of the selected activity data and emission factors, adequacy of the applied methodologies, accuracy and consistency of the calculated emissions and adequacy of the data documentation.
Step 6: Compilation of overall inventory
This activity is undertaken by one of the IDT members.
Step 7: QA of overall inventory summary
One QAT member checks, propose corrective actions and verifies accuracy and consistency of the overall inventory.
Step 8: Conduct key category analyses
This activity is undertaken by IDT member(s). Key sources analysis is conducted applying methodology from IPCC 2006 Guidelines. Dedicated chapter is also included in the NIR.
Step 9: Uncertainty management (as decided)
CTA and IDT member(s) decide the target sector(s) for uncertainty management taking into account the results of the key sources analysis and other country specifics. The corresponding IDT member(s) conducts the uncertainty management analysis applying methodology from IPCC 2006 Guidelines. Dedicated chapter is also included in the NIR.
Step 10: QA of key sources analysis and uncertainty management
One QAT member checks, proposes corrective actions and verifies the accuracy and consistency of the key sources analysis and uncertainty management.
Step 11: Drafting the sectoral chapters of NIR
For each sector, this activity is undertaken by the corresponding IDT member.
Step 12: Draft summary inventory chapter
This activity is undertaken by the IDT members (the same as in Step 6).
Step 13: QA of NIR
CTA checks, proposes corrective actions and approves the NIR.
Step 14: Reporting
MOEPP is in charge for GHG emissions reporting. In accordance to its international (including also European) and national obligations, the MOEPP should prescribe the reporting format to be followed by the IDT members. All the reports should be approved by CTA.

National Inventory Report
Third Biennial Update Report
81 QA/QC and Verification Activities
10.4.2 Reporting, documentation and archiving procedures
The documentation on the data source, the choice of the emission factors and other information relevant for the GHG estimates are documented in the IPCC 2006 inventory database (as Worksheet remarks).
All GHG inventory documents are stored electronically on the server of the Ministry of Environment and Physical Planning and in the database of the Macedonian Academy of Sciences and Arts. This includes quality system documents, reports, original data from data providers, the IPCC Inventory Software files, CRF Reporter database files, the data submitted to the UNFCCC and spreadsheets of the emissions inventory. Furthermore, the decisions reached by the coordinating team, the results of key category and uncertainty analysis, the internal and external review documents, as well as inventory development processes and guidelines materials are documented and archived in the database. The geographical database used for preparing the AFOLU inventory and the digitized maps of land use classification are also stored on the server to assure proper documenting materials for the estimates and the procedures applied in the sector.
After each submission of the national inventory to UNFCCC a complete copy of the full database is archived by the Ministry of Environment and Physical Planning, which is the single location where archives of GHG submissions and all supporting reference material is stored and maintained. Backups of each submission and supportive material are also kept as separate CDs.
10.4.3 Ensuring sustainability
Summing up, the Macedonian inventory process, organized in a way as presented in the previous section, meets the necessary technical conditions for ensuring sustainability, since:
• A strong focus is put on documenting essential information in a concise format;
• Activities and tasks are standardized and clear procedures stipulated;
• Roles and responsibilities of all players are clearly defined.
On top, worth mentioning in this regard are the training materials on GHG inventory preparation developed and constantly updated by the GHG inventory team. These materials are rather country-specific, and being based on personal experience gathered and lessons learned during the GHG inventory preparation in Macedonian conditions, would provide clear guidance for newcomers in the process. Additionally, capacity building activities have been implemented and two new people within the MANU team were trained on development of GHG inventories.

National Inventory Report
Third Biennial Update Report
82 Good practices, improvements and recommendations
11 Good practices, improvements and recommendations
In the Summary report of the Technical analyses of the Macedonian second BUR (TASR.2) it was concluded that the country has reported all the elements of information on greenhouse gases as required by the BUR guidelines (summarized in Table 1 of Annex I of the TASR.2) and commended Macedonia for the level and detail of the information provided in the NIR. Therefore, this NIR (under the 3rd BUR) was developed in the same manner, following and in same elements further improving the good practices from the previous BURs.
11.1 Energy
Good practices/improvements:
• The activity data are updated in compliance with the revised Energy Balances for the period 2005 – 2014 from the SSO (published in October 2016). In the process of updating the data, some errors and inconsistencies were noticed in the tables published by the SSO and with bilateral communication with the institution, the errors/inconsistencies were corrected. This kind of collaboration between the institutions (particularly in the Energy sector) is a good practice and relevant for improving the quality of the information reported in the BURs
• The activity data before 2005 for the Manufacturing industries and Construction category in the IPCC Inventory Software database were disaggregated in accordance with the SSO Energy balances (from 1998 till 2002). For the years for which the SSO did not publish Energy balances data from IEA databases were used.
• In the previous BURs, for the period 1990 – 2005 the category Other Sector also included the emissions under the subcategory Commercial/Institutional, while after 2005 these emissions were reported under the Non-specified subcategory (in accordance with the activity data from the SSO energy balances). In this report, based on the IEA and SSO energy balances, the activity data for the period 1990 to 2005 are included within the Non-Specified instead of Commercial/Institutional subcategory. This was done in order to be compatible with the subcategories reported in the Energy Balances from the SSO, thus reporting a consistent time series of emissions for the period 1990 – 2016 under this category
• The category Diesel and Heating Oil used in the Energy balances until 2011 has been separated into Road Diesel and Heating & Other fueloil in the updated Energy balances from 2005 onwards. Similarly, the Biomass category has been separated into Biomass and Wood Wastes, Wood Briquettes and Pellets and Wood of fruit trees and other plant residues. The advantage of the disaggregation has been reflected in this NIR and different NCVs are used in the IPCC Inventory Software for all of these categories.
• National emission factors are used for lignite, residual fuel oil and natural gas in Energy sector, Fuel combustion activities.
• The average CO2 emission factor from the 2019 Refinements to the 2006 IPCC Guidelines was taken into account for the fugitive emissions from fuels, specifically surface mines.
Recommendations for future inventories:
• Secure and constant channels for acquiring data on composition and carbon content of fuels should be established with relevant institutions in order to facilitate the estimation of country specific emission factors. This can be achieved by signing some kind of agreement, for instance, a Memorandum of Understanding.
• Having in mind that there are several existing biogas power plants, their electricity production should be also taken into account in the next inventories, especially if more of this type of power plants will become available in the future. Since there are no data available on the amount of biogas used for electricity production, it is recommended to develop a separate study for the existing biogas power plants. This study would be also relevant for the AFOLU and Waste sectors since the biogas is produced from manure.

National Inventory Report
Third Biennial Update Report
83 Good practices, improvements and recommendations
11.2 IPPU
Good practices/improvements:
• The activity data for all industrial processes subcategories have been revised, using the Reports for Industry from SSO, thus providing consistent time series of activity data for the whole reporting period, without using interpolation/extrapolation for the missing data. The data from the reports have been grouped using the relevant NACE codes, taking into account their revisions over the relevant period for the NIR.
• The factor for clinker production has been also corrected based on the annual reports from the cement factory.
• The F-gases input data used in the IPCC Software have been adjusted in accordance with the IPCC Guidelines.
• There is no soda ash production in the country and the emissions that have been reported in the previous BURs for this subcategory are now reported as not occurring. The emissions occur only from the use of soda ash and have been reported under subcategory Other uses of soda-ash.
Recommendations for future inventories:
• More detailed data regarding the carbon content of the feedstock in the following sectors: cement production, lime production and steel production. These data can be gathered directly from the industrial plants.
• Segregated data for the F-gas emissions from refrigeration and air-conditioning for the specific part of the equipment life-cycle. These data should be collected by the Ministry of Environment and Physical Planning.
• F-gas emissions from fire protection, aerosols and solvents or reiteration that emissions from these categories are not occurring in the country.
• N2O emissions from medical appliances.
• SF6 emissions from use and disposal of electrical equipment.
11.3 AFOLU
▪ Livestock
Good practices/improvements:
• Inventory of the GHG emissions in livestock for 3rd BUR was done with background data from State Statistical Office. In addition, data for manure used in biogas power plants were considered. Since 2015 two power plants of 3 MW each and 1 plant of 1 MW have been operational. The first two plans in biogas digesters use corn silage and manure form two dairy farms. Liquid manure of 440 m3 have been collected on daily bases (50 t daily manure and the rest is technical water). The last one (1 MW power plant) use 9 t poultry manure (layers) and 5-10 t liquid swine manure. Total reduction of emissions from manure management due to biogas digesters in 2015 -16 was 0.016 Gg CO2 – eq. However, due to lack of sufficient data for GHG emission from those biogas digesters in other related sectors (Energy and Waste) in 3rd BUR the reductions in emissions form manure management due to biogas digesters were neglected.
• Other aspect was commitment of field survey where detailed information were obtained for small dairy cows (less than 30 cows), and small swine farms (up to 50 sows). The outcomes of the survey were available later than 3rd BUR preparation, hence were not part of this report.
Recommendations for future inventories:
• In preparation of next BUR emission of GHG gases form manure management should be reduced for the use of manure in biogas digesters. In addition, Tier 2 methodology should be applied in dairy cows and swine.
▪ Land use
The inventory of the GHG emissions for the 3rd BUR or the sector-agriculture, was based to the available national data from the SSO and Ministry of Agriculture, Forestry and Water Economy (MAFWE) and international data sources, like CORINE Land Cover (CLC) and FAO-Stat.

National Inventory Report
Third Biennial Update Report
84 Good practices, improvements and recommendations
Data from the SSO and CLC were used in order to estimate the area under certain land use category and its dynamics, which serve as activity data according IPCC methodology. Official data published by SSO refers to the area under certain Land Use type for a given year, while data for the areas converted from one to another category of land use were calculated on the base of the available graphical data sets (CORINE Land cover). Land use change has been calculated or a three periods, on the base of 3 data sets: 2000-2006, 2012 and 2018, and interpolated for the gap years between each monitoring campaign of CLC.
CLC data for all land use categories remaining in the same category, for each inventory year, were compared and adjusted to the SSO data, in addition, for this BUR, such comparison and calculation of dynamics among the newly established and uprooted, perennial plantations has been performed as well.
This is a significant improvement since the dynamics between the newly established and uprooted perennial plantations, is a serious sink/emission of CO2.
The improvement of the assessment of GHG emissions from agricultural sector is important, particularly in establishing consistent data series. In this report, Land Use Changes for period 2000-2014, were introduced based on CORINE data sets. Unfortunately there is not CORINE data set available for period before 2000 and it is impossible to conduct even rough estimation of the land use changes in period before year 2000. This can be done through serious approach to assessment of Land Use in the country. It is necessary to develop remote sensing (RS) and Earth Observation (EO) capacities in the country, in order to derive Land use changes because this data is not available from any institution.
For these reasons, in this BUR, a special attention has been payed to the design of detailed methodology and implementation of activities for enforcement of the capacities for RS and EO. Two GIS experts are engaged in this process, and as expected will develop digital data base with higher resolution and accuracy of the LU/LUC or the key categories according IPSS methodology, on a yearly level.
As planned, the following RS and EO activities is expected to be achieved:
• Analyze of the LU/LUC based on a high resolution open source Satellite Imagery photointerpretation
• Comparing the derived data sets with the exiting national graphical data sets , (e.g. aerial photographs available from State Cadastral Office)
• Regular (annual basis) assessment of the land use based on satellite imagery from the current year.
• Maintaining data derived from this activity in geo-data base and make it available for public
• Comparing data obtained from this activity with data provided by state statistical office
• Estimating land use changes on annual basis
This improvement in LU/LUC will allow moving forward in certain cases towards Tier 2, with regards to the activity data in Land subsector of AFOLU. In addition to the LU/LUC data, other activity data sets that needs to be improved, are:
a) Mineral fertilizers use – types and quantities used b) Manure –quantity, quality and management c) Plant organic residues and by-products-quantity and management
In order to move to higher Tier`s in the other sectors, an in addition to the proposed measures for development and improving of the existing LU/LUC data set and other activity data, particular attention should be paid to development of national emission factor for assessing GHG emissions/removals taking in consideration:
a) Field measurement of GHG emissions under: various land use types, land management practices and inputs,
b) SOC dynamics under certain lad use, management practices and Inputs c) Annual biomass productivity of perennial crops measurements (orchards, vineyards, forage etc.)
This is complicated task and there is no other choice than building national capacities on assessing of this data that is not readily available in the country. This is serious gap that should be overcome trough investment in capacity building, particularly in institutions from agricultural and environmental sector.
▪ Forestry
Good practices/improvements:
• Implemented satellite images for land use change from and to Forest land (CORINE Land Cover) for 2000, 2006, 2012 and 2018 and interpolation of the data on annual bases to cover the years in between.
• Improved data for commercial and firewood removals

National Inventory Report
Third Biennial Update Report
85 Good practices, improvements and recommendations
• Improved and updated data for burned forest area, using data from three different sources
Recommendations for future inventories:
• Forest inventory (PE “Nacionalni sumi”, MAFWE, Faculty of Forestry)
• Installation of software for annual evidence of the Land use change
• Develop local tables for annual growth of different species
• Develop system for monitoring the natural disturbance and prompt evidence
• Collect data for other non-wood products
11.4 Waste
Good practices/improvements:
• Fractions for composition of the waste going to the SWDS have been updated using the data from the regional waste management plans.
• The emissions from waste composting activities introduced in SBUR for the period from 2012– 2014, are now extended for the period 2011 – 2016, based on the Annual reports on Quality of the Environment from the Ministry of Environment and Physical Planning.
• The percentage of waste deposited in disposal sites has been recalculated and 90% of the total generated MSW is going to SWDS, including the Uncategorized SWDS. The rest 10% of waste is reported in the category Open Burning of Waste.
• The emissions from incineration of clinical waste have been estimated for period 2000 -2016, based on the activity data available from the SWDS where the incineration is performed (SWDS Drisla).
• More industry sectors have been introduced in the subcategory Industrial wastewater treatment and discharge based on SSO data. The data have been classified in the following industrial sectors: Alcohol Refining, Beer & Malt, Coffee, Dairy Products, Meat & Poultry, Organic Chemicals, Petroleum Refineries, Plastics & Resins, Pulp & Paper (combined), Soap & Detergents, Starch Production, Sugar Refining, Vegetable Oils, Vegetables, Fruits & Juices, Wine & Vinegar. The correlation with the SSO data was made using the NACE codes. At the same time a revision of the overall time series has been made and the inconsistencies identified in the previous BUR were corrected.
Recommendations for future inventories:
• Currently, for the Solid waste disposal there are no data on waste production by industry type. It is recommended for the next inventories to disaggregate the data for waste generated from manufacturing industries by industry types, in order to be able to use the default values of DOC and fossil carbon contents in industrial waste for specific industry types (as per the IPCC 2006 Guidelines, Vol. 5, Ch. 2, Table 2.5). This should be done in close collaboration with the SSO.
• Having in mind that there are several existing biogas power plants, the biogas production in biodigestors should be further investigated and included in the inventory. This could be done as a separate study and in cooperation with biogas power plant installations.
11.5 Gender aspect
The national GHG inventory development process incorporated well balanced gender team: 43% women and 57% men. Additional efforts have been made to integrate gender responsive considerations into the GHG inventory to the extent possible, following the national Action plan on gender and climate change and the UNDP Gender Responsive National Communications Toolkit:
Making Greenhouse Gas Inventory Process More Gender Responsive
Y/N More info
• Engage gender specialists from government, private sector and civil society to develop gender analysis framework for GHG data collection across sectors within the national context
Y Link to the document.
UNFCCC Gender and Climate Change Focal point appointed
Gender consultant engaged to support integration of gender considerations within the 3rd BUR

National Inventory Report
Third Biennial Update Report
86 Good practices, improvements and recommendations
• Establish criteria for technical working group (TWG) membership to ensure that social and gender analysis specialists participate in all aspects of GHG inventory process
Y Network of climate change national practitioners established, comprising social and gender analysis specialists.
• Ensure work plan highlights categories where gendered divisions of labour indicate scope for in-depth gender analysis
N There is absence of official statistical gender disaggregated data in the analyzed sectors. Additionally, the Inventory does not provide data on the labour force in each of the sectors, and therefore cannot include gender perspective in the social aspect as well.
• Where GHG inventories connect to social data, ensure collection of sex-disaggregated data, identify gaps in data and include consideration of gender issues in strategies to overcome data constraints
Y To certain extend. Official data are not collected. However, innovative approach has been used to collect sex-disaggregated data for the household heating sector and used for various case-studies /analyses/policies.
The results of the assessments indicate that at this time the GHG Inventory cannot reflect the gender dimension, due to the absence of official statistical gender disaggregated data in the analyzed sectors: Energy, Industrial Processes and Product Use (IPPU), Agriculture, Forestry and Other Land Use (AFOLU) and Waste, disaggregated by categories and subcategories on the percentage of female and male participation in the production of the GHG emissions.
The official statistical agencies are recommended to start collecting gender disaggregated data in the listed
sectors.
THE POWER OF CLIMATE DATA
According to the GHG inventory, energy is the main “sector to blame” for the national GHG emissions. On contrary, the relevant data statistics are far from gender sensitive and prevent gender responsive policies.
As a result of UNDP’s efforts to introduce innovation into climate change in the country, it was proved that big pool of data can be provided fast and with low-cost for one of the “main” reasons for the increase of greenhouse gases and local air pollution in Skopje – the Household Heating Practice.
Opening the data in a Microsoft PowerBi software tool enabled access and interactive specific analysis of the data in line with citizen and expert needs. The data served as baseline for many analyses, designing and testing actions for climate change mitigation, improving air quality and identification of most vulnerable groups.

National Inventory Report
Third Biennial Update Report
87 Activity data, methodology and emission factors
Appendix I Activity data, methodology and emission factors
A I.1 Activity data
A I.1.1 Energy
Table 57. Activity data used in energy sector for 1990 (in TJ) Solid fuels Liquid fuels Gaseous fuels Biomass
2006 IPCC Categories Lignite Coking coal
Sub-bituminous coal
Anthracite Coke Oven Coke / Lignite Coke
Other bituminoous coal
Residual fuel oil
Motor gasoline
Gas/Diesel oil
LPG Jet kerosene
Natural gas Wood/Wood waste
1.A - Fuel Combustion Activities 53978.5 3079.1 0.0 0.0 0.0 318.5 20221.3 7132.3 11025.6 1886.0 0.0 0.0 7356.0
1.A.1 - Energy Industries 51118.7 0.0 0.0 0.0 0.0 0.0 6221.6 0.0 0.0 0.0 0.0 0.0 0.0
1.A.1.a - Main Activity Electricity and Heat Production 51118.7 0.0 0.0 0.0 0.0 0.0 6221.6 0.0 0.0 0.0 0.0 0.0 0.0
1.A.1.a.i - Electricity Generation 50329.3 40.4
1.A.1.a.ii - Combined Heat and Power Generation (CHP) 789.4 3959.2
1.A.1.a.iii - Heat Plants 2222.0
1.A.1.c - Manufacture of Solid Fuels and Other Energy Industries 0.0 0.0 0.0 0.0 0.0 0.0 0.0 0.0 0.0 0.0 0.0 0.0 0.0
1.A.1.c.ii - Other Energy Industries
1.A.2 - Manufacturing Industries and Construction 2424.9 3079.1 0.0 0.0 0.0 318.5 11399.7 0.0 2641.2 1886.0 0.0 0.0 0.0
1.A.2.a - Iron and Steel 2202.9 212.4 318.5 3759.9 874.0
1.A.2.b - Non-Ferrous Metals 2866.8 520.0 298.2 46.0
1.A.2.c - Chemicals 920.0 85.2
1.A.2.d - Pulp, Paper and Print
1.A.2.e - Food Processing, Beverages and Tobacco 68.3 280.0 340.8
1.A.2.f - Non-Metallic Minerals 880.0 170.4 828.0
1.A.2.g - Transport Equipment
1.A.2.h - Machinery 34.2 92.0
1.A.2.i - Mining (excluding fuels) and Quarrying 280.0 298.2

National Inventory Report
Third Biennial Update Report
88 Activity data, methodology and emission factors
1.A.2.j - Wood and wood products
1.A.2.k - Construction
1.A.2.l - Textile and Leather 102.5 120.0
1.A.2.m - Non-specified Industry 17.1 4639.9 1448.4 46.0
1.A.3 - Transport 0.0 0.0 0.0 0.0 0.0 0.0 0.0 7132.3 3741.0 0.0 0.0 0.0 0.0
1.A.3.a - Civil Aviation 0.0 0.0 0.0 0.0 0.0 0.0 0.0 0.0 0.0 0.0 0.0 0.0 0.0
1.A.3.a.ii - Domestic Aviation
1.A.3.b - Road Transportation 7132.3 3440.0
1.A.3.c - Railways 301.0
1.A.4 - Other Sectors 434.9 0.0 0.0 0.0 0.0 0.0 2599.9 0.0 4643.4 0.0 0.0 0.0 7356.0
1.A.4.a - Commercial/Institutional
1.A.4.b - Residential 208.8 2079.9 3280.2 7356.0
1.A.4.c - Agriculture/Forestry/Fishing/Fish Farms 0.0 0.0 0.0 0.0 0.0 0.0 520.0 0.0 1363.2 0.0 0.0 0.0 0.0
1.A.4.c.i - Stationary 520.0 1363.2
1.A.5 - Non-Specified 226.1 0.0 0.0 0.0 0.0 0.0 0.0 0.0 0.0 0.0 0.0 0.0 0.0
1.A.5.a - Stationary 226.1
Memo Items
International Bunkers
1.A.3.a.i - International Aviation (International Bunkers) 220.5
Table 58. Activity data used in energy sector for 2000 (in TJ)
Solid fuels Liquid fuels Gaseous fuels Biomass
2006 IPCC Categories Lignite Coke
Oven Coke / Lignite Coke
Other
bituminoous coal
Residual
fuel oil
Motor
gasoline
Gas/Diesel
oil
LPG Petroleum
Coke
Jet
kerosene
Natural gas Wood/Wood
waste
1.A - Fuel Combustion Activities 54587.4 2363.5 1869.0 14041.9 6387.0 13294.4 1539.4 2759.5 10.2 2277.3 8897.8
1.A.1 - Energy Industries 54264.9 0.0 12.6 9681.6 0.0 719.9 116.4 0.0 0.0 1983.6 352.0
1.A.1.a - Main Activity Electricity and Heat Production 54262.7 0.0 12.6 9681.6 0.0 552.2 115.4 0.0 0.0 1983.6 348.9
1.A.1.a.i - Electricity Generation 53212.9 4238.8 3.2

National Inventory Report
Third Biennial Update Report
89 Activity data, methodology and emission factors
1.A.1.a.ii - Combined Heat and Power Generation (CHP) 387.5 786.2 332.9
1.A.1.a.iii - Heat Plants 662.2 12.6 4656.5 549.0 115.4 1650.7 348.9
1.A.1.c - Manufacture of Solid Fuels and Other Energy Industries 2.3 0.0 0.0 0.0 0.0 167.7 0.9 0.0 0.0 0.0 3.1
1.A.1.c.ii - Other Energy Industries 2.3 167.7 0.9 3.1
1.A.2 - Manufacturing Industries and Construction 18.9 2363.5 1856.4 3188.1 0.2 2335.4 680.9 2759.5 10.2 293.7 80.3
1.A.2.a - Iron and Steel 14.2 289.3 1856.4 1140.8 1.8 556.5 1064.0 27.3
1.A.2.b - Non-Ferrous Metals 2046.4 125.3 603.9 41.9
1.A.2.c - Chemicals
1.A.2.d - Pulp, Paper and Print 0.1 0.2 0.5
1.A.2.e - Food Processing, Beverages and Tobacco 27.8 15.4 1593.6 5.8 13.2
1.A.2.f - Non-Metallic Minerals 1.1 1891.8 28.4 60.2 1695.4 10.2 225.5 17.4
1.A.2.g - Transport Equipment
1.A.2.h - Machinery 0.2 28.1 13.4 8.2
1.A.2.i - Mining (excluding fuels) and Quarrying 2.6 38.3 40.9 0.9
1.A.2.j - Wood and wood products
1.A.2.k - Construction
1.A.2.l - Textile and Leather 3.4 1.5 2.9 1.5
1.A.2.m - Non-specified Industry 0.3 12.3 39.6 38.6
1.A.3 - Transport 0.0 0.0 0.0 0.0 6340.3 7298.9 93.2 0.0 0.0 0.0 0.0
1.A.3.a - Civil Aviation 0.0 0.0 0.0 0.0 1.2 12.7 0.0 0.0 0.0 0.0 0.0
1.A.3.a.ii - Domestic Aviation 1.2 12.7
1.A.3.b - Road Transportation 6339.1 7106.1 93.2
1.A.3.c - Railways 180.1
1.A.4 - Other Sectors 303.6 0.0 0.0 1172.2 46.6 2940.2 648.9 0.0 0.0 0.0 8465.5
1.A.4.a - Commercial/Institutional
1.A.4.b - Residential 235.3 1093.3 300.9 7617.5
1.A.4.c - Agriculture/Forestry/Fishing/Fish Farms 10.4 0.0 0.0 1172.2 46.6 507.2 0.4 0.0 0.0 0.0 0.0
1.A.4.c.i - Stationary 10.4 1172.2 46.6 507.2 0.4
1.A.5 - Non-Specified 57.9 0.0 0.0 0.0 0.0 1339.7 347.5 0.0 0.0 0.0 848.0
1.A.5.a - Stationary 57.9 1339.7 347.5 848.0

National Inventory Report
Third Biennial Update Report
90 Activity data, methodology and emission factors
Memo Items
International Bunkers
1.A.3.a.i - International Aviation (International Bunkers) 1231.4
Table 59. Activity data used in energy sector for 2005 (in TJ)
Solid fuels Liquid fuels Gaseous fuels Biomass
2006 IPCC Categories Lignite Coking coal
Sub-bituminous
coal
Coke Oven
Coke / Lignite Coke
Residual fuel oil
Motor gasoline
Gas/Diesel oil
LPG Refinery gas
Petroleum Coke
Jet kerosene
Natural gas Wood/Wood waste
1.A - Fuel Combustion Activities 58845.0 68.0 1714.4 460.5 9819.8 5135.1 14685.8 2100.2 92.5 3723.3 0.0 2637.9 8647.2
1.A.1 - Energy Industries 55385.7 0.0 0.0 0.0 3530.6 0.0 91.6 0.0 92.5 0.0 0.0 549.6 1.7
1.A.1.a - Main Activity Electricity and Heat Production 55385.4 0.0 0.0 0.0 3197.8 0.0 1.9 0.0 0.0 0.0 0.0 549.6 0.0
1.A.1.a.i - Electricity Generation 55002.6 145.9 1.9
1.A.1.a.ii - Combined Heat and Power Generation (CHP) 382.8 10.2 0.0
1.A.1.a.iii - Heat Plants 3041.7 549.6
1.A.1.c - Manufacture of Solid Fuels and Other Energy Industries 0.3 0.0 0.0 0.0 332.8 0.0 89.7 0.0 92.5 0.0 0.0 0.0 1.7
1.A.1.c.ii - Other Energy Industries 0.3 332.8 89.7 92.5 1.7
1.A.2 - Manufacturing Industries and Construction 2907.4 68.0 1714.4 460.5 4345.4 0.0 1483.6 272.4 0.0 3723.3 0.0 1966.5 296.0
1.A.2.a - Iron and Steel 2628.0 68.0 1712.1 444.6 1741.9 302.3 20.7 1064.0 1430.7 82.8
1.A.2.b - Non-Ferrous Metals 0.7 21.6 0.5
1.A.2.c - Chemicals 173.2 17.4 119.1
1.A.2.d - Pulp, Paper and Print 0.6 39.9 14.3 75.5 1.9
1.A.2.e - Food Processing, Beverages and Tobacco 2.2 15.6 622.1 457.9 12.6 255.7 11.3
1.A.2.f - Non-Metallic Minerals 0.0 1260.6 79.4 195.5 2659.2 79.7 5.0
1.A.2.g - Transport Equipment
1.A.2.h - Machinery 16.4 0.3 119.6 58.7 15.3 2.9
1.A.2.i - Mining (excluding fuels) and Quarrying 152.0 2.0
1.A.2.j - Wood and wood products
1.A.2.k - Construction

National Inventory Report
Third Biennial Update Report
91 Activity data, methodology and emission factors
1.A.2.l - Textile and Leather 262.0 249.4 87.3 4.4 62.6
1.A.2.m - Non-specified Industry 0.3 138.0 292.7 23.6 5.8 127.5
1.A.3 - Transport 0.0 0.0 0.0 0.0 0.0 5118.7 7919.0 1267.8 0.0 0.0 0.0 0.0 0.0
1.A.3.a - Civil Aviation 0.0 0.0 0.0 0.0 0.0 1.3 0.0 0.0 0.0 0.0 0.0 0.0 0.0
1.A.3.a.ii - Domestic Aviation 1.3
1.A.3.b - Road Transportation 5117.4 7807.2 1267.8
1.A.3.c - Railways 111.8
1.A.4 - Other Sectors 552.0 0.0 0.0 0.0 1943.8 16.4 5191.6 560.0 0.0 0.0 0.0 121.9 8349.5
1.A.4.a - Commercial/Institutional
1.A.4.b - Residential 249.5 1318.9 381.1 8179.2
1.A.4.c - Agriculture/Forestry/Fishing/Fish Farms 4.4 0.0 0.0 0.0 933.9 16.4 80.1 6.3 0.0 0.0 0.0 0.0 41.4
1.A.4.c.i - Stationary 4.4 933.9 16.4 80.1 6.3 41.4
1.A.5 - Non-Specified 298.1 0.0 0.0 0.0 1010.0 0.0 3792.6 172.5 0.0 0.0 0.0 121.9 128.9
1.A.5.a - Stationary 298.1 1010.0 3792.6 172.5 121.9 128.9
Memo Items
International Bunkers
1.A.3.a.i - International Aviation (International Bunkers) (2) 281.9
Table 60. Activity data used in energy sector for 2014 (in TJ)
Solid fuels Liquid fuels Gaseous fuels Biomass
2006 IPCC Categories Lignite Coking coal
Sub-bituminous coal
Coke Oven Coke / Lignite Coke
Residual fuel oil
Motor gasoline
Gas/Diesel oil LPG Petroleum Coke
Jet kerosene
Natural gas Wood/Wood waste
1.A - Fuel Combustion Activities 41717.3 167.4 3186.3 39.7 4913.9 4472.8 20167.8 2898.1 2842.3 0.0 4622.1 9912.6
1.A.1 - Energy Industries 40856.2 0.0 0.0 0.0 1753.3 0.0 79.7 0.0 0.0 0.0 3218.3 3.3
1.A.1.a - Main Activity Electricity and Heat Production 40856.2 0.0 0.0 0.0 1651.0 0.0 0.0 0.0 0.0 0.0 3218.3 0.0
1.A.1.a.i - Electricity Generation 40774.1 1651.0
1.A.1.a.ii - Combined Heat and Power Generation (CHP) 82.0 1537.0
1.A.1.a.iii - Heat Plants 1681.4
1.A.1.c - Manufacture of Solid Fuels and Other Energy Industries 0.0 0.0 0.0 0.0 102.3 0.0 79.7 0.0 0.0 0.0 0.0 3.3
1.A.1.c.ii - Other Energy Industries 102.3 79.7 3.3

National Inventory Report
Third Biennial Update Report
92 Activity data, methodology and emission factors
1.A.2 - Manufacturing Industries and Construction 766.1 167.4 3186.3 39.7 2796.4 0.0 1820.2 353.4 2842.3 0.0 1195.2 281.6
1.A.2.a - Iron and Steel 702.9 148.9 3186.3 32.3 1975.0 112.8 21.0 630.5 763.6 3.4
1.A.2.b - Non-Ferrous Metals 0.8 2.4 38.4 0.1
1.A.2.c - Chemicals 46.9 19.6 0.0 36.3
1.A.2.d - Pulp, Paper and Print 0.3 0.7 9.1 8.6 0.5 15.2 0.2
1.A.2.e - Food Processing, Beverages and Tobacco 0.4 3.4 273.3 298.3 101.9 203.4 188.9
1.A.2.f - Non-Metallic Minerals 0.1 17.8 369.0 115.3 192.8 2211.9 38.7 0.7
1.A.2.g - Transport Equipment
1.A.2.h - Machinery 0.1 4.0 16.5 21.9 31.6 95.4 6.4
1.A.2.i - Mining (excluding fuels) and Quarrying 547.7 0.0 6.2
1.A.2.j - Wood and wood products
1.A.2.k - Construction
1.A.2.l - Textile and Leather 62.2 74.0 162.9 2.6 1.9 45.0
1.A.2.m - Non-specified Industry 0.2 32.5 532.3 0.5 2.2 30.7
1.A.3 - Transport 0.0 0.0 0.0 0.0 0.0 4456.3 16048.5 1994.1 0.0 0.0 6.2 0.0
1.A.3.a - Civil Aviation 0.0 0.0 0.0 0.0 0.0 2.4 0.0 0.0 0.0 0.0 0.0 0.0
1.A.3.a.ii - Domestic Aviation 2.4
1.A.3.b - Road Transportation 4453.9 15936.6 1994.1 6.2
1.A.3.c - Railways 111.8
1.A.4 - Other Sectors 95.1 0.0 0.0 0.0 364.3 16.4 2219.4 550.6 0.0 0.0 202.3 9627.6
1.A.4.a - Commercial/Institutional
1.A.4.b - Residential 37.3 178.5 261.2 1.7 9398.2
1.A.4.c - Agriculture/Forestry/Fishing/Fish Farms 36.7 0.0 0.0 0.0 205.5 16.4 277.1 0.9 0.0 0.0 0.0 56.7
1.A.4.c.i - Stationary 36.7 205.5 16.4 277.1 0.9 56.7
1.A.5 - Non-Specified 21.1 0.0 0.0 0.0 158.8 0.0 1763.7 288.4 0.0 0.0 200.6 172.7
1.A.5.a - Stationary 21.1 158.8 1763.7 288.4 200.6 172.7
Memo Items
International Bunkers
1.A.3.a.i - International Aviation (International Bunkers) (2) 519.5

National Inventory Report
Third Biennial Update Report
93 Activity data, methodology and emission factors
Table 61. Activity data used in energy sector for 2015 (in TJ)
Solid fuels Liquid fuels Gaseous fuels Biomass
2006 IPCC Categories Lignite Coking coal
Sub-bituminous coal
Coke Oven Coke / Lignite Coke
Residual fuel oil
Motor gasoline
Gas/Diesel oil LPG Petroleum Coke
Jet kerosene
Natural gas Wood/Wood waste
1.A - Fuel Combustion Activities 37096.8 325.0 3241.0 15.0 4327.4 4574.3 22521.0 3285.4 2706.0 0.2 4630.6 9095.3
1.A.1 - Energy Industries 36447.5 0.0 0.0 0.0 1580.9 0.0 59.1 0.0 0.0 0.0 3325.9 1.9
1.A.1.a - Main Activity Electricity and Heat Production 36447.5 0.0 0.0 0.0 1571.8 0.0 0.0 0.0 0.0 0.0 3325.9 0.0
1.A.1.a.i - Electricity Generation 36447.5 1571.8
1.A.1.a.ii - Combined Heat and Power Generation (CHP) 1471.4
1.A.1.a.iii - Heat Plants 1854.6
1.A.1.c - Manufacture of Solid Fuels and Other Energy Industries 0.0 0.0 0.0 0.0 9.1 0.0 59.1 0.0 0.0 0.0 0.0 1.9
1.A.1.c.ii - Other Energy Industries 9.1 59.1 1.9
1.A.2 - Manufacturing Industries and Construction 573.8 325.0 3198.7 15.0 2207.4 0.0 1859.5 432.9 2706.0 0.0 1076.5 238.8
1.A.2.a - Iron and Steel 501.5 147.6 2626.6 6.2 1373.6 112.8 17.5 1115.0 665.7 4.0
1.A.2.b - Non-Ferrous Metals 1.4 42.0
1.A.2.c - Chemicals 67.8 19.7 0.1 36.9
1.A.2.d - Pulp, Paper and Print 0.3 16.9 7.0 3.3 15.4 0.2
1.A.2.e - Food Processing, Beverages and Tobacco 316.7 304.4 91.2 214.1 182.2
1.A.2.f - Non-Metallic Minerals 0.3 177.5 572.1 300.1 119.3 242.3 1591.0 34.1 0.8
1.A.2.g - Transport Equipment
1.A.2.h - Machinery 0.0 8.8 16.3 32.6 33.6 103.8 7.4
1.A.2.i - Mining (excluding fuels) and Quarrying 573.1 0.0 3.0
1.A.2.j - Wood and wood products
1.A.2.k - Construction
1.A.2.l - Textile and Leather 71.5 80.7 124.3 2.4 2.5 15.5
1.A.2.m - Non-specified Industry 0.3 35.2 565.0 0.4 4.0 25.7
1.A.3 - Transport 0.0 0.0 0.0 0.0 0.0 4557.0 18140.1 2260.4 0.0 0.0 0.6 0.0
1.A.3.a - Civil Aviation 0.0 0.0 0.0 0.0 0.0 2.8 0.0 0.0 0.0 0.0 0.0 0.0

National Inventory Report
Third Biennial Update Report
94 Activity data, methodology and emission factors
1.A.3.a.ii - Domestic Aviation 2.8
1.A.3.b - Road Transportation 4554.2 18059.4 2260.4 0.6
1.A.3.c - Railways 80.6
1.A.4 - Other Sectors 75.5 0.0 42.3 0.0 539.1 17.3 2462.3 592.1 0.0 0.2 227.5 8854.6
1.A.4.a - Commercial/Institutional
1.A.4.b - Residential 42.3 177.1 292.8 2.6 8616.8
1.A.4.c - Agriculture/Forestry/Fishing/Fish Farms 45.0 0.0 0.0 0.0 225.8 17.3 291.3 1.1 0.0 0.2 0.0 56.7
1.A.4.c.i - Stationary 45.0 225.8 17.3 291.3 1.1 0.2 56.7
1.A.5 - Non-Specified 30.5 0.0 0.0 0.0 313.3 0.0 1993.9 298.2 0.0 0.0 224.9 181.1
1.A.5.a - Stationary 30.5 313.3 1993.9 298.2 224.9 181.1
Memo Items
International Bunkers
1.A.3.a.i - International Aviation (International Bunkers) (2) 582.3
Table 62. Activity data used in energy sector for 2016 (in TJ)
2006 IPCC Categories Lignite Coking coal
Sub-bituminous coal
Coke Oven Coke / Lignite Coke
Residual fuel oil
Motor gasoline
Gas/Diesel oil
LPG Petroleum Coke
Jet kerosene
Natural gas
Wood/Wood waste
1.A - Fuel Combustion Activities 31713.5
762.3 4167.5 42.9 3645.5 4597.9 25902.8 3603.6
1293.7 1.1 7239.6 7606.5
1.A.1 - Energy Industries 31319.6
0.0 0.0 0.0 1132.4 0.0 63.0 0.0 0.0 0.0 5701.8 1.1
1.A.1.a - Main Activity Electricity and Heat Production 31319.6
0.0 0.0 0.0 1121.5 0.0 0.0 0.0 0.0 0.0 5701.8 0.0
1.A.1.a.i - Electricity Generation 31319.6
1121.5
1.A.1.a.ii - Combined Heat and Power Generation (CHP) 4556.3
1.A.1.a.iii - Heat Plants 1145.5
1.A.1.c - Manufacture of Solid Fuels and Other Energy Industries
0.0 0.0 0.0 0.0 10.9 0.0 63.0 0.0 0.0 0.0 0.0 1.1
1.A.1.c.ii - Other Energy Industries 10.9 63.0 1.1
1.A.2 - Manufacturing Industries and Construction 289.6 762.3 4167.5 42.9 1979.7 0.0 1878.1 479.2 1293.7 0.0 1293.3 257.6
1.A.2.a - Iron and Steel 251.6 112.5 2537.9 40.3 1122.0 69.1 14.3 1064.0 875.0 2.4
1.A.2.b - Non-Ferrous Metals 1.5 52.7

National Inventory Report
Third Biennial Update Report
95 Activity data, methodology and emission factors
1.A.2.c - Chemicals 55.4 19.5 0.0 39.3
1.A.2.d - Pulp, Paper and Print 0.2 649.8 1629.6 8.9 5.0 5.6 14.2 2.0
1.A.2.e - Food Processing, Beverages and Tobacco 312.4 293.0 96.0 232.6 152.8
1.A.2.f - Non-Metallic Minerals 0.2 323.4 118.9 255.9 229.6 44.1 1.0
1.A.2.g - Transport Equipment
1.A.2.h - Machinery 0.0 2.6 21.2 64.0 46.4 114.4 10.9
1.A.2.i - Mining (excluding fuels) and Quarrying 552.1 0.0 0.6
1.A.2.j - Wood and wood products
1.A.2.k - Construction
1.A.2.l - Textile and Leather 37.2 102.1 118.8 4.6 2.9 15.2
1.A.2.m - Non-specified Industry 0.4 34.3 636.3 3.7 10.1 33.5
1.A.3 - Transport 0.0 0.0 0.0 0.0 0.0 4580.3 21357.8 2481.1
0.0 0.0 6.6 0.0
1.A.3.a - Civil Aviation 0.0 0.0 0.0 0.0 0.0 2.8 0.0 0.0 0.0 0.0 0.0 0.0
1.A.3.a.ii - Domestic Aviation 2.8
1.A.3.b - Road Transportation 4577.5 21271.5 2481.1
6.6
1.A.3.c - Railways 86.2
1.A.4 - Other Sectors 104.3 0.0 0.0 0.0 533.5 17.6 2603.8 643.3 0.0 1.1 237.9 7347.8
1.A.4.a - Commercial/Institutional
1.A.4.b - Residential 38.2 161.6 320.5 3.8 7122.9
1.A.4.c - Agriculture/Forestry/Fishing/Fish Farms 36.4 0.0 0.0 0.0 221.2 17.6 305.9 1.1 0.0 1.1 0.0 51.2
1.A.4.c.i - Stationary 36.4 221.2 17.6 305.9 1.1 1.1 51.2
1.A.5 - Non-Specified 29.8 0.0 0.0 0.0 312.2 0.0 2136.4 321.6 0.0 0.0 234.1 173.7
1.A.5.a - Stationary 29.8 312.2 2136.4 321.6 234.1 173.7
Memo Items
International Bunkers
1.A.3.a.i - International Aviation (International Bunkers) (2) 664.0

National Inventory Report
Third Biennial Update Report
96 Activity data, methodology and emission factors
A I.1.2 IPPU
Table 63. Activity data used in Industrial processes sector Categories 1990 2000 2005 2014 2015 2016
2.A - Mineral Industry
2.A.1 - Cement production (t) 732,926 870,188 886,529 686,497 695,923 882,222
2.A.2 - Lime production (t) 47,000 15,397 15,009 10,836 8,003 9,125
2.A.3 - Glass Production 1,648 230 68 56 45 241
2.A.4 - Other Process Uses of Carbonates
2.A.4.a - Ceramics* (t) 59,290 9,199 6,767 278 216 357
2.A.4.b - Other Uses of Soda Ash (t) 6,457 3,488 3,128 2,572 2,516 2,462
2.C - Metal Industry
2.C.1 - Iron and Steel Production (t) 274,993 168,386 647,036 189,248 122,632 170,091
2.C.2 - Ferroalloys Production (t) 85,193 57,842 79,390 91,067 63,747 35,038
2.C.3 - Aluminium production (t) 5,487 3,763 20 NO
2.C.5 - Lead Production (t) 53,826 56,077 NO 2,648 4,472
2.C.6 - Zinc Production (t) 108,275 126,992 NO
*Clay consumption
Table 64. Activity data used for Product uses as substitutes for ODS Substance/Blend Import (tones)
2015 2016
HFC-134a 24.9 55.4
R-404A 21.6 43.2
R-407C 1.65 8.1
R-410A 4.3 14.7
R-507 0.214 1.3
HFC-227 / 2.1
R-152A / HFC-152a / 74.2
A I.1.3 AFOLU
Table 65. Activity data used for GHG emissions inventory in Livestock (number of heads)
Species and categories 1990 2000 2005 2014 2015 2016
Dairy Cows 166237 171745 156950 155432 156699 160603
Other Cattle 120937 93223 91235 86175 96743 94165
Sheep 2297115 1250686 1244000 619839 599869 607622
Sheep <1 Y 113671 123426 116933
Goats 62190 81346 88064 101669
Horses 66282 56486 39651 19371 18784 19263
Swine 178537 204135 155753 23511 20857 28671
Finishers 141542 174586 202758
Poultry 5728981 3713369 2617012 1939879 1761145 1865769
Layers 1884289 1423841 1705948
Broilers (year equivalent) 4355 51256 15998
Turkey (year equivalent) 3690 2910 10070
Other poultry 19477 17908 36245
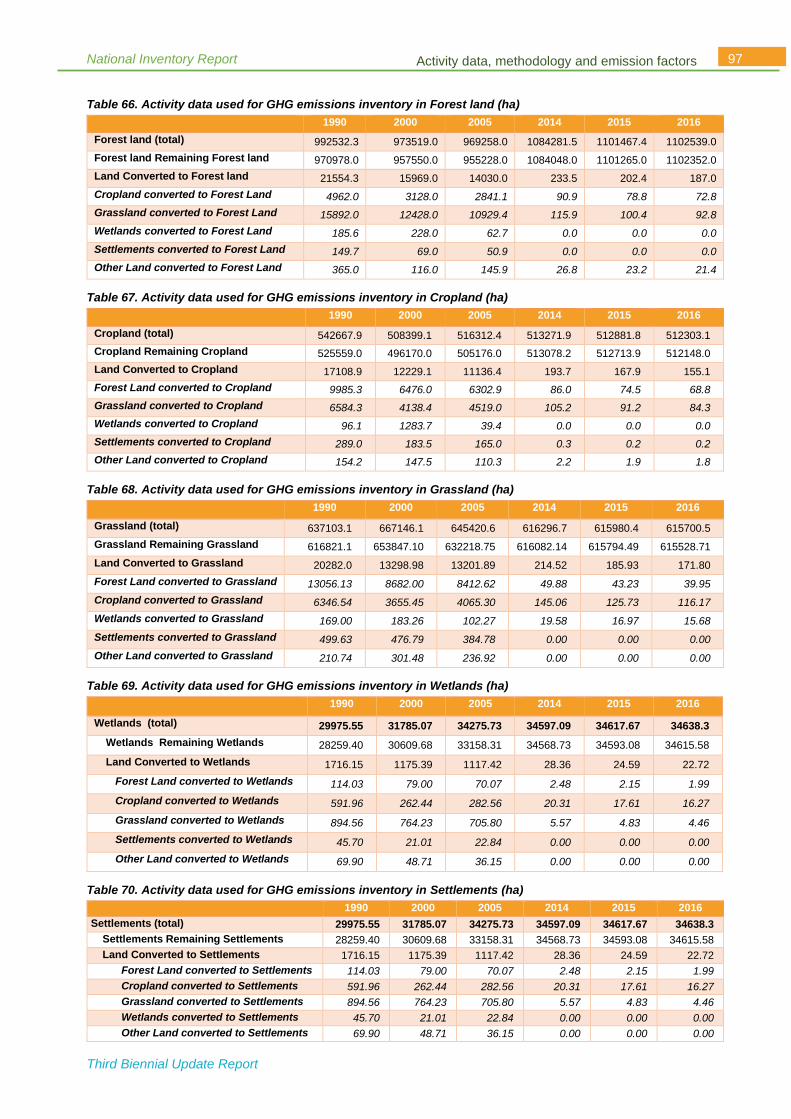
National Inventory Report
Third Biennial Update Report
97 Activity data, methodology and emission factors
Table 66. Activity data used for GHG emissions inventory in Forest land (ha)
1990 2000 2005 2014 2015 2016
Forest land (total) 992532.3 973519.0 969258.0 1084281.5 1101467.4 1102539.0
Forest land Remaining Forest land 970978.0 957550.0 955228.0 1084048.0 1101265.0 1102352.0
Land Converted to Forest land 21554.3 15969.0 14030.0 233.5 202.4 187.0
Cropland converted to Forest Land 4962.0 3128.0 2841.1 90.9 78.8 72.8
Grassland converted to Forest Land 15892.0 12428.0 10929.4 115.9 100.4 92.8
Wetlands converted to Forest Land 185.6 228.0 62.7 0.0 0.0 0.0
Settlements converted to Forest Land 149.7 69.0 50.9 0.0 0.0 0.0
Other Land converted to Forest Land 365.0 116.0 145.9 26.8 23.2 21.4
Table 67. Activity data used for GHG emissions inventory in Cropland (ha)
1990 2000 2005 2014 2015 2016
Cropland (total) 542667.9 508399.1 516312.4 513271.9 512881.8 512303.1
Cropland Remaining Cropland 525559.0 496170.0 505176.0 513078.2 512713.9 512148.0
Land Converted to Cropland 17108.9 12229.1 11136.4 193.7 167.9 155.1
Forest Land converted to Cropland 9985.3 6476.0 6302.9 86.0 74.5 68.8
Grassland converted to Cropland 6584.3 4138.4 4519.0 105.2 91.2 84.3
Wetlands converted to Cropland 96.1 1283.7 39.4 0.0 0.0 0.0
Settlements converted to Cropland 289.0 183.5 165.0 0.3 0.2 0.2
Other Land converted to Cropland 154.2 147.5 110.3 2.2 1.9 1.8
Table 68. Activity data used for GHG emissions inventory in Grassland (ha)
1990 2000 2005 2014 2015 2016
Grassland (total) 637103.1 667146.1 645420.6 616296.7 615980.4 615700.5
Grassland Remaining Grassland 616821.1 653847.10 632218.75 616082.14 615794.49 615528.71
Land Converted to Grassland 20282.0 13298.98 13201.89 214.52 185.93 171.80
Forest Land converted to Grassland 13056.13 8682.00 8412.62 49.88 43.23 39.95
Cropland converted to Grassland 6346.54 3655.45 4065.30 145.06 125.73 116.17
Wetlands converted to Grassland 169.00 183.26 102.27 19.58 16.97 15.68
Settlements converted to Grassland 499.63 476.79 384.78 0.00 0.00 0.00
Other Land converted to Grassland 210.74 301.48 236.92 0.00 0.00 0.00
Table 69. Activity data used for GHG emissions inventory in Wetlands (ha)
1990 2000 2005 2014 2015 2016
Wetlands (total) 29975.55 31785.07 34275.73 34597.09 34617.67 34638.3
Wetlands Remaining Wetlands 28259.40 30609.68 33158.31 34568.73 34593.08 34615.58
Land Converted to Wetlands 1716.15 1175.39 1117.42 28.36 24.59 22.72
Forest Land converted to Wetlands 114.03 79.00 70.07 2.48 2.15 1.99
Cropland converted to Wetlands 591.96 262.44 282.56 20.31 17.61 16.27
Grassland converted to Wetlands 894.56 764.23 705.80 5.57 4.83 4.46
Settlements converted to Wetlands 45.70 21.01 22.84 0.00 0.00 0.00
Other Land converted to Wetlands 69.90 48.71 36.15 0.00 0.00 0.00
Table 70. Activity data used for GHG emissions inventory in Settlements (ha)
1990 2000 2005 2014 2015 2016
Settlements (total) 29975.55 31785.07 34275.73 34597.09 34617.67 34638.3
Settlements Remaining Settlements 28259.40 30609.68 33158.31 34568.73 34593.08 34615.58
Land Converted to Settlements 1716.15 1175.39 1117.42 28.36 24.59 22.72
Forest Land converted to Settlements 114.03 79.00 70.07 2.48 2.15 1.99
Cropland converted to Settlements 591.96 262.44 282.56 20.31 17.61 16.27
Grassland converted to Settlements 894.56 764.23 705.80 5.57 4.83 4.46
Wetlands converted to Settlements 45.70 21.01 22.84 0.00 0.00 0.00
Other Land converted to Settlements 69.90 48.71 36.15 0.00 0.00 0.00

National Inventory Report
Third Biennial Update Report
98 Activity data, methodology and emission factors
Table 71. Activity data used for GHG emissions inventory in Other Land (ha)
1990 2000 2005 2014 2015 2016
Other Land (total) 323056.2
6 335061.5 349939.9 222338 205774.2 217210.6
Other land Remaining Other land 321306.0
0
333342.9
5
348800.6
9
220253.7
6
203967.8
4
215541.5
0
Land Converted to Other land 1750.26 1718.50 1139.20 2084.20 1806.40 1669.10
Forest Land converted to Other
Land 513.30 397.00 287.80 1449.20 1256.00 1160.60
Cropland converted to Other Land 601.30 550.23 330.90 319.60 277.00 255.90
Grassland converted to Other Land 468.20 650.23 414.80 315.40 273.40 252.60
Wetlands converted to Other Land 18.96 39.26 16.90 0.00 0.00 0.00
Settlements converted to Other
Land 148.50 81.78 88.80 0.00 0.00 0.00
A I.1.4 Waste
Table 72. Population used for estimation of GHG emission from Municipal Solid Waste and Domestic Wastewater Treatment and Discharge
Population (in millions)
Year 1950 1951 1952 1953 1954 1955 1956 1957 1958 1959 1960 1961 1962 1963 1964
1.225 1.25151 1.27801 1.30451 1.3133 1.32208 1.33087 1.33965 1.34843 1.35722 1.366 1.406 1.43013 1.45426 1.4784
Year 1965 1966 1967 1968 1969 1970 1971 1972 1973 1974 1975 1976 1977 1978 1979
1.50253 1.52666 1.55079 1.57492 1.59905 1.69151 1.70866 1.72345 1.73755 1.75334 1.77241 1.79556 1.82192 1.84932 1.87465
Year 1980 1981 1982 1983 1984 1985 1986 1987 1988 1989 1990 1991 1992 1993 1994
1.89573 1.9115 1.92273 1.93128 1.93991 1.95049 1.96419 1.98006 1.99847 1.99934 1.99623 1.98846 1.97703 1.96492 1.94593
Year 1995 1996 1997 1998 1999 2000 2001 2002 2003 2004 2005 2006 2007 2008 2009
1.94382 1.94909 1.96064 1.97605 1.99168 2.00487 2.01492 2.02255 2.02677 2.03254 2.03686 2.04194 2.04518 2.04862 2.05272
Year 2010 2011 2012 2013 2014 2015 2016
2.05728 2.05979 2.06229 2.06577 2.06917 2.071278 2.07371
Table 73. Other activity data used for estimation of GHG emission from Municipal Solid Waste
IPCC Regional Default
National
1990 2000 2005 2014 2015 2016
Waste per capita (kg/cap/yr)
520 197 197 281 370 380 376
% to SWDS 90 90 90 90 90 90 90
Table 74. Composition of waste going to the Municipal solid waste disposal sites
food garden paper wood textile nappies other
(%) (%) (%) (%) (%) (%) (%)
36.73 10.72 10.84 0.39 3.68 5.03 32.61
Table 75. GDP (in $ million) used for estimation of GHG emission from Industrial Waste
GDP ($ million)
Year 1970 1971 1972 1973 1974 1975 1976 1977 1978 1979 1980 1981 1982 1983 1984
1,219 1,326 1,384 1,802 2,494 2,800 3,174 3,882 4,648 5,863 6,031 5,941 5,402 5,517 5,934
Year 1985 1986 1987 1988 1989 1990 1991 1992 1993 1994 1995 1996 1997 1998 1999
6,338 6,910 7,425 7,776 8,390 7,871 2,916 2,739 2,963 3,560 4,707 4,413 3,720 3,580 3,673
Year 2000 2001 2002 2003 2004 2005 2006 2007 2008 2009 2010 2011 2012 2013 2014
3,587 3,437 3,791 4,756 5,514 5,987 6,558 8,160 9,834 9,314 9,339 10,395 9,745 10,818 11,362
Year 2015 2016
10,065 10,672

National Inventory Report
Third Biennial Update Report
99 Activity data, methodology and emission factors
Table 76. Other activity data used for estimation of GHG emission from Industrial Waste
National
1990 2000 2005 2014 2015 2016
Waste Generation Rate (Gg/$mGDP/yr)
0.139 0.139 0.139 0.144 0.139 0.139
% to SWDS 90 90 90 90 90 90
Table 77. Total annual amount of solid waste treated by biological treatment facilities (in Gg)
Biological Treatment System Waste Category Type of Waste Waste basis 1990 2000 2005 2014 2015 2016
Composting Municipal Solid Waste Total MSW Dry NO 1.945 2.807 2.239
Table 78. Activity data for waste incineration
2000 2005 2014 2015 2016
Clinical waste (t) 114.90 375.65 572.88 774.87 869.44
Table 79. Activity data used for estimation of the GHG emissions from Open burning of waste
Parametar Unit 1990 2000 2005 2014 2015 2016
Population - P (Capita) 1996227 2004873 2036855 2069172 2071278 2073710
Fraction of Population Burning Waste - P frac (Fraction) 0.1 0.1 0.1 0.1 0.1 0.1
Per Capita Waste Generation - MSWp (kg waste/capita/day) 0.5 0.54 0.77 1.01 1.04 1.03
Fraction of the waste amount burned relative to the total amount of waste treated - Bfrac
(Fraction) 1 1 1 1 1 1
Number of days by year (Day) 365 365 365 365 365 365
A I.2 Methods applied
Table 80. Methods and tiers applied in the preparation of the GHG Inventory (for 2016)
Categories CO2 CH4 N2O HFCs PFCs SF6 Method
used Emiss. factor
Method used
Emiss. factor
Method used
Emiss. factor
Method used
Emiss. factor
Method used
Emiss. factor
Method used
Emiss. factor
1 - Energy T1, T2 CS, DF
T1 DF T1 DF
1.A - Fuel Combustion Activities T1, T2 CS, DF
T1 DF T1 DF
1.A.1 - Energy Industries T2 CS T1 DF T1 DF
1.A.2 - Manufacturing Industries and Construction
T1, T2 CS, DF
T1 DF T1 DF
1.A.3 - Transport T1, T2 CS, DF
T1 DF T1 DF
1.A.4 - Other Sectors T1, T2 CS, DF
T1 DF T1 DF
1.A.5 - Non-Specified T1, T2 CS, DF
T1 DF T1 DF
1.B - Fugitive emissions from fuels T1 DF T1 DF
1.B.1 - Solid Fuels T1 DF
1.B.2 - Oil and Natural Gas T1 DF T1 DF
2 - Industrial Processes and Product Use
T1, T2 CS, DF
T1 DF T1 DF NO,NE NO, NE
2.A - Mineral Industry T1, T2 CS, DF
2.A.1 - Cement production T2 CS
2.A.2 - Lime production T1 DF
2.A.3 - Glass Production T1 DF
2.A.4 - Other Process Uses of Carbonates
T1 DF
2.A.5 - Other (please specify) NO NO NO NO
2.B - Chemical Industry T1 DF
2.B.1 - Ammonia Production NO NO
2.B.2 - Nitric Acid Production NO NO

National Inventory Report
Third Biennial Update Report
100 Activity data, methodology and emission factors
Categories CO2 CH4 N2O HFCs PFCs SF6 Method
used Emiss. factor
Method used
Emiss. factor
Method used
Emiss. factor
Method used
Emiss. factor
Method used
Emiss. factor
Method used
Emiss. factor
2.B.3 - Adipic Acid Production NO NO
2.B.4 - Caprolactam, Glyoxal and Glyoxylic Acid Production
NO NO
2.B.5 - Carbide Production NO NO NO NO
2.B.6 - Titanium Dioxide Production
NO NO
2.B.7 - Soda Ash Production NO NO
2.B.8 - Petrochemical and Carbon Black Production
NO NO
2.B.9 - Fluorochemical Production
2.B.10 - Other (Please specify)
2.C - Metal Industry T2 CS T1 DF NO NO
2.C.1 - Iron and Steel Production T2 CS NO NO
2.C.2 - Ferroalloys Production T2 CS T1 DF
2.C.3 - Aluminium production NO NO NO NO
2.C.4 - Magnesium production NO NO
2.C.5 - Lead Production NO NO
2.C.6 - Zinc Production NO NO
2.C.7 - Other (please specify)
2.D - Non-Energy Products from Fuels and Solvent Use
2.D.1 - Lubricant Use NO NO
2.D.2 - Paraffin Wax Use NO NO
2.D.3 - Solvent Use
2.D.4 - Other (please specify) NO NO
2.E - Electronics Industry NO NO NO NO NO NO
2.E.1 - Integrated Circuit or Semiconductor
NO NO NO NO NO NO
2.E.2 - TFT Flat Panel Display NO NO NO NO
2.E.3 - Photovoltaics NO
2.E.4 - Heat Transfer Fluid NO
2.E.5 - Other (please specify) NO NO NO NO NO NO
2.F - Product Uses as Substitutes for Ozone Depleting Substances
T1 DF
2.F.1 - Refrigeration and Air Conditioning
T1 DF
2.F.2 - Foam Blowing Agents NO NO
2.F.3 - Fire Protection NO NO NO NO
2.F.4 - Aerosols NO NO
2.F.5 - Solvents NO NO NO NO
2.F.6 - Other Applications (please specify)
2.G - Other Product Manufacture and Use
NO NO NO NO NO NO NO NO NO NO
2.G.1 - Electrical Equipment NE NE
2.G.2 - SF6 and PFCs from Other Product Uses
NO NO NE NE
2.G.3 - N2O from Product Uses NO NO
2.G.4 - Other (Please specify) NO NO NO NO NO NO NO NO NO NO
2.H - Other
2.H.1 - Pulp and Paper Industry
2.H.2 - Food and Beverages Industry
2.H.3 - Other (please specify)
3 - Agriculture, Forestry, and Other Land Use
T1 DF T1 DF T1 DF
3.A - Livestock NO NO T1 DF T1 DF
3.A.1 - Enteric Fermentation T1 DF NO NO
3.A.2 - Manure Management T1 DF T1 DF
3.B - Land T1 DF
3.B.1 - Forest land T1 DF
3.B.2 - Cropland T1 DF
3.B.3 - Grassland T1 DF
3.B.4 - Wetlands NO NO
3.B.5 - Settlements T1 DF
3.B.6 - Other Land T1 DF
3.C - Aggregate sources and non-CO2 emissions sources on land
T1 DF T1 DF T1 DF
3.C.1 - Emissions from biomass burning

National Inventory Report
Third Biennial Update Report
101 Activity data, methodology and emission factors
Categories CO2 CH4 N2O HFCs PFCs SF6 Method
used Emiss. factor
Method used
Emiss. factor
Method used
Emiss. factor
Method used
Emiss. factor
Method used
Emiss. factor
Method used
Emiss. factor
3.C.2 - Liming
3.C.3 - Urea application T1 DF
3.C.4 - Direct N2O emissions from managed soils
T1 DF
3.C.5 - Indirect N2O emissions from managed soils
T1 DF
3.C.6 - Indirect N2O emissions from manure management
T1 DF
3.C.7 - Rice cultivations T1 DF
3.C.8 - Other (please specify)
3.D - Other T1 DF
3.D.1 - Harvested Wood Products
T1 DF
3.D.2 - Other (please specify)
4 - Waste T1 DF T1, T2 DF T1 DF
4.A - Solid Waste Disposal T2 DF
4.B - Biological Treatment of Solid Waste
T1 DF
4.C - Incineration and Open Burning of Waste
T1 DF T1 DF T1 DF
4.D - Wastewater Treatment and Discharge
T1 DF T1 DF
4.E - Other (please specify)
5 - Other
5.A - Indirect N2O emissions from the atmospheric deposition of nitrogen in NOx and NH3
NE NE
5.B - Other (please specify)
Memo Items
International Bunkers
1.A.3.a.i - International Aviation (International Bunkers)
T1 DF T1 DF T1 DF
1.A.3.d.i - International water-borne navigation (International bunkers)
NO NO NO NO NO NO
T1 - Tier1 approach, T2 - Tier2 approach, CS - Country specific, DF – Default factor, NO - Not occurring, NE - Not estimated

National Inventory Report
Third Biennial Update Report
102 Activity data, methodology and emission factors
A I.3 Emission factors
A I.3.1 Energy
Table 81. Emission factors used in Energy sector (in kg/TJ)
Fuel CO2 CH4 N2O
Coking coal 94,600 10 1.5
Other Bituminous Coal 94,600 10 1.5
Sub-bituminous Coal 96,100 10 1.5
Lignite 107,879* 1(10)** 1.5
Crude oil 73,333
Residual fuel oil 78,049* 3 0.6
Gas / Diesel oil 74,100 3 0.6
Motor gasoline 69,300 0.5 2
Jet kerosene 71,500 0.5 2
LPG 63,100 1 0.1
Petroleum coke 97,500 3 0.6
Natural gas 55,066* 1 0.1
Biomass 112,000 30 4
* Country Specific Emission Factor (CS EF)
**Default CH4 EF for lignite in Energy industries is 1 kg/TJ and in Manufacturing Industries and Construction is 10 kg/TJ
Note: The default IPCC EF for CH4 and N2O are used. For some of the fuels, the values differ between the IPCC categories in the Energy sector (not all are included in table above).
A I.3.2 IPPU
Table 82. Emission factors used for IPPU sector
Categories CO2 CH4 CF4 C2F6
(t gas/ t product) (kg gas/ t product)
(kg gas/ t product)
(kg gas/ t product)
Mineral Industry
Cement production 0.54
Lime production 0.75
Glass Production 0.20
Other Process Uses of Carbonates
Ceramics 0.44
Other Uses of Soda Ash 0.41
Metal Industry
Iron and Steel Production 0.09
Ferroalloys Production 4.16 1.00
Aluminium production 1.60 1.60 0.40
Lead Production 0.52; 0.25
Zinc Production 1.72
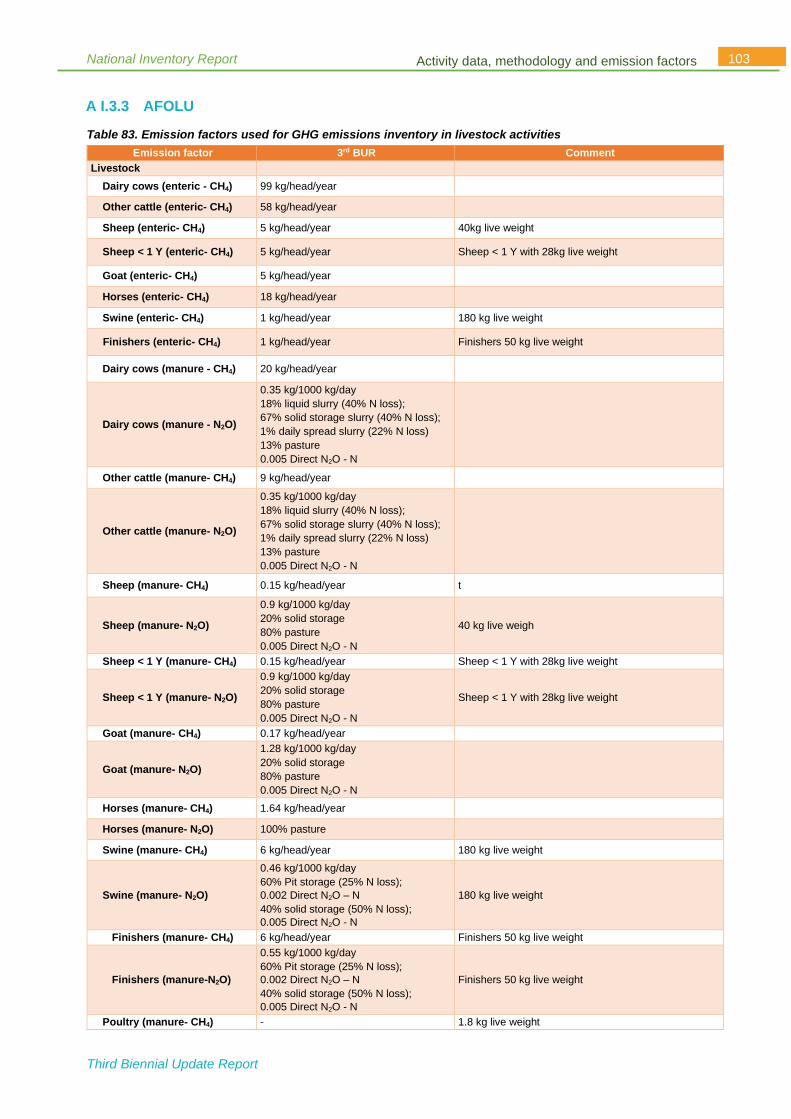
National Inventory Report
Third Biennial Update Report
103 Activity data, methodology and emission factors
A I.3.3 AFOLU
Table 83. Emission factors used for GHG emissions inventory in livestock activities
Emission factor 3rd BUR Comment
Livestock
Dairy cows (enteric - CH4) 99 kg/head/year
Other cattle (enteric- CH4) 58 kg/head/year
Sheep (enteric- CH4) 5 kg/head/year 40kg live weight
Sheep < 1 Y (enteric- CH4) 5 kg/head/year Sheep < 1 Y with 28kg live weight
Goat (enteric- CH4) 5 kg/head/year
Horses (enteric- CH4) 18 kg/head/year
Swine (enteric- CH4) 1 kg/head/year 180 kg live weight
Finishers (enteric- CH4) 1 kg/head/year Finishers 50 kg live weight
Dairy cows (manure - CH4) 20 kg/head/year
Dairy cows (manure - N2O)
0.35 kg/1000 kg/day
18% liquid slurry (40% N loss);
67% solid storage slurry (40% N loss);
1% daily spread slurry (22% N loss)
13% pasture
0.005 Direct N2O - N
Other cattle (manure- CH4) 9 kg/head/year
Other cattle (manure- N2O)
0.35 kg/1000 kg/day
18% liquid slurry (40% N loss);
67% solid storage slurry (40% N loss);
1% daily spread slurry (22% N loss)
13% pasture
0.005 Direct N2O - N
Sheep (manure- CH4) 0.15 kg/head/year t
Sheep (manure- N2O)
0.9 kg/1000 kg/day
20% solid storage
80% pasture
0.005 Direct N2O - N
40 kg live weigh
Sheep < 1 Y (manure- CH4) 0.15 kg/head/year Sheep < 1 Y with 28kg live weight
Sheep < 1 Y (manure- N2O)
0.9 kg/1000 kg/day
20% solid storage
80% pasture
0.005 Direct N2O - N
Sheep < 1 Y with 28kg live weight
Goat (manure- CH4) 0.17 kg/head/year
Goat (manure- N2O)
1.28 kg/1000 kg/day
20% solid storage
80% pasture
0.005 Direct N2O - N
Horses (manure- CH4) 1.64 kg/head/year
Horses (manure- N2O) 100% pasture
Swine (manure- CH4) 6 kg/head/year 180 kg live weight
Swine (manure- N2O)
0.46 kg/1000 kg/day
60% Pit storage (25% N loss);
0.002 Direct N2O – N
40% solid storage (50% N loss);
0.005 Direct N2O - N
180 kg live weight
Finishers (manure- CH4) 6 kg/head/year Finishers 50 kg live weight
Finishers (manure-N2O)
0.55 kg/1000 kg/day
60% Pit storage (25% N loss);
0.002 Direct N2O – N
40% solid storage (50% N loss);
0.005 Direct N2O - N
Finishers 50 kg live weight
Poultry (manure- CH4) - 1.8 kg live weight

National Inventory Report
Third Biennial Update Report
104 Activity data, methodology and emission factors
Poultry (manure- N2O) - 1.8 kg live weight
Layers (manure- CH4) 0.2 kg/head/year 1.8 kg live weight
Layers (manure- N2O)
0.82 kg/1000 kg/day
100% Poultry litter (50% N loss);
0.001 Direct N2O - N
1.8 kg live weight
Broilers (manure- CH4) 0.2 kg/head/year 0.9 kg live weight
Broilers (manure- N2O)
1.1 kg/1000 kg/day
100% Poultry litter (50% N loss);
0.001 Direct N2O - N
0.9 kg live weight, specific factors for broilers were used
Turkey (manure- CH4) 0.9 kg/head/year 6.8 kg live weight, specific factors for Turkey were used
Turkey (manure- N2O)
0.74 kg/1000 kg/day
100% Poultry litter (50% N loss);
0.001 Direct N2O - N
6.8 kg live weight, specific factors for Turkey were used
Other (manure- CH4) 0.2 kg/head/year 1.8 kg live weight
Other (manure- N2O)
0.82 kg/1000 kg/day
100% Poultry litter (50% N loss);
0.001 Direct N2O - N
1.8 kg live weight
A I.3.4 Waste
Figure 69. Parameters used for methane calculations from Solid Waste Disposal
Table 84. Methane correction factor and distribution of waste by type of SWDS
Unmanaged – shallow
Unmanaged – deep
Managed – anaerobic
Managed – semi-aerobic
Uncategorised SWDS
Methane correction factor (MCF) 0.4 0.8 1 0.5 0.6
Fixed distribution (%) 12 46 16 0 26
Table 85. Emission factors used for biological treatment of solid waste
Emission Factor (g/ kg waste treated) CH4 N2O
Composting/Total MSW 10 0.6

National Inventory Report
Third Biennial Update Report
105 Activity data, methodology and emission factors
Table 86. Parameters used for estimation of GHG emissions from Open burning of waste
Parameter Unit
Dry Matter Content - dm (Fraction) 0.97
Fraction of Carbon in Dry Matter - CF (Fraction) 0.38
Fraction of Fossil Carbon in Total Carbon - FCF (Fraction) 0.1
Oxidation Factor - OF (Fraction) 0.58
Methane Emission Factor (kg CH4/Gg Wet Waste) 6500
Nitrous Oxide Emission Factor (kg N2O/Gg Dry Waste) 150
Table 87. Parameters used for estimation of emissions from Domestic and Industrial Wastewater Treatment and Discharge
Estimation of CH4 emission factor for Domestic Wastewater
Type of treatment or discharge Sea, river and lake discharge
Maximum methane producing capacity - B0 (kg CH4/kg BOD) 0.6
Methane correction factor for each treatment system - MCFj 0.1
Fraction of Population Income Group - Ui (Fraction) Rural 0.4; Urban 0.6
Degree of utilization - Tij (Fraction) 0.3
Estimation of emissions of indirect N2O from Domestic Wastewater
Estimation of nitrogen in effluent
Per capita protein consumption (Protein) (kg/person/Year) 28.91
Fraction of nitrogen in protein (Fnpr) (kg N/kg Protein) 0.16
Fraction of non-consumption protein (Fnon-con) (-) 1.4
Fraction of industrial and commercial co-discharged protein (Find-com) (-) 1.25
Emission Factor (kg N2O-N/kg N) 0.005
Estimation of CH4 emission factor for Industrial Wastewater
Type of treatment or discharge Sea, river and lake discharge
Maximum Methane Producing Capacity (B0) (kg CH4/kg COD) 0.25

National Inventory Report
Third Biennial Update Report
106 Detailed tables of the GHG Inventory
Appendix II Detailed tables of the GHG Inventory
Table 88. Detailed results for 1990
Emissions (Gg)
Emissions CO2 Equivalents (Gg)
Emissions (Gg)
Categories Net CO2*
CH4 N2O HFCs
PFCs SF6
Other halogenated
gases with CO2 equivalent conversion
factors
Other halogenated
gases without CO2 equivalent
conversion factors
NOx CO NMVOCs
SO2
Total National Emissions and Removals 9978.1
1 69.61 1.55 NO 91.65
NA, NE 24.99 41.4
7 17.69 96.4
7
1 - Energy 9339.2
5 10.27 0.18
NA
23.98 38.09
11.16 95.97
1.A - Fuel Combustion Activities 9333.6
3 2.77 0.18 23.98 38.0
9 5.58 95.9
7
1.A.1 - Energy Industries 6179.5
9 0.07 0.08 13.51 0.54 0.09 88.9
6
1.A.2 - Manufacturing Industries and Construction 1788.7
7 0.10 0.02 9.18 6.47 0.92 5.99
1.A.3 - Transport 771.48 0.25 0.04 0.02 0.00 0.00 NO
1.A.4 - Other Sectors 568.58 2.34 0.03 1.24 30.8
7 4.56 0.82
1.A.5 - Non-Specified 25.20 0.00 0.00 0.04 0.21 0.02 0.20
1.B - Fugitive emissions from fuels 5.62 7.51
NA
5.58 0.00
1.B.1 - Solid Fuels 5.62 7.48 5.58 NO
1.B.2 - Oil and Natural Gas NO 0.03 NO 0.00
1.B.3 - Other emissions from Energy Production NO NO NO
1.C - Carbon dioxide Transport and Storage
NO NA 1.C.1 - Transport of CO2
1.C.2 - Injection and Storage
1.C.3 - Other
2 - Industrial Processes and Product Use 839.27 0.05 NO,NA 91.65 NO,NA 0.78 1.35 0.02 0.49
2.A - Mineral Industry 333.10
NA
0.74 0.88 0.01 0.22
2.A.1 - Cement production 293.75 0.67 0.79 0.01 0.20
2.A.2 - Lime production 33.72 0.06 0.09 NO 0.02
2.A.3 - Glass Production 0.33 0.01 NO 0.00
2.A.4 - Other Process Uses of Carbonates 5.30 NO

National Inventory Report
Third Biennial Update Report
107 Detailed tables of the GHG Inventory
2.A.5 - Other (please specify) NO
2.B - Chemical Industry NO, NA NO,NA NO,NA
NA NO, NA
2.B.1 - Ammonia Production NO
NA
NA
2.B.2 - Nitric Acid Production
NA NO 2.B.3 - Adipic Acid Production
2.B.4 - Caprolactam, Glyoxal and Glyoxylic Acid Production
2.B.5 - Carbide Production
NO
NO
NA
2.B.6 - Titanium Dioxide Production NA
2.B.7 - Soda Ash Production
2.B.8 - Petrochemical and Carbon Black Production NO
2.B.9 - Fluorochemical Production NA NA
2.B.10 - Other (Please specify) NO NO
2.C - Metal Industry 506.17 0.05 NA NA 91.65 NA 0.04 0.47 0.01 0.27
2.C.1 - Iron and Steel Production 24.75 NA 0.04 0.47 0.01 0.02
2.C.2 - Ferroalloys Production 264.32 0.05 NA
2.C.3 - Aluminium production 8.78 NA 91.65 NA 0.00 NA
2.C.4 - Magnesium production NO, NA
2.C.5 - Lead Production 22.09 NA 0.11
2.C.6 - Zinc Production 186.23 NA 0.15
2.C.7 - Other (please specify) NO
2.D - Non-Energy Products from Fuels and Solvent Use NO,NA
NA
2.D.1 - Lubricant Use NO
2.D.2 - Paraffin Wax Use
2.D.3 - Solvent Use NA
2.D.4 - Other (please specify) NO
2.E - Electronics Industry
NA NA, NO
2.E.1 - Integrated Circuit or Semiconductor
2.E.2 - TFT Flat Panel Display
2.E.3 - Photovoltaics
2.E.4 - Heat Transfer Fluid
2.E.5 - Other (please specify)
2.F - Product Uses as Substitutes for Ozone Depleting Substances
NA NO NA, NO NA NA
2.F.1 - Refrigeration and Air Conditioning
2.F.2 - Foam Blowing Agents
2.F.3 - Fire Protection
2.F.4 - Aerosols

National Inventory Report
Third Biennial Update Report
108 Detailed tables of the GHG Inventory
2.F.5 - Solvents
2.F.6 - Other Applications (please specify)
2.G - Other Product Manufacture and Use
NA NE NA
2.G.1 - Electrical Equipment
2.G.2 - SF6 and PFCs from Other Product Uses
2.G.3 - N2O from Product Uses
2.G.4 - Other (Please specify)
2.H - Other
NA NO, NA NA 2.H.1 - Pulp and Paper Industry
2.H.2 - Food and Beverages Industry
2.H.3 - Other (please specify)
3 - Agriculture, Forestry, and Other Land Use -203.26 44.45 1.26 NA 0.11 NA 5.91 NA
3.A - Livestock
NA
42.36 0.16
NA
0.11 NA 5.87 NA
3.A.1 - Enteric Fermentation 36.33 NO NA
3.A.2 - Manure Management 6.03 0.16 0.11 NA 5.87 NA
3.B - Land -206.31 NO
3.B.1 - Forest land -206.31 NO
3.B.2 - Cropland
NE NA
3.B.3 - Grassland
3.B.4 - Wetlands
3.B.5 - Settlements
3.B.6 - Other Land
3.C - Aggregate sources and non-CO2 emissions sources on land 3.74 2.09 1.09 NA 0.05 NA
3.C.1 - Emissions from biomass burning NA NO NO NA 0.05 NAO
3.C.2 - Liming NO NA NA NA
3.C.3 - Urea application 3.74 NA NA
NA
3.C.4 - Direct N2O Emissions from managed soils NA NA 0.71
3.C.5 - Indirect N2O Emissions from managed soils NA NA 0.28
3.C.6 - Indirect N2O Emissions from manure management NA NA 0.11
3.C.7 - Rice cultivations NA 2.09 NO
3.C.8 - Other (please specify) NO
3.D - Other -0.69 NO
3.D.1 - Harvested Wood Products -0.69 NO
3.D.2 - Other (please specify) NO
4 - Waste 2.86 14.83 0.11 NA 0.12 2.03 0.60 0.00
4.A - Solid Waste Disposal NA 10.62 NA 0.55 NA

National Inventory Report
Third Biennial Update Report
109 Detailed tables of the GHG Inventory
4.B - Biological Treatment of Solid Waste NO
4.C - Incineration and Open Burning of Waste 2.86 0.24 0.00 NA 0.12 2.03 0.05 0.00
4.D - Wastewater Treatment and Discharge NA 3.97 0.11 NA
4.E - Other (please specify) NO
5 - Other NE, NO
5.A - Indirect N2O emissions from the atmospheric deposition of nitrogen in NOx and NH3
NE
5.B - Other (please specify) NO
Memo Items (5)
International Bunkers 15.77 0.00 0.00 NA NE
1.A.3.a.i - International Aviation (International Bunkers) 15.77 0.00 0.00 NA NE
1.A.3.d.i - International water-borne navigation (International bunkers) NO NA NO
1.A.5.c - Multilateral Operations NO
NO - Not occurring, NA – Not Applicable, NE – Not Estimated
*CO2 net emissions (emission minus removals)
Table 89. Detailed results for 2000
Emissions
(Gg) Emissions
CO2 Equivalents (Gg) Emissions
(Gg)
Categories Net CO2* CH4 N2O HFCs PFCs SF6
Other halogenated
gases with CO2 equivalent conversion
factors
Other halogenated
gases without CO2 equivalent
conversion factors
NOx CO NMVOCs SO2
Total National Emissions and Removals 20696.50 62.84 1.39 4.77 62.86 NA, NE, NO 22.33 42.66 31.53 102.96
1 - Energy 9423.60 11.16 0.19
NA
21.26 39.20 11.86 102.41
1.A - Fuel Combustion Activities 9417.55 3.08 0.19 21.26 39.20 5.84 102.41
1.A.1 - Energy Industries 6969.22 0.10 0.09 15.05 0.74 0.11 96.07
1.A.2 - Manufacturing Industries and Construction 1075.61 0.07 0.01 4.24 5.99 0.71 5.63
1.A.3 - Transport 986.11 0.24 0.05 0.01 0.02 0.00 NO
1.A.4 - Other Sectors 258.95 2.39 0.03 1.01 31.80 4.72 0.56
1.A.5 - Non-Specified 127.66 0.29 0.00 0.95 0.65 0.30 0.14
1.B - Fugitive emissions from fuels 6.05 8.08 NA
6.01 0.00
1.B.1 - Solid Fuels 6.05 8.06 6.01 NA

National Inventory Report
Third Biennial Update Report
110 Detailed tables of the GHG Inventory
1.B.2 - Oil and Natural Gas NO 0.02 NO 0.00
1.B.3 - Other emissions from Energy Production NA
1.C - Carbon dioxide Transport and Storage
NO NA 1.C.1 - Transport of CO2
1.C.2 - Injection and Storage
1.C.3 - Other
2 - Industrial Processes and Product Use 819.76 0.04 NO 4.77 62.86 NE, NA,NO 0.84 1.25 0.02 0.54
2.A - Mineral Industry 361.83 NA 0.82 0.97 0.01 0.25
2.A.1 - Cement production 348.77
NA
0.80 0.94 0.01 0.24
2.A.2 - Lime production 11.17 0.02 0.03 NA 0.01
2.A.3 - Glass Production 0.05 0.00 NA
2.A.4 - Other Process Uses of Carbonates 1.85 Na
2.A.5 - Other (please specify) NO NO
2.B - Chemical Industry NO, NA NA,NO
NA NA, NO
2.B.1 - Ammonia Production NO NA
2.B.2 - Nitric Acid Production
NA NA NO 2.B.3 - Adipic Acid Production
2.B.4 - Caprolactam, Glyoxal and Glyoxylic Acid Production
2.B.5 - Carbide Production
NO
NO
NA 2.B.6 - Titanium Dioxide Production NA
2.B.7 - Soda Ash Production NA
2.B.8 - Petrochemical and Carbon Black Production NO
2.B.9 - Fluorochemical Production NA
2.B.10 - Other (Please specify) NO
2.C - Metal Industry 457.93 0.04 NA 62.86 NA, NO 0.02 0.29 0.01 0.30
2.C.1 - Iron and Steel Production 15.15 NA 0.02 0.29 0.01 0.01
2.C.2 - Ferroalloys Production 195.36 0.04 NA
2.C.3 - Aluminium production 6.02 NA 62.86 NA
2.C.4 - Magnesium production NO
2.C.5 - Lead Production 22.97 NA 0.12
2.C.6 - Zinc Production 218.43 NA 0.17
2.C.7 - Other (please specify) NO
2.D - Non-Energy Products from Fuels and Solvent Use
NO NA 2.D.1 - Lubricant Use
2.D.2 - Paraffin Wax Use
2.D.3 - Solvent Use

National Inventory Report
Third Biennial Update Report
111 Detailed tables of the GHG Inventory
2.D.4 - Other (please specify)
2.E - Electronics Industry
NA NO, NA NA
2.E.1 - Integrated Circuit or Semiconductor
2.E.2 - TFT Flat Panel Display
2.E.3 - Photovoltaics
2.E.4 - Heat Transfer Fluid
2.E.5 - Other (please specify)
2.F - Product Uses as Substitutes for Ozone Depleting Substances NA 4.77 NO,NA NA
2.F.1 - Refrigeration and Air Conditioning NA 4.77 NA NA
2.F.2 - Foam Blowing Agents
NA NO NO NA
2.F.3 - Fire Protection
2.F.4 - Aerosols
2.F.5 - Solvents
2.F.6 - Other Applications (please specify)
2.G - Other Product Manufacture and Use
NA NE NA
2.G.1 - Electrical Equipment
2.G.2 - SF6 and PFCs from Other Product Uses
2.G.3 - N2O from Product Uses
2.G.4 - Other (Please specify)
2.H - Other
NO NA NO 2.H.1 - Pulp and Paper Industry
2.H.2 - Food and Beverages Industry
2.H.3 - Other (please specify)
3 - Agriculture, Forestry, and Other Land Use 10449.95 36.64 1.09 NO 0.10 NA 19.05 NA
3.A - Livestock
NA
35.74 0.14
NA
0.10 NA 5.18 NA
3.A.1 - Enteric Fermentation 29.88 NO NA
3.A.2 - Manure Management 5.85 0.14 0.10 NA 5.18 NA
3.B - Land 10441.56
NA
3.B.1 - Forest land 9159.83
3.B.2 - Cropland 657.48
3.B.3 - Grassland 480.96
3.B.4 - Wetlands
3.B.5 - Settlements 126.48
3.B.6 - Other Land 16.81
3.C - Aggregate sources and non-CO2 emissions sources on land 9.09 0.91 0.94 NA 13.87 NA
3.C.1 - Emissions from biomass burning NA NO NA 13.87 NA

National Inventory Report
Third Biennial Update Report
112 Detailed tables of the GHG Inventory
3.C.2 - Liming NO NA
3.C.3 - Urea application 9.09 NA
3.C.4 - Direct N2O Emissions from managed soils NA 0.62
NA
3.C.5 - Indirect N2O Emissions from managed soils NA 0.23
3.C.6 - Indirect N2O Emissions from manure management NA NA
0.10
3.C.7 - Rice cultivations NA 0.91 NA
3.C.8 - Other (please specify) NO
3.D - Other -0.70 NO
3.D.1 - Harvested Wood Products -0.70 NO
3.D.2 - Other (please specify) NO
4 - Waste 3.20 15.00 0.12 NA, NO 0.13 2.21 0.60 0.00
4.A - Solid Waste Disposal NA 11.98 NA 0.56 NA
4.B - Biological Treatment of Solid Waste NO
4.C - Incineration and Open Burning of Waste 3.20 0.26 0.00 NA 0.13 2.21 0.05 0.00
4.D - Wastewater Treatment and Discharge NA 2.77 0.12 NA
4.E - Other (please specify) NO
5 - Other NE, NO
5.A - Indirect N2O emissions from the atmospheric deposition of nitrogen in NOx and NH3 NE
5.B - Other (please specify) NO
Memo Items (5)
International Bunkers 88.05 0.00 0.00 NA NE, NO
1.A.3.a.i - International Aviation (International Bunkers) 88.05 0.00 0.00 NA NE
1.A.3.d.i - International water-borne navigation (International bunkers) NO NA NO
1.A.5.c - Multilateral Operations NO NA NO
NO - Not occurring, NA – Not Applicable, NE – Not Estimated
*CO2 net emissions (emission minus removals)

National Inventory Report
Third Biennial Update Report
113 Detailed tables of the GHG Inventory
Table 90. Detailed results for 2005
Emissions
(Gg) Emissions
CO2 Equivalents (Gg) Emissions
(Gg)
Categories Net CO2* CH4 N2O HFCs PFCs SF6
Other halogenated
gases with CO2 equivalent conversion
factors
Other halogenated
gases without CO2 equivalent
conversion factors
NOx CO NMVOCs SO2
Total National Emissions and Removals 8170.70 60.38 1.50 102.84 0.33
NA, NE, NO 23.56 48.51 18.04 103.4
5
1 - Energy 8930.51 10.58 0.19
NA
22.37 43.23 11.83 103.16
1.A - Fuel Combustion Activities 8924.97 3.18 0.19 22.37 43.23 6.32 103.1
6
1.A.1 - Energy Industries 5913.37 0.07 0.09 14.25 0.56 0.09 94.80
1.A.2 - Manufacturing Industries and Construction 1349.75 0.09 0.01 4.65 7.90 0.98 7.32
1.A.3 - Transport 1021.52 0.28 0.05 0.01 0.00 0.00
1.A.4 - Other Sectors 228.16 2.57 0.03 0.85 34.09 5.06 0.54
1.A.5 - Non-Specified 412.17 0.18 0.00 2.63 0.68 0.19 0.50
1.B - Fugitive emissions from fuels 5.54 7.40
NA
0.00 0.00 5.50 0.00
1.B.1 - Solid Fuels 5.54 7.38 NA NA 5.50 NA
1.B.2 - Oil and Natural Gas NA 0.02 0.00 0.00 0.00 0.00
1.B.3 - Other emissions from Energy Production NO NO
1.C - Carbon dioxide Transport and Storage
NO NA 1.C.1 - Transport of CO2
1.C.2 - Injection and Storage
1.C.3 - Other
2 - Industrial Processes and Product Use 756.70 0.07 NO 102.84 0.33 NA, NE, NO 0.92 2.08 0.04 0.29
2.A - Mineral Industry 368.05
NA
0.84 0.98 0.01 0.25
2.A.1 - Cement production 355.32 0.81 0.95 0.01 0.25
2.A.2 - Lime production 11.13 0.02 0.03 NO 0.01
2.A.3 - Glass Production 0.01 NA 0.00
2.A.4 - Other Process Uses of Carbonates 1.60 NA
2.A.5 - Other (please specify) NO NO
2.B - Chemical Industry NA, NO
NA NA,NO 2.B.1 - Ammonia Production NO NA NA
2.B.2 - Nitric Acid Production NA NO

National Inventory Report
Third Biennial Update Report
114 Detailed tables of the GHG Inventory
2.B.3 - Adipic Acid Production
2.B.4 - Caprolactam, Glyoxal and Glyoxylic Acid Production
2.B.5 - Carbide Production
NO
NO NA
2.B.6 - Titanium Dioxide Production NA
2.B.7 - Soda Ash Production
2.B.8 - Petrochemical and Carbon Black Production NO NA
2.B.9 - Fluorochemical Production NA
2.B.10 - Other (Please specify) NO
2.C - Metal Industry
2.C.1 - Iron and Steel Production 58.23 NO 0.08 1.10 0.03 0.04
2.C.2 - Ferroalloys Production 330.39 0.07 NA
2.C.3 - Aluminium production 0.03 NA 0.33 NA
2.C.4 - Magnesium production
NO NA NO 2.C.5 - Lead Production
2.C.6 - Zinc Production
2.C.7 - Other (please specify)
2.D - Non-Energy Products from Fuels and Solvent Use
NO NA
2.D.1 - Lubricant Use
2.D.2 - Paraffin Wax Use
2.D.3 - Solvent Use
2.D.4 - Other (please specify)
2.E - Electronics Industry
NA NO, NA NA
2.E.1 - Integrated Circuit or Semiconductor
2.E.2 - TFT Flat Panel Display
2.E.3 - Photovoltaics
2.E.4 - Heat Transfer Fluid
2.E.5 - Other (please specify)
2.F - Product Uses as Substitutes for Ozone Depleting Substances NA 102.84 NO,NA NA
2.F.1 - Refrigeration and Air Conditioning NA 102.84 NA NA
2.F.2 - Foam Blowing Agents
NA NO NO NA
2.F.3 - Fire Protection
2.F.4 - Aerosols
2.F.5 - Solvents
2.F.6 - Other Applications (please specify)
2.G - Other Product Manufacture and Use NA NE, NA NA
2.G.1 - Electrical Equipment

National Inventory Report
Third Biennial Update Report
115 Detailed tables of the GHG Inventory
2.G.2 - SF6 and PFCs from Other Product Uses
2.G.3 - N2O from Product Uses
2.G.4 - Other (Please specify)
2.H - Other
NO NA 2.H.1 - Pulp and Paper Industry
2.H.2 - Food and Beverages Industry
2.H.3 - Other (please specify)
3 - Agriculture, Forestry, and Other Land Use -1521.33 33.92 1.19 NA 0.08 NA 5.30 NA
3.A - Livestock
NA
33.44 0.14
NA
0.08 NA 4.67 NA
3.A.1 - Enteric Fermentation 28.23 NA NA
3.A.2 - Manure Management 5.21 0.14 0.08 NA 4.67 NA
3.B - Land -1521.57
NA
3.B.1 - Forest land -2825.49
3.B.2 - Cropland 669.12
3.B.3 - Grassland 503.29
3.B.4 - Wetlands
3.B.5 - Settlements 121.12
3.B.6 - Other Land 10.39
3.C - Aggregate sources and non-CO2 emissions sources on land 1.28 0.48 1.05 NA, NO 0.63 NA
3.C.1 - Emissions from biomass burning NA NO NA 0.63 NA
3.C.2 - Liming NO NA
3.C.3 - Urea application 1.28 NA
3.C.4 - Direct N2O Emissions from managed soils NA 0.71
NA
3.C.5 - Indirect N2O Emissions from managed soils NA 0.26
3.C.6 - Indirect N2O Emissions from manure management NA 0.09
3.C.7 - Rice cultivations NA 0.48 NA
3.C.8 - Other (please specify) NA NO
3.D - Other -1.04
NA 3.D.1 - Harvested Wood Products -1.04
3.D.2 - Other (please specify) NO
4 - Waste 4.82 15.80 0.12 NA, NO 0.18 3.20 0.87 0.01
4.A - Solid Waste Disposal NA 12.64 NA 0.80 NA
4.B - Biological Treatment of Solid Waste NO
4.C - Incineration and Open Burning of Waste 4.82 0.37 0.00 NA 0.18 3.20 0.07 0.01
4.D - Wastewater Treatment and Discharge NA 2.79 0.12 NA 0.00 NA
4.E - Other (please specify) NA

National Inventory Report
Third Biennial Update Report
116 Detailed tables of the GHG Inventory
5 - Other NE, NO
5.A - Indirect N2O emissions from the atmospheric deposition of nitrogen in NOx and NH3
NE
5.B - Other (please specify) NO
Memo Items (5)
International Bunkers 20.16 0.00 0.00 NA NE, NO
1.A.3.a.i - International Aviation (International Bunkers) 20.16 0.00 0.00 NA NE
1.A.3.d.i - International water-borne navigation (International bunkers) NO NA NO
1.A.5.c - Multilateral Operations NO NA NO
NO - Not occurring, NA – Not Applicable, NE – Not Estimated
*CO2 net emissions (emission minus removals)
Table 91. Detailed results for 2014
Emissions
(Gg) Emissions
CO2 Equivalents (Gg) Emissions
(Gg)
Categories Net CO2* CH4 N2O HFCs PFCs SF6
Other halogenated gases with
CO2 equivalent conversion
factors
Other halogenated
gases without CO2
equivalent conversion
factors
NOx CO NMVOCs SO2
Total National Emissions and Removals 4824.71 62.53 1.51 206.60 NA, NE, NO 18.00 54.08 18.42 76.64
1 - Energy 7734.17 10.35 0.20
NA
17.01 48.74 12.73 76.43
1.A - Fuel Combustion Activities 7728.95 3.40 0.20 16.34 45.73 6.68 76.42
1.A.1 - Energy Industries 4727.49 0.05 0.06 10.63 0.51 0.07 69.51
1.A.2 - Manufacturing Industries and Construction 1127.36 0.07 0.01 3.88 7.04 0.81 6.54
1.A.3 - Transport 1624.18 0.33 0.08 0.01 0.00 0.00 NO
1.A.4 - Other Sectors 75.31 2.87 0.04 0.66 37.90 5.69 0.25
1.A.5 - Non-Specified 174.61 0.08 0.00 1.17 0.27 0.11 0.13
1.B - Fugitive emissions from fuels 5.22 6.95
NA
0.67 3.01 6.05 0.01
1.B.1 - Solid Fuels 5.22 6.95 NA NA 5.19 NA
1.B.2 - Oil and Natural Gas 0.00 0.00 0.67 3.01 0.86 0.01
1.B.3 - Other emissions from Energy Production NO NA
1.C - Carbon dioxide Transport and Storage
NO NA 1.C.1 - Transport of CO2
1.C.2 - Injection and Storage

National Inventory Report
Third Biennial Update Report
117 Detailed tables of the GHG Inventory
1.C.3 - Other
2 - Industrial Processes and Product Use 677.76 0.07 206.60 NA, NE, NO 0.67 1.08 0.02 0.20
2.A - Mineral Industry 283.16 NA 0.65 0.76 0.01 0.19
2.A.1 - Cement production 275.68
NA
0.63 0.74 0.01 0.19
2.A.2 - Lime production 6.39 0.02 0.02 NO 0.00
2.A.3 - Glass Production 0.01 NO NO NO 0.00
2.A.4 - Other Process Uses of Carbonates 1.08 NO NO NO NO
2.A.5 - Other (please specify) NO
2.B - Chemical Industry NO, NA
NA NA
2.B.1 - Ammonia Production NO
2.B.2 - Nitric Acid Production
NA NO 2.B.3 - Adipic Acid Production
2.B.4 - Caprolactam, Glyoxal and Glyoxylic Acid Production
2.B.5 - Carbide Production
NO
NO NA
2.B.6 - Titanium Dioxide Production NA
2.B.7 - Soda Ash Production
2.B.8 - Petrochemical and Carbon Black Production NO NA
2.B.9 - Fluorochemical Production NA
2.B.10 - Other (Please specify) NO
2.C - Metal Industry 394.60 0.07 NA, NO 0.03 0.32 0.01 0.01
2.C.1 - Iron and Steel Production 17.03 NA 0.03 0.32 0.01 0.01
2.C.2 - Ferroalloys Production 377.56 0.07 NA
NA,NO
2.C.3 - Aluminium production
NO NA,NO
2.C.4 - Magnesium production
2.C.5 - Lead Production
2.C.6 - Zinc Production
2.C.7 - Other (please specify)
2.D - Non-Energy Products from Fuels and Solvent Use
NO NA NA
2.D.1 - Lubricant Use
2.D.2 - Paraffin Wax Use
2.D.3 - Solvent Use
2.D.4 - Other (please specify)
2.E - Electronics Industry
NA NO,NA NA 2.E.1 - Integrated Circuit or Semiconductor
2.E.2 - TFT Flat Panel Display
2.E.3 - Photovoltaics

National Inventory Report
Third Biennial Update Report
118 Detailed tables of the GHG Inventory
2.E.4 - Heat Transfer Fluid
2.E.5 - Other (please specify)
2.F - Product Uses as Substitutes for Ozone Depleting Substances NA 206.60 NO, NA NA
2.F.1 - Refrigeration and Air Conditioning NA 206.60 NA NA
2.F.2 - Foam Blowing Agents
NA NO NO, NA NA
2.F.3 - Fire Protection
2.F.4 - Aerosols
2.F.5 - Solvents
2.F.6 - Other Applications (please specify)
2.G - Other Product Manufacture and Use
NA NE, NA NA
2.G.1 - Electrical Equipment
2.G.2 - SF6 and PFCs from Other Product Uses
2.G.3 - N2O from Product Uses
2.G.4 - Other (Please specify)
2.H - Other
NO NA 2.H.1 - Pulp and Paper Industry
2.H.2 - Food and Beverages Industry
2.H.3 - Other (please specify)
3 - Agriculture, Forestry, and Other Land Use -3593.70 31.11 1.17 NA 0.08 NA 4.51 NA
3.A - Livestock
NA
30.15 0.13 NA 0.08 NA 4.25 NA
3.A.1 - Enteric Fermentation 25.01 NA NA
NA
3.A.2 - Manure Management 5.14 0.13 0.08 4.25
3.B - Land -3595.88
NA
3.B.1 - Forest land -3632.75
3.B.2 - Cropland 7.34
3.B.3 - Grassland 17.39
3.B.4 - Wetlands
3.B.5 - Settlements 3.10
3.B.6 - Other Land 9.04
3.C - Aggregate sources and non-CO2 emissions sources on land 3.67 0.96 1.04 NA 0.26 NO
3.C.1 - Emissions from biomass burning NA NO NA 0.26 NA
3.C.2 - Liming NO NA
NA
3.C.3 - Urea application 3.67 NA NA
3.C.4 - Direct N2O Emissions from managed soils
NA
0.70
3.C.5 - Indirect N2O Emissions from managed soils 0.25
3.C.6 - Indirect N2O Emissions from manure management 0.09

National Inventory Report
Third Biennial Update Report
119 Detailed tables of the GHG Inventory
3.C.7 - Rice cultivations NA 0.96 NA
3.C.8 - Other (please specify) NO
3.D - Other -1.48
NA 3.D.1 - Harvested Wood Products -1.48
3.D.2 - Other (please specify) NA
4 - Waste 6.48 21.00 0.14
NA
0.24 4.26 1.17 0.01
4.A - Solid Waste Disposal NA 17.65 NA NA 1.08 NA
4.B - Biological Treatment of Solid Waste NA 0.02 0.00 NA 0.00 NA
4.C - Incineration and Open Burning of Waste 6.48 0.50 0.01 0.24 4.26 0.09 0.01
4.D - Wastewater Treatment and Discharge NA 2.83 0.13 NA 0.00 NA
4.E - Other (please specify) NO NA
5 - Other NE, NO
5.A - Indirect N2O emissions from the atmospheric deposition of nitrogen in NOx and NH3 NE
5.B - Other (please specify) NO
Memo Items (5)
International Bunkers 37.14 0.00 0.00 NA NE, NO
1.A.3.a.i - International Aviation (International Bunkers) 37.14 0.00 0.00 NA NE
1.A.3.d.i - International water-borne navigation (International bunkers) NO NA NO
1.A.5.c - Multilateral Operations NO NA NO
NO - Not occurring, NA – Not Applicable, NE – Not Estimated
*CO2 net emissions (emission minus removals)
Table 92. Detailed results for 2015
Emissions
(Gg) Emissions
CO2 Equivalents (Gg) Emissions
(Gg)
Categories Net CO2* CH4 N2O HFCs PFCs SF6
Other halogenated gases with
CO2 equivalent conversion
factors
Other halogenated
gases without CO2 equivalent conversion
factors
NOx CO NMVOCs SO2
Total National Emissions and Removals 6632.71 63.81 1.52 219.06 NA, NE, NO 17.06 53.69 19.70 69.01
1 - Energy 7400.61 9.71 0.19
NA
16.05 48.30 12.40 68.79
1.A - Fuel Combustion Activities 7395.83 3.34 0.19 15.16 44.30 6.51 68.78
1.A.1 - Energy Industries 4242.83 0.04 0.06 9.53 0.47 0.06 62.02

National Inventory Report
Third Biennial Update Report
120 Detailed tables of the GHG Inventory
1.A.2 - Manufacturing Industries and Construction 1061.99 0.07 0.01 3.59 6.81 0.81 6.35
1.A.3 - Transport 1802.65 0.36 0.09 0.00 0.00 NA NA
1.A.4 - Other Sectors 81.65 2.78 0.04 0.66 36.70 5.51 0.26
1.A.5 - Non-Specified 206.70 0.09 0.00 1.38 0.31 0.13 0.15
1.B - Fugitive emissions from fuels 4.78 6.36
NA
0.89 4.01 5.89 0.01
1.B.1 - Solid Fuels 4.78 6.36 NA 4.75 NA
1.B.2 - Oil and Natural Gas 0.00 0.00 0.89 4.01 1.15 0.01
1.B.3 - Other emissions from Energy Production NA NA
1.C - Carbon dioxide Transport and Storage
NO NA 1.C.1 - Transport of CO2
1.C.2 - Injection and Storage
1.C.3 - Other
2 - Industrial Processes and Product Use 570.32 0.05 NA 219.06 NA 0.69 1.00 0.02 0.21
2.A - Mineral Industry 294.43
NA
0.67 0.79 0.01 0.20
2.A.1 - Cement production 288.64 0.66 0.78 0.01 0.20
2.A.2 - Lime production 4.72 0.01 0.02 NA 0.00
2.A.3 - Glass Production 0.01
NA
0.00
2.A.4 - Other Process Uses of Carbonates 1.05 NA
2.A.5 - Other (please specify) NO
2.B - Chemical Industry NO, NA
NA NA
2.B.1 - Ammonia Production NO NA
2.B.2 - Nitric Acid Production NA NO
2.B.3 - Adipic Acid Production
2.B.4 - Caprolactam, Glyoxal and Glyoxylic Acid Production
2.B.5 - Carbide Production NO NO
2.B.6 - Titanium Dioxide Production NA
2.B.7 - Soda Ash Production
2.B.8 - Petrochemical and Carbon Black Production NO
2.B.9 - Fluorochemical Production
2.B.10 - Other (Please specify) NO
2.C - Metal Industry 275.89 0.05 NA 0.02 0.21 0.01 0.01
2.C.1 - Iron and Steel Production 11.04 NA 0.02 0.21 0.01 0.01
2.C.2 - Ferroalloys Production 263.47 0.05 NA
2.C.3 - Aluminium production NO, NA
2.C.4 - Magnesium production
2.C.5 - Lead Production 1.38 NA 0.01

National Inventory Report
Third Biennial Update Report
121 Detailed tables of the GHG Inventory
2.C.6 - Zinc Production NO NA,
2.C.7 - Other (please specify)
2.D - Non-Energy Products from Fuels and Solvent Use
NO NA
2.D.1 - Lubricant Use
2.D.2 - Paraffin Wax Use
2.D.3 - Solvent Use
2.D.4 - Other (please specify)
2.E - Electronics Industry
NA NO, NA NA
2.E.1 - Integrated Circuit or Semiconductor
2.E.2 - TFT Flat Panel Display
2.E.3 - Photovoltaics
2.E.4 - Heat Transfer Fluid
2.E.5 - Other (please specify)
2.F - Product Uses as Substitutes for Ozone Depleting Substances NA 219.06 NO, NA NA
2.F.1 - Refrigeration and Air Conditioning NA 219.06 NA NA
2.F.2 - Foam Blowing Agents
NA NO NO,NA NA
2.F.3 - Fire Protection
2.F.4 - Aerosols
2.F.5 - Solvents
2.F.6 - Other Applications (please specify)
2.G - Other Product Manufacture and Use
NA NE, NO NA NA
2.G.1 - Electrical Equipment
2.G.2 - SF6 and PFCs from Other Product Uses
2.G.3 - N2O from Product Uses
2.G.4 - Other (Please specify)
2.H - Other
NO NA 2.H.1 - Pulp and Paper Industry
2.H.2 - Food and Beverages Industry
2.H.3 - Other (please specify)
3 - Agriculture, Forestry, and Other Land Use -1345.06 32.19 1.18 NA 0.08 NA 6.08 NA
3.A - Livestock
NA
31.26 0.14
NA
0.08 NA 4.35 NA
3.A.1 - Enteric Fermentation 25.78 NA NA
3.A.2 - Manure Management 5.48 0.14 0.08 4.35
3.B - Land -1347.09
NA 3.B.1 - Forest land -1697.39
3.B.2 - Cropland 28.84

National Inventory Report
Third Biennial Update Report
122 Detailed tables of the GHG Inventory
3.B.3 - Grassland 27.94
3.B.4 - Wetlands
3.B.5 - Settlements 9.36
3.B.6 - Other Land 284.16
3.C - Aggregate sources and non-CO2 emissions sources on land 3.51 0.93 1.04 NA 1.73 NA
3.C.1 - Emissions from biomass burning NA NO 1.73 NA
3.C.2 - Liming NO NA NA
NA
3.C.3 - Urea application 3.51 NA NA
3.C.4 - Direct N2O Emissions from managed soils
NA
0.70
3.C.5 - Indirect N2O Emissions from managed soils 0.25
3.C.6 - Indirect N2O Emissions from manure management 0.09
3.C.7 - Rice cultivations NA 0.93 NA
3.C.8 - Other (please specify) NA
3.D - Other -1.48
3.D.1 - Harvested Wood Products -1.48 NA NA
3.D.2 - Other (please specify)
4 - Waste 6.85 21.87 0.14 NA 0.25 4.39 1.20 0.01
4.A - Solid Waste Disposal NA 18.30 NA
NA
NA NA 1.11 NA
4.B - Biological Treatment of Solid Waste NA 0.03 0.00 NA 0.00 NA NA
4.C - Incineration and Open Burning of Waste 6.85 0.51 0.01 0.25 4.39 0.10 0.01
4.D - Wastewater Treatment and Discharge NA 3.03 0.13 NA NA 0.00 NA
4.E - Other (please specify) NA
5 - Other NE, NO
5.A - Indirect N2O emissions from the atmospheric deposition of nitrogen in NOx and NH3 NE
5.B - Other (please specify) NO
Memo Items (5)
International Bunkers 41.64 0.00 0.00 NA NE, NO
1.A.3.a.i - International Aviation (International Bunkers) 41.64 0.00 0.00 NA NE
1.A.3.d.i - International water-borne navigation (International bunkers) NO NA NO
1.A.5.c - Multilateral Operations NO NA NO
NO - Not occurring, NA – Not Applicable, NE – Not Estimated
*CO2 net emissions (emission minus removals)

National Inventory Report
Third Biennial Update Report
123 Detailed tables of the GHG Inventory
Table 93. Detailed results for 2016
Emissions (Gg)
Emissions CO2 Equivalents (Gg)
Emissions (Gg)
Categories Net CO2* CH4 N2O HFCs PFCs SF6
Other halogenated gases with
CO2 equivalent conversion
factors
Other halogenated
gases without CO2
equivalent conversion
factors
NOx CO NMVOCs SO2
Total National Emissions and Removals 5896.75 63.53 1.60 315.72 NA 15.93 47.54 17.38 59.98
1 - Energy 7179.56 8.47 0.19
NA
14.71 41.88 10.74 59.69
1.A - Fuel Combustion Activities 7175.41 2.95 0.19 13.94 38.44 5.64 59.68
1.A.1 - Energy Industries 3785.76 0.04 0.05 8.41 0.51 0.06 53.18
1.A.2 - Manufacturing Industries and Construction 1031.89 0.08 0.01 3.48 6.55 0.79 6.11
1.A.3 - Transport 2056.95 0.39 0.10 0.01 0.00 NA
1.A.4 - Other Sectors 81.75 2.35 0.03 0.59 31.05 4.66 0.24
1.A.5 - Non-Specified 219.07 0.09 0.00 1.46 0.32 0.13 0.16
1.B - Fugitive emissions from fuels 4.15 5.52
NA
0.77 3.44 5.11 0.01
1.B.1 - Solid Fuels 4.15 5.52 NA 4.12 NA
1.B.2 - Oil and Natural Gas 0.00 0.00 0.77 3.44 0.98 0.01
1.B.3 - Other emissions from Energy Production NA NA
1.C - Carbon dioxide Transport and Storage
NO NA 1.C.1 - Transport of CO2
1.C.2 - Injection and Storage
1.C.3 - Other
2 - Industrial Processes and Product Use 541.70 0.02 NO 315.72 NA, NE, NO 0.89 1.31 0.02 0.28
2.A - Mineral Industry 379.39
NA
0.87 1.02 0.01 0.26
2.A.1 - Cement production 372.92 0.85 1.00 0.01 0.26
2.A.2 - Lime production 5.38 0.01 0.02 NA 0.00
2.A.3 - Glass Production 0.05 0.00 NA 0.00
2.A.4 - Other Process Uses of Carbonates 1.04 NA
2.A.5 - Other (please specify) NO
2.B - Chemical Industry NO, NA
NA NA
2.B.1 - Ammonia Production NO NA
2.B.2 - Nitric Acid Production
NA NO 2.B.3 - Adipic Acid Production
2.B.4 - Caprolactam, Glyoxal and Glyoxylic Acid Production

National Inventory Report
Third Biennial Update Report
124 Detailed tables of the GHG Inventory
2.B.5 - Carbide Production
NO
NO NA
2.B.6 - Titanium Dioxide Production NA
2.B.7 - Soda Ash Production
2.B.8 - Petrochemical and Carbon Black Production NO NA
2.B.9 - Fluorochemical Production NA
2.B.10 - Other (Please specify) NO
2.C - Metal Industry 162.31 0.02 NA 0.02 0.29 0.01 0.02
2.C.1 - Iron and Steel Production 15.31 NA 0.02 0.29 0.01 0.01
2.C.2 - Ferroalloys Production 144.67 0.02 NA
2.C.3 - Aluminium production NO, NA
2.C.4 - Magnesium production
2.C.5 - Lead Production 2.33 NA 0.01
2.C.6 - Zinc Production NO, NA
2.C.7 - Other (please specify)
2.D - Non-Energy Products from Fuels and Solvent Use
NO NA
2.D.1 - Lubricant Use
2.D.2 - Paraffin Wax Use
2.D.3 - Solvent Use
2.D.4 - Other (please specify)
2.E - Electronics Industry
NA NO, NA NA
2.E.1 - Integrated Circuit or Semiconductor
2.E.2 - TFT Flat Panel Display
2.E.3 - Photovoltaics
2.E.4 - Heat Transfer Fluid
2.E.5 - Other (please specify)
2.F - Product Uses as Substitutes for Ozone Depleting Substances NA 315.72 NA,NO NA
2.F.1 - Refrigeration and Air Conditioning NA 315.72 NA NA
2.F.2 - Foam Blowing Agents
NA NO NO, NA
NA
2.F.3 - Fire Protection
2.F.4 - Aerosols
2.F.5 - Solvents
2.F.6 - Other Applications (please specify)
2.G - Other Product Manufacture and Use
NA NE,NA NA 2.G.1 - Electrical Equipment
2.G.2 - SF6 and PFCs from Other Product Uses
2.G.3 - N2O from Product Uses

National Inventory Report
Third Biennial Update Report
125 Detailed tables of the GHG Inventory
2.G.4 - Other (Please specify)
2.H - Other
NO NA 2.H.1 - Pulp and Paper Industry
2.H.2 - Food and Beverages Industry
2.H.3 - Other (please specify)
3 - Agriculture, Forestry, and Other Land Use -1831.16 32.62 1.26 NA 0.08 NA 5.43 NA
3.A - Livestock
NA
31.68 0.14
NA
0.08 NA 4.44 NA
3.A.1 - Enteric Fermentation 26.06 NA NA
3.A.2 - Manure Management 5.62 0.14 0.08 NA 4.44 NA
3.B - Land -1834.34
NA
3.B.1 - Forest land -2156.85
3.B.2 - Cropland 31.22
3.B.3 - Grassland 25.80
3.B.4 - Wetlands
3.B.5 - Settlements 2.92
3.B.6 - Other Land 262.57
3.C - Aggregate sources and non-CO2 emissions sources on land 3.19 0.94 1.12 NA 0.99 NA
3.C.1 - Emissions from biomass burning NA NO NA 0.99 NA
3.C.2 - Liming NO NA
NA
3.C.3 - Urea application 3.19 NA NA
3.C.4 - Direct N2O Emissions from managed soils
NA
0.75
3.C.5 - Indirect N2O Emissions from managed soils 0.27
3.C.6 - Indirect N2O Emissions from manure management 0.09
3.C.7 - Rice cultivations NA 0.94 NA
3.C.8 - Other (please specify) NO
3.D - Other
NO NA 3.D.1 - Harvested Wood Products
3.D.2 - Other (please specify)
4 - Waste 6.65 22.42 0.14 NA 0.25 4.35 1.19 0.01
4.A - Solid Waste Disposal NA 18.93 NA
NA
NA NA 1.10 NA
4.B - Biological Treatment of Solid Waste NA 0.02 0.00 NA 0.00 NA NA
4.C - Incineration and Open Burning of Waste 6.65 0.51 0.01 0.25 4.35 0.10 0.01
4.D - Wastewater Treatment and Discharge NA 2.96 0.13 NA NA 0.00 NA
4.E - Other (please specify) NA
5 - Other NE, NO
5.A - Indirect N2O emissions from the atmospheric deposition of nitrogen in NOx and NH3 NE

National Inventory Report
Third Biennial Update Report
126 Detailed tables of the GHG Inventory
5.B - Other (please specify) NO
Memo Items (5)
International Bunkers 47.48 0.00 0.00 NA NE, NO
1.A.3.a.i - International Aviation (International Bunkers) 47.48 0.00 0.00 NA NE
1.A.3.d.i - International water-borne navigation (International bunkers) NO NA NO
1.A.5.c - Multilateral Operations NO NA NO
NO - Not occurring, NA – Not Applicable, NE – Not Estimated
*CO2 net emissions (emission minus removals)

National Inventory Report
Third Biennial Update Report
127 Detailed tables of the key category analysis
Appendix III Detailed tables of the key category analysis
Table 94 presents the level assessment of key categories in 2016 in details, where:
- |Ex,t| is absolute value of emission or removal estimate of source or sink category x in year t - Lx,t is level assessment for source or sink x in latest inventory year (year t).
Table 95 gives an overview of the trend assessment relating to 1990 and 2016, where:
- Ex,t and Ex,0 is real values of estimates of source or sink category x in years t and 0, respectively - Tx,t is trend assessment of source or sink category x in year t as compared to the base year (year 0)
Table 94. Level assessment of key categories in 2016
IPCC Category
code
IPCC Category Green-house
gas
2016 Ex,t
(Gg CO2 Eq)
|Ex,t| (Gg CO2 Eq)
Lx,t Cumulative Total of
Lx,t
1.A.1 Energy Industries - Solid Fuels CO2 3378.73 3378.73 0.27 0.27
3.B.1.a Forest land Remaining Forest land CO2 -2154.20 2154.20 0.17 0.45
1.A.3.b Road Transportation CO2 2050.37 2050.37 0.17 0.61
3.A.1 Enteric Fermentation CH4 651.53 651.53 0.05 0.67
1.A.2 Manufacturing Industries and Construction - Solid Fuels CO2 508.45 508.45 0.04 0.71
4.A Solid Waste Disposal CH4 473.16 473.16 0.04 0.75
1.A.2 Manufacturing Industries and Construction - Liquid Fuels CO2 450.06 450.06 0.04 0.78
2.A.1 Cement production CO2 372.92 372.92 0.03 0.81
2.F.1 Refrigeration and Air Conditioning PFC 315.72 315.72 0.03 0.84
1.A.1 Energy Industries - Gaseous Fuels CO2 313.98 313.98 0.03 0.86
3.C.4 Direct N2O Emissions from managed soils N2O 224.45 224.45 0.02 0.88
1.A.5 Non-Specified - Liquid Fuels CO2 202.97 202.97 0.02 0.90
2.C.2 Ferroalloys Production CO2 144.67 144.67 0.01 0.91
3.A.2 Manure Management CH4 140.56 140.56 0.01 0.92
1.B.1 Fugitive emissions - Solid Fuels CH4 138.08 138.08 0.01 0.93
1.A.1 Energy Industries - Liquid Fuels CO2 93.05 93.05 0.01 1.00
Table 95. Trend assessment of key categories (1990, 2016)
IPCC Cate-gory code
IPCC Category Green-house
gas
1990 Year Estimate
Ex0 (Gg CO2 Eq)
2016 Year Estimate
Ext (Gg CO2 Eq)
Trend Assess-
ment (Txt)
% Contri-bution to
Trend
Cumulative Total of
Contrib. to Trend
3.B.1.a Forest land Remaining Forest land CO2 -206.31 -2154.20 0.15 0.27 0.27
1.A.3.b Road Transportation CO2 749.17 2050.37 0.12 0.23 0.50
1.A.1 Energy Industries - Solid Fuels CO2 5698.04 3378.73 0.03 0.05 0.55
1.A.2 Manufacturing Industries and Construction - Liquid Fuels
CO2 1197.05 450.06 0.03 0.05 0.60
2.F.1 Refrigeration and Air Conditioning PFC 0.00 315.72 0.02 0.05 0.65
1.A.1 Energy Industries - Gaseous Fuels CO2 0.00 313.98 0.02 0.05 0.69
4.A Solid Waste Disposal CH4 265.61 473.16 0.02 0.04 0.74
1.A.4 Other Sectors - Liquid Fuels CO2 545.31 73.50 0.02 0.04 0.78
1.A.1 Energy Industries - Liquid Fuels CO2 481.55 93.05 0.02 0.03 0.81
1.A.5 Non-Specified - Liquid Fuels CO2 0.00 202.97 0.02 0.03 0.84
2.A.1 Cement production CO2 293.75 372.92 0.01 0.03 0.87
2.C.6 Zinc Production CO2 186.23 0.00 0.01 0.02 0.88
1.A.2 Manufacturing Industries and Construction - Solid Fuels
CO2 591.72 508.45 0.01 0.02 0.90
3.C.4 Direct N2O Emissions from managed soils
N2O 211.97 224.45 0.01 0.01 0.91
1.A.2 Manufacturing Industries and Construction - Gaseous Fuels
CO2 0.00 73.38 0.01 0.01 0.92
2.C.3 Aluminium production PFCs 91.65 0.00 0.00 0.01 0.93
3.A.1 Enteric Fermentation CH4 908.22 651.53 0.00 0.01 0.94
3.A.2 Manure Management CH4 150.83 140.56 0.00 0.01 0.95
3.B.2.b Land Converted to Cropland CO2 0.00 32.60 0.00 0.00 0.95

National Inventory Report
Third Biennial Update Report
128 Detailed tables of the key category analysis