Latvia 1st national communication - UNFCCC
74
NATIONAL COMMUNICATION OF THE REPUBLIC OF LATVIA UNDER UNITED NATIONS FRAMEWORK CONVENTION ON CLIMATE CHANGE MINISTRY OF ENVIRONMENTAL PROTECTION AND REGIONAL DEVELOPMENT RIGA 1995
-
Upload
khangminh22 -
Category
Documents
-
view
1 -
download
0
Transcript of Latvia 1st national communication - UNFCCC

NATIONAL COMMUNICATIONOF THE REPUBLIC OF LATVIA
UNDER UNITED NATIONS FRAMEWORK
CONVENTION ON CLIMATE CHANGE
MINISTRY OF ENVIRONMENTAL PROTECTION
AND REGIONAL DEVELOPMENT
RIGA
1995

2
CONTENTS
FOREWORD 4
SUMMARY 5
1. INTRODUCTION 15
2. GENERAL INFORMATION ABOUT THE REPUBLIC OF LATVIA 182.1. Geography . . . . . . . . . . . . . . . . . . . . . . . . . . . . . . . . . . . . . . . . . . . . . . . . . . . 182.2. Climatic conditions . . . . . . . . . . . . . . . . . . . . . . . . . . . . . . . . . . . . . . . . . . . . . 192.3. Population . . . . . . . . . . . . . . . . . . . . . . . . . . . . . . . . . . . . . . . . . . . . . . . . . . . . 202.4. Economy . . . . . . . . . . . . . . . . . . . . . . . . . . . . . . . . . . . . . . . . . . . . . . . . . . . . . 212.5. Environment . . . . . . . . . . . . . . . . . . . . . . . . . . . . . . . . . . . . . . . . . . . . . . . . . . 252.6. National policy and legislation . . . . . . . . . . . . . . . . . . . . . . . . . . . . . . . . . . . . . 25
2.6.1. General policy of state and legislation . . . . . . . . . . . . . . . . . . . . . . . . 252.6.2. Policy and legislation in environment protection prior to the base year . . . . . . . . . . . . . . . . . . . . . . . . . . . . . . . . . . . . . . . . . . . . . 26
3. INVENTORY OF GREENHOUSE GAS EMISSIONS IN LATVIA 273.1. Introduction . . . . . . . . . . . . . . . . . . . . . . . . . . . . . . . . . . . . . . . . . . . . . . . . . . 273.2. CO emissions and removals . . . . . . . . . . . . . . . . . . . . . . . . . . . . . . . . . . . . . . 282
3.2.1. CO emissions in energy sector . . . . . . . . . . . . . . . . . . . . . . . . . . . . . 282
3.2.2. CO emissions in industry . . . . . . . . . . . . . . . . . . . . . . . . . . . . . . . . . 292
3.2.3. CO sinks in land use change and forestry . . . . . . . . . . . . . . . . . . . . 292
3.3. CH emissions . . . . . . . . . . . . . . . . . . . . . . . . . . . . . . . . . . . . . . . . . . . . . . . . . 314
3.3.1. CH emissions in energy sector . . . . . . . . . . . . . . . . . . . . . . . . . . . . . 314
3.3.2. CH emissions in agriculture . . . . . . . . . . . . . . . . . . . . . . . . . . . . . . . 314
3.3.3.CH emissions from municipal waste . . . . . . . . . . . . . . . . . . . . . . . . . 324
3.4. N O emissions . . . . . . . . . . . . . . . . . . . . . . . . . . . . . . . . . . . . . . . . . . . . . . . . . 322
3.4.1. N O emissions in energy sector . . . . . . . . . . . . . . . . . . . . . . . . . . . . . 322
3.4.2. N O emissions in agricultural sector . . . . . . . . . . . . . . . . . . . . . . . . . 332
3.5. Other GHG emissions . . . . . . . . . . . . . . . . . . . . . . . . . . . . . . . . . . . . . . . . . . . 333.6. Converted GHG emissions . . . . . . . . . . . . . . . . . . . . . . . . . . . . . . . . . . . . . . . 34
4. POLICIES AND MEASURES MITIGATING CLIMATE CHANGES 354.1. Introduction . . . . . . . . . . . . . . . . . . . . . . . . . . . . . . . . . . . . . . . . . . . . . . . . . . 354.2. International activities . . . . . . . . . . . . . . . . . . . . . . . . . . . . . . . . . . . . . . . . . . . 354.3. National targets, policy and measures after base year . . . . . . . . . . . . . . . . . . . . 35
4.3.1. General climate policy and legislation in environment protection . . . . . . . . . . . . . . . . . . . . . . . . . . . . . . . . . . . . . . . . . . . . . . . . . . 364.3.2. Measures for reducing CO emissions . . . . . . . . . . . . . . . . . . . . . . . . 372
4.3.2.1. Energy sector . . . . . . . . . . . . . . . . . . . . . . . . . . . . . . . . . . . 374.3.2.2 Industrial sector . . . . . . . . . . . . . . . . . . . . . . . . . . . . . . . . . 394.3.2.3. Land use change and forestry (CO sink) . . . . . . . . . . . . . . 392
4.3.3. Measures for reduction of CH emission . . . . . . . . . . . . . . . . . . . . . 404

3
4.3.3.1. Energy sector . . . . . . . . . . . . . . . . . . . . . . . . . . . . . . . . . . 404.3.3.2. Agriculture . . . . . . . . . . . . . . . . . . . . . . . . . . . . . . . . . . . . 414.3.3.3. Waste management . . . . . . . . . . . . . . . . . . . . . . . . . . . . . . 41
4.3.4. Measures for reduction of N O emissions . . . . . . . . . . . . . . . . . . . . . 422
4.3.4.1. Energy sector . . . . . . . . . . . . . . . . . . . . . . . . . . . . . . . . . . 424.3.4.2. Agriculture . . . . . . . . . . . . . . . . . . . . . . . . . . . . . . . . . . . . 42
4.3.5. Measures for reduction of NO , CO and NMVOC emissions . . . . . . . 43x
4.3.6. Monitoring of GHG emission reducing measures . . . . . . . . . . . . . . . 43
5. PROJECTIONS OF GREENHOUSE GAS EMISSIONS 455.1. Introduction . . . . . . . . . . . . . . . . . . . . . . . . . . . . . . . . . . . . . . . . . . . . . . . . . . 455.2. CO Emissions and Sink . . . . . . . . . . . . . . . . . . . . . . . . . . . . . . . . . . . . . . . . . 472
5.3. CH emissions . . . . . . . . . . . . . . . . . . . . . . . . . . . . . . . . . . . . . . . . . . . . . . . . . 494
5.4. N O emissions . . . . . . . . . . . . . . . . . . . . . . . . . . . . . . . . . . . . . . . . . . . . . . . . . 502
5.5. Other GHG emissions . . . . . . . . . . . . . . . . . . . . . . . . . . . . . . . . . . . . . . . . . . . 515.6. Converted GHG emissions . . . . . . . . . . . . . . . . . . . . . . . . . . . . . . . . . . . . . . . 525.7. Uncertainty . . . . . . . . . . . . . . . . . . . . . . . . . . . . . . . . . . . . . . . . . . . . . . . . . . . 52
6. SYSTEMATIC OBSERVATIONS AND STUDIES 536.1. Observations of environmental pollution and databases . . . . . . . . . . . . . . . . . . 536.2. Monitoring of climate . . . . . . . . . . . . . . . . . . . . . . . . . . . . . . . . . . . . . . . . . . . 536.3. Scientific research and international cooperation . . . . . . . . . . . . . . . . . . . . . . . 54
7. EDUCATION, TRAINING AND PUBLIC AWARENESS 57
REFERENCES 59
ABBREVIATIONS 60
CHEMICAL SYMBOLS AND UNITS OF MEASUREMENT 61
FIGURES 62
TABLES 62
ANNEX 3 64Emissions of greenhouse gases in Latvia in 1990. Tables A.3.1.- A.3.8.
ANNEX 4 67International measures and conventions Latvia participates in Table A.4.1. Relevant national laws, draft laws, resolutions and regulations adopted after base year. Table A.4.2.
ANNEX 5 72Projection of greenhouse gas emissions in Latvia in 2000. Tables A.5.1.- A.5.5.

4
FOREWORD
Alongside with many other countries worldwide Latvia signed the Un ited
Nations Framework Convention on Climate Change during the United Nations
Conference on Environment and Development in Rio de Janeiro, 1992, thu s
demonstrating its determination to play an active role in taking measure s
ultimately aimed at countering irreversible climate changes due t o
anthropogenic activities.
The Saeima of Latvia ratified the Convention on 23 February, 19 95, thus
becoming a Member State to the Convention and undertaking to fulfi l
obligations pursuant to the Convention; Government acknowledges tha t
assessing the current situation and prognosticating developmental trends for
a next decade peculiarities of a transition period in politics and economy are
bound to give rise to various problems and difficulties.
However, Latvian Government believes that the difficulties of a
transition period will be overcome by virtue of efforts of Latvian people and
international assistance; science and modern technologies will develop, a
national policy on climate will be devised and implemented, a period o f
sustained growth will begin in economy.
The National Communication of Latvia demonstrates that th e
Government has already commenced the process.
INDULIS EMSISMinister of StateMinistry of Environmental Protectionand Regional Development

5
SUMMARYINTRODUCTION
Latvia participated at the United Nations Conference on Environment and Developmentat Rio de Janeiro in June, 1992 and signed the Framework Convention on Climate Change. TheConvention is ratified by the Saeima on 23 February, 1995.
National Communication of the Republic of Latvia provides other countries members tothe Convention with general information about Latvia; presents data on emissions of greenhousegases (GHG); outlines policy and measures to be adopted gradually in order to stabilize GHGemissions by 2000 and to prevent these from increasing in future.
Ministry of Environment Protection and Regional Development of the Republic of Latvia:- Department of Environment Protection,- Environment Data Centre,- State Environment Inspection.
Ministry of Transport of the Republic of Latvia:- Ecology Department,- Hydrometeorlogical Agency.
Ministry of Economy of the Republic of Latvia:- Department of Promotion of Entrepreneurial Activities,- Department of Energy Development and Balance of Resources.
Ministry of Agriculture of the Republic of Latvia:- Department of Agriculture,- State Forest Service.
Ministry of Finances of the Republic of Latvia:- Department of Forecasting and Macro Fiscal Analysis.
State Committee of Statistics of the Republic of Latvia:- Administration of Environment Protection Statistics, - Division of Statistics of Material Resources.
Riga City MunicipalityAdvisor of Prime Minister on Environment Protection AffairsEnergy Agency of Latvia
State Institute of Forest Inventory
Foreign institutions:Ministry of Housing, Physical Planning and Environment of the Netherlands,Institute of Environmental Studies at Vrije University of the Netherlands,Polish Foundation of Energy Efficiency
The principal difficulties in preparing the National Communication are linked with deepchanges aimed at transition from centrally planned economy model to market relations, takingplace in all sectors of economy, state administration and legislation in the aftermath of a collapseof the USSR and regaining of independence. Restructuring is still under way in many sectors ofeconomy which have been principal sources of GHG emissions in the past. Since a full-valuesystem for accumulation of statistical data is yet to be devised, it is not possible for the time beingto produce reliable projections or recommendations concerning directions of economicdevelopment up to 2000 and 2010.
Apart from Latvia there is a number Eastern European countries - signatories to theConvention, which are undergoing a transition stage to market-based economy. The specialcircumstances taken into account, the Convention provides for some "flexibility" in preparing the

6
National Communication in countries with transition economies.Within a context of the National Communication of the Republic of Latvia the term
"flexibility" is interpreted in the following way:1. 1990 is designated as a base year in accordance with the Convention, however, to
facilitate better understanding of processes taking place in various sectors of national economy,additionally to the base year, information is presented related to some previous years.
2. Inventory of emissions. Since radical changes have been taking place in Latvianeconomy from 1990, it has been impossible to assess industrial activities in some of subsectors,except cement production, and to evaluate GHG emissions in accordance with the methodologyrecommended by IPCC\OECD, therefore NO , CO and NMVOC emissions pertinent to industriesx
and sectors utilizing solvents are made available from statistical records of Latvian EnvironmentData Centre. CO sink in forestry is assessed in compliance with the methodology of US2
Environmental Protection Agency using database of the Forest Department of the Ministry ofAgriculture.
3. Projection of emissions. Despite all economic sectors are considered in the Chapterdealing with policies and measures aimed at reducing GHG emissions, reliable quantitativeassessment of efficiency of measures is feasible solely in energy sector.
GENERAL INFORMATION ABOUT REPUBLIC OF LATVIA
Latvia is situated on the edge of the Eastern European plane on shores of the Baltic Sea.Location of Latvia and the proximity of the Atlantic Ocean determines climatic conditions, i.e.,moderately warm summers, moderately cold winters, frequent cyclones. A total land area ofLatvia is 64.600 km , including 39% of cultivated land, 44% of forests, shrubs and groves.2
Population of Latvia in 1990 is about 2.7 millions of inhabitants.Latvian economy is undergoing a transition period from centralized planning to market
relations, which has brought about crisis in all sectors of state activities, particularly in an energysector and industries. Latvian energy sector has no considerable resources of its own - 50% ofelectricity and 90% of fuel is imported, thus a transition to market prices in case of energyresources hit Latvian economy exceptionally severely and served as one of the aspects causingits decline.
After regaining independence Latvian legislation is undergoing a transformation stage. Forthe time being legislative acts elaborated and approved after regaining independence are in force,as well as those used in Latvian SSR and the USSR.
INVENTORY OF EMISSIONS
The following gases are considered in GHG inventory in Latvia: CO , CH , N O, NO ,2 4 2 x
CO, NMVOC (non-methane volatile organic compounds). Inventory data on 1990 emissions arepresented in Table S.1. Employing coefficients of the global warming potential (GWP) it isassessed, that aggregated reduced GHG emissions in 1990 amounted to 27632 Gg of CO2
equivalents, of which CO constitute 83.1%, CH - 14.1%, N O - 2.8%.2 4 2
Combustion of fuel is the principal source of CO emissions, whereas agriculture - the2
main source of CH emissions. CO sink in Latvia in 1990 covered about 50% of total CO4 2 2
emissions.Aggregated GHG emissions in Latvia over the period of 1990 -1994 have dropped
markedly due to processes of restructuring and decline of production and fragmentation in many

7
sectors of industry and collective farming.
Aggregate Table S.1. Inventory of GHG emissions in Latvia in 1990 (Gg)
GHG source and sink categories CO CH N O NO CO NMVOC2 4 2 X
Total emissions and sinks 22976.3 158.937 2.38 90.135 363.125 62.7221.All energy 22605.6 4.167 1.03 90.135 363.125 55.3241.A. Fuel combustion 22605.6 2.368 1.03 90.135 363.125 55.3151.A.1. Energy & transformations activities 8274.4 0.509 0.07 15.223 22.727 0.6481.A.a Losses - transport & distribution 34.51.A.2. Industry 2680.4 0.059 0.014 3.362 0.939 0.0991.A.3. Transport 5660.6 1.486 0.108 65.833 329.077 54.1991.A.5. Residential 3140.3 0.184 0.029 2.711 4.414 0.1791.A.6. Agriculture/forestry 1449.7 0.108 0.016 1.582 4.789 0.1241.A.7. Other 1365.7 0.022 0.793 1.424 1.179 0.0661.B. Fugitive fuel emission 1.799 0.0092. Industrial processes 370.7 2.E.1. Cement production 370.73. Solvent and other product use 7.3983.A. Degreasing and dry cleaning 1.1193.B. Chemical products manufacture / processing 0.6803.C. Other 5.5994. Agriculture 111.27 1.3514.A. Enteric fermentation 97.964.B. Animal waste 13.314.C. Agricultural soils 1.3515. Land use change and forestry (-14300)5.C. Managed forests (-14300)6. Waste 43.56.A. Landfills 43.5
POLICIES AND MEASURES MITIGATING CLIMATE CHANGE
No particular national policy mitigating climate change has been elaborated in Latvia. Toa large extent the climate policy is a combination of environmental protection policy and ofdevelopment stratagies in various economic sectors.
Development concepts and plans for Latvian economic sectors:- Environmental Protection Policy Plan (EPPP, elaborated and accepted in 1995),- Projection of Latvian Economic Development (elaborated in 1994),- Public Investment Programme (elaborated in 1994),- Macroeconomic Stabilization Programme (elaborated in 1994),- Energy Master Plan for Latvia (LEDP, elaborated in 1994),- National Development Programme of Motor Transport (elaborated in 1994 in the frameof Transport Development National Programme),- Forest Development Proramme (elaborated in 1992),- Forestry Development Policy (elaborated in 1994),- Concept of National Strategy in Rural Areas (elaborated in 1994),- Concept of National Strategy in Industry (elaborated in 1995).

8
Objectives of national climate policy are formulated in EPPP, i.e., significant improvementof environment quality is sought in territories, where environment quality causes high risks,preventing in the same time deterioration of environment quality in the remaining territory; alsoEPPP is aimed at integration efforts with respect to environment protection in all sectors and sidesof life. Pursuant to Article 4, Clause 2, Paragraph (a) of the Convention on Climate Change"....Parties shall adopt national policies and take corresponding measures on the mitigation ofclimate change, by limiting its anthropogenic emissions of greenhouse gasses and protecting andenhancing its greenhouse gas sinks and reservoirs. These policies and measures will demonstratethat developed countris are taking the lead in modifying longer-term trends in anthropogenicemissions consistent with the objective of the Convention, recognizing that the return by the endof the present decade to earlier levels of anthropogenic emissions of carbon dioxide and othergreenhouse gases not controlled by the Montreal Protocol would contribute to such modification,and taking into account the differences in these Partie's starting points and approaches, economicstructures and resource bases, the need to maintain strong and sustainable economic growth,available technologies and other individual circumstances, as well as the need for equitable andappropriate contributions by each of these Parties to the global effort regarding that objective".Pursuant to Paragraph (a), Clause 2, Article 4 of the Convention on Climate Change towhich Latvia as a Signatory Party, the said objectives relevant to greenhouse gases is tostabilize emissions of these gases by 2000 not exceeding the levels of 1990 emissions. Due toeconomic decline none of the sectors expects rapid growth in production and consumptionactivities before 2000, moreover, the activity levels will fall short of those of 1990, consequently,emissions of GHG in comparison with 1990 shall not increase. However, the levels may growafter 2000 or even earlier, provided unprognosticated changes take place and actual economicdevelopment markedly differs from forecasted scenarios. Thus, the measures characteristic ofLatvia's circumstances, both the planned and implemented ones are considered.
Climate policy and measures in individual economic sectors can be expressed bycombining principal requirements of sectorial development with basic principles of environmentprotection. Most significant measures pertinent to climate policy are connected with energy andtransport sectors. Policy and measures aimed at reducing GHG emissions in all sectors ofeconomy are summarized in Tables S.2.- S.4.

9
Aggregate Table S.2. Policy and measures for reduction of CO emission levels2
Economic sector Economic Laws Education, Governmental Voluntary Scientificmeasures information measures actions studies
1. Energy sector
1.A. Combus- 1. Natural Natural Awareness 1. Free market 1. Indigenous 1. Develop-tion of fuel resource tax resource building price for fuel (I) biofuel ment of1.A.1. Energy (P) tax (P) action "Last 2.Organization of (wood, peat), novel tech-production and 2.Differentiate warning" energy saving more exten- nologiestransformation d excise tax (11.02.95) campaign (I) sive utiliza- (UI)
for different dedicated to 3.Reconstruction of tion of hydro 2. Studiestypes of fuel in GHG impact heating network resources of alter-favour of gas; upon shall cut losses and shall cut CO nativeshall cut CO climate CO emissions by emissions by energy2
emissions by (I) 3% (UI) 2 - 4% (UI) sources6% (P) 4. Installation of 2. Reduction (solar,
2
heat meters shall of heat losses wind) (UI)cut heat consum- by packing 3. Studiesption and CO room during on heat2
emissions by 10 % the cold insulation(UI) season (I) of buildings5. Utilization of al- (UI)ternative energy -construction ofhydroelectric plantson small rivers(UI)6. Financialsupport to scientific research (P)
2
1.A.3. Differentiated 1. Rigo- Education of 1. Changes in tran- More Develop-Transport excise tax on rous re- vehicle sport infrastructure extensive use ment of
different types gulations drivers (I) in favour of water of bicycle productionof petrol (P) of annual transport and rail- transport (UI) of up-to-
vehicle way transport (P) date andcheck-up 2. Restrictions for ecologically(I) private transport friendly2. Speed within cities (UI) transporta-limits (I) 3. Improvements in tion means
public transport and equip-system (P) ment (P)
1.A.5. Heating Natural Natural Ads on heat Free market prices Reduction of Studies onof residential resource tax resource saving in for all types of fuel heat losses by heat insu-buildings (P) tax (P) mass media (I) packing room lation of
(I) during the buildingscold season (UI)(I)
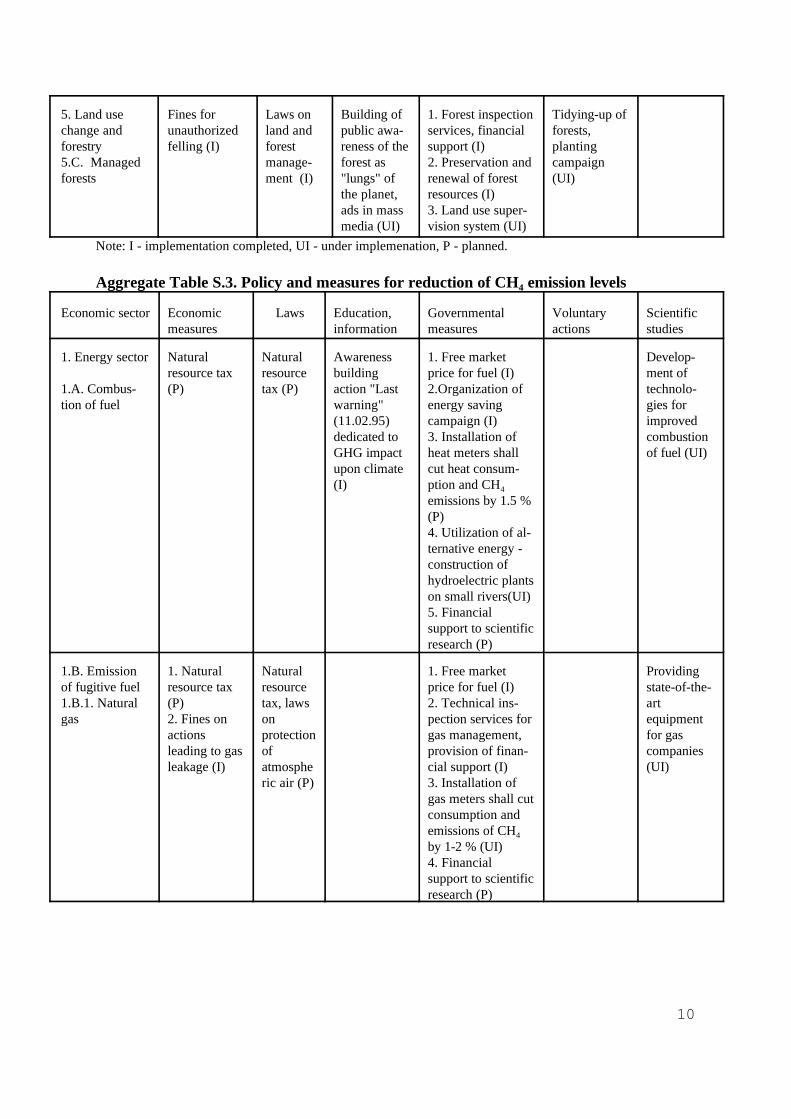
10
5. Land use Fines for Laws on Building of 1. Forest inspection Tidying-up ofchange and unauthorized land and public awa- services, financial forests,forestry felling (I) forest reness of the support (I) planting5.C. Managed manage- forest as 2. Preservation and campaignforests ment (I) "lungs" of renewal of forest (UI)
the planet, resources (I)ads in mass 3. Land use super-media (UI) vision system (UI)
Note: I - implementation completed, UI - under implemenation, P - planned.
Aggregate Table S.3. Policy and measures for reduction of CH emission levels4
Economic sector Economic Laws Education, Governmental Voluntary Scientificmeasures information measures actions studies
1. Energy sector Natural Natural Awareness 1. Free market Develop-
1.A. Combus- (P) tax (P) action "Last 2.Organization of technolo-tion of fuel warning" energy saving gies for
resource tax resource building price for fuel (I) ment of
(11.02.95) campaign (I) improveddedicated to 3. Installation of combustionGHG impact heat meters shall of fuel (UI)upon climate cut heat consum-(I) ption and CH4
emissions by 1.5 %(P)4. Utilization of al-ternative energy -construction ofhydroelectric plantson small rivers(UI)5. Financialsupport to scientificresearch (P)
1.B. Emission 1. Natural Natural 1. Free market Providingof fugitive fuel resource tax resource price for fuel (I) state-of-the-1.B.1. Natural (P) tax, laws 2. Technical ins- artgas 2. Fines on on pection services for equipment
actions protection gas management, for gasleading to gas of provision of finan- companiesleakage (I) atmosphe cial support (I) (UI)
ric air (P) 3. Installation ofgas meters shall cutconsumption andemissions of CH4
by 1-2 % (UI)4. Financialsupport to scientificresearch (P)

11
4. Agriculture Training of Free market prices More4.A. Enteric farmers (I) of energy resources efficientfermentation and fodder causes management4.B. Animal reduction of cattle in privatewaste (I) farms, if
compared tolarge farms:adequate sto-rage condi-tions for ma-nure, itstime-ly turn-in into soil(UI)
6. Waste Fines for 2. Draf- Training 1. Establishment of 1. Actions of 1. Study of6.A. Landfills unauthorized ting of courses in waste management waste sorting utilization
dumping (I) new laws Latvian administration (P) (UI) of biogas(UI) colleges and 2. Construction of 2. Reduction (P)
secondary waste reprocessing of waste 2. Develop-schools (I) plant (P) amount (P) ment of re-
3. Financial cycled was-support for te utilizati-scientific studies on techno-(P) logies (UI)
Note: I - implementation completed, UI - under implemenation, P - planned.
Aggregate Table S.4. Policy and measures for reduction of N O emission levels2
Economic sector Economic Laws Education, Governmental Voluntary Scientificmeasures information measures actions studies
1. Energy Natural Natural Awareness 1. Free market pri-1.A. Com- resource tax resource building ce for fuel (I)bustion of fuel (P) tax (P) action "Last 2.Organization of1.A.1. Energy warning" energy savingproduction and (11.02.95) campaign (I)transformation dedicated to 3. Installation of
GHG impact heat meters shallupon climate cut heat consump-(I) tion and N O emis-2
sions by 1.5 % (P)4. Utilization ofalternative energy -construction of hy-droelectric plantson small rivers(UI)5. Financialsupport to scientificresearch (P)

12
4. Agriculture Laws on Providing 1. Free market pri- 1. Proper sto- Elaboration4.C. Agricul- land ma- consultations ces for organic fer- ring of orga- of scientifi-tural soils nagement and assistance tilizers prevent its nic fertilizers cally sub-
(Chapter to farmers squandering (I) (UI) stantiated4, Appen- executed by 2. Financial 2. Proper recommenddix, companies support of scientific turn-in of fer- ations (UI)Table (I) studies (P) tilizers into4.2) (I) soil (UI)
Note: I - implementation completed, UI - under implemenation, P - planned.
PROJECTIONS
Macroeconomic projection for 2000, GHG emissions inventory for 1990 and assessmentof efficiency of the policy countering climate change form basis for GHG projection.
Macroeconomic projection is elaborated basing on three scenarios of economicdevelopment. Eventual growth of investments is regarded as the main factor fostering furthereconomic growth, which, in its turn to a large extent depends upon macroeconomic policyadopted by the government.
In compliance with the first scenario, to be regarded arbitrarily as a pesimistic one, it isassumed that the government fails to find suitable tools for a more efficient increment ofinvestments. In this event growth of the gross domestic product (GDP) during 1994 and 1995might be insignificant and only beginning with 1996, the growth might amount to 3-4% perannum.
The second scenario is based on the assumption that the growth rate of the gross domesticproduct reaches 6%. Data concerning this scenario are presented with most details, since it isregarded as the most realistic. Summary Tables for each scenario are presented in Appendix 5.
In accordance with the third scenario, it is assumed that the government shall succeed inaccelerating the process of investment, resulting in the growth of gross domestic product alreadyin 1995 by 4%, the most rapid growth (7 - 8 % per annum) is expected to take place in 1998 and1999. Some basic assumptions used in working out macroeconomic projections are demonstratedin Table S.5.
Aggregate Table S.5. Basic assumptions for macroeconomic forecast
Indicators (million Ls in fixed Year 1990 Reduction % by the year 2000prices of 1993) compared to year 1990
Gross domestic product 2953 (-40%) - (-25%)
Energyproduction 365.8 (-22%) - (-15%)
Manufacturing 2053.5 (-54%) - (-37%)
Transport 1121.6 (-25%) - (-6%)
Projection of aggregate GHG emissions in 2000 (2nd scenario corresponding to mediumeconomic growth rates and maximum growth in gross domestic product after 1996 by 6% perannum) is presented in Table S.6.

13
Aggregate Table S.6. Projection of GHG emissions in Latvia in 2000 (Gg)
SEG 1990 2000 (s.2)
CO 22976 169562
CO sink (-14300) (-8940)2
CH 159 114.154
N O 2.38 1.432
NO 90.13 52.48x
CO 363.12 278.23
NMGOS 62.7 39.19
The considerable drop in GHG emissions is attributable to a decline of all economicsectors, however this process will be facilitated by policy and measures referred to in Tables S.2.,S.3. and S.4. Assessment of the efficiency implemented measures is partly feasible solely in energysector, because:
- Latvia has no experience in assessments of this type,- there has been no practice of individual grouping of measures aimed at reduction of
GHG emissions and other air pollution in Latvia previously. The data depicted in Table S.6. reveal that CO emissions in 2000 in comparison with2
1990 will drop by 26%, CH by 28%, N O by 40%. Aggregate GHG emissions expressed in Gg4 2
of CO equivalents (global warming potential) in comparison with 1990 will decrease by 27%.2
SYSTEMATIC OBSERVATIONS AND STUDIES
Institutions subordinated to MEPaRD and Hydrometeorlogical Agency under the Ministryof Transport perform observations and monitoring of climate changes. Climate observations anddatabases asssist scientists in understanding better the climate changes in Latvia and elsewherein the world. Studies related to the aboce issues are undertaken with support of Latvian ScienceCouncil are carried out at Latvian Universities. The principal studies follow:
- spectroscopy and photochemistry of polluted atmosphere;- bio-indicative systems and systems for qualitative environment assessment;- use of novel bio-motoring techniques in fresh water basind;- circulation of organic carbon and biogenic elements in an ecosystem of the Riga Gulf.Applied investigations are connected with development of heat energy saving methods,
as well as with research in the field of energy-intensive and ecologically-friendly techniques forenergy production.
After reinstitution of national sovereignty Latvian scientists are gradually engaging inimplementation of the Programme on Global Climate Change, however the collaboration is merenominal and not attracting any financial support from united international sources or from nationalbudget.
EDUCATION, TRAINING AND PUBLIC AWARENESS

14
During recent 1 to 3 years a wide network of studies related to environment protectionhas been created in Latvian schools and universities. As a result, efforts undertaken by schoolpersonnel and academic community yield valuable initial contribution to put general public andyoung generation in particular in know of environmental issues and eventual impact of these uponglobal climate change.

15
1. INTRODUCTION
The Framework Convention of United Nations on Climate Change has been elaboratedin Rio de Janeiro in June, 1992 during the United Nations Conference on Environment andDevelopment where among other countries the delegation of the Republic of Latvia participated.Alongside with other 165 countries worldwide Latvia signed the Convention, thus becoming aParty to the Convention.
The ultimate objective of this Convention is to achieve the stabilization of greenhouse gas(GHG) concentrations in the atmosphere at a level that would prevent dangerous anthropogenicinterference with the climate system. Greenhouse gases mean those gaseous constituents of theatmosphere, both natural and anthropogenic, that absorb and reemit infrared radiation. Thefollowing gases are included in the list of greenhouse gases: water vapour, carbon dioxide (CO ),2
methane (CH ), nitrous (I) oxide (N O), tropospheric ozone (O ), as well as carbon oxide (CO),4 2 3
nitrogen oxides (NO ), non-methane volatile organic compounds (NMVOCs) and freons, whichx
yield atmospheric GHG as a result of chemical reactions. Scientific research activities give evidence that the rise of an amount of GHG contributes
substantially to increasing the natural greenhouse effect, which causes additional warming of asurface of the Earth and atmosphere and brings about an adverse effect upon the global climate.It manifests itself not only as an increase of the mean global temperature by 0.3 to 0.6 C duringo
the last 100 years, but also as a rise of the level of seas and oceans, occurrence of draughts andheat periods, as well as of storms and floods, increase of precipitation (depositions) levels,depletion of stratospheric ozone layer, formation of smog, weakening and destruction of naturalecosystems [1 - 3].
Pursuant to the Convention, documents have been drafted under the supervision of theMinistry of Environment Protection and Regional Development, required for ratification of theConvention by the Saeima. Convention has been ratified on 23 February 1995. In accordancewith Article 4, paragraph 2 (b) of the Convention within a period of six months after ratificationeach Party shall ensure the availability of detailed information to other Parties, i.e., a nationalcommunication about GHG emissions, sources and sinks. A work group to prepare the NationalCommunication of the Republic of Latvia has been formed pursuant to the resolution #63-r of 25February, 1994 adopted by Prime Minister. The National Communication is aimed at informingother Parties about the situation in Latvia, as well as of measures and climate policy to beimplemented gradually in order to stabilize emissions of GHG at the reference (base) year leveland to prevent its increase in future. The ratification of the Convention is tantamount to a near-term commitment taken by Latvia that it shall return to the CO level of 1990 by 2000, the same2
referring to other anthropogenic GHG emission levels not controlled by the Montreal Protocol.The following institutions have made contribution to elaboration of the National
Communication of the Republic of Latvia:

16
Ministry of Environment Protection and Regional Development of the Republic of Latvia:- Department of Environment Protection,- Environment Data Centre,- State Environment Inspection.
Ministry of Transport of the Republic of Latvia:- Ecology Department,- Hydrometeorlogical Agency.
Ministry of Economy of the Republic of Latvia:- Department of Promotion of Entrepreneurial Activities,- Department of Energy Development and Balance of Resources.
Ministry of Agriculture of the Republic of Latvia:- Department of Agriculture,- State Forest Service.
Ministry of Finances of the Republic of Latvia:- Department of Forecasting and Macro Fiscal Analysis.
State Committee of Statistics of the Republic of Latvia:- Administration of Environment Protection Statistics, - Division of Statistics of Material Resources.
Riga City MunicipalityAdvisor of Prime Minister on Environment Protection AffairsEnergy Agency of Latvia
State Institute of Forest Inventory
Foreign institutions:Ministry of Housing, Physical Planning and Environment of the Netherlands,Institute of Environmental Studies at Vrije University of the Netherlands,Polish Foundation of Energy Efficiency
Latvia participates in international negotiations and projects related to the FrameworkConvention on Climate Change.
Government of the Netherlands and experts from Poland render substantial assistance inpreparation of the National Communication of the Republic of Latvia. A protocol of intentionswas signed in October, 1993 by the Minister of Housing, Physical Planning and Environment ofthe Netherlands Mr. J.G.M. Alders and by the State Minister of Environment of the Republic ofLatvia Mr. I. Emsis on co-operation within a framework of a common project. The commonLatvian-Dutch project "Country Case Study of Greenhouse gases - Sources, Sinks and PotentialMeasures in the Republic of Latvia" was initiated on 1 January, 1994. The project is partiallyfinanced by the Dutch Government. Technical assistance was rendered in assessment of GHGemissions, as well as in printing of the National Communication from Dutch and Polish experts.The Government of Latvia financially supported the part of a project connected with inventoryof GHG emissions, forecasting and preparation of the National Communication.
The principal difficulties in preparing the National Communication are linked with deepchanges taking place in all sectors of economy, state administration and legislation in theaftermath of a regaining of independence. General concept of development in economy for theperiod of up to 2000 is still to be devised, the situation is further aggravated by the processes ofdenationalization and privatization under way.
Apart from Latvia there is a number Eastern European countries - signatories to theConvention, which are undergoing a transition stage to market-based economy. The specialcircumstances taken into account, the Convention provides for some flexibility in preparing theNational Communication in the countries with transition economies.
Within a context of the National Communication of the Republic of Latvia the term

17
"flexibility" is interpreted in the following way:1. 1990 is designated as a base year in accordance with the Convention, however, to
facilitate better understanding of processes taking place in various sectors of national economy,additionally to the base year, information is presented related to some previous years.
2. Inventory of emissions. Since radical changes have been taking place in Latvianeconomy from 1990, it has been impossible to assess industrial activities in some of subsectors,except cement production, and to evaluate GHG emissions in accordance with the methodologyrecommended by IPCC\OECD, therefore NO , CO and NMVOC emissions pertinent to industriesx
and sectors utilizing solvents are made available from statistical records of Latvian EnvironmentData Centre. CO sink in forestry is assessed in compliance with the methodology of US2
Environmental Protection Agency using database of the State Forest Service of the Ministry ofAgriculture.
3. Projection of emissions. Despite all economic sectors are considered in the Chapterdealing with policies and measures aimed at reducing GHG emissions, reliable quantitativeassessment of efficiency of measures is feasible solely in energy sector.

18
2. GENERAL INFORMATION ABOUT THE REPUBLIC OF LATVIA
Information necessary for preparing the National Communication is presented in thisChapter. Concise description of geography, climate, demography, economy, as well as of statepolicy and legislation since the foundation of an independent state till nowadays and also policyand legislation pertinent to environment protection before the reference year are discussed below.
Fig.2.1 Territorial division of Latvia, major cities and rivers.
2.1. GeographyLatvia is located on the edge of the Eastern European plane in the proximity of the
Atlantic Ocean on shores of the Baltic Sea. A total land area of Latvia is 64,400 square kilometresbordering with Estonia to the north, Russia to the east, Byelorussia to the southeast, Lithuaniato the south. Its coastline is nearly 500 km long (Fig. 2.1. and 2.2.) [4, 5].
From geological point of view the earth crust of Latvia is young - it has been formedduring break-away of glaciers by the end of the Ice Age. The mean height of the territory abovesea level equals 87 m, the highest peak point being Gaizinkalns - 312 m above sea level. Of thetotal land area 39 % is cultivated, including 26 % for arable crops; about 44 % of the totalterritory of Latvia are forests, shrubs and groves.
Latvia is not rich in important mineral resources, among combustible resources solely peatis produced at industrial amounts. There are significant reserves of raw building materials -limestone, gypsum, dolomite, clay, gravel.
There are 12,400 rivers in Latvia, but only 777 are more than 10 km long. Longest riversare the Daugava, the Gauja, theVenta, the Ogre. Largest lakes arethe Lubanas, the Raznas, theEngures and the Burtnieku.
Fig.2.2 Location of Latvia inEurope.

19
Riga is the capital of the Republic of Latvia, other largest cities: Daugavpils, Liepaja,Jelgava, Jurmala, Ventspils. Liepaja and Ventspils being ice-free ports on the Baltic Sea havealways played an important role in formation of policy and economy of Latvia [5-7].
2.2. Climatic conditions
Climate in Latvia is determined by its location in the northwest of Eurasia in the proximityof the Atlantic Ocean. To a large extent climate in Latvia is influenced by flows of marine air.Frequent cyclones bring about considerable changes in weather. This results in lower summertemperatures and higher winter temperatures when compared to the average temperature atmedium degrees of latitude for inland areas. The average annual temperature in Riga is +6 C; ino
January it is -4.9 C, in July it is +16.9 C [6, 7]. o o

20
2.3. Population
Population of Latvia has increased from about 1.9 millions in 1935 to 2.7 millions in 1991(Table 2.3.1.). The density of population is about 40 people per square km.
Table 2.3.1. Number of permanent residents
Year Population '000 Including
urban rural
1935 1905936 709321 1196615
1959 2079948 1076024 1003924
1970 2351903 1435207 916696
1979 2502816 1663975 838841
1981 2514640 1693252 821388
1986 2587716 1777830 809886
1990 2673470 1852857 820613
1991 2667870 1847373 820497
1992 2656958 1836344 820614
1993 2565854 1775894 789960Reference: [8].
This increase relates to the period beginning after the 2nd World War up to 1989 and canbe explained as immigration flow from Russia, Byelorussia, and the Ukraine. By virtue of the saidimmigration over this period Latvia exhibited the highest population growth in Europe, whereasthe natural growth (birth rate) kept decreasing continuously. The trend is demonstrated explicitlyby age distribution of population of Latvia by the end of 1993 (Tab.2.3.2).
Table 2.3.2. Age distribution of population (%)
Population age 1990 1991 1992 1993
0-14 yrs 21.5 21.4 21.3 21.0
At working age 57.5 57.3 56.9 56.8
Older than at working age 21.0 21.3 21.8 22.2 Reference: [9].

(1990 = 100%)
1985 1990 1991 1992 19930
20
40
60
80
100
21
2.4. Economy
Latvia belongs to a group of countries the economy of which undergo a period of changes.Rapid transition from planned economy to market relations has caused a deep crisis in all sectorsof Latvian economy [10]. Dinamics of the griss domestic product (GDP) in fixed prices isdemonstrated in Fig. 2.3.
Year Percentage
1985 79.11990 1001991 91.71992 60.81993 48.7
Fig.2.3. Dynamics of gross domestic product. Reference: [8].
There are signs of stabilization of GDP in 1994, moreover 3 - 5 % growth of GDP isprognosticated in 1995 - 1997 and beyond (see Chapter 5). Due to undergoing changes ineconomy (transition to market economy, privatization, restructuring of sectors etc.) it is difficultto elaborate a national programme on implementational policy in economy, although developmentprogrammes or strategic state concepts for the period up to 2000 or 2010 have been worked outor are under consideration in separate sectors:
- Environment Protection Policy Plan (EPPP, elaborated and accepted in 1995),- Projection of Latvian Economic Development (elaborated in 1994),- Public Investment Programme (elaborated in 1994),- Macroeconomic Stabilization Programme (elaborated in 1994),- Energy Master Plan for Latvia (LEDP, elaborated in 1994),- National Development Programme of Motor Transport (elaborated in 1994 in the frameof Transport Development National Programme),- Forest Development Proramme (elaborated in 1992),- Forestry Development Policy (elaborated in 1994),- Concept of National Strategy in Rural Areas (elaborated in 1994),- Concept of National Strategy in Industry (elaborated in 1995).
Thus it is possible to form an insight into an overall state of Latvian economy at thepresent moment and development trends in future.
Energy sector determines development of all remaining sectors of state economy. Latvianenergy sector has no considerable resources of its own - 90% of fuel and 50% of electricity areimported from Russia (75%) of all supplies, the Ukraine, Byelorussia, Estonia and Lithuania.

22
Transmission pipelines for natural gas, oil and oil products are located in Latvia [11].Development Programme of Energy Sector proposes the following basic principles aimed
at ensuring a higher level of independence for Latvian energy sector:- a guaranteed operation of the energy sector,- economical utilization of energy resources,- increasing the role of indigenous energy resources (water, wood, peat); exploration of
oil deposits,- availability of energy supplies both from the East and the West,- opportunity of producing at least 80-85 % of the necessary electric energy in electricpower plants in Latvia (about 50 % at present).The overall recession in economy after 1990 and slump in industrial sector in particular,
has caused a considerable drop in energy consumption levels during recent years (Table 2.4.1.).
Table 2.4.1. Total energy consumption in Latvia (Mtoe)1990 1991 1992 1993
819 6.6 5.42 4.74Reference : [11]
Basing upon GDP development trends and taking into account fuel prices, as well asplanned energy saving activities, experts infer that the level of energy consumption in Latviaduring the period of next 10 - 15 years will not exceed the consumption level of 1990.
There is a comparatively well developed network of transport ways in Latvia: 2413 kmlong railroad network and a public road network of 50,000 km. The geopolitical location ofLatvia requires to pay keen attention to development of a transport system. The changes takingplace during recent years related to regaining of independence have altered all sides of life,including the transport sector. Domestic freight decreases, whereas international freight grows.Problems linked with public transport, ecology and traffic safety are brought into prominence.Table 2.4.2. demonstrates dynamics of transportation means in numbers.
Table 2.4.2. Dynamics of transport means (in numbers)
Number of transport means (by the end of 1990 1991 1992 1993year)
Transport vessels 111 111 107 129
Trucks,'000 67 71 75 85
Buses,'000 12 13 18 20
Cars, '000 283 328 350 391
Railway engines 484 471 431 411
Tram cars 402 421 406 403
Trolley buses 416 401 365 360Reference: [9]
The table depicts the rise in a number of vehicles utilizing internal combustion (cars,

23
trucks, buses) during recent years, whereas a number of transportation means using electricenergy (trolley buses, trams) has decreased. It is expected that the trend will persist in future. Itis worth noting, that fuel consumption in the sector has not risen; this can be attributed to theincrease in fuel prices and a more effective utilization.
Industrial sector played an important role in Latvian economy before 1990, though only40 % of total industrial production was supplied with raw materials from local sources. Theleading branches were engineering industry, light manufacturing, chemical industry, metal andtimber processing works, production of building materials and food industry. 1990 in Latvia canbe characterized as the year of significant recession in various sectors of industry, some branchesdisappearing entirely. The principal aspects causing slump in industrial sector are the following:
1 - change of the existing type of management, cumbersome transition to marketeconomy,2 - marked increase in prices of energy resources and crude materials incoherence in
international market relations (the Eastern market is lost, the Western not developed yet), 3 - poor knowledge and understanding of administration officers in state, production andtechnical management sectors of market economy and of activities under free market conditions,
4 - low competitiveness of manufactured products.Critical situation gives rise to an objective necessity to alter the structure of Latvian
Industry, subject the restructuring process to control to avert spartancity, to lessen eventualnegative social consequences, to implement production techologies which are friendly toenvironment.
The strategic state concept in industrial sector point out as eventual priorities thefollowing directions of development: light manufacturing, engineering industry, pharmaceuticalindustry and biotechnology, timber processing industry and production of building materials fromindigenous crude materials. Table 2.4.3. neveals industrial overall production indices in fixedprices.
Table 2.4.3. Industrial overall production indices (in relative prices; 1990 = 100)
Year Entire industry Including
extractive industries and processing industries electric and heat energy,quarry works water supply
1985 85.6 100 85.6 85.5
1990 100 100 100 100
1991 99.4 89 99.5 97
1992 65 57 64 74
1993 42 33 43 57Reference [9].
Agriculture has traditionally been a developed sector in Latvian economy. Urbanization,decrease in soil fertility, low production efficiency are among the main reasons why the area ofarable land during last 30 years has kept on decreasing and in 1990 constituted 26 % of the totalarea. The change of ownership i.e., transition from collective to private management, initiatedafter 1990, caused severe consequences in Latvian agriculture. From a 50 year long socialistic

24
hypertrophically developed agriculture Latvia inherited socio-economic problems related toreinstitution of land property rights of rural residents as well as to environmental pollution, causedby poorly balanced intensive agriculture (lumping of fields, continuous land reclamation andchemical treatment etc.). By virtue of agrarian reform and a process of reprivatization about188,000 private farmsteads, 103 state farms and 814 enterprises of various sizes have beenformed.The overwhelming majority of these are small and very small farms raising crops and breedingcattle for their own subsistence. At present enterprises specializing in production of competitivegoods are under formation. In many instances farmers turned out to be caught ill-prepared to meetthe requirements of market economy. High prime cost of agriculture products due to use ofobsolete equipment and out-dated technology, as well as lack of proper management skills,prohibits not only successful competition with cheap food products imported from Europeancountries, but also renders any export activities impossible. Export opportunities to Russia andother former USSR countries are marred both by the unstable financial system and by nationalmonetary policy. The aforementioned aspects have contributed to bringing down recentagriculture production levels in Latvia (Table 2.4.4.).
The concept of state strategy in agriculture provides for definite "transition period" aimedat ensuring sustainable growth in rural areas, facilitating formation of well-developed farms basedupon private ownership, assisting employees currently busy in agricultural sector to takevocational training courses, so that in the long run rural Latvia is in a position to join the CommonMarket of European Union.
Table 2.4.4. Indices of agricultural production (in relative prices: 1990 = 100)
Year Agricultural production Cultivation of plants Cattle-breeding
1985 105.3 107.7 102.6
1990 100 100 100
1991 96 105 92
1992 81 94 76
1993 63 93 50Reference: [9].
Forests are largest resources of the Republic of Latvia. Forests cover almost half of theterritory and its share is gradually expanding. Under Latvian circumstances forests are adominating ecosystem, it would have occupied 90 % of the total area had there been notransforming presence of humans. Conceptually, the share of area occupied by forests shall bedetermined in connection with areas required for:
- agriculture,- environment protection,- timber production.Crude or semi-processed timber has become one of the most important items of Latvian
export recently.

25
2.5. Environment
Natural forests, meadows and marshes have remained in Latvia, exhibiting rich populationsof animals and plants. In western and northwestern parts of Europe many of these species are onthe verge of extinction. Environmental problems in Latvia are linked with the so-called "hot-beds"- large industrial and transport centres, Riga region in particular, areas abandoned by Russiantroops. The following environmental problems are designated as priorities:
- trans-boundary transfer of pollution,- eutrophication of water basins, degradation of water ecosystems, - risks related to anthropogenic activities,- problems connected with waste,- decreasing of biological diversity,- degradation of landscapes,- irrational utilization of natural resources,- poor quality of drinking water.The plan of environment protection policy proposes underlying principles and means for
solution of the above problems.
2.6. National policy and legislation2.6.1. General policy of state and legislation
Latvia as an independent state was proclaimed on 18 November 1918. By adopting theConstitutional Law - Satversme on 15 February, 1922 the people of Latvia proclaimed Latvia asan independent democratic parliamentary republic, where sovereign power rests with people. Inpursuance of Satversme the Parliament of the Republic of Latvia - the Saeima is entitled to electthe State President for a period of 3 years.On 1 April, 1925 the Saeima adopted and Presidentannounced the "Law on Structure of Cabinet of Ministers". Pursuant to this Law all StateAdministration Institutions are subordinated to the Cabinet of Ministers.
In 1940 Latvia was occupied and incorporated by the USSR and did not exist as anindependent country but as LSSR. During this period the USSR legislative acts were partlyduplicated or applied directly.
Declaration on regaining of independence of the Republic of Latvia is adopted by theSupreme Soviet on 4 May, 1990 determining a transition period for "de facto" restoration of theState power, as well as for regaining State sovereignty through negotiations. Since the coup d'etatof 19 August, 1991 in the USSR render continuation of negotiations impossible, the constitutionallaw on reestablishment of the state status - independent democratic republic is adopted on 21August, 1991 determining that Latvia is an independent democratic republic and henceforth,solely laws and resolutions adopted by institutions of Supreme State Power and Administrationare in force. After regaining of independence "de facto" gradual reforms of systems of Latvianeconomy and state administration, including judicial system take place:
- the Republic of Latvia becomes a full member of UN on 17 September, 1991;- the Law "Human and civil rights and obligations" comes into force on 10 December,1991;- 5th Saeima of the Republic of Latvia is elected as a result of general democraticelections;- 5th Saeima convened in July, 1993,effectively reenforcing the Satversme of the Republicof Latvia;

26
- the Law of 1 April, 1925 on "Structure of Cabinet of Ministers" is reenforced on 16 July,1993.The supreme legislation right rests with the Saeima (Parliament), however on exceptional
occasions the Cabinet of Ministers, as well as Ministries enjoy rights to adopt legislative acts -regulations, provided these conform to the existing legislation.
After regaining of independence transformation of the entire legislation system is underway. It is a complicated and cumbersome process. Therefore, at the present moment bothlegislative acts are applied, the ones drafted and adopted during the independence years, as wellas some of there devised and applied prior the independence. At the present moment Latvianlegislation is being harmonized with European norms and international standards.
2.6.2. Policy and legislation in environment protection prior to the base year
Right up to 1988 all environmental problems are addressed separately in each economysector, thus yielding solutions inevitably subjected to the interests of a sector. The only institutiontackling environment protection issues outside sectorial approach at that time is an non-governmental organization - Latvian Nature and Monument Protection Association.
Legislation in environmental protection has been closely connected with regulation actson utilization of natural resources. Thus, many of requirements related to environment protectionare included in regulating acts on utilization of natural resources:
- Code of Water (1972);- Code of Land resources (1976);- law on "Atmospheric air protection" (1981.);- law on "Protection on utilization of animals" (1981.);A group of laws indirectly connected with environmental protection is of utmost
significance:- Criminal Code of Latvia (1961) with Amendments envisages criminal liability;- Labour Code of Latvia (1972) envisages disciplinary liability;- Administrative Code of Latvia (1984) with Amendments envisages administrative
liability with respect to infringements in environmental protection.It is worth noting, that some legislative acts approved before 1990 are still in force, for instance,the normative act on: "Permitted concentration levels of hazardous pollutants in the atmosphereabove populated areas". Process of adopting amendments and elaborating new laws which iscurrently under way, is an arduous, expensive and time-consuming undertaking going on in theMinistry of Environmental Protection and Regional Development, as well as in other Ministriesrelated to issues of environment protection (Ministries of Transport, Economy and Agriculture).
Approach to solution of environmental problems is subjected to a cardinal change in 1988,when a special State administration institution is established, i.e., Committee of Nature Protectionwith regional subsidiaries, subordinated to the Council of Ministers. In 1991 the Committee ofNature Protection is transformed into the Committee of Environment Protection, under directsubordination of the Parliament of that period, i.e. the Supreme Soviet till the 5th Saeima iselected in 1993. After reestablishment of the Cabinet of Ministers the Committee of EnvironmentProtection is transformed into the Ministry of Environment Protection and Regional Developmentunder its subordination.
Policy and legislation after the reference year are discussed in Chapter 4.

27
3. INVENTORY OF GREENHOUSE GAS EMISSIONS IN LATVIA
3.1. Introduction
This chapter presents a summarized national inventory of greenhouse gas emissions andremovals by sinks in the Republic of Latvia. It considers anthropogenic emissions of six gasesrecommended by IPCC Draft Guidelines for National Greenhouse Gas Inventories [12]: carbondioxide (CO ), methane (CH ), nitrous oxide (N O), nitrogen oxides (NO ), carbon monoxide2 4 2 x
(CO) and non-methane volatile organic compounds (NMVOCs). The national inventory of theanthropogenic emissions by sources and the removals by sinks is carried out beginning from 1January ,1994 till 31 August, 1994, within a framework of Latvian - Dutch project "Country CaseStudy on Greenhouse Gases - Sources, Sinks and Potential Measures -in the Republic of Latvia"and with technical assistance from Polish Foundation for Energy Efficiency (FEWE).
Estimates of quantities of emissions are calculated employing data given in [13-15] andstatistical information contributed by Latvian Environmental Centre; sinks in forestry are assessedin accordance with [16]. All estimates refer to 1990 emissions, quantities are reported ingigagrams (Gg). The Table 3.1.1. reviews sources and quantities of GHG emissions.
GHG emissions in Latvia are summarized over the following economic sectors (sources):1. Energy ( CO , CO, NO , N O, CH , NMVOC ).2 x 2 4
2. Industry ( CO , CO, NO ).2 x
3. Solvent and other product use ( NMVOC ).4. Agriculture ( CH , N O ).4 2
5. Land use change and forestry ( CO sink).2
6. Waste ( CH ).4
Table 3.1.1. GHG emissions in Latvia in 1990 (Gg)
GHG sources CO CH N O NO CO NMVOC2 4 2 x
TOTAL 22976 158.94 2.380 90.14 363.1 62.7223
1.Energy 22606 4.17 1.03 90.14 363.1 55.3243
2.Industry 371
3. Solvent and other product use 7.398
4. Agriculture 111.27 1.35
5. Land use change & forestry (-14300)
6. Waste 43.50
In accordance with IPCC\OECD requirements GHG emissions are summarized overeconomic sectors (industry and forestry sectors excluded, since these are presented in the text)and are given Tables A.3.1. - A.3.8 in Annex 3.

28
3.2. CO emissions and removals2
CO emissions originate in sectors of energy and industry, whereas sinks are provided by2
land management and forestry. Table 3.2.1. provides the total of CO emissions in each sector.2
The following Chapters give a more detail information about CO emissions in each sector. 2
Table 3.2.1. Total CO emissions in 1990 (Gg)2
Sectors Emission / removal1. Energy 226062. Industry 371TOTAL 229765. Land use change & forestry (-14300)
3.2.1. CO emissions in energy sector2
CO emissions from energy sector are connected with fuel combustion (Table 3.2.2.).2
Elaboration of energy balance is necessary to calculate the quantity of CO emissions, which in2
its turn requires accurate statistical information. To calculate the energy balance the Sovietstatistic system has been used in Latvia prior to 1991, which failed to reflect complete fuelconsumption ,therefore the energy balance for 1990 has been devised Latvian experts technicallyassisted by FEWE, basing on recommendations provided by experts in statistics and energysector.
Emission factors used for calculation of CO emissions (represented in Annex 3 Table2
A.3.2) [14, p.1,9] relating to the lower heat capacity value of fuels.
Table 3.2.2. CO emissions from fuel combustion activities in 1990 (Gg) 2PJ CO2 Emissions (Gg)
1.All energy1.A. Fuel combustionTotal 226061.A.1. Energy & transformations activities 126.11 8274.41.1. Natural gas 68.75 3837.41.2. Oil 55.14 4223.31.3. Solid fuels 2.22 213.71.A.2. Industry 40.04 2680.42.1. Natural gas 20.77 1159.22.2. Oil 14.79 1100.22.3. Solid fuels 4.48 421.01.A.3. Transport 80.14 5660.63.1. Natural gas 1.38 77.13.2. Oil 78.55 5564.13.3. Solid fuels 0.21 19.41.A.5. Residential 43.43 3140.35.1. Natural gas 7.83 437.05.2. Oil 28.98 2077.45.3. Solid fuels 6.62 625.91.A.6. Agriculture / Forestry 18.94 1449.76.1. Natural gas 3.02 168.36.2. Oil 11.26 823.66.3. Solid fuels 4.66 457.8

29
1.A.7. Other 16.12 1400.27.1. Natural gas 1.13 63.17.2. Oil 2.56 183.87.3. Solid fuels 12.44 1153.3
References: [4, 15, 17 - 21].Lasses of 1.A.a are added to 1.A.7 (Table S.1)
3.2.2. CO emissions in industry2
Cement production generates a major share of industrial CO emissions (Table 3.2.3). CO2 2
emissions are estimated on the basis of annual total production of cement and the emission factor[14], (page 2.6).
Table 3.2.3. CO emissions from cement production in 1990 (Gg)2
Emission sources Amount of cement Emission factor CO emission produceed, Gg t CO / t cement Gg2
2
2. Industry 2.E.1. Production of 744.3 0.498 370.661cement
Reference: [17]
3.2.3. CO sinks in land use change and forestry2
Forests and soils (meadows) absorb and accumulate CO from the atmosphere. CO is2 2
potentially emitted upon harvesting trees or converting grassland into cultivated land. Sinceavailable statistical data on grassland conversion to cultivated land for each year, beginningstarting from 1965 up to 1990 are essentially incomplete, CO emissions are not taken into2
consideration. Removals of CO take place due to the reforestation. Atmospheric CO is absorbed2 2
by the growing vegetation. The annual total CO sequestration in forestry (forests, shrubs, groves)2
is calculated using US EPA (Environmental Protection Agency ) methodology [16] and the StateForest Service Data Base of the Ministry of Agriculture of the Republic of Latvia, and equals20600 Gg (Table 3.2.4 and Table A.3.7 from Annex 3). Due to the hemiboreal zone location thecoefficients of boreal and temperate zones offered by IPCC/OECD methodology [8,9] are notapplicable to calculations for Latvia. Moreover, the State Forest Service Data base accountingtree species without specifying primary and secondary forest areas, cannot be used for CO2
sequestration assessment. Inconsistency arose when calculations of biomass increment wereattempted, since IPCC/OECD methodology uses very rough figures for the type of calculations.Also it should be noted that this method fails to account for reduction in biomass increment dueto feeling of trees. The methodology of US EPA [16] permits use of the whole national data basefor different species of trees: the mean age of species, the area covered by species, the biomassincrement of species. The biomass coefficient and the density of dry wood is chosen inaccordance with [16].

30
Table 3.2.4. Calculated CO sink in forestry in 1990 (Gg) 2
5. Land use change and forestry5.C. Forestry
CO sequestration (Gg) 206002
Actual decrease in sequestration ( - 20)
Total CO sequestration 205802
Calculated CO emissions from cut (- 6280)2
- Fuelwood burned 1428
- Exported 628
- Other 4224
Calculated net removals (Gg) 14300References: [16].
Of the said 20600 Gg forests various types of trees sequestrate about 20100 Gg CO2
(Table A.3.7, # 1-7) whereas shrubs and groves, which in pursuance of Latvian Regulations onLand Management are not regarded as forests provided their area fails to exceed 0.5 ha, incompliance with a calculation performed by experts are in a position to sequestrate about 500 Gg of CO (Table A.3.7, # 8-10). A total amount of felled trees in Latvia in 1990 equals 4.542
million m . As a result of felling CO sequestration dropped by 20 Gg. In accordance with [14]32
potential CO emissions from felled trees equals 6280 Gg, hence calculated sink of CO emissions2 2
in 1990 equals 14300 Gg. Latvian experts have a separate opinion concerning the calculationsof CO sequestration differing from the IPCC technique: assumption that all felled trees2
decompose to form CO does not hold. CO emissions shall be calculated only for that part of2 2
felled wood which is not exported, thus no responsibility rests with Latvia concerning theexported share. The methodological approach in this event shall be consistent with approachadopted for countries producing and exporting fossil fuel.However, in elaborating the present Communication IPCC\OECD requirements are observed.

31
3.3. CH emissions4
The main sources of CH emissions in Latvia are energy sector, agriculture and waste4
management (the last two prevail). Table 3.3.1 provides total CH emissions in each sector from4
each source. More detailed information will follow.
Table 3.3.1 Total CH emissions in 1990 (Gg)4
Sectors CH emissions (Gg)4
1. Energy 4.167
1.A. Fuel combustion 2.368
1.A.1. Energy & transformation activities 0.509
1.A.2. Industry 0.059
1.A.3. Transport 1.486
1.A.5. Residential 0.184
1.A.6. Agriculture 0.108
1.A.7. Other 0.022
1.B. Fugitive fuel emissions 1.80
4. Agriculture 111.27
4.A. Enteric fermentation 97.96
4.B. Animal waste 13.31
6. Waste 43.50
TOTAL 158.94References: [4, 14, 15, 17-20, 22]
3.3.1. CH emissions in energy sector4
CH emissions in energy sector originate from incomplete combustion of fuel, as well as4
emissions from gas pipelines. The amount of CH emissions is assessed using energy balance,4
necessary emission factors are chosen from [22] and data of Polish FEWE (Annex 3, TableA.3.3).
3.3.2. CH emissions in agriculture4
The most part of CH emissions comes from agriculture sector. Agriculture activities give4
emissions of GHG through different processes:a) CH emissions from enteric fermentation in domestic animals 4
The production of CH is a part of normal digestive process of the ruminant animals.4
Rumen methanogenic bacteria, or methanogens, is the source of CH produced in ruminant4
animals. Methane is produced as part of the digestive processes of non-ruminant herbivores.b) CH emissions from animal waste4
CH is produced during decomposition of manure under anaerobic conditions. The4
emission factors (Annex 3. Table A.3.4.) which have been used for calculation of the emissionsfrom enteric fermentation and animal waste were adjusted to local conditions. The emissionfactors are chosen from [14].

32
3.3.3.CH emissions from municipal waste4
Methane is produced during anaerobic decomposition of organic matter in landfills in thepresence of methanogenic bacteria. The emission factor is chosen from [14]. Amount of municipalwaste in landfills and CH emissions are given in Annex 3. Table A.3.8.4
Both domestic and commercial and industrial wastewater in Latvia are subjected toaerobic treatment. There is only one anaerobical treatment pilot plant in Latvia. CH emissions4
from wastewater treated there are not taken into account.
3.4. N O emissions2
N O emission sources in Latvia are energy sector and agriculture, the last being of greater2
importance. Table 3.4.1 provides total N O emissions in each sector from each source. More2
detail information of N O emissions presented below.2
Table 3.4.1. Total N O emissions in 1990 (Gg)2
Sectors Emissions (Gg)
1. Energy 1.03
1.A. Fuel combustion 1.03
1.A.1. Energy & transformation activities 0.07
1.A.2. Industry 0.014
1.A.3. Transport 0.108
1.A.5. Residential 0.029
1.A.6. Agriculture 0.016
1.A.7. Other 0.793
4. Agriculture 1.351
4.C. Agricultural soils 1.351
4.C.1. Mineral fertilizers 0.446
4.C.2. Organic fertilizers 0.905
TOTAL 2.38References: [4, 14, 15, 17 - 20, 22, 23]
3.4.1. N O emissions in energy sector2
N O emissions in energy sector originate from fuel combustion. The amount of N O2 2
emissions is assessed using energy balance, the necessary emission factors are presented in[22] and using Polish FEWE data as well (Annex 3, Table A.3.3).
3.4.2. N O emissions in agricultural sector2
N O emissions originate in soils during denitrification and nitrification.2
Commercial nitrogen (N) fertilizers and organic fertilizers provide an additional nitrogensource and increase N O emissions from the soil. Mean emission factors for nitrogen are2
choosen from [14,22]. Since emission factors depend upon the type of a fertilizer, thestructure of a soil, temperature, cultivated crops etc., there is extensive uncertainty in emissionfactors, these might differ by one order of magnitude in either direction from the ones reportedin [14, 22].
The data on turn-in of commercial nitrogen fertilizers in Latvia are obtained from the

33
State Scientific Enterprise "Raziba". N O emissions from all nitrogen containig fertilizer types are summarized in 2
Annex 3, Tables A.3.5 and A.3.6.
3.5. Other GHG emissionsTotal emissions of other GHG including NO , CO and NMVOCs in energy sector,X
utilization of solvents are presented in Table 3.5.1. Principal source of these emissions is transport(Fig.3.1).
Table 3.5.1. Total NO , CO and NMVOC emissions in 1990 (Gg)X
Sectors NO CO NMVOCX
1. Energy 90.135 363.125 55.324
1.A. Fuel combustion 90.135 363.125 55.315
1.A.1. Energy & transformation activities 15.223 22.727 0.648
1.A.2. Industry 3.362 0.939 0.099
1.A.3. Transport 65.833 329.077 54.199
1.A.5. Residential 2.711 4.414 0.179
1.A.6. Agriculture 1.582 4.789 0.124
1.A.7. Other 1.424 1.179 0.066
1.B. Fugitive fuel emissions 0.009
3. Solvent use 7.3983.A. Degreasing and dry cleaning 1.1193.B. Chemical products manufacture / 0.680processing 5.5993.C. Other
TOTAL 90.135 363.125 62.722References: [4, 17 - 20]Note: Emissions from 1.A.a Looses are not included.
The main sources of NO , CO and NMVOC emissions in energy sector is incompletex
combustion, emission of fugitive fuel from gas pipelines and transport. Calculations are basedupon energy balance. Emission factors chosen from [14] and Polish FEWE (Annex 3, TableA.3.3). Assessment of NO and CO emissions using the same factors (NO in transport, inx x
particular) yield emissions differing from information at the disposal of MEPaRD, since theformer are calculated in accordance with alternative technique.
The only GHG emissions originating in utilization of solvents and related products areNMVOCs. The following activities are attributed to this class: degreasing of metallic surfaces,chemical (dry) cleaning, production of chemicals, painting, varnishing etc. Emission amountsare calculated on the basis of the Statistical Report of Latvian Environment Data Centre.

050
100150200250300
350400450
Transport Other
NMVOC
CO
NOx
34
Fig.3.1 NO , CO and NMVOC emissions in 1990 (Gg). (Transport\Others).x
3.6. Converted GHG emissions (Global Warming Potential)In order to juxtapose contribution of various GHG in aggregate emissions a notion of
converted emissions is devised - the global warming potential (GWP). GHG emissions areexpressed in CO equivalents in Gg by using factors of the global warming potential.2
Converted CO , CH , N O emissions are presented in Table 3.6.1. GWP factors are taken2 4 2
from [1].
Table 3.6.1. Total Global Warming Potential, 1990
CO CH N O Total2 4 2
Emissions (Gg) 22976.3 158.937 2.38
GWP factors 1 24.5 320
Effect 22976.3 3894 762 27632
Percentage 83.1 14.1 2.8

35
4. POLICIES AND MEASURES MITIGATING CLIMATE CHANGES
4.1. IntroductionInformation concerning the implemented or planned state policies and measures aimed at
protection of a climate system in Latvia during the period from 1990 - 2000. Data are summarizedby type of economy sector and individual GHG emissions. Due to lack of financial support duringeconomic recession only few of the planned measures have been implemented.
4.2. International activitiesSince climate changes are of a global nature, the National Climate Policy shall conform
to Global Strategies. During last decades a number of international regulating documents havebeen adopted, setting out rights and obligations of Member Countries. Latvia has acceded to someof these (Table A.4.1 and Chapter 6.3.) and is undergoing a process of gradually bringing nationallaws to compliance with international requirements.
4.3. National targets, policy and measures after base yearPolicies and measures implemented or planned during the period of time from 1990 till
2000, which are aimed at preventing climate change are summarized in the Chapter 4.3.1. Generalclimate policy and legislation in Latvia in reference to pollution by GHG or by other types ofpollutants, since these emission groups have not been discerned by legislation, are presented in4.3.1. Chapters 4.3.2 to 4.3.4 address tools employed in environment protection policy, i.e.,economic sanctions or incentives, technological solutions, governmental measures aimed atreduction of CO , CH , N O and other GHG anthropogenic emissions in various economy sectors2 4 2
- energy, agriculture, forestry, waste management, in accordance with perspective developmentplans of respective sectors. Systematic monitoring activities, scientific research (both, national andinternational), education and public awareness building measures are addressed separately (seeChapters 6 and 7).
4.3.1. General climate policy and legislation in environment protectionThe highest institution dealing with environment protection in Latvia is the Ministry of
Environment Protection and Regional Development (MEPaRD) founded in 1993 by restructuringthe Committee of Environment Protection founded in 1991 and by extending the scope of itsfunctions. Regional Environment Protection Committees, Latvian Environment Data Centre, StateEnvironment Inspection, State Environment Expertise Administration, as well as other institutionshave been established, thus laying the basis for development of environment protection policiesand their integration in all sectors of economy.
No special national policy countering climate changes have been adopted in Latvia,"climate change" here means depletion of ozone layer and a greenhouse effect. Since the problemof ozone layer depletion is included in the Montreal Protocol, the Framework Convention onclimate change addresses solely changes caused by GHG. Climate change, alongside with otherpriorities (eutrophication, waste, transport, quality of drinking water) are an integral part ofgeneral environment protection policy. Objectives and underlying principles of the stateenvironment protection policy are set out in the Environment Protection Policy Plan, wheresolutions to priority environment problems as well as appropriate political tools are considered.During elaboration stage of the EPPP, MEPaRD collaborated with other ministries, Riga CityMunicipality, Latvian Environment Data Centre and scientific research institutions. EPPP isapproved by Cabinet of Ministers on 25 April 1995. To a large extent the climate policy is an

36
amalgamation of environment protection policy and of strategic development plans for variouseconomy sectors, i.e., energy, industry etc. One may say, that the national climate policy is at itsdevelopmental stage, because the said plans for various economy sectors have neither beenfinalized yet nor approved by the Cabinet of Ministers.
Objectives of national climate policy are formulated in EPPP, i.e., significant improvementof environment quality is sought in territories, where environment quality causes high risks,preventing in the same time deterioration of environment quality in the remaining territory; alsoEPPP is aimed at integration efforts with respect to environment protection in all sectors and sidesof life. Pursuant to Article 4, Clause 2, Paragraph (a) of the Convention on Climate Change"....Parties shall adopt national policies and take corresponding measures on the mitigation ofclimate change, by limiting its anthropogenic emissions of greenhouse gases and protecting andenhancing its greenhouse gas sinks and reservoirs. These policies and measures will demonstratethat developed countries are taking the lead in modifying longer-term trends in anthropogenicemissions consistent with the objective of the Convention, recognizing that return by the end ofthe present decade to earlier levels of anthropogenic emissions of carbon dioxide and othergreenhouse gases not controlled by the Montreal Protocol would contribute to such modification,and taking into account the differences in these Parties's starting points and approaches, economicstructures and resource bases, the need to maintain strong and sustainable economic growth,available technologies and other individual circumstances, as well as the need for equitable andappropriate contributions by each of these Parties to the global effort regarding that objective".Pursuant to requirements of the Convention on Climate Change, Latvia as a SignatoryParty has taken commitment to stabilize emissions of GHG - CO , CH , NO , NO , CO and2 4 2 x
NMVOC by 2000 at level not exceeding the emission level in 1990. One of the mostpowerful tools for implementation of a climate policy is legislation. Principal laws, regulations orother regulating documents adopted or drafted after the base year, which are in a position to havesignificant influence upon GHG emission, are enlisted in Appendix of Chapter 4, Table 4.2. Thelaw "On Natural Resource Tax" (NRT) has a special role to play: it is conceived for the first timein 1990 and aims at limiting irrational utilization of natural resources, as well as at accumulatingfunds for financial support of environmental protection activities. The Tax comprises twocomponents: 1 - fees for utilization of natural resources and pollution of environment inaccordance with permitted standards and 2 - punitive sanctions for excessive pollution andunauthorized use of natural resources. However, by virtue of rapid changes in economy the taxfails to fulfil its fiscal and regulatory function because rates have devaluated due to inflation andother causes. A new draft NRT has been elaborated which is expected to enter into force in 1995.The tax shall be levied on recovery and utilization of natural resources, introduction of pollutantsinto environment, degradation of environment or resources, as well as import or sale of goods orproducts noxious to environment. The tax introduces some novel economic tools, not envisagedin the previous Law on NRT:
- a scope of usage of the term "natural resource" is extended by introducing the followingamendment "goods or products noxious to environment", including all types of fuel,batteries, accumulators, packaging materials etc., use of these shall be subjected toimposition of an natural resource tax to be payable as an excise tax and partlyreimbursable in the case the said goods or products are subjected to utilization; - natural resource tax rates levied on use of natural resources and pollution ofenvironment have been raised;- emission licences are released for sale, credits are available for tax payments, CO tax2
is introduced, payable through excise tax imposed on fuel.

37
As it follows from Table A.4.2 a system of acts regulating environment protectionissues have been already partly formed in Latvia, however, at the present moment it is not possibleto meet all requirements or to observe regulating acts included in it. The system of regulating actsshall conform to a number of other tools aimed at implementing policies of environmentprotection.
4.3.2. Measures for reducing CO emissions2
Rearrangements taking place in Latvian economy directed at a transition from economyof centralized plans to market economy have caused a deep recession in all sectors of economyin Latvia. Statistics and calculations attest (see Chapter 5) that in none of the sectors, includingenergy sector, which is the main source of CO emissions, a rapid growth of production and2
consumption is anticipated before 2000; moreover these shall fall short of the 1990 level, thusCO emissions if compared to the 1990 level might fail to increase. However, the rise may occur2
right after 2000 or even earlier, provided unexpected changes take place and actual developmentof economy fails to follow scenarios expounded here. It is worth noting, that the first signs ofeconomic recovery have already emerged. This is a reason why the implemented or plannedmeasures adjusted for local circumstances and aimed at reducing CO emissions are being2
addressed. (Note: similar considerations refer also to measures for reduction of other types ofGHG). GHG emission levels in Latvia for the period 1990 to 2000 and expected reductions aredepicted in Table 5.5.1.
4.3.2.1. Energy sectorThe sector comprises combustion of fuel for production of electrical and heat energy, for
transformation, as well as utilization in transport, industrial sector, heating etc.General objectives of Latvian energy sector are to ensure long-term availability of energy
to consumers at lowest possible costs, addressing environmental issues on the way and findingan optimum balance between costs and safety of supplies.
The three programmes devised by LATVENERGO, LATVIJAS GAZE and LATVIJASNAFTA with participation of Swedish company VATTENFALL and Finnish companyIMATRAN VOIMA OY are of utmost significance for further development of energy sector inLatvia:
- programme for Energy Development in Latvia (PEDL) offers a comprehensive reviewof energy sector, as well as strategy of energy supplies, thus setting out recommendations forinvestment in energy sectors;
- restructuring programme for energy sector (elaborated within a framework of PHARE2) defines legislative and regulative scope in energy sector, as well as the procedure to be usedin restructuring electrical energy, oil and natural gas subsectors;
- energy saving strategies in Latvia (within a framework of the project PHARE 3) settingforth measures aimed at energy saving in all economic sectors.
General state policy in energy sector is closely linked with environmental and climatepolicies. Therefore, experts from Latvian Energy Agency, Ministry of Economy, Ministry ofTransport and Ministry of Agriculture have taken active part in elaborating the NationalCommunication and EPPP, as well as have sought to the extent their capacities permit tocoordinate the basic principles of the plan with plans and programmes of development ofrespective economy sectors. EPPP requirements accounted for the fundamental postulates fordevelopment of Latvian energy sector are the following:
- state independence with respect to energy, guaranteed operation of an energy sector;

38
- devising legislation in the energy sector;- rational and economical utilization of energy resources;- balanced energy resource structures are required, ensuring availability of supplies fromalternative sources;- utilization of indigenous fuel and resources;- formation of prices and tariffs in accordance with free market principles.PEDL and EPPP determines that the most important aspect in the subsector of energy
production and transformation within a context of climate policy is an efficient utilization ofenergy resources and energy saving. In order to implement the said principles it is necessary :
- in electrical energy sector to:- perform optimization of flows of electrical energy and reduce losses withinproduction cycles,- use up-to-date and energy-saving technologies, equipment and materials,- wherever it is technically feasible and economically justifiable, the existing boilerhouses shall be reconstructed and their heat energy potential utilized in productionof electrical energy;
- in heat engineering:- to improve technical conditions of the existing heating network; to reduce heatand water losses,- to enhance a transportation system through pipelines,- to supply network systems and individual consumers with heat meters andregulating equipment,- to develop production of heat insulating materials in Latvia;
The data of Latvian Energy Agency demonstrate that, provided all heating network arereconstructed by 2000, losses might be cut by 20 %. Since this undertaking requires massiveinvestments, a partial 10-15% implementation might be considered, yielding about 3 % economyin fuel consumption and respectively cutting the level of CO emissions. In Latvian cities with2
comparatively well developed district heating systems, it would be reasonable to introduce co-generation of heat and electrical energy, thus permitting to save fuel, as well as to mitigateenvironmental pollution by eliminating old boiler-houses and to produce heat and electrical energyduring the same generation cycle. In saving programme it is reasonable to implement thefollowing principle: a part of costs is covered either directly or through tax rebate.
Another approach to reducing CO emission levels is extensive utilization of local2
resources of hydro-power, indigenous fuels (wood, peat) and transition to using alternative energygeneration sources. There is a possibility of obtaining a loan from the World Bank to implementthe following principal projects:
- renovation of hydroelectric power plants of the Daugava cascade;- reconstruction of small boiler-houses and conversion to indigenous fuel;- reconstruction of district heating systems in Riga and Jelgava.Legislation in energy sector is not a too powerful tool yet to cut CO emissions, however2
the new NRT draft offers some solutions of an economic nature - sales of emission licences,excise tax on fuel, through which CO tax can be levied, integral fuel tax facilitating preferable2
utilization of natural gas in the capacity of a fuel (per heat energy unit gas generates the amountof CO , which is smaller by a factor of 2.5 than respective amount in the case liquid fuel).2
Transport shall have a decisive role in promotion of economic development. Onlytransport infrastructure of definite quality is in a position to serve as the basis for further economicdevelopment. The existing transport infrastructure in Latvia, transport means and transportation

39
process fails to meet the standards adopted in countries worldwide. A drop in air quality in areassurrounding cities, highways and railroads testifies to this. The Ministry of Transport currentlyis working out the "National Programme of Transport Development (1995 - 2000). The draft"State Programme for Development of Road Transport" has been elaborated in 1994. TheProgrammes determine that the principal objective of a transport subsector is to ensure a planneddevelopment of efficient transport system, aimed at full satisfaction of ever growing demand inindividuals and economic structures in availability of safe transportation with correspondingguarantees and at acceptable costs. Programmes point out the necessity to devise a package ofmeasures "Development of ecologically friendly system of transportation. Ensuring ecologicallysafe means of transport". A target within the context of EPPP and climate change would be toreduce pollution caused by transport. The following practical measures are considered:
- development and of up-to-date and ecologically clean means of transportation, as wellas production of equipment,- popularization of environment-friendly means of transportation (electric transport,bicycles etc.);- limiting use of individual transportation means in cities;- development of public transportation sector;- education of drivers;- development of national legislation by bringing it as close to requirement of environmentlegislation of European Community as possible;- improvement of a system of taxation and punitive measures.Implementation of the said measures shall ensure reduction of CO emission levels2
generated from vehicles by 2000 if compared with those of 1990 despite the number of vehiclesis expected to increase considerably (Table 5.2.2. in Chapter 5).
Consumption levels of energy resources in industrial sector, heating of buildings etc.,on 2000 shall be lower than respective figures for 1990. Measures for reduction of CO emissions2
is not different from those proposed in the subsector of energy production and transformation,i.e., economical utilization of fossil fuel, substitution of fossil fuel by indigenous fuel (biofuel), up-dating of existing technological communications, installation of heat meters and regulatingequipment.
Total CO emissions in energy subsectors during the period of 1990 - 2000, provided for2
reduction measures are depicted in Table 5.2.1 (see Chapter 5).
4.3.2.2 Industrial sectorProduction of cement is the main source of CO in industrial sector. Since construction2
volumes are dropping considerably in recent years, production of cement has decreasedcorrespondingly, consequently, the CO emissions are also down (see Table 5.2.1.). Modified2
technologies are considered for implementation in future, however at the present moment theanticipated changes have not yet been exactly formulated. There are no plans conceived onmeasures aimed at reducing CO emission levels, neither based upon utilization of CO , nor2 2
related to amended taxation policy.
4.3.2.3. Land use change and forestry (CO sink)2
Forests are the main factor of circulation of carbon (C) in nature. One cubic meter ofnatural wood contains about 0.25 tons of C, generated in plants during the growth process bybinding CO from the air. When natural decomposition of wooden biomass takes place owing to2
microorganisms or by combustion, C is liberated and returns into atmosphere as CO . Thus,2

40
absorbed and desorbed amount of C is at a balance, provided the afforestated area remainsunchanged. As a result of planting of forests and their natural growth additional CO sequestration2
takes place at a level quantitative indicators of which are difficult to assess accurately.The forestry development policy in Latvia is outlined in the "Forestry Development
Programme" and further elaborated in a document "Forestry development policy" . Latviancircumstances taken into account, where forests occupy above 40 % of the total area and forestareas during the period 1990 - 1994 in accordance with statistics have been increasing by 0.5 -1% every year, the following forestry development principles are formulated:
- non-exhausting forest management;- rational utilization of forest resources;- development of cellulose production;- utilization of forest resource residuals in state energy sector.Environment protection, agricultural and wood production requirement taken into
consideration the following forest conservancy measures shall be implemented:- in the vicinity of residential areas existing forests shall be preserved and nurseriesplanted;- the existing forests along rivers, lakes and other reservoirs shall be preserved;- continuous area of ploughed-up fields shall not exceed 50 ha;- every farmstead shall retain or reforest areas, which occupy at least 10 % of the totalfarm territory;- private forests shall be kept in accordance with relevant laws;- previously adopted laws shall be observed and new drafted;However, it should be pointed out that the aforementioned measures in part because of
limited financial means and also due to other reasons, shall be implemented only to an extent,sufficient to renew felled areas, therefore the CO sink, estimated for the base year at 14300 Gg2
is not expected to expand before 2000.CO emissions and sink in various economy sectors for the base year and 2000, with2
measures for reducing CO emissions accounted for, are revealed in Table 5.2.1 (see Chapter 5).2
Measures aimed at reduction of CO are summarized in Table S.2.2
4.3.3. Measures for reduction of CH emission4
4.3.3.1. Energy sector
CH emissions are generated mainly during incomplete combustion processes of biofuel,4
as well as at gas storage and transportation.After the drop of 1990 - 1991, attributed to economic crisis and considerable decrease in
consumption of various types of energy resources, the emission of CH is raising again and is4
expected to reach the level of 1990 by 2000 unless measures are taken aimed at reducingemissions, which have been already discussed together with respective measures for reducing CO2
emissions, moreover, isolation of heating network will decrease CH by reducing fuel4
consumption by 0.5 %, installation of heat meters in energy production and transformation sectorswill reduce CH emissions by 1.5%, similarly, installation of gas meters will reduce CH emissions4 4
of fugitive fuel by 1-2%. The rising trend of CH emissions can be explained by means of some of the underlying4
principles of policies in Latvian energy sector, i.e., wider use of indigenous fuel (wood, peat) aswell as finding a lasting role for natural gas in a balance of energy resources.

41
To Latvia natural gas is supplied through Isborsk - Riga transmission pipeline, it is storedat Incukalns gas storage facility, the capacity of which is 2.1 milliard of m . Liquified gas is3
supplied from Russia by railroad, total volume of storage containers equals 7.500 tons, liquifiedgas exporting facilities are available in the Riga port. Besides, Latvia takes part in implementationof an international project on constructing a gas pipeline around the Baltic sea employing uniquegeologic features of creating new underground gas storage facilities in Latvia, which will increasesafety of gas supplies for all countries involved in the project.
To reduce CH emissions during storage and transportation a number of technical4
measures shall be undertaken - Incukalns gas storage facility shall be put in order (pumps,compressors etc.) and gas transmission pipeline and liquified gas storage containers controlled onregular basis (replacement of worn tubing, checking of pressure in a system etc.).
4.3.3.2. AgricultureCattle breeding is the sole source of CH emissions in agriculture. CH is generated in4 4
intestines during digestion process in ruminants (the amount depends upon a structure of fodder),as well as from animal manure during anaerobic decomposition. The overall slump in economyis reflected also in the sector of cattle breeding, i.e. during the period of time from 1990 to 1994a considerable drop in a number of all types of cattle has taken place in Latvia (and consequentlythe amount of eliminated manure also). At the end of 1994 the downward trend has stopped,however only half of the 1990 level might be reached by 2000. Therefore, CH emissions will fail4
to reach the level of 1990. Pursuant to EPPP it is recommended to optimize a number of cattlein accordance with available areas of pasture. It is expected that the change of ownership formswill contribute to reduction of CH emission levels, since private farmsteads are capable of timely4
turning in manure or of storing it under safe conditions.
4.3.3.3. Waste managementCH is forming in landfills due to anaerobic decomposition of organic substances and in4
small quantities is also educed from sewage water. Up to 1990 the official attitude in Latvia, as well as in the entire USSR with respect to
environment and environment protection has been the following: resources are unrestrictedlyowned by the state or an institution under the rights of a user and are deemed integral part of thetechnological, management or other cycle. This approach failed to envisage any compensation fordamages done to environment. Moral and legislative heritage of this type might cast some lightupon mismanagement of waste in Latvia.
There is no framework law regulating organizational aspects of waste management inLatvia. The Law "On hazardous waste" is adopted, pursuant to which a definite part of waste isseparated and all further handling activities are regulated; the Law also prohibits any import ofhazardous waste. Besides, Latvia has acceded to Basel Convention of 1989 on "the Control overtheTransboundary Movements and of Hazardous waste and their Disposal", which regulatestrans-boundary movements and prohibits import of hazardous waste from developed countriesto countries with economies in a transitional stage, e.g. Latvia.
However, waste is not sorted, consequently waste of all types: municipal, industrial, watertreatment silt, production and hospital - are deposited in landfills ignoring requirements ofenvironment protection. In pursuance with the existing legislation the hazardous waste originatingduring industrial processes shall be managed by enterprises themselves. It is not permitted todispose of this waste in landfills for municipal solid waste. The amount of toxic waste is assessed,however a database is not created yet. Rough registration of municipal waste is under way; a

42
database will be created in near future. No environment monitoring takes place in areas oflandfills, educed CH is not utilized. There are about 500 landfills of this type in Latvia. Despite4
the financial difficulties the government and municipalities are facing under constricted conditionsof transitional period, the lack of means failed to prevent the elaboration of waste managementpolicies. In accordance with EPPP the following basic solutions are to be considered:
- reduction of the amount of waste;- sorting of waste;- reprocessing of waste (recycling, creation of environmentally safe grounds, biologicalreprocessing, incineration);- setting in order sites previously used as waste deposits.Most significant levers to tackle the said problems is strict observance of existing laws
("On natural resource tax", "On hazardous waste" etc.) as well as drafting of new laws, scientificresearch, employment of safer and more reliable technologies in industries, use of less obnoxiouscrude materials, economic incentives and sanctions, building of public awareness. Eduction of CH4
from waste is expected to rise during the period of 1994 - 2000, however falling short of the 1990level. CH emissions in various sectors of economy, with emission reduction measures taken into4
account for the base year and for 2000, are shown in Table 5.3.1 (see Chapter 5). Measures aimedat reducing CH emission levels are summarized in Table S.3.4
4.3.4. Measures for reduction of N O emissions2
4.3.4.1. Energy sectorN O emissions originate from combustion of wood and other types of fuel used in2
agriculture. Consumption of biofuels rises in Latvia and it is likely, that the trend will hold up to2000, however, N O emissions by 2000 shall not exceed the base year level. 2
The amount of N O educed during combustion will decrease alongside with reductions2
in CO and CH emissions, when heating network is isolated and heat meters are installed at2 4
consumer end (reduction by 1.5 % is expected).A marked rise in a number of vehicles in Latvia during the last decade taken into
consideration, as well as the fact, that the specific number of vehicles equipped with convertorsfor catalytic transformation of CO , NO and NMVOCs, the N O emission levels from automobile2 x 2
transport is likely to exhibit rapid increase in future.
4.3.4.2. AgricultureIf soils are overfertilized with organic or mineral fertilizers to an extent plants are not in
a position to utilize, excess nitrogen (N) under the influence of microorganisms and other naturalfactors, transforms into N O. Quantitative assessment of the process is very cumbersome, since2
the educed amount of N O depends upon a sum of various factors (meteorological conditions,2
type of soil, amount of N metabolized by plants, type of utilized fertilizer etc.). There have neverbeen practice in Latvian agriculture of using fertilizers, pesticides and other means of plantprotection at the large quantities these have been used in West European countries. This issue isregulated in legislation. Upon commencement of agrarian reform after 1990 even these meagrequantities have dropped considerably since large farms have been liquidated and there is littlelikelihood that amounts will reach the base year level by 2000. However, beyond 2000development of agricultural production employing intensive production technologies to achievehigh yields, pollution due to agricultural activities might cause problems, provided no precautions

43
are taken.The most effective of these measures - to prevent overfertilization of soils with N-
containing types of fertilizers by elaborating scientifically substantiated recommendations.Problems of this type in Latvia are addressed by State Scientific Production Company "Raziba".Since 1964 up to now there is an expert in every region of Latvia, i.e., agrochemist, whoseobjective is to study soils, to advise on rational liming and use of appropriate fertilizers, to provideconsultations and practical assistance to farmers. It should be noted, that balance calculations ofnutritional substances performed by company "Raziba" demonstrate that the amount of N turnedin by fertilizer fails to cover the amount turned out by crops.
Among other measures the following shall be pointed out:- changes brought about by onset of market economy (prices of mineral fertilizers will goup),- technological arrangements (adequate storage of organic fertilizers, fertilizers turned
directly into soil to facilitate assimilation and metabolism by plants); - legislation (see Chapter 4.3.1).N O emissions in various economic sectors for the base year and for 2000 with measures2
for reduction of emissions taken into account are revealed in Table 5.4.1 (see Chapter 5).Measures aimed at reducing N O are summarized and presented in Table S.4.2
4.3.5. Measures for reduction of NO , CO and NMVOC emissionsx
The main sources of NO , CO and NMVOC emissions are:x
- energy sector (combustion of fuel and emission of fugitive fuel) - eduction of NO , COx
and NMVOCs;- solvent and other product use (mechanical engineering, chemical engineering,household chemistry, timber processing, vehicle maintenance companies) eduction ofNMVOCs.In virtue of economic decline the levels of emission have dropped considerably, therefore,
no measures are being planned. By implementing arrangements aimed at reducing emissions CO2
and other GHG, at the same time reduction of NO , CO and NMVOCs will take place: installationx
of gas and heat meters at consumer end will decrease NOx, CO and NMVOC emissions by 3%,whereas emission of fugitive fuel from gas pipelines will drop by 7%. However, vehiclemaintenance companies might cause problems in relation to NMVOCs, private companies inparticular, the number of which at present is growing fast. As for now, there are no practicalmeans capable of reducing the said emission levels, save the new NRT, after adoption of which,it is likely, that prices of hazardous good or products i.e., solvents, paints and varnishes will rise.However, this step will have little influence upon proprietors of vehicle maintenance companies.
Emissions of NO , CO and NMVOCs in various sectors of economy in the base year andx
2000, with emission reducing measures accounted for, are shown in Table 5.5.1 (see Chapter 5).
4.3.6. Monitoring of GHG emission reducing measuresTo assess the efficiency of measures related to the policies of mitigating climate change
it is necessary to perform monitoring, i.e., systematic collection and summary of data on all typesof measures taken in various sectors of economy aimed at reducing GHG emission levels,indicating the extent to which the said measures have contributed to achieve the goal and howefficient particular measures have been in achieving it. No monitoring of measures taken withina framework of policy of climate change are attempted in Latvia previously, since no finalizedclimate policies have ever been elaborated. In development plans of various economic sectors

44
(energy, industry, agriculture etc.) which are discussed in greater details in Chapter 4.3.2, actualenvironment and climate protecting measures are proposed, however, data related to efficiencyof the said measures are presented mainly as projections. Upon devising national developmentprogrammes (economic development, environment protection) apart from mandatory environmentprotection arrangements, these shall comprise also monitoring of the aforementioned measuresand implementation methods.
The National Communication of the Republic of Latvia under the Framework Conventionon Climate Change basically can be considered as our first serious attempt to summarize and tothe extent our possibilities permit to assess or prognosticate the efficiency of planned andimplemented measures during the period 1990 - 2000, aimed at reducing emission levels of GHG.

0
500
1000
1500
2000
2500
3000
3500
1990 1991 1992 1993 1994 1995 1996 1997 1998 1999 2000
GD
P m
illio
n L
VL
S.1
S.2
S.3
45
5. PROJECTIONS OF GREENHOUSE GAS EMISSIONS 5.1. Introduction
Macroeconomic projection for 2000, GHG emissions inventory for 1990 and assessmentof efficiency of the policy countering climate change form basis for GHG projection.
Macroeconomic projection is elaborated basing on three scenarios of economicdevelopment. Eventual growth of investments is regarded as the main factor fostering furthereconomic growth, which, in its turn to a large extent depends upon macroeconomic policyadopted by the government.
In compliance with the first scenario, to be regarded arbitrarily as a pessimistic one, it isassumed that the government fails to find suitable tools for a more efficient increment ofinvestments. In this event growth of the gross domestic product (GDP) during 1994 and 1995might be insignificant and only beginning with 1996, the growth might amount to 3-4% perannum.
The second scenario is based on the assumption that the growth rate of the gross domesticproduct reaches 6%. Data concerning this scenario are presented with most details, since it isregarded as the most realistic. Summary Tables for each scenario are presented in Appendix 5.
In accordance with the third scenario, it is assumed that the government shall succeed inaccelerating the process of investment, resulting in the growth of gross domestic product alreadyin 1995 by 4%, the most rapid growth (7 - 8 % per annum) is expected to take place in 1998 and1999.
Sectorial development versions have been devised for each scenario. GDP growth curves for various scenarios of economic development are depicted in Fig.5.1.
Fig.5.1. GDP curves for different economic development scenarios. GDP in 1993 prices (millionsof Ls).
The key assumptions used in elaborating macroeconomic projections are presented inTable 5.1.1.

46
Table 5.1.1 Key assumptions in devising macroeconomic projections
Indicator (000'000 Ls in fixed 1993 prices) 1990 Reduction in 2000against 1990
Gross Domestic Product 2 953 (-40%) - (-25%)
Energy production 365.8 (-22%) - (-15%)Processing industries 2053.5 (-54%) - (-37%)Transport services 1121.6 (-25%) - (-6%)
Reference: [17] Forecasting can be divided into 3 stages.The first stage involves analysis of mutual
relations between data on GHG emissions corresponding economic indicators. During the secondstage macro economic forecast for 2000 is elaborated. At the third working stage projections forCO , CH , N O, CO, NO and NMVOC emissions are worked out for 2000 in accordance with2 4 2 x
macroeconomic forecast. In devising reduction in GHG emissions, recommendation of expertsfrom various economic sectors are taken into consideration, as well as sectorial developmentalprogrammes, policies and measures, which are presented in details in 4.3. It is assumed that dueto financial restrictions some of measures will not be implemented completely. Unfortunately,because of scarce statistical data and lack of experience it is possible to calculate the efficiencyof measures in compliance with IPCC\OECD requirements only for separate cases. ProjectedGHG emissions in 2000 pursuant to three scenarios are shown in Table 5.1.2.
Table 5.1.2. Projections of GHG emissions in 2000 (Gg)
GHG 1990 2000 (s.1) 2000 (s.2) 2000 (s.3)
CO 22976 16179 16956 180212
CO removal (-14300) (-8940) (-8940) (-8940)2
CH 158.9 110.75 114.15 114.374
N O 2.38 1.35 1.43 1.622
NO 90.13 48.83 52.48 56.55x
CO 363.1 264.37 278.23 293.69
NMVOC 62.7 36.62 39.19 42

47
5.2. CO Emissions and Sink2
The main source of CO emissions in Latvia is located in energy sector (fuel combustion).2
Total CO emissions in 1990 and 2000 are revealed in Table 5.2.1. in year 2000 compared with2
year 1990. It is explained by the reason that the amount of production will not reach the amountof production in year 1990.
Table 5.2.1. Projections of CO emissions in 2000 (Gg)2
Sources of emissions 1990 2000 (s.1) 2000 (s.2) 2000 (s.3)Total 22976.3 16179 16956 180211.Energy 22605.6 16115 16885 179351.A. Fuel combustion 22605.6 16115 16885 179351.A.1. Energy & transformation activities 8274.4 7510 7775 80401.A.a Losses 34.5 17 17 191.A.2. Industry 2680.4 1254 1395 16961.A.3. Transport 5660.6 3962 4274 45881.A.5. Residential 3140.3 1741 1757 17571.A.6. Agriculture/forestry 1449.7 557 588 6961.A.7. Other 1365.7 1074 1079 11392. Industrial processes 370.7 64 71 86 2.E.1. Cement production 370.7 64 71 86 5. Land use change and forestry (- 14300) (- 8940) (- 8940) (- 8940)5. C. Managed forests (- 14300) (- 8940) (- 8940) (- 8940)
Since none of economic sectors by 2000 will exceed production and consumptionindicators of 1990 (Table 5.1.1), CO emission levels in accordance with all development2
scenarios will fall short of the level of 1990. Consumption levels of primary energy resources inproduction of thermal and electrical energy are projected at consultations with experts of LatvianEnergy Agency. On average the levels might constitute about 70-80% of 1990 level, residentialdemand in thermal energy is expected to reach the level of 1994. Increase in transport servicesand in number of vehicles is anticipated (Table 5.2.2), however CO emissions from vehicles are2
not going to increase (Chapter 4.3.2).
Table 5.2.2. Dynamics of transport means (number of units)
Type of vehicle 1990 1991 1992 1993 1995 2000 2010
Cars, '000 283 328 350 391 420 550-600 700-800
Buses,'000 12 13 18 20 15 20 30
Trucks,'000 67 71 75 85 *) *) *)Reference: [9]. Note: * Due to privatization and restructuring under way it not possible to prognosticate thesefigures in trucking sector yet.
The main measures in reducing CO emissions is regarded to be an energy saving project2
(Chapter 4.3.2, EPPP, LEDP). It is calculated that rehabilitation of heating systems will allow todecrease the level of energy production by 20%. Since due to lack of financial means the saidactivities will not be implemented to full extent, thus aggregate efficiency, as well as reduction in

0
5000
10000
15000
20000
25000
1990 1991 1992 1993 1994 1995 1996 1997 1998 1999 2000
CO
2 em
issi
on
s in
Gg
CO2 S.1.
CO2 S.2.
CO2 S.3.
48
CO emission levels will not exceed 3%. Installation of heat meters in 50% of households, will2
decrease demand in production of thermal energy by 10%, the same reduction is expected in CO2
emissions. Differential fuel tax, which is included in drafted Natural resource tax will influence thestructure of consumption of energy resources in favour of natural gas. Upon combustion gaseduces 2.5 times smaller amount of CO per thermal energy unit than liquid fuels, therefore, CO2 2
emissions may drop by 6%. It is not possible to assess the efficiency of other measures (freemarket prices, public awareness building activities, the entirety of measures related to vehiclesetc.) in quantitative terms. Dynamics of projected CO emissions for the period of 1990-2000 is2
revealed in Fig.5.2.
Fig.5.2. Projected dynamics of CO emissions.2
Calculation of CO sink in land use change and forestry in 2000 yields 8940 Gg of2
CO (14300 Gg for 1990). Projections are based upon an opinion of experts from the State Forest2
Service under the Ministry of Agriculture in pursuance of which a total forest area remains thesame in 2000, as well as upon a view, that felling of trees in likely to increase. Thus, CO sink in2
2000 will equal 20600 Gg. It is expected that 8.4 millions of m of trees are felled in 2000.3
Cleared areas will decrease sequestration by 40 Gg. As a result, total sequestration in 2000 willequal 20560 Gg of CO . Potential CO emissions from felled trees will constitute 11620 Gg, thus2 2
rendering the calculated CO sink to 8940 Gg. It is forecasted that 40% of felled trees are going2
to be exported in 2000 (see Annex 5, Table 5.5).

49
5.3. CH emissions4
CH emissions originate from energy sector (combustion of fuel), emission from gas4
transmission pipelines and gas storage facilities, agriculture and waste management. Total CH4
in 1990 and 2000 are presented in Table 5.3.1.
Table 5.3.1. Projection of CH emissions in 2000 (Gg)4
Source of emissions 1990 2000 (s.2)
Total 158.937 114.15
1. Energy 4.167 3.44
1.A. Fuel combustion 2.368 2.21
1.A.1. Energy & transformation activities 0.509 0.63
1.A.2. Industry 0.059 0.02
1.A.3.Transport 1.486 1.23
1.A.5. Residential 0.184 0,21
1.A.6. Agriculture/Forestry 0.108 0.1
1.A.7. Other 0.022 0.02
1.B. Fugitive fuel emission 1.799 1.23
4. Agriculture 111.27 58.65
4.A. Enteric fermentation 97.96 52.23
4.B. Animal waste 13.31 6.42
6. Waste 6.A. Landfills 43.5 52.06
43.5 52.06
Total CH emissions in energy sector in 2000 will be subjected by identical measures4
considered in relation with CO emissions (Chapter 5.2). Installation of heat meters will reduce2
CH emissions originating from fuel combustion by 1.5%, rehabilitation of district heating4
networks and respective reduction in gas consumption is expected to decrease CH emissions by4
0.5%; however implementation of new natural resource tax draft will enhance gas consumptionand emission from gas pipelines will grow by 1.5%.
A slowdown is forecasted in agricultural sector. Number of cattle will not increase,consequently the same trend will hold in CH emissions.4
It is projected that population in Latvia will be 2500 000 in 2000. Amount of communalwaste might reach 700 Gg against 585 Gg in 1990. CH emissions from communal waste is bound4
to grow, because the hardships of transition stage in economy will not permit to implement wastereducing measures or waste recycling activities before 2000.

50
Measures aimed at reduction of CH emissions in agriculture and waste management are4
at a project stage and are considered in long-term perspective, therefore it is not possible to assesstheir efficiency.
5.4. N O emissions2
N O emissions originate from fuel combustion and agricultural soils. Total N O emissions2 2
in 1990 and 2000 are depicted in Table 5.4.1.
Table 5.4.1. N O emissions in 2000 (Gg)2
Sources of emission 1990 2000 (s.2)Total 2.38 1.431.Energy 1.03 0.761.A. Fuel combustion 1.03 0.761.A.1. Energy & transformation activities 0,07 0.091.A.2. Industry 0.014 0.011.A.3.Transport 0.108 0.061.A.5. Residential 0.029 0.031.A.6. Agriculture/Forestry 0.016 0.021.A.7. Other 0.793 0.554. Agriculture 1.351 0.674.C. Agricultural soils 1.351 0.67
N O emissions from fuel combustion in Latvia are not large: no significant change is2
expected to take place by 2000. Rehabilitation of district heating network might reduceconsumption of fuel, thus bringing about drop in N O, as well as other GHG emissions by 1.5%.2
Utilization of mineral and organic fertilizers will be low since farmers are short of financialmeans. It is not possible to make quantitative assessment of impact of various measures (freemarket prices, education of farmers, legislation etc.) upon reduction in N O emissions.2

51
5.5. Other GHG emissionsNO , CO and NMVOC emissions originate in energy sector (combustion of fuel,X
incl.transport), as well as from use of solvents. Total NO , CO and NMVOC emissions in 1990x
and 2000 are revealed in Table 5.5.1.
Table 5.5.1. Projection of NOx, CO and NMVOC emissions in 2000 (s.2) (Gg) Sources of emission NO CO NMVOCx
1990 2000 1990 2000 1990 2000Total 90.135 52.48 363.125 278.23 62.722 39.191. Energy 90.135 52.48 363.125 278.23 55.324 35.691.A. Fuel combustion 90.135 52.48 363.125 278.23 55.315 35.691.A.1. Energy & transformation 15.223 14.43 22.727 36.65 0.648 0.87activities1.A.2. Industry 3.362 1.57 0.939 0.36 0.099 0.051.A.3.Transport 65.833 30.58 329.077 219.3 54.199 34.31.A.5. Residential 2.711 3.18 4.414 14.69 0.179 0.31.A.6. Agriculture/forestry 1.582 1.21 4.789 6.68 0.124 0.131.A.7. Other 1.424 1.51 1.179 0.55 0.066 0.041.B. Fugitive fuel emission 0.0093. Solvent and other product use 7.398 3.53.A. Degreasing and dry cleaning 1.119 0.083.B. Chemical products 0.680 0.22manufacture / processing3.C. Other 5.599 3.2
No particular measures for reducing NO , CO and NMVOC emissions are considered,x
since these emissions are influenced by measures aimed at reduction of other GHG levels. It isprojected that installation of gas and heat meters will save fuel resulting in decrease of NO , COx
and NMVOC emissions from fuel combustion by 3%, whereas emission of fugitive fuel from gaspipelines will drop by 7%.
Vehicle emission levels will alter. Total amount of emissions from mobile sources consistsof the following key components:
- increase in a number of vehicles;- reduction in fuel consumption in more advanced vehicles;- growth of specific number of vehicles equipped with catalysts;- more severe annual vehicle checks; speed limitations;- restrictions to use of individual transport means in urban areas.Total impact of the aforementioned measures upon NO , CO, NMVOC emission levelsx
is not assessed, because implementation of these depend upon factors, which can not beprognosticated in Latvia at present (world fuel prices, development of science, development ofpublic transport etc.).
Use of solvents and related products takes place in the following subsectors:- mechanical engineering (degreasing, painting);- chemical engineering;- timber procession (varnishing, puttying);- vehicle repair works;- communal services (dry cleaning etc.).

52
If GHG emissions in industrial sectors are under strict control, the same can not be saidabout motor repair works. More attention shall be paid to this factor in future, since markedincrease in a number of vehicles in Latvia bring about equally rapid rise in a number of motorrepair works. Application of more severe standards to these enterprises can result in additionalreduction of NMVOC emissions.
5.6. Converted GHG emissions (Global Warming Potential)
Using factors of the global warming potential (GWP), emissions of CO , CH and N O are2 4 2
calculated for 2000 (Table 5.6.1).
Table 5.6.1. Projection of converted GHG emissions in 2000 (in Gg of CO equivalents)2
GHG GWP Emissions Effect, 1990 Emissions, Effect 2000 (s.2),factors ,1990, Gg 2000 (s.2), Gg
Gg
CO 1 22976 22976 16956 169562
CH 24.5 159 3894 114.15 27974
N O 320 2.38 762 1.43 4572
Total 27632 20210
Converted GHG emissions in 2000 (s.2) will amount to 20210 Gg CO equivalents.2
Comparing with 1990 (27632 Gg CO equivalents) calculated emissions in 2000 will drop by2
27%.
5.7. Uncertainty
Uncertainty in emission forecast originates in macroeconomic projections (Table 5.7.1).Uncertainties in relation to other factors are not assessed.
Table 5.7. 1. Uncertainty of projected emissions in 2000 (%)
GHG Emissions, Gg Uncertainty, %
CO + 5.42
CH 1.64
N O 9.42
NO 7.4x
CO 5.3
NMVOC 6.8
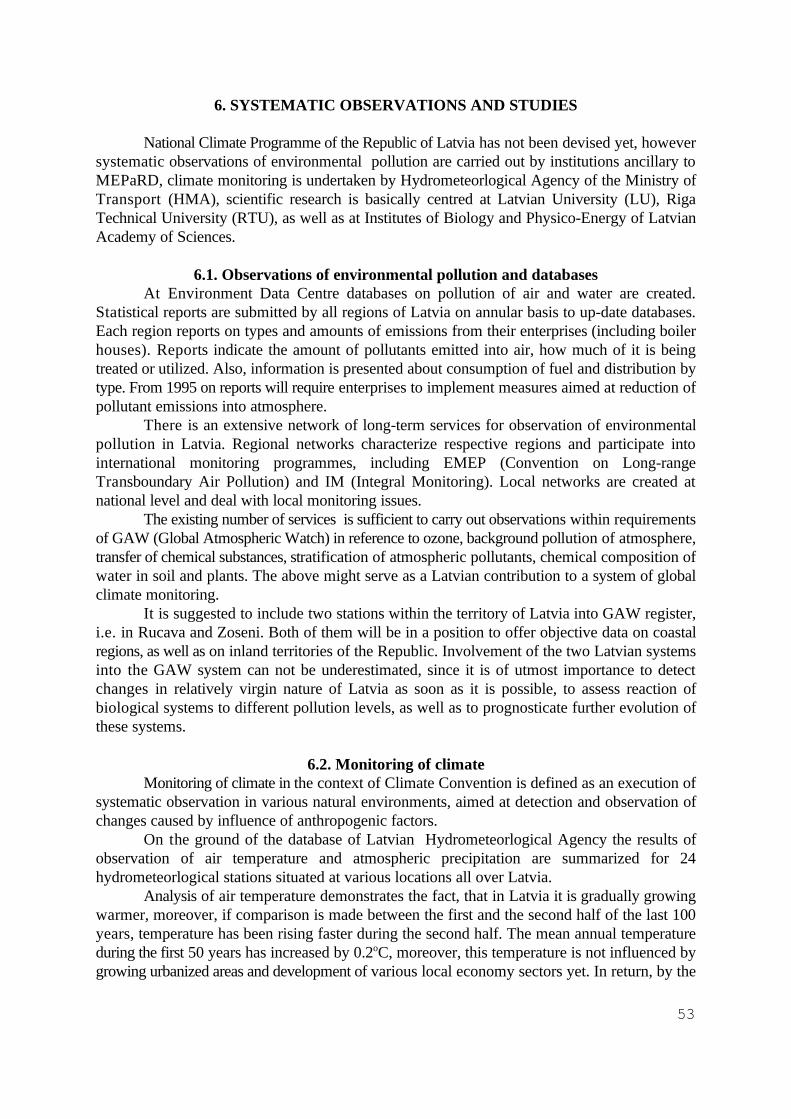
53
6. SYSTEMATIC OBSERVATIONS AND STUDIES
National Climate Programme of the Republic of Latvia has not been devised yet, howeversystematic observations of environmental pollution are carried out by institutions ancillary toMEPaRD, climate monitoring is undertaken by Hydrometeorlogical Agency of the Ministry ofTransport (HMA), scientific research is basically centred at Latvian University (LU), RigaTechnical University (RTU), as well as at Institutes of Biology and Physico-Energy of LatvianAcademy of Sciences.
6.1. Observations of environmental pollution and databasesAt Environment Data Centre databases on pollution of air and water are created.
Statistical reports are submitted by all regions of Latvia on annular basis to up-date databases.Each region reports on types and amounts of emissions from their enterprises (including boilerhouses). Reports indicate the amount of pollutants emitted into air, how much of it is beingtreated or utilized. Also, information is presented about consumption of fuel and distribution bytype. From 1995 on reports will require enterprises to implement measures aimed at reduction ofpollutant emissions into atmosphere.
There is an extensive network of long-term services for observation of environmentalpollution in Latvia. Regional networks characterize respective regions and participate intointernational monitoring programmes, including EMEP (Convention on Long-rangeTransboundary Air Pollution) and IM (Integral Monitoring). Local networks are created atnational level and deal with local monitoring issues.
The existing number of services is sufficient to carry out observations within requirementsof GAW (Global Atmospheric Watch) in reference to ozone, background pollution of atmosphere,transfer of chemical substances, stratification of atmospheric pollutants, chemical composition ofwater in soil and plants. The above might serve as a Latvian contribution to a system of globalclimate monitoring.
It is suggested to include two stations within the territory of Latvia into GAW register,i.e. in Rucava and Zoseni. Both of them will be in a position to offer objective data on coastalregions, as well as on inland territories of the Republic. Involvement of the two Latvian systemsinto the GAW system can not be underestimated, since it is of utmost importance to detectchanges in relatively virgin nature of Latvia as soon as it is possible, to assess reaction ofbiological systems to different pollution levels, as well as to prognosticate further evolution ofthese systems.
6.2. Monitoring of climateMonitoring of climate in the context of Climate Convention is defined as an execution of
systematic observation in various natural environments, aimed at detection and observation ofchanges caused by influence of anthropogenic factors.
On the ground of the database of Latvian Hydrometeorlogical Agency the results ofobservation of air temperature and atmospheric precipitation are summarized for 24hydrometeorlogical stations situated at various locations all over Latvia.
Analysis of air temperature demonstrates the fact, that in Latvia it is gradually growingwarmer, moreover, if comparison is made between the first and the second half of the last 100years, temperature has been rising faster during the second half. The mean annual temperatureduring the first 50 years has increased by 0.2 C, moreover, this temperature is not influenced byo
growing urbanized areas and development of various local economy sectors yet. In return, by the

54
second half of the century the phenomenon of Riga as a major city and as an industrial centrebegins to manifest itself, i.e., if other cities experience a growth of the mean annual temperatureby about 0.5 degrees, Riga exhibits a growth by almost 1 degree.
The range of annual temperature has decreased. Major positive changes have occurredduring winter months, moreover, it has happened mainly at the expense of increase in nighttemperature. The mean annual temperature extremes are brought closer together - the meanminimum has increased at a more rapid rate than the mean maximum.
Annual precipitation amount on the average has risen during the last 50 years. The processis more conspicuous in the areas where prevailing winds and topography promote upwardmovement of air masses. This increase is more pronounced during the beginning stage of a coldperiod.
The total amount of clouds has not changed in practice. There is a minor drop in theamount of low clouds. In spite of this, data analysis testify to the decrease in sunshine durationas well. The mean relative humidity has remained unchanged.
During recent years trends of rise of a water level can be observed in the Riga Gulf andthe water area adjacent to the Latvian territory. Thus, from 1978 on the mean water level in theRiga Gulf has increased by 18 cm (station in Daugavgriva), whereas the mean level in the BalticSea by 14 cm (station in Liepaja). Quantile analysis of the water level and the Daugava throughputhas demonstrated that the detected increase in the water level might be caused by anthropogenicfactors.
6.3. Scientific research and international cooperationClimate observation and databases assist scientists to better understand issues related to
climate changes all over the world and Latvia as well.Under circumstances of the former USSR scientific research with developed countries is
coordinated by central state structures and the scientists from peripheral areas in practice stoodno chances of organizing direct scientific cooperation projects with Western countries and gettinginvolved in International Programmes of Scientific Cooperation.
To full extent this refers to involvement in a variety of Programmes of Global scope, basedupon International Council of Scientific Unions, Paris, France, United Nations EnvironmentProgramme, World Meteorological Organizations, Geneve, Switzerland financially supportedunder the auspices of the above organizations, i.e., World Climate Research Programme (WCRP),International Geosphere and Biosphere Programme (IGBP), Human Dimensions of GlobalChange Programme (HDP) and other projects and programmes concerned with a study of ozonelayer and its protection, tropospheric pollution or effect caused by greenhouse gas emissions.
However, it is appropriate to list a number of research projects supported by the LatvianScience Council and which are directly related to issues of global climate change.
Institute of Geodesy and Geoinformation of Latvian University is active in the field ofGeographical Information Systems, Digital Cartography, Remote Sensing and Geodesic DataAcquisition Systems Based on Satellite Laser Range Meters. Institute of Nuclear Physics andSpectroscopy of Latvian University is engaged in a project "UV and VUV Spectroscopy andPhotochemistry of Polluted Atmosphere". Biological Department of the University together withInstitute of Biology of Latvian Academy of Sciences run research work within the followingprojects "Biogeoindicative System and Methods for Evaluation of Environment Quality", "Useof New Biomonitoring Methods in Evaluation of Biodiversity of Fresh Waters and Its Dynamics";"Circulation of Organic Carbon and Biogenic Elements in Ecosystem of Riga Bay". Besides the

55
listed projects a number of technically oriented studies are to be mentioned, which are carried outat Institute of Physico-energy of Latvian Academy of Sciences and at RTU and are aimed atdesigning equipment for environmental monitoring, implementation of systems and methodseconomizing energy and heat, design of energy-intensive and ecologically friendly energytechnology. The aforementioned research areas might be considered as an integral part of IGBP.Despite limited financial resources the State Hydrometeorlogical Agency being Latvianrepresentative at the World Meteorological Organization (WMO), since 14 June, 1992 is involvednot only in implementation of projects of WMO, but also seeks to meet requirements ofinternational conventions or takes part in carrying out separate their parts, as well as participatesin many international projects.
In pursuance of a subprogramme of the World Climate Research Programme (WCRP) -the World Climate Data and Monitoring Programme, the Hydrometeorlogical Agency in 1994within a framework of Voluntary Co-operation Programme (VCP) received a CLICOM (ClimateComputing) - a climatic data processing system from a donor-country - the U.K., which enablesLatvia to install a software for processing climatological data and to create a national databasemeeting the world standards thus permitting to a fuller extent fulfil international commitments.Beginning with 1995 processing of climatic data is performed at an internationally accepted level.
Interests of Latvia are represented in such WMO programmes as:Hydrology and Water Resources Programme in accordance with which efforts are
undertaken in order to restructure a system of hydrological observations;subprogramme of the Atmospheric Research and Environment Programme aimed at
atmospheric observations (GAW) within a framework of which Latvia is represented withobservation data from the station of a regional level since 1993;
a number of employees have taken part in various training courses within a framework ofthe Education and Training Programme, i.e.: seminars, short-term, long-term, retraining and post-diploma courses;
experts from Latvia have taken an active part in a preparatory work of the Second IPCCAssessment of Intergovernmental Panel on Climate Change (IPPC) to be completed bySeptember, 1995. Besides, Latvia participates in developmental actions on Coastal AreaManagement, since having a sea border, it is economically interested in development ofharmonized strategies for coastal area management, where the current climate changes are takeninto account.
At present first steps are taken in conceiving a National Programme. Within a scope ofHMA a draft of general review and climate programme of Latvia is being devised.
Apart from this Latvian HMA is engaged in co-operation with Scandinavian countries andthe Council of Ministers of Nordic countries in the following projects: "Baltic IntegralMonitoring" (BIM) and "Gulf of Riga".
Also, within a framework of Geneva 1979 Convention on Long-range Transboundary AirPollution Latvia runs measurements in accordance with a Protocol to the 1979 Convention onLong-range Transboundary Air Pollution on Long-term Financing of the Co-operativeProgramme for Monitoring and Evaluation of the Long-range Transmission of Air Pollutants inEurope (EMEP).
Several projects, i.e. (BALTEX - Baltic Sea Experiment), a project aimed at improvementof telecommunications BALTMET (BALTMET-SMHI), a project concerned with hydrology andmeteorology BALTMOD-IHMS (BALTMOD - transfer to Integrated Hydrological ModellingSystem) are represented in a capacity of scientific and technical projects based upon bilateral ormultilateral arrangements between related institutions.

56
Latvia is involved in the work of European Network for Research in Global Change(ENRICH), co-ordinated by European organizations.
Participation of the Latvian side into the Human Dimensions of Global EnvironmentChange Programme (HDP) at present is mainly confined to capacity building process, resultingin quite a rapid improvements in educational aspects (see Chapter 7).
Present estimates testify that, provided a state budget is the sole financial source, there islittle likelihood that economic situation in Latvia in near future will permit to develop nationalprogrammes for climate change or commence systematic, practically orientated research. At thesame time, the existing research infrastructure and qualification of personnel taken intoconsideration, scientific work might begin if international collaboration takes pace andinternational united fund allotted for the said scientific studies are made available to Latvia. Thepresent scientific potential ensures participation in implementation of IGBP as well as HDPproject. Participation of Universities in the above projects can not be overestimated, since theseopen growth opportunities for students who wish to devote themselves professionally to solvingproblems related to global climate change.

57
7. EDUCATION, TRAINING AND PUBLIC AWARENESS
Education is one of the ways to raise public awareness. Along with deterioration of aneconomic situation in Latvia, public interest in protection and rehabilitation of environment hasdecreased in general. Objectives of environmental education at a national level might be thefollowing:
- promotion of public development (harmony of material and spiritual needs and interests);- building of public responsibility in reference to environment;- comprehensive education of public on environmental issues.Education, training and public awareness concerning environmental problems are the key
factors in tackling issues related to climate changes, these are included within WCRP programme.Latvia is neither directly involved in implementation of HDP, nor in any of the projects financedwithin a framework of this programme. However, during recent years by virtue of support byacademic community and universities of Baltic Region, a significant headway is achieved in thefield of academic education in relation to environmental issues and, consequently, withimplementation of HDP programme.
At the same time there is an improvement in the quality of environmental programme atcomprehensive school level; to some extent information is disseminated at municipal level as well.
It is well-marked progress, though insufficient and vulnerable, since it is not sustainableby solely national means. Achievement of a high interest level of general public requires significantancillary resources, at the same time it is of utmost importance since development of privateeconomy is considered and it is necessary to achieve sustainable growth from the very beginning.
Universities and academic circlesAt the present moment it is possible to get Bachelor's Degree in nature sciences in
environmental protection speciality. Apart from it Master's Degrees are conferred at LU in thefollowing fields: environment science and management; Master of Art in Nature Sciences;interdisciplinary environment chemistry. The following Engineer and Master studies are offeredby RTU: "Technologies and equipment in environmental protection", "Water supply, sewage andutilization of water resources". Issues of environmental education are emphasized for Master'sDegree at Latvian Academy of Agriculture, whereas Daugavpils Pedagogical University offersDegree of Master of Art in Pedagogics - teachers for preliminary schools specializing in ecologicalissues.
All the listed study programmes have been conceived during last 1 - 3 years; severaladditional courses are considered at the present moment. As a result efforts undertaken byUniversities and Academic circles give valuable preliminary contribution in speeding up buildingof public awareness, particularly concerning the young generation, on environmental issues andrelated changes in global climate.
Sustainable development principle forms the basis of the strategy of HDP programme. Atpresent only the Programme of Master of Art Studies in Environment Science and Managementat LU is devised within a framework of a "sustainable growth" concept; "Centre of EnvironmentScience and Management Studies" (CESAMS) which implements the programme is seeking toundertake research activities to promote the development of "Local Agenda 21" programmeaimed at ensuring sustainable municipal development.
A database network of Latvian academic institutions being installed at the present momentpromises novel opportunities in near future, since all the said institutions will be in a position toget connected to international networks of climate change programmes and to use the received

58
information, both for training purposes and for research.
Society and mass mediaInvolvement of general public, as well as issue of public awareness is rather pessimistic
at present, mainly due to its low information level, which is caused by a lack of specializedliterature in Latvian, poor library facilities and, of course, by educational problems inherited fromthe previous system.
To a large extent problems are aggravated by the fact that mass media, i.e., press, radio,television for the time being demonstrate poor command of issues related to environment and donot rate these as news highlights. An action the "Last Warning" which takes place in 11.02.95 inmany cities all over the world, also in Riga and informed general public about impact of GHG onclimate.
Non-governmental organizationUpon commencement of transition stage in Latvia, a number of non-governmental
organizations are founded for protection and conservation of environment. Among others LatvianGreen Party, Environment Protection Club, Ecological Centre of Latvian University, LatvianNature Foundation, Children Environment School, Green Library etc., should be mentioned. Anumber of international NGO's have local representations in Latvia: Coalition for Clean Baltics(CCB); World Wildlife Foundation (WWF); Friends of Earth (FOE). Activities of theabovementioned organizations in one way or other promote building of public awareness and carefor changes in global climate. Representatives of NGO's are involved in devising Latvian EPPP.
Comprehensive education systemIn developing environment education secondary schools rely upon assistance of
universities and activities of non-governmental organizations. Sociological polling testifies thatschoolchildren rate environmental issues among priorities.
At the same time Children Environment School as a non-governmental organization tofinance their projects enters competition for international funds. Daugavpils PedagogicalUniversity runs special retraining seminars for teachers, whereas the organization Co-operationfor Peace organize such seminars, both for teachers and pupils. A project "Air Pollution inEurope" is the one having the closest bearing to issues related to global climate change; 110classes from a number of schools are involved, all activities are co-ordinated by the EcologicalCentre of Latvian University.
International assistancePossibilities of Latvia to support education on environmental issues from the state budget
are constrained; the present level in environmental education is achieved by virtue of activities ofinformed part of general public, as well as owing to support of governmental and non-governmental organizations of Nordic countries and European Union. The support continues togrow, which can be regarded as a certain guaranty that knowledge, connected with issues ofenvironment and global climate change, is going to be integrated into Latvian system of education.

59
REFERENCES
1. Radiative Forcing of Climate Change. The 1994 Report of the Scientific Assessment WorkingGroup in IPCC, Summary for the Policymakers. WMO, IPCC, UNEP, 1994.2. Climate Change Science: Current Understanding and Uncertainties. Australia, AustralianAcademy of Technological Sciences and Engineering, 1995.3. The Impact of Climate Change. Nairobi, United nations Environment Programme, 1993.4. National Report of Latvia to UNCED 1992. Latvia, Riga, 1992.5. Latvian Soviet Encyclopedia vol. 5 ,,Riga, Central Encyclopedia Publishing House ,1984.2
6. Latvian Soviet Encyclopedia vol. 6, Riga, Central Encyclopedia Publishing House ,1985.7. The Baltic States. A reference book. Tallin, Riga, Vilnius, 1991. 8. Latvia in Figures 1993. Collection of Statistical Data. State Committee for Statistics of theRepublic of Latvia. Riga, 1994.9. Latvia: Key Statistical Indicator 1993.-1994. State Commitee for Statistics of the Republic ofLatvia. Riga, 1994.10. Report on the Development of the National Economy of Latvia. Riga, Ministry of EconomyRepublic of Latvia, 1994.11. Energy Master Plan of Latvia. Riga, 1994.12. Forecasts of Greenhouse Gas Emissions in Latvia. Ministry of Environmental Protection andRegional Development of the Republic of Latvia. Riga, 1994.13. Greenhouse Gas Inventory, Reporting Instructions, IPCC Draft Guidelines for NationalGreenhouse Gas Inventories,Volume 1. IPCC/OECD Joint Programme,1994.14. Greenhouse Gas Inventory, Workbook, IPCC Draft Guidelines for National Greenhouse GasInventories,Volume 2. IPCC/OECD Joint Programme,1994.15. Greenhouse Gas Inventory, Reference Manual, IPCC Draft Guidelines for NationalGreenhouse Gas Inventories,Volume 3. IPCC/OECD Joint Programme,1994.16. Assesment of Promising Forest Management Practicies and Technologies for Enhancing theConservation and Sequestration of Atmospheric Carbon and their Costs at the Site Level. Editedby R.K.Dixon, P.E.Schroeder, J.K.Winjum, October, 1991. US Environmental Protection AgencyEnvironmental Research Laboratory.17. Statistical Year Book of Latvia - 1991. State Committee for Statistics of the Republic ofLatvia. Riga, 1992.18. Energy Balance for Latvia in 1990 (or most recent historical data) translated from SovietUnion Statistics, 1991. 19. Latvia in Figures 1991. Collection of Statistical Data. State Committee for Statistics of theRepublic of Latvia. Riga, 1992.20. Energy and Environment in Estonia, Latvia and Lithuania, RISO National Laboratory,Roskilde Denmark, January 1992.21. "Latvian Energy balance for 1990" devised by Polish Energy Efficiency Foundation, acceptedat the Department of Energy Develpoment and Balance of Energy of the LR Ministry of Economyon 22.07.1994.22. OECD/OCDE Estimation of GHG Emissions and Sinks. Final Report from OECD ExpertsMeeting 18-21 February 1991”.23. Environmental protection in Latvia, Organic matter in soil, fertilizers and pesticides in Latvia,1993, No.5, Research Center, Committee of Environment Protection, Republic of Latvia.

60
ABBREVIATIONS (TEKSTÂ LIETOTIE SAÎSINÂJUMI)
AREP Atmospheric Research and Environment Programme
BALTEX Baltic Sea Experiment
BALTMOD-IHMS BALTMOD transfer to Integrated Hydrological Modelling System
BIM Baltic Integrated Monitoring
CESAMS Centre of Environment Science and Management Studies
CCB Coalition for Clean Baltic(NGO)
CLICOM Climate Computing
EMEP Protocol to the 1979 Convention on Long-range Transboundary AirPollution on Long-term Financing of the Co-operative Programme forMonitoring and Evaluation of the Long-range Transmission of AirPollutants in Europe
ENRICH European Network for Research in Global Change
EPPP Environmental Protection Policy Plan
FCCC Framework Convention on Climate Change
FEWE Polish Foundation for Energy Efficiency
FOE Friends of Earth
GAW Global Atmospheric Watch
GDP Gross domestic product
Geneva Convention Convention on Long-range Transboundary Air Pollution
GHG Greenhouse gases
GIS Geographical Information Systems
HDP Human Dimensions of Global Change Programme
HMA Hydrometeorological Agency
IGBP International Geosphere and Biosphere Programme
IM Integral Monitoring
IPCC Intergovernmental Panel on Climate Change
LSSR Latvian Soviet Socialistic Republic
LU University of Latvia
MEPaRD Ministry of Environmental Protection and Regional Development
Master Plan Programme of Energy Development
NGO Nongovernmental organization
OECD Organization of Economic Cooperation and Development

61
RTU Riga Technical University
Sink Any process, activity or mechanism which removes a greenhouse gas, anaerosol or a precursor of a greenhouse gas into the atmosphere
UNEP United Nations Environment Programme
USSR Union of Soviet Socialist Rebublics
VCP Voluntary Co-operation Programme
WCRP World Climate Research Programme
WMO World Meteorological Organisation
WWF World Wide Fund (NGO)
CHEMICAL SYMBOLS AND UNITS OF MEASUREMENT
Chemical symbols
C carbon
CH4 methane
CO carbon monooxide
CO2 carbon dioxide
N nitrogen
N2O nitrous oxide
NOx nitrogen oxides
NMGOS non-methane volatile organic compounds
O3 ozone
Units of measurement
Gg gigagram (10 gram)6
GJ giga joule (10 joule)9
ha hectar (10 m )4 2
kg kilogram (10 gram)3
PJ peta joule (10 joule)15
Mtoe megaton oil equivalent

62
FIGURESFig.2.1 Territorial division of Latvia, major cities and rivers.
Fig.2.2 Location of Latvia in Europe.
Fig.2.3. Dynamics of gross domestic product .
Fig.3.1 NO , CO and NMVOC emissions in 1990 (Gg).x
(Transport\Others).
Fig.5.1. GDP curves for different economic development scenarios.GDP in 1993 prices (millions of Ls).
Fig.5.2. Projected dynamics of CO emissions.2
TABLESS.1. Inventory of GHG emissions in Latvia in 1990 (Gg)
S.2. Policy and Measures for reduction of CO emission levels2
S.3. Policy and measures for reduction of CH emission levels4
S.4. Policy and measures for reduction of N O emission levels2
S.5. Basic assumptions for macroeconomic forecast
S.6. Projection of GHG emissions in Latvia in 2000 (Gg)
2.3.1. Number of permanent residents
2.3.2. Age distribution of population (%)
2.4.1. Total energy consumption in Latvia (Mtoe)
2.4.2. Dynamics of transport means (in numbers)
2.4.3. Industrial overall production indices (in relative prices; 1990 = 100)
2.4.4. Indices of agricultural production (in relative prices: 1990 = 100)
3.1.1. GHG emissions in Latvia in 1990 (Gg)
3.2.1. Total CO emissions in 1990 (Gg)2
3.2.2. CO emissions from fuel combustion activities in 1990 (Gg)2
3.2.3. CO emissions from cement production in 1990 (Gg)2
3.2.4. Calculated CO sink in forestry in 1990 (Gg) 2
3.3.1. Total CH emissions in 1990 (Gg)4
3.4.1. Total N O emissions in 1990 (Gg)2
3.5.1. Total NO , CO and NMVOC emissions in 1990 (Gg)X
3.6.1. Total Global Warming Potential, 1990
5.1.1. Key assumptions in devising macroeconomic projection

5.1.2. Projections of GHG emissions in 2000 (Gg)
5.2.1. Projection of CO emissions in 2000 (Gg)2
5.2.2. Dynamics of transport means (number of units)
5.3.1. Projection of CH emissions in 2000 (Gg)4
5.4.1. N O emissions in 2000 (Gg)2
5.5.1. Projection of NOx, CO and NMVOC emissions in 2000 (s.2) (Gg)
5.6.1. Projection of converted GHG emissions in 2000 (in Gg of CO equivalents)2
5.7.1. Uncertainty of projected emissions in 2000 (%)
A.3.1. Energy sector. GHG emissions in Latvia in 1990 (Gg)
A.3.2. Energy sector. CO emissions from fuel combustion in 1990 (Gg) 2
A.3.3. Energy sector. Emission factors of fuels used for residential and agriculture,kg/GJ)
A.3.4. CH emission from agriculturesector. CH emissions from enteric fermentation and 4 4
animal waste in 1990 (Gg)
A.3.5. N O emissions from agriculture sector. N O emissions from fertilizer in 1990 (Gg) 2 2
A.3.6. N O emissions in agriculture sector. N O emissions from organic fertilizer in 19902 2
(Gg)
A.3.7. Land use change and forestry. CO removals from forestry in 1990 (Gg)2
A.3.8. CH emissions from waste. CH emissions from municipal solid waste in 1990 (Gg) 4 4
A.4.1. International agreements and activities Latvia accedes to
A.4.2. Principal laws, resolutions or regulations adopted or drafted after the base year,which might influence GHG emissions
A.5.1. Scenario 1. GHG emissions in Latvia in 2000 (Gg)
A.5.2. Scenario 2. GHG emissions in Latvia in 2000 (Gg)
A.5.3. Scenario 3. GHG emissions in Latvia in 2000 (Gg)
A.5.4. Energy sector. Projection of CO emissions from combustion of different types of2
fuel in 2000 (Gg)
A.5.5. Land management and forestry (CO sink). Projection of CO removals from2 2
forestry in 2000 (Gg)

64
ANNEX 3Chapter 3, Appendix Table A.3.1. Energy sector. GHG emissions in Latvia in 1990 (Gg)
GHG source and sink categories CO CH N O NO CO NMVOC2 4 2 x
1.All energy 22605.6 4.167 1.03 90.135 363.125 55.3241.A. Fuel combustion 22605.6 2.368 1.03 90.135 363.125 55.3151.A.1. Energy & transformation 8274.4 0.509 0.07 15.223 22.727 0.6481.A.a Losses 34.51.A.2. Industry 2680.4 0.059 0.014 3.362 0.939 0.0991.A.3. Transport 5660.6 1.486 0.108 65.833 329.077 54.1991.A.5. Residential 3140.3 0.184 0.029 2.711 4.414 0.1791.A.6. Agriculture/forestry 1449.7 0.108 0.016 1.582 4.789 0.1241.A.7. Other 1365.7 0.022 0.793 1.424 1.179 0.066
1.B. Fugitive fuel emissions 1.799 0.009
Chapter 3, Appendix Table A.3.2. Energy sector. CO emissions from fuel combustion in 2
1990 (Gg)
PJ Emission factor CO EmissionskgCO /GJ (Gg)2
2
1.A. Fuel combustion 344.77 22605.6Fuel typeGasoline 42.30 68.61 2902.1Diesel oil 55.26 73.33 4051.7Residual fuel oil 63.35 76.60 4852.3LPG 3.77 62.44 235.4Other liquid fuel 26.60 72.60 1931.0Coal 26.00 92.71 2410.4Peat 4.20 103.86 436.2Coke 0.42 106 44.5Natural gas 102.87 55.82 5742.2Wood 15.40 92.71 1427.7Bunker 2.23 73.33 163.5Jet fuel 2.37 70.80 167.8
Note: Emissions originating from combustion of wood, jet fuel during international flights and of bunkerfuel are excluded from total CO emissions and are not shown in Table A.3.1.2
Chapter 3, Appendix Table A.3.3. Energy sector. Emission factors of fuels used for residentialand agriculture, kg/GJ)
Types of fuel CH N O NO CO NMVOC4 2 X
Coal 0.0015 0.0014 0.113 0.0535 0.0048Gas 0.0014 0.0001 0.067 0.017 0.0019Oil 0.029 0.0006 0.161 0.015 0.0029Peat & wood 0.002 0.002 0.2 1.5 0.025

65
Chapter 3, Appendix Table A.3.4. CH emissions in agriculture sector. CH emissions from4 4
enteric fermentation and animal waste in 1990 (Gg)
Number of CH emissions (Gg) Emissions factorsdomestic (kg/animals per annum)animals
4
A. Enteric B. Animal A. Enteric B. Animalfermentation waste fermentation waste
4. Agriculture4.A. Enteric fermentation4.B. Animal waste Total 13362 97.964 13.310
Type of domestic animalsCattle 1439 93.959 6.826Dairy 535 43.335 3.210 81.0 6Other 904 50.624 3.616 56.0 4Goats 5 0.025 0.001 5.0 0.12Sheep 165 1.320 0.031 8.0 0.19Pigs 1401 2.102 5.604 1.5 4Horses 31 0.558 0.043 18.0 1.4Poultry 10321 0.805 0.078
Chapter 3, Appendix Table A.3.5. N O emissions from agriculture sector. N O emissions from2 2
fertilizer in 1990 (Gg)
Average consumption Average N O emissions (Gg N year) (Gg)
2
4. Agriculture4.C.Agricultural soils4.C.1. Fertilizer Total 120.3 0.445
Type of fertilizerAmmonium nitrate 67.0 0.273Urea 21.2 0.037Ammonium sulfate 1.6 0.003Aqua ammonia 3.2 0.082Ammonium phosphate 19.2 0.036Other complex 2.2 0.004Other nitrogen 5.9 0.010

66
Chapter 3, Appendix Table A.3.6. N O emissions in agriculture sector. N O emissions from2 2
organic fertilizer in 1990 (Gg)
Amount of fertilizers (Gg) N O emmision s(Gg)N O- N emissions2
(Gg)2
4. Agriculture4.C.Agricultural soils 4.C.2. Organic fertilizer Total 14400 0.576 0.905
Chapter 3, Appendix Table A.3.7. Land use change and forestry. CO removals from forestry2
in 1990 (Gg)
Species Mean age Species Annual stem Annual Species Annual dry Total dry Total annual Totalof covered wood whole-tree wood whole-tree whole-tree carbon atmosphericspecies, area, 10 increment, biomass density biomass biomass sequestrationyears ha m /ha, year increment, 1000kg/ increment increment in Gg/year
6
3
m /ha, year m 1000kg/ha, Latvia 103 3
year 1000kg/year6
CO2sequestrationGg/year
1.Pine 55 1.048 5.0 8.0 0.48 3.84 4.024 2012 7 3782.Spruce 39 0.554 7.6 12.16 0.41 4.99 2.762 1381 5 0643.Birch 39 0.786 4.4 7.04 0.54 3.8 2.988 1494 5 4784.Aspen 44 0.067 7.9 12.64 0.34 4.30 0.288 144 5285.White alder 26 0.144 6.6 10.56 0.37 3.91 0.563 281 1 0326.Black alder 42 0.063 3.9 6.24 0.37 2.31 0.145 73 2677.Oak, ash 48 0.028 6.3 10.08 0.66 6.65 0.186 93 3428.Shrub land 0.15 2.0 0.472 0.94 0.14 7 2609.Small 0.02 5.5 8.8 0.472 4.15 0.08 4 150stands,parks,allies 10.New 0.09 2.0 0.472 0.94 0.08 4 150reforestrationActual decrease (-20)in sequetrationTotal seques- 20 580trationCalculated (- 4.54) (- 7.2622) 0.472 (-3.428) (- 1 7139) (- 6 280)emissions from m. mcut
3
Calculated net 14 300removals
Chapter 3, Appendix Table A.3.8. CH emissions from waste. CH emissions from municipal4 4
solid waste in 1990 (Gg)
Total MSW (Gg) MSW landfilled (Gg) Emission factor CH emission(kgCH /kg of waste) (Gg)4
4
6. Waste6.A.Landfills Total 584.84 497.11 0.0875 43.50

67
ANNEX 4Chapter 4, Appendix Table A.4.1. International agreements and activities Latvia accedes to
No Title Concise annotation
1 United Nations Framework Convention reduction in GHG emission levelson Climate Change (FCCC) (1992)
2 Intergovernmental Panel on Climate is engaged in scientific study of climatic change and itsChange (IPCC) influence, devises an internationally co-ordinated activity
programme
3 United Nations Environmental observation of atmospheric pollutionProgramme\World MeteorologicalOrganization (UNEP\WMO)
4 1979 Convention on Long-range international monitoring of air pollution; reduction of airTransboundary Air Pollution pollution
5 Global Climate Observation System exchange of information among member countries(GCOS)
6 EUROTAC studies tropospheric movement and transformation ofpollutants above Europe
7 Integral monitoring international monitoring of environmental pollution
8 Global Atmospheric Watch (GAW) co-ordinates monitoring programmes on ozone, atmosphericbackground pollution etc.
9 Helsinki Convention on Protection of engaged in protection of environment of the Baltic SeaEnvironment of the Baltic Sea (1974, (1974); protection and improvement of environment of the1992) Baltic Sea basin (1992)
10 London Convention on Preventive marine environment protection against pollution by ships;Protection against Pollution by Ships regulation of ship design
11 Strasbourg Resolutions on Forest monitoring of forest ecosystems, protection of forest geneticProtection (1990) resources, creating a database on forest fires, programme of
physiological assessment of forest tree species, study of anecosystem
12 Helsinki resolutions on forest protection unexhausting management of the European forest,(1993) conservation of biological diversity, methodological
assistance to developing countries, preparing forest ecosystemfor eventual climate change
13 1986 Convention on Urgent Notification determines the exchange of an information flow betweenabout Nuclear Accidents International Agency of Nuclear Energy and Member
Countries
14 1986 Convention on Assistance during prescribes the order assistance is rendered among Membernuclear accidents or radiation emergency Countries during Nuclear Accident or Radiation Emergency
15 1992 Helsinki Convention on outlays necessary arrangements to prevent accidents andTransboundary Effects of Industrial lessen consequences, as well as ensures exchange ofAccidents information and sets order of rendering assistance

68
16 Agreement between Baltic countries "On Dispatch Centre "Baltija" is created to co-ordinate activitiesparallel activities of Estonian, Latvian of Estonian, Latvian and Lithuanian Energy Systemsand Lithuanian Energy Systems"
17 1989 Basel Convention on "the Control determines toxic waste transportation proceduresover theTransboundary Movements and of Hazardous waste and their Disposal",
18 Energy Charter sets guidelines for energy efficiency programmes
19 Free Trade Agreement between EC and regulates free flow of goods in accordance with internationalLatvia quotas
Chapter 4, Appendix Table A.4.2. Principal laws, resolutions or regulations adopted or draftedafter the base year, which might influence GHG emissions
No. Name Concise annotation
General issues of environment protection
1. Law "On environment Fundamental law on environment protection comprises principal rules andprotection (1991) guidelines concerning the rights of the resident for appropriate quality of
environment for living, availability of information about environmentalconditions, the way many environmental issues are tackled, distribution ofauthority in environment protection as well as other issues.
2. Law "On State Ecological Regulates procedures of performing state ecological expertise, its goals,Expertise" (1990) objects and other principal rules
3. Regulatory Act "On State Determines the status of a state inspector and a scope of competence, as wellinspection of environment as regulates order of applying for licences permitting utilization of naturalprotection of the Republic of resources.Latvia" (1990)
4. Law "On Committee of En- Forms legal basis concerning rights and executive means of a number ofvironment Protection of the environmental protection institutions Republic of Latvia" (1990).
Sectorial issues and natural resources
5. Law "On natural resource By adopting this law, for the first time in Latvian history a special tax istax" (1990). imposed on pollution of environment and involvement of natural resources
in economic turnover. Natural resources tax was one of the most influentialeconomic instruments in environment protection, however, in virtue of rapidchanges it fails to perform the fiscal function, due to devaluation of rates. Anew law on natural resources tax is drafted in 1994, which shall enter intoforce in 1995.
6. Resolution "On natural Objective - to reduce pollution and squandering of natural resources, raiseresources and pollution" funds for environment protection.(1990).
7. Law "On hazardous waste" Regulates order to be used in handling hazardous waste.(1993).

No. Name Concise annotation
69
8. Law "On order of Prescribes the order to be used for suspension of activities of enterprises suspension of enterprises, with regard to legislation infringements.institutions andorganizations" (1991).
9. Resolution "Dangerous types Determines dangerous levels of water pollution, sets maximum acceptableof environment pollution concentration in overground water basins and sewage outflow sites for 36and maximum acceptable substances.concentrations in water andsewage (1991).
10. Law "On particularly Specifies particularly preservable natural territories, outlays order ofpreservable natural formation and protection etc.territories" (1993).
11. Law "On use and Defines order of use and organization of land exploitation.organization of landexploitation (1991) withamendments andsupplements (1993)
12. Law "On management and Ensures protection of forest as an ecosystem, as well as renewal of forestutilization of forests" (1994) resources, regulates principal rules of forest management.
13. Law "On rational utilization Prescribes rates of natural resource tax and fines for overproduction ofand protection of land resources. resources" (1994)
14. Regulations "On use of state Determines order of protection and use ecological values of state forests.forests"
15. Regulations "On forest Specifies, that notwithstanding the form of property, forest managementtyping and appropriation of includes enhancement of ecological properties of the forest, protectionparticularly preservable against pests and diseases, provision of fire service and guarding againstforest sectors" (1994) unauthorized utilization.
16. Regulations "On road Regulates traffic safetytraffic" (1994)
17. "State technical check-up Regulates traffic safetyrules for mechanicalvehicles and trailers" (1994)
18. Rules "On trucking" (1994). Regulates traffic safety
19. USSR State standards Regulates acceptable pollution levels."Measuring techniques andstandards of carbon oxideand hydrocarbon contents inexhaustion gases of vehicleswith petrol engines" (1988)
Administrative Code:

No. Name Concise annotation
70
20. Article 55. Infringement of Regulates unauthorized production and overproduction of mineral wealthprotection regulations withrespect to subsoil resources"(1992)
21. Article 58. Environment On pollution of environment with sewage, chemical substances, industrial orpollution and littering communal waste.
22. Article 76. On infringement Punitive sanctions for infringement of rules of transportation, storage andof rules concerning use of pesticides, growth stimulants, mineral fertilizers or other materials.transportation, storage oruse of pesticides, growthstimulants, mineralfertilizers and othermaterials. (1994)
Criminal Code:
23. Article 155\1 with Criminal liability for environmentally adverse actions.amendments.Start-up of an enterprisewithout waste treatmentfacilities or withmalfunctioning wastetreatment facilities (1993)
24. Article 225 with Criminal liability for environmentally adverse actionsamendments.Pollution of water, soil andatmospheric air (1994).
Draft Laws:

No. Name Concise annotation
71
1. "On natural resource tax" This draft law contains several amendments, if compared to the previous,(replacement for Law of which can be divided into three groups: 1990). 1 - indexation of tax rates not bringing about aggravation of economic crisis.
Rates will increase 3 to 5 times with respect to ones used previously.2 - Introduction of new taxation objects. Within the context of climatechanges it is worth mentioning fees, envisaged for consumption of hazardousgoods and products. All energy resources (fuels, combustible materials)affecting ozone layer are included. Revenue shall be allocated to theFoundation of environment protection of Latvia and utilized as financialsupport for alternative energy projects, other programmes, as well asindividual projects in a mixed way - by crediting and providing subsidies.3 - Adoption of new regulating principles: tax credit principle shall beapplied to companies, which implement environment protection measures;use of environment protection licences. This mechanism will be appliedboth, to specify and implement reduction of maximally acceptable pollutionlevels (national or regional quotas) in accordance with national strategy andalso to restrict import or production of obnoxious materials (substancesdepleting an ozone layer, for instance). It is planned to organize licencemarket by using structures of the Environment Protection Foundation;further on it will be developed in the direction of free market of securities.The new NRT draft law is conceived as a package of tools, assuming in thesame time, that its efficiency in mitigating environment pollution (includingpollution types causing climatic changes) will be low. It is expected that thecontribution of this tax to GDP will not exceed 0.5% in 1995, however inenergy sector it might be as high as 4%.
2. On energy sector Comprehensive law on regulation of economic activities in energy sector.
3. On subsoil resources Interim order of utilization of subsoil resources.
4. On conservation of species Prescribes utilization order of wild plants and animals, ensures protection ofand biotopes particularly protectable species and biotopes
5. On chemical substances Determines order to be used for stock-taking, performing safety precautionsupon handling chemical substances; regulates import, production, storing,transportation etc.
6. On protection of air Comprehensive law on air protection in Latvia.
7. On safety strips Comprehensive law on safety strips of all types.
8. On private farmsteads Sets farm management principles, prescribes maximum land area to beowned by one owner.
9. On regulation of Regulates entrepreneurial activities in energy sector.entrepreneurial activities inenergy sector

72
ANNEX 5Chapter 5, Appendix Table A. 5.1. Scenario 1. GHG emissions in Latvia in 2000 (Gg)
GHG source and sink categories CO2 CH4 N2O NOx CO NMVOCTotal emissions and sinks 16179 110.75 1.35 48.83 264.37 36.621.All energy 16115 3.31 0.74 48.83 264.37 33.441.A. Fuel combustion 16115 2.12 0.74 48.83 264.37 33.441.A.1. Energy & transformations activities 7510 0.62 0.08 13.98 36.59 0.861.A.a Losses - transport & distribution 171.A.2. Industry 1254 0.02 0.01 1.41 0.32 0.041.A.3. Transport 3962 1.16 0.05 27.59 205.64 32.071.A.5. Residential 1741 0.21 0.03 3.17 14.69 0.31.A.6. Agriculture/forestry 557 0.09 0.02 1.18 6.58 0.131.A.7. Other 1074 0.02 0.55 1.5 0.55 0.041.B. Fugitive fuel emission 1.19 2. Industrial processes 642.E.1. Cement production 643. Solvent and other product use 3.183.A. Degreasing and dry cleaning 0.073.B. Chemical products manufacture /processing 0.213.C. Other 2.94. Agriculture 55.38 0.614.A. Enteric fermentation 49.384.B. Animal waste 64.C. Agricultural soils 0.615. Land use change and forestry (-8940)5.C. Managed forests (-8940)6. Waste 52. 066.A. Landfills 52.06
Chapter 5, Appendix Table A.5.2. Scenario 2. GHG emissions in Latvia in 2000 (Gg)
GHG source and sink categories CO2 CH4 N2O NOx CO NMVOCTotal emissions and sinks 16956 114,15 1.43 52.48 278.23 39.191.All energy 16885 3.44 0.76 52.48 278.23 35.691.A. Fuel combustion 16885 2.21 0.76 52.48 278.23 35.691.A.1. Energy & transformations activities 7775 0.63 0.09 14.43 36.65 0.871.A.a Losses - transport & distribution 171.A.2. Industry 1395 0.02 0.01 1.57 0.36 0.051.A.3. Transport 4274 1.23 0.06 30.58 219.3 34.31.A.5. Residential 1757 0.21 0.03 3.18 14.69 0.31.A.6. Agriculture/forestry 588 0.1 0.02 1.21 6.68 0.131.A.7. Other 1079 0.02 0.55 1.51 0.55 0.041.B. Fugitive fuel emission 1.232. Industrial processes 712.E.1. Cement production 713. Solvent and other product use 3.53.A. Degreasing and dry cleaning 0.083.B. Chemical products manufacture / processing 0.22

73
3.C. Other 3.24. Agriculture 58.65 0.674.A. Enteric fermentation 52.234.B. Animal waste 6.424.C. Agricultural soils 0.675. Land use change and forestry (-8940)5.C. Managed forests (-8940)6. Waste 52.066.A. Landfills 52.06
Chapter 5, Appendix Table A.5.3. Scenario 3. GHG emissions in Latvia in 2000 (Gg)
GHG source and sink categories CO2 CH4 N2O NOx CO NMVOCTotal emissions and sinks 18021 114.37 1.62 56.55 293.69 421.All energy 17935 3.66 0.81 56.55 293.69 38.081.A. Fuel combustion 17935 2.34 0.81 56.55 293.69 38.081.A.1. Energy & transformations activities 8040 0.64 0.09 14.89 36.71 0.881.A.a Losses - transport & distribution 191.A.2. Industry 1696 0.03 0.01 1.91 0.44 0.061.A.3. Transport 4588 1.33 0.07 33.55 233.35 36.641.A.5. Residential 1757 0.21 0.03 3.18 14.69 0.31.A.6. Agriculture/forestry 696 0.11 0.02 1.43 7.91 0.151.A.7. Other 1139 0.02 0.59 1.59 0.59 0.051.B. Fugitive fuel emission 1.322. Industrial processes 86 2.E.1. Cement production 86 3. Solvent and other product use 3.923.A. Degreasing and dry cleaning 0.083.B. Chemical products manufacture / processing 0.243.C. Other 3.64. Agriculture 58.65 0.814.A. Enteric fermentation 52.234.B. Animal waste 6.424.C. Agricultural soils 0.815. Land use change and forestry (-8940)5.C. Managed forests (-8940)6. Waste 52.066.A. Landfills 52.06

74
Chapter 5, Appendix Table A.5.4. Energy sector. Projection of CO emissions from combustion2
of different types of fuel in 2000 (Gg)
scenario 1 scenario 2 scenario 3
PJ CO PJ CO PJ CO 2 2 2
1.A.Fuel combustion 231.10 16115.3 242.43 16885.4 257,62 17934.5
Fuel types Gasoline 37.40 2565.0 39.91 2738.1 42.96 2947.4Disel oil 31.95 2342.9 34.91 2560.0 39.28 2880.4Heavy fuel oil 48.78 3736.2 51.12 3915.2 54.11 4144.5LPG liquefied gas 2.84 177.3 2.85 177.9 2.89 180.4Other liquid fuel 10.00 726.0 10.00 726.0 10.00 726.0Coal 21.02 1948.7 21.13 1958.7 21.69 2010.8Peat 4.02 421.7 4.02 421.7 4.03 422.7Coke 0.12 12.7 0.13 13.8 0.16 17.1Natural gas 74.97 4184.8 78.36 4374.o 82.50 4605.2
Wood 33.42 3130.1 33.48 3157 34.29 3211.6Bunker fuel 10.85 808.6 11.88 885.5 12.63 941.7
Note: Emissions from combustion of wood and bunker oil are excluded from total CO emissions.2
Chapter 5, Appendix Table A.5.5. Land management and forestry (CO sink). Projection of2
CO removals from forestry in 2000 (Gg)2
5. Land management and forestry5.C. Forestry
CO sequestration (Gg) 206002
Actual decrease in sequestration ( - 40)
Total CO sequestration (Gg) 205602
Calculated CO emissions from cut (Gg), ( - 11620)2
- Fuelwood burned 3157
- Exported 4648
- Other 3815
Calculated net removals (Gg) 8940