Central Statistical Bureau of Latvia - CIRCABC
42
Central Statistical Bureau of Latvia FINAL QUALITY REPORT RELATING TO EU-SILC OPERATIONS 2005, 2006 & 2007 Riga 2009
-
Upload
khangminh22 -
Category
Documents
-
view
0 -
download
0
Transcript of Central Statistical Bureau of Latvia - CIRCABC

Central Statistical Bureau of Latvia
FINAL QUALITY REPORT
RELATING TO EU-SILC
OPERATIONS 2005, 2006 & 2007
Riga 2009
EU-SILC Final Quality Report Latvia 2005-2007
2
0BCONTENTS
Background........................................................................................................................ 4
1. COMMON LONGITUDINAL EUROPEAN UNION INDICATORS BASED ON
THE LONGITUDINAL COMPONENT OF EU-SILC ................................................ 4
2. ACCURACY...................................................................................................................... 5
2.1. SAMPLE DESIGN .............................................................................................................. 5
2.1.1. Type of sampling .......................................................................................................... 5
2.1.2. Sampling units ............................................................................................................. 5
2.1.3. Stratification and sub-stratification criteria .................................................................. 6
2.1.4. Sample size and allocation criteria ............................................................................... 6
2.1.5. Sample selections schemes ........................................................................................... 6
2.1.6. Sample distribution over time....................................................................................... 6
2.1.7. Renewal of sample: rotational groups........................................................................... 7
2.1.8. Weightings .................................................................................................................... 7
2.1.8.1. Design factor .............................................................................................................. 7
2.1.8.2. Non-response adjustments ......................................................................................... 8
2.1.8.3. Adjustments to external data (level, variables used and sources).............................. 8
2.1.8.4. Final longitudinal weights.......................................................................................... 8
2.1.8.5. Final household cross-sectional weight……………………………………………...9
2.1.9. Substitutions.................................................................................................................. 9
2.2. SAMPLING ERRORS .......................................................................................................... 9
2.3. NON-SAMPLING ERRORS................................................................................................ 15
2.3.1. Sampling frame and coverage errors .......................................................................... 15
2.3.2. Measurement and processing errors ........................................................................... 15
2.3.3. Non-response errors .................................................................................................... 18
2.3.3.1. Achieved sample size............................................................................................... 18
2.3.3.2. Unit non-response .................................................................................................... 19
2.3.3.3. Distribution of households by the household status (DB110), by the record of
contact at address (DB120), by the household questionnaire result (DB130) and
by the household interview acceptance (DB135) .................................................... 23
2.3.3.4. Distribution of persons by membership status (RB110).......................................... 23
2.3.3.5. Item non-response .................................................................................................... 24
2.4. MODE OF DATA COLLECTION ........................................................................................ 29
2.5. IMPUTATION PROCEDURE.............................................................................................. 31
2.6. IMPUTED RENT............................................................................................................... 31
2.7. COMPANY CARS ............................................................................................................. 32
3. COMPARABILITY........................................................................................................ 33
3.1. BASIC CONCEPTS AND DEFINITIONS.............................................................................. 33
3.2. COMPONENTS OF INCOME............................................................................................. 33
EU-SILC Final Quality Report Latvia 2005-2007
3
3.2.1. Differences between the national definitions and standard EU-SILC definitions, and
an assessment of the differences mentioned…………………………………...........33
3.2.1.1. Total household gross income……………………………………………….…….33
3.2.1.2. Total disposable household income …………………………………………….…33
3.2.1.3. Total disposable household income, before social transfers other than old-age and
survivor’s benefits…………………………………………………………………33
3.2.1.4. Total disposable household income, before social transfers including old age and
survivor’s benefits……………………………………………………………….…33
3.2.1.5. Imputed rent………………………………………………….……….……………34
3.2.1.6. Income from rental property and land……………………………………………..34
3.2.1.7. Family/children-related allowances……….……...………………………………..34
3.2.1.8. Social exclusion payments not elsewhere classified...……………………………..34
3.2.1.9. Housing allowances....................................................……………………………..34
3.2.1.10. Regular inter-household cash transfers received......................................................34
3.2.1.11. Interest, dividends, profit from capital investments in unincorporated business......34
3.2.1.12. Interest paid on mortgages……………………………………………………........34
3.2.1.13. Income received by people aged under 16……………………………………........35
3.2.1.14. Regular taxes on wealth………………………………………………………........35
3.2.1.15. Regular inter-household transfers paid.………………………………………........35
3.2.1.16. Tax on income and social contributions….……………………………………......35
3.2.1.17. Repayments/receipts for tax adjustments………………………………………......35
3.2.1.18. Cash or near-cash employee income………...…………………………………......35
3.2.1.19. Non-cash employee income………...…………………………………...................35
3.2.1.20. Employers’ social contributions.…...…………………………………...................36
3.2.1.21. Cash profits or losses from self-employment (including royalties)..........................36
3.2.1.22. Value of goods produced for own consumption…………………...........................37
3.2.1.23. Unemployment benefits………………………….………………...........................38
3.2.1.24. Old-age benefits………………………………….………………...........................38
3.2.1.25. Survivors’ benefits……………………………….………………...........................38
3.2.1.26. Sickness benefits……………………………………………………………...……38
3.2.1.27. Disability benefits………………..…………………………………………...……38
3.2.1.28. Education related benefits………………..…………………………………...……38
3.2.2. The source of collecting income variables.................................................................. 38
3.2.3. The form in which income target variables at component level were obtained ......... 39
3.2.4. The method used for obtaining income target variables in required form.................. 39
3.3. TRACING RULES ........................................................................................................... 40
4. COHERENCE ................................................................................................................ 41
4.1. COMPARISON OF INCOME TARGET VARIABLES AND THE NUMBER OF PERSONS WHO
RECEIVE INCOME FROM EACH ‘INCOME COMPONENT’ WITH EXTERNAL SOURCES . 41

EU-SILC Final Quality Report Latvia 2005-2007
4
7BBackground
In Latvia the EU-SILC survey was launched in 2005. The Latvian EU-SILC survey is an annual
survey with a four-year rotational panel and it is carried out as an independent survey, by single
operation covering cross-section and longitudinal primary target variables as well as secondary
target variables.
1. COMMON LONGITUDINAL EUROPEAN UNION
INDICATORS BASED ON THE LONGITUDINAL
COMPONENT OF EU-SILC
Longitudinal indicators are not available, as no rotational group has been yet in the survey for
four years.

EU-SILC Final Quality Report Latvia 2005-2007
5
2. ACCURACY
2.1. SAMPLE DESIGN
In Latvia a stratified two-stage sampling design was used for the EU-SILC survey. At the first
stage a systematic sampling of the primary sampling units (Population Census counting areas)
was carried out. At the second stage a simple random sampling was made to select secondary
sampling units (addresses). The stratification was made depending on a degree of urbanization
of the area. The code of administrative territories was used for stratifying.
2.1.1. Type of sampling
A stratified two-stage sampling was used for the EU-SILC survey in Latvia. A systematic
sampling with inclusion probabilities proportional to the unit size was carried out at the first
stage and a simple random sampling was carried out at the second stage.
2.1.2. Sampling units
The Population Census counting areas were used as primary sampling units (PSUs) at the first
stage. In general, all territory of Latvia is covered in lists of population counting areas. PSUs
were selected by a systematic sampling with inclusion probabilities proportional to the
population size (number of households) of PSUs.
Addresses were used as secondary sampling units (SSUs). Simple random sampling was used to
select SSUs from PSUs selected at the first sampling stage. In Latvia several households can be
registered in one address. All households and individuals living in the selected address were
included in the EU-SILC survey in urban areas, but in rural areas only those households, which
were formed by persons enumerated in the Household List (see 2.3.2.). If none of persons
enumerated in the Household List lived in the selected address, then it was possible:
- to go for an interview to a different address in the same local area (if an interviewer
knew the correct address of the persons enumerated in the Household List);
- to interview all households and individuals living in the selected address (the same as
in urban areas).
EU-SILC Final Quality Report Latvia 2005-2007
6
2.1.3. Stratification and sub-stratification criteria
The stratification was made depending on a degree of urbanization of the area. Riga (the capital
city), six largest towns, other towns and rural areas form four strata. The code of administrative
territories was used for stratification. The stratum is identified in the variable DB050.
2.1.4. Sample size and allocation criteria
According to Regulation (EC) No 1553/2005 of the European Parliament and of the Council of
7 September 2005 amending Regulation (EC) No 1177/2003 concerning Community statistics
on income and living conditions (EU-SILC), Annex II in Latvia the minimum effective sample
size was 3 750 households. The total gross sample size (number of households) was made
according to the non-response rate and effective sample size for at-risk-of-poverty rate after
social transfers. The non-response rate was estimated by using the results of the EU-SILC
survey in the previous years. In 2005 there were 5 692 addresses selected. To compensate the
non-response of the 2005 survey, it was decided to select 5 856 addresses in 2006 and 6 550 in
2007 (a new rotational group was increased).
2.1.5. Sample selections schemes
In the first stage Population Census counting areas (PSUs) were selected by a systematic
sampling with inclusion probabilities proportional to their population size.
A simple random sampling without replacement was used to select addresses (SSUs) in sampled
PSUs. A non-proportional allocation was used to select SSUs.
2.1.6. Sample distribution over time
A sample distribution over time was not used because the EU-SILC survey is organized on an
annual basis. The number of households successfully interviewed in each month of fieldwork
(2005-2007) is shown below in Table 2.1.
EU-SILC Final Quality Report Latvia 2005-2007
7
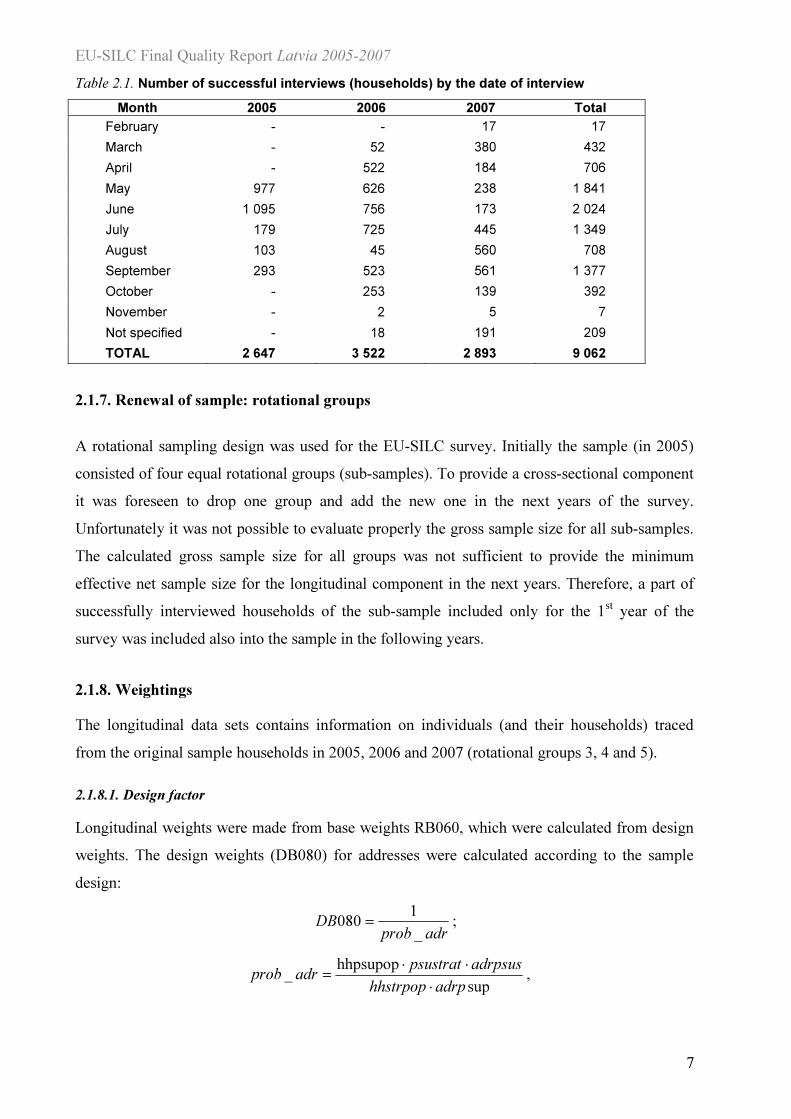
Table 2.1. Number of successful interviews (households) by the date of interview
11BMonth 2005 2006 15B2007 16BTotal
February - - 17 17
March - 52 380 432
April - 522 184 706
May 977 626 238 1 841
June 1 095 756 173 2 024
July 179 725 445 1 349
August 103 45 560 708
September 293 523 561 1 377
October - 253 139 392
November - 2 5 7
Not specified - 18 191 209
TOTAL 2 647 3 522 2 893 9 062
2.1.7. Renewal of sample: rotational groups
A rotational sampling design was used for the EU-SILC survey. Initially the sample (in 2005)
consisted of four equal rotational groups (sub-samples). To provide a cross-sectional component
it was foreseen to drop one group and add the new one in the next years of the survey.
Unfortunately it was not possible to evaluate properly the gross sample size for all sub-samples.
The calculated gross sample size for all groups was not sufficient to provide the minimum
effective net sample size for the longitudinal component in the next years. Therefore, a part of
successfully interviewed households of the sub-sample included only for the 1st year of the
survey was included also into the sample in the following years.
2.1.8. Weightings
The longitudinal data sets contains information on individuals (and their households) traced
from the original sample households in 2005, 2006 and 2007 (rotational groups 3, 4 and 5).
2.1.8.1. Design factor
Longitudinal weights were made from base weights RB060, which were calculated from design
weights. The design weights (DB080) for addresses were calculated according to the sample
design:
adrprobDB
_
1080 = ;
sup
hhpsupop_
adrphhstrpop
adrpsuspsustratadrprob
⋅
⋅⋅
= ,

EU-SILC Final Quality Report Latvia 2005-2007
8
where prob_adr - inclusion probabilities of addresses;
hhpsupop - a number of households in each strata’s each PSU of all population;
psustrat - a number of the PSUs in each strata of sample;
adrpsus - a number of addresses in each strata’s each PSU of sample;
hhstrpop - a number of households in each strata of all population;
adrpsup - a number of addresses in each strata’s each PSU of population.
The inclusion probability of the household and the individual is equal to the inclusion
probability of the address. The design weights were adjusted for outliers (extremely high design
weights) at the address level.
2.1.8.2. Non-response adjustments
Base weights were corrected by non-response in the primary sampling units. The 2006 and 2007
data were adjusted for returnees. New household members with RB110 = 3 (moved into from
outside sample) and former household members with RB110 = 5, 6 or 7 (moved out, died, not
registered in the previous wave and did not live in household anymore) had RB060 = 0. The
newly born (household members with RB110 = 4) received the weight of their mother. For each
year, each rotational group with adjusted design weights was calibrated on the corresponding
year’s population.
2.1.8.3. Adjustments to external data (level, variables used and sources)
For each year, each rotational group with adjusted design weights was calibrated on the
corresponding year’s population. Weights were calibrated (in the household level) on the basis
of demographic data by breaking them down by a degree of urbanization (four groups - strata),
12 age groups (0-15; 16-20; 21-25; 26-30; 31-35; 36-40; 41-45; 46-50; 51-55; 56-60; 61-65;
66+), sex and 6 regions of Latvia (NUTS 3). GREG calibration was used.
2.1.8.4. Final longitudinal weights
Calibrated weights are base weights RB060. For each rotational group, for each wave, the sums
of weights RB060 are equal to the size of the longitudinal population in the scope at each wave
from the start of the panel.
The longitudinal part of 2005 and 2006 are the third and the fourth rotational groups, but for
2006 and 2007 – the third, the fourth and the fifth rotational groups. Only they were selected for
longitudinal weighting. So weights have a formula RB062 = k * RB060, where k is calculated as

EU-SILC Final Quality Report Latvia 2005-2007
9
a proportion - number of households in the corresponding rotational group against the total
number of households in all three longitudinal rotational groups.
2.1.8.5. Final household cross-sectional weight
The final cross-sectional weights DB090 were calculated as a product of the design factor,
non-response adjustment factor and calibration factor:
gwnonrDB ⋅= _090 ,
where g - g-weights of the regression estimator.
2.1.9. Substitutions
No substitution was used.
2.2. SAMPLING ERRORS
The following tables report the mean, the number of observations (before and after imputation)
and the standard error for different income components.
Estimates and their standard errors were computed with cross-sectional weights DB090 at the
household level and PB050 at the personal level.

EU-SILC Final Quality Report Latvia 2005-2007
10
Table 2.2. Mean, number of observations and standard errors of different income components,
2004 (EU-SILC 2005)
Number of observations Income components Mean, LVL 0F
1 Before
imputation After
imputation
Standard error, LVL
1
HY020 Total disposable household income
3 098 2 624 2 629 75
HY022 Total disposable household income before social transfer other than old-age and survivor’s benefits
2 951 2 590 2 598 75
HY023 Total disposable household income before social transfers including old-age and survivor’s benefits
2 669 2 294 2 306 81
Net income components at the household level
HY040N Income from rental of a property or land
314 41 42 56
HY050N Family/Children related allowances
223 838 838 10
HY060N Social exclusion not elsewhere classified
108 226 230 16
HY070N Housing allowances 62 115 124 5
HY080N Regular inter-household cash transfer received
552 289 305 47
HY090N Interest, dividends, profit from capital investments in unincorporated business
976 65 66 568
HY110N Income received by people aged under 16
145 31 31 30
HY120N Regular taxes on wealth 21 1 197 1 337 1
HY130N Regular inter-household cash transfer paid
450 272 283 41
HY145N Repayments/receipts for tax adjustment
-39 308 309 4
Net income components at the personal level
PY010N Employee cash or near cash income
1 905 2 703 2 709 47
PY021N Company car 159 73 73 22
PY035N Contributions to individual private pension plans
118 38 38 16
PY050N Cash benefits or losses from self-employment
1 828 282 282 230
PY080N Pension from individual private plans
0 0 0 0
PY090N Unemployment benefits 445 154 154 62
PY100N Old-age benefits 938 1 665 1 665 16
PY110N Survivor` benefits 574 73 73 50
PY120N Sickness benefits 138 269 269 15
PY130N Disability benefits 705 175 175 21
PY140N Education-related allowances 167 123 124 26
1 Zeros are not included in calculations.

EU-SILC Final Quality Report Latvia 2005-2007
11
Table 2.3. Mean, number of observations and standard errors of different income components,
2005 (EU-SILC 2006)
Number of observations
Income components Mean, LVL 1F
1
Before imputation
After imputation
Standard error, LVL
1
HY020 Total disposable household income
4 064 3 488 3 499 95
HY022 Total disposable household income before social transfer other than old-age and survivor’s benefits
3 866 3 454 3 466 91
HY023 Total disposable household income before social transfers including old-age and survivor’s benefits
3 541 3 090 3 102 97
Net income components at the household level
HY040N Income from rental of a property or land
650 44 44 165
HY050N Family/Children related allowances
319 1 111 1 111 30
HY060N Social exclusion not elsewhere classified
123 189 193 24
HY070N Housing allowances 81 158 160 6
HY080N Regular inter-household cash transfer received
735 390 395 62
HY090N Interest, dividends, profit from capital investments in unincorporated business
1 840 66 73 520
HY110N Income received by people aged under 16
113 54 54 36
HY120N Regular taxes on wealth 25 1 738 1 803 2
HY130N Regular inter-household cash transfer paid
528 375 385 52
HY145N Repayments/receipts for tax adjustment
-51 390 395 6
Net income components at the personal level
PY010N Employee cash or near cash income
2 404 3 729 3 731 53
PY021N Company car 309 59 59 48
PY035N Contributions to individual private pension plans
115 59 62 25
PY050N Cash benefits or losses from self-employment
1 822 351 353 145
PY080N Pension from individual private plans
0 0 0 0
PY090N Unemployment benefits 582 166 166 115
PY100N Old-age benefits 1 000 2 354 2 354 15
PY110N Survivor` benefits 584 88 88 56
PY120N Sickness benefits 222 316 316 36
PY130N Disability benefits 745 251 251 24
PY140N Education-related allowances 231 136 136 37
1 Zeros are not included in calculations.
EU-SILC Final Quality Report Latvia 2005-2007
12
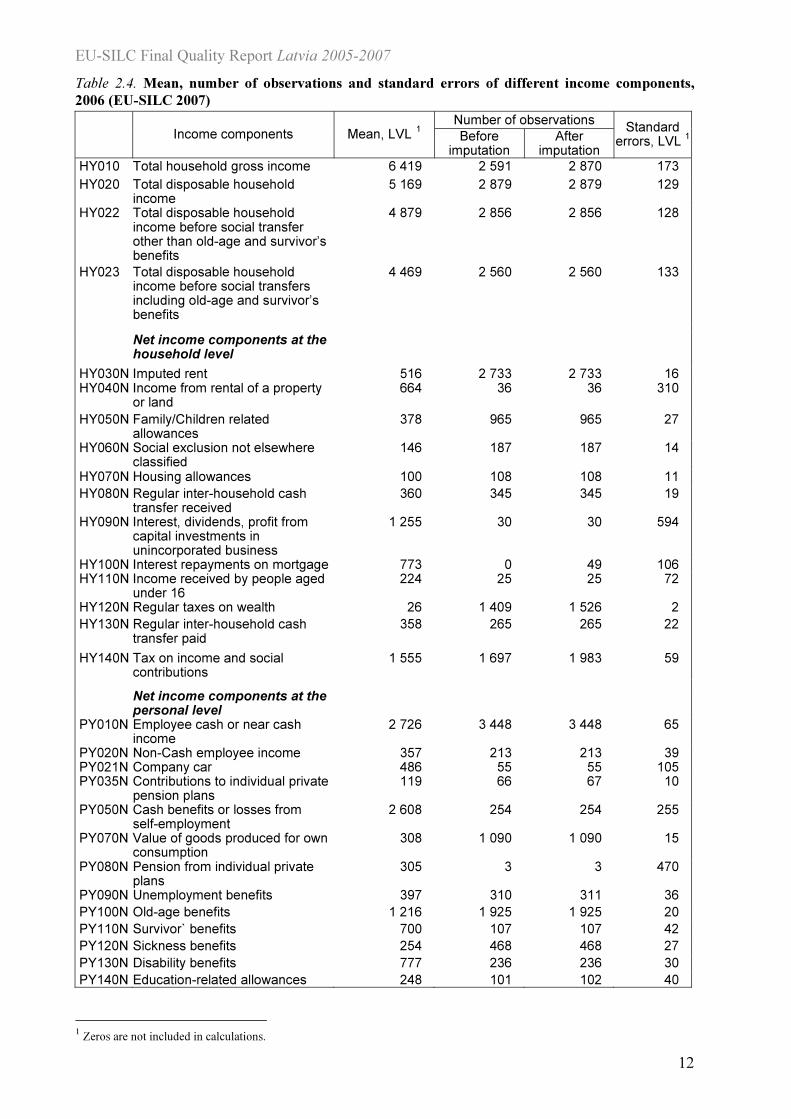
Table 2.4. Mean, number of observations and standard errors of different income components,
2006 (EU-SILC 2007)
Number of observations Income components Mean, LVL 2F
1
Before imputation
After imputation
Standard errors, LVL
1
HY010 Total household gross income 6 419 2 591 2 870 173
HY020 Total disposable household income
5 169 2 879 2 879 129
HY022 Total disposable household income before social transfer other than old-age and survivor’s benefits
4 879 2 856 2 856 128
HY023 Total disposable household income before social transfers including old-age and survivor’s benefits
4 469 2 560 2 560 133
Net income components at the household level
HY030N Imputed rent 516 2 733 2 733 16 HY040N Income from rental of a property
or land 664 36 36 310
HY050N Family/Children related allowances
378 965 965 27
HY060N Social exclusion not elsewhere classified
146 187 187 14
HY070N Housing allowances 100 108 108 11
HY080N Regular inter-household cash transfer received
360 345 345 19
HY090N Interest, dividends, profit from capital investments in unincorporated business
1 255 30 30 594
HY100N Interest repayments on mortgage 773 0 49 106 HY110N Income received by people aged
under 16 224 25 25 72
HY120N Regular taxes on wealth 26 1 409 1 526 2
HY130N Regular inter-household cash transfer paid
358 265 265 22
HY140N Tax on income and social contributions
1 555 1 697 1 983 59
Net income components at the personal level
PY010N Employee cash or near cash income
2 726 3 448 3 448 65
PY020N Non-Cash employee income 357 213 213 39 PY021N Company car 486 55 55 105 PY035N Contributions to individual private
pension plans 119 66 67 10
PY050N Cash benefits or losses from self-employment
2 608 254 254 255
PY070N Value of goods produced for own consumption
308 1 090 1 090 15
PY080N Pension from individual private plans
305 3 3 470
PY090N Unemployment benefits 397 310 311 36
PY100N Old-age benefits 1 216 1 925 1 925 20
PY110N Survivor` benefits 700 107 107 42
PY120N Sickness benefits 254 468 468 27
PY130N Disability benefits 777 236 236 30
PY140N Education-related allowances 248 101 102 40
1 Zeros are not included in calculations.
EU-SILC Final Quality Report Latvia 2005-2007
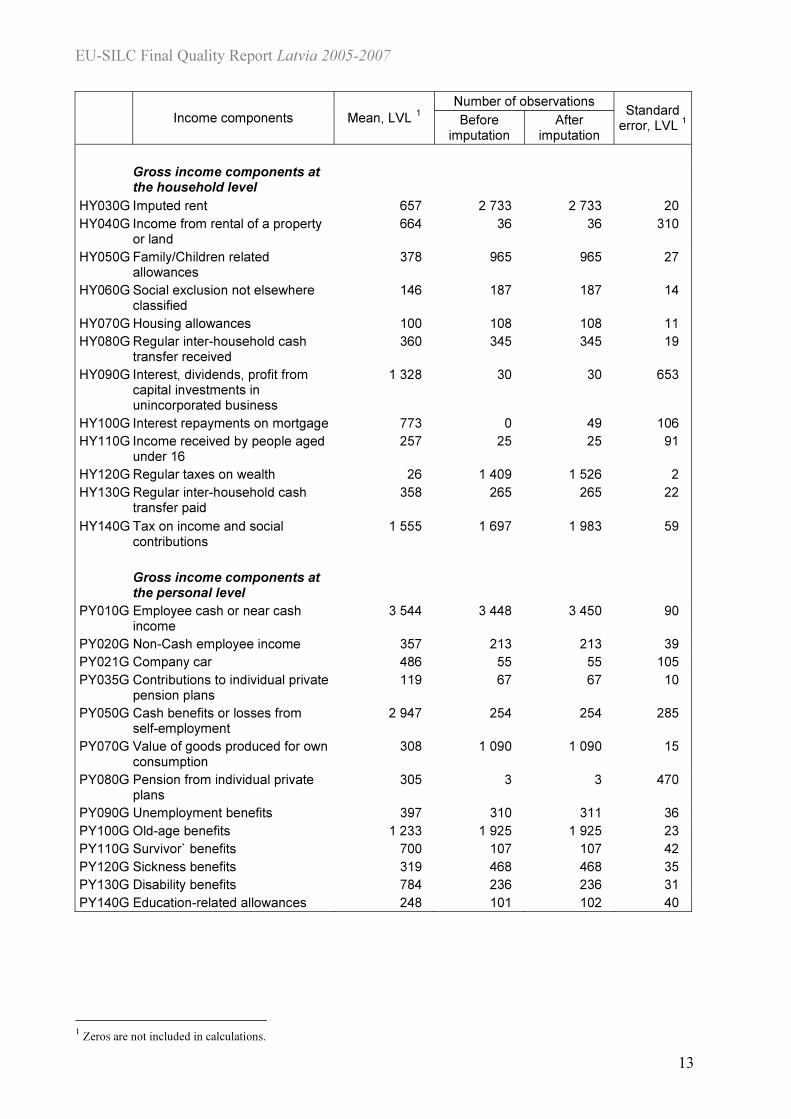
13
Number of observations
Income components Mean, LVL 3F
1
Before imputation
After imputation
Standard error, LVL
1
Gross income components at the household level
HY030G Imputed rent 657 2 733 2 733 20
HY040G Income from rental of a property or land
664 36 36 310
HY050G Family/Children related allowances
378 965 965 27
HY060G Social exclusion not elsewhere classified
146 187 187 14
HY070G Housing allowances 100 108 108 11
HY080G Regular inter-household cash transfer received
360 345 345 19
HY090G Interest, dividends, profit from capital investments in unincorporated business
1 328 30 30 653
HY100G Interest repayments on mortgage 773 0 49 106
HY110G Income received by people aged under 16
257 25 25 91
HY120G Regular taxes on wealth 26 1 409 1 526 2
HY130G Regular inter-household cash transfer paid
358 265 265 22
HY140G Tax on income and social contributions
1 555 1 697 1 983 59
Gross income components at the personal level
PY010G Employee cash or near cash income
3 544 3 448 3 450 90
PY020G Non-Cash employee income 357 213 213 39
PY021G Company car 486 55 55 105
PY035G Contributions to individual private pension plans
119 67 67 10
PY050G Cash benefits or losses from self-employment
2 947 254 254 285
PY070G Value of goods produced for own consumption
308 1 090 1 090 15
PY080G Pension from individual private plans
305 3 3 470
PY090G Unemployment benefits 397 310 311 36
PY100G Old-age benefits 1 233 1 925 1 925 23
PY110G Survivor` benefits 700 107 107 42
PY120G Sickness benefits 319 468 468 35
PY130G Disability benefits 784 236 236 31
PY140G Education-related allowances 248 101 102 40
1 Zeros are not included in calculations.

EU-SILC Final Quality Report Latvia 2005-2007
14
Table 2.5. Mean, number of observations (before and after imputations) and standard errors of the
equivalised disposable income 2004 (EU-SILC 2005), weighted
Number of observations Equivalised disposable income Mean,
LVL Before imputation After imputation
Standard error, LVL
By household size
1 household member 1 702 872 888 76
2 household members 2 178 2 122 2 134 76
3 household members 2 040 1 338 1 341 72
4 and more household members 1 914 1 045 1 045 71
By age groups
<25 1 949 883 885 59
25-34 2 477 629 629 110
35-44 2 499 887 897 104
45-54 1 909 903 912 67
55-64 1 885 764 774 64
65+ 1 535 1 311 1 311 60
By sex
Male 2 106 2 284 2 306 59
Female 1 941 3 093 3 102 40
Table 2.6. Mean, number of observations (before and after imputations) and standard errors of the
equivalised disposable income 2005 (EU-SILC 2006), weighted
Number of observations Equivalised disposable income
Mean, LVL Before imputation After imputation
Standard error, LVL
By household size
1 household member 1 938 1 050 1 067 87
2 household members 2 727 2 890 2 921 86
3 household members 2 650 1 775 1 775 82
4 and more household members 2 409 1 494 1 498 78
By age groups
<25 2 548 1 159 1 166 64
25-34 3 488 830 832 114
35-44 2 803 1 120 1 127 125
45-54 2 483 1 158 1 174 60
55-64 2 252 1 076 1 091 76
65+ 1 872 1 866 1 871 61
By sex
Male 2 648 3 009 3 039 66
Female 2 443 4 200 4 222 40

EU-SILC Final Quality Report Latvia 2005-2007
15
Table 2.7. Mean, number of observations (before and after imputations) and the standard errors of
the equivalised disposable income 2006 (EU-SILC 2007), weighted
Number of observations Equivalised disposable income
Mean, LVL Before imputation After imputation
Standard error, LVL
By household size
1 household member 2 290 909 920 120
2 household members 3 407 2 255 2 261 92
3 household members 3 379 1 488 1 488 95
4 and more household members 3 245 1 210 1 210 92
By age groups
<25 3 118 932 932 82
25-34 4 168 633 633 142
35-44 3 686 899 901 111
45-54 3 249 930 935 99
55-64 2 943 879 887 75
65+ 2 437 1 589 1 591 76
By sex
Male 3 395 2 408 2 419 67
Female 3 090 3 454 3 460 53
2.3. NON-SAMPLING ERRORS
2.3.1. Sampling frame and coverage errors
Two sampling frames were built for each sampling stage. At the first stage counting areas from
the list of the Population Census 2000 were used as a sampling frame. All territory of Latvia was
divided in small areas (smaller than NUTS4) during the Population Census 2000. The list
contained information about the number of households in each counting area.
At the second stage sampling frame was built from the Population Register, statistical register of
dwellings and statistical register of households.
The second stage sampling frame was built by using a copy of the Population Register. Both
statistical registers of dwellings and households were updated by using the Population Register.
2.3.2. Measurement and processing errors
The measurement errors can arise from the questionnaire (effects of the design, content and
wording), from the data collection method (effects of the modes of interviewing), from
interviewers (effects of the interviewer on the response to a question) and from respondents
(effects of the respondent on the interpretation of items). As it was impossible to avoid such
errors completely, several steps were taken by the CSB to reduce them as much as possible.

EU-SILC Final Quality Report Latvia 2005-2007
16
Like as in the EU-SILC 2005 operation 3 types of questionnaires were developed for the
EU-SILC 2006 and 2007 operations: the Household Register (to collect demographic
information about all household members), the Household Questionnaire (to collect all
information related to household – dwelling costs, housing conditions, income components
received at the household level etc.), the Personal Questionnaire (to collect all needed
information for each household member aged 16 and over in the previous calendar year) and the
Household List (an additional document to record all the necessary information about household
members for tracing purposes and for linkage with data from administrative registers). The
Blaise CAPI applications (since 2006) as well as the paper questionnaires of the EU-SILC
survey were available in Latvian and in Russian (the language of the largest ethnic minority in
Latvia).
The CSB interviewers carried out the fieldwork of the EU-SILC survey. For the field staff was
organised an intensive training session. The aims of the training were to introduce the fieldwork
stuff with methodology of the EU-SILC survey, to instruct interviewers for accurate fieldwork
execution of the survey. In 2006 a special emphasis was put on training to work with laptop
computers and using Blaise data entry application. Several tests (including a practical interview
to fill the EU-SILC questionnaires) were developed to check interviewers’ knowledge after the
training session.
To increase response rates several steps were made to introduce Latvian residents with the
EU-SILC survey before starting the fieldwork. A press release was prepared; several
publications were made in national and regional newspapers to provide publicity of the
EU-SILC survey. An introduction letter with a EU-SILC booklet were sent to selected
addresses to establish the first contact with a household before the interview.
Measurement errors were detected by analysing Interviewer’s reports, by organizing discussions
with interviewers after the fieldwork execution and by logical checks and verification of the
received data.
In 2006 and 2007 the processing system of the EU-SILC data became less time consuming as it
had been in 2005. It was related with the introduction of CAPI by using Blaise software. It has
to be noted that the year of 2006 was the first year when laptops were used in social surveys of
the CSB and the EU-SILC was one of the first surveys where the CAPI system was used for
carrying out the survey. Overall, the interviewers adopted computer skills very fast but in
several cases they needed additional explanations about marking answers by using CAPI.

EU-SILC Final Quality Report Latvia 2005-2007
17
Although laptops were given to all interviewers, a part of them made interviews by using paper
questionnaires.
A remarkable number of logical checks as well as a part of personal data from the previous year
of the survey were introduced into the program. Nevertheless, it has to be noted that the program
had one defect in 2006: time registration was not considered completely in cases when
household data were corrected, revised or supplemented for several times and in cases when the
interview was made by using PAPI. This problem was solved in 2007.
There were several factors, which might give the negative impact to the quality of the EU-SILC
2007 data:
- the EU-SILC 2007 Questionnaires contain the largest number of questions than ever
before. Questions about net income and about gross income were asked to
respondents. It was done in that way because a possibility to use administrative data
for making cross-sectional database of the EU-SILC 2007 before the fieldwork was
unclear.
- interviewers had a high workload;
- the interviewers’ stuff was changing very frequently, there were problems to train
newcomers;
- there was a chronic lack of interviewers, especially in Riga and neighboured areas;
- interviewers were hesitating to use the opportunity to agree on the meeting time by
phone;
- the training of interviewers lost its effectiveness if the fieldwork lasted till autumn (in
2007 the training was carried out in the middle of February).
The interviewers complained also about the length of the questionnaire covering too much
information. Several advantages of using laptops were mentioned: easier interviewing, many
mistakes were avoided, laptops increased the respect among respondents, interviewing with
laptops was more prestige and also more convenient. Disadvantages of laptop usage were:
recharging during the interviews was very difficult (respondents were not willing to allow
recharging PC); it was heavy to carry laptops all the time.
EU-SILC Final Quality Report Latvia 2005-2007
18
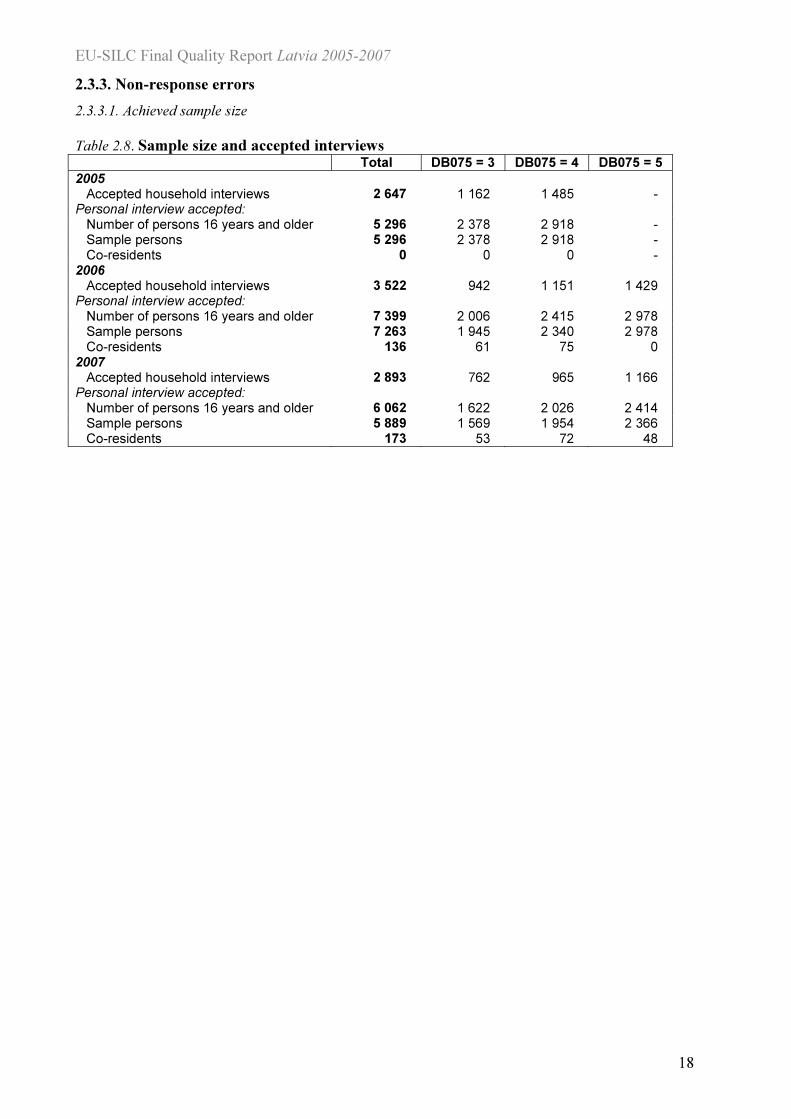
2.3.3. Non-response errors
2.3.3.1. Achieved sample size
Table 2.8. Sample size and accepted interviews Total DB075 = 3 DB075 = 4 DB075 = 5
2005 Accepted household interviews 2 647 1 162 1 485 - Personal interview accepted: Number of persons 16 years and older 5 296 2 378 2 918 - Sample persons 5 296 2 378 2 918 - Co-residents 0 0 0 - 2006 Accepted household interviews 3 522 942 1 151 1 429 Personal interview accepted: Number of persons 16 years and older 7 399 2 006 2 415 2 978 Sample persons 7 263 1 945 2 340 2 978 Co-residents 136 61 75 0 2007 Accepted household interviews 2 893 762 965 1 166 Personal interview accepted: Number of persons 16 years and older 6 062 1 622 2 026 2 414 Sample persons 5 889 1 569 1 954 2 366 Co-residents 173 53 72 48

EU-SILC Final Quality Report Latvia 2005-2007
19
2.3.3.2. Unit non-response
Table 2.9. Household response rate: Comparison of result codes between wave 2 and wave 1 (R3 & R4)
Sample outcome in wave 2 - 2006
DB130=11
DB135=1 DB135=2 DB120=22 DB130=22 DB130=23 DB130=24 DB130=21 DB120=21 NC DB110=10 DB130=23 Total
DB135=1 2 064 4 1 86 8 14 174 3 283 0 8 2 645 DB130=11
DB135=2 1 0 0 0 0 0 0 0 0 0 0 1
DB120=21 0
DB120=22 0
DB120=23 0
DB130=21 0
DB130=22 0
DB130=23 0
DB130=24 0
Sa
mp
le o
utc
om
e
in w
ave
1 -
2005
Total 2 065 4 1 86 8 14 174 3 283 0 8 2 646
DB110=8 28 0 0 0 0 0 2 0 NA NA 0 30
New
household
s in
wa
ve
2 -
2006
DB110=9 0 0 0 0 0 0 0 0 NA NA 0 0
Total 2 093 4 1 86 8 14 176 3 283 0 8 2 676
Wave response rate = 0.784
Refusal rate = 0.066
Non-contact and others = 0.147
Longitudinal follow-up rate = 0.826
Follow-up ratio = 0.836
Achieved sample size ratio = 0.791

EU-SILC Final Quality Report Latvia 2005-2007
20
Table 2.10. Household response rate: Comparison of result codes between wave 3 and wave 2 (R3, R4 & R5)
Sample outcome in wave 3 - 2007
DB130=11
DB135=1 DB135=2 DB120=22 DB130=22 DB130=23 DB130=24 DB130=21 DB120=21 NC DB110=10 DB130=23 Total
DB135=1 2 872 7 0 127 18 20 161 4 200 0 5 3 414 DB130=11
DB135=2 2 0 0 0 0 0 1 0 1 0 0 4
DB120=21 0 0 0 0 0 0 0 0 0 0 0 0
DB120=22 0 0 0 0 0 0 0 0 0 0 0 0
DB120=23 0 0 0 0 0 0 0 0 0 0 0 0
DB130=21 0 0 0 0 0 0 0 0 0 0 0 0
DB130=22 0 0 0 0 0 0 0 0 0 0 0 0
DB130=23 0 0 0 0 0 0 0 0 0 0 0 0
DB130=24 0 0 0 0 0 0 0 0 0 0 0 0
Sa
mp
le o
utc
om
e
in w
ave
2 -
2006
Total 2 874 7 0 127 18 20 162 4 201 0 5 3 418
DB110=8 19 0 0 2 1 1 3 0 NA NA 1 27
New
household
s in
wa
ve
3 -
2007
DB110=9 0 0 0 0 0 0 0 0 NA NA 0 0
Total 2 893 7 0 129 19 21 165 4 201 0 6 3 445
Wave response rate = 0.841
Refusal rate = 0.048
Non-contact and others = 0.068
Longitudinal follow-up rate = 0.892
Follow-up ratio = 0.899
Achieved sample size ratio = 0.847

EU-SILC Final Quality Report Latvia 2005-2007
21
Table 2.11. Personal Interview outcome in wave 2 – 2006 (R3 & R4)
2006
Not completed because of
RB250 = 11, 12, 13 RB250=21 RB250=22 RB250=23 RB250=31 RB250=32 RB250=33 HHnc Pn Pl
Total
1BSample persons forwarded from last wave
[1] RB110 = 1-2 4 180 0 0 23 33 6 0 4 242
[2] RB110 = 6 0
[3] RB110 = -1 0
[4] RB120 = 2 0
[5] RB120 = 3 0
[6] RB120 = 4 0
[7] DB135 = 2 or -1, or DB120 = 21-23 or -1, or DB130 = 21-24 or –1
0
[8] DB110 = 3-6 0
2BNew sample persons
[9] Reached age 16 103 0 0 0 1 0 0 0 0 0 104
[10] Sample additions 0 0 0 0 0 0 0 0
3BNon-sample persons 16+
[11] 2006 from 2005 0 0 0 0 0 0 0 0 0 0 0
Sample persons not forwarded from last wave (excluded died or not eligible according to tracing rules)
[13] From 2005 0
SUM OF ROWS:
1+3+6+7+9+10 4 283 0 0 23 34 6 0 0 0 0 4 346
1+3+6+7+9+10+13 4 283 0 0 23 34 6 0 0 0 0 4 346
1+3+6+7+9+10+11 4 283 0 0 23 34 6 0 0 0 0 4 346
Wave response rate of sample persons = 0.986
Longitudinal follow-up rate = 0.986
Rate (RB250=21) = -
Rate (RB250=22) = -
Rate (RB250=23) = 0.005
Rate (RB250=31) = 0.008
Rate (RB250=32) = 0.001
Rate (RB250=33) = -

EU-SILC Final Quality Report Latvia 2005-2007
22
Table 2.12. Personal Interview outcome in wave 2 – 2007 (R3, R4 & R5)
2007
Not completed because of
RB250 = 11, 12, 13 RB250=21 RB250=22 RB250=23 RB250=31 RB250=32 RB250=33 HHnc Pn Pl
Total
4BSample persons forwarded from last wave
[1] RB110 = 1-2 5 749 3 0 31 40 14 0 5 837
[2] RB110 = 6 66
[3] RB110 = -1 0
[4] RB120 = 2 3
[5] RB120 = 3 39
[6] RB120 = 4 66
[7] DB135 = 2 or -1, or DB120 = 21-23 or -1, or DB130 = 21-24 or –1
0
[8] DB110 = 3-6 0
5BNew sample persons
[9] Reached age 16 129 0 0 1 0 6 0 0 0 0 136
[10] Sample additions 0 0 0 0 0 0 0 0
6BNon-sample persons 16+
[11] 2007 from 2006 85 0 0 0 4 1 0 0 0 0 90
Sample persons not forwarded from last wave (excluded died or not eligible according to tracing rules)
[13] From 2006 0
SUM OF ROWS:
1+3+6+7+9+10 5 878 3 0 32 40 20 0 0 0 0 6 039
1+3+6+7+9+10+13 5 878 3 0 32 40 20 0 0 0 0 6 039
1+3+6+7+9+10+11 5 963 3 0 32 44 21 0 0 0 0 6 129
Wave response rate of sample persons = 0.973 Longitudinal follow-up rate = 0.973 Rate (RB250=21) = 0.000 Rate (RB250=22) = - Rate (RB250=23) = 0.005 Rate (RB250=31) = 0.007 Rate (RB250=32) = 0.003 Rate (RB250=33) = -

EU-SILC Final Quality Report Latvia 2005-2007
23
2.3.3.3. Distribution of households by household status (DB110), by the record of contact at the address
(DB120), by the household questionnaire result (DB130) and by the household interview acceptance (DB135)
Table 2.13.Distribution of households by DB110 DB110
Total 1 2 3 4 5 6 7 8 9 10 11
Total 3 618 0 0 0 0 0 0 0 0 3 618 0 0 2005
% 100 0 0 0 0 0 0 0 0 100.0 0 0 Total 5 043 2 270 95 4 21 24 0 234 30 2 365 0 0
2006 % 100 45.0 1.9 0.1 0.4 0.5 0 4.6 0.6 46.9 0 0 Total 3 566 3 156 63 8 7 27 3 156 40 0 0 106
2007 % 100 88.5 1.8 0.2 0.2 0.8 0.1 4.4 1.1 0 0 3.0
Table 2.14. Distribution of households by DB120 DB120
Total 11 21 22 23 Missing (-1)
Total 3 618 3 328 24 96 153 17 2005
% 100 92.0 0.7 2.7 4.2 0.5 Total 2 490 2 140 15 57 168 110
2006 % 100 85.9 0.6 2.3 6.7 4.4 Total 103 78 4 0 6 15
2007 % 100 75.7 3.9 0 5.8 14.6
Table 2.15. Distribution of households by DB130 DB130
Total 11 21 22 23 24 Missing (-1)
Total 3 328 2 648 306 334 19 21 0 2005
% 100 79.6 9.2 10.0 0.6 0.6 0 Total 4 410 3 526 454 350 29 48 3
2006 % 100 80.0 10.3 7.9 0.7 1.1 0.1 Total 3 234 2 900 165 129 19 21 0
2007 % 100 89.7 5.1 4.0 0.6 0.6 0
Table 2.16. Distribution of households by DB135 DB135
Total 1 2 Missing (-1)
Total 2 648 2 647 1 0 2005
% 100 100.0 0.0 0 Total 3 526 3 522 4 0
2006 % 100 99.9 0.1 0 Total 2 900 2 893 7 0
2007 % 100 99.8 0.2 0
2.3.3.4. Distribution of persons by membership status (RB110)
Table 2.17. Distribution of persons by membership status (RB110) Current household members No current household members
RB110 RB100
Total 1 2 3 4
RB120 = 2 to 4 6 7
Missing (-1)
Total 6 613 6 613 0 0 0 0 0 0 0 2005
% 100 100.0 0 0 0 0 0 0 0 Total 9 188 8 715 39 184 42 112 48 7 0
2006 % 100 94.9 0.4 2.0 0.5 1.2 0.5 0.1 0 Total 7 548 7 100 29 116 42 137 68 1 0
2007 % 100 94.1 0.4 1.5 0.6 1.8 0.9 0.0 0
Table 2.18. Distribution of persons moving out by RB120
RB110 = 5 RB120 = 1
Total This person is a current household member of the household in this wave
This person is not a current household member
RB120 = 2 RB120 = 3 RB120 = 4
Total 153 39 2 5 45 62 2006
% 100 25.5 1.3 3.3 29.4 40.5 Total 192 26 29 4 46 87
2007 % 100 13.5 15.1 2.1 24.0 45.3

EU-SILC Final Quality Report Latvia 2005-2007
24
2.3.3.5. Item non-response
The following tables provide an overview of non-response on the household and individual level. For every income component the total number of
households/persons having received the component and the breakdown with regard to the completeness of information are given.
Table 2.19 Information on item non-response on the household level in 2005
Households having received an amount
Full information Partial information Missing information
Total % Total % Total % Total %
HY020 Total disposable household income 2 629 99.3 2 332 88.7 292 11.1 5 0.2
HY022 Total disposable household income before social transfers other than old-age and survivor’s benefits
2 598 98.1 2 321 89.3 269 10.4 8 0.3
HY023 Total disposable household income before social transfers including old-age and survivor’s benefits
2 306 87.1 2 030 88.0 264 11.4 12 0.5
HY040N Income from rental of a property or land 42 1.6 41 97.6 0 0 1 2.4
HY050N Family/Children related allowances 838 31.7 838 100.0 0 0 0 0
HY060N Social exclusion not elsewhere classified 230 8.7 226 98.3 0 0 4 1.7
HY070N Housing allowances 124 4.7 115 92.7 0 0 9 7.3
HY080N Regular inter-household cash transfer received 305 11.5 289 94.8 0 0 16 5.2
HY090N Interest, dividends, profit from capital investments in unincorporated business
66 2.5 64 97.0 1 1.5 1 1.5
HY110N Income received by people aged under 16 31 1.2 31 100.0 0 0 0 0
HY120N Regular taxes on wealth 1 337 50.5 1 197 89.5 0 0 140 10.5
HY130N Regular inter-household cash transfer paid 283 10.7 272 96.1 0 0 11 3.9
HY145N Repayments/receipts for tax adjustment 309 11.7 307 99.4 1 0.3 1 0.3

EU-SILC Final Quality Report Latvia 2005-2007
25
Table 2.20. Information on item non-response on the household level in 2006
Households having received an amount
Full information Partial information Missing information
Total % Total % Total % Total %
HY020 Total disposable household income 3 499 99.3 1 645 47.0 1 843 52.7 11 0.3
HY022 Total disposable household income before social transfers other than old-age and survivor’s benefits
3 466 98.4 1 625 46.9 1 829 52.8 12 0.3
HY023 Total disposable household income before social transfers including old-age and survivor’s benefits
3 102 88.1 2 055 66.2 1 035 33.4 12 0.4
HY040N Income from rental of a property or land 44 1.2 44 100.0 0 0 0 0
HY050N Family/Children related allowances 1 111 31.5 1 105 99.5 6 0.5 0 0
HY060N Social exclusion not elsewhere classified 193 5.5 189 97.9 0 0 4 2.1
HY070N Housing allowances 160 4.5 158 98.8 0 0 2 1.3
HY080N Regular inter-household cash transfer received 395 11.2 390 98.7 0 0 5 1.3
HY090N Interest, dividends, profit from capital investments in unincorporated business
73 2.1 65 89.0 1 1.4 7 9.6
HY110N Income received by people aged under 16 54 1.5 54 100.0 0 0 0 0
HY120N Regular taxes on wealth 1 803 51.2 1 738 96.4 0 0 65 3.6
HY130N Regular inter-household cash transfer paid 385 10.9 375 97.4 0 0 10 2.6
HY145N Repayments/receipts for tax adjustment 395 11.2 388 98.2 2 0.5 5 1.3

EU-SILC Final Quality Report Latvia 2005-2007
26
Table 2.21. Information on item non-response on the household level in 2007
Households having received an amount
Full information Partial information Missing information
Total % Total % Total % Total %
HY010 Total household gross income 2 870 99.2 50 1.7 2 541 88.5 279 9.7
HY020 Total disposable household income 2 879 99.5 59 2.0 2 578 89.5 242 8.4
HY022 Total disposable household income before social transfers other than old-age and survivor’s benefits
2 856 98.7 1 0.0 2 602 91.1 253 8.9
HY023 Total disposable household income before social transfers including old-age and survivor’s benefits
2 560 88.5 1 0.0 2 371 92.6 188 7.3
HY040G Income from rental of a property or land 36 1.2 35 97.2 0 0 1 2.8
HY040N Income from rental of a property or land 36 1.2 35 97.2 0 0 1 2.8
HY050G Family/Children related allowances 965 33.4 400 41.5 351 36.4 214 22.2
HY050N Family/Children related allowances 965 33.4 400 41.5 351 36.4 214 22.2
HY060G Social exclusion not elsewhere classified 187 6.5 98 52.4 21 11.2 68 36.4
HY060N Social exclusion not elsewhere classified 187 6.5 98 52.4 21 11.2 68 36.4
HY070G Housing allowances 108 3.7 93 86.1 0 0 15 13.9
HY070N Housing allowances 108 3.7 93 86.1 0 0 15 13.9
HY080G Regular inter-household cash transfer received 345 11.9 309 89.6 0 0 36 10.4
HY080N Regular inter-household cash transfer received 345 11.9 309 89.6 0 0 36 10.4
HY090G Interest, dividends, profit from capital investments in unincorporated business
30 1.0 22 73.3 0 0 8 26.7
HY090N Interest, dividends, profit from capital investments in unincorporated business
30 1.0 22 73.3 0 0 8 26.7
HY100G Interest repayments on mortgage 49 1.7 0 0 0 0 49 100.0
HY100N Interest repayments on mortgage 49 1.7 0 0 0 0 49 100.0
HY110G Income received by people aged under 16 25 0.9 20 80.0 0 0 5 20.0
HY110N Income received by people aged under 16 25 0.9 20 80.0 0 0 5 20.0
HY120G Regular taxes on wealth 1 526 52.7 1 409 92.3 0 0 117 7.7
HY120N Regular taxes on wealth 1 526 52.7 1 409 92.3 0 0 117 7.7
HY130G Regular inter-household cash transfer paid 265 9.2 233 87.9 0 0 32 12.1
HY130N Regular inter-household cash transfer paid 265 9.2 233 87.9 0 0 32 12.1
HY140G Tax on income and social contributions 1 983 68.5 35 1.8 1 662 83.8 286 14.4
HY140N Tax on income and social contributions 1 983 68.5 35 1.8 1 662 83.8 286 14.4

EU-SILC Final Quality Report Latvia 2005-2007
27
Table 2.22. Information on item non-response on the individual level 2005
Persons having received an amount
Full information Partial information Missing information
Total % Total % Total % Total %
PY010N Employee cash or near cash income 2 709 50.1 2 672 98.6 5 0.2 32 1.2
PY021N Company car 73 1.3 0 0 0 0 73 100.0
PY035N Contributions to individual private pension plans 38 0.7 23 60.5 0 0 15 39.5
PY050N Cash benefits or losses from self-employment 282 5.2 270 95.7 0 0 12 4.3
PY080N Pension from individual private plans 0 0 0 0 0 0 0 0
PY090N Unemployment benefits 154 2.8 144 93.5 5 3.2 5 3.2
PY100N Old-age benefits 1 665 30.8 1 661 99.8 3 0.2 1 0.1
PY110N Survivor’s benefits 73 1.3 73 100.0 0 0 0 0
PY120N Sickness benefits 269 5.0 267 99.3 0 0 2 0.7
PY130N Disability benefits 175 3.2 175 100.0 0 0 0 0
PY140N Education-related allowances 124 2.3 124 100.0 0 0 0 0
Table 2.23. Information on item non-response on the individual level 2006
Persons having received an amount
Full information Partial information Missing information
Total % Total % Total % Total %
PY010N Employee cash or near cash income 3 731 50.4 3 662 98.2 16 0.4 53 1.4
PY021N Company car 59 0.8 0 0 0 0 59 100.0
PY035N Contributions to individual private pension plans 62 0.8 57 91.9 0 0 5 8.1
PY050N Cash benefits or losses from self-employment 353 4.8 343 97.2 0 0 10 2.8
PY080N Pension from individual private plans 0 0 0 0 0 0 0 0
PY090N Unemployment benefits 166 2.2 152 91.6 6 3.6 8 4.8
PY100N Old-age benefits 2 354 31.8 188 8.0 2 094 89.0 72 3.1
PY110N Survivor’s benefits 88 1.2 88 100.0 0 0 0 0
PY120N Sickness benefits 316 4.3 301 95.3 0 0 15 4.7
PY130N Disability benefits 251 3.4 249 99.2 0 0 2 0.8
PY140N Education-related allowances 136 1.8 134 98.5 0 0 2 1.5

EU-SILC Final Quality Report Latvia 2005-2007
28
Table 2.24. Information on item non-response on the individual level 2007
Persons having received an amount
Full information Partial information Missing information
Total % Total % Total % Total %
PY010G Employee cash or near cash income 3 452 56.9 115 3.3 2 630 76.2 707 20.5
PY010N Employee cash or near cash income 3 452 56.9 2 719 78.8 26 0.8 707 20.5
PY020G Non-Cash employee income 213 3.5 99 46.5 25 11.7 89 41.8
PY020N Non-Cash employee income 213 3.5 99 46.5 25 11.7 89 41.8
PY021G Company car 55 0.9 0 0 0 0 55 100.0
PY021N Company car 55 0.9 0 0 0 0 55 100.0
PY035G Contributions to individual private pension plans 67 1.1 58 86.6 0 0 9 13.4
PY035N Contributions to individual private pension plans 67 1.1 58 86.6 0 0 9 13.4
PY050G Cash benefits or losses from self-employment 254 4.2 210 82.7 22 8.7 22 8.7
PY050N Cash benefits or losses from self-employment 254 4.2 231 90.9 1 0.4 22 8.7
PY070G Value of goods produced for own consumption 1 090 18.0 0 0 0 0 1 090 100.0
PY070N Value of goods produced for own consumption 1 090 18.0 0 0 0 0 1 090 100.0
PY080G Pension from individual private plans 3 0.0 3 100.0 0 0 0 0
PY080N Pension from individual private plans 3 0.0 3 100.0 0 0 0 0
PY090G Unemployment benefits 311 5.1 14 4.5 69 22.2 228 73.3
PY090N Unemployment benefits 311 5.1 14 4.5 69 22.2 228 73.3
PY100G Old-age benefits 1 925 31.8 28 1.5 1 553 80.7 344 17.9
PY100N Old-age benefits 1 925 31.8 27 1.4 1 728 89.8 170 8.8
PY110G Survivor’s benefits 107 1.8 3 2.8 39 36.4 65 60.7
PY110N Survivor’s benefits 107 1.8 3 2.8 39 36.4 65 60.7
PY120G Sickness benefits 468 7.7 16 3.4 70 15.0 382 81.6
PY120N Sickness benefits 468 7.7 17 3.6 97 20.7 354 75.6
PY130G Disability benefits 236 3.9 15 6.4 137 58.1 84 35.6
PY130N Disability benefits 236 3.9 16 6.8 153 64.8 67 28.4
PY140G Education-related allowances 102 1.7 93 91.2 0 0 9 8.8
PY140N Education-related allowances 102 1.7 93 91.2 0 0 9 8.8

EU-SILC Final Quality Report Latvia 2005-2007
29
2.4. MODE OF DATA COLLECTION
In Latvia all persons aged 16 and over at the end of the income reference period were selected for a personal interview.
Table 2.25. Distribution of household members by RB250
HOUSEHOLD MEMBERS 16+ (RB245 = 1 to 3)
Total RB250=11 RB250=12 RB250=13 RB250=14 RB250=21 RB250=22 RB250=23 RB250=31 RB250=32 RB250=33
Total 5 515 5 408 0 0 0 8 1 33 64 1 0 2005
% 100 98.1 0 0 0 0.1 0.0 0.6 1.2 0.0 0
Total 7 508 6 527 0 872 0 0 0 36 59 14 0 2006
% 100 86.9 0 11.6 0 0 0 0.5 0.8 0.2 0
Total 6 165 0 0 6 062 0 3 0 33 45 22 0 2007
% 100 0 0 98.3 0 0.0 0 0.5 0.7 0.4 0
Table 2.26. Distribution of household members by RB250
SAMPLE PERSONS 16+ (RB245 = 1 to 3 and RB100 = 1)
Total RB250=11 RB250=12 RB250=13 RB250=14 RB250=21 RB250=22 RB250=23 RB250=31 RB250=32 RB250=33
Total 5 515 5 408 0 0 0 8 1 33 64 1 0 2005
% 100 98.1 0 0 0 0.1 0.0 0.6 1.2 0.0 0
Total 7 367 6 391 0 872 0 0 0 35 58 11 0 2006
% 100 86.8 0 11.8 0 0 0 0.5 0.8 0.1 0
Total 5 984 0 0 5889 0 3 0 32 40 20 0 2007
% 100 0 0 98.4 0 0.1 0 0.5 0.7 0.3 0

EU-SILC Final Quality Report Latvia 2005-2007
30
Table 2.27. Distribution of household members by RB250
CO-RESIDENTS 16+ (RB245 = 1 to 3 and RB100 = 2)
Total RB250=11 RB250=12 RB250=13 RB250=14 RB250=21 RB250=22 RB250=23 RB250=31 RB250=32 RB250=33
Total 0 0 0 0 0 0 0 0 0 0 0 2005
% 0 0 0 0 0 0 0 0 0 0 0
Total 141 136 0 0 0 0 0 1 1 3 0 2006
% 100 96.5 0 0 0 0 0 0.7 0.7 2.1 0
Total 181 0 0 173 0 0 0 1 5 2 0 2007
% 100 0 0 95.6 0 0 0 0.6 2.8 1.1 0
12BTable 2.28. Distribution of household members by RB260
HOUSEHOLD MEMBERS 16+ (RB245 = 1 to 3) and RB250 = 11 or 13
Total Rb260=1 RB260=2 RB260=3 RB260=4 RB260=5 Missing (-1)
Total 5 408 5 037 0 0 54 317 0 2005
% 100 93.1 0 0 1.0 5.9 0
Total 7 399 848 5 730 310 7 499 5 2006
% 100 11.5 77.4 4.2 0.1 6.7 0.1
Total 6 062 541 4 703 455 3 352 8 2007
% 100 8.9 77.6 7.5 0.0 5.8 0.1
13BTable 2.29. Distribution of household members by RB260
SAMPLE PERSONS 16+ (RB245 = 1 to 3 and RB100 = 1) and RB250 = 11 or 13
Total Rb260=1 RB260=2 RB260=3 RB260=4 RB260=5 Missing (-1)
Total 5 408 5 037 0 0 54 317 0 2005
% 100 93.1 0 0 1.0 5.9 0
Total 7 263 822 5 644 307 7 478 5 2006
% 100 11.3 77.7 4.2 0.1 6.6 0.1
Total 5 889 532 4 569 442 2 336 8 2007
% 100 9.0 77.6 7.5 0.0 5.7 0.1

EU-SILC Final Quality Report Latvia 2005-2007
31
14BTable 2.30. Distribution of household members by RB260
CO-RESIDENTS 16+ (RB245 = 1 to 3 and RB100 = 2) and RB250 = 11 or 13
Total Rb260=1 RB260=2 RB260=3 RB260=4 RB260=5 Missing (-1)
Total 0 0 0 0 0 0 0 2005
% 0 0 0 0 0 0 0
Total 136 26 86 3 0 21 0 2006
% 100 19.1 63.2 2.2 0 15.4 0
Total 173 9 134 13 1 16 0 2007
% 100 5.2 77.5 7.5 0.6 9.2 0
2.5. IMPUTATION PROCEDURE
Data were imputed on the household and personal level. A hot-deck method was used for both
imputations. The main principle of the hot deck method is to use the current data (donors) to
provide imputed values for records with missing values. Homogenous groups for households and
persons were made. Households and items on the personal level were imputed as a random unit of
filled units from the group.
Households were grouped by the type of dwelling, year of construction of the building and the
number of rooms available to the household.
Grouping on the individual level for the 2005 and 2007 surveys was by the following variables: sex,
marital status, main activity status during the income reference period; for the 2006 survey: sex,
living district.
2.6. IMPUTED RENT
Imputed rent (HY030G/HY030N) for 2005 and 2006 was not calculated as it was mandatory only
from 2007.
Using the experience gained from the calculation of imputed rent for the Household Budget Survey
(HBS) it was decided to use a log-linear regression model for the calculation of imputed rent also
for the EU-SILC 2007. The following variables were used for the calculation of imputed rent:
- tenure discount;
- urban / rural area;
- region;
- area of dwelling in square metres.

EU-SILC Final Quality Report Latvia 2005-2007
32
2.7. COMPANY CARS
According to the Latvian situation a method based on a system analysis model was chosen for the
calculation of income from the use company car for personal purposes. Components for calculating
monetary value of this non-cash employee income were included in the questionnaires and collected
directly from respondents: the class of car, the year of the car make, the total amount of kilometres
driven by the company car in the previous calendar year, the annual amount of kilometres driven by
the vehicle for private use, the occupation of the company car user, coverage of the car related costs
made by the employer: fuel, technical inspection of the car, tire purchase (i.e. whether the employer
disbursed bills for fuel purchasing, car’s technical inspection, tire purchase), restrictions of the use
of the company car (i.e. whether the employer created restrictions to employees for the use of the
company car for personal purposes).
EU-SILC Final Quality Report Latvia 2005-2007
33
3. COMPARABILITY
3.1. BASIC CONCEPTS AND DEFINITIONS
Overall, there are no differences between national interpretations of the EU-SILC basic definitions
and concepts and common standards set up in Commission regulations and doc. EU-SILC 065.
There were no changes in basic concepts and definitions from the first wave.
3.2. COMPONENTS OF INCOME
Classification of income components in national EU-SILC survey was made according to the
description of doc. EU-SILC 065 with the exception of income from self-employment (see 3.2.6).
As Latvia had a derogation to collect gross income components from 2007, only net income
components were collected in 2005 and 2006.
3.2.1. Differences between the national definitions and standard EU-SILC definitions, and an
assessment of the differences mentioned
3.2.1.1. Total household gross income
As Latvia had a derogation to collect gross income components from 2007, the total household
gross income was not recorded in 2005 and 2006. There were no divergences from common
standards for 2007.
3.2.1.2. Total disposable household income
There were no divergences from common standards.
3.2.1.3. Total disposable household income, before social transfers other than old-age and survivor’s
benefits
There were no divergences from common standards, but, as we provided income components of
gross series for the first time in 2007, the total disposable household income, before social transfers
other than old-age and survivor’s benefits was calculated from variable HY020 using only net
income components (as it was done before 2007).
3.2.1.4. Total disposable household income, before social transfers including old age and survivor’s
benefits
There were no divergences from common standards, but, as we provided income components of
gross series for the first time in 2007, the total disposable household income, before social transfers

EU-SILC Final Quality Report Latvia 2005-2007
34
including old age and survivor’s benefits was calculated from variable HY020 using only net
income components (as it was done before 2007).
3.2.1.5. Imputed rent
Imputed rent (HY030G/HY030N) for 2005 and 2006 was not calculated as it was mandatory only
from 2007.
Using the experience gained from the calculation of imputed rent for the HBS it was decided to use
a log-linear regression model for the calculation of imputed rent also for the EU-SILC 2007. The
following variables were used for the calculation of imputed rent:
- tenure discount;
- urban / rural area;
- region;
- area of dwelling in square metres.
3.2.1.6. Income from rental property and land
There were no divergences from common standards.
3.2.1.7. Family/children-related allowances
There were no divergences from common standards.
3.2.1.8. Social exclusion payments not elsewhere classified
There were no divergences from common standards.
3.2.1.9. Housing allowances
There were no divergences from common standards.
3.2.1.10. Regular inter-household cash transfers received
There were no divergences from common standards.
3.2.1.11. Interest, dividends, profit from capital investments in unincorporated business
There were no divergences from common standards.
3.2.1.12. Interest paid on mortgages
Interest paid on mortgages for 2005 and 2006 was not calculated as it was mandatory only from
2007.

EU-SILC Final Quality Report Latvia 2005-2007
35
There were no divergences from common standards. Interest paid on mortgages was not asked
directly to the household respondent, but it was calculated from the answers to the questions about:
- the average payment per month;
- the average mortgage interest rate;
- the year, when the dwelling was purchased;
- duration of mortgage loan.
3.2.1.13. Income received by people aged under 16
There were no divergences from common standards. Basically there were included wages and
salaries received during holidays or out of school time.
3.2.1.14. Regular taxes on wealth
There were no divergences from common standards. Taxes on land and real estate were included in
this variable.
3.2.1.15. Regular inter-household transfers paid
There were no divergences from common standards.
3.2.1.16. Tax on income and social contributions
There were no divergences from common standards.
3.2.1.17. Repayments/receipts for tax adjustments
There were no divergences from common standards. From 2007 repayments/receipts for tax
adjustments were included in variable HY140.
3.2.1.18. Cash or near-cash employee income
There were no divergences from common standards.
3.2.1.19. Non-cash employee income
There were no divergences from common standards.
Only non-cash employee income from the use of the company car for personal purposes was
collected in 2005 and 2006. According to the Latvian situation a method based on a system analysis
model was chosen for the calculation of employee non-cash income from the use of the company
car for personal purposes. Components for calculating monetary value of this non-cash employee
income were included in the questionnaires and collected directly from respondents: the class of the
car, the year of the car make, the total amount of kilometres driven by the company car in the

EU-SILC Final Quality Report Latvia 2005-2007
36
previous calendar year, the annual amount of kilometres driven by the vehicle for private use, the
occupation of the company car user, coverage of the car related costs made by the employer: fuel,
technical inspection of the car, tire purchase (i.e. whether the employer paid bills for fuel
purchasing, technical inspection of the car, tire purchase), restrictions of the use of the company car
(i.e. whether the employer created restrictions to employees for the use of the company car for
personal purposes).
3.2.1.20. Employers’ social contributions
The value was not recorded for 2005 and 2006, as it was mandatory to collect this variable only
from 2007. There were no divergences from common standards for 2007.
3.2.1.21. Cash profits or losses from self-employment (including royalties)
For 2005 income (or losses) from self-employment were collected in 2 components: 1) income from
agricultural production and 2) income from the rest self-employment (except income from
agricultural production).
Income from agricultural self-employment was collected in the same way as in the HBS. A
household member responsible for agricultural production was asked to calculate all income
components and expenditures the household had had during the income reference period. Thus, all
self-employment income from agricultural production was counted to the responsible household
member and the amount of self-employment income was agricultural profit minus expenditures
related to the production. There were cases when expenditures had been greater than the profit and
this resulted in minus values.
The second income component (from the rest self-employment except agricultural production) was
asked to each household member aged 16 years and more in the Personal Questionnaire.
Respondents were asked to tell the amount of income they had gained from self-employment for
their own use during the income reference period.
For 2006 the net income and losses from self-employment were collected in 2 components: 1) net
income or losses from agricultural production and 2) net income or losses from the rest
self-employment activities (except income from agricultural production). Both net income
components were asked to each household member in the age of 16 years and over (in the income
reference period) in the Personal Questionnaire. Respondents were asked to tell the net amount of
self-employment income they had had for personal use (incl. making private savings) or losses from

EU-SILC Final Quality Report Latvia 2005-2007
37
self-employment activities during the income reference period. There were additional questions
about the net self-employment income from agricultural production included in the Household
Questionnaire. In the Household Questionnaire income from agricultural self-employment was
collected in the same way as in the HBS. A household member responsible for agricultural
production was asked to calculate all income components and expenditures related to agricultural
production the household had had during the income reference period. Thus, all self-employment
income from agricultural production was counted to the responsible household member and the
amount of self-employment income was agricultural profit minus expenditures related to the
production.
Comparison results of the collected agricultural self-employment income values in the Personal
Questionnaires from all household members eligible for a personal interview and values collected in
the Household Questionnaire from the household respondent responsible for the agricultural
production did not show significant differences. As the income values collected in the Personal
Questionnaires corresponded to the common EU-SILC methodology then it was decided to use
values collected in the Personal Questionnaires.
Only net income components were collected in 2005 and 2006. The gross value was not collected,
as it was mandatory to collect this variable from 2007.
For 2007 the net income and losses from self-employment were collected in 2 components: 1) net
income or losses from agricultural production and 2) net income or losses from the rest
self-employment activities (except income from agricultural production). Both net income
components were asked to each household member in the age of 16 years and over (in the income
reference period) in the Personal Questionnaire. Respondents were asked to tell the net amount of
self-employment income they had had for personal use (incl. making private savings) or losses from
self-employment activities during the income reference period. There were also questions about the
paid taxes to evaluate the gross income.
3.2.1.22. Value of goods produced for own consumption
The value was not recorded in 2005 and 2006. This component was mandatory from 2007.
The value of goods produced for own consumption for 2007 was calculated using the information
from the HBS. A household member responsible for agricultural production was asked to tick from
the list of products those, which the household had produced for own consumption during the
income reference period. This question was asked only to those households, which had used land

EU-SILC Final Quality Report Latvia 2005-2007
38
for certain types of agricultural activities. Depending on the size of the household and consumed
products, the value of goods produced for own consumption was calculated. The value of goods
produced for own consumption by the household as a whole was recorded to the responsible
household member.
3.2.1.23. Unemployment benefits
There were no divergences from common standards. Only the net income component was collected
in 2005 and 2006.
3.2.1.24. Old-age benefits
There were no divergences from common standards. Only the net old-age benefit components were
collected in 2005 and 2006.
3.2.1.25. Survivors’ benefits
There were no divergences from common standards. Only net survivors’ benefits were collected in
2005 and 2006.
3.2.1.26. Sickness benefits
There were no divergences from common standards. Only net sickness benefits were collected in
2005 and 2006.
3.2.1.27. Disability benefits
There were no divergences from common standards. Only net disability benefits were collected in
2005 and 2006.
3.2.1.28. Education related benefits
There were no divergences from common standards. Only net education related benefits were
collected in 2005 and 2006.
3.2.2. The source of collecting income variables
Interviews were used for collecting income variables. The EU-SILC income target variables were
split into more differentiated sub-components. The sub-components were defined according to the
Latvian regulations and benefit system. These components were surveyed in the questionnaire.
Household income variables (such as imputed rent, income from rental property and land, family/
children related allowances, housing allowances etc.) were collected from a household respondent,

EU-SILC Final Quality Report Latvia 2005-2007
39
which was responsible for issues related to dwelling and the whole household. An exception was
income from interest, dividends/ profit from capital investment. This variable together with all
personal income variables (such as employee income, self-employment income, education related
allowances, unemployment benefits etc.) were collected from each household member eligible for a
personal interview.
Since 2006 Latvia started to use administrative records from the State Social Insurance Agency
(SSIA) in the EU-SILC survey. These data were used for old-age benefits. Initially old-age benefits
were collected from personal interviews. After the fieldwork the CSB received data from the SSIA.
Both data sources (data from respondents and data from the SSIA) were checked and validated. In
the result it was decided to use data from the SSIA in the EU-SILC 2006.
After the EU-SILC 2007 fieldwork the CSB of Latvia received the data from the SSIA and data
from the State Revenue Service (SRS) were also available. Both data sources (data from
respondents and data from the SSIA and the SRS) were checked and validated. In the result it was
decided to use data from the SSIA and to some extent from the SRS in the EU-SILC. It was decided
to substitute pensions and state social benefits collected during the EU-SILC 2007 (both net and
gross income components were collected) with data from the SSIA, but there had been still some
minor benefits administrated by local municipalities or pensions paid by other countries and service
pensions, which were not administrated by the SSIA, etc. Thus imputation factor to a large extent
shows the difference between the collected data and data from the administrative registers (recorded
value in the data files).
The exception was net employee cash or near cash income (PY010N), which was available from the
SRS as well, but it was decided to use information from the questionnaires. Gross employee cash or
near cash income (PY010G) was obtained by counting up the net employee cash or near cash
income from the questionnaires with paid taxes on income and social contribution from the SRS.
The obtained gross employee cash or near cash income was compared with the gross employee cash
or near cash income from the questionnaires, thus obtaining an imputation factor, which was
recorded in PY010G_F.
3.2.3. The form in which income target variables at component level were obtained
Only net income amounts (after deducting income taxes and social insurance contributions) were
collected in 2005 and 2006. Both (net and gross) income components were collected in 2007.
3.2.4. The method used for obtaining income target variables in required form
See 3.2.2.

EU-SILC Final Quality Report Latvia 2005-2007
40
3.3. TRACING RULES
For the second and the third waves tracing rules were applied for a longitudinal component
according to the description of the document EU-SILC 065. To identify the residence of a person
moving from one address to another address, the information from the Household List (an
additional document to record personal data about the household member for tracing purposes) of
the previous wave and the Population Register was used.
There were no divergences from common standards

EU-SILC Final Quality Report Latvia 2005-2007
41
4. COHERENCE
In this section will be compared the EU-SILC data with various external data sources: the
Household Budget Survey (HBS), the Labour Force Survey (LFS), wage statistics and social
protection statistics.
The HBS is a continuous survey of households, which has been carried out since 1995 (comparable
data since 2002). The annual net sample size is approximately 4 thousand households. The HBS is
designed to collect information on consumption expenditure of households (information on income
is collected to divide households in quintile groups). The HBS was the source of Laeken indicators
until introduction of the EU-SILC (in 2005).
The LFS is a continuous survey, which has been carried out according to a common EU
methodology since 1995. The annual sample size is about 30 thousand person aged 15 - 74. The
LFS is the main source for labour market information.
4.1. COMPARISON OF INCOME TARGET VARIABLES AND THE NUMBER OF PERSONS WHO RECEIVE
INCOME FROM EACH ‘INCOME COMPONENT’ WITH EXTERNAL SOURCES
In the EU-SILC the average monthly employee cash or near cash income (PY010) in 2006 was
260 LVL (in 2005 – 214 LVL, in 2004 – 169 LVL). In wage statistics this figure was lower –
216 LVL (in 2005 – 176 LVL, in 2004 – 150 LVL). Data of the EU-SILC survey were calculated
for a respondent, who had received employee cash or near cash income (PY010) and who had been
working as an employee at least one month during the income reference period (PL210). The
acquired results show that the EU-SILC data by 20 % exceeded enterprise statistical data on the
average labour income amount in 2006 (by 22% in 2005, by 13% in 2004). The higher estimates
from the EU-SILC are due to the fact that in the EU-SILC average wages and salaries are calculated
for persons receiving income, whereas in wage statistics the unit of enumeration is the job. Thus, in
the EU-SILC all employee’s income is counted into one variable (income from the main job,
second, third etc.), whereas in wage statistics, wages from the second, third etc. job are counted
separately. It should be also taken into account that wage statistics is based on information provided
by employers and in certain cases it corresponds to a part of wages from which have been deducted
taxes (information about informal employee income might be left behind).
Tables 4.1.-4.3. present the number of persons receiving income components in the EU-SILC, the
HBS and in additional external sources. It should be taken into account that in the HBS a part of
income components are obtained only at the household level and for this reason comparisons are

EU-SILC Final Quality Report Latvia 2005-2007
42
made only among those income components, which are obtained in the same way as in the
EU-SILC. Besides, definitions of income components can vary between sources and for that reason
only the components for which sufficiently comparable definitions are presented in the tables
below.
Table 4.1. Number of persons receiving several income components in 2004 (in thousands)
8BEU-SILC target variable EU-SILC HBS Other
sources
Employee cash or near cash income (PY010) 991.8 939.0 877.81
Old-age benefits (PY100) 508.6 492.7 481.72
Survivor’s benefits (PY110) 21.1 23.4 28.82
Disability benefits (PY130) 64.1 - 74.62
1 Wage statistics 2 At the end of year. Social protection statistics (the State Social Insurance Agency) data
Table 4.2. Number of persons receiving several income components in 2005 (in thousands)
9BEU-SILC target variable EU-SILC HBS Other
sources
Employee cash or near cash income (PY010) 1 045.7 969.3 906.61
Old-age benefits (PY100) 513.4 492.8 475.62
Survivor’s benefits (PY110) 16.3 19.6 27.62
Disability benefits (PY130) 64.7 66.7 73.62
1 Wage statistics 2 At the end of year. Social protection statistics (the State Social Insurance Agency) data
Table 4.3. Number of persons receiving several income components in 2006 (in thousands)
10BEU-SILC target variable EU-SILC HBS Other
sources
Employee cash or near cash income (PY010) 1 176.3 995.0 949.01
Old-age benefits (PY100) 495.5 478.1 472.12
Survivor’s benefits (PY110) 24.8 21.6 25.92
Disability benefits (PY130) 71.3 62.4 66.72
1 Wage statistics 2 At the end of year. Social protection statistics (the State Social Insurance Agency) data
In the EU-SILC the number of people receiving employee income is higher than in wage statistics.
It is not unexpected that unofficial work relationships are not included in wage statistics.