Seasonal Encoding by the Circadian Pacemaker of the SCN
6
Current Biology 17, 468–473, March 6, 2007 ª2007 Elsevier Ltd All rights reserved DOI 10.1016/j.cub.2007.01.048 Report Seasonal Encoding by the Circadian Pacemaker of the SCN Henk Tjebbe VanderLeest, 1 Thijs Houben, 1 Stephan Michel, 1 Tom Deboer, 1 Henk Albus, 1,2 Mariska J. Vansteensel, 1 Gene D. Block, 2 and Johanna H. Meijer 1, * 1 Department of Molecular Cell Biology Lab for Neurophysiology Leiden University Medical Center Postal Zone S5-P P.O. Box 9600 2300 RC Leiden The Netherlands 2 Center for Biological Timing Department of Biology University of Virginia Charlottesville, Virginia 22903 Summary The circadian pacemaker of the suprachiasmatic nu- cleus (SCN) functions as a seasonal clock through its ability to encode day length [1–6]. To investigate the mechanism by which SCN neurons code for day length, we housed mice under long (LD 16:8) and short (LD 8:16) photoperiods. Electrophysiological record- ings of multiunit activity (MUA) in the SCN of freely moving mice revealed broad activity profiles in long days and compressed activity profiles in short days. The patterns remained consistent after release of the mice in constant darkness. Recordings of MUA in acutely prepared hypothalamic slices showed similar differences between the SCN electrical activity pat- terns in vitro in long and short days. In vitro recordings of neuronal subpopulations revealed that the width of the MUA activity profiles was determined by the distri- bution of phases of contributing units within the SCN. The subpopulation patterns displayed a significantly broader distribution in long days than in short days. Long-term recordings of single-unit activity revealed short durations of elevated activity in both short and long days (3.48 and 3.85 hr, respectively). The data indicate that coding for day length involves plasticity within SCN neuronal networks in which the phase dis- tribution of oscillating neurons carries information on the photoperiod’s duration. Results and Discussion In Vivo Multiunit Recordings Exposure to long and short photoperiods had marked ef- fects on the circadian pattern of wheel-running activity in mice (Figure S1 in the Supplemental Data available on- line). In short days, animals showed long durations of nocturnal activity, whereas in long days, animals exhibited short intervals of activity. These data agree with previous reports on the wheel-running activity of mice under long or short photoperiods [7, 8]. In vivo mul- tiunit recordings from SCN neurons of freely moving mice in long and short days revealed high discharge rates during the day and low levels during the night, for both photoperiods (Figures 1A and 1B). During exposure to light-dark (LD) cycles, the mean duration of elevated electrical activity, calculated as the width of the peak at half of its amplitude, was 10.48 6 0.61 hr (n = 4) in short days and 14.88 6 1.13 hr (n = 4) in long days. Peak times during the last two days in LD occurred at ‘‘external time’’ (ExT) 11.45 6 0.27 hr (n = 4) for the short-day group and at ExT 15.68 6 0.65 hr (n = 4) for the long-day group (ExT 12 = midday). In both photoperiods, these peaks occurred 4–5 hr before lights off. Half-maximum values were reached 5.89 6 0.31 hr (n = 4) and 10.29 6 1.34 hr (n = 4) before the peak time and 4.60 6 0.28 hr (n = 4) and 4.60 6 0.57 hr (n = 4) after the peak time in short and long days, respectively. The results show that the expan- sion in electrical activity is asymmetrical with respect to the peak times, and lengthening in long days occurs during the rising phase of the electrical activity pattern. After the mice were released in constant darkness, the peak widths remained significantly different and stable for at least 4 days of recording, without evidence of ad- aptation (Figure 1C; two-way ANOVA, p < 0.0001, with post-hoc t tests). The sustained waveform generated by the SCN (Figure 1D) indicates that photoperiodic in- formation is present in the electrical output signal of the SCN in vivo. In Vitro Multiunit and Subpopulation Recordings To investigate whether changes in circadian waveform are caused by a change in phase relationships among oscillating neurons, or due to photoperiod-induced changes in the neuronal activity pattern of individual cells, we explored the multiunit, subpopulation, and single-unit activities of SCN cells in vitro. Exposure of animals to short or long days resulted in narrow or broad multiunit discharge patterns in slices, respectively (Figure S2). These findings are consistent with previous in vitro recordings in rats and hamsters [1, 3] and with in situ measurements in the SCN of rat, hamster, and sheep [2, 4, 5, 9–15]. The maximum frequency of electri- cal-impulse activity occurred at approximately ExT 12 for both photoperiods. Peak time occurred at ExT 11.09 6 0.24 hr (n = 19) for the short-day group and at ExT 12.47 6 0.21 hr (n = 24) for the long-day group. The peak times were not different between the ventral and dorsal SCN (Table S1) or between anterior and pos- terior SCN (Table S2); thus, this finding contrasts with the anterior-to-posterior differentiation observed in situ in the hamster SCN for clock-related genes per2, rev-erba, and dbp [16]. The peak width of multiunit activity showed significant differences between short days (8.14 6 0.33 hr, n = 20) and long days (11.76 6 0.37 hr, n = 22, t test, p < 0.0001). The difference in peak width between short *Correspondence: [email protected]
Transcript of Seasonal Encoding by the Circadian Pacemaker of the SCN
Current Biology 17, 468–473, March 6, 2007 ª2007 Elsevier Ltd All rights reserved DOI 10.1016/j.cub.2007.01.048
ReportSeasonal Encodingby the Circadian Pacemaker of the SCN
Henk Tjebbe VanderLeest,1 Thijs Houben,1
Stephan Michel,1 Tom Deboer,1 Henk Albus,1,2
Mariska J. Vansteensel,1 Gene D. Block,2
and Johanna H. Meijer1,*1Department of Molecular Cell BiologyLab for NeurophysiologyLeiden University Medical CenterPostal Zone S5-PP.O. Box 96002300 RC LeidenThe Netherlands2Center for Biological TimingDepartment of BiologyUniversity of VirginiaCharlottesville, Virginia 22903
Summary
The circadian pacemaker of the suprachiasmatic nu-cleus (SCN) functions as a seasonal clock through
its ability to encode day length [1–6]. To investigatethe mechanism by which SCN neurons code for day
length, we housed mice under long (LD 16:8) and short(LD 8:16) photoperiods. Electrophysiological record-
ings of multiunit activity (MUA) in the SCN of freely
moving mice revealed broad activity profiles in longdays and compressed activity profiles in short days.
The patterns remained consistent after release of themice in constant darkness. Recordings of MUA in
acutely prepared hypothalamic slices showed similardifferences between the SCN electrical activity pat-
terns in vitro in long and short days. In vitro recordingsof neuronal subpopulations revealed that the width of
the MUA activity profiles was determined by the distri-bution of phases of contributing units within the SCN.
The subpopulation patterns displayed a significantlybroader distribution in long days than in short days.
Long-term recordings of single-unit activity revealedshort durations of elevated activity in both short and
long days (3.48 and 3.85 hr, respectively). The dataindicate that coding for day length involves plasticity
within SCN neuronal networks in which the phase dis-tribution of oscillating neurons carries information on
the photoperiod’s duration.
Results and Discussion
In Vivo Multiunit RecordingsExposure to long and short photoperiods had marked ef-fects on the circadian pattern of wheel-running activity inmice (Figure S1 in the Supplemental Data available on-line). In short days, animals showed long durations ofnocturnal activity, whereas in long days, animalsexhibited short intervals of activity. These data agree
*Correspondence: [email protected]
with previous reports on the wheel-running activity ofmice under long or short photoperiods [7, 8]. In vivo mul-tiunit recordings from SCN neurons of freely movingmice in long and short days revealed high dischargerates during the day and low levels during the night, forboth photoperiods (Figures 1A and 1B). During exposureto light-dark (LD) cycles, the mean duration of elevatedelectrical activity, calculated as the width of the peak athalf of its amplitude, was 10.48 6 0.61 hr (n = 4) in shortdays and 14.88 6 1.13 hr (n = 4) in long days. Peak timesduring the last two days in LD occurred at ‘‘external time’’(ExT) 11.45 6 0.27 hr (n = 4) for the short-day group and atExT 15.68 6 0.65 hr (n = 4) for the long-day group (ExT12= midday). Inbothphotoperiods, these peaks occurred4–5 hr before lights off. Half-maximum values werereached 5.89 6 0.31 hr (n = 4) and 10.29 6 1.34 hr (n =4) before the peak time and 4.60 6 0.28 hr (n = 4) and4.60 6 0.57 hr (n = 4) after the peak time in short andlong days, respectively. The results show that the expan-sion in electrical activity is asymmetrical with respectto the peak times, and lengthening in long days occursduring the rising phase of the electrical activity pattern.
After the mice were released in constant darkness, thepeak widths remained significantly different and stablefor at least 4 days of recording, without evidence of ad-aptation (Figure 1C; two-way ANOVA, p < 0.0001, withpost-hoc t tests). The sustained waveform generatedby the SCN (Figure 1D) indicates that photoperiodic in-formation is present in the electrical output signal ofthe SCN in vivo.
In Vitro Multiunit and Subpopulation RecordingsTo investigate whether changes in circadian waveformare caused by a change in phase relationships amongoscillating neurons, or due to photoperiod-inducedchanges in the neuronal activity pattern of individualcells, we explored the multiunit, subpopulation, andsingle-unit activities of SCN cells in vitro. Exposure ofanimals to short or long days resulted in narrow or broadmultiunit discharge patterns in slices, respectively(Figure S2). These findings are consistent with previousin vitro recordings in rats and hamsters [1, 3] and within situ measurements in the SCN of rat, hamster, andsheep [2, 4, 5, 9–15]. The maximum frequency of electri-cal-impulse activity occurred at approximately ExT 12for both photoperiods. Peak time occurred at ExT11.09 6 0.24 hr (n = 19) for the short-day group and atExT 12.47 6 0.21 hr (n = 24) for the long-day group.The peak times were not different between the ventraland dorsal SCN (Table S1) or between anterior and pos-terior SCN (Table S2); thus, this finding contrasts withthe anterior-to-posterior differentiation observed insitu in the hamster SCN for clock-related genes per2,rev-erba, and dbp [16].
The peak width of multiunit activity showed significantdifferences between short days (8.14 6 0.33 hr, n = 20)and long days (11.76 6 0.37 hr, n = 22, t test, p <0.0001). The difference in peak width between short

Seasonal Encoding by the SCN Pacemaker469
Figure 1. SCN Neuronal Activity Measured
In Vivo after Entrainment to Short- or Long-
Day Photoperiods
(A and B) Two typical examples of recordings
showing the last two days of multiunit electri-
cal activity of freely moving mice in an LD
8:16 hr (A) or LD 16:8 hr (B) photoperiod and
the first 4 subsequent days in DD (dark indi-
cated by gray background). Individual data
points represent 10 s epochs. Smoothed
data are indicated by a white line. Drinking
activity is shown at the bottom of each plot.
(C) Mean width of the peak, measured at
half-maximum electrical activity (6SEM) dur-
ing LD and the first 4 days in DD. Gray bars
represent data from animals kept in short-
day photoperiod, and black bars represent
data from long-day animals (short day
length, n = 4, 4, 4, 4, and 2 on the consecu-
tive days, and long day length, n = 4, 5, 5,
5, and 4 on the consecutive days). Asterisks
indicate a significant peak width difference
between the recordings (t test, *p < 0.05,
**p < 0.001).
(D) Smoothed waveforms of the recorded
MUA on the first day in constant darkness.
The x axis represents extrapolated external
time (ExT 0 = midnight, ExT 12 = midday).
The top bar indicates the prior light-dark cycle, and the gray coloring represents lights-on. Data are normalized by setting the first trough value
to 0 and the first peak value to 1. Gray lines represent individual recordings, and black lines are the averaged waveform (short day length n = 4,
long day length n = 5).
and long days in vitro (4 hr) was consistent with the dif-ference obtained in vivo (5 hr). This indicates that photo-periodic information is preserved in the isolated mouseSCN, in vitro, and this finding allows for a more detailedcellular-level investigation of the underlying mechanism.
Subpopulation activity analysis was performed by anoffline analysis of spike amplitude in which we graduallyincreased the threshold and thereby decreased the sizeof the recorded unit population [3]. By including fewerneurons in the recording, the results revealed a narrowerpeak in electrical activity (Figure 2). The duration ofactivity for the smallest subpopulations, measured athalf-maximum amplitude, was 3.72 6 0.31 hr (n = 31)on short days, and 4.31 6 0.33 hr (n = 34) on long days(Figure 3). These durations were not significantly differ-ent from one another (t test, p > 0.25). A gradual increasein population size resulted in an increase in peak width(Figure S3). The increase in peak width occurred espe-cially in the range of more negative, high amplitude,spike threshold levels (between 219 and 210 mV).
Small subpopulations were recorded at all phases ofthe circadian cycle, and especially in long days, a broaddistribution in phases was observed. In short days, themean peak time, determined by a fitted Gaussian distri-bution, was at ExT 11.00 6 0.04 hr, and the mean peaktime for long days was at ExT 12.24 6 0.23 hr. Althoughthe majority of subpopulations peaked during the pro-jected light period, a considerable number of subpopu-lations showed maximal activity in the projected dark(Figure 3). The distribution of subpopulation peak times(with the median of both groups at zero) was signifi-cantly broader in long than in short days (Quartiles, c2
test, p = 0.04). Furthermore, the distribution of thepeak times was significantly different from a uniform dis-tribution in the short days but not in the long-days con-dition (Rayleigh test, short days’ p = 0.0001; long days’
p = 0.39). In addition, the Watson two-sample test com-paring the distributions of the short and long days wassignificant (p < 0.01). The data indicate that differencesin circadian waveform of SCN multiunit activity ob-served under short and long photoperiods result fromthe different spacing of subpopulation activity patterns.
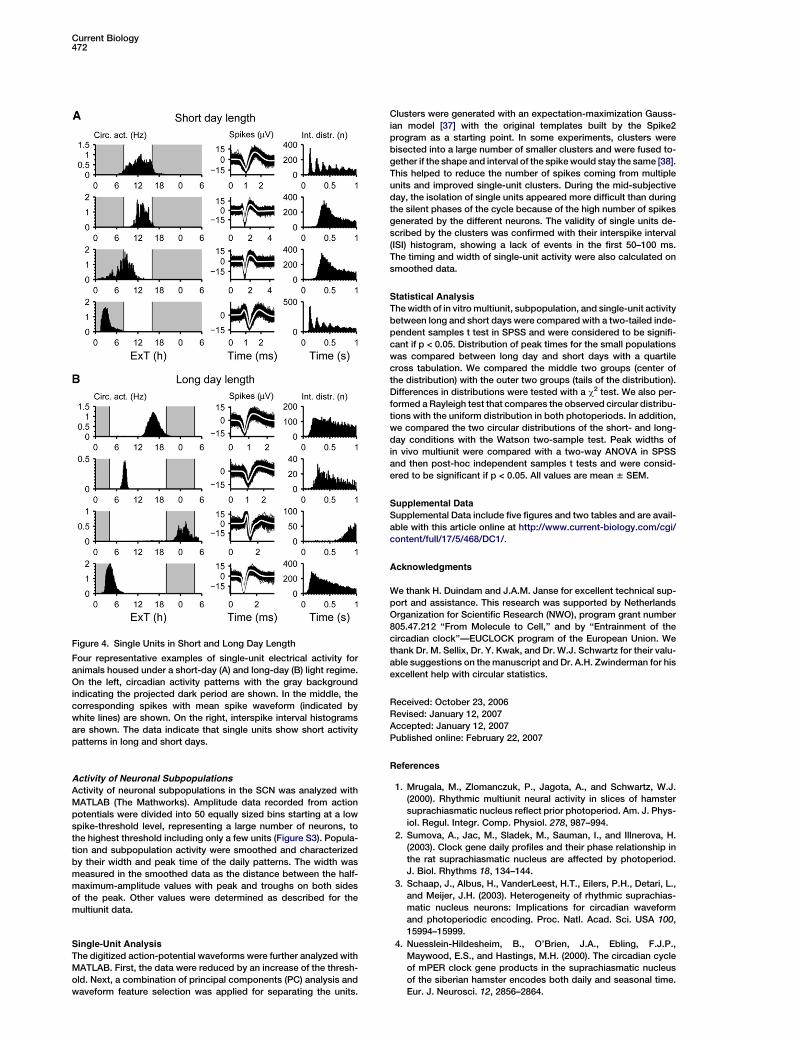
Circadian Single-Unit Activity PatternsSingle units were distinguished with the aid of a clusteranalysis of spike waveform and were verified by the ad-ditional criterion that the interval distribution must beempty at approximately time zero (i.e., units cannot firewith infinite short time intervals). When performing thesingle-unit analysis, we recognized that the single-unitpatterns we measured may not reflect the intrinsic firingpatterns of the individual neurons such as the signals re-corded in dispersed cell cultures [17–19] but, rather, arethe functional patterns of neurons interacting within thenetwork. In short days, we recorded 26 single units (outof 21 slices) and in long days, 26 units (out of 18 slices).The analysis of most recordings yielded one single unit,but in some cases (seven short-day and five long-day re-cordings) two to three units were distinguishable in thesame recording with waveform and interval characteris-tics (Figure S4). The peak times of the single-unit pat-terns occurred at various phases of the circadian cycle(Figure S5). In short as well as long days, single-unit pat-terns were broader during the day than during the night(Figure S5). Some neurons displayed regular firing pat-terns (n = 6 out of 26, both in long and short photope-riods). The mean duration of single-unit activity was3.48 6 0.29 hr (n = 26) on short days and 3.85 60.40 hr (n = 26) on long days (Figure 4 and Figure S5)with no significant difference (t test, p > 0.4).
Single-cell recordings of mPer1 gene expression incultured mouse SCN at the molecular level [20, 21]

Current Biology470
have shown phase differences, which could be changedby light input [20]. Narrow single-unit electrical activitypatterns have been described for the SCN of rat andmouse that were kept in 12:12 hr LD conditions [3, 22].For different photoperiods, however, single-cell record-ings have not been performed.
We now show that single units are active at all phasesof the circadian cycle and that activity waveforms of in-dividual units do not compress or decompress signifi-cantly in short and long days. The presence of neuronalactivity during the night is consistent with previous re-cordings in which sampling of electrical activity for briefperiods of time revealed night-time activity [23]. Al-though small differences in the width of the single-unitactivity pattern in short and long days are not significant,they may exist. Simulation studies, however, haveshown that small differences are insufficient to accountfor 4–5 hr changes in multiunit peak width [24]. Further-more, we cannot rule out that other parameters such as
Figure 2. Three Examples of Normalized Cumulative Electrical Pop-
ulation Activity for Mice Housed under a Short-Day and a Long-Day
Light Regime
The bars on top of each set of graphs represent the light cycle to
which the animals were exposed. Population activity was calculated
by a count of all threshold-crossing action potentials in 2 min bins
over the 24 hr cycle, as a function of external time (ExT 12 = midday).
Maximum spike frequency is normalized to 1 for enabling compari-
son between the graphs. The top graphs show the electrical activity
pattern at near single-unit level. The lower graphs contain increas-
ingly larger populations as we lowered the threshold for action-
potential selection. The data show that the electrical activity pattern
of the SCN is composed of out-of-phase oscillating neuronal popu-
lations. In long days (D–F), we observed a larger phase distribution
between the populations than in short days (A–C).
clock gene expression or membrane potential show dif-ferences between short and long days. However, weshould emphasize the fact that electrical-impulseactivity is a major output of the clock [25]; i.e., westrongly suspect that this is the information that is trans-mitted to downstream processes that would translatephotoperiod information into changes in physiologyand behavior.
Based on the single-unit activity patterns obtained inthis study, it can be calculated that our smallest subpop-ulations consisted of less than five neurons (Figures S3and S5). This calculation is based on the area underthe subpopulation activity curve and the area of themean single-unit activity pattern in short and longdays, respectively (Figure S3). Most of the increase inpeak width occurs when neuronal populations are in-creased from about 1 to 50 neurons (Figure S3). With50 neurons, approximately 75% of the full peak widthis obtained, both in short and in long days, and a furtherraise in population size resulted only in small incrementsin peak width. This leads us to conclude that relativelysmall groups of SCN neurons can carry substantial infor-mation on day length.
The in vivo recordings of SCN activity suggest that thephase distribution remains stable for some time even inthe absence of photic information. This correspondswith behavioral aftereffects observed in mice after expo-sure to different photoperiods [7, 8]. It will be interestingto investigate whether recently identified couplingmechanisms such as VIP receptors or electrical synap-ses [26–29] are involved in the regulation of phase rela-tions between SCN neurons. In the present paper, weobserved that plasticity in the phase differences be-tween neurons is the primary mechanism encoding forday length.
Experimental Procedures
Animals and Recording of Behavioral Activity
Male black 6 (C57B/6JOlaHSD) mice (Harlan, Horst, the Netherlands)
were entrained to 24 hr light-dark (LD) cycles with either long (16 hr)
or short (8 hr) days. The animals were housed separately with food
and water ad libitum. The cages were equipped with a running wheel
for recording locomotor activity of the animals in 1 min intervals. En-
trainment to short and long photoperiods for less than 30 days did
not lead to consistent waveform changes in the circadian rhythm
of electrical activity, either in vivo or in vitro. For that reason, all an-
imals in this study were entrained for 30 days or longer and were
9–14 weeks old when taken for electrophysiological recordings. Of
note, C57 mice show photoperiodic responses in their behavioral
activity patterns despite their melatonin deficiency, indicating that
melatonin is not involved in the regulation of wheel-running activity
duration [30]. All experiments were performed under the approval
of the Animal Experiments Ethical Committee of the Leiden Univer-
sity Medical Center.
In Vivo SCN Multiunit Recording
Recording techniques have been described in detail previously [31,
32]. In brief, tripolar stainless steel electrodes (125 mm, Plastics One,
Roanake, Virginia) were implanted with a stereotactical instrument
in the brain of animals that were under Midazolam/Fentanyl/
Fluanisone anesthesia. Under a 5� angle in the coronal plane, elec-
trodes were aimed at the following stereotaxic coordinates:
0.46 mm posterior to bregma, 0.14 mm lateral to the midline, and
5.2 mm ventral to the surface of the cortex [33]. Two of these elec-
trodes (Polyimide insulated) were used for differential recordings
of multiunit activity from SCN neurons. The third electrode was
placed in the cortex and used as reference. After a recovery period

Seasonal Encoding by the SCN Pacemaker471
Figure 3. Differences in Distribution of Large,
Medium, and Small Population Peak Times in
SCN Neuronal Activity
Circular 24 hr plots of the distribution of peak
times in electrical activity at the multiunit
population level (inner circle, large population
of about 600 units), medium population level
(middle circle, about 250 neurons), and small
population level (outer circle, five neurons or
less).
(A) The circles are centered with midday at
the top, and the gray part represents the
dark. The peak times at the small population
level are widely distributed.
(B) Double-plotted histogram of SCN neuro-
nal subpopulation activity peak times in short
and long day length. The x axis represents
external time. The percentage of populations
that peak around the middle of the day (ExT
12) is greater under short days than under
long days.
(C) Bar graph showing the width (6SEM) of
the activity peaks in short (shown in gray)
and in long days (shown in black) for large,
medium, and small populations. Asterisks
indicate significance (t test, p < 0.0001).
of at least 1 week, the animals were placed in the recording cham-
ber, where drinking activity was monitored and stored per min.
The animals were connected to the recording system with a counter-
balanced swivel system allowing the animals to move freely. After
amplification and filtering (0.5–5 kHz) of the signal (signal-to-noise
ratio 3:1 to 8:1), the action potentials were detected by a window dis-
criminator and counted electronically in 10 s bins. Simultaneously,
drinking activity was monitored and stored in 10 s epochs. After at
least 30 days in the light regime and approximately 5 days of multi-
unit recording in the LD cycle, the animals were released into con-
stant darkness in order to assess the properties of the neuronal ac-
tivity rhythm in the absence of light. At the end of each recording, the
animals were sacrificed and the recording tip was marked with
a small electrolytic current for enabling histological verification of
the electrode location. The iron deposition from the electrode tip
was stained blue with a potassium ferrocyanide containing fixative
solution in which the brain was immersed. Only recordings where
the electrode location was verified to be inside the SCN were taken
into account.
In Vivo Data Analysis
Multiunit activity data were smoothed with a penalized least-
squares algorithm [34]. The time of maximal activity was determined
in the smoothed curve, and the peak width was determined by mea-
surement of the width at half-maximum values determined bilater-
ally. The peak widths for the last two cycles in LD were averaged
for each photoperiod. After the mice were released into constant
darkness, the peak widths were averaged per day for the first
4 days for evaluation of the stability of the SCN waveform. For ob-
taining an average waveform for the first day in DD, the amplitude
between first trough and peak was normalized in each experiment.
In Vitro Electrophysiology
Electrical activity rhythms of SCN neurons were recorded as de-
scribed previously [35]. In brief, coronal hypothalamic slices (400 mm)
containing the SCN were prepared from mice of the long-day and
short-day group, 8 hr and 4 hr before lights-on, respectively. Only
one slice per animal was used for the recording. For the long-day
group, additional experiments were started at 9 hr before lights-on
(this is 1 hr before lights-off) for excluding effects of the time of prep-
aration on the phase and waveform of the rhythm in electrical activity.
During the night, preparations were performed under dim red light-
ing. The slices were kept submerged in a laminar flow chamber and
continuously perfused (1.5 ml/min) with oxygenated artificial cere-
brospinal fluid (35�C, 95% O2, and 5% CO2). Population and single-
unit electrical activity was recorded by two extracellular stationary
platinum/iridium metal electrodes (50 mm diameter, insulated) placed
in the SCN. The signals were amplified (310,000) by a high imped-
ance amplifier, and the bandpass was filtered (0.3 Hz–3 kHz). Action
potentials were selected by a window discriminator (Neurolog sys-
tem, Digitimer, Hertfordshire, UK, signal-to-noise ratio >2:1) and
counted electronically in 10 s bins for at least 26 hr. In addition, the
amplified signals were digitized and recorded by a data acquisition
system (Power1401, Spike2 software, CED, Cambridge, UK). Ampli-
tude and time of all action potentials crossing a threshold of approx-
imately 26 mV were recorded as a measure for subpopulation activity
(see below). With thresholds above 29 mV, spike templates were gen-
erated and thus isolated the activity of several units. The complete
waveforms and time of occurrence of the events crossing the thresh-
old were stored for offline analysis.
In Vitro Data Analysis
Multiunit Activity
Multiunit activity data were smoothed with a penalized least-
squares algorithm [34]. Peak times were determined in the
smoothed data and are given in external time (ExT) with ExT 0 de-
fined as the middle of the night. Consequently, ExT 12 is midday in
both photoperiods [36]. The duration of the elevated SCN activity
was defined as the width of the peak at half-maximum amplitude,
with the values of the peak and the following trough. The location
of the recording electrode was visually assessed. We distinguished
between ventral and dorsal recordings and divided the rostral-
caudal extension into five portions. We compared peak times of
the anterior 40% with the posterior 40% and left out the middle
20% of the SCN. We also compared peak times of the ventral and
dorsal 50% of the SCN.
Current Biology472
Activity of Neuronal Subpopulations
Activity of neuronal subpopulations in the SCN was analyzed with
MATLAB (The Mathworks). Amplitude data recorded from action
potentials were divided into 50 equally sized bins starting at a low
spike-threshold level, representing a large number of neurons, to
the highest threshold including only a few units (Figure S3). Popula-
tion and subpopulation activity were smoothed and characterized
by their width and peak time of the daily patterns. The width was
measured in the smoothed data as the distance between the half-
maximum-amplitude values with peak and troughs on both sides
of the peak. Other values were determined as described for the
multiunit data.
Single-Unit Analysis
The digitized action-potential waveforms were further analyzed with
MATLAB. First, the data were reduced by an increase of the thresh-
old. Next, a combination of principal components (PC) analysis and
waveform feature selection was applied for separating the units.
Figure 4. Single Units in Short and Long Day Length
Four representative examples of single-unit electrical activity for
animals housed under a short-day (A) and long-day (B) light regime.
On the left, circadian activity patterns with the gray background
indicating the projected dark period are shown. In the middle, the
corresponding spikes with mean spike waveform (indicated by
white lines) are shown. On the right, interspike interval histograms
are shown. The data indicate that single units show short activity
patterns in long and short days.
Clusters were generated with an expectation-maximization Gauss-
ian model [37] with the original templates built by the Spike2
program as a starting point. In some experiments, clusters were
bisected into a large number of smaller clusters and were fused to-
gether if the shape and interval of the spike would stay the same [38].
This helped to reduce the number of spikes coming from multiple
units and improved single-unit clusters. During the mid-subjective
day, the isolation of single units appeared more difficult than during
the silent phases of the cycle because of the high number of spikes
generated by the different neurons. The validity of single units de-
scribed by the clusters was confirmed with their interspike interval
(ISI) histogram, showing a lack of events in the first 50–100 ms.
The timing and width of single-unit activity were also calculated on
smoothed data.
Statistical Analysis
The width of in vitro multiunit, subpopulation, and single-unit activity
between long and short days were compared with a two-tailed inde-
pendent samples t test in SPSS and were considered to be signifi-
cant if p < 0.05. Distribution of peak times for the small populations
was compared between long day and short days with a quartile
cross tabulation. We compared the middle two groups (center of
the distribution) with the outer two groups (tails of the distribution).
Differences in distributions were tested with a c2 test. We also per-
formed a Rayleigh test that compares the observed circular distribu-
tions with the uniform distribution in both photoperiods. In addition,
we compared the two circular distributions of the short- and long-
day conditions with the Watson two-sample test. Peak widths of
in vivo multiunit were compared with a two-way ANOVA in SPSS
and then post-hoc independent samples t tests and were consid-
ered to be significant if p < 0.05. All values are mean 6 SEM.
Supplemental Data
Supplemental Data include five figures and two tables and are avail-
able with this article online at http://www.current-biology.com/cgi/
content/full/17/5/468/DC1/.
Acknowledgments
We thank H. Duindam and J.A.M. Janse for excellent technical sup-
port and assistance. This research was supported by Netherlands
Organization for Scientific Research (NWO), program grant number
805.47.212 ‘‘From Molecule to Cell,’’ and by ‘‘Entrainment of the
circadian clock’’—EUCLOCK program of the European Union. We
thank Dr. M. Sellix, Dr. Y. Kwak, and Dr. W.J. Schwartz for their valu-
able suggestions on the manuscript and Dr. A.H. Zwinderman for his
excellent help with circular statistics.
Received: October 23, 2006
Revised: January 12, 2007
Accepted: January 12, 2007
Published online: February 22, 2007
References
1. Mrugala, M., Zlomanczuk, P., Jagota, A., and Schwartz, W.J.
(2000). Rhythmic multiunit neural activity in slices of hamster
suprachiasmatic nucleus reflect prior photoperiod. Am. J. Phys-
iol. Regul. Integr. Comp. Physiol. 278, 987–994.
2. Sumova, A., Jac, M., Sladek, M., Sauman, I., and Illnerova, H.
(2003). Clock gene daily profiles and their phase relationship in
the rat suprachiasmatic nucleus are affected by photoperiod.
J. Biol. Rhythms 18, 134–144.
3. Schaap, J., Albus, H., VanderLeest, H.T., Eilers, P.H., Detari, L.,
and Meijer, J.H. (2003). Heterogeneity of rhythmic suprachias-
matic nucleus neurons: Implications for circadian waveform
and photoperiodic encoding. Proc. Natl. Acad. Sci. USA 100,
15994–15999.
4. Nuesslein-Hildesheim, B., O’Brien, J.A., Ebling, F.J.P.,
Maywood, E.S., and Hastings, M.H. (2000). The circadian cycle
of mPER clock gene products in the suprachiasmatic nucleus
of the siberian hamster encodes both daily and seasonal time.
Eur. J. Neurosci. 12, 2856–2864.

Seasonal Encoding by the SCN Pacemaker473
5. Messager, S., Ross, A.W., Barrett, P., and Morgan, P.J. (1999).
Decoding photoperiodic time through Per1 and ICER gene am-
plitude. Proc. Natl. Acad. Sci. USA 96, 9938–9943.
6. Sumova, A., Travnickova, Z., Peters, R., Schwartz, W.J., and
Illnerova, H. (1995). The rat suprachiasmatic nucleus is a clock
for all seasons. Proc. Natl. Acad. Sci. USA 92, 7754–7758.
7. Pittendrigh, C.S., and Daan, S.A. (1976). Functional analysis of
circadian pacemakers in nocturnal rodents: V. Pacemaker struc-
ture: A clock for all seasons. J. Comp. Physiol. 106, 333–355.
8. Refinetti, R. (2002). Compression and expansion of circadian
rhythm in mice under long and short photoperiods. Integr. Phys-
iol. Behav. Sci. 37, 114–127.
9. Sumova, A., Sladek, M., Jac, M., and Illnerova, H. (2002). The cir-
cadian rhythm of Per1 gene product in the rat suprachiasmatic
nucleus and its modulation by seasonal changes in daylength.
Brain Res. 947, 260–270.
10. Messager, S., Hazlerigg, D.G., Mercer, J.G., and Morgan, P.J.
(2000). Photoperiod differentially regulates the expression of
Per1 and ICER in the pars tuberalis and the suprachiasmatic nu-
cleus of the Siberian hamster. Eur. J. Neurosci. 12, 2865–2870.
11. Lincoln, G., Messager, S., Andersson, H., and Hazzlerigg, D.
(2002). Temporal expression of seven clock genes in the supra-
chiasmatic nucleus and the pars tuberalis of the sheep: Evi-
dence for an internal coincidence timer. Proc. Natl. Acad. Sci.
USA 99, 13890–13895.
12. Tournier, B.B., Menet, J.S., Dardente, H., Poirel, V.J., Malan, A.,
Masson-Pevet, M., Pevet, P., and Vuillez, P. (2003). Photoperiod
differentially regulates clock genes’ expression in the supra-
chiasmatic nucleus of Syrian hamster. Neuroscience 118, 317–
322.
13. Carr, A.J., Johnston, J.D., Semikhodskii, A.G., Nolan, T.,
Cagampang, F.R., Stirland, J.A., and Loudon, A.S. (2003). Photo-
period differentially regulates circadian oscillators in central and
peripheral tissues of the Syrian hamster. Curr. Biol. 13, 1543–
1548.
14. de la Iglesia, H.O., Meyer, J., and Schwartz, W.J. (2004). Using
Per gene expression to search for photoperiodic oscillators in
the hamster suprachiasmatic nucleus. Brain Res. Mol. Brain
Res. 127, 121–127.
15. Johnston, J.D., Ebling, F.J.P., and Hazlerigg, D.G. (2005).
Photoperiod regulates multiple gene expression in the supra-
chiasmatic nuclei and pars tuberalis of the Siberian hamster
(Phodopus sungorus). Eur. J. Neurosci. 21, 2967–2974.
16. Hazlerigg, D.G., Ebling, F.J.P., and Johnston, J.D. (2005). Photo-
period differentially regulates gene expression rhythms in the
rostral and caudal SCN. Curr. Biol. 15, 449–450.
17. Welsh, D.K., Logothetis, D.E., Meister, M., and Reppert, S.M.
(1995). Individual neurons dissociated from rat suprachiasmatic
nucleus express independently phased circadian firing rhythms.
Neuron 14, 697–706.
18. Honma, S., Shirakawa, T., Katsuno, Y., Namihira, M., and
Honma, K. (1998). Circadian periods of single suprachiasmatic
neurons in rats. Neurosci. Lett. 250, 157–160.
19. Herzog, E.D., Aton, S.J., Numano, R., Sakaki, Y., and Tei, H.
(2004). Temporal precision in the mammalian circadian system:
A reliable clock from less reliable neurons. J. Biol. Rhythms 19,
35–46.
20. Quintero, J.E., Kuhlman, S.J., and McMahon, D.G. (2003). The
biological clock nucleus: A multiphasic oscillator network regu-
lated by light. J. Neurosci. 23, 8070–8076.
21. Yamaguchi, S., Isejima, H., Matsuo, T., Okura, R., Yagita, K.,
Kobayashi, M., and Okamura, H. (2003). Synchronization of
cellular clocks in the suprachiasmatic nucleus. Science 302,
1408–1412.
22. Brown, T.M., Hughes, A.T., and Piggins, H.D. (2005). Gastrin-
releasing peptide promotes suprachiasmatic nuclei cellular
rhythmicity in the absence of vasoactive intestinal polypep-
tide-VPAC2 receptor signaling. J. Neurosci. 25, 11155–11164.
23. Gillette, M.U., DeMarco, S.J., Ding, J.M., Gallman, E.A., Faiman,
L.E., Liu, C., McArthur, A.J., Medanic, M., Richard, D., Tcheng,
T.K., et al. (1993). The organization of the suprachiasmatic circa-
dian pacemaker of the rat and its regulation by neurotransmit-
ters and modulators. J. Biol. Rhythms Suppl. 8, 53–58.
24. Rohling, J., Wolters, L., and Meijer, J.H. (2006). Simulation of
day-length encoding in the SCN: From single-cell to tissue-level
organization. J. Biol. Rhythms 21, 301–313.
25. Schwartz, W.J., Gross, R.A., and Morton, M.T. (1987). The supra-
chiasmatic nuclei contain a tetrodotoxin-resistant circadian
pacemaker. Proc. Natl. Acad. Sci. USA 84, 1694–1698.
26. Colwell, C.S., Michel, S., Itri, J., Rodriguez, W., Tam, J., Lelievre,
V., Hu, Z., Liu, X., and Waschek, J.A. (2003). Disrupted circadian
rhythms in VIP- and PHI-deficient mice. Am. J. Physiol. Regul.
Integr. Comp. Physiol. 285, 939–949.
27. Long, M.A., Jutras, M.J., Connors, B.W., and Burwell, R.D.
(2005). Electrical synapses coordinate activity in the suprachias-
matic nucleus. Nat. Neurosci. 8, 61–66.
28. Colwell, C.S. (2005). Bridging the gap: Coupling single-cell oscil-
lators in the suprachiasmatic nucleus. Nat. Neurosci. 8, 10–12.
29. Aton, S.J., Colwell, C.S., Harmar, A.J., Waschek, J., and Herzog,
E.D. (2005). Vasoactive intestinal polypeptide mediates circa-
dian rhythmicity and synchrony in mammalian clock neurons.
Nat. Neurosci. 8, 476–483.
30. Goldman, B.D. (2001). Mammalian photoperiodic system: For-
mal properties and neuroendocrine mechanisms of photoperi-
odic time measurement. J. Biol. Rhythms 16, 283–301.
31. Meijer, J.H., Watanabe, K., Schaap, J., Albus, H., and Detari, L.
(1998). Light responsiveness of the suprachiasmatic nucleus:
Long-term multiunit and single-unit recordings in freely moving
rats. J. Neurosci. 18, 9078–9087.
32. Meijer, J.H., Watanabe, K., Detari, L., and Schaap, J. (1996). Cir-
cadian rhythm in light response in suprachiasmatic nucleus neu-
rons of freely moving rats. Brain Res. 741, 352–355.
33. Paxinos, G., and Franklin, K.B.J. (2001). The Mouse Brain in Ste-
reotaxic Coordinates, Second Edition (San Diego: Academic
Press).
34. Eilers, P.H. (2003). A perfect smoother. Anal. Chem. 75, 3631–
3636.
35. Albus, H., Bonnefont, X., Chaves, I., Yasui, A., Doczy, J., van der
Horst, G.T., and Meijer, J.H. (2002). Cryptochrome-deficient
mice lack circadian electrical activity in the suprachiasmatic nu-
clei. Curr. Biol. 12, 1130–1133.
36. Daan, S., Merrow, M., and Roenneberg, T. (2002). External time–
internal time. J. Biol. Rhythms 17, 107–109.
37. Lewicki, M.S. (1998). A review of methods for spike sorting: The
detection and classification of neural action potentials. Network
9, 53–78.
38. Fee, M.S., Mitra, P.P., and Kleinfeld, D. (1996). Automatic sorting
of multiple unit neuronal signals in the presence of anisotropic
and non-Gaussian variability. J. Neurosci. Methods 69, 175–188.