Expression pattern of circadian genes and steroidogenesis ...

Circadian Phase Has Profound Effects on DifferentialExpression AnalysisPolly Yingshan Hsu, Stacey L. Harmer*
Department of Plant Biology, University of California Davis, Davis, California, United States of America
Abstract
Circadian rhythms are physiological and behavioral cycles with a period of approximately 24 hours that are generated by anendogenous clock, or oscillator. Found in diverse organisms, they are precisely controlled and provide growth and fitnessbenefits. Numerous microarray studies examining circadian control of gene expression have reported that a substantialfraction of the genomes of many organisms is clock-controlled. Here we show that a long-period mutant in Arabidopsis,rve8-1, has a global alteration in phase of all clock-controlled genes. After several days in constant environmental conditions,at which point the mutant and control plants have very different circadian phases, we found 1557 genes to be differentiallyexpressed in rve8-1, almost all of which are clock-regulated. However, after adjusting for this phase difference, only ahandful show overall expression level differences between rve8-1 and wild type. Thus the apparent differential expression ismainly due to the phase difference between these two genotypes. These findings prompted us to examine the effect ofphase on gene expression within a single genotype. Using samples of wild-type plants harvested at thirty-minute intervals,we demonstrated that even this small difference in circadian phase significantly influences the results of differentialexpression analysis. Our study demonstrates the robust influence of the circadian clock on the transcriptome and provides acautionary note for all biologists performing genome-level expression analysis.
Citation: Hsu PY, Harmer SL (2012) Circadian Phase Has Profound Effects on Differential Expression Analysis. PLoS ONE 7(11): e49853. doi:10.1371/journal.pone.0049853
Editor: Frank G. Harmon, USDA-ARS, United States of America
Received May 5, 2012; Accepted October 16, 2012; Published November 20, 2012
Copyright: � 2012 Hsu, Harmer. This is an open-access article distributed under the terms of the Creative Commons Attribution License, which permitsunrestricted use, distribution, and reproduction in any medium, provided the original author and source are credited.
Funding: This work was supported by the National Institutes of Health, National Institute of General Medical Sciences (NIGMS) (http://www.nigms.nih.gov/)[grant number GM069418] and the Taiwan Merit Scholarship (http://web1.nsc.gov.tw/) [grant number: NSC-095-SAF-I-564-014-TMS]. The funders had no role instudy design, data collection and analysis, decision to publish, or preparation of the manuscript.
Competing Interests: The authors have declared that no competing interests exist.
* E-mail: [email protected]
Introduction
Circadian rhythms are physiological and behavioral cycles with
period length around 24 hours that are produced by an
endogenous clock [1]. They are widely observed in nature,
presumably because they help organisms prepare for predictable
environmental change such as day/night cycles. Circadian
rhythms can be further classified according to their daily phases,
or times of peak expression [2–5]. Different groups of circadian
rhythms are timed to occur at specific times of day to optimize
physiology and growth. Functional circadian clocks provide a
crucial fitness advantage in diverse organisms: disruption of clock
components results in disorder of sleep/wake cycles in humans [6]
and reduction of photosynthesis and overall survival in cyanobac-
teria and plants [7,8].
Clock systems can be generalized as consisting of three major
parts [1]: (1) input pathways, which sense environmental timing
cues such as light or temperature and can reset the clock, (2) the
central oscillator (or the central clock), which consists of
interlocking transcriptional/translational feedback loops, and (3)
outputs, biological rhythms with a free-running period of
approximately 24 hours. Although the identities of clock genes
vary between different organisms, many clock components are
transcription factors involved in regulatory feedback loops. In
Arabidopsis, the first-identified transcriptional loop of the central
clock is composed of three transcription factors: CCA1 and LHY,
two MYB-like transcription factors highly expressed in the
morning [9,10], and TOC1, a CCT-domain containing transcrip-
tion factor with peak abundance in the evening [11,12]. The two
morning-phased transcription factors repress TOC1 expression by
directly binding to a motif found in the TOC1 promoter called the
evening element (EE) [12,13]. The EE is overrepresented in
evening-phased genes and when multimerized confers evening-
phased expression on a reporter gene [4,13]. TOC1 was recently
reported to be a transcription factor that directly inhibits CCA1
and LHY expression [14,15], revealing that these three proteins
function in a double-negative feedback loop.
In plants as in other eukaryotes, multiple transcriptional
feedback loops are coupled together to generate the circadian
oscillator. A second negative feedback loop in Arabidopsis is
formed between CCA1/LHY and three TOC1 homologs: PRR5,
PRR7 and PRR9 [16]. We recently described another transcrip-
tional loop involving one of these pseudoresponse regulators and
RVE8, a homolog of CCA1 and LHY. RVE8 promotes expression
of PRR5, possibly by binding to the EE found in the PRR5
promoter, and RVE8 expression is in turn repressed by PRR5 [17].
Transcriptional regulation is not only key to oscillator function
in all eukaryotes studied, but also plays an important role in
control of clock outputs. In the past decade, microarrays have
been widely used in many model systems to simultaneously
monitor levels of thousands of transcripts in the genome. These
studies have revealed that 9% to 30% of the transcriptome in
cyanobacteria, Arabidopsis, Drosophila and mammals is con-
trolled by the clock [2,18–21]. Identification of pathways enriched
PLOS ONE | www.plosone.org 1 November 2012 | Volume 7 | Issue 11 | e49853

for circadian-regulated genes has demonstrated that numerous
essential metabolic and physiological pathways are influenced by
the clock [2,21,22]. The examination of global transcript
abundance over circadian time thus allows the identification of
both components of the circadian oscillator as well as genes and
pathways under circadian regulation.
Here we compare gene expression in the long-period Arabi-
dopsis mutant, rve8-1[17] and in wild-type plants after several days
of growth in constant environmental conditions. This prolonged
time in free-running conditions resulted in a global 4-hour delay,
approximately 17% of a daily cycle, in the phase of both central
clock and output genes in the rve8-1 mutant relative to wild type,
demonstrating that RVE8 acts within the central clock. If we did
not take this phase difference into account, a great number of
genes were identified as differentially expressed; however, only
very few of them showed significant changes in expression levels
and/or patterns of gene expression once we compensated for the
phase difference. This profound influence of phase on global gene
expression prompted us to examine the effects of smaller phase
differences on gene expression. Using publicly available micro-
array data, we demonstrate that even a phase difference as small as
30 minutes (2% of a daily cycle) has a dramatic effect on
expression levels of hundreds of genes, a finding with important
ramifications for the design of all genome-wide studies.
Results
RVE8 Affects Global Circadian-regulated TranscriptionTo identify target genes controlled by RVE8, we examined the
transcriptional profiles of Col and rve8-1 using AGRONOMICS1
tiling arrays, which cover more than 30,000 annotated Arabidopsis
genes [23]. Plants were grown in light/dark cycles for seven days
and then transferred to free-running conditions (continuous light
and temperature). Since rve8-1 has a period only approximately
one hour longer than wild type, we collected samples on the fourth
and fifth days of free run to ensure easy detection of the circadian
phase difference between Col and rve8-1 [17]. Following prepro-
cessing and normalization of raw array data, genes with very low
expression levels were filtered out. An empirical Bayes statistical
analysis using limma [24] was then performed to identify genes
differentially expressed between the two genotypes, in which we
matched the mutant and wild-type samples according to the time
at which they were harvested (i.e. comparing Col_72 and rve8-
1_72). Using a multiple-measure adjusted p value less than 0.05 as
a cut-off, 1557 genes were identified as significantly differently
expressed between Col and rve8-1. Further analysis of the time
course data (see below) revealed that transcript levels of 86% of
these misexpressed genes are controlled by the circadian clock
(Fig. 1I). These differentially expressed genes include key clock
genes such as TOC1 and CCA1 (Fig. 2G–H) as well as a variety of
output genes (Fig. 2B–2F). Alteration of both central clock and
output genes in rve8-1 is consistent with previous reports that
suggest RVE8 functions close to the central clock in Arabidopsis
[17,25] and thus would be expected to directly or indirectly
regulate all clock-controlled genes (CCGs). Inspection of the most
highly differentially expressed genes that are also clock-controlled
show that they all have a delayed phase in rve8-1 compared to Col,
but reveal no obvious change in overall expression levels (Fig. 1C–
1H), with the exception of RVE8 (At3g09600) itself (Fig. 1C).
Hierarchical clustering of the 1557 differentially expressed genes
showed a strong circadian signature. That is, the Col samples
harvested after 76 and 100 hours in free run (24 hours apart)
cluster with each other, as do the rve8-1 samples harvested after 80
and 104 hours in free run (Fig 2A). Notably, these four time points
also cluster with each other. A similar relationship was seen
between all the other time points; i.e., the Col samples cluster most
tightly with the rve8-1 samples collected four hours later.
Validation of microarray results using qRT-PCR on CCGs that
cycle with both low and high amplitudes showed good agreement
between the two techniques (Fig. 2B–H), indicating the microarray
results are reliable. These data show that after four days in free-
run, global circadian gene expression in rve8-1 is delayed about
four hours when compared to Col. The four-hour phase difference
after four days in free run can be attributed to the approximately
one hour longer period in rve8-1 mutants [17,25]. The lack of
apparent overall expression level differences in most of the
‘‘differentially expressed’’ genes once phase is considered
(Fig. 1D–I and Fig. 2B–H) and the close clustering of the wild-
type and rve8-1 samples (Fig. 2A) imply that the majority of the
1557 genes identified as differentially expressed simply have a
different circadian phase in rve8-1, rather than an overall change in
expression levels.
Identification of RVE8 Targets with Altered ExpressionLevels
Since we wished to identify genes with overall alterations in
expression levels in rve8-1, not just those with altered phases, we
adjusted the two time series to compensate for the observed four-
hour difference in phase (Fig. 1 and 2) and then carried out
differential expression analysis. That is, we used limma as
described previously, but this time compared Col_72 with rve8-
1_76, Col_76 with rve8-1_80, etc. (Fig. 3A) We expected four
possible types of outcomes for genes previously identified as
differentially expressed: (1) genes controlled by the clock that do
not have appreciable differences in overall expression levels in rve8-
1 would no longer be identified as differentially expressed,
(compare Fig. 1F and Fig. 3C); (2) differentially expressed genes
that are not controlled by the circadian clock would still show
expression level differences (compare Fig. 1A and Fig. 3B); (3)
genes controlled by the clock that also have changes in expression
levels (like RVE8, compare Fig. 1C and 3D) or a change in phase
other than a four hours delay in rve8-1 would be still recognized as
differentially expressed genes; and (4) genes that are clock-
regulated in only one of the genotypes (Fig. 4C, 4G, and 4H)
might also be differentially expressed. After comparison of these
‘‘offset’’ Col and rve8-1 time courses, only 13 genes passed the
significance criteria for differential expression (adjusted p value ,
0.05; Fig. 3B, 3D, and Fig. 4). Given that most of the 1557 genes
initially identified as differentially expressed are also circadian
regulated (Fig. 1I), the vast majority of these genes fall into our
class 1, simply having a phase delay in rve8-1 rather than an overall
expression level difference between wild type and the mutant.
The 13 genes that are differentially expressed in the phase-offset
datasets fall into each of the above classes 2 – 4. Two of the 13
(At4g29610, and At5g47240) are clock-regulated in both genotypes
(4J–L). The two genes upstream of the RVE8 locus, At3g09580 and
At3g09590 (Fig. 4B and 4C), are also misregulated in rve8-1,
suggesting the T-DNA insertion in RVE8 not only disrupts RVE8
expression but also affects nearby genes. Interestingly, expression
of At3g09590 is clock-regulated with a dawn phase in rve8-1 but not
in Col, suggesting that the enhancer elements within the T-DNA
inserted in the RVE8 locus have imposed RVE8-like expression
patterns on this adjacent gene. Four evening-phased CCGs
(At5g20740, At1g52040, At4g29610, and At5g47240) have reduced
expression levels in rve8-1; two of them lost rhythmic expression in
rve8-1 (Fig. 4G and 4H) and two are still classified as clock-
regulated despite reduced levels in rve8-1 (Fig. 4J and 4K). None of
these 13 differentially expressed genes (except RVE8 itself) have
Circadian Phase Effects on Differential Expression
PLOS ONE | www.plosone.org 2 November 2012 | Volume 7 | Issue 11 | e49853

been reported to affect the circadian clock and are annotated with
diverse functions in plants (Table 1). Our results show that after
correcting for circadian phase only a handful of genes have
significantly altered expression levels in rve8-1.
Investigation of Rhythmic Expression and Generation of aMore Complete Clock-regulated Gene List
In addition to expression levels, we also examined circadian
waveforms in Col and rve8-1. Given that only a dozen genes have
different expression levels between the two genotypes once phase is
taken into account, we expected little or no difference in rhythmic
pattern change except the phase delay in rve8-1. We first compared
the performance of a commonly used method, COSOPT [26],
and a relatively new algorithm, JTK_CYCLE [27], for detecting
cycling genes in Col. Both algorithms test correlations between the
experimental time course data and a series of cosine models
[26,27], however, JTK_CYCLE uses a nonparametric test and
was reported to identify rhythmic genes more reliably with
enhanced resistance to outliers and improved computational
efficiency [27]. Based on previous studies [2,4,27,28] and our
empirical tests, a pMMCb , 0.05 for COSOPT and multiple-
measure adjusted p vlaue , 0.05 for JTK_CYCLE were chosen as
significance thresholds. JTK_CYCLE identified slightly more
cycling genes than COSOPT in Col (4082 found by JTK_CYCLE
compared to 3923 found by COSOPT) with 68 to 71% of the
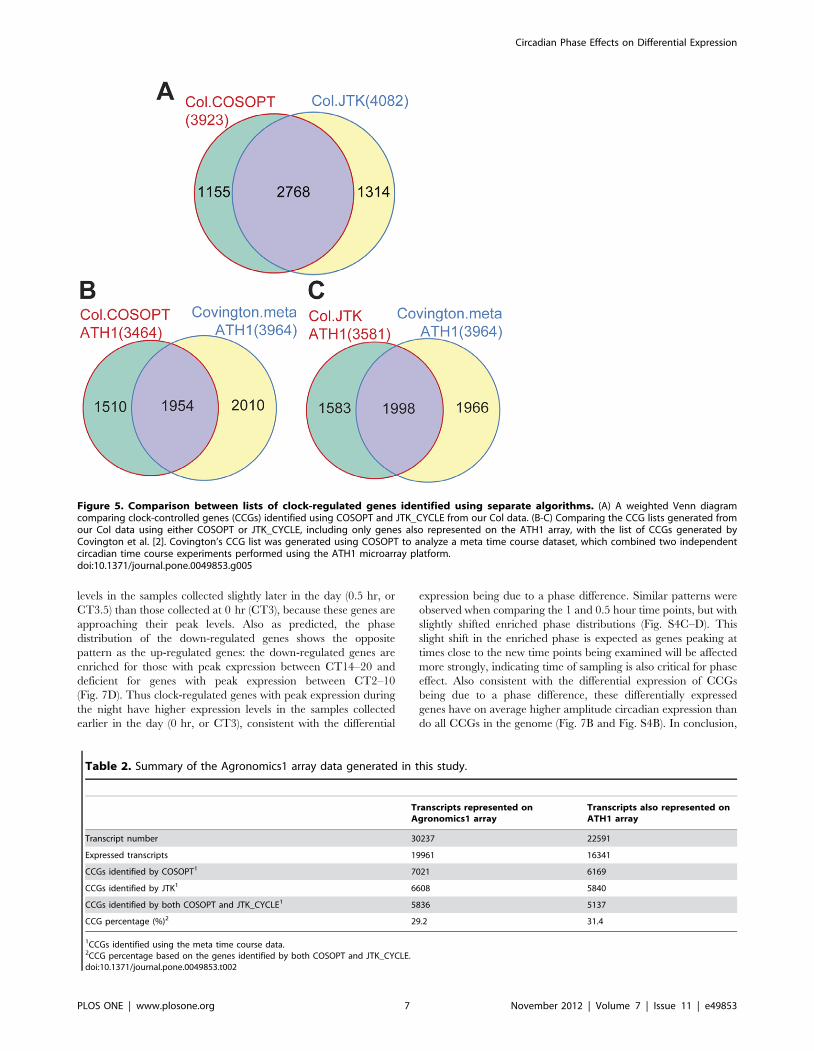
genes shared between the two lists (Fig. 5A). We also examined the
agreement between these gene lists and that obtained in a previous
study by Covington et al. performed using ATH1 arrays [2]. This
previous list was produced using COSOPT to analyze a meta-
dataset generated by combining two independent time courses,
both from Col plants [2]. Considering only genes also represented
on the ATH1 array, our current CCG lists produced by
JTK_CYCLE and COSOPT have similar overlaps with the
Covington gene list, with slightly better coverage provided by the
JTK_CYCLE list (Fig. 5B – C). The agreement between either our
COSOPT or our JTK_CYCLE list with Covington’s list (,50%)
Figure 1. Most of the genes differentially expressed between Col and rve8-1 are clock-regulated. Plants were entrained in light/darkcycles for 7 days before release to constant light and temperature (free run). Samples were harvested at 4-hour intervals over two days, starting after72 hours in free run. RNA was extracted and labeled and then hybridized to tiling microarrays. (A–H) The expression patterns of the 8 mostdifferentially expressed genes. The 72 and 96 hours in the x-axis correspond to subjective dawn. Genes expressed with a circadian rhythm (C–H)display a phase delay of about four hours in rve8-1, but only At3g09600 (RVE8) also has an obvious expression level difference (C). (I) A weighted Venndiagram presents the relative portion of clock-controlled genes (CCGs) among differentially expressed (DE) genes.doi:10.1371/journal.pone.0049853.g001
Circadian Phase Effects on Differential Expression
PLOS ONE | www.plosone.org 3 November 2012 | Volume 7 | Issue 11 | e49853

is greater than a previous report showing around one-third of
CCGs overlapping between independent circadian microarray
studies [2], suggesting our CCG lists generated using Agronomics1
arrays are reliable. Since JTK_CYCLE takes only about 1/32 of
the computing time required by COSOPT and the performance
of the two algorithms is similar (Figure 5), we believe
JTK_CYCLE to be better suited for analysis of large data sets.
To compare rhythmic gene expression in Col and rve8-1, we
determined the cycling genes lists in rve8-1 by JTK_CYCLE using
the same criteria as described above. A similar number of cycling
genes are found in rve8-1 and in Col (3635 and 4082, respectively).
Furthermore the overlap between the CCGs found in Col and in
rve8-1 is about 44 and 49% of each data set (Fig. S1), which is
similar to what we observed when comparing our Col data set with
a previously published list generated using Col plants (Fig. 5B–C).
These results suggest circadian expression patterns are not strongly
different between Col and rve8-1, consistent with the very small
number of genes we find differentially expressed between these
genotypes after we have compensated for phase (Fig. 4). Inspection
of the genes only classified as clock-regulated in one genotype
suggest that these genes are actually clock-regulated in the other
genotype as well. For example, FT is classified as cycling in Col but
not in rve8-1 by JTK_CYCLE, but the transcript shows reasonable
cycling in both genotypes by both microarray and qRT-PCR
analysis (Fig. 2E). This suggests that circadian analysis of single
genotypes, with only 12 time points considered per time course,
results in many CCGs being missed due to insufficient statistical
power.
Covington et al have reported a solution to improve the low
statistical power common in many circadian microarray studies:
combining data sets from different time courses with similar
growth conditons to create a meta-time course allowing more
reliable and robust detection of circadian rhythms [2]. Since there
is little appreciable difference in the transcriptional profiles
between Col and rve8-1 once phase is accounted for (Fig. 2A),
we combined these two time courses to create a four-day meta-
time course consisting of 24 separate samples. Upon analysis of
this four-day meta-time course with COSOPT and JTK_CYCLE,
we identified 7021 (Table S1) and 6608 genes (Table S2) as clock-
controlled, respectively (Table 2). Notably 5836 genes overlap
between the two CCG lists (corresponding to 83% and 88% of
genes identified by COSOPT and JTK_CYCLE, respectively,
Fig. 6A). We next compared the lists of cycling genes generated
using our 24 sample (Col + rve8-1) meta time course with that
generated by Covington et al. using a 25 sample (Col + Col) meta
time course [2]. Restricting our analysis to genes represented on
the ATH1 arrays, we found that the CCG lists generated by either
COSOPT or JTK_CYCLE cover about 71–72% of the genes
defined as CCGs by Covington using COSOPT (Fig. 6B–C). This
is much better agreement than we found using only our Col time
course (Fig. 5B–C), suggesting that combining the Col and rve8-1
time courses to generate one meta data set enhanced identification
of CCGs.
We next compared the CCGs identified by both COSOPT and
JTK_CYCLE with those only identified by either one or the other
method. Genes found to be clock-regulated only by COSOPT or
only by JTK_CYCLE have significantly lower amplitudes than
Figure 2. The circadian transcriptome of rve8-1 has a 4-hour phase delay relative to wild type. (A) Hierarchical clustering of the 1557genes differentially expressed between the Col and rve8-1 time courses. Gene identifications are on the y-axis, time of sample collection andgenotype are on the x-axis. The color key indicates the expression level in log2 scale (red to light yellow: low to high expression) and overallfrequency of each expression level. (B–H) Validation of microarray results using qRT-PCR on clock-controlled genes with a range of amplitudes (shownfrom low to high amplitude). For each panel, the left part shows microarray data and the right shows qRT-PCR results (mean 6 SEM from threetechnical replicates) for the gene examined.doi:10.1371/journal.pone.0049853.g002
Circadian Phase Effects on Differential Expression
PLOS ONE | www.plosone.org 4 November 2012 | Volume 7 | Issue 11 | e49853

those identified by both methods (Fig. S2). This suggests that genes
only identified by one method are less robust cyclers than those
identified by both methods. We therefore considered the list of
genes identified as CCGs by both COSOPT and JTK_CYCLE as
CCGs for subsequent analyses; although we are likely omitting
true clock-regulated genes, we have high confidence in the genes
included in this group. Indeed this gene set, representing the
intersection between the COSOPT and JTK_CYCLE lists, still
includes ,68% of Covington’s CCGs (Fig. 6D). The 1281 genes
excluded from our CCG list but present in Covington’s list
(Fig. 6D) might include genes whose rhythmic expression damps
after a few days in free-run, as Convington’s meta set combines
two circadian time courses collected on days 2 and 3 of free run
while our samples were harvested on days 4 and 5 of free-run. Our
meta list created using the Agronomics1 array includes 3133 genes
not previously reported as CCGs by Covington et al. (Fig. S3), of
which 699 genes are not represented on the ATH1 array. These
additional CCGs include many well-documented clock-regulated
genes, such as PRR5, GI, LUX and CO (Table S1 and S2). Overall,
our cycling list shows good agreement with the previously
identified CCG list, with a similar fraction of the transcriptome
estimated to be clock-regulated in the two experiments [2]
(Table 2). We also validated some newly identified CCGs with
either low or high amplitudes using qRT-PCR (Fig. 2B–2F). The
reproducible detection of rhythmic gene expression using both
microarray and qRT-PCR techniques further suggests our CCG
list generated by analysis of the combined data sets is reliable. This
more complete list of CCGs may enable new insights into plant
physiology.
Phase Differences as Small as Half an Hour can Result inSignificantly Different Levels of Gene Expression
The phase difference between Col and rve8-1 after four days in
free-run is around four hours [17], which had a strong effect on
differential expression analysis despite limited changes in overall
gene expression levels (Figs. 1 and 4). To further investigate
potential effects of phase on determination of differential
expression, we used publicly available microarray datasets to
compare gene expression in Col vegetative shoots harvested at 30-
minute intervals [29]. In this experiment, plants were grown in
light/dark cycles and time 0 was defined as three hours after lights
on, which corresponds to circadian time 3 (CT3). We examined
gene expression levels in Col sampled at times 0, 0.5 and 1 hours.
Comparing the 0 and 0.5 hour (CT3 and CT3.5) samples, 790
genes are differentially expressed according to our criteria
(adjusted p value , 0.05, with analysis carried out using limma).
Of these, 483 are classified as clock-controlled in our meta data set
described above (,61%), much more than the ,1/3 expected by
chance (Fig. 7A and Table 3). We also found a greater fraction of
CCGs than expected when we compared the 0.5 hour and 1 hour
(CT3.5 and CT4) time points (,50% of the 1859 differentially-
expressed genes are clock regulated) (Fig. S4A and Table 3). In
both gene lists, CCGs are significantly overrepresented (p , 2.2 e-
16; Table 3).
If these CCGs are classified as differentially expressed solely due
to a phase difference between the times the plants were harvested,
we would predict that the up-regulated genes would be enriched
for a certain range of phases while the down-regulated genes
would be enriched for the opposite/complementary phases. In
Figure 3. Comparison of transcriptional profiles after compensation for the phase difference. (A) Diagram shows the time pointscompared to each other using limma either without phase adjustment (upper panel) or with phase adjustment (lower panel). After compensating forthe phase difference, Col_72 is compared to rve8_76, and so on. (B–D) New time course data alignments of genes previously classified as the mostsignificantly differentially expressed after adjusting for the phase difference. The time shown on the x-axes is that of the Col samples.doi:10.1371/journal.pone.0049853.g003
Circadian Phase Effects on Differential Expression
PLOS ONE | www.plosone.org 5 November 2012 | Volume 7 | Issue 11 | e49853

accordance with this prediction, genes with peak circadian
expression 4 to 8 hours after dawn (CT4 – CT8) are
overrepresented and oppositely phased genes are underrepresent-
ed amongst the genes that are up-regulated in our ‘‘0.5 vs 0 hour’’
comparison (Fig. 7C). Thus clock-regulated genes with peak
expression during the day (CT4–CT8) have higher expression
Figure 4. Genes differentially expressed between Col and rve8-1 after phase adjustment. (A-K) Genes with overall differences inexpression levels in rve8-1, graphed with the phase adjustment described in the main text. The time shown on the x-axes is that of the Col samples(72 and 96 hours corresponds to subjective dawn). These 11 genes (along with At1g53480 and RVE8 shown in Fig. 3B and 3D) are the only onesidentified as misexpressed in rve8-1. (L) Two out of the 13 differential expressed genes (DE) are classified as clock-controlled genes (CCGs) in both Coland rve8-1 (At4g29610 in Fig. 4J, and At5g47240 in Fig. 4K). Note that At5g20740, At1g52040, and At3g09600 (RVE8, Fig. 3D) which cycle in Col but notin rve8-1 (G, H), are not classified as CCGs in Fig. 4L.doi:10.1371/journal.pone.0049853.g004
Table 1. Annotations for the genes with differential expression levels in rve8-1 after correction for circadian phase.
AGI Short description
At1g53480 unknown protein
At5g11330 monooxygenase family protein
At3g09600 myb family transcription factor (RVE8)
At3g09580 amine oxidase family protein
At3g09590 pathogenesis-related protein, putative
At3g30720 QQS (QUA-QUINE STARCH)
At3g42658 transposable element gene
At1g14250 nucleoside phosphatase family protein / GDA1/CD39 family protein
At5g20740 invertase/pectin methylesterase inhibitor family protein
At1g52040 MBP1 (MYROSINASE-BINDING PROTEIN 1); protein binding
At1g52400 BGLU18 (BETA GLUCOSIDASE 18); catalytic/ cation binding / hydrolase, hydrolyzing O-glycosyl compounds
At4g29610 cytidine deaminase, putative / cytidine aminohydrolase, putative
At5g47240 atnudt8 (Arabidopsis thaliana Nudix hydrolase homolog 8); hydrolase
doi:10.1371/journal.pone.0049853.t001
Circadian Phase Effects on Differential Expression
PLOS ONE | www.plosone.org 6 November 2012 | Volume 7 | Issue 11 | e49853
levels in the samples collected slightly later in the day (0.5 hr, or
CT3.5) than those collected at 0 hr (CT3), because these genes are
approaching their peak levels. Also as predicted, the phase
distribution of the down-regulated genes shows the opposite
pattern as the up-regulated genes: the down-regulated genes are
enriched for those with peak expression between CT14–20 and
deficient for genes with peak expression between CT2–10
(Fig. 7D). Thus clock-regulated genes with peak expression during
the night have higher expression levels in the samples collected
earlier in the day (0 hr, or CT3), consistent with the differential
expression being due to a phase difference. Similar patterns were
observed when comparing the 1 and 0.5 hour time points, but with
slightly shifted enriched phase distributions (Fig. S4C–D). This
slight shift in the enriched phase is expected as genes peaking at
times close to the new time points being examined will be affected
more strongly, indicating time of sampling is also critical for phase
effect. Also consistent with the differential expression of CCGs
being due to a phase difference, these differentially expressed
genes have on average higher amplitude circadian expression than
do all CCGs in the genome (Fig. 7B and Fig. S4B). In conclusion,
Figure 5. Comparison between lists of clock-regulated genes identified using separate algorithms. (A) A weighted Venn diagramcomparing clock-controlled genes (CCGs) identified using COSOPT and JTK_CYCLE from our Col data. (B-C) Comparing the CCG lists generated fromour Col data using either COSOPT or JTK_CYCLE, including only genes also represented on the ATH1 array, with the list of CCGs generated byCovington et al. [2]. Covington’s CCG list was generated using COSOPT to analyze a meta time course dataset, which combined two independentcircadian time course experiments performed using the ATH1 microarray platform.doi:10.1371/journal.pone.0049853.g005
Table 2. Summary of the Agronomics1 array data generated in this study.
Transcripts represented onAgronomics1 array
Transcripts also represented onATH1 array
Transcript number 30237 22591
Expressed transcripts 19961 16341
CCGs identified by COSOPT1 7021 6169
CCGs identified by JTK1 6608 5840
CCGs identified by both COSOPT and JTK_CYCLE1 5836 5137
CCG percentage (%)2 29.2 31.4
1CCGs identified using the meta time course data.2CCG percentage based on the genes identified by both COSOPT and JTK_CYCLE.doi:10.1371/journal.pone.0049853.t002
Circadian Phase Effects on Differential Expression
PLOS ONE | www.plosone.org 7 November 2012 | Volume 7 | Issue 11 | e49853

these results demonstrate that even very small differences in
circadian phase (30 minutes in this example) can cause significant
differences in expression in large numbers of genes, especially
those with high circadian amplitudes.
Discussion
The Role of RVE8 in the Central Clock in ArabidopsisPrevious studies have shown that RVE8 affects the phase of
both central clock genes (CCA1, LHY, and TOC1) and output genes
(CCR2) in both loss-of-function T-DNA mutants and in overex-
pression lines [17,25]. Since the light input pathway was not
appreciably altered in these genotypes [17], these data suggested
RVE8 functions close to the central oscillator in Arabidopsis. By
determining the transcriptional profiles of Col and rve8-1 in the
current study, we have found that as expected given the one hour
long period phenotype of rve8 mutants, all of the central clock
components and output genes display an approximately four-hour
delay in rve8-1 after four days in free-run (Fig. 1 and Fig. 2). This
further supports the hypothesis that RVE8 plays a role in the
central clock in Arabidopsis.
After adjusting for the phase difference between these two time
courses, we identified very few genes with altered expression levels
or patterns in the rve8-1 mutant (Fig. 3 and Fig. 4). Among the 13
genes that do show defects in gene expression not accounted for by
phase, we identified four evening-phased CCGs (At5g20740,
At1g52040, At4g29610, and At5g47240) (Fig. 4G–H and 4J–K).
All four genes have reduced expression levels in rve8-1, while two
of them also lose the rhythmic pattern. RVE8 has been shown to
bind the EE in vitro and in vivo, and has peak protein levels in the
subjective afternoon [17]. Intriguingly, one or more EE-like
sequences (AAATATCT or AAAAATCT) are found within
1500 bp upstream of the transcriptional start sites of all four of
these genes (Figure S5), suggesting they might be direct targets of
RVE8. The reduced levels of these four evening-phased genes in
rve8-1 supports the idea that RVE8 promotes evening gene
expression, perhaps via modulation of histone 3 (H3) acetylation
[25].
Given the clear circadian phenotype in rve8-1 after four days in
free-run, it was surprising that only a few genes show overall
changes in expression levels. One explanation for this might be
partial genetic redundancy within the RVE/CCA1/LHY gene
Figure 6. Comparison of circadian-regulated gene lists generated using meta time course data. Col and rve8-1 time courses werecombined (in the order Col_76…Col_116, rve8_76, rve8_80, …, rve8_116, rve8_72) to create a meta time course data set spanning four days. Clock-controlled genes (CCGs) were identified either using COSOPT or JTK_CYCLE. (A) A weighted Venn diagram comparing CCGs in the meta time coursedata identified using either COSOPT or JTK_CYCLE. (B) Comparison of CCGs identified using COSOPT to analyze the combined Col and rve8-1 metadata set with CCGs identified in a previous study done using ATH1 arrays [2]; only genes also represented on ATH1 arrays were considered. (C)Comparison of CCGs identified using JTK_CYCLE to analyze the combined Col and rve8-1 meta data set with CCGs identified in a previous study doneon ATH1 arrays [2]; only genes also represented on ATH1 arrays were considered. (D) Comparison of CCGs identified by both COSOPT and JTK_CYCLEwith CCGs identified in a previous study done on ATH1 arrays [2]; only genes also represented on ATH1 arrays were considered.doi:10.1371/journal.pone.0049853.g006
Circadian Phase Effects on Differential Expression
PLOS ONE | www.plosone.org 8 November 2012 | Volume 7 | Issue 11 | e49853

family. There are 11 members in this family in Arabidopsis, each
containing a signature single MYB-like domain followed by a
proline-rich region. The closest homologs to RVE8 are RVE3,
RVE4, RVE5, and RVE6, of which all but RVE3 have also been
reported to associate with EE motifs [17]. Another possible
explanation could be that RVE8 acts in the afternoon to promote
evening-phased gene expression, affecting the timing of onset of
transcript accumulation, but does not appreciably influence peak
or trough transcript levels. According to this model, the rve8-1 long
period phenotype might be due to a delay in accumulation of
evening-phased clock genes rather than to overall changes in their
expression levels. Important future directions will be to examine
the expression levels of evening genes in plants mutant for multiple
RVE genes and to investigate the role of RVE8 on the precise
timing of clock gene expression.
Identification of Circadian-regulated GenesA number of time course microarray experiments on Arabi-
dopsis have been conducted to identify circadian-regulated genes
[3,4,22,30,31]. However, only a low percentage of genes (32–37%)
were found to overlap between clock-regulated gene lists generated
using separate datasets [2]. This could be due to insufficient
Figure 7. Small differences in circadian phase have profound effects on differential expression analysis. Differential expression analysisusing a publicly available dataset of Col harvested at time 0 (corresponding to circadian time 3, i.e., 3 hours after dawn, herein defined as ‘‘0 hr’’) and30 minutes later (herein defined as ‘‘0.5 hr’’) [29]. (A) A weighted Venn diagram presenting the proportion of clock-controlled genes (CCGs) amonggenes found to be differentially expressed between the 0 and 0.5 hour samples (DE[0.5 hr-0 hr]). (B) A box plot comparing the circadian amplitudesof the differentially expressed CCGs (DE.cyc[0.5 h-0 hr]) and those of all CCGs. The differentially expressed CCGs have on average significantly highercircadian amplitudes (p , 2.2e-16, Wilcox test). (C–D) The phase distributions of the CCGs classified as ‘‘up-regulated’’ or ‘‘down-regulated’’ between0.5 and 0 hours are plotted alongside the observed phase distribution of all identified CCGs (expected).doi:10.1371/journal.pone.0049853.g007
Table 3. Summary of differential expression analysis in theCol short sampling interval datasets.
Comparison DE1 CCGs2 CCG%3Medianamplitude4
0.5 hr - 0 hr 790 483 *** 61.1 0.2934 ***
1 hr - 0.5 hr 1859 930 *** 50.0 0.2482 ***
1Differentially expressed in the indicated comparison and passing theexpression filter in our Agronomics1 tiling array experiment;2clock-controlled genes identified in the meta time course set by both COSOPTand JTK_CYCLE;3the percentage of CCG in DE list;4Amplitudes were determined using JTK_CYCLE.Clock-controlled genes (CCGs) are overrepresented among the genesdifferentially expressed in samples harvested at 30 minute intervals (Fisher’sexact test on both sets, p , 2.2e-16, ***) when compared to the approximately1/3 of CCGs in the genome. These differentially expressed cycling genes alsohave significantly higher circadian amplitudes (Wilcox’s test on both sets, p ,
2.2e-16, ***) than all CCGs in the genome (median amplitude for allCCGs = 0.2001).doi:10.1371/journal.pone.0049853.t003
Circadian Phase Effects on Differential Expression
PLOS ONE | www.plosone.org 9 November 2012 | Volume 7 | Issue 11 | e49853

statistical power given the low sampling resolution (four hour
intervals), small number of replicates, and short time courses (two
days) in these experiments [2,28]. By combining two independent
microarray datasets followed by detection of rhythmic expression,
Covington et al. found a higher number of cycling genes (3975
genes) that captured 79–87% of the clock-regulated transcripts
identified in individual datasets [2]. These results demonstrate that
the use of meta-data allows the more reliable identification of
cycling genes and significantly increases the agreement between
different data sets.
Given the close similarity between our wild-type and rve8-1
datasets, we used the approach previously described by Covington
et al. [2] and integrated these two independent datasets before
identification of CCGs. We found that 6608 out of 19961
expressed genes (33%) are classified as CCGs using JTK_CYCLE
and a similar number of cycling genes (7021, 35%) are identified
using a second method, COSOPT. This ratio of cycling genes is
similar to the 36% of the expressed genes identified as CCGs by
Covington et al. [2]. Notably, 5835 genes were found in common
between the CCGs identified by either COSOPT or
JTK_CYCLE. Furthermore, when we restricted our CCG list to
the intersection of CCGs identified by both methods, our gene list
still contains 68% of the genes identified in the Covington’s study.
This is remarkably good agreement considering this previous study
used a different microarray platform and identified CCGs using
only COSOPT. Indeed, the agreement between our CCG list and
that of Covington et al. is greater than that previously found when
comparing independent circadian microarray studies [2].
In addition to reliably identifying genes previously designated as
CCGs, we also identified 3133 CCGs not included in the
Covington et al. list. 699 of these are not represented on ATH1
arrays; the remaining 2434 may have been identified as CCGs in
our but not previous experiments because Agronomics1 tiling
arrays are reported to yield more reliable expression levels than
ATH1 arrays [23]. In contrast, Covington’s list contains 1135
CCGs that are not identified in our data sets. This may in part be
due to differences in sampling times, as Covington’s list was
generated from two time courses collected on the 2nd and 3rd day
in free-run while our samples were harvested on the 4th and 5th
day in free-run, at which point some less robust circadian rhythms
may have damped. Despite this, our analysis has generated a more
complete cycling list that includes a number of previously missed,
well-documented, clock-regulated genes as well as novel clock-
regulated genes. This more complete gene list will provide a useful
reference for future study, especially for analysis of genes not
represented on the ATH1 array.
Even Small Differences in Circadian Phase have StrongEffects on Gene Expression
We have demonstrated that without taking phase into account,
1557 genes are identified as differentially expressed between Col
and rve8-1, although follow-up analysis revealed that very few
genes showed alterations in overall expression levels or patterns
between these genotypes. Remarkably, we also found that even a
30-minute difference in phase (just 2.1% of a 24 hour period)
results in the statistically significant misexpression of hundreds of
genes. Most of these differentially expressed genes (50–61%) are
CCGs (Fig. 7A and S4A, and Table 3), underscoring the
importance of the circadian clock in genome-wide regulation of
transcription. However, the effect of circadian phase on the
observed differential expression could still be underestimated.
Hughes et al. compared the numbers of CCGs identified using
samples collected at 1-, 2-, 3-, or 4-hour intervals over two days
[28]. They found that many fewer clock-regulated transcripts were
identified using samples collected at 4-hour intervals, as done in
our and most other circadian studies, than in the other sampling
regimes. In addition, genes with ultradian rhythms (periods of 8 or
12 hours) could only be detected when samples were collected at
intervals of less than 4 hours [28]. Therefore even more of the
genes identified as differentially expressed in these samples may be
clock-regulated than we estimate. Furthermore, other biological
periodic rhythms may contribute to phase differences between
samples. For example, 416 genes (out of 6220 genes in the
genome) in Saccharomyces cerevisiae and approximately 700 genes in
human cells grown in tissue culture have been reported to show
cell-cycle-associated rhythms [32,33].
Our study provides a cautionary note for all biologists: one
should meticulously take the ‘‘time’’ into account when designing
experiments, always harvesting control samples at the same time
(more precisely, at the same phase) since differences as small as 30
minutes in time of sampling can have profound effects on
experimental results. For large experiments that require a lengthy
sample collection times, randomization of genotypes and replicates
will help minimize the profound effects of phase on expression
levels. We further suggest that investigators determine if CCGs are
overrepresented amongst their differentially expressed genes; if so,
this might be a sign that the differential expression is at least
partially due to phase differences between the samples. Finally,
while our current study has focused on transcriptional regulation,
the circadian phase difference that we observed would likely also
affect other physiological processes such as metabolic events,
suggesting it is important to take time of day into account when
designing all types of large-scale experiments.
Materials and Methods
Plant Material, RNA Processing and Array HybridizationSeeds of rve8-1 [17] and Col-0 (originally obtained from Lehle
Seeds) were sterilized, plated on Murashige and Skoog (MS) agar
media containing 3% sucrose, and stratified at 4uC in the dark for
two days. Seedlings were then grown under 12 hours light (50–
60 mmol m22s21 white fluorescent light):12 hours dark conditions
at 22uC for 7 days before being released into constant white light.
Samples (,50 plants per samples) were collected every four hours
on the 4th and 5th days in free-run, immediately frozen in liquid
nitrogen, and then stored at –80uC until being processed. Total
RNA was prepared with TRIzol reagent (Invitrogen), treated with
RNase-free DNase I (Qiagen), and further purified using the
RNeasy MinElute Cleanup Kit (Qiagen). The quality of the
isolated RNA was determined by NanoDrop ND 1000 (NanoDrop
Technologies) and Bioanalyzer 2100 (Agilent). Samples with a
260 nm: 280 nm ratio and a 260 nm: 230 nm ratio between 2 and
2.3, and an RIN (RNA integrity number) value greater than 8
were processed further. Biotin-labeled cRNA was prepared using
the GeneChip 39 IVT Express kit (Affymetrix) and hybridized
onto Affymetrix AGRONOMICS1 Arabidopsis tiling arrays as
previously described [23].
Agronomics1 Array Data AnalysisAnalysis was performed using an open source software under
the Bioconductor [34] project with the statistical programming
language R version 2.13 [35]. The poorly performing probes (since
probes on the tiling array are restricted to fixed windows along the
chromosome, the sequences of 25mer oligonucleotides may not
have optimal hybridization properties) were dynamically masked
during the analysis using the scripts provided by Rehrauer et al.
[23] and were excluded from probe set summaries. Background
correction, normalization, and summarization of probe sets were
Circadian Phase Effects on Differential Expression
PLOS ONE | www.plosone.org 10 November 2012 | Volume 7 | Issue 11 | e49853

based on the Agronomics1 ‘‘all genes’’ CDF files with TAIR.9
annotation [23] and Robust Multichip Averaging (RMA) [36]
implemented in the Aroma.Affymetrix package [37]. After this
low-level analysis, genes with at least four time points showing
expression levels greater than log24.5 in either the Col or the rve8-1
time course were considered to be expressed, and were used for
the downstream analysis. Differential analysis was performed using
the limma (Linear models for microarray data) package [24]:
briefly, the 5th day data were treated as replicates of the 4th day
data in each genotype. Accordingly, six time points with two
replicates in Col and rve8-1 were included in the linear model, and
then empirical Bayes statistics were applied to determine the
differential expression between the comparisons. An adjusted p
value of less than 0.05 was used as a significance threshold. A heat
map of the hierarchical clustering of the differentially expressed
genes was created using the heatmap.2 function implemented in
gplots package [38]. For comparing gene lists, weighted Venn
diagrams were created using the Vennerable package [39]. For
determining the significance of the relative proportions of clock-
controlled genes in the differentially expressed gene lists in a given
comparison and in the whole transcriptome, Fisher’s exact test was
performed using the fisher.test function in R.
The raw data and normalized results have been deposited in the
Gene Expression Omnibus database (GEO) (http://www.ncbi.
nlm.nih.gov/geo) with accession number GSE37278.
qRT-PCRRNA was isolated using TRIzol (Invitrogen) and was treated
with DNase I (Qiagen). cDNA was synthesized using Super-
Scriptase II (Invitrogen) following the manufacturer’s protocol.
qRT-PCR was performed as previously described [40]. Three
technical triplicates for each sample were run using an iQ5 Real
Time PCR machine (Bio-Rad), and starting quantity was
estimated from critical thresholds using the standard curve
method. Data were normalized to the respective PROTEIN
PHOSPHATASE 2A (PP2A) expression levels in each sample. The
primer sets for each transcript are listed in Table S3.
Identification of Cycling Genes Using JTK_CYCLE andCOSOPT
The Col and rve8-1 two-day time course data were first analyzed
separately using JTK_CYCLE to identify clock-controlled genes in
each genotype. Genes with a period ranging from 20 to 28 hours
and an adjusted p value less than 0.05 are considered cycling. In
order to obtain more statistical power for the identification of
clock-regulated genes, the Col and rve8-1 time courses were
combined (in the order Col CT_72, 76, …116, followed by
rve8_76, 80, … 116, 72) to create a four-day meta time course, and
circadian-regulated genes were identified using two independent
cycling-detecting algorithms, JTK_CYCLE and COSOPT. In
both cases, we required the estimated circadian period to be
between 20–28 hours. Based on previous studies [26,27] and our
empirical tests, the significance thresholds for identification of
clock-regulated genes were set to an adjusted p-value , 0.05 for
JTK_CYCLE and a pMMC-b , 0.05 for COSOPT. For genes
with estimated periods other than 24 hours, phase was adjusted
according to the ratio of its period to 24 hours.
Analysis of AtGenExpress DataThe raw data from AtGenExpress ME00325 [29] was
normalized using RMA [36] before differential expression analysis
was carried out using limma [24]. All time points (0, 0.5, 1, 3, 6,
12, and 24 hrs) of the Col shoot control samples were included in
the linear model. The contrasts comparing ‘‘0.5 and 0 hrs’’ and ‘‘1
and 0.5 hrs’’ were then made. Genes with differential expression
given a statistical threshold of an adjusted p-value , 0.05 for
either comparison were separated into up- and down-regulated
genes. The Wilcox test was performed to examine if the circadian
amplitudes of differentially expressed CCGs and those of all CCGs
are significantly different. The phase distributions of these up- and
down-regulated CCGs were plotted in comparison to those of all
CCGs to determine if any particular phase was overrepresented or
underrepresented. Amplitudes and phases were determined by
JTK_CYCLE using the meta time course data as described above.
Supporting Information
Figure S1 A weighted Venn diagram indicating the overlap
between the CCG lists identified from the separate Col and rve8-1
datasets using JTK_CYCLE. The overlap is 44 and 49% of each
data set. This level of agreement compares favorably to the one
third overlap observed between two similar, independent data sets
generated in Col [2], implying that the circadian rhythms in
transcript levels between these two genotypes are unlikely to be
significantly different.
(PDF)
Figure S2 Box plots presenting amplitudes of genes classified as
clock-regulated in Col either by COSOPT alone (A) or
JTK_CYCLE alone (B) and those of genes identified by both
algorithms (JTK/COSOPT overlap). Genes only identified as
cycling by one method have significantly lower amplitudes than
those identified by both methods. The lower amplitudes indicate
those genes are cycling less robustly and might explain why they
are only found using one or the other method. The amplitudes are
significantly different with p , 2.2e-16 (significance determined
using Wilcox test).
(PDF)
Figure S3 A weighted Venn diagram presenting the overlap
between CCGs identified in the meta time course data with all the
transcripts present on Agronomics1 tiling array and the CCGs
identified by Covington et al. [2] using the ATH1 array.
(PDF)
Figure S4 A thirty minute difference in circadian phase has
profound effects on differential expression analysis. Differential
expression analysis using a publicly available dataset of Col plants
harvested at time 0.5 (corresponding to circadian time 3.5, herein
defined ‘‘0.5 hr’’) and 30 minutes later (herein defined ‘‘1 hr’’)
[29]. (A) A weighted Venn diagram presenting the proportion of
clock-controlled genes (CCGs) among genes differentially ex-
pressed between the 1 and 0.5 hour samples (DE[1 hr - 0.5 hr]).
(B) A box plot comparing the amplitudes of the differentially
expressed CCGs (DE.cyc[1 h - 0.5 hr]) and those of all CCGs.
The differentially expressed CCGs have on average significantly
higher amplitude than all CCGs (p , 2.2e-16, Wilcox test). (C–D)
The phase distributions of the CCGs classified as ‘‘up-regulated’’
or ‘‘down-regulated’’ between 1 and 0.5 hours are plotted
alongside the observed phase distribution of all known CCGs
(expected).
(PDF)
Figure S5 The promoters of the four evening-phased genes that
are differentially expressed in rve8-1 contain one or more EE
(AAATATCT) or EE-like (AAAAATCT) sequences. The graph
shown is the output of the SCOPE motif finder (http://genie.
dartmouth.edu/scope/) [41].
(PDF)
Circadian Phase Effects on Differential Expression
PLOS ONE | www.plosone.org 11 November 2012 | Volume 7 | Issue 11 | e49853
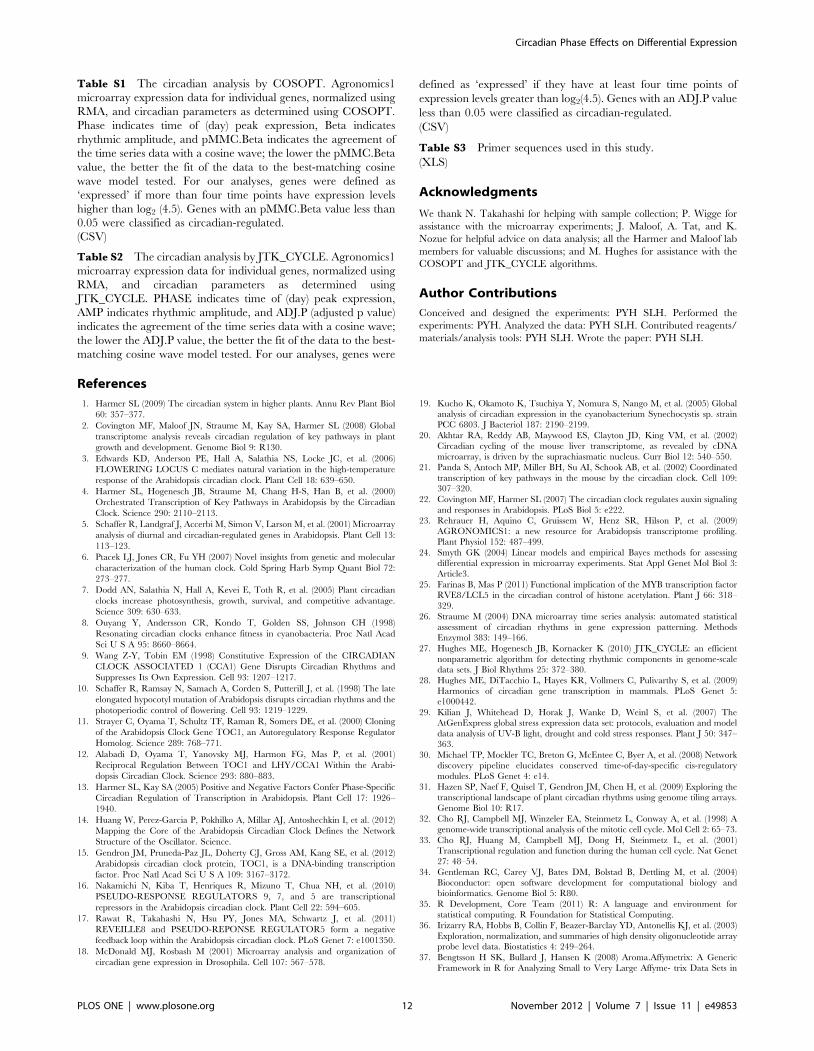
Table S1 The circadian analysis by COSOPT. Agronomics1
microarray expression data for individual genes, normalized using
RMA, and circadian parameters as determined using COSOPT.
Phase indicates time of (day) peak expression, Beta indicates
rhythmic amplitude, and pMMC.Beta indicates the agreement of
the time series data with a cosine wave; the lower the pMMC.Beta
value, the better the fit of the data to the best-matching cosine
wave model tested. For our analyses, genes were defined as
‘expressed’ if more than four time points have expression levels
higher than log2 (4.5). Genes with an pMMC.Beta value less than
0.05 were classified as circadian-regulated.
(CSV)
Table S2 The circadian analysis by JTK_CYCLE. Agronomics1
microarray expression data for individual genes, normalized using
RMA, and circadian parameters as determined using
JTK_CYCLE. PHASE indicates time of (day) peak expression,
AMP indicates rhythmic amplitude, and ADJ.P (adjusted p value)
indicates the agreement of the time series data with a cosine wave;
the lower the ADJ.P value, the better the fit of the data to the best-
matching cosine wave model tested. For our analyses, genes were
defined as ‘expressed’ if they have at least four time points of
expression levels greater than log2(4.5). Genes with an ADJ.P value
less than 0.05 were classified as circadian-regulated.
(CSV)
Table S3 Primer sequences used in this study.
(XLS)
Acknowledgments
We thank N. Takahashi for helping with sample collection; P. Wigge for
assistance with the microarray experiments; J. Maloof, A. Tat, and K.
Nozue for helpful advice on data analysis; all the Harmer and Maloof lab
members for valuable discussions; and M. Hughes for assistance with the
COSOPT and JTK_CYCLE algorithms.
Author Contributions
Conceived and designed the experiments: PYH SLH. Performed the
experiments: PYH. Analyzed the data: PYH SLH. Contributed reagents/
materials/analysis tools: PYH SLH. Wrote the paper: PYH SLH.
References
1. Harmer SL (2009) The circadian system in higher plants. Annu Rev Plant Biol
60: 357–377.
2. Covington MF, Maloof JN, Straume M, Kay SA, Harmer SL (2008) Global
transcriptome analysis reveals circadian regulation of key pathways in plant
growth and development. Genome Biol 9: R130.
3. Edwards KD, Anderson PE, Hall A, Salathia NS, Locke JC, et al. (2006)
FLOWERING LOCUS C mediates natural variation in the high-temperature
response of the Arabidopsis circadian clock. Plant Cell 18: 639–650.
4. Harmer SL, Hogenesch JB, Straume M, Chang H-S, Han B, et al. (2000)
Orchestrated Transcription of Key Pathways in Arabidopsis by the Circadian
Clock. Science 290: 2110–2113.
5. Schaffer R, Landgraf J, Accerbi M, Simon V, Larson M, et al. (2001) Microarray
analysis of diurnal and circadian-regulated genes in Arabidopsis. Plant Cell 13:
113–123.
6. Ptacek LJ, Jones CR, Fu YH (2007) Novel insights from genetic and molecular
characterization of the human clock. Cold Spring Harb Symp Quant Biol 72:
273–277.
7. Dodd AN, Salathia N, Hall A, Kevei E, Toth R, et al. (2005) Plant circadian
clocks increase photosynthesis, growth, survival, and competitive advantage.
Science 309: 630–633.
8. Ouyang Y, Andersson CR, Kondo T, Golden SS, Johnson CH (1998)
Resonating circadian clocks enhance fitness in cyanobacteria. Proc Natl Acad
Sci U S A 95: 8660–8664.
9. Wang Z-Y, Tobin EM (1998) Constitutive Expression of the CIRCADIAN
CLOCK ASSOCIATED 1 (CCA1) Gene Disrupts Circadian Rhythms and
Suppresses Its Own Expression. Cell 93: 1207–1217.
10. Schaffer R, Ramsay N, Samach A, Corden S, Putterill J, et al. (1998) The late
elongated hypocotyl mutation of Arabidopsis disrupts circadian rhythms and the
photoperiodic control of flowering. Cell 93: 1219–1229.
11. Strayer C, Oyama T, Schultz TF, Raman R, Somers DE, et al. (2000) Cloning
of the Arabidopsis Clock Gene TOC1, an Autoregulatory Response Regulator
Homolog. Science 289: 768–771.
12. Alabadi D, Oyama T, Yanovsky MJ, Harmon FG, Mas P, et al. (2001)
Reciprocal Regulation Between TOC1 and LHY/CCA1 Within the Arabi-
dopsis Circadian Clock. Science 293: 880–883.
13. Harmer SL, Kay SA (2005) Positive and Negative Factors Confer Phase-Specific
Circadian Regulation of Transcription in Arabidopsis. Plant Cell 17: 1926–
1940.
14. Huang W, Perez-Garcia P, Pokhilko A, Millar AJ, Antoshechkin I, et al. (2012)
Mapping the Core of the Arabidopsis Circadian Clock Defines the Network
Structure of the Oscillator. Science.
15. Gendron JM, Pruneda-Paz JL, Doherty CJ, Gross AM, Kang SE, et al. (2012)
Arabidopsis circadian clock protein, TOC1, is a DNA-binding transcription
factor. Proc Natl Acad Sci U S A 109: 3167–3172.
16. Nakamichi N, Kiba T, Henriques R, Mizuno T, Chua NH, et al. (2010)
PSEUDO-RESPONSE REGULATORS 9, 7, and 5 are transcriptional
repressors in the Arabidopsis circadian clock. Plant Cell 22: 594–605.
17. Rawat R, Takahashi N, Hsu PY, Jones MA, Schwartz J, et al. (2011)
REVEILLE8 and PSEUDO-REPONSE REGULATOR5 form a negative
feedback loop within the Arabidopsis circadian clock. PLoS Genet 7: e1001350.
18. McDonald MJ, Rosbash M (2001) Microarray analysis and organization of
circadian gene expression in Drosophila. Cell 107: 567–578.
19. Kucho K, Okamoto K, Tsuchiya Y, Nomura S, Nango M, et al. (2005) Globalanalysis of circadian expression in the cyanobacterium Synechocystis sp. strain
PCC 6803. J Bacteriol 187: 2190–2199.
20. Akhtar RA, Reddy AB, Maywood ES, Clayton JD, King VM, et al. (2002)
Circadian cycling of the mouse liver transcriptome, as revealed by cDNA
microarray, is driven by the suprachiasmatic nucleus. Curr Biol 12: 540–550.
21. Panda S, Antoch MP, Miller BH, Su AI, Schook AB, et al. (2002) Coordinated
transcription of key pathways in the mouse by the circadian clock. Cell 109:307–320.
22. Covington MF, Harmer SL (2007) The circadian clock regulates auxin signaling
and responses in Arabidopsis. PLoS Biol 5: e222.
23. Rehrauer H, Aquino C, Gruissem W, Henz SR, Hilson P, et al. (2009)
AGRONOMICS1: a new resource for Arabidopsis transcriptome profiling.Plant Physiol 152: 487–499.
24. Smyth GK (2004) Linear models and empirical Bayes methods for assessingdifferential expression in microarray experiments. Stat Appl Genet Mol Biol 3:
Article3.
25. Farinas B, Mas P (2011) Functional implication of the MYB transcription factorRVE8/LCL5 in the circadian control of histone acetylation. Plant J 66: 318–
329.
26. Straume M (2004) DNA microarray time series analysis: automated statistical
assessment of circadian rhythms in gene expression patterning. MethodsEnzymol 383: 149–166.
27. Hughes ME, Hogenesch JB, Kornacker K (2010) JTK_CYCLE: an efficient
nonparametric algorithm for detecting rhythmic components in genome-scaledata sets. J Biol Rhythms 25: 372–380.
28. Hughes ME, DiTacchio L, Hayes KR, Vollmers C, Pulivarthy S, et al. (2009)Harmonics of circadian gene transcription in mammals. PLoS Genet 5:
e1000442.
29. Kilian J, Whitehead D, Horak J, Wanke D, Weinl S, et al. (2007) TheAtGenExpress global stress expression data set: protocols, evaluation and model
data analysis of UV-B light, drought and cold stress responses. Plant J 50: 347–363.
30. Michael TP, Mockler TC, Breton G, McEntee C, Byer A, et al. (2008) Networkdiscovery pipeline elucidates conserved time-of-day-specific cis-regulatory
modules. PLoS Genet 4: e14.
31. Hazen SP, Naef F, Quisel T, Gendron JM, Chen H, et al. (2009) Exploring thetranscriptional landscape of plant circadian rhythms using genome tiling arrays.
Genome Biol 10: R17.
32. Cho RJ, Campbell MJ, Winzeler EA, Steinmetz L, Conway A, et al. (1998) A
genome-wide transcriptional analysis of the mitotic cell cycle. Mol Cell 2: 65–73.
33. Cho RJ, Huang M, Campbell MJ, Dong H, Steinmetz L, et al. (2001)Transcriptional regulation and function during the human cell cycle. Nat Genet
27: 48–54.
34. Gentleman RC, Carey VJ, Bates DM, Bolstad B, Dettling M, et al. (2004)
Bioconductor: open software development for computational biology andbioinformatics. Genome Biol 5: R80.
35. R Development, Core Team (2011) R: A language and environment for
statistical computing. R Foundation for Statistical Computing.
36. Irizarry RA, Hobbs B, Collin F, Beazer-Barclay YD, Antonellis KJ, et al. (2003)
Exploration, normalization, and summaries of high density oligonucleotide arrayprobe level data. Biostatistics 4: 249–264.
37. Bengtsson H SK, Bullard J, Hansen K (2008) Aroma.Affymetrix: A Generic
Framework in R for Analyzing Small to Very Large Affyme- trix Data Sets in
Circadian Phase Effects on Differential Expression
PLOS ONE | www.plosone.org 12 November 2012 | Volume 7 | Issue 11 | e49853

Bounded Memory. Technical Report 745. Department of Statistics, University
of California, Berkeley, CA.38. Warnes GR (2011) gplots: Various R programming tools for plotting data.
39. Swinton J (2011) Vennerable: Venn and Euler area-proportional diagrams.
R package version 2.1/r78.
40. Martin-Tryon EL, Kreps JA, Harmer SL (2007) GIGANTEA acts in blue light
signaling and has biochemically separable roles in circadian clock and floweringtime regulation. Plant Physiol 143: 473–486.
41. Carlson JM, Chakravarty A, DeZiel CE, Gross RH (2007) SCOPE: a web server
for practical de novo motif discovery. Nucleic Acids Res 35: W259–264.
Circadian Phase Effects on Differential Expression
PLOS ONE | www.plosone.org 13 November 2012 | Volume 7 | Issue 11 | e49853
Copyright © 2022 FDOKUMEN