SEASONAL CHANGE IN LEAF AREA INDEX AT THREE SITES ALONG A SOUTH AMERICAN LATITUDINAL GRADIENT
16
3 ECOTROPICA 12: 87-102, 2006 © Society for Tropical Ecology SEASONAL CHANGE IN LEAF AREA INDEX AT THREE SITES ALONG A SOUTH AMERICAN LATITUDINAL GRADIENT Louise H. Emmons 1 , Patrick Chatelet 2 , Laurent Cournac 3 , Nigel C.A. Pitman 4 , Vicente Vilca V. 4 , Luis Fernando del Aguila 5 & Marc A. Dubois 6 1 Department of Zoology NHB 390 MRC 108, Smithsonian Institution, P.O. Box 37012, Washington, DC 20013-7012 USA 2 CNRS/URA 1183, Museum National d'Histoire Naturelle, 4 avenue du Petit Chateau, 91800 Brunoy, France CEA Cadarache, DSV/DEVM, Laboratoire d'Ecophysiologie de la Photosynthese, 13108 Saint Paul Lez Durance Cedex, France 4 Asociacion para la Conservacion de la Cuenca Amazonfa, Calle Cuzco 499, Puerto Maldonado, Mad re de Dios, Peru 5 Fundacion Amigos de la Naturaleza, Santa Cruz de la Sierra, Bolivia 6 CEA Saclay, DSM/DRECAM, Service de Physique de I'Etat Condense, L'Orme des Merisiers, 91191 Gif surYvette, France Abstract. We measured Leaf Area Index (LAI) monthly, by light transmittance, on two 0.5 km to 1 km transects at each of three South American localities spanning a wide gradient in latitude and dry season severity. Our goals were: (1) to evaluate whether we could use a simple methodology to measure seasonal foliar changes in forest cover; (2) to examine the magnitude of seasonal changes within and between sites; and (3) to see how measured LAI patterns correlated with rainfall and litterfall phenology. Each site showed a predictable annual cycle in LAI. The magnitude of seasonal differences was directly related to the severity of the dry season. Median monthly LAI varied roughly inversely with rainfall: at all sites yearly minima occurred in the months of maximum rainfall, and maxima were recorded in the early to mid dry season. Transects with wet-season flooding had lower LAI than did more xeric transects. Litterfall patterns suggest that the major part of within- site seasonal LAI differences are due to deciduousness. This seemingly obvious result is counterbalanced by the many still unresolved interactions between climate, insolation, deciduousness, and seasonal light availability in tropical forest under- stories. Accepted 17July 2006. Key words: Bolivia, foliage, French Guiana, Leaf Area Index, light, Peru, phenology, seasonality, tropicalforest. INTRODUCTION factor of tree recruitment and growth within forests T r . • i /T ATN i • ii • i (Denslow^d/. 1990). Largely for technical reasons, Lear Area index (LAI), the vertically integrated sur- . , r r\ r i i as outlined by de Wasseige et al. (2003), there have lace ol leaves per unit ol ground area, can be a mea- . r i. r °,. rT . . . r r ir i i • rr been lew studies ol seasonality ol LAI in tropical for- sure ol several lundamental properties ol lorest vege- ,, , , , ••. ' , . •• , ,. , , j • • j ests (Maass et al. 1995, Winhetal. 2001, de Wasseige tation, including photosynthetic productivity and . r -r \ , i • T i • c et al. 2003, Kalacska, Sanchez-Azofeira et al. 2005). structural complexity. Leaves are the primary sites ol , ,. , .. , ITATI-I 1 here have been no lone-term studies and lew studies photosynthesis and transpiration, thus the LAI, which . ... i.-i- -ii • comparing different sites with a standard methodol- mtegrates the light interception by the canopy, is at ^ c- APT . i ii- i ii i j ogy (Kalacska, Sanchez-Azoleila et al. 2005). How- the stand scale directly related to carbon and water OJ . ' . -ii i A c ever, a recently-developed simple technology lor mea- exchange with the atmosphere. As a measurement ol . . J r r . r ,. . • • T ATI-1 • a i i sunng LAI indirectly, by light transmission (LAIL: light interception, LAI likewise rellects plant growth. ° (,<?•<• • TT i .. i -i I-.- • . ..,,... Cournac et al. 2002), has meditated data collection Understory light availability is the principal limiting . so that in contrast to other methods, long transects of hundreds of points are easily sampled to yield data on a landscape scale that are useful for integrating with e-mail: [email protected] satellite imagery or forestry data for large areas. 87
-
Upload
fieldmuseum -
Category
Documents
-
view
0 -
download
0
Transcript of SEASONAL CHANGE IN LEAF AREA INDEX AT THREE SITES ALONG A SOUTH AMERICAN LATITUDINAL GRADIENT
3
ECOTROPICA 12: 87-102, 2006 © Society for Tropical Ecology
SEASONAL CHANGE IN LEAF AREA INDEX AT THREE SITES ALONG A SOUTH AMERICAN LATITUDINAL GRADIENT
Louise H. Emmons1, Patrick Chatelet2, Laurent Cournac3, Nigel C.A. Pitman4, Vicente Vilca V.4, Luis Fernando del Aguila5 & Marc A. Dubois6
1 Department of Zoology NHB 390 MRC 108, Smithsonian Institution, P.O. Box 37012, Washington, DC 20013-7012 USA
2CNRS/URA 1183, Museum National d'Histoire Naturelle, 4 avenue du Petit Chateau, 91800 Brunoy, France
CEA Cadarache, DSV/DEVM, Laboratoire d'Ecophysiologie de la Photosynthese, 13108 Saint Paul Lez Durance Cedex, France
4Asociacion para la Conservacion de la Cuenca Amazonfa, Calle Cuzco 499, Puerto Maldonado, Mad re de Dios, Peru
5 Fundacion Amigos de la Naturaleza, Santa Cruz de la Sierra, Bolivia 6 CEA Saclay, DSM/DRECAM, Service de Physique de I'Etat Condense, L'Orme des Merisiers,
91191 Gif surYvette, France
Abstract. We measured Leaf Area Index (LAI) monthly, by light transmittance, on two 0.5 km to 1 km transects at each of three South American localities spanning a wide gradient in latitude and dry season severity. Our goals were: (1) to evaluate whether we could use a simple methodology to measure seasonal foliar changes in forest cover; (2) to examine the magnitude of seasonal changes within and between sites; and (3) to see how measured LAI patterns correlated with rainfall and litterfall phenology. Each site showed a predictable annual cycle in LAI. The magnitude of seasonal differences was directly related to the severity of the dry season. Median monthly LAI varied roughly inversely with rainfall: at all sites yearly minima occurred in the months of maximum rainfall, and maxima were recorded in the early to mid dry season. Transects with wet-season flooding had lower LAI than did more xeric transects. Litterfall patterns suggest that the major part of within- site seasonal LAI differences are due to deciduousness. This seemingly obvious result is counterbalanced by the many still unresolved interactions between climate, insolation, deciduousness, and seasonal light availability in tropical forest under- stories. Accepted 17July 2006.
Key words: Bolivia, foliage, French Guiana, Leaf Area Index, light, Peru, phenology, seasonality, tropical forest.
INTRODUCTION factor of tree recruitment and growth within forests
T r. • i /T ATN i • ii • i (Denslow^d/. 1990). Largely for technical reasons, Lear Area index (LAI), the vertically integrated sur- . , r r\ r i i as outlined by de Wasseige et al. (2003), there have lace ol leaves per unit ol ground area, can be a mea- . r i. r °,. rT . . . r
r ir i i • rr been lew studies ol seasonality ol LAI in tropical for- sure ol several lundamental properties ol lorest vege- ,, , , , ••. ' , . ••
, ,. , , j • • j ests (Maass et al. 1995, Winhetal. 2001, de Wasseige tation, including photosynthetic productivity and . r -r \
, i • T i • c et al. 2003, Kalacska, Sanchez-Azofeira et al. 2005). structural complexity. Leaves are the primary sites ol
, ,. , .. , ITATI-I 1 here have been no lone-term studies and lew studies photosynthesis and transpiration, thus the LAI, which . ... i.-i- -ii • comparing different sites with a standard methodol-
mtegrates the light interception by the canopy, is at ^ c- APT . i ii- i ii i j ogy (Kalacska, Sanchez-Azoleila et al. 2005). How- the stand scale directly related to carbon and water OJ . '
. -ii i A c ever, a recently-developed simple technology lor mea- exchange with the atmosphere. As a measurement ol . .J r r . r ,. . • • T ATI-1 • a i i sunng LAI indirectly, by light transmission (LAIL: light interception, LAI likewise rellects plant growth. ° (,<?•<• • TT i .. i -i I-.- • . ..,,... Cournac et al. 2002), has meditated data collection Understory light availability is the principal limiting .
so that in contrast to other methods, long transects of hundreds of points are easily sampled to yield data on a landscape scale that are useful for integrating with
e-mail: [email protected] satellite imagery or forestry data for large areas.
87
EMMONS ETAL.
In 2001 we launched a collaborative effort (ECO- FIT France, Amazon Conservation Association, LHE) to compare seasonal changes in LAI in three South American forests spanning 18 degrees of latitude and a gradient in the length and severity of the dry season. All three field sites have well-studied floras and re- search programs which provide the floristic data that is a necessary adjunct to LAI studies (Killeen and Schulenberg 1998, Bongers etal. 2001, Pittman etal. 2001). Our goals were to: (1) measure the annual pat- terns of change in leaf cover across large transects of forest, as indicated by measurements of LAI* (see below for use of the quantity defined as LAI* = &.LAI/0.88); (2) compare the patterns of intra-site dif- ferences between forests on different soil moisture re- gimes; (3) compare interannual patterns with rainfall patterns; and (4) compare annual patterns between sites with differing dry-season stress. We here report the results of four or more years of measurements.
STUDY SITES AND METHODS
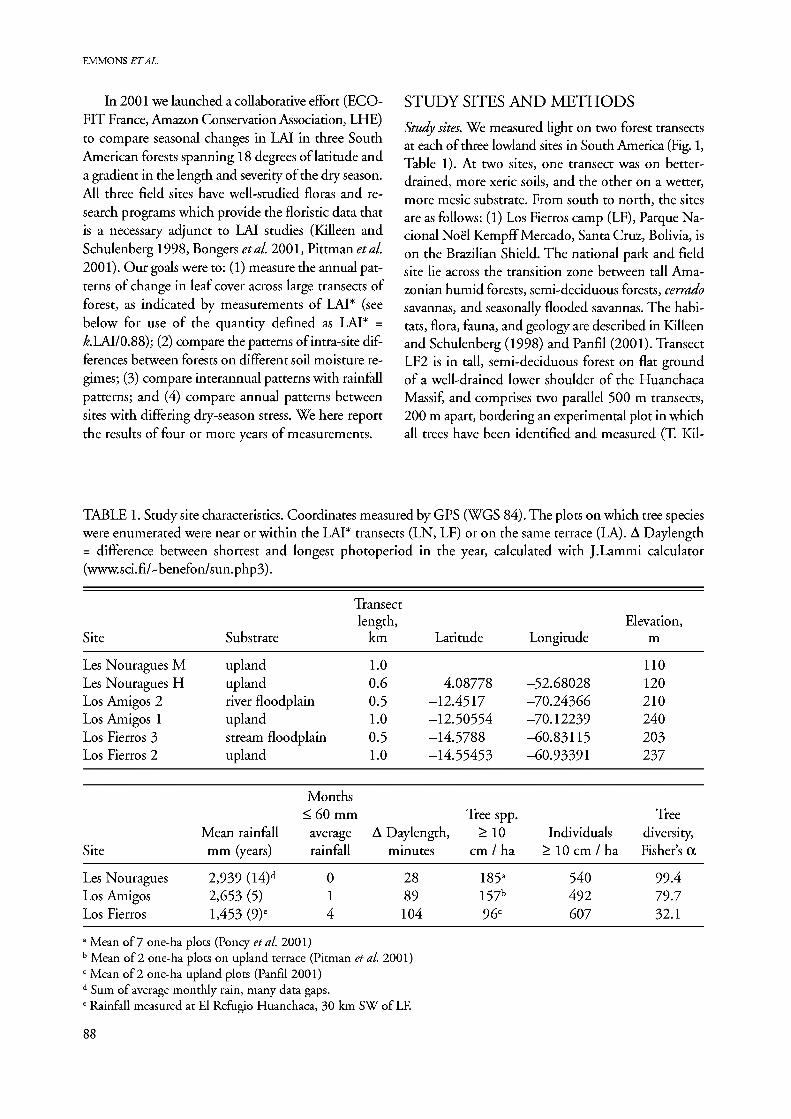
Study sites. We measured light on two forest transects at each of three lowland sites in South America (Fig. 1, Table 1). At two sites, one transect was on better- drained, more xeric soils, and the other on a wetter, more mesic substrate. From south to north, the sites are as follows: (1) Los Fierros camp (LF), Parque Na- cional Noel Kempff Mercado, Santa Cruz, Bolivia, is on the Brazilian Shield. The national park and field site lie across the transition zone between tall Ama- zonian humid forests, semi-deciduous forests, cerrado savannas, and seasonally flooded savannas. The habi- tats, flora, fauna, and geology are described in Killeen and Schulenberg (1998) and Panfil (2001). Transect LF2 is in tall, semi-deciduous forest on flat ground of a well-drained lower shoulder of the Huanchaca Massif, and comprises two parallel 500 m transects, 200 m apart, bordering an experimental plot in which all trees have been identified and measured (T Kil-
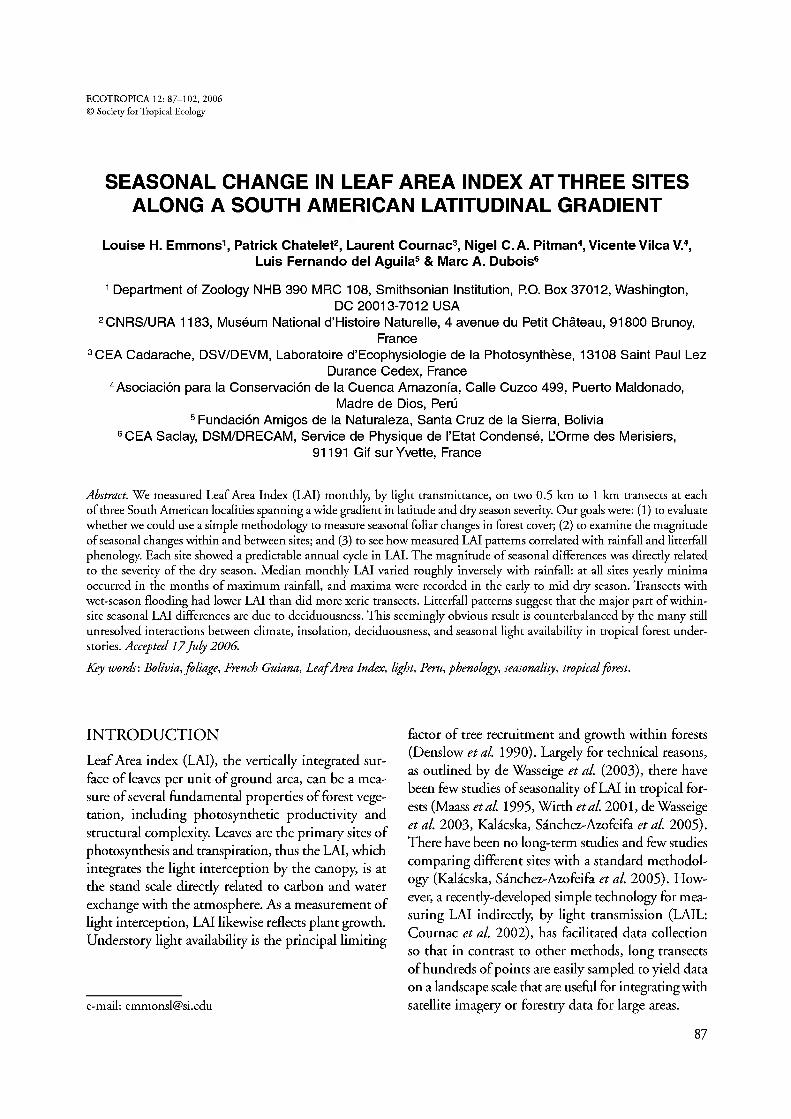
TABLE 1. Study site characteristics. Coordinates measured by GPS (WGS 84). The plots on which tree species were enumerated were near or within the LAI* transects (LN, LF) or on the same terrace (LA). A Daylength = difference between shortest and longest photoperiod in the year, calculated with J.Lammi calculator (www.sci.fi/^benefon/sun.php3).
Transect length, Elevation,
Site Substrate km Latitude Longitude m
Les Nouragues M upland 1.0 110 Les Nouragues H upland 0.6 4.08778 -52.68028 120 Los Amigos 2 river floodpl; iin 0.5 -12.4517 -70.24366 210 Los Amigos 1 upland 1.0 -12.50554 -70.12239 240 Los Fierros 3 stream floodplain 0.5 -14.5788 -60.83115 203 Los Fierros 2 upland 1.0 -14.55453 -60.93391 237
Months < 60 mn L Tree spp. Tree
Mean rainfall average A Daylength, > 10 Individuals diversity, Site mm (years) rainfall minutes cm / ha >10 cm / ha Fisher's a
Les Nouragues 2,939 (I4)d 0 28 185a 540 99.4 Los Amigos 2,653 (5) 1 89 157b 492 79.7 Los Fierros 1,453 (9)c 4 104 96c 607 32.1
a Mean of 7 one-ha plots (Poncy et al. 2001) b Mean of 2 one-ha plots on upland terrace (Pitman etal. 2001) c Mean of 2 one-ha upland plots (Panfil 2001) d Sum of average monthly rain, many data gaps. c Rainfall measured at El Refugio Huanchaca, 30 km SW of LF.
88
SEASONAL CHANGE IN LEAF AREA INDEX
Les Nouragues
Los Amigos
FIG. 1. Locations of the three study sites.
leen, unpublished). Transect LF3, about 15 km from LF2, is 90° to the LF airstrip, in tall, semi-deciduous forest in lowland streamside habitat susceptible to epi- sodes of brief flooding, with temporary standing water during the wet season. (2) Centra de Investigation Rio Los Amigos (LA), near the confluence of the Los Ami- gos and Madre de Dios rivers in Madre de Dios, Peru, is on Subandean Quaternary fluvial deposits that form high terraces bordering river floodplains. The transects are in continuous, tall, semi-evergreen Amazonian for- est. Transect LAI is in tall, mature forest characterized by brazil-nut groves (Bertholletia excelsa) on a high, well-drained terrace dissected by a few small streams within deep erosion gullies. Transect LA2, in low-lying floodplain of the Rio Madre de Dios, is on permanently moist soil seasonally subject to temporary flooding and pools of standing water, but it is not vdrzea forest. This forest is a late stage of river-meander successional vegetation, likely several hundred years old (Foster 1990, Puhakka & Kalliola 1993, Emmons & Dubois 2003). The two LA transects are over 4 km apart. (3) Les Nouragues Field Station (LN), French Guiana, on the Guiana Shield, lies in continuous, tall evergreen forest. The station, climate, vegetation, and fauna are described in Bongers et al. (2001). Transect LNM is mostly of mature forest, but with signs of anthropo-
genic disturbance (likely of Amerindian origin >100 ybp). It is on the "Grand Plateau," a substrate of met- amorphic rocks of the Paramaca series with clay soil. Transect LNH is on the "Petit Plateau," 500 m west of LNM, on granites and crystalline rocks of the Caraibe series partly covered with sandy-clay soil. Neither transect is subject to seasonal standing water. Dry-season length and severity vary inversely with la- titude of the sites (Table 2), as do yearly photoperiod range and tree species richness (Table 1). LN is on the boreal seasonal cycle, while LA and LF are austral.
Light measurements. We marked measured transects with permanent tags at 10 m intervals, where we took light readings. We measured light with a simple LAIL apparatus (Cournac etal. 2002) that has been favour- ably compared with several other methods (Ferment etal. 2001). Transmitted light is recorded with a light- dependent resistor behind an economical off-the-shelf fish-eye lens (spy-hole optic). The method uses the Beer-Lambert law to calculate the attenuation of light by vegetation (I = I0 e ~kLA1; where I = transmitted light, I0 = incident light, k = extinction coefficient). We directly derive a quantity which is not LAI, but rather k.LM, where k is a geometric foliage light-ex- tinction factor of order unity associated with leaf
89
EMMONS ETAL.
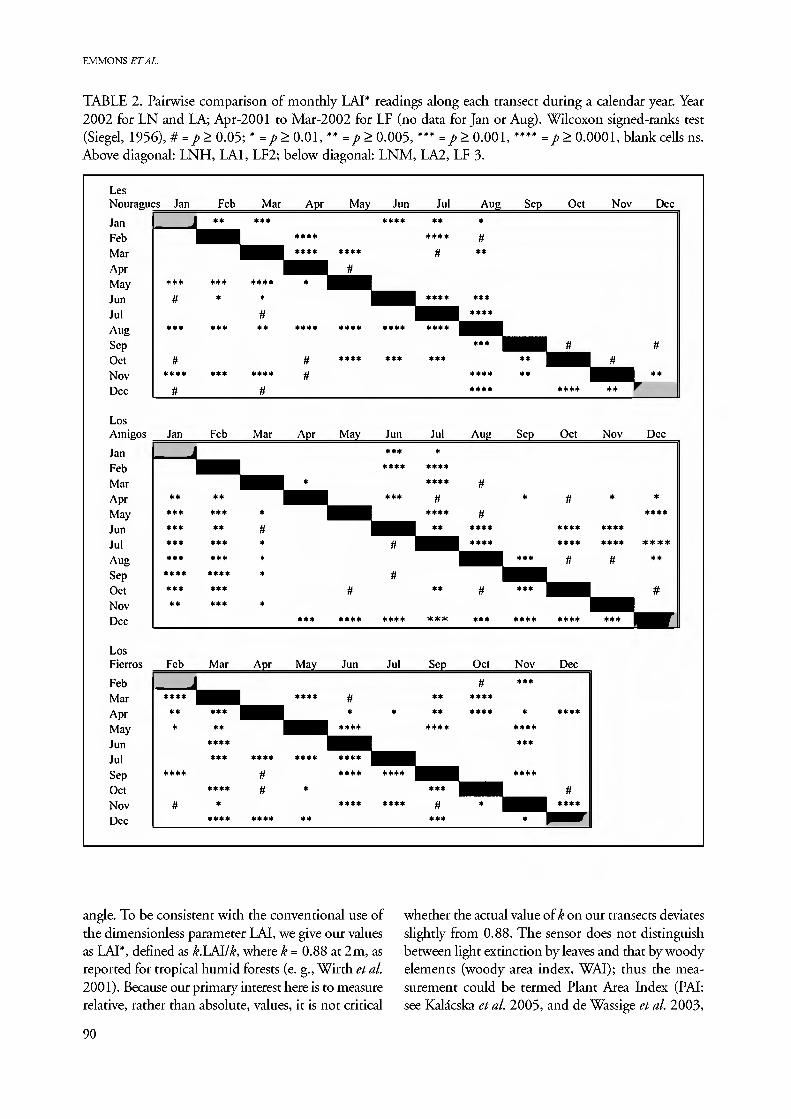
TABLE 2. Pairwise comparison of monthly LAI* readings along each transect during a calendar year. Year 2002 for LN and LA; Apr-2001 to Mar-2002 for LF (no data for Jan or Aug). Wilcoxon signed-ranks test (Siegel, 1956), # = p> 0.05; * = p> 0.01, ** = p> 0.005, *** =/>> 0.001, **** =/>> 0.0001, blank cells ns. Above diagonal: LNH, LAI, LF2; below diagonal: LNM, LA2, LF 3.
Nouragu
Jan Feb Mar Apr May Jun Jul Aug Sep Oct No\ Dec
Los Amigos
Jan Feb Mar Apr May Jun Jul Aug Sep Oct No\ Dec
Los Fierros
Feb Mar Apr May Jun Jul Sep Oct No\ Dec
is Jan Feb Mar Apr May Jun Jul Auu Sep Oct Nov 1 )ec
*S; *** **** **** ****
#
**** ****
U
****
*
ft <•• *
| | | ****
# #
#
**
***
#
***
ft ****
n
• • I
• * *
• * (
**** •
# **
****
#
*
****
0 it
****
****
****
* t *
****
*** ***
****
** **
**** **
Jan Feb Mar Apr May Jun Jul Aug Sep Oct Nov Dec
*
* • • * :-•
****
# ****
**
#
# **** ****
*
***
#
**** ****
#
*
**** ****
#
* ****
**** **
#
** *** *** *** ***
**** *** **
** • •. •-
••••• t
t * •
* 11
**** •:-• * •
* • •
*
# * * *
* r,
n
**** * **
#
* • •
***
**** **** ***
Feb Mar Apr May Jun Jul Sep Oct Nov Dec
**** # *
**** *
M
** ****
# **** ****
***
* **** ***
****
****
# ****
**** ** *
*** **
**** V * *
**** •
****
****
it «
****
****
•
**
**** ****
****
**** ***
# -s * *
* *
angle. To be consistent with the conventional use of the dimensionless parameter LAI, we give our values as LAI*, defined as k.LM/k, where k = 0.88 at 2m, as reported for tropical humid forests (e. g., Wirth etal. 2001). Because our primary interest here is to measure relative, rather than absolute, values, it is not critical
whether the actual value of k on our transects deviates slightly from 0.88. The sensor does not distinguish between light extinction by leaves and that by woody elements (woody area index, WAI); thus the mea- surement could be termed Plant Area Index (PAL see Kalacska et al. 2005, and de Wassige et al. 2003,
90
SEASONAL CHANGE IN LEAF AREA INDEX
for discussions). Wirth & Reth (unpublished, cited in Wirth et al. 2001) estimated that extinction from WAI could equal 0.6 LAI in a deciduous German oak forest, while Kalacska, Calvo-Alvarado et al. (2005) calculated WAI as 0.4 + 0.14 for late successional tropical dry forest in Costa Rica. The contribution of WAI to light extinction is constant for a given transect and thus does not effect our measurements of seasonal change, but its percent importance would increase with decreasing canopy foliage, such that the area of leaves would be increasingly over-represented with increasing leaf loss (Kalacska, Calvo-Alvarado et al. 2005). Emmons & Dubois (2002) discuss the meth- od further; it has also been used in Madagascar (Cour- nac et al. 2004), Eastern Cameroon (Vincens et al. 2000), and Western Congo (Favier et al. 2004).
We made all light measurements between 11 h and 13 h, with the light sensor held at 2 m; only foli- age above this level influenced readings. When taking readings we placed the sensor within an arm's length of the marker, positioned to avoid small transient sunflecks and closely overhanging foliage. Larger, per- sistent, structural sunspots and gaps were sampled normally. We corrected for partial cloud cover as de- tailed in Cournac et al. (2002). We did not sample on days with complete cloud cover. Particularly at LF (Bolivia), dense atmospheric smoke from anthropo- genic burning often significandy decreased dry season solar radiation. We took control readings under open sky and removed any smoke effect from the measure- ment series for that day by normalizing full-sun read- ings to LAI* = 0. At the space and time scales of our project, we consider the ecosystem as more or less con- stant from year to year, and gaps due to treefalls are compensated by growth of other trees (turnover). If a tree fell at a measurement point along the transect, we took subsequent measurements at the same point.
LN (French Guiana) and LA (Peru) have year- round research staff, and measurements were taken on each transect once a month, as near to the same day of the month as weather permitted. LA transec- ts were sampled in 25 months from Apr-01 to Jun- 03, and on 12 additional months in 2004-5. LN was sampled in 39 months from Jul-01 to Dec-03. LF is unstaffed, is remote and difficult to reach in the wet season, and monthly measurements could only be taken on 8 (2001), 6 (2002), 3 (2003), 5 (2004), and 5 (2005) months of the study years. Continuous bad weather prevented sampling of one of the two LF transects in several wet season sessions, when dense clouds formed almost daily during the time window
required for readings. LAIL readings have a small ob- server bias (Cournac et al. 2002); to minimize this, readings at a given site were made as often as possible by the same observer.
Analysis. Because the nature of the forest structure causes asymmetrical punctual readings (sunflecks, tree- fall gaps) with fixed magnitude near LAI* = 0, which are not associated with the general canopy leaf cover, we use the median as the statistic for comparison, to reduce the influence of unidirectional sunlight "noise." This gives LAI* values slightly greater than do the means, but it does not change any of the re- lative comparisons treated below. As light readings were taken at the same markers on each transect for each monthly sample, we use the Wilcoxon matched- pairs signed-ranks test (Siegel 1956) for pairwise sta- tistical comparison of monthly samples for each of the six transects. Each light-reading point subtends a unique foliage and plant species configuration. The Wilcoxon signed-ranks test uses both the direction and magnitude of differences between two samples, with no assumption about the sign of differences. Un- der Ho: the medians of the samples do not differ. As our samples are large (N = 50 - 100 points) the ana- lysis gives p values (Siegel 1956). Tree diversity indi- ces are estimated with Fisher's a, defined implicitly by the formula S = a*ln(l+n/a), where S is number of taxa, n is number of individuals, and a is the Fis- her's a.
RESULTS
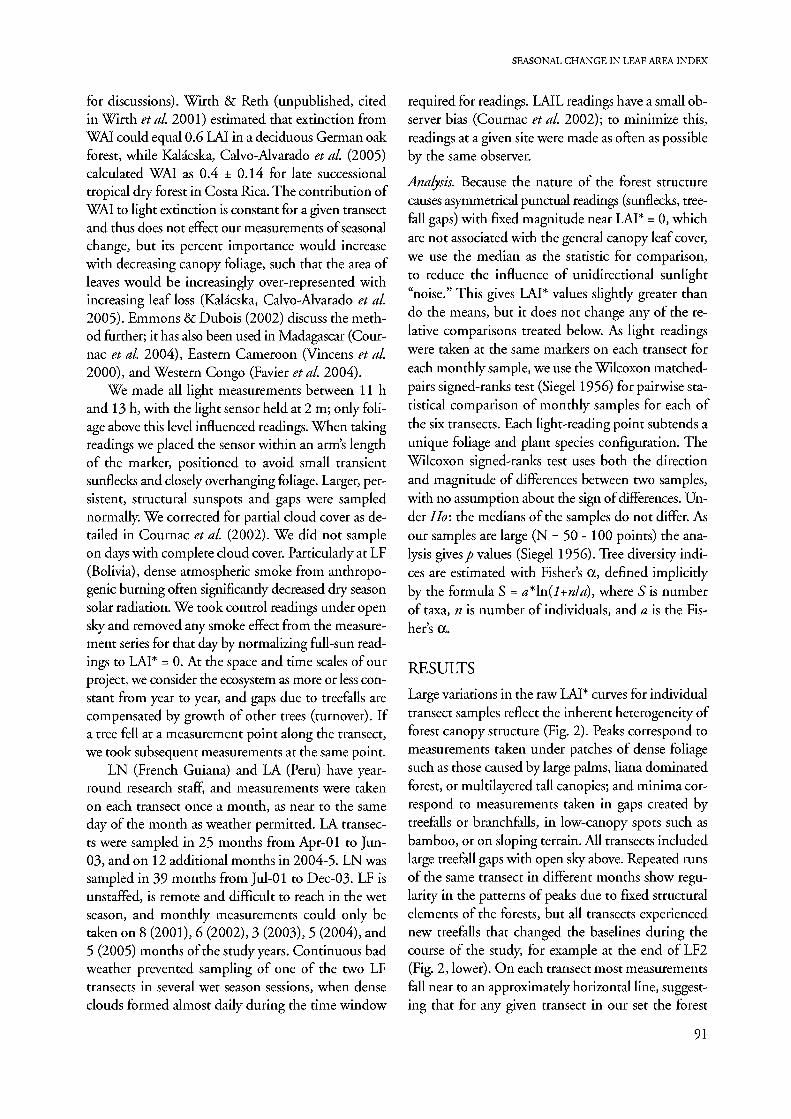
Large variations in the raw LAI* curves for individual transect samples reflect the inherent heterogeneity of forest canopy structure (Fig. 2). Peaks correspond to measurements taken under patches of dense foliage such as those caused by large palms, liana dominated forest, or multilayered tall canopies; and minima cor- respond to measurements taken in gaps created by treefalls or branchfalls, in low-canopy spots such as bamboo, or on sloping terrain. All transects included large treefall gaps with open sky above. Repeated runs of the same transect in different months show regu- larity in the patterns of peaks due to fixed structural elements of the forests, but all transects experienced new treefalls that changed the baselines during the course of the study, for example at the end of LF2 (Fig. 2, lower). On each transect most measurements fall near to an approximately horizontal line, suggest- ing that for any given transect in our set the forest
91
EMMONS ETAL.
Les Nouragues M 2002
1000
200 400 600 BOO 1000
Los Fierros 2
200 400 600 Distance, meters
800 1000
FIG. 2. Raw curves of LAI* transect data from the 1 km, upland forest transects at each site, including all samples from one calendar year (12 months for LN, LA, 8 months for LF). The shape of the top of the series reflects plant structure, the noise below the curves represents sunflecks and light gaps.
has a fairly uniform, "typical" foliage coverage, but that this differs between transects and sites (Fig. 2).
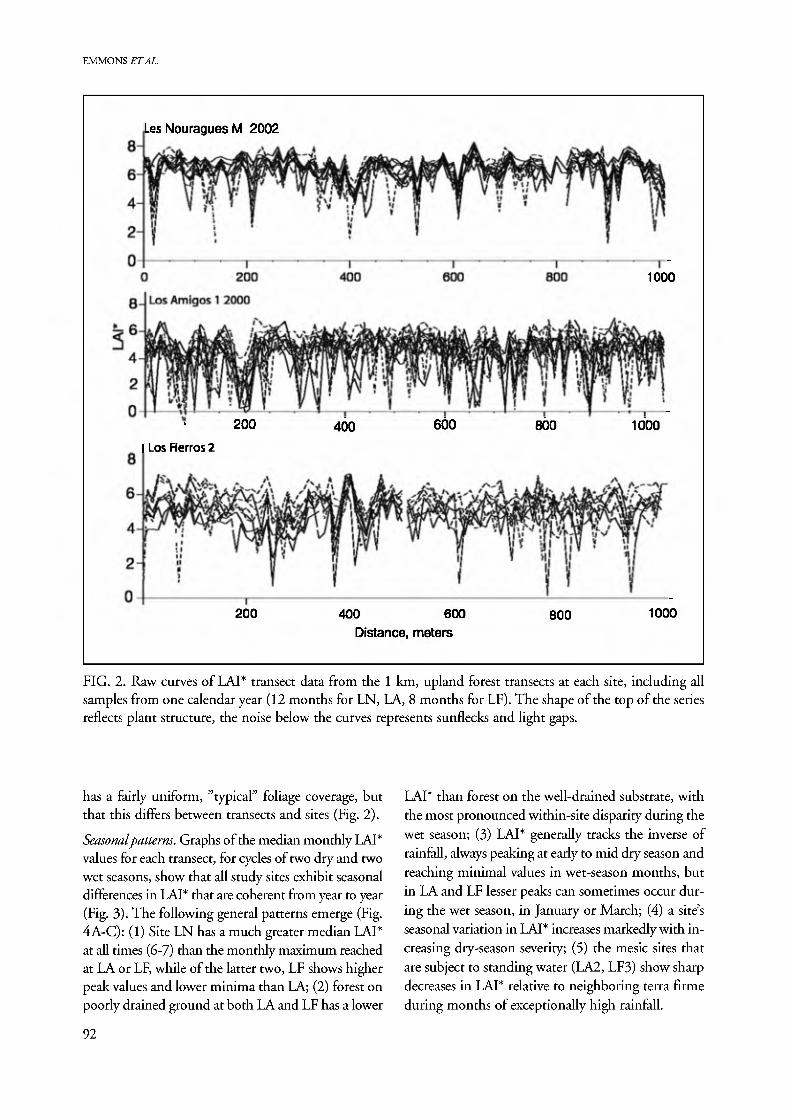
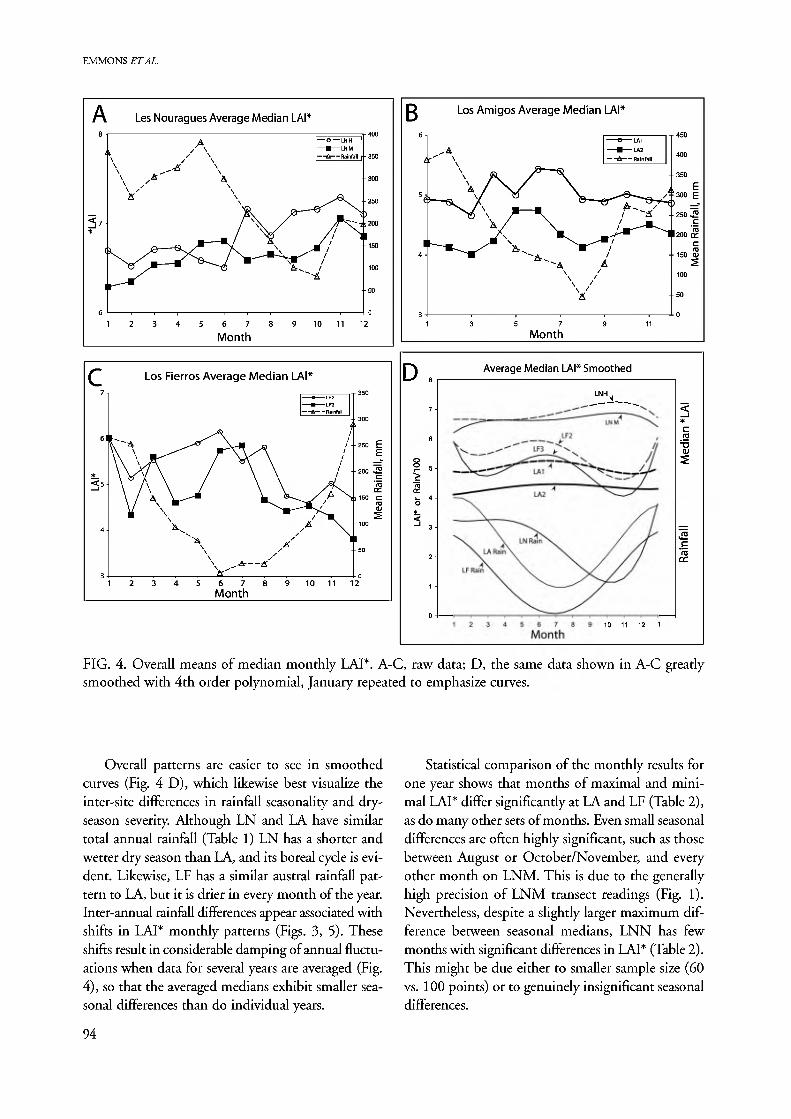
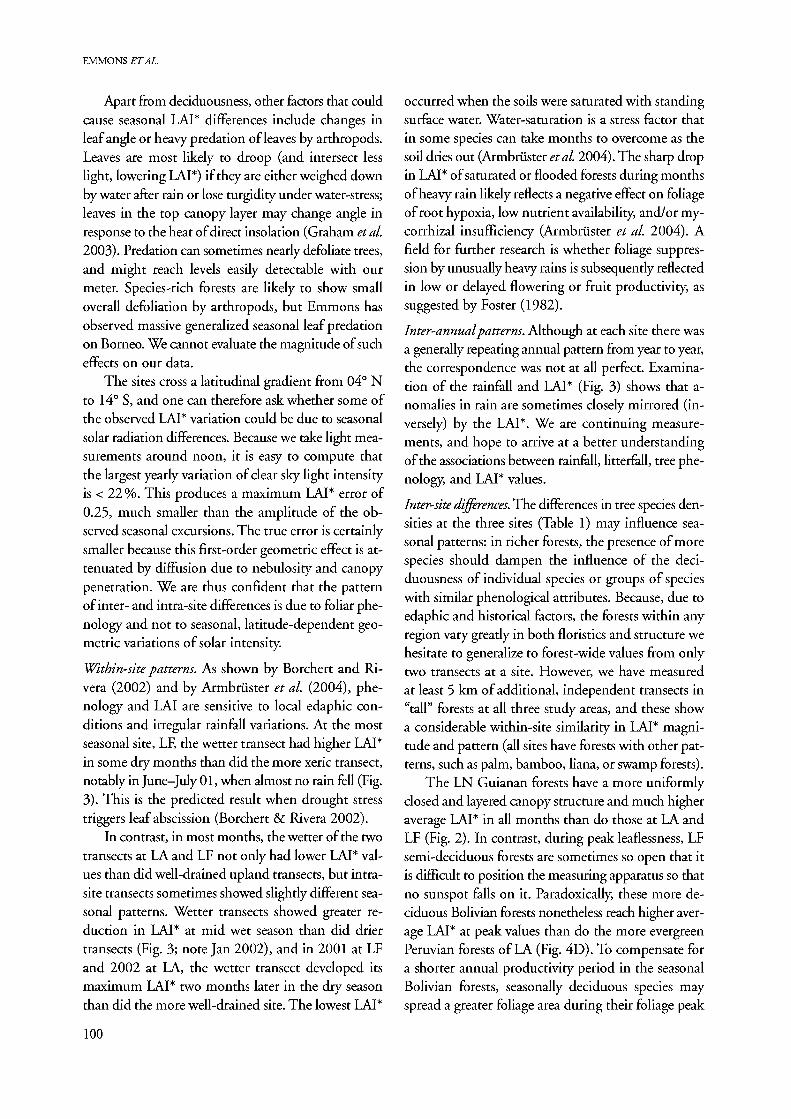
Seasonal patterns. Graphs of the median monthly LAI* values for each transect, for cycles of two dry and two wet seasons, show that all study sites exhibit seasonal differences in LAI* that are coherent from year to year (Fig. 3). The following general patterns emerge (Fig. 4A-C): (1) Site LN has a much greater median LAI*
at all times (6-7) than the monthly maximum reached at LA or LF, while of the latter two, LF shows higher peak values and lower minima than LA; (2) forest on poorly drained ground at both LA and LF has a lower
LAI* than forest on the well-drained substrate, with
the most pronounced within-site disparity during the
wet season; (3) LAI* generally tracks the inverse of
rainfall, always peaking at early to mid dry season and
reaching minimal values in wet-season months, but in LA and LF lesser peaks can sometimes occur dur-
ing the wet season, in January or March; (4) a site's
seasonal variation in LAI* increases markedly with in-
creasing dry-season severity; (5) the mesic sites that
are subject to standing water (LA2, LF3) show sharp
decreases in LAI* relative to neighboring terra firme
during months of exceptionally high rainfall.
92
SEASONAL CHANGE IN LEAF AREA INDEX
Les Nouragues
LN M LN H Rain
Apr-01 Jul-01 Oct-01 Jan-02 Apr-02 Jul-02 Oct-02 Jan-03 Apr-03 Jul-03 Oct-03
8 Los Amigos
Apr-01 Jul-01 Oct-01 Jan-02 Apr-02 Jul-02 Oct-02 Jan-03 Apr-03 Jul-03 Oct-03
Los Fierros
Jan-01Apr Jul Oct Jan-02Apr Jul Oct Jan-03Apr Jul Oct
Month
FIG. 3. Median monthly LAI* for two years on all transects, and local rainfall for those months (additional 2003-5 data not shown). Rainfall for LF was measured at El Refugio Huanchaca, 30 km from the transects.
93
EMMONS ETAL.
f\ Les Nouragues Average Median LAI*
i A •e LNH
• LNM
A Rainfall •350
•300
•250 V
5? * 1 \\ / /T^Ti200
^9 "~*
• 150
100
50
1 2 3 4 5 6 7 8 9 10 11 12
Month
B Los Amigos Average Median LAI*
i -4
© LAI
• LA2
A Rainfall -400
-350 \ /i / ^V
5 = A / \/ \ ,-, A ^.
4-
-A A
V
•250 J5 C
1200 CC
c • 150 <V
- 100
-50
3 5 7 9 11
Month
c Los Fierros Average Median LAI*
e LF2 • LF3 A Rainfall
• 300
4 i 61
\\ \ \\ \ \\ N
^° \•• » / sr\ / ®A \ / vy \ / \ \ /
• 250 E
E
200 J2 c
<,•*- X \^ V *-^//N CC ) 150 C
(Q
\ ^^m~"~?^_ O)
\ ' ^^ ^ 4-
• 100
\ • 50
\ ^•* T A-'
2 3456789 10 11 1 Month
2
D Average Median LAI* Smoothed
TO 0J
10 11 12 1
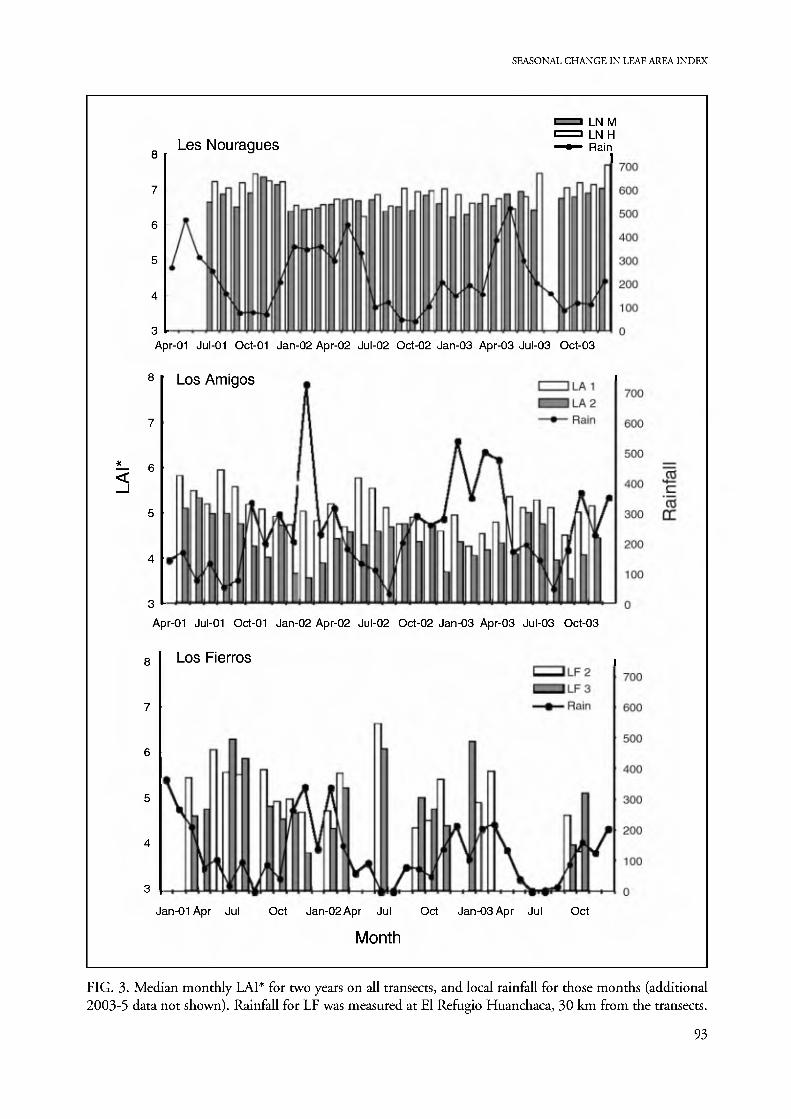
FIG. 4. Overall means of median monthly LAI*. A-C, raw data; D, the same data shown in A-C greatly smoothed with 4th order polynomial, January repeated to emphasize curves.
Overall patterns are easier to see in smoothed curves (Fig. 4 D), which likewise best visualize the inter-site differences in rainfall seasonality and dry- season severity. Although LN and LA have similar total annual rainfall (Table 1) LN has a shorter and wetter dry season than LA, and its boreal cycle is evi- dent. Likewise, LF has a similar austral rainfall pat- tern to LA, but it is drier in every month of the year. Inter-annual rainfall differences appear associated with shifts in LAI* monthly patterns (Figs. 3, 5). These shifts result in considerable damping of annual fluctu- ations when data for several years are averaged (Fig. 4), so that the averaged medians exhibit smaller sea- sonal differences than do individual years.
Statistical comparison of the monthly results for one year shows that months of maximal and mini- mal LAI* differ significantly at LA and LF (Table 2), as do many other sets of months. Even small seasonal differences are often highly significant, such as those between August or October/November, and every other month on LNM. This is due to the generally high precision of LNM transect readings (Fig. 1). Nevertheless, despite a slightly larger maximum dif- ference between seasonal medians, LNN has few months with significant differences in LAI* (Table 2). This might be due either to smaller sample size (60 vs. 100 points) or to genuinely insignificant seasonal differences.
94
SEASONAL CHANGE IN LEAF AREA INDEX
180
140
100
Cocha Cashu Litterfall
D young forest I older forest
O
B
jan mar may jul 1984-5
sep nov
6 Los Amigos 2 Floodplain
Lomerfo, Bolivia
100 £
Los Fierros 2 • mM«u2001
medians 2002
medians 2003
medians 2004
Medians 2005
ii• Jan Mar May Jul Sep Nov
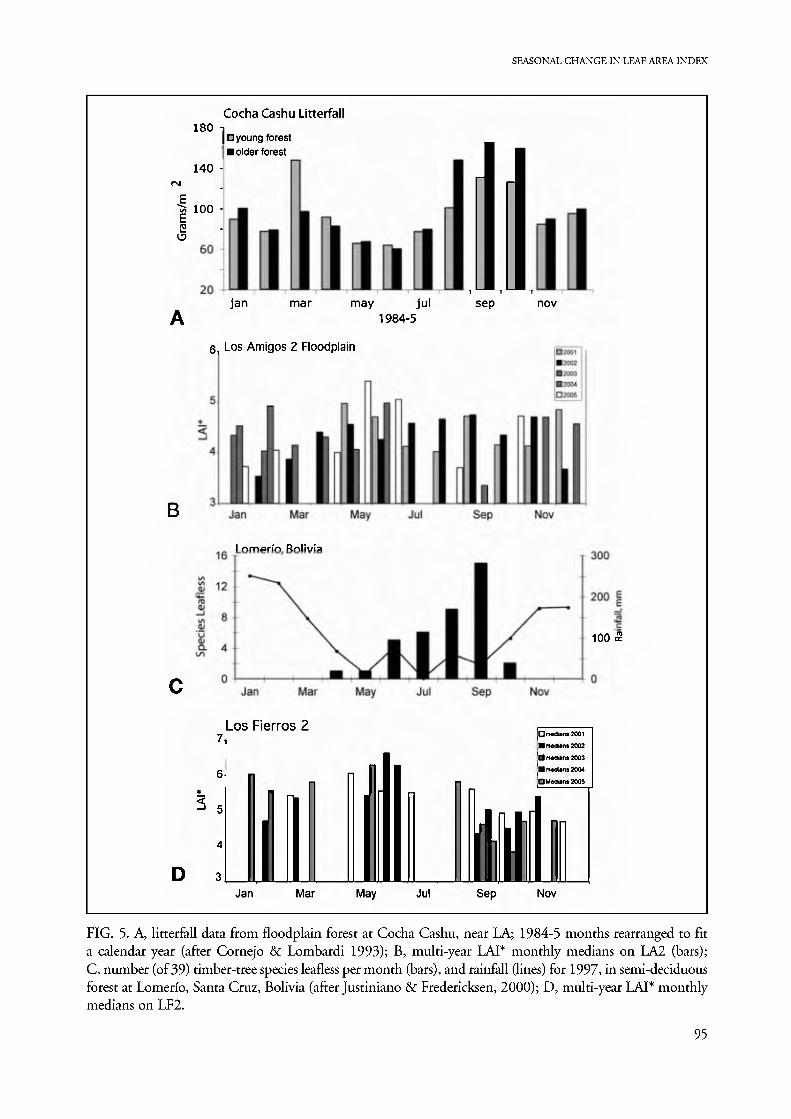
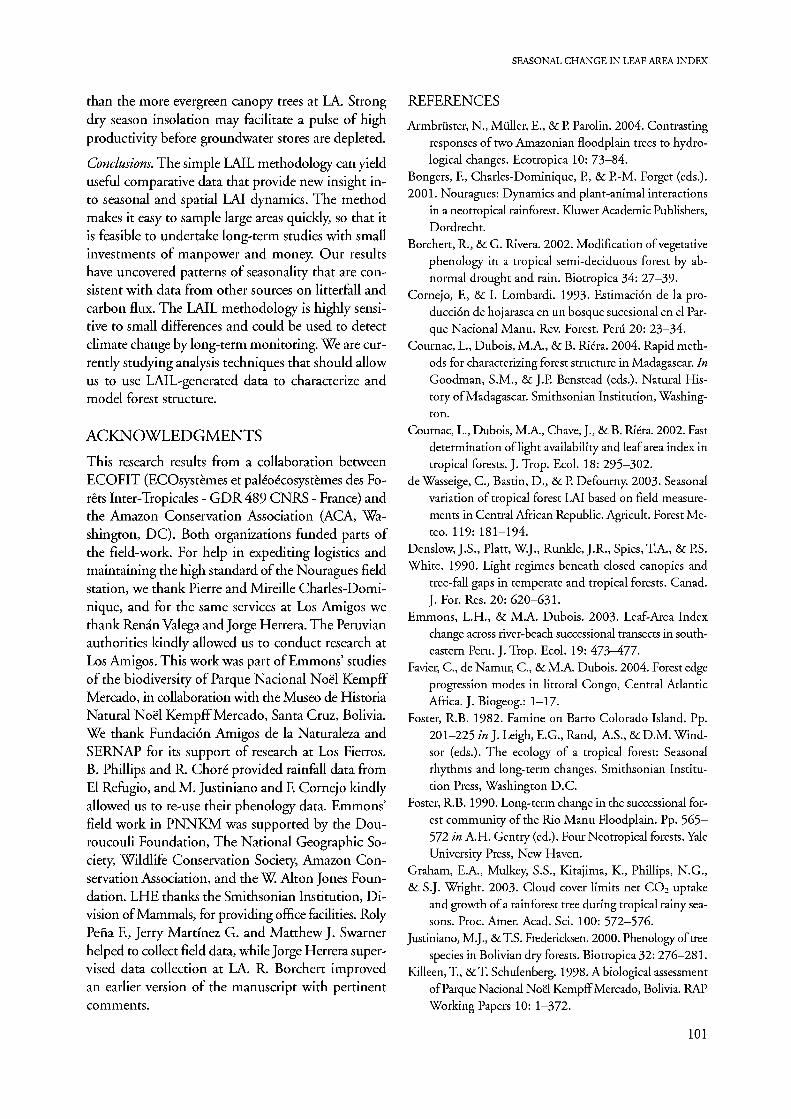
FIG. 5. A, litterfall data from floodplain forest at Cocha Cashu, near LA; 1984-5 months rearranged to fit a calendar year (after Cornejo & Lombardi 1993); B, multi-year LAI* monthly medians on LA2 (bars); C, number (of 39) timber-tree species leafless per month (bars), and rainfall (lines) for 1997, in semi-deciduous forest at Lomerfo, Santa Cruz, Bolivia (after Justiniano & Fredericksen, 2000); D, multi-year LAI* monthly medians on LF2.
95
EMMONS ETAL.
The distribution of monthly median LAI* values in LA2 floodplain can be compared with litterfall pat- terns in the Cocha Cashu floodplain 150 km NW (Cornejo & Lombardi 1993), while that at LF can be compared with phenology data for a forest farther south in the same region (Justiniano & Fredericksen 2000; Fig. 5). In Peruvian floodplain forest, both litterfall and LAI* data sets show bimodal annual pat- terns, with LAI* inversely related to litterfall and ex- hibiting the slight temporal shift expected if growth and functional expansion of new leaves follows peaks in leaf drop. The yearly May•September LAI* maxi- mum coincides with the May-July early dry season minimum litterfall. At the August-October end of the dry season, peak litterfall coincides with declining LAI* that reaches a minimum in October. Although the data for Peruvian sites were taken 18 years apart at different sites, a remarkably consistent pattern is evident, suggesting that an important fraction of the intra-annual variation in LAI* is due to predictable seasonal patterns of leaf-fall.
Justiniano & Fredericksen (2000; Fig. 5) recorded foliar phenology by counting numbers of species with or without leaves for a sample of 39 timber tree spe- cies in a semi-deciduous forest at Lomerio, Bolivia, about 200 km south of Los Fierros. The sampled spe- cies gradually lost leaves throughout the dry season, with a quarter leafless by August and the maximum of half of species leafless in September. Only two spe- cies remained leafless in October. Although these data do not measure the forest-wide pattern, they clearly show sampled trees reaching maximum leaflessness at the end of the dry season. The data from Lomerio in- dicate a unimodal pattern of leaf abscission.
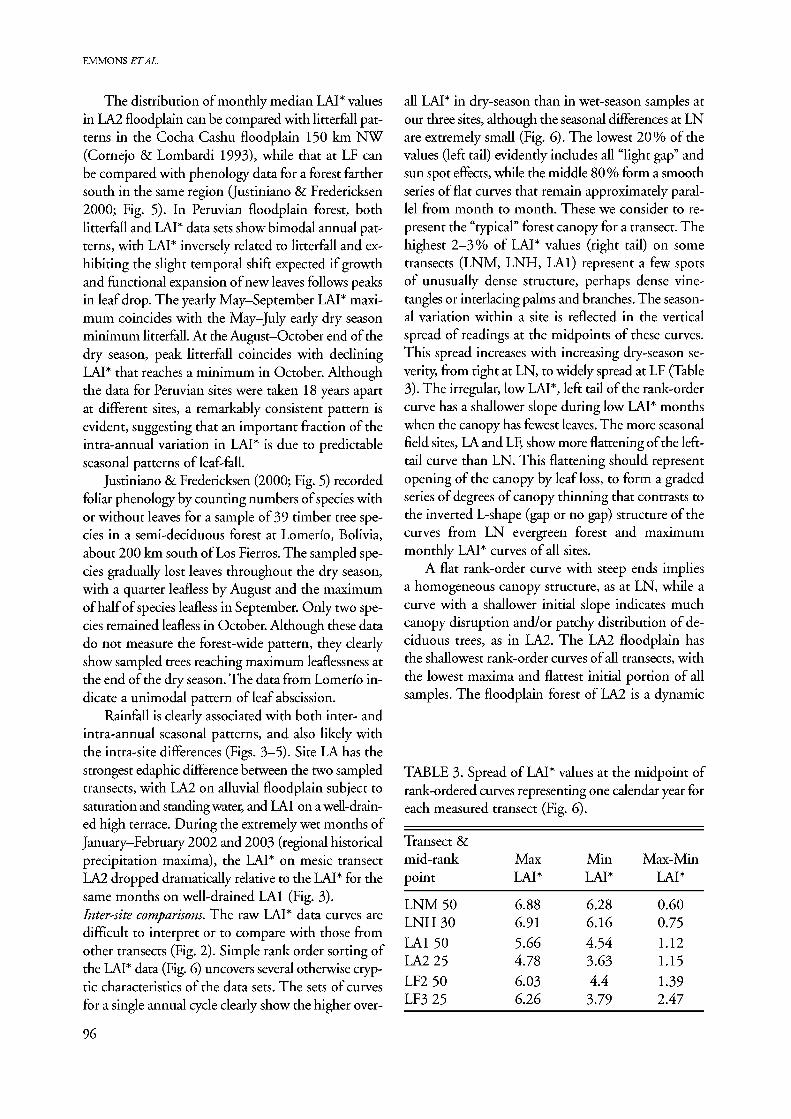
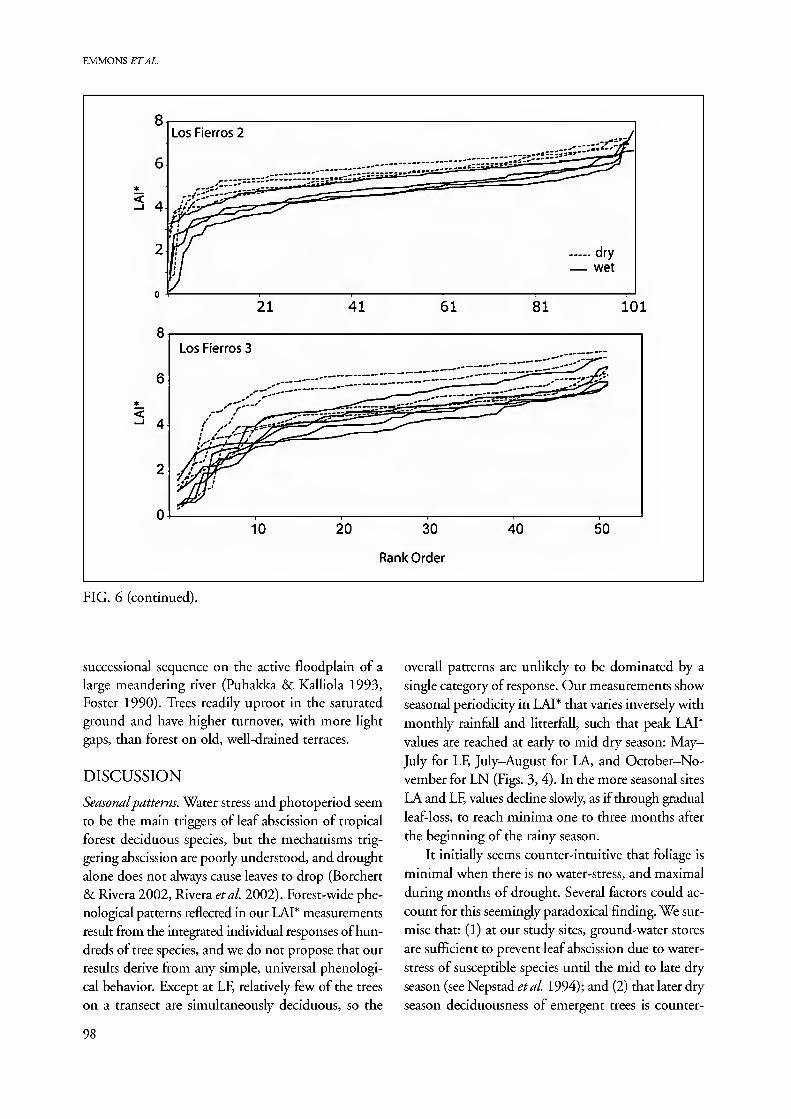
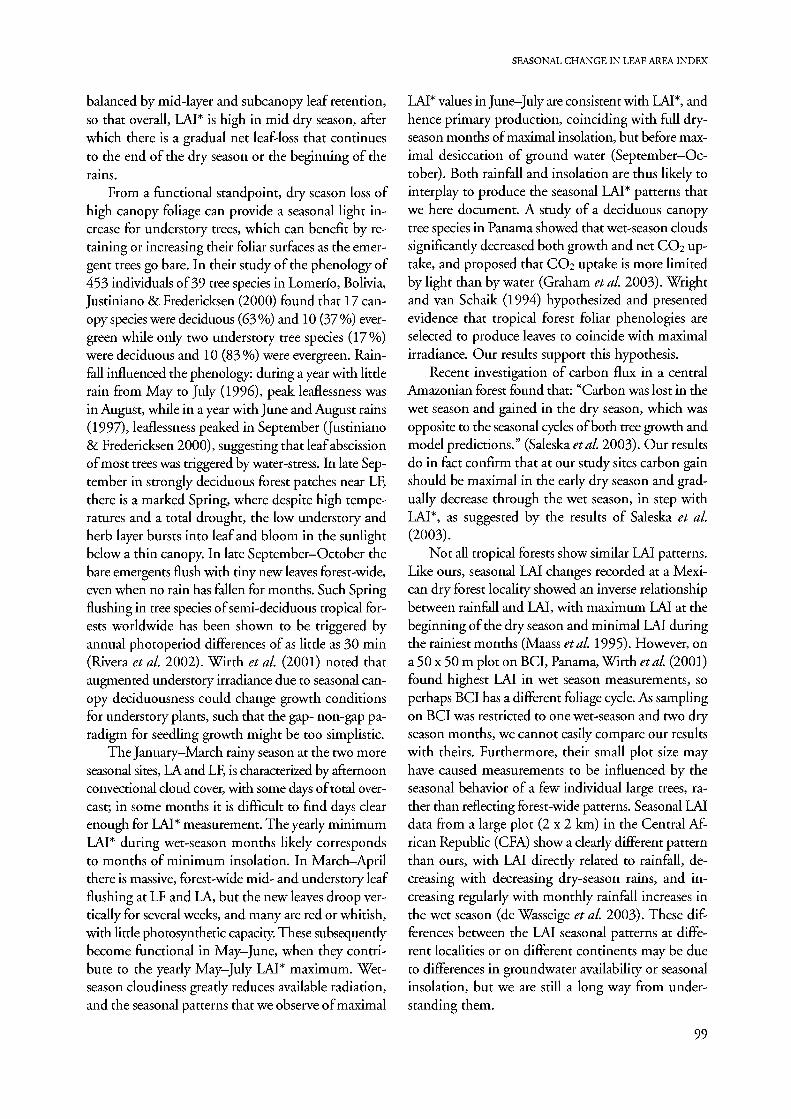
Rainfall is clearly associated with both inter- and intra-annual seasonal patterns, and also likely with the intra-site differences (Figs. 3-5). Site LA has the strongest edaphic difference between the two sampled transects, with LA2 on alluvial floodplain subject to saturation and standing water, and LAI on a well-drain- ed high terrace. During the extremely wet months of January-February 2002 and 2003 (regional historical precipitation maxima), the LAI* on mesic transect LA2 dropped dramatically relative to the LAI* for the same months on well-drained LAI (Fig. 3). Inter-site comparisons. The raw LAI* data curves are difficult to interpret or to compare with those from other transects (Fig. 2). Simple rank order sorting of the LAI* data (Fig. 6) uncovers several otherwise cryp- tic characteristics of the data sets. The sets of curves for a single annual cycle clearly show the higher over-
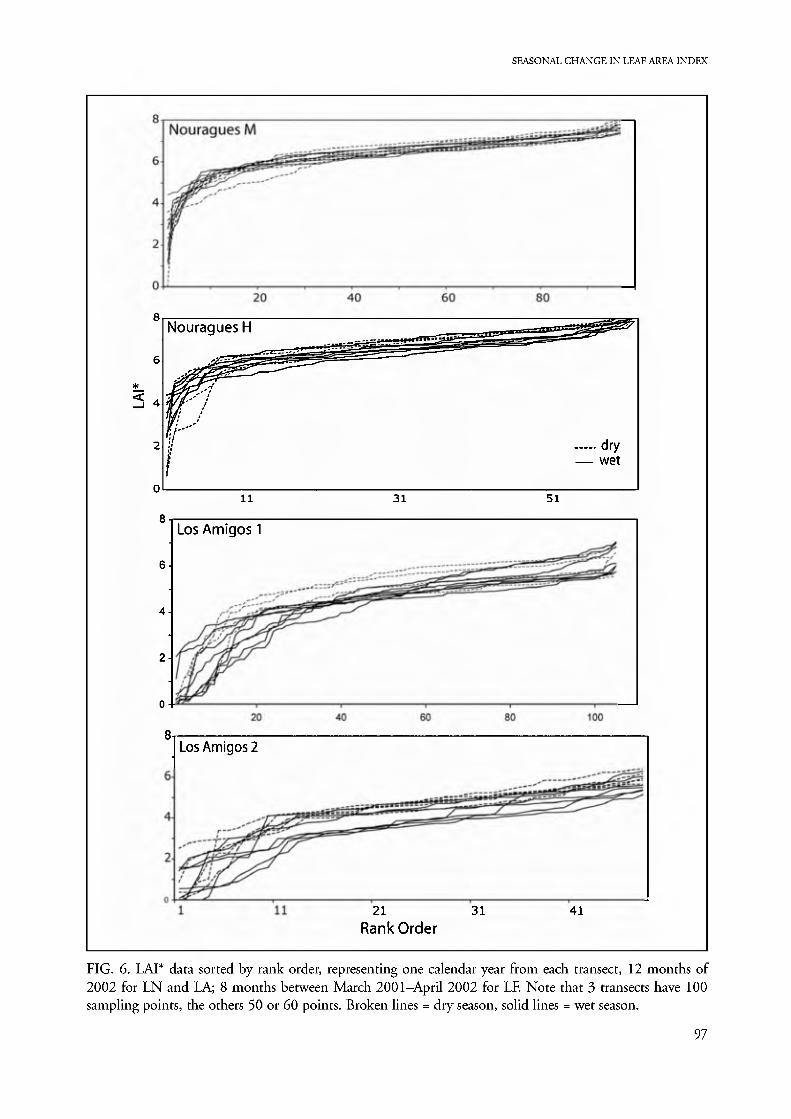
all LAI* in dry-season than in wet-season samples at our three sites, although the seasonal differences at LN are extremely small (Fig. 6). The lowest 20% of the values (left tail) evidently includes all "light gap" and sun spot effects, while the middle 80 % form a smooth series of flat curves that remain approximately paral- lel from month to month. These we consider to re- present the "typical" forest canopy for a transect. The highest 2-3 % of LAI* values (right tail) on some transects (LNM, LNH, LAI) represent a few spots of unusually dense structure, perhaps dense vine- tangles or interlacing palms and branches. The season- al variation within a site is reflected in the vertical spread of readings at the midpoints of these curves. This spread increases with increasing dry-season se- verity, from tight at LN, to widely spread at LF (Table 3). The irregular, low LAI*, left tail of the rank-order curve has a shallower slope during low LAI* months when the canopy has fewest leaves. The more seasonal field sites, LA and LF, show more flattening of the left- tail curve than LN. This flattening should represent opening of the canopy by leaf loss, to form a graded series of degrees of canopy thinning that contrasts to the inverted L-shape (gap or no gap) structure of the curves from LN evergreen forest and maximum monthly LAI* curves of all sites.
A flat rank-order curve with steep ends implies a homogeneous canopy structure, as at LN, while a curve with a shallower initial slope indicates much canopy disruption and/or patchy distribution of de- ciduous trees, as in LA2. The LA2 floodplain has the shallowest rank-order curves of all transects, with the lowest maxima and flattest initial portion of all samples. The floodplain forest of LA2 is a dynamic
TABLE 3. Spread of LAI* values at the midpoint of rank-ordered curves representing one calendar year for each measured transect (Fig. 6).
Transect & mid-rank Max Min Max-Min point LAI* LAI* LAI*
LNM 50 LNH 30 LAI 50 LA2 25 LF2 50 LF3 25
6.88 6.28 0.60 6.91 6.16 0.75 5.66 4.54 1.12 4.78 3.63 1.15
6.03 4.4 1.39 6.26 3.79 2.47
96
SEASONAL CHANGE IN LEAF AREA INDEX
<
11
Los Amigos 1
Los Amigos 2
NouraguesH • -i^~r=r' ""-'-irys"**^^^^
^_sg.g^^=,!^pj^. ""^
>^^
uf' '
fi"
I • dry • wet
31 51
21 31 Rank Order
FIG. 6. LAI* data sorted by rank order, representing one calendar year from each transect, 12 months of 2002 for LN and LA; 8 months between March 2001-April 2002 for LE Note that 3 transects have 100 sampling points, the others 50 or 60 points. Broken lines = dry season, solid lines = wet season.
97
EMMONS ETAL.
8
6
* 5 4
2
Los Fierros 2 _ /
8
6
* < 3 4
2
0
21 41 61 81 101
Los Fierros 3
ij^30^^^ 10 20 30 40 50
Rank Order
FIG. 6 (continued).
successional sequence on the active floodplain of a large meandering river (Puhakka & Kalliola 1993, Foster 1990). Trees readily uproot in the saturated ground and have higher turnover, with more light gaps, than forest on old, well-drained terraces.
DISCUSSION
Seasonal patterns. Water stress and photoperiod seem to be the main triggers of leaf abscission of tropical forest deciduous species, but the mechanisms trig- gering abscission are poorly understood, and drought alone does not always cause leaves to drop (Borchert & Rivera 2002, Rivera etal. 2002). Forest-wide phe- nological patterns reflected in our LAI* measurements result from the integrated individual responses of hun- dreds of tree species, and we do not propose that our results derive from any simple, universal phenologi- cal behavior. Except at LF, relatively few of the trees on a transect are simultaneously deciduous, so the
overall patterns are unlikely to be dominated by a single category of response. Our measurements show seasonal periodicity in LAI* that varies inversely with monthly rainfall and litterfall, such that peak LAI* values are reached at early to mid dry season: May- July for LF, July-August for LA, and October-No- vember for LN (Figs. 3, 4). In the more seasonal sites LA and LF, values decline slowly, as if through gradual leaf-loss, to reach minima one to three months after the beginning of the rainy season.
It initially seems counter-intuitive that foliage is minimal when there is no water-stress, and maximal during months of drought. Several factors could ac- count for this seemingly paradoxical finding. We sur- mise that: (1) at our study sites, ground-water stores are sufficient to prevent leaf abscission due to water- stress of susceptible species until the mid to late dry season (see Nepstad etal. 1994); and (2) that later dry season deciduousness of emergent trees is counter-
98
SEASONAL CHANGE IN LEAF AREA INDEX
balanced by mid-layer and subcanopy leaf retention, so that overall, LAI* is high in mid dry season, after which there is a gradual net leaf-loss that continues to the end of the dry season or the beginning of the rains.
From a functional standpoint, dry season loss of high canopy foliage can provide a seasonal light in- crease for understory trees, which can benefit by re- taining or increasing their foliar surfaces as the emer- gent trees go bare. In their study of the phenology of 453 individuals of 39 tree species in Lomerio, Bolivia, Justiniano & Fredericksen (2000) found that 17 can- opy species were deciduous (63%) and 10 (37%) ever- green while only two understory tree species (17%) were deciduous and 10 (83 %) were evergreen. Rain- fall influenced the phenology: during a year with little rain from May to July (1996), peak leaflessness was in August, while in a year with June and August rains (1997), leaflessness peaked in September (Justiniano & Fredericksen 2000), suggesting that leaf abscission of most trees was triggered by water-stress. In late Sep- tember in strongly deciduous forest patches near LF, there is a marked Spring, where despite high tempe- ratures and a total drought, the low understory and herb layer bursts into leaf and bloom in the sunlight below a thin canopy. In late September-October the bare emergents flush with tiny new leaves forest-wide, even when no rain has fallen for months. Such Spring flushing in tree species of semi-deciduous tropical for- ests worldwide has been shown to be triggered by annual photoperiod differences of as little as 30 min (Rivera et al. 2002). Wirth et al. (2001) noted that augmented understory irradiance due to seasonal can- opy deciduousness could change growth conditions for understory plants, such that the gap- non-gap pa- radigm for seedling growth might be too simplistic.
The January-March rainy season at the two more seasonal sites, LA and LF, is characterized by afternoon convectional cloud cover, with some days of total over- cast; in some months it is difficult to find days clear enough for LAI* measurement. The yearly minimum LAI* during wet-season months likely corresponds to months of minimum insolation. In March•April there is massive, forest-wide mid- and understory leaf flushing at LF and LA, but the new leaves droop ver- tically for several weeks, and many are red or whitish, with little photosynthetic capacity. These subsequently become functional in May-June, when they contri- bute to the yearly May-July LAI* maximum. Wet- season cloudiness greatly reduces available radiation, and the seasonal patterns that we observe of maximal
LAI* values in June-July are consistent with LAI*, and hence primary production, coinciding with full dry- season months of maximal insolation, but before max- imal desiccation of ground water (September-Oc- tober). Both rainfall and insolation are thus likely to interplay to produce the seasonal LAI* patterns that we here document. A study of a deciduous canopy tree species in Panama showed that wet-season clouds significantly decreased both growth and net CO2 up- take, and proposed that CO2 uptake is more limited by light than by water (Graham et al. 2003). Wright and van Schaik (1994) hypothesized and presented evidence that tropical forest foliar phenologies are selected to produce leaves to coincide with maximal irradiance. Our results support this hypothesis.
Recent investigation of carbon flux in a central Amazonian forest found that: "Carbon was lost in the wet season and gained in the dry season, which was opposite to the seasonal cycles of both tree growth and model predictions." (Saleska etal. 2003). Our results do in fact confirm that at our study sites carbon gain should be maximal in the early dry season and grad- ually decrease through the wet season, in step with LAI*, as suggested by the results of Saleska et al. (2003).
Not all tropical forests show similar LAI patterns. Like ours, seasonal LAI changes recorded at a Mexi- can dry forest locality showed an inverse relationship between rainfall and LAI, with maximum LAI at the beginning of the dry season and minimal LAI during the rainiest months (Maass etal. 1995). However, on a 50 x 50 m plot on BCI, Panama, Wirth etal. (2001) found highest LAI in wet season measurements, so perhaps BCI has a different foliage cycle. As sampling on BCI was restricted to one wet-season and two dry season months, we cannot easily compare our results with theirs. Furthermore, their small plot size may have caused measurements to be influenced by the seasonal behavior of a few individual large trees, ra- ther than reflecting forest-wide patterns. Seasonal LAI data from a large plot (2x2 km) in the Central Af- rican Republic (CFA) show a clearly different pattern than ours, with LAI directly related to rainfall, de- creasing with decreasing dry-season rains, and in- creasing regularly with monthly rainfall increases in the wet season (de Wasseige et al. 2003). These dif- ferences between the LAI seasonal patterns at diffe- rent localities or on different continents may be due to differences in groundwater availability or seasonal insolation, but we are still a long way from under- standing them.
99
EMMONS ETAL.
Apart from deciduousness, other factors that could cause seasonal LAI* differences include changes in leaf angle or heavy predation of leaves by arthropods. Leaves are most likely to droop (and intersect less light, lowering LAI*) if they are either weighed down by water after rain or lose turgidity under water-stress; leaves in the top canopy layer may change angle in response to the heat of direct insolation (Graham etal. 2003). Predation can sometimes nearly defoliate trees, and might reach levels easily detectable with our meter. Species-rich forests are likely to show small overall defoliation by arthropods, but Emmons has observed massive generalized seasonal leaf predation on Borneo. We cannot evaluate the magnitude of such effects on our data.
The sites cross a latitudinal gradient from 04° N to 14° S, and one can therefore ask whether some of the observed LAI* variation could be due to seasonal solar radiation differences. Because we take light mea- surements around noon, it is easy to compute that the largest yearly variation of clear sky light intensity is < 22%. This produces a maximum LAI* error of 0.25, much smaller than the amplitude of the ob- served seasonal excursions. The true error is certainly smaller because this first-order geometric effect is at- tenuated by diffusion due to nebulosity and canopy penetration. We are thus confident that the pattern of inter- and intra-site differences is due to foliar phe- nology and not to seasonal, latitude-dependent geo- metric variations of solar intensity.
Within-site patterns. As shown by Borchert and Ri- vera (2002) and by Armbriister et al. (2004), phe- nology and LAI are sensitive to local edaphic con- ditions and irregular rainfall variations. At the most seasonal site, LF, the wetter transect had higher LAI* in some dry months than did the more xeric transect, notably in June-July 01, when almost no rain fell (Fig. 3). This is the predicted result when drought stress triggers leaf abscission (Borchert & Rivera 2002).
In contrast, in most months, the wetter of the two transects at LA and LF not only had lower LAI* val- ues than did well-drained upland transects, but intra- site transects sometimes showed slightly different sea- sonal patterns. Wetter transects showed greater re- duction in LAI* at mid wet season than did drier transects (Fig. 3; note Jan 2002), and in 2001 at LF and 2002 at LA, the wetter transect developed its maximum LAI* two months later in the dry season than did the more well-drained site. The lowest LAI*
occurred when the soils were saturated with standing surface water. Water-saturation is a stress factor that in some species can take months to overcome as the soil dries out (Armbriister etal. 2004). The sharp drop in LAI* of saturated or flooded forests during months of heavy rain likely reflects a negative effect on foliage of root hypoxia, low nutrient availability, and/or my- corrhizal insufficiency (Armbriister et al. 2004). A field for further research is whether foliage suppres- sion by unusually heavy rains is subsequently reflected in low or delayed flowering or fruit productivity, as suggested by Foster (1982).
Inter-annual patterns. Although at each site there was a generally repeating annual pattern from year to year, the correspondence was not at all perfect. Examina- tion of the rainfall and LAI* (Fig. 3) shows that a- nomalies in rain are sometimes closely mirrored (in- versely) by the LAI*. We are continuing measure- ments, and hope to arrive at a better understanding of the associations between rainfall, litterfall, tree phe- nology, and LAI* values.
Inter-site differences. The differences in tree species den- sities at the three sites (Table 1) may influence sea- sonal patterns: in richer forests, the presence of more species should dampen the influence of the deci- duousness of individual species or groups of species with similar phenological attributes. Because, due to edaphic and historical factors, the forests within any region vary greatly in both floristics and structure we hesitate to generalize to forest-wide values from only two transects at a site. However, we have measured at least 5 km of additional, independent transects in "tall" forests at all three study areas, and these show a considerable within-site similarity in LAI* magni- tude and pattern (all sites have forests with other pat- terns, such as palm, bamboo, liana, or swamp forests).
The LN Guianan forests have a more uniformly closed and layered canopy structure and much higher average LAI* in all months than do those at LA and LF (Fig. 2). In contrast, during peak leaflessness, LF semi-deciduous forests are sometimes so open that it is difficult to position the measuring apparatus so that no sunspot falls on it. Paradoxically, these more de- ciduous Bolivian forests nonetheless reach higher aver- age LAI* at peak values than do the more evergreen Peruvian forests of LA (Fig. 4D). To compensate for a shorter annual productivity period in the seasonal Bolivian forests, seasonally deciduous species may spread a greater foliage area during their foliage peak
100
SEASONAL CHANGE IN LEAF AREA INDEX
than the more evergreen canopy trees at LA. Strong dry season insolation may facilitate a pulse of high productivity before groundwater stores are depleted.
Conclusions. The simple LAIL methodology can yield useful comparative data that provide new insight in- to seasonal and spatial LAI dynamics. The method makes it easy to sample large areas quickly, so that it is feasible to undertake long-term studies with small investments of manpower and money. Our results have uncovered patterns of seasonality that are con- sistent with data from other sources on litterfall and carbon flux. The LAIL methodology is highly sensi- tive to small differences and could be used to detect climate change by long-term monitoring. We are cur- rently studying analysis techniques that should allow us to use IAIL-generated data to characterize and model forest structure.
ACKNOWLEDGMENTS
This research results from a collaboration between ECOFIT (ECOsystemes et paleoecosystemes des Fo- rets Inter-Tropicales - GDR 489 CNRS - France) and the Amazon Conservation Association (ACA, Wa- shington, DC). Both organizations funded parts of the field-work. For help in expediting logistics and maintaining the high standard of the Nouragues field station, we thank Pierre and Mireille Charles-Domi- nique, and for the same services at Los Amigos we thank Renan Valega and Jorge Herrera. The Peruvian authorities kindly allowed us to conduct research at Los Amigos. This work was part of Emmons' studies of the biodiversity of Parque Nacional Noel Kempff Mercado, in collaboration with the Museo de Historia Natural Noel Kempff Mercado, Santa Cruz, Bolivia. We thank Fundacion Amigos de la Naturaleza and SERNAP for its support of research at Los Fierros. B. Phillips and R Chore provided rainfall data from El Refugio, and M. Justiniano and F Cornejo kindly allowed us to re-use their phenology data. Emmons' field work in PNNKM was supported by the Dou- roucouli Foundation, The National Geographic So- ciety, Wildlife Conservation Society, Amazon Con- servation Association, and the W. Alton Jones Foun- dation. LHE thanks the Smithsonian Institution, Di- vision of Mammals, for providing office facilities. Roly Pena F, Jerry Martinez G. and Matthew J. Swarner helped to collect field data, while Jorge Herrera super- vised data collection at LA. R. Borchert improved an earlier version of the manuscript with pertinent comments.
REFERENCES
Armbriister, N., Miiller, E., & P. Parolin. 2004. Contrasting
responses of two Amazonian floodplain trees to hydro-
logical changes. Ecotropica 10: 73•84.
Bongers, E, Charles-Dominique, P., & P.-M. Forget (eds.).
2001. Nouragues: Dynamics and plant-animal interactions
in a neotropical rainforest. Kluwer Academic Publishers,
Dordrecht.
Borchert, R, & G. Rivera. 2002. Modification of vegetative
phenology in a tropical semi-deciduous forest by ab-
normal drought and rain. Biotropica 34: 27-39.
Cornejo, E, & I. Lombardi. 1993. Estimacion de la pro- duccion de hojarasca en un bosque sucesional en el Par-
que Nacional Manu. Rev. Forest. Peru 20: 23-34.
Cournac, L., Dubois, M.A, & B. Riera. 2004. Rapid meth-
ods for characterizing forest structure in Madagascar. In
Goodman, S.M., & J.P. Benstead (eds.). Natural His-
tory of Madagascar. Smithsonian Institution, Washing-
ton.
Cournac, L., Dubois, M.A., Chave, J., & B. Riera. 2002. Fast
determination of light availability and leaf area index in
tropical forests. J. Trop. Ecol. 18: 295-302.
de Wasseige, C, Bastin, D., & P. Defourny. 2003. Seasonal
variation of tropical forest LAI based on field measure-
ments in Central African Republic. Agricult. Forest Me-
teo. 119: 181-194. Denslow, J.S., Platt, W.J., Runkle, J.R, Spies, T.A., & PS.
White. 1990. Light regimes beneath closed canopies and
tree-fall gaps in temperate and tropical forests. Canad.
J. For. Res. 20: 620-631. Emmons, L.H., & M.A. Dubois. 2003. Leaf-Area Index
change across river-beach successional transects in south-
eastern Peru. J. Trop. Ecol. 19: 473-477. Favier, C, de Namur, C, & MA. Dubois. 2004. Forest edge
progression modes in littoral Congo, Central Atlantic
Africa. J. Biogeog.: 1-17. Foster, R.B. 1982. Famine on Barro Colorado Island. Pp.
201-225 in J. Leigh, E.G., Rand, A.S., & D.M. Wind- sor (eds.). The ecology of a tropical forest: Seasonal
rhythms and long-term changes. Smithsonian Institu-
tion Press, Washington D.C.
Foster, R.B. 1990. Long-term change in the successional for-
est community of the Rio Manu Floodplain. Pp. 565-
572 in AH. Gentry (ed.). Four Neotropical forests. Yale
University Press, New Haven.
Graham, E.A., Mulkey, S.S., Kitajima, K., Phillips, N.G.,
& S.J. Wright. 2003. Cloud cover limits net C02 uptake and growth of a rainforest tree during tropical rainy sea-
sons. Proc. Amer. Acad. Sci. 100: 572-576.
Justiniano, M.J., &T.S. Fredericksen. 2000. Phenology of tree
species in Bolivian dry forests. Biotropica 32: 276-281.
Killeen, T, &T. Schulenberg. 1998. A biological assessment
of Parque Nacional Noel Kempff Mercado, Bolivia. RAP
Working Papers 10: 1-372.
101
EMMONS ETAL.
Kalacska, M.E.R., Calvo-Alvarado, J.C., & G.A. Sanchez-
Azofeifa. 2005. Calibration and assessment of season changes in leaf area index of a tropical dry forest in different stages of succession. Tree Physiology 25: 733•744.
Kalacska, M.E.R., Sanchez-Azofeifa, G.A., Calvo-Alvarado,
J.C., Pvivard, B., & M. Quesada. 2005. Effects of season and successional stage on leaf area index and spectral vege- tation indices in three Mesoamerican tropical dry forests. Biotropica 37: 486-496.
Maass, J.M., Vose, J.M., Swank, W.T., & A. Martmez-Yrizar. 1995. Seasonal changes of leaf area index (LAI) in a tropi-
cal deciduous forest in west Mexico. For. Ecol. Manage.
74: 171-180. Nepstad, D.C., Carvalho, C.R.D., Davidson, P.H., Jipp, P., Lefebre, A., Negeiros, G.H., da Silva, E.D., Stone, T.A., Trumbore, S.E., & S. Viera. 1994. The role of deep roots
in the hydrological and carbon cycles of Amazonian for-
ests and pastures. Nature 372: 666•669. Panfil, S.N. 2001. Late Holocene forest and savanna diver-
sity and dynamics across an Amazonian ecotone. Ph. D.
Thesis, University of Georgia, Athens. Pitman, N.C.A., Terborgh, J., Silman, M.R., Nunez V.P., Neill, DA., Ceron, C.E., Palacios, W.A., & M. Aulestia. 2001. Dominance and distribution of tree species in upper
Amazonian terra firme forests. Ecology 82: 2101-2117. Poncy, O., Sabatier, D., Prevost, M.-E, & I. Hardy. 2001.
The lowland high rainforest: Structure and species di- versity. Pp. 31-46 in Bongers, E, Charles-Dominique,
P., & P.-M. Forget (eds.). Nouragues: Dynamics and plant-animal interactions in a Neotropical rainforest. Kluwer Academic Publishers, Dordrecht.
Puhakka, M., & R Kalliola. 1993. La vegetacion en areas
de inundacion en la selva baja de la Amazonia Peruana.
Pp. 113-138 in Kalliola, R, Puhakka, M., & W. Dan-
joy (eds.). Amazonia Peruana: Vegetacion humeda trop-
ical en el llano subandino. Proyecto Amazonia, Uni-
versidad de Turku and ONERN, Peru, Jyvaskyla.
Rivera, G., Elliot, S., Caldas, L.S., N.G., Coradin, V.T.R,
& R. Borchert. 2002. Increasing day-length induces spring
flushing of tropical dry forest trees in the absence of rain.
Trees 16: 445-456.
Saleska, S.R, Miller, S.D., Matross, D.M., Goulden, M.L.,
Wofsy, S.C., da Rocha, H.R, de Camargo, P.B., Crill, P.,
Daube, B.C., de Freitas, H.C., Hutyra, L., Keller, M., Kirch-
hoff V., Menton, M., Munger, J.W., Pyle, E.H., Rice, A.H.,
&C H. Silva. 2003. Carbon in Amazon Forests: Unexpected
seasonal fluxes and disturbance-induced losses. Science
302: 1554-1557. Siegel, S. 1956. Nonparametric statistics for the behavioral
sciences. McGraw-Hill Book Company, New York.
Vincens, A., Dubois, M.A., Guillet, B., Achoundoung, G.,
Buchet, G., Kamgang Kabayene Beyala, V., de Namur, C,
& B. Riera. 2000. Pollen-rain-vegetation relationships along
a forest-savanna transect in Southeastern Cameroon.
Rev. Paleobot. Palynol. 110: 191-208.
Wirth, R, Weber, B., & R.R Ryel. 2001. Spatial and tem-
poral variability of canopy structure in a tropical moist
forest. Acta Oecologia 22: 235-244.
Wright, S.J., & C.P. van Schaik. 1994. Light and the phe-
nology of tropical trees. The American Naturalist 143:
192-199.
102