Drivers of β-diversity along latitudinal gradients revisited
Upload
independentCategory
view
1download
0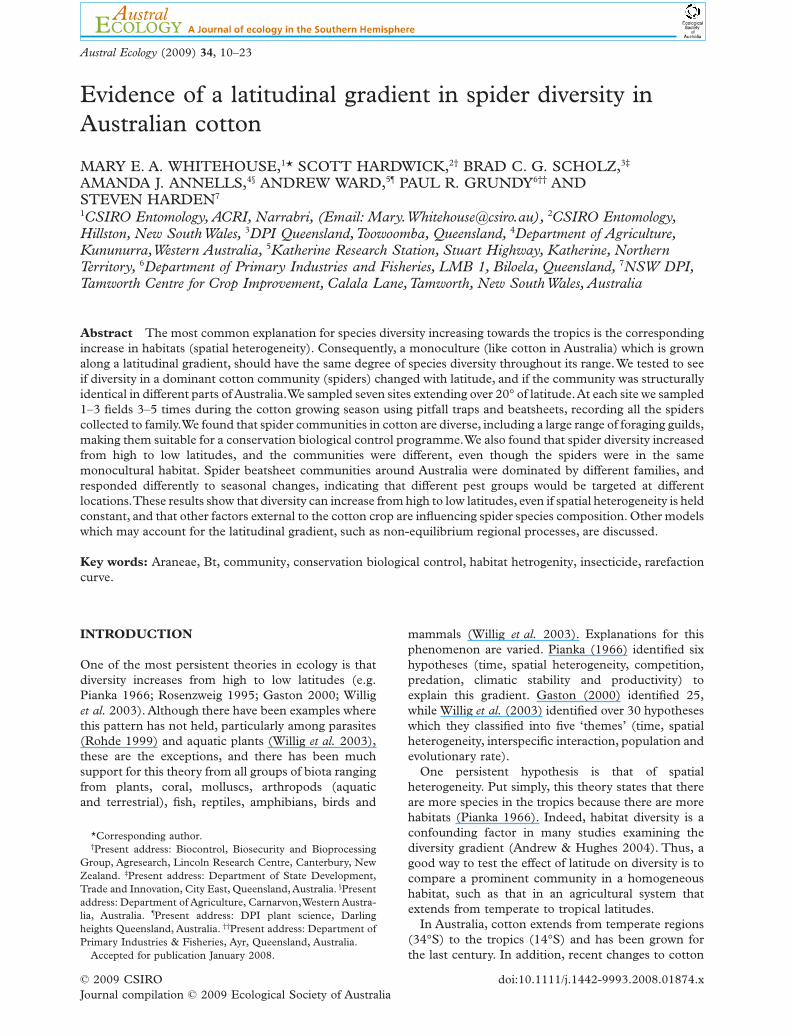
Evidence of a latitudinal gradient in spider diversity inAustralian cotton
MARY E. A. WHITEHOUSE,1* SCOTT HARDWICK,2† BRAD C. G. SCHOLZ,3‡
AMANDA J. ANNELLS,4§ ANDREW WARD,5¶ PAUL R. GRUNDY6†† ANDSTEVEN HARDEN7
1CSIRO Entomology, ACRI, Narrabri, (Email: [email protected]), 2CSIRO Entomology,Hillston, New SouthWales, 3DPI Queensland,Toowoomba, Queensland, 4Department of Agriculture,Kununurra,Western Australia, 5Katherine Research Station, Stuart Highway, Katherine, NorthernTerritory, 6Department of Primary Industries and Fisheries, LMB 1, Biloela, Queensland, 7NSW DPI,Tamworth Centre for Crop Improvement, Calala Lane,Tamworth, New SouthWales, Australia
Abstract The most common explanation for species diversity increasing towards the tropics is the correspondingincrease in habitats (spatial heterogeneity). Consequently, a monoculture (like cotton in Australia) which is grownalong a latitudinal gradient, should have the same degree of species diversity throughout its range.We tested to seeif diversity in a dominant cotton community (spiders) changed with latitude, and if the community was structurallyidentical in different parts of Australia.We sampled seven sites extending over 20° of latitude.At each site we sampled1–3 fields 3–5 times during the cotton growing season using pitfall traps and beatsheets, recording all the spiderscollected to family.We found that spider communities in cotton are diverse, including a large range of foraging guilds,making them suitable for a conservation biological control programme.We also found that spider diversity increasedfrom high to low latitudes, and the communities were different, even though the spiders were in the samemonocultural habitat. Spider beatsheet communities around Australia were dominated by different families, andresponded differently to seasonal changes, indicating that different pest groups would be targeted at differentlocations.These results show that diversity can increase from high to low latitudes, even if spatial heterogeneity is heldconstant, and that other factors external to the cotton crop are influencing spider species composition. Other modelswhich may account for the latitudinal gradient, such as non-equilibrium regional processes, are discussed.
Key words: Araneae, Bt, community, conservation biological control, habitat hetrogenity, insecticide, rarefactioncurve.
INTRODUCTION
One of the most persistent theories in ecology is thatdiversity increases from high to low latitudes (e.g.Pianka 1966; Rosenzweig 1995; Gaston 2000; Williget al. 2003). Although there have been examples wherethis pattern has not held, particularly among parasites(Rohde 1999) and aquatic plants (Willig et al. 2003),these are the exceptions, and there has been muchsupport for this theory from all groups of biota rangingfrom plants, coral, molluscs, arthropods (aquaticand terrestrial), fish, reptiles, amphibians, birds and
mammals (Willig et al. 2003). Explanations for thisphenomenon are varied. Pianka (1966) identified sixhypotheses (time, spatial heterogeneity, competition,predation, climatic stability and productivity) toexplain this gradient. Gaston (2000) identified 25,while Willig et al. (2003) identified over 30 hypotheseswhich they classified into five ‘themes’ (time, spatialheterogeneity, interspecific interaction, population andevolutionary rate).
One persistent hypothesis is that of spatialheterogeneity. Put simply, this theory states that thereare more species in the tropics because there are morehabitats (Pianka 1966). Indeed, habitat diversity is aconfounding factor in many studies examining thediversity gradient (Andrew & Hughes 2004). Thus, agood way to test the effect of latitude on diversity is tocompare a prominent community in a homogeneoushabitat, such as that in an agricultural system thatextends from temperate to tropical latitudes.
In Australia, cotton extends from temperate regions(34°S) to the tropics (14°S) and has been grown forthe last century. In addition, recent changes to cotton
*Corresponding author.†Present address: Biocontrol, Biosecurity and Bioprocessing
Group, Agresearch, Lincoln Research Centre, Canterbury, NewZealand. ‡Present address: Department of State Development,Trade and Innovation, City East, Queensland, Australia. §Presentaddress: Department of Agriculture, Carnarvon,Western Austra-lia, Australia. ¶Present address: DPI plant science, Darlingheights Queensland, Australia. ††Present address: Department ofPrimary Industries & Fisheries, Ayr, Queensland, Australia.
Accepted for publication January 2008.
Austral Ecology (2009) 34, 10–23
© 2009 CSIRO doi:10.1111/j.1442-9993.2008.01874.xJournal compilation © 2009 Ecological Society of Australia
growing, such as the advent of transgenic cotton, haveencouraged a ‘softer’ approach, with fewer broad spec-trum sprays (Fitt 2004) and an emphasis on IntegratedPest Management (IPM) to manage pest infestationsby using the beneficial arthropod community andmore selective products (Deutscher et al. 2005).
Within cotton crops spiders are very prominent.They make up 50% of the beneficial arthropod com-munity in unsprayed cotton crops in Australia (Bishop& Blood 1981), 57% in African cotton (Epieru et al.1998) and up to 80% in Chinese cotton (Zhang 1992).Thus the spider community in cotton is an idealsystem in which to compare latitudinal diversitygradients. Yet, despite their prominence, the role ofspider communities in agricultural systems is usuallyoverlooked, largely because spiders do not fit the clas-sical profile of biological control agents. It is widelyaccepted that an effective biological control agent hasa high degree of prey specificity, short developmenttime relative to prey and high reproductive potential(Huffaker & Messenger 1976; Beddington et al.1978). Spiders on the contrary are generalist predatorswhich attack other beneficials; they have long genera-tion times relative to prey; some are territorial; andthey seldom show density dependent tracking of prey(Provencher & Vickery 1988; Riechert 1999; Pearceet al. 2004). However, within the framework of con-servation biological control, spiders can play an impor-tant role, especially if the aim is to control a range ofpests by reducing ‘predator free space’ via a diversecommunity of predators (Riechert & Bishop 1990;Sunderland 1999).
Thus for a spider community to be effective withinthis framework it needs to be diverse, covering arange of foraging guilds. When spider guild classifi-cations are applied to different crop types, twodistinct groups of structurally similar spider commu-nities are identified (Uetz et al. 1999): crops whosespider fauna is dominated by ground runners andwandering sheet web-builders (peanut, alfalfa,soybean, rice) and crops whose spider fauna is morecomplex and also includes many orb weavers andstalkers (cotton, corn, sugar, sorghum). A morecomplex spider fauna, such as that in cotton, iswhere spiders may be best used to help suppresspests and where changes in diversity along a latitu-dinal gradient might be most prominent.
The latitudinal diversity gradient has ramificationsfor crop management. If the spider community is morediverse in tropical regions, then it may be more effec-tive at reducing predator free space in the tropics. Inaddition, cotton is a uniform habitat across a range oflatitudes and one would predict that the spider com-munity (at least at the level of family or foraging guild)would be the same across the latitudes, but with anincrease in rare species in the tropics (Price et al. 1995;Stevens 2004).
Any change from this pattern could have ramifica-tions at both the theoretical and practical level. At thepractical level, different spider foraging guilds focus ondifferent types of prey (Nyffeler 1999); therefore anychange in the dominant foraging guild could indicate achange in the spider community’s response to a spe-cific pest. At the theoretical level, changes in diversityand in the dominant foraging guild could indicate thatduring the cotton growing season, the spider commu-nity does not reach equilibrium, suggesting that factorsexternal to cotton are influencing the spider commu-nity in cotton.
The aim of this study was to identify the spidercommunities associated with cotton in different loca-tions throughout Australia and test: (i) if there is anincrease in diversity from south to north; as suchan increase would indicate that processes other thanspatial heterogeneity are responsible for the latitudinalgradient; (ii) whether spider communities in cottonaround Australia are structurally identical (that is,whether they consist of the same guilds or spider fami-lies, even if the species change); and (iii) whether thecommunity structure changes over the course of ayear, and if so, if the changes are similar at the differentsites.
METHODS
Spiders were sampled during the 2001/2002 fieldseason at seven sites around Australia, extending fromtemperate climates in the south, to tropical climatesin the north (Fig. 1). Between 1, 2 or 3 fields weresampled at each site, and these varied in size,cotton variety, and spray regime (Appendix 1: http://www.ecolsoc.org.au/What%20we%20do/Publications/Austral%20Ecology/AE.html). In each field 20 pitfalltraps and 20 beatsheets were sampled 3–5 timesduring the cotton growing season (which occurred atdifferent times during the year at different sites,Appendix 1).Two extra pitfall trap samples were takenafter the end of the season (in June) at Hillston.
Beatsheets
Beatsheet sampling has been described elsewhere(Mansfield et al. 2006) and involved using a 1-m stickheld horizontal to the ground to knock animals offcotton plants onto a large yellow plastic sheet(1.5 ¥ 2 m). All spiders knocked onto the beatsheetwere collected and preserved in 70% ethanol for lateridentification.This method is more efficient than othercommon sampling techniques for beneficial arthro-pods such as suction sampling or visual inspection,particularly late in the growing season when the cropcanopy is well developed (Deutscher et al. 2005).
LATITUDINAL GRADIENT IN SPIDER DIVERSITY 11
© 2009 CSIRO doi:10.1111/j.1442-9993.2008.01874.xJournal compilation © 2009 Ecological Society of Australia
Pitfall traps
Each of the 20 pitfall traps consisted of two plasticcups (top diameter: 9 cm, depth 12 cm) one insertedin the other.The outer cup stayed in the ground for thelength of the season while the inner sampling cup,which contained about 2–3 cm of 70% ethanol, wasleft open for 3 days. Traps were closed between sam-pling periods with a lid.The first pitfall trap was placedat least 20 m in from the edge of the field, and thesubsequent cups were placed at intervals of 15 m andone row over so that once all 20 pitfall traps were inplace, the last one was about 305 m into the field and20 rows were being sampled.
Analysis
Samples were categorized into five different timeperiods during the growing season, as indicated by thecotton’s development and ‘degree days’ (DD). Thesewere: (i) at first square (400 DD); (ii) at first flower(800 DD); (iii) at peak squaring (1200 DD); (iv) atpeak boll (1600 DD); and (v) when 60% of the bollsare open (2000 DD).
For the ordination analysis, data from the beat-sheet and pitfall traps were analysed separately andcombined.When analysed separately, the unit of mea-surement was all the beatsheets (or pitfall traps) takenfrom a field on a sample date.When we combined thedata, the unit of measurement was the field on asample date. No single sampling method can accu-rately sample the whole spider community.With beat-sheets we sampled diurnal hunters and web-builders
(but perhaps not the larger web builders). With thepitfall traps we sampled diurnal and nocturnal groundrunners, and males looking for females. By using thesetwo methods we had a better cross section of the spidercommunity as a whole.
We used the programme CONOCO (ter Braak &Smilauer 2002) to calculate the ordinations.We used aDetrended Correspondence Analysis (DCA) as anindirect analysis to see how similar the species com-position of different samples were to each other, and aCanonical Correspondence Analysis (CCA) to see theeffect of key environmental variables on the speciescomposition of the samples. The environmental vari-ables tested were: latitude; field size; ‘Bt’ (whether thecrop was a Bt transgenic or not); DD; and BDI. BDI,or Biological Disruption Index, is a measure of disrup-tion to beneficial insects caused by spraying insecti-cides (Hoque et al. 2002).This index ranges from 0 to8 and reflects the proportional reduction in beneficialarthropod abundance observed after a single ap-plication of an insecticide compared with beneficialarthropod abundance prior to application (e.g.BDI = 5 means a 50% decline in abundance afterapplication).The final BDI for a particular cotton fieldwas determined by combining the scores for eachspray applied over the season; the lower the final score,the softer the regime.
To compare the communities at the different sitesfound throughout the season, we did a direct ordina-tion analysis using degree days as the environmentalvariable. This forced the samples to align themselvesalong the x-axis with respect to degree days (cropdevelopment) while along the y-axis they wereunrestricted.
3 fields, 4 samplesn=1088
Kununurra15.8oS, 128.7oE
Katherine14.4oS, 132.3oE
Darling Downs27.6oS, 151.9oE
Namoi/Pilliga30.3oS, 149.8oE
Boggabilla28.6oS, 150.4oE
Hillston33.3oS, 145.3oE
Biloela24.4oS, 150.5oE
3 fields, 5 Samplesn=1313
2 fields, 3 samplesn=1002
1 field, 4 samplesn=641
2 fields, 3 samplesn=104
2 fields, 5 samplesn=267
2 fields, 3 samples
n=2273 fields, 4 samplesn=1088
Kununurra15.8oS, 128.7oE
Katherine14.4oS, 132.3oE
Darling Downs27.6oS, 151.9oE
Namoi/Pilliga30.3oS, 149.8oE
Boggabilla28.6oS, 150.4oE
Hillston33.3oS, 145.3oE
Biloela24.4oS, 150.5oE
3 fields, 5 Samplesn=1313
2 fields, 3 samplesn=1002
1 field, 4 samplesn=641
2 fields, 3 samplesn=104
2 fields, 5 samplesn=267
2 fields, 3 samples
n=227
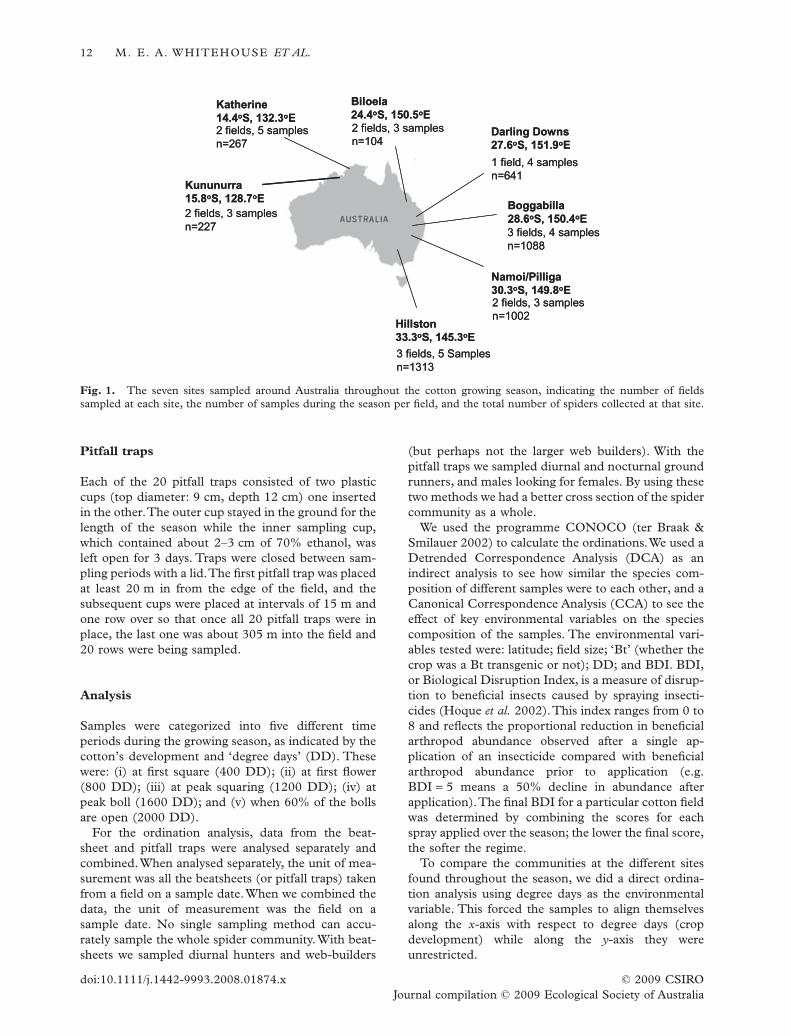
Fig. 1. The seven sites sampled around Australia throughout the cotton growing season, indicating the number of fieldssampled at each site, the number of samples during the season per field, and the total number of spiders collected at that site.
12 M. E. A. WHITEHOUSE ET AL.
© 2009 CSIROdoi:10.1111/j.1442-9993.2008.01874.xJournal compilation © 2009 Ecological Society of Australia
As diversity indices differ in their strength and weak-nesses, we compared the species diversity of spidersusing three indices. We used the Simpson index(Simpson 1949) and Shannon–Weaver index (Shannon&Weaver 1949) to measure evenness (a measure of thedistribution of relative abundances of different taxa in asample) and rarefaction curves (Sanders 1968) tomeasure richness (the number of species in a sample).The Simpson and Shannon–Weaver indices are atdifferent ends of Renyi’s diversity order (Tothmeresz1995) and so they give a good overview of evenness.TheSimpson index we used is corrected for sample-size bias(SI = S((n2-n)/(N2-N), where SI = Simpson index,n = total of individuals of that species, N = total ofindividuals caught) and modified (-ln SI) followingRosenzweig (1995) so that the units increase with anincrease in diversity.The Simpson index is more sensi-tive to dominant species, while the Shannon–Weaverindex (H = -Spilnpi , where pi is the proportional abun-dance of species i) is more sensitive to rare species.
ANOVA assumptions were tested by inspecting thehistogram of residuals, the fitted value plot and thenormal plot.
Rarefaction curves were generated using themethods developed by Holland 2003 (http://www.uga.edu/~strata/software/AnRareReadme.html).
Identification
Spiders were identified to family following the classi-fication of Australian genera used by Raven et al.(2002). Identifying spiders to family allowed us toinclude juvenile spiders, which is important for reliableestimates of species richness, as has been demon-strated for Araneidae and Thomisidae (Jimenez-Valverde & Lobo 2006).
RESULTS
Abundance and diversity
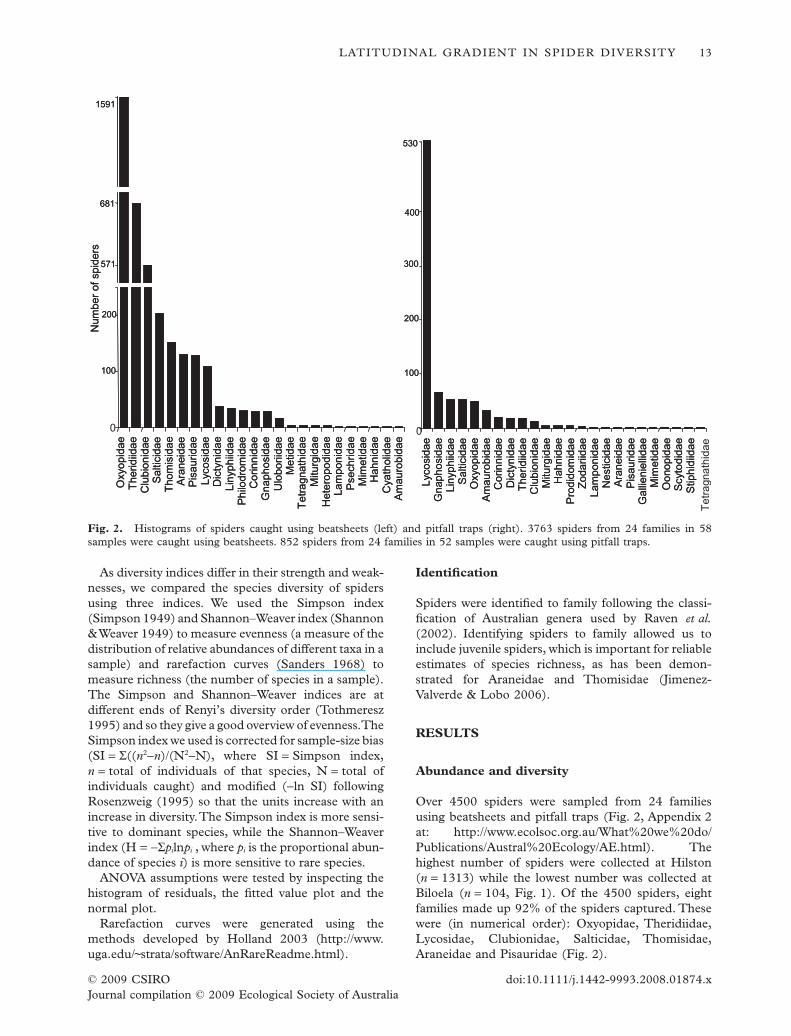
Over 4500 spiders were sampled from 24 familiesusing beatsheets and pitfall traps (Fig. 2, Appendix 2at: http://www.ecolsoc.org.au/What%20we%20do/Publications/Austral%20Ecology/AE.html). Thehighest number of spiders were collected at Hilston(n = 1313) while the lowest number was collected atBiloela (n = 104, Fig. 1). Of the 4500 spiders, eightfamilies made up 92% of the spiders captured. Thesewere (in numerical order): Oxyopidae, Theridiidae,Lycosidae, Clubionidae, Salticidae, Thomisidae,Araneidae and Pisauridae (Fig. 2).
0L
yco
sid
ae
Gn
aph
osid
ae
Lin
yp
hiid
ae
Sa
ltic
idae
Oxyo
pid
ae
Am
au
rob
ida
eC
orin
nid
ae
Dic
tyn
ida
eT
he
rid
iida
eC
lub
ion
idae
Mitu
rgid
ae
Hahn
idae
Pro
did
om
ida
eZ
oda
riid
ae
Lam
pon
idae
Ne
sticid
ae
Ara
neid
ae
Pis
au
rid
ae
Ga
llien
ielli
da
eM
ime
tidae
Oo
nop
idae
Scyto
did
ae
Stiph
idiid
ae
Lyco
sid
ae
Gn
apho
sid
ae
Lin
yp
hiid
ae
Sa
ltic
idae
Oxyo
pid
ae
Am
au
rob
ida
eC
orin
nid
ae
Dic
tyn
ida
eT
he
rid
iida
eC
lub
ion
idae
Mitu
rgid
ae
Hahn
idae
Pro
did
om
ida
eZ
oda
riid
ae
Lam
pon
idae
Ne
sticid
ae
Ara
neid
ae
Pis
au
rid
ae
Ga
llien
ielli
da
eM
ime
tidae
Oo
nop
ida
eS
cyto
did
ae
Stiph
idiid
ae
Te
tra
gna
thid
ae
0
Oxyo
pid
ae
The
rid
iida
eC
lub
ion
idae
Sa
ltic
idae
Thom
isid
ae
Ara
neid
ae
Pis
au
rid
ae
Lyco
sid
ae
Dic
tyn
ida
eL
inyp
hiid
ae
Ph
ilod
rom
idae
Co
rin
nid
ae
Gn
apho
sid
ae
Ulo
bo
riid
ae
Me
tidae
Te
tra
gna
thid
ae
Mitu
rgid
ae
He
tero
po
did
ae
La
mpon
idae
Pse
ch
rid
ae
Mim
etidae
Hahn
idae
Cya
tholid
ae
Am
au
rob
idae
530
100
400
200
300
100
200
571
681
1591N
um
be
r o
f sp
ide
rs
530
100
400
200
300
100
200
571
681
1591N
um
be
r o
f sp
ide
rs
Fig. 2. Histograms of spiders caught using beatsheets (left) and pitfall traps (right). 3763 spiders from 24 families in 58samples were caught using beatsheets. 852 spiders from 24 families in 52 samples were caught using pitfall traps.
LATITUDINAL GRADIENT IN SPIDER DIVERSITY 13
© 2009 CSIRO doi:10.1111/j.1442-9993.2008.01874.xJournal compilation © 2009 Ecological Society of Australia
The Simpson and Shannon–Weaver indices werehighly correlated across all sites using both samplingmethods (Spearmans rank correlation coefficient:r2 = 0.96, d.f. = 12, P < 0.001) indicating no tendencyfor any site to have more rare families. The diversityindices of the beatsheet communities were more eventhan those of the pitfall trap communities.
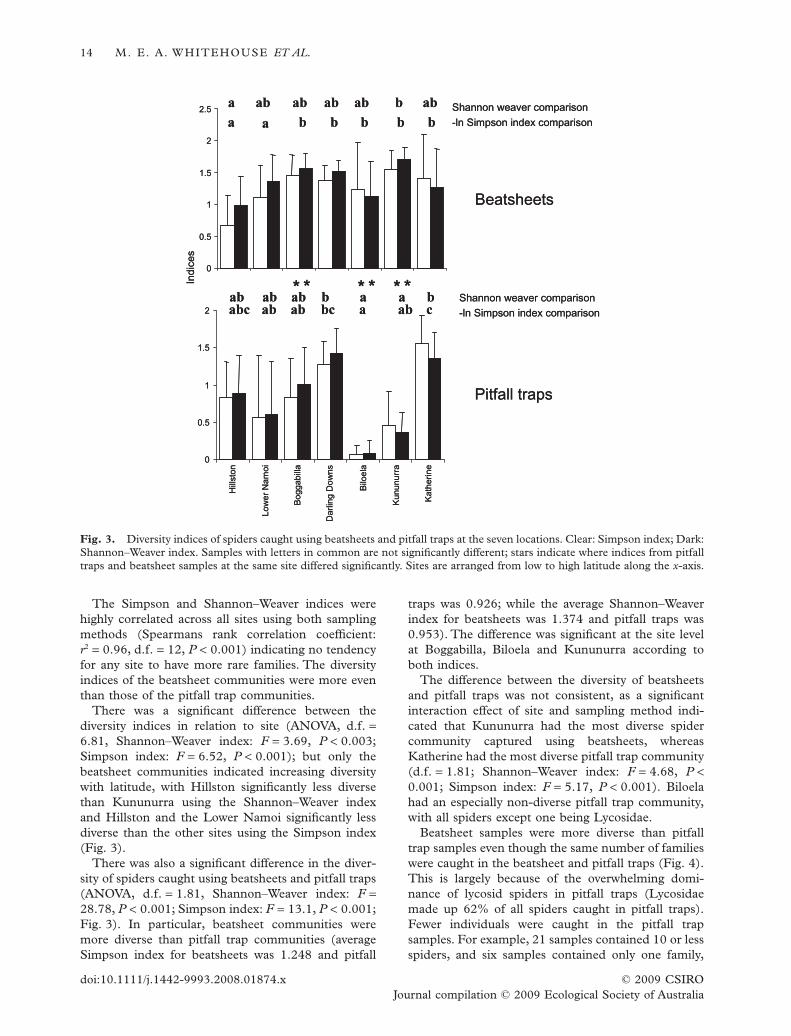
There was a significant difference between thediversity indices in relation to site (ANOVA, d.f. =6.81, Shannon–Weaver index: F = 3.69, P < 0.003;Simpson index: F = 6.52, P < 0.001); but only thebeatsheet communities indicated increasing diversitywith latitude, with Hillston significantly less diversethan Kununurra using the Shannon–Weaver indexand Hillston and the Lower Namoi significantly lessdiverse than the other sites using the Simpson index(Fig. 3).
There was also a significant difference in the diver-sity of spiders caught using beatsheets and pitfall traps(ANOVA, d.f. = 1.81, Shannon–Weaver index: F =28.78, P < 0.001; Simpson index: F = 13.1, P < 0.001;Fig. 3). In particular, beatsheet communities weremore diverse than pitfall trap communities (averageSimpson index for beatsheets was 1.248 and pitfall
traps was 0.926; while the average Shannon–Weaverindex for beatsheets was 1.374 and pitfall traps was0.953). The difference was significant at the site levelat Boggabilla, Biloela and Kununurra according toboth indices.
The difference between the diversity of beatsheetsand pitfall traps was not consistent, as a significantinteraction effect of site and sampling method indi-cated that Kununurra had the most diverse spidercommunity captured using beatsheets, whereasKatherine had the most diverse pitfall trap community(d.f. = 1.81; Shannon–Weaver index: F = 4.68, P <0.001; Simpson index: F = 5.17, P < 0.001). Biloelahad an especially non-diverse pitfall trap community,with all spiders except one being Lycosidae.
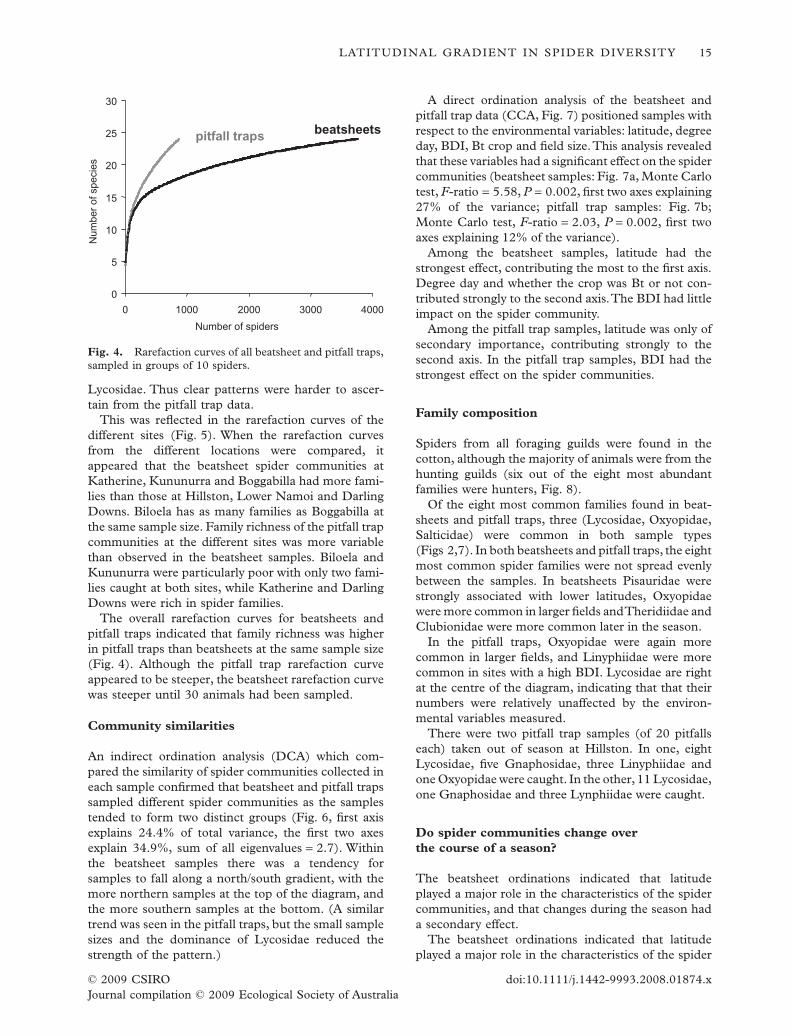
Beatsheet samples were more diverse than pitfalltrap samples even though the same number of familieswere caught in the beatsheet and pitfall traps (Fig. 4).This is largely because of the overwhelming domi-nance of lycosid spiders in pitfall traps (Lycosidaemade up 62% of all spiders caught in pitfall traps).Fewer individuals were caught in the pitfall trapsamples. For example, 21 samples contained 10 or lessspiders, and six samples contained only one family,
0
0.5
1
1.5
2
2.5
Ind
ice
sBeatsheets
0
0.5
1
1.5
2
Hill
sto
n
Low
er
Nam
oi
Bo
gg
ab
illa
Darl
ing
Do
wns
Bilo
ela
Pitfall traps
* *aababc ab bc
a a b b b
a ab ab ab ab
* *a
Kununurr
a
*ab
b
b
*aabab ab
ab
Kath
eri
ne
c
b
bb
Shannon weaver comparison
-ln Simpson index comparison
Shannon weaver comparison
-ln Simpson index comparison
0
0.5
1
1.5
2
2.5
Ind
ice
sBeatsheets
0
0.5
1
1.5
2
Hill
sto
n
Low
er
Nam
oi
Bo
gg
ab
illa
Darl
ing
Do
wns
Bilo
ela
Pitfall traps
* *aababc ab bc
a a b b b
a ab ab ab ab
* *a
Kununurr
a
*ab
b
b
*aabab ab
ab
Kath
eri
ne
c
b
bb
Shannon weaver comparison
-ln Simpson index comparison
Shannon weaver comparison
-ln Simpson index comparison
Fig. 3. Diversity indices of spiders caught using beatsheets and pitfall traps at the seven locations. Clear: Simpson index; Dark:Shannon–Weaver index. Samples with letters in common are not significantly different; stars indicate where indices from pitfalltraps and beatsheet samples at the same site differed significantly. Sites are arranged from low to high latitude along the x-axis.
14 M. E. A. WHITEHOUSE ET AL.
© 2009 CSIROdoi:10.1111/j.1442-9993.2008.01874.xJournal compilation © 2009 Ecological Society of Australia
Lycosidae. Thus clear patterns were harder to ascer-tain from the pitfall trap data.
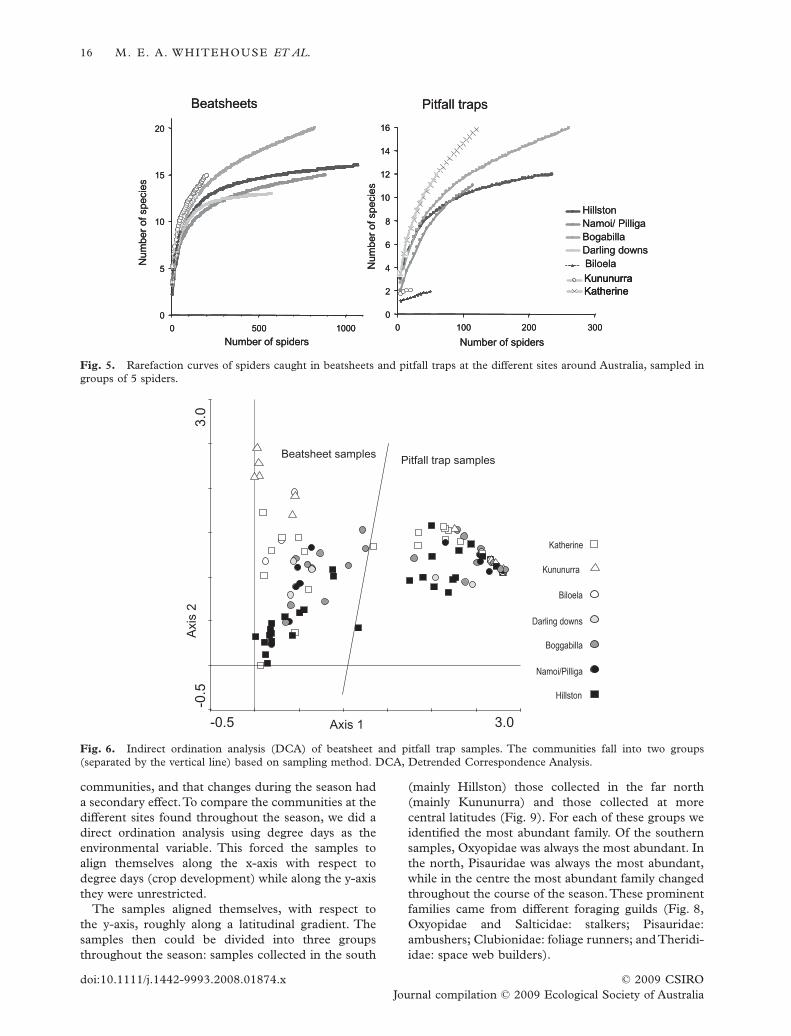
This was reflected in the rarefaction curves of thedifferent sites (Fig. 5). When the rarefaction curvesfrom the different locations were compared, itappeared that the beatsheet spider communities atKatherine, Kununurra and Boggabilla had more fami-lies than those at Hillston, Lower Namoi and DarlingDowns. Biloela has as many families as Boggabilla atthe same sample size. Family richness of the pitfall trapcommunities at the different sites was more variablethan observed in the beatsheet samples. Biloela andKununurra were particularly poor with only two fami-lies caught at both sites, while Katherine and DarlingDowns were rich in spider families.
The overall rarefaction curves for beatsheets andpitfall traps indicated that family richness was higherin pitfall traps than beatsheets at the same sample size(Fig. 4). Although the pitfall trap rarefaction curveappeared to be steeper, the beatsheet rarefaction curvewas steeper until 30 animals had been sampled.
Community similarities
An indirect ordination analysis (DCA) which com-pared the similarity of spider communities collected ineach sample confirmed that beatsheet and pitfall trapssampled different spider communities as the samplestended to form two distinct groups (Fig. 6, first axisexplains 24.4% of total variance, the first two axesexplain 34.9%, sum of all eigenvalues = 2.7). Withinthe beatsheet samples there was a tendency forsamples to fall along a north/south gradient, with themore northern samples at the top of the diagram, andthe more southern samples at the bottom. (A similartrend was seen in the pitfall traps, but the small samplesizes and the dominance of Lycosidae reduced thestrength of the pattern.)
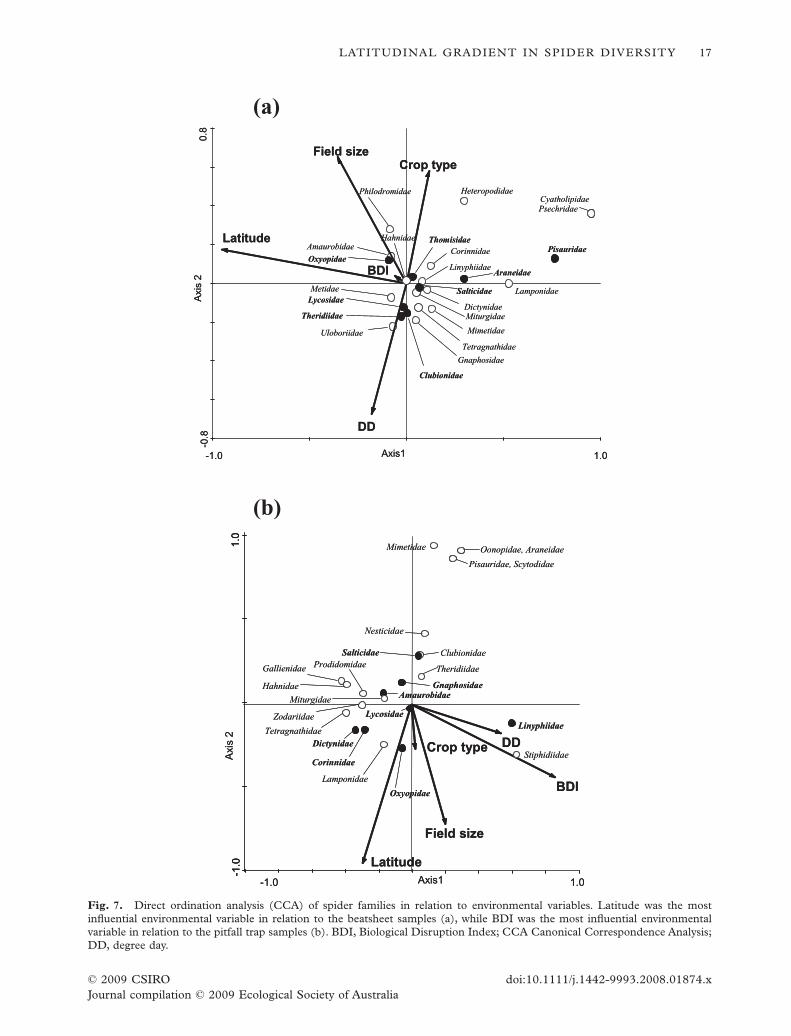
A direct ordination analysis of the beatsheet andpitfall trap data (CCA, Fig. 7) positioned samples withrespect to the environmental variables: latitude, degreeday, BDI, Bt crop and field size.This analysis revealedthat these variables had a significant effect on the spidercommunities (beatsheet samples: Fig. 7a, Monte Carlotest, F-ratio = 5.58, P = 0.002, first two axes explaining27% of the variance; pitfall trap samples: Fig. 7b;Monte Carlo test, F-ratio = 2.03, P = 0.002, first twoaxes explaining 12% of the variance).
Among the beatsheet samples, latitude had thestrongest effect, contributing the most to the first axis.Degree day and whether the crop was Bt or not con-tributed strongly to the second axis.The BDI had littleimpact on the spider community.
Among the pitfall trap samples, latitude was only ofsecondary importance, contributing strongly to thesecond axis. In the pitfall trap samples, BDI had thestrongest effect on the spider communities.
Family composition
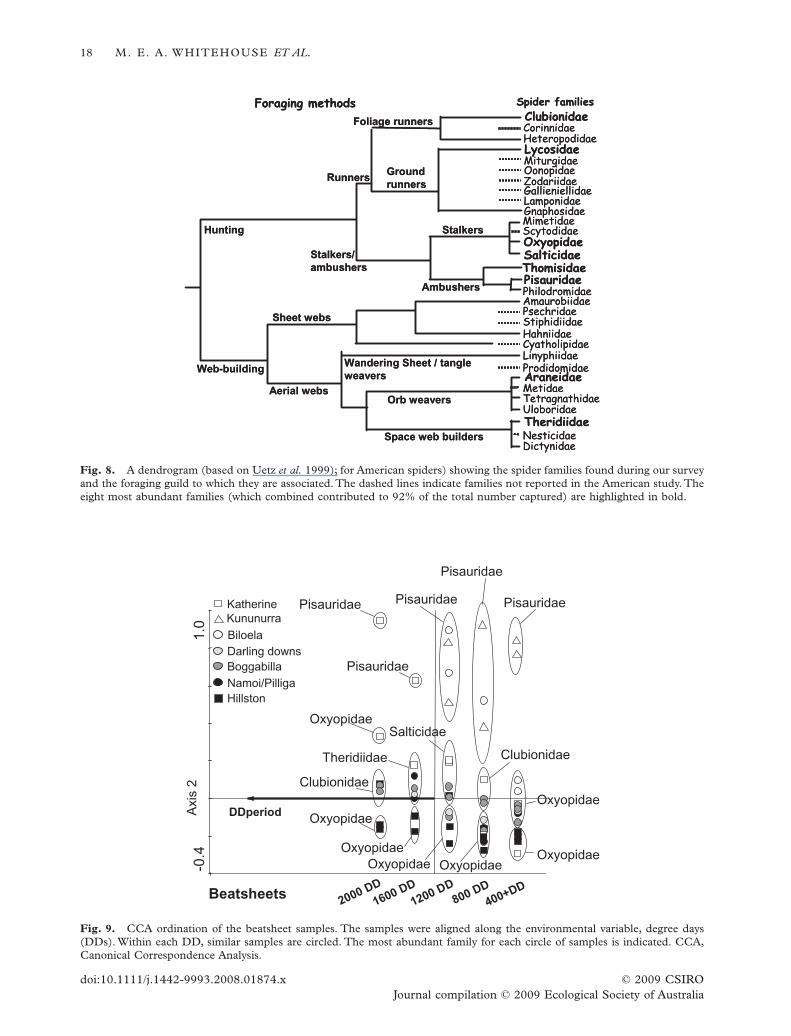
Spiders from all foraging guilds were found in thecotton, although the majority of animals were from thehunting guilds (six out of the eight most abundantfamilies were hunters, Fig. 8).
Of the eight most common families found in beat-sheets and pitfall traps, three (Lycosidae, Oxyopidae,Salticidae) were common in both sample types(Figs 2,7). In both beatsheets and pitfall traps, the eightmost common spider families were not spread evenlybetween the samples. In beatsheets Pisauridae werestrongly associated with lower latitudes, Oxyopidaewere more common in larger fields andTheridiidae andClubionidae were more common later in the season.
In the pitfall traps, Oxyopidae were again morecommon in larger fields, and Linyphiidae were morecommon in sites with a high BDI. Lycosidae are rightat the centre of the diagram, indicating that that theirnumbers were relatively unaffected by the environ-mental variables measured.
There were two pitfall trap samples (of 20 pitfallseach) taken out of season at Hillston. In one, eightLycosidae, five Gnaphosidae, three Linyphiidae andone Oxyopidae were caught. In the other, 11 Lycosidae,one Gnaphosidae and three Lynphiidae were caught.
Do spider communities change overthe course of a season?
The beatsheet ordinations indicated that latitudeplayed a major role in the characteristics of the spidercommunities, and that changes during the season hada secondary effect.
The beatsheet ordinations indicated that latitudeplayed a major role in the characteristics of the spider
Number of spiders
Num
ber
of specie
s
0
5
10
15
20
25
30
0 1000 2000 3000 4000
pitfall traps beatsheets
Fig. 4. Rarefaction curves of all beatsheet and pitfall traps,sampled in groups of 10 spiders.
LATITUDINAL GRADIENT IN SPIDER DIVERSITY 15
© 2009 CSIRO doi:10.1111/j.1442-9993.2008.01874.xJournal compilation © 2009 Ecological Society of Australia
communities, and that changes during the season hada secondary effect.To compare the communities at thedifferent sites found throughout the season, we did adirect ordination analysis using degree days as theenvironmental variable. This forced the samples toalign themselves along the x-axis with respect todegree days (crop development) while along the y-axisthey were unrestricted.
The samples aligned themselves, with respect tothe y-axis, roughly along a latitudinal gradient. Thesamples then could be divided into three groupsthroughout the season: samples collected in the south
(mainly Hillston) those collected in the far north(mainly Kununurra) and those collected at morecentral latitudes (Fig. 9). For each of these groups weidentified the most abundant family. Of the southernsamples, Oxyopidae was always the most abundant. Inthe north, Pisauridae was always the most abundant,while in the centre the most abundant family changedthroughout the course of the season.These prominentfamilies came from different foraging guilds (Fig. 8,Oxyopidae and Salticidae: stalkers; Pisauridae:ambushers; Clubionidae: foliage runners; andTheridi-idae: space web builders).
0
5
10
15
20
0 500 1000
Beatsheets
Number of spiders
Nu
mbe
r o
f spe
cie
s
Pitfall traps
0
2
4
6
8
10
12
14
16
0 100 200 300
Number of spiders
Nu
mbe
r o
f spe
cie
s
Hillston
Namoi/ Pilliga
Bogabilla
Darling downs
Biloela
Kununurra
Katherine
0
5
10
15
20
0 500 1000
Beatsheets
Number of spiders
Nu
mbe
r o
f spe
cie
s
Pitfall traps
0
2
4
6
8
10
12
14
16
0 100 200 300
Number of spiders
Nu
mbe
r o
f spe
cie
s
Hillston
Namoi/ Pilliga
Bogabilla
Darling downs
Biloela
KununurraKununurra
KatherineKatherine
Fig. 5. Rarefaction curves of spiders caught in beatsheets and pitfall traps at the different sites around Australia, sampled ingroups of 5 spiders.
Axis 1
Biloela
Darling downs
Boggabilla
Namoi/Pilliga
Hillston
0.35.0-
-0.5
3.0
Beatsheet samplesPitfall trap samples
Axis
2
Kununurra
Katherine
Fig. 6. Indirect ordination analysis (DCA) of beatsheet and pitfall trap samples. The communities fall into two groups(separated by the vertical line) based on sampling method. DCA, Detrended Correspondence Analysis.
16 M. E. A. WHITEHOUSE ET AL.
© 2009 CSIROdoi:10.1111/j.1442-9993.2008.01874.xJournal compilation © 2009 Ecological Society of Australia
(a)
(b)
0.10.1-
Field size
Latitude
Crop type
BDI
DD
Amaurobidae
Corinnidae
Dictynidae
Gnaphosidae
Miturgidae
Prodidomidae
Tetragnathidae
Zodariidae
Pisauridae, Scytodidae
Gallienidae
Hahnidae
Mimetidae
Nesticidae
Oonopidae, Araneidae
Salticidae
Lamponidae
Oxyopidae
Linyphiidae
Stiphidiidae
Clubionidae
Theridiidae
Lycosidae
Axis1
Axis
2-1
.01
.0
0.10.1-
Field size
Latitude
Crop type
BDI
DD
Amaurobidae
Corinnidae
Dictynidae
Gnaphosidae
Miturgidae
Prodidomidae
Tetragnathidae
Zodariidae
Pisauridae, Scytodidae
Gallienidae
Hahnidae
Mimetidae
Nesticidae
Oonopidae, Araneidae
Salticidae
Lamponidae
Oxyopidae
Linyphiidae
Stiphidiidae
Clubionidae
Theridiidae
Lycosidae
Axis1
Axis
2-1
.01
.0-1
.01
.0
-1.0 1.0
-0.8
0.8
Latitude
Field sizeCrop type
BDI
DD
Clubionidae
Gnaphosidae
Lycosidae
Tetragnathidae
Amaurobidae
Metidae
Oxyopidae
Philodromidae
Theridiidae
Uloboriidae
Araneidae
Cyatholipidae
Pisauridae
Dictynidae
Lamponidae
Mimetidae
Psechridae
Corinnidae
Hahnidae
Heteropodidae
Linyphiidae
Thomisidae
Miturgidae
Salticidae
Axis1
Axis
2
Fig. 7. Direct ordination analysis (CCA) of spider families in relation to environmental variables. Latitude was the mostinfluential environmental variable in relation to the beatsheet samples (a), while BDI was the most influential environmentalvariable in relation to the pitfall trap samples (b). BDI, Biological Disruption Index; CCA Canonical Correspondence Analysis;DD, degree day.
LATITUDINAL GRADIENT IN SPIDER DIVERSITY 17
© 2009 CSIRO doi:10.1111/j.1442-9993.2008.01874.xJournal compilation © 2009 Ecological Society of Australia
Clubionidae
Lycosidae
GnaphosidaeMimetidae
OxyopidaeSalticidaeThomisidae
PhilodromidaeAmaurobiidae
Hahniidae
Linyphiidae
Araneidae
TetragnathidaeUloboridaeTheridiidae
Dictynidae
Hunting
Web-building
Sheet webs
Wandering Sheet / tangle weavers
Stalkers/ambushers
Ambushers
Stalkers
Groundrunners
Foliage runners
Runners
Orb weavers
Space web builders
Aerial webs
Spider familiesForaging methods
Pisauridae
Corinnidae
Miturgidae
Lamponidae
Metidae
Prodidomidae
Heteropodidae
Zodariidae
Cyatholipidae
Gallieniellidae
Nesticidae
Oonopidae
Psechridae
Scytodidae
Stiphidiidae
Clubionidae
Lycosidae
GnaphosidaeMimetidae
OxyopidaeSalticidaeThomisidae
PhilodromidaeAmaurobiidae
Hahniidae
Linyphiidae
Araneidae
TetragnathidaeUloboridaeTheridiidae
Dictynidae
Hunting
Web-building
Sheet webs
Wandering Sheet / tangle weavers
Stalkers/ambushers
Ambushers
Stalkers
Groundrunners
Foliage runners
Runners
Orb weavers
Space web builders
Aerial webs
Spider familiesForaging methods
Pisauridae
Corinnidae
Miturgidae
Lamponidae
Metidae
Prodidomidae
Heteropodidae
Zodariidae
Cyatholipidae
Gallieniellidae
Nesticidae
Oonopidae
Psechridae
Scytodidae
Stiphidiidae
Fig. 8. A dendrogram (based on Uetz et al. 1999); for American spiders) showing the spider families found during our surveyand the foraging guild to which they are associated. The dashed lines indicate families not reported in the American study. Theeight most abundant families (which combined contributed to 92% of the total number captured) are highlighted in bold.
Axis
20.
14.
0-
DDperiod
Kununurra
Katherine
Biloela
Darling downs
Boggabilla
Namoi/Pilliga
Hillston
Oxyopidae
Oxyopidae
Pisauridae
Pisauridae
Clubionidae
Pisauridae
Salticidae
Pisauridae
Oxyopidae
Oxyopidae
Oxyopidae
Clubionidae
Pisauridae
Theridiidae
OxyopidaeOxyopidae
400+DD800 DD
1200 DD1600 DD
2000 DDBeatsheets
Fig. 9. CCA ordination of the beatsheet samples. The samples were aligned along the environmental variable, degree days(DDs). Within each DD, similar samples are circled. The most abundant family for each circle of samples is indicated. CCA,Canonical Correspondence Analysis.
18 M. E. A. WHITEHOUSE ET AL.
© 2009 CSIROdoi:10.1111/j.1442-9993.2008.01874.xJournal compilation © 2009 Ecological Society of Australia
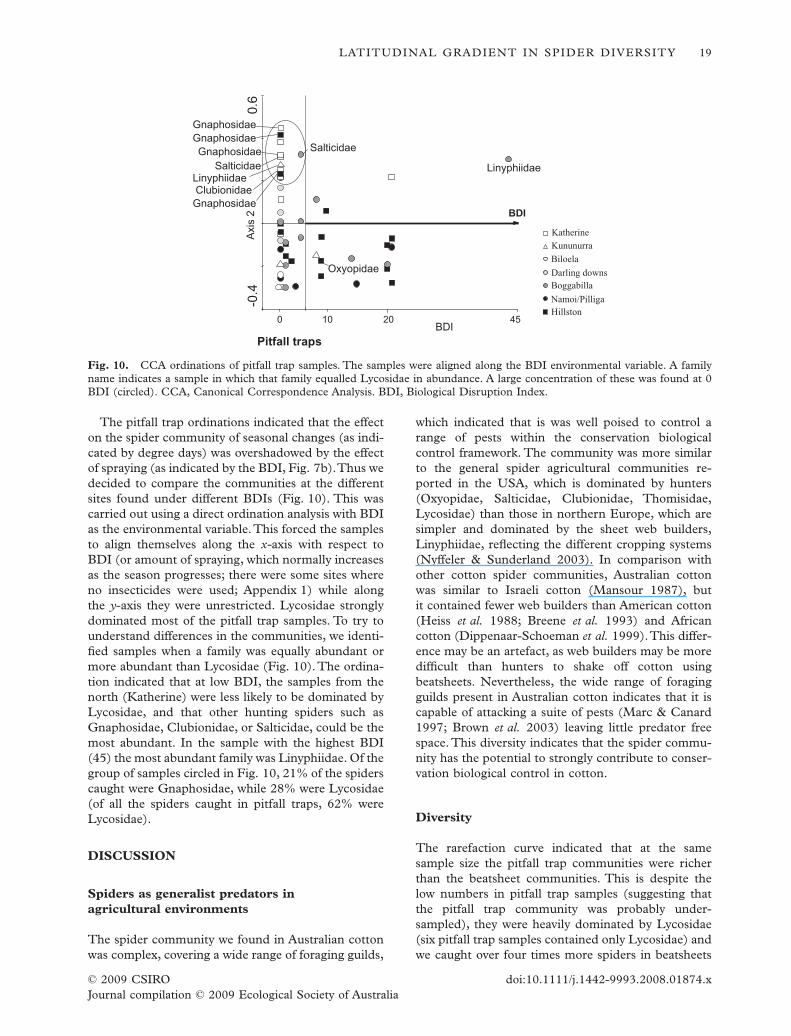
The pitfall trap ordinations indicated that the effecton the spider community of seasonal changes (as indi-cated by degree days) was overshadowed by the effectof spraying (as indicated by the BDI, Fig. 7b).Thus wedecided to compare the communities at the differentsites found under different BDIs (Fig. 10). This wascarried out using a direct ordination analysis with BDIas the environmental variable.This forced the samplesto align themselves along the x-axis with respect toBDI (or amount of spraying, which normally increasesas the season progresses; there were some sites whereno insecticides were used; Appendix 1) while alongthe y-axis they were unrestricted. Lycosidae stronglydominated most of the pitfall trap samples. To try tounderstand differences in the communities, we identi-fied samples when a family was equally abundant ormore abundant than Lycosidae (Fig. 10). The ordina-tion indicated that at low BDI, the samples from thenorth (Katherine) were less likely to be dominated byLycosidae, and that other hunting spiders such asGnaphosidae, Clubionidae, or Salticidae, could be themost abundant. In the sample with the highest BDI(45) the most abundant family was Linyphiidae. Of thegroup of samples circled in Fig. 10, 21% of the spiderscaught were Gnaphosidae, while 28% were Lycosidae(of all the spiders caught in pitfall traps, 62% wereLycosidae).
DISCUSSION
Spiders as generalist predators inagricultural environments
The spider community we found in Australian cottonwas complex, covering a wide range of foraging guilds,
which indicated that is was well poised to control arange of pests within the conservation biologicalcontrol framework. The community was more similarto the general spider agricultural communities re-ported in the USA, which is dominated by hunters(Oxyopidae, Salticidae, Clubionidae, Thomisidae,Lycosidae) than those in northern Europe, which aresimpler and dominated by the sheet web builders,Linyphiidae, reflecting the different cropping systems(Nyffeler & Sunderland 2003). In comparison withother cotton spider communities, Australian cottonwas similar to Israeli cotton (Mansour 1987), butit contained fewer web builders than American cotton(Heiss et al. 1988; Breene et al. 1993) and Africancotton (Dippenaar-Schoeman et al. 1999).This differ-ence may be an artefact, as web builders may be moredifficult than hunters to shake off cotton usingbeatsheets. Nevertheless, the wide range of foragingguilds present in Australian cotton indicates that it iscapable of attacking a suite of pests (Marc & Canard1997; Brown et al. 2003) leaving little predator freespace. This diversity indicates that the spider commu-nity has the potential to strongly contribute to conser-vation biological control in cotton.
Diversity
The rarefaction curve indicated that at the samesample size the pitfall trap communities were richerthan the beatsheet communities. This is despite thelow numbers in pitfall trap samples (suggesting thatthe pitfall trap community was probably under-sampled), they were heavily dominated by Lycosidae(six pitfall trap samples contained only Lycosidae) andwe caught over four times more spiders in beatsheets
45
-0.4
0.6
BDI
Kununurra
Katherine
Biloela
Darling downsBoggabilla
Namoi/PilligaHillston
Linyphiidae
Salticidae
Clubionidae
Oxyopidae
Gnaphosidae
Gnaphosidae
Salticidae
Gnaphosidae
Gnaphosidae
Linyphiidae
Axis
2
BDI20100
Pitfall traps
Fig. 10. CCA ordinations of pitfall trap samples. The samples were aligned along the BDI environmental variable. A familyname indicates a sample in which that family equalled Lycosidae in abundance. A large concentration of these was found at 0BDI (circled). CCA, Canonical Correspondence Analysis. BDI, Biological Disruption Index.
LATITUDINAL GRADIENT IN SPIDER DIVERSITY 19
© 2009 CSIRO doi:10.1111/j.1442-9993.2008.01874.xJournal compilation © 2009 Ecological Society of Australia
than pitfall traps. Nevertheless, we caught the samenumber of species on beatsheets and pitfall traps.
In terms of diversity, both indices indicated that thebeatsheet community was more diverse than the pitfalltrap community. Some authors argue that ‘evenness’or diversity is greater in rarefaction curves with a steepinitial rate of increase (Hurlbert 2004; Olszewski2004). In this study the pitfall trap rarefaction curvelooked steeper than the beatsheet rarefaction curve(suggesting that the pitfall trap community was morediverse) even though the beatsheet curve was steeperin the initial 30 spider samples. This is because therelative proportion of common or rare species influ-ence different parts of the rarefaction curve.The beat-sheet curve was initially steeper because of the highnumber of common species, while the pitfall trapcurve became steeper (masking the beatsheet curve)because in later samples the probability of detecting anew species is largely determined by the number ofrare species. If rarefaction curves have quite differentproportions of rare and common species, then com-parisons between these curves can be deceptive, as inthis case here. Thus care must be taken when tryingto use rarefaction curves to gather information ondiversity.
Community structure at different locations
As cotton is an agricultural monoculture crop, onewould expect the community structure and the samefamilies, or at least the same foraging guilds, to bedominant in cotton throughout Australia, with theaddition of rare families along the latitudinal gradienttowards the tropics (following predictions derivedfrom latitudinal gradient hypotheses; Stevens (2004).This was not the case. The Shannon–Weaver index isparticularly sensitive to rare species, and there was noevidence that it showed an increase in diversity incomparison with the Simpson index in the tropicalsamples in beatsheets or pitfall traps.
However, the beatsheet communities did follow alatitudinal gradient in species diversity, as measured byboth indices, despite some variability in the cottoncrops sampled. For example, the samples at DarlingDowns had chick pea interspersed within the crop, thesize of the plots varied, some crops were transgenicand others were not, and the crops received differentspray regimes. Despite these differences, the presenceof a latitudinal gradient demonstrated that the latitu-dinal gradient model is very robust with respect tospider communities.
The spider community responded differently toseasonal changes at different sites around Australia. Inthe south (Hillston) and north (Kununurra) the samefamily was dominant throughout the season (Oxyopi-dae and Pisauridae, respectively) while communities in
the centre followed a seasonal succession of dominantfamilies (Oxyopidae, Clubionidae, Salticidae, Theridi-idae and Clubionidae). It was unclear why differentguilds dominate different sites and why there was asuccession of dominant families at some sites but notothers. Nevertheless these differences mean that man-agement of specific pests using spiders will need to bemodified at the different sites.
Differing management regimes may be needed asspider families concentrate on different pest species.For example, Oxyopidae, or Lynx spiders, are stalkerswhich attack mirids in cotton (Breene et al. 1989;Nyffeler et al. 1992a,b, M.E.A. Whitehouse & M.Barnett unpubl. data 2006). This family dominatesspider communities in the south, indicating that south-ern spider communities in Australia could be particu-larly resilient to mirid damage. Small Pisauridaedominated the beatsheet samples in the north. Thesespiders are ambushers, and members of the familyattack flies and grasshoppers (Lang & Klarenberg1997; Beckerman et al. 1997). Clubionidae, in particu-lar Cheiracanthium, dominated central locations earlyand late in the season.These spiders attack Helicoverpaspp. larvae (Bishop & Blood 1981), eggs (Scholtz et al.2000; Pearce et al. 2004) and mirids (Breene et al.1989) in cotton, and mites in the laboratory (Mansouret al. 1995). Salticidae (jumping spiders) which wereprominent mid season, prefer jassids in apple orchards(Brown et al. 2003), attack mirids in cotton (Breeneet al. 1989) and Rutherglen bugs in pistachio orchards(Haddad et al. 2004). Theridiidae capture jassids andaphids in cotton (Bishop & Blood 1981). Spider com-munities dominated by these different families willrespond differently to pest pressure.
The pitfall trap community was heavily dominatedby wolf spiders (Lycosidae) which attack pest lepi-dopteran and mirids in cotton, as well as beneficialarthropods including other wolf spiders, damsel bugs,shield bugs and lacewings (Hayes & Lockley 1990). Anexception to the dominance of Lycosidae occurred ina group of samples at 0 BDI, most of which werefrom Katherine. In this group of samples, Lycosidaemade up 28% of the spiders in the samples whileGnaphosidae made up 21%. Gnaphosidae, like mostLycosidae, is a ground runner, although it tends to besmaller and less reliant on sight. Little is known aboutthe feeding preferences of this family group in cotton.Linyphiidae, which were also prominent in pitfalltraps, can control aphids in pastures and wheat(Sunderland et al. 1986; de Barro 1992).
The influence of BDI on the spider community
Although beatsheet samples showed a latitudinal gra-dient, there was no similar trend in the pitfall trap data.In this community, diversity was strongly influenced
20 M. E. A. WHITEHOUSE ET AL.
© 2009 CSIROdoi:10.1111/j.1442-9993.2008.01874.xJournal compilation © 2009 Ecological Society of Australia
by insecticides, as indicated by the BDI. Althoughspiders may be reasonably tolerant of harder insecti-cides such as organophosphates or carbamates (Bajwa& Aliniazee 2001), they are nevertheless affected byinsecticides, in which acaricides are the most toxic(Mansour & Nentwig 1988). Why BDI should affectpitfall trap and not beatsheet communities is unclear.
As spider families vary in their susceptibility to insec-ticides, perhaps species caught in pitfall traps are moresusceptible to insecticides. Of the families which wemainly found in beatsheet samples, Oxyopidae appearto be less affected by sprays than other spider families(Roach & Hopkins 1981; Brown et al. 2003) and canbuild up resistance to some chemicals (Redmond &Brazzel 1968).Theridiidae are not adversely affected byAlphamethrin or Endosulfan sprays, and the webs ofTheridiidae may offer some protection against insecti-cides (Pekar 1999). Philodromidae may be especiallyresistant to organophosphates (Pekar 1999).
Of the species we found in pitfall traps, Lycosidae(like the beatsheet family Clubionidae) are more sus-ceptible to the pyrethroid Alphamethrin than theorganochlorine Endosulfan (van den Berg et al. 1990).Linyphiidae are more susceptible to pyrethroids andthe carbamate Carbaryl than (the predominantly beat-sheet family) Salticidae (Bajwa & Aliniazee 2001), andare severely affected by Alphamethrin and Endosulfan(van den Berg et al. 1990).
Thus it appears that common pitfall trap speciessuch as Lycosidae and Linyphiidae may be more sus-ceptible to insecticide sprays, even though Linyphiidaewas the most prominent family in the pitfall trapsample with the highest BDI. Linyphiidae, though,may be able to re-colonize quickly after a spray eventbecause they are small spiders and prominent balloon-ers (Pearce et al. 2005). Common beatsheet species,such as Oxyopidae, Philodromidae, Theridiidae and,to some extent, Salticidae are less susceptible toinsecticides. This difference may explain the strongereffect of BDI on pitfall trap samples.
Alternatively, the stronger effect of BDI on pitfalltrap samples may indicate a sub-lethal effect of sprays.To be caught in a pitfall trap, the spiders, which areoften male, have to be actively moving around. To becaught in a beatsheet the spider just has to be knockedout of the plant. A high BDI may reduce spider activ-ity, making them less likely to be caught in pitfall traps,but not influencing their tendency to be caught inbeatsheets.
Latitudinal gradient
Even though spatial heterogeneity had been removedas a possible influence, we still found a latitudinaldiversity gradient: the more northern beatsheetsamples tended to have higher diversity indices than
the more southern beatsheet samples.This finding is inagreement with Davidowitz and Rosenzweig (1998)who found a latitudinal gradient of species diversity ingrasshoppers within a single habitat, but counter thatof Andrew and Hughes (2005) who found no latitudi-nal gradient in arthropods in Acacia trees over 9°.
Other factors which could have influenced speciescomposition include differences in crop structure, plotsize, crop type and spray regimes. All of these influ-ences were over-shadowed by latitude in the commu-nities sampled by beatsheets.
In addition, we obtained a latitudinal gradient inspider diversity despite other confounding factors thattend to reduce the latitudinal gradient. For example,our study extended over a short gradient of only 20°which usually reduces the likelihood of observing alatitudinal gradient (Willig et al. 2003). Second, weused animals with a small body size. Hillebrand andAzovsky (2001) report that the influence of latitudinalgradient on species diversity is a sliding scale related tobody size: the larger the organism, the stronger theeffect. Spiders are relatively small animals, reducingthe influence of latitudinal gradient. Third, the studywas conducted in the southern hemisphere where thegradient is less pronounced (Gaston 2000).
The fact that we obtained a diversity gradientdespite these confounding factors emphasizes therobustness of this pattern and the likelihood that thereis more than one factor correlated with latitude con-tributing to the gradient (Blackburn & Gaston 1996;Rohde 1999; Gaston 2000). However, the most impor-tant explanation maybe that spiders in cotton fields arenot at equilibrium. The habitat is ephemeral and onlypresent for about 7–9 months of the year, which maynot be enough time for the community to reachequilibrium. Thus non-equilibrium (regional) pro-cesses may be maintaining the latitudinal gradient inthis system. Non-equilibrium regional processes arebased on the assumption that communities are ‘unsat-urated’ and not in equilibrium; local species richness isdependant on the regional species pool (Hillebrand &Azovsky 2001).
A non-equilibrium regional process may helpexplain both why we found a latitudinal gradient, andwhy species composition, at the family level, variedwith latitude in beatsheet communities. Spiders,especially those caught in beatsheets, need to colonizecotton from the surrounding hinterland. This makesthe hinterland more important to the transient cottonspider community than may be the case in more per-manent habitats. In addition, Lycosidae and Linyphi-idae, the families biased by pitfall traps (Topping &Sunderland 1992) do not need to colonize, as wefound them present in cotton fields even when therewas no crop. Thus the surrounding hinterland mayhave less effect on spiders collected in pitfall traps thanthose collected by beatsheets. The lack of stability in
LATITUDINAL GRADIENT IN SPIDER DIVERSITY 21
© 2009 CSIRO doi:10.1111/j.1442-9993.2008.01874.xJournal compilation © 2009 Ecological Society of Australia
spider communities sampled by beatsheets may havecontributed to the prominence of the latitudinal gra-dient we found in spider diversity – if the spider com-munity in the hinterland was more diverse at lowerlatitudes, then spiders migrating into the cotton fromthe surrounding hinterland would be more diverse,resulting in more diverse spider communities in cottonat lower latitudes despite habitat remaining constant.
ACKNOWLEDGEMENTS
We thank Martin Dillon, Sarah Mansfield, CaitlinJohns, Bob Rees, Judy Nobilo and Trudy Staines(CSIRO, Narrabri); Keera Schrimp (Katherine); andNathaniel Parker (QDPI&F Toowoomba) for help inthe field; Robert Raven, Tracey Parker and Bob Reesfor help with identifying the spiders; Ken Platt forallowing us to work on his farm at Namoi/Pilliga;David Menzel for the use of his farm in Kununurraand Eyal Shochat for comments on the manuscript.Wealso thank cotton CRC and CRDC (project numbers1.3.1AC, 3.2.19AC) for funding the project.
REFERENCES
Andrew N. R. & Hughes L. (2004) Species diversity and struc-ture of phytophagous beetle assemblages along a latitudinalgradient: predicting the potential impacts of climate change.Ecol. Entomol. 29, 527–42.
Andrew N. R. & Hughes L. (2005) Arthropod community struc-ture along a latitudinal gradient: implications for futureimpacts of climate change. Aust. Ecol. 30, 281–97.
Bajwa W. I. & Aliniazee M. T. (2001) Spider fauna in appleecosystem of western Oregon and its field susceptibility tochemical and microbial insecticides. J. Econom. Entomol. 94,68–73.
de Barro P. J. (1992) The impact of spiders and high tempera-tures on cereal aphid (Rhopalosiphum padi) numbers in anirrigated perennial grass pasture in South Australia. Ann.Appl. Biol. 121, 19–26.
Beckerman A. P., Uriarte M. & Schmitz O. J. (1997) Experimen-tal evidence for a behavior-mediated trophic cascade in aterrestrial food chain. Proc. Natl. Acad. Sci. USA 94,10735–8.
Beddington J. R., Free C. A. & Lawton J. H. (1978) Character-istics of successful natural enemies in models of biologicalcontrol of insect pests. Nature 273, 513–9.
van den Berg A. M., Dippenaar-Schoeman A. S. & SchoonbeeH. J. (1990) The effect of two pesticides on spiders in SouthAfrican cotton fields. Phytophylactica 22, 435–41.
Bishop A. L. & Blood P. R. B. (1981) Interactions betweennatural populations of spiders and pests in cotton andtheir importance to cotton production in South-easternQueensland. Gen. App. Entomol. 13, 98–104.
Blackburn T. M. & Gaston K. J. (1996) A sideways look atpatterns in species richness, or why there are so few speciesoutside the tropics. Biodivers. Lett. 3, 44–53.
ter Braak C. J. F. & Smilauer P. (2002) CANOCO ReferenceManual and CanoDraw for Windows User’s Guide: Software
for Canonical Community Ordination (Version 4.5). Micro-computer Power, Ithaca, NY.
Breene R. G., Sterlying W. L. & Dean D. A. (1989) Predators ofthe cotton fleahopper on cotton. Southwest. Entomol. 14,159–67.
Breene R. G., Dean D. A., Nyffeler M. & Edwards G. B. (1993)Biology, predation ecology and significance of spiders inTexas cotton ecosystems with a key to the species. Rep.No. B-1711. Texas Agri. Exper. St.
Brown M.W., Schmitt J. J. & Abraham B. J. (2003) Seasonal anddiurnal dynamics of spiders (Araneae) in West Virginiaorchards and the effect of orchard management on spidercommunities. Commun. Ecosyst. Ecol. 32, 830–9.
Davidowitz G. & Rosenzweig M. L. (1998) The latitudinalgradient of species diversity among North Americangrasshoppers (Acrididae) within a single habitat: a testof the spatial heterogeneity hypothesis. J.Biogeo. 25, 553–60.
Deutscher S., Wilson L. J. & Mensah R. K. (2005) Integrated PestManagement Guidelines for Cotton Production Systems inAustralia, 2nd edn. The Australian Cotton CooperativeResearch Centre, Narrabri.
Dippenaar-Schoeman A. S., van den Berg A. M. & van den BergA. (1999) Spiders in South African cotton fields: speciesdiversity and abundance (Arachnida : Araneae). Afr.Pl.Prot.5, 93–103.
Epieru G., Ocen D., Odeng F. & Barwogeza M. (1998) The roleof spiders in the control of cotton pests in the cotton crop-ping systems of Eastern Uganda. In Proc. World Cot. Res.Conf. 2, pp. 733–4, Athens, Greece.
Fitt G. P. (2004) Implementation and impact of transgenic Btcottons in Australia. In Cotton Production for the NewMillennium. Proc Third World Cot. Res. Conf. 9–13 March2003, pp. 371–81. Agricultural Research Council – Institutefor Industrial Crops, Pretoria, South Africa., Cape Town,South Africa.
Gaston K. J. (2000) Global patterns in biodiversity. Nature 405,220–7.
Haddad C. R., Louw S.V. & Dippenaar-Schoeman A. S. (2004)An assessment of the biological control potential ofHeliophanus pistaciae (Araneae : Salticidae) on Nysius natal-ensis (Hemiptera : Lygaeidae), a pest of pistachio nuts. Biol.Conserv. 31, 83–90.
Hayes J. L. & Lockley T. C. (1990) Prey and Nocturnal activityof wolf spiders (Araneae : Lycosidae) in cotton fields in thedelta region of Mississippi. Environ. Entomol. 19, 1512–8.
Heiss J. S., Harris V. E. & Phillips J. R. (1988) An illustrated andannotated key to the cotton spiders of Arkansas. J. Entomol.Sci. 23, 1–35.
Hillebrand H. & Azovsky A. I. (2001) Body size determines thestrength of the latitudinal diversity gradient. Ecography 24,251–6.
Hoque Z., Dillon M. & Farquharson B. (2002) Three seasons ofIPM in an Areawide Management Group – a comparativeanalysis of field level profitability. In Proc. 11th Aust. Cot.Conf. pp. 749–55. ACGRA, Brisbane, Qld.
Huffaker C. B. & Messenger P. S. (1976) Theory and Practice ofBiological Control. Academic Press, New York.
Hurlbert A. H. (2004) Species–energy relationships andhabitat complexity in bird communities. Ecol. Lett. 8, 741–20.
Jimenez-Valverde A. & Lobo J. M. (2006) Establishing reliablespider (Araneae, Araneidae and Thomisidae) assemblagesampling protocols: estimation of species richness, seasonalcoverage and contribution of juvenile data to species rich-ness and composition. Acta Oecologica 30, 21–32.
22 M. E. A. WHITEHOUSE ET AL.
© 2009 CSIROdoi:10.1111/j.1442-9993.2008.01874.xJournal compilation © 2009 Ecological Society of Australia
Lang A. & Klarenberg A. J. (1997) Experiments on the foragingbehaviour of the hunting spider Pisaura mirabilis(Araneae : Pisauridae): utilization of single prey items. Eur.J. Entomol. 94, 453–9.
Mansfield S., Dillon M. L. & Whitehouse M. E. A. (2006) Theimpact of season-long insecticide regimes on beneficialarthropod communities in Australian cotton fields. Agric.Ecosyst. Environ. 113, 326–35.
Mansour F. (1987) Spiders in sprayed and unsprayed cottonfields in Israel, their interactions with cotton pests and theirimportance as predators of the Egyptian cotton leaf worm,Spodoptera littoralis. Phytoparasitica 15, 31–41.
Mansour F. & Nentwig W. (1988) Effects of agrochemical resi-dues on four spider taxa: laboratory methods for pesticidetests with web-building spiders. Phytoparasitica 16, 317–26.
Mansour F., Bernstein E. & Abo-Moch F. (1995) The potentialof spiders of different taxa and a predacious mite to feed onthe carmine spider mite – a laboratory study. Phytoparasitica23, 217–21.
Marc P. & Canard A. (1997) Maintaining spider biodiversity inagroecosystems as a tool in pest control. Agric. Ecosyst.Environ. 62, 229–35.
Nyffeler M. (1999) Prey selection of spiders in the field.J. Arachnol. 27, 317–24.
Nyffeler M. & Sunderland K. D. (2003) Composition, abun-dance and pest control potential of spider communities inagroecosystems: a comparison of European and US studies.Agric. Ecosyst. Environ. 95, 579–612.
Nyffeler M., Dean D. A. & Sterling W. L. (1992a) Diets, feedingspecialization, and predatory role of two Lynx spiders,Oxyopes salticus and Peucetia viridans (Araneae: Oxyopidae)in a Texas cotton agroecosystem. Environ. Entomol. 21,1457–65.
Nyffeler M., Sterling W. L. & Dean D. A. (1992b) Impact of thestriped Lynx spider (Araneae: Oxyopidae) and other naturalenemies on the cotton fleahopper (Hemiptera: Miridae) inTexas cotton. Environ. Entomol. 21, 1178–88.
Olszewski T. D. (2004) A unified mathematical framework forthe measurement of richness and evenness within andamong multiple communities. Oikos 104, 337–87.
Pearce S., Hebron W., Raven R., Zalucki M. & Hassan E. (2004)Spider fauna of soybean crops in south-east Queenslandand their potential as predators of Helicoverpa spp.(Lepidoptera : Noctuidae). Aust. J. Entomol. 43, 57–65.
Pearce S., Zalucki M. P. & Hassan E. (2005) Spider ballooningin soybean and non-crop areas of southeast Queensland.Agric. Ecosyst. Environ. 105, 273–81.
Pekar S. (1999) Foraging mode: a factor affecting the suscepti-bility of spiders (Araneae) to insecticide applications. Pest.Sci. 55, 1077–82.
Pianka E. R. (1966) Latitudinal gradients in species diversity:a review of concepts. Am. Nat. 100, 33–46.
Price P.W., Diniz I. R., Morais H. C. & Marques E. S. A. (1995)The abundance of insect herbivore species in the tropics –the high local richness of rare species. Biotropica 27, 468–78.
Provencher L. & Vickery W. (1988) Territoriality, vegetationcomplexity, and biological control: the case for spiders.Am. Nat. 132, 257–66.
Raven R. J., Baehr B. C. & Harvey M. S. (2002) Spiders ofAustralia: Interactive Identification to Subfamily. CSIRO Pub-lishing, Collingwood.
Redmond K. R. & Brazzel J. (1968) Response of the striped lynxspider, Oxyopes salticus, to two commonly used pesticides. J.Econ. Entomol. 61, 327–52.
Riechert S. E. (1999) The hows and whys of successful pestsuppression by spiders: insights from case studies. J.Arachnol. 27, 387–96.
Riechert S. E. & Bishop L. (1990) Prey control by an assemblageof generalist predators: spiders in garden test systems.Ecology 71, 1441–50.
Roach S. H. & Hopkins A. R. (1981) Reduction in arthropodpredator populations in cotton fields treated with insecti-cides for Heliothis spp. control. J. Econ. Entomol. 74, 454–7.
Rohde K. (1999) Latitudinal gradients in species diversity andRapoport’s rule revisited: a review of recent work and whatcan parasites teach us about the causes of the gradients?Ecography 22, 593–613.
Rosenzweig M. L. (1995) Species Diversity in Space and Time.Cambridge University Press, Cambridge.
Sanders H. L. (1968) Benthic marine diversity: a comparativestudy. American Naturalist. 102, 243–82.
Scholtz B. C. G., Cleary A. J., Lloyd R. J. & Murray D. A. H.(2000) Predation of Heliothis eggs in dryland cotton on theDarling Downs. In Proc Tenth Aust. Cott. Conf. pp. 113–119.ACGRA, Brisbane, Qld.
Shannon C. E. & Weaver W. (1949) The Mathematical Theoryof Communication, 5th edn. University of Illinois press,Urbana, Chicago, London.
Simpson E. H. (1949) Measurement of diversity. Nature 163,688.
Stevens R. D. (2004) Untangling latitudinal richness gradients athigher taxonomic levels: familial perspectives on the diver-sity of New World bat communities. J. Biogeogr. 31, 665–74.
Sunderland K. (1999) Mechanisms underlying the effects ofspiders on pest populations. J. Arachnol. 27, 308–16.
Sunderland K. D., Fraser A. M. & Dixon A. F. G. (1986) Fieldand laboratory studies on money spiders (Linyphiidae) aspredators of cereal aphids. J. Appl. Ecol. 23, 433–47.
Topping C. J. & Sunderland K. D. (1992) Limitations to the useof pitfall traps in ecological studies exemplified by a study ofspiders in a field of winter wheat. J. Appl. Ecol. 29, 485–91.
Tothmeresz B. (1995) Comparison of different methods fordiversity ordering. J.Veg. Sci. 6, 283–90.
Uetz G. W., Halaj J. & Cady A. B. (1999) Guild structure ofspiders in major crops. J. Arachnol. 27, 270–80.
Willig M. R., Kaufman D. M. & Stevens R. D. (2003) Latitudinalgradients of biodiversity: pattern, process, scale, andsynthesis. Annu. Rev. Ecol. Syst. 34, 273–309.
Zhang Z. Q. (1992) The natural enemies of Aphis gossypii Glover(Hom., Aphididae) in China. J.Appl. Entomol. 114, 251–62.
LATITUDINAL GRADIENT IN SPIDER DIVERSITY 23
© 2009 CSIRO doi:10.1111/j.1442-9993.2008.01874.xJournal compilation © 2009 Ecological Society of Australia
Copyright © 2022 FDOKUMEN


![HvFT1 (VrnH3) drives latitudinal adaptation in Spanish barleys [2011]](https://static.fdokumen.com/doc/165x107/6334165aa1ced1126c0a28cd/hvft1-vrnh3-drives-latitudinal-adaptation-in-spanish-barleys-2011.jpg)