rwandan hiv/aids data synthesis project - UCSF Institute for ...
271
1 TRAC Plus Center for Treatment and Research on AIDS, Malaria, Tuberculosis and Other Epidemics RWANDAN HIV/AIDS DATA SYNTHESIS PROJECT Final Report
-
Upload
khangminh22 -
Category
Documents
-
view
0 -
download
0
Transcript of rwandan hiv/aids data synthesis project - UCSF Institute for ...

1
TRAC Plus
Center for Treatment and Research on AIDS, Malaria, Tuberculosis and Other Epidemics
RWANDAN HIV/AIDS DATA SYNTHESIS PROJECT
Final Report

2
PREFACE
Public health practitioners frequently must make programmatic decisions with data that are less
than perfect. The main reason to use such data is because few well-conducted, high-quality studies exist
that can answer an everyday public health question directly, and often we rely instead on imperfect
surveillance data to guide our actions. This lack of data has been of concern for the human
immunodeficiency virus (HIV) epidemic in Rwanda, where the scale-up of international resources has
required rapid responses in planning and targeting prevention and treatment programs. In recent years in
Rwanda, there has been a proliferation of HIV surveillance data, including sentinel surveillance in
pregnant women, demographic and health surveys, and behavioral surveillance in youth, truck drivers,
and sex workers. There also has been an increase in the number of quantitative and qualitative research
studies, as well as an accumulation of local and national expertise. Despite this increase in available
information, no method for synthesizing the data and no consistent way to analyze or interpret diverse
data has been available. In the absence of time and resources to conduct the perfect study to guide
programmatic and policy decision making, the important question of how can we use existing data to
achieve similar purposes remains.
The Center for Treatment and Research on HIV/AIDS, Malaria, Tuberculosis and other
epidemics (Trac Plus), in conjunction with the Centers for Disease Control and Prevention––Global
AIDS Program (CDC-GAP) Rwanda and with technical assistance from the University of California, San
Francisco (UCSF), conducted an HIV data triangulation exercise to answer high priority questions using
existing data sources in Rwanda. This exercise, funded by the Presidential Emergency Fund for AIDS
Relief (PEPFAR), aimed to better define at-risk populations by geography and risk behavior and to
determine the reach and intensity of corresponding programmatic responses.
This report describes the steps involved in the triangulation exercise, presents the main findings of the
triangulation process, and provides a launching point for next steps, including additional data collection
and future research questions to be answered through triangulation. The true success of this exercise has
been the integral participation of Rwandans, and we hope that the recommendations in this report will be
used to strengthen HIV prevention efforts and improve the quality of life for Rwandan people living with
HIV/AIDS.
3
ACKNOWLEDGEMENTS
The Coordinating Committee for Data Triangulation and Modes of Transmission would like to
thank the following:
Trac Plus and CDC-GAP Rwanda for support in planning and conducting the HIV data
triangulation exercise in Rwanda. This work would not have been possible without the scientific
expertise and logistical support of the people in these organizations.
The Institute for Global Health, University of California, San Francisco, for technical and
logistical support.
For their leadership and support of the triangulation process, the Committee would like to thank
the Triangulation Sub-Working Group members: Hinda Ruton, Adeline Kabeja, Eugenie
Kayirangwa, Gakunzi Sebaziga, and François Ndamage (in memoriam).
For their technical assistance, the Committee would like to thank Stephanie Taché, Jonathan
Aberle-Grasse, Willi McFarland, Heidi Frank, Hilary Spindler, Karen White, Roger Myrick, Lily
Asrat, and Irene Iuppa.
For participation in the Triangulation Stakeholders Meeting, the Committee would like to thank
the Triangulation Task Force: the Center for Infectious Disease Control (CIDC), Center for
Treatment and Research on HIV/AIDS, Malaria, Tuberculosis and other epidemics (Trac Plus);
Commission Nationale de Lutte Contre le SIDA (CNLS); Institut National de Statistique (INS),
the Joint United Nations Programme on HIV/AIDS (UNAIDS), Family Health International
(FHI), Population Services International (PSI), the United States Agency for International
Development (USAID), and the Ecole de Santé Publique de l‘Université Nationale du Rwanda
(School of Public Health of the Rwanda National University).
For their involvement in the Triangulation Technical Working Group, especially in refining the
top questions from 10 to two, the Committee would like to thank Michael Kramer, Anita
Asiimwe, Noni Gachuhi, Justus Kamwesigye, Eugenie Kayirangwa, Félix Ndagije, Elevanie
Nyankesha, François Ndamage, Adeline Kabeja, Catherine Kayitesi, Hinda Ruton, Emilien
Nkusi, Elisabetta Pegurri, Jessica Price, Janine Condo, Gatarayiha Philip, Gakunzi Sebaziga,
Claire Nyiransabimana, Laurence Nyiramasarabwe, and François Sobela.

4
Acronyms
ADB African Development Bank
AIDS Acquired immunodeficiency syndrome
ANC Antenatal care
ART Antiretroviral therapy
ARV Antiretroviral
BSS Behavioral surveillance survey
CDC-GAP US Centers for Disease Control and Prevention Global AIDS Program
CHK Centre Hospitalier Kigali
CNLS Commission Nationale de Lutte Contre le SIDA (National AIDS Control
Commission)
CSW Commercial sex worker
CVCT Couples voluntary counseling and testing
DHS Demographic and Health Survey (conducted every five years in Rwanda
by ORC-Macro)
DRC Democratic Republic of Congo
EPP Estimation and projection package
FHI Family Health International
FY Fiscal year
GAMET Global AIDS Monitoring and Evaluation Team
GLIA Great Lakes Initiative in AIDS
HIV Human immunodeficiency virus
INS Institut National de Statistique (National Institute of Statistics)
MARPS Most-at-risk populations

5
MOH Ministry of Health
MSF Médecins Sans Frontières (doctors without borders)
MSM Men who have sex with men
NASA National AIDS spending assessment
NEC National Ethics Committee
NGO Nongovernmental organization
NHA National Health Accounts
OGAC Office of the US Global AIDS Coordinator
PEPFAR Presidents Emergency Plan For AIDS Relief
PLACE Priorities for local AIDS control efforts
PLWHA People living with HIV/AIDS
PMTCT Prevention of mother-to-child-transmission
PNLS National Program for the Fight Against AIDS
PSF Project San Francisco
PSI Population Services International
STI Sexually transmitted infection
THIS Tanzania HIV/AIDS Indicator Survey
Trac Plus The Center for Treatment and Research on HIV/AIDS, Malaria,
Tuberculosis and other epidemics
UCSF-PPHG University of California, San Francisco–Prevention and Public Health
Group
UNAIDS The Joint United Nations Programme on HIV/AIDS
UNGASS United Nations General Assembly Special Session
UNICEF United Nations Children‘s Fund

6
USAID The United States Agency for International Development
VCT Voluntary counseling and testing
WHO World Health Organization

7
EXECUTIVE SUMMARY
This report summarizes the processes, findings, and recommendations of the Rwanda
Triangulation Project, 2008. ―Triangulation‖ aims to synthesize data from multiple sources to
strengthen the understanding of complex health issues and help make evidence-based public
health decisions. The methodology of triangulation involves overlapping data on prevalence, risk
behaviors, cofactors, and programmatic response for a specific subpopulation or geographic area
of concern. Triangulation was applied to data from Rwanda to answer two over-arching
questions:
What are the differences in HIV prevalence among different population groups over
time? What are the potential causes for these differences?
Are there gaps in HIV/AIDS programmatic coverage according to prevalence and/or
need?
The Rwanda Triangulation Project was carried out from December 2007 to September 2008. The
project was launched with a stakeholder meeting to identify relevant questions. These questions
were prioritized, data sources were identified, and a task force was created. Four months were
devoted to compiling and analyzing data. Over 100 independent sources of information on the
HIV epidemic in Rwanda were found, including demographic and health surveys, HIV
behavioral surveillance data, quantitative and qualitative research studies, and programmatic
reports. A final workshop was held in Kigali in September 2008 to conduct training on the
methods of triangulation, interpret the data, and make recommendations.
Participants at the final triangulation workshop in September 2008 examined a multitude of
HIV/AIDS-related indicators at the national, new province, and former province levels to
understand epidemic patterns by geography. Data from sentinel surveillance at antenatal clinics
(ANCs) were used as the basic gauge of HIV prevalence trends, while the 2005 Demographic
and Health Survey (DHS) was used to look at magnitude of HIV prevalence. Using the ANC
data, the DHS data, and potentially corroborative data from other sources, participants were
charged with identifying regional (new province) epidemic patterns. Participants categorized the
epidemic by ―concerning‖ and ―reassuring‖ using the national DHS indicators as a basis for
comparison.
Data gathered from the Great Lakes Initiative in AIDS (GLIA) show that indicators of risk in
Rwanda appear to be substantially lower than those in other GLIA countries, such as Kenya,
Tanzania, and Uganda. National data indicate low and apparent decline in HIV prevalence
between 2003 and 2005, with a plateau after 2005, based on ANC and DHS HIV prevalence
data. Although the HIV epidemic in Rwanda appears stable and declining, there are significant
urban-rural differences in ANC prevalence. Urban sites outside Kigali show an apparent, but not
always statistically significant, rise between 2005 and 2007. Seven of the 11 ―consistent‖ urban
ANC sites and two of the three ―nonconsistent‖ urban sites show increased prevalence between
2005 and 2007. Rising ANC prevalence in urban areas is concerning because Rwanda is rapidly
urbanizing. By triangulating available ANC data with rates of urbanization, we hypothesize that
the epidemic is influenced by the demographic shift caused by rapid urbanization.

8
Wide regional variation in HIV prevalence exists in terms of magnitude of the disease and trends
over time and in unique features of behavior, culture, and geography influencing local epidemic
patterns. Variability in geographic trends underlines that no single pattern completely explains
the HIV epidemic in Rwanda. Examination of data by new province suggested geographic
variance in the epidemic. Prevalence in Kigali Province is at the highest magnitude of HIV
prevalence in the country, with an overall slight decline according to the ANC and DHS surveys.
There are high levels of risk behavior, as can be seen by the high percentage of people with two
or more sexual partners and the high level of young men reporting high-risk sex compared with
other provinces. Important questions are whether the higher levels of wealth in Kigali, especially
among women, are related to higher-risk behaviors; whether sites associated with high-risk
behaviors are major contributors to the elevated prevalence; and whether higher levels of
serodiscordance among couples drives the epidemic in Kigali.
The prevalence of HIV in ANC sites in East Province is stable or declining, which is
corroborated by the low HIV prevalence from DHS 2005 data. Here, the question is whether
isolation and low levels of urbanization keep the epidemic at low levels in the rural areas of East
Province despite low rates of knowledge about HIV and poor health service uptake. Overall,
North Province has a low prevalence (DHS 2005), but a rise in HIV prevalence was evident at
four of five ANC sites between 2005 and 2007, with prevalence in urban areas higher than those
in rural areas. Main questions to answer are whether urbanization caused by demographic shift
and decentralization is driving the epidemic and whether low prevalence and low levels of risk
behavior in Kigali-Ngali are due to high levels of VCT and PMTCT coverage or to relative
isolation. South Province has low prevalence overall (DHS 2005); however, three of three urban
ANC sites show a rise in prevalence between 2005 and 2007. It is important to know whether
the university setting and urban risk profile in the former province of Butare are associated with
higher-risk behavior and whether transport routes, seasonal workers, and commercial centers in
Ruhango contribute to the epidemic in this province.
West Province has a higher HIV prevalence than the national average among all former
provinces (DHS 2005). This province appears to have a more mature epidemic with less
concentrated HIV infection, as is shown by the higher prevalence of HIV at rural ANC sites
compared with the national average. The important questions are whether economic opportunity,
especially for males (migrant workers in tea plantations, ex-military recruits), and movement
around Lake Kivu is associated with higher HIV prevalence and whether the older stage of the
epidemic, with limited program response, results in sustained and higher urban and rural
prevalence.
The workshop further examined epidemic patterns at the subpopulation level using
programmatic data, behavioral surveillance data, and the published literature. Subpopulations
included serodiscordant couples, refugees, prisoners, commercial sex workers (CSWs), truck
drivers, and youth.
In Rwanda, 2.2% of heterosexual couples are serodiscordant for HIV/AIDS. The HIV negative
members of these discordant couples are at high risk of acquiring the infection. Couples
counseling has been effective in mitigating the spread of infection in other countries and could
be an avenue for future action in Rwanda. In terms of high-risk groups, the high rate of

9
serodiscordance among married couples is a cause for concern and highlights the need for
understanding additional behavioral factors not currently captured in existing data. The absence
of national-level interventions targeting this subpopulation poses a risk for the continued spread
of the epidemic.
The extent and magnitude of the commercial sex industry remains difficult to characterize in
Rwanda. The size of the population of CSWs is unknown. According to mobile voluntary
counseling and testing (VCT) data from Population Services International (PSI), the HIV
prevalence of CSWs in 2007 was 19.2% and as of July 2008 was 16.4%. The illegality of sex
work and the difficulty in capturing the phenomenon of transactional sex outside of commercial
sex work as a risk behavior represent two major barriers for better targeting programmatic
interventions.
There is low HIV prevalence among youth in general; however, women have greater prevalence
than men: 3.9% versus 1.1% in urban areas, respectively and 1% versus 0.3% in rural areas,
respectively. There is a need to better define the specific subcategories of youth at risk in
Rwanda to identify which subpopulations are made vulnerable by transgenerational sex as well
as transactional sex.
The prisoner population in Rwanda is declining. The mobile VCT prevalence declined from
10% in 2006 to 4% in 2007 and remains static (4%) as of July 2008. In prisons, condoms are
contraband and there is a poor rate of condom knowledge. The practice of men having sex with
men in prisons is done in exchange for food, security, or power, or because there are no
alternative partners. The extent to which the interaction between prisoners and women from
surrounding villages during daily work duties places these local populations at risk is not known.
It is not certain whether planned scale-up of services is adequate and whether prisoners are a
diminishing factor in HIV transmission.
Refugees and truckers stand out as subpopulations moving toward reduction of HIV
transmission, with much emphasis on prevention programs in the past years. Refugee camps
have been shown to be protective for women in Rwanda in terms of abstinence, low levels of
high-risk sex, and condom use with high-risk sex. The camps have relatively high programmatic
coverage of VCT and PMTCT services. Refugees do not appear to be driving the HIV/AIDS
epidemic in Rwanda. This group should be studied further as a possible source of lessons
learned for other at-risk groups. In truckers, HIV prevalence remains higher (17.4%; PSI Mobile
VCT, 2007) compared with the general population (6.9%; PSI Mobile VCT, July 2008). Data
from behavioral surveillance surveys (BSSs) among truckers shows that the interaction between
truck drivers and CSWs is decreasing. It is not clear whether improved reduction in risk
behavior despite declining knowledge about HIV is a result of VCT and risk reduction activity.
The trucker population is small but mobile. Although levels of risk behaviors seem to be
decreasing, questions about discordance in couples are important as 67% of truckers reported
being married during the 2006 BSS.

10
Rwanda is one of three African countries supported by the Presidents Emergency Plan For AIDS
Relief (PEPFAR), with over 70% antiretroviral therapy (ART) coverage.1 There are, however,
imbalances of ART and prevention of mother-to-child transmission (PMTCT) coverage in
Kigali-Ngali and the East compared with other provinces. In terms of VCT services, there is
greater coverage in Cyangugu and Kigali-Ngali. Unresolved issues include identifying key
indicators to measure and track the success of prevention efforts and program coverage.
The outcome of deliberations held during the Rwanda Triangulation Workshop led to
recommendations for specific subpopulations: prioritize couples‘ HIV counseling and prevention
with people who are HIV infected to decrease the rate of transmission within discordant couples
and to keep those in serodiscordant relationships healthier; increase prevention programs for
CSWs and sensitize authorities to assist with surveillance efforts; train peer educators and create
youth HIV/AIDS clubs and monitor transgenerational and transactional sex behaviors; conduct
sentinel surveillance in the prisons and sensitize authorities to the existence of men who have sex
with men (MSM) in prisons and to the importance of prisoners‘ access to condoms for HIV
prevention; and systematically collect prevention data as is done with PMTCT and ART data.
The final recommendation advanced by workshop participants was for local continuation of the
triangulation approach to address ongoing high-priority questions for the HIV epidemic in
Rwanda.
The strength of conclusions in the triangulation process is limited to the amount and quality of
data available. In the case of Rwanda, over 100 sources of data were identified, including
sentinel surveillance data and the results of population-based surveys, behavioral surveys,
published scientific papers, and unpublished reports; however, limited access to crucial studies
prohibited deeper interpretation. Additional limitations of the triangulation exercise include
attributing trends in observed HIV indicators to specific causes, interpreting the temporal
coincidence of behavioral indicators and HIV prevalence, and interpreting the representativeness
of data, political demographic shifts, and urban/rural definitions.
1 WHO HIV/AIDS. Data and Statistics Highlights. Accessed October 30, 2008, from
http://www.who.int/hiv/data/en/index.html

11
Estimated # Eligible
for ART: [vi]
DHS 2005 Men Women EPP[ix] 15-49 yrs
Had sex before age
18, youth27.20% 17.60% 2008 2.70%
2+ partners 5.10% 0.60% 2009 2.60%
Unprotected High-Risk
Sex59.10% 80.30% 2010 2.50%
Ever tested 21.90% 24.20% 2011 2.40% 2002 2003 2004 2005 2006 2007 2008
Discordant couples 1.4% (Male HIV+) 0.8% (Female HIV+) 2012 2.30% Natl 4.20% 4.60% .. 2.70% .. 3.40% ..
Male Circumcision % n/a High .. .. ..
HIV Prevalence 2.30% 3.60% Low .. .. ..
Sub Population Prevalence Estimate Program Coverage Comments
CSWs,
(Population size=
unknown)
16.40%
Barriers to better program
interventions include the illegality of
sex work and the difficulty in capturing
the phenomenon of transactional sex
outside of commercial sex work as a
risk behavior.
Youth
(Population size =
XXX)
URBAN: 3.9% women; 1.1%
men
RURAL: 1% women; 0.3%
men
Low HIV prevalence among youth in
general. There is a need to better
define the specific sub-categories of
youth at risk to identify which sub-
populations of youth are vulnerable
and who is vulnerable to
transgenerational and transactional
sex.
Prisoners 4%
In prisons condoms are contraband
and there is poor condom knowledge.
MSM exists for food, security, power,
and having no alternative partner.
Refugees -
Refugee camps have been shown to
be protective for women in terms of
abstinence, low high-risk sex, and
condom use with high-risk sex
Truckers 6.9%
BSS data among truckers shows the
interaction between truck drivers and
sex workers is decreasing.
Discordant Couples
(Population estimate:
59,395 negative
people in discordant
relationships[xiii])
2.20%
High risk of acquiring the infection and
there are no interventions that
currently target this group. Couples
counseling should be a priority. A need
for additional behavioural factors not
currently captured in existing data.
[i] http://www.unaids.org/en/KnowledgeCentre/HIVData/GlobalReport/2008/2008_Global_report.asp
[ii] http://www.who.int/hiv/data/en/index.html Annex 1
[iii] http://www.who.int/hiv/data/en/index.html Annex 1 or 3
[iv] Consistent ANC sites, 2007
[v] http://www.unaids.org/en/KnowledgeCentre/HIVData/GlobalReport/2008/2008_Global_report.asp
[vi] http://www.who.int/hiv/data/en/index.html; Based on UNAIDS methodology
[vii] Rwanda Triangulation Report, Appendix 17
[viii] http://www.unaids.org/en/KnowledgeCentre/HIVData/GlobalReport/2008/2008_Global_report.asp
[ix] Rwanda Epi Update 2008, CNCS
[x] http://www.who.int/tb/publications/global_report/2008/xls/annex3_afr.xls
[xi] http://www.who.int/tb/publications/global_report/2008/xls/annex3_afr.xls
[xii] Planned funding as of second FY07 Congressional Notification to Congress (SAPR 2007 reports)
[xiii] Rwanda Triangulation Report, Section 3.3.1 Discordant Couples (Table 8)
TB Prevalence:
53,166[x]
HIV Prevalence in
incident TB cases:
41%[xi]
Data gathered from the Great Lakes Initiative shows indicators of risk in Rwanda appear
substantially lower than in other GLIA countries (Kenya, Tanzania, Uganda). National data
indicate a low and apparent decline in HIV prevalence between 2003 to 2005, with a plateau after
2005 based on ANC and DHS HIV prevalence data. One of the more protective behaviors
appears to be the low occurrence of multiple partners. Although the HIV epidemic in Rwanda
appears stable and declining, there are significant urban-rural differences in ANC
prevalence.
ANC Prevalence Among 15-49 year olds
Urban sites outside Kigali show an apparent, but not always statistically significant, rise from
2005 to 2007. Seven of the eleven “consistent” urban ANC sites and two of the three “non-
consistent” urban sites show an increased prevalence from 2005 to 2007. Rising ANC
prevalence in urban areas is concerning as Rwanda is rapidly urbanizing. By triangulating
available ANC data with rates of urbanization, we hypothesize that the epidemic is influenced
by the demographic shift caused rapid urbanization. There is also evidence for an
association between higher education and higher socio-economic status and higher HIV
prevalence, which is observed in most sub-Saharan African countries.
Rwanda is a former
colony of Belgium
located in Eastern
Africa – bordering
DRC, Uganda,
Tanzania and
Burundi.
UNAIDS 2008
HIV Incidence:
3.0%[iv]
HIV Prevalence:
2.8%[v]
Estimated # HIV
Infected: 130,000[i]
Estimated ART
Coverage: 71%[ii]
Unmet Need in ART
Coverage: 29%
PMTCT Coverage: 60%[iii]
VCT Coverage: 15.3%[vii]
Rwanda, 2007
Total Population: 9,907,509[viii]
PEPFAR Funding, 2007: $92,441,870[xii]
HIV Funding, per individual infected: $711.09
HIV Prevalence (%) Among 15-24 Year Olds,
ANC 2002-2007 - RWANDA
1.0
3.0
4.03.7
5.4
10.4
11.7
2.42.0
0.0
2.0
4.0
6.0
8.0
10.0
12.0
14.0
2002 2003 2005 *2007
HIV
Pre
va
len
ce
DHS-National National Other urban Kigali Rural

12
TABLE OF CONTENTS
Section Title Page
1. Background 16
1.1. Overview 16
1.2. HIV and AIDS 17
1.3. Programs 18
2. Triangulation Methods 20
2.1. Triangulation is data synthesis for public health decision
making
20
2.2. The triangulation process in Rwanda 21
2.3. Triangulation planning: Steps 1 to 4 23
2.4. Data collection, abstraction of findings, quality rating
and categorization: Step 5
25
2.4.1. Data Identification Process 25
2.4.2. Summarization of Reports and Studies 26
2.4.3. Data Quality Rating 26
2.4.4. Data Categorization 26
2.5. Making observation from data sets and generating
hypotheses: Steps 6 and 7
28
2.6. Data interpretation: Steps 6 to 10 30
2.7. Caveats and limitations 33
3. Trends in HIV Prevalence 35
3.1. National-level data 35
3.1.1. Low and Declining HIV Prevalence 35
3.1.2. Urban and Rural Differences 36
3.1.3. HIV and Urbanization in Rwanda 39
3.1.4. HIV Prevalence by Age Group and Gender 41
3.2. Provincial-level HIV prevalence 42
3.2.1. HIV Prevalence and Neighboring Countries 46
4. HIV Prevalence in Relation to Behaviors,
Attitudes, and Knowledge
48
4.1. Rwanda and east Africa: Regional comparison 48
4.2. National data 51
4.3. Provincial-level data 52
4.3.1. East Province 52
4.3.2. Kigali Province 52
4.3.3. North Province 54

13
4.3.4. South Province 55
4.3.5. West Province 57
5. Programmatic Data 58
5.1. ART program data 58
5.2. PMTCT program data 61
5.2.1. Impact of PMTCT ervices on Prevalence 62
5.3. VCT program data 63
5.4. Programmatic conclusions 64
5.4.1. East Province 64
5.4.2. Kigali Province 64
5.4.3. North Province 64
5.4.4. South Province 65
5.4.5. West Province 65
6. Special Populations 66
6.1. Discordant couples 66
6.2. Refugees 69
6.3. Commercial sex workers 70
6.4. Truckers 72
6.5. Youth 74
6.6. Prisoners 75
7. Data Gaps 76
8. Conclusions and Next Steps 78
9. List of Appendices 79

14
FIGURES, MAPS, AND TABLES
Figure Title Page Box 1 A 12-Step Approach to Triangulation 21
Table 1 Project Timeline 22
Box 2 Final Triangulation Questions 24
Table 2 Former Provinces in Relation to New Provinces 27
Table 3 Workshop Breakout Groups 30
Figure 1 HIV Prevalence Trend from all ANC Consistent Sites (2002,
2003, 2005, and 2007) and DHS 2005 National Prevalence 35
Figure 2 HIV Prevalence among ANC Consistent Sites, 2002-2007,
Rwanda 36
Table 4 HIV Prevalence among ANC Attendees, All Ages, Consistent
Sites Only 37
Figure 3 Median Prevalence of Consistent ANC Sites Stratified by
National, Kigali, Other Urban, and Rural, 15- to 24-year-olds. 39
Figure 4 GLIA Urbanization Trends 39
Figure 5 HIV Prevalence by Age Group and Gender, DHS 2005 41
Map 1 Three Ways of Looking at HIV Distribution, Rwanda (OGAC) 42
Map 2 HIV Prevalence by Old Provinces, Rwanda ANC 2007 43
Map 3 2007 ANC HIV Prevalence Data by Age Group 44
Map 4 HIV Prevalence by Province Based on DHS 2005 and ANC
Sentinel Surveillance Trend by Site 45
Map 5 HIV Prevalence by Province and Neighboring Countries 46
Map 6
HIV Prevalence by Province Based on DHS 2005 and Change in
ANC Sentinel Surveillance Site from 2005 to 2007 by Urban and
Rural ANC Sites, Rwanda
47
Figure 6 International Comparison of Multiple Partners 48
Map 7 Men in Rwanda Who Had 2+ partners 48
Figure 7 Age at First Sexual Intercourse 49
Figure 8 Had Sex by Age 15 49
Figure 9 Engaging in Higher-Risk Sex 49
Figure 10 Condom Use at Last Higher-Risk Sex 49
Table 5 National Indicators 51
Map 8 HIV Prevalence by Province and Percentage of Households in
Highest the Wealth Quintile 54
Figure 11 ANC Prevalence for Ruhango ANC Prevalence Site 56
Map 9 PEPFAR Focus Countries: Estimated Antiretroviral Therapy
Coverage, December 2007 58
Table 6 National ART Coverage by Year 59
Map 10 2007 ART Coverage by Former Province 59
Figure 12 Care and Treatment among Adults and Children, 2007 60
Map 11 PMTCT Coverage 61
Figure 13 Number of HIV-Positive Women, Women on ARV Medications,
and Infants on ARV Medications from 2002 to 2007, Rwanda 61

15
Map 12 VCT Coverage 63
Table 7 Number of HIV-Negative People in Discordant Relationships 66
Figure 14 Discordance in HIV Status among Cohabitating Couples in
Selected African Countries 67
Figure 15 Age-Mixing, GLIA Report 70
Map 13 Major Road Axes, Truck Stops, and Truck Volume, GLIA
Report 72

16
1. BACKGROUND
1.1. Overview
Rwanda, a landlocked central African country, gained independence from Belgium in 1962.
Rwanda ranks 161 of 177 among the world‘s least developed countries according to the United
Nations Development Program‘s 2006 Human Development Index.2 It is the most densely
populated country in Africa and has a population of 9,241,6613 of which 21.8%
4 live in urban
areas. Women 15 to 49 years old make up 48.8% of the population,5 and 42% of the entire
population is less than 15 years old.6 French and English are the official languages. The median
age is 19 years7 and life expectancy at birth is 52 years.
8 Rwanda has one of the highest fertility
rates in sub-Saharan Africa, with 6.1 children per woman (DHS, 2005).9
The 1994 genocide and the conflicts between 1996 and 2000 destroyed Rwanda's delicate
economic base and severely impoverished the population, particularly women, leaving them
disproportionately affected because of their economic, social, and sexual vulnerability.
2 UNDP Human Development Report, 2007/8
3 National Institute of Statistics of Rwanda, 2007
4 UNFPA, PRB. Country Profiles for Population and Reproductive Health: Policy Developments and Indicators
2005. Accessed from http://www.unfpa.org/upload/lib_pub_file/524_filename_country_profiles_2005.pdf 5 UNFPA, PRB. Country Profiles for Population and Reproductive Health: Policy Developments and Indicators
2005. Accessed from http://www.unfpa.org/upload/lib_pub_file/524_filename_country_profiles_2005.pdf 6 CIA World Fact Book, accessed November 12, 2008 from https://www.cia.gov/library/publications/the-world-
factbook/geos/rw.html 7 CIA World Fact Book, accessed November 12, 2008 from https://www.cia.gov/library/publications/the-world-
factbook/geos/rw.html 8 WHO World Health Statistics, 2008
9 Rwanda Demographic and Health Survey (RDHS), 2005

17
1.2. HIV and AIDS
Rwanda has a generalized HIV/AIDS epidemic, with an HIV prevalence of 3.0% among adults
aged 15 to 49 years (RDHS, 2005). It is estimated that 150,000 people, including adults and
children, are living with HIV or AIDS, and an estimated 7,800 people died of AIDS in 2007,
decreasing from 22,000 in 2001.10
Massive population flows due to the genocide in 1994 have
increased the urban population, and HIV prevalence is higher in urban areas (12.8% in Kigali
City and 5% in other urban areas) than in rural areas (2.2%).11
An estimated 220,000 children younger than 17 years had lost one or both parents to HIV-related
death by the end of 2007.12
The predominant mode of HIV transmission is heterosexual, with
transmission from men to women being of primary concern.13
To date, surveillance data or
population size estimates to establish the magnitude of the epidemic among most-at-risk
populations (MARPS) range from limited to nonexistent; however, the country has determined
that populations at higher risk of HIV infection include CSWs, men attending sexually
transmitted infection (STI) clinics, prisoners, MSM, and truck drivers.14,15
10
WHO, UNAIDS, UNICEF. Epidemiological Fact Sheet on HIV and AIDS. July 2008 Update. Accessed from
http://www.who.int/globalatlas/predefinedReports/EFS2008/full/EFS2008_RW.pdf 11
TRAC/MOH/CDC. SURVEILLANCE DE L‘INFECTION À VIH PAR SITES SENTINELLES CHEZ
LES FEMMES ENCEINTES FREQUENTANT LES SERVICES DE CONSULTATION PRENATALE. Rwanda
2005. 12
WHO, UNAIDS, UNICEF. Epidemiological Fact Sheet on HIV and AIDS. July 2008 Update. Accessed from
http://www.who.int/globalatlas/predefinedReports/EFS2008/full/EFS2008_RW.pdf 13
UNGASS Country Progress Report. January 2006-December 2007. 14
WHO, Summary Country Profile for HIV/AIDS Treatment Scale-up. Rwanda, 2005. 15
UNGASS Country Progress Report. January 2006-December 2007.

18
1.3. Programs
The National AIDS Control Commission (CNLS) draws its origin from the PNLS (National
Program for the Fight Against AIDS) which was established in 1987 until 2000, whereupon the
government restructured the PNLS into two new organizations known today as CNLS and the
Center for Treatment and Research on HIV/AIDS, Malaria, Tuberculosis and other epidemics
(Trac Plus) which are under the supervision of the Ministry of Health (MOH).16
The CNLS
ensures multisectoral coordination by implementing the National Multi-sector HIV and AIDS
Policy and the Strategic Plan (2005-2009), which includes the government‘s support for
decentralization, offering opportunities for involving community-level partners and civil society
organizations (United Nations General Assembly Special Session [UNGASS]). The five critical
areas addressed in the strategic plan are: 1) to strengthen HIV prevention measures; 2) to use
surveillance and research to ensure a national HIV/AIDS response adapted to socioeconomic and
health-related developments; 3) to improve care of people infected and affected by HIV/AIDS;
4) to reduce the socioeconomic impact of HIV/AIDS; and 5) to coordinate a multisector response
for improved cost-effectiveness.
To track HIV-related expenditures for 2006, the Rwandan government used the National AIDS
Spending Assessment (NASA) and the National Health Accounts (NHA) and estimated that
there is a trend for increasing HIV-related expenditures, with 87.6 million dollars spent in 2006,
92% of which came from donors.17
In 2006, HIV and AIDS financing was through government
ministries and other public institutions (5%); the private sector, including corporations (0.4%);
out-of-pocket household expenditures (2.2%); and international partners such as UN agencies
(2.5%), the African Development Bank (ADB) (1.0%), the World Bank‘s Multi-sector AIDS
Project (13.2%), the Global Fund (14.8%), USG-PEPFAR (32.9%), and other bilateral donors
(27.8%).18
Under PEPFAR, Rwanda received more than $39.2 million in fiscal year (FY) 2004,
$56.9 million in FY 2005, $72.1 million in FY 2006, $103 million in FY 2007, and
approximately $123 million in 2008.i A further breakdown of total 2006 HIV and AIDS
spending by priority areas shows 31% for care and treatment (decreasing from 39% in 2005),
29% for program management (increasing from 24% in 2005), and 24% for prevention (the same
as in 2005).19
According to the Rwanda 2008 Epidemic Update, among adults (15+ years old), 61,545 were in
need of ART through September 2007, and more than 43,000 (70%) received treatment.
Rwanda is one of the few PEPFAR countries that have met their ART targets. Based on the 90%
target coverage, this number would increase to 79,848 by 2012.20
According to Spectrum21
16
CNLS website, accessed August 20, 2008 from http://www.cnls.gov.rw/historique.php 17
UNGASS Country Progress Report. January 2006-December 2007. 18
UNGASS Country Progress Report. January 2006-December 2007. 19
UNGASS Country Progress Report. January 2006-December 2007. 20
HIV-AIDS in Rwanda. 2008 Epidemic Update. 21
The Epidemic Projection Package (EPP) developed by the UNAIDS Reference Group ―is used to estimate and
project adult HIV prevalence in countries with heterosexual epidemics. The input to EPP is surveillance data from
various sites and years showing HIV prevalence among pregnant women. The prevalence projection produced by
EPP can be transferred to Spectrum to calculate the number of people infected, AIDS cases, AIDS deaths,etc.‖
Accessed from the WHO website, December 5, 2008:
http://www.who.int/hiv/strategic/surveillance/software/en/index.html

19
estimates, 55% of HIV-positive pregnant women received a prophylaxis regimen through
September 2007 for PMTCT.22
The target coverage for 2012 is 95%.23
Nearly half of all adults
and children on treatment are in World Health Organization (WHO) clinical stage 3, showing
that treatment needs to start much earlier.24
By December 2006, 234 of 424 health facilities had
integrated PMTCT, and of women attending ANC, 93.9% were tested for HIV and knew their
results.25
22
HIV-AIDS in Rwanda. 2008 Epidemic Update. 23
HIV-AIDS in Rwanda. 2008 Epidemic Update. 24
UNGASS Country Progress Report. January 2006-December 2007 from TRAC Report, 2006 25
UNGASS Country Progress Report. January 2006-December 2007.
20
2. TRIANGULATION METHODS
2.1. Triangulation is data synthesis for public health decision making
We use the term ―triangulation‖ to refer broadly to the process of identifying, arraying,
examining, and interpreting data from multiple sources to improve our understanding of a public
health problem. Triangulation can be effective when a rigorous, specifically designed research
study is not available or when action is needed urgently. Rather than generating new data to
answer a specific research hypothesis, triangulation seeks to look at the best available evidence
to guide public health decision making. The process uses inductive reasoning by iteratively
refining and modifying a hypothesis to explain empirical observations. Triangulation follows the
principles of second generation HIV surveillance by focusing on trends over time and by
combining data on the prevalence of HIV and STIs, risk behaviors, and program delivery.
Similarly to second generation HIV surveillance, triangulation emphasizes the rapid use of data.
There is a large amount of information on the HIV/AIDS epidemic in Rwanda as a result of
many years of collecting HIV surveillance data, surveying general and specific high-risk
populations, accumulating data from monitoring prevention programs, and conducting research
through multiple national and international institutions. A concerted effort to catalog, array,
examine, and interpret these data, however, has not been undertaken in recent years.
As the CNLS, Trac Plus, and the PEPFAR country team drafted an annual HIV/AIDS plan, the
idea to initiate a triangulation exercise emerged. Team members agreed on the necessity to
analyze systematically the available data on the HIV epidemic to inform the planning of the
response.
21
2.2. The triangulation process in Rwanda
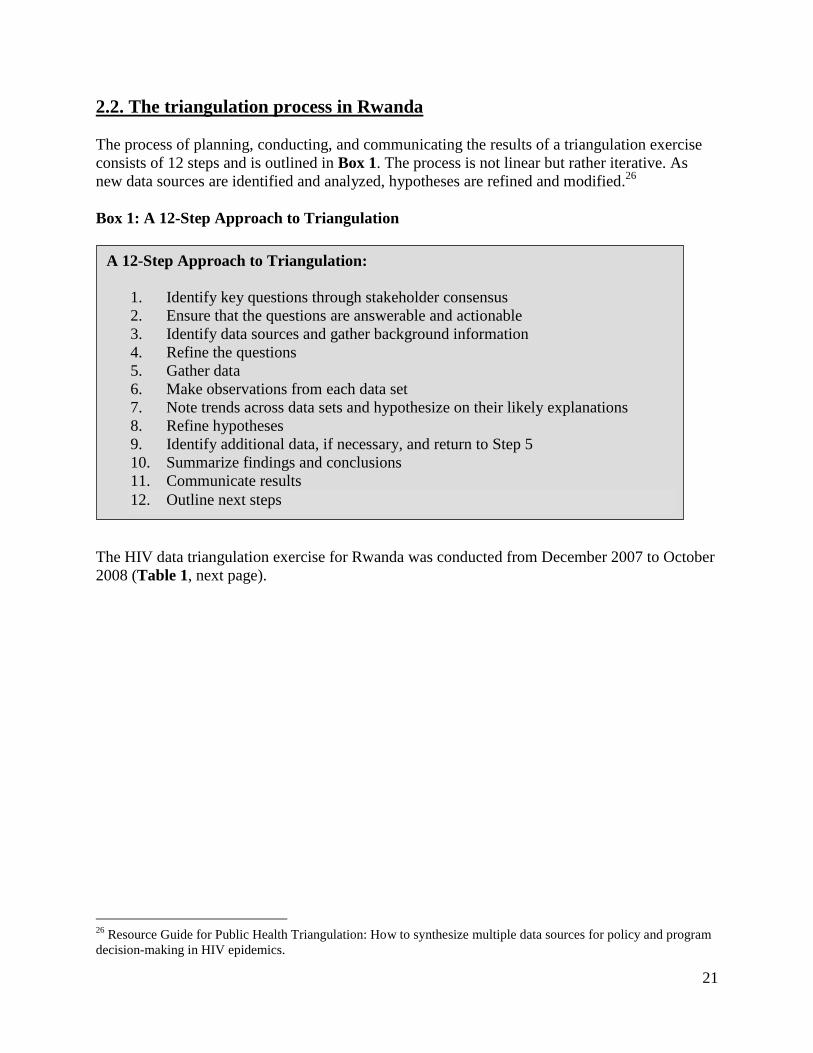
The process of planning, conducting, and communicating the results of a triangulation exercise
consists of 12 steps and is outlined in Box 1. The process is not linear but rather iterative. As
new data sources are identified and analyzed, hypotheses are refined and modified.26
Box 1: A 12-Step Approach to Triangulation
The HIV data triangulation exercise for Rwanda was conducted from December 2007 to October
2008 (Table 1, next page).
26
Resource Guide for Public Health Triangulation: How to synthesize multiple data sources for policy and program
decision-making in HIV epidemics.
A 12-Step Approach to Triangulation:
1. Identify key questions through stakeholder consensus
2. Ensure that the questions are answerable and actionable
3. Identify data sources and gather background information
4. Refine the questions
5. Gather data
6. Make observations from each data set
7. Note trends across data sets and hypothesize on their likely explanations
8. Refine hypotheses
9. Identify additional data, if necessary, and return to Step 5
10. Summarize findings and conclusions
11. Communicate results
12. Outline next steps

22
Table 1: Project Timeline
Dates Activities
November 21, 2007 Formation of Triangulation Task Force (Appendix 1:
Triangulation Taskforce Participants)
Rwandan triangulation working group meeting to identify 10
priority questions related to HIV
March 7-12, 2008 Stakeholders‘ meeting; brainstorming questions relevant to
Rwanda‘s HIV epidemic; narrowing 10 priority questions to two
final questions
Identification of existing data sets, reports, studies
Key informant interviews (officials, researchers, program
managers)
June 16 to July 12,
2008 Triangulation Task Force meetings
Further refinement of two final questions
Key informant interviews (officials, researchers, program
managers)
Data collection, abstraction and categorization
July 25 to August 1,
2008 Joint data analysis with four Trac Plus CDC Rwanda team
members at UCSF
Workshop materials preparation
September 16-19,
2008 Training workshop in triangulation methods
Synthesis and interpretation of triangulation data
October 2008 Preparation of final report

23
2.3. Triangulation planning: Steps 1 to 4
On November 21, 2007, Trac Plus convened a meeting in Kigali to initiate the triangulation
process. An initial list was generated of 33 questions of public health importance to the
HIV/AIDS epidemic in Rwanda. The questions were categorized into three priority areas
(Appendix 2: List of initial important questions). The stakeholders meeting recommended the
formation of a Triangulation Task Force participants (Appendix 1) to prioritize these
questions and to assist and monitor the progress of the Rwanda Triangulation Project. The
Triangulation Task Force comprised representative volunteers from the Rwanda National AIDS
Commission; Rwanda MOH; Rwanda National Statistics Office; US Centers for Disease Control
and Prevention; WHO; UNAIDS; and Rwanda School of Public Health. These questions were
discussed during a conference call among UCSF, Trac Plus, and CDC-GAP Rwanda.
The Triangulation Task Force created the Triangulation Technical Working Group to refine
the questions based on their importance and ability to be acted upon and to select two priority
questions for the initial triangulation exercise. One consideration for selection was to produce
recommendations usable by the MOH and partners during the annual HIV planning meeting in
September 2008. The two questions encompassed many features or sub-questions from the 10
initial priority questions. The Triangulation Technical Working Group consisted of members
from Trac Plus, CNLS, CDC Rwanda, and UCSF
An initial visit to Kigali by the UCSF-CDC team was carried out March 3-7, 2008, with overall
goals of meeting with the Triangulation Task Force to agree on the final questions (Box 2, next
page); explain the triangulation methodology; complete the research protocol and ethical
clearance submission; and identify initial data sources.

24
Box 2: Final Triangulation Questions
Existing data suggested a decline in HIV prevalence in several areas of Rwanda and a rise or
unchanged prevalence in other areas. Based on this, the Triangulation Task Force chose to use
triangulation for several purposes: to verify the current trends in the HIV epidemic (Question 1);
to describe differences in HIV prevalence and risk behavior among different geographic areas
and populations; to understand the reasons behind the prevailing trends in each area in terms of
risk behaviors; and to identify gaps in programmatic coverage to better target prevention efforts.
To address these objectives, the group stratified Question 1 as follows:
Demographic variables (age, sex, geographic location including urban/rural,
socioeconomic status, education level, marital status)
High-risk subpopulations (youth less than 25 years old, truckers, CSWs,
refuges/displaced populations, prisoners, and military personnel)
Risk behaviors (men having sex with men, systematic condom utilization, multiple
concurrent partners, alcohol use, testing behavior, sex with nonregular partners in last 12
months, transactional sex)
Cultural norms and their impact on HIV risk.
Question 2 addressed gaps in programmatic coverage for prevention efforts and was subdivided
as follows:
Program type: condom utilization, PMTCT, VCT, and ART
Size and content of prevention programs
Population served and geographic distribution
Resource allocation programs to be included.
The data synthesis project received ethical clearance from the Rwanda National Ethics
Committee (NEC) and from the CDC for Human Subjects Research Routing, and from the
UCSF Institutional Review Board which have granted nonresearch determination for this
activity.
Triangulation Questions for the Rwanda HIV Data Triangulation
1. What are the differences in HIV prevalence among different population
groups over time (2000-2008)? What are potential causes for these
differences?
2. Are there gaps in HIV/AIDS programmatic coverage according to
prevalence and/or need in Rwanda?

25
2.4. Data collection, abstraction of findings, quality rating and categorization:
Step 5
The Triangulation Sub-Working Group (see Appendix 1) was created from the Triangulation
Technical Working Group to implement the project. Members met bi-weekly over four weeks
between June and July 2008. Main activities of the Triangulation Sub-Working Group during
this period were as follows:
To identify and collect all possible data sources on the HIV epidemic in Rwanda
To conduct a preliminary quality rating of available studies using the data quality
matrices
To assist with abstracting relevant information from the available surveys using a
standardized template of categorized indicators to answer the two questions.
Following this period, the roles and responsibilities of the Triangulation Sub-Working Group
would be to act as a liaison with the Triangulation Task Force, provide logistical assistance in the
planning and executing of the Kigali Triangulation Workshop, and to act continuously as a
resource for coordinating data identification and collection.
2.4.1. Data Identification Process Two processes were undertaken to identify data. First a comprehensive literature review of
published studies and reports was conducted and PubMed, Google Scholar, and Aegis databases
were searched using the key words Rwanda HIV and Rwanda AIDS. Articles on knowledge,
attitudes, behavior, prevention, and prevalence were chosen. Articles that were more clinically
oriented and on basic science without direct implication to the HIV epidemic on a larger scale
were not included.
In the second process to identify data once the final study questions were agreed upon, the
Triangulation Task Force generated an extensive inventory of data sources available in Rwanda
by listing organizations that held data on the HIV epidemic. Using a ―snowball sampling‖
approach, individual meetings with organizations were conducted that led to further
identification of relevant studies. Selection criteria to identify data sources were very broad,
which was done to minimize initial selection bias. Inclusion criteria were all data sets, studies,
and reports related to the topic of interest that were conducted with approval of an appropriate
human studies committee if clearance was required to collect the data. Studies were excluded if
they required ethical clearance and had not obtained it. As a result of this dual approach to
identify information, over 100 independent sources of data were identified (Appendix 3: List of
studies used for triangulation). Data sources included sentinel surveillance, the results of
population-based surveys, behavioral surveys, published scientific papers, unpublished reports,
and abstracts.
Types of data collected included the following:
Sentinel surveillance (e.g., HIV and syphilis prevalence among women at ANC clinics)
Population-based surveys (e.g., the DHS in 2000 and 2005)
Behavioral surveys (e.g., BSS among youth, sex workers, truckers)

26
Data from scientific research projects (e.g., cohort studies, surveys, qualitative studies)
Data from the national census and INS
Data from other health programs (e.g., patients on ART, VCT).
2.4.2. Summarization of Reports and Studies Standardized tables were used to abstract relevant information from the reports and studies
collected. Summaries of reports and studies were carried out using a matrix with the following
headings: report type; methodology; population; findings/results; conclusions (Appendix 4:
Summary tables of reports and studies). Only the sections relevant to the overall questions and
subpopulations identified in one of the two questions were included in this matrix. Secondary
conclusions were included if there was clear evidence within the cited text supporting the
conclusions.
2.4.3. Data Quality Rating A matrix to assess data sources was used to determine the quality of the study based on criteria
deemed relevant for program data, surveillance data, qualitative special studies, and quantitative
special studies. Documents were assessed using this matrix (Appendix 5: Data quality matrix).
Data quality assessment was done at two stages of triangulation:
Prior to data abstraction and interpretation to determine which studies are most
generalizable and which will be used as the basis for prevalence trends.
During interpretation to address contradictory findings from differing data points.
2.4.4. Data Categorization Once data were abstracted from individual reports, the information was grouped into relevant
categories or specific indicators relevant to one of the two main questions (Appendix 6: Data
abstraction nationally and provincially). Findings from data points were summarized and
organized in tabular form by indicator groups and by geographic area and subpopulation.
Note to explain geographic reconciliation
As a result of the 1994 genocide and conflicts between 1996 and 2000, there was a geographic
redistribution of administrative zones on January 1, 2006. The government of Rwanda
established new provinces in the process of decentralizing power and disassociating events of the
genocide with the former provinces. Although the five new provinces (30 districts) encompass
the former 12 provinces along similar borders in South and West provinces, this relative overlap
does not exist for Kigali, North, and East provinces. For the purpose of this exercise, we
attempted to reconcile the differing geographic delineations between data sources collected
before 2006 using the 12 former provinces and data collected after 2006 using the five new
provinces as shown in Table 2 and Appendix 7: Map of former provinces in relation to new
provinces.

27
Table 2: Former Provinces in Relation to New Provinces
New Province Former Provinces
EAST Umutara, Kibungo, Kigali-Rural (part)
WEST Cyangugu, Gisenyi, Kibuye
NORTH Byumba, Kigali-Rural (part), Ruhengeri
SOUTH Butare, Gikongoro, Gitarama
KIGALI Kigali Ville
The group discussed the advantages and limitations of using the former breakdown of provinces
overlaid by the new provinces. Because the former province of Kigali-Ngali overlaps with both
the new East and North provinces, its data were examined for both new provinces and
interpretations were adjusted accordingly.
28
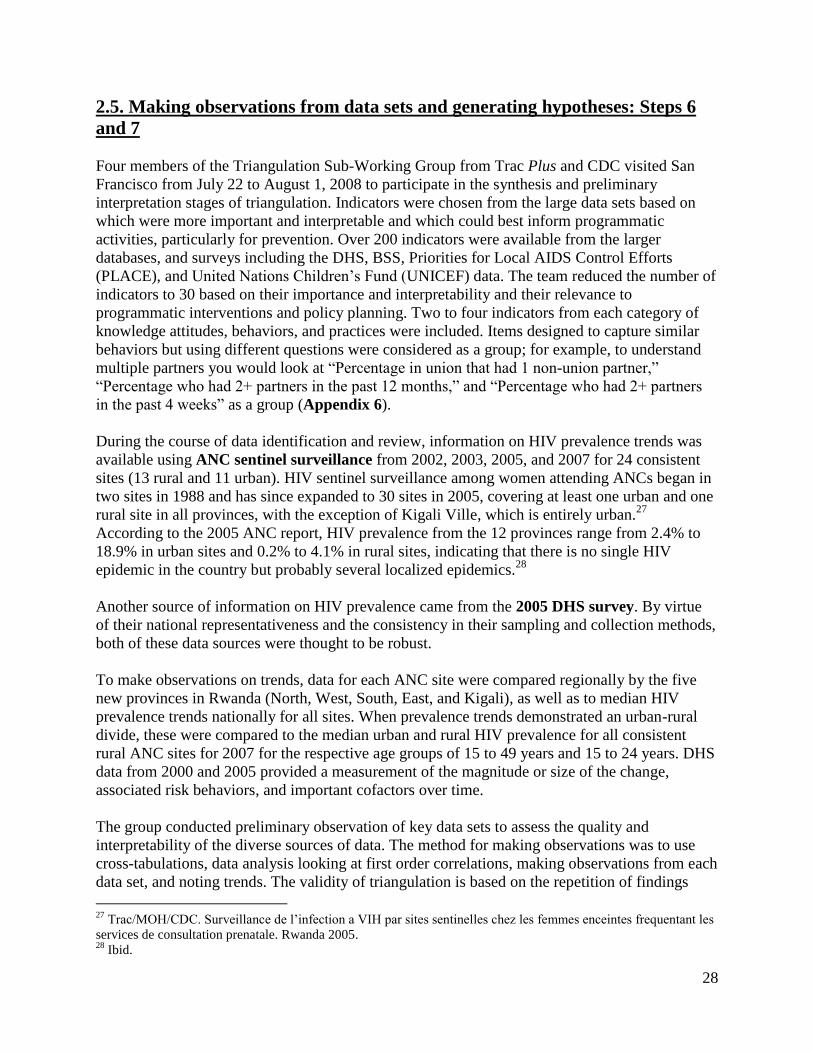
2.5. Making observations from data sets and generating hypotheses: Steps 6
and 7
Four members of the Triangulation Sub-Working Group from Trac Plus and CDC visited San
Francisco from July 22 to August 1, 2008 to participate in the synthesis and preliminary
interpretation stages of triangulation. Indicators were chosen from the large data sets based on
which were more important and interpretable and which could best inform programmatic
activities, particularly for prevention. Over 200 indicators were available from the larger
databases, and surveys including the DHS, BSS, Priorities for Local AIDS Control Efforts
(PLACE), and United Nations Children‘s Fund (UNICEF) data. The team reduced the number of
indicators to 30 based on their importance and interpretability and their relevance to
programmatic interventions and policy planning. Two to four indicators from each category of
knowledge attitudes, behaviors, and practices were included. Items designed to capture similar
behaviors but using different questions were considered as a group; for example, to understand
multiple partners you would look at ―Percentage in union that had 1 non-union partner,‖
―Percentage who had 2+ partners in the past 12 months,‖ and ―Percentage who had 2+ partners
in the past 4 weeks‖ as a group (Appendix 6).
During the course of data identification and review, information on HIV prevalence trends was
available using ANC sentinel surveillance from 2002, 2003, 2005, and 2007 for 24 consistent
sites (13 rural and 11 urban). HIV sentinel surveillance among women attending ANCs began in
two sites in 1988 and has since expanded to 30 sites in 2005, covering at least one urban and one
rural site in all provinces, with the exception of Kigali Ville, which is entirely urban.27
According to the 2005 ANC report, HIV prevalence from the 12 provinces range from 2.4% to
18.9% in urban sites and 0.2% to 4.1% in rural sites, indicating that there is no single HIV
epidemic in the country but probably several localized epidemics.28
Another source of information on HIV prevalence came from the 2005 DHS survey. By virtue
of their national representativeness and the consistency in their sampling and collection methods,
both of these data sources were thought to be robust.
To make observations on trends, data for each ANC site were compared regionally by the five
new provinces in Rwanda (North, West, South, East, and Kigali), as well as to median HIV
prevalence trends nationally for all sites. When prevalence trends demonstrated an urban-rural
divide, these were compared to the median urban and rural HIV prevalence for all consistent
rural ANC sites for 2007 for the respective age groups of 15 to 49 years and 15 to 24 years. DHS
data from 2000 and 2005 provided a measurement of the magnitude or size of the change,
associated risk behaviors, and important cofactors over time.
The group conducted preliminary observation of key data sets to assess the quality and
interpretability of the diverse sources of data. The method for making observations was to use
cross-tabulations, data analysis looking at first order correlations, making observations from each
data set, and noting trends. The validity of triangulation is based on the repetition of findings
27
Trac/MOH/CDC. Surveillance de l‘infection a VIH par sites sentinelles chez les femmes enceintes frequentant les
services de consultation prenatale. Rwanda 2005. 28
Ibid.

29
from multiple data sources, often using findings derived from nonidentical methodologies,
thereby not permitting traditional meta-analysis. Causality was based on the biological and
sociological plausibility application of Bradford Hill Criteria,29
with greater weight given to
nationally represented survey data that use established methodologies and to randomized control
trials and cohort study findings. First-order correlations were repeatedly applied to build a
preponderance of evidence, with particular attention given to trends and outliers (positive and
negative). In doing so, particular emphasis was placed upon Bradford Hill Criteria #2 (strength
of association) and #4 (consistency). This methodology allows for greater risk of ecological
fallacy and both publishing and investigatory bias than more rigorous methodologies. The
absence of statistical certitude using triangulation methodology is one of the major limitations of
triangulation and is further described in the limitations section. The value of triangulation is that
it permits the integration of traditionally ―nonmatchable‖ data types. Hypotheses were generated
to explain the observed trends. Additional sources of data were sought to corroborate or refute
the hypotheses:
Information on prevalence was taken from nationally representative surveillance data in the
form of ANC 2002, 2003, 2005, and 2007 and DHS 2000 and 2005.
Information on HIV knowledge, risk behavior, and practices were taken from nationally
representative or large-scale surveys, such as DHS, BSS 2000 and 2006, and PLACE 2005.
Information on programmatic coverage was taken from existing monitoring and evaluation
databases collected through standardized methods and housed at Trac Plus, as well as
Population Sciences International (PSI).
Clearly summarized conclusions from peer-reviewed scientific studies also were reviewed.
Qualitative studies, descriptive studies, unpublished, or non–peer-reviewed studies, and
operations-research or nonexperimental methodologies were used to complement geographic
trends or prevalence trends for specific subpopulations.
Student studies, studies for which methodologies are unclear or of uncertain quality, and all
other studies were considered when there was no other information available.
Several sources of data were less interpretable than others and were not given as much weight
during the interpretation. Examples of data limitations included nonrepresentativeness of the
sample of the general population (e.g., the PLACE study involved only high-risk sites); the
presence of significant selection bias (e.g., using VCT programmatic data to estimate
prevalence); inconsistent collection methods (e.g., prevention program activity reporting); or
small sample sizes (e.g., behavioral surveillance).
29
Hofler M. The Bradord Hill considerations on causality: a counterfactual perspective. Emerging Themes in
Epidemiology. 2005, 2:11.

30
2.6. Data Interpretation: Steps 6 through 10
The Rwanda Triangulation Workshop was convened in Kigali from September 15 to 19 to
complete steps 6 through 10 of the triangulation process and to synthesize the multiple data
sources as a group. Workshop participants representing 19 institutions attended (Appendix 8:
Triangulation Workshop participants). Participants were invited both to provide insight on the
data sources and to learn the methods of triangulation for future efforts in Rwanda.
The workshop was organized around brief didactic lectures given by the UCSF and CDC
facilitators followed by breakout sessions for small-group work. Groups were generally
organized to focus on one of the five regions (North, South, East, West, and Kigali provinces), as
outlined in Table 3.
Table 3: Workshop Breakout Groups
Group
Assignment New Province Former Provinces
Sub-Group at
National Level
1
EAST
Umutara, Kibungo,
Kigali-Rural (part) Youth
2
WEST
Cyangugu, Gisenyi,
Kibuye Refugees
3
NORTH
Byumba, Kigali-Rural (part),
Ruhengeri Prisoners
4
SOUTH
Butare, Gikongoro,
Gitarama Truckers/sex workers
5
KIGALI Kigali Ville Discordant couples
The tasks of the groups were divided into five exercises, or practicums, each focusing on one
iteration of the triangulation process (e.g., making observations from individual data sets, noting
trends across data sets) and one of several stratification types (e.g., national level, provincial
level). The practicums were as follows:
Practicum A: The purpose of this practicum was to examine a single data set by person,
place, and time; to interpret temporal trends in indicators by person and place,
specifically the ANC sentinel surveillance data; and to compare relative levels of
infection by person, place, and time.
Practicum B: HIV prevalence at ANC sites and DHS, risk behaviors, and HIV
knowledge by the 12 former provinces. The purpose of this practicum was to identify
concurrent trends and relative differences in HIV prevalence, risk behavior, knowledge,
and attitudes within the 12 former provinces of Rwanda; identify concurrent trends and
relative differences in HIV prevalence, risk behavior, knowledge, and attitudes among
subpopulations; generate hypotheses that may explain the temporal trends and differences
31
in the HIV epidemic among the old/new provinces and subpopulations; and to make preliminary
recommendations.
Practicum C: The above HIV indicators were further examined and specific qualitative and
quantitative data from research studies in Rwanda were included. The purpose of this practicum
was to refine hypotheses to explain HIV epidemic trends with respect to new provinces and
subpopulations. The process of refining hypotheses entails determining if the diverse data sources
corroborate, refute, or cause investigators to modify their determination of the direction of the
epidemic and their reasons for the determinations. This practicum also was used to identify places
in greatest need of targeted HIV prevention interventions, their locations at the district or regional
level, and the types of interventions needed. Similarly, there also may be local or regional areas
of prevention where indicators are moving toward reduction. Finally, this exercise was used to
identify information or data gaps by location and by types of measures.
Practicum D: This practicum examined the data on programmatic reach and intensity and unified
it with the previous practicums to provide more insight into Question #2.
Practicum E: This practicum was conducted as a larger group to review and refine observations,
hypotheses, and recommendations based on the information provided in the previous practicums.
After each practicum, groups made presentations of findings followed by facilitated discussions with the
entire workshop (Appendix 9: Workshop agenda).
Participants formed groups each led by a facilitator. Workshop participants examined the site-by-site
ANC sentinel surveillance data and noted the trends and magnitude of HIV prevalence by site, urban/rural
stratifications, all ages (Table 4), and ages 15 to 24 years old (Appendix 10: HIV prevalence among
ANC attendees, ages 15 to 24 years, consistent sites only). Participants considered all consistent sites
across years, additional sites (Appendix 11: ANC data, all sites (2002, 2003, 2005), the initiation of
PMTCT (Appendix 12: Initiation of PMTCT, by ANC site), and regional prevalence of bordering
countries (Map 5 and Appendix 13: Prevalence maps of neighboring countries). During the
workshop, the groups agreed on a uniform approach to examine ANC trends. To determine whether HIV
prevalence was up, down, or level, we looked at trends in HIV prevalence for 2002, 2003, 2005, and
2007. When four years of HIV prevalence points did not show trend, then three points were looked at to
describe a trend that may or may not be changing. Trends for each site were compared at a regional level
for all five new provinces in Rwanda (North, West, South, East, and Kigali) and compared to median HIV
prevalence trends nationally for all sites. When ANC prevalence trends demonstrated an urban/rural
divide, these were compared to the median urban and rural HIV prevalence for all consistent rural ANC
sites for 2007 for the respective age groups of 15 to 49 years old and 15 to 24 years old. Using at least
three points to determine whether there was a change in prevalence, participants determined significance
by measuring p values. Significant prevalence trends by ANC site from 2002/03 to 2007 was a p value for
Mantel-Haenszel of less than 0.05.
To determine the magnitude of prevalence for 15-49 year olds, the DHS 2005 ―former province‖
prevalence and ―new province‖ prevalence was compared relative to the DHS 2005 national, urban, and
rural prevalence, as applicable, and categorized into tertiles as low, medium, or high as follows: low (less
than 2 standard deviations below the urban or rural mean [95% confidence interval]); medium (within 2
standard deviations of the urban or rural mean [95% confidence interval]); high (more than 2 standard
deviations above the urban or rural mean [95% confidence interval]).30
30
Table 15.5 of the Institut National de la Statistique du Rwanda (INSR) and ORC Macro. 2006. Rwanda
Demographic andHealth Survey 2005. Calverton, Maryland, U.S.A.: INSR and ORC Macro.

32 v.9/10/2012
For Practicum B, participants in the same breakout groups were asked to examine additional
data sources (e.g., DHS, PLACE, BSS) for their geographic region or subpopulation to determine
whether data supported or refuted the observed magnitude of HIV prevalence and trends in the
ANC sentinel surveillance data. Specifically, groups were asked to consider the measure of each
indicator, the trend over time, any potential biases and any additional information regarding the
indicator. National indicators were used as reference points from which each of the provinces
could compare themselves. In Appendix 14 (“Reassuring” and “concerning” indicators by
former province), tables portraying set indicators across all former provinces are categorized
into ―reassuring‖ or ―concerning,‖ based on national levels shown in Table 5. Maps also were
generated to portray key indicators by former province (Appendix 15: Rwanda maps showing
key indicators by former province).
After noting whether indicators for each former province were trending in a ―concerning‖ or
―reassuring‖ direction, data were synthesized to provide a summary for each of the five new
provinces. Groups were asked to make tentative interpretations explaining why HIV prevalence
trends and magnitude of HIV prevalence were tending in the observed directions. The province-
level analysis allowed for inclusion of data from quantitative and qualitative research projects
that were carried out in specific locations (Practicum C). Preliminary hypotheses generated
were considered in the context of treatment and prevention activities, as well as other
interventions specific to the region, age group, or location in Practicum D.
For Practicum D, to estimate ART coverage nationally and by province (Appendix 16: ART
program data), we used the 2007 population census of people greater than 15 years old
stratified by former province. We then multiplied this number by the HIV prevalence according
to the 2005 DHS for an estimated number of HIV-positive people. It was estimated that 37% of
HIV–positive people are eligible for ART using eligibility criteria of <350 CD4+ cell count. The
estimate of 37% is a provisional percentage estimated by PEPFAR Adult Treatment Working
Group; a different estimate would change actual numbers of people eligible but not the relative
differences between provinces. Dividing the number of actual ART clients by those eligible
produces an estimated percentage of coverage. Also included in Appendix 16 is the number of
ART sites by province.
To estimate PMTCT coverage nationally and by province, 4% expected pregnancies was
estimated from the total 2007 population. The number of 2007 PMTCT clients was divided by
the expected total pregnancies to estimate PMTCT coverage (Appendix 17: PMTCT program
data).
To estimate the coverage of VCT services, we divided the number of VCT clients by the total
2007 population of people over 15 years old (Appendix 18: VCT program data).

33 v.9/10/2012
2.7. Caveats and Limitations
We recognize several limitations in the methods, data, and interpretations of this triangulation
project. Although our project has sought to identify the most plausible interpretations of the data
viewed as a whole, we recognize that alternative interpretations are possible and uncertainties
remain. The following are key points to consider when interpreting the data presented in this
report:
Is the amount of statistics sufficient? Any study with a very large sample size will
produce a statistically significant difference no matter how small.
What does a decline or increase in HIV prevalence really mean, especially in relation to
ART?
Ascribing causality. Caution must be exercised in attributing the trends in HIV indicators
observed to specific causes. The data do not prove that any particular prevention program or
types of programs caused the upward or downward trends at the national, regional, or provincial
levels outlined in this report. When assessing causal linkages, consideration should be given to
the sequence (e.g., what happened first?), the strength of the associations (e.g., how big a
decrease in risk behavior has occurred?), and consistency across independent data sets (e.g., are
data of HIV infection, behavior, and programs consistent?). Nonetheless, we do believe that the
interpretations we have given are the most plausible when considering the data in aggregate.
Changes in HIV prevalence versus HIV incidence. Several indicators presented in this report
are of HIV prevalence, not HIV incidence. Overall, changes in prevalence should lag behind
changes in risk behaviors. Changes in HIV prevalence may reflect changes in risk behaviors
occurring many years in the past. Similarly, changes in risk behavior detected now may not
manifest as changes in HIV prevalence until many years in the future. Therefore, the temporal
coincidence of behavioral indicators and HIV prevalence as presented in this report must be
interpreted cautiously. Of note, HIV prevalence among young age groups, particularly women
aged 15 to 24 years, may reflect more current trends in HIV transmission or incidence. More
emphasis may therefore be given to the HIV prevalence trends in this younger age group.
Ideally, direct measures of HIV incidence are needed.Newer technologies in detecting recent and
acute HIV infection will help interpretation in the future.
Representativeness of data. Potential selection biases are limitations to interpreting much of the
data included in this report. Who is included in the various data sets varies greatly by source. The
gold standard for representativeness is true population-based or probability-based studies, such
as the DHS surveys. At the other end of the spectrum, programmatic data is very influenced by
access to programs and self-selection of people attending programs. The ANC data, as unlinked
anonymous studies using consecutive sampling, occupy a middle ground in terms of
representativeness. Some trends were difficult to interpret because the nature of ANC
surveillance includes chance variability for specific sites.
Statistical inference. Statistical tests are the traditional yardsticks for inference on differences
and trends. Because triangulation overlaps quantitative, qualitative, and programmatic data,
statistical tests are not always appropriate or possible. We have attempted to include statistical

34 v.9/10/2012
tests where they were appropriate and/or previously available. Other statistical tests, however,
may be deemed necessary.
Mapping. On January 1, 2006, the Rwandan government established new provinces in order to
decentralize power. Although the five new provinces encompass the 12 former provinces more
or less along the same borders in South and West provinces, the same overlap does not exist for
Kigali, North, and East provinces.
• Urban/rural definitions. Due to the high density of the population of Rwanda, urban/rural
definitions are not comparable to those of neighboring countries. The definition used here is on
the Ministry of Local Government, Community Development and Social Affairs old laws with
zones of economic activity.
35 v.9/10/2012
MAIN FINDINGS
The main findings from this study are organized into three sections: data trends on prevalence at
the national and provincial levels; data on behaviors, knowledge, and attitudes in relation to HIV
prevalence at the national level, east African regional level, and provincial levels; and
programmatic data at the national level. Each section contains existing data to provide a multi-
dimensional picture of what is currently known about the HIV epidemic in Rwanda.
3. TRENDS IN HIV PREVALENCE
3.1. National-level data
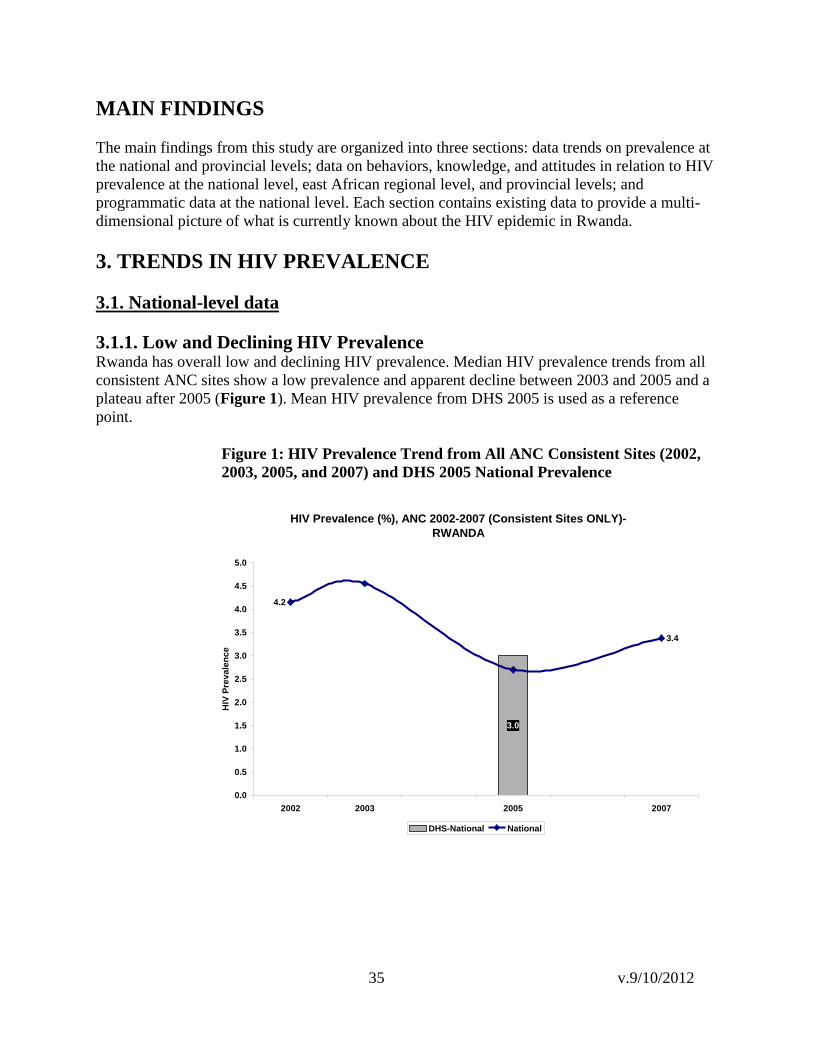
3.1.1. Low and Declining HIV Prevalence
Rwanda has overall low and declining HIV prevalence. Median HIV prevalence trends from all
consistent ANC sites show a low prevalence and apparent decline between 2003 and 2005 and a
plateau after 2005 (Figure 1). Mean HIV prevalence from DHS 2005 is used as a reference
point.
Figure 1: HIV Prevalence Trend from All ANC Consistent Sites (2002,
2003, 2005, and 2007) and DHS 2005 National Prevalence
HIV Prevalence (%), ANC 2002-2007 (Consistent Sites ONLY)-
RWANDA
3.0
3.4
4.2
0.0
0.5
1.0
1.5
2.0
2.5
3.0
3.5
4.0
4.5
5.0
2002 2003 2005 2007
HIV
Pre
va
len
ce
DHS-National National

36 v.9/10/2012
3.1.2. Urban and Rural Differences
There are significant urban and rural differences in Rwanda. Figure 2 represents the median
prevalence by urban and rural ANC sites, separating Kigali and other urban centers.
Kigali has the highest prevalence nationally, with an apparent decrease from 2005 to 2007. Rural
ANC HIV prevalence also shows decreases between 2005 and 2007. ―Other urban‖ prevalence,
which excludes the city of Kigali, is level overall but shows a slight rise between 2005 and 2007
(with a regression trend line slope of 0.35 [y=0.35x +4.5]). To that end, ―other urban‖ sites have
risen the fastest between 2005 and 2007 and may be driving the national increase in slope which
is a reversal from the decreasing 3 year trend from 2002 to 2005.
Figure 2: HIV Prevalence among ANC Consistent Sites, 2002-2007, Rwanda
ANC sentinel site data stratified by urban/rural sites for ANC clients aged 15 to 49 years show
trend lines for median HIV prevalence over time (Table 4, next page). Looking at the prevalence
numbers by urban/rural site over time, we can identify two types of trends. Likewise, the dark
grey shading indicates decreasing urban trends and the light grey indicates decreasing rural
trends. There appears to be decreasing trends between 2002 and 2005 in many urban sites, with a
rise in 2007. This apparent increase in prevalence from 2005 to 2007 was observed in seven of
the 11 consistent urban ANC sites and two of the three nonconsistent urban sites.
According to information displayed in Table 4, the two ANC sites in Kigali city have both the
highest prevalence and together have the highest magnitude of HIV prevalence for Rwanda. This
province remains a critical area of elevated prevalence.
HIV Prevalence (%), ANC 2002-2007 (Consistent Sites ONLY) -
RWANDA
3.0
3.4
5.5
11.0
2.1
4.2
6.7
13.0
3.0
0.0
2.0
4.0
6.0
8.0
10.0
12.0
14.0
2002 2003 2005 2007
HIV
Pre
va
len
ce
DHS-National National Other urban Kigali Rural

37 v.9/10/2012
Table 4: HIV Prevalence among ANC Attendees, All Ages, Consistent Sites Only New
Province
SITE
*Urban/
Rural Former
Province
2002
2003
2005
2007
Trend
**DHS
2005
Magnitude
EAST Kirehe Rural Kibungo 3.4 2.8 2.4 1.8 Decreasing Medium
EAST Ruhuha Rural Kigali Ngali 2.6 4.4 3.9 2.6 Decreasing High
EAST Rukara Rural Umutara 5.1 2.8 3.9 2.7 Irregular Low
EAST Rukomo Rural Umutara 1.6 2.8 0.9 2.1 Level Low
EAST Rwamagana Urban Kibungo 6.2 5.6 4.8 4.1 Decreasing Medium
KIGALI Bilyogo Urban Kigali Ville 13 16.2 18.4 12.0 Irregular
Decrease Medium
KIGALI Gikondo Urban Kigali Ville 13 10.2 7.5 11.5 Irregular
Increase Medium
NORTH Bungwe Rural Byumba 2.8 2 2.6 3.3 Increasing Medium
NORTH Ruli Rural Kigali Ngali 2 1.2 0.3 3.4 Decrease with
upward trend
‘05-‗07 High
NORTH Gitare Rural Ruhengeri 3 1.8 1.6 0.8 Decreasing Low
NORTH Byumba Urban Byumba 6.7 6.1 5.5 9 Decrease with
upward trend
‘05-‗07 Medium
NORTH Ruhengeri Urban Ruhengeri 6.9 6.3 5.4 6.8 Decrease with
upward trend
‘05-‗07 Low
SOUTH Kigembe Rural Butare 1.2 2 1.2 1.5 Level Medium
SOUTH Musebeya Rural Gikongoro 3.1 4.2 2.1 1.5 Decreasing Medium
SOUTH Mugina Rural Gitarama 3.5 4.4 2 1.4 Decreasing High
SOUTH Nyanza Urban Butare 6.7 6.4 3.3 4.7 Decrease with
upward trend
‘05-‗07 Medium
SOUTH Nyamagabe Urban Gikongoro 7.5 6.1 2.4 3.9 Decrease with
upward trend
‘05-‗07 Medium
SOUTH Ruhango Urban Gitarama 3.7 3.1 2.7 7.1 Increasing High
WEST Mashesha Rural Cyangugu 3 4.7 2.7 3.0 Level High
WEST Busasamana Rural Gisenyi 4.6 5.6 2.3 2.7 Decrease with
upward trend
‘05-‗07 Low
WEST Mukungu Rural Kibuye 3.5 1.9 2.3 1.5 Decreasing High
WEST Rusizi Urban Cyangugu 6.1 6.4 4.8 6.3 Level with
upward trend
‘05-‗07 High
WEST Gisenyi Urban Gisenyi 7.1 9.3 8.2 4.0 Decreasing High
WEST Rubengera Urban Kibuye 8.3 7.3 7.3 6.7 Level Low
Median Rural 3 2.8 2.3 2.1
Median Urban 6.9 6.4 5.4 6.8
National 4.2 4.6 2.7 3.4
* The labeling of ―rural‖ and ―urban‖ refers to the location of the sentinel site and is not necessarily representative of the ANC client residence.
** Magnitude used the DHS 2005 ―old province‖ prevalence as compared relative to the DHS 2005 national urban and rural prevalence, as applicable, and categorized into tertiles as low, medium, or high.
Dark grey shading indicates decreasing urban trends and the light grey indicates decreasing rural trends.

38 v.9/10/2012
East Province exhibited an overall high magnitude of HIV prevalence and a mixed picture,
showing areas of both low to high magnitude of HIV prevalence by ―former province.‖ The
ANC HIV prevalence overall declined for the group aged 15 to 49 years, especially in the urban
setting of Rwamagana in former Kibungo Province, when compared to the national median.
There was a decrease in HIV prevalence in two rural sites in Kirehe in former Kibungo and
Ruhuha in former Kigali-Ngali.
North Province showed an overall low magnitude of HIV prevalence and a mixed low to high
magnitude of HIV prevalence by ―former province.‖ There were possible overall increases in
HIV prevalence trends for 15- to 49-year-old ANC clients especially for the rural ANC site
Bungwe in former Byumba, the urban Ruhengeri site in former Ruhengeri, and the rural Ruli site
in former Kigali-Ngali. Similar trends were observed for 15- to 24-year-olds. North Province
showed increasing prevalence from 2005 to 2007 across all rural and urban sites.
South Province showed an overall medium magnitude of HIV prevalence and a mixed low to
high magnitude of HIV prevalence by ―former province‖, with an urban/rural divide consistent
with the national medians. There is a decrease in rural sites and a decrease in urban sites from
2002 to 2005, with an upward trend from 2005 to 2007 in the urban sites. Data from the 15- to
24-year-old age group was irregular and nonconclusive
West Province showed an overall medium magnitude of HIV prevalence and a mixed low to
high magnitude of HIV prevalence by ―former province‖, with the overall highest prevalence in
both urban and rural sites, outside of Kigali. Trends in prevalence demonstrated an urban/rural
divide consistent with national urban/rural medians. The urban sites of Gisenyi in the former
province of Gisenyi and Rubengera in former Kibuye both show decreasing trends in HIV
prevalence. Prevalence in rural sites were level or decreasing. There the 15- to 24-year-old age
group showed fluctuating patterns that were nonconclusive.
This trend in urban/rural difference also is observed in the 15- to 24-year-old age group
(Appendix 10). Figure 3 shows median HIV prevalence among women aged 15 to 24 years
from 2002 to 2007, nationally, for Kigali and for other urban and rural sites. There is greater
variability between data points, and trend analysis is less conclusive in this group. Despite this
limitation, the prevalence in 15- to 24-year-olds showed overall declining patterns in East and
South provinces, which support regional adult trends. Rural prevalence in Bungwe, Ruli, and
Ruhengeri ANC sites in North Province, as well as Mashesha and Mukungu in West Province,
continue to rise. All other rural ANC sites show level, decreasing, or irregular trends in HIV
prevalence for 15- to 24-year-olds. Urban prevalence for this age group is highest in Kigali sites,
Rubengera and Rusizi ANC sites in West Province, and Ruhengeri and Byumba ANC sites in
North Province.

39 v.9/10/2012
Figure 3: Median Prevalence of Consistent ANC Sites Stratified By National, Kigali, Other
Urban, and Rural, 15- to 24-year-olds.
HIV Prevalence (%) Among 15-24 Year Olds,
ANC 2002-2007 - RWANDA
1.0
3.0
4.03.7
5.4
10.4
11.7
2.42.0
0.0
2.0
4.0
6.0
8.0
10.0
12.0
14.0
2002 2003 2005 *2007
HIV
Pre
va
len
ce
DHS-National National Other urban Kigali Rural
3.1.3. HIV and Urbanization in Rwanda Rwanda is undergoing a rapid rate of urbanization in relation to neighboring countries.
Urbanization projections from the Great Lakes Initiatives show Rwanda to be one of the most
rapidly urbanizing countries (Figure 4).
Figure 4: GLIA Urbanization Trends
GLIA and GAMET. Rapid analysis of HIV epidemiological and response data on vulnerable populations in the
Great Lakes Region of Africa (2008).
GAMET, Global AIDS Monitoring and Evaluation Team.

40 v.9/10/2012
From 1990 to 2008, the urban population increased from 5.3% to 21.8%.31
In a research study of
serodiscordant couples enrolled in two clinical research centers in Kigali, Rwanda and in Lusaka,
Zambia, demographic characteristics showed 1,470 (74%) of enrollees had lived in a village until
they were 16 years old in Rwanda versus 396 (21%) of participants in Zambia.32
Additionally,
Rwanda ranks 29th
among the most densely populated countries in the world, with 343
inhabitants per square kilometer.33
As populations increasingly abandon their rural homes and
migrate to cities, they frequently adopt lifestyles and behaviors that may place them at increased
risk for HIV. There exists a potential risk for rapid spread of the epidemic with the shift in
population from a low-prevalence to a high-prevalence environment. A South African study
found that high rates of urbanization are linked with nine factors that contribute to the spread of
AIDS.34
Rwanda has a relatively mature epidemic in a compact geography compared to other
nations in eastern and southern Africa. The country is urbanizing and the prevalence of HIV in
urban ANC sites is higher than that in rural ANC sites. The process of urbanization is a
fundamental feature of socioeconomic development and this factor, among others, may
contribute to resurgence of the HIV epidemic.35
Further investigation into the affect of
urbanization on HIV prevalence in Rwanda is warranted.
31
UNFPA, PRB. Country Profiles for Population and Reproductive Health: Policy Developments and Indicators
2005. Accessed from http://www.unfpa.org/upload/lib_pub_file/524_filename_country_profiles_2005.pdf 32
Stephenson R et al. The demographic profile of sero-discordant couples enrolled in clinical research in Rwanda
and Zambia. AIDS Care, March 2008; 20(3): 395-405. 33
United Nations World Prospects Report (2004 revision) accessed November 7, 2008 from
http://en.wikipedia.org/wiki/List_of_countries_by_population_density 34
Coetzee D, Schneider H. Urbanisation and the epidemic of sexually transmitted diseases in South Africa. Urban
Health Newsl. 1996 Dec;(31):36-41. 35
Tim Dyson. HIV/AIDS and Urbanization. Population and Development Review, Vol. 29, No.3 (Sep., 2003),
pp.427-442)

41 v.9/10/2012
3.1.4. HIV Prevalence by Age Group and Gender
DHS 2005 data show that older age groups are more affected by HIV, with prevalence
decreasing after 40 years of age (Figure 5). Of note is the low prevalence among 25- to 39-year-
old men compared with women of the same age.
Figure 5: HIV Prevalence by Age Group and Gender, DHS 2005
National DHS data shows that there are notable gender differences in HIV prevalence between
men (0.4%) and women (1.5%) in the 15- to 24-year-old age group. This difference also was
seen in women in the higher wealth quintiles, women with higher levels of education, widowed
women, and divorced or separated women. These at-risk subpopulations of women are discussed
in the findings section.
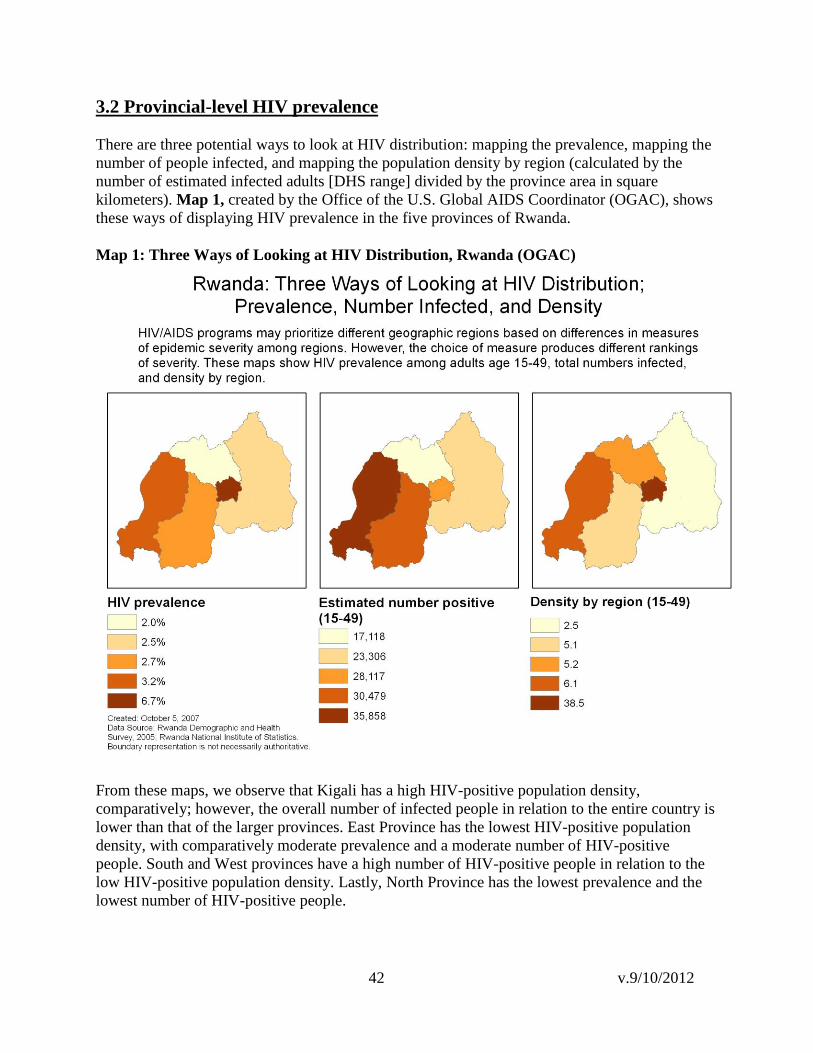
42 v.9/10/2012
3.2 Provincial-level HIV prevalence
There are three potential ways to look at HIV distribution: mapping the prevalence, mapping the
number of people infected, and mapping the population density by region (calculated by the
number of estimated infected adults [DHS range] divided by the province area in square
kilometers). Map 1, created by the Office of the U.S. Global AIDS Coordinator (OGAC), shows
these ways of displaying HIV prevalence in the five provinces of Rwanda.
Map 1: Three Ways of Looking at HIV Distribution, Rwanda (OGAC)
From these maps, we observe that Kigali has a high HIV-positive population density,
comparatively; however, the overall number of infected people in relation to the entire country is
lower than that of the larger provinces. East Province has the lowest HIV-positive population
density, with comparatively moderate prevalence and a moderate number of HIV-positive
people. South and West provinces have a high number of HIV-positive people in relation to the
low HIV-positive population density. Lastly, North Province has the lowest prevalence and the
lowest number of HIV-positive people.

43 v.9/10/2012
The geographic distribution of HIV prevalence in Rwanda, showing provincial data for the five
new provinces and subdivided by the 12 old provinces, is shown in Map 2.
Map 2: HIV Prevalence by Old Provinces, Rwanda ANC 2007

44 v.9/10/2012
Map 3, below, uses the 2007 ANC as a point estimate to show current HIV prevalence, stratified
by former provinces, among women 15 to 49 years old and 15 to 24 years old who attend ANCs.
Byumba and Kibuye are areas of concern for young women, but the 2005 DHS data shows a low
HIV prevalence among young women in Byumba (0.6%), whereas Kibuye is one of the four
provinces, including Gisenyi, Cyangugu, and Kigali, showing 2% or higher HIV prevalence
among young women.
Map 3: 2007 Data on HIV Prevalence in ANCs by Age Group

45 v.9/10/2012
Map 4, below, shows HIV prevalence among the general population based on 2005 DHS data,
with arrows indicating directional change over time between 2002/2003 and 2007 using ANC
sentinel surveillance data among pregnant women 15 to 49 years old by province. Significant
prevalence trends by ANC site from 2002/2003 to 2007 is a p value for Mantel-Haenszel of less
than 0.05.
Map 4: HIV Prevalence by Province Based on DHS 2005 and ANC Sentinel Surveillance
Trend by Site
There is an upward trend in HIV prevalence for Ruhango (urban site) and Ruli (rural site). In
North Province and the southern area of South Province, ANC sites have low prevalence levels
and four show statistically significant declines.

46 v.9/10/2012
3.2.1. HIV Prevalence and Neighboring Countries
Rwanda is a small country, and all former provinces border other countries except for Kigali and
Gitarama. To help us understand how proximity to borders affects HIV prevalence, Map 5
shows Rwandan HIV prevalence from DHS 2005 with most recent available HIV prevalence for
neighboring countries: at the provincial level for Tanzania, Democratic Republic of Congo
(DRC), and Uganda and at the national level for Burundi. Appendix 13 includes HIV prevalence
maps of neighboring countries.
Map 5: HIV Prevalence by Province and Neighboring Countries
The pattern shown on this map does not conclusively point to HIV prevalence being affected by
neighboring countries, despite the porous border between Western Province and DRC. The
proximity of ANC sites to major transport corridors was mapped to determine whether a
geographic pattern related to movement could be seen.

47 v.9/10/2012
Map 6 shows major transportation corridors in Rwanda and HIV prevalence among the general
population based on 2005 DHS data; arrows indicate the directional change in ANC prevalence
from 2005 to 2007.
Map 6: HIV Prevalence by Province Based on DHS 2005 and Change in ANC Sentinel
Surveillance Site from 2005 to 2007 by Urban and Rural ANC Sites, Rwanda
Map 6 describes changes in prevalence between 2005 and 2007 with increases in seven of the 11
urban sites and four of 13 rural sites. Ruhango was the only site with a statistically significant
increase. West Province appears to have a more mature epidemic with less concentrated HIV
infection, as shown by the higher prevalence at rural ANC sites compared to the national median.
Ruhengeri and other urban centers in North Province show increasing HIV prevalence at ANC
sites.
There is higher HIV prevalence in the majority of urban sites and in both urban and rural areas
along the major road through the country, as well as along the road and border areas in the west.
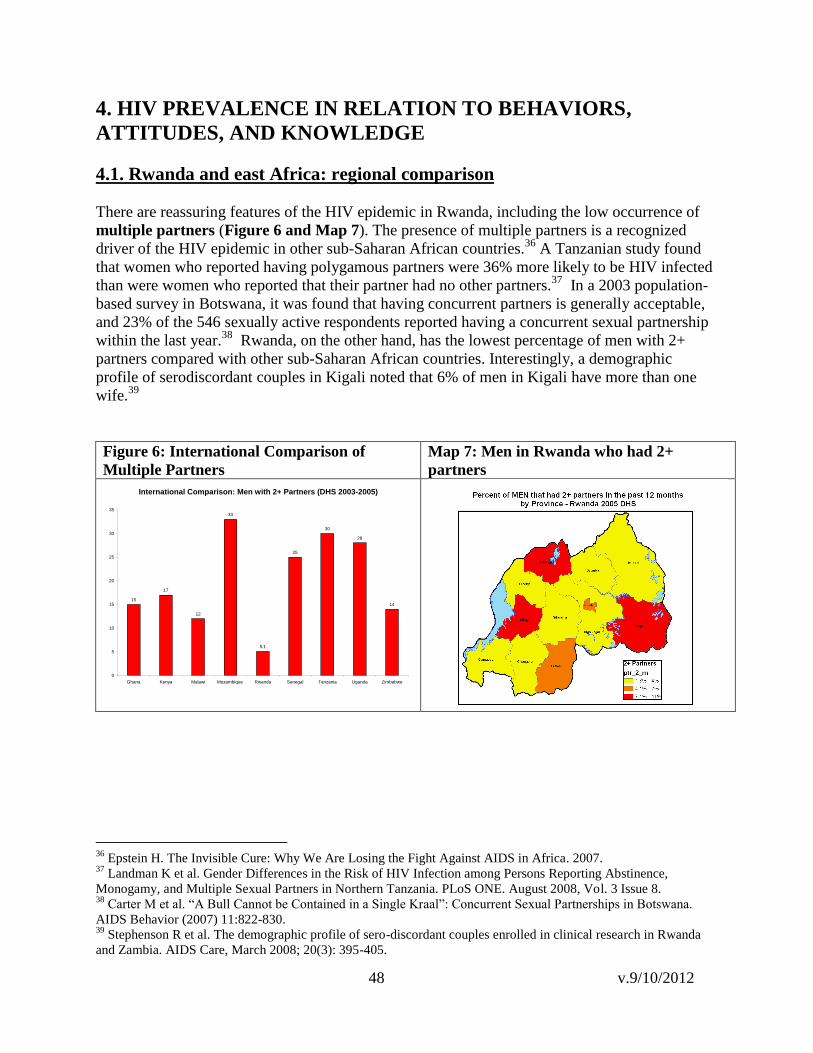
48 v.9/10/2012
4. HIV PREVALENCE IN RELATION TO BEHAVIORS,
ATTITUDES, AND KNOWLEDGE
4.1. Rwanda and east Africa: regional comparison
There are reassuring features of the HIV epidemic in Rwanda, including the low occurrence of
multiple partners (Figure 6 and Map 7). The presence of multiple partners is a recognized
driver of the HIV epidemic in other sub-Saharan African countries.36
A Tanzanian study found
that women who reported having polygamous partners were 36% more likely to be HIV infected
than were women who reported that their partner had no other partners.37
In a 2003 population-
based survey in Botswana, it was found that having concurrent partners is generally acceptable,
and 23% of the 546 sexually active respondents reported having a concurrent sexual partnership
within the last year.38
Rwanda, on the other hand, has the lowest percentage of men with 2+
partners compared with other sub-Saharan African countries. Interestingly, a demographic
profile of serodiscordant couples in Kigali noted that 6% of men in Kigali have more than one
wife.39
Figure 6: International Comparison of
Multiple Partners
Map 7: Men in Rwanda who had 2+
partners
International Comparison: Men with 2+ Partners (DHS 2003-2005)
15
17
12
33
5.1
25
30
28
14
0
5
10
15
20
25
30
35
Ghana Kenya Malawi Mozambique Rwanda Senegal Tanzania Uganda Zimbabwe
36
Epstein H. The Invisible Cure: Why We Are Losing the Fight Against AIDS in Africa. 2007. 37
Landman K et al. Gender Differences in the Risk of HIV Infection among Persons Reporting Abstinence,
Monogamy, and Multiple Sexual Partners in Northern Tanzania. PLoS ONE. August 2008, Vol. 3 Issue 8. 38
Carter M et al. ―A Bull Cannot be Contained in a Single Kraal‖: Concurrent Sexual Partnerships in Botswana.
AIDS Behavior (2007) 11:822-830. 39
Stephenson R et al. The demographic profile of sero-discordant couples enrolled in clinical research in Rwanda
and Zambia. AIDS Care, March 2008; 20(3): 395-405.

49 v.9/10/2012
Condom use: Using a condom at last higher risk sex
0
10
20
30
40
50
60
Kenya Rwanda Tanzania Uganda
GLIA Country
Perc
en
t
Women
Men
Although the overall percentage of men reporting 2+ partners in Rwanda is low, according to the
2005 DHS, the figure grows when people report higher risk intercourse in the past 12 months, as
defined by sexual intercourse with a partner who was neither a spouse nor living with the
respondent. In Kigali, 18.7% of women and 38.3% of men reported this behavior, while only
44.3% and 6.2% of women and men, respectively, reported using a condom at last high-risk
intercourse. Furthermore, there are provincial differences important for outreach efforts (Table
D.14.8 DHS 2005).
When comparing Rwanda to other members of the Great Lakes Region of Africa, including
Kenya, Tanzania, and Uganda, data from the 2008 GLIA show low levels of HIV-risk behavior.
Figure 7 compares age of first sexual intercourse in GLIA countries. Rwanda has a higher age of
first sexual intercourse (age 20 for men and women) than other GLIA countries. The percentage
of Rwandan women aged 15 to 24 years who had sex by the age of 15 was 2.6%, which is
substantially lower than in other GLIA countries. For men aged 15 to 24 years, however, the
percentage was similar to Tanzania and Uganda at 10.8% (Figure 8).
Figure 7: Age at First Sexual Intercourse Figure 8: Had Sex by Age 15
Additionally, compared with people in other GLIA countries, Rwandan men and women are
engaging in higher-risk sex less frequently (Figure 9). Condom use at last higher-risk sex
remains lower in Rwanda than in other GLIA countries (Figure 10).
Figure 9: Engaging in Higher-risk Sex Figure 10: Condom Use at Last
Higher-risk sex
Higher-risk sex: Engaging in higher risk sex in past 12
months, GLIA Report
0
20
40
60
80
100
Kenya Rwanda Tanzania Uganda
GLIA Country
Perc
en
t
Women (15-49 yrs.)
Men (15-49 yrs.)
Women (15-24 yrs.)
Men (15-24 yrs.)
Sexual debut: Age at first sexual intercourse, GLIA
Report
0
5
10
15
20
25
Kenya Rwanda Tanzania Uganda
GLIA Country
Ag
e Women (25-49 yrs.)
Men (25-54/59 yrs.)
Sexual debut: Had sex by age 15, GLIA Report
0
5
10
15
20
25
30
35
Kenya Rwanda Tanzania Uganda
GLIA Country
Perc
en
t
Women (15-24 yrs.)
Men (15-24 yrs.)

50 v.9/10/2012
Rwanda has low condom utilization rates compared with its neighboring countries, as was
confirmed by multiple independent sources (DHS, BSS, UNICEF) and for different
subpopulations, including youth. Condom utilization rates are greater in high-risk sites, although
it still is not adequate. In a Kigali site for the PLACE study, for example, 17% of men and 32%
of women had 2+ partners in the past four weeks, and 56% of both men and women used a
condom at their last high-risk intercourse. The distribution of people reporting 2+ partners in the
past four weeks at PLACE sites was 0% to 43% among women and 1% to 34% among men. The
distribution of condom use at last high-risk sex at PLACE sites was between 10% and 72%
among women and 20% and 62% among men. These data show that prevention activities,
particularly condom utilization, should be scaled up. During the triangulation workshop, the
target rate suggested for condom utilization in Rwanda was 60%.

51 v.9/10/2012
4.2. National data
Data on prevalence, cofactors, behaviors, knowledge, and attitudes are represented in Table 5.
Nationally, both adult women and female youth have a higher prevalence of HIV than men and
male youth. Women compared with men reported greater number of symptoms related to STIs
and greater stigma about HIV. Compared with women, adult men and male youth have greater
comprehensive knowledge about AIDS;40
men reported eight times the rate of 2+ partners in the
last 12 months and twice the rate of condom use at last high-risk intercourse. There are overall
increases in the number of adults and youth reporting ever being tested for HIV.
Table 5: National Indicators
NATIONAL (Unless otherwise specified all data are from DHS 2005)
HIV Prevalence:
ADULTS (15-49): Women (3.6%), Men (2.3%)
YOUTH: 15 – 19 Women (0.6%), Men (0.4%)
YOUTH: 20 - 24 Women (2.5%), Men (0.5%)
YOUTH: 15-24 Women (1.5%), Men (0.4%)
Co-factors:
Self- Reported STI: Women 2000 (2.7%), 2005 (5.0%), Men 2000 (2.1%), 2005 (2.7%)
Behavior:
2+ partners in last 12 months: Women (0.6%), Men (5.1%)
Condom use at last high-risk intercourse: Women (19.7%), Men (40.9%)
Ever Tested: Women 2000 (4.8%), 2005 (24.2%), Men 2000 (7.1%), 2005 (21.9%)
YOUTH: First Sex before age 18: Women (17.6%), Men (27.2%)
Knowledge:
ADULTS: Comprehensive AIDS Knowledge: Women (53.6%), Men (57.5%)
YOUTH: Comprehensive Knowledge: Women (50.9%), Men (53.6%)
YOUTH: Known source of condoms: Women (37%), Men (73%)
Attitude:
Accepting attitudes (all 4): Women (46.1%), Men (51.0%)
40
A person knows that the use of condoms and having just one uninfected faithful partner can reduce the chances of
getting the AIDS virus, knowing that a healthy-looking person can have the AIDS virus, and rejecting the two most
common local misconceptions about AIDS transmission and prevention (transmission by mosquito bites and sharing
food with an infected person).

52 v.9/10/2012
4.3 Provincial-level data
We compared indicators from Appendix 6 across all former provinces. The findings are
summarized below:
4.3.1. East Province
In East Province ANC sites, HIV prevalence is stable or declining, reinforced by the low DHS
HIV prevalence. Kibungo has medium HIV prevalence in urban areas and lower prevalence in
rural areas. Compounded by low rates of HIV testing (PMTCT + VCT), there is a high
percentage of men who have 2+ partners and a high percentage of women who have high-risk
sex. Both sexes have an early sexual debut. Stigma is less common among men than among
women. Umutara has the lowest prevalence in the country, yet there are high levels of stigma,
and HIV knowledge is greater among women than men. Kigali-Ngali is characterized by high
levels of HIV knowledge, low levels of risk behavior, high rates of stigma towards people living
with HIV/AIDS (PLWHA), and low rates of programmatic uptake, as shown by the low HIV
testing rates and low rate of condom use.
Kibungo is a province with overall low prevalence compared to the national average and has a
declining prevalence (Appendix 14, Table 1). Women have higher levels of stigma compared
with men and in the context of higher rates of comprehensive HIV knowledge. Men report
higher rates of risk behaviors with multiple partners in the face of lower prevalence among men.
The percentage of people ever tested for HIV remains low, which is additionally concerning
because STI prevalence has increased among women, and youth have an earlier onset of sexual
debut.
In Umutara (Appendix 14, Table 2), there is low HIV prevalence compared to the national
average and in the presence of low rates of comprehensive HIV knowledge and greater levels of
stigma towards PLWHA. Although women have higher levels of knowledge about HIV, the
percentage ever tested remains low. The relative isolation from major transport corridors and
urban centers may have a protective effect on the population.
Data on ANCs in Kigali-Ngali (Appendix 14, Table 3) show possible declines in prevalence;
however, compared with women, adult men and male youth have a higher prevalence of HIV,
which is a reverse trend from national averages. Although there are high rates of HIV
knowledge, high levels of stigma still exist.
Reasons why HIV prevalence remains low in rural areas of East Province in the presence of low
rates of knowledge and poor service uptake are unclear. The extent to which isolation and low
urbanization favor lower transmission is not known. The apparent high level of risk behavior in
the urban areas of Kibungo is possibly associated with higher prevalence.
4.3.2. Kigali Province HIV prevalence in Kigali is at the highest magnitude in the country, with an overall slight
decline based on ANC and DHS surveys. Data from ANCs show a consistent decrease in
prevalence in Kigali during the years of instability (1990-2002) and after the 1994 genocide,
with increasing prevalence outside of Kigali beginning in the early 1990s, peaking in 1996, and
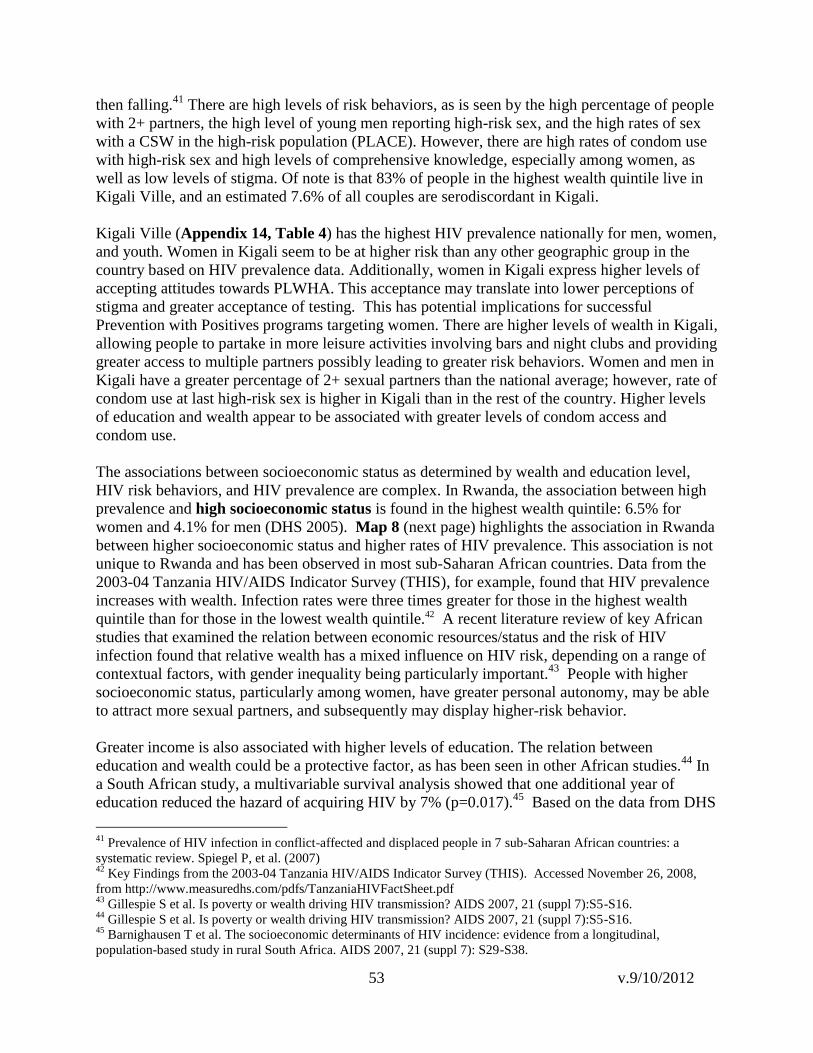
53 v.9/10/2012
then falling.41
There are high levels of risk behaviors, as is seen by the high percentage of people
with 2+ partners, the high level of young men reporting high-risk sex, and the high rates of sex
with a CSW in the high-risk population (PLACE). However, there are high rates of condom use
with high-risk sex and high levels of comprehensive knowledge, especially among women, as
well as low levels of stigma. Of note is that 83% of people in the highest wealth quintile live in
Kigali Ville, and an estimated 7.6% of all couples are serodiscordant in Kigali.
Kigali Ville (Appendix 14, Table 4) has the highest HIV prevalence nationally for men, women,
and youth. Women in Kigali seem to be at higher risk than any other geographic group in the
country based on HIV prevalence data. Additionally, women in Kigali express higher levels of
accepting attitudes towards PLWHA. This acceptance may translate into lower perceptions of
stigma and greater acceptance of testing. This has potential implications for successful
Prevention with Positives programs targeting women. There are higher levels of wealth in Kigali,
allowing people to partake in more leisure activities involving bars and night clubs and providing
greater access to multiple partners possibly leading to greater risk behaviors. Women and men in
Kigali have a greater percentage of 2+ sexual partners than the national average; however, rate of
condom use at last high-risk sex is higher in Kigali than in the rest of the country. Higher levels
of education and wealth appear to be associated with greater levels of condom access and
condom use.
The associations between socioeconomic status as determined by wealth and education level,
HIV risk behaviors, and HIV prevalence are complex. In Rwanda, the association between high
prevalence and high socioeconomic status is found in the highest wealth quintile: 6.5% for
women and 4.1% for men (DHS 2005). Map 8 (next page) highlights the association in Rwanda
between higher socioeconomic status and higher rates of HIV prevalence. This association is not
unique to Rwanda and has been observed in most sub-Saharan African countries. Data from the
2003-04 Tanzania HIV/AIDS Indicator Survey (THIS), for example, found that HIV prevalence
increases with wealth. Infection rates were three times greater for those in the highest wealth
quintile than for those in the lowest wealth quintile.42 A recent literature review of key African
studies that examined the relation between economic resources/status and the risk of HIV
infection found that relative wealth has a mixed influence on HIV risk, depending on a range of
contextual factors, with gender inequality being particularly important.43
People with higher
socioeconomic status, particularly among women, have greater personal autonomy, may be able
to attract more sexual partners, and subsequently may display higher-risk behavior.
Greater income is also associated with higher levels of education. The relation between
education and wealth could be a protective factor, as has been seen in other African studies.44
In
a South African study, a multivariable survival analysis showed that one additional year of
education reduced the hazard of acquiring HIV by 7% (p=0.017).45
Based on the data from DHS
41
Prevalence of HIV infection in conflict-affected and displaced people in 7 sub-Saharan African countries: a
systematic review. Spiegel P, et al. (2007) 42
Key Findings from the 2003-04 Tanzania HIV/AIDS Indicator Survey (THIS). Accessed November 26, 2008,
from http://www.measuredhs.com/pdfs/TanzaniaHIVFactSheet.pdf 43
Gillespie S et al. Is poverty or wealth driving HIV transmission? AIDS 2007, 21 (suppl 7):S5-S16. 44
Gillespie S et al. Is poverty or wealth driving HIV transmission? AIDS 2007, 21 (suppl 7):S5-S16. 45
Barnighausen T et al. The socioeconomic determinants of HIV incidence: evidence from a longitudinal,
population-based study in rural South Africa. AIDS 2007, 21 (suppl 7): S29-S38.

54 v.9/10/2012
2005 in Rwanda, the behaviors of wealthier populations do not appear to be affected by better
education or greater understanding of risk, although further investigation is warranted regarding
the interplay between wealth, education, and HIV risk. Gillespie et al.,41
have demonstrated that
HIV prevention approaches should cut across all socioeconomic strata. They also should be
adapted to specific drivers of transmission within different groups, particularly in terms of
vulnerabilities faced by youth and women, and the contextual character of socioeconomic strata
and HIV.46
Map 8: HIV Prevalence by Province and Percent of Households in the Highest Wealth
Quintile
4.3.3. North Province
North Province has an overall low HIV prevalence (DHS 2005); however, at four of five ANC
sites between 2005 and 2007, there has been a greater rise in prevalence among urban than rural
sites. In terms of risk behavior, the former province of Kigali-Ngali has low levels of risk behavior
and high rates of knowledge, but high levels of stigma towards PLWHA. The former province of
Ruhengeri has low knowledge, high stigma, and an urban/rural divide in terms of prevalence. The
former province of Byumba has low-level risk behavior, high levels of HIV knowledge, and low
rates of stigma in both adults and youth. In Byumba there is greater programmatic uptake in
terms of testing, but low rates of condom use with high-risk sex.
The former province of Byumba (Appendix 14, Table 5) shows prevalence, risk behavior,
knowledge, and attitude in both adults and youth that are better than the national average. DHS
HIV prevalence shows lower risks in the presence of low rates of condom use. Participants
reported in Byumba that there is early marriage and less premarital sex, based on DHS data.
46
Gillespie S et al. Is poverty or wealth driving HIV transmission? AIDS 2007, 21 (suppl 7):S5-S16.

55 v.9/10/2012
According to expert opinion, polygamy exists in this region. The ANC data shows low and
decreasing prevalence until 2007. It is difficult to determine the effect on HIV prevalence of
cross-border travel. Possible factors influencing HIV transmission include the demographic shift
caused by urbanization and decentralization and the effects of ART scale up.
The former province of Ruhengeri (Appendix 14, Table 6) has a lower HIV prevalence than the
national average, but has higher rates of risk behavior, lower levels of knowledge, and poorer
attitudes. The extent to which low-level HIV/AIDS knowledge, unfavorable attitudes towards
PLWHA, and low rates of service utilization are linked are uncertain. Young males have a
higher HIV prevalence than the national average. Ruhengeri has some locations known for
CSWs and risky behavior, based on PLACE and BSS data.
The former province of Kigali-Ngali (Appendix 14, Table 7) is relatively isolated and incomes are
lower, so women may have lower risk. ANC data show possible declines in prevalence; however,
adult men and male youth have higher prevalence of HIV than women, a reverse trend from
national averages. Although HIV knowledge is at a high level, high levels of stigma still exist.
For North Province, it remains unclear whether urbanization caused by demographic shift and
decentralization is driving the epidemic. Indications of a rise in prevalence at ANC urban sites
point in this direction; however, additional data are needed to ascertain this hypothesis. The
impact of ART roll-out in Byumba and the corresponding rise in prevalence cannot be
ascertained from a temporal standpoint.
4.3.4. South Province
South Province benefits from an overall low prevalence (DHS 2005), but three of three urban
ANC sites show a rise in prevalence between 2005 and 2007. In terms of risk behaviors, the
former province of Gikongoro shows early sexual debut and gender discordance, with women
showing greater HIV knowledge than men. There are low rates of both HIV testing and condom
use. In the former province of Butare, HIV prevalence in women is two times greater than that in
men, with higher rates of STI symptoms reported. Testing rates are equal among genders, but
HIV knowledge is at a much higher rate in men. In the former province of Gitarama, there is a high
rate of HIV prevalence among adults compared with youth. High levels of stigma exist, as well
as low rates of both condom usage at last high-risk sex and HIV testing.
HIV prevalence is equal in both sexes in Ginkogoro (Appendix 14, Table 8), differing from the
national rates. There is gender discordance between men and women in terms of knowledge and
attitude. The number of people ―ever tested‖ for HIV is considerably lower than the national
average, possibly due to the lower prevalence of HIV in this province. The border with Burundi
is very rural and there is little commercially related movement.
The prevalence of HIV among women is double that of men in the former province of Butare
(Appendix 14, Table 9). Comprehensive AIDS knowledge and known source of condoms is at a
much higher level for men, which is concerning as the reported STI rate in women is higher than
the national average and considerably higher than that reported by men. Higher rates of ―ever
testing‖ in this former province may be due to a university setting or to greater programmatic
exposure and uptake. Additionally, Butare is a transit point for truckers and therefore for

56 v.9/10/2012
potential spread of HIV. A literature review (2003) noted that few young Rwandans know how
to use a condom correctly.
The former province of Gitarama shows higher comprehensive knowledge and attitudes towards
PLWHA, which could be related to the proximity to Kigali and greater exposure to programs
(Appendix 14, Table 10). Gitarama has the highest prevalence for South Province, possibly due
to its proximity to Kigali and the Ruhango market, which brings traders, CSWs, and seasonal
workers together. The city of Ruhango showed a significantly higher HIV prevalence among
ANC attendees between 2005 and 2007. Figure 11 charts PMTCT and ART initiation at the
Ruhango ANC site showing PMTCT and ART initiation by all clients, all 15- to 24-year-old
clients, first pregnancy in 15- to 24-year-old clients, and non-first pregnancy in 15- to 24-year-
old clients and women living in the catchment area only. Improved access to HIV care and
treatment services in Ruhango may have affected the rise in prevalence.
Figure 11: HIV ANC Prevalence for Ruhango ANC Site
A literature review (2003) for the former provinces of Butare and Gitarama revealed that 77% of
young men and 98% of young women had never purchased condoms; at high rates, young
women and young men felt incapable of convincing their partners to use a condom or incapable
of refusing to have sex; only 38% of young sexually active men and 48% young sexually active
women reported having used a condom at least once in their lives; 85% of young men and 63%
of young women said that they would risk contracting HIV if they did not use a condom,
indicating a low level of perceived risk.
The extent to which the university setting and urban risk profile in Butare province is associated
with elevated risk is difficult to determine from existing data. Discovering the effect of transport
routes, seasonal workers, and commercial centers in Ruhango in perpetuating the epidemic in
South Province remains of high importance. Finding whether areas with high economic activity
and opportunity (e.g., large trading areas) foster larger sexual networks and lead to higher rates
of HIV transmission should be a priority for future research efforts in Rwanda.
RUHANGO: Rwanda ANC Prevalence
0.0
1.0
2.0
3.0
4.0
5.0
6.0
7.0
8.0
2002 2003 2004 2005 2006 2007
HIV
Pre
va
len
ce
All 15-24 yr olds All 1st Preg Amg 15-24 yr olds
Within Catchment Only (15-24 yr olds) Non 1st Pregnancy Amg 15-24 yr olds
PMTCT Initiation:
December 2003 ART May 2005

57 v.9/10/2012
4.3.5. West Province
West Province, consisting of the former provinces of Cyangugu, Gisenyi, and Kibuye, has higher
HIV prevalence than the national average and higher than all former provinces (DHS 2005). This
province appears to have a more mature epidemic with less concentrated HIV infection, as
shown by the higher prevalence at rural ANC sites compared to the national average. The former
province of Cyangugu has a level ANC prevalence in the rural ANC site with a high magnitude of
HIV prevalence, and a level prevalence in the urban ANC site with an increase between 2005
and 2007 (Table 4). In terms of risk behaviors in Cyangugu, low levels of knowledge, high rates
of stigma, and high levels of risk behavior occurring in PLACE sites exists. The former province
of Kibuye has the highest prevalence after Kigali, high rates of STI self-report for men, the
highest number of men with 2+ partners in the past 12 months, early onset sexual debut for men,
high rates of stigma, and the lowest level of condom procurement knowledge. The former
province of Gisenyi has high ANC prevalence in rural areas that is apparently in decline. Gisenyi
shows late onset of sexual debut for women and low numbers of multiple partners, low levels of
HIV knowledge, and high rates of stigma against PLWHA. Of note is that all former provinces
in West Province have a border with Lake Kivu or the DRC. These are associated with higher
levels of economic opportunity and movement, which could be a factor in HIV transmission.
Although ANC data in the former province of Cyangugu (Appendix 14, Table 11) shows leveling
to decreasing HIV prevalence among ANC attendees, according to the DHS, prevalence among
adults and youth is slightly higher than the national average and women have a higher prevalence
of HIV than men. Considering the activity of fisherman and the density of truck routes in
conjunction with the low level of comprehensive knowledge about HIV/AIDS, high levels of
stigma toward PLWHA, high rates of commercial sex, and high levels of multiple partners, the
population in the former province of Cyangugu is at greater risk of perpetuating the HIV
epidemic than are other former provinces of Rwanda.
The former province of Gisenyi (Appendix 14, Table 12) has an HIV prevalence comparable to
the national average for women and slightly higher rates than the national average for men.
Levels of knowledge and positive attitudes toward PLWHA in adults and youth are lower in
Gisenyi than the national averages, as are VCT utilization rates for both men and women.
Prevalence of HIV for adults and youth in the former province of Kibuye (Appendix 14, Table 13)
is higher than the national average. There are also low levels of knowledge of HIV/AIDS in this
population, based on DHS data. Men have a higher rate of STI self-report and a greater number
of multiple partners. Male youth also have an age of sexual debut that is younger than the
national average. High rates of stigma towards PLWHA in men exist, as seen by the very low
rates of accepting attitudes towards PLWHA.
West Province shows patterns characteristic of an older stage of the HIV epidemic. Several
factors place this province at risk for continued increased rates of HIV transmission. These
factors include proximity to the DRC, mobility of populations related to the recent and ongoing
civil conflicts, and greater economic opportunity for males resulting from the presence of tea
plantations and commerce around Lake Kivu.

58 v.9/10/2012
5. PROGRAMMATIC DATA
Rwanda is one of three PEPFAR-supported African countries with over 70% ART coverage,47
yet there is an imbalance of ART and PMTCT coverage in Kigali and East provinces compared
with the other provinces. In terms of VCT services, there is greater coverage in Cyangugu and
Kigali-Ngali.
5.1. ART program data
Rwanda has high levels of ART coverage compared to many other African countries (Map 9).48
Map 9: PEPFAR Focus Countries: Estimated Antiretroviral Therapy Coverage, December
200749
47
WHO HIV/AIDS. Data and Statistics Highlights. Accessed October 30, 2008, from
http://www.who.int/hiv/data/en/index.html 48
WHO HIV/AIDS Data and Statistics Highlights. Accessed October 30, 2008, from
fromhttp://www.who.int/hiv/data/en/index.html 49
Created by OGAC from WHO HIV/AIDS Data and Statistics Highlights
(http://www.who.int/hiv/data/en/index.html)

59 v.9/10/2012
Table 6 shows how national ART coverage has increased over the years, practically doubling
scale-up efforts each year.
Table 6: National ART Coverage by Year
National 2002 2003 2004 2005 2006 2007
ART sites 4 15 31 84 133 165
ART patients 670 4189 8355 19058 34136 47755
Spectrum est need 66090
Map 10 shows 2007 ART coverage by former province and thus provides a smaller geographic
breakdown of program coverage. Umutara and Kigali have the highest rates of ART coverage.
For Kigali, this is explained by the early roll-out of ART services. For Umutara, higher coverage
rates are explained by its low population density, as most of the area is national parks. Areas of
lower coverage include the three former provinces now comprising West Province and may be
due to higher levels of risk behavior and a more mature epidemic with higher rural ANC HIV
prevalence.
Map 10: 2007 ART Coverage by Former Province

60 v.9/10/2012
National findings (73% estimated coverage) are similar to the national ART coverage estimates
calculated for the Rwanda 2008 Epidemic Update (Figure 12).
Figure 12: Care and Treatment among Adults and Children, 2007 (Rwanda 2008 Epidemic Update)

61 v.9/10/2012
5.2. PMTCT program data
In terms of PMTCT (Map 11), there is the greatest coverage in Kigali and East Province,
followed by West Province. As seen in DHS 2005, although 56% of women received HIV
counseling (12% less than estimated PMTCT coverage), only 21% of women surveyed were
counseled, accepted the test, took an HIV test, and received their results. This result should be
factored in during the scaling up and reorientation of PMTCT services to achieve the 2010
universal access goals, and there should be greater incorporation of the PMTCT cascade to
determine programmatic coverage.
Map 11: PMTCT Coverage
Appendix 16, Table 2 displays the progression of women and infants on antiretroviral (ARV)
medications over years, and Figure 13, below, depicts this in graph form.
Figure 13: Number of HIV Positive Women, Women on ARV Medications, and Infants on
ARV Medications from 2002 to 2007, Rwanda
0
2000
4000
6000
8000
10000
12000
2002 2003 2004 2005 2006
women HIV+
women ARV
infant ARV

62 v.9/10/2012
5.2.1. Impact of PMTCT Services on Prevalence Because PMTCT implementation has been shown to have an impact on HIV prevalence in
women of childbearing age in some settings,50
in their visit to UCSF, the Sub-Working Group
members hypothesized that the roll-out of PMTCT services in Rwanda might explain observed
trends in HIV prevalence. To determine whether initiation of PMTCT services had an impact on
HIV prevalence, we looked at trends for women aged 15 to 24 years with first pregnancy only,
all women 15 to 24 years old, and all women 15 to 49 years old in relation to the timing of
PMTCT initiation at each ANC site in Rwanda.
Initiation of PMTCT services can lead to an increase in HIV prevalence by recruiting women
from outside the ANC catchment area to access new services. Women seeking ANC services
living in the catchment area were included and compared to all women to gauge whether changes
in prevalence were the result of changes in service utilization patterns caused by a greater
number of HIV-infected women seeking care in neighboring provinces. This leads to an artificial
elevation of prevalence. There was no consistent effect of recruitment of women from
noncatchment area sites after initiation of PMTCT services across the 24 ANC sites.
PMTCT services can lead to a decrease in HIV prevalence by influencing women‘s reproductive
choices. Once women are aware of their HIV serostatus, they avoid repeat pregnancies by
practicing safe sex. To determine whether this phenomenon was occurring, we compared 15- to
24-year-old women‘s first pregnancies with repeat pregnancies in the same age group and looked
for a trend across ANC sites. There was no consistent corresponding decline in the second group
after initiation of PMTCT services for the 24 ANC sites.
Mapping these variables in all ANC sites shows that the introduction of PMTCT services had no
discernable effect on trends in HIV prevalence for all women aged 15 to 49 years and all women
15 to 24 years old with first pregnancy (Appendix 12).
50
Amouzou A et al. Is HIV Seroprevalence Declining Among Women who Access PMTCT Services? A Multi-
Country Analysis. Accessed November 24, 2008, from
http://uaps2007.princeton.edu/download.aspx?submissionId=70516.
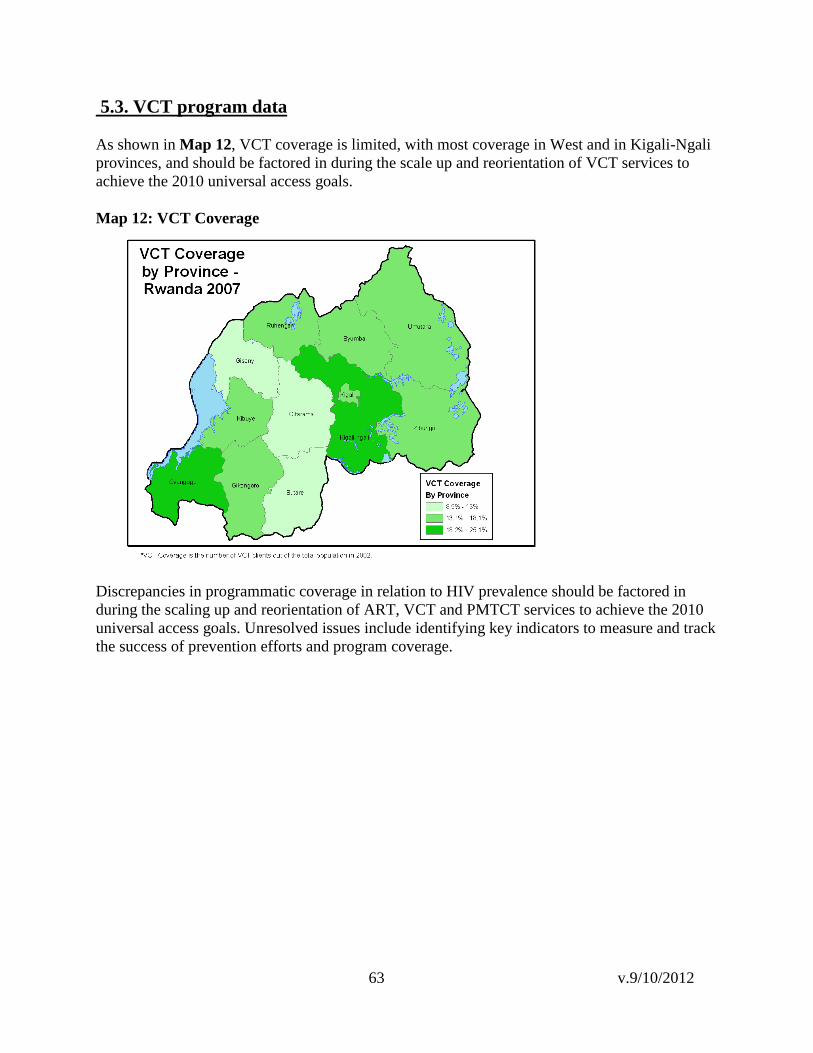
63 v.9/10/2012
5.3. VCT program data
As shown in Map 12, VCT coverage is limited, with most coverage in West and in Kigali-Ngali
provinces, and should be factored in during the scale up and reorientation of VCT services to
achieve the 2010 universal access goals.
Map 12: VCT Coverage
Discrepancies in programmatic coverage in relation to HIV prevalence should be factored in
during the scaling up and reorientation of ART, VCT and PMTCT services to achieve the 2010
universal access goals. Unresolved issues include identifying key indicators to measure and track
the success of prevention efforts and program coverage.

64 v.9/10/2012
5.4. Programmatic conclusions
5.4.1. East Province East Province has relatively high levels of ART, PMTCT, and VCT coverage. There are high
levels of ART coverage in Umutara and Kibungo. With the combined low HIV prevalence and
high rate of service coverage, this province has one of the most comprehensive programs of ART
coverage in Rwanda. Coverage also is related to the low population density of Umutara. The
former province of Kigali-Ngali, however, remains at a low level in ART coverage, with only an
estimated 43% of eligible people receiving treatment. This effect is despite Kigali-Ngali having
the greatest number of ART sites after Kigali Ville.
East Province has a high number of PMTCT sites and shows a high estimated rate of PMTCT
coverage in the former provinces of Kigali-Ngali, Umutara, and Kibungo. Low HIV prevalence in
the presence of high levels of service coverage suggests that most women have access to
PMTCT. Rate of VCT use is high in Kigali-Ngali and intermediate in Umutara and Kibungo.
East Province and Kigali-Ngali have smaller population catchments per VCT site in relation to
other former provinces.
5.4.2. Kigali Province Kigali Province has high overall ART and VCT coverage. Kigali has the greatest number of
ART sites compared to the rest of the country, as well as the greatest number of people eligible
for ART.
In terms of VCT, women in Kigali appear to be more likely to get tested, as shown by the high
rates of ―ever tested‖ individuals. This effect could be related to the greater number of testing
and treatment options available in Kigali when data were collected in 2005 relative to other areas
of Rwanda. The VCT sites in Kigali serve greater numbers of people compared to VCT sites in
the rest of the country, except for Ruhengeri. Kigali does not have the highest number of VCT
centers, which appears paradoxical knowing that efforts to roll out HIV/AIDS services
concentrated in Kigali until 2005 and expecting a greater number of people to have been tested
for HIV. In view of the density of the population affected by HIV, Kigali would benefit from a
scale up of VCT programs. PMTCT coverage for Kigali, as calculated by the number of women
eligible for services, places the city at an intermediate level of coverage. There are only 16 sites
offering PMTCT, and Kigali would benefit from an expansion of the current level of PMTCT
services.
5.4.3. North Province ART coverage is moderate for North Province except for the former province of Kigali-Ngali.
Based on DHS 2005 data, the province has low HIV prevalence compared to the rest of the
country. There are still people eligible for ART who are not receiving treatment, however, which
could be related to the low number of ART sites. North Province should be taken into
consideration for targeted expansion of ART services, especially considering the rising HIV
prevalence in ANC sites.
The province has a large population and thus a high estimate for expected number of
pregnancies. Despite the number of PMTCT sites, testing behavior is lower than desired, with
65 v.9/10/2012
only half of women in Byumba and less than half of pregnant women in Ruhengeri being tested
for HIV. Kigali-Ngali has high levels of PMTCT coverage.
The level of VCT coverage is high in Kigali-Ngali and moderate in Byumba and Ruhengeri.
Whether low prevalence and low levels of risk behavior in Kigali-Ngali is a result of high VCT
and PMTCT coverage or of its relative isolation remains unclear. Access to VCT should be
expanded in Byumba and Ruhengeri where HIV prevalence is rising.
5.4.4 South Province South Province shows moderate ART coverage in the former provinces of Butare and Gikongoro
and low coverage in the former province of Gitarama. It has the least number of ART sites of any
of the provinces in Rwanda. In view of the low HIV prevalence, this is an appropriate
programmatic response; however, people eligible and in need of treatment should have access to
ART, and South Province does not have 100% coverage of people eligible for treatment. The
ANC site in Ruhango had a statistically significant increase in HIV prevalence and should be
closely monitored.
The level of PMTCT coverage is low in the former provinces of Butare and Gitarama and
moderate in Gikongoro. A targeted expansion of PMTCT services would be of benefit to South
Province to address the low coverage.
The low level of VCT coverage in Butare and Gitarama and the moderate coverage in Gikongoro
may be a reflection of the low HIV prevalence in South Province. Considering that Butare is a
university setting, however, a higher uptake of VCT would benefit this area.
5.4.5. West Province West Province has the highest HIV prevalence after Kigali, with calculated ART coverage in the
moderate range for the former province of Cyangugu and in the low range for the former provinces
of Gisenyi and Kibuye. A scale up of ART sites would benefit West Province, especially along
the western borders, where economic activity and population movements could be a risk factor
for higher prevalence.
There is only moderate coverage of PMTCT in this region, although the DHS 2005 data reports a
higher rate of women counseled for HIV who received their results (between 19% and 31% in
West Province) than the rest of the country after Kigali.
The level of VCT coverage is high in the former province of Cyangugu, moderate in Kibuye, and
low in Gisenyi. The number of VCT sites in Kibuye may reflect the lower population density
there; however, Cyangugu could benefit from a greater number of VCT sites as the average
population served per site is 19,000. Likewise in Gisenyi, there are 27,000 people per VCT site.

66 v.9/10/2012
6. SPECIAL POPULATIONS
6.1. Discordant couples
In Rwanda 2.2% of heterosexual couples are serodiscordant. There is a greater percentage of
discordant couples with seropositive men (1.4%) than discordant couples with seropositive
women (0.8%). There are an estimated 59,395 HIV-negative people in serodiscordant
relationships (Table 7), as calculated by dividing the population in half and multiplying it by the
DHS 2005 indicators.
Table 7: Number of HIV-Negative People in Discordant Relationships
New
Province
Former
Province
Pop-2007
(15+
years)
Man HIV
positive,
women
HIV
negative
(DHS
2005)
Women
HIV
positive,
man HIV
negative
(DHS
2005)
# HIV
Negative
Women
(est.)
# HIV
Negative
Men
(est.)
Total
HIV
Negative
(est.)
East Kibungo 462,560 0.8% 2.1% 1,850 4,857 6,707
East Umutara 277,717 2.2% 0.7% 3,055 972 4,027
Kigali Kigali Ville 442,645 5.1% 2.5% 11,287 5,533 16,821
North Byumba 466,207 0.5% 0.3% 1,166 699 1,865
North Kigali-Ngali 519,920 2.0% 1.7% 5,199 4,419 9,619
North Ruhengeri 587,216 0.0% 0.0% 0 0 0
South Butare 478,149 1.3% 1.2% 3,108 2,869 5,977
South Gikongoro 322,577 0.6% 0.0% 968 0 968
South Gitarama 564,156 1.7% 0.0% 4,795 0 4,795
West Cyangugu 400,148 1.3% 0.4% 2,601 800 3,401
West Gisenyi 569,352 1.9% 0.9% 5,409 2,562 7,971
West Kibuye 308,934 1.1% 1.1% 1,699 1,699 3,398
National 5,399,578 1.4% 0.8% 37,797 21,598 59,395
Kigali has the greatest number of serodiscordant couples, followed by Kigali-Ngali and Kibungo.
Although most provinces show men to be HIV positive in the discordant relationship, in
Kibungo women are predominantly HIV positive, and Kibuye shows even proportions of HIV-
positive men and women in discordant relationships. Data from the former province of Ruhengeri
shows a complete absence of discordant couples.
The lack of knowledge about serodiscordance can increase its prevalence, while poor use of
condoms within discordant couples increases seroprevalence. A recent study that modeled data
from the Rwanda DHS 2005 predicted that most heterosexual HIV transmission in urban

67 v.9/10/2012
Rwanda takes place within married or cohabitating couples.51
To reduce HIV transmission,
couples need to know their serostatus and have access to information which enables them to
reduce the risk of infection both inside and outside the union.52
There are multiple possible
cofactors associated with serodiscordant couples; for example, higher prevalence of other STIs
among women can lead to greater vulnerability to HIV infection, female-to-male transmission
risk may be lower among couples where the male partner is circumcised, and the male-to-female
HIV transmission rate is greater than the female-to-male rate.
Figure 14 displays serodiscordant data among other African nations by discordant male (males
being the HIV-positive partners in the relationship) and discordant female (females being the
HIV-positive partner in the relationship). Rwanda shows lower rates of serodiscordance among
couples than do the countries shown; however, it also shows a similar pattern when compared to
the countries with similar prevalence estimates, such as Burkina Faso and Ghana.
Figure 14: Discordance in HIV Status among Cohabitating Couples in Selected African
Countries
Discordance in HIV Status among Cohabitating Couples Source: Demographic Health Surveys
1.7
2.4
1.7
2.8
1.4
4.4
0.9
2.7
1.6
4.4
0.8
3.5
0
1
2
3
4
5
Burkina Faso, 2003 Cameroon, 2004 Ghana, 2003 Kenya, 2003 Rwanda, 2005 Tanzania, 2003-04
HIV
Pre
va
len
ce (
%)
Discordant Male Discordant Female
There are currently no programs at the national level that specifically target couples as a high-
risk group for HIV transmission. Project San Francisco (PSF) in Kigali, Rwanda and in
51
Dunkle et al. New heterosexually transmitted HIV infections in married or cohabitating couples in urban Zambia
and Rwnada: an analysis of survey and clinical data. Lancet 2008; 371:2183-91. 52
Ibid.

68 v.9/10/2012
Lusaka, Zambia is one of the most successful examples of couples VCT (CVCT).53
Beginning with a mobile HIV testing site outside the Centre Hospitalier Kigali (CHK) in
1986, the Rwanda Zambia HIV Research Group has developed the longest-standing and
largest heterosexual HIV-discordant couples‘ cohort in the world at PSF.54
Although couples
represent the largest risk group in Africa, with 60% of new HIV infections acquired from a
spouse, less than 1% of cohabiting couples have been tested together.55
After participating in
the PSF‘s CVCT intervention, the transmission rate of HIV within couples has reduced to 7-
8% per year, compared with 20-25% per year in discordant couples who have not been
counseled.56
In Rwanda, 32,860 couples have been tested for HIV at the PSF CVCT center, of
which 1,722 (5.2%) were serodiscordant couples eligible for enrollment into the intervention,
and 1,435 (83%) enrolled.57
Based on existing evidence on interventions for couples, this
population would benefit from targeted services.
Recommendations:
Reducing transmission within discordant couples in Rwanda could yield a substantial
proportionate reduction in HIV infections. Because many infections can occur in unions and
because the incidence of HIV infection within the year following VCT for couples in Rwandan
serodiscordant couples has been shown to be closer to 3% (seroconversion rates of 4 and 9 per
100 person years, men and women respectively), this is a group that would benefit from targeted
interventions.58,59
A large longitudinal study investigating the effectiveness of male-focused
counseling and testing programs found that male-focused and couple-focused testing appear
effective in reducing risky sexual behavior. Relatively low subsequent rates of seroconversion
suggest that counseling and testing programs are effective for preventing HIV transmission in
these populations. Furthermore, the program was highly effective for promoting condom use in
couples with at least one seropositive partner.60
Couples counseling and Prevention among
Positives programs should be included as a priority in the national prevention strategy.
53
Stephenson R et al. The demographic profile of sero-discordant couples enrolled in clinical research in Rwanda
and Zambia. AIDS Care, March 2008; 20(3): 395-405. 54
Rollins School of Public Health. Rwanda Zambia HIV Research Group. Accessed October 30, 2008, from
http://www.rzhrg.org/ 55
Ibid. 56
Ibid. 57
Stephenson R et al. The demographic profile of sero-discordant couples enrolled in clinical research in Rwanda
and Zambia. AIDS Care, March 2008; 20(3): 395-405. 58
Dunkle et al. New heterosexually transmitted HIV infections in married or cohabitating couples in urban Zambia
and Rwanda: an analysis of survey and clinical data. Lancet 2008; 371:2183-91. 59
Allen S, Tice J, Van de Perre P, et al. Effect of serotesting with counselling on condom use and seroconversion
among HIV discordant couples in Africa. BMJ 1992; 304:1605-09. Accessed from
http://www.pubmedcentral.nih.gov/articlerender.fcgi?artid=1881972 60
Dunkle et al. New heterosexually transmitted HIV infections in married or cohabitating couples in urban Zambia
and Rwanda: an analysis of survey and clinical data. Lancet 2008; 371:2183-91.

69 v.9/10/2012
6.2. Refugees
In Rwanda, refugee camps have been shown to be protective for women in the camps in terms of
abstinence, low levels of high-risk sex, and condom use in high-risk sex. The camps have
relatively high levels of coverage of VCT and PMTCT services. Gihembe Camp PMTCT 2007
HIV prevalence was 2.3% with an estimated population size of 18,081 (UNHCR 200761
) versus
Byumba former province, its host (9%, ANC 2007). Kiziba Camp PMTCT 2007 HIV
prevalence was 1.6% with an estimated population size of 18,130 people (UNHCR 2007) versus
former province Rubengera, its host (6.8%, ANC 2007). Nyabiheke Camp PMTCT 200762
HIV
prevalence was 2% with an estimated population size of 8,582 women (UNHCR 2007).
Recommendations:
Living in a refugee camp appears to be protective against HIV infection compared to populations
living in surrounding areas. Women in camps report lower levels of risk behaviors compared
with the surrounding population and appear to have access to education and services. Refugees
do not appear to contribute disproportionately to the HIV/AIDS epidemic in Rwanda. This group
should be used as a model to learn best practices applicable to other at-risk groups. Additional
data on the total amount of resources required to achieve the success seen in refugee populations
is necessary to ensure reproducibility of this model.
61
UNHCR Accessed November 19, 2008, from http://www.unhcr.org/statistics/STATISTICS/4852366f2.pdf 62
Not a full year of data.

70 v.9/10/2012
6.3 Commercial sex workers (CSWs)
The magnitude of the commercial sex industry in Rwanda remains uncharacterized and the size
of this population is unknown. According to PSI mobile VCT data, the HIV prevalence of
CSWs in 2007 was 19.2% and 16.4% as of July 2008. In terms of risk behavior, data from the
BSS 2006 study on CSWs showed that only 36.2% had comprehensive knowledge of HIV.
CSWs had earlier sexual debut than the general population, and 39.4% (BSS 2006) had sex
before age 15 years compared to 3.9% in the general female population aged 15 to 24 years.
Their median age at first paid sex was 19 (BSS 2006); however, the reported use of CSWs in the
last year went from 2% to 0% according to 2000 and 2005 DHS data. In terms of cofactors,
although the self-report of STIs decreased from 32.9% to 24.7% (BSS 2000 and 2006), these
figures remain higher than those seen among women in the general population. The percentage
of CSWs ever tested for HIV increased from 40.5% to 68.5% (BSS 2000 and 2006); however,
few special health and prevention services exist for this population.
Little information exists on the phenomenon of transactional sex, in which money or goods are
exchanged for sex. The phenomenon is difficult to capture because women and men who engage
in this practice may not consider the transactions to be sex work. The limited amount of data on
intergenerational sex indicates that some form of transactional sex often occurs in these couples.
According to the 2005 DHS, 4.6% of women 15 to 24 years old have had higher-risk sex in the
past 12 months with a man who was 10+ years older. Figure 15 shows higher-risk sex in the
past 12 months with a man 10+ years older happening in Rwanda as well as other GLIA
countries.
Figure 15: Age-mixing, GLIA Report
Age-mixing: Higher-risk sex in the past 12 months
with a man who was >= 10 yrs older, GLIA Report
0
1
2
3
4
5
6
7
8
Kenya Rwanda Tanzania Uganda
GLIA Country
Perc
en
t
Women 15-19 yrs.

71 v.9/10/2012
Recommendations:
There is a need to better characterize the CSW population in Rwanda. Size estimation and
mapping exercises are currently underway by PSI and Trac Plus to determine population size and
locations of CSWs. Barriers to better program interventions targeting CSWs for prevention
efforts include the illegality of sex work as well as the difficulty in capturing the phenomenon of
transactional sex and transgenerational sex outside of commercial sex work. Greater sensitization
and engagement of government authorities to assist with future surveillance activities would be
beneficial. Treatment for STIs should also be linked with prevention interventions, such as
education and condom distribution.

72 v.9/10/2012
6.4. Truckers
According to the GLIA report, the size of the truck driver population in Rwanda is small, with an
estimated 15,513 truckers. Map 13 shows truck routes and their stops through Rwanda and in
neighboring countries.
Map 13: Major Road Axes, Truck Stops, and Truck Volume, GLIA Report
VCT data from PSI‘s Mobile VCT unit may indicate that prevalence among truckers is higher
than the genral population, but no prevalence studies exist for truckers. Although VCT data
cannot be used in lieu of prevalence because of limitations related to self-selection bias, test
refusal bias, duplicate testing, variations in data quality, accessibility, and availability of
individual records,63
it is currently the only data source for truckers in Rwanda. HIV prevalence
from mobile VCT clinics were 17.4% (n=448) in 2007 and 6.9% (n=625) in July 2008. Among
truck drivers, BSS data show that risky sexual behavior between truck drivers and CSWs is
decreasing. The number of CSWs frequented by each trucker over a one-year period decreased
from 3 to 1 between 2000 and 2006; condom use at last high-risk sex was 82%, and the
systematic use of condoms was 57% (BSS 2006). There was a decrease in self-report of STI
symptoms from 10% to 5% between 2000 and 2006 (BSS 2000 and 2006). In spite of improved
risk behavior, there was a decrease in the rate of HIV knowledge between 2000 and 2006.
Additionally, 67% of truckers reported being married, creating a potential serodiscordant
situation and the risk of transmitting infection to their wives. The decrease in HIV prevalence
63
Hladik, Wolfgang a; Masupu, Kereng b; Roels, Thierry c; Plipat, Tanarak d; Kaharuza, Frank e; Bunnell, Rebecca
e; Seguy, Nicole a; Marum, Lawrence H f. Prevention of mother-to-child transmission and voluntary counseling
and testing programme data: what is their utility for HIV surveillance? AIDS. 19 Supplement 2:S19-S24, May 2005.

73 v.9/10/2012
among truckers and decrease in risk behavior provide evidence that much emphasis has been
placed on programmatic interventions for truckers including by CNLS, GLIA, Umbrella de
Conductor, FHI, and several other nongovernmental organizations (NGOs). The extent to which
truckers are also being reached by the neighboring countries of Tanzania, Uganda, Kenya,
Burundi, and DRC is unknown. Efforts to determine the reach of services from neighboring
countries should be included in future surveillance efforts.
Recommendations
There is limited trucker traffic through Rwanda. The population is mobile and proportionally
small. Although the risk behaviors appear to be decreasing, questions about discordance in
couples are important, as most truckers reported being married during the 2006 BSS. Is
improved risk behavior despite declining knowledge a result of VCT and risk reduction activity?
Current programmatic efforts should continue and identification of reasons behind the success
should be addressed in future surveillance efforts to translate best practices to other at-risk
populations, such as CSWs and fishermen. A group recommendation was that fishermen also
should be included as a highly mobile group in the next iteration of triangulation.

74 v.9/10/2012
6.5. Youth
There is a low HIV prevalence among youth in general; however, young women have a greater
prevalence than men, with 3.9% versus 1.1% in urban areas, respectively, and 1% versus 0.3% in
rural areas, respectively. In PSI‘s Kabuga Youth Friendly VCT Center, the HIV prevalence was
3.7% in 2007 and 2.1% in July 2008. Youth comprise 14.7% of PLWHA in Rwanda. Among
youth, there is low levels of and declining condom utilization (DHS 2000-2005) and knowledge
of condom procurement (DHS 2000-2005), which is lower for females than males. Youth have
high levels of stigma towards PLWHA according to responses in both DHS 2005 and BSS 2006.
There is an increasing rate of comprehensive HIV knowledge over time, with greater knowledge
among men than women, as well as an increase in HIV testing behavior over time.
Data from the 2006 BSS and the DHS 2005 are divergent on several aspects characterizing the
youth population. BSS data are presented first, followed by DHS data:
64.5% of young males had sex before age 18 (BSS 2006) vs. 34.9% of young males had
sex before age 15 (DHS 2005)
57.0% of young females had sex before age 18 (BSS 2006) vs. 25.0% of young females
had sex before age 15 (DHS 2005).
39.9% of young people reported condom use at last sex with a non-CSW (n=507), 50%
of males (n=305) and 24.5% of females (n=202) (BSS 2006).
51.2% of young people reported condom use at last sex with a CSW (n=84), 57.9% of
males (n=57) and 37.0% of females (n=27) (BSS 2006).
23.6% of young people reported ever having tested for HIV (n=6,576), 23.6% of males
(n=3,350) and 23.6% of females (n=3,226) (DHS 2005).
69.1% of young people reported knowing where to get a condom (n=5,635), 80.8% of
males (n=3,077) and 55.1% of females (n=2,558) (DHS 2005).
Additionally, in data from BSS 2006 among youth aged 15 to 24 years old, 112 (or 5.5%) of
2,053 youth reported being at least 10 years younger than their partner (14 were male and 98
female). Of the 98 females, 38 young women in these types of relationships lived in Kigali
Ville; 16 lived in East Province, 16 also lived in North Province, 15 in West Province, and 13 in
South Province.
Recommendations: Several important data gaps exist despite past focus of surveillance efforts on this population.
Knowledge of the time period between first sex and marriage is important information to obtain
as it could present the window during which young people become infected and later enter into
discordant unions. Interventions targeting youth, such as life skills training, should continue, as
should simple outreach programs, such as training peer educators and creating youth HIV/AIDS
awareness clubs. Further identification and characterization of high-risk subgroups within the
youth population would be beneficial for more specific targeting. Examples of these populations
include street youth and the formal versus informal sectors; examples of ways in which youth are
rendered more vulnerable include engaging in transactional sex and women having sex with men
who are 10+ years older (transgenerational sex). Indicators characterizing these practices should
be included in the next iteration of BSS among youth.

75 v.9/10/2012
6.6. Prisoners
The prisoner population in Rwanda is declining, with the number of prisoners over time
decreasing from 125,000 prisoners in 2004 to 56,000 prisoners in 2008. This decline is due in
part to the release of people held accountable in the genocide. Nine percent of prisoners were
released in 2004. The mobile VCT prevalence declined from 10% in 2006 to 4% in 2007; it
remains static (4%) as of July 2008. There are limited numbers of studies done with the prisoner
population.
Condoms are contraband in prisons and there is poor condom knowledge overall.64
The practice
of male-male sex is done for reasons of survival, which include food security and physical
security or to gain power. In some instances the practice is done in the absence of alternative
partners. The ability of prisoners to participate in outside work teams allows them to engage in
transactional sex or to have sex with their regular partners.65
There are a total of 14 prisons in Rwanda, and VCT is available in 10 prisons, although these
services mostly began in 2008. An estimated 10,000 prisoners were tested for HIV in 2008. The
ART programs are being scaled up to provide services in seven prisons. There is HIV peer
education in four prisons, and there is planned scale up of all AIDS clubs to all prisons.
Recommendations:
Based on the limited available data, it is unclear whether the prisoner population remains a large
at-risk group for HIV transmission in Rwanda. There is a need to better estimate HIV
prevalence, both within prisons and within neighboring communities, to answer this question.
Estimation can be done by conducting sentinel surveillance in prisons. There are concerns about
whether the planned scale up of services is adequate for this population (e.g., VCT and care and
support services). Another question is whether the vulnerability of prisoners to HIV could be
decreased through the improvement of their nutrition. In addition, the practice of men having sex
with men remains a reality in Rwandan prisons. Prisoners also are allowed to leave the prisons
for work duty, potentially risking populations surrounding prisons.66
Education about HIV
linked with condom distribution could benefit this population. The no-condoms policy in prisons
should be debated at the national level along with sensitization of authorities to men having sex
with men in prisons, as this is a factor in transmission.
64
PSI. Learning from Prisoners. Understanding risk to prevent HIV infection among prisoners and the wider
community. 65
Ibid. 66
Ibid.

76 v.9/10/2012
7. DATA GAPS
Although this initial triangulation exercise catalogued a vast amount of recent data that may be
applied to other issues in the HIV epidemic in Rwanda, gaps in available data also were
identified as follows:
Surveillance Data:
Measures of incidence: Data that are lacking include direct measures of HIV incidence,
such as those using BED assays.
Measures of HIV prevalence linked with behaviors placing people at risk for acquiring
HIV: Detailed information regarding multiple concurrent partnerships, age gaps between
sex partners, and analyses of the risk factors for HIV infection and their attributable
fractions in the epidemic.
Indicator discrepancies: There was great variability in indicators between reports in terms
of how questions were worded. One example was the percentage of people who had 2+
partners in the pasts four weeks, as asked in the PLACE study but not in the DHS or the
BSS. Instead, the DHS asked the number of multiple partners over the past 12 months.
This made the data difficult to compare and thus interpret. This particular indicator,
percentage of people who had 2+ partners in the pasts four weeks, is a strong indication of
multiple concurrent partnerships. Another important indicator and example of
discrepancy was people who had sex before age 18. This indicator was included in the
DHS but was listed as median age at first sex in the PLACE study.
The inability to look at the raw DHS data: It would have been useful to stratify some of
the results by urban/rural and by former province; the association between HIV
prevalence and higher levels of wealth and education by sex and province; demographic
characteristics of people who had multiple partnerships.
Information to describe the increase in prevalence from 2005 to 2007 in various ANC
sites: Data that are lacking include evidence of a demographic shift, decentralization
spurring the increase, or number of ANC clients on ART to make stronger conclusions.
Behavioral surveillance surveys: Surveys among seasonal workers in the agricultural
fields and commercial centers would help reveal the situation in Ruhango, South
Province, as well as West Province along the DRC border, and whether areas of high
economic activity foster sexual networks that lead to higher rates of HIV transmission.
Programmatic Data:
The cause of rising urban HIV prevalence: The increase could be the result of greater
coverage of ART in urban centers. Currently, available data do not allow us to prove or
disprove this hypothesis.
The cause of rising prevalence at ANC sites: Site specific initiation of ART would be
helpful to possibly understand this phenomenon.
The extent to which differences in service coverage are due to the distribution of service
provision should be investigated.
Unresolved issues: Identifying key indicators to measure and track the success of
prevention efforts and program coverage.
77 v.9/10/2012
Prevention interventions: A comprehensive catalog of interventions would have been
useful, including condom distribution and use; Prevention with Positives programs; the
intersection of family planning with PMTCT, VCT, or ART programs; and integration of
STI treatment with HIV services. Information of any of these programs at a national or
even regional level including program coverage and reach would have permitted a more
comprehensive response for triangulation Question #2.
Special Populations:
Refugees
Data on HIV prevention activities in refugee settings: This information could be compiled
to illustrate successful interventions that may be transferrable to the wider population.
Commercial Sex Workers
BSS+: Surveys could be conducted among CSWs beginning with formative research to
understand the community and sensitize authorities.
Transactional sex: Investigate this type of relationship to include appropriate questions in
BSS.
Mobile trade groups
Truck drivers: Conduct BSS+ among truckers and include questions regarding
serodiscordance among couples.
Fishermen: Conduct BSS+ among fisherman and other mobile groups such as seasonal
workers.
Youth
Time from first sex to marriage: Include questions regarding this time period.
Vulnerability: Define subcategories of youth at risk and identify which subpopulations of
youth are most vulnerable and in which ways they are vulnerable.
Female youth: The importance of young girls as a risk group should be captured in a more
specific study, especially in terms of transactional and transgenerational sex.
Students: It would be useful to conduct behavioral surveillance surveys among students
attending university in Butare, South Province to understand elevated risk behaviors in
that area.
Prisoners
Conduct sentinel surveillance in prisons.
Special Studies:
Urbanization and HIV: There are few published studies about the affects of urbanization
on the spread of HIV. This would be an informative study to conduct in Rwanda.

78 v.9/10/2012
8. CONCLUSION AND NEXT STEPS
Secondary analysis and synthesis of existing data on the HIV epidemic in Rwanda point to
several different facets about HIV throughout the country that vary by province, region, and
population. These include 1) HIV is a mature epidemic that may predict future trends in other
African nations; 2) urbanization and economic development are accompanied by sexual risk; and
3) large numbers of serodiscordant couples face higher risk and could be driving the epidemic
despite low rates of multiple partnerships. Additionally, the urban/rural analysis provided useful
insights into the structure of the epidemic, especially when Kigali is separated from other-urban
and rural areas.
Triangulation of data from Rwanda provides a glimpse for the potential direction of HIV
epidemics in sub-Saharan Africa. Rwanda has a relatively mature epidemic in a compact and
densely populated geography compared to other nations in east and southern Africa. The
epidemic moved through high risk populations such as truck drivers and prisoners, and spread to
the general population before stabilizing near current levels. The maturing of the epidemic is
manifesting as older age groups are affected. Even with Rwanda‘s ―protective‖ behaviors as
compared to other GLIA countries, there is a high rate serodiscordancy and presumably higher
HIV transmission within marriage.
In addition, Rwanda may be ahead of other countries in a pattern that may prevail in a "post-
ART roll-out" era. HIV testing has scaled up rapidly and now has relatively high-level reach and
coverage, but with men increasingly lagging behind women due to ANC contact. Coverage for
ART treatment also has been scaled up relatively quickly with current high reach and coverage.
The impact of treatment on HIV prevalence (due to prolonged survival) and HIV incidence (due
to balances in changes in risk behavior and transmissibility by viral load suppression) are likely
to be felt and observed in Rwanda before other countries. These trends are exacerbated and
accelerated in Rwanda by a high rate of urbanization following a gradient of low rates of rural to
high rates of urban HIV prevalence––a trend that also is echoed in other countries of the region,
but not to the same exceptional degree. As Rwanda has an overall low HIV prevalence and has
reached ART treatment goals for the time being, prevention efforts will be the most effective
strategy to control the epidemic. Discussions on how to scale up prevention efforts with a
centralized mechanism for tracking information should be conducted at a national level.
These factors, therefore, combine to paint a new picture of the epidemiology of HIV in sub-
Saharan Africa in the future of high rates of access to testing, high levels of ART coverage,
rising urbanization, rising HIV prevalence under treatment, rising HIV prevalence in marriage,
and a rising age of infection. Lessons may be learned in Rwanda for HIV prevention (e.g., the
potential impact of increased circumcision, increased ART coverage, increased Prevention with
Positives, increased couples counseling, increased male HIV testing) that could be applied more
widely and at earlier stages in other countries to good effect.
The workshop participants recommend local continuation of the triangulation approach to
address the remaining prioritized questions previously identified by the stakeholders and task
force. The methods used to address this first triangulation question are likely to be applicable to
most of the remaining questions initially identified by the stakeholders.

79
9. LIST OF APPENDICES
Appendix Title Page
1 Triangulation task force participants 80
2 List of initial important questions 81
3 List of studies used for triangulation 83
4 Summary tables of reports and studies 123
5 Data quality matrix 204
6 Data abstraction nationally and provincially 205
7 Map of former provinces in relation to new provinces 233
8 Triangulation workshop participants 234
9 Workshop agenda 235
10 HIV prevalence among ANC attendees, ages 15 to 24 years,
consistent sites only 239
11 ANC data, all sites (2002, 2003, 2005) 240
12 Initiation of PMTCT, by ANC site 241
13 Prevalence maps of neighboring countries 254
14 ―Reassuring‖ and ―concerning‖ indicators by former province 256
15 Rwanda maps showing key indicators by former province 264
16 ART program data 269
17 PMTCT program data 270
18 VCT program data 271

80
Appendix 1: Triangulation task force participants
Triangulation Technical Working Group
NAME ORGANIZATION EMAIL ADRESS
Pr KRAMER Michael TRAC plus [email protected]
Dr ASIIMWE Anita TRAC plus [email protected]
GACHUHI Noni USAID [email protected]
KAMWESIGYE Justus USAID [email protected]
Dr KAYIRANGWA Eugenie CDC [email protected]
Dr NDAGIJE Félix CDC [email protected]
MUNYANA Elvanie TRAC plus [email protected]
Dr NDAMAGE François TRAC plus [email protected]
KABEJA Adeline TRAC plus [email protected]
KAYITESI Catherine TRAC plus [email protected]
RUTON Hinda TRAC plus [email protected]
Dr NKUSI Emilien MINISANTE [email protected]
PEGURRI Elisabetta UNAIDS [email protected]
Dr Jessica PRICE FHI [email protected]
Dr Janine Condo School of Public health [email protected]
Gatarayiha J Philip INS [email protected]
Gakunzi Sebaziga CNLS [email protected]
NYIRANSABIMANA M. Claire PSI [email protected]
Dr NYIRAMASARABWE Laurence OMS [email protected]
Dr SOBELA François OMS [email protected]
Triangulation Sub-Working Group
Name Organization Email Address
Adeline Kabeja TRAC plus [email protected]
Ruton Hinda TRAC plus [email protected]
Dr. Eugenie Kayirangwa CDC-Rwanda [email protected]
Dr. Francois Ndamage TRAC plus [email protected]
Lily Asrat UCSF [email protected]
Dr. Stephanie Tache UCSF [email protected]
Irene Iuppa UCSF [email protected]
Other Resource Persons: UCSF/CDC: Roger Myrick; UCSF: Nate Smith, Hilary Spindler,
Karen White, Dominic Montagu, George Rutherford, Willie McFarland, Gail Kennedy

81
Appendix 2: List of initial important questions
On 21
st November 2007, a task force (TF) meeting (the second) was held with the following agenda:
Refining and grouping questions
Questions would be ranked as very important/high priority, important and interesting.
very important/high priority
1. What is the proportion of the population knowing their sero-status? [… in Rwanda/for
Rwanda applies for all subsequent questions]
- relationship to risk behavior (see below)
i. What is the relationship between VCT and adoption of less risky behavior, both for HIV
positive and HIV negative?
- the role of VCT in prevention
- the number of persons knowing their sero status and how it relates to prevention behavior
(see above)
- dynamic between frequenting VCT and behavior
2. Why is the HIV prevalence increasing in rural areas but decreasing in urban areas?
- mapping of prevalence
i. What are the reasons for the discrepancy of prevalence between men and women?
- Which factors are associated with differences in HIV prevalence?
- What are the reasons for the sex difference in prevalence between young (high for girls) and
adult (high for men) persons?
ii. What are the reasons/causes for the feminization of the HIV epidemic?
iii. (What is the exact and) How can the relationship between the prevalence and socio
economic status be explained?
iv. Why are married women at a higher risk than unmarried women?
- subgroup: prostitutes who are married
v. What is the contribution of Rwandan ―cultural aspects‖ on infection rates?
- gender-related aspects
- cultural habits
vi. - Which are the high-risk groups for HIV?
- High-risk settings: alcohol, coercion, secret affairs, prisons, discordant couples, trans-
generational sex, child abuse, prostitution and transactional sex
- Which age-groups are most affected?
vii. Routes of transmission (IVDU, MSM, others?)
viii. What is the role of homosexuality on HIV transmission?
- What is the prevalence?
- Prisons / general population / urban vs. rural
3. Is there really a disproportionate lower number of men seeking care and treatment
compared to woman? If yes, why?
- marker: difference in CD4 counts at start?
4. What is the impact of programs on HIV incidence?
- Is BCC, VCT, PMTCT … working?
i. Did communication program targets includes high risk group
ii. Are programs distributed according to prevalence?
iii. What is the impact/role of PMTCT in prevention of HIV?
iv. What is the relationship between care and treatment (availability of ARV) and adoption of
less risky behavior, both for HIV positive and HIV negative?
- What is the effect of the ARV treatment program on prevention?

82
v. Why is there a high rate of unwanted pregnancies among HIV positive women?
- How many cases can/could be prevented by including family planning in PMTCT?
- What are the reasons for repeated unwanted pregnancies among mothers presenting for
PMTCT services?
Important
5. What is the age of first sexual intercourse for females and males?
6. What are the reasons for low condom use?
- (perceived) poor quality of condoms?
- (perceived) changes in pleasure?
- What rates of condom use in different settings
- impact of condom distribution on risk behavior
- difference between brands?
7. What is the relation between the condom sales and HIV (STI) prevalence?
8. What is the impact of STI prevalence on HIV prevalence and prevention?
- impact of ―neglecting STIs‖
- impact of ABC
9. What impact might circumcision have?
- replacement behavior?
10. What is the impact of the other pillars (other than HIV testing and provision of ARVs for
prevention) of PMTCT

83
Appendix 3: List of studies used for triangulation
List of documents, reports, studies, policies concerning HIV/AIDS in Rwanda (1998-2006)
Document Title Language Organization
Program
Area Data Type Comments
1
Rwanda Enquête
Démographique et de Santé 2000
Rapport de synthèse French TRAC Surveillance Report
2
Rwanda Demographic and
Health Survey 2000 Key
Findings English TRAC Surveillance Report
3
Rwanda Demographic and
Health Survey 2005 English TRAC Surveillance Report
4
HIV Sentinel Surveillance
among Pregnant Women
Attending Antenatal Clinics
(2002 ANC Report) English TRAC Surveillance Report
5
Surveillance de L'infection a
VIH par Sites Sentinelles Chez
les Femmes Enceintes
Frequentant les Services de
Consultation Prenatale (2003
ANC Report) French TRAC Surveillance Report
6
HIV Surveillance among
Pregnant Women Receiving
Antenatal Care. Sentinel Sites in
Rwanda English TRAC Surveillance
Power
Point
7
Surveillance de L'infection a
VIH par Sites Sentinelles chez
les Femmes Enceintes
Frequentant Les Services de
Consultation Prenatale (2005 French TRAC Surveillance Report

84
List of documents, reports, studies, policies concerning HIV/AIDS in Rwanda (1998-2006)
Document Title Language Organization
Program
Area Data Type Comments
ANC Report)
8
Surveillance de L'infection a
VIH par Sites Sentinelles chez
les Femmes Enceintes
Fréquentant Les Services de
Consultation Prénatale (2007) French TRAC Surveillance
Preliminar
y Analysis
TRAC Plus has preliminary
analysis of ANC 2007 data. No
report or finalized analysis is yet
available.
9
Enquete de Surveillance des
Comportements Relatif au
VIH/SIDA (BSS) aupres des
Jeunes, des Professionnelles de
Sexe et des Transporteurs
Routiers au Rwanda (2000 &
2006): Rapport d'Enquete French TRAC Surveillance Report
10 Rapport Annuel du Trac 2005 French TRAC
Program
Data Report
11 Rapport Annuel du Trac 2006 French TRAC
Program
Data Report
12 Rapport Annuel du Trac 2007 French TRAC
Program
Data Report
13
Evolution des Comportements
Sexuels des Camionneurs au
Rwanda entre 2000 et 2006:
Implication pour les Programmes
de Prevention French TRAC Surveillance
Power
Point
14
Changes of Sexual Behaviours of
Sex Workers (Sws) in Rwanda English TRAC Surveillance
Power
Point

85
List of documents, reports, studies, policies concerning HIV/AIDS in Rwanda (1998-2006)
Document Title Language Organization
Program
Area Data Type Comments
between 2000-2006: Implication
for Prevention Programs
15
Evolution des Comportements
Sexuels des Jeunes de 15 a 19
Ans au Rwanda entre 2000 et
2006 French TRAC Surveillance
Power
Point
16
Surveillance Epidemiologique &
Lutte Contre la Maladie au
Rwanda: guide technique au
niveau du district French TRAC Surveillance Guide
17 About TRAC English TRAC Report
18
Enquête Démographique et de
Santé 2005: Prévalence du VIH French TRAC Report
19
Guide d'utilisation des
Medicaments Antiretroviraux
chez l'adulte et l'enfant French TRAC Guide
20
Manuel du Conseiller en Conseil
et Depistage Volontaire du
VIH/SIDA 2002 French TRAC Guide
21
Directives pour l'administration
des anti-retroviraux chez les
femmes enceintes French TRAC
Memorand
um
(Letter)
22
Protocol HIV Sentinel
Surveillance among Women
Receiving Antenatal Care in
Rwanda 2002 French TRAC Protocol
23
Policy Statement on TB/HIV
Collaborative Activities English TRAC Report

86
List of documents, reports, studies, policies concerning HIV/AIDS in Rwanda (1998-2006)
Document Title Language Organization
Program
Area Data Type Comments
24
Guide National pour le Soutien
et la Prise en Charge Alimentaire
et Nutritionnelle Pour les
Personnes Vivant avec le
VIH/SIDA au Rwanda French TRAC Guide
25 Rapport ARV au 31 janvier 2005 French TRAC Report
26 TRAC Realisations 2006 French TRAC Report
27
Etude sur les Priorités Locales
pour les Efforts de Lutte Contre
le SIDA (PLACE) French CNLS Report
28
PLACE Assessment leads to
Better Understanding of
Transmission English CNLS
Power
Point
29
Monitoring and Evaluation of
HIV and AIDS Activities in the
Public Sector English CNLS
Power
Point
30
CADRE STRATEGIQUE
National de Lutte Contre le
SIDA-CNLS French CNLS Plan
31
Impact of HIV/AIDS on the
Gross domestic Product in
Rwanda (2007) English CNLS Report
33
Rapport annuel des activités de
la CNLS 2003 French CNLS Report
34
Rapport de la Deuxieme
Conference Annuelle d‘echange
et de Recherche Sur le VIH et le
Sida French CNLS Report

87
List of documents, reports, studies, policies concerning HIV/AIDS in Rwanda (1998-2006)
Document Title Language Organization
Program
Area Data Type Comments
35
Rapport de la 3ème Conference
Nationale d‘echange et de
Recherche Sur le VIH et le SIDA French CNLS Report
36
Rapport de la 2eme conference
pediatrique French CNLS Report
37
Rapport annuel 2004 CNLS -
global fund mars 2005 French CNLS Report
38
Rapport annuel des activités de
lutte contre le VIH au Rwanda
2005 French CNLS Report
39
Rapport annuel des activités de
la CNLS 2006 French Report
40 Rapport CNLS 2007 French CNLS Report
41
Impact of HIV/AIDS on the
Gross Domestic Product in
Rwanda English Report
42
Formulaire de demande
d‘approbation des projets de
recherche dans le domaine du
VIH/SIDA French CNLS
Applicatio
n/demande
43
Risk and Protection: Youth and
HIV/AIDS in Sub-Saharan
Africa English CNLS Report
44
Plan National de Prevention du
VIH/SIDA French CNLS Plan
45
Socio-Demographic Impact of
AIDS English CNLS Workbook
46
Impact of HIV/AIDS on the
Gross Domestic Product in English CNLS Report

88
List of documents, reports, studies, policies concerning HIV/AIDS in Rwanda (1998-2006)
Document Title Language Organization
Program
Area Data Type Comments
Rwanda
47
Plan Strategique National de
Lutte Contre le VIH/SIDA 2005-
2009 French CNLS Plan
48
Rwanda: Follow-Up to the
Declaration Of Commitment On
HIV/AIDS (UNGASS) English CNLS Report
49
Terms of Reference for the
Preparation of the World Aids
Day in the Fight Against Aids–
2007 English CNLS Guide
50
Rapport des Activites de la
Campagne de la Journee
Mondiale de Lutte contre le Sida
au Rwanda en 2006 French CNLS Report
51
Rapport Annuel 2004: National
Aids Control Commission
Global Fund Projects
Management Unit French CNLS Report
52
Cadre strategique de lutte contre
VIH&SIDA 2002-2006 French CNLS Report
53
Plan National de Suivi et
d‘evaluation pour les
Programmes du VIH/SIDA
(2002-2006) French CNLS Report
54
Cadre Stratégique National du
Rwanda en Communication pour
le Changement de
Comportements en matière du French CNLS Report

89
List of documents, reports, studies, policies concerning HIV/AIDS in Rwanda (1998-2006)
Document Title Language Organization
Program
Area Data Type Comments
VIH/SIDA/IST 2005-2009
55
Politique Nationale de Lutte
Contre le VIH/SIDA French CNLS Report
56
Plan National de Prevention du
VIH/SIDA 2005-2009 French CNLS Report
57
Report of the Joint Mid-Term
Review of the Multisectoral
National Plan of HIV/AIDS
Response 2002-2006 English CNLS Report
58
VIH et SIDA au Rwanda:
Documentation sur les
réalisations dans le cadre de la
réponse au VIH 2003–2007:
Réforme et Appui de l‘ONU à la
Réponse nationale au SIDA au
Rwanda French CNLS Report
59
Strategic Framework For
HIV/AIDS Control 2002-2006
Summary English CNLS Report
60
VIH et SIDA au Rwanda
Documentation sur les
réalisations dans le cadre de la
réponse au VIH 2003 – 2007 :
De la prise en charge du
VIH/SIDA en milieu rural, au
plan national de prise en charge
globale en milieu rural French CNLS Report

90
List of documents, reports, studies, policies concerning HIV/AIDS in Rwanda (1998-2006)
Document Title Language Organization
Program
Area Data Type Comments
61
VIH et SIDA au Rwanda
Documentation sur les
réalisations dans le cadre de la
Réponse au VIH 2003-2007:
Modèle et cadre conceptuels
pour un programme
multisectoriel de lutte contre le French CNLS Report
62
Etude sur l‘intégration du Genre
dans les programmes de lutte
contre le SIDA French CNLS Report
63
ROADS: Rapport de la visite
d‘évaluation Formative de base
à RUSIZI French FHI
Power
Point
64
ROADS: Rapport de la visite
d‘évaluation Formative de base
à Gikondo et Gatsata French FHI
Power
Point
65 ROADS: Rapport de la visite
d‘évaluation Formative de base
à Gatuna
French FHI
Power
Point
66 French FHI Report
67
Enquête de Surveillance des
Comportements (BSS) French FHI Report
68
Auprès des Routiers RWANDA
2000 French FHI Report
70
Task Shifting to Achieve
Universal Access to HIV Care:
Evaluation of a Pilot Program of
Antiretroviral Treatment Service
Delivery by Nurses in Rwanda English FHI Abstract
Have sent list to Jessica Price of
abstracts we are interested in for
which we would like full
reports/papers (6/19/08).
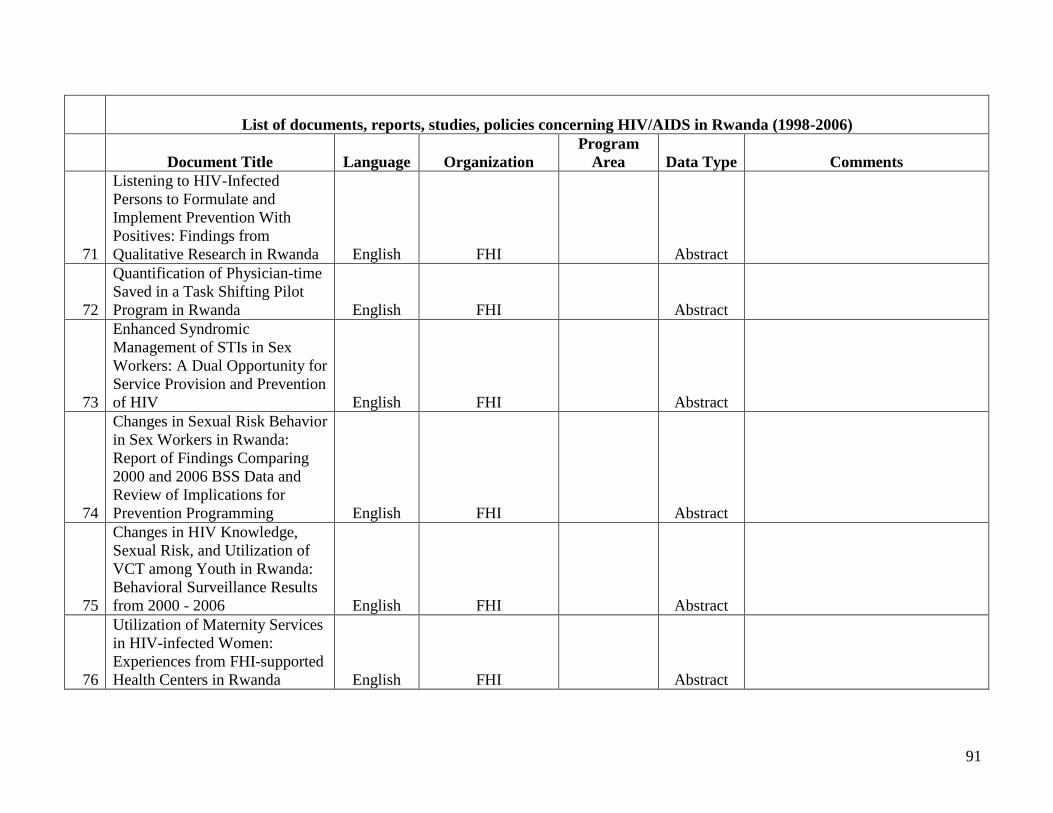
91
List of documents, reports, studies, policies concerning HIV/AIDS in Rwanda (1998-2006)
Document Title Language Organization
Program
Area Data Type Comments
71
Listening to HIV-Infected
Persons to Formulate and
Implement Prevention With
Positives: Findings from
Qualitative Research in Rwanda English FHI Abstract
72
Quantification of Physician-time
Saved in a Task Shifting Pilot
Program in Rwanda English FHI Abstract
73
Enhanced Syndromic
Management of STIs in Sex
Workers: A Dual Opportunity for
Service Provision and Prevention
of HIV English FHI Abstract
74
Changes in Sexual Risk Behavior
in Sex Workers in Rwanda:
Report of Findings Comparing
2000 and 2006 BSS Data and
Review of Implications for
Prevention Programming English FHI Abstract
75
Changes in HIV Knowledge,
Sexual Risk, and Utilization of
VCT among Youth in Rwanda:
Behavioral Surveillance Results
from 2000 - 2006 English FHI Abstract
76
Utilization of Maternity Services
in HIV-infected Women:
Experiences from FHI-supported
Health Centers in Rwanda English FHI Abstract

92
List of documents, reports, studies, policies concerning HIV/AIDS in Rwanda (1998-2006)
Document Title Language Organization
Program
Area Data Type Comments
77
Viral Load Testing Before
Advancing to 2nd
Line or Salvage
ART Regimens: Observations in
75 Rwandan Patients
Experiencing Clinical and/or
Immunological Failure English FHI Abstract
78
Observations on 406 Adverse
Effects Necessitating Drug
Changes in 1st line ARV
Regimen in Patients from Two
Health Facilities in Rwanda and
Recommendations for Patient
Care English FHI Abstract
79
Causes of Mortality in 309 /
5,115 Patients on ARVs in
Rwanda: Recommendations for
Improving HIV Patient Care English FHI Abstract
80
Pregnancy Pregnancy Desires,
and Contraceptive Use among
HIV infected women English FHI
Power
point
Problématique du suivi des
mères et enfants enrôlés dans le
programme de PTME: cas des
sites offrant le régime associant
différents ARV French FHI Poster
81
Enrolling HIV-Infected Children
in AIDS Care and Treatment:
Progress, Gaps, and Needs for
Improving the Process English FHI Poster

93
List of documents, reports, studies, policies concerning HIV/AIDS in Rwanda (1998-2006)
Document Title Language Organization
Program
Area Data Type Comments
82
Contraception – an effective and
underutilized approach to
preventing HIV sequelae English FHI
Power
point
84
Final Adverse Effects
Necessitating Drug Changes in
2st line English FHI
Power
point
85
Effect of VCT on Sexual Risk
Behavior, A 2003-2004 study
among VCT clients in Rwanda English FHI
Power
point
86
Rwanda: Together, Let‘s Invest
in Nutrition to Reduce Poverty English Minisante
Power
Point
87
Définir les Voies pour la
Prévention du VIH/SIDA au
Rwanda : leçons Apprises sur les
Aspects Comportementaux Une
revue de la littérature dans la
période post-génocide 1994-2000 French Minisante Report
88
Rapport annuel MINISANTE
2003 French Minisante Report
89
Rapport Annuel MINISANTE
2004 French Minisante Report
90
Rapport Annuel MINISANTE
2004 French Minisante Report
91
Rapport Annuel MINISANTE
2005 French Minisante Report
92
Ministry Health Annual Report
2005 English Minisante Report
93 Rapport Annuel MINISANTE French Minisante Report

94
List of documents, reports, studies, policies concerning HIV/AIDS in Rwanda (1998-2006)
Document Title Language Organization
Program
Area Data Type Comments
2006
94
Health Sector Cluster Group:
Technical Working Group
Geographic and Thematic
Mapping of Interventions in the
Health Sector English Minisante Report
95
Politique Nationale de Santé
Communautaire French Minisante Report
96
Ministry Of Health: Human
Resources For Health Policy English Minisante Report
97
National Policy for Quality of
Healthcare in Rwanda English Minisante Report
98
Human Resources For Health
Strategic Plan 2006-2010 English Minisante Report
99
Human Resources For Health
Strategic Plan 2006-2010 English Minisante Report
100
Rwanda National Health
Accounts 2002 English Minisante Report
101
Rwanda National Health
Accounts 2003 (April) English Minisante Report
102
Rwanda National Health
Accounts 2003 (January) English Minisante Report
103
Strategie Nationale de
Communication pour le
Changement de Comportement
dans le Domaine de la Sante
2003-2007 French Minisante Report
104
Politique Nationale de Santé
Communautaire French Minisante Report

95
List of documents, reports, studies, policies concerning HIV/AIDS in Rwanda (1998-2006)
Document Title Language Organization
Program
Area Data Type Comments
105 Politique Nationale de Nutrition French Minisante Report
106
1998 Rwanda Sexual Behavior
and Condom Use Survey English PSI Report
107
Projet de Sante de Reproduction
des Adolescents de Butare au
Rwanda : Rapport Comparatif
des Phases 1,2,3 Dans la
Population des Jeunes de Butare French PSI Report
108
Evaluation du Programme de
Prevention du VIH/SIDA/Projet
Militaire au Rwanda French PSI Report
110
Knowledge, Attitudes, and
Practices (KAP) in Rwanda
Refugee Camps: A Study on
HIV/AIDS, STDs, and Gender-
Based Violence English PSI Report
111
Le profil des consommateurs de
condoms au Rwanda en 1998:
rapport d‘enquette French PSI Report
112
Etude de distribution des
préservatifs au Rwanda French PSI Report
113
Projet de Sante de Reproduction
des Adolescents au Rwanda :
Rapport Comparatif dans les
Menages de Butare 2000 – 2002 French PSI Report
114
Sante Reproductive des Jeunes
au Rwanda: Quelques Resultats a
la Lumiere des Donnees Eds
2000 (EDS Rwanda 2000 IInd French PSI Report

96
List of documents, reports, studies, policies concerning HIV/AIDS in Rwanda (1998-2006)
Document Title Language Organization
Program
Area Data Type Comments
Analysis)
115
Learning from Prisoners.
Understanding risk to prevent
HIV infection among prisoners
and the wider community English PSI Report
116
Projet de Sante de Reproduction
des Adolescents au Rwanda :
Rapport de L‘etude Quantitative
a MiParcours (Phase 2) dans la
Population des Eleves et
Etudiants de Butare et Gitarama French PSI Report
117
Sommaire (document title
unknown) French PSI Report
118
Enquete sur la sante reproductive
des etudiants au Rwanda (Butare
et Gitarama), 2000 French PSI Report
119
Explaining Discrepancies in
Reproductive Health Indicators
from Population-Based Surveys
and Exit Surveys: A Case Study
of Rwanda** English PSI
120
Patterns of sexual behavior and
condom use among high school
and university students in Butare
and Gitarama province, Rwanda English PSI
121
The Reach and Impact of the PSI
Adolescent Reproductive Health
Program in Butare Province, English PSI

97
List of documents, reports, studies, policies concerning HIV/AIDS in Rwanda (1998-2006)
Document Title Language Organization
Program
Area Data Type Comments
Rwanda
122
Making the Transition from
Good Girl to Good Wife: Young
Women and Sex Workers‘
Narratives on Social Life,
Sexuality and Risk: Byumba,
Rwanda (Qualitative) English PSI
123
ENQUÊTE NATIONALE SUR
LA DISPONIBILITÉ ET
L‘ACCESSIBILITÉ DU
CONDOM MASCULIN AU
RWANDA French PSI
124
Rwanda (2002): Enquête TRaC
sur l‘Utilisation du Préservatif
par les Jeunes Sexuellement
Actifs (15 à 24 Ans) dans la
Province de Butare French PSI
125
Déterminants de l‘utilisation du
condom par les jeunes de 15-29
ans fréquentant les bars et boîtes
de nuit au Rwanda French PSI
126
Enquête TRaC sur l‘Utilisation
du Préservatif par les Jeunes
Sexuellement Actifs (15 à 24
Ans) dans la Province de
Butare_2002.pdf French PSI
127 Resultats du VCT Militaires French PSI

98
List of documents, reports, studies, policies concerning HIV/AIDS in Rwanda (1998-2006)
Document Title Language Organization
Program
Area Data Type Comments
128
Voluntary Counseling and
Testing for HIV Among
Pregnant Women Presenting in
Labor in Kigali, Rwanda English
University of
Alabama
Published
paper Pub Med
129
The Relationship Between
Alcohol Consumption and
Unprotected Sex Among Known
HIV discordant Couples in
Rwanda and Zambia English Emory University
Published
paper Pub Med
130
The private sector and
HIV/AIDS in Africa: taking of 6
years of applied research English Boston University
Published
paper Pub Med
131
Sexual practices of HIV
discordant and concordant
couples in Rwanda effects of a
testing and counseling
programme for men English
University of
Alabama
Published
paper Pub Med
132
Rapid deployment of electronic
medical records for ARV rollout
in rural Rwanda English Partners in Health
Published
paper Pub Med
133
Prevalence of HIV infection in
confl ict-aff ected and displaced
people in seven sub-Saharan
African countries: a systematic
review English UNHCR
Published
paper Pub Med
134
Enquete de surveillance
comportemental chez les refugies
et la population (2004) French GLIA/UNHCR

99
List of documents, reports, studies, policies concerning HIV/AIDS in Rwanda (1998-2006)
Document Title Language Organization
Program
Area Data Type Comments
135
Preparing for microbicide trials
in Rwanda: Focus group
discussions with Rwandan
women and men English
University of
Amsterdam
Published
paper Pub Med
136
Predictors of HIV Serostatus
among HIV Discordant Couples
in Lusaka, Zambia and Female
Antenatal Clinic Attendants in
Kigali, Rwanda English
University of
Alabama
Published
paper Pub Med
137
Knowledge, Attitudes, and
Practice about AIDS and condom
utilisation Among Health Care
Workers in Rwanda English Sibylle Rahlenbeck
Published
paper Pub Med
138
HIV/AIDS information and
services: The situation
experienced by adolescents with
disabilities in Rwanda and
Uganda English
University College
London
Published
paper Pub Med
139
HIV INFECTION, MALARIA,
AND PREGNANCY: A
PROSPECTIVE COHORT
STUDY IN KIGALI, RWANDA English
Universite´ Victor
Segalen, Bordeaux
Published
paper Pub Med
140
The earliest cases of human HIV
type 1 group M in Congo-
Kinshasa, Rwanda, and Burundi
and the origin of Acquired
Immune Deficiciency Syndrome English
Daniel
Vangroenweghe
Published
paper Pub Med
141
Current trends in Rwanda‘s
HIV/AIDS epidemic English TRAC
Published
paper Pub Med

100
List of documents, reports, studies, policies concerning HIV/AIDS in Rwanda (1998-2006)
Document Title Language Organization
Program
Area Data Type Comments
142
Refugee health in the tropics
(joint meeting with International
Health English TRAC
Published
paper Pub Med
143
Exchange), the challenge of
sexually transmitted infections
control for HIV prevention in
refugee settings: Rwandan
Refugees in Tanzania English
London School of
Hygiene and
Tropical Medicine
Published
paper Pub Med
144
Access to adequate nutrition is a
major potential
obstacle to antiretroviral
adherence among
HIV-infected individuals in
Rwand English Emory University Found on CNLS digital library
145
Utilization of Maternity Services
by HIV-infected Women in FHI-
supported Health Centers in
Rwanda Found on CNLS digital library
146
Safety and immunogenicity of
the VRC recombinant multiclade
HIV-1 adenoviral vector vaccine
alone or in combination with the
VRC multiclade HIV-1 DNA
plasmid vaccine in healthy
African adults Found on CNLS digital library
147
Contraception – an effective and
underutilized approach to
preventing HIV sequelae Found on CNLS digital library

101
List of documents, reports, studies, policies concerning HIV/AIDS in Rwanda (1998-2006)
Document Title Language Organization
Program
Area Data Type Comments
148
IMPLEMENTING HIV/AIDS
TREATMENT AND CARE
PROJECT AMONG MOBILE
POPULATIONS – THE RDF
CONTEXT Found on CNLS digital library
149
Assessment of nutritional
support provided by faith-based
organizations to people affected
by HIV and AIDS Found on CNLS digital library
150
Differencies and similarities in
lipid levels in Rwandan and
United States women with and
without HIV infection Found on CNLS digital library
151
Mobile VCT: an Evaluation of
Innovative HIV-testing
approaches Found on CNLS digital library
152
Expanding HIV care and
treatment to Rwandan prisons: a
Collaborative Approach Found on CNLS digital library
153
Involving men in prevention of
mother-to-child transmission of
HIV programs in Rwanda Found on CNLS digital library
154
Changes in HIV knowledge,
sexual risk, and utilization of
VCT among youth in Rwanda:
behavioral surveillance results
from 2000 – 2006 Found on CNLS digital library
155
ART delivery and adherence in a
program for comprehensive Found on CNLS digital library
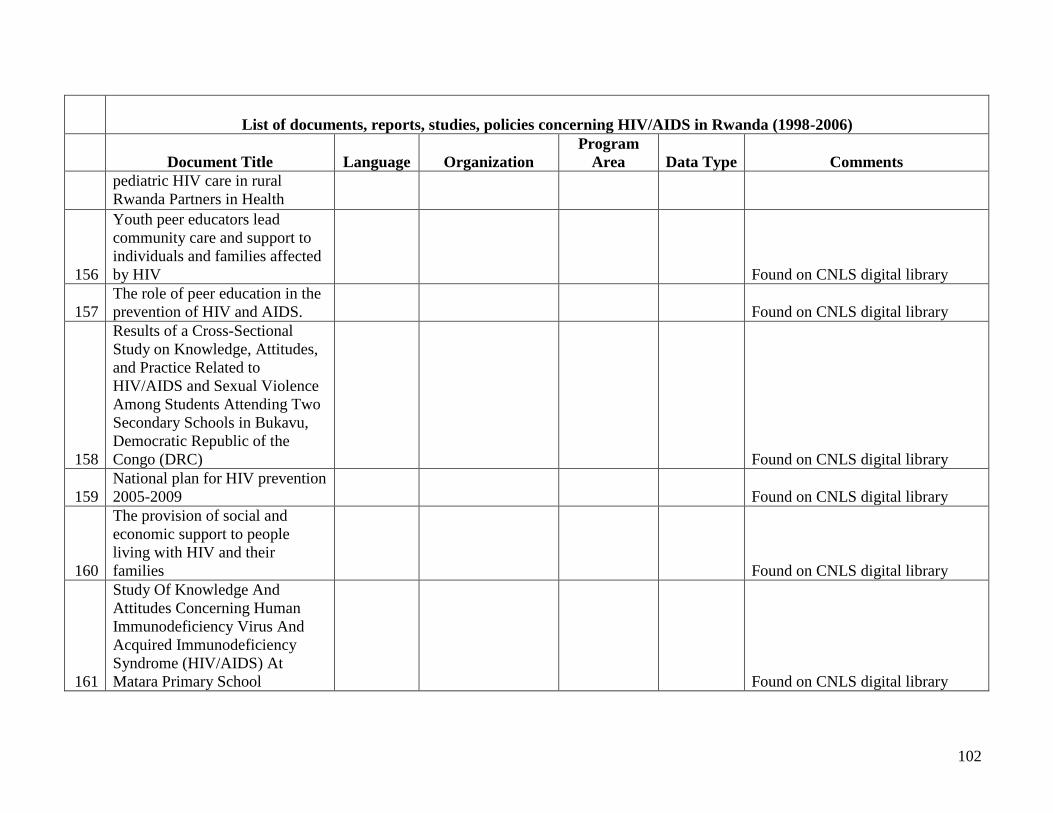
102
List of documents, reports, studies, policies concerning HIV/AIDS in Rwanda (1998-2006)
Document Title Language Organization
Program
Area Data Type Comments
pediatric HIV care in rural
Rwanda Partners in Health
156
Youth peer educators lead
community care and support to
individuals and families affected
by HIV Found on CNLS digital library
157
The role of peer education in the
prevention of HIV and AIDS. Found on CNLS digital library
158
Results of a Cross-Sectional
Study on Knowledge, Attitudes,
and Practice Related to
HIV/AIDS and Sexual Violence
Among Students Attending Two
Secondary Schools in Bukavu,
Democratic Republic of the
Congo (DRC) Found on CNLS digital library
159
National plan for HIV prevention
2005-2009 Found on CNLS digital library
160
The provision of social and
economic support to people
living with HIV and their
families Found on CNLS digital library
161
Study Of Knowledge And
Attitudes Concerning Human
Immunodeficiency Virus And
Acquired Immunodeficiency
Syndrome (HIV/AIDS) At
Matara Primary School Found on CNLS digital library

103
List of documents, reports, studies, policies concerning HIV/AIDS in Rwanda (1998-2006)
Document Title Language Organization
Program
Area Data Type Comments
162
PROJECT EVALUATION
REPORT PREVENTION AND
COUNSELLING OF HIV/AIDS
AND GENERAL
COUNSELLING ACTIVITIES
OF ARCT- RUHUKA. Found on CNLS digital library
163
Rwanda HIV/AIDS Public
Interest Fellowship Program
(RHPIF); progress and
achievements during its' first 2½
years Found on CNLS digital library
164
Utilization of Maternity Services
by HIV-infected Women in FHI-
supported Health Centers in
Rwanda Found on CNLS digital library
165
(Utilitization of maternity
services by HIV-infected women
in FHI.pdf) Found on CNLS digital library
166
Safety and immunogenicity of
the VRC recombinant multiclade
HIV-1 adenoviral vector vaccine
alone or in combination with the
VRC multiclade HIV-1 DNA
plasmid vaccine in healthy
African adults Found on CNLS digital library
167
Expanding HIV care and
treatment to Rwandan prisons: a
Collaborative Approach Found on CNLS digital library
168 (Expanding HIV care treatment Found on CNLS digital library

104
List of documents, reports, studies, policies concerning HIV/AIDS in Rwanda (1998-2006)
Document Title Language Organization
Program
Area Data Type Comments
to Rwandan prisons.pdf)
169
Mobile VCT: an Evaluation of
Innovative HIV-testing
approaches Found on CNLS digital library
170
Involving men in prevention of
mother-to-child transmission of
HIV programs in Rwanda Found on CNLS digital library
171
(Involving men in PMTCT oh
HIV Programs in Rwanda.pdf) Found on CNLS digital library
172
Changes in HIV knowledge,
sexual risk, and utilization of
VCT among youth in Rwanda:
behavioral surveillance results
from 2000 – 2006 Found on CNLS digital library
173
The role of peer education in the
prevention of HIV and AIDS. Found on CNLS digital library
174
Results of a Cross-Sectional
Study on Knowledge, Attitudes,
and Practice Related to
HIV/AIDS and Sexual Violence
Among Students Attending Two
Secondary Schools in Bukavu,
Democratic Republic of the
Congo (DRC) Found on CNLS digital library
175
(Results of Cross-Sectional
Study on KAP Related to HIV &
AIDS.pdf) Found on CNLS digital library
176
Study Of Knowledge And
Attitudes Concerning Human Found on CNLS digital library

105
List of documents, reports, studies, policies concerning HIV/AIDS in Rwanda (1998-2006)
Document Title Language Organization
Program
Area Data Type Comments
Immunodeficiency Virus And
Acquired Immunodeficiency
Syndrome (HIV/AIDS) At
Matara Primary School
177
PROJECT EVALUATION
REPORT PREVENTION AND
COUNSELLING OF HIV/AIDS
AND GENERAL
COUNSELLING ACTIVITIES
OF ARCT- RUHUKA. Found on CNLS digital library
178
Using HIV AIDS Funding to
Improve Health care services for
all Found on CNLS digital library
179
(Using HIV & AIDS Funding
Improve Health Carel.pdf) Found on CNLS digital library
180
Assessment of the role of forum
theatre in HIV/AIDS behavioral
change process among secondary
school adolescents in Butare
province, Rwanda Found on CNLS digital library
181
Report Of the assessment of
treatment, care and support of
children infected and affected by
HIV/AIDS in Rwanda Found on CNLS digital library
182
(Report Assessment Treatment
Care Support Children Infected
.pdf) Found on CNLS digital library
183
Expérience of the youth forum
against HIV/AIDS in Butare Found on CNLS digital library

106
List of documents, reports, studies, policies concerning HIV/AIDS in Rwanda (1998-2006)
Document Title Language Organization
Program
Area Data Type Comments
184
Implementation of the Partners
In Health (PIH) community-
based model of HIV care and
prevention in a rural health
district in Rwanda Found on CNLS digital library
185
Sexual behaviors of people
attending the HIV high
Transmission sites in
Kigali/Rwanda Found on CNLS digital library
186
(Sexual behaviors People
attending HIV high
Transmissionsites.pdf) Found on CNLS digital library
187
FINAL REPORT Community
Needs Assessment of Home-
Based Care for People Living
with HIV/AIDS BUTARE Found on CNLS digital library
188
(Community Needs Assessment
of home based for people living
with HIV.pdf) Found on CNLS digital library
189
Factors influencing HIV
counseling and testing uptake
among TB patients Found on CNLS digital library
190
Assessment of the role of forum
theatre in HIV/AIDS behavioral
change process among secondary
school adolescents in Butare
province, Rwanda Found on CNLS digital library
191
HIV AIDS Family package
initiative Found on CNLS digital library

107
List of documents, reports, studies, policies concerning HIV/AIDS in Rwanda (1998-2006)
Document Title Language Organization
Program
Area Data Type Comments
192
Improving on a successful model
for promoting couples VCT in
two african capitals:mobile
couples HIV testing units Found on CNLS digital library
193
Assessment of Capacity Building
Needs For the Education
Planners and managers in the
Context of Hiv AIDS in
RWANDA French KIST Found on CNLS digital library
194
Using HIV AIDS Funding to
Improve Health care services for
all French Minisante Found on CNLS digital library
195
La prise en charge psychosociale
des enfants vivant avec le HIV French Found on CNLS digital library
196
Evaluation des Services de Sante
Maternelle et Infantile dans le
District Sanitaire de Nyanza French NURSPH - -
University of Rwanda, School of
Public Health website
197
Evaluation des Activites des
Animateurs de Sante en Matiere
de L‘ E. S .P dans la Prefecture
de Byumba French NURSPH - -
University of Rwanda, School of
Public Health website
198
Etude des Connaissances,
Attitudes et Comportements des
Jeunes Eleves des Etablissements
Secondaires Relatifs a l‘
Infection par le VIH en
Prefecture de Butare French NURSPH - -
University of Rwanda, School of
Public Health website
199
Evaluation de la Qualite des
Consultations Prenatales dans le French NURSPH - -
University of Rwanda, School of
Public Health website

108
List of documents, reports, studies, policies concerning HIV/AIDS in Rwanda (1998-2006)
Document Title Language Organization
Program
Area Data Type Comments
District Sanitaire de Kibuye
200
Etude sur les Connaissances,
Attitudes et Pratiques des
Femmes en Age de Procreer du
District Sanitaire de Ruhengeri
en Matiere de Planification
Familiale French NURSPH - -
University of Rwanda, School of
Public Health website
201
Connaissances, Attitudes Et
Pratiques des Femmes Enceintes
en Matiere de Soins Prenatals et
Qualite des Consultations
Prenatales au District Sanitaire
de Kibogora French NURSPH - -
University of Rwanda, School of
Public Health website
202
Connaissances et Attitudes des
Femmes en Age de Procreer
Face au Test de Depistage
Volontaire du VIH/SIDA dans le
District Sanitaire de Kibilizi French NURSPH - -
University of Rwanda, School of
Public Health website
203
Evaluation de la Qualite de la
Consultation Prenatale dans le
District de Sante de Remera-
Kigali French NURSPH - -
University of Rwanda, School of
Public Health website
204
Connaissances, Attitudes et
Pratiques des Eleves des
Etablissements Secondaires de la
Ville de Gitarama en Matiere du
VIH/SIDA French NURSPH - -
University of Rwanda, School of
Public Health website
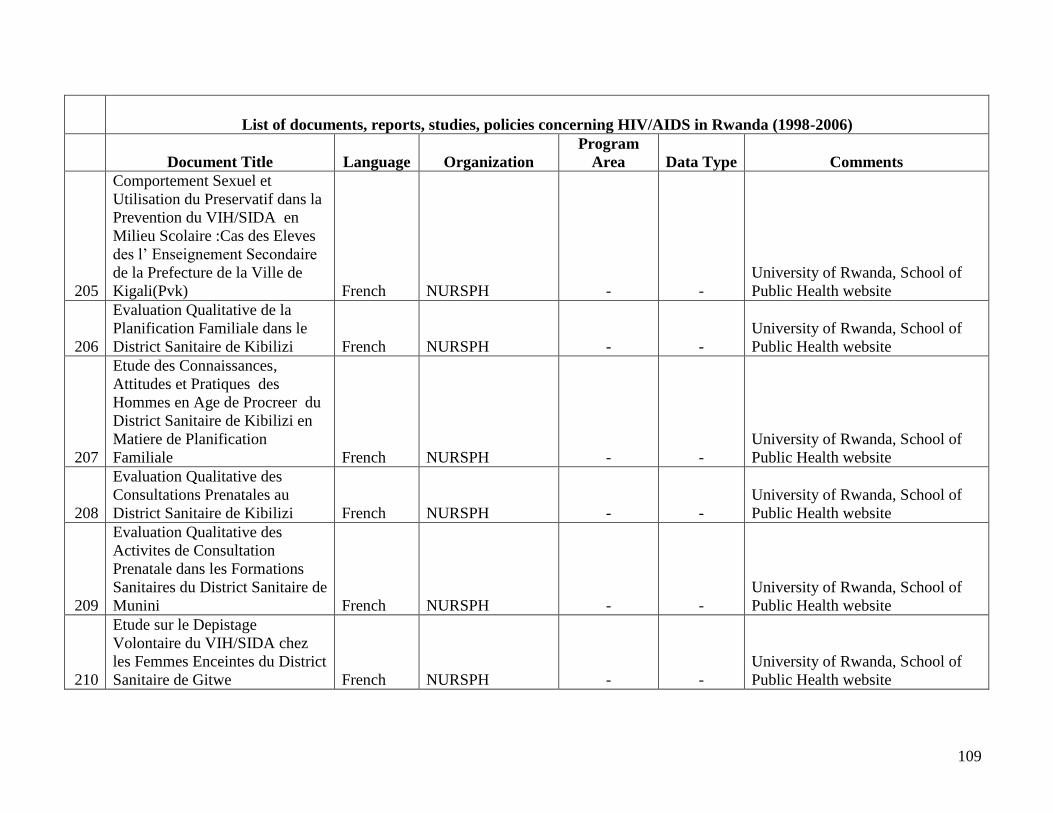
109
List of documents, reports, studies, policies concerning HIV/AIDS in Rwanda (1998-2006)
Document Title Language Organization
Program
Area Data Type Comments
205
Comportement Sexuel et
Utilisation du Preservatif dans la
Prevention du VIH/SIDA en
Milieu Scolaire :Cas des Eleves
des l‘ Enseignement Secondaire
de la Prefecture de la Ville de
Kigali(Pvk) French NURSPH - -
University of Rwanda, School of
Public Health website
206
Evaluation Qualitative de la
Planification Familiale dans le
District Sanitaire de Kibilizi French NURSPH - -
University of Rwanda, School of
Public Health website
207
Etude des Connaissances,
Attitudes et Pratiques des
Hommes en Age de Procreer du
District Sanitaire de Kibilizi en
Matiere de Planification
Familiale French NURSPH - -
University of Rwanda, School of
Public Health website
208
Evaluation Qualitative des
Consultations Prenatales au
District Sanitaire de Kibilizi French NURSPH - -
University of Rwanda, School of
Public Health website
209
Evaluation Qualitative des
Activites de Consultation
Prenatale dans les Formations
Sanitaires du District Sanitaire de
Munini French NURSPH - -
University of Rwanda, School of
Public Health website
210
Etude sur le Depistage
Volontaire du VIH/SIDA chez
les Femmes Enceintes du District
Sanitaire de Gitwe French NURSPH - -
University of Rwanda, School of
Public Health website

110
List of documents, reports, studies, policies concerning HIV/AIDS in Rwanda (1998-2006)
Document Title Language Organization
Program
Area Data Type Comments
211
Connaissances, Attitudes et
Pratiques de la Population du
District Sanitaire de Kibilizi en
Matiere D4 Utilisation du
Preservatif dans la Prevention
contre l‘Infection VIH French NURSPH - -
University of Rwanda, School of
Public Health website
212
Connaissances, Attitudes et
Pratiques des Eleves des
Etablissements de L‘
Enseignement Secondaire de la
Prefecture de Byumba en
Matiere du VIH/SIDA French NURSPH - -
University of Rwanda, School of
Public Health website
213
Connaissances, Attitudes et
Pratiques des Hommes du
District Sanitaire de Gisenyi en
Matiere de Planification
Familiale French NURSPH - -
University of Rwanda, School of
Public Health website
214
Connaissances, Attitudes et
Pratiques des Jeunes de la
Prefecture de Butare en Matiere
du VIH/SIDA: Cas des Olphelins
des Olphelinats Publics de Cette
Prefecture French NURSPH - -
University of Rwanda, School of
Public Health website
215
Connaissances, Attitudes et
Pratiques des Adolescents du
District Sanitaire de Bushenge en
Matiere de Planification
Familiale French NURSPH - -
University of Rwanda, School of
Public Health website

111
List of documents, reports, studies, policies concerning HIV/AIDS in Rwanda (1998-2006)
Document Title Language Organization
Program
Area Data Type Comments
216
Utilisation du Preservatif dans la
Lutte Contre les Maladies
Sexuellement Transmissibles y
Compris le SIDA chez les
Femmes en Age de Procreer du
District Sanitaire Remera French NURSPH - -
University of Rwanda, School of
Public Health website
217
Etude des Connaissances,
Attitudes et Pratiques sur le
Preservatif chez les Etudiants de
l‘ Universite Nationale du
Rwanda French NURSPH - -
University of Rwanda, School of
Public Health website
218
Etude sur la Demande de la
Population Feminine en Age de
Procreer du District Sanitaire de
Nyanza en Matiere de
Planification Familiale French NURSPH - -
University of Rwanda, School of
Public Health website
219
Connaissances, Attitude Et
Comportement en Matiere de l‘
Infection par le VIH/SIDA chez
les Femmes Enceintes du Milieu
Rural de Gitarama French NURSPH - -
University of Rwanda, School of
Public Health website
220
Connaissances, Attitudes Et
Pratiques des Eleves des
Etablissements d‘ Enseignement
Secondaire du District Sanitaire
de Ruhengeri en Matiere du
VIH/SIDA French NURSPH - -
University of Rwanda, School of
Public Health website
221
Connaissances, Attitudes Et
Pratiques des Enfants de la Rue French NURSPH - -
University of Rwanda, School of
Public Health website

112
List of documents, reports, studies, policies concerning HIV/AIDS in Rwanda (1998-2006)
Document Title Language Organization
Program
Area Data Type Comments
de La Ville de Kigali en Rapport
avec le VIH//SIDA
222
Evaluation de L‘ Utilisation des
Medicaments Traditionnels au
Rwanda : Cas de la Region
Sanitaire de Butare French NURSPH - -
University of Rwanda, School of
Public Health website
223
Connaissances, Attitudes et
Pratiques des Femmes en Age de
Reproduction du District
Sanitaire de Kabutare en Matiere
de Planification Familiale French NURSPH - -
University of Rwanda, School of
Public Health website
224
Connaissances, Attitudes et
Pratiques des Eleves des
Etablissements d‘ Enseignement
Secondaire du District Sanitaire
de Gisenyi en Matiere du
VIH/SIDA French NURSPH - -
University of Rwanda, School of
Public Health website
225
Connaissances, Attitudes et
Pratiques des Adolescents du
District Sanitaire de Kigeme en
Matiere de Planification
Familiale French NURSPH - -
University of Rwanda, School of
Public Health website
226
Connaissances, attitudes et
pratiques des jeunes âgés de 15 à
24 ans en matière du VIH/SIDA
dans le district sanitaire de
Rwamagana French NURSPH - -
University of Rwanda, School of
Public Health website

113
List of documents, reports, studies, policies concerning HIV/AIDS in Rwanda (1998-2006)
Document Title Language Organization
Program
Area Data Type Comments
227
Connaissances, attitudes et
pratiques des élèves des écoles
secondaires de la ville de Butare
en matière de l'utilisation du
préservatif dans la prévention
contre l'infection à VIH/SIDA et
les MST French NURSPH - -
University of Rwanda, School of
Public Health website
228
Etude sur les connaissances,
attitudes et pratiques des femmes
en âge de procréer du district
sanitaire de Bugesera en matière
de planification familiale French NURSPH - -
University of Rwanda, School of
Public Health website
229
Etude des connaissances,
attitudes et pratiques des femmes
enceintes de la ville de Kigali en
matière de l' infection à
VIH/SIDA French NURSPH - -
University of Rwanda, School of
Public Health website
230
Etude des connaissances,
attitudes et pratiques des
étudiants l'UNR enmatière du
VIH/SIDA French NURSPH - -
University of Rwanda, School of
Public Health website
231
Connaissances, attitudes et
pratiques de la population
féminine en âge de procréer du
district sanitaire de Remera en
matière de planification familiale French NURSPH - -
University of Rwanda, School of
Public Health website
232
Evaluation des connaissances,
attitudes et pratiques des femmes
en âge de procréer du district French NURSPH -
University of Rwanda, School of
Public Health website

114
List of documents, reports, studies, policies concerning HIV/AIDS in Rwanda (1998-2006)
Document Title Language Organization
Program
Area Data Type Comments
sanitaire de Kibilizi en matière
de planification familiale
233
Evaluation des Connaissances,
Attitudes et Pratiques des
Femmes en Age de Procreer du
District Sanitaire de Kabgayi en
Matiere de Planification
Familiale French NURSPH -
University of Rwanda, School of
Public Health website
234
Etude des Connaissances ,
Attitudes et Pratiques en Matiere
de l‘Infection au VIH chez les
Femmes en Age de Procreer des
Milieux Urbain et Rural du
District Sanitaire de Kabutare French NURSPH -
University of Rwanda, School of
Public Health website
235
Connaissances, Attitudes et
Pratiques de la Population du
District Sanitaire de Kibilizi en
Matiere D4 Utilisation du
Preservatif dans la Prevention
contre L‘Infection VIH French NURSPH -
University of Rwanda, School of
Public Health website
236
Connaissances, Attitudes et
Pratiques des Eleves des
Etablissements de
l‘Enseignement Secondaire de la
Prefecture de Byumba en
Matiere du VIH/SIDA French NURSPH -
University of Rwanda, School of
Public Health website
237
Utilisation du Preservatif dans la
Lutte Contre les Maladies
Sexuellement Transmissibles y French NURSPH - -
University of Rwanda, School of
Public Health website
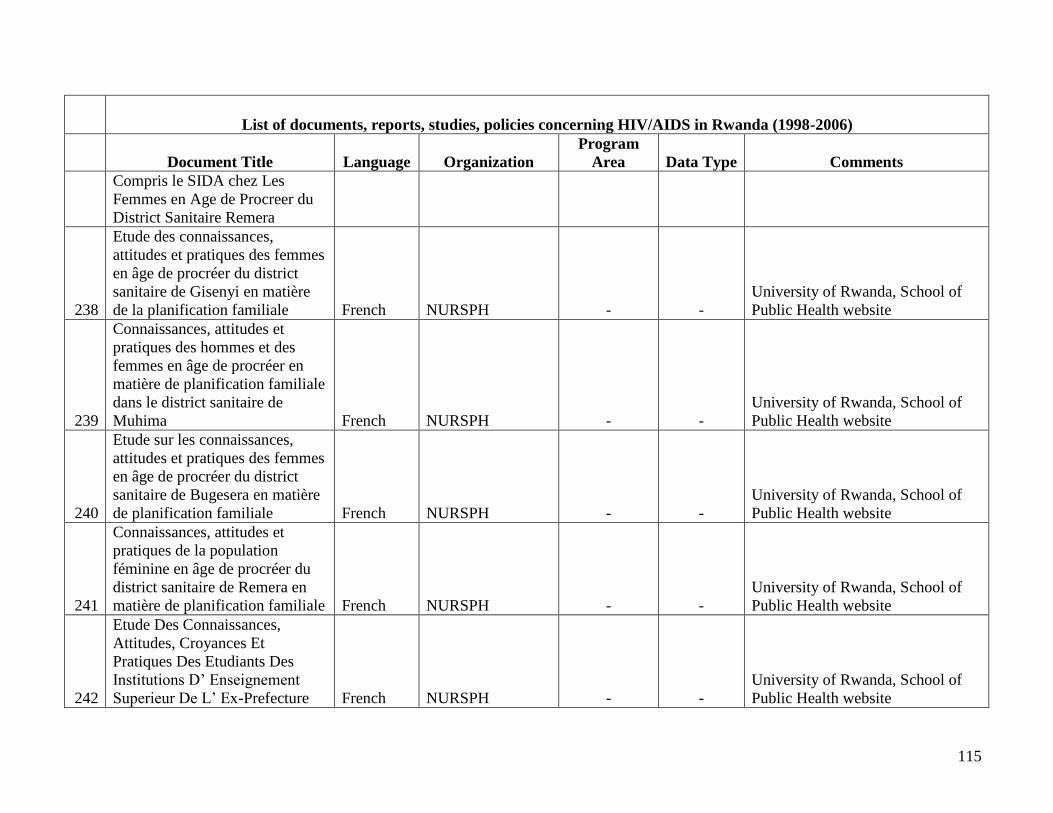
115
List of documents, reports, studies, policies concerning HIV/AIDS in Rwanda (1998-2006)
Document Title Language Organization
Program
Area Data Type Comments
Compris le SIDA chez Les
Femmes en Age de Procreer du
District Sanitaire Remera
238
Etude des connaissances,
attitudes et pratiques des femmes
en âge de procréer du district
sanitaire de Gisenyi en matière
de la planification familiale French NURSPH - -
University of Rwanda, School of
Public Health website
239
Connaissances, attitudes et
pratiques des hommes et des
femmes en âge de procréer en
matière de planification familiale
dans le district sanitaire de
Muhima French NURSPH - -
University of Rwanda, School of
Public Health website
240
Etude sur les connaissances,
attitudes et pratiques des femmes
en âge de procréer du district
sanitaire de Bugesera en matière
de planification familiale French NURSPH - -
University of Rwanda, School of
Public Health website
241
Connaissances, attitudes et
pratiques de la population
féminine en âge de procréer du
district sanitaire de Remera en
matière de planification familiale French NURSPH - -
University of Rwanda, School of
Public Health website
242
Etude Des Connaissances,
Attitudes, Croyances Et
Pratiques Des Etudiants Des
Institutions D‘ Enseignement
Superieur De L‘ Ex-Prefecture French NURSPH - -
University of Rwanda, School of
Public Health website

116
List of documents, reports, studies, policies concerning HIV/AIDS in Rwanda (1998-2006)
Document Title Language Organization
Program
Area Data Type Comments
De La Ville De Kigali (Pvk) En
Matiere De L‘ Infection A
Vih/Sida
243
Evaluation Qualitative Des
Consultations Prenatales Dans
Le District Sanitaire De
Ruhengeri French NURSPH - -
University of Rwanda, School of
Public Health website
244
Connaissances, Attitudes Et
Pratiques Des Adolescents Du
District Sanitaire De Kigeme En
Matiere De Planification
Familiale French NURSPH - -
University of Rwanda, School of
Public Health website
245
Etude Sur La Demande De La
Planification Familiale Dans Le
Contexte Actuel Du Pays Cas
De La Prefecture De Cyangugu French NURSPH - -
University of Rwanda, School of
Public Health website
246
Etude Sur Le Depistage
Volontaire Du Vih/Sida Chez
Les Femmes Enceintes Du
District Sanitaire De Gitwe French NURSPH - -
University of Rwanda, School of
Public Health website
247
Etude Sur Le Depistage
Volontaire Du Vih/Sida Chez
Les Femmes Enceintes Du
District Sanitaire De Gitwe French NURSPH - -
University of Rwanda, School of
Public Health website
248
Etude Des Connaissances,
Attitudes Et Pratiques Sur Le
Preservatif Chez Les Etudiants
De L‘ Universite Nationale Du
Rwanda French NURSPH - -
University of Rwanda, School of
Public Health website

117
List of documents, reports, studies, policies concerning HIV/AIDS in Rwanda (1998-2006)
Document Title Language Organization
Program
Area Data Type Comments
249
Etude Sur La Demande De La
Population Feminine En Age De
Procreer Du District Sanitaire De
Nyanza En Matiere De
Planification Familiale French NURSPH - -
University of Rwanda, School of
Public Health website
250
Plan Strategique National
Multisectoriel de Lutte contre le
VIH et le SIDA 2005-2009 French CNLS
CNLS
PLAN
STRATEGI
QUE
NATIONAL
2005-
2009.pdf Electronic
University of Rwanda, School of
Public Health website
251
Rwanda National Hiv and Aids
Monitoring and Evaluation Plan
2006-2009; Part A : Systems and
Framework English CNLS
RWANDA
NATIONAL
HIV AND
AIDS M&E
plan part
A.pdf Electronic
University of Rwanda, School of
Public Health website
252
Rwanda Politique Nationale sur
les Préservatifs French CNLS
politique_co
ndom
draft.pdf Electronic
University of Rwanda, School of
Public Health website
253
UNGASS Country Report -
Rwanda English CNLS
UNGASS
Rwanda
Jan06 to
Dec07.pdf Electronic
University of Rwanda, School of
Public Health website
254
HIV/AIDS in Rwanda 2008
Epidemic Update English CNLS
Rwanda_Epi
_Updat_200
8.pdf Electronic
University of Rwanda, School of
Public Health website

118
List of documents, reports, studies, policies concerning HIV/AIDS in Rwanda (1998-2006)
Document Title Language Organization
Program
Area Data Type Comments
255
Fonds Mondial de Lutte contre le
Sida, la Tuberculose et le
Paludisme « The Global Fund »
Rapport d‘Audit des Comptes du
Projet 2004 French CNLS
Global Fund
audit
2004.pdf Electronic
University of Rwanda, School of
Public Health website
256
Fonds Mondial de Lutte contre le
SIDA, la Tuberculose et le
Paludisme « The Global Fund »
Rapport d‘Audit des Comptes du
Projet 2005 French CNLS
Global Fund
audit
2005.pdf Electronic
University of Rwanda, School of
Public Health website
257
Guides Nationaux de
Planification des
Programmes de Lutte contre le
VIH et le
SIDA French CNLS
Guide_Natio
nal_planifica
tion_progra
mmes.pdf Electronic
University of Rwanda, School of
Public Health website
258
A summary of research carried
out by SPH Faculty in 2005 English NURSPH
SPH
research-
summary-
2005.doc Electronic
University of Rwanda, School of
Public Health website
259 Health Sector Strategic Plan English MOH
Health sector
strategic
plan.pdf Electronic
University of Rwanda, School of
Public Health website
260
HIV/AIDS Treatment and Care
Plan 2003-2007 English MOH
aids_national
_care_and_tr
eat_plan.pdf Electronic
University of Rwanda, School of
Public Health website
261
Determining the Conditions and
Modalities for Health Care
Delivery to Persons Living with
HIV/AIDS English MOH
health care
delivery to
PLWH.pdf Electronic
University of Rwanda, School of
Public Health website

119
List of documents, reports, studies, policies concerning HIV/AIDS in Rwanda (1998-2006)
Document Title Language Organization
Program
Area Data Type Comments
262
Guide National pour le Soutien
et la Prise en Charge Alimentaire
et Nutritionnelle Pour les
Personnes Vivant avec le
VIH/SIDA au Rwanda French MOH
National
guide for
nutrition for
PLWH.pdf Electronic
University of Rwanda, School of
Public Health website
263
Living with AIDS in Rwanda: A
Study in Three Provinces English MOH
Living with
HIV_AIDS
in
Rwanda_stu
dy in 3
provinces.pd
f Electronic
University of Rwanda, School of
Public Health website
264
Enquete Menage (Health
Seeking Behaviour Survey) dans
les Districts Sanitaires de
Kabutare et Gakoma French
HealthNet
International
HealthNet
Int Enquete
Menage.pdf Electronic
University of Rwanda, School of
Public Health website
265
Les Besoins en Planification
Familiale dans les Provinces de
Byumba et Butare French GTZ
Besoin_Plani
fication-
gtz.pdf Electronic
University of Rwanda, School of
Public Health website
266
Enquete sur la Satisfaction des
Client(E) S des Centres de
Counselling et Depistage
Volontaire de VIH au Rwanda French
Projet VCT Intégré
- GLOBAL FUND
satisfaction
des
clients_VCT
_rapport_fin
al.pdf Electronic
University of Rwanda, School of
Public Health website
267
Couts et Financement des
Services de VCT au Rwanda French
Projet VCT Intégré
- GLOBAL FUND
Rapport_fina
l_VCT_Cost
ing.pdf Electronic
University of Rwanda, School of
Public Health website

120
List of documents, reports, studies, policies concerning HIV/AIDS in Rwanda (1998-2006)
Document Title Language Organization
Program
Area Data Type Comments
268
Kap Study on Infant and Young
Child Feeding
English,
French UNICEF
KAP study
on infant and
young child
feeding.pdf
KAP study
on infant and
young child
feeding_Fr.p
df Electronic
University of Rwanda, School of
Public Health website
269
Etat de santé maternelle et
accessibilité aux services de
santé French UNICEF
Etude de
sante
maternelle_
UNICEF.pdf Electronic
University of Rwanda, School of
Public Health website
270
ESTHER Rwanda-Luxembourg
HAART program for patients
with advanced-stage disease and
limited resources English
recherche_LuxDev
_Rwanda
AbstractEST
HER__jules.
pdf Electronic
University of Rwanda, School of
Public Health website
271
ESTHER Rwanda-Luxembourg:
Adherence to HAART among
advanced-stage, indigent patients English
recherche_LuxDev
_Rwanda
abstract_adh
rence_ESTH
ER.pdf Electronic
University of Rwanda, School of
Public Health website
272
MINISANTE Rapport annuel
2001 French MINISANTE - html
University of Rwanda, School of
Public Health website
273
MINISANTE Rapport annuel
2002 French MINISANTE - html
University of Rwanda, School of
Public Health website
274
Les connaissances, les attitudes
et les pratiques de la
communauté à l'égard du
VIH/SIDA: Enquête menée dans
les districts de Budaha, Gashora, English ACORD - html
University of Rwanda, School of
Public Health website

121
List of documents, reports, studies, policies concerning HIV/AIDS in Rwanda (1998-2006)
Document Title Language Organization
Program
Area Data Type Comments
Kamonyi, Murambi, Mutobo et
Rusumo
275
Étude Qualitative Analytique sur
les Strategies appropriees de
distributions des preservatifs
dans la jeunesse Rwandaise French
Dr Marc
TWAGIRUMUKI
ZA
Conseil National
de la Jeunesse du
Rwanda
DISTRIBUT
ION_REPO
RT_FR Electronic
University of Rwanda, School of
Public Health website
276
Étude Des Facteurs Influençant
L‘Acceptabilité, Accessibilité, Et
Utilisation Des Préservatifs Dans
La Jeunesse Rwandaise :
Connaissances, Attitudes Et
Pratiques French
Dr Marc
TWAGIRUMUKI
ZA
Conseil National
de la Jeunesse du
Rwanda
KAP_COND
OM_REPOR
T_FR Electronic
University of Rwanda, School of
Public Health website
277
Transversal And Descriptive
Study On Needs Assessment For
Youth Centred Intervention On
Hiv/Aids French
Dr Marc
TWAGIRUMUKI
ZA
Conseil National
de la Jeunesse du
Rwanda
NEEDS_RE
PORT_ENG Electronic
University of Rwanda, School of
Public Health website
278
Processus de mise en place du
programme de prévention de
traumatisme mère- enfant du
VIH / SIDA au Rwanda. Solange
Shengero ( projet prevention de
la transmission verticale du
VIH/SIDA au TRAC KIGALI) French
Presentation at
conference: Les
VIIèmes journées
médicales de
Butare
TRAC - htm
University of Rwanda, School of
Public Health website
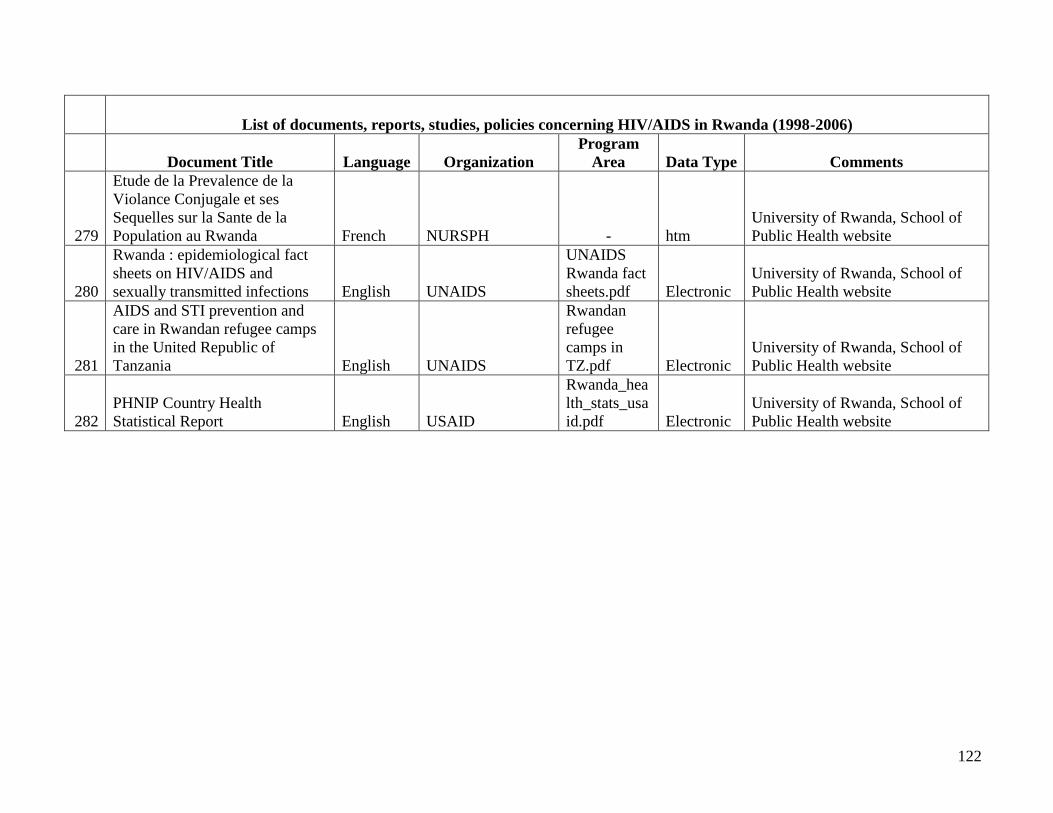
122
List of documents, reports, studies, policies concerning HIV/AIDS in Rwanda (1998-2006)
Document Title Language Organization
Program
Area Data Type Comments
279
Etude de la Prevalence de la
Violance Conjugale et ses
Sequelles sur la Sante de la
Population au Rwanda French NURSPH - htm
University of Rwanda, School of
Public Health website
280
Rwanda : epidemiological fact
sheets on HIV/AIDS and
sexually transmitted infections English UNAIDS
UNAIDS
Rwanda fact
sheets.pdf Electronic
University of Rwanda, School of
Public Health website
281
AIDS and STI prevention and
care in Rwandan refugee camps
in the United Republic of
Tanzania English UNAIDS
Rwandan
refugee
camps in
TZ.pdf Electronic
University of Rwanda, School of
Public Health website
282
PHNIP Country Health
Statistical Report English USAID
Rwanda_hea
lth_stats_usa
id.pdf Electronic
University of Rwanda, School of
Public Health website

123
Appendix 4: Summary Tables of Reports and Studies Practicum C.1 Articles: EAST (Umutara, Kibungo, Kigali-Rural (part))
Report Methodology Population Findings Conclusions
66 / ROADS: Rapport de la visite
d‘evaluation Formative de base a Gatuna
Data collection conducted
by FHI/ROADS and
CDLS Gicumbi,
document review,
discussion with
community members
(youth, persons living
with HIV/AIDS, at-risk
women)
Populations included
in the study were
uneducated youth, at-
risk (vulnerable)
women, people living
with HIV/AIDS
(PLWHA).
This is a high-risk area,
because of its proximity to a
truck route with trucks
passing through via Kenya
and Uganda towards Rwanda,
Bukavu/RDC and Burundi.
Sexuality in Gatuna: there
are very few female sex
workers in this region. Sex
workers work in the city of
Gatuna or on the other side of
the border in Uganda,
returning to their parents‘
house in the evenings.
Condoms are available in
Gatuna, but are rarely used
outside the city, except
among soldiers. VCT: The
closest testing sites to the
region are at Bungwe (12km)
or Buyumba (20km) or at
Kabare in Uganda. Mostly
pregnant women and youth
test. They often test during
their pre-natal exams and
before marriage. Those most
at risk are the least likely to
test. Prevention: A single
formal prevention education
program exists in the region
and focuses on youth. It is run
by the Byumba Catholic
church. Other parishes deliver
HIV prevention messages and
there are several youth
associations which engage in
HIV is a problem in this
region according to
community members. It is
one of the top three concerns
for members of all
populations encountered
during the study. Sex
workers, youth, soldiers,
truckers, single
women/widows are the main
groups at elevated risk
identified by members of the
populations encountered.
Their vulnerability is mostly
influenced by poverty and
alcohol consumption.
There are few sex workers on
the Rwanda side of the border
(Gatuna). However, there are
many sex workers on the
Uganda side of the border.
Unwanted pregnancy is a
common problem. This is
most likely due to the fact
that there is a single condom
distribution point in Gatuna.
Youth are the only population
who benefits from HIV/AIDS
programs.
The closest VCT and
treatment services are located
12km from Gatuna and many
people lack the means of
accessing them.

124
Report Methodology Population Findings Conclusions
peer education. ACPLRWA
(?) in Gatuna provides
education and condoms to
truckers and the local
community. The closest
VCT, ARV, and PMTCT
services are in Buyumba and
Bungwe. STIs are treated
with HIV in the same
location, those suffering from
STIs purchase medication in
local pharmacies. Only the
church parish in Buyumba
cares for OVC, but they are
unable to address the needs of
all of the OVC in the area.
Only the health center at
Bungwe cares for PLWHA,
but is insufficiently equipped
to treat them.
Do free-standing and integrated
voluntary counseling and testing centers
attract users with similar characteristics?
The Rwanda experience: Kamenga, CM;
Karita, E; Ndoli, C; Njamije, D;
Willalon, C; Sahaha, JB; Ngabonziza,
M; Ouattara, R; Murray, D (2002)
Data from a free-standing
VCT center (Centre
Rwandais d'Information
sur le SIDA) and 3
integrated centers
(Kabgayi, Ruli,
Rwamagana) supported
by Family Health
International are
compared. Routinely
collected information
(demographics, reasons
for seeking VCT, and
sexual behaviors) from an
intake questionnaire were
analyzed.
Kabgayi, Ruli,
Rwamagana
27,433 persons
A total of 13150 clients were
served at the free-standing
center and 14283 at the
integrated centers. The mean
age (26.7 vs. 26.1) and the
age distribution were similar
(9% vs. 12% less than 20;
82% vs. 76% between 20-35,
and 9% vs. 12% more than 35
years at the free-standing and
the integrated centers
respectively). 37% of clients
at the free-standing center
were female compared to
47% at the integrated centers.
The most common reason for
seeking VCT was
"unprotected sex" (61%) at
1) In the exception of gender,
reason for seeking VCT, and
number of sex partners, both
free-standing and integrated
VCT centers in Rwanda
generally attract clients with
similar characteristics; 2)
Women are less likely than
men to use free-standing
VCT center. Reasons for this
lower utilization must be
explored and ways to
improve it identified where
free-standing model is used to
provide VCT; and 3) The
proportion of younger users
(less than 20 years) is small at
both free-standing (9%) and

125
Report Methodology Population Findings Conclusions
the free-standing and
"marriage" (48%) at the
integrated centers. At both
settings, marital status, mean
age at first sexual intercourse
(18.4 vs. 18.9), and condom
use at last intercourse (2.8%
vs. 2.5%) were similar. HIV
seropositivity was similar in
both settings (10.3% vs.
9.2%).
integrated (12%) centers.
This finding highlights the
importance of setting youth-
friendly services.
Factors influencing HIV counseling and
testing uptake among TB patients:
Mukadi YD, Bangendanye L, Karibushi
B, Ngabonziza M, Rwakunda D,
Usabinema A, Sahaha JB, van Praag E,
Murray D (2004)
FHI/IMPACT in
collaboration with the
Rwanda MOH has been
implementing an
integrated TB/HIV
intervention in Kabgayi
and Rwamagana district
hospitals. Through the
intervention TB patients
are offered HCT and HIV
infected TB patients have
access to cotrimoxazole
prophylaxis.
Kabgayi, Rwamagana
TB patients
Despite the availability of
HCT and cotrimoxazole
prophylaxis only 68% of the
220 TB patients in
Rwamagana and 48% of the
347 TB patients in Kabgayi
accessed HCT services. The
main difference between
Rwamagana and Kabgayi is
that Rwamagana district
hospital had a TB nurse
trained in HIV counseling
who was dedicated to HCT.
The HIV prevalence was 33%
and 31% in Rwamagana and
Kabgayi respectively. All
HIV infected TB patients
were offered cotrimoxazole
prophylaxis. TB patients on
cotrimoxazole prophylaxis
were among the first to
benefit from HIV treatment
when it became available at
the district hospital.
Readiness of TB patients to
access HCT services
established at or linked to TB
clinics is influenced by the
ability of health care workers
to discuss risks factors for
HIV and benefits of testing
with TB patients.
Recommendation:
Introducing HIV counseling
and testing services in TB
clinics offers the opportunity
to identify patients who will
potentially benefit from ART.
Health care workers need to
be continuously trained and
provided with tools to
encourage TB patients to
access VCT services.
No Report Available
226 / Connaissances, attitudes st pratiques des jeunes ages de 15 a 24 ans en matiere du VIH/SIDA dans le district sanitaire de Rwamagana
240 / Etude sur les connaissances, attitudes et pratiques des femmes en âge de procréer du district sanitaire de Bugesera en matière de planification familiale

126
Practicum C.1 Articles: KIGALI (Kigali-Ville)
Report Methodology Population Findings Conclusions
128 / Voluntary Counseling and Testing
for HIV Among Pregnant Women
Presenting in Labor in Kigali, Rwanda
A pilot-tested
questionnaire was
administered to study
participants to solicit
information regarding
their intentions to accept
or refuse VCT and
treatment of HIV
infection during labor and
delivery if confirmed
infected.
427 pregnant women
– Kigali
The strongest predictive
factor for acceptability of
HIV testing was the
profession of the male
partner. Women whose
partners had skilled and well-
paid jobs were about four
times more likely to accept
HIV testing than were women
whose partners were
unemployed (AOR, 3.5). The
other factor significantly
associated with the
acceptance rate was maternal
age. The likelihood of
acceptance of HIV testing
was about three times higher
among women 35 years or
older than among younger
mothers (AOR, 3.1). For
every 5-year increment in
maternal age, the odds of
acceptance of HIV testing
increased by a factor of 1.20.
Using this important finding,
we constructed an acceptance
rate probability curve that
could serve as a useful tool to
evaluate the efficacy of future
interventions aimed at
improving the acceptability
rate of HIV testing among
pregnant women at the study
site.
129 / The Relationship Between Alcohol
Consumption and Unprotected Sex
Among Known HIV-discordant Couples
in Rwanda and Zambia
This study analyzes data
collected from members
of cohabiting HIV-
discordant couples
regarding alcohol
consumption and self-
reported condom use.
After controlling for
demographic and
socioeconomic co-factors,
alcohol use by male
partners of HIV-
discordant couples was
associated with self-
990 serodiscordant
couples – Kigali
Males who reported alcohol
use in the year prior to
enrollment were 1.47 times as
likely to have unprotected sex
as their non-drinking
counterparts. Compared to
other religions, male
Pentecostals were more likely
to report unprotected sex (OR
1.62). Relative to those who
lived together for 2 years or
less, couples who lived
together for 6–9 years and
those who lived together for
Counseling about alcohol use
should be part of HIV testing
and counseling programs,
particularly among those
found to be HIV-positive.
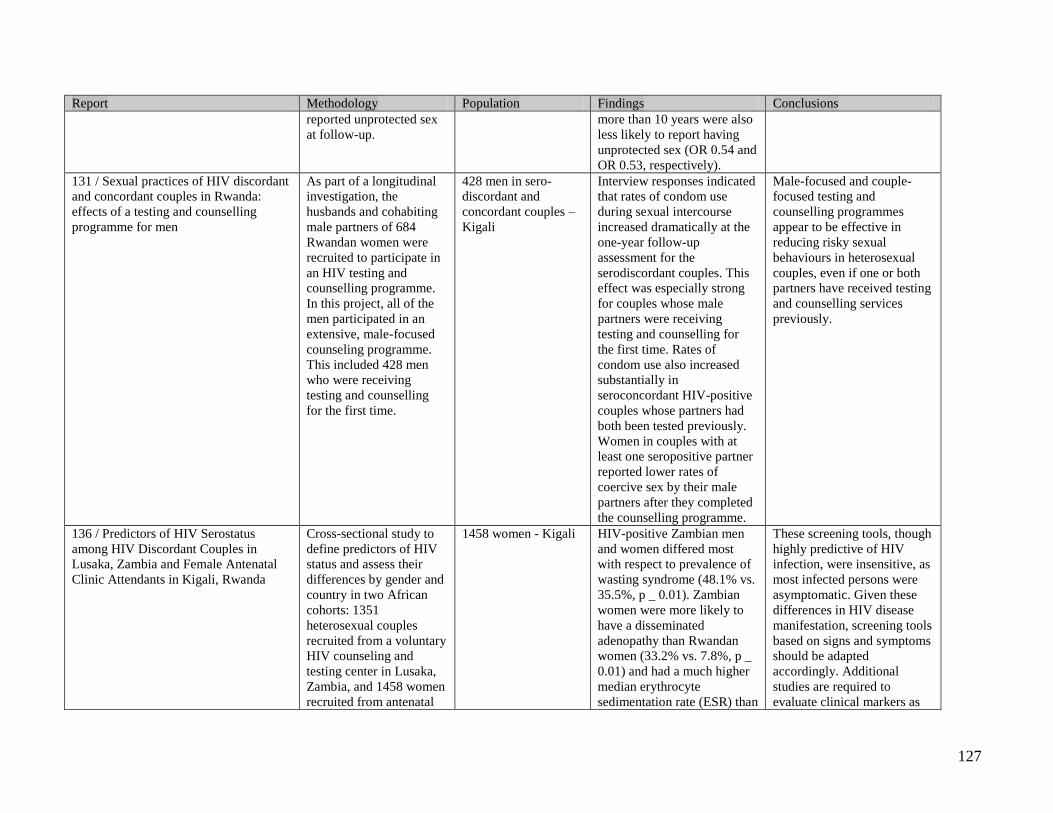
127
Report Methodology Population Findings Conclusions
reported unprotected sex
at follow-up.
more than 10 years were also
less likely to report having
unprotected sex (OR 0.54 and
OR 0.53, respectively).
131 / Sexual practices of HIV discordant
and concordant couples in Rwanda:
effects of a testing and counselling
programme for men
As part of a longitudinal
investigation, the
husbands and cohabiting
male partners of 684
Rwandan women were
recruited to participate in
an HIV testing and
counselling programme.
In this project, all of the
men participated in an
extensive, male-focused
counseling programme.
This included 428 men
who were receiving
testing and counselling
for the first time.
428 men in sero-
discordant and
concordant couples –
Kigali
Interview responses indicated
that rates of condom use
during sexual intercourse
increased dramatically at the
one-year follow-up
assessment for the
serodiscordant couples. This
effect was especially strong
for couples whose male
partners were receiving
testing and counselling for
the first time. Rates of
condom use also increased
substantially in
seroconcordant HIV-positive
couples whose partners had
both been tested previously.
Women in couples with at
least one seropositive partner
reported lower rates of
coercive sex by their male
partners after they completed
the counselling programme.
Male-focused and couple-
focused testing and
counselling programmes
appear to be effective in
reducing risky sexual
behaviours in heterosexual
couples, even if one or both
partners have received testing
and counselling services
previously.
136 / Predictors of HIV Serostatus
among HIV Discordant Couples in
Lusaka, Zambia and Female Antenatal
Clinic Attendants in Kigali, Rwanda
Cross-sectional study to
define predictors of HIV
status and assess their
differences by gender and
country in two African
cohorts: 1351
heterosexual couples
recruited from a voluntary
HIV counseling and
testing center in Lusaka,
Zambia, and 1458 women
recruited from antenatal
1458 women - Kigali HIV-positive Zambian men
and women differed most
with respect to prevalence of
wasting syndrome (48.1% vs.
35.5%, p _ 0.01). Zambian
women were more likely to
have a disseminated
adenopathy than Rwandan
women (33.2% vs. 7.8%, p _
0.01) and had a much higher
median erythrocyte
sedimentation rate (ESR) than
These screening tools, though
highly predictive of HIV
infection, were insensitive, as
most infected persons were
asymptomatic. Given these
differences in HIV disease
manifestation, screening tools
based on signs and symptoms
should be adapted
accordingly. Additional
studies are required to
evaluate clinical markers as

128
Report Methodology Population Findings Conclusions
and pediatric clinics in
Kigali, Rwanda.
either of the two other groups
(78 mm/hr vs. 47 mm/hr, p _
0.01). Multivariable logistic
regression modeling showed
a history of tuberculosis
[odds ratio (OR): 2.8–20.7],
adenopathy on examination
(OR: 4.0–6.3), and an ESR of
_65 mm/hr (OR: 3.1–5.9) to
be strongly predictive of HIV
status in all groups.
predictors of HIV disease
progression and adjust them
according to regional and
gender differences.
139 / HIV infection, Malaria, and
Pregnancy: A prospective cohort study
in Kigali, Rwanda
Prospective cohort study
to determine pregnancy
outcomes after screening
and treating common
genital infections, and
study the maternal
postpartum complications
in HIV-positive in
comparison to HIV-
negative women. Study
was conducted through
VCT sites at ANC clinics.
Baseline information on
age, parity, obstetrical and
medical history, and
socioeconomic
characteristics was
collected on standardized
questionnaires. Each
woman enrolled had a
systematic monthly
follow-up. A minimum of
2 antenatal visits were
performed. After delivery,
mothers were followed
every month until 6
months postpartum.
228 HIV positive and
229 HIV negative
mothers attending the
Centre Hospitalier de
Kigali. Women were
between 21 to 28
weeks of gestation.
*Follow-up of the cohort
was interrupted by the civil
war of 1994*
At inclusion, malaria
prevalence was 8.0% in HIV-
positive women and 3.5% in
HIV-negative women. Over
the study period, the
incidence of malaria was 6.2
per 100 women-months in the
HIV-positive group and 3.5 in
the HIV-negative group The
bulk of the difference
occurred postpartum. The
Kaplan-Meier 9-month
probability of remaining free
of malaria infection was
51.8% in HIV-positive
women and 65.2% in HIV-
negative women. When
taking account in the same
multivariate model (including
HIV infection, primiparity,
CD4 lymphocytes, anemia,
and education level), positive
HIV serostatus remained the
only factor significantly
Association between malaria
and maternal HIV infection
with an increased risk of
malaria occurrence in all
HIV-infected women
Strategies to reduce the
malaria morbidity during
pregnancy should be
reinforced in areas of high
HIV seroprevalence.

129
Report Methodology Population Findings Conclusions
associated with malaria
infection
HIV implementers have a unique
opportunity in Kigali
Lancet (2007)
Editorial piece
n/a
On June 16–19, the
Government of Rwanda will
host the third HIV/AIDS
Implementers‘ Meeting—
Scaling up through
partnerships in Kigali. The
meeting will address on-the-
ground implementation of
HIV/AIDS prevention,
treatment, and care
programs—to share best
practice and disseminate
lessons learned on what
works well and where
improvement is needed.
The participation of many
International cosponsors—
combined with the exemplary
leadership of the Government
of Rwanda—is a strong
signal of the increasing, and
very necessary, coordination
and collaboration now
evident in the global AIDS
response.
Only through joint efforts
from all sectors and at all
levels will the move towards
universal access to HIV
prevention, treatment, care,
and support be achieved. The
opportunities to learn from
each other in Kigali are
enormous and should not be
wasted.
VCT for HIV among pregnant women
presenting in labor in Kigali, Rwanda
Kowalczyk J, et al. (2002)
Questionnaire
administered to women
presenting in labor at the
Central Hospital of
Kigali, Rwanda (2001) as
well as 2 FGDs with 5
women each to
investigate factors related
to acceptability of VCT in
parturient women. (Not
relevant)
427 parturient women
Women whose partners had
skilled and well-paid jobs
were about four times more
likely to accept HIV testing
than were women whose
partners were unemployed
Likelihood of acceptance of
HIB testing was about three
times higher among women
35 years or older than
younger mothers
VCT in Kigali should be
conducted in antenatal
settings instead of at the time
of delivery.
New Challenges for Countries with
Limited Resources: Early diagnosis of
HIV-infection for children under 18
months – First evaluation of WHO
clinical diagnosis proposed in December
2004 (Revised in November 2005) on
Prospective study on 106
hospitalized children less
than 18 months old with
positive HIV serological
test at CHU de Kigali.
January to July 2005.
Kigali
106 hospitalized
children
Forty-eight (45,3 %) of the
106 children (aged from 1 to
17 months) were confirmed
to be infected with HIV using
DNA-PCR. Clinical criteria
proposed by the new WHO
As PCR is not yet widely
available, clinical diagnosis is
necessary. However current
criteria have a very poor
sensitivity and specificity.

130
Report Methodology Population Findings Conclusions
106 children in Kigali, Rwanda: Peltier,
CA; Cyuga, MP; Mukherjee, J;
Tuyishime, G; Omes, C; Muganga, N;
Arendt, V (2005)
Data collected: DNA -
PCR, clinical and
immunological WHO
criteria and absolute CD4
count.
recommendations were
present in 33 children of the
48 HIV-infected children
given a 68,8 % of sensitivity
and 74,1 % of specificity for
HIV infection in comparison
to the gold standard DNA-
PCR. The clinical signs have
a positive predictive value of
68,8 % and a negative
predictive value of 74,1 %.
Using a cut-off of absolute
CD4 under 1500 for children
under 18 months
demonstrated a sensitivity of
70,8 % and a specificity of
63,8 % with a positive
predictive value of 61,8 %
and a negative predictive
value of 72,5 %.
Impact of HIV on pediatric outpatient
clinic use in Kigali, Rwanda: Roberts, J;
Nsengumuremyi, F; Allen, S; Carlson,
C; Kahn, J; Schwalbe, J; Lepage, P
(1990)
472 HIV+ mothers and
997 HIV- mothers
enrolled in a prospective
study of the predictors
and natural history of HIV
infection in Kigali,
Rwanda were offered an
HIV blood test for their
children aged 12 months
to 16 years. HIV+ and
HIV- children were
compared during a 5-
month period in number
of clinic visits, presenting
symptoms (e.g., cough,
fever, diarrhea,
dermatitis), number of
laboratory tests ordered,
and type and cost of
Kigali
153 children
Of 153 children tested, 18
were HIV+. 50% of the HIV+
children and 24% of the HIV-
children had at least 3 clinic
visits in a 5 month period
(p=.02). The distribution of
symptoms was not different
in HIV+ and HIV- children,
but the proportion of HIV+
children requiring care for
dermatitis, cough, and
diarrhea was higher (50% vs.
13%, p <.001; 56% vs. 34%,
p=.08; 33% vs. 20%, p=.20,
respectively). Specific
medications such as oral
rehydration therapy, vitamins
and Bactrim syrup were
prescribed significantly more
HIV+ children required more
frequent attention for
common symptoms in an
outpatient clinic than their
HIV- counterparts, and the
cost per child was higher.

131
Report Methodology Population Findings Conclusions
medications prescribed. often for HIV+ children
resulting in a 1.7 times higher
cost for the HIV+ children
(US$4.30 vs US$2.80).
HAART can be Provided Safely in
African HIV Positive Children: Analysis
of patients in 2 urban health centres in
Kigali: De Naeyer, L; van Griensven, J;
Ubarijoro, S; Mushi, T; Ntabashwa, G;
Gazille, C; Zachariah, R (2006)
Evaluates side effects of
HAART among children
followed in 2 urban health
centres in Kigali, Rwanda
Kigali
230 children
A total of 230 (11%) children
(52% girls) of our cohort on
HAART are children < 13
years (median 6,9 years, IQR
4,5 – 9,5; 248 patient-years of
follow-up). Median CD4% at
start HAART was 13% (IQR
9%-17%, n-190). WHO
stages 1, 2, 3 and 4 were
respectively 14,8%, 50%,
33% and 5%. Majority (91%)
started on D4T/3TC /NVP in
a fixed dose combination
(NVP slightly overdosed), 13
(5%) initiated on 3TC
/AZT/NVP, 3 on 3TC
/D4T/EFV and 4 on 3TC
/AZT/EFV. 96% (n-221) are
still alive and followed up.
Median SGPT level at
baseline was 25,9 (IQR 19,1 -
36,1; n=155). Grade 1 to 4
hepatotoxicity (PACTG
1994) at follow-up was
respectively present in 27%,
3%, 0,5% and 0% (n=197) of
children. Moderate grade 1
(SGPT 1,1 to 2,5 UNL) was
noticed in 22%. Severe
hepatic abnormalities (grade
2-4 and symptomatic grade 1)
appeared in 12 cases (5,2%).
Seven symptomatic (fatigue,
nausea, fever, jaundice, RUQ
pain and/or hepatomegaly)
Rural health centres in Africa
starting access to HAART
should focus more on
children given the fewer side
effects and the better
response to treatment in terms
of morbidity and mortality
compared to adults.
Monitoring of LFT seems
unnecessary since virtually all
children switched treatment
only when clinical signs were
present.

132
Report Methodology Population Findings Conclusions
children changed to EFV.
Four of the eight patients with
grade 2-3 levels continued
NVP with spontaneous
recovery. Grade 3-4 skin
manifestations (ACTG 1992)
(with switch to EFV) were
seen in 11 patients (4,8 %).
Three changed to EFV due to
TB. No lactic acidosis or
peripheral neuropathy was
reported.
Pediatric HIV Needs Assessment in
Rwanda: Fabri, M; Cohen, M; Black, M;
Hakizimana, J; Mulinda-Shambo, B;
d'Adeskyz, A-C (2006)
Needs assessment was
conducted through
structured interviews,
group discussions, and
observations.
Health care providers,
parents, grandparents,
guardians, children,
and representatives of
nongovernmental and
governmental
organizations
involved in the care of
HIV positive women
were interviewed one-
on-one or in focus
groups by an HIV
care physician and
clinical psychologist
assisted by an
interpreter.
appropriate.
Consistently across the
interviewed sectors were five
key needs. The most pressing
issue was the need for food;
followed by school fees;
access to HIV/AIDS health
education and free
medication; social activities
to combat feelings of
isolation, anger, fear, and
stigmatization; and family
concerns such as disclosure
and preparation for death of a
parent.
In developing HIV services
for children in Rwanda,
issues inherent in poverty
must be addressed. Family-
centered models of care
require a multidisciplinary
team to attend to the many
levels of care that need to be
addressed in pediatric HIV
treatment. Appropriate
environmental stimuli in
clinic settings may create a
welcoming atmosphere and
allay fears. Support groups
for caretakers, and
developmentally appropriate
groups for children will
provide information, support,
and social interaction.
Amata Study: Effectiveness of
Antiretroviral Therapy in Breastfeeding
Mothers to Prevent Post-Natal Vertical
Transmission In Rwanda: Arendt V.,
Ndimubanzi P., Vyankandondera J.,
Ndayisaba G., Muganda j., Courteille O.,
Comparison of triple
antiretroviral therapy
(ART) given to
breastfeeding (BF)
mothers with formula
feeding (FF) for
572 HIV+ women
Women were given the
choice between FF or BF
with weaning at 6 months.
The latter group continued
ART until 1 month after the
end of BF. 304 mothers
Breastfeeding under triple
antiretroviral therapy in
children born to HIV-1
infected mothers is a safe way
of avoiding HIV-1 infection
in the baby while keeping the

133
Report Methodology Population Findings Conclusions
Rutanga C., Havuga E., Dhont N.,
Mujawamassiga A., Omes C., Peltier A.
(2007)
prevention of post-natal
mother-to-child
transmission.
(58%) opted for FF while 224
(42%) choose BF under ART.
Diagnostic PCR is so far
available for 419 babies at 6
weeks of age and for 236 at 7
months of age. Among these,
6 children are infected with
HIV (1,4%). All 6 had a
positive PCR already at birth
and, among those tested so
far, none has become infected
through breastfeeding under
ART. Psychomotor
development was assessed at
different timepoints and we
found no difference between
BF and FF children. No
significant difference in
morbidity was observed, with
1.23 disease episodes during
the first 6 months in FF
children compared to 1.21
episodes in BF children
(p=0.81). The difference in
mortality was not significant
either: 9 children under AF
died (2.9%), compared to 3
(1.3%) under BF (p=0.12).
benefits of breastfeeding and
avoiding the stigmatisation
and risks of artificial feeding.
Acceptability of HIV-1 testing of
partners of women from a pMTCT
program in Rwanda since the
introduction of the family approach for
clinical care: RWA/021 TRAC/NRL
project, Lux Development: Havuga E,
Sebuseruka S, Sergi C, Uwimana C,
Kagame A, Arendt V, Rudasingwa J,
Servais J (2003)
168 HIV+ women
Pregnant women tested HIV-
positive in a periurban health
center of Kigali, Rwanda
were asked to invite their
partner for testing and a
questionnaire (April -
September 2003). 77% of
partners came to the clinics
(98% of those turned up for
results, 88% were HIV+).
Only 22% of the partners had
Acceptability of HIV testing
of partners is high in situation
of access to clinical care
through the family approach.
Nonetheless, further
interventions to reduce the
stigmatisation are still needed
notably for the younger
people in situation of free
union.

134
Report Methodology Population Findings Conclusions
a previous testing (7%
simultaneously). The
mentioned reasons for delay
in testing were fear (51%), no
interest (25%), no disclosure
(20%), workload (4%). The
partners were motivated by
the family approach (90/130,
69%) and the good
counselling (31%).
The Impact of Art on Hiv Transmission
among HIV Serodiscordant Couples:
Kayitenkore K., Bekan B., Rufagari J.,
Marion-Landais S., Karita E., Allen S.
(2003)
Investigators reviewed the
clinical charts and
analyzed the data of HIV
discordant couples
followed in Kigali.
1034 serodiscordant
couples
Of the 1034 couples followed
at PSF, 248 have the HIV
positive partner on ART. HIV
negative individuals whose
partners are on ART are less
likely to seroconvert
compared to those whose
partners are not on ART,
OR=0.19 (95% CI 0.05-0.80).
After adjusting for the
confounding effect of
condom use, the result
remains statistically
significant with an OR of
0.21 (95% CI 0.05-0.89).
ARV has a protective effect
on negative partners. The
ongoing up-scaling of ART
could result in a considerable
decrease in HIV incidence in
the population when part of a
comprehensive effort for
treatment and prevention.
However since most
discordant couples have
HIV+ partners who do not
qualify for ARV(based on
current guidelines), therefore
from an epidemiologic
standpoint ART will not
significantly impact the
spread of the epidemic.
HIV Discordant couples in Kigali,
Rwanda: Ndandali B, Allen S,
Karagirwa A, Sahunkwe E (2002)
Retrospective study of
existing files and new
questionnaire.
100 serodiscordant
couples
74% of the couples had
ignored the possibility of the
phenomenon before
consulting. Only 26% of the
couples surveyed were aware
of the possibility of
discordance. 12% of the
couples surveyed had
temporally stopped all sexual
activity and 3% had stopped
them permanently. 29% of
the discordant couples
Lack of knowledge increased
the risk of contamination
among the healthy partner.
Moreover, the phenomenon
of discordance leads to
familial conflicts with
unpredictable consequences
such as separation, divorce
and coercion to have
unprotected sex.
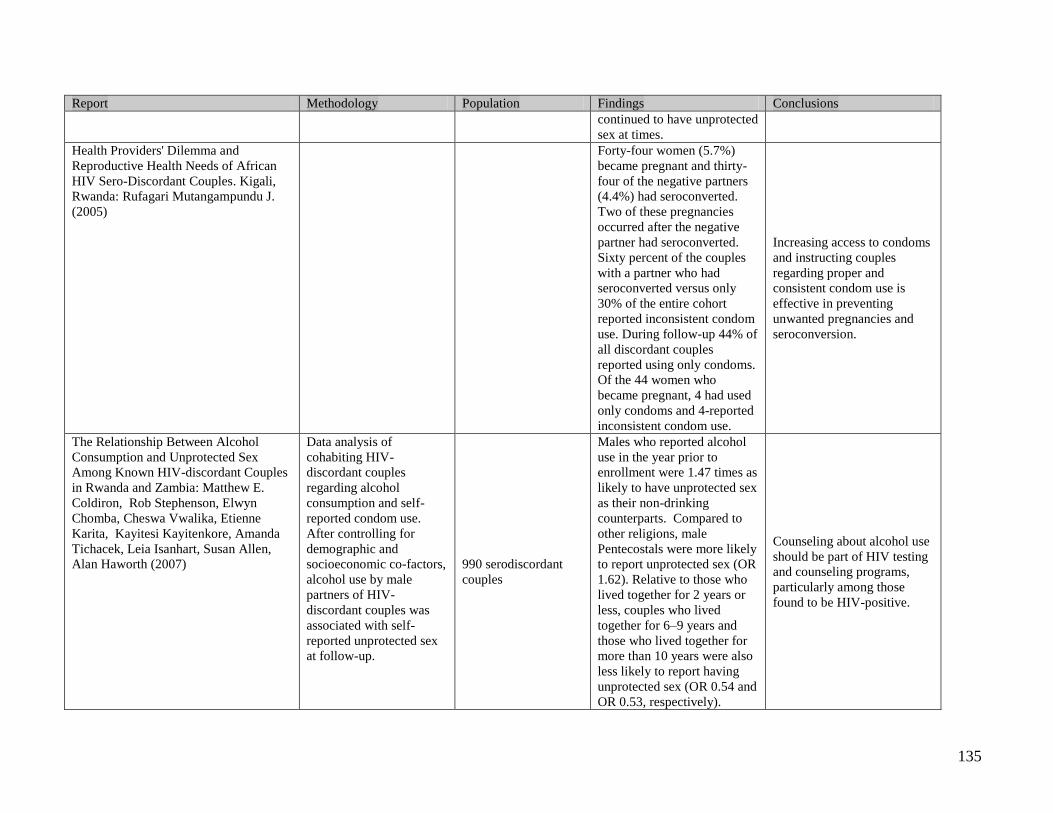
135
Report Methodology Population Findings Conclusions
continued to have unprotected
sex at times.
Health Providers' Dilemma and
Reproductive Health Needs of African
HIV Sero-Discordant Couples. Kigali,
Rwanda: Rufagari Mutangampundu J.
(2005)
Forty-four women (5.7%)
became pregnant and thirty-
four of the negative partners
(4.4%) had seroconverted.
Two of these pregnancies
occurred after the negative
partner had seroconverted.
Sixty percent of the couples
with a partner who had
seroconverted versus only
30% of the entire cohort
reported inconsistent condom
use. During follow-up 44% of
all discordant couples
reported using only condoms.
Of the 44 women who
became pregnant, 4 had used
only condoms and 4-reported
inconsistent condom use.
Increasing access to condoms
and instructing couples
regarding proper and
consistent condom use is
effective in preventing
unwanted pregnancies and
seroconversion.
The Relationship Between Alcohol
Consumption and Unprotected Sex
Among Known HIV-discordant Couples
in Rwanda and Zambia: Matthew E.
Coldiron, Rob Stephenson, Elwyn
Chomba, Cheswa Vwalika, Etienne
Karita, Kayitesi Kayitenkore, Amanda
Tichacek, Leia Isanhart, Susan Allen,
Alan Haworth (2007)
Data analysis of
cohabiting HIV-
discordant couples
regarding alcohol
consumption and self-
reported condom use.
After controlling for
demographic and
socioeconomic co-factors,
alcohol use by male
partners of HIV-
discordant couples was
associated with self-
reported unprotected sex
at follow-up.
990 serodiscordant
couples
Males who reported alcohol
use in the year prior to
enrollment were 1.47 times as
likely to have unprotected sex
as their non-drinking
counterparts. Compared to
other religions, male
Pentecostals were more likely
to report unprotected sex (OR
1.62). Relative to those who
lived together for 2 years or
less, couples who lived
together for 6–9 years and
those who lived together for
more than 10 years were also
less likely to report having
unprotected sex (OR 0.54 and
OR 0.53, respectively).
Counseling about alcohol use
should be part of HIV testing
and counseling programs,
particularly among those
found to be HIV-positive.

136
Report Methodology Population Findings Conclusions
The anti retroviral treatment to the
Kicukiro health center /Kigali-Rwanda:
Hitimana HT (2002-2003)
Evaluate the accessibility
to the ARV treatment in
Rwanda, and evaluate
difficulties of the clinical
and biological follow up.
352 ART patients
From January 2002 to May
2003: 352 patient (0,09% of
the infected people) took
Antiretroviral treatment to the
Kicukiro Health Center of
which 53,4% are men and
46,6% are women.1,4% have
less than 20years old. The
rate of death under treatment
is 6%. The rate of the lost of
view is also 10%. The little
variety range of the products
limit some combinations and
the circuit of medicine
availability is responsible of
certain periods of rupture
whereas resistance tests are
not even feasible to the
country.
Antiretroviral Cover of the
infected people remains very
weak (0,09) this even the
accessibility difficulties are
doubled with significant
abandonment rate due to
socio-economical context.
The facility of biological
controls and the process of
medicine acquirement could
improve medical care and
support for people living with
HIV/AIDS in Rwanda.
ART introduction in a community health
center in Rwanda: Ngabonziza M,
Martinez W, Murray D, Ngirabatware B,
Mukadi YD, Stuart L (2003)
Evaluation
147 ART patients
At the end of December
2003, 147 patients had started
ART; 122 (83%) were
women. At the start of
treatment, their median age
was 39 years and CD4 count
142/mm3. 144 clients (98%)
continue on treatment. Only
two deaths and one default
have occurred. Of the 27
clients who completed 6
months of treatment, the
average CD4 count increased
from 144 to 248/mm3.
LESSONS LEARNED: ART
can be provided successfully
at a community health center
with moderate investments
and using mostly nurses and
social workers. The health
center is capable of
conducting most needed lab
exams for ART monitoring
with limited lab equipment.
Clients readily accept the
observed administration of
ARVs at the start of therapy.
The experience of introducing
ART at Biryogo facilitated
the introduction of ART at a
faster pace in the next three
sites.
RECOMMENDATION: To
make ART accessible and

137
Report Methodology Population Findings Conclusions
improve patient follow-up,
the primary health care
center, representing the first
level of health care, should be
included in the delivery of
ART.
A comprehensive support program for
HIV/AIDS affected families in Rwanda:
Ndayisaba JD, Foex JM, Uwayisenga S,
Haag AL, Mora C (2000-2003)
Evaluation
2,994 persons
After three years of
implementation, AFXB
modules have directly
benefited 2,994 people.
Eighty-five percent of them
have been able to meet their
basic needs and increased
their standard of living above
the poverty line.
Governments need to
promote and implement
comprehensive support
programs for HIV/AIDS
affected families in order to
reduce the negative impact of
HIV among their most
vulnerable citizens.
HIV reference laboratory in Rwanda: a 5
year experience: Karita E, Van de Perre
P (1985-1990)
All serum samples
referred by clinicians or
volunteers are analysed
free of charge providing
that basic demographic
and clinical informations
are given. Samples are
screened by a commercial
ELISA (Organon(R)) and
confirmed by Indirect
Immunofluorescence
(Virion(R)). Discordant
samples are further
confirmed by Western
Blot (Du Pont(R) or
Biorad(R)).
Regarding support to clinical
diagnosis demands increased
steadily from 8,960 in 1986
to 12,899 in 1990. In 1990,
the laboratory personnel
consisted of 10 full-time
employees. New techniques
have been included such as
Polymerase Chain Reaction
and lymphocyte typing. For
this year, a total of 40,000
tests have been performed,
grossly half of these for
support to clinical diagnosis,
and half for serosurveillance
and research activities.
A reference laboratory is a
useful tool to support clinical
diagnosis of HIV infection
and to monitor trends of the
AIDS epidemic. HIV-infected
women are predominating in
the younger adult age groups
when infected men are more
frequent in older age groups.
HIV testing and education promote safer
sex among urban women in Rwanda:
Lindan C, Allen S, Nsengumuremyi F,
Black D, Schwalbe J, Levy J, Hulley S
(1988)
A representative sample
of 1469 childbearing
women was enrolled in a
prospective study of HIV
infection and behaviour
change in 1988. Women
completed a
questionnaire, saw an
1,469 women
Prior to the study, 9% of
women had tried condoms
and/or spermicides, and 3%
had reduced their number of
sex partners due to the threat
of AIDS. At 6 months,
443/1298 (34%) who came in
for follow-up claimed they
HIV testing and education are
important in promoting safer
sex behaviours among
African women. However,
the relationship of women to
their partners also influences
their ability to change
behaviour. Intervention

138
Report Methodology Population Findings Conclusions
educational video in the
local language followed
by a group discussion,
underwent HIV testing
and counseling and were
offered condoms
(recommended) and/or
spermicides. Education
and HIV testing were also
offered to the women's
sexual partners.
were having safer sex in
response to information given
in the project: 21% of 1298
were using condoms, 16%
were using spermicides, 2%
had fewer sex partners.
Women whose partners came
in to be tested, women who
were HIV+, or who had
multiple or promiscuous
partners were more likely to
practice safer sex. However,
women in less socially stable
partner relationships more
frequently chose spermicides
over condoms, while women
in more stable relationships
more frequently chose
condoms. Women rated the
video and HIV testing for
themselves and partners as
the two most important
factors
efforts, therefore, must also
target men.
Regional and Gender Differences in
Mortality Due to HIV in Two Resource
Poor Cities in Africa: S Lakhi (1986-
2003)
Comparison of mortality
rates in cohorts from two
resource poor regions: 1)
Kigali, Rwanda (1,458
women followed from
1986–present, excluding
‗genocide‘ months of
Apr- July of 1994), 2)
Lusaka, Zambia (2,050
men and women enrolled
from 1995–2000).
1,458 women
Mortality rates in HIV(–)
men and women were low
(1–2/1000 PY in women, 9–
10/1000/PY in men) and did
not differ between cities.
Mortality rates were similar
in Zambian and Rwandan
HIV(+) women (4–6/100
PY). No pathogen was
identified in >50% of deaths.
Classical manifestations of
AIDS (Cryptococcus, KS,
and oesophageal candida)
accounted for <10% of
deaths. Severe bacterial
infections (7–13%), malaria
Diagnostic facilities and
criteria changed over time
and differed between Kigali
and Lusaka. Cultural
differences, such as tendency
to die in hospital (<15% of
Rwandans versus >60% of
Zambians) also affected
determination of cause of
death

139
Report Methodology Population Findings Conclusions
(6–13%) and
meningitis/encephalopathy
(4–10%) were more common.
Tuberculosis was more
prevalent in post-genocide
Rwanda (21–30%) compared
to pre-genocide Rwanda
(10%).
Impact of HIV infection on tuberculosis
in Kigali, Rwanda: one year study of 377
cases: Batungwanayo J, Taelman H,
Bogaerts J, Muhlberger F, van Deun A,
van de Perre P (1991)
Analyze and compare the
clinical, diagnostic,
therapeutic and
immunological features of
tuberculosis (TB) in HIV
seropositive (HIV+)
patients (pts) and HIV
seronegative (HIV-) pts,
admitted to and followed-
up in the Department of
Internal Medicine of
CHK.
512 TB patients
Between Jan 91 and Dec 91,
TB was diagnosed in 512 pts,
of whom 377 (227 M, 157 F;
mean age 33 y, range 7-72)
consented to HIV testing. The
most frequent
extrapulmonary involvement
of TB among HIV+ pts were
pleural (n = 77), mediastino-
hilar (n = 42), miliary (n =
25), pericardial (n = 18) and
peripheral nodes (n = 14). In
patients with pulmonary TB
the middle and lower lobes
were significantly more often
involved in HIV+ than in
HIV- pts (59/198, 29.8% vs
3/28, 10.7%; p < 0.04)
whereas cavities were more
frequently seen in HIV- pts
(15/28, 53.5% vs 53/198,
26.7%; p < 0.004). The
mortality rates among HIV+
and HIV- pts (62/334, 18.5%
vs 5/43, 11.6%; p = 0.26) and
the side effects of anti-TB
treatment among HIV+ and
HIV- pts were not
significantly different
(54/334, 16.1% vs 3/43, 6,
9%; p = 0.11).
In the Dept. of Int. Med. of
CHK: 1) TB is strongly
associated with HIV
infection. 2) Extrapulmonary
TB, involvement of middle
and/or lobes and PPD anergy
were significantly more often
seen in HIV+ pts while
cavities were more frequent
in HIV- pts.

140
Report Methodology Population Findings Conclusions
Traditional medicine vs. modern
medicine for AIDS: King R, Homsy J,
Serufilira A, Allen S (1992)
To assess the factors and
perceptions determining
choice between traditional
and Western medicine
(WM) among urban
African women when
confronting illness in
general, and AIDS in
particular.
40 women; 25
traditional healers
were interviewed
The majority of women were
concurrently using traditional
and WM. Among the reasons
for use of TH; 30% greater
effectiveness of the TM over
WM for poisoning, dermatitis
(including herpes zoster),
abscesses, pregnancy and
infertility; dissatisfaction with
the hospital including
treatment failure (13%),
better accessibility of TH
(10%), and preference for TH
medication (10%). Reasons
for consulting WM were:
perceived appropriateness for
specific illnesses, and
exploratory medical
technology (blood
examinations and x-ray) for
illnesses perceived as
internal. 7 out of 40 women
stated they did not consult
TH. All women stated that
TH treat certain illnesses
better than WM, even those
stating they did not consult
the TH. All TH had heard of
AIDS, knew the modes of
transmission and the major
signs. Three TH had a
university level education
while 32% had no formal
education. Five claimed to
have successfully treated
AIDS patients, while 28%
stated herpes zoster as their
specialty.
Women interviewed are
critically using both Western
and traditional medicine.
Women were found to
consult TH for specific
symptoms including certain
HIV related manifestations.
TH were highly

141
Report Methodology Population Findings Conclusions
Region Author(s) / Contact Title/File name Year Sample Findings
Kigali
A Fischer, J-C Karasi, D
Kibibi, C Omes, C
Lambert, A Uwayitu, R
Hemmer, J Van Den
Ende, J-C Schmit and V
Arendt
Antiviral efficacy and
resistance in patients
on antiretroviral
therapy in Kigali,
Rwanda: the real-life
situation in 2002
2002 233 HIV+
patients
Our study aimed to complete the published data on ARV therapy in Africa by
describing the baseline situation in Rwanda before the launch of a large ARV
programme (ESTHER). Prescription habits, frequency and reasons for treatment
interruptions but also antiviral efficay, resistance to ARVs and genotypic variability
of the viruses present in Rwanda were analysed. Among the 233 patients included in
the study, it appeared that a vast majority (91%) were under triple therapy and that
half of them had experienced at least one treatment interruption caused mainly by
drug shortage or financial difficulties. Among 60 blood samples analysed, 26 were in
virological failure with a viral load above 1000 RNA copies/ml and 11 presented
major drug resistance mutations. Finally, virological failure could mainly be
explained by the high frequency of treatment interruptions but also by the emergence
of drug resistance mutations. Consequently the major objective for the ESTHER
programme to improve the situation in Rwanda will be to reduce the drug shortage
and facilitate the financial accessibility of the treatments.
Kigali
Joyce T. Au, Kayitesi
Kayitenkore, Erin
Shutes, Etienne Karita,
Philip J. Peters, Amanda
Tichacek and Susan A.
Allen
Access to adequate
nutrition is a major
potential obstacle to
antiretroviral
adherence among
HIV-infected
individuals in
Rwanda
pub.
2006
71 HIV+
patients
Despite the massive expansion of antiretroviral drugs in Africa, little is known about
the resulting changes in sexual behavior or obstacles to antiretroviral therapy (ART)
adherence. Our evaluation of Rwandan adults on ART found no increase in risky
sexual behaviors, but an obstacle to ART initiation and adherence for 76% of patients
was a fear of developing too much appetite without enough to eat. Access to adequate
nutrition may be a major determinant for long-term adherence to ART.

142
Kigali
JOE¨L LADNER,
VALE´RIANE LEROY,
ARLETTE SIMONON,
ETIENNE KARITA,
JOSEPH BOGAERTS,
ANDRE´ DE CLERCQ,
PHILIPPE VAN DE
PERRE, AND
FRANCOIS DABIS
HIV INFECTION,
MALARIA, AND
PREGNANCY: A
PROSPECTIVE
COHORT STUDY
IN KIGALI,
RWANDA
1992 -
1993
228 HIV+ and
229 HIV-
pregnant
women
In order to study the relation between human immunodeficiency virus (HIV)
infection and malaria in women, during and after pregnancy, a prospective cohort
study was initiated at the Centre Hospitalier de Kigali in Rwanda through routine
voluntary and confidential HIV screening in antenatal clinics. At inclusion in the
cohort of all HIV-positive and an equivalent number of HIV-negative pregnant
women, between 21 and 28 weeks of gestation, sociodemographic characteristics and
medical history during the current pregnancy were collected; screening for malaria
(tick blood smear) and anemia and a CD4 lymphocyte count were systematically
performed. Each woman enrolled had a monthly follow-up until 6 months after
delivery. A clinic was implemented that was accessible and free of charge to every
woman during the study period between scheduled visits. Malaria infection was
systematically screened in case of fever or other compatible symptoms. The cohort
included 228 HIV-positive and 229 HIV-negative women. At inclusion, malaria
prevalence was 8.0% in HIV-positive women and 3.5% in HIV-negative women (P
_0.04). Over the study period, the incidence of malaria was 6.2 per 100 women-
months in the HIV-positive group and 3.5 in the HIV-negative group (relative risk
[RR] _ 1.7, 95% confidence interval [CI] _ 1.4–2.3). The bulk of the difference
occurred postpartum. The Kaplan-Meier 9-month probability of remaining free of
malaria infection was 51.8% in HIV-positive women and 65.2% in HIV-negative
women (P _ 0.013). When taking account in the same multivariate model (including
HIV infection, primiparity, CD4 lymphocytes, anemia, and education level), positive
HIV serostatus remained the only factor significantly associated with malaria
infection (RR _ 1.4, CI _ 1.1–1.6; P _ 0.016). Our study prospectively documents the
association between malaria and maternal HIV infection and highlights the increased
risk of malaria occurrence in all HIV-infected women. Strategies to reduce the
malaria morbidity during pregnancy should be reinforced in areas of high HIV
seroprevalence.

143
Kigali
KAYVON
MODJARRAD, ISAAC
ZULU, ETIENNE
KARITA, NZALI
KANCHEYA, ELLEN
FUNKHOUSER, and
SUSAN ALLEN
Predictors of HIV
Serostatus among
HIV Discordant
Couples in Lusaka,
Zambia and Female
Antenatal Clinic
Attendants in Kigali,
Rwanda
1986-
1987 1458 women
We conducted a cross-sectional study to define predictors of HIV status and assess
their differences by gender and country in two African cohorts: 1351 heterosexual
couples recruited from a voluntary HIV counseling and testing center in Lusaka,
Zambia, and 1458 women recruited from antenatal and pediatric clinics in Kigali,
Rwanda. HIV-positive Zambian men and women differed most with respect to
prevalence of wasting syndrome (48.1% vs. 35.5%, p _ 0.01). Zambian women were
more likely to have a disseminated adenopathy than Rwandan women (33.2% vs.
7.8%, p _ 0.01) and had a much higher median erythrocyte sedimentation rate (ESR)
than either of the two other groups (78 mm/hr vs. 47 mm/hr, p _ 0.01). Multivariable
logistic regression modeling showed a history of tuberculosis [odds ratio (OR): 2.8–
20.7], adenopathy on examination (OR: 4.0–6.3), and an ESR of _65 mm/hr (OR:
3.1–5.9) to be strongly predictive of HIV status in all groups. These screening tools,
though highly predictive of HIV infection, were insensitive, as most infected persons
were asymptomatic. Given these differences in HIV disease manifestation, screening
tools based on signs and symptoms should be adapted accordingly. Additional studies
are required to evaluate clinical markers as predictors of HIV disease progression and
adjust them according to regional and gender differences.
Kigali
Duggan, E; Mukazayire,
C; Hakizimana, J;
Cohen, M; d'Adesky, A;
Anastos, K
VCT IN
PARTNERSHIP
WITH RWANDAN
WOMEN'S
ASSOCIATIONS
FACILITATES
ACCESS TO HIV
CARE FOR
CHILDREN
pub.
2006 212 Children
In partnership with the Rwandan government and Rwandan grass-roots organizations,
Women's Equity in Access to Care and Treatment (WE-ACTx), an NGO,
investigated ways to facilitate rapid access to pediatric HIV care. METHODS: WE-
ACTx established two clinics and a Voluntary Counseling and Testing (VCT)
program in Kigali, with 2 mobile teams providing VCT onsite at our partner
associations throughout Kigali, and with 3 testing sites for "fixed" VCT services at a
clinical site and at two additional locations. The VCT program provides services to
~2500 patients/ month. RESULTS: Of 212 children (0-15) currently receiving HIV
care at both clinics, 84% entered care through VCT. Other means of entry include
PMTCT, hospitalization and referrals from other clinics. 55% of children live with
one parent, 20.7% with both parents and 23.9% with a guardian. 33 children are
orphans, and 78 have lost one parent. Median age at first visit is 6 years; 21.6 % were
CDC HIV stage 1; 34.7% stage 2; 41.6% stage 3 and 2.1% stage 4. At the clinic co-
located with VCT services, 70.8% enter through VCT; 61.4% are seen within one
week of their HIV+ result and 78.9% within two weeks. At the second clinic site,
66.2% of children enter through WE-ACTx VCT. Other means of entry include
external consultation, hospitalization, PMTCT and other VCT programs. Of those
entering care through WE-ACTx VCT, 43.2% enter care within one week, 60.2%
within 2 weeks. By comparison, 15.5% of those entering through other methods are
seen within one week, 26.7% within 2 weeks. CONCLUSIONS: VCT services in
grass-roots associations coordinated with referral to clinical services facilitates rapid
access to needed HIV care for children, and is an easily replicable model.

144
Kigali
Jamease Kowalczyk,
Pauline Jolly, Etienne
Karita, Joseph-Ardent
Nibarere, Joseph
Vyankandondera, and
Hamisu Salihu
Voluntary
Counseling and
Testing for HIV
Among Pregnant
Women Presenting in
Labor in Kigali,
Rwanda
2001 427 pregnant
women
This study investigated factors related to acceptability of voluntary counseling and
testing (VCT) for HIV among pregnant women presenting in labor in Kigali,
Rwanda, in an era of free and effective antiretroviral drugs for prevention of perinatal
transmission of HIV. A pilot-tested questionnaire was administered to study
participants to solicit information regarding their intentions to accept or refuse VCT
and treatment of HIV infection during labor and delivery if confirmed infected. Two
factors correlated significantly with the acceptance rate. The strongest predictive
factor for acceptability of HIV testing was the profession of the male partner. Women
whose partners had skilled and well-paid jobs were about four times more likely to
accept HIV testing than were women whose partners were unemployed (AOR, 3.5).
The other factor significantly associated with the acceptance rate was maternal age.
The likelihood of acceptance of HIV testing was about three times higher among
women 35 years or older than among younger mothers (AOR, 3.1). For every 5-year
increment in maternal age, the odds of acceptance of HIV testing increased by a
factor of 1.20. Using this important finding, we constructed an acceptance rate
probability curve that could serve as a useful tool to evaluate the efficacy of future
interventions aimed at improving the acceptability rate of HIV testing among
pregnant women at the study site.
Kigali Atkinson, J; Karita, E;
Allen, S
RISK REDUCTION
WITHIN
DISCORDANT
COUPLES DUE TO
COUPLES
VOLUNTARY
TESTING AND
COUNSELLING
pub.
2006
793 discordant
cohabiting
heterosexual
couples
Sexual behaviour prior and post couples voluntary counselling and testing (CVCT) is
analysed for 793 cohabiting heterosexual discordant couples. The influence on risk
behaviour of prior testing and the sex of the positive partner is also assessed.
METHODS: Discordant cohabiting couples from one of three same-day CVCT
centres within Kigali, Rwanda were invited to enrol in a prospective study of
heterosexual transmission of HIV. Self-reported sexual behaviour was recorded at
baseline for the previous 3 months prior to CVCT and at 3-monthly intervals
thereafter; in addition, seroconversion and pregnancy were recorded. Risk (the
percentage of reported sexual acts between couples without a condom) was compared
pre and post CVCT. The influence of pre testing or sex of positive partner was
assessed. RESULTS: Overall risk behaviour reduced from 70.2% pre CVCT to 2.1%
after CVCT (p<0.0001). Couples where both partners have been previously tested
were still at considerable risk pre CVCT (risk = 53.3%). When only the positive
partner had been previously tested the risk pre CVCT was lower when this partner
was the male compared to female (risk 68% to 42%: p=0.096). Reported risk post
CVCT was higher in discordant couples where the positive partner was female (risk
3.4% to 0.6%. This is also shown in the higher rate of incident infections in the male
partner than the female partner (15 vs 4). Pregnancies rate in couples with female
positive partner compared to male 60 vs. 45. CONCLUSIONS: Discordant couples
previously tested using traditional practices of individual testing remain at significant
risk for HIV transmission, however CVCT can drastically reduce this risk by
counselling the couple together. Previous testing appears less effective at reducing

145
risk behaviour when the female is the positive partner. The reported risk behaviour
after CVCT is higher when the male partner is the negative partner.
Kigali
David L Roth, Katharine
E Stewart, Olivio J Clay,
Ariane van der Straten,
Etienne Karita and Susan
Allen
Sexual practices of
HIV discordant and
concordant couples in
Rwanda: effects of a
testing and
counselling
programme for men
1991-
1992 428 men
As part of a longitudinal investigation, the husbands and cohabiting male partners of
684 Rwandan women were recruited to participate in an HIV testing and counselling
programme. All of the women and 256 of the men (37%) had previously received
standard testing and generic counselling services. In this project, all of the men
participated in an extensive, male-focused counseling programme. This included 428
men who were receiving testing and counselling for the first time. Interview
responses indicated that rates of condom use during sexual intercourse increased
dramatically at the one-year follow-up assessment for the serodiscordant couples.
This effect was especially strong for couples whose male partners were receiving
testing and counselling for the first time. Rates of condom use also increased
substantially in seroconcordant HIV-positive couples whose partners had both been
tested previously. Women in couples with at least one seropositive partner reported
lower rates of coercive sex by their male partners after they completed the
counselling programme. Male-focused and couple-focused testing and counselling
programmes appear to be effective in reducing risky sexual behaviours in
heterosexual couples, even if one or both partners have received testing and
counselling services previously.

146
Kigali Iwanowski, MR
COUPLES‘ VCT IN
ANC CLINICS:
PREVENTION OF
PERINATAL AND
HETEROSEXUAL
HIV
TRANSMISSION IN
AFRICA
pub.
2003
984 pregnant
women; 964
couples
Objective was to promote involvement of male partners in Voluntary Counselling and
Testing (VCT) and prevention-of-mother-to-child-transmission (PMTCT) services in
antenatal care clinics (ANC). METHODS: Four ANC clinics (two in Lusaka,
Zambia and two in Kigali, Rwanda) were selected. Same-day VCT was provided for
pregnant women. Weekend couples‘ VCT services were promoted by nurses who
distributed written invitations during ANC visits. Nevirapine (NVP) tablets were
given at post-test. RESULTS: In an 8 month period, 984 tested alone and 964 as
couples in Kigali. The prevalence of HIV was 14–17% in Kigali.23-30% of women
in Kigali had been previously HIV tested. For women tested alone in Kigali (25–
30% LFU for HIV+ and 36–41% for HIV–) and no difference was noted in LFU
between couples with or without HIV. Of recorded deliveries in HIV+ women, 83-
91% in Kigali included NVP. CONCLUSIONS: Same-day VCT was feasible for
women in ANC clinics, and the weekend couples‘ VCT programme was popular.
Partner participation was not associated with better follow-up or NVP use overall.
HIV+ women in Kigali were obliged to obtain NVP syrup at the hospital, which may
have contributed to the higher follow-up rate. Pre-measured NVP syrup should be
available for HIV+ women who prefer not to disclose.
Kigali
Henderson, F; Zambia-
Rwanda HIV Research
Group
TRAINING
INFLUENCE
NETWORK
AGENTS (INAs) TO
PROMOTE
VOLUNTARY HIV
COUPLES
TESTING AND
COUNSELLING
(VCT) IN TWO
AFRICAN
CAPITALS:
QUALITATIVE
METHODS AND
RESULTS
pub.
2003 -
We developed a community leadership model to recruit, train and assess
effectiveness of influence network agents (INAs) in CVCT promotion in Kigali,
Rwanda and Lusaka, Zambia. Methods: VCT centre staff familiar with target
neighbourhoods identified a diverse group of candidate INAs. Interested candidates
were recruited and trained to invite couples to participate in VCT. A data collection
and analysis mixed methods (qualitative/quantitative) approach assessed the process
and outcomes of INA efforts. Results: The majority of invited INA candidates
accepted, and only 4/61 dropped out during the first 8 weeks of work. The number of
invitations distributed and resulting proportion of couples tested varied widely. INAs
initially approached family, friends, work colleagues, and neighbours with CVCT
invitations. As time passed, INAs gained confidence to approach other community
members. INAs preferred to approach couples, rather than husband or wife alone, but
this proved difficult for logistical reasons. During training, INAs were encouraged to
preface invitations by public announcements when possible (i.e., to a church group).
Few did so, citing fear of stigma as a deterrent. INAs reported gaining status in their
community because of the activities. Most felt strongly that their task would be easier
if public figures openly endorsed CVCT. Conclusions: Results of this pilot work
suggest that INAs can play a significant role in increasing African couples‘
participation in VCT. However, attention to issues of status, individual respect,
beliefs about being positive, stigma, joint couples recruitment, and content and
delivery style of the VCT and HIV message, is critical if training of INAs is to be
successful.

147
Kigali
Joseph, DL; Allen, S;
Roth, D; Telfair, J;
Sams, K
Improving on a
successful model for
promoting couples'
voluntary counseling
and testing (CVCT)
in two African
capitals: Mobile
couples' HIV testing
units
2003 95 couples
Increases in demand and supply of CVCT are critical. METHODS: "Influence
Network Agents" (INAs), recruited by community leaders, were trained to invite
couples for CVCT using their personally established community networks in Lusaka,
Zambia and Kigali, Rwanda. We improved upon this model by increasing the supply
of CVCT in local communities. INAs invited couples to mobile testing units (MU) in
local churches, schools and administrative offices. RESULTS: INAs dramatically
increased demand for CVCT. Predictors of successful invitations (resulting in a
couple tested) included inviting couples together, inviting couples known to INAs,
and issuing invitations after public announcements. Couples invited in Kigali were
more likely to receive CVCT. INA work in the communities increased the numbers
of couples tested in our facilities by 450% in Kigali over the last three months of
2003. In addition to fixed testing sites, each city utilized 8 MUs. Kigali sites tested 95
couples; numbers of couples tested increased with each site and with geographically
isolated sites. Limited success of MUs should be weighed against costs of such
services. CONCLUSIONS: INAs were effective in recruiting couples to receive
CVCT, and increased the demand for CVCT. MUs providing CVCT in accessible
neighborhood locations may increase testing rates, but more research is needed. The
next phase will assess which methods are most effective for promoting CVCT: using
INAs to increase demand for services at fixed sites or combining INAs and MUs to
enhance supply of CVCT.
Kigali
Casanova, D; Rwanda-
Zambia HIV Research
Group
TAKING IT TO
THE STREETS:
MOBILE UNITS
FOR COUPLES
VOLUNTARY
COUNSELING
AND TESTING
2004-
2005 366 couples
This study considers various factors in determining the success of mobile units
(MUs) to increase couple's VCT (CVCT) uptake in Rwanda and Zambia.
METHODS: MUs were implemented concurrently in Kigali and Lusaka from July
2004-January 2005 where CVCT was not previously available. Political and
community Influential Network Leaders (INLs) identified MU locations for CVCT.
MUs were held at each location twice a week for one month. Influential Network
Agents (INAs) were trained to invite couples to fixed CVCT and MU sites. The
number of couples tested and additional observations were recorded. RESULTS: In
Kigali, MUs were held at 3 schools, 1 private clinic, 1 PLWHA association, and 1
district office from July 2004-January 2005 where 366 couples were tested. The
highest average of couples tested was at the private clinic (14.8). Most sites were
located at least 3kms away from the fixed site. CONCLUSIONS: Successful MU
sites depend on the participation of community and political/administrative leaders as
well as the type of site. In Kigali, the most successful MU benefited from strong INL
involvement and additional leaders at the grassroots level.
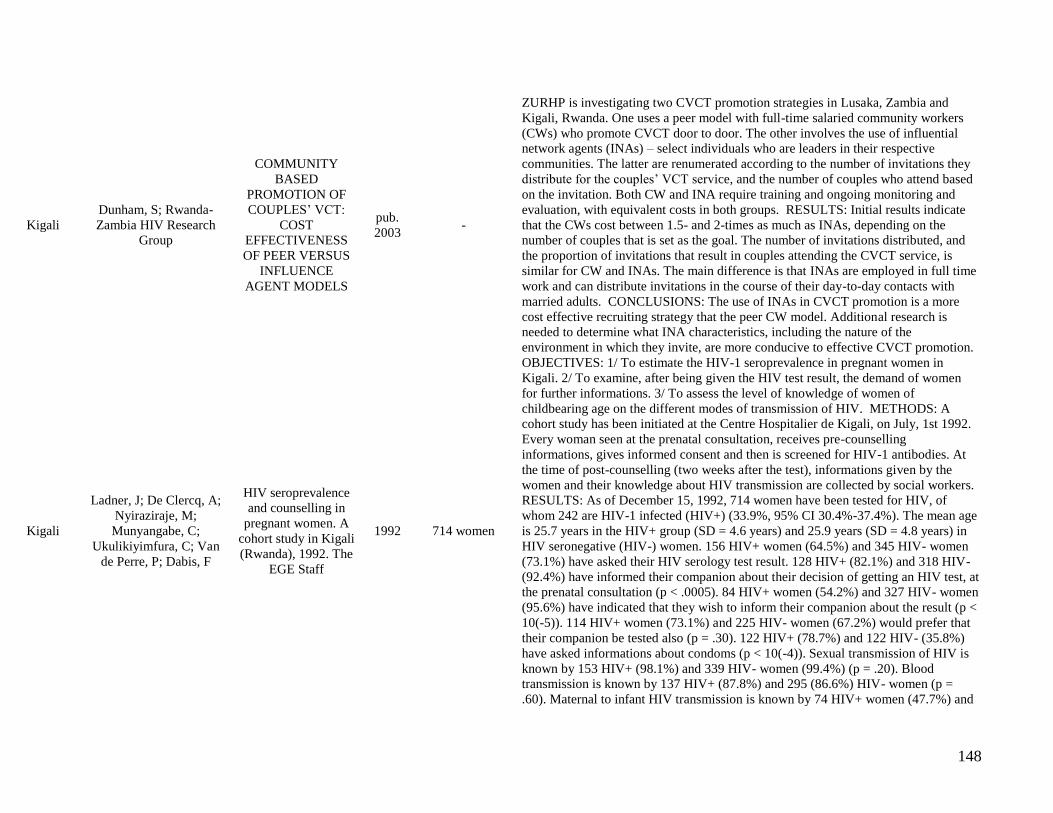
148
Kigali
Dunham, S; Rwanda-
Zambia HIV Research
Group
COMMUNITY
BASED
PROMOTION OF
COUPLES‘ VCT:
COST
EFFECTIVENESS
OF PEER VERSUS
INFLUENCE
AGENT MODELS
pub.
2003 -
ZURHP is investigating two CVCT promotion strategies in Lusaka, Zambia and
Kigali, Rwanda. One uses a peer model with full-time salaried community workers
(CWs) who promote CVCT door to door. The other involves the use of influential
network agents (INAs) – select individuals who are leaders in their respective
communities. The latter are renumerated according to the number of invitations they
distribute for the couples‘ VCT service, and the number of couples who attend based
on the invitation. Both CW and INA require training and ongoing monitoring and
evaluation, with equivalent costs in both groups. RESULTS: Initial results indicate
that the CWs cost between 1.5- and 2-times as much as INAs, depending on the
number of couples that is set as the goal. The number of invitations distributed, and
the proportion of invitations that result in couples attending the CVCT service, is
similar for CW and INAs. The main difference is that INAs are employed in full time
work and can distribute invitations in the course of their day-to-day contacts with
married adults. CONCLUSIONS: The use of INAs in CVCT promotion is a more
cost effective recruiting strategy that the peer CW model. Additional research is
needed to determine what INA characteristics, including the nature of the
environment in which they invite, are more conducive to effective CVCT promotion.
Kigali
Ladner, J; De Clercq, A;
Nyiraziraje, M;
Munyangabe, C;
Ukulikiyimfura, C; Van
de Perre, P; Dabis, F
HIV seroprevalence
and counselling in
pregnant women. A
cohort study in Kigali
(Rwanda), 1992. The
EGE Staff
1992 714 women
OBJECTIVES: 1/ To estimate the HIV-1 seroprevalence in pregnant women in
Kigali. 2/ To examine, after being given the HIV test result, the demand of women
for further informations. 3/ To assess the level of knowledge of women of
childbearing age on the different modes of transmission of HIV. METHODS: A
cohort study has been initiated at the Centre Hospitalier de Kigali, on July, 1st 1992.
Every woman seen at the prenatal consultation, receives pre-counselling
informations, gives informed consent and then is screened for HIV-1 antibodies. At
the time of post-counselling (two weeks after the test), informations given by the
women and their knowledge about HIV transmission are collected by social workers.
RESULTS: As of December 15, 1992, 714 women have been tested for HIV, of
whom 242 are HIV-1 infected (HIV+) (33.9%, 95% CI 30.4%-37.4%). The mean age
is 25.7 years in the HIV+ group (SD = 4.6 years) and 25.9 years (SD = 4.8 years) in
HIV seronegative (HIV-) women. 156 HIV+ women (64.5%) and 345 HIV- women
(73.1%) have asked their HIV serology test result. 128 HIV+ (82.1%) and 318 HIV-
(92.4%) have informed their companion about their decision of getting an HIV test, at
the prenatal consultation (p < .0005). 84 HIV+ women (54.2%) and 327 HIV- women
(95.6%) have indicated that they wish to inform their companion about the result (p <
10(-5)). 114 HIV+ women (73.1%) and 225 HIV- women (67.2%) would prefer that
their companion be tested also (p = .30). 122 HIV+ (78.7%) and 122 HIV- (35.8%)
have asked informations about condoms (p < 10(-4)). Sexual transmission of HIV is
known by 153 HIV+ (98.1%) and 339 HIV- women (99.4%) (p = .20). Blood
transmission is known by 137 HIV+ (87.8%) and 295 (86.6%) HIV- women (p =
.60). Maternal to infant HIV transmission is known by 74 HIV+ women (47.7%) and

149
162 HIV- women (47.4%) (p = .90). Finally, 34 HIV+ women (21.9%) and 69 HIV-
women (20.2%) quote other modes of HIV transmission (p = .70). CONCLUSIONS:
HIV seroprevalence is higher among urban women of childbearing age in Kigali, than
in previous studies carried out in the same hospital. There is a strong wish by women
to known their HIV serological status in this population. Counselling services should
be considered as an additional mean for the reduction of HIV transmission in Rwanda
and should also target to the regular sexual partners of those who accept to be tested.
Kigali
Karita, E; Shah, HD;
Leblanc, N; Beaty, L;
Rwanda-Zambia HIV
Research Group
A
COMPREHENSIVE
APPROACH TO A
PROCESS
EVALUATION OF
COUPLES'
VOLUNTARY
COUNSELING
AND TESTING
(CVCT)
pub.
2006 -
Four tools were developed to assess counselor knowledge of HIV/AIDS and couples'
counseling protocol, counselor adherence to protocol, and protocol effectiveness at
Project San Francisco in Kigali, Rwanda. A written exam and interview assessed
counselor knowledge, an observation checklist determined level of adherence to
protocol during counseling sessions, semi-structured counselor interviews gathered
counselor feedback, and open-ended client exit interviews determined protocol
effectiveness. LESSONS LEARNED: This qualitative/quantitative, triangulated
approach was highly effective. Written exams following didactic trainings and direct
observation of counseling sessions are necessary to accurately assess the quality of
services and design "refresher" trainings. Counselors showed a high level of
knowledge of HIV/AIDS and counselor protocol, but sometimes had difficulty with
more subtle aspects of helping couples communicate with the counselor and with
each other. Clients were highly satisfied with services. Counselors expressed a
variety of needs, including additional training in technical areas like ARV therapy,
requiring CVCT providers to decide whether to invest in in-depth trainings for
counselors or refer couples to other sources. RECOMMENDATIONS: CVCT is an
effective intervention that should be widely replicated, and this study provides a
useful evaluation model specific to couples' VCT. Further research should focus on
developing additional and more time-efficient tools to assess and document the
protocols, quality, and impact of CVCT services.

150
Kigali Sh, J
Extending couples'
voluntary HIV
counseling and
testing (CVCT)
services to non-
cohabiting couples in
Kigali, Rwanda: a
population in need
2003-
2004 -
Projet San Francisco (PSF) has provided CVCT to over 20,000 cohabiting couples in
Kigali, Rwanda since 1988. In October 2003, funding allowed PSF to extend CVCT
services to non-cohabiting (dating/engaged) couples. METHODS: Walk-in couples
and those invited to PSF by Influence Network Agents (INAs) received one-day HIV
and syphilis counseling and testing. HIV and syphilis results were compared for
cohabiting and non-cohabiting couples attending CVCT from Oct03-Jan04. In focus
group discussions, INAs shared their experiences in inviting both groups.
RESULTS:69% of INA invitations were given to cohabiting couples and 31% to non-
cohabiting couples. From Oct03-Jan04, 48% of the invited non-cohabiting couples
and 36% of the invited cohabiting couples attended CVCT. In focus group
discussions, INAs reported that married couples were difficult to invite because of the
perception of lack of trust in the marriage. In comparison, engaged couples were
viewed as receptive to CVCT, while dating couples were reluctant out of fear of
separation. Testing revealed that non-cohabiting couples had a lower prevalence of
HIV infection than cohabitating couples (male 8%, female 16% vs 22%,22%), but a
higher rate of discordant HIV results (19% and 14% respectively). There was no
difference in syphilis results by gender or cohabitation. CONCLUSIONS: INAs
experienced a higher success rate in inviting non-cohabiting couples to participate in
CVCT than cohabiting couples. Considerable percentages of HIV and syphilis in
non-cohabiting couples indicate that they are a significant target population for
CVCT to decrease the rate of HIV and STD transmission. The high proportion of
discordant results among non-cohabiting couples reinforces the importance of pre-
marital testing.
Kigali Sams, K; Shutes, E;
Allen, S; Telfair, J
Walk-ins in the
context of invited
couples to a CVCT
center in Kigali,
Rwanda
pub.
2004
701 cohabiting
couples
To promote demand at a CVCT center in Kigali, Rwanda, Influence Network Agents
(INAs) were nominated by community leaders, screened for ability and motivation,
and educated about HIV/AIDS. INAs were trained to promote CVCT and invite
couples to be tested. Twenty-nine INAs distributed invitations to couples in their
communities. Couples tested at the CVCT center were asked to choose how they
heard about CVCT from a list of sources read by the pre-test counselor. Respondents
could choose multiple answers from the list. RESULTS: During the first ten weeks
of the INA promotion, 376 cohabiting couples with invitations were tested as part of
CVCT. In addition, 325 cohabiting couples without invitations "walked-in" and were
tested. In the ten weeks prior to the INA intervention only 151 "walk-in" cohabiting
couples were tested at CVCT, demonstrating a 115% increase. When asked how they
heard about CVCT, most "walk-in" couples reported that they had heard about CVCT
from a couple previously tested at the center (55%) or from friends (25%). Pamphlet
and radio announcements represented 16% and 13% of respondents respectively.
CONCLUSIONS: INAs were effective in promoting CVCT by issuing invitations to
couples in their communities. In addition, INA promotion encouraged discussion
about the importance of CVCT. CVCT attendance increased dramatically by couples

151
specifically invited by INAs and by "walk-in" couples who had heard about the
service elsewhere.
Kigali
Sardar, G; Rwanda-
Zambia HIV Research
Group
WHAT
INFLUENCES
COUPLES TO GET
TESTED AT
COUPLES VCT
CENTERS IN
KIGALI, RWANDA
AND LUSAKA,
ZAMBIA
2004-
2005 9,335 couples
A comparison of couple's VCT (CVCT) promotional strategies in two African
capitals is presented. METHODS: Promotion of CVCT at 6 CVCT centers in Kigali,
Rwanda and Lusaka, Zambia included distribution of written invitations by Influence
Network Agents (INAs), who were supported by public endorsements from Influence
Network Leaders (INLs) and senior government officials. Information was gathered
from tested couples regarding how they heard about CVCT. RESULTS: Between
May 2004 and January 2005, 9,335 couples were tested in Kigali. In Kigali, 32% of
couples tested were invited by INAs and 68% were walk-ins. The primary way in
which couples heard of CVCT was through couples who had been previously tested
(51%), followed by radio announcements (41%), INAs (36%), posters (32%), and
friends (13%). CONCLUSIONS: One-on-one contact with an INA is an effective
means of promoting CVCT in both Kigali and Lusaka. The hoped for 'snowball
effect' only occurred in Kigali, with tested couples referring many friends for CVCT.
Radio was also a more effective strategy in Kigali, where there is only one local
language.

152
Kigali De Clercq, F;
Katangulia, F
KNOWLEDGE OF
COUPLE'S VCT,
WILLINGNESS
AND OBSTACLES
TO GET TESTED:
RESULTS FROM
HOUSEHOLD
SURVEY
REFLECTING THE
IMPACT OF
COMMUNITY
BASED
PROMOTION
PROGRAM IN
KIGALI/RWANDA
pub.
2005
400 men; 400
women
This study investigates the population's knowledge of CVCT services in Kigali,
Rwanda. METHODS: "Influence Network Agents"(INAs) were trained to invite and
mobilize couples in their community for CVCT. A household survey was conducted
with one adult per household. 400 women and 400 men were interviewed, including
200 from the INA neighborhood and 600 from 3 neighborhoods where INAs had not
worked. RESULTS: Over 84% of the population interviewed knew where to get
tested; 90% of the cohabiting couples and 77% of singles or non-cohabiting couples.
>93% knew about CVCT services and >95% approved of the idea to getting tested
with the partner. INAs felt that obstacles to testing were primarily logistical (time,
cost). In contrast, survey respondents cited fear of the partner (41,7%), fear of stigma
(29,9%) and finance (14,1%). The population cited the radio (59%), religious leaders
(21,8%) and grass-root leaders/INAs/teachers (19%) as the primary means of
mobilization for couples' testing. Residents in the INA neighborhood were more
likely to know about CVCT than those in the other 3 neighborhoods.
CONCLUSIONS: Results indicate a great familiarity with VCT services amongst
couples in Kigali. Although the vast majority approved of the idea to get tested
together, stigma and fear of the partner were cited as main impediment to get tested.
Community based promotional strategies has proven to be the most efficient mean to
tackle those issues. A further integration and mobilization of community leaders with
the INAs would increase the demand for CVCT and overcome stigma by spreading
out the right message on HIV/AIDS prevention in their communities.
Kigali Beyer, A
IMPLEMENTING A
COMMUNITY-
BASED MODEL
FOR THE
PROMOTION OF
COUPLES'
VOLUNTARY
COUNSELING &
TESTING IN TWO
AFRICAN
CAPITAL CITIES:
SIMILARITIES,
DIFFERENCES &
LESSONS
LEARNED
pub.
2005 -
This study investigates the success of a CVCT promotion program in Lusaka, Zambia
and Kigali, Rwanda – two African capitals with a high prevalence of HIV and
different socio-cultural contexts. METHODS: "Influence Network Agents" (INAs)
were trained to invite couples for CVCT services during two 4-month pilot phases. In
each city, training and recruitment of INAs was analogous. INAs were comparably
remunerated according to the number of invitations distributed for CVCT services
and the number of couples who attended as a result of invitations. RESULTS: Over
16,500 invitations have been distributed (4,887 in Rwanda). INAs in Rwanda have
achieved two to three-fold higher response rates from invitations than INAs in
Lusaka. Where the invitation was delivered, the nature of the relationship between
INAs and invitees, and the number of contacts between INAs and invitees differed
between cities. During Phase II, 38% of invitations were given to neighbors or work
colleagues in Kigali. <2% of invitations in Kigali were given to fellow church
members. CONCLUSIONS: Results suggest that differential outside effects such as
the nature of social networks, demographic trends, and cultural perceptions of CVCT
impact promotional strategies. The high response rate in Kigali may indicate a greater
acceptance of and familiarity with VCT services. Kigali is a smaller, less transient
city than Lusaka with only one indigenous language. Sustainable CVCT promotional
activities are dependent on the cohesion and make-up of social capital, both

153
horizontal and vertical social networks, in particular country contexts.
Kigali Beyer, A
Implementing a
community-based
model for the
promotion of couples'
voluntary counseling
& testing in two
African capital cities:
similarities,
differences & lessons
learned
pub.
2004 -
This study investigates the success of a CVCT promotion program in Lusaka, Zambia
and Kigali, Rwanda. METHODS: 'Influence Network Agents' (INAs) were trained to
invite couples for CVCT services during two 4-month pilots. In each city, training
and recruitment of INAs was analogous. INAs were comparably remunerated
according to the number of invitations distributed for CVCT services and the number
of couples who attended as a result of invitations. RESULTS: 4,887 invitations have
been distributed in Rwanda. INAs in Rwanda have achieved two to three-fold higher
response rates from invitations than INAs in Lusaka. Where the invitation was
delivered, the nature of the relationship between INAs and the invitees, and the
number of contacts between INAs and invitees differed between cities. During Phase
II, 38% of invitations were given to neighbors or work colleagues in Kigali, while
<2% of invitations in Kigali were given to fellow church members..
CONCLUSIONS: Results suggest that differential outside effects such as the nature
of social networks, demographic trends, and cultural perceptions of CVCT impact the
effectiveness of promotional strategies. The high response rate in Kigali may indicate
a greater general acceptance of and familiarity with VCT services as compared to
Lusaka. Kigali is a smaller, less transient city than Lusaka, with one indigenous
language compared to five in Lusaka. Sustainable CVCT promotional activities are
dependent on the cohesion and make-up of social capital, both horizontal and vertical
social networks, in particular country contexts.

154
Kigali
H. M. SALIHU, O. N.
NNEDU, E. KARITA, J.
VYANKANDINDERA,
PAULINE E. JOLLY
Predictors of HIV
seropositivity
following
intrapartum voluntary
counseling and
testing among
Rwandan women
2001 427 pregnant
women
We investigated risk factors associated with HIV infection in women who accepted
voluntary counselling and testing (VCT) intrapartum. A survey questionnaire
containing information on sociodemographic characteristics was administered to
parturients at the Central Hospital Kigali after informed consent had been obtained.
Participants were then offered VCT for HIV, and those who accepted were informed
of their results. Of the 427 eligible participants, 317 accepted VCT (74.2%). The
results of 312 (98.4%) of these women were obtained and 50 tested positive for HIV,
yielding an HIV seroprevalence of 16.0% intrapartum. Women who had been
pregnant three or more times were three times as likely to test positive for HIV in
comparison to those of lower parity (OR=2.9; 95% confidence interval (CI)=1.1 –
8.0). This finding contradicts earlier studies performed antenatally among women of
childbearing age and pregnant women in general. This may be attributable to some
inadequacy in the existing health-care infrastructure to effectively detect HIV in
multiparous women antenatally, or may represent a signal that a change in the nature
of the epidemic in Rwanda is occurring.
Kigali and
Butare
Eugene Mutimura,
Aimee Stewart and Nigel
J Crowther
Assessment of
quality of life in
HAART-treated
HIV-positive subjects
with body fat
redistribution in
Rwanda
2005-
2006
50 HIV +
persons with
BFR; 50 HIV+
persons without
BFR
As access to treatment improves in sub-Saharan Africa, the disfiguring nature of body
fat redistribution (BFR) (peripheral atrophy and/or central adiposity) may deter
treatment adherence and initiatives and decrease QoL. We examined the relationship
between BFR and domains of QoL in HAART-treated HIV+ African men and
women with (HIV+BFR, n = 50) and without (HIV+noBFR, n = 50) BFR in Rwanda.
Results: HIV+ subjects with BFR were less satisfied with their body image (4.3 ± 0.1
versus 1.5 ± 0.2; p < .001), self-esteem and social life (4.1 ± 1.4 versus 2.1 ± 0.3; p =
0.003). HIV+BFR were more ashamed in public (4.5 ± 1.2 versus 1.1 ± 1.1), reported
less confident about their health (4.6 ± 1.4 versus 1.5 ± 1.2) and were frequently
embarrassed due to body changes (4.1 ± 1.1 versus 1.1 ± 0.9) (p < .001) than
HIV+noBFR. HIV+ Rwandan women with BFR reported more dissatisfaction with
psychological (8.3 ± 2.9 versus 13.7 ± 1.9), social relationships (6.9 ± 2.3 versus 11.1
± 4.1) and HIV HAART-specific domain of wellbeing (3.1 ± 4.8 versus 6.3 ± 3.6) (p
< .001). Age was associated with independence (r2 = 0.691; p = 0.009) and marital
status was associated with psychological (r2 = 0.593; p = 0.019) and social
relationships (r2 = 0.493; p = 0.007). CD4 count (r2 = 0.648; p = 0.003) and
treatment duration (r2 = 0.453; p = 0.003) were associated with HIV HAART-
specific domain of wellbeing. HIV+ Rwandan women with BFR were significantly
more affected by abdominal adiposity (p < .001), facial and buttocks atrophy (p <
.05) than HIV+ men with BFR. Conclusion: Body fat alterations negatively affect
psychological and social domains of quality of life. These symptoms may result in
stigmatization and marginalization mainly in HAART-treated African women,
adversely affecting HAART adherence and treatment initiatives. Efforts to evaluate
self-perceived body fat changes may improve patients' wellbeing, HAART adherence
and treatment outcomes and contribute towards stability in quality of life continuum.

155
Kigali and
Butare J Uwimana, P Struthers
Met and unmet
palliative care needs
of people living with
HIV/AIDS in
Rwanda
2005 –
2006
306
participants:
PLWHA,
healthcare
professionals,
coordinators
This study investigated met and unmet palliative care needs of PLWHA in selected
areas in Rwanda. The study sample included 306 participants: PLWHA, health care
professionals and coordinators of HIV/AIDS units. Quantitative and qualitative
methodologies were used. Over 50% of PLWHA had symptoms related to HIV/AIDS
most of the time, with the most common symptom being pain. Participation in
activities of daily living was significantly associated with the health status of
PLWHA (p<0.001). The most common perceived palliative care needs of PLWHA
were medical needs, psychosocial needs and the need for financial assistance (77%);
home-based care (47%); nutritional support (44%); and pain relief and management
of other symptoms (43%). Most PLWHA indicated these palliative care needs were
unmet, in particular the need for pain relief, symptom management, financial
assistance and nutritional support. Over 50% of health care professionals reported
they were not trained in palliative care. They indicated that inadequate policy and
resources were the main obstacles to the provision of optimal palliative care.
Addressing unmet palliative care needs would enhance the QoL of PLWHA. In
addition, developing policy related to the provision of palliative care and building the
capacity of health care providers is essential for the provision of adequate palliative
care services in Rwanda.
Kigali and
Nzige
N. VELDHUIJZEN, J.
NYINAWABEGA, M.
UMULISA, B.
KANKINDI, E.
GEUBBELS, P.
BASINGA, J.
VYANKANDONDERA,
& J. VAN DE WIJGERT
Preparing for
microbicide trials in
Rwanda: Focus group
discussions with
Rwandan women and
men
pub.
2006
Female
students,
unmarried
women, married
women, older
women, rural
women, female
sex workers and
men
In preparation for microbicide research in Rwanda, focus group discussions were
conducted to assess sexual and contraceptive behaviour, preferences for vaginal
lubrication, and hypothetical acceptability of microbicides among Rwandan women
and men. Seven focus group discussions were conducted among sexually active
married women, unmarried women, sex workers, female students, older women and
men living in Kigali, Rwanda, and an additional group of women living in a rural
area. The results indicate that condom use is low among Rwandan men and women
and that condoms are mainly used by men during commercial sex. Women have
limited power to negotiate condom or family planning use. Vaginal hygiene practices
are very common and consist primarily of washing with water. Lubrication during
sex is highly preferred by both men and women. Hypothetical microbicide
acceptability after an explanation of what microbicides are and a demonstration with
lubricant jelly was high.

156
Kigali
Ville,
Gitarama
and
Byumba
Babalola S, Kornfield R
Factors hindering the
access of PLWA to
health care and
support resources in
Rwanda
2001 -
For a variety of reasons including fear, misplaced priority, beliefs in witchcraft, and
poor health-seeking behaviors, PLWHA usually wait a long time before getting
tested. PLWHA live under generally poor living conditions with limited access to the
basic necessities of life. They are often victims of opportunistic diseases due to poor
hygiene, inadequate diet and limited access to health care. Although many PLWHA
are aware of the components of a healthy diet, very few can afford adequate nutrition.
There is adequate knowledge about the mode of transmission of HIV/AIDS but the
notion of re-infection appears foreign to the study participants. PLWHA and their
caregivers are generally stigmatized in the society. Communication interventions
designed to improve the living conditions of PLWHA should seek to destigmatize
HIV/AIDS, promote community involvement in the care of PLWHA and strengthen
PLWHA associations.
Kigali,
Butare, and
Ruhengeri
A. K. YOUSAFZAI, K.
EDWARDS, C.
D‘ALLESANDRO, & L.
LINDSTRO¨M
HIV/AIDS
information and
services: The
situation experienced
by adolescents with
disabilities in
Rwanda and Uganda
2003
Disabled and
non-disabled
youth; adult
stakeholders
The study had 2 aims: (1) To explore whether knowledge about HIV and AIDS was
similar among adolescents with disabilities compared with their non-disabled peers;
and (2) To determine factors which may increase vulnerability of disabled
adolescents to HIV infection and/or inappropriate access to HIV related services.
METHODS: A qualitative study using focus group discussions and semi-structured
interviews was conducted with purposefully selected participants in Rwanda and
Uganda. The participants included disabled adolescents, non-disabled adolescents,
parents, teachers, members of disabled people‘s organisations and representatives of
HIV/AIDS organisations. Interviews explored issues of HIV/AIDS knowledge,
access to HIV/AIDS services and perceptions of personal risk. RESULTS. Barriers
preventing adequate access to information about HIV and AIDS experienced by
adolescents with disabilities depended on the nature and severity of the impairment.
For example, parents and health workers were unable to communicate with deaf
adolescents using sign language, adolescents with physical impairments were often
unable to access community meetings about HIV and print material was not adapted
for those with visual impairments. Further, assumptions by health workers and
community members that people with disabilities were not sexually active lead to the
marginalization of disabled people from HIV services. Adolescents with disability
described low self esteem and issues of self efficacy affecting control of safer sexual
relationships. A high level of targeted abuse, rape and exploitation was reported
leading to vulnerability among this population. CONCLUSION. The impact of the
HIV epidemic among people with disabilities is a neglected area. This study supports
the need to develop strategies in HIV prevention programmes that include people
with disabilities.

157
Kigali,
other
urban, and
rural
E Kayirangwa, J Hanson,
L Munyakazi, A Kabeja
Current trends in
Rwanda‘s HIV/AIDS
epidemic
1990 -
2003 -
This paper reviews the history of HIV serological and behavioural surveillance
efforts in Rwanda, dating back to the early 1980s, synthesising findings from
surveillance, research, and other relevant HIV programmatic data. The documentation
reviewed includes published findings, conference abstracts, and unpublished
analyses. Special emphasis is given to more recent sentinel surveillance results and
data collected using known, documented methods. Recent trends in HIV prevalence
were assessed among sites participating in the three most recent consecutive rounds
of antenatal clinic sentinel surveillance. RESULTS: Early HIV surveillance in
Rwanda documented high HIV prevalence in urban areas with HIV widely
disseminated into rural areas by 1986. Between 1988 and 1996, HIV prevalence
among pregnant women ranged from 21% to 33% in Kigali, from 8% to 22% in other
urban settings, and from 2% to 12% in rural settings. More recent surveillance among
pregnant women has demonstrated more moderate prevalence, with urban/rural
differences narrowing slightly. Between 1998 and 2003, HIV prevalence may have
declined in urban areas, whereas rural areas appear to have remained stable. Age at
first sexual intercourse is relatively late in Rwanda (20 years for both males and
females) and has remained stable since at least 1992. CONCLUSIONS: The present
analysis suggests that Rwanda may have experienced declines over the long term in
HIV prevalence in urban areas, especially in Kigali, and may have stable or slightly
rising HIV prevalence in rural areas. The limited behavioural data available suggest
that, on the national level, Rwanda may benefit from a unique combination of low
numbers of partners and late sexual debut, which may have had a mitigating effect on
HIV prevalence.
No Report Available
185 / Sexual behaviors of people attending the HIV high transmission sites in Kigali, Rwanda
192 / Improving on a successful model for promoting couples VCT in two African capitals: mobile couples HIV testing units
203 / Evaluation de la Qualite de la Consultation Prenatale dans le District de Sante de Remera-Kigali
205 / Compotement Sexual et Utilisation du Preservatif dans la Prevention du VIH/SIDA en Milieu Scolaire: Cas des Eleves l‘ Ensignement Socindaire de la Prefecture
de la Ville de Kigali (Pvk)
216 / Utilisation du preservative dans la butte contre les Maladies Sexuellement Transmissibles y Compres le SIDA chez les Femmes en Age de Procreer du District
Sanitaire Remera
221 / Connaissances, attitudes Et Pratiques des Enfants de la Rue de La Ville de Kigali en Rapport avec le VIH/SIDA
229 / Etude des connaissances, attitudes des femmes enceintes de la ville de Kigali en matiere de l‘ infection a VIH/SIDA
231 / Connaissances, attitudes et pratiques de la population feminine en age de procreer du district sanitaire de Remera en mariere de planification familliale
233 / Evaluation des connaissances, attitudes st Pratiques des Femmes en Age de Procreer du District Sanitaire de Kabgayi en Matiere de Planification Familiale
237 / Utilisation du Preservatif dans la Lutte Contre les Maladies Sexuellement Transmissibles y Compris le SIDA chez Les Femmes en Age de Procreer du District
Sanitaire Remera
239 / Connaissances, attitudes et pratiques des hommes et des femmes en âge de procréer en matière de planification familiale dans le district sanitaire de Muhima
241 / Etude Des Connaissances, Attitudes Croyances Et Pratiques Des Etudiants Des Institutiond D‘Enseignement Superieur De L‘ Ex-Prefecture De La Ville Ligali
(Pvk) En Matiere De L‘Infection A VIH/SIDA

158
242 / (Pvk) En Matiere De L‘Infection A Vih/Sida

159
Practicum C.1 Articles: NORTH (Byumba, Kigali-Rural (part), Ruhengeri)
Report Methodology Population Findings Conclusions
122 / Making the Transition from Good
Girl to Good Wife: Young Women and
Sex Workers‘ Narratives on Social Life,
Sexuality and Risk: Byumba, Rwanda
(Qualitative)
Sixteen peer researchers
from the Byumba sex-
worker association and
sixteen young people (15-
24) years were recruited
through the Byumba
youth association and
trained to carry out peer
research among their
peers.
48 sex-workers were
interviewed on three
separate themes,
generating 144
interview narratives.
24 girls and 24 boys
were interviewed by
the youth peer
researchers,
generating a further
144 interviews among
the youth group.
Findings presented in the
report were from the
girls‘ and sex-workers‘
data only.
An over-riding theme
emerging from the
narratives is the
perception that the
process of transition
from adolescence into
adulthood is one that is
fraught with danger,
especially for girls.
Girls are caught in the
contradiction between
the stated ideal behavior
of the ‗good girl‘, and the
constraints of the reality
of life.
The critical moment in
youth is the moment at
which a girl concedes to
have sex with her
boyfriend in order to
maintain the economic
benefits, social status,
and potential to marry
that the relationship
provides.
A major theme of the
sex-workers‘ narratives
is vulnerability of
women who lack male
support from family
(father and brothers), and
from a husband.
Whereas girls‘ narratives
contrast good girls with
Sixteen peer researchers from
the Byumba sex-worker
association and sixteen young
people (15-24) years were
recruited through the Byumba
youth association and trained
to carry out peer research
among their peers.

160
Report Methodology Population Findings Conclusions
bad girls, sex-workers
are set in opposition to
‗wives‘ (socially
acceptable women).
Contrasted with the sub-
ordinate position of
women in society and the
social ostracism of the
sex-worker, is a central
concept of female sexual
pleasure which
dominates in the
encounter between the
sex-worker and client.
Good sex is defined as
kuyanza or ‗wet sex,‘
that is, sex that is
pleasurable to the
woman. A successful
sex-worker is one who is
able to perform wet sex,
and often chooses to
avoid condoms in order
to achieve this.

161
Region Author(s) /
Contact
Title/File
name Year Sample Findings
Byumba
Habumugabe, G;
Ndabamenye, P;
Mubashankwaya,
F
Youth peer
education
leads to
community-
based support:
lessons
learned from a
catholic
diocese in
Rwanda
2003
100,000
youth;
2,788
youth
volunteers
Since 2000, with funding from USAID, Family Health International has supported youth peer
education through Catholic dioceses in Rwanda including the development of a participatory
training guide and reference manual for educators (PEs). Byumba Catholic Diocese began using
these materials in 2001 in their own prevention project for youth. The project focus expanded
when some youth started providing direct assistance to people living with HIV/AIDS
(PLWHA). DESCRIPTION: Through September 2003, the Diocese trained 440 peer educators
(PEs) who reached over 100,000 youth in two years. One reason for the wide reach is the
Diocese's approach of including all youth. PEs are Catholic, Protestant, Pentecostal, Adventist
and Muslim. In 2003, there was an unexpected outcome when project youth contacted PLWHA
associations in their communities to find out what they could do to help. Four PLWHA
associations were located in four focus parishes of the project. With the associations, the youth
identified PLWHA and their families in need and determined how to help them. In all, 2,788
youth volunteered time to help 60 families directly affected by HIV/AIDS. They built simple
houses for 13 families, dug a latrine for one family, cleaned houses and yards for three families,
planted or tended fields for 41 families and helped two families care for hospitalized PLWHA.
LESSONS LEARNED: Although community-based support was not part of the initial project
design, spontaneous implementation of such activities by project youth demonstrates the
importance of stigma reduction in prevention programs. RECOMMENDATIONS: Community-
based support activities should be integrated into prevention programs from the start as a way of
actively reinforcing stigma reduction messages.
Byumba Rahlenbeck, S
Knowledge,
Attitude and
Practice about
AIDS and
Condom
Utilization
among Health
Workers in
Rwanda
2000 350 health
workers
Health workers in rural Rwanda surveyed cross-sectionally on knowledge, attitude and practice
(KAP) about AIDS, HIV, and condom utilization. Participants were 350 health workers from
six randomly chosen communities (three rural, three semirural). In general, knowledge about
HIV/AIDS was moderate to good, with an average of 63% of the questions answered correctly;
men (and younger respondents) had a better knowledge than did women (p = .01; older
participants, p = .015). However, in the specific area of HIV/AIDS symptoms, knowledge was
inadequate. In general, attitude of health workers towards condoms was reported by 17%; the
only variable significantly associated with condom use was having more than one partner during
the past year. Men and those who scored high on knowledge had a more positive attitude
toward infected individuals than did women (p= .003) and those with less knowledge (p=.001).
In conclusion, there is an urgent need to institute educational programs to reduce the stigma
about condoms among health workers in Rwanda.

162
Byumba Spiegel PB,
Schilperoord M
HIV
prevalence in
20 refugee
camps
measured 6
countries in
Sub-Saharan
Africa
2002/2003
900,000 in
20 camps
in 6
countries
The United Nations High Commissioner for Refugees (UNHCR), its implementing partners,
and/or host governments trained personnel and supervised HIV antenatal surveillance using host
governments' protocols. Results were then compared with HIV antenatal sentinel surveillance
results among surrounding local populations when available. HIV prevalence among refugee
populations was 1.5% in Byumba, Rwanda. . HIV prevalence among refugees was significantly
lower when compared to respective surrounding host population in Kenya (both sites) and
Rwanda. UNHCR and other refugee organisations must strongly advocate to counter the
discrimination and misperception and that refugees always have a higher HIV prevalence than
their host communities. . HIV prevalence among populations in their countries of origin before
displacement and the surrounding host countries are critical factors. More research into the
epidemiology of HIV/AIDS among refugees and surrounding populations is needed.
Byumba
Paul B Spiegel,
Anne Rygaard
Bennedsen,
Johanna Claass,
Laurie Bruns,
Njogu Patterson,
Dieudonne
Yiweza, Marian
Schilperoord
Prevalence of
HIV infection
in conflict-
affected and
displaced
people in
seven sub-
Saharan
African
countries: a
systematic
review
pub. 2007 88 articles
We compared HIV prevalence in populations directly affected by conflict with that in those not
directly affected and in refugees versus the nearest surrounding host communities in sub-
Saharan African countries. METHODS: Seven countries affected by conflict (Democratic
Republic of Congo, southern Sudan, Rwanda, Uganda, Sierra Leone, Somalia, and Burundi)
were chosen since HIV prevalence surveys within the past 5 years had been done and data,
including original antenatal-care sentinel surveillance data, were available. We did a systematic
and comprehensive literature search using Medline and Embase. Only articles and reports that
contained original data for prevalence of HIV infection were included. FINDINGS: Of the 295
articles that met our search criteria, 88 had original prevalence data and 65 had data from the
seven selected countries. Data from these countries did not show an increase in prevalence of
HIV infection during periods of conflict, irrespective of prevalence when conflict began.
Prevalence in urban areas affected by conflict decreased in Burundi, Rwanda, and Uganda at
similar rates to urban areas unaffected by conflict in their respective countries. Prevalence in
conflict-affected rural areas remained low and fairly stable in these countries. Of the 12 sets of
refugee camps, nine had a lower prevalence of HIV infection, two a similar prevalence, and one
a higher prevalence than their respective host communities. Despite wide-scale rape in many
countries, there are no data to show that rape increased prevalence of HIV infection at the
population level. INTERPRETATION: We have shown that there is a need for mechanisms to
provide time-sensitive information on the effect of conflict on incidence of HIV infection, since
we found insufficient data to support the assertions that conflict, forced displacement, and wide-
scale rape increase prevalence or that refugees spread HIV infection in host communities.
163
Byumba
Uhagaze B,
Sebaganji M,
Rieger-
Ndakorerwa G,
Rahlenbeck S
Knowledge,
attitude and
practice
towards AIDS
in Rwandan
nursing
students.
2000 173
students
The study was undertaken to evaluate the AIDS-clubs that have been then started in secondary
schools and to provide information for future AIDS educational measures. METHODS: A
cross-sectional study on knowledge, attitude, and practice (KAP) by means of a standardised
questionnaire was conducted among students at a nursing school in Byumba, a semi-rural town
in Rwanda. RESULTS: There were 173 students participating (88%), of whom 141 were
women and 32 men. Mean age was 20.2 years. Prior sexual experience was reported by 29
(21%) of females, and 20 (63%) of males; self-reportedly, 12 (7%) of students were currently
sexually active. In general, knowledge on AIDS was good, with an average of 80% of questions
answered correctly; male students had better knowledge than female students regarding
transmission (p = 0.04) and prevention (p = 0.01) of the disease. Students who had participated
in an AIDS Club scored significantly higher in the knowledge part and had a more positive
attitude towards AIDS and HIV-positive individuals than students that had not yet participated
in a club. Areas where the knowledge was less complete, included the transmission (or non -
transmission e.g. by mosquitoes and/or shared glasses, etc) and the fact that infected people may
be without symptoms and appear healthy. CONCLUSIONS: The results indicate that AIDS
clubs did improve KAP of our students significantly; in addition, areas where our educational
program can to be improved, were identified.
No Report Available
197 / Evaluation des Activities des Animateurs de Sante en Matiere de L‘E.S.P dans la Prefecture de Byumba
212/236 / Connaissances, Attitudes st Pratiques des Eleves des Etablissements de L‘Enseignement Secondaire de la Prefecture de Byumba en Matiere du VIH/SIDA
200 / Etude sur les Connaissances, Attitudes et Pratiques des Femmes en Age de Procreer du District Sanitaire de Ruhengeri en Matiere de Planification Familiale
220 / Connaissances, Attitudes et Pratiques des Eleves des Etablissements d‘Enseignement Secondaire du District Sanitaire de Ruhengeri en Matiere du VIH/SIDA
243/ Evaluation Qualitative Des Consultations Prenatales Dans Le District Sanitaire De Ruhengeri – Abstract only

164
Practicum C.1 Articles: SOUTH (Butare, Gikongoro, Gitarama)
Report Methodology Population Findings Conclusions
107/ Project de Sante de Reproduction
des Adolescents de Butare au Rwanda:
Rapport Comparatif des Phases 1,2,3
Dans la Population des Jeunus de Butare
This study was conducted
in 2003 in an effort to
measure knowledge
change after PSI‘s
adolescent sexual and
reproductive health
project was put in place in
2000. The study was
conducted among youth
in 6 communities
surrounding the city of
Butare with Gitarama
used as a control site for
comparison.
Household-based
interviews were
conducted. Questions
addressed can be grouped
in the following
categories: motivation to
change behavior, capacity
to change behavior,
opportunity to change
behavior (i.e. availability
of condoms), use of
condoms and VCT.
Youth (ages 15-24)
(N = 3116)
Trends are noted among the
years 2000, 2002, and 2003;
A selection of various results:
In 2000, 54% of men and
50% of women said that they
had heard of HIV or an
illness called AIDS. These
proportions increased to 61%
et 64% en 2002 before
reaching 72% and 73% in
2003; Between 2000 et 2002,
the proportion of unmarried
men and women who thought
that condoms are an effective
method to prevent HIV
significantly increased from
69% to 76% for men and
from 60% to 65% for women.
But these proportions
significantly decreased in
2003, reaching the same
levels as in 2000; The
number of men and women
who believe that using a
condom each time one has
sex reduces the risk of
acquiring HIV increased
significantly over time; The
proportion of people using a
condom during the last sex
act with a regular partner
remains low since 2000 (1 in
3 men vs. less than 1 in 3
women). 17% men between
2000 and 2002 consistently
used a condom with their
regular partner, but this
number fell to 7% in 2003.
Goals of project SRA were:
To improve knowledge of
family planning and STI
and HIV/AIDS prevention
among adolescents;
Increase condom use
among youth; Improve
condom acceptance and
use among young women;
Increase awareness of risk
of STI and HIV/AIDS
infection.
Knowledge of HIV and
AIDS has increased
considerably.
Understanding of modes
of HIV transmission has
also greatly improved, but
less than half of
adolescents interviewed
believe that they their
chance of infection is
increased when they have
sex without a condom.
Concerning social support,
while proportions of
friends who tolerate
(accept) condom use
increases over time,
proportions of parents who
tolerate (accept) condom
use has lowered over time.
There is a significant
increase in the number of
adolescents who think that
condoms are [à la portée]
of everyone. Few young
Rwandans (about 1 in 5

165
Report Methodology Population Findings Conclusions
For women, these figures
were 13% in 2000, 8% in
2002 and 5% in 2003. These
changes were significant;
Up to 96% of men in 2002
and 92% in 2003, vs. 95% of
women in 2002 et 94% in
2003 said that they would test
for HIV. However, during
this time period, 6% of men
and 8% of women said they
had already taken an HIV
test. This proportion
represents a significant
increase compared to the
statistics from 2000 (4%) and
2002 (5%).
men and 1 in 20 women)
say they know how to use a
condom correctly.
Youth lack the perception
of risk of contracting HIV
by engaging in unprotected
sex.
The rate of condom use
with regular partners
declined over time.
The high proportion of
youth who know of a
place where they can get
tested for HIV and who
say that they are prepared
to test contrasts the low
proportion of those who
claim to have already
tested.
113/ Project de Sante de Peproduction
des Adolescents au Rwanda: Rapport
Comparatif dans les Menages de Butare
2000 – 2002
116 / Project de Sante de Reproduction
des Adolescents au Rwanda: Rapport de
L‘etude Quantitative a MiParcours
(Phase 2) dans la Population des Eleves
et Etudiants de Butare et Gitarama
This study was
conducted in 2003 in
an effort to measure
knowledge change
after PSI‘s adolescent
sexual and
reproductive health
project was put in
place in 2000.
Specifically, this study
was conducted to
determine:
Knowledge and
attitutdes of youth
regarding STIs and
family planning.
Youth (ages 15-24)
(N = 3147 students)
Participants were found to
have an early sexual debut
(beginning no later than 15
years old). This was true for
24% of the men, but 4% of
the women.
Almost 39% of men and 11%
of women were sexually
active, but 6% of men and 2%
of women reported recent
sexual activity (within the
month preceding the
interview)
Prevalence of both general

166
Report Methodology Population Findings Conclusions
Accessibility to
STI/HIV prevention
and family planning
methods
Sexual behavior
including the number
and types of partners,
history of STIs,
condom use, and other
family planning
methods
Reasons for condom
use and obstacles to
use condom use
Degree of exposure to
the project
sexual activity and recent
sexual activity among the
sample increased
considerably with grade-level
and were particularly
prominent among those in the
highest grade level.
More than half of the men
(59%) and women (51%)
knew at least two methods for
preventing HIV/AIDS
The great majority of high
school and college students
(92% of men and 76% of
women) know where to
obtain condoms.
2 out of 3 men and more than
half of the women said that
condoms protect against STIs
(reported by 66% of men and
55% of women) and/or HIV
(reported by 63% of men and
56% of women)
Purchasing condoms was
fairly rare among high school
and college students. 77% of
men and 98% of women had
never purchased condoms
The great majority of men
(85%) and almost 2 out if 3
women (63%) said that they
would risk contracting HIV if
they didn‘t use a condom.
Most high school and college

167
Report Methodology Population Findings Conclusions
students, whether male (83%)
or female (86%) said that it is
normal for a woman to
request that her partner use a
condom and only 8% of men
and 5% of women said this
decision should be left up to
the man.
In general, there are more
men and women who feel at
ease discussing condom use
(87% of men and 85% of
women) and/or STIs (85% of
men and 88% of women)
with their regular partners
than men and women who
feel incapable of convincing
their partners to use a condom
(84% of men and 82% of
women) or incapable of
refusing to have sex with
them (78% or men and 88%
of women)
Only 38% of sexually active
men and 48% of sexually
active women reported
having used a condom at least
once in their lives.
The rate of condom use at last
sexual intercourse with a
regular partner was 56%
among men and 60% among
women.
Protection against HIV/AIDS
and/or preventing unwanted

168
Report Methodology Population Findings Conclusions
pregnancy are the main
reasons for condom use
among 32% or men and 31%
of women who use condoms
with a regular partner, among
46% of men and 28% of
women who use them with a
non-regular partner, and 50%
of men and 34% of women
who use condoms with a
commercial partner.
118/ Enquete sur la santé reproductive
des studiants au Rwanda (Butare et
Gitarama), 2000
120/ Patterns of sexual behavior and
condom use among high school and
university students in Butare and
Gitarama province, Rwanda. Data stem from a
reproductive health
survey conducted in
October-
November 2000 among a
representative sample of
students aged 15-24 in
secondary schools and
universities in Butare and
Gitarama. Focus on
gender
differentials in sexual
behavior and condom use,
but also examine
differentials by age,
socioeconomic status, and
education.
N= 3,013 students
Less than half (45%) of
males and 16% of females
aged 15-24 reported being
sexually experienced.
Life table analyses show a
median age at first
intercourse of over 24.0
for females and 20.3 for
males.
Only 13% of males and
5% of females report
having a sexual partner in
the past year.
Of those sexually
experienced, only 30% of
males and 42% of females
had ever used condoms.
Among the small group
who reported being
sexually active in the past
year, nearly half of males
(46%) and 71% of
females reported condom
use in their last sex act
with a regular partner.
Reported levels of sexual
activity among Rwandan
students are exceptionally
low for the region.
Among this population of
youth, condom use with
casual partners is high.
Use with regular partners
is high for
females, but fairly low for
males.
Further need for
reproductive
health programs to target
youth, especially youth
who are not yet sexually
active.

169
Report Methodology Population Findings Conclusions
121/ The Reach and Impact of the PSI
Adolescent Reproductive Health
Program in Butare Province, Rwanda
The data are from the
2000 and 2002 rounds of
a reproductive health
survey of youth 15-24
years of age. Logistic
regression analyses are
conducted to determine
trends in reproductive
health behavior and their
predictors, after
controlling for differences
in sample characteristics.
Logistic regression is also
used to estimate the effect
of level of program
exposure on reproductive
health behavior and its
predictors
2000:
2,853
2002:
2,955
Overall prompted recall of
PSI Butare ARH program
activities is fairly low.
Although 24% of
respondents report seeing
billboards for the
multipurpose youth center
around which the program
is focused, only 8% of
youth have ever attended
a peer education session
and 5% or less of youth
report speaking to a peer
educator, reading the
program newspaper or
seeing mobile video unit
shows.
During the first 18 months
of implementation, there
were significant
improvements in
knowledge and use of
voluntary counseling and
testing services among
male and female youth as
well as fewer reported
social barriers that prevent
youth from buying,
negotiating and using
condoms.
Analysis of the effect of
program exposure
suggests that PSI Butare
ARH program contributed
to some, but not all, of
these positive changes.
The data are from the 2000
and 2002 rounds of a
reproductive health survey of
youth 15-24 years of age.
Logistic regression analyses
are conducted to determine
trends in reproductive health
behavior and their predictors,
after controlling for
differences in sample
characteristics. Logistic
regression is also used to
estimate the effect of level of
program exposure on
reproductive health behavior
and its
predictors

170
Region Author(s) /
Contact
Title/File
name Year Sample Findings
Butare
Bugingo G,
Niyitegeka
MJ, Butera JB,
Kleinfeldt V,
Kirsch T
Knowledge,
attitudes, and
practices of
women at high
risk for
AIDS/STDs in
the area of
Butare--Rwanda
pub.
1993
45
unmarried
women
Objective was to relate the knowledge, attitude and beliefs about HIV/AIDS and other STDs to safer sex
practices and to HIV seroprevalence among unmarried Rwandan women living in a densely populated,
semi-urban area of Butare. A detailed questionnaire including various aspects of HIV/AIDS such as
etiology, modes of transmission clinical features and prevention strategies, was administered to each
study participant. A blood sample was also obtained from 38 women who volunteered for HIV testing
after a session of pre-test counselling. The great majority of the surveyed women had satisfactory
knowledge about the ways in which HIV/AIDS and other STDs are transmitted. Despite high levels of
knowledge, only 77% out of 45 surveyed women reported the use of condoms on a irregular basis. We
also found that all the 38 women (100%) who volunteered for HIV testing were HIV seropositive. We
strongly recommend that all unmarried women of the area of Butare who engage in sexual practices
require the use of condoms by their male partners and that further educational compaigns emphasize the
need to promote the use of condom.
Butare Rwangabwoba
JM
The mortality of
TB patients
coinfected with
HIV at the
Nyanza
Hospital,
Rwanda
1992 201 patient
records
Objective was to determine the mortality rate of TB patients coinfected with HIV, treated with H, R, P, E
in the 2-month initial phase and H, R during the 4-month continuation phase. At the end of 12/1992, we
reviewed the clinic records of 248 pts who had been admitted to the TB ward of the Nyanza Hospital
since 1/1991. The mortality rate is expressed as the proportion of TB pts who died between 1/1991 and
12/1992. The RR of death is expressed as the ratio of the incidence of death among TB pts infected with
HIV to its counterpart in TB pts still free of HIV infection when TB was diagnosed. HIV results were
available for 201 pts. (81%). Results: During the two-year period 1/91-12/92, there were a total of 248
pts admitted to the TB ward, including 91 (45.3%) HIV+, 110 (54.7%) HIV-, and 47 whose HIV
serostatus was unknown. One hundred and sixty (66%) pts were males, eighty-eight (34%) were females,
and the mean age was 34 years. In 71.8% of cases TB was localized in the lungs whereas 28.2% of pts
had extra-pulmonary TB. The overall mortality rate was 10.88% and the median time to death was 98
days (range: 2-303). Of the twenty-seven patients who died, 20 were HIV+, 3 were HIV-, and the HIV
serostatus was unknown in 4 cases. The RR of death for HIV+ as compared to HIV- TB pts was 8.06
(95% C.I.: 4.43-14.75). HIV infection is more likely to be associated with increased risk of death among
pts co-infected with M. tb and HIV. The risk factors for death also need to be elucidated in order to
devise appropriate intervention programs aimed at reducing mortality in that group of patients.

171
Butare Prybylski, D
Motivational
factors for
accessing HIV
Voluntary
Counseling and
Testing services
at a multi-
purpose
integrated youth
center in
Rwanda
2001 1,599
persons
High-quality youth-focused confidential HIV voluntary counseling and testing (VCT) services are
provided at Centre Dushishoze in Butare Rwanda. VCT is integrated with STI screening and
reproductive health services in a multi-purpose youth center. Here we describe VCT client motivations
and characteristics during the youth center's first nine months of operation. METHODS: All 1,599 VCT
clients seen between January - September 2001 completed standardized intake questionnaires. Client
HIV serostatus was ascertained using same-day rapid test kit technology. Additional anonymous exit
questionnaires were self-administered by every 5th client. RESULTS: 88% of clients were 15-24 years
of age, 39% were women, and 30% were counseled as couples. The main reasons given for using VCT
services were recent high-risk sexual behavior (42%) and marital planning (38%). HIV seroprevalence
was significantly higher among clients reporting recent high-risk sexual behavior than those seeking
VCT for marital planning (4.8% vs. 2.5%, P=0.03). Clients who sought VCT services for self-reported
recent high-risk sexual behavior were significantly more likely than clients planning marriage to report
>1 sexual partner during the last 12 months (21.6% vs. 3.4%, P<0.001) and unprotected sex in the last 3
months (22.0% vs. 4.0%, P<0.001). They were also more likely to be men (72.3% vs. 46.2%, P<0.001),
access VCT services alone (94.3% vs. 27.2%, P<0.001) and have more than a primary education (55.5%
vs. 13.9%, P<0.001). Almost all (97%) clients surveyed planned to change their future sexual behavior
and 79% intended to discuss their HIV test results with their partners. CONCLUSIONS: Young people
access VCT services for various reasons and these motivational factors have different sociodemographic
and behavioral correlates. Youth-appropriate counseling services and demand creation strategies should
carefully consider these factors in their design.
Butare,
Gitorama
Koumaga, OL;
Yomi, G
The impact of
the Centre
Dushishoze's
actions on the
behavior of
Rwandan
Adolescents
2000-
2003 -
In 2000, in response to the alarming HIV epidemiology in Rwanda, Population Services International
(PSI) set up an Adolescents Reproductive Health Center in Butare. Prior to that, a baseline study was
carried out (October 2000). A mid-term review of the project was done (April 2002), and an evaluation
study was conducted upon the project's completion (October 2003). This presentation seeks to assess the
project's impact on the behavior of the target population. DESCRIPTION: Tilted "Adolescents
Reproductive Health in Rwanda", the project was located at Butare (intervention site) and Gitarama
(control site). Implemented from the Centre Dishushore ", it aimed at upgrading the level of knowledge
and give impetus for behavioral change among adolescents in relation to HIV/AIDS prevention. The
project's main communication channels were posters, pamphlets, radio-broadcasted messages, TV spots
and interpersonal communication through Peer Educators. LESSONS LEARNT: The level of
HIV/AIDS knowledge and the understanding of modes of transmission have increased significantly
(X[2]=94.9; P=0.000). The perception of the risk of contracting the disease is not yet widespread.
Condoms use is beginning to be accepted by adolescents, but is hardly endorsed by parents. However,
correct condoms use is still restricted to a small proportion of adolescents. Finally, the remarkably high
proportion of youths who say they are ready to undergo HIV screening is in sharp contrast with the very
low proportion of those who have already been tested. RECOMMENDATIONS: Efforts should be
made to increase risk perception among adolescents. Moreover, sensitization actions should also be
geared toward parents with the aim of bringing them to admit the relevance of condoms. Specific actions
on the correct use of condoms should be considered. Finally, there is need to identify the major barriers
to HIV screening among the population in order to overcome them.

172
Region Author(s) /
Contact Title/File name Year Sample Findings
Gikongoro
Tonya Renee
Thurman,
Leslie A.
Snider, Neil
W. Boris,
Edward
Kalisa,
Laetitia
Nyirazinyoye,
Lisanne
Brown
Barriers to the
community support of
orphans and
vulnerable youth in
Rwanda
2003 -
2004
32 youth;
61
community
members
In this study, mixed methods are used to elucidate community-level barriers to care for orphans
and vulnerable youth in Rwanda. Data from a large survey of youth heads of household on
perceptions of marginalization from the community and the factors predicting that
marginalization are considered in light of additional data from a survey of adults who
volunteered to mentor these youth and focus groups with both community adults and youth
heads of household. Results highlight how orphans‘ impoverished condition, cause of parents‘
death, and community perceptions of orphan behavior play a role in the marginalization of
orphaned youth in Rwanda. Evidence is also offered to show that targeting humanitarian
assistance to vulnerable youth may inadvertently lessen the level of community support they
receive and contribute to their marginalization. The implications of these data for community-
based program approaches are discussed.
Southeastern
Rwanda
(rural)
H.M. Epino,
A. Karamaga,
P.C. Niyigena,
W. Nagaba, Y.
Uwimana,
S.N. Stulac,
C.D. Mitnick,
J.S.
Mukherjee,
P.E. Farmer,
M.L. Rich
PRELIMINARY
OUTCOMES OF
PATIENTS
RECEIVING
SUPERVISED
ANTIRETROVIRAL
THERAPY IN
RURAL RWANDA
2005-
2006
769 ART
patients
This is a prospective cohort study of 769 HIV-positive patients 15 years or older who initiated
ART between June 1st, 2005 and January 31st, 2006. The treatment package includes
nutritional support, daily visits from an accompagnateur to supervise therapy, provide social
support, and evaluate the patient. Age, CD4, and weight were all recorded at baseline; weight
was recorded monthly after treatment initiation and CD4 was repeated at six months.
RESULTS: During the eight month period, 17,332 people were tested for HIV at six sites in
southeastern Rwanda; 2,084 (12.0%) were HIV-positive, of whom 769 were adults enrolled on
ART. Of adults enrolled on ART, the mean initial CD4 count was 191.1 ± 126.7 cells/mm3,
mean baseline weight was 52.7 ± 8.8kg, and tuberculosis co-infection was diagnosed in 154
(20.0%). 584 (75.9%) received fixed dose combination stavudine, lamivudine, nevirapine twice
daily. At the time of analysis, ART patients had received a mean of 3.0 ± 2.1 months of
treatment, none were lost to follow up, and 17 (2.2%) had died. Accompagnateurs had made
65,277 visits to ART patients and 3,509 food packages had been distributed. Of 78 patients
receiving at least six months of therapy, 24 had repeat CD4 counts and weights that had
increased by a mean of 201.8 ± 161.4 cells/mm3 and 7.1 ± 6.3kg respectively.
CONCLUSIONS: Ambulatory delivery of ART in rural poor communities in Africa is feasible.
Accompagnateurs can assure the delivery of therapy with excellent adherence and patient
follow up. The model of care, which includes nutritional support, can result in rapid weight gain
and improved immunological status among patients receiving ART.

173
Southeastern
Rwanda
(Rural)
K.C. Walker,
P.C. Drobac,
P.C. Niyigena,
B. Nizeye, I.
Hakizinka, B.
Collins, H.M.
Epino, S.N.
Stulac, M.A.
Gillooly, J.J.
Furin, F.R.
Leandre, J.S.
Mukherjee,
P.E. Farmer,
M.L. Rich
IMPLEMENTATION
OF THE PARTNERS
IN HEALTH (PIH)
COMMUNITY-
BASED MODEL OF
HIV CARE AND
PREVENTION IN A
RURAL HEALTH
DISTRICT IN
RWANDA
2005-
2006
17,332 HIV
tests, incl.
3,771
pregnant
women
We describe the initiation of a project to provide comprehensive health services through public
institutions in an HIV-affected region of rural southeastern Rwanda. DESCRIPTION: Between
May 2005 and January 2006, Partners In Health (PIH) and Rwanda's Ministry of Health
implemented a community-based HIV prevention and care program while reinvigorating health
services for a catchment area of 340,000 people. The following elements were included: (1)
rehabilitation and augmentation of services at six health centers and one district hospital, (2)
recruitment and training of 59 care providers and 507 community health workers (CHWs), (3)
reinforcement of existing systems for VCT; maternal and child health; and diagnosis and
treatment of tuberculosis, opportunistic infections, and sexually transmitted infections, (4)
provision of social, economic, and nutritional support to people affected by HIV and other
chronic diseases. LESSONS LEARNED: Rapid scale-up of HIV care has occurred in facilities
previously limited by lack of supplies, electricity, water, and trained personnel. In the first 9
months of operation, 17,332 HIV tests were performed including 3,771 for pregnant women;
ART was initiated in 838; ongoing nutritional and CHW support was provided to all patients on
ART; 438 infants born to HIV infected mothers were enrolled in a formula-feeding program;
school support was provided for 1,436 children; ambulatory visits increased four-fold. Housing
assistance and microfinance programs were initiated in November 2005.
RECOMMENDATIONS: HIV prevention and treatment programs can be scaled-up rapidly,
strengthen primary health services, and be linked to broader poverty reduction efforts.
Region Author(s)
/ Contact
Title/File
name Year Sample Findings
Gitarama
Sam-
Abbenyi A,
Dibeshye T
Prevalence of
reported
condom use
and sources of
procurement
1999 340
persons
Objective was to determine (a) the prevalence of reported condom use, and (b)sources of procurement. On
October 15-30, 1999, 30 administrative cells in 6 communes of Gitarama Health Region GHR)in central
Rwanda were randomly selected. 10 trained experienced interviewers administered a structured
questionnaire to verbally consenting sexually active subjects 15-54 years. 46.2% of participants were
female. 296 (87.1%) recognized a condom; 53 (17.9%) reported ever using condoms while 25 (7.3%)
declared using condoms in September 99. 47 (88.7%)of the 53 subjects reported using condoms for
STD/HIV prevention while 3 subjects (5.7%) as contraceptives. The male to female ratio of reported
condom use was 2:1. Of the 53 subjects reporting condom use, 17 (32.6%) bought them in shops or
pharmacies; 12 (22.6%) from community health animators (CHA); 12 others got them free from health
facilities; 6 from friends while 13 from other sources. Condom use in GHR remains relatively low despite 5
years of grassroot promotion of their use through CHA. More aggressive methods to change attitudes and
behavior should be tested and applied in post-genocide Gitarama.

174
Kigali and
Gitarama
Ndayisaba
JD, Fo[eumlx
JM,
Kamusine A,
Haag AL,
Mora C
The role of
PLWA groups
in providing
HIV/AIDS
care
pub.
2004
117 heads
of
families
from 39
groups
Background: As part of a strategy to support infected and affected people living with HIV in the cities of
Kigali and Gitarama, heads of affected families (HIV+ and HIV-) are encouraged by AFXB Rwanda to
form groups of 10-12 people to support themselves and their PLWA in their localities.Survey was
conducted to assess impact of intervention. Results: Ninety-eight percent (98%) of those surveyed stated
that the group serves as a new family who looks after the children and runs the activity when the owner
cannot work due to the disease. Ninety-five percent (95%) have developed collective IGAs that have
enabled them to deal with their financial problems and to assist their colleagues. Ninety-nine percent (99%)
stated that the group is a good way to help one another, but it is often crippled by its meager assets which
are inadequate to meet all members'demands. More than 90% of those surveyed found these groups to be a
useful way to fight HIV associated issues of stigma and discrimination. Conclusion: Support groups are
fundamental to PLWA's self-care and enable the community to care for their PLWA. They also help fight
HIV related stigma and discrimination.
Butare,
Gitorama
Koumaga,
OL; Yomi, G
The impact of
the Centre
Dushishoze's
actions on the
behavior of
Rwandan
Adolescents
2000-
2003 -
In 2000, in response to the alarming HIV epidemiology in Rwanda, Population Services International (PSI)
set up an Adolescents Reproductive Health Center in Butare. Prior to that, a baseline study was carried out
(October 2000). A mid-term review of the project was done (April 2002), and an evaluation study was
conducted upon the project's completion (October 2003). This presentation seeks to assess the project's
impact on the behavior of the target population. DESCRIPTION: Tilted "Adolescents Reproductive Health
in Rwanda", the project was located at Butare (intervention site) and Gitarama (control site). Implemented
from the Centre Dishushore ", it aimed at upgrading the level of knowledge and give impetus for behavioral
change among adolescents in relation to HIV/AIDS prevention. The project's main communication channels
were posters, pamphlets, radio-broadcasted messages, TV spots and interpersonal communication through
Peer Educators. LESSONS LEARNT: The level of HIV/AIDS knowledge and the understanding of modes
of transmission have increased significantly (X[2]=94.9; P=0.000). The perception of the risk of contracting
the disease is not yet widespread. Condoms use is beginning to be accepted by adolescents, but is hardly
endorsed by parents. However, correct condoms use is still restricted to a small proportion of adolescents.
Finally, the remarkably high proportion of youths who say they are ready to undergo HIV screening is in
sharp contrast with the very low proportion of those who have already been tested.
RECOMMENDATIONS: Efforts should be made to increase risk perception among adolescents. Moreover,
sensitization actions should also be geared toward parents with the aim of bringing them to admit the
relevance of condoms. Specific actions on the correct use of condoms should be considered. Finally, there is
need to identify the major barriers to HIV screening among the population in order to overcome them.

175
Kigali
Ville,
Gitarama
and
Byumba
Babalola S,
Kornfield R
Factors
hindering the
access of
PLWA to
health care and
support
resources in
Rwanda
2001 -
For a variety of reasons including fear, misplaced priority, beliefs in witchcraft, and poor health-seeking
behaviors, PLWHA usually wait a long time before getting tested. PLWHA live under generally poor living
conditions with limited access to the basic necessities of life. They are often victims of opportunistic
diseases due to poor hygiene, inadequate diet and limited access to health care. Although many PLWHA are
aware of the components of a healthy diet, very few can afford adequate nutrition. There is adequate
knowledge about the mode of transmission of HIV/AIDS but the notion of re-infection appears foreign to
the study participants. PLWHA and their caregivers are generally stigmatized in the society.
Communication interventions designed to improve the living conditions of PLWHA should seek to
destigmatize HIV/AIDS, promote community involvement in the care of PLWHA and strengthen PLWHA
associations.
No Report Available
124 / Rwanda (2000): Enquete TRaC sur I‘Utilisation du Preservatif par les Junes Sexuellent Actifs (15 a 24 ans) dans la Province de Butare
126 / Enquête TRaC sur l‘Utilisation du Préservatif par les Jeunes Sexuellement Actifs (15 à 24 Ans) dans la Province de Butare_2002.pdf
180/ Assessment of the role of forum theatre in HIV/AIDS behavioral change process among secondary school adolescents in Butare province, Rwanda
183 / Experience of the youth forum against HIV/AIDS in Butare
187 / Final Report Community Needs Assessment of Home-Based Care for people Living with HIV/AIDS Butare
196 / Evaluation des Services de Sante Matemelle et Infantile dans le District Sanitaire de Nyanza
198 / Etude des Connaissances, Attitudes et Comportements des Jenues Eleves des Etablissments Secondaires Relatifs a l‘ Infection par le VIH en Prefecture de Butare
202/ Connaissances et Attitudes des Femmes en Age de Proceer au Test de Depistage Volontaire du VIH/SIDA dans le District Sanitaire de Kibillizi
204/ Connaissances, Attitude et Pratiques des Eleves des Etablissements Secondaires de la Ville de Gitarama en Matiere du VIH/SIDA
206 / Evaluation Qualitative de la Plantication Familliale dans le District
207 / Etude des Connaissances, Attitudes et Pratiques des Hommes en Age de Procreer du District Sanitaire de Kibilizi en Matiere de Planification Familiale
208 / Evaluation Qualitative des Consultations prenatales au Distric Sanitaire de Kibilizi
209 / Evaluation Qualitative des Activites de Consultation Prenatale dans les Formations Sanitaires du Distric Sanitaire de Munini
211 / Connaissances, Attitudes et Pratiques de la Population du District Sanitaire de Kibilizi en Matiere D4 utilisation du Preservatif dans la Prevention contre l‘Infection
VIH
214 / Connaissances, Attitudes et Pratiques des Jeunes de la Prefecture de Butare en Matiere du VIH/SIDA: Cas des Olphelins des Olphelinats Publics de Cette Prefecture
217 / Etude des Connaissances, Attides et Pratiques sur le Preservatif chez les Etudiants de l‘Universite Nationale du Rwanda
218 / Etude sur la Demande de la Population Feminine en Age de Procreer du District Sanitaire de Nyanza en matiere de Planification Familiale
219 / Connaissances, Attitude et compartement en matiere de L‘Infection par le VIH/SIDA chez les Femmes Enceintes du milieu Rural de Gitarama
222 / Evaluation de L‘Utilisation des Medicaments Traditionnels au Rwanda: Cas de la Region Sanitaire de Butare
223 / Connaissances, Attitdes et Pratiques des Femmes en Age de Reproduction du District Sanitaire de Kabutare en matiere de Planification Familiale

176
227 / Connaissances, attitudes et pratiques des eleves des ecoles secondaires de la ville de Butare en matiere de l‘utlisation du preservatif dans la prevention contre
l‘infection a VIH/SIDA et les MST
228 / Etude sur las connaissances, attitudes et pratiques des femmes en age de procreer du district sanitaire de Bugesera en matiere de planification familiale
232 / Evaluation des connaissances, attitudes et pratiques de sfemmes en age de procreer du district snaitaire de Kibilizi en matiere de planification familiale
234 / Etude des Connaissances, Attitudes et Pratiques en Matiere de l‘Infection au VIH chez les Femmes en Age de Procreer des Milieux Urbain et Rural du District
Sanitaire de Kabutare
235 / Connaissances, Attitudes et Pratiques de la Population du District Sanitaire de Kibilizi en Matiere D4 Utilisation du Preservatif dans la Prention contre L‘Infection
VIH
248 / Etude des Connaissances, Attides et Pratiques sur le preservatif chez les Etudiants de L‘Universite Nationale Du Rwanda
249 / Etude Sur la Demande de la Population Feminine en Age de Procreer du District Sanitaire de Nyanza en Matiere de Planifiation Familiale

177
Practicum C.1 Articles: WEST (Cyangugu, Gisenyi, Kibuye)
Report Methodology Population Findings Conclusions
64/ ROADS: Repport de la visite
de‘evaluation Formative de base a
Gikondo et Gatsata
Data collection conducted
by FHI/ROADS and
CDLS Gicumbi,
document review,
discussion with
community members
(youth, persons living
with HIV/AIDS, at-risk
women)
Populations included
in the study were
uneducated youth, at-
risk (vulnerable)
women, people living
with HIV/AIDS
(PLWHA).
This is a high-risk area,
because of its proximity to a
truck route with trucks
passing through via Kenya
and Uganda towards Rwanda,
Bukavu/RDC and Burundi.
Sexuality in Gatuna: there
are very few female sex
workers in this region. Sex
workers work in the city of
Gatuna or on the other side of
the border in Uganda,
returning to their parents‘
house in the evenings.
Condoms are available in
Gatuna, but are rarely used
outside the city, except
among soldiers. VCT: The
closest testing sites to the
region are at Bungwe (12km)
or Buyumba (20km) or at
Kabare in Uganda. Mostly
pregnant women and youth
test. They often test during
their pre-natal exams and
before marriage. Those most
at risk are the least likely to
test. Prevention: A single
formal prevention education
program exists in the region
and focuses on youth. It is run
by the Byumba Catholic
church. Other parishes deliver
HIV prevention messages and
there are several youth
associations which engage in
peer education. ACPLRWA
(?) in Gatuna provides
HIV is a problem in this
region according to
community members. It is
one of the top three concerns
for members of all
populations encountered
during the study. Sex
workers, youth, soldiers,
truckers, single
women/widows are the main
groups at elevated risk
identified by members of the
populations encountered.
Their vulnerability is mostly
influenced by poverty and
alcohol consumption.
There are few sex workers on
the Rwanda side of the border
(Gatuna). However, there are
many sex workers on the
Uganda side of the border.
Unwanted pregnancy is a
common problem. This is
most likely due to the fact
that there is a single condom
distribution point in Gatuna.
Youth are the only population
who benefits from HIV/AIDS
programs.
The closest VCT and
treatment services are located
12km from Gatuna and many
people lack the means of
accessing them.

178
education and condoms to
truckers and the local
community. The closest
VCT, ARV, and PMTCT
services are in Buyumba and
Bungwe. STIs are treated
with HIV in the same
location, those suffering from
STIs purchase medication in
local pharmacies. Only the
church parish in Buyumba
cares for OVC, but they are
unable to address the needs of
all of the OVC in the area.
Only the health center at
Bungwe cares for PLWHA,
but is insufficiently equipped
to treat them.
No Report Available
158/ Results of a Cross-Sectional Study on Knowledge, Attitudes, and Practice Related to HIV/AIDS and Sexual Violence Among Students Attending Two Secondary
Schools in Bukavu, Democratic Republic of the Congo (DRC)
199/ Evaluation de la Wualite des Consultations Prenatales dans le District Sanitaire de Kibuye
213/ Connaissances, Attitudes et Pratiques des Hommes du District Sanitaire de Gisenyi en Matiere de Planification Familiale
215/ Connaissances, Attitudes et Pratiques des Adolescents du District Sanitaire de Bushenge en Matiere de Planification Familiale
224/ Connaissances, Attitudes et Pratiques des Eleves des Etablissements d‘ Enseignement Secondaire du District Sanitaire de Gisenyi en Matiere du VIH/SIDA
238/ Etude des connaissances, attitudes et pratiques des femmes en âge de procréer du district sanitaire de Gisenyi en matière de la planification familiale
245 / Etude Sur La Demande De La Planification Familiale Dans Le Contexte Actuel Du Pays Cas De La Prefecture De Cyangugu

179
Practicum C.2: Review of articles by sub-population
Practicum C.2 Articles: Military
Report Methodology Population Findings Conclusions
108/ Evaluation du Programme de
Prevention du VIH/SIDA/Projet
Militaire au Rwanda
No Report Available
127/ Resultats du VCT Militaires
Practicum C.2 Articles: PLWHA
Report Methodology Population Findings Conclusions
24/ Guide National pour le Soutien et la
Prise en Charge Alimentaire et
Nutritionnelle Pour les Personnes Vivant
avec le VIH/SIDA au Rwanda
261/ Determining the Conditions and
Modalities for Health Care Delivery to
Persons Living with HIV/AIDS
This is an instruction set
outlining the health care
delivery system for
PLWHA in Rwanda. It
defines terms on a broad
level for relevant items
(i.e., heath care delivery
institutions, antiretroviral
drugs for the programme,
technical committee for
patient selection, and
other terms).
The instruction defines a
Technical Committee for
Patient Selection as:
1. The head of the
programme in the health
care unit designated by
the head of the health care
delivery institution.
2. A representative of the
PLWHA in Rwanda Overview
This instruction covers only
health care delivery
institutions defined as health
facilities (hospitals,
pharmacies, laboratories,
health centres, maternities,
etc.) approved as
beneficiaries of the
programme by the Ministry
responsible for AIDS control.
Importation and stocking of
ARV and other drugs and
reagents at national level
shall be carried out by the
Essential Drugs Procurement
Centre in Rwanda
(CAMERAWA).
The health care delivery
institutions empowered to

180
medical team delivering
health care to PLWHA.
3. The head of the
biological data unit within
the health care delivery
centres.
4. Two representatives of
associations of PLWHIV
located within the
geographical area served
by the health institution
designated by the network
of persons living with
HIV.
5. The heads of
psychosocial teams
designated by the head of
the health care delivery
institution.
6. The matron of the
service.
Additionally, drugs,
laboratory reagents, and
actions to promote the
programme must be listed
by the Centre for
HIV/AIDS Treatment
(TRAC) for use in
Rwanda by the
programme.
prescribe ARV/P drugs must
have:
-a medical team composed of
at least one trained medical
doctor, one trained nurse, and
one trained social worker
-A selection committee for
PLWHIV
-Authorization by the
Minister responsible for
AIDS control.
Trained doctors (including
private doctors) are
empowered to prescribe
ARV/P drugs.
Approved pharmacies must
obtain approval from the
Ministry responsible for
AIDS control to distribute
ARV/P drugs. Pharmacies
must not benefit from this
distribution.
Conditions for Treatment
Beneficiaries of the
programme must:
1. Have been selected by a
Patient Selection Committee
or enrolled through VCTI,
VCT, or PMTCT
programmes.
2. Have a fixed residence in
Rwanda
3. Be unable to pay for
treatment (totally or partly)
4. Meet clinical and
biological criteria established
by the Ministry

181
5. Consent to make a
financial contribution
according to category
6. Consent to become a
member of a sick
insurance/mutual insurance
scheme
7. Consent by indigents or
very low income earners not
required to make financial
contributions to ecome
members of a mutual
insurance scheme or a
nationally-recognized support
group
8. Reveal serological status to
a family member or close
acquaintance
9. Consent to regular home
visits by health workers
10. Consent to stay on long-
term medication
11. Have a close relation to
ensure follow-up and
compliance
12. Untertake to practice safe
sex
13. Not undertake to get
drugs through another
programme
Financial The instruction contains a
table outlining the required
financial contribution by
patients according to socio-
economic categories.
Selection A technical committee

182
(defined previously) is
responsible for patient
selection, determination of
social category, explanation
of treatment, and evaluation
of medical care. A quarterly
report must be submitted to
TRAC, based on TRAC
format guidelines.
262/ Guide National pour le Soutien et la
Prise en Charge Alimentaire et
Nutritionnelle Pour les Personnes Vivant
avec le VIH/SIDA au Rwanda
263/ Living with AIDS in Rwanda: A
Study in Three Provinces

183
Practicum C.2 Articles: Prisoners
Report Methodology Population Findings Conclusions
115 / Learning from Prisoners.
Understanding risk to prevent HIV
infection among prisoners and the wider
community
CNLS (the National
AIDS control
commission) and
MININTER with
implementation support
from Population Services
International Rwanda, Le
Réseau Rwandais des
Personnes Vivant avec le
V.I.H. ( RRP+) and
Options UK conducted
research to better
understand existing risk
behaviour, factors
contributing to this
behaviour, and potential
strategies to mitigate risk
in custodial settings. This
study was conceptualized
by the CNLS and
Ministry of Internal
Security with data
collection led by Options
Consultancy and
supervised by
PSI/Rwanda. The PEER
method has been shown to
be a very effective
method for generating an
in-depth understanding of
how hard-to-research
groups experience and
conceptualise their
behaviour. It is based
upon training members of
the target community (in
this case prisoners) to
carry out in-depth
100 in-depth
interviews with
prisoners
The data suggest a remarkable
degree of support and cooperation
between prisoners, however the
data strongly reflected the
difficult realities of prison life,
with chronic overcrowding,
hunger, inequality and social
isolation acting as drivers for
various forms of risk behaviour.
A consistent theme related to
food, and the lengths to which
prisoners must go to secure
adequate nutrition. The
inadequate supplies provided
through official sources were
supplemented by those foods
permitted from visitors. As family
visits diminish over long periods
in prison, prisoners increasingly
developed other strategies to
secure food. Men having sex
with men (MSM) for material
gain, pleasure and as homosexuals
were discussed by prisoners in
detail. Whilst it is impossible to
quantify these encounters, the
narratives suggest that they are
relatively common. It is not
improbable that many, even the
majority of prisoners would
participate in these relationships;
particularly with many thousands
of prisoners sleeping in very close
proximity for many years of
incarceration. These sexual
relationships between prisoners
can be classified into distinct
types: (1) Transactional
Although intervention
strategies have yet to be
identified in detail, it is likely
that they would include three
components: (1) Inside the
prison: with a focus on
additional support and
behaviour change
interventions involving
prisoners as change agents.
Support may involve income
generation opportunities for
those without visitors,
additional nutrition and
encouraging visiting by
increasing the efficiency of
the process; (2) Outside the
prison: focusing on the sexual
partners of prisoners,
including sex-worker
interventions, condom
distribution and efforts to
promote relationship stability
with wives and other partners.
Extreme care must be taken
not to further stigmatise
prisoners or their sexual
partners; (3) Linking the
above with interventions to
improve health services to
prisoners with a focus on
treating sexually transmitted
infections (STIs) and
Voluntary Counselling and
Testing.
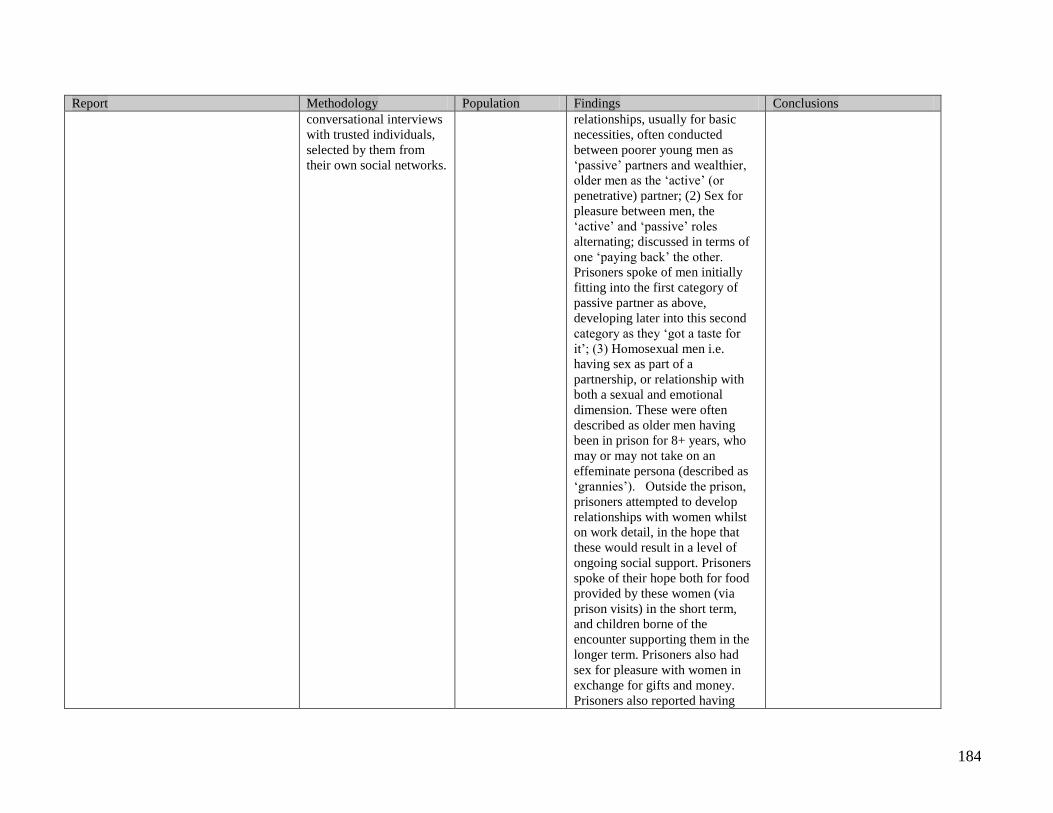
184
Report Methodology Population Findings Conclusions
conversational interviews
with trusted individuals,
selected by them from
their own social networks.
relationships, usually for basic
necessities, often conducted
between poorer young men as
‗passive‘ partners and wealthier,
older men as the ‗active‘ (or
penetrative) partner; (2) Sex for
pleasure between men, the
‗active‘ and ‗passive‘ roles
alternating; discussed in terms of
one ‗paying back‘ the other.
Prisoners spoke of men initially
fitting into the first category of
passive partner as above,
developing later into this second
category as they ‗got a taste for
it‘; (3) Homosexual men i.e.
having sex as part of a
partnership, or relationship with
both a sexual and emotional
dimension. These were often
described as older men having
been in prison for 8+ years, who
may or may not take on an
effeminate persona (described as
‗grannies‘). Outside the prison,
prisoners attempted to develop
relationships with women whilst
on work detail, in the hope that
these would result in a level of
ongoing social support. Prisoners
spoke of their hope both for food
provided by these women (via
prison visits) in the short term,
and children borne of the
encounter supporting them in the
longer term. Prisoners also had
sex for pleasure with women in
exchange for gifts and money.
Prisoners also reported having

185
Report Methodology Population Findings Conclusions
sexual relations with their wives,
where they were willing to wait at
the relevant work site and make
the necessary arrangements with
the guards etc. The data indicate
that whilst prisoners have limited
access to, and understanding of
condoms, they do have a good
knowledge of the modes of
transmission of both HIV and
sexually transmitted infections
(STIs). A very clearly stated
demand for VCT services also
provides further evidence.
No Report Available
167/Expanding HIV care and treatment to Rwandan prisons: a Collaborative Approach
168/ (Expanding HIV care treatment to Rwandan prisons.pdf)

186
Practicum C.2 Articles: Refugees
Report Methodology Population Findings Conclusions
110/ Knowledge, Attitudes, and
Practices (KAP) in Rwanda Refugee
Camps: A Study on HIV/AIDS, STDs,
and Gender-Based Violence
Researchers conducted a
knowledge, attitudes, and
practices (KAP) study
among 800 randomly
selected women and men,
aged 15-49, from Kibuye
and Byumba Congolese
refugee camps. The study
was launched in January
1999.
The KAP survey was
based on the 1998
Rwanda Sexual Behavior
and Condom Use Survey
and then adapted to the
conditions of the refugee
community.
800 randomly selected
women and men in
the refugee
communities of
Kibuye and Byumba
living in Kiziba and
Gihembe camps,
respectively.
Kiziba camp (near
Kibuye town)
contains around
12,315 refugees;
Gihembe camp (near
Byumba) contains
around 15,276
refugees.
The report itself contains
detailed tables and charts that
divide the data from the
surveys by age, sex,
education, religion, and
literacy. Only key points have
been outlined here.
88% of women and 83% of
men had heard of a disease
called AIDS. 50.6% of
women and 64.3% of men
knew of someone suffering
from AIDS.
Most respondents knew that
there are ways of avoiding
AIDS (91.2% of women,
98.9% of men).
Only 30.5% of women and
47.9% of men believe that
someone can be infected with
the AIDS virus with no
symptoms.
10.5% of men and 3.2% of
women experienced first sex
before or at 14 years. More
than 85% of male
respondents reported having a
regular partner outside of
their primary relationship.
93.3% of sexually active male
respondents reported having
casual sexual partners.
11.8% of females reported
Awareness on HIV/AIDS and
understanding HIV
transmission is high in the
refugee communities. Risky
behaviors are commonplace,
while condom usage is low.
Other contraceptive methods
are subsequently low.
The researchers conclude that
behavior change
communication is necessary
to address all these issues for
the refugee community
through interpersonal
communication sessions.

187
Report Methodology Population Findings Conclusions
using a condom at last sexual
intercourse with regular
partner. Reasons for non-use
include partner‘s objection
and trust of partner.
16% of women reported that
they had been verbally
abused by men. 6% of
women reported having
suffered physical violence by
men. Men had subjected
approximately 6% of women
to sexual violence. 18% of
women had undergone both
verbal and physical violence
by men.
13% of non-pregnant women
were using a method to delay
or prevent pregnancies. 75%
of women practice
abstinence; 10% practice
condoms and injections. Oral
contraceptives were used by
5% of women.
Future choices for
contraceptive methods
include: injection (33%),
abstinence (26%), pills
(22%), and condoms (14%).
133/Prevalence of HIV infection in
conflict-affected and displaced people in
seven sub-Saharan African countries: a
systematic review
Researchers searched
PubMed, Embase, and
Medline for journals from
January 1981 onwards
searching for publications
that dealt with HIV and
armed conflict or HIV
Papers and surveys
containing original
HIV prevalence
studies of refugees
from Democratic
Republic of Congo,
southern Sudan,
In the DRC, the first ANC
seroprevalence study of HIV
infection since the war began
in 1960 was undertaken in
2003-2004. It was found that
prevalence was not
significantly different
The researchers concluded
that there is insufficient
evidence that the prevalence
of HIV infection increases in
populations affected by
conflict. There is insufficient
data to conclude that refugees

188
Report Methodology Population Findings Conclusions
epidemic. HIV prevalence
surveys were then
selected based on
countries with a history of
widespread conflict.
Publications were
screened for quality based
on international
guidelines. The
researchers chose 65
original data (papers and
surveys) from 7 countries.
Rwanda, Uganda,
Sierra Leone,
Somalia, and Burundi
were selected for
study.
All data are from
ANC sentinel
surveillance unless
otherwise specified.
between eastern and western
DRC (4.9% vs. 4.1%).
Additionally, prevalence in
eastern DRC sites seemed to
be lower than the nearest
sentinel sites in neighboring
countries.
Data were also provided
comparing the prevalence of
HIV infection in refugee
populations vs. host
communities in selected sites.
Of the 12 sets of refugee
camps, nine (75%) had a
lower prevalence of HIV
infection, two (17%) a similar
prevalence, and one (8%) a
higher prevalence than their
respective host community.
The publication contains a
detailed table of prevalence
findings for individual
refugee populations versus
host communities for selected
sites.
Data for rural Congolese
refugees were studied against
selected host communities in
Tanzania, Rwanda, and
Zambia. Refugees primarily
arrived in Tanzania in 1995-
1996 and had a lower
prevalence of HIV infection
in 2002 than host
communities. Refugees
arrived in Zambia in 1997-
1998 and had a lower
fleeing conflict have a higher
prevalence of HIV infection
than do their surrounding host
communities. If anything, the
opposite seems to be true.
Some evidence supports the
idea that armed conflict could
disseminate HIV throughout a
country when the disease is in
its early stages; based on the
findings from the seven
countries examined in this
study, there are no data to
show that this is the case.
The researchers note that the
prevalence of HIV infection
was higher in urban areas
versus rural areas in this
study. As rural populations
are generally more affected
by conflict, this may explain
why they have a lower or
similar prevalence of HIV
infection when compared to
the host community.
The researchers challenge
past assumptions that conflict
and displacement increase
prevalence of HIV infection,
noting that these assumptions
were made from a few
surveys of questionable
quality. These assumptions,
they note, are understandable,
though they weren‘t
thoroughly scrutinized. Data

189
Report Methodology Population Findings Conclusions
prevalence of HIV infection
in 2002 than host
communities. Additionally,
2002 data from Rwanda
showed refugee camps with a
lower incidence of HIV
infection than the host
community.
Sudanese refugees who
arrived in Uganda between
1995 and 1998 showed
similarly low incidence of
HIV infection when
compared to the host
community.
Rwandan instability from
1992-2002 and genocide in
1994 resulted in displacement
to Tanzania, DRC, and
Burundi. Nearly 73.7% of
4793 people in one study had
been displaced. However, the
overall prevalence of HIV
infection in displaced people
did not seem to differ from
that of the overall population
involved in the study.
Sierra Leone had a civil war
between 1991 and 2000, a
war that was characterized by
widespread violence and
rape. However, Sierra Leone
has been found to have lower
prevalence than neighboring
(peaceful) Guinea (2001).
examined in this study from
these seven countries
counters this assumption.
Additionally, the researchers
warn against generalizations
due to the complex
interactions between
situational factors.

190
Report Methodology Population Findings Conclusions
134/ Enquete de surveillance
comportemental chez les refugies et la
population (2004)
143/ The challenge of sexually
transmitted infections control for HIV
prevention in refugee settings: Rwandan
Refugees in Tanzania
The HIV/AIDS and ST1
programme consisted of 3
phases: a situation
analysis comprising a
literature review, a rapid
ST1 survey, and a
Knowledge Attitudes
Behaviours and Practices
(KABP) survey, followed
by intervention and
monitoring, and final
impact measurement. The
intervention programme
was launched in August
1994, 4 months after the
start of the Rwanda crisis.
Refugees During the baseline ST1 and
KABP surveys, men and
women reported frequent
experience with STI and risky
sexual behaviour prior to the
crisis. Despite high levels of
knowledge of HIV risks and
prevention measures, and
generally appropriate self-
assessment of risk, only 16%
of men admitted to using
condoms during casual sex.
During the STI survey over
50% of ANC attenders were
infected with vaginal
pathogens and 3% had
gonorrhoea; the prevalence of
urethritis was about 10% in
men of whom 30% had NG
and/or CT infections; the
prevalence of active syphilis
was 4% among women and
6% among men. The rapid
STI and KABP surveys
revealed frequent utilization
of alternative STI care
providers (traditional healers
and market vendors) by the
population, who also
expressed their wish for
better preventive and curative
services to be established
through the camp clinics.
Refugee populations are often
exposed to increased risks of
STIs including HIV.
Reproductive health issues
should therefore be addressed
early during a refugee crisis.
STIs case detection and
management should be
improved by training health
workers using the WHO
syndromic approach, and
through IEC campaigns
encouraging attendance at
clinics, but algorithms and
choice of highly effective
drugs should be tailored to
circumstances and cure rates
should be monitored.
Mechanisms to ensure that
results of monitoring efforts
do translate into actual
changes in drug policy need
to be further explored. Efforts
should focus also on reaching
vulnerable groups in the
community such as young
people, women, and people
living with AIDS.

191
Report Methodology Population Findings Conclusions
One hundred and twenty IEC
campaigns with preventative
messages about HIV/AIDS
and STI were conducted in 18
months, reaching about 230
000 sexually active persons.
Condom demand increased
substantially, and about 1.5
million condoms were
distributed in the first 12
months. The number of
reported STI syndromes at
clinics increased markedly
from 20 to about 250 per
week and > 11000 STI
syndromes were treated in the
first 12 months of the
programme to > 18 000 by
the end of the programme.
Antenatal clinic data
indicated that STI prevention
and treatment services were
effective: syphilis prevalence
among ANC attenders
remained low at around 4- 5
%, as did the prevalence in
the male population (5%).
The overall prevalence of
RTI decreased by 25%, from
60% in the first STI survey to
45% in the repeat survey.
281/ AIDS and STI prevention and care
in Rwandan refugee camps in the United
Republic of Tanzania
This document outlines a
programme to establish
AIDS and STI prevention
and care program
attempting to reduce the
prevalence of STIs and
ultimately HIV infection
in the refugee population.
1994 Rwandan
refugees in two large
camps in northwest
Tanzania (Ngara
district)
The objectives of the
programme were to confirm a
need for AIDS and STI
intervention; devise a training
programme for AIDS and STI
prevention and care; to
implement AIDS and STI
control activities in
The researchers noted that
refugee populations are
frequently exposed to an
increased risk of STIs,
including HIV and that STI
control can contribute
substantially to reducing HIV
transmission in places where

192
Report Methodology Population Findings Conclusions
The programme was
conducted in 3 parts:
Phase 1 entailed a rapid
needs assessment,
including a review of
policies, guidelines and
health infrastructure. It
also involved a rapid STI
survey and a rapid
Knowledge, Attitudes,
Beliefs, and Practices
survey (KABP).
Phase 2 (implementation)
involved an information,
education, and
communication package
through mass campaigns,
health promoters, and
peer educators. It also
involved condom supply
and promotion, STI
services, and HIV/AIDS
care. Surveys and testing
were conducted in
outpatient clinics,
antenatal care
departments, and from a
random sample of men
living in the community.
Phase 3 (impact
evaluation) involved
repeated STI and KABP
surveys and dissemination
of reports and planning
with NGOs and other
collaboration with other
agencies; to monitor and
evaluate the
effectiveness/impact of the
programme; and to document
the progress of establishing a
large-scale AIDS and STI
intervention programme
during the Rwandan refugee
crisis in 1994.
The rapid STI and KABP
surveys found that about 10%
of men and women had
reported symptoms of STIs in
their lifetime. Approximately
10% of men reported that
they had paid for sex at some
time in their lives, though
there was a marked reduction
of sexual activity during the
exodus and establishment of
the camps. Only 16% of men
admitted to using condoms
during casual sex (in part due
to myths surrounding the use
of condoms).
High levels of STIs were
recorded in clinics (nearly
60% of women attending
ANC clinics).
Surveys showed that AIDS
and STI interventions were
acceptable to the community,
as they gave people increased
access to STI services.
the infections are prevalent.
The Minimum Initial Services
Package (MISP) should guide
response to refugee crisis.
This includes:
-Information, Education, and
Communication (IEC) to
inform people and encourage
them to attend clinics
promptly
-Condom
promotion/distribution
-STI case management using
the WHO syndromic
approach
-Prevention of congenital
syphilis and Opthalmia at
birth
Additionally, though rapid
situation surveys may provide
immediate and useful
information at a low cost in
the refugee camps, such
surveys should be refined and
combined with other
programme indicators
measuring the process and
quality of services.
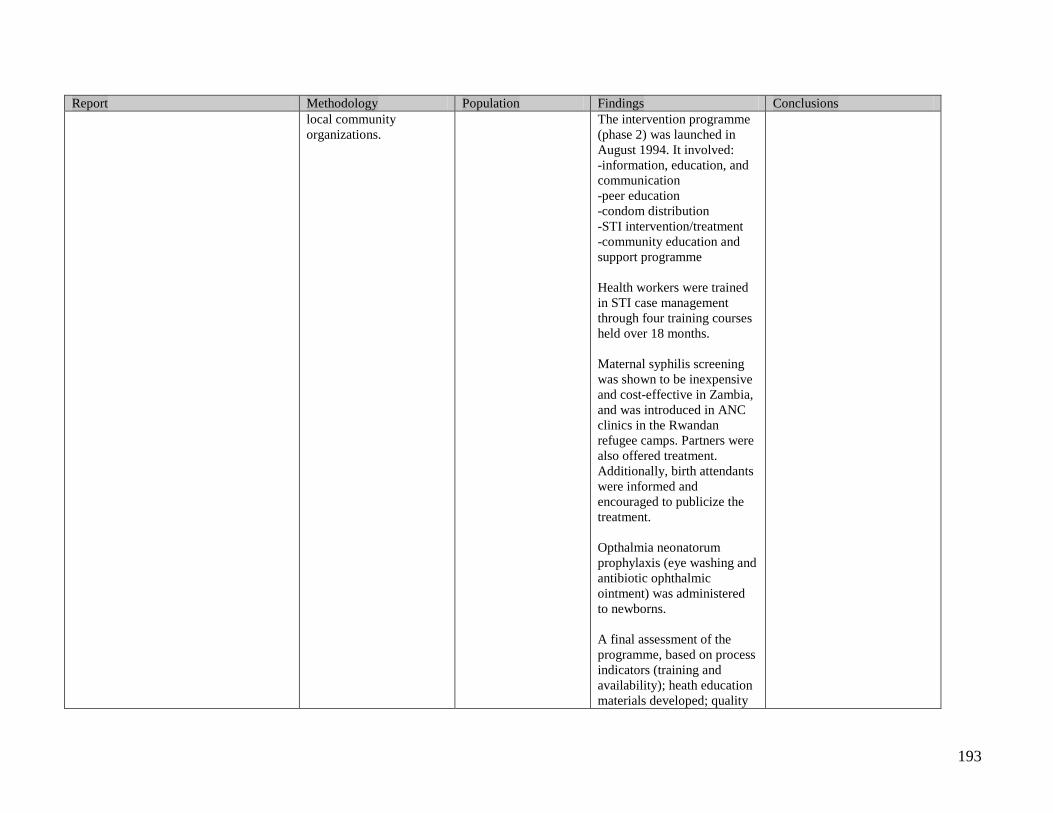
193
Report Methodology Population Findings Conclusions
local community
organizations.
The intervention programme
(phase 2) was launched in
August 1994. It involved:
-information, education, and
communication
-peer education
-condom distribution
-STI intervention/treatment
-community education and
support programme
Health workers were trained
in STI case management
through four training courses
held over 18 months.
Maternal syphilis screening
was shown to be inexpensive
and cost-effective in Zambia,
and was introduced in ANC
clinics in the Rwandan
refugee camps. Partners were
also offered treatment.
Additionally, birth attendants
were informed and
encouraged to publicize the
treatment.
Opthalmia neonatorum
prophylaxis (eye washing and
antibiotic ophthalmic
ointment) was administered
to newborns.
A final assessment of the
programme, based on process
indicators (training and
availability); heath education
materials developed; quality

194
Report Methodology Population Findings Conclusions
indicators (cure rates and
partner treatment rates); and
impact indicators (STI and
KAPB surveys).
The researchers noted that
―the surveys did not report
apparent dramatic changes in
the reported rates of STI and
sexual behavior, the situation
could have been considerably
worse in the absence of any
intervention.‖
Researchers noted an increase
in the number of reported STI
syndromes at clinics
increased from 20 to about
250 per week, and cure rates
of genital discharge in men
was found to be about 70%.
There was a relatively high
incidence of multidrug-
resistant gonococcal strains.
No Report Available
148/ IMPLEMENTING HIV/AIDS TREATMENT AND CARE PROJECT AMONG MOBILE POPULATIONS – THE RDF CONTEXT

195
Practicum C.2 Articles: Sex Workers
Report Methodology Population Findings Conclusions
14/ Changes of Sexual Behaviours of
Sex Workers (Sws) in Rwanda between
2000-2006: Implication for Prevention
Programs
Objective: to determine
the changes observed in
the level of knowledge
and HIV risk behavior of
sex workers in Rwanda
between 2000 and 2006.
Mapping of sites of
prostitution in major
towns in Rwanda
Systematic interview of
SWs present at the sites
during the period of
investigation defined for
the study defines
Data collection via a
standard, pre-coded
questionnaire
Sex Workers (SWs) (n
= 699 [2000]; n =
1041 [2006])
Majority of sample
participants were 20-
24 years of age in
both 2000 and 2006.
Signs of STIs are better
known in 2006 than in 2000.
Ability to cite at least one
sign of STIs:
-69.9% [2006] vs. 59.8%
[2000] in males
-86.9% [2006] vs. 78.7%
[2000] in females
Faithfulness to one uninfected
partner increased in 2006:
-70.4% [2006] vs. 68.4%
[2000]
Abstinence increased in 2006:
-78.6% [2006] vs. 74.6%
[2000]
Condom use decreased
slightly in 2006:
-83.0% [2006] vs. 86.1%
[2000]
The number of at least one of
the HIV/AIDS prevention
methods known increased in
2006 to 91.9% from 90.6% in
2000, while the persistence of
mention of erroneous
methods of transmission
decreased.
The number of individuals
who mentioned the 3 methods
of HIV prevention and are
aware that a person
apparently looking healthy
can transmit the HIV virus
and rejects two of the
erroneous methods of HIV
transmission increased from
26.8 in 2000 to 36.2 in 2006.
Median age of first paid
Generally the level of
knowledge of HIV and STI
increased but there is
persistence of mentioning
erroneous methods of HIV
transmission.
There was a decrease in the
prevalence of STI although
STIs still infect
approximately 1 in 4 SWs.
The study found an improved
access to VCT sites and an
increase in the number of
individuals getting tested.
There is relatively poor
systematic use of the condom.
Future emphasis should be on
educating the masses on all
HIV prevention methods,
improving the
communication regarding the
dangers of STIs and the need
for early treatment,
improving systematic
condom use, and working
with SWs to seek VCT
services.

196
sexual intercourse increased
from 18 to 19 from 2000 to
2006, respectively, though
systemic condom use with a
client within the last seven
days declined from 15.2%
[2000] to 10.1% [2006].
However, condom use with
non paid partners during the
last sexual contact increased
to 66.4% from 53.8%. All
(100%) workers had a
condom at the time of
interview in 2006, versus
60.8% in 2000.
STI prevalence has decreased
to 24.7% in 2006, from 32.9
in 2000, but still remains
high.
Workers who have had an
HIV test or know where to
have one increased by 36.3%
to 82.3 in 2006, and there is
an increased desire to know
one‘s status in 2006 versus
2000.
No Report Available
73/ Enhanced Syndromic Management of STIs in Sex Workers: A Dual Opportunity for Service Provision and Prevention of HIV
74/ Changes in Sexual Risk Behavior in Sex Workers in Rwanda: Report of Findings Comparing 2000 and 2006 BSS Data and Review of Implications for Prevention
Programming

197
Practicum C.2 Articles: Truckers
Report Methodology Population Findings Conclusions
9 / Enquete de Surveillance des
Comportements Relatif au VIH/SIDA
(BSS) aupres des Jeunes, des
Professionnelles de Sexe et des
Transporteurs Routiers au Rwanda (2000
& 2006): Rapport de‘Enquete
13 / Evolution des Comportements
Sexuels des Camionneurs au rwanda
entre 2000 et 2006: Implication pour les
Programmes de Prevention
68 / Aupres des Routiers RWANDA
2000

198
Practicum C.2 Articles: Discordant Couples
Report Methodology Population Findings Conclusions
New heterosexually transmitted HIV
infections in married or cohabiting
couples in urban Zambia and Rwanda:
an analysis of survey and clinical data

199
Practicum C.2 Articles: Youth
Report Methodology Population Findings Conclusions
15/ Evolution des Comportements
Sexuels des Jeunes de 15 a 19 Ans au
Rwanda entre 2000 et 2006
43/ Risk and Protection: Youth and
HIV/AIDS in Sub-Saharan Africa
Riskandprotection.pdf
107/ Projet de Sante de Reproduction des
Adolescents de Butare au Rwanda :
Rapport Comparatif des Phases 1,2,3
Dans la Population des Jeunes de Butare
113 / Projet de Sante de Reproduction
des Adolescents au Rwanda : Rapport
Comparatif dans les Menages de Butare
2000 – 2002
114/ Sante Reproductive des Jeunes au
Rwanda: Quelques Resultats a la
Lumiere des Donnees Eds 2000 (EDS
Rwanda 2000 IInd Analysis)
116/ Projet de Sante de Reproduction des
Adolescents au Rwanda : Rapport de
L‘etude Quantitative a MiParcours
(Phase 2) dans la Population des Eleves
et Etudiants de Butare et Gitarama
118/ Enquete sur la sante reproductive
des etudiants au Rwanda (Butare et
Gitarama), 2000
121/ The Reach and Impact of the PSI
Adolescent Reproductive Health
Program in Butare Province, Rwanda
The data are from the
2000 and 2002 rounds of
a reproductive health
survey of youth 15-24
years of age. Logistic
regression analyses are
conducted to determine
trends in reproductive
health behavior and their
predictors, after
controlling for differences
in sample characteristics.
Logistic regression is also
2000:
2,853
2002:
2,955
Overall prompted recall of
PSI Butare ARH program
activities is fairly low.
Although 24% of
respondents report seeing
billboards for the
multipurpose youth center
around which the program
is focused, only 8% of
youth have ever attended
a peer education session
and 5% or less of youth
report speaking to a peer

200
used to estimate the effect
of level of program
exposure on reproductive
health behavior and its
predictors
educator, reading the
program newspaper or
seeing mobile video unit
shows.
During the first 18 months
of implementation, there
were significant
improvements in
knowledge and use of
voluntary counseling and
testing services among
male and female youth as
well as fewer reported
social barriers that prevent
youth from buying,
negotiating and using
condoms.
Analysis of the effect of
program exposure
suggests that PSI Butare
ARH program contributed
to some, but not all, of
these positive changes.
122/ Making the Transition from Good
Girl to Good Wife: Young Women and
Sex Workers‘ Narratives on Social Life,
Sexuality and Risk: Byumba, Rwanda
(Qualitative)
Sixteen peer researchers
from the Byumba sex-
worker association and
sixteen young people (15-
24) years were recruited
through the Byumba
youth association and
trained to carry out peer
research among their
peers.
48 sex-workers were
interviewed on three
separate themes,
generating 144
interview narratives.
24 girls and 24 boys
were interviewed by
the youth peer
researchers,
generating a further
144 interviews among
the youth group.
Findings presented in the
report were from the
girls‘ and sex-workers‘
data only.
An over-riding theme
emerging from the
narratives is the
perception that the
process of transition
from adolescence into
adulthood is one that is
fraught with danger,
especially for girls.
Girls are caught in the
contradiction between
the stated ideal behavior
Sixteen peer researchers from
the Byumba sex-worker
association and sixteen young
people (15-24) years were
recruited through the Byumba
youth association and trained
to carry out peer research
among their peers.

201
of the ‗good girl‘, and the
constraints of the reality
of life.
The critical moment in
youth is the moment at
which a girl concedes to
have sex with her
boyfriend in order to
maintain the economic
benefits, social status,
and potential to marry
that the relationship
provides.
A major theme of the
sex-workers‘ narratives
is vulnerability of
women who lack male
support from family
(father and brothers), and
from a husband.
Whereas girls‘ narratives
contrast good girls with
bad girls, sex-workers
are set in opposition to
‗wives‘ (socially
acceptable women).
Contrasted with the sub-
ordinate position of
women in society and the
social ostracism of the
sex-worker, is a central
concept of female sexual
pleasure which
dominates in the
encounter between the
sex-worker and client.
Good sex is defined as
kuyanza or ‗wet sex,‘
that is, sex that is
pleasurable to the

202
woman. A successful
sex-worker is one who is
able to perform wet sex,
and often chooses to
avoid condoms in order
to achieve this.
268/ Kap Study on Infant and Young
Child Feeding
KAP study on infant and
young child feeding.pdf
275/ Étude Qualitative Analytique sur
les Strategies appropriees de
distributions des preservatifs dans la
jeunesse Rwandaise
276/ Étude Des Facteurs Influençant
L‘Acceptabilité, Accessibilité, Et
Utilisation Des Préservatifs Dans La
Jeunesse Rwandaise : Connaissances,
Attitudes Et Pratiques
277/ Transversal And Descriptive Study
On Needs Assessment For Youth
Centred Intervention On Hiv/Aids
No Report Available
75/ Changes in HIV Knowledge, Sexual Risk, and Utilization of VCT among Youth in Rwanda: Behavioral Surveillance Results from 2000 - 2006
120/ Patterns of sexual behavior and condom use among high school and university students in Butare and
Gitarama province, Rwanda
124/ Rwanda (2002): Enquête TRaC sur l‘Utilisation du Préservatif par les Jeunes Sexuellement Actifs (15 à 24 Ans) dans la Province de Butare
125/ Déterminants de l‘utilisation du condom par les jeunes de 15-29 ans fréquentant les bars et boîtes de nuit au Rwanda
126/ Enquête TRaC sur l‘Utilisation du Préservatif par les Jeunes Sexuellement Actifs (15 à 24 Ans) dans la Province de Butare_2002.pdf
154/ Changes in HIV knowledge, sexual risk, and utilization of VCT among youth in Rwanda: behavioral surveillance results from 2000 – 2006
155/ ART delivery and adherence in a program for comprehensive pediatric HIV care in rural Rwanda Partners in Health
156 / Youth peer educators lead community care and support to individuals and families affected by HIV
158/ Results of a Cross-Sectional Study on Knowledge, Attitudes, and Practice Related to HIV/AIDS and Sexual Violence Among Students Attending Two Secondary
Schools in Bukavu, Democratic Republic of the Congo (DRC)
172 / Changes in HIV knowledge, sexual risk, and utilization of VCT among youth in Rwanda: behavioral surveillance results from 2000-2006
176/ Study Of Knowledge And Attitudes Concerning Human Immunodeficiency Virus And Acquired Immunodeficiency Syndrome (HIV/AIDS) At Matara Primary
School
180/ Assessment of the role of forum theatre in HIV/AIDS behavioral change process among secondary school adolescents in Butare province, Rwanda
181/ Report Of the assessment of treatment, care and support of children infected and affected by HIV/AIDS in Rwanda
182/ (Report Assessment Treatment Care Support Children Infected .pdf)

203
183 / Experience of the youth forum against HIV/AIDS in Butare
198/ Etude des Connaissances, Attitudes et Comportements des Jeunes Eleves des Etablissements Secondaires Relatifs a l‘ Infection par le VIH en Prefecture de Butare
204/ Connaissances, Attitudes et Pratiques des Eleves des Etablissements Secondaires de la Ville de Gitarama en Matiere du VIH/SIDA
205/ Comportement Sexuel et Utilisation du Preservatif dans la Prevention du VIH/SIDA en Milieu Scolaire :Cas des Eleves des l‘ Enseignement Secondaire de la
Prefecture de la Ville de Kigali(Pvk)
214/ Connaissances, Attitudes et Pratiques des Jeunes de la Prefecture de Butare en Matiere du VIH/SIDA: Cas des Olphelins des Olphelinats Publics de Cette Prefecture
215/ Connaissances, Attitudes et Pratiques des Adolescents du District Sanitaire de Bushenge en Matiere de Planification Familiale
217/ Etude des Connaissances, Attitudes et Pratiques sur le Preservatif chez les Etudiants de l‘ Universite Nationale du Rwanda
220/ Connaissances, Attitudes Et Pratiques des Eleves des Etablissements d‘ Enseignement Secondaire du District Sanitaire de Ruhengeri en Matiere du VIH/SIDA
221/ Connaissances, Attitudes Et Pratiques des Enfants de la Rue de La Ville de Kigali en Rapport avec le VIH//SIDA
224/ Connaissances, Attitudes et Pratiques des Eleves des Etablissements d‘ Enseignement Secondaire du District Sanitaire de Gisenyi en Matiere du VIH/SIDA
225/ Connaissances, Attitudes et Pratiques des Adolescents du District Sanitaire de Kigeme en Matiere de Planification Familiale
226/ Connaissances, attitudes et pratiques des jeunes âgés de 15 à 24 ans en matière du VIH/SIDA
dans le district sanitaire de Rwamagana
227/ Connaissances, attitudes et pratiques des élèves des écoles secondaires de la ville de Butare
en matière de l'utilisation du préservatif dans la prévention contre l'infection à VIH/SIDA et les MST
230/ Etude des connaissances, attitudes et pratiques des étudiants l'UNR enmatière du VIH/SIDA
236/ Connaissances, Attitudes et Pratiques des Eleves des Etablissements de l‘Enseignement Secondaire de la Prefecture de Byumba en Matiere du VIH/SIDA
248/ Etude Des Connaissances, Attitudes Et Pratiques Sur Le Preservatif Chez Les Etudiants De L‘ Universite Nationale Du Rwanda

204
Appendix 5: Data Quality Matrix

205
Appendix 6: Data Abstraction: Nationally and by Province
Practicum B.1: National / Additional HIV indicators, 2000 – 2005
DHS Indicators Population DHS 2000 DHS 2005
PREVALENCE
HIV prevalence Women (15-49 3.6
HIV prevalence Men (15-59) 2.2
HIV prevalence (15 - 19) Women 0.6
HIV prevalence (15 - 19) Men 0.4
HIV prevalence (20 - 24) Women 2.5
HIV prevalence (20 - 24) Men 0.5
HIV prevalence urban Women 8.6
HIV prevalence urban Men 5.8
HIV prevalence rural Women 2.6
HIV prevalence rural Men 1.6
HIV prevalence no education Women 3.3
HIV prevalence no education Men 3
HIV prevalence primary education Women 2.8
HIV prevalence primary education Men 1.8
HIV prvelance secondary or higher education Women 6.4
HIV prvelance secondary or higher education Men 3.2
HIV prevalence lowest wealth quintile Women 2.6
HIV prevalence lowest wealth quintile Men 1.3
HIV prevalence highest wealth quintile Women 6.5
HIV prevalence highest wealth quintile Men 4.1
HIV prevalence (circumcised) Men 3.8
HIV prevalence (uncircumcised) Men 2.1
HIV prevalence marital status (in union) Women 2.8
HIV prevalence marital status (in union) Men 3.5
HIV prevalence never in union Women 0.8
HIV prevalence never in union Men 0.2
HIV prevalence widowed Women 15.9
HIV prevalence widowed Men *
HIV prevalence divorced/seperated Women 10.9
HIV prevalence divorced/seperated Men 5.1
HIV prevalence in polygamous union Women 4.7
HIV prevalence in polygamous union Men 2.3
HIV prevalence not in polygamous union Women 2.5
HIV prevalence not in polygamous union Men 3.5
HIV Prevalence paid for sex in the last 12 months
Yes Men
No Men
HIV Prevalence by had STI in the past 12 months
Yes Women 18.1
No Women 4.2
Yes Men 9.9
No Men 3.0
Discordant Couples
Man HIV positive, women HIV negative 1.4
Woman HIV positive, Man HIV negative 0.8

206
Practicum B.1: National / Additional HIV indicators, 2000 – 2005
(continued)
DHS Indicators Population DHS 2000 DHS 2005
KNOWLEDGE
Avoid HIV infection by using condom Women 36.9 80
Avoid HIV infection by using condom Men 64.9 89.7A healthy person can have AIDS Women 19.8 83.8
A healthy person can have AIDS Men 15.4 91.7
Comprehensive knowledge about AIDS Women 53.6
Comprehensive knowledge about AIDS Men 57.5
HIV can be transmitted by breastfeeding Women 66.5 79.7
HIV can be transmitted by breastfeeding Men 63.6 82.2
Knowledge of PMTCT (HIV can be transmitted by breastfeeding and MTCT risk
can be reduced by drugs) Women 63.7
Knowledge of PMTCT (HIV can be transmitted by breastfeeding and MTCT risk
can be reduced by drugs) Men 69
ATTITUDES
Accepting attitudes toward PLWHA (care for family member) Women 79.6 93.5
Accepting attitudes toward PLWHA (care for family member) Men 87.7 95.8Percentage expressing accepting attitudes on all four indicators (buying vegetables
from shopkeeper, care for family member, female teacher should be allowed to
continue teaching, not want to keep secret that family member is infected with
AIDS). Women 46.1%Percentage expressing accepting attitudes on all four indicators (buying vegetables
from shopkeeper, care for family member, female teacher should be allowed to
continue teaching, not want to keep secret that family member is infected with
AIDS). Men 51.0%
If husband has STD, woman is justified in refusing to have sex with him or asking
that he use condom. Women 95.5
Adult support of education about condom use. Children (12-14) should be taught to
sue condoms. Women 66.4 80.2
Adult support of education about condom use. Children (12-14) should be taught to
use condoms Men 70.8 82.4
BEHAVIOR/PRACTICE
Percentage in union that had 1 non-union partner Women 0.6
Percentage in union that had 1 non-union partner Men 1.8
Percentage not in union that had 1 partner Women 5.8
Percentage not in union that had 1 partner Men 11.3
Percentage had sex with non-marital, non-cohabitating partner in last 12 months Women 6 8
Percentage had sex with non-marital, non-cohabitating partner in last 12 months Men 13 14
Percentage who had 2+ partners in the past 12 months Women 1 0.6
Percentage who had 2+ partners in the past 12 months Men 4 5.1
Percentage who had 2+ partners in the past 4 weeks Women
Percentage who had 2+ partners in the past 4 weeks Men
Percentage who reported using condom at last high-risk intercourse Women 15 19.7
Percentage who reported using condom at last high-risk intercourse Men 51 40.9
Had sex with CSW in last 12 months Women
Had sex with CSW in last 12 months Men 1 0
Ever Tested for HIV Women 4.8 24.2
Ever Tested for HIV Men 7.1 21.9
Percentage of women who received counseling during ANC visit Women 55.8
Percentage of women who were offered and accepted test during ANC visit and
received results Women 23.3
Pregnant women who were counseling, accepted, took test, and received results Women 21.5
Self-reported prevalence of sexually-transmitted infections (STIs) and STI
symptoms Women 2.7 5
Self-reported prevalence of sexually-transmitted infections (STIs) and STI
symptoms Men 2.1 2.7
Use injectable drugs Women
Use injectable drugs Men

207
Practicum B.1: National / Additional HIV indicators, 2000 – 2005 (continued)
DHS Indicators Population DHS 2000 DHS 2005
B
S
S
2
BSS 2006
Youth
UNICEF
2007
YOUTH
Comprehensive knowledge about AIDS (15-24) Women (15-24) 50.9
Comprehensive knowledge about AIDS (15-24) Men (15-24) 53.6
Comprehensive knowledge of source of condoms (15 - 24) Women (15-24) 40 37
Comprehensive knowledge of source of condoms (15 - 24) Men (15-24) 75 73
First sexual intercourse before 15 (15 - 24) Women (15-24) 3.9 7
First sexual intercourse before 15 (15 - 24) Men (15-24) 13.2 7
First sexual intercourse before 18 (15 - 24) Women (15-24) 17.6 11
First sexual intercourse before 18 (15 - 24) Men (15-24) 27.2 11
Median age First sexual intercourse (Place) Women (15-24)
Median age First sexual intercourse (Place) Men (15-24)
Percentage of youth who had higher risk intercourse in the past 12 months Women (15-24) 15
Percentage of youth who had higher risk intercourse in the past 12 months Men (15-24) 48
Percentage of youth who reported using condoms at the last higher risk
intercourse Women (15-24) 23 26
Percentage of youth who reported using condoms at the last higher risk
intercourse Men (15-24) 55 39.5
Percentage of youth who had sex with more than one partner in last 12 months Women (15-24) 1 1
Percentage of youth who had sex with more than one partner in last 12 months Men (15-24) 6 4
Percent of men 20-24 who had sex with CSW in last 12 months Men (20-24) 0 2
Percentage of women who had higher risk intercourse with man 10+ years older Women (15-19) 4.6
Percentage of men who had higher risk intercourse with woman 10+ years older Men (15-19) N/A

208
Practicum B.1: Kibungo - EAST / Additional HIV indicators, 2000 – 2005
PREVALENCE P opulation DHS 2000 DHS 2005
P L AC E
loc ation 1
P L AC E
loc ation 2
HIV prevalence Women 3.4HIV prevalence (15-49) Women/National 3.6%HIV prevalence Men 1.5HIV prevalence (15-59) Men/National 2.2%HIV prevalence (15 - 24) Women 1HIV prevalence (15 - 24) Men 0HIV prevalence R egional 2.6%HIV prevalence (men and women combined) National 3,0%
DHS Indic ators P opulation DHS 2000 DHS 2005
P L AC E
loc ation 1
P L AC E
loc ation 2
KNOWLEDGE K ibunyo-K ayonza R wamag anaAvoid HIV infection by using condom Women 39.6 87.7Avoid HIV infection by using condom Men 63.1 94.1A healthy person can have AIDS Women 18.1 82.4A healthy person can have AIDS Men 14.9 94.5Comprehensive knowledge about AIDS Women 52.7Comprehensive knowledge about AIDS Men 60.6HIV can be transmitted by breastfeeding Women 66 80.7HIV can be transmitted by breastfeeding Men 59.5 89.8Knowledge of PMTCT (HIV can be transmitted by breastfeeding and MTCT risk
can be reduced by drugs) Women 62.9Knowledge of PMTCT (HIV can be transmitted by breastfeeding and MTCT risk
can be reduced by drugs) Men 77.3ATTITUDES
Accepting attitudes toward PLWHA (care for family member) Women 83.6 92.3Accepting attitudes toward PLWHA (care for family member) Men 88.7 98.8Percentage expressing accepting attitudes on all four indicators (buying vegetables
from shopkeeper, care for family member, female teacher should be allowed to
continue teaching, not want to keep secret that family member is infected with
AIDS). Women 43.2%Percentage expressing accepting attitudes on all four indicators (buying vegetables
from shopkeeper, care for family member, female teacher should be allowed to
continue teaching, not want to keep secret that family member is infected with
AIDS). Men 64.7%
If husband has STD, woman is justified in refusing to have sex with him or asking
that he use condom. Women 96.3
Adult support of education about condom use. Children (12-14) should be taught to
sue condoms. Women 70.1 86.2Adult support of education about condom use. Children (12-14) should be taught to
sue condoms. Men 75.7 90.5
BEHAVIOR/PRACTICE
Percentage in union that had 1 non-union partner Women 0.8
Percentage in union that had 1 non-union partner Men 6.6
Percentage not in union that had 1 partner Women 5.9
Percentage not in union that had 1 partner Men 10.7
Percentage who had 2+ partners in the past 12 months Women 0.2Percentage who had 2+ partners in the past 12 months Men 9.8Percentage who had 2+ partners in the past 4 weeks Women 8 9Percentage who had 2+ partners in the past 4 weeks Men 9 11Percentage who reported using condom at last high-risk intercourse Women 20.9 42.9 40Percentage who reported using condom at last high-risk intercourse Men (30.1) 50.0 53.3Had sex with CSW in last 12 months Women 8.0 4
Had sex with CSW in last 12 months Men 6.0 8.0Ever Tested Women 3.3 18.6 53 52
Ever Tested Men 5.4 16.8 46 53
Percentage of women who received counseling during ANC visit Women 41.1Percentage of women who were offered and accepted test during ANC visit and
received results Women 15.1
Pregnant women who were counseling, accepted, took test, and received results Women 14.2Self-reported prevalence of sexually-transmitted infections (STIs) and STI
symptoms Women 3.1 8.5Self-reported prevalence of sexually-transmitted infections (STIs) and STI
symptoms Men 3.5 2.7Use injectable drugs Women 0 0
Use injectable drugs Men 0 0

209
Practicum B.1: Kibungo - EAST / Additional HIV indicators, 2000 – 2005 (continued)
YOUTH P opulation DHS 2000 DHS 2005
P L AC E
loc ation 1
P L AC E
loc ation 2
Comprehensive knowledge about AIDS (15-24) Women (15-24) 50.1Comprehensive knowledge about AIDS (15-24) Men (15-24) 59.8Comprehensive knowledge of source of condoms (15 - 24) Women (15-24) 35.8Comprehensive knowledge of source of condoms (15 - 24) Men (15-24) 86.4First sexual intercourse before 15 (15 - 24) Women (15-24) 6.5 5.4 8.9First sexual intercourse before 15 (15 - 24) Men (15-24) 15 7.8 9.2
First sexual intercourse before 18 (15 - 24) Women (15-24) 23.8
First sexual intercourse before 18 (15 - 24) Men (15-24) 36.2
Median age First sexual intercourse (Place) Women (15-24) 18 18
Median age First sexual intercourse (Place) Men (15-24) 20 18Percentage of youth who had higher risk intercourse in the past 12 months Women (15-24) 17Percentage of youth who had higher risk intercourse in the past 12 months Men (15-24) (53.9)Percentage of youth who reported using condoms at the last higher risk
intercourse Women (15-24) *Percentage of youth who reported using condoms at the last higher risk
intercourse Men (15-24) *Percentage of women who had higher risk intercourse with man 10+ years older Women (15-19) 26.1 18.4Percentage of men who had higher risk intercourse with woman 10+ years older Men (15-19)

210
Practicum B.1: Kigali Ngali – EAST-NORTH / Additional HIV indicators, 2000 – 2005
PREVALENCE P opulation DHS 2000 DHS 2005
P L AC E
loc ation 1
P L AC E
loc ation 2
HIV prevalence Women 2.6HIV prevalence (15-49) Women/National 3.6%HIV prevalence Men 2.7HIV prevalence (15-59) Men/National 2.2%HIV prevalence (15 - 24) Women 0.9HIV prevalence (15 - 24) Men 0.7HIV prevalence R egional 2.7%HIV prevalence (men and women combined) National 3,0%
DHS Indic ators P opulation DHS 2000 DHS 2005
P L AC E
loc ation 1
P L AC E
loc ation 2
KNOWLEDGE Nyamata R uhuhaAvoid HIV infection by using condom Women 41.5 89Avoid HIV infection by using condom Men 65.5 95A healthy person can have AIDS Women 13.9 89A healthy person can have AIDS Men 15.3 90Comprehensive knowledge about AIDS Women 74.4Comprehensive knowledge about AIDS Men 62.6HIV can be transmitted by breastfeeding Women 62.7 77.8HIV can be transmitted by breastfeeding Men 61.8 89.6Knowledge of PMTCT (HIV can be transmitted by breastfeeding and MTCT risk
can be reduced by drugs) Women 65.1Knowledge of PMTCT (HIV can be transmitted by breastfeeding and MTCT risk
can be reduced by drugs) Men 74.4ATTITUDES
Accepting attitudes toward PLWHA (care for family member) Women 87.3 94.8Accepting attitudes toward PLWHA (care for family member) Men 85.1 97.7Percentage expressing accepting attitudes on all four indicators (buying vegetables
from shopkeeper, care for family member, female teacher should be allowed to
continue teaching, not want to keep secret that family member is infected with
AIDS). Women 38.3%Percentage expressing accepting attitudes on all four indicators (buying vegetables
from shopkeeper, care for family member, female teacher should be allowed to
continue teaching, not want to keep secret that family member is infected with
AIDS). Men 53.6%If husband has STD, woman is justified in refusing to have sex with him or asking
that he use condom. Women 97
Adult support of education about condom use. Children (12-14) should be taught to
sue condoms. Women 63.7 73.1Adult support of education about condom use. Children (12-14) should be taught to
sue condoms. Men 68.7 87.9
BEHAVIOR/PRACTICE
Percentage in union that had 1 non-union partner Women 1.1
Percentage in union that had 1 non-union partner Men 0.8
Percentage not in union that had 1 partner Women 5.3
Percentage not in union that had 1 partner Men 13.2
Percentage who had 2+ partners in the past 12 months Women 0Percentage who had 2+ partners in the past 12 months Men 3.5Percentage who had 2+ partners in the past 4 weeks Women 1 9Percentage who had 2+ partners in the past 4 weeks Men 7 7Percentage who reported using condom at last high-risk intercourse Women (12.6) 28.6 40Percentage who reported using condom at last high-risk intercourse Men * 46.3 61.5Had sex with CSW in last 12 months Women 3 13
Had sex with CSW in last 12 months Men 9 9Ever Tested Women 6.7 26 19 18
Ever Tested Men 8 25.2 23 18
Percentage of women who received counseling during ANC visit Women 61.9Percentage of women who were offered and accepted test during ANC visit and
received results Women 25.9
Pregnant women who were counseling, accepted, took test, and received results Women 23Self-reported prevalence of sexually-transmitted infections (STIs) and STI
symptoms Women 2.9 2.2Self-reported prevalence of sexually-transmitted infections (STIs) and STI
symptoms Men 1.2 1Use injectable drugs Women 0.5 0.3Use injectable drugs Men 0.4 1

211
Practicum B.1: Kigali Ngali – EAST-NORTH / Additional HIV indicators, 2000 – 2005
(continued)
YOUTH P opulation DHS 2000 DHS 2005
P L AC E
loc ation 1
P L AC E
loc ation 2
Comprehensive knowledge about AIDS (15-24) Women (15-24) 71.1Comprehensive knowledge about AIDS (15-24) Men (15-24) 55.5Comprehensive knowledge of source of condoms (15 - 24) Women (15-24) 30Comprehensive knowledge of source of condoms (15 - 24) Men (15-24) 72.9First sexual intercourse before 15 (15 - 24) Women (15-24) 2.5 9 18.9First sexual intercourse before 15 (15 - 24) Men (15-24) 4.5 11 15.6
First sexual intercourse before 18 (15 - 24) Women (15-24) 19
First sexual intercourse before 18 (15 - 24) Men (15-24) 14.4
Median age First sexual intercourse (Place) Women (15-24) 18 17
Median age First sexual intercourse (Place) Men (15-24) 18 18Percentage of youth who had higher risk intercourse in the past 12 months Women (15-24) 18Percentage of youth who had higher risk intercourse in the past 12 months Men (15-24) (42.4)Percentage of youth who reported using condoms at the last higher risk
intercourse Women (15-24) *Percentage of youth who reported using condoms at the last higher risk
intercourse Men (15-24) *Percentage of women who had higher risk intercourse with man 10+ years older Women (15-19)
Percentage of men who had higher risk intercourse with woman 10+ years older Men (15-19)

212
Practicum B.1: Umutara - EAST / Additional HIV indicators, 2000 – 2005
PREVALENCE P opulation DHS 2000 DHS 2005
P L AC E
loc ation 1
P L AC E
loc ation 2
HIV prevalence Women 1.7%HIV prevalence (15-49) Women/National 3.6%HIV prevalence Men 1.5%HIV prevalence (15-59) Men/National 2.2%HIV prevalence (15 - 24) Women 0.0%HIV prevalence (15 - 24) Men 0.0%HIV prevalence R egional 1.6%HIV prevalence (men and women combined) National 3,0%
DHS Indic ators P opulation DHS 2000 DHS 2005
P L AC E
loc ation 1
P L AC E
loc ation 2
KNOWLEDGE K AB AR OR E MUS E NY IAvoid HIV infection by using condom Women 30.8 88.3
Avoid HIV infection by using condom Men 56.3 86.0A healthy person can have AIDS Women 23.8 89.7A healthy person can have AIDS Men 24.3 89.8
Comprehensive knowledge about AIDS Women 54.7%Comprehensive knowledge about AIDS Men 39.1%HIV can be transmitted by breastfeeding Women 66.9% 75.8%HIV can be transmitted by breastfeeding Men 61.2% 76.9%Knowledge of PMTCT (HIV can be transmitted by breastfeeding and MTCT risk
can be reduced by drugs) Women 67.8%Knowledge of PMTCT (HIV can be transmitted by breastfeeding and MTCT risk
can be reduced by drugs) Men 68.1%ATTITUDES
Accepting attitudes toward PLWHA (care for family member) Women 83.8% 90.9%Accepting attitudes toward PLWHA (care for family member) Men 94.2% 96.7%Percentage expressing accepting attitudes on all four indicators (buying vegetables
from shopkeeper, care for family member, female teacher should be allowed to
continue teaching, not want to keep secret that family member is infected with
AIDS). Women 42.9%Percentage expressing accepting attitudes on all four indicators (buying vegetables
from shopkeeper, care for family member, female teacher should be allowed to
continue teaching, not want to keep secret that family member is infected with
AIDS). Men 43.5%
If husband has STD, woman is justified in refusing to have sex with him or asking
that he use condom. Women 98.5%
Adult support of education about condom use. Children (12-14) should be taught to
sue condoms. Women 64.3% 85.2%Adult support of education about condom use. Children (12-14) should be taught to
sue condoms. Men 64.1% 91.3%
BEHAVIOR/PRACTICE
Percentage in union that had 1 non-union partner Women 0.0%
Percentage in union that had 1 non-union partner Men 1.5%
Percentage not in union that had 1 partner Women 3.0%
Percentage not in union that had 1 partner Men (2.6)
Percentage who had 2+ partners in the past 12 months Women 0.8%Percentage who had 2+ partners in the past 12 months Men 3.7%Percentage who had 2+ partners in the past 4 weeks Women 13 8Percentage who had 2+ partners in the past 4 weeks Men 17 15Percentage who reported using condom at last high-risk intercourse Women (7.3) 30.3% 16.7%Percentage who reported using condom at last high-risk intercourse Men (27.2) 51.9% 41.0%
Had sex with CSW in last 12 months women 7.0% 2.0%
Had sex with CSW in last 12 months men 15.0% 13.0%Ever Tested Women 2.5% 14.4% 47.0% 1.0%
Ever Tested Men 1.9% 22.0% 42.0% 1.0%
Percentage of women who received counseling during ANC visit Women 63.6%Percentage of women who were offered and accepted test during ANC visit and
received results Women 19.5%
Pregnant women who were counseling, accepted, took test, and received results Women 16.6%Self-reported prevalence of sexually-transmitted infections (STIs) and STI
symptoms Women 2.2% 5.3%Self-reported prevalence of sexually-transmitted infections (STIs) and STI
symptoms Men 2.5% 2.6%Use injectable drugs (PLACE) Women 0.0% 0.0%Use injectable drugs (PLACE) Men 0.0% 0.0%

213
Practicum B.1: Umutara - EAST / Additional HIV indicators, 2000 – 2005
(continued)
YOUTH P opulation DHS 2000 DHS 2005
P L AC E
loc ation 1
P L AC E
loc ation 2
Comprehensive knowledge about AIDS (15-24) Women 50.4%Comprehensive knowledge about AIDS (15-24) Men 35.0%Comprehensive knowledge of source of condoms (15 - 24) Women 45.2%Comprehensive knowledge of source of condoms (15 - 24) Men 76.4%First sexual intercourse before 15 (15 - 24) Women 4.0% 16.5% 15.5%First sexual intercourse before 15 (15 - 24) Men 11.2% 13.8% 15.5%
First sexual intercourse before 18 (15 - 24) Women 23.5%
First sexual intercourse before 18 (15 - 24) Men 27.4%
Median age First sexual intercourse (Place) Women 18 17
Median age First sexual intercourse (Place) Men 18 17Percentage of youth who had higher risk intercourse in the past 12 months Women 9.0%Percentage of youth who had higher risk intercourse in the past 12 months Men (43.0)Percentage of youth who reported using condoms at the last higher risk
intercourse Women *Percentage of youth who reported using condoms at the last higher risk
intercourse Men *Percentage of women who had higher risk intercourse with man 10+ years older
(15 - 19) Women 8.5% 6.0%Percentage of men who had higher risk intercourse with a partner 10+ years older
(15 - 19) Men 5.4% 6.0%

214
Practicum B.1: Kigali Ville - KIGALI / Additional HIV indicators, 2000 – 2005
PREVALENCE P opulation DHS 2000 DHS 2005
P L AC E
loc ation 1
P L AC E
loc ation 2
HIV prevalence Women 9.5HIV prevalence (15-49) Women/National 3.6%HIV prevalence Men 5.6HIV prevalence (15-59) Men/National 2.2%HIV prevalence (15 - 24) Women 5.4HIV prevalence (15 - 24) Men 1HIV prevalence R egional 7.7%HIV prevalence (men and women combined) National 3,0%
DHS Indic ators P opulation DHS 2000 DHS 2005
P L AC E
loc ation 1
P L AC E
loc ation 2
KNOWLEDGE
Ville de K ig ali
S ite 1
Ville de K ig ali
S ite 2Avoid HIV infection by using condom Women 52.7 84.8Avoid HIV infection by using condom Men 78.9 86.2A healthy person can have AIDS Women 7 96.2A healthy person can have AIDS Men 7 97.4Comprehensive knowledge about AIDS Women 65.8Comprehensive knowledge about AIDS Men 61.1HIV can be transmitted by breastfeeding Women 68.4 90.4HIV can be transmitted by breastfeeding Men 64.6 87.7Knowledge of PMTCT (HIV can be transmitted by breastfeeding and MTCT risk
can be reduced by drugs) Women 84Knowledge of PMTCT (HIV can be transmitted by breastfeeding and MTCT risk
can be reduced by drugs) Men 80.8ATTITUDES
Accepting attitudes toward PLWHA (care for family member) Women 92.1 97.6Accepting attitudes toward PLWHA (care for family member) Men 94.5 97.3Percentage expressing accepting attitudes on all four indicators (buying vegetables
from shopkeeper, care for family member, female teacher should be allowed to
continue teaching, not want to keep secret that family member is infected with
AIDS). Women 66.4%Percentage expressing accepting attitudes on all four indicators (buying vegetables
from shopkeeper, care for family member, female teacher should be allowed to
continue teaching, not want to keep secret that family member is infected with
AIDS). Men 23.4%
If husband has STD, woman is justified in refusing to have sex with him or asking
that he use condom. Women 98.9
Adult support of education about condom use. Children (12-14) should be taught to
sue condoms. Women 76 87.3Adult support of education about condom use. Children (12-14) should be taught to
sue condoms. Men 79.1 86.9
BEHAVIOR/PRACTICE
Percentage in union that had 1 non-union partner Women 1.2
Percentage in union that had 1 non-union partner Men 5.8
Percentage not in union that had 1 partner Women 8.3
Percentage not in union that had 1 partner Men 21.3Percentage who had 2+ partners in the past 12 months Women 2.1Percentage who had 2+ partners in the past 12 months Men 6.9Percentage who had 2+ partners in the past 4 weeks Women 32Percentage who had 2+ partners in the past 4 weeks Men 17Percentage who reported using condom at last high-risk intercourse Women 44.3 55Percentage who reported using condom at last high-risk intercourse Men 67.2 55.8Had sex with CSW in last 12 months Women 40
Had sex with CSW in last 12 months Men 26Ever Tested Women 22.9* 53.3
Ever Tested Men 18.4* 44.8
Percentage of women who received counseling during ANC visit Women 76.3Percentage of women who were offered and accepted test during ANC visit and
received results Women 69.4
Pregnant women who were counseling, accepted, took test, and received results Women 63.1Self-reported prevalence of sexually-transmitted infections (STIs) and STI
symptoms Women 7.6 8.4Self-reported prevalence of sexually-transmitted infections (STIs) and STI
symptoms Men 3.3 3.3
Use injectable drugs Women 0.2Use injectable drugs Men 0.5

215
Practicum B.1: Kigali Ville - KIGALI / Additional HIV indicators, 2000 – 2005
(continued)
YOUTH P opulation DHS 2000 DHS 2005
P L AC E
loc ation 1
P L AC E
loc ation 2
Comprehensive knowledge about AIDS (15-24) Women (15-24) 67Comprehensive knowledge about AIDS (15-24) Men (15-24) 56.3Comprehensive knowledge of source of condoms (15 - 24) Women (15-24) 69.6Comprehensive knowledge of source of condoms (15 - 24) Men (15-24) 93.3First sexual intercourse before 15 (15 - 24) Women (15-24) 5.3First sexual intercourse before 15 (15 - 24) Men (15-24) 10
First sexual intercourse before 18 (15 - 24) Women (15-24) 18.7
First sexual intercourse before 18 (15 - 24) Men (15-24) 24.9
Median age First sexual intercourse (Place) Women (15-24) 18
Median age First sexual intercourse (Place) Men (15-24) 18Percentage of youth who had higher risk intercourse in the past 12 months Women (15-24) 39Percentage of youth who had higher risk intercourse in the past 12 months Men (15-24) (81.4)Percentage of youth who reported using condoms at the last higher risk
intercourse Women (15-24) (48.0)Percentage of youth who reported using condoms at the last higher risk
intercourse Men (15-24) (74.9)Percentage of women who had higher risk intercourse with man 10+ years older Women (15-19)
Percentage of men who had higher risk intercourse with woman 10+ years older Men (15-19)

216
Practicum B.1: Byumba - NORTH / Additional HIV indicators, 2000 – 2005
PREVALENCE Population DHS 2000 DHS 2005
PLACE
location 1
PLACE
location 2
HIV prevalence - All ages Women 2.4
HIV prevalence (15-49) Women/National 3.6%HIV prevalence - All ages Men 0.9
HIV prevalence (15-59) Men/National 2.2%HIV prevalence (15 - 24) Women (15-24) 0.6
HIV prevalence (15 - 24) Men (15-24) 0.0
HIV prevalence R egional 1.8%HIV prevalence (men and women combined) National 3,0%
DHS Indicators Population DHS 2000 DHS 2005
PLACE
location 1
PLACE
location 2
KNOWLEDGE BYUMBA RUKOMO
Avoid HIV infection by using condom Women 37.3 79.5
Avoid HIV infection by using condom Men 67.6 95.8A healthy person can have AIDS Women 25.5 85.5
A healthy person can have AIDS Men 17.8 86.4
Comprehensive knowledge about AIDS Women 54.2
Comprehensive knowledge about AIDS Men 62.1
HIV can be transmitted by breastfeeding Women 65.1 78.0
HIV can be transmitted by breastfeeding Men 68.5 78.2
Knowledge of PMTCT (HIV can be transmitted by breastfeeding and MTCT risk
can be reduced by drugs) Women 65.3
Knowledge of PMTCT (HIV can be transmitted by breastfeeding and MTCT risk
can be reduced by drugs) Men 70.7
ATTITUDES
Accepting attitudes toward PLWHA (care for family member) Women 74.4 95.8
Accepting attitudes toward PLWHA (care for family member) Men 85.4 95.8Percentage expressing accepting attitudes on all four indicators (buying vegetables
from shopkeeper, care for family member, female teacher should be allowed to
continue teaching, not want to keep secret that family member is infected with
AIDS). Women 53.9%Percentage expressing accepting attitudes on all four indicators (buying vegetables
from shopkeeper, care for family member, female teacher should be allowed to
continue teaching, not want to keep secret that family member is infected with
AIDS). Men 62.0%
If husband has STD, woman is justified in refusing to have sex with him or asking
that he use condom. Women 95.8
Adult support of education about condom use. Children (12-14) should be taught to
sue condoms. Women 67.1 86.3
Adult support of education about condom use. Children (12-14) should be taught to
use condoms Men 72.8 78.7
BEHAVIOR/PRACTICE
Percentage in union that had 1 non-union partner Women 0.5
Percentage in union that had 1 non-union partner Men 0
Percentage not in union that had 1 partner Women 6.7
Percentage not in union that had 1 partner Men 8.4
Percentage who had 2+ partners in the past 12 months Women 0.5
Percentage who had 2+ partners in the past 12 months Men 1.9
Percentage who had 2+ partners in the past 4 weeks Women 5 1Percentage who had 2+ partners in the past 4 weeks Men 8 2Percentage who reported using condom at last high-risk intercourse Women 8.7 29.4 10
Percentage who reported using condom at last high-risk intercourse Men (25.9) 54.3 39.1
Had sex with CSW in last 12 months Women 7 4
Had sex with CSW in last 12 months Men 8 1
Ever Tested for HIV Women 2.3 21.8 40 34
Ever Tested for HIV Men 9.4 18.8 36 31
Percentage of women who received counseling during ANC visit Women 55.5
Percentage of women who were offered and accepted test during ANC visit and
received results Women 18.1
Pregnant women who were counseling, accepted, took test, and received results Women 17.4
Self-reported prevalence of sexually-transmitted infections (STIs) and STI
symptoms Women 2.6 3.1
Self-reported prevalence of sexually-transmitted infections (STIs) and STI
symptoms Men 2.7 2.0
Use injectable drugs Women 0 0
Use injectable drugs Men 0 0

217
Practicum B.1: Byumba - NORTH / Additional HIV indicators, 2000 – 2005
(continued)
YOUTH Population DHS 2000 DHS 2005
PLACE
location 1
PLACE
location 2
Comprehensive knowledge about AIDS (15-24) Women (15-24) 51.1
Comprehensive knowledge about AIDS (15-24) Men (15-24) 56.6
Comprehensive knowledge of source of condoms (15 - 24) Women (15-24) 39.5
Comprehensive knowledge of source of condoms (15 - 24) Men (15-24) 78.5
First sexual intercourse before 15 (15 - 24) Women (15-24) 4.0 6 3.1
First sexual intercourse before 15 (15 - 24) Men (15-24) 5.8 9.9 7.3
First sexual intercourse before 18 (15 - 24) Women (15-24) 15.7
First sexual intercourse before 18 (15 - 24) Men (15-24) 18.1
Median age First sexual intercourse (Place) Women (15-24) 19 20
Median age First sexual intercourse (Place) Men (15-24) 18 20
Percentage of youth who had higher risk intercourse in the past 12 months Women (15-24) 13.0
Percentage of youth who had higher risk intercourse in the past 12 months Men (15-24) *
Percentage of youth who reported using condoms at the last higher risk
intercourse Women (15-24) *
Percentage of youth who reported using condoms at the last higher risk
intercourse Men (15-24) *
Percentage of women who had higher risk intercourse with man 10+ years older Women (15-19) 2.0 4.1
Percentage of men who had higher risk intercourse with woman 10+ years older Men (15-19) 2.2 1.6

218
Practicum B.1: Ruhengeri - NORTH / Additional HIV indicators, 2000 – 2005
PREVALENCE P opulation DHS 2000 DHS 2005
P L AC E
loc ation 1
P L AC E
loc ation 2
HIV prevalence Women 2.7 2.7HIV prevalence (15-49) Women/National 3.6%HIV prevalence Men 1.5 1.5HIV prevalence (15-59) Men/National 2.2%HIV prevalence (15 - 24) Women 1.0 1HIV prevalence (15 - 24) Men 1.8 1.8HIV prevalence R egional 2.2%HIV prevalence (men and women combined) National 3,0%
DHS Indic ators P opulation DHS 2000 DHS 2005
P L AC E
loc ation 1
P L AC E
loc ation 2
KNOWLEDGE Muko-Mukamira R us umo
Avoid HIV infection by using condom Women 31.7 67.1
Avoid HIV infection by using condom Men 63.5 96.2A healthy person can have AIDS Women 21.9 78.3A healthy person can have AIDS Men 16.2 89.9Comprehensive knowledge about AIDS Women 38.4Comprehensive knowledge about AIDS Men 54.6HIV can be transmitted by breastfeeding Women 60.1 75.4HIV can be transmitted by breastfeeding Men 62.4 61.6Knowledge of PMTCT (HIV can be transmitted by breastfeeding and MTCT risk
can be reduced by drugs) Women 54.2Knowledge of PMTCT (HIV can be transmitted by breastfeeding and MTCT risk
can be reduced by drugs) Men 55.5ATTITUDES
Accepting attitudes toward PLWHA (care for family member) Women 71.6 91.6Accepting attitudes toward PLWHA (care for family member) Men 83.2 98.8Percentage expressing accepting attitudes on all four indicators (buying vegetables
from shopkeeper, care for family member, female teacher should be allowed to
continue teaching, not want to keep secret that family member is infected with
AIDS). Women 36.8%Percentage expressing accepting attitudes on all four indicators (buying vegetables
from shopkeeper, care for family member, female teacher should be allowed to
continue teaching, not want to keep secret that family member is infected with
AIDS). Men 44.6%
If husband has STD, woman is justified in refusing to have sex with him or asking
that he use condom. Women 87.7
Adult support of education about condom use. Children (12-14) should be taught to
sue condoms. Women 60.0 68.7Adult support of education about condom use. Children (12-14) should be taught to
sue condoms. Men 66.0 81.5
BEHAVIOR/PRACTICE
Percentage in union that had 1 non-union partner Women 0
Percentage in union that had 1 non-union partner Men 0.8
Percentage not in union that had 1 partner Women 6.3
Percentage not in union that had 1 partner Men 12.8
Percentage who had 2+ partners in the past 12 months Women 0.8Percentage who had 2+ partners in the past 12 months Men 7.1Percentage who had 2+ partners in the past 4 weeks Women 15 25Percentage who had 2+ partners in the past 4 weeks Men 22 13Percentage who reported using condom at last high-risk intercourse Women (19.2) 30 26.5Percentage who reported using condom at last high-risk intercourse Men * 44.4 22.2Had sex with CSW in last 12 months Women 20 21
Had sex with CSW in last 12 months Men 23 16
Ever Tested Women 3.2 20.4 18 9
Ever Tested Men 5.6 18.1 15 8
Percentage of women who received counseling during ANC visit Women 48.5Percentage of women who were offered and accepted test during ANC visit and
received results Women 18.1
Pregnant women who were counseling, accepted, took test, and received results Women 17.4Self-reported prevalence of sexually-transmitted infections (STIs) and STI
symptoms Women 1.8 2.7Self-reported prevalence of sexually-transmitted infections (STIs) and STI
symptoms Men 1.4 4.4Use injectable drugs Women 0 0Use injectable drugs Men 0 0

219
Practicum B.1: Ruhengeri - NORTH / Additional HIV indicators, 2000 – 2005
(continued)
YOUTH P opulation DHS 2000 DHS 2005
P L AC E
loc ation 1
P L AC E
loc ation 2
Comprehensive knowledge about AIDS (15-24) Women (15-24) 38.7Comprehensive knowledge about AIDS (15-24) Men (15-24) 49.6Comprehensive knowledge of source of condoms (15 - 24) Women (15-24) 29.0Comprehensive knowledge of source of condoms (15 - 24) Men (15-24) 72.4First sexual intercourse before 15 (15 - 24) Women (15-24) 3.3First sexual intercourse before 15 (15 - 24) Men (15-24) 16.1
First sexual intercourse before 18 (15 - 24) Women (15-24) 20.6
First sexual intercourse before 18 (15 - 24) Men (15-24) 30.0
Median age First sexual intercourse (Place) Women (15-24) 19 20
Median age First sexual intercourse (Place) Men (15-24) 19 19Percentage of youth who had higher risk intercourse in the past 12 months Women (15-24) 9.0Percentage of youth who had higher risk intercourse in the past 12 months Men (15-24) (29.8)Percentage of youth who reported using condoms at the last higher risk
intercourse Women (15-24) *Percentage of youth who reported using condoms at the last higher risk
intercourse Men (15-24) *Percentage of women who had higher risk intercourse with man 10+ years older Women (15-19) 28 22.6Percentage of men who had higher risk intercourse with woman 10+ years older Men (15-19)

220
Practicum B.1: Butare - SOUTH / Additional HIV indicators, 2000 – 2005
PREVALENCE P opulation DHS 2000 DHS 2005
P L AC E
loc ation 1
P L AC E
loc ation 2
HIV prevalence Women 3.1%HIV prevalence (15-49) Women/National 3.6%HIV prevalence Men 1.6%HIV prevalence (15-59) Men/National 2.2%HIV prevalence (15 - 24) Women 0.7%HIV prevalence (15 - 24) Men 0.0%HIV prevalence (men and women combined) R egional 2.4%HIV prevalence (men and women combined) National 3,0%
DHS Indic ators P opulation DHS 2000 DHS 2005
P L AC E
loc ation 1
P L AC E
loc ation 2
KNOWLEDGE B UTAR E S AVEAvoid HIV infection by using condom Women 40.3 87.4Avoid HIV infection by using condom Men 68.2 95A healthy person can have AIDS Women 21.4 82.7A healthy person can have AIDS Men 15.1 99Comprehensive knowledge about AIDS Women 58.8%Comprehensive knowledge about AIDS Men 81.5%HIV can be transmitted by breastfeeding Women 71.9% 88.2%HIV can be transmitted by breastfeeding Men 66.3% 84.2%Knowledge of PMTCT (HIV can be transmitted by breastfeeding and MTCT risk
can be reduced by drugs) Women 69.3%Knowledge of PMTCT (HIV can be transmitted by breastfeeding and MTCT risk
can be reduced by drugs) Men 74.4%ATTITUDES
Accepting attitudes toward PLWHA (care for family member) Women 85.7% 97.2%Accepting attitudes toward PLWHA (care for family member) Men 89.7% 98.8%Percentage expressing accepting attitudes on all four indicators (buying vegetables
from shopkeeper, care for family member, female teacher should be allowed to
continue teaching, not want to keep secret that family member is infected with
AIDS). Women 62.2%Percentage expressing accepting attitudes on all four indicators (buying vegetables
from shopkeeper, care for family member, female teacher should be allowed to
continue teaching, not want to keep secret that family member is infected with
AIDS). Men 67.0%
If husband has STD, woman is justified in refusing to have sex with him or asking
that he use condom. Women 98.8%
Adult support of education about condom use. Children (12-14) should be taught to
sue condoms. Women 68.7% 82.8%Adult support of education about condom use. Children (12-14) should be taught to
sue condoms. Men 74.7% 78.7%
BEHAVIOR/PRACTICE
Percentage in union that had 1 non-union partner Women 0.3%
Percentage in union that had 1 non-union partner Men 0.0%
Percentage not in union that had 1 partner Women 5.2%
Percentage not in union that had 1 partner Men 15.6%
Percentage who had 2+ partners in the past 12 months Women 0.6%Percentage who had 2+ partners in the past 12 months Men 5.4%Percentage who had 2+ partners in the past 4 weeks Women 11% 5%Percentage who had 2+ partners in the past 4 weeks Men 12% 7%Percentage who reported using condom at last high-risk intercourse Women (11.6) 50.0% -Percentage who reported using condom at last high-risk intercourse Men * 50.0% -
Had sex with CSW in last 12 months Women 8.0% 3.0%
Had sex with CSW in last 12 months Men 10.0% 3.0%Ever Tested Women 7.3% 24.2% 8.0% 13.0%
Ever Tested Men 10.8% 24.0% 12.0% 11.0%
Percentage of women who received counseling during ANC visit Women 49.9%Percentage of women who were offered and accepted test during ANC visit and
received results Women 16.7%
Pregnant women who were counseling, accepted, took test, and received results Women 16.1%Self-reported prevalence of sexually-transmitted infections (STIs) and STI
symptoms Women 2.8% 7.0%Self-reported prevalence of sexually-transmitted infections (STIs) and STI
symptoms Men 4.8% 0.6%Use injectable drugs Women 0.0% 1.1%Use injectable drugs Men 0.0% 0.0%

221
Practicum B.1: Butare - SOUTH / Additional HIV indicators, 2000 – 2005
(continued)
YOUTH P opulation DHS 2000 DHS 2005
P L AC E
loc ation 1
P L AC E
loc ation 2
Comprehensive knowledge about AIDS (15-24) Women (15-24) 53.7%Comprehensive knowledge about AIDS (15-24) Men (15-24) 78.8%Comprehensive knowledge of source of condoms (15 - 24) Women (15-24) 44.3%Comprehensive knowledge of source of condoms (15 - 24) Men (15-24) 75.5%First sexual intercourse before 15 (15 - 24) Women (15-24) 3.1% 2.6% 6.8%First sexual intercourse before 15 (15 - 24) Men (15-24) 14.4% 2.4% 9.7%
First sexual intercourse before 18 (15 - 24) Women (15-24) 15.3%
First sexual intercourse before 18 (15 - 24) Men (15-24) 26.7%
Median age First sexual intercourse (Place) Women (15-24) 20 20
Median age First sexual intercourse (Place) Men (15-24) 20 20Percentage of youth who had higher risk intercourse in the past 12 months Women (15-24) 14.0%Percentage of youth who had higher risk intercourse in the past 12 months Men (15-24) (39.2)Percentage of youth who reported using condoms at the last higher risk
intercourse Women (15-24) *Percentage of youth who reported using condoms at the last higher risk
intercourse Men (15-24) *Percentage of women who had higher risk intercourse with man 10+ years older Women (15-19) 12.3% 9.8%Percentage of men who had higher risk intercourse with woman 10+ years older Men (15-19) 13.4% 12.6%
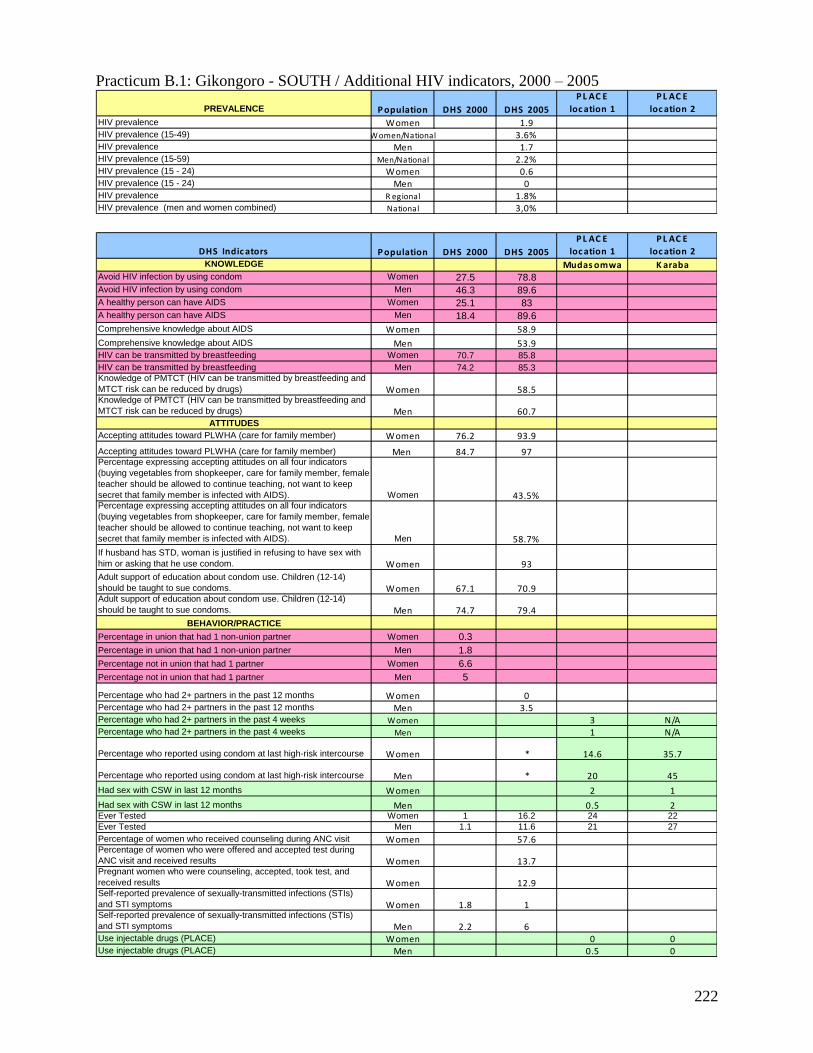
222
Practicum B.1: Gikongoro - SOUTH / Additional HIV indicators, 2000 – 2005
PREVALENCE P opulation DHS 2000 DHS 2005
P L AC E
loc ation 1
P L AC E
loc ation 2
HIV prevalence Women 1.9HIV prevalence (15-49) Women/National 3.6%HIV prevalence Men 1.7HIV prevalence (15-59) Men/National 2.2%HIV prevalence (15 - 24) Women 0.6HIV prevalence (15 - 24) Men 0HIV prevalence R egional 1.8%HIV prevalence (men and women combined) National 3,0%
DHS Indic ators P opulation DHS 2000 DHS 2005
P L AC E
loc ation 1
P L AC E
loc ation 2
KNOWLEDGE Mudas omwa K arabaAvoid HIV infection by using condom Women 27.5 78.8
Avoid HIV infection by using condom Men 46.3 89.6
A healthy person can have AIDS Women 25.1 83
A healthy person can have AIDS Men 18.4 89.6
Comprehensive knowledge about AIDS Women 58.9
Comprehensive knowledge about AIDS Men 53.9HIV can be transmitted by breastfeeding Women 70.7 85.8
HIV can be transmitted by breastfeeding Men 74.2 85.3
Knowledge of PMTCT (HIV can be transmitted by breastfeeding and
MTCT risk can be reduced by drugs) Women 58.5Knowledge of PMTCT (HIV can be transmitted by breastfeeding and
MTCT risk can be reduced by drugs) Men 60.7ATTITUDES
Accepting attitudes toward PLWHA (care for family member) Women 76.2 93.9
Accepting attitudes toward PLWHA (care for family member) Men 84.7 97Percentage expressing accepting attitudes on all four indicators
(buying vegetables from shopkeeper, care for family member, female
teacher should be allowed to continue teaching, not want to keep
secret that family member is infected with AIDS). Women 43.5%Percentage expressing accepting attitudes on all four indicators
(buying vegetables from shopkeeper, care for family member, female
teacher should be allowed to continue teaching, not want to keep
secret that family member is infected with AIDS). Men 58.7%
If husband has STD, woman is justified in refusing to have sex with
him or asking that he use condom. Women 93
Adult support of education about condom use. Children (12-14)
should be taught to sue condoms. Women 67.1 70.9Adult support of education about condom use. Children (12-14)
should be taught to sue condoms. Men 74.7 79.4
BEHAVIOR/PRACTICE
Percentage in union that had 1 non-union partner Women 0.3
Percentage in union that had 1 non-union partner Men 1.8
Percentage not in union that had 1 partner Women 6.6
Percentage not in union that had 1 partner Men 5
Percentage who had 2+ partners in the past 12 months Women 0Percentage who had 2+ partners in the past 12 months Men 3.5Percentage who had 2+ partners in the past 4 weeks Women 3 N/APercentage who had 2+ partners in the past 4 weeks Men 1 N/A
Percentage who reported using condom at last high-risk intercourse Women * 14.6 35.7
Percentage who reported using condom at last high-risk intercourse Men * 20 45
Had sex with CSW in last 12 months Women 2 1
Had sex with CSW in last 12 months Men 0.5 2Ever Tested Women 1 16.2 24 22
Ever Tested Men 1.1 11.6 21 27
Percentage of women who received counseling during ANC visit Women 57.6Percentage of women who were offered and accepted test during
ANC visit and received results Women 13.7Pregnant women who were counseling, accepted, took test, and
received results Women 12.9Self-reported prevalence of sexually-transmitted infections (STIs)
and STI symptoms Women 1.8 1Self-reported prevalence of sexually-transmitted infections (STIs)
and STI symptoms Men 2.2 6Use injectable drugs (PLACE) Women 0 0Use injectable drugs (PLACE) Men 0.5 0

223
Practicum B.1: Gikongoro - SOUTH / Additional HIV indicators, 2000 – 2005
(continued)
Youth P opulation DHS 2000 DHS 2005
P L AC E
loc ation 1
P L AC E
loc ation 2
Comprehensive knowledge about AIDS (15-24) Women 55.1Comprehensive knowledge about AIDS (15-24) Men 52.9Comprehensive knowledge of source of condoms (15 - 24) Women 21.7Comprehensive knowledge of source of condoms (15 - 24) Men 56.4First sexual intercourse before 15 (15 - 24) Women 2.5 3.7 5.6First sexual intercourse before 15 (15 - 24) Men 6.8 13 10.3
First sexual intercourse before 18 (15 - 24) Women 19.8
First sexual intercourse before 18 (15 - 24) Men 21.1
Median age First sexual intercourse (Place) 19 20
Median age First sexual intercourse (Place) 20 21Percentage of youth who had higher risk intercourse in the past 12
months Women 6Percentage of youth who had higher risk intercourse in the past 12
months Men *Percentage of youth who reported using condoms at the last higher
risk intercourse Women *Percentage of youth who reported using condoms at the last higher
risk intercourse Men *Percentage of women who had higher risk intercourse with man 10+
years older (15 - 19) WomenPercentage of women who had higher risk intercourse with man 10+
years older (15 - 19) Men
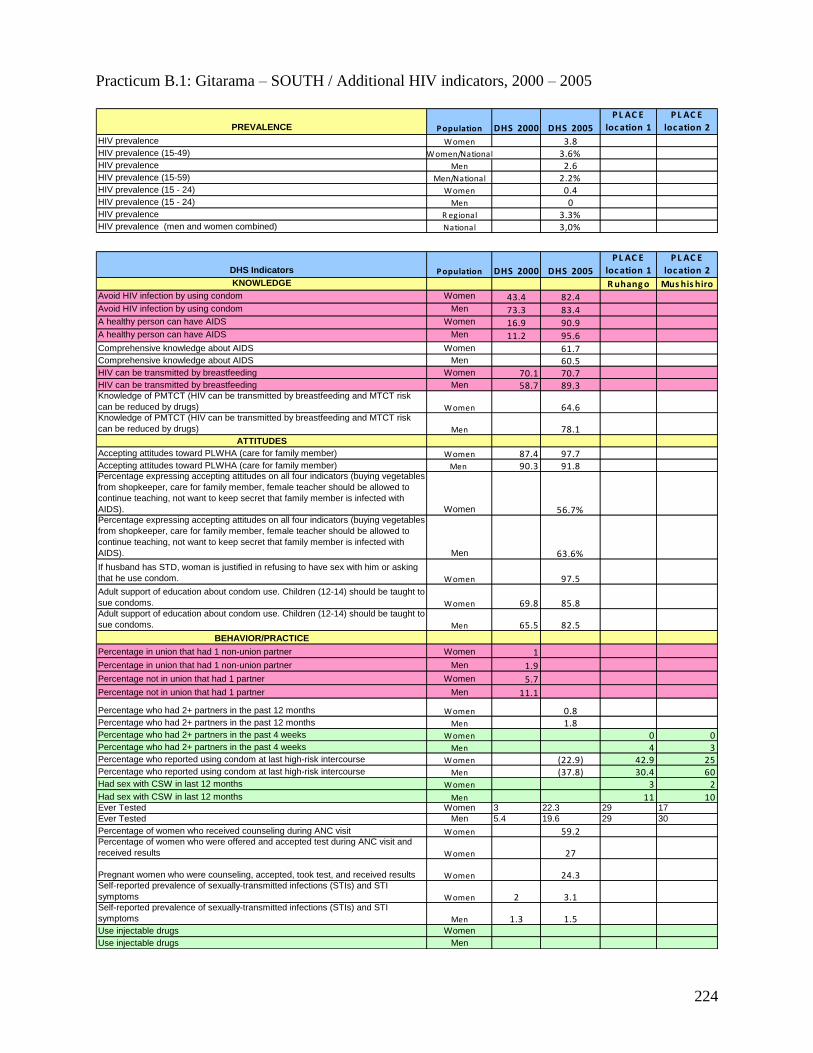
224
Practicum B.1: Gitarama – SOUTH / Additional HIV indicators, 2000 – 2005
PREVALENCE P opulation DHS 2000 DHS 2005
P L AC E
loc ation 1
P L AC E
loc ation 2
HIV prevalence Women 3.8HIV prevalence (15-49) Women/National 3.6%HIV prevalence Men 2.6HIV prevalence (15-59) Men/National 2.2%HIV prevalence (15 - 24) Women 0.4HIV prevalence (15 - 24) Men 0HIV prevalence R egional 3.3%HIV prevalence (men and women combined) National 3,0%
DHS Indicators P opulation DHS 2000 DHS 2005
P L AC E
loc ation 1
P L AC E
loc ation 2
KNOWLEDGE R uhang o Mus his hiroAvoid HIV infection by using condom Women 43.4 82.4Avoid HIV infection by using condom Men 73.3 83.4A healthy person can have AIDS Women 16.9 90.9A healthy person can have AIDS Men 11.2 95.6Comprehensive knowledge about AIDS Women 61.7Comprehensive knowledge about AIDS Men 60.5HIV can be transmitted by breastfeeding Women 70.1 70.7HIV can be transmitted by breastfeeding Men 58.7 89.3Knowledge of PMTCT (HIV can be transmitted by breastfeeding and MTCT risk
can be reduced by drugs) Women 64.6Knowledge of PMTCT (HIV can be transmitted by breastfeeding and MTCT risk
can be reduced by drugs) Men 78.1ATTITUDES
Accepting attitudes toward PLWHA (care for family member) Women 87.4 97.7Accepting attitudes toward PLWHA (care for family member) Men 90.3 91.8Percentage expressing accepting attitudes on all four indicators (buying vegetables
from shopkeeper, care for family member, female teacher should be allowed to
continue teaching, not want to keep secret that family member is infected with
AIDS). Women 56.7%Percentage expressing accepting attitudes on all four indicators (buying vegetables
from shopkeeper, care for family member, female teacher should be allowed to
continue teaching, not want to keep secret that family member is infected with
AIDS). Men 63.6%
If husband has STD, woman is justified in refusing to have sex with him or asking
that he use condom. Women 97.5
Adult support of education about condom use. Children (12-14) should be taught to
sue condoms. Women 69.8 85.8Adult support of education about condom use. Children (12-14) should be taught to
sue condoms. Men 65.5 82.5
BEHAVIOR/PRACTICE
Percentage in union that had 1 non-union partner Women 1
Percentage in union that had 1 non-union partner Men 1.9
Percentage not in union that had 1 partner Women 5.7
Percentage not in union that had 1 partner Men 11.1
Percentage who had 2+ partners in the past 12 months Women 0.8Percentage who had 2+ partners in the past 12 months Men 1.8Percentage who had 2+ partners in the past 4 weeks Women 0 0Percentage who had 2+ partners in the past 4 weeks Men 4 3Percentage who reported using condom at last high-risk intercourse Women (22.9) 42.9 25Percentage who reported using condom at last high-risk intercourse Men (37.8) 30.4 60Had sex with CSW in last 12 months Women 3 2Had sex with CSW in last 12 months Men 11 10Ever Tested Women 3 22.3 29 17
Ever Tested Men 5.4 19.6 29 30
Percentage of women who received counseling during ANC visit Women 59.2Percentage of women who were offered and accepted test during ANC visit and
received results Women 27
Pregnant women who were counseling, accepted, took test, and received results Women 24.3Self-reported prevalence of sexually-transmitted infections (STIs) and STI
symptoms Women 2 3.1Self-reported prevalence of sexually-transmitted infections (STIs) and STI
symptoms Men 1.3 1.5Use injectable drugs Women
Use injectable drugs Men

225
Practicum B.1: Gitarama – SOUTH / Additional HIV indicators, 2000 – 2005
(continued)
YOUTH P opulation DHS 2000 DHS 2005
P L AC E
loc ation 1
P L AC E
loc ation 2
Comprehensive knowledge about AIDS (15-24)
Women (15-
24) 60.4Comprehensive knowledge about AIDS (15-24) Men (15-24) 51.9
Comprehensive knowledge of source of condoms (15 - 24)
Women (15-
24) 38.5Comprehensive knowledge of source of condoms (15 - 24) Men (15-24) 77.4
First sexual intercourse before 15 (15 - 24)
Women (15-
24) 6.1 7.3 6.5First sexual intercourse before 15 (15 - 24) Men (15-24) 24.8 23 16.1
First sexual intercourse before 18 (15 - 24)
Women (15-
24) 10.8
First sexual intercourse before 18 (15 - 24) Men (15-24) 37.8
Median age First sexual intercourse (Place)
Women (15-
24) 19 19
Median age First sexual intercourse (Place) Men (15-24) 17 18
Percentage of youth who had higher risk intercourse in the past 12 months
Women (15-
24) 20Percentage of youth who had higher risk intercourse in the past 12 months Men (15-24) *Percentage of youth who reported using condoms at the last higher risk
intercourse
Women (15-
24) *Percentage of youth who reported using condoms at the last higher risk
intercourse Men (15-24) *
Percentage of women who had higher risk intercourse with man 10+ years older
Women (15-
19)
Percentage of men who had higher risk intercourse with woman 10+ years older Men (15-19)

226
Practicum B.1: Cyangugu - WEST / Additional HIV indicators, 2000 – 2005
PREVALENCE P opulation DHS 2000 DHS 2005
P L AC E
loc ation 1
P L AC E
loc ation 2
HIV prevalence Women 4HIV prevalence (15-49) Women/National 3.6%HIV prevalence Men 2.7HIV prevalence (15-59) Men/National 2.2%HIV prevalence (15 - 24) Women 2.5HIV prevalence (15 - 24) Men 0.5HIV prevalence R egional 3.4%HIV prevalence (men and women combined) National 3,0%

227
Practicum B.1: Cyangugu - WEST / Additional HIV indicators, 2000 – 2005
(continued)
DHS Indic ators P opulation DHS 2000 DHS 2005
P L AC E
loc ation 1
P L AC E
loc ation 2
KNOWLEDGE B ug arama C yang ug uAvoid HIV infection by using condom Women 34.3 72.1Avoid HIV infection by using condom Men 58.1 87.7A healthy person can have AIDS Women 20.3 80.2A healthy person can have AIDS Men 15.7 89.2Comprehensive knowledge about AIDS Women 37.3Comprehensive knowledge about AIDS Men 42HIV can be transmitted by breastfeeding Women 71.5 87.2HIV can be transmitted by breastfeeding Men 58.1 86.5Knowledge of PMTCT (HIV can be transmitted by breastfeeding and MTCT risk
can be reduced by drugs) Women 62.6Knowledge of PMTCT (HIV can be transmitted by breastfeeding and MTCT risk
can be reduced by drugs) Men 69ATTITUDES
Accepting attitudes toward PLWHA (care for family member) Women 81.3 93.5Accepting attitudes toward PLWHA (care for family member) Men 87.9 95.3Percentage expressing accepting attitudes on all four indicators (buying vegetables
from shopkeeper, care for family member, female teacher should be allowed to
continue teaching, not want to keep secret that family member is infected with
AIDS). Women 40.5%Percentage expressing accepting attitudes on all four indicators (buying vegetables
from shopkeeper, care for family member, female teacher should be allowed to
continue teaching, not want to keep secret that family member is infected with
AIDS). Men 50.6%
If husband has STD, woman is justified in refusing to have sex with him or asking
that he use condom. Women 93.5
Adult support of education about condom use. Children (12-14) should be taught to
sue condoms. Women 71 82.2Adult support of education about condom use. Children (12-14) should be taught to
sue condoms. Men 69.4 76.8
BEHAVIOR/PRACTICE
Percentage in union that had 1 non-union partner Women 0.5
Percentage in union that had 1 non-union partner Men 1.6
Percentage not in union that had 1 partner Women 4.3
Percentage not in union that had 1 partner Men 6.5
Percentage who had 2+ partners in the past 12 months Women 0.6Percentage who had 2+ partners in the past 12 months Men 3.9Percentage who had 2+ partners in the past 4 weeks Women 43 35Percentage who had 2+ partners in the past 4 weeks Men 34 29Percentage who reported using condom at last high-risk intercourse Women (10.8) 42.5 35.2Percentage who reported using condom at last high-risk intercourse Men * 44.4 45.4
Had sex with CSW in last 12 months Women 62 52
Had sex with CSW in last 12 months Men 57 55Ever Tested Women 3.8 28.4 31 46Ever Tested Men 7.3 24.9 41 44Percentage of women who received counseling during ANC visit Women 59.5Percentage of women who were offered and accepted test during ANC visit and
received results Women 32.8
Pregnant women who were counseling, accepted, took test, and received results Women 30.6Self-reported prevalence of sexually-transmitted infections (STIs) and STI
symptoms Women 3.6 12.8Self-reported prevalence of sexually-transmitted infections (STIs) and STI
symptoms Men 1.9 5.1Use injectable drugs Women 0 0Use injectable drugs Men 0 0

228
Practicum B.1: Cyangugu - WEST / Additional HIV indicators, 2000 – 2005
(continued)
YOUTH P opulation DHS 2000 DHS 2005
P L AC E
loc ation 1
P L AC E
loc ation 2
Comprehensive knowledge about AIDS (15-24)
Women (15-
24) 34.7Comprehensive knowledge about AIDS (15-24) Men (15-24) 41.8
Comprehensive knowledge of source of condoms (15 - 24)
Women (15-
24) 31.1Comprehensive knowledge of source of condoms (15 - 24) Men (15-24) 68.2
First sexual intercourse before 15 (15 - 24)
Women (15-
24) 5.2 10.2 10First sexual intercourse before 15 (15 - 24) Men (15-24) 11.2 8 6.7
First sexual intercourse before 18 (15 - 24)
Women (15-
24) 13.5
First sexual intercourse before 18 (15 - 24) Men (15-24) 26.8
Median age First sexual intercourse (Place)
Women (15-
24) 17 17
Median age First sexual intercourse (Place) Men (15-24) 18 18
Percentage of youth who had higher risk intercourse in the past 12 months
Women (15-
24) 17Percentage of youth who had higher risk intercourse in the past 12 months Men (15-24) *(46.9)Percentage of youth who reported using condoms at the last higher risk
intercourse
Women (15-
24) *Percentage of youth who reported using condoms at the last higher risk
intercourse Men (15-24) *
Percentage of women who had higher risk intercourse with man 10+ years older
Women (15-
19) 1.7 10.6Percentage of men who had higher risk intercourse with woman 10+ years older Men (15-19) 3.1 2.3

229
Practicum B.1: Gisenyi - WEST / Additional HIV indicators, 2000 – 2005
PREVALENCE P opulation DHS 2000 DHS 2005
P L AC E
loc ation 1
P L AC E
loc ation 2
HIV prevalence Women 3.6
HIV prevalence (15-49) Women/National 3.6%HIV prevalence Men 2.6
HIV prevalence (15-59) Men/National 2.2%HIV prevalence (15 - 24) Women 2.2
HIV prevalence (15 - 24) Men 0.5
HIV prevalence R egional 3.2%HIV prevalence (men and women combined) National 3,0%
DHS Indic ators P opulation DHS 2000 DHS 2005
P L AC E
loc ation 1
P L AC E
loc ation 2
KNOWLEDGE G isenyi Mahoko-NyamyumbaAvoid HIV infection by using condom Women 34 68.5
Avoid HIV infection by using condom Men 68.7 79.2
A healthy person can have AIDS Women 24.3 69.3
A healthy person can have AIDS Men 14.3 84.1
Comprehensive knowledge about AIDS Women 36.2
Comprehensive knowledge about AIDS Men 45.6
HIV can be transmitted by breastfeeding Women 65.1 71.2
HIV can be transmitted by breastfeeding Men 65.3 73.9Knowledge of PMTCT (HIV can be transmitted by breastfeeding and MTCT risk
can be reduced by drugs) Women 45.8Knowledge of PMTCT (HIV can be transmitted by breastfeeding and MTCT risk
can be reduced by drugs) Men 48.1
ATTITUDES
Accepting attitudes toward PLWHA (care for family member) Women 65 81.3
Accepting attitudes toward PLWHA (care for family member) Men 88.4 87.4Percentage expressing accepting attitudes on all four indicators (buying vegetables
from shopkeeper, care for family member, female teacher should be allowed to
continue teaching, not want to keep secret that family member is infected with
AIDS). Women 21.0%Percentage expressing accepting attitudes on all four indicators (buying vegetables
from shopkeeper, care for family member, female teacher should be allowed to
continue teaching, not want to keep secret that family member is infected with
AIDS). Men 48.9%
If husband has STD, woman is justified in refusing to have sex with him or asking
that he use condom. Women 93.7
Adult support of education about condom use. Children (12-14) should be taught to
sue condoms. Women 63,8 70.3Adult support of education about condom use. Children (12-14) should be taught to
sue condoms. Men 64,6 73.3
BEHAVIOR/PRACTICE
Percentage in union that had 1 non-union partner Women 0.6
Percentage in union that had 1 non-union partner Men 2.2
Percentage not in union that had 1 partner Women 5.8
Percentage not in union that had 1 partner Men 10.3
Percentage who had 2+ partners in the past 12 months Women 0.4Percentage who had 2+ partners in the past 12 months Men 3.3
Percentage who had 2+ partners in the past 4 weeks Women 1 1Percentage who had 2+ partners in the past 4 weeks Men 3 10Percentage who reported using condom at last high-risk intercourse Women (23.0) 61.9 *Percentage who reported using condom at last high-risk intercourse Men * 28.6 18.2Had sex with CSW in last 12 months Women 19 5
Had sex with CSW in last 12 months Men 11 7Ever Tested Women 3.7 16.7 53 30
Ever Tested Men 4.1 13.2 45 27
Percentage of women who received counseling during ANC visit Women 54.2Percentage of women who were offered and accepted test during ANC visit and
received results Women 21.3Pregnant women who were counseling, accepted, took test, and received results Women 19.5Self-reported prevalence of sexually-transmitted infections (STIs) and STI
symptoms Women 2.6 4.4Self-reported prevalence of sexually-transmitted infections (STIs) and STI
symptoms Men 0.8 1.4
Use injectable drugs Women
Use injectable drugs Men

230
Practicum B.1: Gisenyi - WEST / Additional HIV indicators, 2000 – 2005
(continued)
YOUTH P opulation DHS 2000 DHS 2005
P L AC E
loc ation 1
P L AC E
loc ation 2
Comprehensive knowledge about AIDS (15-24) Women (15-24) 33.5
Comprehensive knowledge about AIDS (15-24) Men (15-24) 46.2
Comprehensive knowledge of source of condoms (15 - 24) Women (15-24) 23.9
Comprehensive knowledge of source of condoms (15 - 24) Men (15-24) 50
First sexual intercourse before 15 (15 - 24) Women (15-24) 1.7 5 3.5First sexual intercourse before 15 (15 - 24) Men (15-24) 14.6 10.5 6.8
First sexual intercourse before 18 (15 - 24) Women (15-24) 18.1
First sexual intercourse before 18 (15 - 24) Men (15-24) 26
Median age First sexual intercourse (Place) Women (15-24) 18 18
Median age First sexual intercourse (Place) Men (15-24) 19 19Percentage of youth who had higher risk intercourse in the past 12 months Women (15-24) 8
Percentage of youth who had higher risk intercourse in the past 12 months Men (15-24) (24.5)Percentage of youth who reported using condoms at the last higher risk
intercourse Women (15-24) * 92.7 85.2Percentage of youth who reported using condoms at the last higher risk
intercourse Men (15-24) * 90.6 80.6Percentage of women who had higher risk intercourse with man 10+ years older Women (15-19) 4 5.6Percentage of men who had higher risk intercourse with woman 10+ years older Men (15-19)

231
Practicum B.1: Kibuye - WEST / Additional HIV indicators, 2000 – 2005
PREVALENCE P opulation DHS 2000 DHS 2005
P L AC E
loc ation 1
P L AC E
loc ation 2
HIV prevalence Women 4.5HIV prevalence (15-49) Women/National 3.6%HIV prevalence Men 2.5HIV prevalence (15-59) Men/National 2.2%HIV prevalence (15 - 24) Women 2HIV prevalence (15 - 24) Men 0.4HIV prevalence R egional 3.6%HIV prevalence (men and women combined) National 3,0%
DHS Indic ators P opulation DHS 2000 DHS 2005
P L AC E
loc ation 1
P L AC E
loc ation 2
KNOWLEDGE R ubengera Mubuga-MugoneroAvoid HIV infection by using condom Women 21.1 78
Avoid HIV infection by using condom Men 56.2 86.4A healthy person can have AIDS Women 21.6 83.6A healthy person can have AIDS Men 23.2 91.9Comprehensive knowledge about AIDS Women 51.7Comprehensive knowledge about AIDS Men 54.5HIV can be transmitted by breastfeeding Women 64.7 82.2HIV can be transmitted by breastfeeding Men 66.5 86.2Knowledge of PMTCT (HIV can be transmitted by breastfeeding and MTCT risk
can be reduced by drugs) Women 74.2Knowledge of PMTCT (HIV can be transmitted by breastfeeding and MTCT risk
can be reduced by drugs) Men 68.5ATTITUDES
Accepting attitudes toward PLWHA (care for family member) Women 69.3 97.5Accepting attitudes toward PLWHA (care for family member) Men 85.9 95.8Percentage expressing accepting attitudes on all four indicators (buying vegetables
from shopkeeper, care for family member, female teacher should be allowed to
continue teaching, not want to keep secret that family member is infected with
AIDS). Women 53.1%Percentage expressing accepting attitudes on all four indicators (buying vegetables
from shopkeeper, care for family member, female teacher should be allowed to
continue teaching, not want to keep secret that family member is infected with
AIDS). Men 14.4%
If husband has STD, woman is justified in refusing to have sex with him or asking
that he use condom. Women 97.6
Adult support of education about condom use. Children (12-14) should be taught to
sue condoms. Women 58.2 89.7Adult support of education about condom use. Children (12-14) should be taught to
sue condoms. Men 70.8 82
BEHAVIOR/PRACTICE
Percentage in union that had 1 non-union partner Women 0.3
Percentage in union that had 1 non-union partner Men 1.8
Percentage not in union that had 1 partner Women 6.1
Percentage not in union that had 1 partner Men 5.6
Percentage who had 2+ partners in the past 12 months Women 0.8Percentage who had 2+ partners in the past 12 months Men 11Percentage who had 2+ partners in the past 4 weeks Women 3 16Percentage who had 2+ partners in the past 4 weeks Men 3 12Percentage who reported using condom at last high-risk intercourse Women (10.5) 27 72Percentage who reported using condom at last high-risk intercourse Men (43.9) 42 40Had sex with CSW in last 12 months Women 4 6
Had sex with CSW in last 12 months Men 3 16Ever Tested Women 0.8* 20 no figures
Ever Tested Men 2.2* 20.3
Percentage of women who received counseling during ANC visit Women 58Percentage of women who were offered and accepted test during ANC visit and
received results Women 20.6
Pregnant women who were counseling, accepted, took test, and received results Women 19.1Self-reported prevalence of sexually-transmitted infections (STIs) and STI
symptoms Women 0.9 2.1Self-reported prevalence of sexually-transmitted infections (STIs) and STI
symptoms Men 1.5 4.5Use injectable drugs Women 0 0
Use injectable drugs Men 0 0.9

232
Practicum B.1: Kibuye - WEST / Additional HIV indicators, 2000 – 2005
(continued)
YOUTH P opulation DHS 2000 DHS 2005
P L AC E
loc ation 1
P L AC E
loc ation 2
Comprehensive knowledge about AIDS (15-24)
Women (15-
24) 45.8Comprehensive knowledge about AIDS (15-24) Men (15-24) 45.4
Comprehensive knowledge of source of condoms (15 - 24)
Women (15-
24) 37.2Comprehensive knowledge of source of condoms (15 - 24) Men (15-24) 61
First sexual intercourse before 15 (15 - 24)
Women (15-
24) 2.2 9.1 4.5First sexual intercourse before 15 (15 - 24) Men (15-24) 18.4 10 10.1
First sexual intercourse before 18 (15 - 24)
Women (15-
24) 14.2
First sexual intercourse before 18 (15 - 24) Men (15-24) 32.6
Median age First sexual intercourse (Place)
Women (15-
24) 18 18
Median age First sexual intercourse (Place) Men (15-24) 19 19
Percentage of youth who had higher risk intercourse in the past 12 months
Women (15-
24) 10Percentage of youth who had higher risk intercourse in the past 12 months Men (15-24) *Percentage of youth who reported using condoms at the last higher risk
intercourse
Women (15-
24) *Percentage of youth who reported using condoms at the last higher risk
intercourse Men (15-24) *
Percentage of women who had higher risk intercourse with man 10+ years older
Women (15-
19) 4.8 10.4Percentage of men who had higher risk intercourse with woman 10+ years older Men (15-19) 0.9 5.1

233
Appendix 7: Map of Former Provinces in Relation to New Provinces

234
Appendix 8: Triangulation Workshop Attendees
Name Institution Fonction
LOWRANCE David CDC
MANZI Gloria CDC prevention assistant
RAGHUNATHAN Pratima CDC Director
NDAGIJE Felix CDC prevention lead
NAGABA William CDC HIV/AIDS treatment
Aberle-Grasse John CDC
Dr KAYIRANGWA Eugenie CDC
GAKUNZI Sebaziga CNLS M&E Officer
Dr RABEZANAHARY Parfait CRS/AIDSRELIEF Program manager
NYAMVUMBA Emmanuel Drew Care SIS Manager
RADHIKA Jain EGPAF RWANDA M&E Officer
RUTABAGAYA Jacques EGPAF RWANDA technic advisor
BIRINDIGITERO Sostène EGPAF RWANDA data entry officer
Dr TURATE Innocent FHI/ RWANDA MD
SAHUNKUYE Edouard FHI/ RWANDA Program officer
NDAYIZEYE Louise-Andrée GLIA information officer
MUSONI Canisius ICAP M&E Officer
NSHIMIYUMUKIZA Marie
Rose INTRAHEALTH/HCSP VCT/PMTCT program officer
KALEROS Andrew Measure evaluation M&E advisor
KAZOZA Golbert MININTER S&E /HIV/Prison
Dr SOBELA François OMS MO VIH/SIDA
SEBAHUNGU Fidele PSF-IAVI Study Physician
UMUGABEKAZI Emma PSI Counselor
KARANGWA Gérard PSI Research Coordinator
MUGABO Médiatrice PSI VCT Manager
KATANGULIA N. François SSS CBS
KANDANGA Angeline TRAC PLUS Data manager
NYANKESHA Elevanie TRAC PLUS HOD HIV Prevention
GASASIRA RWEGO Antoine TRAC PLUS PMTCT
ASIIMWE Anita TRAC PLUS Director HIV AIDS
HAJABASHI Jeanne D'Arc TRAC PLUS M&E Officer
Prof KRAMER Michael TRAC PLUS DG
CISHAHAYO Shabani TRAC PLUS Director SBI unit
KABEJA Adeline TRAC PLUS
RUTON Hinda TRAC PLUS
BAINGANA Christine TULANE Coordinator
Dr KITOKO MBUGUJE Louis UGP/GF PEM
PEGURRI Elisabetta UNAIDS M&E Officer
TACHE Stephanie UCSF
WHITE Karen UCSF
SPINDLER Hillary UCSF
FRANK Heidi UCSF

235
Appendix 9: Workshop Agenda
Data Triangulation Workshop Agenda: Rwanda (September 16 – 19)
Tuesday, September 16, 2008
Time Presenter Topic
9-9:20am CIDP/TRAC Plus/CDC
Welcome
9:20-10:00 Stephanie Introduction to triangulation
10:00-10:30 Karen/Heidi Ice Breaker
10:30-10:45
Tea Break
10:45-11:15
Stephanie Process update (steps 1-4) for Rwanda
11:15-11:45pm John AG Steps 5 and 6: Gather data and assess quality Make observations from each data set
11:45- 12:30 Adeline Epidemic Context of HIV in Rwanda
12:30-1:30 Lunch
1:30-2:30 Stephanie
Overview / Summary of Practicum Parking Lots Introduction of Breakout Groups Instructions for Practicum A
2:30-2:45
Tea Break
2:45-4:00 Stephanie/ Group Work
Practicum A: ANC Data ANC data (all attendees; 15-24 year olds) Graph & compare your regions (zone) to
national trends & level; prepare to present

236
Wednesday, September 17
Time Presenter Topic
9:00-9:30am Group work
Practicum A: ANC Data (continued)
9:30-10:00 Report Backs by Groups
REPORT BACK #1 PRACTICUM A
(Each group has 5 minutes to present)
10:00 – 10:30 Stephanie Step 7: Note trends across data sets & hypothesize
10:30-10:45
Tea Break
10:45-12:30pm Stephanie and John AG/Group Work
Practicum B.1 and C.1: Surveillance data and additional literature (steps 8-10) by geography Examine multiple indicators (B) and record
input [trends, levels] - biological & behavioral indicators
by Region Interpret, and initiate hypotheses &
recommendations Consider relevant literature (special studies) to
inform / modify hypotheses
12:30-1:30pm Lunch
1:30-2:45pm Group Work Practicum B.1 and C.1, continued Prepare to present
2:45-3:00pm
Tea Break
3:00-4:00pm Report Backs by Groups
REPORT BACK #2 PRACTICUM B.1 AND C.1
Solicit feedback on interim analyses
10 minutes per presentation

237
Thursday, September 18, 2008
Time Presenter Topic
9:00-10:30am Stephanie/Group Work
Practicum B.2 and C.2: Surveillance data and additional literature by sub-population Examine multiple indicators (B) and record
input [trends, levels] - biological & behavioral
indicators by Sub-population Interpret, and initiate hypotheses &
recommendations Consider relevant literature (special
studies) to inform / modify hypotheses
10:30-10:45
Tea Break
10:45-12:30
Stephanie/Group Work
Practicum B.2 and C.2, continued Prepare to present
12:30-1:30pm
Lunch
1:30-2:00 Group Report Backs Report Back #3 Practicum B.2 and C.2
2:00-2:30 Stephanie
Practicum D (Question 2): Program Data Refine all elements from A, B, C Define leading hypotheses about drivers;
leading recommendations how to intervene
Synthesize statements: national & regional
2:30 – 3:15 Group Work Capture specifics on slides or tables Remember material in your “parking lots” Prepare to present
3:15-3:30
Tea Break
3:30-4:30 Group Report Backs
REPORT BACK #4 PRACTICUM D Based on A, B, C, and D
(10 minutes per presentation)

238
Friday, September 19, 2008
Time Presenter Topic
9:00-9:30am Triangulation Taskforce
Present Back
9:30 – 10:00 Stephanie/Group Work Practicum E: Country-wide focus areas
10:00 – 10:15
Tea Break
10:15-11:15 Large Group Discussion
11:15-12:00 CIDP/TRAC Plus/CDC
Evaluation/Closing

239
Appendix 10: HIV Prevalence among ANC Attendees, Ages 15-24, Consistent Sites Only
* The labeling of ―rural‖ and ―urban‖ refers to the location of the sentinel site and is not necessarily representative of the ANC client residence.
Dark grey shading indicates decreasing urban trends and the light grey indicates decreasing rural trends.
New
Province
ANC Site *Urban
/ Rural Former
Province
2002 2003 2005 2007 Trend
EAST Kirehe Rural Kibungo 2.0 2.9 0.6 2.4 Level
EAST Ruhuha Rural Kigali Ngali 1.0 2.4 3.5 1.1 Irregular
EAST Rukara Rural Umutara 4.0 3,8 3.7 1.6 Decreasing
EAST Rukomo Rural Umutara 1.0 2.9 1.6 2.0 Level
EAST
Rwamagana Urban Kibungo 6.1 4.3 3.0 3.4
Decrease with slight
rise from ‗05 to ‗07
KIGALI Bilyogo Urban Kigali Ville 11.6 11.8 13.9 10.9 Level
KIGALI
Gikondo Urban Kigali Ville 11.7 8.7 6.4 9.9
Decrease with rise
from ‗05 to ‗07
NORTH Bungwe Rural Byumba 2.0 0.7 1.9 3.9 Increasing
NORTH Ruli Rural Kigali Ngali 2.0 0.8 0.0 2.8 Increasing
NORTH Gitare Rural Ruhengeri 1.0 0.9 0.0 0.4 Level
NORTH Byumba Urban Byumba 5.4 5.9 3.9 7.2 Rise from ‘05 to ‗07
NORTH
Ruhengeri Urban Ruhengeri 4.0 4.3 3.4 5.6
Decrease with rise
from ‗05 to ‗07
SOUTH Kigembe Rural Butare 2.0 2.5 1.3 0.0 Decreasing
SOUTH Musebeya Rural Gikongoro 5.0 4.6 2.1 1.8 Decreasing
SOUTH Mugina Rural Gitarama 6.0 2.0 5.2 2.5 Irregular
SOUTH Nyanza Urban Butare 4.0 4.0 0.6 3.7 Irregular
SOUTH Nyamagabe Urban Gikongoro 6.0 7.0 2.1 2.8 Irregular
SOUTH Ruhango Urban Gitarama 3.0 3.3 1.2 3.3 Level
WEST Mashesha Rural Cyangugu 2.0 2.9 1.8 3.2 Irregular
WEST Busasamana Rural Gisenyi 5.0 5.4 4.2 2.4 Decreasing
WEST Mukungu Rural Kibuye 3.0 0.8 0.0 1.7 Increasing
WEST
Rusizi Urban Cyangugu 7.0 5.4 2.9 4.8
Decrease with rise
from ‗05 to ‗07
WEST Gisenyi Urban Gisenyi 4.0 6.0 5.4 3.6 Decreasing
WEST
Rubengera Urban Kibuye 8.0 7.0 3.1 5.7
Decrease with rise
from ‗05 to ‗07
Median Rural 2.0 2.5 1.8 2.4
Median Urban 6.0 5.9 3.1 4.8
National 4.0 4.0 2.5 3.0

240
Appendix 11: ANC Data, All Sites (2002, 2003, 2005)
New Province SITE PROVINCE URBAN/RURAL 2002 2003 2005
East Kabuga Kigali Ngali Urban 4.4
East Nyagatare Umutara Urban 3.2
East Rwamagana Kibungo Urban 6.2 5.6 4.8
Kigali Bilyogo Kigali Ville Urban 13 16.2 18.4
Kigali Gikondo Kigali Ville Urban 13 10.2 7.5
North Ruhengeri Ruhengeri Urban 6.9 6.3 5.4
North Byumba Byumba Urban 6.7 6.1 5.5
South Gitarama Gitarama Urban 9.7
South Nyanza Butare Urban 6.7 6.4 3.3
South Nyamagabe Gikongoro Urban 7.5 6.1 2.4
South Ruhango Gitarama Urban 3.7 3.1 2.7
West Gisenyi Gisenyi Urban 7.1 9.3 8.2
West Rubengera Kibuye Urban 8.3 7.3 7.3
West Rusizi Cyangugu Urban 6.1 6.4 4.8
East Ruhuha Kigali Ngali Rural 2.6 4.4 3.9
East Rukara Umutara Rural 5.1 2.8 3.9
East Kirehe Kibungo Rural 3.4 2.8 2.4
East Rukomo Umutara Rural 1.6 2.8 0.9
North Bungwe Byumba Rural 2.8 2 2.6
North Gitare Ruhengeri Rural 3 1.8 1.6
North Ruli Kigali Ngali Rural 2 1.2 0.3
South Mugina Gitarama Rural 3.5 4.4 2
South Musebeya Gikongoro Rural 3.1 4.2 2.1
South Runyombyi Gikongoro Rural 1.6
South Simbi Butare Rural 2.1
South Kigembe Butare Rural 1.2 2 1.2
West Busasamana Gisenyi Rural 4.6 5.6 2.3
West Mashesha Cyangugu Rural 3 4.7 2.7
West Murunda Kibuye Rural 4.1
West Mukungu Kibuye Rural 3.5 1.9 0.2

241
RWAMAGANA: Rwanda ANC Prevalence
0.0
1.0
2.0
3.0
4.0
5.0
6.0
7.0
2002 2003 2004 2005 2006 2007
HIV
Pre
va
len
ce
All 15-24 yr olds All
1st Preg Amg 15-24 yr olds Within Catchment Only (15-24 yr olds)
Non 1st Pregnancy Amg 15-24 yr olds
PMTCT Initiation:
March 2004
Appendix 12: The Initiation of PMTCT, by ANC Site
East Province Kibungo:
Kirehe (Rural)
KIREHE: Rwanda ANC Prevalence
0.0
2.0
4.0
6.0
8.0
10.0
12.0
2002 2003 2004 2005 2006 2007
HIV
Pre
va
len
ce
All 15-24 yr olds All
1st Preg Amg 15-24 yr olds Within Catchment Only (15-24 yr olds)
Non 1st Pregnancy Amg 15-24 yr olds
PMTCT Initiation:
February 2005
Rwamagana (Urban)

242
RUKARA: Rwanda ANC Prevalence
0.0
1.0
2.0
3.0
4.0
5.0
6.0
7.0
8.0
2002 2003 2004 2005 2006 2007
HIV
Pre
va
len
ce
All 15-24 yr olds All
1st Preg Amg 15-24 yr olds Within Catchment Only (15-24 yr olds)
Non 1st Pregnancy Amg 15-24 yr olds
PMTCT Initiation:
April 2004
Kigali Ngali:
Ruhuha (Rural)
RUHUHA: Rwanda ANC Prevalence
0.0
1.0
2.0
3.0
4.0
5.0
6.0
7.0
8.0
9.0
2002 2003 2004 2005 2006 2007
HIV
Pre
va
len
ce
All 15-24 yr olds All
1st Preg Amg 15-24 yr olds Within Catchment Only (15-24 yr olds)
Non 1st Pregnancy Amg 15-24 yr olds
PMTCT Initiation:
March 2004
Umutara:
Rukara, Rural

243
Rukomo (Rural)
RUKUMO: Rwanda ANC Prevalence
0.0
1.0
2.0
3.0
4.0
5.0
6.0
7.0
8.0
2002 2003 2004 2005 2006 2007
HIV
Pre
vale
nce
All 15-24 yr olds All
1st Preg Amg 15-24 yr olds Within Catchment Only (15-24 yr olds)
Non 1st Pregnancy Amg 15-24 yr olds
PMTCT Initiation:
January 2005

244
Kigali Province Bilyogo (Urban)
BIRYOGO: Rwanda ANC Prevalence
0
5
10
15
20
25
2002 2003 2004 2005 2006 2007
HIV
Pre
vale
nce
All 15-24 yr olds All
1st Preg Amg 15-24 yr olds Within Catchment Only (15-24 yr olds)
Non 1st Pregnancy Amg 15-24 yr olds
PMTCT Initiation:
June 2001
Gikondo (Urban)
GIKONDO: Rwanda ANC Prevalence
0.0
2.0
4.0
6.0
8.0
10.0
12.0
14.0
2002 2003 2004 2005 2006 2007
HIV
Pre
vale
nce
All 15-24 yr olds All
1st Preg Amg 15-24 yr olds Within Catchment Only (15-24 yr olds)
Non 1st Pregnancy Amg 15-24 yr olds
PMTCT Initiation:
July 2002

245
BYUMBA: Rwanda ANC Prevalence
0.0
2.0
4.0
6.0
8.0
10.0
12.0
14.0
2002 2003 2004 2005 2006 2007
HIV
Pre
vale
nce
All 15-24 yr olds All
1st Preg Amg 15-24 yr olds Within Catchment Only (15-24 yr olds)
Non 1st Pregnancy Amg 15-24 yr olds
PMTCT Initiation:
May 2001
North Province Byumba:
Bungwe (Rural)
BUNGWE: Rwanda ANC Prevalence
0.0
1.0
2.0
3.0
4.0
5.0
6.0
7.0
8.0
9.0
10.0
2002 2003 2004 2005 2006 2007
HIV
Pre
va
len
ce
1st Preg Amg 15-24 yr olds Non 1st Pregnancy Amg 15-24 yr olds
All 15-24 yr olds All
Within Catchment Only (15-24 yr olds)
PMTCT Initiation:
May 2001
Byumba (Urban)

246
GITARE: Rwanda ANC Prevalence
0.0
1.0
2.0
3.0
4.0
5.0
6.0
7.0
8.0
2002 2003 2004 2005 2006 2007
HIV
Pre
vale
nce
All All 15-24 yr olds
1st Preg Amg 15-24 yr olds Within Catchment Only (15-24 yr olds)
Non 1st Pregnancy Amg 15-24 yr olds
PMTCT Initiation:
March 2005
Kigali Ngali:
Ruli (Rural)
RULI: Rwanda ANC Prevalence
0.0
1.0
2.0
3.0
4.0
5.0
6.0
7.0
8.0
9.0
2002 2003 2004 2005 2006 2007
HIV
Pre
vale
nce
All 15-24 yr olds All
1st Preg Amg 15-24 yr olds Within Catchment Only (15-24 yr olds)
Non 1st Pregnancy Amg 15-24 yr olds
PMTCT Initiation:
December 2001
Ruhengeri:
Gitare (Rural)

247
Ruhengeri (Urban)
RUHENGERI: Rwanda ANC Prevalence
0.0
1.0
2.0
3.0
4.0
5.0
6.0
7.0
8.0
9.0
2002 2003 2004 2005 2006 2007
HIV
Pre
va
len
ce
All 15-24 yr olds All
1st Preg Amg 15-24 yr olds Within Catchment Only (15-24 yr olds)
Non 1st Pregnancy Amg 15-24 yr olds
PMTCT Initiation:
October 2001

248
NYANZA: Rwanda ANC Prevalence
0.0
1.0
2.0
3.0
4.0
5.0
6.0
7.0
8.0
2002 2003 2004 2005 2006 2007
HIV
Pre
va
len
ce
All 15-24 yr olds All
1st Preg Amg 15-24 yr olds Within Catchment Only (15-24 yr olds)
Non 1st Pregnancy Amg 15-24 yr olds
PMTCT Initiation:
May 2005
South Province
Butare:
Kigembe (Rural)
KIGEMBE: Rwanda ANC Prevalence
0.0
0.5
1.0
1.5
2.0
2.5
3.0
2002 2003 2004 2005 2006 2007
HIV
Pre
va
len
ce
All All 15-24 yr olds
1st Preg Amg 15-24 yr olds Within Catchment Only (15-24 yr olds)
Non 1st Pregnancy Amg 15-24 yr olds
PMTCT Initiation:
February 2005
Nyanza (Urban)

249
Gikongoro:
Musebeya (Rural)
MUSEBEYA: Rwanda ANC Prevalence
0.0
1.0
2.0
3.0
4.0
5.0
6.0
7.0
8.0
2002 2003 2004 2005 2006 2007
HIV
Pre
vale
nce
All 15-24 yr olds All
1st Preg Amg 15-24 yr olds Within Catchment Only (15-24 yr olds)
Non 1st Pregnancy Amg 15-24 yr olds
PMTCT Initiation:
September 2005
Nyamagabe (Urban)
NYAMAGABE: Rwanda ANC Prevalence
0.0
1.0
2.0
3.0
4.0
5.0
6.0
7.0
8.0
2002 2003 2004 2005 2006 2007
HIV
Pre
va
len
ce
All 15-24 yr olds All
1st Preg Amg 15-24 yr olds Within Catchment Only (15-24 yr olds)
Non 1st Pregnancy Amg 15-24 yr olds
PMTCT Initiation:
September 2005

250
Gitarama:
Mugina (Rural)
MUGINA: Rwanda ANC Prevalence
0.0
2.0
4.0
6.0
8.0
10.0
12.0
2002 2003 2004 2005 2006 2007
HIV
Pre
va
len
ce
All 15-24 yr olds All
1st Preg Amg 15-24 yr olds Within Catchment Only (15-24 yr olds)
Non 1st Pregnancy Amg 15-24 yr olds
PMTCT Initiation:
June 2005
Ruhango (Urban)
RUHANGO: Rwanda ANC Prevalence
0.0
1.0
2.0
3.0
4.0
5.0
6.0
7.0
8.0
2002 2003 2004 2005 2006 2007
HIV
Pre
va
len
ce
All 15-24 yr olds All
1st Preg Amg 15-24 yr olds Within Catchment Only (15-24 yr olds)
Non 1st Pregnancy Amg 15-24 yr olds
PMTCT Initiation:
December 2003

251
RUSIZI: Rwanda ANC Prevalence
0.0
1.0
2.0
3.0
4.0
5.0
6.0
7.0
8.0
2002 2003 2004 2005 2006 2007
HIV
Pre
va
len
ce
All 15-24 yr olds All
1st Preg Amg 15-24 yr olds Within Catchment Only (15-24 yr olds)
Non 1st Pregnancy Amg 15-24 yr olds
PMTCT Initiation:
May 2004
West Province Cyangugu:
Mashesha (Rural)
MASHESHA: Rwanda ANC Prevalence
0.0
1.0
2.0
3.0
4.0
5.0
6.0
7.0
8.0
2002 2003 2004 2005 2006 2007
HIV
Pre
vale
nce
All 15-24 yr olds All
1st Preg Amg 15-24 yr olds Within Catchment Only (15-24 yr olds)
Non 1st Pregnancy Amg 15-24 yr olds
PMTCT Initiation:
May 2004
Rusizi (Urban)
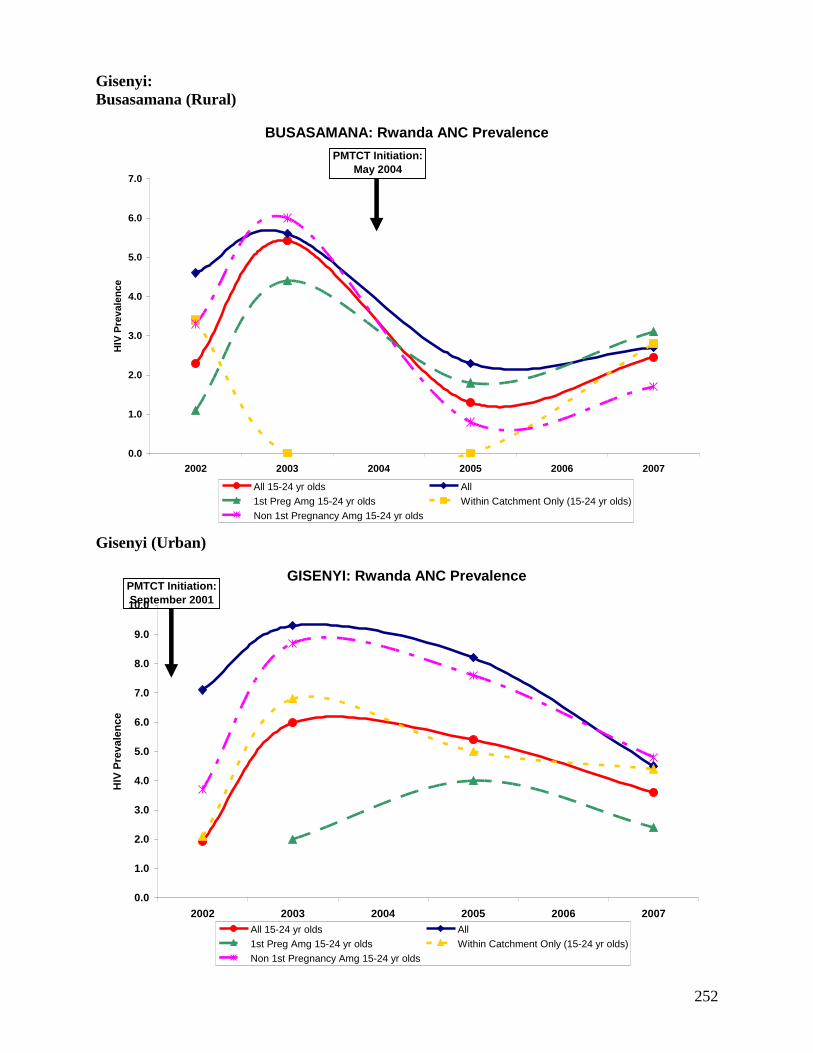
252
Gisenyi:
Busasamana (Rural)
BUSASAMANA: Rwanda ANC Prevalence
0.0
1.0
2.0
3.0
4.0
5.0
6.0
7.0
2002 2003 2004 2005 2006 2007
HIV
Pre
va
len
ce
All 15-24 yr olds All
1st Preg Amg 15-24 yr olds Within Catchment Only (15-24 yr olds)
Non 1st Pregnancy Amg 15-24 yr olds
PMTCT Initiation:
May 2004
Gisenyi (Urban)
GISENYI: Rwanda ANC Prevalence
0.0
1.0
2.0
3.0
4.0
5.0
6.0
7.0
8.0
9.0
10.0
2002 2003 2004 2005 2006 2007
HIV
Pre
va
len
ce
All 15-24 yr olds All
1st Preg Amg 15-24 yr olds Within Catchment Only (15-24 yr olds)
Non 1st Pregnancy Amg 15-24 yr olds
PMTCT Initiation:
September 2001

253
RUBENGERA: Rwanda ANC Prevalence
0.0
1.0
2.0
3.0
4.0
5.0
6.0
7.0
8.0
9.0
2002 2003 2004 2005 2006 2007
HIV
Pre
va
len
ce
All 15-24 yr olds All
1st Preg Amg 15-24 yr olds Within Catchment Only (15-24 yr olds)
Non 1st Pregnancy Amg 15-24 yr olds
PMTCT Initiation:
September 2003
Kibuye:
Mukungu (Rural)
MUKUNGU: Rwanda ANC Prevalence
0.0
1.0
2.0
3.0
4.0
5.0
6.0
7.0
2002 2003 2004 2005 2006 2007
HIV
Pre
va
len
ce
All 15-24 yr olds All
1st Preg Amg 15-24 yr olds Within Catchment Only (15-24 yr olds)
Non 1st Pregnancy Amg 15-24 yr olds
PMTCT Initiation:
April 2005
Rubengera (Urban)

254
Appendix 13: Prevalence Maps of Neighboring Countries
Map 1: HIV Prevalence in Uganda
Map 2: HIV Prevalence in the Democratic Republic of Congo, PNLS 2004

255
Map 3: HIV Prevalence in Tanzania, 2003/4 Tanzania AIDS Indicator Survey (THIS)

256
Appendix 14: „Reassuring‟ and „Concerning‟ Indicators by Former Province
East Province
Table 1: East Province, Kibungo Indicators
East Province: Kibungo (Unless otherwise specified all data are from DHS 2005)
Reassuring Concerning
HIV Prevalence:
Adults: Women (3.4%), Men (1.5%)
Youth: Women (1%), Men (0%)
Co-factors:
• Self reported STI: Decrease in men 3.5% to
2.7% between DHS 2000 and 2005
Behavior:
• 2+ partners in last 12 months: Women
(0.2%)
Knowledge:
• Adult comprehensive AIDS knowledge:
Women (52.7%), Men (60.6%)
• Youth: Comprehensive Knowledge: Women
(50.1%), Men (59.8%)
• Youth: Knows source of condoms: Women
(35.8%), Men (86.4%)
Attitude:
• Accepting attitudes towards PLWHA (all 4):
Men (64.7%)
Co-factors:
• Self reported STI: Increase in women from
3.1% to 8.5% between DHS 2000 and 2005
Behavior:
• Youth: First Sex before age 18: Women
(23.8%), Men (36.2%)
• Ever tested: Women (18.6%), Men (16.8% )
• 2+ partners in last 12 months: Men (9.8%),
DHS 2005; Men (9-11%), PLACE
• Had sex with a CSW in last 12 months: Men
(4-8%), PLACE
Attitude:
• Accepting attitudes towards PLWHA (all 4):
Women (43.2%)
Table 2: East Province, Umutara Indicators
East Province: Umutara (Unless otherwise specified all data are from DHS 2005)
Reassuring Concerning
HIV Prevalence:
Adults: Women (1.7%), Men (1.5%)
Youth: Women (0%), Men (0%)
Co-factors:
• Self reported STI: Men (2.6%)
Behavior:
• 2+ partners in last 12 months: Women
(0.8%),Men (3.7%)
Knowledge:
• Adult comprehensive AIDS knowledge:
Women (54.7%)
• Youth: Comprehensive Knowledge: Women
(50.4%)
• Youth: Knows source of condoms: Women
(45.2%), Men (76.4%)
Co-factors:
• Self reported STI: Increase in women from
2.2% to 5.3% between DHS 2000 and 2005
Behavior:
• Youth: First Sex before age 18: Women
(23.5%), Men (27.4%)
• Ever tested: Women (14.4%), Men (22%)
• Had sex with a CSW in last 12 months: Men
(13-15%), PLACE
Knowledge:
• Adult comprehensive AIDS knowledge: Men
(39.1%)
• Youth: Comprehensive Knowledge: Men
(35%)
Attitude:
• Accepting attitudes towards PLWHA (all 4):
Women (42.9%), Men (43.5%)

257
Table 3: East Province, Kigali-Ngali Indicators
East Province: Kigali-Ngali (Unless otherwise specified all data are from DHS 2005)
Reassuring Concerning
HIV Prevalence:
Adults: Women (2.6%)
Youth: Women (0.9%)
Co-factors:
• Self reported STI: Decreasing in women and
men between DHS 2000 to 2005 to 2.2% and
1%, respectively
• 2+ partners in last 12 months: Women (0%)
Men (3.5%)
Behavior:
• Ever tested: Women (26%), Men (25.2%)
• Youth: First Sex before age 18: Men (14.4%)
Knowledge:
• Adult comprehensive AIDS knowledge:
Women (74.4%), Men (62.6%)
• Youth: Comprehensive Knowledge: Women
(71.1%), Men (55.5%)
• Youth: Knows source of condoms: Men
(73%)
Attitude:
• Accepting attitudes towards PLWHA (all 4):
Men (53.6%)
HIV Prevalence:
Adults: Men (2.7%)
Youth: Men (0.7%)
Behavior:
• Youth: First Sex before age 18: Women
(19%)
• Had sex with a CSW in last 12 months: Men
(9%), PLACE
• One of the few provinces that men and women
reported injection drug use, PLACE
Knowledge: • Youth: Knows source of condoms: Women
(30%)
Attitude:
• Accepting attitudes towards PLWHA (all 4):
Women (38.3%)
Kigali Province
Table 4: Kigali Province, Kigali Ville Indicators
Kigali Province: Kigali Ville (Unless otherwise specified all data are from DHS 2005)
Reassuring Concerning
Behavior:
• Youth: First Sex before age 18: Men (24.9%)
• Ever tested: Women (53.3%), Men (44.8%)
• Reported condom use at last high-risk
intercourse: Women (44.3%), Men (67.2%)
Knowledge:
• Adult comprehensive AIDS knowledge:
Women (65.8%), Men (61.1%)
• Youth: Comprehensive Knowledge: Women
(67%), Men (56.3%)
• Youth: Knows source of condoms: Women
(69.6%), Men (93.3%)
Attitude:
• Accepting attitudes towards PLWHA (all 4):
Women (66.4%)
HIV Prevalence:
Adults: Women (9.5%), Men (5.6%)
Youth: Women (5.4%), Men (1.0%)
Co-factors:
• Self reported STI: Women (8.4%), Men
(3.3%)
Behavior:
• 2+ partners in last 12 months: Women (2.1%)
Men (6.9%)
• Had sex with a CSW in last 12 months: Men
(26%), Women (40%), PLACE
• Youth: First Sex before age 18: Women
(18.7%)
• Women and men reported using injectable
drugs, PLACE
Attitude:
• Accepting attitudes towards PLWHA (all 4):
Men (23.4%)

258
North Province
Table 5: North Province, Byumba Indicators
North Province: Byumba (Unless otherwise specified all data are from DHS 2005)
Reassuring Concerning
HIV Prevalence:
Adults: Women (2.4%), Men (0.9%)
Youth: Women (0.6%), Men (0.0%)
Co-factors:
• Self reported STI: Decreasing among men
from 2.7% to 2.0% between DHS 2000 and
2005
• 2+ partners in last 12 months: Women
(0.5%) Men (1.9%)
Behavior:
• Youth: First Sex before age 18: Women
(15.7%), Men (18.1%)
Knowledge:
• Adult comprehensive AIDS knowledge:
Women (54.2%), Men (62.1%)
• Youth: Comprehensive Knowledge: Women
(51.1%), Men (56.6%)
• Youth: Knows source of condoms: Women
(39.5%), Men (78.%)
Attitude:
• Accepting attitudes towards PLWHA (all 4):
Women (53.9%), Men (62%)
Co-factors:
• Self reported STI: Increasing among women
from 2.6% to 3.1% between DHS 2000 and
2005
Behavior:
• Condom use at last high-risk intercourse:
Women (8.7%); Women (10-29%) Men (39-
54%), PLACE
• Ever tested: Women (21.8%), Men (18.8%)
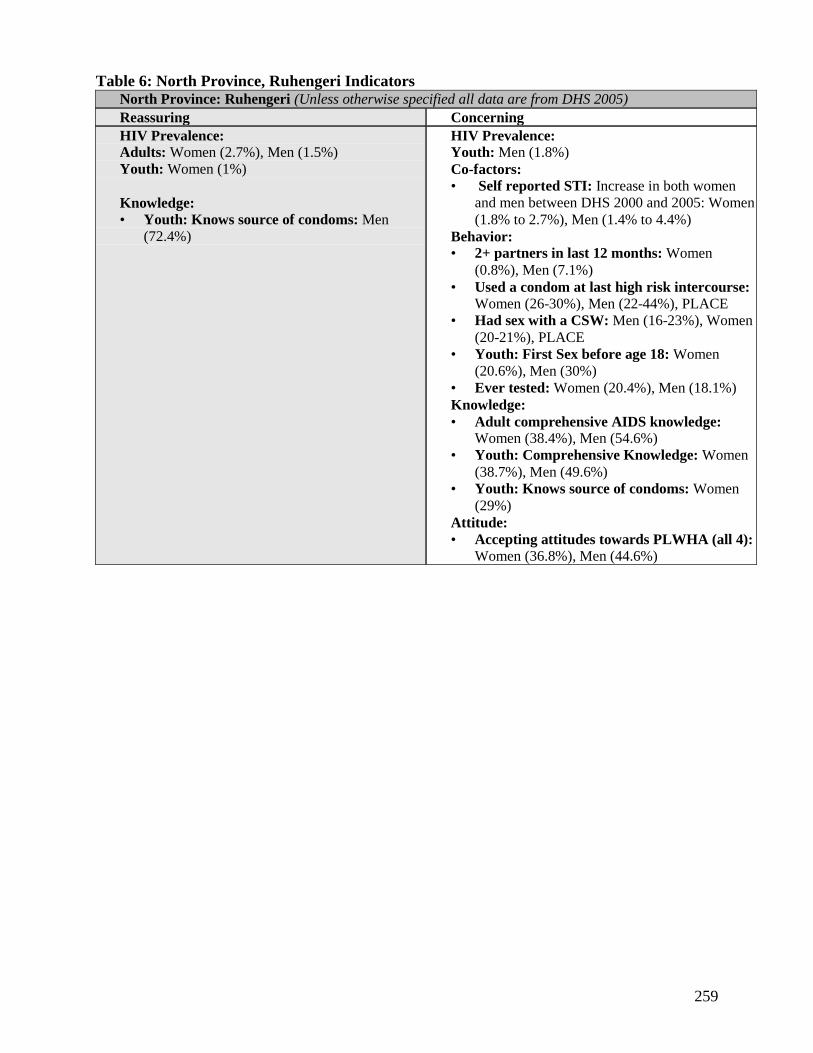
259
Table 6: North Province, Ruhengeri Indicators
North Province: Ruhengeri (Unless otherwise specified all data are from DHS 2005)
Reassuring Concerning
HIV Prevalence:
Adults: Women (2.7%), Men (1.5%)
Youth: Women (1%)
Knowledge:
• Youth: Knows source of condoms: Men
(72.4%)
HIV Prevalence: Youth: Men (1.8%)
Co-factors:
• Self reported STI: Increase in both women
and men between DHS 2000 and 2005: Women
(1.8% to 2.7%), Men (1.4% to 4.4%)
Behavior:
• 2+ partners in last 12 months: Women
(0.8%), Men (7.1%)
• Used a condom at last high risk intercourse:
Women (26-30%), Men (22-44%), PLACE
• Had sex with a CSW: Men (16-23%), Women
(20-21%), PLACE
• Youth: First Sex before age 18: Women
(20.6%), Men (30%)
• Ever tested: Women (20.4%), Men (18.1%)
Knowledge:
• Adult comprehensive AIDS knowledge:
Women (38.4%), Men (54.6%)
• Youth: Comprehensive Knowledge: Women
(38.7%), Men (49.6%)
• Youth: Knows source of condoms: Women
(29%)
Attitude:
• Accepting attitudes towards PLWHA (all 4):
Women (36.8%), Men (44.6%)

260
Table 7: North Province, Kigali-Ngali Indicators North Province: Kigali-Ngali (Unless otherwise specified all data are from DHS 2005)
Reassuring Concerning
HIV Prevalence:
Adults: Women (2.6%)
Youth: Women (0.9%)
Co-factors:
• Self reported STI: Decreasing in women and
men between DHS 2000 to 2005 to 2.2% and
1%, respectively
• 2+ partners in last 12 months: Women (0%)
Men (3.5%)
Behavior:
• Ever tested: Women (26%), Men (25.2%)
• Youth: First Sex before age 18: Men (14.4%)
Knowledge:
• Adult comprehensive AIDS knowledge:
Women (74.4%), Men (62.6%)
• Youth: Comprehensive Knowledge: Women
(71.1%), Men (55.5%)
• Youth: Knows source of condoms: Men
(73%)
Attitude:
• Accepting attitudes towards PLWHA (all 4):
Men (53.6%)
HIV Prevalence:
Adults: Men (2.7%)
Youth: Men (0.7%)
Behavior:
• Youth: First Sex before age 18: Women
(19%)
• Had sex with a CSW in last 12 months: Men
(9%), PLACE
• One of the few provinces that men and women
reported injection drug use, PLACE
Knowledge: • Youth: Knows source of condoms: Women
(30%)
Attitude:
• Accepting attitudes towards PLWHA (all 4):
Women (38.3%)
South Province
Table 8: South Province, Ginkogoro Indicators
South Province: Ginkogoro (Unless otherwise specified all data are from DHS 2005)
Reassuring Concerning
HIV Prevalence: • Adults: Women (1.9%), Men (1.7%)
• Youth: Women (0.6%), Men (0%)
Co-factors:
• Self reported STI: Women (1%)
• 2+ partners in last 12 months: Women (0%)
Men (3.5%)
Behavior:
• Youth: First Sex before age 18: Men (21.1%)
Knowledge:
• Adult comprehensive AIDS knowledge:
Women (58.9)
• Youth: Comprehensive Knowledge: Women
(55.1%)
Attitude:
• Accepting attitudes towards PLWHA (all 4):
Men (58.7%)
Co-factors:
• Self reported STI: Men (6%)
Behavior:
• Youth: First Sex before age 18: Women
(19.8%)
• Ever tested: Women (16.2%), Men (11.6%)
Knowledge:
• Adult comprehensive AIDS knowledge: Men
(53.9%)
• Youth: Comprehensive Knowledge: Men
(52.9)
• Youth: Knows source of condoms: Women
(21.7%) Men (56.4%)
Attitude:
• Accepting attitudes towards PLWHA (all 4):
Women (43.5)

261
Table 9: South Province, Butare Indicators South Province: Butare (Unless otherwise specified all data are from DHS 2005)
Reassuring Concerning
HIV Prevalence:
• Adults: Women (3.1%), Men (1.6)
• Youth: Women (0.7%), Men (0%)
Co-factors:
• Self reported STI: Men (0.6%)
• 2+ partners in last 12 months: Women
(0.6%) Men (5.4%)
Behavior:
• Youth: First Sex before age 18: Women
(15.3%), Men (26.7%)
• Ever tested: Women (24.2%), Men (24%)
Knowledge:
• Adult comprehensive AIDS knowledge: Men
(81.5%)
• Youth: Comprehensive Knowledge: Men
(78.8%)
• Youth: Knows source of condoms: Men
(75.5%)
Attitude:
• Accepting attitudes towards PLWHA (all 4):
Women (62.2%), Men (67%)
Co-factors:
• Self reported STI: Women (7%)
Knowledge:
• Adult comprehensive AIDS knowledge:
Women (58.8%)
• Youth: Comprehensive Knowledge: Women
(53.7%)
• Youth: Knows source of condoms: Women
(44.3%)
Table 10: South Province, Gitarama Indicators
South Province: Gitarama (Unless otherwise specified all data are from DHS 2005)
Reassuring Concerning
HIV Prevalence:
• Youth: Women (0.4%) Men (0%)
Co-factors:
• Self reported STI: Women (3.1%), Men
(1.5%)
Behavior:
• 2+ partners in last 12 months: Women
(0.8%) Men (1.8%)
• Youth: First Sex before age 18: Women
(10%)
Knowledge:
• Adult comprehensive AIDS knowledge:
Women (61.7%), Men (60.5%)
• Youth: Comprehensive Knowledge: Women (60.4%)
• Youth: Knows source of condoms: Women (38.5%), Men (77.4%)
Attitude:
Accepting attitudes towards PLWHA (all
4): Women (56.7%), Men (63.6%)
HIV Prevalence: • Adults: Women (3.8%), Men (2.6%)
Behavior:
• Youth: First Sex before age 18: Men
(37.8%)
• Ever tested: Women (22.3%), Men
(19.6%)
Knowledge:
• Youth: Comprehensive Knowledge: Men
(51.9%)

262
West Province
Table 11: West Province, Cyangugu Indicators
West Province: Cyangugu (Unless otherwise specified all data are from DHS 2005)
Reassuring Concerning
Co-factors:
• Self reported STI: Women
Behavior:
• 2+ partners in last 12 months: Women
(0.6%), Men (3.9%)
• Ever tested: Women (28.4%), Men ( 24.9%)
• Youth: First Sex before age 18: Women
(13.5%), Men (26.8%)
Attitude:
• Accepting attitudes towards PLWHA (all 4):
Men (50.6%)
HIV Prevalence:
Adults: Women (4%), Men (2.7%)
Youth: Women (2.5%), Men (0.5%)
Co-factors:
• Self reported STI: Increased for Women
(3.6% to 12.8%) and Men (1.9% to 5.1%)
between DHS 2000 and 2005
Behavior:
• Had sex with a CSW in last 12 months:
Women (52-62%), Men (55-57%), PLACE
• Used condom at last high risk intercourse: Women (35-43%), Men (29-34%), PLACE
Knowledge:
• Adult comprehensive AIDS knowledge:
Women (37.3%), Men (42%)
• Youth: Comprehensive Knowledge: Women
(34.7%), Men (41.8%)
• Youth: Knows source of condoms: Women
(31.1%), Men (68.2%)
Attitude:
• Accepting attitudes towards PLWHA (all 4):
Women (40.5%)
Table 12: West Province, Gisenyi Indicators
West Province: Gisenyi (Unless otherwise specified all data are from DHS 2005)
Reassuring Concerning
Co-factors:
• Self reported STI: Women (4.4%), Men
(1.4%)
• 2+ partners in last 12 months: Women
(0.4%), Men (3.3%)
Behavior:
• Youth: First Sex before age 18: Men (26%)
HIV Prevalence:
Adults: Women (3.6%), Men (2.6%)
Youth: Women (2.2%), Men (0.5%)
Behavior:
• Youth: First Sex before age 18: Women
(18.1%)
• Ever tested: Women (16.7%), Men (13.2%)
• Had sex with a CSW in last 12 months:
Women (5-19%), Men (7-11%)
Knowledge:
• Adult comprehensive AIDS knowledge:
Women (36.2%), Men (45.6%)
• Youth: Comprehensive Knowledge: Women
(33.5%), Men (46.2%)
• Youth: Knows source of condoms: Women
(23.9%), Men (50%)
Attitude:
• Accepting attitudes towards PLWHA (all 4):
Women (21%), Men (48.9%)

263
Table 13: West Province, Kibuye Indicators
West Province: Kibuye (Unless otherwise specified all data are from DHS 2005)
Reassuring Concerning
Co-factors:
• Self reported STI: Women (2.1%)
Behavior:
• Ever tested: Women (20%), Men (20.3%)
• Youth: First Sex before age 18: Women
(14.2%)
Attitude:
• Accepting attitudes towards PLWHA (all 4):
Women (53.1%)
HIV Prevalence:
Adults: Women (4.5%), Men (2.5%)
Youth: Women (2%), Men (0.4%)
Co-factors:
• Self reported STI: Increased in Men 1.5% to
4.5% between DHS 2000 and 2005
Behavior:
• 2+ partners in last 12 months: Women
(0.8%), Men (11%)
• Youth: First Sex before age 18: Men (32.6%)
• Injection drug use: Men (0.9%), PLACE
Knowledge:
• Adult comprehensive AIDS knowledge:
Women (51.7%), Men (54.5%)
• Youth: Comprehensive Knowledge: Women
(45.8%), Men (45.4%)
• Youth: Knows source of condoms: Women
(37.2%), Men (61%)
Attitude:
• Accepting attitudes towards PLWHA (all 4):
Men (14.4%)

264
Appendix 15: Rwanda maps showing key indicators by former province
Map 1: Percent of Men and Women that had High Risk Sex in the Past 12 Months, DHS
2005

265
Map 2: Percent of Men and Women who had their first sexual intercourse before 18 years,
DHS 2005

266
Map 3: Percent of Men and Women with a comprehensive knowledge of source of
condoms, DHS 2005

267
Map 4: Percent of Men and Women that have ever tested for HIV, DHS 2005

268
Map 5: Percent of Men and Women expressing accepting attitudes on all four indicators,
DHS 2005
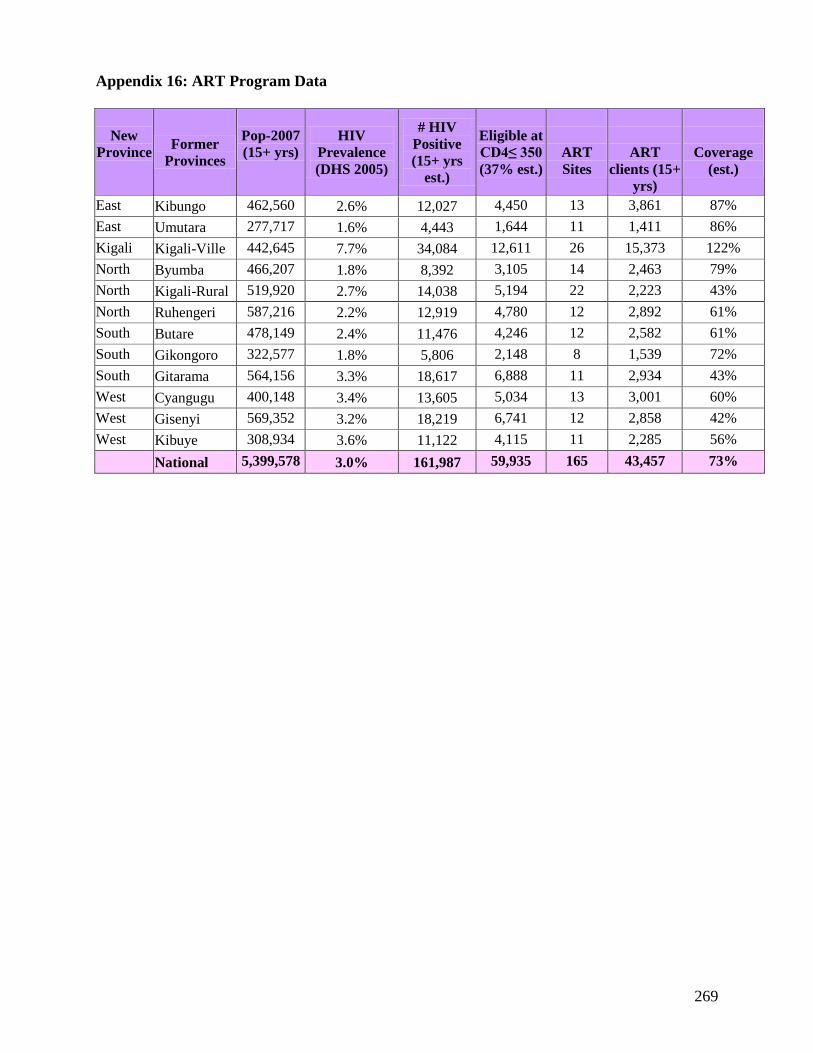
269
Appendix 16: ART Program Data
New
Province Former
Provinces
Pop-2007
(15+ yrs)
HIV
Prevalence
(DHS 2005)
# HIV
Positive
(15+ yrs
est.)
Eligible at
CD4≤ 350
(37% est.)
ART
Sites
ART
clients (15+
yrs)
Coverage
(est.)
East Kibungo 462,560 2.6% 12,027 4,450 13 3,861 87%
East Umutara 277,717 1.6% 4,443 1,644 11 1,411 86%
Kigali Kigali-Ville 442,645 7.7% 34,084 12,611 26 15,373 122%
North Byumba 466,207 1.8% 8,392 3,105 14 2,463 79%
North Kigali-Rural 519,920 2.7% 14,038 5,194 22 2,223 43%
North Ruhengeri 587,216 2.2% 12,919 4,780 12 2,892 61%
South Butare 478,149 2.4% 11,476 4,246 12 2,582 61%
South Gikongoro 322,577 1.8% 5,806 2,148 8 1,539 72%
South Gitarama 564,156 3.3% 18,617 6,888 11 2,934 43%
West Cyangugu 400,148 3.4% 13,605 5,034 13 3,001 60%
West Gisenyi 569,352 3.2% 18,219 6,741 12 2,858 42%
West Kibuye 308,934 3.6% 11,122 4,115 11 2,285 56%
National 5,399,578 3.0% 161,987 59,935 165 43,457 73%

270
Appendix 17: PMTCT Program Data
Table 1: PMTCT Program Data
New
Province
Former
Provinces
Pop-2007
All Ages
Expected
Total
Pregnancies
PMTCT
Sites
2007
PMTCT
clients
2007
PMTCT
clients
divided by
the
expected
total
pregnancies
PMTCT
coverage
(est.)
DHS
2005
DHS 2005
4% of Total
Population
(est.)
% women
received
counseling
during
ANC
% women
counseled,
accepted,
took test
and
received
results
East Kibungo 797,517 31,901 27 23,158 73% 41.1 14.2
East Umutara 478,822 19,153 23 21,641 113% 63.6 16.6
Kigali
Kigali-
Ville 763,181 30,527
16 21,420
70%
76.3 63.1
North Byumba 803,806 32,152 30 16,175 50% 55.5 17.4
North
Kigali-
Rural 896,413 35,857
44 28,121
78%
61.9 23
North Ruhengeri 1,012,441 40,498 19 16,492 41% 48.5 17.4
South Butare 824,394 32,976 21 16,640 50% 49.9 16.1
South Gikongoro 556,167 22,247 22 14,657 66% 57.6 12.9
South Gitarama 972,682 38,907 33 21,714 56% 59.2 24.3
West Cyangugu 689,910 27,596 19 19,384 70% 59.5 30.6
West Gisenyi 981,641 39,266 21 24,986 64% 54.2 19.5
West Kibuye 532,644 21,306 20 15,770 74% 58 19.1
National 9,309,618 372,385 295 240,158 68% 55.8 21.5
(The PMTCT data is from 2007 and includes only the number of women tested)
Table 2: PMTCT Progression from 2002 to 2007, Rwanda
PMTCT
National 2002 2003 2004 2005 2006 2007
PMTCT sites
33
56
120 209 234
295
tot ever tested 46422 88278 183724 364057 602409 842,567
Tested in year 34944 41856 95446 180333 238352 240158
Women HIV+ 3107 3505 6405 8631 9583
Women on
ARV 1547 2866 2621 5782 6611
Infant on ARV 1434 1746 2460 3166 4274

271
Appendix 18: VCT Program Data
New
Province
Former
Provinces
Pop-2007
(15+
years)
Prevalence
(DHS
2005)
# HIV
Positive
(est.)
VCT
Sites
VCT
clients
2007
Annual
Coverage
(15+
years)
% ever
tested
Women
(DHS
2005)
%
ever
tested
Men
(DHS
2005)
East Kibungo 462,560 2.6 20,735 31 66,975 14.5% 18.3% 16.8%
East Umutara 277,717 1.6 7,661 21 46,387 16.7% 24.4% 22.0%
Kigali Kigali-
Ville
442,645
7.7
58,765 22 63,260 14.3% 53.0% 44.7%
North Byumba 466,207 1.8 14,469 30 77,799 16.7% 21.4% 18.8%
North Kigali-
Ngali
519,920
2.7
24,203 46 106,578 20.5% 25.6% 25.2%
North Ruhengeri 587,216 2.2 22,274 20 82,982 14.1% 20.0% 18.0%
South Butare 478,149 2.4 19,785 27 61,981 13.0% 24.1% 23.7%
South Gikongoro 322,577 1.8 10,011 22 50,500 15.7% 16.2% 11.6%
South Gitarama 564,156 3.3 32,099 31 50,430 8.9% 22.1% 19.6%
West Cyangugu 400,148 3.4 23,457 21 100,590 25.1% 28.2% 24.9%
West Gisenyi 569,352 3.2 31,413 21 63,951 11.2% 16.2% 13.2%
West Kibuye 308,934 3.6 19,175 20 55,852 18.1% 19.9% 20.0%
National 5,399,578 3 279,288 312 827,285 15.3%
i UNGASS Country Progress Report. January 2006-December 2007.