RURAL COMMUNITY SURVEY - Statistical Committee of the ...
39
NATIONAL STATISTICAL SERVICE OF THE REPUBLIC OF ARMENIA REPORT On RURAL COMMUNITY SURVEY YEREVAN 2009
-
Upload
khangminh22 -
Category
Documents
-
view
1 -
download
0
Transcript of RURAL COMMUNITY SURVEY - Statistical Committee of the ...

NATIONAL STATISTICAL SERVICE OF THE REPUBLIC OF ARMENIA
REPORT
On
RURAL COMMUNITY SURVEY
YEREVAN 2009
Rural Community Survey Report
2
Table of Contents BACKGROUND .......................................................................................................................3 ACKNOWLEDGMENTS .........................................................................................................3 I. SURVEY METHODOLOGY AND IMPLEMENTATION.............................................4
Sampling ............................................................................................................................4 Survey Instruments ............................................................................................................4 Interviewer Training ..........................................................................................................5 Fieldwork Description .......................................................................................................5 Logical Control, Data Coding and Entry ...........................................................................6
II. SURVEY FINDINGS........................................................................................................6 A. POPULATION ..........................................................................................................6 B. EMPLOYMENT........................................................................................................7 C. SOCIAL INFRASTRUCTURE.................................................................................8
Education ...............................................................................................................8 Health.....................................................................................................................9 Culture and Recreation........................................................................................10
D. PHYSICAL INFRASTRUCTURE AND UTILITIES ............................................11 General ................................................................................................................11 Roads and Transportation ...................................................................................12 Availability of Transportation..............................................................................12 Public Transportation Reliability and Quality ....................................................13 Distances to Key Infrastructure ...........................................................................13 Transportation Costs ...........................................................................................14 Roads....................................................................................................................15
E. ECONOMIC ACTIVITY ........................................................................................15 F. AGRICULTURE AND IRRIGATION ...................................................................17 G. GOVERNMENT POLICIES AND PROGRAMS ..................................................21
III. CONCLUSIONS AND RECOMMENDATIONS ..........................................................22 Recommendations............................................................................................................22
APPENDIX 1: CROP COVERAGE BY MARZ ....................................................................23 APPENDIX 2: QUESTIONNAIRE ........................................................................................28
Rural Community Survey Report
3
BACKGROUND The Government of the Republic of Armenia entered into the Millennium Challenge Compact with the United States of America, acting through the Millennium Challenge Corporation (MCC) on March 27, 2006, providing for a 5-year grant of up to USD 235,650,000 to advance economic growth and reduce poverty in Armenia.
The Compact signed between the Millennium Challenge Corporation and the Government of Armenia aims to reduce rural poverty through a five year program of strategic investment in rural roads and irrigation infrastructure as well as financial and technical support to farmers and agribusinesses. It is expected that the Program will result in increased incomes and reduced poverty in rural areas of Armenia.
To assess the impact of the Program, MCA-Armenia will be using data received through the Integrated Living Conditions Survey (ILCS1) starting from 2007 and during the next four years, which is a household survey conducted annually by the National Statistical Service of the Republic of Armenia (RA NSS). As a result of the rural focus of the MCA-Armenia Program, MCA funding has been used to increase the ILCS sample of rural respondents. Additionally, modifications were made to the ILCS questionnaire. MCA is committed to funding the rural oversample annually from 2007 to 2011. The 2007 ILCS serves as a tool for baseline data collection for MCA-Armenia and will be used for later comparisons and analyses.
In addition, according to the contract amendment signed between MCA-Armenia and RA NSS on September 23, 2008, RA NSS conducted a survey of rural communities that were included in the 2008 ILCS sample. The goal of the Rural Community Survey (RCS) was to collect more comprehensive information at the community level to determine whether alongside with the impacts on the household level, the MCA-Armenia program is affecting improved livelihood at the community level. The following report presents the results of that survey.
ACKNOWLEDGMENTS The National Statistical Service of RA and MCA-Armenia are grateful to everyone who has contributed to the implementation of the Rural Community Survey, and in particular:
• To Millennium Challenge Corporation (MCC) for funding; • To Mathematica Policy Research (MPR) representatives for methodological support to the
survey; • To the “Millennium Challenge Account-Armenia” State Non-Commercial Organization
(SNCO) for financial and technical support; • To all the respondents who participated in the survey and the interviewers and supervisors
who conducted the survey. The report was prepared under the responsibility of:
• Diana Martirosova, Head of the Households Survey Division, the National Statistical Service of RA;
• Gala Husikyan, Programmer for the Rural Community Survey. A special gratitude for support and contribution to the survey implementation and preparation of the report to:
• Rebecca Tunstall, Millennium Challenge Corporation (MCC), for editing the report and providing valuable comments;
1 In MCA-Armenia documentation Integrated Living Conditions Survey (ILCS) is also referred as ISLS (Integrated Survey of Living Standards).

Rural Community Survey Report
4
• Kenneth Fortson, Mathematica Policy Research (MPR), for contribution to the development of survey instruments, overall survey guidance and review;
• Anu Rangarajan, Mathematica Policy Research (MPR), for contribution to the development of survey instruments, overall survey guidance and review;
• Ester Hakobyan, Millennium Challenge Account-Armenia, former Monitoring and Evaluation Officer, for input in the development of survey instrument, overall technical support during the survey planning and implementation;
• Lusine Kharatyan, Millennium Challenge Account-Armenia, Monitoring and Evaluation Officer, for contribution to the development of survey questionnaire, questionnaire pre-test, development of QbyQ detailed instructions and leading the interviewer training;
• Lusine Yeremyan, Millennium Challenge Account-Armenia, Monitoring and Evaluation Specialist, for translating and editing the report.
I. SURVEY METHODOLOGY AND IMPLEMENTATION As mentioned above, the overall goal of the Rural Community Survey was to collect more comprehensive information at the community level to determine whether alongside with the impacts on the household level, the MCA-Armenia program is affecting improved livelihood at the community level. Sampling
The 2008 ILCS sample served as a basis for the Rural Community Survey sample. The primary sampling units for the ILCS are communities, which are selected randomly, stratified by marzes. Overall, 306 communities were included in the ILCS, of which 43 urban and 263 rural communities. For the RCS only rural communities were selected from the overall ILCS sample. As a result, the RCS sample includes 2622 rural communities and the representativeness is ensured at the national level for rural areas. Survey Instruments
The following survey instruments were developed in collaboration with MCA-Armenia, MCC, and the impact evaluators from Mathematica Policy Research:
• Questionnaire (Appendix 2)
• QbyQ detailed instructions to the questionnaire
The draft Rural Community Survey questionnaire was revised based on the comments from all interested parties. Comments from the relevant divisions of RA NSS, as well as members of the National Statistical Council were incorporated. The final version of the RCS questionnaire reflects all comments received. Some preparatory work was done before the survey implementation. The questionnaire was pre-tested twice: in Argavand village of Ararat marz and Aramus village of Kotayk marz. The questionnaire was revised right after the first pretest which allowed RA NSS to conduct the second pre-test with an already improved version of the questionnaire. The second pretest resulted in more questionnaire revisions. The average interview duration was one hour.
2 During the community survey implementation it was revealed that one of the rural communities in Tavush has changed its status and it is a town now. Consequently 262 communities were included in CRS sample, while the ICLS includes 263 rural communities.

Rural Community Survey Report
5
Finally, the questionnaire was finalized by the RA NSS and presented for the review and approval of the National Council on Statistics. On October 28, 2008 the Rural Community Survey Questionnaire was approved by the RA National Council on Statistics by decree No 35-A. On October 29, 2008 the appropriate number of questionnaire copies was made to start the field work. The questionnaire is filled in by an interviewer. Interviewer Training
The interviewer training for the Rural Community Survey questionnaire was conducted on October 30, 2008. Member of the National Council on Statistics G. Gevorgyan and MCA-Armenia M&E Officer E. Hakobyan were present at the interviewer training. While the training was led by MCA-Armenia M&E Specialist L. Kharatyan, Head of the NSS Division on Households Surveys D. Martirosova, Head of the NSS Division on Population Census and Demography K. Kuyumjyan, and the programmer for the Rural Community Survey G. Husikyan also provided input into the training. All the interviewers received the appropriate number of questionnaires, as well as QbyQ instructions and the list of sampled villages. Three experienced data entry specialists were selected for RCS data entry. The interviewers were also provided with detailed instructions on how to fill in the questionnaire. Fieldwork Description
In November 2008, 36 interviewers and 3 supervisors were grouped into a team to conduct the RCS fieldwork. This team carried out the whole survey. The workload of an interviewer on average was somewhat more than 7 villages. The survey was managed and overseen by A. Khangeldyan, ILCS Project Coordinator, G. Husikyan, Project Programmer and L. Kharatyan, MCA-Armenia M&E Specialist. The fieldwork was finalized by the anticipated deadline without any problems. Not a single complaint was recorded by the interviewers. The fieldwork was double-checked throughout its implementation. All the respondents were very supportive. Detailed information about the fieldwork is presented below in Table 1. Table 1 Armenia. Fieldwork Results
Including
Marz Number of
surveyed villages
Only from core sample of the ILCS
Only from oversample of the ILCS
From both core sample and oversample
of the ILCS
Number of interviewers
Aragatsotn 28 15 8 5 4 Ararat 22 17 3 2 4 Armavir 28 13 8 7 4 Gegharkunik 29 16 8 5 4 Lori 35 15 15 5 4 Kotayk 26 15 7 4 4 Shirak 32 13 14 5 4 Syunik 22 10 12 0 2 Vayots Dzor 14 9 3 2 2 Tavush 26 14 9 3 4 Total 262 137 87 38 36 Source: RCS

Rural Community Survey Report
6
Logical Control, Data Coding and Entry The fieldwork started on November 1 and was completed on November 30, 2008. The collected information was then coded, logically controlled and entered. The data was entered in parallel with the submission of the questionnaires. Prior to entering the data, data entering program was pre-tested and redesigned based on the operators’ comments and feedback. The data entry was completed in December 2008. As a result a database of 262 villages was created.
Main survey findings are presented in Section II on Findings.
II. SURVEY FINDINGS A. POPULATION The number of rural residents (permanent village residents) of Armenia as of January 1, 2008 is 1,159.6 thousand, or 35.9 percent of the total RA population. Table 2: Armenia. Population of the Republic of Armenia, 1990-2008 (At the beginning of the year)
To the whole population in percent Years Population Total (thousand people) Urban Rural
1990 3514.9 68.8 31.2 1993 3463.7 68.1 31.9 1996 3248.8 66.2 33.8 1999 3232.1 65.3 34.7 2001* 3213.0 64.3 35.7 2002 3212.9 64.3 35,7 2003 3210.3 64.2 35.8 2004 3212.2 64.2 35.8 2005 3215.8 64.1 35.9 2006 3219.2 64.1 35.9 2007 3222.9 64.1 35.9 2008 3230.1 64.1 35.9 Source: NSS, population statistics Note. *) 2001Census According to the RCS, the number of permanent residents in the surveyed communities as of January 1, 2008 was 571,394 or 49 percent of the permanent rural residents in all of Armenia. Children age 0-15 account for 131,968 or 23 percent of the population covered by the survey, adult males (age 16 and higher) account for 215,059 or 38 percent, and adult females (age 16 and higher) account for 224,367 or 39 percent (See Table 3). Table 3: Armenia. Total Number of Permanent Village Residents by Age and Sex in the Surveyed Villages as of January 1, 2008
Including Number of Permanent Village
Residents as of January 1, 2008
Adult Male
(age 16 and higher)
Adult Female
(age 16 and higher)
Children aged 0-15
571,394 215,059 224,367 131,968
100% 38% 39% 23%
Source: RCS
Rural Community Survey Report
7
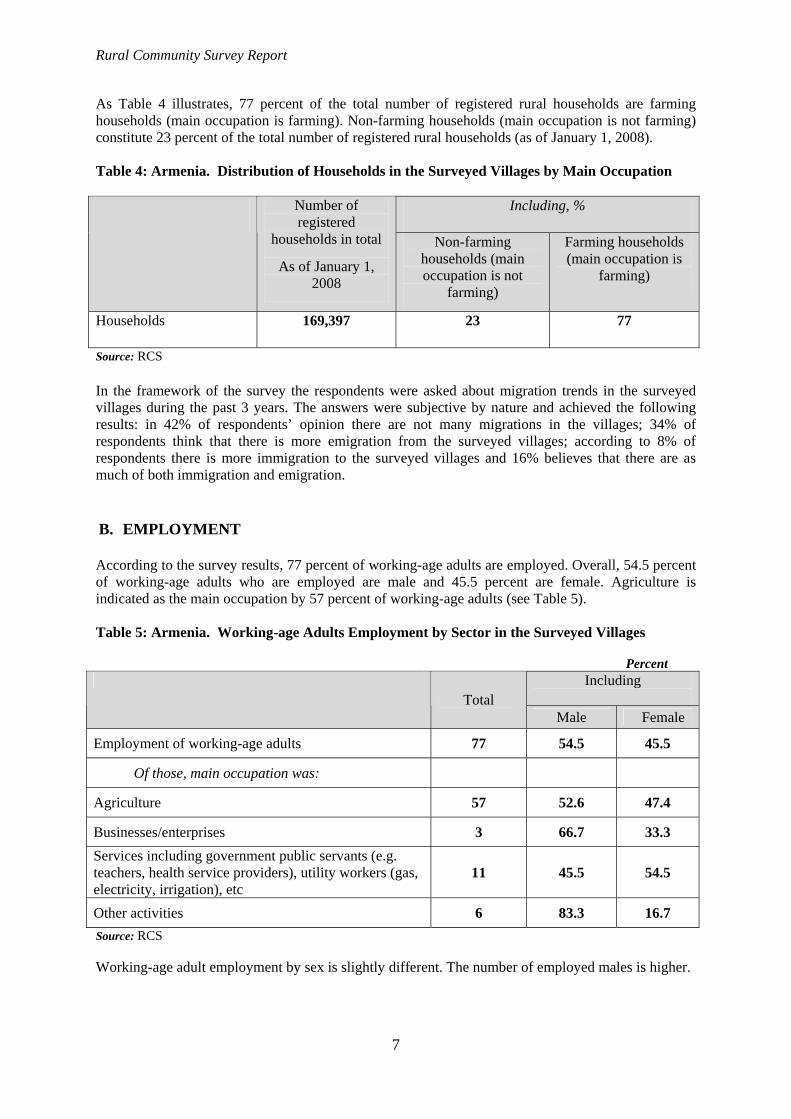
As Table 4 illustrates, 77 percent of the total number of registered rural households are farming households (main occupation is farming). Non-farming households (main occupation is not farming) constitute 23 percent of the total number of registered rural households (as of January 1, 2008). Table 4: Armenia. Distribution of Households in the Surveyed Villages by Main Occupation
Including, % Number of registered
households in total
As of January 1, 2008
Non-farming households (main occupation is not
farming)
Farming households (main occupation is
farming)
Households 169,397 23 77
Source: RCS In the framework of the survey the respondents were asked about migration trends in the surveyed villages during the past 3 years. The answers were subjective by nature and achieved the following results: in 42% of respondents’ opinion there are not many migrations in the villages; 34% of respondents think that there is more emigration from the surveyed villages; according to 8% of respondents there is more immigration to the surveyed villages and 16% believes that there are as much of both immigration and emigration. B. EMPLOYMENT According to the survey results, 77 percent of working-age adults are employed. Overall, 54.5 percent of working-age adults who are employed are male and 45.5 percent are female. Agriculture is indicated as the main occupation by 57 percent of working-age adults (see Table 5). Table 5: Armenia. Working-age Adults Employment by Sector in the Surveyed Villages
Percent Including
Total Male Female
Employment of working-age adults 77 54.5 45.5
Of those, main occupation was:
Agriculture 57 52.6 47.4
Businesses/enterprises 3 66.7 33.3 Services including government public servants (e.g. teachers, health service providers), utility workers (gas, electricity, irrigation), etc
11 45.5 54.5
Other activities 6 83.3 16.7 Source: RCS Working-age adult employment by sex is slightly different. The number of employed males is higher.
Rural Community Survey Report
8
C. SOCIAL INFRASTRUCTURE
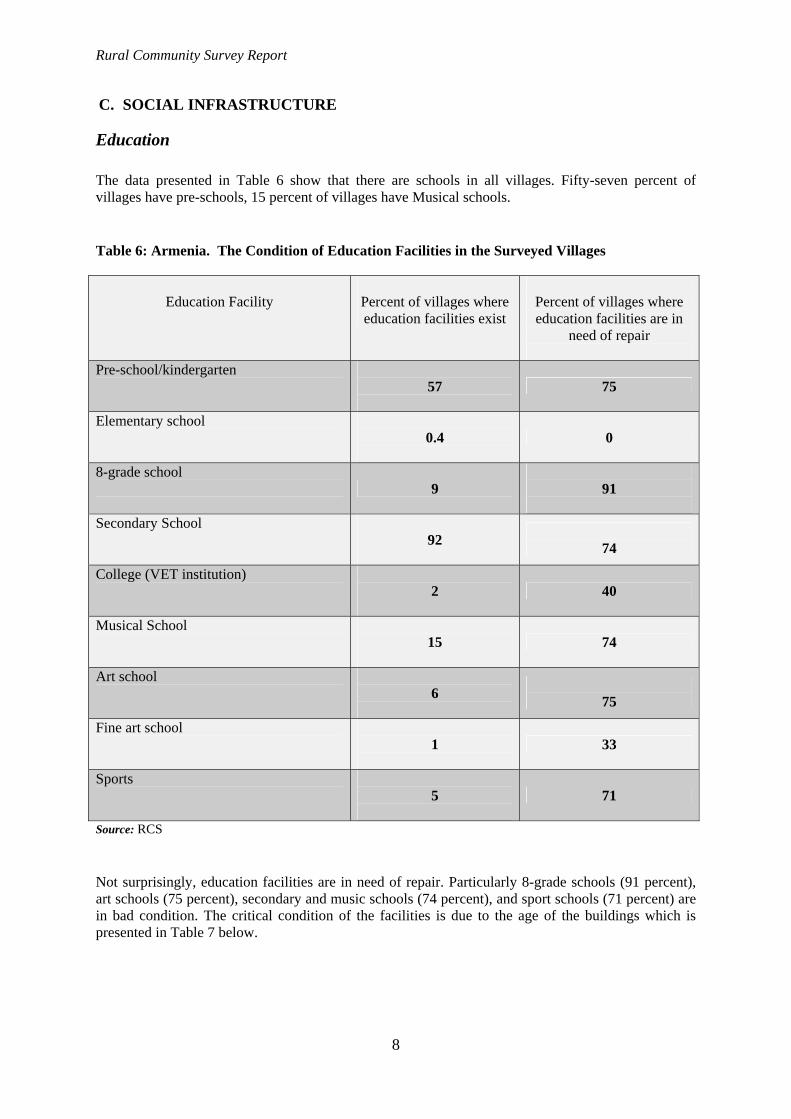
Education The data presented in Table 6 show that there are schools in all villages. Fifty-seven percent of villages have pre-schools, 15 percent of villages have Musical schools. Table 6: Armenia. The Condition of Education Facilities in the Surveyed Villages
Education Facility
Percent of villages where education facilities exist
Percent of villages where education facilities are in
need of repair
Pre-school/kindergarten
57
75
Elementary school
0.4
0
8-grade school 9
91
Secondary School
92
74
College (VET institution)
2
40
Musical School
15
74
Art school
6
75
Fine art school
1
33
Sports
5
71
Source: RCS Not surprisingly, education facilities are in need of repair. Particularly 8-grade schools (91 percent), art schools (75 percent), secondary and music schools (74 percent), and sport schools (71 percent) are in bad condition. The critical condition of the facilities is due to the age of the buildings which is presented in Table 7 below.
Rural Community Survey Report
9
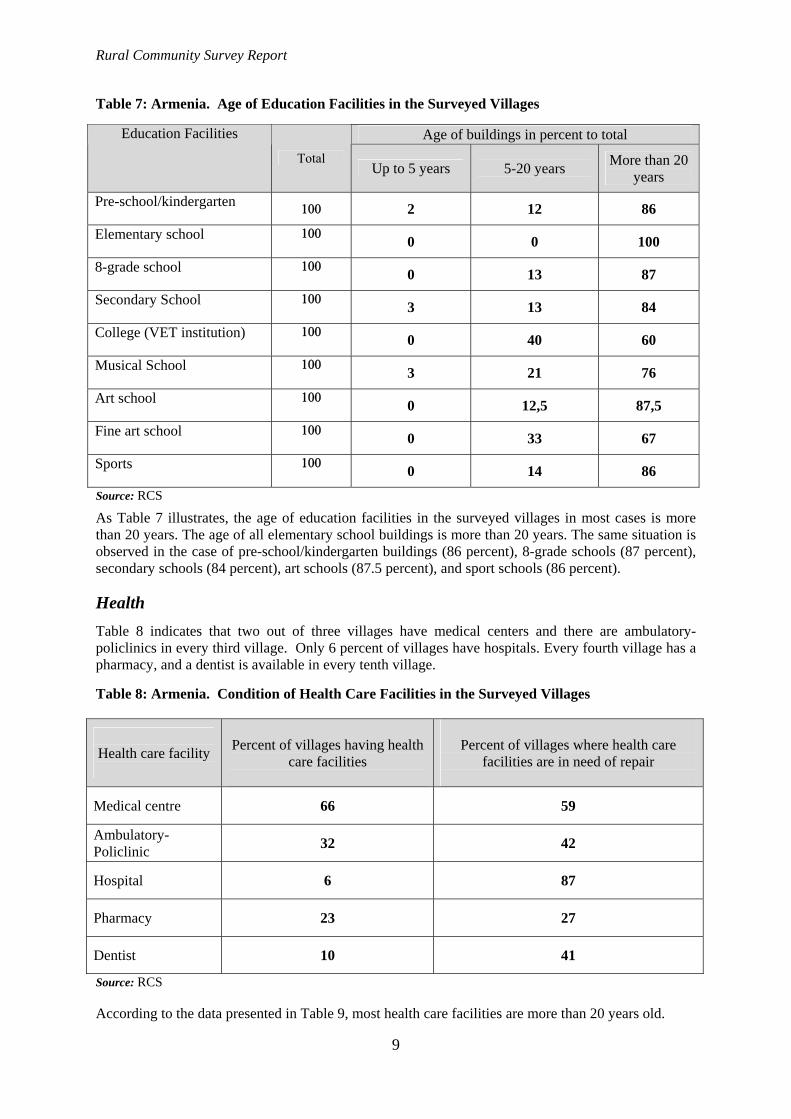
Table 7: Armenia. Age of Education Facilities in the Surveyed Villages
Age of buildings in percent to total Education Facilities
Total Up to 5 years
5-20 years
More than 20 years
Pre-school/kindergarten
100 2 12 86
Elementary school
100 0 0 100
8-grade school
100 0 13 87
Secondary School
100 3 13 84
College (VET institution)
100 0 40 60
Musical School
100 3 21 76
Art school
100 0 12,5 87,5
Fine art school
100 0 33 67
Sports
100 0 14 86 Source: RCS
As Table 7 illustrates, the age of education facilities in the surveyed villages in most cases is more than 20 years. The age of all elementary school buildings is more than 20 years. The same situation is observed in the case of pre-school/kindergarten buildings (86 percent), 8-grade schools (87 percent), secondary schools (84 percent), art schools (87.5 percent), and sport schools (86 percent).
Health
Table 8 indicates that two out of three villages have medical centers and there are ambulatory-policlinics in every third village. Only 6 percent of villages have hospitals. Every fourth village has a pharmacy, and a dentist is available in every tenth village. Table 8: Armenia. Condition of Health Care Facilities in the Surveyed Villages
Health care facility
Percent of villages having health
care facilities
Percent of villages where health care
facilities are in need of repair
Medical centre 66 59
Ambulatory-Policlinic 32 42
Hospital 6 87
Pharmacy 23 27
Dentist 10 41
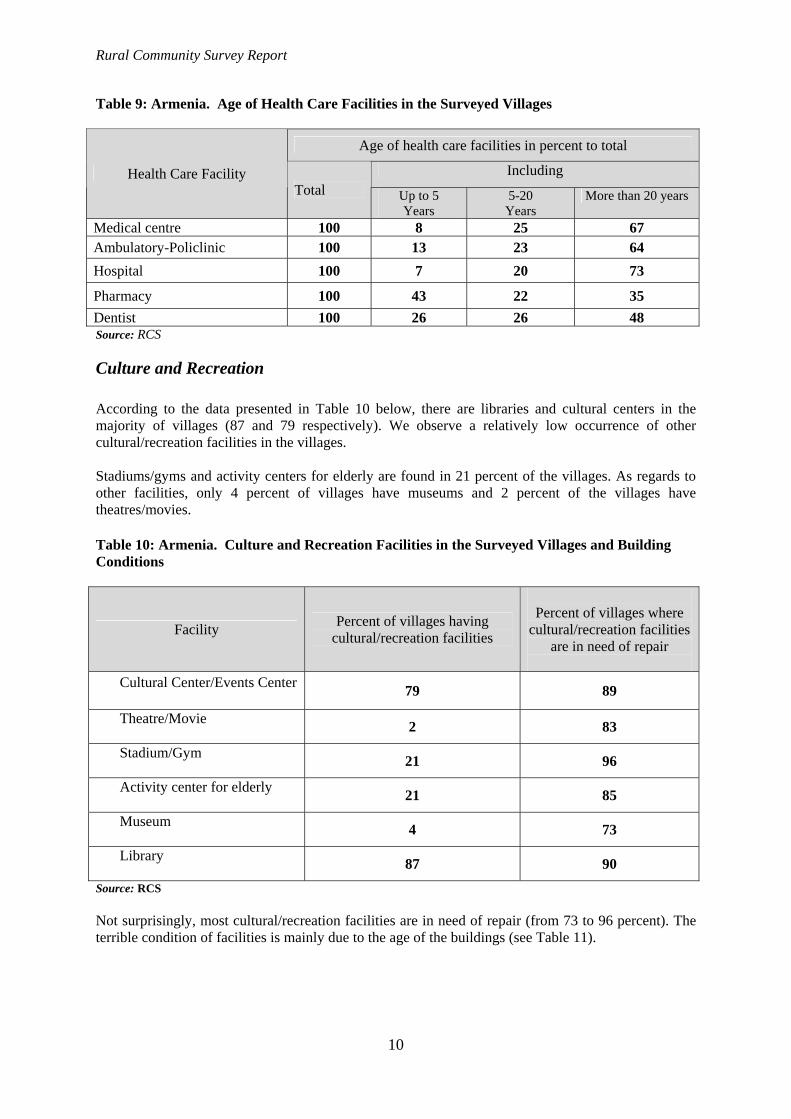
Source: RCS According to the data presented in Table 9, most health care facilities are more than 20 years old.
Rural Community Survey Report
10
Table 9: Armenia. Age of Health Care Facilities in the Surveyed Villages
Age of health care facilities in percent to total
Including Health Care Facility Total Up to 5
Years 5-20
Years More than 20 years
Medical centre 100 8 25 67 Ambulatory-Policlinic 100 13 23 64 Hospital 100 7 20 73
Pharmacy 100 43 22 35 Dentist 100 26 26 48 Source: RCS
Culture and Recreation According to the data presented in Table 10 below, there are libraries and cultural centers in the majority of villages (87 and 79 respectively). We observe a relatively low occurrence of other cultural/recreation facilities in the villages. Stadiums/gyms and activity centers for elderly are found in 21 percent of the villages. As regards to other facilities, only 4 percent of villages have museums and 2 percent of the villages have theatres/movies. Table 10: Armenia. Culture and Recreation Facilities in the Surveyed Villages and Building Conditions
Facility Percent of villages having cultural/recreation facilities
Percent of villages where
cultural/recreation facilities are in need of repair
Cultural Center/Events Center
79 89
Theatre/Movie 2 83
Stadium/Gym 21 96
Activity center for elderly 21 85
Museum 4 73
Library 87 90
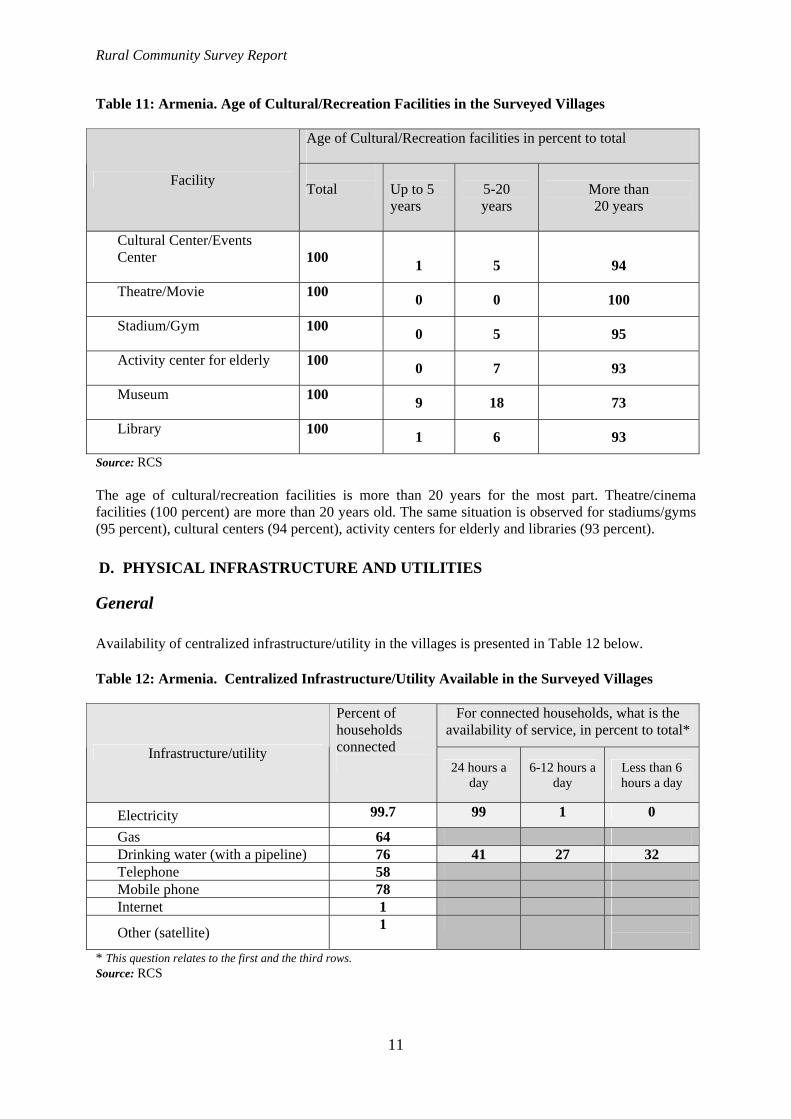
Source: RCS Not surprisingly, most cultural/recreation facilities are in need of repair (from 73 to 96 percent). The terrible condition of facilities is mainly due to the age of the buildings (see Table 11).
Rural Community Survey Report
11
Table 11: Armenia. Age of Cultural/Recreation Facilities in the Surveyed Villages
Age of Cultural/Recreation facilities in percent to total
Facility Total Up to 5
years
5-20 years
More than 20 years
Cultural Center/Events Center
100
1
5
94
Theatre/Movie
100 0 0 100
Stadium/Gym
100 0 5 95
Activity center for elderly
100 0 7 93
Museum
100 9 18 73
Library
100 1 6 93
Source: RCS The age of cultural/recreation facilities is more than 20 years for the most part. Theatre/cinema facilities (100 percent) are more than 20 years old. The same situation is observed for stadiums/gyms (95 percent), cultural centers (94 percent), activity centers for elderly and libraries (93 percent). D. PHYSICAL INFRASTRUCTURE AND UTILITIES
General Availability of centralized infrastructure/utility in the villages is presented in Table 12 below. Table 12: Armenia. Centralized Infrastructure/Utility Available in the Surveyed Villages
For connected households, what is the availability of service, in percent to total*
Infrastructure/utility
Percent of households connected 24 hours a
day 6-12 hours a
day Less than 6 hours a day
Electricity 99.7 99 1 0
Gas 64 Drinking water (with a pipeline) 76 41 27 32 Telephone 58 Mobile phone 78 Internet 1
Other (satellite) 1
* This question relates to the first and the third rows. Source: RCS
Rural Community Survey Report
12
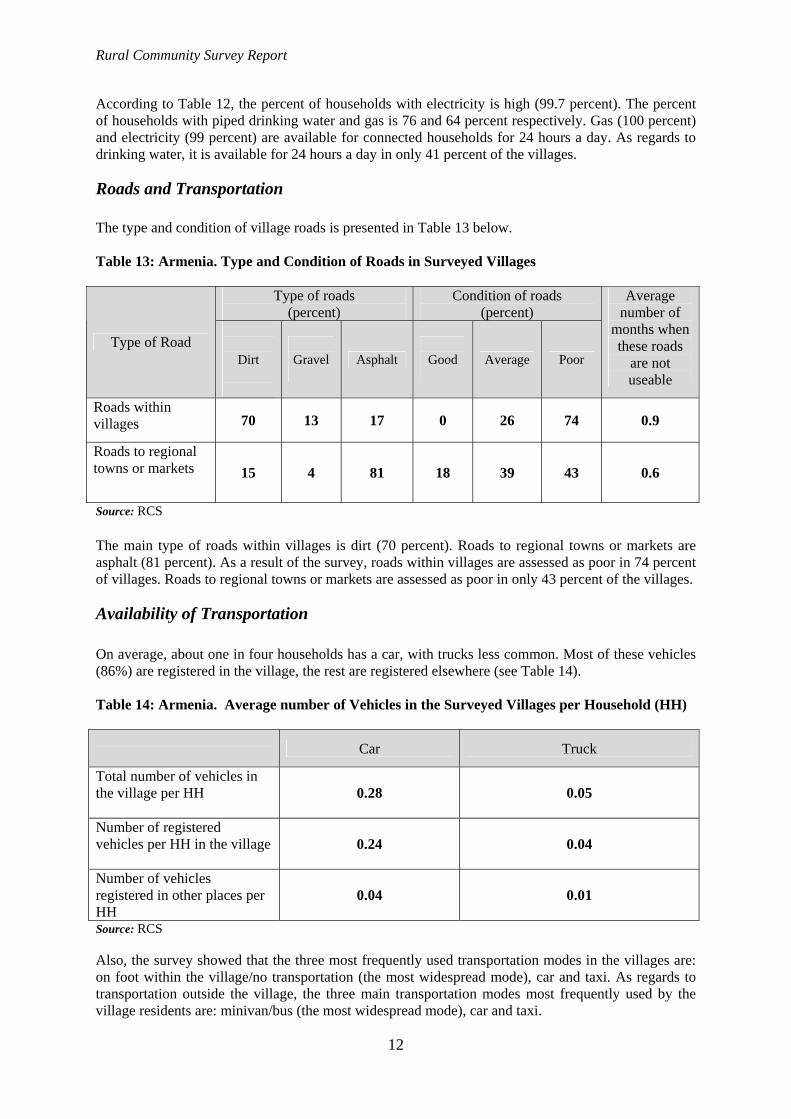
According to Table 12, the percent of households with electricity is high (99.7 percent). The percent of households with piped drinking water and gas is 76 and 64 percent respectively. Gas (100 percent) and electricity (99 percent) are available for connected households for 24 hours a day. As regards to drinking water, it is available for 24 hours a day in only 41 percent of the villages.
Roads and Transportation The type and condition of village roads is presented in Table 13 below. Table 13: Armenia. Type and Condition of Roads in Surveyed Villages
Type of roads (percent)
Condition of roads (percent)
Type of Road
Dirt
Gravel
Asphalt
Good
Average Poor
Average number of
months when these roads
are not useable
Roads within villages 70 13 17 0 26 74 0.9
Roads to regional towns or markets 15 4 81 18 39 43 0.6
Source: RCS
The main type of roads within villages is dirt (70 percent). Roads to regional towns or markets are asphalt (81 percent). As a result of the survey, roads within villages are assessed as poor in 74 percent of villages. Roads to regional towns or markets are assessed as poor in only 43 percent of the villages.
Availability of Transportation On average, about one in four households has a car, with trucks less common. Most of these vehicles (86%) are registered in the village, the rest are registered elsewhere (see Table 14). Table 14: Armenia. Average number of Vehicles in the Surveyed Villages per Household (HH)
Car Truck
Total number of vehicles in the village per HH
0.28 0.05
Number of registered vehicles per HH in the village
0.24 0.04
Number of vehicles registered in other places per HH
0.04 0.01
Source: RCS Also, the survey showed that the three most frequently used transportation modes in the villages are: on foot within the village/no transportation (the most widespread mode), car and taxi. As regards to transportation outside the village, the three main transportation modes most frequently used by the village residents are: minivan/bus (the most widespread mode), car and taxi.
Rural Community Survey Report
13
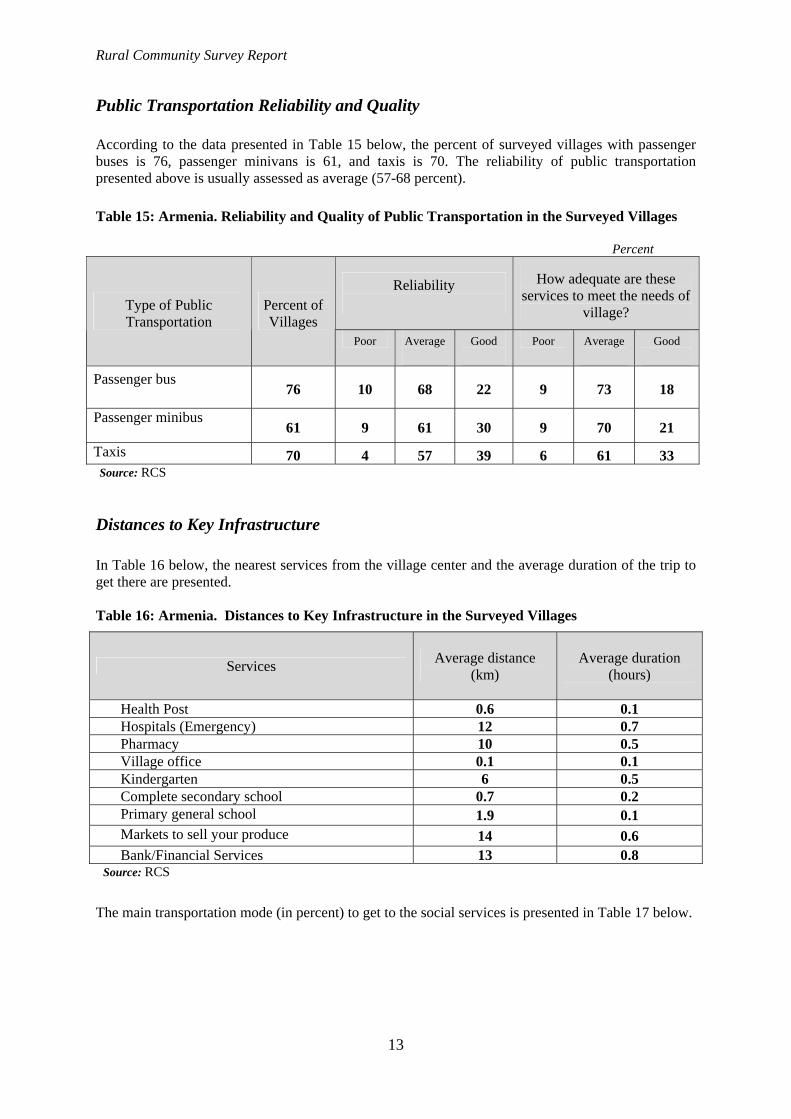
Public Transportation Reliability and Quality According to the data presented in Table 15 below, the percent of surveyed villages with passenger buses is 76, passenger minivans is 61, and taxis is 70. The reliability of public transportation presented above is usually assessed as average (57-68 percent). Table 15: Armenia. Reliability and Quality of Public Transportation in the Surveyed Villages
Percent
Reliability
How adequate are these services to meet the needs of
village? Type of Public Transportation
Percent of Villages
Poor Average
Good
Poor Average
Good
Passenger bus
76 10 68 22 9 73 18
Passenger minibus 61 9 61 30 9 70 21 Taxis 70 4 57 39 6 61 33 Source: RCS
Distances to Key Infrastructure In Table 16 below, the nearest services from the village center and the average duration of the trip to get there are presented. Table 16: Armenia. Distances to Key Infrastructure in the Surveyed Villages
Source: RCS
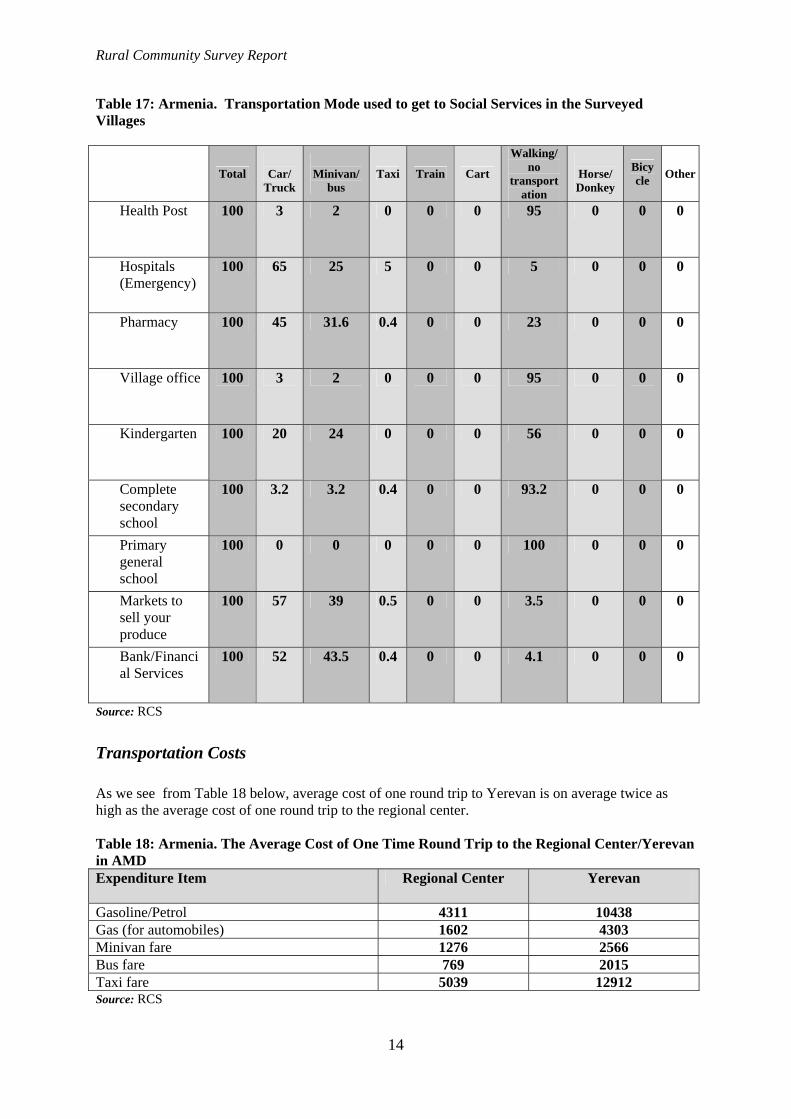
The main transportation mode (in percent) to get to the social services is presented in Table 17 below.
Services Average distance (km)
Average duration
(hours)
Health Post 0.6 0.1 Hospitals (Emergency) 12 0.7 Pharmacy 10 0.5 Village office 0.1 0.1 Kindergarten 6 0.5 Complete secondary school 0.7 0.2 Primary general school 1.9 0.1 Markets to sell your produce 14 0.6 Bank/Financial Services 13 0.8
Rural Community Survey Report
14
Table 17: Armenia. Transportation Mode used to get to Social Services in the Surveyed Villages
Total
Car/ Truck
Minivan/
bus Taxi Train Cart
Walking/no
transportation
Horse/Donkey
Bicycle Other
Health Post 100 3 2 0 0 0 95 0 0 0
Hospitals (Emergency)
100 65 25 5 0 0 5 0 0 0
Pharmacy 100 45 31.6 0.4 0 0 23 0 0 0
Village office 100 3 2 0 0 0 95 0 0 0
Kindergarten 100 20 24 0 0 0 56 0 0 0
Complete secondary school
100 3.2 3.2 0.4 0 0 93.2 0 0 0
Primary general school
100 0 0 0 0 0 100 0 0 0
Markets to sell your produce
100 57 39 0.5 0 0 3.5 0 0 0
Bank/Financial Services
100 52 43.5 0.4 0 0 4.1 0 0 0
Source: RCS
Transportation Costs As we see from Table 18 below, average cost of one round trip to Yerevan is on average twice as high as the average cost of one round trip to the regional center. Table 18: Armenia. The Average Cost of One Time Round Trip to the Regional Center/Yerevan in AMD Expenditure Item Regional Center Yerevan
Gasoline/Petrol 4311 10438 Gas (for automobiles) 1602 4303 Minivan fare 1276 2566 Bus fare 769 2015 Taxi fare 5039 12912 Source: RCS
Rural Community Survey Report
15
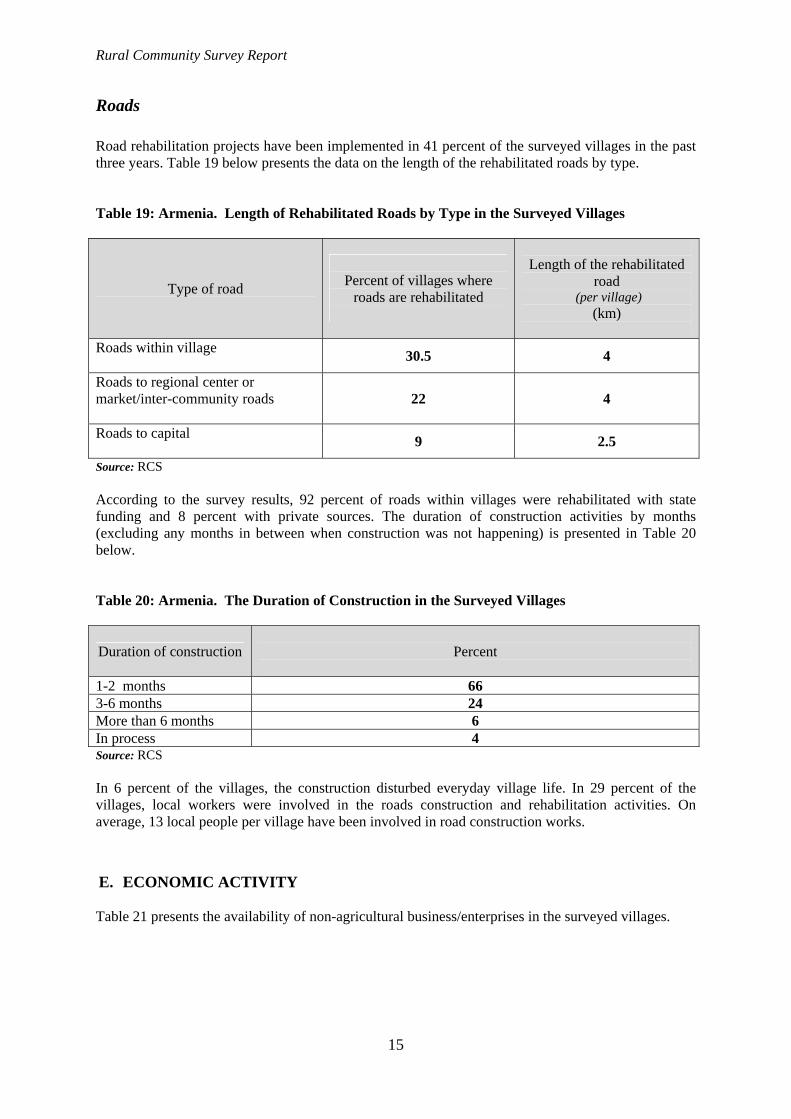
Roads Road rehabilitation projects have been implemented in 41 percent of the surveyed villages in the past three years. Table 19 below presents the data on the length of the rehabilitated roads by type. Table 19: Armenia. Length of Rehabilitated Roads by Type in the Surveyed Villages
Type of road
Percent of villages where
roads are rehabilitated
Length of the rehabilitated
road (per village)
(km)
Roads within village 30.5 4
Roads to regional center or market/inter-community roads
22 4
Roads to capital 9 2.5
Source: RCS
According to the survey results, 92 percent of roads within villages were rehabilitated with state funding and 8 percent with private sources. The duration of construction activities by months (excluding any months in between when construction was not happening) is presented in Table 20 below. Table 20: Armenia. The Duration of Construction in the Surveyed Villages
Duration of construction
Percent
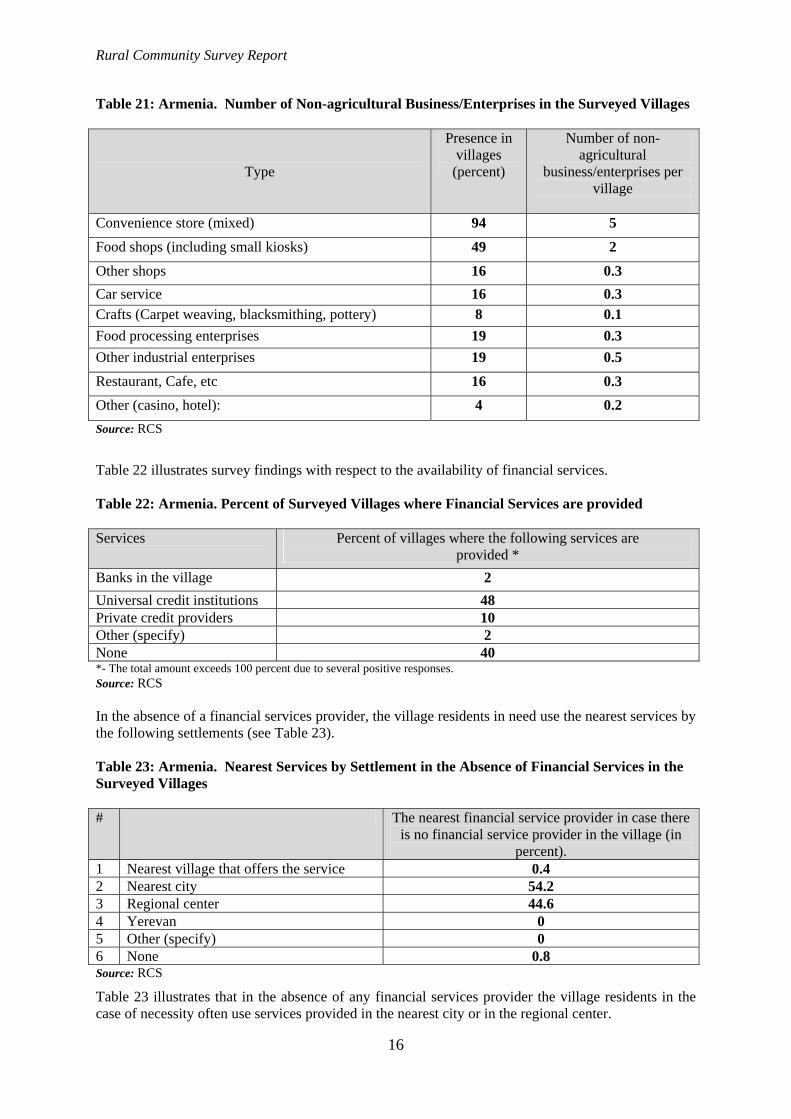
1-2 months 66 3-6 months 24 More than 6 months 6 In process 4 Source: RCS In 6 percent of the villages, the construction disturbed everyday village life. In 29 percent of the villages, local workers were involved in the roads construction and rehabilitation activities. On average, 13 local people per village have been involved in road construction works. E. ECONOMIC ACTIVITY Table 21 presents the availability of non-agricultural business/enterprises in the surveyed villages.
Rural Community Survey Report
16
Table 21: Armenia. Number of Non-agricultural Business/Enterprises in the Surveyed Villages
Type
Presence in villages
(percent)
Number of non-agricultural
business/enterprises per village
Convenience store (mixed) 94 5 Food shops (including small kiosks) 49 2
Other shops 16 0.3 Car service 16 0.3 Crafts (Carpet weaving, blacksmithing, pottery) 8 0.1 Food processing enterprises 19 0.3 Other industrial enterprises 19 0.5 Restaurant, Cafe, etc 16 0.3 Other (casino, hotel): 4 0.2 Source: RCS
Table 22 illustrates survey findings with respect to the availability of financial services. Table 22: Armenia. Percent of Surveyed Villages where Financial Services are provided Services Percent of villages where the following services are
provided * Banks in the village 2 Universal credit institutions 48 Private credit providers 10 Other (specify) 2 None 40 *- The total amount exceeds 100 percent due to several positive responses. Source: RCS In the absence of a financial services provider, the village residents in need use the nearest services by the following settlements (see Table 23).
Table 23: Armenia. Nearest Services by Settlement in the Absence of Financial Services in the Surveyed Villages # The nearest financial service provider in case there
is no financial service provider in the village (in percent).
1 Nearest village that offers the service 0.4 2 Nearest city 54.2 3 Regional center 44.6 4 Yerevan 0 5 Other (specify) 0 6 None 0.8 Source: RCS
Table 23 illustrates that in the absence of any financial services provider the village residents in the case of necessity often use services provided in the nearest city or in the regional center.

Rural Community Survey Report
17
F. AGRICULTURE AND IRRIGATION Percent of farming households by type of agricultural activity and by marz is presented in Table 24 below. Table 24: Armenia. Percent of Farming Households by Type of Agricultural Activity
from which Marz Farming On the total area of
the owned land (kitchen plot is
included )
Only on the kitchen plot
Cattle-breeding
Aragatsotn 83 78.3 21.7 58
Ararat 84 89.3 10.7 34 Armavir 76 77.6 22.4 20 Gegharkunik 97 47.4 52.6 57 Lori 86 65.1 34.9 62 Kotayk 68 69.1 30.9 44 Shirak 71 88.7 11.3 65 Syunik 83 90.4 9.6 70 Vayots Dzor 90 82.2 17.8 64 Tavush 83 80.7 19.3 41
Total 83 69.9 30.1 49 Source: RCS
Total area of agricultural land currently cultivated by households per village is 554 ha (in average). The average total area of cultivated agricultural land for villages in Gegharkunik is 939 hectares (ha), whereas in Vayots Dzor it is estimated to be 280 ha (see Table 25). Table 25: Armenia. Total Area of Agricultural Land Currently Cultivated Per Village in the Surveyed Villages Presented by Marz
Marz Total area of agricultural land cultivated per village (ha)
Aragatsotn 742 Ararat 359
Armavir 558 Gegharkunik 939
Lori 350 Kotayk 440 Shirak 676 Syunik 651
Vayots Dzor 280 Tavush 357 Total 554
Source: RCS
The five most common crops cultivated in the communities are presented in Table 26 below.
Rural Community Survey Report
18
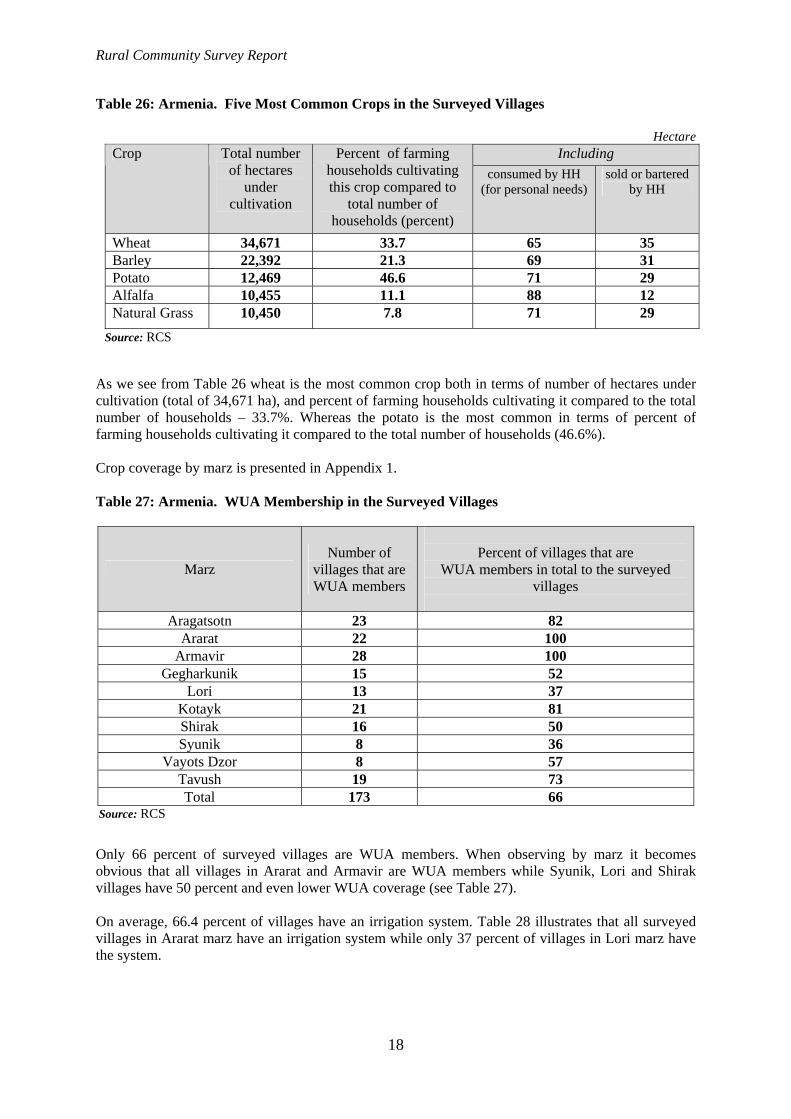
Table 26: Armenia. Five Most Common Crops in the Surveyed Villages
Hectare Including Crop Total number
of hectares under
cultivation
Percent of farming households cultivating this crop compared to
total number of households (percent)
consumed by HH (for personal needs)
sold or bartered by HH
Wheat 34,671 33.7 65 35 Barley 22,392 21.3 69 31 Potato 12,469 46.6 71 29 Alfalfa 10,455 11.1 88 12 Natural Grass 10,450 7.8 71 29
Source: RCS
As we see from Table 26 wheat is the most common crop both in terms of number of hectares under cultivation (total of 34,671 ha), and percent of farming households cultivating it compared to the total number of households – 33.7%. Whereas the potato is the most common in terms of percent of farming households cultivating it compared to the total number of households (46.6%). Crop coverage by marz is presented in Appendix 1. Table 27: Armenia. WUA Membership in the Surveyed Villages
Marz Number of
villages that are WUA members
Percent of villages that are
WUA members in total to the surveyed villages
Aragatsotn 23 82
Ararat 22 100 Armavir 28 100
Gegharkunik 15 52 Lori 13 37
Kotayk 21 81 Shirak 16 50 Syunik 8 36
Vayots Dzor 8 57 Tavush 19 73 Total 173 66
Source: RCS
Only 66 percent of surveyed villages are WUA members. When observing by marz it becomes obvious that all villages in Ararat and Armavir are WUA members while Syunik, Lori and Shirak villages have 50 percent and even lower WUA coverage (see Table 27). On average, 66.4 percent of villages have an irrigation system. Table 28 illustrates that all surveyed villages in Ararat marz have an irrigation system while only 37 percent of villages in Lori marz have the system.

Rural Community Survey Report
19
Table 28: Armenia. Irrigation Systems in the Surveyed Villages
Source: RCS
Crop irrigation practices by marz are presented in Table 29 below. Table 29: Armenia. Irrigation of Crops Using Irrigation Practices in the Surveyed Villages (by Marz)
Including Marz Total Irrigation (canal)
Deep or other well or
drinking water
(pipeline)
Only natural sources,
rivers/rain fed
Irrigation, deep well
and drinking
water
Irrigation and natural sources,
rivers/rain fed
Not watered/ irrigated
Aragatsotn 100 43 2 10 1 4 40
Ararat 100 76 16 6 2 0 0
Armavir 100 74 16 0 0 2
Gegharkunik 100 34 12 15 4 17 18
Lori 100 25 3 27 0 0 45
Kotayk 100 62 17 5 0 5 11
Shirak 100 28 0.1 2 35 0 34,9
Syunik 100 63 0 2 0 0 35
Vayots Dzor 100 62 4 1 9 9 15
Tavush 100 32 4 30 0.5 0 33,5
Total 100 48 9 11 5 5 22
Source: RCS
Overall, 66 percent of arable land was irrigated during the previous main agricultural season.
Marz Percent of villages having irrigation systems
Aragatsotn 50 Ararat 100
Armavir 96 Gegharkunik 69
Lori 37 Kotayk 85 Shirak 56 Syunik 45
Vayots Dzor 86 Tavush 62
Total 66

Rural Community Survey Report
20
Table 30: Armenia. Percent of Irrigated Land in the Surveyed Villages during the Previous Main Agricultural Season (by Marz)
Source: RCS Forty percent of all surveyed villages received water on time during the last main agricultural season, although that indicator fluctuates when observing the picture by marz. As Table 31 illustrates, only 17 percent of the surveyed villages of Lori marz received water on time during the last main agricultural season, whereas, 71 percent of Vayots Dzor villages received water on time. Table 31: Armenia. Percent of On Time Water Receipt in the Surveyed Villages during the Previous Main Agricultural Season (by Marz)
Marz Percent of Villages
Aragatsotn 28 Ararat 55
Armavir 68 Gegharkunik 27
Lori 17 Kotayk 46 Shirak 44 Syunik 36
Vayots Dzor 71 Tavush 31 Total 40
Source: RCS
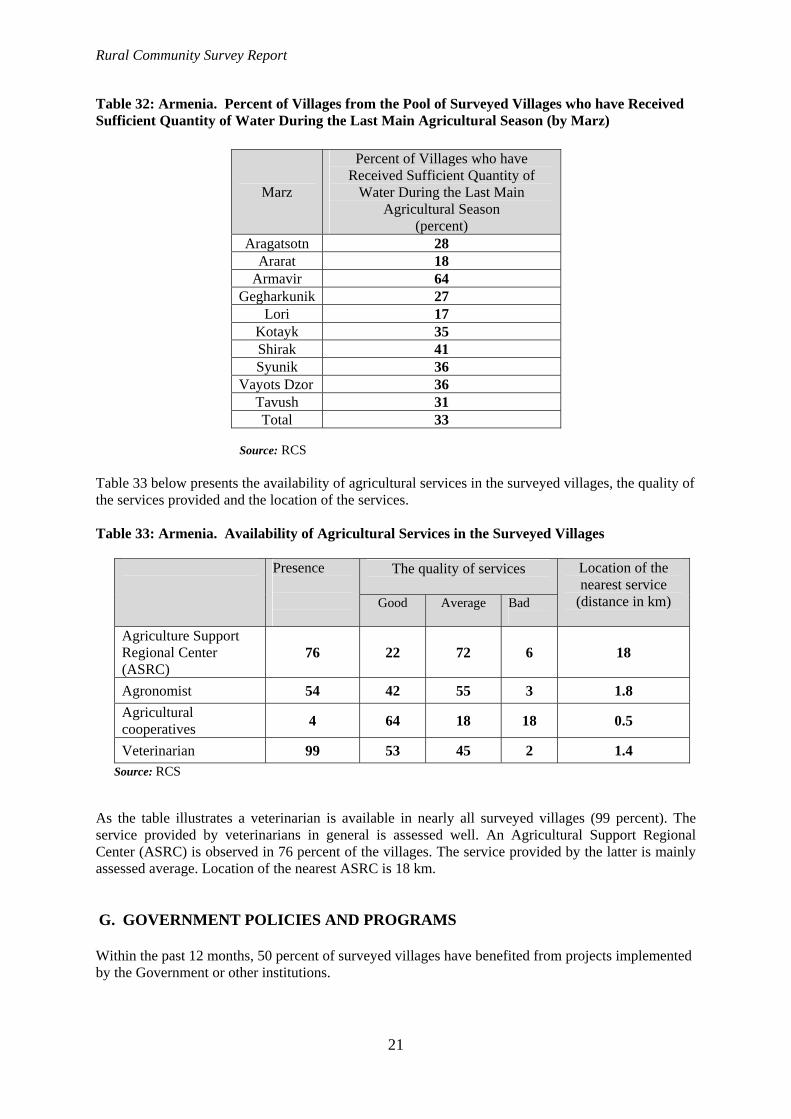
The data presented in Table 32 show that 33 percent of villages have received a sufficient quantity of water during the last main agricultural season. The percent of sufficient water receivers was the lowest in Lori marz (only 17 percent), and the highest in Armavir marz (64 percent).
Marz
Percent of irrigated land
Aragatsotn 63 Ararat 77
Armavir 90 Gegharkunik 64
Lori 37 Kotayk 48 Shirak 68 Syunik 51
Vayots Dzor 66 Tavush 73 Total 66
Rural Community Survey Report
21
Table 32: Armenia. Percent of Villages from the Pool of Surveyed Villages who have Received Sufficient Quantity of Water During the Last Main Agricultural Season (by Marz)
Source: RCS Table 33 below presents the availability of agricultural services in the surveyed villages, the quality of the services provided and the location of the services. Table 33: Armenia. Availability of Agricultural Services in the Surveyed Villages
The quality of services
Presence
Good Average Bad
Location of the nearest service
(distance in km)
Agriculture Support Regional Center (ASRC)
76 22 72 6 18
Agronomist 54 42 55 3 1.8 Agricultural cooperatives 4 64 18 18 0.5
Veterinarian 99 53 45 2 1.4 Source: RCS
As the table illustrates a veterinarian is available in nearly all surveyed villages (99 percent). The service provided by veterinarians in general is assessed well. An Agricultural Support Regional Center (ASRC) is observed in 76 percent of the villages. The service provided by the latter is mainly assessed average. Location of the nearest ASRC is 18 km. G. GOVERNMENT POLICIES AND PROGRAMS
Within the past 12 months, 50 percent of surveyed villages have benefited from projects implemented by the Government or other institutions.
Marz
Percent of Villages who have Received Sufficient Quantity of
Water During the Last Main Agricultural Season
(percent) Aragatsotn 28
Ararat 18 Armavir 64
Gegharkunik 27 Lori 17
Kotayk 35 Shirak 41 Syunik 36
Vayots Dzor 36 Tavush 31 Total 33
Rural Community Survey Report
22
III. CONCLUSIONS AND RECOMMENDATIONS
The 2008 Rural Community Survey carried out by the RA NSS has shown that in villages most of the social infrastructure facilities are in bad condition. Most of those facilities are functioning in old buildings (20 years and older). Therefore, the buildings are in need of repair. Physical infrastructure and utilities (with the exception of electricity) are in need of improvement. Roads within villages are mainly dirt and are in bad condition. In 31 of the surveyed villages roads within the village have been rehabilitated. The average length of the rehabilitated road within the village is 4 kilometers per village. In terms of non-agricultural economic activity, the most frequently found enterprises are shops. At the same time, universal credit institutions are the most widespread among financial service providers (48% of villages). Recommendations General Recommendations
(a) It is strongly recommended to have the Rural Community Survey conducted annually to record the impact dynamics of rural development programs, and particularly the MCA-Armenia Program. As a result, aggregated database with time-series data collected through the 2008-2011 Rural Community Surveys would be created and the list of surveyed communities would be developed. In addition, the annually conducted RCS would help to reduce the number of questions included in the overloaded ILCS Questionnaire.
(b) If a decision is made to conduct the survey annually, then a detailed approach to the next rounds would be developed.
(c) To have a valid comparison, we could also consider a separate HH survey in those communities where MCA-Armenia Projects are implemented.
(d) In the survey budget for the next rounds it is recommended to include a separate position for data analyst, so the survey results are analyzed more comprehensively and presented in a more interesting manner.
(e) For the next rounds it is recommended to have double-key entry and data verification practices.
Questionnaire-related Recommendations If future rounds are implemented, the RCS questionnaire should be revised.
(a) Given that the health post and ambulatory-policlinic are separate items in table B 2.1, it is recommended to have them separated in C 4.1 as well.
(b) In column 5 of the table C 2.2. it is recommended to change the unit of measurement for the duration when roads are not useable from months to days, given that the roads are not usable only for some days during a year and not months.
(c) In column 2 of table 4.1 the “hours” can be changed to “minutes,” given that the duration to get somewhere is most often expressed by minutes.
(d) In table D1 of the questionnaire the word “shop” can be replaced with the word “trade station.”

Rural Community Survey Report
23
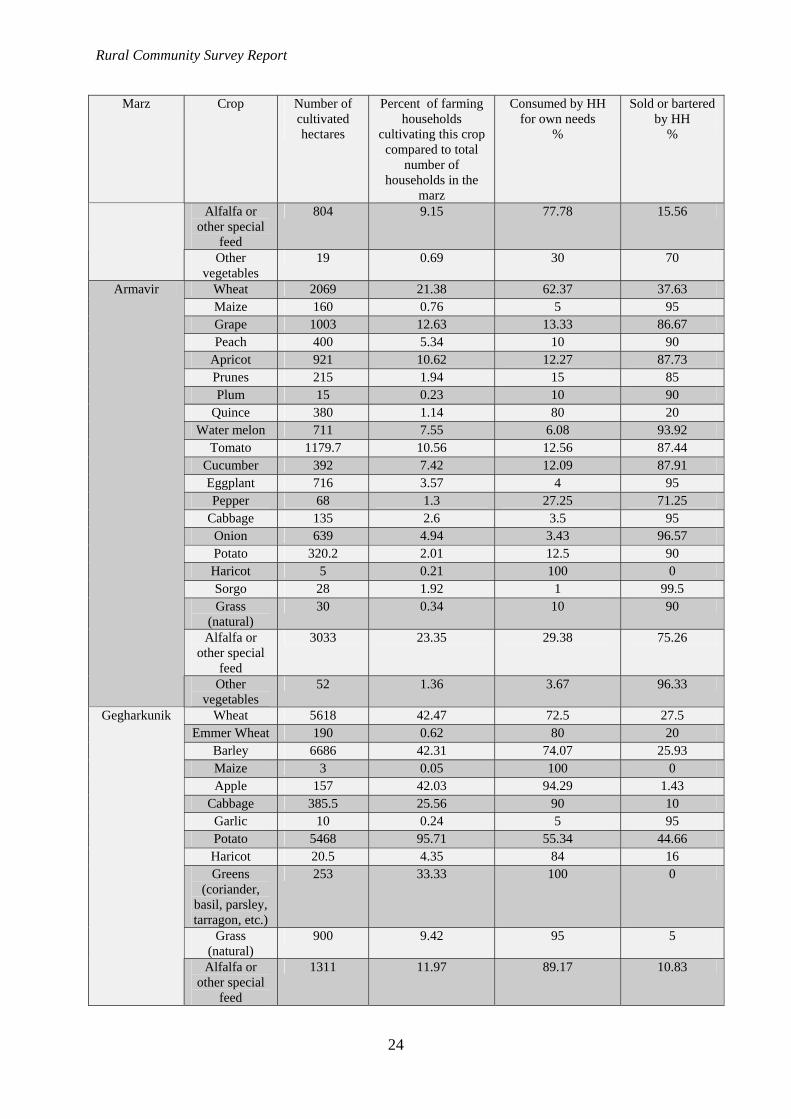
APPENDIX 1: CROP COVERAGE BY MARZ
Marz Crop Number of cultivated hectares
Percent of farming households
cultivating this crop compared to total
number of households in the
marz
Consumed by HH for own needs
%
Sold or bartered by HH
%
Wheat 3116 23.68 75.83 24.17 Emmer Wheat 10 0.11 20 80
Barley 4362 26.47 68.81 31.19 Apple 740 14.34 50.83 49.17 Grape 575 9.57 54 46
Apricot 73 0.97 15 85 Pear 35 2.52 80 20
Sweet Cherry 124 5.46 20 80 Walnut, hazelnut
20 1.89 50 50
Tomato 51.7 3.02 78 22 Cucumber 30 3.99 10 90 Cabbage 51 1.77 63.33 36.67 Carrot 1.5 0.86 62.5 37.5 Onion 10.6 2.29 50 50 Garlic 2 0.89 80 20 Potato 733 32.11 62.37 37.63
Sunflower 20 0.8 0 100 Grass
(natural) 2725 10.85 90 10
Alfalfa or other special
feed
3067 18.93 75.71 24.29
Other fruits 370 6.64 47.5 52.5
Aragatsotn
Other vegetables
5 0.11 100 0
Wheat 1273 9.74 64.62 35.38 Maize 11 0.4 5 95 Apple 42 0.8 21.33 78.67 Grape 1006 27.4 19.47 80.53 Peach 352 7.24 19.55 80.45
Apricot 592 21.67 21.67 78.33 Pear 111 1.63 23.33 76.67
Water melon 320 2.3 15 85 Strawberry 4 0.5 10 90
Tomato 952 32.29 36.18 63.82 Cucumber 9 5.09 75 25 Eggplant 36 1.84 40 60 Pepper 32 3.17 25 75 Onion 40 0.25 10 90 Garlic 7 2.79 40 60 Sorgo 41 2.43 5.5 94.5
Ararat
Greens (coriander,
basil, parsley, tarragon, etc.)
62 5.86 28.33 71.67
Rural Community Survey Report
24
Marz Crop Number of cultivated hectares
Percent of farming households
cultivating this crop compared to total
number of households in the
marz
Consumed by HH for own needs
%
Sold or bartered by HH
%
Alfalfa or other special
feed
804 9.15 77.78 15.56
Other vegetables
19 0.69 30 70
Wheat 2069 21.38 62.37 37.63 Maize 160 0.76 5 95 Grape 1003 12.63 13.33 86.67 Peach 400 5.34 10 90
Apricot 921 10.62 12.27 87.73 Prunes 215 1.94 15 85 Plum 15 0.23 10 90
Quince 380 1.14 80 20 Water melon 711 7.55 6.08 93.92
Tomato 1179.7 10.56 12.56 87.44 Cucumber 392 7.42 12.09 87.91 Eggplant 716 3.57 4 95 Pepper 68 1.3 27.25 71.25
Cabbage 135 2.6 3.5 95 Onion 639 4.94 3.43 96.57 Potato 320.2 2.01 12.5 90 Haricot 5 0.21 100 0 Sorgo 28 1.92 1 99.5 Grass
(natural) 30 0.34 10 90
Alfalfa or other special
feed
3033 23.35 29.38 75.26
Armavir
Other vegetables
52 1.36 3.67 96.33
Wheat 5618 42.47 72.5 27.5 Emmer Wheat 190 0.62 80 20
Barley 6686 42.31 74.07 25.93 Maize 3 0.05 100 0 Apple 157 42.03 94.29 1.43
Cabbage 385.5 25.56 90 10 Garlic 10 0.24 5 95 Potato 5468 95.71 55.34 44.66 Haricot 20.5 4.35 84 16 Greens
(coriander, basil, parsley, tarragon, etc.)
253 33.33 100 0
Grass (natural)
900 9.42 95 5
Gegharkunik
Alfalfa or other special
feed
1311 11.97 89.17 10.83

Rural Community Survey Report
25
Marz Crop Number of cultivated hectares
Percent of farming households
cultivating this crop compared to total
number of households in the
marz
Consumed by HH for own needs
%
Sold or bartered by HH
%
Wheat 3226.5 35.72 65.65 31.74 Barley 917 11.61 77.5 19.13 Maize 361 9.19 50 50 Apple 304.4 30.16 94.44 5.56 Grape 16.4 0.87 55 45 Peach 15 1.99 30 70 Pear 136 19.88 92.86 7.14 Plum 0.4 0.03 100 0
Cherry 0.4 0.03 100 0 Walnut, hazelnut
30.4 3.78 60 40
Cucumber 10 0.71 100 0 Cabbage 123.33 15.25 90 10 Carrot 10 1.49 50 50 Garlic 3 0.99 50 50 Potato 1753.3 75.31 80.31 19.69
Red beet 20 0.99 50 50 Sunflower 450 1.97 15 85
Haricot 10 1.07 100 0 Grass
(natural) 1497 16.23 99 1
Alfalfa or other special
feed
340 3.42 100 0
Other fruits (specify)
298.5 38.07 86.67 13.33
Lori
Other vegetables (specify)
258.1 44.63 94.71 5.29
Wheat 3637 24.28 80.05 19.95 Emmer Wheat 1212.6 7.02 35 65
Barley 1271.7 10.64 87.08 13.17 Maize 1 0.04 70 30 Apple 1192 40.28 55 46.5 Grape 65 6.53 25 75
Apricot 138 17.14 30 70 Pear 197 12.46 51.25 48.75
Prunes 6 1.52 100 0 Sweet Cherry 17.4 5.47 67.5 32.5
Tomato 38.7 5.76 64.75 24 Cucumber 6.2 3.71 63.33 36.67 Cabbage 66.3 2.8 51.2 30.8 Carrot 46 4.72 28.75 51.25 Onion 9.7 1.21 80 20 Potato 214 4.95 79 21
Red beet 3 0.23 7 3
Kotayk
Haricot 32 8.59 44 56
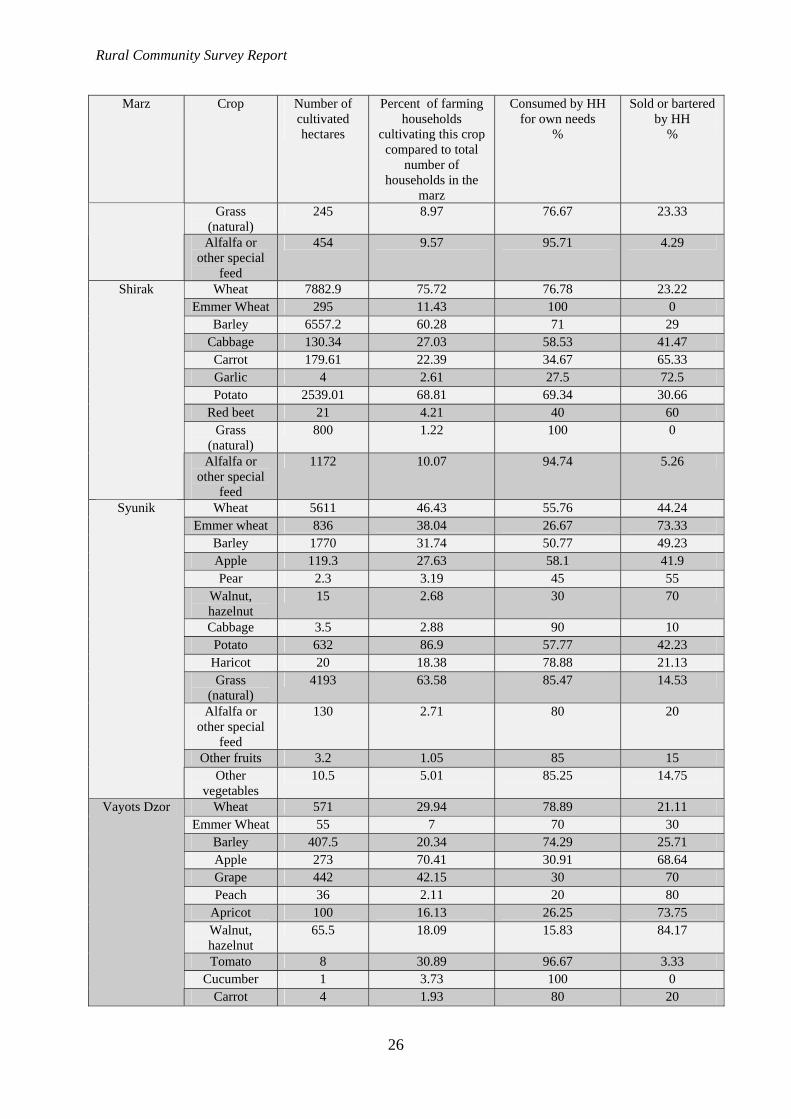
Rural Community Survey Report
26
Marz Crop Number of cultivated hectares
Percent of farming households
cultivating this crop compared to total
number of households in the
marz
Consumed by HH for own needs
%
Sold or bartered by HH
%
Grass (natural)
245 8.97 76.67 23.33
Alfalfa or other special
feed
454 9.57 95.71 4.29
Wheat 7882.9 75.72 76.78 23.22 Emmer Wheat 295 11.43 100 0
Barley 6557.2 60.28 71 29 Cabbage 130.34 27.03 58.53 41.47 Carrot 179.61 22.39 34.67 65.33 Garlic 4 2.61 27.5 72.5 Potato 2539.01 68.81 69.34 30.66
Red beet 21 4.21 40 60 Grass
(natural) 800 1.22 100 0
Shirak
Alfalfa or other special
feed
1172 10.07 94.74 5.26
Wheat 5611 46.43 55.76 44.24 Emmer wheat 836 38.04 26.67 73.33
Barley 1770 31.74 50.77 49.23 Apple 119.3 27.63 58.1 41.9 Pear 2.3 3.19 45 55
Walnut, hazelnut
15 2.68 30 70
Cabbage 3.5 2.88 90 10 Potato 632 86.9 57.77 42.23 Haricot 20 18.38 78.88 21.13 Grass
(natural) 4193 63.58 85.47 14.53
Alfalfa or other special
feed
130 2.71 80 20
Other fruits 3.2 1.05 85 15
Syunik
Other vegetables
10.5 5.01 85.25 14.75
Wheat 571 29.94 78.89 21.11 Emmer Wheat 55 7 70 30
Barley 407.5 20.34 74.29 25.71 Apple 273 70.41 30.91 68.64 Grape 442 42.15 30 70 Peach 36 2.11 20 80
Apricot 100 16.13 26.25 73.75 Walnut, hazelnut
65.5 18.09 15.83 84.17
Tomato 8 30.89 96.67 3.33 Cucumber 1 3.73 100 0
Vayots Dzor
Carrot 4 1.93 80 20

Rural Community Survey Report
27
Marz Crop Number of cultivated hectares
Percent of farming households
cultivating this crop compared to total
number of households in the
marz
Consumed by HH for own needs
%
Sold or bartered by HH
%
Onion 17.4 18.56 77.5 22.5 Potato 72.9 37.46 86 13.5 Haricot 17.5 16.07 88.33 11.67
Alfalfa or other special
feed
127.5 10.33 76.25 23.75
Wheat 1815 37.04 88.61 2.89 Emmer wheat 45 1.79 30 70
Barley 401 9.13 75.83 24.17 Maize 671 37.39 89.72 6.56 Apple 15 3.64 86.67 13.33 Grape 750 29.03 30.42 69.58 Peach 166 3.13 12.5 87.5 Prunes 90 1.79 30 0 Plum 47 19.13 74.17 21.33 Fig 0.1 0.5 100 0
Pomegranate 0.1 0.17 100 0 Cherry 8 1.95 100 0 Cornel 25.5 5.75 12.5 87.5
Water melon 56 0.72 35 65 Tomato 99 7.68 85 1.67
Cucumber 21.9 11.8 88 12 Cabbage 3 5.34 100 0 Onion 70 0.26 90 0 Garlic 90 2.1 35 0 Potato 737 58 94.4 5.75
Red beet 70 2.55 100 0 Sunflower 891 5.53 1 99
Haricot 410.5 48.3 69 31 Tobacco 17.3 0.59 0 100
Tavush
Grass (natural)
60 0.75 90 10
Rural Community Survey Report
28
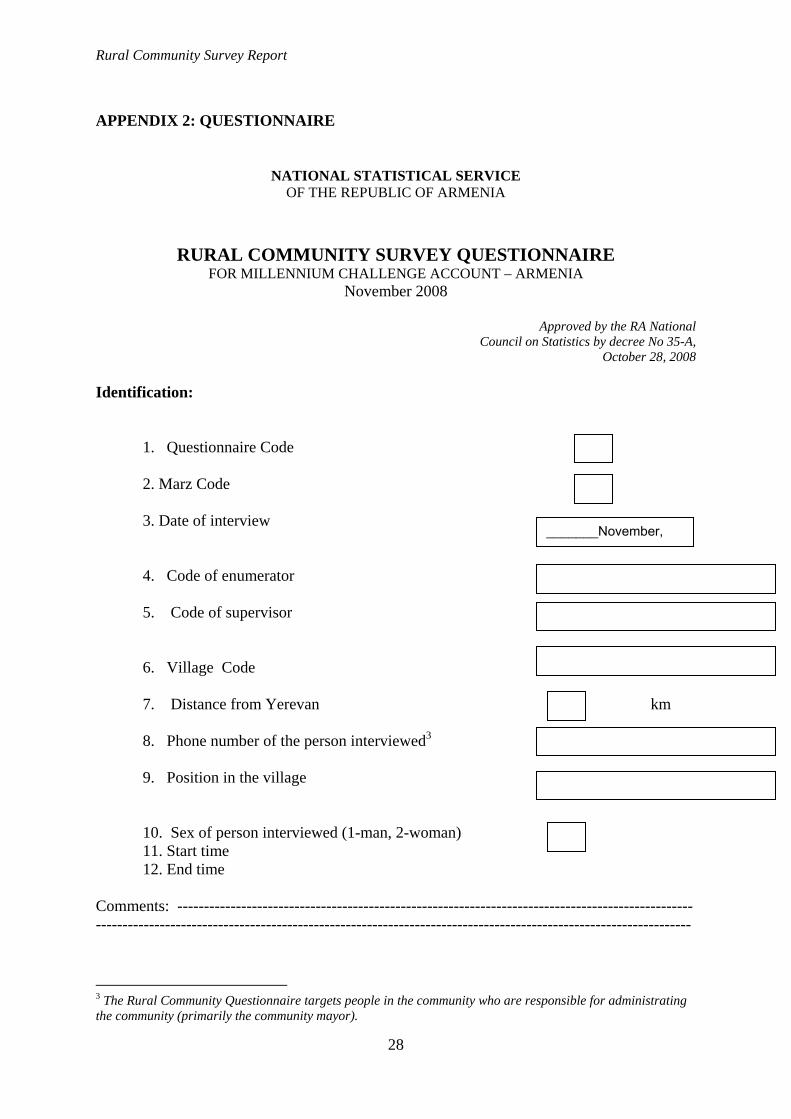
APPENDIX 2: QUESTIONNAIRE
NATIONAL STATISTICAL SERVICE OF THE REPUBLIC OF ARMENIA
RURAL COMMUNITY SURVEY QUESTIONNAIRE FOR MILLENNIUM CHALLENGE ACCOUNT – ARMENIA
November 2008
Approved by the RA National Council on Statistics by decree No 35-A,
October 28, 2008
Identification:
1. Questionnaire Code 2. Marz Code 3. Date of interview 4. Code of enumerator 5. Code of supervisor 6. Village Code 7. Distance from Yerevan km 8. Phone number of the person interviewed3 9. Position in the village
10. Sex of person interviewed (1-man, 2-woman) 11. Start time 12. End time
Comments: -----------------------------------------------------------------------------------------------------------------------------------------------------------------------------------------------------------------
3 The Rural Community Questionnaire targets people in the community who are responsible for administrating the community (primarily the community mayor).
_______November,
Rural Community Survey Report
29
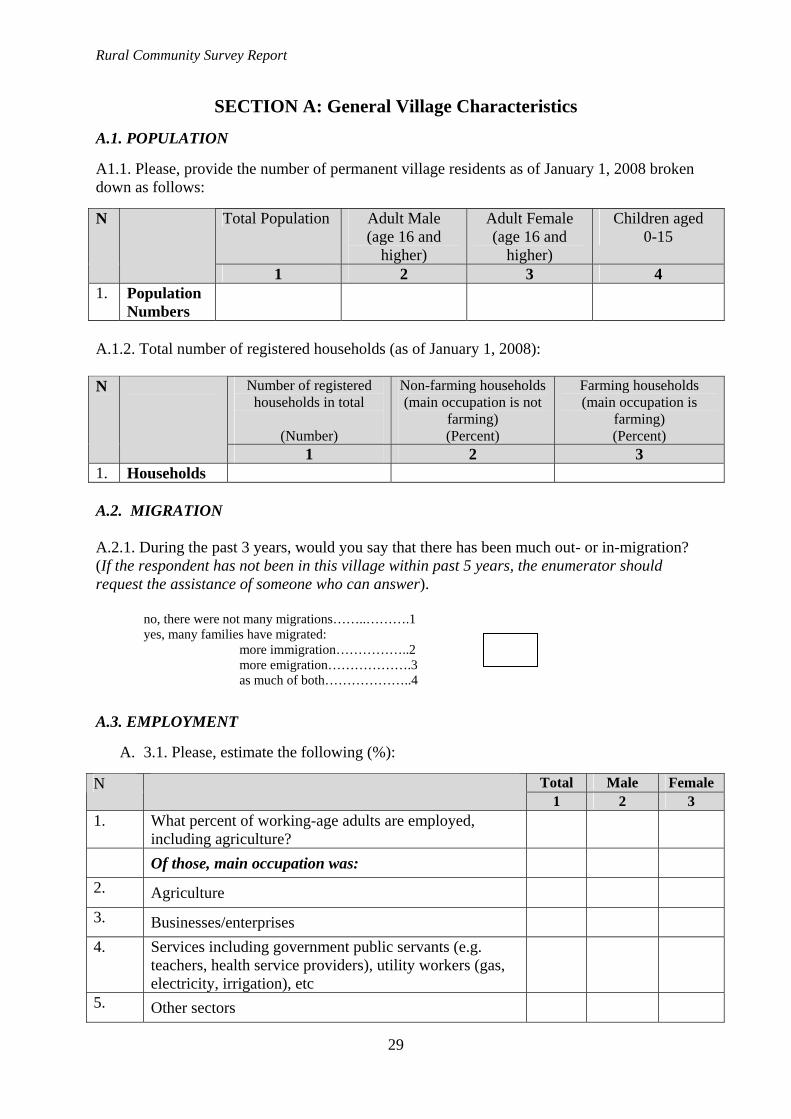
SECTION A: General Village Characteristics A.1. POPULATION A1.1. Please, provide the number of permanent village residents as of January 1, 2008 broken down as follows:
Total Population Adult Male (age 16 and
higher)
Adult Female (age 16 and
higher)
Children aged 0-15
N
1 2 3 4 1. Population
Numbers
A.1.2. Total number of registered households (as of January 1, 2008):
Number of registered households in total
(Number)
Non-farming households (main occupation is not
farming) (Percent)
Farming households (main occupation is
farming) (Percent)
N
1 2 3 1. Households A.2. MIGRATION A.2.1. During the past 3 years, would you say that there has been much out- or in-migration? (If the respondent has not been in this village within past 5 years, the enumerator should request the assistance of someone who can answer).
no, there were not many migrations……..……….1 yes, many families have migrated: more immigration……………..2 more emigration……………….3 as much of both………………..4
A.3. EMPLOYMENT
A. 3.1. Please, estimate the following (%):
Total Male Female N 1 2 3
1. What percent of working-age adults are employed, including agriculture?
Of those, main occupation was:
2. Agriculture
3. Businesses/enterprises
4. Services including government public servants (e.g. teachers, health service providers), utility workers (gas, electricity, irrigation), etc
5. Other sectors

Rural Community Survey Report
30
SECTION B. Social Infrastructure B.1. EDUCATION B1.1. Which of the following educational institutions exists in your community and in what condition?
Number
Age(s) of Buildings (in years)
1. up to 5 years 2. 5-20 years 3. more than 20 years
Building conditions:
in need of repair 1. Yes 2. No
3.
N
Educational Facility
1 2 3
1. Pre-school/kindergarten
2. Elementary school
3. 8-grade school
4. Secondary School
5. College (VET institution)
6. Musical school
7. Art school
8. Fine art school
9. Sports
Rural Community Survey Report
31
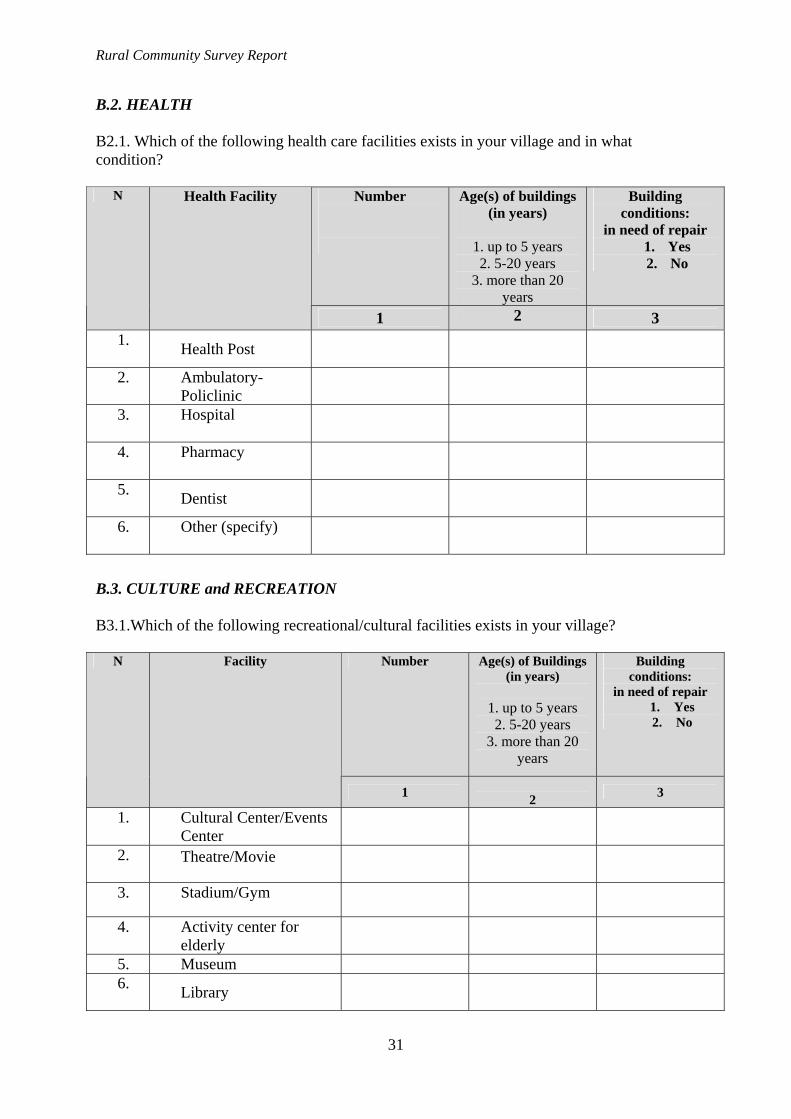
B.2. HEALTH B2.1. Which of the following health care facilities exists in your village and in what condition?
Number
Age(s) of buildings (in years)
1. up to 5 years 2. 5-20 years
3. more than 20 years
Building conditions:
in need of repair 1. Yes 2. No
N Health Facility
1 2 3 1. Health Post
2. Ambulatory-Policlinic
3. Hospital
4. Pharmacy
5. Dentist
6. Other (specify)
B.3. CULTURE and RECREATION B3.1.Which of the following recreational/cultural facilities exists in your village?
Number Age(s) of Buildings (in years)
1. up to 5 years 2. 5-20 years
3. more than 20 years
Building conditions:
in need of repair 1. Yes 2. No
N Facility
1 2 3
1. Cultural Center/Events Center
2. Theatre/Movie
3. Stadium/Gym
4. Activity center for elderly
5. Museum 6. Library
Rural Community Survey Report
32
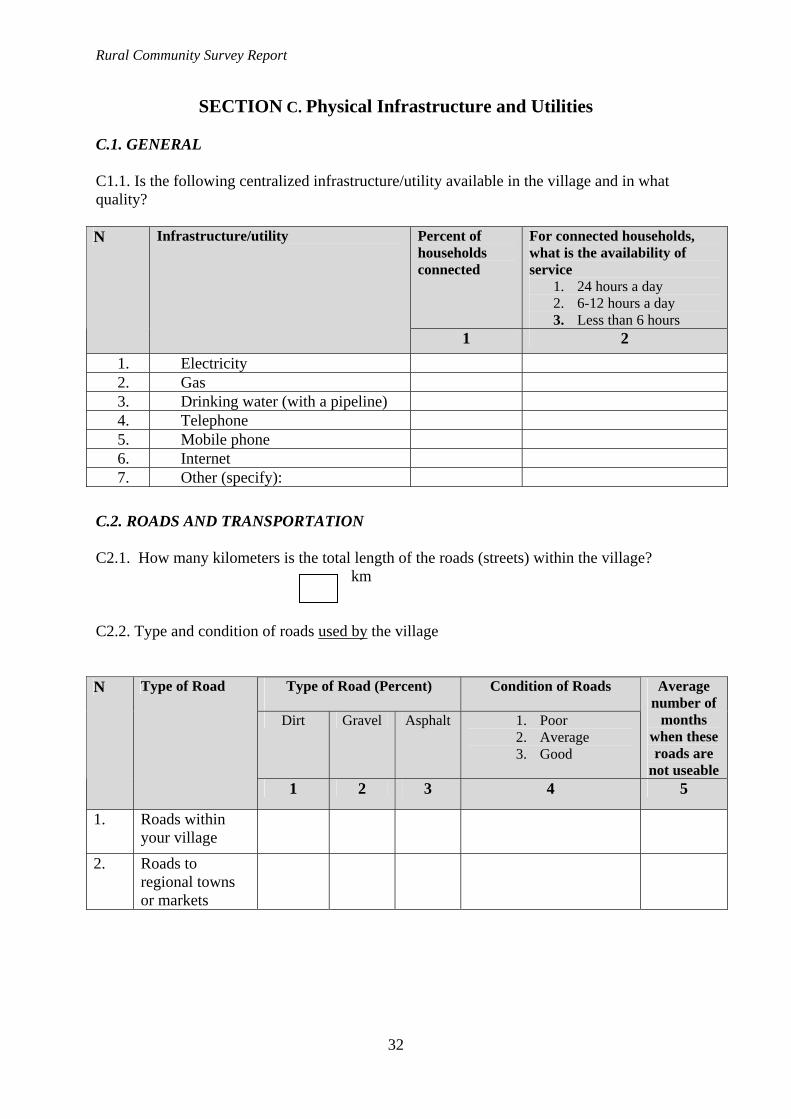
SECTION C. Physical Infrastructure and Utilities
C.1. GENERAL C1.1. Is the following centralized infrastructure/utility available in the village and in what quality?
Percent of households connected
For connected households, what is the availability of service
1. 24 hours a day 2. 6-12 hours a day 3. Less than 6 hours
N Infrastructure/utility
1 2 1. Electricity 2. Gas 3. Drinking water (with a pipeline) 4. Telephone 5. Mobile phone 6. Internet 7. Other (specify):
C.2. ROADS AND TRANSPORTATION C2.1. How many kilometers is the total length of the roads (streets) within the village? km C2.2. Type and condition of roads used by the village
Type of Road (Percent)
Condition of Roads
Dirt Gravel Asphalt 1. Poor 2. Average 3. Good
Average number of
months when these roads are
not useable
N Type of Road
1 2 3 4 5
1. Roads within your village
2. Roads to regional towns or markets

Rural Community Survey Report
33
C.3. AVAILABILITY OF TRANSPORTATION C.3.1 How many registered cars/trucks are there in the village?
Car Truck N 1 2
1. Total number of vehicles in the village
2. Number of vehicles registered in the village
3. Number of vehicles registered in other places (approximately)
C.3.3. Please chose three transportation modes most frequently used by the villagers from the following list starting from the most used one:
Three most frequently used transportation modes within the village
Three most frequently used transportation modes outside the village
N Transportation mode
1 2 1. Car 2. Minivan/bus 3. Taxi 4. Train 5. Cart 6. Walking/no transportation 7. Horse/Donkey
8. Bicycle C.3.4.Public Transportation Availability and Quality
Number Reliability 1. Poor 2. Average 3. Excellent
How adequate are these services to meet the needs of the village? 1. Poor 2. Average 3. Excellent
N Type of Public Transportation
1 2 3 1. Passenger bus lines 2. Passenger minibus lines 3. Taxis
Rural Community Survey Report
34
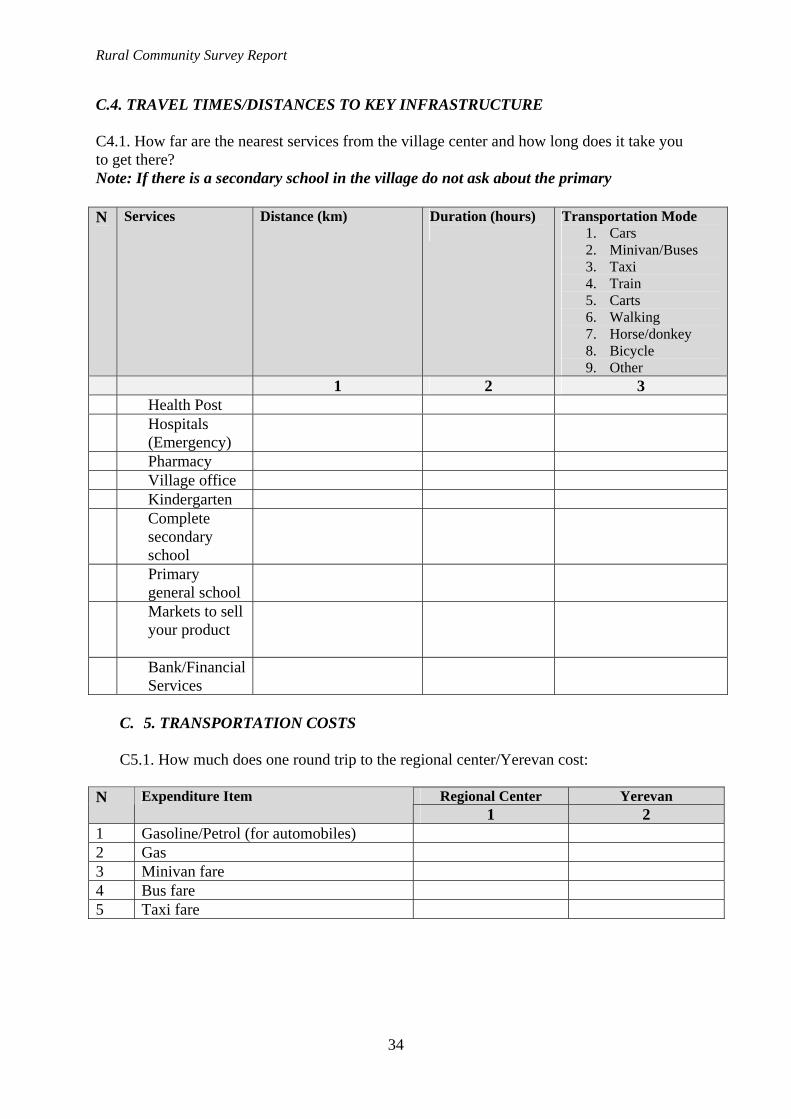
C.4. TRAVEL TIMES/DISTANCES TO KEY INFRASTRUCTURE C4.1. How far are the nearest services from the village center and how long does it take you to get there? Note: If there is a secondary school in the village do not ask about the primary
C. 5. TRANSPORTATION COSTS
C5.1. How much does one round trip to the regional center/Yerevan cost:
Regional Center Yerevan N Expenditure Item
1 2 1 Gasoline/Petrol (for automobiles) 2 Gas 3 Minivan fare 4 Bus fare 5 Taxi fare
N Services Distance (km) Duration (hours)
Transportation Mode 1. Cars 2. Minivan/Buses 3. Taxi 4. Train 5. Carts 6. Walking 7. Horse/donkey 8. Bicycle 9. Other
1 2 3 Health Post Hospitals (Emergency)
Pharmacy Village office Kindergarten Complete secondary school
Primary general school
Markets to sell your product
Bank/Financial Services
Rural Community Survey Report
35
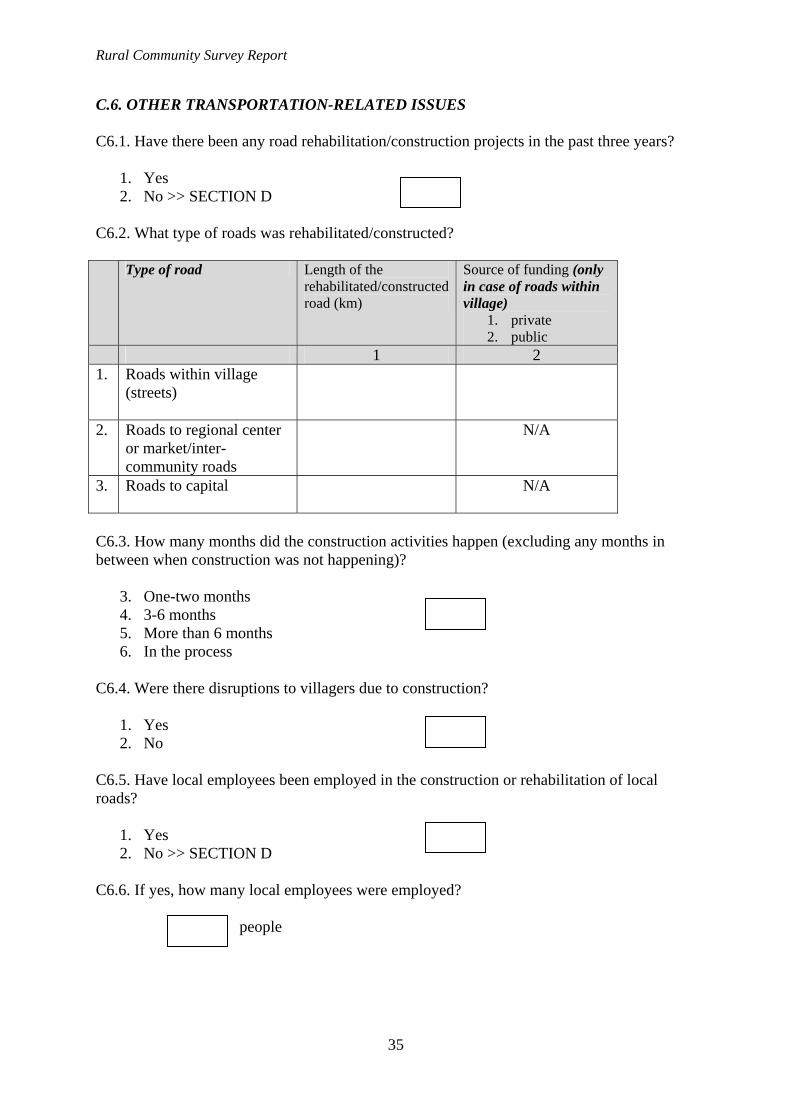
C.6. OTHER TRANSPORTATION-RELATED ISSUES
C6.1. Have there been any road rehabilitation/construction projects in the past three years?
1. Yes 2. No >> SECTION D
C6.2. What type of roads was rehabilitated/constructed? Type of road Length of the
rehabilitated/constructed road (km)
Source of funding (only in case of roads within village)
1. private 2. public
1 2 1. Roads within village
(streets)
2. Roads to regional center or market/inter-community roads
N/A
3. Roads to capital
N/A
C6.3. How many months did the construction activities happen (excluding any months in between when construction was not happening)?
3. One-two months 4. 3-6 months 5. More than 6 months 6. In the process
C6.4. Were there disruptions to villagers due to construction?
1. Yes 2. No
C6.5. Have local employees been employed in the construction or rehabilitation of local roads?
1. Yes 2. No >> SECTION D
C6.6. If yes, how many local employees were employed?
people
Rural Community Survey Report
36
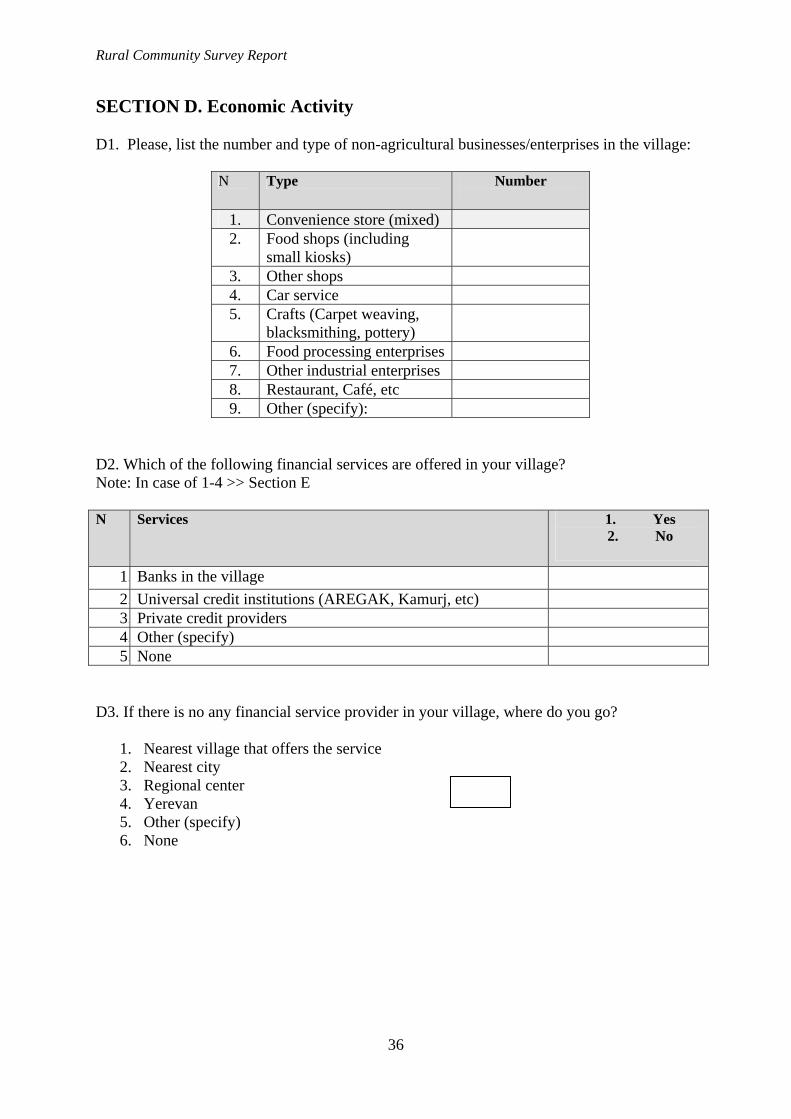
SECTION D. Economic Activity D1. Please, list the number and type of non-agricultural businesses/enterprises in the village:
N Type Number
1. Convenience store (mixed) 2. Food shops (including
small kiosks)
3. Other shops 4. Car service 5. Crafts (Carpet weaving,
blacksmithing, pottery)
6. Food processing enterprises 7. Other industrial enterprises 8. Restaurant, Café, etc 9. Other (specify):
D2. Which of the following financial services are offered in your village? Note: In case of 1-4 >> Section E N Services 1. Yes
2. No
1. Banks in the village 2. Universal credit institutions (AREGAK, Kamurj, etc) 3. Private credit providers 4. Other (specify) 5. None
D3. If there is no any financial service provider in your village, where do you go?
1. Nearest village that offers the service 2. Nearest city 3. Regional center 4. Yerevan 5. Other (specify) 6. None

Rural Community Survey Report
37
SECTION E: Agriculture and Irrigation E.1. What percentage of households is involved in the following agricultural activities?
N Sectors Household %
1. Farming
2. from which, on the total area of the owned land (including kitchen plot)
3. only on kitchen plot 4. green houses 5. Cattle-breeding 6. Other (specify)
E.2. What is the total area of agricultural land currently cultivated by households of your village? ha E.3. What are the five most common crops in your village? N Crop Number of
hectares under cultivation
Share of farming households cultivating this crop compared to total number of households (percent)
Percent of this crop that is consumed by households
Percent of this crop that is sold or bartered
1 2 3 4 1 2 3 4 5
E.4. Is your village a member of a Water User Association?
1. Yes 2. No
Rural Community Survey Report
38
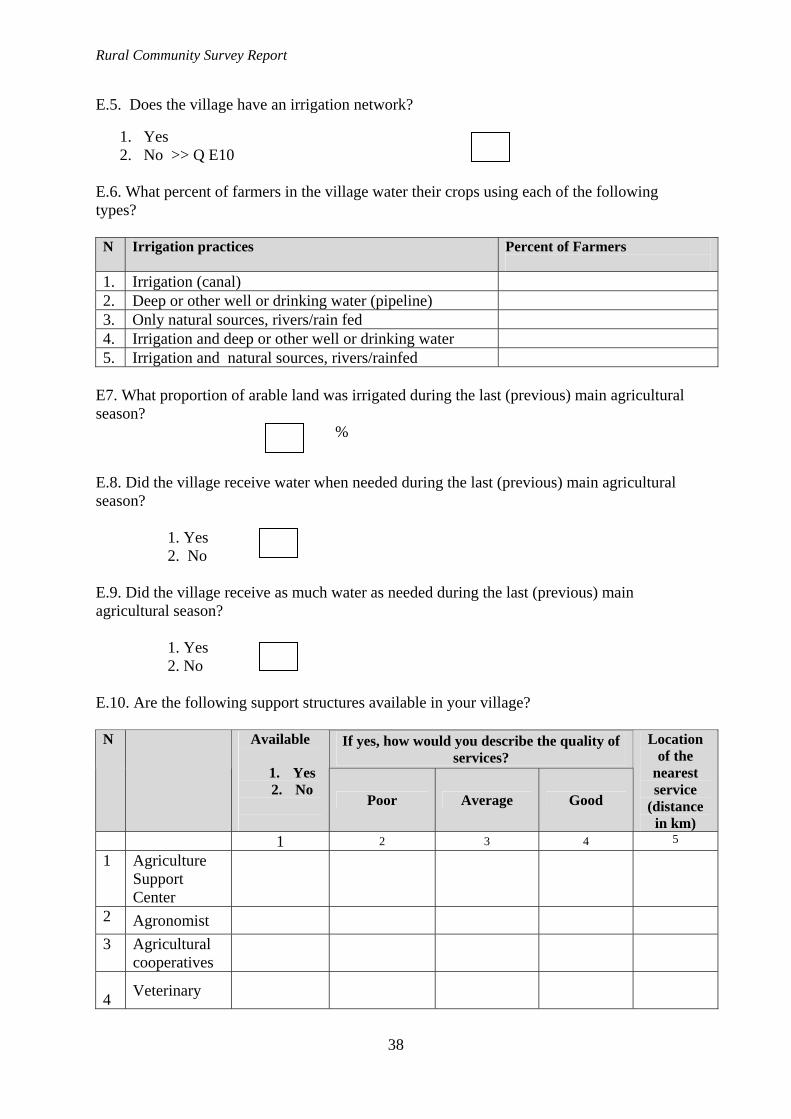
E.5. Does the village have an irrigation network?
1. Yes 2. No >> Q E10
E.6. What percent of farmers in the village water their crops using each of the following types? N Irrigation practices Percent of Farmers
1. Irrigation (canal) 2. Deep or other well or drinking water (pipeline) 3. Only natural sources, rivers/rain fed 4. Irrigation and deep or other well or drinking water 5. Irrigation and natural sources, rivers/rainfed
E7. What proportion of arable land was irrigated during the last (previous) main agricultural season?
% E.8. Did the village receive water when needed during the last (previous) main agricultural season? 1. Yes 2. No E.9. Did the village receive as much water as needed during the last (previous) main agricultural season? 1. Yes 2. No E.10. Are the following support structures available in your village?
If yes, how would you describe the quality of services?
N Available
1. Yes 2. No
Poor Average Good
Location of the
nearest service
(distance in km)
1 2 3 4 5
1 Agriculture Support Center
2 Agronomist
3 Agricultural cooperatives
4 Veterinary

Rural Community Survey Report
39
SECTION F. Government Policies and Programs F.1. Does the village benefit from any project organized by the Government or other institutions within the past 12 months? 1. Yes 2. No>> END F.2. Socio-economic development programs and project activities in the village within the past 12 months:
N
Project / activity name (e.g., hospital
rehabilitation, school construction,
etc.
Start date
End date
Sponsoring Agency
1 2 3 4 1
2
3
4
5
6
7