Role of shellfish hatchery as a reservoir of antimicrobial resistant bacteria
10
Role of shellfish hatchery as a reservoir of antimicrobial resistant bacteria Claudio D. Miranda a,b,⇑ , Rodrigo Rojas a , Marcela Garrido c , Julieta Geisse c , Gerardo González c a Aquatic Pathobiology Laboratory, Department of Aquaculture, Universidad Católica del Norte, 1281 Larrondo Street, Coquimbo, Chile b Centro de Estudios Avanzados (CEAZA), 1281 Larrondo Street, Coquimbo, Chile c Research on Antimicrobial Agents Laboratory, Department of Microbiology, Universidad de Concepción, Concepción, Chile article info Keywords: Florfenicol Heterotrophic bacteria Antimicrobial resistance Scallop culture Chile Hatchery abstract The main aim of this study was to determine the occurrence of resistant bacteria in florfenicol-treated and untreated scallop larval cultures from a commercial hatchery and to characterize some selected flor- fenicol-resistant strains. Larval cultures from untreated and treated rearing tanks exhibited percentages of copiotrophic bacteria resistant to florfenicol ranging from 0.03% to 10.67% and 0.49–18.34%, respec- tively, whereas florfenicol resistance among oligotrophic bacteria varied from 1.44% to 35.50% and 3.62–95.71%, from untreated and treated larvae, respectively. Florfenicol resistant microbiota from reared scallop larvae mainly belonged to the Pseudomonas and Pseudoalteromonas genus and were mainly resis- tant to florfenicol, chloramphenicol, streptomycin and co-trimoxazole. This is the first study reporting antimicrobial resistant bacteria associated to a shellfish hatchery and the results suggest that a continu- ous surveillance of antimicrobial resistance even in absence of antibacterial therapy is urgently required to evaluate potential undesirable consequences on the surrounding environments. Ó 2013 Elsevier Ltd. All rights reserved. 1. Introduction The culture of Chilean scallop Argopecten purpuratus (Lamarck, 1819) is one of the most commercially important industries of Chilean mariculture, and is mainly concentrated in the North re- gion of the country. Although the major supply of scallop’s seeds is the natural environment, due to poor catches of natural seeds, which occur cyclically in Chile (Farías et al., 1998), it has been nec- essary to develop a hatchery system to provide a consistent supply of larvae reared under controlled conditions. Shellfish larval mortalities occurring in controlled cultures are mainly associated with high bacterial loads enhanced by culture conditions such as high temperatures, high food supplies and high larval densities (Lodeiros et al., 1987). In most Chilean commercial scallop hatcheries, periodic outbreaks caused by opportunistic pathogenic bacteria, mainly belonging to Vibrio, Aeromonas and Halomonas species have been reported (Riquelme et al., 1996; Ro- jas et al., 2009). The prevention and control of these pathological events in Chilean scallop culture industry is mainly performed by the admin- istration of antibacterial agents in rearing tanks, and florfenicol is currently the most frequently used antibacterial in Chilean scallop larvae hatcheries (Bravo et al., 2005; Miranda et al., in press). Mir- anda et al. (in press) found that florfenicol was significantly more efficient than oxytetracycline to reduce bacterial content of reared larvae, being highly efficient to reduce larval mortality of cultures at commercial scale. Florfenicol is a synthetic, broad-spectrum fluorinated analogue of chloramphenicol that exerts its antimicrobial activity by inhibit- ing bacterial protein synthesis at the ribosomal level, but the in- creased selective pressure as imposed by the intensive use of florfenicol in aquaculture has accelerated the development and the spread of bacterial resistance to this drug. Various mechanisms accounting for bacterial resistance to florfenicol, including efflux systems, permeability barriers and multidrug transporters have been reported (Schwarz et al., 2004). Despite wide use of florfenicol in Chilean scallop farming, no studies have been developed to evaluate the incidence of florfeni- col-resistant bacteria in scallop rearing hatcheries in Chile and their potential role as reservoirs of antimicrobial resistance, that could be spread to the surrounding seawater microbiota as well as to the hatchery-associated pathogenic microbiota, lowering the efficacy of drug therapy in the future. Considering that prophy- lactic administration of florfenicol in scallop larvae culture is a fre- quent practice in Chile, we decided to investigate its impact on the antibacterial resistant microbiota associated to scallop larvae cul- ture under florfenicol treatment. 0025-326X/$ - see front matter Ó 2013 Elsevier Ltd. All rights reserved. http://dx.doi.org/10.1016/j.marpolbul.2013.06.032 ⇑ Corresponding author at: Aquatic Pathobiology Laboratory, Department of Aquaculture, Universidad Católica del Norte, 1281 Larrondo Street, Coquimbo, Chile. Tel.: +56 51 209762; fax: +56 51 209782. E-mail address: [email protected] (C.D. Miranda). Marine Pollution Bulletin 74 (2013) 334–343 Contents lists available at SciVerse ScienceDirect Marine Pollution Bulletin journal homepage: www.elsevier.com/locate/marpolbul
Transcript of Role of shellfish hatchery as a reservoir of antimicrobial resistant bacteria
Marine Pollution Bulletin 74 (2013) 334–343
Contents lists available at SciVerse ScienceDirect
Marine Pollution Bulletin
journal homepage: www.elsevier .com/locate /marpolbul
Role of shellfish hatchery as a reservoir of antimicrobial resistantbacteria
0025-326X/$ - see front matter � 2013 Elsevier Ltd. All rights reserved.http://dx.doi.org/10.1016/j.marpolbul.2013.06.032
⇑ Corresponding author at: Aquatic Pathobiology Laboratory, Department ofAquaculture, Universidad Católica del Norte, 1281 Larrondo Street, Coquimbo,Chile. Tel.: +56 51 209762; fax: +56 51 209782.
E-mail address: [email protected] (C.D. Miranda).
Claudio D. Miranda a,b,⇑, Rodrigo Rojas a, Marcela Garrido c, Julieta Geisse c, Gerardo González c
a Aquatic Pathobiology Laboratory, Department of Aquaculture, Universidad Católica del Norte, 1281 Larrondo Street, Coquimbo, Chileb Centro de Estudios Avanzados (CEAZA), 1281 Larrondo Street, Coquimbo, Chilec Research on Antimicrobial Agents Laboratory, Department of Microbiology, Universidad de Concepción, Concepción, Chile
a r t i c l e i n f o
Keywords:FlorfenicolHeterotrophic bacteriaAntimicrobial resistanceScallop cultureChileHatchery
a b s t r a c t
The main aim of this study was to determine the occurrence of resistant bacteria in florfenicol-treatedand untreated scallop larval cultures from a commercial hatchery and to characterize some selected flor-fenicol-resistant strains. Larval cultures from untreated and treated rearing tanks exhibited percentagesof copiotrophic bacteria resistant to florfenicol ranging from 0.03% to 10.67% and 0.49–18.34%, respec-tively, whereas florfenicol resistance among oligotrophic bacteria varied from 1.44% to 35.50% and3.62–95.71%, from untreated and treated larvae, respectively. Florfenicol resistant microbiota from rearedscallop larvae mainly belonged to the Pseudomonas and Pseudoalteromonas genus and were mainly resis-tant to florfenicol, chloramphenicol, streptomycin and co-trimoxazole. This is the first study reportingantimicrobial resistant bacteria associated to a shellfish hatchery and the results suggest that a continu-ous surveillance of antimicrobial resistance even in absence of antibacterial therapy is urgently requiredto evaluate potential undesirable consequences on the surrounding environments.
� 2013 Elsevier Ltd. All rights reserved.
1. Introduction
The culture of Chilean scallop Argopecten purpuratus (Lamarck,1819) is one of the most commercially important industries ofChilean mariculture, and is mainly concentrated in the North re-gion of the country. Although the major supply of scallop’s seedsis the natural environment, due to poor catches of natural seeds,which occur cyclically in Chile (Farías et al., 1998), it has been nec-essary to develop a hatchery system to provide a consistent supplyof larvae reared under controlled conditions.
Shellfish larval mortalities occurring in controlled cultures aremainly associated with high bacterial loads enhanced by cultureconditions such as high temperatures, high food supplies and highlarval densities (Lodeiros et al., 1987). In most Chilean commercialscallop hatcheries, periodic outbreaks caused by opportunisticpathogenic bacteria, mainly belonging to Vibrio, Aeromonas andHalomonas species have been reported (Riquelme et al., 1996; Ro-jas et al., 2009).
The prevention and control of these pathological events inChilean scallop culture industry is mainly performed by the admin-istration of antibacterial agents in rearing tanks, and florfenicol is
currently the most frequently used antibacterial in Chilean scalloplarvae hatcheries (Bravo et al., 2005; Miranda et al., in press). Mir-anda et al. (in press) found that florfenicol was significantly moreefficient than oxytetracycline to reduce bacterial content of rearedlarvae, being highly efficient to reduce larval mortality of culturesat commercial scale.
Florfenicol is a synthetic, broad-spectrum fluorinated analogueof chloramphenicol that exerts its antimicrobial activity by inhibit-ing bacterial protein synthesis at the ribosomal level, but the in-creased selective pressure as imposed by the intensive use offlorfenicol in aquaculture has accelerated the development andthe spread of bacterial resistance to this drug. Various mechanismsaccounting for bacterial resistance to florfenicol, including effluxsystems, permeability barriers and multidrug transporters havebeen reported (Schwarz et al., 2004).
Despite wide use of florfenicol in Chilean scallop farming, nostudies have been developed to evaluate the incidence of florfeni-col-resistant bacteria in scallop rearing hatcheries in Chile andtheir potential role as reservoirs of antimicrobial resistance, thatcould be spread to the surrounding seawater microbiota as wellas to the hatchery-associated pathogenic microbiota, loweringthe efficacy of drug therapy in the future. Considering that prophy-lactic administration of florfenicol in scallop larvae culture is a fre-quent practice in Chile, we decided to investigate its impact on theantibacterial resistant microbiota associated to scallop larvae cul-ture under florfenicol treatment.
C.D. Miranda et al. / Marine Pollution Bulletin 74 (2013) 334–343 335
The main goals of this study were to evaluate the occurrence offlorfenicol and oxytetracycline resistance among the bacterial mic-robiota associated to the larval culture of the Chilean scallop (A.purpuratus) not treated and treated with florfenicol, to isolateand identify predominant resistant strains from untreated andtreated reared larvae, as well as to determine their levels of resis-tance to florfenicol and their susceptibility patterns to main groupsof antibacterial agents.
2. Materials and methods
2.1. Sampling
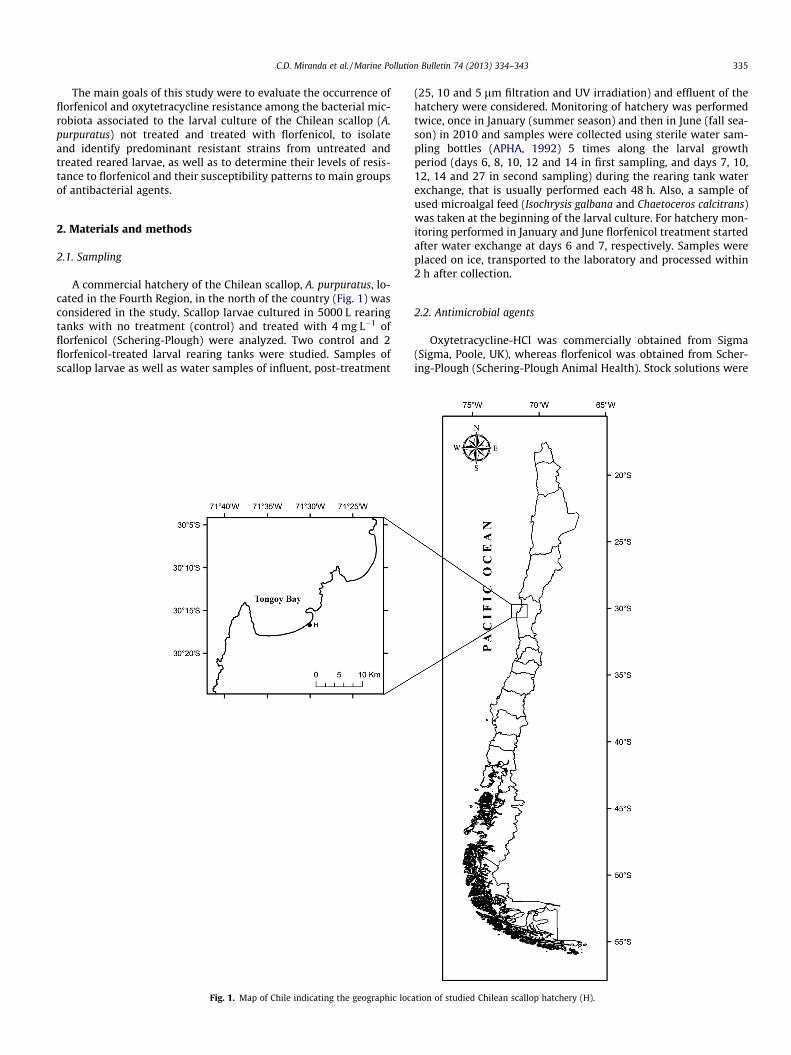
A commercial hatchery of the Chilean scallop, A. purpuratus, lo-cated in the Fourth Region, in the north of the country (Fig. 1) wasconsidered in the study. Scallop larvae cultured in 5000 L rearingtanks with no treatment (control) and treated with 4 mg L�1 offlorfenicol (Schering-Plough) were analyzed. Two control and 2florfenicol-treated larval rearing tanks were studied. Samples ofscallop larvae as well as water samples of influent, post-treatment
Fig. 1. Map of Chile indicating the geographic loc
(25, 10 and 5 lm filtration and UV irradiation) and effluent of thehatchery were considered. Monitoring of hatchery was performedtwice, once in January (summer season) and then in June (fall sea-son) in 2010 and samples were collected using sterile water sam-pling bottles (APHA, 1992) 5 times along the larval growthperiod (days 6, 8, 10, 12 and 14 in first sampling, and days 7, 10,12, 14 and 27 in second sampling) during the rearing tank waterexchange, that is usually performed each 48 h. Also, a sample ofused microalgal feed (Isochrysis galbana and Chaetoceros calcitrans)was taken at the beginning of the larval culture. For hatchery mon-itoring performed in January and June florfenicol treatment startedafter water exchange at days 6 and 7, respectively. Samples wereplaced on ice, transported to the laboratory and processed within2 h after collection.
2.2. Antimicrobial agents
Oxytetracycline-HCl was commercially obtained from Sigma(Sigma, Poole, UK), whereas florfenicol was obtained from Scher-ing-Plough (Schering-Plough Animal Health). Stock solutions were
ation of studied Chilean scallop hatchery (H).
336 C.D. Miranda et al. / Marine Pollution Bulletin 74 (2013) 334–343
prepared in deionized distilled water and filter-sterilized(0.22 lm) before use.
2.3. Sample processing and culturable bacterial count
Culturable counts of heterotrophic and antimicrobial-resistantbacteria were determined by a spread plate method using the sea-water-mimicking medium VNSS agar (Hermansson et al., 1987)and the rich medium Tryptic soy agar (TSA, Difco labs) added with2% NaCl, to determine the levels of oligotrophic and copiotrophicbacteria, respectively. Plates supplemented with florfenicol(30 lg mL�1, Schering-Plough�) or oxytetracycline (30 lg mL�1,Sigma�) were used to determine antibacterial-resistant culturablebacteria, whereas plates without antibacterials were used to deter-mine the total culturable bacteria. Scallop larvae samples wereconcentrated by centrifugation, aseptically weighed and grindedby hand using a sterile glass digester added with 2 mL of sterilephysiological saline (0.85%) (PS) to obtain a homogenate accordingto Nicolas et al. (1996). Appropriate 10-fold dilutions of thehomogenates or water samples in PS were prepared and 0.1 mL ali-quots were inoculated in triplicate onto agar plates. All plates wereincubated at 20 �C for 5 days and the bacterial numbers per mL orper g of sample were calculated as described in Miranda and Rojas(2007).
2.4. Bacterial strains
A number of 128 florfenicol-resistant Gram-negative bacilliwere recovered from scallop larvae from untreated (60 strains)and florfenicol-treated (55 strains) cultures to represent the larvalflorfenicol-resistant bacterial community. Purified strains werestored at �85 �C in Tryptic soy broth (Difco labs) supplementedwith NaCl (2%) and 50% glycerol (2:1) until use (Gherna, 1994).
2.5. Bacterial identification
2.5.1. Phenotypic analysisPhenotypical characteristics, including Gram stain, oxidation/
fermentation of glucose (O/F), growth on MacConkey agar, and oxi-dase production were determined as described by Barrow and Fel-tham (1993) and Hansen and Sörheim (1991) in media added with2% NaCl.
2.5.2. Genotypic analysisIsolates were identified by bacterial 16S rRNA gene sequence
analysis. For amplification of the 16S rRNA genes, crude DNA ex-tracts were obtained from pure bacterial isolates using the Che-lex-based resin InstaGene Matrix (BioRad, Hercules, CA, USA).The 16S rRNA gene was amplified by the polymerase chain reaction(PCR) using primers P0 (50-GAGAGTTTGATCCTGGCTCAG) and P6(50-TACGGCTACCTTGTTACGA) that were designed from the con-served bacterial sequences at the 50 and 30 ends of the 16S rRNAgene (positions 27f and 1495r, respectively, on Escherichia colirDNA) and allowed the amplification of nearly the entire gene (Mi-chaud et al., 2003). The PCR amplicons were sequenced using P0 orP6 primers by primer extension sequencing in Macrogen USA(Rockville, Maryland, USA). Nucleotide sequence alignment andcomparisons were carried out by using BLAST (Basic Local Align-ment Search Tool) on the NCBI (National Center for BiotechnologyInformation), Ribosomal Database Project (RDP) (http://rdp.cme.msu.edu/) or The European Ribosomal RNA database.
2.6. Antimicrobial resistance patterns
Resistant isolates were tested for their susceptibility to 13 anti-microbials by an agar disk diffusion method as was essentially
described in the Clinical and Laboratory Standards Institute (CLSI)guideline M42-A (CLSI, 2006), using Müeller–Hinton agar (Difco)supplemented with NaCl (2%). The antibacterial susceptibility pat-terns of resistant strains were performed using disks containingthe antibacterial agents: amoxicillin (AML, 25 lg), cefotaxime(CTX, 30 lg), chloramphenicol (CM, 30 lg), florfenicol (FFC,30 lg), streptomycin (S, 10 lg), gentamicin (G, 10 lg), kanamycin(K, 30 lg), oxytetracycline (OT, 30 lg), oxolinic acid (OA, 2 lg),flumequine (UB, 30 lg), enrofloxacin (ENR, 5 lg), furazolidone(FX, 100 lg), and sulfametoxazole–trimethoprim (SXT, 1.25 and23.75 lg). All disks were obtained from Oxoid Ltd. (Basingstoke,Hampshire, England). Bacterial strains were suspended in sterile0.85% saline to a turbidity to match a McFarland No. 2 standard(bioMerieux S.A.), diluted 1:20, and streaked on the used media.Plates were incubated for 24–72 h (growth dependent) at 22 �Cand E. coli ATCC 25922 was used as the control strain. Characteriza-tion of strains as resistant was stated according to standards sug-gested by CLSI (CLSI, 2007) or by Miranda and Rojas (2007). Inaddition, the antibacterial resistance index (ARI) of untreated andflorfenicol-treated larvae cultures was determined according toHinton et al. (1985), using the formula ARI = y/nx, in which y wasthe actual number of resistance determinants recorded in a popu-lation of size n, and x was the total number of antibacterials testedfor in the sensitivity test.
2.7. Statistical methods
Oligotrophic and copiotrophic culturable count values weretransformed to log10, whereas proportions of florfenicol and oxy-tetracycline resistance were computed for each scallop cultureand were arcsine-transformed before analysis. One way analysisof variance (ANOVA) (Zar, 1999) was performed to detect signifi-cant differences (P < 0.05) between culturable counts and florfeni-col or oxytetracycline resistance proportions from control andtreated larval cultures. In addition, rearing tanks were comparedin a nested ANOVA analysis. When differences were statisticallysignificant, control and treated larvae, as well as rearing tanks werethen compared against each other using the Tukey test (Zar, 1999).In addition, the frequencies of resistance to the assayed antimicro-bials of the selected strains were compared with Pearson’s Chi-square test, adjusted with Bonferroni’s correction and a P < 0.05was considered to indicate statistical significance. All statisticalanalyses were carried out using the SPSS version 12.0 computerprogram (Norusis, 2004).
3. Results
3.1. Total and resistant bacterial levels
3.1.1. Water and microalgaeTotal culturable counts and percent of antibacterial resistance
of water and microalgae samples from the scallop hatchery arepresented in Tables 1 and 2. In general, culturable counts of oligo-trophic bacteria from water and microalgae samples were slightlyhigher than those of copiotrophic bacteria, showing similar copio-trophic and oligotrophic levels in samples taken in January andJune. As was observed in Tables 1 and 2 microalgae cultures exhib-ited high levels of copiotrophic and oligotrophic culturable counts(>104 CFU mL�1 and >105 CFU mL�1, respectively), showing themaximum culturable count (>106 CFU mL�1) in the oligotrophiccount of I. galbana cultures.
Influent and UV-treated water samples as well as microalgaeexhibited similar and low percentages of antibacterial resistance,exhibiting no detectable or very low percentages of florfenicolresistance in copiotrophic and oligotrophic counts along the

Table 1Heterotrophic plate counts and percentages of florfenicol and oxytetracycline resistance in water and microalgae samples taken in January.
Sample Day Copiotrophic Oligotrophic
Culturable count ± SD (CFU mL�1) FFCR ± SD (%) OTR ± SD (%) Culturable count ± SD (CFU mL�1) FFCR ± SD (%) OTR ± SD (%)
Influent 6 2.41 � 103 ± 3.78 � 102 <0.001 <0.001 8.83 � 102 ± 2.89 � 101 <0.001 <0.0018 4.37 � 102 ± 2.12 � 102 <0.001 <0.001 6.83 � 102 ± 2.36 � 102 <0.001 <0.00110 3.50 � 103 ± 1.50 � 103 <0.001 <0.001 8.00 � 103 ± 1.73 � 103 <0.001 0.71 ± 0.0712 9.00 � 101 ± 6.00 � 101 <0.001 <0.001 3.94 � 103 ± 2.26 � 103 0.17 ± 0.15 2.54 ± 0.2514 3.23 � 102 ± 6.81 � 101 <0.001 <0.001 1.42 � 103 ± 3.30 � 102 0.23 ± 0.41 2.35 ± 1.63
Post-UV 6 1.17 � 103 ± 2.20 � 102 <0.001 <0.001 1.89 � 103 ± 2.32 � 102 0.18 ± 0.31 0.18 ± 0.318 1.19 � 103 ± 2.86 � 102 <0.001 <0.001 2.12 � 103 ± 2.66 � 102 <0.001 2.20 ± 0.5410 1.62 � 103 ± 1.91 � 102 0.41 ± 0.71 <0.001 2.55 � 104 ± 9.70 � 103 0.86 ± 0.04 2.04 ± 0.2812 1.37 � 102 ± 5.51 � 101 <0.001 <0.001 1.29 � 103 ± 8.58 � 101 1.30 ± 0.45 2.08 ± 0.4514 1.65 � 102 ± 4.95 � 101 <0.001 <0.001 3.00 � 102 ± 0.00 <0.001 2.22 ± 1.92
Effluent 6 1.26 � 103 ± 1.40 � 102 1.48 ± 0.49 3.44 ± 0.46 2.03 � 103 ± 2.52 � 102 23.54 ± 6.75 27.21 ± 7.898 1.51 � 103 ± 2.43 � 102 1.55 ± 1.01 1.55 ± 0.38 3.52 � 103 ± 4.13 � 102 4.69 ± 1.63 1.61 ± 0.7210 1.45 � 103 ± 5.18 � 102 <0.001 <0.001 3.15 � 103 ± 1.06 � 103 5.82 ± 1.75 26.77 ± 5.9912 4.03 � 102 ± 1.67 � 102 <0.001 <0.001 1.03 � 104 ± 2.69 � 103 3.46 ± 1.39 2.33 ± 1.2114 1.88 � 103 ± 9.45 � 102 <0.001 <0.001 1.54 � 104 ± 5.12 � 103 14.61 ± 7.06 54.11 ± 10.84
I. galbana 6 3.05 � 105 ± 4.95 � 104 0.01 ± 0.002 <0.001 1.95 � 106 ± 2.05 � 105 0.37 ± 0.01 0.03 ± 0.001
C. calcitrans 6 6.65 � 104 ± 4.95 � 103 0.03 ± 0.01 <0.001 2.52 � 105 ± 6.16 � 104 0.10 ± 0.014 0.06 ± 0.008
�FFCR: Florfenicol resistance; OTR: Oxytetracycline resistance; Mean ± SD of 3 replicates.
Table 2Heterotrophic plate counts and percentages of florfenicol and oxytetracycline resistance in water and microalgae samples taken in June.
Sample Day Copiotrophic Oligotrophic
Culturable count ± SD (CFU mL�1) FFCR ± SD (%) OTR ± SD (%) Culturable count ± SD (CFU mL�1) FFCR ± SD (%) OTR ± SD (%)
Influent 7 1.90 � 103 ± 2.64 � 102 <0.001 <0.001 6.05 � 104 ± 1.06 � 104 0.02 ± 0.01 <0.00110 9.13 � 103 ± 4.80 � 103 <0.001 <0.001 1.34 � 104 ± 1.83 � 103 0.02 ± 0.04 0.10 ± 0.0912 2.41 � 103 ± 1.39 � 103 <0.001 <0.001 4.89 � 103 ± 7.48 � 102 <0.001 <0.00114 2.08 � 102 ± 9.36 � 101 <0.001 <0.001 3.67 � 102 ± 1.15 � 102 5.45 ± 4.72 <0.00127 7.95 � 102 ± 2.66 � 102 <0.001 <0.001 8.29 � 106 ± 2.66 � 105 <0.001 <0.001
Post-UV 7 5.00 � 101 ± 4.36 � 101 <0.001 <0.001 1.27 � 102 ± 1.50 � 102 2.63 ± 4.56 <0.00110 3.33 � 101 ± 2.08 � 101 <0.001 <0.001 6.00 � 101 ± 0.00 <0.001 <0.00112 2.00 � 102 ± 0.00 <0.001 <0.001 1.00 � 102 ± 0.00 3.33 ± 5.77 <0.00114 3.00 � 102 ± 2.83 � 101 <0.001 <0.001 7.47 � 102 ± 4.74 � 102 <0.001 0.45 ± 0.7727 2.75 � 102 ± 6.36 � 101 <0.001 1.21 ± 2.10 1.01 � 103 ± 2.70 � 102 <0.001 1.32 ± 1.15
Effluent 7 2.63 � 102 ± 2.59 � 102 1.27 ± 2.20 <0.001 6.17 � 103 ± 1.69 � 103 0.11 ± 0.09 0.70 ± 0.4710 9.63 � 102 ± 3.19 � 102 <0.001 4.15 ± 3.60 4.21 � 103 ± 7.51 � 102 1.03 ± 0.55 1.74 ± 0.8412 2.19 � 103 ± 1.70 � 102 0.15 ± 0.26 0.91 ± 0.79 1.05 � 104 ± 3.11 � 102 1.82 ± 0.10 1.69 ± 0.2914 2.82 � 103 ± 2.34 � 103 0.64 ± 0.77 0.53 ± 0.46 5.44 � 103 ± 2.50 � 103 5.80 ± 3.32 5.80 ± 2.0027 1.42 � 103 ± 3.02 � 102 0.23 ± 0.41 1.17 ± 0.81 8.08 � 103 ± 1.47 � 103 0.45 ± 0.14 2.39 ± 0.90
I. galbana 7 1.82 � 105 ± 1.24 � 105 0.04 ± 0.03 <0.001 1.02 � 106 ± 1.33 � 106 1.34 ± 0.20 0.40 ± 0.07
C. calcitrans 7 3.60 � 104 ± 5.54 � 104 <0.001 0.06 ± 0.02 1.88 � 105 ± 1.14 � 105 0.02 ± 0.01 1.78 ± 0.16
�FFCR: Florfenicol resistance; OTR: Oxytetracycline resistance; Mean ± SD of 3 replicates.
C.D. Miranda et al. / Marine Pollution Bulletin 74 (2013) 334–343 337
monitoring period. It is noted that in most of the influent and UV-treated water samples taken in January, where resistance to oxy-tetracycline was approximately 2% of oligotrophic counts (Table 1),contrasting with the observed in the samples taken in June, whereoxytetracycline resistance percentages of oligotrophic counts werevery low (Table 2). Otherwise, the majority of samples taken inJune showed no detectable resistance levels among copiotrophicbacteria whereas florfenicol resistance showed maximum valuesof 5.45% and 3.33% of oligotrophic bacteria from influent and UV-treated water samples.
Among water samples, effluent samples demonstrated highestlevels of antibacterial resistance, especially in oligotrophic bacteriasampled in January, with maximum values of florfenicol and oxy-tetracycline resistance of 23.54% and 54.11%, respectively (Table 1).Furthermore, florfenicol and oxytetracycline resistance percent-ages of effluent samples taken at day 14 of larval culture in January(14.61% and 54.11%, respectively) were remarkable higher thanthose observed in June (5.80% at day 14 of culture) (Tables 1 and2). It must be noted that at first day of the sampling period
performed in January, before the start of administration of florfeni-col, oligotrophic bacteria from effluent samples demonstrated ahigh percentage of florfenicol and oxytetracycline resistance(23.54% and 27.21%, respectively). Otherwise, in a high numberof samples, percentages of oxytetracycline resistance were higherthan those observed percentages of florfenicol resistance (Tables1 and 2).
3.1.2. Scallop larvaeLarval cultures treated with antibacterials exhibit no significant
reductions in their bacterial content, observing that most of theirculturable levels of copiotrophic and oligotrophic bacteria alongthe rearing period in both sampled months remained high (>106 -CFU g�1), as demonstrated in Tables 3–6.
Copiotrophic culturable counts of untreated scallop larvae ran-ged from 7.79 � 104 to 1.64 � 107 CFU g�1 in January and from to1.29 � 106 to 1.55 � 107 CFU g�1 in June, whereas oligotrophic cul-turable counts of untreated scallop larvae ranged from 6.86 � 105
to 2.05 � 107 CFU g�1 in January and from 4.53 � 106 to
Table 3Copiotrophic culturable bacterial count (CCBC) and percentage of florfenicol (FFC) and oxytetracycline (OT) resistance in reared larval samples taken in January.
Day Groups with significant differences (P < 0.05)
Control tanks Treated tanks P* P**
1 2 1 2
6 CCBC (CFUg�1) 1.03 � 105 ± 4.85 � 104 5.71 � 105 ± 1.99 � 105
FFC resistance (%) 1.78 ± 1.02 10.67 ± 1.22OT resistance (%) 1.00 ± 0.47 1.85 ± 1.14
8 CCBC (CFU g�1) 1.64 � 107 ± 3.01 � 106 a 1.55 � 106 ± 8.90 � 105 bc 3.23 � 106 ± 1.05 � 106 b 8.62 � 105 ± 4.76 � 105 c 0.0005 0.0045FFC resistance (%) 0.41 ± 0.18 b 5.36 ± 2.45 a 0.19 ± 0.03 b 0.20 ± 0.17 b 0.0000 0.0002OT resistance (%) 0.03 ± 0.01 b 0.04 ± 0.00 b 0.45 ± 0.25 a 0.08 ± 0.00 b 0.0159 0.0041
10 CCBC (CFU g�1) 2.17 � 106 ± 7.06 � 105 a 1.50 � 106 ± 2.49 � 105 a 1.16 � 106 ± 5.19 � 105 a 2.76 � 105 ± 2.28 � 105 b 0.0070 0.0012FFC resistance (%) 0.19 ± 0.03 b 2.03 ± 0.46 a 0.18 ± 0.00 b 0.12 ± 0.02 b 0.0002 0.0623OT resistance (%) 0.18 ± 0.11 b 0.09 ± 0.05 b 0.59 ± 0.24 a 0.24 ± 0.00 a 0.1876 0.0405
12 CCBC (CFU g�1) 1.55 � 106 ± 2.48 � 105 a 1.55 � 106 ± 5.52 � 105 a 2.96 � 105 ± 1.42 � 105 b 1.55 � 106 ± 3.81 � 105 a 0.0000 0.0002FFC resistance (%) 3.93 ± 0.25 a 3.22 ± 1.51 a 1.23 ± 0.13 a 3.67 ± 1.24 a 0.0503 0.2091OT resistance (%) 0.98 ± 0.73 a 0.59 ± 0.19 a 1.96 ± 0.49 a 1.49 ± 0.51 a 0.7936 0.2012
14 CCBC (CFU g�1) 2.08 � 106 ± 4.30 � 105 a 7.79 � 104 ± 2.03 � 104 c 1.83 � 106 ± 1.26 � 106 a 3.62 � 105 ± 1.04 � 105 b 0.0000 0.0181FFC resistance (%) 0.33 ± 0.05 c 8.04 ± 1.49 b 13.87 ± 6.51 ab 18.34 ± 2.94 a 0.0000 0.0000OT resistance (%) 0.02 ± 0.04 b 5.43 ± 2.60 a 4.93 ± 3.73 a 2.11 ± 1.12 a 0.0142 0.2824
Different letters within a row indicate significant differences among groups (P < 0.05).* P-value between replicate tanks.** P-value between control and treated tanks. Statistically significant values (P < 0.05) are bolded.
Table 4Oligotrophic bacterial culturable count (OBCC) and percentage of florfenicol (FFC) and oxytetracycline (OT) resistance in reared larval samples taken in January.
Day Groups with significant differences (P < 0.05)
Control tanks Treated tanks P* P**
1 2 1 2
6 OBCC (CFU g�1) 6.86 � 105 ± 4.85 � 105 1.59 � 106 ± 3.43 � 105
FFC resistance (%) 4.50 ± 1.13 4.64 ± 2.11OT resistance (%) 8.70 ± 1.49 3.60 ± 0.59
8 OBCC (CFU g�1) 2.05 � 107 ± 1.19 � 106 a 4.43 � 106 ± 1.24 � 106 b 6.08 � 106 ± 1.32 � 106 b 2.00 � 106 ± 8.04 � 105 c 0.0000 0.0001FFC resistance (%) 1.28 ± 0.09 b 2.46 ± 1.12 b 3.62 ± 0.98 b 21.19 ± 2.09 a 0.0011 0.0001OT resistance (%) 0.13 ± 0.04 d 0.68 ± 0.21 c 10.68 ± 0.41 a 6.28 ± 1.80 b 0.0001 0.0000
10 OBCC (CFU g�1) 3.59 � 106 ± 8.73 � 104 ab 4.76 � 106 ± 9.22 � 105 a 5.49 � 106 ± 3.74 � 106 a 1.36 � 106 ± 7.87 � 105 b 0.0159 0.0493FFC resistance (%) 6.47 ± 1.60 b 7.34 ± 3.16 b 4.46 ± 2.25 b 95.71 ± 1.51 a 0.0000 0.0000OT resistance (%) 4.80 ± 0.67 c 3.29 ± 0.42 c 23.29 ± 1.45 a 14.40 ± 1.52 b 0.0000 0.0000
12 OBCC (CFU g�1) 1.91 � 106 ± 6.07 � 105 a 2.21 � 106 ± 1.27 � 106 a 1.46 � 106 ± 1.58 � 105 a 2.24 � 106 ± 1.29 � 105 a 0.4076 0.9137FFC resistance (%) 35.50 ± 3.19 a 21.99 ± 3.68 ab 9.14 ± 2.90 c 20.33 ± 6.12 b 0.0012 0.0001OT resistance (%) 4.85 ± 1.14 b 5.26 ± 1.92 b 36.98 ± 2.79 a 5.05 ± 1.54 b 0.0000 0.0000
14 OBCC (CFU g�1) 4.91 � 106 ± 1.78 � 106 a 7.40 � 105 ± 2.80 � 105 bc 2.99 � 106 ± 7.36 � 105 ab 5.12 � 105 ± 1.24 � 105 c 0.0001 0.0239FFC resistance (%) 4.34 ± 0.47 b 2.18 ± 0.63 b 52.13 ± 3.65 a 44.93 ± 7.05 a 0.3592 0.0000OT resistance (%) 21.44 ± 3.11 ab 6.33 ± 4.61 b 18.57 ± 5.61 ab 37.28 ± 7.18 a 0.0120 0.0143
Different letters within a row indicate significant differences among groups (P < 0.05).* P-value between replicate tanks.** P-value between control and treated tanks. Statistically significant values (P < 0.05) are bolded.
338 C.D. Miranda et al. / Marine Pollution Bulletin 74 (2013) 334–343
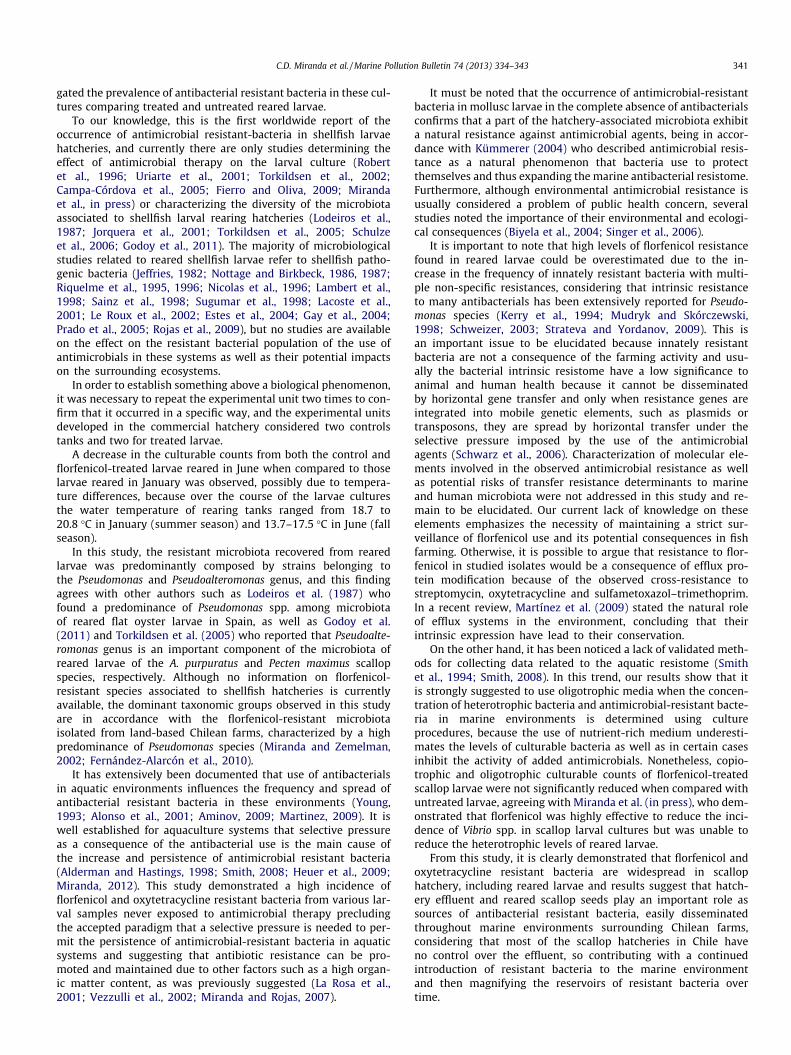
2.63 � 107 CFU g�1 in June (Tables 3–6). On the other hand, copio-trophic culturable counts of florfenicol-treated larvae samples ran-ged from 2.76 � 105 to 1.83 � 106 CFU g�1 in January and9.99 � 105 to 1.70 � 107 CFU g�1 in June (Tables 3 and 5), whereasoligotrophic culturable counts of florfenicol-treated larvae samplesranged from 5.12 � 105 to 6.00 � 106 CFU g�1 in January and from1.73 � 106 to 2.79 � 107 CFU g�1 in June (Tables 4 and 6). It mustbe noted that significant differences (P < 0.05) between controland treated cultures were observed in most of culturable countsalong the rearing periods of January and June cultures, observingthat usually control larvae exhibited higher values than those fromthe treated ones.
Untreated larvae exhibited percentages of copiotrophic bacteriaresistant to florfenicol from 0.33% to 10.67% in January and from0.19% to 5.00% in June (Tables 3 and 5), whereas percentages offlorfenicol resistance from treated larvae varied from 0.12% to18.34% in January and from 0.49% to 10.61% in June (Tables 3
and 5). Otherwise, florfenicol resistance among oligotrophic bacte-ria from untreated larvae varied from 1.28% to 35.50% in Januaryand from 1.44% to 13.24% in June, whereas florfenicol resistancefrom treated larvae ranged from 3.62% to 95.71% in January andfrom 5.21% to 59.72% in June (Tables 4 and 6). As was shown in Ta-ble 3, oxytetracycline resistance for copiotrophic bacteria recov-ered from untreated larvae varied from 0.02% to 5.43% in Januaryand from 0.02% to 8.02% in June, whereas percentages of oxytetra-cycline resistance from treated larvae ranged from 0.08% to 4.93%in January and from 0.46% to 6.97% in June. Otherwise, oligotrophiccounts exhibited higher percentages of oxytetracycline resistancein untreated (from 0.13% to 21.44% in January and from 0.01% to4.88% in June) and florfenicol-treated (from 5.05% to 37.28% in Jan-uary and from 3.41% to 53.19% in June) larvae (Tables 4 and 6).
Tables 3–6 shown the occurrence of significant differences(P < 0.05) between both control rearing tanks as well as betweenboth treated rearing tanks in the majority of copiotrophic and oli-
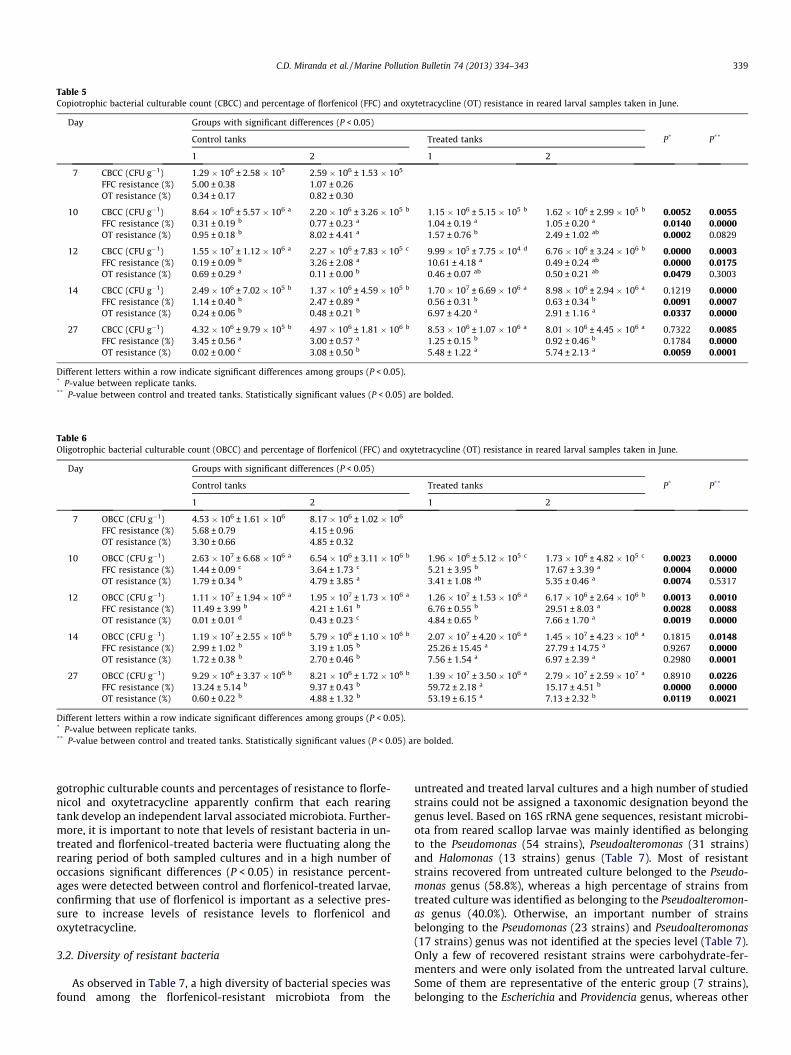
Table 5Copiotrophic bacterial culturable count (CBCC) and percentage of florfenicol (FFC) and oxytetracycline (OT) resistance in reared larval samples taken in June.
Day Groups with significant differences (P < 0.05)
Control tanks Treated tanks P* P**
1 2 1 2
7 CBCC (CFU g�1) 1.29 � 106 ± 2.58 � 105 2.59 � 106 ± 1.53 � 105
FFC resistance (%) 5.00 ± 0.38 1.07 ± 0.26OT resistance (%) 0.34 ± 0.17 0.82 ± 0.30
10 CBCC (CFU g�1) 8.64 � 106 ± 5.57 � 106 a 2.20 � 106 ± 3.26 � 105 b 1.15 � 106 ± 5.15 � 105 b 1.62 � 106 ± 2.99 � 105 b 0.0052 0.0055FFC resistance (%) 0.31 ± 0.19 b 0.77 ± 0.23 a 1.04 ± 0.19 a 1.05 ± 0.20 a 0.0140 0.0000OT resistance (%) 0.95 ± 0.18 b 8.02 ± 4.41 a 1.57 ± 0.76 b 2.49 ± 1.02 ab 0.0002 0.0829
12 CBCC (CFU g�1) 1.55 � 107 ± 1.12 � 106 a 2.27 � 106 ± 7.83 � 105 c 9.99 � 105 ± 7.75 � 104 d 6.76 � 106 ± 3.24 � 106 b 0.0000 0.0003FFC resistance (%) 0.19 ± 0.09 b 3.26 ± 2.08 a 10.61 ± 4.18 a 0.49 ± 0.24 ab 0.0000 0.0175OT resistance (%) 0.69 ± 0.29 a 0.11 ± 0.00 b 0.46 ± 0.07 ab 0.50 ± 0.21 ab 0.0479 0.3003
14 CBCC (CFU g�1) 2.49 � 106 ± 7.02 � 105 b 1.37 � 106 ± 4.59 � 105 b 1.70 � 107 ± 6.69 � 106 a 8.98 � 106 ± 2.94 � 106 a 0.1219 0.0000FFC resistance (%) 1.14 ± 0.40 b 2.47 ± 0.89 a 0.56 ± 0.31 b 0.63 ± 0.34 b 0.0091 0.0007OT resistance (%) 0.24 ± 0.06 b 0.48 ± 0.21 b 6.97 ± 4.20 a 2.91 ± 1.16 a 0.0337 0.0000
27 CBCC (CFU g�1) 4.32 � 106 ± 9.79 � 105 b 4.97 � 106 ± 1.81 � 106 b 8.53 � 106 ± 1.07 � 106 a 8.01 � 106 ± 4.45 � 106 a 0.7322 0.0085FFC resistance (%) 3.45 ± 0.56 a 3.00 ± 0.57 a 1.25 ± 0.15 b 0.92 ± 0.46 b 0.1784 0.0000OT resistance (%) 0.02 ± 0.00 c 3.08 ± 0.50 b 5.48 ± 1.22 a 5.74 ± 2.13 a 0.0059 0.0001
Different letters within a row indicate significant differences among groups (P < 0.05).* P-value between replicate tanks.** P-value between control and treated tanks. Statistically significant values (P < 0.05) are bolded.
Table 6Oligotrophic bacterial culturable count (OBCC) and percentage of florfenicol (FFC) and oxytetracycline (OT) resistance in reared larval samples taken in June.
Day Groups with significant differences (P < 0.05)
Control tanks Treated tanks P* P**
1 2 1 2
7 OBCC (CFU g�1) 4.53 � 106 ± 1.61 � 106 8.17 � 106 ± 1.02 � 106
FFC resistance (%) 5.68 ± 0.79 4.15 ± 0.96OT resistance (%) 3.30 ± 0.66 4.85 ± 0.32
10 OBCC (CFU g�1) 2.63 � 107 ± 6.68 � 106 a 6.54 � 106 ± 3.11 � 106 b 1.96 � 106 ± 5.12 � 105 c 1.73 � 106 ± 4.82 � 105 c 0.0023 0.0000FFC resistance (%) 1.44 ± 0.09 c 3.64 ± 1.73 c 5.21 ± 3.95 b 17.67 ± 3.39 a 0.0004 0.0000OT resistance (%) 1.79 ± 0.34 b 4.79 ± 3.85 a 3.41 ± 1.08 ab 5.35 ± 0.46 a 0.0074 0.5317
12 OBCC (CFU g�1) 1.11 � 107 ± 1.94 � 106 a 1.95 � 107 ± 1.73 � 106 a 1.26 � 107 ± 1.53 � 106 a 6.17 � 106 ± 2.64 � 106 b 0.0013 0.0010FFC resistance (%) 11.49 ± 3.99 b 4.21 ± 1.61 b 6.76 ± 0.55 b 29.51 ± 8.03 a 0.0028 0.0088OT resistance (%) 0.01 ± 0.01 d 0.43 ± 0.23 c 4.84 ± 0.65 b 7.66 ± 1.70 a 0.0019 0.0000
14 OBCC (CFU g�1) 1.19 � 107 ± 2.55 � 106 b 5.79 � 106 ± 1.10 � 106 b 2.07 � 107 ± 4.20 � 106 a 1.45 � 107 ± 4.23 � 106 a 0.1815 0.0148FFC resistance (%) 2.99 ± 1.02 b 3.19 ± 1.05 b 25.26 ± 15.45 a 27.79 ± 14.75 a 0.9267 0.0000OT resistance (%) 1.72 ± 0.38 b 2.70 ± 0.46 b 7.56 ± 1.54 a 6.97 ± 2.39 a 0.2980 0.0001
27 OBCC (CFU g�1) 9.29 � 106 ± 3.37 � 106 b 8.21 � 106 ± 1.72 � 106 b 1.39 � 107 ± 3.50 � 106 a 2.79 � 107 ± 2.59 � 107 a 0.8910 0.0226FFC resistance (%) 13.24 ± 5.14 b 9.37 ± 0.43 b 59.72 ± 2.18 a 15.17 ± 4.51 b 0.0000 0.0000OT resistance (%) 0.60 ± 0.22 b 4.88 ± 1.32 b 53.19 ± 6.15 a 7.13 ± 2.32 b 0.0119 0.0021
Different letters within a row indicate significant differences among groups (P < 0.05).* P-value between replicate tanks.** P-value between control and treated tanks. Statistically significant values (P < 0.05) are bolded.
C.D. Miranda et al. / Marine Pollution Bulletin 74 (2013) 334–343 339
gotrophic culturable counts and percentages of resistance to florfe-nicol and oxytetracycline apparently confirm that each rearingtank develop an independent larval associated microbiota. Further-more, it is important to note that levels of resistant bacteria in un-treated and florfenicol-treated bacteria were fluctuating along therearing period of both sampled cultures and in a high number ofoccasions significant differences (P < 0.05) in resistance percent-ages were detected between control and florfenicol-treated larvae,confirming that use of florfenicol is important as a selective pres-sure to increase levels of resistance levels to florfenicol andoxytetracycline.
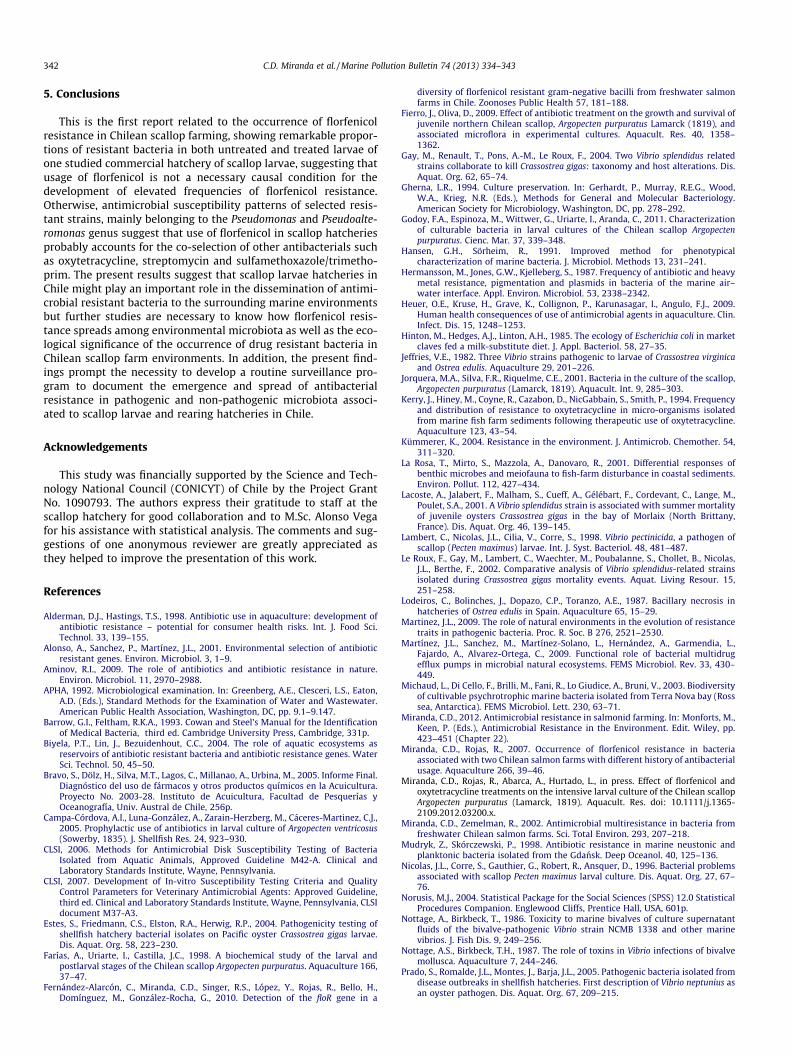
3.2. Diversity of resistant bacteria
As observed in Table 7, a high diversity of bacterial species wasfound among the florfenicol-resistant microbiota from the
untreated and treated larval cultures and a high number of studiedstrains could not be assigned a taxonomic designation beyond thegenus level. Based on 16S rRNA gene sequences, resistant microbi-ota from reared scallop larvae was mainly identified as belongingto the Pseudomonas (54 strains), Pseudoalteromonas (31 strains)and Halomonas (13 strains) genus (Table 7). Most of resistantstrains recovered from untreated culture belonged to the Pseudo-monas genus (58.8%), whereas a high percentage of strains fromtreated culture was identified as belonging to the Pseudoalteromon-as genus (40.0%). Otherwise, an important number of strainsbelonging to the Pseudomonas (23 strains) and Pseudoalteromonas(17 strains) genus was not identified at the species level (Table 7).Only a few of recovered resistant strains were carbohydrate-fer-menters and were only isolated from the untreated larval culture.Some of them are representative of the enteric group (7 strains),belonging to the Escherichia and Providencia genus, whereas other

Table 7Identification and source of florfenicol-resistant strains isolated farm scallop larvae.
Species Scallop culture Total
Not treated(68 strains)
Treated(60 strains)
Brachybacterium arcticum 1 1Brevibacterium sp. 1 1Escherichia coli 1 1Halomonas sp. 5 3 8Halomonas variabilis 3 3Halomonas venusta 2 2Idiomarina sp. 7 7Marinobacter litoralis 1 1Marinobacter squaleniorans 1 1Marinobacter sp. 2 2Marinomonas sp. 4 4Providencia heimbachae 2 2Providencia rettgeri 2 2Providencia sp. 2 2Pseudoalteromonas atlántica 2 2 4Pseudoalteromonas elyakovii 1 1Pseudoalteromonas gracilis 1 1Pseudoalteromonas haloplanktis 1 1Pseudoalteromonas mariniglutinosa 1 3 4Pseudoalteromonas prydzensis 2 2Pseudoalteromonas sp. 4 13 17Pseudoalteromonas tetraodonis 1 1Pseudomonas alcaliphila 1 1Pseudomonas guineae 1 1Pseudomonas knackmussii 1 1Pseudomonas marincola 3 3 6Pseudomonas monteilli 2 2Pseudomonas plecoglossicida 2 2 4Pseudomonas putida 4 4Pseudomonas segetis 7 2 9Pseudomonas stutzeri 3 3Pseudomonas sp. 18 5 23Pychrobacter glacincola 1 1Pychrobacter pulmonis 1 1Pychrobacter sp. 1 1Vibrio inusitatus 1 1Vibrio sp. 2 2
Table 8Antimicrobial resistance of florfenicol-resistant strain isolated from scallop larvaecultures.
Antimicrobial Scallop larvae culture
Untreated(n = 68)
Florfenicol-treated(n = 60)
Amoxicillin 16.2% (11) 20.0% (12)Cefotaxime 4.4% (3) 6.7% (4)Streptomycin* 36.8% (25) 60.0% (36)Gentamicin 0.0% (0) 1.7% (1)Kanamycin* 0.0% (0) 5.0% (3)Chloramphenicol 100.0% (68) 100.0% (60)Florfenicol 100.0% (68) 100.0% (60)Oxytetracycline 48.5% (33) 53.3% (32)Oxolinic acid 5.9% (4) 1.7% (1)Flumequine 0.0% (0) 0.0% (0)Enrofloxacin 0.0% (0) 0.0% (0)Furazolidone* 55.9% (38) 21.7% (13)Sulfametoxazole–
trimethoprim*
42.6% (29) 61.7% (37)
* Significant difference (P < 0.05).
Fig. 2. Antibacterial multiresistance of Gram-negative bacteria isolated fromChilean scallop larval cultures.
340 C.D. Miranda et al. / Marine Pollution Bulletin 74 (2013) 334–343
3 strains belonged to the Vibrio genus. On the other hand, strainsbelonging to the Idiomarina genus were only observed in the resis-tant microbiota from treated larval culture (Table 7).
3.3. Antimicrobial resistance patterns
Antimicrobial resistance patterns of the recovered strains werenot related to specific bacterial species or taxonomic groups andall strains exhibited resistance to chloramphenicol and florfenicoland susceptibility to flumequine and enrofloxacin, whereas themajority of strains isolated from both larval cultures were suscep-tible to cefotaxime and oxolinic acid (Table 8). As observed in Ta-ble 8, an important frequency of resistance to oxytetracycline,furazolidone and sulfametoxazol–trimethoprim was observed inthe resistant microbiota from untreated culture, whereas trea-ted-larvae resistant microbiota exhibited important incidence ofstreptomycin, oxytetracycline and sulfametoxazole–trimethoprimresistance. Significant differences in bacterial resistance to differ-ent antibiotics were found between resistant bacteria isolatedfrom untreated and treated larvae (ANOVA, P < 0.05). Resistanceto streptomycin, kanamycin and sulfamethoxazole–trimethoprimof strains recovered from florfenicol-treated larvae were signifi-cantly higher (P < 0.05) than those from the untreated larvae,whereas strains recovered from untreated larvae exhibited signif-icantly (P < 0.05) higher resistance to furazolidone (Table 8).Otherwise, all strains isolated from untreated larvae were suscep-tible to the aminoglycosides gentamicin and kanamycin, whereas
gentamicin and kanamycin resistance was rare (1.7% and 5.0%,respectively) among strains recovered from florfenicol-treatedlarvae (Table 8).
No significative differences in the occurrence of simultaneousresistance to various antibacterials between strains recovered fromuntreated and treated larval cultures were observed (Table 8). Flor-fenicol-resistant strains from untreated and treated larval culturesexhibited a low incidence of multiresistance, observing that 91.2%of strains from untreated culture and 85.0% strains from florfeni-col-treated showed simultaneous resistance to 3–5 antibacterials(Fig. 2). Highest levels of multiresistance among strains recoveredfrom untreated larvae were observed in 3 groups of 2 strainsexhibiting simultaneous resistance to 6, 7 and 8 antimicrobials,whereas simultaneous resistance to 6 (4 strains) and 7 (4 strains)antibacterials were observed among strains recovered from florfe-nicol-treated larvae. The multiresistance levels of both groups ofresistant strains were similar, exhibiting ARI values of 0.32 and0.33 for strains isolated from untreated and florfenicol-treated lar-vae, respectively.
4. Discussion
Considering that prophylactic administration of florfenicol inscallop larvae culture is a frequent practice in Chile, we investi-
C.D. Miranda et al. / Marine Pollution Bulletin 74 (2013) 334–343 341
gated the prevalence of antibacterial resistant bacteria in these cul-tures comparing treated and untreated reared larvae.
To our knowledge, this is the first worldwide report of theoccurrence of antimicrobial resistant-bacteria in shellfish larvaehatcheries, and currently there are only studies determining theeffect of antimicrobial therapy on the larval culture (Robertet al., 1996; Uriarte et al., 2001; Torkildsen et al., 2002;Campa-Córdova et al., 2005; Fierro and Oliva, 2009; Mirandaet al., in press) or characterizing the diversity of the microbiotaassociated to shellfish larval rearing hatcheries (Lodeiros et al.,1987; Jorquera et al., 2001; Torkildsen et al., 2005; Schulzeet al., 2006; Godoy et al., 2011). The majority of microbiologicalstudies related to reared shellfish larvae refer to shellfish patho-genic bacteria (Jeffries, 1982; Nottage and Birkbeck, 1986, 1987;Riquelme et al., 1995, 1996; Nicolas et al., 1996; Lambert et al.,1998; Sainz et al., 1998; Sugumar et al., 1998; Lacoste et al.,2001; Le Roux et al., 2002; Estes et al., 2004; Gay et al., 2004;Prado et al., 2005; Rojas et al., 2009), but no studies are availableon the effect on the resistant bacterial population of the use ofantimicrobials in these systems as well as their potential impactson the surrounding ecosystems.
In order to establish something above a biological phenomenon,it was necessary to repeat the experimental unit two times to con-firm that it occurred in a specific way, and the experimental unitsdeveloped in the commercial hatchery considered two controlstanks and two for treated larvae.
A decrease in the culturable counts from both the control andflorfenicol-treated larvae reared in June when compared to thoselarvae reared in January was observed, possibly due to tempera-ture differences, because over the course of the larvae culturesthe water temperature of rearing tanks ranged from 18.7 to20.8 �C in January (summer season) and 13.7–17.5 �C in June (fallseason).
In this study, the resistant microbiota recovered from rearedlarvae was predominantly composed by strains belonging tothe Pseudomonas and Pseudoalteromonas genus, and this findingagrees with other authors such as Lodeiros et al. (1987) whofound a predominance of Pseudomonas spp. among microbiotaof reared flat oyster larvae in Spain, as well as Godoy et al.(2011) and Torkildsen et al. (2005) who reported that Pseudoalte-romonas genus is an important component of the microbiota ofreared larvae of the A. purpuratus and Pecten maximus scallopspecies, respectively. Although no information on florfenicol-resistant species associated to shellfish hatcheries is currentlyavailable, the dominant taxonomic groups observed in this studyare in accordance with the florfenicol-resistant microbiotaisolated from land-based Chilean farms, characterized by a highpredominance of Pseudomonas species (Miranda and Zemelman,2002; Fernández-Alarcón et al., 2010).
It has extensively been documented that use of antibacterialsin aquatic environments influences the frequency and spread ofantibacterial resistant bacteria in these environments (Young,1993; Alonso et al., 2001; Aminov, 2009; Martinez, 2009). It iswell established for aquaculture systems that selective pressureas a consequence of the antibacterial use is the main cause ofthe increase and persistence of antimicrobial resistant bacteria(Alderman and Hastings, 1998; Smith, 2008; Heuer et al., 2009;Miranda, 2012). This study demonstrated a high incidence offlorfenicol and oxytetracycline resistant bacteria from various lar-val samples never exposed to antimicrobial therapy precludingthe accepted paradigm that a selective pressure is needed to per-mit the persistence of antimicrobial-resistant bacteria in aquaticsystems and suggesting that antibiotic resistance can be pro-moted and maintained due to other factors such as a high organ-ic matter content, as was previously suggested (La Rosa et al.,2001; Vezzulli et al., 2002; Miranda and Rojas, 2007).
It must be noted that the occurrence of antimicrobial-resistantbacteria in mollusc larvae in the complete absence of antibacterialsconfirms that a part of the hatchery-associated microbiota exhibita natural resistance against antimicrobial agents, being in accor-dance with Kümmerer (2004) who described antimicrobial resis-tance as a natural phenomenon that bacteria use to protectthemselves and thus expanding the marine antibacterial resistome.Furthermore, although environmental antimicrobial resistance isusually considered a problem of public health concern, severalstudies noted the importance of their environmental and ecologi-cal consequences (Biyela et al., 2004; Singer et al., 2006).
It is important to note that high levels of florfenicol resistancefound in reared larvae could be overestimated due to the in-crease in the frequency of innately resistant bacteria with multi-ple non-specific resistances, considering that intrinsic resistanceto many antibacterials has been extensively reported for Pseudo-monas species (Kerry et al., 1994; Mudryk and Skórczewski,1998; Schweizer, 2003; Strateva and Yordanov, 2009). This isan important issue to be elucidated because innately resistantbacteria are not a consequence of the farming activity and usu-ally the bacterial intrinsic resistome have a low significance toanimal and human health because it cannot be disseminatedby horizontal gene transfer and only when resistance genes areintegrated into mobile genetic elements, such as plasmids ortransposons, they are spread by horizontal transfer under theselective pressure imposed by the use of the antimicrobialagents (Schwarz et al., 2006). Characterization of molecular ele-ments involved in the observed antimicrobial resistance as wellas potential risks of transfer resistance determinants to marineand human microbiota were not addressed in this study and re-main to be elucidated. Our current lack of knowledge on theseelements emphasizes the necessity of maintaining a strict sur-veillance of florfenicol use and its potential consequences in fishfarming. Otherwise, it is possible to argue that resistance to flor-fenicol in studied isolates would be a consequence of efflux pro-tein modification because of the observed cross-resistance tostreptomycin, oxytetracycline and sulfametoxazol–trimethoprim.In a recent review, Martínez et al. (2009) stated the natural roleof efflux systems in the environment, concluding that theirintrinsic expression have lead to their conservation.
On the other hand, it has been noticed a lack of validated meth-ods for collecting data related to the aquatic resistome (Smithet al., 1994; Smith, 2008). In this trend, our results show that itis strongly suggested to use oligotrophic media when the concen-tration of heterotrophic bacteria and antimicrobial-resistant bacte-ria in marine environments is determined using cultureprocedures, because the use of nutrient-rich medium underesti-mates the levels of culturable bacteria as well as in certain casesinhibit the activity of added antimicrobials. Nonetheless, copio-trophic and oligotrophic culturable counts of florfenicol-treatedscallop larvae were not significantly reduced when compared withuntreated larvae, agreeing with Miranda et al. (in press), who dem-onstrated that florfenicol was highly effective to reduce the inci-dence of Vibrio spp. in scallop larval cultures but was unable toreduce the heterotrophic levels of reared larvae.
From this study, it is clearly demonstrated that florfenicol andoxytetracycline resistant bacteria are widespread in scallophatchery, including reared larvae and results suggest that hatch-ery effluent and reared scallop seeds play an important role assources of antibacterial resistant bacteria, easily disseminatedthroughout marine environments surrounding Chilean farms,considering that most of the scallop hatcheries in Chile haveno control over the effluent, so contributing with a continuedintroduction of resistant bacteria to the marine environmentand then magnifying the reservoirs of resistant bacteria overtime.
342 C.D. Miranda et al. / Marine Pollution Bulletin 74 (2013) 334–343
5. Conclusions
This is the first report related to the occurrence of florfenicolresistance in Chilean scallop farming, showing remarkable propor-tions of resistant bacteria in both untreated and treated larvae ofone studied commercial hatchery of scallop larvae, suggesting thatusage of florfenicol is not a necessary causal condition for thedevelopment of elevated frequencies of florfenicol resistance.Otherwise, antimicrobial susceptibility patterns of selected resis-tant strains, mainly belonging to the Pseudomonas and Pseudoalte-romonas genus suggest that use of florfenicol in scallop hatcheriesprobably accounts for the co-selection of other antibacterials suchas oxytetracycline, streptomycin and sulfamethoxazole/trimetho-prim. The present results suggest that scallop larvae hatcheries inChile might play an important role in the dissemination of antimi-crobial resistant bacteria to the surrounding marine environmentsbut further studies are necessary to know how florfenicol resis-tance spreads among environmental microbiota as well as the eco-logical significance of the occurrence of drug resistant bacteria inChilean scallop farm environments. In addition, the present find-ings prompt the necessity to develop a routine surveillance pro-gram to document the emergence and spread of antibacterialresistance in pathogenic and non-pathogenic microbiota associ-ated to scallop larvae and rearing hatcheries in Chile.
Acknowledgements
This study was financially supported by the Science and Tech-nology National Council (CONICYT) of Chile by the Project GrantNo. 1090793. The authors express their gratitude to staff at thescallop hatchery for good collaboration and to M.Sc. Alonso Vegafor his assistance with statistical analysis. The comments and sug-gestions of one anonymous reviewer are greatly appreciated asthey helped to improve the presentation of this work.
References
Alderman, D.J., Hastings, T.S., 1998. Antibiotic use in aquaculture: development ofantibiotic resistance – potential for consumer health risks. Int. J. Food Sci.Technol. 33, 139–155.
Alonso, A., Sanchez, P., Martínez, J.L., 2001. Environmental selection of antibioticresistant genes. Environ. Microbiol. 3, 1–9.
Aminov, R.I., 2009. The role of antibiotics and antibiotic resistance in nature.Environ. Microbiol. 11, 2970–2988.
APHA, 1992. Microbiological examination. In: Greenberg, A.E., Clesceri, L.S., Eaton,A.D. (Eds.), Standard Methods for the Examination of Water and Wastewater.American Public Health Association, Washington, DC, pp. 9.1–9.147.
Barrow, G.I., Feltham, R.K.A., 1993. Cowan and Steel’s Manual for the Identificationof Medical Bacteria, third ed. Cambridge University Press, Cambridge, 331p.
Biyela, P.T., Lin, J., Bezuidenhout, C.C., 2004. The role of aquatic ecosystems asreservoirs of antibiotic resistant bacteria and antibiotic resistance genes. WaterSci. Technol. 50, 45–50.
Bravo, S., Dölz, H., Silva, M.T., Lagos, C., Millanao, A., Urbina, M., 2005. Informe Final.Diagnóstico del uso de fármacos y otros productos químicos en la Acuicultura.Proyecto No. 2003-28. Instituto de Acuicultura, Facultad de Pesquerías yOceanografía, Univ. Austral de Chile, 256p.
Campa-Córdova, A.I., Luna-González, A., Zarain-Herzberg, M., Cáceres-Martinez, C.J.,2005. Prophylactic use of antibiotics in larval culture of Argopecten ventricosus(Sowerby, 1835). J. Shellfish Res. 24, 923–930.
CLSI, 2006. Methods for Antimicrobial Disk Susceptibility Testing of BacteriaIsolated from Aquatic Animals, Approved Guideline M42-A. Clinical andLaboratory Standards Institute, Wayne, Pennsylvania.
CLSI, 2007. Development of In-vitro Susceptibility Testing Criteria and QualityControl Parameters for Veterinary Antimicrobial Agents: Approved Guideline,third ed. Clinical and Laboratory Standards Institute, Wayne, Pennsylvania, CLSIdocument M37-A3.
Estes, S., Friedmann, C.S., Elston, R.A., Herwig, R.P., 2004. Pathogenicity testing ofshellfish hatchery bacterial isolates on Pacific oyster Crassostrea gigas larvae.Dis. Aquat. Org. 58, 223–230.
Farías, A., Uriarte, I., Castilla, J.C., 1998. A biochemical study of the larval andpostlarval stages of the Chilean scallop Argopecten purpuratus. Aquaculture 166,37–47.
Fernández-Alarcón, C., Miranda, C.D., Singer, R.S., López, Y., Rojas, R., Bello, H.,Domínguez, M., González-Rocha, G., 2010. Detection of the floR gene in a
diversity of florfenicol resistant gram-negative bacilli from freshwater salmonfarms in Chile. Zoonoses Public Health 57, 181–188.
Fierro, J., Oliva, D., 2009. Effect of antibiotic treatment on the growth and survival ofjuvenile northern Chilean scallop, Argopecten purpuratus Lamarck (1819), andassociated microflora in experimental cultures. Aquacult. Res. 40, 1358–1362.
Gay, M., Renault, T., Pons, A.-M., Le Roux, F., 2004. Two Vibrio splendidus relatedstrains collaborate to kill Crassostrea gigas: taxonomy and host alterations. Dis.Aquat. Org. 62, 65–74.
Gherna, L.R., 1994. Culture preservation. In: Gerhardt, P., Murray, R.E.G., Wood,W.A., Krieg, N.R. (Eds.), Methods for General and Molecular Bacteriology.American Society for Microbiology, Washington, DC, pp. 278–292.
Godoy, F.A., Espinoza, M., Wittwer, G., Uriarte, I., Aranda, C., 2011. Characterizationof culturable bacteria in larval cultures of the Chilean scallop Argopectenpurpuratus. Cienc. Mar. 37, 339–348.
Hansen, G.H., Sörheim, R., 1991. Improved method for phenotypicalcharacterization of marine bacteria. J. Microbiol. Methods 13, 231–241.
Hermansson, M., Jones, G.W., Kjelleberg, S., 1987. Frequency of antibiotic and heavymetal resistance, pigmentation and plasmids in bacteria of the marine air–water interface. Appl. Environ. Microbiol. 53, 2338–2342.
Heuer, O.E., Kruse, H., Grave, K., Collignon, P., Karunasagar, I., Angulo, F.J., 2009.Human health consequences of use of antimicrobial agents in aquaculture. Clin.Infect. Dis. 15, 1248–1253.
Hinton, M., Hedges, A.J., Linton, A.H., 1985. The ecology of Escherichia coli in marketclaves fed a milk-substitute diet. J. Appl. Bacteriol. 58, 27–35.
Jeffries, V.E., 1982. Three Vibrio strains pathogenic to larvae of Crassostrea virginicaand Ostrea edulis. Aquaculture 29, 201–226.
Jorquera, M.A., Silva, F.R., Riquelme, C.E., 2001. Bacteria in the culture of the scallop,Argopecten purpuratus (Lamarck, 1819). Aquacult. Int. 9, 285–303.
Kerry, J., Hiney, M., Coyne, R., Cazabon, D., NicGabbain, S., Smith, P., 1994. Frequencyand distribution of resistance to oxytetracycline in micro-organisms isolatedfrom marine fish farm sediments following therapeutic use of oxytetracycline.Aquaculture 123, 43–54.
Kümmerer, K., 2004. Resistance in the environment. J. Antimicrob. Chemother. 54,311–320.
La Rosa, T., Mirto, S., Mazzola, A., Danovaro, R., 2001. Differential responses ofbenthic microbes and meiofauna to fish-farm disturbance in coastal sediments.Environ. Pollut. 112, 427–434.
Lacoste, A., Jalabert, F., Malham, S., Cueff, A., Gélébart, F., Cordevant, C., Lange, M.,Poulet, S.A., 2001. A Vibrio splendidus strain is associated with summer mortalityof juvenile oysters Crassostrea gigas in the bay of Morlaix (North Brittany,France). Dis. Aquat. Org. 46, 139–145.
Lambert, C., Nicolas, J.L., Cilia, V., Corre, S., 1998. Vibrio pectinicida, a pathogen ofscallop (Pecten maximus) larvae. Int. J. Syst. Bacteriol. 48, 481–487.
Le Roux, F., Gay, M., Lambert, C., Waechter, M., Poubalanne, S., Chollet, B., Nicolas,J.L., Berthe, F., 2002. Comparative analysis of Vibrio splendidus-related strainsisolated during Crassostrea gigas mortality events. Aquat. Living Resour. 15,251–258.
Lodeiros, C., Bolinches, J., Dopazo, C.P., Toranzo, A.E., 1987. Bacillary necrosis inhatcheries of Ostrea edulis in Spain. Aquaculture 65, 15–29.
Martinez, J.L., 2009. The role of natural environments in the evolution of resistancetraits in pathogenic bacteria. Proc. R. Soc. B 276, 2521–2530.
Martínez, J.L., Sanchez, M., Martínez-Solano, L., Hernández, A., Garmendia, L.,Fajardo, A., Alvarez-Ortega, C., 2009. Functional role of bacterial multidrugefflux pumps in microbial natural ecosystems. FEMS Microbiol. Rev. 33, 430–449.
Michaud, L., Di Cello, F., Brilli, M., Fani, R., Lo Giudice, A., Bruni, V., 2003. Biodiversityof cultivable psychrotrophic marine bacteria isolated from Terra Nova bay (Rosssea, Antarctica). FEMS Microbiol. Lett. 230, 63–71.
Miranda, C.D., 2012. Antimicrobial resistance in salmonid farming. In: Monforts, M.,Keen, P. (Eds.), Antimicrobial Resistance in the Environment. Edit. Wiley, pp.423–451 (Chapter 22).
Miranda, C.D., Rojas, R., 2007. Occurrence of florfenicol resistance in bacteriaassociated with two Chilean salmon farms with different history of antibacterialusage. Aquaculture 266, 39–46.
Miranda, C.D., Rojas, R., Abarca, A., Hurtado, L., in press. Effect of florfenicol andoxytetracycline treatments on the intensive larval culture of the Chilean scallopArgopecten purpuratus (Lamarck, 1819). Aquacult. Res. doi: 10.1111/j.1365-2109.2012.03200.x.
Miranda, C.D., Zemelman, R., 2002. Antimicrobial multiresistance in bacteria fromfreshwater Chilean salmon farms. Sci. Total Environ. 293, 207–218.
Mudryk, Z., Skórczewski, P., 1998. Antibiotic resistance in marine neustonic andplanktonic bacteria isolated from the Gdansk. Deep Oceanol. 40, 125–136.
Nicolas, J.L., Corre, S., Gauthier, G., Robert, R., Ansquer, D., 1996. Bacterial problemsassociated with scallop Pecten maximus larval culture. Dis. Aquat. Org. 27, 67–76.
Norusis, M.J., 2004. Statistical Package for the Social Sciences (SPSS) 12.0 StatisticalProcedures Companion. Englewood Cliffs, Prentice Hall, USA, 601p.
Nottage, A., Birkbeck, T., 1986. Toxicity to marine bivalves of culture supernatantfluids of the bivalve-pathogenic Vibrio strain NCMB 1338 and other marinevibrios. J. Fish Dis. 9, 249–256.
Nottage, A.S., Birkbeck, T.H., 1987. The role of toxins in Vibrio infections of bivalvemollusca. Aquaculture 7, 244–246.
Prado, S., Romalde, J.L., Montes, J., Barja, J.L., 2005. Pathogenic bacteria isolated fromdisease outbreaks in shellfish hatcheries. First description of Vibrio neptunius asan oyster pathogen. Dis. Aquat. Org. 67, 209–215.
C.D. Miranda et al. / Marine Pollution Bulletin 74 (2013) 334–343 343
Riquelme, C., Hayashida, G., Toranzo, A.E., Vilches, J., Chavez, P., 1995. Pathogenicitystudies on a Vibrio anguillarum related (VAR) strain causing an epizootic inArgopecten purpuratus larvae cultured in Chile. Dis. Aquat. Org. 22, 135–141.
Riquelme, C., Toranzo, A.E., Barja, J.L., Vergara, N., Araya, R., 1996. Association ofAeromonas hydrophila and Vibrio alginolyticus with larval mortalities of scallop(Argopecten purpuratus). J. Invert. Pathol. 67, 213–218.
Robert, R., Miner, P., Nicolas, J.L., 1996. Mortality control of scallop larvae in thehatchery. Aquacult. Int. 4, 305–313.
Rojas, R., Miranda, C.D., Amaro, A.M., 2009. Pathogenicity of a highlyexopolysaccharide-producing Halomonas strain causing epizootics in larvalcultures of the Chilean scallop Argopecten purpuratus (Lamarck, 1819). Microb.Ecol. 56, 47–52.
Sainz, J.C., Ascencio, F., Maeda-Martínez, A.N., 1998. Experimental vibriosisinduction with Vibrio alginolyticus of larvae of the catarina scallop (Argopectenventricosus = circularis) (Sowerby II, 1842). Microb. Ecol. 35, 188–192.
Schulze, A.D., Alabib, A.O., Tattersall-Sheldrakeb, A.R., Miller, K.M., 2006. Bacterialdiversity in a marine hatchery: balance between pathogenic and potentiallyprobiotic bacterial strains. Aquaculture 256, 50–73.
Schwarz, S., Cloeckaert, A., Roberts, M.C., 2006. Mechanisms and spread of bacterialresistance to antimicrobial agents. In: Aarestrup, F.M. (Ed.), AntimicrobialResistance in Bacteria of Animal Origin. ASM Press, USA, pp. 73–98.
Schwarz, S., Kehrenberg, C., Doublet, B., Cloeckaert, A., 2004. Molecular basis ofbacterial resistance to chloramphenicol and florfenicol. FEMS Microbiol. Rev.28, 519–542.
Schweizer, H.P., 2003. Efflux as a mechanism of resistance to antimicrobials inPseudomonas aeruginosa and related bacteria: unanswered questions. Genet.Mol. Res. 2, 48–62.
Singer, R.S., Ward, M.P., Maldonado, G., 2006. Can landscape ecology untangle thecomplexity of antibiotic resistance? Nat. Rev. Microbiol. 4, 943–952.
Smith, P., 2008. Antimicrobial resistance in aquaculture. Rev. Sci. Tech. 27, 243–264.Smith, P., Hiney, M.P., Samuelsen, O.B., 1994. Bacterial resistance to antimicrobial
agents used in fish farming: a critical evaluation of method and meaning. Ann.Rev. Fish Dis. 4, 273–313.
Strateva, T., Yordanov, D., 2009. Pseudomonas aeruginosa – a phenomenon ofbacterial resistance. J. Med. Microbiol. 58, 1133–1148.
Sugumar, G., Nakai, T., Hirata, Y., Matsubara, D., Muroga, K., 1998. Vibrio splendidusbiovar II as the causative agent of bacillary necrosis of Japanese oysterCrassostrea gigas larvae. Dis. Aquat. Org. 33, 111–118.
Torkildsen, L., Coyne, R., Samuelsen, O.B., Magnesen, T., Bergh, Ø., 2002. Treatmentof the early life stages of scallop (Pecten maximus) with antimicrobial agents;searching for an alternative to chloramphenicol. Aquacult. Int. 10, 399–409.
Torkildsen, L., Lambert, C., Nylund, A., Magnesen, T., Bergh, Ø., 2005. Bacteriaassociated with early life stages of the great scallop, Pecten maximus: impact onlarval survival. Aquacult. Int. 13, 575–592.
Uriarte, I., Farías, A., Castilla, J., 2001. Effect of antibiotic treatment during larvaldevelopment of the Chilean scallop Argopecten purpuratus. Aquacult. Eng. 25,139–147.
Vezzulli, L., Chelossi, E., Riccardi, G., Fabiano, M., 2002. Bacterial communitystructure and activity in fish farm sediments of the Ligurian sea (westernMediterranean). Aquacult. Int. 10, 123–141.
Young, H.K., 1993. Antimicrobial resistance spread in aquatic environments. J.Antimicrob. Chemother. 31, 627–635.
Zar, J.H., 1999. Biostatistical Analysis, fourth ed. Prentice-Hall, Upper Saddle River,NJ, 931p.