Center Riser for V8 inboard and sterndrive unit - Firebird Marine
Upload
khangminh22Category
view
0download
0
Chemical and Process Engineering Research www.iiste.org ISSN 2224-7467 (Paper) ISSN 2225-0913 (Online) Vol.7, 2013
12
Riser Reactor Simulation in a Fluid Catalytic Cracking Unit
Babatope Olufemi1*, Kayode Latinwo2, Ayokunle Olukayode1
1. Chemical Engineering Department, University of Lagos, Lagos, Nigeria
2. Chemical Engineering Department, Ladoke Akintola University of Technology, Ogbomosho, Nigeria * E-mail of the corresponding author: [email protected]
Abstract
A one-dimensional mathematical modelling and simulation of the riser reactor in a fluid catalytic cracking unit was presented in this work. The seemingly increasing demand for lighter fractions of petroleum as source of energy has necessitated that the fluid catalytic cracking (FCC) unit be modelled with greater precision and accuracy. A more accurate model of the riser reactor that is one of the primary functional elements of the FCC unit is important in improving the performance of the entire unit. Salient issues in the presented model were the four-lump kinetic model for the cracking mechanism, slip factor consideration between the phases, exponential catalyst activity deactivation model and the instantaneous estimation of the temperature dependent specific heat capacities of reacting species during the reaction. The model exhibited the behavior expected of a riser reactor based on comparison with some industrial plant data and previous simulations. Simulation results showed that increase in the catalyst to oil ratio (COR) led to increase in gasoline yield only to a particular limit beyond which the yield began to decline. Presented results showed reasonable set of parameters for operating the riser which could lead to better yield. Keywords: One-dimensional (1-D), FCC, riser, hydrodynamic, lump kinetic, modelling, simulation. 1. Introduction
The fluid catalytic cracking (FCC) unit can be said to be a major conversion unit in the petroleum refining process. It upgrades heavy petroleum fractions to more valuable lighter products by cracking, and is a primary producer of gasoline in refineries being sometimes referred to as the heart of the refinery. The performance of the FCC units seemingly depends largely on the riser reactor. The overall economics of refinery plants can therefore be dependent on it. Any improvement in its operation is expected to result in dramatic economic benefits. This improvement can be achieved by the development of an accurate model which can be used to study the process in order to possibly obtain a more optimum and profitable operation.
Schematically, a typical FCC unit is made up of two reaction sub-units and a fractionator. In the first reactor (riser), hot catalyst is brought into contact with the vaporized feed (gas oil) and cracking takes place. The regenerator, in which the coke deposited on the catalyst during the cracking reaction is burnt off to regenerate the catalyst, is the second reaction sub-unit. The regenerated catalyst is circulated back to the riser while the cracked products are sent to the fractionator for recovery.
The complexities of various cracking reactions as well as the hydrodynamic ability of fluid flow in the process pose difficulties in modelling a riser reactor. Most of the available models in literatures are efforts to proffer solutions to the short comings of earlier models some of which include Ali and Rohani
brought to you by COREView metadata, citation and similar papers at core.ac.uk
provided by International Institute for Science, Technology and Education (IISTE): E-Journals

Chemical and Process Engineering Research www.iiste.org ISSN 2224-7467 (Paper) ISSN 2225-0913 (Online) Vol.7, 2013
13
(1997), Arbel et al. (1995), Han and Chung (2001) and Theologos and Markatos (1993) to mention a few. In some, one or two aspects might have been neglected and this possibly could have led to some limitations of the models. One of the important aspects that could have been ignored is the effect of temperature using the assumption of constant temperature. Another area is the effect of complexity of the feed section due to high temperature, high turbulence, concentration gradient and flow inhomogeneity on residence time. The development of adiabatic models has taken care of the assumption of isothermal operating condition. Similarly, the presence of high efficiency injection system which cause all cracking to take place in a short residence time has justified the assumption of instantaneous vaporization and thermal equilibrium viz-a viz residence time. Although, introduction of adiabatic models by some authors furnished significant contributions, but seems to not fully describe other effects. Gupta and Rao (2001) and Arandes and Lasa (1992) have contributed to this study. One more factor that is often disregarded is the slip between the gas and catalyst particles, which is given by the ratio of actual gas and particles velocities. This parameter affects the residence time of catalyst in the riser reactor and consequently the conversion. This present work seeks to wholly account for the effect of temperature by introducing some relevant terms in the model as well as expressing the specific heat capacities of the lumps as a function of temperature. In addition, the slip between the gas and catalyst particles, the four-lump kinetic model necessary for the cracking mechanism and the exponential catalyst deactivation model to describe the decay of catalyst activity were considered in the derived model. 2. Mathematical modeling
In order to develop a mathematical model for this system, the following assumptions were introduced: i. One dimensional ideal plug flow reactor prevails in the riser without radial and axial
dispersion. The reactor is considered as an adiabatic riser. ii. Heat capacities of components vary with temperature along the riser length. iii. Dispersion and adsorption inside the catalyst particles are negligible. iv. The pressure change throughout the riser length is due to static head of catalyst in the riser. v. The coke deposited on catalyst does not affect fluid flow. vi. The riser dynamics is fast enough to justify quasi-steady state model. vii. Instantaneous vaporization occurred in the entrance of the riser. viii. All cracking reactions take place in the riser. Mass balance: Material balance is taken over a volume element of the riser. At the entrance of the riser, the gas oil vaporizes due to the heat transferred to it by both the dispersion steam and catalyst. Hence, each volume element contains both gas and solid phases. The solid phase being the catalyst and coke, while the gas phase consists of the vaporized gas oil and steam. Component material balance is taken over a volume element of the riser for each of the lumped components as follows:

Chemical and Process Engineering Research www.iiste.org ISSN 2224-7467 (Paper) ISSN 2225-0913 (Online) Vol.7, 2013
14
Mass in low of component minus mass out low of component is equal to mass of component consumed / formed
퐹 ∗푑푥푑푧 = 퐴 ∗ 훿 ∗ 휌 ∗ 휏 (1)
퐹 = 퐹 + 퐹 (2) For gas oil
퐹 ∗푑푥푑푧 = 퐴 ∗ 훿 ∗ 휌 ∗ 휏 (3)
For gasoline
퐹 ∗푑푥푑푧 = 퐴 ∗ 훿 ∗ 휌 ∗ 휏 (4)
For light gases
퐹 ∗푑푥푑푧 = 퐴 ∗ 훿 ∗ 휌 ∗ 휏 (5)
For coke
퐹 ∗푑푥푑푧 = 퐴 ∗ 훿 ∗ 휌 ∗ 휏 (6)
Force balance: Based on the assumption that the pressure change throughout the riser length is due to static head of catalyst in the riser, it follows that
−푑푃푑푍 = 휌 ∗ 푔 ∗ 훿 (7)
Which shows that, pressure gradient is balanced by the gravitational force on the catalyst hold up 훿. In Equation 3, the pressure drops due to static head of solid, solid acceleration, solid friction and gas friction are negligible. Hydrodynamic model of riser: The flow pattern in the riser is characterized by parameters such as gas and solid physical properties, gas and catalyst particle velocities as well as the voidage or volume fraction. The average particle velocity in the riser, 푉 is defined by
푉 =퐺
휌 ∗ 훿 (8)
The correlation developed by Patience et al. (1992) for slip factor was used in this work. According to it, numerical value of the slip factor, defined as the ratio of the gas interstitial velocity to the average particle velocity was predicted by the following expression:
Chemical and Process Engineering Research www.iiste.org ISSN 2224-7467 (Paper) ISSN 2225-0913 (Online) Vol.7, 2013
15
Φ =푈휀.푉 = 1 +
5.6퐹푟 + 0.47퐹푟 . (9)
where, 휀 = 1− 훿 (10)
Combining Equations 4 and 5 gives Equation 6 for the average voidage in terms of solid mass flux, interstitial gas velocity, riser diameter and catalyst physical properties.
훿 =퐺
푈 휌 + 휑퐺 (11)
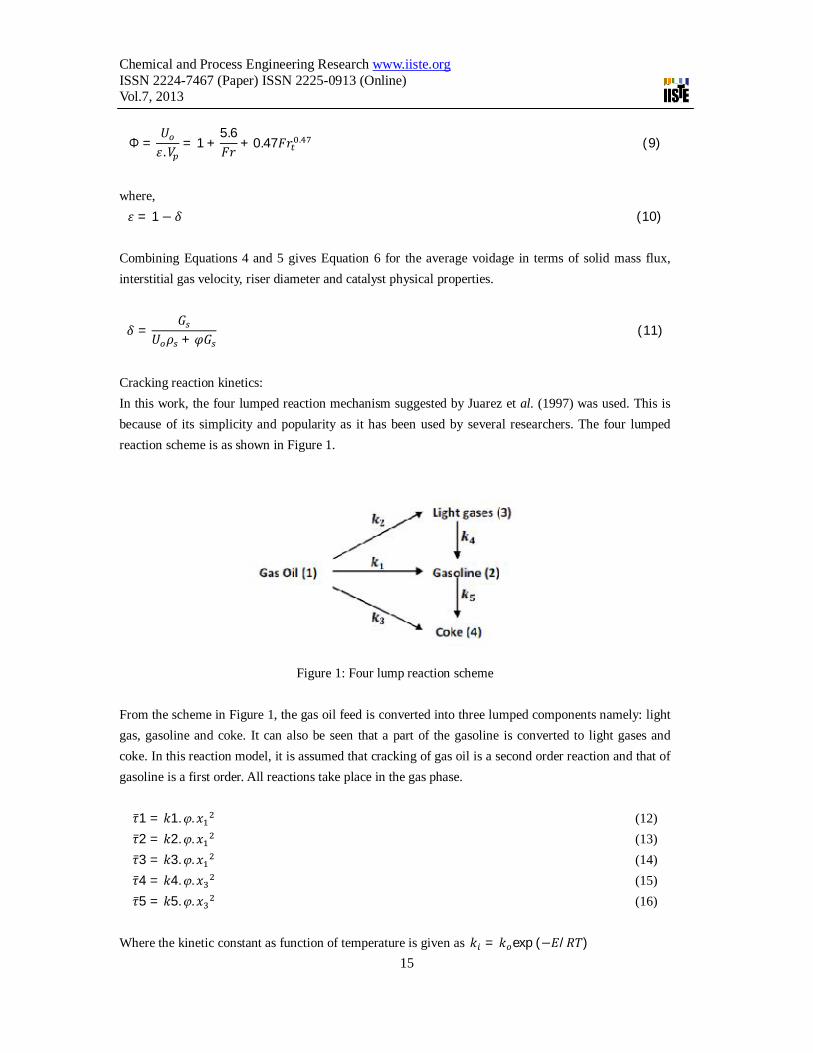
Cracking reaction kinetics: In this work, the four lumped reaction mechanism suggested by Juarez et al. (1997) was used. This is because of its simplicity and popularity as it has been used by several researchers. The four lumped reaction scheme is as shown in Figure 1.
Figure 1: Four lump reaction scheme From the scheme in Figure 1, the gas oil feed is converted into three lumped components namely: light gas, gasoline and coke. It can also be seen that a part of the gasoline is converted to light gases and coke. In this reaction model, it is assumed that cracking of gas oil is a second order reaction and that of gasoline is a first order. All reactions take place in the gas phase. 휏̅1 = 푘1.. 푥 (12) 휏̅2 = 푘2.. 푥 (13) 휏̅3 = 푘3.. 푥 (14) 휏̅4 = 푘4.. 푥 (15) 휏̅5 = 푘5.. 푥 (16)
Where the kinetic constant as function of temperature is given as 푘 = 푘 exp (−퐸/푅푇)

Chemical and Process Engineering Research www.iiste.org ISSN 2224-7467 (Paper) ISSN 2225-0913 (Online) Vol.7, 2013
16
During the reaction, catalyst activity decay is due to the deposition of coke. For the model to be accurate, this effect must be integrated into the expression. The deactivation kinetic model of Weekman (1979) is used. It is calculated by a function as expressed in eq. below. = 푒푥푝(−훼푡 ) (17)
The catalyst decay coefficient is predicted by the Arrhenius equation 훼 = 훼 푒푥푝 (−퐸 푅푇⁄ ) (18)
Energy Balance: Hence, the inlet temperature will be calculated putting into consideration the energy balance of the three components. The expression below is used in calculating the inlet temperature. At Z = 0 푊.퐶 . (푇 − 푇 ) + 퐹 .퐶 . +퐹 .퐶 . 푇 − 푇 +퐹 .∆퐻 + 퐹 .퐶 . (푇 − 푇 ) = 0 (19)
Since the riser operating condition is adiabatic and the reaction is endothermic, energy is consumed. With the assumption of thermal equilibrium of both the solid and gas phases, the energy balance over a volume element of the reactor can be calculated thus At 푍 = ℎ
퐹퐶 +푊 ∗ 퐶푑푇푑푍 = (휏 )(−∆퐻 )(1− 휀)휌 퐴 (20)
퐹퐶 = 퐹 ∗ 푥 퐶 (21)
where,
퐶 = 푚 푐 (22)
In polynomial form, 퐶 = 푎 + 푏푇 + 푐푇 + …… (23)
With the boundary condition that: At 푍 = 0
푥 (0) = 1, 푥 (0) = 0
i represents gasoline, light gases and coke
푇(0) = 푇
At 푍 = ℎ, 푇 = 푇
The complete description of the hydrodynamic transport and reaction model resulted in five first order differential equations in Equations 3 to 6 and Equation 20 with the inclusion of force balance, species

Chemical and Process Engineering Research www.iiste.org ISSN 2224-7467 (Paper) ISSN 2225-0913 (Online) Vol.7, 2013
17
and energy balance equations for 5 independent variables x1, x2, x3, x4, and T. Hence, the problem was well defined. A MATLAB code was developed to solve the problem. The percentage deviation of calculated from plant data were estimated as follows:
%100..%
Plant
CalcPlantDev (24)
3. Results and Discussions On simulation of the riser reactor using some useful parameters which include industrial riser operating conditions (Ali and Rohani, 1997), plant data used for riser simulation by Ahari et al. (2008), modified kinetic parameters by Ahari et al. (2008) and thermodynamic properties of the feed by Ahari et al. (2008), the following results were obtained as presented in Tables 1 to 4 and Figures 2 to 10. Table 1: Outlet composition results from riser reactor simulation Component Composition (wt %)
Gasoline 46.0
Light gases 5.6
Coke 30.0
Gas oil conversion 79.0
Table 2: Comparison of model result with plant result Parameter Plant Model % Dev. Gasoline yield (wt %) 44 46 -4.55
Coke yield (wt %) 5.83 5.60 3.95 Outlet temperature (K) 798 809 -1.39 Table 3: Industrial riser operating conditions (Ali and Rohani, 1997) Operating Conditions Case 1 Case 2 Case 3 Case 4 Feed rate (kg/s) 19.95 25.70 26.90 23.60 Feed quality (API) 22.28 21.76 22.18 22.73 COR (kg/kg) 7.20 6.33 5.43 6.07 Inlet pressure (kPa) 294 294 294 294 Feed temperature (K) 494 494 494 494 Catalyst inlet temperature (K) 960 1033 1004 1006 Steam (wt %) 7.00 5.50 5.00 5.75 Steam temperature (K) 773 773 773 773

Chemical and Process Engineering Research www.iiste.org ISSN 2224-7467 (Paper) ISSN 2225-0913 (Online) Vol.7, 2013
18
Table 4: Comparison of the results predicted in this work with industrial data Parameter Case 1 Case 2
Plant Calc. % Dev. Plant Calc. % Dev. Gasoline yield (wt %) 43.88 46.48 -5.90 46.90 46.39 1.09 Coke yield (wt %) 5.38 5.78 -7.43 5.34 5.48 -2.62 Outlet temperature (K) 795.0 811.1 -2.03 808.0 824.3 -2.01 Parameter Case 3 Case 4
Plant Calc. % Dev. Plant Calc. % Dev. Gasoline yield (wt %) 44.79 46.5 -3.68 41.78 45.53 -8.98 Coke yield (wt %) 5.43 5.59 -2.95 5.69 5.69 0 Outlet temperature (K) 805.0 810.2 -0.64 806.0 816.3 -1.28
Figure 2: Conversion and yield against height of reactor
Figure 3: Pressure profile of Riser
0 5 10 15 20 25 30 350
10
20
30
40
50
60
70
80
90
100
Height of the Reactor(m)
Wt%
gasolinecokelggas oil
0 5 10 15 20 25 30 35230
240
250
260
270
280
290
300
Height of the Reactor (m)
Pre
ssur
e, K
Pa

Chemical and Process Engineering Research www.iiste.org ISSN 2224-7467 (Paper) ISSN 2225-0913 (Online) Vol.7, 2013
19
Figure 4: Temperature profile along the reactor.
Figure 5: Comparison of results for gas oil conversion.
Figure 6: Comparison of results for gasoline
0 5 10 15 20 25 30 35815
820
825
830
835
840
845
850
855
Height of the Reactor(m)
Tem
pera
ture
, K
0 5 10 15 20 25 30 350
5
10
15
20
25
30
35
40
45
50
Height of Riser (m)
Gas oil [Present Work]Gas oil [Ahari et al. (2008)]
0 5 10 15 20 25 30 3520
30
40
50
60
70
80
90
100
Height of Riser (m)
Gas oil [Present Work]Gas oil [Ahari et al. (2008)]
Gas
Oil
(Wt %
) G
asol
ine
(Wt %
)

Chemical and Process Engineering Research www.iiste.org ISSN 2224-7467 (Paper) ISSN 2225-0913 (Online) Vol.7, 2013
20
Figure 7: Comparison of results for coke production
Figure 8: Comparison of results for riser pressure.
Figure 9: Comparison of results for temperature
0 5 10 15 20 25 30 35700
750
800
850
900
950
1000
Height of Riser (m)
Tem
pera
ture
(K)
Temperature [Present work] Temperature [Ahari et al. (2008)]
0 5 10 15 20 25 30 35150
200
250
300
Height of Riser (m)
Pressure [Present Work] Pressure [Ahari et al. (2008)]
0 5 10 15 20 25 30 350
1
2
3
4
5
6
7
Height of Riser (m)
Coke [Present Work] Coke [Ahari et al. (2008)]
Cok
e (W
t %)
Pre
ssur
e (K
Pa)

Chemical and Process Engineering Research www.iiste.org ISSN 2224-7467 (Paper) ISSN 2225-0913 (Online) Vol.7, 2013
21
Figure 10: Effect of COR on the gasoline yield
The simulation result presented in Figure 2 showed the percentage weight fractions of the products and their profiles along the height of the riser. From the graphical presentation, it can be noticed that as the gas oil keeps cracking into other products with its molar concentration decreasing along the riser height, the molar concentration of the three lumps, which include gasoline, light gases and coke increased. It is also observed that conversion of gas oil is more intense at the lower part of the riser where the concentration gradient of gas oil is higher. Outside this region, the steepness of the gas oil concentration profile reduces progressively because of the decline in the rate of cracking. Gasoline yield reaches its maximum within 15 m of the riser height. After this region, the concentration profile is practically constant till the end of the riser. During the reaction both the gas oil and gasoline are being converted to light gases. Hence light gases yield increased progressively throughout the riser height.
The axial pressure profile along the reactor height is presented in Figure 3. It showed a linear decline in pressure through the riser height with the total drop of about 50 KPa. Figure 4 presented the temperature profile of the reacting mixture along the height of the reactor. It can be seen that the input temperature fell from 857 K to 803 K at the bottom. The temperature decline was very sharp at the first 13 m of the riser height because most of the cracking must have taken place in this region. For the remaining part of the riser, the profile decreased less rapidly. This implied that the temperature of reacting mixtures and catalyst activity decreased along the riser height and possibly caused decrease in the rate of reaction.
Figures 5 to 9 compared the model results with that of Ahari et al. (2008). Figure 5 compared gas oil conversion of the model with that of Ahari et al. (2008) for the plant operating conditions stated. The comparison showed a very close contrast with a marginal percentage deviation of 7.69 % at the outlet. The figure also showed a maximum deviation of 9.0 % at 3 m along the riser height. In Figures 6 and 7, a good comparison was obtained between the present work and that of Ahari et al. (2008) for the production of gasoline and coke. From Figure 6, the outlet gasoline concentration gave a percentage deviation of 4.44 % with a maximum deviation of 12.01 % from Ahari et al. (2008) result. Coke yield on Figure 7 gave a percentage deviation of 3.94 % with a maximum deviation of 15.1 %
0 5 10 15 20 25 30 350
5
10
15
20
25
30
35
40
45
50
Height of Riser (m)
Gas
olin
e(W
t%)
COR = 5COR =7COR = 10COR = 15

Chemical and Process Engineering Research www.iiste.org ISSN 2224-7467 (Paper) ISSN 2225-0913 (Online) Vol.7, 2013
22
from Ahari et al. (2008) result at 5m along the riser height. Figure 8 showed a percentage deviation of 3.27 % for outlet pressure comparison while Figure 9 showed a percentage deviation of 0.99 % for outlet temperature comparison.
The effect of changing COR on gasoline yield along the riser height is shown in Figure 10. As observed from the figure, at the entrance section there is high conversion leading to increase in gasoline yield up to a maximum point beyond which increase in the COR tends to a seemingly progressive drop in the gasoline yield. This is consequent upon the higher rate of reaction resulting from increasing the COR which produces more coke. Deactivation of the catalyst due to coke deposition could be said to reduce the catalyst activity, hence the drop in gasoline yield later on. As presented, Table 1 showed outlet compositions results of the riser simulation based on the operating conditions and plant data used. Comparison of model results with that of the plant results is presented in Table 2. Table 3 gave the industrial riser operating conditions used for simulation while Table 4 presented the results of comparison of the simulated results with four different industrial cases. In view of the fact that gasoline is the product of interest, it can be seen that the set of operating conditions and process variables given in case 3 could be better off in running the plant as it gave a seemingly higher yield of gasoline. 4. Conclusion This work presented a one-dimensional adiabatic model of FCC unit riser reactor for a numerical analysis of the process. The model combined hydrodynamic model with the four-lump kinetic model. The model could be considered simple compared with some other sophisticated models available in literatures.
An important contribution of this present work is the inclusion of the specific heat capacities of the gas oil and the lumped components each as a dynamic function of temperature in the developed model, which was usually assumed to be constant in some previous works. Simulation results showed that increasing the COR could bring about increase in gasoline yield up to a maximum point of 45 weight percent. Beyond this point the yield seemed started dropping. Presented results also revealed some plausible set of operating conditions and process variables with which the riser could run to give better yields.
The effect of some variables of interest on the outputs of the riser was also investigated by the model. The yields, temperature and pressure profiles along the height of the riser reactor were computed using the proposed model. The developed model was applied to an industrial FCC unit and a good agreement between the industrial data and simulation results were observed. This demonstrates that the model can be used as a tool for design, control and optimization of an FCC riser unit.
Nomenclature
퐴 cross-sectional area of riser (푚 ) C wt % of coke deposited on catalyst 퐶 specific heat capacity of gas oil (퐾퐽/푘푔퐾) 퐶 specific heat capacity of 푖th lump (퐾퐽/푘푔퐾)

Chemical and Process Engineering Research www.iiste.org ISSN 2224-7467 (Paper) ISSN 2225-0913 (Online) Vol.7, 2013
23
푐 specific heat capacity of 푗th component of 푖th lump (퐾퐽/퐾푔퐾) 퐷 riser diameter (푚) 퐸 activation energy (푘퐽/푚표푙푒) 퐹 mass flow (푘푔/푠) 퐹푟 Froude number 퐹푟 Froude number based on terminal velocity 푔 gravitational constant; (푚/푠 ) 퐺 solid mass flux (푘푔/푚 . 푠) ΔH heat of reaction(푘퐽/푘푔) 훥퐻 gas oil enthalpy of vaporization(푘퐽/푘푔) 푘 kinetic rate constant 푘 pre-exponential factor 푅 gas constant(푘퐽/푚표푙.퐾) 푃 pressure (푘푃푎) 푡 catalyst residence time (푠) T temperature (퐾) 푊 catalyst mass flow rate (푘푔/푠) 푈 terminal velocity of the catalyst particle (푚/푠) 푈 riser superficial velocity (푚/푠) 푉 average catalyst velocity (푚/푠) 푊 mass fraction of component 푖 푍 axial position (푚) 푥 gas oil mass conversion 푦 mass yield Greek symbols 훼 coking constant 휀 void fraction Φ slip factor 휌 density (kg/푚 ) 휏̅ rate of reaction 휑 catalyst decay function Subscripts 푑푠 dispersion steam entering the feed injection system 푙푔 light gases 푔 gas 푔표 gas oil 푔푙 gasoline 푠 solid Superscripts 푉 vapor

Chemical and Process Engineering Research www.iiste.org ISSN 2224-7467 (Paper) ISSN 2225-0913 (Online) Vol.7, 2013
24
References Ahari, J. S., Farshi, A. and K. Forsat, (2008), “A Mathematical Model of the Riser reactor in industrial
FCC unit”, Petroleum & Coal 50 (2), pp. 15-24. Ali, H. and S. Rohani, (1997), “Dynamic Modeling and Simulation of Riser – Type FluidCatalytic
Cracking Unit, Chem.Eng.Tech” 20, pp. 118-130. Arandes, J. M. and H. I. Lasa, (1992), “Simulation and Multiplicity of steady states in fluidized FCCUS,”
Chem.Eng.Sci., 47, pp. 2535-2540. Arbel, A., Z. Huang, I. H. Rinard, R. Shinnar and A. V. Sapre, (1995), “Dynamic and control of fluidized
catalytic crackers.1.Modeling of the current Generation of FCC,s,” Ind.Eng.Chem.Res., 34, pp. 1228-1243.
Gupta A., and D. Subba Rao, (2001), “model for performance of fluid catalytic cracking: Effectof feed
atomization”, Chemical Engineering Science 56, pp. 4489-4503. Han, I. S. and C. B. Chung,(2001), “Dynamic modeling and simulation of a fluidized catalyticcracking
process Part I: Process modeling”, Chem.Eng.Sci., 56, pp. 1951-1971. Juarez, J. A., F. L. Isunza, E. A. Rodriguez and J. C. M. Mayotga, (1997), “ A strategy forKinetics
Parameter Estimation in the Fluid Catalytic Cracking Process,” Ind.Eng.Chem. Res., 36, pp. 5170-5174.
Patience, G. S., J. Chaouki, F. Berruti and S. R. Wong; (1992), “Scaling considerations forCirculating
Fluidized Bed Risers,” Powder Technol. 72, pp. 31-39. Theologos, K. N. and N. C. Markatos, (1993), “Advanced Modeling of Fluid Catalytic Cracking
Riser-Type Reactors,” AIChE J., 39, pp. 1007-1017. Weekman, V. W. Jr, (1979), “Lumps, Models and Kinetics in practice,” AIChE Monograph series11, 75, pp.
250-259.
Copyright © 2022 FDOKUMEN