
Design Study of Composite Repair System for Offshore Riser ...
305
Department of Mechanical, Materials and Manufacturing Engineering Design Study of Composite Repair System for Offshore Riser Applications by Chan Park Hinn, MEng Thesis submitted to The University of Nottingham for the degree of Doctor of Philosophy September 2015
-
Upload
khangminh22 -
Category
Documents
-
view
4 -
download
0
Transcript of Design Study of Composite Repair System for Offshore Riser ...
Department of Mechanical, Materials and Manufacturing Engineering
Design Study of Composite Repair System
for Offshore Riser Applications
by
Chan Park Hinn, MEng
Thesis submitted to The University of Nottingham for the
degree of Doctor of Philosophy
September 2015
i
ABSTRACT
Risers in offshore operations are subjected to corrosion during their service life
cycle. The use of relatively inexpensive, high strength to weight ratio fibre
reinforced polymer composite (FRPC) as a load bearing pipe repair sleeve is an
emerging technology that is becoming common for offshore applications. Risers
experience complex loading profiles and experimental investigations often incur
substantial time, complicated instrumentation and setup costs.
The main aim of this research is to develop a design tool for the repair of offshore
riser that suffers from external corrosion damage on its surface using FRPC
material. The simplest configuration of a fixed platform riser in the form of a
vertical single-wall pipe is being considered. Characterization of the stress-strain
behaviour of the FRPC laminate in the composite repair system subjected to
various load profiles of a common riser is performed. The means of composite
repair takes into account the ease of automated installation. The final repair
method considers the use of unidirectional pre-impregnated (prepreg) FRPC that
is assumed to be helically wounded around the riser.
Finite element models of the composite repair system were developed via
ABAQUS. Global analysis of the entire length of the riser was omitted as
external corrosions usually occurs in a localised manner on the surface of the
riser. Instead, local analyses were conducted where boundary conditions were
applied to mimic an infinitely long cylindrical structure such as the riser. The
local analyses FEA models were made to capture the stress-strain behaviour of
the FRPC laminate subjected to different load profiles including static loadings
such as internal pressure, tensile load and bending load. The design loads were
ii
calculated based on a limit analysis known as Double-Elastic Curve method
developed by Alexander (2008). Proper element selection and mesh convergence
were carried out to determine the FE model that can minimize the time and CPU
memory needed for the simulation without compromising the accuracy of the
results.
The second part of this research integrated experimental tests to validate the FE
model developed using the ABAQUS general purpose code. Due to constraints
on cost and supply of materials and equipment, small-scale tests were conducted.
Similitude relations were used to determine the scale properties between the
model and the prototype. The final results showed that the FE model can
represent the real-life tests of corroded riser repaired with off-axis FRPC
laminate with great accuracy of more than 85%. Hence can be a useful tool for
design and parametric study of the composite repair system.
Using the validated FE model, an extensive parametric study of the composite
repair system with respect to varying corrosion defects was conducted. The
thickness and length of the repair laminate were compared to the ASME PCC-2
standard. Optimum thickness and length of the composite laminate were
determined based on the maximum allowable strains computed using the
Double-Elastic Curve method. In addition, varying fibre angle orientation of the
unidirectional prepreg was considered as it is one of the main factors in helical
winding.
Based on the results from the parametric study, a simple relation was developed
to predict the required thickness of the composite repair system subjected to
combined loading. This relation combined with the developed FE model can be

iii
used to provide a quick design and performance validation of a composite repair
system for offshore riser, which is the main novelty aspect of this research.

i
Acknowledgement
First and foremost, I would like to thank God for his guidance, and for giving
me the wisdom and courage to complete this research work.
I would like to show my gratitude to my supervisor, Dr. Albert Tshai for his
unwavering guidance, advice and help from day one of this research, until the
completion of this thesis.
I would also like to extend my gratitude to my supervisors from the UK campus,
Dr. Mike Johnson and from the China campus, Dr. Choo Hui Leng for their
support during my exchange to the respective campuses.
Special thanks to Professor Li Shuguang for his valuable input and comments
throughout this research, especially in terms of the finite element modelling.
I would not have had this opportunity were it not for the sponsorship from the
University of Nottingham for the Inter-campus PhD Scholarship Program.
Last but not least, I would like to thank my family, especially my mother, who
has endured a lot of hardship in raising me and my siblings, and also giving the
support and encouragement to pursue my goals.
ii
Declaration
This thesis is submitted for the degree of Doctor of Philosophy in the Department
of Mechanical, Materials & Manufacturing Engineering at the University of
Nottingham Malaysia Campus. No part of this thesis has been submitted for any
other degree or diploma at any other university and institution. As far as the
author is aware, all the work in this thesis is original unless reference is made to
other works. Parts of the research work of this thesis have been published or
presented in the followings:
Chapter in Book:
1. P.H. CHAN, K.Y. TSHAI, M. JOHNSON and S. LI, 2015. Chapter 9:
FEA Modelling of FRP Repair in Offshore Risers. In: PROFESSOR
VISTASP KARBHARI, ed., Rehabilitation of pipelines using fibre
reinforced polymer (FRP) composites: 3. Design and Analysis 1st
Edition. Woodhead Publishing Ltd UK. 177-209
Journal Papers:
2. P.H. CHAN, K.Y. TSHAI, M. JOHNSON and S. LI, 2015. The Flexural
Properties of Composite Repaired Pipeline: Numerical Simulation and
Experimental Validation. Composite Structures 133, 312-321
3. P.H. CHAN, K.Y. TSHAI, M. JOHNSON, H.L. CHOO, S. LI and K.
ZAKARIA, 2015. Burst Strength of Carbon Fibre Reinforced HDPE
Strip Pipeline Repair System - A Numerical and Experimental
Approach. Journal of Composite Materials.49(6), 749-756
iii
4. P.H. CHAN, K.Y. TSHAI, M. JOHNSON and S. LI, 2014. FEA of
Combined Static Loadings on Offshore Pipe Riser Repaired with Fibre
Reinforced Composite Laminates. Journal of Reinforced Plastics and
Composites. 33(6), 514-525
5. P.H. CHAN, K.Y. TSHAI, M. JOHNSON and H.L. CHOO, 2014. Finite
Element Modelling of Static and Fatigue Failure of Composite Repair
System in Offshore Pipe Risers. Advanced Materials Research: Material
Research and Applications. 875-877, 1063-1068.
6. P.H. CHAN, K.Y. TSHAI, M. JOHNSON and H.L. CHOO, 2012. Finite
Element Modelling of Composite Repair in Offshore Pipe Riser.
Advanced Materials Research: Advanced Materials and Processes II.
557-559, 2239-2242.
Conference Papers/Abstracts:
1. P.H. CHAN, K.Y. TSHAI, M. JOHNSON, H.L. CHOO and S.
LI, 2013. A Finite Element Study of the Influence of Coupled Loadings
on Offshore Pipe Riser Repaired with Fibre Reinforced
Composite. In: M. JAAFAR, K.H. LEONG, A.R. AZURA and A.Y.
LEONG, eds., 8th Asian-Australasian Conference on Composite
Materials 2012 (ACCM-8): Composites: Enabling Tomorrow's Industry
Today 2. Asian Australasian Association for Composite Materials
(AACM). 1580-1585
2. P.H. CHAN, K.Y. TSHAI, M. JOHNSON, H.L. CHOO and S. LI, 2012.
Finite Element Modelling of Composite Repair in Offshore Pipe Riser.

iv
In: 2nd International Conference on Chemical Engineering and
Advanced Materials (ICCEAM 2012), Guangzhou, China.
3. P.H. CHAN, K.Y. TSHAI, M. JOHNSON and H.L. CHOO, 2012. Finite
Element Modelling of Static and Fatigue Failure of Composite Repair
System in Offshore Pipe Risers. In: 2012 International Conference on
Advanced Material and Manufacturing Science (ICAMMS), Beijing,
China.
v
Table of Contents
ABSTRACT ........................................................................................................ i
Acknowledgement ............................................................................................... i
Declaration .......................................................................................................... ii
Table of Contents ................................................................................................ v
List of Figures .................................................................................................... xi
List of Tables ................................................................................................. xxiv
Abbreviations ................................................................................................. xxvi
Nomenclature ............................................................................................... xxviii
Chapter 1 Introduction ........................................................................................ 1
Chapter 2 Literature Review ............................................................................... 5
2.1 Introduction............................................................................................... 5
2.2 Conventional offshore riser repair methods ............................................. 6
2.3 Composite Repair for Onshore Pipelines ................................................. 7
2.3.1 Types of Composite Repair ............................................................... 9
2.3.2 Existing Onshore Composite Repair Products ................................ 10
2.4 Integration of Composite Repair in Offshore Riser ................................ 14
2.4.1 Limitations in the Application of Composite in Riser Repair ......... 14
2.4.2 Automated Riser Repair Machine ................................................... 17
2.5 Previous Studies on Composite Repair System ...................................... 24
2.5.1 Composite Bonded Repair in Other Applications ........................... 24
vi
2.5.2 Application of FRPC in Onshore Pipeline Repair ........................... 27
2.5.3 Application of FRPC in Offshore Riser Repair ............................... 30
2.5.4 Bonding of Composite to Steel Pipe/Riser ...................................... 33
2.6 Standards & Guidelines .......................................................................... 37
2.6.1 Standards for Pipeline Design ......................................................... 38
2.6.2 Standards for Offshore Riser Design ............................................... 38
2.6.3 Standards for the Evaluation of Corroded Pipeline/Riser Residual
Strength ..................................................................................................... 39
2.6.4 Standards for Corroded Pipeline/Riser Repair ................................ 40
2.7 Concluding Remarks .............................................................................. 41
Chapter 3 Design of Composite Repair System for Offshore Riser ................. 44
3.1 Introduction............................................................................................. 44
3.2 Loading Conditions of a Riser ................................................................ 45
3.2.1 Functional Loads ............................................................................. 45
3.2.2 Environmental Loads ....................................................................... 46
3.2.3 Installation Loads............................................................................. 47
3.2.4 Accidental Loads ............................................................................. 48
3.2.5 Load Cases ....................................................................................... 48
3.3 Design Requirements .............................................................................. 48
3.4 Residual Strength of Corroded Risers .................................................... 49
3.5 Minimum Repair Thickness of the Composite Laminate ....................... 53
3.6 Axial Length of the Laminate Repair ..................................................... 57
vii
3.7 Design Conditions .................................................................................. 58
3.8 Concluding Remarks .............................................................................. 64
Chapter 4 Finite Element Analysis ................................................................... 65
4.1 Introduction............................................................................................. 65
4.2 Fundamentals of FE Modelling within ABAQUS® ............................... 66
4.2.1 Non-linear Solution in ABAQUS Standard ..................................... 66
4.2.2 Selection of Element Type............................................................... 67
4.2.3 Mesh Refinement ............................................................................. 71
4.3 FEA Model of Composite Repair System .............................................. 74
4.3.1 Steel Riser ........................................................................................ 74
4.3.2 Composite Laminate ........................................................................ 75
4.3.3 Materials .......................................................................................... 84
4.3.4 Boundary Conditions ....................................................................... 87
4.3.5 Interaction Properties ....................................................................... 88
4.4 Validation of Numerical Model .............................................................. 92
4.4.1 Classical Mechanics......................................................................... 92
4.4.2 Case study of Helicoid Epoxy Sleeve (HES)TM .............................. 94
4.5 Individual Static Loading ..................................................................... 108
4.5.1 Internal Pressure, Pint ..................................................................... 109
4.5.2 Tensile Load, Ft ............................................................................. 112
4.5.3 Bending Load, Mb .......................................................................... 115
4.6 Combined Static Loading ..................................................................... 118
viii
4.6.1 Combined Internal Pressure, Pint and Tensile Load, Ft ................. 119
4.6.2 Combined Internal Pressure, Pint, Tensile Load, Ft and Bending
Moment, Mb ............................................................................................ 124
4.7 Response of FRPC Repair Laminate .................................................... 129
4.8 Cyclic Loading...................................................................................... 135
4.8.1 Design Conditions ......................................................................... 136
4.8.2 Numerical Modelling ..................................................................... 137
4.8.3 Results and Discussion .................................................................. 138
4.9 Concluding Remarks ............................................................................ 142
Chapter 5 Experimental Testing ..................................................................... 145
5.1 Introduction........................................................................................... 145
5.2 Methodology ......................................................................................... 145
5.3 Materials ............................................................................................... 146
5.4 Experimental Setup ............................................................................... 149
5.5 Similitude Relations ............................................................................. 155
5.6 Experimental Validation ....................................................................... 161
5.6.1 Bare Riser without Corrosion ................................................... 161
5.6.2 Bare Riser with Corrosion ........................................................ 162
5.6.3 Repaired Riser .......................................................................... 166
5.6.4 Comparison between Full Scale Model and Scaled Down
Prototype ................................................................................................. 169
5.7 Concluding Remarks ............................................................................ 171
ix
Chapter 6 Parametric Study of Composite Repair System for Offshore Riser
........................................................................................................................ 173
6.1 Introduction........................................................................................... 173
6.2 Types of Reinforcing Fibres ................................................................. 174
6.2.1 Individual Static Load.................................................................... 177
6.2.2 Combined Static Load ................................................................... 182
6.3 Laminate/Fibre Orientation .................................................................. 187
6.3.1 Combined Internal Pressure, Pint & Tensile Load, Ft .................... 190
6.3.2 Combined Internal Pressure, Pint, Tensile Load, Ft & Bending
Moment, Mb ............................................................................................ 195
6.4 Wrapping Angle.................................................................................... 199
6.5 Varying Corrosion Defects ................................................................... 202
6.5.1 Varying Corrosion Length ............................................................. 202
6.5.2 Varying Corrosion Width .............................................................. 206
6.6 Concluding Remarks ............................................................................ 215
Chapter 7 Conclusions .................................................................................... 217
7.1 Primary Achievements and Contributions to New Knowledge ............ 217
7.2 Recommendations for Future Work ..................................................... 220
References....................................................................................................... 221
Appendix A Industrial Needs for Composite Repair Machine and Its Preliminary
Design ........................................................................................................ 231
A.1 Background ......................................................................................... 231
x
A.2 Statement of Requirements ................................................................. 232
A.3 Riser Traversing Module .................................................................... 235
A.3.1 Improvements on Design ............................................................. 238
A.4 Inspection Module .............................................................................. 238
A.5 Surface Preparation Module ............................................................... 240
A.6 Wrapping Module ............................................................................... 244
A.6.1 Assumptions ................................................................................ 245
A.6.2 Calculations of Wrapping Geometry ........................................... 248
A.6.3 Mechanical System Design .......................................................... 254
A.6.4 Improvements on Design ............................................................. 257
A.6.5 Controlling ................................................................................... 260
A.7 Summary ............................................................................................. 263
Appendix B Calculations of wrapping geometry .......................................... 264
Appendix C MATLAB Code for Wrap Geometry ........................................ 268
xi
List of Figures
Figure 1-1, Methodology .................................................................................... 4
Figure 2-1, Mechanical gouge dent on a pipe..................................................... 8
Figure 2-2, External corrosion on pipe ............................................................... 8
Figure 2-3, Internal corrosion on pipe ................................................................ 8
Figure 2-4, Types of composite repair: (a) Wet lay-up (b) Pre-cured layered (c)
Pre-cured stand-off sleeve (Alexander & Ochoa, 2010) (Alexander, 2006)
(Clock Spring, 2012) ............................................................................ 10
Figure 2-5, Installation of Clock Spring® on a steel pipe (Clock Spring, 2012)
.............................................................................................................. 11
Figure 2-6, Installation of AquaWrap® on a corroded pipeline (Alexander 2005)
.............................................................................................................. 12
Figure 2-7, Prototype of the unmanned underwater robotic crawler (Chatzakos,
et al., 2010) ........................................................................................... 18
Figure 2-8, Sequence of actions for the translational motion along the length of
the riser (Psarros, et al., 2010) .............................................................. 18
Figure 2-9, Sequence of actions for the rotational motion around the
circumference of the riser (Psarros, et al., 2010) .................................. 19
Figure 2-10, Pipe inspection robot by Yukawa et al. ( (Yukawa, et al., 2006)) 20
Figure 2-11, 3D model of the compliant mechanism of SMA-actuated pipe
crawler, (a) crawling device with clamping rings, (b) SMA U-shape
strips (Balaji, et al., 2008) ..................................................................... 21
Figure 2-12, Full assembly of ACCUWRAPTM (SMC, 2011) ......................... 22
Figure 2-13, Semi-automatic composite repair machine Previous Studies on
Composite Repair System (Boulet d'Auria, et al., 2013) ...................... 23

xii
Figure 2-14, (a) Web buckling of unstrengthened RHS (b) Web yielding and
debonding of CFRP strengthened RHS (Zhao, et al., 2006) ................ 25
Figure 2-15, Bending test setup and finite element model of I-beam strengthened
with CFRP strips (Narmashiri, et al., 2010) ......................................... 26
Figure 2-16, Finite element model of cracked steel tube with FRPC patching
(Lam, et al., 2011)................................................................................. 26
Figure 2-17, 3D finite element model used in Duell et al.'s work (Duell, et al.,
2008) ..................................................................................................... 28
Figure 2-18, Comparison between experimental and FEA results (CC =
Circumferential stain in corroded region , CRC = circumferential strain
in corroded region of repair pipe) (Meniconi, et al., 2002) .................. 29
Figure 2-19, Comparison of buckling shapes between full-scale testing and finite
element modelling (Shouman & Taheri, 2011) .................................... 30
Figure 2-20, FRPC-wrapped specimens cured under saltwater conditions (Seica
& Packer, 2007) .................................................................................... 31
Figure 2-21, Finite element model of repaired pipe and enlarged view of
corroded region mesh (Esmaeel, et al., 2012) ...................................... 32
Figure 2-22, Finite element model used in Haghani's work (Haghani, 2010) .. 35
Figure 2-23, Finite element model of FRP-to-steel joint (Yang et al, 2013) ... 35
Figure 2-24, Debonding between the CFRP strip and steel beam (Bocciarelli et
al, 2008) ................................................................................................ 36
Figure 2-25, Shear stress at steel-composite interface of the finite element model
(Alexander, 2007) ................................................................................. 37
Figure 3-1, Parabolic criteria for classifying corrosion defects according to
predicted failure stress (ASME, 1991) ................................................. 50
xiii
Figure 3-2, Process of assessing the remaining strength of a corroded pipe
(ASME, 1991)....................................................................................... 51
Figure 3-3, Pressure level relations (API, 1999) .............................................. 56
Figure 3-4, Limit state analysis of bare riser subjected to Pin .......................... 62
Figure 3-5, Limit state analysis of bare riser subjected to Ft ............................ 62
Figure 3-6, Limit state analysis of bare riser subjected to Mb .......................... 62
Figure 3-7, Limit state analysis of bare riser subjected to Pin, Ft & Mb ........... 63
Figure 4-1, Continuum 3D brick element with 8 nodes (a) and 20 nodes (b) .. 68
Figure 4-2, Conventional and continuum shell elements ................................. 69
Figure 4-3, Coarse mesh with S4R element (riser 1672 elements; sleeve 1034
elements) ............................................................................................... 70
Figure 4-4, Coarse mesh with C3D8R element (riser 3458 elements; sleeve 1119
element): (a) Corroded riser, (b) Corroded riser with CRS .................. 71
Figure 4-5, Intermediate mesh with S4R element (4305 elements) ................. 72
Figure 4-6, Fine mesh with S4R element (6536 elements) .............................. 72
Figure 4-7, Biased mesh with gradual decrease in element size using S4R
element (2046 elements) ....................................................................... 72
Figure 4-8, Biased mesh with fine mesh at corroded region using S4R element
(2669) elements .................................................................................... 72
Figure 4-9, Riser model with 2 elements in thickness direction....................... 73
Figure 4-10, Riser model with 3 elements in thickness direction..................... 73
Figure 4-11, Riser model with 4 elements in thickness direction..................... 73
Figure 4-12, Riser model with 6 elements in thickness direction..................... 73
Figure 4-13, Hoop stress and hoop strain at varying S4R element mesh density
.............................................................................................................. 74
xiv
Figure 4-14, Coordinate system of FRPC ........................................................ 77
Figure 4-15, AS4/3501-6 carbon/epoxy unidirectional lamina strength properties
on Autodesk® Simulation Composite Analysis ..................................... 81
Figure 4-16, AS4/3501-6 carbon/epoxy unidirectional lamina and constituent
properties on Autodesk® Simulation Composite Analysis ................... 82
Figure 4-17, Ramberg-Osgood model .............................................................. 85
Figure 4-18, Quarter pipe model with cross sectional view ............................. 88
Figure 4-19, Full pipe model in four-point bending setup ............................... 88
Figure 4-20, Sectional cut out detail of the Helicoid Epoxy Sleeve System
(HES)TM system (Merit Technologies Sdn. Bhd., Malaysia) ............... 95
Figure 4-21, API 5L grade X52 steel pipe with Helicoid Epoxy SleeveTM system
installed ................................................................................................. 99
Figure 4-22, Meshed parts: (a) API 5L grade X52 pipe with corroded section, (b)
corroded pipe with HESTM, (c) carbon fibre-reinforced PE strip, and (d)
epoxy grout ......................................................................................... 100
Figure 4-23, Normalised modulus of fibre-reinforced composite at varying angle
............................................................................................................ 102
Figure 4-24, Contour plot of hoop strain on the corroded X52 steel pipe ...... 104
Figure 4-25, Computation of PACL and design pressure of an uncorroded pipe
............................................................................................................ 104
Figure 4-26, Computation of PACL and design pressure of corroded pipe ... 105
Figure 4-27, Computation of burst pressure of corroded pipe repaired with
HESTM system ..................................................................................... 105
Figure 4-28, Pressure against hoop strain curves for uncorroded pipe, corroded
pipe and corroded pipe repaired with HESTM system ......................... 106
xv
Figure 4-29, HESTM repaired pipe at burst pressure (a) failure within the repaired
region and (b) close up of failure region ............................................ 107
Figure 4-30, σh contour plot of corroded riser at 22MPa ............................... 110
Figure 4-31, ɛh contour plot of corroded riser at 22MPa ................................ 110
Figure 4-32, σh contour plot of repaired riser at 22MPa ................................. 111
Figure 4-33, ɛh contour plot of repaired riser at 22MPa ................................. 111
Figure 4-34, Limit state analysis of riser subjected to Pint.............................. 112
Figure 4-35, σa contour plot of corroded riser at 1785kN .............................. 113
Figure 4-36, ɛa contour plot of corroded riser at 1785kN ............................... 113
Figure 4-37, σa contour plot of repaired riser at 1785kN ............................... 114
Figure 4-38, ɛa contour plot of repaired riser at 1785kN ................................ 114
Figure 4-39, Limit state analysis of riser subjected to Ft ................................ 115
Figure 4-40, σb contour plot of corroded riser at 120kNm ............................. 116
Figure 4-41, ɛb contour plot of corroded riser at 120kNm .............................. 116
Figure 4-42, σb contour plot of repaired riser at 120kNm .............................. 117
Figure 4-43, ɛb contour plot of repaired riser at 120kNm ............................... 117
Figure 4-44, Limit state analysis of riser subjected to Mb .............................. 118
Figure 4-45, σa contour plot of corroded riser at combined 22MPa and 1785kN
............................................................................................................ 120
Figure 4-46, σh contour plot of corroded riser at combined 22MPa and 1785kN
............................................................................................................ 120
Figure 4-47, ɛa contour plot of corroded riser at combined 22MPa and 1785kN
............................................................................................................ 121
Figure 4-48, ɛh contour plot of corroded riser at combined 22MPa and 1785kN
............................................................................................................ 121
xvi
Figure 4-49, σa contour plot of repaired riser at combined 22MPa and 1785kN
............................................................................................................ 122
Figure 4-50, σh contour plot of repaired riser at combined 22MPa and 1785kN
............................................................................................................ 122
Figure 4-51, ɛa contour plot of repaired riser at combined 22MPa and 1785kN
............................................................................................................ 123
Figure 4-52, ɛh contour plot of repaired riser at combined 22MPa and 1785kN
............................................................................................................ 123
Figure 4-53, Limit state analysis of riser subjected to Pint and Ft (Axial Strain)
............................................................................................................ 123
Figure 4-54, Limit state analysis of riser subjected to Pint and Ft (Hoop Strain)
............................................................................................................ 124
Figure 4-55, Limit state analysis (axial strain) of riser subjected to Pint, Ft and
Mb ........................................................................................................ 125
Figure 4-56, σa contour plot of corroded riser at combined 22MPa, 1785kN and
78kNm ................................................................................................ 126
Figure 4-57, σh contour plot of corroded riser at combined 22MPa, 1785kN and
78kNm ................................................................................................ 127
Figure 4-58, ɛa contour plot of corroded riser at combined 22MPa, 1785kN and
78kNm ................................................................................................ 127
Figure 4-59, ɛh contour plot of corroded riser at combined 22MPa, 1785kN and
78kNm ................................................................................................ 127
Figure 4-60, Limit state analysis (hoop strain) of riser subjected to Pint, Ft and
Mb ........................................................................................................ 128
Figure 4-61, Input of cyclic bending load ...................................................... 137

xvii
Figure 4-62, Defect region and locations of node 1 and node 2 on the laminate
............................................................................................................ 138
Figure 4-63, Strain energy release rate for AO laminate ................................ 138
Figure 4-64, fcriterion for AO and HO laminate at node 1 and node 2 .............. 139
Figure 4-65, Contour plot of axial strain ........................................................ 140
Figure 4-66, Axial stress vs. number of cycles for AO and HO laminates .... 141
Figure 4-67, Hoop stress vs. number of cycles for AO and HO laminates .... 141
Figure 4-68, Final bonded state of AO laminate on riser ............................... 142
Figure 4-69, Final bonded state of HO laminate on riser ............................... 142
Figure 5-1, Dumbbell specimens .................................................................... 147
Figure 5-2, True stress vs. true strain curve of the chosen mild steel pipe ..... 148
Figure 5-3, Length of pipe relative to bending rig.......................................... 149
Figure 5-4, Machined corroded region and location of the two strain gauges 150
Figure 5-5, Four-point bending setup with the aid of an Instron load frame.. 151
Figure 5-6, Insulation film applied on top of strain gauges ............................ 151
Figure 5-7, Specimens of mild steel pipe wrapped with Panex35/MTM57 ... 153
Figure 5-8, Pipe specimen sealed within a nylon bagging film ...................... 154
Figure 5-9, Vacuum bagging of the pipe specimen ........................................ 154
Figure 5-10, Curing of the composite prepreg performed with the aid of vacuum
bagging ............................................................................................... 155
Figure 5-11, Similitude scaling between model and prototype ...................... 157
Figure 5-12, Bending moment diagram for four-point bend setup ................. 159
Figure 5-13, Experiment and FE results of mild steel pipe ............................ 162
Figure 5-14, Section thickness of pipe in FE model ....................................... 162
Figure 5-15, Experiment and FE results of corroded mild steel pipe ............. 163
xviii
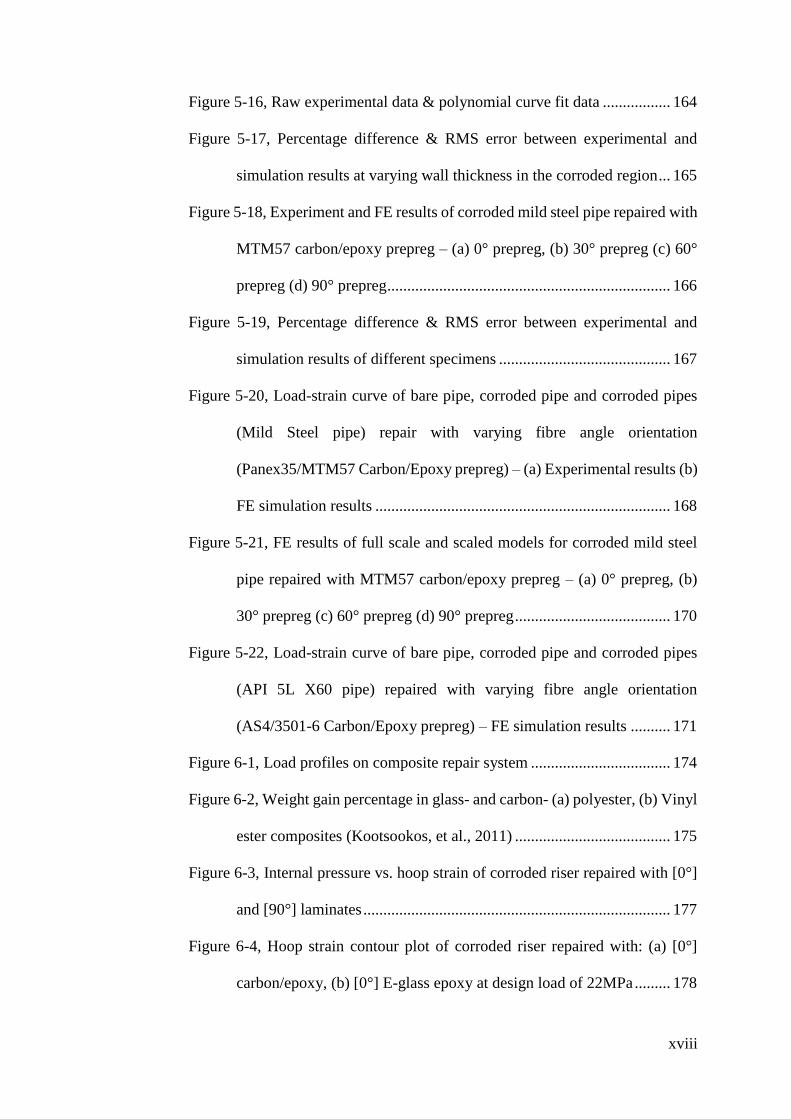
Figure 5-16, Raw experimental data & polynomial curve fit data ................. 164
Figure 5-17, Percentage difference & RMS error between experimental and
simulation results at varying wall thickness in the corroded region ... 165
Figure 5-18, Experiment and FE results of corroded mild steel pipe repaired with
MTM57 carbon/epoxy prepreg – (a) 0° prepreg, (b) 30° prepreg (c) 60°
prepreg (d) 90° prepreg ....................................................................... 166
Figure 5-19, Percentage difference & RMS error between experimental and
simulation results of different specimens ........................................... 167
Figure 5-20, Load-strain curve of bare pipe, corroded pipe and corroded pipes
(Mild Steel pipe) repair with varying fibre angle orientation
(Panex35/MTM57 Carbon/Epoxy prepreg) – (a) Experimental results (b)
FE simulation results .......................................................................... 168
Figure 5-21, FE results of full scale and scaled models for corroded mild steel
pipe repaired with MTM57 carbon/epoxy prepreg – (a) 0° prepreg, (b)
30° prepreg (c) 60° prepreg (d) 90° prepreg ....................................... 170
Figure 5-22, Load-strain curve of bare pipe, corroded pipe and corroded pipes
(API 5L X60 pipe) repaired with varying fibre angle orientation
(AS4/3501-6 Carbon/Epoxy prepreg) – FE simulation results .......... 171
Figure 6-1, Load profiles on composite repair system ................................... 174
Figure 6-2, Weight gain percentage in glass- and carbon- (a) polyester, (b) Vinyl
ester composites (Kootsookos, et al., 2011) ....................................... 175
Figure 6-3, Internal pressure vs. hoop strain of corroded riser repaired with [0°]
and [90°] laminates ............................................................................. 177
Figure 6-4, Hoop strain contour plot of corroded riser repaired with: (a) [0°]
carbon/epoxy, (b) [0°] E-glass epoxy at design load of 22MPa ......... 178
xix
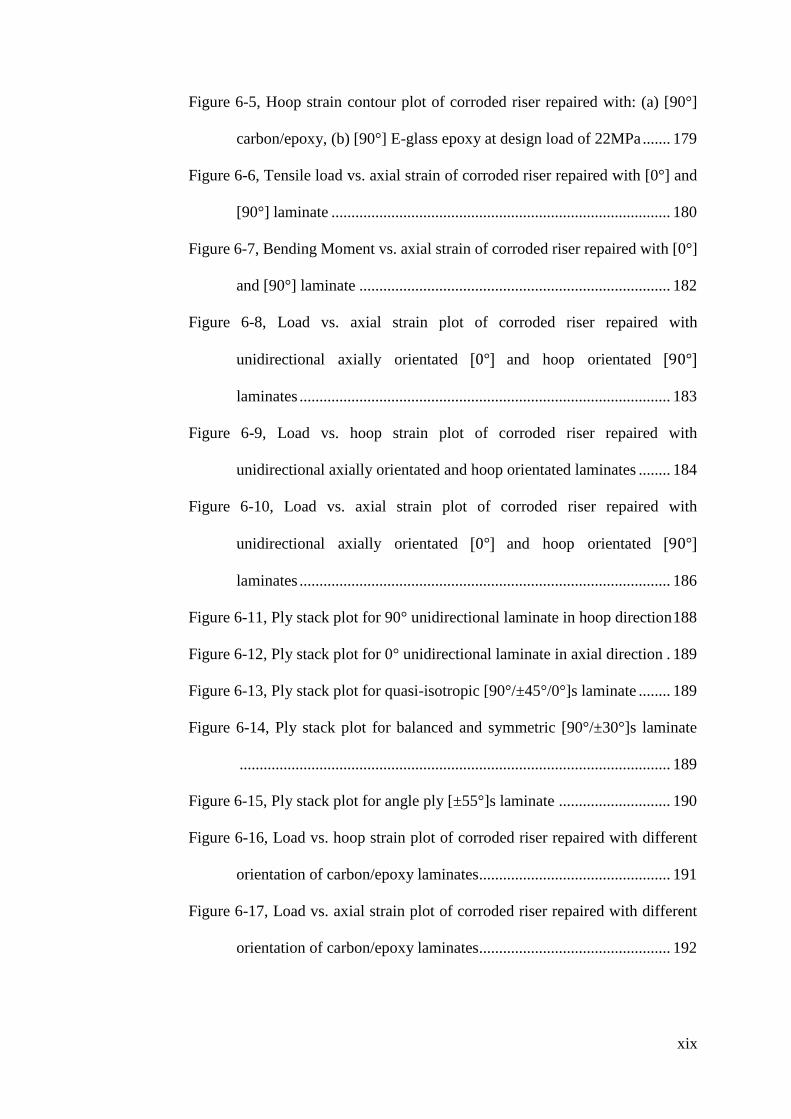
Figure 6-5, Hoop strain contour plot of corroded riser repaired with: (a) [90°]
carbon/epoxy, (b) [90°] E-glass epoxy at design load of 22MPa ....... 179
Figure 6-6, Tensile load vs. axial strain of corroded riser repaired with [0°] and
[90°] laminate ..................................................................................... 180
Figure 6-7, Bending Moment vs. axial strain of corroded riser repaired with [0°]
and [90°] laminate .............................................................................. 182
Figure 6-8, Load vs. axial strain plot of corroded riser repaired with
unidirectional axially orientated [0°] and hoop orientated [90°]
laminates ............................................................................................. 183
Figure 6-9, Load vs. hoop strain plot of corroded riser repaired with
unidirectional axially orientated and hoop orientated laminates ........ 184
Figure 6-10, Load vs. axial strain plot of corroded riser repaired with
unidirectional axially orientated [0°] and hoop orientated [90°]
laminates ............................................................................................. 186
Figure 6-11, Ply stack plot for 90° unidirectional laminate in hoop direction 188
Figure 6-12, Ply stack plot for 0° unidirectional laminate in axial direction . 189
Figure 6-13, Ply stack plot for quasi-isotropic [90°/±45°/0°]s laminate ........ 189
Figure 6-14, Ply stack plot for balanced and symmetric [90°/±30°]s laminate
............................................................................................................ 189
Figure 6-15, Ply stack plot for angle ply [±55°]s laminate ............................ 190
Figure 6-16, Load vs. hoop strain plot of corroded riser repaired with different
orientation of carbon/epoxy laminates................................................ 191
Figure 6-17, Load vs. axial strain plot of corroded riser repaired with different
orientation of carbon/epoxy laminates................................................ 192
xx
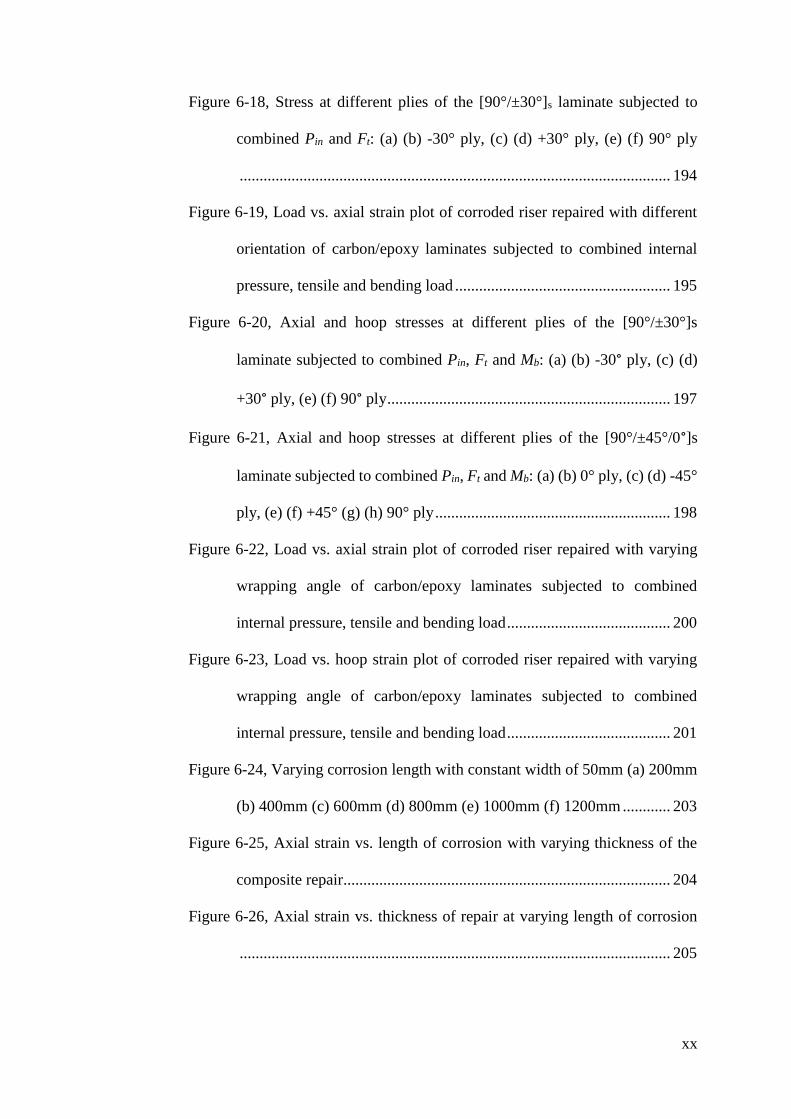
Figure 6-18, Stress at different plies of the [90°/±30°]s laminate subjected to
combined Pin and Ft: (a) (b) -30° ply, (c) (d) +30° ply, (e) (f) 90° ply
............................................................................................................ 194
Figure 6-19, Load vs. axial strain plot of corroded riser repaired with different
orientation of carbon/epoxy laminates subjected to combined internal
pressure, tensile and bending load ...................................................... 195
Figure 6-20, Axial and hoop stresses at different plies of the [90°/±30°]s
laminate subjected to combined Pin, Ft and Mb: (a) (b) -30° ply, (c) (d)
+30° ply, (e) (f) 90° ply ....................................................................... 197
Figure 6-21, Axial and hoop stresses at different plies of the [90°/±45°/0°]s
laminate subjected to combined Pin, Ft and Mb: (a) (b) 0° ply, (c) (d) -45°
ply, (e) (f) +45° (g) (h) 90° ply ........................................................... 198
Figure 6-22, Load vs. axial strain plot of corroded riser repaired with varying
wrapping angle of carbon/epoxy laminates subjected to combined
internal pressure, tensile and bending load ......................................... 200
Figure 6-23, Load vs. hoop strain plot of corroded riser repaired with varying
wrapping angle of carbon/epoxy laminates subjected to combined
internal pressure, tensile and bending load ......................................... 201
Figure 6-24, Varying corrosion length with constant width of 50mm (a) 200mm
(b) 400mm (c) 600mm (d) 800mm (e) 1000mm (f) 1200mm ............ 203
Figure 6-25, Axial strain vs. length of corrosion with varying thickness of the
composite repair.................................................................................. 204
Figure 6-26, Axial strain vs. thickness of repair at varying length of corrosion
............................................................................................................ 205
xxi
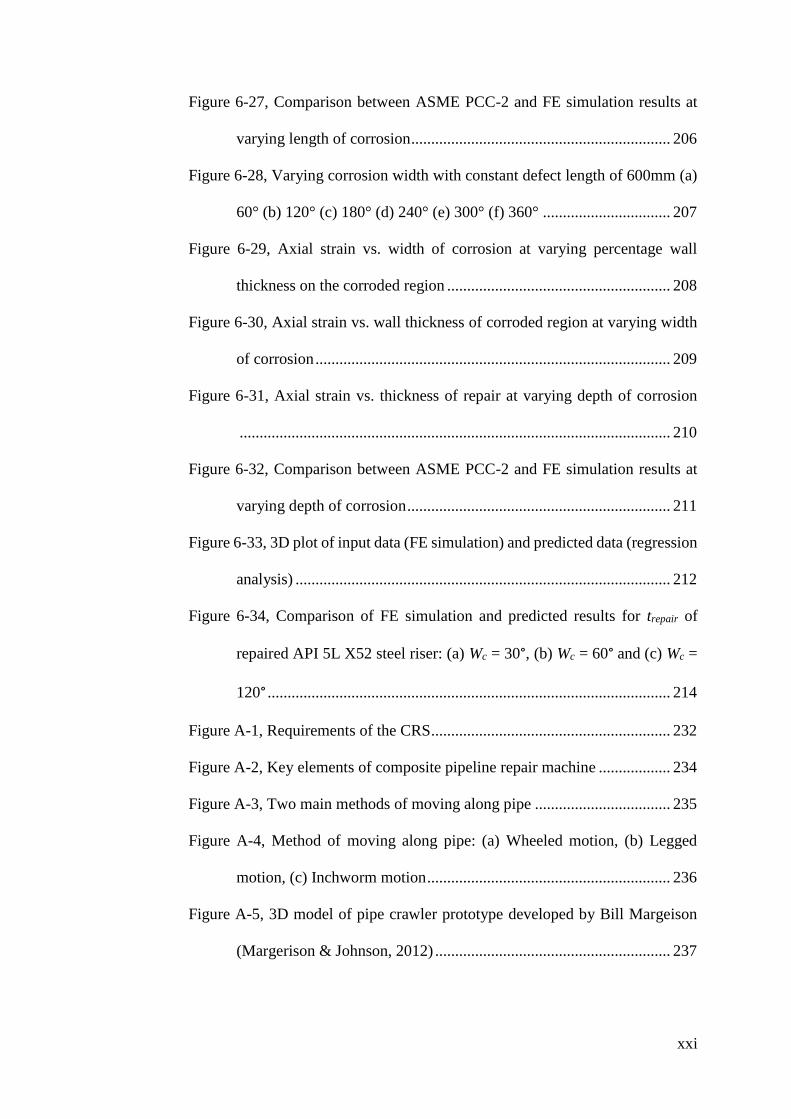
Figure 6-27, Comparison between ASME PCC-2 and FE simulation results at
varying length of corrosion ................................................................. 206
Figure 6-28, Varying corrosion width with constant defect length of 600mm (a)
60° (b) 120° (c) 180° (d) 240° (e) 300° (f) 360° ................................ 207
Figure 6-29, Axial strain vs. width of corrosion at varying percentage wall
thickness on the corroded region ........................................................ 208
Figure 6-30, Axial strain vs. wall thickness of corroded region at varying width
of corrosion ......................................................................................... 209
Figure 6-31, Axial strain vs. thickness of repair at varying depth of corrosion
............................................................................................................ 210
Figure 6-32, Comparison between ASME PCC-2 and FE simulation results at
varying depth of corrosion .................................................................. 211
Figure 6-33, 3D plot of input data (FE simulation) and predicted data (regression
analysis) .............................................................................................. 212
Figure 6-34, Comparison of FE simulation and predicted results for trepair of
repaired API 5L X52 steel riser: (a) Wc = 30°, (b) Wc = 60° and (c) Wc =
120° ..................................................................................................... 214
Figure A-1, Requirements of the CRS ............................................................ 232
Figure A-2, Key elements of composite pipeline repair machine .................. 234
Figure A-3, Two main methods of moving along pipe .................................. 235
Figure A-4, Method of moving along pipe: (a) Wheeled motion, (b) Legged
motion, (c) Inchworm motion ............................................................. 236
Figure A-5, 3D model of pipe crawler prototype developed by Bill Margeison
(Margerison & Johnson, 2012) ........................................................... 237
xxii
Figure A-6, Sequence of the pipe crawler navigating over a flange (Margerison
& Johnson, 2012) ................................................................................ 238
Figure A-7, MEC-Combi Crawler developed by Innospection Ltd (a) crawler
machine (b) subsea inspection (Innospection Ltd, 2013) ................... 240
Figure A-8, Diver operating the Cavidyne CaviBlasterTM (CaviDyne, 2014) 241
Figure A-9, MC211 hydraulically powered twin brushes device (UES, 2014)
............................................................................................................ 242
Figure A-10, Proserv marine growth removal (MGR) tool (Proserv, 2014) .. 242
Figure A-11, Cleaning module prototype (Carey & Johnson, 2013) ............. 243
Figure A-12, Typical completed CRS wrap showing the end effect geometry at
both ends of the repair ........................................................................ 246
Figure A-13, Contour plot of axial strain on the composite repair sleeve with (a)
uniform 45°helical wrap, (b) 45° helical wrap with 90° on both ends 247
Figure A-14, Contour plot of SDV2 on the composite repair sleeve with (a)
uniform 45°helical wrap, (b) 45° helical wrap with 90° wrap at both ends
............................................................................................................ 248
Figure A-15, Wrap profile for the CRS at varying angles - (a) 30°, (b) 45°, (c)
60° and (d) 90° (hoop) ........................................................................ 251
Figure A-16, Force components acting on the prepreg tape and riser ............ 252
Figure A-17, Rendered image of the pipe wrapper prototype (Land, et al., 2012).
............................................................................................................ 254
Figure A-18, Diagram of pipe wrapper prototype (Land, et al., 2012) .......... 255
Figure A-19, Dimensions of the roll ............................................................... 256
Figure A-20, Rendered image of improved design of the wrapping module . 258
Figure A-21, Wrapping sequence of the wrapping module ............................ 259

xxiii
Figure A-22, Flow chart for the wrapping sequence ...................................... 262
Figure B-1, Developed envelope of prepreg path ........................................... 264
xxiv
List of Tables
Table 2-1, Components on the semi-automatic composite repair machine and
their functions (Boulet d'Auria, et al., 2013) .................................................... 23
Table 3-1, Temperature derating factor, ft (ASME, 2003) ............................... 57
Table 3-2, Design load and maximum permissible strain for different load cases
........................................................................................................ 63
Table 5-1, Material properties for Panex35/MTM57 unidirectional prepreg . 148
Table 5-2, Curing conditions and alternative cure cycle for autoclave cure of
MTM57 ......................................................................................... 155
Table 5-3, Similitude relations (Ramu et al, 2012) ........................................ 157
Table 5-1, Mechanical properties of API 5L X60 steel pipe ............................ 85
Table 5-2, Material properties of the chosen FRPC laminate .......................... 86
Table 5-3, Fracture and fatigue properties ........................................................ 91
Table 5-4, Comparison between classical mechanics and numerical results ... 94
Table 5-5, Percentage difference & RMS error between experimental and
simulation results .......................................................................... 164
Table 5-6, Mechanical Properties of API 5L X52 Steel ................................. 101
Table 5-7, Material properties of epoxy grout and carbon fibre-reinforced PE
strip ............................................................................................... 102
Table 5-8, Results from design standards, experimental test and FEA simulation
...................................................................................................... 108
Table 5-9, Stress and strain comparison between corroded riser and repaired riser
...................................................................................................... 118
Table 5-10, Response of FRPC laminate at plastic analysis collapse load .... 130
xxv
Table 5-11, Steel-composite interface and composite interlaminar fatigue
properties ...................................................................................... 136
Table 6-1, Hoop strain of various riser at 22MPa .......................................... 179
Table 6-2, Axial strain of various riser at 1785kN tensile load ...................... 181
Table 6-3, Comparison of axial strain values of riser at 120kNm .................. 182
Table 6-4, Axial and hoop strains of riser subjected to combined 22MPa internal
pressure and 1785kN tensile load ................................................. 185
Table 6-5, Comparison of strain values of riser at 22MPa, 1785kN and 78kNm
...................................................................................................... 186
Table 6-6, Axial and hoop strains of riser repaired with different types of
laminate orientation subjected to 22MPa (Pin) and 1785kN (Ft) .. 193
Table 6-7, Axial and hoop strains of riser repaired with different types of
laminate orientation at 22MPa (Pin), 1785kN (Ft)and 78kNm (Mb)
...................................................................................................... 193
Table 6-8, Appropriate thickness of repair at varying length of corrosion .... 205
Table 6-9, Thickness of repair at varying depth of corrosion......................... 210
Table 6-10, Design load and maximum permissible strain for API 5L X52 steel
riser ............................................................................................... 213
Table 7-1, Input parameters for wrapping profile .......................................... 250
xxvi
Abbreviations
API American Petroleum Institute
ASME American Society of Mechanical Engineers
ASTM American Standard for Testing and Materials
CFRP Carbon fibre reinforced polymer
CRS Composite repair system
DEC Double elastic curve
DL Design load
DNV Det Norske Veritas
DOF Degree of freedom
FE Finite element
FEA Finite element analysis
FRPC Fibre reinforced polymer composite
ISO International Organization for Standardization
MAOP Maximum allowable operating pressure
MCT Multi-continuum theory
PACL Plastic analysis collapse load
RC Corroded riser
RHS Rectangular hollow section
xxvii
RVE Representative volume element
SCR Steel catenary riser
SIF Stress intensity factor
SLS Serviceability limit state
SMA Shape memory alloy
SMTS Specified minimum tensile strength
SMYS Specified minimum yield strength
TLP Tension leg platform
VIV Vortex induced vibrations
WWFE Worldwide failure exercise
xxviii
Nomenclature
dc Depth of the corrosion defect
Dp,i Inner diameter of the riser/pipe
Dp,o Outer diameter of the riser/pipe
Ea Young’s Modulus of the FRPC laminate in the axial direction
Ec Young’s Modulus of the FRPC laminate in the circumferential
direction
Ef Young’s Modulus of the fibre
Em Young’s Modulus of the matrix
Ep Young’s Modulus of the riser material
E1 Longitudinal modulus of FRPC laminate
E2 Transverse modulus of FRPC laminate
EIs-c Combined flexural rigidity of steel riser repaired with FRPC
laminate
fd Design factor for internal pressure
fe Weld joint factor
ft Temperature de-rating factor specified in ASME B31.8
F Sum of axial loads acting on the riser/pipe
xxix
Feff Effective tensile force acting on the steel pipe due to welded end
caps
Ft Tensile force
G12 In place shear modulus
GequivC Critical equivalent strain energy release rate
GI Mode I energy release rate
GII Mode II energy release rate
GIII Mode III energy release rate
GIC Mode I critical energy release rate
GIIC Mode II critical energy release rate
GIIIC Mode III critical energy release rate
Ic Second moment of area for the FPRC repair sleeve
Is Second moment of area for the steel riser/pipe
Lc Length of the corrosion defect
Lover Overlap length of the FRPC laminate
Ltaper Taper length of the composite repair
M Folias factor
Mb Bending moment
n Hardening exponent in the Ramberg Osgood model
xxx
P Transverse force acting on the riser/pipe
Pb Burst pressure of uncorroded pipe
Pb,corr Burst pressure of corroded pipe
Pcont Contact pressure
Pd Design pressure
Pin Internal pressure
Ps Maximum allowable pressure for the riser/pipe with defect
Pt Hydrostatic test pressure (internal minus external pressure)
rp Radius of the riser/pipe
S Scale factor
S12 In plane shear strength
tmin Minimum required thickness of the repair laminate
tp Wall thickness of the riser pipe
ts Remaining wall thickness at defect region of the riser/pipe
v12 Poisson ratio
vf Fibre volum fraction
XT1 Longitudinal tensile strength
XT2 Transverse tensile strength
XC1 Longitudinal compressive strength
xxxi
XC2 Transverse compressive strength
α Yield offset Ramberg-Osgood
ɛa Allowable axial strain on the repair laminate
ɛ12u In plane shear failure strain
ɛT1 Longitudinal tensile failure strain
ɛT2 Transverse tensile failure strain
ɛC1 Longitudinal compressive failure strain
ɛC2 Transverse compressive failure strain
σflow Flow stress of the riser material
σh Hoop stress
σy Yield stress of the riser/pipe material
τ Equivalent frictional stress
τeq Equivalent frictional stress
τcrit Critical frictional stress
μ Coefficient of friction
ɣ Shear strain
1
Chapter 1 Introduction
Offshore pipe risers are deployed under harsh environmental conditions that
frequently cause corrosion to both its internal and external surfaces. Throughout
the life cycle of the risers, they must remain intact and functional within a
predefined safety limit during its operation under a combination of complex
loadings. The typical load profiles sustained by offshore risers include
hydrostatic pressure (internal and external), tension, bending, torsion, impact
and fatigue (ABS, 2008) (DNV, 2010). When localised corrosion occurs on the
surface of the riser, a weak spot is created, thus reducing the ability of the riser
to sustain these loads. Conventional repair techniques incorporating welded or
bolted external steel clamps that are attached to the exterior surface of the riser
faced numerous challenges, including mobilisation of the heavy clamp, safety
associated with welding on an operating riser and the excessive installation
expenses. The use of fibre-reinforced polymer composite (FRPC) as a load
bearing sleeve has emerged as a promising means of pipeline rehabilitation due
to advantages such as high specific strength, high corrosion resistance,
lightweight, do not require welding and are simple to install (Patrick, 2010).
Amid the popularity of FRPC repair techniques, it is mostly applied on onshore
pipelines and less on offshore risers due the complexity of loading conditions
and the difficulty of performing the job on subsea risers.
The current project aims to conduct an in-depth review into the recent advances
in various FRPC rehabilitation techniques, hence to identify its most prominent
challenges and limitations as the subject of further research investigation to
determine the governing parameters crucial for the application FRPC as a load
2
bearing riser repair sleeve. The performances of the FRPC repair system will be
evaluated under loading conditions mimicking those conducted in the local
analysis in the design of a riser. In order to address the viability of the composite
repair sleeve, innovative design based on integrated computational simulations
and experimental validations, as outlined below will be performed.
Riser interface design and treatment technology for corroded riser (RC).
Process, properties and structural characteristics of the repair system.
Local analysis on the complex load bearing capacity of the composite repair
system.
Damage and failure initiation of the composite repair system.
Ease of installation, economic viability and structural integrity during
installation.
1.1 Hypothesis and Objectives
Based on the project background discussed above, there are a number of
imminent research questions which are required to be appropriately addressed in
the current research project:
How do the different types of loading profiles such as combined loads (i.e.
internal pressure, tension and bending), and fatigue load that are typical to
offshore risers in real life scenario affect the performance of a FRPC repair
applied on a localised corrosion defect on the riser?
How do the parameters of the FRPC repair such as fibre types, fibre volume
fraction, fibre orientation etc. affect the performance of the repaired system?

3
How can the design of FRPC repair on a corroded riser be formulated
systematically with considerable accuracy representing the load profiles
sustained by the riser?
The objectives developed from the proposed hypothesis are outlined as below:
1) To analyse the effectiveness of FRPC in repairing external corrosion defect
on steel risers
2) To determine the effects of various loading profiles on the behaviour of the
FRPC repair on corroded steel risers
3) To study the effect of different parameters of the composite repair system
such as the dimensions of the corrosion defect, types of reinforcing fibre and
laminate orientation on its performance
4) To formulate a numerical simulation model and a set of procedures that can
be used to design the FRPC repair on corroded risers.
The research methodologies involve the development of an accurate finite
element analysis model of the riser and the FRPC. Accuracy of the numerical
solution will be validated with lab scale experimental data. Numerous key
parameters (e.g. load profiles, defect size, material properties, repair thickness,
etc.) are varied and the optimised output to the research questions are sought.
The validated FEA model serves to provide a useful platform for parametric
study of the composite repair system for corroded offshore risers, and to furnish
informed decision for the development of an automated wrapping module, which
will be developed based on existing design concepts of automated pipe
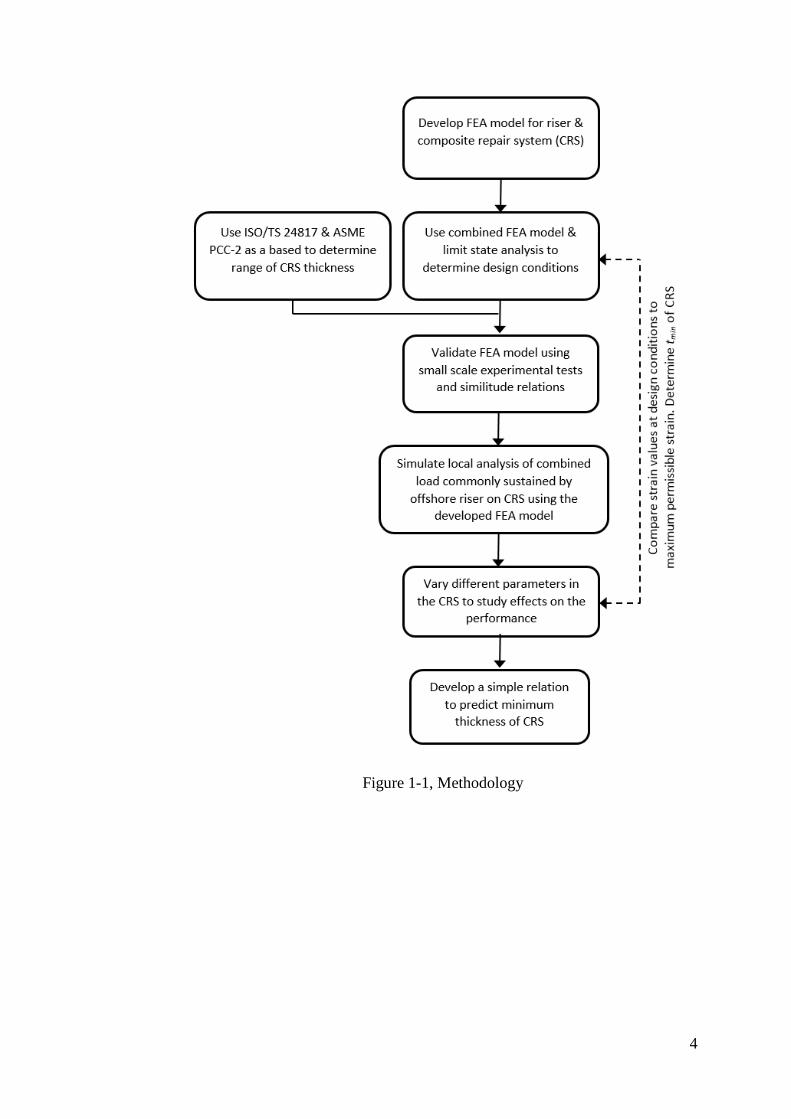
traversing machine. The methodology of this research work is summarised in a
flowchart in Figure 1-1.
4
Figure 1-1, Methodology

5
Chapter 2 Literature Review
2.1 Introduction
Risers in offshore application are subjected to corrosion during their service life
cycle. As the field of offshore riser repair constantly seeks improvement over the
decades, the use of relatively inexpensive, high strength to weight ratio fibre
reinforced polymer composite (FRPC) as a load bearing sleeve for corroded
offshore risers has started to emerge as a significant element in the field of
research and development. The literature review done in this research covered a
wide range of topics. The first part of this review covers the typical offshore riser
repairs that were introduced prior to the emergence of composite repair. The
suitability and limitations of these repair techniques are discussed, which
prompts the need for composite repair to be introduced in the offshore industry.
The pros and cons of using composite as a repair material are studied in order to
understand the significant research gaps needed to confidently apply this repair
technique in offshore risers in the near future. Hence, the existing composite
repair products for onshore pipelines are identified. In addition, standards and
guidelines that are relevant to riser design, pipeline repair and composite testing
and qualifications are being addressed. Research works on composite repair
relevant to onshore pipelines and offshore pipes/risers are scrutinized. The
adhesive bonding behaviour between steel and polymeric composite materials is
studied as it is one of the elements that ensure the quality of the repair. In addition,
the different works on existing automated pipe crawlers and pipe wrapping
devices are looked into in order to understand and propose a composite repair
system that suits the needs for an automated composite repair machine. A
6
summary of the literature review is given at the end of the chapter whereby the
novel research elements are identified.
2.2 Conventional offshore riser repair methods
Riser is one of the most critical components in offshore operation as it is one of
the main elements for extraction of crude oil from the seabed. It is the link
between the seabed and surface in which the main function can be split into
drilling or production. A riser is a long slender vertical cylindrical pipe placed at
or near the sea surface and extending to the ocean floor (Chakrabarti & Frampton,
1982). Risers are subjected to various types of loading due to the forces imposed
by its operation and environment. For a riser to be fit for operation, the design
of risers must comply to the safety limit of various loads in which it must
sustained throughout its life cycle. Being submerged under water, a riser is
subjected to a corrosive environment that can cause significant material loss on
its surface. Apart from that, the erosion on the inner steel surface due to the fluid
in the riser often causes internal corrosion and localised corrosion known as
pitting. When the extend of such corrosion exceeds an allowable threshold, the
performance of a riser can deteriorate so much that it can no longer sustain the
different loadings (e.g. internal pressure, tensile force, bending force) at an
acceptable limit.
In order to maintain the safe and reliable operation of a riser subjected to
excessive corrosion, repair techniques to restore the strength of the riser must be
applied. The earliest means of repairing a riser involves retrieving the corroded
section of the riser to the surface where conventional onshore repair techniques
or replacement of the part can be done (Webb, 1980). This technique is the least
7
favourable one as production needs to be halted, thus causing major inventory
losses. Further development in this area saw the invention of a repair method
that employs a cofferdam to be temporarily installed around the defective section
of the riser to provide a dry and safe area for experience diver to carry out repair
using welded or bolted steel clamp around the weaken area of the riser. However,
such method is limited to shallow water depths where the damage on the pipe
has to be near to the water surface (Tiratsoo, 2003). In addition, incorporation of
an annular gap between the steel clamp and the riser that is then filled with a
grout material such as epoxy can serve to transfer the load from weaken riser
pipe to the steel sleeve more effectively (Palmer & King, 2008).
The use of steel clamps necessitates the mobilisation of heavy structures from
onshore sites to offshore platforms, which incurs high logistics cost. As the main
content being transported by risers is hydrocarbon substances, application of
hyperbaric welding during installation of these steel clamps involves high risk.
In addition, the labour cost for underwater welder can be significant due to the
risk involved such as underwater explosion, electric shock and accumulation of
nitrogen diffused into bloodstream.
2.3 Composite Repair for Onshore Pipelines
Similar to offshore industry, onshore pipelines can be subjected to corrosion
which causes material losses on the surface of the steel pipelines. The main
difference between onshore pipelines repair and offshore risers repair is in the
process itself. As onshore pipelines are not submersed under water, the factors
that affect a repair can be easily controlled and fibre-reinforced polymer
composites has been widely introduced over the past decades. Similar to offshore

8
risers, onshore oil and gas pipelines carry hydrocarbon fluids that are highly
flammable. The use of FRPC material as means of repair can eliminate hot work
and the shutdown of pipeline operation (Patrick, 2004). A survey conducted by
the US Department of Transportation showed that the overall costs can be
reduced by 24% by using composite repair instead of welded steel sleeves. When
compared to the replacement of the whole defective pipe section, the cost can be
further reduced to approximately 73% (RSPA, 2000). To date, various
companies in the oil and gas industry have developed composite repair systems
that are capable of restoring the strength of onshore pipelines sustaining different
types of defects such as mechanical gouge dent (Figure 2-1), external corrosion
(Figure 2-2) and internal corrosion (Figure 2-3).
Figure 2-1, Mechanical gouge dent on a
pipe
Figure 2-2, External corrosion on
pipe
Figure 2-3, Internal corrosion on pipe

9
2.3.1 Types of Composite Repair
The two main categories of composite repairs applicable to onshore pipelines are
flexible wet lay-up systems and pre-cured layered system (Rehberg, et al., 2010)
(Patrick, 2010). Wet lay-up system involves the use of flexible fibre reinforced
fabric that is wetted with an uncured resin matrix on-site which is manually
applied around the pipelines. The wetted fabric will then cure to form a stiff shell
around the damaged pipe. An alternative form of wet lay-up system incorporates
the use of pre-impregnated flexible fibre reinforced fabric that is prevented from
curing before its application. Such systems can be water-activated, UV-activated,
or temperature activated. Pre-cured layered system uses a pre-manufactured
fibre-reinforced composite that it bonded to the defective pipe and held together
between layers using an adhesive. Another form of pre-cured system that is not
widely used in existing composite repair products is the pre-cured stand-off
sleeve. Stand-off sleeve provide higher structural integrity than both wet lay-up
system and pre-cured layered system as it can be pre-manufactured to the
required dimensions under optimum curing conditions. However, such systems
are sized to specific diameters (Shamsuddoha, et al., 2013). Figure 2-4 shows
the different types of composite repair systems.
10
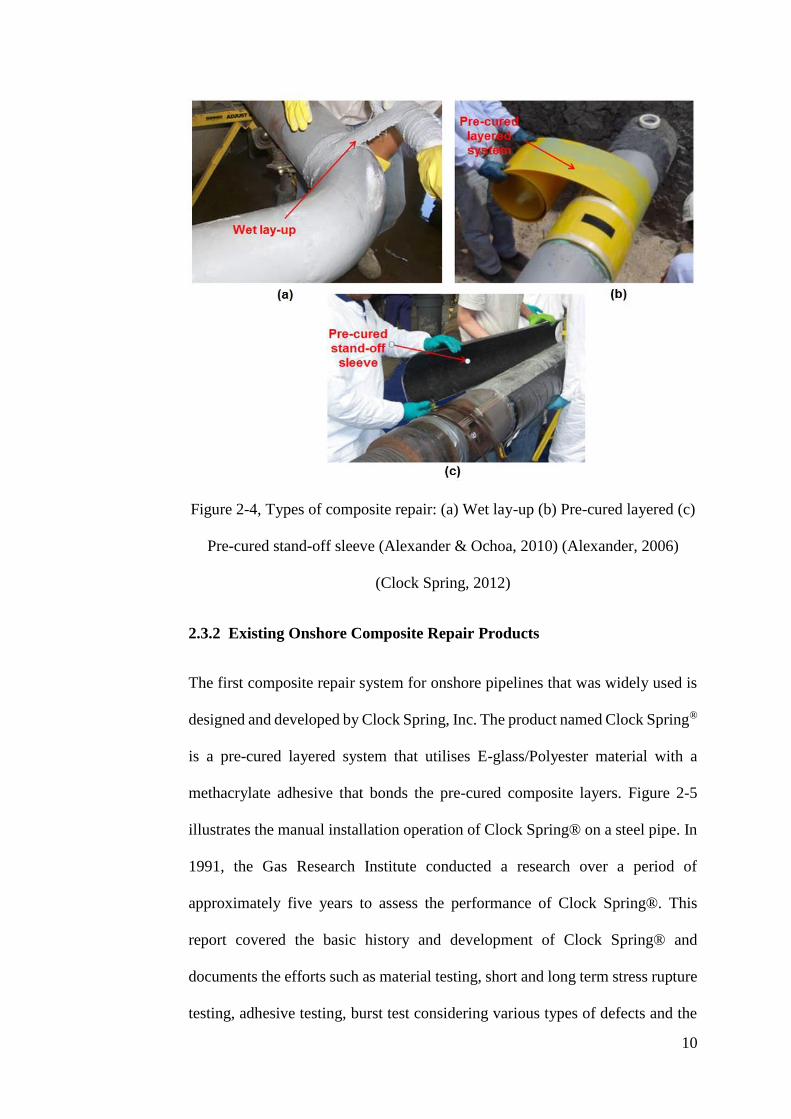
Figure 2-4, Types of composite repair: (a) Wet lay-up (b) Pre-cured layered (c)
Pre-cured stand-off sleeve (Alexander & Ochoa, 2010) (Alexander, 2006)
(Clock Spring, 2012)
2.3.2 Existing Onshore Composite Repair Products
The first composite repair system for onshore pipelines that was widely used is
designed and developed by Clock Spring, Inc. The product named Clock Spring®
is a pre-cured layered system that utilises E-glass/Polyester material with a
methacrylate adhesive that bonds the pre-cured composite layers. Figure 2-5
illustrates the manual installation operation of Clock Spring® on a steel pipe. In
1991, the Gas Research Institute conducted a research over a period of
approximately five years to assess the performance of Clock Spring®. This
report covered the basic history and development of Clock Spring® and
documents the efforts such as material testing, short and long term stress rupture
testing, adhesive testing, burst test considering various types of defects and the

11
field assessment of Clock Spring®. In addition, it also provides a general
procedure for the safe application of Clock Spring® (Alexander, 2006).
Figure 2-5, Installation of Clock Spring® on a steel pipe (Clock Spring, 2012)
The drawbacks of the Clock Spring® pre-cured system is its limitation to
designated pipe sizes and straight pipe sections. Over the years, the pipeline
industry started exploring the use of flexible wet lay-up systems due to its ability
to conform to any pipe diameters and geometries. In 2005, Stress Engineering
Services, Inc. performed a series of test to evaluate the AquaWrap® composite
repair system developed by Air Logistics, Inc. for mechanically-damaged
pipelines. The AquaWrap® is an example of a flexible wet lay-up system that
consists of a water-activated pre-impregnated (i.e prepreg) composite that is
installed over the damage area. A typical installation of AquaWrap® on a
damaged pipeline is shown in Figure 2-6. The repaired specimens were pressure
cycled at 100% maximum allowable operating pressure (MAOP), which is
equivalent to 72% specified minimum yield stress (SMYS) of the pipe. The
results of the tests have proven that the AquaWrap® can increase the fatigue life
from 103,712 pressure cycles for an unrepaired pipe to 928,736 cycles for a
repaired pipe (Alexander, 2005).
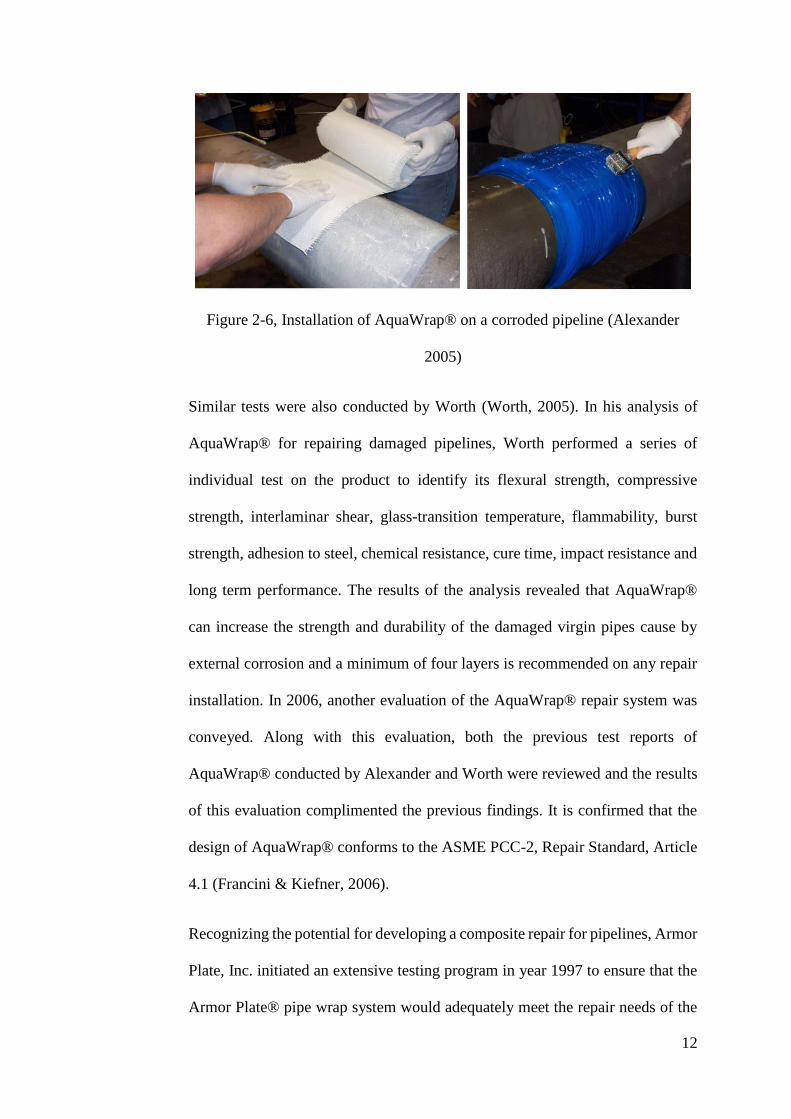
12
Figure 2-6, Installation of AquaWrap® on a corroded pipeline (Alexander
2005)
Similar tests were also conducted by Worth (Worth, 2005). In his analysis of
AquaWrap® for repairing damaged pipelines, Worth performed a series of
individual test on the product to identify its flexural strength, compressive
strength, interlaminar shear, glass-transition temperature, flammability, burst
strength, adhesion to steel, chemical resistance, cure time, impact resistance and
long term performance. The results of the analysis revealed that AquaWrap®
can increase the strength and durability of the damaged virgin pipes cause by
external corrosion and a minimum of four layers is recommended on any repair
installation. In 2006, another evaluation of the AquaWrap® repair system was
conveyed. Along with this evaluation, both the previous test reports of
AquaWrap® conducted by Alexander and Worth were reviewed and the results
of this evaluation complimented the previous findings. It is confirmed that the
design of AquaWrap® conforms to the ASME PCC-2, Repair Standard, Article
4.1 (Francini & Kiefner, 2006).
Recognizing the potential for developing a composite repair for pipelines, Armor
Plate, Inc. initiated an extensive testing program in year 1997 to ensure that the
Armor Plate® pipe wrap system would adequately meet the repair needs of the
13
pipeline industry. The Armor Plate® pipe wrap is a 3-part wet-layup system that
consists of the resin, putty and Armor FiberTM. Stress Engineering Services, Inc.
was again selected as the engineering firm to conduct the evaluation. The results
of the evaluation demonstrated that Armor Plate® is a valid method for repairing
corroded and mechanically-damaged pipes. The strength of the repair is
governed by the thickness of the Armor Plate® wrap and the tensile stress at
each layer of the wrap, where effective stress transfer initiates once plastic flow
occurs in the steel pipe beneath the repair (Alexander & Wilson, 2000). In year
2000, Armor Plate, Inc. successfully expanded their business as numerous
world-wide installations of the Armor Plate® pipe wrap system were made in
regions such as Alaska, Saudi Arabia, China and South Africa (Nace
International, 2011).
In 2000, WrapMaster, Inc. developed a repair system, PermaWrapTM which is
similar to Clock Spring® in a sense that pre-cured composites was employed as
the reinforcement of the repair system. The pre-cured composite used in this
system are hard shell with adhesive installed between layers. One of the main
advantages of PermaWrapTM is that the repairs are magnetic pig detectable and
available in a range of widths (Alexander, 2006).
At present, there are various products of composite repair for onshore pipelines
available in the market. Diomandwrap® is a carbon wrap system developed by
Citadel Technologies, Inc. The wrap used in this repair system is a bi-directional
woven carbon-fiber material which can provide reinforcement in the hoop and
axial directions. Because of the higher elastic modulus of carbon fibres
compared to glass fibres, Diomandwrap® is applicable to higher pressure
pipelines (Citadel Technologies, 2011). Another example of composite repair
14
used to industrial pipelines is the A+ WrapTM developed by Pipe Wrap, LCC.
This system utilises a factory pre-impregnated (prepreg) glass fiber with
moisture cured polyurethane resins (Pipe Wrap, 2011).
2.4 Integration of Composite Repair in Offshore Riser
The intense interest in the research and development of alternative rehabilitation
system for repairing offshore risers has seen a shift from off-site rehabilitation
to in-situ repair using steel clamp and grouting. An ideal means of repair should
involve a reliable and safe method which requires no shutdown of operation in
order to minimise the time and production loss. In the recent years, there are
increasing discoveries of oil reserves being found at great depth into the ocean
seabed. A report made by the US Minerals Management Service (federal agency
responsible for offshore leases and oil activities) stated that twelve deepwater
discoveries were made in Gulf of Mexico alone in 2003, three of which were at
depth greater than 2500m (Ochoa & Salama, 2005). At such depth, it is apparent
that there is a need for more economical and facile maintenance of the offshore
facilities including riser repair. Thus, repair of risers using fibre-reinforced
polymer composite materials have emerged as an attractive option to be
implemented in this field. The FRPC offers great advantages such as high
specific strength, high corrosion resistance, good thermal insulation, do not
require welding and are simple to install (Ochoa & Salama, 2005).
2.4.1 Limitations in the Application of Composite in Riser Repair
The impediment of composite repair in offshore risers is mainly due to the
uncertainties related to the application of the composite material itself. In general,
15
the barriers to greater acceptance of composites into the offshore industry can be
divided into four main key issues which are (Martine, 2007),
1) Technical – Industry competence and familiarity with metallic;
2) Financial – costing methods, excluding life cycle costing;
3) Commercial – difficulty of entry into established supply chains;
4) Awareness – perceptions and lack of knowledge of industry engineer
The major focuses in research of composite repair system are technical and
awareness.
The transition of composite repair from onshore pipelines to offshore riser are
hindered by the lack of databases for the long-term damage mechanisms for life
prediction and no proper in-service integrity monitoring (Ochoa & Salama,
2005). Due to the nature of the composite material itself, where diversity in
reinforcement and matrix combination along with different manufacturing
parameters such as winding angle, fibre volume fraction, curing temperature are
feasible, it gives rise to many uncertainties in the ultimate performance and
lifespan of the composite. Various failure criteria of fibre-reinforced composites
are developed by researches to predict the failure behaviour of composites under
static load, long term loading and fatigue loading. However, among all these
criteria, no benchmark exists to validate the accuracy of the results (Hinton, et
al., 2004).
In addition to the behaviour of the composite material itself, the robustness of
the metal-composite interface is crucial in composite repair system. Although
composite materials have already been widely used in aerospace and automotive
industry, the joining of composite material to steel components is still a non-
16
trivial task, which is highly dependent of several factors such as type of adhesive,
modes of loading and geometry of the adhesive joint (Anyfantis & Tsouvalis,
2013). The availability of well-defined data for the determination of the strength
and durability of the metal-composite bond in tubular wrap is still scarce.
The stress-strain behaviour of composite materials can be non-linear and their
properties are dependent on time and environmental conditions. There is a
significant lack of relevant performance information related to the application of
composite material in hostile offshore environments. Standards that describes
the design of offshore risers relative to the different types of loadings are readily
available but are all based on the use of steel materials. There is no recognised
database for the design properties of composite materials in offshore application
(Ochoa & Salama, 2005), which is essential for the design of composite repair
system for offshore risers.
On top of that, there is no proper health monitoring system applicable to
composite repair system for offshore risers. Various research works, verification
and certification on composite repair system for steel pipelines have utilised
strain gauges as a means of monitoring the performance of the system. Murad
(Murad, 2011) (Murad, et al., 2013) developed an integrated structural health
monitoring approach for composite-based pipeline repair. However, the
cumbersome process of installing electrical strain gauges on the steel pipe prior
to the application of the composite repair greatly limits its adoption in offshore
subsea application.

17
2.4.2 Automated Riser Repair Machine
Current practice of composite repair systems highly rely on manual deployment
of the FRPC material onto the defective area of the steel pipe, e.g. underwater
composite repair near the splash zone and at shallow depths are viable through
human divers. Deepwater repairs at depth of 100 metres and more are not
feasible via manual human divers due to the oxygen toxicity effects. In addition,
quality of repairs can be compromised due to minimal visibility and harsh
conditions of the current forces and cold temperatures which can affect the
human diver. In order to maximise the potential of composite repair for offshore
risers, the feasibility of developing more advanced systems, i.e. unmanned
automated repair machines has attracted great interest amongst major players in
the oil and gas sector.
2.4.2a Pipe Traversing/Crawling Machine
For automated repair to be achievable underwater, automated pipe crawling
systems must be design to carry the repair machine to the corroded site of the
riser. Several researches on pipe traversing machine have been reported.
Chatzakos et al. developed prototype of an unmanned underwater robotic
crawler for subsea flexible risers. The testing of the prototype is shown in Figure
2-7. This robotic crawler uses an inchworm translational motion to navigate
along the length of the riser. The inchworm crawling is achieved by alternating
activation of grippers and linkage mechanism between two main bodies. The
linkage mechanism joins the two bodies and provides translational and rotational
degrees of freedom. Figure 2-8 shows the sequence of action for the linear
translational motion along the length riser, while Figure 2-9 shows the sequence

18
of rotational motion around the circumference of the riser. However, the module
attached to this prototype only consists of a non-destructive testing (NDT)
equipment used for inspection (Chatzakos, et al., 2010). For semi-automated or
fully automated repair to be conducted, repair modules need to be designed and
built on the pipe crawlers.
Figure 2-7, Prototype of the unmanned underwater robotic crawler (Chatzakos,
et al., 2010)
Figure 2-8, Sequence of actions for the translational motion along the length of
the riser (Psarros, et al., 2010)

19
Figure 2-9, Sequence of actions for the rotational motion around the
circumference of the riser (Psarros, et al., 2010)
Yukawa et al. (Yukawa, et al., 2006) developed an onshore oil plant pipe
inspection robot that can traverse along vertical piping, where attachment on the
pipe is achieved using the power generated by wheel-type magnets. This robot
consists of three connected units, with each unit having a “drive part” and a “lift
part”. The robot is capable of traversing flanges by moving these three parts
independently as shown in Figure 2-10. This mechanism is achieved by the
combination of driving and lifting motion provided by the “drive part” and “lift
part”. The “drive part” contains a motor that drives the magnetic wheels to
enable the robot to move along the pipe. Once the sensor detects the presence of
a flange, the motor on the “drive part” stops. At the same time, the motor on the
“lift part” of the first unit overcomes the magnetic force to lift the unit so that it
can avoid the flange. The drive motor on the other two units then moves the
robot along the pipe. The combination of driving and lifting of the three separate
units enables the robot to traverse flanges. The advantage of this system is that
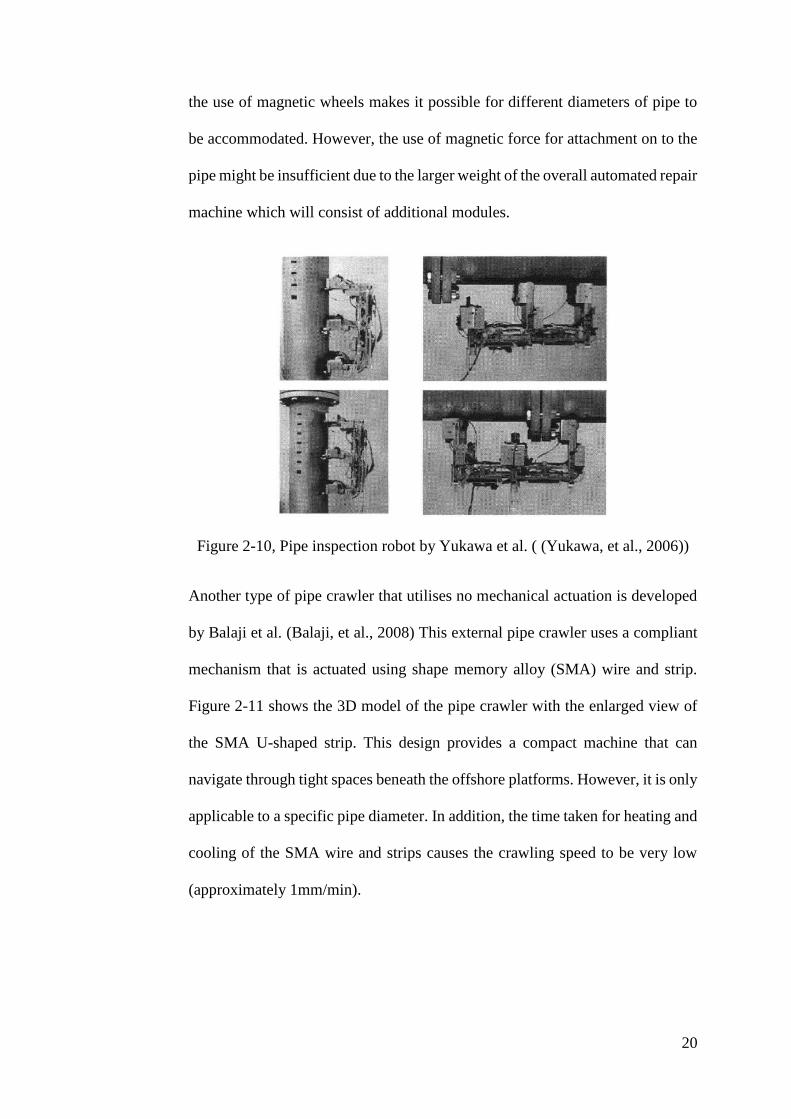
20
the use of magnetic wheels makes it possible for different diameters of pipe to
be accommodated. However, the use of magnetic force for attachment on to the
pipe might be insufficient due to the larger weight of the overall automated repair
machine which will consist of additional modules.
Figure 2-10, Pipe inspection robot by Yukawa et al. ( (Yukawa, et al., 2006))
Another type of pipe crawler that utilises no mechanical actuation is developed
by Balaji et al. (Balaji, et al., 2008) This external pipe crawler uses a compliant
mechanism that is actuated using shape memory alloy (SMA) wire and strip.
Figure 2-11 shows the 3D model of the pipe crawler with the enlarged view of
the SMA U-shaped strip. This design provides a compact machine that can
navigate through tight spaces beneath the offshore platforms. However, it is only
applicable to a specific pipe diameter. In addition, the time taken for heating and
cooling of the SMA wire and strips causes the crawling speed to be very low
(approximately 1mm/min).
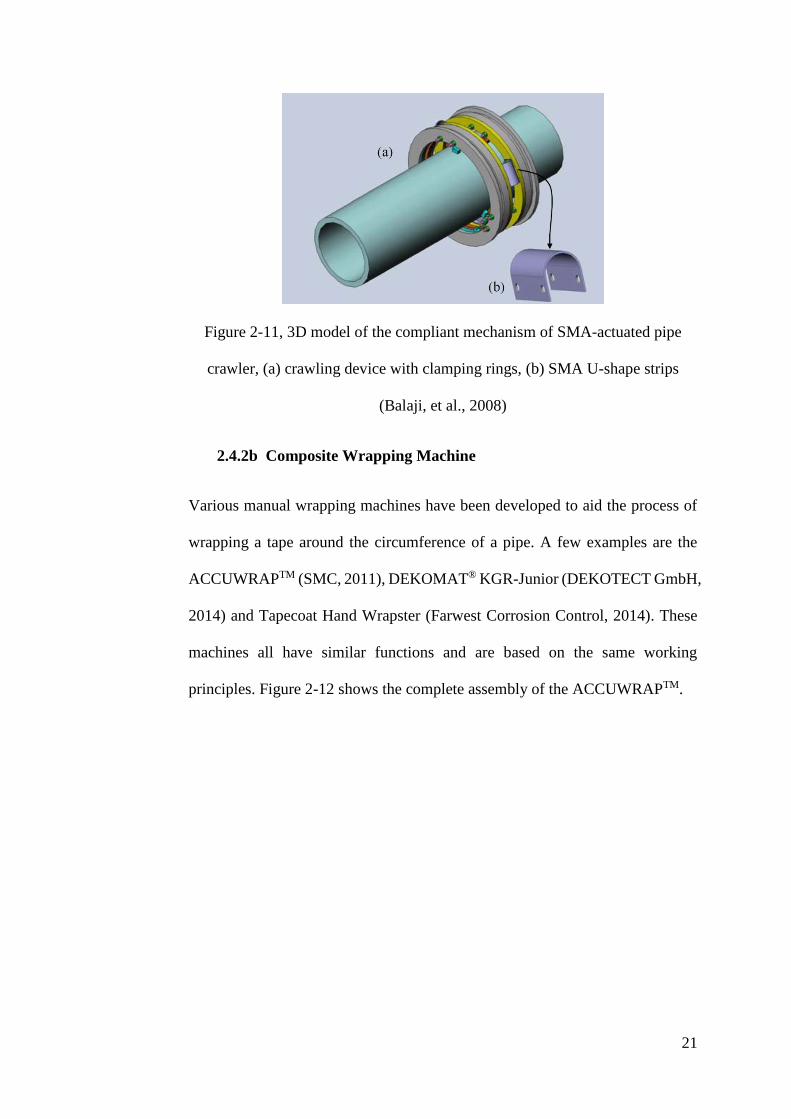
21
Figure 2-11, 3D model of the compliant mechanism of SMA-actuated pipe
crawler, (a) crawling device with clamping rings, (b) SMA U-shape strips
(Balaji, et al., 2008)
2.4.2b Composite Wrapping Machine
Various manual wrapping machines have been developed to aid the process of
wrapping a tape around the circumference of a pipe. A few examples are the
ACCUWRAPTM (SMC, 2011), DEKOMAT® KGR-Junior (DEKOTECT GmbH,
2014) and Tapecoat Hand Wrapster (Farwest Corrosion Control, 2014). These
machines all have similar functions and are based on the same working
principles. Figure 2-12 shows the complete assembly of the ACCUWRAPTM.
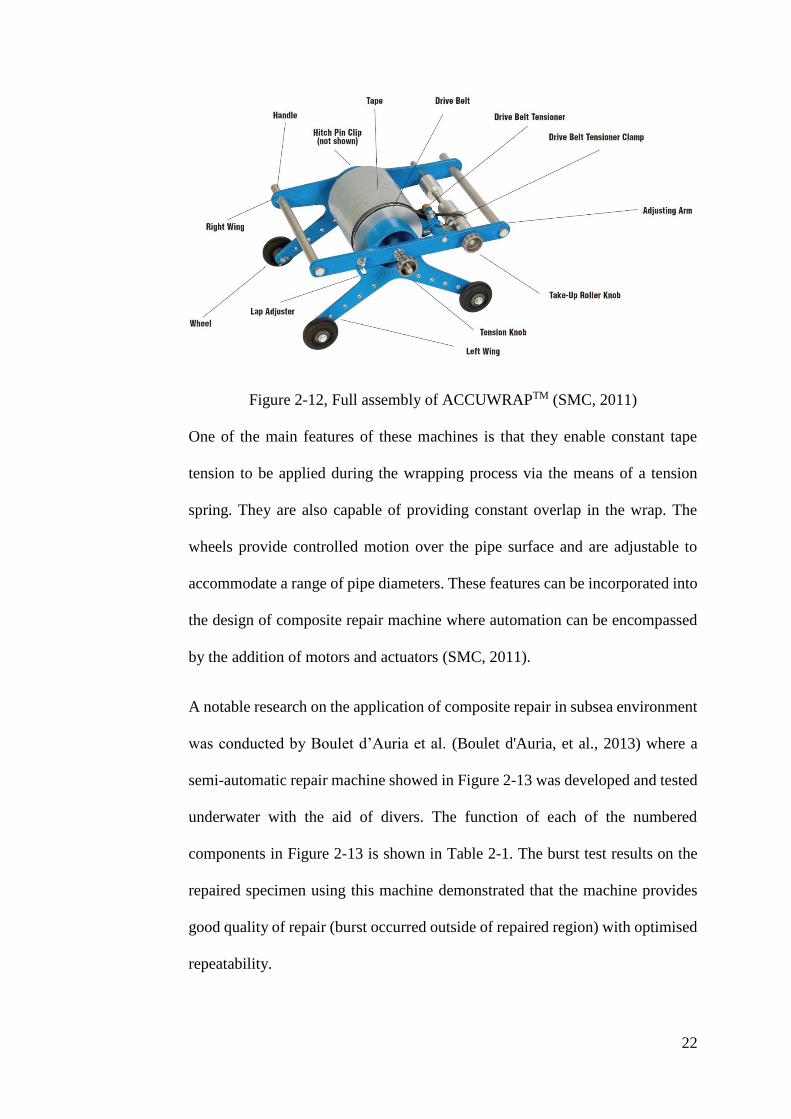
22
Figure 2-12, Full assembly of ACCUWRAPTM (SMC, 2011)
One of the main features of these machines is that they enable constant tape
tension to be applied during the wrapping process via the means of a tension
spring. They are also capable of providing constant overlap in the wrap. The
wheels provide controlled motion over the pipe surface and are adjustable to
accommodate a range of pipe diameters. These features can be incorporated into
the design of composite repair machine where automation can be encompassed
by the addition of motors and actuators (SMC, 2011).
A notable research on the application of composite repair in subsea environment
was conducted by Boulet d’Auria et al. (Boulet d'Auria, et al., 2013) where a
semi-automatic repair machine showed in Figure 2-13 was developed and tested
underwater with the aid of divers. The function of each of the numbered
components in Figure 2-13 is shown in Table 2-1. The burst test results on the
repaired specimen using this machine demonstrated that the machine provides
good quality of repair (burst occurred outside of repaired region) with optimised
repeatability.
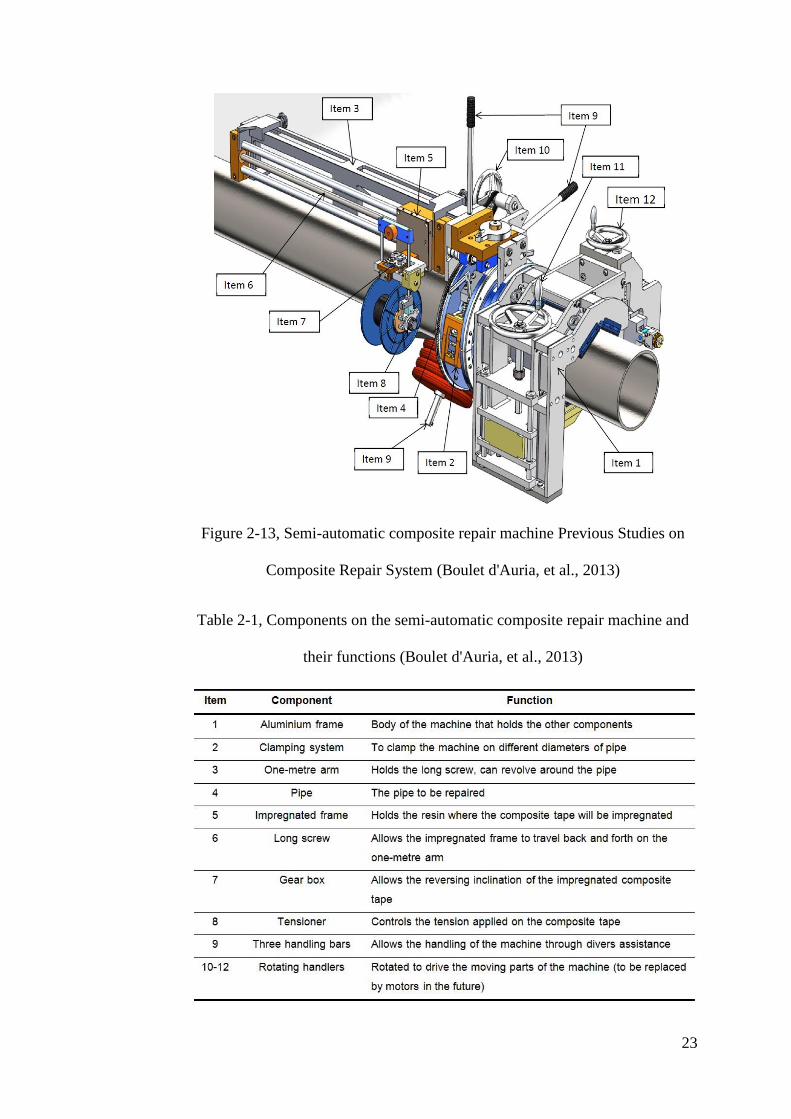
23
Figure 2-13, Semi-automatic composite repair machine Previous Studies on
Composite Repair System (Boulet d'Auria, et al., 2013)
Table 2-1, Components on the semi-automatic composite repair machine and
their functions (Boulet d'Auria, et al., 2013)
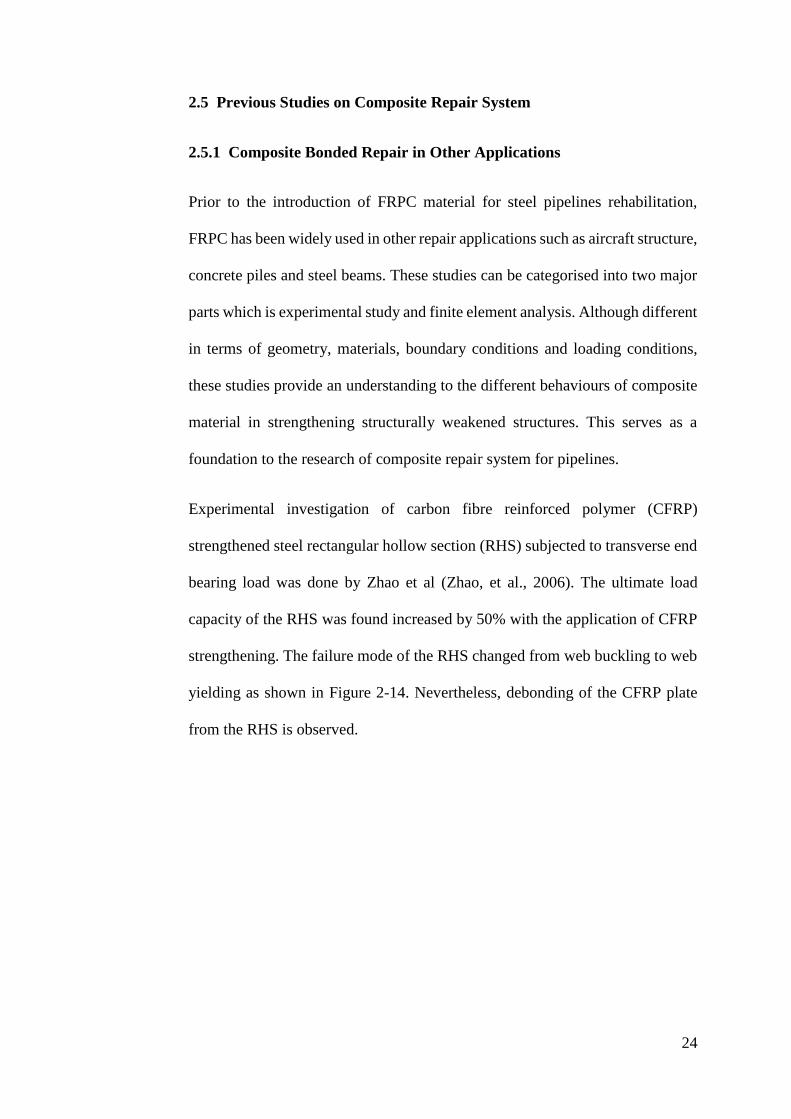
24
2.5 Previous Studies on Composite Repair System
2.5.1 Composite Bonded Repair in Other Applications
Prior to the introduction of FRPC material for steel pipelines rehabilitation,
FRPC has been widely used in other repair applications such as aircraft structure,
concrete piles and steel beams. These studies can be categorised into two major
parts which is experimental study and finite element analysis. Although different
in terms of geometry, materials, boundary conditions and loading conditions,
these studies provide an understanding to the different behaviours of composite
material in strengthening structurally weakened structures. This serves as a
foundation to the research of composite repair system for pipelines.
Experimental investigation of carbon fibre reinforced polymer (CFRP)
strengthened steel rectangular hollow section (RHS) subjected to transverse end
bearing load was done by Zhao et al (Zhao, et al., 2006). The ultimate load
capacity of the RHS was found increased by 50% with the application of CFRP
strengthening. The failure mode of the RHS changed from web buckling to web
yielding as shown in Figure 2-14. Nevertheless, debonding of the CFRP plate
from the RHS is observed.
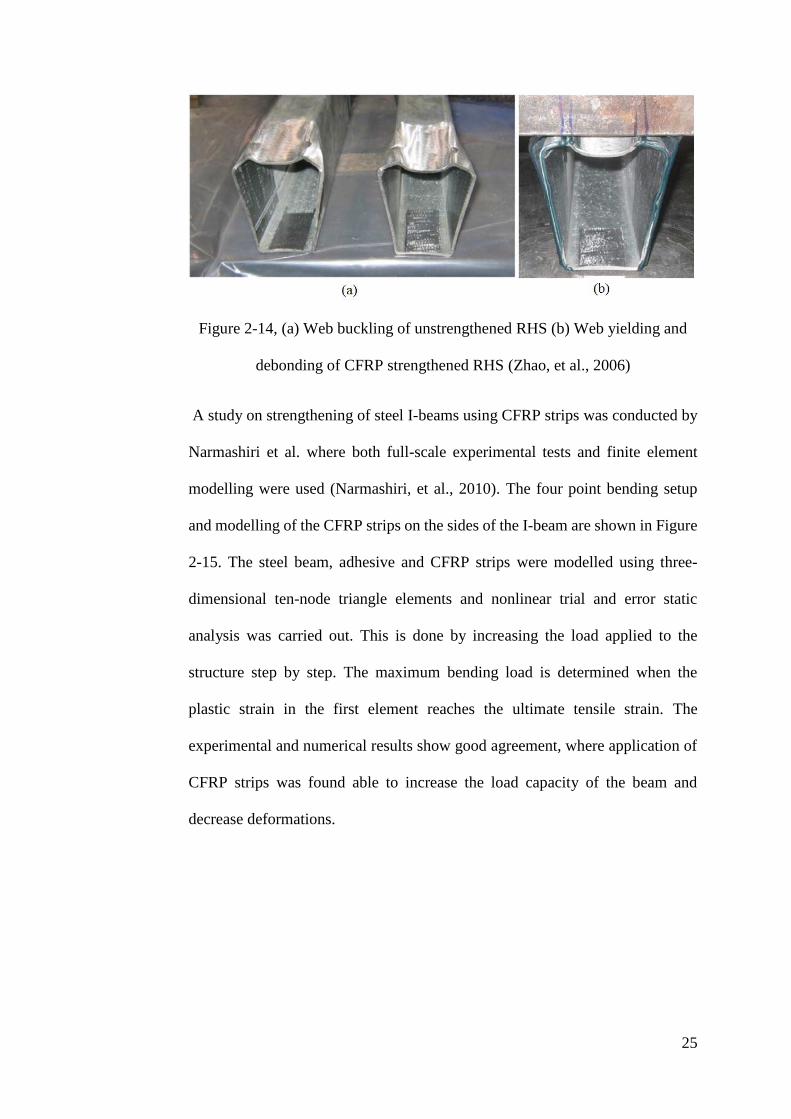
25
Figure 2-14, (a) Web buckling of unstrengthened RHS (b) Web yielding and
debonding of CFRP strengthened RHS (Zhao, et al., 2006)
A study on strengthening of steel I-beams using CFRP strips was conducted by
Narmashiri et al. where both full-scale experimental tests and finite element
modelling were used (Narmashiri, et al., 2010). The four point bending setup
and modelling of the CFRP strips on the sides of the I-beam are shown in Figure
2-15. The steel beam, adhesive and CFRP strips were modelled using three-
dimensional ten-node triangle elements and nonlinear trial and error static
analysis was carried out. This is done by increasing the load applied to the
structure step by step. The maximum bending load is determined when the
plastic strain in the first element reaches the ultimate tensile strain. The
experimental and numerical results show good agreement, where application of
CFRP strips was found able to increase the load capacity of the beam and
decrease deformations.
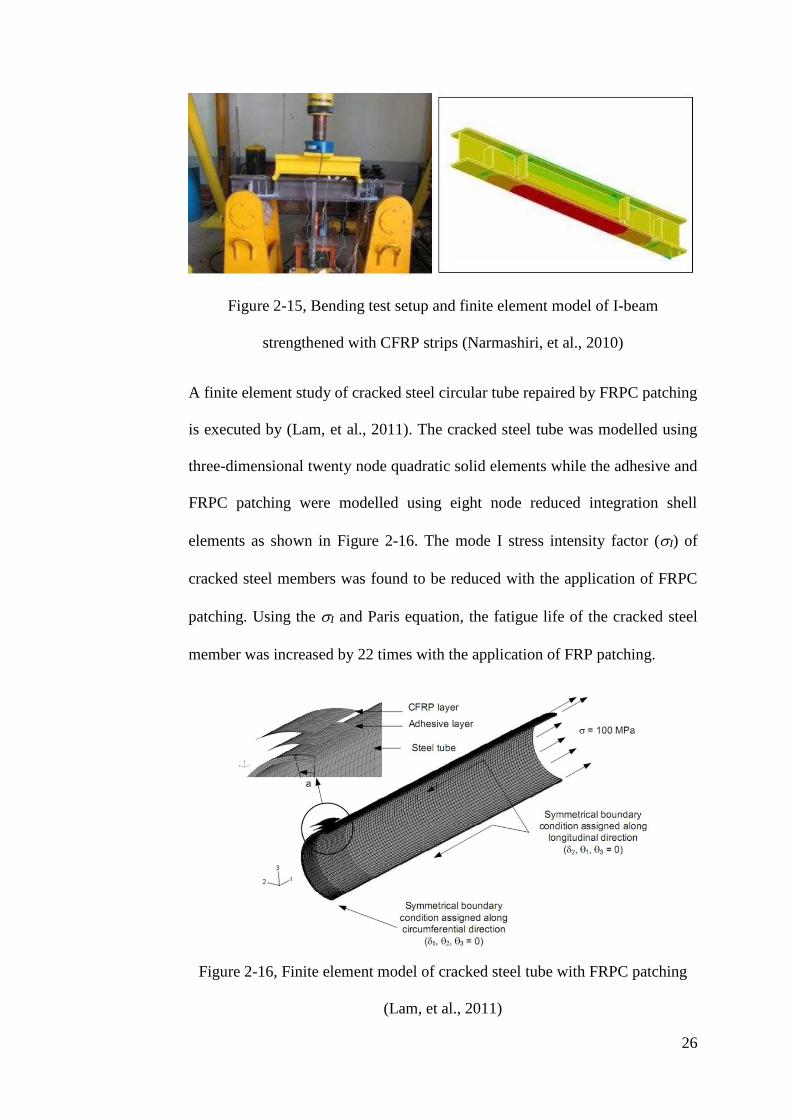
26
Figure 2-15, Bending test setup and finite element model of I-beam
strengthened with CFRP strips (Narmashiri, et al., 2010)
A finite element study of cracked steel circular tube repaired by FRPC patching
is executed by (Lam, et al., 2011). The cracked steel tube was modelled using
three-dimensional twenty node quadratic solid elements while the adhesive and
FRPC patching were modelled using eight node reduced integration shell
elements as shown in Figure 2-16. The mode I stress intensity factor (I) of
cracked steel members was found to be reduced with the application of FRPC
patching. Using the I and Paris equation, the fatigue life of the cracked steel
member was increased by 22 times with the application of FRP patching.
Figure 2-16, Finite element model of cracked steel tube with FRPC patching
(Lam, et al., 2011)
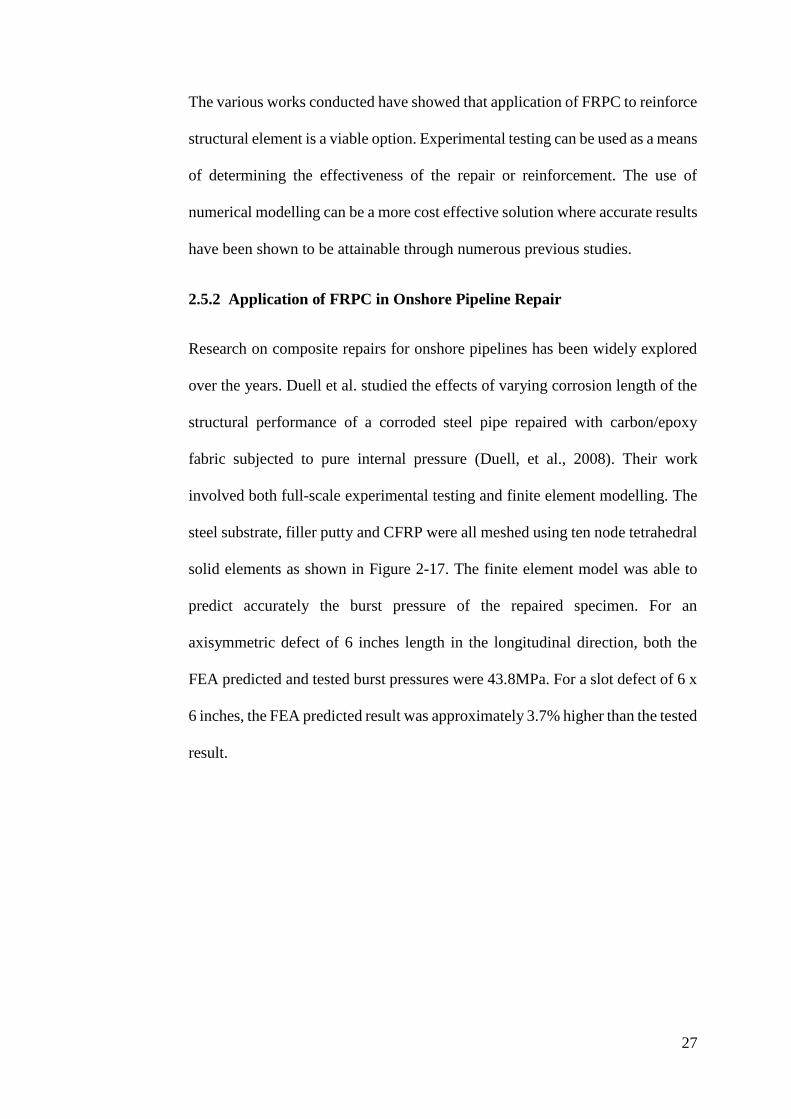
27
The various works conducted have showed that application of FRPC to reinforce
structural element is a viable option. Experimental testing can be used as a means
of determining the effectiveness of the repair or reinforcement. The use of
numerical modelling can be a more cost effective solution where accurate results
have been shown to be attainable through numerous previous studies.
2.5.2 Application of FRPC in Onshore Pipeline Repair
Research on composite repairs for onshore pipelines has been widely explored
over the years. Duell et al. studied the effects of varying corrosion length of the
structural performance of a corroded steel pipe repaired with carbon/epoxy
fabric subjected to pure internal pressure (Duell, et al., 2008). Their work
involved both full-scale experimental testing and finite element modelling. The
steel substrate, filler putty and CFRP were all meshed using ten node tetrahedral
solid elements as shown in Figure 2-17. The finite element model was able to
predict accurately the burst pressure of the repaired specimen. For an
axisymmetric defect of 6 inches length in the longitudinal direction, both the
FEA predicted and tested burst pressures were 43.8MPa. For a slot defect of 6 x
6 inches, the FEA predicted result was approximately 3.7% higher than the tested
result.

28
Figure 2-17, 3D finite element model used in Duell et al.'s work (Duell, et al.,
2008)
Stress analysis was conducted by Meniconi et al. (Meniconi, et al., 2002) to
examine the stress transfer in a pressurised corroded steel pipe repaired with
different types of composite repair system – wet-layup of dry fibre glass fabric
with liquid resin, pre-cured glass fibre composite and pre-impregnated
composite fabric wrapped with water. Finite element analysis that uses 20-node,
reduced integration solid elements was also built to produce a model that can
well represent the composite repair system. The experimental and FEA results
(Figure 2-18) show good agreement in the elastic region with slight deviation
after yielding. The abbreviation “CC” and “CRC’ in Figure 2-18 denotes the
circumferential strain on the unrepaired pipe and repaired pipe respectively,
while the 150% denotes the increase of the repair laminate’s modulus by 50%.
This is based on the hypothesis that continuously wrapped fibres develop more
circumferential stiffness than flat tensile specimens, as properties for composite
laminates are usually tested via flat tensile specimens.
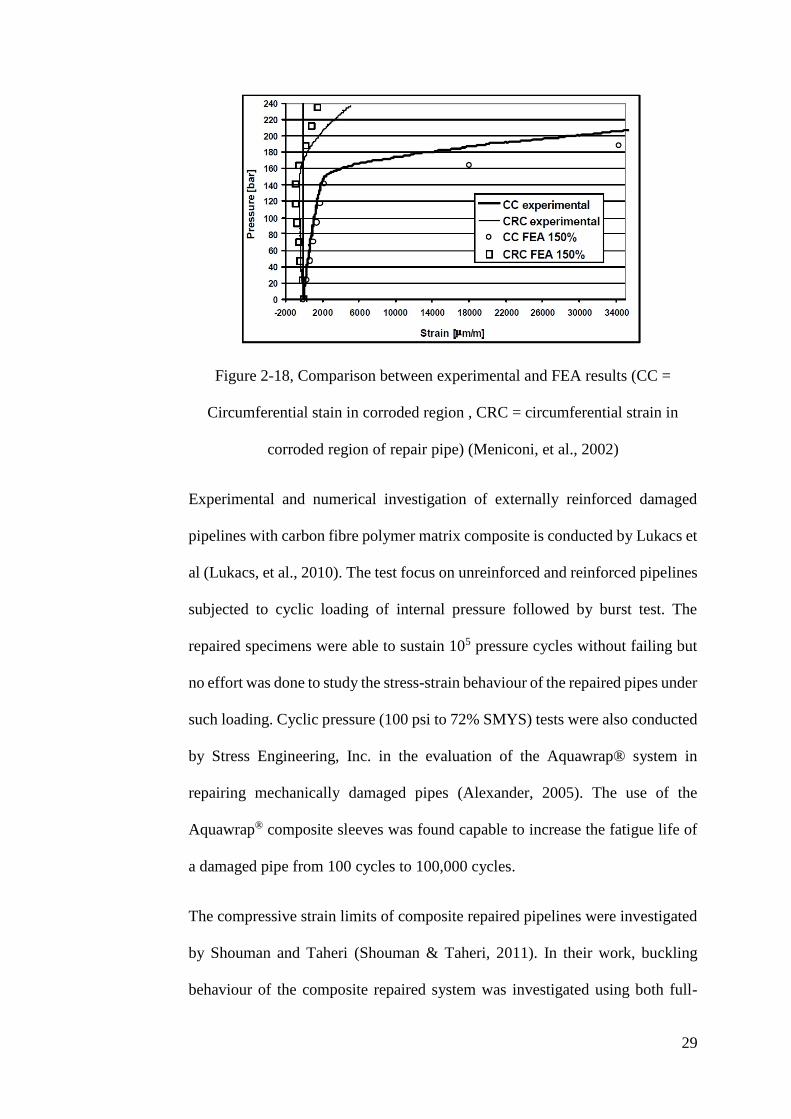
29
Figure 2-18, Comparison between experimental and FEA results (CC =
Circumferential stain in corroded region , CRC = circumferential strain in
corroded region of repair pipe) (Meniconi, et al., 2002)
Experimental and numerical investigation of externally reinforced damaged
pipelines with carbon fibre polymer matrix composite is conducted by Lukacs et
al (Lukacs, et al., 2010). The test focus on unreinforced and reinforced pipelines
subjected to cyclic loading of internal pressure followed by burst test. The
repaired specimens were able to sustain 105 pressure cycles without failing but
no effort was done to study the stress-strain behaviour of the repaired pipes under
such loading. Cyclic pressure (100 psi to 72% SMYS) tests were also conducted
by Stress Engineering, Inc. in the evaluation of the Aquawrap® system in
repairing mechanically damaged pipes (Alexander, 2005). The use of the
Aquawrap® composite sleeves was found capable to increase the fatigue life of
a damaged pipe from 100 cycles to 100,000 cycles.
The compressive strain limits of composite repaired pipelines were investigated
by Shouman and Taheri (Shouman & Taheri, 2011). In their work, buckling
behaviour of the composite repaired system was investigated using both full-
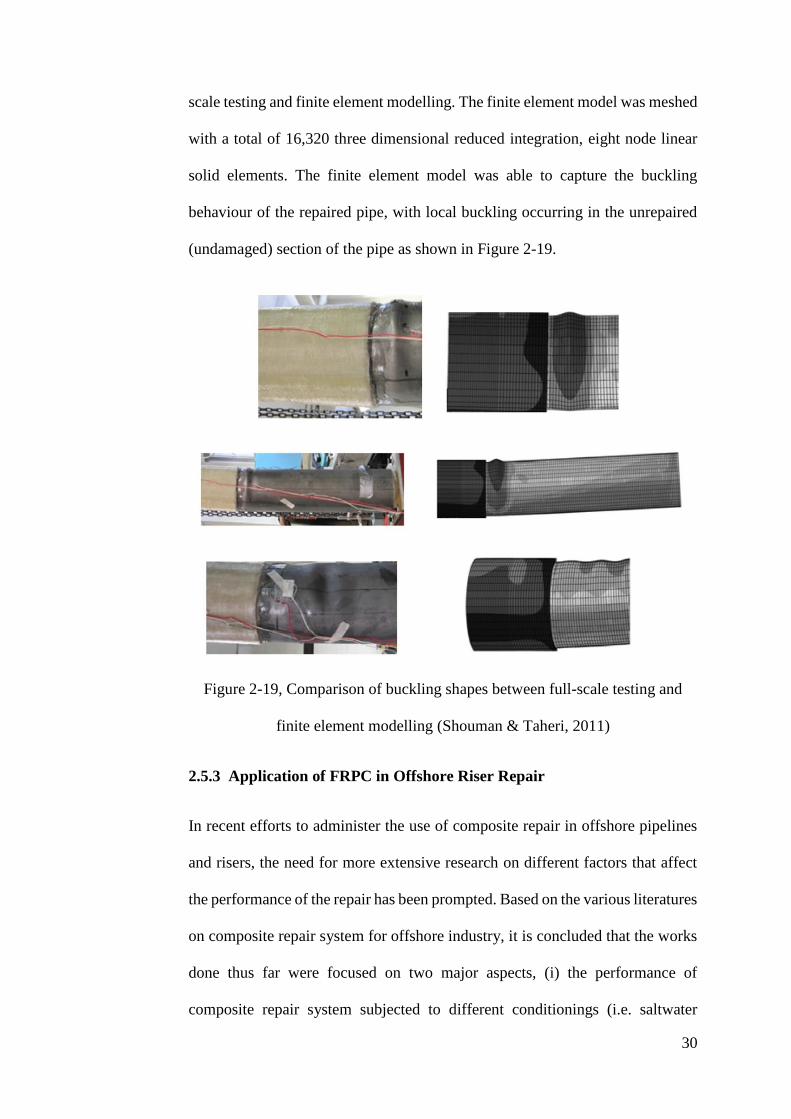
30
scale testing and finite element modelling. The finite element model was meshed
with a total of 16,320 three dimensional reduced integration, eight node linear
solid elements. The finite element model was able to capture the buckling
behaviour of the repaired pipe, with local buckling occurring in the unrepaired
(undamaged) section of the pipe as shown in Figure 2-19.
Figure 2-19, Comparison of buckling shapes between full-scale testing and
finite element modelling (Shouman & Taheri, 2011)
2.5.3 Application of FRPC in Offshore Riser Repair
In recent efforts to administer the use of composite repair in offshore pipelines
and risers, the need for more extensive research on different factors that affect
the performance of the repair has been prompted. Based on the various literatures
on composite repair system for offshore industry, it is concluded that the works
done thus far were focused on two major aspects, (i) the performance of
composite repair system subjected to different conditionings (i.e. saltwater
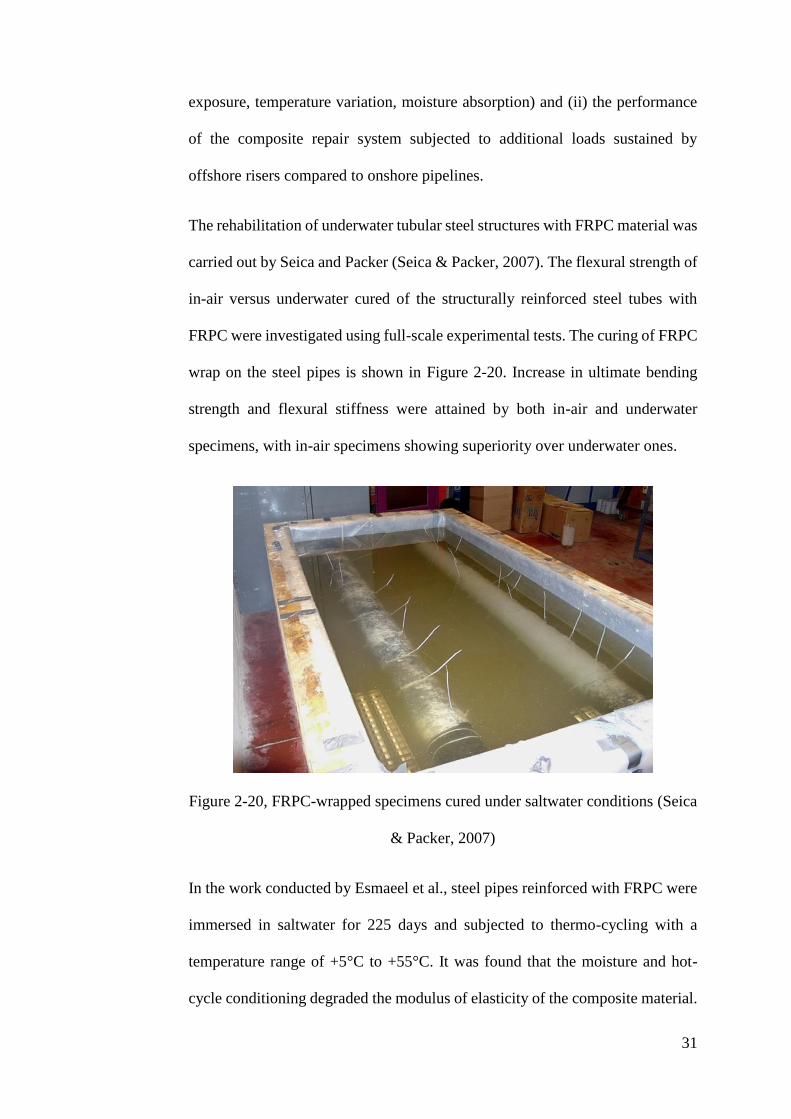
31
exposure, temperature variation, moisture absorption) and (ii) the performance
of the composite repair system subjected to additional loads sustained by
offshore risers compared to onshore pipelines.
The rehabilitation of underwater tubular steel structures with FRPC material was
carried out by Seica and Packer (Seica & Packer, 2007). The flexural strength of
in-air versus underwater cured of the structurally reinforced steel tubes with
FRPC were investigated using full-scale experimental tests. The curing of FRPC
wrap on the steel pipes is shown in Figure 2-20. Increase in ultimate bending
strength and flexural stiffness were attained by both in-air and underwater
specimens, with in-air specimens showing superiority over underwater ones.
Figure 2-20, FRPC-wrapped specimens cured under saltwater conditions (Seica
& Packer, 2007)
In the work conducted by Esmaeel et al., steel pipes reinforced with FRPC were
immersed in saltwater for 225 days and subjected to thermo-cycling with a
temperature range of +5°C to +55°C. It was found that the moisture and hot-
cycle conditioning degraded the modulus of elasticity of the composite material.
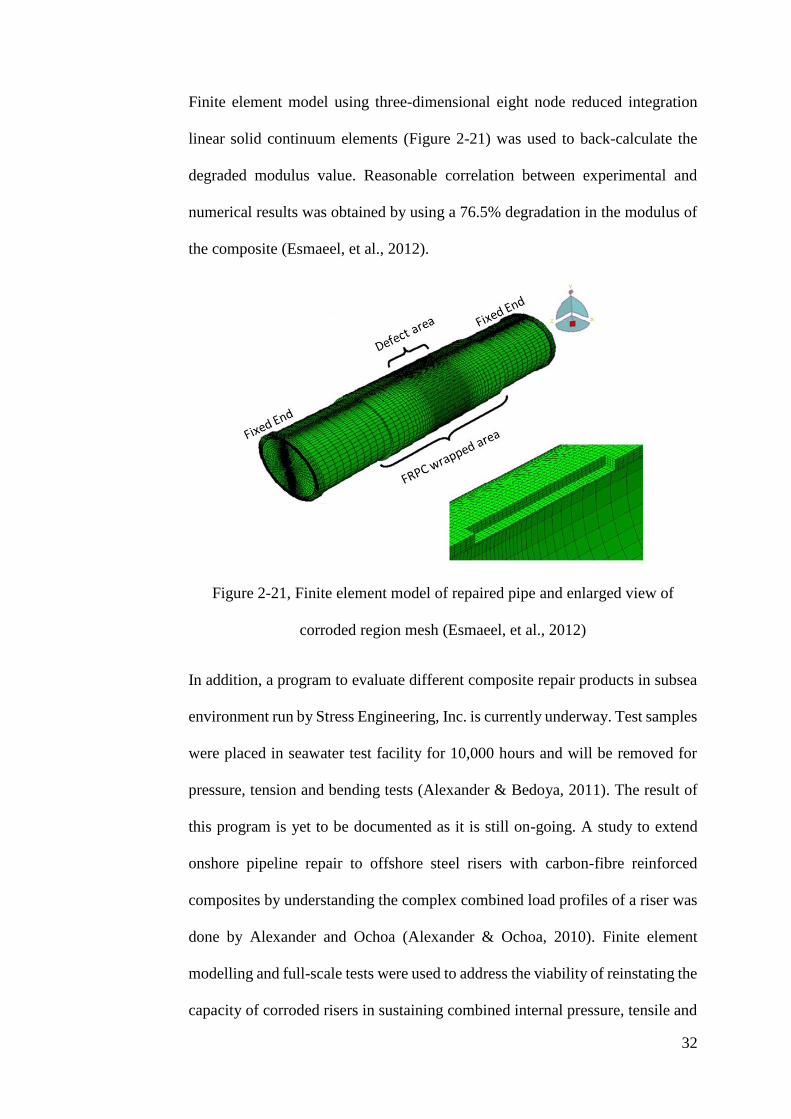
32
Finite element model using three-dimensional eight node reduced integration
linear solid continuum elements (Figure 2-21) was used to back-calculate the
degraded modulus value. Reasonable correlation between experimental and
numerical results was obtained by using a 76.5% degradation in the modulus of
the composite (Esmaeel, et al., 2012).
Figure 2-21, Finite element model of repaired pipe and enlarged view of
corroded region mesh (Esmaeel, et al., 2012)
In addition, a program to evaluate different composite repair products in subsea
environment run by Stress Engineering, Inc. is currently underway. Test samples
were placed in seawater test facility for 10,000 hours and will be removed for
pressure, tension and bending tests (Alexander & Bedoya, 2011). The result of
this program is yet to be documented as it is still on-going. A study to extend
onshore pipeline repair to offshore steel risers with carbon-fibre reinforced
composites by understanding the complex combined load profiles of a riser was
done by Alexander and Ochoa (Alexander & Ochoa, 2010). Finite element
modelling and full-scale tests were used to address the viability of reinstating the
capacity of corroded risers in sustaining combined internal pressure, tensile and
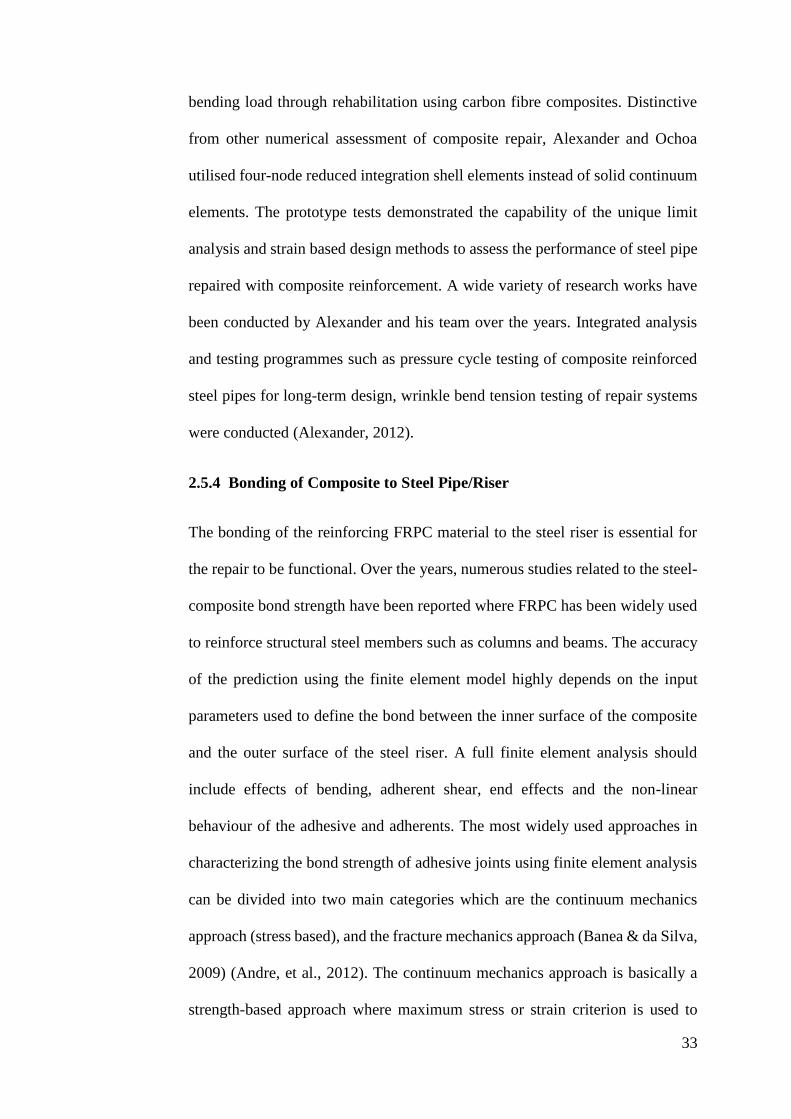
33
bending load through rehabilitation using carbon fibre composites. Distinctive
from other numerical assessment of composite repair, Alexander and Ochoa
utilised four-node reduced integration shell elements instead of solid continuum
elements. The prototype tests demonstrated the capability of the unique limit
analysis and strain based design methods to assess the performance of steel pipe
repaired with composite reinforcement. A wide variety of research works have
been conducted by Alexander and his team over the years. Integrated analysis
and testing programmes such as pressure cycle testing of composite reinforced
steel pipes for long-term design, wrinkle bend tension testing of repair systems
were conducted (Alexander, 2012).
2.5.4 Bonding of Composite to Steel Pipe/Riser
The bonding of the reinforcing FRPC material to the steel riser is essential for
the repair to be functional. Over the years, numerous studies related to the steel-
composite bond strength have been reported where FRPC has been widely used
to reinforce structural steel members such as columns and beams. The accuracy
of the prediction using the finite element model highly depends on the input
parameters used to define the bond between the inner surface of the composite
and the outer surface of the steel riser. A full finite element analysis should
include effects of bending, adherent shear, end effects and the non-linear
behaviour of the adhesive and adherents. The most widely used approaches in
characterizing the bond strength of adhesive joints using finite element analysis
can be divided into two main categories which are the continuum mechanics
approach (stress based), and the fracture mechanics approach (Banea & da Silva,
2009) (Andre, et al., 2012). The continuum mechanics approach is basically a
strength-based approach where maximum stress or strain criterion is used to
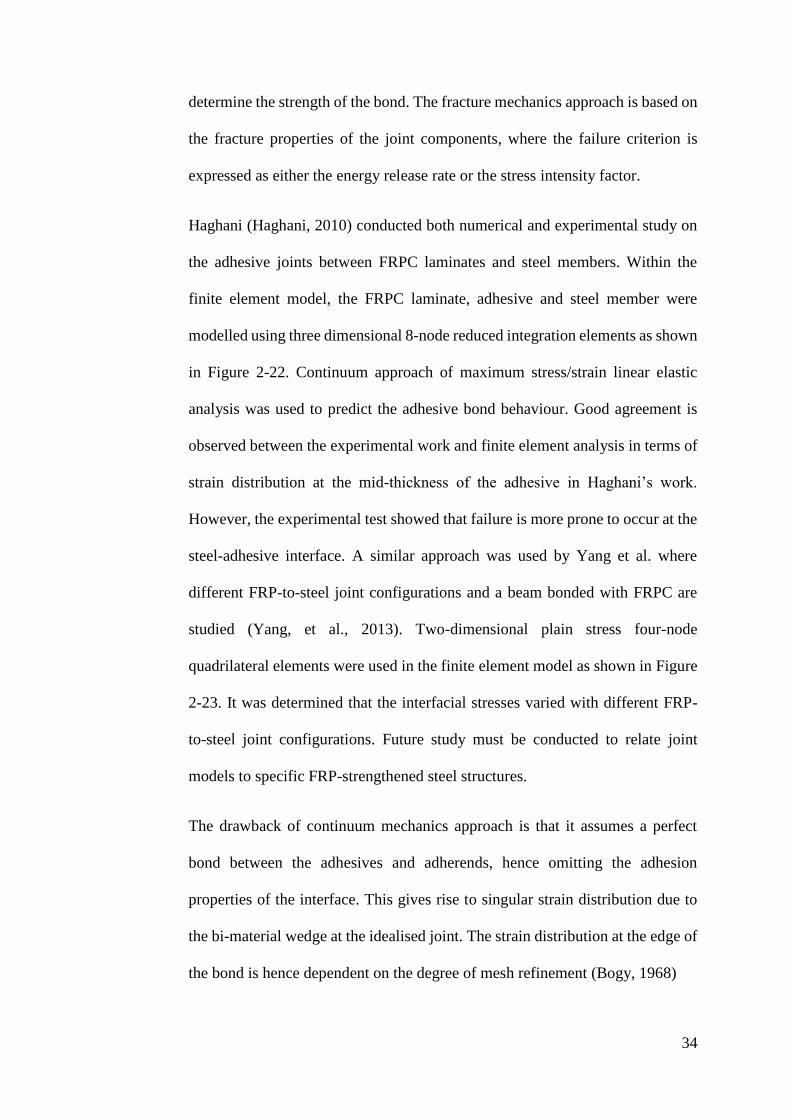
34
determine the strength of the bond. The fracture mechanics approach is based on
the fracture properties of the joint components, where the failure criterion is
expressed as either the energy release rate or the stress intensity factor.
Haghani (Haghani, 2010) conducted both numerical and experimental study on
the adhesive joints between FRPC laminates and steel members. Within the
finite element model, the FRPC laminate, adhesive and steel member were
modelled using three dimensional 8-node reduced integration elements as shown
in Figure 2-22. Continuum approach of maximum stress/strain linear elastic
analysis was used to predict the adhesive bond behaviour. Good agreement is
observed between the experimental work and finite element analysis in terms of
strain distribution at the mid-thickness of the adhesive in Haghani’s work.
However, the experimental test showed that failure is more prone to occur at the
steel-adhesive interface. A similar approach was used by Yang et al. where
different FRP-to-steel joint configurations and a beam bonded with FRPC are
studied (Yang, et al., 2013). Two-dimensional plain stress four-node
quadrilateral elements were used in the finite element model as shown in Figure
2-23. It was determined that the interfacial stresses varied with different FRP-
to-steel joint configurations. Future study must be conducted to relate joint
models to specific FRP-strengthened steel structures.
The drawback of continuum mechanics approach is that it assumes a perfect
bond between the adhesives and adherends, hence omitting the adhesion
properties of the interface. This gives rise to singular strain distribution due to
the bi-material wedge at the idealised joint. The strain distribution at the edge of
the bond is hence dependent on the degree of mesh refinement (Bogy, 1968)

35
Figure 2-22, Finite element model used in Haghani's work (Haghani, 2010)
Figure 2-23, Finite element model of FRP-to-steel joint (Yang et al, 2013)
The fracture mechanics approach can be modelled using finite element analysis
by including a zone of discontinuity modelled by cohesive elements. Bocciarelli
et al. studied the debonding of CFRP on a steel beam reinforced with CFRP
strips subjected to three point bending using cohesive interface elements
(Bocciarelli, et al., 2008). The finite element model was able to capture the
debonding behaviour (Figure 2-24) both quantitatively and qualitatively, with
numerical results showing reasonable agreement to experimental measurements.
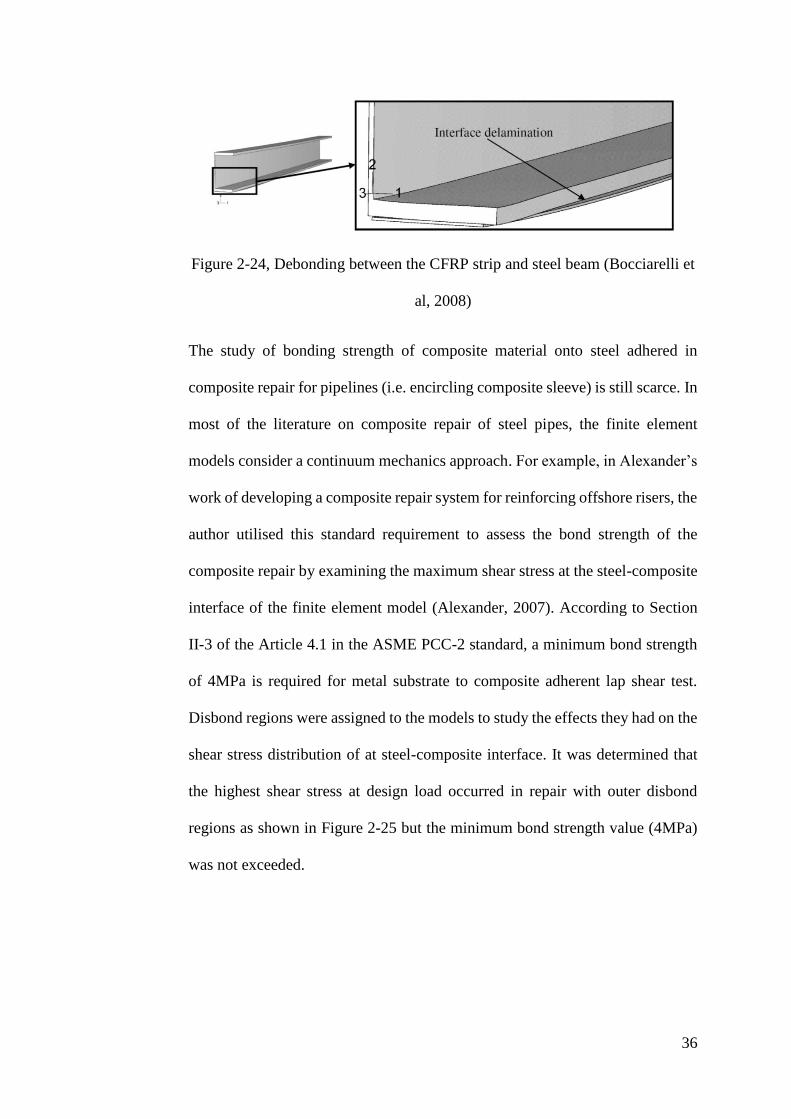
36
Figure 2-24, Debonding between the CFRP strip and steel beam (Bocciarelli et
al, 2008)
The study of bonding strength of composite material onto steel adhered in
composite repair for pipelines (i.e. encircling composite sleeve) is still scarce. In
most of the literature on composite repair of steel pipes, the finite element
models consider a continuum mechanics approach. For example, in Alexander’s
work of developing a composite repair system for reinforcing offshore risers, the
author utilised this standard requirement to assess the bond strength of the
composite repair by examining the maximum shear stress at the steel-composite
interface of the finite element model (Alexander, 2007). According to Section
II-3 of the Article 4.1 in the ASME PCC-2 standard, a minimum bond strength
of 4MPa is required for metal substrate to composite adherent lap shear test.
Disbond regions were assigned to the models to study the effects they had on the
shear stress distribution of at steel-composite interface. It was determined that
the highest shear stress at design load occurred in repair with outer disbond
regions as shown in Figure 2-25 but the minimum bond strength value (4MPa)
was not exceeded.
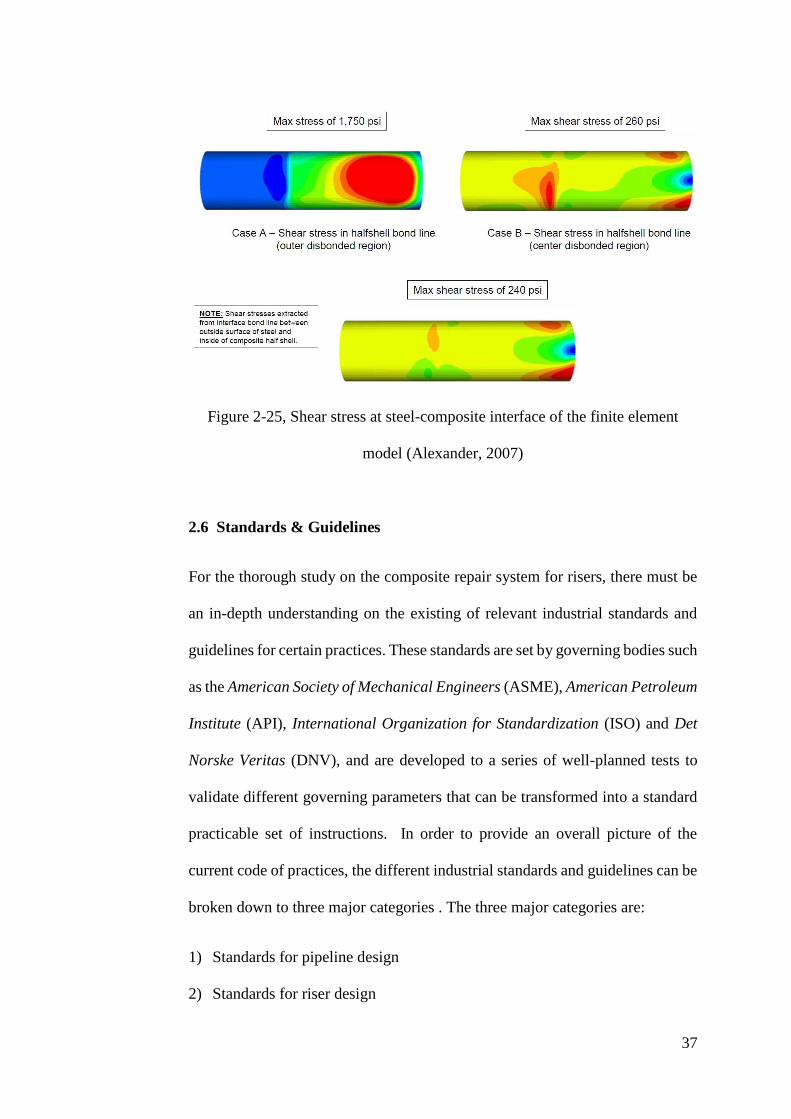
37
Figure 2-25, Shear stress at steel-composite interface of the finite element
model (Alexander, 2007)
2.6 Standards & Guidelines
For the thorough study on the composite repair system for risers, there must be
an in-depth understanding on the existing of relevant industrial standards and
guidelines for certain practices. These standards are set by governing bodies such
as the American Society of Mechanical Engineers (ASME), American Petroleum
Institute (API), International Organization for Standardization (ISO) and Det
Norske Veritas (DNV), and are developed to a series of well-planned tests to
validate different governing parameters that can be transformed into a standard
practicable set of instructions. In order to provide an overall picture of the
current code of practices, the different industrial standards and guidelines can be
broken down to three major categories . The three major categories are:
1) Standards for pipeline design
2) Standards for riser design
38
3) Standards for pipeline and riser repair
2.6.1 Standards for Pipeline Design
ASME B31.4, (2006) Pipeline Transportation for Hydrocarbon Liquid and Other
Liquids (ASME, 2006), and ASME B31.8 (2003) Gas Transmission and
Distribution Piping System (ASME, 2003) are standards related to the design of
pipelines which provide information on the stress and strain limits of industrial
oil and gas pipelines. The ASME B31.4 prescribes requirements for the design,
material, construction, assembly, inspection, and testing of liquid piping system.
This standard gives a reference to the allowable stress values of piping system
manufactured using different steel materials. In addition, it also explains the
viable repair and maintenance methods for the pipelines suffering from different
defects. The ASME B31.8 covers the similar scope as the ASME B31.4 but is
applicable to gas piping system. Although not specifically intended for offshore
risers, these standards provide a good foundation for pipeline design that in turn
defines the requirements on the repair using FRPC materials. The API RP 1111
(1999) Design, Construction, Operation and Maintenance of Offshore
Hydrocarbon Pipelines (Limit State Design) (API, 1999) provides the design
cycles of offshore steel pipelines/risers based on limit states imposed by different
design conditions such as the burst due to internal pressure and the combined
bending and tension during operation.
2.6.2 Standards for Offshore Riser Design
Offshore risers are more complicated than onshore pipelines due to additional
stresses, fatigue and harsh environment. The API RP 2RD (1998) Design of
Risers for Floating Production Systems (FPSs) and Tension-Leg Platforms
39
(TLPs) (API, 1998) and, DNV-OS F201 (2010) Dynamic Risers (DNV, 2010),
ABS (2008) Guide for Building and Classing Subsea Riser Systems (ABS, 2008)
are similar standards that provide a better insight into the design of risers. For
example, the DNV-OS F201 covers the design, materials, fabrication, testing,
operation, maintenance and re-assessment of single pipes steel riser systems. It
provides the design philosophy, safety requirements and classification of loads
for riser system. The framework for global analysis, combined loading analysis,
load effect assessment and fatigue analysis are elaborated.
It is hence prudent to utilise these standards to evaluate the design loads
computed in the current study against the range of design loads that is set within
the safety limits by these standards. The understanding of the different types of
loads sustained by a live riser can be used to determine the load cases in of the
composite repair system. The different types of static and dynamic analysis run
on a riser system can be translated to the analysis of the composite repair system
applied on corroded risers. The global analysis is not taken into consideration as
the corrosion on the riser occurs in a localised manner. The composite repair is
thus designed based on the requirement to suppress the stresses suffered by the
corroded riser in the form of local analyses.
2.6.3 Standards for the Evaluation of Corroded Pipeline/Riser Residual
Strength
The composite repair system serves as a remedy for deteriorated pipeline/riser
that is manifested in the form of an external corrosion. Before concluding that a
means of repair is required on a corroded pipeline/riser, its residual strength must
be determined. The ASME B31G (1991) Method for Determining the Remaining
40
Strength of Corroded Pipelines (ASME, 1991) and DNV-RP-F101 (2010)
Corroded Pipelines (DNV, 2010) are standards that provide guidelines to assess
the condition of corroded pipelines. It is worthy to note that these standards are
meant for the application of corroded pipelines where the residual strength is
determined mainly based on the internal pressure. The effects of combined
internal pressure and axial loads such as bending and tensile loads are outside
the scopes of these standards. In addition, it is not applicable to pipelines
suffering from mechanical damage (i.e. gouge and dents) or sharp defects (i.e.
cracks). In terms of evaluating the residual strength of corroded risers, there is
no specific standard that can address this problem. The existing standards
applicable to pipelines are therefore used as a guide to obtain an approximate
value to be implemented into the design equations of the composite repair system.
Ultimately, the finite element analysis is used as a tool to optimise the composite
repair system based on the residual strength of the risers when different sizes of
corrosion defects are modelled.
2.6.4 Standards for Corroded Pipeline/Riser Repair
Once the corroded pipeline/riser is proven to be non-functional or approaching
failure, a repair method can be applied on the corroded region in order to restore
the strength of the pipeline/riser. The current research is solely focused on the
application FRPC as a repair technique. The ASME PCC-2 (2008) Repair of
Pressure Equipment and Piping, Article 4.1, Non-Metallic Composite Repair
Systems for Pipelines and Pipework: High Risk Application (ASME, 2008) and
the ISO/TS 24817 (2006) Petroleum, Petrochemical and Natural Gas Industries
– Composite Repairs for Pipework – Qualification and Design, Installation,
Testing and Inspection (ISO, 2006) are employed to determine the required
41
properties and parameters of the composite repair. Both of these standards
employ the same equations in the computation of the required thickness of the
composite repair. The equations are based on parameters from both the repair
material and the substrate. The parameters include the modulus of elasticity for
the FRPC and the pipe material, the yield strength of pipe material, the
dimensions of the pipe as well as the maximum allowable pressure of the
corroded pipe. However, the shortcoming of these standards is that the maximum
allowable working pressure (MAWP) is computed based on the ASME B31G
which has the limitation of being only applicable to individual internal pressure
load case. The required thickness computed using the ASME PCC-2 is hence
compared to those obtained via a limit analysis using finite element simulation
to account for the case of combined loadings.
2.7 Concluding Remarks
Based on the literature review discussed, it can be observed that composite repair
for offshore riser is a potential means of reinforcement for offshore steel risers.
Composite repair for onshore pipelines has been widely used in the industry
where numerous research and technical reports have been conducted to validate
their functionality. In an effort to integrate the use of composite repair for
offshore structures, different studies have been conducted to characterize the
performance of such repair. Several research gaps were identified and are further
discussed in the paragraphs below.
Most of the studies on composite repair system for steel pipes were done on the
basis of static loading with majority of them related to the capacity of the
repaired system in sustaining the hoop load as this is the main concern in onshore

42
pipeline failures (Duell, et al., 2008) (Meniconi, et al., 2002). Investigations of
composite repair system for offshore pipeline/riser applications were mostly
focused on the environmental conditioning of the composite material rather than
on the different loading conditions sustained by subsea risers. Studies on
combined loading such as internal pressure, tension and bending were limited.
In addition, the design of the composite repair system in this study were done
based on the industrial standard ASME PCC-2 and ISO/TS 24817. No effort was
conducted to formulate an accurate and repeatable design tool for composite
repair system in offshore riser applications.
The research on the failure mechanisms within the composite material itself and
the steel-composite interface is scarce. One of the major aspects in reinforcing
steel structures with FRPC is to study the bond behaviour between the two.
Although various literatures on the bonding strength and behaviour of the steel-
composite interface is extensive, majority of the studies were conducted on
coupon test specimens (Haghani, 2010) (Bocciarelli, et al., 2008) (Yang, et al.,
2013). Characterization of the actual behaviour of the steel-composite bond were
also manifested in full-scale test and finite element modelling but limited to
patch repair (Zhao, et al., 2006) (Narmashiri, et al., 2010) instead of full
encircled wraps. Local analysis of bond integrity at the steel-composite interface
under cyclic loading mimicking wave/current forces is an important aspect that
is not addressed.
In this study, the understanding of the industrial design standards and guidelines
were used as a basis to ensure that the study of the CRS for offshore risers are
aligned with the riser design requirements. Understanding the effects of different
loading conditions on the composite repair system is one of the essential steps to

43
extending its application to offshore riser. With a design and analysis tool that
can accurately predict the behaviour of the composite repair system, confidence
level in its application on offshore risers can be increased and can be made
repetitive according to a set of standard procedures. However, to the best of the
author’s knowledge, there is no comprehensive research work which addresses
this issue. The lack of such information can hinder the application of composite
repair system at inaccessible depths via automated machine. Thus, this research
gap has prompted the research work documented in this thesis.
44
Chapter 3 Design of Composite Repair System for
Offshore Riser
3.1 Introduction
The literature review conducted in Chapter 2 reveals that the existing standards
and regulations do not have any specific guidelines on the design of oil and gas
offshore riser rehabilitation using FRPC. Nevertheless, there are several
standards available for the repair of onshore pipelines using FRPC (ASME,
2008). These standards provide a basis for the design of composite repair system
for offshore riser. Based on the standards developed for composite repair of
onshore pipelines, modifications and enhancements were carried out to include
additional constraints and loading conditions commonly experienced by offshore
riser. Review into the types of constraints and loadings sustained by typical
offshore riser, along with the procedure for evaluation of residual strength of a
corroded riser were outlined in the current chapter. Based on the calculated
residual strength of the corroded riser, the basic requirements (thickness and
length) of the composite repair can be determined through the established
formulations as described in ASME PCC-2 (ASME, 2008). The computed
dimensions of the composite repair systems provide a starting point for
optimisation of the composite rehabilitation performance based on various
factors such as loading conditions, fibre type, fibre orientation angle and severity
of corrosion defect on the riser surface.
45
3.2 Loading Conditions of a Riser
The design of a composite repair system for an offshore riser can vary
significantly from that of an onshore pipeline. This is due to the fact that risers
are vertically suspended below oil rig floating platform and largely submerged
underwater whereas typical onshore pipelines are horizontally supported. The
position of the riser along with its subsea environment poses more complicated
loading conditions which are required to be taken into account when designing
the composite repair system. These additional loading conditions can be
categorised into functional loads, environmental loads, installation loads and
accidental loads.
3.2.1 Functional Loads
Functional loads are the in-service loads that the riser has to sustain during its
operation. As the main function of a riser is to carry the oil from the wellhead to
the surface, the major functional load is undoubtedly the internal pressure arising
from the fluid pressure acting on the internal walls of the riser. Similar to the
design of onshore pipelines, two conditions of internal pressure, the burst
pressure, Pb, and the design pressure, Pd, can be considered in a riser design. The
burst pressure, Pb, also known as the test pressure, is the acting pressure when
total failure of the pipe occurs and the internal fluid is no longer contained. The
design pressure, Pd, also known as the maximum allowable operating pressure
(MAOP), is the maximum pressure at which a riser may be operated in
accordance with the provisions of the design code. Based on a list of steel
catenary risers (SCR) available at different tension leg platforms (TLP), namely
Auger 1994, Mars 1997, Ram-Powell 1997 and Marlim Semi 1995, the operating
46
pressure of SCR ranges from 14 to 43 MPa (Howells, 1995). The variation in
operating pressure of the riser depends on its nominal pipe size and the wall
thickness. It is also determined by function (fluids) of the riser, such as drilling
riser, oil or gas transmission riser and water injection riser. In addition to the
internal pressure, tension is a common functional load that is applied to a riser.
This is usually a constant tensile force imposed on the riser to avoid buckling
and excessive bending stresses due to platform motion, wave and current forces
and vortex induced vibration (VIV) (Stanton, 2006). The magnitude of the
applied tension depends on the weight of the riser, buoyancy of the riser and the
lateral forces. The first SCR installed from a moored floating platform in water
depth of 910m utilised a design top tension of 1780 kN. This SCR was installed
as part of a program conducted by Petrobas to evaluate the use of SCR connected
to moored platforms. The monitoring program supplies data from real scale
measurements to validate computer models used in the design of floating
production platforms, deep water mooring systems and catenary riser. (Machado
Filho, et al., 2001).
3.2.2 Environmental Loads
Environmental loads are caused by wind, waves and current forces, and vortex
induced vibrations (VIV) (Stanton, 2006). These forces can generate platform
motions which displace the risers relative to its mean position. Environmental
loads vary significantly with weather conditions and hence are highly climate
and location dependent. In most cases, the magnitude of the environmental loads
is insufficient to cause static failure of the riser and hence the composite repair
system. However, wave and current forces are cyclic in nature. The main sources
of fatigue loading on riser can be categorised as:
47
(1) First order wave frequency and second order low frequency vessel motions
due to waves and wind
(2) Vortex induced vibration (VIV) of the riser due to currents
(3) Vortex induced vibration of the riser due to vessel heave (HVIV)
(4) Vortex induced motion (VIM) of the vessel due to currents
In riser design, fatigue stress analyses are usually conducted through global
analyses where the movement of the entire length of the riser from the platform
to the seabed is simulated (DNV, 2010). In this research, global analysis was not
considered as the composite repair system is considered to be applied on a
localised region containing corrosion defect. Hence, two types of local analyses
were conducted to study the environmental load, (i) static analysis and (2)
simplified low cycle fatigue analysis. In the static analysis, a constant bending
load was defined as the only environmental load in order to study the capability
of the CRS in withstanding the deformation. In the fatigue analysis, constant
loading amplitude and frequency defined based on a specific wave data obtained
from literature was applied to study the failure of the CRS through Interlaminar
delamination and disbonding between the FRPC and steel riser.
3.2.3 Installation Loads
Installation loads are those that arise during the deployment of the riser.
Installation loads are dependent on the installation procedures and the technique
in which the riser is tied in to the main production unit on the offshore platform.
As defects such as external corrosion that imposes the need for a repair system
only takes shape after the riser is in service, installation loads are not a major
concern when designing the composite repair system.
48
3.2.4 Accidental Loads
Accidental loads are those that occur inadvertently due to abnormal operating
conditions, technical failure and human error. Accidental loads are those that are
unpredictable and situational dependent with examples such as soil-sliding,
earthquakes and impacts from foreign objects. It is normally not necessary to
combine these loads with other functional and environmental loads unless site-
specific conditions indicate such requirement. Therefore, this type of loads is not
considered in the current research project.
3.2.5 Load Cases
Based on the loading conditions of a riser as discussed in section 3.2 , a set of
typical load cases are derived and used in the study of the CRS with aid of FEA.
The effects due to functional and environmental loads are considered and are
represented in terms of internal pressure, effective tension and effective bending
moment. This is aligned with the load acceptance criteria obtained from section
4, analysis methodology of the DNV-OS-F201 (DNV, 2010) where the main
loading effects considered are the differential pressure, bending moment and
effective tension. These load cases were being simulated through local static
analyses where maximum stresses sustained by the riser were considered. Local
analyses of low cycle fatigue load was conducted to examine the integrity of the
FRPC interlaminar bond and FRPC to steel riser bond.
3.3 Design Requirements
The design requirements of the CRS can be split into two major considerations:
49
1) The composite material wrapped around the riser must be able to sustain
the stresses induced by different loadings to which a riser is susceptible
to. These stresses must not exceed the designed limits while the strain
must be kept below a threshold value above which it will affect the load
carrying capacity of the repaired riser.
2) The interfacial bond between the riser and the composite materials must
be well established such that the composite will not delaminate from the
steel surface. If the steel-composite interface bond is not sufficiently
strong, adequate stress transfer from the steel riser to the composite
material will not take place.
3.4 Residual Strength of Corroded Risers
An essential part in the design of a composite repair system is to determine the
residual strength in the corroded risers. Depending on the severity of the
corrosion defect, the level of reinforcement needed to restore the strength of the
corroded risers can be determined through a series of design calculations. The
residual strength of the corroded riser can be evaluated using the equations
provided in the ASME B31G, Methods for Determining the Remaining Strength
of Corroded Pipelines (ASME, 1991). It is essential to point out here that
employing evaluation based on ASME B31G possessed an inherent limitation
whereby the criteria for corroded pipe to remain in-service as presented in this
Manual are based upon the ability of the pipe to maintain structural integrity
under internal pressure only. It should not be the sole criterion when the pipe is
subjected to a significant secondary stresses (e.g., bending, tension), particularly
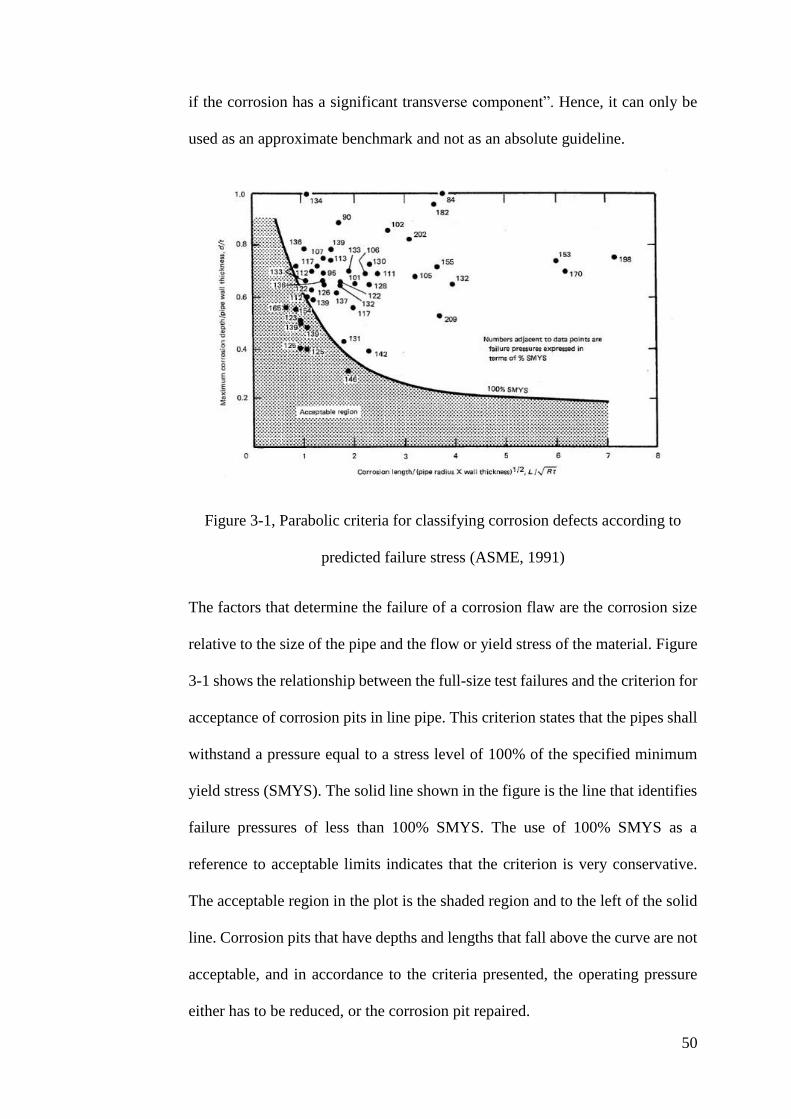
50
if the corrosion has a significant transverse component”. Hence, it can only be
used as an approximate benchmark and not as an absolute guideline.
Figure 3-1, Parabolic criteria for classifying corrosion defects according to
predicted failure stress (ASME, 1991)
The factors that determine the failure of a corrosion flaw are the corrosion size
relative to the size of the pipe and the flow or yield stress of the material. Figure
3-1 shows the relationship between the full-size test failures and the criterion for
acceptance of corrosion pits in line pipe. This criterion states that the pipes shall
withstand a pressure equal to a stress level of 100% of the specified minimum
yield stress (SMYS). The solid line shown in the figure is the line that identifies
failure pressures of less than 100% SMYS. The use of 100% SMYS as a
reference to acceptable limits indicates that the criterion is very conservative.
The acceptable region in the plot is the shaded region and to the left of the solid
line. Corrosion pits that have depths and lengths that fall above the curve are not
acceptable, and in accordance to the criteria presented, the operating pressure
either has to be reduced, or the corrosion pit repaired.

51
Figure 3-2, Process of assessing the remaining strength of a corroded pipe
(ASME, 1991)
The process of assessing the remaining strength of a corroded pipe as suggested
in ASME B31G is shown in Figure 3-2. Once the corrosion depth is determined
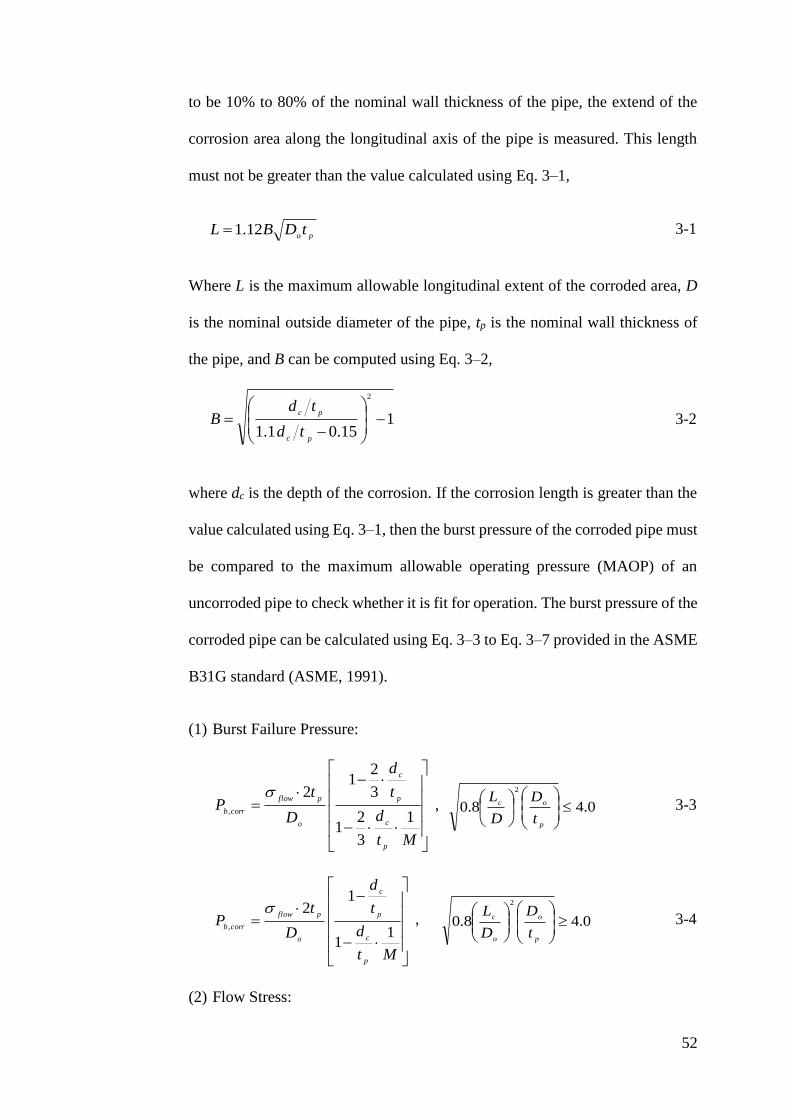
52
to be 10% to 80% of the nominal wall thickness of the pipe, the extend of the
corrosion area along the longitudinal axis of the pipe is measured. This length
must not be greater than the value calculated using Eq. 3–1,
potDBL 12.1 3-1
Where L is the maximum allowable longitudinal extent of the corroded area, D
is the nominal outside diameter of the pipe, tp is the nominal wall thickness of
the pipe, and B can be computed using Eq. 3–2,
115.01.1
2
pc
pc
td
tdB
3-2
where dc is the depth of the corrosion. If the corrosion length is greater than the
value calculated using Eq. 3–1, then the burst pressure of the corroded pipe must
be compared to the maximum allowable operating pressure (MAOP) of an
uncorroded pipe to check whether it is fit for operation. The burst pressure of the
corroded pipe can be calculated using Eq. 3–3 to Eq. 3–7 provided in the ASME
B31G standard (ASME, 1991).
(1) Burst Failure Pressure:
Mt
d
t
d
D
tP
p
c
p
c
o
pflow
corrb1
3
21
3
21
2,
, 0.48.0
2
p
oc
t
D
D
L 3-3
Mt
d
t
d
D
tP
p
c
p
c
o
pflow
corrb1
1
12
,
, 0.48.0
2
p
o
o
c
t
D
D
L
3-4
(2) Flow Stress:
53
MPaSMYSflow 95.68
3-5
(3) Folias Factor:
3.3032.0
2
po
c
tD
LM , 502
poctDL 3-6
2
42
2054.0
251.2
1po
c
po
c
tD
L
tD
L
M
, 502 tDLoc 3-7
Where Pb,corr is the burst pressure of the corroded pipe, σflow is the flow stress of
the pipe material, and M is an empirical constant called the Folias Factor. It
should be noted that these equations are those used for onshore pipelines where
residual strength is computed based on the burst pressure of corroded pipelines.
Risers are subjected to much complex loadings compared to onshore pipeline,
hence utilization of Eq. 3–3 to Eq. 3–7 for computation of residual strength in
corroded riser provide only an approximate value to be used as a reference point
for further design calculations. To enhance the accuracy of the design of CRS
for riser, numerical simulation was employed in the current research whereby
further details will be discussed in Chapter 4 .
3.5 Minimum Repair Thickness of the Composite Laminate
The composite repair laminate must be thick enough to sustain the load
transferred from defective pipelines. The minimum required laminate thickness
can be determined through ASME PCC-2, Repair of Pressure Equipment and
Piping (ASME, 2008) or a similar standard ISO/TS 24817, Petroleum,
Petrochemical and Natural Gas Industries – Composite Repairs for Pipework –
Qualification and Design, Installation, Testing and Inspection (ISO, 2006). With
54
this minimum thickness of the repair laminate, the burst strength of the corroded
pipe will be at least equal to that of a pipe without corrosion. It should be noted
that the calculated minimum repair thickness can be used as an approximate
reference value for the initial stages of the design such that an input value can be
assigned to the numerical models. This is due to the fact that certain calculations
in the ASME PCC-2 are based on the ASME B31G which has its limitations
when applied for risers which are subjected to combined loadings. A range of
thickness values will be modelled to investigate further the required thickness of
the repair laminate. The minimum required laminate thickness, tmin of a repaired
pipe subjected to internal pressure, Pin is determined by:
sd
c
po PPE
E
SMYS
Dt
2min
3-8
where Ep is the tensile modulus of the pipe material, Ec is the tensile modulus of
the composite laminate in the circumferential direction of the pipe, Pd is the
design internal pressure of the pipe and Ps is the maximum allowable pressure
for the pipe with defect as determined from ASME B31G (ASME, 1991). Based
on the design criteria stated in API RP 1111, Design, Construction, Operation
and Maintenance of Offshore Hydrocarbon Pipelines (API, 1999), the values of
Ps for pipeline and riser are equivalent to Pb,corr multiply by a safety factor of 0.9
and 0.75 respectively.
When the pipe is subjected to combined Pin, Ft and Mb, the minimum required
laminate thickness can be calculated via Eq. 3–9
55
s
oa
po PD
F
E
E
SMYS
Dt
2min
2
3-9
where Ea is the tensile modulus of the composite in the axial direction of the pipe
and F is the equivalent axial load due to Pin, Ft and Mb calculated using Eq. 3–
10, in units of Newtons.
22222 44
4toax
o
shaxoMM
DFFpDF
3-10
Where Fax is the applied axial load, Fsh is the apply shear load, Mto is the applied
torsional moment and Max is the applied axial moment. For the combined Pin, Ft
and Mb loading, the values of Fax is equivalent to Ft while the value of Max is
equivalent to the tensile force due to Mb. Fsh and Mto are assumed to be zero due
to the nature of the loading.
The design internal pressure, Pd of the pipe can be determined from API RP 1111,
Design, Construction, Operation and Maintenance of Offshore Hydrocarbon
Pipelines (API, 1999). This process follows a flow where the burst pressure is
slowly segmented into lower pressure values based on suitable design (safety)
factors. This is illustrated in Figure 3-3.
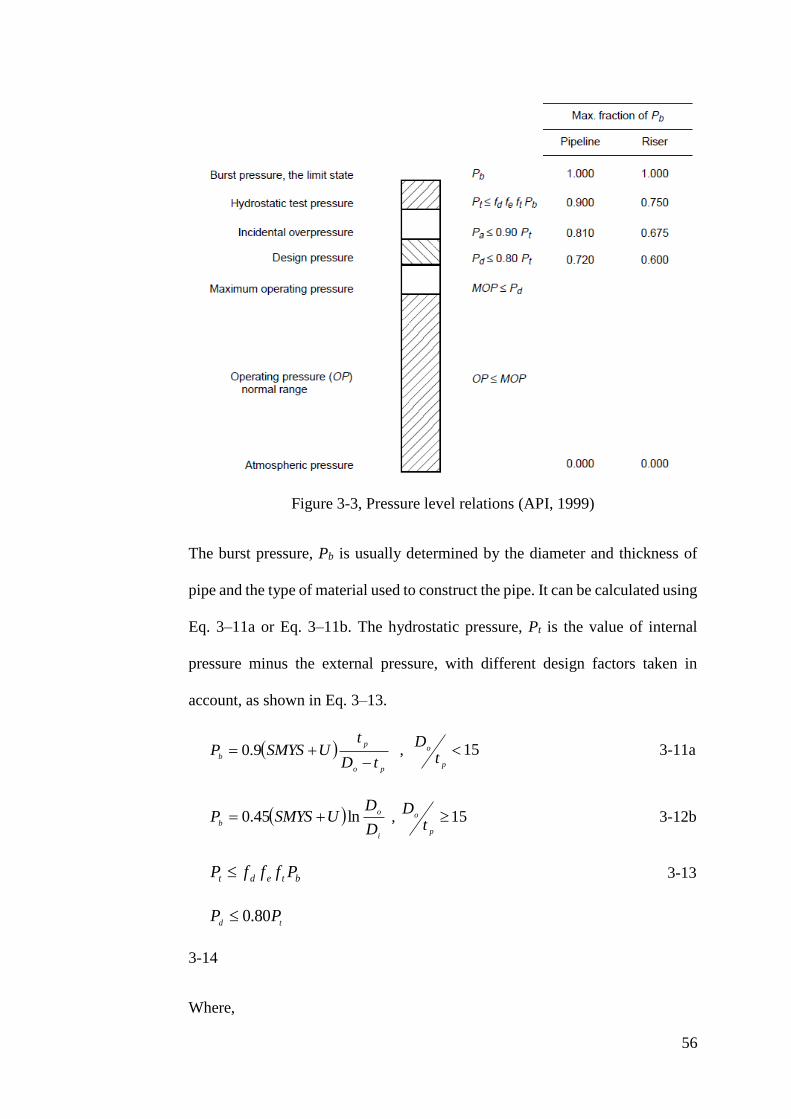
56
Figure 3-3, Pressure level relations (API, 1999)
The burst pressure, Pb is usually determined by the diameter and thickness of
pipe and the type of material used to construct the pipe. It can be calculated using
Eq. 3–11a or Eq. 3–11b. The hydrostatic pressure, Pt is the value of internal
pressure minus the external pressure, with different design factors taken in
account, as shown in Eq. 3–13.
po
p
btD
tUSMYSP
9.0 , 15
p
o
tD
3-11a
i
o
bD
DUSMYSP ln45.0 , 15
p
o
tD
3-12b
btedt PfffP 3-13
tdPP 80.0
3-14
Where,
57
fd = Pin design factor (0.75 for risers)
fe = Weld joint factor (only materials with factor 1.0 are acceptable). The values
of fe can be found in ASME B31.4, Pipeline Transportation Systems for Liquid
Hydrocarbons and Other Liquids (ASME, 2006). Seamless, electric resistance
welded, electric flash welded and submerged arc welded pipes all have fe value
of 1.0.
ft = Temperature de-rating factor as specified in ASME B31.8, Gas Transmission
and Distribution Piping System (ASME, 2003) to account for the thermal stress
that arises for high temperature services. The different values for ft are shown in
Table 3-1.
U = Specified minimum ultimate tensile strength
Di = Internal pipe diameter.
Table 3-1, Temperature derating factor, ft (ASME, 2003)
Temperature (°C) Temperature derating
factor, ft
121 or less 1.000
149 0.967
177 0.933
204 0.900
232 0.867
3.6 Axial Length of the Laminate Repair
In order to prevent delamination of the composite material from repaired pipe
and to ensure sufficient axial load transfer from the pipe to the composite, the
adhesion surface area between reinforcement material and the pipe must be large
enough.

58
The length to which the laminate repair should extend over each side of the
corroded region can be determined through Eq. 3–15,
2/5.2 poover tDL
3-15
where Lover is the overlap length of the composite laminate. The value of Lover is
also dependent on the lap shear strength between the composite laminate and the
steel pipe, τ. Hence, the calculated value of Lover can be checked via Eq. 3–16,
mintEL aa
over 3-16
Where εa is the allowable axial strain on the composite laminate. Subsequently
the total axial length of the repair can be calculated through Eq. 3–17,
taperdefectover LLLL 22
3-17
where Ldefect is the axial length of the defect and Ltaper is the taper length. The
length of the repair is verified through FE models described in Chapter 4 .
According to section II-3 of ASME PCC-2 Article 4.1, a minimum lap shear
strength of 4MPa between the composite and steel substrate is required (ASME,
2008). Hence, the shear stresses on the inner surface of the composite laminate
and outer surface of the steel pipe are monitored to ensure that they do not exceed
that value.
3.7 Design Conditions
To aid with the design of the composite repair system, a study on the repaired
riser pipe subjected to complex loadings is required. Due to the variation of CRS
design cases considered in the current research, it is more time efficient to apply
the stress-strain analysis to determine the performance of the riser without defect,
59
riser with corrosion defect and riser repaired with CRS. The stress-strain analysis
is conducted via finite element analysis (FEA) which is discussed in Chapter 4 .
Based on ASME Boiler & Pressure Vessel Code Section VIII Division 2, there
are three available analysis methods for evaluating the plastic collapse load of
pressure vessels. These methods include: (i) Elastic stress analysis method, (ii)
Limit load method and (iii) Elastic-plastic stress analysis method (ASME, 2007).
In the elastic stress analysis method, a limiting value is used to evaluate the
elastic stress of a structure subjected to predefined load. It does not take into
account the plastic deformation that occurs when the load increases. The limit
load method determine a lower bound to the limit load of a structure and applies
design factors to the limit load such that the onset of plastic collapse will not
occur (Biel & Alexander, 2005). Limit load method is more suitable for the
design of composite repair system as plastic deformation is taken into account
in the analysis. This allows the behaviour of the composite to be evaluated when
the load is transferred from the steel riser to the composite after a certain amount
of plastic deformation. Elastic-plastic stress analysis considers the ultimate stress
and perfect plasticity behaviour. In other words, it considers the non-linear
deformation of the structure until collapse. Both limit load method and the
elastic-plastic analysis method can be analysed numerically.
In the current research, the second method (limit load method) described was
used because only the elastic material properties of FRPC are used as the input.
Based on section 5, Design Criteria for Riser Pipes of DNV-OS-F201 (DNV,
2010), the serviceability limit state (SLS) requires that the riser must be able to
remain in service and operate properly, corresponding to criteria governing the
normal operation of the riser. The technique used here is known as the double-
60
elastic slope method and is founded on a single unified design basis developed
by (Alexander, 2007). This design technique was derived from several oil and
gas industry design codes and standards and is similar to the criterion of collapse
load defined in section 6-153 of ASME Boiler and Pressure Vessel Code (1998),
Section VIII, Division 2 (ASME, 2007). The double-elastic slope method allows
computation of the plastic analysis collapse load (PACL), i.e. the load at which
the material reaches failure after a certain amount of plastic deformation occurs.
It is important to consider some level of plasticity as it is needed for load transfer
from the steel riser to the composite.
The first step of this method is to simulate a FE model of a non-corroded pipe.
The load is then plotted as the ordinate while the strain is plotted as the abscissa
in a linear graph. Subsequently, a double elastic curve (DEC) that has a gradient
half of the linear elastic region of the load-strain curve is plotted through the
origin. The PACL corresponds to the intersection of the DEC and load-strain
curves. Finally, the design load (DL) can be determined by dividing the PACL
with a margin value which in this case is 2. This value is chosen based on the
design procedures for risers as stated in API RP 111 (API, 1999). The fraction
of burst pressure (PACL) at design condition is 0.6 as shown in Figure 3-3. By
taking into account temperature derating factor for maximum service
temperature (Table 3-1) of the riser, the fraction of burst pressure will be
equivalent to,
Tbd fPP 6.0
867.06.0 bd PP
bd PP 52.0
61
2PACLdP
The maximum permissible strain limit is defined as the strain value at the
intersection of the DEC and DL curves.
The load-strain response of a riser is simulated using FEA, in order to compute
the design loads via the DEC method. The riser is an API 5L grade X60 carbon
steel pipe commonly used in the oil and gas industry. The simulated riser has an
outer diameter of 219mm with a wall thickness of 10.3mm. The length of the
riser model for the case of individual internal pressure and tensile load is
2440mm, while the length of the riser model for the case of individual bending
and combined loading is 4570mm. Further details of the material input,
boundary conditions, loading conditions, meshing and element of the riser FE
model are described in Chapter 5.
The computations of design load for individual loading of internal pressure,
tensile load and bending moment using the DEC method are shown in Figure
3-4, Figure 3-5 and Figure 3-6. The computation for the design load for
combined loading of constant internal pressure at 22MPa (DL), constant tensile
load at 1785kN (DL) and varying bending moment is shown in Figure 3-7.
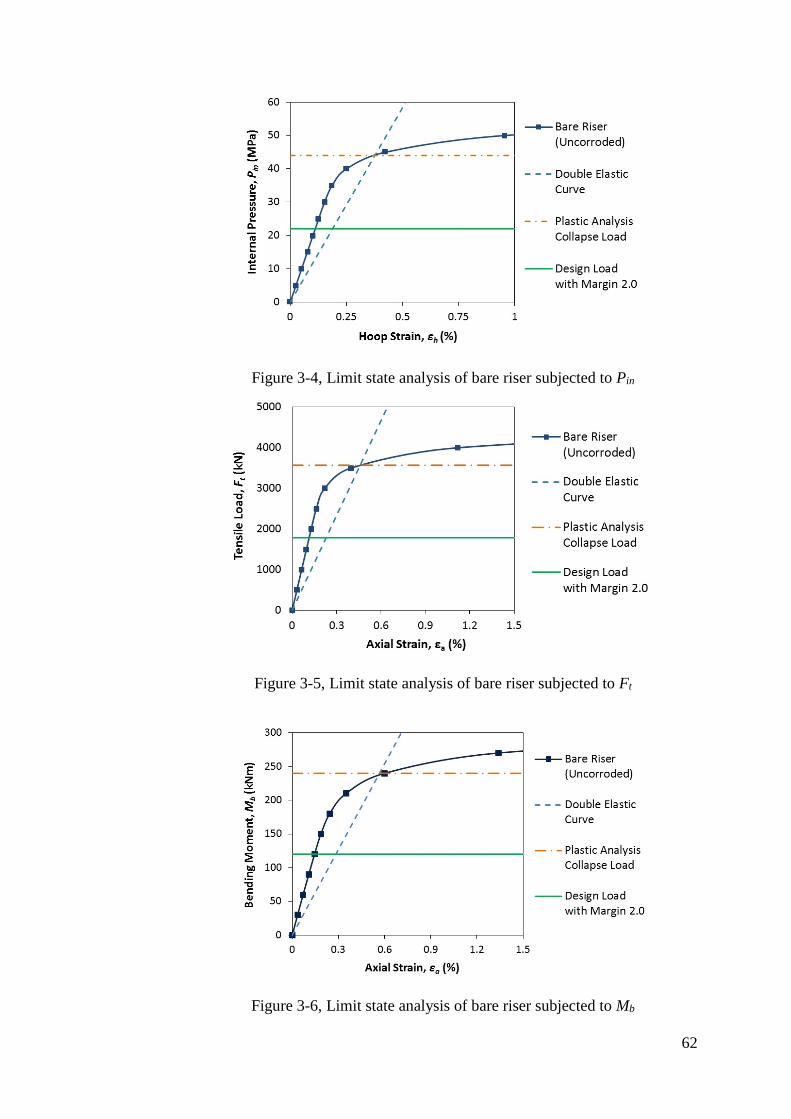
62
Figure 3-4, Limit state analysis of bare riser subjected to Pin
Figure 3-5, Limit state analysis of bare riser subjected to Ft
Figure 3-6, Limit state analysis of bare riser subjected to Mb
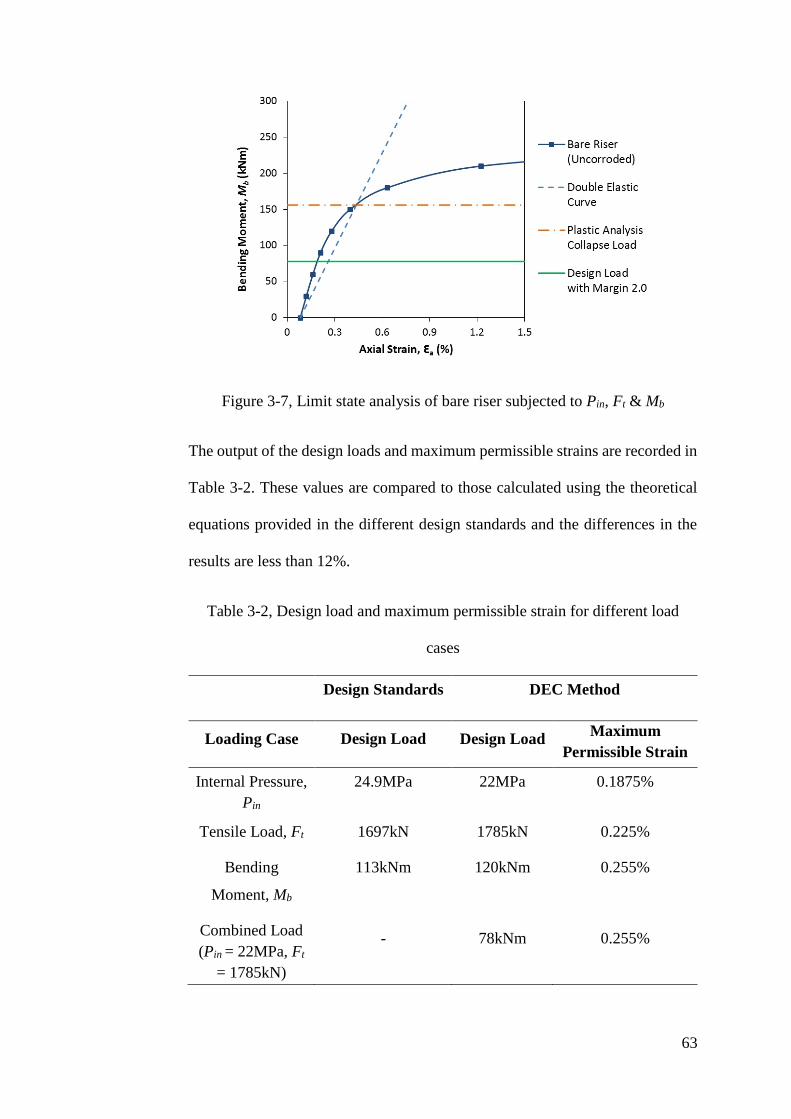
63
Figure 3-7, Limit state analysis of bare riser subjected to Pin, Ft & Mb
The output of the design loads and maximum permissible strains are recorded in
Table 3-2. These values are compared to those calculated using the theoretical
equations provided in the different design standards and the differences in the
results are less than 12%.
Table 3-2, Design load and maximum permissible strain for different load
cases
Design Standards DEC Method
Loading Case Design Load Design Load Maximum
Permissible Strain
Internal Pressure,
Pin
24.9MPa 22MPa 0.1875%
Tensile Load, Ft 1697kN 1785kN 0.225%
Bending
Moment, Mb
113kNm 120kNm 0.255%
Combined Load
(Pin = 22MPa, Ft
= 1785kN)
- 78kNm 0.255%
64
3.8 Concluding Remarks
The load cases included in the current project were discussed. The equations
discussed in this chapter provide benchmark values to be used as a reference in
the design and optimization of the CRS, which will be reported in Chapter 4 ,
Chapter 5 and Chapter 6 . The limit analysis known as double elastic method
developed by Alexander (Alexander, 2007) was used as the main technique of
evaluation for the CRS. The computed design loads and limit strain values will
be used for evaluation of the output results that were obtained from finite element
analysis of the CRS. The computed design conditions via the combined use of
FEA and DEC method provided close approximation to the design standards. In
addition, the load-strain curve provides a clearer representation on the level of
stress and strain sustained by the riser and the CRS, as individual load-strain
curves can be plotted out. The ease of varying the different inputs (i.e. types of
composite material, sizes of corrosion defect, thickness of repair laminate) in the
FE model, combined with the straightforward computation of the DEC method,
provides an optimization tool for the CRS.
65
Chapter 4 Finite Element Analysis
4.1 Introduction
Considering the substantial size of typical risers with diameter in the range of 6
to 10 inches, the construction of a full-scale test facility for CRS of risers would
require significant investment. Numerical approaches such as FEA, on the other
hand provides an efficient and cost effective way to predict the deformation
behaviour such as stress and strain response of structural components subjected
to various forms of loadings. This chapter provides a detailed description of the
application of FE modelling for analysing the CRS of an offshore riser via a
general-purpose FE package ABAQUS® Standard. Appropriate element
selection and localized mesh refinement were applied to reduce computational
time and ensure a fast convergence. Validation of the FE models was conducted
against both classical mechanics solutions and scaled-down experimental tests
(Chapter 5 ). In addition, a case study of the Helicoid Epoxy Sleeve (HES)TM
involving full-scale testing was conducted in collaboration with Merit
Technologies Sdn Bhd. The results provide an auxiliary validation method and
augment the reliability of the FE approach in optimisation of the CRS for
offshore riser.
Local analyses covering the effects of individual static loads (internal pressure,
tension, bending load) and combined loads (combined internal pressure and
tension, combined internal pressure, tension and bending load) which are
common in offshore environment were conducted. Modelling of the relevant
parts is accomplished via ABAQUS/CAE which provides an interface for
creating parts, materials, assembling a model, assigning section properties and
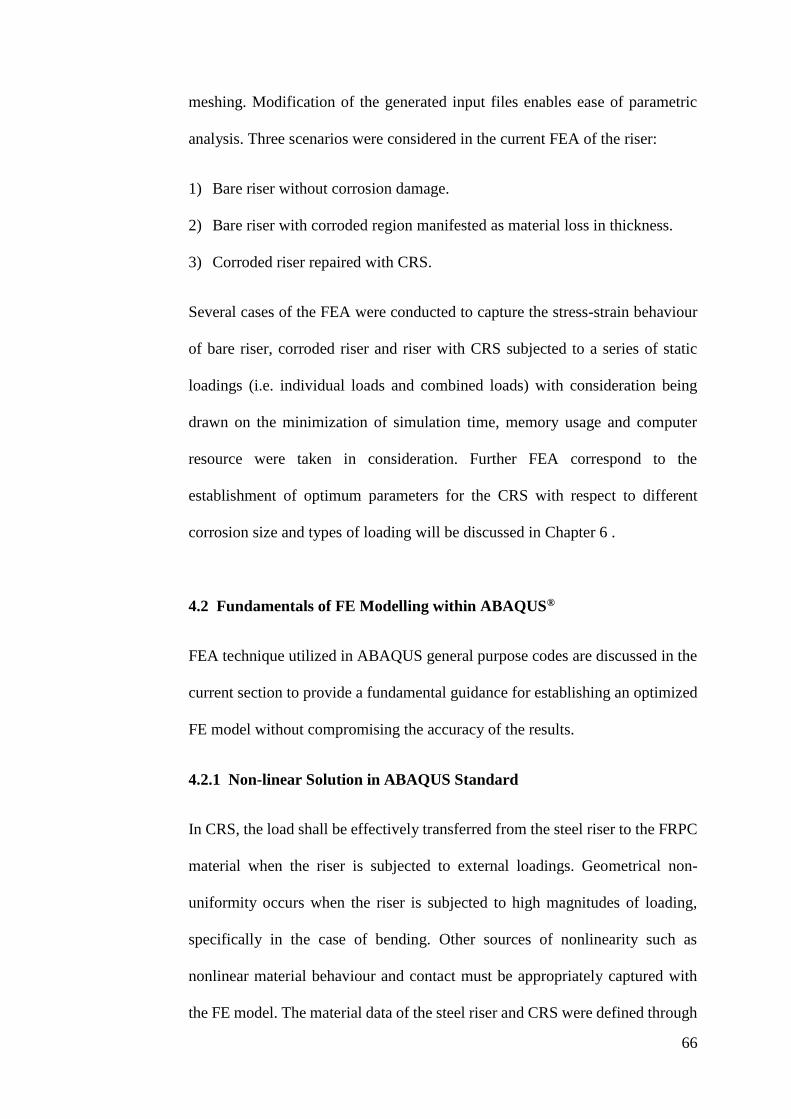
66
meshing. Modification of the generated input files enables ease of parametric
analysis. Three scenarios were considered in the current FEA of the riser:
1) Bare riser without corrosion damage.
2) Bare riser with corroded region manifested as material loss in thickness.
3) Corroded riser repaired with CRS.
Several cases of the FEA were conducted to capture the stress-strain behaviour
of bare riser, corroded riser and riser with CRS subjected to a series of static
loadings (i.e. individual loads and combined loads) with consideration being
drawn on the minimization of simulation time, memory usage and computer
resource were taken in consideration. Further FEA correspond to the
establishment of optimum parameters for the CRS with respect to different
corrosion size and types of loading will be discussed in Chapter 6 .
4.2 Fundamentals of FE Modelling within ABAQUS®
FEA technique utilized in ABAQUS general purpose codes are discussed in the
current section to provide a fundamental guidance for establishing an optimized
FE model without compromising the accuracy of the results.
4.2.1 Non-linear Solution in ABAQUS Standard
In CRS, the load shall be effectively transferred from the steel riser to the FRPC
material when the riser is subjected to external loadings. Geometrical non-
uniformity occurs when the riser is subjected to high magnitudes of loading,
specifically in the case of bending. Other sources of nonlinearity such as
nonlinear material behaviour and contact must be appropriately captured with
the FE model. The material data of the steel riser and CRS were defined through

67
an elastic-plastic properties and elastic lamina properties, respectively with the
FEA. In addition, solution to non-linear problem is highly dependent on element
size, element types, boundary conditions, increment size, tolerance value, and
solution algorithm which must be chosen with care.
ABAQUS utilises an incremental iteration scheme to establish computation
convergence, whereby an equilibrium condition is determined in each increment
by finding the deformation gradient tensor. The basic statement for an
equilibrium condition is that the internal forces, Iint, and the external forces, Pext,
must be equal.
0int IP ext 4-1
Generally, Newton’s method is used as the numerical technique to solve non-
linear equilibrium equations within each increment. In most cases, it takes more
than one iteration in a single increment to determine an acceptable solution. At
the end of each iteration, convergence check is performed by comparing the
difference between Pext and Iint to a specified tolerance value, which is set at 0.5%
by default. In order to solve non-linear problems efficiently, a reasonable initial
and maximum allowable increment size must be assigned. Large increment size
might cause convergence issues while increment size that is too small will result
in wastage of CPU time and memory.
4.2.2 Selection of Element Type
Selection of a suitable element type is essential in building an accurate FE model
for the CRS. One of the most important factors to consider is the degrees of
freedom (DOF) associated with the element, which include (but not limited to)
displacement, rotations, temperature and electric potential. Second order
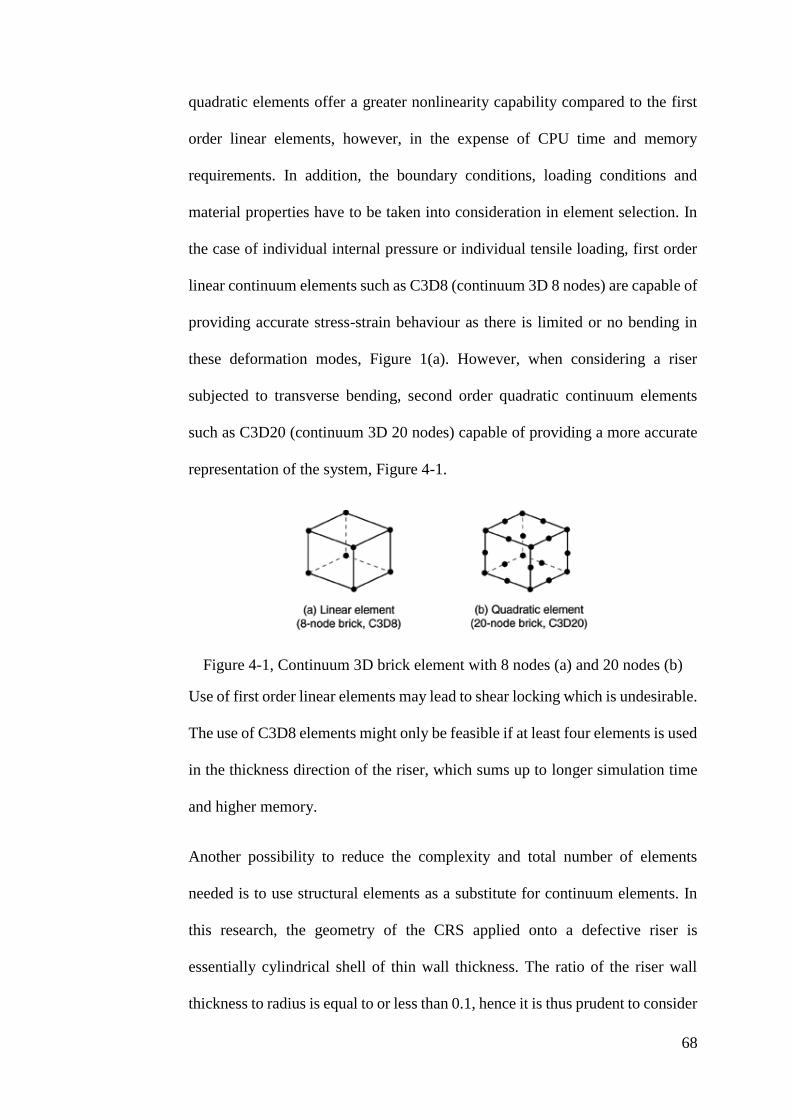
68
quadratic elements offer a greater nonlinearity capability compared to the first
order linear elements, however, in the expense of CPU time and memory
requirements. In addition, the boundary conditions, loading conditions and
material properties have to be taken into consideration in element selection. In
the case of individual internal pressure or individual tensile loading, first order
linear continuum elements such as C3D8 (continuum 3D 8 nodes) are capable of
providing accurate stress-strain behaviour as there is limited or no bending in
these deformation modes, Figure 1(a). However, when considering a riser
subjected to transverse bending, second order quadratic continuum elements
such as C3D20 (continuum 3D 20 nodes) capable of providing a more accurate
representation of the system, Figure 4-1.
Figure 4-1, Continuum 3D brick element with 8 nodes (a) and 20 nodes (b)
Use of first order linear elements may lead to shear locking which is undesirable.
The use of C3D8 elements might only be feasible if at least four elements is used
in the thickness direction of the riser, which sums up to longer simulation time
and higher memory.
Another possibility to reduce the complexity and total number of elements
needed is to use structural elements as a substitute for continuum elements. In
this research, the geometry of the CRS applied onto a defective riser is
essentially cylindrical shell of thin wall thickness. The ratio of the riser wall
thickness to radius is equal to or less than 0.1, hence it is thus prudent to consider
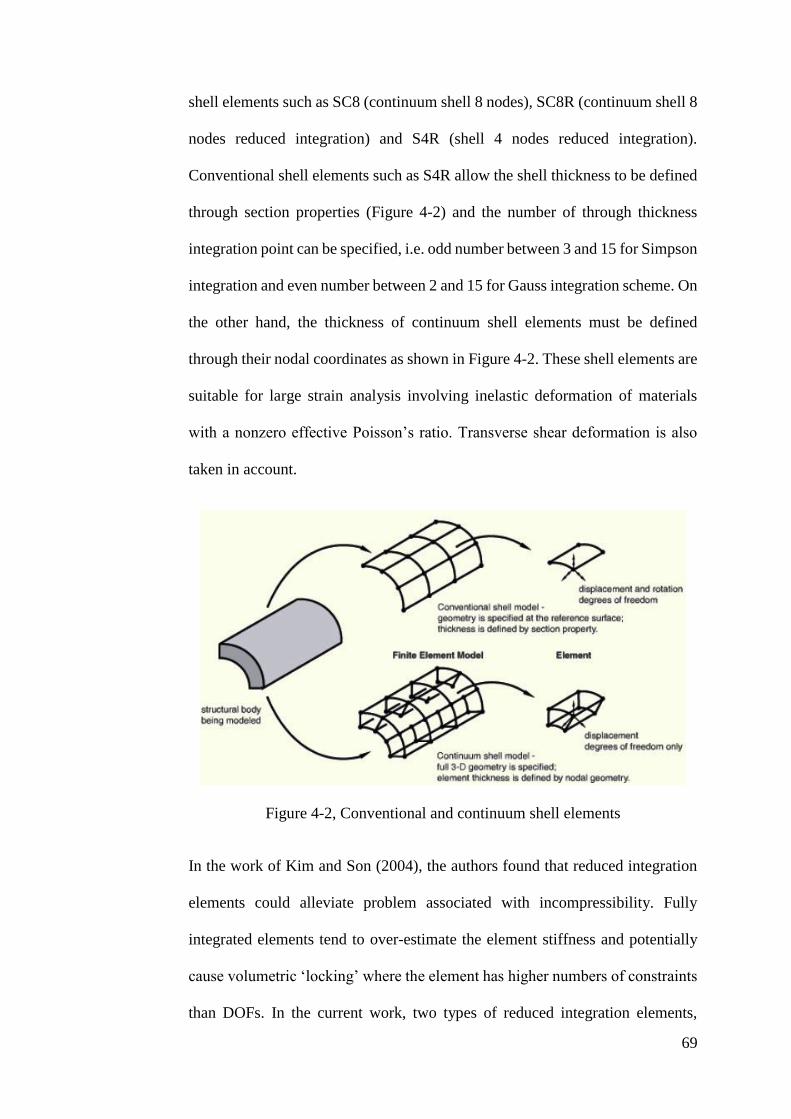
69
shell elements such as SC8 (continuum shell 8 nodes), SC8R (continuum shell 8
nodes reduced integration) and S4R (shell 4 nodes reduced integration).
Conventional shell elements such as S4R allow the shell thickness to be defined
through section properties (Figure 4-2) and the number of through thickness
integration point can be specified, i.e. odd number between 3 and 15 for Simpson
integration and even number between 2 and 15 for Gauss integration scheme. On
the other hand, the thickness of continuum shell elements must be defined
through their nodal coordinates as shown in Figure 4-2. These shell elements are
suitable for large strain analysis involving inelastic deformation of materials
with a nonzero effective Poisson’s ratio. Transverse shear deformation is also
taken in account.
Figure 4-2, Conventional and continuum shell elements
In the work of Kim and Son (2004), the authors found that reduced integration
elements could alleviate problem associated with incompressibility. Fully
integrated elements tend to over-estimate the element stiffness and potentially
cause volumetric ‘locking’ where the element has higher numbers of constraints
than DOFs. In the current work, two types of reduced integration elements,
70
C3D8R and S4R were considered. The results from the two were compared in
terms of the number of elements, CPU time, memory and accuracy of stress-
strain result. Figure 4-3 and Figure 4-4 show the meshed models employing S4R
elements and C3D8R elements, respectively.
For a corroded riser, the simulated hoop stress within and outside the corroded
region is 462.6MPa and 213.7MPa respectively when meshed with S4R
elements, while the model meshed with C3D8R elements predicted 434.8MPa
and 212.4MPa. The maximum percentage difference between these two models
is only 6.4%. However, the use of the C3D8R elements incurs 53% more CPU
memory and 73.3% more CPU time compared to S4R elements in this quarter
symmetry model. Hence S4R elements were selected to conserve simulation
resources.
Figure 4-3, Coarse mesh with S4R element (riser 1672 elements; sleeve 1034
elements)
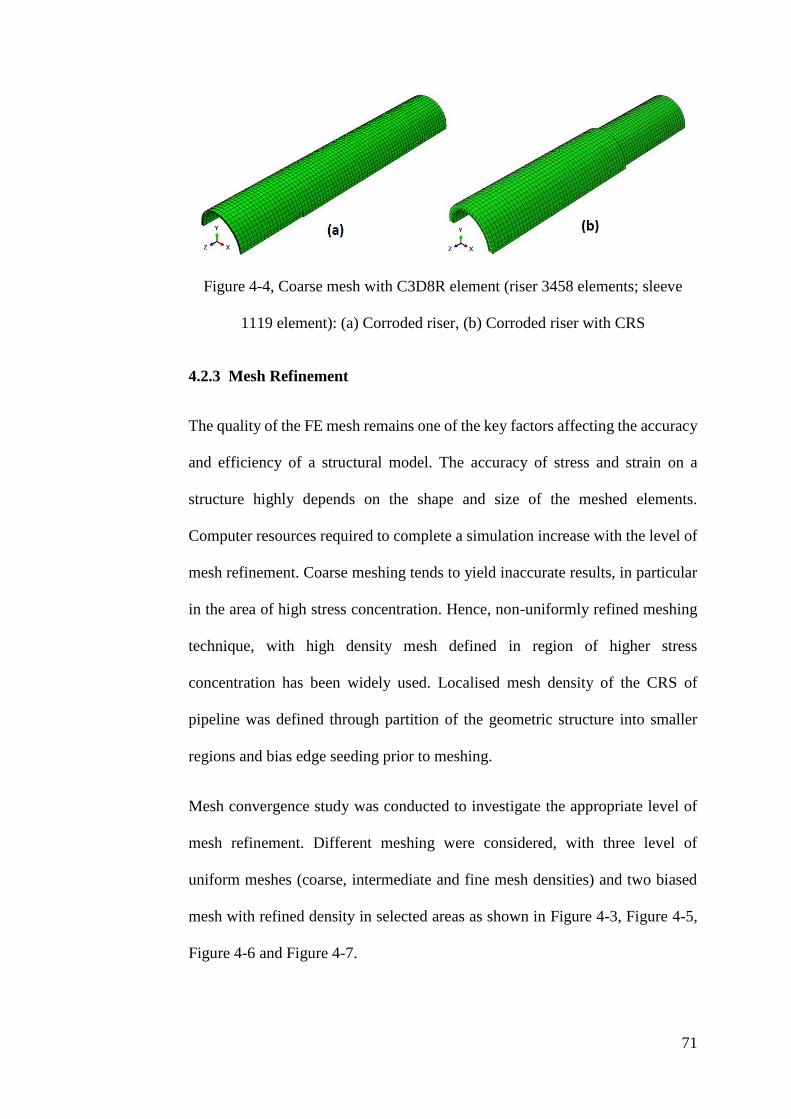
71
Figure 4-4, Coarse mesh with C3D8R element (riser 3458 elements; sleeve
1119 element): (a) Corroded riser, (b) Corroded riser with CRS
4.2.3 Mesh Refinement
The quality of the FE mesh remains one of the key factors affecting the accuracy
and efficiency of a structural model. The accuracy of stress and strain on a
structure highly depends on the shape and size of the meshed elements.
Computer resources required to complete a simulation increase with the level of
mesh refinement. Coarse meshing tends to yield inaccurate results, in particular
in the area of high stress concentration. Hence, non-uniformly refined meshing
technique, with high density mesh defined in region of higher stress
concentration has been widely used. Localised mesh density of the CRS of
pipeline was defined through partition of the geometric structure into smaller
regions and bias edge seeding prior to meshing.
Mesh convergence study was conducted to investigate the appropriate level of
mesh refinement. Different meshing were considered, with three level of
uniform meshes (coarse, intermediate and fine mesh densities) and two biased
mesh with refined density in selected areas as shown in Figure 4-3, Figure 4-5,
Figure 4-6 and Figure 4-7.
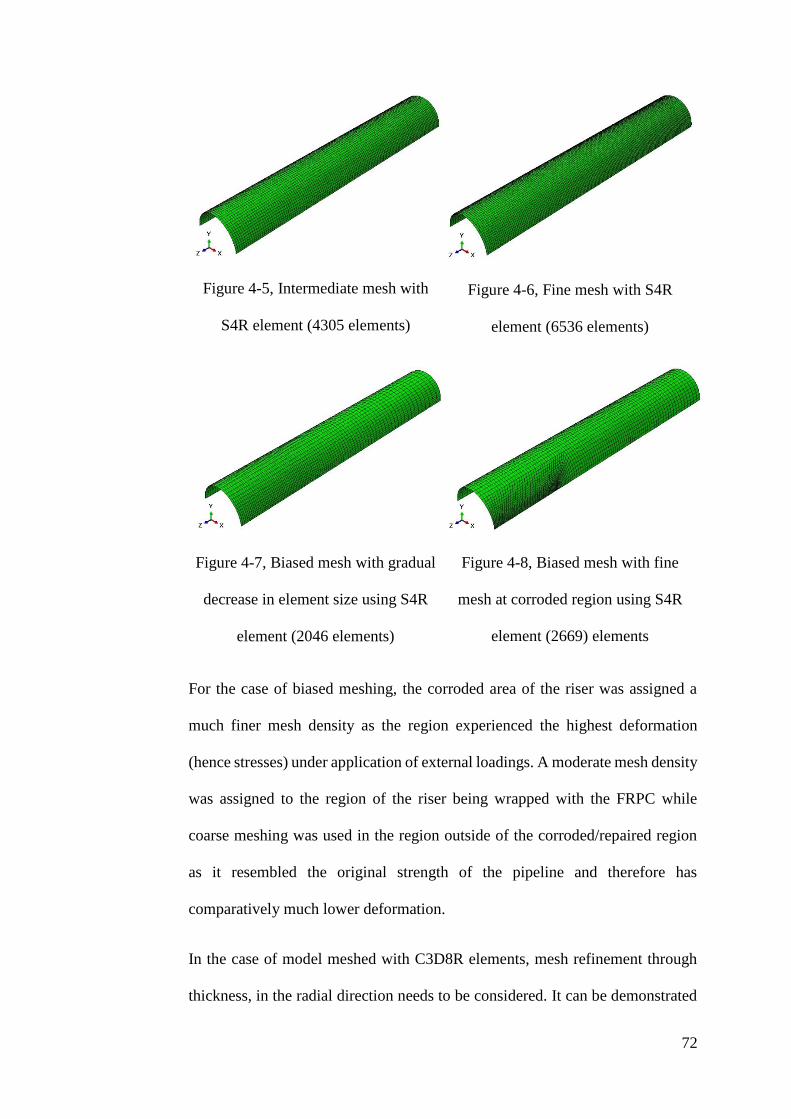
72
Figure 4-5, Intermediate mesh with
S4R element (4305 elements)
Figure 4-6, Fine mesh with S4R
element (6536 elements)
Figure 4-7, Biased mesh with gradual
decrease in element size using S4R
element (2046 elements)
Figure 4-8, Biased mesh with fine
mesh at corroded region using S4R
element (2669) elements
For the case of biased meshing, the corroded area of the riser was assigned a
much finer mesh density as the region experienced the highest deformation
(hence stresses) under application of external loadings. A moderate mesh density
was assigned to the region of the riser being wrapped with the FRPC while
coarse meshing was used in the region outside of the corroded/repaired region
as it resembled the original strength of the pipeline and therefore has
comparatively much lower deformation.
In the case of model meshed with C3D8R elements, mesh refinement through
thickness, in the radial direction needs to be considered. It can be demonstrated
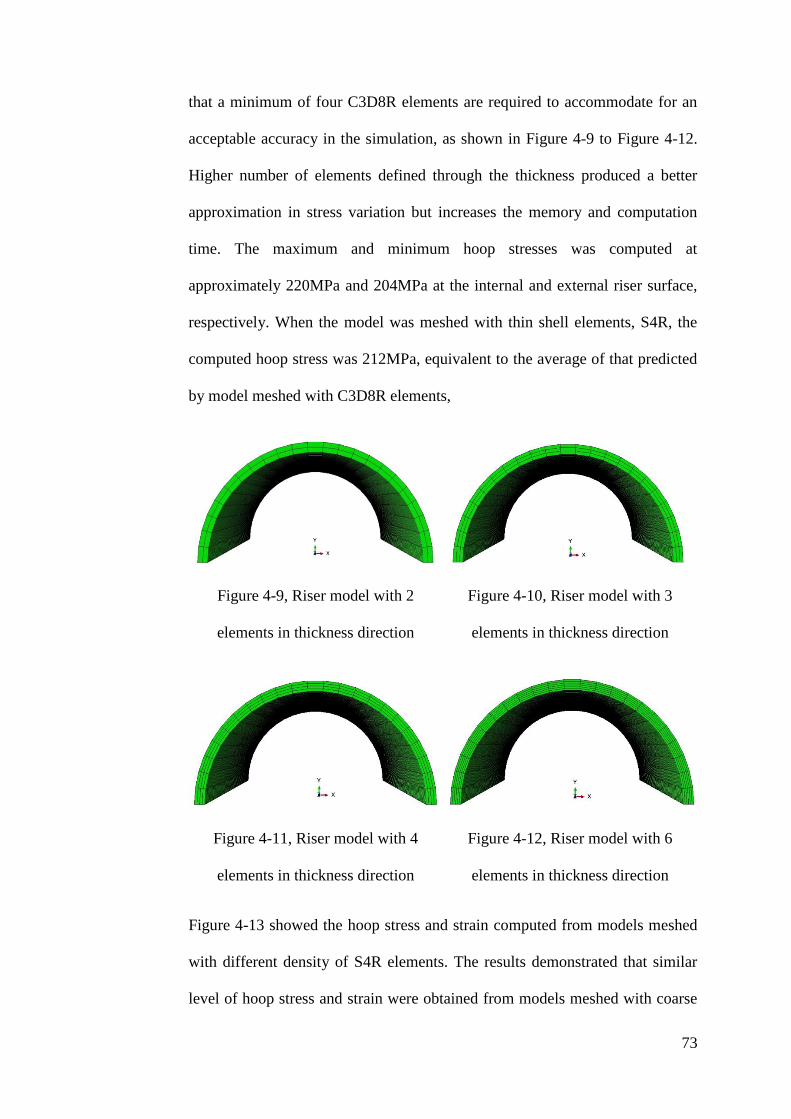
73
that a minimum of four C3D8R elements are required to accommodate for an
acceptable accuracy in the simulation, as shown in Figure 4-9 to Figure 4-12.
Higher number of elements defined through the thickness produced a better
approximation in stress variation but increases the memory and computation
time. The maximum and minimum hoop stresses was computed at
approximately 220MPa and 204MPa at the internal and external riser surface,
respectively. When the model was meshed with thin shell elements, S4R, the
computed hoop stress was 212MPa, equivalent to the average of that predicted
by model meshed with C3D8R elements,
Figure 4-9, Riser model with 2
elements in thickness direction
Figure 4-10, Riser model with 3
elements in thickness direction
Figure 4-11, Riser model with 4
elements in thickness direction
Figure 4-12, Riser model with 6
elements in thickness direction
Figure 4-13 showed the hoop stress and strain computed from models meshed
with different density of S4R elements. The results demonstrated that similar
level of hoop stress and strain were obtained from models meshed with coarse
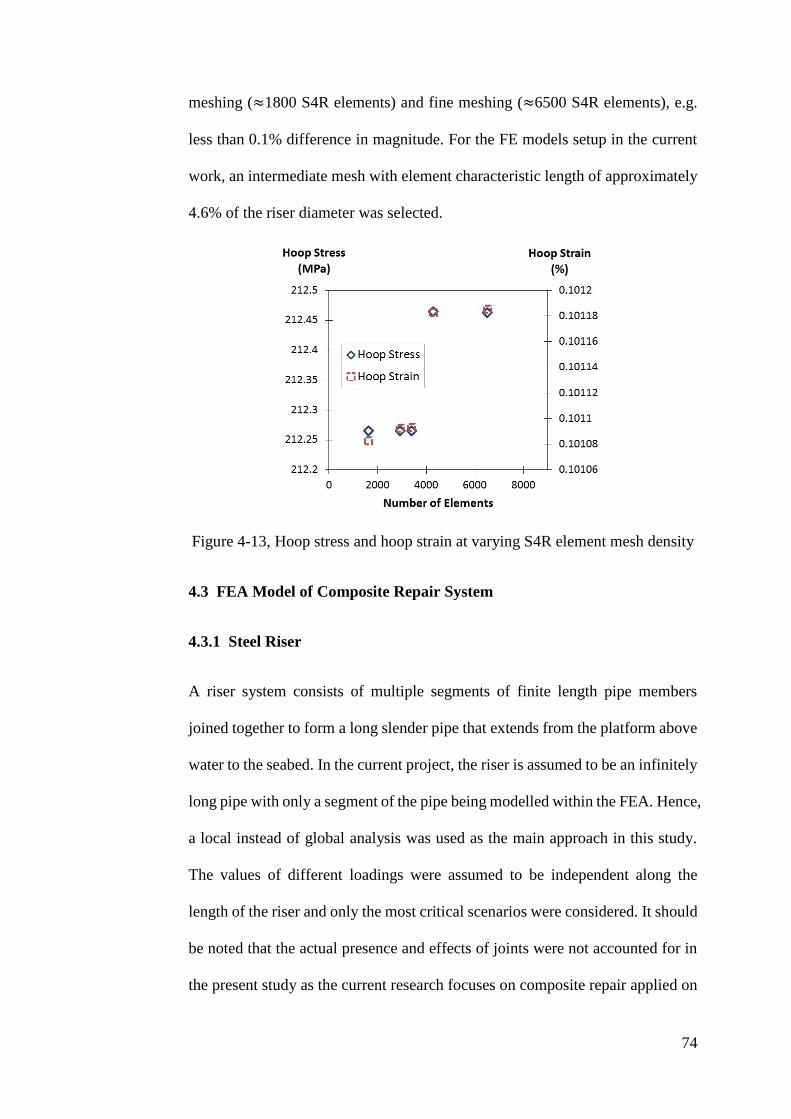
74
meshing (≈1800 S4R elements) and fine meshing (≈6500 S4R elements), e.g.
less than 0.1% difference in magnitude. For the FE models setup in the current
work, an intermediate mesh with element characteristic length of approximately
4.6% of the riser diameter was selected.
Figure 4-13, Hoop stress and hoop strain at varying S4R element mesh density
4.3 FEA Model of Composite Repair System
4.3.1 Steel Riser
A riser system consists of multiple segments of finite length pipe members
joined together to form a long slender pipe that extends from the platform above
water to the seabed. In the current project, the riser is assumed to be an infinitely
long pipe with only a segment of the pipe being modelled within the FEA. Hence,
a local instead of global analysis was used as the main approach in this study.
The values of different loadings were assumed to be independent along the
length of the riser and only the most critical scenarios were considered. It should
be noted that the actual presence and effects of joints were not accounted for in
the present study as the current research focuses on composite repair applied on

75
the segment of riser without the presence of odd geometrical components.
Instead, a set of artificial boundary conditions were assigned at both ends of the
riser to constrain certain DOFs of the riser and this is discussed in section 4.3.4
4.3.2 Composite Laminate
In the field of offshore riser repair where FRPC is used as the main strengthening
material to mitigate the effect of further deterioration, the mechanical properties
and behaviour of the FRPC must be accurately defined. These properties may
include the young’s modulus, tensile strength, compressive strength, shear
strength, and Poisson’s ratio for both the fibre and the matrix respectively. In
addition, properties such as the interlaminar strength between adjacent laminas
as well as the bond strength between the FRPC and the riser surface are also
significant in determining the overall performance of the repair.
4.3.2a Homogenisation of the Composite Properties
FRPCs are made out of two main components, the reinforcing fibre and the
polymer matrix. The types and compositions of the fibres and matrix affect the
overall mechanical properties and bulk behaviour of the FRPC. Dedicated
orientations of the fibre are often designed to produce a customised
reinforcement along a certain axes of the structure. It is hence an anistropic
material and the failure mechanisms can vary vastly depending on the chosen
constituent materials and design.
For unidirectional fibre reinforced polymer, the elastic moduli along the
direction parallel, E1, and transverse, E2, to the fibre orientation can be defined
through the rule of mixtures, as given in Eq. 4–2 and Eq. 4–3 respectively.
76
)1(1 fmff vEvEE
4-2
)1(2
fffm
mf
vEvE
EEE
4-3
where Ef and Em are the elastic moduli of the fibre and matrix respectively and
vf is the fibre volume fraction. There are different failure criteria specifically
developed and applicable for FRPCs. One of the earliest was developed by
(Hashin, 1980), where three dimensional failure of unidirectional fibre
composites was modelled. The Hashin failure criterion takes into account four
distinctive failure modes, namely the tensile and compressive failure modes of
the fibre and the matrix, is the only FRPC failure criterion that was adopted into
ABAQUS general purpose finite element code. In recent years, an effort was
started by (Soden PD, 1998) to assess the different failure criteria for FRPC. The
exercise, referred as the “World Wide Failure Exercise (WWFE)” involved
leading academics and developers of software and numerical codes specialised
in predicting failure in FPRC.
In general, FRPC materials demonstrate orthotropic behaviour, where their
mechanical properties vary along three mutually orthogonal axes of the structure.
The 3-dimensional constitutive equation relating the stress-strain relationship of
a FRPC can be simplified into the form showed in Eq. 4–4,
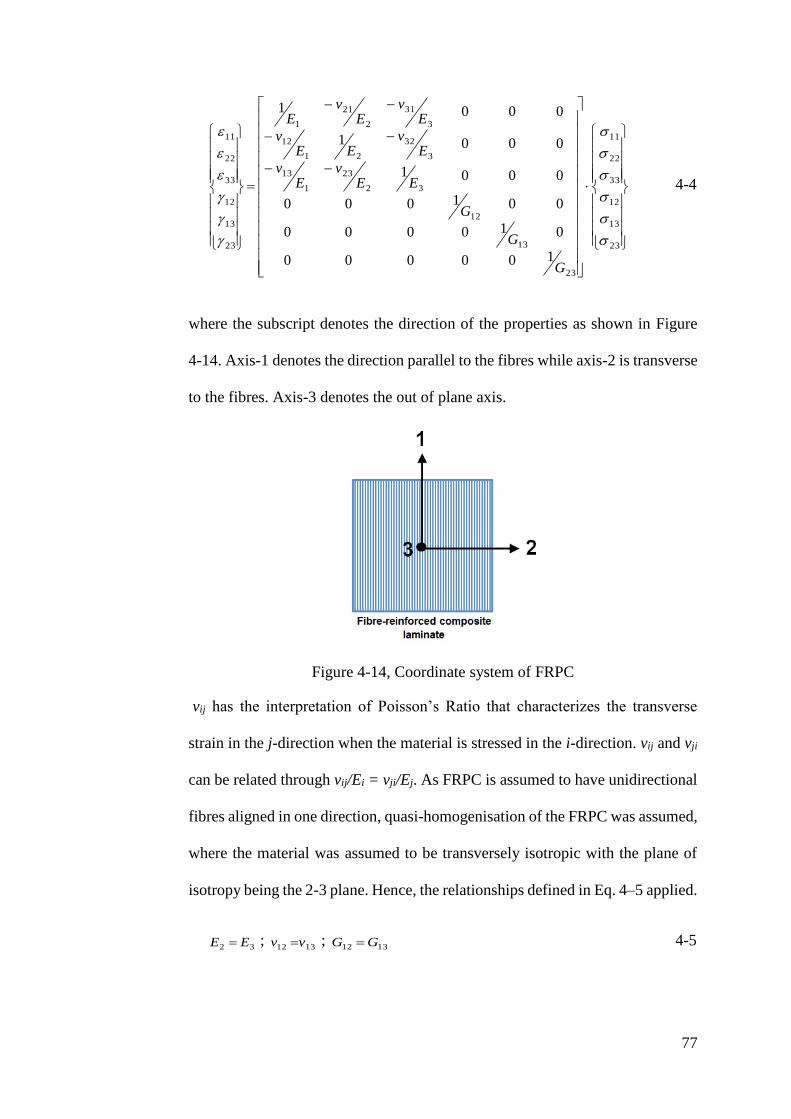
77
23
13
12
33
22
11
23
13
12
32
23
1
13
3
32
21
12
3
31
2
21
1
23
13
12
33
22
11
100000
010000
001000
0001
0001
0001
G
G
G
EEv
Ev
Ev
EEv
Ev
Ev
E
4-4
where the subscript denotes the direction of the properties as shown in Figure
4-14. Axis-1 denotes the direction parallel to the fibres while axis-2 is transverse
to the fibres. Axis-3 denotes the out of plane axis.
Figure 4-14, Coordinate system of FRPC
vij has the interpretation of Poisson’s Ratio that characterizes the transverse
strain in the j-direction when the material is stressed in the i-direction. vij and vji
can be related through vij/Ei = vji/Ej. As FRPC is assumed to have unidirectional
fibres aligned in one direction, quasi-homogenisation of the FRPC was assumed,
where the material was assumed to be transversely isotropic with the plane of
isotropy being the 2-3 plane. Hence, the relationships defined in Eq. 4–5 applied.
32 EE ; 1312 vv ;
1312 GG 4-5
78
This reduces the number of elastic constants required in the constitutive equation,
which can be written in the form showed in Eq. 4–6.
23
13
12
33
22
11
23
12
12
22
23
1
12
2
23
21
12
1
12
1
12
1
23
13
12
33
22
11
100000
010000
001000
0001
0001
0001
G
G
G
EEv
Ev
Ev
EEv
Ev
Ev
E
4-6
As the thickness of the composite laminate is significantly smaller than the other
dimensions, i.e. length and diameter, of the composite repair and the riser,
assumption of a plane stress (σ13 = σ23 = σ33 = 0) condition was applied within the
simulation model. Under this condition, Eq. 4–6 can be further simplified to the
form showed in Eq. 4–7.
12
22
11
12
21
12
1
12
1
12
22
11
100
01
01
G
EEv
Ev
E
4-7
which may be reduced to a more concise form as,
ll S 4-8
Here [S] is known as the compliance matrix that relates the stress and strain
components in the principal directions of the material. The subscript l represents
the laminate coordinates. Multiplying Eq. 4–8 with [S]-1 yield,
ll Q ][ 4-9
79
where [Q] is the stiffness matrix and the terms within the matrix can be defined
as,
66
2212
1211
00
0
0
Q
Q ; 4-10
where
1
22
12
111
1E
Ev
EQ
;
1
22
12
21212
1E
Ev
EvQ
;
1
22
12
222
1E
Ev
EQ
; 1266 GQ
As the properties of the material benchmarked in the WWFE were measured in
accordance to the failure criterion applicable to FRPC, the material parameters
of the CRS as defined in the current work were extracted from those specified in
WWFE.
In this study, the main objective was to assess the overall performance of the
CRS in offshore applications. Thus, behaviour at a macro-level was considered.
Previous studies on composite repaired pipelines subjected to internal pressure
revealed that failure in the repaired region is unlikely to happen (Alexander,
2007) (Bedoya, et al., 2010). Macro-behaviour such as the bonding between the
FRPC and the riser surface is one that poses more concern and should be
considered in the design of composite repair. Withal, progressive failures within
the FRPC itself such as matrix cracking, fibre breakage or fibre pull-out are not
the significant modes of failure of the CRS.
4.3.2b Multi-continuum Theory (MCT) Failure Criteria
A user defined material, characterized using the multi-continuum theory (MCT)
was used in the FE model to assess the condition of the FRPC under the assigned
loads. This micromechanics-based theory obeys the fundamental of continuum
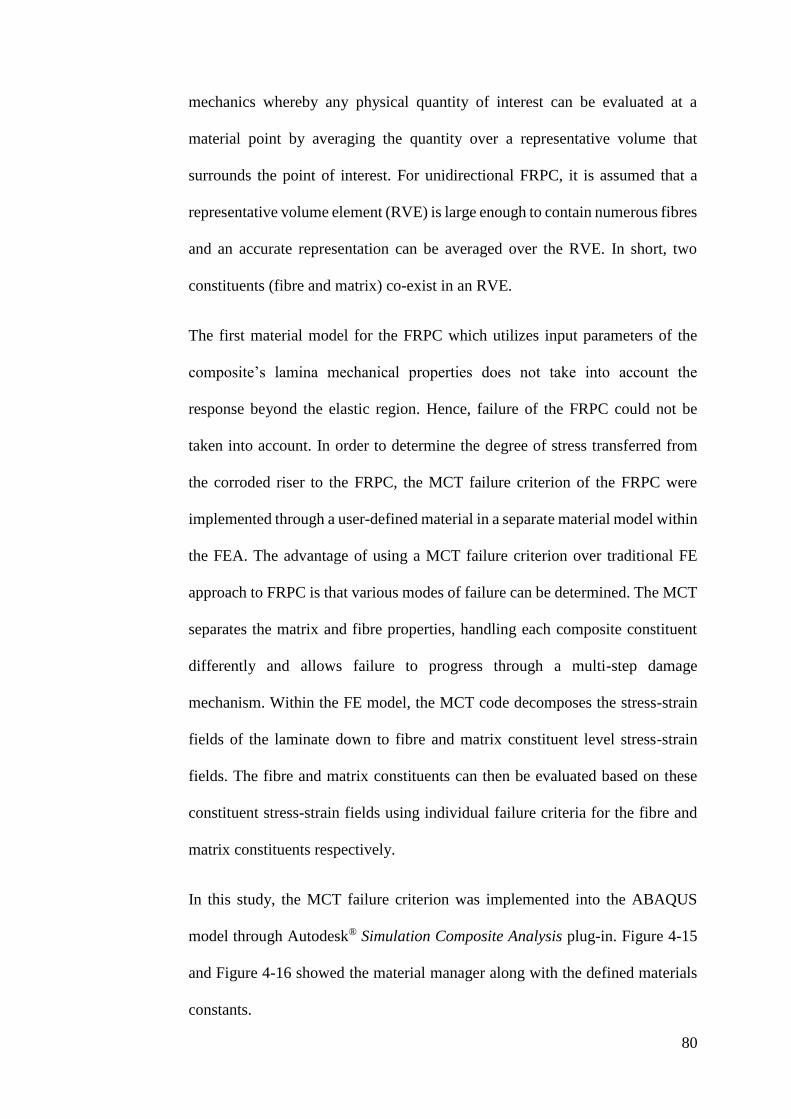
80
mechanics whereby any physical quantity of interest can be evaluated at a
material point by averaging the quantity over a representative volume that
surrounds the point of interest. For unidirectional FRPC, it is assumed that a
representative volume element (RVE) is large enough to contain numerous fibres
and an accurate representation can be averaged over the RVE. In short, two
constituents (fibre and matrix) co-exist in an RVE.
The first material model for the FRPC which utilizes input parameters of the
composite’s lamina mechanical properties does not take into account the
response beyond the elastic region. Hence, failure of the FRPC could not be
taken into account. In order to determine the degree of stress transferred from
the corroded riser to the FRPC, the MCT failure criterion of the FRPC were
implemented through a user-defined material in a separate material model within
the FEA. The advantage of using a MCT failure criterion over traditional FE
approach to FRPC is that various modes of failure can be determined. The MCT
separates the matrix and fibre properties, handling each composite constituent
differently and allows failure to progress through a multi-step damage
mechanism. Within the FE model, the MCT code decomposes the stress-strain
fields of the laminate down to fibre and matrix constituent level stress-strain
fields. The fibre and matrix constituents can then be evaluated based on these
constituent stress-strain fields using individual failure criteria for the fibre and
matrix constituents respectively.
In this study, the MCT failure criterion was implemented into the ABAQUS
model through Autodesk® Simulation Composite Analysis plug-in. Figure 4-15
and Figure 4-16 showed the material manager along with the defined materials
constants.

81
Figure 4-15, AS4/3501-6 carbon/epoxy unidirectional lamina strength
properties on Autodesk® Simulation Composite Analysis
82
Figure 4-16, AS4/3501-6 carbon/epoxy unidirectional lamina and constituent
properties on Autodesk® Simulation Composite Analysis
4.3.2c Bonding between Composite and Steel Riser Surface
The effectiveness of the CRS is highly dependent on the adhesion between the
composite and the steel riser. In real life, variation in material types, curing
conditions, installation procedures and techniques tend to result in varying
83
degrees of localised defects such as micro-voids between the riser and the FPRC
where less than perfect bonding is observed. If large disbonds appear at the
bonding interface, anomaly in the stress distribution would appear and the stress
transfer from the steel riser to the composite decreases. To provide a good
adhesion between the two materials, surface preparation prior to the installation
of the composite material must be observed. The removal of contaminants and
surface cleaning can be done by hand or power tools. Australian standard series
AS1626 titled “Metal Finishing-Preparation and Pretreatment of Surfaces”
provide ten possible methods for surface preparation (MT/9, 1997). One of the
surface preparation techniques that utilises high power tool is grit blasting. This
technique uses high speed of abrasion particles under compressed air stream to
remove unwanted contaminants such as rust from the steel surface. Water jetting
is more advantageous as the use of water in replacement of abrasive particles
produce less dust. The ideal surface preparation is a NACE No.2/SSPC-SP10,
near white metal, blast cleaning, where a surface profile of 63-101 microns is
desired (NACE/SSPC, 2006). Taking into account the importance of surface
bonding, sensitivity and highly flammable environment, water jet is the most
suitable method for surface preparation for rehabilitation of offshore risers. As
qualitative and quantitative characterisation of the surface finishing is not
included in the current research project, a perfect bonding was assumed within
the FEA model. In a separate model, the bonding between the two surfaces was
characterised by fracture mechanics in order to study the integrity of the bond at
the interface.
84
4.3.3 Materials
4.3.3a Riser Materials
In the oil and gas industry, pipeline are typically selected from a range of welded
or seamless carbon steel materials that are standardised by the American
Petroleum Institute pipe specification, API 5L. In a Petrobras project involving
the design and installation of a SCR in the Marlim Field floating production
system, API 5L X60 grade steel pipe was used (Serta, et al., 1996). When there
is no significant yield point in the stress-strain behaviour of the material, the
stress-strain relationship can be defined using the Ramberg-Osgood model (Eq.
4–11). In the work of (Walker & Williams, 1995) , the model shown in Figure
4-17 was found capable of representing the relationship accurately.
1
0
n
pE
4-11
where Ep is the Young’s modulus of the steel pipe, ɛ and σ are the nominal strain
and stress respectively, α is the Ramberg-Osgood’s model yield offset constant,
n is the hardening exponent and σ0 is the yield stress. The parameters showed in
Table 4-1 were extracted from tests run by Ruggieri and Dotta in their work
where numerical modelling of crack growth in high pressure pipeline steels was
studied (Ruggieri & Fernando, 2011).
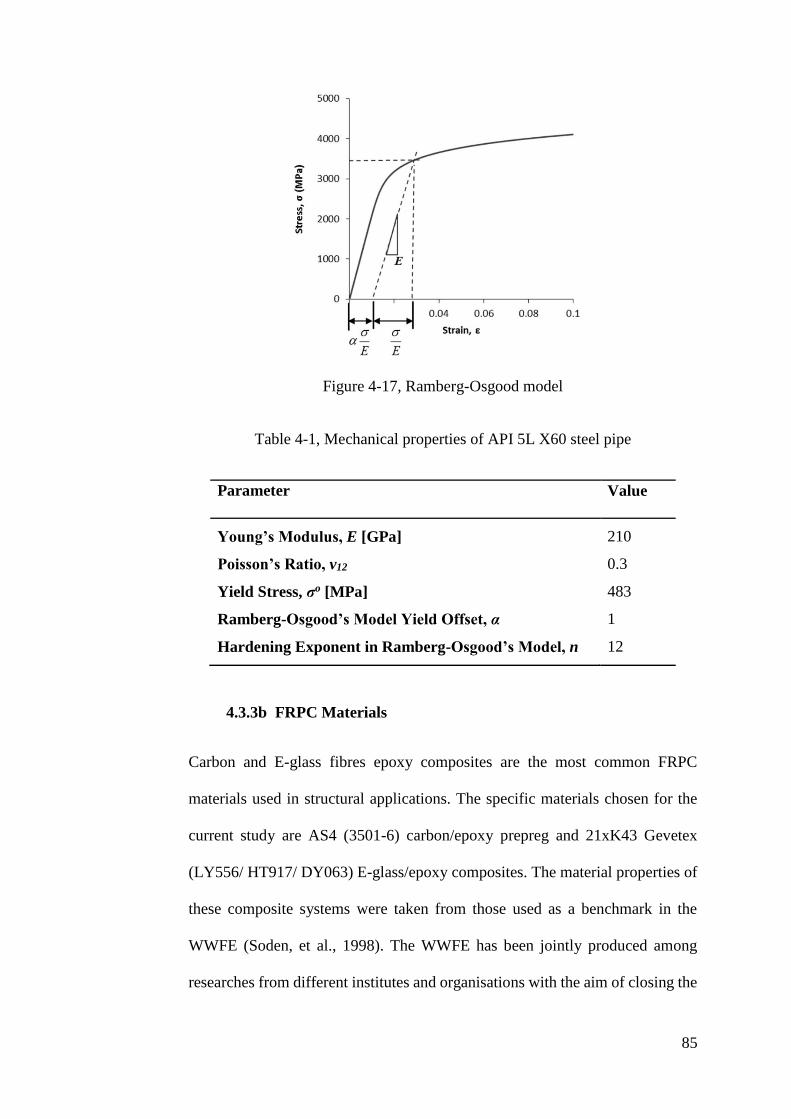
85
Figure 4-17, Ramberg-Osgood model
Table 4-1, Mechanical properties of API 5L X60 steel pipe
Parameter Value
Young’s Modulus, E [GPa] 210
Poisson’s Ratio, v12 0.3
Yield Stress, σo [MPa] 483
Ramberg-Osgood’s Model Yield Offset, α 1
Hardening Exponent in Ramberg-Osgood’s Model, n 12
4.3.3b FRPC Materials
Carbon and E-glass fibres epoxy composites are the most common FRPC
materials used in structural applications. The specific materials chosen for the
current study are AS4 (3501-6) carbon/epoxy prepreg and 21xK43 Gevetex
(LY556/ HT917/ DY063) E-glass/epoxy composites. The material properties of
these composite systems were taken from those used as a benchmark in the
WWFE (Soden, et al., 1998). The WWFE has been jointly produced among
researches from different institutes and organisations with the aim of closing the
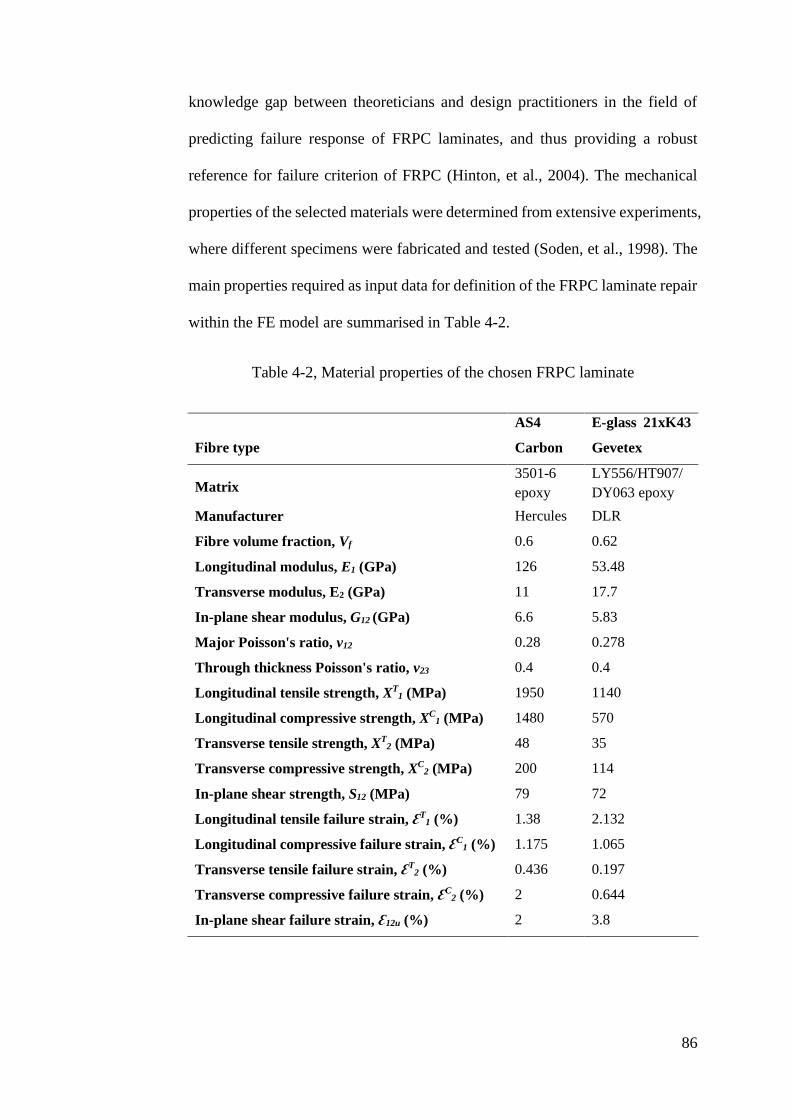
86
knowledge gap between theoreticians and design practitioners in the field of
predicting failure response of FRPC laminates, and thus providing a robust
reference for failure criterion of FRPC (Hinton, et al., 2004). The mechanical
properties of the selected materials were determined from extensive experiments,
where different specimens were fabricated and tested (Soden, et al., 1998). The
main properties required as input data for definition of the FRPC laminate repair
within the FE model are summarised in Table 4-2.
Table 4-2, Material properties of the chosen FRPC laminate
Fibre type
AS4
Carbon
E-glass 21xK43
Gevetex
Matrix 3501-6
epoxy
LY556/HT907/
DY063 epoxy
Manufacturer Hercules DLR
Fibre volume fraction, Vf 0.6 0.62
Longitudinal modulus, E1 (GPa) 126 53.48
Transverse modulus, E2 (GPa) 11 17.7
In-plane shear modulus, G12 (GPa) 6.6 5.83
Major Poisson's ratio, v12 0.28 0.278
Through thickness Poisson's ratio, v23 0.4 0.4
Longitudinal tensile strength, XT1 (MPa) 1950 1140
Longitudinal compressive strength, XC1 (MPa) 1480 570
Transverse tensile strength, XT2 (MPa) 48 35
Transverse compressive strength, XC2 (MPa) 200 114
In-plane shear strength, S12 (MPa) 79 72
Longitudinal tensile failure strain, ƐT1 (%) 1.38 2.132
Longitudinal compressive failure strain, ƐC1 (%) 1.175 1.065
Transverse tensile failure strain, ƐT2 (%) 0.436 0.197
Transverse compressive failure strain, ƐC2 (%) 2 0.644
In-plane shear failure strain, Ɛ12u (%) 2 3.8
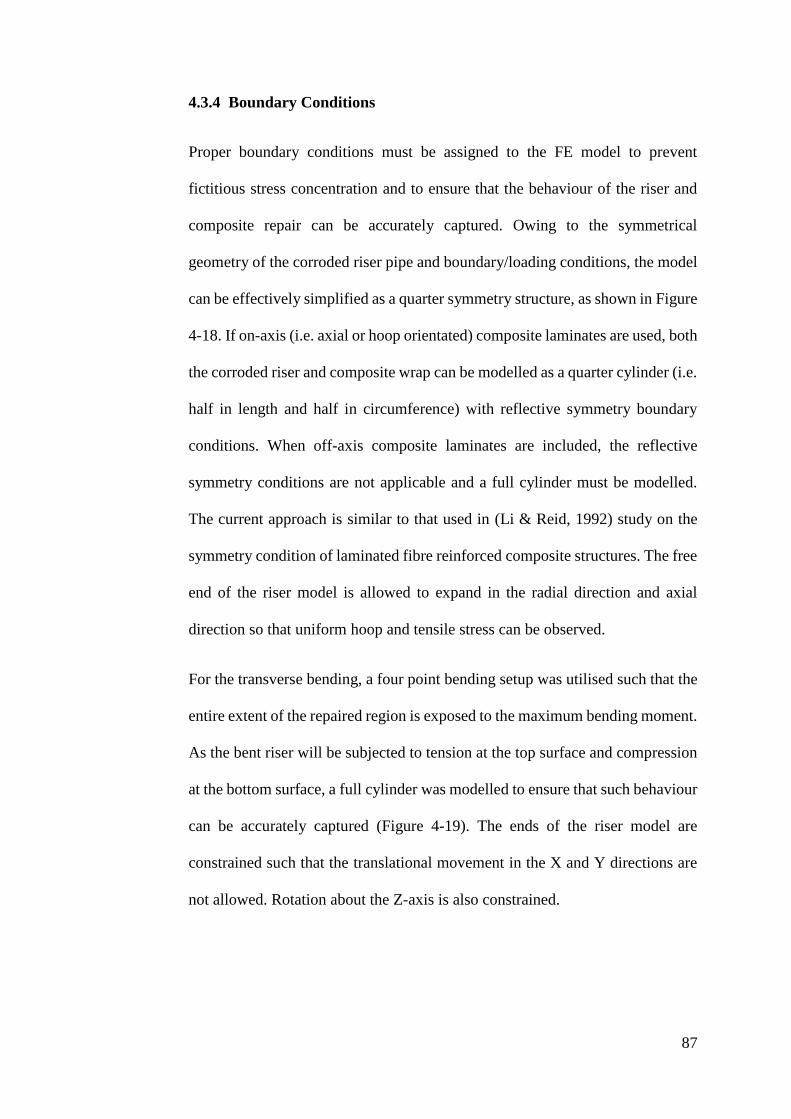
87
4.3.4 Boundary Conditions
Proper boundary conditions must be assigned to the FE model to prevent
fictitious stress concentration and to ensure that the behaviour of the riser and
composite repair can be accurately captured. Owing to the symmetrical
geometry of the corroded riser pipe and boundary/loading conditions, the model
can be effectively simplified as a quarter symmetry structure, as shown in Figure
4-18. If on-axis (i.e. axial or hoop orientated) composite laminates are used, both
the corroded riser and composite wrap can be modelled as a quarter cylinder (i.e.
half in length and half in circumference) with reflective symmetry boundary
conditions. When off-axis composite laminates are included, the reflective
symmetry conditions are not applicable and a full cylinder must be modelled.
The current approach is similar to that used in (Li & Reid, 1992) study on the
symmetry condition of laminated fibre reinforced composite structures. The free
end of the riser model is allowed to expand in the radial direction and axial
direction so that uniform hoop and tensile stress can be observed.
For the transverse bending, a four point bending setup was utilised such that the
entire extent of the repaired region is exposed to the maximum bending moment.
As the bent riser will be subjected to tension at the top surface and compression
at the bottom surface, a full cylinder was modelled to ensure that such behaviour
can be accurately captured (Figure 4-19). The ends of the riser model are
constrained such that the translational movement in the X and Y directions are
not allowed. Rotation about the Z-axis is also constrained.
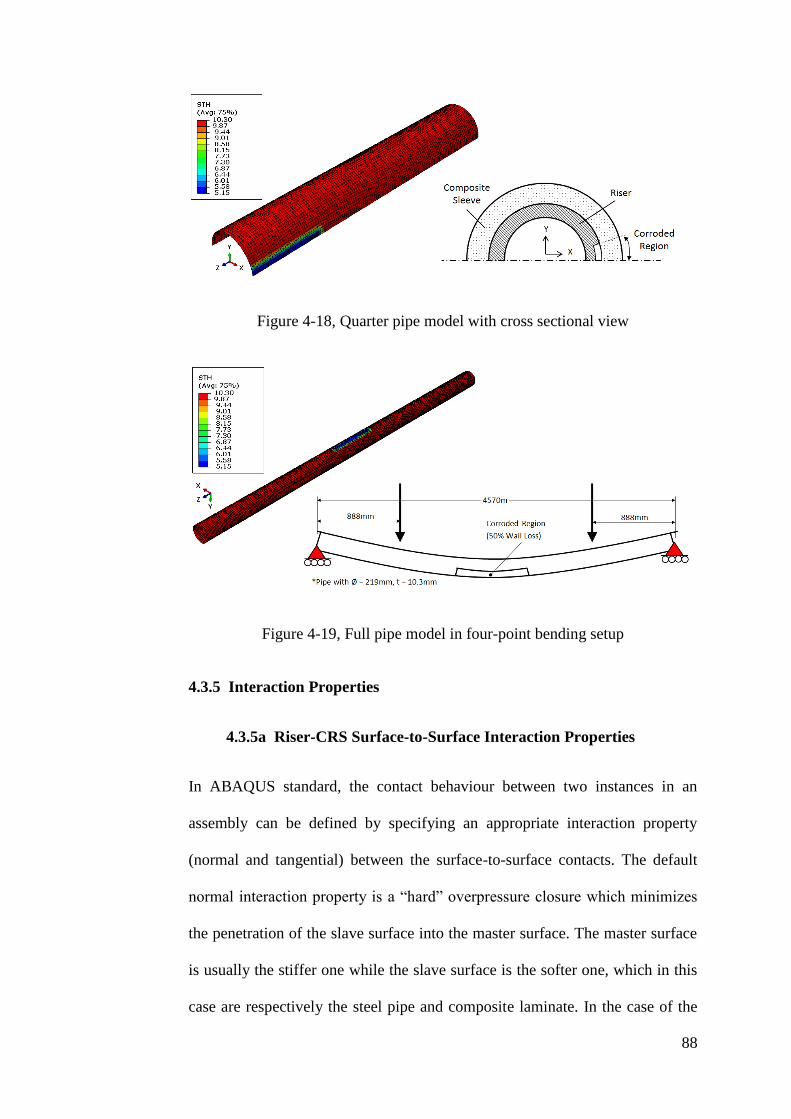
88
Figure 4-18, Quarter pipe model with cross sectional view
Figure 4-19, Full pipe model in four-point bending setup
4.3.5 Interaction Properties
4.3.5a Riser-CRS Surface-to-Surface Interaction Properties
In ABAQUS standard, the contact behaviour between two instances in an
assembly can be defined by specifying an appropriate interaction property
(normal and tangential) between the surface-to-surface contacts. The default
normal interaction property is a “hard” overpressure closure which minimizes
the penetration of the slave surface into the master surface. The master surface
is usually the stiffer one while the slave surface is the softer one, which in this
case are respectively the steel pipe and composite laminate. In the case of the
89
tangential interaction, the contact is governed by a standard coulomb friction
model. The model assumes that there is no relative motion between two
contacting surfaces when the equivalent frictional stress, τeq is less than or equal
to the critical stress, τcrit, Eq. 4–12.
criteq 4-12
where τcrit is proportional to the contact pressure, as in Eq. 4–13.
contcrit P
4-13
while µ is the friction coefficient and Pcont represents the contact pressure. For
the purpose of the current study, the riser and composite laminate was assumed
to establish a perfect bonding and the steel-composite interface was
characterised through a ‘rough’ tangential friction formulation within the FE
model, which is the ideal condition for stress transfer. However, variation in
material types, installation techniques and parameters tend to result in localised
micro-voids between surface interfaces of the repair (i.e. between the riser-FRPC
and between FRPC laminates) where less than perfect bonding is often observed.
With the characterised ‘rough’ tangential contact, the friction coefficient, µ, in
Eq. 4–13 has a value of infinity which resulted in zero sliding motion between
the two surfaces once they come into contact.
Alternatively, a tie constraint can be used to define the bond between the steel
riser and the FRPC laminate. Tie constraint is a surface-based constraint that
limits the motion of the node on the slave surface to the node on the master
surface to which it is closest. The outer surface of the steel riser could be assigned
as the master surface while the inner surface of the FRPC could be assigned as
90
the slave surface. The tie constraint makes the translational and rotational motion
as well as other active DOF equal for the pair of surfaces.
4.3.5b Interaction Properties using Fracture Mechanics
In order to study the integrity of the bond between adjacent plies as well as those
at the steel-composite interface, fracture mechanics was employed in the
characterization of these bonds. The fracture between the adjacent FRPC plies is
known as delamination while the fracture between the FPRC and steel riser is
known as disbonding. The interlaminar and steel-composite bond strengths can
be characterized by their relative energy release rates, which is the energy require
to extend the “crack” per unit length.
Since corroded riser with a CRS often subjected to combined loadings in the
hoop, longitudinal and transverse directions, mixed mode behaviour is assumed.
The Benzeggagh and Kenane (BK) fracture criterion is used to determine the
critical equivalent strain energy release rate, GequivC. The relationship between
the mode I (tensile), II (in-plane shear) and III (out-of-plane shear) energy
release rate and GequivC is given in Eq. 4–14.
IIIIII
IIIIIICIICICequivC
GGG
GGGGGG
4-14
When the system is subjected to the combined loadings, the GIC, GIIC, GIIIC and
GI, GII, GIII represent the critical energy release rate and energy release rate in
mode I, II and III respectively. The values of GIC, GIIC and GIIIC for interlaminar
level of composite material were taken from (Liao & Sun, 1996) where these
values were determined experimentally through the implementation of a new
analytical series solution for AS4 (3501-6 C/E). In the case of steel-composite
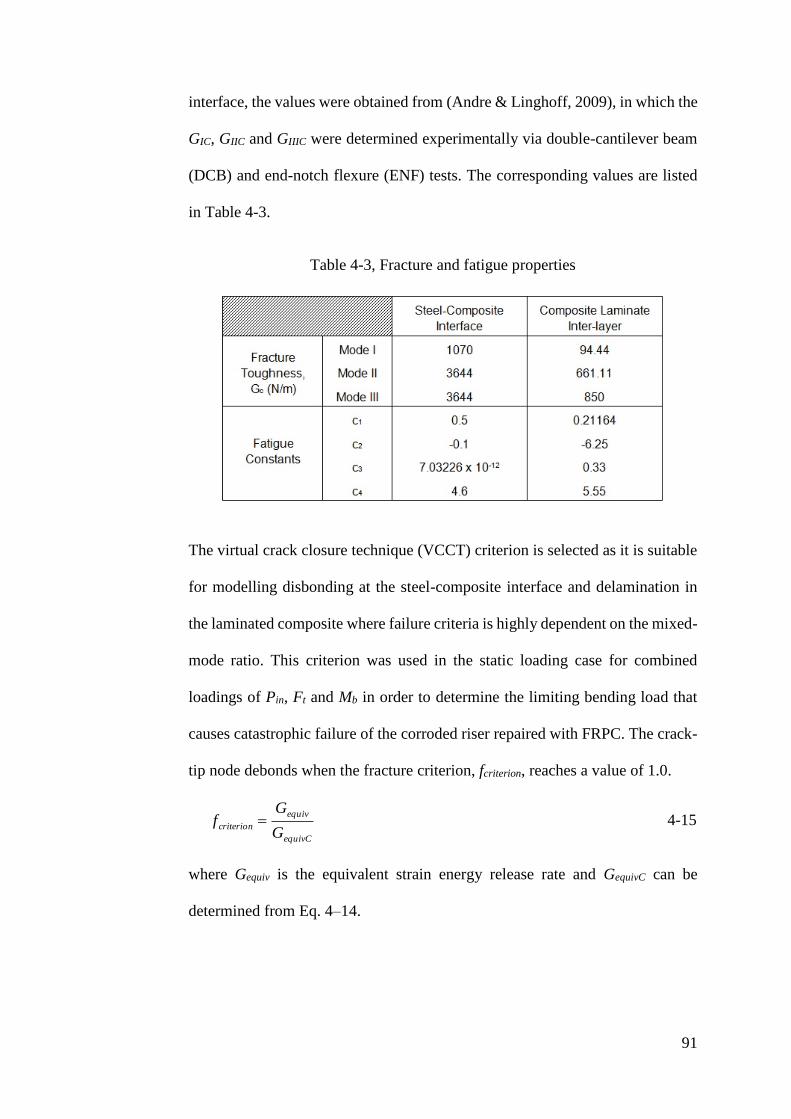
91
interface, the values were obtained from (Andre & Linghoff, 2009), in which the
GIC, GIIC and GIIIC were determined experimentally via double-cantilever beam
(DCB) and end-notch flexure (ENF) tests. The corresponding values are listed
in Table 4-3.
Table 4-3, Fracture and fatigue properties
The virtual crack closure technique (VCCT) criterion is selected as it is suitable
for modelling disbonding at the steel-composite interface and delamination in
the laminated composite where failure criteria is highly dependent on the mixed-
mode ratio. This criterion was used in the static loading case for combined
loadings of Pin, Ft and Mb in order to determine the limiting bending load that
causes catastrophic failure of the corroded riser repaired with FRPC. The crack-
tip node debonds when the fracture criterion, fcriterion, reaches a value of 1.0.
equivC
equiv
criterionG
Gf
4-15
where Gequiv is the equivalent strain energy release rate and GequivC can be
determined from Eq. 4–14.

92
4.4 Validation of Numerical Model
It is important to show that the developed numerical model is accurate enough
to be used in the optimisation of the CRS for offshore risers. In general, there
are two methods that can be used to validate the results obtained from FE model.
The first method uses classical mechanics solutions to obtain the stress and strain
values at identical loading conditions and compare the values with those
obtained in the FE model. However, these analytical solutions are often built on
several assumptions where factors that would affect the results in a real-life
scenario are omitted.
The second method employs experimental validation is a much favourable
method as a lot of assumptions were made in the derivation of classical
mechanics equations. The drawback of experimental validation is the resources
and cost involved in preparing and running the tests.
The robustness of the developed FE model was further validated through a case
study conducted to evaluate the burst resistant of an industrial carbon fibre
reinforced polyethylene strip pipeline repair system. The composite repair
system, known as the Helicoid Epoxy Sleeve (HES)TM is a commercially
available solution designed and developed by Merit Technologies Sdn Bhd. The
results obtained through the numerical model and limit analysis were compared
to those obtained from a full-scale burst test.
4.4.1 Classical Mechanics
The most fundamental numerical model is one where a bare steel riser is
subjected to a single individual loading, i.e. internal pressure. The API 5L X60
steel riser model has a radius, r, and wall thickness, t, of 109.5mm and 10.3mm
93
respectively, giving a r/t ratio of more than 10. Hence, thin wall assumption was
used and the hoop stress can be defined as,
p
p
ht
rPint
4-16
When the composite repair is applied onto a corroded riser, the strength of the
repaired riser in resisting the hoop load can be taken as the sum of the strength
in the FRPC laminate and the remaining strength of the corroded riser, as in Eq.
4–17. This relation assumes perfect load transfer from the corroded steel riser to
the FRPC laminate.
comp
compcomph
steel
corrodedsteelh
r
t
r
tP
,,
int
4-17
where Pint is the applied internal pressure, σh is the hoop stress, t is the wall
thickness and r is the radius. The subscripts ‘corroded’, ‘steel’ and ‘comp’
symbolises the corroded section of the pipe, the steel riser and the composite
repair respectively. The estimate of hoop stress on the FRPC can be calculated
through Eq. 4–18,
compcomp
corrodedsteel
comp
comph
tE
tEt
DP
12
,
4-18
Through Eq. 4–17 and Eq. 4–18, the hoop stress and strain can be calculated and
compared to those extracted from the FE model. The output is tabulated in Table
4-4. It can be noted that the discrepancies are minimal. The hoop stresses of the
corroded steel riser beneath the composite repair computed through the
numerical model and classical mechanics method show reduction by 63.3% and
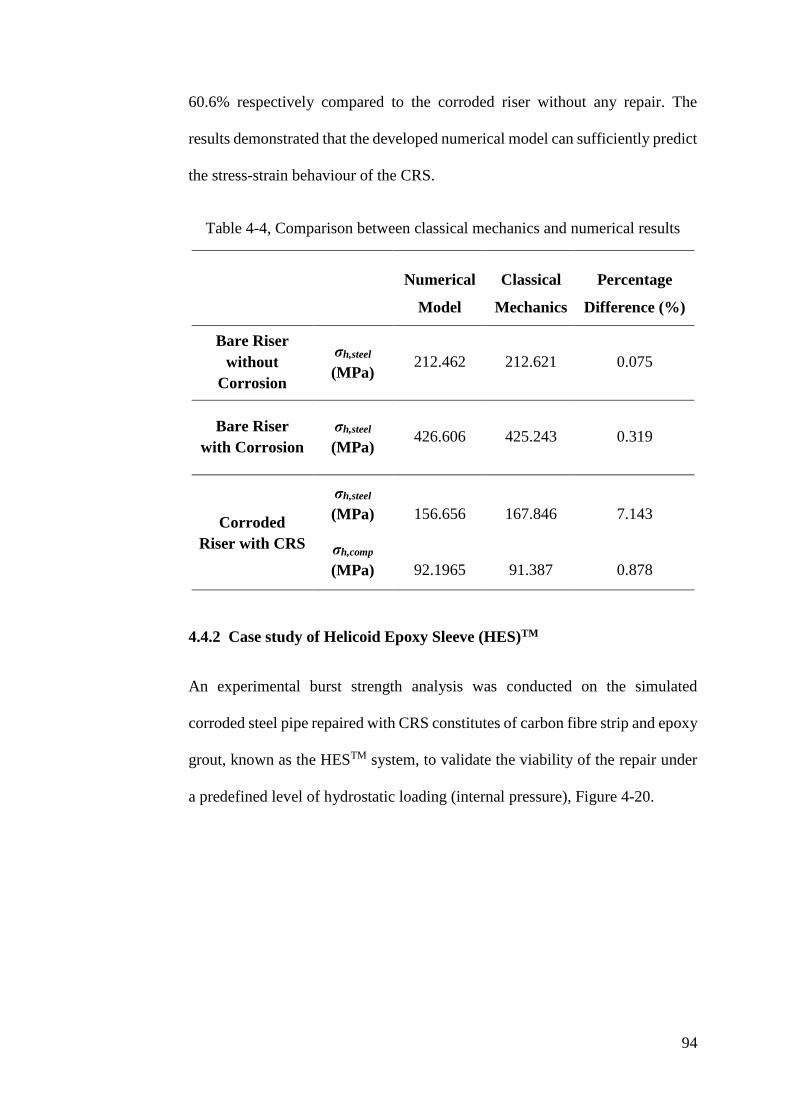
94
60.6% respectively compared to the corroded riser without any repair. The
results demonstrated that the developed numerical model can sufficiently predict
the stress-strain behaviour of the CRS.
Table 4-4, Comparison between classical mechanics and numerical results
Numerical
Model
Classical
Mechanics
Percentage
Difference (%)
Bare Riser
without
Corrosion
σh,steel
(MPa) 212.462 212.621 0.075
Bare Riser
with Corrosion
σh,steel
(MPa) 426.606 425.243 0.319
Corroded
Riser with CRS
σh,steel
(MPa) 156.656 167.846 7.143
σh,comp
(MPa) 92.1965 91.387 0.878
4.4.2 Case study of Helicoid Epoxy Sleeve (HES)TM
An experimental burst strength analysis was conducted on the simulated
corroded steel pipe repaired with CRS constitutes of carbon fibre strip and epoxy
grout, known as the HESTM system, to validate the viability of the repair under
a predefined level of hydrostatic loading (internal pressure), Figure 4-20.
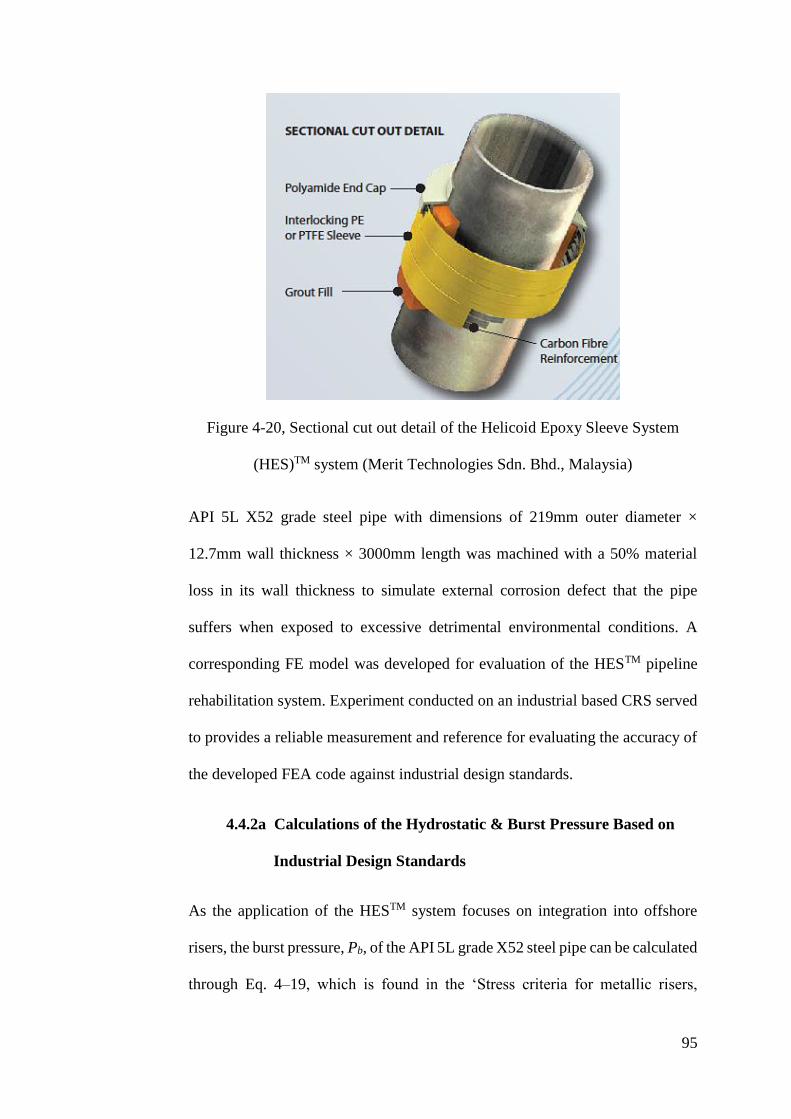
95
Figure 4-20, Sectional cut out detail of the Helicoid Epoxy Sleeve System
(HES)TM system (Merit Technologies Sdn. Bhd., Malaysia)
API 5L X52 grade steel pipe with dimensions of 219mm outer diameter ×
12.7mm wall thickness × 3000mm length was machined with a 50% material
loss in its wall thickness to simulate external corrosion defect that the pipe
suffers when exposed to excessive detrimental environmental conditions. A
corresponding FE model was developed for evaluation of the HESTM pipeline
rehabilitation system. Experiment conducted on an industrial based CRS served
to provides a reliable measurement and reference for evaluating the accuracy of
the developed FEA code against industrial design standards.
4.4.2a Calculations of the Hydrostatic & Burst Pressure Based on
Industrial Design Standards
As the application of the HESTM system focuses on integration into offshore
risers, the burst pressure, Pb, of the API 5L grade X52 steel pipe can be calculated
through Eq. 4–19, which is found in the ‘Stress criteria for metallic risers,
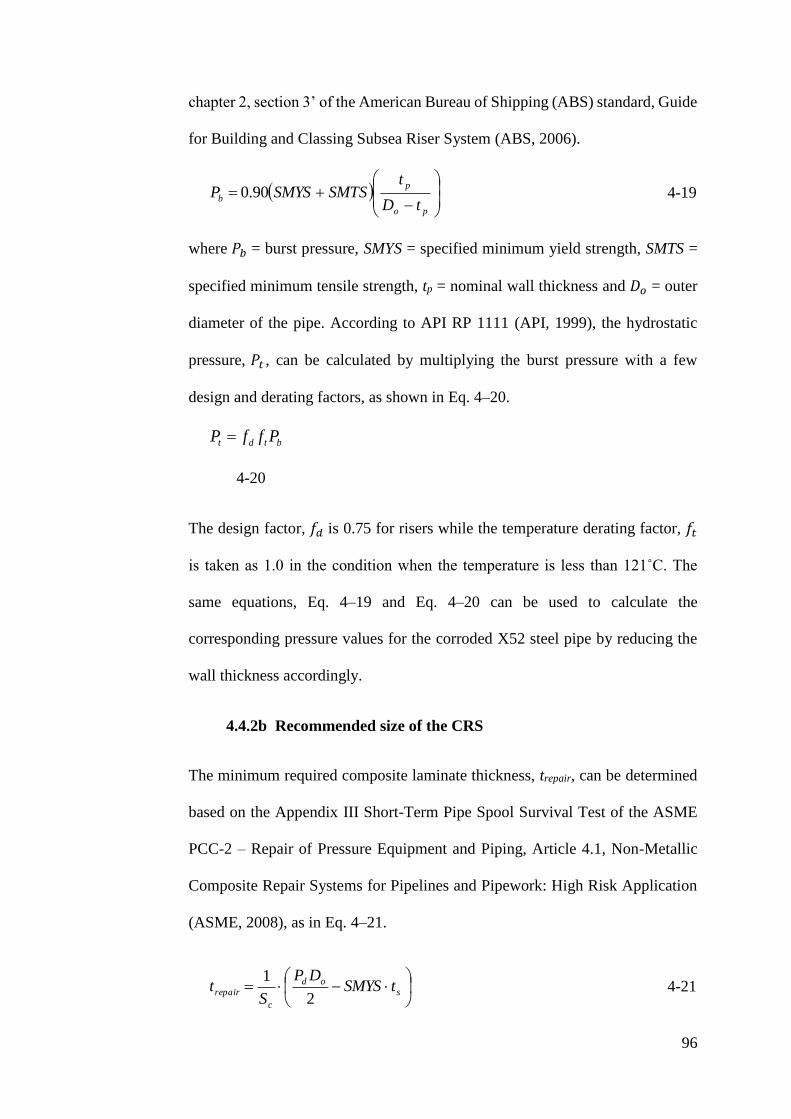
96
chapter 2, section 3’ of the American Bureau of Shipping (ABS) standard, Guide
for Building and Classing Subsea Riser System (ABS, 2006).
po
p
btD
tSMTSSMYSP 90.0 4-19
where 𝑃𝑏 = burst pressure, SMYS = specified minimum yield strength, SMTS =
specified minimum tensile strength, tp = nominal wall thickness and 𝐷𝑜 = outer
diameter of the pipe. According to API RP 1111 (API, 1999), the hydrostatic
pressure, 𝑃𝑡 , can be calculated by multiplying the burst pressure with a few
design and derating factors, as shown in Eq. 4–20.
btdt PffP
4-20
The design factor, 𝑓𝑑 is 0.75 for risers while the temperature derating factor, 𝑓𝑡
is taken as 1.0 in the condition when the temperature is less than 121˚C. The
same equations, Eq. 4–19 and Eq. 4–20 can be used to calculate the
corresponding pressure values for the corroded X52 steel pipe by reducing the
wall thickness accordingly.
4.4.2b Recommended size of the CRS
The minimum required composite laminate thickness, trepair, can be determined
based on the Appendix III Short-Term Pipe Spool Survival Test of the ASME
PCC-2 – Repair of Pressure Equipment and Piping, Article 4.1, Non-Metallic
Composite Repair Systems for Pipelines and Pipework: High Risk Application
(ASME, 2008), as in Eq. 4–21.
s
od
c
repair tSMYSDP
St
2
1 4-21

97
where Do = external pipe diameter, SMYS = specified minimum yield strength of
the pipe, Sc = tensile strength of carbon fibre strip and ts = remaining wall
thickness at defect region of the pipe. According to the segmentation of different
pressure values given in the API RP 1111 (API, 1999), the design pressure, Pd,
can be taken as 0.8 times of the hydrostatic test pressure and the trepair is
determined to be 1.08 mm, i.e. a minimum of 2 layers of the carbon fibre
reinforced PE strip, each of which having a thickness of 0.8 mm will be required.
A sufficient composite-pipe adhesion surface is required for adequate load
transfer from the pipe to the CRS to prevent delamination at the surface interface.
The total axial length of the repair required to ensure an effective pipe
rehabilitation can be computed from Eq. 4–22.
dgrouttotal LLL 2 4-22
where Lgrout is the grout length of the epoxy grout extending at each ends of the
defect and Ld is the axial length of the defect. The Lgrout can be computed using
Eq. 4–23 and is based on the lap shear strength of the epoxy grout to steel, τgrout,
which can be measured based on ASTM D3165 (ASTM, 2008).
SFD
FL
ogrout
eff
grout
2 4-23
where Feff is the effective tensile force acting on the steel pipe due to the
welded end caps. A safety factor, SF, of 3 was employed in the calculation of
the Lgrout to account for the long term degradation of the adhesive strength.
98
4.4.2c Experimental Setup
API 5L grade X52 steel pipe with dimensions of 219 mm OD, 12.7 mm WT and
3000 mm L was supplied by Sumimoto Metal Industries Ltd., Japan. Both ends
of the pipe were welded with adequate strength plates and non-destructive testing
was carried out to ensure the quality of the weld. A metal loss equivalent to 50%
original wall thickness was machined onto the external surface of the pipe to
simulate the corrosion defect. The total axial length of the defect is 622 mm and
over the full circumference of the pipe. Prior to installation of the HES™ system,
surface preparation was conducted by abrasive blasting to a minimum standard
of SA 2.5 and a minimum surface profile of 70 microns. The abrasive blasting
was extended to 25 mm over the length of the repair zone at both ends. During
installation of the HES™ system, the carbon fibre reinforced PE strip was
wounded around the pipe, forming an annulus of 25 mm between the strip and
the pipe. Polyamide end caps were placed at both ends of the sleeve to prevent
leakage prior to the injection of the epoxy grout. The full setup of the HES™
system on the pipe is shown in Figure 4-21. The HC68 epoxy grout with filler is
allowed to cure for 21 days. The internal pressure was applied at a rate of 0.05
MPa/s and hold for 10 minutes at both design pressure and hydrostatic pressure
respectively before increasing the pressure to a level where bursting of the
repaired pipe occurred.
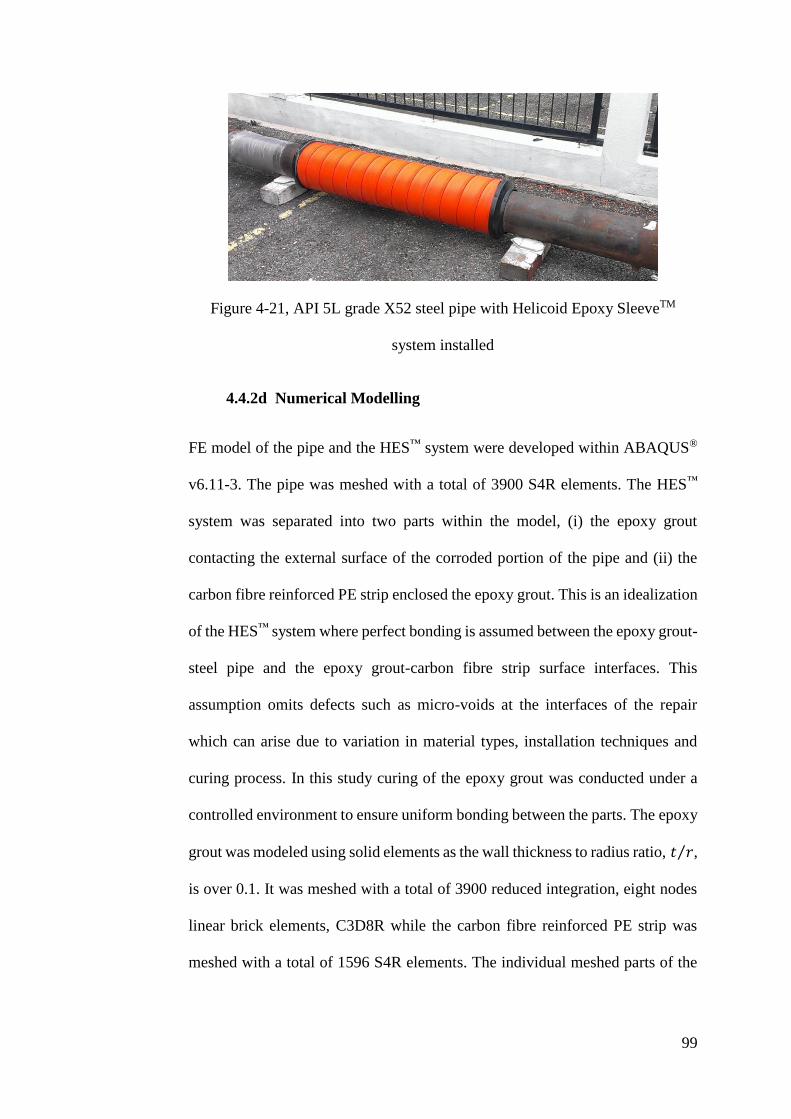
99
Figure 4-21, API 5L grade X52 steel pipe with Helicoid Epoxy SleeveTM
system installed
4.4.2d Numerical Modelling
FE model of the pipe and the HES™ system were developed within ABAQUS®
v6.11-3. The pipe was meshed with a total of 3900 S4R elements. The HES™
system was separated into two parts within the model, (i) the epoxy grout
contacting the external surface of the corroded portion of the pipe and (ii) the
carbon fibre reinforced PE strip enclosed the epoxy grout. This is an idealization
of the HES™ system where perfect bonding is assumed between the epoxy grout-
steel pipe and the epoxy grout-carbon fibre strip surface interfaces. This
assumption omits defects such as micro-voids at the interfaces of the repair
which can arise due to variation in material types, installation techniques and
curing process. In this study curing of the epoxy grout was conducted under a
controlled environment to ensure uniform bonding between the parts. The epoxy
grout was modeled using solid elements as the wall thickness to radius ratio, 𝑡 𝑟⁄ ,
is over 0.1. It was meshed with a total of 3900 reduced integration, eight nodes
linear brick elements, C3D8R while the carbon fibre reinforced PE strip was
meshed with a total of 1596 S4R elements. The individual meshed parts of the

100
pipe, epoxy grout and carbon fibre reinforced PE strip, along with the assembled
model are shown in Figure 4-22.
Figure 4-22, Meshed parts: (a) API 5L grade X52 pipe with corroded section,
(b) corroded pipe with HESTM, (c) carbon fibre-reinforced PE strip, and (d)
epoxy grout
The stress-strain relationship of the API 5L grade X52 steel pipe was defined
using Ramberg-Osgood material model, Eq. 4–24, as this model was found
capable of representing the relationship accurately.
1
n
y
E
4-24
where E = Young’s modulus, ɛ = strain, σ = stress, α = yield offset factor, n =
hardening exponent and 𝜎𝑦 = yield stress of the steel pipe. The model parameters,
shown in Table 4-5, were extracted from (Ruggieri & Fernando, 2011) where
crack growth in high pressure pipeline was numerically modelled.
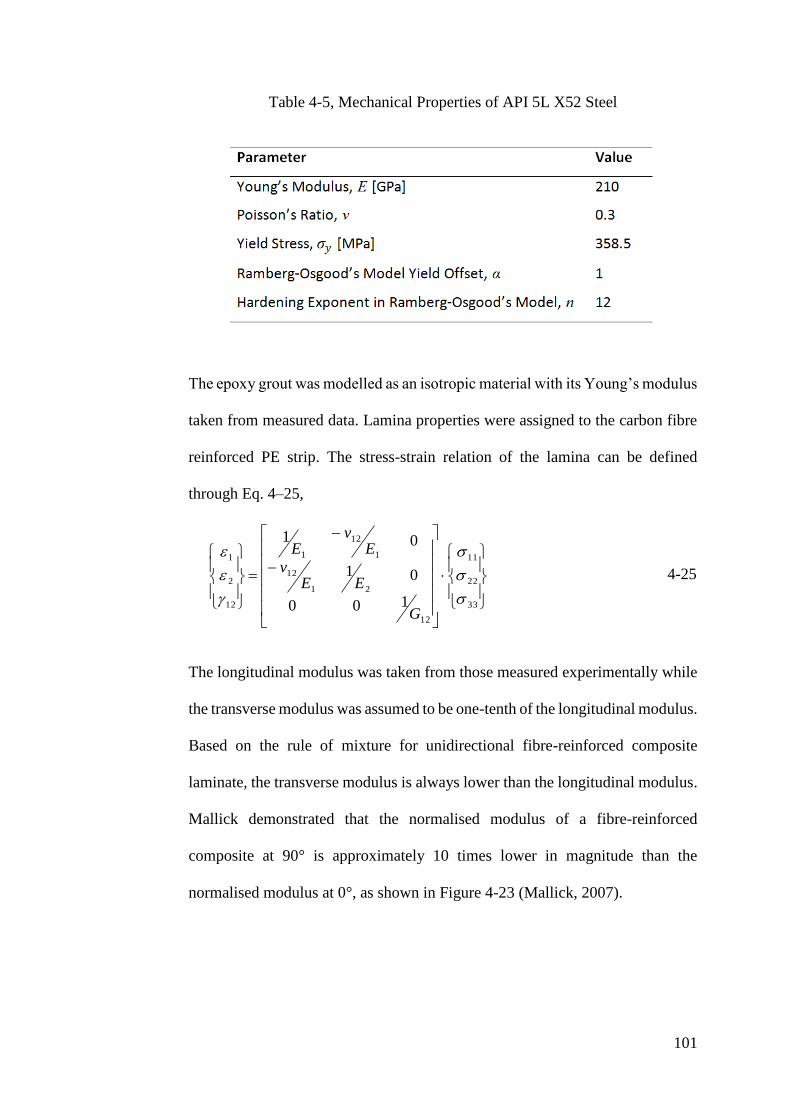
101
Table 4-5, Mechanical Properties of API 5L X52 Steel
The epoxy grout was modelled as an isotropic material with its Young’s modulus
taken from measured data. Lamina properties were assigned to the carbon fibre
reinforced PE strip. The stress-strain relation of the lamina can be defined
through Eq. 4–25,
33
22
11
12
21
12
1
12
1
12
2
1
100
01
01
G
EEv
Ev
E
4-25
The longitudinal modulus was taken from those measured experimentally while
the transverse modulus was assumed to be one-tenth of the longitudinal modulus.
Based on the rule of mixture for unidirectional fibre-reinforced composite
laminate, the transverse modulus is always lower than the longitudinal modulus.
Mallick demonstrated that the normalised modulus of a fibre-reinforced
composite at 90° is approximately 10 times lower in magnitude than the
normalised modulus at 0°, as shown in Figure 4-23 (Mallick, 2007).
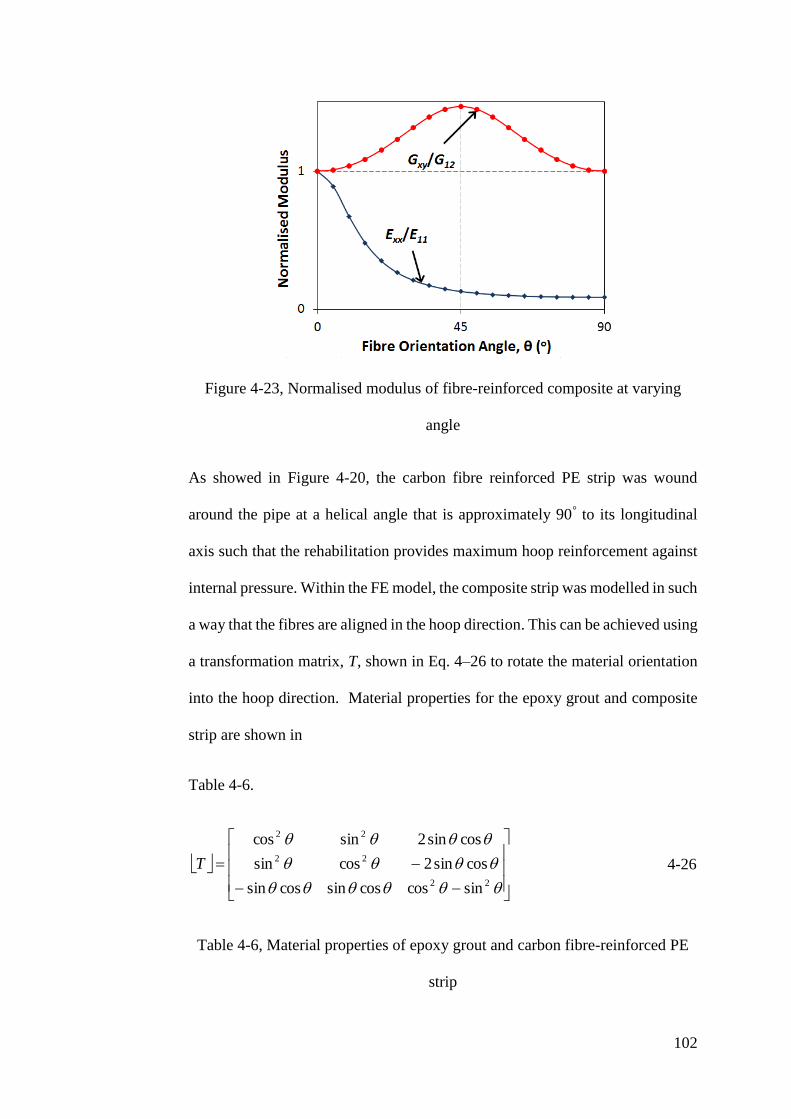
102
Figure 4-23, Normalised modulus of fibre-reinforced composite at varying
angle
As showed in Figure 4-20, the carbon fibre reinforced PE strip was wound
around the pipe at a helical angle that is approximately 90° to its longitudinal
axis such that the rehabilitation provides maximum hoop reinforcement against
internal pressure. Within the FE model, the composite strip was modelled in such
a way that the fibres are aligned in the hoop direction. This can be achieved using
a transformation matrix, T, shown in Eq. 4–26 to rotate the material orientation
into the hoop direction. Material properties for the epoxy grout and composite
strip are shown in
Table 4-6.
22
22
22
sincoscossincossin
cossin2cossin
cossin2sincos
T 4-26
Table 4-6, Material properties of epoxy grout and carbon fibre-reinforced PE
strip

103
4.4.2e Results and discussion
Numerical Analysis
The main output of the FEA required for the computation of burst pressure and
design pressure through Double Elastic Slope method is the hoop strain. Figure
4-24 depicts the hoop strain of the corroded X52 steel pipe. The computations
of the plastic analysis collapse load, PACL (burst pressure) and design pressure
for all three cases, (1) Uncorroded pipe; (2) Corroded pipe and (3) Corroded pipe
repaired with HES™ system are shown in Figure 4-25, Figure 4-26 and Figure
4-27 respectively. The computed design pressure for an uncorroded bare pipe is
25.2 MPa. At this design pressure, the maximum allowable hoop strain, εh,max is
0.211%, as shown by the vertical dotted line in Figure 4-25. From Figure 4-26,
it is apparent that the corroded riser can no longer function under normal
operating conditions as the design pressure is only 12.6 MPa which is half of an
uncorroded pipe. At 25.2 MPa, the hoop strain on the corroded pipe has exceeded
the maximum allowable hoop strain.
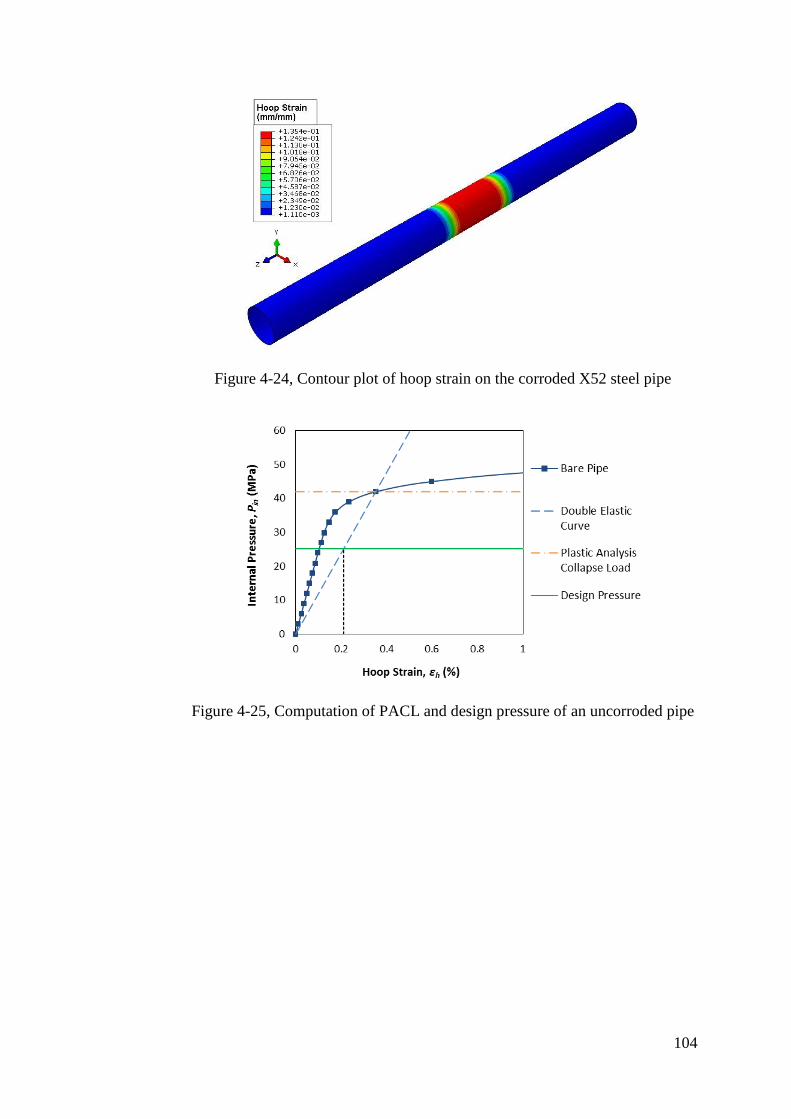
104
Figure 4-24, Contour plot of hoop strain on the corroded X52 steel pipe
Figure 4-25, Computation of PACL and design pressure of an uncorroded pipe
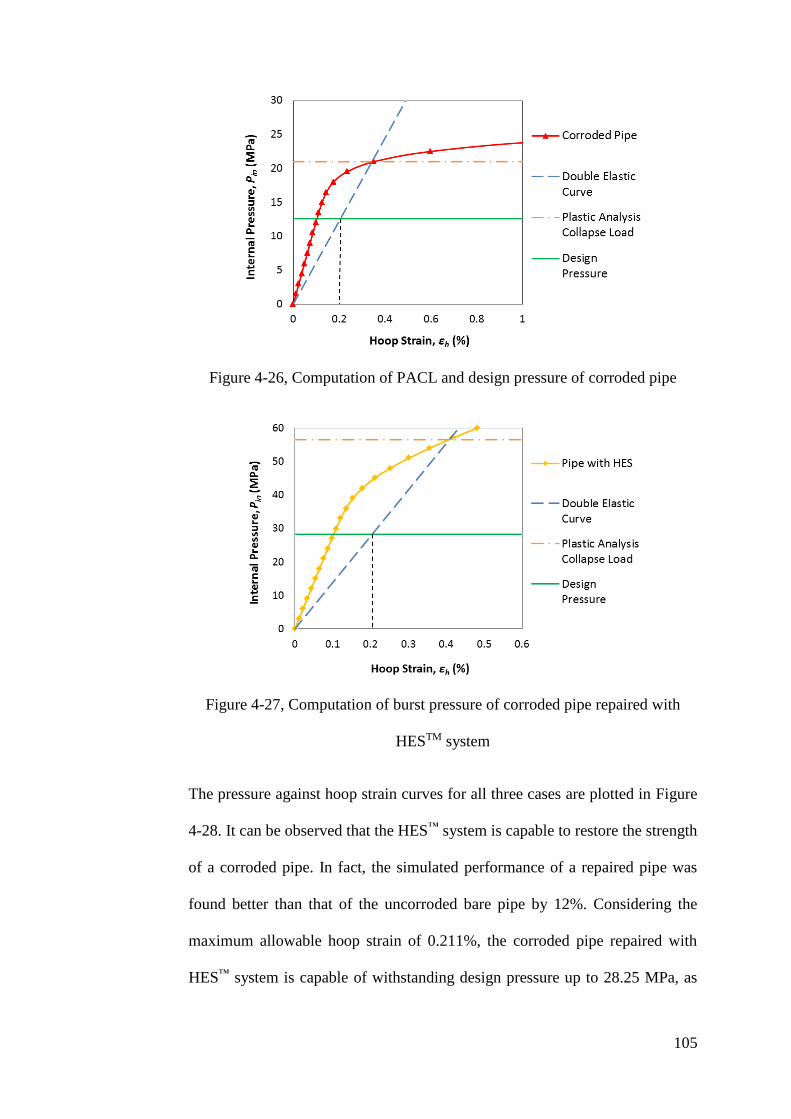
105
Figure 4-26, Computation of PACL and design pressure of corroded pipe
Figure 4-27, Computation of burst pressure of corroded pipe repaired with
HESTM system
The pressure against hoop strain curves for all three cases are plotted in Figure
4-28. It can be observed that the HES™ system is capable to restore the strength
of a corroded pipe. In fact, the simulated performance of a repaired pipe was
found better than that of the uncorroded bare pipe by 12%. Considering the
maximum allowable hoop strain of 0.211%, the corroded pipe repaired with
HES™ system is capable of withstanding design pressure up to 28.25 MPa, as
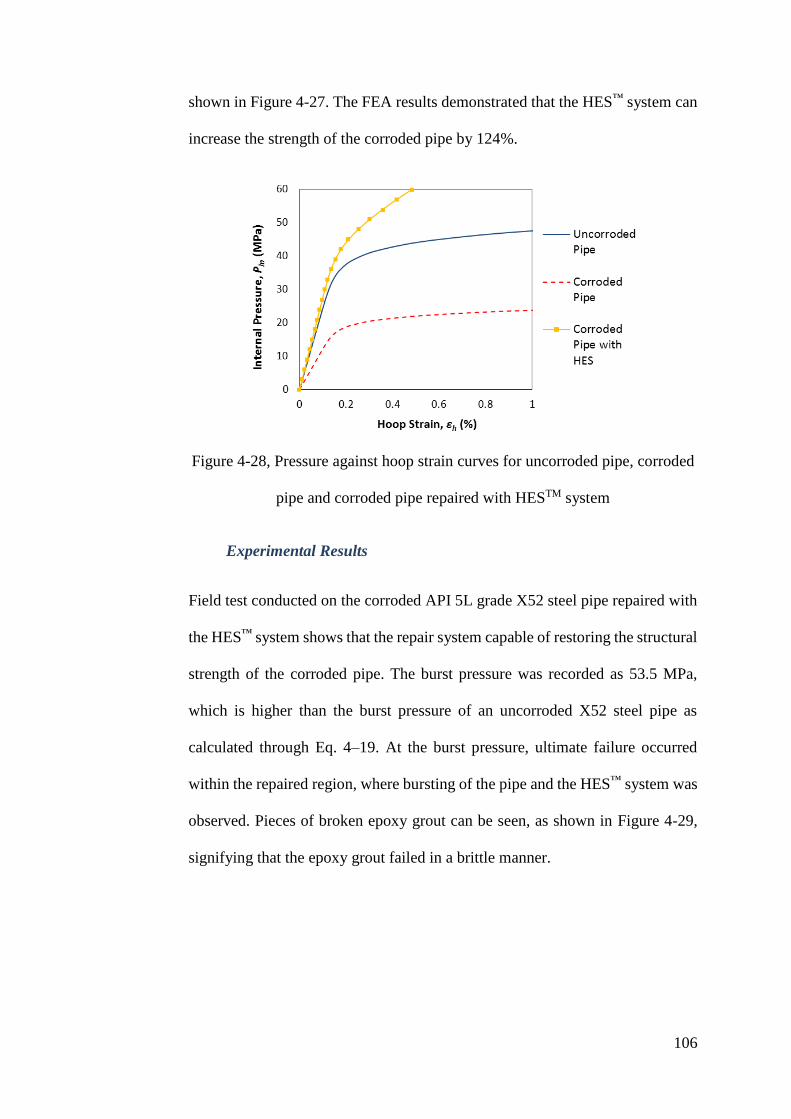
106
shown in Figure 4-27. The FEA results demonstrated that the HES™ system can
increase the strength of the corroded pipe by 124%.
Figure 4-28, Pressure against hoop strain curves for uncorroded pipe, corroded
pipe and corroded pipe repaired with HESTM system
Experimental Results
Field test conducted on the corroded API 5L grade X52 steel pipe repaired with
the HES™ system shows that the repair system capable of restoring the structural
strength of the corroded pipe. The burst pressure was recorded as 53.5 MPa,
which is higher than the burst pressure of an uncorroded X52 steel pipe as
calculated through Eq. 4–19. At the burst pressure, ultimate failure occurred
within the repaired region, where bursting of the pipe and the HES™ system was
observed. Pieces of broken epoxy grout can be seen, as shown in Figure 4-29,
signifying that the epoxy grout failed in a brittle manner.
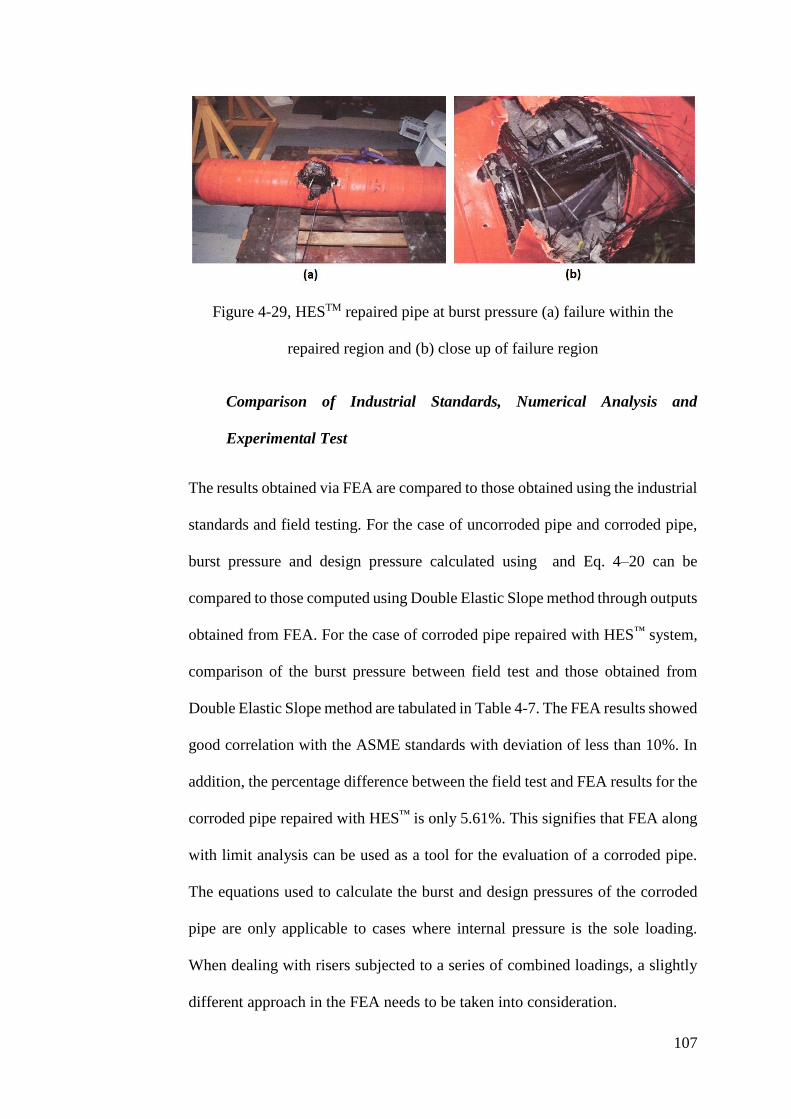
107
Figure 4-29, HESTM repaired pipe at burst pressure (a) failure within the
repaired region and (b) close up of failure region
Comparison of Industrial Standards, Numerical Analysis and
Experimental Test
The results obtained via FEA are compared to those obtained using the industrial
standards and field testing. For the case of uncorroded pipe and corroded pipe,
burst pressure and design pressure calculated using and Eq. 4–20 can be
compared to those computed using Double Elastic Slope method through outputs
obtained from FEA. For the case of corroded pipe repaired with HES™ system,
comparison of the burst pressure between field test and those obtained from
Double Elastic Slope method are tabulated in Table 4-7. The FEA results showed
good correlation with the ASME standards with deviation of less than 10%. In
addition, the percentage difference between the field test and FEA results for the
corroded pipe repaired with HES™ is only 5.61%. This signifies that FEA along
with limit analysis can be used as a tool for the evaluation of a corroded pipe.
The equations used to calculate the burst and design pressures of the corroded
pipe are only applicable to cases where internal pressure is the sole loading.
When dealing with risers subjected to a series of combined loadings, a slightly
different approach in the FEA needs to be taken into consideration.
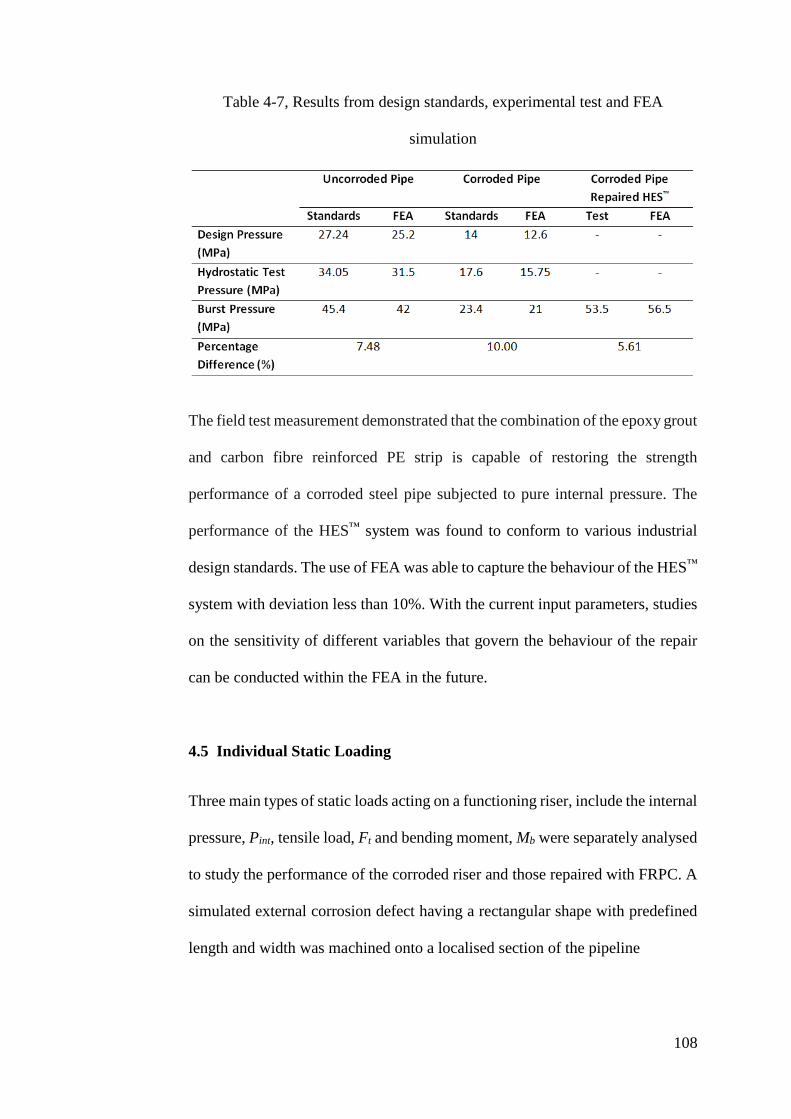
108
Table 4-7, Results from design standards, experimental test and FEA
simulation
The field test measurement demonstrated that the combination of the epoxy grout
and carbon fibre reinforced PE strip is capable of restoring the strength
performance of a corroded steel pipe subjected to pure internal pressure. The
performance of the HES™ system was found to conform to various industrial
design standards. The use of FEA was able to capture the behaviour of the HES™
system with deviation less than 10%. With the current input parameters, studies
on the sensitivity of different variables that govern the behaviour of the repair
can be conducted within the FEA in the future.
4.5 Individual Static Loading
Three main types of static loads acting on a functioning riser, include the internal
pressure, Pint, tensile load, Ft and bending moment, Mb were separately analysed
to study the performance of the corroded riser and those repaired with FRPC. A
simulated external corrosion defect having a rectangular shape with predefined
length and width was machined onto a localised section of the pipeline
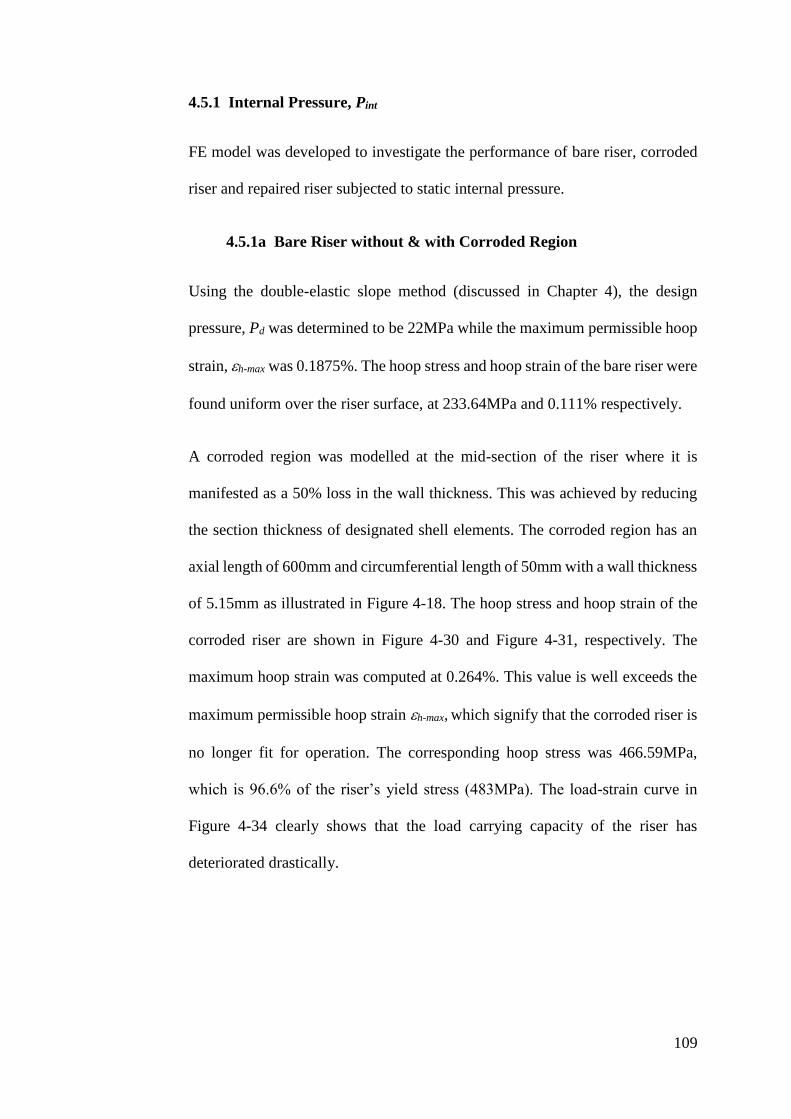
109
4.5.1 Internal Pressure, Pint
FE model was developed to investigate the performance of bare riser, corroded
riser and repaired riser subjected to static internal pressure.
4.5.1a Bare Riser without & with Corroded Region
Using the double-elastic slope method (discussed in Chapter 4), the design
pressure, Pd was determined to be 22MPa while the maximum permissible hoop
strain, h-max was 0.1875%. The hoop stress and hoop strain of the bare riser were
found uniform over the riser surface, at 233.64MPa and 0.111% respectively.
A corroded region was modelled at the mid-section of the riser where it is
manifested as a 50% loss in the wall thickness. This was achieved by reducing
the section thickness of designated shell elements. The corroded region has an
axial length of 600mm and circumferential length of 50mm with a wall thickness
of 5.15mm as illustrated in Figure 4-18. The hoop stress and hoop strain of the
corroded riser are shown in Figure 4-30 and Figure 4-31, respectively. The
maximum hoop strain was computed at 0.264%. This value is well exceeds the
maximum permissible hoop strain h-max, which signify that the corroded riser is
no longer fit for operation. The corresponding hoop stress was 466.59MPa,
which is 96.6% of the riser’s yield stress (483MPa). The load-strain curve in
Figure 4-34 clearly shows that the load carrying capacity of the riser has
deteriorated drastically.

110
Figure 4-30, σh contour plot of corroded riser at 22MPa
Figure 4-31, ɛh contour plot of corroded riser at 22MPa
4.5.1b Corroded Riser Repaired with Composite Laminate
The repair sleeve was modelled over a designated length of the riser. The
material properties of the laminate were defined using lamina properties, where
transversely isotropic material properties are assumed. The repair laminate was
modelled in such a manner that the fibres are aligned in the hoop direction of the
riser. This type of orientated repair is similar to most of the commercially
available products where unidirectional laminate is wrapped around the riser
with the fibres aligned perpendicular to the axis of the pipe. The hoop stress and
hoop strain of the corroded riser beneath the repair are shown in Figure 4-32 and
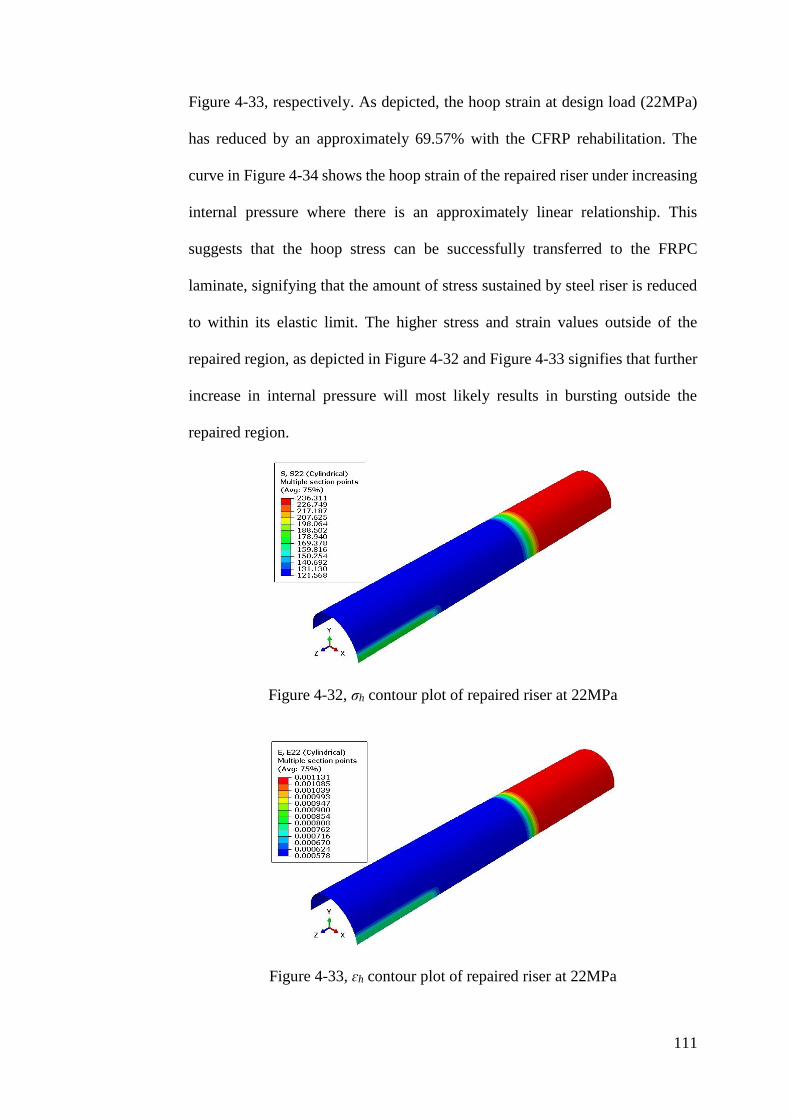
111
Figure 4-33, respectively. As depicted, the hoop strain at design load (22MPa)
has reduced by an approximately 69.57% with the CFRP rehabilitation. The
curve in Figure 4-34 shows the hoop strain of the repaired riser under increasing
internal pressure where there is an approximately linear relationship. This
suggests that the hoop stress can be successfully transferred to the FRPC
laminate, signifying that the amount of stress sustained by steel riser is reduced
to within its elastic limit. The higher stress and strain values outside of the
repaired region, as depicted in Figure 4-32 and Figure 4-33 signifies that further
increase in internal pressure will most likely results in bursting outside the
repaired region.
Figure 4-32, σh contour plot of repaired riser at 22MPa
Figure 4-33, ɛh contour plot of repaired riser at 22MPa
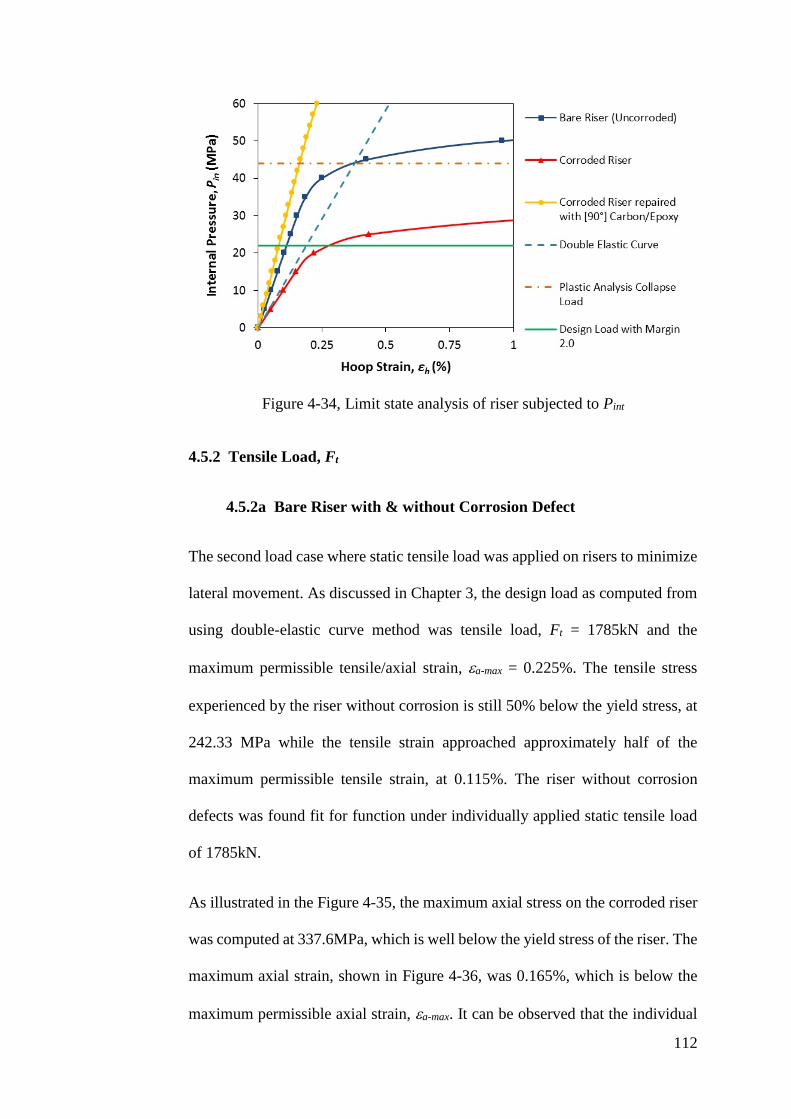
112
Figure 4-34, Limit state analysis of riser subjected to Pint
4.5.2 Tensile Load, Ft
4.5.2a Bare Riser with & without Corrosion Defect
The second load case where static tensile load was applied on risers to minimize
lateral movement. As discussed in Chapter 3, the design load as computed from
using double-elastic curve method was tensile load, Ft = 1785kN and the
maximum permissible tensile/axial strain, a-max = 0.225%. The tensile stress
experienced by the riser without corrosion is still 50% below the yield stress, at
242.33 MPa while the tensile strain approached approximately half of the
maximum permissible tensile strain, at 0.115%. The riser without corrosion
defects was found fit for function under individually applied static tensile load
of 1785kN.
As illustrated in the Figure 4-35, the maximum axial stress on the corroded riser
was computed at 337.6MPa, which is well below the yield stress of the riser. The
maximum axial strain, shown in Figure 4-36, was 0.165%, which is below the
maximum permissible axial strain, a-max. It can be observed that the individual

113
effect of tensile load on a corroded riser is not as detrimental as the impact of
internal pressure alone. However, stress concentration exists at the edge of the
corrosion where there is a sudden change in the thickness of the riser. This high
stress concentration region can be site of a fatigue damage initiation. Hence,
attention is needed to mitigate this condition to prevent further deterioration of
the riser.
Figure 4-35, σa contour plot of corroded riser at 1785kN
Figure 4-36, ɛa contour plot of corroded riser at 1785kN
4.5.2a Corroded Riser Repaired with Composite Laminate
Figure 4-37 and Figure 4-38 show the axial strain of the corroded region beneath
the composite laminate. The stress at the edge of the corrosion defect was found
reduced by 9.18%, which is a relatively small amount compared to the case of

114
pure internal pressure where a reduction of 43.57% was obtained. Figure 4-39
shows the load-strain curve of the repaired riser subjected to tensile load.
Although still within the limits of the maximum permissible axial strain, ɛa,max,
the results suggested that reinforcement solely in the hoop direction of the riser
is not ideal.
Figure 4-37, σa contour plot of repaired riser at 1785kN
Figure 4-38, ɛa contour plot of repaired riser at 1785kN
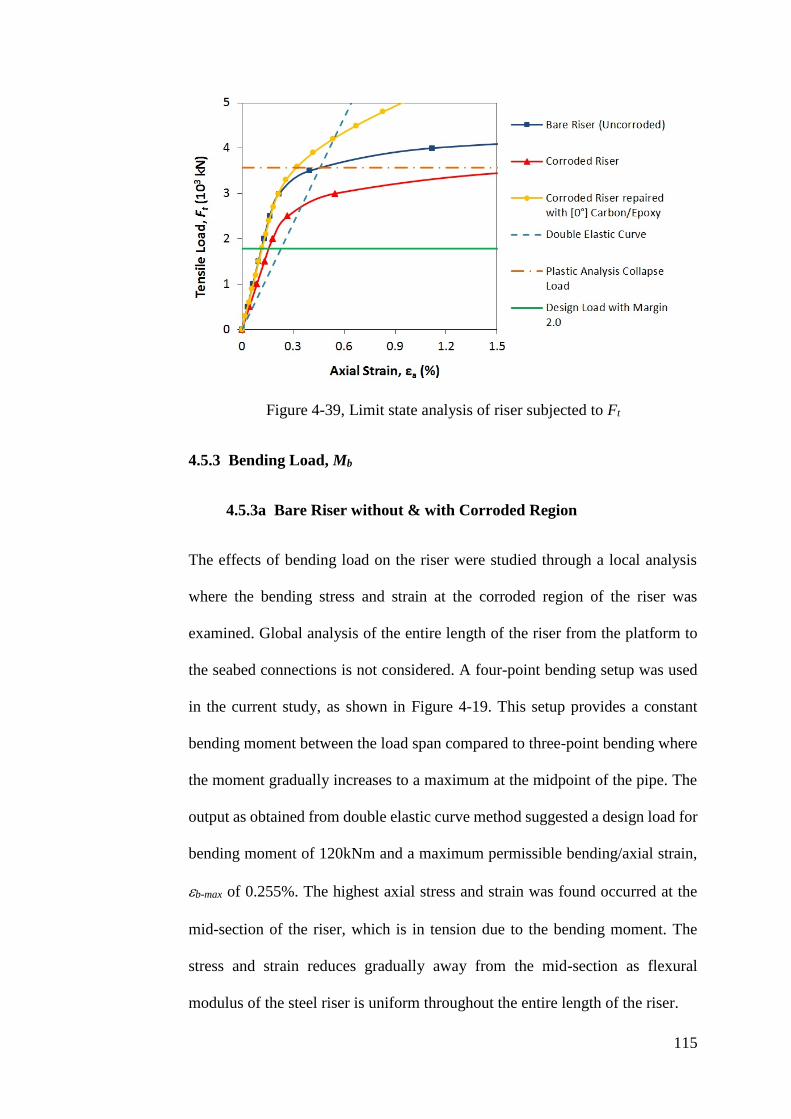
115
Figure 4-39, Limit state analysis of riser subjected to Ft
4.5.3 Bending Load, Mb
4.5.3a Bare Riser without & with Corroded Region
The effects of bending load on the riser were studied through a local analysis
where the bending stress and strain at the corroded region of the riser was
examined. Global analysis of the entire length of the riser from the platform to
the seabed connections is not considered. A four-point bending setup was used
in the current study, as shown in Figure 4-19. This setup provides a constant
bending moment between the load span compared to three-point bending where
the moment gradually increases to a maximum at the midpoint of the pipe. The
output as obtained from double elastic curve method suggested a design load for
bending moment of 120kNm and a maximum permissible bending/axial strain,
b-max of 0.255%. The highest axial stress and strain was found occurred at the
mid-section of the riser, which is in tension due to the bending moment. The
stress and strain reduces gradually away from the mid-section as flexural
modulus of the steel riser is uniform throughout the entire length of the riser.
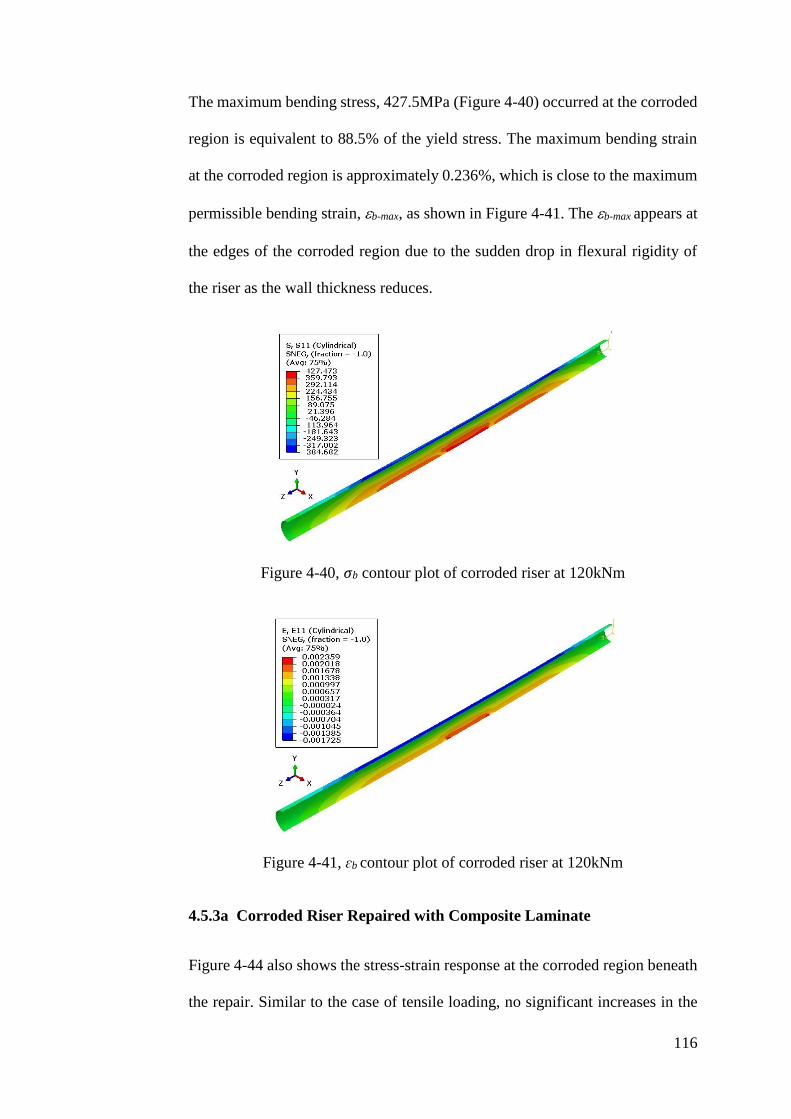
116
The maximum bending stress, 427.5MPa (Figure 4-40) occurred at the corroded
region is equivalent to 88.5% of the yield stress. The maximum bending strain
at the corroded region is approximately 0.236%, which is close to the maximum
permissible bending strain, b-max, as shown in Figure 4-41. The b-max appears at
the edges of the corroded region due to the sudden drop in flexural rigidity of
the riser as the wall thickness reduces.
Figure 4-40, σb contour plot of corroded riser at 120kNm
Figure 4-41, ɛb contour plot of corroded riser at 120kNm
4.5.3a Corroded Riser Repaired with Composite Laminate
Figure 4-44 also shows the stress-strain response at the corroded region beneath
the repair. Similar to the case of tensile loading, no significant increases in the
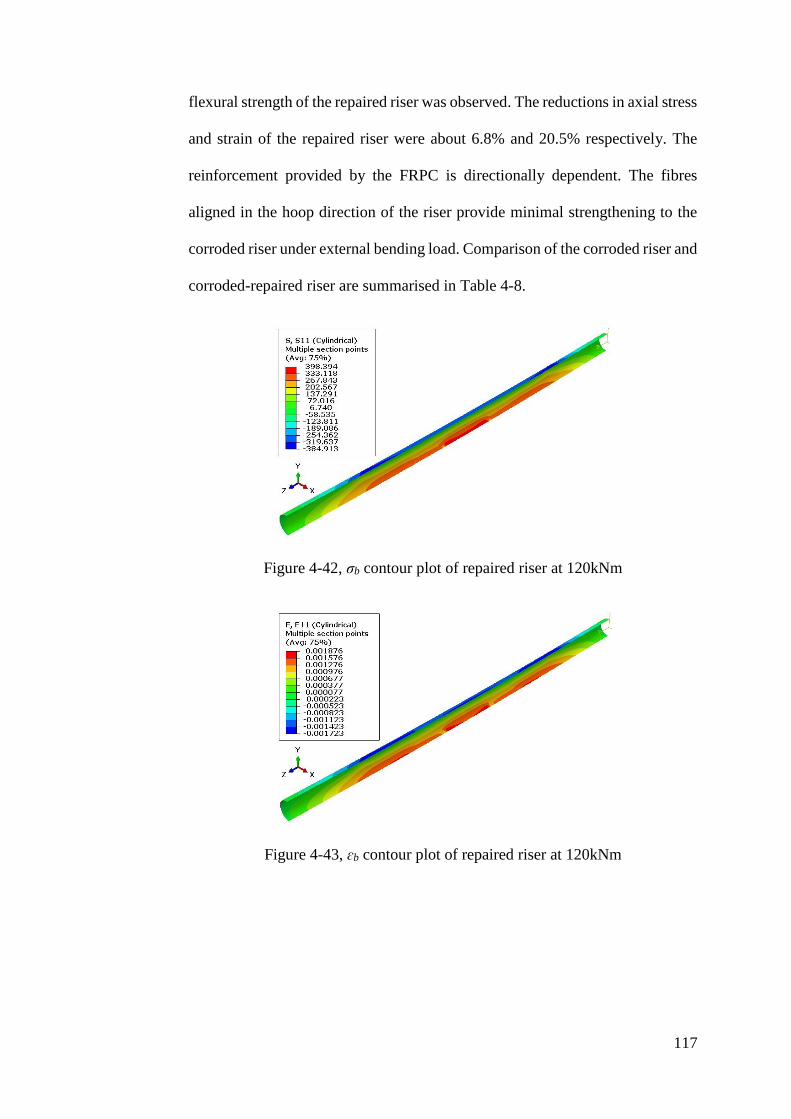
117
flexural strength of the repaired riser was observed. The reductions in axial stress
and strain of the repaired riser were about 6.8% and 20.5% respectively. The
reinforcement provided by the FRPC is directionally dependent. The fibres
aligned in the hoop direction of the riser provide minimal strengthening to the
corroded riser under external bending load. Comparison of the corroded riser and
corroded-repaired riser are summarised in Table 4-8.
Figure 4-42, σb contour plot of repaired riser at 120kNm
Figure 4-43, ɛb contour plot of repaired riser at 120kNm
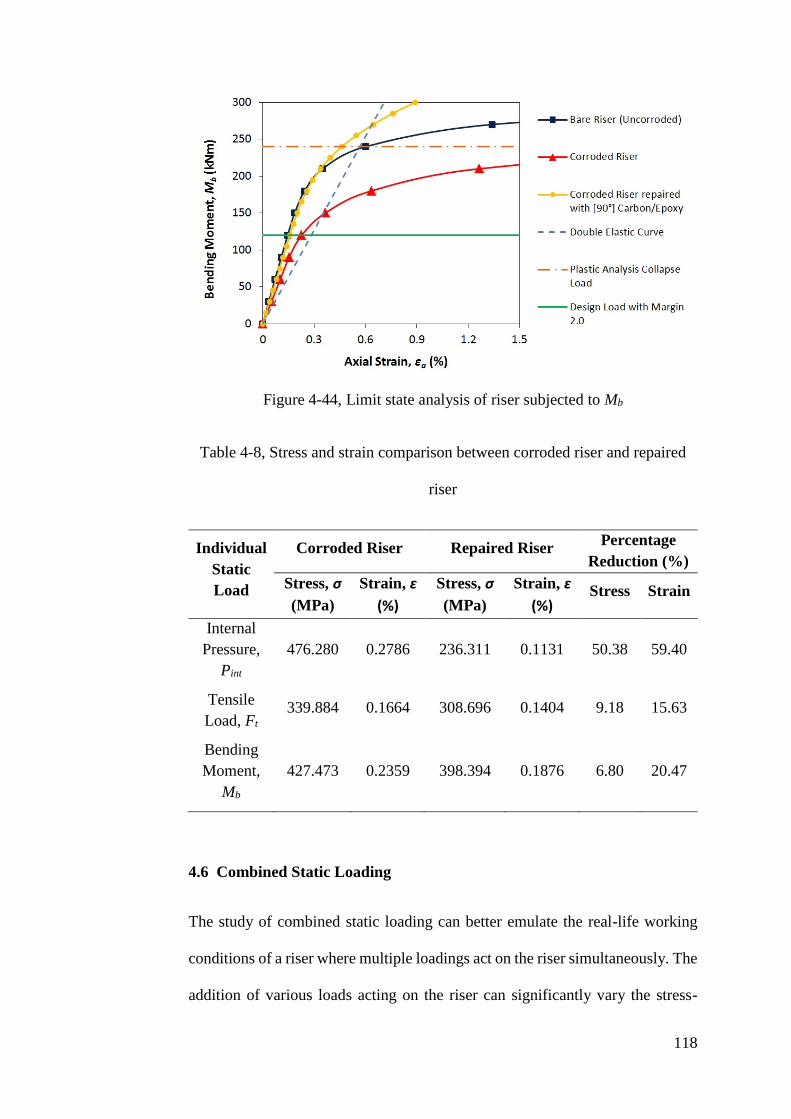
118
Figure 4-44, Limit state analysis of riser subjected to Mb
Table 4-8, Stress and strain comparison between corroded riser and repaired
riser
Individual
Static
Load
Corroded Riser Repaired Riser Percentage
Reduction (%)
Stress, σ
(MPa)
Strain, ɛ
(%)
Stress, σ
(MPa)
Strain, ɛ
(%) Stress Strain
Internal
Pressure,
Pint
476.280
0.2786
236.311
0.1131
50.38
59.40
Tensile
Load, Ft
339.884 0.1664 308.696 0.1404 9.18 15.63
Bending
Moment,
Mb
427.473
0.2359
398.394
0.1876
6.80
20.47
4.6 Combined Static Loading
The study of combined static loading can better emulate the real-life working
conditions of a riser where multiple loadings act on the riser simultaneously. The
addition of various loads acting on the riser can significantly vary the stress-
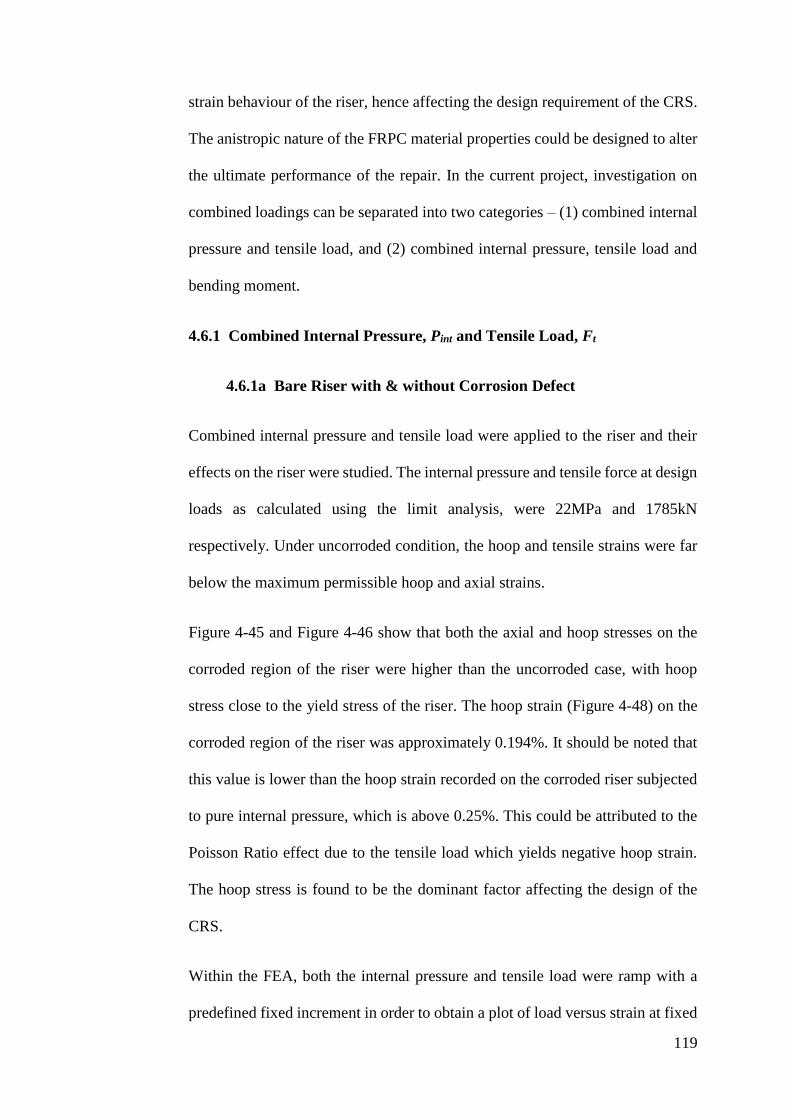
119
strain behaviour of the riser, hence affecting the design requirement of the CRS.
The anistropic nature of the FRPC material properties could be designed to alter
the ultimate performance of the repair. In the current project, investigation on
combined loadings can be separated into two categories – (1) combined internal
pressure and tensile load, and (2) combined internal pressure, tensile load and
bending moment.
4.6.1 Combined Internal Pressure, Pint and Tensile Load, Ft
4.6.1a Bare Riser with & without Corrosion Defect
Combined internal pressure and tensile load were applied to the riser and their
effects on the riser were studied. The internal pressure and tensile force at design
loads as calculated using the limit analysis, were 22MPa and 1785kN
respectively. Under uncorroded condition, the hoop and tensile strains were far
below the maximum permissible hoop and axial strains.
Figure 4-45 and Figure 4-46 show that both the axial and hoop stresses on the
corroded region of the riser were higher than the uncorroded case, with hoop
stress close to the yield stress of the riser. The hoop strain (Figure 4-48) on the
corroded region of the riser was approximately 0.194%. It should be noted that
this value is lower than the hoop strain recorded on the corroded riser subjected
to pure internal pressure, which is above 0.25%. This could be attributed to the
Poisson Ratio effect due to the tensile load which yields negative hoop strain.
The hoop stress is found to be the dominant factor affecting the design of the
CRS.
Within the FEA, both the internal pressure and tensile load were ramp with a
predefined fixed increment in order to obtain a plot of load versus strain at fixed
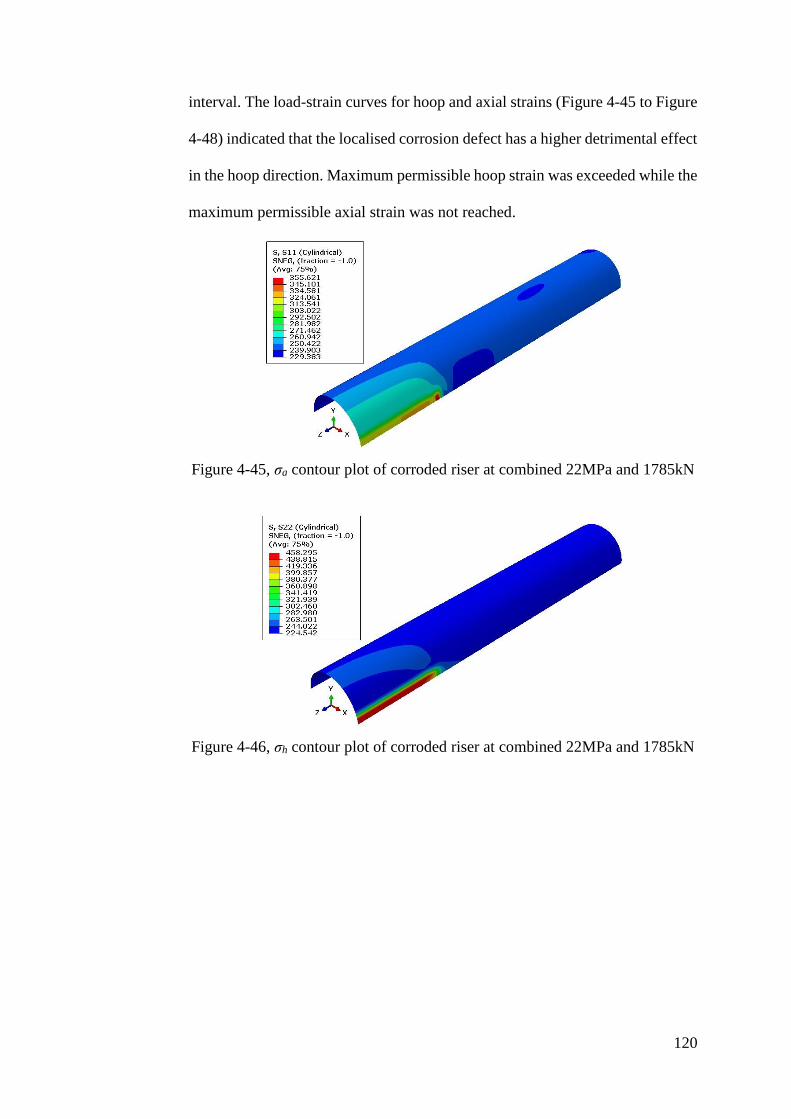
120
interval. The load-strain curves for hoop and axial strains (Figure 4-45 to Figure
4-48) indicated that the localised corrosion defect has a higher detrimental effect
in the hoop direction. Maximum permissible hoop strain was exceeded while the
maximum permissible axial strain was not reached.
Figure 4-45, σa contour plot of corroded riser at combined 22MPa and 1785kN
Figure 4-46, σh contour plot of corroded riser at combined 22MPa and 1785kN
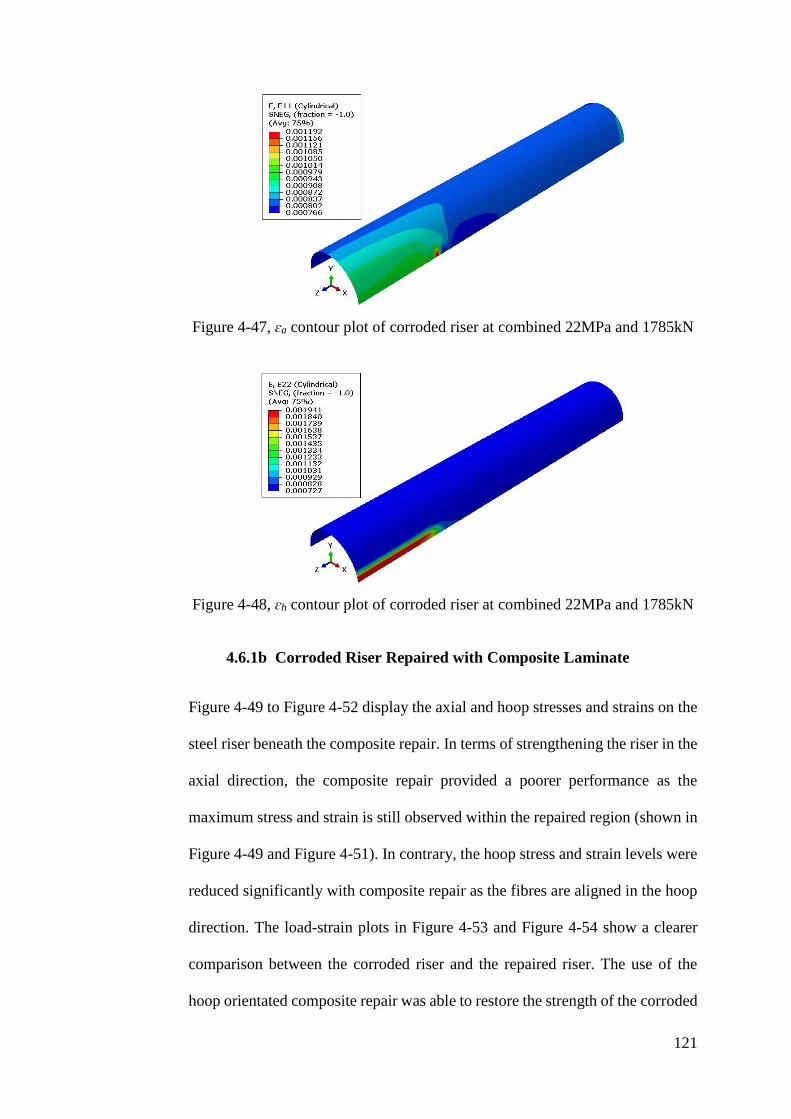
121
Figure 4-47, ɛa contour plot of corroded riser at combined 22MPa and 1785kN
Figure 4-48, ɛh contour plot of corroded riser at combined 22MPa and 1785kN
4.6.1b Corroded Riser Repaired with Composite Laminate
Figure 4-49 to Figure 4-52 display the axial and hoop stresses and strains on the
steel riser beneath the composite repair. In terms of strengthening the riser in the
axial direction, the composite repair provided a poorer performance as the
maximum stress and strain is still observed within the repaired region (shown in
Figure 4-49 and Figure 4-51). In contrary, the hoop stress and strain levels were
reduced significantly with composite repair as the fibres are aligned in the hoop
direction. The load-strain plots in Figure 4-53 and Figure 4-54 show a clearer
comparison between the corroded riser and the repaired riser. The use of the
hoop orientated composite repair was able to restore the strength of the corroded
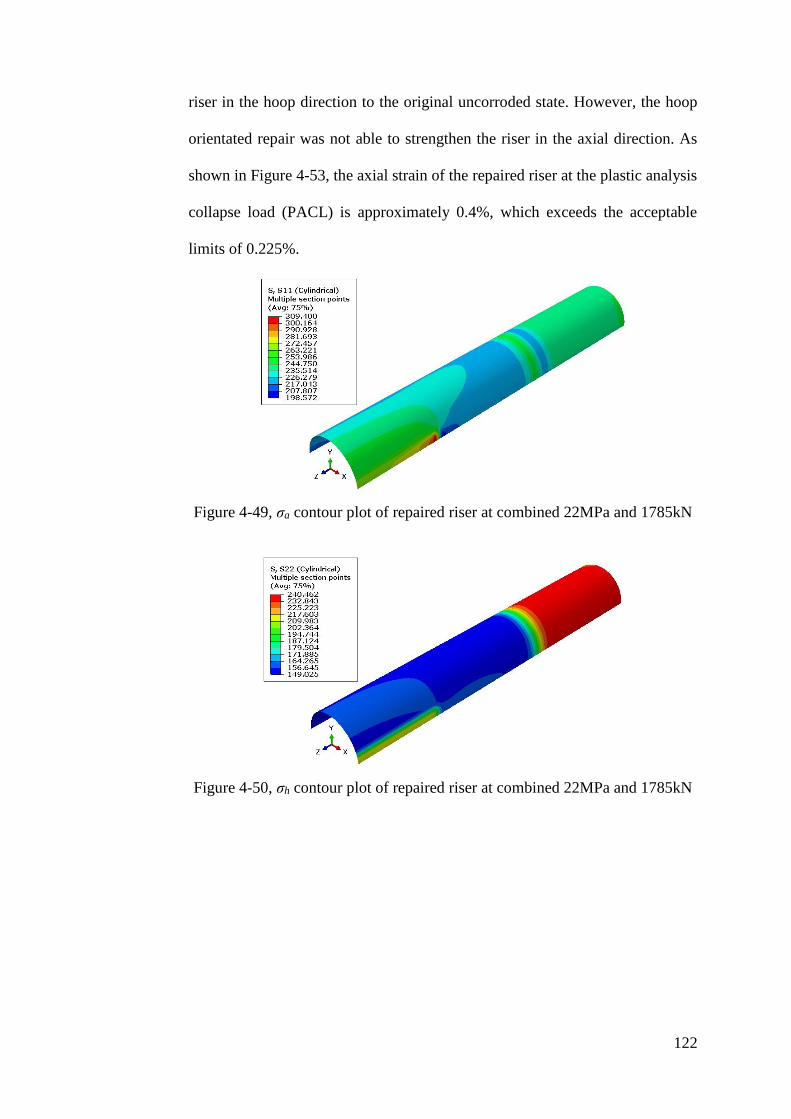
122
riser in the hoop direction to the original uncorroded state. However, the hoop
orientated repair was not able to strengthen the riser in the axial direction. As
shown in Figure 4-53, the axial strain of the repaired riser at the plastic analysis
collapse load (PACL) is approximately 0.4%, which exceeds the acceptable
limits of 0.225%.
Figure 4-49, σa contour plot of repaired riser at combined 22MPa and 1785kN
Figure 4-50, σh contour plot of repaired riser at combined 22MPa and 1785kN
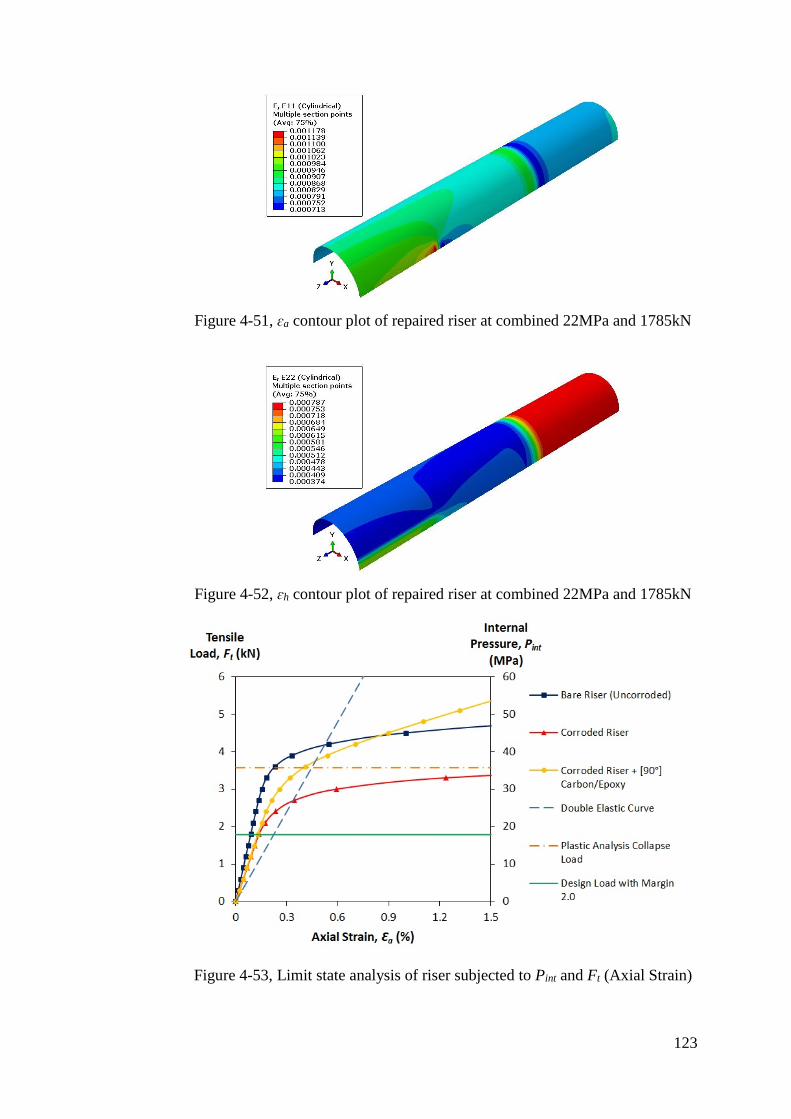
123
Figure 4-51, ɛa contour plot of repaired riser at combined 22MPa and 1785kN
Figure 4-52, ɛh contour plot of repaired riser at combined 22MPa and 1785kN
Figure 4-53, Limit state analysis of riser subjected to Pint and Ft (Axial Strain)
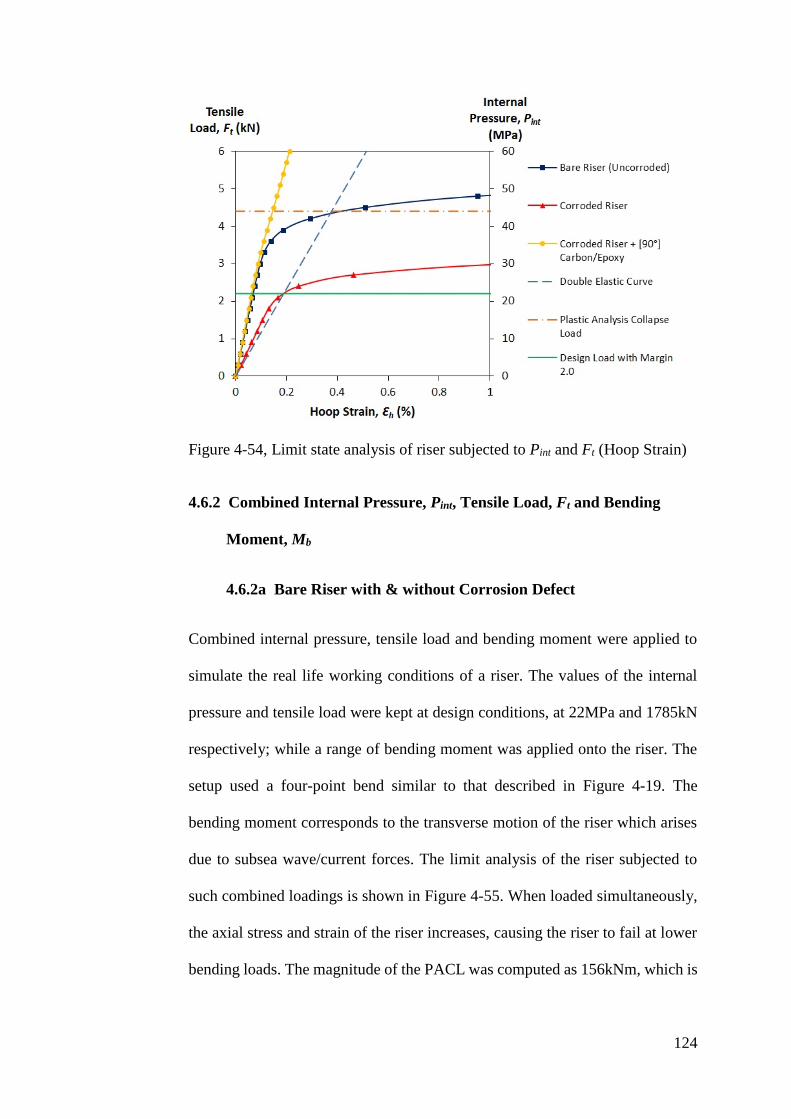
124
Figure 4-54, Limit state analysis of riser subjected to Pint and Ft (Hoop Strain)
4.6.2 Combined Internal Pressure, Pint, Tensile Load, Ft and Bending
Moment, Mb
4.6.2a Bare Riser with & without Corrosion Defect
Combined internal pressure, tensile load and bending moment were applied to
simulate the real life working conditions of a riser. The values of the internal
pressure and tensile load were kept at design conditions, at 22MPa and 1785kN
respectively; while a range of bending moment was applied onto the riser. The
setup used a four-point bend similar to that described in Figure 4-19. The
bending moment corresponds to the transverse motion of the riser which arises
due to subsea wave/current forces. The limit analysis of the riser subjected to
such combined loadings is shown in Figure 4-55. When loaded simultaneously,
the axial stress and strain of the riser increases, causing the riser to fail at lower
bending loads. The magnitude of the PACL was computed as 156kNm, which is
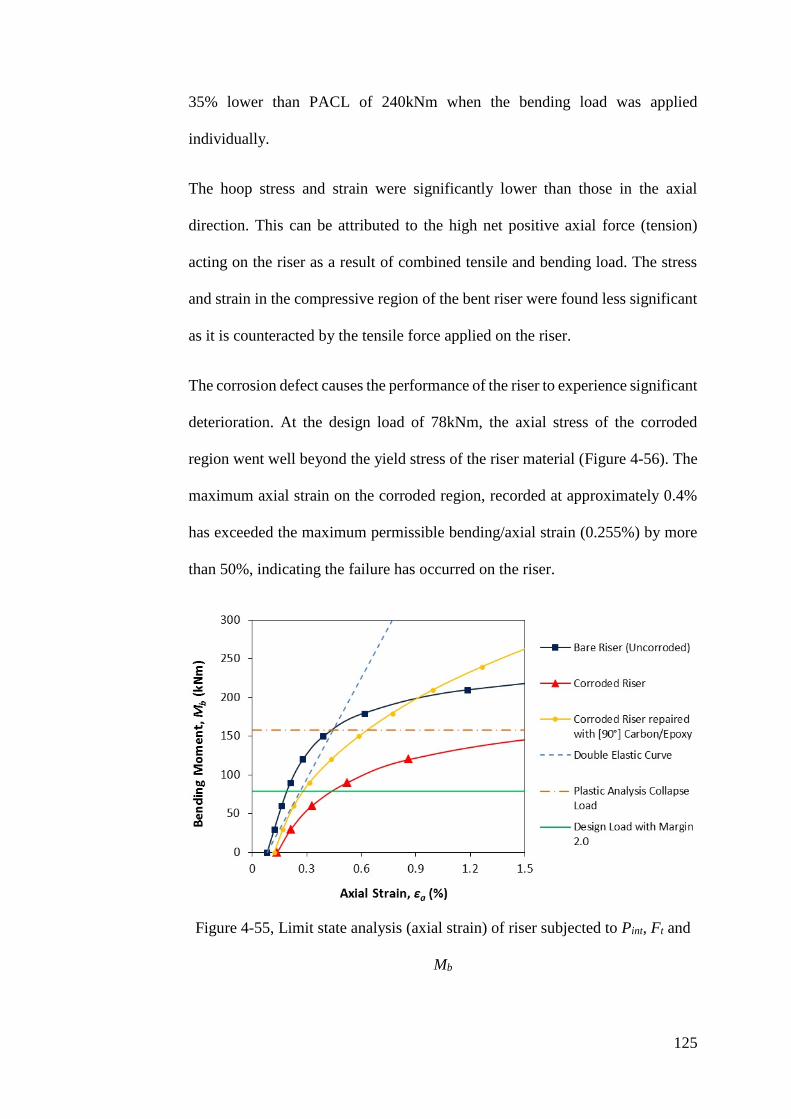
125
35% lower than PACL of 240kNm when the bending load was applied
individually.
The hoop stress and strain were significantly lower than those in the axial
direction. This can be attributed to the high net positive axial force (tension)
acting on the riser as a result of combined tensile and bending load. The stress
and strain in the compressive region of the bent riser were found less significant
as it is counteracted by the tensile force applied on the riser.
The corrosion defect causes the performance of the riser to experience significant
deterioration. At the design load of 78kNm, the axial stress of the corroded
region went well beyond the yield stress of the riser material (Figure 4-56). The
maximum axial strain on the corroded region, recorded at approximately 0.4%
has exceeded the maximum permissible bending/axial strain (0.255%) by more
than 50%, indicating the failure has occurred on the riser.
Figure 4-55, Limit state analysis (axial strain) of riser subjected to Pint, Ft and
Mb

126
The corrosion defect also causes high hoop strain of 0.283% in the corroded
region, which exceeds the maximum permissible hoop strain (0.1875%) by 50%.
Figure 4-60 shows the limit state analysis of the hoop strain within the corroded
region. Without any corrosion defect, the increase in bending load yields
negative hoop strains on the corroded region. The sum of the axial tensile forces
as a result of the combined effects of tension and bending moment was greater
compared to the hoop load imposed by the internal pressure. However, the
corrosion defect causes a drastic increase in hoop stress. The thinning of pipe
wall on the corroded region cause by the axial forces facilitates the increase in
hoop stress.
Figure 4-56, σa contour plot of corroded riser at combined 22MPa, 1785kN and
78kNm

127
Figure 4-57, σh contour plot of corroded riser at combined 22MPa, 1785kN and
78kNm
Figure 4-58, ɛa contour plot of corroded riser at combined 22MPa, 1785kN and
78kNm
Figure 4-59, ɛh contour plot of corroded riser at combined 22MPa, 1785kN and
78kNm
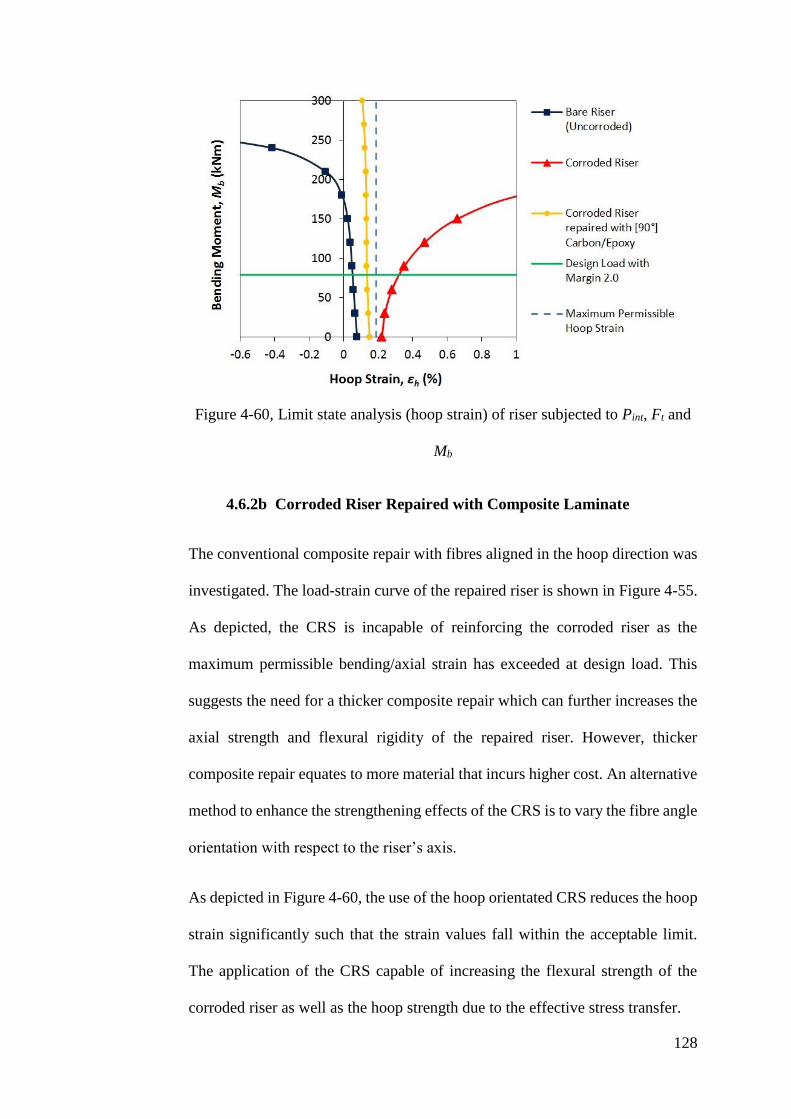
128
Figure 4-60, Limit state analysis (hoop strain) of riser subjected to Pint, Ft and
Mb
4.6.2b Corroded Riser Repaired with Composite Laminate
The conventional composite repair with fibres aligned in the hoop direction was
investigated. The load-strain curve of the repaired riser is shown in Figure 4-55.
As depicted, the CRS is incapable of reinforcing the corroded riser as the
maximum permissible bending/axial strain has exceeded at design load. This
suggests the need for a thicker composite repair which can further increases the
axial strength and flexural rigidity of the repaired riser. However, thicker
composite repair equates to more material that incurs higher cost. An alternative
method to enhance the strengthening effects of the CRS is to vary the fibre angle
orientation with respect to the riser’s axis.
As depicted in Figure 4-60, the use of the hoop orientated CRS reduces the hoop
strain significantly such that the strain values fall within the acceptable limit.
The application of the CRS capable of increasing the flexural strength of the
corroded riser as well as the hoop strength due to the effective stress transfer.
129
4.7 Response of FRPC Repair Laminate
As discussed in section 4.3.2b , the MCT failure criterion was used to
characterise the behaviour of FRPC repair laminate. There are three main state
dependent variables (SDVs) that describe the response of the FRPC. The output
variable SDV1 has values 1, 2 and 3, where 1 = no damage, 2 = matrix failure
and 3 = fibre failure. SDV2 is a variable that ranges from 0.0 to 1.0 and is used
to indicate the fraction of the matrix failure criterion that has been satisfied.
SDV2 = 0 implies that the matrix stress state is zero, while SDV2 = 1 implies
that the matrix stress state has reached failure level. SDV3 is a similar variable
to SDV2 but it describes the state of the fibre. The use of the unidirectional
AS4/3501-6 carbon/epoxy wrapped in the hoop direction (i.e. 90°) to repair the
corroded riser under different load cases is studied. A discussion of the results
for each of the loading cases is shown below.
At design loads, no failure occurs within the AS4-3501-6 carbon/epoxy
laminate, indicated by SDV1 = 1. All these cases simulate ideal stress transfer
from the corroded riser to the FRPC laminate as a perfect bond was assumed.
Hence, even by sustaining the maximum stress transferred from the corroded
riser, the AS4 carbon/epoxy laminate will not fail at design conditions under all
the static loading cases. The response of the FRPC laminate at PACL was also
examined to determine whether failure occurs on the FRPC laminate.

130
Table 4-9, Response of FRPC laminate at plastic analysis collapse load
Loading Case Loading Condition: Plastic Analysis Collapse Load (PACL)
Observations FEA Results
Individual
Static Load:
1) Internal
Pressure
- Even at 44MPa, the FRPC laminate
did not fail as the variable SDV1
still has a value of 1.
- SDV2 has low values indicating that
the matrix is still far from failing.
- Fibres are able to sustain the hoop
stress induced by the internal
pressure. Higher stress states were
observed at the corroded region.
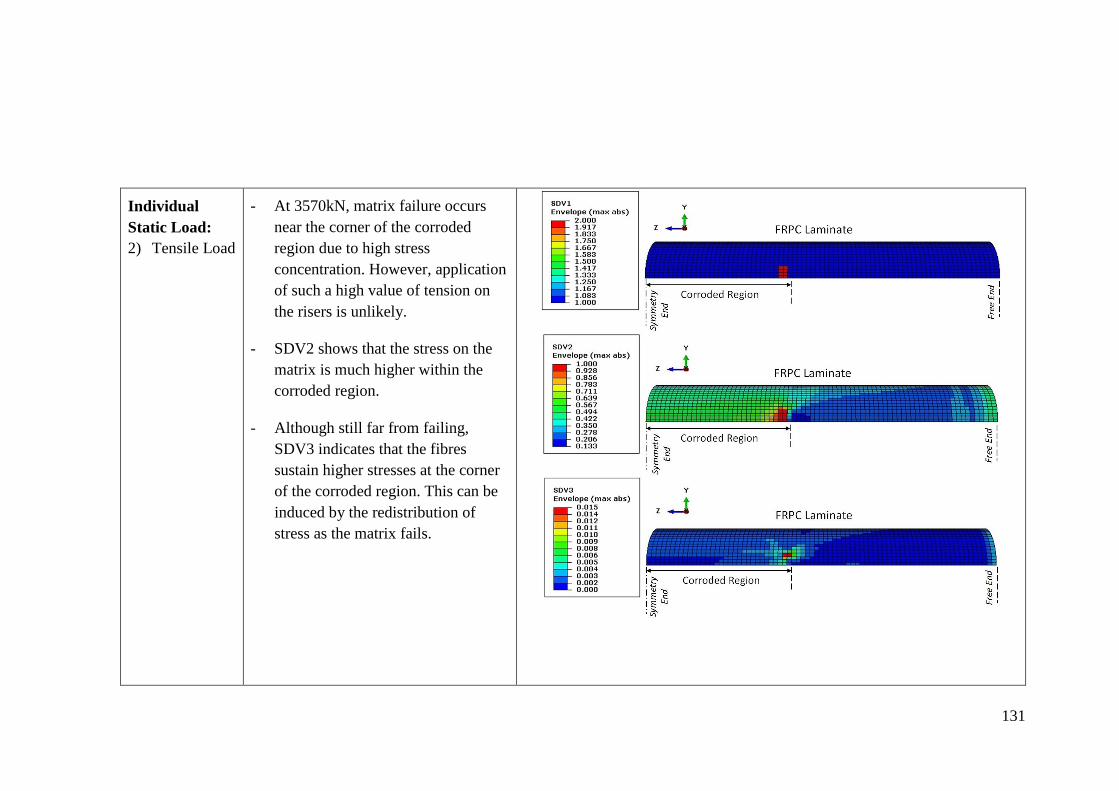
131
Individual
Static Load:
2) Tensile Load
- At 3570kN, matrix failure occurs
near the corner of the corroded
region due to high stress
concentration. However, application
of such a high value of tension on
the risers is unlikely.
- SDV2 shows that the stress on the
matrix is much higher within the
corroded region.
- Although still far from failing,
SDV3 indicates that the fibres
sustain higher stresses at the corner
of the corroded region. This can be
induced by the redistribution of
stress as the matrix fails.
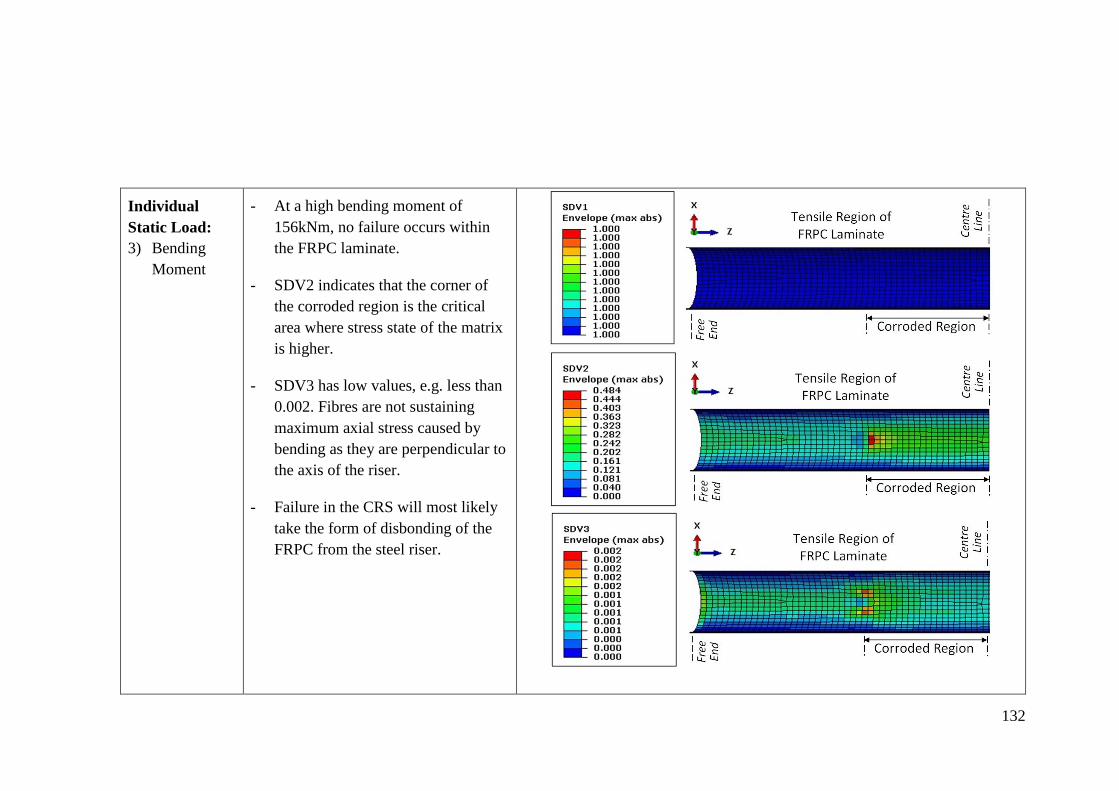
132
Individual
Static Load:
3) Bending
Moment
- At a high bending moment of
156kNm, no failure occurs within
the FRPC laminate.
- SDV2 indicates that the corner of
the corroded region is the critical
area where stress state of the matrix
is higher.
- SDV3 has low values, e.g. less than
0.002. Fibres are not sustaining
maximum axial stress caused by
bending as they are perpendicular to
the axis of the riser.
- Failure in the CRS will most likely
take the form of disbonding of the
FRPC from the steel riser.

133
Combined
Static Load:
1) Internal
Pressure +
Tensile Load
- At 44MPa and 1785kN, no failure is
predicted on the FRPC laminate.
- The addition of tensile force
increases the stress within the
matrix. SDV2 has a higher
maximum value of 0.158 compared
to the pure internal pressure case
where maximum value of SDV2 is
only 0.042.
- Fibres are still able to sustain the
hoop stress. However, off-axis fibre
alignment may be able to reduce to
stress carried by the matrix.
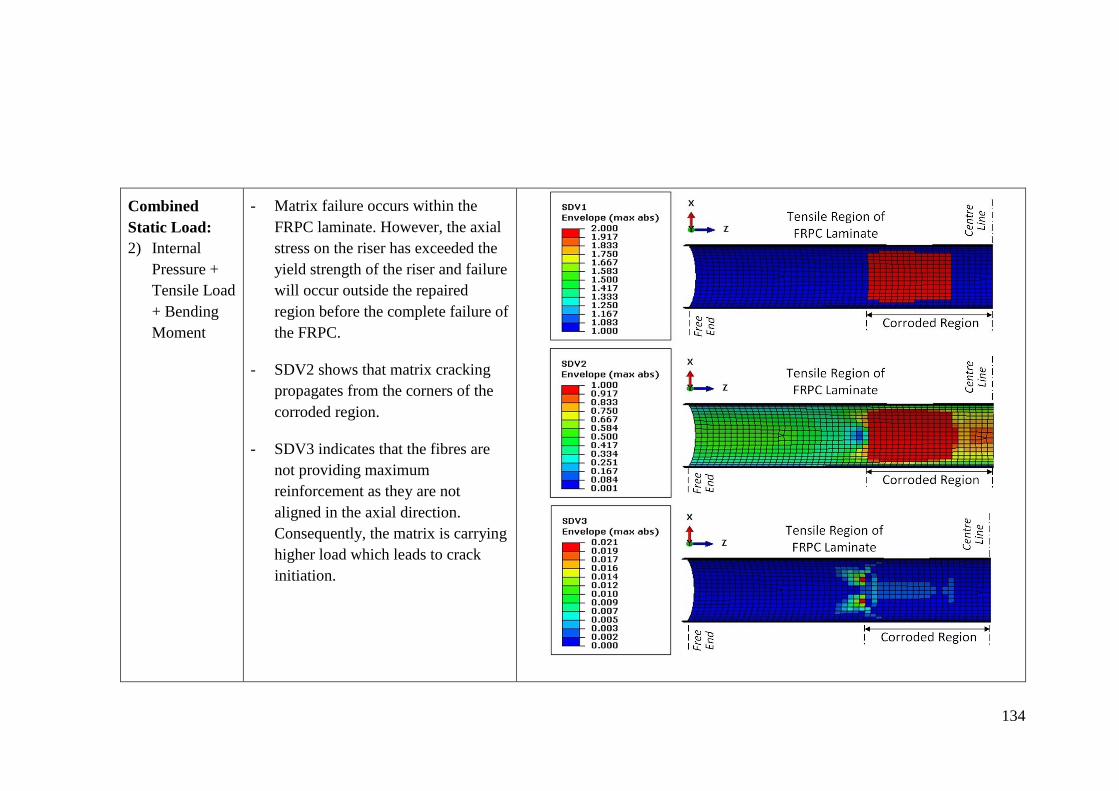
134
Combined
Static Load:
2) Internal
Pressure +
Tensile Load
+ Bending
Moment
- Matrix failure occurs within the
FRPC laminate. However, the axial
stress on the riser has exceeded the
yield strength of the riser and failure
will occur outside the repaired
region before the complete failure of
the FRPC.
- SDV2 shows that matrix cracking
propagates from the corners of the
corroded region.
- SDV3 indicates that the fibres are
not providing maximum
reinforcement as they are not
aligned in the axial direction.
Consequently, the matrix is carrying
higher load which leads to crack
initiation.

135
4.8 Cyclic Loading
The cyclic behaviour of offshore pipe riser repaired with FRPC was studied. FE
model that takes into account failure mechanisms of the composite interlaminar
delamination, disbonding at the composite-steel riser interface, and the
maximum permissible strain of the repaired riser was developed. The effects of
combined static loads on composite interlaminar and steel riser-composite
interface bond were captured through a fracture mechanics approach called
Virtual Crack Closure Technique (VCCT). The effects of cyclic bending due to
dynamic subsea wave forces were evaluated through a direct low cycle fatigue
analysis, where the onset of fatigue delamination and disbonding growth are
characterized based on the Paris Law. The fatigue crack growth initiation
criterion, f, and crack evolution are represented through Eq. 4–27 and Eq. 4–28
respectively.
0.1)( 2
minmax1
c
GGc
Nf 4-27
4minmax3 )(
cGGc
dN
da 4-28
where N is the number of cycles, Gmax and Gmin are strain energy release rates
when the model is loaded up to maximum and minimum load respectively, while
c1, c2, c3 and c4 are material constants. The materials constants were adapted
from NASA’s reports on fatigue characterisation of graphite epoxy composite
and development of benchmark examples for fatigue growth predictions
prepared by (O'Brien, et al., 2010) and (Krueger, 2011). Madelpech et al
(Madelpech, et al., 2009)studied the fatigue behaviour of disbond mechanism in
metallic structures repaired with bonded composite patch provided the material

136
constants of fatigue crack growth at the steel-composite interface. The fatigue
criterion constants are recorded in Table 4-10. Due to limitation of available data
and resources, it is important to note that values for the energy release rate and
fatigue constants used in this study are not taken from measurements of the exact
material used in the FE modelling.
Table 4-10, Steel-composite interface and composite interlaminar fatigue
properties
4.8.1 Design Conditions
Data on the cyclic bending load was based on nonlinear dynamic analysis of
marine risers under random loads in Indian Offshore (Khan, et al., 2011). In
Khan et al.’s study, it was found that the maximum bending stress (along the
length of the riser) due to random wave and current forces is 263.73MPa. This
value was interpreted as the maximum amplitude of the cyclic bending while the
computed average of the random wave, having a period of 14.4 seconds were
taken as input data in the FE model. Linear periodic loading as shown in Figure
4-61 was used.
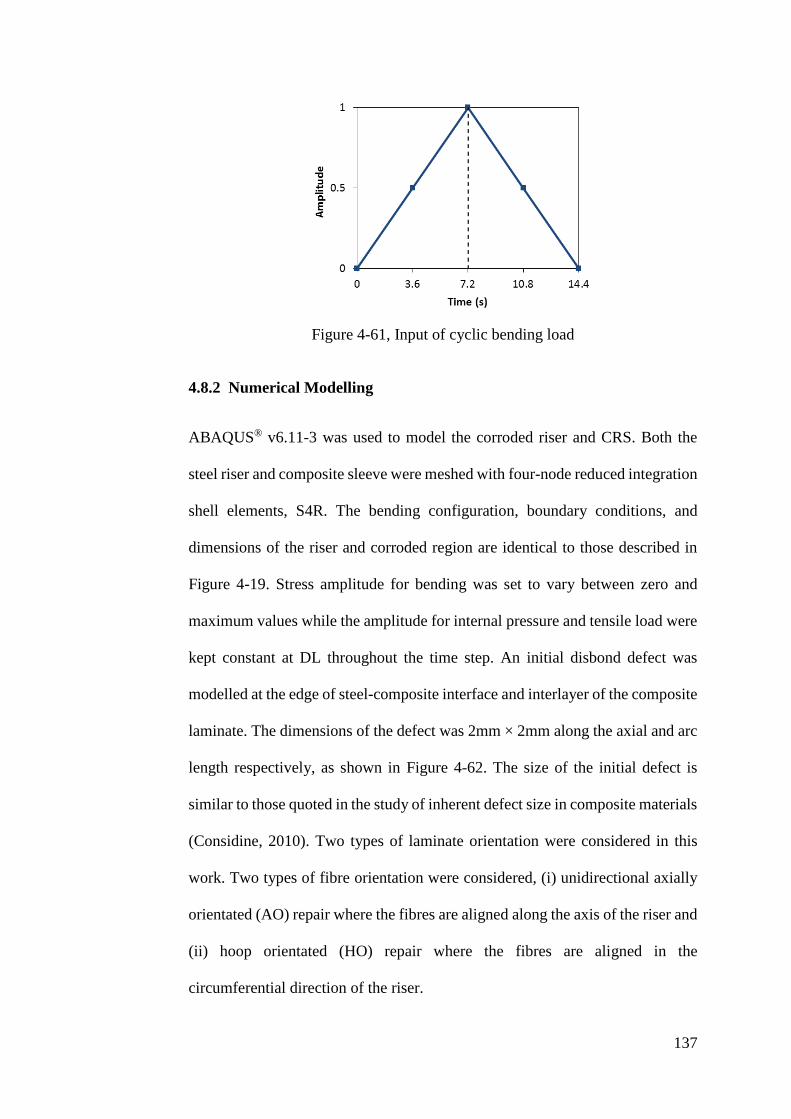
137
Figure 4-61, Input of cyclic bending load
4.8.2 Numerical Modelling
ABAQUS® v6.11-3 was used to model the corroded riser and CRS. Both the
steel riser and composite sleeve were meshed with four-node reduced integration
shell elements, S4R. The bending configuration, boundary conditions, and
dimensions of the riser and corroded region are identical to those described in
Figure 4-19. Stress amplitude for bending was set to vary between zero and
maximum values while the amplitude for internal pressure and tensile load were
kept constant at DL throughout the time step. An initial disbond defect was
modelled at the edge of steel-composite interface and interlayer of the composite
laminate. The dimensions of the defect was 2mm × 2mm along the axial and arc
length respectively, as shown in Figure 4-62. The size of the initial defect is
similar to those quoted in the study of inherent defect size in composite materials
(Considine, 2010). Two types of laminate orientation were considered in this
work. Two types of fibre orientation were considered, (i) unidirectional axially
orientated (AO) repair where the fibres are aligned along the axis of the riser and
(ii) hoop orientated (HO) repair where the fibres are aligned in the
circumferential direction of the riser.
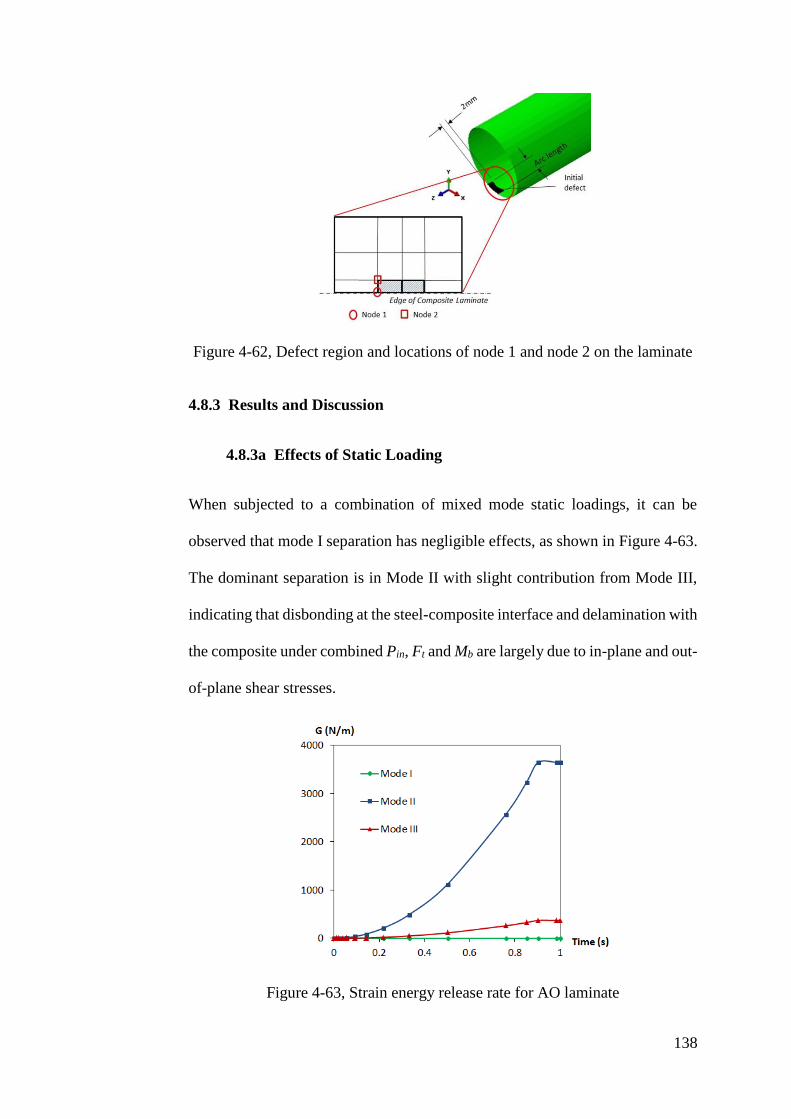
138
Figure 4-62, Defect region and locations of node 1 and node 2 on the laminate
4.8.3 Results and Discussion
4.8.3a Effects of Static Loading
When subjected to a combination of mixed mode static loadings, it can be
observed that mode I separation has negligible effects, as shown in Figure 4-63.
The dominant separation is in Mode II with slight contribution from Mode III,
indicating that disbonding at the steel-composite interface and delamination with
the composite under combined Pin, Ft and Mb are largely due to in-plane and out-
of-plane shear stresses.
Figure 4-63, Strain energy release rate for AO laminate
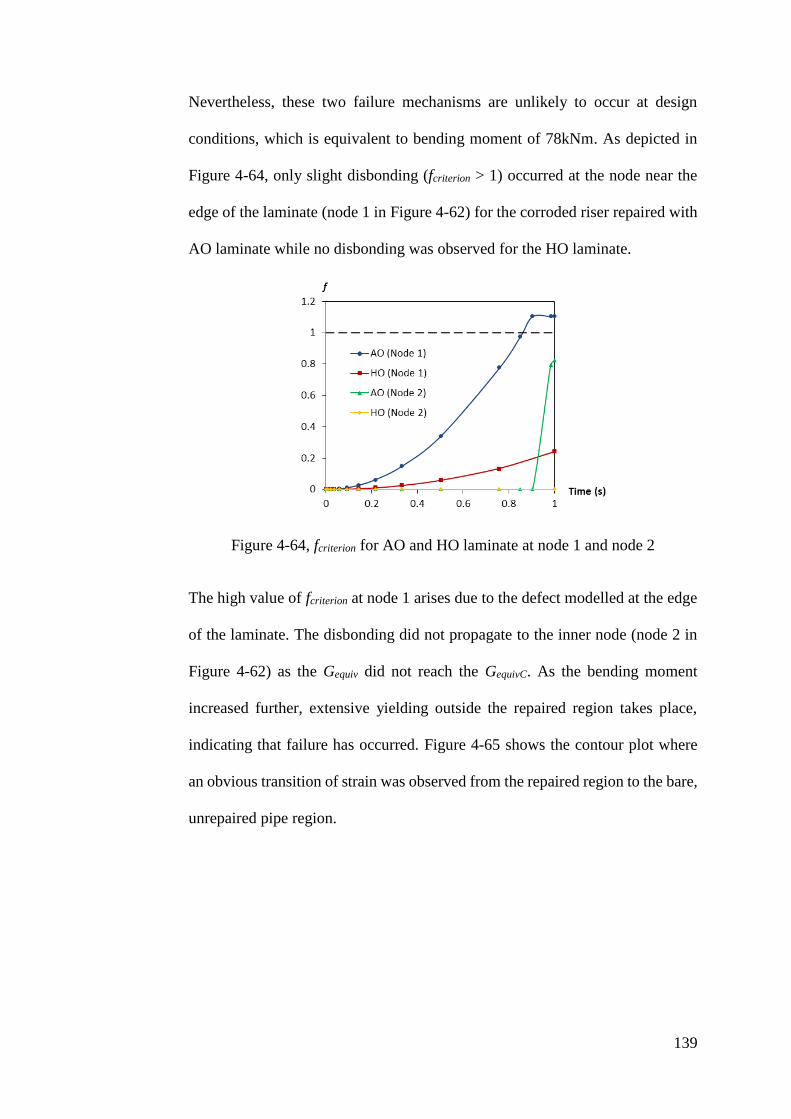
139
Nevertheless, these two failure mechanisms are unlikely to occur at design
conditions, which is equivalent to bending moment of 78kNm. As depicted in
Figure 4-64, only slight disbonding (fcriterion > 1) occurred at the node near the
edge of the laminate (node 1 in Figure 4-62) for the corroded riser repaired with
AO laminate while no disbonding was observed for the HO laminate.
Figure 4-64, fcriterion for AO and HO laminate at node 1 and node 2
The high value of fcriterion at node 1 arises due to the defect modelled at the edge
of the laminate. The disbonding did not propagate to the inner node (node 2 in
Figure 4-62) as the Gequiv did not reach the GequivC. As the bending moment
increased further, extensive yielding outside the repaired region takes place,
indicating that failure has occurred. Figure 4-65 shows the contour plot where
an obvious transition of strain was observed from the repaired region to the bare,
unrepaired pipe region.
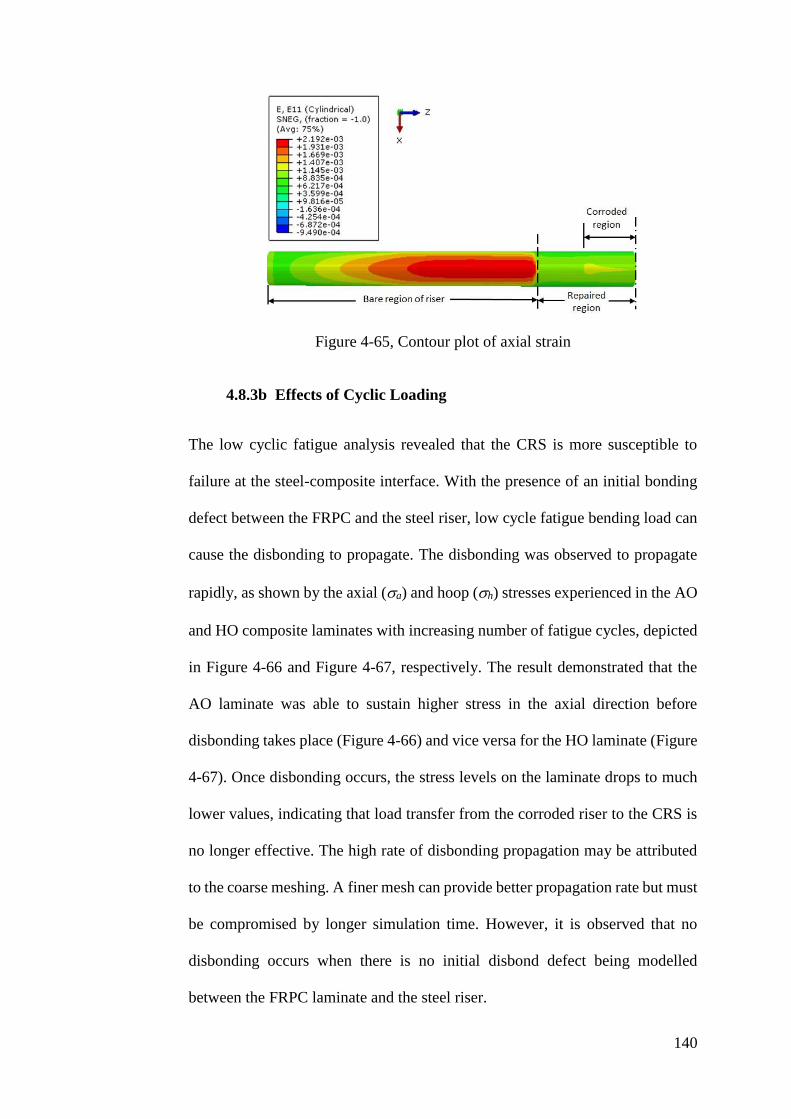
140
Figure 4-65, Contour plot of axial strain
4.8.3b Effects of Cyclic Loading
The low cyclic fatigue analysis revealed that the CRS is more susceptible to
failure at the steel-composite interface. With the presence of an initial bonding
defect between the FRPC and the steel riser, low cycle fatigue bending load can
cause the disbonding to propagate. The disbonding was observed to propagate
rapidly, as shown by the axial (a) and hoop (h) stresses experienced in the AO
and HO composite laminates with increasing number of fatigue cycles, depicted
in Figure 4-66 and Figure 4-67, respectively. The result demonstrated that the
AO laminate was able to sustain higher stress in the axial direction before
disbonding takes place (Figure 4-66) and vice versa for the HO laminate (Figure
4-67). Once disbonding occurs, the stress levels on the laminate drops to much
lower values, indicating that load transfer from the corroded riser to the CRS is
no longer effective. The high rate of disbonding propagation may be attributed
to the coarse meshing. A finer mesh can provide better propagation rate but must
be compromised by longer simulation time. However, it is observed that no
disbonding occurs when there is no initial disbond defect being modelled
between the FRPC laminate and the steel riser.
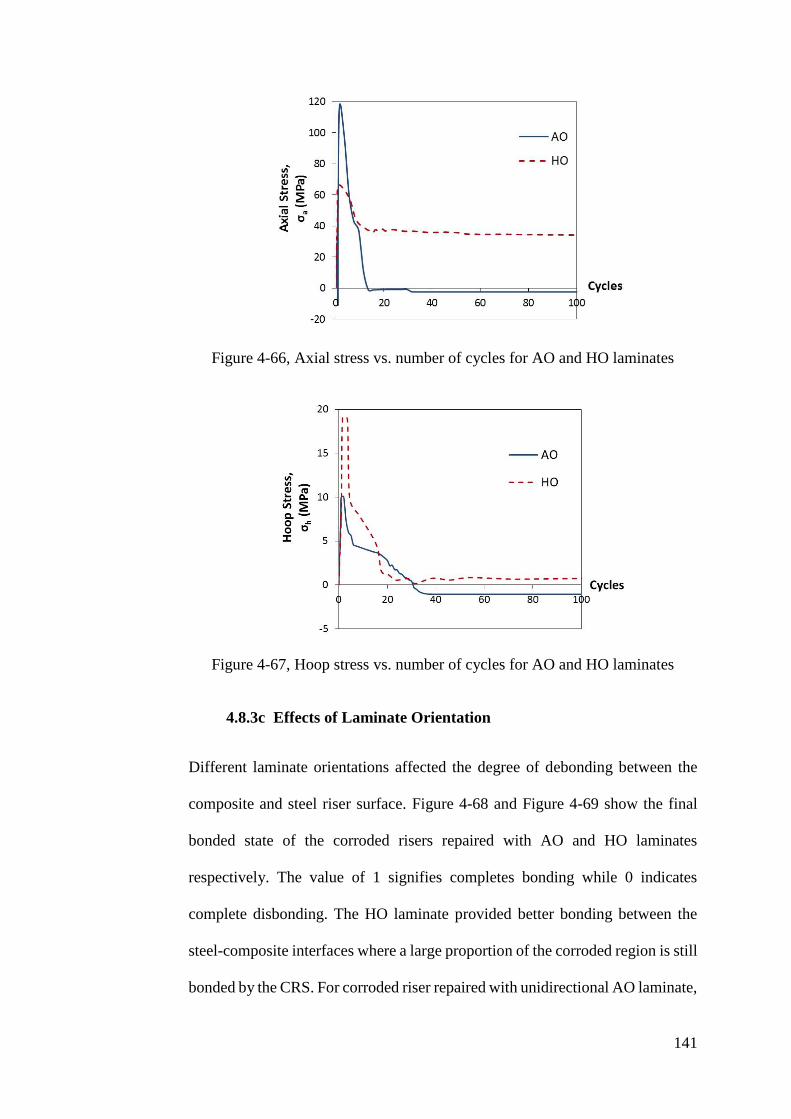
141
Figure 4-66, Axial stress vs. number of cycles for AO and HO laminates
Figure 4-67, Hoop stress vs. number of cycles for AO and HO laminates
4.8.3c Effects of Laminate Orientation
Different laminate orientations affected the degree of debonding between the
composite and steel riser surface. Figure 4-68 and Figure 4-69 show the final
bonded state of the corroded risers repaired with AO and HO laminates
respectively. The value of 1 signifies completes bonding while 0 indicates
complete disbonding. The HO laminate provided better bonding between the
steel-composite interfaces where a large proportion of the corroded region is still
bonded by the CRS. For corroded riser repaired with unidirectional AO laminate,
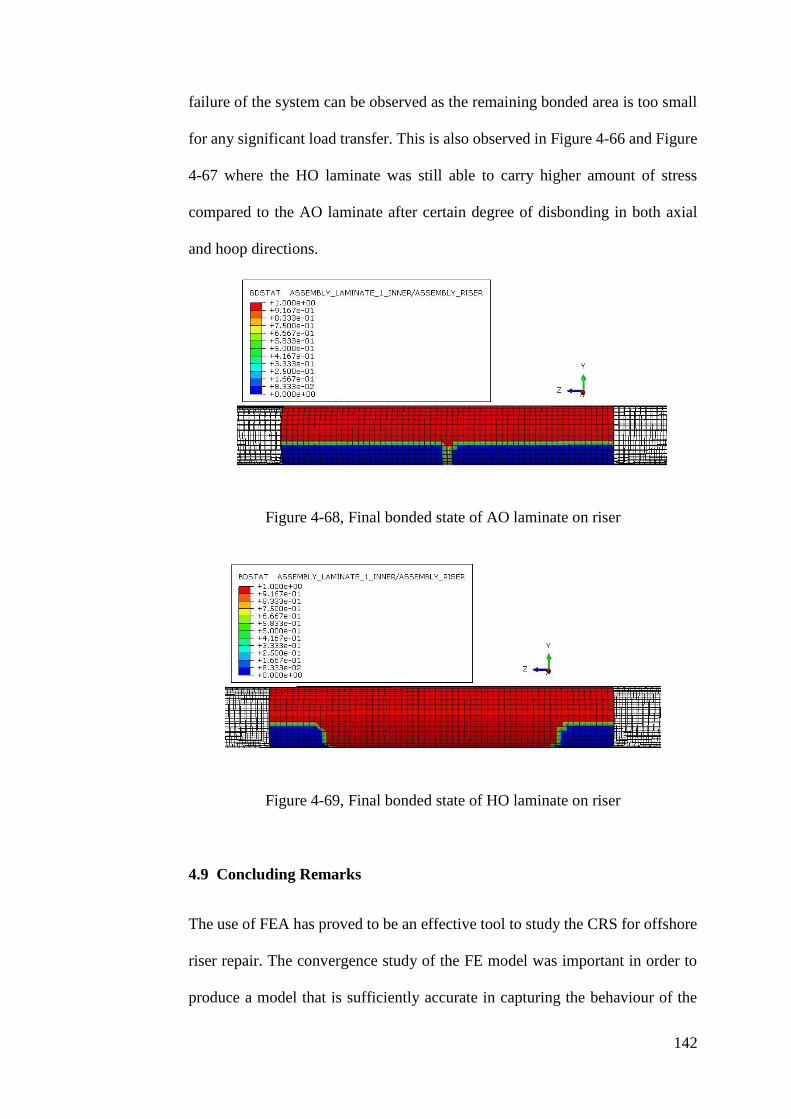
142
failure of the system can be observed as the remaining bonded area is too small
for any significant load transfer. This is also observed in Figure 4-66 and Figure
4-67 where the HO laminate was still able to carry higher amount of stress
compared to the AO laminate after certain degree of disbonding in both axial
and hoop directions.
Figure 4-68, Final bonded state of AO laminate on riser
Figure 4-69, Final bonded state of HO laminate on riser
4.9 Concluding Remarks
The use of FEA has proved to be an effective tool to study the CRS for offshore
riser repair. The convergence study of the FE model was important in order to
produce a model that is sufficiently accurate in capturing the behaviour of the
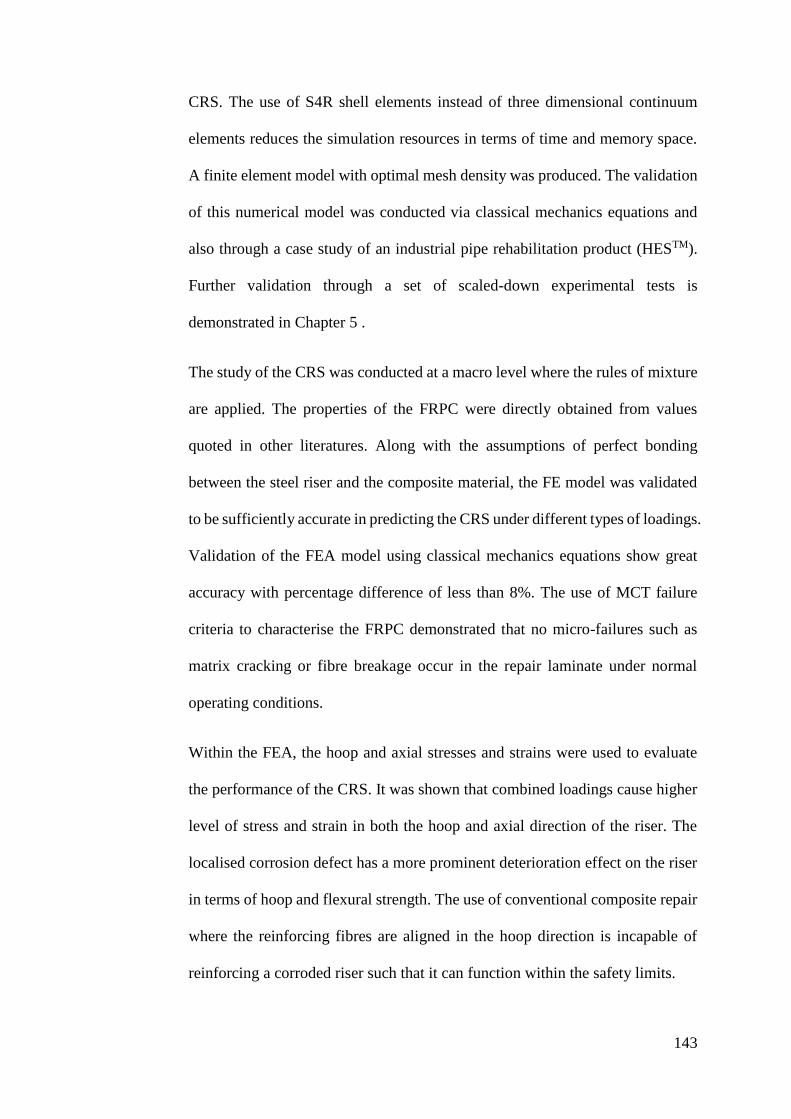
143
CRS. The use of S4R shell elements instead of three dimensional continuum
elements reduces the simulation resources in terms of time and memory space.
A finite element model with optimal mesh density was produced. The validation
of this numerical model was conducted via classical mechanics equations and
also through a case study of an industrial pipe rehabilitation product (HESTM).
Further validation through a set of scaled-down experimental tests is
demonstrated in Chapter 5 .
The study of the CRS was conducted at a macro level where the rules of mixture
are applied. The properties of the FRPC were directly obtained from values
quoted in other literatures. Along with the assumptions of perfect bonding
between the steel riser and the composite material, the FE model was validated
to be sufficiently accurate in predicting the CRS under different types of loadings.
Validation of the FEA model using classical mechanics equations show great
accuracy with percentage difference of less than 8%. The use of MCT failure
criteria to characterise the FRPC demonstrated that no micro-failures such as
matrix cracking or fibre breakage occur in the repair laminate under normal
operating conditions.
Within the FEA, the hoop and axial stresses and strains were used to evaluate
the performance of the CRS. It was shown that combined loadings cause higher
level of stress and strain in both the hoop and axial direction of the riser. The
localised corrosion defect has a more prominent deterioration effect on the riser
in terms of hoop and flexural strength. The use of conventional composite repair
where the reinforcing fibres are aligned in the hoop direction is incapable of
reinforcing a corroded riser such that it can function within the safety limits.
144
Study on cyclic loading demonstrated that disbonding at the composite-steel
riser interface dominated the failure mechanism of the CRS compared to the
interlaminar delamination. When subjected to static loadings, neither of the
failure mechanisms were observed and further increment in bending load causes
failure of the steel riser outside the repaired region. In contrast, with the presence
of an initial disband defect, low cycle fatigue loading weaken the bond between
the composite and steel riser which subsequently causes initiation and
propagation of disbonding between the two. By minimising the defect size at the
steel-composite interface, the occurrence of such failure under low-cycle fatigue
conditions can be prevented. Hence, careful surface preparation, adequate use of
adhesive and wrapping technique are important to ensure sufficient level of
integrity in adhesion between the two surfaces with minimised defects.
Local analyses have shown that the major design study that needs to be
accounted for is the static analysis of combined load. Low cycle fatigue analysis
has demonstrated that no failure via steel-composite disbonding will occur if no
initial defect is present at the edge of the steel-composite interface. The factors
affecting the performance of the composite repair are types of reinforcing fibre,
angle orientation of composite laminate, dimensions of the composite repair (i.e.
thickness and length) and the dimensions of the localised corrosion defect (i.e.
width and length). These factors can be further studied by modifying the FE
model within the CAE interface or directly amend the parameters in the input
file.
145
Chapter 5 Experimental Testing
5.1 Introduction
Analysis of the design and deformation stress-strain responses of a series of CRS
subjected to varying functional and environmental loadings were conducted in
Chapter 3 and Chapter 4 In order to further prove the accuracy of the FEA
model, validation was carried out against scaled experimental four-point bending
analysis. Within the scaled experimental setup, readily available materials were
used in a four-point bending test scaled to a significantly smaller size. Full scale
testing was not chosen in the current research mainly due to the limited material
availability and cost, long lead times in materials preparation, experimental setup
and resources. This chapter outlined the materials, equipment and setup of the
four-point bending experimental. Throughout the chapter, the simulation setup
was referred as the model while the experimental setup was referred as the
prototype. Detailed discussion of a similitude approach used to relate the full
scale model to the scaled down prototype was explained. As in the case of the
FEA, three conditions of the pipe were setup for the four-point bending tests, as
described below:
4) Bare pipe without corrosion damage.
5) Bare pipe with corroded region manifested as material loss in thickness.
6) Corroded pipe repaired with composite laminates.
5.2 Methodology
The FEA model developed in this work was validated by determining the
accuracy of the simulated strain output with that of the experimentally measured
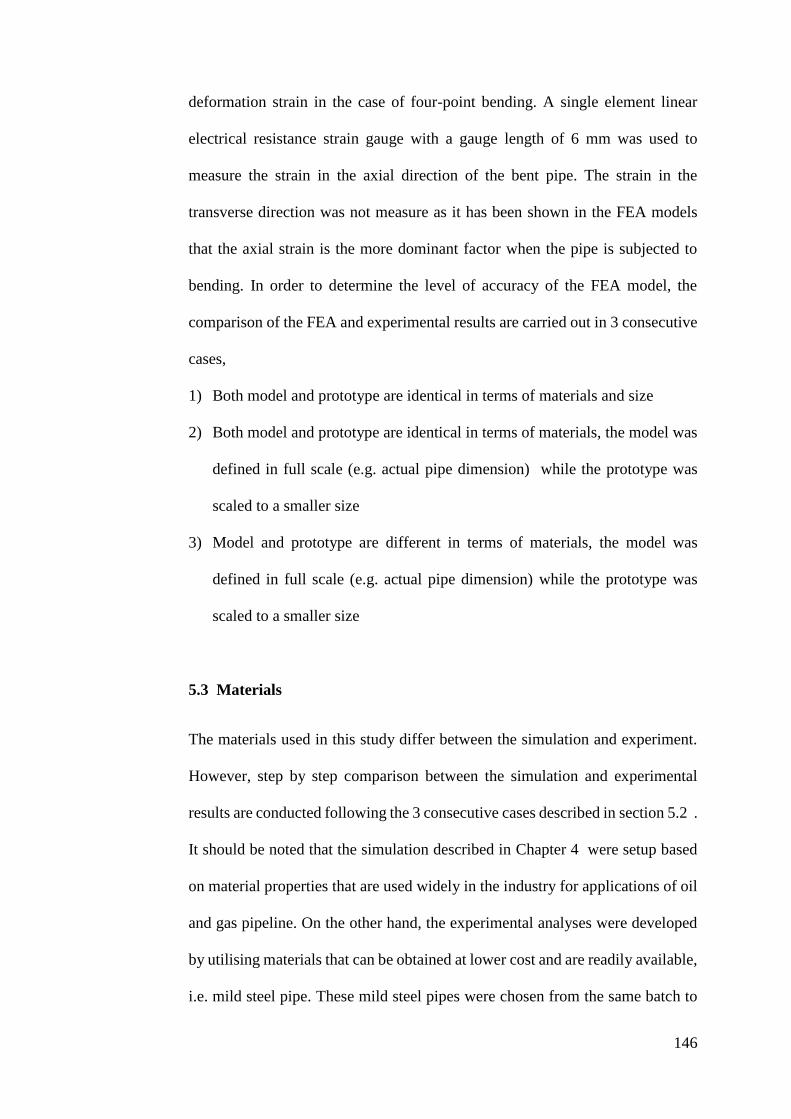
146
deformation strain in the case of four-point bending. A single element linear
electrical resistance strain gauge with a gauge length of 6 mm was used to
measure the strain in the axial direction of the bent pipe. The strain in the
transverse direction was not measure as it has been shown in the FEA models
that the axial strain is the more dominant factor when the pipe is subjected to
bending. In order to determine the level of accuracy of the FEA model, the
comparison of the FEA and experimental results are carried out in 3 consecutive
cases,
1) Both model and prototype are identical in terms of materials and size
2) Both model and prototype are identical in terms of materials, the model was
defined in full scale (e.g. actual pipe dimension) while the prototype was
scaled to a smaller size
3) Model and prototype are different in terms of materials, the model was
defined in full scale (e.g. actual pipe dimension) while the prototype was
scaled to a smaller size
5.3 Materials
The materials used in this study differ between the simulation and experiment.
However, step by step comparison between the simulation and experimental
results are conducted following the 3 consecutive cases described in section 5.2 .
It should be noted that the simulation described in Chapter 4 were setup based
on material properties that are used widely in the industry for applications of oil
and gas pipeline. On the other hand, the experimental analyses were developed
by utilising materials that can be obtained at lower cost and are readily available,
i.e. mild steel pipe. These mild steel pipes were chosen from the same batch to
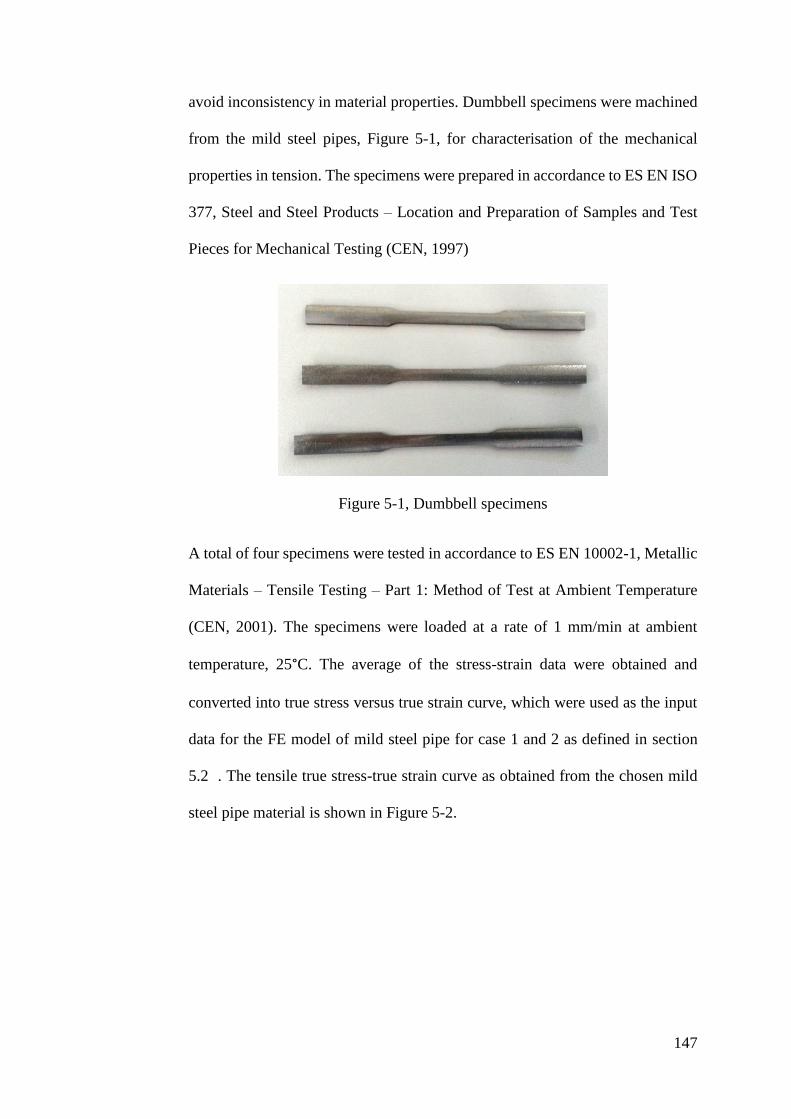
147
avoid inconsistency in material properties. Dumbbell specimens were machined
from the mild steel pipes, Figure 5-1, for characterisation of the mechanical
properties in tension. The specimens were prepared in accordance to ES EN ISO
377, Steel and Steel Products – Location and Preparation of Samples and Test
Pieces for Mechanical Testing (CEN, 1997)
Figure 5-1, Dumbbell specimens
A total of four specimens were tested in accordance to ES EN 10002-1, Metallic
Materials – Tensile Testing – Part 1: Method of Test at Ambient Temperature
(CEN, 2001). The specimens were loaded at a rate of 1 mm/min at ambient
temperature, 25°C. The average of the stress-strain data were obtained and
converted into true stress versus true strain curve, which were used as the input
data for the FE model of mild steel pipe for case 1 and 2 as defined in section
5.2 . The tensile true stress-true strain curve as obtained from the chosen mild
steel pipe material is shown in Figure 5-2.
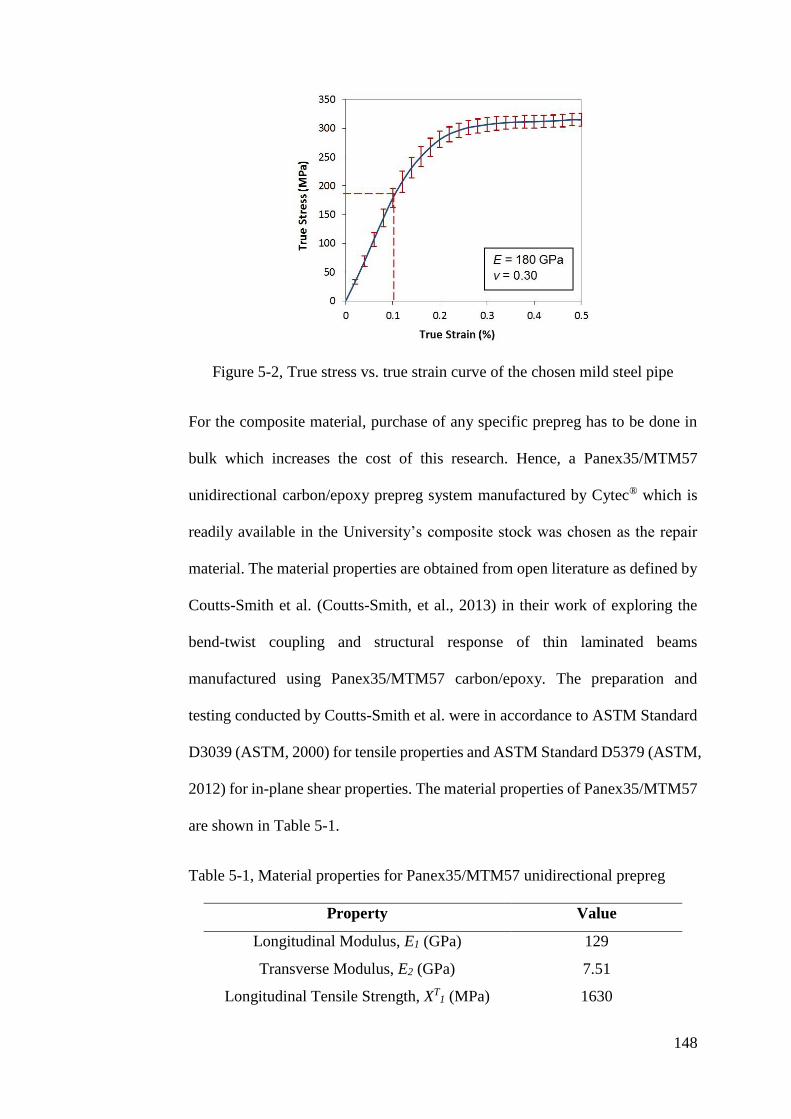
148
Figure 5-2, True stress vs. true strain curve of the chosen mild steel pipe
For the composite material, purchase of any specific prepreg has to be done in
bulk which increases the cost of this research. Hence, a Panex35/MTM57
unidirectional carbon/epoxy prepreg system manufactured by Cytec® which is
readily available in the University’s composite stock was chosen as the repair
material. The material properties are obtained from open literature as defined by
Coutts-Smith et al. (Coutts-Smith, et al., 2013) in their work of exploring the
bend-twist coupling and structural response of thin laminated beams
manufactured using Panex35/MTM57 carbon/epoxy. The preparation and
testing conducted by Coutts-Smith et al. were in accordance to ASTM Standard
D3039 (ASTM, 2000) for tensile properties and ASTM Standard D5379 (ASTM,
2012) for in-plane shear properties. The material properties of Panex35/MTM57
are shown in Table 5-1.
Table 5-1, Material properties for Panex35/MTM57 unidirectional prepreg
Property Value
Longitudinal Modulus, E1 (GPa) 129
Transverse Modulus, E2 (GPa) 7.51
Longitudinal Tensile Strength, XT1 (MPa) 1630
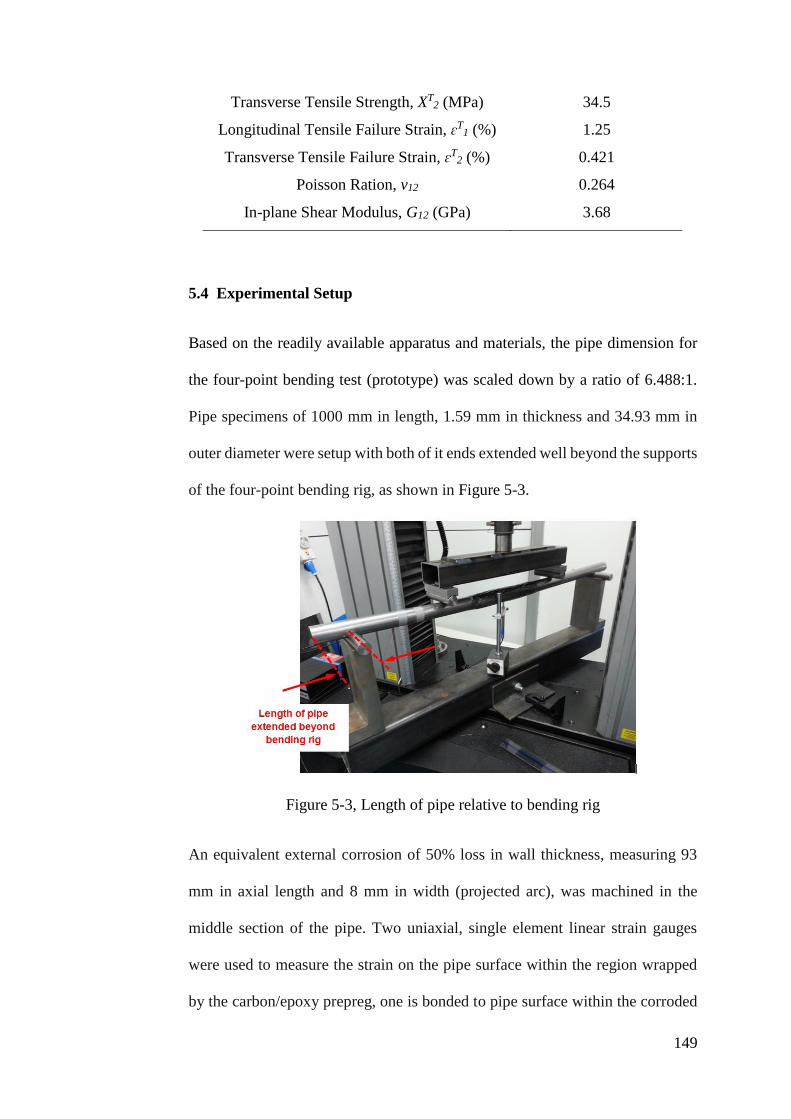
149
Transverse Tensile Strength, XT2 (MPa) 34.5
Longitudinal Tensile Failure Strain, ɛT1 (%) 1.25
Transverse Tensile Failure Strain, ɛT2 (%) 0.421
Poisson Ration, v12 0.264
In-plane Shear Modulus, G12 (GPa) 3.68
5.4 Experimental Setup
Based on the readily available apparatus and materials, the pipe dimension for
the four-point bending test (prototype) was scaled down by a ratio of 6.488:1.
Pipe specimens of 1000 mm in length, 1.59 mm in thickness and 34.93 mm in
outer diameter were setup with both of it ends extended well beyond the supports
of the four-point bending rig, as shown in Figure 5-3.
Figure 5-3, Length of pipe relative to bending rig
An equivalent external corrosion of 50% loss in wall thickness, measuring 93
mm in axial length and 8 mm in width (projected arc), was machined in the
middle section of the pipe. Two uniaxial, single element linear strain gauges
were used to measure the strain on the pipe surface within the region wrapped
by the carbon/epoxy prepreg, one is bonded to pipe surface within the corroded
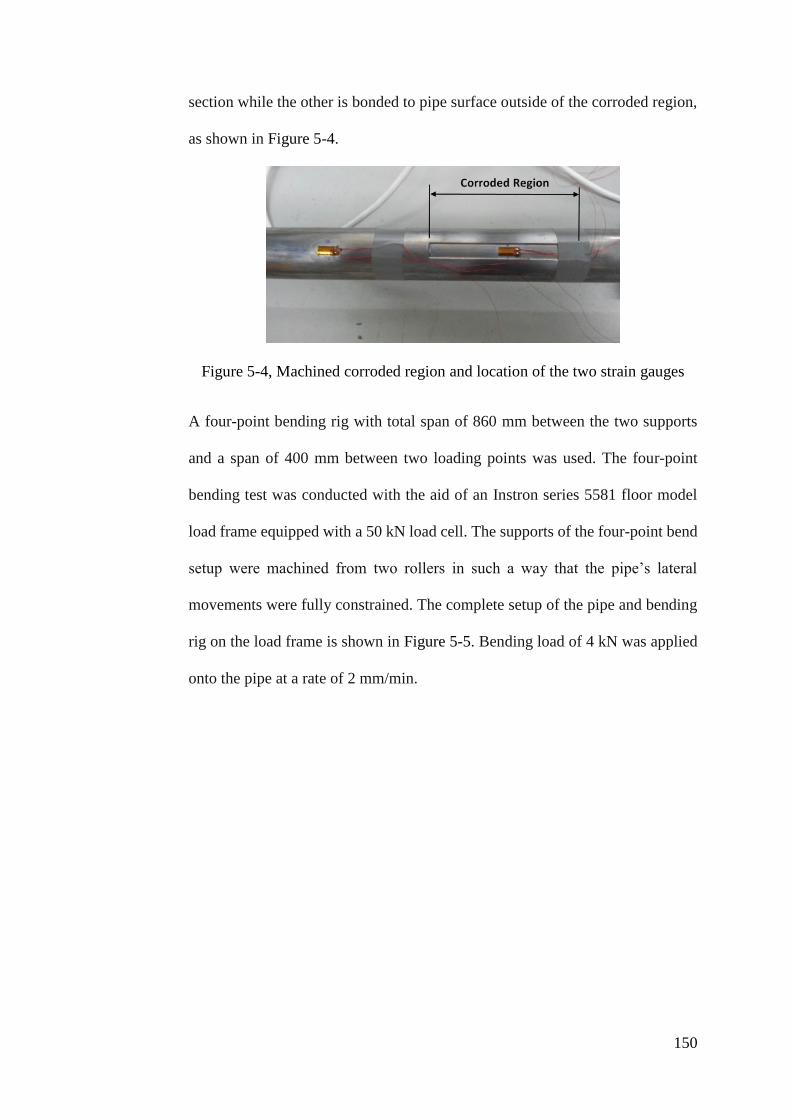
150
section while the other is bonded to pipe surface outside of the corroded region,
as shown in Figure 5-4.
Figure 5-4, Machined corroded region and location of the two strain gauges
A four-point bending rig with total span of 860 mm between the two supports
and a span of 400 mm between two loading points was used. The four-point
bending test was conducted with the aid of an Instron series 5581 floor model
load frame equipped with a 50 kN load cell. The supports of the four-point bend
setup were machined from two rollers in such a way that the pipe’s lateral
movements were fully constrained. The complete setup of the pipe and bending
rig on the load frame is shown in Figure 5-5. Bending load of 4 kN was applied
onto the pipe at a rate of 2 mm/min.
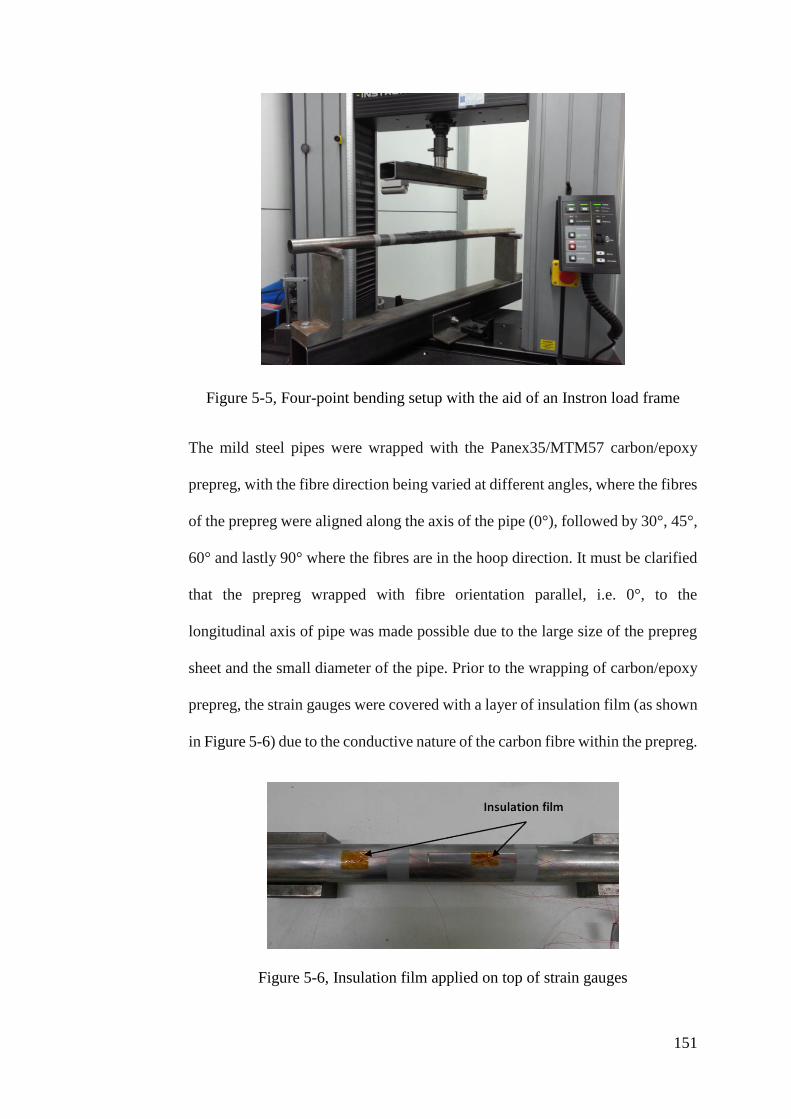
151
Figure 5-5, Four-point bending setup with the aid of an Instron load frame
The mild steel pipes were wrapped with the Panex35/MTM57 carbon/epoxy
prepreg, with the fibre direction being varied at different angles, where the fibres
of the prepreg were aligned along the axis of the pipe (0°), followed by 30°, 45°,
60° and lastly 90° where the fibres are in the hoop direction. It must be clarified
that the prepreg wrapped with fibre orientation parallel, i.e. 0°, to the
longitudinal axis of pipe was made possible due to the large size of the prepreg
sheet and the small diameter of the pipe. Prior to the wrapping of carbon/epoxy
prepreg, the strain gauges were covered with a layer of insulation film (as shown
in Figure 5-6) due to the conductive nature of the carbon fibre within the prepreg.
Figure 5-6, Insulation film applied on top of strain gauges

152
Most conventional composite repair method for pipeline consists of a flexible
layup of on-site wetted or pre-impregnated composite laminate where final
curing takes place at the site of repair, or installation of pre-cured shells that are
pre-manufactured for specific pipe diameter. Considering the repair method of
winding a prepreg tape around the riser, the axial orientated repair laminate is
not practically achievable as the wrap must progress around the length of the
pipe in a circumferential wind, making it more of a helical winding. In the
industry, an axially orientated repair laminate can be achieved with pre-cured
half cylinder shells that are bonded to the pipe. Although on-axis on-site
wrapping of prepreg composite laminate is technically not viable, the modelling
of pure on-axis and off-axis plies as well as the combination of both were
conducted with the aim to provide further insight into the effects of fibre
orientation on rehabilitation performance of the CRS. Figure 5-7 shows the wrap
done at varying angles. It can be observed that the ends of the wrap were not
properly aligned around the circumference of the pipe due to the helical wrap
angle of the prepreg sheet at a particular fibre orientation. However, the wraps
are sufficiently long such that they extend way beyond the corroded section and
the end effects in this case can be assumed to be negligible.
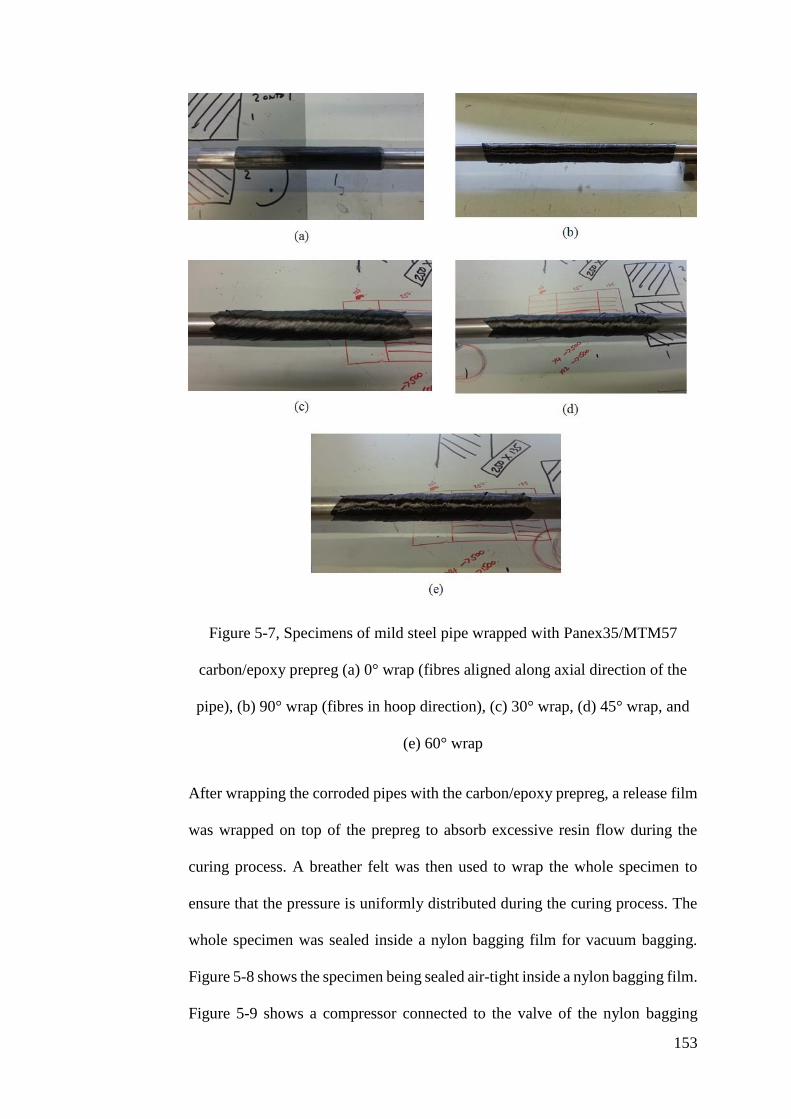
153
Figure 5-7, Specimens of mild steel pipe wrapped with Panex35/MTM57
carbon/epoxy prepreg (a) 0° wrap (fibres aligned along axial direction of the
pipe), (b) 90° wrap (fibres in hoop direction), (c) 30° wrap, (d) 45° wrap, and
(e) 60° wrap
After wrapping the corroded pipes with the carbon/epoxy prepreg, a release film
was wrapped on top of the prepreg to absorb excessive resin flow during the
curing process. A breather felt was then used to wrap the whole specimen to
ensure that the pressure is uniformly distributed during the curing process. The
whole specimen was sealed inside a nylon bagging film for vacuum bagging.
Figure 5-8 shows the specimen being sealed air-tight inside a nylon bagging film.
Figure 5-9 shows a compressor connected to the valve of the nylon bagging
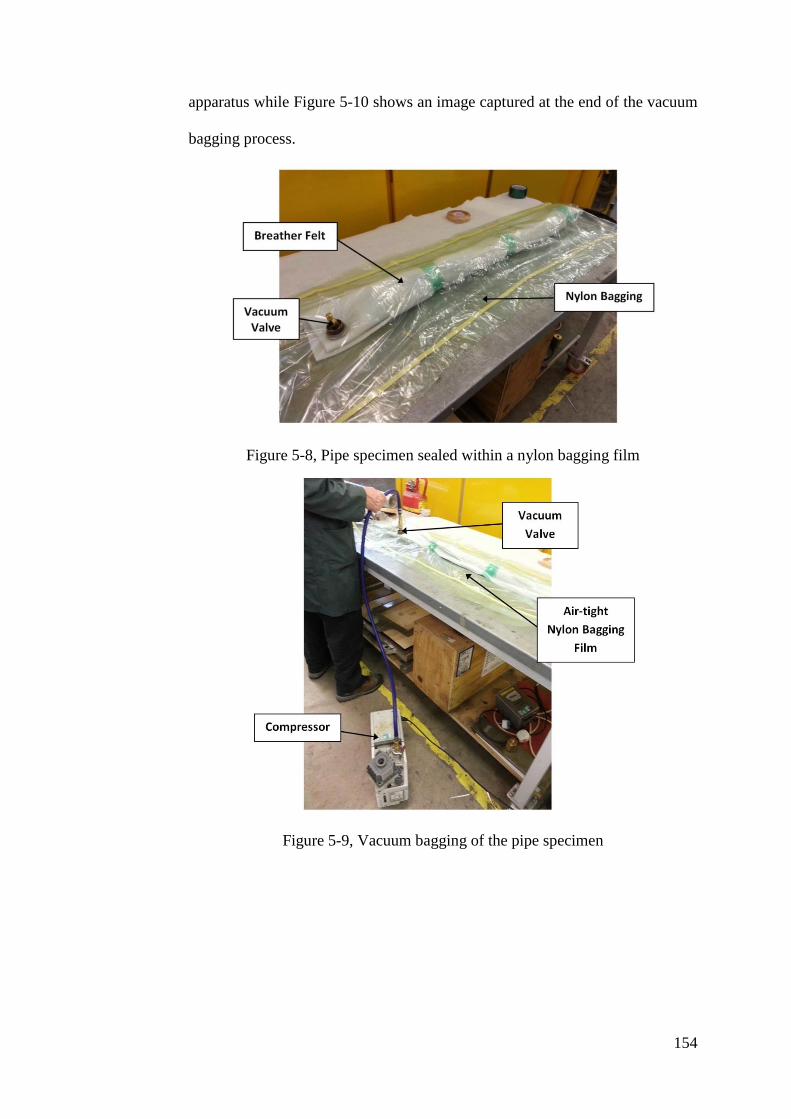
154
apparatus while Figure 5-10 shows an image captured at the end of the vacuum
bagging process.
Figure 5-8, Pipe specimen sealed within a nylon bagging film
Figure 5-9, Vacuum bagging of the pipe specimen
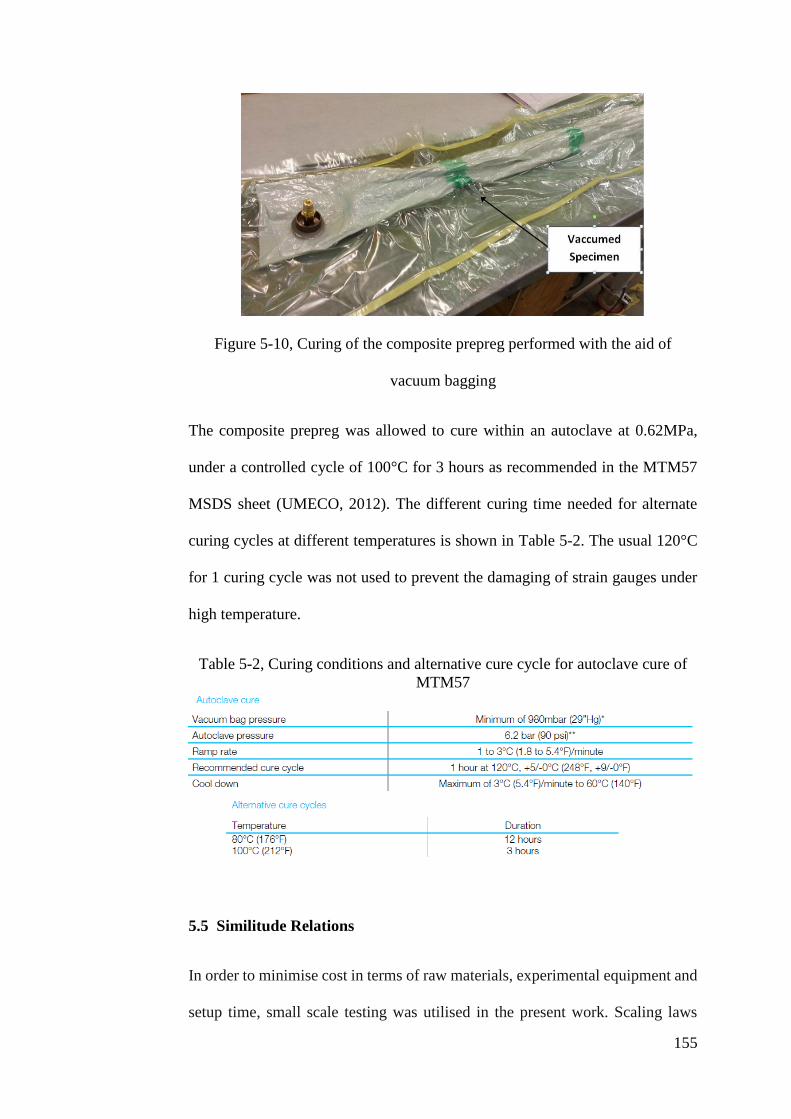
155
Figure 5-10, Curing of the composite prepreg performed with the aid of
vacuum bagging
The composite prepreg was allowed to cure within an autoclave at 0.62MPa,
under a controlled cycle of 100°C for 3 hours as recommended in the MTM57
MSDS sheet (UMECO, 2012). The different curing time needed for alternate
curing cycles at different temperatures is shown in Table 5-2. The usual 120°C
for 1 curing cycle was not used to prevent the damaging of strain gauges under
high temperature.
Table 5-2, Curing conditions and alternative cure cycle for autoclave cure of
MTM57
5.5 Similitude Relations
In order to minimise cost in terms of raw materials, experimental equipment and
setup time, small scale testing was utilised in the present work. Scaling laws
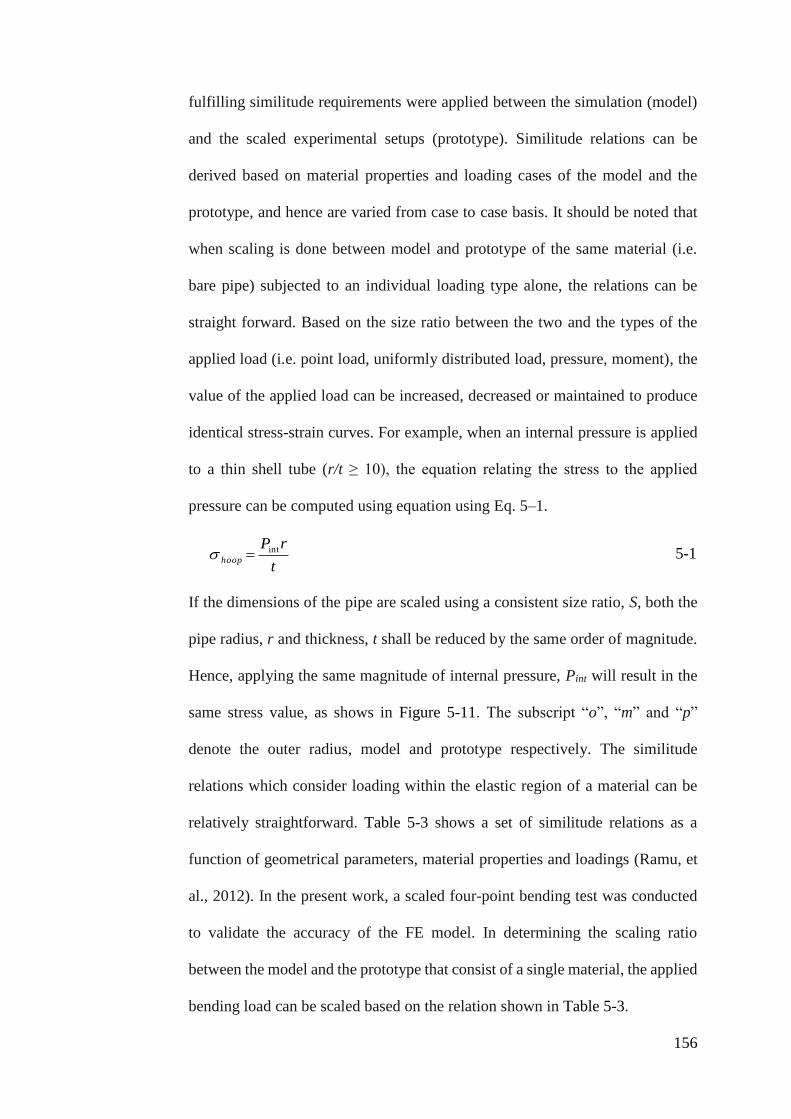
156
fulfilling similitude requirements were applied between the simulation (model)
and the scaled experimental setups (prototype). Similitude relations can be
derived based on material properties and loading cases of the model and the
prototype, and hence are varied from case to case basis. It should be noted that
when scaling is done between model and prototype of the same material (i.e.
bare pipe) subjected to an individual loading type alone, the relations can be
straight forward. Based on the size ratio between the two and the types of the
applied load (i.e. point load, uniformly distributed load, pressure, moment), the
value of the applied load can be increased, decreased or maintained to produce
identical stress-strain curves. For example, when an internal pressure is applied
to a thin shell tube (r/t ≥ 10), the equation relating the stress to the applied
pressure can be computed using equation using Eq. 5–1.
t
rPhoop
int
5-1
If the dimensions of the pipe are scaled using a consistent size ratio, S, both the
pipe radius, r and thickness, t shall be reduced by the same order of magnitude.
Hence, applying the same magnitude of internal pressure, Pint will result in the
same stress value, as shows in Figure 5-11. The subscript “o”, “m” and “p”
denote the outer radius, model and prototype respectively. The similitude
relations which consider loading within the elastic region of a material can be
relatively straightforward. Table 5-3 shows a set of similitude relations as a
function of geometrical parameters, material properties and loadings (Ramu, et
al., 2012). In the present work, a scaled four-point bending test was conducted
to validate the accuracy of the FE model. In determining the scaling ratio
between the model and the prototype that consist of a single material, the applied
bending load can be scaled based on the relation shown in Table 5-3.
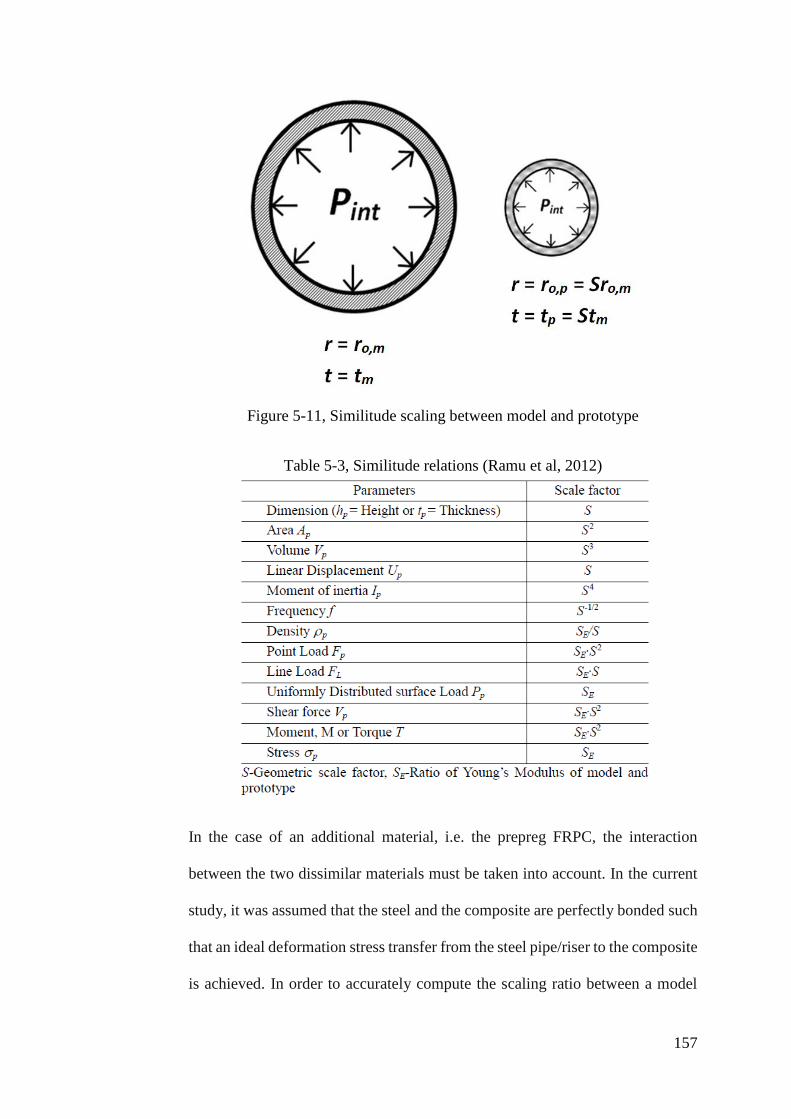
157
Figure 5-11, Similitude scaling between model and prototype
Table 5-3, Similitude relations (Ramu et al, 2012)
In the case of an additional material, i.e. the prepreg FRPC, the interaction
between the two dissimilar materials must be taken into account. In the current
study, it was assumed that the steel and the composite are perfectly bonded such
that an ideal deformation stress transfer from the steel pipe/riser to the composite
is achieved. In order to accurately compute the scaling ratio between a model
158
and a prototype that each contains two dissimilar materials subjected to bending
load, the flexural stiffness must be calculated. Derisi et al. carried out a
similitude study on the bending stiffness of composite tubes whereby an
‘equivalent’ aluminium tube that matched the flexural stiffness of the laminated
composite tube was created in order to match the stress-strain behaviour between
the two. (Derisi, et al., 2012). In the present work, a limitation exists in
identifying a prototype that is capable of matching the flexural stiffness of the
model. Hence, a similitude relation was built by comparing the flexural stiffness
of the CRS model and prototype respectively, and scaling was performed on the
value of the bending load accordingly. Within the elastic limits, the combined
flexural stiffness of the pipe repaired with prepreg FRPC is taken as the sum of
the individual flexural stiffness of the pipe and the prepreg, as shown in Eq. 5–
2.
ccsscs IEIEEI 5-2
Where E is the modulus of elasticity and I is the second moment of area for a
cylindrical structure. The subscript “s” and “c” denotes the steel pipe and prepreg
composite, while the subscript “s-c” represents the pipe repaired with prepreg.
The combined flexural stiffness of the repaired pipe for the model and the
prototype can then be written as,
MccMssMcs IEIEEI 5-3a
PccPssPcs IEIEEI
5-3b
where subscripts M and P denotes the model and prototype respectively. For a
beam subjected to bending, the bending stress and bending strain can be related
to the applied bending moment via the following equations,
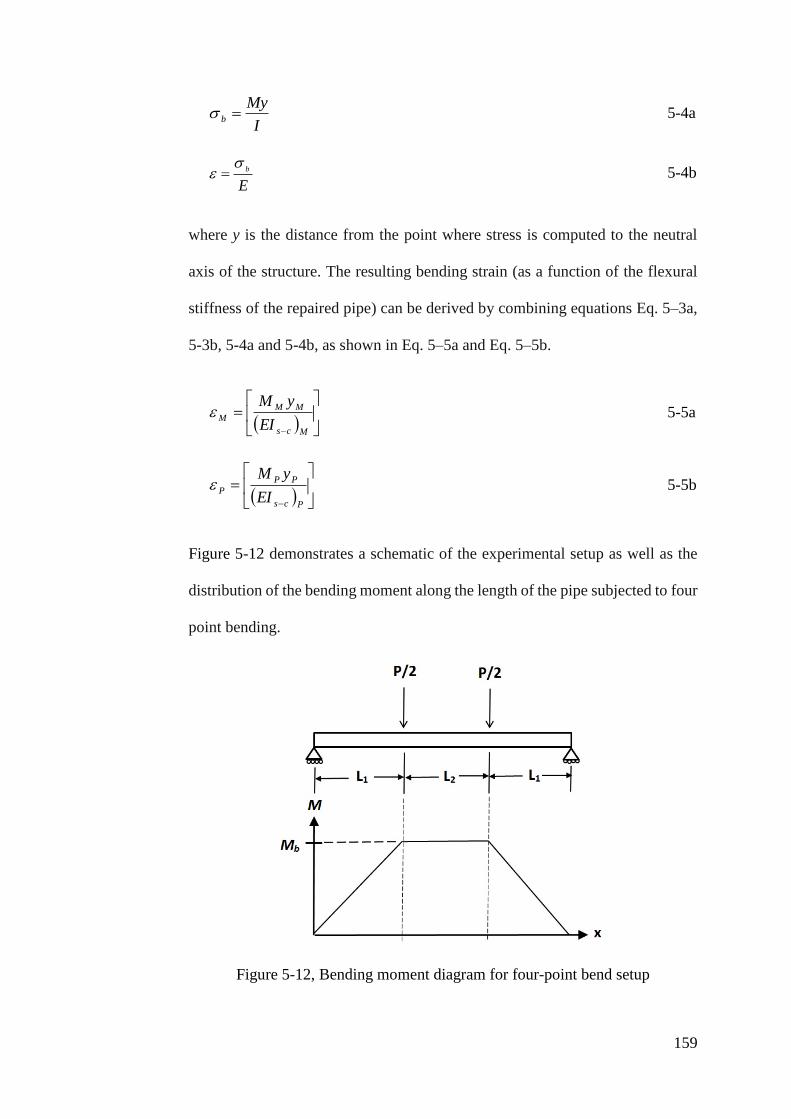
159
I
Myb 5-4a
E
b
5-4b
where y is the distance from the point where stress is computed to the neutral
axis of the structure. The resulting bending strain (as a function of the flexural
stiffness of the repaired pipe) can be derived by combining equations Eq. 5–3a,
5-3b, 5-4a and 5-4b, as shown in Eq. 5–5a and Eq. 5–5b.
Mcs
MM
MEI
yM 5-5a
Pcs
PP
PEI
yM
5-5b
Figure 5-12 demonstrates a schematic of the experimental setup as well as the
distribution of the bending moment along the length of the pipe subjected to four
point bending.
Figure 5-12, Bending moment diagram for four-point bend setup
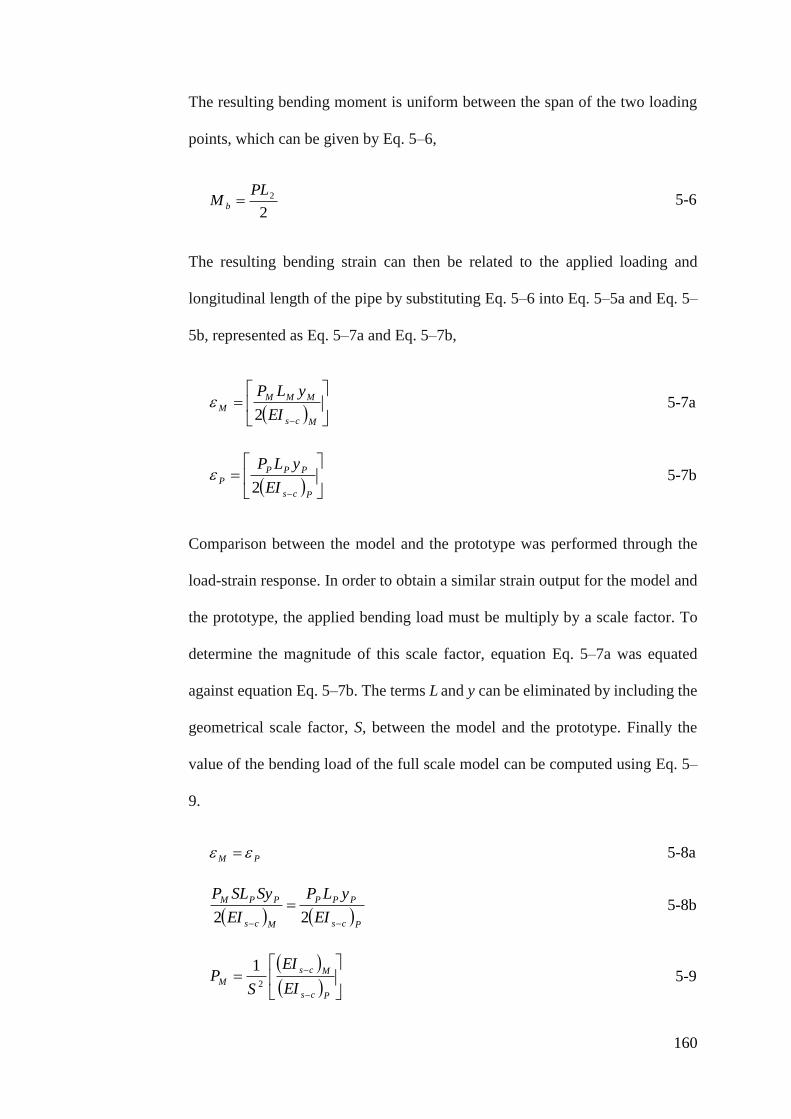
160
The resulting bending moment is uniform between the span of the two loading
points, which can be given by Eq. 5–6,
2
2PLM b
5-6
The resulting bending strain can then be related to the applied loading and
longitudinal length of the pipe by substituting Eq. 5–6 into Eq. 5–5a and Eq. 5–
5b, represented as Eq. 5–7a and Eq. 5–7b,
Mcs
MMM
MEI
yLP
2 5-7a
Pcs
PPP
PEI
yLP
2
5-7b
Comparison between the model and the prototype was performed through the
load-strain response. In order to obtain a similar strain output for the model and
the prototype, the applied bending load must be multiply by a scale factor. To
determine the magnitude of this scale factor, equation Eq. 5–7a was equated
against equation Eq. 5–7b. The terms L and y can be eliminated by including the
geometrical scale factor, S, between the model and the prototype. Finally the
value of the bending load of the full scale model can be computed using Eq. 5–
9.
PM 5-8a
Pcs
PPP
Mcs
PPM
EI
yLP
EI
SySLP
22
5-8b
Pcs
Mcs
MEI
EI
SP
2
1
5-9

161
5.6 Experimental Validation
As discussed in section 5.2, three FE models were setup. The details of the mesh,
boundary conditions, loading condition and interaction properties of the model
were presented in Chapter 4 . A ramp load with fixed time increment was chosen
such that the stress-strain behaviour at different bending load can be observed.
Perfect bonding between the composite laminate and the steel riser was defined.
This conservative solution assumed that maximum load transfer from the steel
riser to the composite laminate takes place.
5.6.1 Bare Riser without Corrosion
Figure 5-13 depicts the simulated axial strain plotted against experimental data
of mild steel bare pipe without corrosion under a bending load. As demonstrated,
the model with the same dimensions and materials were able to capture
accurately, the load-strain behaviour of the steel pipe subjected to an incremental
bending load. By using the scaling law for a bending moment, a similar load-
strain curve can be obtained. It can be demonstrated that the use of reduced
integration 4 node shell elements, S4R can accurately capture the bending
behaviour of the mild steel pipe. In addition, the mesh density is also proven to
be adequate.

162
Figure 5-13, Experiment and FE results of mild steel pipe
5.6.2 Bare Riser with Corrosion
The mild steel pipe was machined with a 93mm × 8mm (length × width) cut-out,
equivalent to 50% loss in wall thickness to simulate a corrosion defect at the
centre of the pipe. In the FE model, the section thickness for a predetermined set
of elements was defined accordingly while all other portions remains as the
original thickness of the pipe, as shown in a contour plot in Figure 5-14.
Figure 5-14, Section thickness of pipe in FE model
A comparison of the results between the experimental and the FE model is shown
in Figure 5-15. A minor discrepancy exist where the simulated model predicted

163
a greater capability to sustain higher bending load at the same strain.. One of the
potential reasons for this discrepancy could be attributed to the edges of the
machined corrosion defect where stress concentration can occur. Due to the
relatively large surface of the gauge element on the scaled-down corrosion defect,
higher strain values adjacent to the edges of the defect can be recorded.
Figure 5-15, Experiment and FE results of corroded mild steel pipe
A third order polynomial curve fit was performed on the experimental data pair
to filters out the recorded noise in the test and to produces strain output at specific
load increments where comparison between the simulation and experimental
data set can be carried out. Figure 5-16 shows the curve of the raw experimental
data plotted using approximately 9600 data points and the polynomial curve
fitted using 20 data points. Both curves show good agreement with coefficient
of determination, R2 of the fitted polynomial curve being higher than 0.995.
Using the data points of the polynomial curve, the percentage difference and root
mean square (RMS) error between the experimental and simulation results were
calculated. The same computation was done for the rest of the specimens, i.e.
bare pipe without corrosion and corroded pipe repaired with varying fibre
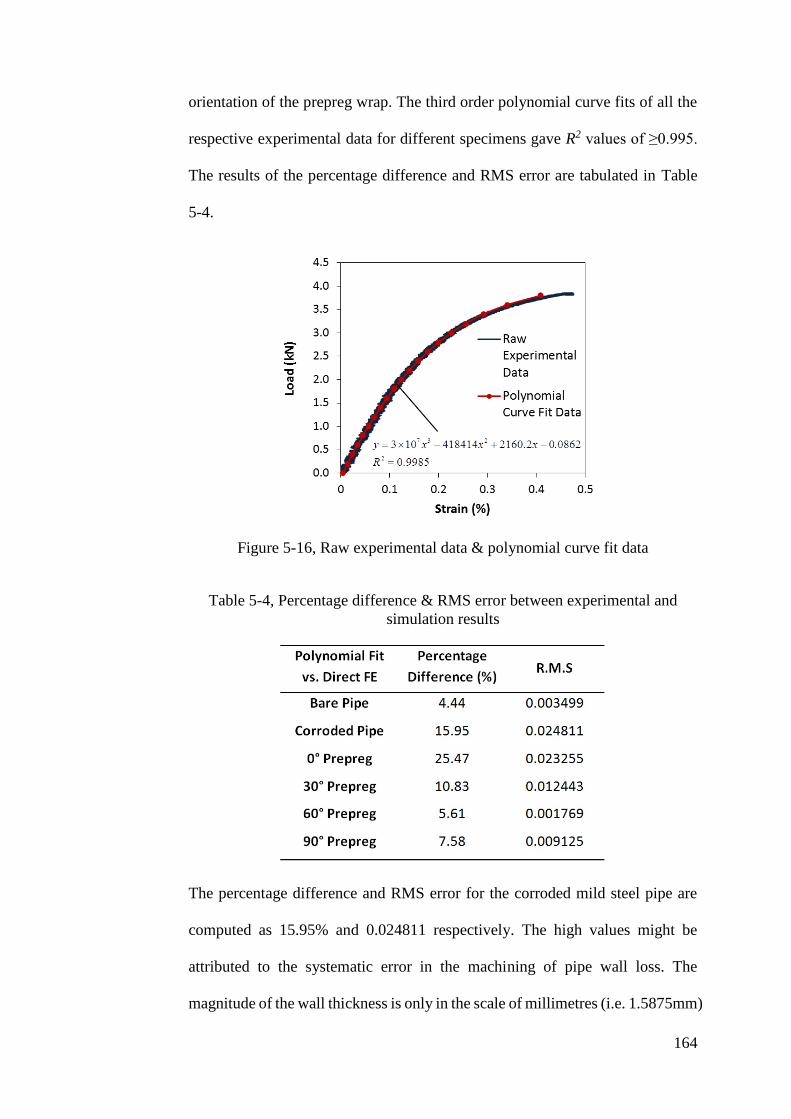
164
orientation of the prepreg wrap. The third order polynomial curve fits of all the
respective experimental data for different specimens gave R2 values of ≥0.995.
The results of the percentage difference and RMS error are tabulated in Table
5-4.
Figure 5-16, Raw experimental data & polynomial curve fit data
Table 5-4, Percentage difference & RMS error between experimental and
simulation results
The percentage difference and RMS error for the corroded mild steel pipe are
computed as 15.95% and 0.024811 respectively. The high values might be
attributed to the systematic error in the machining of pipe wall loss. The
magnitude of the wall thickness is only in the scale of millimetres (i.e. 1.5875mm)
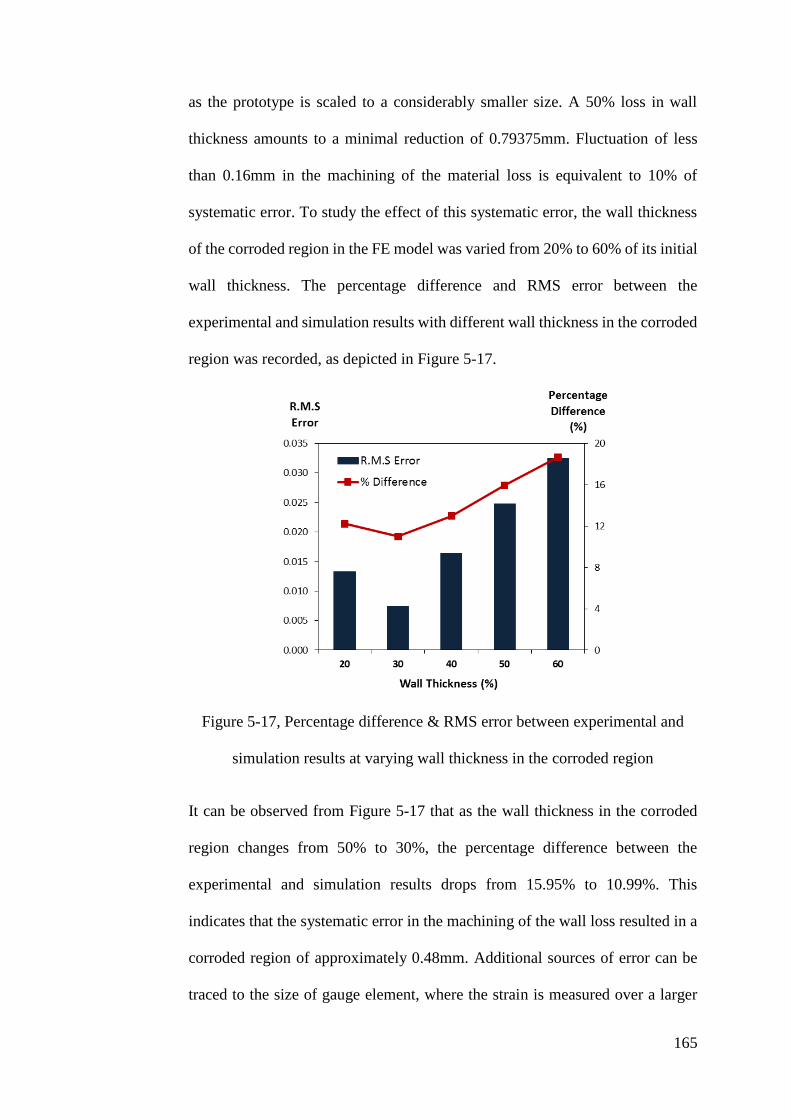
165
as the prototype is scaled to a considerably smaller size. A 50% loss in wall
thickness amounts to a minimal reduction of 0.79375mm. Fluctuation of less
than 0.16mm in the machining of the material loss is equivalent to 10% of
systematic error. To study the effect of this systematic error, the wall thickness
of the corroded region in the FE model was varied from 20% to 60% of its initial
wall thickness. The percentage difference and RMS error between the
experimental and simulation results with different wall thickness in the corroded
region was recorded, as depicted in Figure 5-17.
Figure 5-17, Percentage difference & RMS error between experimental and
simulation results at varying wall thickness in the corroded region
It can be observed from Figure 5-17 that as the wall thickness in the corroded
region changes from 50% to 30%, the percentage difference between the
experimental and simulation results drops from 15.95% to 10.99%. This
indicates that the systematic error in the machining of the wall loss resulted in a
corroded region of approximately 0.48mm. Additional sources of error can be
traced to the size of gauge element, where the strain is measured over a larger
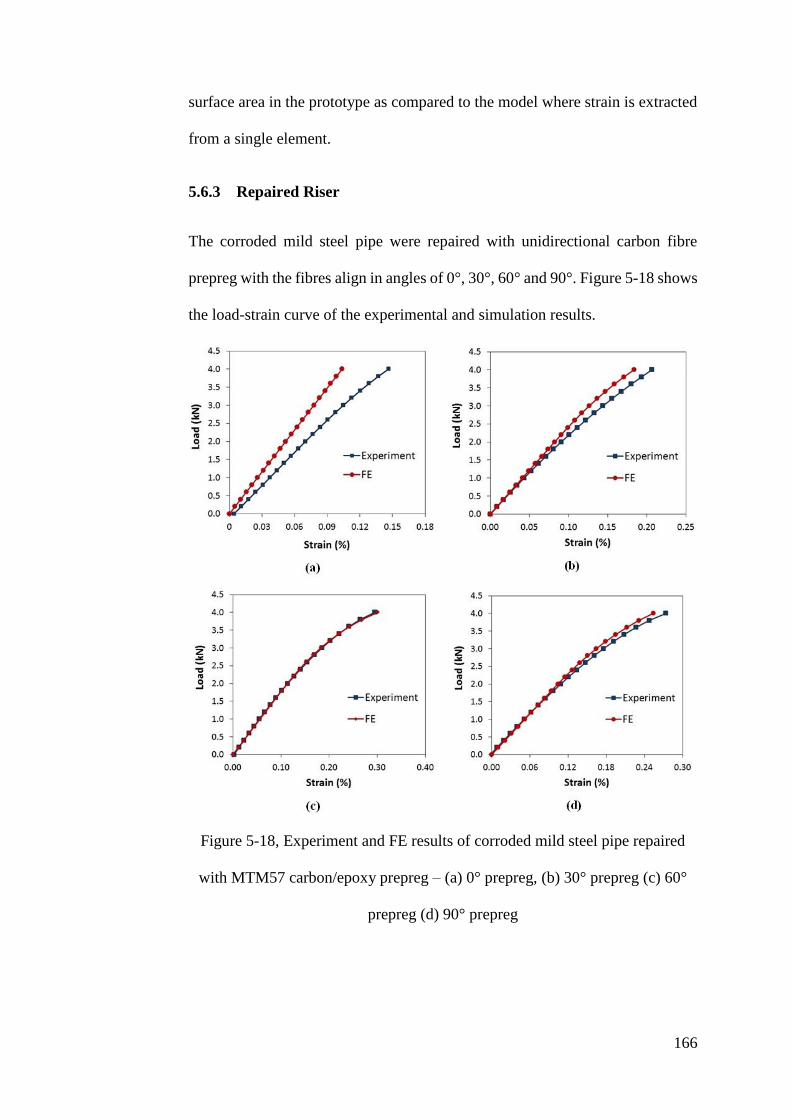
166
surface area in the prototype as compared to the model where strain is extracted
from a single element.
5.6.3 Repaired Riser
The corroded mild steel pipe were repaired with unidirectional carbon fibre
prepreg with the fibres align in angles of 0°, 30°, 60° and 90°. Figure 5-18 shows
the load-strain curve of the experimental and simulation results.
Figure 5-18, Experiment and FE results of corroded mild steel pipe repaired
with MTM57 carbon/epoxy prepreg – (a) 0° prepreg, (b) 30° prepreg (c) 60°
prepreg (d) 90° prepreg
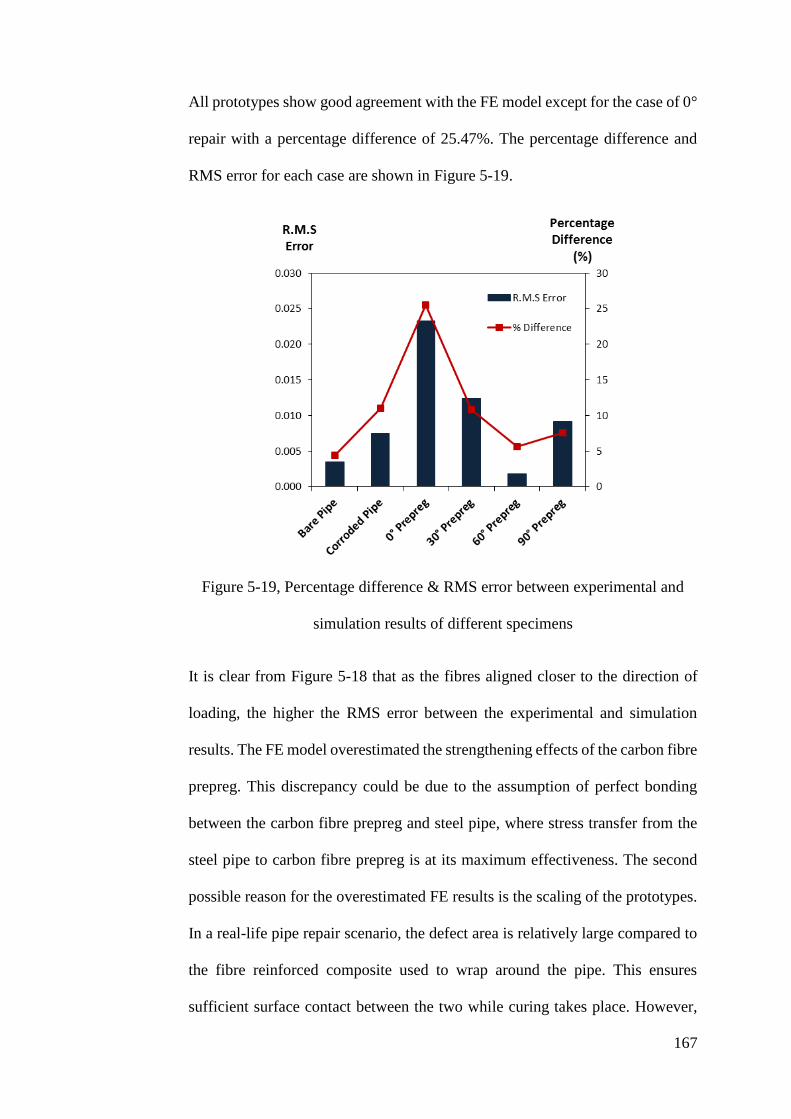
167
All prototypes show good agreement with the FE model except for the case of 0°
repair with a percentage difference of 25.47%. The percentage difference and
RMS error for each case are shown in Figure 5-19.
Figure 5-19, Percentage difference & RMS error between experimental and
simulation results of different specimens
It is clear from Figure 5-18 that as the fibres aligned closer to the direction of
loading, the higher the RMS error between the experimental and simulation
results. The FE model overestimated the strengthening effects of the carbon fibre
prepreg. This discrepancy could be due to the assumption of perfect bonding
between the carbon fibre prepreg and steel pipe, where stress transfer from the
steel pipe to carbon fibre prepreg is at its maximum effectiveness. The second
possible reason for the overestimated FE results is the scaling of the prototypes.
In a real-life pipe repair scenario, the defect area is relatively large compared to
the fibre reinforced composite used to wrap around the pipe. This ensures
sufficient surface contact between the two while curing takes place. However,
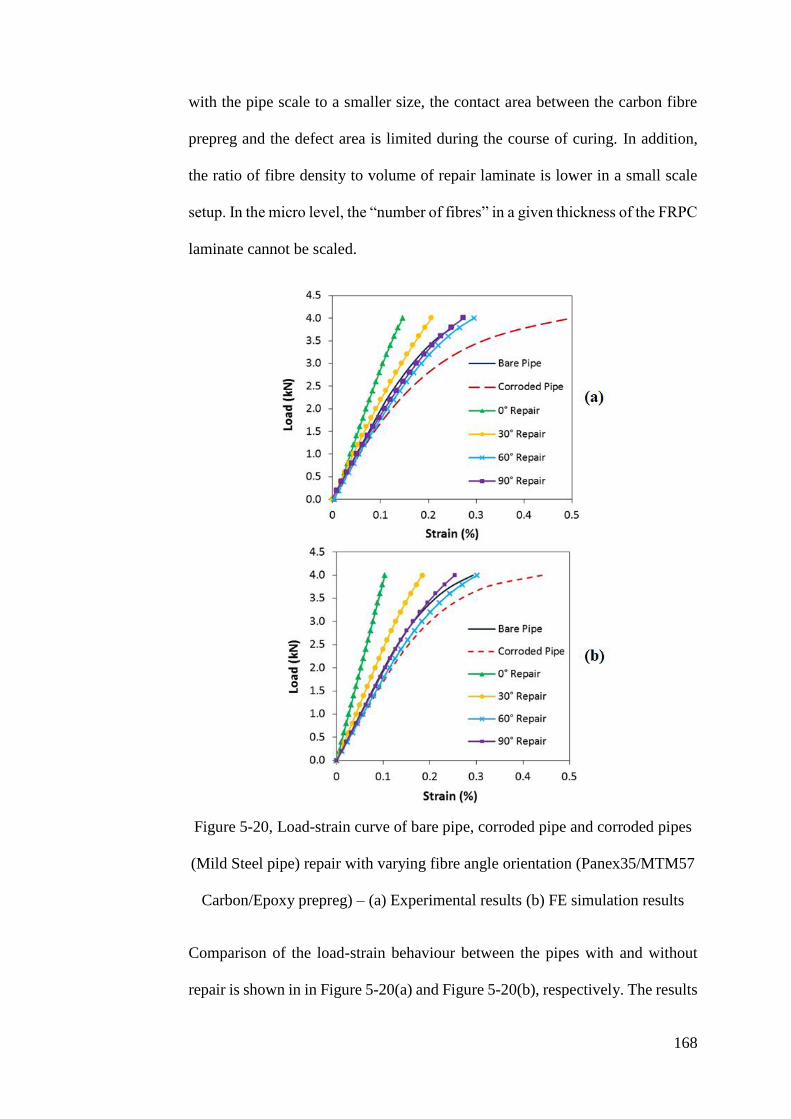
168
with the pipe scale to a smaller size, the contact area between the carbon fibre
prepreg and the defect area is limited during the course of curing. In addition,
the ratio of fibre density to volume of repair laminate is lower in a small scale
setup. In the micro level, the “number of fibres” in a given thickness of the FRPC
laminate cannot be scaled.
Figure 5-20, Load-strain curve of bare pipe, corroded pipe and corroded pipes
(Mild Steel pipe) repair with varying fibre angle orientation (Panex35/MTM57
Carbon/Epoxy prepreg) – (a) Experimental results (b) FE simulation results
Comparison of the load-strain behaviour between the pipes with and without
repair is shown in in Figure 5-20(a) and Figure 5-20(b), respectively. The results
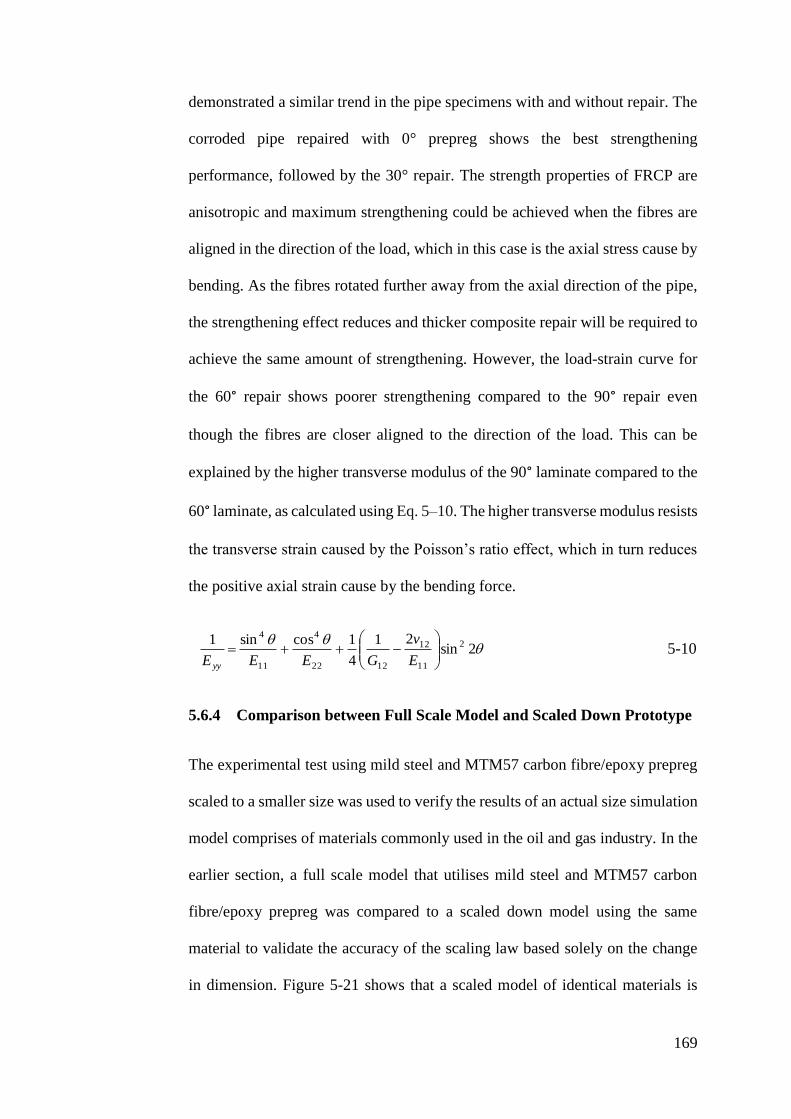
169
demonstrated a similar trend in the pipe specimens with and without repair. The
corroded pipe repaired with 0° prepreg shows the best strengthening
performance, followed by the 30° repair. The strength properties of FRCP are
anisotropic and maximum strengthening could be achieved when the fibres are
aligned in the direction of the load, which in this case is the axial stress cause by
bending. As the fibres rotated further away from the axial direction of the pipe,
the strengthening effect reduces and thicker composite repair will be required to
achieve the same amount of strengthening. However, the load-strain curve for
the 60° repair shows poorer strengthening compared to the 90° repair even
though the fibres are closer aligned to the direction of the load. This can be
explained by the higher transverse modulus of the 90° laminate compared to the
60° laminate, as calculated using Eq. 5–10. The higher transverse modulus resists
the transverse strain caused by the Poisson’s ratio effect, which in turn reduces
the positive axial strain cause by the bending force.
2sin21
4
1cossin1 2
11
12
1222
4
11
4
E
v
GEEE yy
5-10
5.6.4 Comparison between Full Scale Model and Scaled Down Prototype
The experimental test using mild steel and MTM57 carbon fibre/epoxy prepreg
scaled to a smaller size was used to verify the results of an actual size simulation
model comprises of materials commonly used in the oil and gas industry. In the
earlier section, a full scale model that utilises mild steel and MTM57 carbon
fibre/epoxy prepreg was compared to a scaled down model using the same
material to validate the accuracy of the scaling law based solely on the change
in dimension. Figure 5-21 shows that a scaled model of identical materials is
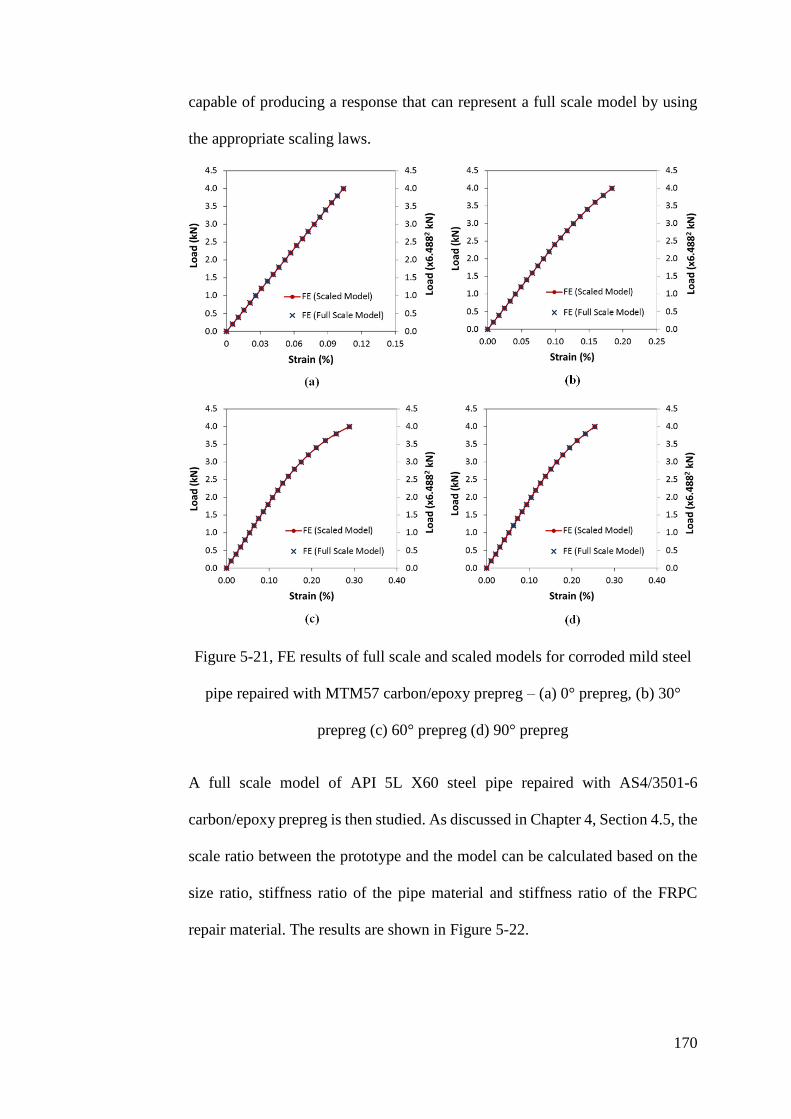
170
capable of producing a response that can represent a full scale model by using
the appropriate scaling laws.
Figure 5-21, FE results of full scale and scaled models for corroded mild steel
pipe repaired with MTM57 carbon/epoxy prepreg – (a) 0° prepreg, (b) 30°
prepreg (c) 60° prepreg (d) 90° prepreg
A full scale model of API 5L X60 steel pipe repaired with AS4/3501-6
carbon/epoxy prepreg is then studied. As discussed in Chapter 4, Section 4.5, the
scale ratio between the prototype and the model can be calculated based on the
size ratio, stiffness ratio of the pipe material and stiffness ratio of the FRPC
repair material. The results are shown in Figure 5-22.
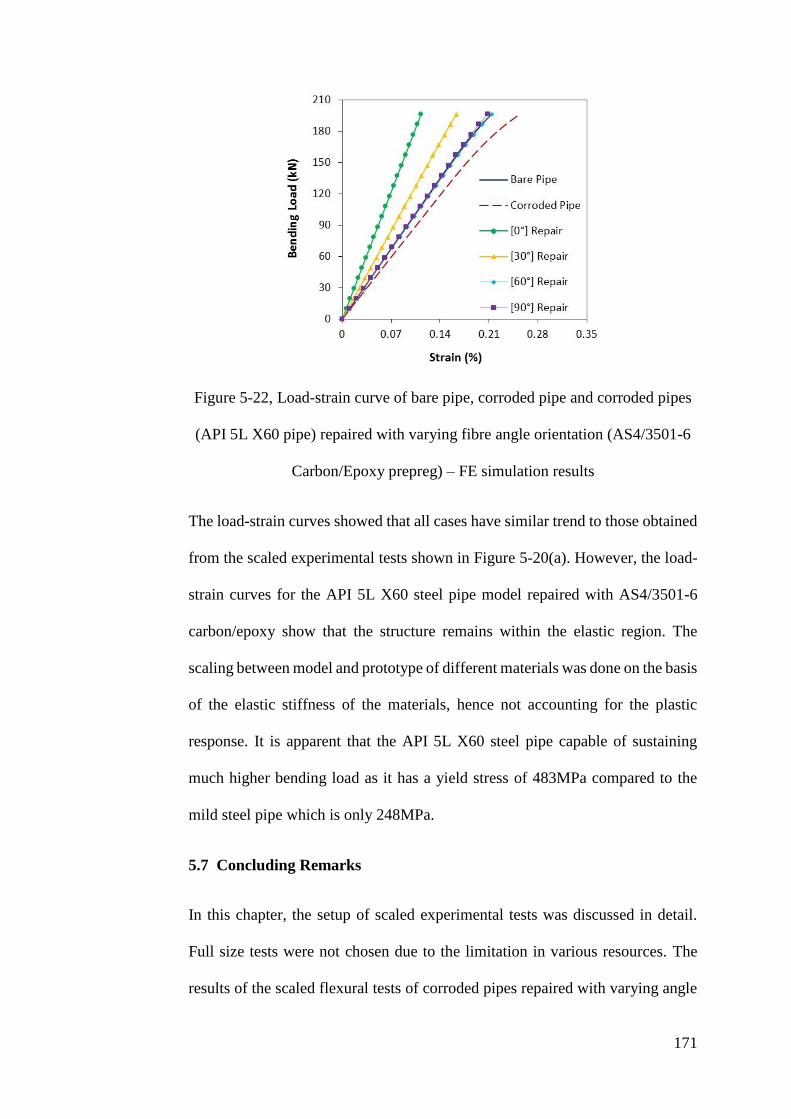
171
Figure 5-22, Load-strain curve of bare pipe, corroded pipe and corroded pipes
(API 5L X60 pipe) repaired with varying fibre angle orientation (AS4/3501-6
Carbon/Epoxy prepreg) – FE simulation results
The load-strain curves showed that all cases have similar trend to those obtained
from the scaled experimental tests shown in Figure 5-20(a). However, the load-
strain curves for the API 5L X60 steel pipe model repaired with AS4/3501-6
carbon/epoxy show that the structure remains within the elastic region. The
scaling between model and prototype of different materials was done on the basis
of the elastic stiffness of the materials, hence not accounting for the plastic
response. It is apparent that the API 5L X60 steel pipe capable of sustaining
much higher bending load as it has a yield stress of 483MPa compared to the
mild steel pipe which is only 248MPa.
5.7 Concluding Remarks
In this chapter, the setup of scaled experimental tests was discussed in detail.
Full size tests were not chosen due to the limitation in various resources. The
results of the scaled flexural tests of corroded pipes repaired with varying angle
172
orientations of FRPC showed a similar trend to those simulated in the FEA
model. Using the similitude relations developed, the FEA models show good
agreement with the small scale experimental tests, particularly within the elastic
region of the stress-strain response, with percentage differences of
approximately 2% to 13% for corroded risers repaired with [30°], [60°] and [90°]
FRPC prepreg. The study of the CRS for corroded risers is conducted via the
combination of limit state analysis and FEA model, where the stress-strain
values at design condition (elastic response) are considered. With these
experimental test results, the accuracy of the FEA model at design conditions is
further strengthened, and the parametric study of the CRS in repairing corroded
risers can be conducted using the FEA model.
173
Chapter 6 Parametric Study of Composite Repair
System for Offshore Riser
6.1 Introduction
The previous chapters demonstrated that FEA modelling could serve as an
effective method for the optimisation oil and gas pipelines CRS and the
simulated static and dynamic behaviours of the CRS are broadly within
reasonable accuracy. Within the FEA model, the optimized element type, mesh
refinement, boundary conditions, interaction properties and loads were
established. In the current chapter, the developed model was used to conduct a
multi-variables study on the effects of process parameters and material
compositions on the performance of the CRS. The parameters being studied
include the type of reinforcement fibre, types of laminate orientation, wrapping
angle of the FRPC, thickness and length of the repair laminate, and the geometry
of the corrosion. For application in the pipeline industries, the study taken into
consideration where the parameters must be transferrable to the construction of
an automated CRS repair machine. A series of externally applied loads were
employed in the current study, the different load profiles are summarised in
Figure 6.1 below.
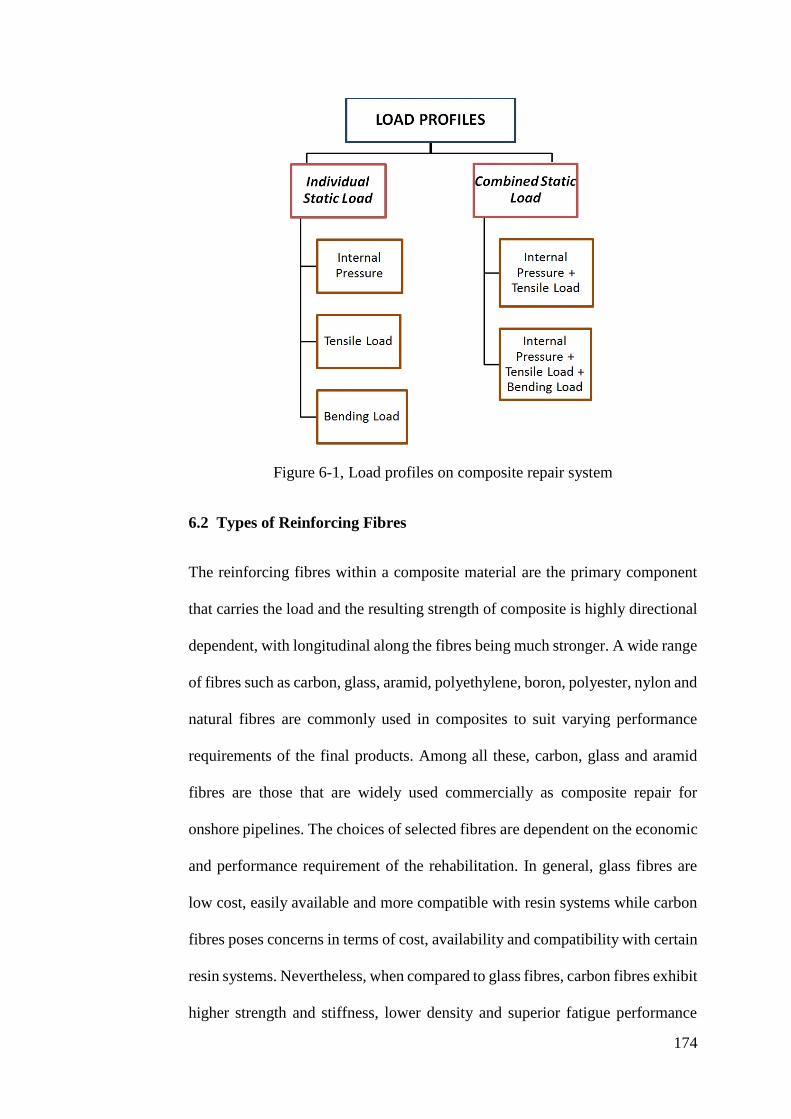
174
Figure 6-1, Load profiles on composite repair system
6.2 Types of Reinforcing Fibres
The reinforcing fibres within a composite material are the primary component
that carries the load and the resulting strength of composite is highly directional
dependent, with longitudinal along the fibres being much stronger. A wide range
of fibres such as carbon, glass, aramid, polyethylene, boron, polyester, nylon and
natural fibres are commonly used in composites to suit varying performance
requirements of the final products. Among all these, carbon, glass and aramid
fibres are those that are widely used commercially as composite repair for
onshore pipelines. The choices of selected fibres are dependent on the economic
and performance requirement of the rehabilitation. In general, glass fibres are
low cost, easily available and more compatible with resin systems while carbon
fibres poses concerns in terms of cost, availability and compatibility with certain
resin systems. Nevertheless, when compared to glass fibres, carbon fibres exhibit
higher strength and stiffness, lower density and superior fatigue performance
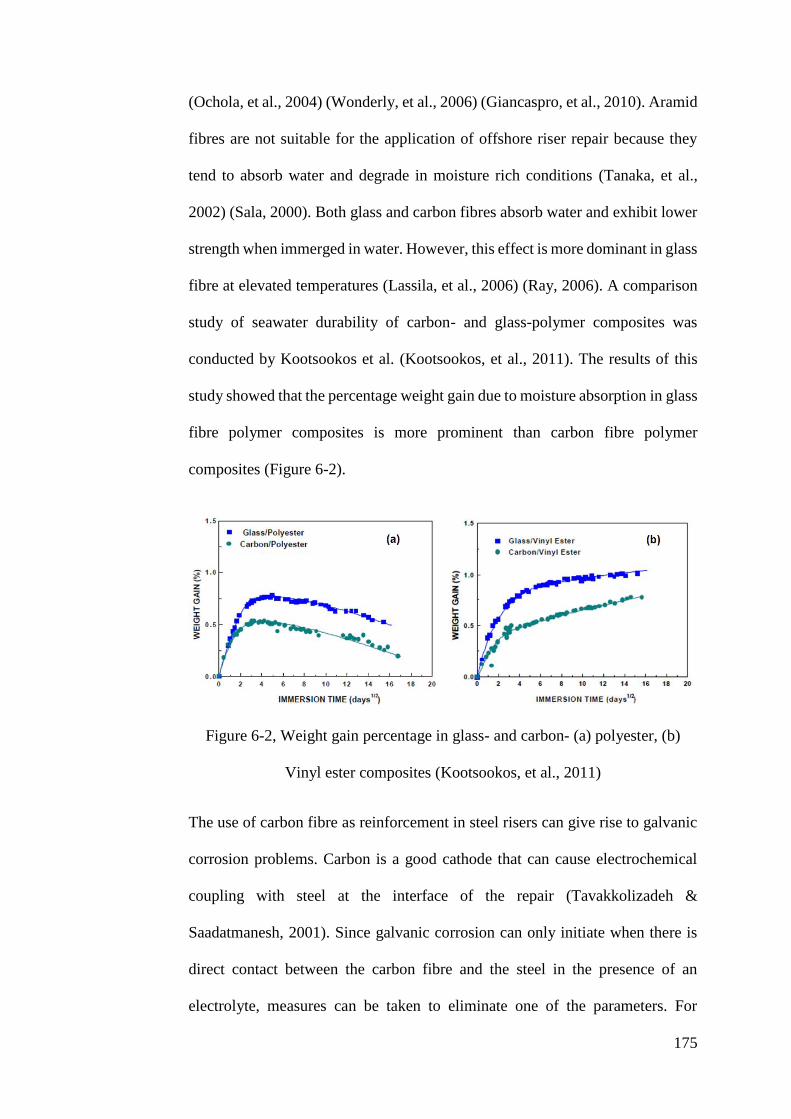
175
(Ochola, et al., 2004) (Wonderly, et al., 2006) (Giancaspro, et al., 2010). Aramid
fibres are not suitable for the application of offshore riser repair because they
tend to absorb water and degrade in moisture rich conditions (Tanaka, et al.,
2002) (Sala, 2000). Both glass and carbon fibres absorb water and exhibit lower
strength when immerged in water. However, this effect is more dominant in glass
fibre at elevated temperatures (Lassila, et al., 2006) (Ray, 2006). A comparison
study of seawater durability of carbon- and glass-polymer composites was
conducted by Kootsookos et al. (Kootsookos, et al., 2011). The results of this
study showed that the percentage weight gain due to moisture absorption in glass
fibre polymer composites is more prominent than carbon fibre polymer
composites (Figure 6-2).
Figure 6-2, Weight gain percentage in glass- and carbon- (a) polyester, (b)
Vinyl ester composites (Kootsookos, et al., 2011)
The use of carbon fibre as reinforcement in steel risers can give rise to galvanic
corrosion problems. Carbon is a good cathode that can cause electrochemical
coupling with steel at the interface of the repair (Tavakkolizadeh &
Saadatmanesh, 2001). Since galvanic corrosion can only initiate when there is
direct contact between the carbon fibre and the steel in the presence of an
electrolyte, measures can be taken to eliminate one of the parameters. For
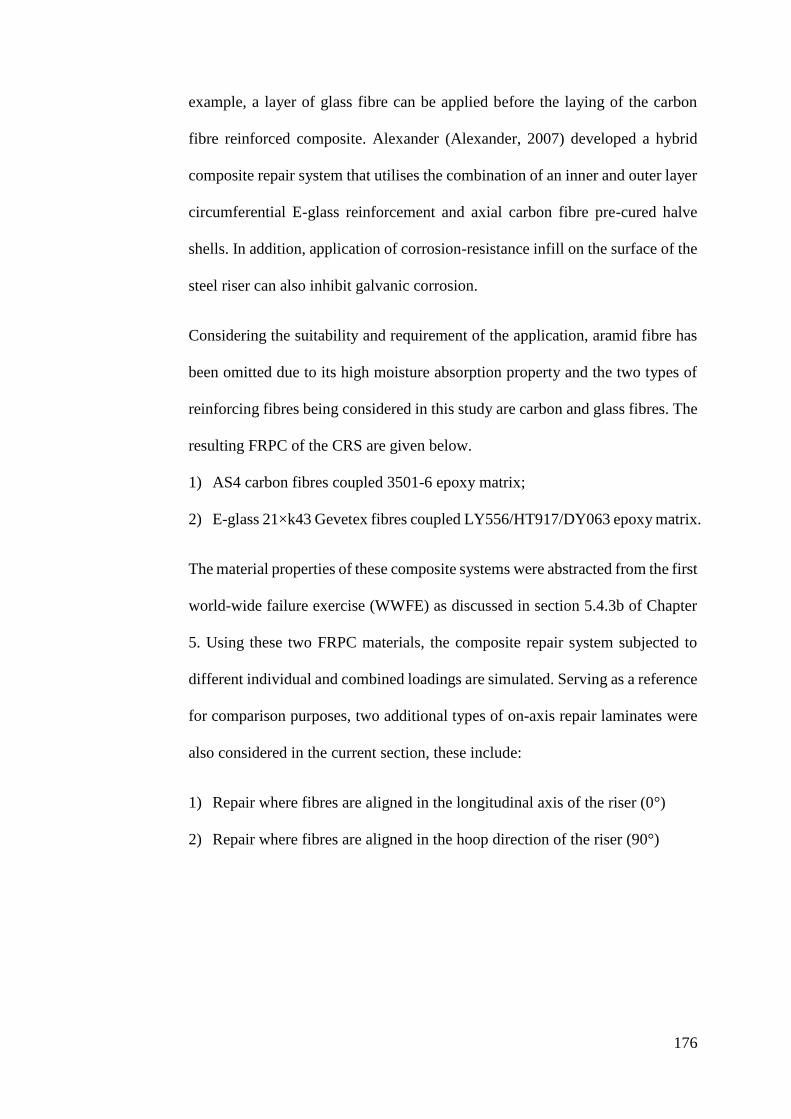
176
example, a layer of glass fibre can be applied before the laying of the carbon
fibre reinforced composite. Alexander (Alexander, 2007) developed a hybrid
composite repair system that utilises the combination of an inner and outer layer
circumferential E-glass reinforcement and axial carbon fibre pre-cured halve
shells. In addition, application of corrosion-resistance infill on the surface of the
steel riser can also inhibit galvanic corrosion.
Considering the suitability and requirement of the application, aramid fibre has
been omitted due to its high moisture absorption property and the two types of
reinforcing fibres being considered in this study are carbon and glass fibres. The
resulting FRPC of the CRS are given below.
1) AS4 carbon fibres coupled 3501-6 epoxy matrix;
2) E-glass 21×k43 Gevetex fibres coupled LY556/HT917/DY063 epoxy matrix.
The material properties of these composite systems were abstracted from the first
world-wide failure exercise (WWFE) as discussed in section 5.4.3b of Chapter
5. Using these two FRPC materials, the composite repair system subjected to
different individual and combined loadings are simulated. Serving as a reference
for comparison purposes, two additional types of on-axis repair laminates were
also considered in the current section, these include:
1) Repair where fibres are aligned in the longitudinal axis of the riser (0°)
2) Repair where fibres are aligned in the hoop direction of the riser (90°)
177
6.2.1 Individual Static Load
6.2.1a Internal Pressure, Pint
As described in Section 3.2.1 of Chapter 3, internal pressure is one of the main
loadings sustained by a riser. Figure 6-3 shows the plot of internal pressure
against hoop strain for CRS with [0°] and [90°] laminates.
Figure 6-3, Internal pressure vs. hoop strain of corroded riser repaired with [0°]
and [90°] laminates
The enlarged section shows that for the case of corroded risers repaired with [0°]
carbon/epoxy laminate and E-glass/epoxy laminate, both system experienced
hoop strain closed to the maximum permissible hoop strain, h-max at design load
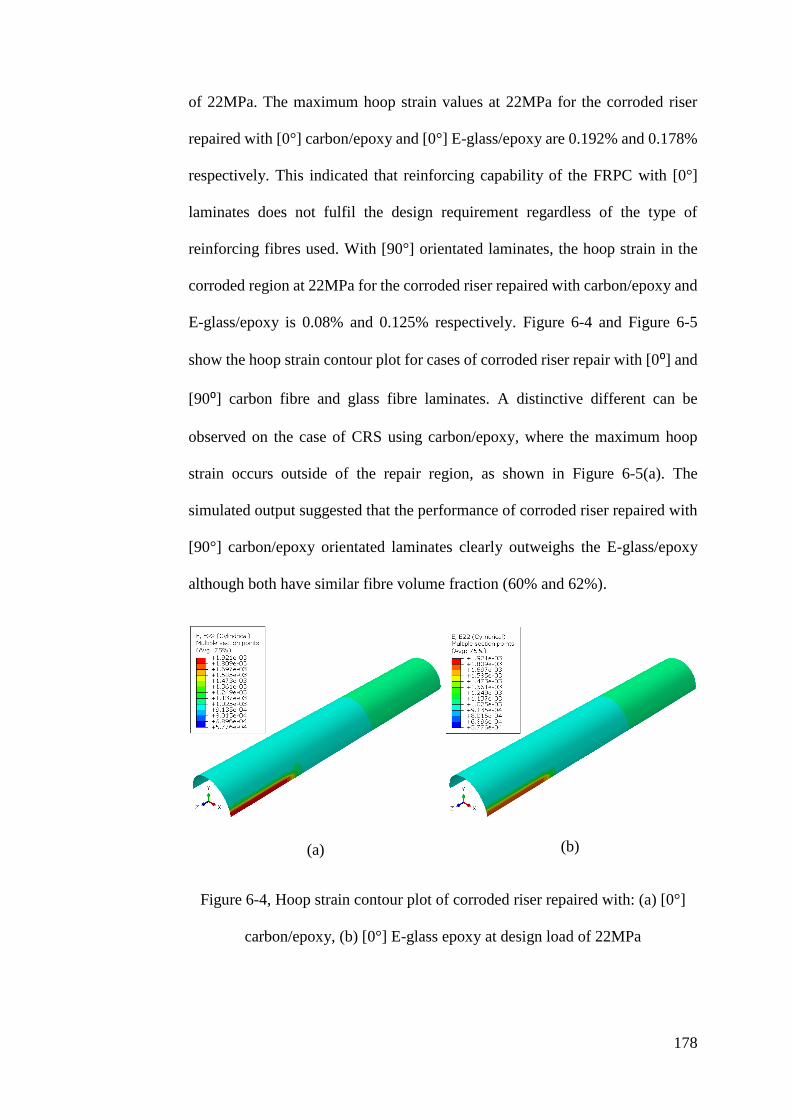
178
of 22MPa. The maximum hoop strain values at 22MPa for the corroded riser
repaired with [0°] carbon/epoxy and [0°] E-glass/epoxy are 0.192% and 0.178%
respectively. This indicated that reinforcing capability of the FRPC with [0°]
laminates does not fulfil the design requirement regardless of the type of
reinforcing fibres used. With [90°] orientated laminates, the hoop strain in the
corroded region at 22MPa for the corroded riser repaired with carbon/epoxy and
E-glass/epoxy is 0.08% and 0.125% respectively. Figure 6-4 and Figure 6-5
show the hoop strain contour plot for cases of corroded riser repair with [0⁰] and
[90⁰] carbon fibre and glass fibre laminates. A distinctive different can be
observed on the case of CRS using carbon/epoxy, where the maximum hoop
strain occurs outside of the repair region, as shown in Figure 6-5(a). The
simulated output suggested that the performance of corroded riser repaired with
[90°] carbon/epoxy orientated laminates clearly outweighs the E-glass/epoxy
although both have similar fibre volume fraction (60% and 62%).
(a)
(b)
Figure 6-4, Hoop strain contour plot of corroded riser repaired with: (a) [0°]
carbon/epoxy, (b) [0°] E-glass epoxy at design load of 22MPa
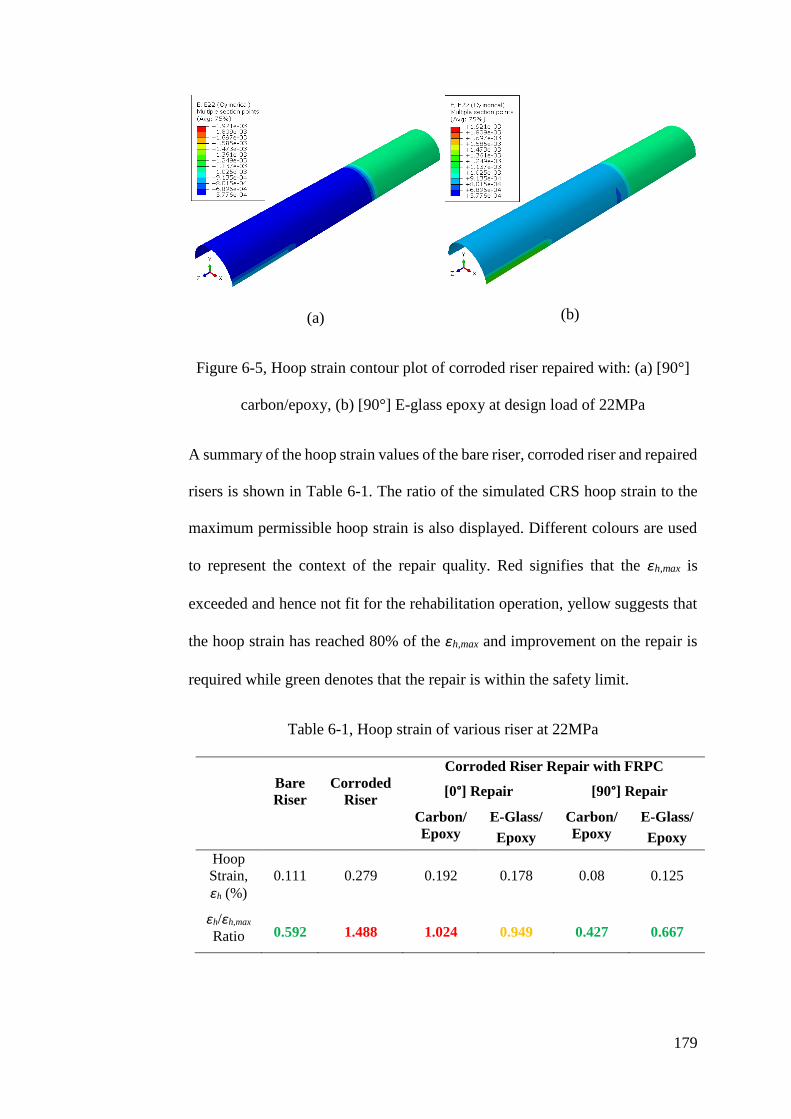
179
(a)
(b)
Figure 6-5, Hoop strain contour plot of corroded riser repaired with: (a) [90°]
carbon/epoxy, (b) [90°] E-glass epoxy at design load of 22MPa
A summary of the hoop strain values of the bare riser, corroded riser and repaired
risers is shown in Table 6-1. The ratio of the simulated CRS hoop strain to the
maximum permissible hoop strain is also displayed. Different colours are used
to represent the context of the repair quality. Red signifies that the ɛh,max is
exceeded and hence not fit for the rehabilitation operation, yellow suggests that
the hoop strain has reached 80% of the ɛh,max and improvement on the repair is
required while green denotes that the repair is within the safety limit.
Table 6-1, Hoop strain of various riser at 22MPa
Bare
Riser
Corroded
Riser
Corroded Riser Repair with FRPC
[0°] Repair [90°] Repair
Carbon/
Epoxy
E-Glass/
Epoxy
Carbon/
Epoxy
E-Glass/
Epoxy
Hoop
Strain,
ɛh (%)
0.111
0.279
0.192
0.178
0.08
0.125
ɛh/ɛh,max
Ratio 0.592 1.488 1.024 0.949 0.427 0.667
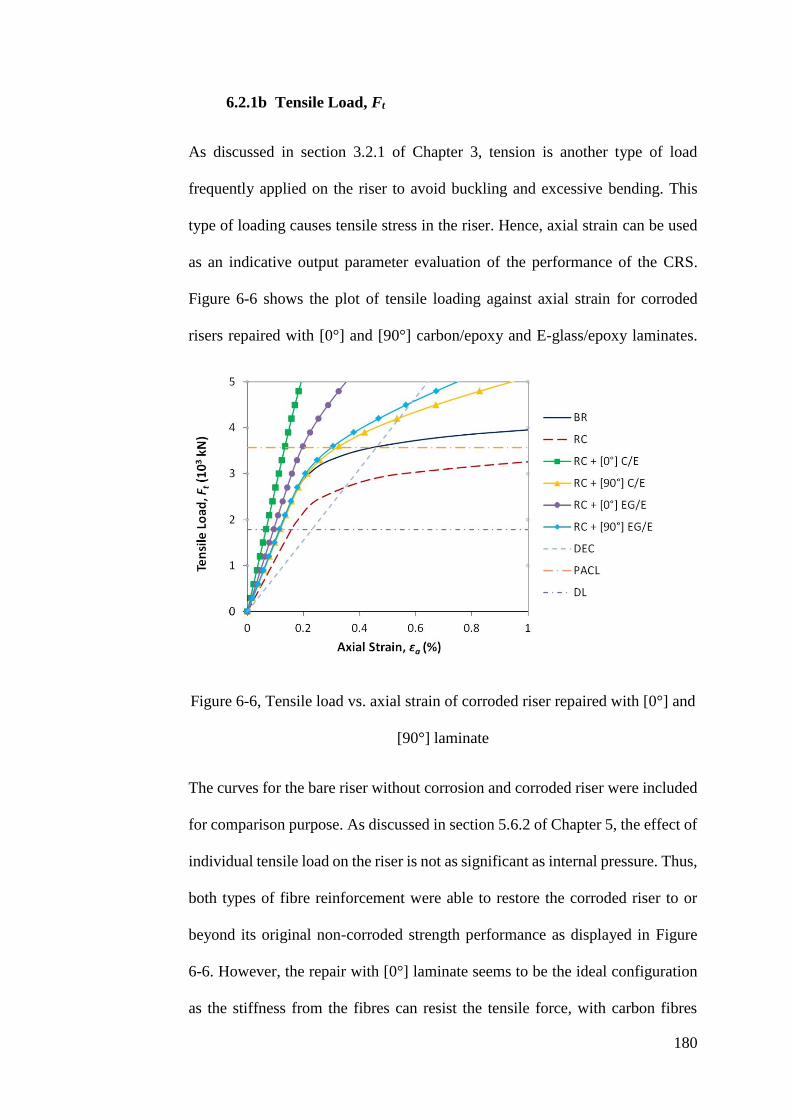
180
6.2.1b Tensile Load, Ft
As discussed in section 3.2.1 of Chapter 3, tension is another type of load
frequently applied on the riser to avoid buckling and excessive bending. This
type of loading causes tensile stress in the riser. Hence, axial strain can be used
as an indicative output parameter evaluation of the performance of the CRS.
Figure 6-6 shows the plot of tensile loading against axial strain for corroded
risers repaired with [0°] and [90°] carbon/epoxy and E-glass/epoxy laminates.
Figure 6-6, Tensile load vs. axial strain of corroded riser repaired with [0°] and
[90°] laminate
The curves for the bare riser without corrosion and corroded riser were included
for comparison purpose. As discussed in section 5.6.2 of Chapter 5, the effect of
individual tensile load on the riser is not as significant as internal pressure. Thus,
both types of fibre reinforcement were able to restore the corroded riser to or
beyond its original non-corroded strength performance as displayed in Figure
6-6. However, the repair with [0°] laminate seems to be the ideal configuration
as the stiffness from the fibres can resist the tensile force, with carbon fibres
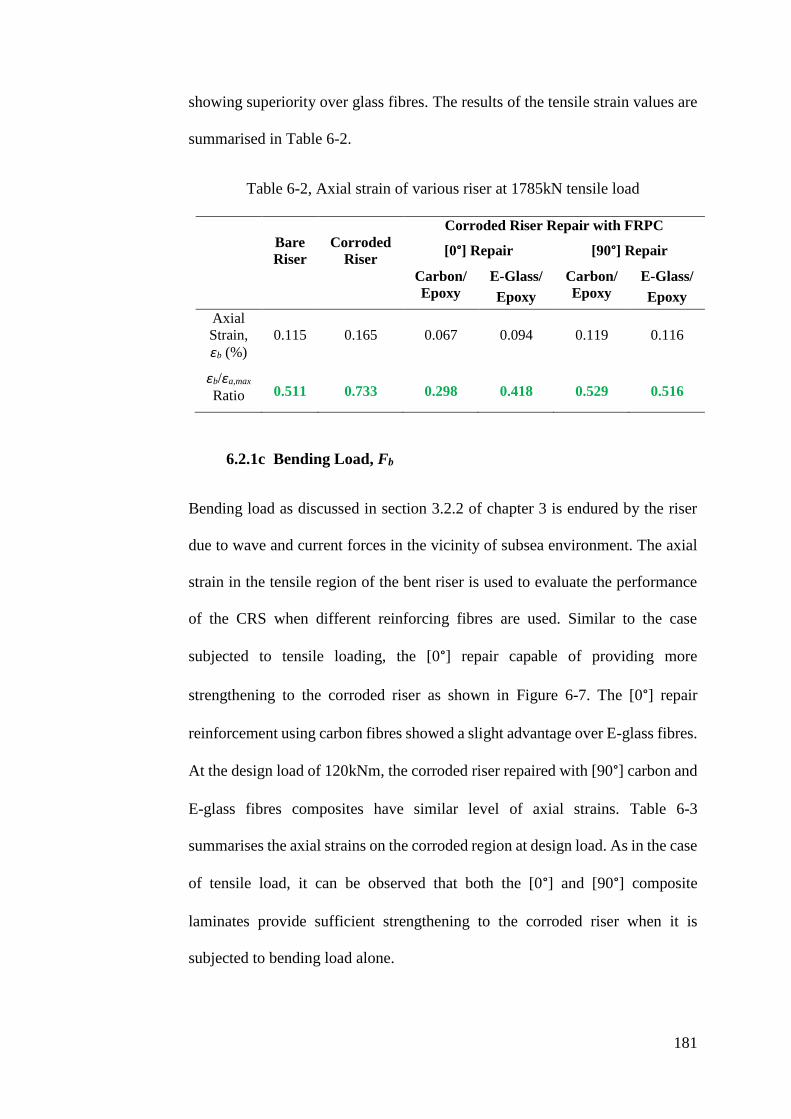
181
showing superiority over glass fibres. The results of the tensile strain values are
summarised in Table 6-2.
Table 6-2, Axial strain of various riser at 1785kN tensile load
Bare
Riser
Corroded
Riser
Corroded Riser Repair with FRPC
[0°] Repair [90°] Repair
Carbon/
Epoxy
E-Glass/
Epoxy
Carbon/
Epoxy
E-Glass/
Epoxy
Axial
Strain,
ɛb (%)
0.115
0.165
0.067
0.094
0.119
0.116
ɛb/ɛa,max
Ratio 0.511 0.733 0.298 0.418 0.529 0.516
6.2.1c Bending Load, Fb
Bending load as discussed in section 3.2.2 of chapter 3 is endured by the riser
due to wave and current forces in the vicinity of subsea environment. The axial
strain in the tensile region of the bent riser is used to evaluate the performance
of the CRS when different reinforcing fibres are used. Similar to the case
subjected to tensile loading, the [0°] repair capable of providing more
strengthening to the corroded riser as shown in Figure 6-7. The [0°] repair
reinforcement using carbon fibres showed a slight advantage over E-glass fibres.
At the design load of 120kNm, the corroded riser repaired with [90°] carbon and
E-glass fibres composites have similar level of axial strains. Table 6-3
summarises the axial strains on the corroded region at design load. As in the case
of tensile load, it can be observed that both the [0°] and [90°] composite
laminates provide sufficient strengthening to the corroded riser when it is
subjected to bending load alone.
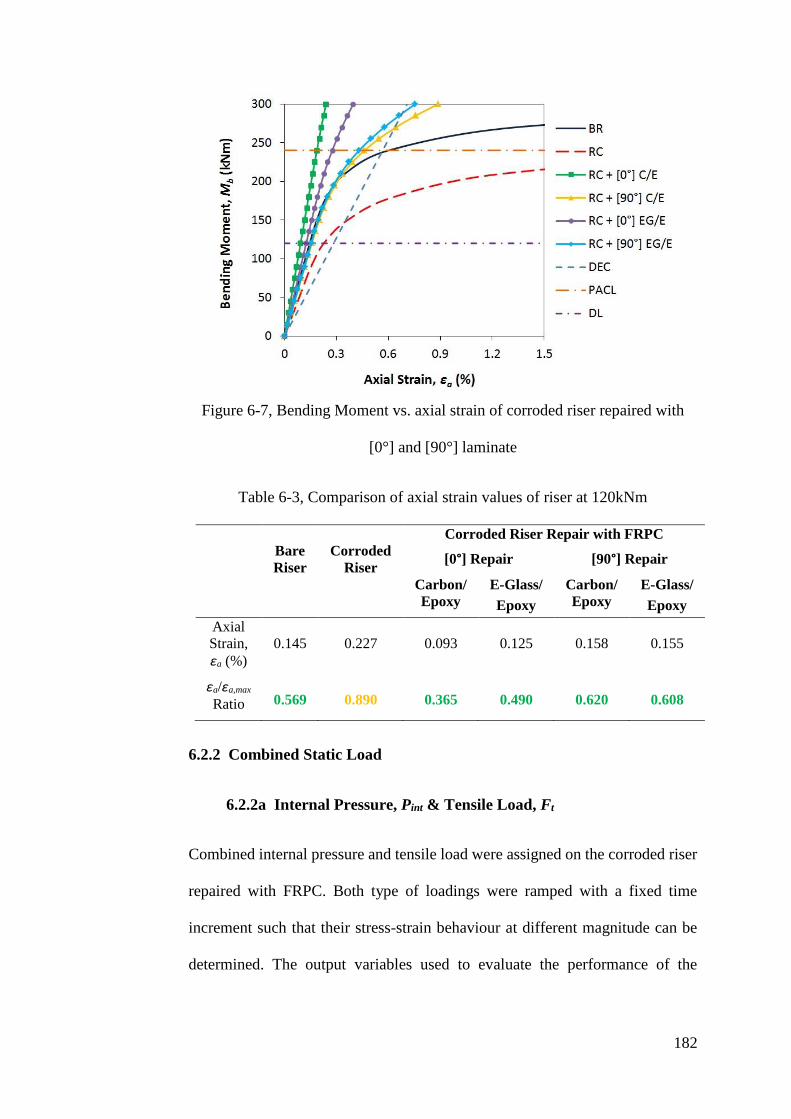
182
Figure 6-7, Bending Moment vs. axial strain of corroded riser repaired with
[0°] and [90°] laminate
Table 6-3, Comparison of axial strain values of riser at 120kNm
Bare
Riser
Corroded
Riser
Corroded Riser Repair with FRPC
[0°] Repair [90°] Repair
Carbon/
Epoxy
E-Glass/
Epoxy
Carbon/
Epoxy
E-Glass/
Epoxy
Axial
Strain,
ɛa (%)
0.145
0.227
0.093
0.125
0.158
0.155
ɛa/ɛa,max
Ratio 0.569 0.890 0.365 0.490 0.620 0.608
6.2.2 Combined Static Load
6.2.2a Internal Pressure, Pint & Tensile Load, Ft
Combined internal pressure and tensile load were assigned on the corroded riser
repaired with FRPC. Both type of loadings were ramped with a fixed time
increment such that their stress-strain behaviour at different magnitude can be
determined. The output variables used to evaluate the performance of the
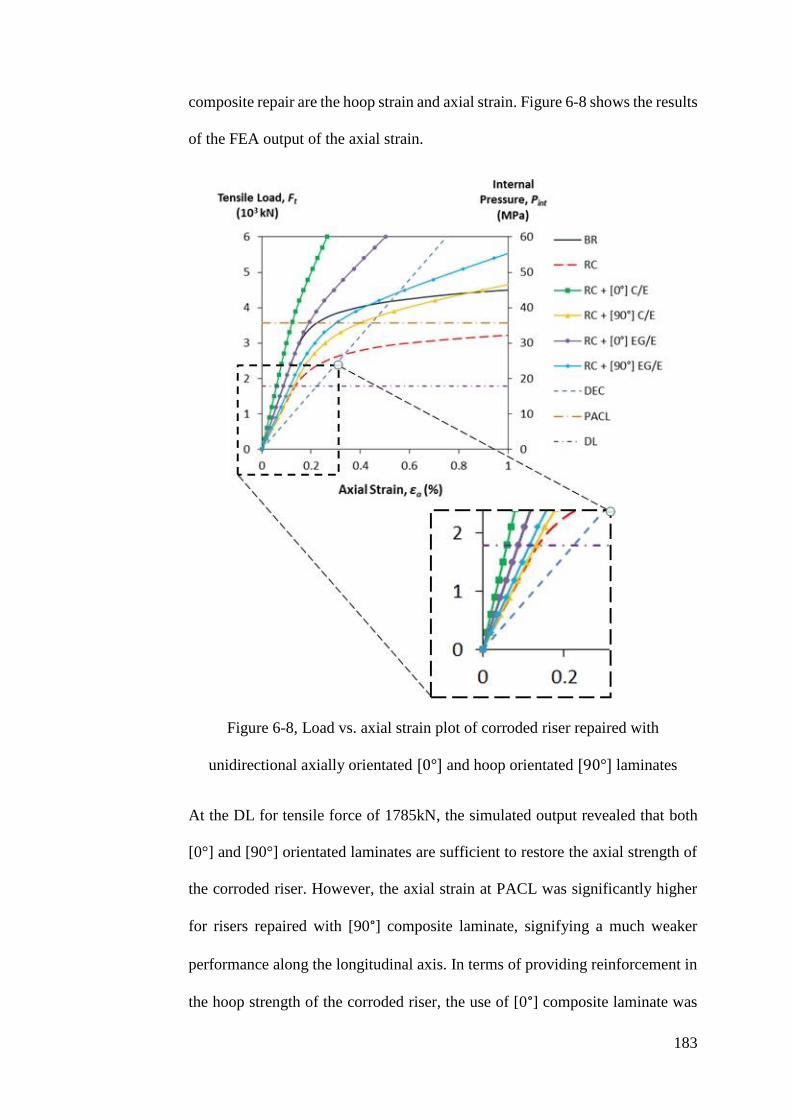
183
composite repair are the hoop strain and axial strain. Figure 6-8 shows the results
of the FEA output of the axial strain.
Figure 6-8, Load vs. axial strain plot of corroded riser repaired with
unidirectional axially orientated [0°] and hoop orientated [90°] laminates
At the DL for tensile force of 1785kN, the simulated output revealed that both
[0°] and [90°] orientated laminates are sufficient to restore the axial strength of
the corroded riser. However, the axial strain at PACL was significantly higher
for risers repaired with [90°] composite laminate, signifying a much weaker
performance along the longitudinal axis. In terms of providing reinforcement in
the hoop strength of the corroded riser, the use of [0°] composite laminate was
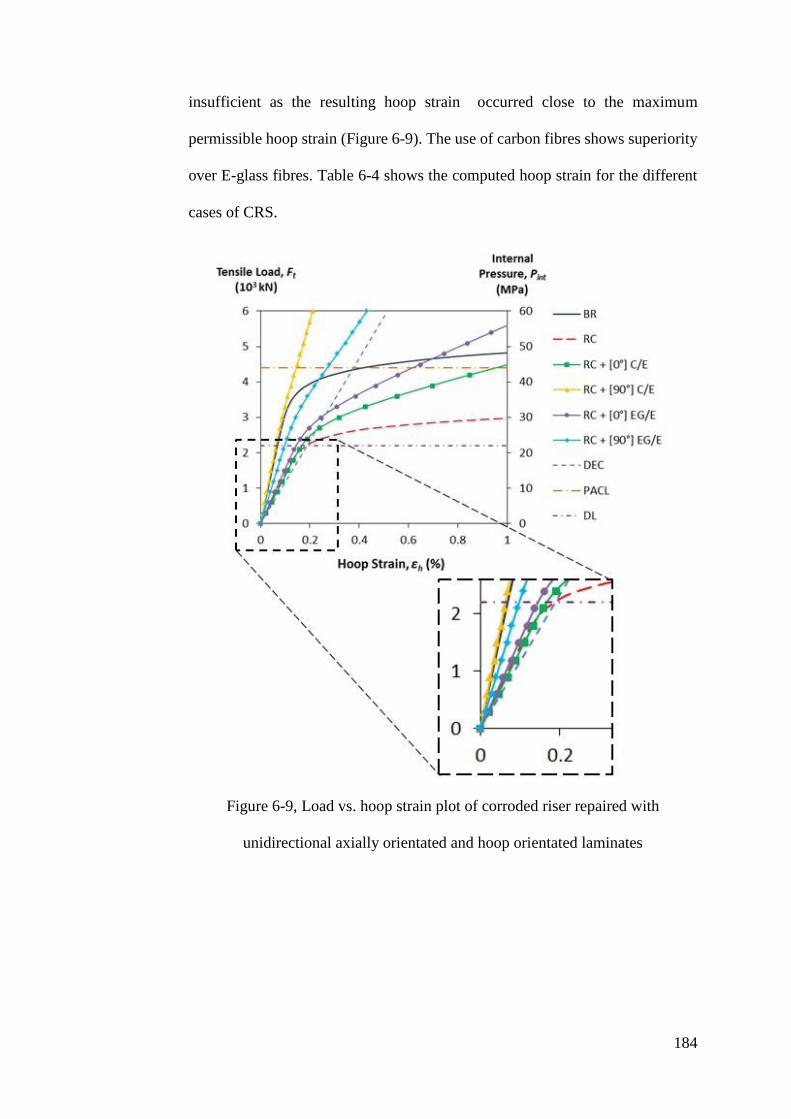
184
insufficient as the resulting hoop strain occurred close to the maximum
permissible hoop strain (Figure 6-9). The use of carbon fibres shows superiority
over E-glass fibres. Table 6-4 shows the computed hoop strain for the different
cases of CRS.
Figure 6-9, Load vs. hoop strain plot of corroded riser repaired with
unidirectional axially orientated and hoop orientated laminates
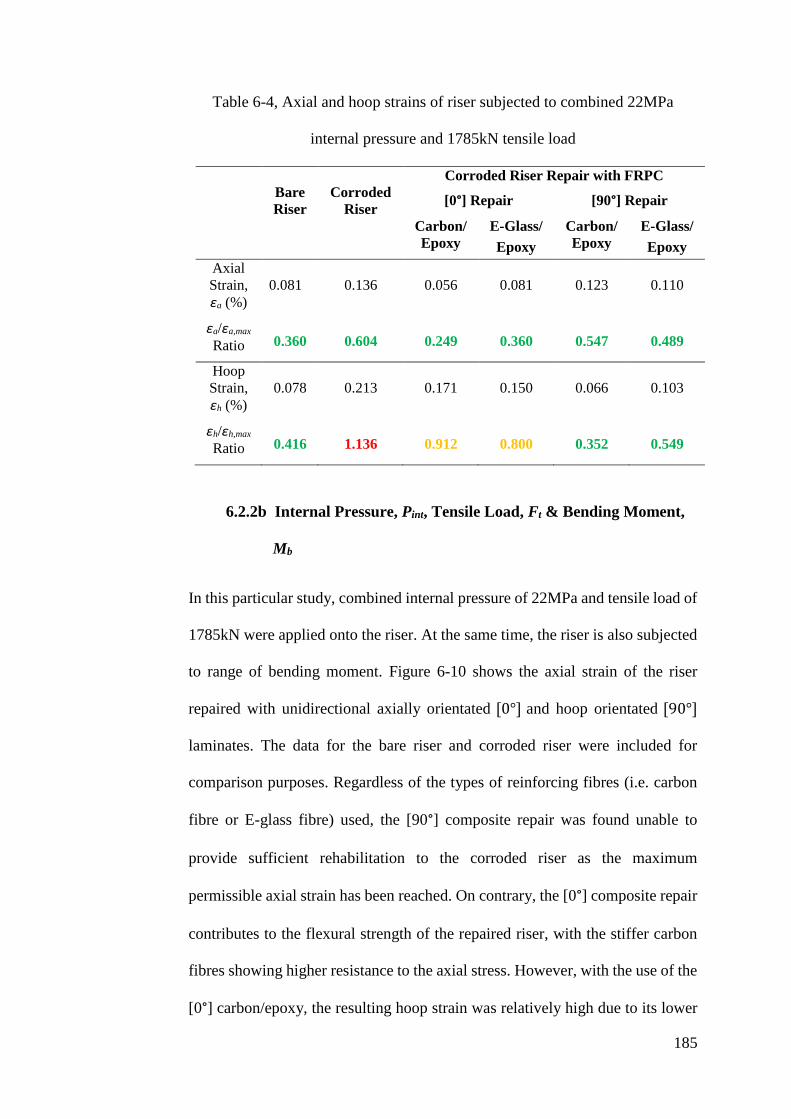
185
Table 6-4, Axial and hoop strains of riser subjected to combined 22MPa
internal pressure and 1785kN tensile load
Bare
Riser
Corroded
Riser
Corroded Riser Repair with FRPC
[0°] Repair [90°] Repair
Carbon/
Epoxy
E-Glass/
Epoxy
Carbon/
Epoxy
E-Glass/
Epoxy
Axial
Strain,
ɛa (%)
0.081
0.136
0.056
0.081
0.123
0.110
ɛa/ɛa,max
Ratio 0.360 0.604 0.249 0.360 0.547 0.489
Hoop
Strain,
ɛh (%)
0.078
0.213
0.171
0.150
0.066
0.103
ɛh/ɛh,max
Ratio 0.416 1.136 0.912 0.800 0.352 0.549
6.2.2b Internal Pressure, Pint, Tensile Load, Ft & Bending Moment,
Mb
In this particular study, combined internal pressure of 22MPa and tensile load of
1785kN were applied onto the riser. At the same time, the riser is also subjected
to range of bending moment. Figure 6-10 shows the axial strain of the riser
repaired with unidirectional axially orientated [0°] and hoop orientated [90°]
laminates. The data for the bare riser and corroded riser were included for
comparison purposes. Regardless of the types of reinforcing fibres (i.e. carbon
fibre or E-glass fibre) used, the [90°] composite repair was found unable to
provide sufficient rehabilitation to the corroded riser as the maximum
permissible axial strain has been reached. On contrary, the [0°] composite repair
contributes to the flexural strength of the repaired riser, with the stiffer carbon
fibres showing higher resistance to the axial stress. However, with the use of the
[0°] carbon/epoxy, the resulting hoop strain was relatively high due to its lower
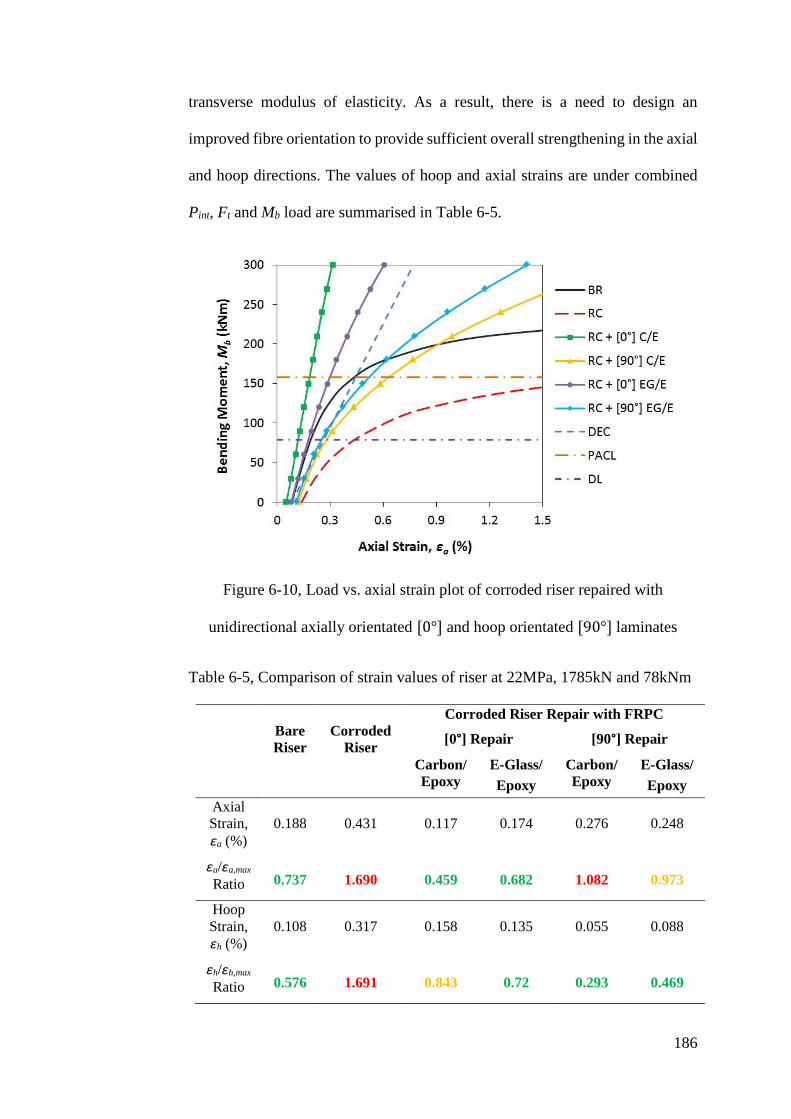
186
transverse modulus of elasticity. As a result, there is a need to design an
improved fibre orientation to provide sufficient overall strengthening in the axial
and hoop directions. The values of hoop and axial strains are under combined
Pint, Ft and Mb load are summarised in Table 6-5.
Figure 6-10, Load vs. axial strain plot of corroded riser repaired with
unidirectional axially orientated [0°] and hoop orientated [90°] laminates
Table 6-5, Comparison of strain values of riser at 22MPa, 1785kN and 78kNm
Bare
Riser
Corroded
Riser
Corroded Riser Repair with FRPC
[0°] Repair [90°] Repair
Carbon/
Epoxy
E-Glass/
Epoxy
Carbon/
Epoxy
E-Glass/
Epoxy
Axial
Strain,
ɛa (%)
0.188
0.431
0.117
0.174
0.276
0.248
ɛa/ɛa,max
Ratio 0.737 1.690 0.459 0.682 1.082 0.973
Hoop
Strain,
ɛh (%)
0.108
0.317
0.158
0.135
0.055
0.088
ɛh/ɛh,max
Ratio 0.576 1.691 0.843 0.72 0.293 0.469

187
6.3 Laminate/Fibre Orientation
Composite repairs for onshore pipelines have largely evolved based on
unidirectional laminate produced in the form of pre-cured half shells or woven
fabric. Most of these repairs are carried out by wrapping the composite laminate
around the corroded region of the pipe, with the fibres wound in such a way that
they align to the hoop direction of the pipe. In the application for offshore riser,
mixed loading profiles causes multi-directional stresses in the riser. Hence, it is
essential to design a suitable laminate orientation that can provide optimum
reinforcement to the corroded riser under the mixed loading profiles. In the past,
the use of different laminate orientation that has fibres aligned at different angles
with respect to the riser axis has proven to be beneficial in providing the
necessary strengthening to a defective riser. In the current project, five types of
laminate orientations typically used in the composite industry were selected to
study their performance on reinforcing corroded riser.
1) 90° unidirectional laminate (in hoop direction) – This type of laminate
was selected as strengthening in the hoop direction of the riser is most
common in order to sustain the internal pressure caused by the contents
being transported.
2) 0° unidirectional laminate (in axial direction) – Axial reinforcement is an
important element as the riser must sustains various axial stresses caused
by the combination of tension and bending loads.
3) Quasi-isotropic [0°/±45°/90°]s laminate – This type of laminate is
common in aerospace industry and is expected to exhibit similar
orthogonal response when the composite is loaded in the 0° and 90°
directions.

188
4) Balanced and symmetric [90°/±30°]s laminate – This laminate consist of
a mixture of off-axis and on-axis plies and is different from the quasi-
isotropic laminate. The addition of the off-axis plies provides a varying
reinforcing behaviour to the composite.
5) Angle ply [±55°]s laminate – This type of laminate can help in
understanding the capability of off-axis plies in sustaining multiple-
directional loads. The [±55°]s laminate is commonly used in industrial
pipework where the composite pipes are manufactured via filament
winding.
Figure 6-11 through to Figure 6-15 show the schematic of the five types of
laminate orientations investigated in the current study.
Figure 6-11, Ply stack plot for 90° unidirectional laminate in hoop direction
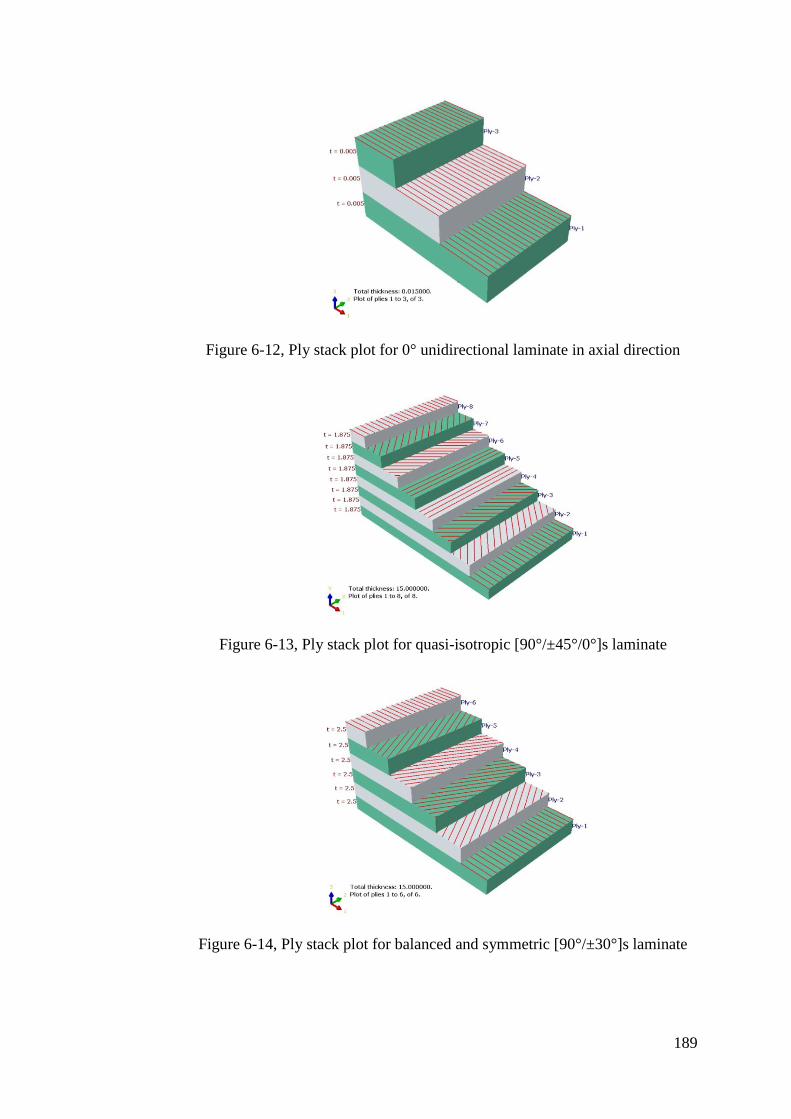
189
Figure 6-12, Ply stack plot for 0° unidirectional laminate in axial direction
Figure 6-13, Ply stack plot for quasi-isotropic [90°/±45°/0°]s laminate
Figure 6-14, Ply stack plot for balanced and symmetric [90°/±30°]s laminate

190
Figure 6-15, Ply stack plot for angle ply [±55°]s laminate
For this section, individual static loading is not included as it has been
determined that on-axis unidirectional laminates provides the best reinforcement
under such conditions. The AS4 carbon fibres coupled 3501-6 epoxy matrix was
chosen as the CRS for its superior performance over the glass fibres epoxy
composite.
6.3.1 Combined Internal Pressure, Pint & Tensile Load, Ft
The results of the corroded risers repaired with different laminate orientations
are shown in Figure 6-16 and Figure 6-17. It can be seen that the [90°] hoop
orientated reinforcement capable of providing the greatest strengthening to the
corroded riser in resisting hoop strain. However, when the axial strain is taken
into consideration, it is evident from Figure 6-17 that the [90°] hoop orientated
laminate cannot restore the performance of the corroded riser as the axial strain
beneath the repair is similar to that of a corroded riser. On the other hand, the
simulated output revealed that [0°] axially orientated unidirectional laminates
capable of sustaining the highest amount of axial load, where the repaired riser
experienced strength improvement beyond that of an uncorroded bare riser in the

191
longitudinal axis. The combined use of on-axis and off-axis plies increases the
stiffness of the laminate in both directions. Both balanced and symmetric
[90°/±30°]s laminate, and quasi-isotropic [90°/±45°/0°]s laminate demonstrated
comparable rehabilitation performance where the strength of the repaired riser
was found higher than the uncorroded bare riser in both axial and hoop directions.
As shown in Figure 6-18, the ±30° plies carries higher fraction of axial stress
while the 90° carries higher hoop stress. The angle ply [±55°]s repair laminate
however showed a comparatively lower strengthening performance (Figure 6-17)
but the maximum permissible axial strain was not exceeded at the design load of
1785kN. The axial strain and hoop strain on the riser beneath the repair at design
load of 22MPa and 1785kN are recorded in Table 6-6.
Figure 6-16, Load vs. hoop strain plot of corroded riser repaired with different
orientation of carbon/epoxy laminates
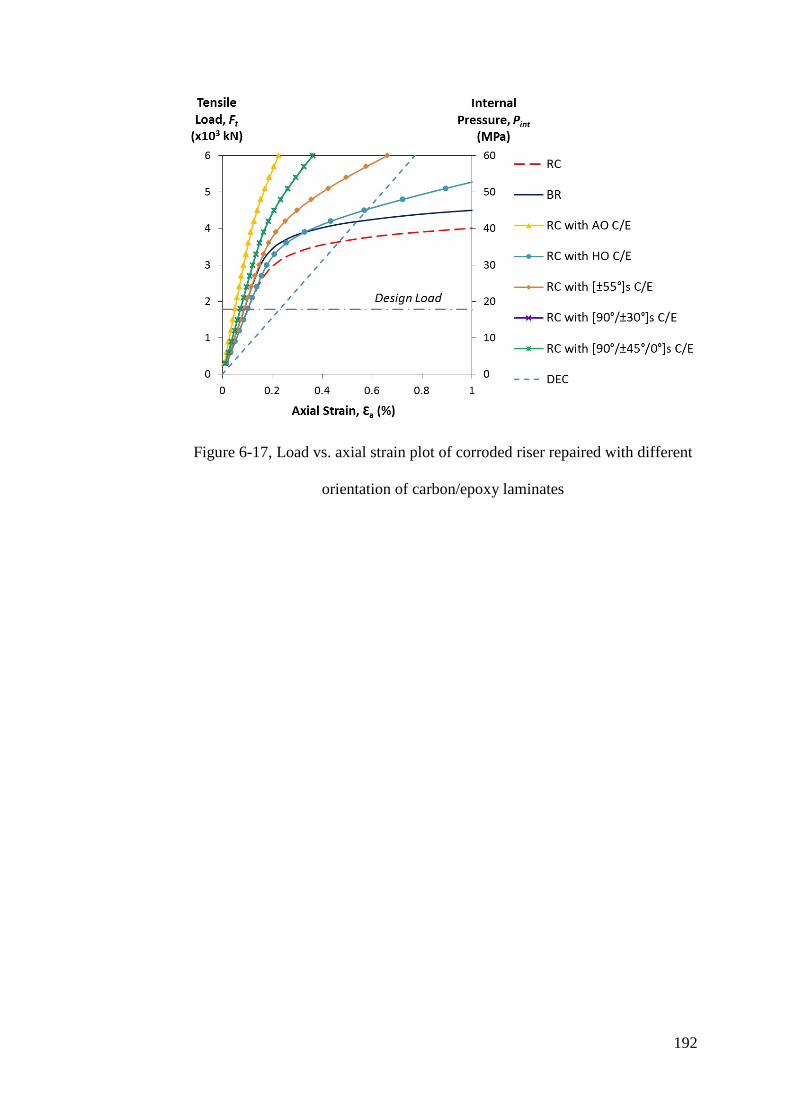
192
Figure 6-17, Load vs. axial strain plot of corroded riser repaired with different
orientation of carbon/epoxy laminates
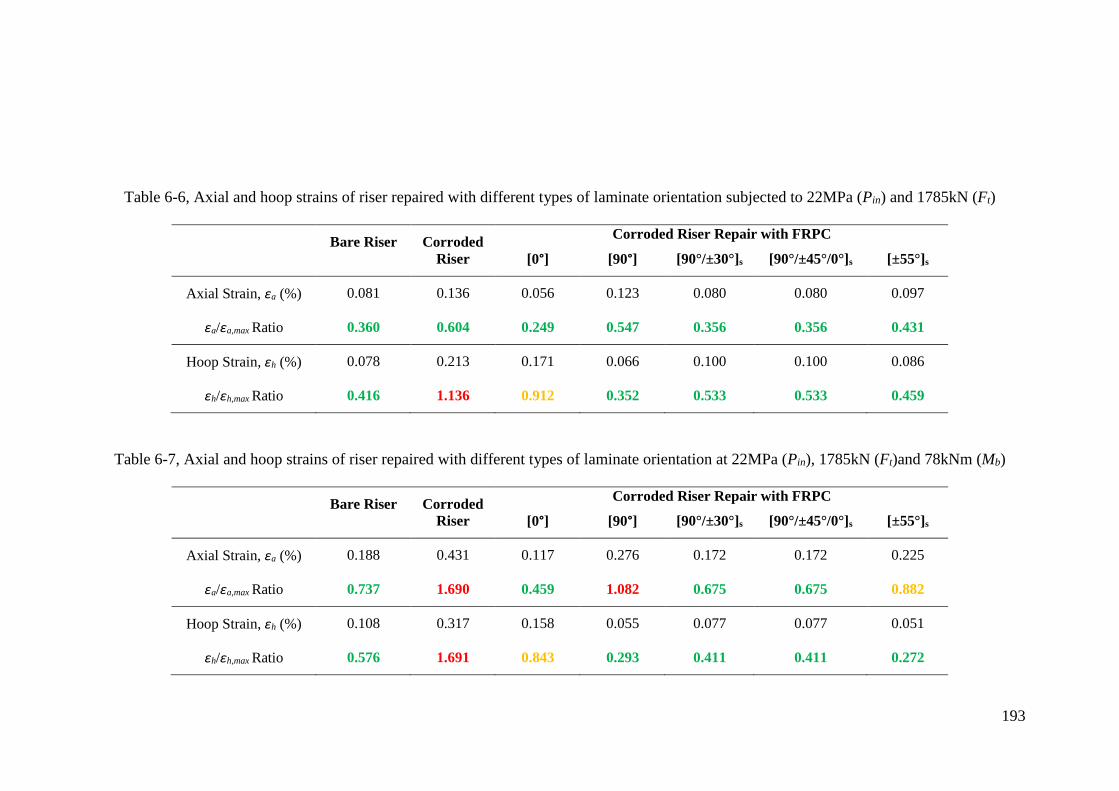
193
Table 6-6, Axial and hoop strains of riser repaired with different types of laminate orientation subjected to 22MPa (Pin) and 1785kN (Ft)
Bare Riser Corroded
Riser
Corroded Riser Repair with FRPC
[0°] [90°] [90°/±30°]s [90°/±45°/0°]s [±55°]s
Axial Strain, ɛa (%) 0.081 0.136 0.056 0.123 0.080 0.080 0.097
ɛa/ɛa,max Ratio 0.360 0.604 0.249 0.547 0.356 0.356 0.431
Hoop Strain, ɛh (%) 0.078 0.213 0.171 0.066 0.100 0.100 0.086
ɛh/ɛh,max Ratio 0.416 1.136 0.912 0.352 0.533 0.533 0.459
Table 6-7, Axial and hoop strains of riser repaired with different types of laminate orientation at 22MPa (Pin), 1785kN (Ft)and 78kNm (Mb)
Bare Riser Corroded
Riser
Corroded Riser Repair with FRPC
[0°] [90°] [90°/±30°]s [90°/±45°/0°]s [±55°]s
Axial Strain, ɛa (%) 0.188 0.431 0.117 0.276 0.172 0.172 0.225
ɛa/ɛa,max Ratio 0.737 1.690 0.459 1.082 0.675 0.675 0.882
Hoop Strain, ɛh (%) 0.108 0.317 0.158 0.055 0.077 0.077 0.051
ɛh/ɛh,max Ratio 0.576 1.691 0.843 0.293 0.411 0.411 0.272
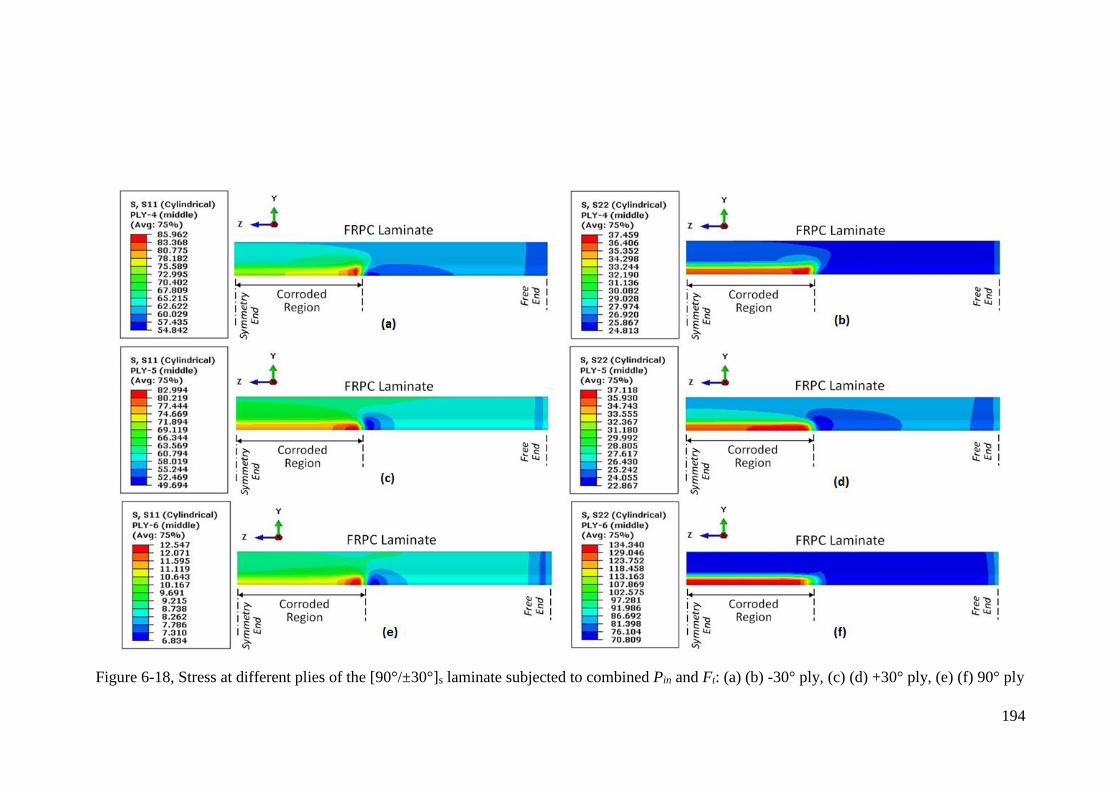
194
Figure 6-18, Stress at different plies of the [90°/±30°]s laminate subjected to combined Pin and Ft: (a) (b) -30° ply, (c) (d) +30° ply, (e) (f) 90° ply

195
6.3.2 Combined Internal Pressure, Pint, Tensile Load, Ft & Bending
Moment, Mb
Bending moment is added to simulate a riser subjected to combined loading
under subsea environment. As shown in Figure 6-19, the [0°] axially orientated
laminate is capable of providing the greatest reinforcement in resisting the tensile
strain caused by bending. For hoop orientated laminate, maximum permissible
axial strain has been reached at design load (78kNm) and hence can be
considered as not fit for the repair application.
Figure 6-19, Load vs. axial strain plot of corroded riser repaired with different
orientation of carbon/epoxy laminates subjected to combined internal pressure,
tensile and bending load
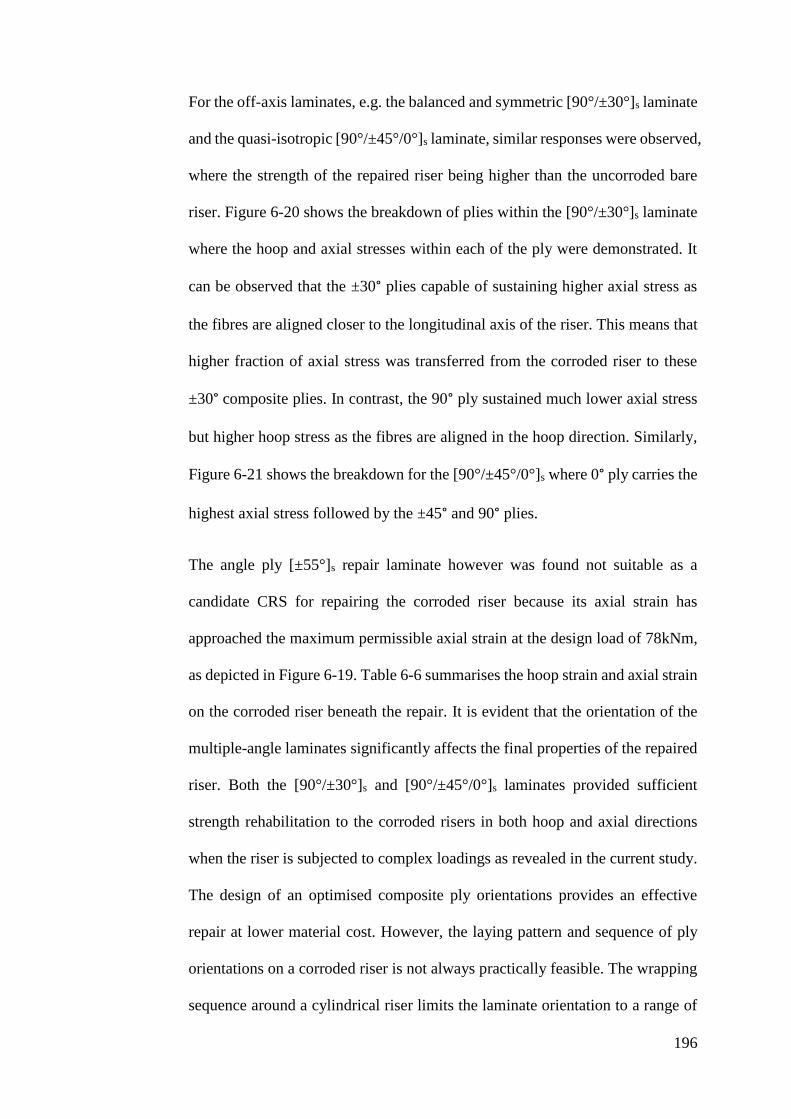
196
For the off-axis laminates, e.g. the balanced and symmetric [90°/±30°]s laminate
and the quasi-isotropic [90°/±45°/0°]s laminate, similar responses were observed,
where the strength of the repaired riser being higher than the uncorroded bare
riser. Figure 6-20 shows the breakdown of plies within the [90°/±30°]s laminate
where the hoop and axial stresses within each of the ply were demonstrated. It
can be observed that the ±30° plies capable of sustaining higher axial stress as
the fibres are aligned closer to the longitudinal axis of the riser. This means that
higher fraction of axial stress was transferred from the corroded riser to these
±30° composite plies. In contrast, the 90° ply sustained much lower axial stress
but higher hoop stress as the fibres are aligned in the hoop direction. Similarly,
Figure 6-21 shows the breakdown for the [90°/±45°/0°]s where 0° ply carries the
highest axial stress followed by the ±45° and 90° plies.
The angle ply [±55°]s repair laminate however was found not suitable as a
candidate CRS for repairing the corroded riser because its axial strain has
approached the maximum permissible axial strain at the design load of 78kNm,
as depicted in Figure 6-19. Table 6-6 summarises the hoop strain and axial strain
on the corroded riser beneath the repair. It is evident that the orientation of the
multiple-angle laminates significantly affects the final properties of the repaired
riser. Both the [90°/±30°]s and [90°/±45°/0°]s laminates provided sufficient
strength rehabilitation to the corroded risers in both hoop and axial directions
when the riser is subjected to complex loadings as revealed in the current study.
The design of an optimised composite ply orientations provides an effective
repair at lower material cost. However, the laying pattern and sequence of ply
orientations on a corroded riser is not always practically feasible. The wrapping
sequence around a cylindrical riser limits the laminate orientation to a range of
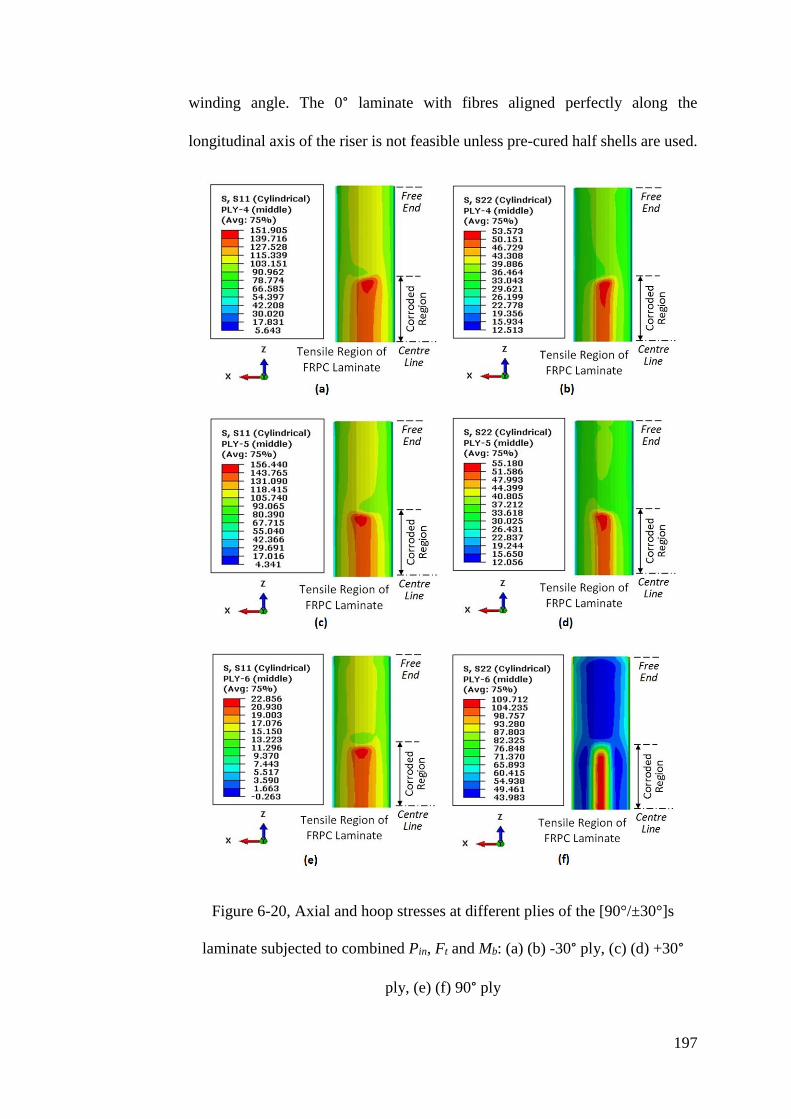
197
winding angle. The 0° laminate with fibres aligned perfectly along the
longitudinal axis of the riser is not feasible unless pre-cured half shells are used.
Figure 6-20, Axial and hoop stresses at different plies of the [90°/±30°]s
laminate subjected to combined Pin, Ft and Mb: (a) (b) -30° ply, (c) (d) +30°
ply, (e) (f) 90° ply
198
Figure 6-21, Axial and hoop stresses at different plies of the [90°/±45°/0°]s
laminate subjected to combined Pin, Ft and Mb: (a) (b) 0° ply, (c) (d) -45° ply,
(e) (f) +45° (g) (h) 90° ply
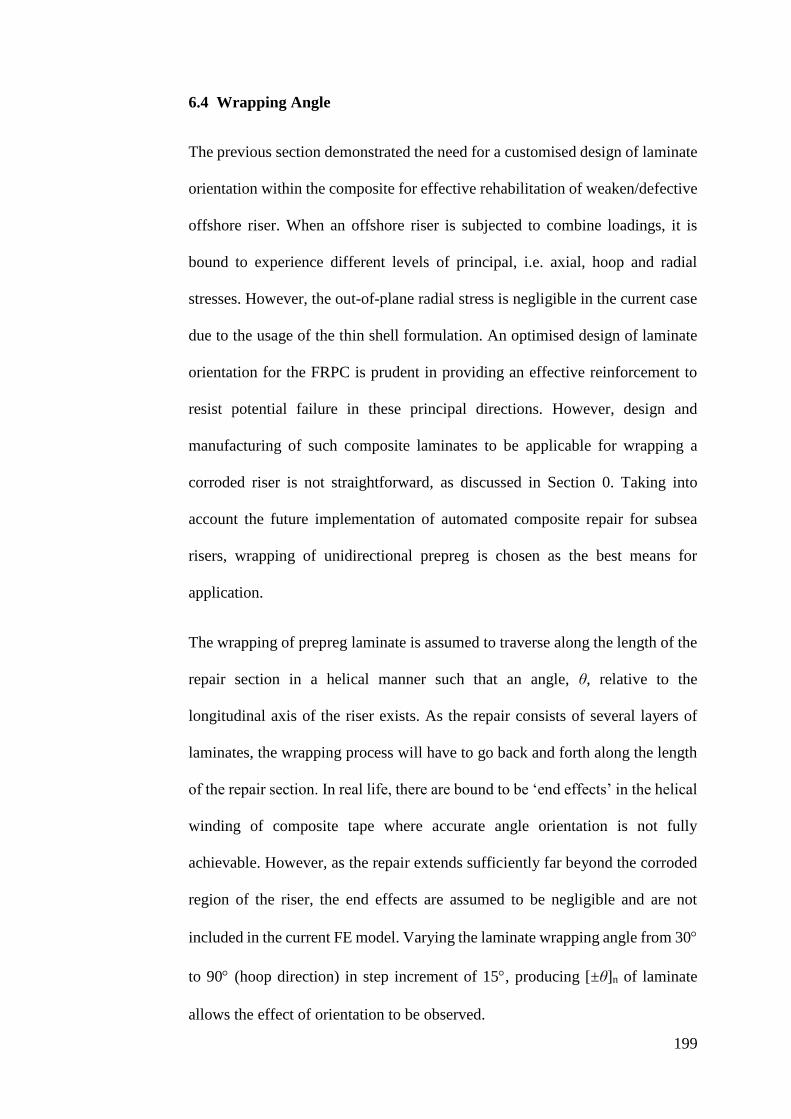
199
6.4 Wrapping Angle
The previous section demonstrated the need for a customised design of laminate
orientation within the composite for effective rehabilitation of weaken/defective
offshore riser. When an offshore riser is subjected to combine loadings, it is
bound to experience different levels of principal, i.e. axial, hoop and radial
stresses. However, the out-of-plane radial stress is negligible in the current case
due to the usage of the thin shell formulation. An optimised design of laminate
orientation for the FRPC is prudent in providing an effective reinforcement to
resist potential failure in these principal directions. However, design and
manufacturing of such composite laminates to be applicable for wrapping a
corroded riser is not straightforward, as discussed in Section 0. Taking into
account the future implementation of automated composite repair for subsea
risers, wrapping of unidirectional prepreg is chosen as the best means for
application.
The wrapping of prepreg laminate is assumed to traverse along the length of the
repair section in a helical manner such that an angle, θ, relative to the
longitudinal axis of the riser exists. As the repair consists of several layers of
laminates, the wrapping process will have to go back and forth along the length
of the repair section. In real life, there are bound to be ‘end effects’ in the helical
winding of composite tape where accurate angle orientation is not fully
achievable. However, as the repair extends sufficiently far beyond the corroded
region of the riser, the end effects are assumed to be negligible and are not
included in the current FE model. Varying the laminate wrapping angle from 30
to 90 (hoop direction) in step increment of 15, producing [±θ]n of laminate
allows the effect of orientation to be observed.
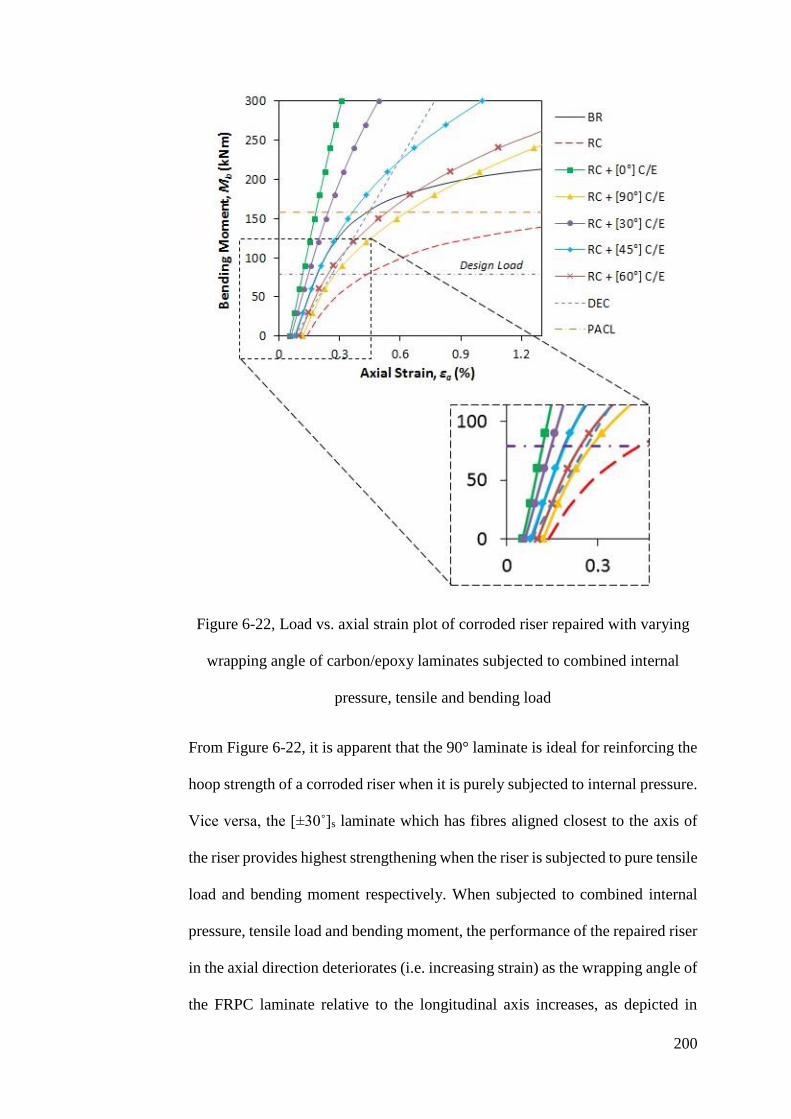
200
Figure 6-22, Load vs. axial strain plot of corroded riser repaired with varying
wrapping angle of carbon/epoxy laminates subjected to combined internal
pressure, tensile and bending load
From Figure 6-22, it is apparent that the 90° laminate is ideal for reinforcing the
hoop strength of a corroded riser when it is purely subjected to internal pressure.
Vice versa, the [±30˚]s laminate which has fibres aligned closest to the axis of
the riser provides highest strengthening when the riser is subjected to pure tensile
load and bending moment respectively. When subjected to combined internal
pressure, tensile load and bending moment, the performance of the repaired riser
in the axial direction deteriorates (i.e. increasing strain) as the wrapping angle of
the FRPC laminate relative to the longitudinal axis increases, as depicted in

201
Figure 6-22. The [90°] repair which emulates the common composite repair in
the industry of onshore pipelines show poor performance in strengthening a riser
subjected to combined loading. Similar to the [90°] laminate repair, the pure
[±60°]s laminate repair is also no suitable for offshore pipeline rehabilitation
application due to the high strain sustained by the composite at the design load.
The [±30°]s and [±45°]s repairs are both capable of reinforcing the corroded riser,
with the [±30°]s showed better strengthening capability. However, application of
such composite repairs via helical wrapping depends on the tack of the prepreg
composite used and friction coefficient of the riser surface. Both must be
sufficient in order to prevent slipping of the prepreg tape during the wrapping
process.
Figure 6-23, Load vs. hoop strain plot of corroded riser repaired with varying
wrapping angle of carbon/epoxy laminates subjected to combined internal
pressure, tensile and bending load
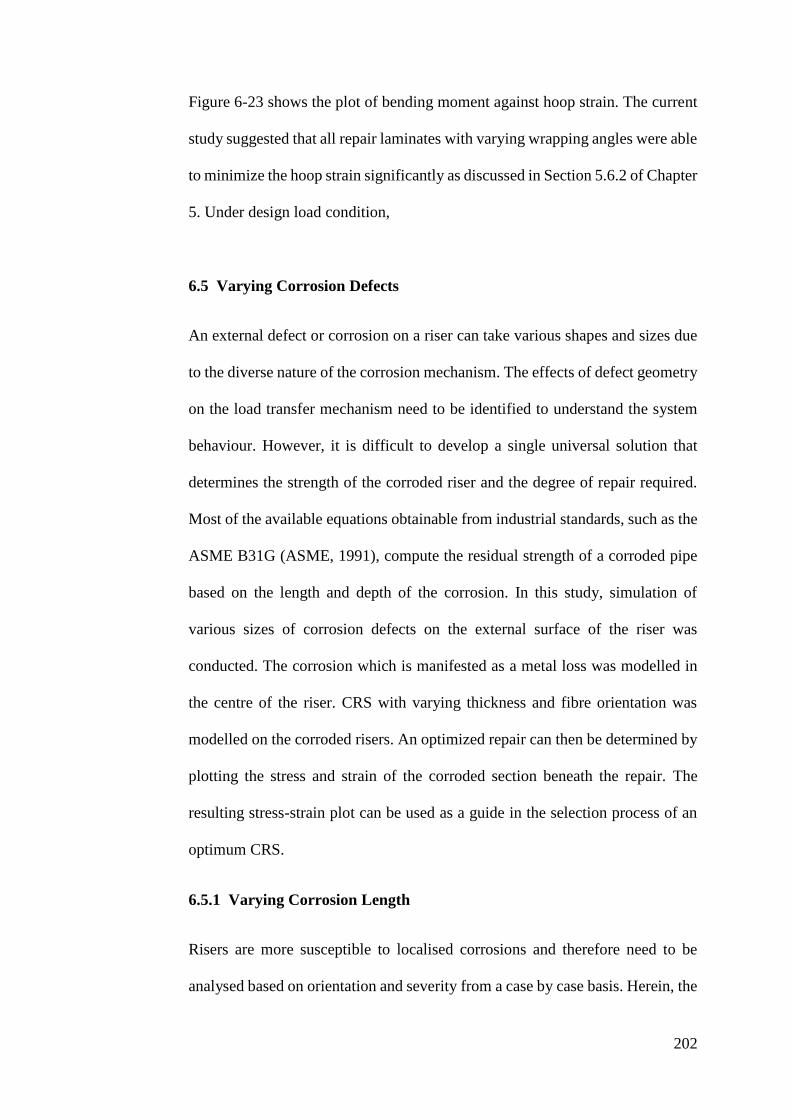
202
Figure 6-23 shows the plot of bending moment against hoop strain. The current
study suggested that all repair laminates with varying wrapping angles were able
to minimize the hoop strain significantly as discussed in Section 5.6.2 of Chapter
5. Under design load condition,
6.5 Varying Corrosion Defects
An external defect or corrosion on a riser can take various shapes and sizes due
to the diverse nature of the corrosion mechanism. The effects of defect geometry
on the load transfer mechanism need to be identified to understand the system
behaviour. However, it is difficult to develop a single universal solution that
determines the strength of the corroded riser and the degree of repair required.
Most of the available equations obtainable from industrial standards, such as the
ASME B31G (ASME, 1991), compute the residual strength of a corroded pipe
based on the length and depth of the corrosion. In this study, simulation of
various sizes of corrosion defects on the external surface of the riser was
conducted. The corrosion which is manifested as a metal loss was modelled in
the centre of the riser. CRS with varying thickness and fibre orientation was
modelled on the corroded risers. An optimized repair can then be determined by
plotting the stress and strain of the corroded section beneath the repair. The
resulting stress-strain plot can be used as a guide in the selection process of an
optimum CRS.
6.5.1 Varying Corrosion Length
Risers are more susceptible to localised corrosions and therefore need to be
analysed based on orientation and severity from a case by case basis. Herein, the
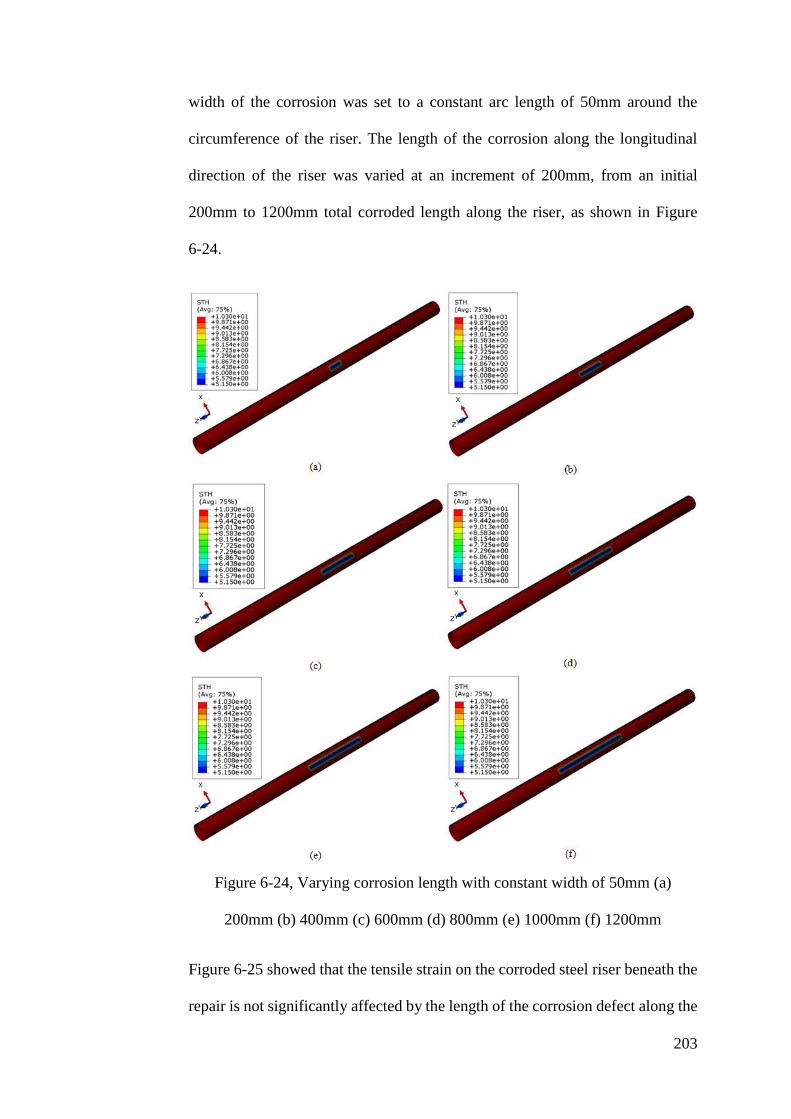
203
width of the corrosion was set to a constant arc length of 50mm around the
circumference of the riser. The length of the corrosion along the longitudinal
direction of the riser was varied at an increment of 200mm, from an initial
200mm to 1200mm total corroded length along the riser, as shown in Figure
6-24.
Figure 6-24, Varying corrosion length with constant width of 50mm (a)
200mm (b) 400mm (c) 600mm (d) 800mm (e) 1000mm (f) 1200mm
Figure 6-25 showed that the tensile strain on the corroded steel riser beneath the
repair is not significantly affected by the length of the corrosion defect along the
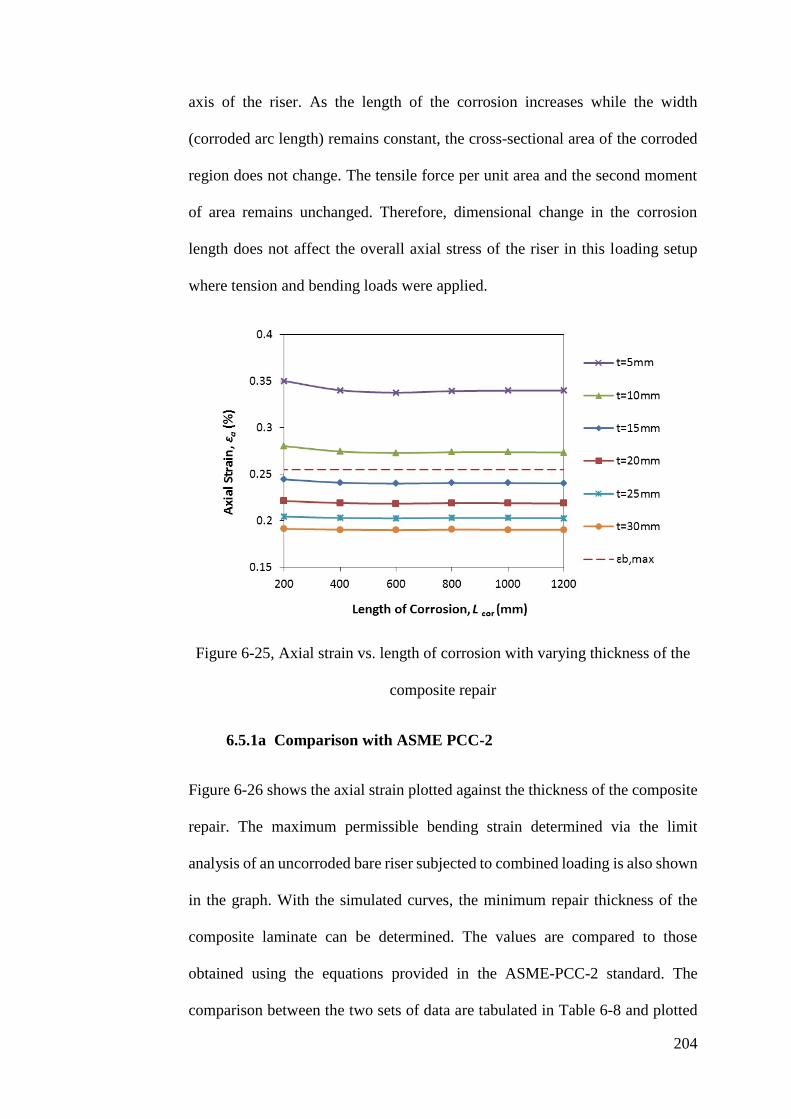
204
axis of the riser. As the length of the corrosion increases while the width
(corroded arc length) remains constant, the cross-sectional area of the corroded
region does not change. The tensile force per unit area and the second moment
of area remains unchanged. Therefore, dimensional change in the corrosion
length does not affect the overall axial stress of the riser in this loading setup
where tension and bending loads were applied.
Figure 6-25, Axial strain vs. length of corrosion with varying thickness of the
composite repair
6.5.1a Comparison with ASME PCC-2
Figure 6-26 shows the axial strain plotted against the thickness of the composite
repair. The maximum permissible bending strain determined via the limit
analysis of an uncorroded bare riser subjected to combined loading is also shown
in the graph. With the simulated curves, the minimum repair thickness of the
composite laminate can be determined. The values are compared to those
obtained using the equations provided in the ASME-PCC-2 standard. The
comparison between the two sets of data are tabulated in Table 6-8 and plotted

205
in Figure 6-27. As observed, the required thickness of repair for a corrosion of
200mm in length calculated using the ASME PCC-2 is significantly lower due
to the smaller length-to-diameter ratio. At greater corrosion lengths, the required
thickness increases as the residual strength for the corroded riser is based solely
on the hoop stress sustained by the riser. The FE simulation shows the effects of
combined loading where axial stress is the main concern. The addition of tensile
load and bending moment on the structure reduced the effect of the hoop stress
cause by the internal pressure. The longer corrosion defect along the axis of the
riser causes the axial stress to be distributed more evenly along the span of the
corrosion, reducing the maximum axial strain sustained by the riser and the CRS.
Figure 6-26, Axial strain vs. thickness of repair at varying length of corrosion
Table 6-8, Appropriate thickness of repair at varying length of corrosion
Length of Corrosion,
Lcor (mm) 200 400 600 800 1000 1200
Thickness
of Repair,
trepair (mm)
ASME
PCC-2 17.40 39.36 41.39 42.64 43.40 43.88
FE
Simulation 13.25 12.50 12.44 12.38 12.31 12.25
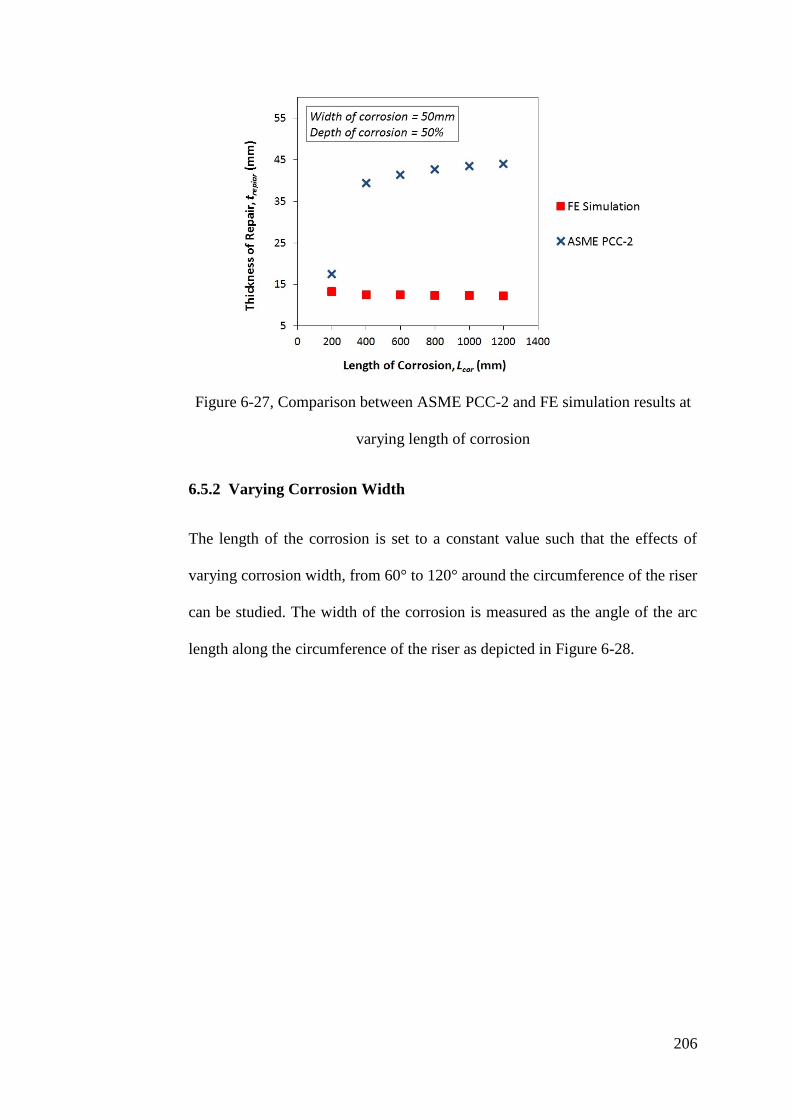
206
Figure 6-27, Comparison between ASME PCC-2 and FE simulation results at
varying length of corrosion
6.5.2 Varying Corrosion Width
The length of the corrosion is set to a constant value such that the effects of
varying corrosion width, from 60° to 120° around the circumference of the riser
can be studied. The width of the corrosion is measured as the angle of the arc
length along the circumference of the riser as depicted in Figure 6-28.
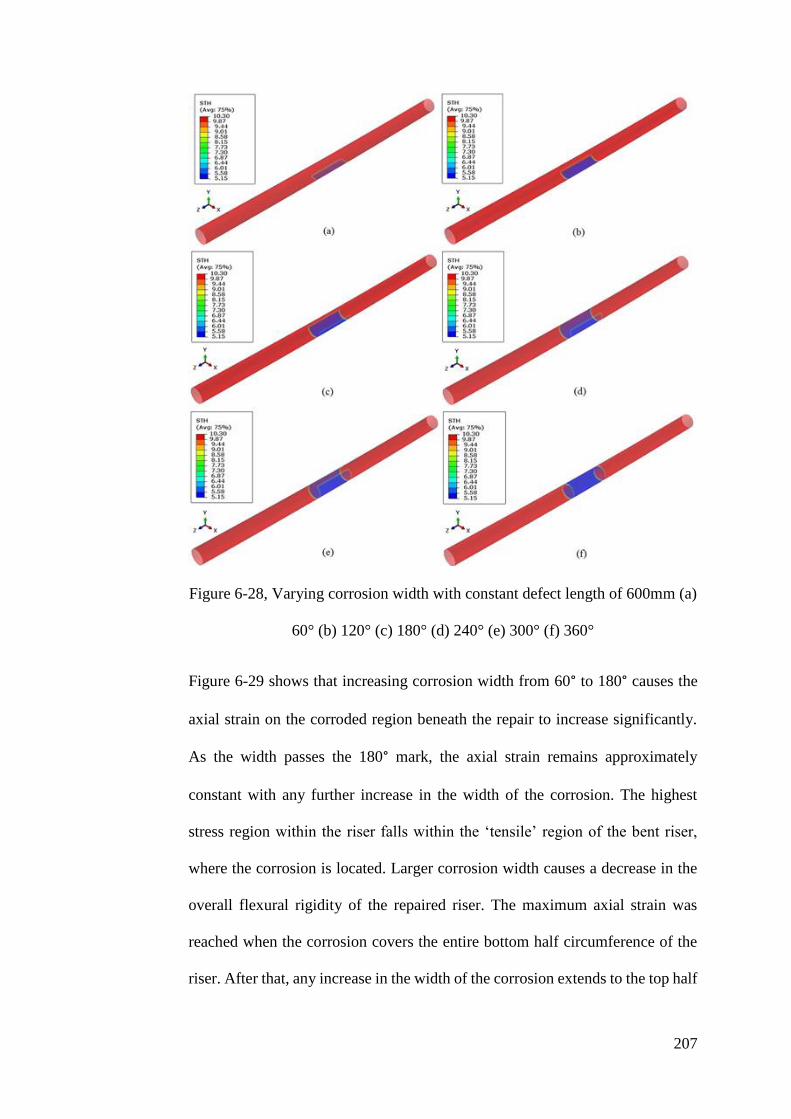
207
Figure 6-28, Varying corrosion width with constant defect length of 600mm (a)
60° (b) 120° (c) 180° (d) 240° (e) 300° (f) 360°
Figure 6-29 shows that increasing corrosion width from 60° to 180° causes the
axial strain on the corroded region beneath the repair to increase significantly.
As the width passes the 180° mark, the axial strain remains approximately
constant with any further increase in the width of the corrosion. The highest
stress region within the riser falls within the ‘tensile’ region of the bent riser,
where the corrosion is located. Larger corrosion width causes a decrease in the
overall flexural rigidity of the repaired riser. The maximum axial strain was
reached when the corrosion covers the entire bottom half circumference of the
riser. After that, any increase in the width of the corrosion extends to the top half
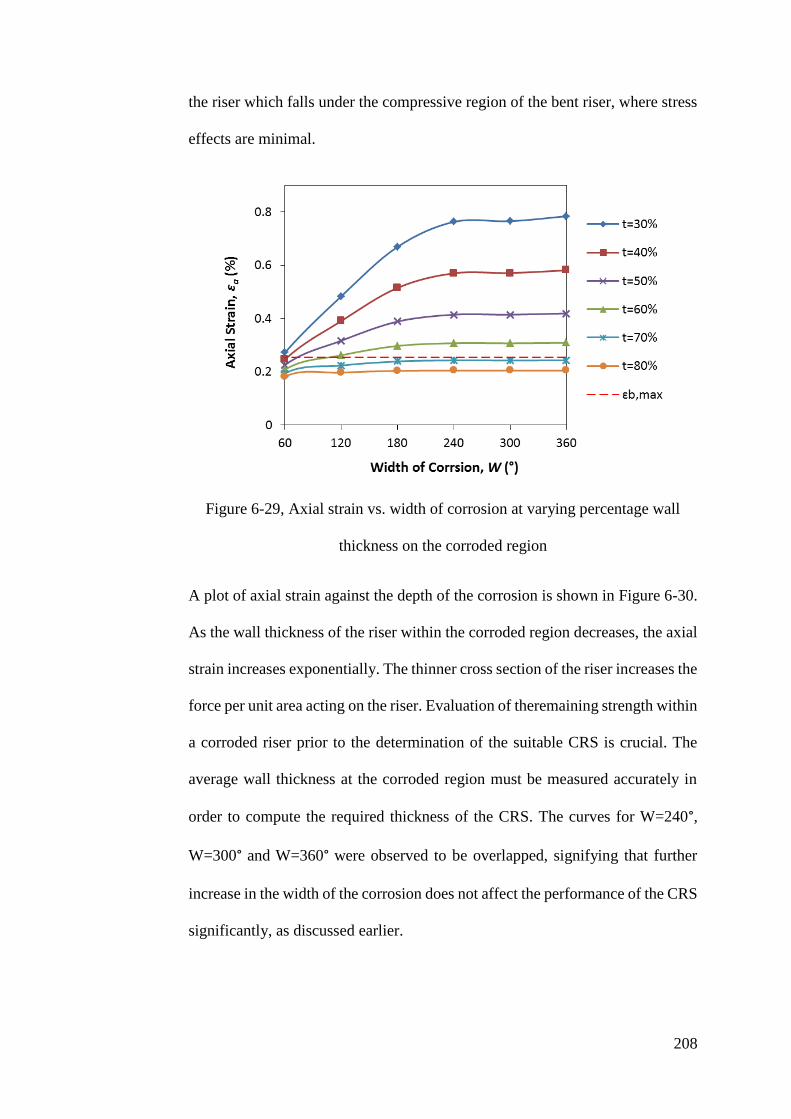
208
the riser which falls under the compressive region of the bent riser, where stress
effects are minimal.
Figure 6-29, Axial strain vs. width of corrosion at varying percentage wall
thickness on the corroded region
A plot of axial strain against the depth of the corrosion is shown in Figure 6-30.
As the wall thickness of the riser within the corroded region decreases, the axial
strain increases exponentially. The thinner cross section of the riser increases the
force per unit area acting on the riser. Evaluation of theremaining strength within
a corroded riser prior to the determination of the suitable CRS is crucial. The
average wall thickness at the corroded region must be measured accurately in
order to compute the required thickness of the CRS. The curves for W=240°,
W=300° and W=360° were observed to be overlapped, signifying that further
increase in the width of the corrosion does not affect the performance of the CRS
significantly, as discussed earlier.
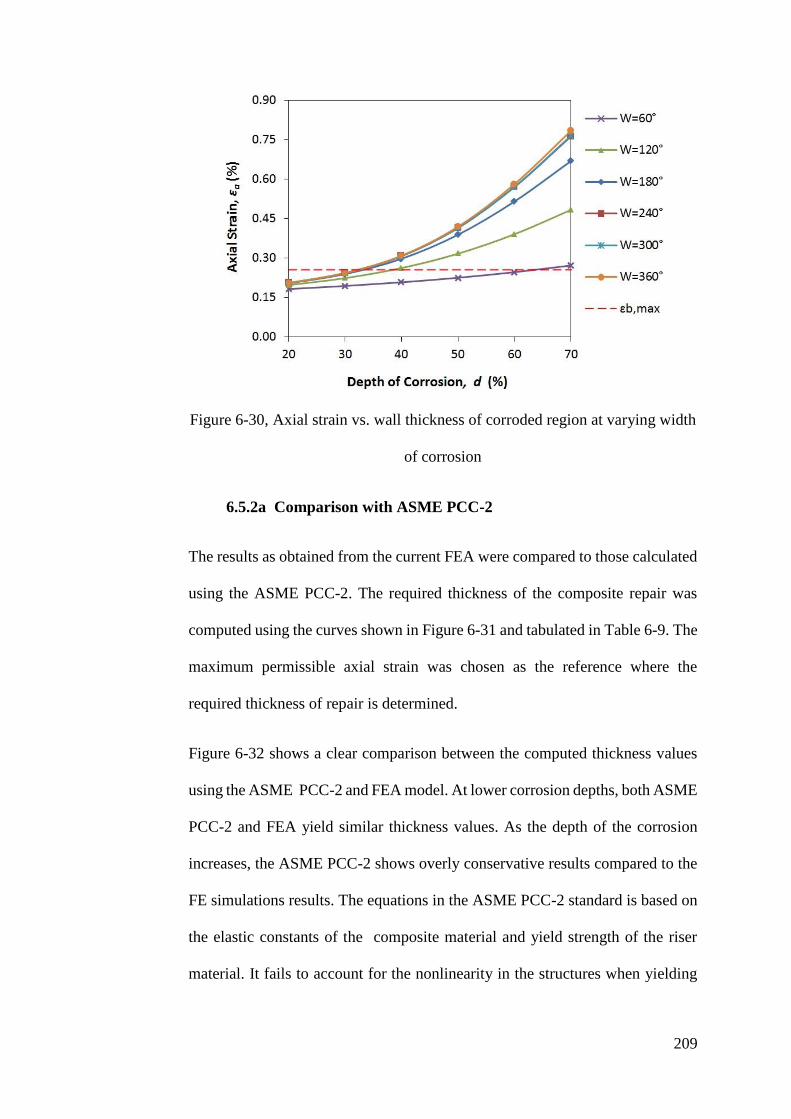
209
Figure 6-30, Axial strain vs. wall thickness of corroded region at varying width
of corrosion
6.5.2a Comparison with ASME PCC-2
The results as obtained from the current FEA were compared to those calculated
using the ASME PCC-2. The required thickness of the composite repair was
computed using the curves shown in Figure 6-31 and tabulated in Table 6-9. The
maximum permissible axial strain was chosen as the reference where the
required thickness of repair is determined.
Figure 6-32 shows a clear comparison between the computed thickness values
using the ASME PCC-2 and FEA model. At lower corrosion depths, both ASME
PCC-2 and FEA yield similar thickness values. As the depth of the corrosion
increases, the ASME PCC-2 shows overly conservative results compared to the
FE simulations results. The equations in the ASME PCC-2 standard is based on
the elastic constants of the composite material and yield strength of the riser
material. It fails to account for the nonlinearity in the structures when yielding
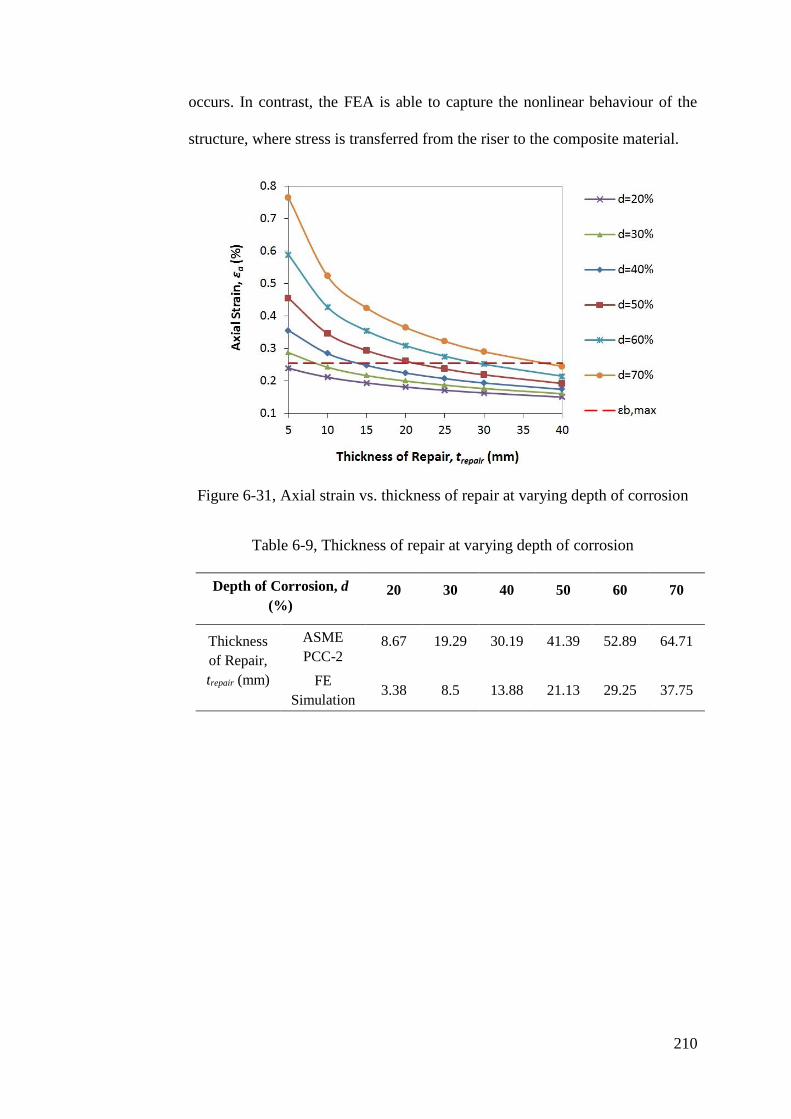
210
occurs. In contrast, the FEA is able to capture the nonlinear behaviour of the
structure, where stress is transferred from the riser to the composite material.
Figure 6-31, Axial strain vs. thickness of repair at varying depth of corrosion
Table 6-9, Thickness of repair at varying depth of corrosion
Depth of Corrosion, d
(%) 20 30 40 50 60 70
Thickness
of Repair,
trepair (mm)
ASME
PCC-2 8.67 19.29 30.19 41.39 52.89 64.71
FE
Simulation 3.38 8.5 13.88 21.13 29.25 37.75
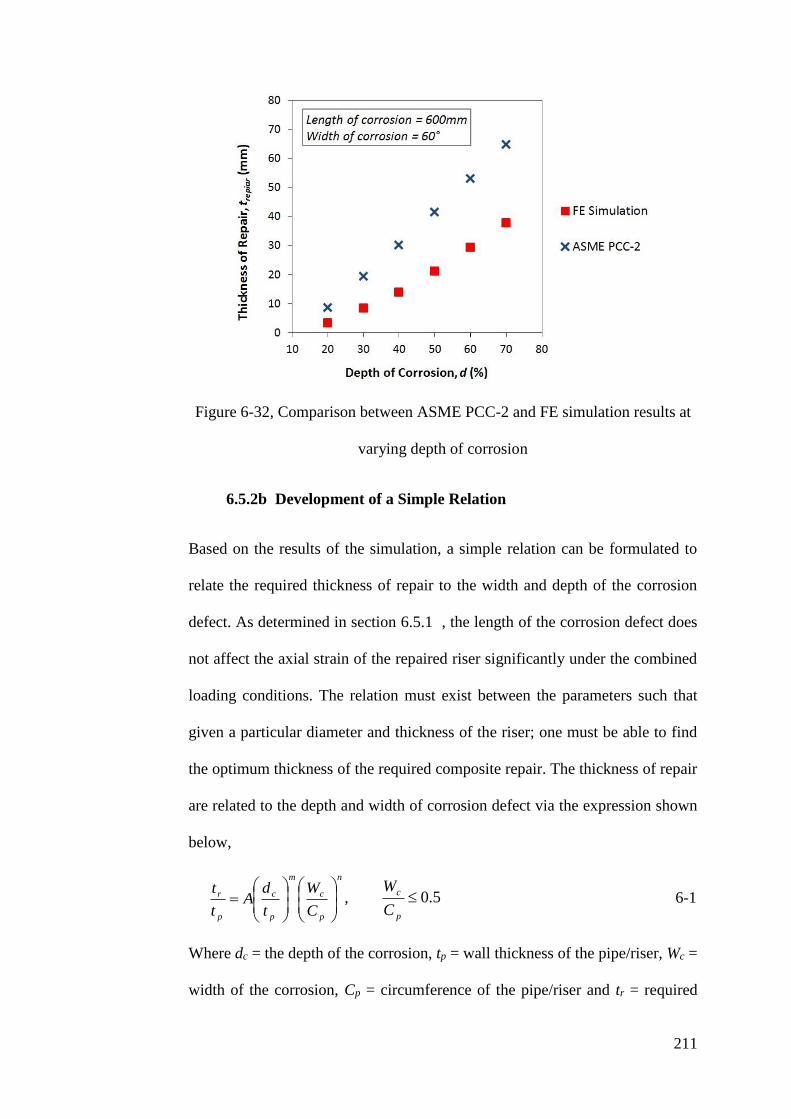
211
Figure 6-32, Comparison between ASME PCC-2 and FE simulation results at
varying depth of corrosion
6.5.2b Development of a Simple Relation
Based on the results of the simulation, a simple relation can be formulated to
relate the required thickness of repair to the width and depth of the corrosion
defect. As determined in section 6.5.1 , the length of the corrosion defect does
not affect the axial strain of the repaired riser significantly under the combined
loading conditions. The relation must exist between the parameters such that
given a particular diameter and thickness of the riser; one must be able to find
the optimum thickness of the required composite repair. The thickness of repair
are related to the depth and width of corrosion defect via the expression shown
below,
n
p
c
m
p
c
p
r
C
W
t
dA
t
t
, 5.0
p
c
C
W 6-1
Where dc = the depth of the corrosion, tp = wall thickness of the pipe/riser, Wc =
width of the corrosion, Cp = circumference of the pipe/riser and tr = required
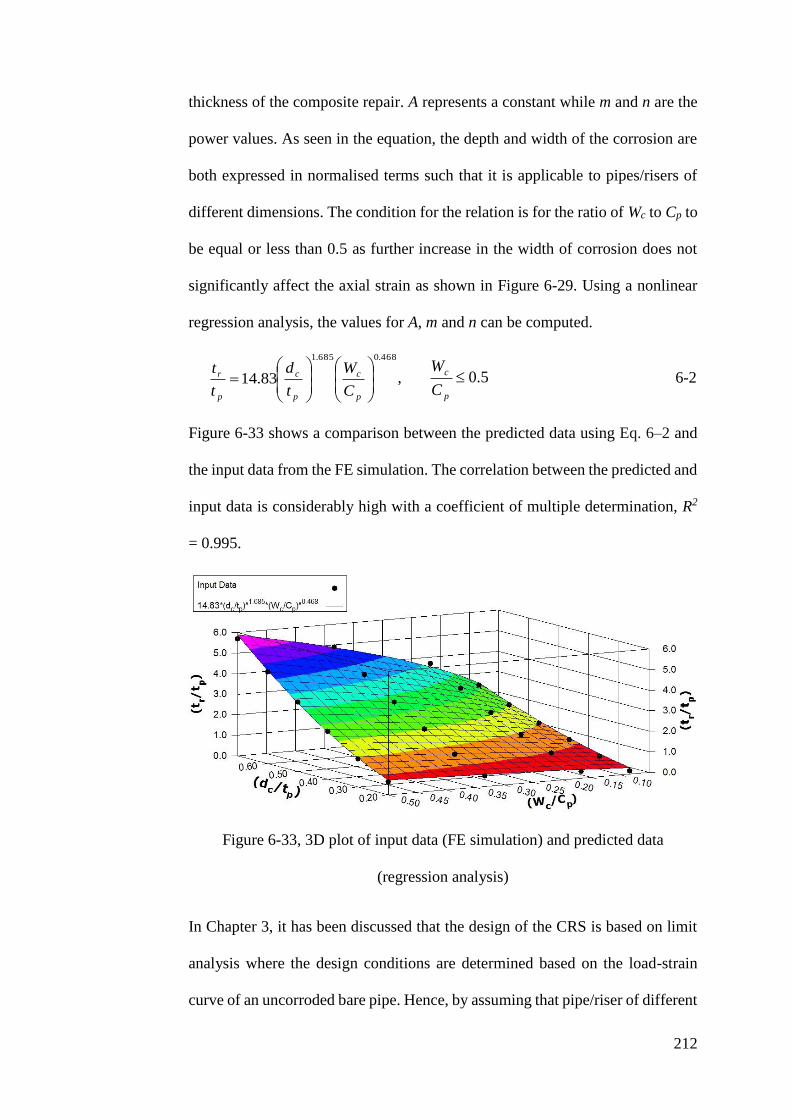
212
thickness of the composite repair. A represents a constant while m and n are the
power values. As seen in the equation, the depth and width of the corrosion are
both expressed in normalised terms such that it is applicable to pipes/risers of
different dimensions. The condition for the relation is for the ratio of Wc to Cp to
be equal or less than 0.5 as further increase in the width of corrosion does not
significantly affect the axial strain as shown in Figure 6-29. Using a nonlinear
regression analysis, the values for A, m and n can be computed.
468.0685.1
83.14
p
c
p
c
p
r
C
W
t
d
t
t, 5.0
p
c
C
W 6-2
Figure 6-33 shows a comparison between the predicted data using Eq. 6–2 and
the input data from the FE simulation. The correlation between the predicted and
input data is considerably high with a coefficient of multiple determination, R2
= 0.995.
Figure 6-33, 3D plot of input data (FE simulation) and predicted data
(regression analysis)
In Chapter 3, it has been discussed that the design of the CRS is based on limit
analysis where the design conditions are determined based on the load-strain
curve of an uncorroded bare pipe. Hence, by assuming that pipe/riser of different
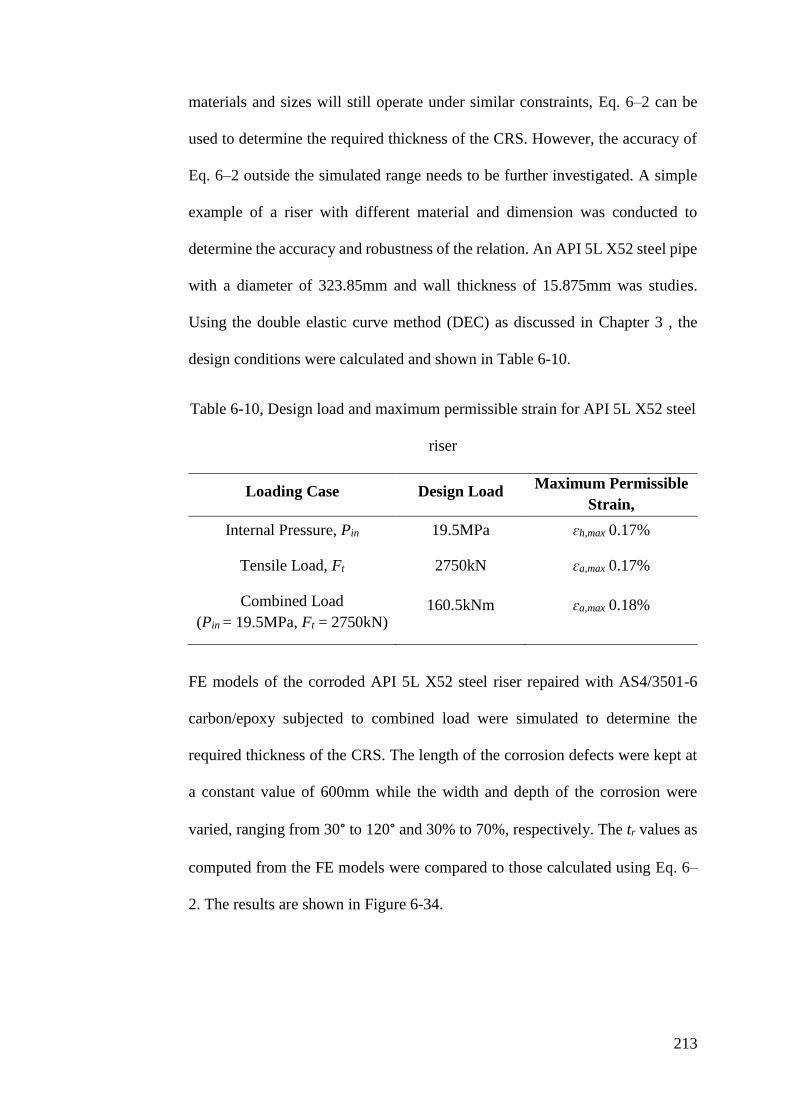
213
materials and sizes will still operate under similar constraints, Eq. 6–2 can be
used to determine the required thickness of the CRS. However, the accuracy of
Eq. 6–2 outside the simulated range needs to be further investigated. A simple
example of a riser with different material and dimension was conducted to
determine the accuracy and robustness of the relation. An API 5L X52 steel pipe
with a diameter of 323.85mm and wall thickness of 15.875mm was studies.
Using the double elastic curve method (DEC) as discussed in Chapter 3 , the
design conditions were calculated and shown in Table 6-10.
Table 6-10, Design load and maximum permissible strain for API 5L X52 steel
riser
Loading Case Design Load Maximum Permissible
Strain,
Internal Pressure, Pin 19.5MPa ɛh,max 0.17%
Tensile Load, Ft 2750kN ɛa,max 0.17%
Combined Load
(Pin = 19.5MPa, Ft = 2750kN) 160.5kNm ɛa,max 0.18%
FE models of the corroded API 5L X52 steel riser repaired with AS4/3501-6
carbon/epoxy subjected to combined load were simulated to determine the
required thickness of the CRS. The length of the corrosion defects were kept at
a constant value of 600mm while the width and depth of the corrosion were
varied, ranging from 30° to 120° and 30% to 70%, respectively. The tr values as
computed from the FE models were compared to those calculated using Eq. 6–
2. The results are shown in Figure 6-34.
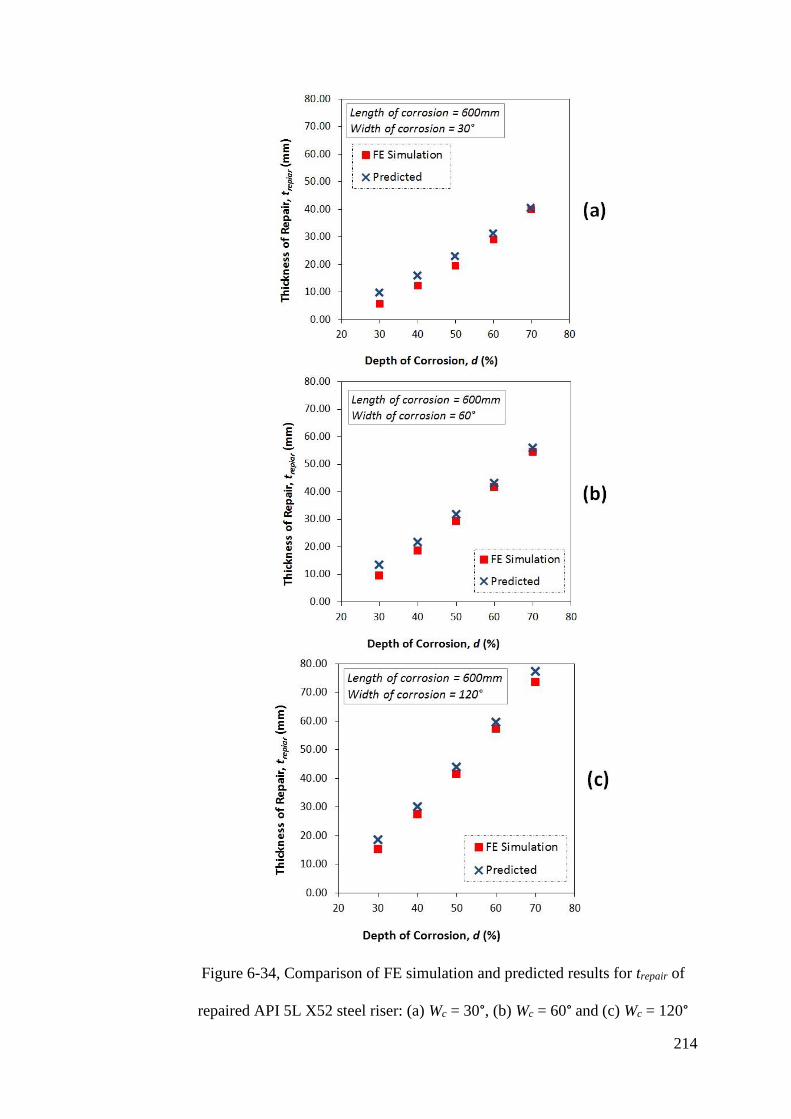
214
Figure 6-34, Comparison of FE simulation and predicted results for trepair of
repaired API 5L X52 steel riser: (a) Wc = 30°, (b) Wc = 60° and (c) Wc = 120°
215
As observed, the relation formulated using the nonlinear regression analysis was
found capable to produce accurate prediction on the required thickness of CRS,
with tolerance of ±4mm. The percentage error tends to increase in scenario
where the corrosion defects are less detrimental (i.e. smaller width and lower
depth). Such defects require relatively thin repair and hence fluctuation in
magnitude of ±4mm will result in a higher percentage difference.
6.6 Concluding Remarks
The simulation using FEA has demonstrated that carbon reinforcing fibres
provide much better strengthening to a corroded riser. However, the main
strengthening occurs in the direction parallel to the fibres. Hence, mixed
laminate orientations can be beneficial to a CRS as they can provide a much
balanced reinforcement to a corroded riser, in both hoop and axial directions
where stresses are most significant. Section 6.3 demonstrated the need for
reinforcement to sustain the hoop stress caused by internal pressure as well as
axial stress caused by the combined tensile force and bending load. However,
fabrication of laminates with mixed lamina orientations is not always feasible,
in particular in the case where fibre orientation is aligned along the longitudinal
axis of the riser, such laminates are usually fabricated as full-cured parts prior to
rehabilitation installation.
The automation of subsea composite repair on corroded riser can be made
feasible by employing a simple application mechanism, which is the winding of
prepreg tapes. The winding/wrapping angle determines the strength of the CRS.
Under combined loading of internal pressure, tension and bending moment,
winding angle that aligns the fibres closest to the longitudinal axis of the riser
216
provides highest resistance to the axial stress. The current study revealed that
[±30°] and [±45°] laminates capable to provide sufficient axial strengthening.
However, [±45°] laminates provides an additional advantage to strengthen the
corroded riser in the hoop direction. This is essential as the bending force usually
fluctuates depending on the wave and current forces. When bending force is at
its minimal, the effects of hoop stress from the internal pressure become more
significant.
A simple relation has been developed for computation of the required thickness
of the CRS under combined loadings. This relation determines the optimum
thickness of the repair based on the width and depth of the corrosion defect and
is different from those available in ASME PCC-2 as the computation in ASME
PCC-2 fails to account for the increase in width of corrosion as well as the effects
of axial stress on the corrosion defect. The prediction via this relation produces
great accuracy assuming that risers are designed based on limit analysis.
217
Chapter 7 Conclusions
7.1 Primary Achievements and Contributions to New Knowledge
The current section concludes primary achievements, main findings and
contributions of this research work.
- CRS using pre-impregnated FRPC in the form of a tape is effective in
reinforcing a corroded riser subjected to combined loading, where the use of
carbon/epoxy show superior strengthening performance (reduces axial strain
in corroded region by up to 58%) compared to glass/epoxy (reduces axial
strain in corroded region by up to 36%).
- The effects of individual static loading (i.e. internal pressure, tension and
bending) on a corroded riser repair with CRS. With individual loading, the
CRS used should consist of unidirectional laminates where fibres are aligned
with the direction of the load. However, CRS with pure axially orientated
fibres (parallel with axis of riser) are not practically achievable via helical
wrapping.
- The effects of combined static loading on a corroded riser repair with CRS.
With combined internal pressure, tension and bending, the dominant stress
which is most likely to cause failure of the repaired riser in the axial stress.
CRS for this combined loading case is very much different compared to
individual loading cases. Fibres more closely aligned in the axial direction
of the riser will provide better strengthening to a corroded riser.
- The use of strain energy release rate to characterise the bond integrity
between the FRPC laminate and the steel riser under static and cyclic
bending. Current standard on composite repair for oil and gas pipelines such
218
as ASME PCC-2 (ASME, 2008) and ISO/TS 24817 (ISO, 2006) addresses
the bond integrity through the measurement of lap shear strength where an
average of 4MPa must be demonstrated. With the complex loading
conditions sustained by a riser, strain energy release rates used in mixed
mode failure criteria will give more in-sight into the failure mechanism of
the CRS and hence improved qualification data.
- In practice, full-scaled experiments are used to validate the accuracy of a
numerical model in predicting the stress-strain behaviour of a CRS. This
research has proven that validation via small-scaled tests are equally
achievable with percentage difference of less than 13%. The small-scaled
tests developed through similitude relations can reduce the cost and
resources needed for the experiment.
- The effects of length, width and depth of the corrosion defect on the required
thickness of the CRS. When subjected to combined loading of internal
pressure, tension and bending at design conditions, the increase in length
width and depth cause an increase in the required thickness of repair.
However, increase in length does not affect the thickness of repair
significantly. This suggested that the bi-axial loading condition is very much
different from conventional onshore pipeline repair where major loading is
only in the hoop direction.
- Development of an accurate FEA model capable of predicting the
performance of a CRS in strengthening a corroded riser, which can be used
to conduct a comprehensive parametric study on the CRS. Careful selection
of different parameters such as element type, mesh refinement, interaction
properties and boundary conditions was performed to ensure that minimum
219
simulation time and resources without compromising the accuracy of the
results. This FEA model which was validated through scaled-down flexural
tests can be used to optimize the different parameters of the CRS. The
detailed framework in optimizing the CRS through the FEA model can be
summarized as
1) As a reference point, the equation in ASME PCC-2 was used to obtain
the probable thickness of the repair that should be modelled.
2) Reduced integration shell elements, S4R which are capable of capturing
large strain (i.e. inelastic deformation) under different loading conditions
were used to model both the corroded riser and CRS. Stress-strain
behaviour of both the CRS and corroded riser was studied.
3) Fracture mechanics using strain energy release rate was applied to study
the bond integrity at the interlaminar interface and steel-composite
interface.
4) Multi-Continuum Theory (MCT) failure criteria was incorporated to
study the tendency of the FRPC to fail under the assigned loading
conditions.
5) Fibre angle, thickness of repair, length of defect and width of defect were
easily changed via the input file of the FEA model in the process of
optimizing the CRS.
- A design tool for CRS on offshore risers which combines the use of accurate
FEA model, limit analysis and a simple relation equation. The minimum
thickness of the CRS can be determined using the simple relation, followed
by a performance analysis using the developed FEA model and limit analysis.
220
7.2 Recommendations for Future Work
The preliminary design of the composite repair machine currently proposed in
the Appendix A can be further developed into a fully functional prototype. Initial
stages can involve the development of the prototype for wrapping module alone
where the desired thickness, length and angle of the composite wrap can be
achieved. This prototype can be a scaled-down version where the demonstration
of the wrapping sequence can be demonstrated on a smaller pipe spool in a
laboratory environment. Once wrapping has been proven to be feasible, testing
of the wrapping spool can be done by loading the specimen onto a test rig.
The procedures and results of the small-scaled experiment on the flexural
properties of the CRS were discussed. Future work can include the development
of a small-scale cyclic bending rig which can be used to validate the behaviour
of the CRS subjected to cyclic bending. This can be highly valuable as offshore
risers are continuously subjected to cyclic bending forces due to wave and sea
current.
The study on response of the FRPC laminate under static loading conditions
using MCT failure criterion has proven that the repair laminate will not fail under
static design conditions. The FEA model can be further improved by
incorporating a user-subroutine that characterizes the FRPC material via fatigue
failure criterion. Hence, the behaviour of both the steel-composite interface bond
and FRPC laminate of the CRS subjected to cyclic loading can be studied
simultaneously to observe the failure mechanism of the CRS.
221
References
ABS, 2008. Guide for Building and Classing Subsea Riser Systems. American
Bureau of Shipping, Houstan, TX, USA.
Alexander, C., 2005. Evaluation of the AquaWrap® System in Reparing
Mechanically-Damaged Pipes, Azusa, California: Air Logistics, Inc..
Alexander, C., 2006. Asssessing the Use of Composite Materials in Repairing
and Reinforcing Offshore Riser Pipes. s.l., s.n.
Alexander, C., 2006. State of the Art Assessment of Composite Systems Used to
Repair Transmission Pipelines. Calgary, Alberta, Canada, s.n.
Alexander, C., 2007. Development of a Composite Repair System for
Reinforcing Offshore Risers. PhD Thesis, Texas A&M University.
Alexander, C., 2012. Design of An Optimized Composite Repair System for
Offshore Risers Using Integrated Analysis and Testing Techniques. 30 April - 3
May, Houstan, Texas, USA, s.n., p. OTC 23164.
Alexander, C. & Bedoya, J., 2011. Using Composite Materials to Reinforce
Onshore Pipelines: New Insights and Lessons Learned. October 31 - November
3, Houstan, Texas, USA, s.n.
Alexander, C. & Ochoa, O., 2010. Extending Onshore Pipeline Repair to
Offshore Steel Risers with Carbon-Fibre Reinforced Composites. Composite
Structures, pp. 92: 499-507.
Alexander, C. & Wilson, F., 2000. Recent Test Results and Field Experience
with Armor Plate Pipe Wrap in Repairing Corroded and Mechanically-
Damaged Pipes, Houstan, Texas, USA: Stress Engineering, Inc..
Andre, A., Haghani, R. & Biel, A., 2012. Application of Fracture Mechanics to
Predict the Failure Load of Adhesive Joints used to Bond CFRP Laminates to
Steel Members. Construction and Building Materials, pp. 27: 331-340.
Andre, A. & Linghoff, D., 2009. Damage Modelling of Adhesive Joint in
Composite Reinforced Metallic Beams. September, Malmo, Sweden, s.n.
Anyfantis, K. N. & Tsouvalis, N. G., 2013. Loading and Fracture Response of
CFRP-to-Steel Adhesively Bonded Joints with Think Adherents - Part I:
Experiments. Composite Structures, Volume 96, pp. 850-857.
API, 1998. API Recommended Practice 2RD: Design of Risers for Floating
Production Systems (FPSs) and Tension-Leg Platforms (TLPs). American
Petroleum Institute, Washington, DC, USA .
222
API, 1999. API Recommended Practice 1111: Design, Construction, Operation
and Maintenance of Offshore Hydrocarbon Pipelines (Limit State Design).
American Petroluem Institute, Washington DC, USA.
ASME, 1991. ASME B31G: Manual for Determining the Remaining Strength
of Corroded Pipelines. The American Society of Mechanical Engineers, New
York, USA.
ASME, 2003. ASME B31.8: Gas Transmission and Distribution Piping System.
The American Society of Mechanical Engineers, New York, USA.
ASME, 2006. ASME B31.4: Pipeline Transportation Systems for Liquid
Hydrocarbons and Other Liquids. The American Society of Mechanical
Engineers, New York, USA.
ASME, 2007. ASME Boiler & Pressure Vessel Code. Rules for Construction of
Pressure Vessels. Section VIII, Division 2, Alternative Rules. The American
Society of Mechanical Engineers, New York, USA.
ASME, 2008. ASME PCC-2: Repair of Pressure Equipment and Piping. The
American Society of Mechanical Engineers, New York, USA.
ASTM, 2000. Standard Test Method for Tensile Properties of Polymer Matrix
Composite Materials, West Conshohocken, United States: ASTM International.
ASTM, 2008. ASTM D3165: Standard Test Method for Strength Properties of
Adhesives in Shear by Tension Loading of Single-Lap-Joint Laminated
Assemblies, West Conshocken, PA, USA: The American Society of Testing and
Materials.
ASTM, 2012. E8/E8M-11: Standard Test Method for Tension Testing of
Metallic Mateials, West Conshohocken, United States: ASTM International.
ASTM, 2012. Standard Test Method for Shear Properties of Composite
Materials by the V-Notched Beam Method, West Conshohocken, United States:
ASTM International.
Balaji, G., Biradar, P., CN, S. & Venkata Ramaiah, K., 2008. An SMA-actuated,
Compliant Mechanism-based Pipe-crawler. July 24-26 Bangalore, India, s.n.
Banea, M. & da Silva, L., 2009. Adhesively Bonded Joints in Composite
Materials: An Overview. Proceedings of the IMechE, Part L: Journal of
Materials and Applications.
Bedoya, J., Alexander, C. & Precht, T., 2010. Repair of High Pressure Pipe
Fittings Using Composite Materials. Sep 27 - Oct 1, Calgary, Alberta, Canada,
8th International Pipeline Conference.

223
Biel, R. & Alexander, C., 2005. Applications of Limit Load Analyses to Assess
the Structural Integrity of Pressure Vessels. 17-21 July, Denver, ASME.
Bocciarelli, M., Colombi, P., Fava, G. & Poggi, C., 2008. Cohesive
Delamination in Steel Elements Strengthened with CFRP Plates. 22-24 July,
Zurich, Switzerland, s.n.
Bogy, D., 1968. Edge Bonded Dissuilar Orthogonal Elastic Wedges Under
Normal and Sheal Loading. Journal of Applied Mechanics, pp. 35: 460-466.
Boulet d'Auria, S. et al., 2013. Subsea Pipeline Repair by Composite System:
One Step Deeper. 6-9 May, Houstan, Texas, USA, s.n.
C, A., 2007. Development of a Composite Repair System for Reinforcing
Offshore Risers. PhD Thesis, Texas A&M University.
Carey, A. & Johnson, M., 2013. Cleaning Mechanism for Oil Riser Repair
System, Report submitted for Individual Project: The University of Nottingham.
CaviDyne, 2014. CaviBlasterTM Underwater Cleaning System. [Online]
Available at:
http://www.cavidyne.com/Downloads/CaviBlaster_Web_Brochure_020808.pd
f
[Accessed September 2014].
CEN, 1997. ES EN ISO 377, Steel and Steel Products - Location and Preparation
of Samples and Test Pieces for Mechanical Testing. European Committee for
Standardization, Brussels, Belgium.
CEN, 2001. ES EN 10002-1, Metaillic Materials - Tensile Testing - Part 1:
Method of Test at Ambient Temperature. European Committee for
Standardization, Brussels, Belgium.
Chakrabarti, S. & Frampton, R., 1982. Review of Riser Analysis. Applied Ocean
Research, pp. 4(2): 73-90.
Chatzakos, P., Papadmitriou, V. & Psarros, D., 2010. On the Development of an
Unmanned Underwater Robotic Crawler for Operation on Subsea Flexible
Risers. s.l., s.n.
Citadel Technologies, 2011. Diamondwrap®: Structural Carbon/Epoxy Rehab
System for the Prevention and Repair of Corroded Pipe System. [Online]
Available at: http://cittech.com/documents/diamondwraphpinfo.pdf
[Accessed 6 November 2011].
Clock Spring, 2012. Clock Spring® Pipe Reinforcement and Repair System.
[Online]
Available at: www.clockspring.com/wp-content/uploads/2011/12/Clock-
224
Spring-2012web.pdf
[Accessed November 2011].
Considine, J., 2010. Inherent Defect Size: Calculation and Use for Composite
Materials. Pennsylvania, USA, s.n., pp. June 27 - July 2.
Coutts-Smith, L., Heslehurst, R. & Smith, W., 2013. Tailoring Laminate Bend-
Twist Coupling Through Ply Position. Melbourne, Australia, CRC-ACS,
Composites Australia.
DEKOTECT GmbH, 2014. Product Information on DEKOMAT KGR- Junior.
[Online]
Available at:
http://www.speccoats.co.za/DataSheets/Dekomat_KGR_Junior.pdf
[Accessed April 2014].
Derisi, B., Hoa, S. & Hojjati, M., 2012. Similitude Study on Bending Stiffness
and Behavior of Composite Tubes. Journal of Composite Materials, pp. 0(0): 1-
16.
DNV, 2010. Offshore Service Specification DNV-OSS-302: Offshore Riser
Systems. Det Norske Veritas, Norway.
DNV, 2010. Offshore Standard DNV-OS-F201: Dynamic Risers. Det Norske
Veritas, Norway.
DNV, 2010. Recommended Practice DNV-RP-F101: Corroded Pipelines. Det
Norske Veritas, Norway.
Duell, J., Wilson, J. & Kessler, M., 2008. Analysis of a Carbon Composite
Overwrap Pipeline Repair System. International Journal of Pressure Vessels
and Piping, pp. 85: 782-788.
Esmaeel, R., Khan, M. & Taheri, F., 2012. Asssessment of the Environmental
Effects on The Performance of FRP Repaired Steel Pipes Subjected to Internal
Pressure. Journal of Pressure Vessel Technology, pp. 134(041702): 1-7.
Farwest Corrosion Control, 2014. Tapecoat Hand Wrapster #3 Tape Wrapping
Tool. [Online]
Available at: http://www.farwestcorrosion.com/tapecoat-hand-wrapster-3-tape-
wrapping-tool.html
[Accessed April 2014].
Francini, R. & Kiefner, J., 2006. Evaluation of the AquaWrap® Composite
Repair System, Azusa California: Air Logistics, Inc..
225
Giancaspro, J., Papakonstantinou, C. & Balaguru, P., 2010. Flexural Response
of Inorganic Hybrid Composites with E-glass and Carbon Fibres. Journal of
Engineering Materials and Technology, pp. 132: 1-8.
Grewal, H. S. & Hojjati, M., 2015. Inter-ply Friction Measurement of Out-of-
Autoclave Thermosetting Prepreg Composites. Montreal, Quebec, Canada, 62nd
CASI Aeronautics Conference and AGM 3rd GARDN Conference.
Haghani, R., 2010. Analysis of Adhesive Joints Used to Bond FRP Laminates to
Steel Members - A Numerical and Experimental Study. Construction and
Building Materials, pp. 24: 2243-2251.
Hashin, Z., 1980. Failure Criteria for Unidirectional Fiber Composites. Journal
of Applied Mechanics, pp. 47: 329-334.
Hinton, M., Kaddour, A. & Soden, P., 2004. The World-Wide Failure Exercise:
Its Origin, Concept and Content. In: Failure Criterion in Fibre Reinforced
Polymer Composites: The World-Wide Failure Exercise. Oxford: Elsevier, pp.
2-26.
Howells, H., 1995. Advances in Steel Catenary Riser Design. Aberdeen, s.n.
Innospection Ltd, 2013. [Online]
Available at: http://www.innospection.com/pdfs/Data%20Sheet%20MEC-
Combi%20Crawler%20v01-2013.pdf
[Accessed 1 July 2014].
ISO, 2006. ISO/TS 24817: Petroleum, Petrochemical and Natural Gas Industries
– Composite Repairs for Pipework – Qualification and Design, Installation,
Testing and Inspection. International Organization for Standardization, Geneva,
Switzerland.
Khan, R., Kaur, A., Singh, S. & Ahmad, S., 2011. Nonlinear Dynamic Analysis
of Marine Risers under Random Loads for Deepwater Fields in Indian Offshore.
Procedia Engineering, 14, pp. 1334-1342.
Kootsookos, A., Mouritz, A. & St John, N., 2011. Comparison of Seawater
Durability of Carbon- and Glass-Polymer Composites. Beijing, China,
Proceedings of ICCM-13.
Krueger, R., 2011. Development and Application of Benchmark Examples for
Mode II Static Delamination Propagation and Fatigue Growth Prediction,
Hampton, Virginia, USA: Report prepared for NASA, NASA/CR-2011-217305.
Lam, C., Cheng, J. & Yam, C., 2011. Finite Element Study of Cracked Steel
Circular Tube Repaired by FRP Patching. Procedia Engineering, Volume 14,
pp. 1106-1113.
226
Land, P. et al., 2012. Creepy Crawler, Report submitted for Group Design
Project: University of Nottingham.
Lassila, L., Nohrstrom, T. & Vallittu, P., 2006. The Influence of Short-term
Water Storage on The Flexural Properties of Unidirectional Glass Fibre-
Reinforced Composites. Biomaterials, pp. 298: 111-117.
Liao, W. & Sun, C., 1996. The Determination of Mode III Fracture Toughness
in Thick Composite Laminates. Composite Science and Technology, pp. 56: 489-
499.
Li, S. & Reid, S., 1992. On the Symmetry Conditions for Laminated Fibre-
Reinforced Composite Structures. International Journal of Solids and Structures,
pp. 29(23): 2867-2880.
Lukacs, J. et al., 2010. Experimental and Numerical Investigations of External
Reinforced Damaged Pipelines. Procedia Engineering, Issue 2, pp. 1191-1200.
Machado Filho, R. et al., 2001. The Monitoring System for A Steel Catenary
Riser Suspended from A Floating Platform in Deepwater. s.l., s.n.
Madelpech, P., Juaneda, S. & Pradels, M., 2009. Bonded Composite Patch to
Repair Metallic Structures: Fatigue Behaviour of a Disbond. Edinburgh, United
Kingdom, s.n., p. July.
Mallick, P., 2007. Fibre-Reinforced Composites: Materials, Manufacturing and
Design, 3rd ed.. New York, USA: CRC Press, Taylor & Francis Group.
Margerison, B. & Johnson, M., 2012. Drive Mechanism for an Oil Riser Repair
System, Report submitted for Individual Project: University of Nottingham.
Martine, R., 2007. A Technology Gap Review of Composites in the UK Oil and
Gas Industry, Hertfordshire, UK: Materials Engineering Research Laboratory
Ltd.
Meniconi, L., Freire, J., Vieira, R. & Diniz, J., 2002. Stresss Analysis of Pipelines
with Composite Repairs. 29 September - 3 October, Calgary, Alberta, Canada,
s.n., pp. IPC02-2372.
MT/9, A. S. C., 1997. Metal Finishing - Preparation and Pretreatment of Surfaces,
Method Selection Guide. AS 1627, Part: 0.. Homebush, NSW: Standards
Association of Australia.
Murad, M., 2011. An Intergrated Structural Health Monitoring Approach to
Composite-Based Pipeline Repair. Thesis submitted for PhD, s.l.: Cranfield
University.
227
Murad, M., Frost, S. & Brennan, F., 2013. Bonding Integrity Study between
Steel Pipeline and Composite Wraps Using Structural Health Monitoring
Technique. Journal of Pipeline Systems Engineering and Practice 4, pp. 68-73.
Nace International, 2011. MP Buyers Guide: Wil Cor, Inc.. [Online]
Available at: http://mpbuyersguide.com
[Accessed 4 November 2011].
NACE/SSPC, 2006. Joint Surface Preparation Standard NACE No.2/SSPC-SP
10, Near-White Metal Blast Cleaning. Houstan, Texas, USA, s.n.
Narmashiri, K., Jumaat, M. & Ramli Sulong, N., 2010. Shear Strength of Steel
I-Beam by Using CFRP Strips. Scientific Research and Essays, pp. 5(16): 2155-
2168.
O'Brien, T., Johnston, W. & Toland, G., 2010. Mode II Interlaminar Fracture
Toughness and Fatigue Characterization of Graphite Epoxy Composite Material,
Hampton, Virginia, USA: Report prepared for NASA, NASA/TM-2010-216838.
Ochoa, O. & Salama, M., 2005. Offshore Composites: Transition Barriers to an
Enabling Technology. Composite Science and Technology, pp. 65: 2588--2696.
Ochola, R., Marcus, K., Nurick, G. & Franz, T., 2004. Mechanical Behaviour of
Glass and Carbon Fibre Reinforced Composites at Varying Strain Rates.
Composite Structures, pp. 63: 455-467.
Palmer, A. & King, R., 2008. Subsea Pipeline Engineering 2nd ed.. s.l.:Penwell.
Patrick, A., 2004. Composite - Case Studies of Pipeline Repair Applications.
Pigging and Services Association.
Patrick, A., 2010. The Use and Application of Composite Repairs. PetroMin
Pipeliner.
Pipe Wrap, 2011. Pipe Repair Product: A+ Wrap. [Online]
Available at: http://www.piperepair.net/pwplus.html#proc
[Accessed 8 November 2011].
Proserv, 2014. Proserv Marine Growth Removal (MGR) Tool. Product
Specification Sheet. [Online]
Available at:
http://www.proserv.com/uploads/filemanager/media/Literature/MARINE/Mari
ne_Growth_Removal/Spec_Sheets/Proserv_Marine_Growth_Removal_%28M
GR%29_Tool.pdf
[Accessed September 2014].
Psarros, D. et al., 2010. A Service Robot for Subsea Flexible Riser - Analysis
and Systematic Design. IEEE Robotic & Automation Magazine, pp. 55 - 63.
228
Ramu, M., Prabhu Raja, V. & Thyla, P., 2012. Establishment of Structural
Similitude for Elastic Models and Validation of Scaling Laws. KSCE Journal of
Civil Engineering, pp. 17(1): 139-144.
Ray, B., 2006. Temperature Effect During Humid Ageing on Interfaces of Glass
and Carbon Fibres Reinforced Epoxy Composites. Journal of Colloid Interface
Science, pp. 298: 111-117.
Rehberg, T., Schad, M. & Green, M., 2010. Non-Metallic Composite Repair
Systems for Pipes and Pipelines. Pipe Technology 3R International Special
Edition.
RSPA, 2000. 2000. Department of Transportation, 98-4733, Pipeline Safety:
Gas and Hazardous Liquid Repair.
Ruggieri, C. & Fernando, D., 2011. Numerical Modelling of Ductile Crack
Extension in High Pressure Pipelines with Longitudinal Flaws. Engineering
Structures, pp. 33: 1423-1438.
Sala, G., 2000. Composite Degradation due to Fluid Absorption. Composite
Engineering B, pp. 31: 357-373.
Seica, M. & Packer, J., 2007. FRP Materials for the Rehabilitation of Tubular
Steel Structures for Underwater Applications. Composite Structures, pp. 80:
440-450.
Serta, O. et al., 1996. Steel Catenary Riser for Marlim Field FPS P-XVIII.
Houstan, 6-9 May.
Shamsuddoha, M. et al., 2013. Effectiveness of Using Fibre-Reinforced Polymer
Composites for Underwater Steel Pipeline Repairs. Composite Structures, pp.
100: 40-54.
Shouman, A. & Taheri, F., 2011. Compressive Strain Limits of Composite
Repaired Pipelines under Combined Loading States. Composite Structures, pp.
93: 1538-1548.
SMC, 2011. AccuwrapTM II - Hand Held Pipe Wrapping Machine. [Online]
Available at: http://sawyermfg.com/wp-content/uploads/2011/07/Accuwrap-
II.pdf
[Accessed April 2014].
Soden PD, H. M. K. A., 1998. Lamina Properties, Lay-Up Configurations and
Loading Conditions for a Range of Fibre-Reinforced Composite Lamiantes.
Composite Science and Technology, pp. 58: 1011-1022.
Soden, P., Hinton, M. & Kaddour, A., 1998. Biaxial Test Results for Strength
and Deformation of a Range of E-Glass and Carbon Fibre Reinforced Composite
229
Laminates: Failure Exercise Benchmark Data. Composite Science and
Technology, p. 58(7): 1225.
Soden, P., Kaddour, A. & Hinton, M., 1998. Lamina Properties, Lay-Up
Configurations and Loading Conditions for a Range of Fibre-Reinforced
Composite Laminates. Composite Science and Technology, pp. 58: 1011-1022.
Stanton, P., 2006. Overview of Deepwater Drilling and Production Risers.
Technip.
Tanaka, K., Minoshima, K., Grela, W. & Komai, K., 2002. Characterization of
The Aramid/Epoxy Interfacial Properties by Means of Pull-out Test and
Influence of Water Absorption. Composite Science and Technology, pp. 62:
2169-2177.
Tavakkolizadeh, M. & Saadatmanesh, H., 2001. Galvanic Corrosion of Carbon
and Steel in Aggressive Environments. Journal of Composites for Construction,
pp. 5: 200-210.
Tiratsoo, J., 2003. Pipeline Pigging and Integrity Technology 3rd ed..
s.l.:Clarion Technical Publishers.
UES, 2014. UES Marince Cleaning Tool Model: MC211 Data Sheet. [Online]
Available at: http://www.uesltd.net/pdf/MC211%20Data%20Sheet.pdf
[Accessed September 2014].
UMECO, 2012. MTM57 Series MSDS Sheet, s.l.: Umeco Structural Materials
Ltd.
Walker, A. & Williams, K., 1995. Strain Based Design of Pipelines. Copenhagen,
Denmark, s.n., pp. 5: 345-350.
Webb, G., 1980. Inspection and Repair of Oil and Gas Production in Deep Water.
Ocean Management, pp. 7: 31-326.
Wonderly, C., Grenestedt, J., Fernlund, G. & Cepus, E., 2006. Comparison of
Mechanical Properties of Glass Fibre/Vinyl Ester and Carbon Fibre/Vinyl Ester
Composites. Composites: Part B, pp. 36: 417-426.
Worth, F., 2005. Analysis of AquaWrap® for Use in Repairing Damaged
Pipelines: Environmental Exposure Conditions, Property Testing Procedures,
and Field Testing Evaluations, Azusa, California: Air Logistics.
Yang, J., Smith, S. & Feng, P., 2013. Effect of FRP-to-Steel Bonded Joint
Configuration on Interfacial Stresses: Finite Element Investigation. Thin-Walled
Structures, pp. 62: 215-228.

230
Yukawa, T., Suzuki, M., Satoh, Y. & Okano, H., 2006. Design of Magnetic
Wheels in Pipe Inspection Robot. October 8-11, Tapei, Taiwan, s.n., pp. 235-
240.
Zhao, X., Fernando, D. & Al-Mahadi, R., 2006. CFRP Strengthened RHS
Subjected to Transverse End Bearing Force. Engineering Structures, pp. 28:
1555-1565.
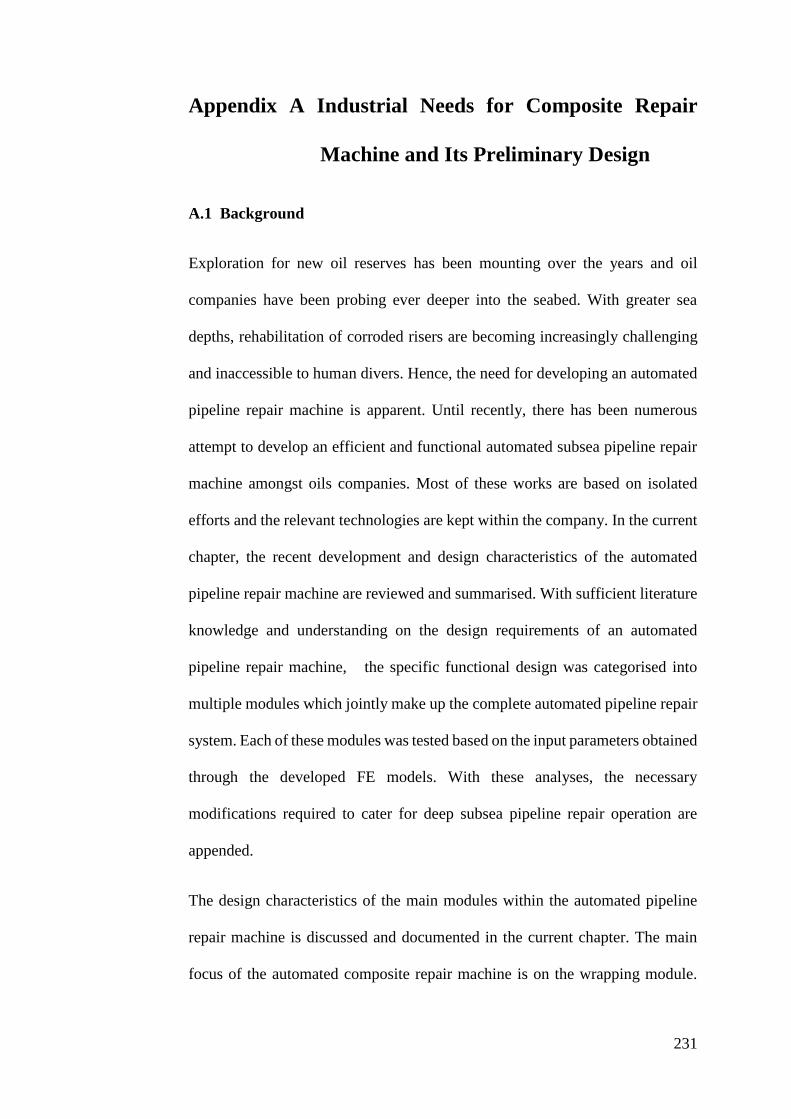
231
Appendix A Industrial Needs for Composite Repair
Machine and Its Preliminary Design
A.1 Background
Exploration for new oil reserves has been mounting over the years and oil
companies have been probing ever deeper into the seabed. With greater sea
depths, rehabilitation of corroded risers are becoming increasingly challenging
and inaccessible to human divers. Hence, the need for developing an automated
pipeline repair machine is apparent. Until recently, there has been numerous
attempt to develop an efficient and functional automated subsea pipeline repair
machine amongst oils companies. Most of these works are based on isolated
efforts and the relevant technologies are kept within the company. In the current
chapter, the recent development and design characteristics of the automated
pipeline repair machine are reviewed and summarised. With sufficient literature
knowledge and understanding on the design requirements of an automated
pipeline repair machine, the specific functional design was categorised into
multiple modules which jointly make up the complete automated pipeline repair
system. Each of these modules was tested based on the input parameters obtained
through the developed FE models. With these analyses, the necessary
modifications required to cater for deep subsea pipeline repair operation are
appended.
The design characteristics of the main modules within the automated pipeline
repair machine is discussed and documented in the current chapter. The main
focus of the automated composite repair machine is on the wrapping module.
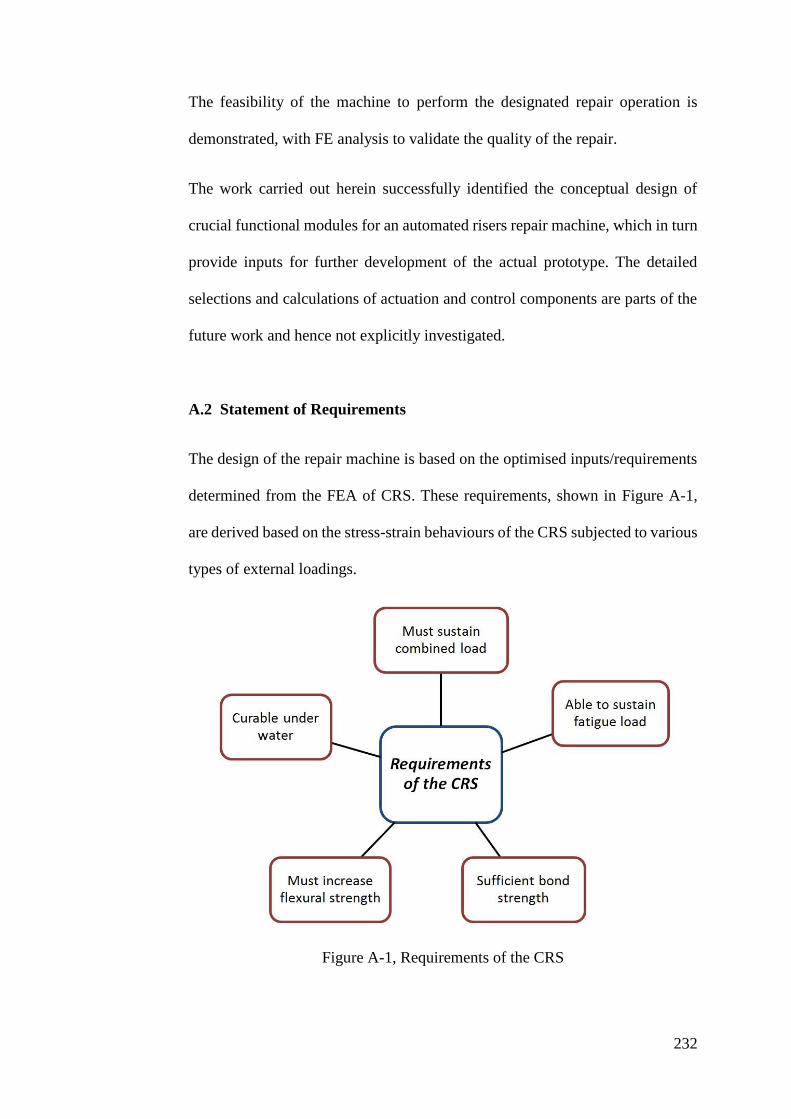
232
The feasibility of the machine to perform the designated repair operation is
demonstrated, with FE analysis to validate the quality of the repair.
The work carried out herein successfully identified the conceptual design of
crucial functional modules for an automated risers repair machine, which in turn
provide inputs for further development of the actual prototype. The detailed
selections and calculations of actuation and control components are parts of the
future work and hence not explicitly investigated.
A.2 Statement of Requirements
The design of the repair machine is based on the optimised inputs/requirements
determined from the FEA of CRS. These requirements, shown in Figure A-1,
are derived based on the stress-strain behaviours of the CRS subjected to various
types of external loadings.
Figure A-1, Requirements of the CRS

233
For the composite to be curable under water, selection of the suitable FRPC has
to be done. At present, there are various composite repair products that are made
to be curable through contact with moisture and UV light. Thermal curing is
often not recommended in offshore environment due to the highly flammable
nature of the hydrocarbon fluids. It is hence assumed that products for repair of
subsea risers are readily available and the actual design (i.e. dimensions) of the
repair can be optimised based on the mechanical properties of the FRPC.
The ability of the CRS to sustain combined load and to increase the flexural
strength of the corroded riser depends very much on the design of the repair,
which is dependent of the size of the corrosion defect. This includes the thickness,
length, and types of material of the repair which has been discussed in the
previous chapters. In addition, the wrapping must be made so that the combined
orientation of the laminate (alignment of fibres with respect to longitudinal axis
of the riser) is optimum. Hence, an inspection device must be included in the
automated repair machine to measure and determine the severity of the corrosion
defect. Furthermore, the repair machine must be able to carry sufficient material,
able to deposit the material along a designated length of the riser, and able to
control the angle of wrap.
As highlighted in Chapter 4 , one of the main failure mechanism of the CRS is
dictated by the disbonding between the FRPC and steel riser surface interfaces,
whereas failure via delamination within the FRPC plies is not the dominant
factor. It is therefore essential for the CRS to establish sufficient bond strength
for adequate load transfer as well as to endure the cyclic loading in an offshore
environment. In conventional pipeline repair, the quality of this bond strength is
highly dependent on the method of surface preparation employed, as well as the
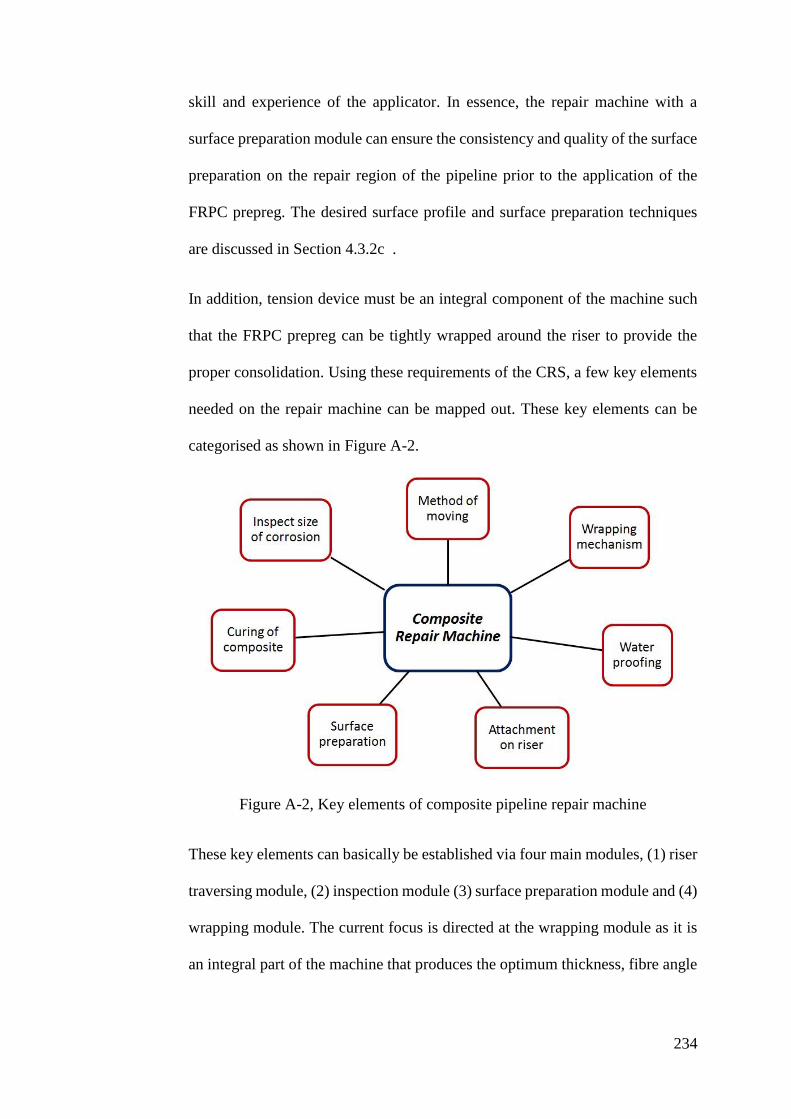
234
skill and experience of the applicator. In essence, the repair machine with a
surface preparation module can ensure the consistency and quality of the surface
preparation on the repair region of the pipeline prior to the application of the
FRPC prepreg. The desired surface profile and surface preparation techniques
are discussed in Section 4.3.2c .
In addition, tension device must be an integral component of the machine such
that the FRPC prepreg can be tightly wrapped around the riser to provide the
proper consolidation. Using these requirements of the CRS, a few key elements
needed on the repair machine can be mapped out. These key elements can be
categorised as shown in Figure A-2.
Figure A-2, Key elements of composite pipeline repair machine
These key elements can basically be established via four main modules, (1) riser
traversing module, (2) inspection module (3) surface preparation module and (4)
wrapping module. The current focus is directed at the wrapping module as it is
an integral part of the machine that produces the optimum thickness, fibre angle
235
and length of the CRS. Other modules will be discussed on a conceptual level
were previous designs are reviewed.
A.3 Riser Traversing Module
The design of the riser traversing module is based on two of the key elements of
the composite repair machine – (i) method of moving/traversing of FRPC
prepreg and (ii) method of attaching the FRPC onto the defective riser surface.
The in-depth literature review carried out in Chapter 2 highlighted that various
work has been conducted to develop pipe crawling machine that can travel up
and down along a vertical pipe. In order to draw out a conceptual design for the
riser traversing module, it is important to determine the specific type of riser
which the machine is supposed to operate on. The CRS studied in this research
project has been focusing on rehabilitation for single-walled steel riser
experienced a certain level of corrosion defects. In this respect, the path of travel
over the flange of the steel riser has to be taken into consideration. In general,
the common traversing mechanisms along a cylindrical pipe can be divided into
two major categories, as showed in Figure A-3. The continuous motion uses
wheeled motion, while the discrete motion includes legged motion and
inchworm motion, shown in Figure A-4
Figure A-3, Two main methods of moving along pipe

236
Figure A-4, Method of moving along pipe: (a) Wheeled motion, (b) Legged
motion, (c) Inchworm motion
The wheeled motion is rejected as the transmission of motion depends on friction
between the wheels and the surface of the riser. In an underwater environment,
the existence of water can distort the frictional force, causing the application to
be risky and highly complicated from a mechanical design point of view. The
continuous motion also signifies that the wheels will have to be in contact with
the riser at all times. This makes travelling over the flange of the steel riser
unachievable. The discrete motion on the other hand is more suitable for
navigating over the flange of the riser. The inchworm motion can be
implemented with clamping mechanism such that the traversing module is made
out of at least two articulated bodies. As one body is clamped on the riser, the
other body can move away from the first body. As soon as the second body
completes its motion, the roles of clamping and moving are interchanged
between the first and second body. This discrete motion enables the machine to
move pass the flange of the riser as the clamp opens.
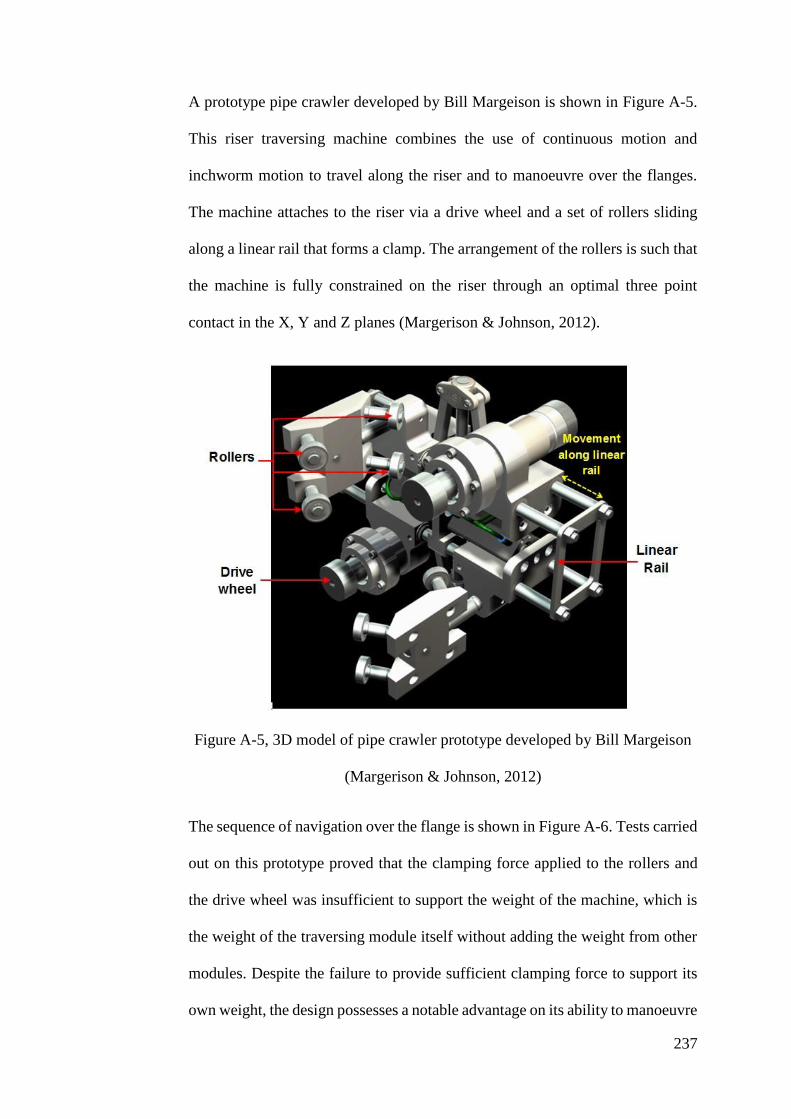
237
A prototype pipe crawler developed by Bill Margeison is shown in Figure A-5.
This riser traversing machine combines the use of continuous motion and
inchworm motion to travel along the riser and to manoeuvre over the flanges.
The machine attaches to the riser via a drive wheel and a set of rollers sliding
along a linear rail that forms a clamp. The arrangement of the rollers is such that
the machine is fully constrained on the riser through an optimal three point
contact in the X, Y and Z planes (Margerison & Johnson, 2012).
Figure A-5, 3D model of pipe crawler prototype developed by Bill Margeison
(Margerison & Johnson, 2012)
The sequence of navigation over the flange is shown in Figure A-6. Tests carried
out on this prototype proved that the clamping force applied to the rollers and
the drive wheel was insufficient to support the weight of the machine, which is
the weight of the traversing module itself without adding the weight from other
modules. Despite the failure to provide sufficient clamping force to support its
own weight, the design possesses a notable advantage on its ability to manoeuvre
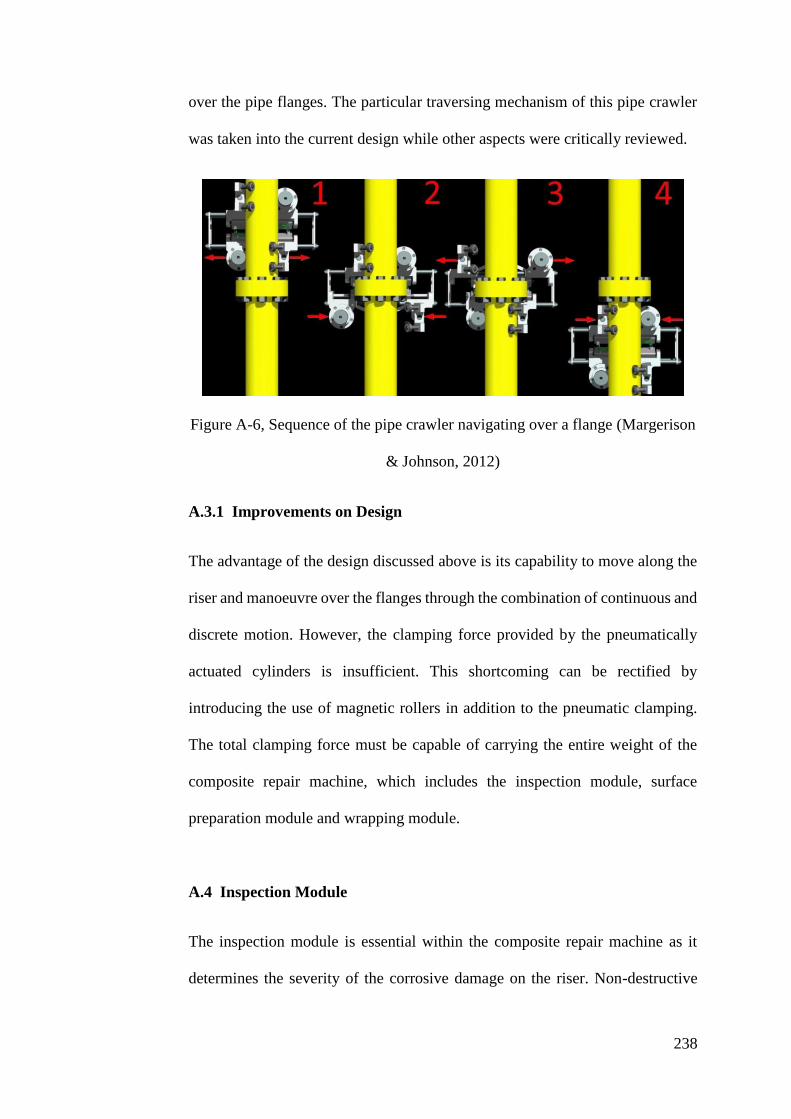
238
over the pipe flanges. The particular traversing mechanism of this pipe crawler
was taken into the current design while other aspects were critically reviewed.
Figure A-6, Sequence of the pipe crawler navigating over a flange (Margerison
& Johnson, 2012)
A.3.1 Improvements on Design
The advantage of the design discussed above is its capability to move along the
riser and manoeuvre over the flanges through the combination of continuous and
discrete motion. However, the clamping force provided by the pneumatically
actuated cylinders is insufficient. This shortcoming can be rectified by
introducing the use of magnetic rollers in addition to the pneumatic clamping.
The total clamping force must be capable of carrying the entire weight of the
composite repair machine, which includes the inspection module, surface
preparation module and wrapping module.
A.4 Inspection Module
The inspection module is essential within the composite repair machine as it
determines the severity of the corrosive damage on the riser. Non-destructive
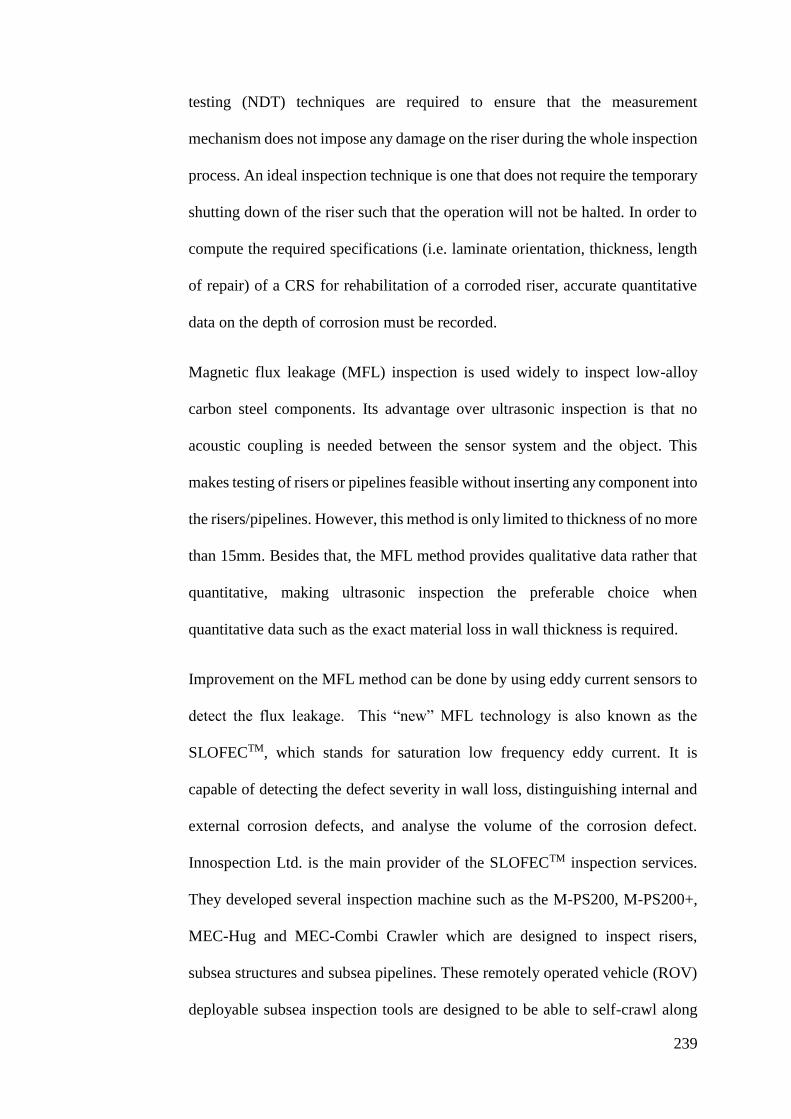
239
testing (NDT) techniques are required to ensure that the measurement
mechanism does not impose any damage on the riser during the whole inspection
process. An ideal inspection technique is one that does not require the temporary
shutting down of the riser such that the operation will not be halted. In order to
compute the required specifications (i.e. laminate orientation, thickness, length
of repair) of a CRS for rehabilitation of a corroded riser, accurate quantitative
data on the depth of corrosion must be recorded.
Magnetic flux leakage (MFL) inspection is used widely to inspect low-alloy
carbon steel components. Its advantage over ultrasonic inspection is that no
acoustic coupling is needed between the sensor system and the object. This
makes testing of risers or pipelines feasible without inserting any component into
the risers/pipelines. However, this method is only limited to thickness of no more
than 15mm. Besides that, the MFL method provides qualitative data rather that
quantitative, making ultrasonic inspection the preferable choice when
quantitative data such as the exact material loss in wall thickness is required.
Improvement on the MFL method can be done by using eddy current sensors to
detect the flux leakage. This “new” MFL technology is also known as the
SLOFECTM, which stands for saturation low frequency eddy current. It is
capable of detecting the defect severity in wall loss, distinguishing internal and
external corrosion defects, and analyse the volume of the corrosion defect.
Innospection Ltd. is the main provider of the SLOFECTM inspection services.
They developed several inspection machine such as the M-PS200, M-PS200+,
MEC-Hug and MEC-Combi Crawler which are designed to inspect risers,
subsea structures and subsea pipelines. These remotely operated vehicle (ROV)
deployable subsea inspection tools are designed to be able to self-crawl along
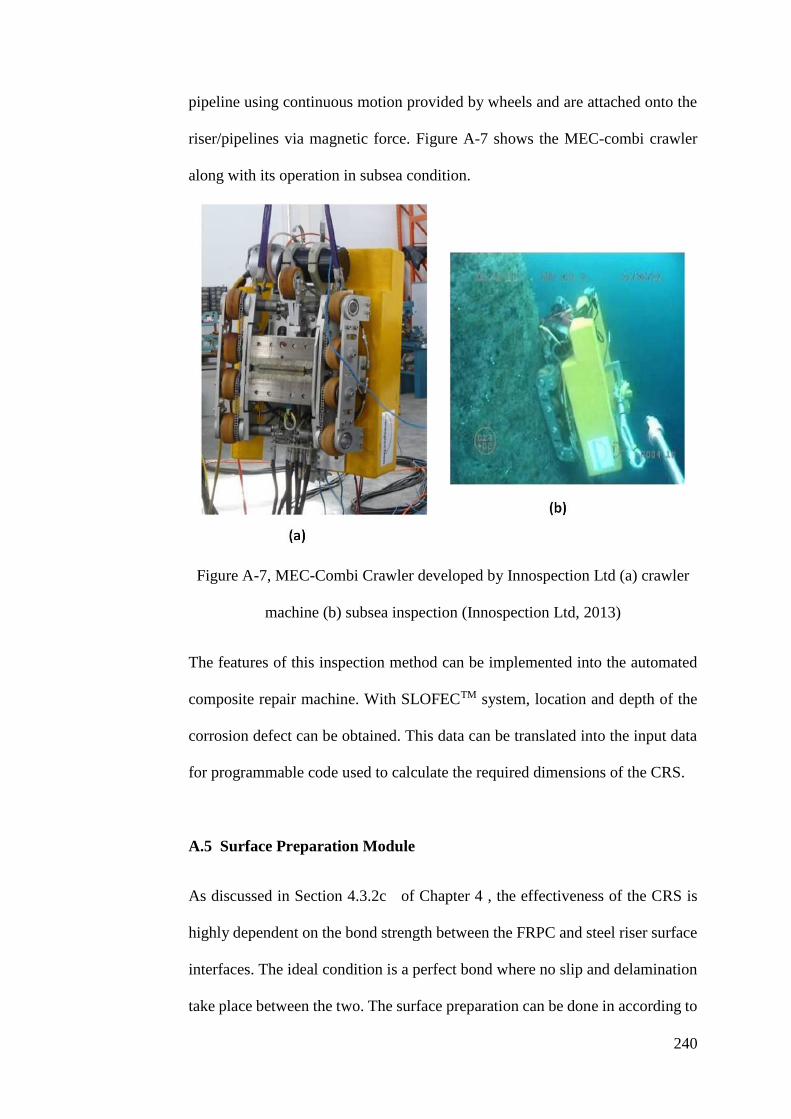
240
pipeline using continuous motion provided by wheels and are attached onto the
riser/pipelines via magnetic force. Figure A-7 shows the MEC-combi crawler
along with its operation in subsea condition.
Figure A-7, MEC-Combi Crawler developed by Innospection Ltd (a) crawler
machine (b) subsea inspection (Innospection Ltd, 2013)
The features of this inspection method can be implemented into the automated
composite repair machine. With SLOFECTM system, location and depth of the
corrosion defect can be obtained. This data can be translated into the input data
for programmable code used to calculate the required dimensions of the CRS.
A.5 Surface Preparation Module
As discussed in Section 4.3.2c of Chapter 4 , the effectiveness of the CRS is
highly dependent on the bond strength between the FRPC and steel riser surface
interfaces. The ideal condition is a perfect bond where no slip and delamination
take place between the two. The surface preparation can be done in according to
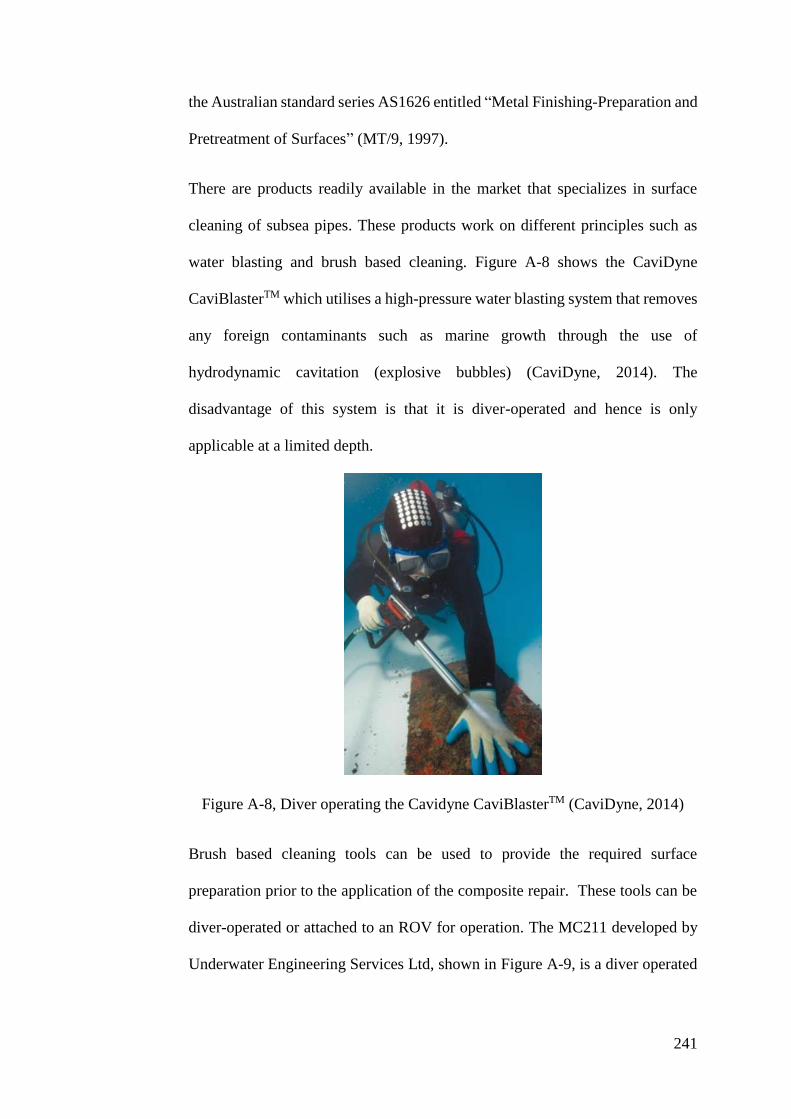
241
the Australian standard series AS1626 entitled “Metal Finishing-Preparation and
Pretreatment of Surfaces” (MT/9, 1997).
There are products readily available in the market that specializes in surface
cleaning of subsea pipes. These products work on different principles such as
water blasting and brush based cleaning. Figure A-8 shows the CaviDyne
CaviBlasterTM which utilises a high-pressure water blasting system that removes
any foreign contaminants such as marine growth through the use of
hydrodynamic cavitation (explosive bubbles) (CaviDyne, 2014). The
disadvantage of this system is that it is diver-operated and hence is only
applicable at a limited depth.
Figure A-8, Diver operating the Cavidyne CaviBlasterTM (CaviDyne, 2014)
Brush based cleaning tools can be used to provide the required surface
preparation prior to the application of the composite repair. These tools can be
diver-operated or attached to an ROV for operation. The MC211 developed by
Underwater Engineering Services Ltd, shown in Figure A-9, is a diver operated
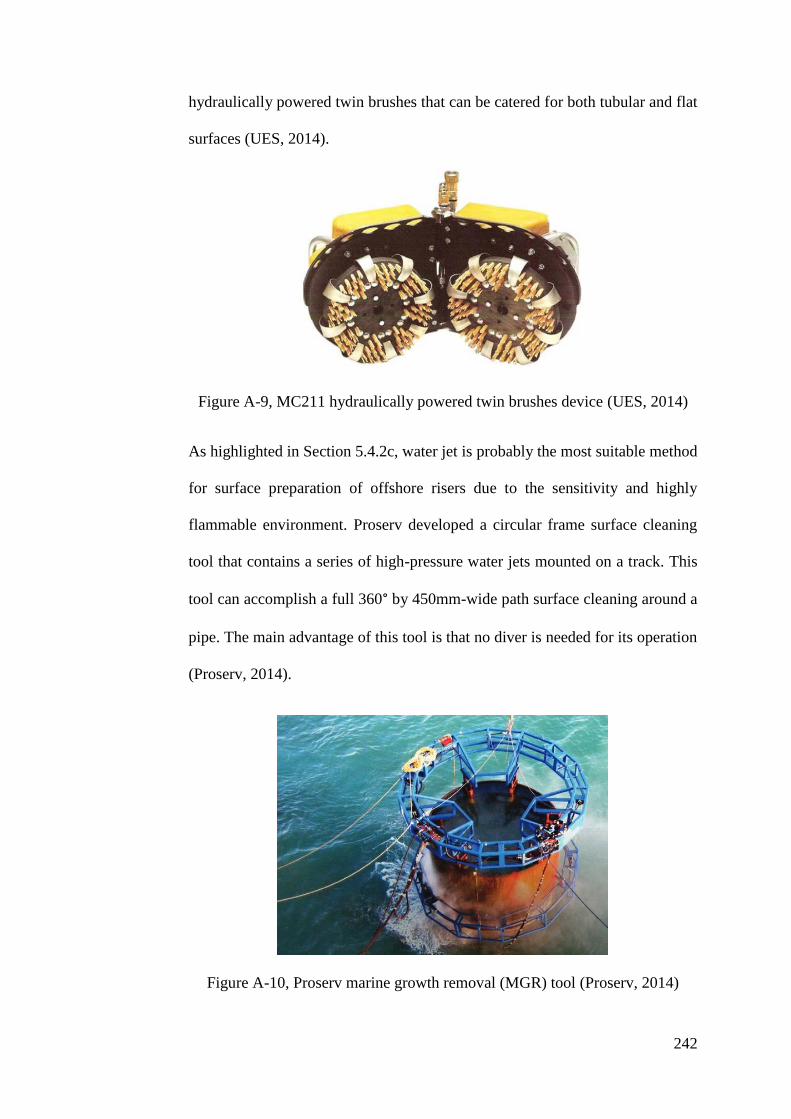
242
hydraulically powered twin brushes that can be catered for both tubular and flat
surfaces (UES, 2014).
Figure A-9, MC211 hydraulically powered twin brushes device (UES, 2014)
As highlighted in Section 5.4.2c, water jet is probably the most suitable method
for surface preparation of offshore risers due to the sensitivity and highly
flammable environment. Proserv developed a circular frame surface cleaning
tool that contains a series of high-pressure water jets mounted on a track. This
tool can accomplish a full 360° by 450mm-wide path surface cleaning around a
pipe. The main advantage of this tool is that no diver is needed for its operation
(Proserv, 2014).
Figure A-10, Proserv marine growth removal (MGR) tool (Proserv, 2014)
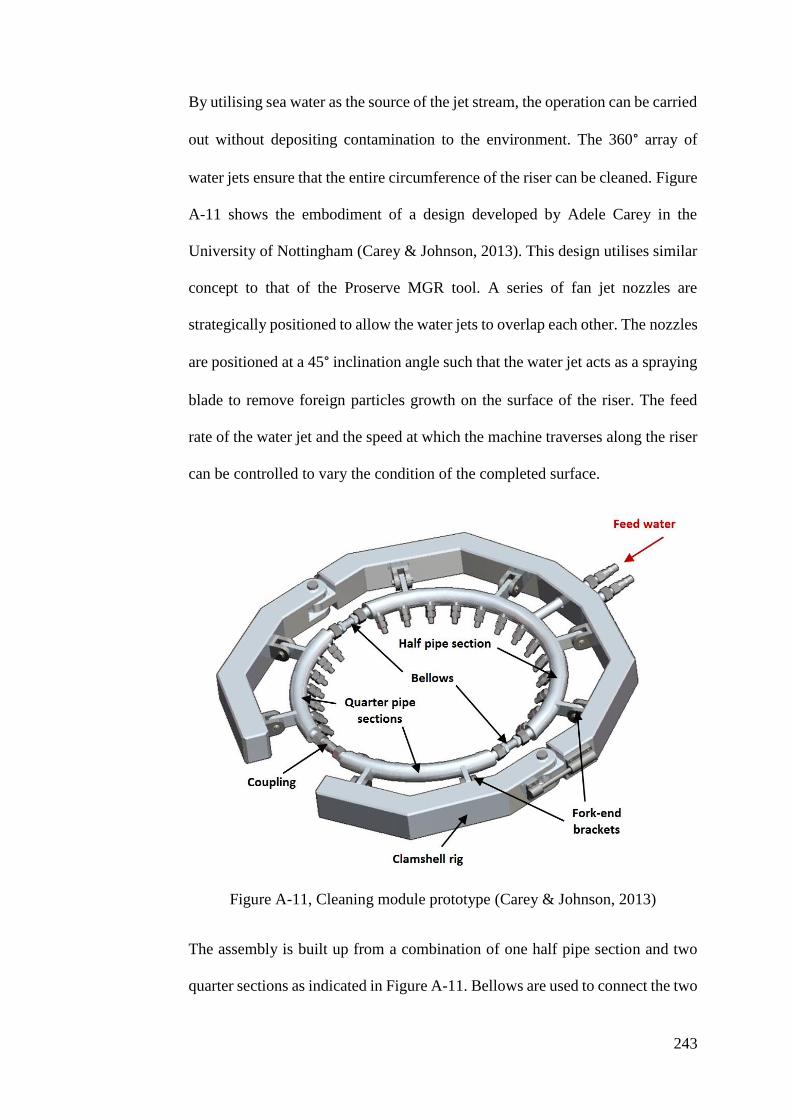
243
By utilising sea water as the source of the jet stream, the operation can be carried
out without depositing contamination to the environment. The 360° array of
water jets ensure that the entire circumference of the riser can be cleaned. Figure
A-11 shows the embodiment of a design developed by Adele Carey in the
University of Nottingham (Carey & Johnson, 2013). This design utilises similar
concept to that of the Proserve MGR tool. A series of fan jet nozzles are
strategically positioned to allow the water jets to overlap each other. The nozzles
are positioned at a 45° inclination angle such that the water jet acts as a spraying
blade to remove foreign particles growth on the surface of the riser. The feed
rate of the water jet and the speed at which the machine traverses along the riser
can be controlled to vary the condition of the completed surface.
Figure A-11, Cleaning module prototype (Carey & Johnson, 2013)
The assembly is built up from a combination of one half pipe section and two
quarter sections as indicated in Figure A-11. Bellows are used to connect the two
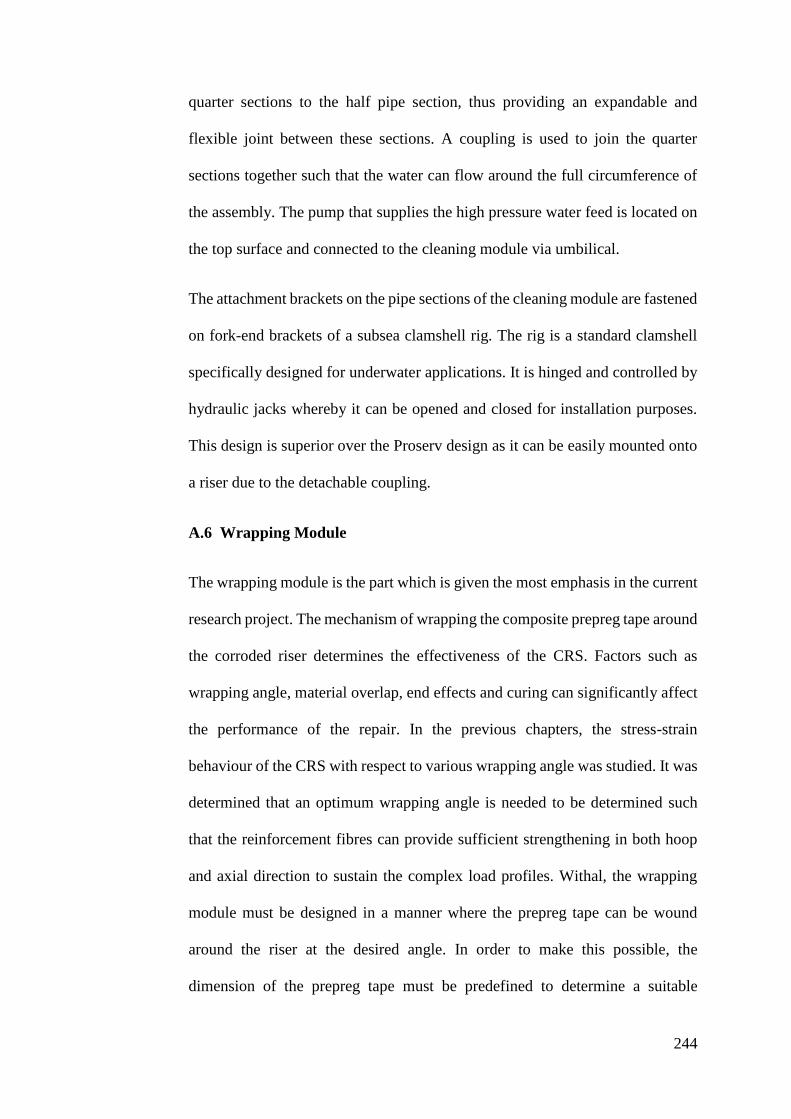
244
quarter sections to the half pipe section, thus providing an expandable and
flexible joint between these sections. A coupling is used to join the quarter
sections together such that the water can flow around the full circumference of
the assembly. The pump that supplies the high pressure water feed is located on
the top surface and connected to the cleaning module via umbilical.
The attachment brackets on the pipe sections of the cleaning module are fastened
on fork-end brackets of a subsea clamshell rig. The rig is a standard clamshell
specifically designed for underwater applications. It is hinged and controlled by
hydraulic jacks whereby it can be opened and closed for installation purposes.
This design is superior over the Proserv design as it can be easily mounted onto
a riser due to the detachable coupling.
A.6 Wrapping Module
The wrapping module is the part which is given the most emphasis in the current
research project. The mechanism of wrapping the composite prepreg tape around
the corroded riser determines the effectiveness of the CRS. Factors such as
wrapping angle, material overlap, end effects and curing can significantly affect
the performance of the repair. In the previous chapters, the stress-strain
behaviour of the CRS with respect to various wrapping angle was studied. It was
determined that an optimum wrapping angle is needed to be determined such
that the reinforcement fibres can provide sufficient strengthening in both hoop
and axial direction to sustain the complex load profiles. Withal, the wrapping
module must be designed in a manner where the prepreg tape can be wound
around the riser at the desired angle. In order to make this possible, the
dimension of the prepreg tape must be predefined to determine a suitable
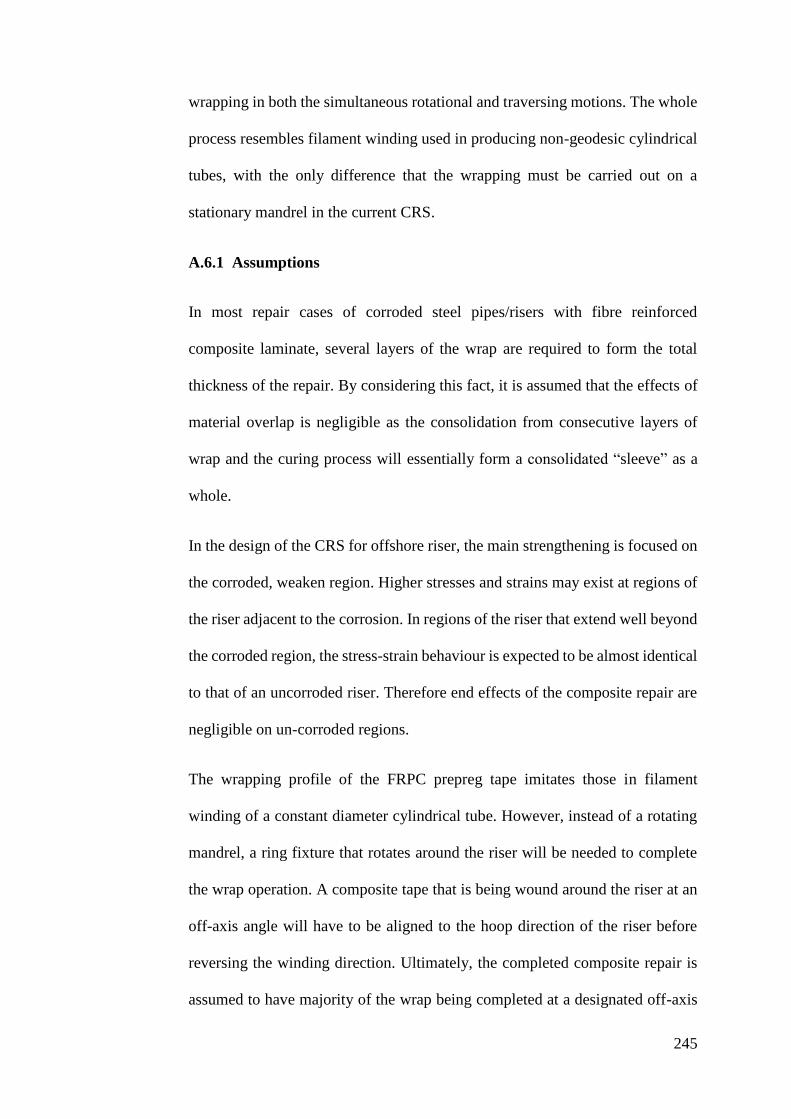
245
wrapping in both the simultaneous rotational and traversing motions. The whole
process resembles filament winding used in producing non-geodesic cylindrical
tubes, with the only difference that the wrapping must be carried out on a
stationary mandrel in the current CRS.
A.6.1 Assumptions
In most repair cases of corroded steel pipes/risers with fibre reinforced
composite laminate, several layers of the wrap are required to form the total
thickness of the repair. By considering this fact, it is assumed that the effects of
material overlap is negligible as the consolidation from consecutive layers of
wrap and the curing process will essentially form a consolidated “sleeve” as a
whole.
In the design of the CRS for offshore riser, the main strengthening is focused on
the corroded, weaken region. Higher stresses and strains may exist at regions of
the riser adjacent to the corrosion. In regions of the riser that extend well beyond
the corroded region, the stress-strain behaviour is expected to be almost identical
to that of an uncorroded riser. Therefore end effects of the composite repair are
negligible on un-corroded regions.
The wrapping profile of the FRPC prepreg tape imitates those in filament
winding of a constant diameter cylindrical tube. However, instead of a rotating
mandrel, a ring fixture that rotates around the riser will be needed to complete
the wrap operation. A composite tape that is being wound around the riser at an
off-axis angle will have to be aligned to the hoop direction of the riser before
reversing the winding direction. Ultimately, the completed composite repair is
assumed to have majority of the wrap being completed at a designated off-axis
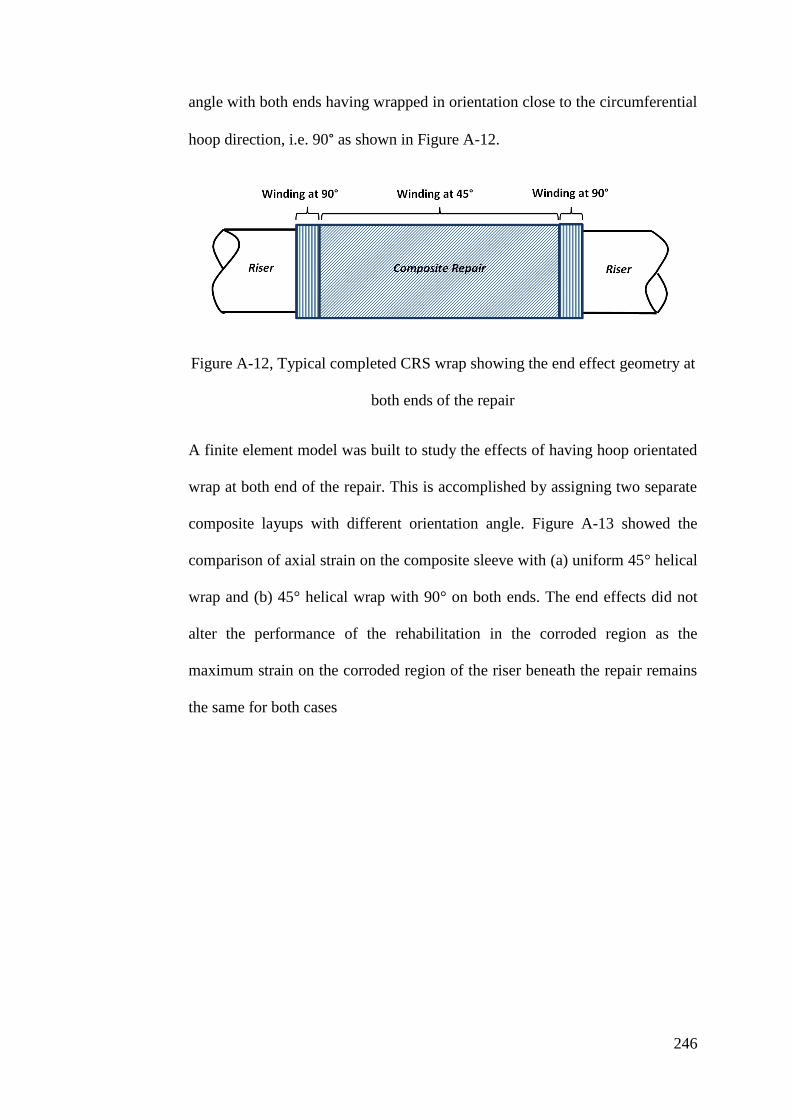
246
angle with both ends having wrapped in orientation close to the circumferential
hoop direction, i.e. 90° as shown in Figure A-12.
Figure A-12, Typical completed CRS wrap showing the end effect geometry at
both ends of the repair
A finite element model was built to study the effects of having hoop orientated
wrap at both end of the repair. This is accomplished by assigning two separate
composite layups with different orientation angle. Figure A-13 showed the
comparison of axial strain on the composite sleeve with (a) uniform 45° helical
wrap and (b) 45° helical wrap with 90° on both ends. The end effects did not
alter the performance of the rehabilitation in the corroded region as the
maximum strain on the corroded region of the riser beneath the repair remains
the same for both cases
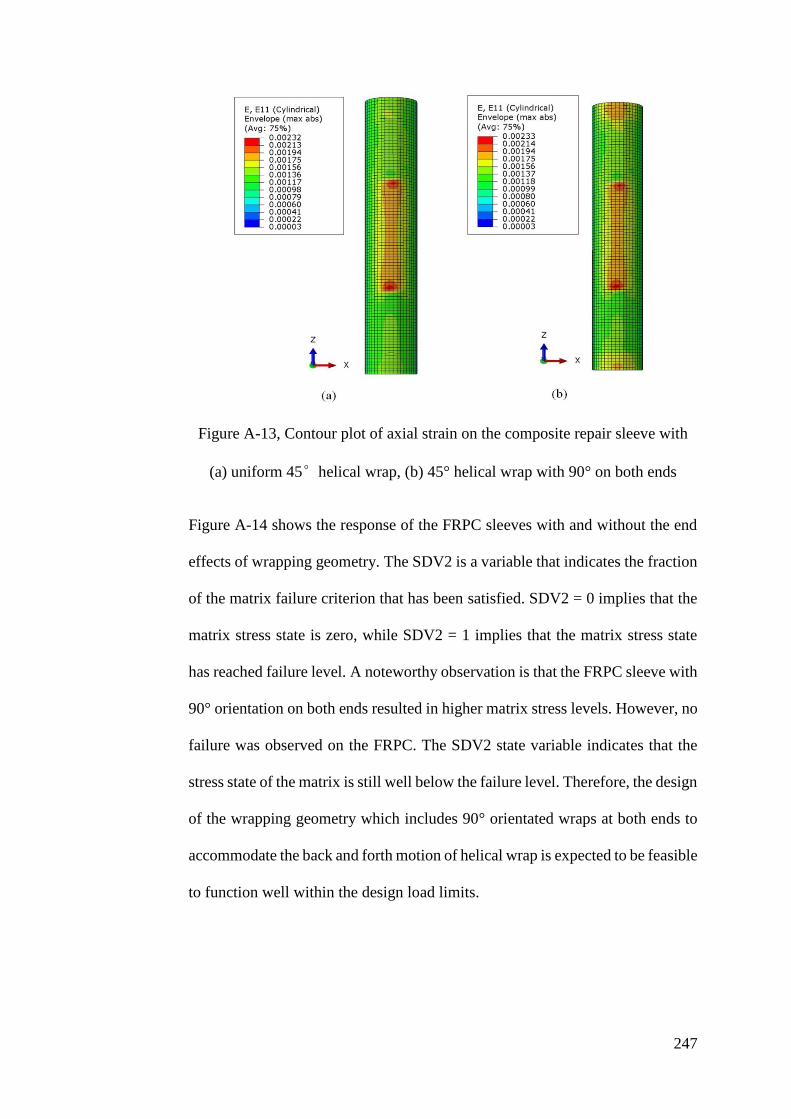
247
Figure A-13, Contour plot of axial strain on the composite repair sleeve with
(a) uniform 45°helical wrap, (b) 45° helical wrap with 90° on both ends
Figure A-14 shows the response of the FRPC sleeves with and without the end
effects of wrapping geometry. The SDV2 is a variable that indicates the fraction
of the matrix failure criterion that has been satisfied. SDV2 = 0 implies that the
matrix stress state is zero, while SDV2 = 1 implies that the matrix stress state
has reached failure level. A noteworthy observation is that the FRPC sleeve with
90° orientation on both ends resulted in higher matrix stress levels. However, no
failure was observed on the FRPC. The SDV2 state variable indicates that the
stress state of the matrix is still well below the failure level. Therefore, the design
of the wrapping geometry which includes 90° orientated wraps at both ends to
accommodate the back and forth motion of helical wrap is expected to be feasible
to function well within the design load limits.
248
Figure A-14, Contour plot of SDV2 on the composite repair sleeve with (a)
uniform 45°helical wrap, (b) 45° helical wrap with 90° wrap at both ends
A.6.2 Calculations of Wrapping Geometry
As discussed in previous sections, it is best to have the composite prepreg tape
wound around the corroded riser at a combination of off-axis angle (±θ) built up
from multiple overlapping lamina. This imply that the composite tape within a
particular laminate essentially follow a helical path with constant angle while it
is being laid around the circumference of the corroded region of the riser. Taking
this into consideration, the wrapping/winding process of the prepreg tape around
the cylindrical riser can be evaluated based on a helix equation. A circular helix
of radius Ro and pitch 2πb in the x, y, z Cartesian coordinates can be described
using Eq. A–1, A–2 and A–3,
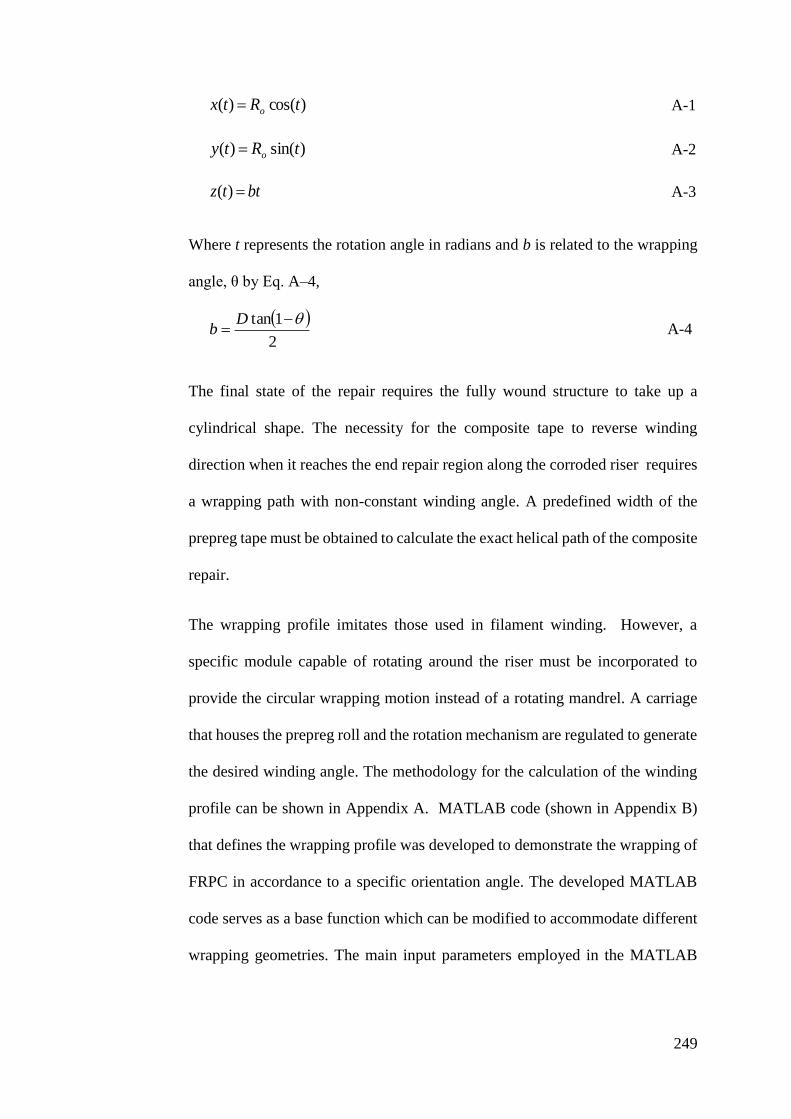
249
)cos()( tRtx o A-1
)sin()( tRty o A-2
bttz )( A-3
Where t represents the rotation angle in radians and b is related to the wrapping
angle, θ by Eq. A–4,
2
1tan
Db A-4
The final state of the repair requires the fully wound structure to take up a
cylindrical shape. The necessity for the composite tape to reverse winding
direction when it reaches the end repair region along the corroded riser requires
a wrapping path with non-constant winding angle. A predefined width of the
prepreg tape must be obtained to calculate the exact helical path of the composite
repair.
The wrapping profile imitates those used in filament winding. However, a
specific module capable of rotating around the riser must be incorporated to
provide the circular wrapping motion instead of a rotating mandrel. A carriage
that houses the prepreg roll and the rotation mechanism are regulated to generate
the desired winding angle. The methodology for the calculation of the winding
profile can be shown in Appendix A. MATLAB code (shown in Appendix B)
that defines the wrapping profile was developed to demonstrate the wrapping of
FRPC in accordance to a specific orientation angle. The developed MATLAB
code serves as a base function which can be modified to accommodate different
wrapping geometries. The main input parameters employed in the MATLAB
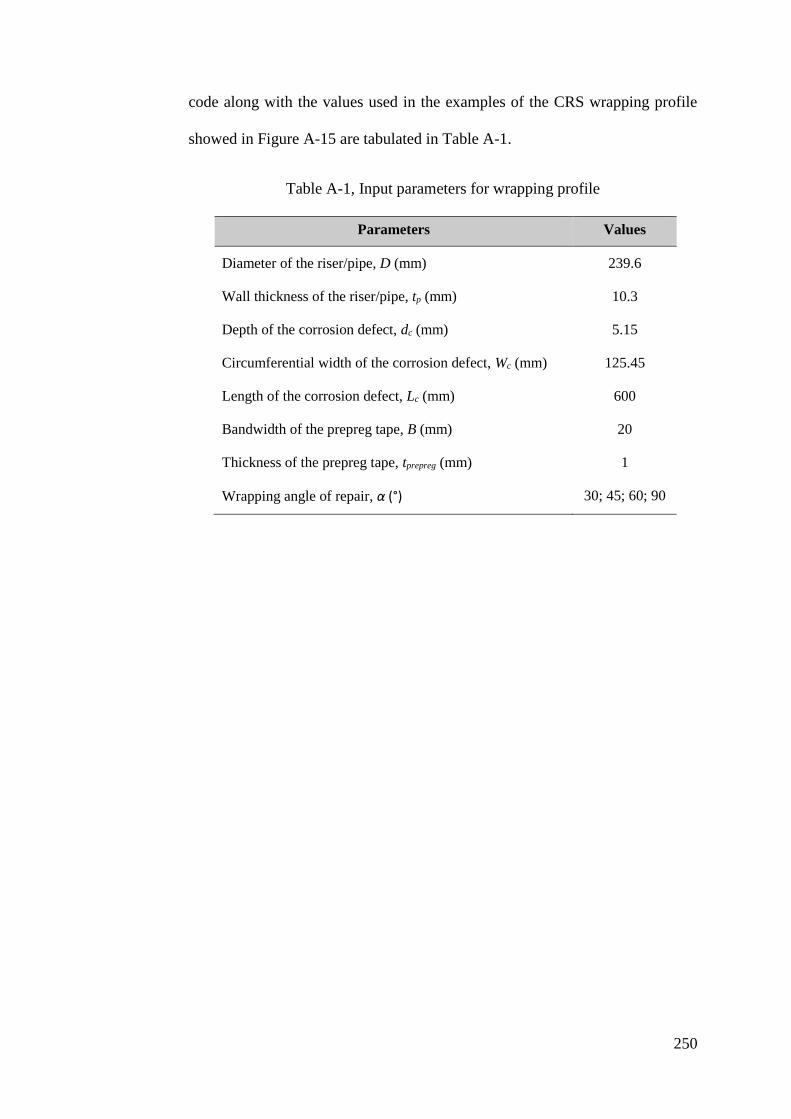
250
code along with the values used in the examples of the CRS wrapping profile
showed in Figure A-15 are tabulated in Table A-1.
Table A-1, Input parameters for wrapping profile
Parameters Values
Diameter of the riser/pipe, D (mm) 239.6
Wall thickness of the riser/pipe, tp (mm) 10.3
Depth of the corrosion defect, dc (mm) 5.15
Circumferential width of the corrosion defect, Wc (mm) 125.45
Length of the corrosion defect, Lc (mm) 600
Bandwidth of the prepreg tape, B (mm) 20
Thickness of the prepreg tape, tprepreg (mm) 1
Wrapping angle of repair, α (°) 30; 45; 60; 90
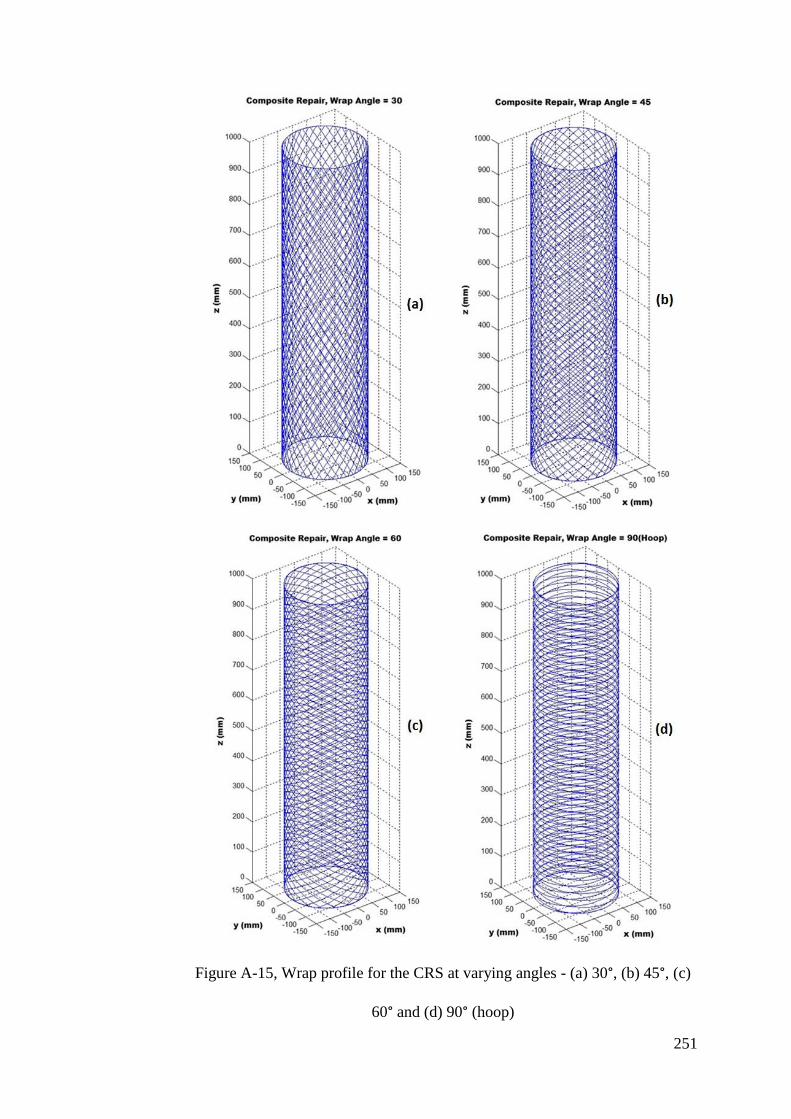
251
Figure A-15, Wrap profile for the CRS at varying angles - (a) 30°, (b) 45°, (c)
60° and (d) 90° (hoop)
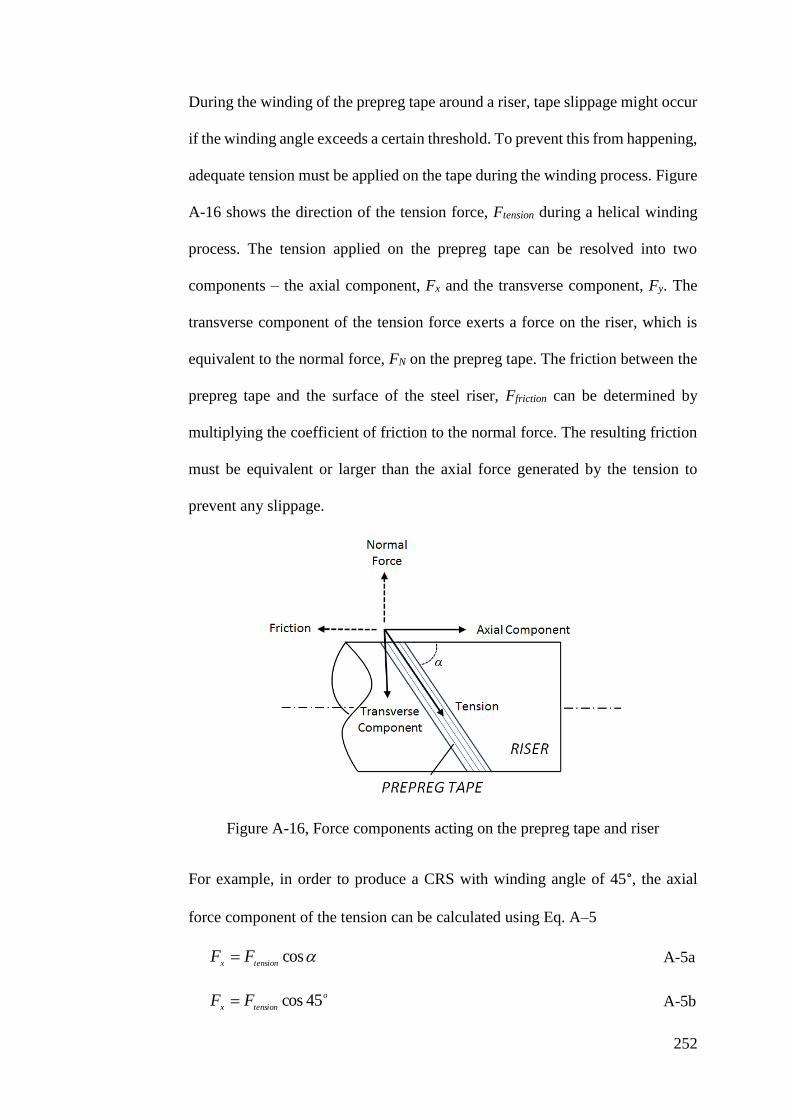
252
During the winding of the prepreg tape around a riser, tape slippage might occur
if the winding angle exceeds a certain threshold. To prevent this from happening,
adequate tension must be applied on the tape during the winding process. Figure
A-16 shows the direction of the tension force, Ftension during a helical winding
process. The tension applied on the prepreg tape can be resolved into two
components – the axial component, Fx and the transverse component, Fy. The
transverse component of the tension force exerts a force on the riser, which is
equivalent to the normal force, FN on the prepreg tape. The friction between the
prepreg tape and the surface of the steel riser, Ffriction can be determined by
multiplying the coefficient of friction to the normal force. The resulting friction
must be equivalent or larger than the axial force generated by the tension to
prevent any slippage.
Figure A-16, Force components acting on the prepreg tape and riser
For example, in order to produce a CRS with winding angle of 45°, the axial
force component of the tension can be calculated using Eq. A–5
costensionx
FF A-5a
o
tensionxFF 45cos A-5b

253
tensionxFF 7071.0 A-5c
The transverse component of the tension can be calculated using Eq. A–6,
sintensiony
FF A-6a
o
tensionyFF 45sin A-6b
tensionyFF 7071.0 A-6c
The frictional force is equivalent to the coefficient of friction of the prepreg tape
multiply by the normal force acting on the prepreg tape (Eq. A–7a), where the
normal force is equivalent to transverse force component (Eq. A–7b).
NfrictionFF A-7a
tensionyfrictionFFF 7071.0 A-7b
In order to prevent slippage of the prepreg tape during winding at an angle of
45°, the minimum value of the coefficient of friction can be calculated by
equating Eq. A–5c to Eq. A–7b,
tensiontensionFF 7071.07071.0 A-8
1
Hence, the coefficient of friction between the prepreg tape and the steel surface
must be at least 1 to produce a CRS via winding at 45°. The coefficient of friction
is affected by the temperature of the prepreg during the winding operation. The
coefficient of friction decrease with the increase in temperature as the viscosity
of the resin in the prepreg system decreases exponentially. In addition, the
coefficient of friction increases with the velocity at which the prepreg is being
pulled (Grewal & Hojjati, 2015). Hence, the wrapping speed and the temperature

254
must be regulated effectively in order to produce a CRS at a desired winding
angle.
A.6.3 Mechanical System Design
A prototype wrapping machine developed within the University of Nottingham
was used as the basis for designing the wrapping module of the composite repair
machine (Land, et al., 2012). The final rendered image of this original wrapping
machine is shown in Figure A-17.
Figure A-17, Rendered image of the pipe wrapper prototype (Land, et al.,
2012).
The functionality of the wrapping module can be categorised into two parts:
traversing unit and rotary unit. The traversing unit consists of a lead screw, a
rotary ring and a motor as shown in Figure A-18. The rotation of the lead screw
is accomplished via a variable speed motor. This lead screw translates the rotary
motion into the traversing motion of the rotary ring along the length of the repair.
The traversing speed of the ring is controlled by the speed of the motor and the
pitch of the lead screw.
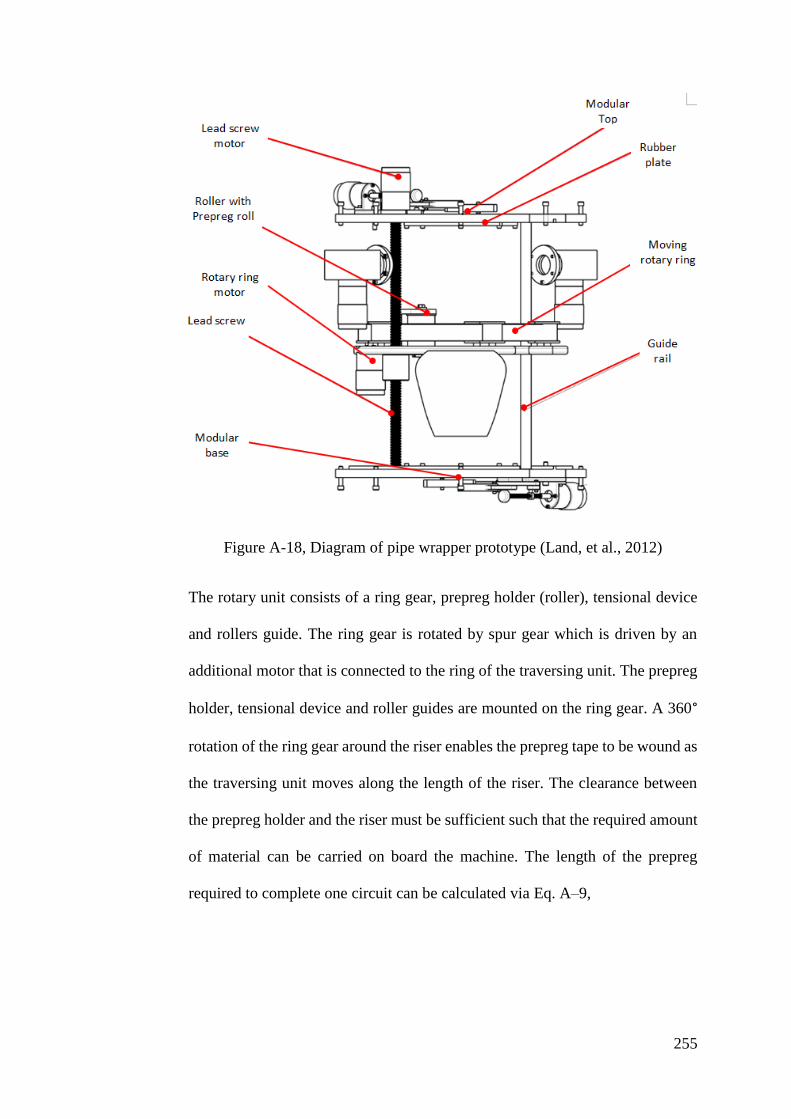
255
Figure A-18, Diagram of pipe wrapper prototype (Land, et al., 2012)
The rotary unit consists of a ring gear, prepreg holder (roller), tensional device
and rollers guide. The ring gear is rotated by spur gear which is driven by an
additional motor that is connected to the ring of the traversing unit. The prepreg
holder, tensional device and roller guides are mounted on the ring gear. A 360°
rotation of the ring gear around the riser enables the prepreg tape to be wound as
the traversing unit moves along the length of the riser. The clearance between
the prepreg holder and the riser must be sufficient such that the required amount
of material can be carried on board the machine. The length of the prepreg
required to complete one circuit can be calculated via Eq. A–9,
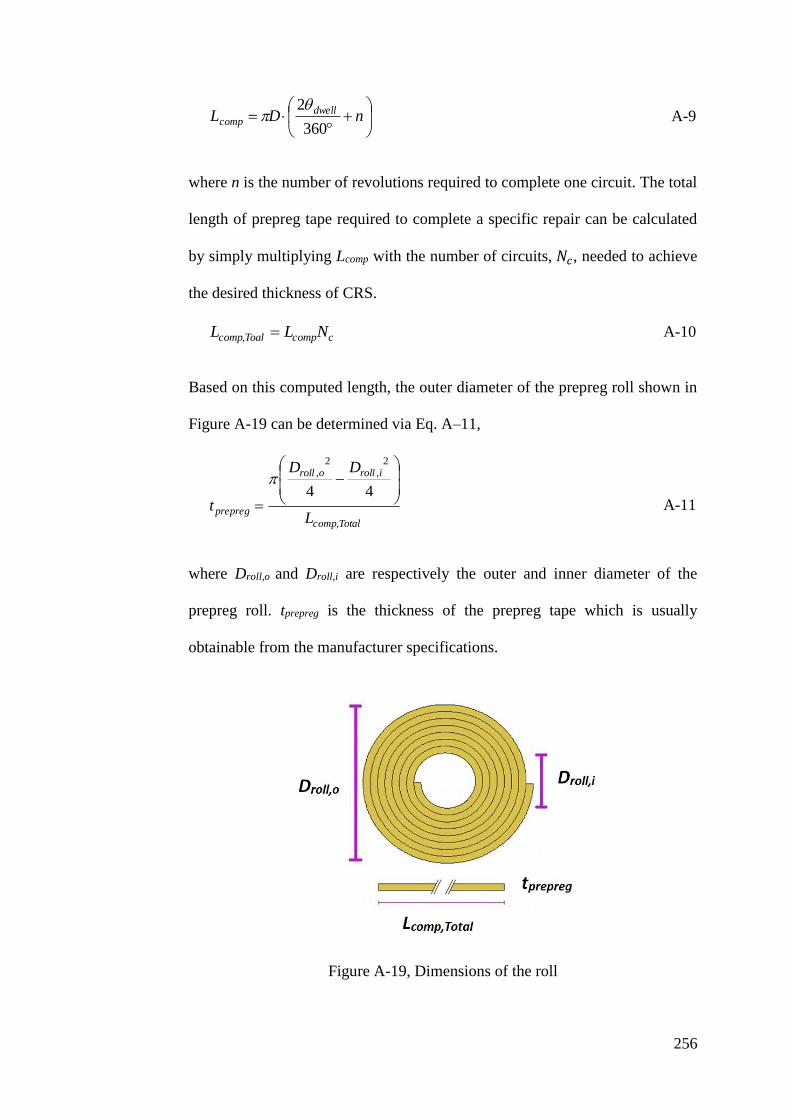
256
nDL dwell
comp360
2 A-9
where n is the number of revolutions required to complete one circuit. The total
length of prepreg tape required to complete a specific repair can be calculated
by simply multiplying Lcomp with the number of circuits, 𝑁𝑐, needed to achieve
the desired thickness of CRS.
ccompToalcomp NLL , A-10
Based on this computed length, the outer diameter of the prepreg roll shown in
Figure A-19 can be determined via Eq. A–11,
Totalcomp
irolloroll
prepregL
DD
t,
2,
2,
44
A-11
where Droll,o and Droll,i are respectively the outer and inner diameter of the
prepreg roll. tprepreg is the thickness of the prepreg tape which is usually
obtainable from the manufacturer specifications.
Figure A-19, Dimensions of the roll

257
For example, if the total length of prepreg tape required to conduct a wrap on a
corroded riser is 10m while the thickness of the prepreg tape and diameter of the
roller are 1mm and 20mm respectively, the outer diameter of the prepreg roll can
be calculated as,
10
4
2.0
4001.0
22,
orollD
22, 05273.0 mD oroll
mmD oroll 96.22,
The tensional device is designed to generate a constant tension force in the
prepreg tape throughout the winding process. As discussed, this tension force is
needed to prevent the slipping of the prepreg tape during the winding process.
In addition, adequate tension force can ensure proper consolidation of the
prepreg on the riser during the curing process.
A.6.4 Improvements on Design
This existing repair machine, shown in Figure A-17, contains two propellers
which serve to help the device traverse along the length of the riser. This feature
can be discarded as the movement of the composite repair machine will be
facilitated by continuous motion of the magnetic rollers (wheeled motion along
the riser) and discrete motion of the linear rail clamps (inchworm motion of the
clamp over the flanges) to accommodate the traversing motion over a flange
(discussed in section A.3). A preliminary model of the wrapping module was
developed to aid in the visualization of the wrapping mechanism. The major
parts in the module are labelled as shown in Figure A-20. The length of the lead
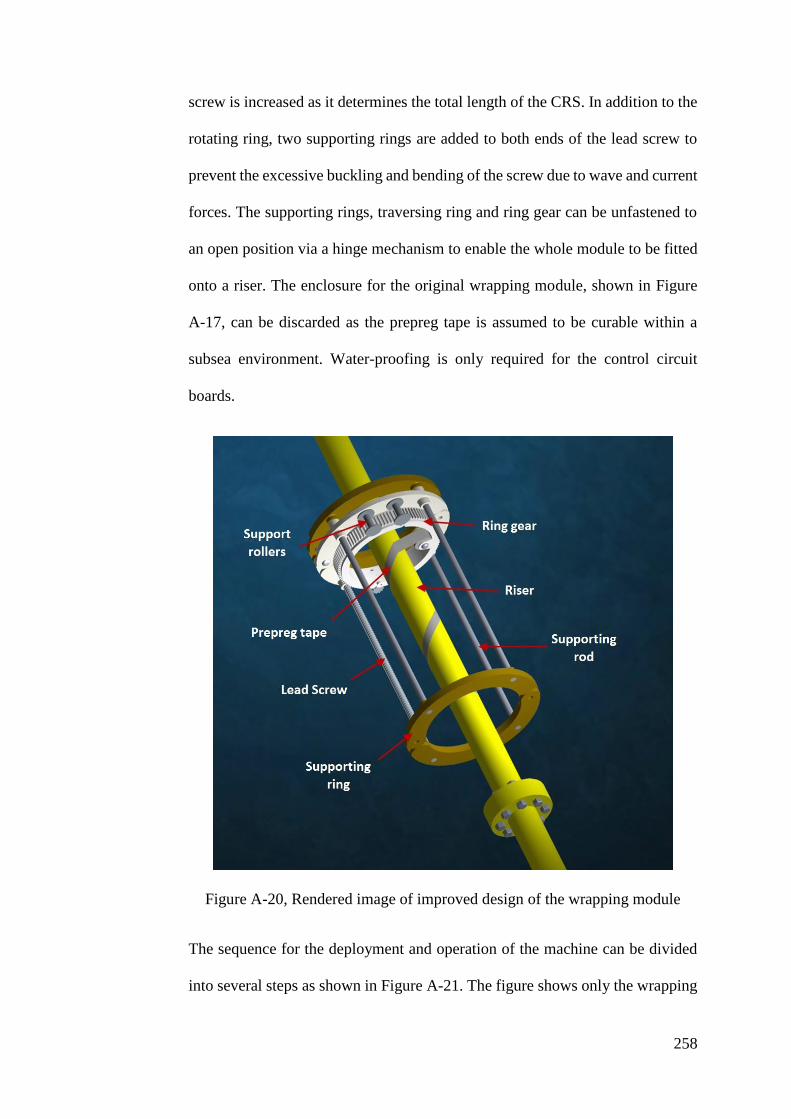
258
screw is increased as it determines the total length of the CRS. In addition to the
rotating ring, two supporting rings are added to both ends of the lead screw to
prevent the excessive buckling and bending of the screw due to wave and current
forces. The supporting rings, traversing ring and ring gear can be unfastened to
an open position via a hinge mechanism to enable the whole module to be fitted
onto a riser. The enclosure for the original wrapping module, shown in Figure
A-17, can be discarded as the prepreg tape is assumed to be curable within a
subsea environment. Water-proofing is only required for the control circuit
boards.
Figure A-20, Rendered image of improved design of the wrapping module
The sequence for the deployment and operation of the machine can be divided
into several steps as shown in Figure A-21. The figure shows only the wrapping
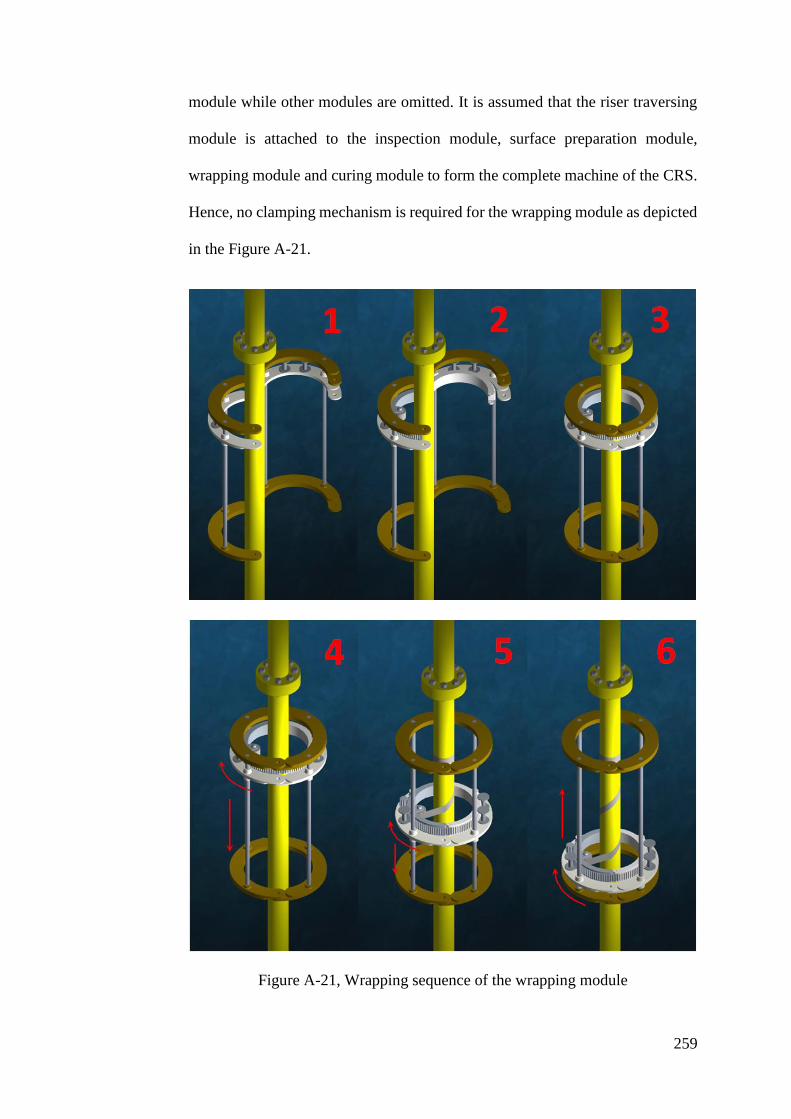
259
module while other modules are omitted. It is assumed that the riser traversing
module is attached to the inspection module, surface preparation module,
wrapping module and curing module to form the complete machine of the CRS.
Hence, no clamping mechanism is required for the wrapping module as depicted
in the Figure A-21.
Figure A-21, Wrapping sequence of the wrapping module
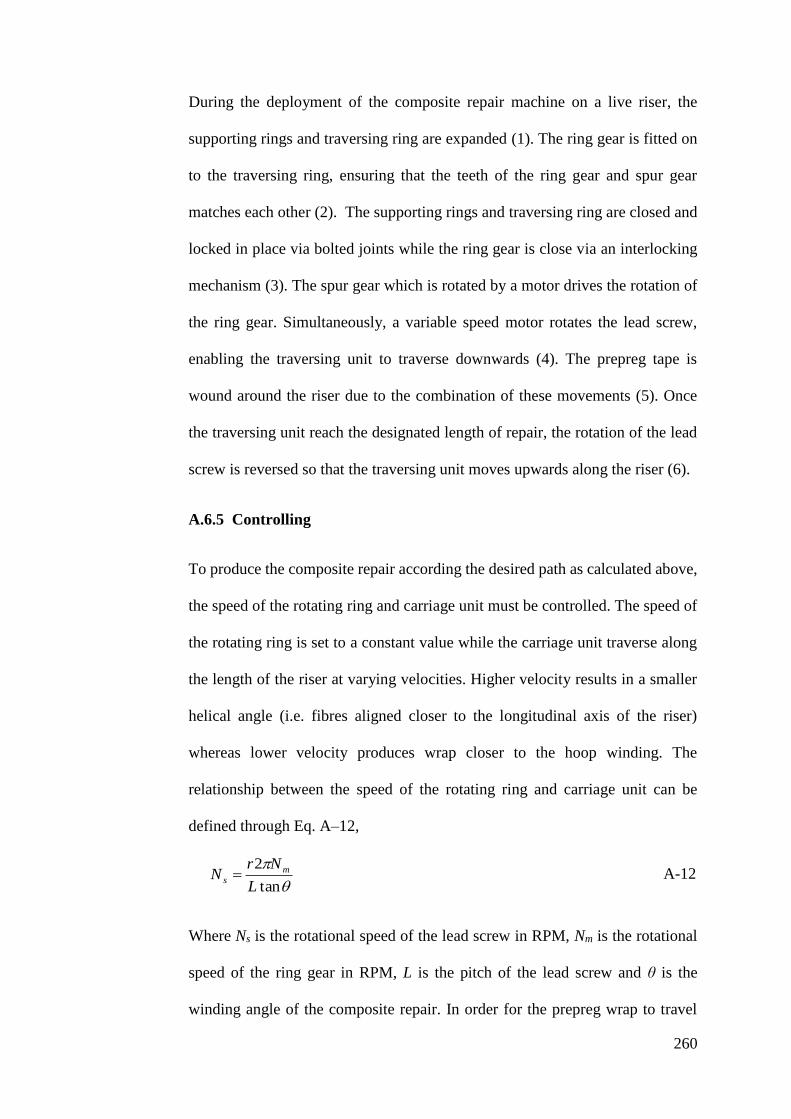
260
During the deployment of the composite repair machine on a live riser, the
supporting rings and traversing ring are expanded (1). The ring gear is fitted on
to the traversing ring, ensuring that the teeth of the ring gear and spur gear
matches each other (2). The supporting rings and traversing ring are closed and
locked in place via bolted joints while the ring gear is close via an interlocking
mechanism (3). The spur gear which is rotated by a motor drives the rotation of
the ring gear. Simultaneously, a variable speed motor rotates the lead screw,
enabling the traversing unit to traverse downwards (4). The prepreg tape is
wound around the riser due to the combination of these movements (5). Once
the traversing unit reach the designated length of repair, the rotation of the lead
screw is reversed so that the traversing unit moves upwards along the riser (6).
A.6.5 Controlling
To produce the composite repair according the desired path as calculated above,
the speed of the rotating ring and carriage unit must be controlled. The speed of
the rotating ring is set to a constant value while the carriage unit traverse along
the length of the riser at varying velocities. Higher velocity results in a smaller
helical angle (i.e. fibres aligned closer to the longitudinal axis of the riser)
whereas lower velocity produces wrap closer to the hoop winding. The
relationship between the speed of the rotating ring and carriage unit can be
defined through Eq. A–12,
tan
2
L
NrN m
s A-12
Where Ns is the rotational speed of the lead screw in RPM, Nm is the rotational
speed of the ring gear in RPM, L is the pitch of the lead screw and θ is the
winding angle of the composite repair. In order for the prepreg wrap to travel

261
back and forth along the riser at the designated length of repair, instructions have
to be given to the traversing unit such that it will stop and reverse its direction.
This can be achieved by calculating the cycle time for the traversing unit to travel
from one end to the other end of the repair. A timer along with a position sensor
can be used to provide feedback to the current position of the traversing unit and
the ring gear. A flow chart for the control of the wrapping sequence is shown in
Figure A-22. Input values for the position and timing sensors are based on the
calculated values from the wrapping geometry code.
262
Figure A-22, Flow chart for the wrapping sequence
263
A.7 Summary
To the knowledge of the project team, an automated composite repair machine
that can operate in subsea conditions is not currently available in the commercial
market. Preliminary design for the major modules crucial for the
accomplishment of the automated riser repair operation was proposed in the
present work. These conceptual designs were achieved by implementing various
improvements on the existing modules available in the literature. For the
traversing module, surface preparation module and inspection module, it is
determined that various systems exist in the market where modifications can be
implemented to suit the function of the automated repair machine.
Based on the developed MATLAB code for the wrapping geometry of the
composite repair and the preliminary 3D CAD model, a probable form of the
wrapping module was designed, whereby the model can be further develop to
build up the complete automated repair machine for CRS. The developed
concept which is based on the principles of filament winding is a simple two-
degrees-of-freedom machine. Initial aim would be to produce the prototype that
is capable of producing the desired wrapping geometry without considering the
use of proper prepreg material and its curing. Extensions can then be made to
incorporate the actual wrapping and curing on a scaled pipe to study the stress-
strain behaviour of the CRS produced in a dry environment prior to its
implementation under a water enclosure.
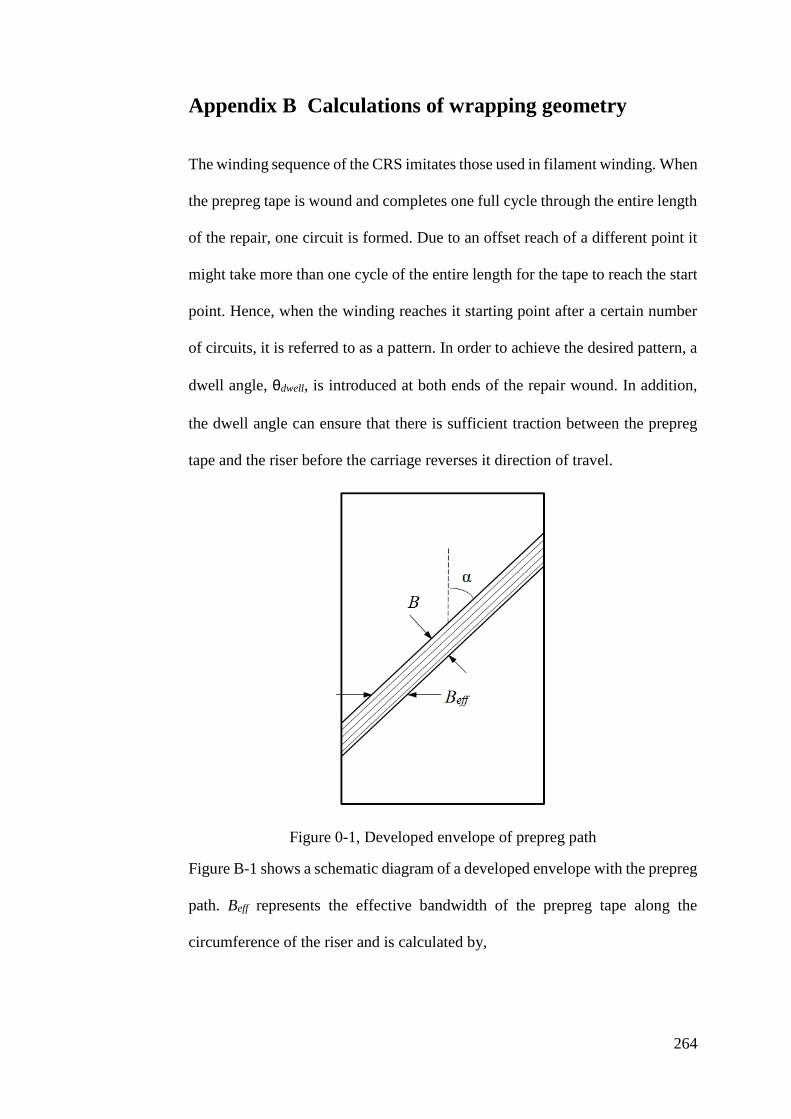
264
Appendix B Calculations of wrapping geometry
The winding sequence of the CRS imitates those used in filament winding. When
the prepreg tape is wound and completes one full cycle through the entire length
of the repair, one circuit is formed. Due to an offset reach of a different point it
might take more than one cycle of the entire length for the tape to reach the start
point. Hence, when the winding reaches it starting point after a certain number
of circuits, it is referred to as a pattern. In order to achieve the desired pattern, a
dwell angle, θdwell, is introduced at both ends of the repair wound. In addition,
the dwell angle can ensure that there is sufficient traction between the prepreg
tape and the riser before the carriage reverses it direction of travel.
Figure 0-1, Developed envelope of prepreg path
Figure B-1 shows a schematic diagram of a developed envelope with the prepreg
path. Beff represents the effective bandwidth of the prepreg tape along the
circumference of the riser and is calculated by,
265
cos
BBeff B-1
In order for the wrapping sequence to complete one circuit, the prepreg band has
to travel twice the length of the repair. The corresponding number of revolutions
of the prepreg band around the riser for one complete circuit can be computed
using Eq. A–2
D
Ln r
tan2 B-2
Where n = number of revolutions required to complete one circuit, Lr = the length
of the composite repair system. The value of n can be expressed in terms of
degrees (°). Two times the dwell angle can be added to determine total number
of degrees required to make a full circuit,
dwelln 2 B-3
The value θ is then subtracted by a whole multiple of 360° to obtain the angular
advance, θadv of the prepreg band once a circuit is completed. This angular
advance exists as the prepreg band will often not be able to return to its original
starting point due to the complexity of the motion. In order to make a pattern,
there needs to be a multiple of advance angles such that this multiple will be
equal to a multiple of 360°. This can be expressed as,
360)()( km adv B- 4
Where m and k are integers and should be as small as possible. However, the
value of θadv might not be a whole number that is a factor of 360°, causing m and
k to be very large before Eq. B–4 can be satisfied. This can be resolved by
adjusting the dwell angle. For example if θadv = 81°, it can be adjusted to a whole
number 90° which is a factor of 360°. The dwell angle can then be adjusted to
266
be θdwell + (90°-81°)/2. The ratio of (m/k) gives the number of circuit (number
of advance angles) required to complete a pattern.
In the computation of a complete pattern as described above, the prepreg band
will go back exactly to the same position where it originally started. This is
undesirable because if the process continues, the prepreg tape with follow the
same path over and over again without covering the whole surface of the riser.
It is hence desirable to advance the position of the prepreg band, one bandwidth
distance along the circumference of the riser after the completion of one circuit.
This distance can be expressed in angular value and is calculated via Eq. B–5
360D
Beff
B-5
This advanced angular value, Δθ can be accummulated over the total number of
circuits needed to form a pattern. In each circuit, the divided value of Δθ is shared
by two dwell angles as the prepreg band travel back and forth in one circuit. In
other words, the new dwell can hence be obtained by adding the values below,
2
1
m
k B-6
A pattern may consist of intersections of prepreg band (i.e. band crossovers) at
certain sections. Crossovers can occur at more than one section depending on the
dimension of the riser and the winding angle. A layer is defined as a set of
patterns that provides complete surface coverage along the entire length of the
repair. As discussed earlier, Beff represents the effective bandwidth of the prepreg
267
tape along the circumference of the riser. Hence, for full surface coverage, the
number of circuits required can be calculated as,
eff
cB
DN
B-7
where Nc is the total number of circuits needed to form a layer. In order to form
a composite repair that has the required thickness, several layers have to be
wound. The total number of circuits needed to form the complete CRS can be
computed with the knowledge of the thickness value of the prepreg tape.
prepreg
crepair
totalct
NtN ,
B-8

268
Appendix C MATLAB Code for Wrap Geometry
%Key in required input data D = 239.6; tp = 10.3; dc = 5.15; Wc = 125.45; Lc = 600; Cp = pi*D; B = 20; tpreg = 1; theta = 45*pi/180;
%D = Outer diameter of the pipe %tp = Thickness of the pipe %dc = Depth of the corrosion defect %Wc = Width of the corrosion defect %Lc = Length of the corrosion defect %Cp = Circimference of the pipe %B = Bandwidth of the prepreg tape %tpreg = Thickness of cured prepreg %theta = Winding angle of the composite repair relative to the
axis of the pipe
%The required length and thickness of the composite repair tr = (14.83*((dc/tp)^1.685)*((Wc/Cp)^0.468))*tp; Lo = 2.5*((D*tp/2)^0.5); Lr = round(2*Lo + Lc + 224.3626);
%tr = Thickness of the repair %Lo = Length of the repair extending over one side of the
corrosion defect %Lr = Total length of the composite repair
%%CALCULATION OF THE COMPOSITE REPAIR SYSTEM'S WRAPPING SEQUENCE%% %The the effective bandwith of the composite prepreg wrap around
the %circumference of the pipe Be = B/cos(theta);
%The number of revolutions required for the prepreg tape to travel
the %required length of the repair Nr = Lr*tan(theta)/(pi*D);
%The number of revolutions required for the prepreg tape wrap to
complete %one circuit (i.e. back and forth the length of repair, Lr) Nc = 2*Nr;
%The value of Nc expressed in terms of radians, Ncr = 2*pi*Nc;
%The dwell angle has to be added to both ends of the winding in
order to %obtain the total number of degrees required to make a circuit Ncrd = Ncr + 2*pi;
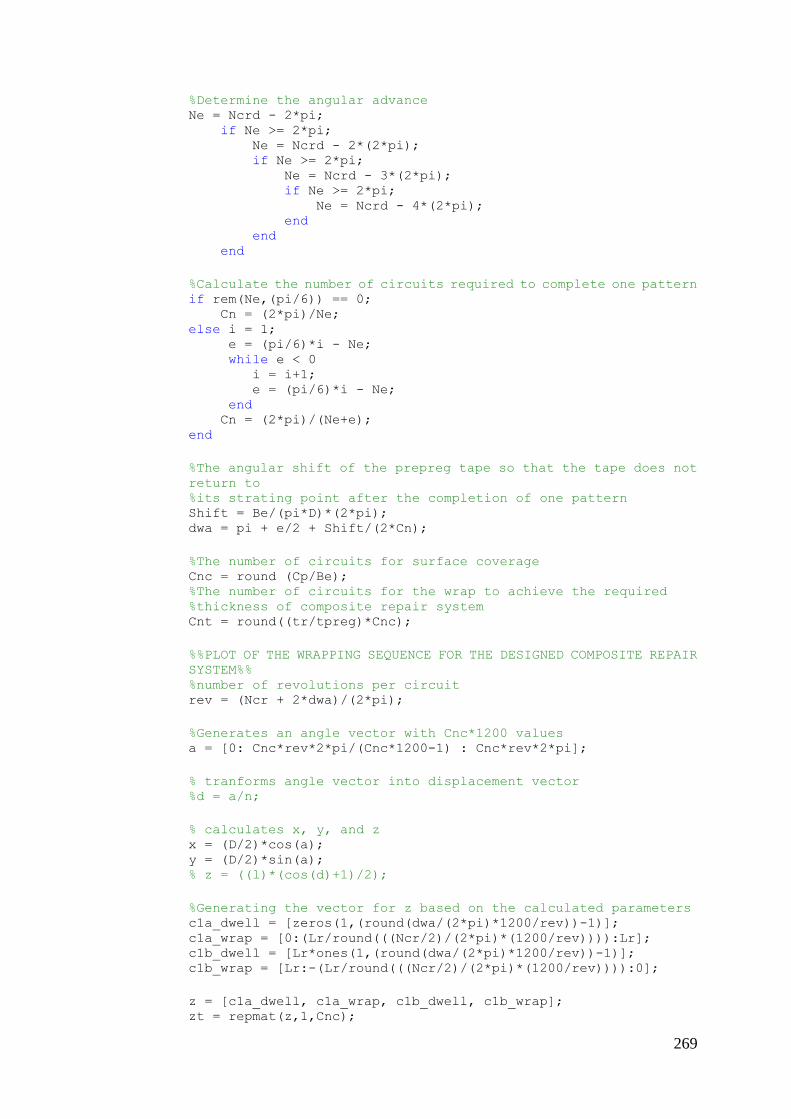
269
%Determine the angular advance Ne = Ncrd - 2*pi; if Ne >= 2*pi; Ne = Ncrd - 2*(2*pi); if Ne >= 2*pi; Ne = Ncrd - 3*(2*pi); if Ne >= 2*pi; Ne = Ncrd - 4*(2*pi); end end end
%Calculate the number of circuits required to complete one pattern if rem(Ne,(pi/6)) == 0; Cn = (2*pi)/Ne; else i = 1; e = (pi/6)*i - Ne; while e < 0 i = i+1; e = (pi/6)*i - Ne; end Cn = (2*pi)/(Ne+e); end
%The angular shift of the prepreg tape so that the tape does not
return to %its strating point after the completion of one pattern Shift = Be/(pi*D)*(2*pi); dwa = pi + e/2 + Shift/(2*Cn);
%The number of circuits for surface coverage Cnc = round (Cp/Be); %The number of circuits for the wrap to achieve the required %thickness of composite repair system Cnt = round((tr/tpreg)*Cnc);
%%PLOT OF THE WRAPPING SEQUENCE FOR THE DESIGNED COMPOSITE REPAIR
SYSTEM%% %number of revolutions per circuit rev = (Ncr + 2*dwa)/(2*pi);
%Generates an angle vector with Cnc*1200 values a = [0: Cnc*rev*2*pi/(Cnc*1200-1) : Cnc*rev*2*pi];
% tranforms angle vector into displacement vector %d = a/n;
% calculates x, y, and z x = (D/2)*cos(a); y = (D/2)*sin(a); % z = ((l)*(cos(d)+1)/2);
%Generating the vector for z based on the calculated parameters c1a_dwell = [zeros(1,(round(dwa/(2*pi)*1200/rev))-1)]; c1a_wrap = [0:(Lr/round(((Ncr/2)/(2*pi)*(1200/rev)))):Lr]; c1b_dwell = [Lr*ones(1,(round(dwa/(2*pi)*1200/rev))-1)]; c1b_wrap = [Lr:-(Lr/round(((Ncr/2)/(2*pi)*(1200/rev)))):0];
z = [c1a_dwell, c1a_wrap, c1b_dwell, c1b_wrap]; zt = repmat(z,1,Cnc);

270
%3D plot of the composite repair system winding pattern plot3(x,y,zt, 'linewidth',1) grid on axis equal title('A helix - 3D view') xlabel('x = cos(a)') ylabel('y = sin(a)') zlabel('z = d')