Drilling Riser Model Test for Software Verification - Unit
21
Drilling Riser Model Test for Software Verification Decao Yin * SINTEF Ocean † Trondheim, Norway Email: [email protected] Halvor Lie SINTEF Ocean Trondheim, Norway Massimiliano Russo Kongsberg Oil & Gas ‡ Houston, Texas, USA Guttorm Grytøyr Statoil Oslo, Norway ABSTRACT Marine drilling riser is subject to complicated environmental loads which include top motions due to Mobile Offshore Drilling Unit (MODU), wave loads and current loads. Cyclic dynamic loads will cause severe fatigue accumulation along the drilling riser system, especially at the subsea wellhead (WH). Statoil and BP have carried out a comprehensive model test program on drilling riser in MARINTEK’s Towing Tank in February 2015. The objective is to validate and verify software predictions of drilling riser behaviour under various environmental conditions by use of model test data. Six drilling riser configurations were tested, including different components such as Upper Flex Joint (UFJ), tensioner, marine riser, Lower Marine Riser Package (LMRP), Blow-Out Preventer (BOP), Lower Flex Joint (LFJ), buoyancy elements and seabed boundary model. The drilling riser models were tested in different load conditions. Measurements were made of micro bending strains and accelerations along the riser in both In-Line (IL) and Cross-Flow (CF) directions. Video recordings were made both above and under water. In this paper, the test set-up and test program are presented. Comparisons of results between model test and RIFLEX simulation are presented on selected cases. Preliminary results show that the drilling riser model tests are able to capture the typical dynamic responses observed from field measurement, and the comparison between model test and RIFLEX simulation is promising. Nomenclature BC Boundary Condition. * Corresponding author, Tel: +47 91997166, Email: [email protected], [email protected] † Former MARINTEK, merged as SINTEF Ocean since 1st Jan 2017. ‡ Worked at Statoil, then changed job to Konsberg Oil & Gas.
-
Upload
khangminh22 -
Category
Documents
-
view
2 -
download
0
Transcript of Drilling Riser Model Test for Software Verification - Unit
Drilling Riser Model Test for Software Verification
Decao Yin∗
SINTEF Ocean†
Trondheim, NorwayEmail: [email protected]
Halvor LieSINTEF Ocean
Trondheim, Norway
Massimiliano RussoKongsberg Oil & Gas‡
Houston, Texas, USA
Guttorm GrytøyrStatoil
Oslo, Norway
ABSTRACTMarine drilling riser is subject to complicated environmental loads which include top motions due to Mobile
Offshore Drilling Unit (MODU), wave loads and current loads. Cyclic dynamic loads will cause severe fatigueaccumulation along the drilling riser system, especially at the subsea wellhead (WH).
Statoil and BP have carried out a comprehensive model test program on drilling riser in MARINTEK’s TowingTank in February 2015. The objective is to validate and verify software predictions of drilling riser behaviour undervarious environmental conditions by use of model test data.
Six drilling riser configurations were tested, including different components such as Upper Flex Joint (UFJ),tensioner, marine riser, Lower Marine Riser Package (LMRP), Blow-Out Preventer (BOP), Lower Flex Joint (LFJ),buoyancy elements and seabed boundary model.
The drilling riser models were tested in different load conditions. Measurements were made of micro bendingstrains and accelerations along the riser in both In-Line (IL) and Cross-Flow (CF) directions. Video recordingswere made both above and under water.
In this paper, the test set-up and test program are presented. Comparisons of results between model test andRIFLEX simulation are presented on selected cases. Preliminary results show that the drilling riser model testsare able to capture the typical dynamic responses observed from field measurement, and the comparison betweenmodel test and RIFLEX simulation is promising.
NomenclatureBC Boundary Condition.
∗Corresponding author, Tel: +47 91997166, Email: [email protected], [email protected]†Former MARINTEK, merged as SINTEF Ocean since 1st Jan 2017.‡Worked at Statoil, then changed job to Konsberg Oil & Gas.
BOP Blow Out Preventer.CF Cross Flow.DOF Degree of freedom.EI Bending stiffness.FBG Fiber Bragg grating.FEM Finite element method.FS Full-scale.ID Inner diameter.IL In Line.JIP Joint Industry Project.LFJ Lower Flex JointLMRP Lower Marine Riser Package.MODU Mobile Offshore Drilling Unit.MS Model scale.OD Outer diameterRIFLEX Riser system analysis program developed by MARINTEK.SIMA Simulation and analysis tool for marine operations and floating systems, developed by MARINTEK.UFJ Upper Flex Joint.VIV Vortex Induced Vibrations.WH Wellhead.A Wave amplitude.CD Drag coefficient.CM Added mass coefficient.D Diameter.k Wave number.M Bending moment.m Index (negative inverse slope) of S-N curve.m/l Mass per unit length.T Tension.u Velocity.z Coordinate along the drilling riser model.γ Peak-enhancement factor.ε Phase angle.ζ Wave elevation.η Body motion.κ Curvature.ρ Density of fluid.ω Angular frequency.
1 IntroductionThe marine drilling riser is a conduit which connects the offshore wellhead and the Mobile Offshore Drilling Unit
(MODU) positioned above the wellhead, providing a temporary extension of the subsea well to the MODU. During drillingoperations, the marine drilling riser is mechanically attached to the well and tensioned at the top end, and there is fluidcirculating inside the riser [1].
The external loads on the marine drilling riser are waves, currents and top motions of MODU, such as mean andoscillations due to wind, current and waves, drive off and drift off. The stochastic responses are transferred to subsea alongthe riser, introducing dynamic loading on the subsea WH, consequently, causing severe fatigue accumulation.
There exists a lot of full scale (FS) measurements, an example of using in situ monitoring data to provide realisticvortex-induced vibrations (VIV) fatigue damage to drilling riser and WH [2], another example is using measured BOPstack data to estimate WH fatigue damage [3]. The full scaled measured data is difficult to use for verification due tocomplicated environmental load and structure, which are not well defined. Model tests are realistic methods for this purpose.Unfortunately, not much experimental work has been done for software verification purpose. A wellhead fatigue analysismethodology was developed by Statoil and DNV, and the detailed procedure is presented in the JIP ‘Structure Well Integrity’[4], based on the JIP work, a recommended practice on ‘wellhead fatigue analysis’ is developed [5].
It is important to ensure the riser load results are conservative in the design phase. Different lower end boundaryconditions (BC) were investigated and it is shown that the lower BC modelling approach may affect global riser load estimate
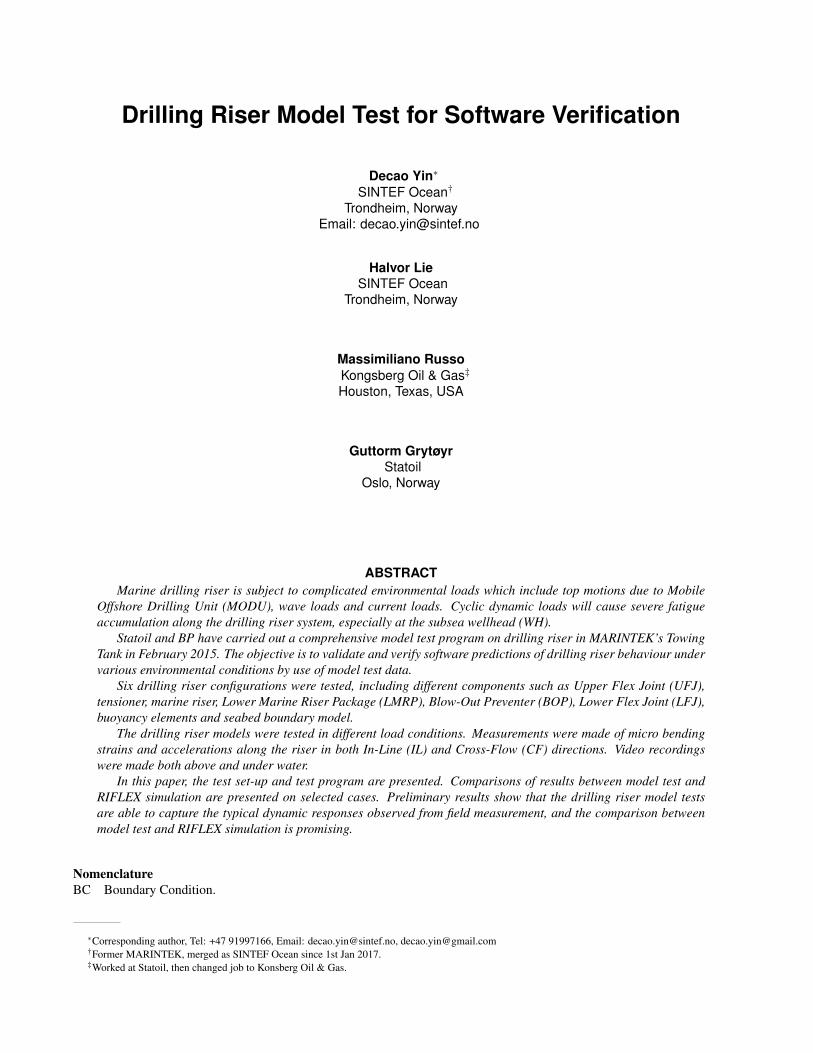
Fig. 1: Typical drilling riser system operated from a MODU [5].
[1] [6]. It is not necessary that fixed lower BC always give conservative results, so it is recommended to check the designwork with fixed BC as a starting point, and have a final design check with realistic lower BC.
In this paper, we study shallow water drilling risers dynamic responses. The scaling factor of 1 : 19, which is suitablewith respect to the quality of the waves, the model size, and handling of the model in the test set-up. In total six drillingriser configurations under various environmental conditions are modelled physically and numerically. The results in modelscale (MS) are presented and discussed. The present experimental study provides a simplified but well-defined drilling risersystem, the model test results can be used to validate riser analysis software by establishing a numerical riser finite elementmethod (FEM) model to closely match the physical model, and comparing the measurements to predictions.
2 Drilling Riser SystemIn this section, a brief introduction of drilling riser system is given. Figure 1 presents a sketch of a typical drilling riser
system.
2.1 TensionerThe drilling riser connects the WH and the MODU, and it is top tensioned by a tensioner system which provides the
pretension and compensate heave motions of MODU due to waves to avoid buckling of the drilling riser.
2.2 Marine riserMarine riser is assembled of riser joints. Outside the bare riser, there are usually high pressure kill and choke lines
circulating fluids, booster lines injecting additional fluid at the bottom end of the riser to facilitate the return of the cuttings,and auxiliary lines supplying power to the BOP.
2.3 Buoyancy jointBuoyancy joints attach to the bare riser and provide additional buoyancy force, so the submerged weight of the riser is
reduced, consequently, the required top tension is reduced.
2.4 Upper flex joint (UFJ)/Lower flex joint (LFJ)UFJ is located between the riser top end and the tensioner (telescopic joint), and it is designed to allow angular mis-
alignment between the riser and the rig, so that the bending moment on the riser and rig equipment is reduced.LFJ is located between the riser lower end and the BOP stack. LFJ allows angular misalignment between the riser and
BOP stack, thereby reducing the local bending moment.
2.5 Drill stringIn a real drilling riser system, there will be mud and drill cuttings circulating in the space between the drill string and
marine riser, and drill string transports drilling fluid and torque to the drill bit through the drill pipe. In the model test set-up,the mud has been replaced with water.
2.6 Blow out preventer (BOP)BOP are high-pressure valves which control the circulation of liquids and gases during drilling operation. It consists of
BOP stacks and LMRP located above the BOP stacks. The BOP stack is a heavy unit and with very large stiffness, and havebecome longer, larger and heavier on the latest generation drilling rigs.
2.7 Wellhead (WH)Subsea wellhead is located at the top of an oil and gas well, and it connects the well and BOP stack. Wellhead provides
a means to hang off and seal off casing used in drilling the well.
2.8 Drilling riser responseFor a typical drilling riser configuration including LMRP and BOP, two characteristic types of responses have been
reported [7] prior to the model tests:
1. The BOP is oscillating at its natural period, dragging the riser along2. The riser is excited at its natural period while the BOP acts like a dead weight
VIV can be excited when drilling riser is subjected to currents [2], VIV suppression devices such as fairings can be usedto reduce the fatigue damage. However this has not been a part of this study.
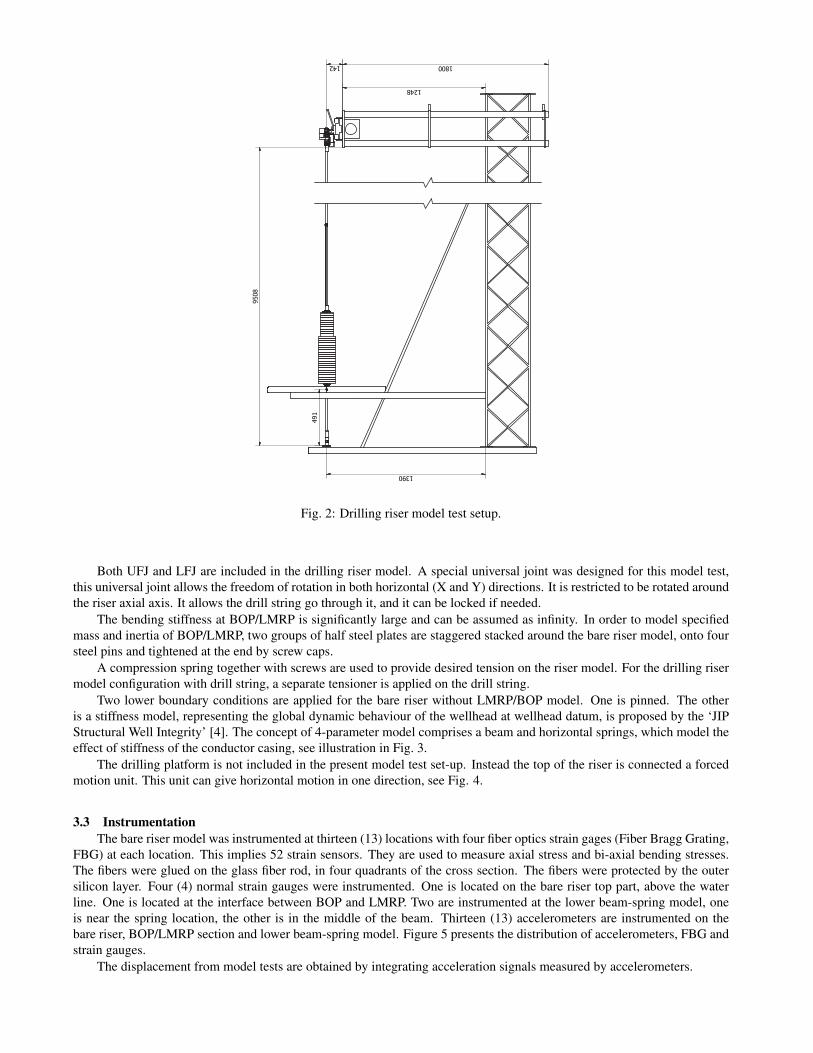
3 Experimental Method3.1 Test set-up
Figure 2 shows the overview of the model test set-up. A steel truss beam is used to connect the lower end of the risermodel and to the carriage. On the top side, steel substructures are added to enhance the stiffness of the rig and accommodatethe horizontal oscillator. On the bottom side of the rig, four chains were spread diagonally to keep the rig vertical and providestiffness. The truss beam is hinged on to the vertical beams, and it can be lifted to a horizontal position by the crane on thetowing carriage.
3.2 Drilling riser modelThe properties of different parts of the drilling riser model and corresponding FS values are summarized in Tab. 1. The
drilling riser model is in 1 : 19 scale, Froude scaling is applied in present study, see Tab. 2.In the model tests, only bare riser and riser with buoyancy elements were modelled, the additional kill and choke lines
parallel to the bare riser were not modelled for simplicity. The core of the (bare) riser model was a fibreglass reinforcedpipe. This core fibreglass pipe has an outer diameter of 20 mm and a wall thickness of 1.5 mm and was fabricated by asubcontractor, Vello Nordic AS. The optical fibres, accelerometers and their cables were glued on the outer surface of thefibreglass pipe. A silicon tube was wrapped around the instrumentation and cables. Due to the cables and silicon tube, theouter diameter of the riser model was increased to 28 mm generally. At the locations of accelerometers, The outer diameterwas slightly larger locally at the accelerometer locations.
One of the drilling riser configurations in present study has buoyancy joint. In practice, drilling riser buoyancy modulesare fitted along the riser to reduced the top tension and the weight of drilling riser in water by providing additional buoyancyforce. In this case, the buoyancy modules are located in the lower part of the riser to reduce the tension force along the riser.Each buoyancy element is designed as two half sections outside of the bare riser, made of Dinvinycell and ballasted by steelpins inside, with half rings at both ends. The buoyancy elements were manufactured by MARINTEK.
In the model test, the drill string model is a long rod, and the bare riser is water filled but without circulating.
9508
1800142
491
1248
1390
Fig. 2: Drilling riser model test setup.
Both UFJ and LFJ are included in the drilling riser model. A special universal joint was designed for this model test,this universal joint allows the freedom of rotation in both horizontal (X and Y) directions. It is restricted to be rotated aroundthe riser axial axis. It allows the drill string go through it, and it can be locked if needed.
The bending stiffness at BOP/LMRP is significantly large and can be assumed as infinity. In order to model specifiedmass and inertia of BOP/LMRP, two groups of half steel plates are staggered stacked around the bare riser model, onto foursteel pins and tightened at the end by screw caps.
A compression spring together with screws are used to provide desired tension on the riser model. For the drilling risermodel configuration with drill string, a separate tensioner is applied on the drill string.
Two lower boundary conditions are applied for the bare riser without LMRP/BOP model. One is pinned. The otheris a stiffness model, representing the global dynamic behaviour of the wellhead at wellhead datum, is proposed by the ‘JIPStructural Well Integrity’ [4]. The concept of 4-parameter model comprises a beam and horizontal springs, which model theeffect of stiffness of the conductor casing, see illustration in Fig. 3.
The drilling platform is not included in the present model test set-up. Instead the top of the riser is connected a forcedmotion unit. This unit can give horizontal motion in one direction, see Fig. 4.
3.3 InstrumentationThe bare riser model was instrumented at thirteen (13) locations with four fiber optics strain gages (Fiber Bragg Grating,
FBG) at each location. This implies 52 strain sensors. They are used to measure axial stress and bi-axial bending stresses.The fibers were glued on the glass fiber rod, in four quadrants of the cross section. The fibers were protected by the outersilicon layer. Four (4) normal strain gauges were instrumented. One is located on the bare riser top part, above the waterline. One is located at the interface between BOP and LMRP. Two are instrumented at the lower beam-spring model, oneis near the spring location, the other is in the middle of the beam. Thirteen (13) accelerometers are instrumented on thebare riser, BOP/LMRP section and lower beam-spring model. Figure 5 presents the distribution of accelerometers, FBG andstrain gauges.
The displacement from model tests are obtained by integrating acceleration signals measured by accelerometers.

(a) 4 parameter beam-spring lower boundarymodel [4].
(b) Lower BC with lockable universaljoint.
Fig. 3: Soil model.
Fig. 4: Drilling riser top unit: One dof forced motion actuator, tensioner of marine riser, tensioner of drill string, heavecompensation, UFJ, horizontal potentiometer and 3 component force measurement.
Fig. 5: Instrumentation distribution.
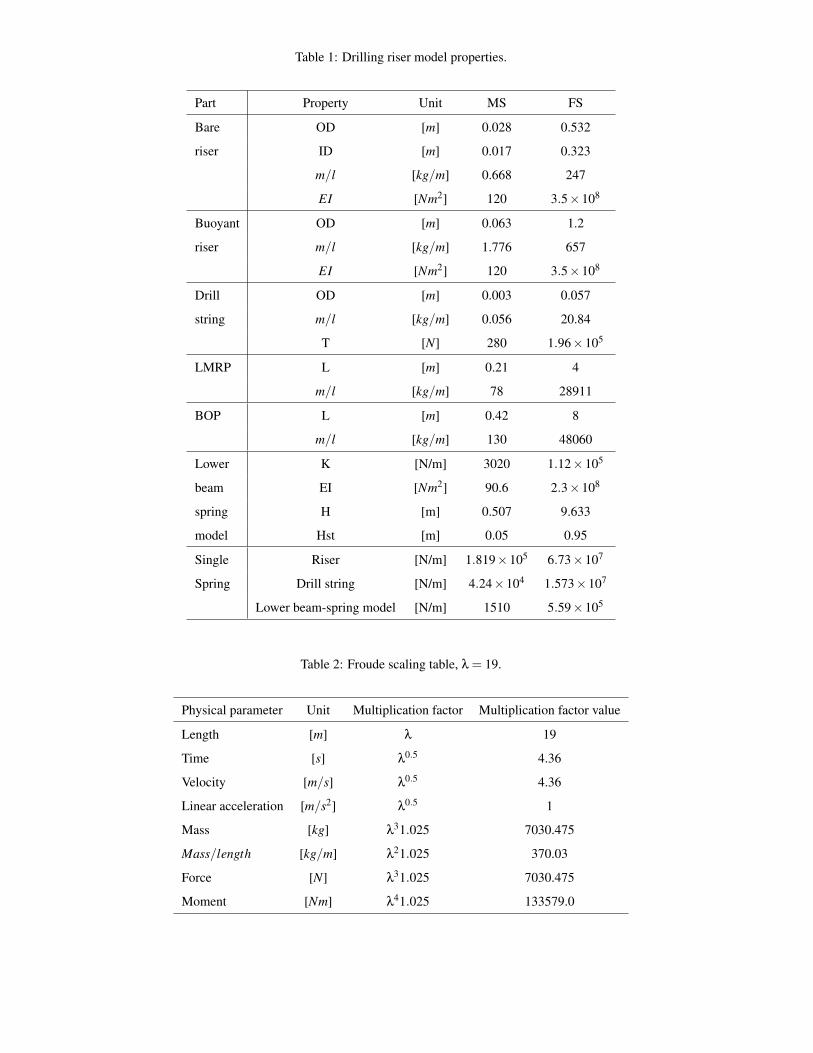
Table 1: Drilling riser model properties.
Part Property Unit MS FS
Bare OD [m] 0.028 0.532
riser ID [m] 0.017 0.323
m/l [kg/m] 0.668 247
EI [Nm2] 120 3.5×10⁸
Buoyant OD [m] 0.063 1.2
riser m/l [kg/m] 1.776 657
EI [Nm2] 120 3.5×10⁸
Drill OD [m] 0.003 0.057
string m/l [kg/m] 0.056 20.84
T [N] 280 1.96×10⁵
LMRP L [m] 0.21 4
m/l [kg/m] 78 28911
BOP L [m] 0.42 8
m/l [kg/m] 130 48060
Lower K [N/m] 3020 1.12×10⁵
beam EI [Nm2] 90.6 2.3×10⁸
spring H [m] 0.507 9.633
model Hst [m] 0.05 0.95
Single Riser [N/m] 1.819×10⁵ 6.73×10⁷
Spring Drill string [N/m] 4.24×10⁴ 1.573×10⁷
Lower beam-spring model [N/m] 1510 5.59×10⁵
Table 2: Froude scaling table, λ = 19.
Physical parameter Unit Multiplication factor Multiplication factor value
Length [m] λ 19
Time [s] λ0.5 4.36
Velocity [m/s] λ0.5 4.36
Linear acceleration [m/s2] λ0.5 1
Mass [kg] λ31.025 7030.475
Mass/length [kg/m] λ21.025 370.03
Force [N] λ31.025 7030.475
Moment [Nm] λ41.025 133579.0
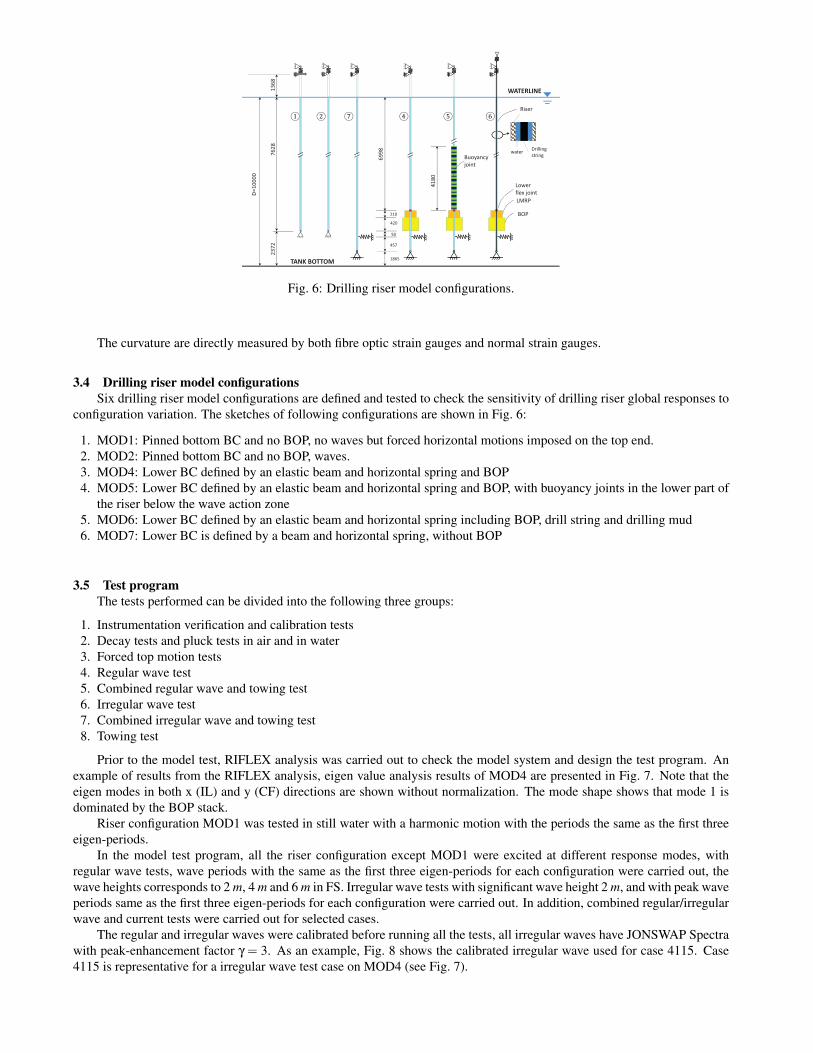
Fig. 6: Drilling riser model configurations.
The curvature are directly measured by both fibre optic strain gauges and normal strain gauges.
3.4 Drilling riser model configurationsSix drilling riser model configurations are defined and tested to check the sensitivity of drilling riser global responses to
configuration variation. The sketches of following configurations are shown in Fig. 6:
1. MOD1: Pinned bottom BC and no BOP, no waves but forced horizontal motions imposed on the top end.2. MOD2: Pinned bottom BC and no BOP, waves.3. MOD4: Lower BC defined by an elastic beam and horizontal spring and BOP4. MOD5: Lower BC defined by an elastic beam and horizontal spring and BOP, with buoyancy joints in the lower part of
the riser below the wave action zone5. MOD6: Lower BC defined by an elastic beam and horizontal spring including BOP, drill string and drilling mud6. MOD7: Lower BC is defined by a beam and horizontal spring, without BOP
3.5 Test programThe tests performed can be divided into the following three groups:
1. Instrumentation verification and calibration tests2. Decay tests and pluck tests in air and in water3. Forced top motion tests4. Regular wave test5. Combined regular wave and towing test6. Irregular wave test7. Combined irregular wave and towing test8. Towing test
Prior to the model test, RIFLEX analysis was carried out to check the model system and design the test program. Anexample of results from the RIFLEX analysis, eigen value analysis results of MOD4 are presented in Fig. 7. Note that theeigen modes in both x (IL) and y (CF) directions are shown without normalization. The mode shape shows that mode 1 isdominated by the BOP stack.
Riser configuration MOD1 was tested in still water with a harmonic motion with the periods the same as the first threeeigen-periods.
In the model test program, all the riser configuration except MOD1 were excited at different response modes, withregular wave tests, wave periods with the same as the first three eigen-periods for each configuration were carried out, thewave heights corresponds to 2 m, 4 m and 6 m in FS. Irregular wave tests with significant wave height 2 m, and with peak waveperiods same as the first three eigen-periods for each configuration were carried out. In addition, combined regular/irregularwave and current tests were carried out for selected cases.
The regular and irregular waves were calibrated before running all the tests, all irregular waves have JONSWAP Spectrawith peak-enhancement factor γ = 3. As an example, Fig. 8 shows the calibrated irregular wave used for case 4115. Case4115 is representative for a irregular wave test case on MOD4 (see Fig. 7).
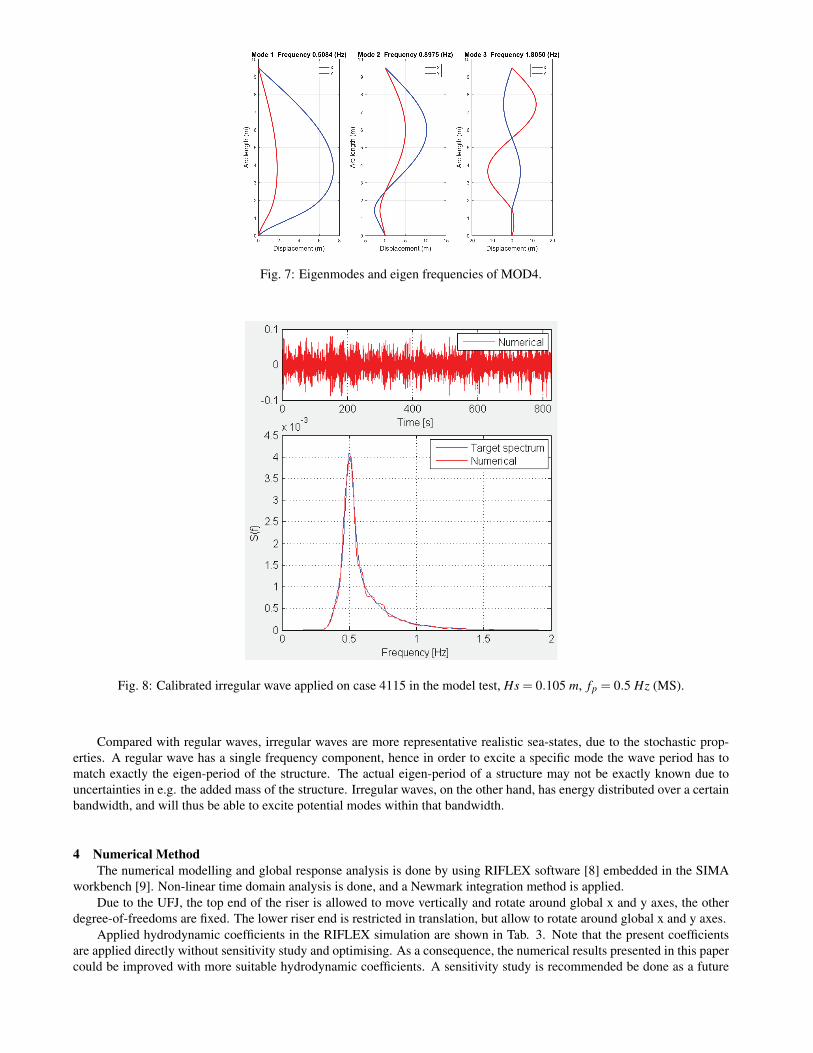
Fig. 7: Eigenmodes and eigen frequencies of MOD4.
Fig. 8: Calibrated irregular wave applied on case 4115 in the model test, Hs = 0.105 m, fp = 0.5 Hz (MS).
Compared with regular waves, irregular waves are more representative realistic sea-states, due to the stochastic prop-erties. A regular wave has a single frequency component, hence in order to excite a specific mode the wave period has tomatch exactly the eigen-period of the structure. The actual eigen-period of a structure may not be exactly known due touncertainties in e.g. the added mass of the structure. Irregular waves, on the other hand, has energy distributed over a certainbandwidth, and will thus be able to excite potential modes within that bandwidth.
4 Numerical MethodThe numerical modelling and global response analysis is done by using RIFLEX software [8] embedded in the SIMA
workbench [9]. Non-linear time domain analysis is done, and a Newmark integration method is applied.Due to the UFJ, the top end of the riser is allowed to move vertically and rotate around global x and y axes, the other
degree-of-freedoms are fixed. The lower riser end is restricted in translation, but allow to rotate around global x and y axes.Applied hydrodynamic coefficients in the RIFLEX simulation are shown in Tab. 3. Note that the present coefficients
are applied directly without sensitivity study and optimising. As a consequence, the numerical results presented in this papercould be improved with more suitable hydrodynamic coefficients. A sensitivity study is recommended be done as a future
work.
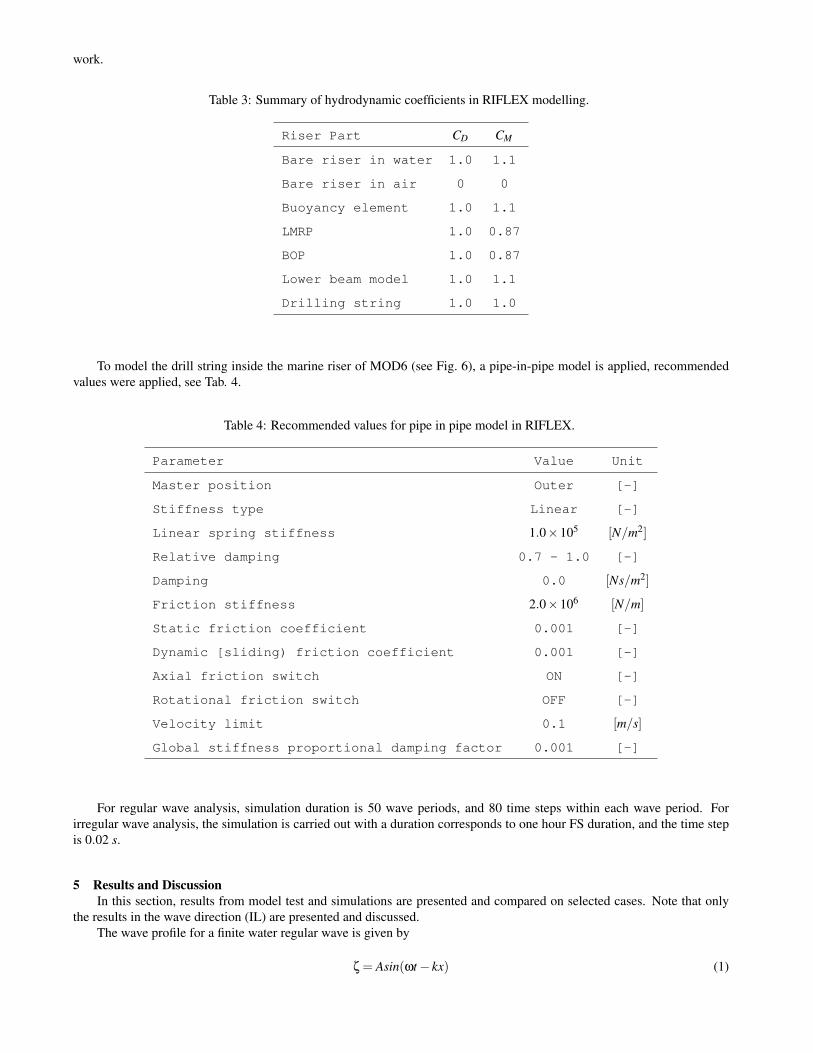
Table 3: Summary of hydrodynamic coefficients in RIFLEX modelling.
Riser Part CD CM
Bare riser in water 1.0 1.1
Bare riser in air 0 0
Buoyancy element 1.0 1.1
LMRP 1.0 0.87
BOP 1.0 0.87
Lower beam model 1.0 1.1
Drilling string 1.0 1.0
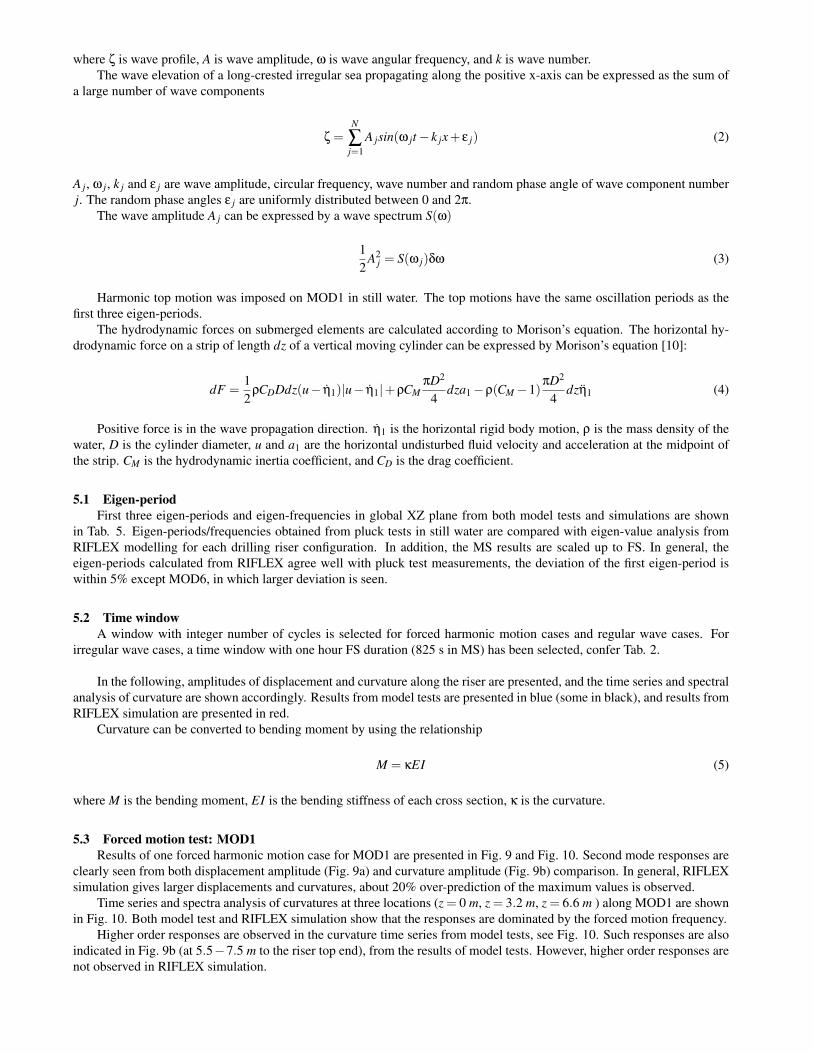
To model the drill string inside the marine riser of MOD6 (see Fig. 6), a pipe-in-pipe model is applied, recommendedvalues were applied, see Tab. 4.
Table 4: Recommended values for pipe in pipe model in RIFLEX.
Parameter Value Unit
Master position Outer [-]
Stiffness type Linear [-]
Linear spring stiffness 1.0×10⁵ [N/m2]
Relative damping 0.7 - 1.0 [-]
Damping 0.0 [Ns/m2]
Friction stiffness 2.0×10⁶ [N/m]
Static friction coefficient 0.001 [-]
Dynamic [sliding) friction coefficient 0.001 [-]
Axial friction switch ON [-]
Rotational friction switch OFF [-]
Velocity limit 0.1 [m/s]
Global stiffness proportional damping factor 0.001 [-]
For regular wave analysis, simulation duration is 50 wave periods, and 80 time steps within each wave period. Forirregular wave analysis, the simulation is carried out with a duration corresponds to one hour FS duration, and the time stepis 0.02 s.
5 Results and DiscussionIn this section, results from model test and simulations are presented and compared on selected cases. Note that only
the results in the wave direction (IL) are presented and discussed.The wave profile for a finite water regular wave is given by
ζ = Asin(ωt− kx) (1)
where ζ is wave profile, A is wave amplitude, ω is wave angular frequency, and k is wave number.The wave elevation of a long-crested irregular sea propagating along the positive x-axis can be expressed as the sum of
a large number of wave components
ζ =N
∑j=1
A jsin(ω jt− k jx+ ε j) (2)
A j, ω j, k j and ε j are wave amplitude, circular frequency, wave number and random phase angle of wave component numberj. The random phase angles ε j are uniformly distributed between 0 and 2π.
The wave amplitude A j can be expressed by a wave spectrum S(ω)
12
A2j = S(ω j)δω (3)
Harmonic top motion was imposed on MOD1 in still water. The top motions have the same oscillation periods as thefirst three eigen-periods.
The hydrodynamic forces on submerged elements are calculated according to Morison’s equation. The horizontal hy-drodynamic force on a strip of length dz of a vertical moving cylinder can be expressed by Morison’s equation [10]:
dF =12
ρCDDdz(u− η1)|u− η1|+ρCMπD2
4dza1−ρ(CM−1)
πD2
4dzη1 (4)
Positive force is in the wave propagation direction. η1 is the horizontal rigid body motion, ρ is the mass density of thewater, D is the cylinder diameter, u and a1 are the horizontal undisturbed fluid velocity and acceleration at the midpoint ofthe strip. CM is the hydrodynamic inertia coefficient, and CD is the drag coefficient.
5.1 Eigen-periodFirst three eigen-periods and eigen-frequencies in global XZ plane from both model tests and simulations are shown
in Tab. 5. Eigen-periods/frequencies obtained from pluck tests in still water are compared with eigen-value analysis fromRIFLEX modelling for each drilling riser configuration. In addition, the MS results are scaled up to FS. In general, theeigen-periods calculated from RIFLEX agree well with pluck test measurements, the deviation of the first eigen-period iswithin 5% except MOD6, in which larger deviation is seen.
5.2 Time windowA window with integer number of cycles is selected for forced harmonic motion cases and regular wave cases. For
irregular wave cases, a time window with one hour FS duration (825 s in MS) has been selected, confer Tab. 2.
In the following, amplitudes of displacement and curvature along the riser are presented, and the time series and spectralanalysis of curvature are shown accordingly. Results from model tests are presented in blue (some in black), and results fromRIFLEX simulation are presented in red.
Curvature can be converted to bending moment by using the relationship
M = κEI (5)
where M is the bending moment, EI is the bending stiffness of each cross section, κ is the curvature.
5.3 Forced motion test: MOD1Results of one forced harmonic motion case for MOD1 are presented in Fig. 9 and Fig. 10. Second mode responses are
clearly seen from both displacement amplitude (Fig. 9a) and curvature amplitude (Fig. 9b) comparison. In general, RIFLEXsimulation gives larger displacements and curvatures, about 20% over-prediction of the maximum values is observed.
Time series and spectra analysis of curvatures at three locations (z = 0 m, z = 3.2 m, z = 6.6 m ) along MOD1 are shownin Fig. 10. Both model test and RIFLEX simulation show that the responses are dominated by the forced motion frequency.
Higher order responses are observed in the curvature time series from model tests, see Fig. 10. Such responses are alsoindicated in Fig. 9b (at 5.5−7.5 m to the riser top end), from the results of model tests. However, higher order responses arenot observed in RIFLEX simulation.
Table 5: Eigen-periods and eigen-frequencies from pluck tests in water.
Model Test RIFLEX Modelling
T (s) f (Hz) T (s) f (Hz)
Conf. nth mode MS FS MS FS MS FS MS FS
MOD1/2
1 1.548 6.746 0.646 0.148 1.543 6.728 0.648 0.149
2 0.677 2.951 1.477 0.399 0.692 3.016 1.445 0.332
3 0.382 1.664 2.619 0.601 0.399 1.741 2.503 0.574
MOD7
1 1.468 6.399 0.681 0.156 1.497 6.523 0.668 0.153
2 0.612 2.666 1.635 0.375 0.679 2.961 1.472 0.338
3 0.367 1.600 2.725 0.625 0.399 1.740 2.505 0.575
MOD4
1 2.000 8.718 0.5 0.115 2.180 9.501 0.459 0.105
2 1.321 5.760 0.757 0.174 1.303 5.679 0.768 0.176
3 0.613 2.671 1.632 0.374 0.609 2.654 1.642 0.377
MOD5
1 2.818 12.286 0.355 0.081 2.822 12.299 0.354 0.081
2 1.691 7.370 0.591 0.136 1.685 7.343 0.594 0.136
3 0.845 3.685 1.183 0.271 0.835 3.639 1.198 0.275
MOD6
1 1.818 7.925 0.55 0.126 2.573 11.217 0.389 0.089
2 1.111 4.843 0.9 0.206 1.318 5.744 0.759 0.174
3 0.556 2.422 1.8 0.413 1.170 5.100 0.855 0.196
(a) Displacement. (b) Curvature.
Fig. 9: MOD1. Test1011: Amplitude of displacement and curvature. Forced harmonic motion, A = 0.013 m, T = 0.677 s inMS, A = 0.25 m, T = 2.95 s in FS.
5.4 Drilling riser without drill string: MOD45.4.1 Regular wave
Configuration MOD4 represents a typical drilling riser model including marine riser, LFJ, LMRP/BOP and beam-springlower BC, but without drill string. Results of a regular wave case are presented in Fig. 11 and Fig. 12.
Note that the regular wave period and irregular wave peak period are set as the first eigen-period, so first mode responsesare expected. It is seen from Fig. 11a that the largest displacement amplitude occurs at around 8.5 m to the riser top end,where the LMRP/BOP is located, the responses are dominated by the heavy LMRP/BOP. RIFLEX simulation underestimatethe displacement amplitude at middle part of marine riser, BOP stack and lower BC about 30%.
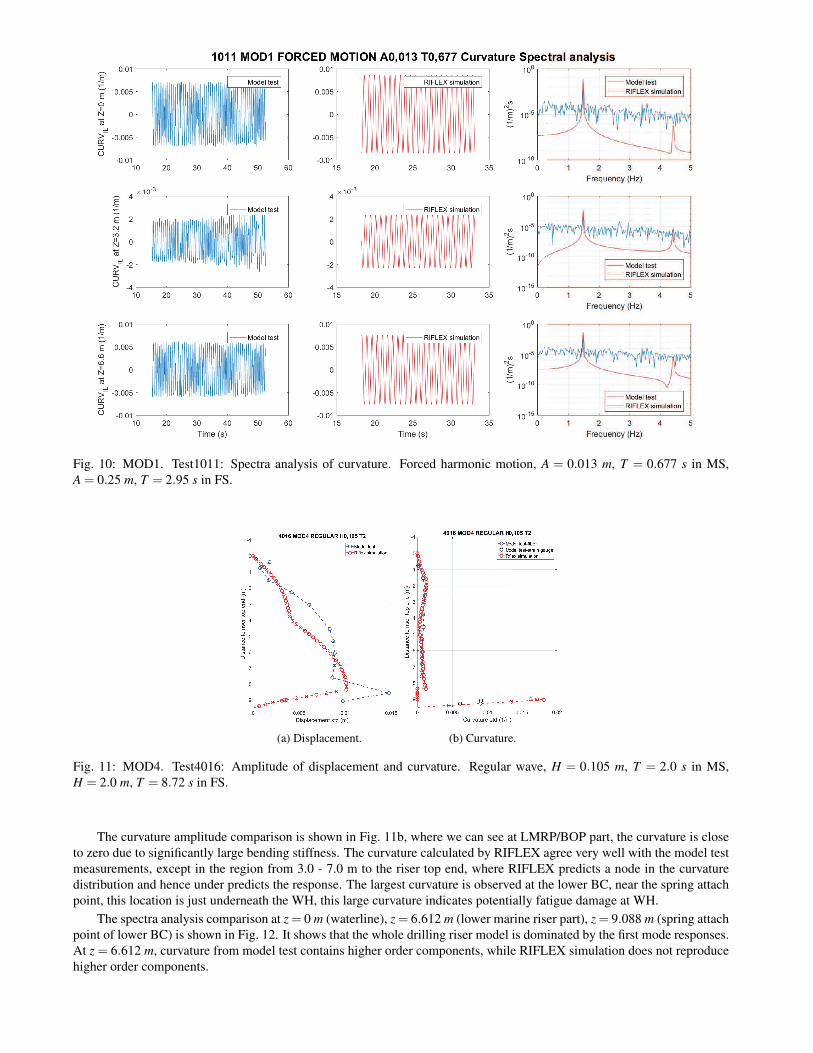
Fig. 10: MOD1. Test1011: Spectra analysis of curvature. Forced harmonic motion, A = 0.013 m, T = 0.677 s in MS,A = 0.25 m, T = 2.95 s in FS.
(a) Displacement. (b) Curvature.
Fig. 11: MOD4. Test4016: Amplitude of displacement and curvature. Regular wave, H = 0.105 m, T = 2.0 s in MS,H = 2.0 m, T = 8.72 s in FS.
The curvature amplitude comparison is shown in Fig. 11b, where we can see at LMRP/BOP part, the curvature is closeto zero due to significantly large bending stiffness. The curvature calculated by RIFLEX agree very well with the model testmeasurements, except in the region from 3.0 - 7.0 m to the riser top end, where RIFLEX predicts a node in the curvaturedistribution and hence under predicts the response. The largest curvature is observed at the lower BC, near the spring attachpoint, this location is just underneath the WH, this large curvature indicates potentially fatigue damage at WH.
The spectra analysis comparison at z = 0 m (waterline), z = 6.612 m (lower marine riser part), z = 9.088 m (spring attachpoint of lower BC) is shown in Fig. 12. It shows that the whole drilling riser model is dominated by the first mode responses.At z = 6.612 m, curvature from model test contains higher order components, while RIFLEX simulation does not reproducehigher order components.
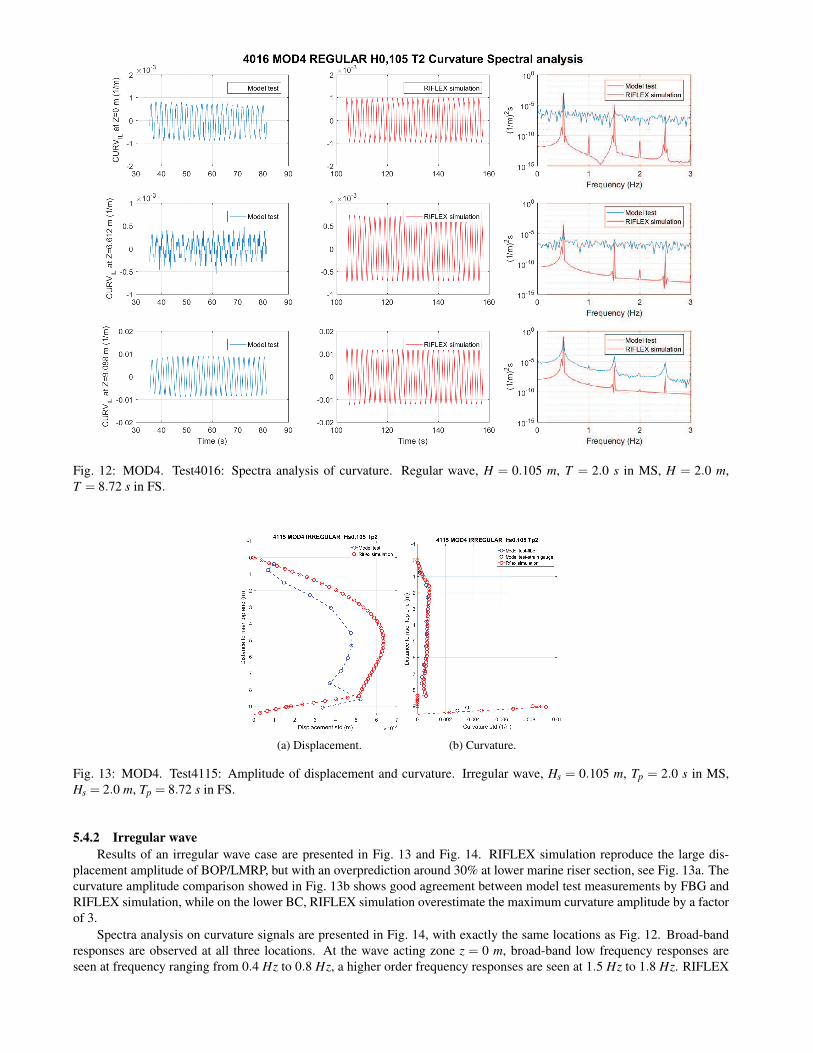
Fig. 12: MOD4. Test4016: Spectra analysis of curvature. Regular wave, H = 0.105 m, T = 2.0 s in MS, H = 2.0 m,T = 8.72 s in FS.
(a) Displacement. (b) Curvature.
Fig. 13: MOD4. Test4115: Amplitude of displacement and curvature. Irregular wave, Hs = 0.105 m, Tp = 2.0 s in MS,Hs = 2.0 m, Tp = 8.72 s in FS.
5.4.2 Irregular waveResults of an irregular wave case are presented in Fig. 13 and Fig. 14. RIFLEX simulation reproduce the large dis-
placement amplitude of BOP/LMRP, but with an overprediction around 30% at lower marine riser section, see Fig. 13a. Thecurvature amplitude comparison showed in Fig. 13b shows good agreement between model test measurements by FBG andRIFLEX simulation, while on the lower BC, RIFLEX simulation overestimate the maximum curvature amplitude by a factorof 3.
Spectra analysis on curvature signals are presented in Fig. 14, with exactly the same locations as Fig. 12. Broad-bandresponses are observed at all three locations. At the wave acting zone z = 0 m, broad-band low frequency responses areseen at frequency ranging from 0.4 Hz to 0.8 Hz, a higher order frequency responses are seen at 1.5 Hz to 1.8 Hz. RIFLEX
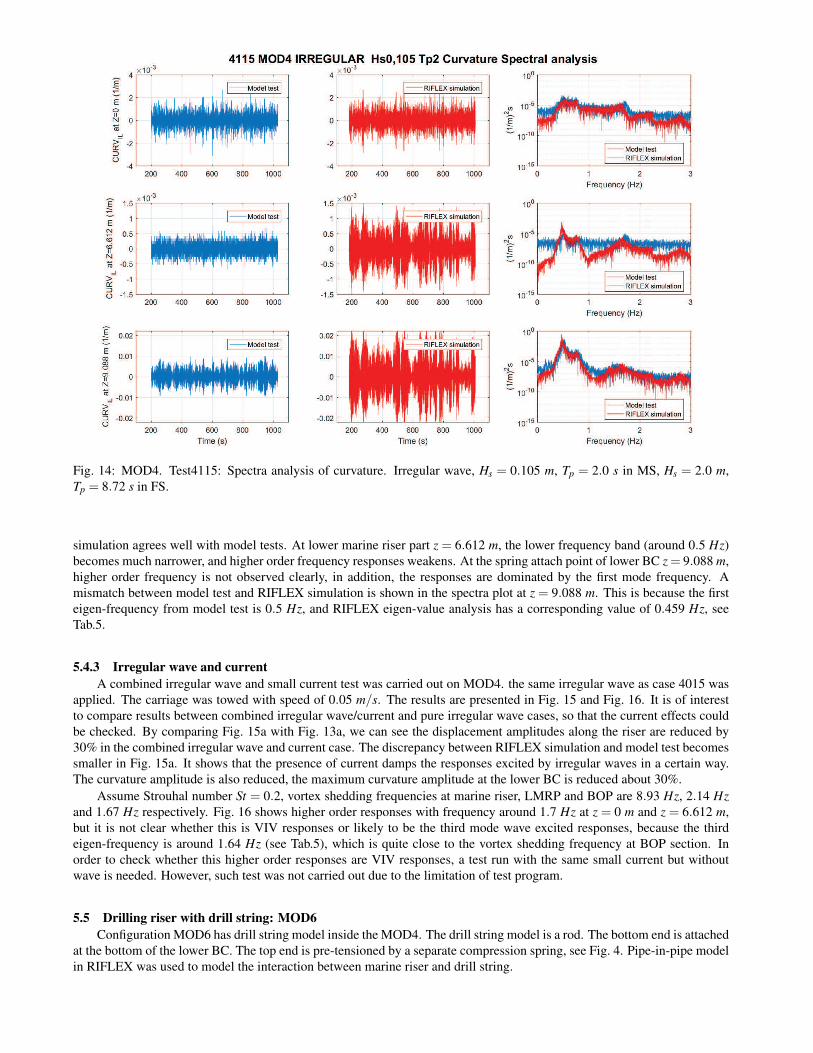
Fig. 14: MOD4. Test4115: Spectra analysis of curvature. Irregular wave, Hs = 0.105 m, Tp = 2.0 s in MS, Hs = 2.0 m,Tp = 8.72 s in FS.
simulation agrees well with model tests. At lower marine riser part z = 6.612 m, the lower frequency band (around 0.5 Hz)becomes much narrower, and higher order frequency responses weakens. At the spring attach point of lower BC z = 9.088 m,higher order frequency is not observed clearly, in addition, the responses are dominated by the first mode frequency. Amismatch between model test and RIFLEX simulation is shown in the spectra plot at z = 9.088 m. This is because the firsteigen-frequency from model test is 0.5 Hz, and RIFLEX eigen-value analysis has a corresponding value of 0.459 Hz, seeTab.5.
5.4.3 Irregular wave and currentA combined irregular wave and small current test was carried out on MOD4. the same irregular wave as case 4015 was
applied. The carriage was towed with speed of 0.05 m/s. The results are presented in Fig. 15 and Fig. 16. It is of interestto compare results between combined irregular wave/current and pure irregular wave cases, so that the current effects couldbe checked. By comparing Fig. 15a with Fig. 13a, we can see the displacement amplitudes along the riser are reduced by30% in the combined irregular wave and current case. The discrepancy between RIFLEX simulation and model test becomessmaller in Fig. 15a. It shows that the presence of current damps the responses excited by irregular waves in a certain way.The curvature amplitude is also reduced, the maximum curvature amplitude at the lower BC is reduced about 30%.
Assume Strouhal number St = 0.2, vortex shedding frequencies at marine riser, LMRP and BOP are 8.93 Hz, 2.14 Hzand 1.67 Hz respectively. Fig. 16 shows higher order responses with frequency around 1.7 Hz at z = 0 m and z = 6.612 m,but it is not clear whether this is VIV responses or likely to be the third mode wave excited responses, because the thirdeigen-frequency is around 1.64 Hz (see Tab.5), which is quite close to the vortex shedding frequency at BOP section. Inorder to check whether this higher order responses are VIV responses, a test run with the same small current but withoutwave is needed. However, such test was not carried out due to the limitation of test program.
5.5 Drilling riser with drill string: MOD6Configuration MOD6 has drill string model inside the MOD4. The drill string model is a rod. The bottom end is attached
at the bottom of the lower BC. The top end is pre-tensioned by a separate compression spring, see Fig. 4. Pipe-in-pipe modelin RIFLEX was used to model the interaction between marine riser and drill string.

(a) Displacement. (b) Curvature.
Fig. 15: MOD4. Test4120: Amplitude of displacement and curvature. Irregular wave, Hs = 0.105 m, Tp = 2.0 s, U =0.05 m/s in MS, Hs = 2.0 m, Tp = 8.72 s, U = 0.22 m/s in FS.
Fig. 16: Test4120: Spectra analysis of curvature. Irregular wave, Hs = 0.105 m, Tp = 2.0 s, U = 0.05 m/s in MS, Hs = 2.0 m,Tp = 8.72 s, U = 0.22 m/s in FS.
5.5.1 Regular waveResults of one regular wave case are shown in Fig. 17 and Fig. 18. It shows that response displacement amplitude
is over-predicted by RIFLEX simulation, see Fig. 17a. Model test measurements show that the maximum displacementamplitude is at LMRP/BOP, while RIFLEX simulation has maximum displacement amplitude at the lower marine riser part.The over-prediction of maximum displacement has a factor of 3. The LMRP/BOP displacement amplitude predicted by theRIFLEX simulation agrees well with model test measurements. The curvature amplitude comparison is shown in Fig. 17b.At the top half section of the marine riser (0 to 4 m to the riser top end), RIFLEX simulation agrees well with model test.At lower half marine riser and lower BC, the curvature predicted by the RIFLEX simulation is about twice of model testmeasurements. Spectra analysis shows that the entire riser is dominated by the first mode responses with almost single
(a) Displacement. (b) Curvature.
Fig. 17: Test6005: Amplitude of displacement and curvature. Regular wave, H = 0.105 m, T = 1.835 s in MS, H = 2.0 m,T = 8 s in FS.
Fig. 18: Test6005: Spectra analysis of curvature. Regular wave, H = 0.105 m, T = 1.835 s in MS, H = 2.0 m, T = 8 s in FS.
frequency.
5.5.2 Irregular waveResults of one irregular wave case are shown in Fig. 19 and Fig. 20. RIFLEX simulation over-predict the displacement
amplitude by a factor around 2, which is less than the regular wave case, compare Fig. 19a and Fig. 17a. In the irregularwave case, the model test measured maximum displacement amplitude at both middle part of marine riser and LMRP/BOP,RIFLEX simulation has higher displacement amplitude at lower part of marine riser. The RIFLEX simulation slightlyoverestimates the curvature amplitude along the marine riser, but overestimates curvature amplitude at spring attach point oflower BC with a factor of 3. Depending on the index of S-N curve (m) to calculate fatigue damage, the fatigue damage has afactor of 3m consequently. Broadband frequency responses are observed in the spectra analysis shown in Fig. 20, especially
(a) Displacement. (b) Curvature.
Fig. 19: Test6105: Amplitude of displacement and curvature. Irregular wave, Hs = 0.105 m, Tp = 1.835 s in MS, Hs = 2.0 m,Tp = 1.835 s in FS.
Fig. 20: Test6105: Spectra analysis of curvature. Irregular wave, Hs = 0.105 m, Tp = 1.835 s in MS, Hs = 2.0 m, Tp = 1.835 sin FS.
at the wave acting zone (z = 0 m). Higher order responses (around 1.5−1.8 Hz, near 3rd eigen-frequency) are also seen, butbecomes insignificant as water depth increases.
Compare Fig. 19a and Fig. 19b: From 0 to 8 m to the riser top end, the displacement standard deviations predicted byRIFLEX are much larger than that of the model test (a factor around 2), but the curvatures are at the same level. This couldbe explained by the relationship between displacement(deflection) and curvature. For a beam, the curvature is the secondorder differentiation of the displacement. Fig. 21 shows examples of the mode-shapes of displacement and curvature. Thedisplacement mode-shapes are normalized to unity with respect to the maximum norm. It is seen that the amplitudes of thecorresponding mode-shapes of curvature increase strongly with mode number. In Fig. 19, mode 2 exists in the displacementmeasured from model tests, at the location 7.5 m from riser top end. The spectra plot in Fig. 20 also shows there is higher
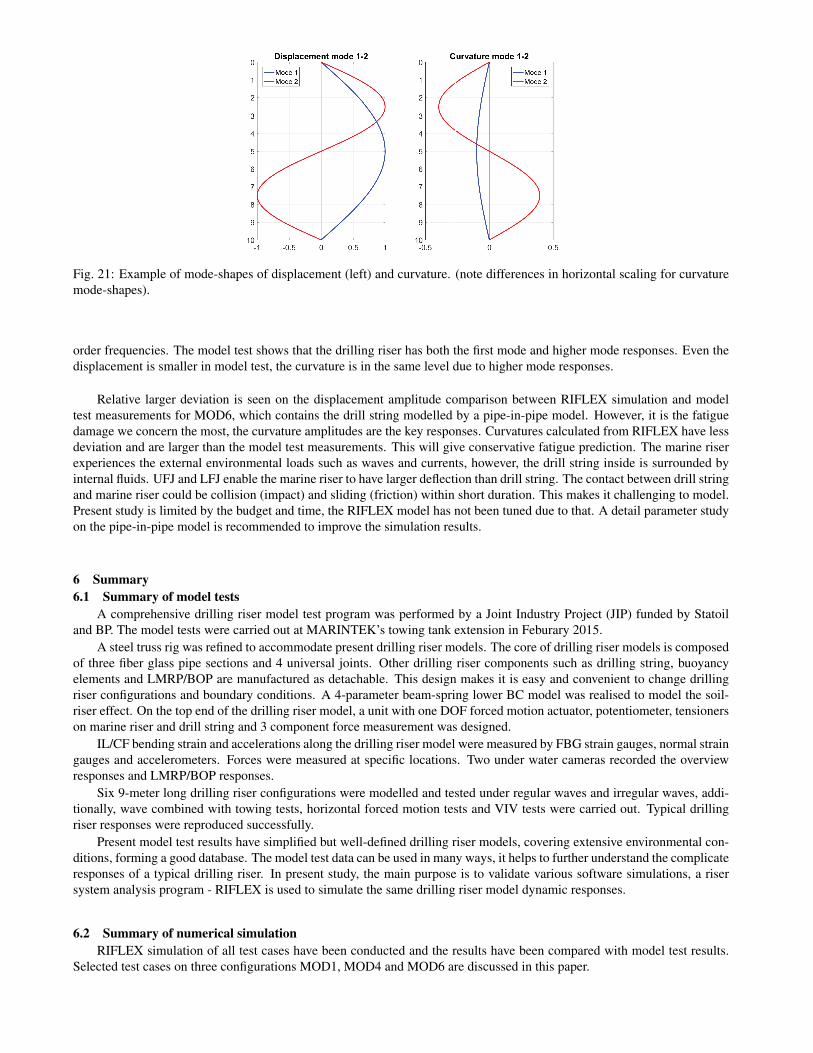
Fig. 21: Example of mode-shapes of displacement (left) and curvature. (note differences in horizontal scaling for curvaturemode-shapes).
order frequencies. The model test shows that the drilling riser has both the first mode and higher mode responses. Even thedisplacement is smaller in model test, the curvature is in the same level due to higher mode responses.
Relative larger deviation is seen on the displacement amplitude comparison between RIFLEX simulation and modeltest measurements for MOD6, which contains the drill string modelled by a pipe-in-pipe model. However, it is the fatiguedamage we concern the most, the curvature amplitudes are the key responses. Curvatures calculated from RIFLEX have lessdeviation and are larger than the model test measurements. This will give conservative fatigue prediction. The marine riserexperiences the external environmental loads such as waves and currents, however, the drill string inside is surrounded byinternal fluids. UFJ and LFJ enable the marine riser to have larger deflection than drill string. The contact between drill stringand marine riser could be collision (impact) and sliding (friction) within short duration. This makes it challenging to model.Present study is limited by the budget and time, the RIFLEX model has not been tuned due to that. A detail parameter studyon the pipe-in-pipe model is recommended to improve the simulation results.
6 Summary6.1 Summary of model tests
A comprehensive drilling riser model test program was performed by a Joint Industry Project (JIP) funded by Statoiland BP. The model tests were carried out at MARINTEK’s towing tank extension in Feburary 2015.
A steel truss rig was refined to accommodate present drilling riser models. The core of drilling riser models is composedof three fiber glass pipe sections and 4 universal joints. Other drilling riser components such as drilling string, buoyancyelements and LMRP/BOP are manufactured as detachable. This design makes it is easy and convenient to change drillingriser configurations and boundary conditions. A 4-parameter beam-spring lower BC model was realised to model the soil-riser effect. On the top end of the drilling riser model, a unit with one DOF forced motion actuator, potentiometer, tensionerson marine riser and drill string and 3 component force measurement was designed.
IL/CF bending strain and accelerations along the drilling riser model were measured by FBG strain gauges, normal straingauges and accelerometers. Forces were measured at specific locations. Two under water cameras recorded the overviewresponses and LMRP/BOP responses.
Six 9-meter long drilling riser configurations were modelled and tested under regular waves and irregular waves, addi-tionally, wave combined with towing tests, horizontal forced motion tests and VIV tests were carried out. Typical drillingriser responses were reproduced successfully.
Present model test results have simplified but well-defined drilling riser models, covering extensive environmental con-ditions, forming a good database. The model test data can be used in many ways, it helps to further understand the complicateresponses of a typical drilling riser. In present study, the main purpose is to validate various software simulations, a risersystem analysis program - RIFLEX is used to simulate the same drilling riser model dynamic responses.
6.2 Summary of numerical simulationRIFLEX simulation of all test cases have been conducted and the results have been compared with model test results.
Selected test cases on three configurations MOD1, MOD4 and MOD6 are discussed in this paper.
Eigenvalue analysis has been done on each configuration for design of the model and also compared with pluck testresult. Eigen frequencies agree with each other very well in general except MOD6 , which includes the internal drill string.
Non-linear time domain analysis has been done for both forced motion tests, regular wave tests and irregular wave tests.Key results such as displacement and curvature amplitudes along the riser from model tests and RIFLEX simulations arecompared. Curvature time history and spectral analysis results at selected locations are presented in addition.
In most of the selected cases, RIFLEX over-predict the displacement and curvature amplitude. For MOD1 with harmonicforce motions, the over-prediction is about 20%. For MOD4 under irregular wave, the over-prediction on the maximumdisplacement amplitude is about 30%, the curvature amplitude is overestimated by a factor up to 3. For MOD6, an over-prediction of displacement and curvature amplitudes with factor 2 to 3 is seen on both regular and irregular wave cases.The only exception is MOD4 under regular wave, in which RIFLEX simulation underestimates the maximum displacementamplitude about 30%. This overestimations indicate conservative prediction. In case maxima, or extreme responses are infocus, one should consider to run the RIFLEX simulations with the same wave sample as measured in the model test. Thiswould provide a deterministic verification, and identify individual maxima and minima.
As the WH fatigue is the main concern for a drilling riser, the curvature along the riser is of interest. Large curvature isobserved near the WH from both model tests and RIFLEX simulations. From the comparison, RIFLEX predicts the curvaturevery well.
Spectrum analysis shows the frequency components of responses at selected locations. In general, narrow-band re-sponses around loading frequency are seen for both forced harmonic motion cases on MOD1 and regular wave cases onMOD4 and MOD6. Broad-band responses are observed in irregular wave cases, and higher order frequency responses areshown especially at wave acting zone.
In general, RIFLEX simulation give reasonably good results as compared with those from the model tests. Especiallygood comparison is seen for simple configurations. As the complexity increases, larger gap between RIFLEX simulationand model test is observed.
MOD6 with drill string is modelled by a pipe-in-pipe model. The eigen-value analysis and dynamic analysis do notagree with model test measurements as well as the other configurations. The values recommended in the RIFLEX manualfor pipe-in-pipe analysis may not be relevant for marine drilling risers with drill strings inside. The data set from the modeltests will give the industry the possibility to calibrate the software codes.
Large difference is observed for some of the regular wave tests with wave period same as eigen-period of the riser model.This is mainly because a regular wave has a single frequency, which makes it difficult to hit exactly at the eigen-frequency ofeach configuration, a slight difference between frequencies can result in non-resonance response and make a big differencein responses. In that sense, irregular wave tests are more practical and representative, broad-band irregular wave can excitemulti-frequency responses. Comparison of irregular wave tests have shown to be very good and promising.
A detail parameter sensitivity study on both hydrodynamic coefficients and pipe-in-pipe model is needed in order to op-timising the simulation, so that the software prediction can be improved and a better understanding of the dynamic responsescan be achieved.
7 Future WorkThis series of model tests are successful and the data are of high quality. It covers several key topics related to drilling
riser system. The present work shows the first comparison between model test results and simulation. The parameters givenas input to the simulations have not been tuned. A detail analysis of the model test data is highly recommended so that wecan get better understanding of the drilling riser dynamic responses, and predict the WH fatigue more accurately.
Several potential activities are suggested:
1. Sensitivity study of hydrodynamic coefficients2. Sensitivity study of pipe-in-pipe model3. Sensitivity study of drilling riser configurations4. Environmental loads on drilling risers5. VIV of drilling risers6. Comparison study with field measurements7. Deterministic comparison of irregular response, using measured wave and motion as excitation to RIFLEX
AcknowledgementsThe authors would like to thank STATOIL and BP for their funding support and allowing the publication of the present
paper, their contribution and comments on this study are highly appreciated.
References[1] Reinas, L., Russo, M., and Grytøyr, G., 2012. “Wellhead fatigue analysis method: The effect of variation of lower
boundary conditions in global riser load analysis”. In ASME 2012 31st International Conference on Ocean, Offshoreand Arctic Engineering, Vol. 1, pp. 283–295.
[2] Tognarelli, M., Taggart, S., and Campbell, C., 2008. “Actual VIV fatigue response of full scale drilling risers: withand without suppression devices”. In ASME 2008 27th International Conference on Offshore Mechanics and ArcticEngineering, Vol. 5, pp. 513–525.
[3] McNeill, S., Agarwal, P., Kluk, D., Bhalla, K., Young, R., Burman, S., and Denison, S. E., 2014. “Subsea Wellheadand Riser Fatigue Monitoring in a Strong Surface and Submerged Current Environment”. In Offshore TechnologyConference, no. OTC-25403-MS, Offshore Technology Conference, pp. 1–16.
[4] Grytøyr, G., Hørte, T., and Lem, A. I., 2011. Wellhead Fatigue Analysis Method Rev 01. Tech. Rep. Report no/DNVReg No.: 2011-0063/ 12Q5071-26, Det Norske Veritas, Høvik, Norway.
[5] DNVGL, 2015. Recommended Practice DNVGL-RP-0142 Wellhead fatigue analysis. Edition April 2015, Høvik,Norway.
[6] Reinas, L., Sæther, M., and Svensson, J., 2012. “Wellhead fatigue analysis method: A new boundary conditionmodelling of lateral cement support in local wellhead models”. In ASME 2012 31st International Conference onOcean, Offshore and Arctic Engineering, Vol. 1, pp. 47–57.
[7] Russo, M., 2014. Personal communication. June.[8] MARINTEK, 2012. RIFLEX Theory Manual, 4.0v0 ed. Trondheim, Norway.[9] MARINTEK, 2014. SIMA User Guide. Trondheim, Norway.
[10] Faltinsen, O. M., 1993. Sea Loads on Ships and Offshore Structures. Cambridge Ocean Technology Series. CambridgeUniversity Press, ch. 7, pp. 223–227.