
Ring test assessment of the mKir2.1 growth based assay in Saccharomycescerevisiae using parametric...
10
METHODS Ring test assessment of the mKir2.1 growth based assay in Saccharomyces cerevisiae using parametric models and model-free fits Guido Hasenbrink & Lucie Kolacna & Jost Ludwig & Hana Sychrova & Maik Kschischo & Hella Lichtenberg-Fraté Received: 9 May 2006 / Revised: 12 July 2006 / Accepted: 7 August 2006 / Published online: 8 November 2006 # Springer-Verlag 2006 Abstract Inward rectifying K + (Kir) channels are a subfamily of the potassium channel superfamily. They mediate potassium influx into the cells, a process respond- ing to the polarization state, a variety of intracellular messengers and specific auxiliary proteins, thereby they are involved in important physiological processes such as the pacemaker activity in the heart, insulin release, and potassium uptake in glial cells. The Saccharomyces cerevisiae mKir2.1 in vitro assay was subjected to a ring test assessment. Compound-associated mKir2.1 modulating effects were detected by growth determination of function- ally complemented S. cerevisiae cells in a 96-well format within 15 h. Dose–response diagrams and EC 50 value calculations were determined by parametric model and model-free fits using cubic spline interpolation. These characteristics were evaluated by statistical methods to determine reproducibility among working groups. Nonpara- metric bootstrap simulations of the variability of the data revealed that EC 50 values of the mKir2.1 indicator strain were well-matched (81–92 μM), enabling unambiguous quantitative statements about inhibitory effects and no significant influence of the different laboratory conditions. Limitations of the assay include compounds/samples that are either insoluble under the conditions of the test or strongly cytotoxic to yeast. Thus, the described test is a sensitive and reliable tool that can be used in different laboratories and is applicable in drug discovery and development as simple and reliable prescreening procedure. Keywords Short-term in vitro test . Parametric models . Model-free fits . Saccharomyces cerevisiae Introduction The controlled opening and closing of K + channels in mammalian cells governs several crucial processes such as the generation of electrical impulses in nerve and muscle cells, the release of neurotransmitters and hormones, sensory transduction, and epithelial transport (Shieh et al. 2000). K + channels, each encoded by separate and unlinked genes, comprise a structurally diverse family of ion trans- port proteins. Inwardly rectifying K + (Kir) channels constitute a distinct family of channels that comprises seven channel subfamilies (Jan and Jan 1997; Nichols and Lopatin 1997; Doupnik et al. 1995). Kir (IRK) channels have a structure that is simpler than that of other ion chan- nel families, the general structure of a Kir channel consists of two membrane-spanning domains (M1 and M2) that flank the highly conserved pore (P) region. Molecular defects in several Kir channel genes were recently shown to cause acquired and inherited chronic and paroxysmal disorders, Appl Microbiol Biotechnol (2007) 73:1212–1221 DOI 10.1007/s00253-006-0589-x G. Hasenbrink : H. Lichtenberg-Fraté (*) Molecular Bioenergetics, Institut für Zelluläre und Molekulare Botanik (IZMB), Universität Bonn, Kirschallee 1, 53115 Bonn, Germany e-mail: [email protected] L. Kolacna : H. Sychrova Department of Membrane Transport, Institute of Physiology, Academy of Sciences of the Czech Republic, Prague, Czech Republic J. Ludwig Physiologisch-chemisches Institut, Universität Tübingen, Tübingen, Germany M. Kschischo University of Applied Sciences Koblenz, Remagen, Germany
Transcript of Ring test assessment of the mKir2.1 growth based assay in Saccharomycescerevisiae using parametric...
METHODS
Ring test assessment of the mKir2.1 growth based assayin Saccharomyces cerevisiae using parametric modelsand model-free fits
Guido Hasenbrink & Lucie Kolacna & Jost Ludwig &
Hana Sychrova & Maik Kschischo &
Hella Lichtenberg-Fraté
Received: 9 May 2006 /Revised: 12 July 2006 /Accepted: 7 August 2006 / Published online: 8 November 2006# Springer-Verlag 2006
Abstract Inward rectifying K+ (Kir) channels are asubfamily of the potassium channel superfamily. Theymediate potassium influx into the cells, a process respond-ing to the polarization state, a variety of intracellularmessengers and specific auxiliary proteins, thereby theyare involved in important physiological processes such asthe pacemaker activity in the heart, insulin release, andpotassium uptake in glial cells. The Saccharomycescerevisiae mKir2.1 in vitro assay was subjected to a ringtest assessment. Compound-associated mKir2.1 modulatingeffects were detected by growth determination of function-ally complemented S. cerevisiae cells in a 96-well formatwithin 15 h. Dose–response diagrams and EC50 valuecalculations were determined by parametric model andmodel-free fits using cubic spline interpolation. Thesecharacteristics were evaluated by statistical methods todetermine reproducibility among working groups. Nonpara-metric bootstrap simulations of the variability of the data
revealed that EC50 values of the mKir2.1 indicator strainwere well-matched (81–92 μM), enabling unambiguousquantitative statements about inhibitory effects and nosignificant influence of the different laboratory conditions.Limitations of the assay include compounds/samples thatare either insoluble under the conditions of the test orstrongly cytotoxic to yeast. Thus, the described test is asensitive and reliable tool that can be used in differentlaboratories and is applicable in drug discovery anddevelopment as simple and reliable prescreening procedure.
Keywords Short-term in vitro test . Parametric models .
Model-free fits . Saccharomyces cerevisiae
Introduction
The controlled opening and closing of K+ channels inmammalian cells governs several crucial processes such asthe generation of electrical impulses in nerve and musclecells, the release of neurotransmitters and hormones,sensory transduction, and epithelial transport (Shieh et al.2000). K+ channels, each encoded by separate and unlinkedgenes, comprise a structurally diverse family of ion trans-port proteins. Inwardly rectifying K+ (Kir) channelsconstitute a distinct family of channels that comprisesseven channel subfamilies (Jan and Jan 1997; Nichols andLopatin 1997; Doupnik et al. 1995). Kir (IRK) channelshave a structure that is simpler than that of other ion chan-nel families, the general structure of a Kir channel consists oftwo membrane-spanning domains (M1 and M2) that flankthe highly conserved pore (P) region. Molecular defects inseveral Kir channel genes were recently shown to causeacquired and inherited chronic and paroxysmal disorders,
Appl Microbiol Biotechnol (2007) 73:1212–1221DOI 10.1007/s00253-006-0589-x
G. Hasenbrink :H. Lichtenberg-Fraté (*)Molecular Bioenergetics, Institut für Zelluläre und MolekulareBotanik (IZMB), Universität Bonn,Kirschallee 1,53115 Bonn, Germanye-mail: [email protected]
L. Kolacna :H. SychrovaDepartment of Membrane Transport, Institute of Physiology,Academy of Sciences of the Czech Republic,Prague, Czech Republic
J. LudwigPhysiologisch-chemisches Institut, Universität Tübingen,Tübingen, Germany
M. KschischoUniversity of Applied Sciences Koblenz,Remagen, Germany
including ventricular tachycardia (long QT syndrome;Tristani-Firouzi et al. 2002), hypertension (Cox 2002),deafness (Schwartz et al. 2006), certain types of renal trans-port disorders (Bartter’s syndrome; Derst et al. 1997), andfamilial hyperinsulinism (persistent hyperinsulinemic hy-poglycemia of infancy; Someya et al. 2000). In conjunctionwith the multitude of functional roles in the central nervoussystem Kir channel gating defects were also implicated inpolygenic CNS diseases (Neusch et al. 2003). K+ channelsas important targets for potential pharmacological treatmentwere difficult to study in comparison to other drug targetssuch as receptors. Of particular interest to the regulatoryauthorities and the pharmaceutical industry is the fact thatseveral drugs were recently withdrawn due to severe adverseeffects on K+ channels (Ridley et al. 2006; Recanatini et al.2005). With increased knowledge regarding the function ofthese channels and when more specific modulators of theiractivity are available or potential adverse effects can bedetected early in the drug development process, it is likely thatthe use of such compounds may be of great value to improvepatients’ responses to drug therapies. In addition, there is agrowing interest among pharmaceutical companies in devel-oping targeted drugs to specific K+ channel molecules.
This study is based on a test strategy for the detection andevaluation of compound-mediated modulating effects on themKir2.1 channel expressed in yeast. Yeast (Saccharomycescerevisiae) is an attractive and widely used model because thecellular structure is similar to mammalian cells with internalorganelles and similar chromosome structure, DNA repair,and metabolic processes. The indicator test utilizesS. cerevisiae, a eukaryotic organism, as the biologicalcomponent of the bioassay. Yeast cells contain only onemember of the K+ channel superfamily, Tok1p is a two-pore,voltage-dependent outward rectifying K+ channel (Ketchum etal. 1995) that under certain conditions also mediates inwardK+ uptake (Fairman et al. 1999). Potassium uptake is mediatedby the related plasma membrane transporters, Trk1p andTrk2p, doubly disrupted strains do not grow under potassium-limiting (≤10 mM) conditions (Bertl et al. 2003). Prior workfocused on the expression of the mammalian K+ channelmKir2.1 in a suitable S. cerevisiae host strain, reconstitution ofthe channel activity, and characterization of the growthcharacteristics (Hasenbrink et al. 2005).
The mouse Kir2.1 channel is a member of the Kirchannels and shares 98.6% identity on amino acid levelwith its human homolog. The physiological function ofKir2.1 is the maintenance of resting membrane potentialand modulation of action potential waveforms; the channelactivity is, among other roles, involved in the regulation ofblood flow and pressure (Chrissobolis and Sobey 2003;Haddy et al. 2006).
By using yeast, our assay therefore combines a eukary-otic test system with the advantages of characteristics
connected to prokaryotic systems like the short incubationtime, reproducible growth rates, and simple optical readouts. The current study reports the ring test assessment ofthe bioassay involving three participating laboratories. Intotal, 15 different datasets on the specific inhibitor CsCl (as“gold standard”) comprising 1,440 single growth curveswere collected and subjected for statistical evaluation,including nonparametric bootstrap estimates to assessreproducibility and transferability of the assay. A criticalobjective was to develop a method applicable for routine,almost automatic growth data evaluation. Therefore, param-etric models and model-free fits using cubic splineinterpolation were implemented.
Materials and methods
Yeast strains and growth conditions
Haploid S. cerevisiae yeast strains used in this study werePLY240T-GFP-mKir2.1 (MATa his3-Δ200 leu2-3,112 trp1-Δ901 ura3-52 suc2-Δ9 trk1Δ51 trk2Δ50::kanMX tok1::PPMA1-GFP/mKir2.1) and PLY240T-GFP (MATa his3-Δ200 leu2-3,112 trp1-Δ901 ura3-52 suc2-Δ9 trk1Δ51trk2Δ50::kanMX tok1::PPMA1-GFP) as described inHasenbrink et al. (2005). Strains were grown aerobicallyat 30°C in growth media as previously described.
Assay conditions
The growth-based assays were carried out according to thestandard operation protocols (SOPs) in liquid complete syn-thetic dextrose arginine phosphate medium (Rodriguez-Navarro and Ramos 1984). Briefly, stationary phase cellswere diluted in fresh medium to a start optical density (OD)600of 0.35 (pathlength 1 cm, Pharmacia Ultrospec 2000 Spec-trophotometer) corresponding to 4×10⁶ cells/ml. Growth as-sessment was obtained by photometric determination of theturbidity at 600 nm in 15-min intervals in transparent 96-wellmicrotiter plates using microplate readers at 30°C incubationtemperature and constant agitation for 15 h. The effect of Cs+
on growth was investigated by application of 0, 3, 10, 30,100, 300, 1,000, 3,000, 10,000 and 30,000 μM CsCl inmedium containing 3% DMSO. The technical reader equip-ment was at Bonn: TECAN Spectra Fluoro Plus, at Prague:BIO-TEK EL808IU, and at Tübingen: TECAN Genios.
Data gathering and statistical analysis
Integral determination This growth evaluation was per-formed by the approximation of the area under the growthcurves obtained within 12.5 h of incubation as previouslydescribed (Hasenbrink et al. 2005).
Appl Microbiol Biotechnol (2007) 73:1212–1221 1213

Model-based fits of growth curves Time courses of theoptical densities for each microplate well were first trans-formed to a semilogarithmic scale (see Fig. 1a for anexample). The OD of each time point was normalized toOD0 at time point zero and the logarithm of OD/OD0 wasplotted as a function of time. These transformed timecourses were fitted against three different models of cellulargrowth: Logistic, Gompertz, and Richards models, adaptedfrom Zwietering et al. (1990). The nonlinear least squarefits for each model (Bates and Watts 1988) were comparedaccording to the Akaike information criterion (Sakamoto etal. 1986). Very briefly, the Akaike criterion provides a scorethat measures how well each of the three models fits the(transformed) time course. The best fitting model, i.e., thefit with the highest value of the Akaike criterion, was usedto determine three parameters of the growth curve: μ(growth rate), λ (length of lag phase), and A (maximum cellgrowth) (example in Fig. 1a).
Model-free fits of growth curves For some time courses,none of the three model formulas (Logistic, Gompertz, and
Richards) for growth provided reliable fits. Thus, cubicspline fits were employed as an alternative to the model-based fits. Spline fits do not assume a simple functionalrelationship for the growth curve. Instead, the growth curveis represented as a superposition of basis functions, here,cubic splines. The smoothness of the function depends onthe choice of a smoothness parameter. A very small value ofthe smoothing parameter results in a wiggly line, which isvery sensitive to outliers and represents a lot of randomnoise in the data. On the other extreme, a very high value ofthe smoothness parameter results in a very smooth curve,which could miss important trends in the data. An optimalchoice of the smoothness parameter will ignore the randomscatter in the growth curve, but follow the main trend of thedata. A suitable choice of the parameter can be obtained bycross validation. In cross validation, the spline fit isperformed for various values of the smoothing parameterusing random subsets of the data points. These randomsamples allow us to simulate the noise in various measure-ments. The smoothing parameter is set to a value thatprovides the most reliable fit over all random samples.
Fig. 1 a Exemplary fitting of a single growth curve obtained from asingle well of a 96-well plate. The circles represent the opticaldensities measured at successive time points. The OD was normalizedto the OD at time point zero and all the fits were performed on log-transformed data [ln(OD/OD0)]. The best fitting parametric growthcurve (here Richards’ law) as provided by grofit is indicated by thedotted line. The fourth parameter in the four-parameter Richards modelis a shape parameter, which was not included. The straight dashed lineis tangent to the fitted growth curve at the maximum specific growthrate and has the slope μ. A spline fit (solid line) was also used toderive the maximum slope μNP of the growth curve, providing in this
case almost identical values. In contrast to μ, the asymptotic maximumcell growth value A of the growth curve or the length of the lag phase1 are sometimes difficult to estimate from the growth curves.b Comparison of dose–response curves from one experiment asobtained by integral based growth determination (upper panel) orgrowth determination by parametrical fit using grofit (lower panel).The different calculations-based ordinates are plotted vs concentrationfor the control strain (black circles) and the mKir2.1-expressing strain(white squares and gray squares, after subtraction of the correspondingcontrol values) indicative for, in principle, comparably good evaluationmethods
1214 Appl Microbiol Biotechnol (2007) 73:1212–1221
The maximum slope μNP of the growth curve (Fig. 1a)provides a measure of the growth rate and was used asresponse for the assessment of CsCl toxicity. It wasestimated from the spline fit by taking the maximum ofthe numerical derivative with respect to time.
Dose–response curve Cubic splines were also applied to fitthe log-transformed dose–response relationship. From thefit of ln(1+μNP) vs ln(1+concentration [CsCl]), we estimat-ed the half maximum value, denoted by ec50 (Fig. 3), of theresponse. The actual EC50 values in concentration unitswere obtained by the inverse transformation EC50=exp(ec50)−1.
Analysis of single-day measurements
To analyze the effects of strain, laboratory, and possible inter-actions between laboratory and strains, a two-way analysis ofvariance (ANOVA) was performed. The model EC50ijk ¼m þ laboratoryð Þiþ strainð Þj þ laboratory� strainð Þij þ "ijkwas fitted to the data (Sokal and Rohlf 1994). Here, i and jdenote the cell indices for the laboratory and the strain factor,respectively, and k indicates the observation in thecorresponding cell. The variable laboratory corresponds tothe effect of laboratory conditions (Prague, Bonn, orTübingen) and strain corresponds to the strain (control orindicator strain mKir2.1). Interactions between strain andlaboratory are taken into account by the variable laboratory ×strain. The remaining variance in the data is described by thenormal random noise ɛijk. Assumptions like normality of theresiduals and homogeneity of variance were checked bystandard methods for residual analysis (quantile–quantileplots, residual plots).
Bootstrap analysis of EC50
Confidence intervals for the mean EC50 values in thedifferent laboratories and for the two different strains wereobtained from nonparametric bootstrap simulations (Efronand Tibshirani 1993). The main idea of the bootstrap is tosimulate random noise by taking random samples from thedata. These bootstrap replicates are, in contrast to crossvalidation, random samples with replacements. For eachcondition (a laboratory using a particular strain), 1,000bootstrap replications of the data were taken. For eachbootstrap replicate, the dose–response relationship wasfitted as described above and the corresponding EC50
values were estimated. The mean of the bootstrap distribu-tion provides an estimate for the EC50 value, while thestandard deviation of the bootstrap distribution can be usedto calculate the 95% confidence interval for the EC50 (Efronand Tibshirani 1993). In addition, a plot of the bootstrap
distributions for the control and the mKir2.1 indicator in thesame laboratory allows us to visualize the overlap betweenboth strains (cf. Fig. 4d–f). A small overlap indicatesreliable differences between both strains.
Software
Data fitting and statistical analyses were performed byusing the R package for statistical computing (The RFoundation for Statistical Computing, http://www.r-project.org). Nonlinear least squares fits were performed with thenls and spline fits with smooth.spline. Proprietary software(grofit) for data fitting and evaluation of response param-eters was specifically developed for this work.
Results
The mKir2.1 yeast growth-based test deploys a strategy forthe detection and evaluation of compound-mediated mod-ulating effects on the mammalian K+ channel by functionalexpression in the simple eukaryote S. cerevisiae. Comple-mentation of the K+ uptake defective trk1,2 yeast pheno-type is dependent on K+ movement into the cytosol,mediated by the inward rectifying mKir2.1 channel. Theminiaturized liquid assay is based on restoration of cellgrowth in limiting potassium concentrations (10 mM ofKCl) by functional channels. Sensitivity and specificity ofthe growth-based assay, including comparisons to in vivoelectrophysiological measurements, were already shown(Hasenbrink et al. 2005). To enable ring test assessment ofthe assay, Good Laboratory Practice-compliant standardi-zation of working procedures and SOPs were developed.Refinement of protocols was conducted by two laborato-ries: the developing (Bonn) and one other laboratory withsignificant experience (Prague) in the relevant area,including feedback, discussions, and on-site demonstra-tions. Upon such SOPs, intralaboratory reproducibility wasinvestigated with a limited number of tests. CsCl, a knownblocker (Thompson et al. 2000) of the mKir2.1 inwardrectifying channel was applied in four different concen-trations with an n≥10 in three replicate tests. The calculatedoverall mean growth values at 0 mM (no inhibition ofgrowth, 60 data sets) and at 0.25 mM CsCl (almost fullinhibition, 30 data sets) differed by more than two standarddeviations (data not shown). We thus concluded that theassay provided clearly differentiable effects in terms ofgrowth inhibition between the control and the mKir2.1indicator strain. Next, the protocol transfer phase comprisedthe transfer of method and SOPs also to the third laboratory(Tübingen) followed by a small ring test of the assay in thethree participating laboratories. The effect of Cs+ on growthwas investigated by application of nine concentrations (3,
Appl Microbiol Biotechnol (2007) 73:1212–1221 1215
10, 30, 100, 300 μM and 1, 3, 10, 30 mM) of CsCl plus apositive culture control in liquid medium containing 3%DMSO. This concentration range comprised more stepsthan suggested in the SOPs to obtain unambiguousinhibition kinetics that support specific comparisons be-tween the different conducting laboratories, particularlywith regard to the different technical equipment (reader) inuse. The addition of DMSO was chosen due to the fact thatprobably most application compounds are rather solvable inDMSO than in water. In total, 12 different datasets (fivefrom Prague, four from Bonn, and three from Tübingen)comprising 1,440 single growth curves upon exposure withthe mKir 2.1 specific inhibitor CsCl (as gold standard) werecollected from the participating laboratories for statisticalevaluation.
Detection of the mKir2.1-specific response
Within the test development phase the determination ofgrowth parameters involved integral calculation (approxi-mation of the area under the growth curves obtained within12.5 h of incubation). EC50 values were determined byeither Hill plot analysis for monophasic inhibition kineticsor by fitting biphasic kinetic curves (Hasenbrink et al.2005). However, biphasic growth curves rendered the useof integral values difficult. In search of a reliablecharacteristic growth parameter for the model system, theprogram grofit was developed. It enables a semiautomaticfitting of the parameters’ growth rate (μ), length of lagphase (1), and maximum cell growth (A) according to threedifferent growth models (general logistic, Gompertz, andRichards as adapted from Zwietering et al. (1990) for every
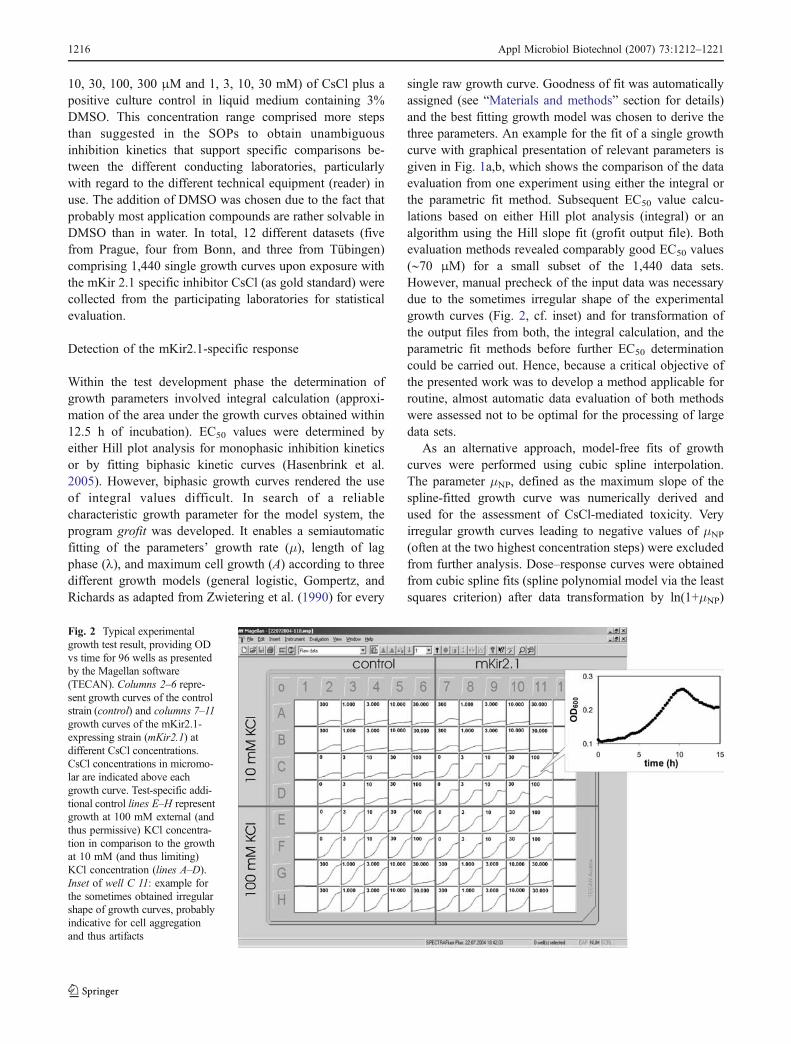
single raw growth curve. Goodness of fit was automaticallyassigned (see “Materials and methods” section for details)and the best fitting growth model was chosen to derive thethree parameters. An example for the fit of a single growthcurve with graphical presentation of relevant parameters isgiven in Fig. 1a,b, which shows the comparison of the dataevaluation from one experiment using either the integral orthe parametric fit method. Subsequent EC50 value calcu-lations based on either Hill plot analysis (integral) or analgorithm using the Hill slope fit (grofit output file). Bothevaluation methods revealed comparably good EC50 values(∼70 μM) for a small subset of the 1,440 data sets.However, manual precheck of the input data was necessarydue to the sometimes irregular shape of the experimentalgrowth curves (Fig. 2, cf. inset) and for transformation ofthe output files from both, the integral calculation, and theparametric fit methods before further EC50 determinationcould be carried out. Hence, because a critical objective ofthe presented work was to develop a method applicable forroutine, almost automatic data evaluation of both methodswere assessed not to be optimal for the processing of largedata sets.
As an alternative approach, model-free fits of growthcurves were performed using cubic spline interpolation.The parameter μNP, defined as the maximum slope of thespline-fitted growth curve was numerically derived andused for the assessment of CsCl-mediated toxicity. Veryirregular growth curves leading to negative values of μNP(often at the two highest concentration steps) were excludedfrom further analysis. Dose–response curves were obtainedfrom cubic spline fits (spline polynomial model via the leastsquares criterion) after data transformation by ln(1+μNP)
Fig. 2 Typical experimentalgrowth test result, providing ODvs time for 96 wells as presentedby the Magellan software(TECAN). Columns 2–6 repre-sent growth curves of the controlstrain (control) and columns 7–11growth curves of the mKir2.1-expressing strain (mKir2.1) atdifferent CsCl concentrations.CsCl concentrations in micromo-lar are indicated above eachgrowth curve. Test-specific addi-tional control lines E–H representgrowth at 100 mM external (andthus permissive) KCl concentra-tion in comparison to the growthat 10 mM (and thus limiting)KCl concentration (lines A–D).Inset of well C 11: example forthe sometimes obtained irregularshape of growth curves, probablyindicative for cell aggregationand thus artifacts
1216 Appl Microbiol Biotechnol (2007) 73:1212–1221
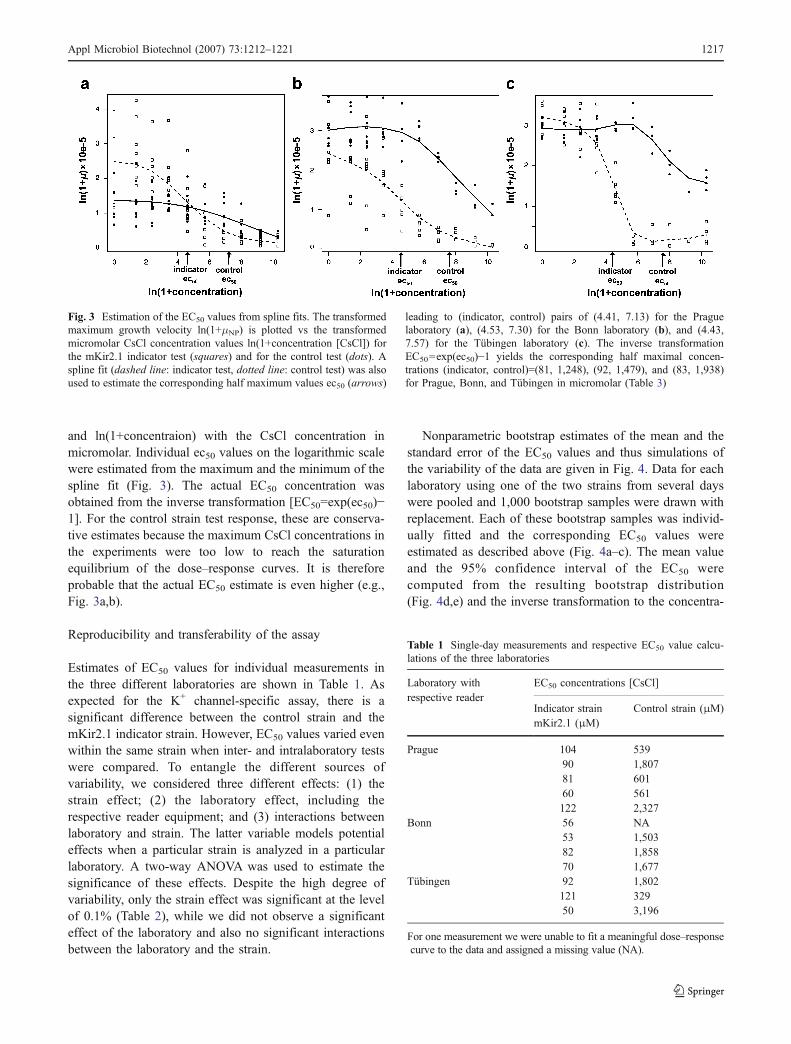
and ln(1+concentraion) with the CsCl concentration inmicromolar. Individual ec50 values on the logarithmic scalewere estimated from the maximum and the minimum of thespline fit (Fig. 3). The actual EC50 concentration wasobtained from the inverse transformation [EC50=exp(ec50)−1]. For the control strain test response, these are conserva-tive estimates because the maximum CsCl concentrations inthe experiments were too low to reach the saturationequilibrium of the dose–response curves. It is thereforeprobable that the actual EC50 estimate is even higher (e.g.,Fig. 3a,b).
Reproducibility and transferability of the assay
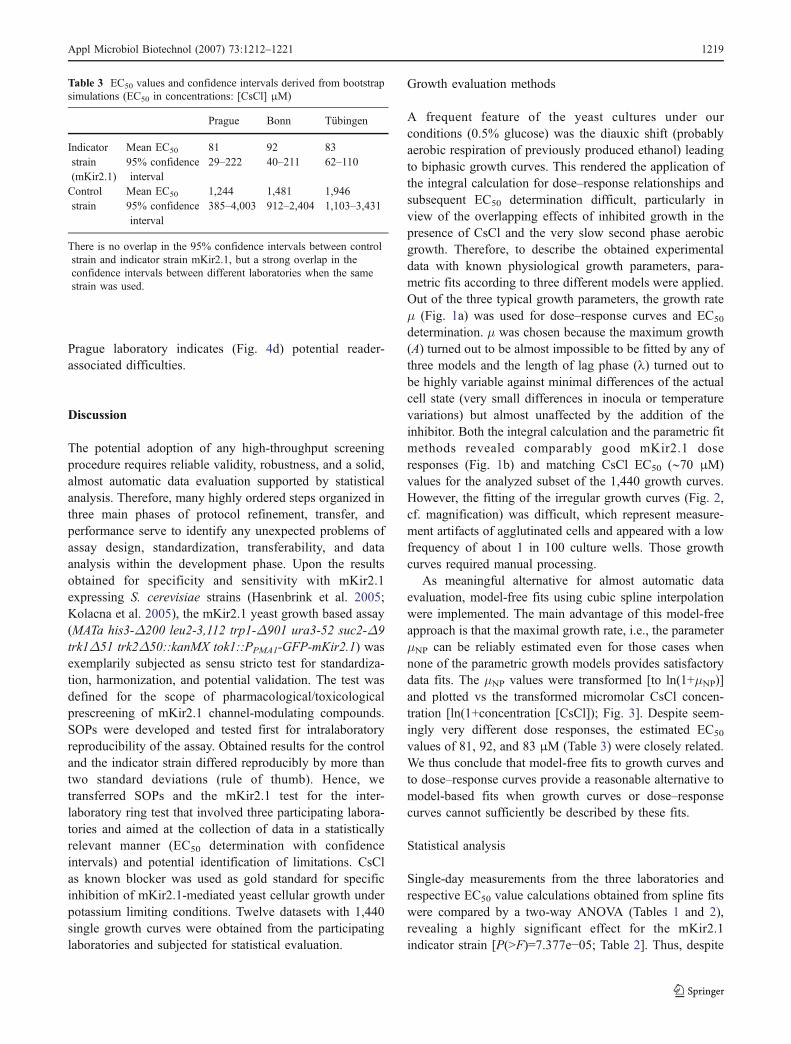
Estimates of EC50 values for individual measurements inthe three different laboratories are shown in Table 1. Asexpected for the K+ channel-specific assay, there is asignificant difference between the control strain and themKir2.1 indicator strain. However, EC50 values varied evenwithin the same strain when inter- and intralaboratory testswere compared. To entangle the different sources ofvariability, we considered three different effects: (1) thestrain effect; (2) the laboratory effect, including therespective reader equipment; and (3) interactions betweenlaboratory and strain. The latter variable models potentialeffects when a particular strain is analyzed in a particularlaboratory. A two-way ANOVA was used to estimate thesignificance of these effects. Despite the high degree ofvariability, only the strain effect was significant at the levelof 0.1% (Table 2), while we did not observe a significanteffect of the laboratory and also no significant interactionsbetween the laboratory and the strain.
Nonparametric bootstrap estimates of the mean and thestandard error of the EC50 values and thus simulations ofthe variability of the data are given in Fig. 4. Data for eachlaboratory using one of the two strains from several dayswere pooled and 1,000 bootstrap samples were drawn withreplacement. Each of these bootstrap samples was individ-ually fitted and the corresponding EC50 values wereestimated as described above (Fig. 4a–c). The mean valueand the 95% confidence interval of the EC50 werecomputed from the resulting bootstrap distribution(Fig. 4d,e) and the inverse transformation to the concentra-
Fig. 3 Estimation of the EC50 values from spline fits. The transformedmaximum growth velocity ln(1+μNP) is plotted vs the transformedmicromolar CsCl concentration values ln(1+concentration [CsCl]) forthe mKir2.1 indicator test (squares) and for the control test (dots). Aspline fit (dashed line: indicator test, dotted line: control test) was alsoused to estimate the corresponding half maximum values ec50 (arrows)
leading to (indicator, control) pairs of (4.41, 7.13) for the Praguelaboratory (a), (4.53, 7.30) for the Bonn laboratory (b), and (4.43,7.57) for the Tübingen laboratory (c). The inverse transformationEC50=exp(ec50)−1 yields the corresponding half maximal concen-trations (indicator, control)=(81, 1,248), (92, 1,479), and (83, 1,938)for Prague, Bonn, and Tübingen in micromolar (Table 3)
Table 1 Single-day measurements and respective EC50 value calcu-lations of the three laboratories
Laboratory withrespective reader
EC50 concentrations [CsCl]
Indicator strainmKir2.1 (μM)
Control strain (μM)
Prague 104 53990 1,80781 60160 561122 2,327
Bonn 56 NA53 1,50382 1,85870 1,677
Tübingen 92 1,802121 32950 3,196
For one measurement we were unable to fit a meaningful dose–responsecurve to the data and assigned a missing value (NA).
Appl Microbiol Biotechnol (2007) 73:1212–1221 1217
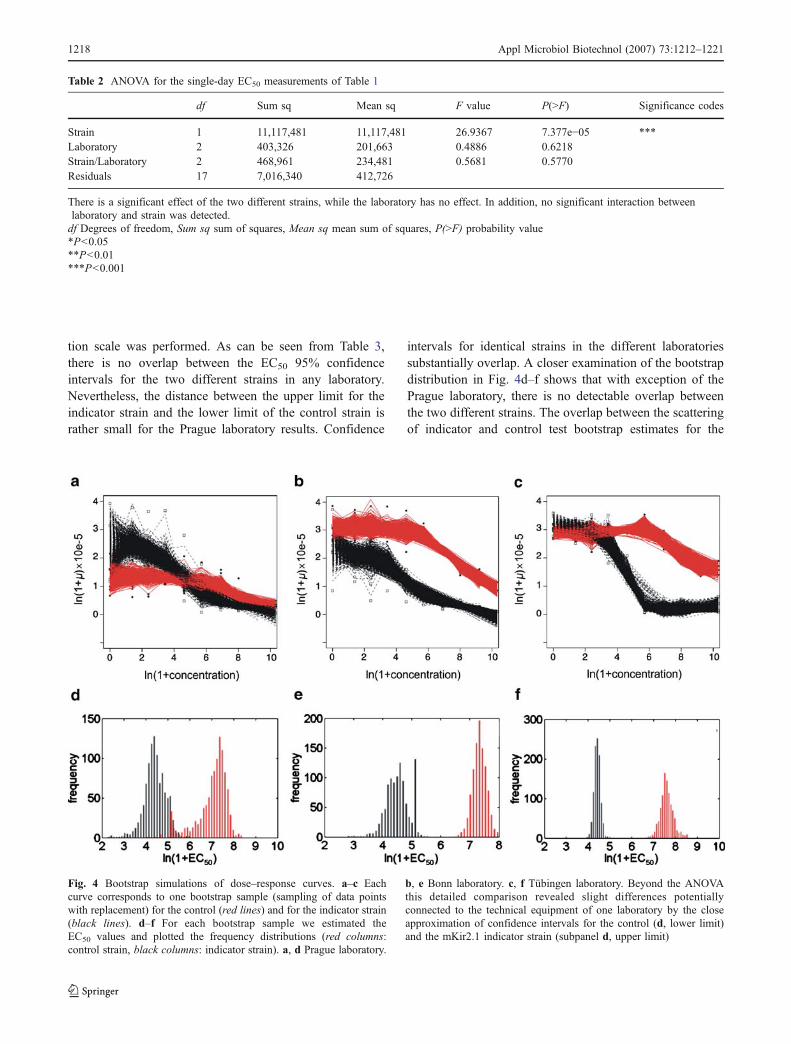
tion scale was performed. As can be seen from Table 3,there is no overlap between the EC50 95% confidenceintervals for the two different strains in any laboratory.Nevertheless, the distance between the upper limit for theindicator strain and the lower limit of the control strain israther small for the Prague laboratory results. Confidence
intervals for identical strains in the different laboratoriessubstantially overlap. A closer examination of the bootstrapdistribution in Fig. 4d–f shows that with exception of thePrague laboratory, there is no detectable overlap betweenthe two different strains. The overlap between the scatteringof indicator and control test bootstrap estimates for the
Table 2 ANOVA for the single-day EC50 measurements of Table 1
df Sum sq Mean sq F value P(>F) Significance codes
Strain 1 11,117,481 11,117,481 26.9367 7.377e−05 ***Laboratory 2 403,326 201,663 0.4886 0.6218Strain/Laboratory 2 468,961 234,481 0.5681 0.5770Residuals 17 7,016,340 412,726
There is a significant effect of the two different strains, while the laboratory has no effect. In addition, no significant interaction betweenlaboratory and strain was detected.df Degrees of freedom, Sum sq sum of squares, Mean sq mean sum of squares, P(>F) probability value*P<0.05**P<0.01***P<0.001
Fig. 4 Bootstrap simulations of dose–response curves. a–c Eachcurve corresponds to one bootstrap sample (sampling of data pointswith replacement) for the control (red lines) and for the indicator strain(black lines). d–f For each bootstrap sample we estimated theEC50 values and plotted the frequency distributions (red columns:control strain, black columns: indicator strain). a, d Prague laboratory.
b, e Bonn laboratory. c, f Tübingen laboratory. Beyond the ANOVAthis detailed comparison revealed slight differences potentiallyconnected to the technical equipment of one laboratory by the closeapproximation of confidence intervals for the control (d, lower limit)and the mKir2.1 indicator strain (subpanel d, upper limit)
1218 Appl Microbiol Biotechnol (2007) 73:1212–1221
Prague laboratory indicates (Fig. 4d) potential reader-associated difficulties.
Discussion
The potential adoption of any high-throughput screeningprocedure requires reliable validity, robustness, and a solid,almost automatic data evaluation supported by statisticalanalysis. Therefore, many highly ordered steps organized inthree main phases of protocol refinement, transfer, andperformance serve to identify any unexpected problems ofassay design, standardization, transferability, and dataanalysis within the development phase. Upon the resultsobtained for specificity and sensitivity with mKir2.1expressing S. cerevisiae strains (Hasenbrink et al. 2005;Kolacna et al. 2005), the mKir2.1 yeast growth based assay(MATa his3-Δ200 leu2-3,112 trp1-Δ901 ura3-52 suc2-Δ9trk1Δ51 trk2Δ50::kanMX tok1::PPMA1-GFP-mKir2.1) wasexemplarily subjected as sensu stricto test for standardiza-tion, harmonization, and potential validation. The test wasdefined for the scope of pharmacological/toxicologicalprescreening of mKir2.1 channel-modulating compounds.SOPs were developed and tested first for intralaboratoryreproducibility of the assay. Obtained results for the controland the indicator strain differed reproducibly by more thantwo standard deviations (rule of thumb). Hence, wetransferred SOPs and the mKir2.1 test for the inter-laboratory ring test that involved three participating labora-tories and aimed at the collection of data in a statisticallyrelevant manner (EC50 determination with confidenceintervals) and potential identification of limitations. CsClas known blocker was used as gold standard for specificinhibition of mKir2.1-mediated yeast cellular growth underpotassium limiting conditions. Twelve datasets with 1,440single growth curves were obtained from the participatinglaboratories and subjected for statistical evaluation.
Growth evaluation methods
A frequent feature of the yeast cultures under ourconditions (0.5% glucose) was the diauxic shift (probablyaerobic respiration of previously produced ethanol) leadingto biphasic growth curves. This rendered the application ofthe integral calculation for dose–response relationships andsubsequent EC50 determination difficult, particularly inview of the overlapping effects of inhibited growth in thepresence of CsCl and the very slow second phase aerobicgrowth. Therefore, to describe the obtained experimentaldata with known physiological growth parameters, para-metric fits according to three different models were applied.Out of the three typical growth parameters, the growth rateμ (Fig. 1a) was used for dose–response curves and EC50
determination. μ was chosen because the maximum growth(A) turned out to be almost impossible to be fitted by any ofthree models and the length of lag phase (1) turned out tobe highly variable against minimal differences of the actualcell state (very small differences in inocula or temperaturevariations) but almost unaffected by the addition of theinhibitor. Both the integral calculation and the parametric fitmethods revealed comparably good mKir2.1 doseresponses (Fig. 1b) and matching CsCl EC50 (∼70 μM)values for the analyzed subset of the 1,440 growth curves.However, the fitting of the irregular growth curves (Fig. 2,cf. magnification) was difficult, which represent measure-ment artifacts of agglutinated cells and appeared with a lowfrequency of about 1 in 100 culture wells. Those growthcurves required manual processing.
As meaningful alternative for almost automatic dataevaluation, model-free fits using cubic spline interpolationwere implemented. The main advantage of this model-freeapproach is that the maximal growth rate, i.e., the parameterμNP can be reliably estimated even for those cases whennone of the parametric growth models provides satisfactorydata fits. The μNP values were transformed [to ln(1+μNP)]and plotted vs the transformed micromolar CsCl concen-tration [ln(1+concentration [CsCl]); Fig. 3]. Despite seem-ingly very different dose responses, the estimated EC50
values of 81, 92, and 83 μM (Table 3) were closely related.We thus conclude that model-free fits to growth curves andto dose–response curves provide a reasonable alternative tomodel-based fits when growth curves or dose–responsecurves cannot sufficiently be described by these fits.
Statistical analysis
Single-day measurements from the three laboratories andrespective EC50 value calculations obtained from spline fitswere compared by a two-way ANOVA (Tables 1 and 2),revealing a highly significant effect for the mKir2.1indicator strain [P(>F)=7.377e−05; Table 2]. Thus, despite
Table 3 EC50 values and confidence intervals derived from bootstrapsimulations (EC50 in concentrations: [CsCl] μM)
Prague Bonn Tübingen
Indicatorstrain(mKir2.1)
Mean EC50 81 92 8395% confidenceinterval
29–222 40–211 62–110
Controlstrain
Mean EC50 1,244 1,481 1,94695% confidenceinterval
385–4,003 912–2,404 1,103–3,431
There is no overlap in the 95% confidence intervals between controlstrain and indicator strain mKir2.1, but a strong overlap in theconfidence intervals between different laboratories when the samestrain was used.
Appl Microbiol Biotechnol (2007) 73:1212–1221 1219

the fact that single-day EC50 values may (severely) vary,the difference to the control strain is in any case significantenough to enable unambiguous statements. A very smallinteraction effect between laboratory (including respectivereader equipment) and strain became only apparent bydetailed bootstrap simulations and histogram analysis(Fig. 4). The overlap of the bootstrap distributions inFig. 4d is indicative for this interaction effect that was notrevealed by the ANOVA analysis. The main conclusionsfrom the statistical analysis can be summarized as follows:(1) EC50 values of the indicator strain are highly signifi-cantly lower than that of the control strain; (2) there is nosignificant influence of different laboratory conditions(thus, the described test is a reliable tool, which can beused in different laboratories); and (3) despite detection ofsignificant influences of the laboratories within the single-day measurements, the bootstrap estimates indicated someoverlap between the indicator mKir2.1 and control strainsfor one laboratory. The most parsimonious explanation isthe reader equipment. Therefore, in the final guidelines forthe assay, detailed recommendations for a number ofsuitable readers will be incorporated.
Limitations
This assay determines the potential toxicity of the testmaterial toward the heterologously expressed mKir2.1channel in yeast (provided all controls were incorporatedto ensure the identification of potential general cytotox-icity), involving observations throughout three to five cellcycles (generations). The assay is applicable to chemicalsubstances that are soluble under the conditions of the test.Colored materials and materials of low water solubility thatform turbid suspensions or dispersions must be tested usingcolor/turbidity controls as blank controls. Substances thatare insoluble or substances that are complexed withmedium ingredients can falsify the test results. Limitationsof the assay include compounds/samples that are stronglycytotoxic to yeast (i.e., no growth can be observed due toimmediate lethal effects on the cellular metabolism ratherthan on the expressed channel).
Summary
The method of growth change determination is reliable toqualitatively and quantitatively characterized heterologouslyexpressed mKir2.1 inward rectifying channels by toxicolog-ical parameters like effective concentrations (EC) of poten-tial inhibitors. The introduced data evaluation proceduresprovide reliable assessments whereby the model-free fitsalso offer the advantage to process very large data sets evenunder conditions when simple parametric models do notsufficiently describe physiological results.
Acknowledgements This work was supported by EC grant QLK3-CT2001-00401. The authors thank T. Hartung (European Center forthe Validation of Alternative Methods) for critical discussions.
References
Bates DM, Watts DG (1988) Nonlinear regression analysis and itsapplications. Wiley, New York
Bertl A, Ramos J, Ludwig J, Lichtenberg-Frate H, Reid J, Bihler H,Calero F, Martinez P, Ljungdahl PO (2003) Characterization ofpotassium transport in wild-type and isogenic yeast strainscarrying all combinations of trk1, trk2 and tok1 null mutations.Mol Microbiol 47:767–780
Chrissobolis S, Sobey CG (2003) Inwardly rectifying potassiumchannels in the regulation of vascular tone. Curr Drug Targets 4(4):281–289
Cox RH (2002) Changes in the expression and function of arterialpotassium channels during hypertension. Vascul Pharmacol38:13–23
Derst C, Konrad M, Kockerling A, Karolyi L, Deschenes G, Daut J,Karschin A, Seyberth HW (1997) Mutations in the ROMK genein antenatal Bartter syndrome are associated with impaired K+
channel function. Biochem Biophys Res Cummun 230:641–645Doupnik CA, Davidson N, Lester HA (1995) The inward rectifier
potassium channel family. Curr Opin Neurobiol 5:268–277Efron B, Tibshirani R (1993) An introduction to the bootstrap.
Chapman & Hall, New YorkFairman C, Zhou X, Kung C (1999) Potassium uptake through the TOK1
K+ channel in the budding yeast. J Membr Biol 168:149–157Haddy FJ, Vanhoutte PM, Feletou M (2006) Role of potassium in
regulating blood flow and blood pressure. Am J Physiol RegulIntegr Comp Physiol 290:546–552
Hasenbrink G, Schwarzer S, Kolacna L, Ludwig J, Sychrova H,Lichtenberg-Fraté H (2005) Analysis of the mKir2.1 channelactivity in potassium influx defective Saccharomyces cerevisiaestrains determined as changes in growth characteristics. FEBSLett 579:1723–1731
Jan LY, Jan YN (1997) Voltage-gated and inwardly rectifyingpotassium channels. J Physiol 505:267–282
Ketchum KA, Joiner WJ, Sellers AJ, Kaczmarek LK, Goldstein SA(1995) A new family of outwardly rectifying potassium channelproteins with two pore domains in tandem. Nature 376:690–695
Kolacna L, Zimmermannova O, Hasenbrink G, Schwarzer S, LudwigJ, Lichtenberg-Fraté H, Sychrova H (2005) New phenotypes offunctional expression of the mKir2.1 channel in potassiumefflux-deficient Saccharomyces cerevisiae strains. Yeast22:1315–1323
Neusch C, Weishaupt JH, Bahr M (2003) Kir channels in the CNS:emerging new roles and implications for neurological diseases.Cell Tissue Res 311(2):131–138
Nichols CG, Lopatin AN (1997) Inward rectifier potassium channels.Annu Rev Physiol 59:171–191
Recanatini M, Poluzzi E, Masetti M, Cavalli A, De Ponti F (2005) QTprolongation through hERG K(+) channel blockade: currentknowledge and strategies for the early prediction during drugdevelopment. Med Res Rev 25(2):133–166
Ridley JM, Milnes JT, Hancox JC, Witchel HJ (2006) Clemastine, aconventional antihistamine, is a high potency inhibitor of theHERG K+ channel. J Mol Cell Cardiol 40(1):107–118
Rodriguez-Navarro A, Ramos J (1984) Dual system for potassiumtransport in Saccharomyces cerevisiae. J Bacteriol 159:940–945
Sakamoto Y, Ishiguro M, Kitagawa G (1986) Akaike informationcriterion statistics. D. Reidel, Tokyo
1220 Appl Microbiol Biotechnol (2007) 73:1212–1221

Schwartz PJ, Spazzolini C, Crotti L, Bathen J, Amlie JP, Timothy K,Shkolnikova M, Berul CI, Bitner-Glindzicz M, Toivonen L,Horie M, Schulze-Bahr E, Denjoy I (2006) The Jervell andLange-Nielsen syndrome: natural history, molecular basis, andclinical outcome. Circulation 113(6):783–790
Shieh CC, Coghlan M, Sullivan JP, Gopalakrishnan M (2000)Potassium channels: molecular defects, diseases, and therapeuticopportunities. Pharmacol Rev 52:557–594
Sokal RR, Rohlf FJ (1994) Biometry. Freeman, New YorkSomeya T, Miki T, Sugihara S, Minagawa M, Yasuda T, Kohno Y, Seino
S (2000) Characterization of genes encoding the pancreatic beta-cellATP-sensitive K+ channel in persistent hyperinsulinemic hypogly-cemia of infancy in Japanese patients. Endocr J 47:715–722
Thompson GA, Leyland ML, Ashmole I, Sutcliffe MJ, Stanfield PR(2000) Residues beyond the selectivity filter of the K+ channelKir2.1 regulate permeation and block by external Rb+ and Cs+.J Physiol 526:231–240
Tristani-Firouzi M, Jensen JL, Donaldson MR, Sansone V, MeolaG, Hahn A, Bendahhou S, Kwiecinski H, Fidzianska A,Plaster N, Fu YH, Ptacek LJ, Tawil R (2002) Functionaland clinical characterization of KCNJ2 mutations associatedwith LQT7 (Andersen syndrome). J Clin Invest 110:381–388
Zwietering MH, Jongenburger I, Rombouts FM, van ’t Riet K (1990)Modeling of the bacterial growth curve. Appl Environ Microbiol56:1875–1881
Appl Microbiol Biotechnol (2007) 73:1212–1221 1221