
One Size Fits All? An Exploratory Study of the Body-Garment ...
215
One Size Fits All? An Exploratory Study of the Body-Garment Relationship for a Sheath Dress A Thesis SUBMITTED TO THE FACULTY OF THE UNIVERSITY OF MINNESOTA BY Robin Lee Carufel IN PARTIAL FULFILLMENT OF THE REQUIREMENTS FOR THE DEGREE OF MASTER OF SCIENCE Elizabeth Bye, Ph.D. April 2017
-
Upload
khangminh22 -
Category
Documents
-
view
4 -
download
0
Transcript of One Size Fits All? An Exploratory Study of the Body-Garment ...

One Size Fits All? An Exploratory Study of the Body-Garment Relationship for a Sheath
Dress
A Thesis
SUBMITTED TO THE FACULTY OF THE
UNIVERSITY OF MINNESOTA
BY
Robin Lee Carufel
IN PARTIAL FULFILLMENT OF THE REQUIREMENTS
FOR THE DEGREE OF
MASTER OF SCIENCE
Elizabeth Bye, Ph.D.
April 2017

Robin Lee Carufel
2017 ©

i
I would like to acknowledge my advisor, Dr. Elizabeth Bye, for without her this
thesis would have never started or finished.
I would also like to acknowledge the contributions of Dr. Marylin DeLong, who
steered me towards excellent references.
Finally, I would like to acknowledge Dr. Linsey Griffin, who graciously stepped into
my committee at the last minute and provided excellent feedback.

ii
This thesis is dedicated to my amazing husband, Aaron Carufel. Thank you for your
enduring patience for all the time I had to spend writing instead of with you, for freely
sharing your expertise with Excel, and your steadfast support as I chase my dream.

iii
Abstract
Body-form variations and corresponding pattern dimensions were analyzed for 39
subjects with the aim of informing the development of a body-form based block system.
Results indicated that similar body measurements did not produce similar body forms,
and that findings from comparing body-form variations to pattern dimensions can provide
important suggestions for the creation of a body-form based block system. However,
whole block shapes could not be categorized based on the body-form variations analyzed
here. Recommendations for specific pattern components, such as front neck drop and
shoulder slope are presented.

iv
Table of Contents Abstract .................................................................................................................... iii
List of Tables .......................................................................................................... vii
List of Figures ........................................................................................................... x
Chapter 1 Introduction .................................................................................................. 1
The Problem .............................................................................................................. 2
Significance & Rationale .......................................................................................... 4
Definition of Terms................................................................................................... 5
Chapter 2 Literature Review ......................................................................................... 6
Body Form ................................................................................................................ 6
Sizing .................................................................................................................... 6
Form Assessment ................................................................................................ 12
Section Summary ................................................................................................ 30
Pattern ..................................................................................................................... 31
What is a pattern?................................................................................................ 31
History................................................................................................................. 32
Research .............................................................................................................. 34
Section Summary ................................................................................................ 37
Chapter 3 Sample Selection ........................................................................................ 38
HDL Master Database............................................................................................. 38
CAESAR Database ................................................................................................. 40
Height ...................................................................................................................... 42
Method .................................................................................................................... 43
ASTM D5585-11e1 .............................................................................................. 43
ASTM Size 12 Filter ........................................................................................... 45
Final Subset: MDB + CAESAR ......................................................................... 45
ASTM All Size Filter .......................................................................................... 47
Self-Sort Method ................................................................................................. 49
Chapter 4 Methods ...................................................................................................... 57
Differences from Gazzuolo’s BGR ......................................................................... 59

v
Analytical Component ............................................................................................ 61
Sheath Dress Abstraction .................................................................................... 62
Explanation of Fit Rules ..................................................................................... 72
Block Creation ........................................................................................................ 74
Dimensional Component ........................................................................................ 76
Generation ........................................................................................................... 76
Collection ............................................................................................................ 76
Analysis............................................................................................................... 79
Visual Component .................................................................................................. 80
Physiological Component ....................................................................................... 82
Chapter 5 Results ........................................................................................................ 91
Dimensional ............................................................................................................ 91
Neck Dimensions ................................................................................................ 92
Shoulder Dimensions .......................................................................................... 93
Shoulder Blade Dimensions ................................................................................ 94
Bust Dimensions ................................................................................................. 96
GLBFP Dimensions ............................................................................................ 98
Buttocks Dimensions ........................................................................................ 100
GLBSP .............................................................................................................. 102
Visual .................................................................................................................... 103
Neck .................................................................................................................. 103
Shoulder ............................................................................................................ 105
Shoulder Blades ................................................................................................ 107
Bust ................................................................................................................... 110
GLBFP .............................................................................................................. 111
Buttocks ............................................................................................................ 114
GLBSP .............................................................................................................. 116
Physiological ......................................................................................................... 119
Neck .................................................................................................................. 119
Shoulder ............................................................................................................ 120

vi
Shoulder Blades ................................................................................................ 127
Bust ................................................................................................................... 130
GLBFP .............................................................................................................. 132
Buttocks ............................................................................................................ 137
GLBSP .............................................................................................................. 139
Summary ............................................................................................................... 140
Chapter 6 Discussion and Conclusion ...................................................................... 141
Introduction ........................................................................................................... 141
Question One ........................................................................................................ 141
Neck .................................................................................................................. 142
Shoulder ............................................................................................................ 145
Shoulder Blades ................................................................................................ 151
Bust ................................................................................................................... 154
Greatest Lower-Body Front Prominence .......................................................... 156
Buttocks ............................................................................................................ 161
Greatest Lower-Body Side Prominence............................................................ 164
Fit Model vs. Sample ........................................................................................ 167
Conclusion ........................................................................................................ 171
Question Two ........................................................................................................ 172
Upheld ............................................................................................................... 172
Partially Upheld ................................................................................................ 180
Not Upheld ........................................................................................................ 186
Conclusion ........................................................................................................ 193
Conclusion ............................................................................................................ 194
Chapter 7 References ................................................................................................ 196

vii
List of Tables
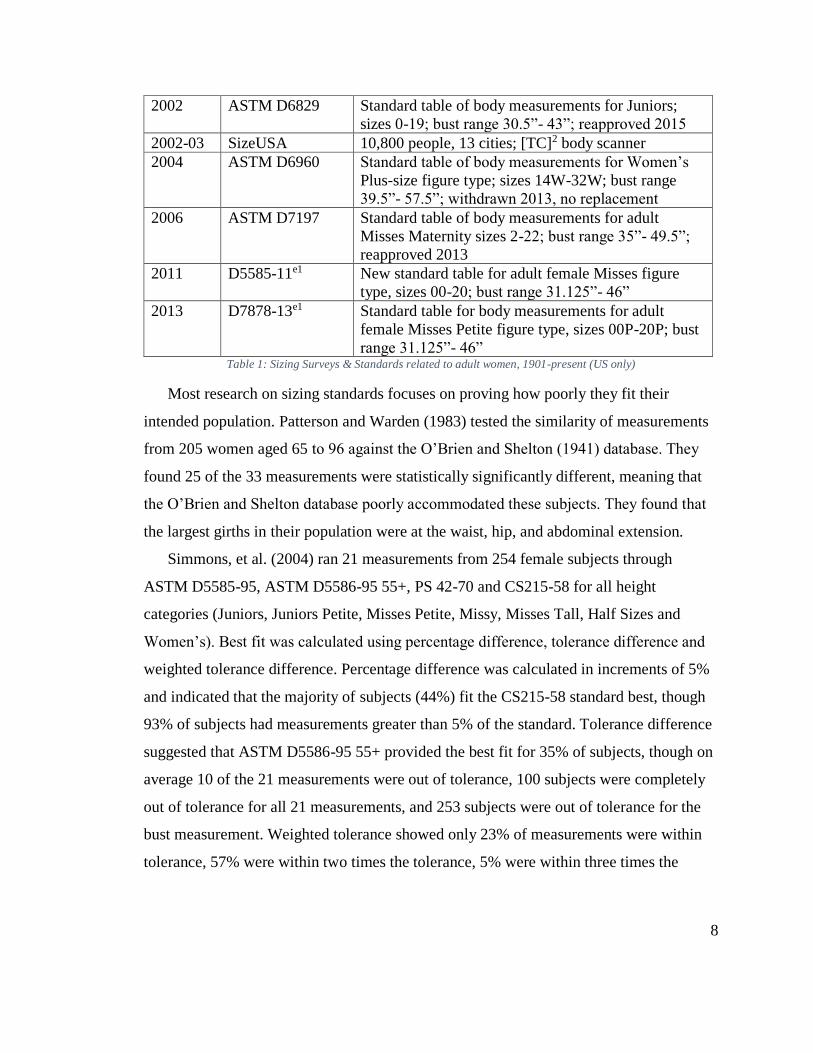
Table 1: Sizing Surveys & Standards related to adult women, 1901-present (US only) .... 8
Table 2: Aggregate Loss Percent, data from Ashdown (1998), p. 335 ............................. 11
Table 3: American vs. Korean Body Shapes .................................................................... 23
Table 4: MDB Racial Diversity - entire population.......................................................... 38
Table 5: MDB Description - entire population ................................................................. 39
Table 6: CAESAR Description - entire population .......................................................... 40
Table 7: CAESAR Racial Diversity - entire population ................................................... 41
Table 8: Height ranges in ASTM size standards .............................................................. 42
Table 9: Results from ASTM Size 12 Filter for MDB and CAESAR .............................. 45
Table 10: MDB + CAESAR data – female, age 18-54, height 62.5”-70” ........................ 46
Table 11: MDB + CAESAR races - female, age 18-54, height 62.5"-70" ....................... 46
Table 12: Total number of girth matches organized by size ............................................. 48
Table 13: Subject’s matches by specific girth combinations, organized by size .............. 48
Table 14: Data of the 19 fit models, arranged from least number of matches to most ..... 54
Table 15: Descriptive Statistics for Final Sample Set ...................................................... 56
Table 16: Fitting Rules for Basic Sheath Dress ................................................................ 75
Table 17: Assumptions ..................................................................................................... 90
Table 18: Neck Circumference vs. Neck Thickness, Neck-to-Shoulder Transition, and
Collarbone Visibility ....................................................................................................... 120
Table 19: Front Neck Drop vs. Neck Tilt ....................................................................... 121
Table 20: Shoulder Seam vs. Shoulder Length Description ........................................... 121
Table 21: Shoulder Seam vs. Shoulder Point Sharpness ................................................ 122
Table 22: Shoulder Seam vs. Shoulder Point Alignment ............................................... 124
Table 23: Averaged Shoulder Slope vs. Shoulder Slope Description and Shoulder Point
Sharpness ........................................................................................................................ 125
Table 24: Averaged Shoulder Slope vs. Shoulder Length Description and Neck-to-
Shoulder Transition ......................................................................................................... 126
Table 25: Bodice Back Waist Dart Depth vs. Prominence Point Alignment ................. 127
Table 26: Between Bodice Waist Darts Distance vs. Blade Width ................................ 128

viii
Table 27: Bodice Back Waist Dart Width vs. Blade Prominence & Blade Description 129
Table 28: Bust Dart Depth vs. Bust Fullness .................................................................. 130
Table 29: Bust Dart Depth vs. Ribcage Containment ..................................................... 131
Table 30: Between Front Waist Darts Distance vs. Bust Point Width Description ........ 131
Table 31: Waist Circumference vs. Waist Indentation ................................................... 132
Table 32: Front Waist Width vs. GLBFP Identifier ....................................................... 133
Table 33: Front Waist Width vs. GLBFP Description .................................................... 134
Table 34: Front Waist Width vs. Past Bust Extension .................................................... 134
Table 35: Skirt Front Waist Dart Depth vs. GLBFP Alignment..................................... 136
Table 36: Skirt Front Waist Dart Width vs. GLBFP Description ................................... 137
Table 37: Skirt Back Waist Dart Depth vs. Buttocks Length and Fullest Part of Buttocks
......................................................................................................................................... 138
Table 38: Skirt Back Waist Dart Depth vs. Buttocks Alignment ................................... 138
Table 39: Skirt Back Waist Dart Depth vs. Buttocks Prominence Description.............. 139
Table 40: Skirt Curve Length vs. GLBSP Location, Alignment & Description ............ 140
Table 41: Neck Thickness - Sample vs. Reviewed Literature ........................................ 142
Table 42: Neck-to-Shoulder Transition - Sample vs. Reviewed Literature .................... 143
Table 43: Collarbone Visibility - Sample vs. Reviewed Literature ................................ 144
Table 44: Neck Tilt - Sample vs. Reviewed Literature .................................................. 145
Table 45: Shoulder Length – Sample vs. Reviewed Literature ...................................... 146
Table 46: Shoulder Point Sharpness - Sample vs. Reviewed Literature......................... 147
Table 47: Shoulder Point Alignment - Whole-Body Form & Shoulder Width .............. 149
Table 48: Shoulder Slope - Sample vs. Reviewed Literature ......................................... 150
Table 49: Prominence Point Alignment - Sample vs. Reviewed Literature ................... 151
Table 50: Shoulder Blade Prominence - Sample vs. Reviewed Literature ..................... 152
Table 51: Shoulder Blade Description - Sample vs. Reviewed Literature ..................... 153
Table 52: Shoulder Blade Width - Sample vs. Reviewed Literature .............................. 154
Table 53: Bust Fullness - Sample vs. Reviewed Literature ............................................ 155
Table 54: Ribcage Containment - Sample vs. Reviewed Literature ............................... 155
Table 55: Bust Point Width - Sample vs. Reviewed Literature ...................................... 156

ix
Table 56: Waist Indentation - Sample vs. Reviewed Literature ..................................... 157
Table 57: GLBFP Location - Sample vs. Reviewed Literature ...................................... 158
Table 58: GLBFP Description - Sample vs. Reviewed Literature .................................. 159
Table 59: GLBFP Alignment - Sample vs. Reviewed Literature ................................... 160
Table 60: Buttocks Prominence - Sample vs. Reviewed Literature ............................... 162
Table 61: Buttocks Length - Sample vs. Reviewed Literature ....................................... 162
Table 62: Buttocks Fullest Part - Sample vs. Reviewed Literature ................................ 163
Table 63: Buttocks Alignment - Sample vs. Reviewed Literature ................................. 164
Table 64: GLBSP Location - Sample vs. Reviewed Literature ...................................... 165
Table 65: GLBSP Alignment - Sample vs. Literature .................................................... 166
Table 66: GLBSP Description - Sample vs. Literature................................................... 167
Table 67: Body-Form Variations - Fit Model vs. Sample .............................................. 168
Table 68: Upheld Assumptions ....................................................................................... 173
Table 69: Partially Upheld Assumptions ........................................................................ 180
Table 70: Not Upheld Assumptions ................................................................................ 187

x
List of Figures
Figure 1: FEA Consumer Needs Model from Lamb & Kallal (1992), Fig. 1, p. 42........... 3
Figure 2: Table 2 from Alexander, Pisut & Ivanescu (2012), p. 8 ..................................... 9
Figure 3: Graphical representations of goodness of fit of subjects with each sizing
system; A. ASTM D5585-94, B. Linear, C. Two-Tiered, D. Unconstrained (Ashdown,
1998, pp. 333-4) ................................................................................................................ 12
Figure 4: Proportions (from Liechty et al., 2010, Fig. 4.15, p. 74)................................... 14
Figure 5: Examples of Posture, from left: Excellent, Good, Poor, Bad. (from Latzke &
Quinlan (1940), Fig. 42, p. 73) ......................................................................................... 15
Figure 6: Examples of average and alterative whole body shapes (from Rasband &
Liechty, 2006, Fig. 2.2, pp. 25-6) ..................................................................................... 16
Figure 7: Istook et al. (2004) versus Devarajan (2003) .................................................... 22
Figure 8: Neck Width and Length (from Minott, 1978, Fig. 7.1b, p. 52) ......................... 24
Figure 9: Shoulder Slope (from Minott, 1978, Fig. 7.1e, p. 53) ....................................... 24
Figure 10: Shoulder Width (from Minott, 1978, Fig. 7.1d, p. 53) .................................... 25
Figure 11: Back Width (from Minott, 1978, Fig. 7.1h, p.54) ........................................... 25
Figure 12: Chest (from Minott, 1978, Fig. 7.1f, p. 53) ..................................................... 25
Figure 13: Bust (from Minott, 1978, Fig. 7.1g, p. 54) ...................................................... 26
Figure 14: Arm Fullness (from Maehren & Meyers, 2005, p.29)..................................... 26
Figure 15: Waist (from Maehren & Meyers, 2005, p. 30) ................................................ 27
Figure 16: Abdomen (from Maehren & Meyers, 2005, p. 34) ......................................... 27
Figure 17: Hip shapes, from left: Average, Little Difference, Heart, Semi-Heart, Diamond
and Rounded Diamond (from Minott, 1974, Fig. 2.2a & 2.2b, p. 11) .............................. 27
Figure 18: Seat (from Maehren & Meyers, 2005, p. 35) .................................................. 28
Figure 19: Thighs (from Maehren & Meyers, 2005, p. 32) .............................................. 29
Figure 20: Technical sketch of HDL scansuit from Kim et al. (2014), Fig. 2, p. 5 .......... 39
Figure 21: ASTM D5585-11e1 Standard table of body measurements for adult female
Misses figure type, size range 00-20 (ASTM International, 2011, p. 3) .......................... 44
Figure 22: Sample of bust matrix showing layout and color coding ................................ 50
Figure 23: Sample of final matrix showing layout and color coding ............................... 51
file:///C:/Users/Robin%20Carufel/Desktop/Master's%20Thesis/Chapters%20All%203.0.docx%23_Toc479960174

xi
Figure 24: Bar chart showing number of groups based on number of subjects per group 52
Figure 25: Example of the layout and color coding used to assess the fit models ........... 53
Figure 26: Front, right side, back, and left side images for the fit model ......................... 55
Figure 27: Ages of #2062 Sample Set .............................................................................. 56
Figure 28: The modified version of Gazzuolo's (1985) Body-Garment Relationship
Framework used in this study ........................................................................................... 58
Figure 29: Sheath Dress .................................................................................................... 61
Figure 30: Gazzuolo (1985) “Figure I-5: Ease Where Hollows Are Spanned Between
Prominences”, p. 79 .......................................................................................................... 62
Figure 31: Sheath Dress Block Pieces .............................................................................. 63
Figure 32: Dimensions ...................................................................................................... 77
Figure 33: Regions analyzed during visual analysis ......................................................... 81
Figure 34: Neck Circumference ........................................................................................ 92
Figure 35: Front Neck Drop .............................................................................................. 93
Figure 36: Shoulder Seam ................................................................................................. 94
Figure 37: Averaged Shoulder Slope ................................................................................ 94
Figure 38: Bodice Back Waist Dart Depth ....................................................................... 95
Figure 39: Bodice Back Waist Dart Width ....................................................................... 96
Figure 40: Between Back Waist Darts Distance ............................................................... 96
Figure 41: Bust Dart Depth ............................................................................................... 97
Figure 42: Between Front Waist Darts Distance .............................................................. 97
Figure 43: Waist Circumference ....................................................................................... 98
Figure 44: Front Waist Width ........................................................................................... 99
Figure 45: Skirt Front Waist Dart Depth ........................................................................ 100
Figure 46: Skirt Front Waist Dart Width ........................................................................ 100
Figure 47: Skirt Back Waist Dart Depth ......................................................................... 101
Figure 48: Skirt Back Waist Dart Width......................................................................... 101
Figure 49: Skirt Curve Length ........................................................................................ 102
Figure 50: Examples of Neck Thickness from left: Thin, Average, Thick..................... 103
Figure 51: Examples of Neck-to-Shoulder Transition, from left: Sharp, Smooth .......... 103

xii
Figure 52: Collarbone Visibility ..................................................................................... 104
Figure 53: Examples of Collarbone Visibility, from top left: Flat, Nearly Flat, Visible,
Prominent ........................................................................................................................ 104
Figure 54: Neck Tilt ........................................................................................................ 104
Figure 55: Examples of Neck Tilt, from top left: Straight, Slightly Forward, Forward, Far
Forward ........................................................................................................................... 105
Figure 56: Examples of Shoulder Length, from left: Short, Average, Long .................. 106
Figure 57: Examples of Shoulder Point Sharpness, from left: Sharp, Smooth ............... 106
Figure 58: Examples of Shoulder Point Alignment, from left: Inside b, hh & t; Aligned
w/b, outside hh, inside t; Aligned w/b & hh, inside t; Aligned w/b, inside hh & t; Outside
b & hh, inside t; Outside b, aligned w/hh, inside t; Outside b, inside hh & t ................. 106
Figure 59: Shoulder Point Alignment ............................................................................. 107
Figure 60: Examples of Shoulder Slope, from left: Flat, Slightly Sloped, Sloped, More
Sloped, Steep................................................................................................................... 107
Figure 61: Shoulder Slope Description ........................................................................... 107
Figure 62:Blade Prominence........................................................................................... 108
Figure 63: Examples of Shoulder Blade Prominence, from left: Flat, Almost Flat, Visible,
Prominent ........................................................................................................................ 108
Figure 64: Blade Description .......................................................................................... 109
Figure 65: Examples of Shoulder Blade Description, from left: Flat, Softly Pointed,
Pointed, Softly Rounded, Rounded ................................................................................. 109
Figure 66: Examples of Blade Width, from left: Narrow, Average, Wide ..................... 110
Figure 67: Examples of Bust Fullness, from left: Very Small, Small, Average, Full, Very
Full .................................................................................................................................. 110
Figure 68: Bust Fullness ................................................................................................. 111
Figure 69: Examples of Ribcage Containment, from left: Contained, Not Contained ... 111
Figure 70: Examples of Bust Point Width, from left: Narrow, Average, Wide ............. 111
Figure 71: Waist Indentation .......................................................................................... 112
Figure 72: Examples of Waist Indentation, from top left: None, Barely, Slight, Indented
......................................................................................................................................... 112

xiii
Figure 73: Examples of GLBFP Identifier, from left: Abdomen, Stomach, Both .......... 113
Figure 74: Greatest Lower-Body Front Prominence Description ................................... 113
Figure 75: Examples of GLBFP Description, from left: Flat, Oval, Softly Pointed, Softly
Rounded, Rounded .......................................................................................................... 114
Figure 76: Greatest Lower-Body Front Prominence Alignment .................................... 114
Figure 77: Examples of Past Bust Extension, from left: Yes, Aligned, No .................... 114
Figure 78: Examples of Buttocks Prominence, from left: Flat, Prominent .................... 115
Figure 79:Examples of Buttocks Length, from left: Short, Long ................................... 115
Figure 80: Examples of Buttocks Fullest Part Location, from left: Low, Middle, High 116
Figure 81: Buttocks Alignment ....................................................................................... 116
Figure 82: Examples of GLBSP Location, from left: High-hip, Thighs ........................ 117
Figure 83: Greatest Lower-Body Side Prominence Alignment ...................................... 117
Figure 84: Greatest Lower-Body Side Prominence Description .................................... 117
Figure 85: Examples of GLBSP Description, from top left: Flat, Softly Pointed, Pointed,
Softly Rounded, Rounded ............................................................................................... 118
Figure 86: How posture affects neck tilt (from Latzke & Quinlan, 1940, Fig. 42, p. 73)
......................................................................................................................................... 144
Figure 87: Prominent Collarbones, from Minott (1978), Fig. 7.1c, p. 52....................... 147
Figure 88: Shoulder Blade Prominence Types, from Minott (1978),Figure 7.1i, p. 54 . 151
Figure 89: Tilted Hip Forward (Minott, 1974, Fig. 2.5, p. 11), Sway Front, Sway Back
(Rasband & Liechty,2006, pp. 332 & 336) ..................................................................... 159
Figure 90: Seat level vs Hip Type (from Minott, 1978, Fig. 7.1k, p. 55) ....................... 164
Figure 91: Upheld Assumptions, Dimension Locations ................................................. 172
Figure 92: Partially Upheld Assumptions – Dimension Locations ................................ 181
Figure 93: Not Upheld Assumptions – Dimension Locations ........................................ 188
file:///C:/Users/Robin%20Carufel/Desktop/Master's%20Thesis/Chapters%20All%203.0.docx%23_Toc479960260
file:///C:/Users/Robin%20Carufel/Desktop/Master's%20Thesis/Chapters%20All%203.0.docx%23_Toc479960261

1
Chapter 1 Introduction
This case study explores the relationship between the human body and the clothing
that covers it. This relationship covers objective and subjective measures of fit as well as
the design features of a garment. These three areas interact in multiple ways, most of
which are still unknown. These areas require separate research before tackling the
associations between them. This study focused on objective measures of fit for American
women between the ages of 18 and 54.
Assumptions about the body-garment relationship abound in the apparel industry but
have no scientific backing. Stemming from the switch from made-to-measure to ready-
made clothing, manufacturers have been trying to figure out ways to cater to the variety
of body-forms inherent to the American population without resorting to customized
manufacturing practices. Unfortunately, with the loss of traditional customization
practices, the knowledge of how to pattern for various body-forms has been mostly lost to
history. Currently apparel manufacturers consolidate sizing and design to fit many body-
types in one garment; leading to the current trend of shapeless, oversized garments, that
fit few women.
While we know how to measure the human body thanks to traditional anthropometry,
we have yet to classify body-forms that are of practical use to the apparel industry. Linear
body measurements do not accurately describe a body’s form in a way that is useful for
pattern-drafting. Adjustments are an accepted part of the development process, but slow
down production. Research using objective measures of fit to evaluate the body-garment
relationship is vital to support current and future apparel manufacturing practice.
The purpose of this case study was to determine if apparel block shapes could be
categorized based on distinct body-form variations. The goal of this thesis was to
empirically establish that similar body measurements do not produce similar body forms.
The remainder of this chapter will explain the problem, the rationale and significance
of this research, and end with a list of key terms. Chapter two critiques the relevant
literature pertaining to body-form and pattern-shape. Chapter three shares the process of
choosing a sample set, and describes the basic statistical make-up of the final sample set.

2
Chapter four applies a modified version of Gazzuolo’s (1985) body-garment relationship
framework to this study. Chapter five presents the results from the dimensional, visual,
and physiological components, and chapter six concludes with a discussion of the results
as well as future research recommendations.
The Problem
The problem facing the apparel industry is that the clothing it makes does not fit its
intended population. One contributing factor of poor fit stems from not understanding the
physical forms of the American female populace. This paper asks the questions: What do
American women’s bodies actually look like? And how do these variations relate to
garment patterns?
Other researchers have posed similar questions, but their solutions have been based
on assumptions about the human body rather than anchored in a content analysis. This
may be due to a lack of formal theories present in the apparel design discipline focused
on pattern-drafting and fit.
We can start by parsing out what we know from what we think we know. Apparel has
been a trial-and-error industry since the first person chose to cover themselves in leaves
and animal skins. This has led to differing ways to create patterns (drafting vs. draping
via Joseph-Armstrong, 2006; Bergh, 2006; Jaffe & Relis, 2005), as well as different ways
to grade patterns (direct vs. proportional via Aldrich, 2007), and different ways to fit and
alter patterns (Minott, 1978; Palmer & Alto, 2005; Rasband & Liechty, 2006). This
smorgasbord of options provides us with numerous techniques for varying situations.
Unfortunately, most of these options have not been tested empirically, and some of
those tested were shown to be less than accurate. For instance, Bye, LaBat, McKinney,
and Kim (2008) tested the fit of customized versus traditionally graded garments to
conclude that traditionally graded patterns did not provide a good fit across a range of
seven sizes. Schofield and LaBat (2005b) compared two bodice patterns, one with grade
rules from traditional grading practices and one with grade rules developed from
regression analysis of the 1988 ANSUR survey, based on seven assumptions found

3
during their earlier research (Schofield & LaBat, 2005a) to find that none of the
traditional grading assumptions were supported.
One example of theory created by and for the apparel community is the FEA
Consumer Needs Model by Lamb and Kallal (1992) (Figure 1). The FEA, or Functional-
Expressive-Aesthetic, model aims to help an apparel designer develop design criteria
based on the needs of their specific target
population.
The functional segment includes the elements
of fit, mobility, comfort, protection and
donning/doffing. Much of the work done in this
segment leads to a physical product, like the
project by LaBat and Sokolowski (1999) which
redesigned an athletic ankle brace for a sports
medicine soft goods company. In this project, the
researchers drafted a design process and tested it. Other research in this area has led to
understanding that an entire segment of the
population (women aged 55 and older) did not fit
the voluntary sizing system then in place, and triggered the creation of a new one
(Patterson & Warden, 1983; Goldsberry, Shim & Reich, 1996a; Salusso, Borkowski,
Reich & Goldsberry, 2006).
While this is a helpful general model, it leaves out how to conduct each aspect of
each component. To make this an easier model to use, each sub-component (i.e. Fit, Art
Elements, Status) needs theories and methodologies of their own. This project focused on
empirically identifying factors related to the fit sub-component. By comparing analyses
of the female body with their corresponding custom-fit pattern blocks, the researcher
questioned how the body-form affected the pattern-shape.
The first research question deals with description, while the second is theoretical:
1. What are the body-form variations across a single size?
2. What do these findings suggest for the development of a body-form based block
system?
Figure 1: FEA Consumer Needs Model from
Lamb & Kallal (1992), Fig. 1, p. 42

4
Significance & Rationale
There are over 78 million women between the ages of 18 and 54 in the US as of the
most recent census (US Census Bureau, 2015) and they all need clothing that fits. As
sizing standards are considered trade secrets and a competitive advantage in the apparel
industry, it is unknown how many companies draft their own standards and how many
use the ASTM voluntary standards provided by the US government.
ASTM standards do not fit the US female population well, as shown by the results
from research conducted by Patterson & Warden (1983), Salusso-Deonier, DeLong,
Martin, and Krohn (1985), Goldsberry et al. (1996a), Salusso et al. (2006), Ashdown
(1998), Simmons, Istook, and Devarajan (2004), Alexander, Connell, and Presley (2005),
Pisut and Connell (2007), and Alexander, Pisut, and Ivanescu (2012).
Research into body-form variations and how they affect pattern blocks can improve
sizing standards by making them more realistic. In addition, the use of Gazzuolo’s (1985)
body-garment relationship framework tests a model that has the potential to advance fit
theory. By testing specific relationships between body-form variations and pattern block
components (for example, bust prominence vs. bust dart depth), this research provides a
starting point for examining which factors influence apparel pattern shapes.
Understanding which relationships affect the final apparel pattern shape allows pattern-
drafters to more accurately represent different body-types in clothing. This will provide
apparel manufacturers with the means to tailor their products more specifically to their
target customers, improving their competitive advantage and increasing brand loyalty.

5
Definition of Terms
Assumption: An educated guess about the relationship between a body-form variation
and a dimension.
Basic Block: A two-dimensional foundational garment pattern with no style lines, style
ease, seam allowances, hems, dart interiors or markings; also called a sloper or master.
Body-form: The female human body; a three-dimensional biomorphic form.
Body-form variation: A specific physical aspect of the human body-form, such as neck
thickness or shoulder length.
Circumference: The full, circular distance around the body.
Depth: A straight line spanning the distance from dart point to the midpoint of the dart
opening.
Dimension: A measurement taken from the basic block.
Ease: The space between the garment and the body.
Fit: The relationship of the garment to the body; impacted by ease.
Fit Criteria: Rules based on how the garment should interact with the body.
Length: The distance between two points, generally vertical.
Size: Denotes a group of women similar in height, bust, waist, and hip girth
measurements.
Width: The distance between two points, not necessarily straight, and generally
horizontal.

6
Chapter 2 Literature Review
This chapter discusses the primary factors that informed this project, defines
important terminology and explains the assumptions underlying the project. The first half
focuses on body form, and the second half focuses pattern shape.
Body Form
This section outlines and critiques research concerning body-form variation. Of
specific interest are systems for classifying subjects, such as sizing standards and form
assessment.
Sizing
Sizing systems divide a given population into groups based on body measurements so
that the majority of the population is represented in the system using the least number of
sizes possible (Petrova, 2007). Such systems are relatively new – up until the early 1900s
custom-fit apparel still dominated the market (Aldrich, 2007). Additionally, sizing
surveys, the act of measuring the populace, are time consuming and expensive (LaBat.
2007). Table 1 lists historical surveys and standards pertaining to adult females starting
from the O’Brien and Shelton survey of 1941 until 2013.
Only six anthropometric sizing surveys have been conducted in the US in the last 75
years: The O’Brien and Shelton survey in 1941, ANSUR in 1988, NCTRF in 1990, the
Reich and Goldsberry survey in 1993, CAESAR in 1998, and SizeUSA in 2002. These
surveys influenced the government’s published standards for women’s apparel: CS215-
58, PS 42-70, ASTM D5585, D5586, D6829, D6960, D7197 and D7878. Sizing
standards are documents developed through stakeholder consensus that represent the total
range of sizes for ready-made garments (LaBat, 2007; Petrova, 2007). These standards
are voluntary and the extent of their use is unknown as sizing is considered a competitive
advantage by the industry.

7
Year Name Description
1941 USDA Misc. Pub.
454: Women’s
measurements for
garment and
pattern
construction
150,000 women; published by the US Department of
Agriculture; part of the O’Brien and Shelton study
1945 CS151 Commercial standard, recommended by The Mail
Order Association of America
1958 CS215-58; Body
Measurements for
the Sizing of
Women’s Patterns
and Apparel
Voluntary standard; published by the National
Bureau of Standards; based on analysis of 1939-1940
study; 9 sizes, bust ranges from 30.5” to 43”
1970 PS 42-70 Voluntary product sizing standard; set grades at 1”
for girth and 1.5” for height; published by the U.S.
Dept. of Commerce; 9 sizes, bust ranges from 31.5”
to 44”
1988 ANSUR Measured 1,774 men and 2,208 women; US Army
Natick
1990 NCTRF National survey of U.S. Navy personnel
1991 NAHM Standard
for the Size of
Pantyhose and
Women’s Tights
Pantyhose specification recommended by the
National Association of Hosiery Manufacturers
(NAHM); originally developed around 1970 using
information taken from consumer feedback on the
NAHM website; based on 1941 U.S. Dept. of
Agriculture data and 1968 E. I. DuPont de Nemours
& Co. via the Home Testing Institute data.
1993 ASTM Survey of
Women 55+
Reich & Goldsberry surveyed 6,786 women aged
55+ from 38 states; measured at 58 body locations
1994 ASTM D5586 Standard tables of body measurements for Women
aged 55+ (All Figure Types); based on Reich &
Goldsberry (1993) survey; reapproved 1995, 2001,
2010
1994 ASTM D5585 Standard table of body measurements for adult
female Misses figure type; sizes 2-20, bust range 32”-
44.5”; reapproved 1995, 2001
1998-
2002
CAESAR
(Civilian
American and
European Surface
Anthropometry
Resource)
10,000 people in North America, Italy & the
Netherlands; Cyberware body scanner for some
measurements + 40 measurements were taken via
tape measure and caliper.
8
2002 ASTM D6829 Standard table of body measurements for Juniors;
sizes 0-19; bust range 30.5”- 43”; reapproved 2015
2002-03 SizeUSA 10,800 people, 13 cities; [TC]2 body scanner
2004 ASTM D6960 Standard table of body measurements for Women’s
Plus-size figure type; sizes 14W-32W; bust range
39.5”- 57.5”; withdrawn 2013, no replacement
2006 ASTM D7197 Standard table of body measurements for adult
Misses Maternity sizes 2-22; bust range 35”- 49.5”;
reapproved 2013
2011 D5585-11e1 New standard table for adult female Misses figure
type, sizes 00-20; bust range 31.125”- 46”
2013 D7878-13e1 Standard table for body measurements for adult
female Misses Petite figure type, sizes 00P-20P; bust
range 31.125”- 46” Table 1: Sizing Surveys & Standards related to adult women, 1901-present (US only)
Most research on sizing standards focuses on proving how poorly they fit their
intended population. Patterson and Warden (1983) tested the similarity of measurements
from 205 women aged 65 to 96 against the O’Brien and Shelton (1941) database. They
found 25 of the 33 measurements were statistically significantly different, meaning that
the O’Brien and Shelton database poorly accommodated these subjects. They found that
the largest girths in their population were at the waist, hip, and abdominal extension.
Simmons, et al. (2004) ran 21 measurements from 254 female subjects through
ASTM D5585-95, ASTM D5586-95 55+, PS 42-70 and CS215-58 for all height
categories (Juniors, Juniors Petite, Misses Petite, Missy, Misses Tall, Half Sizes and
Women’s). Best fit was calculated using percentage difference, tolerance difference and
weighted tolerance difference. Percentage difference was calculated in increments of 5%
and indicated that the majority of subjects (44%) fit the CS215-58 standard best, though
93% of subjects had measurements greater than 5% of the standard. Tolerance difference
suggested that ASTM D5586-95 55+ provided the best fit for 35% of subjects, though on
average 10 of the 21 measurements were out of tolerance, 100 subjects were completely
out of tolerance for all 21 measurements, and 253 subjects were out of tolerance for the
bust measurement. Weighted tolerance showed only 23% of measurements were within
tolerance, 57% were within two times the tolerance, 5% were within three times the

9
tolerance and 15% were more than three times the tolerance. Regardless of the evaluation
method, at least 50% of subject’s measurements were inconsistent with the standards.
To test the accuracy of ASTM D6960-04: Standard Table of Body Measurements for
Women’s Plus-size Figure Type; sizes 14W-32W Alexander et al. (2012) compared the
bust, waist, and hip circumferences of the standard with women from the SizeUSA
database. The tolerance for each size was -1” to +.9999”. Figure 2 provides the bust,
waist and hip measurements for all ten sizes as well as how many women fit each single
measurement, how many fit two measurements, and how many fit all three
measurements. In total 4,105 women fit the sizes based on bust girth, 4,855 women fit the
sizes based on waist girth, and 3,968 women fit the sizes based on hip girth. For the
combinations of two measurements 1,228 subjects matched both bust and waist, and 874
matched waist and hip. Combining all three measurements resulted in 261 matches,
though none of them fit sizes 30W or 32W (Figure 2). T-tests revealed that a) SizeUSA
subjects were approximately 2” larger than the ASTM standard at the waist, and b) hip
girths were generally smaller than the ASTM standard. This analysis showed that as sizes
increase fewer women satisfy all three measurements and that hip measurements may be
smaller than assumed.
One critique of the study is that the total number of subjects is not listed, thus it is
impossible to know what percentage fit the standard.
Figure 2: Table 2 from Alexander et al. (2012), p. 8

10
In addition to proving the sizing systems fit an intended population poorly, some
research also proposed alternative sizing systems. Salusso-Deonier et al. (1985)
developed a multivariate method for structuring a sizing system around body-form
variation using principle component analysis. Principle component analysis groups
multiple measurements into principle components (PC) for classification. Fifteen
principle components were extracted from the 54 measurements taken from 1,217 Army
women, aged 17 to 35 of either White or African American descent. PC1 (overall body
thickness, 38 measurements) and PC2 (body length, 23 measurements) explained 60% of
the variation among subjects’ proportions and so were selected as the variables for the
Principle Component Sizing System (PCSS). All subject’s PC1 and PC2 scores were
plotted and the graph sectioned into size ranges defined by height and weight.
The PCSS system was compared to PS 42-70. Salusso-Deonier et al. (1985) classified
subjects into PS 42-70 sizes using height and bust girth. PS 42-70 covered 95% of the
sample. Differences between similar sizes of PS 42-70 and the PCSS were computed.
Thicknesses were similar, but lengths were not, especially for shoulder length, cross-front
and cross-back width, crotch height, and sleeve inseam length. Notably these differences
coincided with the areas of greatest misfit found during classification.
To quantitatively test the two systems, 200 subjects were randomly selected and
sorted via computer algorithm into the best fitting size for both systems. Goodness of fit
was calculated by comparing the difference between the subject’s measurements with
their size’s measurements. Results indicated that the PCSS system was better 95% of the
time for the whole body and upper body and 67% of the time for the lower body. These
results may indicate that population lengths and widths, though not necessarily
circumferences, vary more widely than assumed in government sizing standards. It also
suggests that the lower body may vary more widely than the upper body.
Goldsberry et al. (1996a) compared the measurements from 6,652 women aged 55
and older to PS 42-70. Subjects were sorted into PS 42-70’s sizes and the mean
differences between the subject’s measurements and PS 42-70’s measurements were
calculated. The results showed that 80% of the sample had statistically significant
differences from PS 42-70, manifested in wider central and lower torsos, flatter buttocks,

11
lower bust-lines, broader shoulders and enlarged armscyes. PS 42-70 was concluded
inadequate for the needs of women 55 and older. ASTM D5586-94: Standard Tables of
Body Measurements for Women Aged 55+ (All Figure Types) was developed based partly
on this study’s results.
Ten years after the development of ASTM D5586-94 Salusso et al. (2006) tested it
against a new sizing system generated using principle component analysis. The Principle
Component Sizing System 55+ (PCSS 55+) used 6,657 subjects from the original 1993
ASTM-funded Goldsberry and Reich survey used to generate ASTM D5586-94. PCSS
55+ had 25 sizes (30 less than ASTM D5586-94) and fit 95% of subjects. Comparisons
of PCSS 55+ to PS 42-70 and ASTM D5586-94 indicated that PCSS 55+ was a more
efficient and effective sizing system.
Ashdown (1998) built three optimized lower-body specific sizing systems (Linear,
Two-Tiered and Unconstrained) and tested them against ASTM D5585-94. The linear
system had proportionally consistent increments between all ten sizes. The two-tiered
system had two tiers with five sizes each, and used proportionally consistent increments
between sizes within each tier. The unconstrained system searched for ten optimized
sizes so grades between sizes differed. 752 women were chosen from the 1988 ANSUR
database based on stature and a waist-to-hip difference of 10.5”. Half the sample was
used to build the three optimized systems while the other half was used to test them and
ASTM D5585-94. Figure 3 presents three-dimensional plots of each sizing system plus
the data cloud of the 376 subjects. Aggregate loss (the difference between the body
measurement of a subject and the measurement of their closest size) was calculated for all
four systems as a ranking mechanism. All three optimized systems performed better than
ASTM D5585-94 (Table 2).
Sizing System Aggregate Loss %
ASTM D5585-94 4.8%
Linear 2.9%
Two-Tiered 2.7%
Unconstrained 2.7% Table 2: Aggregate Loss Percent, data from Ashdown (1998), p. 335

12
Figure 3: Graphical representations of goodness of fit of subjects with each sizing system; A. ASTM D5585-94, B.
Linear, C. Two-Tiered, D. Unconstrained (Ashdown, 1998, pp. 333-4)
Form Assessment
Body-form assessment is an under-studied area in academia, but the topic appears in
all basic sewing books. Body form assessment scales classify human bodies into specific
categories. Categories may take the form of sizes, numbers, heights, volumes, letters, or
shapes. This section highlights studies concerned with classifying human body form,
beginning with the difference between a shape and a form.
Shape vs. Form
The design field has defined the terms ‘shape’ and ‘form’ thusly:
1. ‘Shape’ is a two-dimensional enclosed space, distinctly separated in some way
(ex. an outline) from the background and other shapes (Hemmis, 2016).
2. ‘Form’ is a three-dimensional shape, where the third dimension is added by depth
or volume (Hemmis, 2016).

13
There are three types of shapes: geometric, curvilinear and biomorphic. Geometric
shapes are defined by mathematical formulas, for instance, length times height always
describes a rectangle. Curvilinear shapes are those curved shapes found in nature that are
not biological, for example, the outline of a lake. Biomorphic shapes are those ambiguous
shapes from biological organisms, such as an amoeba. (Hemmis, 2016) The human body,
in all its varied heights, weights, volumes, angles, and arcs, is a biomorphic form.
Due to the difficulty of describing biomorphic forms like the human body, forms are
often flattened to allow for shape identification. More research into form identification of
the human body is essential to fully understand body-form variation.
Figure Evaluation – Observed vs. Standard
Pattern drafting and fitting texts are where most designers and pattern makers learn
about human body classification, or as it is colloquially known, ‘figure evaluation’.
Figure evaluation relies on comparisons between an observed form and a standard one.
As such, patterning and alteration texts focus on defining the standard form as well as
common “deviations”.
Figure evaluations can be broken into four categories: Proportions, Posture, Whole
Body and Body Components. In the following sections both the standard and deviations
will be discussed.
Proportions
Proportions are the relationships between different body component lengths (Palmer
& Alto, 2005). These relationships are the fundamental building blocks of any garment
patterning system. Clear understanding of the locations of major body sites assists in the
determination of pattern features, such as seamlines and darts; and determines grading
rules.
Patterning texts agree that the standard figure is evenly divided lengthwise at the hips,
and that the knees are halfway between hipline and floor (Latzke & Quinlan, 1940;
Liechty, Pottberg, & Rasband, 1986; Maehren & Meyers, 2005; Rasband & Liechty,
2006), but from there, texts differ. Latzke and Quinlan (1940) set the standard figure at

14
seven heads tall; Liechty et al. (1986) set the standard figure at seven and a half heads
tall; and Palmer and Alto (2005) set the standard figure at 8 heads tall. Maehren and
Meyers (2005), and Rasband and Liechty (2006) set the underarm as halfway between the
top of the head and hipline, while Latzke and Quinlan set the halfway point at the nipples
(Figure 4).
Maehren and Meyers (2005) put the waistline halfway between
underarm and hipline. Rasband and Liechty (2006) set the elbows at
waist level, equally dividing the arm in half, with the wrist bone level
with the crotch and fingertips with the mid-thigh. Latzke and Quinlan
(1940) are the only text to define the relationships for widths, setting the
shoulders and hips at one and a half heads each, the bust at one and a
quarter heads, the waist at one head, the knees and calves at three-
quarter heads each, the ankles at a half head, the upper arm at one third
of a head, the elbow at one quarter of a head, and the wrist at three-
sixteenths of a head; with the length for the foot at one head.
There are three deviations from the standard figure for proportions:
short-waisted, long-waisted and asymmetrical. Short- and long-waisted
proportions refer to ratios of length measurements between the underarm and hips. Short-
waisted figures have waists closer to the underarm than the hips, resulting in a waist
higher than that found in the standard figure (Maehren & Meyers, 2005). Long-waisted
figures are the opposite; waists are closer to the hips than the underarm, resulting in a
waist lower than that found in the standard figure (Maehren & Meyers, 2005).
Asymmetrical proportions refer to either a difference between the right and left sides of
the body (Minott, 1974, 1978) or between the front and back fullness at specific body
sites (Liechty et al., 1986).
Posture
Correct (or average or standard) posture is typified by an upright stance, with head
and neck centered over the shoulders, hips and ankles; a slightly lifted chest; shoulders
pulled back and slightly down; abdomen contracted and flat, buttocks contracted and
Figure 4:
Proportions (from Liechty et al., 2010,
Fig. 4.15, p. 74)

15
pulled slightly under; arms hanging relaxed at sides with elbows bent slightly forward;
knees straight but relaxed and feet pointing straight ahead with ankles at right angles to
feet (Latzke & Quinlan, 1940; Minott, 1974; Liechty et al., 1986). An example of
excellent posture is shown on the left-hand side of Figure 5.
Figure 5: Examples of Posture, from left: Excellent, Good, Poor, Bad. (from Latzke & Quinlan (1940), Fig. 42, p. 73)
Rasband and Liechty (2006) state that “poor posture is the most common figure
variation” (p. 29). Poor posture alters the body configuration, causing key areas, such as
shoulders, breasts, buttocks, etc. to move out of alignment. There are five common
incorrect posture variations cited in the literature: Overly Erect Posture, Slumped Posture,
Swayed Back, Tilted Hip-Forward Posture and Tilted Hip-Backward Posture.
Overly erect posture results in a prominently lifted bust and lengthened chest
measurement, an arched back and shortened upper back measurement, a pulled back head
and hyperextended knees. Slumped posture (aka Rounded back posture) results in the
opposite: a concave chest and shortened chest measurement, rounded upper back and
shoulders, increased upper back width and length measurements, and a forward tilting
head. Swayed back posture is typified by a forward tilting pelvis, prominent abdomen
and protruding buttocks. (Liechty et al., 1986)
Those with tilted hip-forward posture have slightly slouched backs, with either
prominent hip bones or a roll in the front waist, and flat, low buttocks. The front floor-to-
waist measurement is typically longer than the back floor-to-waist measurement. Those

16
with the tilted hip-backward posture are the opposite: the stomach appears lower, the
buttocks are high and prominent, and the person appears to be leaning forward. The front
floor-to-waist measurement is typically shorter than the back floor-to-waist measurement.
(Minott, 1974).
Whole Body
Eight whole body figure shapes were identified from the reviewed pop-culture
patterning texts: Average/Hourglass, Triangle, Inverted Triangle, Rectangle, Tubular,
Oval/Rounded, Elliptical and Diamond (Figure 6). The goal of classifying women by
overall figure shape is to teach them where they deviate from the average figure shape.
Figure 6: Examples of average and alterative whole body shapes (from Rasband & Liechty, 2006, Fig. 2.2, pp. 25-6)
The average figure shape is generally considered to be an hourglass. For the
average/hourglass figure shape, the shoulders and hips are equally wide and the waist is
10-11” smaller than the bust and hip circumference measurements. In general, this shape
is considered well balanced, with no area more or less prominent than any other.
(Maehren & Meyers, 2005; Rasband & Liechty, 2006)
The triangle figure shape is typified by hips that are wider than their shoulders, with a
two inch or larger difference between the hip and bust circumference measurements. This
difference causes the body to appear bottom-heavy. The inverted triangle figure is the

17
opposite of the triangle figure. The shoulders are wider than the hips, with a one inch or
larger difference between the bust and hips. This difference causes the body to appear
top-heavy. (Maehren & Meyers, 2005; Rasband & Liechty, 2006)
The rectangular figure has equally wide shoulders, waist, and hips, with the waist
circumference measuring seven inches or less in difference from the bust or hips. The
tubular figure is a variation of the rectangluar figure – they are narrower through the
shoulders and hips and thinner overall. Both the retanglar and tubular figures appear
straight up and down. (Maehren & Meyers, 2005; Rasband & Liechty, 2006)
The oval/rounded figure has fullly-rounded body areas and is generally considered
short of stature. The elliptical shape is relatively narrow, yet still rounded. The diamond
figure is represented by a wider midriff (or waist) than their shoulders or hips. (Latzke &
Quinlan, 1940; Rasband & Liechty, 2006)
Research into whole-body forms for is scarce. One study on somatotypes by Olds,
Daniell, Petkov, and Stewart (2013) used K-means cluster analysis to find the naturally
occurring body forms for a purposive sample 301 Austrialian adults (148 males, 153
females) aged 17 to 65. Olds et al. defined somatotyping as “the quantification of human
body shape, independent of body size” (p. 936). Below are the measurements extracted
from the scans:
• “eight segmental volumes (head + neck + thorax, abdomen, pelvis, upper arms,
lower arms + hands, buttocks, thighs, lower legs + feet);
• nine breadths: head width, bigonial, biacromial, nipple spacing, biiliocristal,
bitrochanteric, biepicondylar femur, bimalleolar, biepicondyler humerus;
• six girths: arm, forearm, waist, hip, calf, ankle; and
• six lengths: head, acromiale-radiale, radiale-stylion, upper leg, lower leg, foot
length.” (p. 937)
K-means cluster analysis requires the researcher to input the number of clusters prior
to analysis. In order to determine the number of clusters Olds et al. (2013) separated
scans by gender, then applied a v-fold cross-validation to the scans, yielding 3 clusters
per gender. Mean values for the 29 dimensions were calculated across each cluster and
were termed “cluster centroids”, representing the most ‘typical’ shape per cluster. Z-

18
scores were used to quantify the differences between centroids and subjects. Caricatures,
or an “anthropometric profile that exaggerates the differences between the cluster
centroid and the overall average for the sample” (p. 938) were also developed. Every
subject in a cluster was compared with both centroid and caricature figures to find the
scan most similar to each.
For the males, cluster one comprised 22% of the sample, and was categorized as
endomorphic; cluster two comprised 31% of the sample and was categorized as endo-
mesomorphic; and cluster three compromised 47% of the sample and was categorized as
ectomorphic. For the females, cluster one comprised 41% of the sample and was
described as substantially adipose; cluster two comprised 34% of the sample and was
described as “relatively slim, narrow, and muscular” (p. 941); and cluster three comprised
25% of the sample and was described as ectomorphic. Olds et al. (2013) concluded that
this study provided support for the tripartite classification system and found that cluster
analysis was an objective way to group profiles. They admit that the outputs are fully
dependent on the inputs and that with different inputs their study could have found
different clusters.
The centroid and caricature figures visually indicate differences between the average
subject and the most extreme subject for each cluster. The problem with this approach is
that shape is viewed only through the tripartite ecto-, endo- and mesomorph system,
which ignores shape and focuses on volume. For example, the female centroid of cluster
one could be described as an “oval” form, whereas the caricature for cluster one could be
described as a “top hourglass” form. It is entirely possible for these two women to have
the same volume, but they cannot be classified as the same form. Moreover, the
measurements utilized for this analysis are surprising; chest girth is missing, yet foot
length and nipple space are included. Overall, this study shows that shape can vary across
similar volumes, indicating that it may also vary within a single size.
The most extensive research into whole-body form generated by apparel academics is
in the Istook, Simmons, and Devarajan (2004) Female Figure Identification Technique
(FFIT) for Apparel system. The FFIT for apparel project aimed to mathematically
analyze and sort body shapes using scans taken from the Textile/Clothing Technology
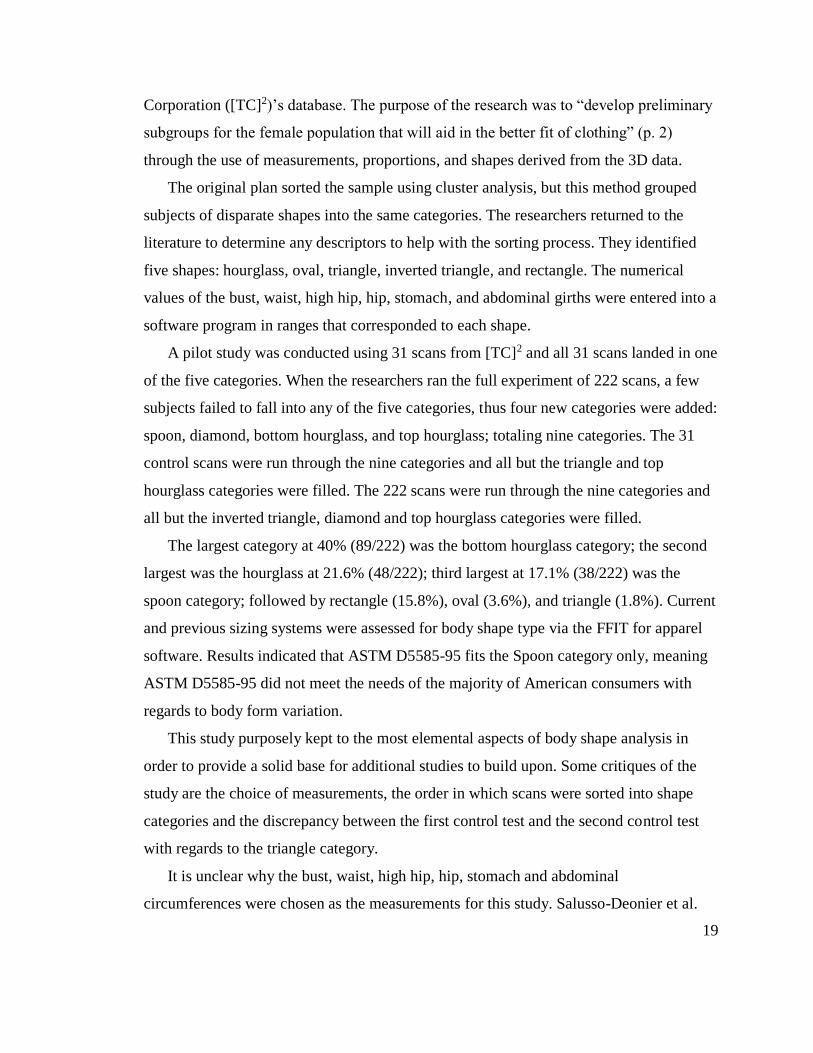
19
Corporation ([TC]2)’s database. The purpose of the research was to “develop preliminary
subgroups for the female population that will aid in the better fit of clothing” (p. 2)
through the use of measurements, proportions, and shapes derived from the 3D data.
The original plan sorted the sample using cluster analysis, but this method grouped
subjects of disparate shapes into the same categories. The researchers returned to the
literature to determine any descriptors to help with the sorting process. They identified
five shapes: hourglass, oval, triangle, inverted triangle, and rectangle. The numerical
values of the bust, waist, high hip, hip, stomach, and abdominal girths were entered into a
software program in ranges that corresponded to each shape.
A pilot study was conducted using 31 scans from [TC]2 and all 31 scans landed in one
of the five categories. When the researchers ran the full experiment of 222 scans, a few
subjects failed to fall into any of the five categories, thus four new categories were added:
spoon, diamond, bottom hourglass, and top hourglass; totaling nine categories. The 31
control scans were run through the nine categories and all but the triangle and top
hourglass categories were filled. The 222 scans were run through the nine categories and
all but the inverted triangle, diamond and top hourglass categories were filled.
The largest category at 40% (89/222) was the bottom hourglass category; the second
largest was the hourglass at 21.6% (48/222); third largest at 17.1% (38/222) was the
spoon category; followed by rectangle (15.8%), oval (3.6%), and triangle (1.8%). Current
and previous sizing systems were assessed for body shape type via the FFIT for apparel
software. Results indicated that ASTM D5585-95 fits the Spoon category only, meaning
ASTM D5585-95 did not meet the needs of the majority of American consumers with
regards to body form variation.
This study purposely kept to the most elemental aspects of body shape analysis in
order to provide a solid base for additional studies to build upon. Some critiques of the
study are the choice of measurements, the order in which scans were sorted into shape
categories and the discrepancy between the first control test and the second control test
with regards to the triangle category.
It is unclear why the bust, waist, high hip, hip, stomach and abdominal
circumferences were chosen as the measurements for this study. Salusso-Deonier et al.
20
(1985) found that body thickness and length were crucial components for creating a
sizing system and paved the way for future empirical assessment of the most important
measurements needed in assessing the human body for sizing purposes. While
categorizing a body for whole-body form requires a different mindset than classifying a
body for size, the idea that there are certain measurements that are more predictive of size
should indicate there are certain measurements more predictive of form. Running a
principle component analysis on the body measurements would have provided the FFIT
for apparel study with an empirical set of basic measurements to derive ratios from.
The order in which scans are sorted is well thought out in this study, but a program
that could analyze the ratios and sort into shape categories without the need to place one
category before another would be more valuable. This issue directly leads into the final
issue with the FFIT study. The triangle category was filled during the first control trial
with five shapes, but not during the second trial with nine shapes, even though the
subjects’ data did not change between trials. This discrepancy calls into question some of
the basic ratios used by the software, as well as the process of body-form classification.
To validate the FFIT for apparel software Devarajan (2003) chose to test three
objectives:
1. Try FFIT on a larger population;
2. Test the software’s accuracy and verify the five ratios are better predictors of
body shape than random chance alone; and
3. Analyze if the nine shape are statistically different from each other.
The validation tested 887 body scans – 222 from the North Carolina State University
(NCSU) body scan database and 665 from [TC]2’s database. The 887 scans were split
into two groups: training data (356 scans comprised of 222 scans from NCSU and 134
scans from [TC]2) and test data (531 scans from [TC]2).
The first objective was tested by comparing the results from cluster analysis with
those from the FFIT for apparel software. Devarajan (2003) aimed to see if the number of
clusters obtained using the five body measurement ratios equaled the number of shape
categories used in the FFIT for apparel software. All 531 scans were sorted into a shape
category and all nine categories were filled, with the rectangle shape having the greatest

21
number of scans and the diamond and inverted triangle categories tying for the least
number of scans. Because all of the scans were classified into categories Devarajan
(2003) concluded that the FFIT for apparel software works for larger populations.
For the second objective, a discriminant function was developed from the training
data and validated using the test data. All of the data was visually analyzed by experts as
part of creating the discriminant function. Data from frequency tables were used to
compare the accuracy of sorting with the discriminant function against sorting with the
FFIT for apparel software. The FFIT software was more accurate for all but the diamond
and inverted triangle shapes and was more accurate when all the percentages were
averaged into a Hit ratio (66.10 for the discriminant function versus 89.27 for the FFIT
software). Since the Hit ratio of the FFIT for apparel software was higher than the Hit
ratio for the discriminant function Devarajan (2003) determined that the five ratios used
to classify body shapes are more accurate than random chance alone.
To test the final objective, multivariate analysis of variance (MANOVA) was used on
all 887 scans. MANOVA determined if all nine body shapes were significantly different
based on the five body ratios utilized as category determinants. The shapes are:
hourglass, bottom hourglass, top hourglass, triangle, inverted triangle, oval, spoon,
rectangle, and diamond. The six measurements are the bust, waist, hips, high hip,
stomach, and abdomen circumferences. The five ratios are:
1. Absolute difference between the bust and hip measurement.
2. Difference between bust and waist measurement.
3. Difference between hip and waist measurement.
4. Ratio of high hip to waist.
5. Difference between the bust and the average of waist, stomach and abdomen
measurements (Devarajan, 2003, Table 6, p. 47).
Devarajan (2003) used Wilk’s Lambda as the statistical criteria for assessing the final
objective and found it was very small for each of the five ratios. This revealed a
significant difference between the nine shape groups based upon the five body
measurement ratios used in the FFIT for apparel software.

22
There are two important points that must be addressed. The same data used to create
the software was used (in part) to validate it. Of the 887 scans used, 253 were the same
scans used to create the software (222 from the NCSU database and 31 from [TC]2’s
database). While redundancy is necessary in validation, the data were used as a
convenient sample rather than as validation.
The second issue appears when you look carefully at the data in Figure 7.
Figure 7: Istook et al. (2004) versus Devarajan (2003)
A discrepancy occurs in the hourglass data. Devarajan (2003) has 46 scans in the
hourglass category while Istook et al. (2004) has 48 scans. After the visual analysis of the
training data two scans were found to be incorrectly categorized. These two scans were
re-categorized as top hourglass and the software code was rewritten. It can only be
assumed that the Devarajan (2003) thesis uses the updated software.
One study that branched off from the original FFIT for apparel study compared body
shapes between Korean and American women and looked into the proportions of shapes
according to age (Lee et al., 2007). Using [TC]2’s Body Measurement Software (BMS),
measurements were extracted from the 3D avatars of 6,310 American women and 1,799
Korean women. The bust, waist, high hip, hip, stomach and abdominal circumferences
were used to sort shapes. While there are nine shapes identified in the FFIT for apparel
study, this study only used seven shapes: hourglass, bottom hourglass, top hourglass,
spoon, triangle, inverted triangle, and rectangle. The researchers argued that the oval and
diamond shapes were left out due to a lack of data which would not allow them to
process the ratios for these shapes.

23
Results from the comparison showed distinct differences between proportions of
shape between American and Korean women. A breakdown of the categories is
summarized in Table 3.
Categories American Women Korean Women
Hourglass 3rd 5th
Bottom Hourglass 4th 4th
Top Hourglass 6th N/A
Spoon 2nd 3rd
Triangle 5th 2nd
Inverted Triangle 7th 6th
Rectangle 1st 1st Table 3: American vs. Korean Body Shapes
When comparing the proportions between American and Korean women it was found
that American women have greater proportions for bust, waist, high hip, and hip
circumferences as well as higher proportions in the waist, high hip and hip heights.
Korean women have higher proportions for bust height.
The most important finding of this study was that most American women fall under
the rectangle category, and not the bottom hourglass category as previously seen in the
original FFIT for apparel study. This suggests a major difference in how apparel should
be patterned because proportions for a rectangular body will be different from
proportions for a bottom hourglass body. This also shows how important it is to do shape-
analysis studies on larger populations.
The major difference between this study and the original FFIT for apparel study was
the use of only seven of the nine shapes. It was not only the choice to use seven shapes,
but the choice to use these particular seven shapes that is surprising. The top hourglass
shape was not found in either of tests run by Istook et al. (2004), yet was chosen for
inclusion in this study. The oval and diamond shapes, while rarely found in the original
study, were present, thus it would make sense to use them for this study. The claim that
the oval and diamond shapes were not used due to error on the part of the SizeUSA
database is strange, since both the original FFIT for apparel study (Istook et al., 2004)
and the validation of the FFIT for apparel software (Devarajan, 2003) used data from the
SizeUSA database without issue.

24
Body Components
Another way of thinking about figure classification is to break the body down into its
component parts and evaluate each part separately from the others. In some instances, the
same component is evaluated by multiple measures. For example, shoulders are evaluated
both by slope and by width. Evaluation of body components is conducted both visually,
usually with images to use as references, and by measurements. Analysis by body
component is useful when more detail is needed than that provided by whole body
evaluation.
The neck can be classified as average, wide, or narrow in width, or average, short, or
long in length (Figure 8). No measurements accompany these images. (Minott, 1978)
Figure 8: Neck Width and Length (from Minott, 1978, Fig. 7.1b, p. 52)
Shoulder slope is measured by extending a vertical line from the shoulder point to the
level of the base of the neck. An average shoulder slope measures 2”, sloping shoulders
measure more than 2”, and square shoulders measure less than 2”. (Maehren & Meyers,
2005).
Figure 9: Shoulder Slope (from Minott, 1978, Fig. 7.1e, p. 53)
Shoulder width is determined by the difference between the shoulder blade
measurement and the cross-back shoulder width measurement. Average figures have the
same or up to a half inch difference, wide figures have back shoulder widths 5/8” or

25
larger than their shoulder blade measurements, and narrow figures have shoulder blade
measurements 5/8” or larger than their cross-back shoulder width measurement. (Minott,
1978). Figure 9 shows Minott’s (1978) illustrations of shoulder slope, and Figure 10
shows her illustrations of shoulder width.
Figure 10: Shoulder Width (from Minott, 1978, Fig. 7.1d, p. 53)
Back width can be classified as average, broad or narrow in width (Figure 11). No
measurements accompany these images. (Minott, 1978)
Figure 11: Back Width (from Minott, 1978, Fig. 7.1h, p.54)
The chest is the area above the bust and can be classified as hollow, prominent or
average (Minott, 1978) (Figure 12).
Figure 12: Chest (from Minott, 1978, Fig. 7.1f, p. 53)
The bust can be classified by fullness and by height of the bust point (Minott, 1978;
Maehren & Meyers, 2005). Average fullness is considered a B cup, and the bust

26
circumference measures 10” larger than the waist (Liechty et al., 1986; Maehren &
Meyers, 2005). A full bust is considered a C cup or larger; and a small bust is an A cup,
with little or no curve (Maehren & Meyers, 2005). There are no written explanations for
bust point height, only the images provided by Minott (1978). Bust fullness and bust
point height are illustrated in Figure 13.
Figure 13: Bust (from Minott, 1978, Fig. 7.1g, p. 54)
The arms are primarily evaluated by upper arm fullness (Figure 14). Maehren and
Meyers (2005) describe the average arm as softly curved without excessive flesh or
muscle, and Minott (1978) quantifies the average arm as a 1.5” to 2.25” difference
between the upper arm circumference and the elbow circumference. Full arms appear
“heavy”, with more flesh and muscle (Maehren & Meyers, 2005). They are quantified by
a 2.25” or greater difference between the upper arm circumference and elbow
circumference (Minott, 1978). Thin arms appear bony, with little flesh or muscle mass
(Maehren & Meyers, 2005), they are quantified by a 1/4” to 1 3/8” difference between
the upper arm circumference and the elbow circumference (Minott, 1978).
Figure 14: Arm Fullness (from Maehren & Meyers, 2005, p.29)
Maehren and Meyers (2005) classify the waist as either average, thick or small
(Figure 15). An average waist has a 9.5” to 10” difference from the hip circumference. A
thick waist has a less than 9.5” difference from the hip circumference and little to no

27
waist indentation. A small waist has a greater than 10” difference from the hip
circumference and a pronounced waist indentation.
Figure 15: Waist (from Maehren & Meyers, 2005, p. 30)
Figure 16: Abdomen (from Maehren & Meyers, 2005, p. 34)
The abdomen is below the waist and can be either average, full or flat (Figure 16). An
average abdomen is slightly rounded, while a full abdomen is prominently rounded. A
flat abdomen appears either straight or hollow. (Maehren & Meyers, 2005)
Figure 17: Hip shapes, from left: Average, Little Difference, Heart, Semi-Heart, Diamond and Rounded Diamond
(from Minott, 1974, Fig. 2.2a & 2.2b, p. 11)
There are five options for the hips: Average, Small, Full, Heart and Diamond (Figure
17). There is disagreement on what an average waist-to-hip difference is. Liechty et al.
(1986) quantify average hips at 10” larger than the waist; Maehren and Meyers (2005)
argue they are 9.5” to 10” larger than the waist, a .5” range; and Minott (1978) argues
they are 8” to 11.5” larger than the waist, a 3.5” range.

28
A disagreement also exists for the small hip shape (i.e. Minott’s Little Difference hip
shape). Maehren and Meyers (2005) quantify small hips as less than 9.5” larger than the
waist, while Minott (1978) quantifies them at less than 8” larger than the waist; a 1.5”
difference. Only Maehren and Meyers acknowledge the full hip shape, which is
quantified as at least 10” larger than the waist.
Minott (1978) distinguishes between the upper and lower hip circumferences. The
upper hip circumference is measured 3” to 4.5” below the waist. While not specified, the
lower hip circumference may be considered the same as the true hip circumference, 7” to
9” below the waist.
Minott (1974, 1978) breaks the heart shape into two categories: Heart and Semi-heart.
Heart has a greater upper hip circumference than lower hip or seat-level circumferences.
The heart-shape is also prominently rounded below the waist. Semi-heart has similar
upper and lower hip circumferences, with the lower hip circumference possibly up to 1.5”
larger than the upper hip circumference. The curve below the waist is not as extreme as
the heart shape.
Minott (1974, 1978) breaks the diamond shape into two categories: Diamond and
Rounded Diamond. Diamond is distinguished by prominent thighs and a lower hip 11.5”
or larger than the waist. The rounded diamond is distinguished by both prominent thighs
and curves below the waist. There is a 2” or more difference between the upper and lower
hip circumferences, and there may be less than an 11.5” difference between lower hip and
waist.
Figure 18: Seat (from Maehren & Meyers, 2005, p. 35)
Maehren & Meyers (2005) outline four options for seat shape: Average, Full, Flat and
Swaybacked (Figure 18). Average seats have a small, high curve. Full seats have larger,

29
rounded curves. Flat seats have little to no curve. Swaybacked seats jut prominently from
the hollow just below the waist.
Figure 19: Thighs (from Maehren & Meyers, 2005, p. 32)
Maehren and Meyers (2005) classify three thigh fullness’s: Average, Full and Thin
(Figure 19). An average thigh is softly rounded, with a small gap between the inner
thighs. Full thighs bulge out and have no gap between the thighs. Thin thighs appear
straight along the inner thigh and have a large gap.
Body Shape Assessment Scale
The Body Shape Assessment Scale (BSAS)© was created by Connell, Ulrich,
Brannon, Alexander and Presley (2006) to address the issue of body shape classification.
It is the only academic research that combines posture, whole-body form, and component
body form classification. This study identified existing body shape scales, tested them
using 42 body scans of women aged 20-55, and developed the following nine BSAS©
subscales from the results:
1. Body Build: Slender, Average, Full and Heavy
2. Body Shape: Hourglass, Pear, Rectangle, and Inverted Triangle
3. Hip Shape: Straight, High, Mid, and Low
4. Shoulder Slope: Square, Average, and Sloped
5. Front Torso Shape: b, B, & D
6. Bust Shape: Flat, Average, and Prominent
7. Buttocks Shape: Flat, Average, and Prominent
8. Back Shape: Flat, High, Middle, and Low
9. Posture: Aligned, Forward Alignment, and Compensating Alignment

30
Body Build, Body Shape and Posture are for the whole body, while the remaining six
are for body components. An additional 100 scans were classified by five experts using
the BSAS© and the results were utilized to create a software program for assessing large
populations quickly and efficiently.
The Body Shape subscale was adapted from August (1981), which used six body
shapes: circle, pear, rectangle, inverted triangle and hourglass. Connell et al. (2006)
observed no circle or inverted triangle shapes in their sample of 42 women, thus those
were eliminated from the scale. The Female Figure Identification Technique (FFIT) for
apparel study (Istook et al., 2004) has nine statistically validated shapes (Devarajan,
2003), which include an inverted triangle and an oval shape. Why the FFIT for apparel
shapes were not included is unclear, as they are covered in the literature review. At the
very least the nine FFIT shapes should have suggested to the BSAS© researchers that
four shapes are too few to cover the entire population adequately.
The terminology used in the BSAS© is subjective. For example, one person’s “flat”
could be another person’s “average”. Additional queries include how body build is
determined and if there is a mathematical formula to distinguish between “full” and
“heavy”. One interesting observation by the authors was that subjects who barely belong
to one category are close to belonging to adjacent categories. This points to the fluidity of
body shape and marks one of the major difficulties involved in classification of
biomorphic forms.
Section Summary
Based on the above review of sizing systems and shape assessment scales and
incorporating the theoretical understanding that the human body is a biomorphic form,
the first assumption of this study is: People have unique and distinctive body forms.
In apparel, form categorization is a means to an end. Knowing the form provides
useful information for designing, patterning, fitting, and aesthetics.

31
Pattern
This section outlines and critiques research concerning patternmaking and grading
practice. Of specific interest are the underlying assumptions of patternmaking and
grading. This section ends with the second underlying assumption of this research study,
and the research questions.
What is a pattern?
There are three ways to create garment patterns in the garment industry. The first is
draping, where a designer manipulates fabric directly on a body-form. The second is
drafting, where a designer uses measurements to draft a two-dimensional garment
pattern, either on paper or a computer. The third method is flat patterning, which
manipulates basic drafted patterns to create stylized patterns for grading and production.
There are three types of garment patterns in the garment industry. A foundational
pattern is called a basic block, a sloper, or a master. They have no style lines, style ease,
seam allowances, hems, dart interiors, or markings. A style block is a variation of the
basic block that represents a manufacturer’s preferred starting style or silhouette. Style
blocks include style lines and ease, but not seam allowances, hems, dart interiors, or
markings. The style block is graded up and down to provide a manufacturer with a range
of sizes for production. Production patterns are the final type of garment pattern. They are
used to make markers for cutting materials, and include style lines, style ease, seam
allowances, hems, dart interiors, and all pattern markings needed to ensure correct
production of the final garment. (Joseph-Armstrong, 2006).
Ease is the space between the garment and the body. There are two types of ease:
basic and style. Basic, comfort, or movement ease allows for necessary body movements,
such as breathing and walking. In general, the industry uses two inches of basic ease at
the bust and hips and one inch of basic ease at the waist. Style ease is any additional
space added after the addition of basic ease. The amount of style ease added depends on
the designer’s intentions for garment aesthetics.
As discussed in the body-form section, a shape is a two-dimensional enclosed space,
distinctly separated from its surroundings in some way (Hemmis, 2016). Remember also

32
that the human body is a biomorphic form, thus it is a three-dimensional ambiguous
shape. In this study, a garment pattern is a two-dimensional abstraction of a body’s form;
in other words, a garment pattern is the shape that represents a given body-form.
History
Before the industrial revolution made ready-made apparel available cheaply, all
clothing was custom-made. Dressmakers and tailors analyzed the body-form and
movements of their clients, to produce garments that fit perfectly (Kidwell & Christman,
1974). A brief history of garment manufacture provides understanding of how the
garment industry ended up with the patterning, grading, and sizing system that it has
now.
The original unit of measure for tailors was a strip of parchment paper, notched at
important body locations for each client. These notched strips were eventually replaced
with tape measures, which included units of measurement instead of notches.
Measurements from the tapes became the basis for drafting patterns and cutting material
in the eighteenth and nineteenth centuries. (Kidwell & Christman, 1974; Aldrich, 2007)
Originally, new clothing was created from measurements taken from the client’s
garments, not their bodies. In the mid-1800s tailors started measuring the bust and waist
under a client’s attire, though remaining measurements were still taken over the garment.
It wasn’t until the beginning of the 1900’s that taking measurements near the body
became the standard. (Aldrich, 2007)
Dressmakers relied on the creation of a ‘body’ (i.e. the pattern shape that fit an
individual’s body) to make women’s apparel. Aldrich (2007) argues that as literacy rates
increased amongst women, dressmakers started publishing pattern-drafting books to show
their process and provide peers with templates and measurement tools. The method of
drafting a ‘body’ was simple, and various styles of garment could be created from this
base pattern. The ‘body’ is the origin of the current basic blocks used by the garment
industry. (Aldrich, 2007)
Ready-made apparel began due to America’s rising class demanding clothing as
aesthetically pleasing as those worn by America’s upper class, though without the price
33
attached to ‘customers work’. Tailors responded by modifying their manufacturing
process to provide respectable, reasonably priced clothing for purchase directly off the
shelf. (Kidwell & Christman, 1974)
The shift from ‘customers work’ to ready-made required a reimagining of the pattern-
drafting process. Tailors invented two drafting systems during the first half of the
nineteenth century: Direct, and Proportional. Direct systems used a variety of
measurements taken from a body or garment to calculate pattern points and draft a new
pattern. Proportional, or divisional, systems were based on the principle that the human
body is proportional and that a single measurement, for example the bust, could predict
the rest. The proportional system led to the idea of proportional sizing, which is the
foundation of current ready-made sizing and grading. (Kidwell & Christman, 1974;
Heisey, Brown & Johnson, 1988; Aldrich, 2007).
The mid-1800s brought about the American Civil War, with thousands of soldiers in
need of uniforms, as well as a newfound interest in human anatomy, specifically the
study of body proportions. Soldiers were measured and their data analyzed. Guillame
Compaing and Henry Wampen used their knowledge of human anatomy to create the
earliest grading systems. In 1881, Charles Hecklinger, an American tailor, combined the
idea of the ‘body’ with proportional drafting to develop the first systematic adaptation
methods for block patterns, which became the basis for applying size charts to patterns
(Kidwell & Christman, 1974; Aldrich, 2007).
Improvements in textile technology, manufacturing equipment and systems,
transportation, the development of an American wool industry, and an influx of semi-
skilled immigrants allowed the American garment industry to flourish (Kidwell &
Christman, 1974; Aldrich, 2007). The creation of the ‘progressive bundle system’, where
similar pieces of individual garments were cut and bundled together for easier
transportation around the factory, improved factory efficiency (Aldrich, 2007).
With the increase in manufacturing, grading methodology changed. The three most
popular grading methods were: Vincent’s 1908 nesting system, Scheifer’s 1908 shift
system, and the radial system. Vincent’s nesting system had a pattern-maker draft the
smallest, middle, largest sizes, which were nested; diagonal lines were drawn through the
34
main points of these three patterns and the remaining sizes were marked along these
lines. Scheifer’s shift method began with a base pattern and, by following a set of
instructions, a semi-skilled worker could grade any pattern. The radial method was a
combination of the previous two methods whereby radial lines extend from specific
points of a base pattern and alternate sizes were marked along the radial lines. (Aldrich,
2007).
Men’s ready-made apparel was easily attainable and of good quality. Women’s
lagged behind. Aldrich (2007) attributed this lag to the complexity of women’s garments
in the late nineteenth century: the corset, the tailored bodice, and the tailored jacket. The
years 1908 to 1913 saw a drastic change in women’s styles. The corset was abandoned in
favor of a more relaxed, ‘soft cylinder’ look, which could easily be drafted with a
rectangular block pattern. Along with the change in style came a change in attitude:
women began believing that ready-made was superior to home-made. (Aldrich, 2007).
All of the changes the American apparel industry went through during the two
hundred years of the industrial revolution improved the financial security of the country,
eliminated class-distinctions in dress and made American citizens the richest average
citizens in the world. And, while manufacture of ready-made became more consistent
than home-made, the loss of skill in fitting garments has set the current apparel industry a
new round of problems.
Research
Research into pattern shape focuses either on grading or on pattern shape change
driven by the body. Schofield and LaBat (2005a) analyzed 40 US sizing charts from 1873
to 2000, finding that a) all charts had constant intervals between sizes for all
measurements, b) as size increased so did all vertical measurements, c) there were
constant differences between the principle girths, and d) grades were used. It was
concluded that grading predates sizing systems, sizing is partially based on accepted
practice, and that very few grade rules are based on body measurements. Schofield and
LaBat (2005b) built upon their previous research by testing the grading assumptions they
discovered. Two bodice patterns, one with grade rules from traditional grading practices,
35
and one with grade rules developed from regression analysis of the 1988 ANSUR survey,
were compared. They concluded that none of the grading assumptions of traditional
grading were supported.
Bye, LaBat, McKinney, and Kim (2008) compared traditional grading practices to
optimum ones through the evaluation of the fit of sheath dresses drafted using traditional
grading rules, and sheath dresses custom-fit to subjects. Eight women, ranging in age
from 19 to 36 years, were found that matched the bust, waist, hop, and height
measurements for ASTM D5585-95 sizes 6-20. The size 8 was used as the fit model. A
basic sheath dress (side seam front bust darts, two front and two back waist darts, back
shoulder darts, opening at center back and no waistline seam) was graded using
traditional grading methods, with grade intervals of 1” for sizes 6-10, 1.5” for sizes 10-
18, and 2” for sizes 18-20. Ease amounts were kept consistent throughout the range at 2”
at the bust and hip, and 1” at the waist. Participants were scanned in the traditionally
graded dresses to provide a permanent record.
The fit-to-shape patterns were made by adjusting the sheath dresses until they visually
met all eight of Armstrong’s (2000a, b) fit criteria:
1. “center front and center back aligns with the body center;
2. armscye fits smoothly;
3. the waist level aligns with body waist;
4. no stress or gapping at neckline;
5. side seam hangs vertically;
6. shoulder seam centered on the shoulder;
7. skirt hangs straight from the hip to the hem and cross grain parallel to the floor;
and
8. no strain at bust, waist or hip.” (Bye et al., 2008, p. 82-3).
After adjusting the dresses on the subjects, the patterns were adjusted to reflect these
changes.
The final dresses and corresponding patterns were analyzed both quantitatively and
qualitatively. Quantitative analysis included counting the number of adjustments,
organizing the adjustments by body measurement and grade location for each size,
36
averaging the adjustments for each size; nesting the patterns and analyzing for differences
between sizes, comparing the sizes between the two nests; and measuring and comparing
key pattern segments. Qualitative analysis included visually assessing the difference
between the traditionally graded pattern and the fit-to-shape pattern for each size, as well
as comparing the silhouettes of each subject to every other subject.
The average number of alterations was 3.4 per size, and more than half of the total
alterations occurred in the neck and shoulder areas. Due to the number of alterations and
the placement of the alterations, the authors concluded that traditional grading does not
provide good fit across a size range. Based on its exploratory nature, the results of this
study cannot be generalized, but when combined with the results of Schofield and LaBat
(2005a, b), indicate that traditional manufacturing cannot provide well-fitting apparel for
a population.
A few studies compare patterns from different body forms, though they do not
compare the pattern to the body. Schofield, Ashdown, Hethorn, LaBat, and Salusso
(2006) explored satisfaction with pant shape for women 55 and older. One hundred and
seventy-six women, aged 55 to 80, tried on pants with either a full- or flat-seat,
performed simple movements in the pants, and rated their satisfaction with the pants. In
addition, experts analyzed the fit of the pants. The majority of subjects preferred the flat-
seat pants, and expert analysis determined that the flat-seat pants fit subjects best.
The largest issue with this study was that while the researchers used hip
circumference as the primary control dimension when sizing the pant patterns, the
participants were allowed to choose any size their preferred for the fit evaluations. This
changed the study from observing “objective good fit” to observing “subjective good fit”,
which was not the stated aim of the study. This could have skewed the results of the
expert evaluators, as they were not looking at pants that were supposed to fit correctly.
To see how well the pants fit based on linear measurements, the researchers needed to
assign sizes based on participants’ linear measurements.
Sohn and Bye (2012) investigated changes in sheath dress patterns throughout the
three pregnancies of two women; finding that each woman’s body changed differently,
resulting in two very different patterns. This study provided evidence that a) grading

37
should not be proportional because humans do not grow proportionally, and b) different
bodies change differently and that these differences affect the patterns.
Song and Ashdown (2012) built upon their 2011 study, which found three lower-body
forms (curvy, hip tilt, and straight) from an analysis of 2,981 18-to-35-year-old SizeUSA
subjects. In the 2012 study, they tested if basic blocks created for these three lower-body
forms were a better starting point in the customization of pants than a standard basic
block.
Out of the 83 female participants (aged 18 to 35), nine participants were used as fit
models for each of the three groups and nine participants were used as fit testers for each
of the three groups. Each of the fit models had two pairs of pants created for them – one
pant was customized using the body-form block pattern as the base (Type A), and one
pant was customized using the industry pattern as the base (Type B). The 27 participants
tried on both pairs of pants, filled out a questionnaire assessing twelve body locations,
and at the end of the fit session were asked to choose the pair that fit best. Three fit
experts were asked to judge the fit using photographs taken of the participants and were
asked to choose the best fitting pair of pants for each participant.
For the fit experts, out of 81 of the total comparisons, 70.4% were in favor of the
shape-driven customized pants, and 24.7% were in favor of the standard-driven
customized pants. The Type A pant was scored significantly higher than the Type B pant.
For the fit models, 59.3% selected the Type A pant, and 40.7% selected the Type B pant
as the best fitting pant. The researchers concluded that basic blocks made using body
form information generates better fitting customized patterns.
Section Summary
Based on the above analysis of history and patterning practice, it becomes clear that
body-form variation does affect apparel block shapes. Additionally, the way we have
traditionally graded and sized patterns is not sufficient to provide the current population
with well-fitting clothing.

38
Chapter 3 Sample Selection
This chapter presents the sample selection process. To facilitate understanding of
body form variations, female subjects who share a single size were selected. Body scans
of female subjects from both the University of Minnesota’s Human Dimensioning
Laboratory© scan database and the CAESAR database were analyzed and selected for
inclusion based on four factors: gender, age, height, and circumference measurements for
the bust, waist, and hips.
HDL Master Database
The University of Minnesota’s College of Design houses the Human Dimensioning
Laboratory© (HDL) which maintains a database of scanned subjects for use in research.
This Master Database (MDB) consists of 365 scans from 305 subjects. Both genders are
included and range in age from 18 to 78 with an average age of 26. Three subjects are
pregnant, and over half the subjects are Caucasian, with 35.6% electing not to include
their race. The majority of female subjects wear bras and panties while the male subjects
wear either boxers or briefs. Descriptive statistics for the database are summarized in
Table 4 and Table 5.
Summary
Race # Females # Males # Total % Total
White 176 23 199 54.5%
No Response 130 0 130 35.6%
Asian 24 3 27 7.4%
Other 3 0 3 0.8%
African American 2 0 2 0.5%
Mixed White/African American 2 0 2 0.5%
Native American/Alaskan 1 0 1 0.3%
Mixed White/Asian 1 0 1 0.3%
Total 339 26 365 100.0% Table 4: MDB Racial Diversity - entire population
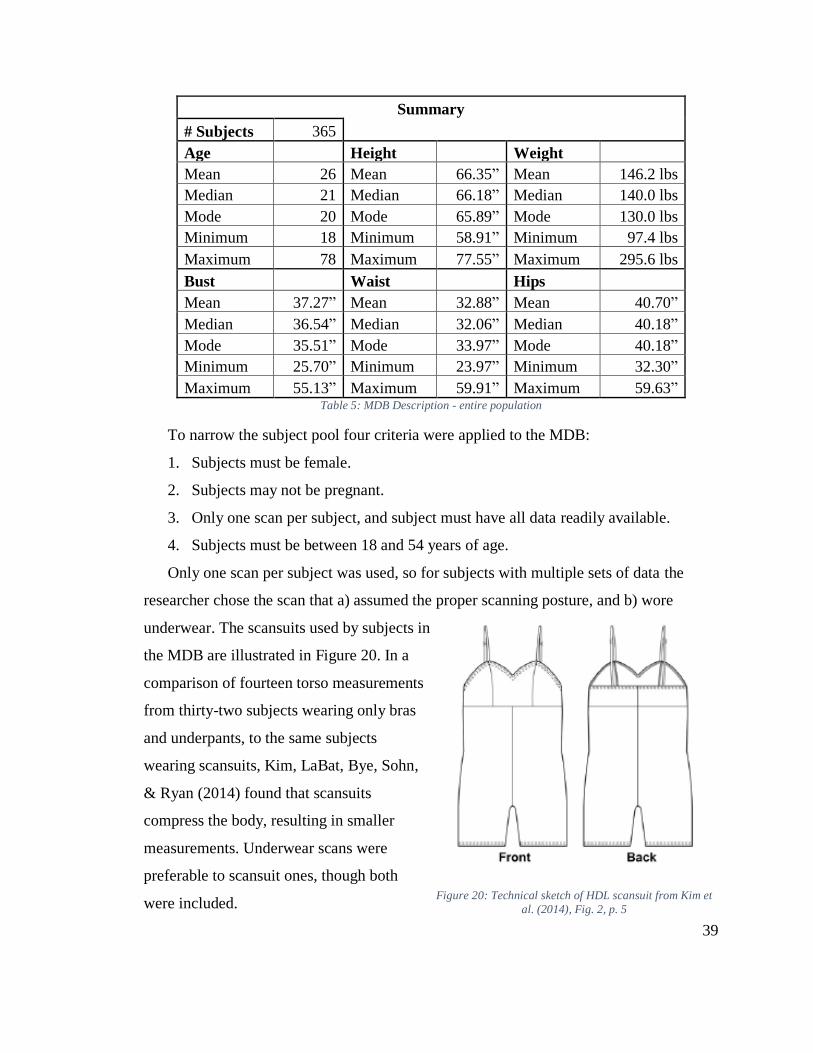
39
Summary
# Subjects 365
Age Height Weight
Mean 26 Mean 66.35” Mean 146.2 lbs
Median 21 Median 66.18” Median 140.0 lbs
Mode 20 Mode 65.89” Mode 130.0 lbs
Minimum 18 Minimum 58.91” Minimum 97.4 lbs
Maximum 78 Maximum 77.55” Maximum 295.6 lbs
Bust Waist Hips
Mean 37.27” Mean 32.88” Mean 40.70”
Median 36.54” Median 32.06” Median 40.18”
Mode 35.51” Mode 33.97” Mode 40.18”
Minimum 25.70” Minimum 23.97” Minimum 32.30”
Maximum 55.13” Maximum 59.91” Maximum 59.63” Table 5: MDB Description - entire population
To narrow the subject pool four criteria were applied to the MDB:
1. Subjects must be female.
2. Subjects may not be pregnant.
3. Only one scan per subject, and subject must have all data readily available.
4. Subjects must be between 18 and 54 years of age.
Only one scan per subject was used, so for subjects with multiple sets of data the
researcher chose the scan that a) assumed the proper scanning posture, and b) wore
underwear. The scansuits used by subjects in
the MDB are illustrated in Figure 20. In a
comparison of fourteen torso measurements
from thirty-two subjects wearing only bras
and underpants, to the same subjects
wearing scansuits, Kim, LaBat, Bye, Sohn,
& Ryan (2014) found that scansuits
compress the body, resulting in smaller
measurements. Underwear scans were
preferable to scansuit ones, though both
were included. Figure 20: Technical sketch of HDL scansuit from Kim et
al. (2014), Fig. 2, p. 5

40
The 18-54 age range was chosen to follow the ASTM age groupings, which splits
adult women into two groups, 18-54 and 55+.
Application of these four criteria resulted in 256 female subjects with an average age
of 23 and similar diversity profile to the broader database.
CAESAR Database
The Human Dimensioning Laboratory© owns a copy of the CAESAR database,
which includes scans, measurements, and demographic information for each subject.
CAESAR North America includes 2391 subjects, of which over 75% are Caucasian. Age
ranges from 18 to 79, with an average age of 40. Female subjects wear a sports bra and
short bicycle shorts. Male subjects wear bicycle shorts. Descriptive statistics for this
database are summarized in Table 6 and Table 7.
The CAESAR North America database was screened using the same criteria as the
MDB database. Application of the criteria resulted in 1109 female subjects with an
average age of 37 and similar diversity profile to the broader database.
Summary
# Subjects 2391
Age Height Weight
Mean 40 Mean 67.11” Mean 169.8 lbs
Median 39 Median 66.93” Median 162.5 lbs
Mode 39 Mode 66.73” Mode 151.0 lbs
Minimum 18 Minimum 49.13” Minimum 86.5 lbs
Maximum 79 Maximum 82.05” Maximum 399.9 lbs
Bust Waist Hips
Mean 39.24” Mean 33.39” Mean 41.35”
Median 38.50” Median 32.76” Median 40.59”
Mode 36.22” Mode 28.35” Mode 41.42”
Minimum 29.09” Minimum 21.93” Minimum 31.50”
Maximum 61.97” Maximum 67.01” Maximum 72.20” Table 6: CAESAR Description - entire population

41
Summary
Race #
Females
#
Males
#
Total %
White 964 872 1836 76.8%
African American 148 116 264 11.0%
Asian/Pacific Islander 93 83 176 7.4%
Asian/Pacific Islander Chinese 45 38 83 3.5%
Asian/Pacific Islander Filipano 16 13 29 1.2%
Asian/Pacific Islander Asian Indian 4 13 17 0.7%
Asian/Pacific Islander Japanese 7 9 16 0.7%
Asian/Pacific Islander Vietnamese 11 4 15 0.6%
Asian/Pacific Islander Korean 7 4 11 0.5%
Asian/Pacific Islander Other 3 2 5 0.2%
Spanish/Hispanic 18 33 51 2.1%
Spanish/Hispanic Mexican American 8 16 24 1.0%
Spanish/Hispanic Other 8 11 19 0.8%
Spanish/Hispanic Puerto Rican 2 3 5 0.2%
Spanish/Hispanic Cuban 0 3 3 0.1%
Other Mixed Race 25 12 37 1.5%
Other Not Listed Above 7 4 11 0.5%
No Response 5 4 9 0.4%
Native American/Alaskan 4 3 7 0.3%
Total 1264 1127 2391 100.0% Table 7: CAESAR Racial Diversity - entire population

42
Height
This study focused on understanding body form variations within a single size, so it
was necessary to limit the height range so that extreme variations did not skew results.
The American Society for Testing and Materials’ (ASTM) sizing standards were
reviewed for height ranges for the Misses category. The most current standard, ASTM
D5585-11e1, sets the height for all sizes at 65”. Alternative ASTM standards were
reviewed and are summarized in Table 8.
Standards Minimum Maximum
ASTM D5585-11e1, Misses 00-20 65” 65”
ASTM D5585-95 (2001), Misses 2-20 63.5” 68”
ASTM D7878-13e1, Misses Petite 00P-20P 62.5” 62.5”
ASTM D5586-10, Misses 55+ 62.7” 67.08”
ASTM D5586-10, Misses Tall 55+ 66.66” 69.81”
ASTM D5586-10, Misses Petite 55+ 59.63” 62.57” Table 8: Height ranges in ASTM size standards
ASTM D5585-95 (2001), an older version of the Misses standard, spans a range of
4.5”, which might not show variations in body form due to height. ASTM D7878-13e1,
the current standard for Misses Petite, sets the height for all sizes at 62.5”. This was the
shortest height found, so it was set as the lower limit for this study’s height range.
ASTM D5586-10, the current standard for Misses 55+ gives ranges for all subsets of
the 55+ standard (Misses, Tall, Petite, Women’s, Half-sizes), but they overlap.
Additionally, the ASTM D5586-10 set includes a comparison of heights for D5586 to
D5585, indicating that the sizes from the different standards do not correspond to each
other, rendering D5586 inappropriate for evaluating women under 55 years of age.
With no acceptable upper limit provided by ASTM, the researcher consulted with two
experts who suggested setting the upper limit at 70”. The full range then became 62.5” to
70”, which spanned 7.5”.
Application of this height criterion to both the MDB and CAESAR databases resulted
in 215 and 821 female subjects, respectively. The average ages and diversity profiles of
the datasets remained the same as the screened ages and diversity profiles for the
databases.

43
Method
Two methods were tested to establish a sample set for this research. The first method
sorted subjects into ASTM sizes, but failed to produce a large enough sample size. The
second was a self-sorting method which produced nineteen sample sets with 40+ subjects
per group. One sample set was selected for this study.
Both methods used the bust, waist and hip girth measurements of the subjects, as they
are important for both body form and garment fit. Istook et al. (2004) used these
measurements when developing the Female Figure Identification Technique (FFIT) for
apparel software. In their study of fit preferences of young adult women Alexander,
Connell, and Presley (2005) found that a majority of their sample had fit problems at the
bust, waist and hips of their clothing. Additionally, in a test of how accurate ASTM
D6960-04 was Alexander et al. (2012) used bust, waist, and hip girth measurements to
sort subjects from the Size USA database into standard sizes.
ASTM D5585-11e1
The American Society for Testing and Materials (ASTM) provides the apparel
industry with voluntary product standards for use in sizing clothing. The current Misses
standard, D5585-11e1 Standard Tables of Body Measurements for Adult Female Misses
Figure Type, Size Range 00-20, was used in this study (Figure 21). Using data from the
U.S. Department of Commerce, CAESAR, Size USA, Alvanon Inc. and various industry
sources, D5585-11e1 is the most up to date sizing standard available (ASTM
International, 2011).
This standard introduced two body types: Curvy and Straight. These two shapes are
defined by different values for the waist, high hip, hip seat, thigh and mid-thigh girth
measurements (ASTM International, 2011). This study evaluated subjects based on the
values for the Straight body type due to findings in Lee et al. (2007) that indicated
American women are predominantly rectangular in shape.

44
Figure 21: ASTM D5585-11e1 Standard table of body measurements for adult female Misses figure type, size range 00-
20 (ASTM International, 2011, p. 3)

45
ASTM Size 12 Filter
The MDB subset was filtered to find subjects within +/-1” of the ASTM D5585-11e1
bust, waist and hip girth measurements for the straight size 12. ASTM D5585-11e1 uses
variable grading, though the differences are all in increments of one-eighth inches. Size
12 was chosen because analysis of the ASTM standard showed it to have a minimum 1.5”
grade between adjacent sizes.
An excel spreadsheet was created with the 215 eligible subjects’ database number,
bust, waist, and hip girth measurements. The following formula was used:
=IF(AND(SGIRTH<=AGIRTH+1,SGIRTH>=AGIRTH-1)=TRUE,1,0)
Where ‘SGIRTH’ corresponds to the girth measurement for each subject, and ‘AGIRTH’
corresponds to the ASTM girth measurement for size 12. For size 12 the bust girth is
38.75”, the waist girth is 32.25”, and the hip girth is 41”. The formula finds if a subject’s
girth measurement is between -1” and +1” of the ASTM size 12 measurement for each
individual circumference. The same formula was applied to the CAESAR North
American dataset. Results are summarized in Table 9.
Bust Waist Hips Total
Bust +
Waist
Bust +
Hips
Waist
+ Hips
All
Three
MDB 16 23 32 71 5 11 4 1
CAESAR 46 47 119 212 26 28 18 7
Total 62 70 151 331 31 39 22 8 Table 9: Results from ASTM Size 12 Filter for MDB and CAESAR
Combining the seven subjects from the CAESAR database with the one subject from
the MDB resulted in a total of eight subjects. Eight subjects are not an adequate sample
size, so both CAESAR and the MDB were reviewed to see if any of the ASTM D5585-
11e1 sizes (00-20) produced an acceptable sample size for this study.
Final Subset: MDB + CAESAR
Combining the eligible candidates from the MDB and CAESAR databases resulted in
1036 subjects. The age range of this subset is 18 to 54, with an average age of 34.
Descriptive statistics for the final subset are summarized in Table 10 and Table 11.

46
Summary
# Subjects 1036
Age Stature Weight
Mean 34 Mean 65.56” Mean 152.6 lbs
Median 34 Median 65.31” Median 143.5 lbs
Mode 20 Mode 63.78” Mode 135.0 lbs
Minimum 18 Minimum 62.50” Minimum 86.5 lbs
Maximum 54 Maximum 69.92” Maximum 344.9 lbs
Bust Waist Hips
Mean 37.50” Mean 31.33” Mean 41.45”
Median 36.47” Median 30.04” Median 40.42”
Mode 33.86” Mode 28.35” Mode 41.42”
Minimum 30.20” Minimum 22.17” Minimum 31.50”
Maximum 61.22” Maximum 58.98” Maximum 68.43” Table 10: MDB + CAESAR data – female, age 18-54, height 62.5”-70”
Summary
Race # %
White 774 74.7%
African American 102 9.8%
No Response 75 7.2%
Asian/Pacific Islander 50 4.8%
Asian/Pacific Islander Other 19 1.8%
Asian/Pacific Islander Chinese 18 1.7%
Asian/Pacific Islander Vietnamese 4 0.4%
Asian/Pacific Islander Filipano 3 0.3%
Asian/Pacific Islander Korean 3 0.3%
Asian/Pacific Islander Japanese 2 0.2%
Asian/Pacific Islander Asian Indian 1 0.1%
Other Mixed Race 15 1.4%
Other Not Listed Above 8 0.8%
Spanish/Hispanic 7 0.7%
Spanish/Hispanic Mexican American 3 0.3%
Spanish/Hispanic Other 3 0.3%
Spanish/Hispanic Puerto Rican 1 0.1%
Native American/Alaskan 5 0.5%
Total 1036 100% Table 11: MDB + CAESAR races - female, age 18-54, height 62.5"-70"
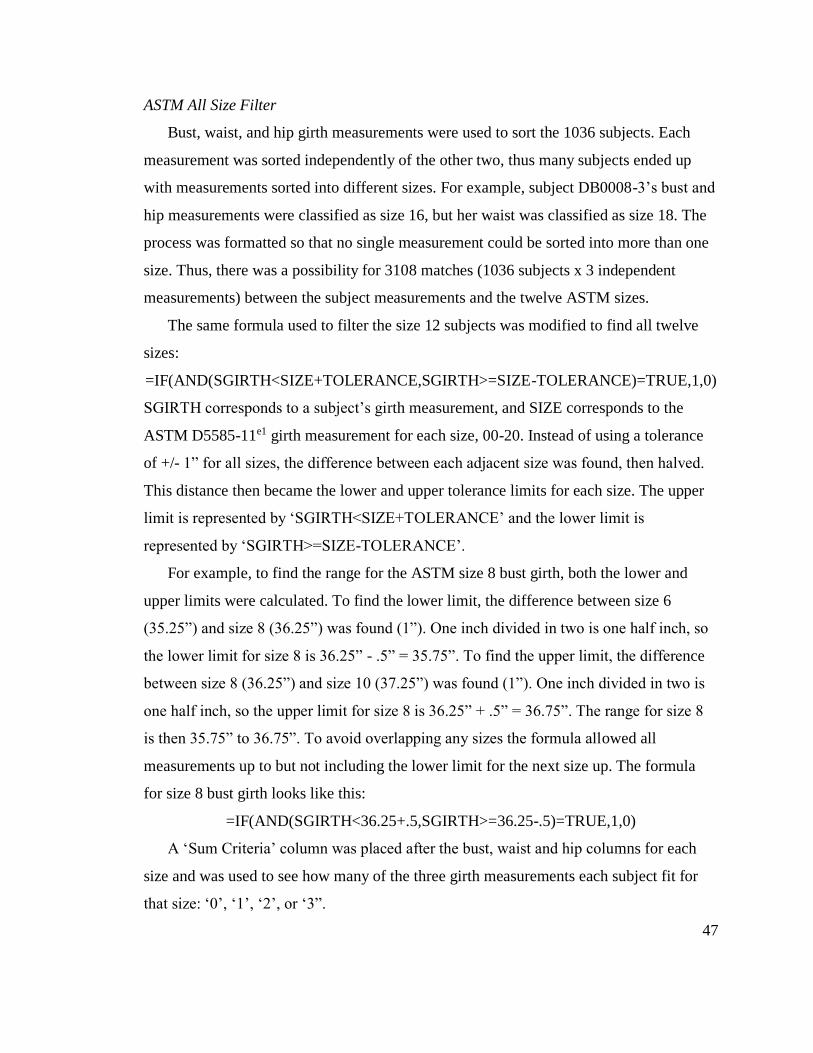
47
ASTM All Size Filter
Bust, waist, and hip girth measurements were used to sort the 1036 subjects. Each
measurement was sorted independently of the other two, thus many subjects ended up
with measurements sorted into different sizes. For example, subject DB0008-3’s bust and
hip measurements were classified as size 16, but her waist was classified as size 18. The
process was formatted so that no single measurement could be sorted into more than one
size. Thus, there was a possibility for 3108 matches (1036 subjects x 3 independent
measurements) between the subject measurements and the twelve ASTM sizes.
The same formula used to filter the size 12 subjects was modified to find all twelve
sizes:
=IF(AND(SGIRTH<SIZE+TOLERANCE,SGIRTH>=SIZE-TOLERANCE)=TRUE,1,0)
SGIRTH corresponds to a subject’s girth measurement, and SIZE corresponds to the
ASTM D5585-11e1 girth measurement for each size, 00-20. Instead of using a tolerance
of +/- 1” for all sizes, the difference between each adjacent size was found, then halved.
This distance then became the lower and upper tolerance limits for each size. The upper
limit is represented by ‘SGIRTH<SIZE+TOLERANCE’ and the lower limit is
represented by ‘SGIRTH>=SIZE-TOLERANCE’.
For example, to find the range for the ASTM size 8 bust girth, both the lower and
upper limits were calculated. To find the lower limit, the difference between size 6
(35.25”) and size 8 (36.25”) was found (1”). One inch divided in two is one half inch, so
the lower limit for size 8 is 36.25” - .5” = 35.75”. To find the upper limit, the difference
between size 8 (36.25”) and size 10 (37.25”) was found (1”). One inch divided in two is
one half inch, so the upper limit for size 8 is 36.25” + .5” = 36.75”. The range for size 8
is then 35.75” to 36.75”. To avoid overlapping any sizes the formula allowed all
measurements up to but not including the lower limit for the next size up. The formula
for size 8 bust girth looks like this:
=IF(AND(SGIRTH<36.25+.5,SGIRTH>=36.25-.5)=TRUE,1,0)
A ‘Sum Criteria’ column was placed after the bust, waist and hip columns for each
size and was used to see how many of the three girth measurements each subject fit for
that size: ‘0’, ‘1’, ‘2’, or ‘3”.

48
Results
After sorting 3108 measurements from the 1036 subjects into the twelve ASTM
D5585-11e1 sizes, the data was summarized into Table 12 and Table 13 for analysis.
Size 1 Match 2 Matches 3 Matches Total
00 70 0 0 70
0 77 8 0 85
2 136 29 0 165
4 199 40 2 241
6 256 53 2 311
8 251 52 6 309
10 271 85 4 360
12 254 57 2 313
14 192 44 4 240
16 120 27 7 154
18 77 20 3 100
20 50 16 4 70
Total 1953 431 34 2418 Table 12: Total number of girth matches organized by size
1 Match 2 Matches 3 Matches
Size Bust Waist Hips B&W B&H W&H B&W&H Total
00 14 54 2 0 0 0 0 70
0 30 46 1 7 0 1 0 85
2 80 44 12 20 7 2 0 165
4 86 56 57 19 17 4 2 241
6 98 76 82 29 11 13 2 311
8 87 71 93 25 12 15 6 309
10 78 71 122 36 27 22 4 360
12 53 78 123 23 18 16 2 313
14 44 46 102 15 12 17 4 240
16 19 38 63 12 5 10 7 154
18 21 22 34 10 5 5 3 100
20 13 10 27 8 4 4 4 70
Total 623 612 718 204 118 109 34 2418 Table 13: Subject’s matches by specific girth combinations, organized by size
Of the 3108 possible matches, there were 2481 hits. This indicates that ASTM
D5585-11e1 was able to accommodate 77.8% of the 3108 measurements for this group of

49
1036 female subjects. As seen in Table 12 the ‘1 Match’ column has 1953 hits; the ‘2
Matches’ column has 431 hits, and the ‘3 Matches’ column has 34 hits. This means that
of the 1036 subjects, only 34 (3.3%) had all three girths sorted into the same size. Table
13 was created to better understand which girths matched each size.
Sizes 00, 0, and 2 all had subjects within the accepted range for the bust, waist, hips,
or some combination thereof, but no size had subjects matching all three measurements.
Sizes 4, 6, and 12 all had two subjects matching all three measurements; size 18 had three
subjects; sizes 10, 14, and 20 each had four subjects; and size 8 had six subjects. Size 16
had the greatest number of subjects matching all three measurements: seven.
Based on these results, ASTM D5585-11e1 did not provide a compatible point of
reference for either the Master Database or the CAESAR North America database.
Searching all the ASTM sizes produced a smaller sample set than when looking only at
+/-1” of size 12. A self-sorting method was chosen as an alternate approach to sample
selection.
Self-Sort Method
The self-sorting method used the data from the final subset of 1036 subjects to
determine subjects who were similar to each other for each of the three key girth
measurements (bust, waist, hip).
Unlike ASTM’s sizing standards or Simmons et al.’s (2004) FFIT for apparel, which
use preconceived definitions of body forms to create their systems, this self-sorting
method allowed the deferment of body form classification. Delaying body form
classification was crucial for this study to retain its validity, as body-form variations were
classified after the garment was fit to the body and the pattern dimensions were collected.
By sorting the sample set into size groups using bust, waist, and hip girths, body-form
variations were revealed after the patterning process was finished.
There was no precedent for this sorting method found in the literature, thus a data
analysis expert was consulted. The goal was to find a set of women who were similar
enough that they could be considered the same size. Subjects within +/-1” of each other’s
girth measurements were considered similar in size. Alexander et al. (2012) used this

50
range to test the measurements of SizeUSA subjects against ASTM sizes. Additionally, a
+/-1” tolerance was reasonable, given a one inch grade is accepted as an industry
standard. Only subjects who matched all three girths and formed a large enough sample
group were considered for inclusion in this study.
Four matrices were created: one for bust girth, one for waist girth, one for hip girth,
and one for the sum of the prior three. To create bust, waist and hip girth matrices, the
database number and girth measurement for all 1036 eligible subjects were arrayed both
vertically and horizontally (Figure 22) such that every subject was tested against every
other subject. Matches were represented by the number ‘1’ and were color coded for ease
of visual confirmation while searching the matrix. Figures 22 and 23 are modified
examples of the real matrices. In these examples subjects DB0003-DB0008 were
eliminated from the ‘Subject #’ row because subjects DB0009-DB0012 were more
illustrative of the matching process.
Subject # DB0002-2 DB0009 DB0010 DB0011 DB0012
Subject # Bust 32.6 33.15 32.46 33.26 36.31
DB0002-2 32.6 0 1 1 1 0
DB0003 39.81 0 0 0 0 0
DB0004-3 36.91 0 0 0 0 1
DB0005 32.77 1 1 1 1 0
DB0006 34.83 0 0 0 0 0 Figure 22: Sample of bust matrix showing layout and color coding
The equation used to determine if subjects were within +/-1” of each other is:
=IF(SUBR=SUBC,0,IF(AND(SRGIR<=SCGIR+1,SRGIR>=SCGIR-1)=TRUE,1,0))
Where ‘SUBR’ corresponds to the subject number in the subject row and ‘SUBC’
corresponds to the subject number in the subject column. If these two match, then the
equation requires a response of ‘0’; otherwise the results would show that every person
matches themselves. For example, the cell shared by DB0002-2 (column) and DB0002-2
(row) has a ‘0’ in it, which means that the equation recognizes that this is the same person
and so must not compare their girths (Figure 22).
When ‘SUBR’ does not match ‘SUBC’, then the equation continues onto the next
part of the process, determining if the girth of the subject in the row (SRGIR) is within

51
+/-1” of the girth of the subject in the column (SCGIR). The upper limit is represented by
‘SRGIR<=SCGIR+1’, and the lower limit is represented by ‘SRGIR>=SCGIR-1’. If the
subjects’ girth is within +/-1” of each other, then the equation produces a response of ‘1’.
For example, the cell shared by DB0005 and DB0010 has a ‘1’ in it, which means that
they are within +/-1” of each other for the bust girth measurement (Figure 22). If the
subjects’ girth is not within +/-1” of each other, then the equation produces a response of
‘0’. For example, the cell shared by DB0003 and DB0009 has a ‘0’ in it, which means
that they are not within +/-1” of each other for the bust girth measurement (Figure 22).
The final matrix amalgamated the results from the bust, waist and hip girth matrices
to determine the final number of matches between subjects. To create the final matrix, the
database number for all 1036 eligible subjects was arrayed both vertically and
horizontally (Figure 23), maintaining the order from the bust, waist, and hip matrices.
Matches Subject # DB0002-2 DB0009 DB0010 DB0011 DB0012
2 DB0002-2 0 1 3 2 0
1 DB0003 0 0 0 0 0
7 DB0004-3 0 1 0 1 2
4 DB0005 3 1 3 2 0
4 DB0006 0 1 0 1 1 Figure 23: Sample of final matrix showing layout and color coding
The equation for this matrix is:
='Bust Matrix'!C#+'Waist Matrix'!C#+'Hip Matrix'!C#
Where ‘C#’ refers to the specific cell within a matrix shared by two subjects. The cells
could either have a ‘0’, ‘1’, ‘2’, or ‘3’ in them. The cells containing the numbers 1, 2, and
3 were color coded in various shades of green for ease of visual confirmation when
searching the matrix. A ‘1’ meant that subject pair had only one girth measurement
within the specified +/-1” tolerance. A ‘2’ meant that subject pair had two girth
measurements within the specified +/-1” tolerance. A ‘3’ meant that subject pair had all
three girths within the specified +/-1” tolerance, and were considered “a match”.
The ‘Matches’ column, on the left-most side of Figure 23, was created to count how
many times subjects in the ‘Subject #’ column matched all three girths with subjects in

52
the ‘Subject #’ row. Groups were formed based on how many matches a subject in the
‘Subject #’ column had with subjects in the ‘Subject #’ row.
Results
Figure 24: Bar chart showing number of groups based on number of subjects per group
Figure 24 charts the number of groups (y-axis) based on the number of subjects in
each grouping (x-axis). The higher the number of subjects in a group the lower the
number of groups there are, illustrating how difficult it is to create sizes that fit a majority
of the population. One hundred and one subjects did not match any other subject, leaving
935 subjects matched with at least one other subject. An average group consisted of 13.8
members. There were nineteen groups with 40+ matches, and the largest group consisted
of 47 members.
These nineteen groups were chosen for further analysis, as 40 subjects was an
adequate number to see body form variation across a size. The nineteen groups each had
one subject who matched to everyone else. This subject was marked as the ‘fit model’ for
their group. Each fit model’s age, bust girth, waist girth, hip girth, height, weight, and
number of matches are presented in Table 14.
As this was an exploratory study, only one group was desired for analysis. To insure a
diverse sample set, each fit model’s age, bust girth, waist girth, hip girth, height, and
weight were compared to their match group’s averages (Figure 25).
101
76
5343
52
33323040
2423242435
2516
2419202215
2214
23
8 1324
1522171417
1122
141218
103 7 5 1 5 2 2 0 3 1
0 2 4 6 8 10 12 14 16 18 20 22 24 26 28 30 32 34 36 38 40 42 44 46
Nu
mb
er o
f G
rou
ps
Number of Subjects
Number of Groups based on Number of Subjects per Group

53
Subject #DB0046-3 Group Subj - Grp.
Age 21 35 -14
Bust 36.60 36.55 0.05
Waist 29.08 29.18 -0.10
Hip 40.21 40.01 0.20
Height 63.46 65.97 -2.51
Weight 0.0 153.5 -153.5
Matches 42 Figure 25: Example of the layout and color coding used to assess the fit models
The difference between the fit model and the group average is seen in the 'Subj –
Grp.’ column of Figure 25. Negative differences (when the group average was higher
than the subject’s data) were color coded for easy viewing.
Four rounds of review occurred to determine the best set of subjects. The first point of
review determined if any crucial measurements were missing. Subjects DB0046-3 and
DB0152 were removed as their weight measurements were missing. The average,
minimum, and maximum of the differences was calculated for the remaining seventeen
fit models.
The second point of review required the value of the differences between the fit
model and group average for bust, waist, and hip girths be within or equal to half the
minimum or maximum value from the average of the Round 1 passes. The bust range was
-.11 to .09. The waist range was -.06 to .07. The hip range was -.11 to .08. Seven fit
models passed the second round.
The third point of review required observation of the body scans. Fit models were
eliminated if their scan exhibited unusual variations (i.e. asymmetry, disproportionate,
poor posture, etc.). Six fit models passed the third round.
For the final point of review, a fit expert was asked to review the final six candidates.
The fit model needed to closely represent the average of their sample set. #1751 and
#2461 were 14 and 12 years younger than their sample set respectively. #1994 and #2486
were 4.09” and 3.20” taller than the average of their sample set respectively. This left
#104 and #2062. Fit model #2062 was chosen because she had a greater number of
matches than fit model #104.

54
#104 #1140 #1222 #1801 #1939 #2011 DB0046-3 #1460 #2461
Age 32 48 39 46 29 29 21 23 23
Bust 35.12 35.94 35.00 33.23 36.65 34.84 36.60 35.94 35.79
Waist 28.31 28.43 28.35 26.42 29.53 27.64 29.08 29.69 28.39
Hip 39.49 39.92 39.57 38.27 39.45 39.76 40.21 39.96 40.39
Height 64.37 65.63 65.16 69.02 69.09 66.18 63.46 64.29 63.46
Weight 128.5 137.5 144.0 136.0 142.0 127.0 0.0 145.5 133.5
Matches 40 40 40 40 40 41 42 42 42
#2486 #2598 #2062 #2389 #1751 #1994 DB0139 DB0152 #121 #2681
Age 37 39 33 40 19 37 20 28 49 40
Bust 36.34 36.22 35.83 36.69 35.75 35.75 36.51 36.23 36.30 36.22
Waist 29.80 29.53 28.82 29.17 28.78 28.82 29.60 29.79 29.25 29.13
Hip 40.59 39.13 39.61 39.53 39.33 39.29 39.64 39.86 39.25 39.96
Height 69.02 63.31 66.81 67.52 63.94 69.76 68.72 62.80 64.76 64.17
Weight 145.5 131.5 142.0 138.5 135.0 140.0 130.0 0.0 140.0 144.0
Matches 42 42 43 43 44 44 46 46 46 47 Table 14: Data of the 19 fit models, arranged from least number of matches to most

55
Fit model #2062 is 33 years old, the same average age as her sample set. She weighs
142.0 pounds, which is 4.8 pounds more than her group’s average. She is 66.81” tall,
which is 1.22” taller than her group’s average. She has a bust girth of 35.83” (.05”
smaller than the group’s average), a waist girth of 28.82” (the same as the group’s
average), and a hip girth of 39.61” (.02” smaller than the group’s average). Figure 26
shows the front, right side, back, and left side views of #2062’s scan. While her
alignment is slightly skewed, it was determined that it would not have enough of an effect
on the pattern block to require choosing another candidate.
Figure 26: Front, right side, back, and left side images for the fit model
Fit model #2062’s sample set consists of 43 subjects: nine from the MDB and 34
from CAESAR. The age range spans 31 years with an average age of 33. Figure 27
illustrates the age distribution of the sample set: 18-19 has three subjects (7%); 20-29 has
sixteen subjects (37%); 30-39 has ten subjects (23%); 40-49 has thirteen subjects (30%);
and 50-54 has one subject (2%).
Height spans 7.26” with a group average of 65.59”. Weight spans 21 pounds with a
group average of 137.2 pounds. Both the bust girth and waist girth span 1.93” with group
averages of 35.88” and 28.82” respectively. Hip girth spans 1.82” with a group average
of 39.63”. Descriptive statistics are summarized in Table 15.
The different races present in this subset are: White (N = 36, 84%), African American
(N = 2, 5%), and Asian (N = 1, 2%). Four subjects (9%) elected not to include their race
in the databases. Often a sample heavily skewed towards one race is considered a

56
limitation. This research sorted by primary measurements only. Race may be a factor in
body-form variation, but further analysis of other sample sets is necessary to provide a
thorough understanding.
Figure 27: Ages of #2062 Sample Set
3
2 2
4
2
1 1
2 2
1 1 1 1
3
1
2 2 2 2
1
3
2
1 1
1 9 2 0 2 1 2 3 2 5 2 6 2 7 2 8 2 9 3 1 3 2 3 3 3 4 3 7 3 8 3 9 4 0 4 2 4 3 4 6 4 7 4 8 4 9 5 0
NU
MB
ER
OF
SU
BJE
CT
S
AGES
AGES OF #2062 SAMPLE SET
Summary
Age Height Weight
Mean 33 Mean 65.59” Mean 137.2 lbs
Median 33 Median 64.89” Median 137.0 lbs
Mode 23 Mode 64.72” Mode 144.0 lbs
Minimum 19 Minimum 62.50” Minimum 128.5 lbs
Maximum 50 Maximum 69.76” Maximum 149.5 lbs
Bust Waist Hips
Mean 35.88” Mean 28.82” Mean 39.63”
Median 35.86” Median 28.78” Median 39.57”
Mode 35.39” Mode 28.35” Mode 39.96”
Minimum 34.88” Minimum 27.87” Minimum 38.77”
Maximum 36.81” Maximum 29.80” Maximum 40.59”
Table 15: Descriptive Statistics for Final Sample Set
57
Chapter 4 Methods
This research aims to explore the proposition 1) that similar body measurements do
not produce similar body forms, and 2) that apparel block shapes can be categorized
based on distinct body form variations. The research questions are:
1. What are the body form variations across a single size?
2. What do these findings suggest for the development of a body-form based block
system?
This chapter presents the theoretical framework, the procedure to generate, collect and
analyze data, and the twenty-seven assumptions used to test question two.
A modified version of Gazzuolo’s (1985) Body-Garment Relationship (BGR)
framework provides the theoretical framework to guide this research (Figure 28). The
BGR is composed of four major components: the analytical component, the dimensional
component, the visual component and the physiological component. The analytical
component guided the process of abstracting the garment, determining the operational
definitions for orienting the garment to the body and identifying essential dimensions.
The dimensional component focused on the pattern; the collection of measurements
identified during the analytical phase allowed for pattern block comparison among the
sample set. The visual component focused on analysis of the body form; allowing for
comparisons among the sample set. The physiological component compared the pattern-
shape variances identified during the dimensional phase, against the body-form variances
identified during the visual phase to clarify how the body affected block formation.
This framework combines qualitative and quantitative research into one mixed
methods approach. The analytical and visual components focused on in-depth
understanding via description, a key tenant of qualitative research. The dimensional and
physiological components focused on comparisons between quantitative and categorical
data. A mixed methods approach provides the researcher with a more comprehensive
understanding of the body-garment relationship. As this project was exploratory in
nature, statistical analyses, such as principle component analysis and analysis of variance
were not conducted. The scope of this project became too large to conduct such tests,

58
though the researcher suggests such tests be conducted to more fully understand the
correlations between the body and garment.
Figure 28: The modified version of Gazzuolo's (1985) Body-Garment Relationship Framework used in this study

59
Differences from Gazzuolo’s BGR
While Gazzuolo’s (1985) Body-Garment Relationship framework is an ideal guide
for this research, there are two crucial differences between the research method suggested
by Gazzuolo and that used in this study:
1. Use of virtual fitting.
2. Visual analysis of fit.
Due to technological advances since Gazzuolo proposed her framework, the data
available for this study is digital. This means that instead of fitting real fabric to live
models, the researcher fit virtual fabric to virtual models (aka ‘avatars’). These avatars
are scans of real women, gathered at an earlier time using a body scanner. Body scanners
are ideal form capturing devices because they are a fast, non-contact, accurate method of
body measurement that provides a permanent record in the form of an avatar that can be
saved and used by any researcher with access to the scanner’s database (Bye, LaBat &
DeLong, 2006; Nayak, Padhye, Wang, Chatterjee, & Gupta, 2015). Benefits of the
avatars include the ability to rotate the scan so that any angle of the body-form can be
easily viewed, the ability to extract data in the form of points, lengths, surfaces, shapes
and volume (Bye et al, 2006), and the ability to export the scan to computer-aided design
(CAD) systems.
The virtual-fitting process for this research used Optitex’s pattern-making CAD
program. This CAD program follows the traditional pattern making and fitting process;
patterns are created two-dimensionally and then sewn to create a three-dimensional
garment. The difference from traditional, manual pattern-making and fitting lies in the
streamlining of the process. Because the sewing is done virtually it takes seconds to
“sew” the pattern together. This allows pattern makers to see a sample of their work
immediately, so they can correct fit and style errors in mere minutes, instead of the time it
takes to pattern, cut and sew an actual garment. This speeds up the traditional flat-pattern-
to-3D-garment process, and replaces the need to draft a new pattern from scratch.
As it currently exists, virtual measurement and virtual garment design software do not
allow for pattern makers to use Gazzuolo’s (1985) planar method (the methodology she
proposes for use with the BGR framework). While body scanners can take any

60
measurement, and find the x/y/z coordinates of specific body locations, they cannot mark
those locations for export into a CAD program. Additionally, the ability to decide where
pattern pieces are placed on the body in a virtual environment only allows for a crude
approximation of placement on a large body segment, such as ‘the left arm’. Though the
degree of precision necessary for the planar methodology is not yet fully realized in
virtual environments, the technology provides new information previously unavailable,
such as tension maps and model invisibility.
Visual analysis of fit has a long history that validates its accuracy. A well-trained
fitter understands how the garment should look on the body when it fits correctly and has
the knowledge of how to alter a pattern to arrive at this result. There is a wide spectrum
of interpretation of the term ‘good fit’, thus to allay the issue of using a personal
interpretation of ‘good fit’, precise garment abstraction and clear definitions of the fit
rules have been established. Garment abstraction and fit rules are discussed in-depth
during the analytical phase of this chapter.

61
Analytical Component
The analytical component abstracts the garment, determines the operational
definitions of garment orientation and identifies essential dimensions. This sets the
foundation and bounds the research; which requires a thorough discussion of the sheath
dress and the fit rules to be used.
A basic, sleeveless sheath dress was selected for this experiment because it covers the
locations most often associated with body form: the shoulders, bust, waist, stomach,
abdomen, high hip, hips, and thighs (Simmons et al., 2004; Lamport, 2008, 2010).
Sleeves add an extra layer of complexity to garment fit, but are not critical to reviewing
body-form variation, thus they were not included. Basic blocks, with their minimal ease
amounts, are the closest approximation of the body that is possible for a garment. As this
study focused on understanding body form through the analysis of a garment’s shape, the
basic block was the ideal tool. An image of the sheath dress is presented in Figure 29.
Figure 29: Sheath Dress
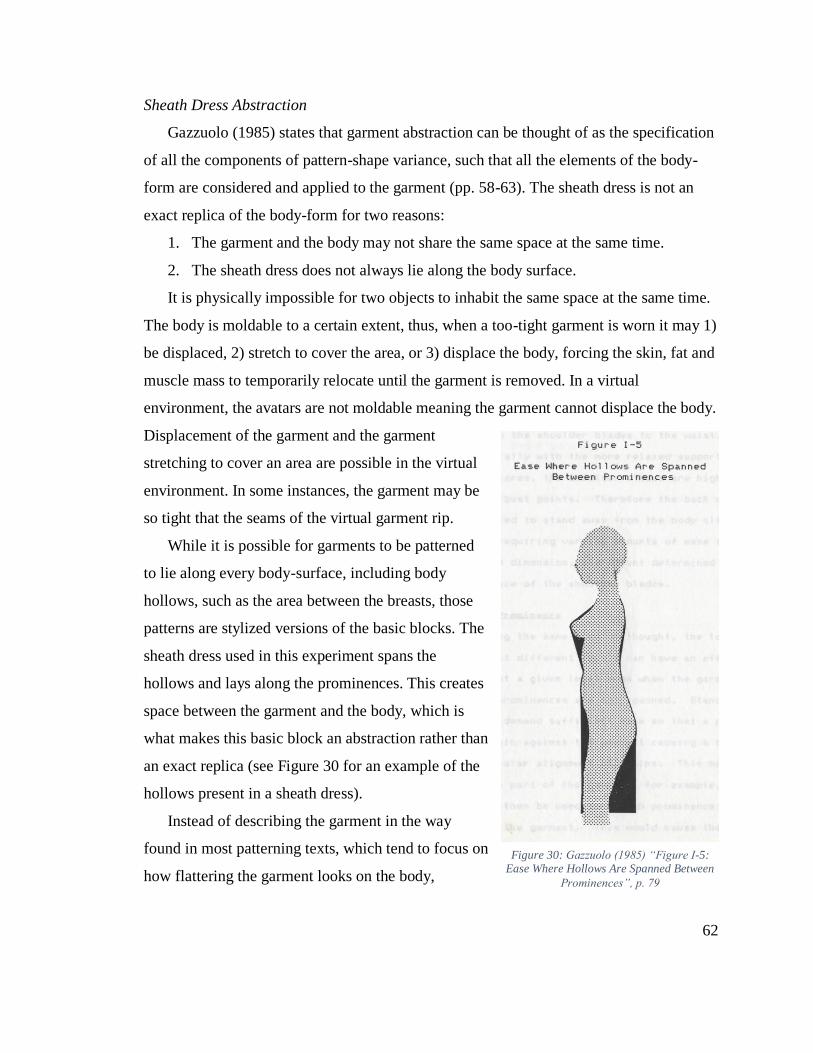
62
Sheath Dress Abstraction
Gazzuolo (1985) states that garment abstraction can be thought of as the specification
of all the components of pattern-shape variance, such that all the elements of the body-
form are considered and applied to the garment (pp. 58-63). The sheath dress is not an
exact replica of the body-form for two reasons:
1. The garment and the body may not share the same space at the same time.
2. The sheath dress does not always lie along the body surface.
It is physically impossible for two objects to inhabit the same space at the same time.
The body is moldable to a certain extent, thus, when a too-tight garment is worn it may 1)
be displaced, 2) stretch to cover the area, or 3) displace the body, forcing the skin, fat and
muscle mass to temporarily relocate until the garment is removed. In a virtual
environment, the avatars are not moldable meaning the garment cannot displace the body.
Displacement of the garment and the garment
stretching to cover an area are possible in the virtual
environment. In some instances, the garment may be
so tight that the seams of the virtual garment rip.
While it is possible for garments to be patterned
to lie along every body-surface, including body
hollows, such as the area between the breasts, those
patterns are stylized versions of the basic blocks. The
sheath dress used in this experiment spans the
hollows and lays along the prominences. This creates
space between the garment and the body, which is
what makes this basic block an abstraction rather than
an exact replica (see Figure 30 for an example of the
hollows present in a sheath dress).
Instead of describing the garment in the way
found in most patterning texts, which tend to focus on
how flattering the garment looks on the body,
Figure 30: Gazzuolo (1985) “Figure I-5: Ease Where Hollows Are Spanned Between
Prominences”, p. 79

63
Gazzuolo (1985) outlines six discussion elements necessary for abstracting the garment:
a. “Level of abstraction (complexity)
b. Grain orientation
c. Means of suspension
d. Reduction
e. Division
f. Correspondence” (p. 506)
Each element is discussed in turn.
Level of Abstraction
This is a correspondence-level garment, meaning it is the highest level of complexity
for garment abstraction. The front and back of the dress are differentiated and the
seamlines and darts of this sheath dress are located relative to the body-form. Figure 31
shows the six block pieces that make up the sheath dress.
Figure 31: Sheath Dress Block Pieces

64
The Bodice
The bodice’s longest length (both front and back) extends vertically from the high
point shoulder to the waistline seam. The greatest width for the bodice front extends from
the right-hand corner of the bottom of the armscye and the right side-seam (aka the
underarm point), to the left-hand underarm point. The greatest width for the bodice back
extends horizontally from the underarm point to the center back seam. The bodice center
front line extends vertically from the center of the hollow between the clavicles at the
base of the neck to the waistline. The bodice center back seam extends vertically from the
top of the spinous process of the seventh cervical vertebrae to the waistline. The waistline
for the bodice lies in the center of each subject’s natural waist, defined as where the body
visually indents on the sides.
The bodice front has four darts: one each on either side of the center front line in the
waist seam and one each on either side of the center front in the side seam. None of the
bodice front darts reach all the way to the bust apex, they measure a shorter length so that
the fullness they create at their points covers the bust apex.
The bodice back left has two darts: one at the mid-point of the shoulder seam and one
in the waist seam. Like the front darts, the bodice back left darts measure short of the
shoulder blade apex so that their fullness, created at their points, covers it. The bodice
back right is the mirror image of the bodice back left. In addition to having different dart
locations for the bodice front and the bodice back, the dart lengths and widths vary in
their dimensional reduction from front to back.
There are four major prominences for the bodice: the shoulder blades, the shoulder
point, the bust, and the rib cage. Gazzuolo (1985) only focuses on the prominences
affecting the front and back of the garment, but as technology allows spherical rotation of
the avatar, we can now include side prominences. The prominences affecting the front of
the bodice are the bust and shoulder point. The prominences affecting the back of the
bodice are the shoulder blades and the shoulder point. The prominences affecting the
sides of the bodice are the bust and rib cage. The bust may be wide enough to extends
beyond the width of the chest and create hollows along the side seam. Likewise, the rib
cage may also be wide enough to form a hollow between it and the waist seam.

65
The Skirt
The skirt’s longest length begins at the center waistline and extends vertically to the
bottom edge of the block (aka the hem). The waistline for the skirt lies in the center of
each subject’s natural waist, defined as where the body visually indents on the sides. The
greatest width for the skirt front extends horizontally across the level of greatest lower-
body side prominence. The greatest width for the skirt back left extends horizontally from
the side seam at the level of greatest lower-body side prominence to the center back
seam. The skirt back right is a mirror image of the skirt back left. The skirt hem ends at
the suprapatella.
The skirt front has two darts: one on either side of the center front line at the waist
seam, extending towards the greatest lower-body front prominence. These darts align
with the bodice front waist darts. Unlike the bodice, which is drafted of straight lines, the
skirt side seams curve from the level of the greatest lower-body side prominence to the
waist seam. The length and degree of curve depends upon the subject.
The skirt back left has one dart which extends towards the buttocks. This dart aligns
with the bodice back waist dart. Like the skirt front, the side seams of the skirt back left
curve from the level of the greatest lower-body side prominence to the waist seam. The
length and degree of curve depends upon the subject. The skirt back right is the mirror
image of the skirt back left. In addition to having different dart locations for the skirt
front and the skirt back, the dart lengths and widths will also vary in their dimensional
reduction from front to back.
There are six possible major prominences for the skirt: the stomach, the abdomen, the
high hip, the hip, the buttocks, and the thighs. The prominences affecting the front of the
skirt are the stomach and abdomen. It is likely that one of the two will be the major
prominence, rather than both being major prominences. The prominence affecting the
back of the skirt is the buttocks. The prominences affecting the sides of the skirt are the
high hip, hip and thighs. Again, it is likely that one of the three will be the major
prominence, rather than all three being major prominences.
66
Grain Orientation
Grain is the direction of yarns in a fabric. A woven fabric has two grains, a
lengthwise grain (identified by the warp yarns) and a crosswise grain (identified by the
weft yarns). Lengthwise grain is less elastic than crosswise grain, which is good for
maintaining vertical stability while also allowing the material to stretch slightly as it
rounds the body’s curves. It is standard practice to orient the lengthwise direction of
blocks along the lengthwise grain of a piece of fabric.
For this research, the blocks were oriented so that the lengthwise grain fell vertically
along the center front and center back of each block piece, but was on the bias at the
bodice side seams and the curved sides of the skirt. Bias is not a grain, instead it is all
other directions besides the lengthwise or crosswise grains (Gazzuolo, 1985, p. 65). It is
also much more elastic than either the lengthwise or crosswise grains, as there is nothing
preventing it from stretching in whichever direction it chooses. As such, having certain
areas of the blocks fall on the bias, while unavoidable, made it necessary to pay close
attention to the balance of the garment.
Balance is essentially the way a garment hangs on the body (Gazzuolo, 1985). Both
vertical and lateral balance must be addressed if the garment is to maintain its intended
suspension on the body (Wilson, 1950 via Gazzuolo, 1985). Balance points for this
sheath dress included the center front and center back neck points, the high-point
shoulder points, the shoulder points, the center front and center back waist points, and the
side waist points. Balance lines for the sheath dress included the bust-line and the line of
greatest lower body prominence. Adjusting the lengths and widths attached to the balance
points maintain correct grain orientation for the basic blocks.
Means of Suspension
According to Gazzuolo (1985), suspension is the act of a garment hanging from the
body, which is achieved by making the garment opening smaller than the body below it,
so that the garment stays on the body. This sheath dress is suspended from the body at
two locations: 1) the shoulders, and 2) the location of greatest lower-body prominence.
67
The suspension at these two locations is determined by the total neckline circumference
and the waistline circumference.
The neck has the smallest circumference of the upper body. The total circumference
of the neckline is what determines the widthwise position of the shoulder seams. A
larger-than-necessary neckline will push the shoulder seams towards the edge of the
shoulders, potentially causing the garment to slide off the body at the shoulders. Careful
determination of the total neckline circumference will help maintain the proper position
of the bodice and help properly position the entire garment.
The upper body suspension site ends at the waistline, which is a secondary suspension
location for this sheath dress. The waist is the smallest circumference of the lower body,
and the second smallest of the upper body. With improper placement of the shoulder
seams a larger-than-necessary waist circumference can potentially cause the skirt to slide
off the body at the location of greatest lower-body prominence. Careful determination of
the waistline circumference will help maintain the proper position of the skirt.
As the garment is an abstraction of the body-form, spaces appear under the greatest
prominences. The area that includes all of these spaces is called a ‘suspension site’. For
the bodice, the suspension site spans from the shoulder to the waistline and includes
spaces from the shoulder to the bust prominence, the shoulder blade prominence to the
waist, the bust prominence to the waist, and the rib cage to the waist. For the skirt, the
suspension site spans from the abdomen/stomach to the hem, and includes spaces from
the abdomen/stomach to the thighs or hem, the high-hip/hip/thigh to the hem, and the
buttocks to the hem.
Reduction/Enlargement
In order to achieve suspension and shape the garment to the body, either reduction or
enlargement must occur. Reduction, is the act of making garment lengths and widths
smaller. Enlargement is the opposite of reduction, or, the act of making garment lengths
and widths larger. Both are necessary as the basic blocks are altered to fit each subject
rather than made anew each time.

68
According to Gazzuolo (1985) there are two types of reduction: 1) Dimensional
reduction, used for altering a larger amount to a smaller one; and 2) Contour reduction,
used to shape the garment to align with the body’s natural contours. This follows that
there are two types of enlargement: dimensional and contour. Reduction and enlargement
can occur simultaneously in the same garment. For example, the bust circumference may
need to be reduced while the hip circumference may need to be enlarged in order to fit
the subject’s body correctly.
Methods to reduce and enlarge the blocks include: darts, tucks, pleats, gathers, shaped
seams, smocking, easing, flare or a combination of these (Gazzuolo, 1985, p. 89). For
these basic blocks, the only reduction/enlargement features necessary are darts and
shaped seams.
Dimensional reduction/enlargement occurs at any location necessitating a change in
length or width measurements. For example, changing the bodice front shoulder seam so
that it matches the length of the bodice back shoulder seam. Another example would be
changing the dart intake at the waistline to align the waistline circumference more closely
to the body’s waist circumference. For this sheath dress, dimensional
reduction/enlargement can occur at any seamline, the hem, and at all of the darts.
Contour reduction/enlargement occurs at locations necessitating shaping so that the
garment aligns with the body’s natural curves. Contour shaping may occur in this sheath
dress are at the neckline, armhole, and skirt side seams.
Division
Division is essentially how the garment is broken down into separate pieces. Division
is responsible for determining the seam locations for each block piece. For this sheath
dress, there two main units: the bodice and the skirt. These are further divided into six
block pieces: the bodice front, the bodice back left, the bodice back right, the skirt front,
the skirt back left, and the skirt back right (Figure 31).
The bodice front and the skirt front divide at the waistline creating two front pieces.
The bodice back divides from the skirt back at the waistline and is again divided down
the center back so that there are four back pieces. The bodice front attaches to the bodice

69
back at the shoulder seams and the side seams. The skirt front attaches to the skirt back at
the side seams.
The side seam for the skirt is perpendicular to the floor and splits the body in half
(Gazzuolo, 1985). There is no consensus on where the bodice side seams should be
placed (Gazzuolo, 1985). Thus, for this research, the bodice side seam will extend from
one inch below the subject’s armpit (at the mid-point of front and back) to the mid-point
of the subject’s side waist.
The division of the shoulder seams front and back determine their forward or
backward position on the body as well as how the neckline circumference is divided.
Careful attention to forward/backward position of the shoulder seams will help maintain
proper bodice positioning on the upper body.
Correspondence
Correspondence specifies the anatomical locations of the major pattern points. For
this garment, correspondence occurs at all block borders as well as the points of greatest
prominence. The correspondence points and seams are ordered from the top of the body
down:
High-Point-Shoulder. The high-point-shoulder falls at the base of the neck, along the
middle of the top of the shoulder for both the front and back block pieces.
Shoulder Point. The shoulder point falls at the outermost edge of the acromion for
both front and back block pieces.
Shoulder Seam. The shoulder seam extends from the high-point-shoulder in a straight
line ending at the shoulder point. The shoulder darts are embedded in the shoulder
seam and must be sewn before the front and back shoulder seams are sewn together.
Center Back Neck Point. The center back of the bodice block falls at the top of the
spinous process of the seventh cervical vertebra.
Center Front Neck Point. The center front of the bodice block falls at the center of the
hollow between the clavicles at the base of the neck.
Neckline. The neckline is created when the shoulder seams are sewn together and
curves around the base of the neck, starting at the center back neck point, passing

70
through the right high-point-shoulder, the center front neck point, the left high-point
shoulder, and ending again at the center back neck point. The curve of the back
neckline will be shallower than the curve of the front neckline.
Shoulder Blade Apex. The shoulder blade apex is the most protruded point of the
greatest shoulder blade prominence. The shoulder darts are located at the mid-point of
the shoulder seam, and are oriented diagonally towards the shoulder blade apex. The
back waist darts are centered under the shoulder blade apex in the waist seam, extend
vertically, and vary in width and length depending upon the subject. Freedom of
movement is provided by the fullness at the bodice back waist dart points.
Underarm Point. The underarm point falls 1” below the axilla, midway between the
subject’s front and back, for both front and back blocks. The underarm point is the
uppermost side seam point and the bottommost armscye point.
Armhole. The armhole is created when the shoulder seams and side seams of the
bodice are sewn together, and curves around the arm socket, from the underarm point,
up the chest, through the shoulder point, and down the back to end at the underarm
point. The curve under the arm is greater than the curve over the shoulder point.
Bust Apex. The bust apex is the point of greatest bust prominence, usually at the
nipple. The bust darts are located in the bodice side seams, pointing towards the bust
apex. The waist darts are in the bodice waist seam, are centered under the bust apex,
and extend vertically. The width and length of the bodice darts depends on the
subject. The fullness at their points provides the necessary room for breathing.
Center Front Waist Point. The center front waist point is vertically centered under the
center front neck point, in the middle of the subject’s waist.
Center Back Waist Point. The center back waist point is vertically centered under the
center back neck point, along the spine, in the middle of the subject’s waist.
Side Waist Points. The side waist points fall at the mid-point between the subject’s
front and back, in the middle of the subject’s waist, and are the same for the bodice
and skirt on both the right and left sides of the body.
Waist Seam. The waist seam extends around the body horizontally, making a full
circle from the center back waist point, the side right waist point, the center front
71
waist point, the side left waist point, and back to the center back waist point. The
waist seam connects the bodice to the skirt. The bodice and skirt darts are embedded
in the waist seams and must be sewn before the waist seams are sewn together.
Greatest Lower-Body Front Prominence. This point varies depending upon the
subject and may correspond to either the stomach or abdomen. The skirt front waist
darts will vary in width and length depending on the subject.
Buttocks Prominence. The skirt back waist darts point towards the buttocks
prominence, but do not reach all the way to it.
Greatest Lower-Body Side Prominence. This point may correspond to either the high-
hip, hip, or thighs and varies by subject. This is where the side seam starts curving up
to the side waist point.
Knees. The garment will hang straight down from the point of greatest lower-body
prominence to end the hem directly at the suprapatella.
Side Seam. The side seam starts at the underarm point, extending in a straight line to
the side waist point, where it curves to the point of greatest lower body prominence,
and then extends straight down to end at the hem. The bust dart is embedded in the
bodice side seam and must be sewn before the side seam.
Center Front Line. The center front line starts at the center front neck point, passes
through the mid-point of the left and right bust apexes, goes through the center front
waist point, passes over the bellybutton, and extends in a vertical line to the hem. The
center front line is imaginary in this dress, but important, as it helps orient the
lengthwise grain.
Center Back Seam. The center back seam starts at the center back neck point, travels
along the middle of the spine, passes through the center back waist point and extends
in a vertical line to the hem. The center back seam is created when the back left and
back right halves of the dress are sewn together. Lengthwise grain is aligned with the
center back seam.

72
Explanation of Fit Rules
The fitting rules were developed from the description of the sheath dress in the
correspondence section. Fitting rules are not suggested in Gazzuolo’s (1985) BGR
framework, but an addition based on the needs of this study. Gazzuolo did not need fit
rules because her use of the planar methodology fit the blocks to her subjects using x/y/z
coordinates. Visual analysis of fit was employed as the methodology for fit evaluation
and the principles of reduction and enlargement were used to achieve it. This section
explains each rule, ending with a list in Table 16.
This specific garment abstraction provided a consistent 2D block for comparison
across the sample set. Thus, changing the abstraction by splitting blocks into more pieces,
combining blocks into fewer pieces, or altering the locations of correspondence points,
darts, and seams would have made comparison between blocks impossible. Blocks
needed to be similar in their major elements for comparison:
1. Dress cannot change substantially in configuration from the one described during
garment abstraction – maintains number of block pieces, correspondence points,
and seams.
Ease is the amount of space added to the pattern for the comfort of the subject.
Patterning texts differ as to how much ease is necessary, though they all agree that some
is needed. The subjects in this study were virtual and could not specify ease preference.
The elimination of ease preference was beneficial, as the closer the garment conformed to
the body, the more accurately body-form variations were represented in the block shapes.
As long as the dress fit the subject well, the amount of space between the subject and the
block was viewed as the correct ease. This led to the second rule:
2. Blocks conform as close to body as possible without displacing or stretching the
garment at any location.
Adjustments at balance points (center front and center back neck points, high-point
shoulder, shoulder points, center front and center back waist points, side waist points, and
points of greatest lower-body side prominence) affect the grain orientation of each block.
The side seam usually does not follow the lengthwise grain, though this may vary by
subject. The shoulder seams, while straight, are usually sloped at some angle, causing the

73
grain to be on the bias at the shoulders. The center front and center back are always on
the lengthwise grain. If these two locations were oriented correctly, then the entire
garment was considered balanced. The following rules supported this:
3. Center front and center back lengthwise grain are perpendicular to floor.
4. Hem is parallel to the floor at center front and center back.
Darts are reduction/enlargement elements that help the garment abstraction conform
to the body. Their lengths and widths varied depending on the subject. Darts needed to
point towards the major prominence in their area:
5. Dart tips point towards the major prominence in their area.
The reason for abstracting the correspondence points, seams, and major prominences
was to help determine where the pattern and the body aligned so that blocks could be
compared during the dimensional phase. This rule oriented the block-shape to the space
inhabited by the body-form:
6. Correspondence points of blocks match correspondence locations on body:
• High point shoulder matches mid-point of shoulder at base of neck.
• Shoulder point matches outermost edge of the acromion.
• CB neck point matches top of spinous process of the seventh cervical vertebra at
base of neck.
• CF neck point matches center of hollow between clavicles at base of neck.
• Underarm point matches midway between subject’s front and back, 1” below
axilla.
• CF waist point matches middle of subject’s waist, centered under CF neck point.
• CB waist point matches middle of subject’s waist, centered under CB neck point
on spine.
• Side waist point matches midway between subject’s front and back, in middle of
subject’s waist.
• Point of greatest lower-body side prominence matches the subject’s side at the
high-hip, hip or thigh level.
• Hem matches the height of the suprapatellas.
74
If the correspondence points met there was no need to specify fitting rules for the
correspondence of major prominences or seams. Major prominences will change
depending on the subject. Seams are the connections between correspondence points.
Technically, the neckline is not a seam, but it is an important location, as the suspension
of the garment depends on the width of the neckline. The same holds true for the waist
seam. These two seams must follow the contour of the body quite closely, thus the
following rules:
7. Neckline curves through all correspondence points at base of neck.
8. Waist seam curves through all correspondence points at waist.
Block Creation
Basic blocks created by the University of Minnesota were the basis for this pattern.
The fit model’s bust girth, waist girth and hip girth measurements were compared to the
bust girth, waist girth and hip girth measurements of the basic blocks and the most
representative size was selected. The front shoulder dart was moved into the side seam, at
bust level.
Moving the bust dart into the side seam allowed accurate triangulation of the bust
prominence on the bodice block. Reducing the number of waist darts in the skirt from
two per side to one per side made it easier to track changes in the skirt darts. Changes in
position, length, and width of darts provided useful dimensional data.
The fit rules were applied to the blocks, resulting in a custom set of blocks for the fit
model. Song and Ashdown (2012) showed how starting with a pattern customized to your
population provided a better fitting final garment after customizing the pattern further for
each individual in their study. Customized starting blocks were used in this research to
reduce the amount of alterations necessary and to end with better fitting final garments.
Only the right side of the garment was adjusted. Optitex’s CAD system automatically
mirrors changes made on the “working half” of the garment to the “mirrored half” of the
garment so that changes are identical.

75
1. Dress cannot change substantially in configuration from the one described
during garment abstraction – maintains number of block pieces, correspondence
points and seams.
2. Blocks conform as close to body as possible without displacing or stretching
the garment at any location.
3. Center front and center back lengthwise grain are perpendicular to floor.
4. Hem is parallel to the floor at center front and center back.
5. Dart tips point towards the major prominence in their area.
6. Correspondence points of blocks match correspondence locations on body:
• High point shoulder matches mid-point of shoulder at base of neck.
• Shoulder point matches outermost edge of the acromion.
• CB neck point matches top of spinous process of the seventh cervical vertebra
at base of neck.
• CF neck point matches center of hollow between clavicles at base of neck.
• Underarm point matches midway between subject’s front and back, 1” below
axilla.
• CF waist point matches middle of subject’s waist, centered under CF neck
point.
• CB waist point matches middle of subject’s waist, centered under CB neck
point on spine.
• Side waist point matches midway between subject’s front and back, in middle
of subject’s waist.
• Point of greatest lower-body side prominence matches the subject’s side at
either the high-hip, hip or thigh level.
• Hem matches the height of the suprapatellas.
7. Neckline curves through all correspondence points at base of neck.
8. Waist seam curves through all correspondence points at waist.
Table 16: Fitting Rules for Basic Sheath Dress
76
Dimensional Component
The dimensional component used the operational definitions from the analytical
phase to generate, collect, and analyze data from the pattern blocks. The goal of the
dimensional component was to describe the major block-shape variations in this sample.
Lengths and widths were collected from the blocks at specific locations correspondent to
critical body-form sites. Sorting the blocks into groups based on the dimensional data
effectively sorted the body-forms into groups as well. Analysis of the quantitative data
allowed for comparison between the blocks and block-groups in the sample set.
Generation
To generate data, the pattern blocks were fit to each individual within the sample.
There is no specific method to follow for fitting garments to individuals. Thus, the
researcher chose to fit each individual based on the individual needs of each subject.
In general, width was addressed first. The appropriate darts, seams, or circumferences
were enlarged or reduced. Once the garment was large enough to skim the body, length
was adjusted. This often led to a re-adjustment in the width of the garment. Only one
adjustment was made at any given time so that the effect of the change could be viewed
by the researcher. The process continued until the garment met the fitting rules outlined
during the analytical phase (Table 16).
Collection
Data collection consisted of choosing dimensions that corresponded to specific body-
form variations. It was necessary that dimensions directly compared to the body-form, so
that the physiological phase could be carried out smoothly. All dimensions were collected
from the right-hand side of the garments, to correspond with the side of the garments that
were altered. The collected dimensions are highlighted in Figure 32.
The two neck dimensions are highlighted in dark blue on the bodice blocks. The first
neck dimension is the neck circumference, composed of the measurements from the
center front neck point to the high-point shoulder and the high-point shoulder to the
center back neck point, doubled. The second neck dimension is the front neck drop, the

77
vertical distance between the center front neck point and the height of the high-point
shoulder, represented by the vertical teal line in Figure 32.
Figure 32: Dimensions
The two shoulder dimensions are highlighted in purple on the bodice front block. The
first shoulder dimension is the shoulder seam length; a straight line from the high-point
shoulder to the shoulder point. Due to the use of the shoulder dart on the bodice back
block, the front and back shoulder seams measured the same length, so only the front
shoulder seam was measured.
The second shoulder dimension is the averaged shoulder slope. Shoulder slope was
taken using the method suggested for determining body shoulder slope in Maehren and
Meyers’ (2005) book, The Perfect Fit. A horizontal line was extended from the high-
point shoulder, while a vertical line was extended from the shoulder point. The distance

78
from the shoulder point to the level of the horizontal line represented the shoulder slope.
This may be referred to as shoulder drop in other texts. Both the front and back shoulder
slopes were taken. To take the back shoulder slope the dart was first closed, then the
measurement was taken. The dart was re-opened afterwards. The two slopes were
averaged to create a composite measurement.
The three dimensions that correspond to the shoulder blade are highlighted in light
blue on the bodice back pieces. The first shoulder blade dimension is the bodice back
waist dart depth: the vertical distance between the dart point and the midpoint of the dart
opening. The second shoulder blade dimension is the bodice back waist dart width, which
is the measurement of the dart opening. The third shoulder blade dimension is the
distance between the back waist darts: a straight line from the center back waist point to
the first dart leg, doubled.
The two bust dimensions are highlighted in green on the bodice front block. The first
bust dimension is the bust dart depth: the distance between the dart point and the
midpoint of the dart opening. The second bust dimension is the distance between the
front waist darts: a straight line from the first dart leg to the center front waist point,
doubled.
The four dimensions that correspond to the greatest lower-body front prominence are
highlighted in pink on the skirt front block. The first greatest lower-body front
prominence is the waist circumference. This was calculated by adding the distance from
the waist of the bodice front block to the distance from the waist of the bodice back
blocks. Both of these distances were calculated the same way: the distance from the right
side waist point to the outside dart leg added to the inside dart leg to the center waist
point, doubled. The second greatest lower-body front prominence is the front waist width,
which equates to the front half of the waist circumference dimension.
The third greatest lower-body front prominence is the skirt front waist dart depth: the
distance from the dart point to the midpoint of the dart opening. The fourth greatest
lower-body front prominence is the skirt front waist dart width: the measurement of the
dart opening.

79
The two buttocks dimensions are highlighted in red on the skirt back right piece. The
first buttocks dimension is the skirt back waist dart depth: the distance from the dart point
to the midpoint of the dart opening. The second buttock dimension is the skirt back waist
dart width: the measurement of the dart opening.
The final dimension corresponds to the greatest lower-body side prominence and is
highlighted in yellow on the skirt front block. The skirt curve length curves from the right
side waist point to the point of greatest lower-body side prominence.
Analysis
A spreadsheet of dimensions was organized by subject. Each subject received an
identifier (a1-a44) to protect their identity. Each dimension was sorted from smallest to
largest and graphed. Descriptive frequencies (mean, minimum, maximum, range and
standard deviation) were calculated for each dimension in addition to each subject’s
standard deviation from the mean within each dimension.
Graphs were set up with subjects on the x-axis and measurements on the y-axis. Each
visible value on the y-axis equates to one standard deviation. The minimum and
maximum y-axis values equate to the smallest and largest standard deviation necessary to
show all data points for each dimension. The graphs visually represented the range of the
measurements within a single dimension and allowed for group identification.
80
Visual Component
Gazzuolo’s (1985) intent with the visual component was to quantitatively compare
the critical values of one subject’s body with another’s. Gazzuolo’s visual component
focuses on analysis of the major lengths, widths, angles, and radii of the body to
understand the proportionate and spatial relationships among critical body sites and to
uncover the extent of physical prominences. Gazzuolo’s visual component focuses on
analysis of the body form; allowing for comparisons among the sample set. Upon
consideration of the technological advances beyond those available in 1985, and the
blocks being empirical abstractions of each subject’s body, this section was updated.
Gazzuolo (1985) used photographs to take measurements of the body. This research
used body scans, which are virtual three-dimensional representations of the body taken
via a body scanner. Scanning technology has the ability to extract any number of
measurements in a matter of seconds, thus providing detailed measurements of each
subject. But, since the blocks are empirical abstractions of the body, the dimensions
collected from the blocks were used in lieu of the dimensions taken from the body.
The goal for the visual component was to describe the major body-form variations of
this sample set to answer the first research question: What are the body-form variations
across a single size? Qualitative visual analysis and rich descriptions of the subjects were
used to understand the variability of the sample.
Body-form variations were identified by close inspection of each subject’s body scan
using ScanWorX, software developed for analysis of body scan data. Figure 33 shows the
regions analyzed for each subject. Purple equates to the neck and shoulders; green to the
bust; blue to the shoulder blades; pink to the greatest lower-body front prominence;
orange to the buttocks; and yellow to the greatest lower-body side prominence. Based on
the analytical component, these six regions each held the potential to affect the outcome
of the dress-blocks, altered during the dimensional phase.
To organize the results from the visual analysis phase, an Excel spreadsheet was
created to record each individual’s body-form variations. Variations were labeled by
specific body-part (i.e. shoulder or bust) and measurement entity (i.e. length or fullness).
Each variation had at least two categories with labels such as ‘long’, ‘small’ or ‘at high-

81
hip’. Tallies of how many subjects fell into each category within each body-form
variation allowed for comparisons within individual body-form variations.
Figure 33: Regions analyzed during visual analysis

82
Physiological Component
The physiological component explains the block-shape variances using the body-form
variances. Gazzuolo (1985) recommends digging deep into all the possible reasons a
subject’s body may present a variation. Reasons may include heredity, nutrition, and the
environment. Understanding what causes body-form variations could allow designers to
create better fitting garments for targeted populations. While this information would be
invaluable to the apparel market, this level of detail is outside the scope of this study.
Body-form variables were compared to pattern dimensions utilizing the groupings
identified during the dimensional component. Descriptions of the body-form variables
identified during the visual component gave meaning to the measurements collected
during the dimensional component. Table 17 lists the body component, pattern
dimension, and assumption for each of the body-form variables associated with the body
component.
Assumptions were based upon consideration of how the body could affect the pattern
blocks at specific locations. A strict one-to-one comparison was used to bound the
research. Garment abstraction aided in this endeavor, as it caused the researcher to
consider both the way the sheath dress was constructed and how it interacted with the
body. Explanations for each assumption are as follows.
The pattern blocks are made up of points connected by lines. The lines alter based on
the change in point locations. Points can move horizontally and vertically. Diagonal
movement is a combination of horizontal and vertical movements and thus will not be
discussed in the following analysis.
The neck circumference and front neck drop are affected by changes in the neck
points. The side neck points can either move horizontally (inwards towards the neck, or
outwards, towards the shoulder point) or vertically (towards the torso or away from it).
The center front and center back neck points can only move vertically. When all neck
points shift towards the neck the result should be a smaller neck circumference, and when
they all shift away from the neck the result should be a larger neck circumference.
Three body-form variations have an opportunity to affect the neck circumference:
neck thickness, the neck-to-shoulder transition, and collarbone prominence. How thick

83
the neck is may cause the some or all of the neck points to shift position. The type of
neck-to-shoulder transition may cause the side neck points to shift horizontally. A more
prominent collarbone may be due to a subject having a less fat and muscle mass, making
their bones easier to see. If this is the case, then it can be extrapolated that this subject
may have a thinner neck. Thus, the more prominent the collarbone, the smaller the neck
circumference should be, and vice versa.
The front neck drop may be affected by one body-form variation: neck tilt. How tilted
the neck is may cause the center front neck point to move vertically. A greater tilt should
shift the center front neck point more towards the torso. It is also possible that the side
neck points may shift vertically, and if they move in concert with the center front neck
point, then they would negate the effect of neck tilt on the pattern, at least as measured by
front neck drop. It is expected that even if the side neck points do move, the change in
center front neck point will be large enough to show the effect of neck tilt as measured by
front neck drop.
The shoulder seam and averaged shoulder slope are affected primarily by changes in
the shoulder point, and secondly by changes in the side neck points. The shoulder point
can move horizontally and vertically: towards the torso or away from it. The side neck
points can move horizontally or vertically, as described above. Both horizontal and
vertical changes in either the shoulder point or the side neck points should shorten or
lengthen the shoulder seam. If both the shoulder point and side neck point move in
concert with each other this would most likely equate to a change in the neck, rather than
a change in the shoulder. Only vertical changes at the shoulder point or side neck points
affect the shoulder slope.
Three body-form variations have the opportunity to affect the shoulder seam:
shoulder length, shoulder point softness, and shoulder point alignment. Shoulder length
may cause the shoulder point to shift horizontally, either shortening or elongating the
shoulder seam. The shoulder point on the body was identified as being either sharp or soft
during the visual analysis phase of the research. A sharper shoulder point was easier to
perceive than a soft one, making the placement of the pattern shoulder point easier on the
sharp shoulders than the soft ones, which may result in longer shoulder seam

84
measurements for subjects with soft shoulders. Shoulder point alignment compares the
alignment of the shoulder point with the bust, high-hip, and thigh of the subject. The type
of alignment with each body component should indicate the shoulder seam length.
Four body-form variations have the opportunity to affect the averaged shoulder slope
dimension: shoulder slope, shoulder point sharpness, shoulder length, and the neck-to-
shoulder transition. Vertical changes in the shoulder point or the side neck point reflect
the slope of the shoulder on the body. If the body’s shoulder slope is steeper, then the
shoulder seam should mimic that, resulting in a greater slope measurement. Shoulder
point softness may affect the slope, as the longer the shoulder seam becomes the greater
the slope measurement should also be. As stated previously, neck-to-shoulder transition
type may shift the side neck points horizontally, which should affect the length of the
shoulder seam, and by extension the amount of shoulder slope.
The bodice back waist dart depth and width are affected by the back waist dart tip
point and the back waist dart leg points. All of these points can move horizontally and
vertically. The dart tip point only moves horizontally when the dart leg points move right
or left in tandem. As the dart tip point moves vertically upward, towards the neck, the
back waist dart lengthens; as the dart point moves vertically downwards, towards the
waist, the back waist dart shortens. As the dart leg points move horizontally apart they
widen the dart; as they move horizontally towards each other they narrow the dart. The
dart legs were always moved the same distance so that the dart tip point stayed in the
center of the dart. As the dart leg points move vertically upwards, towards the neck, they
decrease the bodice back waist dart depth, and as it moves vertically downwards, towards
the waist, they increase the bodice back waist dart depth.
The between back waist darts distance is affected by the back waist dart leg points.
When the dart leg points move in the same direction they alter the distance between the
center back and the dart. Movement towards the center back narrows the between back
waist darts distance, while movement towards the side seam widens the between back
waist darts distance.
One body-form variation has the opportunity to affect the bodice back waist dart
depth: prominence point alignment. The shoulder blade prominence point equated to

85
three locations on the arm and may pull the dart tip point towards the neck, resulting in a
longer dart depth for the higher locations.
Two body-form variations have the opportunity to affect the bodice back waist dart
width: blade prominence and blade description. A larger shoulder blade prominence may
push the dart leg points outwards, increasing the width of the back waist dart. Five types
of shoulder blade descriptions were found during the visual analysis of the sample. The
flatter or softer types may pull the dart leg points inwards, narrowing the bodice back
waist dart.
One body-form variation has the opportunity to affect the between back waist darts
distance: shoulder blade width. Shoulder blades farther apart in width should result in
increased distance between the inner dart legs of the back bodice blocks. A wider
shoulder blade width could result from a narrower back waist dart or from the back waist
dart moving further from the center back seam.
The bust dart depth is affected by the horizontal movements of the three dart points.
When the dart tip point moves towards the bust it lengthens the bust dart; when it moves
towards the side seam it shortens the bust dart. When the dart leg points move towards
the side seam they lengthen the bust dart; when they move towards the bust they shorten
the bust dart. When the dart points move in tandem the dart depth does not change.
Two body-form variation have the opportunity to affect the bust dart depth: bust
fullness and ribcage containment. General sewing knowledge assumes that the larger the
prominence, the deeper and wider the corresponding dart. Given this assumption, it
follows that the fuller the bust, the deeper the dart. Ribcage containment may be the
result of smaller busts, which should lead to shorter bust dart depths.
The between front waist dart distance is affected by the horizontal movement of the
bodice front waist dart. Movement towards the center front narrows the distance between
the front waist darts distance, while movement towards the side seam widens the between
back waist darts distance. One body-form variation has the opportunity to affect the
between back waist darts distance: bust point width. Bust points further apart in width
should result in increased distance between the inner dart legs of the front bodice block.

86
The waist circumference is affected by the horizontal movements of the side waist
points, the center back waist points, and the waist dart leg points. Care was taken to keep
the waist of the bodice and skirt the same during the patterning phase. Inward movement
of the of the side and center back waist points, as well as outward movement of the waist
dart leg points should result in a narrower waist circumference. Outward movement of
the side and center back waist points, as well as inward movement of the waist dart leg
points should result in a wider waist circumference.
One body-form variation has the opportunity to affect the waist circumference: waist
indentation. Waist indentation varies among the sample, from non-existent to indented.
The degree of indentation may result in waist circumference variation, with the more
indented waists smaller in circumference.
The front waist width equates to half of the full waist circumference, and is affected
by the horizontal movements of the side waist points and the bodice front waist dart leg
points. As the side waist points move outwards, away from the torso, and the waist dart
leg points move inwards, narrowing the dart, the front waist width should increase. As
the side waist points move inwards, towards the torso, and the waist dart leg points move
outwards, widening the dart, the front waist width should decrease.
Three body-form variations have the opportunity to affect the front waist width:
greatest lower-body front prominence identifier, description, and past bust extension. The
type of GLBFP varies among the sample and may change the width measurement by
moving the front waist dart legs inward or outward. Past bust extension may be affected
by the type of GLBFP. This assumption does not strictly match with the front waist
width, but if the type of GLBFP does extend past the bust, it is more likely the front waist
width is larger.
The skirt front waist dart depth and width are affected by the horizontal and vertical
movements of the front waist dart tip point and the front waist dart leg points. All dart
points can move horizontally and vertically, though the dart tip point only moves
horizontally when the dart leg points move horizontally in the same direction. As the dart
tip point moves downwards, towards the hem, the dart deepens; and as it moves upwards,
towards the waist, the dart shortens. As the dart leg points move horizontally outwards

87
they widen the dart; and as they move horizontally inwards they narrow the dart. The dart
legs can also move vertically; as they move upwards, towards the neck, they deepen the
dart and as they move downwards, towards the hem, they shorten the dart.
One body-form variation has the opportunity to affect the skirt front waist dart depth:
greatest lower-body front prominence alignment. One body-form variation has the
opportunity to affect the skirt front waist dart width. These assumptions are based on the
premise that the larger the prominence, the deeper and wider the corresponding dart.
Visual analysis revealed that the GLBFP aligned at various points along the lower torso,
indicating that the dart depth may vary based on these points. Visual analysis also
revealed that the GLBFP could be described a few different ways. Flatter and softer
GLBFPs may pull the dart legs closer together, narrowing the dart.
The skirt back waist dart depth and width are affected the same way that the skirt
front waist dart depth and width are. Three body-form variations have the opportunity to
affect the skirt back waist dart depth: buttocks length, the fullest part of the buttocks and
buttocks alignment. One body-form variation has the opportunity to affect he skirt back
waist dart width: buttocks prominence. All assumptions are based on the premise that the
larger the prominence, the deeper and wider the corresponding dart. A longer buttock can
pull the skirt back waist dart tip point towards the hem, thereby lengthening the dart. If
the fullest part of the buttocks is lower, then the skirt back waist dart tip point should be
pulled towards the hem, lengthening the dart. Alignment of the buttocks was shown to
vary during visual analysis, indicating that the dart depth may vary based on these points.
Buttocks prominence was composed of two categories: flat and prominent. A prominent
buttock may push the dart legs further apart, widening the dart.
The skirt side seam curve length is affected by the side waist point and the greatest
lower-body side prominence point. Care was taken to insure the front and back curves
were the same. The points can all move horizontally and vertically. Horizontal changes
affect the curvature, which affect the length, as a rounder curve is longer than a flatter
one. Moving the side waist point horizontally inwards, towards the center of the body,
should result in a longer curve length; while moving it outwards, away from the center of
the body, should result in a shorter curve length. Moving the side waist point vertically

88
downwards, towards the hem, should result in a shorter curve length, while moving it
upwards, towards the neck, should result in a longer curve length. Moving the GLBSP
point horizontally inwards, towards the center of the body, should result in a shorter
curve length; while moving it outwards, away from the center of the body, should result
in a longer curve length. Moving the GLBSP point vertically downwards, towards the
hem, should result in a longer curve length; while moving it upwards, towards the waist,
should result in a shorter curve length. Combinations of movement between the side
waist point and the GLBSP point can result in any number of shorter or longer curve
lengths.
Three body-form variables have the opportunity to affect the skirt side seam curve
length: the greatest lower-body side prominence location, alignment and description.
Visual analysis revealed two locations for the GLBSP: high-hip and thigh. The location
on the body affected where the GLBSP point was placed, so the curve length should be
partly dependent upon the location of the GLBSP. Visual analysis revealed that the
GLBSP could be described a few different ways. Flatter and softer GLBSPs may make
the curve flatter, shortening the curve length.

89
Body
Component
Pattern Dimension
Assumptions
Neck Neck circumference
The thicker the neck, the larger the neck circumference.
A smooth neck-to-shoulder transition will produce a larger neck circumference, while
a sharp neck-to-shoulder transition will produce a smaller neck circumference.
The more prominent the collarbone, the smaller the neck circumference will be.
Neck Front neck drop
The more forward tilted the neck is in relation to the torso, the longer the front neck
drop measurement will be.
Shoulder Shoulder seam
The longer the shoulder, the larger the shoulder seam measurement will be.
The softer the shoulder point, the longer the shoulder seam measurement will be.
The farther the shoulder point is outside the bust, high-hip and thigh widths, the longer
the shoulder seam measurement will be.
Shoulder Averaged shoulder slope
The more sloped the shoulder, the larger the shoulder slope measurement will be.
The softer the shoulder point, the larger the shoulder slope measurement will be.
The longer the shoulder, the larger the shoulder slope measurement will be.
A smooth neck-to-shoulder transition will produce a larger shoulder slope
measurement, while a sharp neck-to-shoulder transition will produce a smaller
shoulder slope measurement.
Shoulder
Blade
Bodice back waist dart
depth
The further the shoulder blade prominence point is from the waist, the larger the
bodice back waist dart depth measurement will be.
Shoulder
Blade
Bodice back waist dart
width
The more prominent the shoulder blade, the larger the bodice back waist dart width
measurement will be.
The type of shoulder blade prominence will affect the measurement of the bodice back
waist dart width.
Shoulder
Blade
Between back waist darts
distance
The wider apart the shoulder blade prominence points are, the larger the between back
waist darts distance measurement will be.
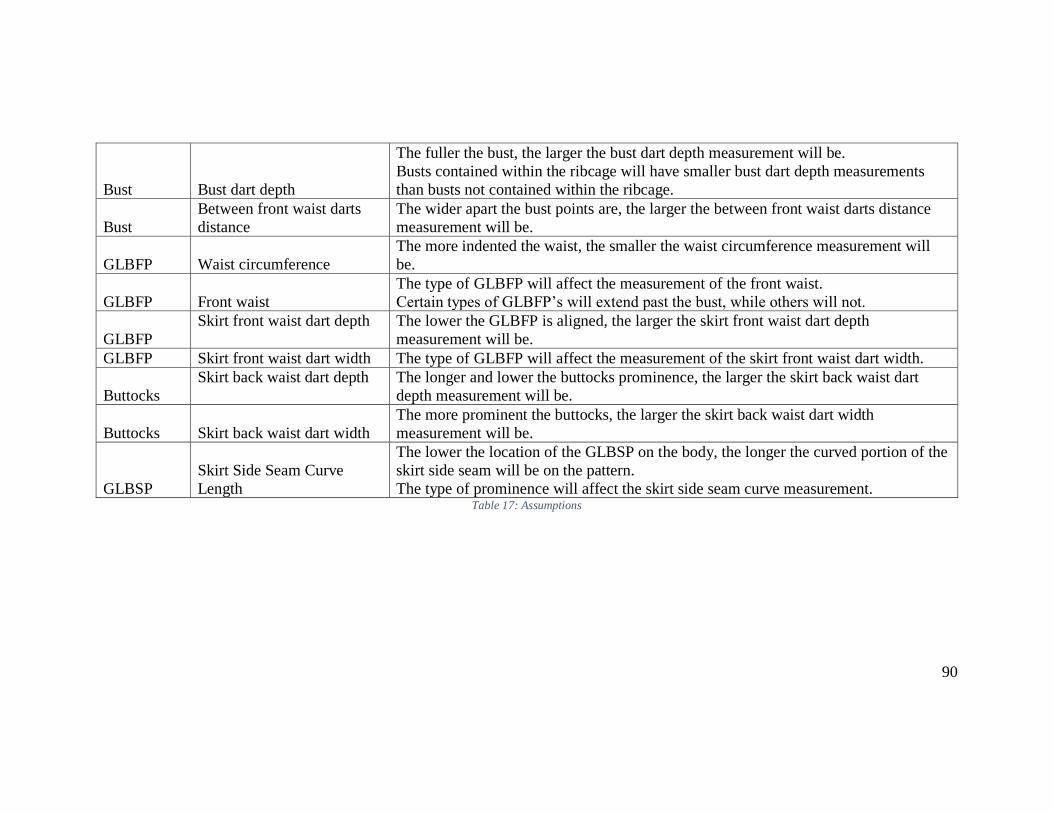
90
Bust Bust dart depth
The fuller the bust, the larger the bust dart depth measurement will be.
Busts contained within the ribcage will have smaller bust dart depth measurements
than busts not contained within the ribcage.
Bust
Between front waist darts
distance
The wider apart the bust points are, the larger the between front waist darts distance
measurement will be.
GLBFP Waist circumference
The more indented the waist, the smaller the waist circumference measurement will
be.
GLBFP Front waist
The type of GLBFP will affect the measurement of the front waist.
Certain types of GLBFP’s will extend past the bust, while others will not.
GLBFP
Skirt front waist dart depth
The lower the GLBFP is aligned, the larger the skirt front waist dart depth
measurement will be.
GLBFP Skirt front waist dart width The type of GLBFP will affect the measurement of the skirt front waist dart width.
Buttocks
Skirt back waist dart depth
The longer and lower the buttocks prominence, the larger the skirt back waist dart
depth measurement will be.
Buttocks Skirt back waist dart width
The more prominent the buttocks, the larger the skirt back waist dart width
measurement will be.
GLBSP
Skirt Side Seam Curve
Length
The lower the location of the GLBSP on the body, the longer the curved portion of the
skirt side seam will be on the pattern.
The type of prominence will affect the skirt side seam curve measurement. Table 17: Assumptions

91
Chapter 5 Results
This chapter presents the results from the dimensional, visual, and physiological
components of data analysis. Though the majority of people have some level of body
asymmetry, only the right side of the dress blocks were altered, assuming a symmetrical
body. Four of the 43 subjects were removed from the sample set due to extreme
asymmetry which compromised the fit of the garment on the avatars.
The fit model is the standard for this sample, and thus was not included in analysis of
the sample. Information about the fit model is presented during the dimensional and
visual components to show how the sample differs from the standard.
Dimensional
Nineteen measurements were extracted from the blocks. Some of the measurements
were manipulated to determine measurements meaningful to body-form variation. As
only the right side of the patterns was altered, the width measurements equal one quarter
of the full body circumference. To calculate a circumference, the front and back
measurements were doubled and added together. The front and back shoulder slopes were
averaged to simplify analysis. This resulted in sixteen dimensions for analysis.
Each dimension was sorted from smallest to largest and graphed using a dot plot. Dot
plots were chosen to allow the researcher to see how the sample measurements ranged
naturally. A histogram was considered; however, this method requires pre-selection of
groups. There is no data to suggest preset ranges for individual dimensions. Additionally,
histograms require equidistant ranges for each bar on the graph, which did not support the
formation of unique groups.
The graphs present the range of measurements for each dimension, and illustrate
groupings among subjects. Groupings were color coded, with a red dot denoting the fit
model. Descriptive frequencies (mean, minimum, maximum, range, and standard
deviation) were calculated for each dimension. The fit model was excluded from the data
used to calculate the descriptive frequencies, but included in the graphs. The number of
standard deviations each subject was from the mean was calculated and the minimum and

92
maximum standard deviations were set as the minimum and maximum limits on the y-
axis of each graph.
Neck Dimensions
Two dimensions corresponded to the neck: neck circumference and front neck drop.
The front neck drop was measured by placing a horizontal line at both the high-point
shoulder and the center front neck points and measuring the vertical distance between the
lines.
Figure 34: Neck Circumference
The mean for the neck circumference was 15.75”; 1.125” larger than the fit model.
The range was 2.72”, with the minimum at 14.41” and the maximum at 17.13”. The
standard deviation was 0.725”. The fit model equaled the second smallest neck
circumference measurement in the sample: 14.625”. No distinct group were identified
from this graph, though the diagonal line indicates variation in fit (Figure 34).
The mean for the front neck drop was 3.58”; 0.53” larger than the fit model. The
range for this dimension was 1.16”, with the minimum at 2.86” and the maximum at
4.05”. The standard deviation was 0.35”. The fit model equaled the sixth smallest front
14.28
15.01
15.74
16.47
17.20
0 5 10 15 20 25 30 35 40
Neck Circumference

93
neck drop measurement in the sample: 3.05”. Five groups were identified from this graph
(Figure 35).
Figure 35: Front Neck Drop
Shoulder Dimensions
Two dimensions corresponded to the shoulder: shoulder seam and averaged shoulder
slope. Shoulder seam is the distance from the high-point shoulder to the shoulder point.
Averaged shoulder slope is composed of the front and back shoulder slope
measurements. Shoulder slope was measured by placing horizontal lines through the
high-point shoulder and shoulder point, and then measuring the vertical distance between
the lines.
The mean for shoulder seam was 3.95”; 0.05” smaller than the fit model. The range
for this dimension was 0.97”, with the minimum at 3.5” and the maximum at 4.47”. The
standard deviation was 0.22”. The fit model equaled the sixth largest shoulder seam
measurement in the sample: 4”. Five groups were identified from this graph (Figure 36).
The mean for averaged shoulder slope was 1.24”; .01” smaller than the fit model. The
range for this dimension was 0.70”, with the minimum at 0.875” and the maximum at
1.57”. The standard deviation was 0.14”. The fit model equaled the tenth smallest
2.86
3.22
3.58
3.94
0 5 10 15 20 25 30 35 40
Front Neck Drop

94
averaged shoulder slope measurement in the sample: 1.25”. Five groups were identified
from this graph (Figure 37).
Figure 36: Shoulder Seam
Figure 37: Averaged Shoulder Slope
Shoulder Blade Dimensions
Three dimensions corresponded to the shoulder blades: bodice back waist dart depth,
bodice back waist dart width, and the between back waist darts distance. The between
3.31
3.52
3.73
3.94
4.15
4.36
4.57
0 5 10 15 20 25 30 35 40
Shoulder Seam
0.84
0.97
1.10
1.23
1.36
1.49
1.62
0 5 10 15 20 25 30 35 40
Averaged Shoulder Slope

95
back waist darts distance equals the center back waist point to the first bodice back waist
dart leg measurement, doubled.
The mean for the bodice back waist dart depth was 7.36”; 1.39” smaller than the fit
model. The range for this dimension was 3.25”, with the minimum at 5.5” and the
maximum at 8.75”. The standard deviation was 0.68”. The fit model equaled the largest
bodice back waist dart depth measurement in the sample: 8.75”. Five groups were
identified from this graph (Figure 38).
Figure 38: Bodice Back Waist Dart Depth
The mean for the bodice back waist dart width was 1.53”; 0.22” smaller than the fit
model. The range for this dimension was 0.89”, with the minimum at 0.875” and the
maximum at 1.77”. The standard deviation was 0.25”. The fit model equaled the second
largest bodice back waist dart width measurement in the sample: 1.75”. Four groups were
identified from this graph (Figure 39).
The mean for the between back waist darts distance was 5.68”; 0.75” larger than the
fit model. The range for this dimension was 3.53”, with the minimum at 4.94” and the
maximum at 8.47”. The standard deviation was 0.8”. The fit model equaled the smallest
between back waist darts distance measurement in the sample: 4.94”. Three groups were
identified from this graph (Figure 40).
5.29
5.99
6.69
7.39
8.09
8.79
0 5 10 15 20 25 30 35 40
Bodice Back Waist Dart Depth

96
Figure 39: Bodice Back Waist Dart Width
Figure 40: Between Back Waist Darts Distance
Bust Dimensions
Two dimensions corresponded to the bust: bust dart depth and between front waist
darts distance. The between front waist darts distance equals the center front waist point
to the first bodice waist dart leg measurement, doubled.
0.80
1.05
1.30
1.55
0 5 10 15 20 25 30 35 40
Bodice Back Waist Dart Width
4.86
5.66
6.46
7.26
8.06
8.86
0 5 10 15 20 25 30 35 40
Between Back Waist Darts Distance
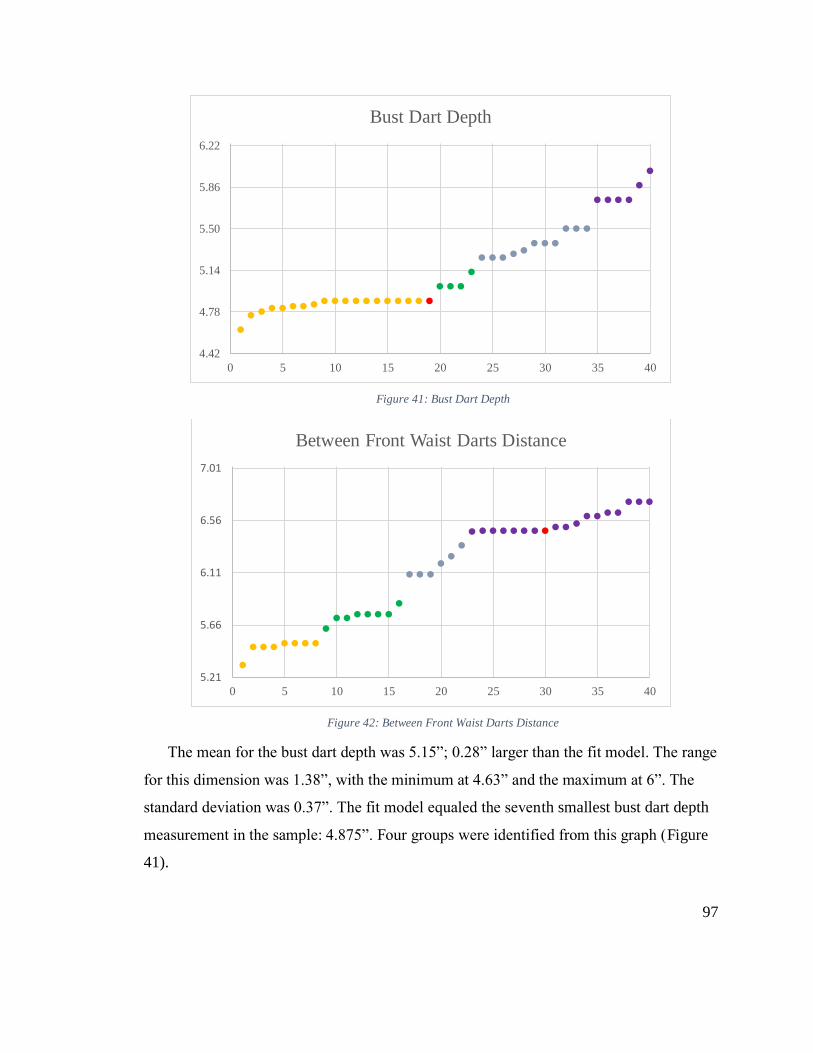
97
Figure 41: Bust Dart Depth
Figure 42: Between Front Waist Darts Distance
The mean for the bust dart depth was 5.15”; 0.28” larger than the fit model. The range
for this dimension was 1.38”, with the minimum at 4.63” and the maximum at 6”. The
standard deviation was 0.37”. The fit model equaled the seventh smallest bust dart depth
measurement in the sample: 4.875”. Four groups were identified from this graph (Figure
41).
4.42
4.78
5.14
5.50
5.86
6.22
0 5 10 15 20 25 30 35 40
Bust Dart Depth
5.21
5.66
6.11
6.56
7.01
0 5 10 15 20 25 30 35 40
Between Front Waist Darts Distance

98
The mean for the between front waist darts distance was 6.1”; 0.36” smaller than the
fit model. The range for this dimension was 1.41”, with the minimum at 5.31” and the
maximum at 6.72”. The standard deviation was 0.45”. The fit model equaled the sixth
largest between front waist darts distance measurement in the sample: 6.47”. Four groups
were identified from this graph (Figure 42).
GLBFP Dimensions
Four dimensions corresponded to the greatest lower-body front prominence: waist
circumference, front waist width, skirt front waist dart depth, and skirt front waist dart
width.
Figure 43: Waist Circumference
The mean for waist circumference was 32.28”, 0.91” larger than the fit model. The
range for this dimension was 5”, with the minimum at 30.94” and the maximum at
35.94”. The standard deviation was 1.09”. The fit model equaled the third smallest waist
circumference measurement in the sample: 31.125”. Four groups were identified from
this graph (Figure 43).
The mean for the front waist width was 17.41”, 0.44” larger than the fit model. The
range for this dimension was 4.13”, with the minimum at 15.66” and the maximum at
30.09
31.18
32.27
33.36
34.45
35.54
0 5 10 15 20 25 30 35 40
Waist Circumference

99
19.78”. The standard deviation was 0.82”. The fit model equaled the sixth smallest front
waist width measurement in the sample: 16.97”. Six groups were identified from this
graph (Figure 44).
Figure 44: Front Waist Width
The mean for the skirt front waist dart depth was 4.17”; 1.83” smaller than the fit
model. The range for this dimension was 3”, with the minimum at 3” and the maximum
at 6”. The standard deviation was 0.68”. The fit model equaled the ninth largest skirt
front waist dart depth measurement in the sample: 4.23”. Five groups were identified
from this graph (Figure 45).
The mean for the skirt front waist dart width was 0.69”, 0.05” smaller than the fit
model. The range for this dimension was 0.41”, with the minimum at 0.48” and the
maximum at 0.89”. The standard deviation was 0.08”. The fit model equaled the sixth
largest skirt front waist dart width measurement in the sample: 0.73”. Three groups were
identified from the graph (Figure 46).
14.96
15.77
16.58
17.39
18.20
19.01
19.82
0 5 10 15 20 25 30 35 40
Front Waist Width

100
Figure 45: Skirt Front Waist Dart Depth
Figure 46: Skirt Front Waist Dart Width
Buttocks Dimensions
Two dimensions corresponded to the buttocks: skirt back waist dart depth and skirt
back waist dart width.
The mean for the skirt back waist dart depth was 7.39”; 0.52” larger than the fit
model. The range for this dimension was 3.63”, with the minimum at 5” and the
2.82
3.50
4.18
4.86
5.54
0 5 10 15 20 25 30 35 40
Skirt Front Waist Dart Depth
0.45
0.53
0.61
0.69
0.77
0.85
0.93
0 5 10 15 20 25 30 35 40
Skirt Front Waist Dart Width

101
maximum at 8.63”. The standard deviation is 0.75”. The fit model equaled the sixth
smallest skirt back waist dart depth measurement in the sample: 6.875”. Three groups
were identified from this graph (Figure 47).
Figure 47: Skirt Back Waist Dart Depth
Figure 48: Skirt Back Waist Dart Width
The mean for the skirt back waist dart width was 1.84”; 0.22” smaller than the fit
model. The range for this dimension was 0.89”, with the minimum at 1.17” and the
maximum at 2.06”. The standard deviation was 0.26”. The fit model equaled the largest
4.44
5.18
5.92
6.66
7.40
8.14
0 5 10 15 20 25 30 35 40
Skirt Back Waist Dart Depth
1.09
1.34
1.59
1.84
2.09
0 5 10 15 20 25 30 35 40
Skirt Back Waist Dart Width

102
skit back waist dart width measurement in the sample: 2.06”. Four groups were identified
from this graph (Figure 48).
GLBSP
One dimension corresponded to the greatest lower-body side prominence: skirt curve
length. The skirt curve length extends from the waist to the point of greatest lower-body
side-prominence.
The ratio of the skirt curve to the skirt side seam mean was 10.78”; 0.34” smaller than
the fit model. The range for this dimension was 8.28”, with the minimum at 4.83” and the
maximum at 13.11”. The standard deviation was 1.92”. The fit model had the fifteenth
smallest skirt curve length measurement in the sample. Two groups were identified from
this graph (Figure 49).
Figure 49: Skirt Curve Length
3.22
5.11
7.00
8.89
10.78
12.67
14.56
0 5 10 15 20 25 30 35 40
Skirt Curve Length

103
Visual
Each dimension corresponded to at least one body-form variable. Scans were visually
analyzed in ScanWorX, measurement software by Human Solutions of North America,
Inc. Descriptions were generated from the scans. Data and graphs for the twenty-seven
body-form variables are presented in this section. Each graph includes the descriptors and
count for each variable.
Neck
Analysis of the neck included neck thickness, the neck-to-shoulder transition,
collarbone visibility, and neck tilt. The fit model had an average neck thickness, a smooth
neck-to-shoulder transition, a visible collarbone, and a slightly forward neck tilt.
Neck thickness produced three groups: thin, average, and thick (Figure 50). Thirteen
subjects had thin necks, twelve subjects had average necks, and fourteen subjects had
thick necks. Neck-to-shoulder transition produced two groups: sharp and smooth (Figure
51). There were twenty-eight subjects in the sharp group, and eleven subjects in the
smooth group. Collarbone visibility ranged from flat, nearly flat, visible, and prominent
(Figure 52 & Figure 53). Neck tilt ranged from straight, slightly forward, forward, and far
forward (Figure 54 & Figure 55).
Figure 50: Examples of Neck Thickness from left: Thin, Average, Thick
Figure 51: Examples of Neck-to-Shoulder Transition, from left: Sharp, Smooth

104
Figure 52: Collarbone Visibility
Figure 53: Examples of Collarbone Visibility, from top left: Flat, Nearly Flat, Visible, Prominent
Figure 54: Neck Tilt
6
16
15
2
0 5 10 15 20
Prominent
Visible
Nearly Flat
Flat
Collarbone Visibilty
5
18
8
8
0 5 10 15 20
Far Forward
Forward
Slightly Forward
Straight
Neck Tilt

105
Figure 55: Examples of Neck Tilt, from top left: Straight, Slightly Forward, Forward, Far Forward
Shoulder
Analysis of the shoulder included shoulder length description, shoulder point
sharpness, shoulder point alignment, and shoulder slope description. The fit model had an
average shoulder length, soft shoulder points that aligned with the bust, but were inside
the high-hip and thigh, and slightly sloped shoulders.
Shoulder length description produced three groups: short, average, and long (Figure
56). Eleven subjects were in the short group, ten subjects were in the average group, and
eighteen subjects were in the long group. Shoulder point sharpness was either sharp or
soft (Figure 57). The sharp group included sixteen subjects, and the soft group included
twenty-three subjects.

106
Figure 56: Examples of Shoulder Length, from left: Short, Average, Long
Figure 57: Examples of Shoulder Point Sharpness, from left: Sharp, Smooth
Shoulder point alignment was assessed by the placement of sagittal planes at both
shoulder points and analysis of the relation of the planes to the bust, high-hip, and thigh.
Alignment was inside, aligned, or outside of each body component (Figure 58 & Figure
59). Shoulder slope description ranged from flat, slightly sloped, sloped, more sloped,
and steep (Figure 60 & Figure 61).
Figure 58: Examples of Shoulder Point Alignment, from left: Inside b, hh & t; Aligned w/b, outside hh, inside t; Aligned
w/b & hh, inside t; Aligned w/b, inside hh & t; Outside b & hh, inside t; Outside b, aligned w/hh, inside t; Outside b,
inside hh & t

107
Figure 59: Shoulder Point Alignment
Figure 60: Examples of Shoulder Slope, from left: Flat, Slightly Sloped, Sloped, More Sloped, Steep
Figure 61: Shoulder Slope Description
Shoulder Blades
Analysis of the shoulder blades included prominence point alignment, blade
prominence, blade description, and blade width. The fit model’s shoulder blade
162
810
111
0 5 10 15 20
Outside b, inside hh & t
Outside b, aligned w/hh, inside t
Outside b & hh, inside t
Aligned w/b; inside hh & t
Aligned w/b & hh, inside t
Aligned w/b, outside hh, inside t
Inside b, hh & t
Shoulder Point Alignment
6
6
20
4
3
0 5 10 15 20
Steep
More Sloped
Sloped
Slightly sloped
Flat
Shoulder Slope Description

108
prominence was aligned at the arm join, her blade prominence was visible and rounded in
appearance, and average in width.
Prominence point alignment was assessed by marking the prominence points with a
transverse plane and seeing where on the body it matched. Prominence point alignment
occurred at the armpit, arm join, or above the arm join. Seven subjects’ shoulder blades
aligned with their armpits, thirty subjects’ shoulder blades aligned with their arm join,
which is above the armpit, and one subject’s shoulder blades aligned above the arm join.
One subject’s alignment was obscured due to the sports bra covering her back.
Blade prominence was flat, almost flat, visible, or prominent (Figure 62 & Figure 63).
Blade points were flat, softly pointed, pointed, softly rounded, or rounded (Figure 64 &
Figure 65).
Figure 62:Blade Prominence
Figure 63: Examples of Shoulder Blade Prominence, from left: Flat, Almost Flat, Visible, Prominent
5
20
4
10
0 5 10 15 20
Prominent
Visible
Almost flat
Flat
Blade Prominence

109
Figure 64: Blade Description
Figure 65: Examples of Shoulder Blade Description, from left: Flat, Softly Pointed, Pointed, Softly Rounded, Rounded
Width between the blades was assessed by marking the blade prominence points with
sagittal planes and determining the distance between them in relation to the entire back.
Blade width produced three categories: narrow, average, and wide (Figure 66). Fifteen
subjects had narrow widths, seven subjects had average widths, and fourteen subjects had
wide widths. Three subjects’ widths were obscured due to the sports bras covering their
backs.
17
2
3
6
11
0 2 4 6 8 10 12 14 16 18
Rounded
Softly rounded
Pointed
Softly pointed
Flat
Blade Description

110
Figure 66: Examples of Blade Width, from left: Narrow, Average, Wide
Bust
Analysis of the bust included descriptions of bust fullness and bust point width, as
well as determination of ribcage containment. The fit model had an average bust fullness,
her breasts were contained within her ribcage, and the distance between the bust points
was wide.
Bust fullness produced descriptors: very small, small, average, full, and very full
(Figure 67 & Figure 68). Ribcage containment was determined by assessing if the breasts
were wider than the torso at the bustline (Figure 69). Twenty-six subjects had their busts
contained within their ribcage, while thirteen did not.
Figure 67: Examples of Bust Fullness, from left: Very Small, Small, Average, Full, Very Full
Bust point width was assessed by marking the bust points with sagittal planes and
determining the distance between them in relation to the entire front. Bust point widths
produced descriptors: narrow, average, and wide (Figure 70). Nine subjects had narrow

111
bust point widths, thirteen subjects had average bust point widths and seventeen subjects
had wide bust point widths.
Figure 68: Bust Fullness
Figure 69: Examples of Ribcage Containment, from left: Contained, Not Contained
Figure 70: Examples of Bust Point Width, from left: Narrow, Average, Wide
GLBFP
Analysis of the greatest lower-body front prominence included waist indentation,
GLBFP identification, GLBFP description, GLBFP alignment and understanding whether
the GLBFP extended further than the bust. The fit model’s waist was barely indented, the
abdomen was her greatest lower-body front prominence, which was rounded, and aligned
with her high-hip. Her abdomen did not extend past her bust.
2
18
3
15
1
0 5 10 15 20
V. Full
Full
Not small or full
Small
V. Small
Bust Fullness
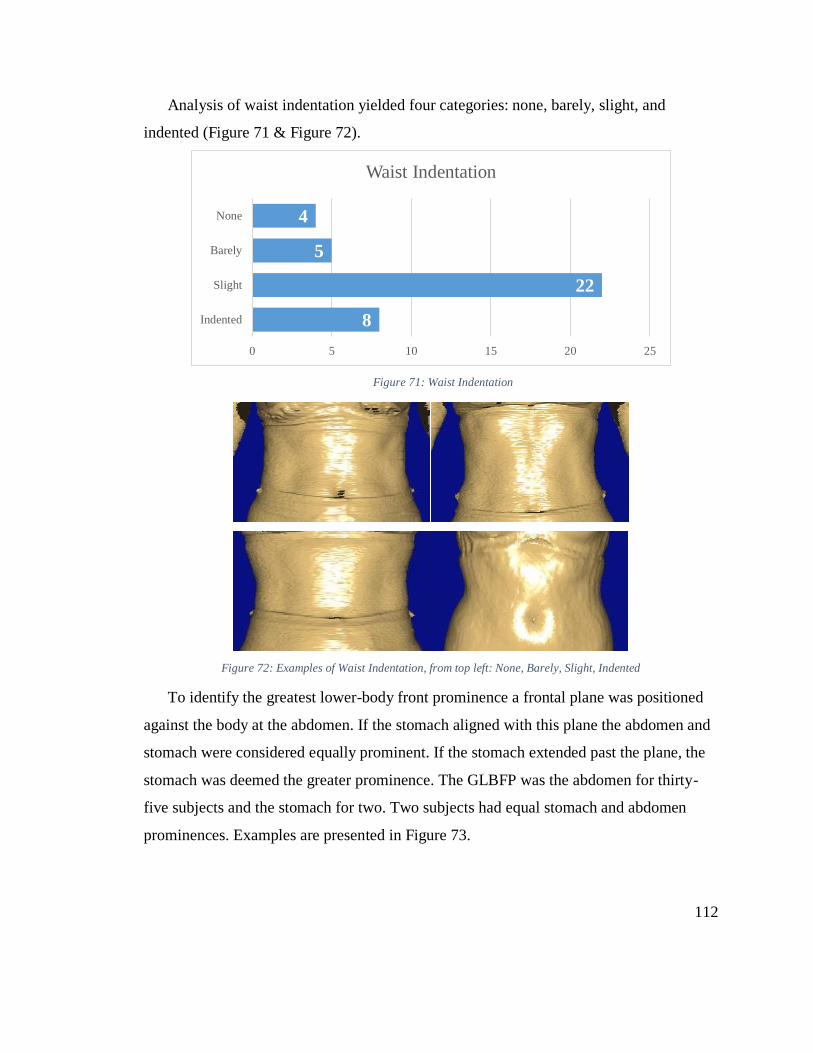
112
Analysis of waist indentation yielded four categories: none, barely, slight, and
indented (Figure 71 & Figure 72).
Figure 71: Waist Indentation
Figure 72: Examples of Waist Indentation, from top left: None, Barely, Slight, Indented
To identify the greatest lower-body front prominence a frontal plane was positioned
against the body at the abdomen. If the stomach aligned with this plane the abdomen and
stomach were considered equally prominent. If the stomach extended past the plane, the
stomach was deemed the greater prominence. The GLBFP was the abdomen for thirty-
five subjects and the stomach for two. Two subjects had equal stomach and abdomen
prominences. Examples are presented in Figure 73.
8
22
5
4
0 5 10 15 20 25
Indented
Slight
Barely
None
Waist Indentation
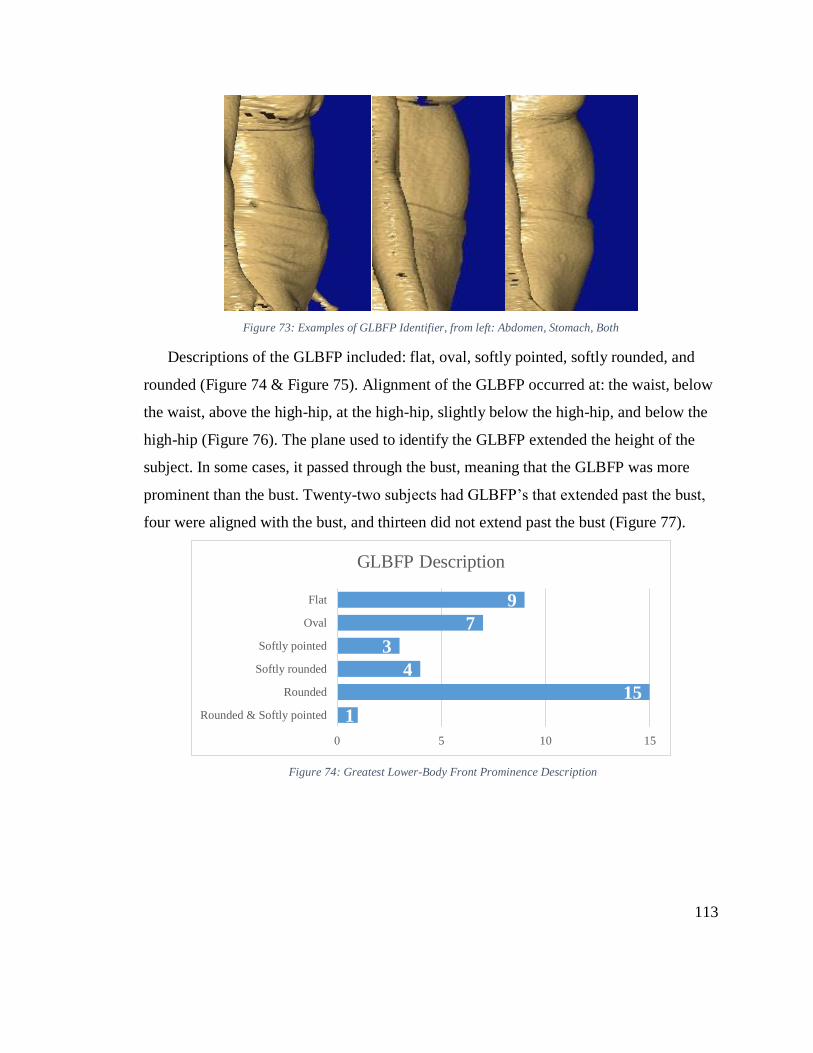
113
Figure 73: Examples of GLBFP Identifier, from left: Abdomen, Stomach, Both
Descriptions of the GLBFP included: flat, oval, softly pointed, softly rounded, and
rounded (Figure 74 & Figure 75). Alignment of the GLBFP occurred at: the waist, below
the waist, above the high-hip, at the high-hip, slightly below the high-hip, and below the
high-hip (Figure 76). The plane used to identify the GLBFP extended the height of the
subject. In some cases, it passed through the bust, meaning that the GLBFP was more
prominent than the bust. Twenty-two subjects had GLBFP’s that extended past the bust,
four were aligned with the bust, and thirteen did not extend past the bust (Figure 77).
Figure 74: Greatest Lower-Body Front Prominence Description
1
15
4
3
7
9
0 5 10 15
Rounded & Softly pointed
Rounded
Softly rounded
Softly pointed
Oval
Flat
GLBFP Description

114
Figure 75: Examples of GLBFP Description, from left: Flat, Oval, Softly Pointed, Softly Rounded, Rounded
Figure 76: Greatest Lower-Body Front Prominence Alignment
Figure 77: Examples of Past Bust Extension, from left: Yes, Aligned, No
Buttocks
Analysis of the buttocks included description of the prominence and length, a
notation of where the fullest part of the buttocks was in relation to the buttocks length,
84
213
111
0 5 10 15 20 25
Below high-hip
Slightly below high-hip
High-hip
Above high-hip
Below waist
Waist & Below High-hip
Waist & High-hip
GLBFP Alignment
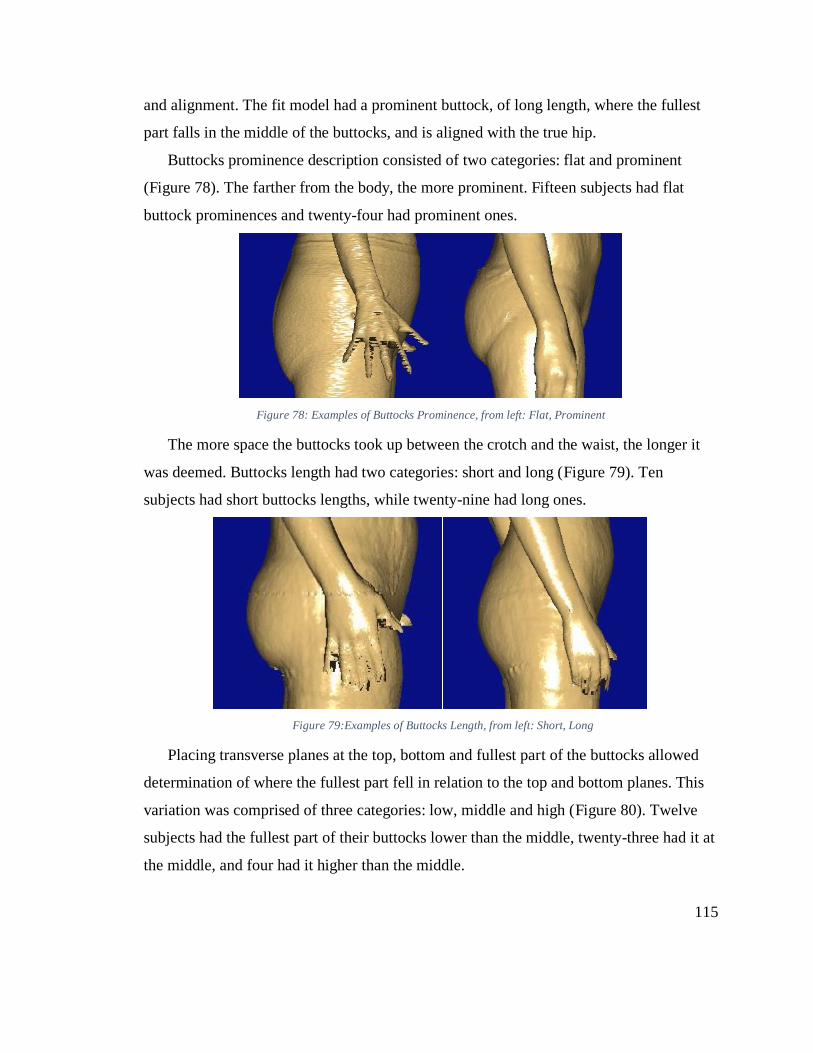
115
and alignment. The fit model had a prominent buttock, of long length, where the fullest
part falls in the middle of the buttocks, and is aligned with the true hip.
Buttocks prominence description consisted of two categories: flat and prominent
(Figure 78). The farther from the body, the more prominent. Fifteen subjects had flat
buttock prominences and twenty-four had prominent ones.
Figure 78: Examples of Buttocks Prominence, from left: Flat, Prominent
The more space the buttocks took up between the crotch and the waist, the longer it
was deemed. Buttocks length had two categories: short and long (Figure 79). Ten
subjects had short buttocks lengths, while twenty-nine had long ones.
Figure 79:Examples of Buttocks Length, from left: Short, Long
Placing transverse planes at the top, bottom and fullest part of the buttocks allowed
determination of where the fullest part fell in relation to the top and bottom planes. This
variation was comprised of three categories: low, middle and high (Figure 80). Twelve
subjects had the fullest part of their buttocks lower than the middle, twenty-three had it at
the middle, and four had it higher than the middle.

116
Figure 80: Examples of Buttocks Fullest Part Location, from left: Low, Middle, High
The buttocks alignment was determined by placing a transverse plane at the fullest
part of the buttocks. Since the plane bisected the entire body, alignment was determined
by viewing where the plane bisected the hips. Alignment occurred at: the true hip,
slightly below the true hip, below the true hip, and far below the true hip (Figure 81).
Figure 81: Buttocks Alignment
GLBSP
Analysis of the greatest lower-body side prominence included location and alignment
identification, and description of the prominence. The fit model’s GLBSP location was
the thigh, which was aligned above the crotch and was rounded in description.
GLBSP location categories were: the high-hip and thighs (Figure 82). Four subjects
had their greatest lower-body side prominence at the high-hip, and thirty-five at the
thighs.
1
10
12
16
0 5 10 15 20
Far below true hip
Below true hip
Slightly below true hip
True hip
Buttocks Alignment

117
Figure 82: Examples of GLBSP Location, from left: High-hip, Thighs
GLBSP alignment categories included: below the crotch, at the crotch, above the
crotch, below the abdomen, and at the abdomen (Figure 83).
Figure 83: Greatest Lower-Body Side Prominence Alignment
Description categories included: flat, softly pointed, pointed, softly rounded, and
rounded (Figure 84 & Figure 85).
Figure 84: Greatest Lower-Body Side Prominence Description
3
1
12
20
3
0 5 10 15 20
Abdomen
Below abdomen
Above crotch
Crotch
Below crotch
Greatest Lower-Body Side Prominence
Alignment
14
8
2
10
5
0 5 10 15
Rounded
Softly rounded
Pointed
Soft Point
Flat
Greatest Lower-Body Side Prominence
Description

118
Figure 85: Examples of GLBSP Description, from top left: Flat, Softly Pointed, Pointed, Softly Rounded, Rounded

119
Physiological
This section describes the interaction between pattern dimensions and body-form
variables. Analysis of each pattern dimension included at least one body-form variable.
Each body-form variable included at least two categories, which were color-coded for
ease of analysis.
Body-form variables were matched to pattern dimensions. Using Excel, pattern
dimension measurements were sorted from smallest to largest, sorting the body-form
variables at the same time. Tallies of each category within each body-form variation were
calculated to see how many of each category fell within each group (identified during the
dimensional component). For pattern dimensions that did not suggest groups, tallies were
calculated to see how many of each category fell below and above the mean.
Neck
The pattern dimensions for the neck included the neck circumference and front neck
drop. Body-form variables tested against the neck included neck thickness, the neck-to-
shoulder transition, collarbone visibility, and neck tilt.
Neck circumference was compared to neck thickness, the neck-to-shoulder transition,
and collarbone visibility. There were nineteen subjects below the mean, and twenty
subjects above for neck circumference. Thin necks were the majority below the mean, at
56.2%, while thick necks were the majority above, at 50%. A sharp neck-to-shoulder
transition was the majority both above and below the mean, at 68.4% and 75%
respectively. The ‘nearly flat’ collarbone category was the majority below the mean, at
52.6%, while the visible collarbone category was the majority above, at 45%. Summaries
of the data are displayed in Table 18.
Neck Thickness
Below Mean
Thin 10 52.6%
Thick 4 21.1%
Not thick or thin 5 26.3%
Total 19 100%
Above Mean
Thin 3 15%
Thick 10 50%
Not thick or thin 7 35%
Total 20 100%
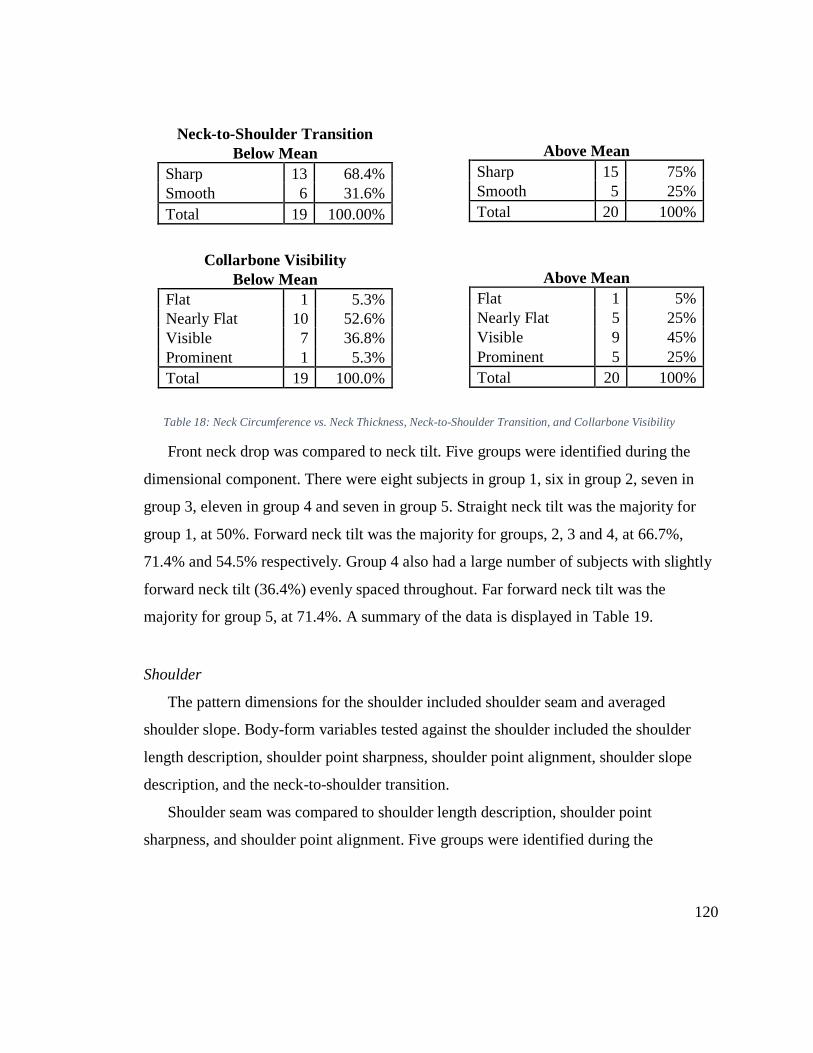
120
Neck-to-Shoulder Transition
Below Mean
Sharp 13 68.4%
Smooth 6 31.6%
Total 19 100.00%
Above Mean
Sharp 15 75%
Smooth 5 25%
Total 20 100%
Collarbone Visibility
Below Mean
Flat 1 5.3%
Nearly Flat 10 52.6%
Visible 7 36.8%
Prominent 1 5.3%
Total 19 100.0%
Above Mean
Flat 1 5%
Nearly Flat 5 25%
Visible 9 45%
Prominent 5 25%
Total 20 100%
Table 18: Neck Circumference vs. Neck Thickness, Neck-to-Shoulder Transition, and Collarbone Visibility
Front neck drop was compared to neck tilt. Five groups were identified during the
dimensional component. There were eight subjects in group 1, six in group 2, seven in
group 3, eleven in group 4 and seven in group 5. Straight neck tilt was the majority for
group 1, at 50%. Forward neck tilt was the majority for groups, 2, 3 and 4, at 66.7%,
71.4% and 54.5% respectively. Group 4 also had a large number of subjects with slightly
forward neck tilt (36.4%) evenly spaced throughout. Far forward neck tilt was the
majority for group 5, at 71.4%. A summary of the data is displayed in Table 19.
Shoulder
The pattern dimensions for the shoulder included shoulder seam and averaged
shoulder slope. Body-form variables tested against the shoulder included the shoulder
length description, shoulder point sharpness, shoulder point alignment, shoulder slope
description, and the neck-to-shoulder transition.
Shoulder seam was compared to shoulder length description, shoulder point
sharpness, and shoulder point alignment. Five groups were identified during the

121
dimensional component. There were four subjects in group 1, seven in group 2, twenty-
three in group 3, three in group 4 and two in group 5.
Neck Tilt
Group 1
Straight 4 50%
Slightly Forward 2 25%
Forward 2 25%
Far Forward 0 0%
Total 8 100%
Group 2
Straight 1 16.7%
Slightly Forward 1 16.7%
Forward 4 66.7%
Far Forward 0 0%
Total 6 100%
Group 3
Straight 1 14.3%
Slightly Forward 1 14.3%
Forward 5 71.4%
Far Forward 0 0.0%
Total 7 100%
Group 4
Straight 1 9.1%
Slightly Forward 4 36.4%
Forward 6 54.5%
Far Forward 0 0.0%
Total 11 100%
Group 5
Straight 1 14.3%
Slightly Forward 0 0.0%
Forward 1 14.3%
Far Forward 5 71.4%
Total 7 100% Table 19: Front Neck Drop vs. Neck Tilt
Shoulder Length Description
Group 1
Short 4 100%
Long 0 0%
Average 0 0%
Total 4 100%
Group 2
Short 3 42.9%
Long 1 14.3%
Average 3 42.9%
Total 7 100%
Group 3
Short 4 17.4%
Long 12 52.2%
Average 7 30.4%
Total 23 100%
Group 4
Short 0 0%
Long 3 100%
Average 0 0%
Total 3 100%
Group 5
Short 0 0%
Long 2 100%
Average 0 0%
Total 2 100% Table 20: Shoulder Seam vs. Shoulder Length
Description
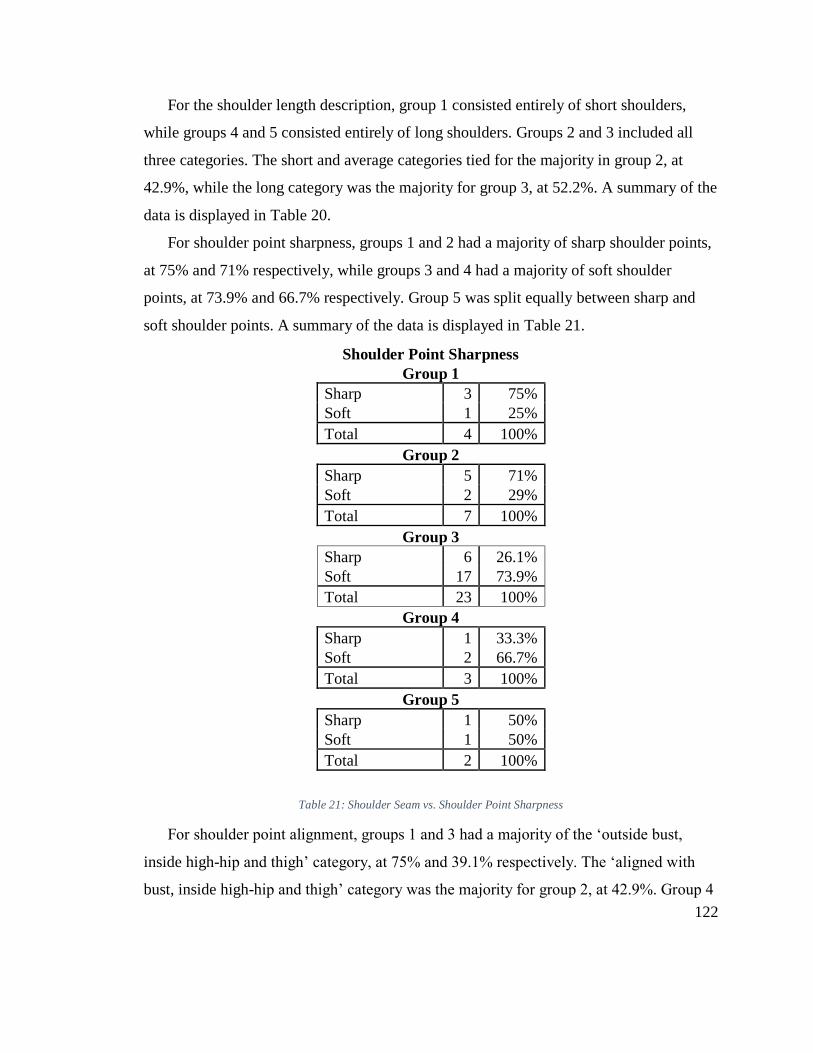
122
For the shoulder length description, group 1 consisted entirely of short shoulders,
while groups 4 and 5 consisted entirely of long shoulders. Groups 2 and 3 included all
three categories. The short and average categories tied for the majority in group 2, at
42.9%, while the long category was the majority for group 3, at 52.2%. A summary of the
data is displayed in Table 20.
For shoulder point sharpness, groups 1 and 2 had a majority of sharp shoulder points,
at 75% and 71% respectively, while groups 3 and 4 had a majority of soft shoulder
points, at 73.9% and 66.7% respectively. Group 5 was split equally between sharp and
soft shoulder points. A summary of the data is displayed in Table 21.
Shoulder Point Sharpness
Group 1
Sharp 3 75%
Soft 1 25%
Total 4 100%
Group 2
Sharp 5 71%
Soft 2 29%
Total 7 100%
Group 3
Sharp 6 26.1%
Soft 17 73.9%
Total 23 100%
Group 4
Sharp 1 33.3%
Soft 2 66.7%
Total 3 100%
Group 5
Sharp 1 50%
Soft 1 50%
Total 2 100%
Table 21: Shoulder Seam vs. Shoulder Point Sharpness
For shoulder point alignment, groups 1 and 3 had a majority of the ‘outside bust,
inside high-hip and thigh’ category, at 75% and 39.1% respectively. The ‘aligned with
bust, inside high-hip and thigh’ category was the majority for group 2, at 42.9%. Group 4

123
was split evenly between three categories. Group 5 was split evenly between the two
categories. A summary of the data is in Table 22.
Shoulder Point Alignment
Group 1
Inside bust, high-hip & thigh 0 0%
Aligned w/bust, outside high-hip, inside thigh 0 0%
Aligned w/bust & high-hip, inside thigh 0 0%
Aligned w/bust; inside high-hip & thigh 1 25%
Outside bust & high-hip, inside thigh 0 0%
Outside bust, aligned w/high-hip, inside thigh 0 0%
Outside bust, inside high-hip & thigh 3 75%
Total 4 100%
Group 2
Inside bust, high-hip & thigh 0 0%
Aligned w/bust, outside high-hip, inside thigh 1 14.3%
Aligned w/bust & high-hip, inside thigh 0 0%
Aligned w/bust; inside high-hip & thigh 3 42.9%
Outside bust & high-hip, inside thigh 1 14.3%
Outside bust, aligned w/high-hip, inside thigh 0 0%
Outside bust, inside high-hip & thigh 2 28.6%
Total 7 100%
Group 3
Inside bust, high-hip & thigh 1 4.3%
Aligned w/bust, outside high-hip, inside thigh 0 0%
Aligned w/bust & high-hip, inside thigh 0 0%
Aligned w/bust; inside high-hip & thigh 6 26.1%
Outside bust & high-hip, inside thigh 6 26.1%
Outside bust, aligned w/high-hip, inside thigh 1 4.3%
Outside bust, inside high-hip & thigh 9 39.1%
Total 23 100%
Group 4
Inside bust, high-hip & thigh 0 0%
Aligned w/bust, outside high-hip, inside thigh 0 0%
Aligned w/bust & high-hip, inside thigh 1 33.3%
Aligned w/bust; inside high-hip & thigh 0 0%
Outside bust & high-hip, inside thigh 0 0%
Outside bust, aligned w/high-hip, inside thigh 1 33.3%
Outside bust, inside high-hip & thigh 1 33.3%
Total 3 100%

124
Group 5
Inside bust, high-hip & thigh 0 0%
Aligned w/bust, outside high-hip, inside thigh 0 0%
Aligned w/bust & high-hip, inside thigh 0 0%
Aligned w/bust; inside high-hip & thigh 0 0%
Outside bust & high-hip, inside thigh 1 50%
Outside bust, aligned w/high-hip, inside thigh 0 0%
Outside bust, inside high-hip & thigh 1 50%
Total 2 100% Table 22: Shoulder Seam vs. Shoulder Point Alignment
Averaged shoulder slope was compared to shoulder slope description, shoulder point
sharpness, shoulder length description, and the neck-to-shoulder transition. Five groups
were identified during the dimensional component. There were three subjects in group 1,
five in group 2, twenty-five in group 3, five in group 4 and one in group 5.
For shoulder slope description, the flat category was the majority for group 1, at
66.7%. The sloped category appeared in groups 1, 2, 3 and 4, and was the majority for
groups 2 and 3, at 40% and 64% respectively. The steep category made up the majority of
group 4, at 60%, and comprised the entirety of group 5. A summary of the data is
displayed in Table 23.
For shoulder point sharpness, both the sharp and soft categories appeared in groups 1,
2, 3 and 4. Sharp shoulder points comprised the entirety of group 1 and the majority of
group 2, at 60%. Soft shoulder points were the majority for groups 3, and 4, at 68% and
60% respectively, and comprised the entirety of group 5. A summary of the data is
displayed in Table 23.
For shoulder length description, short shoulders comprised the entirety of group 1,
and were the majority for group 2, at 80%. Long shoulders were the majority for groups 3
and 4, at 48% and 80% respectively, and comprised the entirety of group 5. Average
shoulders appeared in groups 3 and 4 as the second largest contingent, at 36% and 20%
respectively. A summary of the data is displayed in Table 24.
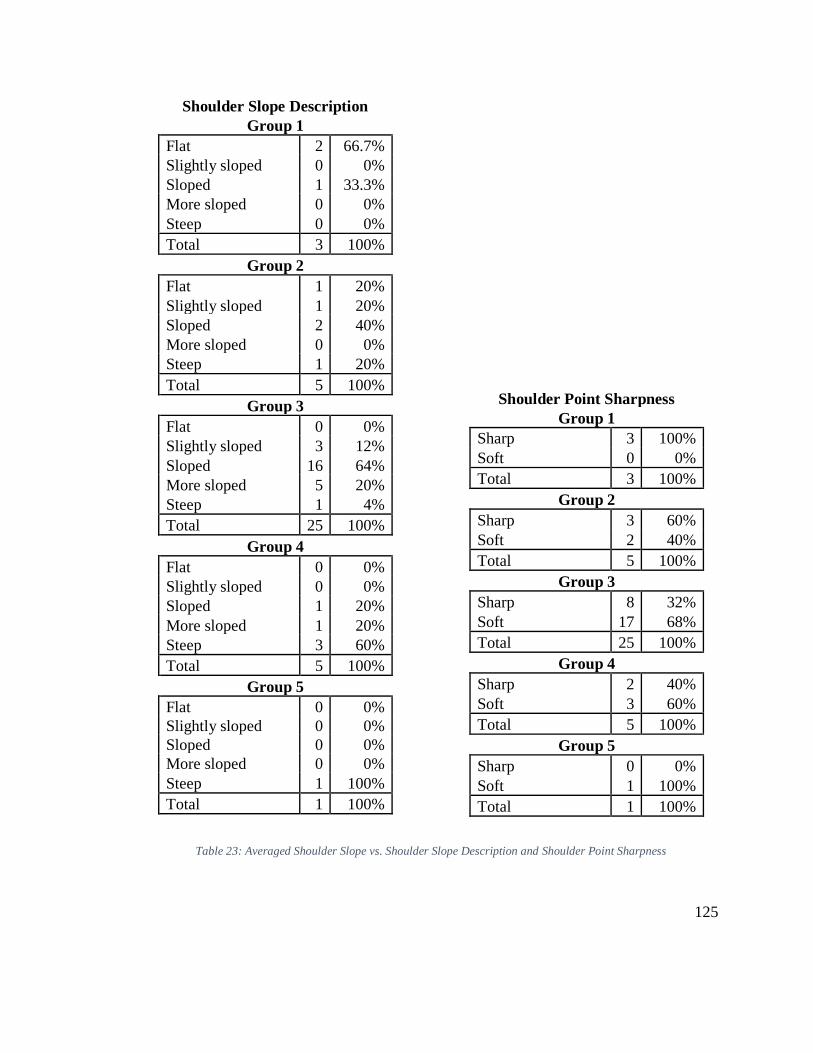
125
Shoulder Slope Description
Group 1
Flat 2 66.7%
Slightly sloped 0 0%
Sloped 1 33.3%
More sloped 0 0%
Steep 0 0%
Total 3 100%
Group 2
Flat 1 20%
Slightly sloped 1 20%
Sloped 2 40%
More sloped 0 0%
Steep 1 20%
Total 5 100%
Group 3
Flat 0 0%
Slightly sloped 3 12%
Sloped 16 64%
More sloped 5 20%
Steep 1 4%
Total 25 100%
Group 4
Flat 0 0%
Slightly sloped 0 0%
Sloped 1 20%
More sloped 1 20%
Steep 3 60%
Total 5 100%
Group 5
Flat 0 0%
Slightly sloped 0 0%
Sloped 0 0%
More sloped 0 0%
Steep 1 100%
Total 1 100%
Shoulder Point Sharpness
Group 1
Sharp 3 100%
Soft 0 0%
Total 3 100%
Group 2
Sharp 3 60%
Soft 2 40%
Total 5 100%
Group 3
Sharp 8 32%
Soft 17 68%
Total 25 100%
Group 4
Sharp 2 40%
Soft 3 60%
Total 5 100%
Group 5
Sharp 0 0%
Soft 1 100%
Total 1 100%
Table 23: Averaged Shoulder Slope vs. Shoulder Slope Description and Shoulder Point Sharpness

126
For the neck-to-shoulder transition, the sharp transition comprised the entirety of
group 1, and was the majority for groups 2, 3 and 4, at 60%, 72% and 80% respectively.
The smooth neck-to-shoulder transition comprised the entirety of group 5. A summary of
the data is displayed in Table 24.
Shoulder Length
Description
Group 1
Short 3 100%
Long 0 0%
Average 0 0%
Total 3 100%
Group 2
Short 4 80%
Long 1 20%
Average 0 0%
Total 5 100%
Group 3
Short 4 16%
Long 12 48%
Average 9 36%
Total 25 100%
Group 4
Short 0 0%
Long 4 80%
Average 1 20%
Total 5 100%
Group 5
Short 0 0%
Long 1 100%
Average 0 0%
Total 1 100%
Neck-to-Shoulder
Transition
Group 1
Sharp 3 100%
Smooth 0 0%
Total 3 100%
Group 2
Sharp 3 60%
Smooth 2 40%
Total 5 100%
Group 3
Sharp 18 72%
Smooth 7 28%
Total 25 100%
Group 4
Sharp 4 80%
Smooth 1 20%
Total 5 100%
Group 5
Sharp 0 0%
Smooth 1 100%
Total 1 100%
Table 24: Averaged Shoulder Slope vs. Shoulder Length Description and Neck-to-Shoulder Transition

127
Shoulder Blades
The pattern dimensions for the shoulder blades included the bodice back waist dart
depth, the bodice back waist dart width and the between bodice back waist darts distance.
Body-form variables for the shoulder blade included prominence point alignment, blade
prominence, blade description, and blade width.
The bodice back waist dart depth was compared to prominence point alignment. Five
groups were identified during the dimensional component. There were three subjects in
group 1, sixteen in group 2, twelve in group 3, six in group 4 and two in group 5.
The ‘at arm join’ category occurred in every group, was the majority for groups 2, 3
and 4 (81.3%, 83.3% and 83.3% respectively), and tied for majority for groups 1 and 5
(33.3% and 50% respectively). The armpit category was spread throughout the sample
and the ‘above arm join’ category only appeared in group 2. A summary of the data is
displayed in Table 25.
Prominence Point Alignment
Group 1
Armpit 1 33.3%
At arm join 1 33.3%
Above arm join 0 0%
Obscured 1 33.3%
Total 3 100%
Group 2
Armpit 2 12.5%
At arm join 13 81.3%
Above arm join 1 6.3%
Obscured 0 0%
Total 16 100%
Group 3
Armpit 2 16.7%
At arm join 10 83.3%
Above arm join 0 0%
Obscured 0 0%
Total 12 100%
Group 4
Armpit 1 16.7%
At arm join 5 83.3%
Above arm join 0 0%
Obscured 0 0%
Total 6 100%
Group 5
Armpit 1 50%
At arm join 1 50%
Above arm join 0 0%
Obscured 0 0%
Total 2 100%
Table 25: Bodice Back Waist Dart Depth vs. Prominence Point Alignment

128
The bodice back waist dart width was compared to blade prominence and blade
description. Four groups were identified during the dimensional component. Three
subjects were in group 1, six in group 2, fourteen in group 3, and sixteen in group 4.
For blade prominence, the flat category occurs in every group, and was the majority
for group 1, at 66.7%. The visible category was the majority for groups 2, 3 and 4, at
66.7%, 50%, and 56.3% respectively. For blade description both the flat and rounded
categories appeared in every group. The flat category was the majority for group 1, at
66.7%. The soft point category was the majority for group 2, at 50%. The rounded
category was the majority for groups 3 and 4, at 50% for both. Summaries of the data are
displayed in Table 27.
The distance between the bodice back waist darts was compared to blade width.
Three groups were identified during the dimensional component. Twenty-one subjects
were in group 1, sixteen in group 1 and two in group 3.
For blade width, the narrow category was the majority for group 1, at 57.1%. The
wide category was the majority for group 2, at 62.5% and comprised the entirety of group
3. The average category only appeared in group 1, and comprised 33.3% of the group. A
summary of the data is displayed in Table 26.
Blade Width
Group 1
Narrow 12 57.1%
Wide 2 9.5%
Average 7 33.3%
Obscured 0 0%
Total 21 100%
Group 2
Narrow 3 18.8%
Wide 10 62.5%
Average 0 0%
Obscured 3 18.8%
Total 16 100%
Group 3
Narrow 0 0%
Wide 2 100%
Average 0 0%
Obscured 0 0%
Total 2 100%
Table 26: Between Bodice Waist Darts Distance vs. Blade Width

129
Blade Prominence
Group 1
Flat 2 66.7%
Almost Flat 0 0%
Visible 0 0%
Prominent 1 33.3%
Total 3 100%
Group 2
Flat 1 16.7%
Almost Flat 1 16.7%
Visible 4 66.7%
Prominent 0 0%
Total 6 100%
Group 3
Flat 4 28.6%
Almost Flat 1 7.1%
Visible 7 50%
Prominent 2 14.3%
Total 14 100%
Group 4
Flat 3 18.8%
Almost Flat 2 12.5%
Visible 9 56.3%
Prominent 2 12.5%
Total 16 100%
Blade Description
Group 1
Flat 2 66.7%
Soft Point 0 0%
Pointed 0 0%
Softly Rounded 0 0%
Rounded 1 33.3%
Total 3 100%
Group 2
Flat 1 16.7%
Soft Point 3 50%
Pointed 0 0%
Softly Rounded 1 16.7%
Rounded 1 16.7%
Total 6 100%
Group 3
Flat 4 28.6%
Soft Point 1 7.1%
Pointed 1 7.1%
Softly Rounded 1 7.1%
Rounded 7 50%
Total 14 100%
Group 4
Flat 4 25%
Soft Point 2 12.5%
Pointed 2 12.5%
Softly Rounded 0 0%
Rounded 8 50%
Total 16 100%
Table 27: Bodice Back Waist Dart Width vs. Blade Prominence & Blade Description

130
Bust
The pattern dimensions for the bust included the bust dart depth and the between
bodice front waist darts distance. Body-form variables for the bust included bust fullness,
ribcage containment, and bust point width.
The bust dart depth was compared to bust fullness and ribcage containment. Four
groups were identified from the dimensional component. Eighteen subjects were in group
1, four in group 2, eleven in group 3, and six in group 4.
For bust fullness, the full category appeared in all four groups. The small category
was the majority for group 1, at 61.1%. The full category comprised the entirety of group
2, and was the majority for groups 3 and 4, at 54.5% and 50% respectively. A summary
of the data is displayed in Table 28.
Bust Fullness
Group 1
V. Small 0 0%
Small 11 61.1%
Average 2 11.1%
Full 5 27.8%
V. Full 0 0%
Total 18 100%
Group 2
V. Small 0 0.0%
Small 0 0.0%
Average 0 0.0%
Full 4 100.0%
V. Full 0 0.0%
Total 4 100%
Group 3
V. Small 0 0%
Small 3 27.3%
Average 1 9.1%
Full 6 54.5%
V. Full 1 9.1%
Total 11 100%
Group 4
V. Small 1 16.7%
Small 1 16.7%
Average 0 0%
Full 3 50%
V. Full 1 16.7%
Total 6 100%
Table 28: Bust Dart Depth vs. Bust Fullness
For ribcage containment, the majority of groups 1 and 3 had their breasts contained
within their torso, at 77.8% and 72.7% respectively. The majority of group 4 had breasts
that were not contained within their torso, at 66.7%. Summaries of the data are displayed
in Table 29.
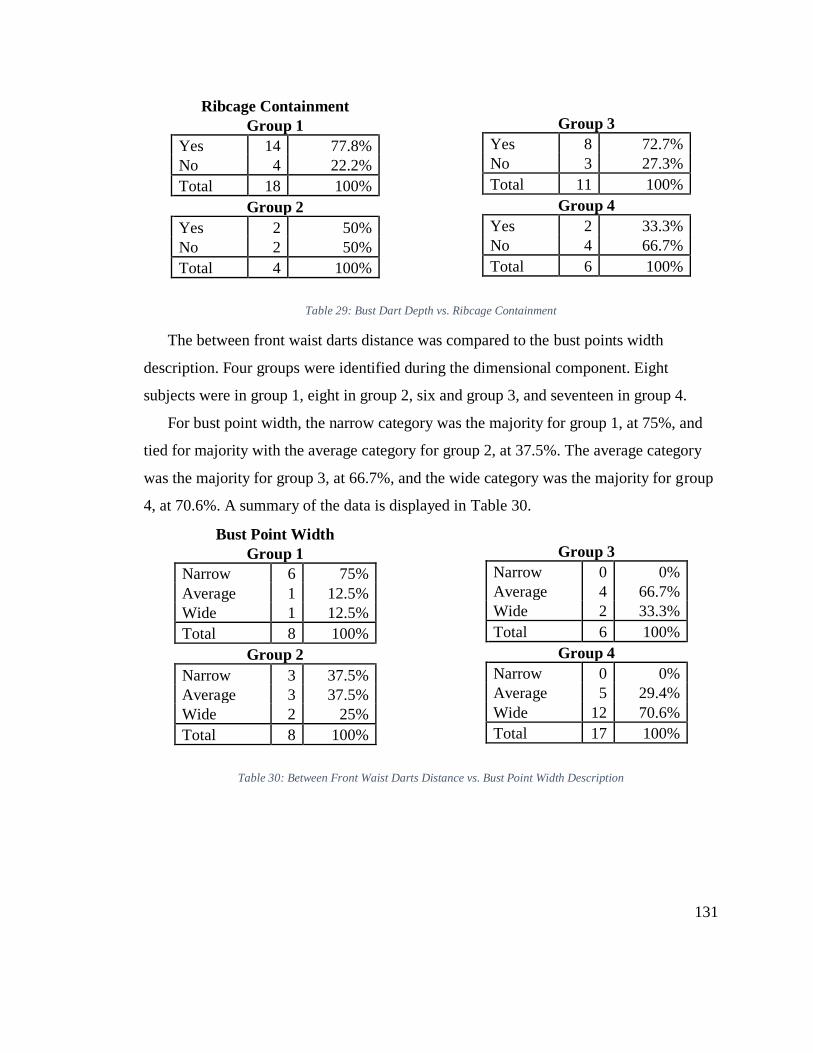
131
Ribcage Containment
Group 1
Yes 14 77.8%
No 4 22.2%
Total 18 100%
Group 2
Yes 2 50%
No 2 50%
Total 4 100%
Group 3
Yes 8 72.7%
No 3 27.3%
Total 11 100%
Group 4
Yes 2 33.3%
No 4 66.7%
Total 6 100%
Table 29: Bust Dart Depth vs. Ribcage Containment
The between front waist darts distance was compared to the bust points width
description. Four groups were identified during the dimensional component. Eight
subjects were in group 1, eight in group 2, six and group 3, and seventeen in group 4.
For bust point width, the narrow category was the majority for group 1, at 75%, and
tied for majority with the average category for group 2, at 37.5%. The average category
was the majority for group 3, at 66.7%, and the wide category was the majority for group
4, at 70.6%. A summary of the data is displayed in Table 30.
Bust Point Width
Group 1
Narrow 6 75%
Average 1 12.5%
Wide 1 12.5%
Total 8 100%
Group 2
Narrow 3 37.5%
Average 3 37.5%
Wide 2 25%
Total 8 100%
Group 3
Narrow 0 0%
Average 4 66.7%
Wide 2 33.3%
Total 6 100%
Group 4
Narrow 0 0%
Average 5 29.4%
Wide 12 70.6%
Total 17 100%
Table 30: Between Front Waist Darts Distance vs. Bust Point Width Description

132
GLBFP
The pattern dimensions for the abdomen included the waist circumference, the front
waist width, the skirt front waist dart depth, and the skirt front waist dart width. The
body-form variations included waist indentation, the GLBFP identifier, the GLBFP
description, whether the GLBFP extended further than the bust, and GLBFP alignment.
The waist circumference was compared to waist indentation. Four groups were
identified during the dimensional component. Thirty-six subjects were in group 1, with
one subject in each of the remaining three groups.
For waist indentation, the slight category was the majority for group 1, at 58.3% and
comprised the entirety of group 4. The indented category comprised the entirety of group
2. The ‘none’ category comprised the entirety of group 3. A summary of the data is
displayed in Table 31.
Waist Indentation
Group 1
None 3 8.3%
Barely 5 13.9%
Slight 21 58.3%
Indented 7 19.4%
Total 36 100%
Group 2
None 0 0%
Barely 0 0%
Slight 0 0%
Indented 1 100%
Total 1 100%
Group 3
None 1 100%
Barely 0 0%
Slight 0 0%
Indented 0 0%
Total 1 100%
Group 4
None 0 0%
Barely 0 0%
Slight 1 100%
Indented 0 0%
Total 1 100%
Table 31: Waist Circumference vs. Waist Indentation
The front waist width was compared to the GLBFP identifier, the GLBFP description
and whether the GLBFP extended further than the bust. Six groups were identified from
the dimensional component. One subject was in group 1, four in group 2, twenty-seven in
group 3, two each in groups 4 and 5, and three in group 6.
For the GLBFP identifier, the abdomen comprised the entirety of groups 1, 2, and 5,
and was the majority for group 3, at 96.3%. The abdomen and both categories were tied

133
for majority in group 4, at 50%. All three categories were tied in group 6. A summary of
the data is displayed in Table 32.
GLBFP Identifier
Group 1
Abdomen 1 100%
Stomach 0 0%
Both 0 0%
Total 1 100%
Group 2
Abdomen 4 100%
Stomach 0 0%
Both 0 0%
Total 4 100%
Group 3
Abdomen 26 96.3%
Stomach 1 3.7%
Both 0 0%
Total 27 100%
Group 4
Abdomen 1 50%
Stomach 0 0%
Both 1 50%
Total 2 100%
Group 5
Abdomen 2 100%
Stomach 0 0%
Both 0 0%
Total 2 100%
Group 6
Abdomen 1 33.3%
Stomach 1 33.3%
Both 1 33.3%
Total 3 100%
Table 32: Front Waist Width vs. GLBFP Identifier
For the GLBFP description, the rounded category was the majority for groups 2, 3,
and 6 (50%, 37% and 66.7% respectively), and tied for majority in group 4, at 50%. The
softly rounded category comprised the entirety of group 1, and tied for majority with the
oval category in group 5, at 50%. A summary of the data is displayed in Table 33.
GLBFP Description
Group 1
Flat 0 0%
Oval 0 0%
Softly pointed 0 0%
Softly rounded 1 100%
Rounded 0 0%
Rounded & Softly
pointed 0 0%
Total 1 100%
Group 2
Flat 0 0%
Oval 1 25%
Softly pointed 1 25%
Softly rounded 0 0%
Rounded 2 50%
Rounded & Softly
pointed 0 0%
Total 4 100%

134
Group 3
Flat 9 33.3%
Oval 4 14.8%
Softly pointed 2 7.4%
Softly rounded 2 7.4%
Rounded 10 37%
Rounded & Softly
pointed 0 0%
Total 27 100%
Group 4
Flat 0 0%
Oval 0 0%
Softly pointed 0 0%
Softly rounded 0 0%
Rounded 1 50%
Rounded & Softly
pointed 1 50%
Total 2 100%
Group 5
Flat 0 0%
Oval 1 50%
Softly pointed 0 0%
Softly rounded 1 50%
Rounded 0 0%
Rounded & Softly
pointed 0 0%
Total 2 100%
Group 6
Flat 0 0%
Oval 1 33.3%
Softly pointed 0 0%
Softly rounded 0 0%
Rounded 2 66.7%
Rounded & Softly
pointed 0 0%
Total 3 100%
Table 33: Front Waist Width vs. GLBFP Description
For the past bust extension, subjects with GLBFP’s that extended past their bust
comprised the entirety of groups 1 and 2 and were the majority for group 3, at 51.9%.
Subjects that did not have GLBFP’s extending past their bust were the majority of group
6, at 66.7%. A summary of the data is displayed in Table 34.
Past Bust Extension
Group 1
Yes 1 100%
Aligned 0 0%
No 0 0%
Total 1 100%
Group 2
Yes 4 100%
Aligned 0 0%
No 0 0%
Total 4 100%
Group 3
Yes 14 51.9%
Aligned 4 14.8%
No 9 33.3%
Total 27 100%
Group 4
Yes 1 50%
Aligned 0 0%
No 1 50%
Total 2 100%
Group 5
Yes 1 50%
Aligned 0 0%
No 1 50%
Total 2 100%
Group 6
Yes 1 33.3%
Aligned 0 0%
No 2 66.7%
Total 3 100%
Table 34: Front Waist Width vs. Past Bust Extension
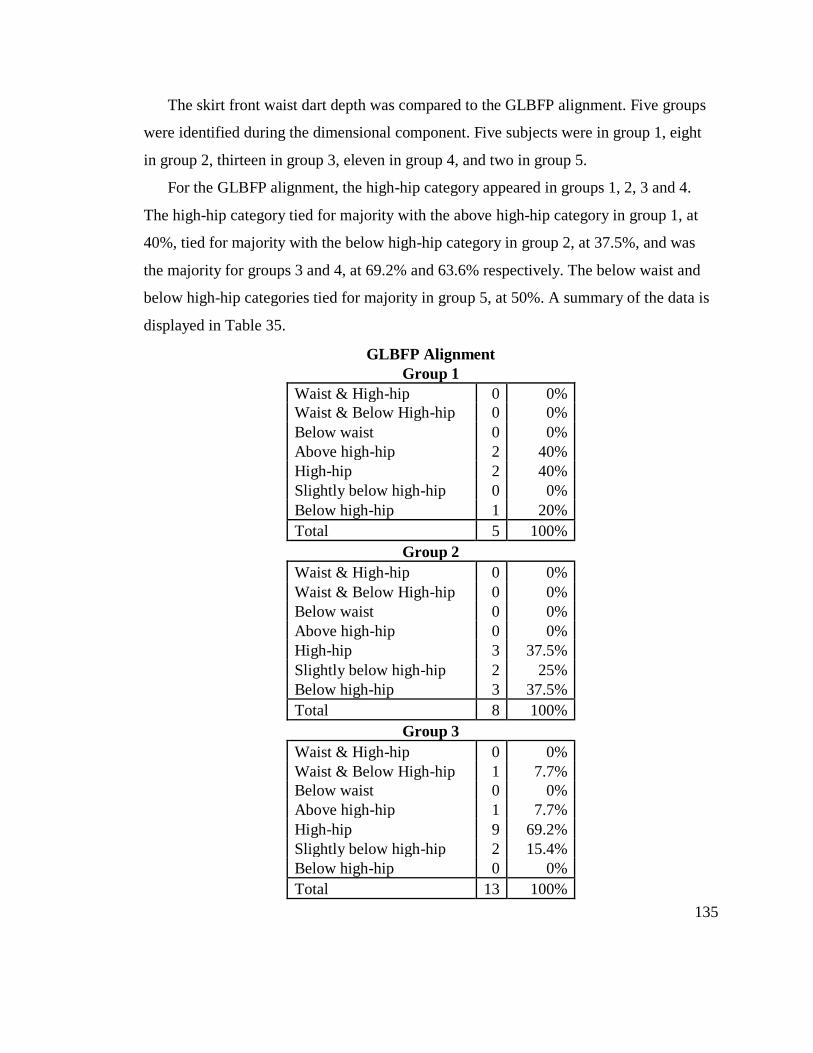
135
The skirt front waist dart depth was compared to the GLBFP alignment. Five groups
were identified during the dimensional component. Five subjects were in group 1, eight
in group 2, thirteen in group 3, eleven in group 4, and two in group 5.
For the GLBFP alignment, the high-hip category appeared in groups 1, 2, 3 and 4.
The high-hip category tied for majority with the above high-hip category in group 1, at
40%, tied for majority with the below high-hip category in group 2, at 37.5%, and was
the majority for groups 3 and 4, at 69.2% and 63.6% respectively. The below waist and
below high-hip categories tied for majority in group 5, at 50%. A summary of the data is
displayed in Table 35.
GLBFP Alignment
Group 1
Waist & High-hip 0 0%
Waist & Below High-hip 0 0%
Below waist 0 0%
Above high-hip 2 40%
High-hip 2 40%
Slightly below high-hip 0 0%
Below high-hip 1 20%
Total 5 100%
Group 2
Waist & High-hip 0 0%
Waist & Below High-hip 0 0%
Below waist 0 0%
Above high-hip 0 0%
High-hip 3 37.5%
Slightly below high-hip 2 25%
Below high-hip 3 37.5%
Total 8 100%
Group 3
Waist & High-hip 0 0%
Waist & Below High-hip 1 7.7%
Below waist 0 0%
Above high-hip 1 7.7%
High-hip 9 69.2%
Slightly below high-hip 2 15.4%
Below high-hip 0 0%
Total 13 100%

136
Group 4
Waist & High-hip 1 9.1%
Waist & Below High-hip 0 0%
Below waist 0 0%
Above high-hip 0 0%
High-hip 7 63.6%
Slightly below high-hip 0 0%
Below high-hip 3 27.3%
Total 11 100%
Group 5
Waist & High-hip 0 0%
Waist & Below High-hip 0 0%
Below waist 1 50%
Above high-hip 0 0%
High-hip 0 0%
Slightly below high-hip 0 0%
Below high-hip 1 50%
Total 2 100% Table 35: Skirt Front Waist Dart Depth vs. GLBFP Alignment
The skirt front waist dart width was compared to the GLBFP description. Three
groups were identified during the dimensional component. One subject was in group 1,
thirty-five in group 2, and three in group 3.
For the GLBFP description, the softly rounded category comprised the entirety of
group 1. The rounded category was the majority for groups 2 and 3, at 37.1% and 66.7%
respectively. The flat category is the second largest contingent in group 2, at 25.7%. A
summary of the data is displayed in Table 36.
GLBFP Description
Group 1
Flat 0 0%
Oval 0 0%
Softly pointed 0 0%
Softly rounded 1 100%
Rounded 0 0%
Rounded & Softly pointed 0 0%
Total 1 100%

137
Group 2
Flat 9 25.7%
Oval 6 17.1%
Softly pointed 3 8.6%
Softly rounded 3 8.6%
Rounded 13 37.1%
Rounded & Softly pointed 1 2.9%
Total 35 100%
Group 3
Flat 0 0%
Oval 1 33.3%
Softly pointed 0 0%
Softly rounded 0 0%
Rounded 2 66.7%
Rounded & Softly pointed 0 0%
Total 3 100% Table 36: Skirt Front Waist Dart Width vs. GLBFP Description
Buttocks
The pattern dimensions for the buttocks included the skirt back waist dart depth, and
the skirt back waist dart width. The body-form variations included descriptions of the
length, fullest part, prominence, and buttocks alignment.
The skirt back waist dart depth was compared to buttocks length and fullest part
descriptions, as well as buttocks alignment. Three groups were identified during the
dimensional component. There was one subject each in groups 1 and 2, and thirty-seven
subjects in group 3.
For buttocks length, the long category comprised the entirety of group 1 and was the
majority for group 3, at 75.7%. The short category comprised the entirety of group 2. For
the description of the fullest part of the buttocks, the low category comprised the entirety
of group 1. The high category comprised the entirety of group 2. The middle category
was the majority for group 3, at 62.2%. Summaries of the data are displayed in Table 37.
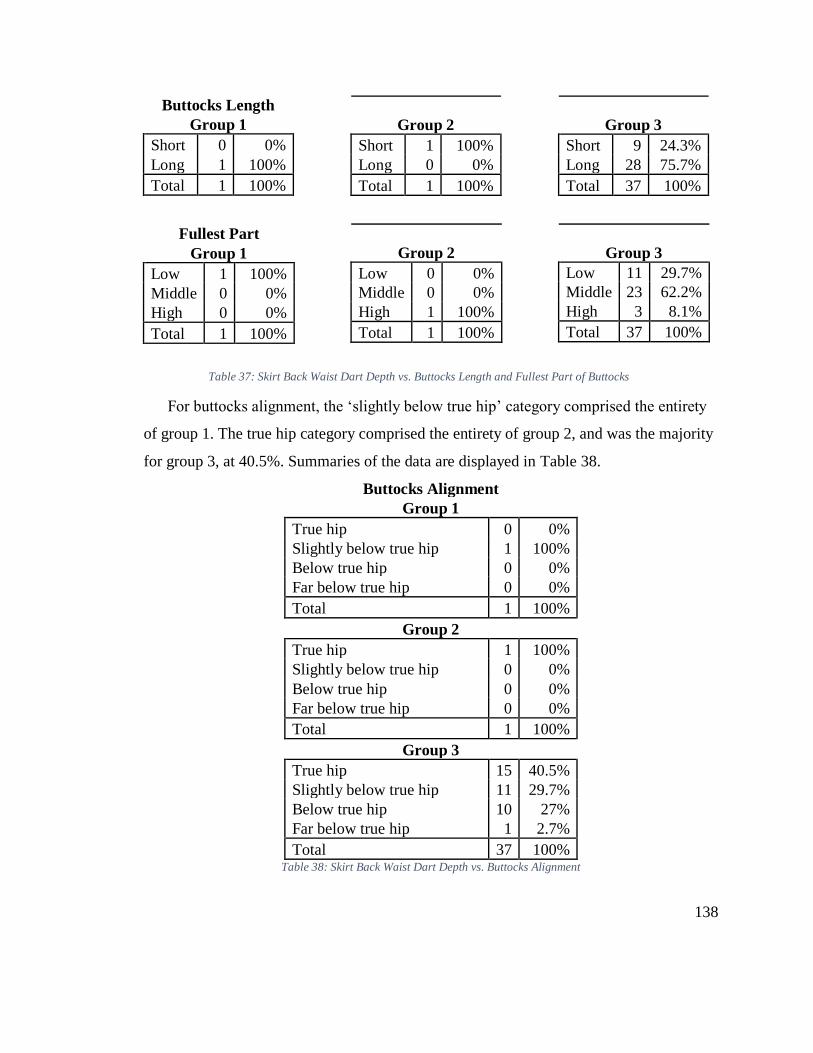
138
Buttocks Length
Group 1
Short 0 0%
Long 1 100%
Total 1 100%
Group 2
Short 1 100%
Long 0 0%
Total 1 100%
Group 3
Short 9 24.3%
Long 28 75.7%
Total 37 100%
Fullest Part
Group 1
Low 1 100%
Middle 0 0%
High 0 0%
Total 1 100%
Group 2
Low 0 0%
Middle 0 0%
High 1 100%
Total 1 100%
Group 3
Low 11 29.7%
Middle 23 62.2%
High 3 8.1%
Total 37 100%
Table 37: Skirt Back Waist Dart Depth vs. Buttocks Length and Fullest Part of Buttocks
For buttocks alignment, the ‘slightly below true hip’ category comprised the entirety
of group 1. The true hip category comprised the entirety of group 2, and was the majority
for group 3, at 40.5%. Summaries of the data are displayed in Table 38.
Buttocks Alignment
Group 1
True hip 0 0%
Slightly below true hip 1 100%
Below true hip 0 0%
Far below true hip 0 0%
Total 1 100%
Group 2
True hip 1 100%
Slightly below true hip 0 0%
Below true hip 0 0%
Far below true hip 0 0%
Total 1 100%
Group 3
True hip 15 40.5%
Slightly below true hip 11 29.7%
Below true hip 10 27%
Far below true hip 1 2.7%
Total 37 100% Table 38: Skirt Back Waist Dart Depth vs. Buttocks Alignment
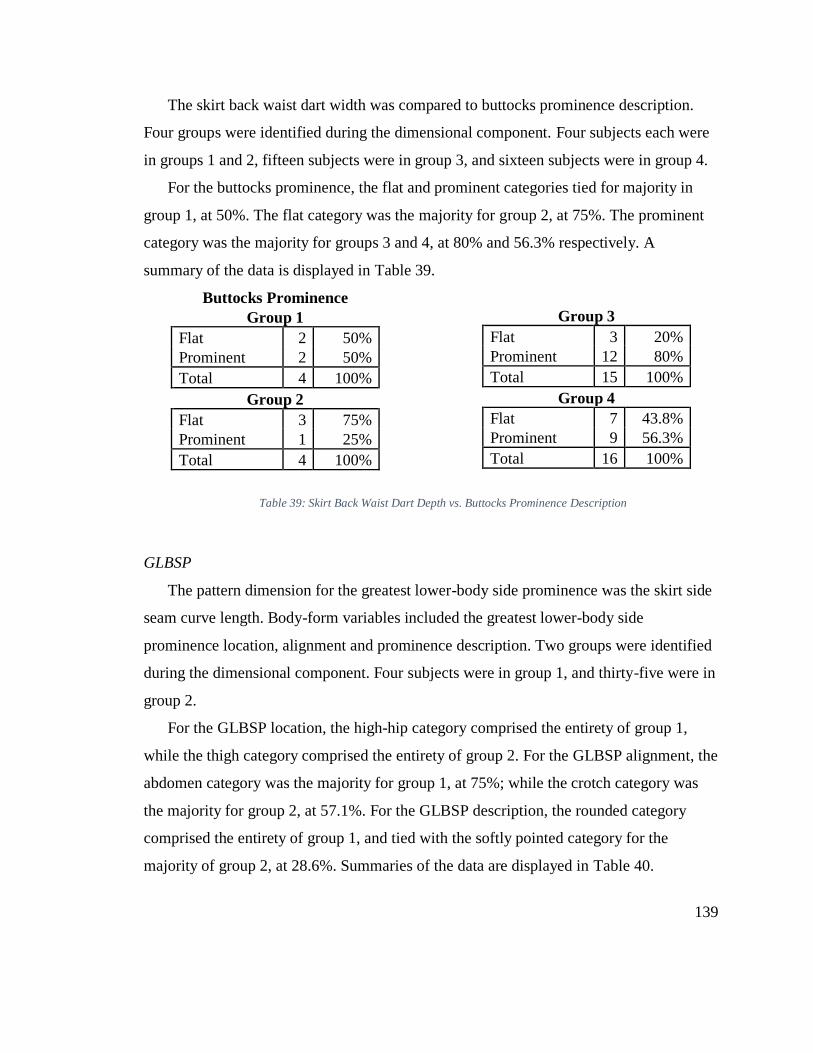
139
The skirt back waist dart width was compared to buttocks prominence description.
Four groups were identified during the dimensional component. Four subjects each were
in groups 1 and 2, fifteen subjects were in group 3, and sixteen subjects were in group 4.
For the buttocks prominence, the flat and prominent categories tied for majority in
group 1, at 50%. The flat category was the majority for group 2, at 75%. The prominent
category was the majority for groups 3 and 4, at 80% and 56.3% respectively. A
summary of the data is displayed in Table 39.
Buttocks Prominence
Group 1
Flat 2 50%
Prominent 2 50%
Total 4 100%
Group 2
Flat 3 75%
Prominent 1 25%
Total 4 100%
Group 3
Flat 3 20%
Prominent 12 80%
Total 15 100%
Group 4
Flat 7 43.8%
Prominent 9 56.3%
Total 16 100%
Table 39: Skirt Back Waist Dart Depth vs. Buttocks Prominence Description
GLBSP
The pattern dimension for the greatest lower-body side prominence was the skirt side
seam curve length. Body-form variables included the greatest lower-body side
prominence location, alignment and prominence description. Two groups were identified
during the dimensional component. Four subjects were in group 1, and thirty-five were in
group 2.
For the GLBSP location, the high-hip category comprised the entirety of group 1,
while the thigh category comprised the entirety of group 2. For the GLBSP alignment, the
abdomen category was the majority for group 1, at 75%; while the crotch category was
the majority for group 2, at 57.1%. For the GLBSP description, the rounded category
comprised the entirety of group 1, and tied with the softly pointed category for the
majority of group 2, at 28.6%. Summaries of the data are displayed in Table 40.

140
GLBSP Location
Group 1
Thigh 0 0%
High-Hip 4 100%
Total 4 100%
Group 2
Thigh 35 100%
High-Hip 0 0%
Total 35 100%
GLBSP Alignment
Group 1
Abdomen 3 75%
Below Abdomen 1 25%
Above Crotch 0 0%
Crotch 0 0%
Below Crotch 0 0%
Total 4 100%
Group 2
Abdomen 0 0%
Below Abdomen 0 0%
Above Crotch 12 34.3%
Crotch 20 57.1%
Below Crotch 3 8.6%
Total 35 100%
GLBSP Description
Group 1
Flat 0 0%
Softly Pointed 0 0%
Pointed 0 0%
Softly Rounded 0 0%
Rounded 4 100%
Total 4 100%
Group 2
Flat 5 14.3%
Softly Pointed 10 28.6%
Pointed 2 5.7%
Softly Rounded 8 22.9%
Rounded 10 28.6%
Total 35 100%
Table 40: Skirt Curve Length vs. GLBSP Location, Alignment & Description
Summary
Nineteen measurements yielded sixteen pattern dimensions for analysis in the
dimensional component. These sixteen dimensions suggested twenty-seven body-form
variables for analysis in the visual component. The physiological component displayed
the interaction between the pattern dimensions and body-form variables. The next chapter
will discuss the body-form variations for this single size, as well as the what these
findings suggest for the development of a body-form based block system.
141
Chapter 6 Discussion and Conclusion
Introduction
This chapter synthesizes the data reported in the previous chapter. The dimensional,
visual, and physiological results were considered in terms of the two research questions:
1. What are the body form variations across a single size?
2. What do these findings suggest for the development of a body-form based block
system?
Question One
There are numerous body-form variations in this sample. Every individual body
component had one or more body-form variables to analyze. And every body-form
variable had at least two categories. A visual content analysis was used to categorize each
body-form variation. For each body-form variation, differences between subjects were
considered and significant differences resulted in new categories. The results indicate that
there are body-form variations in this single size.
In this study, the term “average” indicated that a variation did not belong in either the
upper or lower categories of the body-form variable. It did not indicate that the variation
matched the fit model or some other, outside standard. In the reviewed literature,
sometimes the texts displayed images of what an “average” body-form variation looked
like, but most commonly, they did not. Generally, the reviewed literature displayed only
images of the variations from the average or ideal figure. Though, all texts preceded the
variations section with a section on the “average” or “ideal” female body. Where the
literature did not directly state that there was an “average” body-form variation, the
researcher assumed there was one and that it represented each text’s “average/ideal”
female body. This assumption was based on the understanding that there can be no
variations without something to compare against. The term ‘a/i’ was used to indicate that
a text did not specify an average, but did indirectly compare against one.

142
Neck
Four body-form variations with thirteen within-component categories were
determined by analyzing the neck region of each subject: neck thickness, neck-to-
shoulder transition, collarbone visibility, and neck tilt. For this sample, the most common
neck variations were thick necks, sharp neck-to-shoulder transitions, visible collarbones,
and forward neck tilts.
Neck thickness produced three categories: thin, average, and thick. Thick necks were
the most common, at fourteen subjects. This number is essentially even with the thin (13)
and average (12) categories. This may mean that any pattern blocks created from data in
this sample may need to have three different neck circumference options.
Neck thickness was prevalent in the literature, though the terminology differed by
text. Only Palmer and Alto (2005) shared the same terms as this study. Minott (1978)
used synonyms, while Rasband and Liechty (2006), and Liechty, Rasband and Pottberg-
Steineckert (2010) used terminology with a possibility for broader interpretation (Table
41). There are no measurements associated with this figure variation, which provides
future researchers with an opportunity to determine what measurements or proportions
match thin, average, and thick necks.
Two variations on neck thickness not accounted for in this study were the uneven and
muscular neck variations from Palmer and Alto (2005). Observations of this sample
noted uneven and muscular necks, but did not equate them with neck thickness, nor did
they become categories for other neck variations. Future research may wish to include
these variations to determine if they affect neck thickness or other neck variations.
Sample Thin Average Thick
Minott (1978) Narrow Average Wide
Palmer & Alto (2005) Thin a/i Thick
Rasband & Liechty (2006) Smaller a/i Larger
Liechty et al. (2010) Smaller a/i Larger Table 41: Neck Thickness - Sample vs. Reviewed Literature
The neck-to-shoulder transition produced two categories: sharp and smooth. A sharp
neck-to-shoulder transition looked like a right angle between the neck and shoulder,
while a smooth neck-to-shoulder transition looked like the muscles from the neck swept

143
down gently into the shoulder, forming a curved ramp. Sharp neck-to-shoulder transitions
were most prevalent in this sample, consisting of twenty-eight subjects, which was more
than double the number of subjects in the smooth category (11).
The terminology used in this study differs from the terminology used in the reviewed
literature. First, the transition is described differently, and second the number of
categories within this variation is different (Table 42).
Sample Sharp n/a Smooth
Rasband & Liechty (2006) Low Neck Base a/i High Neck Base
Liechty et al. (2010) Low Neck Base a/i High Neck Base Table 42: Neck-to-Shoulder Transition - Sample vs. Reviewed Literature
The neck and shoulder are conjoined, thus there must always be a neck-to-shoulder
transition. The Rasband and Liechty (2006) and Liechty et al. (2010) texts focus on the
neck base, providing them with an “average/ideal” category. They state that neck
angularity is based on neck muscle development: A low neck base has less muscle
development than the ideal, while a high neck base has more. This study considered the
transition itself, which must be described as a curve or angle, and does not afford an
“average” definition.
This contrast in focus revealed a discussion point. If we accept that the muscle
development of the neck base causes the neck-to-shoulder transition to behave in certain
ways, then this study focused on the end result, rather than the cause. If this is so, then the
neck-to-shoulder transition may not be the best body-form variation to use for the
assessment of fit. Researchers should compare neck base muscle development to neck-to-
shoulder transitions to see if there is a causal effect.
Collarbone visibility produced four categories: flat, nearly flat, visible, and
prominent. Flat meant that the bones and hollow could not be seen; nearly flat meant the
bones and hollow were barely visible; visible meant the bones and hollow could be easily
identified; and prominent meant that the bones protruded from the body, with a deep
hollow.
The most prevalent collarbone types found in the study were the visible (16) and
nearly flat (15) categories, followed by the prominent (6) and flat (2) categories. Minott
(1978) and Liechty et al. (2010) were the only texts to mention collarbone visibility, and

144
they only mentioned a prominent collarbone (Table 43), which Liechty et al. defined as
“larger and round out more than average/ideal” (p. 263). No definition of an ideal
collarbone was given in either text.
Sample Flat Nearly Flat Visible Prominent
Minott (1978) n/a n/a a/i Prominent
Liechty et al. (2010) n/a n/a a/i Prominent Table 43: Collarbone Visibility - Sample vs. Reviewed Literature
The fact that flat and nearly flat collarbones are not discussed in the reviewed
literature may indicate (a) that they are not known, or (b) that they do not impact fit. If
option (a) is true, then this study has added to the body of knowledge by adding two new
categories to the body-form variation of collarbone visibility. If option (b) is true, then
this researcher suggests that discussion of collarbone visibility should include all of the
options before deciding on the relevancy of each option. Research into collarbone height
and hollow depth should be conducted to more accurately define the categories presented
in this study.
Figure 86: How posture affects neck tilt (from Latzke & Quinlan, 1940, Fig. 42, p. 73)
Neck tilt produced four categories: straight, slightly forward, forward, and far
forward. The categories are a continuum of how forward the neck appeared in relation to
the torso. The literature only suggested two options for neck tilt: average/ideal or

145
forward. In this case, the term “forward” most likely covers any deviation from average,
which would include the more specific terminology used in this study of “slightly
forward”, “forward”, and “far forward” (Table 44).
Sample Straight Slightly Forward Forward Far Forward
Rasband & Liechty (2006) a/i n/a Forward n/a
Liechty et al. (2010) a/i n/a Forward n/a Table 44: Neck Tilt - Sample vs. Reviewed Literature
This body-form variation may be caused by posture, as Liechty et al. (1986) note that
a forward head may be caused by rounded back posture or slumped posture. Latzke and
Quinlan (1940) showed that the neck tilts more and more forward as posture becomes
worse and worse (Figure 86), though they do not specifically discuss neck tilt in their
book. If we assume that the general term used in the literature (“forward”) covers all
deviations from the straight neck tilt, and that neck tilt results from poor posture, then
79.5% of this sample may have poor posture.
No other suggestions besides posture were found in the literature to explain forward
neck tilt. As Latzke and Quinlan (1940) showed, posture can range from very poor to
excellent (Figure 86). Overall posture was not evaluated in this study. Researchers should
measure the angle at which the neck tilts forward at different postures to more clearly
define the categories presented in this study. Additionally, while this study focused on
adult women between the ages of 18 and 54, posture changes may also affect women 55
years and older, so analysis of neck tilt for women 55 years and older may provide
helpful information with regards to apparel block production.
Shoulder
Four body-form variations with seventeen within-component categories were
determined by analyzing the shoulder region of each subject: shoulder length description,
shoulder point sharpness, shoulder point alignment, and shoulder slope description. For
this sample, the most common shoulder variations were long shoulder lengths, soft
shoulder points, shoulder point alignment outside the bust and inside the high-hip and
thigh, and sloped shoulders.

146
Shoulder length produced three categories: short, average, and long. The long group
was the most common, at eighteen subjects, while the short and average groups were just
about equal at eleven and ten subjects each. Pattern blocks made for this sample should
adjust the shoulder seam measurement for a long shoulder length, but also have options
for short and average lengths.
The shoulder length description for this study focused on the distance from high-point
shoulder to shoulder point, while the literature only discussed shoulder width (Table 45),
which is the span from one shoulder point to the other and includes neck breadth within
the measurement. The relationship between shoulder length and shoulder width should be
tested as it relates to drafting and pattern alteration. Shoulder length may be more
relevant to patterning the shoulder seam than shoulder width.
Sample: Shoulder Length Short Average Long
Minott (1978): Shoulder Width Narrow Average Wide
Maehren & Meyers (2005): Shoulder Width Narrow a/i Broad
Palmer & Alto (2005): Shoulder Width Narrow Average Broad
Rasband & Liechty (2006): Shoulder Width Narrower a/i Wider/Broad
Liechty et al. (2010): Shoulder Width Narrower a/i Wider/Broad Table 45: Shoulder Length – Sample vs. Reviewed Literature
The shoulder point sharpness variation produced two categories: sharp and soft. The
collarbone was followed to its natural end to locate a reference for the shoulder point. If
the shoulder point was easy to see and the shoulder angled sharply into the arm, the
shoulder point was sharp. If the shoulder point was difficult to see, or if the shoulder
angled softly into the arm, then the shoulder point was soft. Soft shoulder points were the
most common, at twenty-three subjects, while sharp shoulder points were around two-
thirds the size, at sixteen subjects.
There was nothing in the literature about the sharpness of the shoulder point, though
there were numerous descriptions of the shoulder that may account for differences in
shoulder point softness (Table 46). Common themes among the possible variations noted
in the literature included the size and placement of the shoulder bones, as well as muscle
development at the shoulder joint.

147
Sample Sharp n/a Soft
Minott (1978) Prominent Collarbone a/i n/a
Maehren & Meyers
(2005)
Forward Thrust
Shoulders a/i n/a
Palmer & Alto (2005) Forward Shoulders a/i n/a
Rasband & Liechty (2006) Forward Shoulder Joint a/i Posterior Arm Joint
Short Arm Joint a/i Long Arm Joint
Liechty et al. (2010) Prominent Collarbone a/i n/a
Forward Shoulder Joint a/i Posterior Arm Joint
Shorter Shoulder Joint a/i Longer Shoulder Joint
Smaller Shoulder Joint a/i Larger Shoulder Joint Table 46: Shoulder Point Sharpness - Sample vs. Reviewed Literature
Minott (1978) and Liechty et al. (2010) were the only texts to note that the collarbone
may impact the shoulder joint. Minott only includes an image (Figure 87), but this image
does convey how the collarbone can cause sharpness of the shoulder point.
Forward shoulders were found in four of the five reviewed
texts and equate to the shoulder joint being rotated farther
forward than is considered average or ideal. The opposite, a
posterior arm joint, was only found in two texts, and equated to
a shoulder joint positioned farther back on the body than
average or ideal. Liechty et al. (2010) considered the forward or
posterior positioning of the shoulder joint in connection with
the collarbone, saying the collarbone bowed forward for the
forward shoulder joint and lay flatter/straighter for the posterior shoulder joint. These
variations may indicate that collarbone structure may influence the position of the
shoulder point, though not the sharpness of the shoulder point.
Shoulder joint length, or the distance between the arm hinge and the shoulder point,
was noted by Rasband and Liechty (2006) and Liechty et al. (2010) and was comprised of
differences in bone length and muscle development. Longer joints resulted from longer
bones and/or fleshier arms, and smaller joints resulted from shorter bones and/or less
flesh at the arm joint. The length of the bone may or may not impact shoulder point
sharpness, but more flesh may cover the bone, making the point soft, while less flesh may
reveal the bone, making the point sharp.
Figure 87: Prominent
Collarbones, from Minott
(1978), Fig. 7.1c, p. 52

148
Liechty et al. (2010) was the only text to discuss the general size of the shoulder joint.
Larger shoulder joints had larger bones and/or more developed musculature, while
smaller shoulder joints had smaller bones and/or less developed musculature. As with the
length of the shoulder joint, more flesh may cover the bone and create a soft point, while
less flesh may reveal the bone and create a sharp point.
As shoulder point sharpness is not discussed in the literature it may indicate that (a) it
is not known, (b) it is known, but discussed in different ways, or (c) it does not impact fit.
If option (a) is true, then this study added to the body of knowledge by providing a new
body-form variation to describe the shoulder. If option (b) is true, then this study
condensed discussion from multiple areas into one, which may speed up description and
improve the pattern block alteration process. If option (c) is true, and shoulder point
sharpness does not impact fit, then this researcher suggests studies be conducted on how
bone structure and musculature development impact the shoulder joint.
Shoulder point alignment compared the relation of the shoulder points to the bust,
high-hip, and thigh widths of the subjects in the sample. Alignment could have been
inside, aligned, or outside each of the three body components, for a possible twenty-seven
combinations. Alignment at the waist was not recorded, as all of the subjects’ waists were
inside the plane used to judge alignment. Seven combinations were seen in this sample.
The most common combinations were a) outside the bust, inside the high-hip and thigh
(16), b) aligned with the bust, inside the high-hip and thigh (10), and c) outside the bust
and high-hip, inside the thigh (8). The remaining four categories had a combined total of
five subjects; or about a third of the most common category.
Shoulder point alignment may indicate whole-body form, as it triangulates shape
through four different body areas (Table 47). The only combination inside the bust, was
also inside the high-hip and thighs, and so required a whole-body form that had narrow
shoulders and a wider lower torso. Two whole-body forms accommodate these needs: the
rectangular form and the oval form (Latzke & Quinlan, 1940; Simmons et al., 2004;
Maehren & Meyers, 2005; Rasband & Liechty, 2006)
Combinations aligned with the bust required a whole-body form that had average to
narrow shoulders and a wide lower torso. The only whole-body form that accommodates

149
these needs is the triangular form (Simmons et al., 2004; Maehren & Meyers, 2005;
Rasband & Liechty, 2006).
Combinations that were outside the bust required a whole-body form that had both a
wide shoulder and a wide lower torso. The only whole-body form that accommodates
these needs is the hourglass (Simmons et al., 2004; Maehren & Meyers, 2005; Rasband &
Liechty, 2006).
Sample Whole-Body Form Shoulder Width
Inside b, hh & t Rectangular or Oval Narrow
Aligned w/b, outside hh, inside t Triangular Narrow
Aligned w/b & hh, inside t Triangular Narrow
Aligned w/b, inside hh & t Triangular Average
Outside b, inside hh & t Hourglass Broad
Outside b, aligned w/hh, inside t Hourglass Broad
Outside b & hh, inside t Hourglass Broad Table 47: Shoulder Point Alignment - Whole-Body Form & Shoulder Width
The results suggest this sample may be made up of rectangular, oval, triangular and
hourglass whole-body forms. The majority of the sample, 66.7%, falls into the hourglass
category, while the second largest category, the triangular form was 30.8%. This was the
only body-form variation to compare different body components in this study. As such,
they provided a rough sketch of how alignment relates to the whole body-form. A larger
sample may include body-forms for all 27 possible combinations, providing researchers
with more detailed descriptions of whole body-form.
Shoulder point alignment may also indicate shoulder width, a common variation
described in the literature, and compiled in Table 45. Shoulder width, the distance
spanning from the left shoulder point to the right shoulder point, measured across the
back of the body, can be either narrow, average, or wider/broad. Liechty et al. (2010)
posit that shoulder width is influenced by bone structure, thus shorter bones equate to a
narrower shoulder width, while longer bones equate to a wider/broader shoulder width.
Shoulder width may also be influenced by posture, specifically curved or erect upper
backs. As bone structure cannot be accurately assessed via body scans, a future study
where a subject’s x-rays are overlaid on their body scan may be helpful in assessing this
variation.
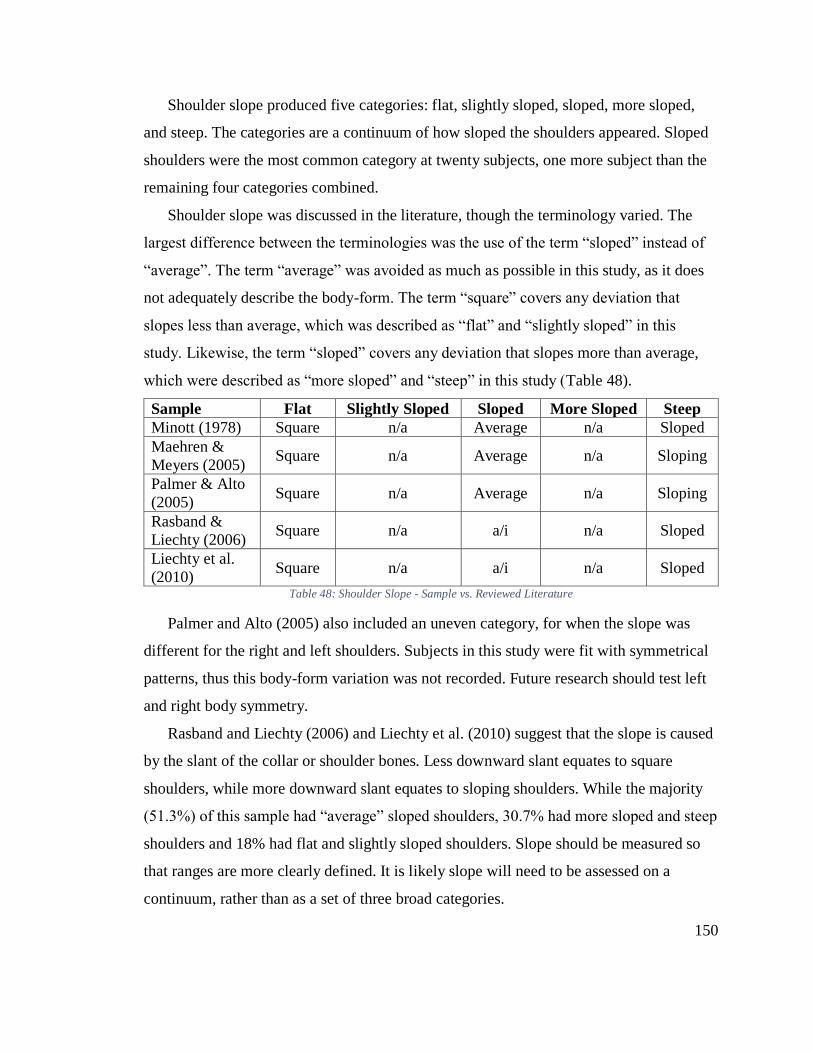
150
Shoulder slope produced five categories: flat, slightly sloped, sloped, more sloped,
and steep. The categories are a continuum of how sloped the shoulders appeared. Sloped
shoulders were the most common category at twenty subjects, one more subject than the
remaining four categories combined.
Shoulder slope was discussed in the literature, though the terminology varied. The
largest difference between the terminologies was the use of the term “sloped” instead of
“average”. The term “average” was avoided as much as possible in this study, as it does
not adequately describe the body-form. The term “square” covers any deviation that
slopes less than average, which was described as “flat” and “slightly sloped” in this
study. Likewise, the term “sloped” covers any deviation that slopes more than average,
which were described as “more sloped” and “steep” in this study (Table 48).
Sample Flat Slightly Sloped Sloped More Sloped Steep
Minott (1978) Square n/a Average n/a Sloped
Maehren &
Meyers (2005) Square n/a Average n/a Sloping
Palmer & Alto
(2005) Square n/a Average n/a Sloping
Rasband &
Liechty (2006) Square n/a a/i n/a Sloped
Liechty et al.
(2010) Square n/a a/i n/a Sloped
Table 48: Shoulder Slope - Sample vs. Reviewed Literature
Palmer and Alto (2005) also included an uneven category, for when the slope was
different for the right and left shoulders. Subjects in this study were fit with symmetrical
patterns, thus this body-form variation was not recorded. Future research should test left
and right body symmetry.
Rasband and Liechty (2006) and Liechty et al. (2010) suggest that the slope is caused
by the slant of the collar or shoulder bones. Less downward slant equates to square
shoulders, while more downward slant equates to sloping shoulders. While the majority
(51.3%) of this sample had “average” sloped shoulders, 30.7% had more sloped and steep
shoulders and 18% had flat and slightly sloped shoulders. Slope should be measured so
that ranges are more clearly defined. It is likely slope will need to be assessed on a
continuum, rather than as a set of three broad categories.

151
Shoulder Blades
Four body-form variations with fifteen within-component categories were determined
by analyzing the upper back region of each subject: shoulder blade prominence point
alignment, blade prominence, blade description, and blade width. For this sample, the
most common shoulder blade variations were prominence points aligned at the arm join,
visible blade prominences, rounded shoulder blades, and narrow shoulder blade widths.
Shoulder blade prominence point alignment occurred at the armpit, arm join, or above
the arm join. The most common alignment occurred at the arm join, with thirty subjects.
This is over four times as many as the next alignment category (at the armpit, seven
subjects). Arm join alignment shows a clear dominance in this sample, so any pattern
created for this sample should align the bodice back waist dart tip with the arm join,
which may or may not be above the underarm point.
None of the reviewed literature discussed shoulder
blade prominence in terms of where it aligned with other
body components (Table 49). The closest the literature
came was in Minott (1978), where the author sketched
shoulder blade “problems”, which included blade
prominence at either the top or bottom of the blades
(Figure 88). Understanding where the prominence point
aligns with other body components can help with the accurate placement of back darts in
a pattern. While the shoulder blade prominence points were found to correspond to the
lower part of the shoulder blades in this sample, future research should take into account
that they may occur higher up on the back, in which case, the shoulder dart becomes
more important.
Sample Armpit At Arm Join Above the Arm Join
Minott (1978) Lower Blades Prominent a/i Upper Blades Prominent Table 49: Prominence Point Alignment - Sample vs. Reviewed Literature
Shoulder blade prominence produced four categories: flat, almost flat, visible, and
prominent. Visible blades were the most common, at twenty subjects (51.3%). Flat blades
Figure 88: Shoulder Blade Prominence Types, from Minott (1978),Figure 7.1i,
p. 54

152
were the next most common category, at ten subjects. The remaining subjects were
almost evenly split between the prominent (5) and almost flat (4) categories.
Sample Flat Almost Flat Visible Prominent
Palmer & Alto (2005) n/a n/a a/i Prominent
Liechty et al. (2010) Flat n/a a/i Prominent
Alternative Explanations
Palmer & Alto (2005) Straight/Erect/Sway
or Flat Back n/a a/i
Rounded
Back
Rasband & Liechty
(2006) Erect Upper Back n/a a/i
Rounded
Upper Back
Liechty et al. (2010) Erect Upper Back n/a a/i Rounded
Upper Back Table 50: Shoulder Blade Prominence - Sample vs. Reviewed Literature
Only two texts included direct mentions of shoulder blade prominence, and only one
of those included a flat alternative (Table 50). Based on the data from this sample, a flat
prominence should be included before a prominent option, as the flat category had double
the number of subjects as the prominent category. The flat option may not be added
because it does not affect pattern fit, or because it is classified as something else.
Explanations for the flat shoulder blade variation in Liechty et al. (2010) say it can be
due to an overly erect posture. Three texts included an erect upper back category, which
is defined as flat, resulting from an overly erect posture (Table 50). This definition
confounds shoulder blade prominence with posture. Research needs to test if there is a
difference between a flat shoulder blade due to an overly erect posture and a flat shoulder
blade due to bone structure.
Likewise, explanations for the prominent shoulder blade variation in Liechty et al.
(2010) say the back can appear rounded. A rounded back is a common postural variation
amongst the literature (Table 50). The upper back becomes overly curved, and at the most
extreme has been labeled “dowager’s hump”. Again, this confounds shoulder blade
prominence with posture and research should test for a difference between prominent
blades and rounded posture.
Both texts that discussed shoulder blade prominence indicated that there was an
average/ideal blade prominence. The most common category for this sample was the
visible blade prominence, which can equate to this average/ideal. Based on this sample, a

153
case can be made that the average is in fact the most common type of blade prominence,
and any pattern made for this sample should use the visible category as its guide.
Shoulder blade description produced five categories: flat, softly pointed, pointed,
softly rounded and rounded. The most common category was the rounded category with
seventeen subjects. This equals the next two categories added together, flat (11) and
softly pointed (6). The smallest categories were pointed (3) and softly rounded (2). It is
possible that these categories could have been combined with the softly pointed and
rounded categories without repercussion.
The type of prominence (flat, pointed or rounded) is not present in the literature. It is
possible that the type of prominence does not affect garment fit which may be why it has
been left out. The other option is that it has been categorized as a postural variation, such
as Palmer and Alto’s (2005) three rounded back variations: slightly round, high round,
and very round (Table 51). Future research should spend time separating the variations
created by the shoulder blades from the variations created by the spine.
Sample Flat Softly Pointed Pointed Softly Rounded Rounded
Palmer & Alto
(2005) n/a n/a
High
Round Slightly Round Very Round
Table 51: Shoulder Blade Description - Sample vs. Reviewed Literature
Shoulder blade width resulted in three categories: narrow, average, and wide. The
narrow and wide categories were nearly even with fifteen and fourteen subjects,
respectively. Both of these categories were double the average category (7), indicating
that it may be more common to have a non-standard blade width than a standard one.
Analysis of the shoulder blade width focused on the distance between blades, while
the literature only discussed total back width (Table 52), which spans from one arm join
to the other, and includes shoulder blade width. Total back width was not assessed in this
study, though future studies may wish to assess upper back width, shoulder blade width,
and their proportional relationship.
Liechty et al. (2010) discuss upper back width in terms of muscle development; when
there is more muscle back width increases and vice versa. With less muscle the back may
appear overly erect (Liechty et al., 2010), a postural variation. As shoulder blades are part
of the skeletal system, more or less musculature on the back should not affect their

154
placement. As blade width may impact the depth, width, and placement of darts pointing
towards the upper back, it is important for the literature to discuss the possible variations
inherent to this body-form variation.
Sample – Blade Width Narrow Average Wide
Minott (1978) – Back Width Narrow Average Broad
Palmer & Alto (2005) – Back Width Narrow a/i Broad
Maehren & Meyers (2005) – Back Width Narrow a/i Broad
Rasband & Liechty (2006) – Upper Back Width Narrower a/i Wider/Broad
Liechty et al. (2010) – Upper Back Width Narrow a/i Wider Table 52: Shoulder Blade Width - Sample vs. Reviewed Literature
Bust
Three body-form variations with ten within-component categories were determined
by analyzing the bust region of each subject: bust fullness, ribcage containment, and bust
point width. For this sample, the most common bust variations were full busts, busts
contained within a subject’s ribcage width, and wide bust point widths.
Bust fullness produced five categories: very small, small, average, full, and very full.
The full category was the most common with eighteen subjects, followed closely by the
small category (15). The remaining three categories accounted for six subjects total,
which was a third the size of the full category. While the small number of subjects in the
extreme categories may indicate that the five categories could be condensed into two or
three, this would be a premature decision. If bust fullness relates to bra cup size (A, B, C,
D, etc.) then finding five variations within our sample is not surprising.
The literature mostly discussed bust fullness in terms of bra cup size, indicating that a
B-cup is average and that deviations from that result from smaller or larger busts (Table
53). Bra cup size is determined by taking the difference between the full bust
circumference and the high bust circumference (Palmer & Alto, 2005). The larger the
difference, the higher the bra cup size needed. But, as Palmer and Alto (2005) point out,
bra cup labeling is not consistent across band size (determined by the underbust
circumference); and a 38A may have the same cup size as a 32D. As such, bra cup size
may not be appropriate for describing bust fullness. Researchers should consider a way to
describe bust fullness that does not depend upon size labeling. A good start may be the
categories presented herein.

155
An alternative description of bust fullness found in the Rasband and Liechty (2006)
and the Liechty et al. (2010) texts is the prominent bust (Table 53). Prominent busts
differ from larger busts by being conical in shape and usually a C-cup or larger. Bust
shape was not noted during analysis, though future research may wish to compare how
bust shape affects bust fullness.
Sample Very Small Small Average Full Very Full
Minott (1978) n/a Small Average Large n/a
Maehren &
Meyers (2005) n/a Small/ <B
Average/
B Full/ ≥C n/a
Palmer & Alto
(2005) n/a A B C/Full D, DD
Rasband &
Liechty (2006) n/a
Smaller/
<B a/i/B
Larger/ >B
Prominent/ ≥C n/a
Liechty et al.
(2010) n/a
Smaller/
<B a/i/B
Larger
Prominent/ ≥C n/a
Table 53: Bust Fullness - Sample vs. Reviewed Literature
The bust was either contained within the upper ribcage or not. Ribcage containment
was the most common variation in this sample. Twenty-six subjects had busts contained
within their ribcage, while half that number (13) did not.
Ribcage containment was not mentioned in the literature, though ribcage width was
(Table 54). Liechty et al.’s (2010) wider and narrower rib cages, defined as wider or
narrower than average/ideal, when combined with bust fullness may provide an
explanation for ribcage containment. Fuller busts and a narrower rib cage may cause the
bust to extend past the ribcage, while smaller busts and a wider rib cage may cause the
bust to stay within the ribcage. Ribcage was not assessed in this study, but should be
considered in conjunction with bust fullness in future research. In instances where the
bust is wider than the ribcage, the pattern will need to reflect this, as there will be a
hollow along the side of the body between the bust and the back.
Sample No n/a Yes
Liechty et al. (2010) Narrower Rib Cage a/i Wider Rib Cage Table 54: Ribcage Containment - Sample vs. Reviewed Literature
Bust point width produced three categories: narrow, average, and wide. The wide
category was the most common in this sample, with seventeen subjects, followed by the
average (13), and narrow (9) categories. Liechty et al. (2010) was the only text to refer to
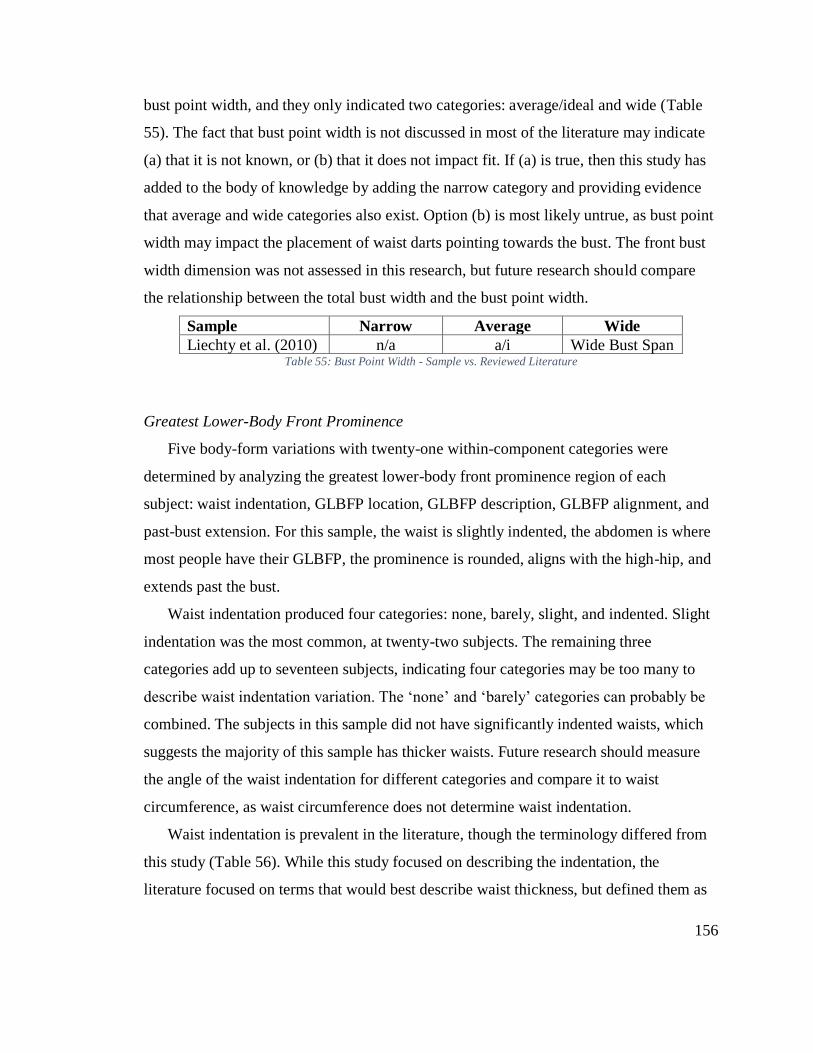
156
bust point width, and they only indicated two categories: average/ideal and wide (Table
55). The fact that bust point width is not discussed in most of the literature may indicate
(a) that it is not known, or (b) that it does not impact fit. If (a) is true, then this study has
added to the body of knowledge by adding the narrow category and providing evidence
that average and wide categories also exist. Option (b) is most likely untrue, as bust point
width may impact the placement of waist darts pointing towards the bust. The front bust
width dimension was not assessed in this research, but future research should compare
the relationship between the total bust width and the bust point width.
Sample Narrow Average Wide
Liechty et al. (2010) n/a a/i Wide Bust Span Table 55: Bust Point Width - Sample vs. Reviewed Literature
Greatest Lower-Body Front Prominence
Five body-form variations with twenty-one within-component categories were
determined by analyzing the greatest lower-body front prominence region of each
subject: waist indentation, GLBFP location, GLBFP description, GLBFP alignment, and
past-bust extension. For this sample, the waist is slightly indented, the abdomen is where
most people have their GLBFP, the prominence is rounded, aligns with the high-hip, and
extends past the bust.
Waist indentation produced four categories: none, barely, slight, and indented. Slight
indentation was the most common, at twenty-two subjects. The remaining three
categories add up to seventeen subjects, indicating four categories may be too many to
describe waist indentation variation. The ‘none’ and ‘barely’ categories can probably be
combined. The subjects in this sample did not have significantly indented waists, which
suggests the majority of this sample has thicker waists. Future research should measure
the angle of the waist indentation for different categories and compare it to waist
circumference, as waist circumference does not determine waist indentation.
Waist indentation is prevalent in the literature, though the terminology differed from
this study (Table 56). While this study focused on describing the indentation, the
literature focused on terms that would best describe waist thickness, but defined them as

157
types of indentation. For example, Liechty et al. (2010) use the term “larger”, but define
it as indenting less than average/ideal. This mixing of thickness and indentation is
confusing, as terms such as “large” or “narrow” better express levels of thickness. This
study proposes new terminology for the description of waist indentation that is not
confounded with waist thickness.
Sample None Barely Slight Indented
Minott (1978) n/a n/a Average Indented
Maehren & Meyers (2005) n/a Thick Average Small
Palmer & Alto (2005) n/a Thick a/i Small
Rasband & Liechty (2006) n/a Larger/Wider a/i Smaller/Narrower
Liechty et al. (2010) n/a Larger a/i Smaller Table 56: Waist Indentation - Sample vs. Reviewed Literature
Two locations for the greatest lower-body front prominence were posited in the
dimensional phase of the methods chapter: the stomach and the abdomen. Observations
revealed a third option: these locations could be equally prominent. Thirty-five subjects
had the abdomen as the GLBFP, two had the stomach and two had both locations equally
prominent. The location of the GLBFP has implications for front waist darts on pattern
blocks. The abdomen location allows basic blocks for skirts and dresses with front waist
darts to remain as is, but if the GLBFP the stomach, which is above the waist, then front
waist darts pointing towards the abdomen may not be necessary. Additionally, if both
locations are equally prominent, then basic blocks may not require front waist darts at all.
Given the implications of GLBFP location it was surprising to find so little about this
body-form variation in the literature (Table 57). The dearth of information may be due to
the literature considering the below-bust portion of the torso the “abdomen”, whereas this
study split the below-bust portion of the torso into two parts (above the waist = stomach;
below the waist = abdomen). The closest mention of differences in GLBFP location was
of high abdominal contours, which protrude from directly under the bust, and low
abdominal contours, which drop over the crotch (Rasband & Liechty, 2006; Liechty et
al., 2010). The high abdominal contour may correspond to the stomach category from this
study. An alternative option was presented in Liechty et al. (2010) whereby flared lower
ribs may protrude and cause the stomach to appear to be a location for the GLBFP.

158
Body-form descriptions should be grounded in accurate terminology. Apparel should
borrow terms from anthropometry or medicine to describe the body. Having a formal
taxonomy of body-form variations will improve communication between designers,
engineers, professors, and medical professionals.
Sample Abdomen Stomach Both n/a
Rasband & Liechty
(2006) a/i
High Abdominal
Contour n/a
Low Abdominal
Contour
Liechty et al. (2010) a/i
High Abdominal
Contour n/a
Low Abdominal
Contour
a/i Flared Lower Ribs n/a n/a Table 57: GLBFP Location - Sample vs. Reviewed Literature
Greatest lower-body front prominence description produced five categories: flat, oval,
softly pointed, softly rounded, and rounded. The most common category was rounded,
with fifteen subjects, followed by flat (9), and oval (7). The softly pointed and softly
rounded categories added up to equal the oval category. The categories with ‘softly’ in
front of them indicated that there was some prominence, but not enough to be labeled as
‘pointed’ or ‘rounded’. It is possible that these distinctions are not necessary and the
softly rounded category could be combined with the rounded category.
The literature distinguished between prominent, average, and flat abdomens, though
the terminology differed among texts. None of the literature shared the terminology of
this study, though descriptions of the terms indicated they held the same meaning. As the
meanings from the literature are the same, this study proposes that the terms from this
study be used to describe the GLBFP, as they are more descriptive.
There were no common terms for the softly pointed category in the literature, which
could indicate that (a) it doesn’t really exist, (b) it is so uncommon it doesn’t need to be
discussed, or (c) it has gone unnoticed. As shown in this study, softly pointed GLBFP’s
do exist, so option (a) is most likely untrue. Only three subjects from this study were
categorized as softly pointed, so option (b) may be true; a larger sample will provide
researchers with a greater understanding of the proportion of softly pointed GLBFPs in
the population. If option (c) is true, then this study has added to the body of knowledge
by discovering a previously unknown description for the GLBFP.

159
Alternative explanations for the GLBFP
‘rounded’ and ‘oval’ descriptions were found in the
literature on posture (Table 58). The explanations for
the rounded description contradict each other: the
‘sway front’ posture has the pelvis tilted backward
(Rasband & Liechty, 2006; Liechty et al., 2010),
while Minott (1974) has the pelvis tilted forward in
the ‘tilted hip forward’ postural variation. As can be
seen in Figure 89 both result in rounded abdomen,
though the placement of the abdomen changes. The
sway front places the abdomen lower, while the tilted
hip forward posture places the abdomen higher, close to the waist. The contradiction in
pelvis tilt does not inhibit description of the GLBFP; these postural variations may play a
larger role in GLBFP alignment.
Sample Flat Oval
Softly
Pointed
Softly
Rounded Rounded
Minott (1978) n/a Large Front n/a n/a n/a
Maehren &
Meyers (2005) Flat n/a n/a Average Full/Prominent
Palmer & Alto
(2005) n/a Full Tummy n/a n/a n/a
Rasband &
Liechty (2006) Smaller/Flat n/a n/a a/i Larger/Prominent
Liechty et al.
(2010) Smaller/Flat n/a n/a a/i Large/Prominent
Alternative Explanations
Minott (1974) n/a n/a n/a a/i
Tilted Hip
Forward
Liechty et al.
(1986) n/a
Swayed
Back n/a a/i n/a
Rasband &
Liechty (2006) n/a Sway Back n/a a/i Sway Front
Liechty et al.
(2010) n/a Sway Back n/a a/i Sway Front
Table 58: GLBFP Description - Sample vs. Reviewed Literature
Figure 89: Tilted Hip Forward (Minott,
1974, Fig. 2.5, p. 11), Sway Front, Sway Back (Rasband & Liechty,2006, pp. 332 &
336)

160
The sway back posture, indicated by a forward tilt of the pelvis and increased
abdominal curvature (Liechty et al., 1986) may produce the ‘oval’ GLBFP description.
For the sway back, Figure 89 shows how the forward tilt produces a curve starting under
the bust, extending over the waist, and ending in the groin. Posture was not analyzed in
this study, but analysis of how posture affects the GLBFP may provide useful
implications for front waist dart placement.
The greatest lower-body front prominence alignment variation produced six
categories: at waist, below waist, above high-hip, at high-hip, slightly below high-hip,
and below high-hip. The most common alignment occurred at the high-hip, with twenty-
one subjects. A couple categories accounted for the same general area. The ‘below waist’
and ‘above high-hip’, and ‘slightly below high-hip’ and ‘below high-hip’ categories
could be combined without repercussion. As these locations change depending upon an
individual’s waist and high-hip locations, when considering how GLBFP alignment
affects pattern blocks, waist, and high-hip data will be necessary to draw conclusions.
While Rasband and Liechty (2006) and Liechty et al. (2010) note that there could be
high or low abdominal contours, none of the reviewed literature related the GLBFP to
other parts of the body (Table 59). It is possible for postural variations to change the
alignment of the GLBFP, as seen in Figure 89; but this is not well established. Future
research should consider how body parts relate to each other, especially for the skeletal
system and the GLBFP.
Sample At Waist Below Waist/
Above High-Hip
At High-
Hip
Slightly Below/
Below High-Hip
Rasband &
Liechty (2006)
High Abdominal
Contour
n/a a/i Low Abdominal
Contour
Liechty et al.
(2010)
High Abdominal
Contour
n/a a/i Low Abdominal
Contour
Minott (1974) n/a Tilted Hip
Forward
n/a n/a
Rasband &
Liechty (2006)
Sway Back n/a a/i Sway Front
Liechty et al.
(2010)
Sway Back n/a a/i Sway Front
Table 59: GLBFP Alignment - Sample vs. Reviewed Literature

161
An interesting finding from the study was that for the majority (22) of subjects the
GLBFP extended farther forward than the bust prominence. Thirteen subjects did not
have their GLBFP extend past the bust prominence, and four subjects had their GLBFP
aligned with the bust.
This is a completely new body-form variation, the finding of which was made
possible by the use of body-scanning technology. As none of the literature discussed past-
bust extension, there is either (a) no knowledge of its existence, or (b) it does not affect
apparel patterns. If it is (a), then this study has extended the body of knowledge for the
apparel field by providing a new relationship to test among the body. If (b) is true, and
the past-bust extension of the GLBFP does not affect apparel patterns, then this can be
verified through research focused on the relationship. As front waist darts are meant to
reduce the pattern from the bust to the waist, having the GLBFP extend past the bust may
reduce or eliminate the need for front waist darts.
Buttocks
Four body-form variations with eleven within-component categories were determined
by analyzing the buttocks region of each subject: buttocks prominence, buttocks length,
buttocks fullest part, and buttocks alignment. For this sample, the most common buttocks
variations were prominent and long, with the fullest part in the middle and aligned with
the true hip.
Buttocks prominence produced two categories: flat and prominent. Prominent
buttocks were the most common, at twenty-four subjects. Flat buttocks followed with
fifteen subjects, indicating that any patterns made for this sample should have two types
of skirt back patterns.
Buttocks prominence was prevalent in the literature, though the terminology differed
slightly for the prominent category, and all of the literature included an average category
(Table 60). Liechty et al. (2010) note that prominent buttocks may have greater muscle
development, while flat buttocks may have less than average buttocks. Because muscle
develops differently in each person, it would be beneficial to measure muscle tone and
compare it to buttocks prominence. Plus, while this study did not have an average

162
category, creating a continuum of flat to prominent would accommodate those subjects
that do not easily fall into one category or the other.
Posture can also account for differences in buttocks prominence (Table 60). When the
top of the pelvis tilts backwards (Sway Front, Tilted Hip-Forward) the buttocks protrude
less, resulting in a flat seat (Minott, 1974; Rasband & Liechty, 2006; Liechty et al.,
2010). When the top of the pelvis tilts forwards, the buttocks protrude more, resulting in a
more prominent seat (Minott, 1974; Rasband & Liechty, 2006; Liechty et al., 2010).
Posture was not assessed in this study, so future studies should consider how posture
affects buttocks prominence and contrast that to muscle tone and fat deposits.
Sample Flat n/a Prominent
Maehren & Meyers (2005) Flat Average Full
Palmer & Alto (2005) Flat a/i Full
Rasband & Liechty (2006) Smaller/Flat a/i Larger/Prominent
Liechty et al. (2010) Flat a/i Large Prominent
Alternative Explanations
Minott (1974) Tilted Hip-Forward Average Tilted Hip-Backward
Maehren & Meyers (2005) n/a n/a Swaybacked
Palmer & Alto (2005) n/a a/i Sway Back
Rasband & Liechty (2006) Sway Front a/i Sway Back
Liechty et al. (2010) Sway Front a/i Sway Back Table 60: Buttocks Prominence - Sample vs. Reviewed Literature
Buttocks length produced two categories: long and short. Long buttocks were the
most common, with twenty-nine subjects. This was nearly three times as many subjects
as the short category (10). This suggests that pattern blocks created for this sample should
have a longer waist to crotch length, and but also an option to shorten this length.
Only two texts mentioned the length of the lower torso in connection to the buttocks
(Table 61). Both note that buttock length is due to the length of the pelvic area, indicating
that the skeletal system may play a crucial role in this body-form variation. Length may
also be affected by muscle tone or posture. Overlaying x-rays on scans will provide data
on pelvis length and posture.
Sample Short n/a Long
Rasband & Liechty (2006) Shorter Lower Torso a/i Longer Lower Torso
Liechty et al. (2010) Shorter Lower Torso a/i Longer Lower Torso Table 61: Buttocks Length - Sample vs. Reviewed Literature

163
The fullest part of the buttocks was determined by placing transverse planes at the
top, bottom, and fullest part of the buttocks. The fullest part fell at three locations: low on
the buttocks, in the middle of the buttocks, and high on the buttocks. The most common
location for the fullest part of the buttocks was in the middle, with twenty-three subjects.
This is nearly twice the next largest category (low, twelve subjects), and six times the
smallest category (high, four subjects). Patterns made for this sample should align dart
lengths with the middle of the buttocks, but also provide an option to lengthen the darts
for subjects in the low category.
Sample Low Middle High
Rasband & Liechty (2006) Low Contour a/i High Contour
Liechty et al. (2010) Low Curve a/i High Contour Table 62: Buttocks Fullest Part - Sample vs. Reviewed Literature
Rasband and Liechty (2006) and Liechty et al. (2010) were the only texts to discuss
the height of the buttocks contour (Table 62). They describe two variations: high and low
buttocks contours. High contours were described as having a shorter distance from the
most prominent point to the waist. Low contours were described as dropping below the
crotch. The low category from this study does not match the low category from these
texts, as demonstrated by the four categories of buttocks alignment: true hip, slightly
below true hip, below true hip, and far below true hip. In no instance did the most
prominent point of the buttocks drop below the crotch. This discrepancy indicates that
there may be another level to this body-form variation. A larger sample should provide
evidence of whether this even lower buttocks contour exists or not.
Alignment of the buttocks prominence most commonly occurred at the true hip, with
sixteen subjects. The second most common alignment occurred slightly below the true
hip (12), followed by the below the true hip (10) category. The closeness of the top three
categories indicates that patterns made for this sample should include three different dart
lengths to match the different hip alignments.
Minott (1978) was the only text to equate hip type with buttocks prominence
alignment (Table 63). Figure 90 shows three variations of buttocks prominence and hip
alignment: heart, diamond, and standard. The buttocks appear to align below the hip for
the heart-shaped hip. There is no distinction between how low the buttocks align below
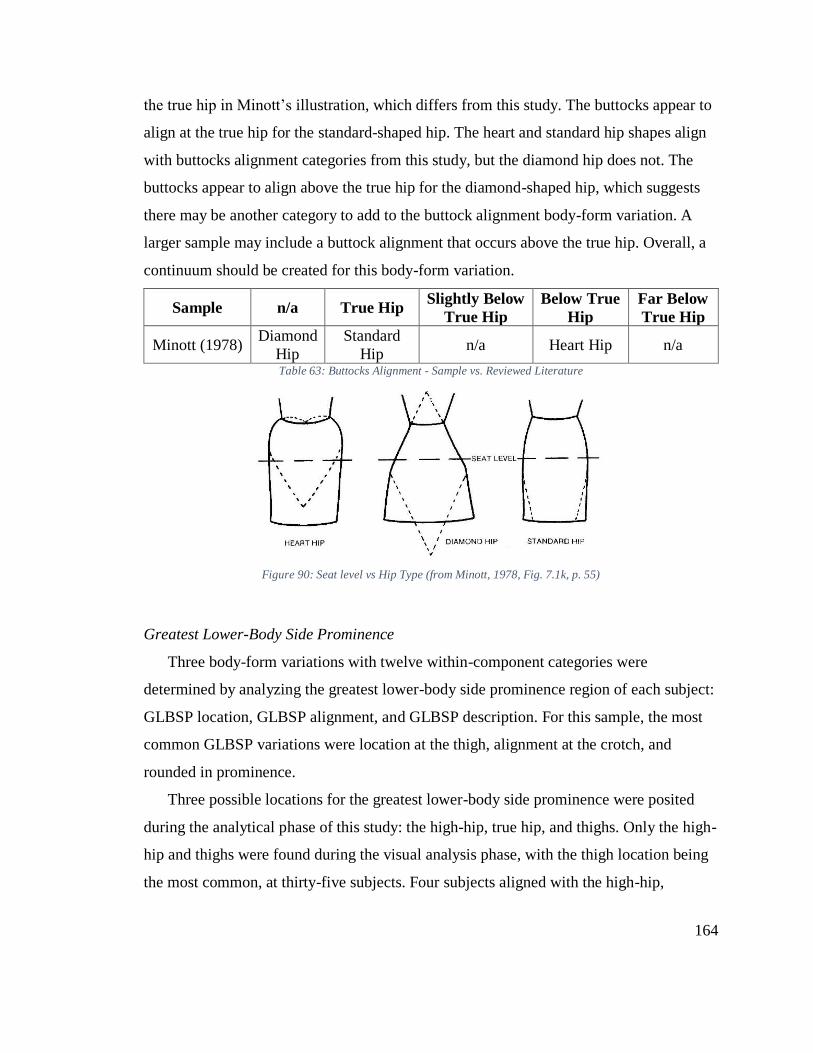
164
the true hip in Minott’s illustration, which differs from this study. The buttocks appear to
align at the true hip for the standard-shaped hip. The heart and standard hip shapes align
with buttocks alignment categories from this study, but the diamond hip does not. The
buttocks appear to align above the true hip for the diamond-shaped hip, which suggests
there may be another category to add to the buttock alignment body-form variation. A
larger sample may include a buttock alignment that occurs above the true hip. Overall, a
continuum should be created for this body-form variation.
Sample n/a True Hip Slightly Below
True Hip
Below True
Hip
Far Below
True Hip
Minott (1978) Diamond
Hip
Standard
Hip n/a Heart Hip n/a
Table 63: Buttocks Alignment - Sample vs. Reviewed Literature
Figure 90: Seat level vs Hip Type (from Minott, 1978, Fig. 7.1k, p. 55)
Greatest Lower-Body Side Prominence
Three body-form variations with twelve within-component categories were
determined by analyzing the greatest lower-body side prominence region of each subject:
GLBSP location, GLBSP alignment, and GLBSP description. For this sample, the most
common GLBSP variations were location at the thigh, alignment at the crotch, and
rounded in prominence.
Three possible locations for the greatest lower-body side prominence were posited
during the analytical phase of this study: the high-hip, true hip, and thighs. Only the high-
hip and thighs were found during the visual analysis phase, with the thigh location being
the most common, at thirty-five subjects. Four subjects aligned with the high-hip,
165
indicating there were two distinct groups in this sample. Patterns for these two groups
will require different starting locations for the hip curve.
There are many names for the GLBSP locations identified in this study, though they
all indicate three locations for the greatest lower-body side prominence: high-hip, hip,
and thighs (Table 64). The standard among all texts was that the hip is the most common
GLBSP, and the high-hip and thigh locations are deviations from the norm. The results
from this sample contradict this, indicating that the hip might not be the most useful
location for fitting apparel. Due to the great variability in this body-form variation future
research should attempt to describe all of the possible locations for the GLBSP, as well as
any combinations of them. The GLBSP may be one of the clearest ways to sort subjects
into groups.
Sample High Hip n/a Thighs
Minott (1974, 1978) Heart, Semi-Heart Hips Diamond,
Rounded Diamond
Maehren & Meyers (2005) n/a Hips n/a
Palmer & Alto (2005) n/a Hips Full Thighs
Rasband & Liechty (2006) High Hip
Curve/Square Hips
Low Hip Curve/Sloped,
Large Thighs at Side
Liechty et al. (2010) High Hip Curve Hips Low Hip Curve,
Larger Thighs at Side Table 64: GLBSP Location - Sample vs. Reviewed Literature
Five categories were produced by assessing the GLBSP alignment: below the crotch,
at the crotch, above the crotch, below the abdomen, and at the abdomen. The below
crotch, at crotch, and above crotch relate solely to the thighs; the most common
alignment occurred at the crotch, with twenty subjects. Alignment above the crotch came
second, at twelve subjects. Thigh alignment always occurred below buttocks alignment,
indicating that while the buttocks may hold the largest circumference, aligning the hip
curve point with the buttocks alignment may not lead to accurate patterns.
The below abdomen and at abdomen alignment locations relate solely to the high-
hips; the most common alignment occurred at the abdomen, with three subjects.
Conclusions on this variation cannot be made on such a small number of subjects and
future research should attempt to find a sample where the majority of subjects have the
high-hip as the GLBSP to determine alignment more clearly.
166
There are no direct references to the greatest lower-body side prominence alignment
in the literature, though inferences can be made from descriptions of hip types and thigh
fullness (Table 65). Minott’s (1974, 1978) heart and semi-heart hip types, and Rasband
and Liechty (2006), and Liechty et al.’s (2010) high hip curve variation are described as
occurring 3-4.5” below the waist, which may correlate to the abdomen area. Rasband and
Liechty, and Liechty et al. describe the thighs as having extra weight at the crotchline and
below the hips, which may correlate to the at crotch and above crotch categories from this
study. Future research should categorize the different alignments of the GLBSP types,
and compare them to buttocks body-form variations.
Minott’s (1974, 1978) rounded diamond hip type is unique in that it has prominences
at both the high-hip and thighs, thus the GLBSP could align at any of the five categories
in this study. While not recorded in this study, there were subjects that appeared to have
both prominent high-hips and thighs, though there was always one that was slightly more
prominent. Considering combinations of GLBSPs may lead to more accurately fitting
patterns, as it may be necessary to have hip curve points at multiple locations on patterns
for subjects with dual GLBSPs.
Sample
Below
Crotch At Crotch
Above
Crotch
Below
Abdomen
At
Abdomen
Minott (1974, 1978)
Heart, Semi-Heart
Rounded Diamond
Rasband & Liechty
(2006) Large Thighs at Side High Hip Curve/Square
Liechty et al. (2010) Larger Thighs at Side High Hip Curve Table 65: GLBSP Alignment - Sample vs. Literature
The greatest lower-body side prominence descriptions produced five categories: flat,
softly pointed, pointed, softly rounded, and rounded. Rounded GLBSPs were the most
common, with fourteen subjects; followed by the softly pointed (10), softly rounded (8),
and flat (5) categories. As with the greatest lower-body front prominence, designations of
‘softly’ indicated that there was some prominence, but not enough for the full rating of
‘pointed’ or ‘rounded’. Only two subjects fell into the pointed category, indicating that
the softly pointed and pointed categories could be combined.
167
The literature does not describe the greatest lower-body side prominence. Instead it
describes the width of the pelvis (Table 66). Rather than describing the width of the lower
body, it would be better to describe the side prominence itself. The flatness, pointedness,
or roundness of the GLBSP may change the angle of the hip curve on the pattern. Future
research should focus on creating clear description categories for the GLBSP.
Sample Flat
Softly
Pointed Pointed
Softly
Rounded Rounded
Maehren &
Meyers (2005) Small n/a n/a Average Full
Palmer & Alto
(2005) Small n/a n/a a/i Full
Rasband &
Liechty (2006) Smaller/Narrower n/a n/a a/i Larger/Wider
Liechty et al.
(20100 Smaller/Narrower n/a n/a a/ Larger/Wider
Table 66: GLBSP Description - Sample vs. Literature
Fit Model vs. Sample
Fit models are commonly used in the apparel industry to simulate the body-form of
targeted customers. Basic measurements, such as bust, waist, and hip girth are common
considerations for fit models. As this study has shown, basic measurements do not fully
describe the human body. The purpose of this section is to share how the differences in
body-forms between the fit model and the sample may impact garment fit.
Throughout the results chapter, data on both the sample and the fit model were
presented. The previous sections in this chapter have outlined the differences between the
body-form variations found in this study and those present in the literature. This section
will discuss the differences between the body-form variations of the fit model and the
most common body-form variations in the sample, with implications for garment fit.
Twenty-seven total body-form variations, with ninety-nine within-component
categories were determined for this sample. The fit model and the sample match for
sixteen of the variations, but do not match for eleven. The focus of this section will rest
on the eleven non-matches, as these are what will cause garments created for this sample
to fit it poorly.
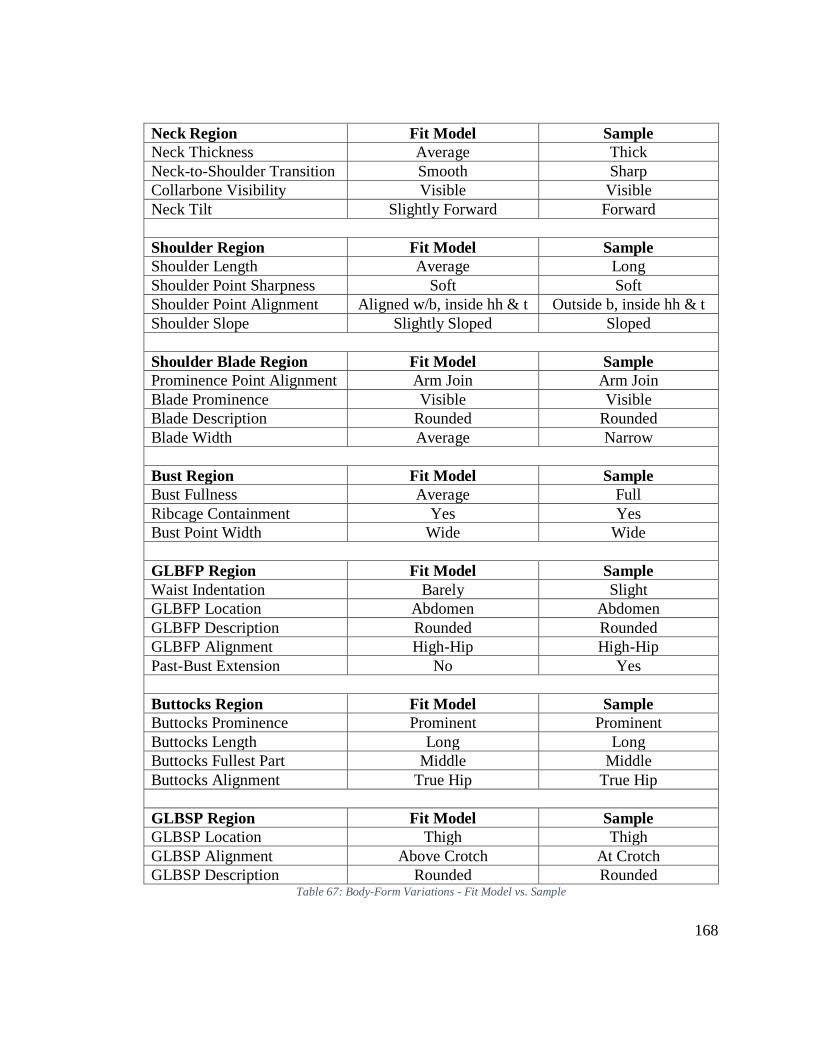
168
Neck Region Fit Model Sample
Neck Thickness Average Thick
Neck-to-Shoulder Transition Smooth Sharp
Collarbone Visibility Visible Visible
Neck Tilt Slightly Forward Forward
Shoulder Region Fit Model Sample
Shoulder Length Average Long
Shoulder Point Sharpness Soft Soft
Shoulder Point Alignment Aligned w/b, inside hh & t Outside b, inside hh & t
Shoulder Slope Slightly Sloped Sloped
Shoulder Blade Region Fit Model Sample
Prominence Point Alignment Arm Join Arm Join
Blade Prominence Visible Visible
Blade Description Rounded Rounded
Blade Width Average Narrow
Bust Region Fit Model Sample
Bust Fullness Average Full
Ribcage Containment Yes Yes
Bust Point Width Wide Wide
GLBFP Region Fit Model Sample
Waist Indentation Barely Slight
GLBFP Location Abdomen Abdomen
GLBFP Description Rounded Rounded
GLBFP Alignment High-Hip High-Hip
Past-Bust Extension No Yes
Buttocks Region Fit Model Sample
Buttocks Prominence Prominent Prominent
Buttocks Length Long Long
Buttocks Fullest Part Middle Middle
Buttocks Alignment True Hip True Hip
GLBSP Region Fit Model Sample
GLBSP Location Thigh Thigh
GLBSP Alignment Above Crotch At Crotch
GLBSP Description Rounded Rounded Table 67: Body-Form Variations - Fit Model vs. Sample
169
As seen in Table 67, the neck and shoulder regions have the most non-matches
between the fit model and the sample, with different categories for 75% of each region.
The fit model has a smaller neck thickness than the sample which may cause the neck
circumference of a pattern to be too small. As garment suspension for the upper torso is
based on the neck circumference, a too small neckline will cause the shoulder seam to
ride-up on the neck, affecting garment positioning and balance negatively. The fit
model’s smooth neck-to-shoulder transition may cause the neck circumference of a
pattern to be larger than necessary, causing the shoulder seam to hang off the body at the
shoulder point, affecting garment positioning and balance negatively. The outcomes of
these two variations directly contradict each other. Because of this, the outcomes may
equate to the outcomes a thick neck and sharp neck-to-shoulder transition creates for a
pattern.
The fit model has a less tilted neck than the sample (Table 67), which may cause the
center front neck point to rest above the center of the clavicle hollow, which would be too
high for this sample. A higher center front neck point could cause a shorter front neck
drop, which would alter the balance of the garment, potentially causing tightness over the
bust, and raised waist- and hem-lines.
The fit model has a shorter shoulder length than the sample (Table 67), which may
result in the shoulder point of the pattern not reaching the outside of the acromion on the
body. Garment balance may be negatively affected, as the shoulder seam may pull the
bust up, causing raised waist- and hem-lines. Additionally, garments made with sleeves
will find the armhole too tight, and that the sleeve cap fits poorly over the shoulder.
Patterns drafted for the fit model will fit a triangular whole-body form (aligned with
bust, inside high-hip and thigh), while the sample requires an hourglass whole-body form
(outside bust, inside high-hip and thigh) (Table 67). This may result in garments poorly
fitting the upper torso of the sample, which will affect total garment balance and cause
garments that are drafted to fit the lower torso well appear to fit poorly.
The fit model has slightly sloping shoulders which are a little bit flatter than the
sample (Table 67). Patterns drafted for a flatter slope may pull at the shoulder seam. The
stress placed on the shoulder seam will lead to a shorter life for the garment. Balance may

170
also be affected if the pulling raises the bustline of the garment, thereby raising the waist-
and hem-lines too.
The remaining five regions have between 60% and 100% of body-form variation
matches between the fit model and the sample (Table 67). The buttocks region has 100%
agreement and will not be discussed.
The fit model has a wider blade width than the sample (Table 67), resulting in the
bodice back waist darts placing further out on the pattern than necessary. As such, they
will not point to the shoulder blade prominence of the sample. Large width between the
shoulder blades may cause a garment to look too wide for the body, causing aesthetic
issues.
The fit model has a smaller bust than the sample (Table 67). This will cause pulling
around the bust and will negatively affect garment balance. Tightness at the bustline may
pull other parts of the garment forwards and towards the bust, and out of correct
alignment.
The fit model has less waist indentation than the sample (Table 67), resulting in a
wider waistline, which hangs further from the body. The waistline is a suspension
location for garments, which means that garment balance is affected by changes to the
waistline. A larger waistline could cause a garment to hang lower on the body than
intended, shifting all pattern components to the wrong place.
The sample has their greatest lower-body front prominence extend past the bust,
while the fit model does not (Table 67). As this is a completely new body-form variation,
there is no guidance on how this may affect patterns. Speculatively, this variation may
impact the use of front waist darts. With the GLBFP not extending past the bust
prominence, the pattern should need darts to reduce from the bust to the waist. Past-bust
extension may eliminate the need for front waist darts. If this is the case, then patterns
made for the fit model will have darts, while the sample may not need them. This would
add an extra step to the production process that if eliminated would surely save apparel
producers money and may lead to better fit for customers.
The fit model’s greatest lower-body side prominence alignment occurs slightly higher
on the body than the sample (Table 67). This places the hip curve point too high on the

171
pattern for the sample. If the side seam starts curving early, the garment will be too tight
at the GLBSP, causing the garment to wrinkle and ride-up the thighs. Balance will also
be affected as the garment will bunch around the GLBSP, causing there to be excess
fabric above the GLBSP and a raised hemline.
Overall, the major differences between the fit model and the sample occur in the neck
and shoulder regions. The remainder of the body regions matched well, which makes
sense as they were all impacted by the bust, waist, and hip girth measurements used to
select the sample. Adding the neck circumference or shoulder length measurement to the
sorting process may help move the fit model closer to the body-form variations of the
sample.
Conclusion
Question one asked what the body-form variations were across a single size.
Originally, the goal was to determine holistic body-form types, but due to the detailed
information gleaned during content analysis this was changed to bound the scope of the
study. The next step for this project is to compare across the sample to discover common
combinations of body-form variations.
This section discussed the variations found in the sample as well as variations
prevalent in the literature. Many of the body-form variations from this study differed
from those found in the literature and some new variations were recorded. Many of the
differences came from terminology. Synonyms abound in the literature, even in texts
written by the same authors. Theorists should endeavor to define body-form variation
terminology so that researchers and manufacturers have a standardized vocabulary for
communication.
This section ended with a comparison of the fit model and the most common body-
form variations for the sample. This exercise demonstrated how garments made for a fit
model the same size as intended customers, may still not fit those customers due to body-
form variations.
The next section will address the second research question by comparing body-form
variations to pattern dimensions in an exploratory attempt to group subjects by variation.

172
Question Two
While there are numerous body-form variations in this sample, there were not always
clear-cut groupings when comparing dimensions and body-form variations. Some
dimensions and variation combinations were more apparent than others. This section
discusses the implications for the development of a body-form based block system by
assumption status, starting with the upheld assumptions.
Upheld
Ten of the twenty-seven assumptions were upheld (Table 68). Figure 91 shows the six
dimensions associated with the assumptions. The neck, shoulder, shoulder blades, bust,
and greatest lower-body side prominence regions were affected.
Figure 91: Upheld Assumptions, Dimension Locations

173
Body Region Assumption
Neck The more forward tilted the neck is in relation to the torso, the longer
the front neck drop measurement will be.
Shoulder
The longer the shoulder, the larger the shoulder seam measurement
will be.
The softer the shoulder point, the longer the shoulder seam
measurement will be.
The more sloped the shoulder, the larger the shoulder slope
measurement will be.
The softer the shoulder point, the larger the shoulder slope
measurement will be.
The longer the shoulder, the larger the shoulder slope measurement
will be.
Shoulder
Blade
The wider apart the shoulder blade prominence points are, the larger
the between back waist darts distance measurement will be.
Bust
The fuller the bust, the larger the bust dart depth measurement will be.
Busts contained within the ribcage will have smaller bust dart depth
measurements than busts not contained within the ribcage.
GLBSP The lower the location of the GLBSP on the body, the longer the
curved portion of the skirt side seam will be on the pattern. Table 68: Upheld Assumptions
The only upheld assumption for the neck compared the front neck drop dimension to
the neck tilt body-form variation. Four categories were identified for neck tilt: straight,
slightly forward, forward, and far forward, and five groups were identified from the front
neck drop graph (Figure 35Figure 34Table 18). Group 1 was made of primarily straight
necks, while group 5 was primarily far forward necks. Groups 2, 3, and 4 were primarily
composed of forward necks, indicating that it may be safe to combine the middle of the
sample into one group. Slightly forward necks were spread out over groups 1 through 4,
with the highest concentration in group 4. Averaging the measurements for each body-
form category, and arranging them in order of smallest-to-largest, showed a progression
from straight-to-far forward.
The data suggest that the more forward tilted the neck is, the longer the front neck
drop dimension is. This finding suggests that pattern blocks based on body-forms may
need at least four distinct neck drop lengths. As posture may play a role in neck tilt,
pattern blocks may not need all four neck drop lengths if consumers all share similar
posture.
174
Five assumptions from the shoulder were upheld; two focus on the shoulder seam
dimension, and three focus on the averaged shoulder slope dimension. Shoulder length,
shoulder point softness, and shoulder slope description were the three body-form
variations tested. Five groups were identified from both the shoulder seam and averaged
shoulder slope graphs (Figure 36 & Figure 37).
The first upheld shoulder assumption compared the shoulder seam dimension to the
shoulder length description body-form variation. Three categories were identified for
shoulder length: short, average, and long. Group 1 was comprised solely of short shoulder
lengths, group 2 had a tie for majority between the short and average lengths, while long
shoulder lengths comprised the majority of group 3, and the entirety of groups 4 and 5.
Groups 4 and 5 could potentially be condensed into one group. Averaging the
measurements for each body-form category, and arranging them in order of smallest-to-
largest, showed a progression from short-to-long.
The data suggest that the longer the shoulder length is, the larger the shoulder seam
dimension is. This finding suggests that pattern blocks based on body-forms may need
three distinct shoulder seam lengths. Though, as there was a great amount of difference
between the fit model and the sample for the shoulder region, choosing a fit model with a
shoulder length that matches the target market may eliminate the need to pattern multiple
shoulder seam lengths.
The second upheld shoulder assumption compared the shoulder seam dimension to
the shoulder point softness body-form variation. Two categories were identified for
shoulder point softness: sharp, and soft. Sharp shoulder points comprised the majority for
groups 1 and 2, while soft shoulder points comprised the majority for groups 3 and 4;
sharp and soft tied for majority in group 5 (at one person each). Averaging the
measurements for each body-form category showed that shoulders with soft shoulder
points were longer than shoulders with sharp shoulder points.
The data suggest that soft shoulder points equate to longer shoulder seam
measurements. This finding, in conjunction with the previous finding on shoulder length,
suggests that people with soft shoulder points may also have long shoulder lengths, while
people with sharp shoulder points may have short or average shoulder lengths. As such,

175
shoulder point sharpness may be an indicator of shoulder length. Future research may
wish to test if there are degrees of softness/sharpness for the shoulder point, how the
shoulder point softness body-form variation compares to the shoulder length description
body-form variation, and if these comparisons lead to specific shoulder seam lengths.
The third upheld shoulder assumption compared the averaged shoulder slope
dimension to the shoulder slope description body-form variation. Five categories were
identified for shoulder slope description: flat, slightly sloped, sloped, more sloped, and
steep. Flat slopes comprised the majority of group 1, while group 2 and 3 had the sloped
category as the majority, group 4 had the steep category as the majority, and group 5 was
comprised solely of one subject, who had a steep slope. The slightly sloped category was
distributed throughout groups 2 and 3, mostly toward the smaller measurements, while
the more sloped category was distributed in groups 3 and 4, mostly towards the larger
measurements. Averaging the measurements for each body-form category, and arranging
them in order of smallest-to-largest, showed a progression from flat-to-steep.
The data suggest that the more sloped the shoulder is, the larger the averaged
shoulder slope dimension is. This finding suggests that pattern blocks based on body-
forms may wish to use a sloped shoulder (average: 1.24”) as the base, but also have
alternative slopes available, depending on the collarbone slant of target customers.
Vertical changes in the shoulder point or the side neck point on the pattern block will
affect the shoulder slope, thus this pattern dimension is tied to changes made to the neck
circumference and front neck drop, as well as changes at the armscye. Future research
should compare shoulder slope to neck and arm body-form variations and pattern
dimensions.
The fourth upheld shoulder assumption compared the averaged shoulder slope
dimension to the shoulder point sharpness body-form variation. Group 1 was composed
solely of sharp shoulder points and sharp shoulder points comprised the majority for
group 2, commensurate with the smallest averaged shoulder slope measurements. Soft
shoulder points comprised the majority for groups 3 and 4, and were the sole inhabitants
of group 5, commensurate with the largest averaged shoulder slope measurements.
Averaging the measurements for each body-form category showed that shoulders with
176
soft shoulder points had larger averaged shoulder slopes than those with sharp shoulder
points. The data suggest that soft shoulder points equate to larger averaged shoulder slope
measurements.
The fifth, and final, shoulder assumption compared the averaged shoulder slope
dimension to the shoulder length description body-form variation. Group 1 was
composed solely of short shoulder lengths, and group 2 had a majority of short shoulder
lengths. Groups 3 and 4 had a majority of long shoulder lengths, and group 5 was
comprised solely of long shoulder lengths. Average shoulder lengths were distributed
throughout group 3, close to the mid-length measurements. Averaging the measurements
for each body-form category, and arranging them in order of smallest-to-largest, showed
a progression from short-to-long. The data suggest that the longer the shoulder length, the
larger the averaged shoulder slope dimension.
The findings from shoulder assumptions one, two, four, and five are linked. Soft
shoulder points equate to longer shoulder seam measurements, and to larger averaged
shoulder slope measurements. The longer the shoulder length description, the longer the
shoulder seam dimension and the larger the averaged shoulder slope dimension. These
findings suggest that the shoulder length description and the shoulder point sharpness
body-form variations may be correlated. Two suggestions for developing pattern blocks
for a body-form based system derive from these findings:
1. When someone is assessed with soft shoulder points, she most likely needs a
pattern with a longer shoulder seam.
2. When someone is assessed with sharp shoulder points, she most likely needs a
pattern with a shorter shoulder seam.
Future research will need to determine exact lengths for short, average, and long shoulder
seams, as well as classify soft and sharp shoulder points by the height of the acromion.
The only upheld assumption for the shoulder blade compared the between back waist
darts distance dimension to the shoulder blade width body-form variation. Three
categories were identified for blade with: narrow, average, and wide, and three groups
were identified from the between back waist darts distance graph (Figure 40). Narrow
blade widths comprised the majority of group 1, while wide blade widths comprised the

177
majority of group 2, and were the only inhabitants of group 3. Average blade widths only
occurred in group 1, but they were toward the larger measurements of this group.
Averaging the measurements for each body-form category, and arranging them in
order of smallest-to-largest, revealed that the wide category was greater than the narrow
and average categories by nearly an inch, but the narrow category was greater than the
average category by .06”. This is most likely due to the fact that subjects with average
blade widths only occurred in group one, but three subjects with narrow blade widths
occurred in group 2, increasing the value of narrow category’s average. As there was still
a clear split between narrow, average, and wide, this assumption was upheld.
The data suggest that the wider the shoulder blade width is (as assessed by the
distance between the shoulder blade prominence points), the larger the between back
waist darts distance dimension is. This finding suggests that pattern blocks based on
body-forms may need three alternative dart placement locations depending upon the
width of the shoulder blade.
Two assumptions from the bust were upheld, both focused on the bust dart depth
dimension. The body-form variations assessed were bust fullness and ribcage
containment. Four groups were identified from the bust dart depth graph (Figure 41).
The first upheld bust assumption compared the bust dart depth dimension to the bust
fullness body-form variation. Five categories were identified for bust fullness: very small,
small, average, full, and very full. The small category comprised the majority of group 1,
while the full category comprised the majority of groups 2, 3, and 4. The average
category appeared in groups 1 and 3; and the very full category appeared in groups 3 and
4. The very small category comprised one subject and had the largest bust dart depth
measurement of the sample. This may have been a patterning error, or the subject may
have a very deep upper ribcage, which when combined with very small breasts and an
average bust point width, produced a long dart. Averaging the measurements for each
body-form category, and arranging them in order of smallest-to-largest, revealed that the
small and average categories had the same average (5”), but that they are both smaller
than the full category, which is smaller than the very full category.

178
Aside from the single subject in the very small category, the data suggest that the
fuller the bust, the larger the bust dart depth measurement. This finding suggests that
pattern blocks based on body-forms may need multiple bust dart depths depending upon
bust fullness. Currently, bra sizing is used to define bust fullness, but sizing standards
differ by company, and also within companies by band size (Palmer & Alto, 2005).
Future research should quantify the levels of bust fullness by measuring breast depth,
width, length, and volume.
The second upheld bust assumption compares the bust dart depth dimension with the
ribcage containment body-form variation. The breasts were either contained within the
ribcage width or not. Group 1 covered about half the sample, while groups 2, 3, and 4
covered the remainder. The majority of groups 1 and 3 had busts contained within their
ribcage width, while the majority of group 4 did not. Averaging the measurements for
each body-form category showed that subjects with ribcage containment had shorter bust
dart depths than subjects without ribcage containment.
The data suggest that ribcage containment does affect bust dart depth, with
containment leading to smaller bust dart depth measurements than non-containment. This
finding suggests two things:
1. When someone is assessed has having her busts contained within her ribcage, she
should be assigned to patterns with smaller bust dart depths.
2. When someone is assessed as having her busts not contained within her ribcage,
she should be assigned to patterns with larger bust dart depths.
Taking the findings from both upheld bust assumptions suggests that bust fullness
may not be the only factor involved in bust dart depth. Since all the subjects in this study
have a bust circumference within two inches of each other, the body-form variations
witnessed at the bust are most likely a combination of ribcage depth and bust fullness.
Future research should assess ribcage depth, and assess how much of the bust dart covers
the ribcage, and how much covers the breast. It is possible that smaller busts have wider
and/or deeper ribcages, while fuller busts have narrower and/or shallower ribcages.

179
The only upheld assumption for the greatest lower-body side prominence compared
the skirt curve length dimension to the GLBSP location and alignment body-form
variations. Two groups were identified from the skirt curve length graph (Figure 49).
GLBSP locations included the high-hips and the thighs. Group 1 was comprised
solely of the high-hip category, while group 2 was comprised solely of the thigh category.
Averaging the measurements for each body-form category showed that the thigh category
had a much longer skirt curve length than the high-hip category (11.34” vs. 5.89”).
GLBSP alignment produced five categories: at the abdomen, below the abdomen,
above the crotch, at the crotch, and below the crotch. Categories pertaining to the
abdomen only appeared in group 1, corresponding to the high-hip body-form location
category. Categories pertaining to the crotch only appeared in group 2, corresponding to
the thigh body-form location category. The above the crotch category corresponded to the
smaller measurements in group 2, while the at the crotch category corresponded to the
larger measurements. Two of the three below-crotch subjects corresponded to the larger
measurements, while one corresponded to the smaller measurements in group 2.
Averaging the measurements for each body-form category, and arranging them in order
of smallest-to-largest, showed that aside from the below crotch category, the other
categories showed a progression from alignment at the abdomen to alignment at the
crotch.
The data suggest that the lower the location of the GLBSP is on the body, the longer
the skirt curve length dimension is. This finding suggests that pattern blocks based on
body-forms may need at least two different locations for the skirt curve point. One will
need to be much higher on the body, centered around the abdomen, with a steeper curve
between the waist and high-hip, while the other will need to be lower on the body,
centered around the crotch, with a gentler curve over the lower torso.
Another aspect of this finding is the lengths associated with the GLBSP location
categories. Standard practice places the hip at 7” to 9” below the waist (Maehren &
Meyers, 2005; Minott, 1974), and Minott (1974) places the high-hips 3” to 4.5” below the
waist. The average skirt curve lengths for both groups are longer than the upper limits for

180
both of these by at least an inch. Pattern blocks based on body-forms may need longer
skirt curve lengths than traditionally used.
Partially Upheld
Eight of the twenty-seven assumptions were partially upheld, meaning there were
indications of possible connections between body-form variations and pattern
dimensions, but more research is needed to confirm their presence (Table 69). Figure 92
shows the seven dimensions associated with these assumptions. All seven body regions
were affected. In general, there were many more categories in each of the tested body-
form variations for the partially upheld assumptions than for the upheld assumptions.
This created difficulty in assessing data patterns with such a small sample size.
Body Region Assumption
Neck The thicker the neck, the larger the neck circumference.
Shoulder
A smooth neck-to-shoulder transition will produce a larger shoulder
slope measurement, while a sharp neck-to-shoulder transition will
produce a smaller shoulder slope measurement.
Shoulder
Blade
The type of shoulder blade prominence will affect the measurement of
the bodice back waist dart width.
Bust The wider apart the bust points are, the larger the between front waist
darts distance measurement will be.
GLBFP
The type of GLBFP will affect the measurement of the front waist.
Certain types of GLBFPs will extend past the bust, while others will
not.
Buttocks The longer and lower the buttocks prominence, the larger the skirt
back waist dart depth measurement will be.
GLBSP The type of prominence will affect the skirt side seam measurement. Table 69: Partially Upheld Assumptions
The only partially upheld assumption for the neck compared the neck circumference
dimension to the neck thickness body-form variation. Three categories were identified for
neck thickness: thin, average, and thick. As no groups were produced from the neck
circumference graph (Figure 34) the data were analyzed by splitting the sample at the
mean. The majority of subjects below the mean had thin necks, while the majority above
had thick necks. Average necks were evenly distributed through the sample, with 26.3%
below the mean, and 35% above. Averaging the measurements for each body-form

181
category, and arranging them in order of smallest-to-largest, showed a progression from
thin-to-thick.
The data suggest that the thicker the neck, the larger the neck circumference
dimension, but the fact that the average neck thickness category defied grouping indicates
that this assumption cannot be fully validated.
Figure 92: Partially Upheld Assumptions – Dimension Locations
The only partially upheld assumption for the shoulder compared the averaged
shoulder slope dimension to the neck-to-shoulder transition body-form variation. Two
categories were identified for the neck-to-shoulder transition: smooth and sharp, and five
groups were identified from the averaged shoulder slope graph (Figure 37). There was a
loose grouping of smooth neck-to-shoulder transitions around the larger measurements,
and only sharp neck-to-shoulder transitions appeared at the smallest measurements.

182
Though the sharp neck-to-shoulder transitions were the majority for the sample (70%)
and spanned the whole measurement range. Averaging the measurements for each body-
form category showed that the smooth category was larger than the sharp category by
.05”.
The data suggest that a smooth neck-to-shoulder transition may produce steeper
slopes, while a sharp neck-to-shoulder transition may produce flatter slopes. Because the
difference between the averages is so small, the wide range of measurements for the
sharp neck-to-shoulder transition, and the loose grouping for the smooth neck-to-shoulder
transition, this assumption cannot be fully validated.
The only partially upheld assumption for the shoulder blade compared the bodice
back waist dart width dimension to the shoulder blade description body-form variation.
Shoulder blade description produced five categories: flat, softly pointed, softly rounded,
pointed, and rounded; and four groups were identified from the bodice back waist dart
width graph (Figure 39). Group 1 comprised a majority of flat blades, correspondent with
the smallest width measurements. Group 2 comprised a majority of softly pointed blades,
correspondent with the second smallest width measurements. Groups 3 and 4 comprised a
majority of rounded blades, correspondent with the largest width measurements.
Averaging the measurements for each body-form category showed that the flat
category was the smallest, the soft categories were in the middle, and the fullest
categories were the largest. Additionally, the pointed category was larger than the softly
pointed category, and the rounded category was larger than the softly rounded category.
The data suggest that the type of shoulder blade prominence may affect the bodice
back waist dart width dimension, but not all of the categories grouped. The softly
rounded and pointed categories had so few members that they did not group, and the flat
and rounded categories spanned the entire measurement range. A larger sample size is
needed to fully validate this assumption.
The only partially upheld assumption for the bust compared the between front waist
darts distance dimension to the bust point width body-form variation. Bust point width
produced three categories: narrow, average, and wide; and four groups were identified
from the between front waist darts distance graph (Figure 42). The narrow category was
183
the majority for group 1, and only appeared in groups 1 and 2, correspondent with the
smallest measurements. The average category was the majority for group 3, had the four
largest measurements in the sample, and appeared in all four groups. The four subjects
with the largest measurements may have wider waists than the rest of the sample, causing
the between darts distance to be wider. The wide category appeared in all four groups,
but was the majority for group 4. Averaging the measurements for each body-form
category, and arranging them in order of smallest-to-largest, showed a progression from
narrow-to-wide.
The data suggest that the wider the bust points are, the larger the between front waist
darts distance dimension may be. Due to both the average and wide categories appearing
in all of the categories, as well as four average subjects holding the largest measurements
in the sample, this assumption cannot be fully validated.
Two assumptions from the greatest lower-body front prominence were partially
upheld, and both focused on the front waist width dimension. The GLBFP location,
GLBFP description, and past-bust extension were the body-form variations tested. Six
groups were identified from the front waist width graph (Figure 44).
The first partially upheld GLBFP assumption compared the front waist width
dimension to the GLBFP location and description body-form variations. Three categories
were identified for the GLBFP location: abdomen, stomach, and both. The abdomen
category was the majority for the sample, and dominated the smaller front waist
measurements. The stomach category was evenly split between group 3 and group 6. The
both category occurred in groups 4 and 6. Averaging the measurements for each body-
form category, and arranging them in order of smallest-to-largest, showed that the
abdomen had the smallest average, and the both category had the largest average.
Five categories were identified for the GLBFP description: flat, oval, softly pointed,
softly rounded, and rounded. There were no clear groupings for this comparison, though
the rounded category clustered loosely around the mid-to-large measurements in group 3.
The stomach location had only oval descriptions, but the both category had one rounded
and one combination (rounded + softly pointed). Averaging the measurements for each

184
body-form category, and arranging them in order of smallest-to-largest, showed that the
there was no real order.
The data suggest that GLBFP location has a stronger influence on the front waist
width dimension than the GLBFP description body-form variation does. But, since the
abdomen category comprised 90% of the sample, a larger sample is needed to more
accurately understand how the stomach and both categories affect front waist width. Due
to this and the unclear groupings from the GLBFP description, this assumption cannot be
fully validated.
The second partially upheld GLBFP assumption compared the front waist width
dimension to the past-bust extension and GLBFP description body-form variations. Three
categories were identified for the past-bust extension: yes, aligned, and no. Groups 1 and
2 were comprised solely of the yes category, and the majority of group 3 was comprised
of the yes category. The aligned category only occurred in group 3. The no category
clustered around the smaller measurements in group 3 and around the largest
measurements in groups 4, 5, and 6. Averaging the measurements for each body-form
category, and arranging them in order of smallest-to-largest, showed the yes category had
the smallest average, while the no category had the largest.
Five categories were identified for the GLBFP description: flat, oval, softly pointed,
softly rounded, and rounded. There were not clear groupings when comparing this body-
form variation to the front waist width dimension, but comparisons of this body-form
variation to the past-bust extension body-form variation provided some interesting data.
The flat category aligned with the no category for seven subjects, and the aligned
category for two subjects. The oval and softly pointed categories both aligned with the
yes category for all subjects. The softly rounded category aligned with the yes category
for half of its subjects, and the no category for the other half. The rounded category
aligned with the yes category for nine subjects, the aligned category for two subjects, and
the no category for four subjects. Averaging the measurements for each body-form
category, and arranging them in order of smallest-to-largest, showed there was no clear
order; the softly rounded category had the smallest average, while the rounded category
had the largest.

185
The data suggest that subjects with the smallest front waist measurements had their
GLBFP extend past their bust, while subjects with the larger front waist measurements
did not have their GLBFP extend past the bust. Additionally, while there were no groups
identified from a comparison of the GLBFP description body-form variation and the front
waist width dimension, description categories grouped by past-bust extension categories.
The data from this comparison suggests that the oval, softly pointed, and rounded
description categories do extend past the bust, while the flat category does not. Because
there are not clear groupings by dimension, but there are by body-form variation, this
assumption cannot be fully validated. It does indicate a possible correlation between past-
bust extension and GLBFP description though.
The only partially upheld assumption for the buttocks compared the skirt back waist
dart depth dimension to the buttocks length, and buttocks fullest part body-form
variations. There were three groups identified from the skirt back waist dart depth graph
(xx). Two categories were identified for buttocks length: short and long. The long
category was the majority for this body-form variation (75.7%) and the long and short
categories were evenly spaced throughout the measurement range, forming no groups.
Averaging the measurements for each body-form category, and arranging them in order
of smallest-to-largest, showed that the short category was smaller than the long category.
Three categories were identified for buttocks fullest part: low, middle, and high. The
middle category was the majority for this body-form variation (59%), but the low
category loosely clustered around the mid-to-large measurements, and the high category
clustered around the smaller measurements. Comparing the buttocks fullest part variation
to the length variation showed that the low and long categories corresponded strongly,
and the middle and long categories corresponded strongly, though not as strongly as the
low and long categories. Averaging the measurements for each body-form category, and
arranging them in order of smallest-to-largest, showed a progression from high-to-low.
The data suggest that the longer and lower the buttocks prominence, the larger the
skirt back waist dart depth measurement. Due to the loose clustering, and the fact that the
middle and long categories also correspond strongly, this assumption cannot be fully
validated. A larger sample should provide more concrete evidence.

186
The only partially upheld assumption for the greatest lower-body side prominence
compared the skirt curve length dimension to the GLBSP description body-form
variation. Five categories were identified for the GLBSP description: flat, softly pointed,
pointed, softly rounded, and rounded; two groups were identified from the skirt curve
length graph (Figure 49). Group 1 was comprised entirely of the rounded category. Group
two had loose clusters: the flat category was close to the smaller measurements, the
rounded was close to the small-to-mid measurements, and the softly pointed category was
around the mid-to-large measurements. The rounded and softly pointed categories tied for
the majority of group 2.
Averaging the measurements for each body-form category, and arranging them in
order of smallest-to-largest, showed that the rounded category had the lowest average,
followed by the flat category, the pointed category, the softly rounded category, and the
softly pointed category. The soft categories had the largest averages, about one to one and
a half inches larger than the full categories. The rounded category comprises the entirety
of group 1, which holds the high-hip subjects who have much smaller measurements, this
may partly account for why the average is so low.
The data suggest there may be some prominences that affect the skirt curve length
dimension, for example the rounded category and the high-hip side prominence body-
form category, but the data are not conclusive. The small number of subjects with high-
hip’s as the greatest lower-body side prominence, the looser groupings for the thigh
prominence category, and the mixed-up averages indicate that this assumption cannot be
fully validated.
Not Upheld
Nine of the twenty-seven assumptions were not upheld, meaning there were either no
groupings, or groups were opposite from what was expected (Table 70). Figure 93 shows
the eight dimensions associated with these assumptions; five of these dimensions deal
with darts. The neck, shoulder, shoulder blades, greatest lower-body front prominence,
and buttocks regions were affected.

187
Body Region Assumption
Neck
A smooth neck-to-shoulder transition will produce a larger neck
circumference, while a sharp neck-to-shoulder transition will produce
a smaller neck circumference.
The more prominent the collarbone, the smaller the neck
circumference will be.
Shoulder The farther the shoulder point is outside the bust, high-hip, and thigh
widths, the longer the shoulder seam measurement will be.
Shoulder
Blade
The further the shoulder blade prominence is from the waist, the larger
the bodice back waist dart depth measurement will be.
The more prominent the shoulder blade, the larger the bodice back
waist dart width measurement will be.
GLBFP
The more indented the waist, the smaller the waist circumference
measurement will be.
The lower the GLBFP is aligned, the larger the skirt front waist dart
depth measurement will be.
The type of GLBFP will affect the measurement of the skirt front
waist dart width.
Buttocks The more prominent the buttocks, the larger the skirt back waist dart
width measurement will be. Table 70: Not Upheld Assumptions
Two assumptions for the neck were not upheld, and both focus on the neck
circumference dimension. The neck-to-shoulder transition and collarbone visibility were
the two body-form variations tested. No groups were identified from the neck
circumference graph (Figure 34); thus, the data were analyzed by splitting the sample at
the mean.
The first not upheld neck assumption compared the neck circumference dimension to
the neck-to-shoulder transition body-form variation. Two categories were identified for
the neck-to-shoulder transition: smooth and sharp. Both categories were equally
distributed below and above the mean, though there were mostly sharp subjects for the
largest neck circumferences. Averaging the measurements for each body-form category
showed that the sharp category was greater than the smooth category.
The data suggest that sharp neck-to-shoulder transitions produce larger neck
circumferences, while smooth neck-to-shoulder transitions produce smaller neck-to-
shoulder transitions. Rasband and Liechty (2006) and Liechty et al. (2010) suggest that
the neck-to-shoulder transition is affected by neck muscle development. Extrapolating

188
from their definitions, the sharp transitions should have less muscle development, while
the smooth transitions should have more. This should indicate that smooth transitions be
larger, as there is more mass around the neck. As this finding is opposite from what was
expected, future research should attempt to understand why.
Figure 93: Not Upheld Assumptions – Dimension Locations
The second not upheld neck assumption compared the neck circumference dimension
to the collarbone visibility body-form variation. Four categories were identified for
collarbone visibility: flat, nearly flat, visible, and prominent. Groupings were loose
clusters, with the nearly flat category the majority below the mean, and the visible
category the majority above. The flat category was equally distributed below and above
the mean, and the prominent category stayed close to the mean. Averaging the

189
measurements for each body-form category, and arranging them in order of smallest-to-
largest, generally showed that there was a progression from flat-to-prominent.
The data suggest that the more prominent the collarbone, the larger the neck
circumference dimension. This is opposite what was assumed in this study, but provides
an opportunity for future research. It was assumed that prominent collarbones were due to
a subject having less fat and muscle mass, making the skeletal system easier to view, and,
by extension, the neck thinner. Testing the interactions between the skeletal and muscular
systems for the neck against pattern dimensions, such as neck circumference, should
provide more detailed information on how body-form variations affect pattern
dimensions.
The only not upheld shoulder assumption compared the shoulder seam dimension to
the shoulder point alignment body-form variation. Seven categories were identified for
shoulder point alignment: Inside the bust, high-hip, and thigh; aligned with the bust,
outside the high-hip, inside the thigh; aligned with the bust and high-hip, inside the thigh;
aligned with the bust, inside the high-hip and thigh; outside the bust, inside the high-hip
and thigh; outside the bust, aligned with the high-hip, inside the thigh; and outside the
bust and high-hip, inside the thigh. Five groups were identified from the shoulder seam
graph (Figure 36). There were no clear patterns among the alignment categories. The
most common variation, ‘outside bust, inside high-hip and thigh’, occurred in all five
groups, was the majority for groups 1 and 3, tied for majority in groups 4 and 5, and was
the second largest contingent of group 2. Averaging the measurements for each body-
form category also produced no clear groups.
The data suggest the shoulder seam dimension cannot be categorized using the
shoulder point alignment body-form variation. With seven categories, this sample may
not have been large enough to show distinctive groupings. Alternatively, the shoulder
seam dimension may not be the correct pattern dimension to compare with shoulder point
alignment. This was the only body-form variation that compared different body
components, thus, those components may be more useful in categorizing this variation.
190
Two assumptions for the shoulder blade were not upheld; they both focused on the
bodice back waist dart. Prominence point alignment and shoulder blade prominence were
the two body-form variations tested.
The first not upheld shoulder blade assumption compared the bodice back waist dart
depth dimension to the shoulder blade prominence point alignment body-form variation.
Three categories were identified for prominence point alignment: at the armpit, at the arm
join, and above the arm join, and five groups were identified from the bodice back waist
dart depth graph (Figure 38). There were no groupings. Additionally, averaging the
measurements for each body-form category, and arranging them in order of smallest-to-
largest, showed that subjects with prominence point alignment at the armpit had the
largest average, while subjects with prominence point alignment above the arm join had
the smallest average.
The data suggest that the closer shoulder blade prominence is to the waist, the larger
the bodice back waist dart depth measurement. This is opposite from what was expected
and may be due to differences in overall back length. As the majority of the sample has
their shoulder blade prominence in essentially the same place on the body, placing the
bodice back dart tip at the location of the arm join allows for pattern standardization.
Depending on overall back length, the depth of the dart will differ by subject group, but
now only one aspect of the pattern has to change, rather than two.
The second not upheld shoulder blade assumption compared the bodice back waist
dart width dimension to the shoulder blade prominence body-form variation. Four
categories were identified for shoulder blade prominence: flat, almost flat, visible, and
prominent, and four groups were identified from the bodice back waist dart width graph
(Figure 39). There were no groupings, as all categories were distributed throughout the
range of measurements. Averaging the measurements for each body-form category, and
arranging them in order of smallest-to-largest, showed that the flat category was smallest,
the prominent category came next, followed by the almost flat category, and ended with
the visible category.
The data suggest that there may be no correlation between the shoulder blade
prominence body-form variation and the width of the bodice back waist dart. This goes

191
directly against accepted pattern-drafting practice, which states that the fuller and more
prominent the body prominence, the deeper and wider the corresponding dart.
Alternatively, the bodice back waist darts may be a reduction device to eliminate excess
material between the upper torso and the waist, rather than as a way to accommodate the
shoulder blade prominences. This indicates darts may serve more than one purpose in a
garment: prominence accommodation and reduction.
Three assumptions from the greatest lower-body front prominence were not upheld;
one focused on the waist circumference dimension, and the other two on the skirt front
waist dart. Waist indentation, GLBFP alignment, and GLBFP description were the three
body-form variations tested.
The first not upheld GLBFP assumption compared the waist circumference dimension
to the waist indentation body-form variation. Four categories were identified for waist
indentation: none, barely, slight, and indented; four groups were identified from the waist
circumference graph (Figure 43). The none and barely categories were spaced evenly
throughout the measurement range, forming no groups. The slight category clustered
around the smallest and the largest measurements, while the indented category clustered
loosely around the mid-to-large measurements. Averaging the measurements for each
body-form category, and arranging them in order of smallest-to-largest, resulted in the
following order: slight (32.21”), barely (32.28”), indented (32.36”), and none (32.5”).
The data suggest that waist indentation may not impact the waist circumference
dimension. The subjects in this study all shared a similar waist circumference, as well as
thicker waists, with minimal indentation. Before concluding that there is no connection
between waist indentation and waist circumference in a size, future research should
consider testing other populations, as well as other body-form variations that may impact
waist indentation, such as ribcage width and length, and high-hip prominence.
The second not upheld assumption for the GLBFP compared the skirt front waist dart
depth dimension to the GLBFP alignment body-form variation. Six categories were
identified for GLBFP alignment: below the high-hip, slightly below the high-hip, at the
high-hip, above the high-hip, below the waist, and at the waist; five groups were
identified from the skirt front waist dart depth graph (Figure 45). There were no groups

192
found in the data, though the below high-hip and slightly below high-hip categories
seemed to cluster together, indicating there need not be two separate groups to identify
this area. Averaging the measurements for each body-form category, and arranging them
in order of smallest-to-largest, revealed no groupings either.
The data suggest that greatest lower-body front prominence alignment alone cannot
account for the skirt front waist dart depth. There is not enough known about the distance
between the waist and high-hip, or how the GLBFP and these body-form variations
interact. The high-hip may occur at different locations for each woman, and may have
greater or lesser prominence for each woman. Closer inspection of the lower-body front
prominence is necessary before drawing conclusions about how it relates to pattern
dimensions.
The third, and final, not upheld GLBFP assumption compared the skirt front waist
dart width dimension to the GLBFP description body-form variation. Five categories
were identified for GLBFP description: flat, oval, softly pointed, softly rounded, and
rounded; three groups were identified from the skirt front waist dart width graph (Figure
46). No groupings were found during analysis of the data. Averaging the measurements
for each body-form category, and arranging them in order of smallest-to-largest, revealed
that the softly rounded category was smaller than the rounded category, but that the flat
category and the rounded category had the same value. The oval category had the largest
value.
The data suggest that the GLBFP descriptions may not be the best body-form
variation to compare against the skirt front waist dart width. It is possible that five body-
form categories were too many for this sample size. It may also be the case, as with the
bodice back waist dart, the skirt front waist dart is primarily for reducing the pattern from
the greatest lower-body circumference to the waist, and not for accommodating the shape
of the lower-body front prominence.
The only not upheld assumption for the buttocks compared the skirt back waist dart
width dimension to the buttocks prominence body-form variation. Two categories were
identified for the buttocks prominence: flat and prominent; four groups were identified
from the skirt back waist dart width graph (Figure 48). The flat category appeared around
193
both the smallest and the largest measurements in the range. The prominent category
clustered loosely around the middle of the measurement range. Averaging the
measurements for each body-form category revealed that the flat category was smaller
than the prominent category, but only by .04”.
The data suggest that greater buttocks prominence did not result in larger skirt back
waist dart width measurements. Since all of the subjects had hip circumferences that were
within 2” of each other, the discrepancy in skirt back waist dart width for the flat buttocks
prominence subjects may be due to some of the flat category subjects having wide hips.
Hip, or pelvis, width was not assessed in this study, by may be an important indicator to
help explain the skirt back waist dart width dimension. Due to the skirt back waist dart
acting as a reduction device as well as a prominence accommodating device, the width of
the pelvis may be of greater importance than the prominence of the buttocks. Researchers
may find that buttocks prominence is a better indicator of skirt back waist dart width
when the pelvis is narrow, but that pelvis width is a better indicator when it is wide.
Conclusion
Question two asked what the findings from this study suggest for the development of
a body-form based block system. The aim of this second question was to empirically
show that apparel block shapes can be categorized based on distinct body-form
variations. Twenty-seven assumptions were discussed and ten led to specific suggestions
for how specific body-form variations affect specific pattern dimensions. The remaining
seventeen assumptions require further analysis before suggestions can be created. The
overall aim for question two was not reached, but a start has been made.
Many of the seventeen unanswered assumptions indicated that either a different body-
form variation should be tested, or that more than one body-form variation impacted the
pattern dimension. The next step for this project is to run statistical analyses, such as
ANOVA or t-tests, on all twenty-seven assumptions, and to start comparing multiple
body-form variations against single pattern dimensions.

194
Conclusion
This case study explored the relationship between the human body and the clothing
that covered it, aiming to make a case for why body form variations need to be integrated
into pattern block development. Assumptions abound about what women’s bodies look
like, as well as what pattern blocks should look like, but little research has empirically
tested this relationship. Knowing how body-form variations affect the pattern block will
provide manufacturers with the means to tailor their products to specific customers,
improving the end product and ensuring a competitive advantage in a crowded market.
Research into body-form variation has either focused on how poorly women’s sizing
standards fit the current population, or classifying female bodies using pre-conceived
notions of how bodies look. The literature on body-form variation suggested that people
have unique and distinctive body forms, leading to the question: What are the body-form
variations across a single size?
Research into patterning practice generally explores the relationships between
grading and sizing. Some of the research compared patterns created for different body
forms, though they did not compare specific body-form variations to pattern dimensions.
The literatures suggested that body-form variation does affect apparel block shapes,
leading to the second question: What do these findings suggest for the development of a
body-form based block system?
This study concludes that there are multiple body-form variations across a single size,
and that the findings from comparing body-form variations to pattern dimensions can
provide important suggestions for the creation of a body-form based block system.
Based on the results and discussion of the two research questions, a body-form based
block system may be quite complex, and require a new mode of thinking about pattern-
drafting. If each body-form category requires different pattern dimensions, this may
cause the system to become overly complex. For example, having multiple dart lengths
and widths, combined with multiple neck circumferences and shoulder slopes will make a
pattern unreadable. Instead, if patterns are considered more like puzzles, with many
separate pieces, then only the specific pattern dimensions needed for a specific body can
be combined. This necessitates a large library of pattern dimension pieces, but once

195
compiled, can be combined in infinite ways. This would not only allow large
manufacturers, such as The Gap or Target, to create better fitting garments for their target
markets, but it would allow small manufacturers to specialize in custom design.
This study provided the research community with a base on which to explore the
body-garment relationship in terms of pattern block generation. While many relationships
were tested in this study there are many more that still need to be analyzed. Next steps
include testing each region of the body, determining exact dimensions for each body-
form category, comparing multiple sizes, and finding combinations of body-form
variations.

196
Chapter 7 References
Aldrich, W. (2007). History of sizing systems and ready-to-wear garments. In S.
Ashdown (Ed), Sizing in clothing: Developing effective sizing systems for ready-to-
wear clothing (pp. 1-56). Cambridge: Woodhead Publishing Limited.
Alexander, M., Connell, L. J. & Presley, A. B. (2005). Clothing fit preferences of young
female adult consumers. International Journal of Clothing Science and Technology,
17(1), 52-64.
Alexander, M., Pisut, G. R. & Ivanescu, A. (2012). Investigating women's plus-size body
measurements and hip shape variation based on SizeUSA data. International Journal
of Fashion Design, Technology and Education, 5(1), 3-12.
Ashdown, S. (1998). An investigation of the structure of sizing systems: A comparison of
three multidimensional optimized sizing systems generated from anthropometric data
with the ASTM standard D5585-94. International Journal of Clothing Science and
Technology, 10(5), 324-341.
ASTM International. (2001). D5586-01: Standard tables of body measurements for
women aged 55 and older (All Figure Types). ASTM International, 1-20.
ASTM International. (2001). Standard table of body measurements for adult female
misses figure type, sizes 2-20: D5585-95 (2001). ASTM International, 1-4.
ASTM International. (2004). D6960-04: Standard table of body measurements relating to
women’s plus size figure type, sizes 14W-32W. ASTM International, 1-4.
ASTM International. (2006). D7197-06: Standard table of body measurements for misses
maternity sizes two to twenty-two (2-22). ASTM International, 1-4.
ASTM International. (2010). Standard tables of body measurements for women aged 55
and older (all figure types): D5586/D5586M-10. ASTM International, 1-20.
ASTM International. (2011). Standard tables of body measurements for adult female
misses figure type, size range 00-20: D5585-11e1. ASTM International, 1-7.
ASTM International. (2013). Standard tables for body measurements for adult female
misses petite figure type, size range 00P-20P: D7878/D7878M-13e1. ASTM
International, 1-7.

197
Bergh, R. (2006). Make your own patterns: An easy step-by-step guide to making over 60
dressmaking patterns. London: New Holland Publishers (UK) Ltd.
Bye, E., LaBat, K. L. & DeLong, M. R. (2006). Analysis of body measurement systems
for apparel. Clothing and Textiles Research Journal, 24(2), 66-79.
Bye, E., LaBat, K., McKinney, E. & Kim, D. (2008). Optimized pattern grading.
International Journal of Clothing Science and Technology, 20(2), 79-92.
Connell, L. J., Ulrich, P. V., Brannon, E. L., Alexander, M. & Presley, A. B. (2006).
Body shape assessment scale: Instrument development for analyzing female figures.
Clothing and Textiles Research Journal, 24(4), 80-95.
Devarajan, P. (2003). Validation of ‘Female Figure Identification Technique (FFIT) for
apparel’ methodology (Unpublished master’s thesis). North Carolina State
University, Raleigh.
Gazzuolo, E. B. (1985). A theoretical framework for describing body form variation
relative to pattern shape (Unpublished master’s thesis). University of Minnesota, St.
Paul.
Goldsberry, E., Shim, S. & Reich, N. (1996a). Women 55 years and older: Part I. Current
body measurements as contrasted to the PS 42-70 data. Clothing and Textiles
Research Journal, 14(2), 108-120.
Heisey, F. L., Brown, P. & Johnson, R. F. (1988). Three-dimensional pattern drafting: A
theoretical framework. Clothing and Textiles Research Journal, 6(3), 1-9.
Hemmis, P. (2016). The elements of design, shape and form [PowerPoint slides].
Retrieved from https://ay15.moodle.umn.edu/pluginfile.php/1508461/mod_resource/
content/1/DES%201101w%20Sp16%20Elements%20Shape%20and%20Form.pdf
Istook, C. L., Simmons, K. P. & Devarajan, P. (2004). Female figure identification
technique (FFIT) for apparel. 147-173. Retrieved from
http://www.iffti.com/downloads/past_conferences/HKPU,%202002/A/147-173.pdf
Jaffe, H. & Relis, N. (2005). Draping for fashion design (4th ed.). Upper Saddle River,
NJ: Pearson Prentice Hall.
Joseph-Armstrong, H. (2006). Patternmaking for fashion design (4th ed.). Upper Saddle
River, NJ: Pearson Prentice Hall.

198
Kidwell, C. B. & Christman, M. C. (1974). Suiting everyone: The democratization of
clothing in America. Washington, D.C.: Smithsonian Institution Press.
Kim, D-E., LaBat, K., Bye, E., Sohn, M. & Ryan, K. (2014). A study of scan garment
accuracy and reliability. The Journal of the Textile Institute, 106(8), 1-9.
LaBat, K. L. (2007). Sizing standardization. In S. Ashdown (Ed), Sizing in clothing:
Developing effective sizing systems for ready-to-wear clothing (pp. 88-107).
Cambridge: Woodhead Publishing Limited.
LaBat, K. L. & Sokolowski, S. L. (1999). A three-stage design process applied to an
industry-university textile product design project. Clothing and Textiles Research
Journal, 17(1), 11-20.
Lamb, J. M. & Kallal, M. J. (1992). A conceptual framework for apparel design. Clothing
and Textiles Research Journal, 10(2), 42-47.
Lamport, I. (2008, August 22). To belt or not to belt? [Web log post]. Retrieved from
https://insideoutstyleblog.com/2008/08/to-belt-or-not-to-belt.html.
Lamport, I. (2010, November 2). Body shapes explained – Defining points [Web log
post]. Retrieved from https://insideoutstyleblog.com/2010/11/body-shapes explained-
defining-points.html.
Latzke, A. & Quinlan, B. (1940). Clothing: An introductory college course. Chicago: J.
B. Lippincott Company.
Le Pechoux, B. & Ghosh, T. K. (2002). Standard sizing and fit testing applied to
women’s hosiery. Textile Progress, 32(1), 1-59.
Lee, J. Y., Istook, C. L., Nam, Y. J. & Park, S. M. (2007). Comparison of body shape
between USA and Korean women. International Journal of Clothing Science and
Technology, 19(5), 374-391.
Liechty, E. G., Pottberg, D. N. & Rasband, J. A. (1986). Fitting and pattern alteration: A
multi-method approach. New York: Fairchild Publications.
Liechty, E., Rasband, J. & Pottberg-Steineckert, D. (2010). Fitting & pattern alteration:
A multi-method approach to the art of style selection, fitting and alteration (2nd ed.).
New York, NY: Fairchild Books.
Maehren, B. & Meyers, S. (Eds.) (2005). The perfect fit: The classic guide to altering

199
patterns. Chanhassen, MN: Creative Publishing International.
Minott, J. (1974). Pants and skirts: Fit for your shape (2nd ed.). Minneapolis, MN:
Burgess Publishing Company.
Minott, J. (1978). Fitting commercial patterns: The Minott method. Minneapolis, MN:
Burgess Publishing Company
Nayak, R., Padhye, R., Wang, L., Chatterjee, K. & Gupta, S. (2015). The role of mass
customization in the apparel industry. International Journal of Fashion Design,
Technology and Education, 8(2), 162-172.
Olds, T., Daniell, N., Petkov, J. & Steward, A. D. (2013). Somatotyping using 3D
anthropometry. A cluster analysis. Journal of Sports Sciences, 31(9), 936-944.
Palmer, P. & Alto, M. (2005). Fit for real people: Sew great clothes using any pattern!
(2nd ed.). Portland, OR: Palmer/Pletsch Incorporated.
Patterson, C. A. & Warden, J. (1983). Selected body measurements of women aged 65
and older. Clothing & Textiles Research Journal, 2, 23-31.
Petrova, A. (2007). Creating sizing systems. In S. Ashdown (Ed), Sizing in clothing:
Developing effective sizing systems for ready-to-wear clothing (pp. 57-87).
Cambridge: Woodhead Publishing Limited.
Pisut, G. & Connell, L. J. (2007). Fit preferences of female consumers in the USA.
Journal of Fashion Marketing and Management: An International Journal, 11(3),
366-379.
Rasband, J. A. & Liechty, E. L. G. (2006). Fabulous fit: Speed fitting and alteration (2nd
ed.). New York, NY: Fairchild Publications, Inc.
Robinette, K. M., Blackwell, S., Daanan, H., Boehmer, M., Fleming, S., Brill, T.,
Hoeferlin, D. & Burnsides, D. (2002). Civilian American and European surface
anthropometry resource (CAESAR) final report, Volume 1: Summary (Report
#AFRL-HE-WP-TR-2002-0169). Wright-Patterson AFB, OH: United States Air
Force Research Laboratory.
ScanWorX [Computer Software]. Cary, NC: Human Solutions of North America, Inc.
Salusso, C. J., Borkowski, J. J., Reich, N. & Goldsberry, E. (2006). An alternative

200
approach to sizing apparel for women 55 and older. Clothing and Textiles Research
Journal, 24(2), 96-111.
Salusso-Deonier, C. J., DeLong, M.R., Martin, F. B. & Krohn, K. R. (1985). A
multivariate method of classifying body form variation for sizing women’s apparel.
Clothing and Textiles Research Journal, 4(1), 38-45.
Schofield, N. A., Ashdown, S. P., Hethorn, J., LaBat, K. & Salusso, C. J. (2006).
Improving pant fit for women aged 55 and older through an exploration of two pant
shapes. Clothing and Textiles Research Journal, 24(2), 147-160.
Schofield, N. A. & LaBat, K. L. (2005a). Exploring the relationships of grading, sizing,
and anthropometric data: Table 1. Comparison of sizing charts from 1873 to 2000.
Clothing and Textiles Research Journal, 23(1) 14.
Schofield, N. A. & LaBat, K. L. (2005b). Defining and testing the assumptions used in
current apparel grading practice. Clothing and Textiles Research Journal, 23(3), 135-
150.
Simmons, K. P., Istook, C. L. & Devarajan, P. (2004). Female figure identification
technique (FFIT) for apparel, Part I: Describing female shapes. Journal of Textile and
Apparel, Technology and Management, 4(1), 1-16.
Sohn, M. & Bye E. (2012). Visual analysis of body shape changes during pregnancy.
International Journal of Fashion Design, Technology and Education, 5(2), 117-128.
Song, H. K. & Ashdown, S. P. (2012). Development of automated custom-made pants
driven by body shape. Clothing and Textiles Research Journal, 30(4), 315-329.
U.S. Census Bureau. (2015). Annual estimates of the resident population for selected age
groups by sex for the United States, states, counties and Puerto Rican Commonwealth
and municipios: April 1, 2010 to Jul 1, 2015. Retrieved from http://factfinder.census.
gov/faces/tableservices/jsf/pages/productview.xhtml?src=bkmk.
United States Air Force Research Laboratory. (2002). Civilian American and European
surface anthropometry resource (CAESAR) [Data set].
Yu, W. (2004). Human anthropometrics and sizing systems. In J. Fan, W. Yu, & L.
Hunter (Eds), Clothing appearance and fit: Science and Technology (pp. 174-183).
Cambridge: Woodhead Publishing Limited.