Rev 1 to "Offsite Dose Calculation Manual." W/one oversize encl.
216
TABLE OF CONTENTS SECTION or TABLE 1.0 SUBJECT INTRODUCTION TS SECTION or. TABLE PAG E 2.0 2.1 . 2. 1.1 2.1.2 2. 1.2. 1 2. 1.2.2 2. 1.2.3 2. 1.3 2.1.3.1 2. 1.3.2 2.2 2.3 2.4 2.5 2.6 3.11.1.1 3.3.7.10 3.11.1.1 4.11.1.1.2 3.11.1.2 3.11.1.3 4.11.1. 2 4.11.1.3- 1 Liquid Effluent Dose Factor Derivation — Ait Liquid Effluent Sampling Representativeness Liquid Radwaste System Operation 4.11-1 note b 3. 11.1.3 LIQUID EFFLUENTS Liquid Effluent Monitor Alarm Setpoints Basis Setpoint Determination Methodology Liquid Radwaste Effluent Radiation Alarm Setpoint Contaminated Dilution Water Radwaste Effluent Monitor Alarm Setpoint Calculations Service Water and Cooling Tower Blowdown Effluent Radiation Alarm Setpoint Discussion Liquid Radwaste Effluent Service Water and Cooling Tower Blowdown Liquid Effluent Concentration Calculation Liquid Effluent Dose Calculation 2 2 2 2 2-3 5 6-9 10-12 12 13-14 14-15 15-16 16-17 Table 2-1 Table 2-2 Figure 2-1 Liquid Effluent Detector Response Ait Liquid Effluent Dose Factor Liquid Radwaste Treatment System thru 2-8 Flow Diagrams Figure 2-9 Liquid Radiation Monitoring Figure 2-10 Off-line Liquid Monitor 3.11.1.3 3. 11.3 18 19 20-2 7 28 29 3.0 3.1 3.1. 1 3. 1.2 3.1.2. 1 3. 1.2.2 3.1.2.3 3. 1.3 3.1.3.1 3. 1.3.2 3.1.3.3 3.2 3.2.1 3.2.2 GASEOUS EFFLUENTS Gaseous Effluent Monitor Alarm Setpoints Basis Setpoint Determination Methodology Stack Noble Gas Radiation Alarm Setpoint Vent Noble Gas Radiation Alarm Setpoint Offgas Pretreatment Radiation Alarm Setpoint Discussion Stack Effluent Vent Effluent ~ Offgas Process Gaseous Effluent Dose Rate Calculation Total Body Dose Rate Due to Noble Gases Skin Dose Rate Due to Noble Gases 3.11.2. 1 3 '.7.11 3. 11.2. 1 3.11.2.1. a 4.11.2.1.1 3.11.2.1. a 4. 11.2. 1. 1 30 30 30 30 30-31 31-32 32 33 34 35 36 37 37-38 38-3 9 -i May 1986 8606110219 860605, PDR *DOCK-05000410 '" A . PDR~. vq v i ~ if wqv, v ~syyre, p r sv:g v, pv y y
-
Upload
khangminh22 -
Category
Documents
-
view
3 -
download
0
Transcript of Rev 1 to "Offsite Dose Calculation Manual." W/one oversize encl.
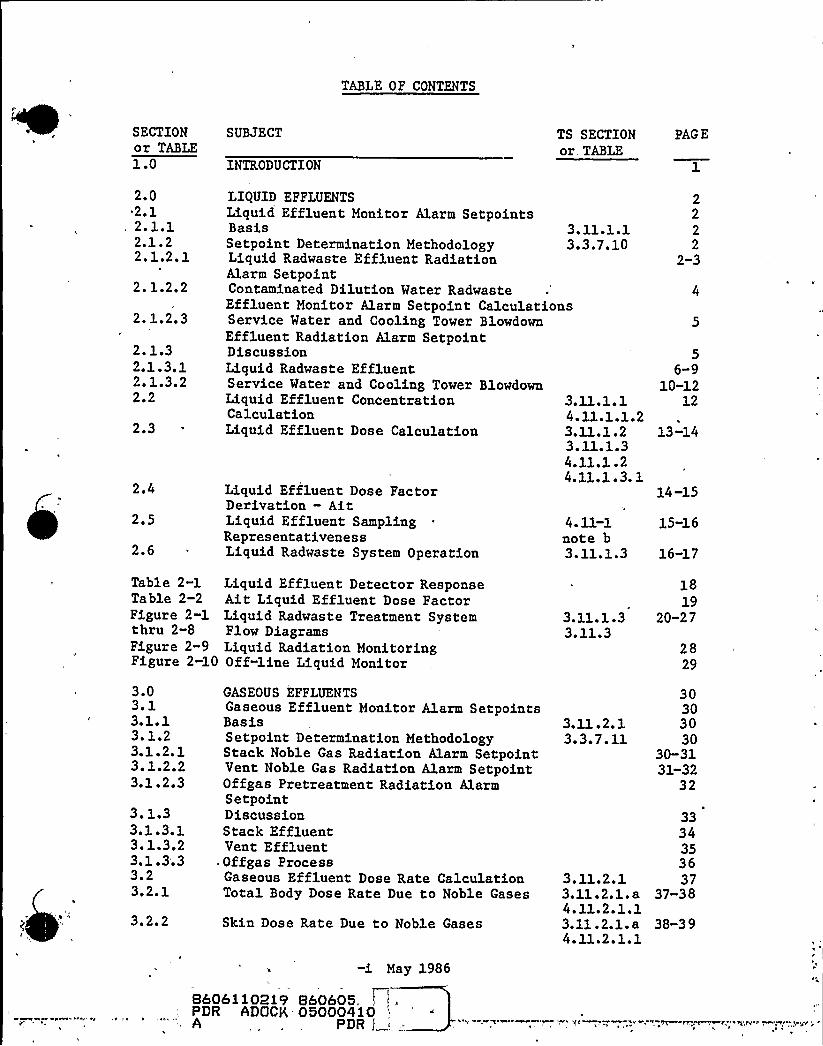
TABLE OF CONTENTS
SECTIONor TABLE1.0
SUBJECT
INTRODUCTION
TS SECTIONor. TABLE
PAG E
2.02.1
. 2. 1.12.1.22. 1.2. 1
2. 1.2.2
2. 1.2.3
2. 1.32.1.3.12. 1.3.22.2
2.3
2.4
2.5
2.6
3.11.1.13.3.7.10
3.11.1.14.11.1.1.23.11.1.23.11.1.34.11.1. 24.11.1.3- 1
Liquid Effluent Dose FactorDerivation — AitLiquid Effluent SamplingRepresentativenessLiquid Radwaste System Operation
4.11-1note b3. 11.1.3
LIQUID EFFLUENTSLiquid Effluent Monitor Alarm SetpointsBasisSetpoint Determination MethodologyLiquid Radwaste Effluent RadiationAlarm SetpointContaminated Dilution Water RadwasteEffluent Monitor Alarm Setpoint CalculationsService Water and Cooling Tower BlowdownEffluent Radiation Alarm SetpointDiscussionLiquid Radwaste EffluentService Water and Cooling Tower BlowdownLiquid Effluent ConcentrationCalculationLiquid Effluent Dose Calculation
2222
2-3
56-9
10-1212
13-14
14-15
15-16
16-17
Table 2-1Table 2-2Figure 2-1
Liquid Effluent Detector ResponseAit Liquid Effluent Dose FactorLiquid Radwaste Treatment System
thru 2-8 Flow DiagramsFigure 2-9 Liquid Radiation MonitoringFigure 2-10 Off-line Liquid Monitor
3.11.1.33. 11.3
1819
20-2 7
2829
3.03.13.1. 13. 1.23.1.2. 13. 1.2.23.1.2.3
3. 1.33.1.3.13. 1.3.23.1.3.33.23.2.1
3.2.2
GASEOUS EFFLUENTSGaseous Effluent Monitor Alarm SetpointsBasisSetpoint Determination MethodologyStack Noble Gas Radiation Alarm SetpointVent Noble Gas Radiation Alarm SetpointOffgas Pretreatment Radiation AlarmSetpointDiscussionStack EffluentVent Effluent
~ Offgas ProcessGaseous Effluent Dose Rate CalculationTotal Body Dose Rate Due to Noble Gases
Skin Dose Rate Due to Noble Gases
3.11.2. 13 '.7.11
3. 11.2. 13.11.2.1. a4.11.2.1.13.11.2.1. a4. 11.2. 1. 1
30303030
30-3131-32
32
3334353637
37-38
38-3 9
-i May 1986
8606110219 860605,PDR *DOCK-05000410'"A . PDR~. vq v i ~ if wqv, v ~syyre, p r sv:g v, pv y y
TABLE OF CONTENTS
SECTIONor TABLErr:3
3.3
3.3.1
3.3.23.3.3
SUBJECT
Organ Dose Rate Due to I-1 1, I-1Tritium and Particulates with half-lives greater than 8 daysGaseous Effluent Dose CalculationMethodology
Gamma Air Dose Due to Noble Gases
Beta Air Dose Due to Noble GasesOrgan Dose Due to I-131, I-133, Tritiumand Particulates with half-livesgreater than 8 days.
TS SECTIONor TABLE
3.11.2.l.b4.11.2.1.23. 11.2. 23.11.2.33.11.2.53.11.2.2.a4. 11.2.23.11.2.2. b
'3.11 2.33.11 2.54.11.2.34.11 .2.5. 1
PAG E
39~1
41-42
, 42
4343-45
3.4
3.4. 1
3.4.23.4.3
3.4.4
3.4.53.4.63.53.6
3.7
3.8
Table 3-1Table 3-2Table 3-3Table 3-4Table 3-5Table 3-6Table 3-7to 3-10Table 3-11Table 3-12to 3-15Table 3-16to 3-18Table 3-19to 3-21
3.11.2.4
3. 11.2. 5
Offgas Noble Gas Detector ResponseBi and Vi- Plume Shine Dose FactorsKi, Li, Mi and Ni- Immersion Dose FactorsPi- Ground Plane Dose Rate FactorsPi- Inhalation Dose Rate FactorsPi- Food (Cow Milk) Dose Rate FactorsRi- Inhalation Dose Factors for InfantChild, Teen and AdultRi- Ground Plane Dose FactorsRi- Cowmilk Ingestion .Dose Factors forInfant, Child, Teen and AdultRi- Cowmeat Ingestion Dose Factors forChild, Teen and AdultRi- Vegetation Ingestion Dose Factors forChild, Teen and Adult
Gaseous Effluent Dose Factor Definitionand DerivationBi- Plume Shine Gamma Air Dose FactorVi- Plume Shine Total Body Dose FactorKi, Li, Mi and Ni- Immersion Dose FactorsPi- I'odine, Particulate and TritiumOrgan Dose Rate FactorsRi- Iodine, Particulate and TritiumOrgan Dose FactorsX/Q and Wv- Dispersion Factors for Dose RateWs and Wv- Dispersion Factors for DoseGaseous Effluent I-133 EstimationUse of Concurrent Meteorological Data vs.Historical DataGaseous Radwaste Treatment SystemOperationVentilation Exhaust Treatment SystemOperations
45.
45-47
4747-51
51-5 7
58595959
59
60
616263646566
67-70
7172-75
76-7 8
79-81
-ii May 1986
TABLE OF CONTENTS
S ECTIONor TABLETable 3-22
Figure 3-1thru 3-3Figure 3-4
Figure 3-5Figure 3-6
SUBJECT
X/Q, Wv and Ws- Di,spersion Factors forReceptor LocationsGaseous Radwaste Treatment System FlowDiagramsVentilation Exhaust Treatment SystemFlow DiagramsGaseous Radiation MonitoringGaseous Effluent Monitoring System
3.11.2.4
3.11.2.5
83-85
86
8788
TS SECTION PAGE
or TABLE82
4.0 URANIUM FUEL CYCLE 3.11.4 89-90
4.14.24.34,4
Evaluation of Doses From Liquid Effluents 4.11.4.1Evaluation of Doses From Gaseous Effluents 4.11.4.1Evaluation of Doses From Direct Radiation 4.11 .4.2Doses to Members of the Public Within 6.9. 1.8Site Boundary
90-91929293-94
5.0
5.1
5.25.3
Table 5.1
95
95
9597-97
98"1003. 12.14. 12. 1Table 3.12-1Note (a)
ENVIRONMENTAL MONITORING PROGRAM 3.124. 12
Sampling Stations 3. 12. 14.12.1
Interlaboratory Comparison Program 4. 12.3Capabilities for Thermoluminescent DosimetersUsed for Environmental MeasurementsRadiological Environmental MonitoringProgram Sampling Locations
6.0
6.16.26.36.4FigureFigureFigure
DISCUSSION OF TECHNICAL SPECIFICATIONREFERENCESTable 3.12-1 note gTable 3.12-1 note hTable 3.12-1 note iTable 3.12-1 note 1
5.1-1 Nine Mile Point On-Site Map5.1-2 Nine Mile Point Off-Site Map5. 1.3-1 Site Boundaries
101
101101102102
-iii May 1986
OFF-SITE DOSE CALCULATION MANUAL (ODCM)
INTRODUCTION
This is the OFFSITE DOSE CALCULATION MANUAL (ODCM), referenced in theNine Mile Point — Unit 2 Technical Specification. It describes themethodology for liquid and gaseous effluent monitor alarm setpointcalculations, the methodology for computing the offsite dose due toliquid effluents, gaseous effluents, and the uranium fuel cycle aswell as the radiological environmental monitoring and interlaboratorycomparison programs.
The ODCM will be reviewed and approved by the NRC. Changes shall beprovided in the semi annual radioactive effluent release reportssubmitted to the NRC.
Section 2 establishes methods used to calculate the Liquid EffluentMonitor Alarm setpoints and to demonstrate compliance with TS Section3. 11.1.1 limits on concentration of releases to the environment asrequired in TS Section 3.3.7.10'nd 4.11.1.1.2 respectively.Additionally, the method used to calculate the cumulative dosecontributions from liquid effluents and the methods used to assurethorough mixing and sampling of liquid radioactive waste tanks to bedischarged as required in TS Section 4.11.1 .2, 4.11.1.3.1 and Table4. 11"1 note b respectively are presented.
Section 3 establishes calculational methods used to calculate theGaseous Effluent Monitor Alarm setpoints and to demonstratecompliance with TS Section 3.11.2.1 limits on dose rates due togaseous releases to the environment as required in TS Section3.3.7.11, 4.11.2.1.1 and 4.11 .2.1 .2 respectively. Additionally, thecalculational methods used to calculate cumulative dose contributionsfrom gaseous effluents as required in TS Section 4.11 .2.2, 4.11 .2.3and 4.11.2.5 are presented.
S ection 4 establishes the method used to determine cumulative dosecontributions from the Uranium Fuel Cycle as required by TS Section4. 11.4.1, 4.11.4.2 and 6.9.1.8.
Section 5 establishes the environmental monitoring program asrequired by TS Section 3.12 and 4,12 including the InterlaboratoryComparison Program required by TS Section 4. 12.3.
Section 6 discusses some of the references contained in TS Table3.12-1, Radiological Environmental Monitoring Program.
May 1986

0
2.0 LIQUID EFFLUENTS
Service Water A and B, Cooling Tower Blowdown and the LiquidRadioactive Waste Discharges comprise the Radioactive LiquidEffluents at Unit 2. (See figure 2-9) Presently there are notemporary outdoor tanks containing radioactive water capable ofaffecting the nearest known or future water supply in an unrestrictedkorea. NUREG 0133 and Regulatory Guide 1.109, Rev. 1 were followed inthe development of this section.
2.1
2. 1.1
Liquid Effluent Monitor Alarm Setpoints
Basis
Technical Specification 3. 11.1.1 provide the basis for the alarmsetpoints: The concentration of radioactive material released inliquid effluents to UNRESTRICTED AREAS (see Figure 5.1.3-1) shall belimited to the concentrations specified in 10 CFR 20, Appendix B,Table II, Column 2, for radionuclides other than dissolved orentrained noble gases'or dissolved or entrained nobles gases, theconcentration shall be limited by 2 x 10⁻⁴ microcurie/ml totalactivity.
2. 1.2 Setpoint Determination Methodology
2.1.2.1 Liquid Radwaste Effluent Radiation Alarm Setpoint
This monitors setpoint takes into account the dilution of RadwasteEffluents provided by the Service Water and Cooling Tower Blowdownflows. Detector response for the nuclides to be discharged (cpm) ismultiplied by the Actual Dilution Factor (dilution flow/waste streamflow) and divided by the Required Dilution Factor (total fraction ofMPC in the waste stream) ~ A safety factor is used to ensure that thelimit is never exceeded. Service Water and Cooling Tower Blowdownare normally non-radioactive. If they are found to be contaminatedprior to a Liquid Radwaste discharge then an alternative equation isused to take into account the contamination. If they becomecontaminated during a Radwaste discharge, then the discharge will beimmediately terminated and the situation fully assessed.
Normal Radwaste Effluent Alarm Setpoint Calculation'.
Alarm Setpoint < [0.8«(F/f)*U.(Ci"CFi)]/[H.(Ci/MPCi)) + Background.Where:
Alarm Setpoint The Radiation Detector Alarm Setpoint, cpm0.8 Safety Factor, unitlessF Nonradioactive dilution flow rate, gpm. Service
-2- May 1986

Ci
CFi
fMP Ci
Background
Zi(Ci+CFi)
Zi(Ci/MPCi)
CR*ZiCi
F/f
Water Flow ranges from 30,000 to 58,000 gpm.Blowdown flow is typically 10,200 gpm.Concentration of isotope i in Radwastetank prior to dilution, uCi/mlDetector response for isotope i, net cpm/uCi/mlSee Table 2-1 for a list of nominal valuesThe permissible Radwaste Effluent Flow rate, gpmSymbol to denote multiplication.Concentration limit for isotope i from 10CFR20Appendix B, Table II, Column 2, uCi/mlDetector response when sample chamber is filledwith nonradioactive water, cpmThe total detector response when exposed to theconcentration of nuclides in the Radwaste tank,cpmThe total fraction of the 10CFR20, Appendix B,Table II, Column 2 limit that is in the Radwastetank, unitless ~ This is also known as the RequiredDilution Factor (RDF )An approximation toZi(CiCFi) determined,at each calibration of the effluent monitor, byrecording monitor cpm response to a typicalradwaste tank mixture analyzed by multichannelanalyzer (traceable to NBS) ~ CR is a weightedsummation of CF.An approximation to (F+f)/f, the Actual DilutionFactor in effect during a discharge.
Permissible effluent flow, f, shall be calculated to determinethat MPC willnot be exceeded in the discharge canal.
f (Dilution Flow) * (1 — Fraction Tempering)(RDF) " 1.5
Fraction Tempering A diversion of some fraction of discharge flow tothe intake canal for the purpose of temperaturecontrol .
NOTE: If Actual Dilution Factor is set equal to the Required DilutionFactor, then the alarm points required by the above equationscorrespond to a concentration of 80X of the Radwaste Tankconcentration. No discharge could occur, since the monitor would bein alarm as soon as the discharge commenced. To avoid thissituation, maximum allowable radwaste discharge flow is calculatedusing a multiple (usually 1.5 to 2) of the Required Dilution Factor,resulting in discharge canal concentration of 2/3 to 1/2 of MPC.
-3" May 1986
2.1.2.2 Contaminated Dilution Water Radwaste Effluent Monitor Alarm SetpointCalculation:
The allowable discharge flow rate for a Radwaste tank, when one of thenormal dilution streams (Service Water A, Service Water B, or Cooling TowerBlowdown) is contaminated, will be calculated by an iterative process.Using Radwaste tank concentrations with a nominal radwaste effluent flowrate (200 gpm, for example) the resulting fraction of MPC in the dischargecanal will be calculated.
FMPC ~ Zi [Zs(Fs*Cis)/(MPCi*Zs[Fs])]
Then the permissible radwaste effluent flow rate is given by:
f Nominal FlowFMPC"2
The corresponding Alarm Setpoint will then be calculated using thefollowing equation, with f limited as above.
0. 8* Zi (Ci*CFi)Alarm Setpoint
Zi[Zs(Fs*Cis)/(MPCi*Zs[Fs])]+ Background
Where:
Alarm Setpoint ~ The Radiation Detector A1arm Setpoint, cpm
0.8FsCi
Cis
CFi
MP Ci
fBackground
EL( Ci"CFi )
Zs [Fs+Cis]
Zs [Fs]
Safety Factor, UnitlessAn Effluent flow rate for stream s, gpmConcentration of isotope i in Radwastetank prior to dilution, uCi/mlConcentration of isotope i in Effluent stream sincluding the Radwaste Effluent tankundiluted, uCi/m 1Detector response for istope i, net cpm/nCi/mlSee Table 2-1 for a list of nominal valuesConcentration limit for isotope i. from 10CFR20Appendix B, Table II, Column 2, ;iCi/mlThe permissible Radwaste Effluent Flow rate, gpmDetector response when sample chamber is filledwith nonradioactive water, cpmThe total detector response when exposed to theconcentration of nuclides in the Radwaste tank,cpmThe total activity of nuclide i in all Effluentstreams, uCi-gpm/mlThe total Liquid Effluent Flow rate, gpm(Service Water & CT Blowdown & Radwaste)
-4- May 1986
0
2.1.2.3 Service Water and Cooling Tower Blowdown Effluent Alarm Setpoint
These monitor setpoints do not take any credit for dilution of eachrespective effluent stream. Detector response for the distribution ofnuclides potentially discharged is divided by the total MPC fraction of theradionuclides potentially in the respective stream. A safety factor isused to ensure that the limit is never exceeded.
Service Water and Cooling Tower Blowdown are normally non-radioactive. Ifthey are found to be contaminated by statistically significant increase indetector response then grab samples will be obtained and analysis meetingthe LLD requirements of Table 4.11-1 completed so that an estimate ofoffsite dose can be made and the situation fully assessed.
Service Water and Cooling Tower Blowdown Alarm Setpoint Equation:
Alarm Setpoint < [0.8*Ei (Ci*CFi)]/[Ei (Ci/MPCi)] + Background.
Where:
Alarm Setpoint
0.8Ci
CPi.
MP Ci
Background ~
Ei(Ci«CFi)
Ei ( Ci/MPCi)
CR*EiCi
The Radiation Detector Alarm Setpoint,cpmSafety Pactor, unitlessConcentration of isotope i in potentialcontainment, uCi/mlDetector response for isotope i,, net cpm/uCi/mlSee Table 2-1 for a list of nominal valuesConcentration limit for isotope i from 10CFR20Appendix B, Table II, Column 2, uCi/ml
Detector response when sample chamber is filledwith nonradioactive water, cpmThe total detector response when exposed to theconcentration of nuclides in the potentialcontainment, cpmThe total fraction of the 10CFR20, Appendix B,Table II, Column 2 limit that is in the potentialcontainment, unitless.An approximation to Ei(CiCFi) determined,at each calibration of the effluent monitor, byrecording monitor cpm response to a typicalcontaminant mixture analyzed by multichannelanalyzer (traceable to NBS). CR is a weightedsummation of CPi .
2.1.3 Discussion
-5" May 1986
2.1.3.1 Liquid Radwaste Effluent Monitor
The Liquid Radioactive Waste System Tanks are pumped to the dischargetunnel which in turn flows directly to Lake Ontario. At the end of thedischarge tunnel in Lake Ontario, a diffuser structure has been installed.Its purpose is to maintain surface water temperatures low enough to meetthermal pollution limits. However, it also assists in the near fielddilution of any activity released'ervice Water and the Cooling TowerBlowdown are also pumped to the discharge tunnel and will providedilution. If the Service Water or the Cooling Tower Blowdown is found tobe contaminated, then its activity will be accounted for when calculatingthe permissible radwaste effluent flow for a Liquid Radwaste discharge .The Liquid Radwaste System Monitor provides alarm and automatic terminationof release if radiation levels above its alarm setpoint are detected.
The radiation detector is a sodium iodide crystal. It is a scintillationdevice. The crystal is sensitive to gamma and beta radiation. However,because of the metal walls of the sample chamber and the absorptioncharacteristics of water, the monitor is not particularly sensitive to betaradiation. Actual detector response Ei(Ci*CFi), cpm, will be evaluatedby placing a sample of typical radioactive waste into the monitor andrecording the gross count rate, cpm. A calibration ratio, CR,cpm/uCi/ml, will be developed by dividing the noted detector response,Ei(Ci*CFi) cpm, by total concentration of activity Zi(Ci), uCi/cc.
The quantification of the activity will be completed with gammaspectrometry equipment whose calibration is traceable to NBS. Thiscalibration ratio will be used for subsequent setpoint calculations in thedetermination of detector response:
Zi. ( Ci*CFi) CR* EL( Ci )
Where the factors are all as defined above.
For the calculation of ZL( Ci/MPCi) the contribution from non gammaemitting nuclides except tritium will be initially estimated based on theexpected ratios to quantified nuclides as listed in the FSAR Table 11 .2.5.Fe-55, Sr-89 and Sr-90 are 2.5, 0.25 and 0.02 times the concentration ofCo-60. Periodic analysis of waste for these non gamma emitting nuclides byoffsite analysis will provide a better estimate once sufficient activity ispresent.
Tritium concentration is assumed to equal the latest concentration detectedin the monthly Tritium analysis (performed offsite) on liquid radioactivewaste tanks discharged or based on the latest tritium detected in the spentfuel pool if liquid radioactive waste tank discharges have not been madewithin the last 6 months.
—6- May 1986
Nominal flow rates of the Liquid Radioactive Waste System Tanks dischargedis 165 gpm while dilution flow from the minimum number of Service WaterPumps always in service is over 30,000 gpm, and Cooling Tower Blowdown is10,200 gpm. Because of the large amount of dilution the alarm setpointcould be substantially greater than that which would correspond to theconcentration actually in the tank. Potentially a discharge could continueeven if the distribution of nuclides in the tank were substantiallydifferent from the grab sample obtained prior to discharge which was usedto establish the detector alarm point. To avoid this possibility of "Nonrepresentative Sampling" resulting in a erronous assumptions about thedischarge of a tank, the tank is recirculated for a minimum of 2.5 tankvolumes prior to sampling.
A setpoint of 1.65 time the square root of the background above backgroundwill be used until grab sample analysis with the required LLD sensitivityon TS Table 4.11-1 detects activity. The square root of the background isan estimate of the standard deviation of backgrounds 1 .65 times the squareroot corresponds to approximately the 95% confidence level that thedetector response is due to normal variances.
May 1986
A sample calculation is presented below assuming tank concentrationsequivalent to the diluted concentration presented in FSAR Table ll.2.5which is the expected concentration of effluent waste after dilution thatare discharged with the design limit for fuel failure (the table below isthe undiluted concentration corresponding to a tank 2040 gal per daydischarge with only cooling tower blowdown dilution of 10,200 gpm).
ISOTOPENAME
A
ACTIVITYCONCENTRATION
uCi/mlB
(Ci)
MPC
uCi/mlC
(MPCi)
FRACTIONOF MPC
(B/C)D
( Ci/MPCi )
DETECTORRESPONSE
cpm/uCi/mlE
(CFi)
CPM
TOTALcpm
F
( CiCFi)
H3NA24P32CR51MN54MN56FE55FE59C058C060NI63NI65CU64ZN65B R83BR84SR89SR90SR91SR92Y91Y92Y93ZR95ZR97NB95M099TC99MRU103RU105RU106AG110MTE129MTE131M
8.4E-31.7E-66.8E-82.0E-62.4E-S3.2E-73. 5E-71.0E-86. 8E-81.4E-73. 5E-101.8E-94.3E-66.8E-83.3E-88.9E-143.6E-S2.4E-94. 6E-77.6E-S1.7E-84.6E-75. 1E-72.7E-91.0E-92.7E-96.0E-71.2E-66. 8E-96.8E-S1.0E-133.5E-101.4E-S2.4E-S
3E-33E-52E-52E-31E-41E-48E-45E-59E-53E-53E-5IE-42E-41E-43E-6
3E-63E-75E-56E-53E-56E-53E-56E-52E-51E-44E-53E-3SE-5IE-41E-53E-32E-54E-5
2.85.7E-23.4E-31.03-32.4E-43.2E-34.3E-42.1E-47. 6E-44.7E-31. 1E-51.8E-52. 1E-26.8E-41.1E-2
1.2E-37.8E-39.3E-31.2E-35.7E-47.8E-31.7E-34.5E-55. 2E-52.7E-51.6E-24.1E-48. 5E-56.3E-41.0E-41.1E-57.4E-56.0E-4
8. 42E71.2E7
8.63E71.14ES1.65E8
1.12ES7.8E3
1.22ES8.17E72.47E82.05E7
8.35E7
8.5E72.32E72.32E7
1.98E+03.9E+1
9.0E-17.8E+02.4E+1
1 .OE-52.8E-4
5. 7E+16. 1E+04.2E+09.5
2.3E-1
2.4E-11.4E+12.8E+1
-8- May 1986
"' Vl'h" hh 'f fhfh ',h „h 'h jd I ]$( h j ' ' h h h hh'hg»'t
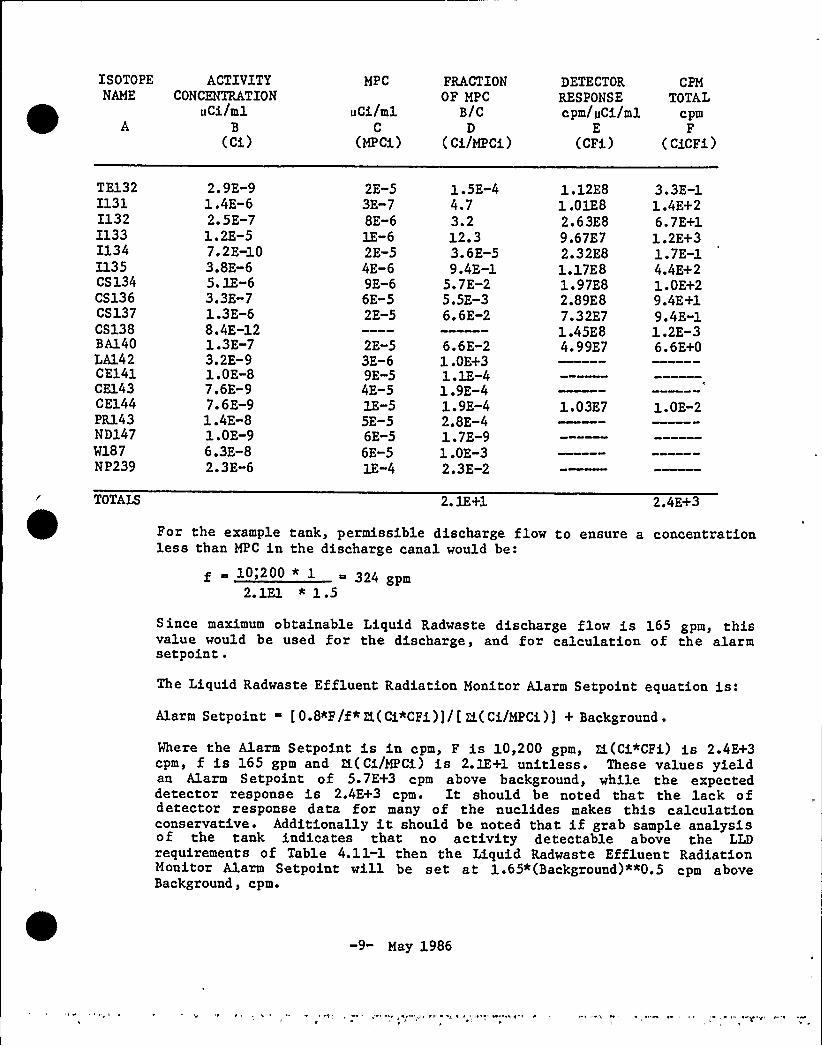
ISOTOPENAME
A
ACTIVITYCONCENTRATION
uCi/mlB
(ci)
MPC
uci/mlC
(MPci)
FRACTIONOF MPC
B/CD
(ci/Mpci)
DETECTORRESPONSEcpm/uci/ml
E(CFi)
CPM
TOTALcpm
F
( CicFi )
TE132I131I132I133I134I135CS134CS136CS137CS138BA140LA142CE141CE143CE144PR143ND147W187NP239
2. 9E-91.4E-62. 5E-71.2E-57. 2E-103.8E-65. 1E-63.3E-71.3E-68.4E-121.3E-73.2E-91.0E-87.6E-97.6E-91.4E-81.0E-96.3E-82.3E«6
2E-53E-78E-61E-62E-54E-69E-66E-52E-5
2E-53E-69E-54E-51E-55E-56E-56E-5lE-4
1.5E-44.73.212.33.6E-59.4E-l
5. 7E-25.5E-36. 6E-2
6. 6E-21.0E+31. 1E-41.9E-41.9E-42.8E-41.7E-91.0E-32.3E-2
1.12E81 .01E82.63E89.67E72.32E81.17E81.97E82.89E87.32E71.45E84.99E7
1.03E7
3. 3E-11,4E+26.7E+11.2E+31.7E-14.4E+21.0E+29.4E+19. 4E-11.2E-36.6E+0
1.0E-2
2. 1E+1 2.4E+3
For the example tank, permissible discharge flow to ensure a concentrationless than MPC in the discharge canal would be'.
~s 10 ~ 200 * 1 cx 324 gpm2.1El * 1.5
Since maximum obtainable Liquid Radwaste discharge flow is 165 gpm, thisvalue would be used for the discharge, and for calculation of the alarmsetpoint .
The Liquid Radwaste Effluent Radiation Monitor Alarm Setpoint equation is:Alarm Setpoint [ 0.8«F/f* ZL( Ci*CFi))/[H.( Ci/MPci)] + Background .
Where the Alarm Setpoint is in cpm, F is 10,200 gpm, Q.(ci"CFi) is 2.4E+3cpm, f is 165 gpm and Ef,( Ci/MPci) is 2.1E+1 unitless. These values yieldan Alarm Setpoint of 5.7E+3 cpm above background, while the expecteddetector response is 2.4E+3 cpm. It should be noted that the lack ofdetector response data for many of the nuclides makes this calculationconservative. Additionally it should be noted that if grab sample analysisof the tank indicates that no activity detectable above the LLDrequirements of Table 4.11-1 then the Liquid Radwaste Effluent RadiationMonitor Alarm Setpoint will be set at 1.65*(Background)*"0.5 cpm aboveBackground, cpm.
-9" May 1986
2.1.3.2 Service Water and Cooling Tower Blowdown Effluent Monitor
Service Water A and B and the Cooling Tower Blowdown are pumped to thedischarge tunnel which in turn flows directly to Lake Ontario. Normal flowrates for each Service Water Pump is 15,000 gpm while that for the CoolingTower Blowdown is 10,200 gpm. Credit is not taken for any dilution ofthese individual effluent streams.
The radiation detector is a sodium iodide crystal. It is a scintillationdevice. The crystal is sensitive to gamma and beta radiation. However,because of the metal walls in its sample chamber and the absorptioncharacteristics of water, the monitor is not particularly sensitive to betaradiation.Detector response Zi(Ci"CFi) will initially be assumed to correspond tothat calculated by the manufacturer. However, this will be evaluated priorto Commercial Operation and during every fuel cycle by placing a dilutedsample of Reactor Coolant (after a two hour decay) in the monitor andnoting its gross count rate. Reactor Coolant is chosen becauserepresents the most likely contaminate of Station Waters.A two hour decay is chosen by judgement of the staff of Niagara MohawkPower Corporation.'Reactor Coolant with no decay contains a considerableamount of very energetic nuclides which would bias the detector responseterm high. However assuming a longer than 2 hour decay is not realistic asthe most likely release mechanism is a leak through the Residual HeatRemoval Heat Exchangers which would contain Reactor Coolant duringshutdowns.
The initial setpoint calculation is presented as both an example and forthe purposes of documenting the calculation. It will be recalculated priorto commercial operation and during every fuel cycle when a Radiochemicalanalysis of Reactor Coolant is completed for E bar determination asrequired by TS Table 4.4.5-1 or when activity is detected in the respectiveeffluent stream.
ISOTOPENAME
HF18NA24P32CR51MN54MN56FE55FE59C058C060NI63
2 HR DECAYACTIVITY
CONCENTRATIONuCi/ml
B
(Ci)1.0E-21.9E-33.7E-37.8E-52.3E-34.0E-52.9E-23.9E-48.0E-55. OE-35.0E-43.9E-7
MPC
uCi/ml
C
(MPCi)3E-35E-43E-52E-52E-3lE-41E-48E-45E-59E-53E-53E-5
FRACTIONOF MPCB/C
D
( Ci/MPCi)3.33.81.2E-23.91.24. OE-12.9E-24. 9E-11.65. 6E-11.7E-11.3E-2
DETECTORRESPONSE
cpm/UCi/ml
E(CFi)
8.42E71.2E8
8.63E71.14E81.65E8
CPM
TOTALcpm
F( CiCFi )
3.4E33.5E6
6.9E35. 7E58.3E4
-10- May 1986

ISOTOPENAME
A
NI65CU64ZN65ZN69MBR83BR84RB89SR89SR90SR91SR92Y91Y92Y93ZR95ZR97NB95M099TC99MRU103RU105RU106AG110MTE129MTE131MTE132I131I132I133I134I135CS 134CS136CS137CS138BA140LA142CE141CE143CE144PR143ND147F87NP239
TOTALS
2 HR DECAYACTIVITY
CONCENTRATION«Ci/ml
B
(Ci)
3.OE-41. 1E-27.8E-57.4E-41.3E-22. 1E-31.0E-43. IE-32.3E-46. OE-26.6E-21.1E-41.3E-21.0E-24.OE-52.9E-54. 1E-52.2E-22.2E-15.4E-54.5E-38. 4E-66.0E-51.1E-42.7E-44.8E-2lo3E-21. 2E-11.5E-18.0E-21.4E-11.6E-4l.1E-42.4E-41.4E-29.0E-37.1E-3
8. 1E-5
2.3E-l
MPC
«Ci/ml
C
(MPCi)
1E-42E-41E-46E-53E-6
3E-63E-75E-56E-53E-56E-53E-56E-52E-5aE-44E-53E-38E-51E-4lE-53E-52E-54E-52E-53E-7SE-61E-62E-54E-69E-66E-52E-5
2E-53E-69E-54E-5lE-55E-56E-56E-5lE-4
FRACTIONOF MPC
B/C
D
( Ci/MPCi)
3.05. 5E17.8E-11.2E14.3E3
1.0E37.7E21 ~ 2E31.1E33.72.2E23.3E26.7E-11 ~ 54. IE-I5. 5E-17.3E16.8E-14.5E18. 4E-12.05.56.82.4E34.3E41.5E41.5E54.0E33.5E41.8E11.81.2E1
4.5E22.4E3
3.5
2.3E3
~ E
DETECTORRESPONSE
cpm/ uci/ml
E
(CFi)
1.12E8
7.8E3
1.22E88.17E72.47ES2.05E7
8.35E7
8.5E72.32E72.32E7
1.12ES1 -01E82.63ES9.67E72.32E81.17ES1-97E82.89E87.32E71.45ES4.99E7
1.03E7
CPM
TOTALcpm
F
( CicFi )
2.4E5
2.4El
7.3E65.4E62.7E42.7E5
3.3E3
3.5E35. 1E55. 1E6
5.4E61.3E63.2E71.45E71.86E71.6E73.2E43.2E41.8E42.0E64.5E5
3.6E2
a.
May, 1986
The Service Water Effluent Radiation Monitor Alarm Setpoint equation is:Alarm Setpoint ~ [0.8*Ei(Ci*CFi)]/[Ei(Ci/MPCi)]+ Background.
Where the Alarm Setpoint is in cpm, Zi(Ci"CFi) is 1.2E8 cpm, "andEi(Ci/MPCi) is 2.7E5 unitless. These values yield an Alarm Setpoint of3.55E2 cpm above background. It should be noted that the lack of detectorresponse data for many of the nuclides makes this calculation conservative.
2.2 Liquid Effluent Concentration Calculation
This calculation documents compliance with TS Section 3.11.1.1:
The concentration of radioactive material released in liquid effluents toUNRESTRICTED AREAS (see Figure 5.1.3-,1) shall be limited to theconcentrations specified in 10 CFR 20, Appendix B, Table II, Column 2, forradionuclides other than dissolved or entrained noble gases. For dissolvedor entrained noble gases, the concentration shall be limited to 2 x 10E-4microcurie/ml total activity.The concentration of radioactivity from Liquid Radwaste, Service Water Aand B and the Cooling Tower Blowdown are included in the calculation. Thecalculation is performed for a specific period of time. No credit takenfor averaging or totaling. The limiting concentration is calculated asfollows:
MPC Fraction Ei [ zs(Cis*Fs)/(MPCi" Zs(Fs)) ]
Where.'PC Fraction ~
Ci s
Fs
MPCi ~
Es(Cis<Fs)
Xs(Fs)
The limiting concentration of 10 CFR 20,Appendix B, Table II, Column 2, forradionuclides other than dissolved orentrained noble gases. For noble gases, theconcentration shall be limited to 2 x 10E-4microcurie/ml total activity, unitlessThe concentration of nuclide i in particulareffluent stxeam s, uCi/mlThe flow rate of a particular effluentstream s, gpmThe limiting concentration of a specificnuclide i from 10CFR20, Appendix b, TableII> Column 2 (noble gas limit is 2E-4),ICi/mlThe total activity rate of nuclide i, in allthe effluent streams s, uCi/ml *gpmThe total flow rate of all effluent streamss, gpm.
A value of less than one for MPC fraction is considered acceptable forcompliance with TS Section 3.11.1.1.
-12" May 1986
2.3 Liquid Effluent Dose Calculation Methodology
This calculation documents compliance with TS Section 4.11.1.2 and4.11.1.3.1 for doses due to liquid releases't is completed once permonth to assure that TS Section 3.11.1.2 and 3.11.1.3 are not exceeded:
The dos'e or dose commitment to a MEMBER OF THE PUBLIC from radioactivematerials in liquid effluents released, from each unit, to UNRESTRICTEDAREAS (see Figure 5.1.3-1) shall be limited:
a. During any calendar quarter to less than or equal to 1.5 mrem to thewhole body and to less than or equal to 5 mrem to any organ, and
b. During any calendar year to less than or equal to 3 mrem to the wholebody and to less than or equal to 10 mrem to any organ.
The liquid radwaste treatment system shall be OPERABLE, and appropriateportions of the system shall be used to reduce releases of radioac'tivitywhen the projected doses due to the liquid effluent, from the unit, toUNRESTRICTED AREAS (see figure 5.1.3-1) would exceed 0.06 mrem to the wholebody or 0.2 mrem to any organ in a 31-day period.
Doses due to Liquid Effluents are calculated monthly for the fish ingestionand drinking water pathways from all detected nuclides in liquid effluentsreleased to the unrestricted areas using the following expression fromNUREG 0133, Section 4.3.
Dt EL [Ait*ZL"(dTl*Cil<Fl)]
Where:
Dt
dT1
Ci1
Ait
The cumulative dose commitment to the total body or any organ, tfrom the liquid effluents for the total time period E1(dT1),mremThe length of the 1 th time period over which Cil and Fl areaveraged for all liquid releases, hoursThe average concentration of radionuclide, i, in undilutedliquid effluents during time period dT1 from any liquid release,pci/mlThe site related ingestion dose commitment factor to the totalbody or any organ t for each identified principal gamma or betaemitter, mrem/hr per uCi/ml. Table 2-2.The near field average dilution factor for Cil during any liquideffluent release Defined as the ratio of the maximum undilutedliquid waste flow during release to the product of the averageflow from the site discharge structure to unrestricted receivingwaters times 5.9. (5.9 is the site specifice applicable factorfor the mixing effect of the discharge structure.) See the NineMile Point Unit 2 Environmental Report — Operating LicenseStage, Table 5.4-2 footnote 1.
<3- May 1986
Example Calculation —Thyroid
A sample of a radwaste tank indicates I-131 and H"3 concentrations of1.5E-6 and 8.9E-3 uCi/cc respectively. The tank contains 20,000 gallonsof waste to be discharged. The tank is discharged at 165 gpm and there is30,000 gpm of available dilution water:
Dt zi[Ait*E1(dT1*Cil*F1)]~
Where Dt mrem is the dose to organ t, Ait mrem/hr per gi/ml is theingestion dose commitment factor, dT hours is the time interval over whichthe release occurs, Ci uCi/ml is the undiluted concentration of nuclide iin the release and Fl unitless is the dilution factor for the release.From Table 2-2 Ait is 7.21E4 and 3.37E-1 mrem/hr per pCi/ml respectivelyfor I-131 and H-3 dose to the thyroid. Prom the discharge and dilutionflow rate, Pl unitless can be
calculated-'l
~ 165gpm/(30,000gpm «5.9) ~ 9.32E-04.
From the tank volume and discharge rate the length of time required for thedischarge is:
dT 20,000 gal/165 gpm ~ 121.2 min ~ 2.02 hr
These values will yield 2.04E-4 and 5,65E-6 mrem for I-131 and H-3respectively for the thyroid when inserted into the equation for Dt. Thusthe total dose from the tank is 2.06E-4 mrem to the thyroid. The doselimit to the maximum exposed organ is specified by TS Section 3.11.1.2 and3.11.1.3.
2.4 Liquid Effluent Dose Factor Derivation AitAit mrem/hr per pCi/ml takes into account the dose from ingestion of fishand drinking water. It should be noted that the fish ingestion pathway isthe most significant pathway for dose from liquid effluents ~ The waterconsumption pathway is included for consistancy with NUREG 0133. Drinkingwater is not routinely sampled as part of the Environmental MonitoringProgram because of its insignificance.
The above equation for calculating dose contributions requires the use ofdose factor Ait for each nuclide, i, which embodies the dose factors,pathway transfer factors (e.g., bioaccumulation factors), pathway usagefactors, and dilution factors for the points of pathway origin. The adulttotal body and organ dose factor for each radionuclide will be used fromTable E-11 of Regulatory Guide 1.109. The dose factor equation for a freshwater site is:
Ait ~ Ko"(Uw/Dw + Uf*BFi)*DFi
->4- May 1986
E' ~ ~/
h I

Where.Ait
Ko
Uw
UfBFi
DFi
Dw
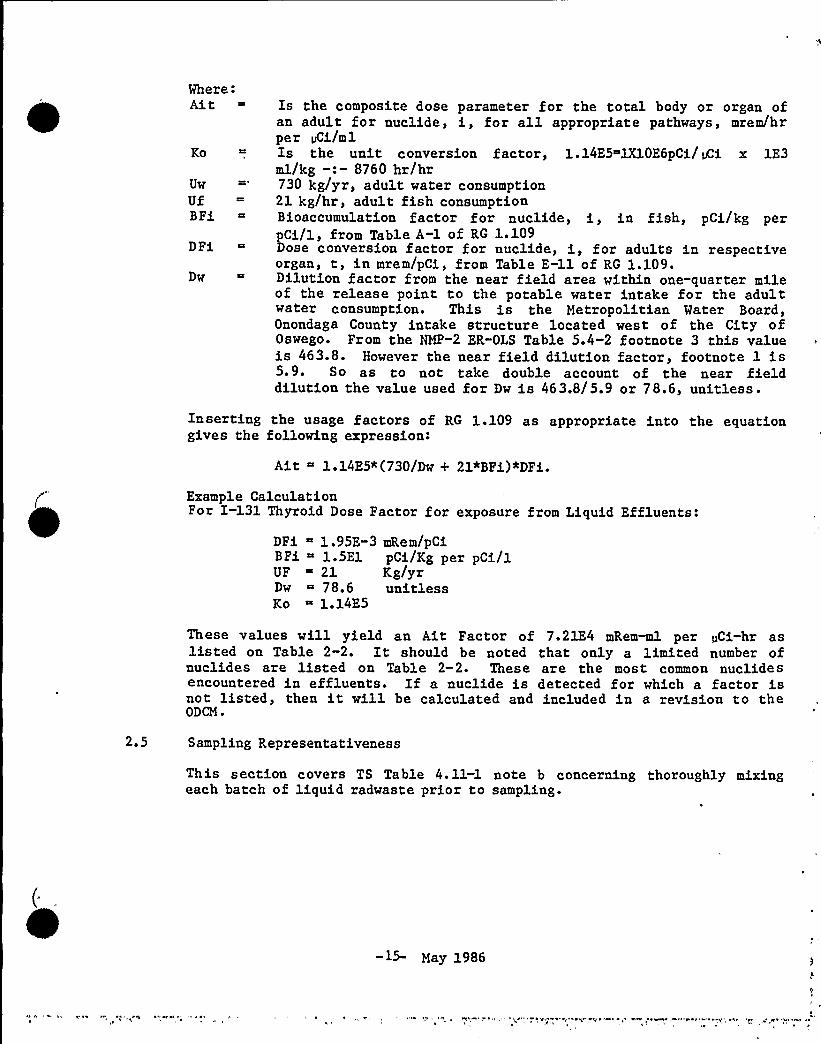
Is the composite dose parameter for the total body or organ ofan adult for nuclide, i, for all appropriate pathways, mrem/hrper pai/mlIs the unit conversion factor, 1.14E5~1X10E6pCi/ 4i x 1E3ml/kg -: —8760 hr/hr730 kg/yr, adult water consumption21 kg/hr, adult fish consumptionBioaccumulation factor for nuclide, i, in fish, pCi/kg perpCi/1, from Table A-1 of RG 1.109Dose conversion factor for nuclide, i, for adults in respectiveorgan, t, in mrem/pCi, from Table E-11 of RG 1.109.Dilution factor from the near field area within one-quarter mileof the release point to the potable water intake for the adultwater consumption. This is the Metropolitian Water Board,Onondaga County intake structure located west of the City ofOswego. From the NMP-2 ER-OLS Table 5.4-2 footnote 3 this valueis 463.8. However the near field dilution factor, footnote 1 is5.9. So as to not take double account of the near fielddilution the value used for Dw is 463.8/5.9 or 78.6, unitless.
Inserting the usage factors of RG 1.109 as appropriate into the equationgives the following expression:
Ait ~ 1.14E5*(730/Dw + 21*BFi)+DFi.
Example CalculationFor I-131 Thyroid Dose Factor for exposure from Liquid Effluents:
DFi ~ 1.95E-3 mRem/pCiBFi ~ 1.5E1 pCi/Kg per pCi/1UF 21 Kg/yrDw ~ 78.6 unitlessKo 1.14E5
These values will yield an Ait Factor of 7.21E4 mRem~ per pCi-hr aslisted on Table 2-2. It should be noted that only a limited number ofnuclides are listed on Table 2 2. These are the most common nuclidesencountered in effluents. If a nuclide is detected for which a factor isnot listed, then it will be calculated and included in a revision to theODCM ~
2.5 Sampling Representativeness
This section covers TS Table 4. 11-1 note b concerning thoroughly mixingeach batch of liquid radwaste prior to sampling.
May 1986
Liquid Radwaste Tanks at Nine Mile Point Unit 2 contain a sparger sprayring which assist the mixing o f the tank contents while it is beingrecirculated prior to sampling. This sparger effectively mixes the tankfaster than simple recirculation. Normal recirculation flow is 165 gpm andthe tank contains up to 25,000 gallons although the entire contents are notdischarged; To assure that the tanks are adequately mixed prior tosampling, it is a plant requirement that the tank be recirculated for thetime required to pass 2.5 times the volume of the tank:
Recirculation Time 2.5*T/R
Where:
Recirculation Time Is the minimum time to recirculate the Tank, min
2.5 Is the plant requirement, unitless
Is the tank volume, gal
Is the recirculation flow rate, gpm .
Additionally the Alert Alarm setpoint of the Liquid Radwaste EffluentRadiation Monitor is set at a value corresponding to not more than twiceits calculated response to the grab sample. Thus this radiation monitorwill alarm if the grab sample is significantly lower in activity than anypart of the tank contents being discharged.
Service Water A and B and the Cooling Tower Blowdown are sampled from theradiation monitor on each respective stream. These monitors continuouslywithdraw a sample and pump it back to the effluent stream. The length oftubing between the continuously flowing sample and the sample spigotcontains less than 200ml which is adequately purged by requiring a purge ofat least 1 liter when grabbing a sample.
2.6 Li uid Radwaste S stem 0 eration
Technical Specification 3.11.1.3 requires the Liquid Radwaste TreatmentSystem to be OPERABLE and used when projected doses due to liquid radwastewould exceed 0.06 mrem to the whole body or 0.2 mrem to any organ in a31&ay period. Cumulative doses will be determined at least once per 31days (as indicated in Section 2.3) and doses will also be projected if theradwaste treatment systems are not being fully utilized.Full utilization will be determined on the basis of utilization of theindicated components of each process stream to process contents of therespective system collection tanks:
1) Low Conductivity (Waste Collector): Radwaste Filter (see Fig. 2-2)and Radwaste Demin. (see Fig. 2-3)
2) High Conductivity (Floor Drains): Floor Drain Filter (see Fig. 2-5)or Waste Evaporator (see"Fig. 2-6)
-16- May 1986

3) Regenerant Waste: Regenerant Evaporator (see Pig. 2-8)
NOTE: Regenerant Evaporator and Was te Evaporator may be use dinterchangeably.
The dose projection indicated above will be performed in accordance withthe methodology of Section 2.3 when ever Liquid Waste is being dischargedwithout treatment in order to determine that the above dose limits are notexceeded.
-17- May 1986
t e ~ or
TABLE 2-1
LIQUID EFFLUENT DETECTORS RESPONSES *
NUCLIDE
Sr 89Sr 91Sr 92Y 91Y 92Zr 95Nb 95Mo 99Tc 99mTe 132Ba 140Ce 144Br 84I 131I 132I 133I 134I 135Cs 134Cs 136Cs 137Cs 138Mn 54Mn 56Fe 59Co 58Co 60
(CPM/ pCi/ml) x 10
0.78E»041.220. 8172.470. 2050.835'.
850.2320. 2321.120.4990.103l.121.012. 630.9672. 321.17 .
1. 972.890. 7321.450. 8421.20. 863l.141. 65
* Values from SWEC purchase specification NMP2-P281F .
-18- May 1986

TABLE 2-2
Ai q VALUES - LIQUID+
mrem - mlhr — uCi
H 3 3.37E-1 3.37E-1
NU GLIDE T BODY GI-TRACT BONE LIVER KIDNEY THYROID LUNG
3.37E-1 3.37E-1 3.37E-1 3.37E-1
Cr 51 1.28 3.21E2 2. 81E-1 7. 63E-1 1. 69
Mn 54 8.36E2 1.34E4
Fe 59 9.40E2 8. 18E3
Co 58 2.01E2 1.82E3
Co 60 5.70E2 4.85E3
Zn 65 3.33E4 4.65E4
Sr 89 6.44E2 3.60E3
Sr 90 1.36E5 1.60E4
Zr 95 5.91E-2 2.77E2
Mo 99 2.05El 2.50E2
I 131 1.26E2 5.80E1
I 133 2.78E1 8.21E1
Cs 134 5.79E5 1.24E4
Cs 136 8.86E4 1.40E4
Cs 137 3.42E5 1.01E4
Ba 140 1.41El 4.45E2
Ce 141 2.48E-3 8.36El
Nb 95 1.34E2 1.51E6
La 140 2.03E-2 5.63E3
Ce 144 9.05E-2 5.70E2 1.69 7.04E-1 4. 18E-1
4.38E3 1.30E3
1.04E3 2.45E3
9.00E1
2.58E2
2'.32E4 7.38E4 4.93E4
2.24E4
5.52E5
2.72E-1 8.74E-2 1.37E-1
1.08E2 2.44E2
1. 54E2 2. 20E2 3. 7 7E2 7. 21E4
5.25E1 9. 13E1 1.59E2 1.34E4
2. 98E5 7. 09E5 2. 29E5
3. 12E4 1.23E5 6.85E4
3.82E5 5.22E5 1-77E5
2.16E2 2.71E-l 9.22E-2
3.23E-2 2.19E-2 1.02E-2
4.47E2 2.49E2 2.46E2
1.52E-1 7.67E-2
6.85E2
7. 61E4
9.39E3
5.89E4
1.57E-1
* Calculated in accordance with NUREG 0133, Section 4.3.1
C9- May 1986

~ I,I ~
'k~ I
1 ~
'llrj
I=I .=-
TSS"3
(~r:~. IP 14
l
I--I:~ litI
II A~' ~
I
,I.~IIVI~W
T,';1-..1 GIIII
', ~' l pl'.
'T
II
IF~ "~ ~
I-—':.I';I
~:-"-I,
~I'iS"-.> <"):.
I ~
II II-(;-i~:=-.I,
~I>lM~41
~HI
@)
(.=)111'
)
("-) I=-'I
I=—.I{l )SI
I I{ )(1
(- R
Ill 0
I ~ 0 I
II ~ I
~ .I I>l.A";I. - I I -1I—..:.I
~
I I I{N)
{~J. '4
Il '(- I~ ~
I I"-I I=-II
0 vr ~ I V 0 ~
(=s —,.:
'I
,~>( I (~):->1{ - - -'Ill
I ~I ~I ~
~ I ~
{ IS(=I" "
R
5 S.
I )/I II I
0 «N
ODCH PiI',. 2-1
Low ConductivityLiquid Waste
0 II'
I I I I
v. I 0 ~
I ~ ~
V ~IN
I=-SI'{"'I
W I.I
ll~ ~ ~ ~ 0
, ~ .0
0
{m>00 ~
IN >Nv> ~{1 8
/( ) A,
IIAIv~>II
0
S
l I,j ~ r ~ 0 ~ III
I.==I (" I I-" I.VI~ \ I
:{0 I'I i-) „.. l {„".)I „,,'I''.'
I~ v
~....,t,
k.I(v >{ )
~ II—"I ~
I,{v 11 )
~ I ~
FIGURE II/ 11
NAI4>AI IIvl {>AN~ NA'l O'l ll
NINE MILE POINTNUCLEAR STATION UNIT-2
fklAI. SASKIY ANALYSIS RI{IORI
I>fCfI>Of4 l>0>All{NO>lfNI 11
: -~ I >-iI"-f«-(=)II( )I I
(:LI.„
)I- I-e )-
: E)I> ~ « I ) —I(-)
~ e ee
ODCH Pig. 2-2
Low Conductivity
Liquid Waste
'1.>e"e> e ~
1
::". )I(=)
1 ~ I I
( I A<A
> ~ V «
eRI I ~
II
>)IIm I=."'I
> j~ ~ L
FIGUBL 111 te
RAOKIAI.IMI~) IIASI( SIS)l I)
«e
NINE MILE POINTNUCLEAR STATION UNIT-2
fRIAL SAfCf2 ANALYSIS RKPOR)
AI)2)R)I)fIII22 IXCfM82II IIA)
(le ~
Ilie
tee ~) \
I e ~
~ ~ e
re»
»ft ftIII~
(») 'I
I ~ ~
e 0»e
1~)e I e I
(=) III I'I".f,',
I- ."L-') I
III ~
~ III»"'„I"-.I"I
l)'I
~ '
~
t
I
~ ~ e ~ \ ~ J
~e0 ~
()(-")
~I;t)IL
ltt,j,Iel
I'.I-g- (= .
( ) Ill
I» )la
() II
III (~~) ee te ) I ( )
tf Q«t
(X ()«II'"-
J ( I——,'I
e ~ A ~ k )
:.:p)+
(II „"Jj(ef}
()'I'-")
'I
~ Il If~I~ ~
~ wl
Ie ~
'4
~an't
'I
I
~ I
S
I;. IrI
wI» e
»»I;el ~ 4 I II
(=)f ~
I
;,'.. I=. ~I
III »jl ~~- ():)
::(-;) (=)
«Lt I
I~ 'I ~
~ \ e~t~ (),1.==1)I"')'Q
I=-.~l -.'=
~ tg»Itl')i3
-')
C ~ 4 ~7ew e
.I((:.'}I
g=). f llm
I~lr I,I ee~ e
tW
(-".)Qe ~ hl ~
Cy- (-q
r»ew
~ rr
ODCH Fig. 2-3
Low ConductivityItl
~ I iquid Waste
e et e
I~ e» II
HA ~ .I —(")
FIQUIIQ )l) k,
kAIII)AI'IAIIIAJIAI IIA'ett Rf'»IIII
e»ee»ee
NINE MILE POINTNUCLEAR STATION ()NIT-2
fRIAL SAfC1'I AIIALYQSRft»ORI
AAetNDkttltf3 OECtl4%II IM
~ ~~ MM
I ~ 1 ~ '
~ I~ I I ''
so I Iv w~ R I s - ~
I~ s
ev v~s>
~ ve ~
s ~ ~ Is
4~ I
I e g )
I1 I
~ ~
w ~I ~ M ~ ~
i~I——:(ll(MP Q
gesvve'. g)
IL1
I=:I ( )p
(-")'I,
~) IW MIlI
e
~ ~ 'C' ~ o I
Il'
I=,!I (.")~ iA.„('-')'
I
L~ ev
I~I w vo
(..I. !=III=.I()I~f"-)(M)
II M'e)
(=K(=,)'I ...g -,=-
~ vso
Q. I=,J
(=) -'.';:. I=.„.l<HA-
»v
1 „I
I='I ("-,I~ ~ evM
I- llllvV )I I
4t
ODCH n.I;. 2-4
girth Conductivity
l,iquid Waste
~ ov ~
~ ~ A
:S=I'==~::-. f~b' ~
'01 s
~ s ~ ~
I
~ ~ ~
~ e
I'I I
... C's I=,:II—:I(.) '.(' ~ g ("g () I. ij
-) ':.::. I'- I:="'I—"'I s
~114M'.ee I ~
I
(A.I='(™I1 ss ~ ~l
I.IAW> I I IIII
I ~ ~
M ~ M o v~ M QMoM
(M).I(=)j 0'- '""
I
I .... e ~
(-I,I——.I I=.'I
I~I '=) (=>(=) .:ve
Iv e
IM ~
(MI - I. I
MvMeI~ ev o
(M).I-I.—I("I5'" '""
~ )FIGURE II7 llkAINtIAClhl IAJIkl ISAoll 5'Ihllk
NINE MILE POINTNUCLEAR STATION UNIT-2
fNIAL 'esAf CIY AHAB''Ieslov kflsoklAlltNDMtklfl MCIMAI4IIA5
I I ' Ii ts(
l~l
}} }.}: (-„'I .
I--I( I ('}}
I lilI'I
(SS)
! L<I»I
~I
lixhs)
~ ~ I
~, I )
I I
l',, llI()
I (? ~ }N
'Y II~ I
»I
!
III rlh
~}r ~
s lS~
~ ) I I
~~
~I
h
~
~
~~~
IIII~
~~~I~~
~~
~I1
~
III~~
~
~
~~
~
C
I:I'A
() (") ()'+" "lS
~:. I=.I
( )II~w
I Ili ~
~r
l
~ ~ w ~ (Sy I (~Ms(* mill
- Pr)
(e)f I'~As(~ ~ S )
-(")) I
(fi) (~) I"4Qsl(:Sf'( ~ („).:i ](+I I ~I.I I(
w'}ll / I I »IS3)"'S
~
SI I'
'(
!:SYRSI
l
P l
~ W }W
» (I(is) „(m S(
( ) I/I
(Y)(~)(A) (r) ("»)
()ip
A
I."=-sl ~ I (}:LIL'fS(
~ ~ ~ )
-. PY)I,'I w}~ r ~
(SS)
(A,I g,}S}.
(',"-) I((
(ass(
:„ I (q~r
» I(S
4M) C}
III Il}~ ~
I 'l
iRI IR( Il~s( (
~P("4"„„(=!:(I )('
('i (-') I.:"(':'')
(I) I ~: I 1('")I II
« ~r' ((R)I I
I II I I
(„T ls»llli ~ )
-g)~ ~ }
(R),(, I~s(
'
~ rrw ww r r wL
Cww\ ~
»A(-.):
(~),i,~ r g}
(RIP
ODCH Fig. 2-5
High ConductivityLiquid Waste
~ ~l}}rr )
. (MA»I-""'Q}t('AT}'-I
'.I—S I(~ ~l r ~
I ~ll-AgJ-~kL-
C ~ ~ ~
(((A)I((»)I((>)
I'IGUAt IS 2 SI
NAIW}AIMIS
IMPAR}
WA'>ll ''IM
AMfNOMLNIYj
NINE MILE POINTNUCLEAR STATION UNIT-2
YINAL SAFCSY ANALYStS Rfi}ORS
:
>4f f ~
llfji~
'>~lI
I\
I
I o
I )oo
(»I( )II
V () p ~
(a> ~ o «
ooo oa(oa ~
II <=j I ->I
1- -)I ~
Ii~ 7 ~
~J-< aoa ~
„I.=i)'(=)
j) I>=YI~lp7
i~1'"(»")'-
I
ago~ I
o ~ II, >I r',. (:,)
~ a ~ r
I, I
I II V»
I ~''I
I
ol»() ('->-qi (=>I o \a »~ ~ ~ oI~
o ~
I»oftfl>I~~I ( ) I, >)
'I'-) i=I).='-) {-')I I II~>:I«f
I
I,I -, II
?I P )~l)
~ ~ ~
~ 4~I a
~ ao ~ 7
I
I >i
I
II
o a» ~
(.=:) (=) = .
o
I, I
II
II -"
I I
I„.II"——>»
>7 ~WIII~'(;) Nf
aYI I
I (
l=>l'C)"I 'I ~
~ I
"-»M II~
(
fr"'oa ~ o I laoa )
w a"o< o ~ Itl»II) I )
I »a o
(-) 0fI ill>
Jaa»»oI—I
~a «»o~ Ioa 7
~ S 7~ l ~ ~ aa ~ A j I
I—:) <){)(P» I ~
I A I ~ ~ I l
aITI Ill,'IIII
I—,:I „i
'I=:I
'(y
l=>i
("-). I'H'.gi-urC). (=
-'- 4l.orl»o I. I
)=—.I~ I
"~nI I> I I( a
I
II
I
I~ ~ ~
I~)83
):.=.-.) {)
ODCM Fig. 2-6
High ConductivityI.iquid Maste
\ »w» a»
»» ~~ » a \
4»goo a,a
Q RI 'll—I
~ o~i )- I I~ I(
. <.~: =,){=')l=l: I=:I
of
I
(-.y „,--,IR l)1
~or ~
Iii" ?""
~I () ~
I M 'a»o(IIa ~, 1I
~ a»l ~ I ~ I ~" PI
FIIIURE I>7 II
IIA>AI>AIIIVI II>>I%I WAOal> SIS>IM
NINE MILE POINTNUCLEAR STATION UNIT-2
CR>A>. SAfE >Y ANALYSIS RCPORT
AMKMD'�>2> DECKMSEII
ISSUE
0, ~
s
~ wlj~l) ( w ls),-'k
) *)s I
wwsI "s ~ 's ~
i~ sf
)III)IIJ ~ ~ s I(e,l, 5.'
I II I
-w)I» 1 )~I'
IM~ &4I ~ 1 ~ I
is~
els 1 ~ ~
)II@>t( I
0(li)
~ \ ~s4 i
Ij»I~»I'(,(ii,
Al)
I-I~ )~I
II
J(s-(".> „(:.)I".w~f,„.„: ~
ss
(~
) I WI) (WI
"( ) )~I)(-) (;.I
(Il)
~ 1 ~ $s ~ k)ws«
W WSI~ si
si ~ ~
s' I
ASis ~ Wisv
,X)~$)
'"„') '.P(:I
glJ~>)f. Ill „
~)
r1)
): nl':
(~i -h3 C-S" (4
I) )II I
('=!-()'is
s I(
( I'.".ll
IIMI)II
(.'-')I
( lP) )(,( ZWI~ ).JAI)
I Q)r),I m ):1$1$ )
I s
Iv ~~ ~ 's
I) ') (= "C-
1) yiw's)~ ~s" -~'()I(l
sHs
s)Jse s p)si)IHI LIIT g j~ll
W H W
I's
C) )'III)(W() II I ~ ~
)A
IMs -»
(>
sir(I
WA W ~ iS
s ~
<")-
~ gs ~
(Ie) l)l ~ w,s's ~
'(ie) i»i ')~I)(~)1( k
g ~ ~
j~'s t)IPI)
(Ie) ~ tie)
<ssii I ll
I r".+Y~ 1 ~
sA i 1 (ie)
)~i] I „,
(3
ill'.~(-)q)~~I) q(-".:I
)~)I('»'I (~'i IX—": I
(s v ~
~ ii )
(ag. »IPSA
ODCH Fig. 2-7
Regenerant Waste
FIGURE II/ LI
IIAlsilhS Il'll Ikliel WIV,II;SCIIM
NINE MILE POINTNUCLEAR STATION UNITw2
FWIAI. 5A)f)Y AMAL15I5 II(PORI
DKEXMeellleelAMIMtSIIIII11
W
~ e A ~ IN A
~ to
) '"p ( ~(
,~ ~ e eh
I-—.-I'I:.I: I )I
(-).,„I, .I (-„I
e ~
) '-It ~ I
~ ~
eI~I"-
~~Sf) I~e.I
( t)
~ ,I,~I Hf (,lhasa l
;I ~ ~ ~
~ e '
e
w)eI A feet>
I~ >'
~ ne oI
I( ~ ~ ~ 4 I
I "I'
~ 1)e II'(-1
«o e
~ t A
-I'(')oe I=I'"
(-) —I—
I '(-)'=:IA ~ > ~ ~
( (e)'Wt
WIIII ~ > o' I
~%o ~~ ~
te H t~e wwI"~+I' >
0( )
~ g~)
e ~ t ~ ~ ~
..( ),".IT>.Re
I'I~e
I''I''
Hl(
t
I'., II ~ t )
I.=:I-(.-),I ~ )II—I;=:I—II I
':„~Hi I I~>I>~
II
( )
I=.:Ie )(9 +~~II
w1
e ee
~ ~ 'e~ oe ~ '
oee ~O'ee oe ~
re eo%
I~
I
w e ~ 'M
-I„-),„.~;--.I ODCM I'ig. 2-8() (e)~~
Regenerant Waste
I,I-=.'"' —,. I!
=) .-- .iQ)(-) 4
I Il) ~
'
I>I ~
FIGURE II.P II>
I>AIA>>ACII>I I IOIHI WA'I >W'l I>
NINE MILE POINTNUCLEAR STATION UNIT-2
fHAL SAIKIY ANAIY>>I>e RIPORI
AMf»OMl»I tA DfCt l>WAR I0$$

g
00
RHR Sf RV I cf RlIER IA )
RHR SERVICE NAIER 18)
fROII RHR HEAIKI, EIA
FROII CCP Hflff1. EIA.IB.ICQl Clf 0
COOl FH6 101 fR
IRON RHR HKAIKA. EIB
IRON CCS HEAIEI. KIA.IB.IC
IRON SflE PRECOOLERS ETA.28
al Clr u
LAKE
Ol CAI I
OA CAI I
SAP I'LINP
Ql Cli I
SAP PUNP
IRON NVS 5151EN
IRON NVS SISTER
'Rf146A
SERVICE WATER
~RE~II68
Ql CAI I
RHR HEAl ElcHAHGER E1A
Ol CAI I
RHR Hflf ffcHAHCLR E11I
023B
I
Ol CAT III
I'0iFRONRBCtCR $ 15'ItN
I
I
10 CRS STSIE'NI
10 CRS 5'ISIEN
I
I
I
COOL IH6 101ER
BlQVOQVH
BLOVOOVH
al CAI ffRE
101
OISCHARC'E BAI
I
ALL l10010 RAOTASTE EfflUKHT OISCHARCES
5FC PUNPS
CIRCULAIIHC RAIfR PURPS
SFC I ILIER/DENIHS
RE ACF LOI SCHlRCE SHUIOOVH)
206 OA Clf ff
SFC HEAT EICHAHCKRS ODCH Fig. 2-9
SFC STSILN
I
I
cSPENT FUElPOOL
Ol CAI I~ Ol Clf EI
Ol CAI I
FIGURE 11.5-8
LIQUIDRADIATIONMONITORINGSHEET 2 OF 2
NIAGARA MOHAWK POWER CORPORATI(NINE MILE POINT-UNIT 2FINAL SAFETY ANALYSIS REPORT
INTERCHANGEABLEPURGE OR
TEST CONNECTION GRABSAMPLER
S
I
(2) ITI I
I
TS
I(2) I
S
CS
LIDUID
SAMPI.ER
DETECTORL
DATAACQUISITION
UNIT(DAU)
I
(8)
FI FS
I
Pl
PUMP
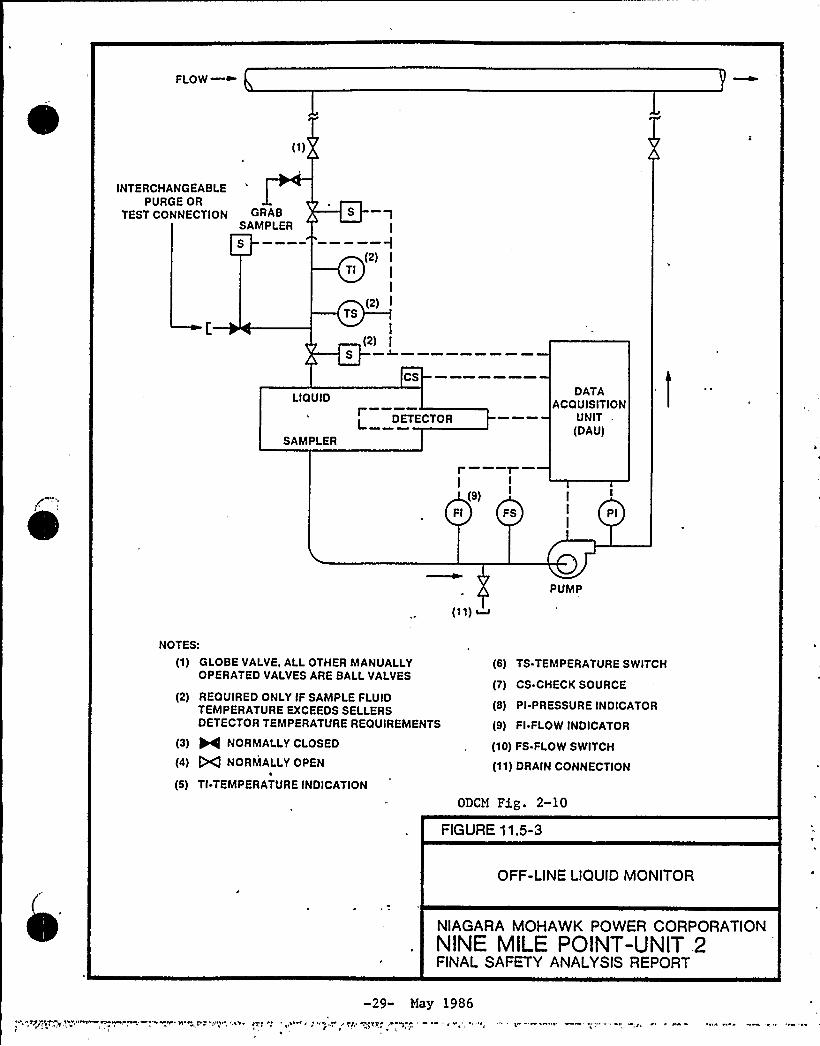
NOTES:
(1) GLOBE VALVE,ALLOTHER MANUALLYOPERATED VALVES ARE BALLVALVES
(2) REOUIRED ONLY IF SAMPLE FLUIDTEMPERATURE EXCEEDS SELLERSDETECTOR TEMPERATURE REOUIREMENTS
(3) ~ NORMALLYCLOSED
(4) fOCg NORMALLYOPEN
(5) TI-TEMPERATURE INDICATION
(6) TS-TEMPERATURE SWITCH
(7) CS-CHECK SOURCE
(8) PI-PRESSURE INDICATOR
(9) FI-FLOW INDICATOR
(10) FS-FLOW SWITCH
(11) DRAIN CONNECTION
ODCM Fig. 2-10
FIGURE 11.5-3
OFF-LINE LIQUID MONITOR
NIAGARA MOHAWK POWER CORPORATIONNINE MILE POINT-UNIT 2FINAL SAFETY ANALYSIS REPORT
-29- May 1986

3.0 GASEOUS EFFLUENTS
The gaseous effluent release points are the stack and the combinedRadwaste/Reactor Building vent. (See Figure 3.5) The stack effluentpoint includes Turbine Building ventilation, main condenser offgas(after charcoal bed holdup), and Standby Gas Treatment Systemexhaust. NUREG 0133 and Regulatory Guide 1.109, Rev. 1 were followedin the development of this section.
3. 1 Gaseous Effluents Monitor Alarm Setpoints
3.1.1 Basis
Technical ,Specification Section 3.11.2. 1 and 3.11.2.7 provide thebasis for the gaseous effluent monitor alarm setpoints.
TS Section 3.11.2.1:The dose rate from radioactive materials released in gaseouseffluents from the site to areas at or beyond the SITE BOUNDRY (seeFigure 5. 1.3-1) shall be limited to the following:
a. For noble gases: Less than or equal to 500 mrem/yr to'he wholebody and less than or equal to 3000 mrem/yr to the skin, and
b. For iodine-131, for iodine-133, for tritium, and for allradionuclides with half-lives greater than 8 days: Less than orequal to 1500 mrem/yr to any organ.
TS Section 3.11.2.7:The radioactivity rate of noble gases measured downstream of therecombiner shall be limited to less than or equal '350,000microcurie.es/second during offgas system operation.
3.1.2 Setpoint Determination Methodology
The alarm setpoint for Gaseous Effluent Noble Gas Monitors are basedon a dose rate limit of 500 mrem/yr to the Whole Body. Thesemonitors are sensitive to only noble gases. Because of this it isconsidered impractical to base their alarm setpoints on organ doserates due to iodines or particulates. Additionally skin dose rate isnever significantly greater than the whole body dose rate. The alarmsetpoint for the Offgas Noble Gas monitor is based on a limit of350 000 uCi/sec. This is the release rate for which a FSARaccident analysis was completed. At this rate the Offgas Systemcharcoal beds will not contain enough activity so that their failureand subsequent release of activity will present a significant offsitedose assuming accident meterology.
3. 1.2. 1 Stack Noble Gas Detector Alarm Setpoint Equation:
0.&R*ZL(Ci)Alarm Setpelat < ~EE Ci~epl
Alarm Setpoint Is the alarm setpoint of the Stack Effluent Monitor,uCi/se c
-30" May 1986
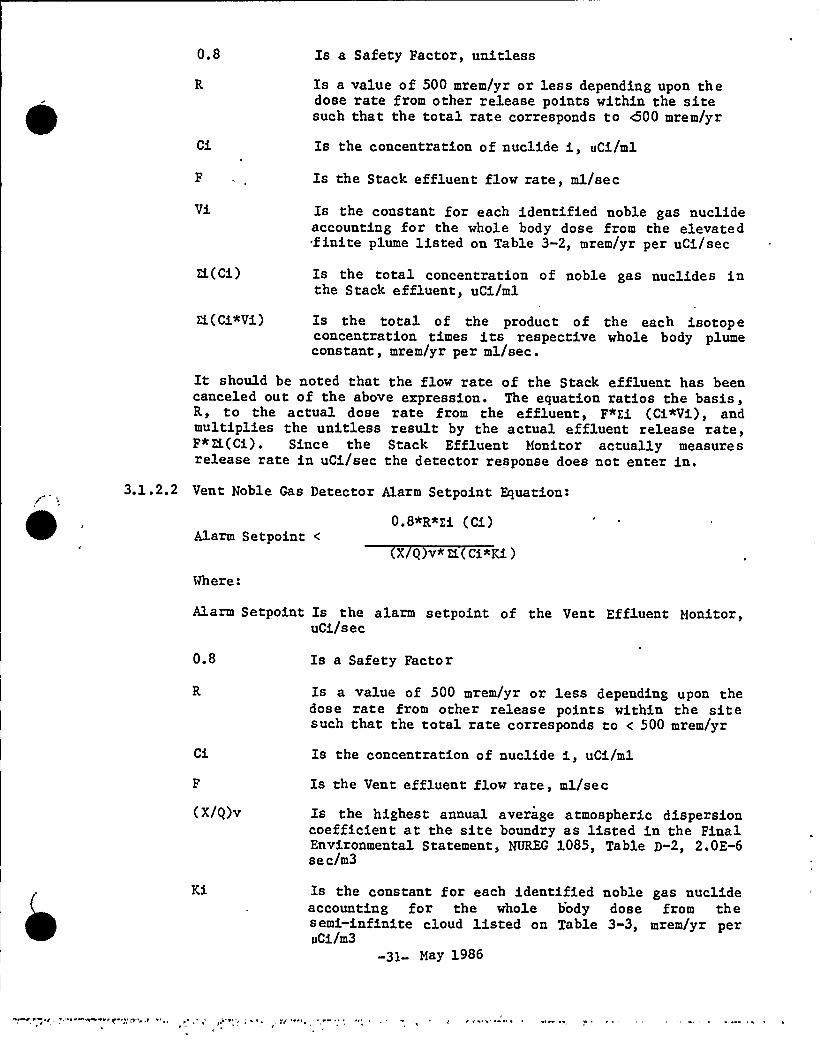
0.8 Is a Safety Factor, uni ties s
Is a value of 500 mrem/yr or less depending upon thedose rate from other release points within the sitesuch that the total rate corresponds to <500 mrem/yr
Is the concentration of nuclide i, uCi/ml
Is the Stack effluent flow rate, ml/sec
Is the constant for each identified noble gas nuclideaccounting for the whole body dose from the elevatedfinite plume listed on Table 3-2, mrem/yr per uCi/sec
Is the total concentration of noble gas nuclides inthe Stack effluent, uCi/ml
a.(ci*Vi) Is the total of the product of the each isotopeconcentration times its respective whole body plumeconstant, mrem/yr per ml/sec.
It should be noted that the flow rate of the Stack effluent has beencanceled out of the above expression. The equation ratios the basis,R, to the actual dose rate from the effluent, F*Ei (Ci<Vi), andmultiplies the unitless result by the actual effluent release rate,F*EL(Ci). Since the Stack Effluent Monitor actually measuresrelease rate in uCi/sec the detector response does not enter in.
3.1 .2.2 Vent Noble Gas Detector Alarm Setpoint Equation:
Alarm Setpoint <0.8*R*Ei (Ci)
Where:
Alarm Setpoint Is the alarm setpoint of the Vent Effluent Monitor,uCi/sec
0.8 Is a Safety Factor
Is a value of 500 mrem/yr or less depending upon thedose rate from other release points within the sitesuch that the total rate corresponds to < 500 mrem/yr
Ci Is the concentration of nuclide i, uCi/ml
Is the Vent effluent flow rate, ml/sec
(X/Q)v Is the highest annual average atmospheric dispersioncoefficient at the site boundry as listed in the FinalEnvironmental Statement, NUREG 1085, Table D-2, 2.0E-6se c/m3
Is the constant for each identified noble gas nuclideaccounting for the whole body dose from thesemi-infinite cloud listed on Table 3-3, mrem/yr peruCi/m3
May 1986
zL(ci) Is the total concentration of noble gas nuclides inthe Vent effluent, uci/ml
Zi(ci«Ki) Is the total of the product of the each isotopeconcentration times its respective whole bodyimmersion constant, mrem/yr per ml/m3
It should be noted that the flow rate of the Vent effluent has beencanceled out of the above expression. The equation ratios the basis,R, to the actual dose rate from the effluent, F*(X/Q)v*Ei(ci*Ki)and multiplies the unitless result by the actual effluent releaserate, F* Zi.(ci). Since the Vent Effluent Monitor actually measuresrelease rate in uci/sec the detector response does not enter in.
3.1 .2.3 Offgas Pretreatment Noble Gas Detector Alarm Setpoint Equation:
Alarm Setpoint <
Where.'larm
Setpoint
0.8*350,000*2.1E-3*Zi(ci*CFi)f Ei Ci + Background
Is the alarm setpoint for the offgas pretreatmentNoble Gas Detector, cpm
0.8 Is a Safety Factor, unitless
350,000 Is the Technical Specification Limit for OffgasPretreatment, uci/sec
2. 1E-3 Is a unit conversion, 60 sec/min / 28317 ml/CF
Ci Is the concentration o f nuclide, i, in theOffgas, uci/ml
CFi Is the Detector response to nuclide i, netcpm/uci/ml See Table 3-1 for a list of nominalvalues. See section 3.1.3.3 for discussion
Background
Zi(cicFi)
Is the Offgas System Flow rate, CFM
Is the detector response when its chamber isfilled with nonradioactive air, cpm
Is the summation of the product of the nuclideconcentration and corresponding detectorresponse, net cpm
Zi(Ci) Is the summation of the concentration of nuclidesin offgas, uci/ml
-32- May 1986
Discussion
The Stack at Nine Mile Point Unit 2 receives the Offgas aftercharcoal bed delay, Turbine building ventilation and the Standby GasTreatment system exhaust. The Standby Gas Treatment system exhaustthe primary containment during normal shutdowns and maintains anegative pressure on the Reactor Building during secondarycontainment isolation. The Standby Gas Treatment will isolate onhigh radiation during primary containment purges. The Stack isconsidered an elevated release because its height (131m) is more than2.5 times the height of any adjacent buildings. Nominal flow ratefor the stack is 102,000 CFM.
The Offgas system has a radiation detector downstream of therecombiners and before the charcoal decay beds'he offgas, afterdecay, is exhausted to the main stack. The system will automaticallyisolate if its pretreatment radiation monitor detects levels ofradiation above the alarm setpoint.
The Vent contains the Reactor Building ventilation above and belowthe refuel floor and the Radwaste Building ventilation effluents.The Reactor Building Ventilation will isolate when radiation monitorsdetect high levels of radiation (these are seperate monitors, nototherwise discussed in the ODCM). It is considered a combinedelevated/ground level release because even though it is higher thanany adjacent buildings it is not more than 2.5 times the height.Nominal flow rate for the vent is 237,310 CFM.
Nine Mile Point Unit 1 and the James A Fitzpatrick nuclear plantsoccupy the same site as Nine Mile Point Unit 2. Because of theindependance of these plants safety systems, control rooms andoperating staffs it is assumed that simultaneous accidents are notlikely to occur at the different units. However, there are tworelease points at Unit 2. It is assumed that if an accident were tooccur at Unit 2 that both release points could be involved'hus thefactor R which is the basis for the alarm setpoint calculation isnominally taken as equal to 250 mRem/yr. If there are significantreleases from any gaseous release point on the site (>25mRem/yr)for an extended period of time then the setpoint will be recalculatedwith an appropriately smaller value for R.
Initially, and in accordance with Specification 4.3.7. 11, theGermanium multichannel analysis systems of the Stack and Vent will becalibrated with gas, or with cartridge standards (traceable to NBS)in accordance with Table 4.3.7.11-1, note (c) ~ The quarterly ChannelFunctional Test will include operability of the 30cc chamber and thedilution stages to confirm monitor high range capability. (SeeFigure 3-6).
-33- May 1986
3.1.3. 1 Stack Noble Gas Detector Alarm Setpoint
This detector is made of germanium. It is sensitive to only gammaradiation. However, because it is a computer based multichannelanalysis system it is able to acurately quantify the activityreleased in terms of iCi of specific nuclides. Only pure alpha andbeta emitters are not detectable, of which there are no common noblegases. A distribution of Noble Gases corresponding to offgas ischosen for the nominal alarm setpoint calculation.Offgas is chosen because it represents , the most significantcontaminate of gaseous activity in the plant. The followingcalculation will be used for the initial Alarm Setpoint ~ It will berecalculated if a significant release is encountered. In that casethe actual distribution of noble gases will be used in thecalculation. The listed activity concentrations Ci, correspond tooffgas concentration expected with the plant design limit for fuelfailure .
ISOTOPENAME
ACTIVITYCONCENTRATION
uCi/ml
B(Ci)
PLUMEFACTOR
mrem-secyr-uCi
'
(Vi)
PLUMEFACTOR
mrem/ rml sec
D (B*C)(Ci~Vi)
KR83KR85KR85MKR87KR88KR89KR90XE131M
'XE133XE133MXE135XE135MXE137XE138AR41
8.74E-24.90E-4'1.56E-15. 23E-15.32E-11.63
3. 82E-42.06E-17.35E-35. 88E-15. 91E-12. 111.93
3.28E-53.21E-39.98E-32. 21E-2l.92E-21.51E-26.55E-55.93E-43.44E-46.12E-36.12E-32.88E-31.33E-21.61E-2
1. 61E-85.01E-35. 22E-3l.18E-23.13E-2
2.50E-81.22E-42.53E-63.60E-33.62E-36.08E-32.57E-2
TO ALS 8.
The alarm setpoint equation is:Alarm Setpoint ~ 0.8*R+Zi(Ci)/Zi(Ci+Vi).
9. 28E-2
Where the Alarm Setpoint is in uCi/sec, R is taken as 250mrem/yr,Z(Ci) is 8.36 uCi/ml and Z(Ci*Vi) is 9.28E-2 mrem/yr perml/sec. These values yield an alarm setpoint of 1.80E4 pCi/sec.
-34- May 1986
3.1.3.2 Vent Effluent Noble Gas Detector Alarm Setpoint
This detector is made of germanium. It is sensitive to only gammaradiation. However, because it is a computer based multichannelanalysis system it is able to accurately quantify the activityreleased in terms of uCi of specific nuclides. Only pure alpha andbeta emitters are not detectable, of which there are no common noblegases. A distribution of Noble Gases corresponding to that expectedwith the design limit for fuel failure offgas is chosen for thenominal alarm setpoint calculation. Offgas is chosen because itrepresents the most significant contaminate of gaseous activity inthe plant. The following calculation will be used for the initialAlarm Setpoint. It will be recalculated if a significant release isencountered. In that case the actual distribution of noble gaseswill be used in the calculation.
ISOTOPENAME
A
ACTIVITYCONCENTRATION
uCi/ml
IMMERSIONFACTOR
mre m~3yr-uCi
C
IMMERSION
FACTORmrem~3y~
D~(B*C)
KR83KR85KR85MKR87KR88KR89KR90XE131MXE133XE133MXE135XE135MXE137XE138AR41
8.74E-24.90E-41.56E-15.23E-15. 32E-11.63
3.82E-42.06E-17.35E-35. 88E-1
~ 5.91E-12. 111.93
7. 56E-21.61E-l1.17E-35.92E31.47E41.66E41.56E49. 15El2. 94E22.51E21. 81E33, 12E31.42E31.83E38.84E3
6. 63E-37.90E-3l.82E23. 10E37.82E32.71E4
3.50E-26. 06E11.841.06E31.84E33.00E31.70E4
TOTALS 8.36 6. 12E4
The Vent Effluent Noble Gas Monitor Alarm Setpoint equation is'.
Alarm Setpoint 0.&R*H(Ci)/[(X/Q)v*ZHCi"Ki)]~
Where, the Alarm Setpoint is in uCi/sec, R is 250mrem/yr,H.(Ci) is 8.36 uCi/ml, (X/Q) is 2.0E-6 sec/m3 andZi(Ci"Ki) is 6. 12E4 mrem/yr per ml/m3. This will yield an
alarm setpoint of 1.41E4 uCi/sec.
-35- May 1986
3. 1.3.3 Offgas Noble Gas Detector Alarm Setpoint
The Radiation Detector is a sodium iodide crystal. It is ascintillation device and has a thin mylar window so that it issensitive to both gamma and beta radiation. Detector responseEi(Ci"CFi) will be evaluated from isotopic analysis of offgasanalyzed on a multichannel analyzer, traceable to NBS, prior tocommercial operation. A distribution of offgas corresponding to thatexpected with the design limit for fuel failure is used to establishsetpoint initially, assuming the nominal response listed on Table3-1. The monitor nominal response values will be confirmed duringinitial calibration using a Transfer Standard source traceable to,theprimary calibration performed by the vendor. However, a revision tothe ODCM will contain an updated distribution and total detectorresponse based on actual plant experiences. The initial calculationis presented below.
ISOTOPENAME
A
ACTIVITYCONCENTRATION
uCi/mlB
(Ci)
DETECTORRESPONSE
cpm/uci/mlC
(CFi)
DETECTORCPM
cpmD
( Ci*CFi)
KR83KR85KR85MKR87KR88KR89KR90XE131MXE133XE133MXE135XE135MXE137XE138AR41
8.74E-24.90E-41.56E-15. 23E-15. 32E-11.63
3.82E-42.06E-17. 35E-35.88E-15. 91E-12. 111.93
4.30E34.80E38.00E37.60E3
1.75E3
5. 10E3
8.10E37. 10E3
2.117.50E34.18E34.04E3
3.60E2
3.00E3
1.73E41.37E4
~ 99E
The Offgas Noble Gas Monitor Alarm Setpoint equation is:Alarm Setpoint ~ 0.8*350,000+2.1E-3*Xi(Ci*CFi)/[f"Ei(Ci)]+ Bkg.
Where the Alarm Setpoint is in cpm, Zi(Ci*CFi) is 4.99E4 cpm, f is25CFM and ZL(Ci) is 8.36 uCi/cc. This will yield an alarmsetpoint of 1.40E5 cpm above background. Particulates and Iodinesare not included in this calculation because this is a noble gasmonitor.
May 1986
3.2 Gaseous Effluents Dose Rate Calculation
This section covers TS Section 4.11.2.1.1 and 4.11.2.1.2 concerningthe calculation of dose rate from gaseous effluents for compliancewith TS Section 3. 11.2.1.
TS Section 3.11.2.1:
The dose rate from radioactive materials released in gaseouseffluents from the site to areas at or beyond the SITE BOUNDARY (seeFigure 5.1.3-1) shall be limited to the following:
a. For noble gases: Less than or equal to 500 mrem/yr to the wholebody and less than or equal to 3000 mrem/yr to the skin, and
b. For iodine-131, iodine-133, for tritium, and for allradionuclides in particulate form with half-lives greater than 8days: Less than or equal to 1500 mrem/yr to any organ:
3.2. 1 Whole Body Dose Rate Due to Noble Gases
This calculation covers TS Section 3.11 .2.1.a (for whole body) and4. 11.2. 1.1. The dose from the plume shine of elevated releases istaken into account with the factor Vi. The dose from Vent releasestakes into account the exposure from immersion in the semi-infinitecloud and the dispersion from the point of release to the receptorwhich is at the East site boundary. The release rate is averagedover the period of concern. The factors are discussed in greaterdetail later.Whole body dose rate due to noble gases:
mrem/yr Zi [Vi*Qis + Ki (X/Q)v*Qiv ]
Where:
Vi Is the constant accounting for the gamma radiation from theelevated finite plume of the Stack releases for eachidentified noble gas nuclide, i. Listed on Table 3-2,mrem/yr per uCi/sec
Qis Is the release rate of each noble gas nuclide, i, from theStack release averaged over the time period of concern,uCi/se c
Ki is »the constant accounting for the whole body dose ratefrom immersion in the semi-infinite cloud for eachidentified noble gas nuclide, i. Listed on Table 3-3,mrem/yr per uCi/m3
37 May 1986
(X/Q)v Is the highest calculated annual average relativeconcentration at or beyond the site boundry for the Vent.Final Environmental Statement, NUREG 1085, Table D-2,2.0E-6 se c/m3
Qiv Is the release rate of each noble gas nuclide, i, from theVent release averaged over the time period of concern,uCi/se c
Example Calculation:
Assume an analysis of the Stack and Vent Effluents indicate that1.81E4 and 1.26E4 uCi/sec of Xe-133 are being released from eachpoint respectively. From Table 3-2, Vi is 5.93E-4 mrem/yr peruCi/sec. From Table 3-3 Ki is 2.94E2 mrem/yr per pCi/m3. (X/Q)vis 2.0E-6 sec/m3. These values yield a whole body dose rate of 10.7and 7.41 mrem/yr from the Stack and Vent respectively for a total of18.1 mrem/yr. This value is added to the whole body dose ratesobtained from the Nine Mile Point-Unit 1 and James A. Fitzpatrickplants to obtain the site dose rate to the whole body from noble gasreleases. The whole body dose rate due to noble gases is specifiedby TS Section 3.11.2.l.a.
Skin Dose Rate Due to Noble Gases
This calculation covers TS 'Section 3. 11.2.1.a ( for skin) and4.11.2.1.1. For Stack releases this calculation takes into accountthe exposure from beta radiation of a semi infinite cloud by use ofthe factor Li. Additionally the dispersion of the released activityfrom the stack to the receptor is taken into account by use of thefactor (X/Q) . Gamma radiation exposure from the overhead plume istaken into account by the factor 1.1Bi.For vent releases the calculations also take into account theexposure from the beta and gamma radiation of the semi infinate cloudby use of the factors Li and 1.1Mi respectively. Dispersion is takeninto account by use of the factor (X/Q). The release rate isaveraged over the period of concern. The factors are discussed ingreater detail later.
Skin dose rate due to noble gases
.'rem/yr~ Ei [ (Li*(X/Q)s + 1.1*Bi)«Qis + (Li + 1.1*Mi)*(X/Q)v+Qiv]
Where:
Is the constant to take into account the skin dose dueto each noble gas nuclide, i, from immersion in thesemi-infinite cloud, mrem/yr per pCi/m3
Is the constant accounting for the air gamma dose ratefrom immersion in the semi-infinite cloud for eachidentified noble gas nuclide, i. Listed on Table 3-3,mrad/yr per uCi/m3 1.1 is a unit conversionconstant, mrem/rad
-38- May 1986
Bi Is the constant accounting for the air gamma dose ratefrom exposure to the overhead plume of elevatedreleases of each identified noble gas nuclide,Listed on Table 3-2, mrad/yr per pCi/sec.
(X/Q)v Is the highest calculated annual average relativeconcentration at or beyond the site boundary for theVent. Final Environmental Statement, NUREG 1085,Table D-2, 2.0E-6 sec/m3
(X/Q)s Is the highest calculated annual average relativeconcentration at or beyond the site boundary for theStack. Final Environyental Statement, NUREG 1085,Table D-2, 4.5E-8 sec/m~
Qiv Is the release rate of each noble gas nuclide, i, fromthe Vent release averaged over the time period ofconcern, uCi/se c
Qis Is the release rate of each noble gas nuclide, i, fromthe Stack release averaged over the time period ofconcern, uCi/se c
Example Calculation:
Assume an analysis of the Stack and Vent Effluents indicate that1.81E4 and 1.26E4 uCi of Xe-133 are released from each point. FromTable 3-2, Bi is 6.12E-4 mrad/yr per uCi/sec. From Table 3-3, Liand Mi are 3.06E2 and 3.53E2 mrem.mrad/yr per pCi/m3 respectively .(X/Q) for the Stack and Vent is 4.5E-8 and 2.0E-6 sec/m3respectively. These values yield a skin dose rate of 12.6 and 17.5mrem/yr for the Stack and Vent respectively for a total rate of 30.1mrem/yr. This value is added to the skin dose rates obtained fromNine Mile Point-Unit 1 and the James A. Fitzpatrick plants to obtainthe site dose rate to the skin from noble gas releases. The skindose rate limit due to noble gases is specified by TS Section3.11.2.1.a.
3.2.3 Organ Dose Rate Due to I-131, I-133, Tritium, and Particulates withHalf-lives greater than 8 days.
This calculation covers TS Section 3.11.2.1.b and 4.11.2.1.2. Thefactor Pi takes into account the dose rate received from the groundplane, inhalation and food (cow milk) pathways. Ws and Wv take intoaccount the atmospheric dispersion from the release point to thelocation of the most conservative receptor for each of the respectivepathways. The release rate is averaged over the period of concern.The factors are discussed in greatez detail later.
-39- May 1986
Organ dose rates due to iodine-131, iodine-133, tritium and allradionuclides in particulate form with half-lives greater than 8 days:
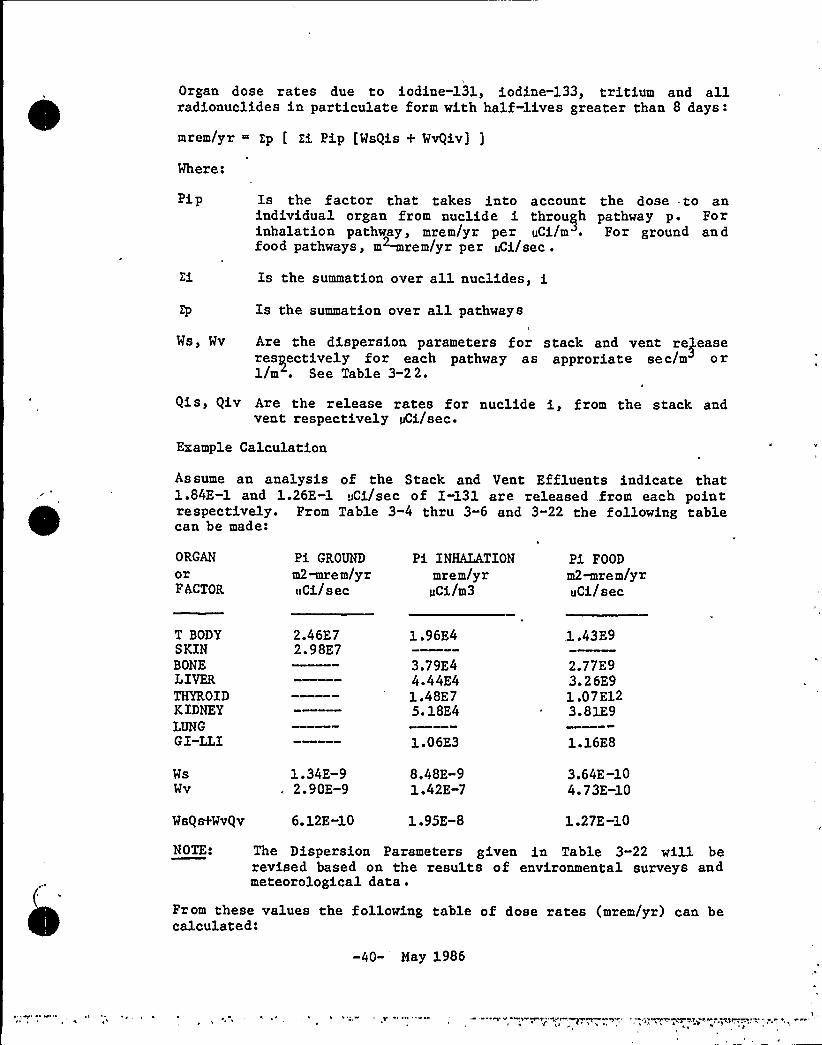
mrem/yr Zp [ Zi Pip [WsQis + WvQiv] j
Where.'ip
Is the factor that takes into account the dose to anindividual organ from nuclide i through pathway p. Forinhalation pathway, mrem/yr per uCi/m ~ For ground andfood pathways, m mrem/yr per Ri/sec .
Zi Is the summation over all nuclides, iZp Is the summation over all pathways
Ws, Wv Are the dispersion parameters for stack and vent re easeresyectively for each pathway as approriate sec/m or1/m . See Table 3-22.
Qis, Qiv Are the release rates for nuclide i, from the stack andvent respectively pCi/sec.
Example Calculation
Assume an analysis of the Stack and Vent Effluents indicate that1.84E-1 and 1.26E-l uCi/sec of I-131 are released .from each pointrespectively. From Table 3-4 thru 3-6 and 3-22 the following tablecan be made:
ORGAN
orFACTOR
Pi GROUND
m2~rem/yriiCi/sec
Pi INHALATIONmrem/yrpci/m3
Pi FOOD
m2~re m/yruCi/sec
T BODYSKINBONELIVERTHYROIDKIDNEYLUNGG I-LLI
2.46E72.98E7
1.96E4
3.79E44.44E41.48E75. 18E4
1.06E3
1.43E9
2.77E93. 26E91.07E123. 81E9
1.16E8
WsWv
1.34E-92.90E-9
8.48E-91.42E-7
3.64E-104.73E-10
WsQs+WvQv 6.12E-10 1.95E-8 1.27E-10
NOTE: The Dispersion Parameters given in Table 3-22 will berevised based on the results of environmental surveys andmeteorological data .
From these values the following table of dose rates (mrem/yr) can becalculated:
-40- May 1986
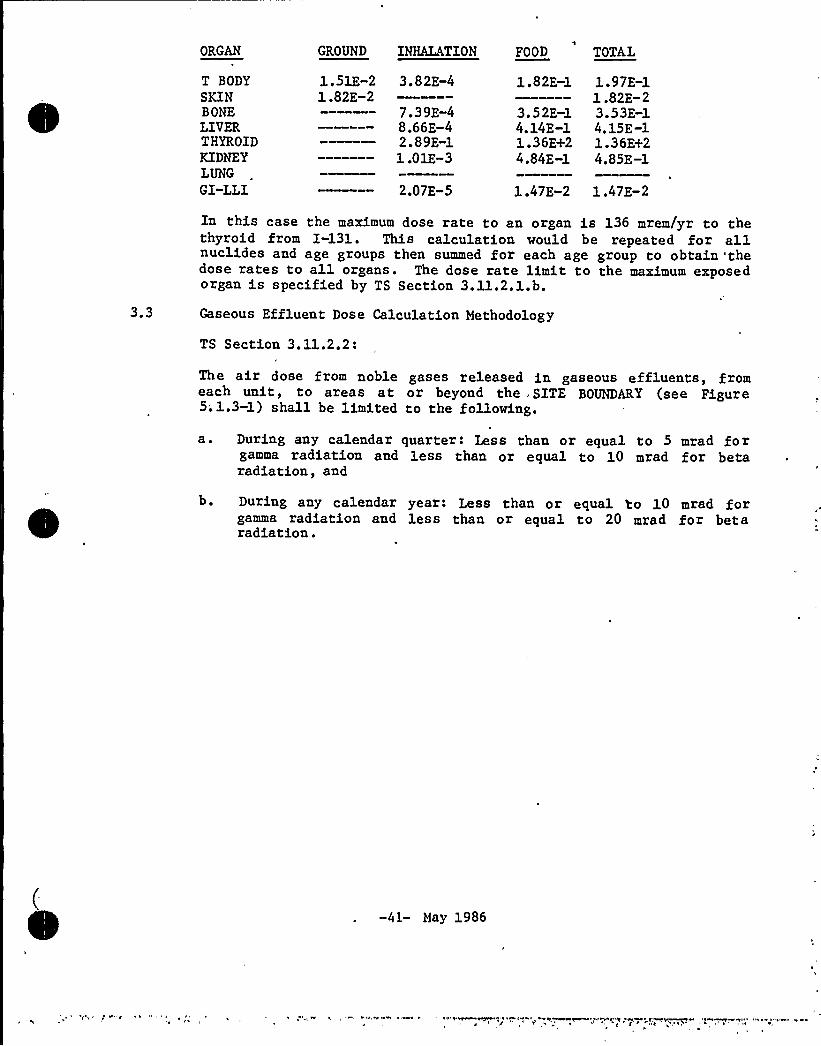
ORGAN GROUND INHALATION FOOD TOTAL
T BODY
SKINBONELIVERTHYROIDKIDNEYLUNGGI-LLI
1.51E-21.82E-2
3.82E-4
7.39E-48.66E-42. 89E-11.01E-3
2.07E-5
1.82E-1
3. 5 2E-14. 14E-11.36E+24.84E-1
1. 97E-11 .82E-23. 53E-14.15E-11.36E+24.85E-1
1.47E-2 1.47E-2
3.3
In this case the maximum dose rate to an organ is 136 mrem/yr to thethyroid from I-131. This calculation would be repeated for allnuclides and age groups then summed for each age group to obtain 'thedose rates to all organs. The dose rate limit to the maximum exposedorgan is specified by TS Section 3.11.2.l.b.Gaseous Effluent Dose Calculation Methodology
TS Section 3.11.2.2:
The air dose from noble gases released in gaseous effluents, fromeach unit, to areas at or beyond the SITE BOUNDARY (see Figure5.1.3-1) shall be limited to the following.
a. During any calendar quarter: Less than or equal to 5 mrad forgamma radiation and less than or equal to 10 mrad for betaradiation, and
b. During any calendar year: Less than or equal to 10 mrad forgamma radiation and less than or equal to 20 mrad for betaradiation.
-41- May 1986
TS Section 3.11.2.3:
The dose to a MEMBER OF THE PUBLIC from iodine-131, iodine-133,tritium, and all radioactive material in particulate form withhalf-lives greater than 8 days in gaseous effluents released, fromeach unit, to areas at or beyond the SITE BOUNDARY (see Figure5. 1.3-1) shall be limited to the following:
a. During any calendar quarter: Less than or equal to 7.5 mrem toany organ and,
b. During any calendar year: Less than or equal to 15 mrem to anyorgan.
TS Section 3.11.2.5:
The VENTILATION EXHAUST TREATMENT SYSTEM shall be OPERABLE andappropriate portions of this system shall be used to reduce releasesof radioactivity when the projected doses in 31 days from iodine andparticulate releases, from each unit, to areas at or beyond the SITEBOUNDARY (see Figure 5.1.3-1) would exceed 0.3 mrem to any organ of aMEMBER OF THE PUBLIC.
Gamma Air Dose Due to Noble Gases
This calculation covers TS Section 3.11.2.2 and 4.11.2.2.
Gamma air dose due to noble gases released is calculated monthly.The factor Mi takes into account the dose from immersion in thesemi-infinite cloud of the vent release. The factor X/Q takes intoaccount the dispersion of vent releases to the most conservativelocation. The factor Bi takes into account the dose from exposure tothe plume of the stack releases. The release activity is totaledover the period of concern. The factors are discussed in greaterdetail later.
Gamma air dose due to noble gases.'
Zj. ~Mi{X/Q)vQiv + Bi Qis]
Where the constants have all been previously defined. Note tha tsince Q is expressed as uCi/sec, the constant 3.17E-8 secgiven in NUREG-0133, section 5.3. 1 may be omitted, provided that theannual dose calculated is divided by 4 to yield quarter dose, or 12to yield monthly dose, as applicable.
Example Calculation
Assume an analysis of the Stack and Vent Effluents indicate that1.42E11 and 9.91E10 uCi of Xe-133 are released from each pointrespectively over the last quarter. This correlates to 1.81E4 and1.26E4 pCi/sec respectively. From Table 3-2, Bi is 6.12E-4 mrad/yrper uCi/sec. From Table 3-3 Mi is 3.53E2 mrad/yr per pCi/m3.(X/Q)v is 2.0E-6 sec/m3. These values yield a gamma air dose rate of11.1 and 8.9 mrad/yr from the Stack and Vent respectively for a totalof 20.0 mrad/yr or 5.0 mrad for the quarter. The gamma air doselimit due to noble gases is specified by TS Section 3.11.2.2.
-42- May 1986
Beta Air Dose Due to Noble Gases
This calculation covers TS Section 3.11.2.2 and 4.11 .2.2.
Beta air dose due to noble gases released is calculated monthly. Thefactor Ni takes into account the dose from immersion in the cloud ofall the releases. The factor X/Q takes into account the dispersionof releases to the most conservative location. The factors arediscussed in greater detail later.
Beta air dose due to noble gases:
ZiNi[(X/Q)vQiv + (X/Q)s Qis]
Where the constants have all been previously defined .
Example Calculation
Assume an analysis of the Stack and Vent Effluents indicate that1.42E11 and 9.91E10 uCi of Xe-133 are released from each pointrespectively over the last month. This correlates to 1.81E4 and1.26E4 4i/sec respectively. From Table 3-3, Ni is 1.05E3 mrad/yrper »Ci/m3. (X/Q) for the Stack and Vent is 4.5E-8 and 2.0E-6sec/m3 respectively. These values yield a beta air dose of 0.9 and26.5 mrad/yr for the Stack and Vent respectively for a total of 27.4mrad/yr or 6.8 mrad over the last quarter ~ The beta air dose limitdue to noble gases is specified by TS Section 3.11.2.2.
Organ Dose Due'o I-131, I-133, Tritium and Particulates withhalf-lives greater than 8 days.
This calculation covers TS Section 3.11 .2.3, 3.11 .2.5, 4.11 .2.3, and4. 11.2.5. 1. Organ dose due to I-131, I-133, Tritium and Particulateswith half-lives greater than 8 days released is calculated monthly .The factor Ri takes into account the dose received from the groundplane, inhalation, food (cow milk, cow meat and vegetation)pathways. Ws and Wv take into account the atmospheric dispersionfrom the release point to the location of the most conservativereceptor for each of the respective pathways. The release is totaledover the period of concern. The factors are discussed in greaterdetail later.
Organ dose due to iodine-131, iodine-133, tritium radionuclides inparticulate form with half-lives greater than 8 days
mrem ~ 3.17E-8 Ep [ Ei Rip [Ws Qis + Wv Qiv] ]
Where:
3. 17E-8 Is the inverse of the number of seconds in a year
Rip Is the factor that takes into account the dose to anindividual organ from nuclide i through pathway p.
«43- May 1986
Ws, Wv
Is the summation over all nuclides i.Is the summation over all pathways p,
Are the dispersion parameters for the stack and vent
respectively for each pathway as appropriate sec/mor 1/m . See Table 3-22,
Qis, Qiv Are the amount of activity of nuclide i released fromthe stack or vent respectively over the period ofconcern, uCi. If activity released is given interms of release rate, uCi/sec, then the constant3. 17E-8 sec may be omitted, provided that theannual dose calculated is divided by 4 to yieldquarter dose, or 12. to yield monthly dose, asapplicable.
Example Calculation
Assume an analysis of the Stack and Vent Effluents indicate that1.45E6 and 9.9E5 uCi of I-131 are released from each pointrespectively over the last quarter. This correlates 1.84E-1 and1.26E-1 uCi/sec respectively. Calculate the dose to a childsorgans. From Tables 3-8,11,13,16 and 19 the following table can bemade:
ORGAN
orFACTOR
Ri-GROUNDm2-mrem/ r
Ri-I%M.ATION Ri-MILKmrem/ ruCi m3
Ri-MEAT Ri-VEGETATIONm2-mrem/ ruCi sec
T BODYSKINBONELIVERTHYROIDKIDNEYLUNGG I-LLI
2.09E7E
4.81Z44.81E41.62E77. 88E4
2. 84E3
6.51E86.55E82. 17Ell1.08E9
5.83E7
8.26E68.32E62.75E91.37E7
7.40E5
.16E
1.43E81.44E84.75 E102.36E8
1.28E7
WsWv
1.34E-92.90E-9
8.48E-91.42E-7
3.64E-10 1. 15E-9 9.42E-104.73E-10 1.86E-9 1.50E-9
WsQs+WvQv 6. 12E-10 1 .95E-8 1.29E-10 4.46E-10 3.62E-10
From these values the following table of annual dose (mrem) can be calculated:
ORGANT BODY
SKINBONELIVERTHYROIDKIDNEYLUNGGI-LLI
GROUND1.11E-21. 28E»2
INHALATION
9.38E-49.38E-43. 16E-11.54E-3
5.54E-5
MILKE-2
8. 40E-28.45E-228. 01 .39E-1
MEAT~1E-3
3.69E-33.71E-31.236.11E-3
VEGE.MHE-2
5. 18E-25.21E-217.28.54E-2
TOTALK7KE-21.28E" 21.40E-11.41E-146.72.32E-1
7.52E-3 3.30E-4 4.63E-3 1.25E-2
-44- May 1986
3.4
In this case the maximum quarterly dose to the child organ is 46.7/411.7 mrem to the thyroid from I-131. The calculation would be
repeated for all nuclides and age groups and summed to find themaximum dose to any organ. The dose limit to the maximum exposedorgan is specified by TS Section 3.11.2.3 and 3.11.2.5.
Gaseous Effluent Dose Factor Definition and Derivation
Bi and„Vi- Plume Shine Factor For Gamma and Beta Doses (Table 3-2)
Bi (mrad/yr per uCi/sec) is calculated by modeling the effluentfrom the Stack as a line source with an elevation above ground equalto the stack height (131m).
From "Introduction to Nuclear Engineering" by Lamarsh, page 410, theflux o at a point a distance of x from an .infinite line emitting S
gammas/sec per cm is.o S/4x.
S is proportional to release rate Q (uCi/sec) and inversly to windspeed U (cm/sec):
S ~ Q/U.
The distance of an individual on the ground from the elevated plumeis approximately, equal to the height of the stack h (meters). Thegamma radiation from the plume is attenuated by the air. This isproportional to the exponential of the negative product of the stackheight h (m) and the air attenuation coefficient Uo, 1/m:
exp (-Uo*h),.This is a conservative assumption .because only the portion of theplume directly overhead is at a distance of h. The bulk is muchfurther away.
Additionally, there is a dose buildup factor which, from RG 1.109Appendix F-ll, 12, is equal to:
1+[(Uo-Ua)*Uo*h]/Ua
where Ua (1/m) is the air energy absorption coefficient .
"4>" May 1986
The dose D at a point is proportional to the flux o, energy E (Mev)of the radiation, air energy absorption coefficient Ua (m-1) and unitconversion constant K:
D K*o*E*Ua.
Substitution in the above formula for flux from an infinite linesource yields:
D - K*S~E*Ua/[4*x].
Substitution for S yields:
D K"Q*E~Ua/[4*x*U].
Substitution for x of Stack height h yields:
D K*Q*E*Ua/[4*h*U].
Factoring in the air attenuation and corresponding dose buildupfactors yields.
D ~ K~Q*E"[Ua+(Uo-Ua)*Uo*h]exp(-Uo*h)/[4*h"U].
Bi is the gamma air dose received on the ground for a given releaserate Q. Thus:
B ~ D/Q ~ K*E*[Ua+(Uo-Ua)*Uo*h]~exp(-Uo~h)/[4*h*U].
Where.
K ~ 1.447E4 mrad-dism /Mev~Ci-yr, U is 5.71 m/sec and the othersymbols are as discussed above.
To calculate Vi (mrem/yr per uCi/sec), the factor to account for theTotal Body dose rate for a given release rate Q (uCi/sec) aconversion ratio of 1.1 mrem/mrad is assumed between tissue and airdoses. If the Total Body tissue density Td (gm/cc) is assumed to be5gm/cc (like a rock) and Ut (cm2/gm) is the energy absorption fortissue then:
V 1.1*B*exp(-Td*Ut).
Example Calculation
Ua, Ue and Ut all vary with the energy of the radiation. Figure3.5-6 and Table 3.5-1 (b-muscle) of the "CRC Handbook of RadiationMeasurement and Protection" list values for the variables. For a0.25 Mev gamma:
Uo 0.0145 m-1Ua ~ 0.0036 m-1Ut ~ 0.0306 cm2/gm.
-46- May 1986
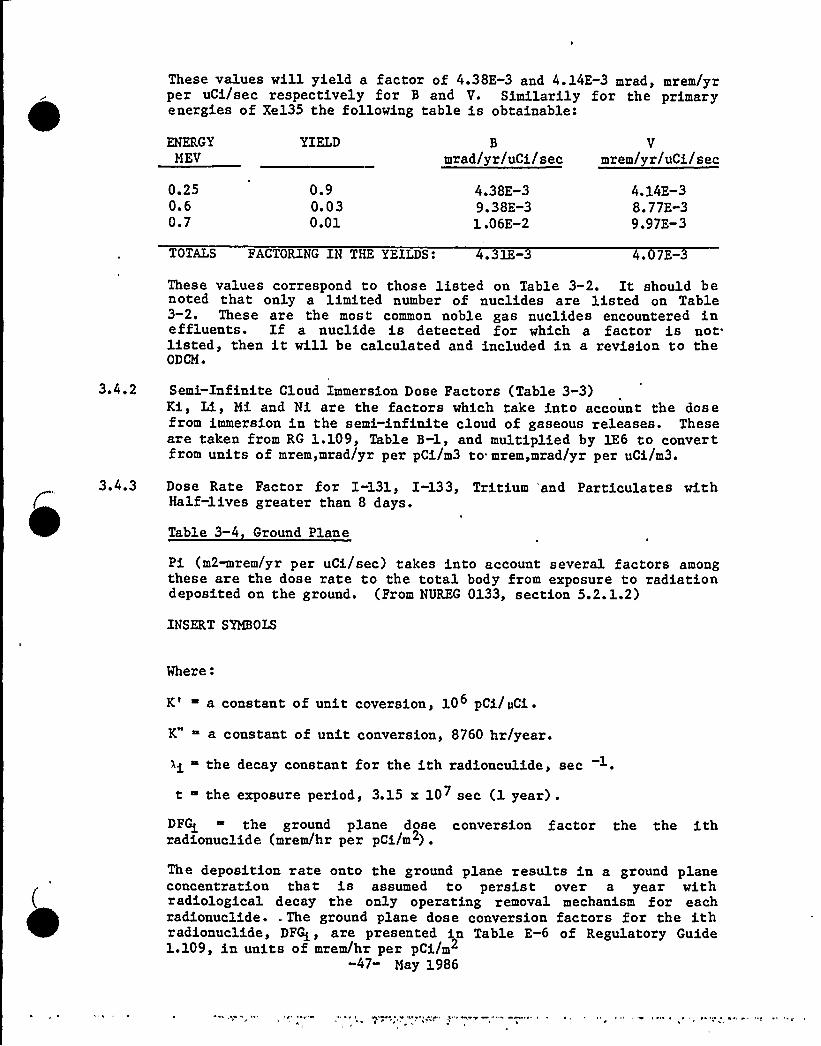
These values will yield a factor of 4.38E-3 and 4.14E-3 mrad, mrem/yrper uCi/sec respectively for B and V. Similarily for the primaryenergies of Xe135 the following table is obtainable:
ENERGYMEV
YIELD B
mrad/yr/uCi/secV
mrem/yr/uCi/sec
0.250.60.7
0.90.030.01
4.38E-39. 38E-31.06E-2
4.14E-38.77E-39.97E-3
TOTALS FACTORING IN THE YEILDS: .31E- .07E-
These values correspond to those listed on Table 3-2. It should benoted that only a limited number of nuclides are listed on Table3-2. These are the most common noble gas nuclides encountered ineffluents. If a nuclide is detected for which a factor is not=listed, then it will be calculated and included in a revision to theODCM.
Semi-Infinite Cloud Immersion Dose Factors (Table 3-3)Ki, Li, Mi and Ni are the factors which take into account the dosefrom immersion in the semi-infinite cloud of gaseous releases. Theseare taken from RG 1.109, Table B-l, and multiplied by lE6 to convert,from units of mrem,mrad/yr per pCi/m3 to mrem,mrad/yr per uCi/m3.
Dose Rate Factor for I-131, I"133, Tritium 'and Particulates withHalf"lives greater than 8 days.
Table 3-4 Ground Plane
Pi (m2~rem/yr per uCi/sec) takes into account several factors amongthese are the dose rate to the total body from exposure to radiationdeposited on the ground. (From NUREG 0133, section 5.2.1.2)
INSERT SYMBOLS
Where.''
constant of unit coversion, 106 pCi/pCi.
K" a constant of unit conversion, 8760 hr/year.
>i ~ the decay constant for the ith radionculide, sec
t ~ the exposure period, 3.15 x 10⁷ sec (1 year) .
DFQ the ground plane dose conversion factor the the ithradionuclide (mrem/hr per pCi/m ) .
The deposition rate onto the ground plane results in a ground planeconcentration that is assumed to persist over a year withradiological decay the only operating removal mechanism for eachradionuclide. . The ground plane dose conversion factors for the ithradionuoldde, Dpdi, are presented in 1able E-6 of Regulatory Guide1.109, in units of mrem/hr per pCi/m
-47- May 1986
Resolution of the units yields.
Pi (Ground) 8.76 x 10 DFQ (1-e "i )/kiExample Calculation
For the I-131 total body dose rate factor for exposure from theground:
9.98E-7 sec-1DFGi 2.80E-9 mrem/hr per Ci/m2
These values will yield a Pi factor of 2.46E7 m2~rem/yr per uCi/secas listed on Table 3-4. It should be noted that only a limitednumber of nuclides are listed on Table 3-4. These are the mos tcommon nuclides encountered in effluents. If a nuclide is detectedfor which a factor 'is not listed, then it will be calculated andincluded in a revision to the ODCM.
Pi (m2~rem/yr per uCi/sec) also takes into account the dose rate tothe skin from exposure to the ground.
Example Calculation
For the I-131 skin dose rate factor for exposure from the ground:
~ 9.98E-7 sec"1DFGi 3.40E-9 mrem/hr per pCi/m2
These values will yield a Pi factor of 2.98E7 m2-mrem/yr per uCi/secas listed on Table 3-4. It should be noted that only a limitednubmer of nuclides are listed on Table 3-4. These are the mostcommon nuclides encountered in effluents. If a nuclide is. detectedfor which a factor is not listed, then ith will be calculated andincluded in a revision to the ODCM.
Table 3-5, Inhalation
Pi (mrem/yr per uCi/m3) also takes into account the dose rate tovarious organs from inhalation exposures (From NUREG 0133, section5.2.1. 1)
Pi ~ K'(BR) DFAi (mrem/yr per @CD./m )
Where.
K' constant of unit conversion, 106 pCi/XCi.
BR the breathing rate of the infant age group, in m3/yr.
DFAi ~ the organ inhalation dose factor for the infant age groupfor the ith radionuclide, in mrem/pCi. The total body isconsidered as an-organ in the selection of DFAi.
-48- May 1986
The age group considered is the infant group. The infant's breathingr ate is taken as 1400 m /yr from Table E-5 of Regulatory Guide3
1.109. The inhalation dose factors for the infant, DFAi arepresented in Table E-10 of Regulatory Guide l.109, in unit s o fmrem/pCi ..
Resolution of the unitsyeilds.'i
(inhalation) 1.4 x 10 DFAi.
Example Calculation.'or
the I-131 thyroid dose rate factor for exposure from inhalation:
DFAi 1.06E-2 mrem per pCi
This value will yield a Pi factor of 1.48E7 mrem/yr per uCi/m3 aslisted on Table 3-5. It should be noted that only a limited numberof nuclides are listed on Table 3-5. These are the most commonnuclides encountered in effluents. If a nuclide is detected f'rwhich a factor is not listed, then it will be calculated and includedin a revision to the ODCM.
Table 3-6, Food (Cow Milk)
Pi (m2~rem/yr per uCi/sec) also takes into account the dose rate tovarious organs from the ingestion of cow milk. (From NUREG
0133'ection5.2.1.3).
~ ~~O(U ) -A t~ K r
> +z F DFL1 ~t 3 f] (a> mree/yr per uC1/sec)p ( w
Where:
K' constant of unit conversion, 106 pCi/pCi.~ the cow's consumption rate, in kg/day (wet weight).
Uap the infant ' milk consumption rate, in 1 iters/yr.
Yp ~ the agricultural productivity by unit area, in kg/m
Fm ~ the stable element transfer coefficients, in days/liter.r fraction of deposited activity retained on cow's feed grass.
DFLi the maximum organ ingestion dose factor for the ithradionuclide, in mrem/pCi .
1i ~ the decay constant for the ith radionuclide, in sec
the decay constant for removal of activity on leaf andplant surfaces by weathering, 5.73 x 10 7 sec.( corresponding to a 14 day half-time).
the transport time from pasture to cow, to milk, to infant,in sec.
-49- May 1986
A fraction of the airborne deposition is captured by the ground planevegetation cover. The captured material is removed from thevegetation (grass) by both radiological decay and weatheringprocesses.
The values of Qp, U n, and Y are provided in Regulatory Guide1 .109, Tables E-3, E-S, and E-E5, as 50 kg/day, 330 liters/day and0.7 kg/m , respectively. The value tf is provided in RegulatoryGuide 1.109, Table E-15, as 2 days (1.73 x 10⁵ seconds) ~ Thefraction, r, has a value of 1.0 for radioiodines and 0.2 forparticulates, as presented in Regulatory Guide 1.109, Table E-15.
Table E-1 of Regulatory Guide 1.109 provides the stable elementtransfer coefficients, Fm, and Table E-14 provides the ingestiondose factors, DFLi, for the infant's organs .
Resolution of the units yields:
~<:, tooer z.4xl(P o 0R.< [e 1 f] (m'~rem/yr per ~C1/sec)
for all radionuclides, except tritium.
The concentration of tritium in milk is based on its airborneconcentration rather than the deposition rate.
K'"QFU OFl.< f0.7 (0. / )) (mree/yr per pCi/ms)
Where:
K''™a constant of unit conversion, 10 gm/kg ~
H absolute humidity of the atmosphere, in gm/m /0.75 ~ the fraction of total feed that is water.
0.5 the ration of the specific activity of the feed grass water toatmospheric water.
From Table E-1 and E-14 of Regulatory Guide 1.109, the values of Fand DFLi for tritium are 1 .0 x 10 day/liter and 3.08 x 10 ~mrem per pCi, respectively. Assuming an average absolute humidity of8 grams/meter , the resolution of units yields:
Pi (food) ~ 2.4 x 10³ mrem/yr per pCi/m
for tritium, only
Example Calculation:
For I-131 thyroid does rate factor for exposure from cow milkingestion:
-50-- May 1986
r 1.0 unities s for Iodine sFm ~ 6E-3 days/literDFLi 1.39E-2 mre m/pCi
9.98E-7 sec-1~w 5.73E-7 sec-1tf 1.73E+5 sec
These values will yield a Pi factor of 1.07E12 mrem/yr per uCi/sec aslisted on Table 3-6. It should be noted that only a limited numberof nuclides are listed on Table 3-6. These are the most commonnuclides encountered in effluents. If a nuclide is detected forwhich a factor is not listed, then it will be calculated and includedin a revision to the ODCM.
3.4.4 Dose Factor for I-131, I-133, Tritium and Particulates withhalf-lives greater than 8 days.
TABLES 3.7 to 3.10, Ri VALUES - INHALATION
Ri (mrem/yr per uCi/m3) takes into account several factors, amongthese are the dose rate to various organs from inhalation exposure.(From NUREG 0133, Section 5.3.1.1).
Ri K'(BR) a (DFAi)a- (mrem/yr per uCi/m )
Where:
K' constant of unit conversion, 10 pCi/pCi ~
(BR)a — th~ breathing rate of the receptor of age group (a),inm /yr.
(DFQ)a ~ the organ inhalation dose factor for the receptor ofage group (a) for the ith radionuclide, in mrem/pCi.The total body is considered as an organ in theselectS, on of (DFAi)a.
The breathing rates (BR)a for the various age groups are tablulatedbelow, as given in Table E-5 of the Regulatory Guide 1.109
'reathinRate (m ~/ r)
InfantChildTeenAdult
140 0370080008000
Inhalation dose factors (DFAi)a for the various age groups aregiven in Tables E-7 throught E-10 of Regulatory Guide 1.109.
Example Calculation:
For the I-131 infant thyroid dose factor for exposure from inhalation:
DFAi ~ 1.06E-2 mrem per pCi
-51- May 1986
These values will yield a Ri factor of 1.48E7 mrem/yr per uCi/m3 aslisted on Table 3-7. It should be noted that only a limited numberof nuclides are listed on Table 3-7 thru 3-10. These are the mostcommon nuclides encountered in effluents ~ If a nuclide is detectedfor which a factor is not listed, then it will be calculated ndincluded in a revision to the ODCM.
TABLE 3-11, Ri VALUES — GROUND PLANE
Ri (m2~rem/yr per uCi/sec) also takes into account the dose fromexposure to radiation deposited on the ground. (From NUREG 0133,Section 5.3. 1.2) ~
K'K"(SF)DFQ [(1-e"i")/~i) (m mrem/yr per uCi/sec)
Where:
K' constant of unit conversion, 10 pCi/pCi.K" ~ a constant of unit conversion, 8760 hr/year.
~i ~ the decay constant for the ith radionuclide, sec 1 .
t the exposure time, 4.73 x 10 sec (15 years) ~
DFGi the ground plane dose conversion factor for the ith radionuclide(mrem/hr per pCi/m ) .
SF ~ the shielding factor (dimensionless).
A shielding factor of 0.7 is suggested in Table E-15 of Regulatory Guide1.109. A tabulation of DFGi values is presented in Table E-6 of RegulatoryGuide 1.109.
Example Calculation:
For the I-131 total body dose factor for exposure to the ground:
9.98E-7 sec-1DFGi ~ 2.80E-9 mrem/hr per pCi/m2
These values will yield a Ri factor of 1.72E7 m2mrem/yr per uCi/sec a slisted on Table 3 11. It should be noted that only a limited number ofnuclides are listed on Table 3-11. These are the most common nuclidesencountered in effluents. If a nuclide is detected for which a factor is notlisted, then it will be calculated and included in a revision of the ODCM.
Ri (m2~rem/yr per uCi/sec) also takes into account the dose to the skin fromexposure to the ground.
-52- May 1986

Example Calculation:
For the I-131 skin dose factor for exposure to the ground:
9.98E-7 sec-1DFGi 3.40E-9 mrem/hr per pCi/m2.
These values will yield a Ri factor of 2.09E7 m2~rem/yr per uCi/secas listed on Table 3 11. It should be noted that only a limitednumber of nuclides are listed on Table 3-11. These are the mostcommon nuclides encountered in effluents. If a nuclide is detectedfor which a factor is not listed, then it will be calculated anincluded i'n a revision to the ODCM.
TABLES 3-12 to 3-15 Ri VALUES —COW MILK
Ri (m2mrem/yr per uCi/sec) also takes into account the dose rate tovarious organs from the ingestion of milk for all age groups. (FromNUREG 0133, Section 5.3.1.3) ~
4(Ua ~ r~r (>-r r >e-'i'~]
t5
(0 ~~/W ptr uC)/etc}2
Where:
K' a constant of unit conversion, 10 pCi/pCi ~
+ - the cow's consumption rate, in kg/day (wet weight).
Uap the receptor' milk consumption rate, in 1 iters/yr.Y
P the agricultural productivity by unit area of pasture feedgrass, in kg/m2
Ys the agricultural productivity by unit area of stored feed,in kg/m2.
Fm ~ the stable element transfer coefficients, in days/liter.r ~ fraction of deposited activity retained on cow's feed grass.
(DFLi)a the organ ingestion dose factor for the ithradionuclide for the receptor in age group (a), inmrem/pCi ~
the decay constant for the ith radionuclide, in sec
-53- May 1986
"w the decay constant for removal of activity on leaf andplant surfaces by weathering, 5.73 x 10 " sec(corresponding to a 14 day half-time) ~
. the transport time from pasture to cow, to milk, to'eceptor, in sec.
th the transport time from pasture, to harvest, to cow, tomilk, to receptor, in sec.
f mm
P fraction of the year that the cow is on pasture(dimensionless).
f me
s fraction of the cow feed that is pasture grass while thecow is on pasture (dimensionless).
SPECIAL NOTE: The above equation is applicable in the case that themilk animal is a goat.
Milk cattle are considered to be fed 'from two potential sources,pasture grass and stored feeds. Following the development inRegulatory Guide 1.109, the values of fp and fs will beconsidered unity.
Tabulated below are the appropriate parameter values and theirreference,to Regulatory Guide 1.109. In case that the milk animal isa goat, rather than a cow, refer to Regulatory Guide 1.109 for theappropriate parameter values.
Parameter
r (dimensionless)
Fm (days/liter)Uap (liters/yr) - Infant
— Child- Teen— Adult
(DFLL)a fmzem/PCi)Yp (kg/m )Ys (kg/m2)tf (seconds)th (seconds)QF (kg/day)
Value
1.0 for radioiodine0.2 for particulatesEach stable element330330400
. 310Each radionuclide0.72.01.73 x 105 (2 days)7.78 x 10 (90 days)50
Fable
E-15E-15E-1E-5E-5E-5E-5
E-ll to E-14E-15E-15E-15E-15E-3
The concentration of tritium in milk is based on the .airborneconcentration rather than the deposition. Therefore, the Ri isbased on [x/Q]:
FgFUapFLi[0.75(0.5/H)) (mrem/yr per uCi/m )
-54- May 1986
Where:
K" a constant of unit conversion, 10 gm/kg ~
H absolute humidity of the atmosphere, in gm/m3
0.75 ~ the fraction of total feed that is water.
0.5 ~ the ratio of the specific activity of the feed grass water toatmospheric water.
and other parameters and values are given above. The value of H isconsidered as 8 grams/meter , in lieu of site specific information.
Example Calculation:
For I-131 infant thyroid dose factor from milk ingestion:
r ~ 1 .0 unitless for IodinesFm 6 E-3 days/liter for cows and 6E-2 for goatsDFLi 1.39E-2 mrem/pCi
~ 9.98E-7 sec -1~w 5.73E-7 sec -1tf 1.73E+5 sec.
These values will yield a factor of 5.26E11 and 6.31Ell mrem/yr peruCi/sec respectively for cow and goat milk. However, the actual doseto the infant thyroid is also dependant on the highest relativedeposition at respective cow and goat locations. At the Nine MilePoint Nuclear Station these deposition coefficients are 4.73E-10 and1.33E-10 m-2 respectively for cows and goats'ecause the goatdeposition is relatively so much smaller than the slightly larger Rifactor, cow milk is the limiting milk ~ If the location of the cowand goat milk receptors changes so that this is no longer true thenthe Ri factor will be revised accordingly. Table 3 12 list theinfant thyroid dose factor from I-131 as 5.26E11 mrem/yr peruCi/sec ~ It should be noted that only a limited number of nuclidesare listed on Table 3 12 thru 3 15. These are the most common .
nuclides encountered in effluents ~ If a nuclide is detected forwhich a factor is not listed, then it will be calculated and includedin a revision to the ODCM.
TABLES 3-16 — 3-18, Ri VALUES — COW MEAT
(m2~rem/yr per uCi/sec) also takes into account the dose rateto various organs from the ingestion of cowmeat for all age groupsexcept infant. (From NUREG 0133, Section 5.3.1 .4)
q~(u, ) (1 f f )e 3 h -X<t<R<[D/Ql K' F (r)(WL<) ~ e
1 aS
(m wren/~", oar uc1/sec)2
-55- May 1986
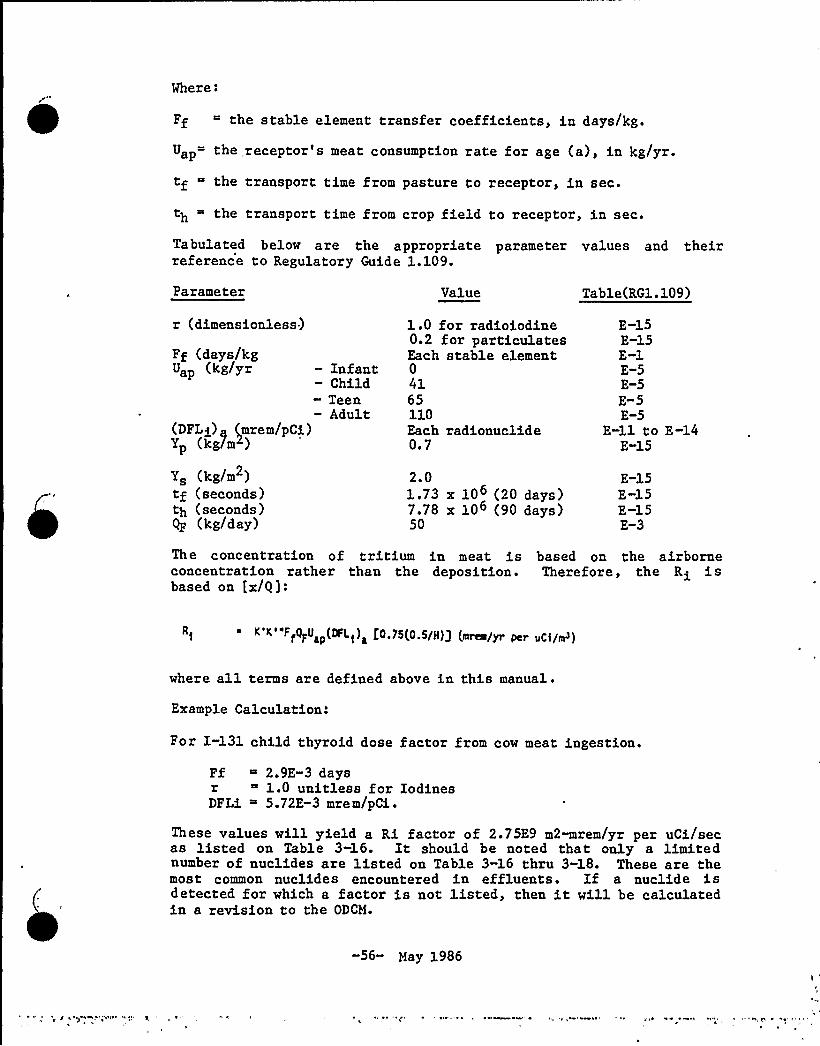
Where:
Ff the stable element transfer coefficients, in days/kg.
Uap the receptor' meat consumption rate for age (a), in kg/yr.
tf the transport time from pasture to receptor, in sec.
th the transport time from crop field to receptor, in sec.
Tabulated below are the appropriate parameter values and theirreference to Regulatory Guide 1.109.
Parameter Value Table(RG1.109)
r (dimensionless)
Ff (days/kgUap (kg/yr
(DFLi)a (.mrem/pCi)Y (kg/mc)
Ys (kg/m )tf (seconds)th (seconds)Qp (kg/day)
— Infant- Child- Teen— Adult
1.0 for radioiodine0.2 for particulatesEach stable element04165110Each radionuclide0.7
2.01.73 x 10 (20 days)7.78 x 10 (90 days)50
E-15E-15E-1E-5E-5E-5E-5
E-11 to E-14E-15
E-15E-15E-15E-3
The concentration of tritium in meat is based on the airborneconcentration rather than the deposition. Therefore, the Ri isbased on [x/9]:
<'<'"F~IFU (OFL) a f0.75(0.5/H)j (mrna/yr Per l,gl/H)
where all terms are defined above in this manual ~
Example Calculation:
For I-131 child thyroid dose factor from cow meat ingestion.
Ff 2.9E-3 daysr 1.0 unitless for IodinesDFLi ~ 5.72E-3 mrem/pCi ~
These values will yield a Ri factor of 2.75E9 m2~rem/yr per uCi/secas listed on Table 3 16. It should be noted that only a limitednumber of nuclides are listed on Table 3-16 thru 3-18. These are themost common nuclides encountered in effluents. If a nuclide isdetected for which a factor is not listed, then it will be calculatedin a revision to the ODCM.
-56- May 1986
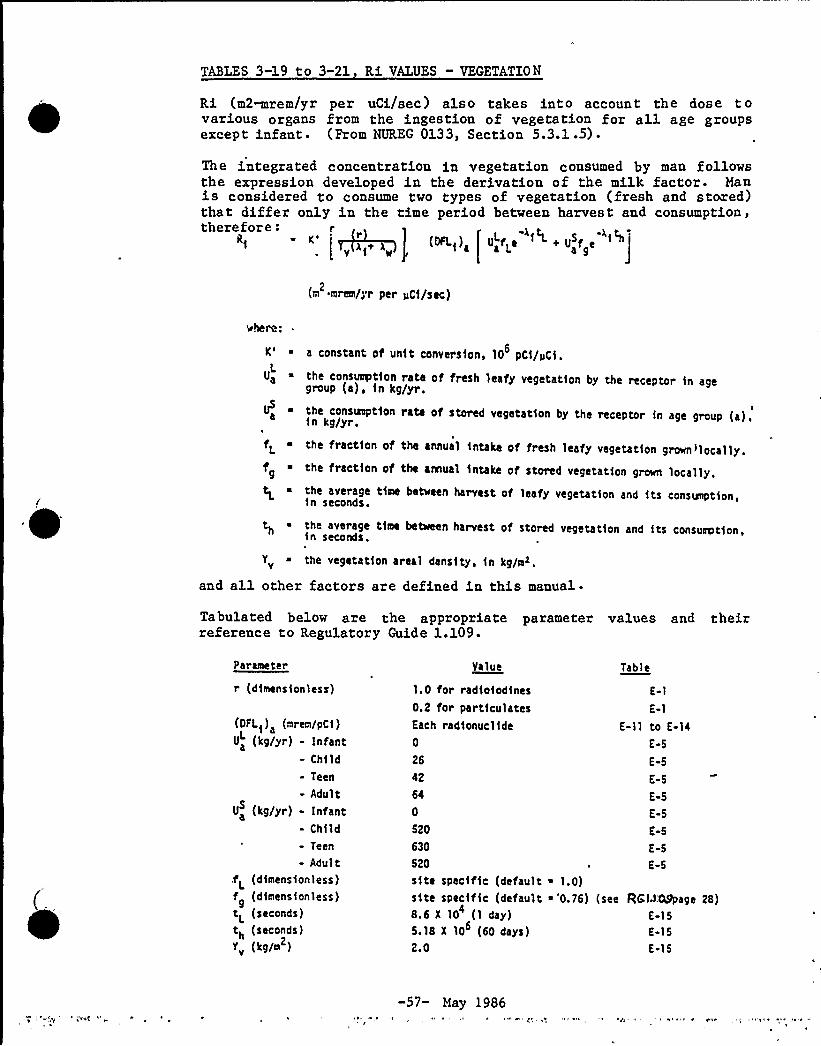
TABLES 3-19 to 3-21 Ri VALUES - VEGETATION
Ri (m2~rem/yr per uCi/sec) also takes into account the dose tovarious organs from the ingestion of vegetation for all age groupsexcept infant ~ (From NUREG 0133, Section 5.3.1.5) ~
The integrated concentration in vegetation consumed by man followsthe expression developed in the derivation of the milk factor. Manis considered to consume two types of vegetation (fresh and stored)that differ only in the time period between harvest and consumption,therefore: l >-
(0FL ) ULf e 1 L+ USf[
Ai+ X 'I a aL agJ
(m m rem/3 r per pCI /s ec )2
K' constant of unit conversion, 10 pC1/PC1 ~
LUa the consumption rate of fresh leafy vegetat1on by the receptor 1n agegroup (a), 1n kg/yr.U ~ the consumption rate of stored vegetation by the receptor in age group (a).1n kg/yr.
fL ~ the fraction of the annual intake of fresh leafy vegetation grown ilocally .
the fraction of the annual intake of stored vegetation green locally.the average t1me behreen harvest of leafy vegetation and its consunptlon,1n seconds.
t„ the average t1me bebaen harvest of stored vegetation and its consumption,in seconds.
Yv the vegetat1on areal density. in kg/ms.
and all other factors are defined in this manuals
Tabulated below are the appropriate parameter values and theirreference to Regulatory Guide 1.109.
Parameter Value Table
r (dimens ionless)
(DFLi ) a(mrem/pC1)
U (kg/yr) - Infant- Child- Teen
- AdultU (kg/yr) - Infant
- Child- Teen
- Adult.fL (dimensionless)f (dimensionless)
tL (seconds)
th (seconds)
Y„ (kg/m )
1 ~ 0 for radioiodines0.2 for particulatesEach radionucl1de0
26
42
64
0
520
630
520
s1te specific (defaultsite specific (default8.6 X 10 (1 day)5.18 X 10 (60 days)2.0
E-1
E-1
E-11 to E-14
E-5
E-5
E-5
E-5
E-5
E-5
E-5
E-5~ 1.0)~ '0.76) (see RGIJ08page 28)
E-15
E-15
E-15
-57- May 1986
The concentration of tritium in vegetation is based on the airborneconcentration rather than the deposition. Therefore, the Ri isbased on [x/Q]:
"(x/Ql . K'r™ u r + u ea L a <(OFL< a f ' .5/H)] (cree/yr per usaf/e ).
where all terms have been defined above and in this manual ~
Example Calculation
For I-131 child thyroid dose factor to the from vegetation ingestion.'
~ 1 .0 unitless for IodinesDFLi ~ 5.72E-3 mrem.pCi.
These values will yield a Ri factors of 4.75E10 m2mrem/yr pe ruCi/sec as listed on Table 3 19. It should be noted that only alimited number of nuclides are listed on Table 3-19 thru 3-21. Theseare the most common nuclides encountered in effluents. If a nuclideis detected for which a factor is not listed, then it will becalculated and included in a revision to the ODCM.
X/Q and Wv — Dispersion Parameters for Dose Rate, Table 3-22
The dispersion parameters for the whole body and skin dose rat ecalculation correspond to the highest annual average dispersionparameters at or beyond the unrestricted area boundary. This is atthe East Site boundary. These values were obtained from the NineMile Point Unit 2 Final Environmental Statement, NUREG 1085 Table D-2for the Vent and stack. These were calculated using the methodologyof Regulatory Guide 1.111, Rev. 1. The Stack was modeled as anelevated release point because its height is more than 2.5 times thanany adjacent building. The Vent was modeled as a ground levelrelease because even though it is higher than any adjacent buildingit is not more than 2.5 times the height.
The NRC Final Environmental Statement values for the Site BoundaryX/Q and D/Q terms were selected for use in calculating EffluentMonitor Alarm Points and compliance with Site Boundary Dose Ratespecifications because they are conservative when compared with thecorresponding NMPC Environmental Report values. In addition, theStack "intermittent release" X/Q was selected in lieu of the"continuous" value, since it is slightly larger, and also would allownot making a distinction between long term and short term releases .
The dispersion parameters for the organ dose calculations wereobtained from the Environmental Report, Figures 7B-4 (Stack) and 7B-8(Vent) by locating values corresponding to currently existing (1985)pathways. It should be noted that the most conservative pathways donot all exist at, the same location. It is conservative to assumethat a single individual would actually be at each of the receptorlocations.
-58- May 1986

3.4.6 Wv and Ws —Dispersion Parameters for Dose, Table 3-22
3.5
The dispersion parameters for dose calculations were obtained chieflyfrom the Nine Mile Point Unit 2 Environmental Report Appendix 7B3 asnoted in Section 3.4.5. These were calculated using the methodologyof Regulatory Guide 1.111 and NUREG 0324. The Stack was modeled asan elevated release point because its height is more than 2.5 timesthan any adjacent building. The Vent was modeled as a combinedelevated/ground level release because even though it is higher thanany adjacent building it is not more than 2.5 'times the height .Average meterology over the appropriate time period was used.Dispersion parameters not available from the ER were obtained fromC.T. Main Data report dated November, 1985, or as described inSection 3.4.5, the FES.
I-133 Es timation
The 'Stack and Vent Effluent Monitor at Nine Mile Point-Unit 2 are online isotopic monitors. They are designed to automatically collectiodine. samples on charcoal cartridges and isotopically analyze themwith a sensitivity which exceeds the LLD requirement on TS Table4. 11-2 of 1E-12 uCi/cc. During those time periods in which theI-133 analysis cannot meet the LLD requirement, the I-133concentration will be estimated as 4 times the I-131 concentration,or by ratio applied to the I-1'31 concentration. The ratio will bedetermined at least quarterly by analysis of short duration samples .
3.6 Use of Concurrent Meteorological Data vs. Historical Data
It is the intent of NMPC to use dispersion parameters based onhistorical meteorological data to set alarm points and to determineor predict dose and dose rates in the environment due to gaseouseffluents. When the methodology becomes available, it is the intentto use meteorological conditions concurrent with the time of releaseto determine gaseous pathway doses. Alarm points and dosepredictions or estimates will still be based on historical data. TheODCM will be revised at that time.
3.7 Gaseous Radwaste Treatment S stem 0 eration
Technical Specification 3.11.2.4 requires the Gaseous RadwasteTreatment System to be in operation whenever the main condenser aireffector system is in operation. Since the system was designedwithout a bypass, station design results in compliance with thespecification. The components of the system which must operate totreat offgas are the Preheater, Recombiner, Condenser, Dryer,Charcoal Adsorbers, HEPA Filter, and Vacuum Pump. See Figures 3-1,3-2, and 3-3, Offgas System.
-59- May 1986
3.8 Ventilation Exhaust Treatment S stem 0 eration
Technical Specification 3.11.2.5 requires the Ventilation ExhaustTreatment System to be OPERABLE when projected doses in 31 days dueto iodine and particulate releases would exceed 0.3 mrem to any organof a member of the publica The appropriate components, which affectiodine or'articulate release, to be OPERABLE are:
1) HEPA Filter - Radwaste Decon Area2) HEPA Filter — Radwaste Equipment Area3) HEPA Filter —Radwaste General Area
Whenever one of these filters is not OPERABLE, iodine and particulatedose projections will be made for the remainder of the currentcalendar month, and for each month (at the time of calculatingcumulative monthly dose contributions) that the filter remainsinoperable, in accordance with 4.11.2.5. 1. Predicted release ratewill be used, with the methodology of Section 3.3.3. See Figure 3-5,Gaseous Radiation Monitoring.
-60- May 1986
TABLE 3-1
NUCLIDE
Kr 85Kr 85mKr 87Kr 88Xe 133Xe 133mXe 135Xe 135mXe 137Xe 138
OFFGAS PRETREATMENT*DETECTOR RESPONS E
NET CPM/pCi/cc
4.30E+34.80E+38.00E+37.60E+31.75E+3
5.10E+3
8.10E+37. 10E+3
«Values from SWEC purchase specification NMP2-P281F
-61- May 1986
TABLE 3-2
PLUME SHINE PARAMETERS*
NUCLIDE B (mrad/ r —. uCi/sec) V (mrem/yr —. pCi/sec)
K" 83m
Kr 85
Kr 85m
Kr 87
Kr 88
Kr 89
3.5. 1E-5
3. 39E-3
1.04E-2
2.34E-2
2.01E-2
1.59E-2
3.28E-5
3.21E-3
9.98E-3
2.21E-2
1.92E-2
1. 51E-2
Xe 131m
Xe 133
Xe 133m
Xe 135
Xe 135m
Xe 137
Xe 138
6.90E-5
6. 12E-4
3.62E-4
4.31E-3
6.55E-3
3.07E-3
1.38E-2
6.55E-5
5.93E-4
3.44E-4
4.09E-3
6.12E-3
2.88E-3
1.33E-2
Ar 41 1.69E-2 1.61E-2
*Bi and Vi are calculated for critical site boundary location; 1 .6km
in the easterly direction.
-62- May 1986
TABLE 3-3
DOSE FACTORS*
Nuclide ~K(r Bcdy)** Li (B-Skin)** ~M(y-Air)***~N(B-Air�
)***
Kr 83m
Kr 85m
Kr 85
Kr 87
Kr 88
Kr 89
Kr 90
Xe 131m
Xe 133m
Xe 133
Xe 135m
Xe 135
Xe 137
Xe 138
Ar 41
7.56E-02
1.17E3
'1.61E1
5. 92E3
1.47E4
1.66E4
1.56E4
9. 15E1
2.51E2
2.94E2
3. 12E3
l.81E3
1.42E3
8.83E3
8.84E3
1.46E3
1.34E3
9.73E3
2.37E3
1 ~ 01E4
7.29E3
4.76E2
9.94E2
3.06E2
7.11E2
1.86E3
1.22E4
4.13E3
2.69E3
1.93E1
1.23E3
1.72El
6. 17E3
1.52E4
1.73E4
1.63E4
1.56E2
3.27E2
3. 53E2
3.36E3
1.92E3
1.51E3
9.21E3
9.30E3
2.88E2
1.97E3
1.95E3
1.03E4
2.93E3
1.06E4
7.83E3
1.11E3
1.48E3
1.05E3
7.39E2
2.46E3
1.27E4
4. 75E3
3.28E3
"From, Table B-l.Regulatory Guide 1.109 Rev. 1
**mrem/yr per uCi/m .3
***mrad/yr per uCi/m3
-63- May 1986
TABLE 3-4
Pi VALUES GR UND PLANE**
NUCLIDE
!iCi/se c
TOTAL BODY SKIN
H 3
C 14
Cr 51
Mn 54
Fe 59
Co 58
Co 60
Zn 65
Sr 89
Sr 90
Zr 95
* Nb 95
Mo 99
I 131
I 133
Cs 134
Cs 137
Ba 140
* La 140
Ce 141
Ce 144
6.64E6
1.10E9
3.88E8
5.27E8
4.40E9
6.87E8
3.06E4
3.44E8
3.50E8
5.71E6
2.46E7
3.50E6
2. 81E9
1.15E9
2. 93E7
2. 10E8
1.95E7
5.85E7
7.85E6
1.29E9
4.56E8
6. 18E8
5. 17E9
7.90E8
3.56E4
3.99E8
4. 12E8
6.61E6
2.98E7
4.26E6
3.28E9
1.34E9
3.35E7
2.38E8
2. 20E7
6.77E7
*Daughter Decay Product. Activity level and effective half life assumed toequal parent nuclide.*~Calculated in accordance with NUREG 0133, Section 5.2.1.2.
-64- May 1986

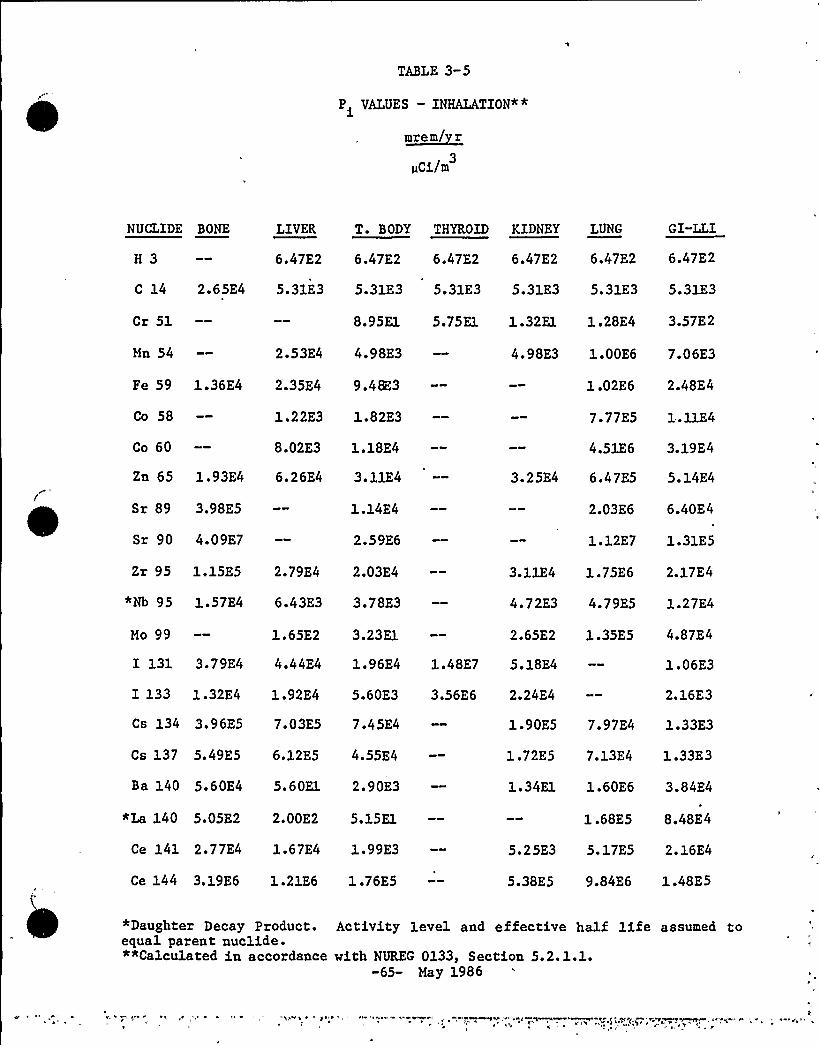
TABLE 3-5
P VALUES — INHALATION+*
m~rem/ r
uci/m3
NUCLIDE BONE LIVER Y. BODY YHYROID KIDNEY LUNG GI-LLI
H 3
C 14 2.65E4
Cr 51
Mn 54
5.31E3 5.31E3 5.31E3 5.31E3 5.31E3 5.31E3
8.95E1 5.75E1 1.32E1 1.28E4 3.57E2
2.53E4 4.98E3 4.98E3 1.00E6 7.06E3
6.47E2 6.47E2 6.47E2 6.47E2 6.47E2 6.47E2
Fe 59 1.36E4 2.35E4 9.48E3
Co 58
Co 60
1.22E3 1.82E3
8.02E3 1.18E4
Zn 65 1.93E4 6.26E4 3.11E4
1.02E6 2.48E4
7. 77E5 1'lE44.51E6 3. 19E4
3.25E4 6.47E5 5.14E4
Sr 89 3.98E5
Sr 90 4.09E7
1.14E4
2.59E6
2.03E6 6.40E4
1.12E7 1-31E5
Mo 99 1.65E2 3.23El
Zr 95 1.15E5 2.79E4 2.03E4
*Nb 95 1.57E4 6.43E3 3.78E3
3.11E4 1.75E6 2.17E4
4.72E3 4.79E5 1.27E4
2.65E2 1.35E5 4.87E4
I 131 3.79E4 4.44E4 1.96E4 1.48E7 5.18E4
I 133 1.32E4 1.92E4 5.60E3 3.56E6 2.24E4
1.06E3
2. 16E3
Cs 134 3.96E5 7.03E5 7.45E4
Cs 137 5.49E5 6.12E5 4.55E4
Ba 140 5.60E4 5.60El 2. 90E3
*La 140 5.05E2 2.00E2 5.15El
Ce 141 2.77E4 1.67E4 1.99E3
Ce 144 3.19E6 1.21E6 1.76E5
1.68E5 8.48E4
5.25E3 5.17E5 2.16E4
5.38E5 9.84E6 1.48E5
1.90E5 7.97E4 1.33E3
1.72E5 7.13E4 1.33E3
1.34E1 1.60E6 3.84E4
*Daughter Decay Product. Activity level and effective half life assumed toequal parent nuclide.""Calculated in accordance with NUREG 0133, Section 5.2. 1.1.
-65- May 1986
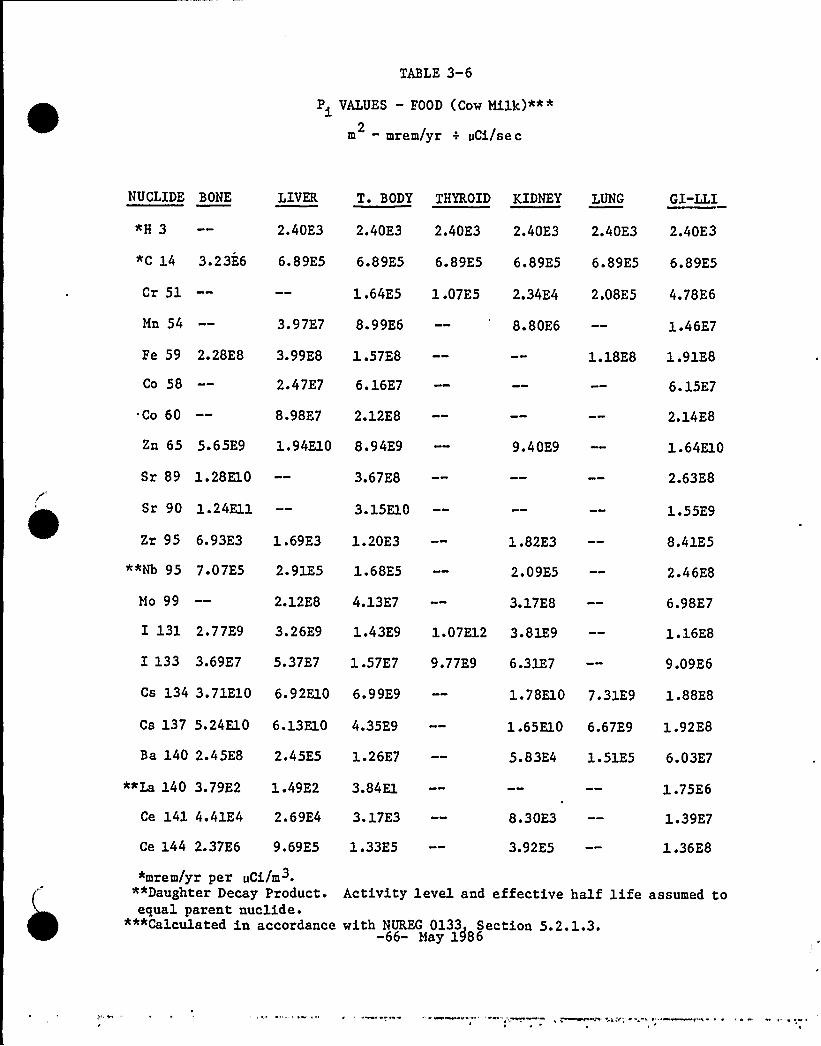
TABLE 3-6
P VALUES — FOOD (Cow Milk)*+*im —mrem/yr — uCi/se c
2
NUGLIDE BONE LIVER Y ~ BODY YHYEOYD KIDNEY LUNG GI-LLI
*H 3 2.40E3 2.40E3 2.40E3 2.40E3 2.40E3 2.40E3
*C 14 3.23E6 6.89E5 6.89E5 6.89E5 6.89E5 6.89E5 6.89E5
Cr 51 1.64E5 1.07E5 2.34E4 2.08E5 4.78E6
Mn 54 3.97E7
Fe 59 2.28E8 3.99ES
Co 58 2.47E7
Co 60 8.98E7
8. 99E6 8.80E6
1.57ES
6.16E7
2.12ES
Zn 65 5.65E9 1.94E10 8.94E9 9.40E9
Sr 89 1.28E10
Sr 90 1.24E11
Zr 95 6.93E3 1 .69E3
*"Nb 95 7.07E5 2.91E5
Mo 99 2.12E8
3.67E8
3. 15E10
1.20E3
1.68E5
4.13E7
1.82E3
2.09E5
3. 17E8
I 131 2.77E9 3.26E9 1.43E9 1.07E12 3.81E9
I 133 3.69E7 5.37E7 1.57E7 9.77E9 6.31E7
1.18ES
1.46E7
1.91ES
6. 15E7
2.14E8
l.64E10
2.63ES
1.55E9
8.41E5
2.46ES
6.98E7
1.16E8
9.09E6
Cs 134 3.71E10 6.92E10 6.99E9 1.78E10 7.31E9 1.88E8
Cs 137 5.24E10 6.13E10 4.35E9 1.65E10 6.67E9 1.92ES
Ba 140 2.45E8 2.45E5 1.26E7 5.83E4 1.51E5 6.03E7
*«La 140 3.79E2 1.49E2
Ce 141 4.41E4 2.69E4
Ce 144 2.37E6 9.69E5
3.84El
3.17E3
1N33E5
8.30E3
3.92E5
1.75E6
1.39E7
1.36ES
*mrem/yr per uCi/m3.~*Daughter Decay Product.equal parent nuclide.
***Calculated in accordance
Activity level and effective half life assumed to
with NUREG 0133 Section 5.2.1.3.-66- May 1586
~ ~~ ~
TABLE 3-7
R VALUES .— ZÃiALATION— INFANT**im~rem/ ruci/m3
G I-LLI6.47E2
LUNG
6.47E2
T. BODY THYROID KIDNEYLIVER
6.47E2
NUCLIDE BONE
H 3
C. 14
6.47E2 6.47E2 6.47E2
5.31E3 5. 31E3 5. 31E32. 65E4 5. 31E3 5.31E3 5.31E3
Cr 51
Mn 54
Fe 59
Co 58
Co 60
Zn 65
2.53E4 4.98E3
1.36E4 2.35E4 9.48E3
1.22E3 1.82E3
8.02E3 1.18E41.93E4 6.26E4 3.11E4
4.98E3 1.00E6
1.02E6
7. 77E5
4.51E6
3.25E4 6.47E5
7.06E3
2.48E4
1.11E4
3. 19E4
5.14E4
8.95El 5.75E1 1.32E1 1.28E4 3.57E2
Sr 89 3.98E5
Sr 90 4.09E7
1.14E4
-2.59E6
2.03E6 6.40E4
1.12E7 1.31E5
Zr 95 1.15E5 2.79E4 2.03E4"Nb 95 1.57E4 6.43E3 3.78E3
3. 11E4 1.75E6 2. 17E4
4.72E3 4.79E5 1.27E4Mo 99
I-131 3.79E4
I 133 1.32E4Cs 134 3.96E5
1.65E24.44E4
1.92E47.03E5
3.23E11.96E4
5.60E3
7.45E4
1.48E7
3.56E6
2.65E2
5. 18E4,
2.24E4
1.90E5
1.35E5
7.97E4
4.87E4
1.06E3
2. 16E3
1.33E3Cs 137 5.49E5
Ba 140 5.60E4
6. 12E5 4.55E4
5.60E1 2.90E31 .72E5 7.13E4
1.34E1 1.60E6
1 e33E3
3.84E4
"La 140
Ce 141
5.05E2 2.00E2 5.15E1
2.77E4 1.67E4 1.99E3
Ce 144 3.19E6 1.21E6 1.76E5
1.68E5 8.48E4
5.25E3 5.17E5 2.16E4
5.38E5 9.84E6 1.48E5
*Daughter Decay Product. Activity level and effective half life assumed toequal parent nuclide.«*This and following R Tables Calculated in accordance with NUREG 0133,Section 5.3. 1, excpet C 14 values in accordance with Regulatory Guide 1.109Equation C-8.
-67- May 1986
TABLE 3-8
R VALUES — INHALATION- CHILD
m~reml rnCi/m
3
NUCLIDE BONE
H 3
LIVER T. BODY THYROID KIDNEY LUNG GI-LLI
1.12E3 1.12E3 1.12E3 1.12E3 1.12E3 1.12E3
C 14 3.59E4 6.73E3 6.73E3 6.73E3 6.73E3 6.73E3 6.73E3
Cr 51
Mn 54 4.29E4 9.51E3 1.00E4 1-58E6 2.29E4
1.54E2 8.55El 2.43E1 1.70E4 1 .08E3
Pe 59 2.07E4 3.34E4 1.67E4
Co 58
Co 60
1.77E3 3.16E3
1.31E4 2.26E4
Zn 65 4.26E4 1.13E5 7.03E4
1.27E6 7.07E4
1. 11E6 3. 44E4
7.07E6 9.62E4
7.14E4 9.95E5 1.63E4
Sr 89 5.99E5
Sr 90 1.01E8
1.72E4
6.44E6
2. 16E6 1 .67E5
1.48E7 3.43E5
Mo 99 1.72E2 4.26El
Zr 95 1.90E5 4.18E4 3.70E4
*Nb 95 2.35E4 9. 18E3 6.55E3
5.96E4 2.23E6 6-11E4
8.62E3 6.14E5 3.70E4
3.92E2 1.35E5 1.27E5
I 131 4.81E4 4.81E4 2.73E4 1.62E7 7.88E4
I 133 1.66E4 2.03E4 7.70E3 3.85E6 3.38E4
2.84E3
5.48E3
Cs 134 6. 51E5 1.01E6 2.25E5
Cs 137 9.07E5 8.25E5 1.28E5
Ba 140 7.40E4 6.48E1 4.33E3
*La 140 6.44E2 2. 25E2 7.55El
Ce 141 3.92E4 1.95E4 2.90E3
Ce 144 6.77E6 2. 12E6 3.61E5
3.30E5 1.21E5 3. 85E3
2.82E5 1 .04E5 3.62E3
2. 11El 1.74E6 1.02E5
1.83E5 2.26E5
8. 55E3 5.44E5 5. 66E4
1.17E6 1.20E7 3.89E5
*Daughter Decay Product. Activity level and effective half life assumed toequal parent nuclide.
-68- May 1986
TABLE 3-9
R VALUES — INHALATION —TEEN
m~rem/ r
uCi/m3
NUCLIDE BONE LIVER I. BODY IHYEOID KIDNEY LUNG GI-LLI
H 3 1.27E3 1.27E3 1.27E3 1.27E3 1.27E3 '1.27E3
C 14 2.60E4 4.87E3 4.87E3 4.87E3 4.87E3 4.87E3 4.87E3
Cr 51
Mn 54 5.11E4 8.40E3 1.27E4 1.98E6 6.68E4
1.35E2 7.50E1 3.07E1 2.10E4 3.00E3
Fe 59 1.59E4 3.70E4 1.43E4
Co 58
Co 60
2.07E3 2.78E3
1.51E4 1.98E4
Zn 65 3.86E4 1.34E5 6.24E4
1.53E6 1.78E5
1.34E6 9.52E4
8.72E6 2.59E5
8.64E4 1.24E6 4.66E4
Sr 89 4.34E5
Sr 90 1.08E8
1.25E4
6.68E6
2.42E6 3.71E5
1.65E7 7.65E5
Mo 99 1.69E2 3.22E1
Zr 95 1.46E5 4.58E4 3.15E4
*Nb 95 1.86E4 1.03E4 5.66E3
6.74E4 2.69E6 1.49E5
1. 00E4 7. 51E5 9. 68E4
4.11E2 1.54E5 2.69E5
I 131 3.54E4 4.91E4 2.64E4 1.46E7 8.40E4
I 133 1.22E4 2.05E4 6.22E3 2.92E6 3.59E4
6.49E3
1.03E4
Cs 134 5.02E5 1.13E6 5.49E5
Cs 137 6.70E5 8.48E5 3.11E5
Ba 140 5.47E4 6.70E1 3.52E3
*La 140 4.79E2 2.36E2 6.26E1
Ce 141 2.84E4 1.90E4 2.17E3
Ce 144 4.89E6 2.02E6 2.62E5
3.75E5 1.46E5 9.76E3
3.04E5 1.21E5 8.48E3
2. 28E1 2. 03E6 2. 29E5
2. 14E5 4.87E5
8. 88E3 6. 14E5 1.26E5
1.21E6 1.34E7 8.64E5
*Daughter Decay Product. Activity level and effective half life assumed toequal parent nuclide.
-69- May 1986

TABLE 3-10
R VALUES —INHALATION —ADULTim~rem/ r
pCi/m3
NUCLIDE BONE LIVER Y. BODY YHYROID KIDNEY LUNG GI-LLI
H 3 1.26E3 1 .26E3 1.26E3 1.26E3 1 .26E3 1.26E3
C 14 1.82E4 3.41E3 3.41E3 3.41E3 3.41E3 3.41E3 3.41E3
Cr 51
Mn 54 3. 96E4 6.30E3 9. 84E3 1.40E6 7. 74E4
1.00E2 5.95E1 2.28E1 1.44E4 3.32E3
Fe 59 1.18E4 2.78E4 1.06E4
Co 58
Co 60
1.58E3 2.07E3
1.15E4 1.48E4
Zn 65 3.24E4 1.03E5 4.66E4
1.02E6 1-88E5
9.28E5 1.06E5
5.97E6 2.85E5
6.90E4 8.64E5 5.34E4
Sr 89 3.04E5
Sr 90 9.92E7
8.72E3
6.10E6
1.40E6 3.50E5
9.60E6 7.22E5
Mo 99 1.21E2 2.30E1
Zr 95 1.07E5 3.44E4 2.33E4
*Nb 95 1.41E4 7.82E3 4.21E3
5.42E4 1.77E6 1.50E5
7.74E3 5.05E5 1.04E5
2.91E2 9. 12E4 2.48E5
I 131 2.52E4 3.58E4 2.05E4 1.19E7 6.13E4
I 133 8.64E3 1.48E4 4.52E3 2.15E6 2.58E4
6. 28E3
8.88E3
Cs 134 3.73E5 8.48E5 7.28E5
Cs 137 4.78E5 6.21E5 4.28E5
Ba 140 3.90E4 4.90E1 2.57E3
*La 140 3.44E2 1.74E2 4.58El
Ce 141 1-99E4 1.35E4 1.53E3
Ce 144 3.43E6 1.43E6 1.84E5
2.87E5 9.76E4 1.04E4
2.22E5 7.52E4 8.40E3
1.67E1 1.27E6 2.18E5
1.36E5 4.58E5
6.26E3 3. 62E5 1.20E5
8.48E5 7.78E6 8.16E5
*Daughter Decay Product. Activity level and effective half life assumed toequal parent nuclide.
-70- May 1986
TABLE 3-11
R VALUES —GROUND PLANEiALL AGE GROUPS
m - mrem/yr -.'pCi/se c2
NUCLIDE TOTAL BODY SKIN
H 3
C 14
Cr 51
Mn 54
Fe 59
Co 58
Co 60
Zn 65
Sr 89
Sr 90
Zr'5*Nb 95
Mo 99
I 131
I 133
Cs 134
Cs 137
Ba 140
«La 140
Ce 141
Ce 144
4.65E6
1.40E9
2.73E8
3.80E8
2. 15E10
7.46E8
2. 16E4
2.45E8
2.50E8
3.99E6
1.72E7
2.45E6
6. 83E9
1 .03E10
2.05E7
1.47E8
1.37E7
6.96E7
5.50E6
1.64E9
3.20E8
4.45E8
2.53E10
8.57E8
2.51E4
2.85E8
2. 94E8
4.63E6
2.09E7
2.98E6
7.97E9
1.20E10
2.35E7
1.66E8
1.54E7
8.07E7
*Daughter Decay Product. Activity level and effective half life assumedto equal. parent nuclide.
-7>- May 1986
NUCLIDE BONE LIVER
TABLE 3-12
R VALUES — COW MILK —INFANTi2
m harem/yr -'. uCi/sec
Y. BODY YHYROYD KIDNEY LUNG GI-LLI
*H 3 2.38E3 2.38E3 2.38E3 2.38E3 2.38E3 2.38E3
*C 14 3.23E6 6.89E5 6.89E5 6.89E5 6.89E5 6.89E5 6.89E5
Cr 51
Mn 54 2.51E7 5.68E6 5.56E6 9.21E6
8.35E4 5.45E4 1.19E4 1 .06E5 2.43E6
Fe 59 1.22ES 2.13E8 8.38E7
Co 58
Co 60
1.39E7 3.46E7
5.90E7 1.39ES
Zn 65 3.53E9 1.21E10 5.58E9 5.87E9
Sr 89 6.93E9
Sr 90 8.19E10
1.99E8
2.09E10
Zr 95 3.85E3 9.39E2 6.66E2
**Nb 95 3. 93E5 1.62E5 9.35E4
1 .01E3
1.16E5
Mo 99 1.04ES 2.03E7 1.55ES
I 131 1.36E9 1.60E9 7.04E8 5.26E11 1.87E9
I 133 1.81E7 2.64E7 7.72E6 4.79E9 3.10E7
6.29E7 1.02E8
3.46E7
1.40ES
1. 02E10
1.42ES
1.02E9
4.68E5
1.37E8
3.43E7
5.72E7
4.46E6
Cs 134 2.41E10 4.49E10 4.54E9
Cs 137 3.47E10 4.06E10 2.88E9
Ba 140 1.21E8 1.21E5 6.22E6
**La 140 1.86E2 7.35E1 1.89E1
Ce 141 2.28E4 1.39E4 1.64E3
Ce 144 1.49E6 6.10E5 8.34E4
4.28E3
2.46E5
8.63E5
7.18E6
8.54E7
1.16E10 4.74E9 1.22E8
1.09E10 4.41E9 1.27E8
2.87E4 7.42E4 2.97E7
*mrem/yr per uCi/m«*Daughter Decay Product. Activity level and effective half life assumed toequal parent nuclide.
May 1986
NUCLIDE BONE LIVER
TABLE 3-13
R VALUES —COW MILK - CHILDi2
m harem/yr -'. uCi/sec
Y. BODY YHYROID KIDNEY LUNG GI-LLI
*H 3 1.57E3 1.57E3 1.57E3 1 .57E3 1.57E3 1 .57E3
*C 14 1.65E6 3.29E5 3.29E5 3.29E5 3.29E5 3.29E5 3.29E5
Cr 51
Mn 54 1.35E7 3.59E6 3. 78E6 1.13E7
5.27E4 2.93E4 7.99E3 5.34E4 2.80E6
Fe 59 6.52E7 1.06ES 5.26E7
Co 58
Co 60
6.94E6 2.13E7
2.89E7 8.52E7
Zn 65 2.63E9 7.00E9 4.35E9 4.41E9
Sr 89 3.64E9
Sr 90 7.53E10
1.04E8
1.91E10
Zr 95 2.17E3 4.77E2 4.25E2
**Nb 95 2.10E5 8.19E4 5.85E4
Mo 99 4.07E7 1 .01E7
6.83E2
7. 70E4
8.69E7
I 131 6.51ES 6.55ES 3.72E8 2. 17E11 1.08E9
I 133 8.58E6 1.06E7 4.01E6 1.97E9 1.77E7
3.06E7 1. 10E8
4.05E7
1.60E8
1.23E9
1.41ES
1.01E9
4.98E5
1.52ES
3.37E7
5.83E7
4.27E6
Cs 134 1.50E10 2.45E10 5.18E9
Cs 137 2.17E10 2.08E10 3.07E9
Ba 140 5.87E7 5.14E4 3.43E6
*"La 140 8.92E1 3.12E1 1.05El
Ce 141 1.15E4 5.73E3 8.51E2
Ce 144 1.04E6 3.26E5 5.55E4
2.51E3
1.80E5
8.69E5
7.15E6
8.49E7
7. 61E9 2. 73E9 1.32E8
6.78E9 2.44E9 1.30E8
1.67E4 3.07E4 2.97E7
*mrem/yr per uCi/m**Daughter Decay Product. Activity level and effective half life assumed toequal parent nuclide.
-73- May 1986
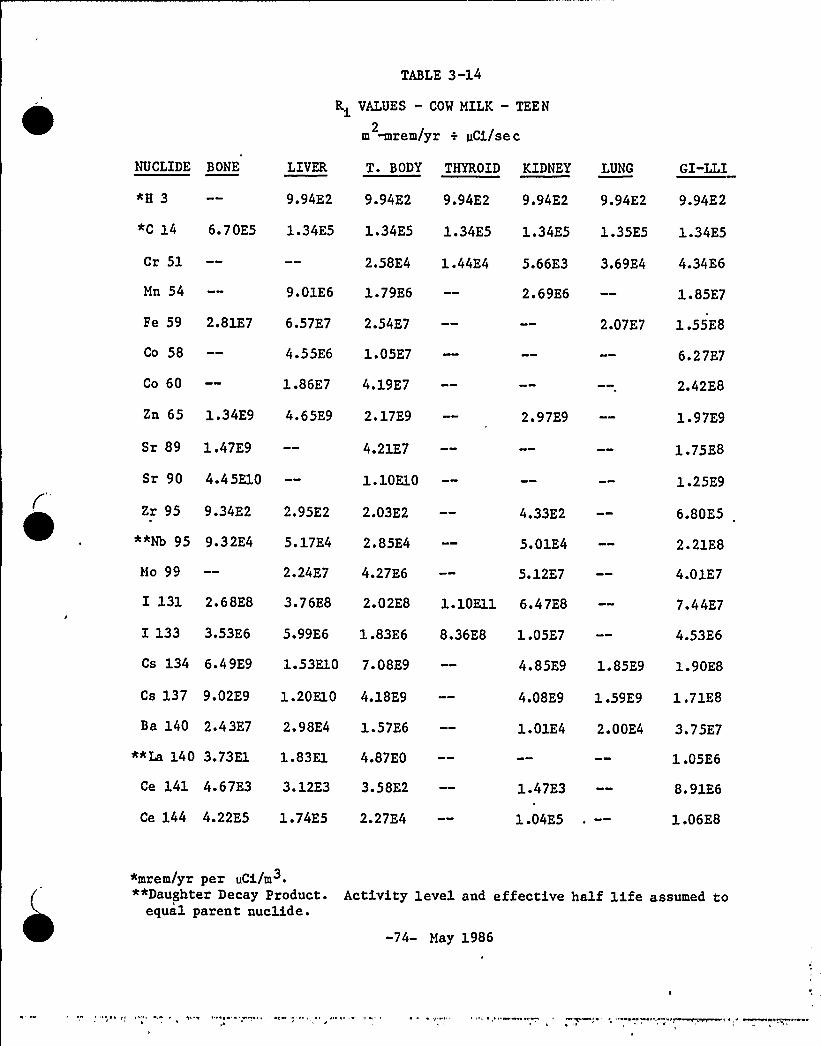
NUCLIDE BONE LIVER
TABLE 3-14
Ri VALUES - COW MILK - TEEN
2m harem/yr -'. uCi/sec
Y. BODY IHYEOID KIDNEY LUNG GI-LLI
*H 3 9.94E2 9.94E2 9.94E2 9.94E2 9.94E2 9.94E2
*C 14 6.70E5 1.34E5 1.34E5 1.34E5 1.34E5 1-35E5 1-34E5
Cr 51
Mn 54 9.01E6 1.79E6 2.69E6 1.85E7
2.58E4 1.44E4 5.66E3 3.69E4 4.34E6
Fe 59 2.81E7 6.57E7 2.54E7
Co 58
Co 60
4.55E6 1.05E7
1.86E7 4.19E7
Zn 65 1.34E9 4.65E9 2.17E9 2.97E9
Sr 89 1.47E9
Sr 90 4.45E10
4.21E7
1.10E10
Zr 95 9.34E2 2.95E2 2.03E2
**Nb 95 9.32E4 5.17E4 2.85E4
Mo 99 2.24E7 4.27E6
4.33E2
5.01E4
5.12E7
I 131 2.68ES 3.76ES 2.02E8 1.10E11 6.47E8
I 133 3.53E6 5.99E6 1.83E6 8.36E8 1.05E7
2.07E7 1.55ES
6. 27E7
2.42E8
1.97E9
1.75ES
1.25E9
6.80E5
2.21ES
4.01E7
7.44E7
4.53E6
Cs 134 6.49E9 1.53E10 7.08E9
Cs 137 9.02E9 1.20E10 4.18E9
Ba 140 2.43E7 2.98E4 1.57E6
**La 140 3.73E1 1.83E1 4.87EO
Ce 141 4.67E3 3.12E3 3.58E2
Ce 144 4.22E5 1.74E5 2.27E4
1.47E3
1.04E5
1.05E6
8.91E6
1.06E8
4.85E9 1.85E9 1.90ES
4.08E9 1.59E9 1.71ES
1.01E4 2.00E4 3.75E7
"mrem/yr per uCi/m**Daughter Decay Product. Activity level and effective half life assumed to
equal parent nuclide.-74- May 1986

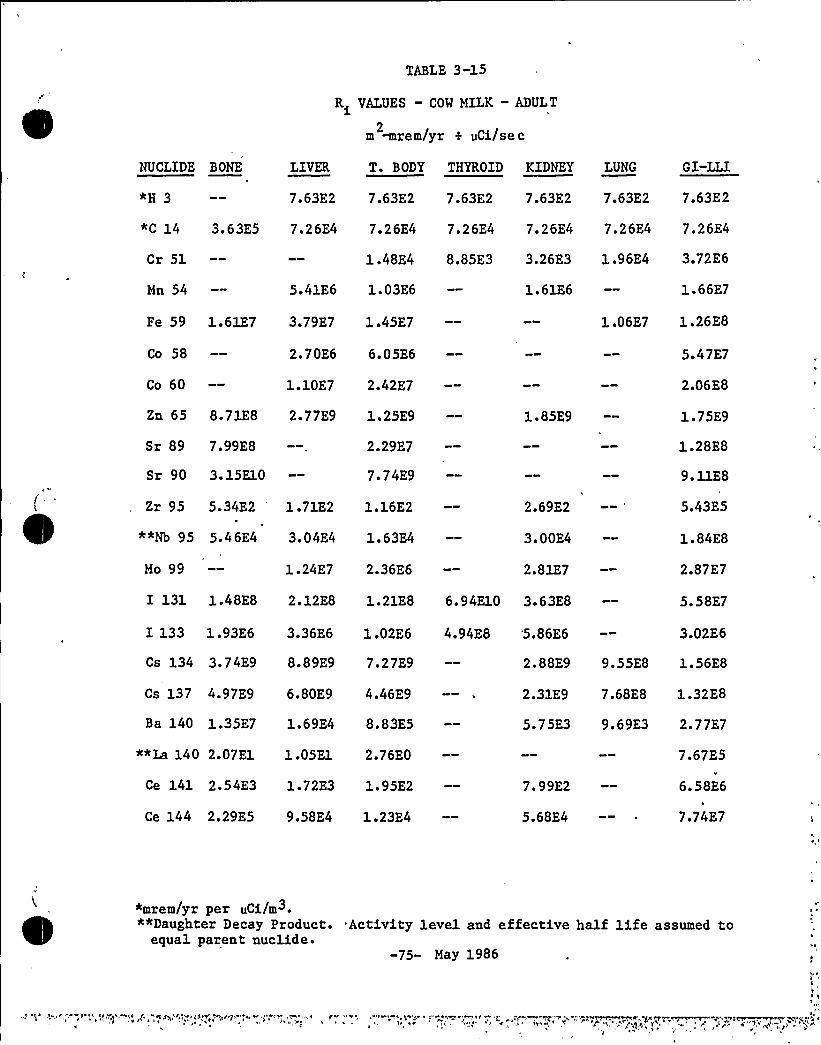
NUCLIDE BONE LIVER
TABLE 3-15
R VALUES —COW MILK —ADULTim ~rem/yr -'. uCi/sec2
1. BODY YHYROID KIDNEY LUNG GI-LLI
*H 3 7.63E2 7.63E2 7.63E2 7.63E2 7.63E2 7.63E2
*C 14 3.63E5 7.26E4 7.26E4 7.26E4 7.26E4 7.26E4 7.26E4
Cr 51
Mn 54 5.41E6 1.03E6 1.61E6 1.66E7
1.48E4 8.85E3 3.26E3 1.96E4 3.72E6
Fe 59 1.61E7 3.79E7 1.45E7
Co 58
Co 60
2.70E6 6.05E6
1.10E7 2.42E7
Zn 65 8.71ES 2.77E9 1.25E9 1.85E9
Sr 89 7.99E8
Sr 90 3.15E10
2.29E7
7.74E9
Zr 95 5.34E2 1.71E2 1.16E2
**Nb 95 5.46E4 3.04E4 1.63E4
Mo 99 1.24E7 2.36E6
2.69E2
3. 00E4
2.81E7
I 133 1.93E6 3.36E6 1.02E6 4.94E8 '5.86E6
I 131 1.48E8 2. 12E8 1. 21ES 6. 94E10 3. 63ES
1.06E7 1.26E8
5.47E7
2.06ES
1.75E9
1.28ES
9.11ES
5.43E5
1.84E8
2.87E7
5. 58E7
3.02E6
Cs 134 3.74E9 8.89E9 7.27E9
Cs 137 4.97E9 6.80E9 4.46E9
Ba 140 1.35E7 1.69E4 8.83E5
"*La 140 2.07E1 1.05E1 2.76EO
Ce 141 2.54E3 1.72E3 1.95E2
Ce 144 2.29E5 9.58E4 1.23E4
7. 99E2
5.68E4
7.67E5V
6.58E6
7.74E7
2.88E9 9.55E8 1.56E8
2.31E9 7.68E8 1.32ES
5.75E3 9.69E3 2.77E7
"mrem/yr per uCi/m"*Daughter Decay Product. -Activity level and effective half life assumed to
equal parent nuclide.-75- May 1986
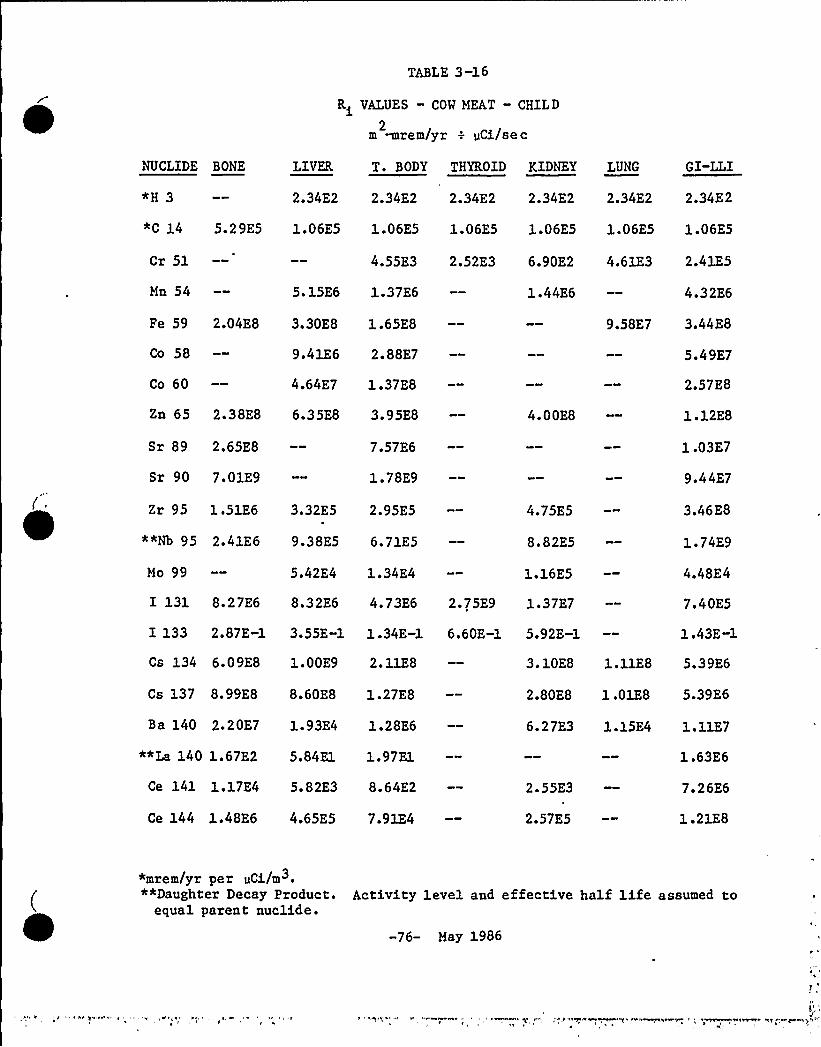
NUCLIDE BONE LIVER
TABLE 3-16
R VALUES — COW MEAT - CHILD
2m ~rem/yr -'. pCi/se c
Y. BODY YHYROID KIDNEY LUNG GI-LLI
"H 3 2.34E2 2.34E2 2.34E2 2.34E2 2.34E2 2.34E2
*C 14 5.29E5 1.06E5 1.06E5 1.06E5 1.06E5 1.06E5 1.06E5
Cr 51
Mn 54 5.15E6 1.37E6 1.44E6 4.32E6
4.55E3 2.52E3 6.90E2 4.61E3 2.41E5
Fe 59 2.04ES 3.30E8 1.65ES
Co 58
Co 60
9.41E6 2. 88E7
4.64E7 1.37E8
Zn 65 2.38E8 6.35ES 3.95E8 4.00ES
Sr 89 2.65E8
Sr 90 7.01E9
7.57E6
1.78E9
Zr 95 1.51E6 3.32E5 2.95E5
**Nb 95 2.41E6 9.38E5 6. 71E5
Mo 99 5.42E4 1.34E4
4.75E5
8.82E5
1.16E5
I 131 8.27E6 8.32E6 4.73E6 2.75E9 1.37E7
I 133 2.87E-1 3.55E-1 1 .34E-1 6.60E-1 5.92E-1
9.58E7 3.44ES
5.49E7
2.57E8
1.12ES
1.03E7
9.44E7
3.46ES
1.74E9
4.48E4
7.40E5
1.43E-1
Cs 134 6.09ES 1.00E9 2.11ES
Cs 137 8.99E8 8.60ES 1.27E8
Ba 140 2.20E7 1.93E4 1.28E6
"*La 140 1.67E2 5.84E1 1.97E1
Ce 141 1.17E4 5.82E3 8.64E2
Ce 144 1.48E6 4.65E5 7.91E4
2.55E3
2.57E5
1.63E6
7.26E6
1.21E8
3.10E8 1.11ES 5.39E6
2.80E8 1 .01E8 5.39E6
6.27E3 1.15E4 1.11E7
*mrem/yr per uCi/m*~Daughter Decay Product. Activity level and effective half life assumed to
equal parent nuclide.-76- May 1986
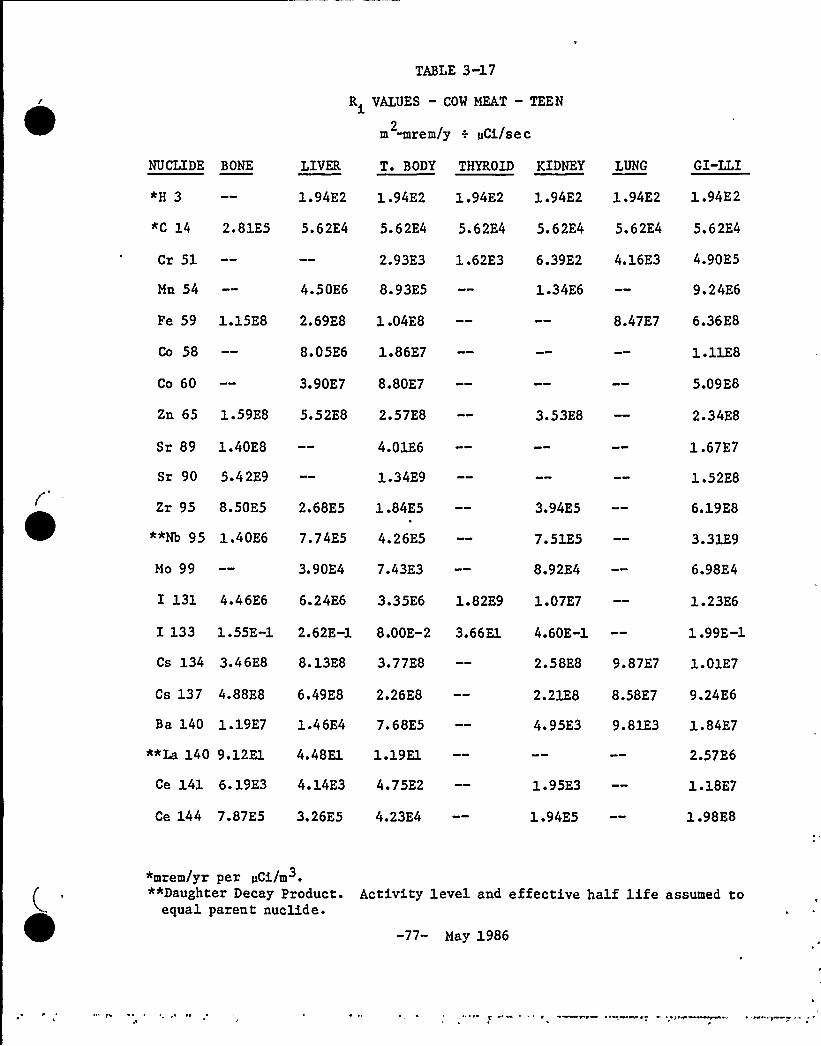
NUCLIDE BONE LIVER
TABLE 3-17
R VALUES —COW MEAT - TEENim harem/y —. pCi/sec2
Y. BODY YHYROYD KIDNEY LUNG GI-LLI
*H 3 1.94E2 1.94E2 1.94E2 1.94E2 1.94E2 1.94E2
*C 14 2.81E5 5.62E4 5.62E4 5.62E4 5.62E4 5.62E4 5.62E4
Cr 51
Mn 54 4.50E6 8.93E5 1.34E6 9.24E6
2.93E3 1.62E3 6.39E2 4.16E3 4.90E5
Fe 59 1.15ES 2.69ES 1 .04ES
Co 58
Co 60
8.05E6 1.86E7
3.90E7 8.80E7
Zn 65 1.59E8 5.52ES 2.57E8 3.53ES
Sr 89 1.40E8
Sr 90 5.42E9
4.01E6
1.34E9
Zr 95 8.50E5 2.68E5 1 .84E5
**Nb 95 1.40E6 7.74E5 4.26E5
Mo 99 3.90E4 7.43E3
3.94E5
7. 51E5
8.92E4
I 133 1.55E-1 2.62E-l S.OOE-2 3.66El 4.60E-1
I 131 4.46E6 6.24E6 3.35E6 1.82E9 1.07E7
8.47E7 6.36E8
l.11ES
5.09E8
2.34ES
1.67E7
1.52E8
6. 19E8
3.31E9
6.98E4
1.23E6
1.99E-1
Cs 134 3.46ES 8. 13E8 3.77ES
Cs 137 4.88ES 6.49E8 2.26ES
Ba 140 1.19E7 1.46E4 7.68E5
*"La 140 9.12E1 4.48El 1.19E1
Ce 141 6.19E3 4.14E3 4.75E2
Ce 144 7.87E5 3.26E5 4.23E4
1.95E3
1.94E5
2.57E6
1.18E7
1-98ES
2. 58ES 9. 87E7 1. 01E7
2.21ES 8.58E7 9.24E6
4.95E3 9.81E3 1.84E7
*mrem/yr per pCi/m3.+*Daughter Decay Product. Activity level and effective half life assumed to
equal parent nuclide.-77- May 1986
NUCLIDE BONE jIVER
TABLE 3-18
R VALUES — COW MEAT —ADULTi2
m ~rem/yr -.'uCi/sec
T. BODY THYROID KIDNEY jUNG GI-jjI*H 3 3.25E2 3.25E2 3.25E2 3.25E2 3.25E2 3.25E2
AC 14 3.33E5 6. 66E4 6. 66E4 6. 66E4 6. 66E4 6. 66E4 6. 66E4
Cr 51
Mn 54 5.90E6 1.13E6 1.'76E6 1.81E7
3.65E3 2.18E3 8.03E2 4.84E3 9.17E5
Fe 59 1.44ES 3.39E8 1.30ES
Co 58
Co 60
1.04E7 2.34E7
5.03E7 1.11E8
Zn 65 2.26ES 7.19E8 3.25E8 4.81E8
Sr 89 1.66E8
Sr 90 8.38E9
4.76E6
2.06E9
Zr 95 1.06E6 3.40E5 2.30E5
**Nb 95 1.79E6 9.94E5 5.35E5
Mo 99 4.71E4 8.97E3
5.34E5
9.83E5
1.07E5
I 133 1.85E-l 3.22E-1 9.81E-2 4.73El 5.61E-1
I 131 5.37E6 7.67E6 4.40E6 2.52E9 1.32E7
9.46E7 1.13E9
2.12ES
9.45ES
~ 4. 53ES
2.66E7
2.42E8
1.08E9
6.04E9
1.09E5
2.02E6
2.89E-1
Cs 134 4.35E8 1.03E9 8.45E8
Cs 137 5.88ES 8.04ES 5.26E8
Ba 140 1.44E7 1.81E4 9.44E5
"*La 140 1.11E2 5.59El 1.48El
Ce 141 7.38E3 4.99E3 5.66E2
Ce 144 9.33E5 3.90E5 5.01E4
2.32E3
2.31E5
4. 10E6
1.91E7
3. 16E8
3.35ES l.11E8 1. 81E7
2.73ES 9.07E7 1.56E7
6. 15E3 1.04E4 2.97E7
"mrem/yr per >iCi/m~"Daughter Decay Product. Activity level and effective half life assumed to
equal parent nuclide.-78- May 1986
TABLE 3-19
R VALUES — VEGETATION —CHILD
m ~rem/yr —. pCi/sec2
NUCLIDE BONE I IVER 1. BODY THYROID KIDNEY LUNG G I-LLI
~H 3 4.01E3 4.01E3 4.01E3 4.01E3 4.01E3 4.01E3
"C 14 3.50E6 7.01E5 7.01E5 7.01E5 7.01E5 7.01E5 7.01E5
Cr 51
Mn 54 6.65E8 1.77E8 1.86ES
1.17E5 6.49E4 1.77E4 1.18E5 6.20E6
5.58E8
Fe 59 3.97E8 6.42E8 3.20E8
Co 58
Co 60
6.45E7 1.97E8
3.78E8 1.12E9
Zn 65 8.12E8 2.16E9 1.35E9 1.36E9
Sr 89 3.59E10
Sr 90 1.24E12
1.03E9
3. 15E11
Zr 95 3.86E6 8.50E5 7.56E5
**Nb 95 7.50E5 2.92E5 2.09E5
Mo 99 7.70E6 1.91E6
I 131 1.43ES 1.44E8 8.16E7
1.22E6
2.74E5
1.65E7
4.75E10 2.36E8
I 133 3.52E6 4.35E6 1.65E6 8.08E8 7.25E6
1.86E8 6.69E8
3.76ES
2. 10E9
3. 80E8
1.39E9
1.67E10
8.86E8
5.40E8
6.37E6
1.28E7
1.75E6
Cs 134 1.60E10 2.63E10 5.55E9
Cs 137 2.39E10 2.29E10 3.38E9
Ba 140 2.77ES 2.43E5 1.62E7
**La 140 3.37E4 1.18E4 3.97E3
Ce 141 6.56E5 3.27E5 4.85E4
Ce 144 1.27ES 3.98E7 6.78E6
1.43E5
2.21E7
3.28E8
4.08E8
1 .04 E10
8. 15E9 2. 93E9 1.42ES
7.46E9 2.68E9 1.43ES
7. 90E4 1.45E5 1.40ES
«mrem/yr per uCi/m ~
""Daughter Decay Product. Activity level and effective half life assumed toequal parent nuclide.
-79- May 1986
NUCLIDE BONE LIVER
TABLE 3-20
R VALUES - VEGETATION — TEENi2
m ~rem/yr -'. uCi/sec
T. BODY THYROID KIDNEY LUNG GI-LLI
«H 3 2.59E3 2.59E3 2.59E3 2.59E3 2.59E3 2.59E3
*C 14 1.45E6 2.91E5 2. 91E5 2. 91E5 2. 91E5 2. 91E5 2. 91E5
Cr 51
Mn 54 4.54ES 9.01E7 1.36ES 9.32ES
6.16E4 3.42E4 1.35E4 8.79E4 1.03E7
Fe 59 1.79ES 4.18ES 1.61E8
Co 60
4.37E7 1.01E8
2.49ES 5.60E8
Zn 65 4.24E8 1.47E9 6.86E8 9.41ES
Sr 89 1.51E10
Sr 90 7.51Ell
4.33ES
1.85E11
Zr 95 1.72E6 5.44E5 3.74E5
**Nb 95 3.44E5 1.91E5 1.05E5
Mo 99 5.64E6 1.08E6
7.99E5
1.85E5
1.29E7
I 131 7. 68E7 1.07E8 5. 78E7 3. 14E10 l.85E8
I 133 1.93E6 3.27E6 9.98E5 4.57ES 5.74E6
1.32E8 9.89ES
6. 02E8
3.24E9
6.23ES
1.80E9
2.11E10
1.26E9
8. 16ES
1 .01E7
2. 13E7
2.48E6
Cs 134 7.10E9 1.67E10 7.75E9
Cs 137 1.01E10 1.35E10 4.69E9
Ba 140 1.38E8 1.69E5 8. 91E6
5.31E9 2.03E9 2.08E8
4.59E9 1.78E9 1.92ES
5. 74E4 1. 14E5 2. 13E8
**La 140 1.69E4 8.32E3 2.21E3
Ce 141 2.83E5 1.89E5 2.17E4
Ce 144 5.27E7 2.18E7 2.83E6
8.89E4
1.30E7
4.78ES
5.40E8
1.33E10
>mrem/yr per uCi/m««Daughter Decay Product. Activity level and effective half life assumed to
equal parent nuclide.-80- May 1986
TABLE 3-21
R VALUES - VEGETATION —ADULTim ~rem/yr —. pCi/sec2
NUCLIDE BONE LIVER T. BODY THYROID KIDNEY LUNG GI-LLI
+H 3 2.26E3 2.26E3 2.26E3 2.26E3 2.26E3 2.26E3
*C 14 8.97E5 1.79E5 1.79E5 1.79E5 1.79E5 1.79E5 1.79E5
Cr 51 4.64E4 2.77E4 1.02E4 6.15E4 1.17E7
Mn 54 3.13E8
Pe 59 1.26E8 2.96E8
Co 58 3.08E7
Co 60 1.67ES
Zn 65 3.17ES 1.01E9
Sr 89 9.96E9
Sr 90 6.05Ell
5. 97E7 9.31E7
1.13ES
6.90E7
3.69ES
4.56E8
2.86E8
1.48E11
6. 75E8
Zr 95 1.18E6 3.77E5 2.55E5
*"Nb 95 2.41E5 1.34E5 7.20E4
Mo 99 6. 14E6 1.17E6
5.92E5
1.32E5
1.39E7
I 131 8.07E7 1.15E8 6.61E7 3.78E10 1.98E8
I 133 2.08E6 3.61E6 1.10E6 5.31ES 6.30E6
9.58E8
8.27E7 1.02E9
6.24E8
3.14E9
6.36E8
1.60E9
1. 75E10
1.20E9
8.13ES
1.42E7
3.05E7
3.25E6
Cs 134 4.67E9 1.11E10 9.08E9
Cs 137 6.36E9 8.70E9 5.70E9
Ba 140 1.29E8 1.61E5 8.42E6
**La 140 1.58E4 7.93E3 2.11E3
Ce 141 1.97E5 1.33E5 1.51E4
Ce 144 3.29E7 1.38E7 1 .77E6
3.59E9
2.95E9
5.49E4
6.19E4
8.16E6
1.19E9 1.94ES
9.81E8 1 .68E8
9.25E4 2.65ES
5.86E8
5. 09E8
1.11E10
*mrem/yr per uCi/m3"*Daughter Decay Product.
equal parent nuclide.Activity level and effective half life assumed to
-81- May 1986
TABLE 3-22DISPERSION PARAMETERS AT CONTROLLING LOCATIONS*
X/Q,Uv aad U VALUES
VENT-
SiteBoundary"**
DIRECTION
1,600
~l( /
2.00 E-6
U~/(m E)
2.10E-9
Inhalationand GroundPlane
E (104') 1,800 1.42E-7 2. 90E-9
Cow Milk
Goat Milk+"
Meat Animal
Vegetation
ESE (130') 4,300
E (89') 12,500
E (114') 2,600
E (96') 2,900
4. 11E-8
1.75E-8
1.17E-7
1.04E-7
4. 73E-10
1.33E-10
1.86E-9
1.50E-9
S EAUX
SiteBoundary***
Inhalationand GroundPlane
1,600
E (109') 1,700
4.50E-8
8. 48E-9
6.00E-9
1.34E-9
Cow Milk
Goat Milk**
Meat Animal
Vegetation
NOTE:
ESE (135') 49200
E (94') 12,500
E (114') 2,500
E (96') 2,800
1.05E-8
1 .80E-8
1.13E-8
1.38E-8
3. 64E-10
1.84E-10
1.15E-9
9.42E-10
Inhalation and Ground Plane are annual average values. Othersare grazing season only.
*X/Q and D/Q values from NMP-2 ER-OLS..** —X/Q and D/Q from C.T. Main Data Report dated November 1985.***y/Q and D/Q from NMP-2 FES, NUREG-1085, May 1985.
-82- May 1986

p1 ~ f}"a)
0
*}T>
C)
~t t
~~~
(~I~ II~
~III~rI~IIIII
II
I~~
~
~
~
~
~~~
~
~
~
l~
t
I.i F,=})
0 0
rat ~ t»4
0 0
p)
l-;~C><y,'o0:
l==---=I~» a»lilac I p
1
+7>hg A l
(") ~
.-'(q)
( )
f'}Ac
"„.—-- -- Oi
0
Cl
at»rC.„..3 I -0 V=-.
0 'C).'„. ~0m"
':
'.. o » aa
. ~ ~ ~ ~
0 0-.'-Q
Oo 0 O-O0r»r ~ »
4..S':40 0
0:'
OOOO 0
-('P}!t t-y
'
.:::: 0::":--::. ~"-a"-:
4»
~t
~ » 4r ra
0—
0:0:.-0
I OUT 0:-0~ 0-:.='.-'----7;
F ICURC 3-1
at f GAS STSII il
NINE MILE POINTNUCLEAR STATION UNIT-2
fHAl 5AfflT ANALYSIS }}U%llf
l>fCti>AAIIlHAAl>ANOMA>tfTT

Q0'?
I
I) rr ~
yryrI rir
a'I
I
I00
I~ )—LIIV/I~
-'b '> ~ ~r
. AI
=Mr
1 cl rrr—j~<rrar S"
~S~r tS~II Ar f~
r
-,r
*
/
iIIIi()O 8 e
rl ~ I A
r
aS~FIGURE 3-2
IYICAS SISIIM
NINE MILE POINTNUCLEAR STATION UNIT-2
FOAL SAYS lY ANALYSIS IILlrONI
DNCKMdfrrIIOA

7
1k
'
tt 1
l ~
\ ~
.(C gl
0..
I00
I
~ ~
:SA Sh
ISI ~ l5 'r
~ AtFlt'Yl>
~ t7I A.I >
ISI78 tt
~ ~
» ~
+ Fili @7 ~r ~ '7-0
»tl' t
%4k. Skttk'Sldli
gp IA 87
lILI.t:, >
F ICURE 3-3
IIII A Sit II II
» P~ t»t ~
NINE MILE POINTNUCLEAR STATION UNIT-2
FNAl SAISIT AIIALYSIS lISPORf
AIKsKWCIIIfI DECEll8EII IIAI
a
I
I
-I x
~ Pe
~'I
~ Wo ~
C Pi+~ W
C
~ JPN
L"-.3
~\Ilw),,' 1 ~ « I ~w
(=')wing,
I
(B) . (»II)
II*', !Ie)
I J
"",„'. CI CI'I'I'~'. ( )
IJ
('5))I(@ -I
)-8.( ) ~ R.
~ ( ) Q)P
(.=„'1 (.@
!I I
t
:- 0::I-
::,. -:'08; .I
(a)~ Pa ~
(=-):VVV
VVV
:».=:)gvvv~ Pr '»I
~ w ~ ~ ~VVV I'papa
CIVVV
VJ It
a~e
~ ~ ' ~ ~ ~
~ ~ ~ ~
IrA !I C
t & ( I "~ ~ -'-
I( .~ 1
( 11«'o I
:I'43(.:.)(-:j'I""'.
~ ~ ra
~ PI W ~'I»8
.rIAZZJ I'Xa»22~22'JJ
~ le»RI' t
~ .- ~
wp
»»'
~ PPfftRW.
~ Cit tit 'J
OAT QTR +ST
QJf i» Jtr c»JJ fF»t JJ;~ZZZl Z7J
~ pr» et
.„0 „„0II» CI
(FP0: .,'f,... (i.) .;
~ PI W I t
IIJ..I
)
I I
'i r~ I,
l;.I» ~
I I »
( .)
~ IWI
~ ~(~) ~
:1)E ] Ivvv,:VVV'
a I IV'I
I.VW ~
IVVj .i/ 'Ir
II
VV »RjI:,V ti I
II--IVV'J
VVV
VVV
~ e
p I ~ P
Qe - ~
i!O Qg
P ~
~ Pat »t
gn /.::::
~P"f wo» I
.n ':j) <
6I
a 'I
~ ww t
:,: 0
'-C «SP'[JJ''aortae»'aaarV'Ci7r . Jf/7 J t».J
~ \ g p ~
9I ——. + .. IriI ~ t ~
0
i.7 I ~
~ Iwr ~
::(j .
))=„Ol:lg]
,0~ ~
M ~ I» ~ I» ~ ~
C2% .. R~
L CfpaCN, ~WI
pe I
:: c:—;::::):~ IW
(=.,)
er«taPIP (. rtLJ]. IrIIVt»
(Qg PQ&
~ ww»a ~
-8 ..Q 'e -~~ ~IS~I «~
p rwF fCURE 3-4tRINARI LIINIAINI»INItVRCf INIISIANIISI >IS IRIAll»fNI
«»»e w ~ w
NINE MILE J'OINTNUCLEAR STATION-UNIT 8
IINAL SAISIT ANALTSIS RftoRf
Iiara II»lacalla (la II a(tl Illlik
Cia(la
ailalsll NNIRINCCia(All ll(a IIIIS(la(la
cla
ili~ ciaI kilt Ilk
A
~ I l»l OIII~ Iac rtt)$(iaIra It(~ l(allllilaa(la
altalsitI
11)ll(l~
llrI alta IllIlkIlalall lla
aa I5(III(t IIOC
II(~ IIa I
a(ta Iil(iaOl Cll (1
I(tI I I ( I (k. J\l5 a t illi()NAlll(i irialIIIliaaisaiaiila
~ Als'ANI (lia)k(ICIOR Ollr(OINC aooll
a(10» INC»ook
Cls t tilll(ilail Cla
»
t(flak ~ PRIil(I I Ifarllallla ISIIAIIaa>l'kf'I
faCIOR Oailolae A(raaliolllac )look
R
CAS t ~
~ IAI II'OlA 1 (
4(
CONIAINN(NI
CASA ~ T ~' Rica»RI OA(ar fttall(co(art (00
tckllal Ool(OINCI(NII(IIION
oa CAI tl1
kea(At)ON NOO( ~ CISIO CIIOOgra < illa )SIO IiaI 5II5
)Sit Cl ~ CONIIINI(NI tklCt eaa I
Oa Cll (I -OA CAI ICia
e — Siatl( lit
..tRAOIASI( R(A(10kOOIIOINC (IalPSI lfa(
ON (lkfisoiotict»io(NIkbailiok
))III(1~ iai 0)lira aa
( Ia ia 5 I
)OOOOCIN
oi cat tf—aIoa eal 1 Ia—oa cu ($
oacai 1 I oa car »
5CI5Rf Cls ~
10$
acl.coaralaafaf toac(SC1$
SII(ia(Otto CI~
illa (I~
I IrkiII aa
alla $ 1 lca
ON (lkt *
isorotic(rf(O(NINON) )ok
Ol Cal Ioa ca( O
(OII)kt era(Ra(OR ~ el(AN Srrikc(aao stir t tlkios( i I k(041((t$t'llaa
OIICA$ 5151( ~
a(CIIANICI( IICOON~oat ol scalaC(
(Oat(a(c(lao ~ claao !Ill$(ar -' erae(NS(RS
CA5 ~ ACflOIICAS DIS(NARC(ISOIAIIONI
~k( R('II)LI
CNAkCOI(IOSOIIIRS
Oa Car ll
)0 CIN
Slat(t )lt
Slat(( Ilt
Slat(( 'lit
Ol Cal Q
Oa Car 0
OOISII( ilkla)alt IORCONIIO( ROON
INII»ltasl) ~
1500(IN
a(elle)SOCIO caINIIA(I a($ I I
.I1111(RS
n1
I I(»RS
CAP~
R~f acr< Or(ass IC IIIIIIok)...(N"'I+A
C)--'RfIAC
ACIIIItlss ICIIllllok)100 Cas ~
ACf(tlt(SS ACIIIAI)ON)
Ol Cal 5t)Ster ~ (Ia lair alaa (al»lt<
(aai( a 1 II(~ at lcr Or(ass actlllrioNI I I lake IIII(iIII
ACI a AO)CNA'llc (Oalko( Ioaerioata ~ ~ tosl ASCII(ill RONI IOR
~ a talIICOIAII I ICOIN( 5latl lac Cltill(IIIClk ~ CONIINOOOS llaaoka( Noallok
~ ~ Salt(a aeaar(D INNNION
FIGURE 3-5
GASEOUS RAOIATIONMONITORING
NIAGARA MOHAWKPOWER CORPORATIONNINE MILE POINT-UNIT 2FINAL SAFETY ANALYSIS REPORT
AMENDMENT23 OECEMBER 198!
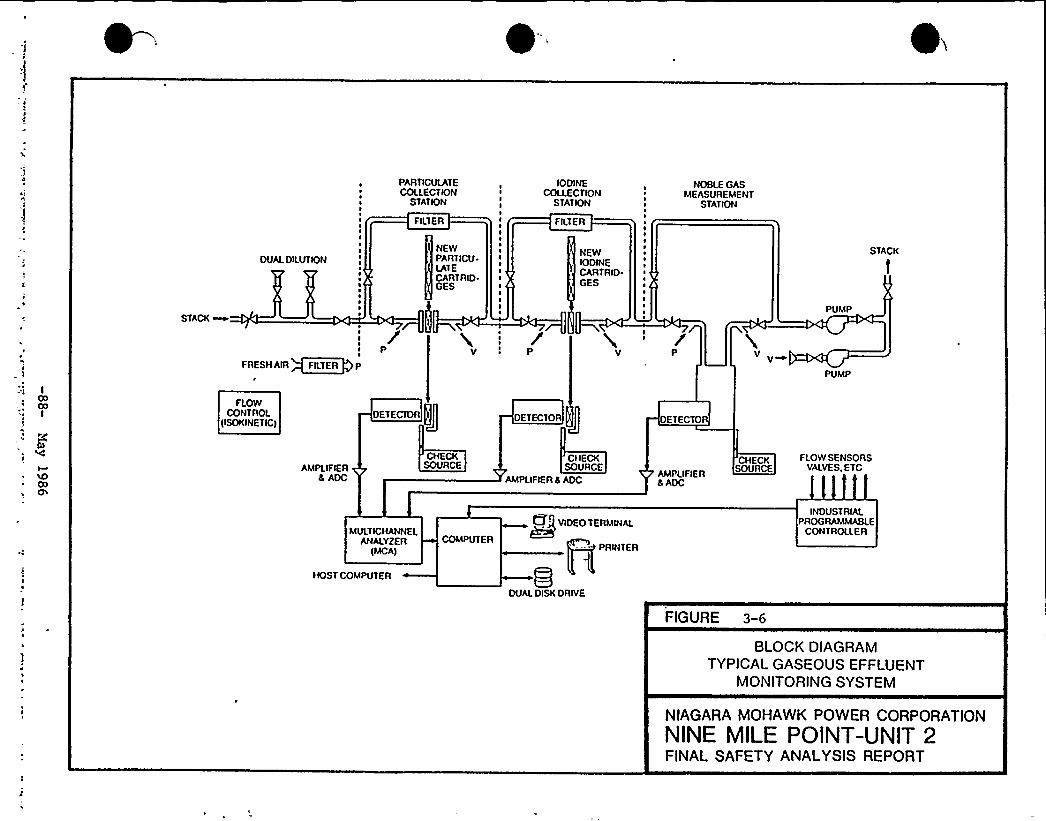
PARTICULATECOLLECTION
STATION
FILTER
IODINECOLLECTION
STATION
FILTER
NOBLE GASMEASUREMENT
STATION
DUALDILUTIONNEWPARTICU.lATECARTRID.GES
NEWIODINECARTRID-GES
STACK
STACK ~II
FRESHAIR FILTER P
P V
PUMP
FLOWCONTROL
(ISOKINETICIDETECIOR DETECTOR DETECTOR
AMPLIFIERd ADC
CHECKSOURCE
CHECKSOURCE
AMPLIFIERd ADCAMPLIFIERd ADC
CHECKSOURCE
FLOW SENSORSVALVES.ETC
MULTICHANNELANALYZER
{MCA)COMPUTER
lf'IDEO TERMINAL44PRINTER
INDUSTRIALPROGRAMMABLE
CONTROI.lER
HOST COMPUTER
DUALDISK DRIVE
FIGURE 3-6
BLOCK DIAGRAMTYPICALGASEOUS EFFLUENT
MONITORING SYSTEM
NIAGARA MOHAWK POWER CORPORATIONNINE MILE POINT-UNIT 2FINAL SAFETY ANALYSIS REPORT
4.0 URANIUM FUEL CYCLE
The "Uranium Fuel Cycle" is defined in 40 CFR Part 190.02 (b) asfollows:
"Uranium fuel cycle means the operations of milling of uraniumore, chemical conversion of uranium, isotopic enrichment ofuranium, fabrication of uranium fuel, generation of electricityby a light~atermooled nuclear power plant using uranium fuel,and reprocessing of spent uranium fuel, to the extent that thesedirectly support the production of electrical power for publicUse utilizing nuclear energy, but excludes mining operations,operations at waste disposal sites, transportation of anyradioactive material in support of these operations, and thereuse of recovered non~ranium special nuclear and by-productmaterials from the cycle."
Section 3/4.11 .4 of the Technical Specifications requires that whenthe calculated doses associated with the effluent releases exceedtwice the applicable quarter or annual limits, the licensee shallevaluate the calendar year doses and, if required, submit a SpecialReport to the NRC and limit subsequent releases such that the dosecommitment to a real individual from all uranium fuel cycle sourcesis limited to 25 mrem to the total body or any organ (except thethyroid, which is limited to 75 mrem). This report is to demonstratethat radiation exposures to all real individuals from all uraniumfuel cycle sources (including all liquid and gaseous effluentpathways and direct radiation) are less than the limits in 40 CFRPart 190. If releases that result in doses exceeding the 40 CFR 190limits have occurred, then a variance from the NRC to permit suchreleases will be requested and if possible, action will be taken toreduce subsequent releases.
The report to the NRC shall contain:
2)
Identification of all uranium fuel cycle facilities oroperations within 5 miles of the nuclear power reactor units atthe site, that contribute to the annual dose of the maximumexposed member of the public.Identification of the maximum exposed member of the public and adetermination of the total annual dose to this person from allexisting pathways and sources of radioactive effluents anddirect radiation.
The total body and organ doses resulting from radioactive material inliquid effluents from Nine Mile Point Unit 2 will be summed with thedoses resulting from the releases of noble gases, radioiodines, andparticulates'he direct dose components will also be determined byeither calculation or actual measurement. Actual measurements willutilize environmental TLD dosimetry. Calculated measurements willutilize engineering calculations to determine a projected direct dosecomponents In the event calculations are used, the methodology willbe detailed as required in Section 6.9.1.8 of the TechnicalSpecifications. The doses from Nine Mile Point Unit 2 will be addedto the doses to the maximum exposed individual that are contributedfrom other uranium fuel cycle operations within 5 miles of the site.
-89- May 1986
4.0 (Cont')
For the purpose of calculating doses, the results of theEnvironmental Monitoring Program may be included to provide moreref ined estimates of doses to a real maximum exposed individual.Estimated doses, as calculated from station effluents, may bereplaced by doses calculated from actual environmental sample results.
4,1 Evaluation of Doses From Liquid Effluents
For the evaluation of doses to real members of the public from liquideffluents either calculational data based on liquid effluents and theequations found in section 2.3 of the ODCM may be used or actual fishsample and - shoreline sediment sample data may be used. Dosescalculated from actual sample data will only consider the fish andshoreline sediment pathways since other possible aquatic pathways arenot considered significant.
Doses to members of the public based on actual sample analysis datawill be calculated using the equations and factors, as applicable,found in Regulatory Guide 1.109. The methodology used will bepresented in detail as required by section 6.9.1 .8 of the TechnicalSpecifications.
Equations used to evaluate fish and shoreline sediment samples arebased on Regulatory Guide 1.109 methodology'ecause of the samplemedium type and the half-lives of the radionuclides historicallyobserved, the decay corrected portions of the equations are
deleted'his
does not reduce the conservatism of the calculated doses butincreases the simplicity from an evaluation point of view.
The dose from fish sample media is calculatedas.'1)
Rwb Zi [Cif x u x 1000 x Diw
Where:
The total dose to the whole body of an adult in mrem peryear
Cif The concentration of radionuclide i in fish samples inpCi/gram
The consumption rate of fish for an adult (21 kg per year)
1000 Grams per kilogram
Diwb The dose factor for radionuclide i for the whole body of anadult (R.G. 1.109, Table E-11)
The fractional portion of the year over which the dose isapplicable.
(2) Rl Zi [Cif x u x 1000 x Dil x f]
-90- May 1986

Where '.
Rl The total dose to the liver of an adult (maximum exposedorgan) in mrem per year
Cif The concentration o f radionuclide i in fish samples inpCi/gram
u The consumption rate of fish for an adult (21 kg per year)
1000 ~ Grams per kilogram
Dil The dose factor for radionuclide i for the liver of anadult (R.G. Table E-ll)
f ~ The fractional portion of the year over which the dose isapplicable.
The dose from shoreline sediment sample media is calculated as:
Rwb Zi [Cis x u x 40,000 x 0.3 x Diwb
and
Rsk Zi [Cis x u x 40,000 x 0.3 x Disk x
Where:
The total dose to the whole body of a teenager (maximumexposed age group) in mrem per year
Rsk The total dose to the skin of a teenager (maximum exposedage group) in mrem per year
Cis The concentration of radionuclide i in shorelin'e sedimen tin pCi/gram
The usage factor. This is assumed as 67 hours per year bya teenager
40) 000 The product of the assumed density of shoreline sediment(40 kilogram per square meter to a depth of 2.5 cm) timesthe number of grams per kilogram
0.3 The shore width factor for a lake
Diwb The dose factor for radionuclide i for the total body (R.G.1.109, Table E-6)
Disk The dose factor for radionuclide 1 for the skin (R.G.1.109, Table E-6)
The fractional portion of the year over which the dose isapplicable
-91- May 1986
4.2 Evaluation of Doses From Gaseous Effluents
For the evaluation of doses to real members of the public fromgaseous effluents, the pathways contained in section 3.0 of the ODCMwill be considered and include ground deposition, inhalation, cowsmilk, goats milk, meat, and food products (vegetation) ~ However, anyupdated field data may be utilized that concerns locations of realindividuals, real time meteorological data, location of criticalreceptors, etc. Data from the most recent census and sample locationsurveys should be utilized. Doses may also be calculated from actualenvironmental sample media, as available. Environmental sample mediadata such as TLD, air sample, milk sample and vegetable (food crop)sample data may be utilized in lieu of effluent calculational data.
Doses to members of the public from the pathways contained in ODCMsection 3.0 as a result of gaseous effluents will be calculated usingthe dose factors of Regulatory Guide 1.109 or the methodology of theODCM, as applicable. Doses calculated from environmental samplemedia willutilize the methodologies found in Regulatory Guide 1.109.
4.3 Evaluation of Doses From Direct Radiation
Section 3.11 .4.a of the Technical Specifications requires that thedose contribution as a result of direct radiation be considered whenevaluating whether the dose limitations of 40 CFR 190 have beenexceeded. Direct radiation doses as a result of the reactor, turbineand radwaste buildings and outside radioactive storage tanks (asapplicable) may be evaluated by engineering calculations or byevaluating environmental TLD results at critical receptor locations,site boundary or other special interest locations. For theevaluation of direct radiation doses utilizing environmental TLDs >
the critical receptor in question, such as the critical residence,etc., will be compared to the control locations'he comparisoninvolves the difference in environmental TLD results between thereceptor location and the average control location result-
-92- May 1986
4.4 Doses to Members of the Public Within the Site Boundary ~
Section 6.9. 1.8 of the Nine Mile Point Unit 2 TechnicalSpecifications requires that the Semiannual Effluent Release Reportinclude an assessment of the radiation doses from radioactive liquidand gaseous effluents to members of the public due to theiractivities inside the site boundary as defined by Figure 5.1.3 of thespecifications. A member of the public, as defined by the TechnicalSpecifications, would be represented by an individual who visits thesites'nergy Information Center for the purpose of observing theeducational displays or for picnicing and associated activities. Itis assumed that an individual would spend four hours per week fortwelve weeks at the Energy Information Center. The time spent at thefacility is assumed to occur from approximately July 1 to September30 of each year. Thus, the first Semiannual Effluent Release Reportwill not address this particular dose because the summer season isthe period of concern. The second report will address this dosebased on forty eight hours occupancy. Other time periods of the yearare not considered because any time spent inside the site boundaryduring months other than July-September is estimated to be less than2-3 hours-
The pathways considered for the evaluation include the inhalationpathway with the resultant lung dose and the direct radiation dosepathway with the associated total body dose. The direct radiationdose pathway, in actuality, includes several pathways. Theseinclude: the direct radiation gamma dose to an individual from onoverhead plume, a submersion gamma plume dose, and a ground planedose (deposition). Other pathways, such as the ingestion pathway,are not applicable'n addition, pathways associated with waterrelated recreational activities are not applicable here. Theseinlcude swimming and wading which are prohibited at the facility.The inhalation pathway is evaluated by identifying the applicableradionuclides (radioiodine, tritium and particulates) in the effluentfor the appropriate time period. The radionuclide concentrations arethen multiplied by the appropriate X/9 value, inhalation dose factor,air intake rate, and the fractional portion of the year in question.Thus, the inhalation pathway is evaluated using the followingequation adapted from Regulatory Guide 1.109.
NOTE: The following equation is adapted from equations C-3 and C-4 ofRegulatory Guide 1.109. Since many of the factors are in unitsof pCi/m , m /sec., etc., and since the radionuclide decayexpressions have been deleted because of the short~ distanceto the receptor location, the equation presented here is notidentical to the Regulatory Guide equations.
R ~ Z i[Ci F X/Q DFA i)a Ra t]
-93- May 1986

4 ' (Cont'd)
where
R the dose for the period in question to the lung ()) for allradionuclides (i) for the adult age group (a) in mrem pertime period.
Ci Theaverage
concentration in the stack release of radionuclidein pCi/m for the period in question
F = Average effluent flowrate in m /sec .
X/Q The plume dispersion parameters'or a location 0.50miles west of NMP-1 are 2.88E-7 (X/Q) and 2.84E-9(D/Q) for the NMP-2 Vent and 7.31E-7 (X/Q) and 4.37E-9(D/Q) for the NMP-2 stack (data from C.T. Main Reportdated ll/85). A X/Q value based on real timemeteorology may also be utilized for the period inquestion) .
DFAiga the inhalation dose factor for radionuclide i, thelung g, and adult age group a in mrem per pCi found onTable E-10 of Regulatory Guide 1.109.
Ra annual air intake for individuals in age group a inM per year (this value is 8 000 m per year andwas obtained from Table E-5 of Regulatory Guide 1.109).
fractional portion of the year for which radionuclidewas detected and for which a dose is to be
calculated (equals 0.0055 years).
The direct radiation gamma dose pathway includes any gamma doses froman overhead plume, submersion in the plume and ground plane dose(deposition). This general pathway will be evaluated by averageenvironmental TLD readings't least two environmental TLD locationswill be utilized and located in the approximate area of the EnergyInformation Center (EIC) and the facility picnic area. These TLDswill be placed in the field on approximately July 1 and removed onapproximately September 30 of each year (this time interval iscomposed of one quarterly TLD collection period) ~ The average TLDreadings will be ad)usted by the average control TLD readings'hisis accomplished by subtracting the average quarterly control TLDvalue from the average EIC TLD value. The applicable quarterlycontrol TLD values will be utilized after adjusting for theappropriate time period (as applicable).
-94- May 1986
5.0 ENVIRONMENTALMONITORING PROGRAM
5.1 Sampling S tations
The current sampling locations are specified in Table 5-1 and Figures5.1-1, 5.1-2. The meteorological tower location is shown on Figure5. 1-1. The location is shown as TLD location 817. The EnvironmentalMonitoring Program is a )oint effort between the Niagara Mohawk PowerCorporation and the New York Power Authority, the owners andoperators of the Nine Mile Point Units 1 and 2 and the JamesA.FitzPatrick Nuclear Power Plants, respectively. Sampling locationsare chosen on the basis of historical average dispersion ordeposition parameters from both units. The environmental samplinglocation coordinates shown on Table 5-1 are based on the NMP-2reactor centerline.
The average dispersion and deposition parameters for the two unitshave been calculated for a 5 year period, 1978 through 1982. Thesedispersion calculations are attached. The calculated dispersion ordeposition parameters will be compared to the results of the annualland use census. If it is determined that a milk sampling locationexists at a location that yields a significantly higher (e.g. 50X )calculated D/Q rate, the new milk sampling location will be added tothe monitoring program within 30 days. If a new location is added,the old location that yields the lowest calculated D/Q may be droppedfrom the program after October 31 of that year.
5.2 Interlaboratory Comparison Program
Analyses shall be performed on samples containing known quantities ofradioactive materials that are supplied as part of a Commissionapproved or sponsored Interlaboratory Comparison Program, such as theEPA Crosscheck Program. Participation shall be only for those media,e.g., air, milk, water, etc., that are included in the Nine MilePoint Environmental Monitoring Program and for which cross checksamples are available. The Quality Control sample results shall bereported in the Annual Radiological Environmental Operating Report sothat the Commission staff may evaluate the
results'pecific
availablesample media for which EPA Cross Check Program samples areinclude the
following.'ross
beta in air particulate filtersgamma emitters in air particulate filtersI-131 in milkgamma emitters in milkgamma emitters in food productgamma emitters in watertritium in waterI-131 in water
-95- May 1986
5.3 Capabilities for Thermoluminescent Dosimeters Used for EnvironmentalMeasurements
Required detection capabilities for thermoluminescent dosimeters usedfor environmental measurements required by the TechnicalSpecifications are based on ANSI Standard N545> section 4.3. TLDsare defined as phosphors packaged for field
users
In regard to the detection capabilities for thermoluminescentdosimeters, only one determination is required to evaluate the abovecapabilities per type of TLD. Furthermore, the above capabilitiesmay be determined by the vendor who supplies the TLDs ~ Requireddetection capabilities are as follows.
5.3. 1 Uniformity shall be determined by giving TLDs from the same batch anexposure equal to that resulting from an exposure rate of 10 uR/hrduring the field cycle. The responses obtained shall have a relativestandard deviation of less than 7.5% ~ A total of at least 5 TLDsshall be evaluated.
5.3.2 Reproducibility shall be determined by giving TLDs repeated exposuresequal to that resulting from an exposure rate of 10 uR/hr during thefield cycle. The average of the relative standard deviations of theresponses shall be less than 3.0X. A total of at least 4 TLDs shallbe evaluated.
5.3.3 Dependence of exposure interpretation on the length of a field cycleshall be examined by placing TLDs for a period equal to at least afield cycle and a period equal to half the same field cycle in anarea where the exposure rate is known to be constants This testshall be conducted under approximate average winter temperatures andapproximate average summer temperatures'or these tests, the ratioof the response obtained in the field cycle to twice that obtainedfor half the field cycle shall not be less than 0.85. At least 6TLDs shall be evaluated.
5.3.4 Energy dependence shall be evaluated by the response of TLDs tophotons for several energies between approximately 30 keV and 3 MeV.The response shall not differ from that obtained with the calibrationsource by more than 25X for photons with energies greater than 80 keVand shall not be enhanced by more than a factor of two for photonswith energies less than 80 keV. A total of at least 8 TLDs shall beevaluated .
5.3.5 The directional dependence of the TLD response shall be determined bycomparing the response of the TLD exposed in the routine orientationwith respect to the calibration source with the response obtained fordifferent orientations. To accomplish this, the TLD shall be rotatedthrough at least two perpendicular planes. The response averagedover all directions shall not differ from the response obtained inthe standard calibration position by more than 10X. A total of atleast 4 TLDs shall be evaluated.
-96- May 1986

Light dependence shall be determined by placing TLDs in the field fora period equal to the field cycle under the four conditions found inANSI N545, section 4.3.6. The results obtained for the unwrappedTLDs shall not differ from those obtained for the TLDs wrapped inaluminum foil by more than 10' total of at least 4 TLDs shall beevaluated for each of the four conditions.
Moisture dependence shall be determined by placing TLDs (that is, thephosphors packaged for field use) for a period equal to the fieldcycle in an area where the exposure rate is known to be constant.The TLDs shall be exposed under two conditions: (1) packaged in athin, sealed plastic bag, and (2) packaged in a thin, sealed plasticbag with sufficient water to yield observable moisture throughout thefield cycle ~ The TLD or phosphor, as appropriate, shall be driedbefore readout. The response of the TLD exposed in the plastic bagcontaining water shall not differ from that exposed in the regularplastic bag by more than 10X. A total of at least 4 TLDs shall beevaluated for each condition.
Self irradiation shall be determined by placing TLDs for a periodequal to the field cycle in an area where the exposure rate is lessthan 10 uR/hr and the exposure during the field cycle is known. Ifnecessary, corrections shall be applied for the dependence ofexposure interpretation on the length of the field cycle (ANSI N545,section 4.3.3) ~ The average exposure inferred from the responses ofthe TLDs shall not differ from the known exposure by more than anexposure equal to that resulting from an exposure rate of 10 uR/hrduring the field cycle. A total of at least 3 TLDs shall beevaluated.
-97- May 1986

Nine Mile Point Nuclear StationRadiological Environmental Monitoring Program
Sampling Locations
Table 5.1
Type ofSample
Radioiodine andParticulates (air)
Radioiodine andParticulates (air)Radioiodine andParticulates (air)Radioiodine andParticulates (air)Radioiodine andParticulates (air)
"MapLocation Collection Site (Env. Program No.)
Nine Mile Point Roadnorth (R-1)
Co. Rt. 29 & Lake Road(R-2)
Co. Rt. 29 (R-3)
Village of Lycoming, NY(R-4)
Montario Point Road(R-5)
Location
1.8 mi 8 88'
1.1 mi 8 104'SE
1.5 mi 8 132':SE
1.8 mi 8 143'E
16.4 mi 8 42'E
Direct Radiation (TLD)
e Direct Radiation (TLD)
Direct Radiation (TLD)
Direct Radiation (TLD) 9
Direct Radiation (TLD) 10
Direct Radiation (TLD) llDirect Radiation (TLD) 12
Direct Radiation (TLD) 13
Direct Radiation (TLD) 14
Direct Radiation (TLD) 15
Direct Radiation (TLD) 16
Direct Radiation (TLD) 17
Direct Radiation (TLD) 18
"Map - See Figures 5.1-1 and 5.1-2
North Shoreline Area (75)
North Shoreline Area (76)
North Shoreline Area (77)
North Shoreline Area (23)
JAF east boundary (78)
Rt ~ 29 (79)
Rt.,29 (80)
Miner Road (81)
Miner Road (82)
Lakeview Road (83)
Lakeview Road (84)
Site Meteorological Tower (7)
Energy Information Center (18)
0.1 mi 8 5'
O.l mi 8 25'„NNE
0.2 mi 8 45'E0.8 mi 8 70'NE
1.0 mi 8 90'
1.1 mi 8 115'SE
1.4 mi 8 133'E
1.6 mi 8 159'SE
1.6 mi 8 181'
1.2 mi 8 200 .SSW
1.1 mi 8 225',SW
0.7 mi 8 250'SW
0.4 mi 8 265'
-98- May 1986
Nine Mile Point Nuclear Station Unit 1Radiological Environmental Monitoring Program
Sampling Locations
Table 5.1( Continued )
Type ofSample
* MapLocation Collection Site (Env. Pro ram No.) Location
Direct. Radiation (TLD) 19 North Shoreline (85)
Direct Radiation (TLD) 20 North Shoreline (86)
Direct Radiation (TLD) 21 North Shoreline (87)
Direct Radiation (TLD) 22 Hickory Grove Road (88)
Direct Radiation (TLD) 23 Leavitt Road (89)
Direct Radiation (TLD) 24 Rt. 104 (90)
Direct Radiation (TLD) 25 Rt. 51A (91)
Direct Radiation (TLD) 26 Maiden lane Road (92)
Direct Radiation (TLD)
Direct Radiation (TLD)
27 Co. Rt. 53 (93)
28 Co ~ Rt ~ 1 (94)
Direct Radiation (TLD) 29 Lake Shoreline (95)
Direct Radiation (TLD) 30 Phoenix, NY Control (49)
Direct Radiation (TLD) 31 S.W. Oswego, Control (14)
Surface Water
Surface Water
.*Map —See Figures 5. 1-1(NA) - Not applicable
38 OSS Inlet Canal (NA)
39 JAFNPP Inlet Canal (NA)
and 5.1-2
-99- May 1986
Direct Radiation (TLD) 32 Scriba, NY (96)
Direct Radiation (TLD) 33 Alcan Aluminum, Rt. 1A (58)
Direct Radiation (TLD) 34 Lycoming, NY (97)
Direct Radiation (TLD) 35 New Haven, NY (56)
Direct Radiation (TLD) 36 W. Boundary, Bible Camp (15)
Direct Radiation (TLD) 37 Lake Road (98)
0.2 mi 8 294'N4
0."1 mi 8 315'W
0.1 mi 8 341'%
4.5 mi 8 97'
4.1 mi 8 ill'SE4.2 mi 8 135'E
4.8 mi 8 156'SE
4.4 mi 8 183'
4.4 mi 8 205'Sb
4.7 mi 8 223'W
4.1 mi 9 237'Sb
19.8 mi 8 170'
12.6 mi 8 226'h
3.6 mi 8 199'SW
3.1 mi 8 220'W
1.8 mi 8 143'E5.3 mi 8 123'SE
0.9 mi 8 237'SW
1.2 mi 8 101'
7.6 mi 8 235'W
0.5 mi 8 70'NE
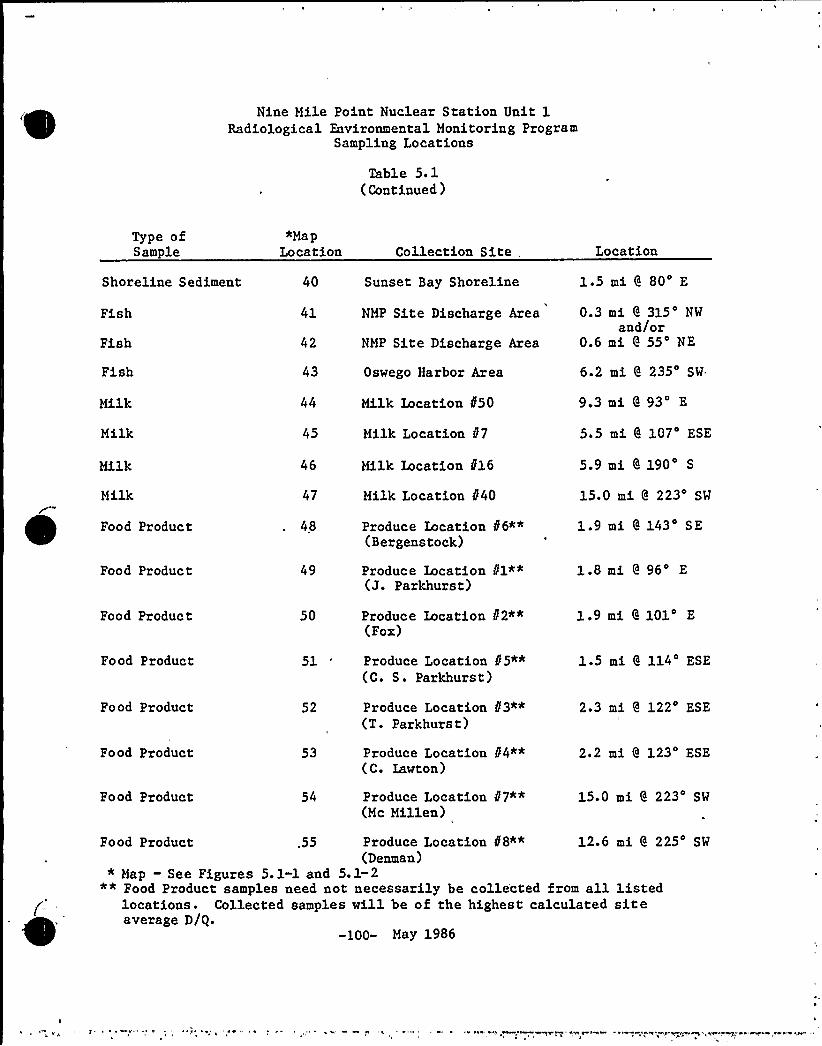
Nine Mile Point Nuclear Station Unit 1Radiological Environmental Monitoring Program
Sampling Locations
Table 5.1(Continued)
Type ofSample
a'MapLocation Collection Site Location
Shoreline Sediment 40 Sunset Bay Shoreline 1.5 mi 8 80'
Fish
Fish
41
42
NMP Site Discharge Area
NMP Site Discharge Area
0.3 mi 8 315'Wand/or
0.6 mi 8 55'EPish
Milk
Milk
Milk
Milk
Food Product
43
44
45
46
47
48
Milk Location 850
Milk Location 87
Milk Location 816
Milk Location 840
9.3 mi 8 93'
5.5 mi 8 107'SE
5.9 mi 8 190'
15.0 mi 8 223'W
Produce Location 86"" 1.9 mi 8 143'E(Bergenstock)
Oswego Harbor Area 6.2 mi 8 235'W.
Pood Product 49 Produce Location 81**(J. Parkhurst)
1.8 mi 8 96'
Food Product
Food Product
50 Produce Location b'2~*(Fox)
Produce Location 85**(C. ST Parkhurst)
1.9 mi 8 101'
1.5 mi 8 114'SE
Food Product
Food Product
Pood Product
53
54
Produce Location /13**(T. Parkhurst)
Produce Location 84"*(C. Lawton)
Produce Location 87"*(Mc Millen)
2.3 mi 8 122'SE
2.2 mi 8 123'SE
15.0 mi 8 223'W
12.6 mi 8 225'WFood Product
-100- May 1986
.55 Produce Location 88**(Denman)
" Map —See Figures 5. 1-1 and 5. 1-2** Pood Product samples need not necessarily be colle'cted from all listed
locations'ollected samples will be of the highest calculated siteaverage D/Q.
»» Pll I" %W I g'»», + g% A, 'bg»'
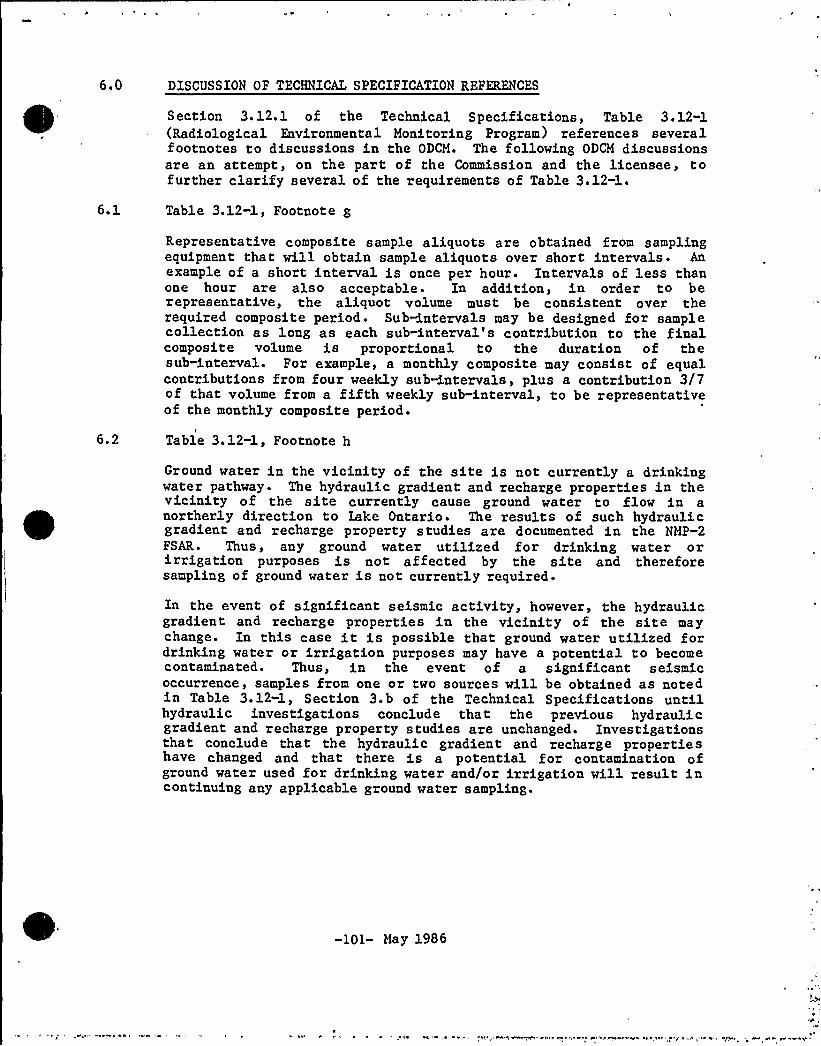
6.0 DISCUSSION OF TECHNICAL SPECIFICATION REFERENCES
S ection 3. 12. 1 o f the Technical Specifications, Table 3. 12-1(Radiological Environmental Monitoring Program) references severalfootnotes to discussions in the ODCM. The following ODCM discussionsare an attempt, on the part of the Commission and the licensee, tofurther clarify several of the requirements of Table 3.12-1.
6.1 Table 3.12-1, Footnote g
Representative composite sample aliquots ar e obtained from samplingequipment that will obtain sample aliquots over short intervals ~ Anexample of a short interval is once per hour. Intervals of less thanone hour are also acceptable'n addition, in order to berepresentative, the aliquot volume must be consistent over therequired composite periods Sub&ntervals may be designed for samplecollection as long as each sub-interval's contribution to the finalcomposite volume is proportional to the duration of thesub-interval. For example, a monthly composite may consist of equalcontributions from four weekly sub&ntervals, plus a contribution 3/7of that volume from a fifth weekly sub-interval, to be representativeof the monthly composite period.
6.2 Table 3.12-1, Footnote h
Ground water in the vicinity of the site is not currently a drinkingwater pathway- The hydraulic gradient and recharge properties in thevicinity of the site currently cause ground water to flow in anortherly direction to lake Ontario ~ The results of such hydraulicgradient and recharge property studies are documented in the NMP-2FSAR. Thus, any ground water utilized for drinking water orirrigation purposes is not affected by the site and thereforesampling of ground water is not currently required.
In the event of significant seismic activity, however, the hydraulicgradient and recharge properties in the vicinity of the site maychange. In this case it is possible that ground water utilized fordrinking water or irrigation purposes may have a potential to becomecontaminated. Thus, in the event of a significant seismicoccurrence, samples from one or two sources will be obtained as notedin Table 3.12-1, Section 3.b of the Technical Specifications untilhydraulic investigations conclude that the previous hydraulicgradient and recharge property studies are unchanged. Investigationsthat conclude that the hydraulic gradient and recharge propertieshave changed and that there is a potential for contamination ofground water used for drinking water and/or irrigation will result incontinuing any applicable ground water sampling.
-101- May 1986
0
6.3 Table 3.12-1, footnote iCurrently, there are no drinking water sources (from Lake Ontario)that can be affected by the site under normal operating conditions .The closest drinking water source is near the City of Oswego. Thissource is located in an "upmurrent" direction for the majority ofthe time based on local Lake Ontario currents. In addition, thesource is significantly affected by the "plume" from the Oswego Riverwhich enters Lake Ontario at a point between the site and thesources The source is located approximately eight miles to the westof the site.
Other drinking water sources within 50 miles of the site range from20 to 50 miles'hese sources are beyond any significant influenceof the site.
In the event a drinking water source (other than the source near theCity of Oswego) is established within 10 miles of the site (currentmiles in contrast to air miles), then the new source will beevaluated for any significant dose effects based on dilutioncriteria. Sources found to be significantly affected by the sitewill be added to the Radiological Environmental Monitoring Programrequired by Table 3.12-1, section 3.C of the Technical Specifications.
6.4 Table 3.12-1, footnote 1
Considering the shoreline topography and land development within 10miles of the site> and the dilution factors beyond 10 miles, onlymajor irrigation projects where food products are irrigated with LakeOntario water need be considered for specification 4.C of Table3. 12-1 ~
Major irrigation projects are defined as agricultural projects wherefood products for human consumption are grown and irrigation waterfrom Lake Ontario is used frequently." Major irrigation projects arenot considered to be small private gardens located on the lake shoreat summer residences or year-round residences where occasional use oflake water during times of draught has been observed ~ Major projectsinclude pumps and piping systems, either permanent or temporary, thatsupply lake water to agricultural projects on a frequent
basis'n-frequentuse of lake water is not considered to have asignificant effect on food products'herefore, such a situationdoes not constitute a major irrigation project.
Currently, no major irrigation projects exist within 10 miles of thesite (May 1986).
-102- May 1986
(d)~E
();)(j)
~~(c)
0I 0
~ (b)wet why
VocT 155AZlO4
~5 jiffZtaTRICxauclXJA K7wCi
(c)
i MIVJtf
l.sawiee
NIACARA llOHAWKROWUt CORPORATlOH ~Gt AVTHORlTY
5TATE OF RKW YORK
t(s)
oner
5CKl~ NLL5
TECHNICAL SPECIFICATIONSFIGURE 5. 1. 3-1 SITE BOUNDARIES
NINE NILE POINT UNIT 2
NOTES TO FIGURE 5.1.3-1
(a) NMP1 Stack (height is 350')
(b) NMP2 Stack (height is 430')
(c) JAFNPP Stack (height is 385')
(d) NMP1 Radioactive Liquid Discharge (Lake Ontario, bottom)
(e) NMP2 Radioactive Liquid Discharge (Lake Ontario, bottom)
(f) JAFNPP Radioactive Liquid Discharge (Lake Ontario, bottom)
(g) Site Boundary
(h) Lake Ontario-Shoreline
(i) Meteorological Tower
(j) Training Center
(k) Energy Information Center
Additional Information:- NMP2 Reactor Building Vent is located 187 feet above ground level- JAFNPP Reactor and Turbine Building Vents are located 173 feet above
ground level- JAFNPP Radwaste Building Vent is 112 feet above ground level- The Energy Information Center and adjoining picnic area are
UNRESTRICTED AREAS within the SITE BOUNDARY that are accessible toMEMBERS OF THE PUBLIC
- Lake Road, a private road, is an UNRESTRICTED AREA within the SITE
BOUNDARY accessible to MEMBERS OF THE PUBLIC
NINE MILE POINT UNIT 2
I
O.
3
+rFFpj
181.1S /
4 303 7) 50 11. 2)6 318'7) 7 398.7) 9,>.„10
l
(A)l
11 >8 1)'12 13 14 15 16
LAKE ON ARI
O ~
78.7)
C
1)8.7) i(
00tT0
E(METOR LOCRTC L TOWER)
238.2)
~+KE ROAD
G
191.2'!188. 7>
-S
(~I
0
F IGURE 5.I I
Nine Mile Point On-Site Map „
JTEnvironmental SampleLocation
5 W — Compass Coordinate
(Mj — Sector Designation
180 —Radian Angle from North
FEET 0
A128OX.SCATR600 1200
METERS 0
1 .))36 )m.
200 400
/M
ON0Z
o
43'30'Approxl
+l3
)TIEXPERT p~
CARDMINER ROAD
NER
3
ROAD5 j 6 7 12 13 14 15

JEFFERSONEo Im
COUNTY
I
IEastBoylslwi
UfTJE Juriwfb Wor..
31411 TAMEiI MANAGEMENT
I ARElU I
North Boylston."EFFEREON
m 4 IlTo ivor„
COUNTY
WA H ta PlantCorners
6 ylsloCe
BuylstF I GURE 5. I- 2
1 Illenh 0Calholc Churcf
Come sN iln d
II
Lrlenna1
1
1
1
imd
1
Y Landy Cre5
ek lGreInbo
I
I
lI
l
I~lr) 8 gw)4 15
j
A,, N D
0 0
15
IS Sm nwge
1
E L ~ D / 1
1
1
1,Ici'
1
1
I
O
3
ONEJ// OUN
y'
N
NINE MILE POINT OFF -SITE MAP (2/86) meChurch
S ra fur»C R E E K
Rainbo Shore
M WVoreaSCALE OF MILES
I I cwn
E D FI
I
B echarviue
I
I
arsisLAJ(:Erl ai rw
OrwellA p i
1Rchl nd
LEGEND Chateaug ySelki k
IhteratataU.S. & Stale High aysCounty RoadsTown RoadsCounty LinesTo n LineyCny & Vnlag ~ LineaRanroada
51OA
....LLOnt iu
H~L
170 I R ~w,","W E K, LSi Ii 10 1
8
w
P
ONTARIO ~ s
Environmental SampleLocation p I
I emI
I
Il~I
N
Pinevillsswo Point
acnMe
M wo Bay BeN 1 Mile Po Senna t
Bfidg8
17
O mate Beach ——, -I
d
41
'I/Ty1 itf
'
Corns s
)1
40 Iho soaks
Pl I Hick~Point Grove
353
3 Tens
IS
OE
N1'1
//
I ke Vie
411
AltmafL
ls4 18
Lycomins1!
Arth r3
Barber's Corners
B I 000 4t 'verNster
0NwlhScnb 3w 'w
civ Wr,lkI a a
io
m iaNewHamn
OZ0 10
04 0
WJ S4114
TollGale /
/IW
Hammond'5 )Cor ers
I
V E "NHB
r
exlcoI M 5 0: WL L I( AK 50 g
10A
M ~HO d die 104
//
//
/
So ihN Ha enOS'/EGO~7 I I
OugwayM nleVPmlth* i 0
CheckersHouse
I )k.
M
M ple Hih005lr
B A104
0 n.J
C„XHAPP 1 V41181
GAME MANAGEMEIVf
n
mihgsBridg
3044Austin'u
A81
rA
STATEsm0. v 58 SA
lr 4fbawL 1 g g ARElOd,
'Tr3GbHappy
8 V hey
I
I
Klyuks'omers '9
'5n
'1.
35
Sar
lysi ylb d3$
5/uthScfibo 3,
P rlSr Af nIeu3
n 0
3 l 57
"015
/O
TbC«d
n msto iiP ddu
rbm I Weg~70
Trr
H4 Aw„
Fir nd
00
IwrSA C p
4N rlOs ego
5 u 8
00
/f 50i7
,g'R I)5No Ih AmboyIehPaH 1 45 'E Iuo/in 'I
45 Sayle's Cornem ~ Munger'sCorners
045 mw
R14e
jO
/rn«
0'I
B 0 Y ~atst8
d'ki
~00
4
L
w)'-1
1
CI Nord35A
L E3
Brake'sCoihors A
3
-R M /7
iv rii
,Grrywwl
/ ca
In.nh/Constantia
I
H stlhgslays
3$R 50M die Cltfrsil/ Amboy Center
I45JerryUpeon
nersPalernnUdl
Me &d
15
sfit
48 p I
l
\ '1
441
twaiiisCorners
45
EastPslermo
/ts
Pe 1 Curners/
IS
45$ 5V 0~ISLit~i Unit Y /No
Hanlinnib 1
30IJ
Litde
'.„,.,AI.54
M
4U nder'rwnsrs H $ '0
Corn rna0'a ii»0
sl/Fartsy'0I Coal@I ~
r-liil n
r ~ PI 5 T
IJI In i(54 u
4), Ex i iiaiJbm14
I
0
FULTONHn ntbal Il sa
14 SeltlHasli gCen.
4IGdbert
Mills
E
CWS H nd
IE
7
/nr ss
R0
E / Gayviue
WW400 0
C 0~BAA N g N I Roose elt orner
N IN T 4 A
0 I Arbm
an„»a
McMahon'sCorns
e
40R u Aw, N es,51 F
//.
//ru
5'( '// R
0 u 0
lr
h0 lipsCorners
Hannibal
e
Centfalgqnarel
llI
33 ConstantiaCenter
WestMunim
48 annegvide104
Bo e 'sCorn rs
n
0
South Hannibal
)l 3037
WfCaughdehoy
u ri ~o
171
E P Elr
ir 4011 40
4 p2I- - - -=+—
god y— 4'- ——-
Onstentia cs,",si'"'7 7
Nun
//+ L.~. / 0 (V
/ JL'F1 OA 1
our Cl rd d
S racy I(50 lp 1
~ ~—w.
i70
To N V. 370 COUNTYn 0 llf4 flail
01
CAYUGAHill
South G anbyi 0I «
L 0
I
p Clev0
eh.0
land UU 0 4ton
O
oenlx'7/
.e
g F ernhs0
Bay
s 0io Sy ucur 40
COUNTY To Sy a «se
TIAPERTURE
CARD
O TOA'IJI
0
0
Iz
efy(eMsc ""O~
~o
Th ee Rwers
I
I
I
I
I
I
Coeydght, THE NATIONALSURV EY 3379Chester Vermont 03343
'EPRODUCED BY PERMISSIONOF COPYRIGHT OWNERSRELEASE NUMBER 313B3
'rvOUN I uwu
20 M 79