Response to Letter Regarding Article, "High-Density Substrate Mapping in Brugada Syndrome: Combined...
17
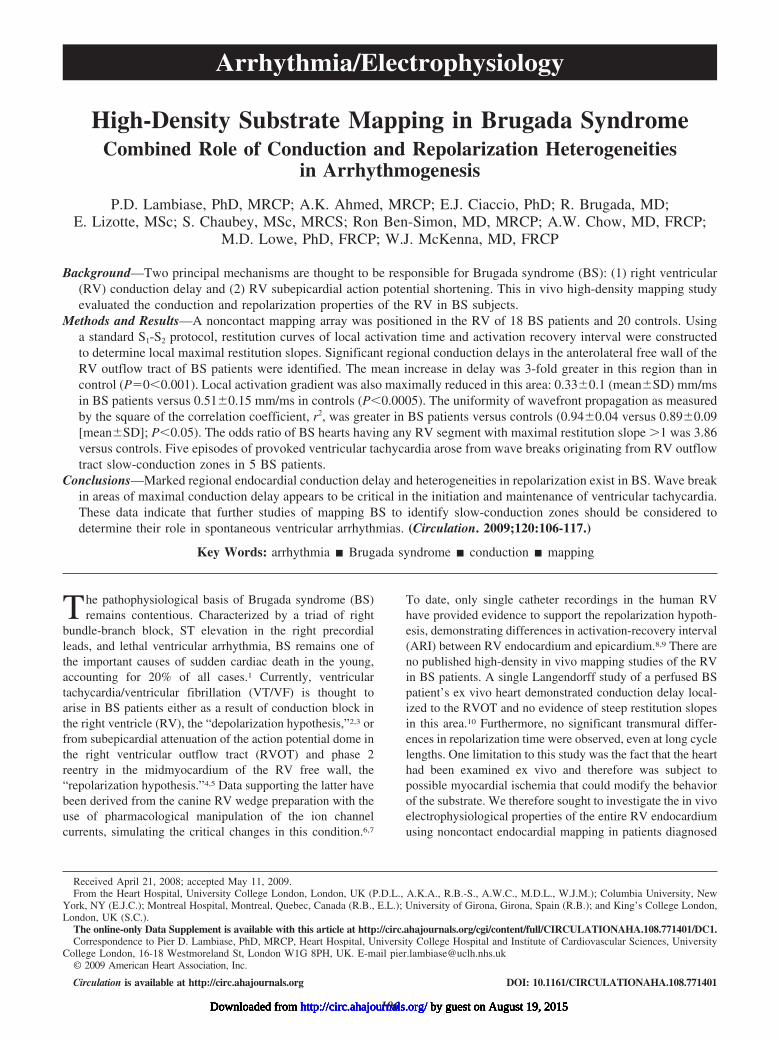
High-Density Substrate Mapping in Brugada Syndrome Combined Role of Conduction and Repolarization Heterogeneities in Arrhythmogenesis P.D. Lambiase, PhD, MRCP; A.K. Ahmed, MRCP; E.J. Ciaccio, PhD; R. Brugada, MD; E. Lizotte, MSc; S. Chaubey, MSc, MRCS; Ron Ben-Simon, MD, MRCP; A.W. Chow, MD, FRCP; M.D. Lowe, PhD, FRCP; W.J. McKenna, MD, FRCP Background—Two principal mechanisms are thought to be responsible for Brugada syndrome (BS): (1) right ventricular (RV) conduction delay and (2) RV subepicardial action potential shortening. This in vivo high-density mapping study evaluated the conduction and repolarization properties of the RV in BS subjects. Methods and Results—A noncontact mapping array was positioned in the RV of 18 BS patients and 20 controls. Using a standard S 1 -S 2 protocol, restitution curves of local activation time and activation recovery interval were constructed to determine local maximal restitution slopes. Significant regional conduction delays in the anterolateral free wall of the RV outflow tract of BS patients were identified. The mean increase in delay was 3-fold greater in this region than in control (P00.001). Local activation gradient was also maximally reduced in this area: 0.330.1 (meanSD) mm/ms in BS patients versus 0.510.15 mm/ms in controls (P0.0005). The uniformity of wavefront propagation as measured by the square of the correlation coefficient, r 2 , was greater in BS patients versus controls (0.940.04 versus 0.890.09 [meanSD]; P0.05). The odds ratio of BS hearts having any RV segment with maximal restitution slope 1 was 3.86 versus controls. Five episodes of provoked ventricular tachycardia arose from wave breaks originating from RV outflow tract slow-conduction zones in 5 BS patients. Conclusions—Marked regional endocardial conduction delay and heterogeneities in repolarization exist in BS. Wave break in areas of maximal conduction delay appears to be critical in the initiation and maintenance of ventricular tachycardia. These data indicate that further studies of mapping BS to identify slow-conduction zones should be considered to determine their role in spontaneous ventricular arrhythmias. (Circulation. 2009;120:106-117.) Key Words: arrhythmia Brugada syndrome conduction mapping T he pathophysiological basis of Brugada syndrome (BS) remains contentious. Characterized by a triad of right bundle-branch block, ST elevation in the right precordial leads, and lethal ventricular arrhythmia, BS remains one of the important causes of sudden cardiac death in the young, accounting for 20% of all cases. 1 Currently, ventricular tachycardia/ventricular fibrillation (VT/VF) is thought to arise in BS patients either as a result of conduction block in the right ventricle (RV), the “depolarization hypothesis,” 2,3 or from subepicardial attenuation of the action potential dome in the right ventricular outflow tract (RVOT) and phase 2 reentry in the midmyocardium of the RV free wall, the “repolarization hypothesis.” 4,5 Data supporting the latter have been derived from the canine RV wedge preparation with the use of pharmacological manipulation of the ion channel currents, simulating the critical changes in this condition. 6,7 To date, only single catheter recordings in the human RV have provided evidence to support the repolarization hypoth- esis, demonstrating differences in activation-recovery interval (ARI) between RV endocardium and epicardium. 8,9 There are no published high-density in vivo mapping studies of the RV in BS patients. A single Langendorff study of a perfused BS patient’s ex vivo heart demonstrated conduction delay local- ized to the RVOT and no evidence of steep restitution slopes in this area. 10 Furthermore, no significant transmural differ- ences in repolarization time were observed, even at long cycle lengths. One limitation to this study was the fact that the heart had been examined ex vivo and therefore was subject to possible myocardial ischemia that could modify the behavior of the substrate. We therefore sought to investigate the in vivo electrophysiological properties of the entire RV endocardium using noncontact endocardial mapping in patients diagnosed Received April 21, 2008; accepted May 11, 2009. From the Heart Hospital, University College London, London, UK (P.D.L., A.K.A., R.B.-S., A.W.C., M.D.L., W.J.M.); Columbia University, New York, NY (E.J.C.); Montreal Hospital, Montreal, Quebec, Canada (R.B., E.L.); University of Girona, Girona, Spain (R.B.); and King’s College London, London, UK (S.C.). The online-only Data Supplement is available with this article at http://circ.ahajournals.org/cgi/content/full/CIRCULATIONAHA.108.771401/DC1. Correspondence to Pier D. Lambiase, PhD, MRCP, Heart Hospital, University College Hospital and Institute of Cardiovascular Sciences, University College London, 16-18 Westmoreland St, London W1G 8PH, UK. E-mail [email protected] © 2009 American Heart Association, Inc. Circulation is available at http://circ.ahajournals.org DOI: 10.1161/CIRCULATIONAHA.108.771401 106 Arrhythmia/Electrophysiology by guest on August 19, 2015 http://circ.ahajournals.org/ Downloaded from by guest on August 19, 2015 http://circ.ahajournals.org/ Downloaded from by guest on August 19, 2015 http://circ.ahajournals.org/ Downloaded from by guest on August 19, 2015 http://circ.ahajournals.org/ Downloaded from by guest on August 19, 2015 http://circ.ahajournals.org/ Downloaded from by guest on August 19, 2015 http://circ.ahajournals.org/ Downloaded from
-
Upload
independent -
Category
Documents
-
view
2 -
download
0
Transcript of Response to Letter Regarding Article, "High-Density Substrate Mapping in Brugada Syndrome: Combined...
High-Density Substrate Mapping in Brugada SyndromeCombined Role of Conduction and Repolarization Heterogeneities
in Arrhythmogenesis
P.D. Lambiase, PhD, MRCP; A.K. Ahmed, MRCP; E.J. Ciaccio, PhD; R. Brugada, MD;E. Lizotte, MSc; S. Chaubey, MSc, MRCS; Ron Ben-Simon, MD, MRCP; A.W. Chow, MD, FRCP;
M.D. Lowe, PhD, FRCP; W.J. McKenna, MD, FRCP
Background—Two principal mechanisms are thought to be responsible for Brugada syndrome (BS): (1) right ventricular(RV) conduction delay and (2) RV subepicardial action potential shortening. This in vivo high-density mapping studyevaluated the conduction and repolarization properties of the RV in BS subjects.
Methods and Results—A noncontact mapping array was positioned in the RV of 18 BS patients and 20 controls. Usinga standard S1-S2 protocol, restitution curves of local activation time and activation recovery interval were constructedto determine local maximal restitution slopes. Significant regional conduction delays in the anterolateral free wall of theRV outflow tract of BS patients were identified. The mean increase in delay was 3-fold greater in this region than incontrol (P�0�0.001). Local activation gradient was also maximally reduced in this area: 0.33�0.1 (mean�SD) mm/msin BS patients versus 0.51�0.15 mm/ms in controls (P�0.0005). The uniformity of wavefront propagation as measuredby the square of the correlation coefficient, r2, was greater in BS patients versus controls (0.94�0.04 versus 0.89�0.09[mean�SD]; P�0.05). The odds ratio of BS hearts having any RV segment with maximal restitution slope �1 was 3.86versus controls. Five episodes of provoked ventricular tachycardia arose from wave breaks originating from RV outflowtract slow-conduction zones in 5 BS patients.
Conclusions—Marked regional endocardial conduction delay and heterogeneities in repolarization exist in BS. Wave breakin areas of maximal conduction delay appears to be critical in the initiation and maintenance of ventricular tachycardia.These data indicate that further studies of mapping BS to identify slow-conduction zones should be considered todetermine their role in spontaneous ventricular arrhythmias. (Circulation. 2009;120:106-117.)
Key Words: arrhythmia � Brugada syndrome � conduction � mapping
The pathophysiological basis of Brugada syndrome (BS)remains contentious. Characterized by a triad of right
bundle-branch block, ST elevation in the right precordialleads, and lethal ventricular arrhythmia, BS remains one ofthe important causes of sudden cardiac death in the young,accounting for 20% of all cases.1 Currently, ventriculartachycardia/ventricular fibrillation (VT/VF) is thought toarise in BS patients either as a result of conduction block inthe right ventricle (RV), the “depolarization hypothesis,”2,3 orfrom subepicardial attenuation of the action potential dome inthe right ventricular outflow tract (RVOT) and phase 2reentry in the midmyocardium of the RV free wall, the“repolarization hypothesis.”4,5 Data supporting the latter havebeen derived from the canine RV wedge preparation with theuse of pharmacological manipulation of the ion channelcurrents, simulating the critical changes in this condition.6,7
To date, only single catheter recordings in the human RVhave provided evidence to support the repolarization hypoth-esis, demonstrating differences in activation-recovery interval(ARI) between RV endocardium and epicardium.8,9 There areno published high-density in vivo mapping studies of the RVin BS patients. A single Langendorff study of a perfused BSpatient’s ex vivo heart demonstrated conduction delay local-ized to the RVOT and no evidence of steep restitution slopesin this area.10 Furthermore, no significant transmural differ-ences in repolarization time were observed, even at long cyclelengths. One limitation to this study was the fact that the hearthad been examined ex vivo and therefore was subject topossible myocardial ischemia that could modify the behaviorof the substrate. We therefore sought to investigate the in vivoelectrophysiological properties of the entire RV endocardiumusing noncontact endocardial mapping in patients diagnosed
Received April 21, 2008; accepted May 11, 2009.From the Heart Hospital, University College London, London, UK (P.D.L., A.K.A., R.B.-S., A.W.C., M.D.L., W.J.M.); Columbia University, New
York, NY (E.J.C.); Montreal Hospital, Montreal, Quebec, Canada (R.B., E.L.); University of Girona, Girona, Spain (R.B.); and King’s College London,London, UK (S.C.).
The online-only Data Supplement is available with this article at http://circ.ahajournals.org/cgi/content/full/CIRCULATIONAHA.108.771401/DC1.Correspondence to Pier D. Lambiase, PhD, MRCP, Heart Hospital, University College Hospital and Institute of Cardiovascular Sciences, University
College London, 16-18 Westmoreland St, London W1G 8PH, UK. E-mail [email protected]© 2009 American Heart Association, Inc.
Circulation is available at http://circ.ahajournals.org DOI: 10.1161/CIRCULATIONAHA.108.771401
106
Arrhythmia/Electrophysiology
by guest on August 19, 2015http://circ.ahajournals.org/Downloaded from by guest on August 19, 2015http://circ.ahajournals.org/Downloaded from by guest on August 19, 2015http://circ.ahajournals.org/Downloaded from by guest on August 19, 2015http://circ.ahajournals.org/Downloaded from by guest on August 19, 2015http://circ.ahajournals.org/Downloaded from by guest on August 19, 2015http://circ.ahajournals.org/Downloaded from

with BS. The principal objectives were to determine whetherlocalized endocardial conduction delay in the RVOT is acharacteristic feature of BS and to identify whether signifi-cant endocardial repolarization gradients exist in the RVcompared with controls. The study evaluated regional differ-ences in repolarization time with the use of a standard S1-S2
restitution protocol. The degree of regional11 and localconduction delay was measured with 2 techniques, includingactivation gradient (AG) quantification.12
Clinical Perspective on p 117
MethodsMapping was performed in 38 patients (BS group, n�18; controlgroup, n�20). The control group consisted of 12 patients withunifocal RVOT ectopics and 8 with supraventricular tachycardia.They had normal resting and signal-averaged ECGs, a negativeajmaline challenge test, structurally normal hearts on echocardiog-raphy, and no family history of sudden cardiac death. Informedconsent was obtained after local research ethics committee approval.The noncontact mapping study and pacing protocol were performedbefore ablation in the control patients or VT stimulation studies inthe BS group. The technique for noncontact mapping in the ventriclehas been described in detail elsewhere.13 The multielectrode array(Ensite, St Jude Medical) was deployed via the left femoral vein inthe RVOT (see Methods in the online-only Data Supplement fordetailed protocol).
Genetic TestingBlood samples (10 mL) were obtained from participating BSsubjects. Genomic DNA was isolated from peripheral blood leuko-cytes with the use of a commercial kit (Gentra System, Puregene).The exons of SCN5A were amplified and analyzed by directsequencing. Polymerase chain reaction products were purified withExosap (USB) and were directly sequenced from both directionswith the ABI PRISM BigDye Terminator Cycle Sequencing Reac-tion and the ABI PRISM 3130XL Automatic DNA Sequencer.
Study ProtocolAfter 3 minutes of steady state RV apical pacing at 400 ms, anextrastimulus (S2) was introduced after a drivetrain of 10 beatsaccording to a standard S1-S2 restitution protocol (see Methods in theonline-only Data Supplement) and was repeated during pacing fromthe RVOT. All patients were studied in the absence of ajmalineadministration. A VT stimulation protocol was also performed (seeMethods in the online-only Data Supplement).
The time from the pacing artifact to electrogram peak negativedV/dt was used as the local activation time. ARI was defined as theinterval between activation time and repolarization time and mea-sured as described previously.14,15 The slope of the ARI restitutioncurve was calculated by the least mean squares method.16 The RVwas divided into 16 anatomic segments,15 and the restitution slopeswere studied in the segments from the RVOT, RV body, and apex.
Endocardial Regional DelayMean increase of delay (MID) was calculated by dividing theintegrated increase of delay (area under the curve) by the intervalbetween baseline cycle length and the refractory period.11 Thedegree of delay was measured from 4 segments in the RVOT and theRV body and 4 segments at the apex. Activation times in the leftventricular outflow tract (LVOT) were recorded from a steerablequadrapolar catheter positioned retrogradely through the aortic valveand applied to the septal surface of the LVOT.
Endocardial Local Activation DelayAreas of local activation delay during sinus rhythm were determinedto estimate the location of the diastolic pathway with the use of AG
quantification. During sinus rhythm without pacing, activation timesdetermined from noncontact unipolar recordings at 64 locationsdefined by Cartesian coordinates were used to construct a3-dimensional activation map.12 This is described in detail in theonline-only Data Supplement. In summary, AG was determined bycomputing the linear regression of activation times from 4 to 6recording sites that were spatially aligned in the direction of thepropagating wavefront and in proximity to one another along theendocardial surface in sinus rhythm. Where slow conduction oc-curred on the map (ie, greatest local activation delay), the3-dimensional position, AG magnitude, and square of the correlationcoefficient (r2), which is a measure of uniformity of wavefrontpropagation along the endocardial surface, were calculated.
In 5 patients with VT/VF induced during the electrophysiologystudy, the reentrant VT circuit activation wavefront was mapped; anarrow was drawn directly through the midline of the diastolicpathway on the computerized mapping grid, and the differencebetween the estimated and actual isthmus was determined as follows.Five equally spaced digital points were placed along each arrow onthe computerized mapping grid. The absolute distance betweencorresponding points along each arrow ([point 1, arrow 1 to point 1,arrow 2], [point 2, arrow 1 to point 2, arrow 2], . . .) was calculatedand averaged for the 5 distances.
Statistical AnalysisThe mean�SD of computed values of AG and r2 at the region ofgreatest local activation delay was determined for BS patients versuscontrol patients. The unpaired t test was used to assess the statisticalsignificance of the difference between BS and controls for each ofthese parameters (SigmaStat version 3.11, 2004). The MID andelectrogram data were modeled with the use of mixed effects linearregression (software, MLwIN version 2.01), and statistical signifi-cance was inferred from the model. The ARI data were comparedwith the use of curve fitting. MLwIN was used to fit a regressionmodel to the ARI restitution curve data, and statistical significancewas inferred from the model fit. A logistic regression model(STATA) was fitted to evaluate the odds of a segment of control/BShearts having maximal restitution slopes (Smax) �1. As multiplesegments were analyzed in each heart, clustering was used to adjustfor error.
To power the study to 80% with a significance of 0.05, STATA8.2 software was employed. From pilot studies, mean MID was 8.3(SD 2.5) in control hearts, and mean MID was 14.7 (SD 5.9) in BShearts. Seventeen patients in each group were calculated as sufficientto detect at least a 50% regional difference in MID. In a normal heart,the mean AG was 0.5 mm/ms (SD 0.15). To identify a �40%difference in AG between BS and control groups, n�10 wasrequired. Finally, with the mean maximal slope of the normal heartbeing 0.5 (SD 0.2), n�10 was required to detect an increase in meanSmax of �40%.
The authors had full access to and take full responsibility for theintegrity of the data. All authors have read and agree to themanuscript as written.
ResultsPatient Characteristics and Results of SCN5AMutation ScreeningDemographics of the BS study subjects are shown in the Table.The 20 control subjects had a mean age of 48 years (9 men, 11women). Eighteen BS subjects were studied; 28% had sponta-neous resting type 1 ECG changes, and the remainder had a type1 response to ajmaline provocation. Four had a previous VT/VFarrest, and 5 had a positive VT simulation study at whichsustained VT/VF was induced.
We screened by direct sequencing the exons and exon-intron boundaries of SCN5A of the BS patients. Nucleotidesequencing in individuals revealed a missense mutation (G to
Lambiase et al Brugada-Mapping Heterogeneities 107
by guest on August 19, 2015http://circ.ahajournals.org/Downloaded from

A substitution at nucleotide 5038) in 1 BS subject (Table,patient 8), causing the substitution of alanine to threonine(designated A1680T). Mutation A1680T had been describedpreviously as being responsible for sudden arrhythmic deathsyndrome.17
Control GroupThe conduction and repolarization data were initially comparedin the RVOT ectopic and supraventricular tachycardia patients.No significant differences in MID (RVOT [mean�SEM],6.0�0.8 versus 6.8�0.8 ms; body, 8.5�2.2 versus 9.9�2.4 ms;apex, 8.5�2.2 versus 8.4�3.2 ms), AG (mean, 0.52�0.16versus 0.49�0.14 mm/ms), or proportion of Smax �1 wereidentified between these patients’ RVs. They were thereforegrouped together and treated as a single control group of patientsfor the rest of the analysis.
Isochronal Mapping to Identify the Site ofMaximal DelayFigure 1 illustrates the isochronal maps recorded during RVapical pacing at 400 ms obtained from a control patient and at400-, 600-, and 800-ms coupling intervals in a BS patient.There are clear differences in depolarization time in the RVbetween the 2 patients. Overall activation of the RV tookalmost twice as long to propagate across the chamber com-pared with the control. The isochrones are homogeneouslyseparated in most of the BS RV, but isochronal crowding wasevident in the anterolateral RVOT, representing a line ofconduction delay of �40 ms over this site (Figure 1B). Themean endocardial activation time in patients with type 1resting ECG during sinus rhythm was 125�10 ms, coincidingwith the peak of J-point elevation in the type 1 patients(Figure 1C). The lines of conduction delay in BS patients
were functional. There was evidence of conduction slowingin this basal area at 800-ms pacing cycle length withoutevidence of double potentials (Figure 1B). This contrasts withthe control group, in which conduction was more rapid andthere were no consistent lines of conduction delay in theanterolateral RVOT.
Quantification of Local and RegionalConduction DelayAs the graphs in Figure 2A and 2B demonstrate, significantlocal differences in the RVOT activation time occurred in BSpatients. Statistically significant regional conduction delaywas found between the RVOT and apex of BS and controlsubjects (Figure 2B). Within the BS group, significant delayswere also identified between the RVOT and apex, which wasnot evident in the control RV (Figure 2B). The LVOTactivation curves also had a normal appearance without thedelayed upstroke of the BS RVOT activation curve (data notshown).
With the use of an alternative well-validated method toquantify the extent of regional conduction delay and inhomo-geneity,12,18 significant reductions in AG in the RVOT of BSpatients versus controls were identified (Figure 3A). AG wasreduced by 35%. At the slow-conducting region, the meanAG as determined by linear regression was 0.33�0.1 mm/msin BS patients versus 0.51�0.15 mm/ms in control patients(P�0.0005). Significantly higher correlation coefficientswere measured at the site of maximal delay in BS, a measureof local stability in conduction. The uniformity of wavefrontpropagation as measured by the square of the correlationcoefficient, r2, was 0.94�0.04 for BS patients versus0.89�0.09 for control patients (P�0.05) (Figure 3B). Withthe use of a linear discrimination function of AG�0.425 mm/ms
Table. BS Subjects: Demographics
SubjectNo. Age, y Sex Syncope
Family History ofSudden Cardiac Death
Type 1 BSECG at Rest
Previous Historyof VT/VF
Inducible VT/VF atElectrophysiological Study
LatePotentials
ICD Implanted/ICD Therapy
1 38 F � � � � � � �/�
2 24 F � � � � � � �
3 50 F � � � � � � �
4 66 M � � � � � � �
5 54 F � � � � � � �
6 44 F � � � � � � �
7 25 F � � � � � � �
8 75 F � � � � � � �
9 51 M � � � � � � �/�
10 19 M � � � � � � �/�
11 47 M � � � � � � �/�
12 47 M � � � � � � �/�
13 71 F � � � � � � �
14 54 F � � � � � � �
15 40 F � � � � � � �
16 53 F � � � � � � �/�
17 59 M � � � � � � �/�
18 23 M � � � � � � �/�
ICD indicates implantable cardioverter-defibrillator.
108 Circulation July 14, 2009
by guest on August 19, 2015http://circ.ahajournals.org/Downloaded from
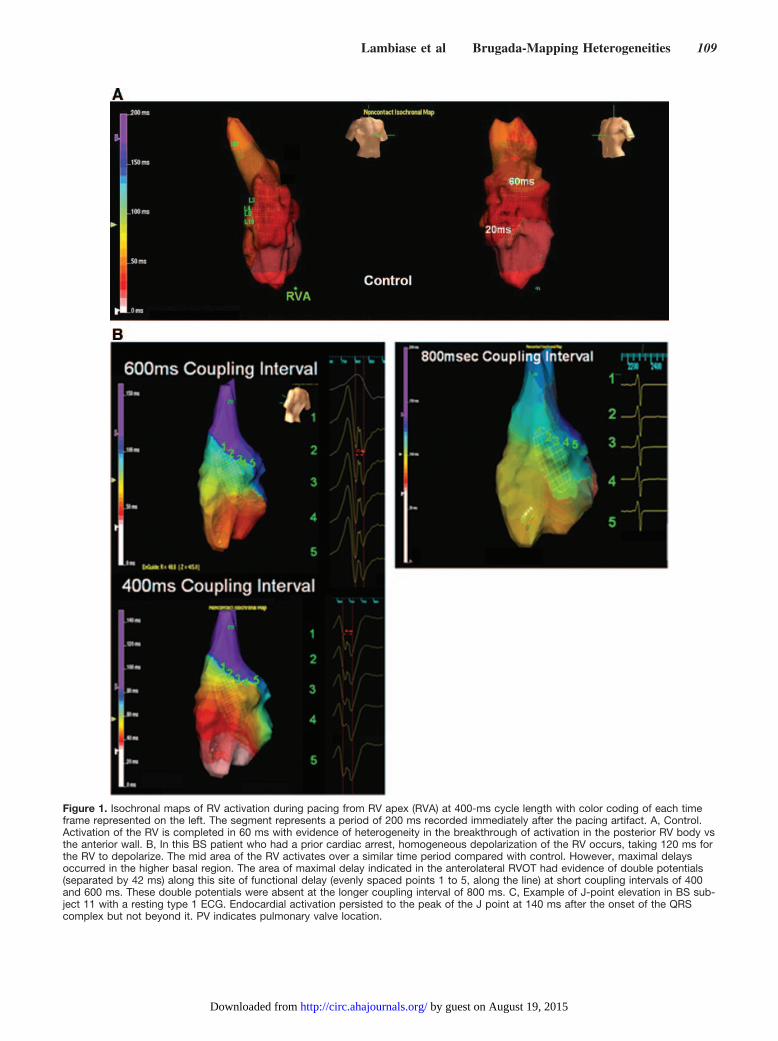
Figure 1. Isochronal maps of RV activation during pacing from RV apex (RVA) at 400-ms cycle length with color coding of each timeframe represented on the left. The segment represents a period of 200 ms recorded immediately after the pacing artifact. A, Control.Activation of the RV is completed in 60 ms with evidence of heterogeneity in the breakthrough of activation in the posterior RV body vsthe anterior wall. B, In this BS patient who had a prior cardiac arrest, homogeneous depolarization of the RV occurs, taking 120 ms forthe RV to depolarize. The mid area of the RV activates over a similar time period compared with control. However, maximal delaysoccurred in the higher basal region. The area of maximal delay indicated in the anterolateral RVOT had evidence of double potentials(separated by 42 ms) along this site of functional delay (evenly spaced points 1 to 5, along the line) at short coupling intervals of 400and 600 ms. These double potentials were absent at the longer coupling interval of 800 ms. C, Example of J-point elevation in BS sub-ject 11 with a resting type 1 ECG. Endocardial activation persisted to the peak of the J point at 140 ms after the onset of the QRScomplex but not beyond it. PV indicates pulmonary valve location.
Lambiase et al Brugada-Mapping Heterogeneities 109
by guest on August 19, 2015http://circ.ahajournals.org/Downloaded from

for classification, the method of AG determination has a sensi-tivity of 89% and a specificity of 86% to predict BS in this studypopulation (Figure 3C). No significant differences in AG and r2
were identified between the spontaneous and ajmaline-inducedpatients.
Fractionation of ElectrogramsSignificant prolongation of the sinus rhythm electrograms wasidentified in the RVOT versus apex of BS subjects, which wasnot apparent in the controls (Figure 4A and 4B). These electro-grams were also significantly more prolonged (Figure 4B) andcomplex in the BS RVOT segments versus controls (3.1�0.5versus 2.5�0.5 polyphasic components; P�0.05). The electro-grams in the BS RVOT segments were more polyphasic than
RV body and apex (3.1 versus 1.8 [RV body] and 1.7 [RV apex];P�0.01), which did not occur in controls.
Endocardial ARI Restitution CurvesThe mean ARIs of all the segmental restitution curves at400-ms baseline cycle length in the BS RV and control RVduring RV apical pacing were compared. Overall, there weresignificant differences in ARI in the midportion of therestitution curve between BS and control hearts (Figure 5Aand 5B). The mean ARI in the midrange of diastolic intervalswas 15 ms longer in control hearts versus BS (P�0.05;confidence interval, 4-24 ms) at 400 ms, and this differencepersisted over the 210- to 600-ms diastolic interval range.
Figure 1. Continued.
Figure 2. A, Conduction curves derivedfrom 5 sites: RVOT, RV body (�2), RVapex, and LVOT of a BS subject. There isa delayed upstroke in RVOT conductioncurve, resulting in an increased areaunder the curve. AT indicates activationtime; CI, coupling interval. B, MID for BSand control subjects (mean�SEM).*P�0.05 vs BS RVOT.
110 Circulation July 14, 2009
by guest on August 19, 2015http://circ.ahajournals.org/Downloaded from

When the ARI restitution curves in all the RVOT and apicalsegments were compared in the BS and control patients, therewas a significant dispersion of repolarization between thesesegments versus controls (Figure 5C). Analysis of all the curvesby model fitting and testing for interaction confirmed significantdifferences in the ARI at apex and base in BS at both long andshort diastolic intervals, which did not occur in controls. Seg-mental ARIs were longer at apex versus RVOT in controls onlyat long diastolic intervals (P�0.05). There was a crossover ofARIs, resulting in significantly more prolonged ARIs at longdiastolic intervals in the RVOT versus apex in BS, whichreversed at short diastolic intervals, such that at negative diastol-
ic intervals the apical ARI became longer than the basal in BShearts (P�0.05). This suggests that there is a large interval-dependent dispersion of ARI in BS patients.
The maximal slopes of ARI restitution curves were com-pared between control and BS subjects (examples are shownin Figure 5D). The odds of a BS heart having any segmentwith a maximum ARI slope �1 was 3.86 (95% confidenceinterval, 1.48 to 10.07) times higher than that in the controlheart (P�0.05). There was a trend in the proportion of RVOTand apical segments with Smax �1 being significantly greaterin BS versus controls, but this did not reach statisticalsignificance. No significant differences in proportion of Smax
Figure 3. A, Minimal AG in BS patients andcontrols. B, Uniformity of wavefront propa-gation as measured by the square of thecorrelation coefficient, r2, in the 2 groups. C,Scatterplot of AG vs r2 of BS and normalsubjects. Using a linear discriminant func-tion of AG�0.425 mm/ms for classification,the method has a sensitivity of 88.8% anda specificity of 86% to predict BS on thebasis of AG alone.
Figure 4. A, Fractionated electrograms recorded in the RVOT of 3 BS vs control subjects (at 200 mm/s). B, Mean QRS duration of theelectrogram (ms) compared in the BS and normal subjects from segments in the RVOT, RV body, and apex.
Lambiase et al Brugada-Mapping Heterogeneities 111
by guest on August 19, 2015http://circ.ahajournals.org/Downloaded from

�1 were identified between the spontaneous and ajmaline-induced BS patients in the 3 regions.
The mean of the greatest segmental Smax from the RVOT ofBS was twice that of control RVOT segments (0.84�0.3versus 0.42�0.2; P�0.002, unpaired t test). The apical-basaldifferences in maximal local restitution slopes were preservedwith pacing from the RVOT (RVOT, Smax 0.93�0.3 versusapex, 0.51�0.2; P�0.01, paired t test) in BS hearts.
Initiation of VT and VFIn 5 BS patients, VT was induced that degenerated into VFduring the VT stimulation protocol. (An example of theinitiation is shown in detail in Figure 6.) A consistent featureseen in all 5 cases that provoked VF was progressive slowingof conduction, followed by formation of an arc of functionalconduction block on the anterior RVOT endocardium. Eachepisode of VF initiation consistently demonstrated the site ofearliest wave break, and fractionation arose from an anteriorRVOT site. These key areas that initiated VF correlated withthe same regions of altered myocardial electrophysiology,identified during sinus rhythm and steady state remote RVpacing, characterized by altered dispersion of ARI and slowconduction in BS patients. The restitution slope between the
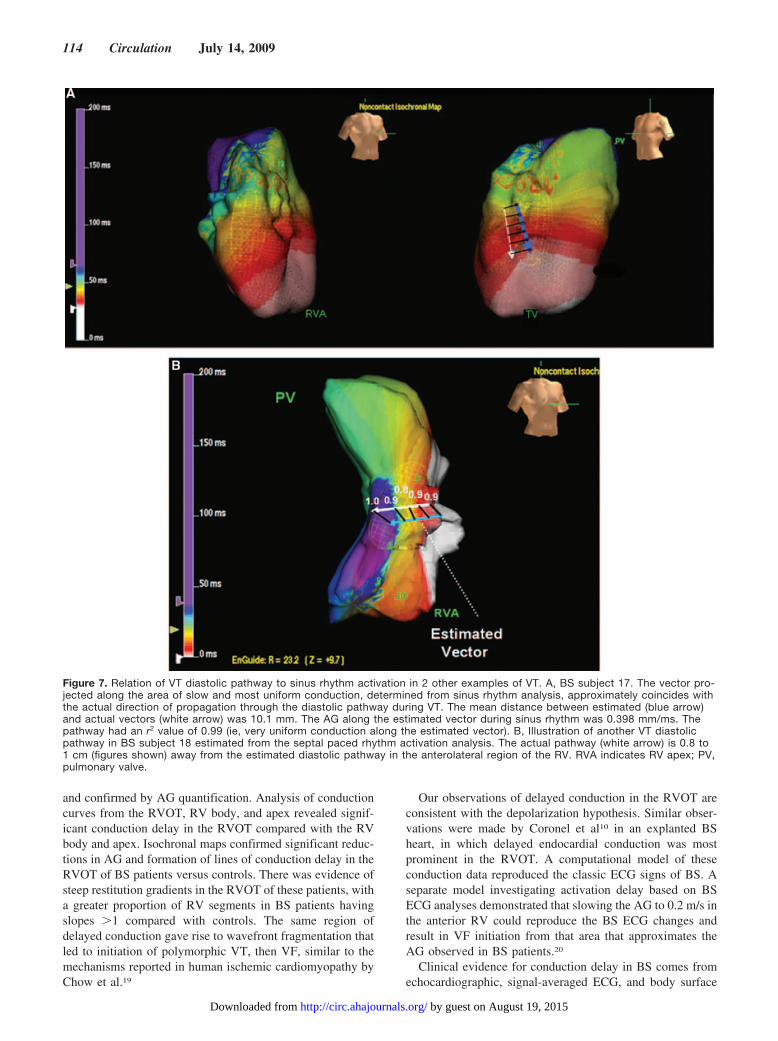
lines of conduction block in Figure 6 was �1, suggesting thatconduction delay accounted for wave break, ultimately lead-ing to polymorphic VT and VF. Lines of functional blockevolved on a beat-to-beat basis, but the region of slowconduction that these lines bordered was limited to theanterior wall of the RVOT. Furthermore, the same data wereanalyzed with the custom-designed AG quantification tech-nique developed by Ciaccio et al.12 The site of wave breakoccurred in areas of local conduction delay, as shown for 2BS subjects 17 and 18 in Figure 7. This slow-conduction zoneformed at the region of greatest local activation delay asdetermined by sinus rhythm AG quantification.12 Wave breaktended to coincide with slow-fast conduction boundaries atthe edges of this region. From the set of 5 patients in whichthe isthmus location estimated by sinus rhythm analysis wascompared with the location of the diastolic pathway as inFigure 7, the mean difference in location was 8.7�1.6 mm.
DiscussionThis is the first study to describe the electrophysiologicalsubstrate responsible for the changes seen in BS in vivo, withthe use of high-resolution noncontact endocardial mapping
Figure 5. A, Average ARI for normal and BS hearts recorded from all segments in RVOT, body, and apex over different diastolic inter-vals (DI) during a 400-ms baseline restitution curve. B, Mean difference in ARI between BS hearts and normal hearts during a 400-msrestitution curve. The difference is plotted with its 95% confidence interval. The ARIs are significantly shorter in BS hearts in the middi-astolic range. C, Example of the mean ARI in the apex and RVOT in control and BS hearts illustrating relative regional changes in meansegmental ARIs. D, Examples of ARI restitution curves measured from 3 segments in the regions RVOT, RV body, and RV apex, withSmax of 1.1 demonstrated in the RV body.
112 Circulation July 14, 2009
by guest on August 19, 2015http://circ.ahajournals.org/Downloaded from

Figure 6. Initiation of VT (which subsequently degenerated into VF) after development of an arc of functional block during a VT stimula-tion study (BS subject 18). Orthogonal isochronal maps on each panel show activation from the entire RV. A sequence of isochronalmaps with reference time scale on the left of each map corresponds to 5 sampled time windows. The Ensite computer-generated iso-chrones correspond to the peak negative dV/dtmax time point of each electrogram. The time scale of the isochrones is shown on the leftof each map in 20-ms increments. The position of the Ensite array and mapping catheter can also be seen within the RV. Sampledareas of reconstructed electrograms are shown in the lower panel. The position of each electrogram is also marked on the isochronalmaps (electrograms: 1 to 10). Two reference ECG electrodes are also included at the top of the figure. A shows the first ectopic beatthat occurs after a fusion beat seen on the second pacing artifact (at 600-ms coupling interval). A time window of 150 ms is taken tocreate the map. Earliest activity arises from the midanterior RV wall. No lines of block are seen from the reconstructed electrograms orisochronal maps. In B, a further ectopic arising from a position similar to the first beat occurs (time window, 150 ms); limited lines ofconduction block starting to develop above and below the earliest points of activation on the anterior wall (�50 ms activation differencebetween 2 adjacent areas) can be seen on the isochronal activation, and slowing of conduction is suggested by the more prolongedelectrograms. C, With a time window of 120 ms, the next sequence of RV activity arises just after the next pacing artifact. This arisesfrom a superior and more septal point on the anterior RV wall. A region of conduction block with crowding of isochrones and temporaldifferences in activation of immediate adjacent areas of 80 to 90 ms is present. Electrograms at positions 6 to 8 demonstrate a singleearly negative unipolar activation, which contrasts with the double potentials seen in the reconstructed electrograms (electrograms 3 to5) within the adjacent area forming a border of conduction block. D shows the next time window of 110 ms after C. Continued activitywith the earliest region (now in white) follows from the latest regions in C. Activity revolves around lines of conduction block and propa-gates into the previously protected area. There is a delay of 100 ms between the latest activation of the beat on electrogram 3 in C andthe earliest electrogram 6 in this panel. This sequence of activation may be consistent with reentry. However, there is a delay of 100ms between the latest activation of the beat on electrogram 3 in C and the earliest electrogram 6 in this panel. This could be explainedby delay created by turning of the wavefront around the line of conduction block in this area. The earliest electrograms progress fromelectrogram 6 to 8 with far field deflections seen on 3 to 5, which lie on a border of conduction block. E shows the immediate timewindow spanning 110 ms after D. The earliest region is now white, replacing the latest area on D (blue and purple). Activation duringthis beat follows the same path of activity shown in D, proceeding around the region of conduction block in the RVOT with evidence ofdouble potentials in electrograms 3 to 5 and sharp negative deflection in electrograms 6 to 8 at the site of latest activation.
Lambiase et al Brugada-Mapping Heterogeneities 113
by guest on August 19, 2015http://circ.ahajournals.org/Downloaded from
and confirmed by AG quantification. Analysis of conductioncurves from the RVOT, RV body, and apex revealed signif-icant conduction delay in the RVOT compared with the RVbody and apex. Isochronal maps confirmed significant reduc-tions in AG and formation of lines of conduction delay in theRVOT of BS patients versus controls. There was evidence ofsteep restitution gradients in the RVOT of these patients, witha greater proportion of RV segments in BS patients havingslopes �1 compared with controls. The same region ofdelayed conduction gave rise to wavefront fragmentation thatled to initiation of polymorphic VT, then VF, similar to themechanisms reported in human ischemic cardiomyopathy byChow et al.19
Our observations of delayed conduction in the RVOT areconsistent with the depolarization hypothesis. Similar obser-vations were made by Coronel et al10 in an explanted BSheart, in which delayed endocardial conduction was mostprominent in the RVOT. A computational model of theseconduction data reproduced the classic ECG signs of BS. Aseparate model investigating activation delay based on BSECG analyses demonstrated that slowing the AG to 0.2 m/s inthe anterior RV could reproduce the BS ECG changes andresult in VF initiation from that area that approximates theAG observed in BS patients.20
Clinical evidence for conduction delay in BS comes fromechocardiographic, signal-averaged ECG, and body surface
Figure 7. Relation of VT diastolic pathway to sinus rhythm activation in 2 other examples of VT. A, BS subject 17. The vector pro-jected along the area of slow and most uniform conduction, determined from sinus rhythm analysis, approximately coincides withthe actual direction of propagation through the diastolic pathway during VT. The mean distance between estimated (blue arrow)and actual vectors (white arrow) was 10.1 mm. The AG along the estimated vector during sinus rhythm was 0.398 mm/ms. Thepathway had an r2 value of 0.99 (ie, very uniform conduction along the estimated vector). B, Illustration of another VT diastolicpathway in BS subject 18 estimated from the septal paced rhythm activation analysis. The actual pathway (white arrow) is 0.8 to1 cm (figures shown) away from the estimated diastolic pathway in the anterolateral region of the RV. RVA indicates RV apex; PV,pulmonary valve.
114 Circulation July 14, 2009
by guest on August 19, 2015http://circ.ahajournals.org/Downloaded from

mapping data.3,21 The latter 2 have been shown to beindependent predictors of VT/VF.22,23 Nagase et al8 showedthat delayed potentials from the epicardium coincided withlate potentials from signal-averaged ECG. However, to date,there has been no in vivo determination of the preciselocation and extent of delayed conduction in the RV endo-cardium of the human BS heart. With the use of 2 methods tomeasure conduction delay, our study demonstrates that endo-cardial activation delay is most pronounced in the RVOT.This regional inhomogeneity of conduction, especially in theRVOT, reinforces the concept that conduction delay contrib-utes to the signature ECG changes of BS and is proarrhyth-mic.24 AG is 35% lower in BS patients. In BS patients, thisconduction delay increases the likelihood of reentry acrossboundaries of slow-fast conduction, where there is the poten-tial for impedance mismatch and functional unidirectionalblock.25,26
The lower uniformity of activation in the controls andgreater variability from patient to patient as measured by thesquare of the correlation coefficient (r2) (0.89�0.09 incontrols versus 0.94�0.04 for BS; P�0.05) may be due to thefact that normal endocardial surface conduction arises fromdeeper tissue via the Purkinje network, and thus moreendocardial breakthrough occurs. The greater uniformity ofdepolarization in BS may be due to the fact that surfaceconduction is limited to the endocardium and occurs less bybreakthrough from mid and epicardial tissue. The lower AGobserved in specific areas of the RVOT in BS may suggest astructural basis for the creation of the substrate from whichconduction abnormalities arise, as has been described ininfarct-related ventricular arrhythmias.27 Fibrosis has beendocumented in clinical BS cases and SCN5A knockoutmurine models of the condition.10,28–31 Such a process wouldserve to uncouple myocardial layers perhaps through diseaseof the Purkinje network ,which has been demonstrated inanother disorder arising through mutations in the SCN5Asodium channel gene: Lev-Lenègre disease.32
SCN5A mutations currently occur in only 20% of BS cases(6% in this study), and the consistent identification of RVOTconduction delay in all the patients from this series suggeststhat the features of BS arise from a number of factors leadingto conduction block as opposed to a single sodium chan-nelopathy. As Coronel et al33 suggested recently, the funda-mental problem in BS may be secondary to conduction delayarising from genetic, structural, or pharmacological causes.The right precordial ST elevation characteristic of the condi-tion is a final phenotypic expression of this conductionabnormality, and the regional ECG abnormalities wouldcorrelate to the location of the conduction abnormality in theRV. Although endocardial activation did not continue into thecoved ST segment in this study, RV epicardial activation maycontinue beyond the J point, or endocardial activation delayitself may cause prolongation of repolarization, contributingto persistent ST elevation. Indeed, BS may represent amyocardial disorder in which specific ion channelopathiessuch as SCN5A mutations interact with structural abnormal-ities to promote arrhythmia, although these mutations maynot be as proarrhythmic or clinically significant in normalmyocardium.
Repolarization AbnormalitiesThis study demonstrated that steep restitution slopes �1 existin a greater proportion of segments in BS hearts versuscontrols. Contrary to the report of Hayashi et al,34 slopes �1were identified in all BS patients independent of inducible orspontaneous VF. This can be explained by the fact thatHayashi et al mapped only 2 sites and therefore could notexamine the heterogeneity in ARI restitution in the entire RV.The greater percentage of slopes �1 in the BS RV versuscontrols implicates a global repolarization abnormality in theRV endocardium, which may enhance the vulnerability toarrhythmia.
The finding of slopes �1 in normal RV myocardium hasbeen described previously by 2 independent groups withcontact and noncontact recordings and suggests that theidentification of slopes �1 alone does not necessarily indi-cate a high-risk substrate.14,16 The greater proportion of steeprestitution slopes in the BS subjects and apical-basal disper-sion of repolarization over a range of coupling intervals in theRVOT would increase the probability of wave break of localreentrant wavefronts and the degeneration of stable VT intoVF as proposed by the action potential duration restitutionhypothesis.35 The combination of conduction delay and het-erogeneities in ARI restitution slopes would create the idealsubstrate for local wave break to initiate VT and the degen-eration of VT into VF. It is interesting to note that a crossoverof regional ARI occurs in BS and not controls at longercoupling intervals, suggesting persistence of action potentialduration dispersion at both rapid and slow heart rates.Therefore, at rapid heart rates, regional action potentialduration dispersion facilitates conduction block to create theconditions to promote reentry and VT. Steep restitutionslopes would then serve to destabilize the VT and promotedegeneration into VF.
Data from the canine RV wedge preparation implicatephase 2 reentry as a result of epicardial dispersion ofrepolarization without significant shortening in endocardialaction potential duration at closely coupled extrasystoles asthe trigger for ventricular arrhythmia.6,36 This is consistentwith heterogeneous Ito channel distribution with highermembrane densities in the epicardial tissue than in theendocardium. Nagase et al9 have recently demonstratedprolonged epicardial ARIs in BS after administration ofpilsicainide. However, type 1 ECG changes and epicardialprolongation in ARI also occurred in SCN5A mutation–negative subjects, implying other mechanisms of transmuralrepolarization differences. Such dispersion in repolarizationcould be maximized if local fibrosis or another mechanism ofmyocyte uncoupling were to promote the differences inrepolarization gradients.
In a recent canine optical mapping study, Aiba et al7
showed marked dispersion of repolarization in the RVOTepicardium compared with the endocardium with maximumrepolarization gradients at the initiation of VF. Furthermore,conduction velocity restitution was progressively depressedfrom polymorphic VT to VF, suggesting that conductiondelay is an important determinant of wave break and VFinitiation/maintenance in this model.
Lambiase et al Brugada-Mapping Heterogeneities 115
by guest on August 19, 2015http://circ.ahajournals.org/Downloaded from
We conclude that although epicardial repolarization gradi-ents might explain phase 2 reentry and the initiation of VT inBS, marked regional endocardial conduction delay in combi-nation with regional differences in repolarization kinetics arekey elements of the arrhythmogenic substrate in this condi-tion and could be critical in the initiation and maintenance ofVT. The degeneration of VT to VF in humans is due to wavebreak at areas of steep ARI restitution slopes. The develop-ment of wave break would be consistent with high impedancemismatch, similar to the situation in infarct border zones.This may result from fibrosis in the tissue in this condition,for which there is evidence from other studies.24 Biopsy datafrom these sites of maximal conduction slowing and wavebreak would enhance our understanding of the substrate inthese specific sites but are not currently available from theseclinical cases.
Study LimitationsThis study employed noncontact mapping to investigateendocardial conduction and repolarization kinetics. Epicar-dial data were not collected because of ethical limitations inmapping RV epicardium via the conus branch so that theroles of epicardial conduction block and action potentialduration changes were not examined. However, epicardialRV sites may also be clinically important. This study inves-tigated VT initiation after programmed stimulation, whichmay differ from spontaneous VT/VF in this syndrome.However, practical considerations prevented mapping ofspontaneous VF, which did not occur during the mappingstudies in these patients.
Clinical ImplicationsRisk stratification in BS remains a significant challenge. Theinducibility of VT during an electrophysiological study is apotential determinant of sudden death.37,38 The identificationof regional RVOT conduction delay and block in this condi-tion suggests that conduction delay is an important commonfeature of BS. The recent observation that fragmented QRScomplexes are a predictor of prognosis in BS supports thecontention that these conduction abnormalities are an impor-tant contributor to the arrhythmogenic substrate in thisdisease.39,40 Why this form of channelopathy has such alocalized predilection affecting the RVOT rather than a morewidespread ventricular manifestation remains unexplained.
Having identified slow-conduction zones in the BS RVOT,future studies should investigate whether they play a role inspontaneous arrhythmogenesis. This information could in-form potential targeted therapies if a local endocardial orepicardial abnormality is confirmed to play a role in sponta-neous VT/VF.
Sources of FundingThis study was supported by the British Heart Foundation, StephenLyness Memorial Fund (P.L., W.J.M.), Ramon Brugada Sr Founda-tion, and Fondation de l’Institut de Cardiologie de Montreal (R.B.).
DisclosuresDr Lambiase reports having served on the St Jude Medical AdvisoryBoard. The other authors report no conflicts of interest.
References1. Ackerman MJ, Splawski I, Makielski JC, Tester DJ, Will ML, Timothy
KW, Keating MT, Jones G, Chadha M, Burrow CR, Stephens JC, Xu C,Judson R, Curran ME. Spectrum and prevalence of cardiac sodiumchannel variants among black, white, Asian, and Hispanic individuals:implications for arrhythmogenic susceptibility and Brugada/long QTsyndrome genetic testing. Heart Rhythm. 2004;1:600–607.
2. Antzelevitch C. Late potentials and the Brugada syndrome. J Am CollCardiol. 2002;39:1996–1999.
3. Tukkie R, Sogaard P, Vleugels J, de Groot IK, Wilde AA, Tan HL. Delay inright ventricular activation contributes to Brugada syndrome. Circulation.2004;109:1272–1277.
4. Antzelevitch C. Cellular basis and mechanism underlying normal andabnormal myocardial repolarization and arrhythmogenesis. Ann Med.2004;36(suppl 1):5–14.
5. Shu J, Zhu T, Yang L, Cui C, Yan GX. ST-segment elevation in the earlyrepolarization syndrome, idiopathic ventricular fibrillation, and theBrugada syndrome: cellular and clinical linkage. J Electrocardiol. 2005;38(suppl):26–32.
6. Kimura M, Kobayashi T, Owada S, Ashikaga K, Higuma T, Sasaki S,Iwasa A, Motomura S, Okumura K. Mechanism of ST elevation andventricular arrhythmias in an experimental Brugada syndrome model.Circulation. 2004;109:125–131.
7. Aiba T, Shimizu W, Hidaka I, Uemura K, Noda T, Zheng C, Kamiya A,Inagaki M, Sugimachi M, Sunagawa K. Cellular basis for trigger andmaintenance of ventricular fibrillation in the Brugada syndrome model:high-resolution optical mapping study. J Am Coll Cardiol. 2006;47:2074–2085.
8. Nagase S, Kusano KF, Morita H, Fujimoto Y, Kakishita M, Nakamura K,Emori T, Matsubara H, Ohe T. Epicardial electrogram of the right ven-tricular outflow tract in patients with the Brugada syndrome: using theepicardial lead. J Am Coll Cardiol. 2002;39:1992–1995.
9. Nagase S, Kusano KF, Morita H, Nishii N, Banba K, Watanabe A,Hiramatsu S, Nakamura K, Sakuragi S, Ohe T. Longer repolarization inthe epicardium of the right ventricular outflow tract causes type 1 elec-trocardiogram in patients with Brugada syndrome. J Am Coll Cardiol.2008;51:1154–1161.
10. Coronel R, Casini S, Koopmann TT, Wilms-Schopman FJ, Verkerk AO,de Groot JR, Bhuiyan Z, Bezzina CR, Veldkamp MW, Linnenbank AC,van der Wal AC, Tan HL, Brugada P, Wilde AA, de Bakker JM. Rightventricular fibrosis and conduction delay in a patient with clinical signs ofBrugada syndrome: a combined electrophysiological, genetic, his-topathologic, and computational study. Circulation. 2005;112:2769–2777.
11. Kawara T, Derksen R, de Groot JR, Coronel R, Tasseron S, LinnenbankAC, Hauer RN, Kirkels H, Janse MJ, de Bakker JM. Activation delayafter premature stimulation in chronically diseased human myocardiumrelates to the architecture of interstitial fibrosis. Circulation. 2001;104:3069–3075.
12. Ciaccio EJ, Chow AW, Davies DW, Wit AL, Peters NS. Localization ofthe isthmus in reentrant circuits by analysis of electrograms derived fromclinical noncontact mapping during sinus rhythm and ventriculartachycardia. J Cardiovasc Electrophysiol. 2004;15:27–36.
13. Schilling RJ, Davies DW, Peters NS. Characteristics of sinus rhythmelectrograms at sites of ablation of ventricular tachycardia relative to allother sites: a noncontact mapping study of the entire left ventricle.J Cardiovasc Electrophysiol. 1998;9:921–933.
14. Yue AM, Franz MR, Roberts PR, Morgan JM. Global endocardial elec-trical restitution in human right and left ventricles determined by non-contact mapping. J Am Coll Cardiol. 2005;46:1067–1075.
15. Yue AM, Betts TR, Roberts PR, Morgan JM. Global dynamic coupling ofactivation and repolarization in the human ventricle. Circulation. 2005;112:2592–2601.
16. Taggart P, Sutton P, Chalabi Z, Boyett MR, Simon R, Elliott D, Gill JS.Effect of adrenergic stimulation on action potential duration restitution inhumans. Circulation. 2003;107:285–289.
17. Hofman-Bang J, Behr ER, Hedley P, Tfelt-Hansen J, Kanters JK,Haunsøe S, McKenna WJ, Christiansen M. High-efficiency multiplexcapillary electrophoresis single strand conformation polymorphism(multi-CE-SSCP) mutation screening of SCN5A: a rapid geneticapproach to cardiac arrhythmia. Clin Genet. 2006;69:504–511.
18. Ciaccio EJ. Localization of the slow conduction zone during reentrantventricular tachycardia. Circulation. 2000;102:464–469.
116 Circulation July 14, 2009
by guest on August 19, 2015http://circ.ahajournals.org/Downloaded from
19. Chow AW, Segal OR, Davies DW, Peters NS. Mechanism of pacing-induced ventricular fibrillation in the infarcted human heart. Circulation.2004;110:1725–1730.
20. Okazaki O, Yamauchi Y, Kashida M, Izumo K, Akatsuka N, OhnishiS, Shoda M, Nirei T, Kasanuki H, Ebato M, Mashima S, Harumi K,Wei D. Possible mechanism of ECG features in patients with idio-pathic ventricular fibrillation studied by heart model and computersimulation. J Electrocardiol. 1998;30(suppl):98 –104.
21. Eckardt L, Bruns HJ, Paul M, Kirchhof P, Schulze-Bahr E, Wichter T,Breithardt G, Borggrefe M, Haverkamp W. Body surface area of STelevation and the presence of late potentials correlate to the induc-ibility of ventricular tachyarrhythmias in Brugada syndrome. J Car-diovasc Electrophysiol. 2002;13:742–749.
22. Ikeda T, Sakurada H, Sakabe K, Sakata T, Takami M, Tezuka N, Nakae T,Noro M, Enjoji Y, Tejima T, Sugi K, Yamaguchi T. Assessment of nonin-vasive markers in identifying patients at risk in the Brugada syndrome:insight into risk stratification. J Am Coll Cardiol. 2001;37:1628–1634.
23. Takami M, Ikeda T, Enjoji Y, Sugi K. Relationship between ST-segmentmorphology and conduction disturbances detected by signal-averaged elec-trocardiography in Brugada syndrome. Ann Noninvasive Electrocardiol.2003;8:30–36.
24. Peters NS, Coromilas J, Severs NJ, Wit AL. Disturbed connexin43 gapjunction distribution correlates with the location of reentrant circuits inthe epicardial border zone of healing canine infarcts that cause ventriculartachycardia. Circulation. 1997;95:988–996.
25. Ciaccio EJ, Scheinman MM, Wit AL. Relationship of specific elec-trogram characteristics during sinus rhythm and ventricular pacingdetermined by adaptive template matching to the location of functionalreentrant circuits that cause ventricular tachycardia in the infarcted canineheart. J Cardiovasc Electrophysiol. 2000;11:446–457.
26. Ciaccio EJ, Ashikaga H, Kaba RA, Cervantes D, Hopenfeld B, Wit AL,Peters NS, McVeigh ER, Garan H, Coromilas J. Model of reentrantventricular tachycardia based on infarct border zone geometry predictsreentrant circuit features as determined by activation mapping. HeartRhythm. 2007;4:1034–1045.
27. de Bakker JM, van Capelle FJ, Janse MJ, Tasseron S, Vermeulen JT, deJonge N, Lahpor JR. Slow conduction in the infarcted human heart:‘zigzag’ course of activation. Circulation. 1993;88:915–926.
28. Corrado D, Basso C, Buja G, Nava A, Rossi L, Thiene G. Right bundlebranch block, right precordial ST-segment elevation, and sudden death inyoung people. Circulation. 2001;103:710–717.
29. van Veen TA, Stein M, Royer A, Le Quang K, Charpentier F, ColledgeWH, Huang CL, Wilders R, Grace AA, Escande D, de Bakker JM, vanRijen HV. Impaired impulse propagation in Scn5a-knockout mice:
combined contribution of excitability, connexin expression, and tissuearchitecture in relation to aging. Circulation. 2005;112:1927–1935.
30. Papadatos GA, Wallerstein PM, Head CE, Ratcliff R, Brady PA,Benndorf K, Saumarez RC, Trezise AE, Huang CL, Vandenberg JI,Colledge WH, Grace AA. Slowed conduction and ventricular tachycardiaafter targeted disruption of the cardiac sodium channel gene Scn5a. ProcNatl Acad Sci U S A. 2002;99:6210–6215.
31. Frustaci A, Priori SG, Pieroni M, Chimenti C, Napolitano C, Rivolta I,Sanna T, Bellocci F, Russo MA. Cardiac histological substrate in patientswith clinical phenotype of Brugada syndrome. Circulation. 2005;112:3680–3687.
32. van Veen TA, Stein M, Royer A, Le Quang K, Charpentier F, ColledgeWH, Huang CL, Wilders R, Grace AA, Escande D, de Bakker JM, vanRijen HV. Mouse model of SCN5A-linked hereditary Lenegre’s disease:age-related conduction slowing and myocardial fibrosis. Circulation.2005;111:1738–1746.
33. Coronel R, Berecki G, Opthof T. Why the Brugada syndrome is not yeta disease: syndromes, diseases, and genetic causality. Cardiovasc Res.2006;72:361–363.
34. Hayashi M, Takatsuki S, Maison-Blanche P, Messali A, Haggui A,Milliez P, Leenhardt A, Extramiana F. Ventricular repolarization resti-tution properties in patients exhibiting type 1 Brugada electrocardiogramwith and without inducible ventricular fibrillation. J Am Coll Cardiol.2008;51:1162–1168.
35. Nolasco JB, Dahlen RW. A graphic method for the study of alternation incardiac action potentials. J Appl Physiol. 1968;25:191–196.
36. Yan GX, Antzelevitch C. Cellular basis for the Brugada syndrome andother mechanisms of arrhythmogenesis associated with ST-segment ele-vation. Circulation. 1999;100:1660–1666.
37. Brugada P, Brugada R, Mont L, Rivero M, Geelen P, Brugada J. Naturalhistory of Brugada syndrome: the prognostic value of programmed elec-trical stimulation of the heart. J Cardiovasc Electrophysiol. 2003;14:455–457.
38. Gasparini M, Priori SG, Mantica M, Coltorti F, Napolitano C, GalimbertiP, Bloise R, Ceriotti C. Programmed electrical stimulation in Brugadasyndrome: how reproducible are the results? J Cardiovasc Electrophysiol.2002;13:880–887.
39. Morita H, Kusano KF, Miura D, Nagase S, Nakumara K, Morita ST, OheT, Zipes DP, Wu J. Fragmented QRS as a marker of conduction abnor-mality and predictor of prognosis in Brugada syndrome. Circulation.2008;118:1697–1704.
40. Postema PG, van Dessel PFHM, de Bakker JMT, Dekker LRC, Lin-nenbank AC, Hoogendijk MG, Coronel R, Tijssen JGP, Wilde AAM,Tan HL. Slow and discontinuous conduction conspire in Brugadasyndrome: a right ventricular mapping and stimulation study. CircArrhythmia Electrophysiol. 2008;1:379 –386.
CLINICAL PERSPECTIVECharacterized by coved J-point elevation in leads V1 through V3 and ventricular arrhythmia in apparently structurallynormal hearts, the risk stratification and treatment of Brugada syndrome remain areas of active research. There is somedebate in the literature in regard to whether proarrhythmia is secondary to localized right ventricular conductionabnormalities or transmural differences in repolarization in the anterior right ventricular wall. A single Langendorff studyof a perfused Brugada syndrome patient’s ex vivo heart published in this journal (Circulation. 2005;112:2769–2777)demonstrated conduction delay localized to the right ventricular outflow tract without significant transmural differences inrepolarization time. There are no published in vivo high-density mapping studies of the Brugada right ventricle examiningconduction-repolarization kinetics and arrhythmogenesis. We performed an endocardial mapping study of the rightventricle in Brugada syndrome patients and demonstrate that significant localized conduction delays exist in the rightventricular outflow tract of Brugada syndrome patients compared with controls. Furthermore, these sites coincide with thediastolic pathway of induced ventricular tachycardia. Significant endocardial repolarization heterogeneities exist in theBrugada ventricle, which could explain the propensity of ventricular tachycardia to degenerate into ventricular fibrillationin these patients. The recent observation that fragmented QRS complexes are a predictor of prognosis in Brugada syndrome(Circulation. 2008;118:1697–1704) supports the contention that these conduction abnormalities are an importantcontributor to the arrhythmogenic substrate in this disease.
Lambiase et al Brugada-Mapping Heterogeneities 117
by guest on August 19, 2015http://circ.ahajournals.org/Downloaded from
1
Supplemental Material
Methods
The multi-electrode array (MEA) (Ensite, St Jude Medical) was deployed via the left
femoral vein in the RVOT. Right ventricular geometry was created by dragging a 5F
mapping catheter along the endocardial surface of the RV. The RV geometry was
created in the usual manner taking care to ensure that the array was positioned at a site
within 4cm of the RV apex, body and RVOT surfaces to obtain accurate NC unipolar
electrogram data from these sites. Detailed geometry creation was assessed by
ensuring dense surface point acquisition and editing during collection to eliminate
inaccurate interpolated surface projections with sparse geometric points in any given
area. RV pacing was established using a quadrapolar catheter placed in the RV apex
and RVOT.
Study Protocol
After 3 minutes of steady state RV apical pacing at 400msec, an extrastimulus (S2) was
introduced after a drivetrain of 10 beats according to a standard S1-S2 restitution protocol.
The coupling interval of S1-S2 was increased in stepwise fashion in increments of 50msec
until a sinus beat occurred and then decremented by 50ms every cycle to the baseline coupling
interval, by 20 ms every cycle to 300ms and by 5ms every cycle from 300ms until the
ventricular effective refractory period (ERP) was encountered. This was repeated during
pacing from the right ventricular outflow tract. All patients were studied in the absence of
ajmaline administration.
The VT stimulation protocol consisted of a 9 beat drivetrain at 600, 500 and 400 msec
baseline cycle length respectively followed by S2 until ventricular refractoriness (VERP) or
200msec coupling interval was reached. This was repeated for each baseline drivetrain adding
2
S3 to S2 until ventricular refractoriness or 200msec coupling interval. Finally S4 was added
keeping the preceding beat (S3) 10msec above VERP or at 200msec. This protocol was
performed with pacing in the RV apex and RVOT.
The non-contact mapping data were collected with a recording bandwidth of 0-300Hz
in all cases and measurements made with a filter band width of 0.1-25Hz as
previously described14. Investigators (PL, AA, EJC, SJ) were blinded to the
measurements of other investigators. The array was maintained in the same position
throughout the performance of the restitution curves and VT stimulation study. In 2
cases the array was repositioned to ensure acquisition of accurate apical data when the
distance was greater than 4cm from the array.
The time from the pacing artefact to electrogram peak negative dV/dt was used as the
local activation time (AT). Activation-recovery interval (ARI) was defined as the
interval between activation time (AT) and repolarization time (RT) and measured as
previously described14, 15. In summary, the RT was measured at the dV/dtmax for the
negative T-wave, the dV/dtmin of the positive T-wave, and at the mean time between
dV/dtmax and dV/dtmin for the biphasic T-wave. T waves with an interrupted
descending or ascending phase, resulting in double-peak derivatives at these sites
were measured at the mean time between two peak derivatives. The unipolar
electrograms with flat T waves and ST-segment elevation without discernable T-wave
upstroke were excluded from measurement. Diastolic interval was measured from the
end of repolarization (RT) from the preceding beat to the AT of the following beat.
The slope of the restitution curve was calculated using the least mean squares
method16. The RV was divided into 16 anatomical segments15 and the restitution
slopes studied in the segments from the RVOT, RV body and apex.
3
Measurement of Endocardial Local Activation Delay
Areas of local activation delay during sinus rhythm were determined to estimate the
location of the diastolic pathway using a method termed activation gradient
quantification. During sinus rhythm without pacing, activation times determined from
NC unipolar recordings at 64 locations defined by Cartesian coordinates were used to
construct a three-dimensional activation map11. Conduction velocity was determined
by computing the linear regression of activation times from 4-6 recording sites that
were spatially aligned in the direction of the propagating wavefront and in proximity
to one another along the endocardial surface in sinus rhythm. From regression
analysis, the slope of the regression line in milliseconds and the regression coefficient
is obtained. The conduction velocity of the propagating wavefront was calculated
from the mean distance between adjacent recording sites used for regression divided
by the slope of the regression line. The regression coefficient is an estimate of the
uniformity of wavefront propagation along the endocardial surface at any measured
region. This regression analysis was performed at all regions of the activation map.
Where slow conduction occurred on the map (i.e., greatest local activation delay), the
three-dimensional position, conduction velocity magnitude (CV), and regression
coefficient (r2) were calculated.
The vector along which CV was least with r2 value >0.9 was considered to be the best
estimate of the direction of propagation along the diastolic pathway during ventricular
tachycardia re-entry. The CV and r2 value was tabulated at these points for all
patients. In 5 patients with VT/VF induced during the EP study, the re-entrant VT
circuit activation wavefront was mapped; an arrow was drawn directly through the
midline of the diastolic pathway on the computerized mapping grid, and the
difference between the estimated and actual isthmus was determined as follows. Five

4
equally spaced digital points were placed along each arrow on the computerized
mapping grid. The absolute distance between corresponding points along each arrow:
(point 1, arrow 1 - point 1, arrow 2), (point 2, arrow 1 - point 2, arrow 2) ... was
calculated, and averaged for the five distances.
A.W. Chow, M.D. Lowe and W.J. McKennaP.D. Lambiase, A.K. Ahmed, E.J. Ciaccio, R. Brugada, E. Lizotte, S. Chaubey, Ron Ben-Simon,
and Repolarization Heterogeneities in ArrhythmogenesisHigh-Density Substrate Mapping in Brugada Syndrome: Combined Role of Conduction
Print ISSN: 0009-7322. Online ISSN: 1524-4539 Copyright © 2009 American Heart Association, Inc. All rights reserved.
is published by the American Heart Association, 7272 Greenville Avenue, Dallas, TX 75231Circulation doi: 10.1161/CIRCULATIONAHA.108.7714012009;120:106-117; originally published online June 29, 2009;Circulation.
http://circ.ahajournals.org/content/120/2/106World Wide Web at:
The online version of this article, along with updated information and services, is located on the
http://circ.ahajournals.org/content/suppl/2009/07/07/CIRCULATIONAHA.108.771401.DC1.htmlData Supplement (unedited) at:
http://circ.ahajournals.org//subscriptions/
is online at: Circulation Information about subscribing to Subscriptions:
http://www.lww.com/reprints Information about reprints can be found online at: Reprints:
document. Permissions and Rights Question and Answer this process is available in the
click Request Permissions in the middle column of the Web page under Services. Further information aboutOffice. Once the online version of the published article for which permission is being requested is located,
can be obtained via RightsLink, a service of the Copyright Clearance Center, not the EditorialCirculationin Requests for permissions to reproduce figures, tables, or portions of articles originally publishedPermissions:
by guest on August 19, 2015http://circ.ahajournals.org/Downloaded from