Morphology and surface heterogeneities in synthetic goethites
11
Journal of Colloid and Interface Science 261 (2003) 244–254 www.elsevier.com/locate/jcis Morphology and surface heterogeneities in synthetic goethites Bénédicte Prélot, a Frédéric Villiéras, a,∗ Manuel Pelletier, a Gilles Gérard, a Fabien Gaboriaud, b Jean-Jacques Ehrhardt, b Jane Perrone, b Michel Fedoroff, c Jeanine Jeanjean, c Gregory Lefèvre, c Léo Mazerolles, c Jean-Louis Pastol, c Jean-Claude Rouchaud, c and Catherine Lindecker d a Laboratoire Environnement et Minéralurgie, UMR 7569 CNRS/INPL, BP40, 54501 Vandoeuvre-lès-Nancy Cedex, France b Laboratoire de Chimie-Physique et Microbiologie pour l’Environnement LCPME, UMR 7564 CNRS/UHP, 405, rue de Vandoeuvre, 54600 Villers-lès-Nancy, France c Centre d’Études de Chimie Métallurgique, CNRS UPR 2801, 15, rue Georges Urbain, 94407 Vitry-sur-Seine, France d Institut de Physique Nucléaire d’Orsay, Groupe de Radiochimie, 15, rue Georges Clémenceau, 91406 Orsay Cedex, France Received 16 September 2002; accepted 9 January 2003 Abstract In the framework on a study of the acido-basic and sorption properties of iron oxides, a thorough characterization of two types of goethite powders was performed in several laboratories joined in a common project. Chemical analysis by ICPAES; high-resolution SEM, TEM, and AFM observations; XRD with line width analysis; and argon and nitrogen sorption isotherms were used for that purpose. The main crystallographic faces of goethite particles could be identified as {001}, {101}, and {121}, and their abundance correlated with the distribution of low-pressure argon adsorption local isotherms. These results will be very useful for further studies on the relationship between surface reactivity in aqueous solution and orientation of solid surfaces. 2003 Elsevier Science (USA). All rights reserved. Keywords: Goethite; XRD; SEM; TEM; AFM; Gas adsorption; Morphology 1. Introduction Sorption and desorption at solid–liquid interfaces play a key role in the control of the transport of toxic and radioactive elements in surface and underground waters. In these processes, minerals of crystalline rocks, sediments, soils, and mobile colloidal particles act as sorbents, which can delay or stop the migration of solutes. Whatever the considered scale is, meaningful modeling of the migration of elements in water then requires a good knowledge of sorption mechanisms. This is especially an important goal for predicting the long-term safety of radioactive waste depositories. In the past, several models have been proposed for that purpose. Among them, the most commonly used models to de- scribe ion sorption and quantify the acido-basic and sorption properties of oxy-hydroxide surfaces are the ion exchange model, the 2-pK surface complexation model designed by * Corresponding author. E-mail address: [email protected] (F. Villiéras). Stumm [1], and the multisite complexation model (MUSIC) developed by Hiemstra et al. [2–4]. The choice of the ade- quate model appears tricky as fitting of a given experimen- tal sorption data set by these models leads to several sets of sorption parameters, which may be different and model dependant. Furthermore, application of the two last models (2-pK and MUSIC) depends mainly on assumptions on the nature of surface complexes and on the electrostatic layer structure. The setting of the different free parameters in- creasingly complicates these approaches. The MUSIC model [2–4] assumes that, due to their differ- ent surface structure and composition, the various crystalline faces of a crystal support specific surface sites with different acid–base properties (specific equilibrium constants) and, as a consequence, should present various sorption behaviors, which may be considered in the framework of the surface heterogeneity concepts. As surface defects, the presence of different crystalline faces then controls the feature of sorp- tion curves obtained on real solids. A detailed study of the nature of the solid faces is needed to be able to apply this model. As a consequence, it is necessary to obtain realistic determination and quantification of the different faces (sur- 0021-9797/03/$ – see front matter 2003 Elsevier Science (USA). All rights reserved. doi:10.1016/S0021-9797(03)00058-4
-
Upload
independent -
Category
Documents
-
view
3 -
download
0
Transcript of Morphology and surface heterogeneities in synthetic goethites

types oftion SEM,ose. Thewith thebetween
Journal of Colloid and Interface Science 261 (2003) 244–254www.elsevier.com/locate/jcis
Morphology and surface heterogeneities in synthetic goethites
Bénédicte Prélot,a Frédéric Villiéras,a,∗ Manuel Pelletier,a Gilles Gérard,a Fabien Gaboriaud,b
Jean-Jacques Ehrhardt,b Jane Perrone,b Michel Fedoroff,c Jeanine Jeanjean,c Gregory Lefèvre,c
Léo Mazerolles,c Jean-Louis Pastol,c Jean-Claude Rouchaud,c and Catherine Lindeckerd
a Laboratoire Environnement et Minéralurgie, UMR 7569 CNRS/INPL, BP40, 54501 Vandoeuvre-lès-Nancy Cedex, Franceb Laboratoire de Chimie-Physique et Microbiologie pour l’Environnement LCPME, UMR 7564 CNRS/UHP, 405, rue de Vandoeuvre,
54600 Villers-lès-Nancy, Francec Centre d’Études de Chimie Métallurgique, CNRS UPR 2801, 15, rue Georges Urbain, 94407 Vitry-sur-Seine, France
d Institut de Physique Nucléaire d’Orsay, Groupe de Radiochimie, 15, rue Georges Clémenceau, 91406 Orsay Cedex, France
Received 16 September 2002; accepted 9 January 2003
Abstract
In the framework on a study of the acido-basic and sorption properties of iron oxides, a thorough characterization of twogoethite powders was performed in several laboratories joined in a common project. Chemical analysis by ICPAES; high-resoluTEM, and AFM observations; XRD with line width analysis; and argon and nitrogen sorption isotherms were used for that purpmain crystallographic faces of goethite particles could be identified as {001}, {101}, and {121}, and their abundance correlateddistribution of low-pressure argon adsorption local isotherms. These results will be very useful for further studies on the relationshipsurface reactivity in aqueous solution and orientation of solid surfaces. 2003 Elsevier Science (USA). All rights reserved.
Keywords: Goethite; XRD; SEM; TEM; AFM; Gas adsorption; Morphology
laynds. Inentsichthe
tione ofoal
steose
de-tionngeby
de-en-
l setsdel
delstheayerin-
er-llinerentd, asviors,acece ofrp-thethislisticsur-
1. Introduction
Sorption and desorption at solid–liquid interfaces pa key role in the control of the transport of toxic aradioactive elements in surface and underground waterthese processes, minerals of crystalline rocks, sedimsoils, and mobile colloidal particles act as sorbents, whcan delay or stop the migration of solutes. Whateverconsidered scale is, meaningful modeling of the migraof elements in water then requires a good knowledgsorption mechanisms. This is especially an important gfor predicting the long-term safety of radioactive wadepositories. In the past, several models have been propfor that purpose.
Among them, the most commonly used models toscribe ion sorption and quantify the acido-basic and sorpproperties of oxy-hydroxide surfaces are the ion exchamodel, the 2-pK surface complexation model designed
* Corresponding author.E-mail address: [email protected] (F. Villiéras).
0021-9797/03/$ – see front matter 2003 Elsevier Science (USA). All rights rdoi:10.1016/S0021-9797(03)00058-4
,
d
Stumm [1], and the multisite complexation model (MUSIC)developed by Hiemstra et al. [2–4]. The choice of the aquate model appears tricky as fitting of a given experimtal sorption data set by these models leads to severaof sorption parameters, which may be different and modependant. Furthermore, application of the two last mo(2-pK and MUSIC) depends mainly on assumptions onnature of surface complexes and on the electrostatic lstructure. The setting of the different free parameterscreasingly complicates these approaches.
The MUSIC model [2–4] assumes that, due to their diffent surface structure and composition, the various crystafaces of a crystal support specific surface sites with diffeacid–base properties (specific equilibrium constants) ana consequence, should present various sorption behawhich may be considered in the framework of the surfheterogeneity concepts. As surface defects, the presendifferent crystalline faces then controls the feature of sotion curves obtained on real solids. A detailed study ofnature of the solid faces is needed to be able to applymodel. As a consequence, it is necessary to obtain readetermination and quantification of the different faces (
eserved.
B. Prélot et al. / Journal of Colloid and Interface Science 261 (2003) 244–254 245
n
endif-
ture) ors forchra-e-ands is
facethepar-zcnd
weter-ies.acetion,
diesmonper-
onto
nlylarpost
Inemaces
d inthatuctsom-
ofticracm-
hodscanrcetotionand
oe-er-e isLSME)e-sed
.na-ec-
e-s ind byas
rontes:om-
im-ret. Inandsuchiron
lec-iveis-M,withec-
face areas, ratio, . . . ), to makeaccurate attribution betweesurface properties and surface energetic heterogeneity.
In addition, when experimental information for a givmineral sorbent is considered, the results published byferent authors may vary strongly. For instance, the literashows variable data for the point of zero charge (pzcsurface acidity constants of goethite. Indeed, pzc valuethis iron oxyhydroxide vary between 7 and 9.5 [4–18]. Suvariations are often attributed to different kinds of prepation of the sorbents or to different kinds of conditioning bfore sorption experiments. In a recent work, GaboriaudEhrhardt [7] have demonstrated that this range of valuemainly due to carbonate sorption onto the goethite surprior to the titration. In addition, they demonstrated thatsurface charge values depend upon the morphology ofticles, i.e., on the crystalline faces, distribution, while pvalues are only slightly influenced by it (between 9.0 a9.1).
In an attempt to test the various available models,started a study in which the sorbent is carefully characized in terms of structural, textural, and chemical propertThe main objectives of this work are then to study the surfproperties of sorbents with the same chemical composibut with various morphologies (size, faces ratio,. . .), by us-ing complementary experimental techniques. These stuare conducted by several laboratories joined in a comproject, to make use of complementary methods and extise.
The sorbent chosen for this study is goethite (α-FeOOH),an iron oxyhydroxide, which is one of the most commoxide minerals in soils [19]. It accounts for the brownyellow color of many soils, even though it is present in osmall quantities. Goethite crystallizes usually in acicushape, elongated in theb crystallographic axis (space grou#62, Pnma setting). According to previous studies, the mcommon reported faces are {101}, {001}, and {210} [20].connection to the needle-like morphology, {210} faces seto be the fastest growing faces compared to the other fforming the surface of the goethite crystal [22,23].
To make valid comparisons between results obtainethe laboratories involved in this project, it is necessaryall experiments should be performed on the same prodFor that purpose, two types of goethite were chosen: a cmercial one (BASF) and a goethite synthesized in onethe laboratories involved (LCPME). These two synthegoethite samples were then submitted to a thorough chaterization of their structural and textural properties by cobining various experimental approaches. Several metwere used for this characterization: elemental analysis, sning and transmission electron microscopy and atomic fomicroscopy for morphological studies, X-ray diffractiondetermine structural studies, nitrogen adsorption–desorpat the solid–gas interface for surface area and porosity,finally low-pressure argon adsorption.
.
-
-
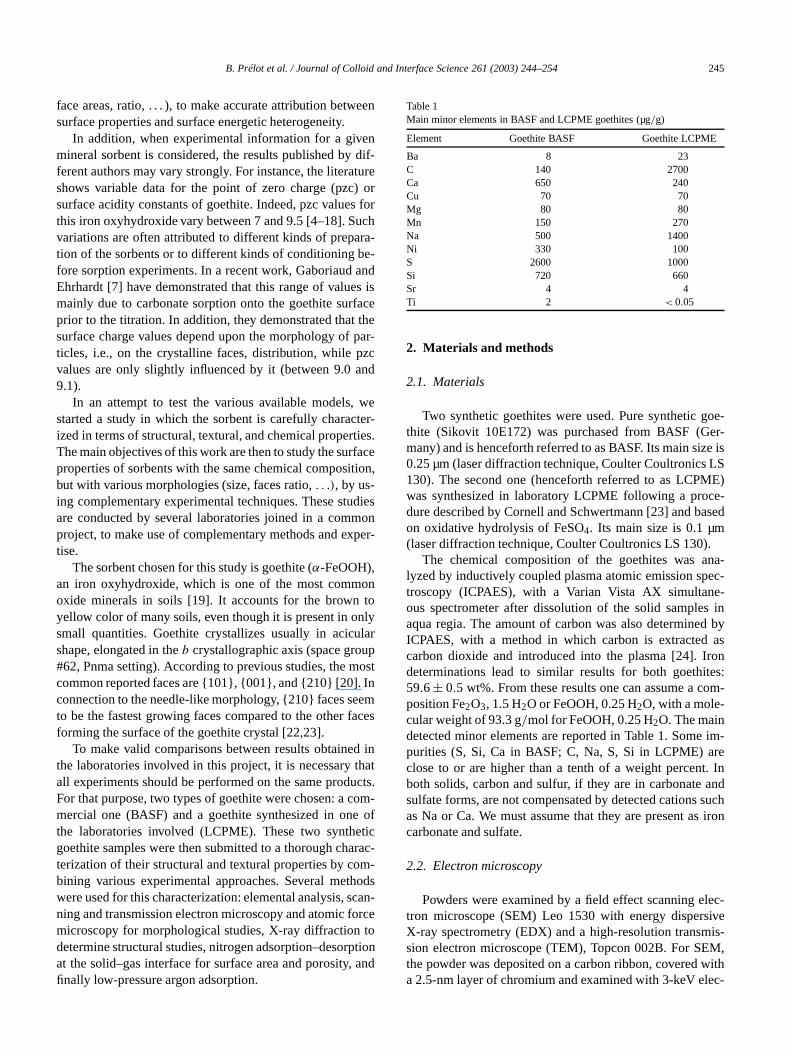
Table 1Main minor elements in BASF and LCPME goethites (µg/g)
Element Goethite BASF Goethite LCPME
Ba 8 23C 140 2700Ca 650 240Cu 70 70Mg 80 80Mn 150 270Na 500 1400Ni 330 100S 2600 1000Si 720 660Sr 4 4Ti 2 < 0.05
2. Materials and methods
2.1. Materials
Two synthetic goethites were used. Pure synthetic gthite (Sikovit 10E172) was purchased from BASF (Gmany) and is henceforth referred to as BASF. Its main siz0.25 µm (laser diffraction technique, Coulter Coultronics130). The second one (henceforth referred to as LCPwas synthesized in laboratory LCPME following a procdure described by Cornell and Schwertmann [23] and baon oxidative hydrolysis of FeSO4. Its main size is 0.1 µm(laser diffraction technique, Coulter Coultronics LS 130)
The chemical composition of the goethites was alyzed by inductively coupled plasma atomic emission sptroscopy (ICPAES), with a Varian Vista AX simultanous spectrometer after dissolution of the solid sampleaqua regia. The amount of carbon was also determineICPAES, with a method in which carbon is extractedcarbon dioxide and introduced into the plasma [24]. Ideterminations lead to similar results for both goethi59.6± 0.5 wt%. From these results one can assume a cposition Fe2O3, 1.5 H2O or FeOOH, 0.25 H2O, with a mole-cular weight of 93.3 g/mol for FeOOH, 0.25 H2O. The maindetected minor elements are reported in Table 1. Somepurities (S, Si, Ca in BASF; C, Na, S, Si in LCPME) aclose to or are higher than a tenth of a weight percenboth solids, carbon and sulfur, if they are in carbonatesulfate forms, are not compensated by detected cationsas Na or Ca. We must assume that they are present ascarbonate and sulfate.
2.2. Electron microscopy
Powders were examined by a field effect scanning etron microscope (SEM) Leo 1530 with energy dispersX-ray spectrometry (EDX) and a high-resolution transmsion electron microscope (TEM), Topcon 002B. For SEthe powder was deposited on a carbon ribbon, covereda 2.5-nm layer of chromium and examined with 3-keV el
246 B. Prélot et al. / Journal of Colloid and Interface Science 261 (2003) 244–254
grid
enu
Mcannnewere
ghly
hreegestipsionhan
tha
edod-eretedzer.
p of
ralnts
ionrierods
untsept et-
entara-r to
ygaz
ply-by
6].SA
re
siondel
Kiumely0,wasak.s aereing
yzedureacer ofiumntitybe
thisf theion.eoustive
s of
s–nd
e-an
pac-lds onon
ns.no-
ns) ofac-
sid-ng
trons. For TEM, the powder was deposited on a coppercovered with a carbon membrane.
2.3. Atomic force microscopy
Atomic force microscopy (AFM) images have beacquired in air with a Thermomicroscopes Explorer Ec+scanning probe microscope using both 100× 100 µmand a 2.5 × 2.5 µm piezoelectric scanners [7]. The AFimages were collected using noncontact mode with ssize range from 5 µm to 500 nm depending on the scaused. To study goethite particles, clean glass slidesdipped in a goethite suspension (20 mg/l) for 1 h at apH close to 4.0. Then, the glass was rinsed thorouwith pure water and dried at 60◦C. The AFM images arepresented in the deflection mode to emphasize the tdimensional structure of the particles. The raw imawere not corrected for tip artifacts because the AFMused in this study (silicon cantilevers for high-resolutnoncontact imaging with typical radius of curvature less t10 nm, 1650.00 Thermomicroscopes) had sharper edgesgoethite particles.
2.4. X-ray diffraction
X-ray diffraction (XRD) measurements were performon powders of goethites, without any grinding, to avoid mification of the particles size. The crystal structures wdetermined with a curved monochromator in the diffracbeam, a scintillation counter, and a pulse-height analyThe CoKα radiation has been used with a scanning ste0.05◦(2θ) in the range 15◦ < 2θ < 120◦. Line profile analy-sis was performed by the Philips APD code. The integwidths of lines were calculated after fitting measuremeto pseudo-Voigt curves either by half-width determinat(approximate method) or from Fourier coefficients (Fousingle line method). The comparison of these two methleads to an estimation of the determination accuracy.
2.5. N2 step-by-step adsorption isotherm
Nitrogen adsorption isotherms at 77 K (adsorbed amovs relative pressureP/P0) were recorded on a step-by-stautomatic setup built in the Laboratoire EnvironnemenMinéralurgie. High vacuum, lower than 10−4 Pa, was ensured by a turbomolecular pump. Pressure measuremwere performed with 0–1000 Pa and 0–100,000 Pa Btron Type pressure sensors provided by Edwards. Prioadsorption, samples were outgassed overnight at 120◦C un-der a residual pressure of 0.01 Pa. Nitrogen N55 (purit>
99.9995%) used for experiments was provided by Alpha(France).
Specific surface areas (SSAs) were determined by aping the Brunauer–Emmet–Teller (BET) equation [25] andusing 0.163 nm2 for a cross-sectional area of nitrogen [2In the present study, the error of determination of the S
r
n
s
was ±0.2 m2/g. Micropore (0–2 nm) volumes, mesopo(2–40 nm) size distributions, and macropore (> 40 nm)surface areas were determined through a matrix invermethod designed by Olivier [27] using a parallel pore moand isotherm desorption branches.
2.6. Low-pressure Ar adsorption isotherms
Low-pressure isotherms of argon adsorption at 77were recorded on a lab-built automatic quasi-equilibrvolumetric setup described in Refs. [28,29]. Approximat1000 mg of sample was outgassed overnight at 12◦Cunder a residual pressure of 10−4 Pa. After outgassinga slow, constant, and continuous flow of adsorbateintroduced into the adsorption cell through a microleFrom the recording of quasi-equilibrium pressure afunction of time, high-resolution adsorption isotherms wobtained with more than 2000 data points for the fillof the first layer. High purity argon (> 99.995%) wasprovided by Alphagaz (France). The data were then analusing the derivative isotherm summation (DIS) proceddesigned by Villiéras et al. [29–31] to examine the surfheterogeneity of the samples. Due to the large numbeexperimental data points acquired by the quasi-equilibrmethod, the experimental derivative of the adsorbed quaas a function of the logarithm of relative pressure cancalculated accurately. A patchwise formalism is used inprocedure to describe surface heterogeneity. Each on patches is characterized by its own energy distributThe total derivative adsorption isotherm on a heterogensurface is simulated by the sum of local theoretical derivaadsorption isotherms on homogeneous surfaces,
(1)θt =∑
i
Xiθit,
where θt is the total adsorption isotherm andθit are theadsorption isotherms on the different energetic domainthe surface, withXi being its contribution toθt . The lo-cal isotherms chosen are the Langmuir/Bragg–WilliamTemkin and BET/Hill adsorption isotherms for one layer amultilayer adsorption, respectively.
Each local isothermθit is characterized by three paramters: the normal interaction (C) between the surface andadsorbed molecule, the lateral interactions (ω) between twoneighboring adsorbed molecules, and the monolayer caity (amount of gas adsorbed) (Vm) of the domain. Normainteraction between adsorbates and surface sites depenthe position of the maximum of the derivative isothermsthe lnP/P0 axis and on the intensity of lateral interactioThe height of the maxima (area of the peak) gives the molayer capacityVm of the local isotherm. Lateral interactioare easily detected through the shape (half-height widththe derived isotherm. In fact, the intensity of lateral intertions must be considered as a best-fit parameterω∗ enclosingfurther information about the heterogeneity of the conered adsorption domain asω∗ decreases with the spreadi
B. Prélot et al. / Journal of Colloid and Interface Science 261 (2003) 244–254 247
ad-iva-
e miati-
Thefreef in-
m-eseceshichlesanfrom
beenand
eded
ndings docesleEMover
ends
clesar-
of normal adsorption energies [29]. It is then used as anjustable parameter allowing the correct modeling of dertive widths.
In the present case, samples are not considered to bcroporous and multilayer adsorption could be mathemcally removed from experimental adsorption isotherms.derivatives thus correspond to the first layer adsorptionenergy distribution and can be regarded as fingerprints oteractions between given solid–probe couples.
3. Results
3.1. Scanning electron microscopy
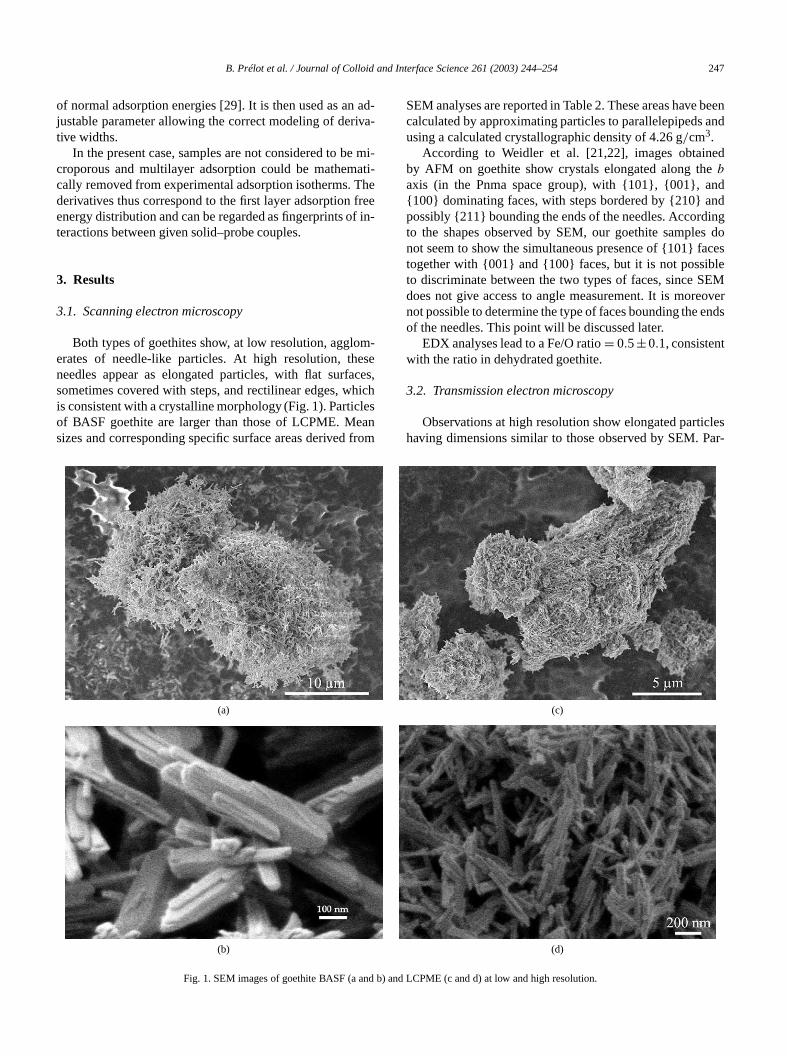
Both types of goethites show, at low resolution, aggloerates of needle-like particles. At high resolution, thneedles appear as elongated particles, with flat surfasometimes covered with steps, and rectilinear edges, wis consistent with a crystalline morphology (Fig. 1). Particof BASF goethite are larger than those of LCPME. Mesizes and corresponding specific surface areas derived
-
,
SEM analyses are reported in Table 2. These areas havecalculated by approximating particles to parallelepipedsusing a calculated crystallographic density of 4.26 g/cm3.
According to Weidler et al. [21,22], images obtainby AFM on goethite show crystals elongated along thbaxis (in the Pnma space group), with {101}, {001}, an{100} dominating faces, with steps bordered by {210} apossibly {211} bounding the ends of the needles. Accordto the shapes observed by SEM, our goethite samplenot seem to show the simultaneous presence of {101} fatogether with {001} and {100} faces, but it is not possibto discriminate between the two types of faces, since Sdoes not give access to angle measurement. It is morenot possible to determine the type of faces bounding theof the needles. This point will be discussed later.
EDX analyses lead to a Fe/O ratio= 0.5±0.1, consistentwith the ratio in dehydrated goethite.
3.2. Transmission electron microscopy
Observations at high resolution show elongated partihaving dimensions similar to those observed by SEM. P
(a) (c)
(b) (d)
Fig. 1. SEM images of goethite BASF (a and b) and LCPME (c and d) at low and high resolution.
248 B. Prélot et al. / Journal of Colloid and Interface Science 261 (2003) 244–254
BET,
d a
amles.hehaticityrm
isse-
face
.42-21}
oftheed tocles
izetoa-
lineea-thesead-
sur-(ar-age,do-esexisttes.ne-rved
lesis-n ofes
d anre orm-arti-re-
aticles
bicng,
e
-ari-y a
her.her-ich
Table 2Mean dimensions and surface area of goethite particles from SEM,surface area, and porosity parameters (BJH model)
BASF LCPMEgoethite goethite
SEMDimensions from SEM (nm) 600× 80× 80 300× 40× 40SEM specific surface area (m2/g) 13 25
Nitrogen adsorptionVm (BET monolayer volume) (cm3/g) 4.1 8.7BET energetic constantC 563 205BET specific surface area (m2/g) 17.9 38.0PSD total specific surface area (m2/g) 17.6 41.6PSD surface area of micropores (m2/g) 0.9 0PSD volume of mesopores (cm3/g) 0.17 0.16PSD surface area of macropores (m2/g) 0 23.3
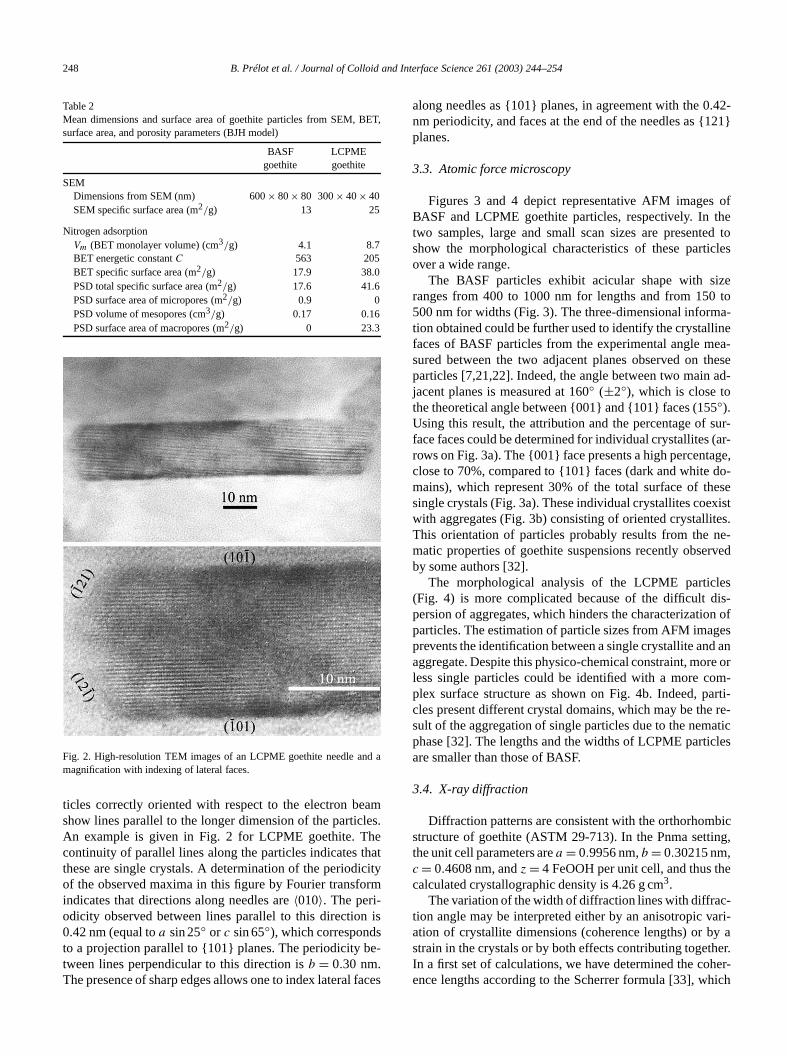
Fig. 2. High-resolution TEM images of an LCPME goethite needle anmagnification with indexing of lateral faces.
ticles correctly oriented with respect to the electron beshow lines parallel to the longer dimension of the particAn example is given in Fig. 2 for LCPME goethite. Tcontinuity of parallel lines along the particles indicates tthese are single crystals. A determination of the periodof the observed maxima in this figure by Fourier transfoindicates that directions along needles are〈010〉. The peri-odicity observed between lines parallel to this direction0.42 nm (equal toa sin25◦ or c sin 65◦), which correspondto a projection parallel to {101} planes. The periodicity btween lines perpendicular to this direction isb = 0.30 nm.The presence of sharp edges allows one to index lateral
salong needles as {101} planes, in agreement with the 0nm periodicity, and faces at the end of the needles as {1planes.
3.3. Atomic force microscopy
Figures 3 and 4 depict representative AFM imagesBASF and LCPME goethite particles, respectively. Intwo samples, large and small scan sizes are presentshow the morphological characteristics of these partiover a wide range.
The BASF particles exhibit acicular shape with sranges from 400 to 1000 nm for lengths and from 150500 nm for widths (Fig. 3). The three-dimensional informtion obtained could be further used to identify the crystalfaces of BASF particles from the experimental angle msured between the two adjacent planes observed onparticles [7,21,22]. Indeed, the angle between two mainjacent planes is measured at 160◦ (±2◦), which is close tothe theoretical angle between {001} and {101} faces (155◦).Using this result, the attribution and the percentage offace faces could be determined for individual crystallitesrows on Fig. 3a). The {001} face presents a high percentclose to 70%, compared to {101} faces (dark and whitemains), which represent 30% of the total surface of thsingle crystals (Fig. 3a). These individual crystallites coewith aggregates (Fig. 3b) consisting of oriented crystalliThis orientation of particles probably results from thematic properties of goethite suspensions recently obseby some authors [32].
The morphological analysis of the LCPME partic(Fig. 4) is more complicated because of the difficult dpersion of aggregates, which hinders the characterizatioparticles. The estimation of particle sizes from AFM imagprevents the identification between a single crystallite anaggregate. Despite this physico-chemical constraint, moless single particles could be identified with a more coplex surface structure as shown on Fig. 4b. Indeed, pcles present different crystal domains, which may be thesult of the aggregation of single particles due to the nemphase [32]. The lengths and the widths of LCPME particare smaller than those of BASF.
3.4. X-ray diffraction
Diffraction patterns are consistent with the orthorhomstructure of goethite (ASTM 29-713). In the Pnma settithe unit cell parameters area = 0.9956 nm,b = 0.30215 nm,c = 0.4608 nm, andz = 4 FeOOH per unit cell, and thus thcalculated crystallographic density is 4.26 g cm3.
The variation of the width of diffraction lines with diffraction angle may be interpreted either by an anisotropic vation of crystallite dimensions (coherence lengths) or bstrain in the crystals or by both effects contributing togetIn a first set of calculations, we have determined the coence lengths according to the Scherrer formula [33], wh

B. Prélot et al. / Journal of Colloid and Interface Science 261 (2003) 244–254 249
kent
di-linezesE.
MEom-EMt thervedFor
keneight
reddo-ions
en-
hsh
(a)
(b)
Fig. 3. AFM deflection mode images of the BASF goethite particles taat (a) 5-µm and (b) 700-nm scan sizes. Thez-profile describes the heighdistributions along the line shown within image b.
does not take into account any strain, for crystallographicrections perpendicular to each plane giving a diffraction(LS in Table 3). The results show that in general the siof BASF goethite crystals are larger than those for LCPMThe relative ratio between BASF dimensions and LCPdimensions are in good agreement with SEM results. Cparison of widths and depths obtained from XRD and Sshows that they are of the same order of magnitude. Bularger dimensions (600 and 300 nm, respectively) obseby electron microscopies are not found by this method.
(a)
(b)
Fig. 4. AFM deflection mode images of the LCPME goethite particles taat (a) 5-µm and (a) 900-nm scan sizes. The z-profile describes the hdistributions along the line shown within image b.
the direction parallel to theb axis, the (020) diffraction lineleads, respectively, to values of 25 and 22 nm.
To explain this discrepancy, Weidler et al. [21] considethat goethite particles consist of many crystallographicmains. Schwertmann et al. [12] deduced crystal dimensfrom the Scherrer formula, except in the〈010〉 directions,where electron images were used to determine the dimsions.
A more accurate interpretation of diffraction lines widtmay be found through Williamson–Hall plots [34], whic

250 B. Prélot et al. / Journal of Colloid and Interface Science 261 (2003) 244–254
sid-
ots.
c-. In},
s,per-
co-pemerval-errens.
or-
ted.derit
in ath-
izeisac-
yedam-
res-largervee of
nsis-
Es theET
wiceted
EM,ionstepsllytronggen.erfaceto besitesSF
rmsted2.
theretricenorears
areagibles aant
Table 3Coherence lengths and strain in goethite crystals
Directions BASF LCPME
LSa LWH
b Strain LSa LWH
b Strain(nm) (nm) (%) (nm) (nm) (%)
〈101〉 35± 4 40c 14± 2 18c
〈210〉 55± 5 27± 2〈020〉 25± 3 22± 2〈200〉〈400〉〈600〉
37± 434± 334± 3
145± 5
J0.1
22± 223± 222± 2
25± 3 0.05
〈111〉 27± 3 21± 1〈301〉 30± 3 60c 18± 2 26c
〈201〉〈402〉
30± 122± 1
}50± 5
0.219± 216± 2
}22± 3 0.1
〈011〉 30± 3 20± 1〈610〉 33± 5 23± 3
〈010〉 � 25 � 0.3 � 22 � 0.4〈100〉 45c 25c
〈001〉 32c 15c
a LS (nm), coherence length from Scherrer formula (strain not conered).
b LLWH (nm), coherence length and strain from Wilhamson–Hall plc Lengths extrapolated from {h00} and {h01} families of planes.
consider the variation of width as a function of the diffration angle for families of parallel crystallographic planesour case, we have only two of such families, {200}, {400{600} and {201}, {402}, respectively. For these familiewe can calculate a coherence length in the directionspendicular to these planes and a value of strain (LWH inTable 3). From these values, we can also extrapolateherence lengths for directions perpendicular to {h,0,l} typlanes, other than the planes belonging to the two forfamilies, using geometrical relationships. The obtainedues are higher than the values deduced from the Schformula, indicating that strains also exist in these directioIt is likely that strain also exists in other directions. Unftunately, for the〈010〉 direction and other〈hkl〉 directionswith k = 0, neither dimension nor strain can be calculaWe can only determine an upper limit of strain if we consithat the line width is entirely due to strain, or a lower limof coherence length, if we consider that there is no straall (Table 3 for 010). Taking into account the results of higresolution electron microscopy, it is more likely that the sof crystallites along theb axis has to be deduced from thmethod and that strain contributes dominantly to the diffrtion line widths.
3.5. Nitrogen adsorption–desorption isotherms
Nitrogen adsorption–desorption isotherms are displaon Fig. 5a. The same shape is obtained for the two sples with very large adsorbed amounts for relative psure higher than 0.8. This suggests the presence ofmesopores and macropores. The small hysteresis obsat high relative pressure is consistent with the presenc
r
ed
(a)
(b)
Fig. 5. (a) N2 adsorption isotherm and (b) N2 pore size distribution ongoethite BASF and LCPME.
large mesopores while the shape of the hysteresis is cotent with needle-shaped particles [26].
Due to the smaller size of its particles, the LCPMsample adsorbs higher amounts of nitrogen than doeBASF sample. This is evidenced by the calculated Bspecific surface area (Table 2), which appears to be tas high as that of the LCPME goethite. Areas calculaby this method are higher than those calculated from Sbut, in fact, the agreement is good, since SEM calculatsimplify the shape of particles and do not consider sand other defects. The high-C energetic constants generasuggest that the samples are microporous or that very sinteractions occur between the goethite surface and nitroHowever, the use of thet-plot method, designed by de Boet al. [35] to evaluate micropore volumes and open surareas, shows that neither sample can be consideredmicroporous and that high-energy surface adsorptionare more likely. This energy constant is higher for the BAsample than for the LCPME one.
Pore size distributions, derived from desorption isotheand calculated from Olivier’s procedure [27], are presenin Fig. 5b with corresponding results tabulated in TableThe obtained curves confirm that mesopores are ralarge. The volume of mesopores, converted into geomvolumes by taking into account the density of liquid nitrogat 77 K (0.808 g/cm3), is of the same order of magnitude fthe two samples. However, the LCPME sample also appmacroporous for more than 50% of its specific surfacewhile the macropore surface area seems to be neglifor the BASF sample. In turn, this latter sample showsmall amount of micropores, but this is not really significcompared to the total specific surface area.

B. Prélot et al. / Journal of Colloid and Interface Science 261 (2003) 244–254 251
onsb),
theobed tocor-
77 Keir
are
ingcalnedhigh
areaest
.2%les,tiond
forthsSFndsh
ionsrvedn is
are[29],iron
er-ori-ces.Mthe
ys-
are
3.6. Low-pressure Ar adsorption
The condensation adsorption energy distributi(CAED) obtained with argon are shown in Figs. 6a and 6together with its DIS modeling (Table 4). The features ofderivative depend on the nature of the solids and the prIn all cases, several local derivative isotherms were usemodel experimental ones, revealing the heterogeneity ofresponding solid surfaces.
(a)
(b)
Fig. 6. Experimental derivative argon adsorption isotherms obtained aton (a) goethite BASF and on (b) goethite LCPME together with thdecomposition using the DIS procedure.
.
Argon condensation adsorption energy distributionsvery similar for the two samples with a peak for lnP/P0around−4 and a shoulder at higher energy. DIS modelof the experimental curves is obtained with three loderivative isotherms, corresponding to the aforementiopeak and shoulder, and an additional small peak at veryadsorption energy (lnP/P0 ≈ −11.5). This high-energypeak represents 2.3 and 0.8% of the total surfacefor BASF and LCPME samples, respectively. The lowadsorption energy domain is located at the same lnP/P0value for both samples and represents 66.5 and 69of the total surface area for BASF and LCPME samprespectively. For the medium-energy peak, the adsorpenergy is slightly higher for BASF than for LCPME, antheir relative proportions are 31.2 and 30.0%.
Although relative surface areas are roughly the samethe two samples, some differences exist, like the widof the two main peaks, which are broader for the BAsample. From a quantitative point of view, this correspoto lower values of theω∗ parameter, which even reacnegative values for the BASF sample. As the peak positare roughly the same for the two samples, the obsedifferences inω∗ values suggest that surface organizatiodifferent for the two samples. Indeed, the lowestω∗ valuesobtained for the BASF sample indicate that its surfacesmore heterogeneous than those of the LCPME sampleprobably due to more disorder in the surface oxygen andlayers.
4. Discussion
To study sorption mechanisms at the solid–liquid intface, it is necessary to determine the crystallographicentation and the surface area of the different reacting faIn the case of the studied goethite, SEM, TEM, and AFimages show that the two goethites have approximatelysame morphology with different sizes and that different crtallographic faces are observed. Except for the〈001〉 di-rection, coherence lengths derived from XRD analysis
n
specific
Table 4Parameters of the DIS decomposition of derivative argon adsorption isotherm on goethite BASF and LCPME
Domain lnP/P0 position Adsorbed volume Specific area % Lateral interactio(cm3/g) (m2/g) (ω∗/kT )
Goethite BASF1 −3.9 2.71 10.05 66.5 −0.22 −7.4 1.27 4.72 31.2 −0.73 −11.8 0.09 0.34 2.3 0
Total 15.11
Goethite LCPME1 −4.0 6.05 22.44 69.2 0.92 −6.9 2.62 9.73 30.3 03 −11.0 0.07 0.26 0.8 0
Total 32.43
Note. Cross sectional area of argon, 0.138 nm2 [26]. % is the percentage of the total specific surface area, recalculated from the summation of the threesurfaces obtained for each individual domain.

252 B. Prélot et al. / Journal of Colloid and Interface Science 261 (2003) 244–254
hisartitedby
lsoptioeou
ad-It isughusedfordi-w,ad-
acesorpaturtion, theSF
amelogyed
ons.ape
. 7a.shipticle
th alisticmmculateergy
s,ce,ite
eas
t withfnncyms iton.ate
igh-esultes,rrors,errorracy
r-for
ac-
two-ex-
itro-his
rds
ch.FM,s ofta-ess21}ablengach
een
lower than the dimensions obtained from microscopy. Tshows that crystallographic defects are present inside pcles in addition to the polycrystalline organization suggesby AFM. Such structural heterogeneities, emphasizedstrain values derived from Williamson–Hall plots, are aexpressed on the surface as DIS analysis of argon adsorisotherms show that BASF surfaces are more heterogenthan LCPME ones.
Argon adsorption experiments show that very similarsorption distributions are obtained for the two samples.well established that because of its ability to adsorb thrononpolar interactions with surface sites, argon can beto determine the geometrical properties or lamellarityphyllosilicates [29,36–38], and layered silica-like magaites [38]. Indeed, for all phyllosilicates studied up to noargon CAED presents common features: a low-energysorption peak corresponding to the adsorption on basal fand a shoulder at higher energy corresponding to the adtion on edge faces. The peak positions depend on the nof the mineral, and on the nature of surface compensacations for negatively charged clays. In the present casesimilarity in argon adsorption energies indicates that BAand LCPME goethite particles probably present the scrystallographic faces. This then suggests that, by anawith phyllosilicates, quantitative information can be derivfrom argon adsorption in terms of mean particle dimensi
As a first approximation, we have assumed that the shof particles is close to parallelepipeds schematized in FigIt can then be easily demonstrated that the relationbetween specific areas of each type of face and par
(a)
(b)
Fig. 7. Schematic representations of the particle morphology, wisimplified rectangular shape for the main faces (a) and with a reamorphology showing the crystallographic faces according to Wulfatheory [39] and AFM (b). These shapes and dimensions are used to calthe extension of the dimensions of faces, in correlation with the Ar endomains.
-
ns
s-e
dimensions are
(2)L1 = 2
S1d,
(3)L2 = 2
S2d,
(4)L3 = 2
S3d,
whereL1, L2, and L3, are the lengths of particle edgeS1 > S2 > S3 are the specific areas of each type of faandd is the calculated crystallographic density of goeth(4.26 g/cm3). Using the three argon specific surface arderived from the DIS procedure (Table 4),L1, L2, andL3have been calculated (first part of Table 5).
These obtained values show a rather good agreementhe sizes measured by SEM and by XRD in the case oL1andL2, if we consider the difficulty in determining meavalues in these directions by SEM. The small discrepaobserved forL1 on the BASF sample probably results frosize dispersion, as evidenced in Fig. 1, which makedifficult to obtain accurate mean values in that directiThe results forL3 do not agree, as they greatly overestimthe SEM values and the trend (LCPME< BASF) is notfulfilled. This can be easily explained by the fact thatL3is derived from the lowest surface area, i.e., from the henergy adsorption peak. Indeed, the local isotherms rfrom fitting of experimental curves with theoretical onand small errors on the two main peaks generate large eon the high-energy residual peak (peak 3). At presentS3values can be considered to have a high estimation(probably more than 50%), which explains the bad accuonL3 derived from argon adsorption.
Therefore, theL3 dimension is more accurately detemined from images obtained by SEM: 600 and 300 nmBASF and LCPME samples, respectively. Taking intocount L3 SEM values andL1 and L2 argon values, it ispossible to calculate the specific surface areas of thepowders as 15.5 and 33.7 m2/g for BASF and LCPME samples, respectively. This remains in good agreement withperimental argon surface areas (resp., 15.1 and 32.4 m2/g).These values are also in rather good agreement with ngen values, but they are far from SEM values (Table 2). Tremark confirms that theL3 dimension has only very littleinfluence on the total specific surface area; in other wovery high accuracy onS3 is required to derive realisticL3lengths.
This geometrical approximation was a first approaA more realistic shape, however, can be proposed. ASEM, and TEM observations suggested that lateral facegoethite laths consist of {101} and {001} faces. The oriention of the terminal faces of the needles is difficult to assby these methods, except with TEM, which suggested {1faces. Another approach is to calculate the most probgrowing faces through the theory of Wulfmann [39]. Usithe Pnma symmetry of the crystals and the energy of etype of face, the most likely crystal morphologies have b
B. Prélot et al. / Journal of Colloid and Interface Science 261 (2003) 244–254 253
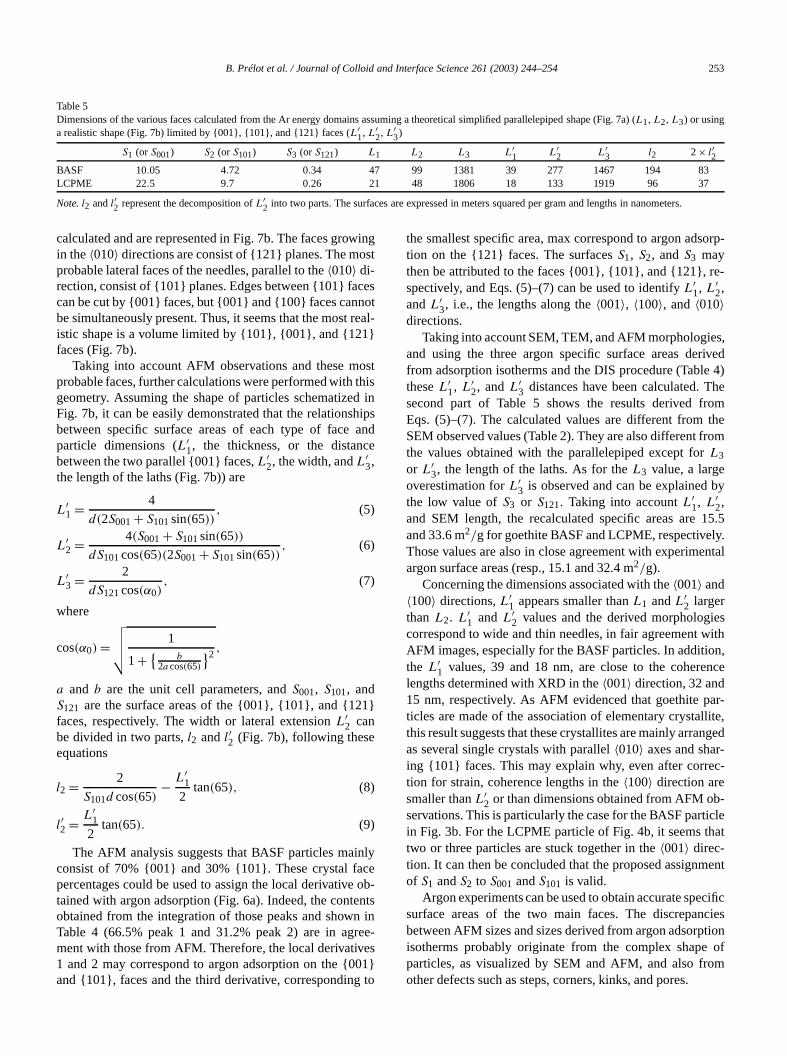
Table 5Dimensions of the various faces calculated from the Ar energy domains assuming a theoretical simplified parallelepiped shape (Fig. 7a) (L1, L2, L3) or usinga realistic shape (Fig. 7b) limited by {001}, {101}, and {121} faces (L′
1, L′2, L′
3)
S1 (or S001) S2 (or S101) S3 (or S121) L1 L2 L3 L′1 L′
2 L′3 l2 2× l′2
BASF 10.05 4.72 0.34 47 99 1381 39 277 1467 194 83LCPME 22.5 9.7 0.26 21 48 1806 18 133 1919 96 37
Note. l2 andl′2 represent the decomposition ofL′2 into two parts. The surfaces are expressed in meters squared per gram and lengths in nanometers.
wingst
cesotreal}
ostthisd inhipsande
1}
inlyce
obentsn inree-es01}to
sorp-
e-
s,rivede 4)he
romtherom
by
15.5ly.ental
eswithn,nce
ar-llite,nged-c-
b-icleat
ent
cificciestionof
om
calculated and are represented in Fig. 7b. The faces groin the〈010〉 directions are consist of {121} planes. The moprobable lateral faces of the needles, parallel to the〈010〉 di-rection, consist of {101} planes. Edges between {101} facan be cut by {001} faces, but {001} and {100} faces cannbe simultaneously present. Thus, it seems that the mostistic shape is a volume limited by {101}, {001}, and {121faces (Fig. 7b).
Taking into account AFM observations and these mprobable faces, further calculations were performed withgeometry. Assuming the shape of particles schematizeFig. 7b, it can be easily demonstrated that the relationsbetween specific surface areas of each type of faceparticle dimensions (L′
1, the thickness, or the distancbetween the two parallel {001} faces,L′
2, the width, andL′3,
the length of the laths (Fig. 7b)) are
(5)L′1 = 4
d(2S001+ S101sin(65)),
(6)L′2 = 4(S001+ S101sin(65))
dS101cos(65)(2S001+ S101sin(65)),
(7)L′3 = 2
dS121cos(α0),
where
cos(α0) =√√√√ 1
1+ {b
2a cos(65)
}2,
a and b are the unit cell parameters, andS001, S101, andS121 are the surface areas of the {001}, {101}, and {12faces, respectively. The width or lateral extensionL′
2 canbe divided in two parts,l2 andl′2 (Fig. 7b), following theseequations
(8)l2 = 2
S101d cos(65)− L′
1
2tan(65),
(9)l′2 = L′1
2tan(65).
The AFM analysis suggests that BASF particles maconsist of 70% {001} and 30% {101}. These crystal fapercentages could be used to assign the local derivativetained with argon adsorption (Fig. 6a). Indeed, the contobtained from the integration of those peaks and showTable 4 (66.5% peak 1 and 31.2% peak 2) are in agment with those from AFM. Therefore, the local derivativ1 and 2 may correspond to argon adsorption on the {0and {101}, faces and the third derivative, corresponding
-
-
the smallest specific area, max correspond to argon adtion on the {121} faces. The surfacesS1, S2, andS3 maythen be attributed to the faces {001}, {101}, and {121}, rspectively, and Eqs. (5)–(7) can be used to identifyL′
1, L′2,
andL′3, i.e., the lengths along the〈001〉, 〈100〉, and〈010〉
directions.Taking into account SEM, TEM, and AFM morphologie
and using the three argon specific surface areas defrom adsorption isotherms and the DIS procedure (TabltheseL′
1, L′2, andL′
3 distances have been calculated. Tsecond part of Table 5 shows the results derived fEqs. (5)–(7). The calculated values are different fromSEM observed values (Table 2). They are also different fthe values obtained with the parallelepiped except forL3
or L′3, the length of the laths. As for theL3 value, a large
overestimation forL′3 is observed and can be explained
the low value ofS3 or S121. Taking into accountL′1, L′
2,and SEM length, the recalculated specific areas areand 33.6 m2/g for goethite BASF and LCPME, respectiveThose values are also in close agreement with experimargon surface areas (resp., 15.1 and 32.4 m2/g).
Concerning the dimensions associated with the〈001〉 and〈100〉 directions,L′
1 appears smaller thanL1 andL′2 larger
than L2. L′1 and L′
2 values and the derived morphologicorrespond to wide and thin needles, in fair agreementAFM images, especially for the BASF particles. In additiothe L′
1 values, 39 and 18 nm, are close to the coherelengths determined with XRD in the〈001〉 direction, 32 and15 nm, respectively. As AFM evidenced that goethite pticles are made of the association of elementary crystathis result suggests that these crystallites are mainly arraas several single crystals with parallel〈010〉 axes and sharing {101} faces. This may explain why, even after corretion for strain, coherence lengths in the〈100〉 direction aresmaller thanL′
2 or than dimensions obtained from AFM oservations. This is particularly the case for the BASF partin Fig. 3b. For the LCPME particle of Fig. 4b, it seems thtwo or three particles are stuck together in the〈001〉 direc-tion. It can then be concluded that the proposed assignmof S1 andS2 to S001 andS101 is valid.
Argon experiments can be used to obtain accurate spesurface areas of the two main faces. The discrepanbetween AFM sizes and sizes derived from argon adsorpisotherms probably originate from the complex shapeparticles, as visualized by SEM and AFM, and also frother defects such as steps, corners, kinks, and pores.
254 B. Prélot et al. / Journal of Colloid and Interface Science 261 (2003) 244–254
ableheirgy.
heythetal},rgoninceacens,on,
tosize
ionous
on.rtiesencetheand
thester-an-ing
er-
e
ce
96)
79)
003)
5)
9.im.
85)
) 87.him.
ce
00)
s.),oil
—
96)
os-
ies,.
.309.ros-
tion
ois,s.),olid
ng-
d-
v, J.P.
der
M.
es,
n,
.
5. Conclusion
Using several complementary methods, we wereto characterize two goethite samples, in terms of tchemical composition, crystal structure, and morpholoParticle sizes of the two goethites are different, but tshow the same crystal face distribution as evidenced byargon adsorption energy distributions. A model of crysmorphology including three types of faces, {001}, {101and {121}, has been proposed. Results of low-pressure asorption are in rather good agreement with this model, seach local isotherm could be assigned to one type of fTaking into account AFM, SEM, and TEM observatioX-ray line widths analysis, argon adsorption distributiand the most likely growing faces, it was possibledetermine the crystal face areas and to approximate theof particles and those of elementary crystal units.
These data will be very useful for further characterizatof these solids and their superficial properties in aquesolution, through acido-basic titration and ion sorptiThese data will also be used for modeling sorption properelated to the heterogeneity, the reactivity, and the presof defects or impurities, and they will be needed forcorrelations among surface orientation, sorption sites,sorption constants.
Acknowledgments
This work has been performed in the framework ofresearch network PRACTIS (GdR 1115: “Physicochimie deActinides et autres radioéléments en solutions et aux infaces”, Atelier “Réactivité de surface de goethites”). JeMarie Génin is acknowledged for his help in synthesizLCPME goethite.
References
[1] W. Stumm, Chemistry of the Solid–Water Interface, Wiley–Intscience, New York, 1992.
[2] T. Hiemstra, W.H. Van Riemsdijk, G.H. Bolt, J. Colloid InterfacSci. 133 (1989) 91.
[3] T. Hiemstra, J.C.M. De Wit, W.H. Van Riemsdijk, J. Colloid InterfaSci. 133 (1989) 105.
[4] T. Hiemstra, W.H. Van Riemsdijk, J. Colloid Interface Sci. 179 (19488.
[5] J.A. Davis, J.O. Leckie, J. Colloid Interface Sci. 67 (1978) 90.[6] T.D. Evans, J.R. Leal, P.W. Arnold, J. Electroanal. Chem. 105 (19
161.
.
s
[7] F. Gaboriaud, J.-J. Ehrhardt, Geochim. Cosmochim. Acta 67 (2967.
[8] K.F. Hayes, J.O. Leckie, J. Colloid Interface Sci. 115 (1987) 564.[9] C.K.D. Hsi, D. Langmuir, Geochim. Cosmochim. Acta 49 (198
1931.[10] D.G. Lumsdon, L.J. Evans, J. Colloid Interface Sci. 164 (1994) 11[11] L. Lövgren, S. Sjöberg, P.W. Schindler, Geochim. Cosmoch
Acta 54 (1990) 1301.[12] U. Schwertmann, P. Cambier, E. Murad, Clays Clay Miner. 33 (19
369.[13] L. Sigg, W. Stumm, Colloids Surf. 2 (1981) 101.[14] R. Strauss, G.W. Brümmer, N.J. Barrow, Eur. J. Soil Sci. 48 (1997[15] A. Van Geen, A.P. Robertson, J.O. Leckie, Geochim. Cosmoc
Acta 58 (1994) 2073.[16] P. Venema, T. Hiemstra, W.H. Van Riemsdijk, J. Colloid Interfa
Sci. 192 (1997) 94.[17] M. Villalobos, J.O. Leckie, Geochim. Cosmochim. Acta 64 (20
3787.[18] W.A. Zeltner, M.A. Anderson, Langmuir 4 (1988) 469.[19] U. Schwertmann, R.M. Taylor, in: J.B. Dixon, S.B. Weed (Ed
Minerals in Soil Environment, in: SSSA Book Serie, Vol. 1, SScience Society of America, Madison, WI, 1989, pp. 379–438.
[20] U. Schwertmann, R.M. Cornell, Iron Oxides in the LaboratoryPreparation and Characterization, VCH, Weinheim, 1991, 137.
[21] P.G. Weidler, T. Schwinn, H.E. Gaub, Clays Clay Miner. 44 (19437.
[22] P.G. Weidler, S.J. Hug, T.P. Wetche, T. Hiemstra, Geochim. Cmochim. Acta 62 (1998) 3407.
[23] R.M. Cornell, U. Schwertmann, in: The Iron: Structure, PropertReactions, Occurrences and Uses, VCH, Weinheim, 1996, p. 573
[24] J.C. Rouchaud, M. Fedoroff, French Patent No. 99.12967 (1999)[25] S. Brunauer, P.H. Emmet, E. Teller, J. Am. Chem. Soc. 60 (1938)[26] S.G. Gregg, G.K.S.W. Sing, in: Adsorption, Surface Area and Po
ity, 2nd ed., Academic Press, London, 1982.[27] J.P. Olivier, in: 4th International Symposium on the Characteriza
of Porous Solids, 1996.[28] L. Michot, M. François, J.M. Cases, Langmuir 6 (1990) 677.[29] F. Villiéras, L. Michot, J.M. Cases, I. Bérend, F. Bardot, M. Franç
G. Gérard, J. Yvon, in: W. Rudzinski, W.A. Steel, C. Zgrablich (EdEquilibria and Dynamics of Gas Adsorption on Heterogeneous SSurfaces, Elsevier, Amsterdam, 1997, p. 573.
[30] F. Villiéras, J.M. Cases, M. François, L. Michot, F. Thomas, Lamuir 8 (1992) 1789.
[31] F. Villiéras, L. Michot, F. Bardot, J.M. Cases, M. François, W. Ruzinski, Langmuir 13 (1997) 1104.
[32] B.J. Lemaire, P. Davidson, J. Ferré, J.P. Jamet, P. Panine, I. DozoJolivet, Phys. Rev. Lett. 88 (2002) 125507.
[33] P. Scherrer, Nach. Ges. Wiss. Göttingen 2 (1918) 96.[34] G.K. Williamson, W.H. Hall, Acta Metall. 1 (1953) 22.[35] J.H. de Boer, B.C. Lippens, B.G. Linsen, J.C.P. Broekhollf, A. van
Heuvel, Th.J. Osinga, J. Colloid Interface Sci. 21 (1966) 405.[36] F. Bardot, F. Villiéras, L.J. Michot, M. François, G. Gérard, J.
Cases, J. Dispersion Sci. Technol. 19 (1998) 739.[37] L.J. Michot, F. Villiéras, M. François, J. Yvon, R. Le Dred, J.M. Cas
Langmuir 10 (1994) 3765.[38] F. Villiéras, L.J. Michot, F. Bardot, M. Chamerois, C. Eypert-Blaiso
G. Gérard, J.M. Cases, C. R. Geosci. 334 (2002) 597.[39] A.R. Roosen, R.P. McCormack, Comput. Mater. Sci. 11 (1998) 16