RESEARCH REPORT FINAL NAKAKONGE MASTULA
107
KYAMBOGO UNIVERSITY THE IMPACT OF INVENTORY MANAGEMENT ON COST A CASE STUDY OF CROWN BEVERAGES LIMITED BY NAKAKONGE MASTULA 10/U/139930/PLD/PD A RESEARCH REPORT SUBMITTED TO THE SCHOOL OF MANAGEMENT AND ENTREPRENEURSHIP IN PARTIAL FULFILLMENT OF THE REQUIREMENTS FOR THE AWARD OF THE BACHELOR’S DEGREE IN PROCUREMENT AND LOGISTICS MANAGEMENT OF KYAMBOGO UNIVERSITY JULY 2013
-
Upload
independent -
Category
Documents
-
view
1 -
download
0
Transcript of RESEARCH REPORT FINAL NAKAKONGE MASTULA
KYAMBOGO UNIVERSITY
THE IMPACT OF INVENTORY MANAGEMENT ON COST
A CASE STUDY OF CROWN BEVERAGES LIMITED
BY
NAKAKONGE MASTULA
10/U/139930/PLD/PD
A RESEARCH REPORT SUBMITTED TO THE SCHOOL OF MANAGEMENT AND
ENTREPRENEURSHIP IN PARTIAL FULFILLMENT OF THE REQUIREMENTS FOR
THE AWARD OF THE BACHELOR’S DEGREE IN PROCUREMENT AND LOGISTICS
MANAGEMENT OF KYAMBOGO UNIVERSITY
JULY 2013

DECLARATION
I declare that the information in this report has never been
submitted for the Award of Bachelor’s Degree in any Institution
or University.
NAME : NAKAKONGE MASTULA
REG NO : 10/U/139930/PLD/PD
Signature : ………………………………………
NAKAKONGE MASTULA 10/U/139930/PLD/PD 2

APPROVAL
This is to certify that this Research Report has been carried out
under my supervision and that the report is now ready for
submission to the Board of Examiners of Kyambogo University with
my due approval.
Signature:……………………………..…………...
MR. WALAKIRA HUSSEIN
(Supervisor)
Date…………………………….……………...
NAKAKONGE MASTULA 10/U/139930/PLD/PD 3

DEDICATION
Special dedications of this report go to my dear mum for her
support and courage which have uplifted my life and education. I
love you mum and thank you.
I also dedicate this report to all my lovely brothers and sisters
like Joel, Sharifah, Shakirah and all my friends not forgetting
my discussion group mates; thank you guys for doing everything
possible to make me this good.
May the Almighty God bless you all abundantly
NAKAKONGE MASTULA 10/U/139930/PLD/PD 4
ACKNOWLEDGEMENT
Great thanks first go to my Creator for the gift of life and all
the provisions He has provided for me during the course of my
studies which has really been a miraculous thing that I stand to
testify about because it has been a tag of war. And I really
thank the Almighty for the way He provided for me because the
truth is, there was no way I could have prospered and for this I
promise to glorify His Name everywhere I will be.
NAKAKONGE MASTULA 10/U/139930/PLD/PD 5

Felt thanks go to my family for the support they have given me
during my course of study in Kyambogo University for the three
years course in Procurement and Logistics Management. May the
Lord reward them abundantly
My supervisor Mr. Walakira Hussein for his supervision and
corrections made for easy compilation, thank you very much Sir.
To all sources that made it easy for accessibility of the
available literature including the Barclays Library of Kyambogo
University, Makerere University Business School Main Library
(MUBS), and others cafes, News papers and Documentations.
I also appreciate and thank with a genuine spirit my dear friends
Acen Brenda Binta, Katushabe Sheila, Balyesiima Brian and
Rwakahangi Simon Peter who always gave me courage and stood with
me throughout .Thank you guys and may the good Lord always grant
you peace, happiness and success.
Lastly I wish to thank the management of Crown Beverages Limited
which allowed me to carry out my research from their
organization. Thank You.
MAY THE ALMIGHTY GOD REWARD YOU ALL
NAKAKONGE MASTULA 10/U/139930/PLD/PD 6

TABLE OF CONTENTSDECLARATION.........................................................ii
APPROVAL...........................................................iii
DEDICATION..........................................................iv
ACKNOWLEDGEMENT......................................................v
LIST OF TABLES......................................................xi
LIST OF FIGURES....................................................xii
LIST OF GRAPHS....................................................xiii
LIST OF PIE CHARTS.................................................xiv
LIST OF ABBREVIATIONS...............................................xv
ABSTRACT...........................................................xvi
CHAPTER ONE:........................................................17
1.0 Introduction..................................................17
1.1 Background of the Study.......................................17
1.2 Statement of the Problem......................................19
1.3 Purpose of the Study..........................................20
1.4 Objectives of the Study.......................................20
1.4.1 General objective.............................................20
1.4.2 Specific objectives...........................................20
1.5 Research Questions............................................20
1.6 Significance of the Study.....................................20
1.7 Scope of the Study............................................21
1.7.1 Content Scope.................................................21
1.7.2 Geographical scope............................................21
NAKAKONGE MASTULA 10/U/139930/PLD/PD 7

1.7.3 Time scope....................................................21
1.8 Definition of the Key Terms...................................21
CHAPTER TWOLITERATURE REVIEW...................................................22
2.0 Introduction..................................................22
2.1 Methods or Techniques of Inventory Management.................22
2.1.1 The ABC Analysis..............................................22
2.1.2 Vendor Managed Inventory (VMI)................................25
2.1.3 Distribution Requirement Planning (DRP).......................26
2.1.4 Maximum and Minimum Stock level Systems (To Establish Re-OrderPoint) 27
2.1.5 Safety Stock..................................................28
2.1.6 Material requirement Planning (MRP)...........................28
2.1.7 Manufacturing Resource Planning (MRP 11)......................30
2.1.8 Just-in-time (JIT)............................................30
2.1.9 Economic Order Quantity (EOQ).................................31
2.2 Costs of acquiring and managing Inventory......................33
2.2.1 Acquisition costs.............................................33
2.2.2 Ordering Costs................................................33
2.2.3 Carrying Costs................................................34
2.2.4 Stock-out Costs...............................................35
2.2.5 Shortage Costs................................................35
2.2.6 Holding Costs.................................................36
2.2.7 Opportunity Cost of Capital Tied up in Inventory..............36
NAKAKONGE MASTULA 10/U/139930/PLD/PD 8

2.2.8 Management and administrative costs...........................36
2.2.9 Obsolete Inventory, (Write Off Cost)..........................36
2.2.10 Depreciation costs............................................37
2.3 The impact of Inventory Management on Cost Control,...........37
2.3.1 Approaches to Cost Control in Inventory Management............38
CHAPTER THREE.......................................................39
METHODOLOGY.........................................................39
3.0 Introduction..................................................39
3.1 Research Design...............................................39
3.2 Study population..............................................39
3.3 Sampling design...............................................39
3.4 Sampling size and composition.................................39
3.5 Sampling area.................................................40
3.6 Data Collection Instruments...................................40
3.6.1 Questionnaire.................................................40
3.6.2 Observation...................................................40
3.7 Reliability and validity of data..............................41
3.8 Data Sources..................................................41
3.8.1 Primary data..................................................41
3.8.2 Secondary data................................................41
3.9 Study variables...............................................42
3.10 Data collection procedure.....................................42
3.11 Data Processing and Presentation..............................42
3.12 Anticipated Problems of the Study.............................43
NAKAKONGE MASTULA 10/U/139930/PLD/PD 9

3.13 Solutions to the Anticipated Problems.........................43
CHAPTER FOUR:.......................................................44
DATA PRESENTATION, INTERPRETATION AND ANALYSIS OF THE FINDINGS......44
4.0 Introduction..................................................44
4.1 Presentation of Findings......................................44
4.1.1 Findings on the Age Group of the Respondents..................46
Findings on the Academic Qualifications of Respondents..............47
4.1.2 Findings on the Department/ Section (Composition of Respondents)48
4.1.3 Findings on the period spent in the Current Position..........49
4.1.4 Findings on the Respondents’ views about the type of Inventoryheld 50
4.1.5 Findings on respondents’ views about how Inventory is acquired51
4.1.6 Findings on the respondents’ views about techniques used tomanage Inventory....................................................51
4.1.7 Findings on the respondents’ views about which departments carryout Inspection of Materials.........................................52
4.1.8 Findings on the respondents’ views about the Inspection Methodsapplied.............................................................53
4.1.9 Findings on the respondents’ views about Inventory HoldingTechniques used.....................................................54
4.1.10 Findings on the respondents’ views about when an order is placed55
4.1.11 Findings of respondents’ views on what determines the Quantitiesto be ordered for...................................................56
4.1.12 Findings on the respondents’ views about the costs associatedwith acquiring and managing Inventory...............................56
NAKAKONGE MASTULA 10/U/139930/PLD/PD 10

4.1.13 Findings on the respondents views about the cost effectiveplaces to keep in the Inventory.....................................57
4.1.14 Findings on the respondents’ views about whether Stock Taking iscarried out.........................................................58
4.1.15 Findings on the respondents’ views about the Role that InventoryManagement plays towards Cost Control...............................58
4.1.16 Findings on the respondents’ views about how Inventorymanagement impacts on Cost Control..................................59
4.1.17 Findings on the respondents’ views about the major Cost ControlStrategies..........................................................60
4.1.18 Findings on the respondents’ views about the Departments thatwork closely with the Stores department.............................61
CHAPTER FIVE........................................................62
DISCUSSION, CONCLUSION AND RECOMMENDATION...........................62
5.0 Introduction..................................................62
5.1 Discussion of findings........................................62
5.1.1 Inventory Management Techniques...............................62
5.1.2 Inventory Management Costs....................................63
5.1.3 Impact of Inventory Management and Approaches of Cost Control.64
5.2 Summary.......................................................65
5.3 Conclusion....................................................65
5.4 Recommendations...............................................66
5.5 Areas for further Research....................................66
APPENDICES..........................................................67
REFERENCES..........................................................67
BUDGET 68
NAKAKONGE MASTULA 10/U/139930/PLD/PD 11
SCHEDULE............................................................69
RESEARCH QUESTIONAIRE...............................................70
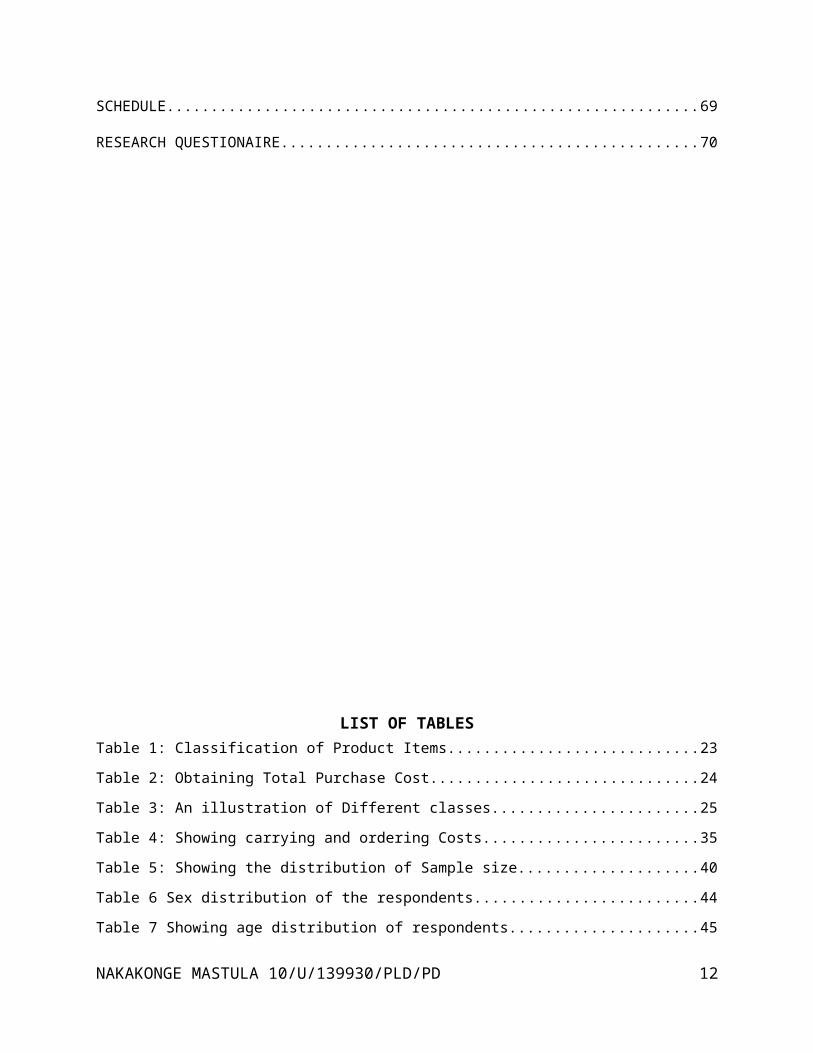
LIST OF TABLESTable 1: Classification of Product Items............................23
Table 2: Obtaining Total Purchase Cost..............................24
Table 3: An illustration of Different classes.......................25
Table 4: Showing carrying and ordering Costs........................35
Table 5: Showing the distribution of Sample size....................40
Table 6 Sex distribution of the respondents.........................44
Table 7 Showing age distribution of respondents.....................45
NAKAKONGE MASTULA 10/U/139930/PLD/PD 12

Table 8: Age bracket of the Respondents.............................46
Table 9: Academic Qualifications....................................47
Table 10 Shows composition of Respondents...........................48
Table 11: Period of Time spent by respondents.......................49
Table 12 Findings on the respondents' views about the type of
Inventory held......................................................50
Table 13 Shows respondents' views about how Inventory is acquired. . .51
Table 14: Showing respondents’ views about inspection...............52
Table 15: When order is placed......................................55
Table 16: The cost of effective places to keep in the inventory.....57
Table 17: Does the company carry out Stock taking...................58
Table 18 Showing impact of inventory management on Cost Control.....59
Table 19: Showing departments which work with stores department.....61
NAKAKONGE MASTULA 10/U/139930/PLD/PD 13

LIST OF FIGURESFigure 1: PARETO CURVE..............................................24
Figure 2: Illustration of distribution chain........................26
Figure 3 Economic Order Quantity....................................27
Figure 4 MRP System.................................................29
Figure 5 A Graphical Representation of EOQ Model....................32
Figure 6 Ordering Costs.............................................34
Figure 7 Carrying Costs.............................................34
NAKAKONGE MASTULA 10/U/139930/PLD/PD 14

LIST OF GRAPHSGraph 1: A bar graph showing the age bracket of respondents.........46
Graph 2: Showing respondents’' views about techniques of Inventory
Management..........................................................51
Graph 3: Respondents' views about Inventory Holding Techniques......54
Graph 4 What determines the quantities to be ordered...............56
Graph 5 Showing about the Role of inventory management towards cost
control.............................................................58
NAKAKONGE MASTULA 10/U/139930/PLD/PD 15
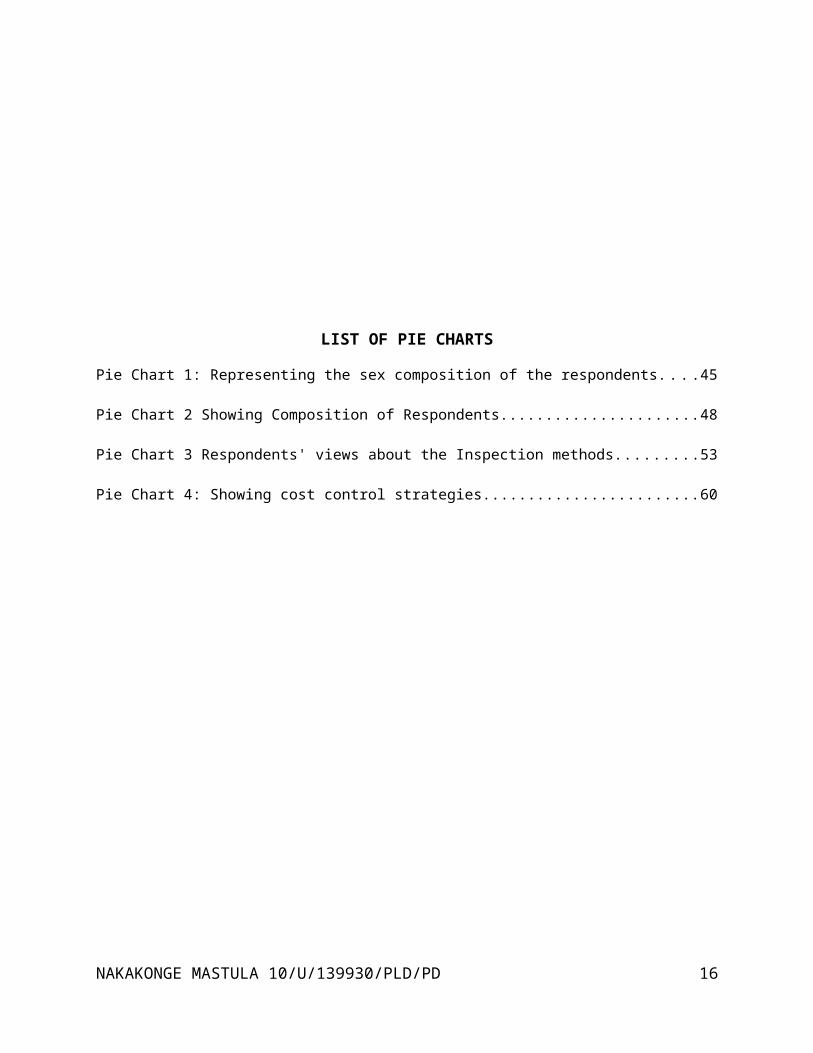
LIST OF PIE CHARTS
Pie Chart 1: Representing the sex composition of the respondents....45
Pie Chart 2 Showing Composition of Respondents......................48
Pie Chart 3 Respondents' views about the Inspection methods.........53
Pie Chart 4: Showing cost control strategies........................60
NAKAKONGE MASTULA 10/U/139930/PLD/PD 16

LIST OF ABBREVIATIONS
MRP Materials Resource Planning
JIT Just In Time
VMI Vendor Managed Inventory
MRP II Manufacturing Resource Planning
EOQ Economic Order Quantity
BOM Bill of Materials
DRP Distribution Requirement Planning
NAKAKONGE MASTULA 10/U/139930/PLD/PD 17

ABSTRACT
The study focused on the “Impact of Inventory Management on Cost
Control”. This study was carried out at Crown Beverages Limited
located in Nakawa Industrial Area along Kampala-Jinja Highway.
The research questions sought to find out thevarious Inventory
Management Techniques or methods used in an organization, the
various costs incurred which are associated with inventory
management while acquiring and maintaining inventory in an
organizationand an investigation on the impact of inventory
management on cost control within an organization and the
approaches which can be used to control inventory costs.
To effectively carry out this study, the researcher used
different tools of collecting data including questionnaires,NAKAKONGE MASTULA 10/U/139930/PLD/PD 18

interviews and observation. The researcher collected data from
different departments in the company including the Procurement
Department, Production Department, Accountants Department, Stores
Department, Administration Department and Marketing and Sales
Department. The research was qualitative and quantitative in
nature thus the data collected was presented and analyzed in
essay and tabular forms for easy interpretation.
Basing on the objectives, it was revealed that most of the
Inventory Management Techniques used are ABC Analysis and
Economic Order Quantity (EOQ). Ordering and Acquisition Costs
plus the Carrying and Stock-out Costs were the costs highly
associated with Inventory Management in the organization’s
routine operations. The impact that existed between Inventory
Management and Cost Control was that “the higher the inventory
held, the less the costs and the less the inventory held, the
higher costs associated with inventory management in an
organization and vice versa”. The approaches which were mostly
used to control inventory costs were, using average stock levels
and purchasing according to actual demand.
NAKAKONGE MASTULA 10/U/139930/PLD/PD 19

CHAPTER ONE:
1.0 Introduction
For an organization to achieve efficiency in its operations,
proper inventory management has to be ensured. Therefore this
chapter consists of the introduction of the study with several
subsections such as background, statement of the problem,
objectives of the study, research questions, and scope of the
study and significance of the study.
1.1 Background of the Study
Uganda Manufacturers Association (UMA)’s report of 2002 advances
that inventory or materials constitute a large part of current
assets for most of all businesses in Uganda. On average, they are
60% of the current assets in the balance sheet and because large
inventories are maintained by firms, a considerable amount of
funds is required to be committed to them. Inventory refers to
anything needed for work activity such as building materials or
writing materials. Materials are not necessarily tangible, they
can be information. It is therefore absolutely important to
manage inventory and control costs effectively and efficiently in
order to avoid unnecessary investment and minimize the costs
associated with stock such as carrying costs, ordering costs and
stock out costs.
Michaud J.P. and Grant A.K. (2005), define inventory management
as stock items which are taken into store and held until required
NAKAKONGE MASTULA 10/U/139930/PLD/PD 20

or as deliveries to the point of consumption. The control of
these materials is known as inventory management. They emphasize
that the function of inventory management is to obtain the
maximum materials turnover consistence with the maintenance of
sufficient materials to meet the organization’s requirements in
terms of production. Firms hold from 14% – 50% of their capital
invested in inventories. New Vision of 14th April 2003 page 23
shows many companies listing inventory management as their first
priority. Inventory management becomes one of the purchasing
goals; it involves the planning, ordering and scheduling of
materials used in the manufacturing process. It exercises control
over the three types of inventories like Raw materials, Work in
progress and finished goods. Usually operational managers have an
ambivalent attitude towards inventories. On the other hand, they
provide security in a complex and uncertain environment knowing
that you have items in stock whenever customers or production
schedule demand for them.
According to Gray .J. (2002), Inventory management is expressed
as quantity or money such as raw materials, work in progress, and
finished goods. Managers for generations have tried to control
inventories accurately and relatively simple. 1930 – 1940’s
brought mixed reasons to procure in Economic Manufacturing
Inventories. 1950’s so reviewed research effort devoted to
controlling inventories. Inventories make up sizeable percentage
of a company’s assets and usually the largest single current
assets. Inventory refers to the value of quantity of raw
NAKAKONGE MASTULA 10/U/139930/PLD/PD 21
materials, components, assemblies, consumables and finished stock
that are kept or stored for production. (Lysons,2003) Inadequate
inventories will bring about stock outs which will discourage
customers visiting your company, reduce on sales, increase costs
and reduce overall profitability. This helps management to
provide an outstanding customer service that ensures maximization
of returns on inventory management. This involves measures of
inventory management such as use of ABC Analysis, Safety Stock
Quantity, Economic Order Quantity (EOQ) and Just-in-time (JIT)
Analysis, use of predicated demand during the supplier review or
order cycle; the normal length of time between typical
replenishment order with the supplier, protecting the
organization against theft, establishing an approved stock list
for each warehouse and other techniques. (Jon 2005).
According to Lucy (1995), Inventory Management involves material
control systems, proper and systematic recording of inventory and
storage of the right amount of inventory by organizations. Too
much inventory creates mounting storage and kinds of carrying
costs. Too much inventory on the other hand can lead to
interruptions in the production and leads to losses in an
organization (Kakuru, 2005). In managing inventory, the firm’s
objective should be on consonance with cost immunization
principle. To achieve this, the firm should determine optimum
level of inventory efficiently and controlled inventories make
the firm flexible. Inefficiently inventory management results
into unbalanced inventory and inflexibility. Therefore to avoid
NAKAKONGE MASTULA 10/U/139930/PLD/PD 22

this, different measures should be applied and these measures may
include Economic Order Quantity, ABC Analysis, Just-in-time
technique to mention but a few in order to manage inventory and
control costs (Pandey, 1995).
Organizational costs involve the value of Economic resources used
as a result of production of any commodity or performing any
services for instance of UGX 5,000 is spent to produce 1,000
units of cloth, then this amount is referred to as Costs
(Saleemi, 2002), adds that to control costs, they need to first
be classified as fixed costs, variable costs, direct and indirect
costs and costs classified according to function like security
costs. Thus it is necessary for organizations to manage
inventories by holding optimum levels that ensure minimum costs.
This is because both excessive and inadequate inventories are
undesirable as it ties up the organization’s funds, increase
costs and loss of profitability.
1.2 Statement of the Problem
According to Kakuru (2005), Inventory constitutes the largest
part of the organization’s current assets for their continuous
operations. It is absolutely imperative to manage inventories
efficiently and effectively in order to control costs. Inventory
management is an important aspect for the improvement of
performance within an organization. Just like any kind of
investment business, inventory management needs to serve the
NAKAKONGE MASTULA 10/U/139930/PLD/PD 23

purpose of minimizing costs, maximizing profits, accurate record
keeping and adequate material availability among others.
Much as organizations are trying hard to improve on inventory
management in order to control costs, in many cases inventory
management has turned into a major cash flow constraint which is
associated with so many hardships in form of costs such as stock
out costs, high inventory security costs, insurance costs,
falling victim of the “Bull whip effect;” to much distasted stock
in inventory and items in stock get misplaced as stated by (Doug
Brinlee, 2007).
Despite the fact that organizations still make use of inventory
management techniques in order to minimize costs which in fact is
an output of many inter-organizational processes; but the results
of the findings are not always clearly expressed. Therefore, it
is on this background that the researcher is intending to
investigate on the impacts of inventory management on cost
control at Crown Beverages Ltd located in Nakawa Industrial
Area.
NAKAKONGE MASTULA 10/U/139930/PLD/PD 24

1.3 Purpose of the Study
To examine the impact of inventory management on cost control at
Crown Beverages Ltd located Nakawa.
1.4 Objectives of the Study
1.4.1 General objective To investigate on the impact of inventory management on cost
control within an organization and the approaches which can be
used to control inventory costs.
1.4.2 Specific objectives To examine the various inventory management techniques or
methods used in an organization.
To analyze the various costs incurred which are associated
with inventory management while acquiring and maintaining
inventory in an organization.
1.5 Research Questions
i. What are the various inventory management techniques or
methods used by most organizations?
ii. What are the various costs incurred while acquiring and
maintaining inventory in an organization?
iii. How does inventory management impact on cost control in an
organization and what approaches can be used to control
inventory costs?
1.6 Significance of the Study
The purchasing managers in very many organizations concerning the
methods of inventory management will learn new ideas and
perception on the use of better inventory management techniques.
NAKAKONGE MASTULA 10/U/139930/PLD/PD 25

The study will provide useful guidelines to the potential readers
and researchers who may have interest in learning on the same
topic.
The research will avail information on how to maintain average
stock in an organization and overcome unnecessary costs related
to stocks like stock out costs.
The research will help improve on the researcher’s knowledge and
capabilities to research about more other topics and give him/
her insight about Inventory Management and Cost Control as well
as partial fulfillment for the award of a Bachelor’s Degree of
Procurement and Logistics Management of Kyambogo University.
The study will benefit the Government of the Republic of Uganda,
the general public and potential investors in many organizations.
As they will appreciate different methods of inventory management
and cost control and strike a balance between the two variables.
1.7 Scope of the Study
1.7.1 Content Scope
The study was centered on the impact of inventory management and
cost control in an organization. Therefore the study investigated
mainly on the following.
To examine the inventory management techniques used in an
organization.
To analyze the various costs incurred in managing inventory in
an organization.
NAKAKONGE MASTULA 10/U/139930/PLD/PD 26

To investigate on the impact of inventory management on cost
control in an organization and the approaches which can be
used to control inventory costs.
1.7.2 Geographical scope
The study was conducted in Crown Beverages Ltd Central store in
Nakawa Industrial Area along Kampala –Jinja Road
1.7.3 Time scope
The research was carried out between February 2009 to May 2013
1.8 Definition of the Key Terms
Inventory Management; this involves planning, ordering,
implementation and scheduling the use of materials in an
organization with in its various user departments like;
Production Department, Accounting and Finance among others.
Application; these are methods used to improve on inventory
management or control in an organization.
Cost; this involves all the expenses incurred by an organization
or a sacrifice foregone to attain a benefit for example,
Transportation Costs, Administration Costs, Marketing and
Distribution and Inventory Costs all can be incurred to attain
profitability.
Cost control; these are strategies employed by various
organizations with an attempt to control on costs.
NAKAKONGE MASTULA 10/U/139930/PLD/PD 27

CHAPTER TWO
LITERATURE REVIEW
2.0 Introduction
This chapter is an analysis of some of the major issues on
existing literature on inventory management as studied by other
scholars. It dealt with relevant literature on inventory
management and cost control and it was associated with
discussions on relation to the research objectives.
2.1 Methods or Techniques of Inventory ManagementThese involve techniques and systems to control the firm’s
investment in stock. They include recording and monitoring of
stock levels, forecasting future demand and deciding when and how
much to order (Lysons Kenneth, 2003).
2.1.1 The ABC AnalysisAccording to Zenz, (2002) Today’s inventory control mangers
define pareto analysis into three categories i.e. A, B and C.
The A-items number only from 10%-20% of the total inventory
control number of items. However, they may account for 65%-80% of
the dollar tied up in the inventory. A-items deserve excessive
attention like general electronic copper.
The B-items number only from 10%-15% of the tied inventory and
typically they tie up to 20%-25% of the dollar invested in the
inventory. B-items deserve the Economic Order Quantity Analysis
or some other forms of verifying the right quantity to buy in
stock.NAKAKONGE MASTULA 10/U/139930/PLD/PD 28

The C-items number only from 65% of all items in inventory.
However their combined dollar value totals only 5% of the entire
investment in the inventory, clerical personnel or computers
connect suppliers. Computers order the C-items for many firms
because most firm’s find that a small number of purchased items
account for the major portion of the purchased value. It is often
advisable to clarify purchased items according to value, unit,
cost, unit volume, shelf, and life and dollar investment.
According to Alan Muhumum, et al. (2002), stated that A:B:C
analysis is a systematic structured approach to distinguish
between vital few and trivial many. In many organizations under
taking large control of a few orders will control the bulky of
the organization’s work load. It can also be called out by income
and also by contribution.
According to Arord and Pandey, (1995) A:B:C Analysis is an
inventory management technique where a firm analyzes each
inventory item on the basis of its costs, frequency of usage,
seriousness of stock, lead time and other issues of importance to
each item. Items are analyzed according to their values so that
costly and valuable materials are given greater attention and
care. The ABC Analysis classifies items under three distinct
groups A, B, and C.
“A” items constitute stock which is necessary for proper
functioning and operation of the business with it making 80% of
value and 20% in items of stock. A firm has to take serious
NAKAKONGE MASTULA 10/U/139930/PLD/PD 29

control of such items, maintain proper records, carry out
continuous stock review and keep minimum inventory.
“B” items represent relatively least value stock under simple
management. They usually comprise 15% of value of the business
and 50% of stock. These items therefore require reasonable
attention by management.
“C” items are low value materials which represent a very large
number of items but with relatively least value. This category is
under a simple management.
Table 1: Classification of Product Items
Category Degree of
control
Types of
records
lot sizes Frequency
of review
Size of
safety
stock
levelsA Tight Accurate
and
complete
Low Continuous Small
B Moderate Good Medium Occasional ModerateC Loose simple Large infrequent LargeSource: Secondary Source
Graphically, it can be shown in form of a Pareto curve
NAKAKONGE MASTULA 10/U/139930/PLD/PD 30

Figure 1: PARETO CURVE
Percentage
Costs
Item A Item B
Source: Financial Management I.M Pandey,(1995).
Drury, (2000) States that there are two stages involved in
classifying stock under the ABC model;
Stage One:
For each item in stock, multiply the price to obtain the total
purchase cost. This can be illustrated as below;
Table 2: Obtaining Total Purchase Cost
Ite
m
Estimated
usage
Unit
price
(£)
Total per cost (£)
1
2
3
4
60,000
20,000
1,000
10,000
1.00
0.05
0.01
0.02
60,000
1,000
100
200
NAKAKONGE MASTULA 10/U/139930/PLD/PD 31

5
6
100,000
80,000
0.01
2.00
1,000
160,000Source: Secondary Data
Stage Two:
Group all the above items in descending order of purchase price
and then divide into class A (top 10%), class B (next 20%) and
then class C (bottom 70%).
Table 3: An illustration of Different classes
Class No. of Items
in Stock
% of items
in Stock
Total Cost %
A
B
C
1,000
2,000
7,000
10
20
70
730,000
190,000
80,000
73
19
8
Total 10,000 100 1,000,000 100
Source: Secondary Data
According to Lysons and Gillingham,(2003) Under ABC Analysis, the
basic items are known as class A-items. These require close day
to day control because of their budgetary importance for instance
a household may buy different items such as food items which
account for the bulk of annual expenditure in shops because they
are needed frequently. Group C items are items that are
occasionally needed and do not require to spend hours comparing
the price the price from different suppliers because it does notNAKAKONGE MASTULA 10/U/139930/PLD/PD 32

make any economic sense. They are regularly received but are not
closely controlled as Class A items.
2.1.2 Vendor Managed Inventory (VMI)According to Gray,R.B. et al.(2002), This approach presupposes
transfer of responsibility of managing and controlling inventory
from the purchasing organization (who is the owner thereof) 2to
the supplier (seller) upon agreed terms. The purchasing
organization has the legal ownership of the goods, but the goods
after purchase will be kept with the supplier, and delivered to
the buyer’s premises on the basis or order quantity and time (how
frequently) of replenishment. Modern developments have seen the
emergence of a new practice: vendor owned Inventory (VOI), where
the inventory is kept at the buyer’s premises (on consignment)
and the buyer pays for what has been used/ sold. Thus Vendor
Inventory is refered to as Consignment Inventory or Stock.
2.1.3 Distribution Requirement Planning (DRP)According to Gallaway et al. (2000), it is an inventory control
and scheduling technique that applies Material Requirement
Planning (MRP), principles to distribution inventories. It is
used in a multi arrangement environment, for example a
supermarket chain; the regional ware house derives their demand
from individual supermarkets multi-arrangement (echelon) means
that instead of independent control of the same item at different
distribution points using Economic Order Quantity (EOQ) formula,
the dependent at a high echelon (for example Central warehouse)
NAKAKONGE MASTULA 10/U/139930/PLD/PD 33

is derived from the requirement of lower echelons (for example
Regional ware house)
Figure 2: Illustration of distribution chain
Sourc
e: purchasing and supply chain management, Kenneth lysons(2006)
DRP uses several variables which include;
The required quantity of products needed at the beginning of a
period.
The constrained quantity of products needed at the beginning of a
period.
The recommended order quantity at the beginning of a period.
The back ordered demand at the end of a period.
The on hand inventory at the end of a period.
2.1.4 Maximum and Minimum Stock level Systems (To Establish Re-Order Point)
Another widely used method of inventory management involves the
establishment of minimum and maximum control levels. The last
NAKAKONGE MASTULA 10/U/139930/PLD/PD 34
central warehouseregional ware houseoutletsoutletsregional ware houseoutletsoutlets

unit of inventory could be used up at the moment the new shipment
arrives. The maximum inventory would then be correct orderly
quantity in practice. It would be unwise to follow this extreme
policy since it involves planning that is much too close for
safety. In minimum system, a safety tender is established which
becomes the minimum point below which the inventory should not go
under normal circumstances. The maximum inventory consists of
this safety factor plus the correct orderly quantity. The size of
these safety factors depends on the importance of the particular
item to be stored.
2.1.4.1 Re-Order PointThis technique answers the question when should an order be made?
This question is answered by using the lead time and average
usage of an item in the firm. (Pandey, 1995) Defines a re-order
point as that inventory level at which an order should be placed
to replenish the inventory. It is determined among others by lead
time, which the time is normally taken in replenishing delivery
after an order has been made. Re-order point is crucial in a firm
especially where the lead time is short. Graphically, it can be
shown as below;
Figure 3 Economic Order Quantity
Quantity
NAKAKONGE MASTULA 10/U/139930/PLD/PD 35
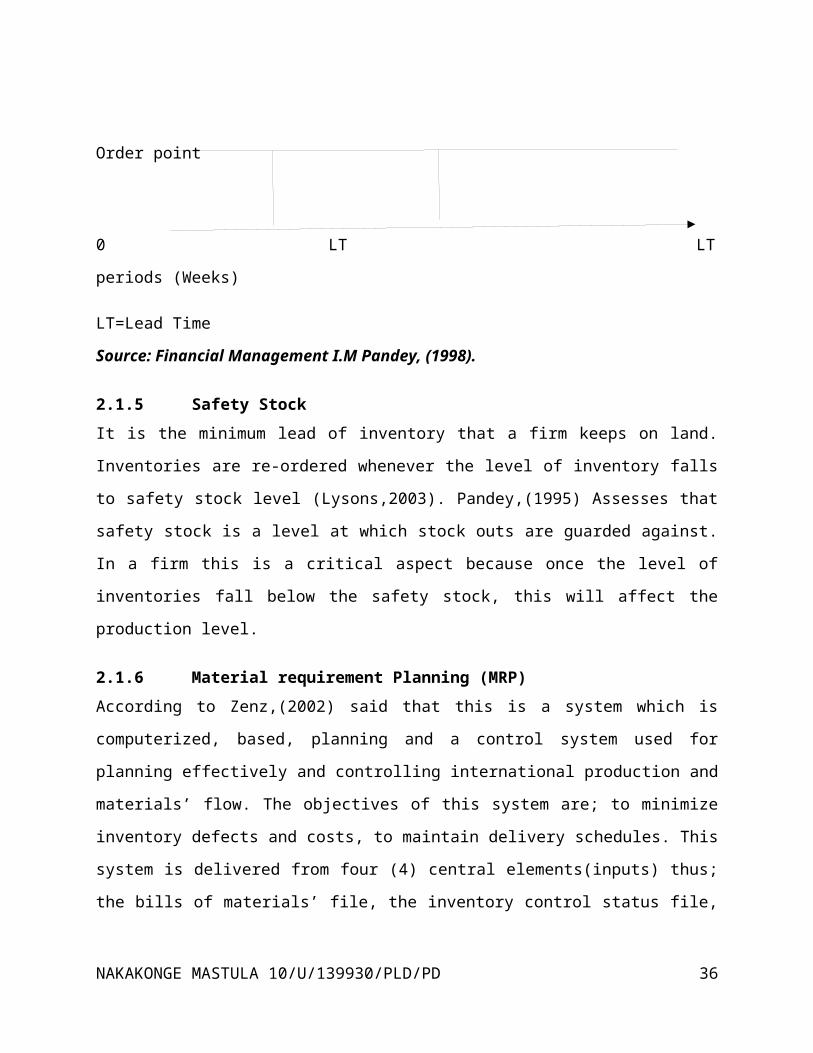
Order point
0 LT LT
periods (Weeks)
LT=Lead Time
Source: Financial Management I.M Pandey, (1998).
2.1.5 Safety StockIt is the minimum lead of inventory that a firm keeps on land.
Inventories are re-ordered whenever the level of inventory falls
to safety stock level (Lysons,2003). Pandey,(1995) Assesses that
safety stock is a level at which stock outs are guarded against.
In a firm this is a critical aspect because once the level of
inventories fall below the safety stock, this will affect the
production level.
2.1.6 Material requirement Planning (MRP)According to Zenz,(2002) said that this is a system which is
computerized, based, planning and a control system used for
planning effectively and controlling international production and
materials’ flow. The objectives of this system are; to minimize
inventory defects and costs, to maintain delivery schedules. This
system is delivered from four (4) central elements(inputs) thus;
the bills of materials’ file, the inventory control status file,
NAKAKONGE MASTULA 10/U/139930/PLD/PD 36

the master file and the production schedule and material
requirement planning packages.
Bill of Materials (BOM) file is a list of all items that
comprise each assembly and such assembly that makes up the final
product. The bill of materials identifies all the components
required to produce a scheduled quantity of an assembly and the
structure of now these components fit together to make that
assembly. The BOM can be viewed as a product structure tree,
similar to an organization chart below.
Inventory control status file this comprises of the records of
individual items of inventory and their status. It shows the on
hand balances, open orders and lead time. The ISF provides
information on the identification and quantity of items in stock.
Materials Requirement planning (MRP) package, this calculates
the net requirements from the balance in stock to release
purchase orders for items to be purchased and produce reports and
productions according to demand information.
Master Production schedule; this is a plan for the finished
goods production over a period of time. That is to say it shows
what should be produced and when it needed This MPS indicates the
quantity and timing of each item the Organization produces. MRP
can reduce inventory by providing information on the actual
inventory required for parent items rather than stocking enough
components for estimated parent demand.
NAKAKONGE MASTULA 10/U/139930/PLD/PD 37

Outputs of MRP
A planned order release, this indicates when to release orders,
materials and delivery to specified customers.
Resource notices; these show the need to advance or post pond
inventory orders to net requirements.
Expediting instructions in respect to overdue orders
Data to determine capacity required for production schedules e.g.
machinery, man power.
Elements of the MRP System
Figure 4 MRP System
Source: purchasing and supply chain management, Kenneth lysons(2006)
According to Muhleman et el. (2002), this method can operate
quite simply and satisfactory when orders of finished goods are
being received at a constant or at a least smooth and slowly
NAKAKONGE MASTULA 10/U/139930/PLD/PD 38
Customer order
MRP Package
Master production schedule
BOM
Engineering changes
Schedule reports
Forecasts
Inventory Status file
Inventory transactions
varying rate. This reflects the work in progress and raw
materials require. However if the demand for the finished goods
is humpy or erratic, then his method may involve holding stock of
work in progress of raw materials for extensively a long period.
Finally Material Requirement Planning (MRP) has a universal
applicable element for inventory control and can be most
advantageous applied items that have discontinuous and non-
uniform depending on demand for assembly, production,
manufacturing or fabrication operations.
2.1.7 Manufacturing Resource Planning (MRP 11)MRP11 is an integrated information system used by business. It
evolved from material requirement planning systems by including
the integration of additional data, such as employee and
financial needs. The system is designed to centralize, integrate
and process information for effective decision making in
scheduling, design engineering, inventory management and cost
control in manufacturing.
This is virtually concerned with resources entering in the
production process including man power, machinery and money. In
addition to materials, MRP 11 extends the idea of MRP to other
areas in the business such as marketing and finance. Thus central
data bases hold information on product structure that’s to say
the bill of materials file which can be up dated due to design
changes by engineering. At wider information provided by the MRP
11 System from simulations of business plans can be used to
NAKAKONGE MASTULA 10/U/139930/PLD/PD 39
estimate plant investment needs and work force requirements. This
information can then be used to coordinate efforts across
departments including marketing, financing, engineering and
manufacturing.
2.1.8 Just-in-time (JIT)According to Richard (1998), it is on inventory management system
that schedules materials to arrive precisely when they are needed
on production line. It is designed to reduce level of
organization’s inventory to zero. The system can also be referred
to as Kan Ban or Stockless system.
It is an approach to inventory management and control in which
inventories are acquired and inserted in production at the exact
times they are needed home. This is to avoid unnecessary expenses
associated with keeping stock at hand. Ebert,(1986) and Drury,
(1995) assert that costs like holding costs, security costs,
storage costs are avoided using this technique of Just-in-time
(JIT).
JIT can also be defined as the recent approach to inventory
management developed by Japan’s manufacturing enterprise that is
gaining first recognition as a management tool (Kakuru, 2001).
According to Zenz, (2002) stated that Just-in-time emerges, it
means the uninterrupted flow of 100% accepted materials delivered
on due details and optimal costs of 100% of the time. This is a
trend towards a smaller inventory to high holding costs and meets
the international competition. The industries making the mostNAKAKONGE MASTULA 10/U/139930/PLD/PD 40

progress in inventory management are the industries that have
reached the international competition like Japan and America
manufacturers because they do not have strikes and the causes of
shortage of materials because there suppliers are nearby and
under tight control. Just-in-time success may include contracting
between manufacturers and the carrier must focus on the smallest
inventory levels in JIT. Distribution manufacturers need to know
the exact status of their materials at all levels. Many
distribution channel members see JIT as a way of transfer of
inventory burden to their supplier and to get more favorable
price while many suppliers see JIT as a quick fix and a way to
guarantee a high level of sales. However JIT can reduce the
distribution channels conflicts and promote channel co-operation.
2.1.8.1 Requirements for a Successful JIT ModelSchedules of production requirements should be precise and exactin time and amount.
Organization structures that facilitate co-operation support andcommitment so that work force is committed to meeting theschedules of work.
Relationship with suppliers so that delays in delivery of inputsis minimized (Kakuru, 2001).
Drury, (2000) Explains JIT as a philosophy where by firms giveattention to reduce stock levels at minimum by implementing JITpurchase techniques.
Objectives of JIT purchasing;
NAKAKONGE MASTULA 10/U/139930/PLD/PD 41

To purchase goods so that delivery immediately precedes theiruse. This can be achieved through co-operation with thesuppliers.
Companies that have implemented JIT purchase have subsequentlyreduced their investment in raw materials and work in progressstock.
2.1.9 Economic Order Quantity (EOQ)
EOQ is the most commonly used approach of attaining the goals of
inventory management (Kakuru, 1998) the model answers the
questions such as how much quantity should be ordered? Pandey,
(1998) defines EOQ as that level of stock which minimizes the
total of ordering and carrying costs. (Lysons, 2003) Defines it
as the optimal ordering quantity for an item of stock that
minimizes costs. It works under the following assumptions.
Demand is known and is constant.
The only variable costs are the cost of placing an order and
holding costs.
The receipt of inventory is instantaneous.
The lead time is known and constant.
However, the EOQ model has been criticized basing on the
following;
That demand is not always constant and sometimes may not be known
because people’s demand differs from time to time.
That there are other variables costs which include stock out
costs and carrying costs.
NAKAKONGE MASTULA 10/U/139930/PLD/PD 42

The receipt of inventory is not instantaneous. It always takes
time to receive ordered quantity. The lead time is not always
constant
According to Kakuru, (2003) EOQ is the most used approach in
attaining the goals of inventory management. The model is used to
determine the optimal amount of inventories to order that
minimizes the cost of inventory while ensuring liquidity to the
business.
According to Nair,(2000) EOQ is that quantity at which the costs
of ordering the annual requirements of an item and the inventory
carrying costs are equal that is when the total of the two costs
is the lowest. Under EOQ, the inventory carrying costs are
calculated on the average working stock which is taken as 50% of
the order quantity.
Figure 5 A Graphical Representation of EOQ Model
Carrying costs
40
Rupees
30
Ordering costs
Total
costs
20
NAKAKONGE MASTULA 10/U/139930/PLD/PD 43

10 Point
of Minimum costs 0 2 4
6 8 10 Quantity
Source: Nair,(2000)
It will be observed from the graph that the lowest total cost is
at the point where the line ordering costs interests the line of
ordering costs and the Economic Order Quantity is observed at the
point of the lowest total costs.
2.2 Costs of acquiring and managing InventoryAccording to Eddowes and Sternfield, (1995) when inventories are
ordered for and kept, costs will be occurred in ordering and
delivery process. Furthermore, costs will rise in storage and
administering of stock. Each type of stock will comprise of fixed
and variable cost elements. However, according to Lysons and
Gillingham, (2003) Economics of stock control are determined by
analysis of costs incurred in obtaining inventory under the
heading of acquisition costs, holding costs and stock out costs.
2.2.1 Acquisition costsLysons and Gillingham, (2003) define acquisition costs as thecosts incurred in placing an order irrespective of the size. Forinstance, preliminary costs, placement costs and post placementcosts. These costs vary according to complexity of the order andthe seniority of the staff involved whether order preparations ismanual or computerized and whether repeat orders cost less than
NAKAKONGE MASTULA 10/U/139930/PLD/PD 44
initial orders. Ordering costs can be requisitioning, orderplacing, transportation, receiving, inspection, storing and costsof clerical staff while carrying costs can be handling costs,costs of deterioration obsolescence, security, lighting costs(Pandey, 1995).
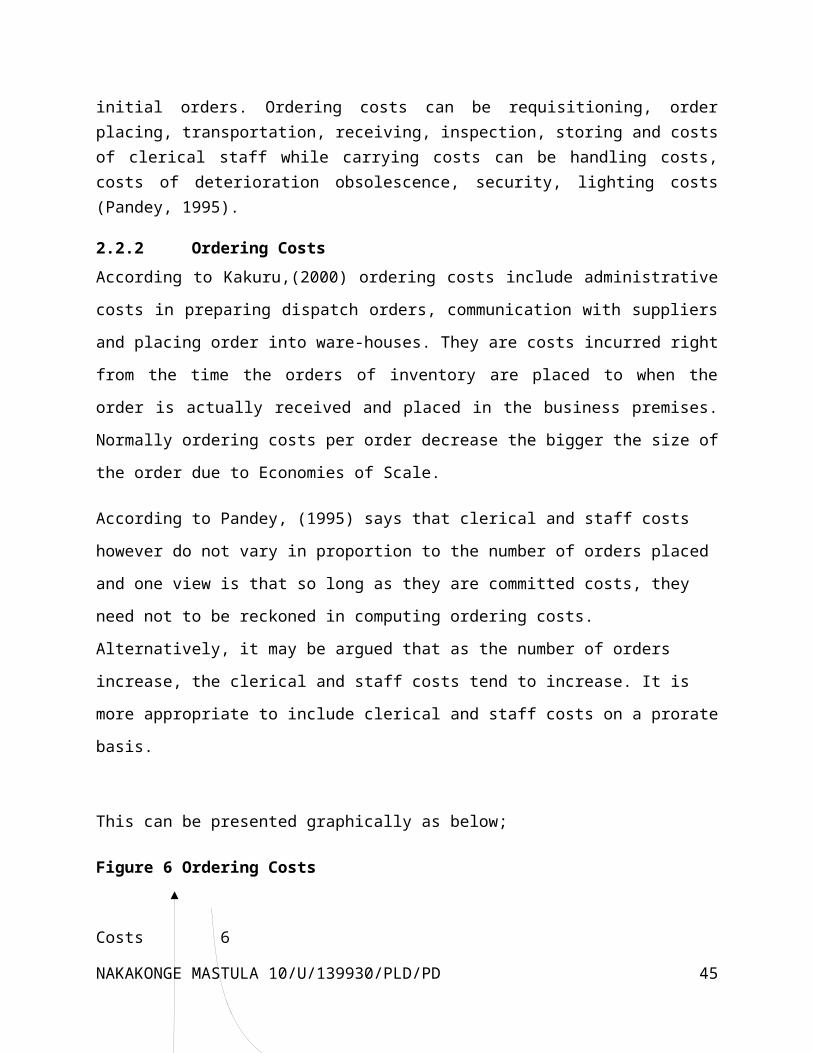
2.2.2 Ordering CostsAccording to Kakuru,(2000) ordering costs include administrative
costs in preparing dispatch orders, communication with suppliers
and placing order into ware-houses. They are costs incurred right
from the time the orders of inventory are placed to when the
order is actually received and placed in the business premises.
Normally ordering costs per order decrease the bigger the size of
the order due to Economies of Scale.
According to Pandey, (1995) says that clerical and staff costs
however do not vary in proportion to the number of orders placed
and one view is that so long as they are committed costs, they
need not to be reckoned in computing ordering costs.
Alternatively, it may be argued that as the number of orders
increase, the clerical and staff costs tend to increase. It is
more appropriate to include clerical and staff costs on a prorate
basis.
This can be presented graphically as below;
Figure 6 Ordering Costs
Costs 6
NAKAKONGE MASTULA 10/U/139930/PLD/PD 45

4
2
Ordering costs
0 2 4
6 Quantity
Source: Pandey, (1995).
It is shown above that as the order size increases, ordering
costs reduce.
2.2.3 Carrying CostsThese are expenses incurred to keep the inventories in business
from the time of receipt to the time they enter the production
and marketing function. Examples may include storage charges and
opportunity of funds tied up in inventories. These costs normally
increase as more inventories are maintained (Baily Peter and
Jessop David et al, 2003).
Figure 7 Carrying Costs
CC
6
Costs
4
NAKAKONGE MASTULA 10/U/139930/PLD/PD 46

2
0 2 4 6
Quantity
CC: Carrying Costs
It can be shown that as the quantity ordered for increases,
carrying costs will also increase.
Table 4: Showing carrying and ordering Costs
Ordering Costs Carrying Costs
Acquisitioning
Order placing
Transportation
Receiving, inspection and
storage
Clerical and staff
Ware housing
Handling
Clerical and staff
Insurance
Deterioration and
obsolescence
Source: primary data, Baily Peter and Jessop David et al. (2003).
2.2.4 Stock-out CostsThese involve costs of running out of inventory and are comprised
of loss of production output, costs of idle time and fixed over
heads spent over a reduced output, costs of action taken to deal
with the stock out for instance buying from a stockiest at an
increased price and loss of customer good will. These costs are
difficult to estimate or incorporate into inventory models
(Lysons and Gillingham, 2003).NAKAKONGE MASTULA 10/U/139930/PLD/PD 47

According to Drury, (2000) defined stock outs as the opportunity
costs of running out stock. In the case of finished goods, the
opportunity cost will consist of loss of contribution if
customers take their business elsewhere because of failure to
meet delivery. This will be discounted value of the lost
contribution of future sales.
2.2.5 Shortage CostsThis occurs when an item is needed but cannot be supplied from
stock. This will end up in lost goods will, lost reputation, loss
of potential future sales. Shortage costs may also include
payment for positive action to remedy the shortage, expending
orders, sending out emergence orders, paying for special
deliveries, storing partly finished goods or using alternative or
more expensive suppliers (Doblar Donald.W and Brut David.N,
2003).
2.2.6 Holding CostsThis is the cost of holding one unit of an item of stock for a
given period of time. It includes cost of tied up money either
interest on debt or opportunity cost on cash storage space with
supplying ware house rent rate heat and light; loss due to
damage, deterioration, obsolescence and pilferage, handling
including special packaging, refrigeration, putting on pallets.
Administration costs include stock checks and computer updates,
Insurances and taxes on machinery and equipment (Pandey, 1998).
NAKAKONGE MASTULA 10/U/139930/PLD/PD 48

2.2.7 Opportunity Cost of Capital Tied up in InventoryAccording to Kenneth Lysons, (2003) Opportunity cost is the cost
incurred when an alternative is made and the other is fore gone.
This cost category is also a noncash charge to the business but
with an understanding on capital. Budgeting is easy to understand
that capital is scarce and must be allocated to its most
efficient use where it will achieve the best expected returns and
add a value to the business. So the capital tied up in inventory
could be invested elsewhere in the business and generate an equal
or better returns. This gives management a decision to make
forego and incurs cost of holding stock or transfer stock to
investment capital.
2.2.8 Management and administrative costsAccording Kenneth lysons and Brian Famington, (2006) Management
costs involve getting things done through other people,
leadership at its best. This means inspiring staff to achieve
demanding goals. As to this it’s a substantial cost of doing
business, and may vary from 10%-40% of the value of inventory. It
is therefore important to understand and have the ability to
manage these different inventory cash when making production or
inventory holding size decision including determining safety
stock levels. However, to make management work easier inventory
software package that allow tracking of inventory costs have been
invented and may be useful to management and administrative.
NAKAKONGE MASTULA 10/U/139930/PLD/PD 49

2.2.9 Obsolete Inventory, (Write Off Cost).According to Lucey, T. (2003), Obsolete inventory costs are
common in technology based products and computer clip businesses
build to stock inventory systems, and single orders inventory
models. This is due to the industry moving very quickly in terms
of product development and product lines could be out of date in
12 months or less and are forced to be sold at a discount
resulting in a loss. Obsolescence is also commonly encountered in
piece parts, bought out parts, tools, gauges and fittings when
there is permanent change in the production programme involving
discontinuing the product for which this item is held. This calls
for maximum care and attention by management so as to reduce this
cost.
2.2.10 Depreciation costsThese are not cash cost for the business but never the less
should be taken in to account as it will most likely be realized
when the inventory is sold. Depreciation is a measure of the
wearing out, consumption or other reduction in the useful
economic use of fixed asset whether arising from use or efflux
ion of time. When a business buys a fixed asset or inventory it
will intend to keep it and use it for period of years. It is
extremely unlikely that these stock or assets will retain their
original value throughout their lives, because of reasons such
as, wear and tear, repairs by non experts leading to further
damage, technology or power silent damages hence a need for the
NAKAKONGE MASTULA 10/U/139930/PLD/PD 50

organization to minimize of cost for example by hiring and
writing off value of the item. (Drury, 2000).
2.3 The impact of Inventory Management on Cost Control,Inventory management should be to ensure that inventories needed
to sustain operations are available at all times but to hold
costs of ordering and carrying the inventories to the lowest
possible levels.
There should be a systematic control and regulation of purchase,
storage and usage of material in such a way so as to maintain an
even flow of production and excessive investment in inventory.
The Economic Order Quantity can be found by applying a formula
that incorporates the basic relationship between holding and
ordering costs. The relationship can be stated as follows; the
number of orders for the period is total demand for the item of
stock for a period (D) divided by the quantity obtained in Units
(Q). Total ordering costs are obtained by multiplying these
numbers of orders by the order costs per order (Drury, 2000).
According to Brigham and Gapenski, (2002) using inventory
planning and control techniques, a firm can reduce its levels of
inventory without adverse effects on organizational costs which
has a favorable impact on its operations. Therefore, over
investment in inventory should be avoided because funds are tied
up leading to loss of returns and increase costs.
NAKAKONGE MASTULA 10/U/139930/PLD/PD 51

In addition, Arora, (1998) explains that proper inventory
management leads to reduction of capital that can be tied up in
inventories. Most organizations try to maintain minimum stock
levels in order to avoid holding capital in stock. However, this
also involves its own costs.
The above discussion explains that there is a strong impact
inventory management on cost control specifically acquisition and
maintenance costs of inventory.
2.3.1 Approaches to Cost Control in Inventory ManagementWater, (2002) argues that one of the most important points to
note about inventory management and cost control is that some
costs rise with the amount of stock held and others fall. The
holding costs will be higher when there is more stock but the
shortage cost will be lower.
Therefore inventory management must balance these competing costs
and suggest policies that give the lower overall inventory costs.
He still argues that to balance these competing costs, it must
answer the three basic questions.
What should be stocked?
No items should be stocked however cheap without considering the
costs and benefits. This means that affirm to control costs
associated with inventory management should stop unnecessary new
items being added in stock and it should make regular researche
NAKAKONGE MASTULA 10/U/139930/PLD/PD 52

to move obsolete or dead stock which could rise costs in turn
(Waters, 2002).
When should an order be placed?
This depends on the inventory technique or management system
used, type of demand, whether high or low, steady or erratic,
known exactly or estimated in order not to over stock or under
stock because the two situations result into increased costs. So
to minimize on costs associated with inventory management, all
that should be properly handled (Waters, 2002).
How much should be ordered?
If large frequency orders are placed the average stock level is
high but the costs of placing and administering orders are low.
If small frequency orders are placed, the average stock levels
are low, but the costs of placing and administering orders are
much higher so to control costs associated with inventory
management, this has to be catered for. (Waters, 2002).
CHAPTER THREE
METHODOLOGY
3.0 Introduction
This chapter comprises of how the study was conducted, the
samples, particulars and sample size. It clearly indicates the
instruments used how data was collected and analyzed. It also
explored the type of data to be collected, sources of data, and
how data was processed and presented ensuring quality.
NAKAKONGE MASTULA 10/U/139930/PLD/PD 53

3.1 Research DesignThe study used non experimental research design which includes
both the quantitative and qualitative methods of data collection.
Both primary and secondary data was collected. A case study
design was adopted because of its ability to generate information
through in-depth study of the case under investigation.
Qualitative and quantitative design especially the descriptive
research design was used based on questionnaires and observation.
The researcher used the above methods because of many aspects
which were covered by the study of inventory management and cost
control.
3.2 Study populationThe researcher used both Male and female respondents from various
departments of Crown Beverages limited. Management and staff were
targeted. However, only 30 respondents available by the time of
the study were considered. This population was chosen because it
covered all individuals who are directly and indirectly involved
in inventory management.
3.3 Sampling designThis study used random sampling technique where by purposive
sampling was employed. Through random sampling, the researcher
obtained list of managers and employees who were latter given
questionnaires to fill.
3.4 Sampling size and compositionDue to the large population of employees in Crown Beverages
Limited, the researcher took a representative sample of 30
NAKAKONGE MASTULA 10/U/139930/PLD/PD 54

respondents that were picked from different departments that is
stores, finance, procurement, marketing among others.
Table 5: Showing the distribution of Sample size
Departments Number of Respondents
Procurement Department 04
Production Department 07
finance Department 05
Stores Department 06
Administration Department 04
Marketing and sales
Department
04
Total 30
Source: Primary Data
3.5 Sampling area
The study was carried out at Crown Beverages Ltd located in
Nakawa Industrial Area along Kampala –Jinja road, Kampala
district
3.6 Data Collection Instruments
3.6.1 QuestionnaireThis was one of the data collecting instruments that the
researcher will use to obtain data from different people.NAKAKONGE MASTULA 10/U/139930/PLD/PD 55

Questionnaires will be designed and distributed to the
respondents. They were used because they are simple and quick to
answer. Responses will be easy to compare and present and also
they maintain high levels of confidence.
3.6.2 Observation
The researcher made some personal observation which helped him or
her to get data from the existing literature. This enabled him or
her to obtain first hand information.
3.7 Reliability and validity of data
For reliability of the data, the researcher ensured that data is
only collected from the concerned and knowledgeable respondents
in the field of study. In this case, respondents that gave
reliable information included employees of the organization, and
other relevant authorities of the organization.
In order to ensure validity the questionnaire was made clear and
understandable, the questionnaire was first discussed by the
researcher with the supervisor; this included careful choice of
words, order and structure of questions plus pre-testing was done
amongst selected categories of respondents.
After receiving the questionnaires, manual editing was done,
followed by coding. Frequency count of different provisions was
done and this gave the number of occurrences and percentages out
NAKAKONGE MASTULA 10/U/139930/PLD/PD 56

of total occurrences for different responses. And lastly simple
conclusions were drawn from the given percentages and numbers.
3.8 Data Sources
The researcher used both primary and secondary data sources.
3.8.1 Primary data
The primary data source involved research aimed at collecting
data, directed towards the research objectives. In case of
questionnaire administration, respondents were selected using
simple random sampling techniques. First hand data was from
explanations, conclusions and recommendations of the study.
3.8.2 Secondary data
Secondary data was obtained from literature review,
questionnaires, news-papers (new vision and monitor), documentary
materials, magazines, encyclopedic which helped the researcher to
get the required data and the research was dominated by both data
from the primary sources and secondary sources.
3.9 Study variables
The study had two variables that is to say inventory management
as the independent variable and cost control as the dependent
variable.
NAKAKONGE MASTULA 10/U/139930/PLD/PD 57

3.10 Data collection procedure
The researcher first got a recommendation letter from Kyambogo
University Administration and then issued it to the organization
of the study on the first visit.
On the second visit, the researcher distributed the
questionnaires to the respondents in various departments that
were willing to give the required data. After some time, the
researcher went back to pick the questionnaires that been
answered by then.
On the occasional visits to the organization the researcher tried
to make some observation which availed him or her with more
information.
3.11 Data Processing and PresentationAfter the data was collected, it was processed to manageable
proportions for better presentation and analysis. This involved
editing, coding and presentation of quantitative and qualitative
data.
Editing; this was concerned with detecting and correcting errors
and ensuring completion of question answering. Field editing were
employed to ensure that questionnaires are fully answered in
respect to all relevant questions to the respondents. The filled
in questionnaires were then checked for uniformity and error
detection for the omitted questions. This kept errors at minimum.
NAKAKONGE MASTULA 10/U/139930/PLD/PD 58

Coding; this involved processing of classified answers to
questions into meaningful categories to develop their essential
pattern. It helped the researcher to summarize the data and get
frequency patterns which facilitated the tabulation of the data.
Quantitative data was analyzed using dummy table and qualitative
data was analyzed using a simple descriptive analysis. This
involved two stages that include; quick impressionistic summary
and secondary analysis. The researcher ensured that in the field,
informers comment on all topics in the relevant group interview.
3.12 Anticipated Problems of the Studyi. There were a lot of costs incurred during the research
process and such costs included transportation costs,
feeding costs, accommodation costs and stationery costs.
ii. The researcher spent a lot of time during the course of the
research by obtaining data, analyzing data, typing, editing,
printing and binding data obtained.
iii. The researcher was not able to collect all the data needed
because of some problems like changes in weather,
geographical location and much more others.
iv. Another problem was that the information needed would not
easily be obtained because the respondents were sometimes
not willing to share information because they expected
something in return like a reward or payment for work done
to assist.
NAKAKONGE MASTULA 10/U/139930/PLD/PD 59
v. The research also consumed a lot of the researcher’s time
since many managers and employees were consulted in the
process of obtaining information or data.
vi. The research project also required a lot of funds in terms
of finance to facilitate the whole process of research which
was limited like when buying stationery materials such as
books, pencils and others like transportation, typing,
printing, binding and data processing.
vii. Since research was a process of obtaining information about
something, some organizations were less willing to provide
their confidential information and this was yet another
limitation the researcher faced while conducting the
research as inaccessibility of required data.
viii. In the process of reviewing to the literature in chapter
two, the researcher also to some extent faced the problem of
limited literature review hence a major limitation and the
inaccessibility of the internet plus the website.
3.13 Solutions to the Anticipated Problemsi. First the University Council for Research Committee should
consider investing in research such that students do not
have to use a lot of their monies doing research thus
reducing on costs.
ii. There is need to create more time for research since it is
taken as a course unit that must be passed to obtain an
Award of either a Diploma, Degree or Masters.
NAKAKONGE MASTULA 10/U/139930/PLD/PD 60

CHAPTER FOUR:
DATA PRESENTATION, INTERPRETATION AND ANALYSIS OF THE FINDINGS
4.0 IntroductionThis chapter deals with the presentation, interpretation and
analysis of the major findings of the study using figures, tables
and graphs followed by their detailed analysis. These findings
and discussions are represented according to the research
objectives of the study as shown below.
i. What are the various inventory management techniques or
methods used by most organizations?
ii. What are the various costs incurred while acquiring and
maintaining inventory in an organization?
iii. How does inventory management impact on cost control in an
organization and what approaches can be used to control
inventory costs
4.1 Presentation of FindingsThe research sample comprised of thirty respondents from the
various departments of crown beverages limited.
Table 6 Sex distribution of the respondents
SEX FREQUENCY PERCENTAGE
MALE 16 53.3
FEMALE 14 46.6
TOTAL 30 100%
Source: Primary Data
NAKAKONGE MASTULA 10/U/139930/PLD/PD 61

From the table, majority of the respondents of the organization
were male represented by 53.3%, as compared to the female
respondents, represented by 46.6%.This implies that the male
dominated most of the positions held in the organization.
Table 7 Showing age distribution of respondents
Age Bracket
(Ages)
Frequency Percentage (%)
Below 25
25 – 30
30 – 35
35 – 40 and
above
04
19
06
1
13.3
63.3
20
3.3
Totals 30 100
Source: primary data
From the table I above, the majority of the respondents which
were 63.3 were within the age bracket of 25-30.This was followed
by those under the age bracket of 36 and above, they were
represented by 37% finally those under the age bracket of 18-35
were represented by 23%. This implies that the study involved
different respondents with varying ages which provided the
NAKAKONGE MASTULA 10/U/139930/PLD/PD 62

researcher with the current and longtime information about impact
of inventory control on operational efficiency of an
organization.
Pie Chart 1: Representing the sex composition of the respondents
216
144
A PIE CHARTMale Female
Source: Primary Data
From the above Pie-chart, it is evident that majority of the
respondents were male with 53.3% (216°) and female covered about
46.7% (153°). This was simply because majority of the male were
in the Production, Stores, Administration departments and this
implies that the company employed more males than females since
it deals more in production matters and they are more
knowledgeable in matters relating to production.
4.1.1 Findings on the Age Group of the RespondentsTable 8: Age bracket of the Respondents
NAKAKONGE MASTULA 10/U/139930/PLD/PD 63

Age Bracket
(Ages)
Frequency Percentage (%)
Below 25
25 – 30
30 – 35
35 – 40 and
above
04
19
06
1
13.3
63.3
20
3.3
Totals 30 100
Graph 1: A bar graph showing the age bracket of respondents
below 25 25-30 30-35 35-40 and above
0
10
20
30
40
50
60
70
frequencypercentageColumn1
Source Primary Data
From the table and graph above, four(4)were below the age of
twenty five years and this represented 13.3%thus implies that
NAKAKONGE MASTULA 10/U/139930/PLD/PD 64

these are fresh graduates and have less experience, nineteen
(19)were between the age of twenty five (25) years and thirty
(30)years, this represented 63.3% and this is because at this
age, people have acquired experience, six (6) for those in the
age bracket of thirty (30) to thirty five (35), this represented
20% and these are relatively high since they have acquired
skills, experience and have decided to be loyal to the company.
Ten (10) were between the age of thirty five (35)and forty (40)
above which represented 10%. This implies that people with skills
and wider experience tend to look for further opportunities which
are better and none was above sixty years which is 0% implying
that at this age many people are preparing to retire from
working.
Findings on the Academic Qualifications of Respondents
Table 9: Academic Qualifications
Qualifications Frequency Percentage (%()
PHD
Master’s Degree
Bachelor’s Degree
Diploma
0
04
20
06
0
13.3
66.7
20
Total 30 100
Source: Primary Data
NAKAKONGE MASTULA 10/U/139930/PLD/PD 65
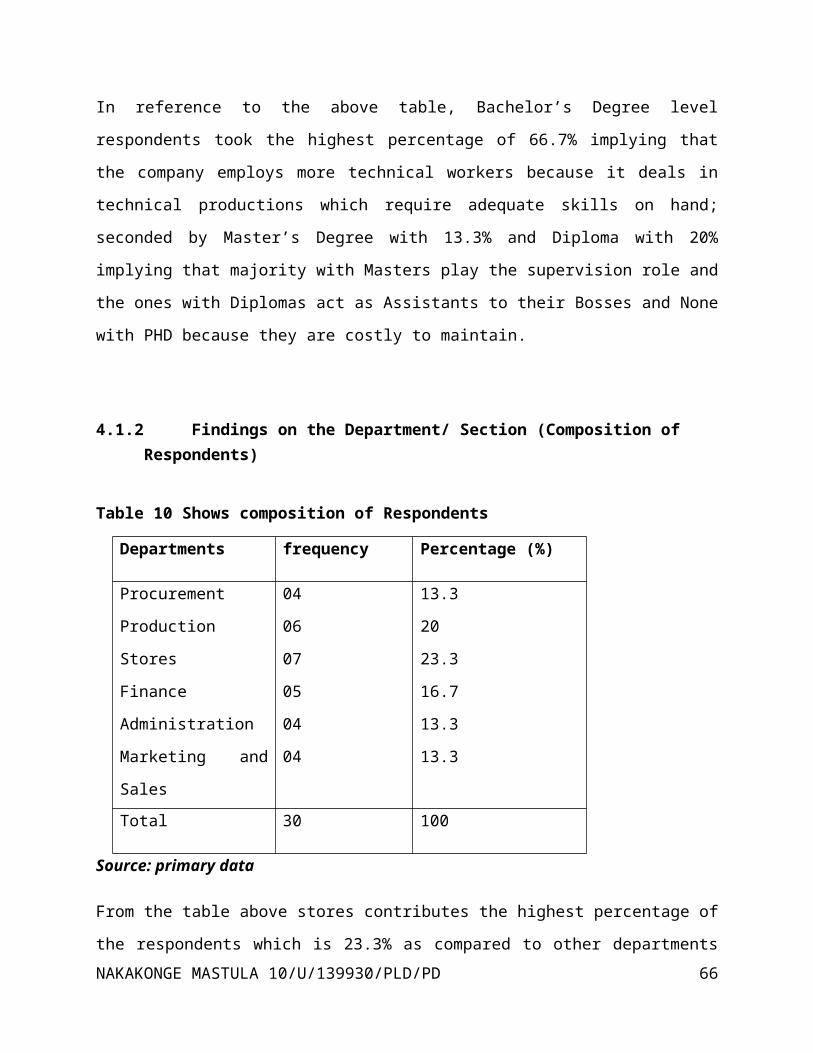
In reference to the above table, Bachelor’s Degree level
respondents took the highest percentage of 66.7% implying that
the company employs more technical workers because it deals in
technical productions which require adequate skills on hand;
seconded by Master’s Degree with 13.3% and Diploma with 20%
implying that majority with Masters play the supervision role and
the ones with Diplomas act as Assistants to their Bosses and None
with PHD because they are costly to maintain.
4.1.2 Findings on the Department/ Section (Composition of Respondents)
Table 10 Shows composition of Respondents
Departments frequency Percentage (%)
Procurement
Production
Stores
Finance
Administration
Marketing and
Sales
04
06
07
05
04
04
13.3
20
23.3
16.7
13.3
13.3
Total 30 100
Source: primary data
From the table above stores contributes the highest percentage of
the respondents which is 23.3% as compared to other departmentsNAKAKONGE MASTULA 10/U/139930/PLD/PD 66

that is to say procurement 13.3%, production 20%, finance 16.7%,
administration 13.3% and marketing with 13.3%. This emphasis that
most of the inventory management is mainly carried out in the
stores especially with regards to cost control.
Pie Chart 2 Showing Composition of Respondents
13%
20%
23%17%
13%13%
COMPOSITION OF RESPONDENTSProcurement Department
Production Department
Stores Department Marketing & Sales Department
Finance Department Administration Department
Source: Primary Data
According to the information in the pie-chart; 23.3% was for
those in the store department and this is 84° implying that
storage is apriority to ensure consistence in supply if inputs
and continued production. 20% were from the production department
which is 72° merging to be the second largest because the company
is a manufacturing or production one. 16.7% was from the Finance
department which is 60°, implying that Finance too plays a major
role in financing the activities of the company. 13.3% was from
the Marketing and Sales department which is 48°, implying that
for any output produced must be sold to obtain a profit out of
NAKAKONGE MASTULA 10/U/139930/PLD/PD 67
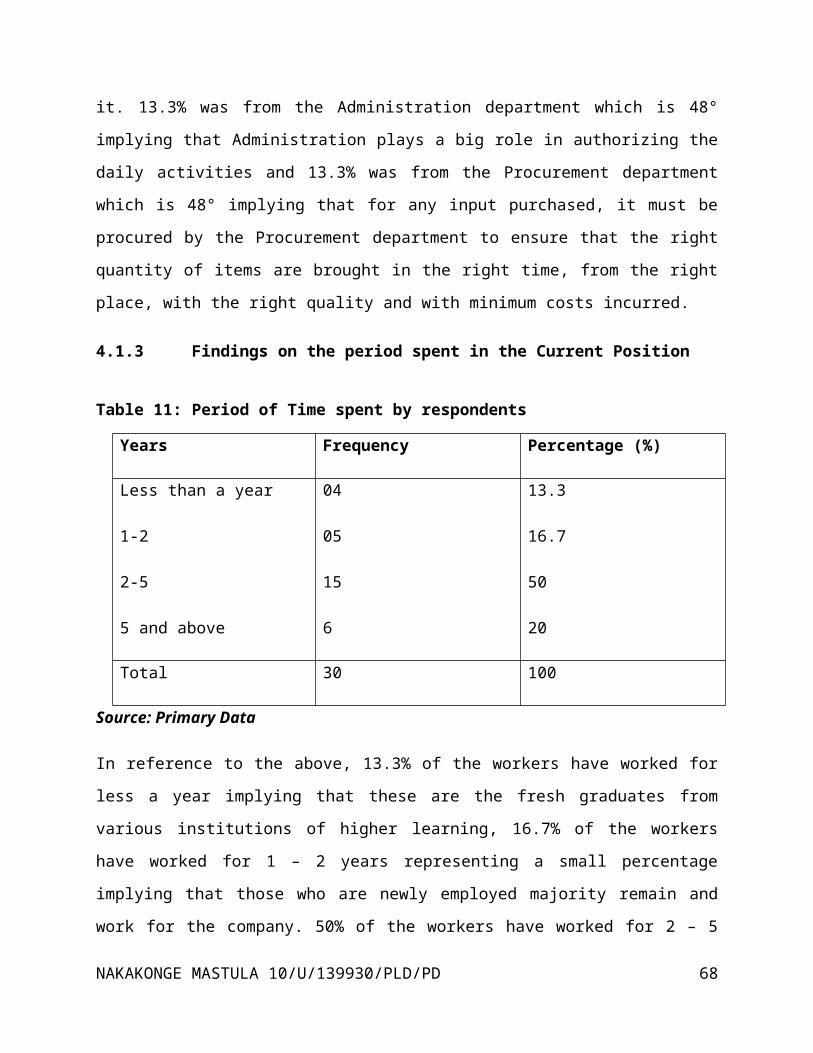
it. 13.3% was from the Administration department which is 48°
implying that Administration plays a big role in authorizing the
daily activities and 13.3% was from the Procurement department
which is 48° implying that for any input purchased, it must be
procured by the Procurement department to ensure that the right
quantity of items are brought in the right time, from the right
place, with the right quality and with minimum costs incurred.
4.1.3 Findings on the period spent in the Current Position
Table 11: Period of Time spent by respondents
Years Frequency Percentage (%)
Less than a year
1-2
2-5
5 and above
04
05
15
6
13.3
16.7
50
20
Total 30 100
Source: Primary Data
In reference to the above, 13.3% of the workers have worked for
less a year implying that these are the fresh graduates from
various institutions of higher learning, 16.7% of the workers
have worked for 1 – 2 years representing a small percentage
implying that those who are newly employed majority remain and
work for the company. 50% of the workers have worked for 2 – 5
NAKAKONGE MASTULA 10/U/139930/PLD/PD 68

years implying that majority of the workers stay in the company
and work for it because it has got a clear vision and mission and
20% of the workers have worked for 5 years and above which
implies that the company has got good working conditions and a
conducive environment and good payment structures which make
workers desire to work for long.
4.1.4 Findings on the Respondents’ views about the type of Inventory held
Table 12 Findings on the respondents' views about the type of Inventory held
Inventor
y
Strong
ly
agree
% Agree % Not
sur
e
% Disagr
ee
% Stron
gly
disag
ree
% Total
%
Raw
material
s
25 83
.3
5 16.
7
0 0 0 0 0 0 100
Work in
progress17
56
.7
12 40 1 3.
3
0 0 0 0 100
Componen
ts
10 33
.3
8 26.
7
7 23
.3
3 10 2 6.
7
100
Finished
goods
26 86
.7
4 13.
3
0 0 0 0 0 0 100
NAKAKONGE MASTULA 10/U/139930/PLD/PD 69

Source: Primary Data
From the above table; 100% of the respondents strongly agreed and
agreed with raw materials none of the respondents disagreed or
wasn’t sure implying the company purchases more of Raw materials
as its major inputs because it is a manufacturing company like
chemicals, sugar. 96.7% of the respondents both strongly agreed
and agreed with work in progress which is and only one respondent
was not sure implying that the majority agreed with the work in
progress which are used in the assembly of the final products and
those who were not sure could be those who have worked for less
than one year and some were students on internship. Components
and finished goods took up small percentages when it came to
agreeing than disagreeing surely because the company produces
based on the Pull strategy mostly than the Push, so it has less
finished items in-store.
4.1.5 Findings on respondents’ views about how Inventory is acquired
Table 13 Shows respondents' views about how Inventory is acquired
Methods Frequency Percentage (%)Out-sourcing
In-sourcing
Both Out and In-
sourcing
Not sure
25
0
0
5
83.8
0
0
16.7
NAKAKONGE MASTULA 10/U/139930/PLD/PD 70
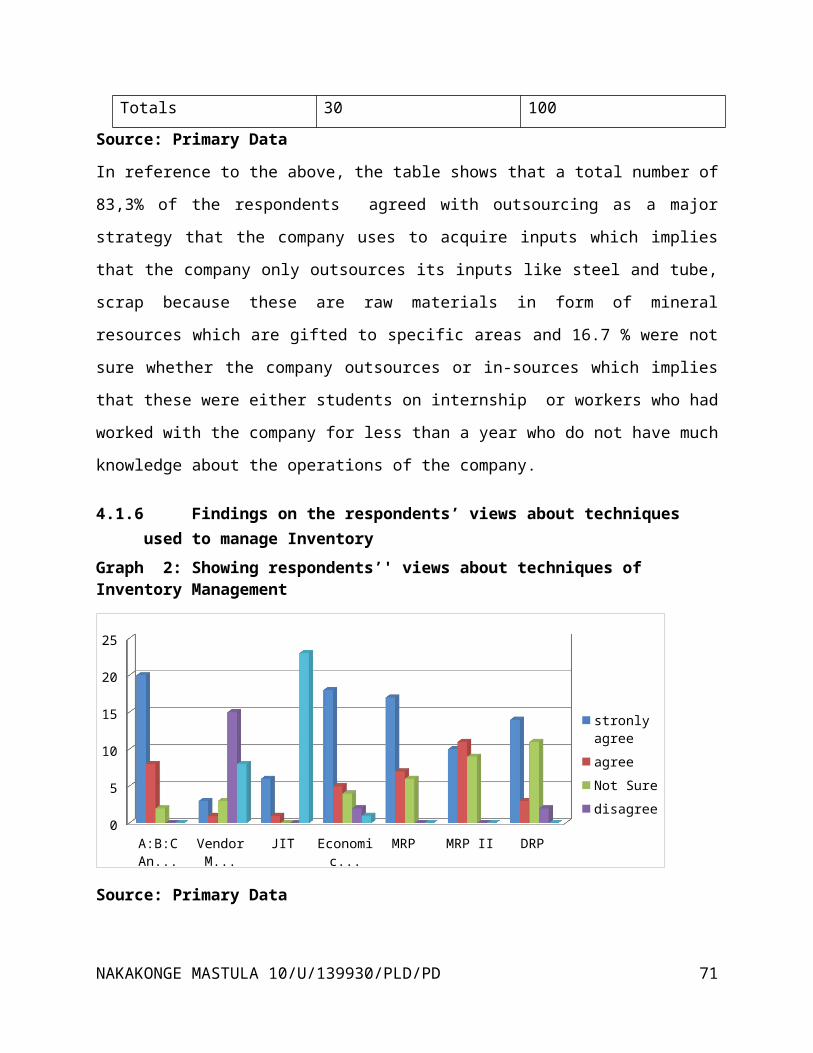
Totals 30 100Source: Primary Data
In reference to the above, the table shows that a total number of
83,3% of the respondents agreed with outsourcing as a major
strategy that the company uses to acquire inputs which implies
that the company only outsources its inputs like steel and tube,
scrap because these are raw materials in form of mineral
resources which are gifted to specific areas and 16.7 % were not
sure whether the company outsources or in-sources which implies
that these were either students on internship or workers who had
worked with the company for less than a year who do not have much
knowledge about the operations of the company.
4.1.6 Findings on the respondents’ views about techniques used to manage Inventory
Graph 2: Showing respondents’' views about techniques of Inventory Management
A:B:C An...
Vendor M...
JIT Economic...
MRP MRP II DRP0
5
10
15
20
25
stronly agreeagreeNot Suredisagree
Source: Primary Data
NAKAKONGE MASTULA 10/U/139930/PLD/PD 71

Analysis of the graph above indicates that 93.3% of the
respondents strongly agreed and agreed about the use of A:B:C
Analysis,.7% were not sure this implies that the company
categories its commodities according to their value and frequency
in use and the most expensive or just moving items are given much
priority than others. 13.3% strongly agreed and agreed about the
use of Vendor Managed Inventory, 76.6% strongly disagreed and
disagreed and 10% were not sure which implies that the company
keeps much of its inventory at its premises and less with its
suppliers because it deals in routine activities which require
stock to always be ready. 23.3% strongly agreed and agreed about
the use of Just-in-time, 76.6% strongly disagreed and disagreed
implying that the company rarely purchases on spot but rather
purchases on planned agenda since it mostly uses organization
policies to purchase. 76.6% strongly agreed and agreed about the
use of Economic Order Quantity, 13.3% strongly disagreed and
disagreed, 13.3% were not sure implying that the company mostly
uses established Economic Order Quantity levels below or above
which it cannot purchase and those who were not sure majority
were students on internship and some workers who have worked for
less than a year. 56.7% strongly agreed and agreed about the use
of Distribution Requirement planning, 36.7% were not sure and
6.7% disagreed that implies that the company sales its products
through its regional ware houses and outlets to increase on its
market potential
NAKAKONGE MASTULA 10/U/139930/PLD/PD 72

4.1.7 Findings on the respondents’ views about which departments carry out Inspection of Materials
Table 14: Showing respondents’ views about inspection
Departme
nt
Stron
gly
Agree
% Disag
ree
% No
t
Su
re
% % Stron
gly
disag
ree
% Tot
al
%disa
gree
Stores 22 73
.3
5 16
.7
2 6.
7
1 3.
3
0 0 100
Procurem
ent
20 66
.7
6 20 0 0 3 10 1 3.
3
100
Producti
on
15 50 10 33
.3
5 16
.7
0 0 0 0 100
Auditing 27 90 3 10 0 0 0 0 0 0 100Administ
ration
10 33
.3
10 33
.3
2 6.
7
4 13
.3
4 13
.3
100
Source: Primary Data
From the above, the Stores department, Auditing and Procurement
departments had the highest percentage of respondents who were
strongly agreeing than those who were disagreeing or NOT SURE,
implying that the procurement department is responsible for
procuring the right quality and the Stores plus the Auditing make
sure that this is achieved to minimize on unnecessary costs
related to poor quality inputs.
NAKAKONGE MASTULA 10/U/139930/PLD/PD 73

4.1.8 Findings on the respondents’ views about the InspectionMethods applied
Pie Chart 3 Respondents' views about the Inspection methods
60%
33%
7%
INSPECTION METHODS
100% InspectionCertified MethodAcceptance Method
Source: primary data
From the above Pie-chart, 18 respondents agreed 216° which
implies that the company ensures defect free of all the inputs
coming into the organization’s stores to ensure total quality
outputs. 10 respondents ticked Certified Method which is 120°
which implies that the company also follows the authorization of
Uganda Bureau of Statistics (UBOS) that if the items are stamped
then they can be used, like wise with the Acceptance Method which
took a response of 2 that is 24° implying that for some items
like scrap are just accepted in their state which they are
brought in.
NAKAKONGE MASTULA 10/U/139930/PLD/PD 74

4.1.9 Findings on the respondents’ views about Inventory Holding Techniques used
Graph 3: Respondents' views about Inventory Holding Techniques
Source: primary Data
Analysis of the graph above indicates that 60% of the respondents
ticked the Manual Material Handling Method which implies that the
company moves most of its materials with fellow human beings than
machines. 26.7% agreed with Mechanical Material Handling
indicating that the company to some extent makes use of material
handling techniques such as wheel barrows, pallet trucks,
spillage trucks, pulley blocks, fork lift trucks, tractors,
measuring equipment in order to reduce on human fatigue and
increase morale. 13.3% ticked automated material handling.
NAKAKONGE MASTULA 10/U/139930/PLD/PD 75
048
121620Inventory Holding Techniques
Inventory Holding Techniques

4.1.10 Findings on the respondents’ views about when an order is placed
Table 15: When order is placed
Period Frequency Percentage (%)
As often as required by the
Organization
Every Week
After a Month
Semi-Annually
15
08
05
02
50
26.7
16.7
6.7
Total 30 100
Source: Secondary Source
In reference to the above table, 50% of the respondents agreed
that the company places an order as at when need raises based on
Economic Order Quantity that is an order is placed not above or
below the reorder point. 26.7% agreed with making orders every
week as this too is a policy of the company. 16.7% sidelined with
making monthly orders for particular items which are imported
usually and 6.7% sidelined with semi-annually which implies that
NAKAKONGE MASTULA 10/U/139930/PLD/PD 76

they are particular items which are brought on annual basis like
those which are very expensive that funds are searched and saved
in advance.
4.1.11 Findings of respondents’ views on what determines the Quantities to be ordered for
Graph 4 What determines the quantities to be ordered
strongly agree
agree not sure disagree strongly disagree
0
5
10
15
20
25
30
Actual DemandForecast Demand
Source: primary data
NAKAKONGE MASTULA 10/U/139930/PLD/PD 77

From Graph 4; 90% of the respondents strongly agreed and agreed
about the use of Organization’s Purchasing Policy to place an
order which takes us back to the use of Economic Order Quantity
that is to place an order according to the re-order points
established. 3.3% disagreed which implies that to some extent the
company places orders based on actual demand or forecast demand
as a measure to use Push Strategy or Pull Strategy and 6.7% were
not sure which implies that these were students on internship or
workers who had worked for less than a year.
4.1.12 Findings on the respondents’ views about the costs associated with acquiring and managing Inventory.
Findings of the study showed that majority of the respondents
agreed with carrying costs and stock out costs are the major
costs incurred with indicated 73.3% implying that the company
incurred high carrying costs, 26.7% disagreed with these costs
which gave a room for the other costs such as Ordering and
Acquisition and Shortage costs and Administration costs like
staff salaries and allowances are also incurred.
4.1.13 Findings on the respondents views about the cost effective places to keep in the Inventory
Table 16: The cost of effective places to keep in the inventory
Place Frequency Percentage (%)
Company’s premises 24 80NAKAKONGE MASTULA 10/U/139930/PLD/PD 78

Bonded ware houses 2 6.7
Vendor/supplier’s premises 4 13.3
Public ware houses 0 0Total 30 100
Source: Primary Data
Findings of the study showed that 80% of the respondents agreed
with the company’s premise which implies that the company is
benefiting from keeping its Inventory around as it also reduces
on costs like Rent, Security, Insurance and others. 13.3% agreed
with vendor/ supplier’s premises which implies that the company
uses Vendor Managed Inventory as a cost cutting strategy, 6.7%
agreed with Bonded Ware Houses which implies that the company
uses them to store some of its assets like Motor Vehicles and
others that are not yet cleared by Uganda Revenue Authority.
NAKAKONGE MASTULA 10/U/139930/PLD/PD 79

4.1.14 Findings on the respondents’ views about whether Stock Taking is carried out.
Table 17: Does the company carry out Stock taking
Period Frequency Percentage (%)
Weekly
Monthly
Semi-Annually
Annually
4
24
2
0
13.3
50
6.7
0
Source: Primary data
From the table above, 80% 0f the respondents accepted that Stock
Taking is carried out on a Monthly Basis; this implies that the
company does this in order to avoid Stock out since one of the
respondents in the store is badly affected by stock outs. 13.3%
accepted that stock taking is carried out weekly, 6.7% semi
annually and none of the respondents accepted annually which
implies that stocktaking should always be carried as much as
often to avoid stock outs and its associated dangers
4.1.15 Findings on the respondents’ views about the Role that Inventory Management plays towards Cost Control.
Graph 5 Showing about the Role of inventory management towards cost control
NAKAKONGE MASTULA 10/U/139930/PLD/PD 80

0102030
Strongly AgreeagreeNot suredisagreestrongly disagree
Source: primary data
From the graph above, it indicates that an average Twenty five
(25) which is 83.3% strongly agreed and agreed that Inventory
Management reduces on Resource Wastage, Increases on Production
Efficiency and Increases on Profitability and customer
servicewhich implies that Inventory Management plays a major role
in the day to day operations of the company. Five (5) which is
16.7% were not sure which implies that these were students on
internship or workers who had worked for less than a year with
the company.
4.1.16 Findings on the respondents’ views about how Inventory management impacts on Cost Control
Table 18 Showing impact of inventory management on Cost Control
Impact Frequency Percentag
e
The higher the Inventory held, the less
the costs
The less the Inventory, the higher the
16
8
53.3
26.7
NAKAKONGE MASTULA 10/U/139930/PLD/PD 81

costs
The bigger the order made, the less the
ordering costs
The less the order made, the higher the
ordering costs
All the above
3
2
1
10
6.7
3.3
Total 30 100
Source: Primary data
Analysis of the table above indicates that 53.3% agreed that the
higher the Inventory held, the less the cost and 26.7% still
agreed that the less the Inventory, the higher the costs which
implies that keeping other factors constant, the high the
Inventory held, the less the costs per unit load like labor
costs, security, insurance, rates and lightening. 10% agreed that
the bigger the order made, the less the ordering costs and still
6.7% agreed that the less the order made, the higher the ordering
costs which implies that whenever a company places a huge order,
it saves through transportation costs, cash and trade discounts
plus the others and 3.3% said all the above implying that if the
company plays well its operational games, it can greatly minimize
its costs through proper Inventory Management.
NAKAKONGE MASTULA 10/U/139930/PLD/PD 82

4.1.17 Findings on the respondents’ views about the major CostControl Strategies
Pie Chart 4: Showing cost control strategies
50%
27%
17%
7%
A PIE CHART SHOWING COST CONTROL STRATEGIES
using average stockstoring only items in usepurchasing according to actual demandpurchasing cheaper materials
Source: Primary Source
From the above Pie Chart, 50% of respondents agreed with the Use
of Average Stock Strategies and this represented a responses rate
of 180° which implies that purchasing is done according to re-
order levels. 27% of respondents agreed with Storing only Items
in Use which represented a response of 96° implying that the
company to some extent only stores items that it commonly uses.
17% of respondents agreed that the company sometimes purchases
according to Actual Demand which represented 60° as Pull Strategy
to cut costs and 6% of the respondents agreed that the company
sometimes purchases cheaper items which represented 24° implying
NAKAKONGE MASTULA 10/U/139930/PLD/PD 83

that when buying items such as packaging and promotional
materials, the company purchases cheaper ones to cut on costs.
4.1.18 Findings on the respondents’ views about the Departments that work closely with the Stores department
Table 19: Showing departments which work with stores department
Departments Frequency Percentage
Purchasing and Procurement
Marketing and Sales
Logistics and
Transportation
Production and Operations
All the above
0
0
0
0
30
0
0
0
0
100
Total 30 100
Source: Primary Data
Analysis of the above table indicates that all the thirty (30)
respondents which is 100% agreed that all the mentioned
departments work closely with the Stores department, which
implies that production and operations department sets the demandNAKAKONGE MASTULA 10/U/139930/PLD/PD 84

levels, the purchasing and procurement purchases the right
quality and quantity from the right sources of the right place in
the right time. The logistics and transportation ensures that
items get from their point of origin to the company’s premises
and after all that is done, the marketing department extends the
finished products/ goods to the final customers which implies
that all the departments are interconnected and work together as
a team in order to enable the company achieve its over-all
objectives.
CHAPTER FIVE
DISCUSSION, CONCLUSION AND RECOMMENDATION
5.0 IntroductionThis Chapter goes into depth analysis of the findings relating it
with the objectives of the study and the literature review in
Chapter Two. It covers summary of findings and comes up with
conclusions and specific recommendation and areas for further
research
NAKAKONGE MASTULA 10/U/139930/PLD/PD 85

5.1 Discussion of findingsThe researcher found out that most of the respondents were male
60% and 40% females. The percentage difference is due to the fact
the Crown Beverages Ltd deals in manufacturing which is
attributed to more males who are very energetic and aggressive at
work. Crown Beverages Ltd employs workers of age brackets below
25 years who took up 13.3% because they are cheap to maintain,
workers of 25 – 30 years who took up 63.3% with the highest
percentage because they are young, strong and aggressive at work.
Workers who range from 30 – 35 were the majority with 20% because
they are responsible towards work and few were between 35 – 40
and above which is 3.3% because they do managerial roles.
Majority of the employees in the company are university graduates
with Diplomas, Degree and Master’s Degree; this is because work
done within the company needs knowledge and experience of which
even the work experience in the company is between 2 – 5 years
which still reveals that employment is done on contractual terms.
Production and Stores department take up the highest percentage
of 90% and 72% respectively because much of the work done in the
company is geared by production and stores.
5.1.1 Inventory Management TechniquesWith regard to objective one of the study, the researcher found
out that the most type of inventories held are raw materials,
work in progress and finished goods/ products implying that most
of the production is done with unprocessed inputs and then
transformed to better final products.
NAKAKONGE MASTULA 10/U/139930/PLD/PD 86

The researcher found out that Crown Beverages Ltd obtains its
inputs through outsourcing with 83.3% which implies that the
company takes much of its time concentrating on its core
activities like production.
The researcher found out that Crown Beverages Ltd uses most A:B:C
Analysis and Economic Order Quantity. This was revealed by 66.7%
of the respondents on average who agreed implying that the
company categories its major stock items according to value and
purchases according to the established stock levels like re-order
points in order not to experience stock outs. This ensures
objective one of this research project.
Findings from table 9, show that the Auditing department and
Stores department scored the highest percentage of 90% and 73.3%
respectively who strongly agreed than with Production,
Procurement and Administration, implying that the company basses
its activities on technicality because it’s usually Auditors who
are experienced in ensuring Quality inputs and Stores confirms
it. More can be obtained from the Uganda Manufacturers
Association Report of 2002.
Results from Pie Chart 3, reveal that (18) respondents which is
216° agreed with 100% inspection, (5) respondents which is 120°
agreed with Certified Method and (2) respondents which is still
24° agreed with Acceptance method, implying that the company with
the efforts to ensure defect free and Total Quality Output in
order to minimize on costs associated with poor quality output
NAKAKONGE MASTULA 10/U/139930/PLD/PD 87

and in order to achieve Total Quality Management, it ensures that
the method used to inspect inputs is 100% inspection which is
shown by the highest degrees of 216° and the other methods are
applied for less relevant items like packaging materials and
components.
Findings from Graph 3, reveal that Crown Beverages Ltd uses
Manual Material Handling techniques mostly with the highest
percentage of 60% than Mechanical with 26.7% which indicates that
the company deals mostly in production of beverages and others of
which the use of a complexity method like Automated Material
Handling would be very costly yet the company aims at minimizing
costs.
5.1.2 Inventory Management CostsWith regard to objective number two of the study, the researcher
found out that most of the respondents do understand the various
costs incurred in acquiring and maintaining Inventory.
The researcher found out that Crown Beverages Ltd places an order
as often as required by the organization which implies that the
organization focuses more on the customers’ requirements and
rarely runs out of stock and it mostly uses Economic Order
Quantity (EOQ).
Findings from Graph 4, explained what determines the quantities
to be ordered for in Crown Beverages Ltd as majority respondents
strongly agreed and agreed with forested demand which means that
NAKAKONGE MASTULA 10/U/139930/PLD/PD 88

the organization largely purchases depending on its predetermined
order points through its periodic previews.
With respect to chapter two of the study, the researcher found
out that the most costs incurred while acquiring and maintaining
Inventory are carrying costs and stock out costs followed by
storage and Administration costs together with ordering and
acquisition costs as its emphasized by Kenneth Lysons and Brain
Farmington (2006). An also it was statistically analyzed in
chapter Four and it answers the researcher’s objective number
two.
The researcher found out that the most cost effective place to
keep the Inventory is in the company’s premises with 30
respondents which is 75% implying that the company keeps most of
its stock around its premises in order to control costs related
to Inventory like security costs, rent and rates, Insurance,
staff costs and others as they can easily be controlled if the
company keeps its stock around and controls stock outs.
Table 10 summarized when stock taking is carried out, taking the
highest frequency and percentage of 63.3% was Monthly which
implies that Crown Beverages Ltd carries out stock taking monthly
in order to determine its re-order points and work against
occurrence of stock outs, pilferage, and depreciation, obsolete
of items in stock however stock taking for some components is
carried out weekly.
NAKAKONGE MASTULA 10/U/139930/PLD/PD 89
5.1.3 Impact of Inventory Management and Approaches of Cost Control
The results in Graph 5 indicated an average of 24 respondents
which is 80% agreeing with all the above that is to say that
Inventory Management reduces on Resource Wastage, Increases on
Operational efficiency and Increases Profitability implying that
the company greatly benefits in Inventory Management as a Cost
Saving Strategy.
In relation with Arord’s (1998), suggestions that proper
Inventory Management leads to reduction of capital that can be
tied up in Inventories which is further explained in table 13 of
chapter 4, implying that if that Inventory is properly managed,
it can greatly minimize on the overall costs in the organization
and this answers objective three of the study.
The researcher found out that the company uses Average Stock
level establishment as the most Cost Cutting Strategy in
Inventory Management with the response rate of 15 which is 50%
than the use of storing items only in use, purchasing according
to actual demand or purchasing cheaper materials implying that
the company uses mostly the Economic Order Quantity as the most
suitable Material handling technique than others to establish re-
order points.
Also the researcher found out that Crown Beverages Ltd
departments majority work closely with the Stores department in
order for the organization to achieve its overall objectives
NAKAKONGE MASTULA 10/U/139930/PLD/PD 90
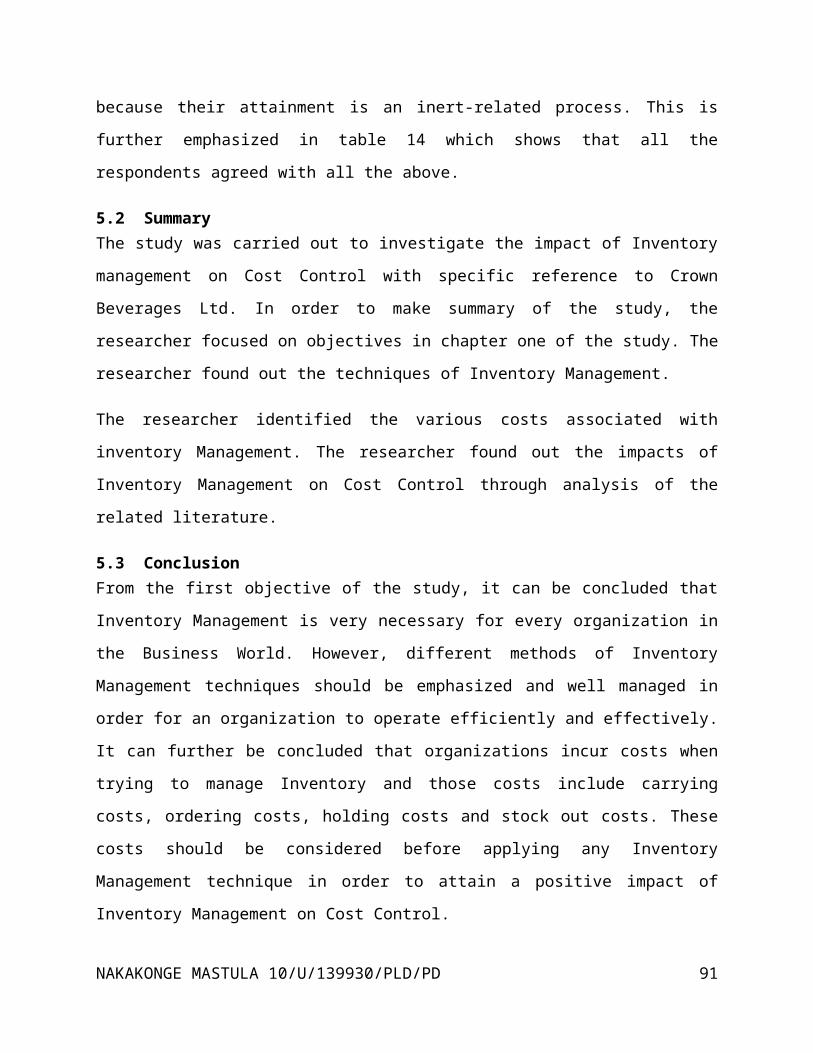
because their attainment is an inert-related process. This is
further emphasized in table 14 which shows that all the
respondents agreed with all the above.
5.2 SummaryThe study was carried out to investigate the impact of Inventory
management on Cost Control with specific reference to Crown
Beverages Ltd. In order to make summary of the study, the
researcher focused on objectives in chapter one of the study. The
researcher found out the techniques of Inventory Management.
The researcher identified the various costs associated with
inventory Management. The researcher found out the impacts of
Inventory Management on Cost Control through analysis of the
related literature.
5.3 ConclusionFrom the first objective of the study, it can be concluded that
Inventory Management is very necessary for every organization in
the Business World. However, different methods of Inventory
Management techniques should be emphasized and well managed in
order for an organization to operate efficiently and effectively.
It can further be concluded that organizations incur costs when
trying to manage Inventory and those costs include carrying
costs, ordering costs, holding costs and stock out costs. These
costs should be considered before applying any Inventory
Management technique in order to attain a positive impact of
Inventory Management on Cost Control.
NAKAKONGE MASTULA 10/U/139930/PLD/PD 91

5.4 RecommendationsThe following are the researcher’s recommendations to different
organizations that can lead to an effective Inventory Management
System which can lead to reduction in Costs associated with
Inventory.
Organizations should continuously review their inventory level
and place an order whenever it falls to a predetermined level
that is the re-order point. This can help to avoid stock out
costs.
Organizations should ensure that the amount of quantities ordered
under Economic order Quantity in order remains the same from one
period to the next. This means that the ordering costs and the
quantities ordered should be the same as an order is placed, as
it will help to minimize on the ordering costs.
For organizations that are certain of their customers and
suppliers, Just-in-Time (JIT) Inventory Management technique can
be appropriate a fact being that some costs are prevented for
instance holding costs and this increases on the effectiveness
and efficiency of an organization.
Organizations should also carry out regular stock taking to
reconcile Inventory at hand with that ordered so as to avoid
costs in form of losses.
NAKAKONGE MASTULA 10/U/139930/PLD/PD 92

Safety stock can be kept by organizations that are not certain of
their supplier and customers so as to avoid stock outs and panic
buying.
There should be proper Inventory Management records especially
under an emergency situation and also to assist during stock
taking and in times of Auditing.
5.5 Areas for further ResearchFurther research should be carried out on the factors that
determine the level of Inventory to be held in an organization.
The implications of some Inventory Management techniques like
Just-in-Time (JIT) technique.
Further research should be done on the other Costs cutting
strategies that can be used by an organization rather than proper
Inventory management alone.
APPENDICES
REFERENCESAsan Muhuman and John Oaklandet al; (2002).Purchasing and Supply
ChainManagement.11thEdition.
Baily Peter and Jessop David et al; (2002).Purchasing Principles
and Management.8th Edition Prentice all Financial Times Great
Britain.
NAKAKONGE MASTULA 10/U/139930/PLD/PD 93

David Jessop and Gallaway et al; (2000).Storage and Supply of
Materials,2nd Edition London UK International Business Press.
DoblarDonald and Brut David .N. (2003).Purchasing and Supply
ManagementText and Cases, 6th Edition. Tata McGraw-Hill Company
Ltd, New Delhi.
Gray R.B Laughlin R and Bebbington .J. (2002).Procurement
Management Methods andMeaning2nd Edition, London UK International
Business Press.
Kakuru Julius,(2001) Basic Financial Management,1st Edition
Makerere University Business School (MUBS) Kampala Uganda.
KeeviethLysons and Brian Famington, (2006).Purchasing and Supply
ChainManagement, 7th Edition, Prentice Hall.
Lucey .T.( 2003). Costing, 4thEdition DP Publications, Aldrine
Place London.
Lysons Kenneth, (2003).Purchasing and Supply Chain
Management,Pearson Education Ltd, England.
Lysons Kenneth and G. (2000).Public Management Reform,
AComparative Analysis, Oxford University Press, New York.
Pandeyi.M. (2003).Financial Management, 7th Revised Edith, Vikas
Publishing House PVT ltd New Delhi.
Robert G.B. (2003). Less Risk in Inventory Estimates.A Journal
Presentation Harvard Business Review, July-August Page 204-109.
NAKAKONGE MASTULA 10/U/139930/PLD/PD 94
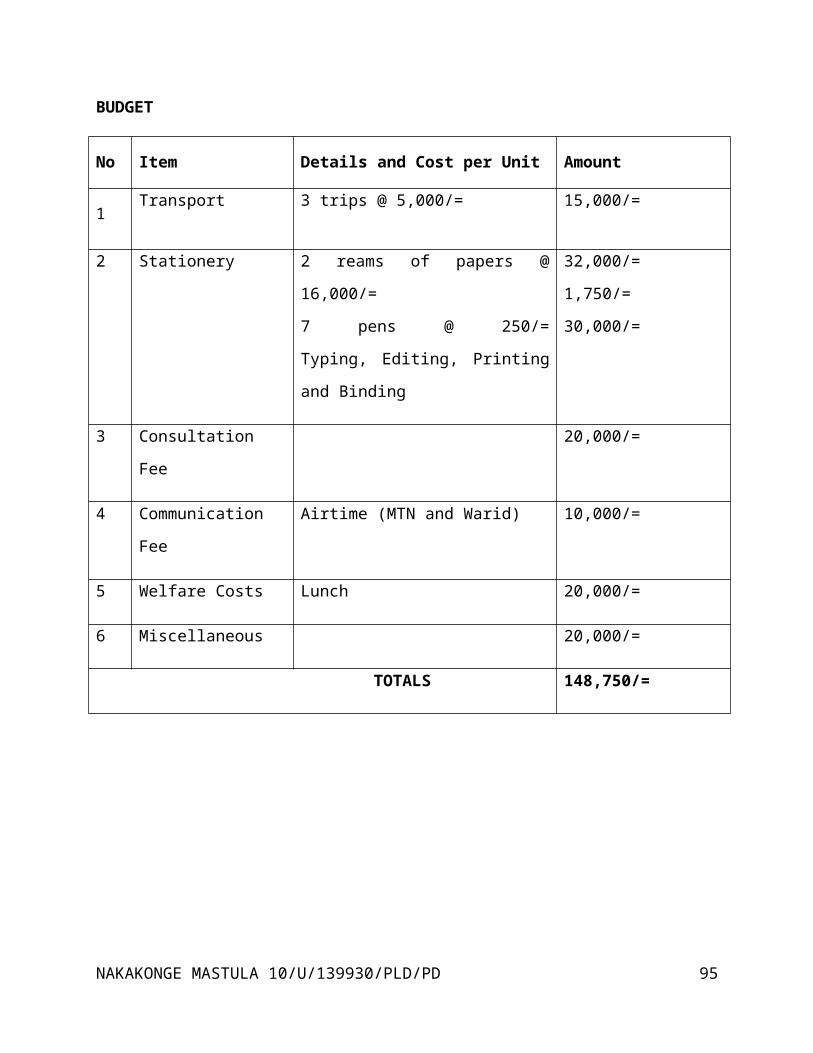
BUDGET
No Item Details and Cost per Unit Amount
1Transport 3 trips @ 5,000/= 15,000/=
2 Stationery 2 reams of papers @
16,000/=
7 pens @ 250/=
Typing, Editing, Printing
and Binding
32,000/=
1,750/=
30,000/=
3 Consultation
Fee
20,000/=
4 Communication
Fee
Airtime (MTN and Warid) 10,000/=
5 Welfare Costs Lunch 20,000/=
6 Miscellaneous 20,000/=
TOTALS 148,750/=
NAKAKONGE MASTULA 10/U/139930/PLD/PD 95
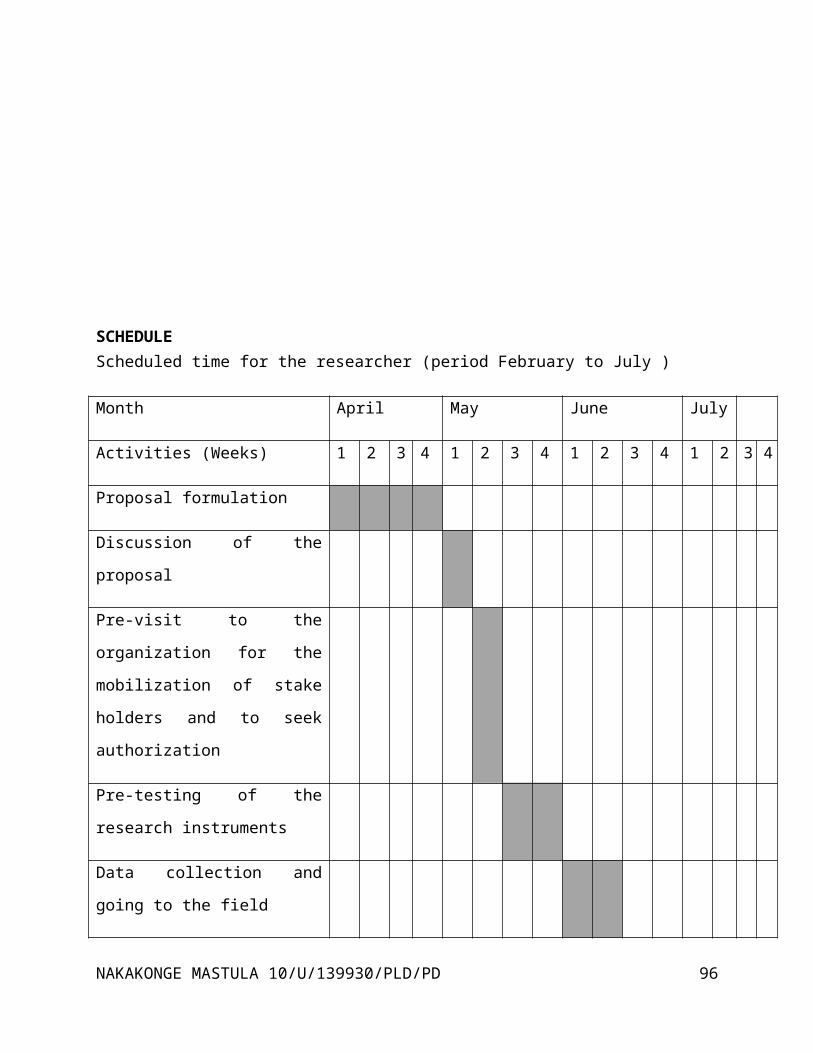
SCHEDULEScheduled time for the researcher (period February to July )
Month April May June July
Activities (Weeks) 1 2 3 4 1 2 3 4 1 2 3 4 1 2 3 4
Proposal formulation
Discussion of the
proposal
Pre-visit to the
organization for the
mobilization of stake
holders and to seek
authorization
Pre-testing of the
research instruments
Data collection and
going to the field
NAKAKONGE MASTULA 10/U/139930/PLD/PD 96

Data processing,
analyzing and
presentation
Presentation and
discussion of
preliminary report with
supervisor
Correction of errors if
any and binding the
report
Presentation of the
final report to the
supervisor
RESEARCH QUESTIONAIREQUESTIONNAIRE
KYAMBOGO UNIVERSITY
SCHOOL OF MANAGEMENT AND ENTREPRENEURSHIP
RESEARCH QUESTIONNAIRE
Dear Sir/ Madam,
NAKAKONGE MASTULA 10/U/139930/PLD/PD 97

I am NAKAKONGE MASTULA a student of Kyambogo University pursuing
a Bachelor’s Degree in Procurement and Logistics Management. As
part of the requirement of the award of this degree, I am
expected to carry out research and my subject of study is
“Impacts of Inventory Management on Cost Control.”
I am seeking assistance from your organization while conducting
this research and any information which will be offered, will be
only in line with academic matters and will be kept confidential.
Your contribution towards this cause will be highly appreciated.
My contacts are 0784-426254and 0701-215501
SECTION A: (BIO-DATA)
Please tick in the boxes provided.
1. Gender
Male b)
Female
2. Age group
a) 20 – 25 years c) 26 – 30 years
b) 30 - 39 years d) 40 years and above
3. Academic Qualifications
a) Diploma c) Bachelor’s Degree
b) Master’s Degree d) PHD
NAKAKONGE MASTULA 10/U/139930/PLD/PD 98

4. Which department do you belong to?
a) finance department d) Production department
b) Procurement department e)Stores department
c) Administration department f) Marketing
and sales department
g) Others
5. How long have you served in the above position?
a) Less than a year c) 1-2 years
b) 2 - 5 years d) 5 years and
above
SECTION B: (THE VARIOUS INVENTORY MANAGEMENT TECHNIQUES AND
METHODS USED IN AN ORGANIZATION).
6. What type of inventory do you commonly hold in your
organization?
Inventory Strong
ly
Agree
Agree Not
sure
Disagr
ee
Strongly
disagree
Raw
materials
Work in
progress
NAKAKONGE MASTULA 10/U/139930/PLD/PD 99

Components
Finished
goods
7. How do you acquire Inventory in to the organization?
a) In-sourcing c) Out-
sourcing
b) Both In and Out Sourcing
8. Which inventory management techniques do you commonly use in
your organization?
Techniques Stron
gly
agree
Agre
e
Not
Sur
e
Disag
ree
Stron
gly
disag
ree
A:B:C Analysis
Vendor managed Inventory
Just – in – Time (JIT)
NAKAKONGE MASTULA 10/U/139930/PLD/PD 100
Economic Order Quantity (EOQ)
Material Requirement Planning
(MRP)
Material resource Planning
(MRPII)
Distribution requirement
planning(DRP)
9. Which departments carry out inspection of the material coming
in the organization to ensure defect free items in to the
store?
Departments Strong
ly
Agree
Agree Not
sure
Disagr
ee
Strong
ly
disagr
ee
The Stores Department
Procurement Department
Production Department
Auditing
Administration
NAKAKONGE MASTULA 10/U/139930/PLD/PD 101

10. Which inspection method is applied on materials, on their
receipt in to the organization’s store?
a) Certified method c) 100%
Inspection
b) acceptance method
11. What material handling techniques do you use while receiving
and issuing materials to the user department in the organization?
a) Computerized Electronic Handling c)
Mechanical Material Handling
b) Automated Materials Handling d)
Manual Materials Handling
e) Others
SECTION C: (THE VARIOUS COSTS INCURRED WHILE ACQUIRING MANAGEMENT
INVENTORY)
12. When do you place an order to acquire inventory in to the
organization?
a) As often as required by the organization d)
Every week
b) After every Month
e) Semi-annually
c) Annually
13. What determines the quantities to be ordered for in to the
organization?
NAKAKONGE MASTULA 10/U/139930/PLD/PD 102
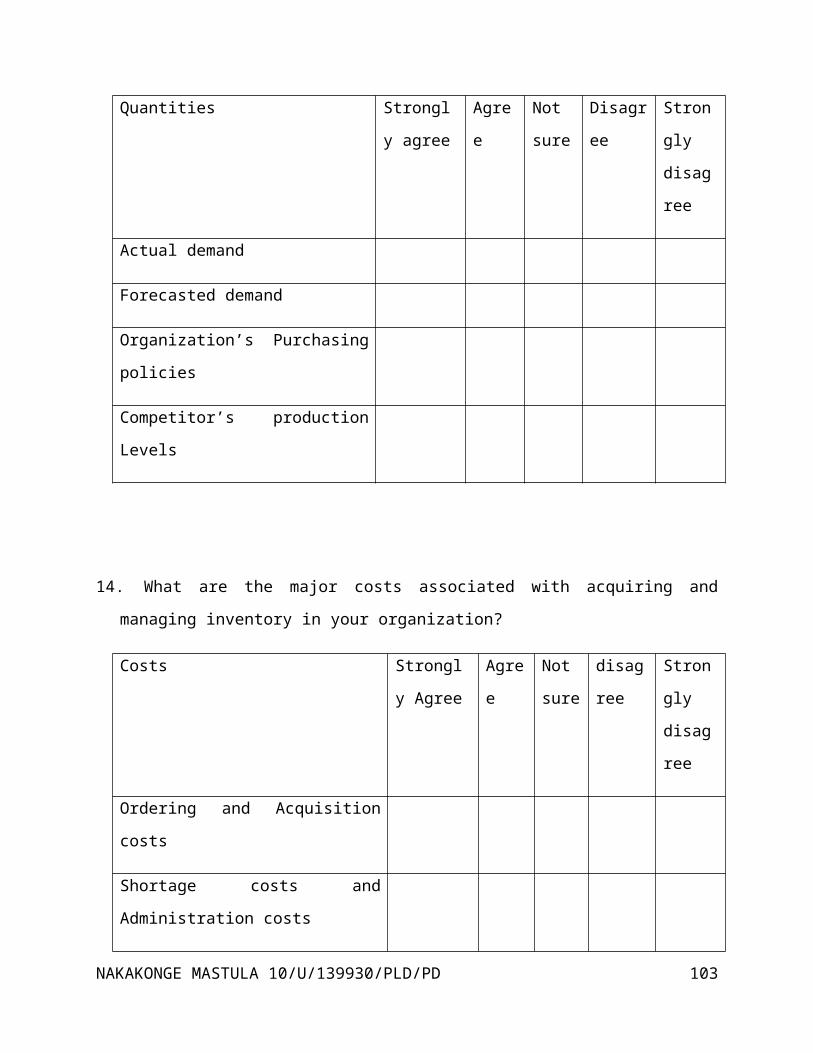
Quantities Strongl
y agree
Agre
e
Not
sure
Disagr
ee
Stron
gly
disag
ree
Actual demand
Forecasted demand
Organization’s Purchasing
policies
Competitor’s production
Levels
14. What are the major costs associated with acquiring and
managing inventory in your organization?
Costs Strongl
y Agree
Agre
e
Not
sure
disag
ree
Stron
gly
disag
ree
Ordering and Acquisition
costs
Shortage costs and
Administration costs
NAKAKONGE MASTULA 10/U/139930/PLD/PD 103

Carrying costs and stock
out costs
15. What are the most cost effective places to keep your
inventory in?
Company’s premises c) Vendor/
supplier’s premises
Bonded Ware-houses e) Public
ware-houses
16. When do you carry out stock taking to determine the status
of individual items in store?
Period Stron
gly
agree
agree Not
Sure
disag
ree
Stron
gly
disag
ree
Weekly
Monthly
Semi – annually
Annually
NAKAKONGE MASTULA 10/U/139930/PLD/PD 104

SECTION D: (THE IMPACTS OF INVENTORY MANAGEMENT ON COST CONTROL
AND THE APPROACHES USED TO CONTROL INVENTORY COSTS).
17. What role does Inventory management play towards cost
control in an organization?
ROLE Stronglyagree
Agree NotSure
Disagree
StronglyDisagree
Improved customer service
Increases on profitability
Reduces on resource
wastage
Increases on operational
efficiency
All the above
18. Basing on the options below, how does inventory management
impact on cost control?
a) The higher the inventory held, the less the costs
b) The less the Inventory, the higher the costs
c) The bigger the order made, the less the ordering costs
d) The less the order made, the higher the ordering costs
NAKAKONGE MASTULA 10/U/139930/PLD/PD 105
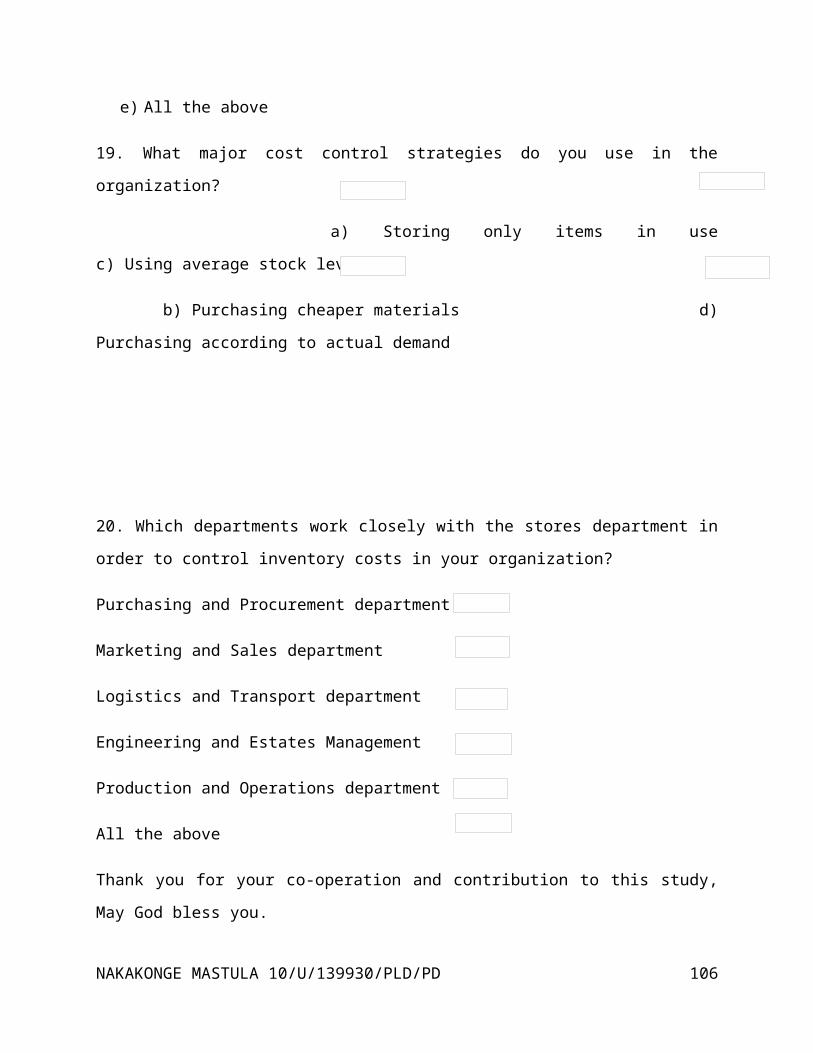
e) All the above
19. What major cost control strategies do you use in the
organization?
a) Storing only items in use
c) Using average stock level
b) Purchasing cheaper materials d)
Purchasing according to actual demand
20. Which departments work closely with the stores department in
order to control inventory costs in your organization?
Purchasing and Procurement department
Marketing and Sales department
Logistics and Transport department
Engineering and Estates Management
Production and Operations department
All the above
Thank you for your co-operation and contribution to this study,
May God bless you.
NAKAKONGE MASTULA 10/U/139930/PLD/PD 106

NAKAKONGE MASTULA 10/U/139930/PLD/PD 107