Rapid mechanical squeezing with pulsed optomechanics - arXiv
R
Ga
b
c
a
ARRAA
KNPSEP
1
t[sbhsetqosa[tipttoet
i
0h
Sensors and Actuators A 189 (2013) 313– 320
Contents lists available at SciVerse ScienceDirect
Sensors and Actuators A: Physical
jo u rn al hom epage: www.elsev ier .com/ locate /sna
esearch on spectral response of pulsed eddy current and NDE applications
ui Yun Tiana,b, Yunze Hec,∗, Ibukun Adewalea, Anthony Simma
School of Electrical and Electronic Engineering, Newcastle University, Newcastle upon Tyne, NE1 7RU, United KingdomState Key Laboratory of Mechanical Transmission, Chongqing University, PR ChinaCollege of Mechatronics and Automation, National University of Defense Technology, Changsha 410073, PR China
r t i c l e i n f o
rticle history:eceived 16 July 2012eceived in revised form 1 October 2012ccepted 7 October 2012vailable online 26 October 2012
a b s t r a c t
Using pulsed excitation, pulsed eddy current (PEC) technique generates responses over a wide rangeof frequencies, containing more information than traditional eddy current inspection in the frequencydomain. This paper investigates the spectral response of PEC under varying probe lift-off, material prop-erties (electrical conductivity and magnetic permeability) and directional tensile stress. It is shownthat material properties and lift-off exhibit different spectra patterns. Using normalisation in fre-
eywords:on-destructive testing (NDT)ulsed eddy currentpectral responselectrical conductivity
quency domain, the lift-off effect can be reduced. Spectra for both electrical conductivity and magneticpermeability show a complex pattern. Tensile stress measurement in aluminium 2024 and 5083 is investi-gated, which show similar spectra pattern to electrical conductivity variation. Applications for corrosioncharacterisation, displacement measurement and profile inspection can be developed in the future inconjunction with time-domain features.
ermeability
. Introduction
As a rapidly developing technique, pulsed eddy current (PEC)esting has found applications in metal thickness measurement1], defect detection in multi-layered structures [2–4], stress mea-urement [5] and corrosion detection [6,7] amongst others. PECased characterisation theory and feature extraction techniquesave also been developed and studied [8]. As PEC responses canense multiple system and material parameters such as lift-off,lectrical conductivity and magnetic permeability, it is importanto understand their influence and responses in the time and fre-uency domains. However, most of the previous work has focusedn the transient analysis in the time-domain [9], extracting featuresuch as peak values, rising times, and zero-crossing time [10,11],nd analysing responses using principal component analysis (PCA)12], independent component analysis (ICA) [13,14], and shape fea-ures [15]. The plethora of information from eddy current responsesn the frequency domain has also been investigated. Yang et al.roposed a new feature, the frequency spectrum separating point,o improve accuracy in defect classification [16]. Kiwa et al. usedhe Fourier transform of a PEC response to visualise cross-sections
f conductive materials and defects on different depths [17]. Het al. have used the magnitude of specified frequency componentso reduce the lift-off effect and classify defects [18,19]. Also, they∗ Corresponding author. Tel.: +86 13467698133.E-mail addresses: [email protected] (G.Y. Tian), [email protected] (Y. He),
[email protected] (I. Adewale).
924-4247/$ – see front matter © 2012 Elsevier B.V. All rights reserved.ttp://dx.doi.org/10.1016/j.sna.2012.10.011
© 2012 Elsevier B.V. All rights reserved.
combined frequency band selection and PCA to classify the defectsin multi-layered structures [20]. Grimberg et al. used power spec-trum measurements to evaluate prosthetic heart valves [21]. Chuenet al. used the nonlinear eddy current and frequency spectrum mea-surements to characterise case hardening profiles [22]. However,the specific spectral response due to physical properties of samplesand lift-off has not yet been fully understood.
To understand and reduce the lift-off effect, Giguere and Duboisconducted intensive investigations of lift-off and proposed the Lift-off point of Intersection (LOI), representing a lift-off independentpoint in time-domain PEC signals [23] to eliminate lift-off effectsin multi-layer structures [24,25]. Lefebvre and Mandache investi-gated the characteristics of lift-off via theory and experiment [26]and proposed the use of the LOI slope to accurately measure thethickness of a non-conductive layer on a conductive substrate [27].The normalisation technique has been applied in time-domain toreduce the invariance due to lift-off [28]. All of this work usestime-domain analysis. A further reduction of lift-off effects in thetransient response is expected in the frequency domain, which willbe examined in this work.
This paper will address the spectral response of PEC undervarying lift-offs and material properties (such as electrical con-ductivity and magnetic permeability). The rest of the paper isorganised as follows. Firstly, time domain analysis is reviewed andfrequency-domain analysis method is proposed in Section 2. Next,
the numerical and experimental studies of spectral response arecarried out in Section 3, which is followed by experimental resultsof stress measurement in Section 4. Finally, our conclusions andfurther work are outlined in Section 5.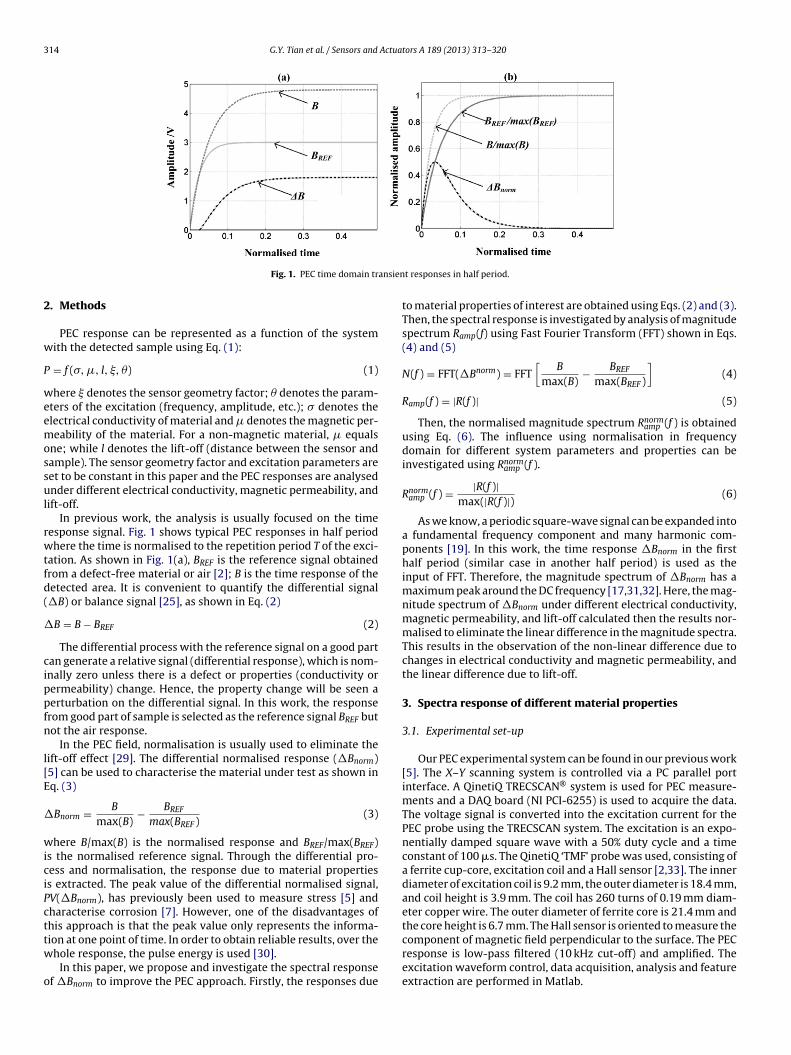
314 G.Y. Tian et al. / Sensors and Actuators A 189 (2013) 313– 320
ansien
2
w
P
weemossul
rwtfd(
�
cippfn
l[E
�
wiciPcttw
o
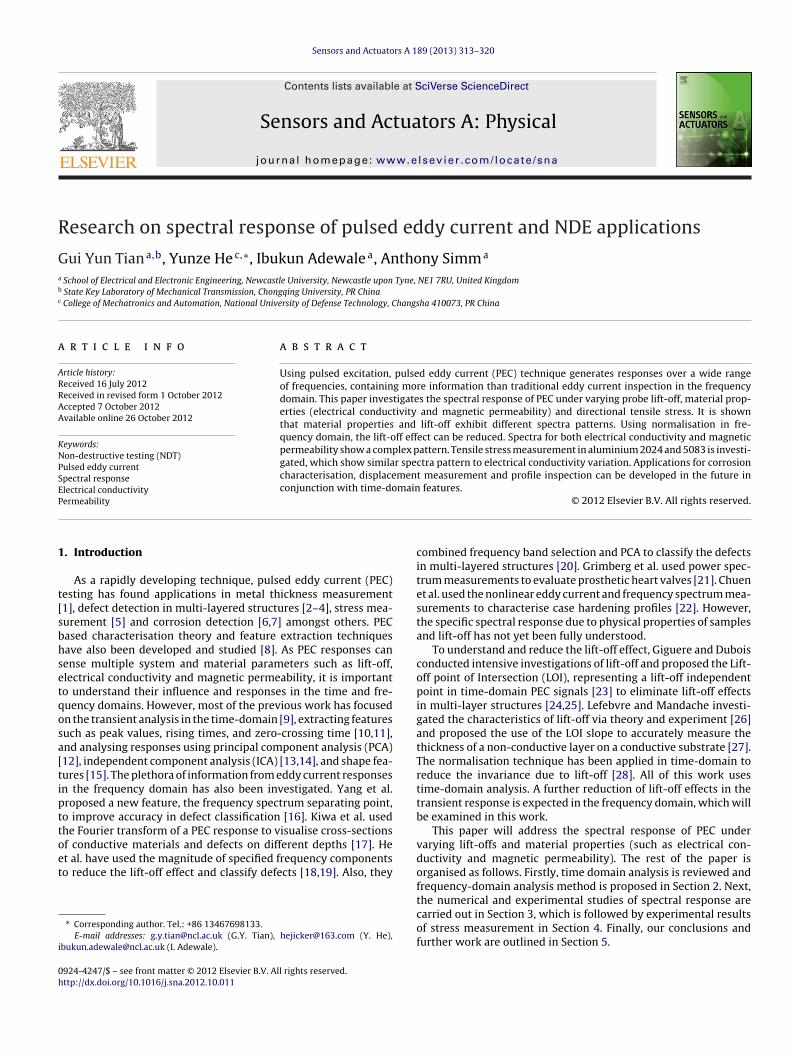
Fig. 1. PEC time domain tr
. Methods
PEC response can be represented as a function of the systemith the detected sample using Eq. (1):
= f (�, �, l, �, �) (1)
here � denotes the sensor geometry factor; � denotes the param-ters of the excitation (frequency, amplitude, etc.); � denotes thelectrical conductivity of material and � denotes the magnetic per-eability of the material. For a non-magnetic material, � equals
ne; while l denotes the lift-off (distance between the sensor andample). The sensor geometry factor and excitation parameters areet to be constant in this paper and the PEC responses are analysednder different electrical conductivity, magnetic permeability, and
ift-off.In previous work, the analysis is usually focused on the time
esponse signal. Fig. 1 shows typical PEC responses in half periodhere the time is normalised to the repetition period T of the exci-
ation. As shown in Fig. 1(a), BREF is the reference signal obtainedrom a defect-free material or air [2]; B is the time response of theetected area. It is convenient to quantify the differential signal�B) or balance signal [25], as shown in Eq. (2)
B = B − BREF (2)
The differential process with the reference signal on a good partan generate a relative signal (differential response), which is nom-nally zero unless there is a defect or properties (conductivity orermeability) change. Hence, the property change will be seen aerturbation on the differential signal. In this work, the responserom good part of sample is selected as the reference signal BREF butot the air response.
In the PEC field, normalisation is usually used to eliminate theift-off effect [29]. The differential normalised response (�Bnorm)5] can be used to characterise the material under test as shown inq. (3)
Bnorm = B
max(B)− BREF
max(BREF )(3)
here B/max(B) is the normalised response and BREF/max(BREF)s the normalised reference signal. Through the differential pro-ess and normalisation, the response due to material propertiess extracted. The peak value of the differential normalised signal,V(�Bnorm), has previously been used to measure stress [5] andharacterise corrosion [7]. However, one of the disadvantages ofhis approach is that the peak value only represents the informa-
ion at one point of time. In order to obtain reliable results, over thehole response, the pulse energy is used [30].In this paper, we propose and investigate the spectral responsef �Bnorm to improve the PEC approach. Firstly, the responses due
t responses in half period.
to material properties of interest are obtained using Eqs. (2) and (3).Then, the spectral response is investigated by analysis of magnitudespectrum Ramp(f) using Fast Fourier Transform (FFT) shown in Eqs.(4) and (5)
N(f ) = FFT(�Bnorm) = FFT[
B
max(B)− BREF
max(BREF )
](4)
Ramp(f ) = |R(f )| (5)
Then, the normalised magnitude spectrum Rnormamp (f ) is obtained
using Eq. (6). The influence using normalisation in frequencydomain for different system parameters and properties can beinvestigated using Rnorm
amp (f ).
Rnormamp (f ) = |R(f )|
max(|R(f )|) (6)
As we know, a periodic square-wave signal can be expanded intoa fundamental frequency component and many harmonic com-ponents [19]. In this work, the time response �Bnorm in the firsthalf period (similar case in another half period) is used as theinput of FFT. Therefore, the magnitude spectrum of �Bnorm has amaximum peak around the DC frequency [17,31,32]. Here, the mag-nitude spectrum of �Bnorm under different electrical conductivity,magnetic permeability, and lift-off calculated then the results nor-malised to eliminate the linear difference in the magnitude spectra.This results in the observation of the non-linear difference due tochanges in electrical conductivity and magnetic permeability, andthe linear difference due to lift-off.
3. Spectra response of different material properties
3.1. Experimental set-up
Our PEC experimental system can be found in our previous work[5]. The X–Y scanning system is controlled via a PC parallel portinterface. A QinetiQ TRECSCAN® system is used for PEC measure-ments and a DAQ board (NI PCI-6255) is used to acquire the data.The voltage signal is converted into the excitation current for thePEC probe using the TRECSCAN system. The excitation is an expo-nentially damped square wave with a 50% duty cycle and a timeconstant of 100 �s. The QinetiQ ‘TMF’ probe was used, consisting ofa ferrite cup-core, excitation coil and a Hall sensor [2,33]. The innerdiameter of excitation coil is 9.2 mm, the outer diameter is 18.4 mm,and coil height is 3.9 mm. The coil has 260 turns of 0.19 mm diam-eter copper wire. The outer diameter of ferrite core is 21.4 mm andthe core height is 6.7 mm. The Hall sensor is oriented to measure the
component of magnetic field perpendicular to the surface. The PECresponse is low-pass filtered (10 kHz cut-off) and amplified. Theexcitation waveform control, data acquisition, analysis and featureextraction are performed in Matlab.
G.Y. Tian et al. / Sensors and Actuators A 189 (2013) 313– 320 315
Table 1Sample nomenclature and respective conductivities.
Standard Electricalconductivity (S/m)
Skin depth at100 Hz (mm)
W179 59.47 × 10⁶ 4.61A179 36.02 × 10⁶ 5.93G179 29.52 × 10⁶ 6.55R179 22.45 × 10⁶ 7.51S179 18.92 × 10⁶ 8.18C179 14.33 × 10⁶ 9.40
3
es8tla
aRni
Fr
U179 9.63 × 10⁶ 11.47T179 2.184 × 10⁶ 24.08
.2. Standard electrical conductivity samples
PEC responses are obtained from samples with a set of knownlectrical conductivity standards. These standard conductivityamples, provided by National Physical Laboratory, UK, are disks of0 mm diameter and 10 mm thicknesses with homogeneous elec-rical conductivities ranging from 2.18 × 10⁶ to 59.47 × 10⁶ S/m,isted in Table 1. The skin depths for all samples at 100 Hz excitationre also listed in Table 1.
In the experiments of the excitation frequency being 100 Hz
nd the amplitude being 2.52 V, samples (W179, A179, G179,179, S179 and C179) with skin depth smaller than the thick-ess of 10 mm are tested. The time response from sample W179s selected as the reference signal BREF. Fig. 2 shows �Bnorm of the
102
103
104
0
50
100
150
200
250
300
350
400
frequency(Hz)
mag
nitu
de
(a) magnitude spectrum
W179A179G179R179C179
102
-0.01
0
0.01
0.02
0.03
0.04
0.05
0.06
freque
norm
alis
ed m
agni
tude
(c) differential normalise
ig. 3. Spectral patterns for different electrical conductivity samples: (a) magnitude spectesponse.
Fig. 2. Differential normalised responses for different conductivity samples.
different electrical conductivity standard samples according to Eq.(3). Because B is the time response from sample W179, �B
REF normof W179 is zero. As the electrical conductivity is increased, theamplitude of �Bnorm response decreases.
102
103
104
0
0.2
0.4
0.6
0.8
1
frequency(Hz)
norm
alis
ed m
agni
tude
(b) normalised magnitude spectrum
W179A179G179R179C179
103
104
ncy(Hz)
d magnitude spectrum
A179G17 9R179C179
ra; (b) normalised magnitude spectra; (c) differential magnitude spectra with A179
3 Actuators A 189 (2013) 313– 320
cptmbAssiRnF
WuW0addintR
ltR
F1
16 G.Y. Tian et al. / Sensors and
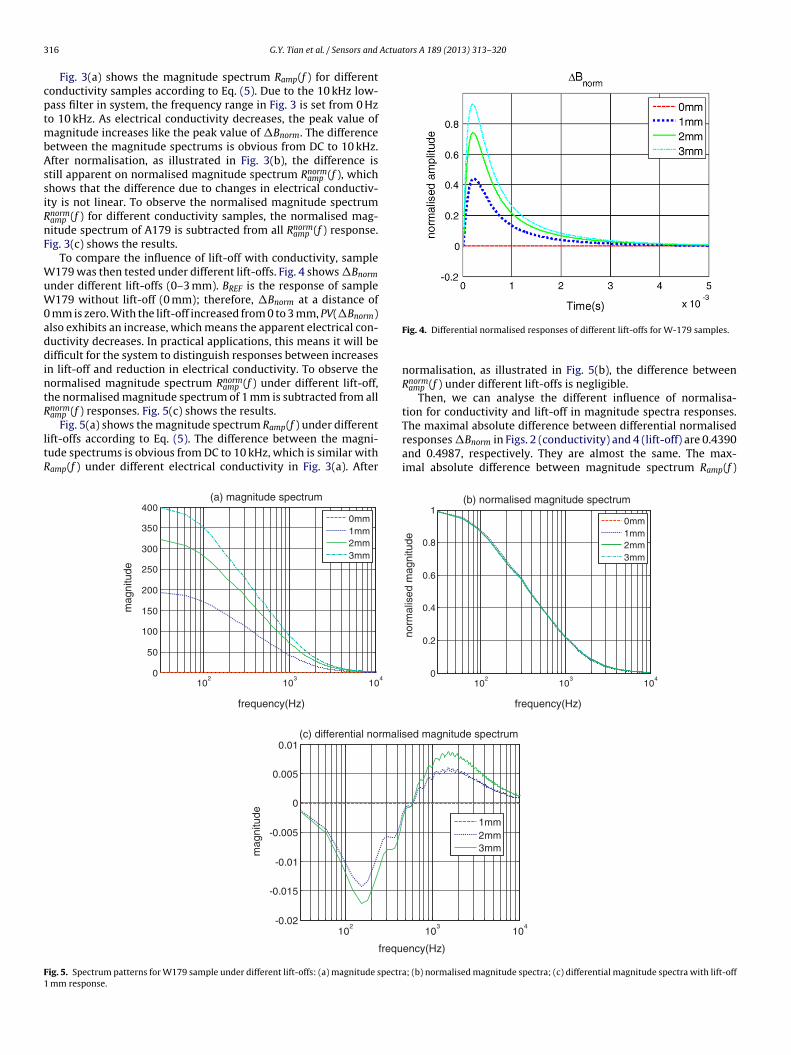
Fig. 3(a) shows the magnitude spectrum Ramp(f ) for differentonductivity samples according to Eq. (5). Due to the 10 kHz low-ass filter in system, the frequency range in Fig. 3 is set from 0 Hzo 10 kHz. As electrical conductivity decreases, the peak value of
agnitude increases like the peak value of �Bnorm. The differenceetween the magnitude spectrums is obvious from DC to 10 kHz.fter normalisation, as illustrated in Fig. 3(b), the difference istill apparent on normalised magnitude spectrum Rnorm
amp (f ), whichhows that the difference due to changes in electrical conductiv-ty is not linear. To observe the normalised magnitude spectrumnormamp (f ) for different conductivity samples, the normalised mag-itude spectrum of A179 is subtracted from all Rnorm
amp (f ) response.ig. 3(c) shows the results.
To compare the influence of lift-off with conductivity, sample179 was then tested under different lift-offs. Fig. 4 shows �Bnorm
nder different lift-offs (0–3 mm). BREF is the response of sample179 without lift-off (0 mm); therefore, �Bnorm at a distance of
mm is zero. With the lift-off increased from 0 to 3 mm, PV(�Bnorm)lso exhibits an increase, which means the apparent electrical con-uctivity decreases. In practical applications, this means it will beifficult for the system to distinguish responses between increases
n lift-off and reduction in electrical conductivity. To observe theormalised magnitude spectrum Rnorm
amp (f ) under different lift-off,he normalised magnitude spectrum of 1 mm is subtracted from allnormamp (f ) responses. Fig. 5(c) shows the results.
Fig. 5(a) shows the magnitude spectrum Ramp(f ) under differentift-offs according to Eq. (5). The difference between the magni-ude spectrums is obvious from DC to 10 kHz, which is similar withamp(f ) under different electrical conductivity in Fig. 3(a). After
102
103
104
0
50
100
150
200
250
300
350
400
frequency(Hz)
mag
nitu
de
(a) magnitude spectrum
0mm1mm2mm3mm
102
-0.02
-0.01 5
-0.01
-0.00 5
0
0.005
0.01
frequ
mag
nitu
de
(c) differential normalis
ig. 5. Spectrum patterns for W179 sample under different lift-offs: (a) magnitude spectr mm response.
Fig. 4. Differential normalised responses of different lift-offs for W-179 samples.
normalisation, as illustrated in Fig. 5(b), the difference betweenRnorm
amp (f ) under different lift-offs is negligible.Then, we can analyse the different influence of normalisa-
tion for conductivity and lift-off in magnitude spectra responses.The maximal absolute difference between differential normalised
responses �Bnorm in Figs. 2 (conductivity) and 4 (lift-off) are 0.4390and 0.4987, respectively. They are almost the same. The max-imal absolute difference between magnitude spectrum Ramp(f )102
103
104
0
0.2
0.4
0.6
0.8
1
frequency(Hz)
norm
alis
ed m
agni
tude
(b) normalised magnitude spectrum
0mm1mm2mm3mm
103
104
ency(Hz)
ed magnitude spectrum
1mm2mm3mm
a; (b) normalised magnitude spectra; (c) differential magnitude spectra with lift-off
G.Y. Tian et al. / Sensors and Actuators A 189 (2013) 313– 320 317
102 103 1040
50
100
150
200
250
300
mag
nitu
de
(a) magnitude spectrum
0mm1mm2mm3mm
102 103 1040
0.2
0.4
0.6
0.8
1
frequency(Hz)
norm
alis
ed m
agni
tude
(b) normali sed magnitude spectrum
0mm1mm2mm3mm
fs: (a) magnitude spectra; (b) normalised magnitude spectra.
raTblF0rdtnId
Rtdmte
lssnTcNtbtrm
frequency(Hz)
Fig. 6. Spectrum patterns for A179 with different lift-of
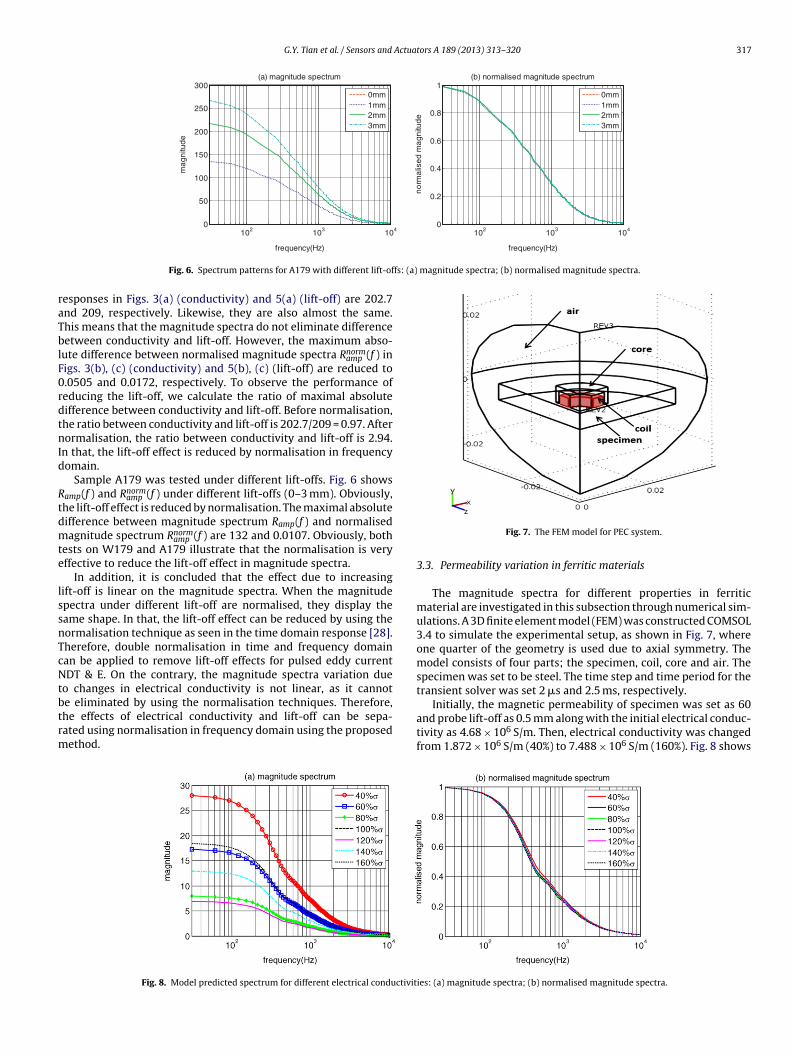
esponses in Figs. 3(a) (conductivity) and 5(a) (lift-off) are 202.7nd 209, respectively. Likewise, they are also almost the same.his means that the magnitude spectra do not eliminate differenceetween conductivity and lift-off. However, the maximum abso-
ute difference between normalised magnitude spectra Rnormamp (f ) in
igs. 3(b), (c) (conductivity) and 5(b), (c) (lift-off) are reduced to.0505 and 0.0172, respectively. To observe the performance ofeducing the lift-off, we calculate the ratio of maximal absoluteifference between conductivity and lift-off. Before normalisation,he ratio between conductivity and lift-off is 202.7/209 = 0.97. Afterormalisation, the ratio between conductivity and lift-off is 2.94.
n that, the lift-off effect is reduced by normalisation in frequencyomain.
Sample A179 was tested under different lift-offs. Fig. 6 showsamp(f ) and Rnorm
amp (f ) under different lift-offs (0–3 mm). Obviously,he lift-off effect is reduced by normalisation. The maximal absoluteifference between magnitude spectrum Ramp(f ) and normalisedagnitude spectrum Rnorm
amp (f ) are 132 and 0.0107. Obviously, bothests on W179 and A179 illustrate that the normalisation is veryffective to reduce the lift-off effect in magnitude spectra.
In addition, it is concluded that the effect due to increasingift-off is linear on the magnitude spectra. When the magnitudepectra under different lift-off are normalised, they display theame shape. In that, the lift-off effect can be reduced by using theormalisation technique as seen in the time domain response [28].herefore, double normalisation in time and frequency domainan be applied to remove lift-off effects for pulsed eddy currentDT & E. On the contrary, the magnitude spectra variation due
o changes in electrical conductivity is not linear, as it cannot
e eliminated by using the normalisation techniques. Therefore,he effects of electrical conductivity and lift-off can be sepa-ated using normalisation in frequency domain using the proposedethod.Fig. 8. Model predicted spectrum for different electrical conductivit
Fig. 7. The FEM model for PEC system.
3.3. Permeability variation in ferritic materials
The magnitude spectra for different properties in ferriticmaterial are investigated in this subsection through numerical sim-ulations. A 3D finite element model (FEM) was constructed COMSOL3.4 to simulate the experimental setup, as shown in Fig. 7, whereone quarter of the geometry is used due to axial symmetry. Themodel consists of four parts; the specimen, coil, core and air. Thespecimen was set to be steel. The time step and time period for thetransient solver was set 2 �s and 2.5 ms, respectively.
Initially, the magnetic permeability of specimen was set as 60and probe lift-off as 0.5 mm along with the initial electrical conduc-tivity as 4.68 × 10⁶ S/m. Then, electrical conductivity was changedfrom 1.872 × 10⁶ S/m (40%) to 7.488 × 10⁶ S/m (160%). Fig. 8 shows
ies: (a) magnitude spectra; (b) normalised magnitude spectra.
318 G.Y. Tian et al. / Sensors and Actuators A 189 (2013) 313– 320
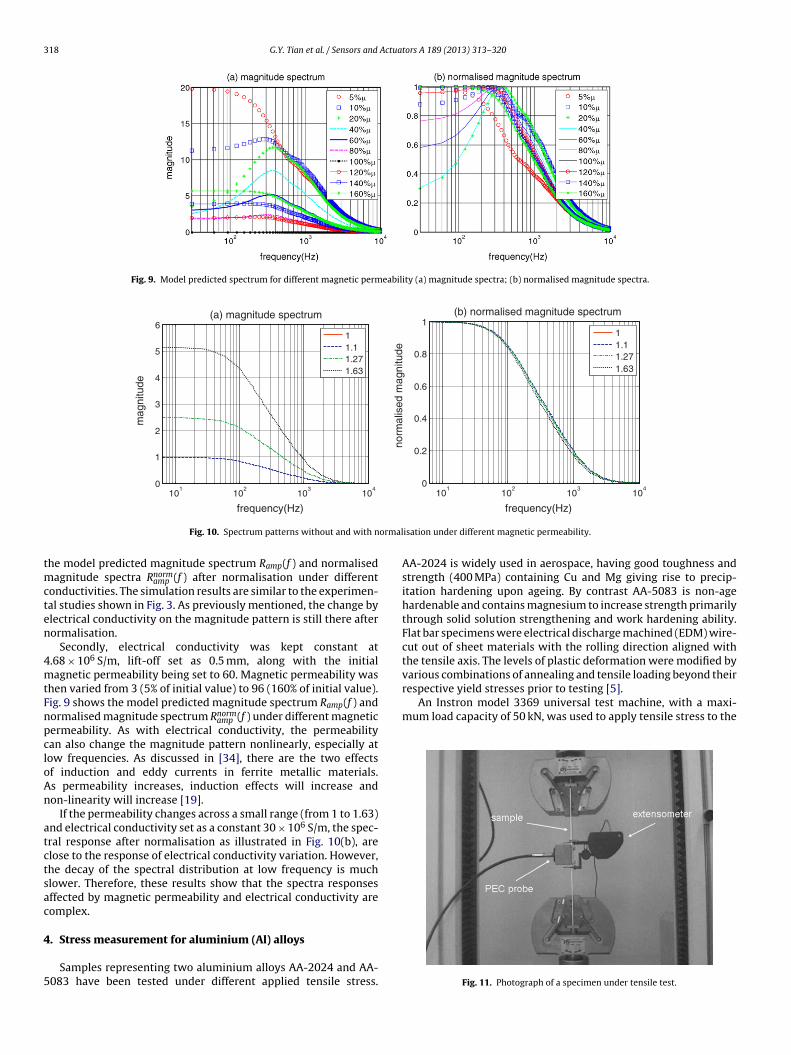
Fig. 9. Model predicted spectrum for different magnetic permeability (a) magnitude spectra; (b) normalised magnitude spectra.
101
102
103
104
0
1
2
3
4
5
6
mag
nitu
de
(a) magnitude spectrum
11.11.271.63
101
102
103
104
0
0.2
0.4
0.6
0.8
1
norm
alis
ed m
agni
tude
(b) normalised magnitude spectrum
11.11.271.63
ormal
tmcten
4mtFnpcloAn
atctsac
4
5
various combinations of annealing and tensile loading beyond theirrespective yield stresses prior to testing [5].
An Instron model 3369 universal test machine, with a maxi-mum load capacity of 50 kN, was used to apply tensile stress to the
frequency(Hz)
Fig. 10. Spectrum patterns without and with n
he model predicted magnitude spectrum Ramp(f ) and normalisedagnitude spectra Rnorm
amp (f ) after normalisation under differentonductivities. The simulation results are similar to the experimen-al studies shown in Fig. 3. As previously mentioned, the change bylectrical conductivity on the magnitude pattern is still there afterormalisation.
Secondly, electrical conductivity was kept constant at.68 × 106 S/m, lift-off set as 0.5 mm, along with the initialagnetic permeability being set to 60. Magnetic permeability was
hen varied from 3 (5% of initial value) to 96 (160% of initial value).ig. 9 shows the model predicted magnitude spectrum Ramp(f ) andormalised magnitude spectrum Rnorm
amp (f ) under different magneticermeability. As with electrical conductivity, the permeabilityan also change the magnitude pattern nonlinearly, especially atow frequencies. As discussed in [34], there are the two effectsf induction and eddy currents in ferrite metallic materials.s permeability increases, induction effects will increase andon-linearity will increase [19].
If the permeability changes across a small range (from 1 to 1.63)nd electrical conductivity set as a constant 30 × 106 S/m, the spec-ral response after normalisation as illustrated in Fig. 10(b), arelose to the response of electrical conductivity variation. However,he decay of the spectral distribution at low frequency is muchlower. Therefore, these results show that the spectra responsesffected by magnetic permeability and electrical conductivity areomplex.
. Stress measurement for aluminium (Al) alloys
Samples representing two aluminium alloys AA-2024 and AA-083 have been tested under different applied tensile stress.
frequency(Hz)
isation under different magnetic permeability.
AA-2024 is widely used in aerospace, having good toughness andstrength (400 MPa) containing Cu and Mg giving rise to precip-itation hardening upon ageing. By contrast AA-5083 is non-agehardenable and contains magnesium to increase strength primarilythrough solid solution strengthening and work hardening ability.Flat bar specimens were electrical discharge machined (EDM) wire-cut out of sheet materials with the rolling direction aligned withthe tensile axis. The levels of plastic deformation were modified by
Fig. 11. Photograph of a specimen under tensile test.
G.Y. Tian et al. / Sensors and Actuators A 189 (2013) 313– 320 319
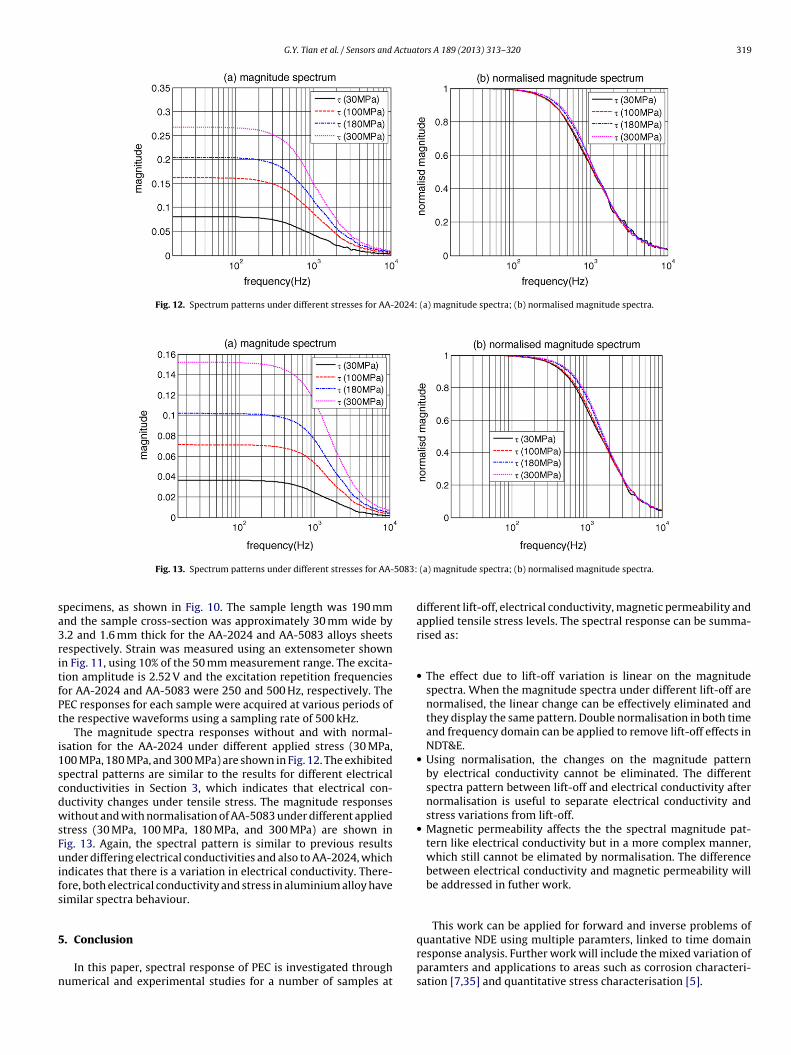
Fig. 12. Spectrum patterns under different stresses for AA-2024: (a) magnitude spectra; (b) normalised magnitude spectra.
5083:
sa3ritfPt
i1scdwsFuifs
5
n
This work can be applied for forward and inverse problems of
Fig. 13. Spectrum patterns under different stresses for AA-
pecimens, as shown in Fig. 10. The sample length was 190 mmnd the sample cross-section was approximately 30 mm wide by.2 and 1.6 mm thick for the AA-2024 and AA-5083 alloys sheetsespectively. Strain was measured using an extensometer shownn Fig. 11, using 10% of the 50 mm measurement range. The excita-ion amplitude is 2.52 V and the excitation repetition frequenciesor AA-2024 and AA-5083 were 250 and 500 Hz, respectively. TheEC responses for each sample were acquired at various periods ofhe respective waveforms using a sampling rate of 500 kHz.
The magnitude spectra responses without and with normal-sation for the AA-2024 under different applied stress (30 MPa,00 MPa, 180 MPa, and 300 MPa) are shown in Fig. 12. The exhibitedpectral patterns are similar to the results for different electricalonductivities in Section 3, which indicates that electrical con-uctivity changes under tensile stress. The magnitude responsesithout and with normalisation of AA-5083 under different applied
tress (30 MPa, 100 MPa, 180 MPa, and 300 MPa) are shown inig. 13. Again, the spectral pattern is similar to previous resultsnder differing electrical conductivities and also to AA-2024, which
ndicates that there is a variation in electrical conductivity. There-ore, both electrical conductivity and stress in aluminium alloy haveimilar spectra behaviour.
. Conclusion
In this paper, spectral response of PEC is investigated throughumerical and experimental studies for a number of samples at
(a) magnitude spectra; (b) normalised magnitude spectra.
different lift-off, electrical conductivity, magnetic permeability andapplied tensile stress levels. The spectral response can be summa-rised as:
• The effect due to lift-off variation is linear on the magnitudespectra. When the magnitude spectra under different lift-off arenormalised, the linear change can be effectively eliminated andthey display the same pattern. Double normalisation in both timeand frequency domain can be applied to remove lift-off effects inNDT&E.
• Using normalisation, the changes on the magnitude patternby electrical conductivity cannot be eliminated. The differentspectra pattern between lift-off and electrical conductivity afternormalisation is useful to separate electrical conductivity andstress variations from lift-off.
• Magnetic permeability affects the the spectral magnitude pat-tern like electrical conductivity but in a more complex manner,which still cannot be elimated by normalisation. The differencebetween electrical conductivity and magnetic permeability willbe addressed in futher work.
quantative NDE using multiple paramters, linked to time domainresponse analysis. Further work will include the mixed variation ofparamters and applications to areas such as corrosion characteri-sation [7,35] and quantitative stress characterisation [5].
3 Actua
A
cgLHhcJN
R
[
[
[
[
[
[
[
[
[
[
[
[
[
[
[
[
[
[
[
[
[
[
[
[
[
[
20 G.Y. Tian et al. / Sensors and
cknowledgements
The authors would like to thank Dr. Morozov previously of New-astle University for his experimental data from previous EPSRCrants (EP/E005071/1). The work was jointly funded by State Keyaboratory of Mechanical Transmission Open Project in 2010. Mr.e would like to thank China Scholarship Council for sponsoringis visiting study to Newcastle University, and Ministry of Edu-ation for Scholarship Award for Excellent Doctoral Student (No.:Y20101). The authors would like to thank Mr. Stuart Crichton atewcastle for English proof reading.
eferences
[1] H.C. Yang, C.C. Tai, Pulsed eddy-current measurement of a conducting coatingon a magnetic metal plate, Measurement Science and Technology 13 (2002)1259–1265.
[2] R.A. Smith, G.R. Hugo, Transient eddy current NDE for ageingaircraft—capabilities and limitations, Insight: Non-Destructive Testingand Condition Monitoring 43 (2001) 14–25.
[3] Y. He, F. Luo, M. Pan, F. Weng, X. Hu, J. Gao, B. Liu, Pulsed eddy current techniquefor defect detection in aircraft riveted structures, NDT and E International 43(2010) 176–181.
[4] Y. He, F. Luo, X. Hu, B. Liu, J. Gao, Defect identification and evaluationbased on three-dimensional magnetic field measurement of pulsed eddy cur-rent, Insight: Non-Destructive Testing and Condition Monitoring 51 (2009)310–314.
[5] M. Morozov, G. Yun Tian, P.J. Withers, The pulsed eddy current response toapplied loading of various aluminium alloys, NDT and E International 43 (2010)493–500.
[6] T.W. Krause, D. Harlley, V.K. Babbar, K. Wannamaker, Pulsed eddy current thick-ness measurement of selective phase corrosion on nickel aluminum bronzevalves, AIP Conference Proceedings (2010) 401–408.
[7] Y. He, G. Tian, H. Zhang, M. Alamin, A. Simm, P. Jackson, Steel corrosion charac-terisation using pulsed eddy current systems, IEEE Sensors Journal 12 (2012)2113–2120.
[8] G.Y. Tian, A. Sophian, D. Taylor, J. Rudlin, Wavelet-based PCA defect classifi-cation and quantification for pulsed eddy current NDT, in: IEE Proceedings:Science Measurement and Technology, 2005, pp. 141–148.
[9] Y. He, F. Luo, M. Pan, X. Hu, B. Liu, J. Gao, Defect edge identification with rect-angular pulsed eddy current sensor based on transient response signals, NDTand E International 43 (2010) 409–415.
10] G.Y. Tian, A. Sophian, Defect classification using a new feature for pulsed eddycurrent sensors, NDT and E International 38 (2005) 77–82.
11] Y. He, F. Luo, M. Pan, X. Hu, J. Gao, B. Liu, Defect classification based on rectan-gular pulsed eddy current sensor in different directions, Sensors and ActuatorsA: Physical 157 (2010) 26–31.
12] A. Sophian, G.Y. Tian, D. Taylor, J. Rudlin, A feature extraction technique basedon principal component analysis for pulsed Eddy current NDT, NDT and E Inter-national 36 (2003) 37–41.
13] G. Yang, G.Y. Tian, P.W. Que, T.L. Chen, Independent component analysis-based feature extraction technique for defect classification applied forpulsed eddy current NDE, Research in Nondestructive Evaluation 20 (2009)230–245.
14] Y. He, M. Pan, F. Luo, X. Hu, Support vector machine and optimised fea-ture extraction in integrated eddy current instrument, Measurement (2012),http://dx.doi.org/10.1016/j.measurement.2012.09.014
15] T. Chen, G.Y. Tian, A. Sophian, P.W. Que, Feature extraction and selection fordefect classification of pulsed eddy current NDT, NDT and E International 41(2008) 467–476.
16] B. Yang, F. Luo, Y. Zhang, X. Cao, Quantification and classification of cracks inaircraft multi-layered structure, Jixie Gongcheng Xuebao/Chinese Journal ofMechanical Engineering 42 (2006) 63–67.
17] T. Kiwa, T. Kawata, H. Yamada, K. Tsukada, Fourier-transformed eddy current
technique to visualize cross-sections of conductive materials, NDT and E Inter-national 40 (2007) 363–367.18] Y. He, M. Pan, F. Luo, G. Tian, Pulsed eddy current imaging and frequency spec-trum analysis for hidden defect nondestructive testing and evaluation, NDT andE International 44 (2011) 344–352.
tors A 189 (2013) 313– 320
19] Y. He, M. Pan, F. Luo, G. Tian, Reduction of lift-off effects in pulsed eddy currentfor defect classification, IEEE Transactions on Magnetics 47 (2011) 4753–4760.
20] M. Pan, Y. He, G. Tian, PEC frequency band selection for locating defects intwo-layer aircraft structures with air gap variations, IEEE Transactions onInstrumentation and Measurement, submitted for publication.
21] R. Grimberg, L. Udpa, A. Savin, S.C. Chan, R. Steigmann, S.S. Udpa, Noninvasiveevaluation of Bjork–Shiley convexo-concave prosthetic heart valves, NDT andE International 42 (2009) 421–429.
22] C. Shiu Chuen, R. Grimberg, J.A. Hejase, Z. Zhiwei, P. Lekeakatakunju, L. Udpa,S.S. Udpa, Nonlinear eddy current technique for characterizing case hardeningprofiles, IEEE Transactions on Magnetics 46 (2010) 1821–1824.
23] S. Giguere, S.J.M. Dubois, Pulsed eddy current: finding corrosion independentlyof transducer lift-off, AIP Conference Proceedings 509 (2000) 449–456.
24] S. Giguère, B.A. Lepine, J.M.S. Dubois, Pulsed eddy current technology:characterizing material loss with gap and lift-off variations, Research in Non-destructive Evaluation 13 (2001) 119–129.
25] B.A. Lepine, J.S.R. Giguere, D.S. Forsyth, A. Chahbaz, J.M.S. Dubois, Interpretationof pulsed eddy current signals for locating and quantifying metal loss in thinskin lap splices, AIP Conference Proceedings 615 (2002) 415–422.
26] C. Mandache, J.H.V. Lefebvre, Transient and harmonic eddy currents: lift-offpoint of intersection, NDT and E International 39 (2006) 57–60.
27] J.H.V. Lefebvre, C. Mandache, Pulsed eddy current measurement of lift-off, 2006,pp. 669–676.
28] G.Y. Tian, Y. Li, C. Mandache, Study of lift-off invariance for pulsed eddy-currentsignals, IEEE Transactions on Magnetics 45 (2009) 184–191.
29] G.Y. Tian, A. Sophian, Reduction of lift-off effects for pulsed eddy current NDT,NDT and E International 38 (2005) 319–324.
30] D.G. Park, C.S. Angani, G.D. Kim, C.G. Kim, Y.M. Cheong, Evaluation of pulsededdy current response and detection of the thickness variation in the stainlesssteel, IEEE Transactions on Magnetics 45 (2009) 3893–3896.
31] C.S. Angani, D.G. Park, C.G. Kim, P. Leela, M. Kishore, Y.M. Cheong, Pulsed eddycurrent differential probe to detect the defects in a stainless steel pipe, Journalof Applied Physics 109 (2011), 07D348–07D350.
32] C.S. Angani, D.G. Park, C.G. Kim, P. Leela, P. Kollu, Y.M. Cheong, The pulsededdy current differential probe to detect a thickness variation in an insulatedstainless steel, Journal of Nondestructive Evaluation 29 (2010) 248–252.
33] R.A. Smith, D. Edgar, J. Skramstad, J. Buckley, Enhanced transient eddy currentdetection of deep corrosion, Insight: Non-Destructive Testing and ConditionMonitoring 46 (2004) 88–91.
34] G.Y. Tian, Z.X. Zhao, R.W. Baines, The research of inhomogeneity in eddy currentsensors, Sensors and Actuators, A: Physical 69 (1998) 148–151.
35] Y. He, F. Luo, M. Pan, Defect characterisation based on pulsed eddy currentimaging technique, Sensors and Actuators, A: Physical, vol. 164, pp. 1-7, 2010.
Biographies
Guiyun Tian obtained his B.Sc. in metrology and instrumentation and M.Sc. in preci-sion engineering at the University of Sichuan (Chengdu, PR China) in 1985 and 1988,respectively. Currently, he is Chair professor in Sensor Technologies at the School ofElectrical and Electronic Engineering, Newcastle University. He has joint backgroundin engineering and computer science. His research interests are broadly in the areasof sensor and instrumentation, signal processing, Electromagnetic non-destructiveevaluation and structural Health Monitoring in particular. He has published over180 book chapters and papers in English and Chinese in the above areas.
Yunze He received his bachelor’s degree from Xi’an Jiaotong University in 2006and got his master degree in instrument science and technology from NationalUniversity of Defense Technology in 2008. He finished his Joint PhD candidate inSchool of Electrical and Electronic Engineering, Newcastle University, UK and Col-lege of Mechatronics and Automation, National University of Defense Technology,Changsha, China in 2012. His research interests are focused on electromagneticnon-destructive testing, instrumental science and technology.
Ibukun Adewale received BSc (Hons) Electrical & Electronic Engineering degreefrom the University of Lagos in 2004 and obtained MSc degree in Communicationsand Signal Processing with distinction from Newcastle University, UK in 2008. Heis currently working towards his PhD in Electromagnetic Non-destructive Test-
ing and Evaluation at Newcastle University. His research interests in the maininclude finite element modelling and characterisation of complex systems, designand development of electromagnetic NDT sensors for structural health monitoringand development of novel processing algorithm for signal enhancement and featureextraction.Copyright © 2022 FDOKUMEN