Pulsed-Discharge Electron-Capture Detector: Kinetic Model ...
8
Journal of Chromatographic Science, Vol. 34, August 1996 Pulsed-Discharge Electron-Capture Detector: Kinetic Model, Response Factors, and Temperature Dependence W.E. Wentworth* and Y. Wang University of Houston, Department of Chemistry, Houston, Texas 77204-5641 Wayne Odegard and E.C.M. Chen University of Houston Clear Lake, Houston, Texas 77058 Stanley D. Stearns Valco Instruments Co., Inc., P.O. Box 55603, Houston, Texas 77255 Abstract The absolute electron capture coefficient, KEC for a variety of compounds that undergo different electron capture mechanisms is determined by using a pulsed-discharge electron capture detector (PDECD). The temperature dependence of the representative compounds is measured. Two different dopant gases, hydrogen and methane, are used. The relative responses cover 5-6 orders of magnitude, just as in the radioactive ECD. The exceptions are discussed. The absolute response factors of the PDECD are greater than for the radioactive ECD for most compounds and are much greater for the alkyl iodides. The general temperature dependence is similar to that in the radioactive ECD. The results are discussed in terms of the kinetic model for ECDs. These results have been used to develop a commercial, nonradioactive ECD that is now being field-tested. Introduction The development of sensitive and selective detectors has played a major role in the establishment of gas chromatog- raphy as an unrivaled analytical tool. Chief among the detectors for gas chromatography are the ionization detectors. Recently, a pulsed-discharge helium ionization source was used in a uni- versal detector and also in a selective detector, namely, a pulsed- discharge electron-capture detector (PDECD). This use in both types of detectors is accomplished with the same basic hard- ware; only the potentials and the detector-scavenging gas need to be changed (1,2). The development of a nonradioactive ECD is especially important because the ECD is the most sensitive detector available for many compounds. In a paper introducing the PDECD (1), the potential use in the analysis of pesticides was demonstrated. The absolute responses, linear dynamic range, and minimum detectable quantities (MDQ) for five com- pounds were reported. The advantages and disadvantages of the radioactive ECD were considered, and the need for a non- radioactive ECD was also discussed (1). Additional response factors for 40–50 different compounds were measured to better *Author to whom correspondence should be addressed. characterize the detector and to provide data for producing a commercial detector. These compounds have a wide range of re- sponses in the standard ECD. Compounds such as hexafluo– robenzene, nitrobenzenes, and acetophenone undergo nondis- sociative electron capture in the ECD, whereas the alkyl halides undergo dissociative electron capture. Some compounds such as the chloroalkenes and the aryl halides undergo both disso- ciative and nondissociative capture. In addition, the normal low response of compounds such as alkanes and methanol was established because they were used as solvents for the deter- minations (3). Two distinct sets of data collected by different operators are reported here with two dopant gases, hydrogen and methane, and slightly different detectors. The results for hydrogen indi- cated that ionization was competing with the electron capture processes for some compounds and dictated that a different dopant, such as methane, should be used. In addition, some physical modifications in the detector were made in the process of commercialization. The studies using methane as a dopant reflect these modifications. In all cases absolute response factors were calculated. From these values, the cleanliness of the de- tector can be inferred, and the MDQs can be estimated. The values of the capture coefficients are compared with values obtained in the radioactive ECD and calculated values that are expected based on the kinetic model of the ECD, mea- sured values of rate constants, and the structure of the com- pound. For the most part, the values compare well with those obtained with the radioactive detector; however, there are some exceptions, and these are discussed. The consistency of the re- sults for compounds measured in both detectors illustrates the ruggedness of the detector. For compounds that are not "maximum" capturing com- pounds (i.e., those defined as K EC < 10 9 ), the temperature is an important variable in analytical ECD work. For example, for dis- sociative compounds, the temperature should be high for max- imum response, whereas for nitrobenzenes and hexafluo- robenzene, the detector temperature should be low. In addition, temperature variations will affect the precision of the analysis for these compounds. With hydrogen, the responses were mea- sured at 373 K. In the case in which methane was used as a 368 Reproduction (photocopying) of editorial content of this journal is prohibited without publisher's permission. Downloaded from https://academic.oup.com/chromsci/article/34/8/368/321508 by guest on 02 June 2022
-
Upload
khangminh22 -
Category
Documents
-
view
1 -
download
0
Transcript of Pulsed-Discharge Electron-Capture Detector: Kinetic Model ...

Journal of Chromatographic Science, Vol. 34, August 1996
Pulsed-Discharge Electron-Capture Detector: Kinetic Model, Response Factors, and Temperature Dependence W.E. Wentworth* and Y. Wang Universi ty of Houston, Department of Chemistry, Houston, Texas 77204-5641
Wayne Odegard and E.C.M. Chen Universi ty of Houston Clear Lake, Houston, Texas 77058
Stanley D. Stearns Valco Instruments C o . , Inc., P.O. Box 55603 , Houston, Texas 77255
Abstract
The absolute electron capture coefficient, KEC for a variety of compounds that undergo different electron capture mechanisms is determined by using a pulsed-discharge electron capture detector (PDECD). The temperature dependence of the representative compounds is measured. Two different dopant gases, hydrogen and methane, are used. The relative responses cover 5-6 orders of magnitude, just as in the radioactive ECD. The exceptions are discussed. The absolute response factors of the PDECD are greater than for the radioactive ECD for most compounds and are much greater for the alkyl iodides. The general temperature dependence is similar to that in the radioactive ECD. The results are discussed in terms of the kinetic model for ECDs. These results have been used to develop a commercial, nonradioactive ECD that is now being field-tested.
Introduction
The development of sensitive and selective detectors has played a major role in the establishment of gas chromatography as an unrivaled analytical tool. Chief among the detectors for gas chromatography are the ionization detectors. Recently, a pulsed-discharge helium ionization source was used in a universal detector and also in a selective detector, namely, a pulsed-discharge electron-capture detector (PDECD). This use in both types of detectors is accomplished with the same basic hardware; only the potentials and the detector-scavenging gas need to be changed (1,2). The development of a nonradioactive ECD is especially important because the ECD is the most sensitive detector available for many compounds. In a paper introducing the PDECD (1), the potential use in the analysis of pesticides was demonstrated. The absolute responses, linear dynamic range, and minimum detectable quantities (MDQ) for five compounds were reported. The advantages and disadvantages of the radioactive ECD were considered, and the need for a nonradioactive ECD was also discussed (1). Additional response factors for 40–50 different compounds were measured to better
*Author to whom correspondence should be addressed.
characterize the detector and to provide data for producing a commercial detector. These compounds have a wide range of responses in the standard ECD. Compounds such as hexafluo– robenzene, nitrobenzenes, and acetophenone undergo nondis-sociative electron capture in the ECD, whereas the alkyl halides undergo dissociative electron capture. Some compounds such as the chloroalkenes and the aryl halides undergo both dissociative and nondissociative capture. In addition, the normal low response of compounds such as alkanes and methanol was established because they were used as solvents for the determinations (3).
Two distinct sets of data collected by different operators are reported here with two dopant gases, hydrogen and methane, and slightly different detectors. The results for hydrogen indicated that ionization was competing with the electron capture processes for some compounds and dictated that a different dopant, such as methane, should be used. In addition, some physical modifications in the detector were made in the process of commercialization. The studies using methane as a dopant reflect these modifications. In all cases absolute response factors were calculated. From these values, the cleanliness of the detector can be inferred, and the MDQs can be estimated.
The values of the capture coefficients are compared with values obtained in the radioactive ECD and calculated values that are expected based on the kinetic model of the ECD, measured values of rate constants, and the structure of the compound. For the most part, the values compare well with those obtained with the radioactive detector; however, there are some exceptions, and these are discussed. The consistency of the results for compounds measured in both detectors illustrates the ruggedness of the detector.
For compounds that are not "maximum" capturing compounds (i.e., those defined as KEC < 109), the temperature is an important variable in analytical ECD work. For example, for dissociative compounds, the temperature should be high for maximum response, whereas for nitrobenzenes and hexafluo-robenzene, the detector temperature should be low. In addition, temperature variations will affect the precision of the analysis for these compounds. With hydrogen, the responses were measured at 373 K. In the case in which methane was used as a
368 Reproduction (photocopying) of editorial content of this journal is prohibited without publisher's permission.
Dow
nloaded from https://academ
ic.oup.com/chrom
sci/article/34/8/368/321508 by guest on 02 June 2022
Journal of Chromatographic Science, Vol. 34, August 1996
dopant, measurements were made at 423 K. The values of KEC
were measured as a function of detector temperature for the chloromethanes, tetrachloroethylene, and hexafluorobenzene. The temperature dependence is compared with that obtained from the radioactive ECD and from the kinetic model.
On the basis of these results, it is clear that the basic ECD mechanisms are operative and the usual determinations that are carried out with a radioactive ECD can be carried out with the PDECD. This is illustrated by a comparison between chro-matograms obtained from a pulsed-discharge helium ionization detector (PDHID) and a PDECD. The relative responses to various compounds illustrate the selectivity of the detectors, and the signal-to-noise ratios demonstrate that the selective analyses are practical. A commercial detector is currently in the hands of instrument manufacturers and users for further testing.
Kinetic model The kinetic model for the ECD (3–6) assumes a constant pro
duction of thermal electrons. In the case of the PDECD, the electrons are generated by photoionization of the dopant. In addition, the electrons must be thermalized. A potential competing process is the ionization of the sample by photons. The rate constant for the production of the electrons is designated kp. The sample reacts with the thermal electrons by either instantaneous dissociation with a rate constant of k12 or the formation of a stable negative ion with a rate constant of k1, which can subsequently dissociate with the rate constant k2 or detach with the rate constant k–1. The overall loss of electrons is by recombination with positive ions, and the process has a second-order rate constant, k'D. Similarly, the loss of any of the negative ions is also by recombination with positive ions but has a rate constant, k'N.
If the concentration of positive species is approximately constant, then these bimolecular rate constants can be replaced with pseudo-unimolecular rate constants, kD and kN, where kD = k'D [D+] and kN = k'N[D+]. If impurities reduce the standing current, then the rate constants for these losses can be expressed by a rate constant for reaction with impurities, k\. It is assumed that these impurities are "maximum" capturing species that do not release electrons by detachment. The reactions are
Eq l
Eq 2
Eq 3
The photons that cause ionization of the dopant are produced in pulses at the frequency of the pulsed discharge. This is usually in the range of 2–3 kHz or a pulse interval of 300–500
μs. This pulse interval is small compared with the residence time of the sample in the detector, which is approximately 0.10 s. Consequently, the sample is exposed to the generation of electrons in approximately 200–300 pulses before it leaves the detector. In this period of time, we can assume that the electrons and negative ions acquire a steady–state condition. Under these steady-state assumptions, in the absence of a sample molecule, AB, the electron current, Ib, is given by
100
Figure 1. Simulated chromatograms of direct and corrected electron capture detector (ECD) responses for a concentration range of 2 orders of magnitude.
369
Dow
nloaded from https://academ
ic.oup.com/chrom
sci/article/34/8/368/321508 by guest on 02 June 2022
Journal of Chromatographic Science, Vol. 34, August 1996
Eq 4
In the presence of a capturing species, AB, the following additional reactions can take place:
Under steady-state conditions,
Eq 5
Eq 6
Eq 7
Eq 8
Eq 9
where Ie_ is the electron current in the presence of the capturing species and
Eq 10
From Equation 10, it is clear that the absolute value of the phe-nomenological capture coefficient, KEC, is a function of the cleanliness of the detector. However, relative values are independent of the impurities in the detector in most cases because the term kD
+ kI[I] will cancel in Equation 10. The relative responses are
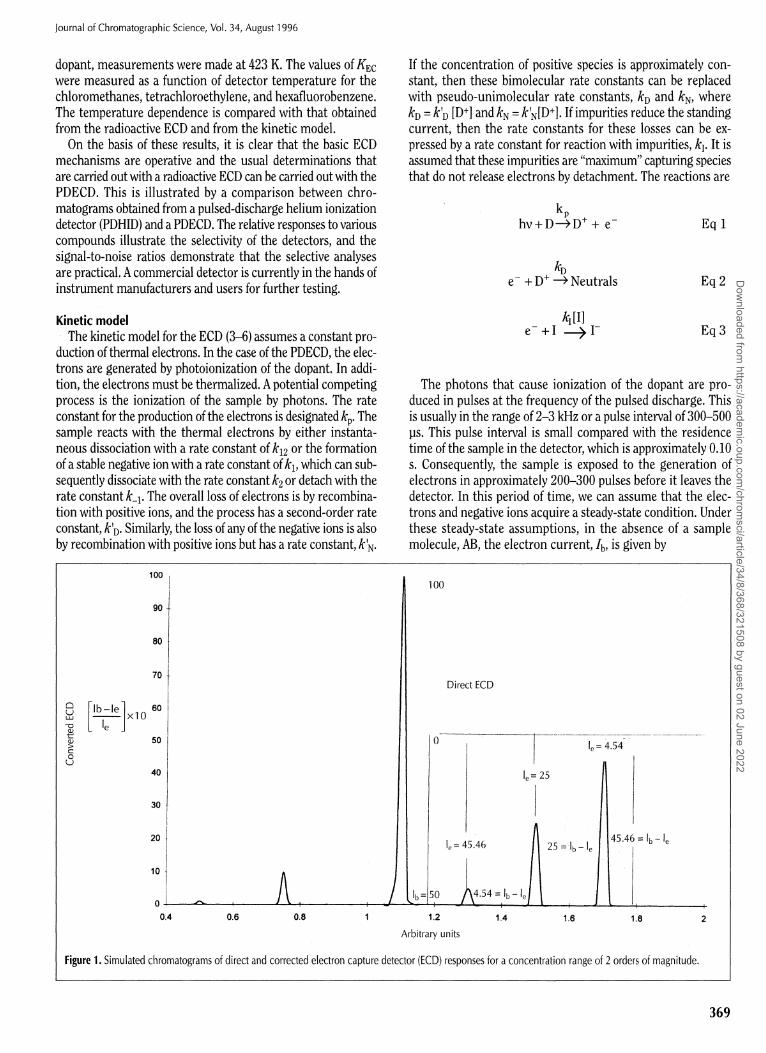
Figure 2. Flow pattern and cross-sectional diagram for the nonradioactive electron-capture detector.
only functions of the rate constants of the various molecules; thus, it is important to establish a value of the standing current for a given dopant by obtaining absolute capture coefficients.
Calculation of capture coefficients In Figure 1, a series of simulated chromatograms are shown
in which the peaks represent a concentration change of 2 orders of magnitude. The standing current is equal to b and is 50 units. The highest direct ECD peak is 45.5 units, and the converted signal is 10 because b – e = 45.46 and e = 4.54 units. When the moles injected are reduced by a factor of 10, the peak height for the corrected response decreases to 1.0, but that of the direct signal, b – e, is 25. This is only a decrease of a factor of 2. When the concentration is again reduced by a factor of 10, the corrected response is 0.1, but the peak height of the direct signal is 4.54 not 2.5. This is only a decrease by a factor of 5. For another decrease in concentration by a factor of 10, the direct signal is 0.495, which is almost a factor of 10. The corrected response is linear up to 90% capture and can be used to determine the absolute values of the capture coefficients.
If the peaks are symmetrical, as is frequently the case with modern capillary columns, only the peak height needs to be converted. When the chromatograms are recorded on a strip chart recorder, the chart speed on the recorder should be increased to obtain an accurate measurement of the peak width. The area can then be obtained by simple triangulation. The other data that are required are the flow rate through the detector and the moles of sample in the detector. This requires the measurement of the split ratio for split injections. The calculation for KEC is then given by
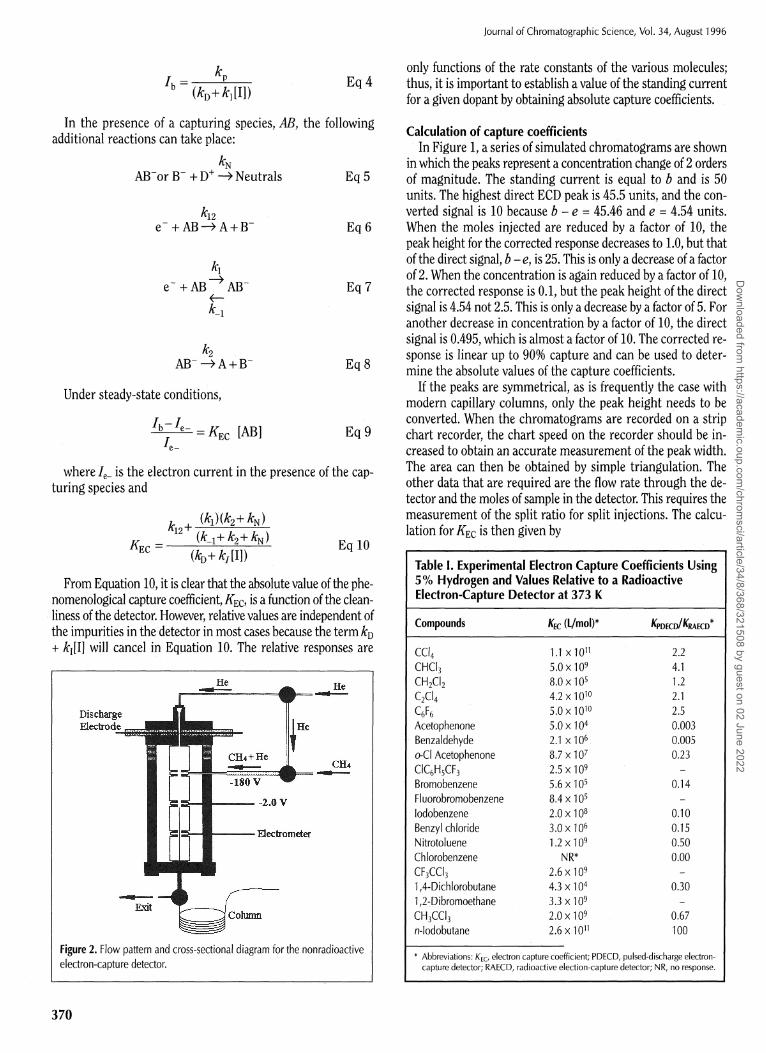
Compounds KEC (L/mol)* K P D E C D / K R A E C D *
CCI 4 1.1 × 10 1 1 2.2 CHCI3 5.0 ×10⁹ 4.1 CH 2 CI 2 8.0 ×10s 1.2 C 2 CI 4 4.2 ×10¹⁰ 2.1
C 6 F 6 5.0 ×10¹⁰ 2.5
Acetophenone 5.0 ×10⁴ 0.003 Benzaldehyde 2.1 ×10⁶ 0.005 o-CI Acetophenone 8.7 ×10⁷ 0.23 CIC 6 H 5 CF 3 2.5 ×10⁹ – Bromobenzene 5.6 × 10 5 0.14 Fluorobromobenzene 8.4×10⁵ – lodobenzene 2.0×10⁸ 0.10 Benzyl chloride 3.0×10⁶ 0.15 Nitrotoluene 1.2 × 10 9 0.50 Chlorobenzene NR* 0.00 CF3CCI3 2.6×10⁹ – 1,4-Dichlorobutane 4.3×10⁴ 0.30 1,2-Dibromoethane 3.3×10⁹ – CH3CCI3 2.0×10⁹ 0.67 n-lodobutane 2.6×10¹¹ 100
370
Table I. Experimental Electron Capture Coefficients Using 5% Hydrogen and Values Relative to a Radioactive Electron-Capture Detector at 373 Κ
* Abbreviations: KEC electron capture coefficient; PDECD, pulsed-discharge electron-capture detector; RAECD, radioactive election-capture detector; NR, no response.
Dow
nloaded from https://academ
ic.oup.com/chrom
sci/article/34/8/368/321508 by guest on 02 June 2022
Journal of Chromatographic Science, Vol. 34, August 1996
Eq l l
where ([b - e]/e)max (which has no units) is the corrected height at the peak maximum; the measured peak width at corrected half height is converted to the half time by dividing by the chart speed. The volumetric flow rate is measured with a bubble flow meter. It is the total flow rate through the detector and is typically 5 × 10⁴ L/s. The moles injected are determined from the sample size, the concentration, and the split ratio and are typically in the range of 1.0 fmol for a high-capturing com-
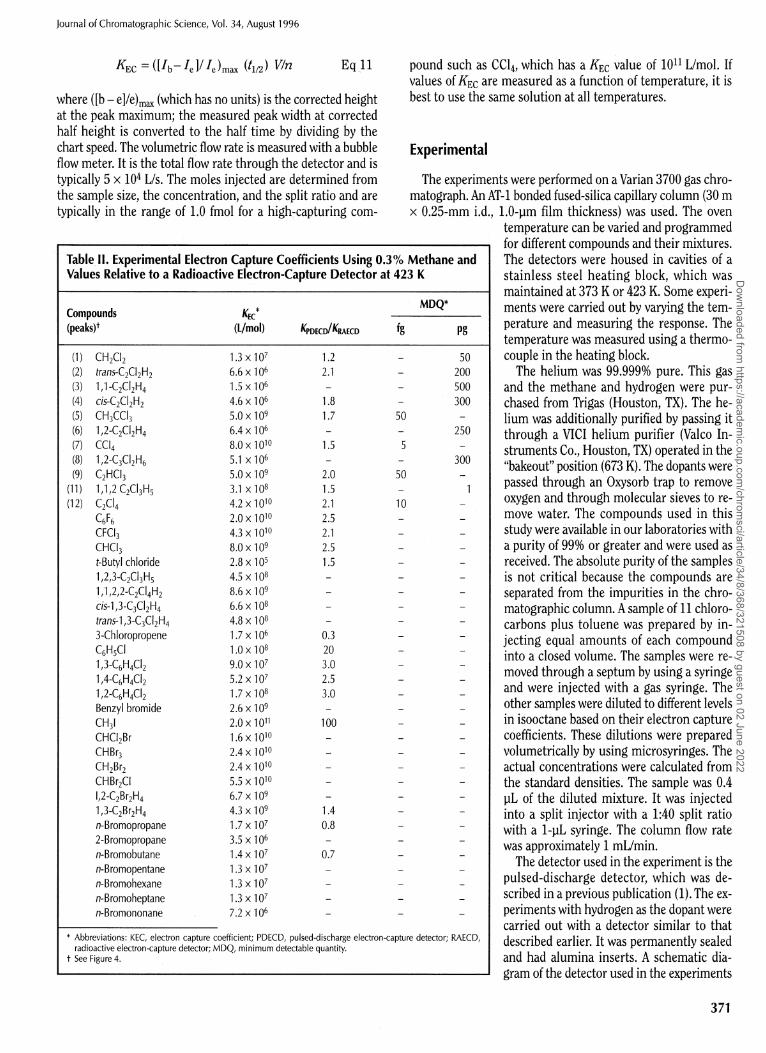
Compounds ΚEC* MDQ*
(peaks)† (L/mol) K P D E C D / K R A E C D fg Pg
(1) CH 2 CI 2 1.3 × 10 7 1.2 50 (2) trans-C 2Cl 2H 2 6.6×10⁶ 2.1 200 (3) 1,1-C 2CI 2H 4 1.5 ×10⁶ – 500 (4) c is-C 2 CI 2 H 2 4.6×10⁶ 1.8 300 (5) CH3CCI3 5.0×10⁹ 1.7 50 (6) 1 / 2-C 2 Cl 2 H 4 6.4×10⁶ – 250 (7) CCI4 8.0×10¹⁰ 1.5 5 (8) 1 / 2–C 3 Cl 2 H 6 5.1 ×10⁶ - 300 (9) C 2 H C l 3 5.0×10⁹ 2.0 50
(11) 1,1,2 C 2 Cl 3 H 5 3.1 ×10⁸ 1.5 1 (12) C 2 C l 4 4.2×101 0 2.1 10
C 6 F 6 2.0×10¹⁰ 2.5 _
CFCI3 4.3×10¹⁰ 2.1 – CHCI3 8.0×10⁹ 2.5 – t-Butyl chloride 2.8 ×10s 1.5 – 1,2,3-C 2Cl 3H 5 4.5×10⁸ – – 1,1,2,2-C 2Cl4H 2 8.6×10⁹ – – cis-1 , 3 -C 3 Cl 2 H 4 6.6×10⁸ – – tranS-1,3-C 3Cl 2H 4 4.8×10⁸ – – 3-Chloropropene 1.7 × 10 6 0.3 – C 6 H 5 C l 1.0 × 10 8 20 – 1,3-C6H4Cl2 9.0×10⁷ 3.0 – 1,4-C 6 H 4 Cl 2 5.2 ×10⁷ 2.5 – 1,2-C 6 H 4 Cl 2 1.7 × 10 8 3.0 – Benzyl bromide 2.6×10⁹ - – CH3I 2.0 ×10¹¹ 100 -CHCl 2Br 1.6 ×10¹⁰ – – CHBr 3 2.4 ×10¹⁰ – – CH 2 Br 2 2.4×10¹⁰ – – CHBr 2Cl 5.5 ×10¹⁰ – – l ,2–C 2Br 2H 4 6.7×10⁹ - – 1,3–C 2Br 2H 4 4.3×10⁹ 1.4 -n-Bromopropane 1.7 × 10 7 0.8 – 2-Bromopropane 3.5×10⁶ – – n-Bromobutane 1.4 ×10⁷ 0.7 – n–Bromopentane 1.3 ×10⁷ - – n-Bromohexane 1.3 × 10 7 – – n-Bromoheptane 1.3 × 10 7 – – n-Bromononane 7.2×10⁶ – –
pound such as CCl 4 , which has a KEC value of 10 1 1 L/mol. If values of KEC are measured as a function of temperature, it is best to use the same solution at all temperatures.
Experimental
The experiments were performed on a Varian 3700 gas chro-matograph. An AT-1 bonded fused-silica capillary column (30 m × 0.25-mm i.d., 1.0-μm film thickness) was used. The oven
temperature can be varied and programmed for different compounds and their mixtures. The detectors were housed in cavities of a stainless steel heating block, which was maintained at 373 Κ or 423 K. Some experiments were carried out by varying the temperature and measuring the response. The temperature was measured using a thermocouple in the heating block.
The helium was 99.999% pure. This gas and the methane and hydrogen were purchased from Trigas (Houston, TX). The helium was additionally purified by passing it through a VICI helium purifier (Valco Instruments Co., Houston, TX) operated in the "bakeout" position (673 K). The dopants were passed through an Oxysorb trap to remove oxygen and through molecular sieves to remove water. The compounds used in this study were available in our laboratories with a purity of 99% or greater and were used as received. The absolute purity of the samples is not critical because the compounds are separated from the impurities in the chromatographic column. A sample of 11 chloro-carbons plus toluene was prepared by injecting equal amounts of each compound into a closed volume. The samples were removed through a septum by using a syringe and were injected with a gas syringe. The other samples were diluted to different levels in isooctane based on their electron capture coefficients. These dilutions were prepared volumetrically by using microsyringes. The actual concentrations were calculated from the standard densities. The sample was 0.4 μL of the diluted mixture. It was injected into a split injector with a 1:40 split ratio with a 1-μL syringe. The column flow rate was approximately 1 mL/min.
The detector used in the experiment is the pulsed-discharge detector, which was described in a previous publication (1). The experiments with hydrogen as the dopant were carried out with a detector similar to that described earlier. It was permanently sealed and had alumina inserts. A schematic diagram of the detector used in the experiments
371
* Abbreviations: KEC, electron capture coefficient; PDECD, pulsed-discharge electron-capture detector; RAECD, radioactive electron-capture detector; MDQ, minimum detectable quantity.
† See Figure 4.
Table II. Experimental Electron Capture Coefficients Using 0.3% Methane and Values Relative to a Radioactive Electron-Capture Detector at 423 Κ D
ownloaded from
https://academic.oup.com
/chromsci/article/34/8/368/321508 by guest on 02 June 2022
Journal of Chromatographic Science, Vol. 34, August 1996
with methane as a dopant is shown in Figure 2. Helium makeup gas first flows through the pulsed-discharged region. Downstream are the three equally spaced electrodes. The bottom electrode closest to the gas exit serves as an electron collector and is connected to an electrometer for amplification. The voltages are applied to the other two electrodes. A special feature of the detector is that the dopant gas can be input through the tube connected to the electrode that is nearest to the discharge. The electrode tube is connected to the dopant gas source by a piece of fused-silica capillary column for the purpose of electrical insulation. The capillary column is extended into the detector cell from the gas exit and is positioned at the central electrode. The effluent from the column mixes with makeup helium and then vents at the outlet of the detector.
An advantage of the configuration of the detector is that the detector can conveniently be converted to PDHID or PDECD. In the ionization mode (PDHID), the dopant gas flow is cut off and the corresponding electrode is voltage floated, whereas the central one has a high-bias potential. In the electron capture mode (PDECD), a potential of 20–120 V is applied to the dopant gas inlet electrode and a 1–2 V potential is applied to the central one. Another advantage of the detector is that the discharge electrodes can be easily dismantled. This provides a convenient way to routinely clean the platinum discharge tips if they become contaminated.
The parameters used in the experiment are as follows: The pulse period is 300 μs, and the pulse width is 20 μs, which generates a 20–mA discharge current. The flow rate of helium makeup gas, which is controlled by a pressure regulator and a fixed restrictor, is 30 mL/min. The pure methane dopant gas used in the ECD mode is diluted by helium before entering the detector cell so that the methane dopant concentration can be easily controlled using a pressure regulator. The eventual methane concentration in the detector is set at an approximate
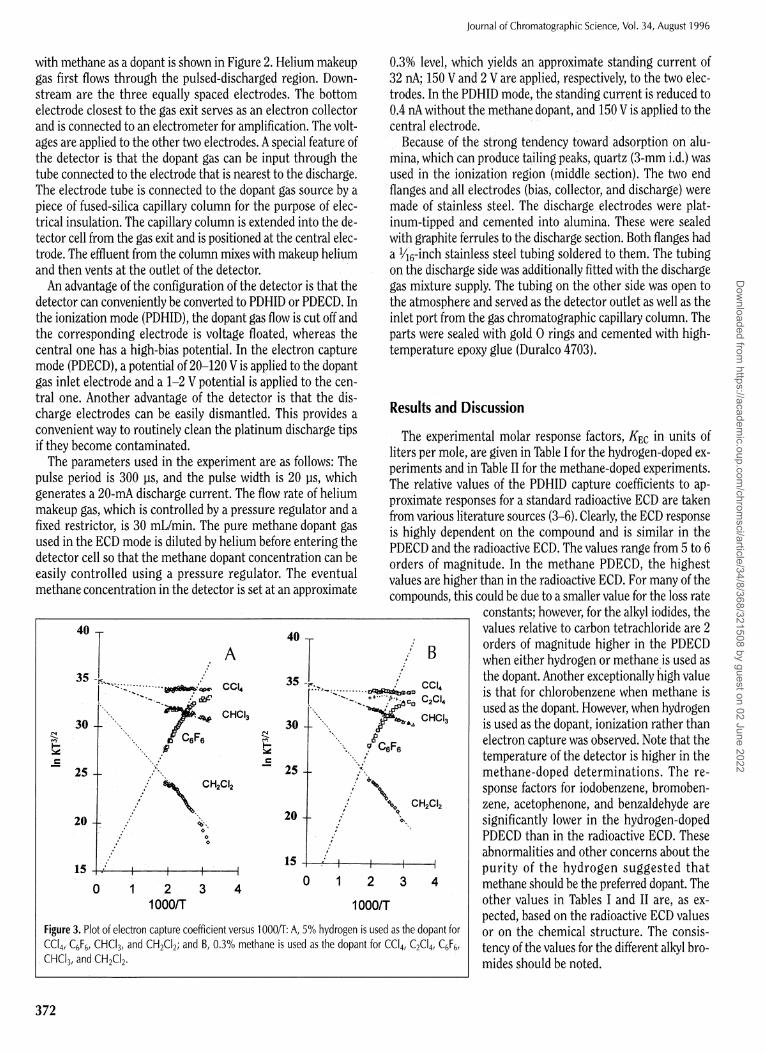
Figure 3. Plot of electron capture coefficient versus 1000/T: A, 5% hydrogen is used as the dopant for C C l 4 / C 6 F 6 / C H C l 3 , and C H 2 C l 2 ; and B, 0.3% methane is used as the dopant for C C l 4 / C 2 C l 4 / C 6 F 6 , CHCI3, and C H 2 C l 2 .
0.3% level, which yields an approximate standing current of 32 nA; 150 V and 2 V are applied, respectively, to the two electrodes. In the PDHID mode, the standing current is reduced to 0.4 nA without the methane dopant, and 150 V is applied to the central electrode.
Because of the strong tendency toward adsorption on alumina, which can produce tailing peaks, quartz (3-mm i.d.) was used in the ionization region (middle section). The two end flanges and all electrodes (bias, collector, and discharge) were made of stainless steel. The discharge electrodes were platinum-tipped and cemented into alumina. These were sealed with graphite ferrules to the discharge section. Both flanges had a 1/16-inch stainless steel tubing soldered to them. The tubing on the discharge side was additionally fitted with the discharge gas mixture supply. The tubing on the other side was open to the atmosphere and served as the detector outlet as well as the inlet port from the gas chromatographic capillary column. The parts were sealed with gold Ο rings and cemented with high-temperature epoxy glue (Duralco 4703).
Results and Discussion
The experimental molar response factors, KEC in units of liters per mole, are given in Table I for the hydrogen-doped experiments and in Table II for the methane-doped experiments. The relative values of the PDHID capture coefficients to approximate responses for a standard radioactive ECD are taken from various literature sources (3-6). Clearly, the ECD response is highly dependent on the compound and is similar in the PDECD and the radioactive ECD. The values range from 5 to 6 orders of magnitude. In the methane PDECD, the highest values are higher than in the radioactive ECD. For many of the compounds, this could be due to a smaller value for the loss rate
constants; however, for the alkyl iodides, the values relative to carbon tetrachloride are 2 orders of magnitude higher in the PDECD when either hydrogen or methane is used as the dopant. Another exceptionally high value is that for chlorobenzene when methane is used as the dopant. However, when hydrogen is used as the dopant, ionization rather than electron capture was observed. Note that the temperature of the detector is higher in the methane-doped determinations. The response factors for iodobenzene, bromoben-zene, acetophenone, and benzaldehyde are significantly lower in the hydrogen-doped PDECD than in the radioactive ECD. These abnormalities and other concerns about the purity of the hydrogen suggested that methane should be the preferred dopant. The other values in Tables I and II are, as expected, based on the radioactive ECD values or on the chemical structure. The consistency of the values for the different alkyl bromides should be noted.
372
Dow
nloaded from https://academ
ic.oup.com/chrom
sci/article/34/8/368/321508 by guest on 02 June 2022
Journal of Chromatographic Science, Vol. 34, August 1996
The absolute electron capture coefficients can be calculated from rate constants for thermal electron attachment measured by other techniques and an estimate of the electron loss rate constants. For example, the rate constant, k 1 2 , for carbon tetrachloride (3) has been measured at room temperature and is 2.5 × 10 1 4 L/(mol·s). If the loss rate constants, (kD + kI[I]), are 2.5 × 10³ per second, then KEC = 10 1 1 L/mol. This is comparable with the value that is reported in Table I. Likewise, the value of k1 for hexafluorobenzene is 9.0 × 10 1 3 L/(mol-s), and that for nitro-toluene is 6 × 10 1 1 L/(mol·s). When the same value for the loss rate constants is used, the equation for the value of hexafluorobenzene is KEC = 3.6 × 10 1 0 L/mol, which again is comparable with the value in Table I. Thus, the absolute magnitude of KEC
can be used as a measure of the cleanliness of the detector. All of the values in Table II are of the expected relative mag
nitudes except for chlorobenzene. The compounds with the lowest response factors are the dichloroalkanes, and those with the largest values are carbon tetrachloride and dibro-mochloromethane. As shown in Table I, the response factor for chlorobenzene is about 1 order of magnitude larger than in the radioactive ECD. The response factor for the dichlorobenzenes is approximately the same as that for chlorobenzene, whereas that in the radioactive ECD is about 2 orders of magnitude larger at 423 Κ (4). It is possible that this is due to an increase in the rate constant for thermal electron attachment (k1), which results from a wider distribution of electron energies.
In Figure 3, the temperature dependence is illustrated by plotting ln (KECT3/2) versus 1000/T. In the data for hydrogen, the values for methylene chloride drop at low temperatures and eventually give a positive peak. This is another indication that ionization competes with electron capture for this dopant.
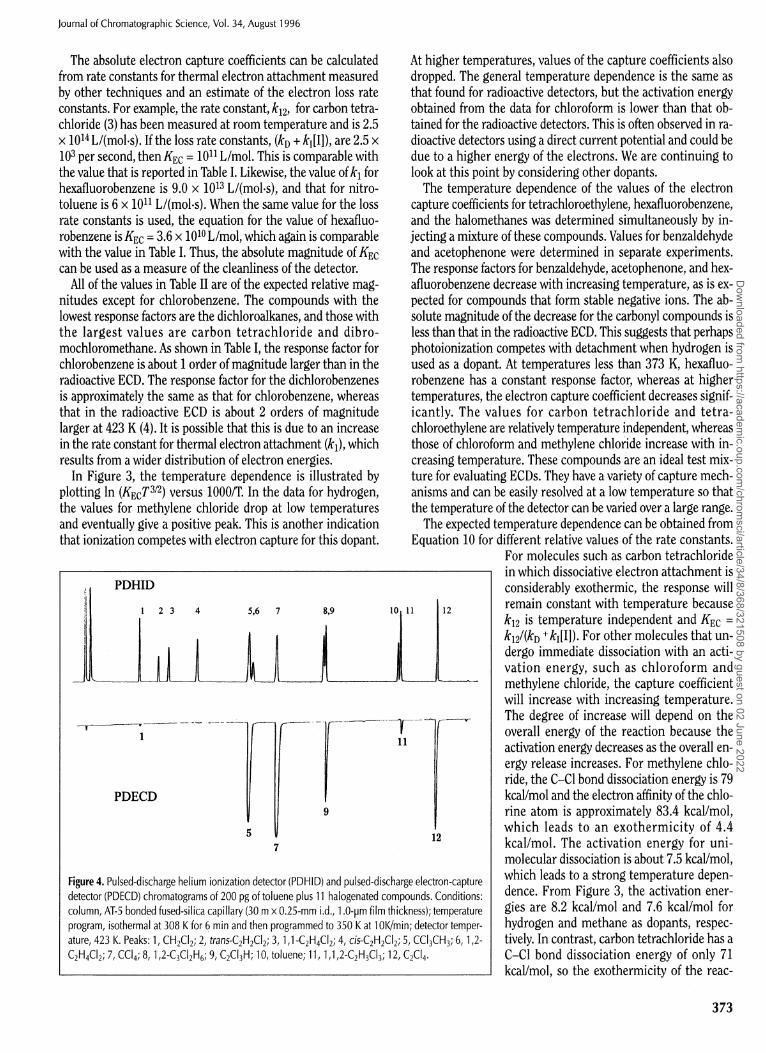
Figure 4. Pulsed-discharge helium ionization detector (PDHID) and pulsed-discharge electron-capture detector (PDECD) chromatograms of 200 pg of toluene plus 11 halogenated compounds. Conditions: column, AT-5 bonded fused-silica capillary (30 m × 0.25-mm i.d., 1.0-μm film thickness); temperature program, isothermal at 308 Κ for 6 min and then programmed to 350 Κ at 10K/min; detector temperature, 423 K. Peaks: 1, C H 2 C l 2 ; 2, frans-C 2H 2Cl 2; 3 ,1 ,1 -C 2 H 4 Cl 2 ; 4, c is -C 2 H 2 Cl 2 ; 5, C C l 3 C H 3 ; 6,1,2-C 2 H 4 C l 2 ; 7, C C l 4 ; 8 ,1 ,2 -C 3 Cl 2 H 6 ; 9, C 2 C l 3 H ; 10, toluene; 11,1,1,2-C 2 H 3 Cl 3 ; 12, C 2 C l 4 .
At higher temperatures, values of the capture coefficients also dropped. The general temperature dependence is the same as that found for radioactive detectors, but the activation energy obtained from the data for chloroform is lower than that obtained for the radioactive detectors. This is often observed in radioactive detectors using a direct current potential and could be due to a higher energy of the electrons. We are continuing to look at this point by considering other dopants.
The temperature dependence of the values of the electron capture coefficients for tetrachloroethylene, hexafluorobenzene, and the halomethanes was determined simultaneously by injecting a mixture of these compounds. Values for benzaldehyde and acetophenone were determined in separate experiments. The response factors for benzaldehyde, acetophenone, and hexafluorobenzene decrease with increasing temperature, as is expected for compounds that form stable negative ions. The absolute magnitude of the decrease for the carbonyl compounds is less than that in the radioactive ECD. This suggests that perhaps photoionization competes with detachment when hydrogen is used as a dopant. At temperatures less than 373 K, hexafluorobenzene has a constant response factor, whereas at higher temperatures, the electron capture coefficient decreases significantly. The values for carbon tetrachloride and tetrachloroethylene are relatively temperature independent, whereas those of chloroform and methylene chloride increase with increasing temperature. These compounds are an ideal test mixture for evaluating ECDs. They have a variety of capture mechanisms and can be easily resolved at a low temperature so that the temperature of the detector can be varied over a large range.
The expected temperature dependence can be obtained from Equation 10 for different relative values of the rate constants.
For molecules such as carbon tetrachloride in which dissociative electron attachment is considerably exothermic, the response will remain constant with temperature because k12 is temperature independent and KEC = k12/(kD
+ kI[I]). For other molecules that undergo immediate dissociation with an activation energy, such as chloroform and methylene chloride, the capture coefficient will increase with increasing temperature. The degree of increase will depend on the overall energy of the reaction because the activation energy decreases as the overall energy release increases. For methylene chloride, the C–Cl bond dissociation energy is 79 kcal/mol and the electron affinity of the chlorine atom is approximately 83.4 kcal/mol, which leads to an exothermicity of 4.4 kcal/mol. The activation energy for uni-molecular dissociation is about 7.5 kcal/mol, which leads to a strong temperature dependence. From Figure 3, the activation energies are 8.2 kcal/mol and 7.6 kcal/mol for hydrogen and methane as dopants, respectively. In contrast, carbon tetrachloride has a C–Cl bond dissociation energy of only 71 kcal/mol, so the exothermicity of the reac-
373
Dow
nloaded from https://academ
ic.oup.com/chrom
sci/article/34/8/368/321508 by guest on 02 June 2022
Journal of Chromatographic Science, Vol. 34, August 1996
tion is 12.4 kcal/mol and the activation energy is approximately 0 (-0.6 kcal/mol). The values from Figure 3 are -0.3 and -0.4 kcal/mol for the two dopants. The activation energy for chloroform is 3.4 kcal/mol. The activation energy calculated using the data in Figure 3 is 1.5 kcal/mol. This is the greatest discrepancy in the values for the activation energies. The intercepts range from 33 to 35 for the PDECD data, which is consistent with values from the radioactive ECD.
For molecules such as hexafluorobenzene, which has a moderate electron affinity, the electron capture coefficient is found by using KEC = k1/(kD + kI[I]) at lower temperatures. The temperature dependence is small because the activation energy for the rate constant k1 is unusually low. At higher temperatures Equation 10 becomes KEC = k1kN/{k1(kD + kI[I])}. Because the temperature-dependent term k–1 is in the denominator, KEC will decrease with increasing temperatures at higher temperatures. The degree of decrease will depend on the molecular electron affinity. The experimental value is 19.5 kcal/mol, and the lines in Figure 3 are drawn by using a value of 18.5 kcal/mol.
Other molecules such as the chloroethylenes and dichlorobenzenes can have temperature regions that exhibit all three behaviors. At low temperature kN predominates over k–1
whereas at high temperatures k2 predominates over k–1 and the electron capture coefficient is given by KEC = k1/(kD + kI[I]) at both the highest and lowest temperatures. At intermediate temperatures, k–1 predominates in the denominator and kN
predominates over k2 in the numerator so that KEC = k1kN/{k–1(kD + kI[I])} at lower temperatures. At higher temper-
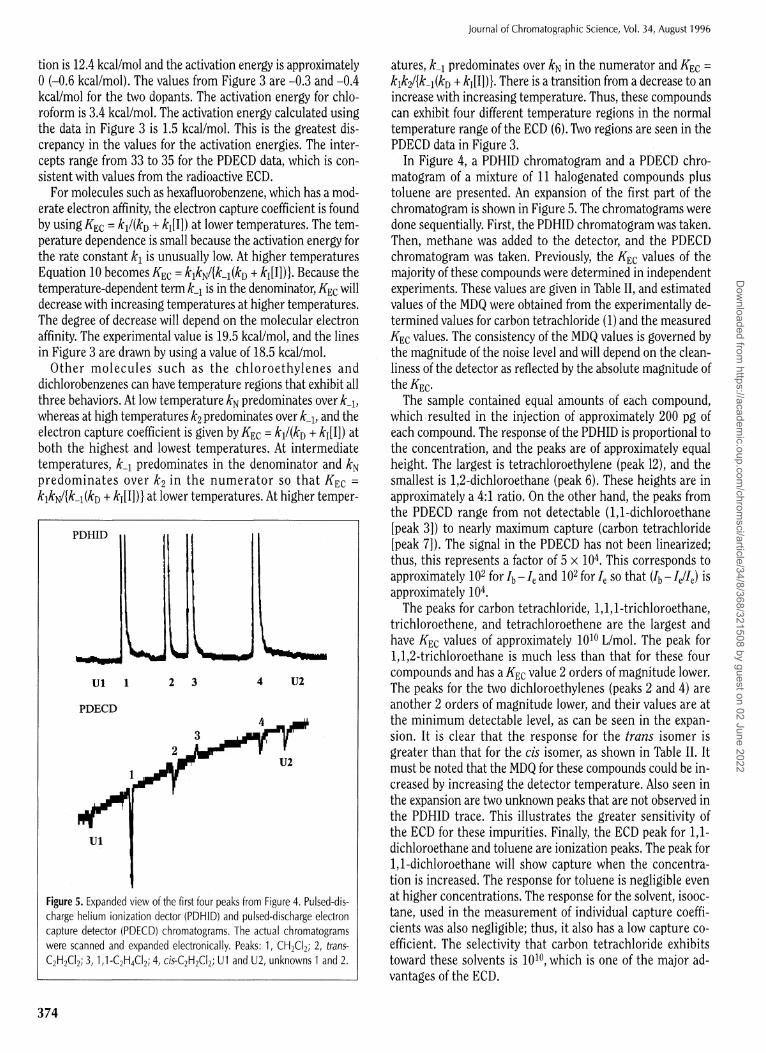
Figure 5. Expanded view of the first four peaks from Figure 4. Pulsed-dis-charge helium ionization dector (PDHID) and pulsed-discharge electron capture detector (PDECD) chromatograms. The actual chromatograms were scanned and expanded electronically. Peaks: 1, C H 2 C l 2 ; 2, trans-C 2 H 2 C l 2 ; 3, 1,1-C 2H 4Cl 2; 4, c is -C 2 H 2 Cl 2 ; U1 and U2, unknowns 1 and 2.
atures, k–1 predominates over kN in the numerator and KEC = k1k2/{k–1(kD + kI[I])}. There is a transition from a decrease to an increase with increasing temperature. Thus, these compounds can exhibit four different temperature regions in the normal temperature range of the ECD (6). Two regions are seen in the PDECD data in Figure 3.
In Figure 4, a PDHID chromatogram and a PDECD chro-matogram of a mixture of 11 halogenated compounds plus toluene are presented. An expansion of the first part of the chromatogram is shown in Figure 5. The chromatograms were done sequentially. First, the PDHID chromatogram was taken. Then, methane was added to the detector, and the PDECD chromatogram was taken. Previously, the KEC values of the majority of these compounds were determined in independent experiments. These values are given in Table II, and estimated values of the MDQ were obtained from the experimentally determined values for carbon tetrachloride (1) and the measured KEC values. The consistency of the MDQ values is governed by the magnitude of the noise level and will depend on the cleanliness of the detector as reflected by the absolute magnitude of the K E C .
The sample contained equal amounts of each compound, which resulted in the injection of approximately 200 pg of each compound. The response of the PDHID is proportional to the concentration, and the peaks are of approximately equal height. The largest is tetrachloroethylene (peak 12), and the smallest is 1,2-dichloroethane (peak 6). These heights are in approximately a 4:1 ratio. On the other hand, the peaks from the PDECD range from not detectable (1,1-dichloroethane [peak 3]) to nearly maximum capture (carbon tetrachloride [peak 7]). The signal in the PDECD has not been linearized; thus, this represents a factor of 5 × 10⁴. This corresponds to approximately 102 for Ib – Ie and 102 for Ie so that (Ib – Ie/Ie) is approximately 104.
The peaks for carbon tetrachloride, 1,1,1-trichloroethane, trichloroethene, and tetrachloroethene are the largest and have KEC values of approximately 10 1 0 L/mol. The peak for 1,1,2-trichloroethane is much less than that for these four compounds and has a KEC value 2 orders of magnitude lower. The peaks for the two dichloroethylenes (peaks 2 and 4) are another 2 orders of magnitude lower, and their values are at the minimum detectable level, as can be seen in the expansion. It is clear that the response for the trans isomer is greater than that for the cis isomer, as shown in Table II. It must be noted that the MDQ for these compounds could be increased by increasing the detector temperature. Also seen in the expansion are two unknown peaks that are not observed in the PDHID trace. This illustrates the greater sensitivity of the ECD for these impurities. Finally, the ECD peak for 1,1-dichloroethane and toluene are ionization peaks. The peak for 1,1-dichloroethane will show capture when the concentration is increased. The response for toluene is negligible even at higher concentrations. The response for the solvent, isooc-tane, used in the measurement of individual capture coefficients was also negligible; thus, it also has a low capture coefficient. The selectivity that carbon tetrachloride exhibits toward these solvents is 10 1 0, which is one of the major advantages of the ECD.
374
Dow
nloaded from https://academ
ic.oup.com/chrom
sci/article/34/8/368/321508 by guest on 02 June 2022

Journal of Chromatographic Science, Vol. 34, August 1996
Conclusions
The PDECD responds to compounds "high" electron-capture coefficients (K E C > 107 L/mol) in the same manner as the radioactive ECD and can be used to quantitate these compounds in the 10–1000–fg range. The kinetic processes that govern the response of the PDECD are the same as those that govern the radioactive ECD, as indicated by the general temperature dependence of the capture coefficient. When hydrogen is used as a dopant, ionization may compete with electron capture. When methane is used, this competition is minimized; thus, methane is the preferred dopant. The simultaneous use of a PDHID and a PDECD allows for good quantitative and qualitative analysis of components in a mixture of 12 halocarbons.
Acknowledgments
The authors wish to thank Larry Sims from the electronics shop at the University of Houston for assistance in this study. This research was carried out in collaboration with Valco Instruments (Houston, TX). This research was supported by Valco Instruments, the Robert A. Welch Foundation (Grant E-095
and UHCL Chemistry Departmental Grant), and the Texas Advanced Technology Development and Transfer Program 1993 (Project Number 00365-076).
References
1. W.E. Wentworth, E.D. D'Sa, H. Ca i , and S.D. Stearns. Environmental applications of the pulsed–discharge electron capture detector. J. Chromatogr. Sci. 30:47-55 (1992).
2. W.E Wentworth, S.V. Vasnin, S.D. Stearns, and C.J. Meyer. Pulsed discharge he l ium ion izat ion detector. Chromatographia 34: 219–25(1992).
3. W.E. Wentworth and E.C.M. Chen. Theory of electron capture. In Electron Capture. A . Zlatkis and C. Poole, Eds., Elsevier, New York, NY, 1981, pp 27–65.
4. W.E. Wentworth, R.S. Becker, and R. Tung. Electron attachment to some aromatic and aliphatic chloro, bromo and iodo compounds. ]. Phys. Chem. 71:1652–59 (1967).
5. W.E. Wentworth and E.C.M. Chen. Electron attachment mechanisms. ]. Gas Chromatogr. 5:170–79 (1967).
6. E.D. D'Sa, W.E. Wentworth, and E.C.M. Chen. Thermal electron attachment to chloro– and bromo ethylenes. The demonstration of a new electron capture detector mechanism. J. Phys. Chem. 92: 285–90(1988).
Manuscript accepted February 28 ,1996 .
375
Dow
nloaded from https://academ
ic.oup.com/chrom
sci/article/34/8/368/321508 by guest on 02 June 2022