Municipal Sewage Discharge Criteria Technical Assessment ...
210
DRAFT DEC. 6/93 MINISTRY OF ENVIRONMENT, LANDS AND PARKS 628, 35/t1J966/ 1993 DAYTON & KNIGHT LTD. MUNICIPAL SEWAGE DISCHARGE CRITERIA TECHNICAL CPBC c. 1 v i VI CTOR IA MUNICIPAL SEWAGE DISCHARGE CRITERIA TECHNICAL ASSESSMENT REPORT NO. 1 BEST AVAILABLE CONTROL TECHNOLOGY Prepared by: DAYTON & KNIGHT LTD. Consulting Engineers West Vancouver, B.C. in association with MONTGOMERY-WATSON Consulting Engineers, Inc. Bellevue, WA, U.S.A.
-
Upload
khangminh22 -
Category
Documents
-
view
2 -
download
0
Transcript of Municipal Sewage Discharge Criteria Technical Assessment ...

DRAFT DEC. 6/93
MINISTRY OF ENVIRONMENT, LANDS AND PARKS
628, 35/t1J966/ 1993DAYTON & KNIGHT LTD.MUNICIPAL SEWAGE DISCHARGE
CRITERIA TECHNICALCPBC c. 1 v i VI CTOR I A
MUNICIPAL SEWAGE DISCHARGE CRITERIA
TECHNICAL ASSESSMENT REPORT NO. 1
BEST AVAILABLE CONTROL TECHNOLOGY
Prepared by:
DAYTON & KNIGHT LTD.Consulting EngineersWest Vancouver, B.C.
in association with
MONTGOMERY-WATSONConsulting Engineers, Inc.
Bellevue, WA, U.S.A.
MINISTRY OF ENVIRONM.E.~T,LANDS AND PARKSMUNICIPAL SEWAGE DISCHARGE CRITERIA
TECHNICAL ASSESSMENT REPORT NO.1BEST AVAllABLE CONTROL TECHNOLOGY
DRAFT
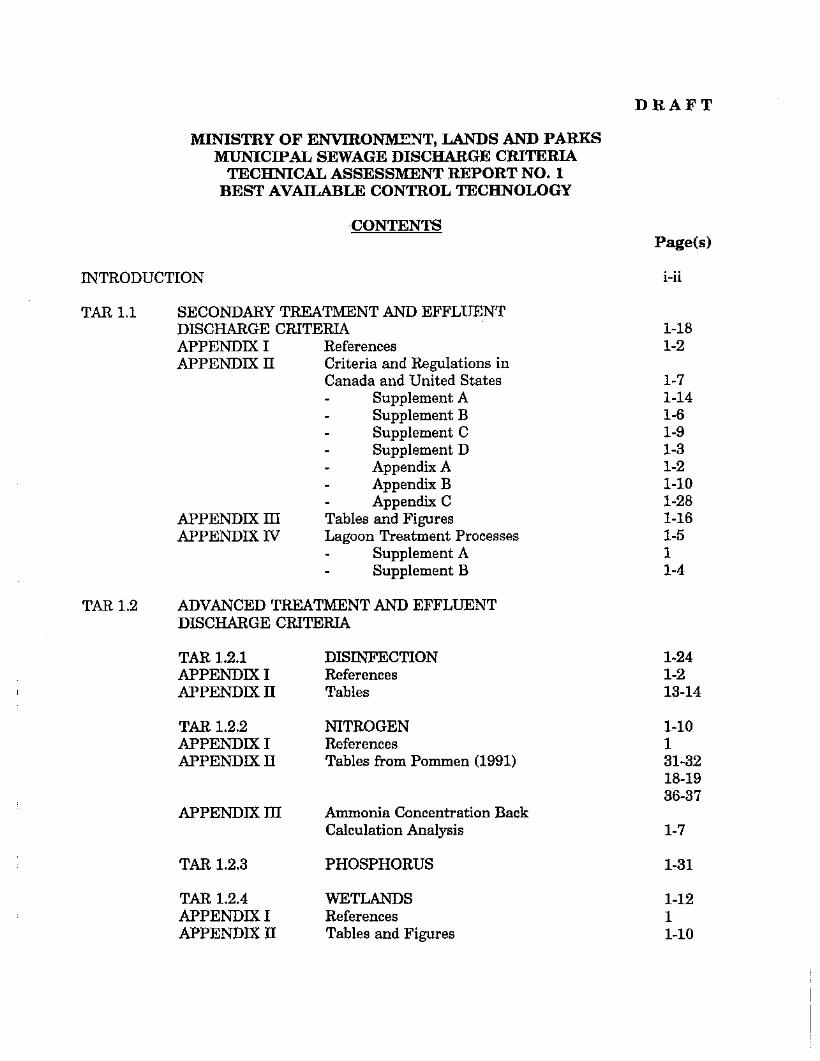
CONTENTSPage(s)
INTRODUCTION i-ii
TAR 1.1 SECONDARY TREATMENT AND EFFLUENTDISCHARGE CRITERIA 1-18APPENDIX I References 1-2APPENDIXll Criteria and Regulations in
Canada and United States 1-7Supplement A 1-14Supplement B 1-6Supplement C 1-9Supplement D 1-3Appendix A 1-2Appendix B 1-10Appendix C 1-28
APPENDIX ill Tables and Figures 1-16APPENDIX IV Lagoon Treatment Processes 1-5
Supplement A 1Supplement B 1-4
TAR 1.2 ADVANCED TREATMENT AND EFFLUENTDISCHARGE CRITERIA
TAR 1.2.1 DISINFECTION 1-24APPENDIX I References 1-2APPENDIXll Tables 13-14
TAR 1.2.2 NITROGEN 1-10APPENDIX I References 1APPENDIXll Tables from Pommen (1991) 31-32
18-1936-37
APPENDIX ill Ammonia Concentration BackCalculation Analysis 1-7
TAR 1.2.3 PHOSPHORUS 1-31
TAR 1.2.4 WETLANDS 1-12APPENDIX I References 1APPENDIXll Tables and Figures 1-10
DRAFT
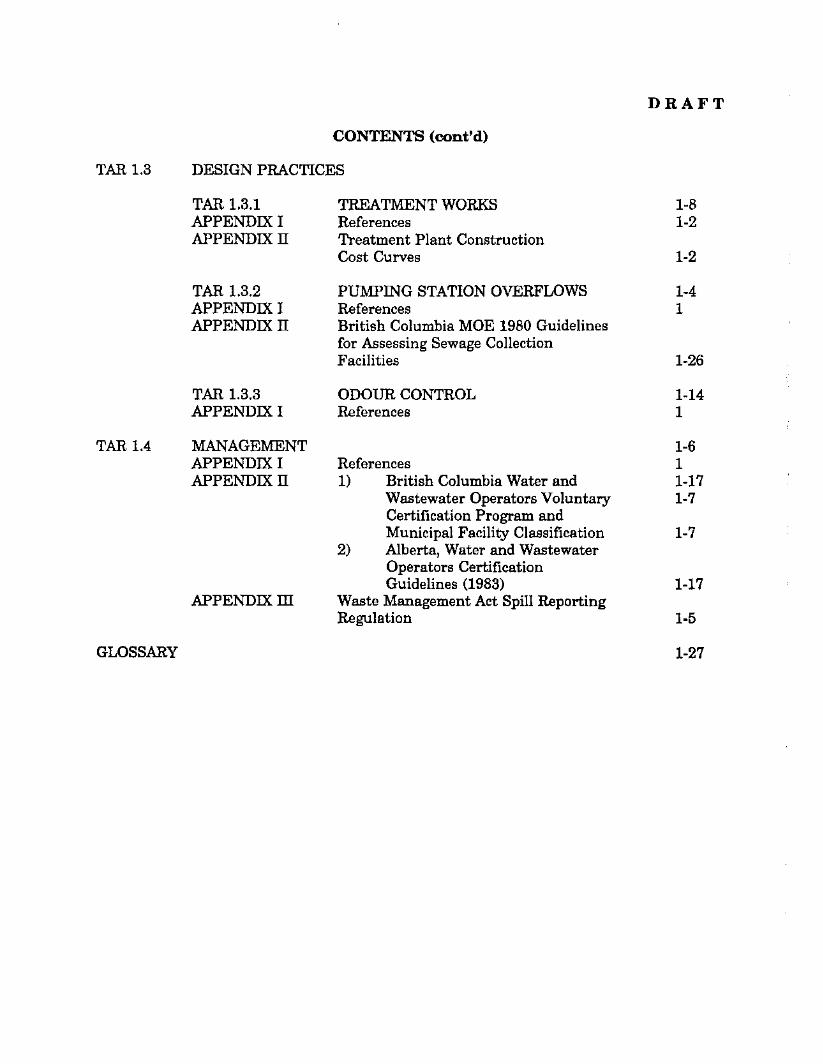
CONTENTS (cont'd)
TAR 1.3 DESIGN PRACTICES
TAR 1.3.1 TREATMENT WORKS 1-8APPENDIX I References 1-2APPENDIXll Treatment Plant Construction
Cost Curves 1-2
TAR 1.3.2 PUMPING STATION OVERFLOWS 1-4APPENDIX I References 1APPENDIXll British Columbia MOE 1980 Guidelines
for Assessing Sewage CollectionFacilities 1-26
TAR 1.3.3 ODOUR CONTROL 1-14APPENDIX I References 1
TAR 1.4 MANAGEMENT 1-6APPENDIX I References 1APPENDIXll 1) British Columbia Water and 1-17
Wastewater Operators Voluntary 1-7Certification Program andMunicipal Facility Classification 1-7
2) Alberta, Water and WastewaterOperators CertificationGuidelines (1983) 1-17
APPENDIXID Waste Management Act Spill ReportingRegulation 1-5
GLOSSARY 1-27

MINISTRY OF ENVIRONMENT, LAND AND PARKSMUNICIPAL SEWAGE DISCHARGE CRITERIA
TECHNICAL ASSESSMENT REPORT NO.1BEST AVAllABLE CONTROL TECHNOLOGY
INTRODUCTION
DRAFT
6 Dec/93
The Ministry of Environment, Lands and Parks has adopted an Environmental Protection
Program that will provide for the Province new directions in environmental protection.
An element in the Program is the revision to the current Pollution Control Objectives for
Municipal Type Waste Discharges that were established in 1975. The revision will take the
form of Municipal Sewage Discharge Criteria.
The Discharge Criteria are technology driven, incorporating BestAvailable Control Technology
(BACT), a policy direction that has been mandated by the Ministry.
This Technical Assessment Report (TAR) identifies and gives a description of secondary
treatment processes, presents effiuent quality parameters achievable by the secondary
treatment processes, identifies and gives a brief description of advanced treatment processes
for disinfection, nitrogen and phosphorus reduction, and use of wetlands, presents effiuent
quality parameters achievable by the advanced treatment processes, discusses design practices
for treatment works and reviews management, operations and reporting practices. The
Discharge Criteria address municipal type wastewater. Industrial wastewaters which do not
discharge to a Municipal sewerage system and stormwater discharges are excluded from the
new criteria.
The sections and subsections which follow are set out in the Ministry's standard assessment
format and each section or subsection is largely a stand-alone review, including background,
subject description, assessments, financial impact, recommendations, references and appendices.
Where appropriate, related sections are referenced.
- i -

DRAFT
The intent of the assessments is to evaluate current wastewater criteria, both in British
Columbia and elsewhere, to consider improvements and where appropriate to make
recommendations for new criteria.
The assessments consider the Ministry goals of reduce, reuse, and recycle through use of BACT
as a minimum treatment to maximize the achievement of the 3R goals. A philosophical change
is needed to recognize that BACT provides a means to recover the usefulness of municipal
wastewater as opposed to the current state of disposal of effluent.
Separate TARs deal with Effluent to Surface Waters, Effluent to Land, Combined Sewer
Overflows and Inflow and Infiltration, and the Financial Impact of Implementing BACT. A
Summary Document has also been prepared.
A glossary of terms is appended to provide definitions and abbreviations for all TARs.
- ii -

MINISTRY OF ENVIRONMENT, LANDS AND PARKSMUNICIPAL SEWAGE DISCHARGE CRITERIA
TECHNICAL ASSESSMENT REPORT NO.1BEST AVAllABLE CONTROL TECHNOLOGY
DRAFT
5 Dec/93
TAR 1.1 SECONDARY TREATMENT AND EFFLUENT DISCHARGE CRITERIA
Introduction
Secondary treatment technologies and effluent discharge criteria are evaluated in the following
technical assessment report. The mechanical plant and lagoon assessments review capabilities
and provide commentary on performance. Recommendations are made for discharge criteria
for the secondary processes and for monitoring requirements.
TAR 1.1 includes four appendices and appendix supplements.
Appendix I contains references to the main text.
Appendix IT contains criteria and regulations for Canada and the United States. Four
supplements to Appendix IT are included. Supplement A provides Canadian Standards and
Guidelines. Supplement B includes comparative tables for Canadian treatment criteria.
Supplement C provides effluent discharge criteria from the guidelines for selected Canadian
provinces. Supplement D describes discharge criteria and regulations in the United States.
Supplement D has three appendices. Appendix A is the U.S. Clean Water Act history.
Appendix B is the State of Colorado water quality compliance strategy. Appendix C is the
State of Washington draft surface water quality guidelines.
Appendix ill contains reference figures and tables for the main text.
Appendix IV contains a technical assessment report for lagoon treatment processes. Its
supplement contains referenced figures and tables.

MINISTRY OF ENVIRONMENT, LANDS AND PARKSMUNICIPAL SEWAGE DISCHARGE CRITERIA
TECHNICAL ASSESSMENT REPORT NO. 1BEST AVAllABLE CONTROL TECHNOLOGY
DRAFT
6 Dec/93
TAR 1.1 SECONDARY TREATMENT AND EFFLUENT DISCHARGE CRITERIA
Subject
Secondary treatment processes and effiuent discharge criteria.
Objective
The following report discusses effiuent discharge criteria currently in use in Canada and theUnited States. Additionally, a review of the capability of proven secondary treatment optionsis presented, and effiuent criteria which can be achieved with each option are identified. Thereport concludes with recommended effiuent discharge criteria applicable to secondarytreatment.
Scope
The criteria which are developed as a result of the TAR reports will impact municipalities andregional districts which own and operate sewage treatment systems. Industrial wastewatertreatment systems are not anticipated to be directly impacted by the proposed criteria. Ingeneral, communities will require a secondary level of treatment or better.
Responsibility
The Ministry of Environment is responsible for establishing new municipal sewage dischargecriteria and for enforcing compliance once the criteria have been adopted into a Permit orOperational Certificate.
Background
Present British Columbia criteria are contained in the B.C. Environment publication, PollutionControl Objectives for Municipal Type Waste Discharges in British Columbia, (1975), alsoreferred to as the "red book". Objectives for effiuent disposal exist for discharge to surfacewater and to the ground. Surface discharges are presently divided into three sub categories:streams, rivers and estuaries; lakes; and the sea. Ground discharges are divided as well intothree sub categories: exfiltration basins; spray irrigation; and sub surface disposal.
Existing Ministry practice excludes effiuent discharges to ground below 22.7 maid (5000 Igpd)from "red book" criteria, instead referring such discharges to regulation by B.C. Ministry ofHealth.
The Objectives are based upon effiuent quality, with effiuent discharge criteria divided into twocategories, AA and BB levels. The AA set of criteria are applied to facilities constructed afterthe adoption of these Objectives. Within these two categories, effiuent criteria are varied tosuit the discharge medium, (rivers, ground, etc.). Parameters which are typically controlledand monitored are BOD5, suspended solids and dissolved oxygen. Acceptable levels of
- 1 -

DRAFT
phosphorus and the chlorine residual from chlorination/dechlorination depend upon the impactthat excessive quantities of these substances would have upon the receiving environment.Additional pollutants, usually resulting from industry, are also monitored if the presence ofsuch substances is significant.
Existing guidelines may require Environmental Assessment Studies when water qualityobjectives are exceeded outside of the defined "initial dilution zone", or when the dischargevolumes are large. Regardless, effiuent quality monitoring is required to determine compliancefor all permitted discharges. Long term monitoring frequency is at the discretion of theMinistry, while standards are set for the minimum monitoring requirements after start-up.
The discharge objectives for effiuent disposal to receiving waters are organized into two levelsof effiuent quality, designated as Level AA and Level BB. Level AA is the more stringentstandard. All new discharges are required to meet Level AA objectives. These objectives arepresented in Table 5-1. Effiuent quality criteria have been established for different types ofreceiving water, and have been classified according to the magnitude of flow, defined in termsof dry weather flow. Generally, a secondary level of treatment is required for discharges tostreams having less than 2000:1 dilution, into embayed marine waters and when sprayed ontocrop and pasture lands. A lower level of treatment is allowed where the river dilution exceeds2000:1, for discharges to open marine waters and for spray irrigation ofrange and forest lands.Additional limits are provided in Table 5-2, which outlines additional parameters which are ofconcern, and in Table 5-3, which establishes receiving water quality objectives that are to bemet outside the initial dilution zone. The tables are contained Supplement B to Appendix II,as part of comparative standards for the Provinces and in Appendix m.
The Ministry has established that the new discharge criteria are to be based on best availablecontrol technology (BACT), which the Ministry has defined as secondary treatment. Effiuentcriteria applicable to secondary treatment and treatment processes capable of meeting thedischarge criteria need to be defined.
Description of the Subject
Following primary treatment, which consists of the physical removal ofsuspended solids froma wastewater, is a biological treatment step generally referred to as secondary treatment.Secondary treatment consists of bio-oxidizing organic suspended solids and organic dissolvedsolids. Facilities at a typical secondary wastewater treatment plant may be classified on afunctional basis into the following categories: flow equalization, solids removal, biologicaltreatment, effiuent disinfection, odour control, effiuent reuse and disposal, and Shldgetreatment and its reuse.
To require the use ofbest available control technology (BACT) (or secondary treatment), someunderstanding of performance that is achievable through use of the secondary treatmentprocesses is needed. As well, an understanding of effiuent discharge criteria currently in useelsewhere is desirable to ensure that the new criteria are reasonable relative to those appliedin other jurisdictions.
Subject Characterization
The main purpose of requiring secondary treatment is to reduce the impact of discharges tothe receiving environment (water, land and air). Biological treatment will oxidize toxic
- 2 -

DRAFT
organics and can reduce inorganic toxicity such as ammonia. A secondary effluent thereforeprovides an improved product for beneficial reuse both as liquid and as a sidestream ofbiosolids. Odour treatment (described in a separate <:tSsessment) is also a consideration intreatment design to reduce impact on air. Thereduce, reuse and recovery objectives are betterundertaken using secondary treatment.
The important contaminant categories in wastewater treatment include suspended solids,biodegradable organics, pathogens, nutrients, refractory organics, heavy metals, toxic organicsand inorganics, and dissolved inorganic solids. Secondary treatment technologies can deal withthe first three categories and the heavy metals and toxic constituents that are associated withparticulate matter which are concentrated in the sludge.
Current British Columbia objectives (British Columbia, 1975) define secondary treatment interms of suspended solids (SS) and 5 day biochemical oxygen demand (BODfj)' For example,for discharges to streams with available dilution ofbetween 20:1 and 200:1, the effluent qualitymust not exceed a SS of 40 mg/L and a BODfj of 30 mg/L.
The United States Environmental Protection Agency (USEPA) definition of secondarytreatment includes three effluent parameters; these are the 5-day BOD, suspended solids andpH. The substitution of 5-day carbonaceous BOD (CBODfj) for BODfj may be made at theoption ofthe National Pollutant Discharge Elimination System (NPDES) permitting authority.Substitution of chemical oxygen demand (COD) or total organic carbon (TOC) may bepermitted for BODfj when a long term BOD:COD or BOD:TOC correlation has beendemonstrated. Also, special interpretations of the definition of secondary treatment arepermitted for publicly owned treatment works: (1) served by combined sewer systems, (2)using waste stabilization ponds and trickling filters, (3) receiving industrial flows, or (4)receiving less concentrated influent wastewater from separate sewers. The Federal Register:"Secondary Treatment Regulation," 40 CFR Part 133 (EPA (1989», may be consulted forprecise requirements of exceptions. The general definition of secondary treatment in theUnited States is presented in Table 1:
TABLE 1MINIMUM U.s. EPA SECONDARY TREATMENT STANDARDSIra_
BODfj (total)
Suspended Solids
mg/L
mg/L
30·
30·
45
45
Hydrogen-ion cone. pH units range of 6.0 to 9.0 at all times
• On a 30 day average basis, the minimum removal efficiency for BOD and SS is85%.
- 3 -

DRAFT
Experience in Other Jurisdictions
1. CANADA
In Canada, discharge criteria are typically based upon a combination of technology,effiuent quality and water quality. A summary of the discharge criteria used in variousprovinces follows. Details are provided in Appendix IT, and supplements A and B.Supplement C provides criteria for several provinces.
a) Alberta (1988): Albert Environment's Standards and Guidelines for Municipal WaterSupply, Wastewater, and Storm Drainage Facilities (1988) requires for minimumtreatment the use of Best Practicable Technology (BPT). Design and constructionrequirements are given in this manual.
Effiuent quality requirements vary depending upon the serviced population and are asfollows:
Maximmn ConrentrationPopulation Less than 20,000:- Aerated Lagoons- Mechanical Treatment
Population Greater than 20,000:- Aerated Lagoons- Mechanical Treatment
Maximum Conrentration
20 mg/LBODli
20 mgIL BODli and 'ISS
Additional requirements are on a site specific basis. Note that for lagoons, no limit isimposed on suspended solids.
b) Newfoundland - Labrador (1990): Effiuent discharge criteria are established by theEnvironmental Control <Water and Sewage) Regulations (1980) under the Departmentof Consumer Affairs and Environment Act (1973). Effiuent quality criteria are set asa maximum of 20 mg/L BODli and 30 mg/L TSS with modification allowed by theDepartment on a site specific review basis. A summary is in Appendix IT.
c) Ontario (1983): Ontario Ministry of Environment Policy Manual No. 08-01 Levels ofTreatment for Municipal and Private Sewage Treatment Works Discharging to SurfaceWaters (1983) requires that the normal level of treatment be secondary. Effiuentdischarge objectives and guidelines are provided in Appendix IT. Objectives are used bythe Ministry to regulate BODli, TSS and Total-P, while the guidelines are used toregulate only BODli and TSS. For secondary treatment, typical objective values are 15mg/L BODli, 15 mg/L TSS and 1.0 mg/L Total-P, while the Guidelines require 25 mg/Lfor both BODli and TSS.
d) Quebec (1992): Criteria used by la Ministere de l'Environnement are appended as atable in Appendix IT, Supplement C, which is translated from extracts from one of theirpolicy documents which they have provided. Discharge criteria are based upon acombination of technology and design flow passing through the plant. Standards orlimits which are required to be met are either maximum effiuent quality limits or a
-4-

DRAFT
specified technology treatment efficiency as averaged over annually, quarterly, monthlyor weekly periods for each category of treatment technology. For non aerated lagoons,minimum removal efficiency is 60 percent for both BOD5 and TSS. Criteria for aeratedlagoons do not include a standard for TSS and removal efficiencies for BOD5 areseasonal varying from 65 to 85 percent. By contrast, mechanical plants must meeteffluent qualities of 20 to 40 mgIL BOD5 and 20 to 30 mg/L TSS, and treatmentefficiencies of 70 to 90 percent.
e) Saskatchewan (1989): Saskatchewan Environment and Public Safety (Water QualityBranch) has produced a booklet entitled A Guide to Sewage Works Design (1989). Thisdesign guide is applied to all sewage works controlled under Water Pollution ControlAct and waterworks legislation. Minimum base technology is secondary, and is modifiedto comply with water quality objectives.
Guidelines are set for treatment plant design, particularly for loadings, size andconstruction. Performance guidelines are extracted from Table 4.1 ofthe Guide and areincluded in Appendix TI, Supplement C. Typical performance ranges for secondarytreatment are 10 -70 mg/L BOD5, 10 - 60 mg/L TSS, 2 - 7 mg/L P, and 5 - 40 mg/L N.The variation in concentrations reflect seasonal adjustments.
2. UNITED STATES
Appendix TI, Supplement D, provides a discussion ofmunicipal sewage discharge criteriaand regulations in the United States.
Under authorization of the Clean Water Act, EPA defined secondary treatment asachieving an effluent quality of30 mg/L BOD and suspended solids on a 30 day average.Weekly averages must not exceed 45 mg/L for these constituents, and provisions arealso made for utilizing carbonaceous BOD (CBOD) as an effluent indicator. Treatmentperformance is also required to achieve at least an 85 percent reduction of BOD andsuspended solids on a 30 day average basis, even if this mandates better than 30/30effluent quality.
Section 304 of the Clean Water Act Amendments of1981 complicated the interpretationof secondary treatment performance requirements by stating that "such biologicaltreatment facilities as oxidation ponds, lagoons, ditches, and trickling filters shall bedeemed equivalent to secondary treatment" provided that "water quality will not beadversely affected by deeming such facilities as the equivalent ofsecondary treatment."Biological treatment processes can thus be considered equivalent to secondary treatmentwithout achieving 30/30 performance, if water quality is not adversely impacted. Thisprovision was primarily intended to ease the burden of costly plant upgrades on ruralcommunities, and in general, has only been applied to smaller treatment plants. It wasalso used as part of the basis for certain ocean dischargers requesting a waiver of fullsecondary treatment; however, these waiver requests were denied by EPA.
Discharge criteria were reviewed for a number ofAmerican states. Most states have inplace either regulations or guidelines for the design of sewage treatment plants. Ingeneral, effluent quality criteria are established in order to meet receiving water qualityobjectives. In a few instances, specific criteria are set regarding the efficiency orperformance of treatment works. However, it is more common that receiving water
- 5 -

DRAFT
quality objectives and effiuent quality limits are set. Table 2-8 of Appendix ill giveseffiuent standards required of secondary treatment processes including toxicity andcoliform reduction. As examples ofregulations, the following states have been selected:
a) Washington (1991): The draft standards specify water use classes including AA Extraordinary, A - Excellent, B - Good, C - Fair, Lake class and Wetlands class. Eachclass is described for use, chemical and physical characteristics, coliform levels and othervalues.
Substances are given for chronic and acute concentrations in receiving waters.
Water quality, antidegradation policy, outstanding water resource protection, wetlandsmitigation, mixing zones (wastewater, stormwater, combined sewers), allowablereductions, and an inventory with classification for the State's water resources aregiven. Finally, implementation and enforcement procedures are provided.
I IClass AA
IA I B I C I Lake
IWetland IMarine
FW*, Fecal 50/100 mL & 100/1000 mL 200/100 mL & - 50/100 mL & Class AAColiform < 10% & < 10% < 10% < 10% or Class
> 100/mL > 43/100 mL > 400/100 mL > 100/100 mL ~or
relatedreceivingstream, orClass B
MW** 14/100 mL & 14/100 mL & 100/100 mL & 200/100 mL - -,Fecal < 10% < 10% 10% & 10%Coliform > 43/100 mL 43/100 mL < 200/100 mL < 400/100
mL
FW,D.O. > 9.5 mgIL > 8.0 mgIL > 6.5 mgIL - No decrease Notspecified
MW,D.O. > 7.0 mgIL > 6.0 mgIL > 5.0 mgIL 4mgIL - -FW,pH 6.5 - 8.5 6.5 - 8.5 6.5 - 8.5 - No change No
change
MW,pH 7.0 - 8.5 7.0 - 8.5 7.0 - 8.5 6.5 - 9.0 - -
* FW = fresh water*. MW' - marine water
b) Oregon (1987): Oregon administrative rules stipulate effiuent discharge criteria on asite specific basis (particular to watersheds). Although they seasonally vary, and aresite specific, they can be generalized as follows:
A minimum of secondary treatment is required unless other specified.During low flows, effiuent water quality may not exceed a concentration of 10mg/L (20 mg/L for Columbia River) for both TSS and BOD:;.
- 6 -

DRAFT
Effluent BOD concentration divided by the dilution factor (ratio of receivingstream flow to effluent flow) shall not exceed one unless otherwise approved.
c) Wisconsin (1986): The Wisconsin Department of Natural Resources defines theirpollution parameters as the 95th percentile value for the 30 day average effluent qualityachieved by a treatment works in a period ofat least 2 years, excluding values attributedto upsets, bypasses, operational errors, and other unusual conditions ... and ... a 7-dayaverage value (as) equal to 1.5 times the value desired ...
Treatment technology should be equivalent to secondary treatment. All publicly-ownedtreatment works, and private domestic sewage treatment works must meet thefollowing minimum criteria, which is based upon receiving water classification.
i) Water classified for aquatic and fish life:
30 day average BODo and TSS less than or equal to 30 mg/L7 day average BODo and TSS less than or equal to 45 mg/L30 day average percent removal not less than 85%effluent pH shall be between 6.0 and 9.0 where required by theDepartment30 day average CBODomay not exceed 25 mg/L7 day average CBODomay not exceed 40 mg/L
ii) Where receiving water is classified by the Department as intermediate aquaticlife, then:
the 30 day average BODo may not exceed 15 mg/Lthe 30 day average TSS may not exceed 20 mg/Lthe daily maximum BODo and TSS may not exceed 30 mg/Lthe 30 day average treatment removal may not be less than 85%the NHs-N, 7 day average may not exceed 3.0 mg/L from May 1 toOctober 31, and 6.0 mg/L from November 1 to April 30the effluent pH shall be between 6.0 and 9.0the minimum effluent dissolved oxygen level shall be 4.0 mg/L
iii) Where waters are classified as marginal by the Department, then:
the 30 day average BODo and TSS may not exceed 20 mg/Lthe 7 day average BODo and TSS may not exceed 30 mg/Lthe effluent pH shall be between 6.0 and 9.0the daily minimum effluent dissolved oxygen shall be 4.0 mg/L
Assessment of Control Options, Methods and Technolow,es
The following sections describe secondary processes and identify effluent quality achievable bythese processes as presented in various design manuals. The final section concludes with aperformance summary of some secondary treatment plants.
Appendix ill presents tables and figures referred to in the text. Appendix IV providesadditional description of lagoon processes.
- 7 -

DRAFT
1. SECONDARY PROCESSES
A variety or biological processes are available for treatment of wastewaters. They aregenerally classified as suspended growth and attached growth processes. Treatmentsystems classified as suspended growth include activated sludge, contact stabilization,extended aeration, oxidation ditches, waste stabilization ponds and aerated lagoons.Attached growth biological processes include the trickling filter process, the tricklingfilter-solids contact process, and the rotating biological contactor (RBC).
The processes examined in this assessment include mechanical plants and lagoonsystems. The plants vary upwards from 400 mS/d. Smaller plants from 22.5 mS/d aredescribed in the land application assessment and are assumed to be package plants usedprimarily in unincorporated areas.
a) Activated Sludge Processes
The activated sludge process uses a mixture ofwastewater and biologically active sludgewhich is agitated and aerated to achieve BODI) removal. The activated sludge issubsequently separated from the mixed liquor by sedimentation and wasted or returnedto the process as needed. There are conventional and modified activated sludgeprocesses which have been developed to meet specific requirements and to achieveeconomic advantages in operation and construction. The major modifications of theactivated sludge process are related to the flow regime in the aeration tank., with theextremes of plug flow and completely mixed. Figures I and 10-2 to 10-7 ofAppendix illshow the flow schematics of the major types of activated sludge processes.
i) Conventional
Conventional activated sludge is characterized by the introduction of influentwastewater and return activated sludge at one end of the aeration tank, a plug flowaeration tank., and diffused aeration.
ii) Complete Mix
Complete mix activated sludge is characterized by introduction of influent wastewaterand return activated sludge throughout the aeration basin and the use of a completelymixed aeration tank.. Complete mix aeration tanks may be arranged in series toapproximate plug flow and conventional activated sludge.
iii) Step Aeration or Step Feed
Step aeration activated sludge is characterized by introduction of the influentwastewater at two or more points in the aeration tank., use of a plug-flow aerationtank., and diffused aeration. Advantages claimed are more efficient use of air andimproved ability to operate during shock loads.
- 8 -

DRAFT
iv) Tapered Aeration
Tapered aeration is similar to conventional activated sludge except that the air supplyis tapered to meet the organic load within the tank. More air is added to the influentend of the tank where the organic loading and oxygen demand are the greatest.
v) Contact Stabilization
Contact stabilization activated sludge is characterized by the use of two aeration tanksfor each process train, one to contact the influent wastewater and return activatedsludge (contact tank) and the other to aerate the return activated sludge (stabilizationtank) and promote the biodegradation of the organics absorbed to the bacterial floes.
vi) Extended Aeration
Extended aeration activated sludge is characterized by a low F/M ratio, long sludge age,and long aeration tank detention time (greater than 18 hours).
vii) High-Rate Aeration
High-rate aeration activated sludge is characterized by high F/M ratio, low sludge age,short aeration tank detention time, and high mixed-liquor suspended solids. High-rateaeration should be followed by other BOD and suspended solids removal processes toprovide secondary treatment.
viii) High-Purity Oxvgen
High-purity oxygen activated sludge is characterized by the use of high-purity oxygeninstead of air for aeration. The main advantage is reduced reactor volume, althoughimproved settling is also claimed.
ix) Kraus Process
Kraus process activated sludge is characterized by use of an aeration tank to aerate aportion of the return activated sludge, digester supernatant, and digested sludge inorder to provide nitrogen (ammonia) to a nitrogen-deficient wastewater. The processis best suited to an industrial wastewater which is low in nitrogen.
x) Sequencing Batch Reactors (SBR)
The SBR process is a fill-and-draw, non-steady state activated sludge process in whichone or more reactor basins are filled with wastewater during a discrete time period, andthen operated in a batch treatment mode. SBR accomplishes equalization, aeration, andclarification in a timed sequence and may be compared to extended aeration in loadingand reaction times. Two basic types are used. One uses a continuous feed and theother uses intermittent feed. Both use intermittent discharge. At least six proprietaryprocesses are available in North America.
- 9 -
DRAFT
xi) Aeration Tanks
The size of the aertiLlon tank for any particular adaptation of the process should bedetermined by rational calculations based on such factors as the size of the plant,degree of treatment desired, mixed liquor suspended solids concentrations (MLSS),BODfj loading to mixed liquor suspended solids ratio (F!M ratio), and final settling basinprovided. Table 11.9 (WEF Manual of Practice (1992» summarizes the characteristicsof different types of aeration equipment. (See Appendix TIl)
xii) Oxidation Ditches
The oxidation ditch is a modified form of the activated sludge process and may beclassified in the plug flow, extended aeration group. Brush-rotor (or disk type) aeratorsare normally used for mixing and oxygen transfer.
b) Trickling Filters
A trickling filter consists of a bed of inert media, such as plastic or other syntheticmaterial, wood, broken stone, gravel or slag, 5 to 10 em in size, on which a biologicalslime is grown. Coal has been suggested, but is not a good media since it will breakdown over time. New trickling filters are constructed using modular plastic media,which provides greater surface area and a high void ratio. Wastewater is distributedover the top of the bed and trickles down through the media. This process generallyhas a lower power requirement than other secondary treatment processes.Pretreatment is required in the form of effective clarifiers equipped with scum removaldevices. The biological solids formed on the trickling fllter are sloughed off andconcentrated in clarifiers.
Figure 12.3 of Appendix TIl identifies flow diagrams of single and two-stage tricklingfilter plants (WEF Manual of Practice No.8 (1992».
c) Trickling Filter-Solids Contact
The trickling filter-solids contact process is a combination trickling filter and a shortdetention activated sludge, in series. The low volume contact tank preceded by thetrickliIig filter is operated as an activated sludge process to remove fine low specificgravity fractions from the trickling filter effiuent through contact with a final clarifierrecycle. The resulting effiuent is equal or better than provided by conventionalactivated sludge.
d) Rotating Biological Contactors <REC)
A rotating biological contactor consists of a series of closely spaced circular disks ofpolystyrene or polyvinyl chloride. The disks are partially submerged and slowly rotatedthrough the wastewater. In operation, biological growths become attached to thesurfaces of the disks and eventually form a slime layer over the entire wetted surfaceof the disks. The rotation of the disks alternately contacts the biomass with theorganic material in the wastewater and then with the atmosphere for adsorption ofoxygen. The minimal acceptable primary treatment required prior to the rotating
- 10-

DRAFT
contact process is screening, grit removal, and primary clarification equipped with scumand grease collecting devices.
e) Lagoon Systems
Lagoons are normally of earth bermed construction, with some method of lining toprevent leakage. In a series of ponds, sedimentation of solids and anaerobicdecomposition of the settled solids occurs in the first cell.
Secondary treatment is provided by oxidizing or stabilizing the organic matter intostable end products, to reduce the BOD and SS. This is generally accomplished in theprimary and secondary cells of the lagoon. A third step is often included to polish thewastewater, wherein remaining BOD and SS are allowed to settle out and degradebefore discharge.
The oxygen distribution in the pond determines the type of lagoon. Aerobic lagoonshave dissolved oxygen distributed throughout the pond depth; anaerobic ponds have nodissolved oxygen, and facultative ponds have an aerobic surface layer and an anaerobicbottom layer.
Depending on size and depth, among other factors, an unaerated lagoon can be aerobic,anaerobic or facultative. Organic matter is decomposed and assimilated by aerobic andfacultative bacteria. The oxygen required for aerobic respiration is provided by naturalsurface reaeration, and by photosynthetic algae. Unaerated stabilization lagoons areshallow ponds typically with a 0.9 to 1.5 m liquid depth.
i) Aerobic Lagoons
In aerobic lagoons, organic matter is biologically oxidized in the presence ofD.O. Theselagoons are normally 0.9 to 1.2 m deep.
ii) Anaerobic Lagoons
In anaerobic lagoons, where no D.O. is present, anaerobic bacteria degrade the organicmatter into partially oxidized products.
An anaerobic lagoon is quite often used as a roughing process before an aerobic orfacultative lagoon. The liquid depth of an anaerobic pond is typically 3 m or greater.
iii) Facultative Lagoons
Most lagoons are facultative. They have an anaerobic zone where settleable solids aredegraded and solubilized and an aerobic zone where the soluble organic matter andanaerobically degraded organic acids are oxidized. Oxygen supply relies on naturalsurface oxygen transfer and addition by photosynthetic algae and so is restricted to thepond surface. Facultative lagoons are normally 0.9 to 1.8 m deep.
- 11-

DRAFT
iv) Aerated Lagoons
Aerated lagoons do not depend on photosynthetic algae or natural surface reat;jn:ttionto maintain a D.O. level in the pond. Dissolved oxygen is provided by mechanicalsurface aerators or by diffused aeration equipment.
Aerated lagoons can be categorized as either completely mixed or facultative dependingon the amount of mixing provided. In completely mixed aerated lagoons, enough D.O.and mixing is provided to satisfy the organic loading, and to maintain the solids insuspension. Depending on the mixing energy provided, the settleable solids and thebiological biomass may be in suspension. At lower mixing energy levels, only thebiological biomass may be in suspension, with the settleable solids undergoing anaerobicdecomposition in the bottom sludge layer.
For aerated lagoons, either completely mixed or facultative, a liquid operating depth of3 - 4.5 m is normal. In colder climates, the deeper lagoons will have lower heat losses,Le. less surface area.
v) Lagoon Performance Improvements
In lieu of polishing cells, a clarifier or sand filter may be incorporated into the processstream to polish the treated effiuent. Recycle of the lagoon effiuent is also practised,particularly for aerated lagoon processes incorporating a clarifier. In this latter case,the lagoon process approximates an extended aeration activated sludge process.
Chemical addition to reduce TP levels can also be incorporated into a lagoonwastewater treatment process.
Supporting data on lagoon processes are presented in Appendix IV.
2. EFFLUENT QUALITY ACHIEVABLE BY SECONDARY TREATMENT PROCESSES
The previous section has identified different biological waste treatment options. Thefollowing provides a general synopsis of typical removal efficiencies and otheroperational characteristics for several secondary treatment processes. This compilationwas formed from information contained in the reference, Metcalf and Eddy (1991).
- 12-

DRAFT
a) Activated Sludge
Operational characteristics of activated sludge processes follows.
:::!B~::..:::::··::··:·::·:::!:::·~QP:!::::::!:ii:.:::.;::M;~¢ijti9ijjm:Jt:~9.YiY.;f&:%J:
Conventional 85-95
Complete-mix 85-95
Step-feed 85-95
Use for low strength domestic wastes. Processis susceptible to shock loads.
Use for general application. Process is resistentto shock loads, but is susceptible to filamentousgrowths.
Use for general application for a wide rage ofwastes.
Modified aeration
Contactstabilization
Extendedaeration
High-rateaeration
Kraus process
High-purityoxygen
Oxidation ditch
Sequencing batchreactor
Deep shaftreactor
60-75
80-90
75-95
75-90
85-95
85-95
75-95
85-95
85-95
Use for intermediate degree of treatment wherecell tissue in the effluent is not objectionable.
Use for expansion of existing systems andpackage plants.
Use for small communities, package plants, andwhere nitrified effluent is required. Process isflexible.
Use for general applications with turbineaerators to transfer oxygen and control flocsize.
Use for low-nitrogen, high-strength wastes.
Use for general application with high-strengthwaste and where limited space is available atsite. Process is resistant to slug loads.
Use for small communities or where large areaor land is available. Process is flexible.
Use for small communities where land area islimited. Process is flexible and can removenitrogen and phosphorus.
Use for general application with high-strengthwastes. Process is resistant to slug loads.
-13 -
DRAFT
b) Trickling Filters
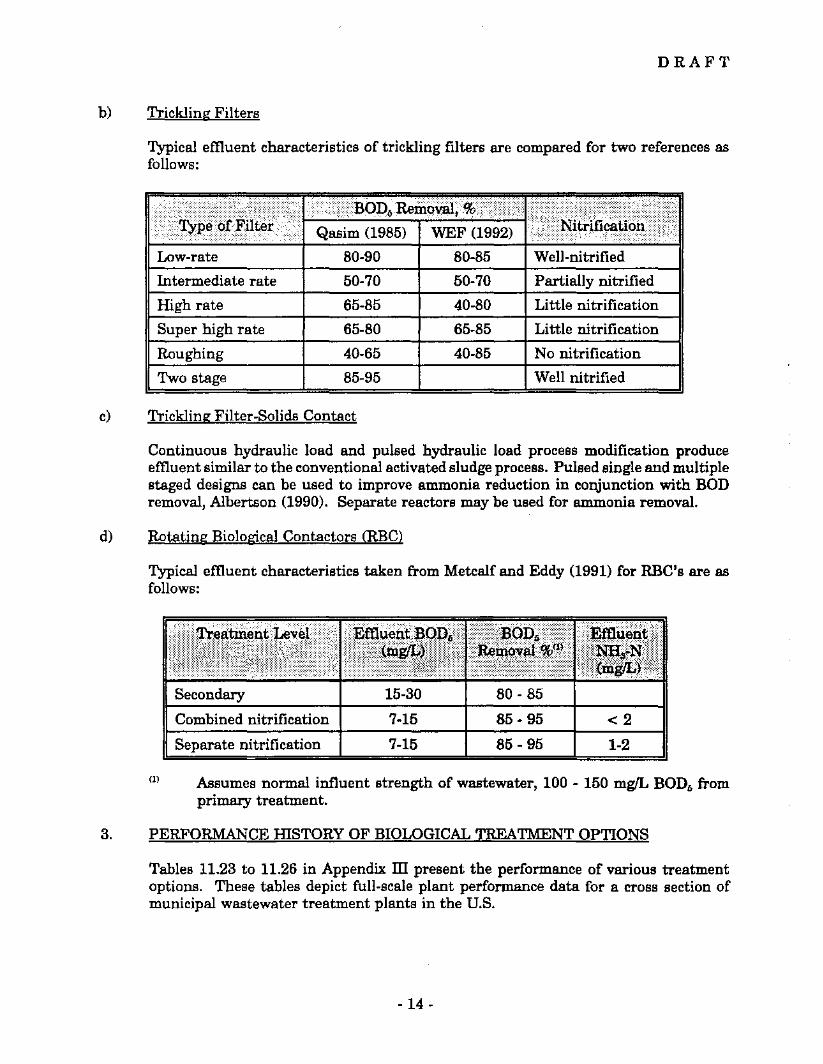
Typical effiuent characteristics of trickling filters are compared for two references asfollows:
Low-rate
Intermediate rate
High rate
Super high rate
Roughing
Two stage
.. . .. ":::;::::~;. ...., .
..····)I:'·'QQ:p;~ili9Y4J}I· ::;:{{.Qasim (1985) WEF (1992)
80-90 80-85
50-70 50-70
65-85 40·80
65-80 65-85
40-65 40-85
85-95
Well-nitrified
Partially nitrified
Little nitrification
Little nitrification
No nitrification
Well nitrified
c) Trickling Filter-Solids Contact
Continuous hydraulic load and pulsed hydraulic load process modification produceeffiuent similar to the conventional activated sludge process. Pulsed single and multiplestaged designs can be used to improve ammonia reduction in conjunction with BODremoval, Albertson (1990). Separate reactors may be used for ammonia removal.
d) Rotating Biological Contactors (REC)
Typical effiuent characteristics taken from Metcalf and Eddy (1991) for RBC's are asfollows:
Secondary
Combined nitrification
Separate nitrification
---15-30 80 - 85
7-15 85 - 95 < 2
7-15 85 - 95 1-2
(1) Assumes normal influent strength of wastewater, 100 - 150 mg/L BOD6 fromprimary treatment.
3. PERFORMANCE mSTORY OF BIOLOGICAL TREATMENT OPTIONS
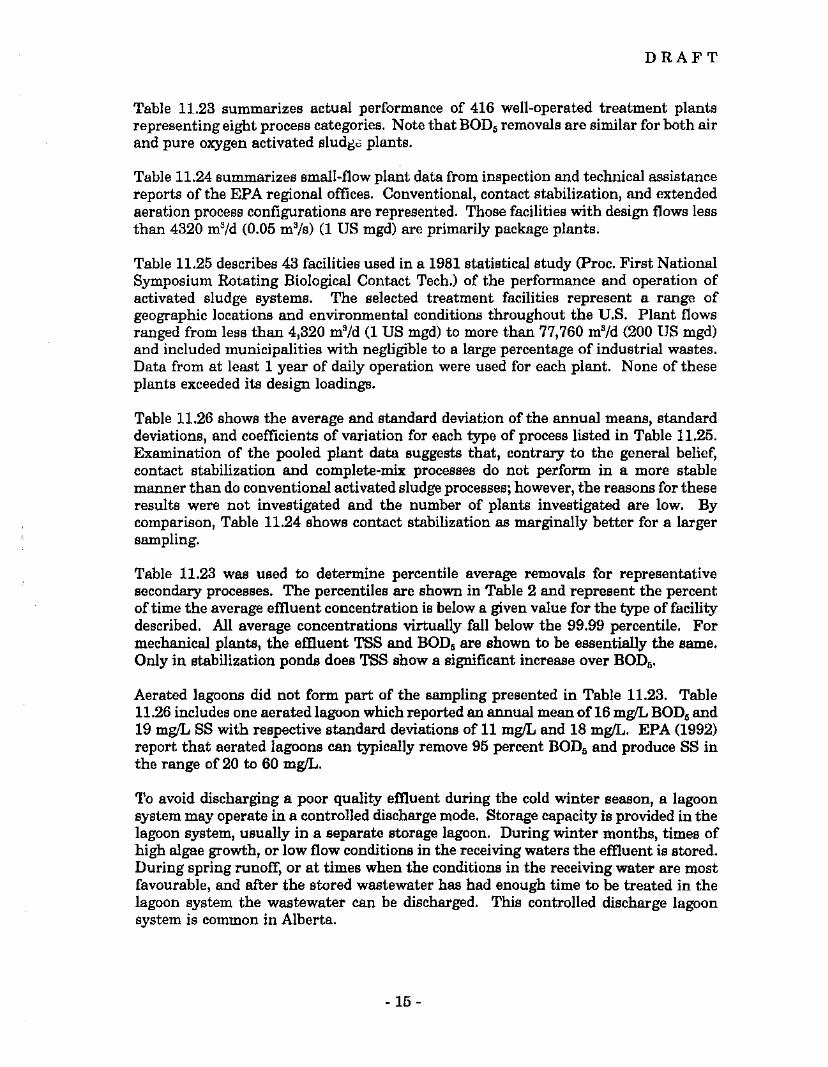
Tables 11.23 to 11.26 in Appendix ill present the performance of various treatmentoptions. These tables depict full-scale plant performance data for a cross section ofmunicipal wastewater treatment plants in the U.S.
- 14-
DRAFT
Table 11.23 summarizes actual performance of 416 well-operated treatment plantsrepresenting eight process categories. Note that BOD6 removals are similar for both airand pure oxygen activated SlUdge plants.
Table 11.24 summarizes small-flow plant data from inspection and technical assistancereports of the EPA regional offices. Conventional, contact stabilization, and extendedaeration process configurations are represented. Those facilities with design flows lessthan 4320 maid (0.05 ma/s) (1 US mgd) are primarily package plants.
Table 11.25 describes 43 facilities used in a 1981 statistical study (Proc. First NationalSymposium Rotating Biological Contact Tech.) of the performance and operation ofactivated sludge systems. The selected treatment facilities represent a range ofgeographic locations and environmental conditions throughout the U.S. Plant flowsranged from less than 4,320 maid (1 US mgd) to more than 77,760 maid (200 US mgd)and included municipalities with negligible to a large percentage of industrial wastes.Data from at least 1 year of daily operation were used for each plant. None of theseplants exceeded its design loadings.
Table 11.26 shows the average and standard deviation of the annual means, standarddeviations, and coefficients of variation for each type of process listed in Table 11.25.Examination of the pooled plant data suggests that, contrary to the general belief,contact stabilization and complete-mix processes do not perform in a more stablemanner than do conventional activated sludge processes; however, the reasons for theseresults were not investigated and the number of plants investigated are low. Bycomparison, Table 11.24 shows contact stabilization as marginally better for a largersampling.
Table 11.23 was used to determine percentile average removals for representativesecondary processes. The percentiles are shown in Table 2 and represent the percentoftime the average effiuent concentration is below a given value for the type of facilitydescribed. All average concentrations virtually fall below the 99.99 percentile. Formechanical plants, the effiuent TSS and BOD6 are shown to be essentially the same.Only in stabilization ponds does TSS show a significant increase over BOD6•
Aerated lagoons did not form part of the sampling presented in Table 11.23. Table11.26 includes one aerated lagoon which reported an annual mean of 16 mg/L BOD6 and19 mg/L SS with respective standard deviations of 11 mg/L and 18 mg/L. EPA (1992)report that aerated lagoons can typically remove 95 percent BOD6 and produce SS inthe range of 20 to 60 mg/L.
To avoid discharging a poor quality effiuent during the cold winter season, a lagoonsystem may operate in a controlled discharge mode. Storage capacity is provided in thelagoon system, usually in a separate storage lagoon. During winter months, times ofhigh algae growth, or low flow conditions in the receiving waters the effiuent is stored.During spring runoff, or at times when the conditions in the receiving water are mostfavourable, and after the stored wastewater has had enough time to be treated in thelagoon system the wastewater can be discharged. This controlled discharge lagoonsystem is common in Alberta.
-15 -

DRAFT
Of benefit for a controlled discharge system is that less operator control and effiuentmonitoring is required. Data compiled from Alberta (Beier, 1987) showed that forcontrolled discharge lagoon systems, either facultative, or anaerobic roughing lagoonsfollowed by facultative lagoons, discharging once a year during the fall achieved the besteffiuent quality. This study concluded that systems which provide 12 months storagecan generally meet the Alberta secondary sewage effiuent requirements of 25 mg/LBOD6 (for populations less than 20,000).
Small package plants used largely in unincorporated areas for subdivisions orcommercial businesses treat wastewater flows in the lowest range of regulation flowrequirements (above 22.5 m8/d, 5000 Igpd). These small plants are not represented inthe samplings described. Bryck (1985) shows that the plants are generally incapableof meeting present British Columbia (1975) effiuent standards due primarily toinadequate operator attention or training.
TABLE 2SUMMARY OF RESULTS FOR SECONDARY TREATMENT PLANTS
(From Table 11.23 in WEF-MOP (1992), see Appendix ill)
Process Category Effiuent BOD, mg/L for Effiuent TSS, mg/L forPercentiles(a) Percentiles(a)
50%(b) 90% 95% 99.99% 50%(b) 90% 95% 99.99%
Trickling filter, rock 26 39 43 66 25 39 43 68
Trickling filter, plastic 19 31 34 56 19 30 33 52.5
Trickling filter-solids contact Insufficient data (assume equal to conventional activated sludge)
Activated sludge, conventional 15 25 28 47.5 14 30 35 64
Activated sludge, contact 13 23 26 45 14 26 29 51stabilization
Activated sludge, extended 7 13 15 25.5 10 19 32 38aeration
RBC 17 30 34 58 15 26 42 49
Sequencing batch reactors (SBR) Insufficient data (assume equal to extended aeration)
Oxidation ditch 8.5 16 18 32 12 23 39 47
Stabilization pond 23 35 39 62 39.5 68.5 79 130
a) Percentiles assume standard distribution for mean and standard deviation of Table11.23 data. The percentiles illustrate the percent of the time that the averageconcentration is below a given value.
b) Overall facility mean for all plants examined.
- 16 -

DRAFT
Financial Impact Assessment
See TAR 5.1 for treatment plant capital and operating costs.
Recommendations
Effiuent discharge criteria should complement the BACT secondary treatment capabilitiesunless receiving water quality objectives dictate higher levels of treatment. Percentile basedcriteria using flow ranges are given in Table 3 for BOD, TSS and pH. A less complicated andpossibly more suitable approach is to adopt the EPA criteria of Table 1 for the average 30 dayand 7 day concentrations and a minimum 85 percent reduction.
Where more stringent limits are required, improved operation or added processes may berequired as described in the advanced wastewater treatment assessments. Toxicity, nutrientreduction and disinfection are discussed in these other technical assessments.
TABLE 3PROPOSED BACT.MINIMUM EFFLUENT DISCHARGE CRITERIAANNUAL EFFLUENT PERCENTILE(a) FOR MECHANICAL PLANTS
Flow BOD6 mg/L TSS mg/L pHCategory Effiuent Flow Range
50% 95% 99.99%(b) 50% 95% 99.99%(b) Range
1 22.5-749 m8/d(c) 40 48 60 40 52 70 6-9
2 750-4,999 m8/d 25 33 45 25 45 60 6-9
3 5,000-24,000 m8/d 25 33 45 25 45 60 6-9
4 25,000-99,999 m8/d 20 30 45 20 30 45 6-9
5 > 1,000,000 m8/d 20 30 45 20 30 45 6-9
(a) Percent of time that parameter is less than value shown.
(b) BOD and TSS must not be greater than 30 mg/L at any time where UV or ozone disinfectionis to be effective.
(c) Standards may be more stringent for discharge to land, especially for small plants usingsubsurface disposal.
Criteria for lagoons are presented in Appendix N. The 50 percentile for BOD6 and TSS is 30mg/L and the maximum allowable (99.9 percentile) is 45 mg/L BOD6 and 60 mg/L TSS.
All treatment should provide at least an 85 percent removal of TSS and BOD6•
- 17 -

DRAFT
The minimum criteria do not apply to permitted bypasses, plant upsets, operational errors orother unusual conditions. Any unusual condition resulting in a lowering of effluent qualitymust be reported to the Ministry for prior approval when planned or otherwise reported as anunplanned event.
The recommended monitoring frequency for BOD/j, TSS and flows remains similar to existingrequirements of Table 5-5 of the British Columbia (1975) objectives and is given in Table 4.
(a) COD may be used in place of CBOD/j where CBOD/j is examined with COD every fifthsampling.
D
D
D
D
D
D
D
D
W
Twice W
D
D
W
W
Twice W
22.5-749 mS/d
750-4,999 mS/d
> 100,000 mS/d
5,000-24,999 mS/d
25,000-99,999 mS/d4
3
2
5
1
f!bwi·P~Wg9pr
TABLE 4SAMPLING REQumEMENTS
~~~~B
Q =W =M =D =TIW =C1 =C2 =Cs =
QuarterlyWeeklyMonthlyDailyTwice WeeklySample composited from 4 grab samples over 2 hours at maximum flowSample composited in proportion to flow over 8 hours in daytime.Sample composited in proportion to flow over 24 hours.
- 18 -

DRAFT
MINISTRY OF ENVIRONMENT, LANDS AND PARKSMUNIClPAL SEWAGE DISCHARGE CRITERIA
TECHNICAL ASSESSMENT REPORT NO.1BEST AVAllABLE CONTROL TECHNOLOGY
APPENDICES
TAR 1.1
Page(s)
SECONDARY TREATMENT AND EFFLUENT DISCHARGE CRITERIA
APPENDIX I
APPENDIXll
Supplement A
Supplement B
Supplement C
Supplement D
Appendix A
Appendix B
Appendix C
APPENDIXID
APPENDIXN
Supplement A
Supplement B
References
Criteria and Regulations in Canada andUnited States
Summary of Canadian Standards and Guidelinesfor Wastewater Treatment and Disposal
Comparative Tables Treatment Criteria in Canada
Effiuent Discharge Criteria in Select Provinces
Municipal Sewage Discharge Criteria and Regulationsin the United States
Evolution of the U.S. Clean Water Act
. State of Colorado Water Quality Compliance Strategy
State of Washington Draft Surface WaterQuality Standards
Tables and Figures
Lagoon Treatment Processes
References
Figures and Tables
1-2
1-7
1-14
1-6
1-9
1-3
1-2
1-10
1-28
1-16
1-5
1
1-4
DRAFT
MINISTRY OF ENVIRONMENT, LANDS AND PARKSMUNICIPAL SEWAGE DISCHARGE CRITERIA
TECHNICAL ASSESSMENT REPORT NO.1BEST AVAllABLE CONTROL TECHNOLOGY
TAR 1.1 SECONDARY TREATMENT AND EFFLUENT DISCHARGE CRITERIA
APPENDIX I
References, pages 1 - 2

DRAFT
MINISTRY OF ENVmONMENT, LANDS AND PARKSMUNICIPAL SEWAGE DISCHARGE CRITERIA
TECHNICAL ASSESSMENT REPORT NO.1BEST AVAllABLE CONTROL TECHNOLOGY
APPENDIXI·REFERENCES
Alberta (1988), Standards and Guidelines for Municipal Water Supply, Wastewater, and StormDrainage Facilities, Alberta Environment, Environmental Protection Services, Standards andApprovals Division, Edmonton.
Albertson (1991) Orris E., Open Memorandum in Update: SK Concept and Electrically DrivenDistributors, Enviro Enterprises Inc.
British Columbia (1975), Pollution Control Objectives for Municipal Type Waste Dischargesin British Columbia, Department of Lands, Forests and Water Resources, Water ResourcesService, Victoria, B.C..
Bryck (1985), J. M. G., Operating Experiences with Small Treatment Plants on the SunshineCoast, Proceedings of B.C. Water & Waste Association, Spring Seminar, June 3-4, held inRichmond, B.C., 5 pp.
Environment Canada (1980), Design and Selection of Small Wastewater Treatment Systems,Environment Canada, Economic & Technical Review, EPS 3-WP-80-3.
EPA (1977), Wastewater Treatment Facilities for Sewered Small Communities, Process DesignManual, U.S. EPA, Environmental Research Information Center, EPA-625/1-77-009.
EPA (1989), USEPA Federal Register: "Secondary Treatment Regulation," 40 CFR Part 133.
EPA (1992), Wastewater TreatmentlDisposal for Small Communities, EPA/625/R-92/005,September.
Hildebaugh (1980) J. A. and R. D. Miller. "Full-Scale Rotating Biological Contactor forSecondary Treatment and Nitrification." Proc. First National Symposium Rotating BiologicalContactor Technology, Champion, PA.
Kansas (1978), Minimum Standards of Design for Water Pollution Control Facilities, State ofKansas, Department of Health and Environment, Topeka.
Metcalfand Eddy (1991), Wastewater Engineering: Treatment, Disposal, Reuse, Third Edition,McGraw Hill.
Montana (1988), Administrative Rules ofMontana, Title 16, Chapter 20 - Water Quality, SubChapter 6 - Surface Water Quality Standards, Montana Department of Health andEnvironmental Sciences, Helena.
Newfoundland (1990), Environmental Control <Water & Sewage) Regulations, Government ofNewfoundland - Labrador, Department of Consumer Affairs and Environment, St.-Johns.
lof2

DRAFT
Oklahoma (1987), Standards for Water Pollution Control Facilities, Oklahoma StateDepartment of Health, Water Facilities Engineering Service.
Ontario (1983), Levels of Treatment for Municipal and Private Sewage Treatment WorksDischarging to Surface Water, M.O.E. Policy Manual 08-6, Ontario Environment, Toronto.
Oregon (1987), "Water Pollution", Oregon Administrative Rules, Chapter 340, Division 41,Department of Environmental Quality, Salem.
Qasim (1985) S.R., Wastewater Treatment Plant: Planning, Design and Operation.
Quebec (1992), "Exigences Specifiques aux Stations d'Epuration", Ministere del'Environnement du Quebec, personal communication.
Reynolds (1982) T. D., Unit Operations and Processes in Environmental Engineering, TexasA&M University.
Saskatchewan (1989), A Guide to Sewage Works Design, Saskatchewan Environment andPublic Safety, Regina.
Tennessee (1989), Design Criteria for Sewage Works, State ofTennessee, Department ofHealthand Environment, Division of Water Pollution Control, Nashville.
Washington (1991), State ofWashington Draft Surface Water Quality Standards, F-WQ-91-101,January (Refer to Appendix IT, Supplement D (Appendix C)).
WEF-MOP (1992), Design ofMunicipal Wastewater Treatment Plant, WEF Manual ofPracticeNo.8, ASCE Manual on Engineering Practice No. 36.
Wisconsin (1986), "Sewage Treatment Works", Wisconsin Administrative Code, Chapter NR210, Department of Natural Resources, Madison.
2of2

DRAFT
MINISTRY OF ENVIRONMENT, LANDS AND PARKSMUNICIPAL SEWAGE DISCHARGE CRITERIA
TECHNICAL ASSESSMENT REPORT NO.1BEST AVAllABLE CONTROL TECHNOLOGY
TAR 1.1 SECONDARY TREATMENT AND EFFLUENT DISCHARGE CRITERIA
APPENDIXTI
Criteria and Regulations in Canadaand United States, pages 1 • 7

DRAFT
TECHNICAL ASSESSMENT REPORTMUNICIPAL SEWAGE DISCHARGE CRITERIA
AND REGULATIONS IN CANADA
Objective
Collection and review of Canadian criteria and regulations relating to municipal sewagetreatment and disposal.
Background: British Columbia
Present British Columbia criteria are contained in the B.C. Environment publication, PollutionControl Objectives for Municipal Type Waste Discharges in British Columbia, (1975), alsoreferred to as the "red book". Objectives for effiuent disposal exist for discharge to surfacewater and to the ground. Surface discharges are presently divided into three sub categories:streams, rivers and estuaries; lakes; and the sea. Ground discharges are divided as well intothree sub categories: exfiltration basins; spray irrigation; and sub surface disposal.
Existing Ministry practice excludes effiuent discharges to ground below 22.7 m3/d (5000 Igpd)from "red book" criteria, instead referring such discharges to regulation by B.C. Ministry ofHealth.
Objectives are base upon effiuent quality, with effiuent discharge objectives are divided intotwo categories, AA. and BB levels. The AA. set of criteria is applied to facilities constructedafter the adoption of these objectives, and to all other discharges over a period of time asdetermined by the Director. Within these two categories, effiuent objectives are varied to suitthe discharge medium, (rivers, ground, etc.). Parameters which are typically controlled andmonitored are BOD5, suspended solids and dissolved oxygen. Acceptable levels of phosphorusand the chlorine residual from chlorination/dechlorination depend upon the impact thatexcessive quantities of these substances would have upon the receiving environment.Additional pollutants, usually resulting from industry, are also monitored if the presence ofsuch substances is significant.
The Pollution Control Objectives (PCO) may require Environmental Assessment Studies whenwater quality objectives are exceeded outside of the defined "initial dilution zone", or when thedischarge volumes are large. Regardless, effiuent quality monitoring is required to determinecompliance for all permitted discharges. Long term monitoring frequency is at the discretionof the Ministry, while standards are set for the minimum monitoring requirements after startup.
The proposed new guidelines for British Columbia require a baseline minimum of secondarytreatment (BACT) and the imposition of appropriate effiuent quality criteria for conventionalparameters such as BOD5 and SS. Should the receiving environment be particularly sensitiveto other discharge parameters, then an effiuent limit concentration would be imposedconsistent with BACT for that parameter (e.g. phosphorus). Ifassimilative capacity is at risk,a maximum allowable mass discharge will be imposed recognizing the need to leave capacityfor similar use of the stream by others.
10f7

DRAFT
Data Review Methodology
Data collection h~ been based primarily upon the criteria and guidelines obtained by B.C.Environment in 1990 from other provincial and federal environmental ministries. TheProvincial ministries were also contacted for updated information. Respondents includedAlberta, Saskatchewan, Manitoba, Ontario, Quebec, Newfoundland-Labrador and EnvironmentCanada.
Review of the supplied correspondence suggested that both the Ontario and Quebecenvironment ministries would have had new standards - guidelines produced by 1991 (at leastin draft form). Quebec has produced a water quality criteria document while both ministriesconfirm that other new regulations are still in the developmental stages and that they havenot modified any of their policies since 1990.
Environment Canada undertook a review of existing Canadian regulations and standards aspart of their study for the development of Wastewater Regulations for Federal Facilities in1989. The information contained within the report was reviewed with respect to the currentregulations in place as reported by the respondent provinces.
Supplement A, gives a list of these sources including a table of contents for each significantdocument received from the respondents.
Supplement B gives comparative tables of the existing regulations and guidelines as extractedfrom the Wastewater Regulations for Federal Facilities study.
Supplement C lists the effluent discharge criteria for select provinces.
The Environment Canada survey concluded that final effluent quality throughout Canada islargely determined on a site specific basis.
Subject Characterization
a) Regulation
The information received may be categorized into the following:
• Criteria and Guidelines• Objectives and Policies• Legislation - Law
Criteria and guidelines for disposal are often referenced either directly or indirectly to aregulatory document or a statute. By themselves compliance with criteria and guidelines areonly voluntary.
A mandatory compliance of guidelines or criteria would result in a standard, and would haveto be legally enforceable through a statute or legislation.
Criteria and guidelines are developed to provide a minimum level of control for protection ofthe environment.
20f7

DRAFT
Modification of criteria and guidelines result in the creation of objectives and policies. Likecriteria and guidelines, objectives and policies require the support of a legal mechanism, inorder to make them mandatory. Objectives and policies are generally designed to allow criteriaand guidelines to be applied on a site specific basis.
Legislation and laws provide the legal framework required to implement the objectives andpolicies. This may be by either explicit or implicit means. For example, implicitimplementation of objectives would require any issuance of discharge permits being subject tothe review of a Ministry with set policies and objectives, while an explicit system would eitherreference specific requirements, or state the policy within a legal text. Such explicit legislationmay be referred to as Regulations or Rules, where specific objectives and policies are mademandatory through law.
b) General Approach
The pollution control objectives developed by any government may approach environmentalmanagement by either regulating receiving water quality or discharge effiuent quality.
In order to regulate water quality, specified quality objectives are set for a group of waterbodies or courses. Assimilative capacity is used, such that water quality is not changed beyonda predetermined limit.
Alternatively, discharge effiuent quality may be regulated by establishing either minimumtreatment technologies and/or effluent quality parameters.
Although both approaches recognize the assimilative capacity ofthe receiving environment, theregulation of receiving water quality allows for the potential of maximum exploitation of thenatural assimilative capacity of the environment, while regulation based upon effluent qualityparameters may not. However, if there is one or more users ofa systems' assimilative capacity,which may be particulary the case for latecomers, then the proportioning of rights for the useof that assimilative capacity could result in imbalances in the form of subsidies if two 'like'users are not treated equally with respect to discharge effluent allocations.
Regardless, the criteria for both approaches are typically modified on a site specific basis.
Experience in Other Jurisdictions: Canada
Alberta
The Alberta Clean Water Act requires the regulation of municipal wastewater treatmentplants. New expanded plants are required to meet the mandatory standards contained inStandards and Guidelines for Municipal Water Supply, Wastewater and Storm DrainageFacilities (1988). Regulation is therefore, based upon a combination of Best PracticableTechnology and effiuent discharge quality.
Minimum wastewater treatment standards are applied to two categories, based upon the designpopulation of the system. New or expanded systems with a population less than 20,000 arerequired to have either:
3 of7

DRAFT
• wastewater stabilization pond with 1 year storage.• aerated lagoon, with final effluent less than 25 mg BODJ,L• mechanical t ...aatment with final effluent less than 25 mg BODJ,L and 25 mg TSS/L
New or expanded systems with populations greater than 20,000, are required to have either:
• wastewater stabilization pond with 1 year storage.• aerated lagoons with final effluent less than 20 mg BODJ,L• mechanical treatment with final effluent less than 20 mg BODJ,L and 20 mg TSS/L
Additionally, the minimum dilution ratio is 1:10, with lake discharge discouraged, or prohibitedon a case by case basis.
Manitoba
The Manitoba Environment Act regulates discharges from sewage treatment plants andeffluent discharges on a site specific basis, based upon water quality objectives. Objectives arebased upon a 1:10 year return, 7 day consecutive low flow (7Q10).
All effluent discharges are required to be licensed. New or amended licences require approvalby the Ministry. Typically, water quality is divided between different classes of water use.With respect to effluent, requirements are typically 30 mg BODJ,L and 30 mg TSS/L, withadditional parameters being reviewed and added or relaxed on a site specific basis. Treatmentmethodology is not regulated, nor is self monitoring required.
Newfoundland - Labrador
The Newfoundland & Labrador Department of Environment and Lands under theEnvironment Act has issued the Environmental Control <Water & Sewage) Regulation whichregulates discharges to surface water. Specific criteria effluent discharge quality regulate themaximum standard concentration for BOD6, solids, phosphorus, metals, cyanide and oils.Typical effluent values are a maximum of 20 mg BODJ,L, and 30 mg TSS/L. In addition,guidelines are also published for sewage system design, with the Environmental Control <Water& Sewage) Regulations appended to it.
Ontario
Ontario regulations are developed on a site specific basis based upon receiving water qualityobjectives, and enhanced with effluent quality and treatment policies. Policies establishedunder the authority of the Ontario Water Resources Act, are contained in the publicationWater Management, Goal, Policies, Objectives and Implementation Procedures of the Ministryof the Environment, (1987, 1984), also known as the "blue book".
Existing regulations strive for secondary treatment, although exception is given on a sitespecific basis. The absolute minimum treatment level is primary. Effluent limits and criteriaare written into new and recent discharge permits, referred to as "Certificate of Approval".
4of7
DRAFT
Treatment, and minimum effiuent requirements are provided under "Policy Manuals". PolicyManual 08-01 (Levels of Treatment for Municipal and Private Sewage Treatment WorksDischarging to Surface Waters) sets requirements for treatment plants, outfalls, and plantoperation. The Guidelines for Design of Sewage Treatment Works complements this policymanual. Policy manual 08-04 (Policy to Govern the Provision and Operation of Phosphorus'Removal Facilities at Municipal, Institutional and Private Sewage Treatment Works) regulatesphosphorus levels in discharges. Typically a level of 1.0 mg/L Total P is permitted, except intothe lower great lakes and St. Lawrence River where 0.5 mg/L Total P is the limit for largeflows (> 4500 m3/d).
Policy 08-06 (policy to Govern Sampling and Analysis Requirements for Municipal and PrivateSewage Treatment Works (Liquid Waste Streams Only) sets the requirements for effiuentanalysis, and permit compliance evaluation. The minimum sampling frequency is typically onceper month, but will vary with the size of facility and nature of the effiuents. Sampling istypically for BODo, suspended solids, ammonia, nitrogen and total phosphorus. Additionalparameters may be added on a site specific basis. Sampling and analysis are required as partof the "Certificate ofApproval". Plants which fail to meet permit criteria in three consecutiveassessments are considered to be in violation of the permit. Action against the offender variesdepending upon the magnitude of the offence.
A draft policy (Effiuent Disinfection Requirements for Sewage Works Discharging to SurfaceWaters) has yet to be finalized, but is presently being used in the interim on all new treatmentplants and revised permits. The current base requirement is that all effiuent discharges bedisinfected, with relaxation being made on a site specific basis under the guidelines, "ConditionsRequired to Qualify for Relaxation of Disinfection Requirements".
Quebec
"Loi sur la Qualite de l'Environnement" (L.Q.E.) is the principal environmental law in Quebec,given that there are no statutory regulations or objectives presently in place. Policies exist in"unofficial" form only. The Quebec Ministry ofEnvironment is presently formalizing guidelinesand policies and has produced the first documents (March 1991) relating to water qualitycriteria and methods for determining water quality criteria.
Regulation of discharges is achieved under the L.Q.E. where Article 22 requires a "Certificateof Authorization" from the Ministry prior to construction of all outfalls.
Article 25 gives the Ministry the power to specifically regulate municipal discharge limits, whileArticle 27 allows the Ministry to designate treatment methodology. Article 31 is presentlyunder revisions to incorporate the new water quality criteria and guidelines which have beendeveloped.
The present LQE does not elaborate on specific guidelines or criteria for the various articles,instead referring regulation to the Ministry on a site specific, case by case basis. Unofficialdesign criteria for treatment plants, titled "Exigences Specifiques aux Stations d'Epuration"form the basis of their regulation development, and present practice.
5 of7

DRAFT
In principle the mInImUm standard is secondary, either mechanical or biological, withmodifications made again on a site specific basis. Minimum effiuent quality guidelines ortreatment efficiencies are required to be met on weekly, monthly, or yearly averages wah setBODo, TSS and Phosphorous parameters, depending upon the type of treatment technologyused. Proposed effiuent quality self monitoring requirements are similar to other canadianprovinces.
Saskatchewan
Saskatchewan policy and general objectives are contained in the booklet Water QualitvObjectives (1975, 1983). The 1987 Water Pollution Control and Waterworks Regulationsrequires a permit for all discharges, and details municipal sewage discharge requirements. Theconstruction, or alteration of any sewage works above 18 mS/d flow requires approval of theSaskatchewan Water Corporation (SWC) under the SWC Act. All new treatment works are tobe secondary or facultative lagoons with modifications being permitted on a site specific basis.Facultative lagoons must have the maximum BODo loading to the primary cell, with dischargesfrom the treatment plant not permitted between November 1 and spring runoff.
Effiuent discharge is related to the assimilative capacity of the receiving environment, and isbased upon 1:10 year return, 7 day consecutive low flow. In addition, no more than 30% of thenatural assimilative capacity is to be used for dispersed discharges. In general, the maximumBODo created dissolved oxygen deficit shall be no more than 5 mg/L and TSS levels shall notbe increased more than 10 percent beyond background levels. Sampling frequencyrequirements are not standardized, and permit compliance requirements are not specificallyaddressed in any present guidelines.
Assessment: Canadian Wastewater Discharge Management Practices
A comparative table of existing treatment requirements is given in Supplement B as extractedfrom the Environment Canada review.
All provinces permit adjustments to their objectives, criteria, or standards which allow for sitespecific requirements. Only the complexity of the requirement and review process vary fromprovince to province.
Common wastewater management practices include a policy where new discharges requirereview before permits are issued and require monitoring on a periodic basis once dischargesbegin.
The regulatory framework used in achieving the permitted effiuent quality may work from oneof either two directions: final receiving water quality criteria; or effiuent discharge criteria.Regardless, the existing regulations and standards are all worded to allow enough flexibilityto review specific application on a case by case basis.
60f7

DRAFT
Recommendations
The proposed criteria for BACT as a base 2.~ secondary treatment in conjunction with effluentcriteria for BODij and TSS is consistent with criteria in use for other provinces. Also, the useof more stringent effluent criteria as applied to phosphorus to meet BACT for phosphorusremoval is also supported. Where assimilative capacity is determined as limiting, the use ofa mass discharge allocation to the discharger is proposed and is to be determined by theMinistry. Where specific effluent constituents will exceed allowable concentrations in theinitial dilution and mixing zones, back calculation to determine allowable dischargeconcentrations is to be required; (an example is ammonia). End of pipe toxicity tests will formthe basis of an acceptable discharge regardless of other requirements.
70f7

DRAFT
MINISTRY OF ENVIRONMENT, LANDS AND PARKSMUNICIPAL SEWAGE DISCHARGE CRITERIA
TECHNICAL ASSESSMENT REPORT NO.1BEST AVAllABLE CONTROL TECHNOLOGY
TAR 1.1 SECONDARY TREATMENT AND EFFLUENT DISCHARGE CRITERIA
Supplement Ato
Appendixll
Summary of Canadian Standards andGuidelines for Wastewater Treatment and Disposal, pages 1 - 14

Alberta EnvironmentStandards and Guidelines for
Municipal Water Supply, Wastewater and Storm Drainage Facilities
ForewordAcknowledgementsGlossary of termsList of Tables and Figures1 Permits and Licences
1.1 Clean Water Act Legislation1.1.1 Defmition of a Municipal Plant1.1.2 Facilities Exempted from A Permit and Licence1.1.3 Approval of Local Authority1.1.4 Current Knowledge
2 Water Distribution and Transmission3 Sanitary Sewers and Pumping Stations
3.1 Application for a Permit to Construct3.1.1 Permit3.1.2 Permit Cost Increase3.1.3 Permit Amendment3.1.4 Certificate of Compliance
3.2 Other Approvals from Alberta Environment3.2.1 Licence or Permit, Water Resources Act3.2.2 Construction in Restricted Development Lands3.2.3 Reclamation of Disturbed Lands
3.3 Sewer Design3.3.1 Gravity Pipe strength3.3.2 Manholes
3.4 Wastewater Pumping Stations3.5 Forcemains
4 Water Supply and Treatment5 Wastewater Treatment and Disposal
5.1 Application for a Permit to Construct5.2 Other Approvals5.3 Licence to operate5.4 Minimum treatment Requirements
5.4.1 Best Practical Technology Wastewater Stabilization Ponds5.4.2 Best Practical Technology Mechanical Plants5.4.3 Drainage Course Requirements
5.4.3.1 Seasonal Discharge from Wastewater Stabilization Ponds5.4.3.2 .Continuous Discharge from Mechanical Plants
5.5 Wastewater Stabilization Ponds5.6 Aerated Lagoons5.7 Mechanical Wastewater Treatment
1 of 14

5.8 Sludge Processing and Disposal5.9 Wastewater Disinfection5.10 Phosphorous Control
5.10.1 Need Assessment5.10.2 Phosphorus Removal Criteria5.10.3 Phosphorous Control Technologies
5.11 Land Application of Municipal Wastewater5.11.1 General5.11.2 Environmental Approval5.11.3 Methods of Land Application
6 Stormwater Drainage
Alberta EnvironmentEarth Sciences Division
A Practical Guide to Municipal Wastewater Irrigation
IntroductionHealth AspectsEconomicsTreatment EfficienciesWastewater ChemistryFactors Affecting the Feasiblity of Land Treatment of WastewatersDesignSurface IrrigationOperationSummary of Advantages and DisadvantagesReferences
Alberta EnvironmentMunicipal Branch
Guidelines for the Design, Approval, and operation of Sewage Lagoonsfor Municipal Developments
Table of Contents1 Introduction2 Application for a Contruction Approval3 Application for an Operating Approval4 Design Considerations5 Operations and MaintenanceTable I Calculated Volumes for Two-Month Treatment CellTable IT Calculated Volumes for One-Year Storage Cell
2 of 14

British Columbia Ministry of EnvironmentWaste Management Branch
Pollution Control Objective forMunicipal Type Waste Discharges in British Columbia
1 Introduction1.1 The Inquiry1.2 Submissions
2 The Objectives2.1 General2.2 Format2.3 Receiving Environment and Initial Dilution ZOne
3 Solid Waste Landfills3.1 Discharge Objectives3.2 Upgrading Existing Landfills
3.2.1 Location and Operation3.2.2 ~chate
3.3 Environmental Assessment Studies3.4 Landfill Location and Control Objectives3.5 Monitoring3.6 Disposal of Hazardous Wastes
3.6.1 General3.6.2 Objectives for Disposal of Hazardous Wastes in Landfills
3.7 Disposal of Semi-solid Wastes3.8 Site MaintenanceTables 3-1 to 3-3
4 Refuse and Sludge Incineration4.1 Objectives for Incinerator Emissions4.2 Upgrading Existing Operations4.3 Environmental Assessment Studies4.4 MonitoringTable 4-1
5 Effluent Disposal5.1 Discharge Objectives for Disposal to Receiving Waters5.2 Discharge Objectives for Disposal to Ground5.3 Upgrading Existing Discharges5.4 Environmental Assessment Studies -Disposal to Receiving Waters
5.4.1 Effluent Discharges to Streams, Rivers, -and Estuaries5.4.2 Effluent Discharges to Lakes5.4.3 Effluent Discharges to the Se:l
3 of 14

5.5 Environmental Assessment Studies - Ground Disposal5.6 Ground Disposal Design Criteria
5.6.1 Exfiltration Basins5.6.2 Spray Irrigation5.6.3 Sub-surface Disposal
5.7 Monitoring5.7.1 General5.7.2 Sampling Procedures5.7.3 Effluent Monitoring5.7.4 Receiving Water Monitoring
5.8 Outfall Length Objectives5.9 Commissioning New Works5.10 Emergencies and Spillways5.11 Domestic Waste Connections to Industrial Sewer Systems5.12 Non-domestic Waste Connections to Municipal Sewer5.13 Treatment Plants5.14 Combined Sewer Discharges
5.14.1 General5.14.2 Allowable Systems5.14.3 Existing Combined Systems5.14.4 Storm Sewers
5.15 Posting of OutfallsTables 5-1 to 5-5
6 Semi-solid Waste Disposal
7 Glossary of Terms
Manitoba EnvironmentManitoba Surface Water Ouality Objectives
SummaryTable of ContentsPreamble1 Introduction
1.1 Application of Surface Water Quality Objectives1.2 Natural Characteristics Outside of Objectives1.3 Limitations and Interpretation of Surface Water Quality Objectives1.4 Development of Specific Surface Water Quality Objectives1.5 High Quality Waters1.6 Exceptional Value Waters1.7 General Requirements1.8 Minimum and Maximum Flows and Levels
4 of 14

1.8.1 Rivers and Streams1.8.2 Intermittent Streams1.8.3 Lakes, Bays, Marshes, Sloughs, Impoundments and Other Wetlands
1.9 Mixing Zones2 Beneficial Uses
2.1 Class 1: Domestic Consumption2.2 Class 2: Aquatic Life and Wildlife
2.2.1 Category a: Cold Water Aquatic Life, Cool Water Aquatic Life, andWildlife2.2.1.1 Specific Requirements
2.2.2 Category b: Cool water Aquatic Life and Wildlife2.2.2.1 Specific Requirements
2.3 Class 3: Industrial Consumption2.4 Class 4: Agricultural Consumption2.5 Class 5: Recreation2.6 Class 6: Other Uses
3 References
Government of ManitobaChapter E125 The Environment Act
Government of ManitobaChapter E125 The Environment Act
Manitoba Regulation 163/88Licensing Procedures Regulations
Government of ManitobaChapter E125 The Environment Act
Manitoba Regulation 164/88Classes of Development Regulation
Government of Newfoundland and LabradorDepartment of Consumer Affairs and Environment
Procedures for Selection and Approval of a New Waste Disposal Site
Government of Newfoundland and LabradorDepartment of Consumer Affairs and Environment
An Act Respecting the Department of Environment and LandsChapter 21
Government of Newfoundland and LabradorDepartment of Consumer Affairs and Environment
Newfoundland Regulation 156/80
5 of 14

Environmental Control (Water and Sewage Regulation)
Government of Newfoundland and LabradorDepartment of Consumer Affairs and Environment
An Act Respecting the Disposal of Waste Material
Government of Newfoundland and LabradorDepartment of Consumer Affairs and Environment
Guidelines for Design. Construction. and Operation of Water and Sewage Systems
I Approval of Regulatory AuthorityII Development of Standards and Guidelinesill Preliminary EngineeringIV Water WorksV Instrumentation, Data Collection, and Controls
V.I GeneralV.2 Sewer and AppurtenancesV.3 Sewage pump stationsV.4 Sewage TreatmentV.5 Screening and Grit RemovalV.6 SettlingV.7 Biological TreatmentV.8 Sludge HandlingV.9 DisinfectionV.IO Wastewater Treatment Ponds (Lagoons)V.11 Small Treatment PlantsV.12 Septic tank SystemsV.13 Holding tanks for Trailer Parks
VI Electrical ..VII Construction ~ Environmental Concernsvm Operator TrainingIX SafetyX Drawings and Specifications
Appendix A: The Environmental Controls (Water and Sewage Regulations)Appendix B: DefmitionsAppendix C: References
Ontario Ministry of EnvironmentPolicy Manual No. 08-04
Policy to Govern the Provision. Operationand Assessment of Phosphorous Removal Facilities
at Municipal. Institutional. and Private Treatment Works
6 of 14

1 Reason for Phosphorous Removal2 Compliance Assessment3 Basin Requirements
3.1 Lake Eire3.2 Lake Superior, Lake Huron, Lake Ontario, St. Lawrence, and Ottawa River Basins
4 Recreational Waterways Requirements5 More Stringent Requirements6 Phosphorous Removal Based Upon Water Assessment Studies7 Sample Collection And Analysis for Effluent Phosphorous Determination8 Guidelines9 Deviation from Policy GuidelinesAppendix A
0.1 Introduction0.2 Terminology0.3 Municipal Removal Requirements0.4 Frequency of Sample Collection0.5 Measurement of Soluble Phosphorous Concentration0.6 Exemption from Equipment Installation Requirements0.7 Design Guidelines0.8 Reference
Ontario Ministry of EnvironmentPolicy Manual No. 08-01
Levels of Treatment for Municipal and PrivateSewage Treatment Works Discharging to Surface Waters
1 Ministry Requirements of Municipal and Private Sewage Works2 Normal Level of Treatment
2.1 Relaxation of Normal Treatment2.2 Higher Than Normal Treatment
3 Review of Treatment Levels4 Effluent Requirements5 Effluent Requirements Compliance Assessment and Enforcement6 Phosphorous Removal Requirements7 Effluent Disinfection Requirements8 By-Passing and Combined Sewer Overflows9 Sewage Treatment Works Expansion10 Sampling and Analysis Requirements11 Deviation from Policies and GuidelinesAppendix A: Guidelines for the Determination ofTreatment Requirements for Municipal
and Private Sewage Treatment Works Discharging to Surface Waters
7 of 14

0.1 Rational0.2 missing0.3 mIssmg
0.3.10.3.20.3.30.3.40.3.50.3.60.3.70.3.8
Table 1
Appendix B:
missingRelaxation of Normal TreatmentHigher Than Normal TreatmentSewage BypassmissingCombined Sewer SystemsNon-eompliance of Existing WorksEffluent Design Objectives and Effluent Guidelines
Procedural Guidelines for Relaxation of Normal Level of Treatment forMunicipal and Private Sewage Works Discharging to Surface Waters
0.1 General0.2 Application Procedures0.3 Supporting Documentation
0.3.1 General Considerations0.3.2 Supplementary Information Requirements
0.3.2.1 Economic Impact0.3.2.2 missing0.3.2.3 missing0.3.2.4 Compliance With Objectives
Appendix C: Procedural Guidelines for the Derivation of Sewage Treatment WorksEffluent Requirements and for the Incorporation of Effluent Requirementsinto Certificates of AWroval for New or Expanding Sewage TreatmentWorks
0.5.20.5.3
0.1 General0.2 Administration0.3 missing0.4 mIssmg0.5 Compliance Assessment and Enforcement
0.5.1 Effluent Sampling and Analysis for Screening Purposes0.5.1.1 . Incorporating Effluent Sampling and Analysis
Requirements into Certificates of Approval0.5.1.2 Routine Sampling and Analysis ProgrammissingAction Needed with Apparent Non-eompliance
Annex 1 Procedural Guidelines for the Derivation of Sewage Treatment Works
8 of 14

Effluent Requirements and for the Incorporation of Effluent Requirementsinto Certificates of Approval for New ur Expanded Sewage TreatmentWorks
Ontario Ministry of EnvironmentPolicy Manual No. 08-06
Policy to Govern Sampling and Analysis Requirements for Municipal and PrivateSewage Treatment Works (Liquid Waste Streams Only)
1 Sampling Locations2 Routine Sampling and Analysis Program3 Special Sampling and Analysis Program4 Sampling and Analysis for Operators' Control5 Analyst's Qualifications6 Sampling and Analysis Procedures7 Sampling and Analysis Responsibility8 Deviation from Policies and Guidelines
Appendix: Guidelines for Sampling and Analysis Requirements for Municipal and PrivateSewage Treatment Works (Liquid Waste Stream)
0.1 General0.2 Routine Sampling and Analytical Program
0.2.1 Sample Collection0.2.2 Sample Preservation0.2.3 Sample Size0.2.4 Timing of Sample Collection and Submission for Analysis0.2.5 Sample Analysis and Data Reporting
0.3 Special Sampling and Analysis Program0.4 Less Stringent Sampling and Analysis Programs0.5 Additional References Pertaining to Sampling and Analysis Techniques
Ontario Ministry of the EnvironmentWater Management
Goals. Policies. Objectives and Implementation Procedures of theMinistry of the Environment. May 1984
IntroductionSurface Water
Quality ManagementQuantity Management
Ground WaterQuality Management
9 of 14

Quantity ManagementProvincial Water Quality Objectives
Surface water QualitySurface Water QuantityGround Water QualityGround Water Quantity
Table 1: Provincial Water Quality ObjectivesTable 2: Substances with Zero Tolerance LimitsTable 3: Ontario Drinking Water ObjectivesTable 4: Water Quality Criteria for Agricultural Uses
Ontario Ministry of EnvironmentDRAFT POLICY
Effluent Disinfection Requirements for Sewage Works andDischarges to Surface Waters
Ontario Water Resources Act (Section 17, and 24, R.S.O.,1980)
Bacteriological Quality Criteria for Disinfected Sewage Works Effluentsand Procedures for Operating and Monitoring Disinfection ProcessesConditions Required to Qualify for Relaxation of DisinfectionRequirements. Application Procedures and Receiving Water QualityMonitoring RequirementsDisinfection of Lagoon EffluentsProcedural Guidelines for the Addition of Dechloronation Process
Guideline B:
Guideline C:Guideline D:
Rationale1 Ministry Policy on Disinfection of Sewage Works Effluents2 Disinfection Requirements in Mechanical Sewage Works
2.1 Effluent Requirements2.2 Compliance Assessment and Enforcement2.3 Relaxation of Disinfection Requirements
3 Disinfection Requirements of Lagoon Effluents4 Disinfection Requirements of Sewage Work Bypasses and Combined Sewer Overflows5 Dechloronation Requirements6 Deviation7 ReferenceGuideline A:
Ontario Ministry of the EnvironmentLegal Services Branch
Generic Conditions for Industrial and MunicipalSewage
IndexAcknowledgementsIntroduction
10 of 14

1 General2 Operation and Maintenance3 Performance4 Monitoring and Recording5 Reporting6 Financial Assurance7 MiscellaneousReasons
Ministere de I'Environnement du QuebecPersonal Communications, letter of August 17,1992
Annexe I: Exigences Specifiques aux Stations d,Epuration(Specific Criteria for Treatment Plants)
Annexe II: Loi sur la Oualite de l'Environnement, Article 31(Environment Quality Law)
Saskatchewan Environment and Public SafetyWater Quality Branch
A Guide to Sewage Works Design
Foreword1 Information Submissions for Approval
1.1 Approval Requirements1.2 General1.3 Sanitary Collection1.4 Pumping Stations1.5 Forcemains1.6 Sewage Treatment1.7 Storm Sewers
2 Sanitary Sewers2.1 General2.2 Gravity Collection Systems2.3 Pressure System2.4 Special Innovative System
3 Sewage Pump Station4 Sewage Treatment
4.1 General4.2 Primary4.3 Secondary (Biological)4.4 Waste Stabilization Ponds (Lagoons)'4.5 Chemical (phosphorous Control)4.6 Effluent Disinfection4.7 Supplemental Treatment4.8 Sludge
11 of 14

4.9 Effluent Disposal5 Stonn DrainageGlossary
Saskatchewan Environment and Public SafetySurface Water Quality
Foreword1 General Policies2 Uses of Water Quality Objectives3 Objectives for Effluent Discharges
3.1 General Objectives3.2 Guidelines for Effluent Mixing Zones
4 Surface Water Quality Objectives4.1 General Surface Water Quality Objectives4.2 Specific Surface Water Quality Objectives
4.2.1 Aquatic and Wildlife4.2.2 Recreational Uses
4.2.2.1 Contact Recreation4.2.2.2 . Non-Contact Recreation
4.2.3 Agricultural Uses4.2.3.1 Crop Irrigation4.2.3.2 Livestock Watering
4.2.4 Potable Water Supply5 Algae and Aquatic Nutrients6 Information SourcesReferencesExplanatory Notes
Saskatchewan Environment and Public SafetyGuidelines for Groundwater Monitoring
Wells at Wastewater Disposal Sites
Summary1 Introduction
1.1 Scope1.2 Objectives
2 Planning2.1 Background2.2 Information Sources/Types2.3 Site Evaluation
3 Construction3.1 Drilling Methods
12 of 14

3.2 Well Design3.2.1 Diameter3.2.2 Depth3.2.3 Casing3.2.4 Screens
3.3 Well Grouts, Seals and Caps3.4 Initial Monitoring Development3.5 Topographic Survey
4 Operation4.1 Sampling Equipment
4.1.1 Samplers4.2 Sampling Procedures
4.2.1 Well Levels4.2.2 Purging4.2.3 Sample Collection
4.3 Parameters and Frequency4.4 Sample Handling and Shipment
Saskatchewan Environment and Public SafetyTwo Cell Lagoon
Operation and Maintenance
Introduction1 Physical Description of a Typical Wastewater Treatment Lagoon2 Wastewater Treatment Steps3 Operation and Maintenance
3.1 Operation3.1.1 When You Should Discharge3.1.2 Discharge Procedure3.1.3 Odour control3.1.4 Removal of Floating Debris3.1.5 Operational Records
3.2 Maintenance3.2.1 Dyke Maintenance3.2.2 Removal of Sludge Mounds3.2.3 Maintenance of Overflow3.2.4 Fence and gate Repairs3.2.5 Vegetation control
4 Sampling and Laboratory Control5 Lagoon Observations6 Safety Considerations
6.1 Personal Hygiene6.2 Public Health
13 of 14

Province of SaskatchewanRevised Regulations of Saskatchewan
Chapter E-1O.2 Reg 2The Environment Management and Protection Act
Environment CanadaWastewater Regulations for Federal Facilities
CEPA Part IV Wastewater Regulations
Outline1 Executive Summary2 Existing Knowledge of Federal Wastewaters and Review of Canadian Federal Requirements3 Canadian Provincial and Territorial Requirements
3.1 Newfoundland3.2 Nova Scotia3.3 Prince Edward Island3.4 New Brunswick3.5 Quebec3.6 Ontario3.7 Manitoba3.8 Saskatchewan3.9 Alberta3.10 British Columbia3.11 Yukon3.12 Northwest Territories
4 United States Federal Requirements5 Detailed Comparison of Jurisdictional Requirements6 Summary and Conclusions7 Recommended Draft Regulation for Federal Facilities8 References
14 of 14

DRAFT
MlNISTRY OF ENVIRONMENT, LANDS AND PARKSMUNICIPAL SEWAGE DISCHARGE CRITERIAT~CHNICALASSESSMENT REPORT NO.1
BEST AVAllABLE CONTROL TECHNOLOGY
TAR 1.1 SECONDARY TREATMENT AND EFFLUENT DISCHARGE CRITERIA
Supplement Bto
Appendixll
Comparative Tables·Treatment Criteria in Canada, pages 1 - 6
1 Canadian Environmental Protection Agency: Chapter IV, Wastewater Regulations forFederal Facilities, Draft, 1990.

TABLE 5.1
JURISDICTIONAL REQUIREMENTS fOR DISCHARGES TOBODIES Of WATER
Effluent Newfoundland British ColumbiaParameters Requirements Requirements(mg/l unlessotherwise noted)
EstablishedNew Disch. Dischargeslevel AA Level B8
BODS 20 Table 3.10.1Suspended Solids 30 covers theseDissolved Solids 1000 parameters forColiform - faecal 1000/100 mL various types of
- total 5000/100 mL receiving water withTemperature 32.C various dilution ratiospH pH 5.5-9.0
* Phosphorus (P) 0.0005Oils (Ether extract) 15floating debris None to be
(Oil & Grease) Visible 15 30TLm (96hr) 100% 75%Aluminum 2.0 4.0Arsenic 0.5 0.05 0.25Barium 5.0 1.0 1.0Boron 5.0 5 5Cadmium 0.05 0.005 0.01Chlorine 1.0Chromium (total)Chromium(hexavalent) 0.05 0.1 '0.3 .Chromium(trivalent) 1.0Cobalt 0.1 0.5Copper 0.3 0.2 0.5Cyanide 0.025 0.1 0.5Iron .(total) 10 0.3 1.0
* Up-dated (1992)Phosphorus (P
2OS)
1 of 6
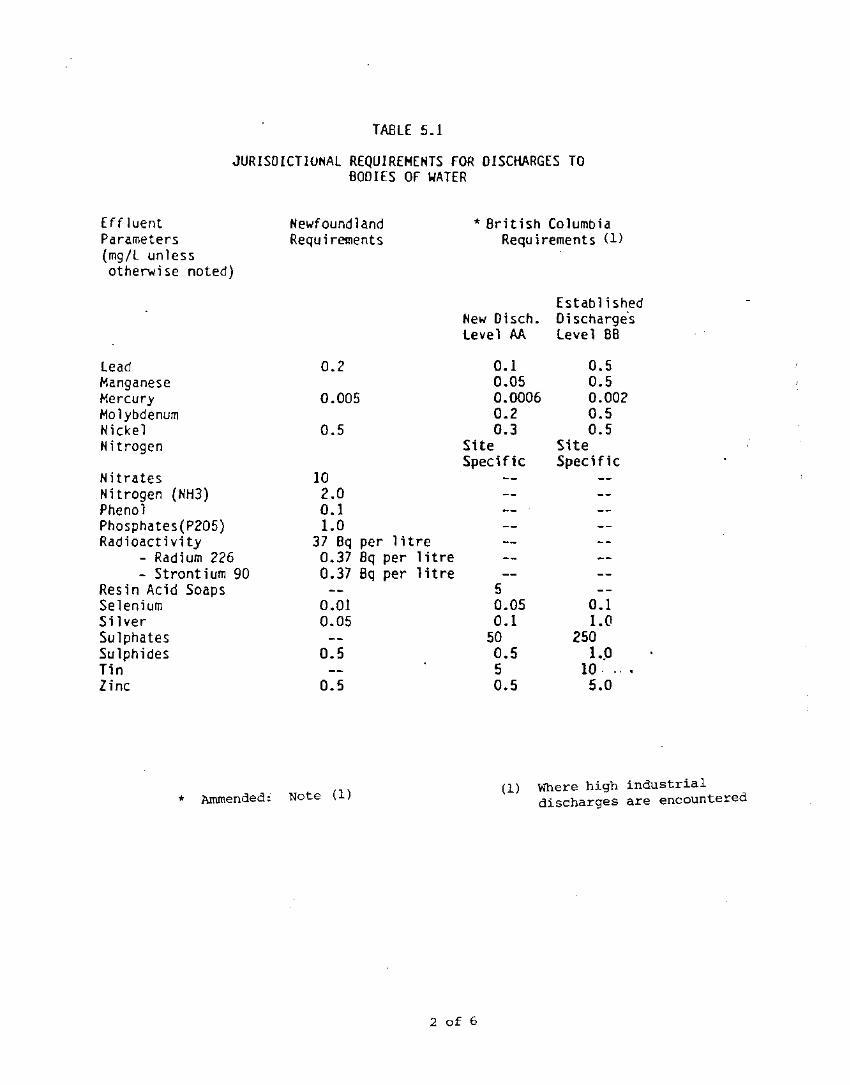
TABLE 5.1
JURISDICTIONAL REQUIREMENTS fOR DISCHARGES TOBODIES OF WATER
Effluent Newfoundland * British ColumbiaParameters Requirements Requirements (1)(mg / L un 1essotherwise noted)
EstablishedNew Disch. Oi sCharge"slevel AA level B8
Lead 0.2 0.1 0.5Manganese 0.05 0.5Mercury 0.005 0.0006 0.002Molybdenum 0.2 0.5Nickel 0.5 0.3 0.5Nitrogen Site Site
Specific SpecificNitrates 10Nitrogen (NH3) 2.0Phenol 0.1Phosphates(P205) 1.0Rad i oact ivity 37 Bq per 1itre
- Radium 226 0.37 Bq per litre- Strontium 90 0.37 Bq per litre
Resin Acid Soaps 5Selenium 0.01 0.05 0.1Silver 0.05 0.1 1.0Sulphates 50 250Sulphides 0.5 0.5 1.PTin 5 10· ..•Zinc 0.5 0.5 5.0
* Ammended: Note (1)
2 of 6
(1) Where high industrialdischarges are encountered

TABLE 5.1.1
REGULATIONS/GUIDELINES fOR OISCHARGESTO BODIES Of WATER BY JURISOICTION
Effluent Limi ts If guidelines are Are Therefor Discharges to they Enforceable JurisdictionalReceiving Waters on Basis of Insurance Water QualityAs Guidelines or of Certificate of Guidelinesas Regulation Approval? Published?
NEWFOUNDLAND Regulations N/A No
NOVA SCOTIA Guidelines Yes No
PRINCE EDWARD Values not Approval is NoISLAND Published Required
NEW BRUNSWICK Guidelines Yes Yes
* QUEBEC Values not Approval is NoPublished Required
ONTARIO Guidelines Yes Yes
MANITOBA Values not Yes YesPublished
SASKATCHEWAN Guidelines Yes Yes
ALBERTA Guidelines Yes Yes
BRITISH COLUMBIA Guidelines Yes Yes
YUKON Guidelines Yes YesTERRITORIES
NORTHWEST Guidelines Yes NoTERRITORIES
CANADIAN Guidelines No YesFEDERAL(For federalEstablishments)
* Up-dated (1992)
Quebec Values Not Published
3 of 6
Approval is Required Yes
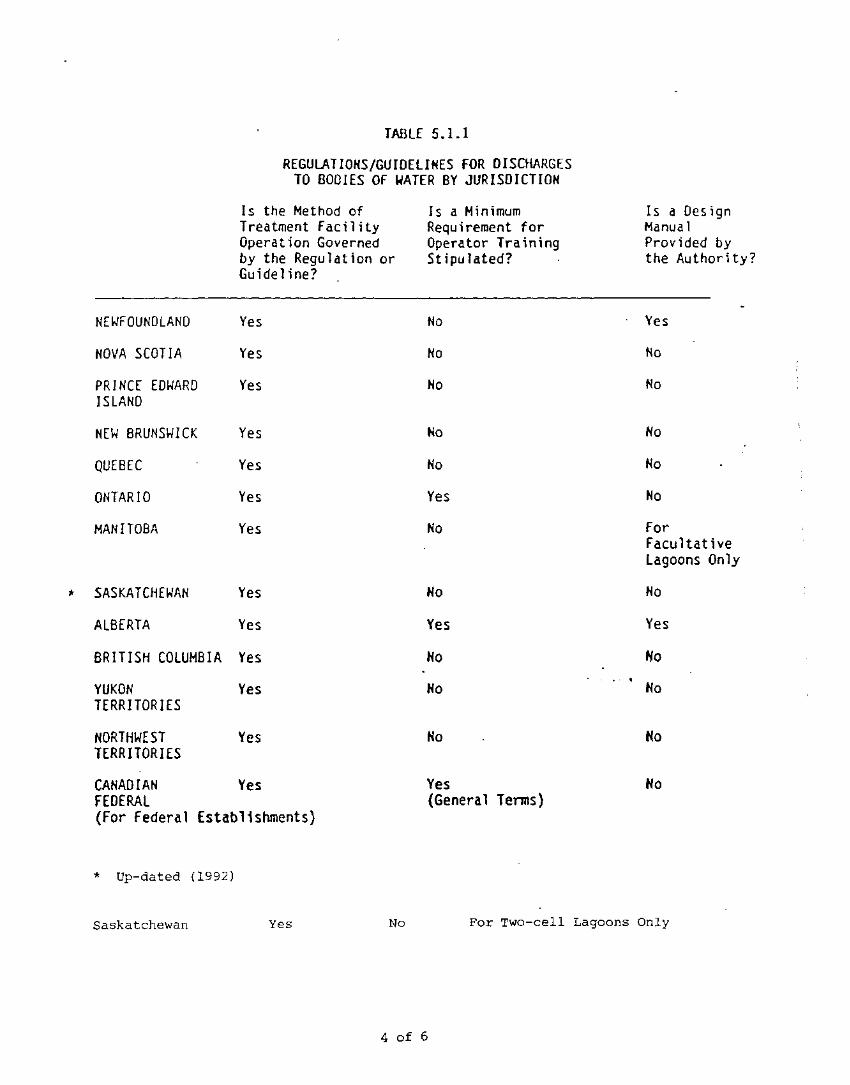
TABLE 5.1.1
REGULATIONS/GUIDELINES FOR DISCHARGESTO BODIES OF WATER BY JURISDICTION
Is the Method of Is a Minimum Is a DesignTreatment Facility Requirement for ManualOperation Governed Operator Training Provided byby the Regulation or Stipulated? the Authority?Guideline?
NEWFOUNDLAND Yes No Yes
NOVA SCOTIA Yes No No
PRINCE EDWARD Yes No NoISLAND
NEW BRUNSWICK Yes Ho Ho
QUEBEC Yes No No
ONTARIO Yes Yes No
MANITOBA Yes No ForFacultativelagoons Only
'Jt SASKATCHEWAN Yes No No
ALBERTA Yes Yes Yes
BRITISH COLUMBIA Yes No Ho
YUKON Yes No NoTERRITORIES
NORTHWEST Yes No NoTERRITORIES
CANADIAN Yes Yes NoFEDERAL (General Tenns)(For Federal Establishments)
* Up-dated (1992)
Saskatchewan Yes No
4 of 6
For Two-cell Lagoons Only

TABLE 5.1.1
REGULATIONS/GUIDELINES fOR DISCHARGESTO BODIES Of WATER BY JURISDICTION
Principal Effluent limitsAssociated with PredominantTechnology
Effluent limitsBased on Typeof Technologyor on ReceivingWater Quality
Type ofTechnologyPredominant lyRequired
5.S.(mg/L)
Phosphorus (mg/L)
* NEWFOUNDLAND Technology Secondary 20 30 -0.0005
NOVA SCOTIA Both Secondary See Section 3.2(less forocean disposal)
PRINCE EDWARD Both N/A N/A NolA N/AISLAND
NEW BRUNSWICK Both Secondary 20 20
* QUEBEC Both N/A N/A N/A N/A
* ONTARIO Both Secondary 15 15 3.5
MANITOBA Both Secondary 30 30
SASKATCHEWAN Both Secondary 10-25 10-25 3.5-6.5
ALBERTA Both Secondary 20-25 20':'Z5 • -BRITISH COLUMBIA Technology Secondary See Section 3.10
YUKON Both Secondary See Tables 3.11.1 & 3.11.2TERRITORIES
NORTHWEST Both Secondary See Table 3.12.1TERRITORIES
CANADIAN Both Secondary 20 25 1.0FEDERAL(FOR FEDERALESTABLISHMENTS)
Up-dated (1992)
Newfoundland: Technology Secondary 20 30 1.° (P 20Li)Ontario Both Secondary 15 15 1. 0 mgt (1984)Quebec: Both Secondary 15-40 15-40 0.4-1.0
5 of 6
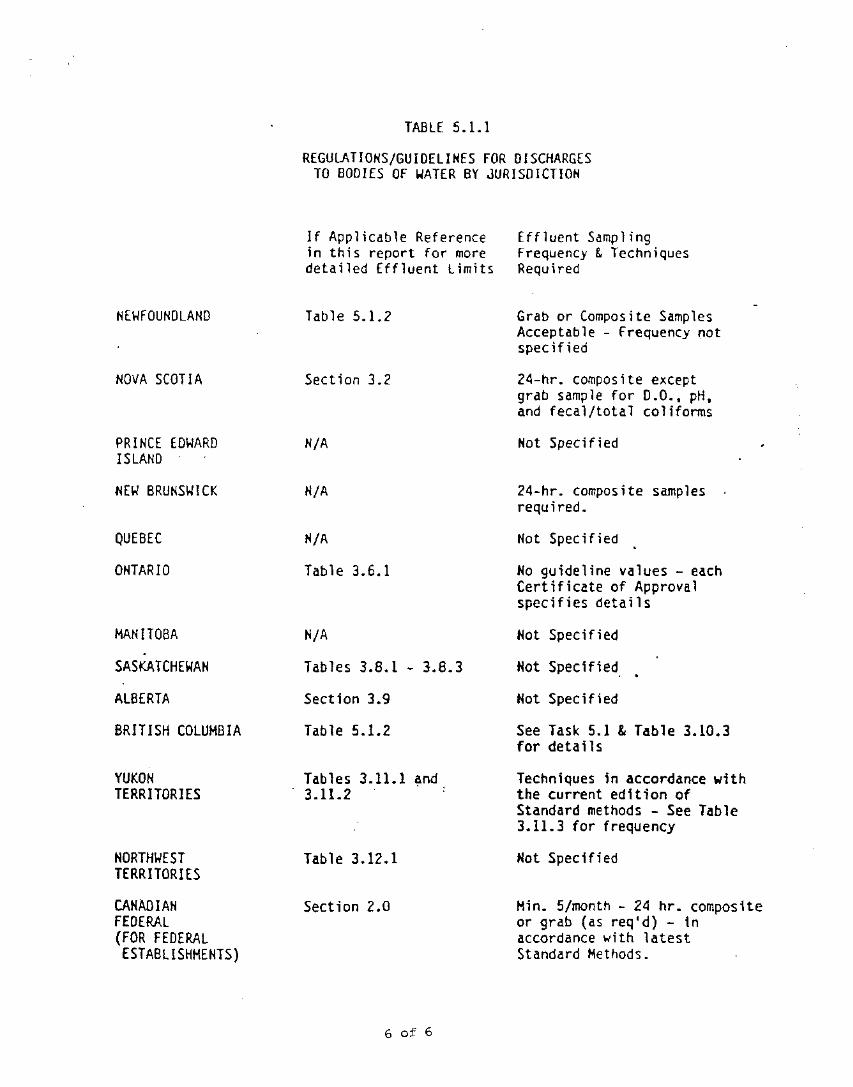
TABLE 5.1.1
REGULATIONS/GUIDELINES FOR DISCHARGESTO BODI£S OF WATER BY JURISDICTION
MANITOBA N,/A
SASKATCHEWAN Tables 3.8.1 - 3.8.3
ALBERTA Section 3.9
BRITISH COLUMBIA Tab le 5.1.2
YUKON Tab les 3.11.1 ~nd
TERRITORIES 3.11.2
NEWFOUNDLAND
NOVA SCOTIA
PRINCE EDWARDISLAND
~EW BRUNSWICK
QUEBEC
ONTARIO
NORTHWESTTERRITORIES
CANADIANFEDERAL(FOR FEDERAL
ESTABLISHMENTS)
If Applicable Referencein this report for moredetailed Effluent Limits
Table 5.1.2
Section 3.2
N/A
No/A
N/A
Table 3.6.1
Table 3.12.1
Section 2.0
6 of 6
Effluent SamplingFrequency &TechniquesRequired
Grab or Composite SamplesAcceptable - frequency notspecified
24-hr. composite exceptgrab sample for D.O., pH,and fecal/total coliforms
Hot Specified
24-hr. composite samples .required.
Not Specified
No guideline values - eachCertificate of Approvalspecifies details
Not Specified
Hot Spec if ied. •
Not Spec if ied
See Task 5.1 &Table 3.10.3for details
Techniques in accordance withthe current edition ofStandard methods - See Table3.11.3 for frequency
Not Specified
Min. 5/month - 24 hr. compositeor grab (as req'd) - inaccordance with latestStandard Methods.

APPENDIX A
Evolution Of TheU.S. Clean Water Act
Pages 1 - 2

SUMMARY OF FEDERAL CLEAN WATER LEGISLAnONIN TIlE UNITED STATES
(CONTINUED)
1977 PL 95-211, The Clean Water Act · Implement recommendations · Extended deadline foc achieving · Extended deadline foc achieving BIT to · Provisions of 1972 Act retained, withof 1977 of the national study secOlldary treatmOlt April I, 1979 shift of focus back to states
commission
· Stabilised annual authorisations at $5B · BAT requiremOlts redefmed foc three · EPA defined BPf for municipal plants
· Accelerate lagging municipal for FY 1980 to FY 1982 classes of pollutants: cOllventional, as secondary treatmOltdischarge imp£ovemOlts non<onventional, and toxic pollutants
· Established "set-asides" for · Compliance with secondary standards
· Further defme control for toxic irmovativelalternative technologies and · Deadline to meet effluent limits for increased from 40% ofP01W's inpollutant.! for rural areas toxic pollutant.! established as July I, 1975 to over 75% in 1980
1984
· Encourage state management · Narrowed grant eligibilities: removed · Many POTW's received extensionsofconstruction grants, separate storm sewers · Recognised limited technical since grant moneys could not beNPDES permitting, and information available for establishing dispased fast Olou~h to meet deadlinesdredgo-and-fiIl permitting · Gave states authority to set grant effluOlt standards for many pollutantsprograms priorities, but allowed EPA to
challenge
1981 PL 97-117, The Construction · Reduce time for grantees to · Reduced grant eligibilities to plants, · No significant change in industrial · No new enforcement p£ovisionsGrant Amendment.! of 1981 complete P£Ogram interceptors, pumping stations and discharge requirements
infiltrationfmflow control only · EPA and states focused on renewal of
· Focus more attention on · EPA's difficulty in establishing effluent NPDES permits and P01W's meetingsound financial basis for · Grant share reduced from 75% to 55% standards for many pollutants based on compliance schedules included inadequate PCYIW opo-atioos of eligible cost.! limited or non-existing technical permits
information remained
· Focus on existing rather than · Created a separate national fund offuture needs $200M annually for combined sewer
overflow (CSO) correction
· Limited amount of reserve capacity thatis grant-eligible
· Planning & design were only grant-eligible for small communities, thoughgrantees received an allowance for thesecosts in the construction grant
· Required co1.ifJcation that plant metdesign specifications and effluentstandards at end of frrst year ofOPO"ation
APPENDIX A Page 2

SUMMARY OF FEDERAL ClEAN WATER LEGISLATIONIN TIlE UNITED STATES
(CONTINUED)
1977 PL 95-217. The Clean Water Act · Implemmt recommmdations · Extmded deadline for achieving · Extended deadline for achieving BVf to · ProvisiolU of 1972 Act retained. withof 1977 of the national study secondary treatment April I. 1979 shift of focus back to states
commission
· Stabilised annual authorisatiOD5 at $5B · BAT requirements redefmed for three · EPA defined BVf for municipal plants
· Accelerate lagging municipal for FY 1980 to FY 1982 classes of pollutants: conventional. as secondary treatmmtdisdwge imp.-ovemmts non<onventional, and toxic pollutants
· Established "set-asides" for · Compliance with secondary standards
· Further define control for toxic innovative/a1tomative technologies and · Deadline to meet effluent limits for increased from 40% ofP01Ws inpollutants for IUral areas toxic pollutants established IU July 1. 1975 to over 75% in 1980
1984
· &x:ourage state management · Narrowed grant eligibilities: removed · Many POTW's roceived extensionsofconstruction grants, sepuale storm sewers · Recognised limited tochnical since grant moneys could nol beNPDES ptrmitting. and information available for establishing dispersed fast mou~h to mea deadlinesdredgl>and-fill permitting · Gave states authority to set grant effluent standards for many pollutantsprograms priorities, but allowed EPA to
challenge
1981 PL 97-117, The Construction · Reduce time for grantees to · Reduced grant eligibilities to plants, · No signifICant change in industrial · No new enforcement provisionsGrant Amendments of 1981 complete program interceptors. pumping statiOD5 and di.!charge mJuirements
infiltrationfmflow control only · EPA and states focused on renewal of
· Focus more attention on · EPA's difficulty in establishing effluent NPDES permits and P01Ws meetingsound financial basis for · Grant share reduced from 75% to 55% standards foc many pollutants based on compli3flCe schedules included inadequate rorw operations of eligible costs limited or non-existing technical permits
information remained
· Focus on existing rather than · Created a separate national fund offuture needs $200M annually for combined sewer
overflow (CSO) correction
· Limited amount of reserve capacity thatis grant-eligible
· Planning &: design were only grant-eligible for small communities. thoughgrantees received an allowance for thesecosts in the constroction grant
· Required certifICation that plant mddesign specifications and emuentstandards III end of first year ofooo-ation
APPENDIX A Page 2

DRAFT
MINISTRY OF ENVIRONMENT, LANDS AND PARKSMUNICIPAL SEWAGE DISCHARGE CRITERIA
TECHNICAL ASSESSMENT REPORT NO.1BEST AVAllABLE CONTROL TECHNOLOGY
TAR 1.1 SECONDARY TREATMENT AND EFFLUENT DISCHARGE CRITERIA
Supplement Cto
Appendixll
Effluent Discharge Criteria in Select Provinces, pages 1 - 9

)5.4 Minimum Treatment Requirements
The minimum standard for municipal wastewater treatment inAlberta is !J"~' ":i: ' '--.:-'-: ',:--:',:, ~'~~«'-'i'.' (">i':-.}·j;·~i1:·~ ",.,.i";j·j0r·.ltion 'is '3i'::.~i ~'.:~ :;urr:~ ; .... ::.;:- :;:>~)-:;t:i 111 til':provl n(:~. the major fae t'J[ iJS2d to D:::' ,i,':! l. ':;h ',n) :,:~.,a.tertreatm\:!n't
levels is the provision of affordable and demonstrated treat·:,}',:technologies. i.e .• BPT. It is recognized. however. that thepopulation and geographi~ location of a municipality are alsosignificant factors in determining the wastewater treatmentrequirements. and therefore the definition of BPT must reflectboth economics and environmental impact.
"~:.:""::~';':~~"~"'" ,,:::.,.~-:-.~~~' ..J :'. .::~
BPTforprojects with a design population of fewer than 20.000 1Sdefined as either wastewater stabilization ponds with 12 monthsstorage ..:,'aerated lagoons. produci ng a fi nal,effl uent .B90~Jas, ..
. defined in the glossary> of 25 mg/Li or me,<:h~nl,cal wastewaten-.ftreatment p~oducing a final effluent with ~QP:~~~ total suspendedsolids nSS) concentration of less than '25,mg7L~
~ .~: .. -" "" ". ".:':: . ~~'
~, . .< ... 'j;.:: . . , . ... ';" : .,J...BPT for a projects with a design popul ation more than 20.00() isconsidered as either wastewater stabilization ponds with 12""".months stqrage. aerated lagoons producing a final effluentiBOp ofless than/20~mg/J with the possi ble"'addi tional:~requi rement~:for
/"phosphorusc'control and/or effl uent di si nfection. or .mechani cal,was tewater,~;;trea tment 'produci ng BOD :and ,ISS" effl uentconcentratiol1s 'of less than 20 mg/t with the possible additionalrequirement for phosphorus control and/or effluent disinfectionif warranted by!~he water quality and downstream use of thereceiving watershed. The higher percentage BOD and TSS removalsachievable at larger plants are a definite advantage of havinglarger centralized facilities.
Although the minimum storage requirement is 12 months forwastewater stabilization ponds'discharging to a drainage coursein Alberta. it may be accept~ble to provide fewer than 12 monthsstorage when the final effluent is used for an approved municipal~astewater irrigation program. ,Refer to sections 5.11. 5.11.1.and 5.11.2.1 for'standards pertaining to wastewater irrigation.
1 of 9

•11/1\\
SaskatchewanEnvironment andPublic Safety
2 of 9
SaskatchewanWalter Scott Building3085 Albert Street'Regina, CanadaS4S OB1

•
®'Ontario
Ministryof theEnvironment
Ministeredel'Environnemet
TAllL£ 1
EFFLUENT CRITERIA
aEffluent Design Objectives
pEffluent Guidelines
Treatment Level and Processes
BOD 5S(mg~L) (mg/L)(unless otherwise noted)
1'otalPhosphorus(mg!L)as P
Ammonia +Ammonium Nitrogen(mg/L)as N
BOD(mg~L)
•IL __~~
SS(mg/L)
50% removal70% removal 1.0
woHI
~
A~ Primary Treatment
- without P removal- 'with P removal
B. Secondary Treatment or EQuiv.Conventional A.S.- withou~ P removal- with P removal
Contact Stabilization
- without P removal- with P removal
Extended Aeration
- without P removal- with p', removal
Continuous Discharge Lagoon(series operation)
- without P removal- with P removal
Seasonal Retention Lagoon
without P removalwith P removal by batch
chemical dosagewith P removal by continuous
chemical dosage
Physical-Chemical Treatment
30% removal'50% removal
1515
2020
1515
2525
2515
25
20
1515
2020
1515
3030
3020
30
20
1.0
1.0
1.0
1.0
1.0/0.5
1.0
1.0
-Y-Y
2525
2525
2525
3030
3025
30
25
-Y_1
25,25
2525
2525
4040
4025
40
25

G Gouvernement du QuebecMinisterede l'Environnement
Ministere de l'Environnement du Quebec
Exigences Specifiques aux Stations d'Epuration(Specific Requirements for Treatment Plants)
Article 22: Specific Discharge Standards: The effluent from a treatment plant must bepresent in concentrations less than or equal to the standards prescribed or reflecta treatment efficiency greater than or equal to the minimumprescribed treatmentplant efficiency.
Categories of Treatment Plants
Category Design (m3/d)
1 < 7502 750 - 4,9993 5,000 - 24,9994 25,000 - 99,9995 > 100,000
a) Suspended Biologic Culture (Activated Sludge)
All categories:
Parameters Standard Efficiency Average
BODij 20 mgIL 90% (annual)1'8S 20 mgIL 90%
Total-P 0.8 mgIL(l) 90%
Categories 1, 2, 3, 4, 5:
Parameters Standard Efficiency Average
BODij 30 mgIL 85% (quarterly 1 & 2)1'88 30 mgIL 85% (monthly 3 & 4)
Total-P 1 mgIL 85% (weekly 5)
4 of 9

a· Gouvernement du Quebec. Ministere
de I'Environnement
.
b) Fixed Biologic Culture (other than biologic filtration)
All categories:
Parameters Standard Efficiency Average
BODo 25 mg/L 80% (annual)TSS 25 mg/L 80%
Total-P 0.8 mg/L(l) 90%
Categories 1, 2, 3, 4, 5:
Parameters Standard Efficiency Average
BODo 35 mg/L 70% (quarterly 1 & 2)TSS 35 mg/L 70% (monthly 3 & 4)
Total-P 1 mg/L 85% (weekly 5)
c) Biologic Filtration (Trickling Filters. Sand Filters)
All categories:
Parameters Standard Efficiency Average
BODo 25 mg/L 80% (annual)TSS 25 mg/L 80%
Total-P 0.8 mg/L(l) 90%
Categories 1, 2, 3, 4, 5:
Parameters Standard Efficiency Average
BODo 40 mg/L 70% (quarterly 1 & 2)TSS 30 mg/L 85% (monthly 3 & 4)
Total-P 1 mg/L 85% (weekly 5)
5 of 9

a'· Gouvernement du QuebecMinisterede l'Environnement
d) Aerated Lagoons
Type Number of Cells Detention Time
A 1 T > 16 days2 13 - 19.93 12·16.94 11 - 15.9
B 2 > 203 17 - 24.94 16 - 22.9
C 3 > 254 > 23
T = 0.85 liquid volume of stages (m3)
design flow (m3/d)
Type A - Aerated Lagoons
Parameters Standard Efficiency Average
BODe; 30 mgIL 65%Total-P 1 mgIL(l) 85%
Averages during June, July, August quarter
BODe; 25 mgIL 80%
Averages during December, January, February quarter
BODe; 30 mgIL 60%
Type B - Aerated Lagoons
Parameters Standard Efficiency Average
BODe; 25 mgIL 75%Total-P 1 mgIL(l) 85%
Averages during June, July, August quarter
BODe; 20 mgIL 85%
Averages during December, January, February quarter
BODe; 25 mgIL 70%
6 of 9

a Gouvernement du QuebecMinisterede l'Environnement
Type C - Aerated Lagoons
-Parameters Standard Efficiency Average
BOD5 20 mg/L 85%Total-P 1 mg/L(l) 85%
Averages during June, July, August quarter
BOD5 15 mg/L 90%
Averages during December, January, February quarter
BOD5 20 mg/L 80%
e) Non Aerated Lagoons
Treated effiuent must be equal to, or better than, 60% of the annual efficiency for TSSand BOD5 removal.
o Mechanical-Chemical Treatment
Parameters Standard Efficiency Average
TSS 20 mg/L 75% (annual)Total-P 0.8 mg/L 80%
Categories 1, 2, 3, 4 and 5:
Parameters Standard Efficiency Average
TSS 30 mg/L 60% (quarterly 1,2)Total-P 1 mg/L 70% (monthly 3,4)
(weekly 5)
g) Tertiary Filtration
Parameters Standard Efficiency Average
BOD5 15 mg/L 90% (annual)TSS 15 mg/L 90%
Total-P 0.4 mg/L(l) 95%
7 of 9

a Gouvernement du QuebecMinisterede I'Environnement
Categories 1, 2, 3, 4, 5:
Parameters Standard Efficiency Average
BOD{j 20 mg/L 85% (quarterly 1 & 2)TSS 20 mg/L 85% (monthly 3 & 4)
Total-P 0.5 mg/L 92% (weekly 5)
NOTE: (1) Average during the period of phosphorus removal.
8 of 9

r 'tJ v\.u 1- Ou n d
SCHEDULE A
Column ICONSTITUENTS
B.().D .Coli/l)nll - f;lcraJ ..(:olil(lrm - total. .Solids (dissoh-ed) .S()lid~ (suspendcd) ..()ils (Ether extrart) .Floaling debris. oils and grease ..Ar~enir : .Bariul1l ..Boroll .Ca<ll1l iUI1l ..Chlorine .Chromiulll (hexavalcnt) .(:hrol1liulll (trivalent) ..Copper ; .Cyanidt .Iron (IOtal) : : .I.ead _ .~1errl1r\' ... .:-;kk(·I 1 .
Nitrates .~il rogtll (al1lmoniacal) .Phenol .Phospnatcs (total as P20~) ..Phosphorus (c1enlental) :, .Sc!tniul11 : .SuHides .SilH'r .Zil1c : ..
9 of 9
Column 2MAXIMUM CONTENT
(in milligrams per litreunless noted)
201000/100 ml5000/100 ml
1000 (see note)30 (see note)
15None to be visible
0.55.05.0
0.051.0
0.051.00.3
0.025100.2.0050.5102.00.11.0
0.00050.010.5
0.050.5

DRAFT
MINISTRY OF ENVIRONMENT, LANDS AND PARKSMUNICIPAL SEWAGE DISCHARGE CRITERIA
TECHNICAL ASSESSMENT REPORT NO.1BEST AVAllABLE CONTROL TECHNOLOGY
TAR 1.1 SECONDARY TREATMENT AND EFFLUENT DISCHARGE CRITERIA
Supplement Dto
Appendixll
Municipal Sewage Discharge Criteriaand Regulations in the United States, pages 1 • 3

DRAFT
TECHNICAL ASSESSMENT REPORTMUNICIPAL SEWAGE DISCHARGE CRITERIAAND REGULATIONS IN THE UNITED STATES
PREPARED BY: Forrest Vaughan, JMM
REVIEWED BY: Patrick Burke, JMM
OBJECTIVE
This Technical Assessment Report (ToAR.) discusses the current federal and stateregulations concerned with municipal wastewater discharges in the United States.
BACKGROUND
The history of clean water legislation in the U.S. dates back to 1948, and illustrates a continualprogression of efforts to maintain and improve water quality. This history also reflects thecommitment of the U.S. federal government to provide funding for treatment works at a levelwhich was needed to accomplish the goals of the legislation. Appendix A provides a briefsummary of the evolution of the original Federal Water Pollution Control Act of 1948 into theClean Water Act in effect today in the U.S.
CURRENT REGULAnONS IN TIlE UNTIED STATES
The Clean Water Act of 1987 amended and extended previously existing legislation to 1994. Thehistory of this legislation has involved a distinct cycle: legislate, implement, evaluate, and legislateagain. The history of water pollution control legislation in the U.S.A also reflects a periodicchange in focus, by managing either water quality or effluent quality (Water EnvironmentFederation, 1987). This change of focus is in part responsible for the evolution of the title of thelegislation from the previous Federal Water Pollution Control Act (focus on pollution control) tothe current Clean Water Act (focus on water quality).
The official title of the first Clean Water Act was The Federal Water Pollution Control ActAmendments of 1972. Section 101(a) stated, "The objective of this Act is to restore and maintainthe chemical, physical, and biological integrity of the Nation's waters." In other words, itestablished the goal of water quality restoration as fundamental, with pollution control as a meansof achieving that goal. This law marked a disti~ct break with the philosophy of previous water
M3272006 1

pollution control laws, and established the following precepts of U.S. water quality policy (WaterEnvironment Federation, 1987): \
1. No one has the right to pollute the navigable waters of the United States. Anyone wishingto discharge pollutants must obtain a permit to do so.
2. Pennits shall limit the composition ofa discharge and the concentrations of the pollutants init. Anyone violating the conditions of a permit is subject to fmes and imprisonment
3. Some pennit conditions require the best controls technology can produce, regardless of thereceiving water's ability to purify itself naturally. In essence, CongreSs decreed that certainlevels of control are de facto worth their cost
4. Any limits or control higher than the minimum federal requirements must be based onreceiving water quality. The only way to impose higher standards than those called for inthe Act was to demonstrate that the continued protection of the receiving water demandedsuch limits.
The Clean Water Act in the U.S. obligated funding for research into pollutants, controltechnologies and water quality criteria; funding for planning, design and construction of treatmentworks; and delegated to the Environmental Protection Agency the authority to establish and enforcestandards for secondary treatment, surface water quality, and limits for toxic pollutants. The Actalso included the provision for review of the impacts of the legislation after implementation and, ifnecessary, revise legislation to meet changing requirements of society and the environment
The Clean Water Act establishes minimum standards and outlines procedures for restoring andmaintaining water quality throughout the states. However, the states are also encouraged toestablish their own standards and procedures within the outlined objectives of the Act.Responsibility for permitting discharges, managing funds for the construction of treatment works,and other regulatory programs may be delegated to the states upon each state showing that it willconduct its programs in accordance with federal guidelines. On the other hand, if a state can not orchooses not to develop such a program, the. regional office of the EPA will serve as the leadregulatory agency.
CURRENT REGULATIONS IN 1HEINDIVIDUAL STATFB
Water quality goals and government policy are usually established in legislation that presents aninventory of water resources by water body and water course, and describes water quality criteria,technological criteria, and the dischargers to be regulated. The policies for enforcement of thestandards and the application of technology are as important as the statement of the standardsthemselves. Appendix B provides a concise summary of a typical state program, the ColoradoWater Quality Compliance Strategy - Executive Summary. Appendix C contains a recentpublication discussing the State of Washington Surface Water Quality Standards, and proposedrevisions to these standards. The Colorado and Washington programs are representative of surfacewater quality criteria for other states.
Inventory of Waters: As a first step in developing criteria for regulations, an inventory of waterbodies and water courses is prepared. The inventory describes these water resources in terms ofecosystems supported, or other beneficial uses of the waters. Waters may be differentiated basedon uses. For example, uses such as agricultural irrigation, transportation, recreation, or drinkingwater supply may be identified as separate classes that have definable water quality parametersnecessary for that use. In addition, waters that historically support wildlife, fish or shellfish mayhave different, defmable water quality parameters that set these resources apart from all others and
M3272006 2

are deserving of special protection. An inventory of waters and their uses is necessary to defineand justify the water quality parameters to be assigned for those waters.
Water Quality Standards: The individual states are responsible for establishing the water qualitystandards for their own water bodies and water courses. These standards usually include thefollowing general categories:
• Minimum standards for all waters at all times, including both traditional water qualityparameters and toxies.
• More stringent standards for water quality-limited water bodies and water courses, and forbeneficial reuse.
• Special standards for protection of outstanding or unique water resources, such as dedicateddrinking water sources or those supporting unique wildlife and ecosystems.
• Designation of beneficial uses of waters, either by general classifications or specificinventories.
Effluent Discharge Standards: After water quality goals are defined, the states then developeffluent discharge standards for dischargers which are aimed at maintaining the established waterquality standards.
• Technology-based effluents limits - For municipal dischargers, these criteria generally defmethe minimum treatment as secondary treatment, and may establish higher levels (one or more)for protection of wildlife (such as nitrification of ammonia) or maintenance of outstandingwaters (such as advanced waste treatment). For industrial dischargers, these criteria areusually categorical limits based on the industrial processes employed and the pollutantsnormally constituting the discharge. These technology-based limits would be applied in allcases unless more stringent limits are indicated to maintain water quality.
• Water quality-based effluent limits - For both municipal and industrial dischargers, effluentlimits based on water quality criteria are established on a case-by-case basis. These limits haveas their primary goal the restoration of water quality (e.g., limits on the phosphorus content ofdischarges to lakes or impoundments) or the maintenance of water quality for a specificpurpose (e.g., limits on nutrients, or on metals and toxic substances discharged to sources ofdrinking water). Water quality-based effluent limits would be applied in special cases whererestoration or maintenance of water quality depends on these limits being in place.
Design Criteria: Some states have established design criteria for wastewater and water treatmentand conveyance facilities to provide guidelines to owners, designers and regulators as to theminimum standards for the sanitary facilities. The "Ten States Standards" are probably the bestknown collection of design criteria (The Great Lakes - Upper Mississippi River Board of StateSanitary Engineers, 1990). However, these criteria are updated only about every seven years, somany member states of the board responsible for these standards maintain their own standards aswell, to remain current on new developments in technology (Wisconsin Statutes, Chapter 147).
M3272006 3

REFERENCES
Colorado Department of Health, Colorado Water Quality Compliance Strategy - ExecutiveSummary, July, 1984.
Florida Statutes, Chapter 403
Florida Administrative Code Chapters 17-3, 17-6 and 17-610.
The Great Lakes - Upper Mississippi River Board of State Sanitary Engineers, Standards forSewerage Facilities, 1990.
Water Environment Federation (formerly The Water Pollution Control Federation), The CleanWater Act of1987, 1987.
Wisconsin Code, Chapters NR 100 through NR 299.
Wisconsin Statutes, Chapter 147

APPENDIXB
State of ColoradoWater Quality
Compliance Strategy
Pages 1 - 10

APPENDIX B
COLORADO WATER QUALITY
COMPLIANCE STRATEGY
EXECUTIVE SUMMARY
C:olorado Department of Health.
Denver, Colorado
July 1984

TABLE OF CONTENTS
I. Introduction 3
II. Background 3
III. Definitions 3
IV. Goal 5
V. Statement of Policies 5
VI. Water Quality Priorities 6
VII. Roles and Responsibilities 7
VIII. Water Quality Compliance Strategy 8
2

COLORADO WATER QUALITY COMPLIANCE STRATEGY
I. Introduc tion
The purpose of this document is to summarize the strategy and procedures thatthe Colorado Department of Health will follow to achieve compliance with itsregulatory requirements for wastewater facilities at the earliest possibletime. This strategy proposes a stronger enforcement posture to deal withnoncompliance than might have been the State's position in the past. Thedriving factors to determine compliance or noncompliance are discharge monitoring reports (DMR's), inspection reports, routine monitoring, complaints,etc. However, other water quality program elements play an important role inwastewater treatment performance and compliance. These program elementsinclude planning, water quality standards, permitting, ambient monitoring,construction grants and enforcement. This strategy covers all wastewatertreatment facilities in the State, i.e., industrial and municipal (domestic).
II. Background
The Clean Water Act states that the primary responsibility rests with theStates to prevent, reduce, and eliminate pollution. EPA delegated the NationalPollutant Discharge Elimination System (NPDES) permit program to the. State ofColo-rado in 1975. Under this program, Colorado issues all the appropriatepermits to dischargers in the State and prOVides all the necessary compliancetracking and enforcement actions to achieve compliance.
In implementing this compliance strategy, all of the State water quality program activities will come into play, but the ones that are considered in thisreport are ambient and effluent monitoring, facility inspections, permitting,facility assessment and compliance, enforcement actions, additional complianceevaluations, and assessment of civil penalties.
III. Definitions
A. Compliance Strategy - an on-going process that evaluates all wastewatertreatment facilities in the State, determines compliance or noncompliancewith permit effluent limits and conditions of each, assesses the degree ofnoncompliance, determines the appropriate compliance evaluations and/orenforcement actions needed to achieve compliance, and assesses and imposesappropriate civil penalties. When effluent compliance is achieved, theprocess further evaluates whether or not instream water quality standardsare met to see if further treatment or additional permit conditions arenecessary.
B. Compliance - a facility is meeting all of its effluent limits and conditions set forth in its permit.
C. Noncompliance - a facility is not meeting some aspect of its permit or isdischarging without a permit.
3
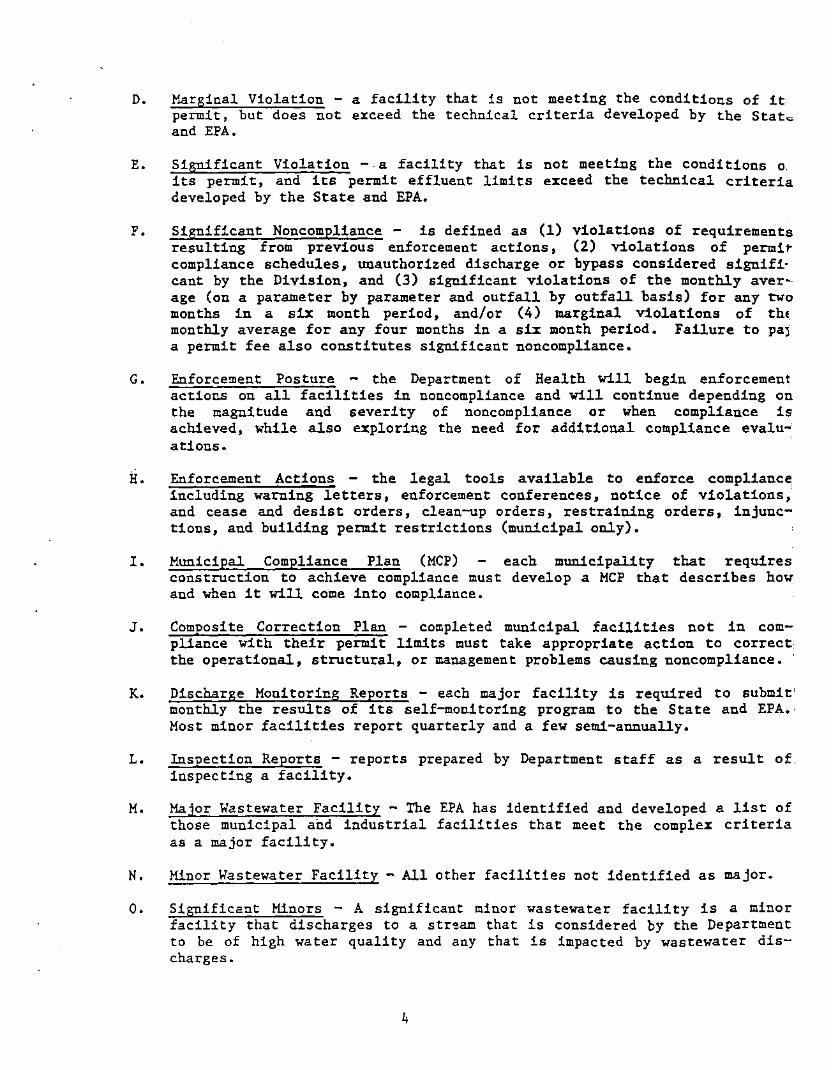
D. Marginal Violation - a facility that is not meeting the conditions of itpermit, but does not exceed the technical criteria developed by the Statband EPA.
E. Significant Violation -: a facility that is not meeting the conditions 01its permit, and its permit effluent limits exceed the technical criteriadeveloped by the State and EPA.
F. Significant Noncompliance - is defined as (1) violations of requirementsresulting from previous enforcement actions, (2) violations of permit"compliance schedules, unauthorized discharge or bypass considered signifi~
cant by the Division, and (3) significant violations of the monthly averL
age (on a parameter by parameter and outfall by outfall basis) for any twomonths in a six month period, and/or (4) marginal violations of thtmonthly average for any four months in a six month period. Failure to pa)a permit fee also constitutes significant noncompliance.
G. Enforcement Posture - the Department of Health will begin enforcemen~actions on all facilities in noncompliance and will continue depending onthe magnitude and severity of noncompliance or when compliance i~
achieved, while also exploring the need for additional compliance evalu,ations •
.H. Enforcement Actions - the legal tools available to enforce complianc~
including warning letters, enforcement conferences, notice of violations ,Iand cease and desist orders, clean-up orders, restraining orders, injunctions, and building permit restrictions (municipal only).
I. Municipal Compliance Plan (MCP) each municipality that requiresconstruction to achieve compliance must develop a MCP that describes hoW[and when it will come into compliance.
J. Composite Correction Plan - completed municipal facilities not in com-,pl1ance with their permit limits must take appropriate action to correctlthe operational, structural, or management problems causing noncompliance. \
K. Discharge Monitoring Reports - each major facility is required to submitmonthly the results of its self-monitoring program to the State and EPA.Most minor facilities report quarterly and a few semi-annually.
L. Inspection Reports - reports prepared by Department staff as a result ofinspecting a facility.
M. Major Wastewater Facility - The EPA has identified and developed a list ofthose municipal and industrial facilities that meet the complex criteriaas a major facility.
N. Minor Wastewater Facility - All other facilities not identified as major.
o. Significant Minors - A significant minor wastewater facility is a minorfacility that discharges to a str~am that is considered by the Departmentto be of high water quality and any that is impacted by wastewater discharges.
4

IV. Goal
The major goal of this compliance strategy is to protect, maintain and improvethe quality of Colorado's waters, as defined by water quality standards, withemphasis on correcting point source problems (wastewater treatment facilities),in a consistent, economical, and equitable manner within the· authorities ofState and Federal laws and regulations.
V. Statement of Policies
A. The Colorado Department of Health will emphasize its regulatory and enforcement role in implementing this Strategy to ensure compliance.
B. It is the responsibility of wastewater treatment facility owners to ensurecompliance. They are also responsible for making all major decisionsregarding the methods by which they achieve and maintain compliance.
C. In order to be more effective in performing its regulatory responsibilities, the Department will limit its technical assistance and advice suchthat it will not perform the role of a technical consultant to wastewaterentities.
D. All facilities in noncompliance will be subjected to some form of enforcement action.
E. The Department will direct its resources with special emphasis in priorityorder on facilities (1) creating a significant health problem, (2) discharging to priority water segments, (3) classified as majors or significant minors, and (4) have been constructed with State and/or Federal funds.
F. The Department will continue to establish effluent limits and enforceablecompliance schedules as applicable for all dischargers as part of itspermitting process. However, those facilities that do not now have thecapability of meeting their final effluent limits, the Department willdevelop enforceable compliance schedules for each one by July 1985.
G. The Department will develop for those facilities in F above, complianceschedules that will require them to be in compliance with the requirementsof the Federal Clean Water Act by July 1988.
H. For municipal Wastewater treatment facilities, compliance must be achievedwhether or not EPA or State construction grant assistance is available.All permittees are responsible for establishing financial programs toassure availability of sufficient funds for proper operation, maintenanceand replacement of facilities.
I. The Department will coordinate with wastewater treatment entities, EPA andother appropriate agencies to ensure a uniform and equitable approach tothe implementation of this compliance strategy.
5

VI. WATER QUALITY PRIORITIES
The water quality priorities established in this report will be the drivingforce in establishing monitoring, inspection and enforcement priorities tc!,implement this compliance strategy. Due to resource constraints, those facil~
ities located in high priority stream segments will be given an overall higheremphasis than those facilities in low priority stream segments.
However, no facility in noncompliance will be exempted from some form of enforcement action. Lower priority facilities will be checked on a random basis t~
ensure the maximum possible compliance of all facilities in the State. Regard~
less of stream location, all majors will be given priority.
A. Objective: The objective of setting these priorities is to coordinate theState's resources so as to concentrate its efforts in those stream seg~
ments with the highest priority. But, to also assign limited resources tolower priority streams in an overall effort to ensure maximum compliance.!Also, the Department will emphasize its health related responsibilities!and give high priority to stream segments used for drinking water supply.
B. List of Water Quality Priorities
-1. High Water Quality Segments
2. Water Quality Limited Segments
a. Threatenedb. Impairedc. All Others
3. Effluent Limited Segments
a. Domestic Water Supplyb. Aquatic Life 1c. Aquatic Life 2d. Recreation Class 1e. Recreation Class 2f. Agricultural
C. List of Facility Priorities
1. Major facilities
2. Significant minor facilities
3. Minor facilities
6

VII. Roles and Responsibilities
The Colorado Water Quality Control Act specifies the roles and responsibilities of the Vpt:er Quality Control Commission and the Water Quality ControlDivision of the Colorado Department of Health, in protecting, maintaining andimproving the quality of Colorado's surface waters and groundwater.
A summary of the roles and responsibilities of the key entities involved inimplementation of this compliance strategy are given below:
A. Water Quality Control Commission - The Act requires the Commission to"develop and maintain a comprehensive and effective program forprevention, control and abatement of water pollution and for waterquality protection throughout the entire State". The Commissionpromulgates control regulations, permit regulations, establisheswater quality standards, and classifies State waters.
B. Water Quality Control Division - The. Division is responsible forimplementing the State's water quality control program. The Divisiondefines iudividual effluent requirements to be consistent with thecurrent water quality standards and the Federal and State technologybased effluent requirements. These effluent requirements are madepart of point source discharge permits which also contain effluentmonitoring, schedules of compliance, record keeping, etc. The permitconditions and effluent limits are required to ensure that theState's waters are protected from unlawful degradation from dischargers. In addition, the Division monitors for compliance, evaluates field conditions (ambient monitoring), develops proposed waterquality standards, administers the construction grants program,monitors point sources, and ensures compliance through enforcement.The four Sections under the Division Director that perform the abovefunctions are Permits and Enforcement, Administrative Services,Planning and Standards, and Field Services. The specific responsibilities of each Section in implementing this compliance strategy areincluded in Section IX, Key Program Elements.
C. Permittees - Permittees are responsible for constructing, operating,maintaining, and upgrading their wastewater treatment facilities inorder to be in compliance with their permit effluent limits andconditions.The 1972 Federal Clean Water Act required by 1977 that allmunicipal-facilities to have constructed secondary treatment and allindustrial facilities to have constructed best practicable treatment(BPI). The 1977 Federal Clean Water Act extended the July 1, 1977deadline for eligible municipal facilites to July 1, 1983, and established a July 1, 1984 deadline for compliance with best availabletreatment requirements for toxics.
7

VIII.
For municipal facilities, the State law also requires the entity to!begin planning when the flows reach 80% of design capacity and con-Istruction of an expansion at the 95% level. This is to be doneregardless of the availability of Federal or State funds. Further,it is the responsibility of the entity to determine what is causingnoncompliance and correct the problems using internal staff or technical consultants, as needed. Adequate effluent and ambient monitoring by the entities provides verification of compliance witheffluent limits and the impact on receiving waters.
Water Quality Compliance Strategy
This section summarizes the State's Compliance. Strategy. It is an ongoingprocess that evaluates all wastewater treatment facilities in the State, determinescompliance or noncompliance with permit effluent limits and conditions of each,assesses the degree of noncompliance, determines the appropriate complianceevaluations and/or enforcement 'actions needed to achieve compliance, and assessesand imposes appropriate civil penalties. When effluent compliance is achieved, theprocess further evaluates whether or not instream water quality standards are metto see if further treatment or additional permit conditions are necessary.
A. Facility Assessment
The first step in the process is to assess each wastewater facility in theState to see if it is in compliance with its permit conditions.
The Discharge Monitoring Reports (DMR's) are one method to identify compliance or noncompliance of wastewater facilities. Other methods includeinspection reports, effluent monitoring, and observed violations that willneed to be monitored. The Department presently reviews over 300 DMR's permonth, inspects all major facilities at least annually and performseffluent monitoring on many of the major, significant minor and minorfacilities annually in an effort to increase the number of facilities incompliance.
B. Assess the Degree of Noncompliance
If a facility is in noncompliance, then the State determines what degreeof noncompliance, i.e., marginal violation, significant violation orsignificant noncompliance. This is based on State and EPA criteria.
C. Enforcement Actions
Once noncompliance has been determined, whether marginal or significant,the Department will be in an enforcement posture and will take whateverenforcement actions that are appropriate. The enforcement actionsinclude: warning letters, conferences, notice of violations letters,notice of violations and cease and desist orders, clean-up orders,restraining orders and injunctions, building permit restrictions (municipal), compliance order, and revoking permit.
8
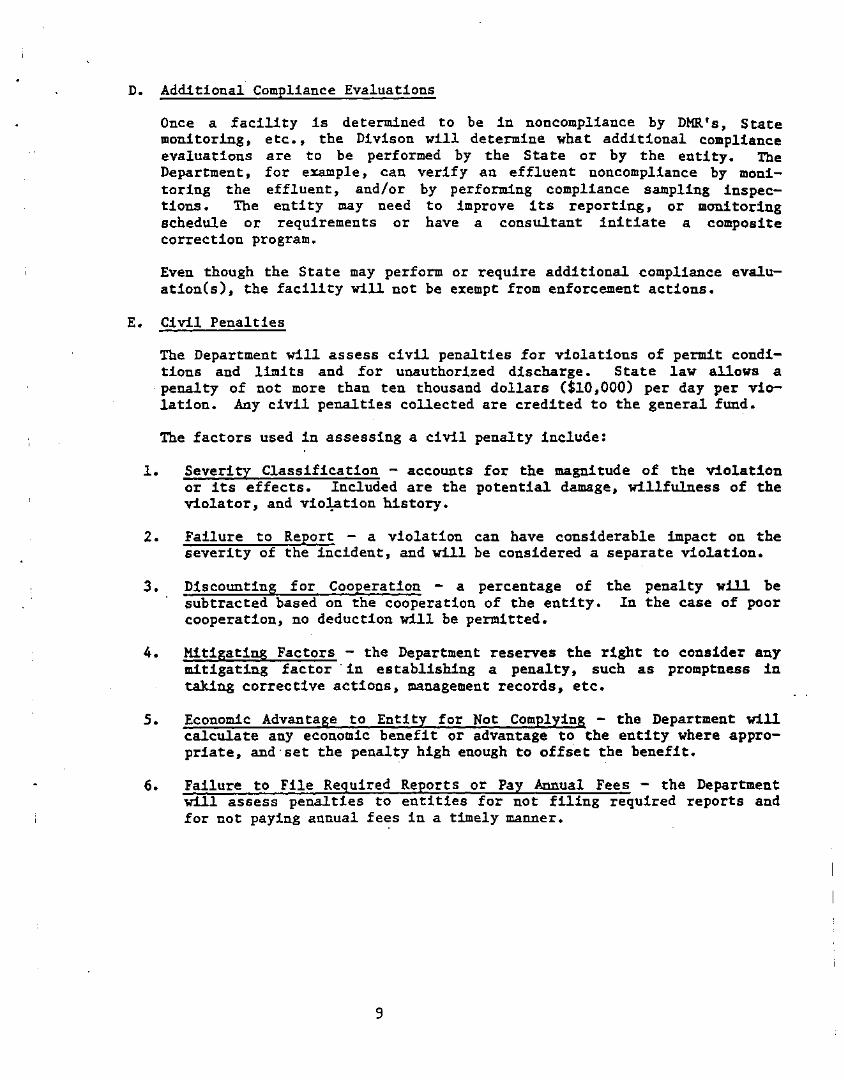
D. Additional Compliance Evaluations
Once a facility is determined to be in noncompliance by mm.'s, Statemonitoring, etc., the Divison will determine what additional complianceevaluations are to be performed by the State or by the entity. TheDepartment, for example, can verify an effluent noncompliance by monitoring the effluent , and/or by performing compliance sampling inspections. The entity may need to improve its reporting, or monitoringschedule or requirements or have a consultant initiate a compositecorrection program.
Even though the State may perform or require additional compliance evaluation(s), the facility will not be exempt from enforcement actions.
E. Civil Penalties
The Department will assess civil penalties for violations of permit conditions and limits and for unauthorized discharge. State law allows apenalty of not more than ten thousand dollars ($10,000) per day per violation. Any civil penalties collected are credited to the general fund.
The factors used in assessing a civil penalty include:
1. Severity Classification - accounts for the magnitude of the violationor its effects. Included are the potential damage, willfulness of theviolator, and vio3;ation history.
2. Failure to Report - a violation can have considerable impact on theseverity of the incident, and will be considered a separate violation.
3. Discounting for Cooperation - a percentage of the penalty will besubtracted based on the cooperation of the entity. In the case of poorcooperation, no deduction will be permitted.
4. Mitigating Factors - the Department reserves the right to consider anymitigating factor "in establishing a penalty, such as promptness intaking corrective actions, management records, etc.
5. Economic Advantage to Entity for Not Complying - the Department willcalculate any economic benefit or advantage to the entity where appropriate, and"set the penalty high enough to offset the benefit.
6. Failure to File Required Reports or Pay Annual Fees - the Departmentwill assess penalties to entities for not filing required reports andfor not paying annual fees in a timely manner.
9

F. Compliance
After one or more enforcement actions, the Department will evaluate whethe~
or not compliance has been accomplished. If not, enforcement actions wi]continue as appropriate. If compliance has been accomplished, the Department will check to see if water quality standards are met.
G. Compliance Letter
The Department will issue a Compliance Letter to a permittee that ha:achieved compliance with the order for at least three months or two repor'ting periods is less frequent than monthly. The letter will state that theprevious problems have been corrected.
H. Water Quality Review
Once it has been determined that a facility is in compliance, the Departmentwill check. to see if instream water quality standards are being met. If i!problem exists, the Department will determine if it is from the facility orother sources including nonpoint.
I. Reissue Permits
The Department will revise permits needing modifications due to 1nstre~
problems or other reasons as soon as possible. Otherwise, other permits~ll be reissued prior to renewal dates.
J. Continue Tracking Comuliance
The Department will repeat the above process on a regular basis to ensurercompliance. i
IX. Coordination
A. The State of Colorado has established as part of its permit delegationpackage operating procedures needed to coodinate permitting, grants, compliance, and enforcement activities.
B. Entities with construction grant schedules will be coordinated at criticalm.11estones with any related permit compliance schedules, Le., in permitmodificatons or - other enforceable EPA/State mechanisms. Coordination between permit and construction grant schedules is critical in providing aunified response from the State to the entity.
10

APPENDIXC
State of WashingtonDraft Surface
Water Quality Standards
Intra - 2 pages
Pages 1 - 28

~~~"A':,~~~ill~ lTAJ~ Was'hington's Surface Water'Oualily, Standards":ECO·LO GY .. '
Proposed Revisions and Pu~l~c~eetingNotice. .'. '". . ~ ':.
Public comments on proposed changes to Washington's standards to protect the quality ofsurface waters will be taken at five public meetings to be held in ,Feb!U~ryaround the state.Meeting locations and times are included at the end of this paper; ,
Triennial reviewWashington's Surface Water Quality Standards [Chapter 173-201 WAC} protect a widerange of beneficial uses for surface waters. Beneficial uses include dom~ti~agricult,ura1
and indWitrial water ~upplies,recreation, wildlife habitat, fish and $h~~comtrierceandnavigation. The standards contain chemical, physical~d biological characteristics to 'support,beneficial uses. The standards'are used to set limits'on discharges to surface' .waters through Ecology's water quality permitting program. They also guide Ecology's , 'water qtajllty activities in areaswhere permits are.not required. Every three years Ecologyrevi~w9 the state's surface water quality standardS to make sureWas~iskeepi;ng upwith pollution problems and important changes in water quality management.: ' , ,', .
.... ,...;.
Public involvementIn April 1990, Ecology proposed a list of topics to be addressed during the triennial reviewand developed discussion papers on each topic; About 3,600 ~,c::\ividua1s._!U1d groups weremailed a public notice summarizing the topics. Five worksh~s were he~d'aro~nd the statelast summer to discuss topics proposed for review by Ecology and receive public,comments on other topics to address. Following the workshops, staff responded in writingto the comments received and prepared a final list of topics to be addressed in, the review.Ecology has also formed work groups representing various interests and~ of expertiseto advise staff on specific revisions. As revisions were developed on specific topics, copieswere mall.~to'~sons who indicated an interest in those topi~.
Publiche~gs on 'Ecology's final~proposed revisions are scheduled for June 1991. Publicmeetings are being held in February to provide an opportunity for early public review ofthe proposed changes. , ' ,Enclosed is a document shoWiJlg how the proposed new language would be incorporatedinto the standards. The document also explains the proposed ~anges. , '"
.. . ",
Proposed revisions·Ecology is proposing amendments to the surface water'quality-standards to:
• update Washington's antidegradation policy;
• adopt numerical limits for additional toxic substances;
• establish criteria limiting the combined effects of toxies on aquatic life;
January 1991
F·WQ·91·101

., adopt a human health risk level used. to set limits on carcinogens in water;
• clarify how the standards apply to nonpoint sources of pollution; and
• reclassify specific water bodies.Revisions are also proposed. to clarify Ecology's existing authority related to permittedactivities involving wetlands. No new i~gulatoryauthority or permitting proced.ures.areproposed.. The amendments proposed for wetlands will establish a basis for consistentdecision-making by Ecology.
Public meetingsBelow is the schedule for public meetings to discuss the proposed revisions toWashington's surface water quality standards'. All meetings begin at 7 p.m.
• Ellensburg, February II, Hal Holmes Center, 201 N. Ruby.
• Spokane, February 12, Spokane County Health Center, W. 1101 College.
• Redmond, February 13, Ecology Northwest Regional Office, 4350 150th Ave.
• Vancouver, February 19, Fort Vancouver High School, 570 E. 18th.
• Port Angeles, February 20, City Council Chambers, 321 E. 5th. St.
Public comment and informationPublic comments received by March 5, 1991, will be considered before Ecology files a finaldraft rule with the state code revisor. Public hearings on the final draft rule will be held inJune. The deadline for comments on the final draft rule is June 28, 1991. For moreinformation or to submit written comments contact Mark Hicks, Water Quality Program,Department of Ecology, Mail Stop PV-11, Olympia, WA 98504-8711, (206) 438-7087.
Washington State Department of EcologyMail Stop PV-11Olympia, Washington 98504-871.1
...--c::......

DRAFT - January 23. 1991 - DRAFT
Chapter 173-201 WAC
WATER QUALITY STANDARDS FOR SURFACE WATERSOF THE STATE OF WASHINGTON
allENTS:
173-201-140
173-201-130
173-201-060
173-201-050
YAC173-201-010 Introduction.173-201-025 Definitions.173-201-035 General water use and criteria classes.173-201-045 Toxic substances.173-201-047 Radioactive Substances Criteria.173-201-055 General considerations.173-201-070 Antidegradation policy.173-201-075 Outstandi~ resource waters.173-201-080 lIeU-.nQa...ini-~ Igat ion.173-201-085 Mixf."'i()~·.173-201-087 .0~~Drt~~erm modifications.173-201-090)''' G~al-::;classif icat ions.173-201-09Z1 SpeQjfic classifications-Freshwater.173-201·~~~··;t;:Aw.tC·if ic class if ications'Harine water.173~201-l'OQ, Achievement considerations.173·~~.9t:1.10·:;t: I~!.:.ementat ion•
.173:m:~t~o S~ei I lance•.;:}173-20"di5 Eii'f'«cement •
.:::::». ':;::::::~::':::~:;-;~:~~~~:. .. ..:.::::=:. .:;::!;~::;::: ...
·'~:~:hDISIl.GSITIQ.l:OFi$ECTlONS FORMERLY QIUFIED IN THIS CHAPTER
~'t.. ··::b:·20t~~::::~;';::~;:,. Water use and qual lty criterie. (Stetutoryl' .%?t;;·.. ~t.)r:;:;,,~:,;, '.' Authority: RC\I 90.48.035. 78-02'043 (Order DEA ..; ;.:.,. .?::: n'32), § 173-201-020, filed 1117/78; Order 73-4, §
...;::, ··;;~h.· ;:l;:· ..;;;;}" q,;::j:::. 173'201-020, filed 7/6/73.] Repeeled by 82-12'078
..;;!;., .,,<;:,.~,. ;;::.;;:;.:,,:~: ..:•.:·.:.:.·.·:·.;.;.:.:t;::.,.:::·.::.::••:i.:•.:'~::..::..:.:..•.;:::;?:;i" A(Ourtdheorr i tyD:E R'" ~29-0'.24)8'. 035f•i led 6/2182. Stetutory
·:\t~::~.~':;::~"~:::~~ .n ''In'201-030 Water use a~"quality criterie--Generel water use
<)~'; <~$l [fi~:'~('i~I;;~;~~!u~~.Hh~~~~"~173-201-040 Water use and quality criterie--Generll
considerations. (Order 73-4, § 173'201-040, filed7/6/73.] Repealed by 78-0Z'043 (Order OE n-3Z),filed 1/17/78. Statutory Authority: ROW 90.48.035.Characteristic uses to be protected. (StatutoryAuthority: RCW 90.48.035. 78-02-043 (Order DE77-32), § 173-Z01-050, filed 1/17/78; Order 73,4, §173-201-050, filed· 7/6/73.] Repealed by 8Z-12-078(Order DE 8Z-1Z)' filed 6/2/82. StatutoryAuthority: RCW 90.48.035.Water course classification. (Order 73-4, §173-201-060, filed 7/6/73.] Repeeled by 78-02-043(Order DE n-3Z)' filed 1/17/18. StatutoryAuthority: RCII 90.48.035.Definitions. [Order 73-4, § 173-Z01-130, filed716/73.] Repealed by 78-02-043 (Order DE n-3Z),filed 1/17/78. Statutory Authority: ROW 90.48.035.Hi scell aneous. (Statutory Authori ty: ReW90.48.035. 78-0Z'043 (Order DE n-3Z), §173-Z01-140, filed 1/17/18: Order 73-4, §173-201-140, filed 7/6/73.] Repealed by 8Z-12-078(Order DE 82-12), filed 6/2/82. StatutoryAuthority: RCII 90.48.035.
This COll1lleflt colum wi II be used to identify anychanges which are being proposed to the WaterQuality Standards. All additions, deletions, newsections, new section nutCers and any other changeshave been identified. Several existing sectionsand subsections have been moved, or made into newsections to make the WAC easier to understand.These reorganizationsl changes have also been notedin this colum. New language proposed for thechapter has been underlined.
WAC 173-201-010 Introduction. (1) The purpose of this chapter isto establish water quality standards for surface waters of the stateof Washington consistent with public health and Jl',blic enjoymentthereof, and the propagation and protection of fish, shellfish, andwildlife, pursuant to the provisions of chapter 90.48 RCW and thepolicies and purposes thereof.
(2) This chapter shall be reviewed periodically by the department
1

DRAFT - January 22, 1991 - DRAFT
lXM4EIHS: and appropriate reVISIons shall be undertaken.(3) The water use and quality criteria set forth in ~AC
173-201-035 through 173-201-087 are established in conformance withpresent and potential water uses of the surface waters of the stateof \Jashington and in consideration of the natural water qual itypotential and limitations of the same. These shall be the solecri teri a for sa id waters. (Statutory Author; ty: RCW 90.48.035 and90.48.260. 88-02-058 (Order 87~6), § 173-201-010, filed 1/6/88.Statutory Authority: RC~ 90.48.035. 82-12-078 (Order DE 82-12), §173-201-010, filed 6/2182; 78- 02·043 (Order DE 77·32), §173-201-010, filed 1/17/78; Order 73,4, § 173-201-010, filed7/6/73.]
Added to clarify wetlands criteria.
Added to clarity wetlands criteria.
Added to clarify wetlands criteria.
Added to clarify mixing zone criteria.
Added to clarify mixing zone criteria.
Added to clarify wetlands criteria.
Added to clarify toxic substances crite~ta.
Added to clarity toxic substances criteria.
WAC 173-201-025 Definitions. The following definitions areintended to facilitate the use of Chapter 173-201 ~AC:
"Acute toxicitY" means any mortality measured by acute toxicitytests approved by the department, including at least one fish and oneinvertebrate species."',.
"AKART" AcronymAoruiilt known, available, and reasonable methodsof prevent ion. conti.of/'·and treatment". AKART shall rAAresent themost current mstb2doloar for preventing. controlling. or abating thepollutants aViocistedwith a discharge that can be reasomblyrequired. The concept of AKART applies to both point and nonpointsources nt. poH\:!tion.
"Baclcground'cOnditions" The biological, chemical, and physicalcondi.r1ons of:".a water body, upstream from the point or nonpointsourc:to·q~f·::·:.ny discharge under cons iderat ion. BackgrO\A'ld s~l ing~ocation in' an ~1orcement action would be upstream from the point
,':', ~f,:.:'~;(11$charger..:.' but 'not upstream from other inflows. I f several··":t:::~isch.arges t'CJ'any watef body exist, and enforcement action is being
't~ken for pO$~jSle violations to the standards, background sampling~ WOUld ~~undertaken immediately upstream from each discharge.
Added to clarify nonpoint source control langua~l::' '\t::::),',..· "Best':':M'wpnt Practices (BMP)" Physical. structural. and/or
~~\;~::t::::::::::)' *. :~~~~;;b~~:~~~c~~eav';;tovo~ ~~: :~~~~':~t ;~sac~::s~ed singly':·"M9':1 .. Those wetlands that are acidic, peat fonning and whose
.,:::;:::,::':prim8'ry water source is rai nwater., :~':"Chronic toxicity" means any lethal or sublethal effects as
"'!l8sured by chronic toxicity tests approved by the department,including at least one fish, one'invertebrate, and one plant speciesas applicable.
"Constructed wetlands" Those wetlands intentionally constructedon nonwetland sites for the sole purpose of wastewater or stonnwatertreatment and managed as such. Constructed wetlands are normallyconsidered as part of the collection and treatment system.
"Critical condition" lJIlen the physical, chemical, and biologicalcharacteristics of the receiving water environment interact with theeffluent to produce the greatest potential impact on aquatiC biotaand existing and characteristic water uses.
"Damage to the ecosystem" Any demonstrated or predicted stressto aquatic or terrestrial organisms or cOlllTUnities of organisms whichthe department reasonably concludes may interfere in the health orsurvival success or natural structure of such populations. Thisstress may be due to, but ;s not limited to. alteration in habitator changes in water temperature, chemistry, or turbidity, and shallconsider the potential build up of discharge constituents or tenporalincreases in habitat alteration which may create such stress in thelong- term.
"Department" State of \Jashington department of ecology."Director" Director of the state of \Jashington department of
ecology."Estuary" Tidal wetland and deepwater habitats that are usually
semienclosed by land but have open, partial, or sporadic access tothe open ocean, and in which ocean water is at least occasionallydiluted by fr~sh water runoff from land.
"fecal coliform" That portion of the coliform group which ispresent in the intestinal tracts and feces of warm-blooded animalsas detected by the product of acid or gas from lactose in a suitableculture mediun within 24 hours at 44,5 plus or minus 0.2 degreesCelsius.
"fen" Those wetlands that are generally acidic, peat forming andwhose primary water source is grOUndwater or surface water, exceptmarl fens.
Added to clarify mixing zone criteria.
2

DRAFT - January 22, 1991 - DRAFT
Added to clarify wetlands criteria.
Added to clarify wetlands criteria.
Added to clarify wetlands criteria.
Added to clarify wetlands criteria.
language
"Geometric mean" The nth root of a product of n factors."Groundwater eKchange" The di scharge and recharge of gr04.nd water
at the wetland. Discharge is inflow to a wetland from an aquifer.seeps or springs that increases the avai lable SUPply of surfacewater. Recharge is outflow from a wetland downgradient to an aquiferor downstream to surface water for base flow maintenance. Exchangemay include groundwater discharge in one season followed by rechargelater in the year.
"Hardness" A measure of the calciUll and magnesiuw salts presentin water. For purposes of this chapter, hardness is llIeasured inmilligrams per liter as calciUll carbonate (C.CO.).
"Hydrodynamics" The dynamic energy. force. or IIIOtion of fluidsas affected by the physical forces acting upon those fluids.
"Hydroperi ad" the seasonal occurrence of flooding arwJ/or soilsaturation; enconpasses depth, frequency, duration. arwJ seasonalpattern of inundation.
"Isolated wetlands" Those wetlands which are outside of arwJ notconnected to any 100 year flood plain of a lake. river. or stream.and have no cont i nuous 'bydr ic soil between the wet I arwJ arwJ anysurface water. .:': ;..:.: :.:;:::.:
"Harl fens" T!Jose":'$etlands that are alkal ine or neutral pH as aresult of bufleri"9~by~alciUllcompounds in the soil.
"Hean deterltion t:ime" The time obtained by dividing a reservoir'smean annue.l Ilri:nillJ,llr total storage by the 30-day ten-year low-flowfrom tht! reservoif'.
"H!i;'ation::~r translocation" Any natural movement of an organisMorcOllllUl-i~:ies of organisms from one locality to another locality.;.:(·"Hiti9U·ion" "'!Qs, in the following order of preference:
.':'. <:::::.:.tal'·Avoiding the':i!pact altogeth!'r by not taking a certain action"<::):Dr par-:f' of an" act ion;::::"
~&. ":\\<IS} Hinimt:tjd9 inpacts by limiting the degree or magnitude of the.:;.:1' ··::t t... ~.ion. a~. it~;':':iIl,P~ement8tion, by ~sing appropr.iate technology. or.$'~~dN taklrs !f.flr.matlve steps to aVOid or reduce 'pcts;:~~ (e) Rtittify'ing the inpact by repairing. rehabil itating, or
.....:'./::.. :(::~:::........:.:), rdfiir.:ing·:Jhe affected envirormentj
.::::::::::::.,. "',,:,(Pi'Seducing or el iminating the inpact over time by preservation:{t:~%%·:t .:::::::::::::lQd··:1ilaintenance operations during the I Ife of the actton; arwJ
':i~\~\::\::;. ..:.:::if .:; :!.' ~~'iv~~'i;:r=::i\i:e ~:~ou~~:s i;;~Vi~~flsa.cing, enhancing. or
",. «itS:) '~'i; ~:t~~;::~u;~: '~:~V~;:~t:,'::,,:: t~~~:f:':'7::::...:..... where m;,dng results in the dilution of the effluent with the
r~ceiving water. As condi t ioned by \lAC 173-201'085. the water qual itvstandards may be partially modified to allow dilution of effluent ina limited volUlle of receiving water.
"Permi tit A docunent issued pursuant to RC\l 90.48.160 et seq_ or90.48.260 or both, specifying the waste treatment arwJ controLrequirements and waste discharge conditions.
"pH" The negative logarithm of the hydrogen ion concentration."Practicable alternative" An alternative that is avaihble and
capable of being carried out after taking into consideration cost.existing technology. and logistics in light of overall projectpurposes. It may include an ar~a not owned by the applicant whichcould r~l!Isonably have been or be obtained, util iled. exparwJed. or/lII!Inaged In order to ful f it the bas ic purpose of the proposedactivi ty,
"Primary contact recreation" Activities where a person would havedi rect contact wi th water to the point of c~lete subnergence.including but not limited to skin diving, swimming and water skiing_
"Secondary contact recreation" Activities where a person's watercontact would be I imited (wading or fishing) to the extent thatbacterial infections of eyes, ears, respiratory or digestive systemsor urogenital areas would normally be avoided.
"Shoreline stabilization" The anchoring of soil at the water'sedge, or in shallow water, by fibrous plant root complexes; this mayinclude long-term accretion of sediment or peat, along with shorelineprogradation in such areas.
"Stormwater" That portion of precipitation that does not naturallypercolate into the ground or evaporate, but flows via overland flow.interflow, pipes, and other features of I!I stormweter drainage systeMinto a defined surface waterbody, or a constructed infiltrationfacility,
Added to clarify stormwater controlproposed in \lAC'173-201-085 and 110.
Added to clarify mixing
Added to clarify mixing zone criteria.
Added to clarify wetlands criteria.
Added-to clarify wetlands criteria.
Added to clarify wetlands criteria.
COM:IlTS:Added to clarify wetlands criteria.
3

DRAFT - January 22, 1991 - DRAFT
~AC'173'20"035 was formerly GeneralConsiderations, now moved to WAC-173·201-055.
WAC· 173'201-035 is the new section n~r forGeneral water use and criteria classes, formerly~AC·'73-201·035·045.
The existing criteria statement for Class AAfreshwater reads: "fecal col iform organisms shallnot exceed a geometric mean value of 50organisms/lOa mL, with not more than 10 percent ofs~les exceeding 100 organisms/100 mL." Theintent of this statement is that even if the mean
language
Added to clarify wetlands criteria.
Added to clarify wetlands criteria.
"Stormwater attenuation" The process by which peak flows frOllprecipitation and rl6lOff velocities are slOWed as a result of passincithrough a wetland.
."S~ormwater drainage syst~' Constructed features whose primaryeXIstIng and/or CharacterIstIc surface water use is to function aspart of a system to collect. convey. Channel. filter. hold. inhibit,retain, treat, detain, infiltrate or direct stonnwater.
"Surfac,e waters of the state" InclUde lakes, rivers, ponds,strellmS,lnland waters, saltwaters, wetlands and all other surfacewaters and water courses within the jurisdiction of the state ofWashington.
"T~ratureNWater teq>erature expressed in degrees Celsius (·C)."Turbidi tV" The clari ty of water expressed as nephelClllletric
turbidity units (NTU) and measured with a calibrated turbidileter."Upwell ingN The arnJal natural phellomenon where the sUIIIler
prevailing, northerly winds parallel to ~ashington's coast producea seaward transport of surface waters. Cold, deeper more sll inewaters rich in nutrietils...and low in dissolVed oxygen rise to replacethe surface water~cThe. cotd, oxygen deficient water flows into PugetSOtXld and other coas{al"es:tUaries replacing the deep water with lowerdissolved oXy'~.cOnl:~ntrations reaching the surface during latesl.l1lller and fall. ;';'. .;;.
lIWater'd~enrl' A use or a portion of a use which reQUiresdi rect cont&tJ wj:th the water and cannot ex istat a non'waterlocati~n due to·the intrinsic nature of its operations.
''\tater qual ity inprovement" The natural processes in a wetlandthar'··e·H~r trap •. c-onvert or transform waterborne pollutants entering
..,:the wet Iand f rQl!l!l2npo i nt sources .'Added to clarify wetlands criteria. k ::,·:,.·".·~t1ands"·' Those'areas that are inundated or saturated by surface
Because the state water qual ity standards ·'~Zt:.. or 9r.ound wllter. at a ·.fr!!Quency and duration sufficient to support,iq3lement the federal law, for regulatory."".. "':",nd"'that unii1!r- normal circUllStances do support. a prevalence ofcons i stency we are propos ing to adopt the ·'\t:. ...ngetati9.0 t¥Pica II y adapted for life in saturated soi l conditions,definition of wetlands used in the federal clfin ':.: :~*,:r"such a!, ~wm; marshes. bogs, and similar areas. This includesWater Act. *.WUhndt"'''created. restored or enhanced as part of a mitigation
,~~ ~~~h::w./::;· .·Qt·O?iduri. This excludes constructed wetlands.
":';;;"!~jt.:~.~.~.....;:(~.;,....:,.;;..,;. ";;;::\~~AlI United States Envi ronnental Protect i on Agency.
.... . ':::::::::::::;::. ":""",:lldl ite habitat" Waters of the state used by, or that directlyAmended to clarify the iq30rtance Ot:::;... wil.d~lte +.•.~.:;.. ":or indirectly provide food support to fish, other aquetic life andhabitat protection. ...:.:::;:.: ::~::::. '.;.' wildlife for any life history stage or activity. [Stltutory
'4f,:::::"'''>::~;!j:: "::::~:~. '. :~\:::'::~~~~~~ ~~~5 ~C\Jf i~°ed48;~:~S:~ s~~~~~~~O'A~~~~;~;~ ~~der 9O~r~~~35 ~.,:.;::::::;::::::.;.. n-12·078 (Order DE 82·120, § 173-201-025, fi led 6/2/82; 78- 02-043
-:.:rder DE 77-32), § 173-201-025, filed 1/17/78.)
\W: 173-201-035 General water use and criteri. classes. Thefollowing criteri a Shall apply to the various classes of surfacewaters in the state of Washington:
(1) Class AA (extraordinary).(a) General characteristic. Water qual ity of this class shall
markedl y and uni forml y exceed the requi rements for all orsubstantially all uses.
(b) Characteristic uses. Characteristic uses shall include, butnot be limited to, the following:
(I) Water supply (domestic, industrial, agricultural).(ii) Stock watering.(iii) fish and shellfish:Salmonid migration, rearing, spawning, and harvesting.Other fish migration, rearing, spawning, and harvesting.Clam, oyster, and mussel rearing, spawning, and harvesting.Crustaceans and other shellfish (crabs, shrimp, crayfish,
scallops, etc.) rearing, spawning, and harvesting.(iv) Wildlife habitat.(v) Recreation (primary contact recreation, sport fishing,
boating, and aesthetic enjoyment).(vi) Commerce and navigation.(c) Water quality criteria:(i) fecal coliform organisms:(A) freshwater' fecal col i form organisms shall not exceed a
geometric mean value of 50 organisms/100 mL with not more than 10percent of !h!-samples used in calculating the mean value exceeding100 organisms/IOO mL.
(B) Marine water - fecal coliform organisms shall not exceed ageometric mean value of l' organisms/100 mL, with not more than 10
Added to clarify stormwater controlproposed in ~AC'173-201-085 and 110.
Amended to clarify wetlands criteria.
aJM:NTS:AOded to clarify wetlands criteria.
4
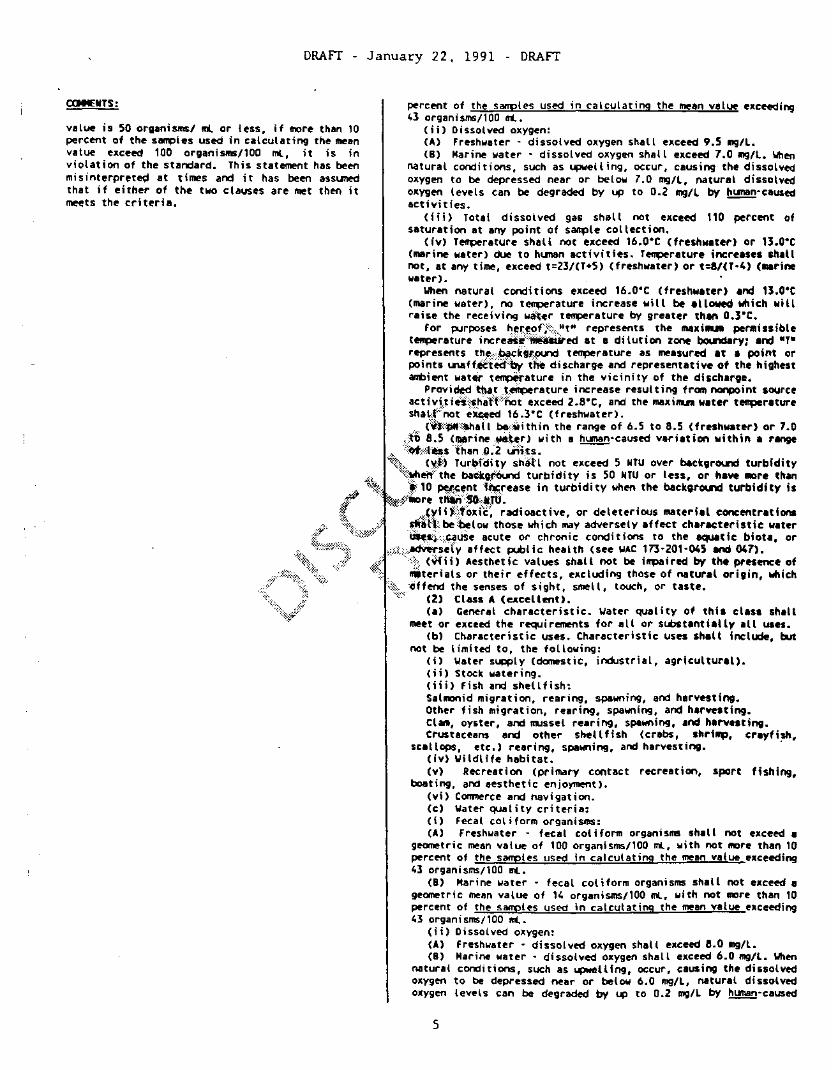
DRAFT - January 22. 1991 - DRAFT
percent of the sanples used in calculating the mean value exceeding43 organisms/100 ml.
(ii) Dissolved oxygen:(A) Freshwater - dissolved oxygen shall exceed 9.5 mg/l.(8) Marine water' dissolved oxygen shall exceed 7.0 mg/l. ~en
natural conditions, such as upwelling, occur, causing the dissolVedoxygen to be depressed near or below 7.0 mg/l, natural dissolVedoxygen levels can be degraded by up to 0.2 mg/l by l!..!:!!!!!!-causedact i vit i es.
(iii) Total dissolved ga6 shall not exceed 110 percent ofsaturation at any point of sample collection.
(iv) Temperature shall not exceed 16.0·C (freshwater) or 13.0·c(marine water) due to human activities. Temperature increases shallnot, at any time, exceed t=23/CT+5) (freshwater) or t=s/n-4) (.rinewater).
When natural conditions exceed 16.0·C (freshwater) and 13.0·C(marine water), no temperature increase will be allowed which witlraise the receiving w~t.r temperature by greater than 0.3·C.
For purposes h~r.~of-;':\."t" represents the maxinn penlli ss ibletemperature increde':;~ed at a di lution zone bou1dary; and "T"represents the::·,;~ciC9f:9U"d temperature as measured at a point orpoints '-I'Illtt~"tea=;;~ the discharge and representative of the highestambient wat.r temperature in the vicinity of the discharge.
Provi~ ·tl\a.t J.rature increase resulting from nonpoint sourceactivi..tin:::'$haff';:not exceed 2.8·C, and the maxillUll water temperatureshaL~~not eXCeed 16.3·C (freshwater) •
.. {i:'KpM:;'Shall bediithin the range of 6.5 to 8.5 (freshwater) or 7.0.Ai) 8.5 ("rine.~ter) with a human-caused variltion within a range
..,. ·::::o.t:::::t~s "fitan .,0:2 Jilt.s. --'~:t,. ('!t.;H Tur~fdity shaH not exceed 5 NTU over background turbidityV{~en~the bact;,fOund turbidity is 50 NTU or less, or have MOre than
dfr ~%~;. :t 10 ~(;entt~.rease in turbidi ty when the background turbidity isil .'. :~ ·:.$-:':'iIIore t'*!··!O::M.Tti".:» •.• ...(.~iif::!t"oxfc·~ radioactive, or deleterious materilt concentrations
..:'. ·:;\~h;:::;,::::::/;; stliH::be·below those which may adversely affect chlracteristic wlteri:~;.~.::.:.~:;:::::::.:.:.:.:;;:..:.....:•.: ~lif:.:..~use acute or chronic conditions to the lIqUIItic biotl, or.." . ,.::::::;:::.::.ldWf'set"y affect public health (see WAC 173-201-045 and 047> •
..:i~t~::l::: .;:)::; .tit·· ....::::::;. (Viii) Aesthetic values shalt not be i~ired by the presence of
..•;.::?:.:;:;;;:,,=:}:;... '.\!;. ., "'terials or their effects, excluding those of natural origin, which
..::. ;:t:::. liffend the senses of sight, smell, touch, or taste.
·::·::~·;::·':;;:~i/:;;:: ":::::.: ~~~ ~~:~a~ ~e::::cl::i);tiC. Water quality of this class shillmeet or exceed the requirements for all or substantilily III uses.
(b) Characteristic uses. Characteristic uses shall include, butnot be limited to, the following:
(i) Water supply (domestic, industrial, agricultural).(ii) Stock watering.(iii) Fish and shellfish:Salmonid migration, rearing, spawning, and harvesting.Other fish migration, rearing, spawning, and harvesting.CIani, oyster, and IlUSsel rearing, spawning, and harvesting.Crustaceans and other shellfish (crabs, shriMp, crayfish,
scallops, etc.) rearing, spawning, and harvesting. .(iv) Wildlife habitat.(v) Recreation (primary contact recreation, sport fishing,
boating, and aesthetic enjoyment).(vi) Commerce and navigation.(c) Water quality criteria:(i) Fecal coliform organisms:(A) Freshwater - fecal col itorm organi sms shall not exceed a
geometric mean value of 100 organisms/100 ml, with not more than 10percent of the samples used in calculating the mean value exceeding43 organisms/100 ml.
(8) Marine water - fecal coliform organisms shall not exceed ageometric mean value of 14 organisms/100 ml, with not more than 10percent of the sanples used in calCUlating the mean value exceeding43 organisms/lOa mL.
(ii) Dissolved oxygen:(A) Freshwater' dissolved oxygen shall exceed 8.0 mg/l.(8) Marine water - dissolved oxygen shall exceed 6.0 mg/l. When
natural conditions, such as upwell ing, occur, causing the dissolVedoxygen to be depressed near or below 6.0 mg/l, natural dissolvedoxygen levels can be degraded by up to 0.2 llIll/l by l!!:!!!!!D-caUSed
OM'EIlrs:
value is 50 organisms/ ml or less, if more than 10percent of the s~les used in calculating the meanvalue exceed 100 organisms/100 ml, it is inviolation of the standard. This statement has beenmisinterpreted at times and it has been assumedthat if either of the two clauses are met then itmeets the criteria.
5

DRAFT
<)
January 22, 1991 - DRAFT
activities.(iii) Total dissolved gas shall not exceed 110 percent
saturation at any point of sample collection.(iv) Tef1llerature shall not exceed 18.0·C (freshwater>· or 16.0.r
(marine water) due to human activities. Tef1llerature increases sh~l.
not, at any time, exceed 6=28/(T+7) (freshwater) or t=l21(T': 1
(marine water). ..WIlen natural conditions exceed 18.0·C(freshwater) and 16.0·C
(marine water), no temperature increase will be allowed which willraise the receiving water temperature by greater than O.3·C.
For purposes hereof, lit" represents the maxillU'i penaissil: ,t~rature increase measured at a dilution zone boundary; and ",represents the background temperature as measured at a point orpoints unaffected by the discharge and representative of the high~~~
ambient water temperature in the vicinity of the discharge.Provided that temperature increase resulting from nonpoint sour
activities shall not exceed 2.8·C, and the maximum water temperatureshall not exceed 18.3~C (freshwater).
(v) pH shall be.within the range of 6.5 to 8.5 (freshwater) !7.0 to 8.5 (mari"ew8ter.:)- with a human· caused variation withinrange of less than()..S units. --
(vi) Turbfdi t'jt.:;:jihaU not exceed 5 NTU over background turbidi tywhen the background turbidity is 50 NTU or less, or have more th~~
a 10 per.£.ent:·::,,j ncrease in turbidi ty when the background turbidi ty .more than 50 ')lro';
(yn) Tcii(j~, radioactive, or deleterious material concentrationssnaf,l::::b&:below those which may adversely affect characteristic watertises, caUSe acute, or chronic conditions to the aquatic biota,
,adv.ersely affect public health (see WAC 173-201-045 or 047).:t;,:, (Viii) A.esthetic values shall not be i~ired by the presence t>~
',::'mat@tials or' ttleir effects, excluding those of natural origin, which«: offend :the senses of sight, smell, touch, or taste.
'::';'i:,i/' (3) \:ctass.. 8:(good).,~(a) {teneral Characteristic. Water quality of this class shal
~~t}or"~ceed the requirements for most uses.':\',:;"U>l:,~;:::diaracteristicuses. Characteristic uses shall include, byt
,,::;,j:;::::.::,not-:;:'be 'I imi ted to, the following:.. :\::: (l) lJater supply (industrial and agricultural).
~ (ii) StOCk watering.-\t::/:::::" (i i i) Fish and shell fish:
Salmonid migration, rearing, and harvesting.Other fish migration, rearing, spawning, and harvesting.Clam, oyster, and mussel rearing and spawning.Crustaceans and other shellfish (crabs, shri~, crayfish,
scallops, etc.) rearing, spawning, and harvesting.(iv) lJildlife habitat.(v) Recreation (secondary contact recreation, sport fishing!
boating, and aesthetic enjoyment).(vi) Commerce and navigation.(c) lJater quality criteria:(i) Fecal coliform organisms:(A) Freshwater - fecal col iform organisms shall not exceed '"
geometric mean value of 200 organisms/laO ml, with not more than 10percent of the samples used in calculating the mean value exceedi~A
400 organisms/laO ml.(B) Marine water' fecal coliform organisms shall not exceed
geometric mean value of 100 organisms/laO mL, with not more than 10percent of the samples used in calCUlating the mean value exceeding200 organisms/laO ml.
(ii) Dissolved oxygen:(A) Freshwater - dissolved oxygen shall exceed 6.5 mg/L.(B) Marine water - dissolved oxygen shall exceed 5.0 mg/L. When
natural conditions, such as upwelling, occur, causing the dissolveoxygen to be depressed near or below 5.0 mg/L, natural dissolv~
oxygen levels can be degraded by up to 0.2 mg/L by ~·caust':·_
activities.(iii) Total dissolved gas shall not exceed 110 ~rcent ot
saturation at any point of sample collection.(iv) Temperature shall not exceed 21.0·C (freshwater) or 19.0·
(marine water) due to hunan activities. Temperature increases shallnot, at any time, exceed t=34/(T+9) (freshwater) or t=16/T (marin·water) .
\Jhen natural conditions exceed 21.0·C (freshwater) and 19.0·1
6

caw'ITS:
DRAFT - January 22, 1991 - DRAFT
(marine water), no temperature increase will be allowed which witlraise the receiving water temperature by greater than 0.3·C.
For purposes hereof, "t" represents the maxi_ permissibletemperature increase measured at a dilution zone boundary; and NTRrepresents the background temperature as measured at a point orpoints unaffected by the discharge and representative of the highestambient water temperature in the vicinity of the discharge.
Provided that temperature increase resulting from nonpoint sourceactivities shall not exceed Z.S·C, and the maximum water temperatureshall not exceed Zl.3·C (freshwater).
(v) pH shall be within the range of 6.5 to 8.5 (freshwater) and7.0 to 8.5 (marine water) with a hunan-caused variation within.range of less than 0.5 units. ------
(vi) Turbidity shall not exceed 10 NTU over background turbiditywhen the background turbidity is 50 NTU or less, or have MOre thana 20 percent increase in turbidity when the background turbidity ismore than 50 NTU.
(vii) Toxic, radioactiye, or deleterious material concentrationsshall be below those.w.hic!'t":1Il8Y adversely affect characteristic wateruses, cause acute cr." i-li+onh: conditions to the ~tic biota, oradversely affecJ.:p..Ibl i~..health (see WAC 173-201-047).
(viii) Aes~hetiC::::, values shall not be reduced by dissolved.suspended, float ing/:or sutmerged matter not attributed to naturalcauses, !>4:.:.as·;::;:;·to.. :~ffect water use or taint the flesh of ediblespec ies... . <':; '. .":.:.:.:....
(4).{:· Class'C. (fair).JaJ«8'~al characteristic. Water quality of this class shall."t or eJ(.~eed th~<ir,!!ClUirements of selected and essential uses •
.':'. "'::':':(:b)::::::',Charac ter i sdc" uses. Charac teri s tic uses shall include, but:··:::t~t ~::;.( imi teef tQ~ the::;:'following:
..., ":::\\.( ff \later'::'~ly (industri al) ••"!?: h~ Jkft) H~. (s"~id and other fish migration).
4r'\":~::::::~i:"(ii i )t'~t-..:d'On (secondary contact recreation, sport fishing,::1.. boa~ifl.9, .~ aesthetic enjoyment) •
.iii:' ··:·::it::::::::::. :)'i:~~:-r ~=r~~~yn~;:~:~::": marine water.
:t::~:::;:: :..·.:..:::::::} ..:(.:/ .::'::. (ll:.:.. Fecal col i form organi SRIS shall not exceed a geometric lIll!an<ititi\.. .' ):. v.t~({f 200 organi sRlS/l00 1Ill, with not more than 10 percent of the
..::/:.:::t;'i\.. \\:. '. tk.:.. s!!Fles used in calculating the mean value exceeding 400.:::::)' '::::: ···:\:.. 0t'9anisms/l00 1Ill •
..::::::::::>. ,:::: ..... (ii) Dissolved oxygen shall exceed 4.0 mg/l. \/hen natural:':~::(":::¥;: conditions, such as upwell ing, occur, causing the dissolved ollygen
to be depressed near or below 4.0 mg/L, natural dissolved ollygenlevels can be degraded by up to 0.2 mg/L by hUlllln·ca-.ed activities.
(i i i) Temperature shall not exceed 22.0·C due to human activit les.Temperature increases shall not, at any time, exceed t=20/CT+2).
\/hen natural conditions exceed 22.0·C, no temperature increasewill be allowed which will raise the receiving water temperature bygreater than 0.3·C.
for purposes thereof, "t" represents the maxi_ permissibletemperature increase measured at a dilution zone boundary; and NTrepresents the background temperature as measured at a pointl.nlIffected by the discharge and representative or the highest anaientwater temperature in the vicinity of the discharge.
(iv) pH shall be within the range of 6.5 to 9.0 with a ~caused variation within a range of less than 0.5 units.
(v) Turbidity shall not exceed 10 NTU over background turbiditywhen the background turbidity is 50 NTU or less, or have more thana 20 percent increase in turbidity when the background turbidity ismore than 50 NTU.
(vi) Toxic, radioactive, or deleterious material concentrationsshall be below those which may adversely affect charlcteristic wateruses, cause acute or chronic conditions to the aquatic biota, oradversely affect public health (see WAC 173-201-045 and 047).
(vi i) Aesthet ic values shall not be interfered with by thepresence of obnoxious wastes, slimes, aquatic growths, or materialswhich will taint the flesh of edible species.
(5) Lake class.(a) General characteristic. Water quality of this class shall
meet or exceed the requirements for all or substantially all uses.(b) Characteristic uses. Characteristic uses shall include, but
not be limited to, the following:(i) \later supply (domestic, industrial, agricultural).
7

DRAFT - January 22. 1991 - DRAFT
\Jater qual lty of this class shallfor all or substantially all uses.include, but not be limited to, the
(ii) StOCK watering.( iii) fish and she II fish:Salmonid migration, rearing, spawning, and harvesting.Other fish migration, rearing, spawning, and harvesting.Clam and mussel rearing, spawning, and harvesting.Crayfish rearing, spawning, and harvesting.(iv) ~ildlife habitat.(v) Recreation (primary contact recreation, sport fishing,
boating, and aesthetic enjoyment).(vi) Commerce and navigation.(e) ~ater quality criteria:(i) Fecal coliform organisms shall not exceed a geometric mean
value of 50 organisms/l00 ml, with not more than 10 percent of thesarrples used in calculating the me"n value exceeding 100organisms/l00 ml.
(ii) Dissolved oxygen - no measurable decrease from naturalconditions.
(iii) Total dissot-ved gas shall not exceed 110 percent ofsaturation at any point of sample collection.
(iv) Temperature:.~ no"measurable change from natural conditions.(v) pH - na"l!leasmable change from natural Conditions.(vi) Turbidity s"all;not exceed 5 NTU over background Conditions.(vii) TOKic, radioactive, or deleterious material concentrations
shall be·',less:::.than,··those which may affect public health, the naturalaquati.c erwironrnent, or the desirability of the water for any use.
(Vni) Aesthetic values shall not be impaired by the presence ofmaterJal:s:'Cr their.::effects, excluding those of natural origin, whichoffend thesenses'Qf sight, smell, touch, or taste... : (6), \let/sods Cl ass
.;~~~~~}. Cal General chara£teristics.":-:"ineet' or exc~·. the regui rements
~ (b) Characteristic uses shall. :~::::::::.::=dollowlngi·:": :_ .
. ... i \later 's' l domestic industrial.4~l' "''1 r;:'sh and shell fish:·t\~S'lmonfd migration, rearing. spawning, and harvesting.
;:.i=::::::>'. "'O:sber fish migration, rearing, spawning, and harvesting."}::. Cram, oyster, and mussel rearing, spawning, and harvesting.
_..:} Crustaceans and other shell fish (crabs, shrinps, crayfish,q~.isc8llops, etc.) rearing, spawning, and harvesting.
..:::::::., (i i i) ~i ldl i fe habi tat.(iv) Recreation (primary contact recreation, sport fishing,
boating, and aesthetic enjoyment).(v) Commerce and navigation.(vi) Aesthetics.(vii) Groundwater exchange.(viii) ~ater quality improvement.(ix) Stormwater attenuation.(x) Shoreline stabilization.(c) ~etlands shall not be used for the treatment of stormwater.
Stormwater must be treated using best management practices inaccordance with IJAC 173-201-'10(3) prior to discharge into" wetland.
(d) ~ater quality criteria:(i) Fecal coliform organisms:(A) For wetlands adjacent to another waterbody, the fecal coliform
criteria for that waterbody's class apply to the wetland.(B) For isolated wetlands with the characteristic uses of domestic
water supply, or primary contact recreation and shellfish, the fecalcoliform criteria of Class AA waters (see ~AC 173-201-035(1)(c)(i»apply to Class AA wetlands, as defined in IJAC 173-201-090(6), andthose for Class A (s~e IJAC 173-201-035(2)(c)(i» apply to Class Awetlands, as defined in ~AC 173-201-090(7).
(C) F0r iS0late<.l wetlands without the characteristic uses ofdomestic ~ater supply, or primary contact recreation and shellfish,the fecal coliform criteria of Class B waters apply.
(ii) pH - No measurnble change from natural background conditions.(iii) Turbidity:(A) for wetlands adjacent to another waterbody, the turbidity
criteria for that waterbody's class apply to the wetland.(8) For isolated wetlands the turbidity shall not exceed 5 NTU
over baCKground conditions when the baCKground turbidity is 50 NTUor less, or have more than a 10 percent increase in tu\bidity wherthe baCKground turbidity is more than 50 NTU.
CCJM:IHS:
Because wetland standards are being proposed forinclusion in the Surface ~ater Quality Standards,it is important that the water quality criteria forwetlands be consistent with the existing standards,so that the wetlands classifications conform withthe general classifications (\lAC 173-201-090) Worthe other surface waters of the state. \,1M: f'k ...:i201-035 General water use and criteriatHass~~>:~~~'"
establishes characteristic uses for each 'etiiSt~f
surface waters and applies quality cH~:t;eria:::i:'toprotect those uses; where appropri4f.i~th~~~riccriteria may vary for Class AA and;Clai.~A ·~aters.
This is the fonmat we have f~llow~! for thewetlands class as well. In addit:ibn to' thecharacteristic uses established fof
e
the othersurface waters, which have been applied to wetlandsas well, there are some additional uses which areunique to wetlands. These include grOlndwaterexchange, water quality improvement, stormwaterattenuation, and shoreline stabilization. ~ater
qual i ty cri teri a to protect these unique valueshave also been established. These include criteriato prevent nutrient loading in a wetland so thatthe characteristic uses are not degraded, andcriteria to maintain the natural physical andbiological characteristics of a wetland.
8

DRAfT - January 22, 1991 - DRAFT
O.71a 0.0019b
2,319.0 13.0
69,Oc 36.Od
5,100.0 700.0
0.035i,cO.233i,d
2,600.0
87 d
0.0019 b
h,d
2,500.0
7,550.0
750 c
9,000.0 610.0
2.5 a
850.0 48.0
360.0c 190.0d
5,300.0
g,c
Benzene e
Benzidine e
ArSflnic (Tri)
Arsenic (Pent) e
Antimony e
Alumim.m
Ammonia (un-ioniZed NH3)
Acrylonitrile ~
Aldrin/Dieldrin
The department current I y uses the narrat i vestatement in existing WAC 173-201-047(4), whichreferences the use of EPA criteria, to enforce allof EPA's criteria. The adoption of all of EPAsaquatic lite criteria, however, would provide aconvenient I ist of some cOIImOnly found toxicpollutants for which criteria have been developed.This list would be useful to permit writers,dischargers, and other parties interflsted in thedepartment's toxics control program.
(iv) To~ic, radioactive, or deleterious material concentrationsshall be below those which may adversely affect characteristic wateruses. cause acute or chronic conditions to aquatic and terrestrialbiota. or adversely' affect public health or welfare.
(v) Aesthetic values shall not be reduced by dissolved. suspended.floating, or submerged matter not attributed to natural causes. soas to affect water use, or form nuisances, or taint tissue of ediblespecies.
(vi) Nutrients shall not be introduced to or allowed to accUlUlatein a wetland such that they directly or indirectly degrade thewetland or interfere with the existing or characteristic uses of thewetland.
(vii> Natural physical and biological characteristics shall bemaintained and protected so that there is no significant degradationof characteristic uses. except as provided for in the wetlandsmitigation section, ~AC 173-201-080. Physical and biologicalcharacteristics shall be maintained by:
(A) Maintaining hydfglogical COnditions, including hydroperiod.hydrodynamics, ang nsturat water temperature variations necessary tosupport vegetat ion::,wlii-dt::::wculd be present naturally; and
(B) MaintajniQS sybstrate characteristics necessary to supportvegetation which itOuld'::be present naturally. [Statutory Authority:R~ 90.48.035 and 90.48.260. 88-02-058 (Order 87-6), § 173- 201-045,filed 116/88'~:::·St~tiJtoryAuthority: RC~ 90.48.035. 82-12-078 (OrderDE 82~~2):~~. 173t 201-045, filed 6/2/82; 78-02-043 (Order DE 77-32),§ 173':::201-04'. filed 1/17178.1
:;::~::::~~::::::;:;;:::::::. ::;:";
:/,::::.. \lAC 1.'p~201-p4S:::}oxic slbstances. (1) Except where local specifls.. ~. ':~:?that may· be more sensitive than the species used to develop thfl'\i~\follgw'ing c-rite,.ia. arid whflre local envirorvnental conditions warrant
\oIAC-173·201-045 was formerly Generel water use and ..::~: ·<:torlf restrie:tive critflria, the following criteria shill apply to allcriteria classes, now moved to \oIAC·173·201-035•.,~ .~, 4!rface:::'.lIIater't·,of the state of ~ashington for the protection of
:'1i'Y :,,~iaguati6:HUtr:::(.v·iIIlues are ug/L for all substances except AlIIllOnia Ind\oIAC-173·201·045(1) is the new subsection nurber:t~r Chl~rid~:::Y,ich are "'9/L):the table of aquatic lite toxic criteria, f~~'v . .:.}: ..;:;:1'" ..::~:::::\\oIAC-173·201-047(1). The opening language if!' (1) iif~::::':' <:::::,:::/::i::::::::,,:;.' Freshwater Marine Wlterproposed to clarify the use of t~, "::':~mc ,,:·.... §~ubl.i=..~·tt,1!~!:.nc=e .....:::.Ac:::;u~t:..:e'--_....:C:.:.h:.:.r.:::o:.:n.:.:ic::-_.::.Ac::u~tl.:e=-.:::Ch:.:ir~on:::.:..:i::..ecri te~ia. The department proposes ·t~:::....add,(:~:67 '{:::..' :::::····,,·::\:;~t. >runer, c cr iter i a to th i s tabl e. ::::::::::,::*:,\::: ':::::'::'" :;Ml=:"en::.:.::a~ph~t.:..:h.::.e:.:ne~~,-- 1.:...,..:7~0:.:::0~. ~0_..:.5:.::2.:::0.:.. O=--__.:.9.:.70~.0~..:.7..:.10:::;.:..:::0
EPA is requesting the state ado~t::::Jnto::Ithe water ·\t:;:::::'~",::.cr:..;0::.;I:..:e::..:i..:..n:...::.e ....;68"",-",",,0,--_......:2,-,l..:.•.;.0 ",,5",,5~.0:.-__quality standards all appropriate::lI4iatie lifetoxic criteria prOlllJlgated by EPA that are notcurrently listed within the standards. The currenttable contains 26 toxic substances. Adopting allof EPA's prOll1Jlgated aquatic lite criteria wouldadd an additional 64 toxic substances to the tablein existing WAC 173-201-047(1).
~AC'173'201'045 is the new section number for Toxicsubstances, formerly WAC-173-201-047. ------
aMEIITS:
100.0 0.34
j,c k,d 43c 9.3d
35,200.0 50,000.0 -2.4a 0.0043b 0.09a O.OO4b
860 i ! c 230 Ld
250.0 50.0 160.0 129.0
The department proposes to correct severaltypographic errors in the criteria and associatedequations. Errors in the Ammonia criteria and inseveral of the calculations following the toxiccriteria table have been noted and are revisedhere.
Beryl I ium e
BHC (total of isomers) e
Cad'nium
Carbon Tetrachloride e
Chlordane
Chloride (DissolVed) hh
Chlorinated Benzenes e
130.0 5.3
9

DRAFT - January 22, 1991 - DRAFT
a»4M£IITS: Chlorinated Naphthalenes e
Chlorine (Total Residual)
Chloroalkyl Ethers e
Chloroform e
Chlorop/lenol 2
Chlorop/lenol 4 e
Chloro-4 Methyl-3 Phenol e
Chloropyrifos
Chromiun (Hex)
Chromiun (Tri)
Copper
Cyanide
DOT e_}-
QOT ;~t~tite (DO£) e
Oichloropropanes e
Dichloropropenes e
_~lchlorophenol 2,4 e
.::~~
....---
....;;-il~{on
:'\::,'>0 i cho l~r~~~~s e_--~;#'>-. ·W:
-etc~foroeth8ne 1,2 e
Dieldrin/Aldrin f
Dimethyl Phenol 2,4 e
Dinitrotoluene e
Dioxin (2,3,7,S-TCOD) e
Oiphenylhydrazine 1,2 e
Endosul fan e
Endrin e
Ethylbenzene e
Fluoranthene e
Guthion e
Haloethers e
Halomethanes e
Heptachlor e
Hexachloroethane e
Hexachlorobutadiene e
10

DRAFT - January 22. 1991 - DRAFT
COM:IITS: Hexachlorocyclohexane(lindane)e 2.0a O.OBb 0.16a
Hexachlorocyclopentadiene e 7.0 5.2 7.0
Iron e , ,000.0
Isop/lorone e 117,000.0 . 12.900.0 -
lead u 140.Oe 5.6.Od
Malathion e 0.1 0.1
Mercury (II) v
Methoxychlor e
2.4.0c 0.012d,w 2.1e
0.03
O.025d
0.03
Naphthalene e 2.300.0 620.0 2.350.0
Nickel" .." .....:.. x,c y,d 75.0c a.3d
Nit robenzene I!':.. : 27.000.0 . 6,680.0
Polynuclear Aromatic Hydrocarbons •
10.200.0 2.560.0
3.300jOO.0-
4.850.0
3.0
0.014b
940,0
230.0 150.0
5 ,850,0
0.065c O.OUd
7,240.0 1,100.0
z,e aa,d
Ni trosemin9···e
Nit ropl1enol se
... .:..
Seleniun
Si Iver
Tetrachlorinated Ethanes e
Tetrachloroethane 1,1,2,2 e
Tetrachloroethyle-ne e
20.0c 5.0d
bb,a 0.12
9,320.0
2.400.0
5.280.0 840.0
9,020.0
10,200.0 450.0
Tetrachlorophenol 2,3,5,6 e 440.0
Thalliun e 1,400,0 40.0ce 2,130.0
Toluene e 17,500.0 - 6,300.0 5,000,0
Toxaphene O,73c.dd O,0002d,•• O.21c,dd O.OOO2d•••
Trichlorinated Ethanes e 18,000.0
Trichloroethane ',',1 e 31 ,200.0 -
Trichloroethane " ',2 e 9,400.0
Trichloroethylene e 45,000.0 2'.900,0 2,000.0
Trichlorophenol 2,4,6 e 970.0
Zinc ff ,c gg,d 95.Oe M.Od
Notes to Table:
11

"::;"
DRAFT - January 22. 1991 - DRAFT
a. An instantaneous concentration not to be exceeded at any time.
b. A 24·hour average not to be exceeded.
c. A 1-hour average concentration not to be exceeded more than onceevery three years.
d. A 4-day everage concentration not to be exceeded more than onceevery three years.
e. Criteria reDresents the lowest Observable Effects level <lOEl) forthe substance. lOEl velues do not represent a Ho Observed EffectsConcentration. In some cases a single organism may have been usedto set the lOEl value.
f. Aldri n is metabol icall y converted to 0 ieldri n. Therefore, the suaof the Aldrin and Dhl.ldrin concentrations are CClq)Bred with theDieldrin criteria.
g. Shall not exceed:·t.h~·:~rical value given by 0.s2IFT/FPH/2,
where: fT':':: 10ioi~!:.....ft"'l; TCAP ~ T :!: 30Hi:" 10·o:r""'" ; 0 ~ T :!: TCAP...•....
Ffllt =:,.::::; 8 ~ pH ~ 9
FP"::: 1.\0"···... ' ; 6.5 ~ pH :!:
1.258.0
TCAP' = 20"t;.. Salmonids present.l~P ~:·.2s·C: Salmonids absent.
where: FT and FPH are as shown in (9) above except:TCAP = 1s·C; Salmonids presentTCAP = 20·C; Salmonids absent
i. Measured in milligrams per liter rather than micrograms per liter.
I. Exeected to be more tox ic to seed es more sens it ive than theearliest life cycle stages for rainbow trout.
m. Organoleptic Value. Imparts taste to fish.
n. Salinity dependent effects. At low salinity the 1-hour averagemay not be sufficiently protective.
p. ~e(O."~( Ift(~"-"""'lIll .. "'It
q. ~e (o ....U(III("'.."..-,..... II I ..... '
r. ~eIO.I""\( IfIl("'-""_"'J l.·.~l
s. Mortality has been observed at concentrations as low as 70.0 ug/l.
t. ~ e(I.21 H 1fl f flM"--. .. 11 • 1."01
v. Criteria for Mercury (II) may not adequately protect Coho Salmon,Rainbow Trout, Bluegill. and Haddock.
w. If the 4'day average concentration exceeds 0.012 uq/L more then
12

DRAFT - January 22. 1991 - DRAFT
CtM4EIITS: once in a 3-year period. the edible portion of the consumed speciesshould be analyZed to determine whether the concentration ofmethylmercury exc~s the fDA action level.
cc. One species tested showed toxic reaction after 2.600 hours at 20!!9Ll..:.
dd. Channel Catfish mai:<be more acutely sensitive.
ff. ~ .a~··~~:~~;~~11.•._,
g~ Jt~~f::;:~~·7); ,~\~:::t~tt~'{~::' ba;·::~:~..disSOlVed chloride in association with sodiun.
The state has agreed to allow EPA to promulgatehuman health criteria for priority pollutants forthe state during 1991. Although EPA is basingthese criteria on the risk level of 1:1,000,000,the state may need to use a human health risk levelto regulate substances not promulgated by EPA. Theinclusion of a risk level in the standards willprovide an i~rtant tool for the protection ofhuman health through the implementation of ambientwater quality criteria in state waters.
WAC-173-201-045(7) Added to formally establish thehuman health risk level that will be used incalculating ambient water quality criteria. Whenregulating carcinogenic substances using humanhealth criteria, it is necessary to establish alevel of risk to be used. The department has beenusing the risk level of 1:1,000,000, whichrepresents one additional cancer case in 1,000,000ellposed population, to set anOient water qualitycriteria. It has been suggested the risk levelshould be formally established as part of the waterquali ty standards. This change would insure itsconsistent use and make it less subject to ease bycase legal challenge.
WAC-173·201·45(5) and (6) Added to clarify the useof biomonitoring and biocriteria for aquatic lifeprotection and to support the "No Toxics" narrativestatement in existing WAC 173-201,047(4). Numericcriteria may not ensure the protection of allspec ies in an aquat i c cOllllU'li ty U'lder allcircunstances involving a waste discharge. Thepotential increased susceptibility of local species ':::"to toxins, and the potential synergistic and ··<:i~.,]'his criterion gobably will not be adequately protective when the~ntagonistic effects, of nultiple con~aminants.~ke ~<~:, 'Chloride is _eeiated with potassiun, calciun, or _ann"., ratherIt nee!ssary to valIdate that aquatIC cOIlIlU'lltle~ ·':'t'(>. ..span sost.tll!!.~ ...,.. ··:::~t.are beIng protected. .,?" ~« '~:~. 4:'·':<:<:::~~.,
t1. <" ii ..411e sn'tus of the fi sh cOllllU'li ty should be lIIOrtitored whenever theTo acc~lish the necessary level of prot.~ticiit::.:.:.:.:.::::'.:., c«iceljtrat:'ion of seleniun exceeds 5.0 ug/l in salt water.the department shall uti I ize whole ..#fluent·"..··· ':::;::::::"'i:::::~<::<:<: ..
toxicity testing using test organisms.:::::~rid::;~R-i!.~ d::l::::::::,,:. (:1~:::USEPA Qual ity Criteria for Water, 1986 shall be used in themeasure in'stream cOIlIlU'lity healtfh:.: ~frig .:{ ..' use arid interpretation of the values listed in s\bsection (1) of thisbiocriteria. Biocriteria establish:::;·jt~dsfor :::" s_tion.aquatic cOllllU'lity population st.ytture'i.that are ':':::~:::::.)'" (3) Concentrations of toxic, and other substances with tOllicrepresentative of a healthy waterbodyi Whole ·..·propensities not listed in subsection (1) of this section shall beeffluent toxicity testing subjects tlie:::qhcharger's determined in consideration of USEPA's Quality Criteria for Water,effluent to toxicity testing using standard test 1986, and as revised, and other relevant infol"llltion •• appropriate.organisms and protocols. (4) Toxic substances shall not be introduced .bove natural
background levels in waters of the state which ..y adversely affectcharacteristic water uses, cause acute or chronic conditions to theaquatic biota, or adversely affect public health, a. detennined bythe department. (Statutory Authority: RCW 90.48.035 and 90.48.260)
(5) The numeric toxics criteria may not ensure the protection ofall species in a particular aquatic cOllllU"lity U'lder all circunstancesinvolving point and nonpoint waste discharges. The highest protectionfrom toxici ty is afforded wi th a triad approach which utit hesnumeric criteria, whole effluent and instream tOllicity testing, andbiosurveys. This triad approach to toxics control. combining the useof numeric criteria, whole effluent testing, and bioassessments, isintended to provide a higher degree of confidence that aquaticcOllllU'lities are being protected.
(6) In evaluating conpl iance with this section. the departmentshall employ numeric criteria. whole effluent toxicity testing, andbiosurveys, as applicable. The results of the whole effluenttoxicity tests do not overrule the numeric criteria of WAC-173-201'045 <1l. (2) and (3).
(7l For calculating criteria for the protection of human health,the department shall utilize a risk level of 1:1,000,000, or oneadditional cancer case in LOOO,OOO exposed. This risk level isintended for establishing specific criteria and shall not be used toestimate acceptable statewide occurrences of cancer incidence. Thisrisk level appl ies regardless of the actual size of the subgrouPexposed. (Statutory Authority: R~ 90.48.035 and 90.48.260. 88,02058 (Order 87-6), § 173-201'047, filed 1/6/88.)
Reviser's note: The brackets and enclosed material in the text ofthe above section occurred in the copy fi led by the agency.
13

DRAFT - January 22, 1991 - DRAFT
cx:MEIITS:\/liC-1T3-201-047 is IS new section for Radioactivesubstances: this language existed as ~AC-173-201
035(11) and (12) in the current regulation and hasbeen placed in a separate section adjacent to thetoxics criteria in recognition of its independentstatus.
~AC-1n-201·047 was formerly Toxic substances, nowmoved to ~AC-173-201-045.
~C 173-201-047 Radioactive substances. (1) Deleteriouconcentrations of radioactive materials for all classes shall be adetermined by the lowest practicable concentration attainable and Lno case shall e,.;ceed:
(a) 1/100 of the values listed in \lAC 402-24-220 (Column 2, TableII, Appendix A, rules and regulations for radiation protection); or,
(b) USEPA Drinking IJater Regulations for radionucl ides, apublished in the Federal Register of July 9, 1976, or subsequentrevisions thereto.
(2) Nothing in this chapter shall be interpreted to be applicablito those aspects of governnental regulation of radioactive water.which have been pr~ted from state regulation by the Atomic Enerv'.Act of 1954, as amended, as interpreted by the United States SupremeCourt in the cases of Northern States Power Co. v. Minnesota 405 U.S1035 (19n) and Train v. Colorado Publ ic Interest Research Group, 42\u.s. 1 (1976).
Section IJAC·173·201-055 did not exist previously.
~AC-173-201-055 is the new section nuTber for.General considerations, formerly ~AC-173·201-035.
(3) is proposed in order to clarify the use of thefecal coli form criteria in existing \lAC 173-201035. A problem exists with the current use of thefecal coliform criteria. At times, data collectedover long periods have been used to calculate themean and have been used to average out periods ofnonc~l iance.
\W: 173-201-055 G4iheral considerlltions. The following generalguidelines shall .. aw.!f:::·.. to the water quality criteria anclassifications set forttt: in ~AC 173-201-035 through 173-201-09';hereof: ' ." '::" .
. (1) At th~:-a)ouiidery':between waters of different classifications,Many of the subsections in existing ~AC 173-201-035 the w.ater quality(criteria for the higher classification sh.l.~
have been moved to different sections within the prevall..;':',:... .,.".:..:.....:::,..proposed rule. The state's antidegradation policy, (2l:.dnbr.ackl'iih waters of estuaries, where the fresh and mari!)e,.;isting section ~AC 173-201-035(8), is proposed as water. 'qualitv:criteria differ within the same classification, 'thesubsection IJAC173-201-070. To iq>rove the cr:jt~;ihf:$hall be.::fhterpolated on the basis of salinity: except thatregulation of mixing zones, the department proposes the marine'watef"'~Utycriteria shall apply for dissolVed oxygejto move existing subsections ~AC 173-201-035(3) and whei'!::·tt!e sal iftity i9::··-one part per thousand or greater and for fecal(7), and to insert the proposed mixing zone col if~rm or.ganisms when the sal inity is ten parts pel" thousand 0,criteria in the new section, ~AC 173-201-085. The ·Weater.· , .department proposes to change existing \I~ :::. :.:}: (3) U)·.qetetinjning cO!!pl iance with the fecal col iform criteria i,;173-201-035(8)(e) to clarify the use of short·term :':~;:Wf\lAC 173~gQl•.G35, averaging of data collected beyond II 30-day period!modification of the standards, and organize it i~to '. or('beyonlf"a specific discharge event under investigation, shall no'~new section ~AC 173-201-087. The d~t~.: ..:.:.::::{· p;:' eVmitted when such averaging would skew the data set so as toproposes to change existing subsect~~.. ,.,.JIAe'·:···" 1lIlISlc':"l'loncO!!pl iance periods.173-201-035(5) to clarify the applicabil:!tr:'lj'('::;~e :;:::::::::;;:::;;;::.. ('~l., The water quality criteria herein established for totastandards to controlling nonpoint s6Urce ...;<ti·ild . dbsolved gas shall not apply when the stream How exceeds the 7·day'stormwater pollution and the use o(;#dt::.,m8~ement .;;:: .:';;" 1~year frequency flood.pract Ices in pollut Ion controL{l>rogr_.·· The ·'<:t:::.:;}:·· (5) \laste dl,charge perml ts, whether issued pursuant to theproposed replacement language wOUld be/iplaced in'National Pollutant Discharge elimination System 01" otherwise, shallexisting section ~AC 173-201-110 as ~ctlon (3), be conditioned in such manner as to authorize discharges which ~:Remaining subsections have been renumbered. the water quality standards.
(a) However, persons discharging wastes in c~l iance with theterms and conditions of permits shall not be subject to civil a~
criminal penalties on the basis that discharge violates water qualitjstandards.
(b) Permits shall be subject to modification by the departmentwhenever it appears to the department the discharge violates waterqual i ty standards. Modification of permi ts, as provided herein, shaltbe subject to review in the same marner as originally issued permits
(6) No waste discharge permit will be issued which violateLestablished water qual ity cri ted a, except, as provided for \TIder IoIAC173-201-087.
(7) Due consideration will be given to the precision and accuracof the saq>l ing and analytical methods used as well as existin.'conditions at the time, in the application of the criteria.
(8) The analytical testing methods for these criteria shall be inaccordance with the "Guidel ines Establ ishing Test Procedures for thiAnalysis of Pollutants" (40 C.F.R. Part 136) and other or supersedinmethods publ ished and/or approved by the department followin\>consultation with adjacent states and concurrence of the USEPA.
(9) Nothing in this chapter shall be interpreted to prohibit threstablishment of effluent limitations for the control of the thermalc~nent of any discharge in accordance with Section 316 of thFederal Clean loIater Act (33 U.S.C. 1251 et seq.). (StatutoryAuthority: RCIJ 90.48.035 and 90.48.260. 88-02-058 (Order 87-6), ~
173-201-035, filed 1/6/88. Statutory Authority: RCIoI 90.48.035182-12-078 (Order DE 82-12), § 173-201-035, filed 6/2/82; 78-02-04(Order DE 77-32), § 173-201'035, filed 1/17/78.]
\lAC-173·201-070 is the new Ant idegradat ion section,formerly ~AC·173-201-035(8).
~C 173-201-070 Antidegradation. Antidegradation pol icy. Tantidegradation pol icy of the state of \lashington, as generall
14

DRAFT - January 22, 1991 - DRAFT
a:MCEMTS:
\,IAC·173-201·070 was formerly Generalclassifications, now moved to ~AC-173-201-090.
EPA has suggested the antidegradation policycontained in the existing water quality standards(~AC 173-201-035(8» does not provide as adequateprotection as the federal antidegradation pol icylanguage (40 C.F.R. Part 131.12). EPA isrequesting the state to adjust the policy languagein the state's water quality standards to ensure itis at least as protective as the federal language.Specific changes requested by EPA include requiringintergovernmental coordination and publicparticipation in the process of reviewing requeststo lower water qual ity, and requi ring bestmanagement practices by nonpoint source pollutiongenerators to avoid degradation. These requestedchanges are consistent with the state's currentpollution control strategy and are proposed herein.
'..<•.;
\lAC 173-201-080 \letlands .itigation. This section applies toactivities which may adversely affect water quality in wetlands. Theoverall goal of mitigation shall be no net loss of wetlands functionand acreage. \,Ihere practicable, i"!?rovement of wetland qualityshould be encouraged.
(1) \,later quality in Class AA wetlands shall be maintained andprotected.
(2) \,later qual lty in Class A wetlands shall be maintained andprotected unless it can be shown that the impact is unavoidable andnecessary. Avoidance shall be the primary means to achieve the waterquality goals of this chapter.
(a) For water-dependent activities, unavoidable and necessarywater quality impacts can be demonstrated where there are nopracticable alternatives which would:
(i) Not involve a wetland or which would have less adverse waterquality impact on a wetland; and
(ii) Not have other more significant adverse consequences to theenvironment or human health.
(b) lJhere nonwater-dependent activities are proposed. it shall bepresumed that adverse impacts are avoidable. This presumption may
~AC'173'201'080 was formerly Specificclassifications--freshwater, now moved to ~AC 173201-045.
The ~t'tlands mitigation section will require thedevelopment of a mitigation plan for projects whichmay not otherwi se meet state water quali tystandards for wetlands. This section adopts apriority sequence for mitigation of avoidance~
minimization~ and restoration, enhancement, andcreation of wetlands to replace lost wetlandfunctions. Perhaps more than any other, this
~AC-173-201-080 is a new section for ~etlands
mitigation; it did not exist previously.
.::}:... ::<:·:\iAF.:173-201"075 OUtstanding resource waters. ~aters meeting one~AC-173-201-075 is a new section for ·Outstanding. ·,:·:·:W rno.-e of thS fgtlowing criteria shall be considered for outstandingresource waters; it did not exist previously. .>{~ rjAourcewatet. designation. Designations shaH be adopted in
,.":;:' .... h ......:,c·cordaftCe>:·.:.wit!!':· the provisions of RCW 34.05. AchinistrativeSection ~AC-173-201'075 did not exist previousl,f" ··:·:::>:··Procedura:;·Att~·
~~ ~ .;ftl. ~aters in national parks, national monuments. nationalOutstanding resource waters are a componentif.(lf t~::;.;:;:::::·.:: :.' et.servest national wi ldl ife refuges, national wilderness areas.state's Antidegradation policy as proposed4j~~~: .N"fed!r.at~vild and scenic rivers, national seashores. national~rine173-201'070. The categories of waters ~~~h can..:~:::::::··:·:';·:·hncttl!ries. national recreation areas. national scenic: areas anddesignated as Outstanding Resourc:e ~at.rs};::~ t'i\:us .::;. n.tional estuarine research reserves;receive a higher level of protec;i:&i}'::juive:· been .....(2) ~aters in state parks, state wilderness Brees. state wildlifeexpanded from that in the existinj~antidiQradation "~~nagement areas and state scenic rivers;policy to better identify waters\:de~rving the (3) ~etlands that are determined by the dAA!'rtment of naturalhighest level of protection availab(~~Y The Clean resources to meet the criteria of the ~ashington Natural Heritage~ater Act allows for the highest level of Program;protection for waters constituting an "Outstanding (4) Mapped occurrences of priority species and their habitats asNat ional Resource". Under the antidegradat i on determ; ned by the department of wi ldl He;policy it also gives the states the authority to (5) Oocunented critical habitat for threatened species of nativedetermine what those waters may be. This section anad I'omous fish populations as determined by the department ofwill provide the criteria for designating fisheries;outstanding resource waters, with more emphasis on (6) High quality. regionally rare wetland communities withwaters of statewide significance as well as irreplaceable ecological functions, including sP/!agrun bogs and fens.national importance. The regulatory process for marl fens, estuarine wetlands and mature forested sW!!!pSj anddesignating these waters is still being developed, {n ~aters of exceptional recreational or ecological significance.and will be adopted in a rule-making processseparate from the Triennial Review. It is certain,however, that the list of Outstanding Resource~aters will be designated by rule with full publicinvolvement and review.
(4)(c) is a restatement of existing \,lAC 173-201035(8)( f). It is intended to clari fy that evenwhen lowering water quality in high quality watersIS authorized, the lower water quality shall stillbe of high enough quality to support all existinguses.
15

DRAFT - January 22, 1991 - DRAFT
The existing criteria for mIXIng zones is 'in ~AC'
173-201-035(3) and (7); the department is proposingto replace it with this section.
section provides a consistent method for theconditioning of Federal 404 permits under the 401water quality certification program.
Mixing zones are areas of water adjacent toeffluent outfalls where the effluent is allowed tobe di luted to meet water qual i ty standards. Thedepartment currently rei les on state and federalguidance docunents to establi sh detailed cOII'pli ancecriteria for mixing zones in discharge permits.The Puget Sound ~ater Quality Authority and EPAhave requested the department to place specificcriteria for regulating mixing zones in the waterquality standards. The effort to develop effectivecriteria for inclusion within the standards wasinitiated last year. Key elements to the mixingzone draft cri teri a include the establ i shment ofmaximum allowable sizes for mixing zones in varioustypes of waterbodies, and the establishment ofnarrative criteria which are designed to protectaquatic communities and other beneficial water usesin the waters in and surrounding mixing zones.
.:::;:·':,::,.)i\IAC 173'201-085 Mixing zones. (1) The allowable size and
"'t:~.,JOcation of a mixing zone and the associated effluent limits~established in a discharge permit shall be based on:
(a) The requirement that AKART be fully applied;(b) Consideration of the chemical and physical interaction of the!
effluent and the receiving water;(c) The critical condition for discharge;(d) The protection of sensitive and imoortant habitats and!
exis·ting and characteristic uses of the waterbody: lind(e) Minimization of the area of water quality degradation.(2) No mixing zone shall be granted unless the supporting
information clearly indicates the mixing zone avoids degradation ofsensitive or important habitat, does not adversely impact anyexisting or Characteristic uses of the waterbody outside of themixing zone, and does not adversely affect public health asdetermined by the department.
(3) ~ater quality criteria shall not be violated outside of theboundary of a mixing zone as a result of the discharge for which themixing zone was authorized.
(4) The maximum size of a mixing zone shall cooply with thefollowing:
(a) In rivers and streams, mixing zones shall comply with the mostrestrictive combination of the following:
(i) Not extend in a downstream direction for a distance greaterthan 300 feet plus the depth of water over the diffuser or outfallor upstream for a distance of over 100 feet;
(ii) Not utilize greater than twenty-five percent of the flow; or(iii) Not occupy greater than twenty-five percent of the cross
sectional width of the waterbody. This size limitation «4)(a» maybe applied to estuaries havino flow characteristics that resemblerivers.
(b) In estuaries, mixing zones shall:(i) Not extend in any horizontal direction tor 8 distance greater
than 200 feet plus the depth of water over the diffuser or outfall,and
be rebutted upon a demonstration that:(i) The basic protect purpose caMot reasonably be accooplishe
utilizing alternative sites in t~e general region that would avoidor result in less adverse water quality imoact on a wetland; ~
(ii) A reduction in the size, scope, configuration, or density ofthe project as proposed and all alternative designs of the projec'as proposed that would avoid, or result in less adverse water qual it'irrpact on a wetland wi II not accoopl ish the basic purpose of theproject; and
(iii) In cases where the applicant has rejected alternatives t(the project as proposed due to constraints such as zoning!deficiencies of infrastructure. or parcel size, the applicant ha~
made reasonable attempt to remove or accommodate such constraints:(3) ~hen it has been determined that lowering the water qualitr
of a wetland is unavoidable and'necessary and has been minimized tithe maximum extent practicable, wetland losses and degradation shalrbe offset. where apprcpri ate and practicable, through del iberaterestoration, creation. '91' enhancement of wetlands.
(a) In-Idnd repi:tiement,.. of functional values shall be provided.unless it is (o\lld:.that":··:;n-kind replacement is not feasible oripractical due .. to:::'-10e '~baracteristics of the existing wetland and IIgreater bene1it can be demonstrated by an alternative. In suchcases. subst·itute resources of equal or greater ecological valUf'shall be",provh:led·.
(bl·~n·stte replacement shall be provided, unless it is found thaton-sHe replacement is not feasible or practIcal due to physicalfeatures-"cf.: the pr;operty or a greater benef i t can be demonstrated by'!ising an.,'alternativ.e site; In such cases, r~placement shall occuri
'<':::'_ wi'thfn::the same watenhed and proximity. •":::':'::",-.. (¥:);;-"A mi'$:i9a~:;on phn shall be r~ired for proposed mitigation
Pto jects. :.::( . .,'. }::" ..,S':: (d) Res·r.orar-ion, enhancement,' or replacement shall be cO!!J?leted
.~f~:'· ··::::::::·'·::):)rior ta::;!!J!t'"!Jed degradation, where oossible. In all other cases,;
~":":':'::.:,.•,,:.:;.:.,:.:,::,::,.;,::' ~ reatSll:at1Qn. enhancement. or replacement shall be cO!!pleted prior to'," ute. o'~ occypancy of the activity or develognent. or irrmediately afteract'JVities that wi II t!!'!!pOrad ly disturb wetlandS, except as provided
,:",;,:-:::::by \lAC 173-201-087. ...'
a:JM:NTS:
16

aMENTS:
DRAFT - January 22, 1991 - DRAFT
(ii) Not occupy greater than twenty-five oercent of the crosssectional width of the waterbody. 'or the purpose of WAC173'201-085, areas to the east of a line from Green Point (FidalgoIsland) to Lawrence Point (Orcas Island) are considered estuarine,as are all of the Strait of Georgia and the San Juans north of Orcas.To the east of Deception Pass, and to the south and east of AdmiraltyHeed, and south of Point Wilson on the Quimper Peninsula, is PugetSound proper, which is considered to be entirely estuarine. Allwaters existing within bays from Point Wilson westward to CapeFlattery and south to the North Jetty of the Columbia River shallalso be categorized as estuarine.
(c) In oceanic waters. mixing zones shall not extend in anyhorizontal direction for a distance greater than 300 feet plus thedepth of water over the diffuser or outfall. For the purpose of WAC173-201-085, all marine waters not classified as estuarine in WAC173'201'085(3)(b) shall be categoriZed as oceanic.
(d) In lakes, andjn reservoirs having 8 ~an detention timegreater than 15 days, mhllng zones shall not be allowed .....less it canbe demonstrated to.:JM ..Ulisfaction of the department that:
( i) Other sit ing, ·:technotog ica I, and manager i al opt ions that wouldavoid the need·:f.,,,,::·:!! lake mi x ing zone are not reasonably achievablej
(ii) The:"~ixini< zone is necessary to accommodate importanteconomic or social development in the area in which the waters areI ocated; ···F ..,.>:::<:;:;:;-
(H.i:-) Al:t. technological and managerial ~thods available forII' ion. r~tion and removal that are economicall achievable
!o!SlUld···~·····itplementedprior to discharge,.:::f.Ae) In,;:lake!fj ":Wilting zones shall root, either singly or in
<l\ cOiitltij!tion whh other mixing zones, exceed the most restrictive'~\Sombi@tion::of the fort owing:
-:i1:: ..\\ (q Exceed-:::t~ percent of the volunej . ,,,p :;: :. ..;:if' (i I )·:kc.eedti!£! percent of the surface area (mexlllUIl radIal extent
,.;:'.:: ::.:.::::..::..::.:..,::: :.: .:~~*~::1~~:l·"e9ardless of whether it reaches the surface) of a":l, . .:t:(iji)i~tend beyond f i #teen percent of the width of the waterbody.
{~:~~~:::::;::::..:.:..::::.:..::.::...::: ..·lSY::A::::'lone of acute criteria exceedance is allowed only if it can;::::···:··::tlt<bfmonstrated to the department's satisfaction that the
"'::: c9CCentration of, and exposure duration and frequency of. the.:::. di'scharqe wi II not create a barrier to the migration or translocation··::::\..:of indigenous organisms to a degree that has the potential to cause
. damage to the ecosystem, Acute criteria are based on nunericcriteria and bioassays approved by the department, as generallyguided under WAC 173-201-045(1) through (5). and shall be ~t IS nell'to the point of discharge as practicably attainable. Conptiance shillbe determined by mooi toring data or cal ibrated ~Is .pproved by thedepertment and/or by the use of bioassays utilizing representativedilution ratios. In no case shall the zone where acute criteria maybe exceeded be greater than the most restrictive of the fOllowing:
(a) Ten percent of the distance from the edge of the outfallstructure to the furthest horizontal edge of an authoriZed mixingzone. as applied in any spatial direction;
(b) Fifty times the discharge length seale in any spatialdirection from each discharge port; the discharge length scale is thesquare-root of the cross'sectional area of any discharge outlet. Inthe case of multi-port diffusers, this requirement must be ~t foreach port using the appropriate discharge length scale of that port;2!:
(e) Five times the local water depth in any horizontal directionfrom any discharge outlet. The local water depth is defined as thenatural water depth (existing prior to the instlltation of thedischarge outlet) prevailing under critical conditions.
(6) Mixing lones may overlap if it can be demonstrated to the 'Idepartment's satisfaction that:
(a) The separate and combined effects of the discharges can bedetermi ned; and
(b) The combined effects would only cause a combined exceedanceof \lAC 173-201-085(3) and would not create a barrier to aQUaticorganism migration or translocation.
(7) Stormwater:(a) Any "point source", as defined by 40 C.F.R. Part 122.2, used
for collecting and conveying stonTlWater located at an industrialplant or directly related to manutacturi!'l9, processing, or rawmaterials storage at an industrial plant shall fully conform to WAC
17

~IITS:
DRAFT - January 22. 1991 - DRAFT
, 73-201 -085.<b) All stormwater discharges not fitting the description given
in (7)(a) above shall be required to utilize all best managementpractices and treatment technology determined appropriate by thedepartment to ach i eve ~uJ l CO!l'Jll i ance wi th \.lAC 173-201 -085. I f adischarger is adhering to a cO!l'Jlliance schedule assigned by thedepartment for inplementation of all appropriate best managementpractices. they may be allowed a mixing zone that varies from \.lAC173-201-085, provided doing so noes not adversely impact existing orcharacteristic water uses ana would not result in d8llll!lge to theecosystem.
(c) MiXing zones for stormwater discharges shall be based on avolume of runoff corresponding to a design ston. approved by thedepartment. Exceedances from the mixing zone size criteria (WAC173-201-085(4) through (6» due to precipitation events greater thanthe approved design storm may be allowed by the depertment. if itwould not result in adverse impact to existing or characteristic usesof the waterbody or r~lt in damage to the ecosystem, or adverselyaffect publ ie health,as determined by the department.
(8) Cont>ined s-ewer Civerflows e!!!?loying at-site treatment and.having achieve(J·',t!'e srtatest reasonable reduction in accordance with'chapter 173"245 ~C, may be allowed an average once per yearexemption to the size criteria in \.lAC 173-201-085(4) through (6).provided:;:.th·e::::·.d.i:tcharge would not resul t in an adverse i!!pact toexisting &2d characteristic uses, result in damage to the ecosystem, (or !lst:'ersely:::affec.t publ ic health as determined by the depertment.: (9r£xceedanc!s from the size criteria (WAC 173-201-085(4) through .
.. (6P mav",be considered by the department in the following cases: '::':::" ':':::':'::"(";5"). For dii:charg&!.existing prior to July 2. 1991 (or for proposed"::'\:::,di oorgeS:':!fi tlt.~engineering plans formally approved by the c!ep8rtment
·tL "\prior to Juty::··2. 1991);.', ';:;':::i ;', .::f' (b) :5;!btre .Herat ion of the size conf igurat ion is expected to j.
:~f':::' ::::~~~:::., result '::ii!r-"Cffl!!Iter protection to aQUatic organisms. sensitive or
,~,.•,~.'~A,::."."•••.••,>".•,,} ilPQ[tans habitat. or other existing and characteristic U!!!i.., "''' ·:::K (f) Were the volume of water in the effluent is providing a"···x·"· ,,9f..Jt.~::=benetit to existing and Characteristic uses of the waterbody
';:::::i';l ::~~::::::::i:;mJfht1? flow augmentation than the benefit of removing the discharge •.)::' rt such removal is the remaining feasible option; and
:':" .,.j (d) \JtIere the exceedance is clearly necessary to accorrrnodate,:·'t:::;::::::;'l5?Ortant economic or social develo~nt in the area in which the
.. waters are located.(10) Before an exceedance from the size criteria may be allowed
under \.lAC 173-201 -085(10), it must clearly be demonstrated to thedepartment's satisfaction that:
(a) AKART is in full application;(b) All siting, technological, and managerial options which would [
result in full or significantly closer compliance that areeconomically achievable are being utilized; and
(c) The proposed mixing zone shall not have a reasonable potentialto result in a loss of sensitive or i!\]?Ortant habitat, interfere withthe recreat ional use of the waterbody, resul t in damage to theecosystem, or adversely affect public health as determined by thedepartment.
(11) Any exemptions granted to the size criteria shall bereexamined during each permit renewal period for changes in'cO!!!?li ance capabit i ty. Any increased capabit i ty to cO!!ply shall bereflected in the renewed discharge permit.
(12) The department may establish permit limits and measures ofcO!!!?li ance for hLman heal th based cri teri a (based on l i fet imeexposure levels), independent of \.lAC 173-201-085.
~AC-173-201-087 is a new section number for Shortterm modifications, formerly subsection ~AC-173
201-035(8)(e),
S~ct;on \.lAC, 173-201'087 did not exist previously.
The existing criteria for short-term modificationsIs in IJAC-173-201-035 and 100; it has beenconsol idated here for clarification. \.lith theexception of formally establishing a maximum of 12months for any modification period, the departmentis not proposing any change in the administration
YAC 173-201-087 Short-ten- ~ifications_ (1) The criteria andspecial conditions established in ~AC 173-201-045 through ~AC
173-201-085 may be modified for a specific water body on a short-tembasis when necessary to accommodate essential activities, respond toemergencies, or to otherwise protect the public interest. even thoughsuch activities may result in a temporary reduction of water qualityconditions below those criteria and classifications established bythis regulation. Such modification shall be issued in writing by thedirector or his/her designee subject to such terms and conditions ashe/she may prescribe, and such modification shall not exceed a twelvemonth period.
(2) Notwithstanding the above, the aquatic application of
18
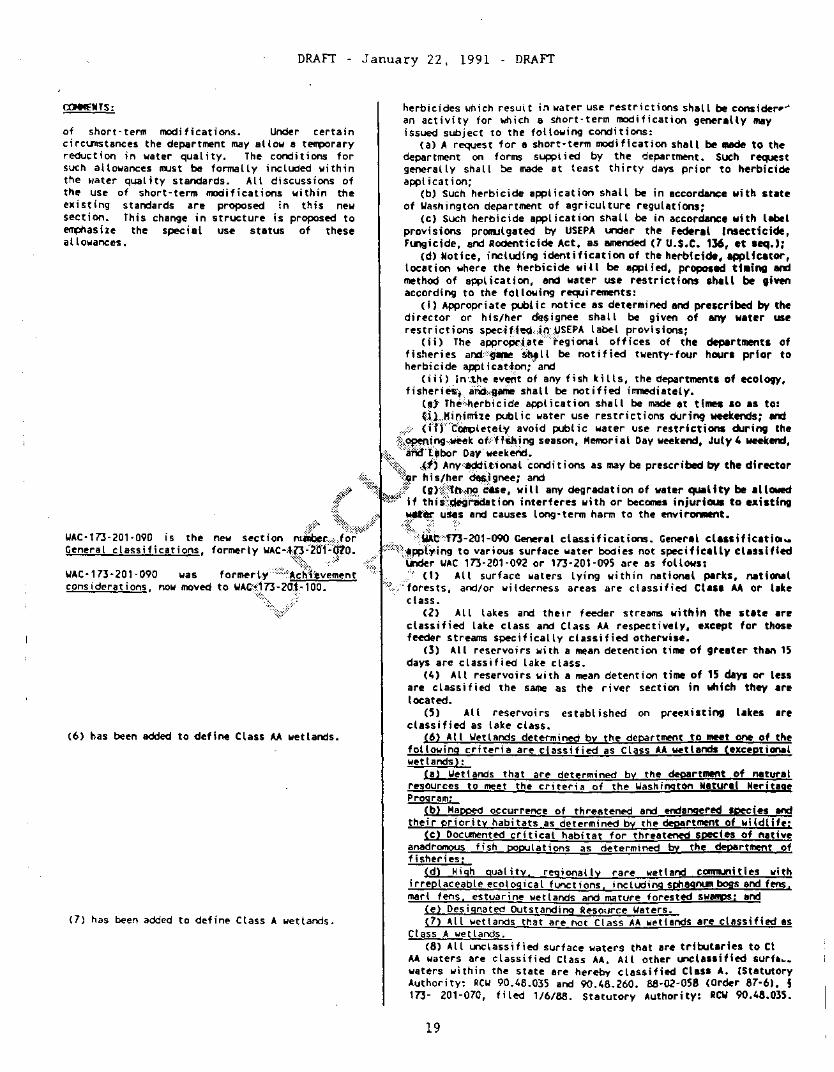
DRAFT - January 22, 1991 - DRAFT
aMENTS:
(6) has been added to define Class AA wetlands.
(7) has been added to define Class A wetlands.
of short-term modifications. Under certaincircumstances the department may allow a temporaryreduction in water qual ity. The conditions forsuch allowances must be formally included withinthe water qual i ty standards. All discussions ofthe use 01 short-term modifications within theexisting standards are proposed in this newsection. This change in structure is proposed to~asize the special use status of theseallowances.
herbicides which result in water use restrictions shall be consider""an activity for which a short-term modification generally Nyissued subject to the following conditions:
(a) A request for a short-term modification shall be made to thedepartment on forms suppl ied by the Ijepartment. Such requestgenerally shall be made at least thirty days prior to herbicideappl icat ion;
(b) Such herbicide application shall be in accordance with stateof Washington department of agriculture regulations;
(c) Such herbicide application shall be in accordance with labelprovisions prOlllJlgated by USEPA under the Federal Insecticide,FlA'lgi ci de, and Rodenticide Act, as amended (7 U.S.C. 136, et seq.);
(d) Notice, including identification of the herbicide, appltcator,location where the herbicide wi II be applied, proposed tiMing andmethod of appl ication, and water use restrictions shall be givenaccording to the following requirements:
(i) Appropriate public notice as determined and prescribed by thedirector or his/her de~ignee shall be given of any water userestrictions spec·,jU~.::HI."..USEPA label provisions;
(i i) The approi:ir:::i.ate····:·:fegional offices of the depIIrtments offisheries anli:::::~8/!Il!~~11 be notified twenty-four hours prior toherbicide appl icatlon;' and
(iii) In~1~e ev~t of any fish kills, the departments of ecology,fisherh!S:.: ciAd,:"!Jame shall be notified inmediately.
(el The:;·tlerbicide application shall be made at timetl so as to:(h...~ioimite publ ic water use restrictions during weekends; and
.:::::;> (nr··t~leteIY avoid publ ic water use restrictions during the·:l:~Ii.ng·.:weekof;::HSt"ing season. Memorial Day weekend, July 4 weekend,
:';i>. "':ana'hbar Day' weekef'id..··::"t:,::.. .(f> AnY·:~i·t·;onal conditions as may be prescribed by the director
.+::., '\j9r his(her '~)gnee; and%.*~~:>~t· ..·:l':: (\J){ttll·,-Q9 eUe, will any degradation of water quality be allowed'0 • %*-" if this:':d09HSdation interferes with or becames injurious to existing
"'C-m-201-090 ;, the ~. ,,";on m'~~~ .. (l~!-:~-::~:-:~::::.::a:~ ::::'HI<atl~_General classifications, formerly WAC-ll.3:20·'-0?0. :;::;.;~:t:;\"pp{¥ing to various surface water bodies not specifically classified
";:;:>':" ..,::." '~r WAC 173-201-092 or 173-201·095 are as follows:WAC-173-201·090 was formerl'~:::;'''':':::A~;Wi'e~~ment .' :,,: (1) All surface waters lying within national parks, nationalconsiderations, now moved to WAG/173-20l-100. :::::::,.}··..forests. and/or wilderness areas are classifiedClas. AA or like
"':::::'" ..:'::' . cl as s •.~~:"::/':::::.. (2) All lakes and thei r feeder streams wi thin the state Ire
classified lake class and Class AA respectively, except for thosefeeder streams specifically classified otherwise.
(3) All reservoirs with a mean detention time of greater than 15days are classified lake class.
(4) All reservoirs with a mean detention time of 15 days or lessare classified the same as the river section in which they Irelocated.
(5) All reservoirs established on preexisting likes Irecllssified as lake class.
(6) All Wetlands determined by the department to meet one of thefollowing criteria are classified as Class AA wetlands <exceptionalwetlands):
(a) Uetlands that are determined by the department of naturalresources to meet the criteria of the Uashington Natural HeritageProgram;
(b) Mapped occurrence of threatened and endangered seeeies andtheir priority habitats as determined by the department of Wildlife;
(c) Documented critical habitat for threatened species of nativeanadromous fish populations as determined by the department offisheries:
(d) High quality, regionally rare wetland communities withirreplaceable ecological functions, including spt!agnun bogs and fens,marl fens, estuarine wetlands and mature forested swamps; and
(e) Designated Outstanding Resource Waters.(7) All wetlands that are not Class AA wetlands are classified as
Class .A wetlands,(8) All unclassified surface waters that are tributlries to Cl
AA waters are classified Class AA. All other unclassified surf6~_
waters within the state are hereby classified Class A. (StatutoryAuthority: RCU 90.48.035 and 90.48.260. 88-02-058 (Order 87-6), §173- 201-070. 1iled 1/6/88. Statutory Authori ty: RCV 90.48.035.
19

DRAFT - January 22, 1991 - DRAFT
cu.e£NTS: 82-12-078 (Order DE 82-12), § 173-201-070, filed 6/2/82; 78-02-043,!(Order DE n- 32>. § 1'73-201-070, filed 1/17/78; Order 73-4, §"173-201-070, filed 7/6/73.]
Class A
Class A
Class A
Class A
Class AAClass A
Class A
Class A
Class AA.
Class AA
Class A l1
Class AACless AA (Class AA;Cless A "
Class A
Class AAClass AClass AAClass AAClass AIClass AClass AAClass A
Class A
Class A
YAC 173-201-092 Specific classifications--Freshweter. Specificfresh surface waters of the state of ~ashington are classified as~
follows:(1) American River.(2) Big Quilcene River and tributaries.(3) BUfll)ing River.(4) Burnt Bridge Creek.(5) Cedar River from Lake ~ashington to the
Maplewood Bridge (river mile 4.1).(6) Cedar River and tributaries from the Maplewood
Bridge (river mile 4.1) to Landsburg Dam (river mile- 21.6).
(7) Cedar River and tributaries from Landsburg Dam(river mile 21.6) to headwaters. Special condition no waste discharge;::1iHI .!:!! permitted.
(8) Chehalis Rl\'erfi"Ol;i upper bolndary ofGrays Harbor~.t,::t:1Il.~l is (river mile 3.1, longitude123·45'45" 'etf to S@nm6n Creek (river mile 65.8).
(9) Chehalis River from Scammon Creek (river mile65.8) t~*Hew~~i~iver (river mile 75.2). Specialcondit.i on·:~':·:.diSlol ved oxygen sha II exceed 5.0 mg/Lfr~::;~.~ .. 1/')0 Septerrber 15. For the remainder of~~e yeaf:~the distolved oxygen shall meet Class A
:~.cri teri a.•:.:.(' .";' :':"";::" ~·:':::;;:::·:t1(t~ Chehafi s RI~ from Newaukun River (r iver~t~mile~15.2)~toRock Cf~ek (river mile 106.7).
':'};.; (11) Chei1.1i~ River, from Rock Creek (rivHali le 1~~7..) to':lI.eadwaters.
:.::::; . (12)::Chefi.Us River, south fork.·(lJ) ~ewack River.(J4) Chiwawa River.dS).:cispus River.(t~) Clearwater River.(17) Cle Elun River.(18) Cloquallum Creek.(19) Clover Creek from outlet of Lake Spanaway
to inlet of Lake Steilacoom.(20) Columbia River from mouth to the ~ashington·
Oregon border (river mile 309.3), Special conditions temperature shall not exceed 20.0·C due to humanactivities. ~en natural conditions exceed 20.0·C,no temperature increase will be allowed which willraise the receiving water temperature by greaterthan 0.3·C; nor shall such temperature increases, atany time, exceed 0.3·C due to any single source or1.1·C due to all such activities combined. Dissolvedoxygen shall exceed 90 percent of saturation.
(21) Columbia River from Washington-Oregonborder (river mile 309.3) to Grand Coulee Dam(river mi le 596.6). Special condition fromWashington'Oregon border (rive~ mile 309.3) toPriest Rapids Dam (river mile 397.1). Temperatureshall not exceed 20.0·C due to hunan activities.~en natural conditions exceed 20.0·C, no temperatureincrease will be allowed which will raise thereceiving water temperature by greater than 0.3·C;nor shall such temperature increases, at any time,exceed t=34/(T+9).
(22) Columbia River from Grand Coulee Dam(river mile 596.6) to Canadian border (river mile745.0) •
(23) Colville River.,(24) Coweeman River from mouth to Mulhollard
Creek (river mile 18.4).(25) Coweeman River from Mulholland Creek
(river mile 18.4) to headwaters.(26) Cowli tz River from mouth to base of R·i He
Lake Dam (river .ile 52.0).(27) Cowlitz River from base of Riffe Lake Dam
This section l istl specific classes for certainfreshwater waterbodies in the state and includesspecial conditions for discharges to those waters.The department has been evaluating data for fourwaterbodies from this list for potential upgrade intheir classifications. AI a result of this effort,the department proposes to reclassify two of thewaterbodies evaluated.
~AC-173-201-092 is the new section number forSpecific Classifications--Freshwater, formerly~AC
173-201-080_
Section ~AC-173-201-092 did not exist previously.
The Cedar River from Lake ~ashington to LandsburgDam (river mile 21.6) is currently Class A. Thedepartment has been conducting an analysis of waterquality data for this waterbody to determine if thewaterbody should be reclassified as Class AA. Thedepartment's review supports the upgrade of thatportion of the waterbody segment above river milefour. It will be necessary to create a newwaterbody segment to ifll)lement this newClass if icat ion.
20

aMENTS:
DRAFT - January 22, 1991 - DRAFT
(river mile 52.0) to headwaters.(28) Crab Creek and tributaries.(29) Decker Creek.(30) Descnutes River from mouth to boundary
of Snoqualmie Hational Forest (river mile 48.2).(31) Deschutes River from boundary of Snoqualmie
National Forest (river mile 48.2) to headwaters.(32) Dickey River.(33) Dosewallips River and tributaries.(34) Duckabush River and tributaries.(35) Dungeness River from mouth to Canyon Creek
(river mile 10.8).(36) Dungeness River and tributaries from Canyon
Creek (river mile 10.8) to headwaters.(37) Duwamish River from mouth south of a line
bearing 2540true from the H~ corner of berth 3,terminal No. 37 to the Black River (river mile 11.0)(Duwamish River continues as the Green River abovethe Bl ack River).: .....,.:':':...:.:...:.:....
(38) Elochoman ittver.(39) Elwna:it;:Yef and tributaries.(40) Enttat River from ~enatchee Hational Forest
boundary. (river mi:le 20.5) to headwaters.(41) Grande.cROnde River from mouth to Oregon
border (rhrer mile 37>. Special condition t~.r.ature '!ihal LflOt exceed 20.0·C due to hunan
.:.ctivli:··les:. \o'hen,::;fiatural conditions exceed 20.0·C,·fOq...t~ature·':lncr:ease will be allowed which will
.;~~, "flifs·lnthe receivin9'{~ter t~rature by greater~~~0~h~/O.3·C;\por-:·shallsuch temperature increases, at
~~. "Jny time, e~e~ t=34/(T+9).:$i' .:\~, ;~,:,**4'. (42i:'i:Ct:~.~...R:fver from Grays River Falls (river
,X ," Illlle 15;~.,) fcj:·:headwaters.·.w. ..:i ..;;;"<'('0.3) ':4reen River (Cowl i tz County).
;,,;::i":.' ··:::,t,::::<::::<:.· <to:, ('4) (ii-een River (King County) from Black River;:.:... ..... ...., .. (H\ier':iilile 11.0 and point where Duwamish River
·:t:::.. "::::;:;;:':::';.;":::;~J ..;:,. :::::::::::::::::i;u.)nttnues as the Green River) to west boundary~;t~ ~~~ ~ See. 27-T21N-R6E (west boundary of flaming
-:.:.:' ::):. ~yser State Park at river mile 42.3).• ~ (45) Green River (King County) from west
boundary of Sec. 27-T21N-R6E (west boundary ofFlaming Geyser State Park, river mile 42.3) towest boundary of Sec. 13-T21N-R7E (river mile 59.1).
(46) Green River and tributaries (King County)from west boundary of Sec. 13-T21N-R7E (rivermile 59.1) to headwaters. Special condition -no waste discharge will be permitted.
(47) Hamma Hamme River and tributaries.(48) Hanaford Creek from mouth to east boundary
of Sec. 25-T15N-RlW (river mile 4.1). Specialcondition - dissolved oxygen shall exceed 6.5 mg/L.
(49) Hanaford Creek from east boundary of Sec.25-T15N-RlW (river mile 4.1) to headwaters.
(50) Hoh River and tributaries.(51) Hoquiam River (continues as west fork
above east fork) from mouth to river mile 9.3(Dekay Road bridge) (upper limit of tidal influence).
(52) Humptulips River and tributaries frommouth to Olympic National Forest boundary on eastfork (river mile 12.8) and west fork (river mile 40.4)(main stem continues as west fork).
(53) Humptulips River, east fork from OlympicNational Forest boundary (river mile 12.8) toheadwaters.
(54) Humptulips River, west fork from OlympicNational Forest boundary (river mile 40.4) toheadwaters.
(55) Issaquah Creek.(56) Kalama River from lower Kalama River
Falls (river mile 10.4) to headwaters.(57) Klickitat River from little Klickitat
River (river mile 19.8) to headwaters.(58) lake ~ashington Ship Canal from Government
21
Class AAClass 8Class AA
Class A
Class AAClass AClass AAClass AI.
Class A
Class AA
Class 8Class AClass AI.
Class AI.
Class A
Cla•• AI.Cla.s AI.
Class A
Class AI.
Cla.s AAClass AI.
Class A
Cla.. ACla.s AA
Class 8
Class A
Class AI.
Class 1.4Class A
Class AI.
Class AI.

COM:lIlTS :
DRAFT - January 22, 1991 - DRAFT
Locks (river mile 1.0) to Lake ~ashington (rivermile 8.6). Special condition' salinity shall notexceed one part per thousand (1.0 ppt) at any pointor depth along a line that transects the ship canalat the University Bridge (river mile 6.1).
(59) Lewis River, east fork, from Multon Falls(river mile 24.6) to headwaters.
(60) Little ~enatchee River.(61) Hethow River from mouth to Chewack River
(river mile 50.1).(62) Hethow River from Chewack River (river
mile 50.1) to headwaters.(63) Hill Creek from mouth to 13th street
bridge in Walla Walla (river mile 6.4). Specialcondition' dissolved oxygen concentration shallexceed 5.0 mg/L.
(64) Hill Creek from... 13th Street bridge inWalla Walla (river mile·;i6.4) to Walla WallaI./aterworks Dam (river:·:·llIile>·25.2).
(65) Hill Creek ~~·tti&ftaries from city ofWalla I./alla Wat-eno.rkt:':Oam (river mile 25.2) toheadwaters. SpeeiaUbmdition . no wastedischarge will be P«i1'mitted.
(66) Naehes-;::~t",.r· from Snoqualmie NationalForest.bou-ldary {river mile 35.7) to headwaters.
(61:)..Nasell~River from Naselle "Falls"(~scade':"iie::river.tIl·i Ie 18.6) to headwaters.
~ (~") Newaukum"~i"ver.
.. ::..·'t69>"NisquaHy Ri'i'tr from mouth to Alder Dam'":::lr ivet':"mi Ie ·:44.2.).:. .
':::,":'::.(70) NisquaUy River from Alder Dam (river. "::'::.., mtle 44.:t):·to hNdwaters.
.):::::"::::::::,}:' (71) ~sKt River from mouth to Maple
:j~\::::w~:;:f!' C~:j~r~::;s:~:eR~:;:)irom Maple Creek (river
'~~\:::@:':.'.::'.:.:.::'::":~:':' mif~:::49:;::l) to headwaters.';'. . ..::.::;:;::'::::'\':::.. ('73}. Nooksack River, south fork, f rom mouth
.. ·:·:···..··:::~~\::,'~~:t:..:::::., ..:<~:::::.... t:~jf:~~U:O~;:;: ~~~;~~ :~:h 1:~;~: from Skookum
()¥'f~i'~~~:r::'::;~ ~~,;~~::::'.(77) Palouse River from mouth to south fork
(Colfax, river mile 89.6).(78) Palouse River from south fork (Colfax,
river mile 89.6) to Idaho border (river mile 123.4).Special condition' temperature shall not exceed20.0·C due to human activities. When naturalconditions exceed 20.0·C, no temperature increasewill be allowed which will raise the receivingwater temperature by greater than 0.3·C; nor shallsuch temperature increases, at any time, exceedt=34/(T+9).
(79) Pend Oreille River from Canadian border(river mile 16.0) to Idaho border (river mile 87.7).Special condition' temperature shall not exceed20.0·C due to human activities. When naturalconditions exceed 20.0·C, no temperature increasewill be allowed which will raise the receiving watertemperature by greater than 0.3·C; nor shall suchtemperature increases, at any time, exceed t=34/(T+9).
(SO) Pilchuck River from city of SnohomishWaterworks Dam (river mile 26.8) to headwaters.
(81) Puyallup River from mouth to river mile 1.0.(82) Puyallup River from river mile 1.0 to
King Creek (river mile 31.6).(83) Puyallup River from Kings Creek (river
mile 31.6) to headwaters.(84) Queets River and tributaries.(85) Quillayute River.(86) Quinault River and tributaries.(87) Salmon Creek (Clark County).(8S) Satsop River from mouth to west fork
22
Lake Class
Class AAClass AA
Class A
Class M
Class B
Class A
Class M
Class M
Class AAClass A
Class A
Class M
Class A
Class M
Class A
Class AAClass MClass A
Class B
Class A
Class A
Ctass AAClass B
Class A
Class AAClass AAClass AAClass MClass AA

The Snoqualmie River from mouth to the westboundary of Twin falls State Park on the south fork(river mile 9.1) is Class A. The department hasbeen conducting an analysis of water quality datilfor this waterbody to determine if the waterbodyshould be reclassified as Class AA. Thedepartment's analysis supports the upgrade.
CCMEIITS:
DRAFT - January 22, 1991 - DRAFT
(river mile 6.4).(89) Satsop River, east fork.(90) Satsop River, middle fork.(91) Satsop River, west fork.(92) Skagit River from mouth to Skiyou Slough
lower end (river mile 25.6).(93) Skagit River and tributaries (includes
Baker, Suak, Suiattle, and Cascade rivers) fromSkiyou Slough-lower end, (river mile 25.6) toCanadian border (river mile 127.0).
(94) Skokomish River and tributaries.(95) Skookunchuck River frOlll Bloody Run Creek
(river mile 21.4) to headwaters.(96) Skykomish River from mouth to Hay Creek
(above Gold Bar at river mile 41.2).(97) Skykomish River from Hay Creek (Above
Gold Bar at river mile~41.2) to headwaters •.(98) Snake River fr~~~th to Washington
Idaho-Oregon border:::::(r:J'~':I:t:::mi Ie 176.1). Specialcondi t ion. .:..::::.:.. ".,.:.:...:.'
(a) Below C(~,o.ater.::.River (river mile 139.3).Temperature shall ~t exceed 20.0·C due to humanactivities. '!.!hen nBtural conditions exceed 20.0·C,no temperatl,Jre::;::irICrease wi II be allowed which wi IIraise*~ne receiving water temperature by greaterthan4J.•J.~.:C.;. nOr sha:ll such temperature increases,a~>any······nii*.; exceed t=34/(T+9).1\~(ptAboVe CI&arNa~er River (river mile 139.3).
'~\.. r.,.itture sh'all not:;::exceed 20.0·C due to human··<;:::~thtfties.<.::IJh~ natural conditions exceed 20.0·C,
.~}: ... temperlltur.:{'ncreases will be allowed which will.::~:f~ "h" .r:iise ttie::::rcceN'ing water temperature by greater
;..:.;...::::!.:...:..·:i;::::i::~::than o.l~pi ~. 'shall such temperature increases, at. } anr::t~mei:exceed O.3·C due to any single source or
:.{:::" ·::t:::::::::::::::::: lU·C/due,,:to all such activities combined..::::;. " ..·~:::·$nohomish River from mouth and east of
.~~~~:::~:::::::;m:::.:;:;~~ .::: :f.:'~:::;::::~~!~N 1~~~~~~~~Wt~~~~e:e;o I~~:~~ver
:::~:.:.. mi·te 8.1). Special condition· fecal col;form~rganisms shall not exceed a g~tric mean valueof 200 organisms/100 ml with not more than 10percent of the samples used in calculating the meanvalue exceeding 400 organisms/100 ml.
(100) Snohomish River upstream from latitude. 47056'30"N (southern tip of Ebey Island river mile8.1) to confluence with Skykomish and SnoqualmieRiver (river mile 20.5).
(101) Snoqualmie River and tributaries frommouth to west boundary of Twin falls State Park onsouth fork (river mile 9.1).
(102) Snoqualmie River, middle fork.(103) Snoqualmie River, north fork.(104) Snoqualmie River, south fork, from west
boundary of Twin falls State Park (river mile 9.1)to headwaters.
(105) Soleduck River and tributaries.(106) Spokane River from mouth to long lake
Dam (river mile 33.9). Special condition temperature shall not exceed 20.0·C due to humanactivities. When natural conditions exceed 20.0·C,no temperature increase will be allowed which willraise the receiving water temperature by greaterthan 0.3·C; nor shall such temperature increases,at any time, exceed t=34/(T+9).
(107) Spokane River from long lake Dam (rivermile 33.9) to Nine Mile Bridge (river mile 58.0).Special conditions:
(a) The average euphotic zone concentration oftotal phosphorus (as P) shall not exceed 25mg/lduring the period of June 1 to OCtober 31.
(b) Temperature shall not exceed 20.0·C, due tohuman activities. When natural conditions exceed20.0·C, no temperature increase will be allowed
23
Class ItClass AAClass AAClass AA
Class A
Class AAClass AA
Class AA
Class A
Class AA
Class A
Class A
Class A
Class AAClass AAClass AA
Class AAClass AA
Class A
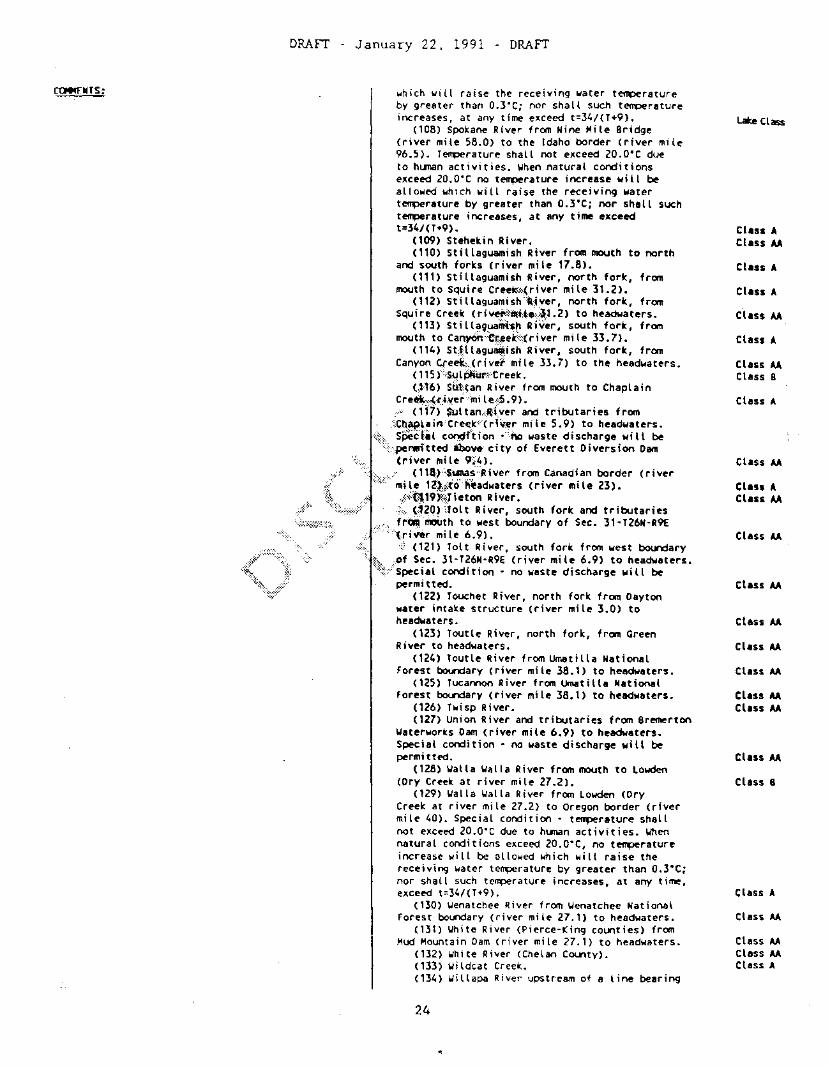
C'l:M'fIlTS:
DRAFT - January 22, 1991 - DRAFT
which will raise the receiving water temperatureby greater than 0.3·C; nor shall such temperatureincreases, at any time exceed t=34/(T+9).
(108) Spokane River from Nine Hile Bridge(river mile 58.0) to the Idaho border (river mile96.5). Temperature shall not exceed 20.0·C dueto human activities. ~hen natural conditionsexceed 20.0·C no temperature increase will beallowed whlch will raise the receiving watertemperature by greater than 0.3·C; nor shall suchtemperature increases, at any time exceedt=34/(T+9).
(109) Stehekin River.(110) Stillaguamish River from mouth to north
and south forks (river mile 17.8).(111) Stillaguamish River, north fork, from
mouth to Squire CreeK-~(river mile 31.2).(112) Sti Ilaguamish':~Jver, north fork, from
Squire Creek (ri~:::iilu:.::.:~~.2) to headwaters.(113) Still~g~nri~~ River, south fork, from
mouth to Can)'(ii't:;:C!,#ek:::::(river mile 33.7>.(114) St~:\lagu~ish River, south fork, from
Canyon Cre~~(riv~ mile 33.7) to the headwaters.( 115 f::Sill pm.r~:·C reek.(jt~) Suttan River from mouth to Chaplain
Cre.:::.,(riyer:··:mi le..::5 .9) •:,;"., <i{i)'$iJl tan.Jl{ver and tributaries from::C.b.AA~ain·Creek·::·(rfv~r mile 5.9) to headwaters.
"t:::.. specllil c~rtion ··:·flo waste discharge will be"::{:J>el'lllftted above' city of Everett Diversion Dam
(river mile 9~4).
(ll~F·Slolllas::iliver from Canadian border (rivermile 12).;~:t'o:·ti~adwaters (river mile 23).~~)tl19iiJieton River.
.::;::. (hO) Jolt River, south fork and tributariesfr~:'mouth to west boundary of Sec. 31-T26N-R9E
':"(river mi le 6.9).-::: (121) Tolt River, south fork from west t:xxrdary
:b. .p1 Sec. 31-T26N-R9E (river mile 6.9) to headwaters.'·::::::;::·:'Special condition - no waste discharge will be
permi tted.(122) Touchet River, north fork from Dayton
water intake structure (river mile 3.0) toheadwaters.
(123) Toutle River, north fork, from GreenRiver to headwaters.
(124) Toutle River from Umatilla NationalForest boundary (river mile 38.1) to headwaters.
(125) Tucannon River from umatilla NationalForest boundary <river mile 38.1) to headwaters.
(126) Twisp River.(127) Union River and tributaries from Bremerton
~aterworks Dam <river mile 6.9) to headwaters.Special condition' no waste discharge will bepermitted.
(128) ~alla ~alla River from mouth to lowden(Dry Creek at river mile 27.2).
(129) ~alla ~alla River from lowden (DryCreek at river mile 27.2) to Oregon border (rivermile 40). Special condition - temperature shallnot exceed 20.0·C due to human activities. ~en
natural conditions exceed 20.0·C, no temperatureincrease will be allowed which will raise thereceiving water temperature by greater than 0.3·C;nor shall such temperature increases, at any time,exceed t=34/(T+9).
(130) ~enatchee River from ~enatchee NationalForest boundary (river mile 27.1) to headwaters.
(131) ~hite River (Pierce-King counties) fromHud Hountain Dam <river mile 27.1) to headwaters.
(132) ~hite River (Chelan County).(133) ~ildcat Creek.(134) ~illapa River upstream of 8 line bearing
24
lake Class
Clasa AClass AI.
Class A
Class A
Class AI.
Class A
Class AI.Class B
Class A
Class AI.
Clasa AClass AI.
Class AI.
Class AI.
Class AI.
Class AI.
Class AI.
Class AI.Class AI.
Class AI.
Class B
Class A
Class M
Class MClass MClass A
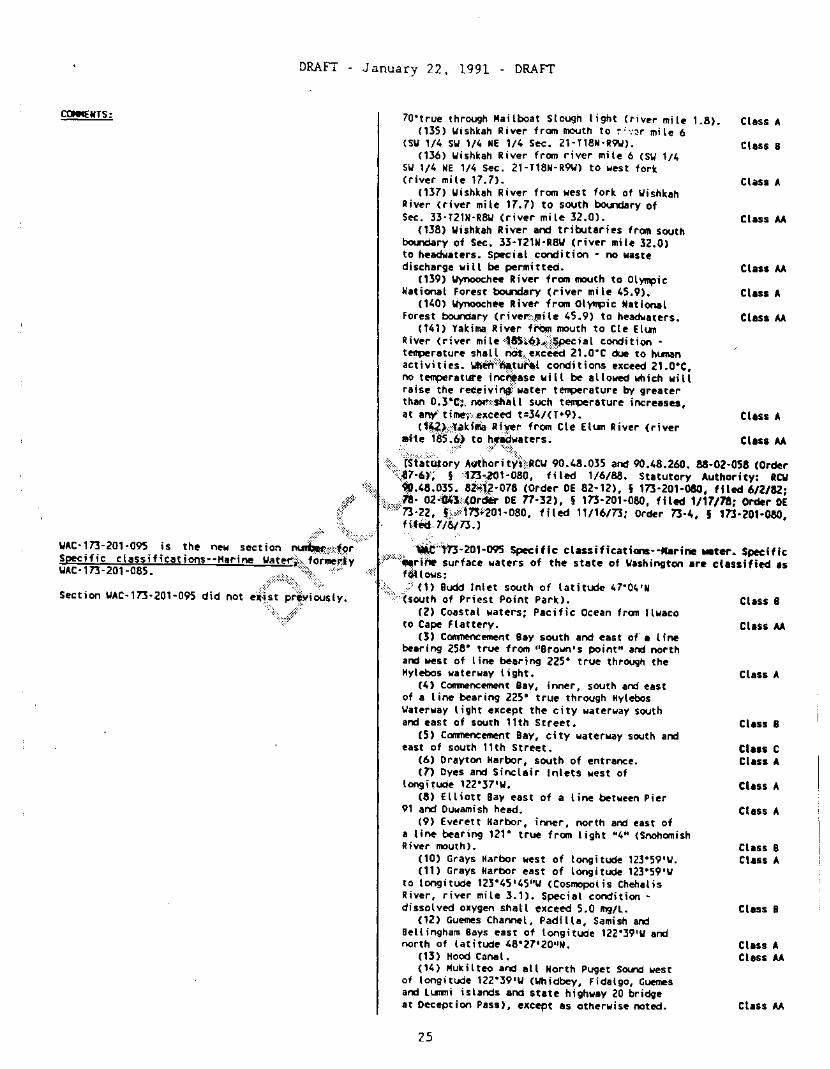
DRAFT - January 22, 1991 - DRAFT
Class M
CllSs B
Class A
Class M
Class M
Class M
Class A
Class A
Class 8
Class M
Class A
Class 8
Class CClass A
Class A
Class A
Cliss BClass A
Class AClass M
Class M
Class B
~NTS: lO"true through Mailboat Slough I ight (river mile 1.8). Class A(135) ~ishkah River from mouth to i:~~r mile 6
(SW 1/4 S~ 1/4 NE 1/4 Sec. 21-T18N·R9W).(136) ~ishkah River from river mile 6 (S~ 1/4
SW 1/4 NE 1/4 Sec. 21-T18N-R9W) to west fork(river mile 17.7).
(137) ~ishkah River from west fork of WishkahRiver (river mile 17.7) to south boundary ofSec. 33'T21N'R8~ (river mile 32.0).
(138) ~ishkah River and tributaries from southboundary of Sec. 33'T21N'R8~ (river mile 32.0)to headwaters. Special condition' no wastedischarge will be permitted.
(139) ~hee River from mouth to Ol~ic
National Forest boundary (river mile 45.9).(140) ~hee River from Ol~ic National
Forest boundary (rive~~~ile 45.9) to headwaters.(141) Yakima River f~ mouth to Cle Elum
River (river mile <ll!S~*)~;:::~cial Condition •t~rature shaq Mt::.;exc'eed 21.0"C due to hunanactivities. ~~:~~tu~.t conditions exceed 21.0"C,no t~rature inc,*ase will be allowed which willraise the reeeivinO!water temperature by greaterthan 0.3~C:. ~~sh~ll such t~rature increases,at anY·timew~exceed t=34/(T+9).
(1~J::,J.akiliia Ri.yer from Cle Elum River (river~1e 185.6) to h~aters.
:{:.;.•.•::. ':;.,:'. :t::·: " .:::>~. ·';·::it::.:,+::" 'tSfiiti#ory Alithori ty't:"cIl~ 90.48.035 and 9O.4S.26O. 88'02-0S8 (Order
""";::t7'6l: § ":S7J~:101'080, filed 1/6/88. Statutory Authority: RCW~t~ ·to.4S.03S. Si~j2'07S (Order DE S2'12), § 173-201,080, ffled 6/2/82;
.,,~. ···:,,:,.:......:.18· 02""1:,:;(order DE 77-32), § 173'201-080, filed 1117/78; Order DE,;r" X:'::':<:"73'22 , S::::.:;::'11!:+201·OSO, filed 11/16/73; Oreler 73·4, § 173·201'080,.:\ filed 7/6/73.]
~AC·173·201·095 is the new section ~:,:,:::;:;,::::::::;:::: ..; .. ··:~::·:;.'rl.201·095 Specific classifications··...rine ...ter. SpecificSpecific classifications--Harine ~ater"h:..iormeily :~::i':"":'_riiie surface waters of the state of ~ashington are classified as~AC-173-201·085. ";:'::~":' ,::".,.., .:::;::: f61lows:
Soot'''' "'C-m'201-095 dId not ·(~tl~'IY' ''%;t:+:; ;!:;;~::::~;" ::;~:;:;~:::::':IWKO'.:::::,:, to Cape Flattery.
(3) Commencement Bay south and east of' a linebelring 258· true from "Brown'S point" and nol"thand west of line bearing 225" true through theHylebos waterway light.
(4) Comnencement Bay, inner, south and eastof a line bearing 22S· true through Hytebos~aterway light except the city waterway southand east of south 11th Street.
(S) Commencement Bay, city waterway south andeast of south 11th Street.
(6) Drayton Harbol", south of 'entrance.(7) Dyes and Sinclair Inlets west of
longitude 122"37'~.
(S) Elliott Bay east of a line between Pier91 and Duwamish head.
(9) Everett Harbor, inner, north and east ofa line bearing 121" true from light "4" (SnohomishRiver mouth).
(10) Grays Harbor west of longitude 1Z3"59'~.
(11) Grays Harbor east of longitude 1Z3"S9'~
to longitude 123·4S'4S"~ (Cosmopolis ChehalisRiver, river mile 3.1). Special condition •dissolved oxygen shall exceed S.O mg/l.
(12) Guemes Channel, Padilla, Samish andBellingham Bays east of longitude 122"39'W andnorth of latitude 48"27'20"N.
(13) Hood Canal.(14) Mukilteo and all North Puget Sound west
of longitude 122"39'~ (Whidbey, Fidalgo, Guemesand lummi islands and state highway 20 bridgeat Deception Pass), except as otherwise noted.
2S

ca.cfNTS:
DRAFT - January 22, 1991 - DRAFT
(15) Oakland Bay west of longitude 123'OS'\J(inner Shelton harbor).
(16) Port Angeles south and west of a linebearing 152' true from buoy "2" at the tip ofEdiz Hook.
(17) Port GilIliJle south of latitude 47'1S'20"N. N.(18) Port Townsend west of a line between Point
Hudson and I(a la po int •(19) Possession Sound, south of latitude 47'S7'N.(20) Possession Sound, Port Susan, Saratoga
Passage, and Skagit Bay east of Whidbey Islandand state highway 20 bridge at Deception Passbetween latitude 47'S7'N (Mukilteo) and latitude48'27'20"N (Smilk Bay), except as otherwise noted.
(21) Puget Sound through Admiralty Inlet andSouth Puget Sound, south and west to longi tude122'52'30"\1 (Brisco PQint) and longi tude 122'Sl'\Jnorthern tip of Hartstene Island).
(22) Sequim Bav..1;outh~~d of entrance.(23) South PugeNSounc{'\iest of longitude
122'52'30"\1 (Brisco Point) and longi tude 122'Sl'\J(northern t~p of H~rtstene Island, except as otherwisenoted)." ';\.. :..~~:
(24) ·'S.·rafbo.f,::·:Juan de Fuca.(~) Tott.-en Inlet and Little Slcoolcun Inlet, west of
lonsHtude.12Z'"S'32!! (west side of Steall'i>oat Island)...{., (Z6r'~H lapa .eay seaward of a l ioe bearing 70'
·:.:~r.!oIe..th~h MallbGat Slough light (\Jillapa River,ft'WF:mile L8).
';:\.~.':::"":" " ".. ..;:::::;., -:F
Class B
Class AClass A
Class AClass M
Class A
Class MClass AA
Class AClass M
Class AA
Class A
\JAC-173'201-100 was formerlymoved to \JAC-173-201·110.
now
\JAC-173-201-110 is the new section number forImplementation, formerly \JAC-173-201-100.
\JAC-173-201-110 was formerly Surveillance, nowmoved to \JAC-173-201-120.
The statement on nonpoint source pollution controlin existing \lAC 173-201-035(5) is proposed forrevision te .~ke its intent more clear. Theprimary clarIfication needed is that the waterquality standards apply to nonpoint source andstormwater pollution regardless of whether thedepartment has a defined "program" in place for thecontrol of a particular type of nonpoint source orstormwater pollution. Additionally, the departmentproposes to include language addressing the use ofbest management practices for nonpoint source andstormwater pollution control. The control of
UAC 173-201-110 I-ple.cntation. (1) Discharges from municipal,conmercial, and industrial operations. The primary means to be usedfor controlling rronicipal, conmercial, and industrial wastedischarges shall be through the issuance of waste disposal permits,as provid-ed for in RC\J 90.48.160 and following.
(2) Miscellaneous waste discharge or water qual ity effect sources.The director shall, through the issuance of regulatory permits,directives, and orders, as are appropriate, control miscellaneouswaste discharges and water quality effect sources not covered by \JAC173-201-110(1) hereof.
(3) Nonpoint source and stormwater pollution:(a) Activities which generate nonpoint source pollution shall be
conducted so as to cmlr wi th the water gua Ii ty standards. Theprimary means to be used for requiring compliance with the standardsshall be through waste discharge permits, rules, orders, anddirectives issued by the department. establ ishiM best Nnllgementpractices for activities which generate nonpoint source pollution.
(b) Best Management Practices shall be designed 50 that wh~n all
26

DRAFT - January 22. 1991 - DRAFT
CCMMfNTS:
nonpoint source pollution coomonly utilizes bestmanagement practices for the activity generatingthe nonpoint source pollution. Not all managementpractices known to control pollution from aparticular activity may be needed in each case, sothe management practices are generally adopted in asequential fashion. If a set of best managementpractices is i~lemented, and does not result inwater quality standards compliance, additionalmanagement practices will be required untilcompl iance is finally attained. Best managementpractices may be required in waste dischargepermits or through regulatory orders and directivesof the department. The proposed language addressesthe nature of nonpoint source and stormwaterpollution control and the use of best managementpractices as a primary control measure.
~AC-173-201-120 is the new section number forSurveillance, formerly ~AC-173-201-110.
~AC-173-201-125 is a new section ~r forEnforcement, formerly ~AC-173-201-1~O.
Section ~AC-173-201-125 did not exist previously.
Existing ~AC 173-201-120(3) incorrectly states thatthe maximum fine for violating the surface waterquality standards is five thousand dollars, whereasthe correct amount that the director may levy for acivil penalty is a fine of up to ten thousanddollars per day against a person who violates thestandards. This error is corrected here.
appropriate combinations of individual best management practices areutilized, violation of water quality criteria should be prevented.I f a discharger is applying all best management practices appropriateor required by the department in good faith and a violation of waterquality criteria occurs. the discharger shall modify existingpractices or apply further water pollution control measures toachieve compliance with water quality criteria.
tc) Activities which contrib.Jte to nonpoint source pollution shallnormally be conducted uti! !zing best management practices to preventviolation of water quality criteria. ~en applicable best managementpractices are not being inplemented, the department llIlIy concludeindividual activities are discharging matter that tends to causepollution pursuant to the provisions in RCW 90.48.080. In thesesituations. the department may pursue voluntary corrective action.orders. directives, permits. or civil or criminal sanctions to gaincompliance with tne standards.
(d) Activities which. discharge pollutants in stormwater shall beconducted so as to coopb with the water qual ity standards. Theprimary means to ~··used.for requiring cO!lJlliance shall be throughwaste discharge perm"!:s. rules, orders. and directives issued by thedepartment e~t.llbH:shil'\!l best management practices for activitieswhich generate rlQl'lPOint source stormwater pollution. Theconsideration and control procedures in ~AC 173-201<3Hb) and (c)apply to··:::the·:1:Ofrtrol of pollutants in stormwater. [StatutoryAuthQ~Hy: ~tw 90.48.035 and 90.48.260. 88-02-058 (Order 87-6), §173-lQ.1.;JQO,filed::. 1/6/88. Statutory Authority: RCW 90.48.035.7a-02~iJ4"3lorderOf n-32), § 173-201-100, filed 1/17/78; Order 73-4,!.1n~20l~·'00, +HlWi 7/6/73.]:.:::;:::.;.....:<:: :';'.
·:l\;::::.:. \lAC·,73-.201-120 Surveillance. A continuing surveillance program,·l. a~certainlitl~ther the regulations, waste disposal permits, orders,
.'~,...~ dir~ti:~es~lgatedand/or issued by the deperttnent are being"::;:;;;:;:;::"compl i ed.:wlt"h~·;;:wi II be conducted by the department suff as follows:
.{(·ll l;,specting treatment and control facilities.<.. (Z) HonHoring and reporting waste discharge characteristics.
...... (3)':'Monitoring receiving water quality. [Statutory Authority: RC~
~»'~;9Q.48~035. 78-02-043 (Order DE 77-32), § 173-201-110, filed 1/17/78;Order 73-4, § 173-201-110, filed 7/6/73.]
\lAC 173-201-125 Enforcement. To insure that the provisions ofchapter 90_48 RC~. the standards for water qual ity pronulgatedherein, the terms of waste disposal permits, and other orders anddirectives of the department are fully complied with, the followingenforcement tools will be relied upon by the department, incooperation with the attorney general as it deems appropriate:
(1) Issuance of notices of violation and regulltory orders asprovided for in RC~ 90.48.120. Under this section, whenever in theopinion of the department a person is violating or lbout to violatechapter 90.48 RC~, the department shall notify Slid person of itsdetermination. Within thirty days said person shill notify thedepartment of the action taken or being taken in response to thedepartment's determination, whereupon the department llIlIy issue aregulatory order as it deems appropriate. ~enever the departmentdeems inrnediate action is necessary to accomplish the purpose ofchapter 90.48 RC~, it may issue a regulatory order without firstgiving notice and thirty days for response.
(2) Ini t i at ion of act ions request i ng injunct ive or otherappropriate relief in the various courts of the state, as providedfor in RC~ 90.48.037.
(3) Levying of civil penalties as provided for in RC~ 90.48.144.Under this section, the director may levy a civil penalty up to tenthousand dollars per day against a person who violates the terms ofa waste discharge permit, or who discharges without such a permitwhen the same ;s required, or violates the provisions of RCW90.48.080. If the amount of the penalty, which is subject tomitigation or remission by the department, is not paid within thirtydays after receIpt of said notice, the attorney general, upon requestof the director, shall bring an action in superior court to recoverthe same.
(4) Initiation of a criminal proceeding by the appropriate countyprosecutor, as provided for in RCW 90.48.140.
(5) Issuance of regulatory orders or directives as provided forin RC~ 90.48.240. [Statutory Authority: RC\I 90.48.035. 82-12-078
27

DRAFT - January 22, 1991 - DRAFT
(Order DE 72-12), § 173-201-120, filed 6/2/82; 78-02-043 (Order DE77-32), § 173-201-120, filed 1117/78; Order 73-4, § 173-201-120,filed 7/6/73.]
28

DRAFT
MINISTRY OF ENVmONMENT, LANDS AND PARKSMUNICIPAL SEWAGE DISCHARGE CRITERIA
TECHNICAL ASSESSMENT REFCRT NO.1BEST AVAllABLE CONTROL TECHNOLOGY
TAR 1.1 SECONDARY TREATMENT AND EFFLUENT DISCHARGE CRITERIA
APPENDIXID
Tables and Figures, pages 1 • 16

DRAFT
MINISTRY OF ENVmONMENT, LANDS AND PARKSMUNICIPAL SEWAGE DISCHARGE CRITERIA
TECHNICAL ASSESSMENT REPORT NO.1BEST AVAllABLE CONTROL TECHNOLOGY
TAR 1.1 SECONDARY TREATMENT AND EFFLUENT DISCHARGE CRITERIA
APPENDIXID
Tables and Figures
List of Figures
Figure 1Figure 10-2Figure 10-3Figure 10-4Figure 10-5Figure 10-6Figure 10-7Figure 5-1Figure 12.3
Activated Sludge Process SchematicsTypical Schematic for a Conventional Plug-Flow Activated ProcessComplete-Mix Activated-Sludge ProcessFlow Diagram for Step-Feed Aeration Activated-Sludge ProcessFlow Diagram for Contact Stabilization Activated-Sludge ProcessHigh-Purity Oxygen Activated-Sludge ProcessOxidation Ditch Activated-Sludge ProcessTypical Wastewater Stabilization PondsFlow Diagrams of Single and Two-Stage Trickling Filter Plants
List of Tables
Table 5-1Table 5-2Table 5-3Table 11.9Table 5.1Table 11.23Table 11.24Table 11.25Table 11.26
Table 2-8
Effiuent Quality Objectives - Discharges to Receiving WatersLimits for Effiuent Parameters that May be of Concern in Specific DischargeReceiving Water Quality Maintenance ObjectivesCharacteristics of Some Aeration EquipmentWastewater Stabilization Pond RequirementsSummary of Results for Sanitary Treatment PlantsActivated Sludge Summary, EPA Region DataActivated Sludge Treatment Plants StudiedStatistics of the Annual Effiuent BOD and SS Concentration Data for DifferentProcess TypesMinimum National Performance Standards for POTW's Secondary TreatmentEquivalency
1 of 16

~_..~"'_~'_.""'_.~•. _'!'!"!'J....~_.•.~.. _!"."!'"'l•• 1""'.~~!!I!II.."'._.. llI!I!Ii_."'.....------~l(.,r:_lbU/?C~
FIGURE !ACTIVATED SLUDGE-PROCESS SCHEMATICS
'\.
'----- S'ucl;. Tr.o'mOll' olld
E'f'uectt
Sluclq.OI'lIou'
'.,
.,,
C O'N V E N T ION A L ACTIVATED SLUDGE PROCESS
A'tura«tl•• S'udq« 0,.,00.'
AERATIONIAS'H
----- SludO. Tru'lII .. ' .nd Ole"...,
STEP. AERATION
____..... SIuda. ft.,...,.----- Sludo. Tlta'••,,' C1l1d 01.'.0.'
Eftlu.t
CONTACT S T A 8 I L I Z A T I ON PROCESS
Sor.." Oft" 10' CO...hICI'O'
It•• w.,t••• t.r A!ltATIOrt Efflll."tCLAIt.
TANK
S,t.dq. ".t • r II S , • d o •W••t.
EXT END EO· A ERA· T ION PROCESS
It.hI,,, SIuda. Woote S'ud;e
Ito. "."••otor
.~rl••,yS.d' ••IItCltlOll '------- S'uda. Troo'lII.nt and 01'00'.'
It ,.,IIl4ln,
COMPL ETE MIX ACTIVATEO SLUOGE
* Prllllor,. S.dllll.ntatlon OOft II. o",ltt.d, fll. u,. 01 Ser.oft or COllllllfavtor i. 1I00 •• ,or,..
2 of 16

Untreatedwastewater
Sludge
Effluent
III: } ~~SIUdge
L ~~~~~~ ~
FIGURE 10-2Typical schematic for a conventional plug-flow activated process.
Effluent
,Return sludge : Waste sludge
------------------------------------------~
Mechanical aerators(one or more depending
on size of aeration basin)............-------,
Influent ......------~
FIGURE 10-3Complete-mix activated-sludge process (typical schematic for four-cell process).
EffluentiI,I Retum sludge ,..------------------------- Waste sludge
Influent
(a)
Untreated
wastewater
Effluent
(b)
FIGURE 10-4Row diagram for step-feed aeration activated-sludge process: (a) simplified schematic and(b) typical physical configuration.
3 of 16

EffluentUntreatedwastewater
rIIII I~ ~~~~~ i __~~~?_
/
FIGURE 10-5Flow diagram for contact stabilization activated-sludge process.
Oxygenvent
Pressuresignal
Controlvalve
Wastewaterfeed Effluent
FIGURE 10-6High-purity oxygen activated-sludge process:' schematic of three-stage configuration,
Waste sludge
Purpose!Operation
Influent---
Percent of:Max. Cycle Influent
Volume TIme
rl ~EffluentFILL
25 to 100 25
Add~1-/,;,,;.l,L;;~~...L.::.~ substrate
Air0nI0lt
. (al
~Air
IDLE 0nI0ltT
Waste'.'" sludge
AirOff
AirOff
AirOnICyde
Clarify
, REACT
~RAW
TEffluent
Removeeffluent
Reaction~o.L;:"""~)";:':'~~ time
100 35
100 20
351025 5
100 to 35 15
(b)
.RGURE10-7·'O)ddation ditch activated-sludge process: (a) schematic of oxidation ditch process and (b) aerial view
. of oxidation ditch process (from Envirex Inc.).
FIGURE 8-21Typical operatillQ sequence for asequencing batch reactor [37].
4 of 16

(
/'"
\...
FIG. 5.1
INFLUENT
TYPICAL WASTEWATER STABILIZATION PONDS
2 OR 4 ANAEROBIC CELLS IN SERIES EACH EMERGENCY OUTFALLWITH 2 DAYS HOLDING CAPACITY, BASED /<OPfiOnal)ON DESIGN FLOW. OPERATING DEPTHOF 3.0 TO 3.5 METRES •
;t
. IIIII
~-----
EMERGENCY BYPASS<Optional)
5 of 16

Legend(:::::::;.:] Primary Tank R=Recirculationo Filters SL=Sludge Return
Bllntermediate Tank• Secondary or
Final Tank
(I) - I·.·.
RI R2
(i)
~==-Fl, ----6----.~=R;---·
Q) • :::::::::::: 1st SL nd •t. - _
(k)~~l.. ~--------..
r-"-=-.R
(m).. SL ndL..: ~ _
~1 -1BIll€i ·R2
(n) ::::::;:::: SL 1st nd----- --------------- --_.-
(b)
R(+SL)
(a)~....- .
R +SL SL
(c) I :::::::::r SL'-----.....------~
(d)~R
(e) :':.';'.':.:.:.:.:.:.' S[I..._--~-------_ ..
R
Figure 12.3 Flow diagrams of single- and two-stage trickling filter plants.
6 of 16
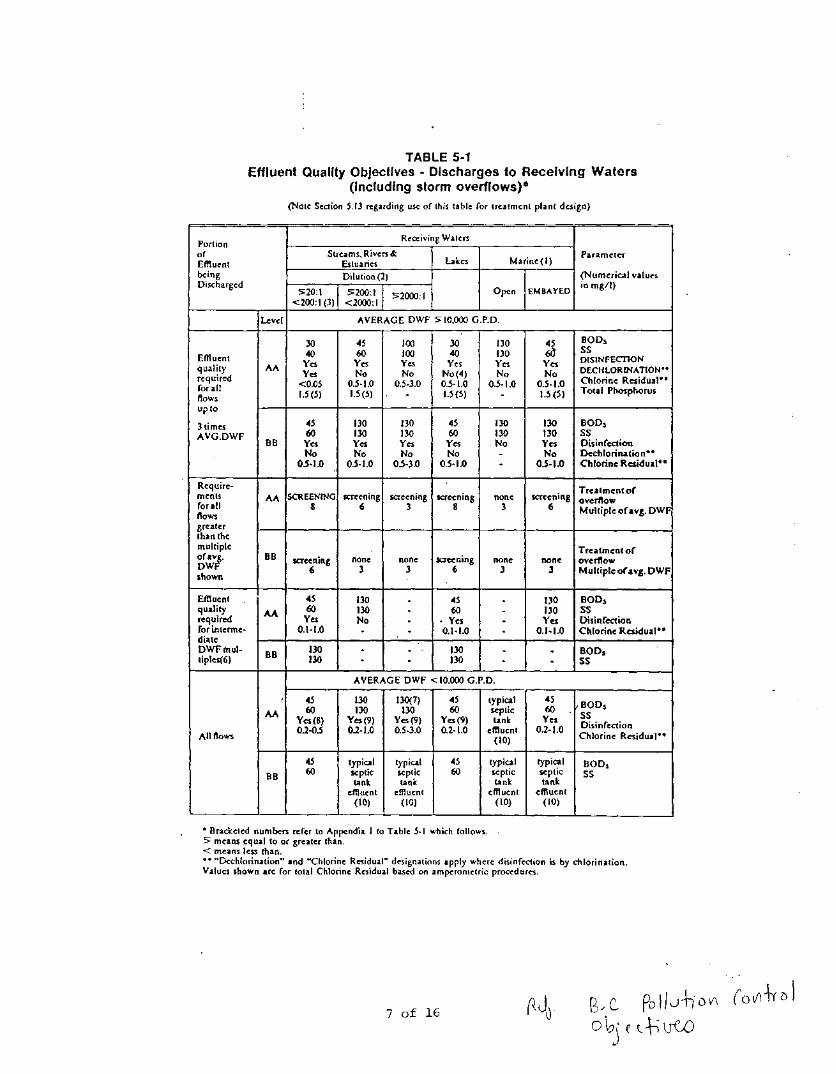
TABLE 5-1Effluent Quality Objectives - Discharges to Receiving Waters
(Including storm overflows)·(Note Section 5.13 regarding use of this table for treatment plant design)
PortionReceiving Waters
of Streams. Rivers '"Lakes Marine(l)
ParametaEffluent Estuariesbeing Dilution (2) (Numerical valuesDischarged
>20:1 >200:1 Open EM BAYEDin mg/I)
<200:1 (3) <2000:1>2000:1
uvel AVERAGE DWF >10.000 G.P.D.
30 45 100 30 130 45 BOD.
40 60 100 40 130 63 SSEffluent
Yes Yes Yes Yes Yes Yes DISINFECTIONquality AA
Yes No No No (4) No No DECHLORINAnON"required Chlorine Residual""forall <0.05 0.5·1.0 05·3.0 0.5·1.0 05·1.0 0.5·1.0
Total Phosphorusnows 1.5(5) 1.5(5) - 1.5 (5) - 1.5 (5)
upto
3 times 45 130 130 45 130 130 BOD.
AVG.DWF 60 130 130 60 130 130 SSBB Yes Yes Yes Yes No Yes Disinrection
No No No No - No Dechlorination"OS-1.0 OS-1.0 OS·3.0 05-1.0 - O.S-I.O Chlorine Residual"'
Require- TreatmenlofmenlS AA SCREENING screening screening screening none screening overllowfor all 8 6 3 8 3 6 Multiple oravg. DWFnowsgrealerlhanthemultiple Treatment orofa1' BB screening none none screening none none overllowOW 6 3 3 6 3 3 Multipleorng. DWFshown
Effluent 45 130 - 45 · 130 BODsquality AA 60 130 · 60 - 130 SSrequired Yes No - Yes · Yes Disinrcctionrori.ntenne- 0.1-1.0 · - 0.1-1.0 · 0.1·1.0 Ch.lorine Residual"diateDWFmul-
BB 130 · · 130 · . BODstiples(6) 130 · · 130 · . SS
AVERAGE DWF < 10,000 G.P.D.
I 45 130 130(7) 45 lypical 45BODs
AA 60 130 130 60 septic 60SSYeseS) Yes (9) Yes (9) Yes (9) lank YesDisinfection
AllftowsO.2-oS 0.2-1.0 0.5-3.0 0.2-1.0 effluent 0.2-1.0
Chlorine Residual"(10)
45 lypical typical 45 typical typi~l BOD$BB 60 septic septic 60 septic septiC SS
lank lank . lank lankeffluent effluent effluent effluent
(10) (10) (10) (10)
• Bracketed numbers refer to Appendix I to Table 5·1 which follows.> means equal to or greater than.< means less than.•• MDechlorination" and ~h1orine Residual" designations apply where disinfection is by chlorination.Values shown are for tOlal Chlorine Residual based on amperometric procedures.
7 of 16

TABLE 5-2limits for Effluent Parameters That may be of Concerr.
In Specific Olscharge(1)·
ParamelerMaximum Concenlralions(2)mgtl (excepl pH and Tl..)
. levelAA levelBB
Methylene Blue Active Substances 5 -Oil and Grease 15 30pH 6.5-8.5 6.5- 8.5Phenol 0.2 0.4Tl.,(96 hr.) (3). 100% 75%Aluminum (Total) 2.0 4.0Arsenic (Total) 0.05 0.25Barium (Dissolved) 1.0 1.0Boron (Dissolved) 5 5Cadmium (Dissolved) 0.005 0.01Chromium (Total) 0.1 0.3Cobalt (Dissolved) 0.1 0.5Copper (Dissolved) 0.2 0.5Cyanide (Tolal) 0.1 0.5Fluoride (Dissolved) 5.0 .Iron (Dissolved) 0.3 1.0lead (Tolal) a.05 0.1Manganese (Dissolved) 0.05 0.5Mercury (Total) 0.0006 0.002Molybdenum (Tolal) 0.2 0.5Nickel (Dissolved) 0.3 0.5Nitrogen ('I) . .Resin Acid Soaps 5 -Selenium (Tolal) 0.05 0.1Silver (Tolal) 0.1 1.0Sulphale (Dissolved) (5) SO 2SOSulphide (Dissolved) 0.5 1.0Tin (Tolal) S 10Zinc (Tolal) 0.5 5.0
• Brackeled numbers refer 10 Appendix 10 Table 5-2 which follows.
APPENDIX TO TABLE 5-2Explanatory Notes
I. The limits apply to discharges to all receiving waters and to ground unless otherwise noted. However. a limit will only be shown.on a permit were investigations inaccordance with Section 5.I2 indicate this is needed.
2. Levels may be adjusted. to take account of background levels in the water supply.Other parameters may be added at the discretion of the Director. .
3. TLm (96 hr.) samples to be prior to chlorination.
4. A limitation on nitrogen may be required where site-specific studies indicatenitrogen to be a controlling factor for eutrophication or where the nitrogen levelof the effluent is considered to be abnormally high.
S. Applies to freshwater only.
8 of 16

TABLE 5-3Receiving Water Quality Maintenance ObJectlves(1)·
Parameter Objeclive
Dissolved Oxygen Decrease nol to exceed 10%
Residual Chlorine Below detectable Iimils (amperomelric method)
Nulrients No detectable increase in site-specificproductivity-limiting parameters (2) (5)
Colironns-recdving waters (3)-shellfish meat (3)
Toxicity No increase above background (4)
Settleable Solids Negligible increase
Floatable Solids and &um Negligible increase
Oil None visible on water surface
Organisms No change in productivity or developmentornuisance rondi tions (5)
Heavy Metals Negligible increase
• Bracketed numbers refer to Appendix to Table 5-3 which follows.
APPENDIX TO TABLE 5-3Explanatory Notes
I. These objectives are for the maintenance of background receiving w~ter quality.generally expressed in terms of the maximum allowable change for specifiedparameters. They are not applicable within the initial dilution zone as defined inthis document. Other discharges may be taken into account in determiningwhether the allowable maximum change is to be less than any value given. Otherparameters may be added by the Dire~tor.
2. Limiting parameters will normally be taken as phosphates and/or nitrogenforms.
3. In general. total coliform levels are not to exceed a median MPN of 1000/100 mlor a fecal coliform median MPN of 200/ 100 ml and in shellfish waters are not toexceed a fecal coliform median MPN of 14/100 ml and shellfish meats may notshow a fecal coliform level greater than MPN of230 per 100 gm. reference maybe made to B.C. Health Branch "Recommended Water Quality Standards" andthe "National Shellfish Sanitation Program Manual of Operation" published bythe U.S. Department of Health. Education and Welfare.
4. As measured in a 96 hour TLm static bioassay test.
5. Productivity refers to biological parameters which are not amenable to tabulation; however. th~ following nuisance conditions are typical of those to beconsidered:In freshwater lakes. presence of: I) massive growths of planktonic bluegreenalgae (Cyanophyceae) for more than several days duration; 2) massive growths ofattached, filamentous diatoms (Bacillariophyceae) and/or rooted aquatic plantsespecially near the shoreline.In rivers and streams, presence of massive growths of attached green algae(Chlorophyceae). filamentous diatoms (Bacillariophyceae) and/or rootedaquatic plants. slime-forming bacteria (as Sphaerotilus). sludge worms (Tubificidae) or chironomids (Chironomidae).At sea or in estuaries, presence ofsludge beds with reduced species diversity and arestricted range of predominant organisms such as Capitella capitata.
9 of 16
~.ell. eo I)J-h'~ ~ (0 Y\l"1 cJ
ob 'Q c+)!Jr' A\J" ..J-J
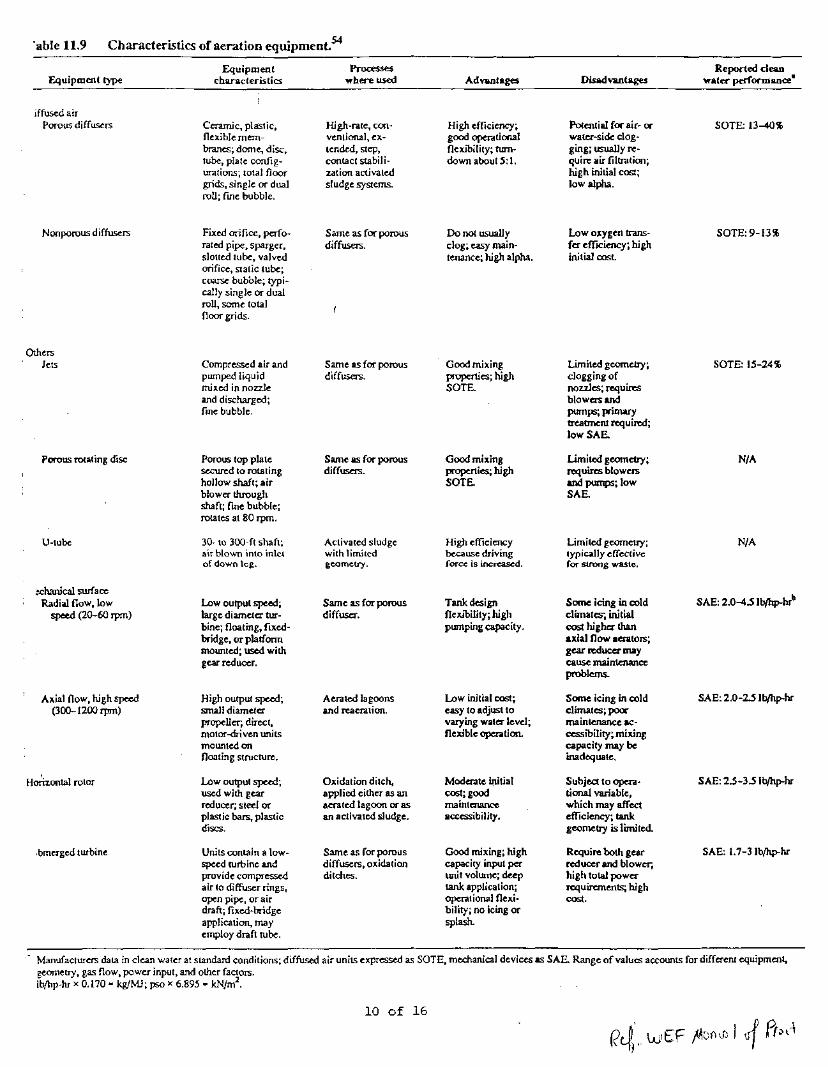
'able 11.9 Characteristics of aeration equipment.54
Equipment Processes Reported deanEquipment type characteristics where used Advantages Disadvantages water performance"
iffuscd airPorous diffusers Ceramic, plastic, High-rate, con- High efficiency; Potential for air- or SOTE: 13-40%
flexible mem- ventional, ex- good operational water-side clog-branes; dome, disc, tended, step, flexibility; tum- ging; usually re-tube, plate config- contact stabili- down about 5: 1. quire air filtration;urations; total floor zation activated high initial cost;grids, single or dual sludge systems. low alpha.roll; fme bubble.
Nonporous diffusers Fixed orifice, perfo- Same as for porous Do not usually Low oxygen trans- SOTE:9-13%rated pipe, sparger, diffusers. clog; easy main- fer effICiency; highslotted tube, valved tenance; high alpha. ini tial costorifice, stat ic tube;coarse bubble; typi-cally single or dualroll, some totalfloor grids.
OthersJets Compressed air and Same as for porous Good mixing Limited geometry; SOTE: 15-24%
pumped liquid diffusers. properties; high clogging ofmixed in nozzle SOTE. nozzles; requiresand discharged; blowers andfine bubble. pwnps; primary
treatment required;10wSAE.
Porous rotating disc Porous top plate Same as for porous Good mixing Limited geometry; N/Asecured to rotating diffusers. properties; high requires blowershollow shaft; air SOTE. and pumps; lowblower through SAE.shaft; fine bubble;rotates at 80 rpm.
U-tube 30· to 300-ft shaft; Activated sludge High efficiency Limited geometry; N/Aair blown inlo inlel with limiled because driving typically effectiveof down leg. geometry. force is increased. for strong waste.
.:chanical surfaceSAE: 2.0-4.5 Jb/hp-hrbRadial flow, low Low output speed; Same as for porous Tank design Some icing in cold
speed (20-60 rpm) large diameter tur- diffuser. flexibility; high climates; initialbine; floating, fixed- pumping capacity. cost higher thanbridge, or platform axial flow aerators;mounted; used with gear reducer maygear reducer. cause maintenance
problems.
Axial flow, high speed High output speed; Aerated lagoons Low initial cost; Some icing in cold SAE: 2.0-2.5 Ib/hp-hr(300-1200 rpm) small diameter and reaeration. easy to adjust to climates; poor
propeller; direct, varying water level; maintenance &C-
motor~ven units flexible operation. ccssibility; mixingmounted on capacity may befloating structure. inadequate,
Horizontal rotor Low output speed; Oxidation ditch, Moderate initial Subject to opera- SAE: 2.5-3.5 lb/hp-hrused with gear applied either as an cost; good tiona! variable,reducer; steel or aerated lagoon or as maintenance which may affectplastic bars, plastic an activated sludge. accessibility. efficiency; tankdiscs. geometry is limited.
ibmerged turbine Units contain a low- Same as for porous Good mixing; high Require both gear SAE: 1.7-3Ib/hp-hrspeed turbine and diffusers, oxidation capacity input per reducer and blower;provide compressed ditches. unit volume; deep high total powerair to diffuser rings, tank application; requirements; highopen pipe, or air operational flexi- cost.draft; fixed-bridge bility; no icing orapplication, may splash.employ draft tube.
Manufacturers data in clean water at standard conditions; diffused air units expressed as SOTE, mechanical devices as SAE. Range of values accounts for different equipment,geometry, gas flow, power input, and other factors.Ib/hp-hr x 0.170 • kgfMJ; pso x 6.895 - kN/rn2
•
10 of 16

TABLE 5.1WASTEWATER STABILIZATION POND REQUIREMENTS
NUMBER OF REQUIREMENT FORREQUIREMENT FOR j
DESIGN AVERAGE DAILY FLOW 12 MONTHM3 ANAEROBIC CELLS FACULTATIVE CELUS) STORAGE CELL(S) 1
I
Less than 70 0 NO YESMax. depth = 1.5 m
I
70 - 250 0 YES YESI
Max. depth = 2.5 m\
250 - 500 2 YES YES IMax. depth = 2.5 m I
Greater than 500 4 YES YES IMax. depth = 2.5 m
11 of 16

Table 11.23ran~e (min - max} I 121
Summary or results for secondary treatment plants I d'. me Ian
Number Emuent 800. m&!L Emuent TSS, m&!L .. f1ow,mgdI'roceu ot Standud Cotn'lclent ot Standard Coemclent ot Standard Cotn'lclent or
uttgory plantt Mean' derlallon' 'trlallon' $,.' S,' Mean' deviatIon' nrlatIon' S,.' sl Mean' derla tlon' nrLttloo'
Trid:.ling filter, rod: 64 '.49-57.5' 2.41-~.72 0.11-1.02 1.71-14.5' 2.02-23.27 9.11-101.3 3.24-121.1 0.11-1.65 2.12-27.00 2.91-51.09 0.03-9.42 0.00(-2.36 0.C6-0.9726.03 10.05 0.40 ,5.1, ,7.67 25.25 10.77 0.50 6.21 7.46 0.65 0.23 0.27
I
Trid:.ling filter. pbstle 17 7.tt-U41 3.62-27.45 0.1$-0.90 3.04-13.73 3.40-19.46 5.76-42.13 5.40-19.11 0.27-1.40 2.36-12.72 3.3!-IOI 0.13-1.61 0.07-2.36 0.16-0.&611.91 9.3g 0.49 5.4' 7.01 19.36 • .29 0.65 $.11 7.05 0.92 0.-«:> 0.3!
.... Activated sludge. 66 3.92-41.49 2.39-34.12 0.19-1.99 1.50-21.29 1.57-27.39 5.05-52.25 2.71-7&.20 0.11-2.21 1.22-39.03 I.ro-5,(,31 0.05-12.7 0.02-11.79 0.04-1.04N CC!lventional 14.79 '.1' 0.66 5.01 . 6.65 14.30 12.33 0.13 6.19 g.75 1.17 0.53 0.240H1 Activated sludge. conttd 57 3.'2-4$.43 1.05-0.66 0.07-1.13 1.00-32.« 0.9'-31.95 3.66-46.7.5 1..52-7.5.14 0.23-2.02 1.67-39.53 2.22-50.12 0.002-56.23 0.002-16.22 0.C6-1.35
.~subillnllon 12.63 '.16 0.60 5$4 6.U 13.10' 9.30 0.71 6.24 I 0.36 0.13 O.3oC
Actlvlled sl,udge. e:ttended 2. 2.67-27.19 0.96-19.11 0.21-2.03 0.67-17.15 0.95-19.6 2.46-33.3.50.46-31.10 0.n-I.95 0.19-35.45 0.25-36.97 0.01-5.10 0.0C6-0.19 0.11-1.32aendon 7.20 4.60 0.71 3.01 3.!9 9.71 7.11 0.66 3.42 4.77 0.10 O.OS O.3oC
ROC 27 4.79-32.27 4.49-47.43 0.29-1.47 2.7.5-20.27 3.39-31.60 6.65-22.16 4.47-22.11 0,39-1.27 1.70-15.26 3.22-17.17 O.()6..3 t.Ell 0.03-1.96 0.12-1.1916.99 10.19 0.51 6.26 7.'9 15.1.5 '.46 0.69 4.50 6.40 0.71 0.23 0,31
O:tldation ditch 21 2.93-29.20 1.13-17.9.5 0.14-1..59 1.01-17.22 1.23-17." 3.77-31.5.5 ,1.11-47.65 0.21-1.16 1.,(6-222.12 1.92-3!9.1 0.01-6.33 0.00(- 1.15 !.09-1.161.40 .5." 0.57 3.91 .5.51 12.26 1.61 0.61 5.91 9.16 0.11 0.07 0,31
Subillullon pond 37 !.59-20.96 5.79-46.5 0.25-1.01 4.59-31.70 5.31-46.39 12.ro-l33.00 .5.29-156.97 O.~I.II 3.1!-12I.17 ....($-135.9. 0.03-2.73 0.(0)-1.57 0.~-0.!3
22.71 9.7' 0.51 '.04 '.63 39•.51 22.56 0:63 17.10 19.44 0,31 0.09 0.31
• OveraU (aclllly mans., OveraU (.dIlIY standard de'flallons., Ovent (.dllly cod1idenrs ot nrlarlon.I OveraU (aclllty standard devllllons ot 3O-day movlnt .vera.es.t OvenU (acllity sundard devlallons o(7.day movln. I"en.es. ,

Table 11.24 Activated sludge summary, EPA region data. l23
Flow,mgda Influent, mgfL Emuent, mgfL Removal, %
Location Ind process Average Design BOD5 TSS BOD5 TSS BOD5 TSS
~ Conventionals::Aspen, Colo. t.t 2.0 336 298 19 20 94 93{5
"" Missoula, Mont. 5.5 10.0 133 129 54 48 59 63::I Snowmass, Colo. 0.8 0.8 185 180 34 53 82 71~'i'- Havre, Monl. \.3 1.8 275 275 31 30 89 87
O"l Barstow, Calif. 1.7 4.5 150 250 IS 25 89 90;:) W. Sacramento, Calif. 3.5 2.5 140 130 20 27 86 79~ Carmel, Calif. 2.5 3.0 200 300 20 30 90 90S. Monterey, Calif. 3.5 4.6 250 250 35 70 86 72toB' Zephur Cove, Nev. 1.0 3.0 334 237 12 II 96 950- Fairfield, Ohio \.3 1.0 173 172 16 26 85 85
O"l Grand Rapids, N. Dak. 38 - 100 140 18 40 82 71f-J
(:;.Average removal 85 8Tw ~-0 ~ Contact stabilization
t-n ""~ Richwood, W.Va. 0.39 0.5 89 94 30 33 67 65f-J :: Pen Argyl, Pa. 1.1 0.95 162 75 16 26 90 62(j'\
"" Lolo, Mont. 0.15 0.25 233 172 17 12 93 93::I.... Baden, Pa. 0.55 0.5 206 202 12 21 89 90Lancaster, Pa. 9.24 12.0 168 227 32 35 81 85Manteca, Calif. \.3 3.2 200 180 30 25 75 86Savage, Md. 5.9 - 158 206 32 41 86 80C0l'1l1vilIe, Iowa 0.9 - 135 ISO 26 24 81 84
Average removal 83 8T
Extended aerationAthens, W.Va. 0.15 0.25 129 258 14 3~ 88 84Follansbee, W.Va. 0.5 0.5 200 190 IS 48 92 75Cheyenne, Wyo. 0.43 0.8 262 272Elizabeth, Colo. - 0.065 441 341 30 96 ' 93 72Elbert, Colo. 0.007 0.025 208 125 , 16 27 92 78
Avmge removal 9t Ti
~ I • mgd x 3785 • m1/d.~

Table 11.25 Activated sludge treatment plants studied.124
Plant Plant Type of Averagenumber location Year process flow, mgd
1 Michigan 76 Complete mix 14.22 California 07-75/6-76 Conventional 100.03 California 76 Complete mix/contact 16.2
stabilization4 Wisconsin 76 Contact stabilization 23.75 _ lllinois 76 Step feed 69.76 lllinois 76 Conventional 66.27 Illinois 76 Conventional 69.1'8 Maryland 76 Step feed 15.29 New York 77 Complete mix 18.6
10 Alabama 06-76/5-77 Aerated lagoon 23.611 Michigan 10-76/9-77 Complete mix 0.7412 Virginia 76 Conventional/step feed 15.813 Alabama 07-76/6-77 Conventional/step feed 10.514 lllinois 76 Conventional 2.215 lllinois 76 Step feed 3.316 California 75 Step aeration 6.317 California 76 Step aeration 2.418 California 76 Step aeration 29.019 California 76 Step aeration 7.120 lllinois 76 Conventional 209.021 Illinois 76 Conventional 189.022 lllinois 76 Conventional 188.023 Illinois 76 Step feed 185.0'24 Michigan 73 Conventional 1.925 Michigan 74 Conventional 2.126 Michigan 75 Conventional 2.127 Michigan 76 Conventional 2.328 Michigan 77 Conventional 2.129 Michigan 77 Conventional 9.530 Michigan 77 Conventional 9.531 Connecticut 76 Conventional 3.832 California 76 Plug flowfI{raus • 47.133 Ohio 76 Contact stabilization 2.834 Nevada 75 Conventional/tapered 17.035 Kansas 76 Contact stabilization 10.436 Washington 76 Conventional/step feed 30.837 California 76 Complete mix/step feed 13.938 Michigan 10-76/1 0-77 Step feed 17.339 Michigan 77 Conventional/contact 33.3
stabilization
\40 Michigan 12-76/1 1-77 Extended aeration 0.56
41 Michigan 01-77/10-77 Conventional 26.94i Wisconsin 76 Conventional 81.6
Wisconsin Conventional 54.0 !-43 76 !
i
638 Design ofMunicipal Wastewater Treatment Plants
14 of 16

Table 11.26 Statistics of the annual effiuent BOD and SS concentration data for different process types.l24
Standard Coefficient of
rr No. of Annual mean deviation variation8
Process type plants 81. - 81. 8 xx x x'";::rt:l..'"t;>..
(>q BOD;:l~ Conventional 18 12.80 6.85 9.54 7.99 0.69 0.25Sotl:l Complete mix 5 16.82 6.67 13.24 6.51 0.77 0.13o'
Step feed/aeration<#
13 10.84 7.68 8.28- 7.56 0.68 0.25<:>(>q-. Contact stabilization 4 38.38 32.08 28.17 20.92 0.76 0.14'"t:l- Extended aeration 1 14.41 5.31 0.37~ - -'" Kraus 1 24.02 9.85 0.41t:l - -§' Aerated lagoon 1 30.35 - 11.61 - 0.38'";::r
I-' ' .,.lJ1
0 I All plants 43 15.76 13.43 11.28 10.49 0.70 0.23I-h
I-'m I
~
Conventional 18 14.92 10.53 16.02 18.61 0.86 0.38
Complete mix 5 19.88 14.19 19.65 16.92 1.00 0.51
Step feed/aeration 13 16.23 16.65 16.83 23.89 0.83 0.34
Contact stabilization 4 40.88 26.75 37.66 26.18 0.90 0.14
Extended aeration 1 8.82 - 5.28 - 0.60
~IKraus 1 24.12 - 9.26 - 0.38
Aerated lagoon - 1 58.79 - 18.71 - 0.32_.All plants 43 19.40 17.03 18.35 20.60 0.84 I 0.37
--a Average values from all plants, not calculated from parameter averages.

a Chemical oxygen demand (COD) or total organic carbon (TOC) may be substituted for theS-day BOD when a long-tenn BOD:COD or BOD:TOC correlation has been dmlonstrated.
b Percent removal requirements may be waived on a case-by-case basis for combined sewerservice areas and for separate sewer areas not subject to excessive inflow and infiltrationwhere the base flow plus infiltration is ~120 gpd/cap and the base flow plus infiltration .and inflow is ~275 gpd/cap.
C Not defined in federal secondary treatment equivalency regulations but permits typicallyinclude cited levels, often only on a seasonal basis.
d The state may adjust the SS limits for ponds subject to EPA approval.
Minimum national performance standards for POTWs (secondarytreatment equivalency).10
,.'.
/",:
" ,~,
(i()
(is
45
45
7-dayaverage
30
85
25
85
200
3O-day average
30
85
Within the range of 6.0-9.0 at all times
Site specific
16 of 16
Design ofMunicipal Wastewater Treatment Plants
Parameter
34
Trickling filters and stabilization ponds(equivalent of secondary treatment)
S-day BOD,· the most stringent of
Effluent, mgfL 45
Percent removalb 65
S-dal BOD: the most stringent of
Effluent, mgfL 40
Percent removalb 65
Suspended solids (SS),d the most stringent of
Effluent, mgfL 45
Percent removalb 65
pH, whole effluent toxicity and fecal colifonn bacteria remain unchanged
Conventional secondary treatment processes
5-day BOD,· the most stringent of
Effluent, mgfL
Percent removalb
5-dal BOD,· the most stringent of
Effluent, mgfL
Percent removalb
Suspended solids (SS), the most stringent of
Effluent, mgfL
Percent removalb
pH, units
Whole effluent toxicity
Fecal coliform bacteria, MPN/loo roLe
Table 2.8

DRAFT
MINISTRY OF ENVIRONMENT, LANDS AND PARKSMUNICIPAL SEWAGE DISCHARGE CRITERIA
TECHNICAL ASSESSMENT REPORT NO.1BEST AVAllABLE CONTROL TECHNOLOGY
TAR 1.1 SECONDARY TREATMENT AND EFFLUENT DISCHARGE CRITERIA
APPENDIX IV
Lagoon Treatment Processes, pages 1 - 5

DRAFT
TECHNICAL ASSESSMENT REPORTBEST AVAllABLE CONTROL TECHNOLOGY
LAGOON TREATMENT PROCESSES
Objective
To review sewage treatment lagoon processes which are applicable to municipal wastewaters,to determine treatment levels achievable with these various processes and to recommendeffluent standards for different flow categories. This assessment is undertaken separately frommechanical treatment, to recognize the difference between the two and to providerecommendations which are suitable for lagoons alone.
Description of Subject
Lagoon performance differs from mechanical treatment plants; many designs are in use andoperational practises will affect treatment capabilities. Lagoon performance requires a separateassessment from mechanical plants to establish method, capabilities and operation forachieving a secondary treatment level, and for establishing effluent standards which areacceptable from a design, operations, and regulatory standpoint.
Raw medium strength domestic sewerage contains about 200 mg/L TBOD5, 200 mg/L TSS and10 mg/L P. The reduction ofTBOD5 and TSS to lower levels, typically 45 mg/.L BOD5 and 60mg/L TSS, represents a secondary treated effluent. Lagoons achieve this reduction bybiological assimilation of the organic matter and settling out and decomposition of the organicand inorganic solids. The lagoon operation differs from mechanical treatment plants mainlyin the time of treatment. Although lagoons are capable of high quality effluents, effects oftemperature can be more pronounced on treatment capability and solids carryover due to algaegrowth or benthic resuspension due to turnovers can cause high effluent suspended solidsconcentrations.
The level of treatment achieved by a lagoon system is typically characterized by the influentand effluent TBOD5, and TSS levels. Other parameters which may be regulated include flow,total phosphorus concentration, ammonia concentration, and coliform levels.
The following factors should be considered when selecting the design hydraulic and organicloadings:
• characteristics ofthe raw wastewater, TBOD5, TSS, TP, NHs-N, TKN, other organic andinorganic compounds, pH, hardness;
• pretreatment if any;• extremes ofthe wastewater temperature, and climatic conditions at the lagoon location;• treatment efficiency required.
Assessment of Control Options. Methods and Technologies
The following section provides a description of lagoon treatment and the treatment capabilitiesfor lagoon systems.
10f5

DRAFT
1) Lagoon Systems
Lagoons are normally of earth bermed construction, with some method of lining to preventleakage. In a series of ponds, sedimentation of solids and anaerobic decomposition of thesettled solids occurs in the first cell.
Secondary treatment is provided by oxidizing or stabilizing the organic matter into stable endproducts, to reduce the BOD and SS. This is generally accomplished in the primary andsecondary cells of the lagoon. A third step is often included to polish the wastewater, whereinremaining BOD and SS are allowed to settle out and degrade before discharge.
. The oxygen distribution in the pond determines the type of lagoon. Aerobic lagoons havedissolved oxygen distributed throughout the pond depth; anaerobic ponds have no dissolvedoxygen, and facultative ponds have an aerobic surface layer and an anaerobic bottom layer.
An unaerated lagoon can be aerobic, anaerobic or facultative. Organic matter is decomposedand assimilated by aerobic and facultative bacteria. The oxygen required for aerobicrespiration is provided by natural surface reaeration, and by photosynthetic algae. Unaeratedstabilization lagoons are shallow ponds typically with a 0.9 to 1.5 m liquid depth.
a) Aerobic Lagoons
In aerobic lagoons, organic matter is biologically oxidized in the presence ofD.O. Theselagoons are normally 0.9 to 1.2 m deep.
b) Anaerobic Lagoons
In anaerobic lagoons, where no D.O. is present, anaerobic bacteria degrade the organicmatter into partially oxidized products. The anaerobic stabilization of the organicmatter occurs in two steps.
First, the acid fermenting bacteria degrade the complex organics, e.g carbohydrates,proteins, fats, oils, into organic fatty acids, primarily acetic and propionic acids.
Second, methane bacteria feed on the organic acids converting them to CO2, ammonia,~S and methane gas.
An anaerobic lagoon is quite often used as a roughing process before an aerobic orfacultative lagoon. The liquid depth of an anaerobic pond is typically 3 m or greater.
c) Facultative Lagoons
Most lagoons are facultative. They have an anaerobic zone where settleable solids aredegraded and solubilized and an aerobic zone where the soluble organic matter andanaerobically degraded organic acids are oxidized. Oxygen supply relies on naturalsurface oxygen transfer and addition by photosynthetic algae and so is restricted to thepond surface. Facultative lagoons are normally 0.9 to 1.8 m deep.
20f5
DRAFT
d) Aerated Lagoons
Aerated lagoons do not depend on photosynthetic algae or natural surface reaerationto maintain a D.O. level in the pond. Dissolved oxygen is provided by mechanicalsurface aerators or by diffused aeration equipment.
Aerated lagoons can be categorized as either completely mixed or facultative dependingon the amount of mixing provided. In completely mixed aerated lagoons, enough D.O.and mixing is provided to satisfy the organic loading, and to maintain· the solids insuspension. Depending on the mixing energy provided, the settleable solids and thebiological biomass may be in suspension. At lower mixing energy levels, only thebiological biomass may be in suspension, with the settleable solids undergoing anaerobicdecomposition in the bottom sludge layer.
Facultative aerated lagoons provide a lower mixing energy level, and enough oxygen inthe aerobic layer to satisfy the organic load. Anaerobic degradation of the settleablebiomass and solids occurs in the bottom layer, with aerobic oxidation occurring in theupper layer.
For aerated lagoons, either completely mixed or facultative, a liquid operating depth of3 - 4.5m is normal. In colder climates, the deeper lagoons will have lower heat losses,Le. less surface area.
In lieu of polishing cells, a clarifier or sand filter may be incorporated into the processstream to polish the treated effiuent. Recycle of the lagoon effiuent is also practised,particularly for aerated lagoon processes incorporating a clarifier. In this latter case,the lagoon process approximates an extended aeration activated sludge process.
Chemical addition to reduce TP levels can also be incorporated into a lagoonwastewater treatment process.
2) Capabilities of Lagoon Systems
Previous sections of this report have discussed types of lagoon treatment systems. Thefollowing provides a general synopsis of removal efficiencies and other operationalcharacteristics for lagoon processes..
USEPA states that faculatitve ponds can usually achieve a effiuent TBODo ~ 30 mg/L, and aneffiuent TSS ranging from ~ 30 to over 100 mg/L. The latter is usually a consequence of algaecarry over in the effiuent. Typically detention times vary upon climatic conditions and uponlagoon wastewater liquid temperatures from 20 to over 180 days. Of the stabilization pondsanalyzed, the EPA results show that on a 50 percentile of plants surveyed, effiuent BODo was23 mg/L, but effiuent TSS was 39.5 mg/L. This contrasts to mechanical plants in which TSSand BODo are the same (see TAR 1.1, Table 2).
Aerated lagoons treatment system can provide a similar quality ofeffiuent; TBODoremoval upto 95%, and TSS ranging from 20 to 60 mg/L (EPA 1992) are possible.
The major factor affecting the performance of a facultative of aerobic lagoon system is thewastewater temperature in the lagoons. As the temperature drops the microbial processes slow
30f5

DRAFT
down, necessitating longer detention times and larger lagoon volumes to achieve the effluentquality required.
To avoid discharging a poor quality effluent during the cold winter season, a lagoon systemmay operate in a controlled discharge mode. Storage capacity is provided in the lagoon system,usually in a separate storage lagoon. During winter months, times of high algae growth, orlow flow conditions in the receiving waters the effluent is stored. During spring runoff, or attimes when the conditions in the receiving water are most favourable, and after the storedwastewater has had enough time to be treated in the lagoon system the wastewater can bedischarged. This controlled discharge lagoon system, is very common in Alberta.
Of benefit for a controlled discharge system is that less operator control and effluentmonitoring is required. Data compiled from Alberta (by Beier, 1987) showed that for acontrolled discharge lagoon systems, either facultative, or anaerobic roughing lagoons followedby facultative lagoons, discharging once a year during the fall, achieved the best effluentquality. This study concluded that systems which provide 12 months storage can generallymeet the Alberta secondary sewage effluent requirements of 25 mg/L BOD and 25 mg/L TSS.
USEPA (1983) states that lagoons can achieve low levels of NHs-N as well with up to 99% ofthe NHs-N being nitrified. Recent studies of lagoons in Alberta (by Beier, 1987) show thatlagoon systems operating with 2 (or more) anaerobic all followed by 1 (or more) facultative celldischarging once a year in the late fall achieved low NHs-N values, (2.8 mg/L average) low T-Pvalues of 2.4 mg/L average, TBODlj average of 8 mg/L, and T.S.S. of 22 mg/L. This lagoonconfiguration is shown on Figure 1, Supplement B and is the standard for Alberta.
In facultative lagoons, algae in the surface layer takes up carbon dioxide, and thus increasesthe surface layer pH which at times exceeds 10 (EPA 1992). This results in favourableconditions for ammonia volatilization but increases toxicity. In aerobic lagoons, algae is notnormally present, and unless the system is under loaded or specifically designed fornitrification, little nitrification will occur.
Phosphorus can be removed from a lagoon process in three ways: i) by chemical precipitation,ii) by biological assimilation into the biomass, or iii) by assimilation by algae. Chemicaladdition using alum of ferric chloride may be continuous, or for seasonal discharges, thechemical can be mixed into the storage cell using power boats just prior to the discharge. Onerecent study, (USEPA 1992) investigated the phosphorus levels for lagoon systems inMinnesota to Michigan states. The Minnesota influent valves ranged from 1.5 to 6.0 mg/L,average 3.3 mg/L; and after chemical addition most were below 1 mg/L). In Michigan for the21 lagoon systems studied the influent TP ranged from 0.5 mg/L to 15 mg/L; average 4. 1 mg/L.Again after chemical addition, TP was usually < 4 mg/L.
Recommendations
Proposed minimum BACT standards for lagoon sewage treatment systems are given in Table 1for BOD, TSS and pH. Where more stringent limits are required, improved operation or addedprocesses may be required as described in the advanced wastewater treatment assessments.Toxicity, nutrient reduction and disinfection are discussed in these other technical assessments.
4of5

DRAFT
TABLE 1PROPOSED MINIMUM LAGOON EFFLUENT DISCHARGE CONCENTRATIONS
TBODo (mg!L) TSS (mg!L) pH
(a) 50% 99.9% 50% 99.9%
30 45 306-9
60
(a) percent of time that parameter is less than value shown.
Monitoring frequency for BODo, TSS and flows for records remains similar to requirements ofTable 5-5 of the British Columbia (1975) objectives and is given in Table 2. The standards donot include permitted bypasses, plant upsets, operational errors or other unusual conditions.
TABLE 2SAMPLING REQUIREMENTS - LAGOON SYSTEMS
Flow Effluent Flow TBODo TSS Flows (all)Category Range
Frequency Type Frequency Type Frequency
1 22.5-749 mS/d W C1 W C1 D
2 750-4,999 mS/d W CJCs TwiceW CJCs D
3 5,000-24,999 mS/d TwiceW Cs D Cs D
4 25,000-99,999 mS/d D Cs D Cs D
5 > 100,000 mS/d DC Cs D Cs D
(a) COD may be used in place of TBODowhere TBODois examined with COD every fifthsampling.
Q =W =M =D =T/W =C1 =
C2 =Cs =
QuarterlyWeeklyMonthlyDailyTwice WeeklyComposite sample from 4 grab samples evenly sampled or 2 hours atmaximum flow.Composite sample in proportion to flow over 8 hours in daytime.Composite sample in proportion to flow over 24 hours.
(b) For lagoon systems practising controlled discharge operations, monitoring frequencyduring discharge to be daily for both TSS and TBODo, and monitoring to start 1 weekprior to discharge to determine effiuent quality.
50f5

DRAFT
SUPPLEMENT A TOAPPENDIX IV
References
Alberta (1988), Standards and Guidelines for Municipal Water Supply, Wastewater, and StormDrainage Facilities, Alberta Environment, Environmental Protection Services, Standards andApprovals Division, Edmonton.
Alberta (1991), Guidelines for the Design, Approval, and Operation of Sewage Lagoons forMunicipal Developments, Alberta Environment, Environment Protection Services, Standardsand Approvals Division.
Beier (1987), A. G., Alberta Environment, Lagoon Performance in Alberta, Cold RegionsEnvironmental Engineering, Proceeding of the Second International Conference, March.
British Columbia (1975), Pollution Control Objectives for Municipal Type Waste Dischargesin British Columbia, Department of Lands, Forests and Water Resources, Water ResourcesService, Victoria, B.C..
Environment Canada (1980), Design and Selection of Small Wastewater Treatment Systems,Environment Canada, Economic & Technical Review, EPS 3-WP-80-3.
EPA (1977), Wastewater Treatment Facilities for Sewered Small Communities, Process DesignManual, U.S. EPA, Environmental Research Information Center, EPA-625/1-77-009.
EPA (1992-1), Phosphorus Removal in Lagoon Treatment Systems, Water Compliance BranchTechnical Support Sector, USEPA Region 5, February.
EPA (1992-2), Wastewater TreatmentlDisposal for Small Communities, EPN625/R-92/005,September.
Metcalfand Eddy (1991), Wastewater Engineering: Treatment, Disposal, Reuse, Third Edition,McGraw Hill.
Novatec Consultants Inc. (1990), Alberta Storage Lagoon Toxicity Assessment, NovatecConsultants Inc., October.
Reynolds (1982) T. D., Unit Operations and Processes in Environmental Engineering, TexasA&M University.
Wastewater Committee of the Great Lakes (1990), Upper Mississippi River, Board of StatePublic Health and Environmental Managers, Recommended Standards for WastewaterFacilities, 1990 Edition.
WEF-MOP (1992), Design ofMunicipal Wastewater Treatment Plant, WEF Manual ofPracticeNo, 8, ASCE Manual on Engineering Practice No. 36.
WPCF (1990), Operation of Municipal Wastewater Treatment Plants, MOP No. 11.
1of1

SUPPLEMENT B TOAPPENDIX IV
FIGURES AND TABLES, pages 1 - 4
Figure 1 Common Pond Configurations and Recirculation Systems
Figure 2 Details of an Aerated Lagoon System
Figure 5.1 Typical Wastewater Stabilization Ponds
Table 5.1 Wastewater Stabilization Pond Requirements
DRAFT

DRAFT
FIGURE 1
COMMON POND CONFIGURATIONS AND RECmCULATION SYSTEMS
RECYCLE
INTRAPOND RECIRCULATION
SERIES
-
,....- -
f+ -- PARALLEL SERIES
n··~·LY
PARALLEL
INTRAPOND RECIRCULATION
Figure 1 Common pond configurations and recirculation systems.
Ref: WEF MOP No. 11
lof4

DRAFT
FIGURE 2
DETAll..S OF AN AERATED LAGOON
-----------------_-:...-_-----'-----------
dAerator 0Influent
o o
Figure 2. Details ofanAerated Lagoon System
Effluent
Dike
Influent
Sludge to
Disposal(al Layout for an Aerated Lagoon System
Surface Aerator
Sludge to Disposal
(hI Profile through an Aerated Lagoon System
Effluent
Sludge to
Disposal(el Flowsheet of an Aerated Lagoon System
Q VLagoon
Q
S,Q
S,
Ref: R. Reynolds, Unit Operations and Processesin Environmental Engineering
2of4

DRAFT
FIGURE 5.1
TYPICAL WASTEWATER STABILIZATION PONDS
2 OR 4 ANAEROBIC CELLS IN SERIES, EACHWITH 2 DAYS HOLDING CAPACITY, BASEDON DESIGN FLOW. OPERATING DEPTHOF 3.0 TO 3.5 METRES
INFLUENT --o'.iHJ~--+~+-,,,,;,-r-,,,:,
.0", ;. Of
I. ,. ,,,,"'.r--
: EMERG~CY "BYPASs :(Opfional)
EMERGENCY/(OPfiOnal) _
•
OUTFALL
EFFLUENT·
Ref: Alberta EnvironmentStandards & Guidelines
3 of4

DRAFT
TABLE 5.1
WASTEWATER STABILIZATION POND REQumEMENTS
REQUIREMENT FORDESIGN AVERAGE DAILY FLOW NUMBER OF REQUIREMENT FOR 12 MONTH
M3 ANAEROBIC CELLS FACULTATIVE CEWSl STORAGE CEWSl
.. less than 70 0 NO YES.. .. Max. depth =.1.5 m
70-250 0 YES YESMax. depth = 2.5 m
250-500 ... 2 YES . YES, Max. depth = ?oS m'.
Greater than 500 4 YES YESMax. depth = 2.5 m
Ref: Alberta EnvironmentStandards & Guidelines
4of4

MINISTRY OF ENVIRONMENT, LANDS AND PARKSMUNICIPAL SEWAGE DISCHARGE CRITERIA
TECHNICAL ASSESSMENT REPORT NO.1BEST AVAllABLE CONTROL TECHNOLOGY
DRAFT
6 Dec/93
TAR 1.2 ADVANCED TREATMENT AND EFFLUENT DISCHARGE CRITERIA
Introduction
Advanced treatment and effluent discharge criteria (beyond requirements of secondary
treatment) are presented in this section. Technologies are reviewed for capability, criteria for
British Columbia and other jurisdictions are examined and new criteria are recommended.
In this section, disinfection includes requirements for both surface water discharges and land
application. Nitrogen and phosphorus are assessed for surface water discharges only.
Wetlands are examined as a treatment component and as a receiving environment.

MINISTRY OF ENVIRONMENT, LANDS AND PARKSMUNICIPAL SEWAGE DISCHARGE CRITERIA
TECHNICAL ASSESSMENT REPORT NO.1BEST AVAllABLE CONTROL TECHNOLOGY
DRAFT
6 Dec/93
TAR 1.2 AnVANCED TREATMENT AND EFFLUENT DISCHARGE CRITERIA
Subject
TAR 1.2.1 - Disinfection
Disinfection processes and advanced wastewater treatment for protection of public health.
Objective
To review disinfection processes and specifically coliform reduction methods which areapplicable to municipal sewage, to determine levels of disinfection achievable with thesevarious processes, and to propose criteria for coliform reduction to allow discharge to surfacewaters, to land, and for non consumptive reuse.
Scope
The criteria which are developed as a result of this TAR will impact municipalities and regionaldistricts which own and operate sewage treatment systems. Industrial or agriculturalwastewater treatment systems are not anticipated to be impacted by the proposed criteria.
Responsibility
At present dischargers monitor their effiuent, and Ministry ofEnvironment/Ministry ofHealthmonitor the receiving waters and environment for coliform levels.
Backiround
Disinfection applies to all municipal wastewater effiuents disposed ofon ground or in receivingwaters in which there exists a chance of human contact. The concern for human contact is forthe prevention of human disease causing organisms carried in wastewater effiuents. Coliformreduction is an indicator which is used to evaluate disinfection effectiveness. This may not besufficient for virus, protozoan and helminth (parasitic worm) reduction, and other treatmentsteps may be needed where risk of human contact is high. Effiuent from septic tank tile fieldsor on-site small sand filters treating septic tank effiuent, unless the use of the treated effiuentpresents a risk of human exposure, is not required to be disinfected. As well, effiuentdischarged to marine waters which are not used for recreational contact purposes does notrequire disinfection. Coliform reduction alone may not be sufficient for some effiuent reusesand added treatment may need assessment.
Disinfection requirements are established for both surface waters and land application.
a) Surface Water
Provincial Objectives (British Columbia, 1975) list coliform discharge levels for receiving
- 1 -

DRAFT
waters which state "total coliform levels not to exceed a median MPN of 1000/100 mL,or a fecal coliform median MPN of 200/100 mL, and in shellfish waters are not toexceed a fecal coliform median MPN of 14/100 and shellfish meats may not show a fecalcoliform level greater than MPN of 230 per 100 (f'.
The frequency for monitoring effiuent for coliform levels is typically quarterly, monthly,or weeldy,.depending on the effiuent flow; the higher the flow the more frequent thetesting.
b) Land Application
British Columbia (1992) criteria for use of reclaimed water to be used on cereal orforage crops, golf courses and farm and forest lands are as follows:
"Fecal coliforms are used as the indicator organism for evaluating the microbiologicalsuitability ofreclaimed water as determined by multiple-tube fennentation or membranefilter procedures and based on a minimum ofnot less than five samples taken over notmore than a 30-day period. The fecal coliform content of reclaimed water shall notexceed a running log mean of 200/100 mL, nor shall more than 10 percent of totalsamples during any 30-day period exceed 400/100 mL. The running log mean valuesoffecal coliform MPN's will be calculated on a minimum offive weekly samples duringthe irrigation season."
"For high access areas (public parks and playgrounds) with unlimited public access andfrequented by small children, the effiuent must meet the log mean of less than 2.2 fecalcoliforms/100 mL."
Description of the Subiect
Disinfection is practised to reduce the transmission of infectious diseases where human contactwith the wastewater is probable. Domestic wastewater carries human pathogens excreted infecal wastes of infected individuals. The pathogens of concern are enteric bacteria, viruses,protozoa and helminths (parasitic worms). Common bacterial diseases are salmonellosis (Le.typhoid), cholera, gastroenteritis, etc. Common viral diseases are hepatitis, polio virus,reoviruses, etc. Common protozoan diseases are giardiasis and amoebiasis. Common parasiticworms include Ancylostoma (hookworm), Ascaris, Taenia (tapeworm) and Trichuris.
Six pathways of waterborne transmission of these pathogens are:
(1) ingestion of untreated water;(2) ingestion of treated drinking water;(3) ingestion of aquatic food species infected with pathogens absorbed from contaminated
waters;(4) invasion resulting from skin contact with contaminated water;(5) food crop irrigation with untreated water;(6) fodder or pasture irrigation with untreated water.
The total or fecal coliform test uses the coliform species as an indicator organism for thepresence of pathogenic organisms in the wastewater or receiving water sample. This may notbe sufficient for all reclaimed water reuses.
- 2 -

DRAFT
Human feces contain about 1012 organisms per gram, with total coliform organisms estimatedat 107 to 109 per gram and fecal coliform organisms estimated at 106 to 109 per gram (USEPA1986).
As the wastewater passes through a conventional wastewater treatment plant, coliforms arereduced. Table 1 (USEPA 1986) indicates typical coliform numbers to be found in wastewatertreated to various degrees.
TABLE 1TYPICAL COMPOSITION OF DOMESTIC WASTEWATER
_ •••J••Raw wastewater 200 200 35 107-108 106-107
Table 2 (USEPA 1986) lists the range of pathogenic and indicator organisms found insecondary effiuent. Fecal coliforms are distinguished from total coliforms by incubating thetest samples at 44.5°C for 24 hours. Fecal refers to the origin of the coliform, Le. from theintestines of warm-blooded animals. Coliforms, however, are not good indicators fortuberculosis, many viruses, Giardia (USEPA 1986), or parasitic worms (Feachem, 1983).
TABLE 2SECONDARY EFFLUENT RANGES FOR PATHOGENIC AND
INDlCATOR ORGANISMS PRIOR TO DISINFECTION
__iTotal coliforms 45,000 2,020,000
Fecal coliforms 11,000 1,590,000
Fecal streptococci· 2,000 146,000
Salmonella sp. 12 570
Viruses 0.05 1,000
• Assuming removal efficiencies for fecal streptococci similar to the fecal coliformremoval efficiencies.
Primary and secondary treatment removes 80 to 90 percent ofprotozoan cysts. Filtration mustbe used to remove the remainder. Removal of parasitic worms is described in Table 3 andillustrates a similar effectiveness of primary and secondary treatment as well as filtration.
- 3 -

DRAFT
Disinfection by chlorination is ineffective in killingAscaris eggs. Although Ascaris eggs remainviable in seawater for long periods, they did not develop until removed (Feachem, 1983). Infresh water, Feachem reports eggs are likely to be found below sewage outfalls and can remain
. viable for several months.
TABLE 3REDUCTION OF HELMINTH EGGS BY SEWAGE TREATMENT PROCESSES
(from Feachem (1983»
IProcess
IHookwonna IAscaris I~:= I Taenia
Ispp.
Two hours' sedimentation 80 96 90 75
Complete activated sludge plant 85 98 100 ND
Two complete trickling filter plants 82 95 93 ND92 96 100 ND
Pilot-scale biodisc plant with 1 hour of secondary 50 79 60 NDsedimentation
Pilot-scale oxidation ditch with secondary 81 94 100 100sedimentation
Pilot-scale aerated lagoon without secondary 70 92 100 100sedimentation
Four waste stabilization pond systems (as low as 93 100 100 1006 days settles all hookworm eggs, but larvae may 88 100 100 100pass out into the effiuent) 100 100 100 100
100 100 100 100
ND:Source:Note:
a:
No data.These data all taken from Panicker P.V.R.C. and Krishnamoorthi KP. (1978).Percent reductions refer to influent compared with effiuent. Most eggs notfound in the effiuent are concentrated in the raw sludge.Ancylostoma duodenale and Necator americanus.
Large numbers of hookworm and Ascaris eggs reportedly enter sewage systems in endemicareas. The fate of hookworm eggs is similar to Ascaris eggs, but hookworm eggs are less denseand they may hatch. The hookworm eggs are similarly sized but have a lower specific gravity(1.055 compared to 1.11) and thus a lower settling velocity. Hookworm egg removals are lessthan those for Ascaris eggs. The hatched hookworm eggs may survive for 5 days. Whenremoved by settling, the eggs are retained in the sludge.
Discrete settling is a function of surface area. Settling velocity ofa particle is determined fromits diameter and specific gravity. For hookworm and Ascaris eggs, the following may bedetermined:
- 4 -

DRAFT
Diameter Specific Stokes Law Complete Removal(mtr) Gravity Settling Velocity Overflow Rate
m3Jm2-d
Hookworm 50 J.l + 10 J.l 1.055 3x10..a cm/s 2.5
Ascaris 50 J.l + 10 J.l 1.11 10-2 cm/s 8.6
Since most primary settling tanks are designed for overflow rates of 30 to 40 m3Jm2-d (WPCF,1985), it is doubtful if the reported removals in Table 3 of 80 percent hookworm removal and96 percent Ascaris removal are possible. At 30 m3Jm2-d overflow, about 10 percent is probablefor hookworm and 30 percent for Ascaris. In any case, the removal rates would not exceedremoval efficiencies of suspended solids which are typically 60 to 65 percent.
Subiect Characterization
Coliform determination is described in Standards Methods (APHA-AWWA-WEF 1992). Themanual details standard analytical procedures to determine total coliform and fecal coliformvalues. The test results are described in terms of the Most Probable Number (MPN) of fecalcoliforms (FC) or total coliforms (TC) per 100 mL, or for the membrane filtration techniquethe result is the actual number of coliform colonies or colony forming units counted per 100mL sample. For a number of samples, the MPN values are often log averaged or the medianvalue is used, which yields an "averaged" MPN value for the number ofsamples taken, in whichthe effect of individual extreme values is minimized.
Log average =
N
Methods to isolate other bacteria may be used; however, virus identification and otherpathogen identification are not normally carried out.
Experience in Other Jurisdictions
a) Discharge to Surface Water
Saskatchewan
Disinfected effiuent total coliforms are not to exceed 2500 per 100 mL and fecalcoliforms are not to exceed 200 per 100 mL. Chlorine residuals are to be held between0.5 and 2.5 mg/L. Saskatchewan (1989) requires a 15 minute contact time at peak hourflow when using chlorination.
Newfoundland (Environment Canada, 1990)
Disinfection requirements limit fecal coliforms to less than 1000 per 100 mL and totalcoliforms to 5000 per 100 mL for all effiuent discharges.
- 5 -
DRAFT
Quebec (Environment Canada, 1990)
Effiuent requirements limit fecal coliforms to 400 per 100 mL and total coliforms to2400 per 100 mL.
Ontario (Environment Canada, 1990)
Ontario effiuent requirements specify a limit of 200 per 100 mL for fecal coliforms.
Manitoba (Environment Canada, 1990)
No pre-established limits are set for coliform concentrations in the effiuent, but thegeneral established limits are 1500 per 100 mL total coliforms and 200 per 100 mL fecalcoliforms.
United States
For gauging water quality, two standards in common use in the U.S. are a totalcoliform value (TC) of 1000 :MPN/100 mL and a fecal coliform (FC) value of 200:MPN/IOO mL. Guidelines for primary contact recreational waters adopted by manyStates require that the fecal coliform content not exceed a geometric (log) mean of 200MPN/100 mL, and no more than 10% of the samples taken in any 30 day period exceed400 FC MPN/100 mL (USEPA 1986).
The California State standard for nonrestricted recreational uses of wastewater andshallow ocean discharges in close proximity to shellfish areas specifies 7 day medianT.C. value of 2.2/100 mL (or less) at some point in the treatment process (USEPA1986).
USEPA in 1977 recommended, for approved shellfish areas (Le. those areas whereshellfish may be taken to direct marketing), a fecal coliform median value of 14MPN/IOO mI, with no more than 10% of the samples exceeding 43 MPN/IOO mI.
Most states have fecal and total coliform standards and take dilution factors, receivingwater use and characteristics into account, (recreational, shellfish areas, etc.).
b) Discharge to Land
Alberta (1988)
In Alberta, health aspects are addressed by setting a minimum one-week intervalbetween irrigation and contact with undisinfected effiuent. Salmonella spp. and E. coliare identified as two possible pathogens which will affect both humans and animals(livestock), but are inactivated by prolonged exposure to sunlight.
Disinfection of sewage effiuent prior to irrigation is warranted when there are publichealth concerns, e.g. golf courses,parks, vegetable crops.
Onsite lagoon storage is recommended to balance loadings during climatic and seasonalvariations.
- 6 -
DRAFT
Specific criteria areas follows:
• L.:.. the case of primary wastewater treatment, effiuent treatment shall befollowed by 7 months of storage through the use of anaerobic cells in series.
• Storage cells shall be sized to store effiuent outside of growing season(s) andeffiuent generated.
• At least 7 days prior to crop harvesting and livestock grazing.
• At least 30 days prior to grazing by dairy cattle.
California (1978) (1991)
For application to land or other reuses of reclaimed water, California (1978), (1991)requires TC reductions to meet specified reuse criteria, but as well includes minimumtreatment requirements to assure removal of other pathogens (virus, protozoa andparasitic worms). A Disinfected Tertiary Treatment level is described for highest reusepotential. Two additional treatment levels are described as either Disinfected Secondary-2.2 Reclaimed Water or Disinfected Secondary -23 Reclaimed Water for reuse as highcontact risk and low contact risk applications. An Undisinfected Secondary ReclaimedWater is permitted in irrigation uses where no contact is permitted for humanconsumption (Le., forests, non consumptive crops, sugar beets with 24 day restriction,etc.). Table 1 in Appendix IT is copied from the reclamation criteria and compares thefour standards.
The Disinfected Tertiary Treated Reclaimed Water requires secondary pretreatmentwhich ensures an effiuent turbidity (NTU) of less than 10, 95 percent of the time.Following filtration the NTU must be less than 5. Chemical coagulation is added ifthisis not achieved. (The coagulation step may be in conjunction with the filtration stepas opposed to a separate coagulation-sedimentation step.) Filtration rates must notexceed 3.4 Us.m2 (5 USgpm/f't2). A 2 hour chlorine contact time is required. To ensuredisinfection has been obtained, the median number oftota! coliform (TC) bacteria in theeffiuent:
i) does not exceed 2.2 per 100 m.L in the last 7 days for which analyses arecompoleted;
ii) does not exceed 23 per 100 m.L in more than one sample in any 30 day period.
The Disinfected Secondary - 2.2 Reclaimed Water requires water to be oxidized anddisinfected to ensure that the median TC in the effiuent:
i) does not exceed 2.2 per 100 m.L in the last 7 days for which analyses arecompleted;
ii) does not exceed 23 per 100 m.L in any two consecutive samples.
The Disinfected Secondary - 23 Reclaimed Water requires water to be oxidized anddisinfected to ensure that the median TC in the effiuent:
- 7 -

DRAFT
i) does not exceed 23 per 100 mL in the last 7 days for which analyses arecompleted;
ii) does not exceed 240 per 100 mL in any two consecutive samples.
Oregon (1990)
Oregon requires that water reclaimed from sewage treatment plants meet criteria whichvary according to water re-use. The criteria are appended. Disinfection is required inall applications except levell, which is application to timber and seed fodder crops.Livestock are not allowed to be on the pasture when effiuent is applied to pasturelands.For food crops, there is to be no effiuent irrigation 3 days prior to harvesting.
Areas where contact with the reclaimed water poses a health risk are controlled andmarked with warning signs.
Oklahoma (1987)
Treatment requirements for the land disposal of wastewater vary according to proposedapplication objectives. Golf course irrigation requires the highest rates of treatmentand disinfection.
Wastewater applied to agriculture need not be disinfected, but is subject to a 30 dayperiod between last application and harvest.
Application of effiuent to areas with a high potential for ground contact, such asathletic fields, is prohibited.
Vermont (1990)
Effiuent disinfection is required for all effiuent spray irrigation systems. A 20 minutechlorine contact time with a 1.0 mg/L free chlorine residual or 4.0 mg/L total chlorineresidual at the nozzle is required prior to spraying. Alternate disinfection techniquesrequire departmental approval. Isolation distances greater than 100 feet (30.5 m) arerequired to separate the disposal system from any water surface, and a minimum of200feet (61 m) from any water supply sources (surface or ground) or areas frequented bythe public. Special review is required by the State in order to permit effiuent irrigationof "contact" uses, golf courses, ski trails, etc. No requirements for storage are specified.
World Health Organization <WHO)
The WHO studies state that helminths (intestinal worms) pose the highest riskpathogen in wastewater irrigation systems. They limit the nematode eggs concentrationof Ascaris or Trichuris to 1 per litre, and the geometric mean fecal coliform MPN to1000/100 mL for unrestricted wastewater irrigation. WHO combines this withcontrolled irrigation techniques and restrictive cropping practices. Table 4 (WPCF,1989) lists microbial guidelines used by various states and the WHO.
- 8 -

DRAFT
TABLE 4MICROBIAL GUIDELINES USED BY VARIOUS STATES ACTIVE IN RECYCLING
WASTEWATER AND BY THE WORLD HEALTH ORGANIZATION (WHO)
Parks,playgrounds, and
schoolyards
State
Ariz.
Calif.
Colo.
Fla.
Ga.
Mont.
Neb.
N.M.
Ore.
Totalcoliforms/100 mL
2.2
2.2"
20
2.2
100
Fecalcoliforms/100 mL
25
100
10
Enteric Ascarisvirus/40 L
125 0
S.C. 4
Utahb 3
Wash. 2.2
Wyo.
WHO 200(lawns)
"This is the Colorado standard; the burden of proof is on the discharger for different stands, that is, Colorado Springs has demonstrated 400 fecal coliformsas its safe limit.
b No wastewater reuse allowed-only water reuse of run-off origin is practiced.<Geometric mean concentration. .
..... - ... Parametet.I1~.n.9....B.?!.~~~.!lJ>~i~~.~~ ...~~l~~!~l!d ••~i... ';

DRAFT
TABLE 4 (CONT'D)MICROBIAL GUIDELINES USED BY VARIOUS STATES ACTIVE IN RECYCLING
WASTEWATER AND BY THE WORLD HEALTH ORGANIZATION (WHO)
State
Ariz.
Calif.
Colo.
Fla.
Ga.
Mont. 2.2
Neb.
N.M.
200
Spray irrigationof food crops
200
1000
Surface irrigationof food crops
are.
S.C.
Utah'
100 10 100 10
VVash. 2.0
VVyo.
VVHO 1000b <IlL 1000e<IlL
'No wastewater reuse allowed-only water reuse of run-off origin is practiced.bGeometric mean concentration.- =Parameter has no guidelines assigned or is not regulated.Notp·JlJ som""<l~es thron"lv:mt tj1"JJ5;. the"Amit:robi::olJimits at:"J;·tI.v,ed to t""bidity ·,,·,,"'-Ior otp...",,1}ysic?l·...J.. ..racter.;"t;M of tr--~"laimc' ---'er.

DRAFT
Assessment of Control Options. Methods and Technologies
The following section provides detail on pathogen removal by disinfection anti iurthertreatment, septic tank effiuent disinfection and an evaluation of disinfection effectivenesscomparing chlorination, UV and ozonation. Added also is discussion on risk.
1) Pathogen Removal from Treated Wastewater Effiuent
Pathogen reduction to safe levels following secondary treatment requires disinfection andsupplemental treatment. For disinfection, numerous factors are involved in evaluatingalternatives. These include effectiveness of disinfectant, both capital and operating costs,practicality, results of pilot studies, and assessment of adverse affects. Each case is usuallyassessed individually. Factors such as the degree of treatment required, (number ofloga of killrequired), the dilution obtainable in the receiving water, pH, temperature, TSS, level oftreatment of the wastewater, occurrence of nitrification (Le. primary, secondary or tertiarytreatment), and discharge flow all influence the evaluation of the disinfection alternatives.Depending on the effiuent quality required, 3 to 9 logs ofcoliform kill may be needed, Le. from107-109range to 108
- 2.2range. The most common barrier methods ofdisinfecting wastewaterare chlorination, ozonation and ultraviolet light. Chlorination usually involves dosing withchlorine (CI2) gas or hypochlorite solution. Other less common disinfection methods utilizechlorine dioxide and bromine chloride. At present, the most utilized is chlorine gas.
a) ChlorinationIHypochlorination
Typical chlorine doses to achieve disinfection are listed in Table 5 (WEF 1992).
TABLE 5TYPICAL CHLORINE DOSAGES
----Prechlorination (raw wastewater) 6-25 mg/L 15-40 mg/L 20 mg/L
Disinfection - 5-20 mg/La 18-24 mg/Lbprimary effiuent
Disinfection - 2-8 mg/La 6-9 mg/Lb 8 mg/Laactivated sludge effiuent
Disinfection - 1-5 mg/La 4-6 mg/Lb 6 mg/Lafiltered effiuent
a
bNo treatment or coliform values are specified in the reference.For 200 MPN fecal coliform/100 mL or 1000 MPN total coliform/100 mI.
One commonly used relationship which describes coliform reduction and C.t parametersis the Collins-Selleck model described by:
- 11 .
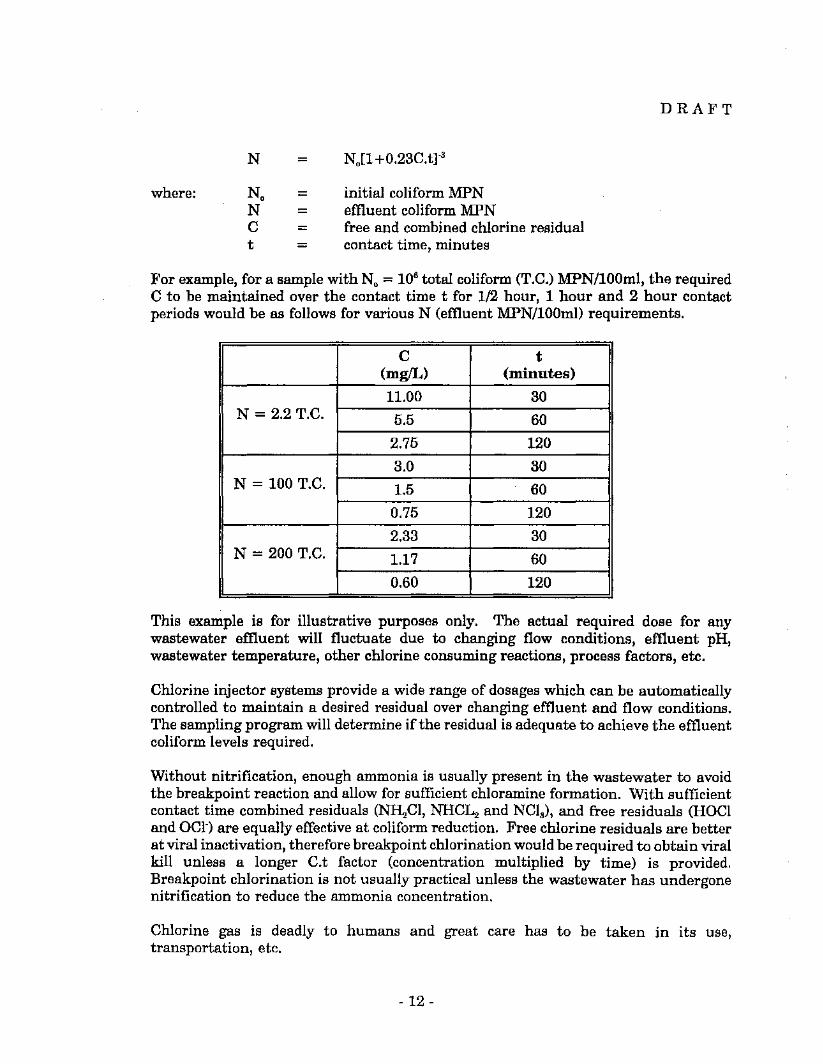
DRAFT
N = No[l +0.23C.t]"s
where: No = initial coliform MPNN = effiuent coliform MPNC = free and combined chlorine residualt = contact time, minutes
For example, for a sample with No = 106 total coliform (T.C.) MPN/100ml, the requiredC to be maintained over the contact time t for 1/2 hour, 1 hour and 2 hour contactperiods would be as follows for various N (effiuent MPN/100ml) requirements.
C t(mgIL) (minutes)
11.00 30N = 2.2T.C. 5.5 60
2.75 120
3.0 30N = 100 T.C. 1.5 60
0.75 120
2.33 30N = 200 T.C. 1.17 60
0.60 120
This example is for illustrative purposes only. The actual required dose for anywastewater effiuent will fluctuate due to changing flow conditions, effiuent pH,wastewater temperature, other chlorine consuming reactions, process factors, etc.
Chlorine injector systems provide a wide range of dosages which can be automaticallycontrolled to maintain a desired residual over changing effiuent and flow conditions.The sampling program will determine if the residual is adequate to achieve the effiuentcoliform levels required.
Without nitrification, enough ammonia is usually present in the wastewater to avoidthe breakpoint reaction and allow for sufficient chloramine formation. With sufficientcontact time combined residuals (~CI, NHC~ and NCIs), and free residuals (HOCIand OCl") are equally effective at coliform reduction. Free chlorine residuals are betterat viral inactivation, therefore breakpoint chlorination would be required to obtain viralkill unless a longer C.t factor (concentration multiplied by time) is provided.Breakpoint chlorination is not usually practical unless the wastewater has undergonenitrification to reduce the ammonia concentration.
Chlorine gas is deadly to humans and great care has to be taken in its use,transportation, etc.
- 12 -

DRAFT
Any residual chlorine, either free or combined, is toxic to aquatic species anddechlorination is often practised to lower the chlorine residual to non detectable limits.Sulphur dioxide gas addition is the predominant method of dechlorinating wastewatereffiuent. Some stable chloro-organic compounds can be formed as a result ofchlorination (WPCF, 1986, WEF-ASC, 1992).
Hypochlorite, as calcium hypochlorite (Ca(OCI)2, a dry solid) or sodium hypochlorite(NaOCl, available as a solution) is much safer to handle, but requires more equipmentto utilize. Cost of these materials is usually a bit more than for Cl2gas.
b) Chlorine Dioxide (CI02) (EPA 1986)
CI02 is a hazardous, explosive, and unstable gas which is not transportable. It istypically manufactured "on site" by several patented processes. It is a strong oxidantand is a very effective bactericide (equal to CI2).
Byproducts of chlorine dioxide chlorination are not easily formed. THM chloroformdoes not form to any appreciable amount, and CI02 does not react with ammonia toform the toxic chloramines.
Dechlorination of CI02 using sulphur dioxide can be used to remove residual (toxic)CI02•
c) Bromine Chloride (BrCI) (EPA 1986)
BrCl is a hazardous, corrosive gas made from bromine and chlorine gas. Handling andsafety precautions are as required for chlorine gas. BrC~ is a visible red vapour andvery pungent and irritating if inhaled, and if liquid, will burn skin and other tissues.
Bromine chloride reacts to form hypobromous acid. Hypobromous acid in the presenceofammonia forms bromamines which are very effective disinfectants. Bromamines havebeen demonstrated to be superior to chloramines in both bactericidal and virucidalactivity (WPCF 1986). The environmental impacts are less, as well, since the unstablebromamines break down sooner.
Bromamines have been shown to be better germicides than chloramines. No contacttime (C.t) standards are as yet available for bromine chloride. Dose-contact time isusually determined by pilot study.
Organobromine and bromine residues are thought to be less toxic to aquatic life thanchlorine residuals, thus less stringent total bromine residual concentrations areproposed. However, the long-term environmental impacts ofBrCI disinfection requirefurther research.
Nevertheless, BrCI is an approved disinfectant for wastewater treatment plants in theU.S. under USEPA. Other advantages ofusing BrCl, other than the better (lower) totalresidual oxidant concentration, are as follows:
- 13-

DRAFT
• BrCI is active over a wide pH range, i.e. at pH 8, 90% of BreI exists as activeHOBr.
• BrCI is very effective at low temperatures.
• Bromamine residuals in secondary wastewater are very short-lived; half lifeshown to be less than 10 minutes. Therefore, debromination may not berequired if adequate detention, before release, is allowed.
]
In general, BrCI disinfection facilities are similar to those used for chlorination gasfacilities.
d) Ozone Disinfection (03)
0 3 is a strong oxidant that has a short half life. It is therefore manufactured on site.Typically ozone has been used on nitrified and filtered secondary effiuents, especiallyif an oxygen activated process is being used.
Typical ozone dosages to achieve various disinfection standards are listed in Table 6(WEF 1992).
TABLE 6TYPICAL OZONE DOSAGES
--_••Filtered, secondary 35 to 40 mg/l 15 to 20 mg/l 12 to 15 mg/l
Filtered, nitrified 15 to 20 mg/l 5 to 10 mg/l 3 to 5 mg/l
The benefits of ozone over other conventional disinfectants are:
• very effective virucide;• is minimally affected by ammonia or pH;• any ozone residuals are dissipated rapidly and are not normally found by the
time the effiuent is discharged;• dissolved oxygen levels in the effiuent will increase.
There are numerous WWTP's using ozone for disinfection in the U.S. and Europe.Dose and contact time are usually determined by pilot scale tests.
Ozone will react with nitrite, iron, manganese, sulfide, cyanide ions, and lower thelevels of these compounds, but the dose of ozone will have to be increased to achievethe required coliform reduction.
- 14-

DRAFT
Other substances (aromatic compounds, pesticides, humic acids), also react with ozoneand generally the oxidized materials are more biodegradable. Both the organic andinorganic substances will make up an initial ozone demand.
If ozone dose/contact time is high enough, it appears there is no technical basis forexcluding the use of ozone following any treatment scheme (USEPA 1986). Costconsiderations, however, usually limit the use of ozone to wastewater which is of goodquality (nitrified and low TCOD), so that required transferred ozone dosages are in the4 to 14 mg/L range. Due to the short half life of ozone (typically 10 minutes), thedesign of the contact chamber must eliminate short circuiting, maximize ozone transferinto the liquid, maximize mixing and bubble contact time. Often multiple staged ozonecontact basins are required.
The high capital and operating costs of an ozone disinfection system and the need forozone gas dissolution and offgas treatment do not usually allow ozone disinfection tobe economic. However, if the receiving waters will not allow chlorine/dechlorination,or if viral inactivation is of concern, ozone may be economic. If stringent regulationson chlorination and chlorinated byproducts come into effect, ozone becomes moreattractive. The handling, storage, transportation and safety concerns associated withchlorine gas are also eliminated.
Ozone is toxic to humans. The maximum exposure for an 8 hour period is 0.1 ppm (byvolume) and no worker should be exposed to a ceiling concentration in excess of 0.3ppm for more than 10 minutes, as proposed by OSHA (USEPA 1986). The toxicity is'a function of exposure and concentration. Humans can smell ozone at about 0.01 ppm,and as such, humans have some warning about its presence at below toxicconcentrations. Ozone is also lethal to aquatic organisms, but no more so than residualchlorine (WPCF, 1986); however, this residual is short lived, usually only a fewminutes. Often ozone monitors are interlocked with the ozone system, and shut offthesystem upon detection.
Methods for the measurement of ozone residual are numerous. Standard Methods(AWWA-WPCF-APHA 1992) lists the indigo colorimetric method, in which the minimumdetectable concentration is about 2 J,lg/L. The indigo method, a decolorizationprocedure measures the change in absorbency spectrophotometrica1ly. Measurementsencompass the 0.005 to 30 mg/L range (WPCF 1986).
e) Ultraviolet Radiation
UV wastewater disinfection systems have gained in popularity over the last decade orso, with an estimated 50 plants employing UV disinfection in 1989 to over 500 in 1991(USEPA 1992). A summary of 30 operating systems in use in the U.S.A. is given inTable 7. All plants by design or circumstance achieve nitrification, and minimalcoliform densities are observed after UV disinfection in wastewater with BOD and TSSlevels less than 10 mg/L. The UV systems are generally designed for peak flows.Design loadings typically vary from 1438 maid per kW to 6430 maid per kW, with anaverage of about 3440 maid per kW (USEPA 1992).
- 15-

DRAFT
TABLE 7SUMMARY OF DESIGN SIZING/PERFORMANCE CHARACTERISTICS FOR SELECTED PLANTS
Peak lTV STlt_Dedsn Peak to(h) PermitCa) D..isn Peak E!!luent Quality(C)Flow Aonraal 2: Limit IfUlllblr IfUIIlblr Loadins Typical Level C~/~ Bachrial(aj
Plant.__ ~ Ratio ~ ClOOmL-l) Ini Channel! I!!!h. ClMdtkW) ~ ..I§L _3_-_ ~UOOmL-1J
1. Waldron, AL 1.0 1.2 80 Ifonl a 1 2 1.~8 - -2. Bridssvil1e, DE 1.2 1.~ 25 200 V 1 2 0.38 8 4 3.8 (TIIf) 253. Dakota City, IA 0.5 1.0E 83 200 V 1 1 0.8 <10 13-15 - 1150-1804. Cave City, XY 1.5 2.5 50 ZOO B 1 Z 0.88 5 3 - <10S. Edsrw.ter, MD O.S 1.0E 18 14 B 1 Z 0.47 8 ~ 0.9 (TIIf) 1.8
6. Clearaprinsa, MD 0.4 2.0 ~O 200 B 1 1 0.47 <10 <10 - <27. Leadwood, Ii) loS 3.0 30 200 B 1 1 ~.O 7-14 4-10 - <18. OUa, LA 0.3 1.0 100 Z~ B 1 2 1.12 S 0.5 - <19. Dewey, OIC 1.1 Z.7~ 55 200 H 1 1 0.66 <20 78 - 31
10. Stoney Creek, VA 1.5 2.5 60 ZOO V 1 4 1.0 4 S - 10-40
11. Peteraburs, WV 1.8 3.0 83 200 B 1 2 1.159 <10 <10 <0.1 <2012. Ozark, AL 5.25 2.5 43 1,000 V 2 - 1.18 16 ZO 0.4 <100 Ce )13. Jea.up, MD 1.8 1.0E 70 ZOO H 1 Z 1.65 <3 <3 <lTXN <414. Llbanon, Ii) 3'.5 1.~ Sll 400 H 1 2 0.82 - - - In COlIIp(!)15. Abbevi111 , LA 4.5 2.75 130 200 H 1 2 0.88 4 8 1-2 <
18. Hanover, IfB 7.0 3.0 " 240 TeCb) a 1 2 0.82 <30 <10 - 200-220(!)17. If.. ProvidencI, IfJ 8.0 3.0 25 200 B 3 Z 0.89 10-20 , ~-1~ l-Z <10018. Owa..o, ~ 3.0 1.25 ~4 200 V 2 3 1.32 10 10.1 - <5lSI. Bishapir., PA 3.e 1.SI ~O 200 V 1 4 1.11 <10 <10 - 30-4020. ACCCXllOO, VA 2.9 1.25 Sl4 ZOO a 1 1 0.96 <10 <1~ - <100
21. White SulphurSprinsl, WV 4.0 2.5 70 200 B 1 2 o.e~ , 5-8 3-5 <1 <10
ZZ. Williamaon, WV 5.0 1.7 33 200 B 1 1 0.93 18 11 - 4523. Athena, AL 13.0 LSI Sl8 1,000 B 1 2 1.88 e 13 2.4 3Z424. G<.mniaon, CO 8.7 1.8 24 8,000 V 3 2 o.Sle <10 <10 - <20025. Eaat Chicaso, IL 38.0 2.4 Sl2 200 B 2 2 1.03 1.7 5.2 - 12
28. Olathl, J:S 25.0 4.0 27 200 B 2 2 3.25 12-17 8-12 o.e <1027. Cblul&'I, a: 5.0 Averaal 54 200 V 2 3 0.47 <10 7-12 <1 <20028. Willow GrovI, PA 17.5 2.5 Sl8 300 B 1 2 0.85 5-10 10 0.5 In COlIIp(!)29. Warminatlr, PA 18.0 2.0 82 200 B 1 2 0.85 5 <10 1.1 4330. Collilrvilll, tIf 7.0 2.0 51 200 V 2 4 1.17 10 4-10 - 3.10
(a)rloll colitorm, unll.' oth.rwi•• noted. 30-d aver... i ••hawn, unle•• Dotld otherwi••• See Table C tor tull permit d••cription.(b)Totll colitorm; valul i. Dot to Ixceed, In1 • .mplinS.(C)Aver,,1 levll! typical ot pertormancl. ! ..ed on dilcullion with operator••(d)rlcil coli!orm, unll" otherwiae noted.(I)Leval. When .acond ataal nitri!icltion in operation. Fe It'nl. incr.i•• to 700 to eoo Fe/l00 L Without nitritication.(!)Datl not avlilabl.. Stlted to bl in cOlllpliancl.(S)Total Coli!orm.(h)E deaisnat.a planta with equaliEltion.

DRAFT
UV radiation is usuallyproducedfrom a mercurylamp whose light output (85%) is atthe wavelength 253.7 mm. This wave length corresponds to the peak absorption oflight by DNA molecules. The germicidal effects ofUV radiation are caused by thedestruction cell's protein replication systems, in particular the breakdown ofthereplication of proteins from damaged DNA and RNA molecules.
UV's principal advantage is that it leaves no residuals or chemical intermediates in thetreated wastewater to affect aquatic life. UV systems are relatively simple and take uplittle space. UV radiation has to penetrate the organism to be effective, thereforeturbidity and SS greatly hinder the dose absorbed by the organisms. Effluent qualityparameters such as flow rate, SS, initial bacterial number and density, bacterial densityassociated with the SS, etc. all affect the absorbed dose.
UV disinfection is affected by four main factors; these are effiuent flow rate, initialbacterial density, SS concentration, and the UV absorbency of the wastewater. UVradiation efficiency is primarily limited by the protection of microorganisms insidewastewater floc composed of suspended solids. Therefore, SS must be very low toachieve low MPN values. In addition, photoactivation, where the organism repairs thedamage caused by the UV radiation through the absorption of natural light occurs.This reactivation causes an increase of about 1 log in the number of survivingcoliforms, which may have to be taken into account. It is suggested that for best UVreactor operation, the effiuent should generally contain less than 10 to 15 mg/L TSSand less than 5 to 10 NTU in turbidity (WPCF 1990).
UV disinfection is basically a safe process, without the problems associated with ozoneor chlorination disinfection. UV radiation is damaging to the eyes and skin, but thisradiation is easily shielded; plexiglass covers and the water layer, if the UV tubes aresubmerged, are typical precautions taken. There is some risk associated with theelectrical systems as high voltages are used in the mercury arc lamps.
UV systems require the lamps to be cleaned regularly and to be replaced regularly, sincethe lamps loose their UV output over time, or burn out. Power consumption is also amajor cost. The UV systems can often be retrofitted into the chlorine contact tank withminimal cost.
f) Natural Die-Off
Natural processes of organism die-off or inactivation can reduce pathogen levels. Mostmathematical models are based on first order kinetics, that is N(t) = No e-kt, or N =No/(l+kt), where k is the rate constraint. Typical coliform organism k values for theformer equation, based on a lagoon system study in Logan City, Utah were 0.5(summer) and 0.03 (winter) days·l.
Lagoons for example, using a summer k of 0.5 days·t, could achieve significant coliformreductions, 107 down to 102/100 mL in 23 days, but in winter 384 days would berequired. Dilution will also reduce coliform/pathogen concentrations.
- 17 -

DRAFT
g) Additional Treatment
For virus destruction, disinfection with chlorine will render effiuent noninfective, buthigh dosages may be necessary and wastewater must be highly purified. A residual of1 - 2 mg/L is needed for 1 - 2 hours to be effective. Addition of a second barrier byfiltration and coagulant (or most effective, a coagulant-sedimentation step) willremovevirus. California requires an NTU < 5 for 95% of the time. Storage (at 20°C orgreater) also will inactivate virus but is a less effective method.
The presence or absence of coliforms is an indication of the presence or absence ofharmful bacteria. Their absence does not necessarily reflect the absence of otherharmful pathogens. Helminths such as Ascaris, Ancylostoria (hookworm), Taenia(tapeworm), and Trichuris may be present. Disinfection by chlorination often has littleeffect on helminth viability. For example, chlorination has no effect on Ascaris eggs.Table 3 describes removals for primary and secondary treatment processes. Tertiarytreatment by filtration removes remaining protozoan cysts and helminth eggs such ashookworm and Ascaris. Where filtration is provided, storage ponds are not necessary.
2) Disinfection of Septic Tank Effiuent
Septic tank effiuent is not normally disinfected. A high degree of coliform reduction occurs inthe tile field surrounding soils and within a sand filter if one is used to treat septic tankeffiuent.
Table 8 (Metcalf & Eddy 1991) lists typical natural treatment levels possible with onsitetreatment systems.
TABLE 8
Treatment performance of onsite system components and intermittent or recirculating sand filtersB
1.0 ft belowbottom of
Septic tank leachrield
Raw waste effluent trench
Parameter (1) (2) (3)
BODs, mgll 210-530 140-200 0
SS, mgll 237-600 50-90 0
Nitrogen, mgllTotal 35-80 25-60
NH'; 7-40 20-60 2Gb
NOJ <1 <1 40b
Tolal phosphorus, mgll 10-27 10-30 lOb
Fecal coliforms, MPN/100 mL 106-10 10 103 -106 20-102
Viruses, PFU/mLC Unknown 105 -107 20-103
• Adapted in part (rom Refs 2, 23, 28, and 30.
C Value varies from the background level up to the indicated value.
c PFU ~ plaque forming units.Nole: It x 0.3048 .~ m
- 18-
3.0 ft belowbottom ofleachfield
trench(4)
oo
Intermittentsand filter
effluent(5)
<10<10
<0.525
Recirculatinggranular-mediurtl
filter effluent(6)
<15<15
<0.52S

DRAFT
3) Disinfection Levels Achievable
Finger (1992) concluded in Seattle, WA, studies, which evaluated disinfection methods forconsumptive (crop irrigation) and non consumptive (heating and cooling) reclaimed waterreuse, that the addition of a 20 minute second stage chlorination or UV, following secondarytreatment, could meet a TC of 2.2 MPN/100 mL without prior filtration. By comparison,ozonation following sand filtration could not meet this requirement. (Chemical coagulationwas not included ahead of the filter.) Heath (1992) in California studies showed ozonerequirements were impractically high to achieve even moderate coliform requirements. UV,however, was found to be a practical choice and could meet disinfection requirements.
Use of UV and chlorination appears to be the two best choices for disinfection. Other factorsgaining importance in disinfection processes are limits put on the disinfection byproducts.Total residual chlorine concentration often is specified to be less than 0.05 mg/L to protectaquatic species, and total residual oxidant (TRO) concentrations are also starting to beregulated in the U.S.A. Often these requirements dictate the disinfection process to be used,and may exclude the use of chlorine. Also, with lower effiuent standards being required forT.S.S. and TBODli, the effiuent quality becomes more amenable to UV as a first choice indisinfection methods with ozone being a distant second.
4) Risk
EPA (1985) provided a disinfection risk assessment which, for wastewater treatment, was ableto conclude:
a) Lack of data makes it impossible to distinguish between hazard levels of chlorine usewith other alternatives such as ozonation or UV disinfection. In general, ozonation andUV methods are less of a concern to the environment. Ozone poses a risk to workersand vegetation, but is less risk to aquatic life than chlorine. UV poses a threat ofradiation burns. Both UV and ozone production using high voltage systems posesimilar hazards for exposure. These are small.
b) Chlorine accidents at wastewater treatment plants are low, accounting for only 4percent of accidents.
c) Chlorine transportation is normally by rail. The risk of low frequency-highconsequence results of a shipment are not quantifiable, but the results of an accidentcan be catastrophic (fatalities, injuries and property damage).
d) Ozone use results in a higher operating cost and uses about twice the energy aschlorination. Operations and maintenance costs for ozonation are 35 percent higherthan for chlorination. (Disinfection costs, however, represent only a few percent of atotal operations budget for a treatment plant.) The energy use for chlorine (and UV)is about 1/10 that of ozonation.
- 19-

DRAFT
e) No conclusion'could be reached on the desirability of requiring wastewater disinfection.The use of chlorine was heavily weighted to suggest that it may have an associatedhigher risk with use, but data are insufficient to confirm this conclusion.
Financial Impact Assessment
Typical capital and O&M costs for plants ranging from 500 m8/d to 2000 m3/d are shown inTable 9.
TABLE 9OPERATING AND CAPITAL COSTS FOR DISINFECTION(e)
Average O&M$ Capital $Annual
Cl2 UV Ozone Cl2 UV OzoneFlow(a) (b) (c) (d)
1,000 m8/d 5,000 2,000 7,000 135,000 100,000 220,000
5,000 m8/d 20,000 9,500 28,000 420,000 180,000 650,000
10,000 m8/d 35,000 16,500 50,000 700,000 300,000 1,035,000
20,000 m8/d 60,000 30,000 85,000 1,100,000 500,000 1,650,000
(a) Chlorine gas, $1.40/kg plus maintenance.(b) UV, $0.05/kW-hr, 1.6 W/hr/1000 m8/d plus lamps and maintenance.(c) Ozone, $0.05/kW-hr, 1 kW/kg OJd, 12.5 kg 0Jd/1000 m 8/d plus maintenance.(d) Includes 60 minute contact tank and sulphonation.(e) Costs were determined from supplier quotations for various plant sizes (Fischer Porter,
Trojan and Petwa Canada Ltd.).
UV is less costly than chlorination and where effluent quality TSS and light absorptioncharacteristics are low (high transmissivity), UV would be the economical choice assumingother conditions are met.
Recommendations
Recommended coliform criteria and supplemental treatment (in addition to BACT secondary)are set out in Table 10 for various receiving water and land uses. Other uses such as reclaimedwater for industrial purposes or urinal and toilet flushing should be evaluated on a case-bycase basis. Table 10 provides general guidelines only and distinguishes between irrigationpractice for spray, drip or surface applications. Spray irrigation is a higher concern and isaccordingly restricted for reuse options that require lower disinfection.
For protection of public health and the environment, three treatment levels are recommendedto meet reuse needs. For high human exposure and contact, reclaimed water should meetTable 10 coliform reductions and include a coagulation filtration process as well as disinfection.For lower human exposure and contact, the reclaimed water must meet the disinfection
- 20-

DRAFT
requirements of Table 10, but does not require the coagulation filtration step. For conditionshaving little or no human exposure, the reclaimed water requires a minimum secondarytreatment only. For reuse proposals not shown in Table 10 (non restricted recreational use,flushing toilets and urinals, etc.), special provisions may be required by the Ministry ofHealthand the Ministry of Environment.
Disinfection systems utilizing chlorine must be monitored for the disinfectant residual on acontinuous basis and should the dose or time parameters fall below design conditions, samplingof the effiuent for MPN coliform levels should be every 4 hours to ensure coliform reductionis still being achieved. This is to ensure that public health is being protected.
For UV systems, a similar monitoring of dose and contact time should be provided and thesame precautions employed.
For those effiuents that discharge into a receiving body of water upstream of a drinking watersource, or into a primary contact recreational body of water, it is recommended that a sitespecific assessment be made as to the choice of disinfectant to be employed and the doserequired, so as to best protect the public's health. The critical items of concern are viralcontamination, and disinfection byproduct concentration levels.
Monitoring for viral contamination and disinfection byproducts should be established by theMinistry on a case-by-case basis. For discharges to primary contact recreational use waters,the indicator organisms to be monitored should include Enterococci organisms (in addition tofecal or total coliform organisms), as these organisms are the most efficient bacterial indicatorof water quality for marine and freshwater swimming (APHA-AWWA-WEF 1992).
For chlorinated effiuents discharging to aquatic life bearing waters, dechlorination to meet theProvincial water quality objectives after dilution zone mixing (Table 18 Appendix IT attached)(L. W. Pommen, 1991) is recommended, with due consideration to minimum dilution ratios.If these receiving water requirements cannot be met, then alternative methods of disinfectionshould be investigated.
- 21-

TABLE 10DISINFECTION REQUffiEMENTS
DRAFT
Use BACT plusCoagulation
FiltrationDisinfection
FC<2.2/100 mL,(median of last
7 tests)FC<23/100 mL,<2 consecutive
.::lKiwr·(QWS8~~:i:::::ii:::
Discharge tofreshwater (rivers,streams, lakes)- non-recreation- recreation AllowedDischarge tomarine waters:
BACT plusDisinfection
FC <14/100 mL
Allowed
BACT plusDisinfection
FC <200/100mL
Allowed
BACT plusDisinfection
FC< 1000/100mL
Not allowed
BACT
Not allowed
- non recreational- recreationalDischarge toshellfish bearingwaters
:!i:mliilifiQii:i:i:::ii:::!:::!!:!I::::::i:i::i!:!i!I::Public Areas:Parks, playgrounds,school yards,cemeteries,residential yards,unrestricted golfcourse use
Class C2:Golf courses,freeway landscapeClass Cl:Non edible crops,pasture, sod farms,silviculture,ornamental plantsClass B:Fodder, pasture formilking animals(not bearing foodcrops)
AllowedAllowedAllowed
AllowedSp, D, Su
AllowedSp, D, Su
AllowedSp, D, Su
AllowedSp, D, Su
AllowedAllowed
Allowed
Not allowed
AllowedSp, D, Su
AllowedSp, D, Su
AllowedSp, D, Su
- 22-
AllowedAllowed
Not allowed
Not allowed
AllowedSp, D, Su
AllowedSp, D, Su
AllowedSp, D, Su
AllowedNot allowedNot allowed
Not allowed
Not allowed
AllowedSp, D, Su
AllowedSp, D, Su
AllowedNot allowedNot allowed
Not allowed
Not allowed
Not allowed
AllowedD, Su

DRAFT
Use
Class A:Vmeyards,orchards, foodcrops(2)
BACT plus BACT plus BACT plus BACT plus BACTCoagulation- Disinfection Disinfection Disinfection
Filtration FC < 14/100 mL FC <200/100mL FCDisinfection < 1000/100mL
FC<2.2/100 mL,(median of last
7 tests)FC<23/100 mL,<2 consecutive
Allowed Not allowed Not allowed Not allowed Not allowedD, Su
Sp = spray D = drip or trickle Su = surface (ridge, furrow or flood)
(1) Allowed for discharge to freshwater environments where it can be shown that dischargewill not impact on the use of the receiving waters. Disinfection equipment may berequired at the direction of the Director.
(2) Class A, spray irrigation on food crops, requires advanced pretreatment using filtrationand coagulation clarification (see TAR 3.1.1 (Surface Application to Land).
Table 11 provides monitoring frequency and type for five flow categories. For lower flows, thefrequency has increased from the requirements of Table 5-2 of the British Columbia (1975)objectives.
TABLE 11PROPOSED SAMPLING (a)
Flow EffiuentFlow Sampling RequirementsCategory Range
m31
Frequency (b) Type
1 22.5 - 749 M G
2 750 - 4,999 W G
3 5,000 - 24,999 Twice W G
4 25,000 - 99,999 D G
5 > 100,000 D G
- 23-

DRAFT
(a) At point of application or discharge unless otherwise permitted.(b) Failure requires correction and monitoring frequency of testing every 4 hours
for any 24 hours following assurance that coliform level has reached permittedlevel.
G = grabQ = quarterlyM = monthlyW = weeklyD = daily
- 24-

DRAFT
MINISTRY OF ENVIRONMENT, LANDS AND PARKSMUNICIPAL SEWAGE DISCHARGE CRITERIA
TECHNICAL ASSESSMENT REPORT NO.1BEST AVAllABLE CONTROL TECHNOLOGY
APPENDICESPage(s)
TAR 1.2 ADVANCED TREATMENT AND EFFLUENT DISCHARGE CRITERIA
TAR 1.2.1 DISINFECTIONAPPENDIX I References 1-2APPENDIXll Tables 13-14
TAR 1.2.2 NITROGENAPPENDIX I References 1APPENDIXll Tables from Pommen (1991) 31-32
18-1936-37
APPENDIXID Ammonia Concentration Back Calculation Analysis 1-7
TAR 1.2.3 PHOSPHORUSAPPENDIX I References 1APPENDIXll Figures 4-6, 4-7, 4-15 from Sedlak (1991) 1-2
TAR 1.2.4 WETLANDSAPPENDIX I References 1APPENDIXll Tables and Figures 1-10

DRAFT
MINISTRY OF ENVIRONMENT, LANDS AND PARKSMUNICIPAL SEWAGE DISCHARGE CRITERIA
TECHNICAL ASSESSMENT REPORT NO.1BEST AVAllABLE CONTROL TECHNOLOGY
TAR 1.2 ADVANCED TREATMENT AND EFFLUENT DISCHARGE CRITERIA
APPENDIX I
References, pages 1 • 2

DRAFT
MINISTRY OF ENVIRONMENT, LANDS AND PARKSMUNICIPAL SEWAGE DISCHARGE CRITERIA
TECHNICAL ASSESSMENT REPORT NO.1BESTAVAllABLECONTROLTECBNOLOGY
APPENDIXI-REFERENCES
References
APHA-AWWA-WEF (1992), Standard Methods For The Examination Of Water AndWastewater, 18th Edition, A. E. Greenberg, L. S. Clescent, A. D. Eaton, editors.
British Columbia (1975), Pollution Control Objectives for Municipal Type Waste Dischargesin British Columbia, Ministry of Environment & Parks.
British Columbia (1992), Ministry of Environment, Health & Safety Criteria for Use ofReclaimed Wastewater.
California (1978), Wastewater Reclamation Criteria, Title 22, Division 4, EnvironmentalHealth, State of California, Dept. of Health Services, Berkeley,
California (1991), Draft Language for Amendments to Title 22, California Code ofRegulationsfor Review by the Department of Health Services Policy Review Committee, StatewideReclamation Criteria, Part 1, State of California, Dept. of Health Services, EnvironmentalManagement Branch, October,
Environment Canada (1990), Wastewater Regulations for Federal Facilities, CEPA Part IVWastewater Regulations, Environment Canada.
EPA (1985), Risk Assessment of Wastewater Disinfection, EPA/600/14, April 1985.
EPA (1986), Design Manual, Municipal Wastewater Disinfection, EPA/625/1-86/021.
EPA (1992), mtraviolet Disinfection Technology Assessment, EPA 832-R-92-004, September.
Feachem (1983) Richard G., David J. Bradley, Handa Garelick, D. Duncan Mara, Sanitationand Disease, Health Aspects of Disease and Wastewater Management, World Bank Studies onWater Supply and Sanitation 3, John Wiley & Sons.
Finger (1992), Richard E., et al, Pilot Scale Testing of Alternative Technologies for MeetingEffiuent Reuse Criteria, Vol. IX, Conference Proceedings, WEF, New Orleans, October.
Heath (1992), Mark S., et al, A Comparative Bench-Scale Evaluation of Ozone, UV Radiation.and Chlorine for Inactivation ofTotal Coliform Bacteria in Filtered and Unfiltered Wastewater,Paper presented to Pacific Northwest Water Pollution Conference, Boise, Idaho, October(James M. Montgomery, Consulting Engineers);
Metcalf & Eddy (1991), Wastewater Engineering, Treatment Disposal Reuse, Third Edition,1991.
lof2

DRAFT
Panicker and Krishnamoorthi (1978), P. V. R. C. Panicker and K P. Krishnamoorthi,"Elimination ofEnteric Parasites During Sewage Treatment Processes," Indian Association forWater Pollution Control Technical Annual, §, pp. 130, 138.
Pommen (1991), L. W., Approved and Working Criteria for Water Quality, Ministry ofEnvironment, Water Management Division, Water Quality Branch, May, 1991.
Saskatchewan (1989), A Guide to Sewage Works Design, Saskatchewan Environment andPublic Safety, Water Quality Branch, WPC 77.
Scot Bondi (1991), Wastewater Disinfection Alternative - Bromine Chloride, W.E.F. OperationForum.
WEF-ASCE (1992), Design of Municipal Wastewater Treatment Plants, Manual of PracticeNo.8,1992. .
W.P.C.F. (1986), Wastewater Disinfection, M.O.P. FD-10.
W.P.C.F. (1990), Operation of Municipal Wastewater Treatment Plants, M.O.P., No. 11.
Bibliography
F. D. Dryden et. al., 1979, Virus Removal in Advanced Wastewater Treatment Systems, F. D.Dryden, C. Chew, M. W. Selma, JWPCF Vol. 51, No.8, August, 1979.
USEPA, 1985, Risk Assessment ofWastewater Disinfection, D. Hubly, W. Chappell, J. Lawning,M. Maltempo, D. Chiras, J. Morris, USEPN600/2-85/037, April, 1985.
USEPA, 1991, Proceedings of the U.S. EPA Municipal Wastewater Treatment TechnologyForum - 1991, EPA 430/09-91-020, September, 1991.
2of2

DRAFT
MINISTRY OF ENVmONMENT, LANDS AND PARKSMUNICIPAL SEWAGE DISCHARGE CRITERIA
TECHNICAL ASSESSMENT REPORT NO.1BEST AVAllABLE CONTROL TECHNOLOGY
TAR 1.2 ADVANCED TREATMENT AND EFFLUENT DISCHARGE CRITERIA
APPENDIXll
Tables, pages 13· 14

DRAFT
TABLE ~S
SUMMARY OF WATER QUALITY CRITERIA FOR CHLORINE(22)
(Continuous
Measurement
Water Use
Freshwater
Aquatic Life
Marine and
Estuarine
Aquatic Life
1Average
Exposure)
Jig/L TRCo4
CPoS
2
3
or
2Average (Controlled
Intermittent Exposure)4 S
~g/L TRC or CPO
[1074 (duration)-0. 704 1
[20.36(duration)-0·o41
Maximum3 (Controlled
Intermittent Exposures)
Jig/L TRCo4 or CPOS
100 regardless of the
duration of exposure .
40 regardless of the
duration of exposure
. . 6,7 dIrr:Loat:Lon none propose none proposed 1000
1
2
3
4
S
6
7
The average should be based on at least S samples, equally spaced intime, and the averaging period should not be less than -4 days nor morethan 30 days for freshwater, and not less than 2 hours nor more than 30days for marine or estuarine water. This is the threshold of chronictoxicity.
Duration is the exposure period in minutes. This is the threshold ofacute toxicity.
For aquatic life, the total duration of exposure in any consecutive 24hour period should not exceed 2 hours. This is the threshold of acutetoxicity.
Total Residual Chlorine in freshwater.
Chlorine-Produced Oxidants in marine or estuarine water.
For plants grown in soilless media.
To be applied as a maximum under continuous or intermittent exposuresituations.
- 13-

Table 1. Suitable Uses of Reclaimed WaterConditions in Which Use is Allowed a.J
Use Disinfected Disinfected Disinfected UndisinfecledTertiary Secoodary-2.2 Seo:JDdary-23 SecondaryRedaimed Reclaimed Reclaimed Reclaimedlater Water Water Water
lUJll>Iy ior • IlOQ-f'eStn:leli reera.Uooal ImpOIllllImenl Allowod N>l. allowed Not aIIo-..l Not allowed
IIusiIIlIf lDiIeta &Ill! lIl1Il&lI IIId pnIIlIII( dram lnpl Allowod Not allowed Not aIIo-..l Not alloW<!
all "lA!r _ otbor Ulan potable _ or AI»-! Not ~ Not a&-1 Not allowedfood JftpU't.tiDa (foolDate b) (6:lotDote b)
~lJoI1 01:
pub. p/IIJ'I"l'IDds. 1P:booI:JVds. ftSidml.iaI:JVds. Sp'ay. drip, Not ~ Not ~ Not allowedIIId pi~ __ted wii.b I'l!!Iiimca ar Ilrilee
I"aItnr:IaI acoeos fOIl coar.IOS. eemetenes. &ll4 iree..y ia.DdIcapes SinY. 4np, "'I"Y. 4np, .'>I"y. en;.. Not allowedor rome. or~ or--"
DOCl-IlIiblo ~lJoI1 al. oUxr _ with Sp'ay. drip, SinY. drip, Siny· Grip. Not allowedliIIlil.ei publi: cqaare (1ootDole c)
01' __ or __ar-we
(footnote c1 IfooUJ:ltAo c1Illd IarmI Spray. drip, Spray. drip, Sfny. Grip. Not allowed
or~
or __ or __
~~~~- Spray, drip, Siny. drip, Spray. drip. Not allowedor rome. oroun- or~
all food aopI Spray. drip, Not aJ.IlnoIoj Not w.- Not allowedor~
food aopI tbal are __ C"JUll'i aDQ DOl. CllOUCtel by reciaIIDecI "'leI' Spray. Grip. ~or Not w.- Not allowedor I'lII"tIer surlace
~ lor aWlanc ammaII IIId oUler __ Spray. cIrip, SenY. drip, Spray. Grip. Not allowedor~ or~
or __
fodder 1L(.. alfaU&l. 6ber (a.&. llllUIllll. Siny. drip, SinY. drip, Sfny. .... ~orIIId !I!l!d ....... DOt ..Iftl by bumIm or-m or lIIriIce or--e ~
~ IIId~ bMDc 6lOli CftlII Spray. drip, Ilripar Ilripar Ilriporor I'lII"tIer !I'lII'1ace -aot IIIrlIcl!
orc:!IuoiI IIId t'Im)VliI DOl. b.rmc 6lOli aopI~~ Sin~ ~~
Drip oror "'"-
~ tns &Ill! oUler trees DOl. C""'II lor food Siny. drip, SinY. drip. Spray. Ilnp. Drip oror wrlllcf or~ or~ IIIrlIcl!
food CIll!' wilidI -1IDllerIo~~ Siny, drip. Spray. drip, Siny. Grip. Ilnpor~ bdore A.aAiI~ (L(.. SUCV"" or IlIria
or __or tarDce -we
L tas
iDdUltnil~ at.iIizia( -aor u-s. fcIrocft U' naporatiaa. AIIIrotd Not allowed Not .a-d Not allowed..~ or otbor latlll'l t.bat cnu. ___ or oUler mirl .0
iDd_ -uac DIll. WIImIc CllIOliIIr -.- ...... I1'&pOnlIlKl. 4IIDwed ~ AIiDWIll Not allowed1lft1lll!' __ ot.ber '-Un l.bIl CIWUI ___ ar oUIIr mirl '0
• IDli1aIU'aI~ 1IIUI cqaun 0( -an IIootDole ell AIPecI Not allowed /ooI.~ Not allowed
mcIU1tnU~ 1IIlbout apIlIIIn 0( -an 1/ool.DOl..e e) AIIDwed ~ AIiDWIllo Not allowed
iDcIQItmJ boiIa' feci AIiIIwe<I ~ ~ Not allowed
"lei' Jrltmr ~ .......'_ 01 boddilI mueraI aI'OIIlIcI AIiIIwe<I Not allowed /001. **- Not allowedpipelmes lor potabII WWr cllInar water IbaNces
"lei' JrlUll( lor '010'_ 01 boddilI_t.erw aI'OIIlIcI ~
Iallowed ~ Not allowed
pipeline lor~ water. -ee. II.onD cIniDa(oe. &Ill!cu. &DcI coacIlIItI lor eilctricity
~ lOll lor~ at -.ucI.'OII _
I AIloweG AiIowod allowed Not allowedIaDcIfilis. &DcI eiIntIefoe
I 1IUlllIIf &grepl.e Ulli ma.iI:Iac COllICI'eU ~ Allowed allowed Not allowed
~__ .... aDQ oUla' SlIrlaces lor elun COCllrol AIIo>we<I I Allowed jIDwod Not allowed
~ brusoos &DlI _ -.n- 4UnD( IUftI. .-pmc IoIIDwed AIIowecI AIIowecI Not allowed
QUIAIII( IllULUy~ (/ooI.nol.e 0 Allowed AIIowecI AiIDwod Not allowed
lire fiplunc oy GIJDlllm« tnlaI -=n.1l. AIIDwecI iJlDwecI AIIDwecI Not alloW<!
supply lor. I'l!StI'I:I.elI~~_nl AIIo>we<I iJlDwecI /lOt ~ Not allowed
lUJ'Illy lor _ al. IiIh il&IcDones 6IIowed allowed Not allD-: Not allowed
-.nq c:arporauaa :JVds. lDl& &DlI-....u.s AIPecI I AIIowecI Not ur.-: o Not alIo1!Od
I rupply lor~ _"", ! ,.,. 1III.l>lIul. -.u.. Iounwn IIIIltwed i AIIowecI I -- Not aIllnl<d II rupply - _lite *"oDWn Allowed Not....-
/lOt __Not alJowecI

MINISTRY OF ENVmONMENT, LANDS AND PARKSMUNICIPAL SEWAGE DISCHARGE CRITERIA
TECIINICAL ASSESSMENT REPORT NO.1BEST AVAllABLE CONTROL TECHNOLOGY
DRAFT
.6 Dec/93
TAR 1.2 ADVANCED TREATMENT AND EFFLUENT DISCHARGE CRITERIA
Subject
TAR 1.2.2 - Nitrogen
Nitrogen reduction.
Obiective
To review existing regulatory requirements regarding nitrogen reduction, to review nitrogentreatment process and to establish associated effluent limits.
Scope
The criteria which are developed as a result ofthis TAR will impact municipalities and regionaldistricts which own and operate sewage treatment systems.
Responsibility
The Ministry of Environment is responsible for setting nitrogen and particularly ammoniaconcentration limits for effluent discharges. At present dischargers monitor their effluent fornitrogen/ammonia permit requirements and Ministry of Environment monitors the receivingwater or ground disposal site. Fisheries & Oceans may also monitor ammonia levels inreceiving waters. The Ministry of Environment is responsible for ensuring compliance withthe criteria for protection of the environment.
Background
Presently ammonia and other nitrogen forms are classified as nutrients. The British Columbiawater quality objective is "no detectable increase in site specific productivity-limitingparameters" (British Columbia, 1975). Otherwise, toxicity indirectly establishes a limit onammonia but no specific concentrations are given.
The Water Management Division (pommen, 1991) has published criteria for nitrates, nitritesand ammonia to protect both marine and freshwater life. These criteria are applicable outsidethe initial dilution zone. Nitrate and nitrite concentrations for aquatic life protection in freshwater are permitted a maximum of 200 mg/L NOs-N and 0.06 N02-N, and an average of < 40mg/L NOs-N and < 0.02 N02-N. (Nitrite concentrations permitted are controlled by chlorideconcentrations. Refer to Appendix IT tables from Pommen (1991).) For a temperature of 10°C,marine water may contain maximum average day total ammonia concentrations from 1.5 to 148mg/L depending on pH and salinity. For the same temperature, marine water may contain anaverage 5 to 30 day total ammonia concentration range between 0.26 and 20 mg/L dependingon pH and salinity. Allowable freshwater ammonia concentrations, provided by Pommen(1991), for between 10 and 20°C and pH 6.5 to 8.0 are no more than 0.76 to 1.84 mg/L over a30 day average, to no more than 5.6 to 25.5 mg/L for a daily average.
- 1 -

DRAFT
Description of the Subiect
The concentratior. ::;f nitrogen in its various forms in a receiving water or aquifer may beunacceptable. Treatment prior to discharge may be required.
Nitrogen control and the reduction of effiuent ammonia concentration levels in wastewatertreatment plant effiuents has a direct environmental impact. The presence of nitrogen (orforms of nitrogen) in a wastewater discharge can be undesirable for several reasons:
1. Free, unionized ammonia is toxic to fish and many other aquatic organisms.2. Ammonia is an oxygen consuming compound which will deplete the dissolved oxygen
in receiving waters and hypolimnion of lakes.3. Nitrogen can be available as a nutrient to aquatic plants and consequently contribute
to eutrophication.4. The nitrate ion is a potential health hazard in water consumed by infants and can also
affect adults.
Depending on the local circumstances, the removal of some or all forms of nitrogen may berequired.
Subject Characterization
a) General
Ammonia (NHs), ammonium (NH.+), nitrite (N02), nitrate (N0J, and organic nitrogencontribute to total-nitrogen (TN) concentration in an effiuent sample. Total Kjeldahlnitrogen (TKN), is the sum of organic-N plus ammonia-No
Typical raw domestic sewage contains 60% organic forms of N (soluble urea and aminoacids) and 40% in the ammonia form. Total nitrogen in domestic sewage is between 20and 85 mg/L-N with a typical medium strength of 40 mg/L-N (Metcalf & Eddy, 1991).(Lower total nitrogen concentrations of about 80 mgIL appear more frequently inBritish Columbia and ammonia is typically 60 to 80 percent of TKN.)
b) Analytical Nitrogen Measurement Methods WHA-AWWA-WEF. 1992)
Ammonia-N can be measured by nesslerization (20 JJ,g NHs-NIL to 5 mg NHs-NILconcentration range), using phenate (10 JJ,g NHs-NIL to 500 JJ,g NHs-NIL concentrationrange), using distillation followed by filtration (normally used for NHs-N concentrationgreater than 4 mgIL), and using NHs selective electrode (0.03 to 1400 mgILconcentration range) methods.
TKN is measured by digesting the organic compounds containing N in the trinegativestate with concentrated acid to release the amino-nitrogen and convert them toammonium sulfate. Free NHs and NH.+ are also converted to ammonium sulfate. Theammonia content in the ammonium sulfate is then distilled into boric acid and theammonia concentration determined by one of the above mentioned methods.
Nitrite (N02-) can be measured by a colorimetric method (5 to 1000 JJ,g N02--N/Lconcentration range). Nitrate (N0s-) can be measured by numerous colorimetric
- 2 -

DRAFT
methods over a concentration range of 0.01 mg to 10 N03"-NIL, and by a nitrate ionelectrode method over a range of 0.14 to 1400 mg N03-NIL.
Section 4500 of Standard Methods (APHA-AWWA-WEF, 1992) details the analyticalmethods one can use to measure the various forms of nitrogen in a sample.
Experience in Other Jurisdictions
Criteria for nitrogen and ammonia discharges vary throughout the U.S.A. and Canada. Theypredominantly reflect a requirement to control ammonia below a toxic threshold. Variouscriteria are used to determine ammonia concentrations allowable in the receiving water.
a) Washington (1991):
The new draft water quality standards place limits on unionized ammonia for fresh andmarine waters and differentiate between acute and chronic concentrations. For marinewaters, an acute concentration of 0.035 mg/L as a 1 hour concentration is not to beexceeded more than once in three years. A chronic concentration of 0.233 mg/L on a4 day average is not to be exceeded more than once every three years. (The chronicconcentration appears to be incorrectly entered since the chronic should be about 0.003mg/L for a 0.035 mg/L acute.)
For fresh waters see State of North Dakota (1989) except concentration =(0.52/FT/FPH/2) mg/L.
b) Oregon (1989): Chapter 340, Div. 41, Administrative Rules, File 6-12-89, EQC 6-289.Department of Environmental Quality.
Ammonia limits are established for receiving waters within the state and are related totemperature and pH, as tabulated in the criteria for each basin. For example, BearCreek subbasin must not exceed 0.25 mg/L ammonia nitrogen through May toNovember, and 1.0 mg/L through December and April. Other basins may not includeammonia as criteria.
c) State of North Dakota (1989): Standards of Water Quality for North Dakota, Rule 3316-02, North Dakota State Department of Health, Bismark, North Dakota.
(i) Ammonia is described and limited by its un-ionized state in relation totemperature and pH in the receiving water, by formula:
un-ionized ammonia concentration = (0.427/FT/FPH/2) mg/L
where FT = 10o.03(20-TCAP) TCAP<T<30°CFT = 10o.03(20-T) O<T<TCAPFPH = 1 89H <9FPH = 1 + 107.4-pH 6.59H<8
1.25TCAP = 20°C salmonoidsTCAP = 25°C otherwise
- 3 -

DRAFT
(ii) A limit is also placed on ammonia in the effiuent discharge at(0.658/FT/FPH/ratio) mgfL
where Ratio =Ratio =
1624x 107•7-pH
1+107.4-pH
7.79H<96.59H <7.7
d) Virginia (1988): Commonwealth of Virginia, State Water Control Board Regulations,Water Quality Standards, VR 680-21-00.
Both un-ionized and total ammonia concentrations are provided in a tabular formatshowing allowable receiving water concentration limits. For example, a 10cC receivingwater containing salmonoids and pH 6.5 to 9, allowable total ammonical concentrationlimits vary from 2.2 to 0.16 mgfL. At 20CC the concentration varies from 1.49 to 0.13mgfL. For waters not containing salmonoids, at 20cC the allowable respectiveconcentrations increase to 2.1 to 0.17 mgfL.
e) Nebraska (1990): Title 117 - Nebraska Surface Water Quality Standards, NebraskaDepartment of Environmental Control.
Un-ionized and total ammonia concentrations are tabulated for various receiving waterstreams and are stipulated for 1 hour averages and 4 hour averages. The 1 hourallowable concentrations are one log higher than the Virginia restrictions. The 4 hourrestrictions are similar to the Virginia restrictions.
f) Minnesota (1988): Minnesota Rules Chapter 7050, Standards for the Protection of theQuality and Purity of Waters of the Station.
Un-ionized ammonia receiving water concentrations are limited to 0.016 mgfL for ClassA and 0.04 mgfL for Class B streams, regardless of temperature or pH.
f) Ontario (1978): Water Management. Goals. Policies. Objectives, and ImplementationProcedures of the Ministry ofEnvironment, Ontario Ministry ofEnvironment (RevisedMay, 1984).
Ammonia nitrogen limits are discussed in terms of un-ionized ammonia and 0,02 mgfLis the limit accepted for protection of aquatic life in a receiving environment. Forreceiving streams no limits are discussed for nitrates or nitrites. (When water wouldbe used for animal consumption, nitrates plus nitrites (NO.tN) must be less than 100mgfL, and nitrites (N02-N) no more than 10 mgfL.)
h) Manitoba (1988): Manitoba Surface Water Quality Objectives, Manitoba Environment,Province of Manitoba, Winnipeg, Manitoba, July 15.
The Manitoba standards limit ammonia concentrations in the receiving water using thesame criteria as North Dakota (1989). No standards are provided for nitrate andnitrite.
i) Alberta (1993): The Alberta standards are out of date and reference is made toCanadian surface water quality objectives. Presently, Calgary only has water quality
- 4-

DRAFT
limits for ammonia (Calgary). Total ammonia in the effiuent is restricted to 3 mg/Lsummer and 10 mg/L winter. A 5 mg/L summer and 10 mg/L winter may be used.
Assessment of Control Options. Methods and Technology
Control options include calculation of the nitrogen concentration in the discharge to meetreceiving water criteria, and the selection of treatment processes which will provide thenitrogen control. Since ammonia is the primary concern, a back calculation is examined in thissection to determine the effiuent concentration.
Three commonly used ammonia reduction processes are biological nitrification, ion exchangeand air stripping. Biological nitrification converts the Ammonia-N to Nitrite-N, then toNitrate-N. The second step, if nitrogen removal is required, is denitrification. Biologicaldenitrification involves the conversion of Nitrate to N2 gas by heterotrophic bacteria underanoxic conditions. The N2 gas is released to the atmosphere. The following describes biologicaland physical nitrogen treatment technology. An example back calculation for effiuent ammoniaconcentration follows.
a) Biological Methods for Ammonia Reduction
Figures 1, 2, 3, 4 and 5 show common biological process schematics used for removingammonia, nitrates and nitrites. The process flow trains are divided into threegroupings depending on the nitrogen removal achieved. The first grouping showsvarious schematics of biological ammonia removal processes. These processes reducethe ammonia levels to moderate to low levels. The second process grouping can beapplied when complete nitrification is required. The biological processes use a separatestage or combined nitrification/denitrification reactors, and each uses different carbonsupplies and solids management techniques. The last grouping shows various combinednitrification and denitrification processes including phosphorus removal. The modifiedBardenpho, D.C.T., modified D.C.T., and A2/0 processes. incorporate phosphorusremoval and denitrification, as well as nitrification and BOD reduction.
Biological nitrification is the oxidation of ammonia (NHa+) to nitrate with nitriteformation as an intermediate. The microorganisms involved are the autotrophic speciesNitrosomonas and Nitrobacter which carry out the reaction in two steps:
2 NH.+ + 3 O2 Nitrosomonas 2 N02- + 2 ~O+ 4 H+ + new cells
2 N02- + O2 Nitrobacter 2 NOa- + new cells
The extent of biological nitrification that occurs during treatment is dependent on thenitrifYing organisms present. The cell yield is dependent on the organisms present inthe treatment process. The stoichiometric equation for nitrification indicates that forone gram of ammonia nitrogen removed, approximately:
4.33 g of O2 are consumed0.15 g of new cells are formed
7.1 g of alkalinity (as CaCOJ are destroyed0.08 g of inorganic carbon are consumed
Nitrification is pH sensitive with the optimum range between 7.0 and 8.0.Temperature, sludge age (or solids retention time) and inhibition by numerous toxic
- 5 -

DRAFT
materials are variables that affect biological nitrification. The goals of the nitrificationprocess are to reduce ammonia levels and to exert the nitrogen-oxygen demand in thetreatment plant and not in the receiving body of water.
Biological nutrient removal processes can achieve effluent ammonia concentrations aslow as 0.05 mg/L, and typically less than 0.5 mg/L are achievable. Soluble organicnitrogen concentrations will be about 1.0 to 1.5 mg/L, therefore treated effluent TKNconcentrations of less than 1.5 mg/L are possible (Randall, 1992). Most organic N willbe converted to ammonia-N in a conventional WWTP, and therefore can undergonitrification (thus TKN is the common constituent used to measure the total ammoniaload to be nitrified).
If denitrification follows nitrification, effluent levels of NOs-N plus N02-N of about 1mg/L are possible (Sedlak, 1991). This, combined With TKN levels of 1.5 mg/L meansthat plant effluent total nitrogen levels of 3.0 mg/L are possible. However, a moretypical (and economical) effluent TN level is about 10.0 mg/L (in which ammoniaconcentrations would be less than 3 mgIL-N and likely less than 1 mgIL-N). Otherwise,large reactor volumes are needed to ensure complete nitrification at low temperaturesand to achieve low levels of 3.0 mg/L TN.
If total nitrogen levels have to be reduced, the second step which mayor may not bepart of an ammonia removal process is biological denitrification. This biological anoxicprocess uses heterotrophic organisms and a source of carbon to convert nitrate tonitrogen gas. Temperature, pH, D.O. level, oxidation reduction potential (measured asORP in mV as Eo AglAgCl) and availability of a readily consumable carbon source aremajor factors that affect the denitrification process.
Nitrification processes are often found in the aerobic reactor of an activated sludgesystem in oxidation ditches, in trickling filters and in REC's. Denitrification occurs inthe anoxic reactors of an activated sludge process, either in a single sludge or dualsludge process, in fIXed film column reactors, and in the anoxic zone of an oxidationditch.
Of note, conventional primary treatment can remove about 20% of the total nitrogen;that is, there is some nitrogen associated with the particulate organic matter which isremoved. Conventional secondary treatment will remove more particulate organicnitrogen and transform some to ammonium and other inorganic forms. Someammonium will be assimilated into new cell mass, and some soluble organic N will beconverted to ammonium. In total, following primary and secondary treatment andclarification, about 30 percent of the raw influent total nitrogen level can be removed(USEPA, 1975).
b) Physical-Chemical Methods
There are several physical-chemical methods that can remove ammonia. Breakpointchlorination, ion exchange, and air stripping.
Breakpoint chlorination involves adding chlorine to the effluent, which reacts with theammonium ion to produce chloramines, and the release of N2 gas. About 95 to 99percent of the influent ammonia is converted to N2 gas. The remainder nitrogen is
- 6 -

DRAFT
typically nitrate and nitrogen trichloride. The pH and temperature of the effluent willdetermine the ammonia reduction possible using C12; this is because ammonia andammonium are in equilib:ium in solution and the chemical reaction is pH dependent.About 8 to 10 mg of chlorine are required per mg of ammonia-N removed. The processalso lowers the pH of the effluent, unless there is sufficient alkalinity. Caustic soda orlime may be used to neutralize the effluent.
For an effluent containing 25 mg/L NHa-N, a large dose of chlorine is required (250mg/L). Because of the high dosage requirements (and potential for associated safetyand odour problems), breakpoint chlorination for ammonia reduction is seldompractised unless it follows a nitrification process. In addition the residual chlorine willoften require removal, ie. dechlorination, using sulphur dioxide. The U.S. EPA newdesign manual for nitrogen control, recommends breakpoint chlorination for use onlyin polishing applications where most of the ammonia has been removed (Heidman,1992).
Air stripping involves raising the pH of the effluent to 10 or 11 to convert theammonium ion to ammonia, then running the effluent through an air stripping towerto strip the NHafrom solution into the air. Up to 95 percent of the ammonia-N can beremoved. Problems with freezing of the effiuent in the stripping tower in coldertemperatures, pH readjustment measures, deposition of calcium carbonate on the towermedia (when lime is used for increasing the pH) and air pollution abatement measures(which may be of concern) are common design considerations when undertaking anammonia stripping process. Nitrate and organic-N are not removed to any extent.Odour associated with the NHa vapour in the discharge from a properly operatingstripping tower is usually below the threshold concentration of 35 mglma. (EPA 1975).Heidman (1992) reports that Tahoe could remove no more than 40 percent NHa.
Ion exchange involves passing the effluent through an ion exchange resin column whichis selective for the ammonium ions. The zeolite, clinoptilolite, a natural occurringmineral, is the prime material used. To prevent fouling of the zeolite (silicate) theeffiuent is usually filtered prior to passing through the zeolite column. Regenerationof the zeolite is required upon ammonium breakthrough. Up to 90 to 97 percent of theeffiuent ammonium level can be removed; nitrate, nitrite, and organic-N are notremoved by the ion exchange process. Heidman (1992) reports that the costs areunacceptably high.
Table 1 lists various treatment operations and processes, and the percent nitrogenremovals possible (Metcalf & Eddy, 1991). Of note, bacterial assimilation of nitrogenfor growth and respiration purposes can account for significant ammonia removal,depending on the treatment process. Heterotrophic bacteria, including denitrifiers andautotrophic bacteria (nitrifiers) and nitrate (nitrite) reduction to nitrogen gas all uptakeammonia for growth and denitrifiers use nitrates (nitrites) as electron acceptors forrespiration. The bacteria are recovered from the liquid stream in the clarifiers.
- 7 -

TABLE 1EFFECT OF VARIOUS TREATMENT OPERATIONS AND
PROCESSES ON REMOVAL OF NITROGEN COMPOUNDsa
DRAFT
Treatment Operation or Nitrogen COmpound Affected by Process ProbableProcess Bemovalof
Organic Nitrogen NHa-NH.+ NOa" Total Nitrogenby Process, %b
A Conventional Treatment:
Primary 10-20% removed No effect No effect 5-10
Secondary 15-20% removede < 10% removed Slight effect 10-30urea _ NHs-NH.+d
B Biological Processes:
Bacterial assimilation No effect 40-70% removed Slight 30 -70
Denitrification Not applicable Not applicable 80-90% removed 70 - 95
HarVesting algae Partial transformation to NHs-NH.+_ cells
d_ cells
50-80
Nitrification Limited effect _NOs-d No effect 5-20
Oxidation ponds, Partial transformation to NHS-NH4+ Partial removal by Partial removal by 20-90....
atripping nitrification!- denitrification
Lagoons partiBl transformation to NHs"NH4+ _NOs-d Partial removal by 0-90"nitrification!denitrification
C Chemical Processes:
Breakpoint chlorination Uncertain 90-100% removed No effect 80-95
Chemical coagu1ati.on 60-70% removed Slight effect Slight effect 20-30
Carbon adsorption 3().6()% removed Slight effect Slight effect 10-20
Selective ion exchange for Slight. uncertain 80-97% removed No effect 70-95ammonium
Selective ion exchange for Slight effect Slight effect 75-90% removed 70-90nitrate
D Physical Operations:
Filtration 30-95% of 8U8pended organic N Slight effect Slight effect 20-40removed
Air atripping No effect 60-95% removed No effect 60-90
Electrodialysis 100% of BUSpended organic N 3()..5()% removed 3()..5()% removed 40-50removed
Reverse osmosis 60-90% removed 60-90% removed 60-90% removed 80-90
• Adapted from Ref. 4.b Depends on the fraction of in11uent nitrogen for which the process is effective and other processes in treatment plant.e Soluble organic nitrogen, in the form ofurea and amino acids, is reduced substantially by secondary treatment.d Arrow denotes "conversion to."e BC lagoon eft1uents are observed to show little to no ammonia conversion, the EPA design manual EPA (1983) states that
removals of 99% are poesible in facultative pond systems.
- 8 -

DRAFT
c) Calculation of Effluent Ammonia Concentrations
Appendix ill describes a method ofcalculating effluent ammonia concentration for threealternative conditions. Since pH and temperature affect the concentration of the unionized toxic ammonia form, both are part of the criteria needed to calculate an effluentconcentration. The allowable concentrations in the receiving water are obtained fromthe Pommen (1991) tables of Appendix n. The background receiving waterconcentration must be subtracted from the allowable limit to obtain the allowableincrease over background.
The effluent concentration for surface water discharges is determined by backcalculation for dilution effects occurring in the initial dilution zone (100 mdownstream). The receiving water stream energy, outfall diffuser type, location, depthof water and effluent flow are used to determine the outfall dilution that occurs withinthe initial dilution zone. For all but special cases (high pH, high temperature orinadequate initial dilution «20:1», the allowable total ammonia effluentconcentrations at discharge would be well above normal ammonia concentrations in nonnitrified effluent from municipal secondary treatment plants.
Ammonia may require up to 50% reduction where effluents also are discharged to highpH, high temperature receiving waters in order to meet non toxic chronic levels. Whereless than 20:1 dilutions are available, ammonia reductions may be needed.
Financial Impact Assessment
The addition of ammonia reduction to conventional secondary biological process increases thecapital cost by 25 to 50 percent. Where existing secondary capacity is large (Le. long aerationtimes such as in extended aeration), no capacity increases are likely needed or retrofit costs willlikely be low. .
Recommendations
The current practice of setting effluent ammonia concentrations based on site specific waterquality evaluations should be retained. The nitrogen load or ammonia concentration levelshould be set upon review of the impact that the effluent discharge will have on the overallwater quality of the receiving water body.
1. For discharge to land, the impact on groundwaters should be assessed (to avoidincreasing nitrate levels and the associated drinking water health risk).
2. Spray irrigation on lands should assess the nutrient uptake and should set effluentnitrogen concentrations accordingly.
3. In fish bearing bodies of water, the various forms of nitrogen (primarily ammonia andnitrate) should not exceed the concentration levels listed in the Water Quality Criteriaby Pommen (1991).
When ammonia removal is the only requirement, an economical nitrification system can beselected. However, if very low levels of effluent ammonia concentrations are required, then aseparate or combined nitrification and denitrification process will be required.
- 9 -

DRAFT
Ammonia effiuent limits shall be back calculated using diffusion models as demonstrated inthis assessment and detailed in Technical Assessment Report No.2, Effiuent to Surface Water.In most instances in British Columbia, effiuent discharges to surface waters should not requireammonia reduction following secondary treatment. Receiving waters with high temperature,high pH and available dilutions less than 20:1 are the probable exceptions.
- 10-

1. BIOLOGICAL NITRIFICATION PROCESSES
AEROBIC
INFLUENT
RBS was
EFFLUENT
PRIMARYSLUDGE
a) SINGLE STAGE CARBON OXIDATIONAND NITRIFICATION PROCESS
AEROBIC AEROBIC
INFLUENT EfFLUENT
PRIMARYSLUDGE
RBS WBS RBS was
FIGURE 1
b) SEPARATE STAGE CARBON OXIDATIONAND OXIDATION NITRIFICATION PROCESS
~DAYTON & KNIGHT LTD.e-.umng £"fI/ttHn=====================================================~ACAD DWG. 196-15C

AEROBIC
AEROBIC
INFLUENT
PRIMARYSLUDGE·
RBS WBSEFFLUENT
FIXED GROVVTH(FILM) REACTOR
c) SEPARATE STAGE CARBON OXIDATIONAND FIXED GROWTH (FILM) NITRIFICATION PROCESS
BOD REDUCTION NITRIFICATION
INFLUENT
PRIMARYSLUDGE
FIXED GROWTH REACTORS
EFFLUENT
WBS
d) SINGLE OR DUAL STAGE II
CARBON OXIDATION AND OXIDATJON
L' NITRIFICATION PROCESS
1R?~~I2~~NIGHT LTD. FIGURE 2 J~ ACAD OWG. 19~6:=-=1=:=5===C====================================::::::

2. COMBINED BIOLOGICAL NITRIFICATION / DENITRIFICATION
CARBON SOURCE
INFLUENT
AEROBICCARBON OXIDATION &
NITRIFICATIONANOXIC
DENITRIFICATION
/EFFLUENT..
RBS was RBS WBS
a) lWO SLUDGE CARBON OXIDATION, NITRIFICATIONAND DENITRIFICATION PROCESS
MIXED UQUOR RECYCLE
INFLUENT
AEROBICCARBON OXIDATION &
NITRIFICATION
ANOXICDENITRIFICATION
RBS
EFFLUENT
b) SINGLE SLUDGE DUAL RECYCLE CARBON OXIDATION,NITRIFICATION AND DENITRIFICATION PROCESS
INFLUENT
AEROBICCARBON OXIDATION &
NITRIFICATIONANOXIC
DENITRIFICATION
RBS
EFFLUENT
was
FIGURE 3
c) SINGLE SLUDGE, SINGLE RECYCLE CARBON OXIDATION,NITRIFICATION AND ENDOGENOUS DENITRIFICATION
cl] DAYTON & KNIGHT LTD.e-HI"fI£ngI"..,..=============================================================~ACAD DWG. 196-15C

3. COMBINED BIOLOGICAL NITRIFICATION / OENTRIFICATION / PHOSPHORUS REMOVAL
R
INFLUENT
RBS
EFFLUENT
ANAEROBIC ANOXIC AEROBIC ANOXIC AEROBIC FINALCLARIFIER
a) PHOREDOX (OR MODIFIED BARDENPHO)
(BARDENPHO PROCESS IS FOR NITROGEN REMOVAL:MODIFIED PROCESS REMOVES BOTH P AND N)
R2 R1
INFLUENT
RBS
WBS
EFFLUENT
ANAEROBIC ANOXIC AEROBIC FINALCLARIFIER
FIGURE 4
b) UNIVERSITY OF CAPETOWN (UCT) (OR VIP HIGH RATE)
.~ DAYTON l KNIGHT LTD.CoMu/HIIg CtttIIrtHn ====::================================================-:/ACAD DWG. 196-15C

R2 Rl
INFLUENT
RBS
ANAEROBIC ANOXIC ANOXIC AEROBIC FINALClARIFIER
INFLUENT
c) MODIFIED UCT
RBS was
ANAEROBIC ANOXIC AEROBIC FINALClARIFIER
FIGURE 5
d) ANAEROBIC / ANOXIC / OXIC. A2/0
~DAYTON & KNIGHT LTD.Con.uHl"fl Cng/nHrw =======================================================';::/t ACAD DWG. 196-15C

DRAFT
MINISTRY OF ENVIRONMENT, LANDS AND PARKSMUNICIPAL SEWAGE DISCHARGE CRITERIA
TECHNICAL ASSESSMENT REPORT NO.1BEST AVAllABLE CONTROL TECHNOLOGY
TAR 1.2 ADVANCED TREATMENT AND EFFLUENT DISCHARGE CRITERIA
APPENDIX I
References, page 1

DRAFT
MINISTRY OF ENVIRONMENT, LANDS AND PARKSMUNICIPAL SEWAGE DISCHARGE CRITERIA
TECHNICAL ASSESSMENT REPORT NO.1BEST AVAllABLE CONTROL TECHNOLOGY
APPENDIXI-REFERENCES
References
Alberta (1993), telephone conversation with David Spink, Alberta Environment, March 5, 1993.
APHA-AWWA-WEF (1992), Standard Methods for the Examination ofWater and Wastewater,18th Edition, A. E. Greenberg, L. S. Clescent, A. D. Eaton, Editors, APHA-AWWA-WEF.
British Columbia (1975), Pollution Control Objectives for Municipal Type Waste Dischargesin British Columbia, Ministry of Environment and Parks.
EPA (1975), Process Design Manual for Nitrogen Control.
Fisher (1979), H.B., et. al, Mixing in Inland and Coastal Waters, Academic Press, San Diego.
Heidman (1992) James A., "New EPA Process Design Manual for Nitrogen Control",Proceedings 5th WEF/JSWA Joint Technical Seminar on Sewage Treatment Technology,Yokohama, Japan, pp. 3, 18, June 24.
Metcalf & Eddy (1991), Wastewater Engineering, Treatment, Disposal, Reuse, 3rd edition.
Pommen (1991) L. W., Approved and Working Criteria for Water Quality, Ministry ofEnvironment, Water Management Division, Water Quality Branch, May.
Randall (1992) C. W. et al, "Design & Retrofit of Wastewater Treatment Plants for BiologicalNutrient Removal", C. W. Randall, J. L. Barnard, H. D. Stensel, editors, Biological NutrientRemoval, Vol. 5, Water Quality Management Library, Technomic Publishing, Lancaster, PA.
Sedlak (1991) R., Phosphorus & Nitrogen Removal from Municipal Wastewater, Principles toPractice, 2nd edition, R. Sellak editor.
Washington(1991),StateofWashingtonDraftSurfaceWaterQualityStandards,F-WQ-91-101,January.
WEF-ASCE (1992), Design of Municipal Wastewater Treatment Plants, Vol. I and IT, WEFASCE Manual of Practice No.8.
lof1
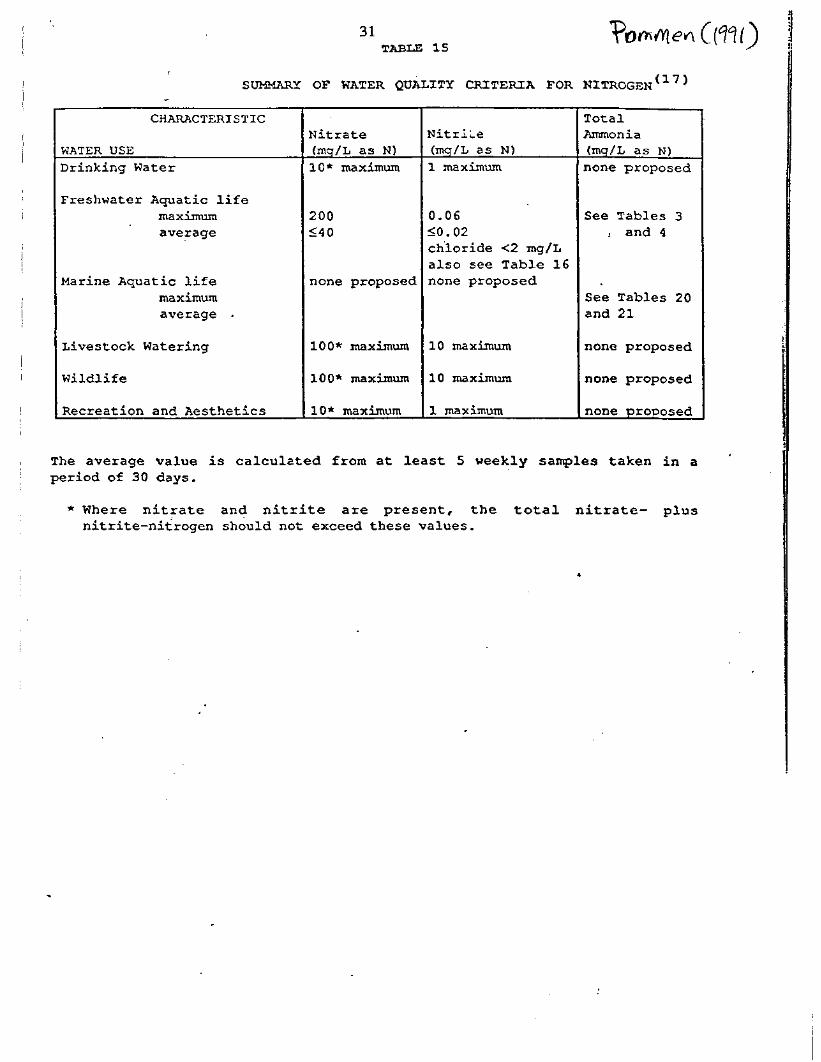
31TABLE 1.5
SUMMARY OF WATER QUALITY CRI:TERIA FOR NITROGEN (1. 7 )
WATER USE
CHARACTERISTICNitrate(mq/L as N)
NitrL.e(rnq/L as N)
TotalAmmonia(mq/L as N)
Drinking Water
Freshwater Aquatic lifemaximumaverage
Marine Aquatic lifemaximumaverage
10* maximum
200:S;o40
none proposed
1 maximum
0.06:S;0.02chloride <2 mg/Lalso see Table 16none proposed
none proposed
See Tables 3! and 4
See Tables 20and 21
Livestock Watering
Wildlife
Recreation and Aesthetics
100* maximum 10 maximum
100* maximum 10 maximum
10* maximum 1 maximum
none proposed
none proposed
none proposed
The average value is calculated from at least 5 weekly samples taken in aperiod of 30 days.
* Where nitrate an~ nitrite are present, the total nitrate- plusnitrite-nitrogen should not exceed these values.
•

32
TABLE 16
CRITERIA FOR NITRITE FOR PROTECTION OF
FRESHWATER AQUATI~ LIFE(17)
Chloride Concentration Maximum Nitrite Concentration Average Nitrite
(mg/L) (mg/L as N) Concentration*
(moiL as N)
less than 2 0.06 0.02
2-4 0.12 0.04
4-6 0.18 0.06
6-8 0.24 0.08
8-10 0.30 0.10
qreater than 10 0.60 0.20
* the 30-d average chloride concentration should be used to dete~ne the
appropriate 30-d average nitrite criterion.

18~ABLE 3
AVERAGE 30-DAY CONCENTRATION OF TO~A~ AMMONIA NITROGEN FOR PROTECTION OF
FRESHWATER AQUATIC LIFE(17)(ing/L-N)
pH Temperature ( 'Cl0.0 1.0 2.0 3.0 4.0 5.0 6.0 7.0 8.0 9.0 10.0
6.5 2.08 2.05 2.02 1.99 1.97 1.94 1.92 1.90 1.88 1.86 1.846.6 2.08 . 2.05 2.02 1.99 1.97 1.94 1.92 1.90 1.88 1.86 1.846.7 2.08 2.05 2.02 1.99 1.97 1.94 1.92 1.90 ' 1.88 1.86 1.846.8 2.08 2.05 2.02 1.99 1.96 1.94 1.92 1.90 1.88 1.86 1.846.9 2.08 2.05 2.02 1.99 1.97 1.94 1.92 1.90 1.88 1.86 1.847.0 2.08 2.05 2.02 1.99 1.97 1.94 1.92 1.90 1.88 1.86 1.847.1 2.08 2.05 2.02 1.99 1.97 1.94 1.92 1.90 1.88 1.86 1.847.2 2.08 2.05 2.02 1.99 1.96 1.95 1.92 1.90 1.88 1.86 1.857.3 2.08 2.05 2.02 1.99 1.97 1.95 1.92 i.90 1.88 1.86 1.857.4 2.08 2.05 2.02 2.00 1.97 1.95 1.92 " 1.90 1.88 1.87 1.857.5 2.08 2.05 2.02 2.00 1.97 1.95 1.93 1.91 1.88 1.87 1.857.6 2.09 2.05 2.03 2.00 1.97 1.95 1.93 1.91 1.89 .1.87 1.857.7 2.09 2.05 2.03 2.00 1.98 1.95 1.93 1.91 1.89 1.87 1.867.8 1.78 1.75 1.73 1.71 1.69 1.67 1.65 1.63 1.62 1.60 1.597.9 1.50 1.48 1.46 1.44 1.43 1.41 1.39 1.38 1.36 1.35 1.348.0 .1.26 1.24 1.23 1.21 1.20 1.18 1.17 1.16 1.15 1.14 1.138.1 1.00 0.989 0.976 0.963 0.952 0.942 0.932 0.922 0.914 0.906 0.8998.2 0.799 0.788 0.777 0.768 0.759 0.751 0.743 0.736 0.730 0.724 0.7188.3 0.636 0.628 ' 0.620 0.613 0.606 0.599 0.594 0.588 0.583 0.579 0.5758.4 0.508 0.501 0.495 0.489 0.484 0.479· 0.475 0.471 0.·..67 0.464 0.4618.5 0.405 0.400 0.396 0.381 0.387 0.384 0.380 0.377 0.375 0.372 0.3708.6 0.324, 0.320 0.317 0.313 0.310, 0.308 0.305 0.303 0.301 ' 0.300 0.2988.7 0.260
".0.257 0.254 0.251 0.249 0.247 ,,' 0.246 0.244 0.243 '.: 0.242 0.241
8.8 0.208', ,0.206 0.204 0.202 0.201 " 0.200 0.198 0.197 0.197 " 0.196 0.1968.9 0.168 '0.166 0.165 0.163 0.162 . 0.161 ' 0.161 0.160 ,0.160" : 0.160 0.1609.0 0.135 '0.134 0~133 0.132 0.132 " 0.131 0.131 0.131 " 0.'131, 0.131 0.131
, ,
11.0 12.0 13.0 14.0 15.0 ,16.0 17.0 18.0 19.0 20.0
6.5 1.82 ' .:1.81 1.80 1.78 1.77, 1.64 1.52 1.41 1.31 1.226.6 .1.82 ,': '1..81 1~80 1.78 1.77 1~64 1.52 1.41 1.31 1.226.7 1.83"" '1..81 1.80 1.78 1.77· ' 1.64 1.52 ' 1.41 ,1.31 ,1.226.8 1.83 ;: 1.81 ' ,1.80 1.78 1.77 ' , 1.64 1.52 1.42 ',1.32 1.226.9 1.82 ' 1.81, ..1.80 1.78 1.77 1.64 1.53 1.42 1.32 1.227.0' 1.83 1.81 ",1.80 1.79 1.77 ' :1..64 1.53 1.42 ' '1.32 1.22' ,7.1 1.83 1.81 1.80 1.79 1.77 ::',1.65 ';' 1.53 1.42 ,·'1.-32 1.23 '7.2 1.83 ,1.81 1.80 1.79 1·78 1.65 1.53 ' 1.42 1.32 1.23 '7.3 1.83 ':1.82 1.80 1.79, 1.'78 _1,65 1.53 1.42 1.'32 1.237.4 1.83 1.82 ' '1.80 1.79 1.78 .: 1.65 1.53 1.42 1.-32 ' 1.237.5 1.83 '1.82 ,1.81 1.80 1.78 1.66 1.54 1.43 ' 1.33' 1.23.7.6 1.84 '1.82 1.81 1.80 1.79 1.66 1.54 1.43 1.33 1.247.7 1.84 1.83 1.81 1.80 1.79 1.66 1.54 1.44 1.34 1.247.8 1.57 '1.56 1..55 1.54 ,1.53 1.42 1.32 1.23 1.14 1.077.9 1.33 1.32 1.31 1.31' 1.30 1.21 1.12 1.04 0.970 0.9048.0 1.12 1.11 1.10 1.10 1.09 1.02 0.944 0.878 0.818 0.7628.1 0.893 ,0.887 0.882 0.878 0.874 0.812 0.756 0.704 0.655 0.6118.2 0.714 0.709 0.706 0.703 0.700 0.651 '0.606 0.565 0.527 0.4918.3 0.571 0.568 0.566 0.564 0.562 ' : 'O~523 0.487 0.(55 0.424 0.3968.4 0.458 0.456 0.455 0.453 0.(52 0.421 0.393 0.367 0.343 0.3218.5 0.369 0.367 0.366 0.366 0.365 0.341 0.3,18 0.298 0.278 ' 0.261
"
8.6 0.297 ' 0.297 0.296 0.296 0.296 0.277 0.259 0.242 0.227 0.2138.7 0.241 0.240 0.240 0.241 0.241 0.226 0.212 0.198 0.186 0.1758.8 0.196 0.196 0.196 0.197 0.198 0.185 0.174 0.164 0.154 0.1458.9 0.160 0.161 0.161 0.162 0.163 0.153 0.144 0.136 0.128 0.1219.0 0.132 0.132 0.133 0.134 0.135 0.128 0.121 0.114 0.108 0.102
- the average of the measured values must be less than the average of thecorresponding individual values in this Table.
- each measured value is compared to the corresponding individual values in this Table.
0-
No more than one in five of the measur~d values can be greater than one-and-a-halftimes the corresponding criteria ~alues in this Table.

19TABLE 4
MAXIMUM CONCENTRATION OF TOTAL AMMONIA NITROGEN FOR
PROTECTION OF FRESHWATER AQUATIC LIFE(17)
(mg/L-N)
pH Temperature (·C)0.0 1.0 2.0 3.0 04.0 5.0 6.0 7.0 8.0 9.0 10.0
6.5 27.7 28.3 27.9 27.5 27.2 26.8 26.5 26.2 26.0 25.7 25.56.6 27.9 27.5 27.2 26.8 26.04 26.1 25.8 25.5 25.2 25.0 204.76.7, 26.9 26.5 26.2 25.9 25.5 25.2 24.9 24.6 24.4 24.1 23.96.8 25.8 25.5 25.1 24.8 24.5 24.2 23.9 23.6 23.4 23.1 22.96.9 204.6 24.2 23.9 23.6 23.3 23.0 22.7 22.5 22.2 22.0 21.87.0 23.2 22.8 22.5 22.2 21.9 21.6 21.4 21.1 20.9 20.7 20.57.1 21.6 21.3 20.9 20.7 20.04 20.2 19.9 19.7 19.5 ,19.3 19.17.2 19.9 19.6 19.3 19.0 18.8 18.6 18.3 18.1 17.9 17.8 17.67.3 18.1 17.8 17.5 17.3 17.1 16.9 16.7' 16.5 16.3 16.2 16.07.4 16.2 16.0 15.7 15.5 15.3 15.2 15.0 14.8 14.7 14.5 14.47.5 104.4 14.1 14.0 13.8 13.6 13.4 13.3 13.1 13.0 12.9 12.77.6 12.6 12.4 12.2 12.0 11.9 11.7 11.6 11.5 11.4 11.3 11.27.7 10.8 10.7 10.5 10.4 10.3 10.1 10.0 9.92 9.83 9.73 9.657.8 9.26 9.12 8.98 8.88 8.77 ,8.67 8.57 8.48 8.40 8.32 8.257.9 7.82 7.71 7.60 7.51 7.42 7.33 7.25 7.17 7,.10 7.04 6.988.0 6.55 . 6.46 6.37 6.29 6.22 6.14 6.08 6.02 '5.96 5.91 5.868.1 5.21 '5.14 5.07 5.01 4.95 4.90 4.84 4.80 4.75 4.71 4.678.2 4.15 '4.09 4.04 3.99 3.95 3.90 3.86 3.83 '3.80 3.76 3.748.3 3.31 3.27 3.22 3.19 3.15 3.12 3.09 3.06 3.03 3.01 2.998.4 2.64 2.61 2.57 2.54 ,2.52 ,2.49 ~.47 ' 2.45 ,2.43 2.41 2.408.5 2.11 2.08, . 2.06 2.03 2.01 1.99 1.98 " 1.96" 1"95 1.94 1.938.6 1.69 1.67 " 1.65, 1.63 .1.61, ' 1.60 1.59' 1.58 ,1.57 1.56 1.558.7 1.35 1.33 "1.32 ,1.31 1.30 ' 1.29 1.28 1.27 ,1.26 l:26 l.258.8 1.08 1.07:' , 1.06 1.05 1.04 1.04 1.03 ' 1.03 1.02 1.02 1.028.9 0.871 0.863 0.856 0.849 0.844 0.839 0.836 0.833 0.832 0.831 0.8319.0 0.703 0.697, 0.692 0.688 0.685 0.682 0.681 0.681 0.680 0.681 0.682
.,'
11.0 12.0 13.0 14.0 15.0 16.0 17.0 18.0, ' '19.0, 20.0"
6.5 25.2 25.0,' :, ,24.8 24.6 24.5 24.3 24.2 24.0 23.9 23.86.6 24.5 ' 24.3 ' :,,24.1 23.9 23.8 24.6 23.5 23.3 23.3 23.2
·6.7 23.7 , '23.5 :23.3 '23.1 23.0 ' 22.8 22.7, 22.6. , ,22.5 22.46.8 22.7 :,22.5 ",: 22.3 22.2 22.0 ' 21.9' 21.8 21.7 21.6 21.56.9 21.6 21.4' ; ,21.3 , 21.1 ,21.0 20.8 ' 20.7' 20.6 20.5 20.47.0 ' 20.3 20~2, 20.0 19.9 19.7 19.6 19.5 ' 19.4 19.3 19.27.1 18.9 18.8 18.7 ',18.5 l8.4 " 18.3 18.2 18.1 18.0 17.97.2 17.4 17.3 17.2 ' 17.1 ' , 16.9 16.8 16.8 16.7, .16.6 16.57.3 15.9 15.7 15.6 15.5 15.4 15.3 15.2 15.2 " 15.1 15.17.4 14.2 14.1 14.0 13.9 13.9 13.8 13.7 13.6 13.6 13.57.5 12.6 12.5 12.4 12.4 '12.3 ' 1:2.2 12.2 12.1 12.1 12.07.6 11.1 11.0 10.9 10.8 10.8 10.7 10.7 10.6 10.6 10.57.7 9.57 9.50 9.43 9.37 9.31 9.26 9.22 9.81 9.15 9.12'.8 8.18 8.12 8.07 8.02 7.97 7.93 7.90 7.87 7.84 7.827.9 6.92 6.88 6.83 6.79 6.75 , 6.72 6.69 6.67 6.65 6.64'8.0 5.81 '5.78 5.74" 5.71 5.68 5.66 5.64 5.62 5.61 5.608.1 4.64 4.61 4.59 4.56 4.54 4.53 4.51 4.50 4.49 4.498.2 3.71 3.69 3.67 3.65 3.64 3.63 3.62 3.61 3.61 3.618.3 2.97 2.96 2.94 2.93 2.92 2.92 2.91 2.91 2.91 2.918.4 2.38 2.:37 2.36 2.36 2.35 2.35 2.35 2.35 2.35 2.368.5 1.92 1.91 1.91 1.90 1.90 1.90 1.90 1.90 1.91 1.928.6 1.55 1.54 1.54 1.54 1.54 1.S4 1.55 loSS 1.56 1.578.7 1.25 1.25 1.25 1.25 1.25 1.26 1.26 1.27 1.28 1.298.8 1.02 1.02 1.02 1.02 1.03 1.03 1.04 1.05 1.06 1.078.9 0.832 0.834 0.838 0.842 0.847 0.853 0.861 0.870 0.880 0.8919.0 0.684 0.688 0.692 0.698 0.704 0.711 0.720 0.729 0.740 0.752

36
~ABLE 20MAXIMUM CONCENTRA~ION OF TOTAL AMMONIA NITROGEN
FOR PROTECTION OF SALTWATER AQUA~IC LIFE (43 >(mg/L-N)
Temperature ( ·C)0 5 10 15 20 25
1ili Sa1.inity -' 10 glkg
7.0 270 191 131 92 62 447.2 175 121 83 58 40 277.4 110 77 52 35 25 177.6 69 48 33 23 16 117.8 44 31 21 15 10 ·7.18.0 27 19 13 9.4 6.4 4.68.2 18 12 8.5 5.8 4.2 2.9
. 8.4 11 7.9 5.4 3.7 2.7 1.98.6 7.3 5.0 3.5 2.5 1.8 1.38.8 4.6 3.3 2.3 1.7 1.2 0.929.0 2.9 2.1 1.5 1.1 0.85 0.67
Sa1inity - 20 glkg
7.0 291 200 137 96 64 447.2 183 125 87 60 .' 42 29 - .,
. . ..
7.4 116 79 '54 37 ..27 '18·~17
.. '
7.6 :'~"'.:. ': 73 . 5~ .35 23 .. ·.·,.11 .'.... "
7·8 '. ·'.::46 31 23 15 11 .. 7.5. .
8.0 . '29 20 14 9.8 6.7 4.8.... 4~4 ..8.2 19 13 8.9 6.2 3.1
8.4 12 8.1 5.6 4.0 ;:.:,2.9.'. . 2.0-..-
7 .~...8.6 . '.. 5.2 3.7 2.7 ~ : --. l~ 9 1.48.8 <'.4.8 3.3 2.5 1.7 . .1.3 0.949.0
..~ . '3.1 2.3 1.6 1.2 0~87 0.69
. :".
. Salinity - .30 g/kg
7.0 .312 . 208 .148 102 71· .48:94 ·44 ..31 -7.2 196. 135 64
7.4 125 85 58 .40 '27 197.6 79 54 27 25 21 127.8 50 33 23 16 11 7.98.0 31 21 15 10 7.3 5.08.2 20 14 9.6 6.7 4.6 3.38.4 12.7 8.7 6.0 4.2 2.9 2.18.6 . 8.1 5.6 4.0 2.7 2.0 1.48.8 -5.2 ~.5 2.5 1.8 1.3 1.09.0 3.3 2.3 1.7 1.2 0.94 0.71
g/kg salinity is equivalent per thousand (ppt 0to parts or '00>
Intermediate values of pH, temperature or salinity shou1d be interpolatedlinearly. The freshwater criteria apply at sa~inities <10 g/kg (see Tables 3and 4) •

". .. 37
~ABLE 21.AVERAGE 5 ~O 30-DAY CONCENTRAT1:0N OF TOTAL
FOR PROTECT1:0N OF SALTWATER AQUAT1:C(mq/L-N)
AMMON1:A N1:TROGENL1:FE (43)
Temperat<:.::-e (. C)o 5 10 15
pH Salinity ... 10 g/kg20 25
7.07.27.47.67.88.08.28.48.68.89.0
41261710
6.64.12.71.71.10.690.44
2918127.24.72.91.81.20.750.500.31
20127.85.03.12.0-1.30.810.530~34
0.23
148.75.33.42.21.400.870.560.370.250.17
9.4 '5.93.72.41.50.970.620.410.270.180.13
6.64.12.61.71.10.690.440.290.200.140.10
Salinity - 20 g/kg
7.07.27.4 '7~6 ,"7.8,8.08.28~4 '
, 8~68.89.0
44271811
6.94.42.81.81.10.720.47
301912,, 7.5
4.73.01.91.20.780.500.34 "
2113....;;,.•
"'/:,',,, . 8.1,(", '5~3
3.42.11.30.84,0.560.370.24
149.05.63.42.31.50.940.590.410.260.18
9.76.24.1'2.51.61.0
,0.66~'O.44
',',0.28':;0.19 "0 •.13
6.64.42.71.71.10.720.470.30O.?O0.140.10
Salinity -30 g/kg
7.07.27.4
'7.67.88.08.28~4
8.68.89.0
472919
'127.54.73.0
'1.91.20.780.50
3120138.15.03.12.11.30.840.530.34
2214
" ' 8.75.63.42.2,1.40.900.590.370.26
159.75.93.72.41.61.00.620.410.270.19
11~'
6.6 ." ,4.1':,
',3.11.71.10.690.440.30
'0.200.14
7.24.72.91.81.20.750.500.310.220.150.11
.The criterion value is obtained by using the average pH, temperature andsalinity field values, and is compared to the mean of the measured ammoniaconcentrations. 1:ntermediate values of pH, temperature or salinity should beinterpolated linearly. The freshwater criteria apply at salinities <10 g/kg(See Tables 3 and 4) •

DRAFT
MINISTRY OF ENVIRONMENT, LANDS AND PARKSMUNICIPAL SEWAGE DISCHARGE CRITERIA
TECHNICAL ASSESSMENT REPORT NO.1BEST AVAllABLE CONTROL TECHNOLOGY
TAR 1.2 ADVANCED TREATMENT AND EFFLUENT DISCHARGE CRITERIA
APPENDIXID
Ammonia ConcentrationBack Calculation Analysis, pages 1 • 7

DRAFT
APPENDIX ill
CALCULATION OF MAXIMUM EFFLUENT CONCENTRATIONBASED UPON RECEIVING WATER CRITERIA
Calculation of allowable eflluent concentration at discharge includes consideration of theenvironmental characteristics of the discharge sites. Discharges to streams will behavedifferently than to estuaries, lakes and the ocean. For all cases, the ratio of allowableconcentration to initial discharge concentration can be determined through mixing models.Present provincial legislation requires that water quality objectives be met outside ofthe initialdilution (regulatory mixing) zone. Concentrations of eflluent at the boundaries of the initialdilution zone (100 m from outfall diffuser) will vary non-uniformly across the cross-section,depth and length of the zone. Concentrations will show a decrease non-linearly as the effluentmoves away from the source.
In most instances a well designed outfall should be able to achieve an initial dilution of 20:1or greater with ambient water within the initial dilution zone. Based upon this assumption,site specific water quality parameters can be used with an assumed minimum 20:1 dilutionratio (for illustration only) to calculate the allowable maximum effluent concentrations. Withrespect to ammonia-nitrogen, critical temperatures and pH are summarized in Table 1 for fourBritish Columbia river systems to illustrate the resultant critical 30-day chronic ammonianitrogen levels. Both temperature and pH vary seasonally, thus affecting allowable ammoniaconcentrations. Therefore, worst case combinations are shown in Table 1.
TABLE 1
ALLOWABLE EFFLUENT AMMONIA CONCENTRATIONFOR 20:1 DILUTION IN INITIAL DILUTION ZONE
River Critical Critical Allowable AllowableTemp. pH Receiving Maximum
OC Water EflluentConcentration(lI) Concentration(b)
mg/L mg/L
Elk (Southern Rockies) 10 8.4 0.461 9.22
Fraser (Central Interior) 16 8.2 0.651 13.02
Similkameen (Eastern 17 8.2 0.606 12.12Okanagan-West Kootenays)
Skeena (North West Coast) 15 8.1 0.874 17.48
(a) At edge of initial dilution zone, 30 day chronic NHa concentration.(b) Assuming 20:1 dilution within initial dilution zone and negligible background ammonia
concentrations.
In the examples in TAR 2.1, Eflluent to Surface Water, dispersion equations and models wereused to estimate dilution ratios at the boundary of the initial dilution zone.
1 of 7

DRAFT
For example, the Kispiox outfall on the Skeena River is estimated to have total dilutionranging between:
ColC = 337 to 1230.
Using the receiving water maximum ammonia concentration of 0.874 mg/L, then the effiuentconcentration should not exceed 295 mg/L.
Discharge to a lake may be represented by an outfall on Okanagan Lake (contained in TAR2.1). Seasonal variations give a minimum summer dilution of38:1 and a minimum fall dilutionof23:1 within the initial dilution zone. Temperature variations and a pH of 8.1 gives a 30 dayammonia concentration for summer of 0.611 mg/L and 0.952 mg/L for fall (pommen, 1991).
In turn, back calculating based upon summer dilution of CICo = 38, The summer effiuentammonia concentration must not exceed 23.2 mg/L, and fall effiuent ammonia concentrationsmust not exceed 21.9 mg/L.
In this instance, the critical limit occurs in the fall.
A side discharge into the Cheakamus River can be used to illustrate the sensitivity that outfalllocation may have on dilution. Tabulation of the results and figures follow. (Note thatequation (2.4) of TAR 2.1 has been modified to account for nearness of the shore boundaryconditions, and is accurate only for Ymin = 0; immediate side discharge. If distance of theoutfall into the river remains small, < 1 m, then the modified equation is a closeapproximation.)
A 30 consecutive day, 10 year low flow of 2:9 mS/s is assumed in the example. The allowable30 day average total ammonia concentration in the receiving stream is 1.64 mg/L and thebackground concentration is negligible. (The 1.64 mg/L is selected as an example for a streampH of 7 and a stream temperature of 16°C.) Four cases are considered for a 100 m long by 8.75m wide (25% of stream width) mixing zone. The location of the side ofbank outfall is changedby moving it slightly further into the river for three of the cases, while the fourth location hasthe discharge in the centre of the stream. For any discharge at or close to shore, the availabledilution is less than an outfall located in the centre of the stream since the bank forms one ofthe boundaries of the mixing zone and limits the dispersion of the plume. The four cases aresummarized as follows:
Case (a):
Case (b):
Case (c):
The discharge at the shoreline, Ymax = 8.75, Ymin = 0.00 m:- dilution available is 6.2:1- allowable effiuent would be: 6.2 x 1.64 mg/L = 10.12 mg/L.
The discharge at 0.25 m from the shoreline, Ymax = 8.5 m, Ymin = 0.25 m:- dilution available is 14.7:1- allowable effiuent would be: 14.7 x 1.64 mg/L = 24.11 mg/L.
The discharge at 0.5 m from the shoreline, Ymax = 8.25 m, Ymin = 0.5 m:- dilution available is 29.3:1- allowable effiuent would be: 29.3 x 1.64 mg/L = 48.05 mg/L.
For these three cases, the dilution 100 m downstream of the centreline of discharge plume(which is close to shore) results in an allowable concentration of 63.9 mg/L.
2 of 7

Case (d):
DRAFT
The discharge is in the middle (centre) of the stream,(1) Ymax = 4.375 m, Ymin= -4.375 m:- dilution available is 77.9:1- allowable effiuent would be 77.9 x 1.64 mg/L = 127.7 mg/L.
When the outfall is located in the centre of the stream, the available dilution is effectivelydouble that of a side discharge when measured 100 m downstream. Therefore, locating theoutfall near to the centre of stream flow is critical if the available dilution potential of boththe outfall and stream are to be maximized.
(1) The stream is not considered to be the mixing zone. The mixing zone is 12.5 percentof either side of the stream centreline, or 25 percent of the stream width.
3 of 7

IEquation:
Characteristics:
Mixing in Rivers: Dilution Model
C/Co=2*(4 PI Et x/u) A 0.5 exp[(-y2u)/(4 x Et)] Fischer et aI., 1979
Side Discharge.
Parameters:
Qr =w =d =
Ar =
2.9 m3/s35.0m
0.4m14 m2
River flowMedian width of riverMedian river depthMean cross-sectional area of river
u = 0.207 m/su' = @sqrt(gdS)
= 0.1 *(u)= 0.021 m/s
Et = 0.6*d*u'= 0.005 m2/s
Mean velocityShear velocity
Transverse mixing coefficient ± 50%, Fischer et aI., 1979
Yo =Xmax =Ymax =Ymin =
Mixing Zone (Initial Dilution Zone, B.C. Environment, 1975) Extents:Cmax = 1.64 mg/L Max Cone. of Water Quality Parameter outside of Zone
25% Proportion of Cross-section Used for Mixing Zone0.00 m Outfall offset from Shore (transverse)100 m X-axis longitudinal limit of mixing zone
8.75 m Y-axis transverse limits, origin at outfall0.00 m Y-axis transverse limits, origin at outfall
Results:Min:X 63.9 mg/L Concentration 100 m DownstreamMin:Y 10.1 mg/L Concentration along transverse Mixing Zone BoundaryMax Discharge Cone. 10.1 mg/L for Max Background Cone. 1.6 mg/LMin Dilution 6.2:1
~.... ~
~....-----
~
~~
/'
Resultant Source Concentration for Min. Downstream ConcentrationMax Discharge Cone. 10.1 mg/Lfor Max Background Cone. 1.6 mg/L
o
Dayton & Knight Ltd.
20 _40 60 80X - Downstream (metres)
_ Ymax ---+- Ymin __ Centreline
4 of 7
100 120
30-Dec-92

IEquation:
Characteristics:
Mixing in Rivers: Dilution Model
C/CO=2*(4 PI Etx/u) A. 0.5 exp[{-y2 u)/(4 x Et)) Fischer et aI., 1979
Side Discharge
Qr =w =d =
Ar =
2.9 m3/s35.0m
0.4m14 m2
River flowMedian width of riverMedian river depthMean cross-sectional area of river
Parameters:u = 0.207 m/su' = @sqrt(gdS)
= 0.1 *(u)= 0.021 m/s
Et = 0.6*d*u'= 0.005 m2/s
Mean velocityShear velocity
Transverse mixing coefficient ± 50%, Fischer et al., 1979
Yo =Xmax =Ymax =Ymin =
Mixing Zone (Initial Dilution Zone, B.C. Environment, 1975) Extents:Cmax = 1.64 mg/L Max Conc. of Water Quality Parameter outside of Zone
25% Proportion of Cross-section Used for Mixing Zone0.25 m Outfall offset from Shore (transverse)100 m X-axis longitudinal limit of mixing zone
8.50 mY-axis transverse limits, origin at outfall-0.25 m Y-axis transverse limits, origin at outfall
Results:Min:X 63.9 mg/L Concentration 100 m DownstreamMin:Y 24.0 mg/L Concentration along transverse Mixing Zone BoundaryMax Discharge Cone. 24.0 mg/L for Max Background Cone. 1.6 mg/LMin Dilution 14.7:1
~
~~
/
~100
g 80I::o.~ 60
~u8 40Q)
120
~ 0o
Resultant Source Concentration for Min. Downstream ConcentrationMax Discharge Cone. 24.0 mgfL for Max Background Cone. 1.6 mgfL
20 _~W 60 80 100X - Downstream (metres)
_ Ymax -+- Ymin __ Centreline
120
Dayton & Knight Ltd. 5 of 7 30-Dec-92

IEquation:
Characteristics:
Mixing in Rivers: Dilution Model
C/Co=2*(4 PI Et x/u) A 0.5 exp[(-y2u)/(4 x Et}] Fischer et al. , 1979
Side Discharge
Qr =w =d =
Ar =
2.9 m3/s35.0m
0.4 m14 m2
River flowMedian width of riverMedian river depthMean cross-sectional area of river
Parameters:u = 0.207 m/su' = @sqrt(gdS)
= 0.1*(u)= 0.021 m/s
Mean velocityShear velocity
Yo =Xmax =Ymax =Ymin =
Et = 0.6*d*u' Transverse mixing coefficient ± 50%, Fischer et aI., 1979= 0.005 m2/s
Mixing Zone (Initial Dilution Zone, B.C. Environment, 1975) Extents:Cmax = 1.64 mg/L Max Cone. of Water Quality Parameter outside of Zone
25% Proportion of Cross-section Used for Mixing Zone0.50 m Outfall offset from Shore (transverse)100 m X-axis longitudinal limit of mixing zone
8.25 m Y-axis transverse limits, origin at outfall-0.50 m Y-axis transverse limits, origin at outfall
Results:Min:X 63.9 mg/L Concentration 100 m DownstreamMin:Y 48.1 mg/L Concentration along transverse Mixing Zone BoundaryMax Discharge Cone. 48.1 mg/L for Max Background Cone. 1.6 mg/LMin Dilution 29.3:1
~100
g 80~o.-.....~ 60
~40CI)
~ 20o
~ 0o
Resultant Source Concentration for Min. Downstream ConcentrationMax Discharge Cone. 48.1 mgIL for Max Background Cone. 1.6 mgIL
20 _~m 60 80 100X - Downstream (metres)
_ Ymax -.- Ymin ---.-- Centreline
120
Dayton & Knight Ltd.6 of 7
30-Dec-91'

IEguation:
Characteristics:
Mixing in Rivers: Dilution Model
C/Co =(4 PI Et x/u) ....... 0.5 exp[(-y2u)/(4 x Et)] Fischer et al., 1979
Centreline Discharge
Qr =w =d =
Ar =
2.9 m3/s35.0 m
0.4 m14 m2
River flowMedian width of riverMedian river depthMean cross-sectional area of river
Parameters:u = 0.207 m/su' = @sqrt(gdS)
= 0.1*(u)= 0.021 m/s
Et = 0.6*d*u'= 0.005 m2/s
Mean velocityShear velocity
Transverse mixing coefficient ± 50%, Fischer et aI., 1979
Xmax =Ymax =Ymin =
Mixing Zone (Initial Dilution Zone, B.C. Environment, 1975) Extents:Cmax = 1.64 mg/L Max Conc. of Water Quality Parameter outside of Zone
25% Proportion of Cross-section Used for Mixing Zone100 m X-axis limit of mixing zone
4.375 mY-axis limits, origin ar outfall-4.375 m
Results:Min:X 127.7 mg/L ConcentrationMin:Y 450026.7 mg/L ConcentrationMax Discharge Conc. 127.7 mg/L for Max Background Conc. 1.64 mg/LMin Dilution 77.9:1
Resultant Source Concentration for Min. Downstream ConcentrationMax Discharge Cone. 127.7 mg/L for Max Background Cone. 1.64 mg/L
~150
S"-'"t::o
.;::: 100gt::IUUt::oU 50IU
I~ a
a
Dayton & Knight Ltd.
20 40 60 80X - Downstream (metres)
_ Ymax _ Ymin -.k- Centreline
7 of 7
100 120
15-Jan-93