Reports User Guide PowerSchool Student ... - USD 261
200
Reports User Guide PowerSchool Student Information System
-
Upload
khangminh22 -
Category
Documents
-
view
1 -
download
0
Transcript of Reports User Guide PowerSchool Student ... - USD 261

Reports User GuidePowerSchool
Student Information System

Reports User Guide
Introduction © 2004 Apple Computer, Inc. All rights reserved. 2
Document PropertiesCopyright © 2004 Apple Computer, Inc. All rights reserved. This document is the property
of Apple Computer, Inc. and is for reference only. It is not to be reproduced ordistributed in any way without the express written consent of Apple Computer,Inc. Other brands and names are the property of their respective owners.
Owner Technical Communication and Documentation
Last Updated 8/10/2004
Version 4.0
Please send comments, suggestions, or requests for this document to [email protected] feedback is appreciated.

Reports User Guide
Introduction © 2004 Apple Computer, Inc. All rights reserved. 3
ContentsIntroduction ...................................................................................................................................................................... 7
Legend ............................................................................................................................................................................................ 8
Audience................................................................................................................................................................................ 8
Reports Menu ................................................................................................................................................................... 9
Group Reports..................................................................................................................................................................... 9
How to Display the Reports Menu................................................................................................................... 9
Report Queue...................................................................................................................................................................... 9
How to View the Report Queue Jobs ............................................................................................................. 9
How to View Completed Report Queue Jobs ..........................................................................................10
How to Understand Report Queue Job Details.......................................................................................12
How to View the Report Queue Status........................................................................................................14
How to Set Report Queue Preferences ........................................................................................................16
Report Status .....................................................................................................................................................................17
How to View Your Reports in the Report Queue....................................................................................18
How to View Your Completed Report Details..........................................................................................19
Report Structure.......................................................................................................................................................................21
Report Formatting ........................................................................................................................................................23
Report Styles......................................................................................................................................................................24
How to Add a Report Style ................................................................................................................................25
Run, Print, and Save Reports .....................................................................................................................................26
How to Run a Report for a Single Student.................................................................................................26
How to Run a Report for a Group of Students.........................................................................................29
How to Print a Report...........................................................................................................................................32
How to Save a Report ...........................................................................................................................................33
Alternate Ways to Create Reports...........................................................................................................................33
How to Use a Template From Another PowerSchool System .........................................................34
How to Copy a Template From Your PowerSchool System..............................................................34
How to Create a Template in Another Application...............................................................................34
Custom Reports .............................................................................................................................................................35
Report Cards ......................................................................................................................................................................35
How to Open a Preview Page...........................................................................................................................35
How to Add a Custom Report Card Template .........................................................................................36

Reports User Guide
Introduction © 2004 Apple Computer, Inc. All rights reserved. 4
How to Preview a Report Card.........................................................................................................................45
How to Edit a Custom Report Card Template..........................................................................................46
How to Delete a Custom Report Card Template ....................................................................................48
Mailing Labels ...................................................................................................................................................................49
How to Open a Preview Page...........................................................................................................................49
How to Add a Mailing Label Layout..............................................................................................................50
How to Edit a Mailing Label Layout ..............................................................................................................54
How to Delete a Mailing Label Layout.........................................................................................................56
Print Mailing Labels........................................................................................................................................................58
How to Print Mailing Labels ..............................................................................................................................58
Form Letters.......................................................................................................................................................................59
How to Add a Custom Form Letter ...............................................................................................................60
How to Edit a Custom Form Letter................................................................................................................65
How to Delete a Custom Form Letter ..........................................................................................................71
Object Reports ..................................................................................................................................................................73
How to Open a Preview Page...........................................................................................................................73
How to Create an Object Report Template ...............................................................................................74
How to Edit an Object Report Template.....................................................................................................80
Objects on an Object Report .............................................................................................................................................85
Text Objects .......................................................................................................................................................................85
How to Create Text Objects...............................................................................................................................86
Line Objects........................................................................................................................................................................90
How to Create Line Objects...............................................................................................................................90
Box Objects.........................................................................................................................................................................94
How to Create Box Objects................................................................................................................................94
Circle Objects.....................................................................................................................................................................97
How to Create Circle Objects............................................................................................................................97
Transcript List Objects ............................................................................................................................................... 100
How to Create Transcript List Objects....................................................................................................... 100
Fee List Objects ............................................................................................................................................................. 104
How to Use Fees List Objects ........................................................................................................................ 104
Fees List Objects ........................................................................................................................................................... 113
How to Use Fees List Objects ........................................................................................................................ 113
Picture Objects............................................................................................................................................................... 117

Reports User Guide
Introduction © 2004 Apple Computer, Inc. All rights reserved. 5
How to Use Picture Objects............................................................................................................................ 117
Sequence Objects ........................................................................................................................................................ 119
How to Use Sequence Objects...................................................................................................................... 119
Report Pictures .............................................................................................................................................................. 122
How to View a Report Picture ....................................................................................................................... 122
How to Add a Report Picture......................................................................................................................... 122
How to Delete a Report Picture.................................................................................................................... 123
Object Reports With Standards Grades ............................................................................................................ 124
Object Reports With Test Tags .............................................................................................................................. 127
Preconfigured Reports ..............................................................................................................................................130
Attendance Reports .................................................................................................................................................... 130
How to Run the Absentee Report ............................................................................................................... 130
How to Run the Consecutive Absences Report.................................................................................... 133
How to Run the Monthly Student Attendance Report..................................................................... 134
How to Run the PowerGrade Attendance Report............................................................................... 136
How to Run the Weekly Attendance Summary Report.................................................................... 137
How to Run the Period Attendance Verification Report.................................................................. 138
Attendance Count and Audit Reports............................................................................................................... 139
How to Run the Attendance Count Report ............................................................................................ 139
How to Run the Class Attendance Audit Report ................................................................................. 142
How to Run the Cumulative Attendance Summary Report........................................................... 143
How to Run the Student Attendance Audit Report........................................................................... 145
How to Run the Year-to-Date Attendance Summary Report........................................................ 148
Membership Reports .................................................................................................................................................. 150
How to Run the ADM/ADA by Date Report ........................................................................................... 150
How to Run the ADM/ADA by Minute Report ...................................................................................... 152
How to Run the ADM/ADA by Student Report .................................................................................... 154
How to Run the Aggregate Membership Audit Report ................................................................... 157
Student Listings ............................................................................................................................................................ 158
How to Run the Class Rosters (PDF) Report ........................................................................................... 158
How to Run the Master Schedule (PDF) Report................................................................................... 162
How to Run the Student Schedule Listing Report.............................................................................. 166
Enrollment Reports...................................................................................................................................................... 169
How to Run the Class Size Reduction Report........................................................................................ 169

Reports User Guide
Introduction © 2004 Apple Computer, Inc. All rights reserved. 6
How to Run the Enrollment by Grade Report....................................................................................... 171
How to Run the Enrollment by Section Report.................................................................................... 171
How to Run the Enrollment Summary by Date Report.................................................................... 174
How to Run the Vocational Courses Aggregate Membership Report...................................... 174
How to Run the School Enrollment Audit Report............................................................................... 176
How to Run the Section Enrollment Audit Report ............................................................................. 176
Standards Reports........................................................................................................................................................ 176
How to Run Standards Reports..................................................................................................................... 176
How to Run Teacher Gradebooks Reports.............................................................................................. 178
Single Student Standards Report......................................................................................................................... 182
How to Set Up the Single Student Standards Report ....................................................................... 182
How to Access the Single Student Standards Report ....................................................................... 184
Grade and Gradebook Reports.............................................................................................................................. 185
How to Run the Grade Count Report ........................................................................................................ 185
How to Run the Grade Count By Teacher Report ............................................................................... 186
How to Run the Class Rankings Report .................................................................................................... 187
How to Run the Graduation Progress Report........................................................................................ 188
How to Run the Honor Roll Report............................................................................................................. 189
Statistics ............................................................................................................................................................................ 190
How to Run the Parent Access Statistics Report.................................................................................. 190
Discipline Reports......................................................................................................................................................... 191
How to Run the Discipline Log Report ..................................................................................................... 191
PowerLunch Reports................................................................................................................................................... 192
How to Run the Cash Report ......................................................................................................................... 192
How to Run the Meal Count Listing Report ........................................................................................... 193
How to Run the Meal Count Report........................................................................................................... 195
How to Take PowerLunch Class Counts................................................................................................... 196
How to Run the Transaction Detail Report............................................................................................. 197

Reports User Guide
Introduction © 2004 Apple Computer, Inc. All rights reserved. 7
IntroductionUse PowerSchool Help to learn the PowerSchool Student Information System (SIS) and to serve as areference for your daily work. However, before you can begin using PowerSchool, the PowerSchooladministrator at your school must set up the system and import the data from your previoussystem. Once those steps are complete, you can start using PowerSchool. Use PowerSchool Help toassist you in navigating in PowerSchool.
PowerSchool Help is updated as PowerSchool is updated. Not all versions of PowerSchool Help areavailable in a printable guide. For the most up-to-date information, click Help on any page inPowerSchool.
There are user guides available that include the same information as PowerSchool Help for eachmajor release of PowerSchool. These user guides include instructions for certain user roles, thoughthese roles will vary depending on your school or district's circumstances. For the most recentversion of the printable guides, visit the PowerSchool Customer Support web site athttps://www.powerschool.com/support/documentation/userguides/. This URL is case-sensitive.
Note: You need a username and password to view anything on the PowerSchool Customer Supportweb site. Contact your PowerSchool administrator for access.
You are encouraged to read each section of the help that pertains to you. While the introductorysections build a foundation of knowledge that you will use every time you log on to PowerSchool,the remaining sections are independent of each other and can be read in any order. However, ifyou have never used PowerSchool before, it will be most helpful if you start with the section“Introduction to PowerSchool.” Whenever you read this guide, keep the following points inmind:
• The actions you can perform in PowerSchool depend on your job responsibilities andsubsequently on your level of access to PowerSchool. Some users only have viewing rightsto some pages. Others can view or edit any page. Still other users can view or edit any page,and create new ones as well. Finally, some pages are view-only for everyone. This guideoutlines viewing, editing, and creating options for most pages. Depending on your needsand your level of access, only certain options will be applicable and available to you. If youfind that your work requires a greater level of access, contact the system administrator atyour school.
• Almost all of the activities described in this guide begin by selecting the appropriatestudent or group; thus, it is imperative that you understand how to search for and select astudent. For detailed instructions on how to do this, refer to the section "Search andSelect."
• The school and student records used in this guide differ from those displayed on your pageas you work. You will work with real data based on student records at your school. Thegraphics in this guide are only examples.
• In PowerSchool, different pages provide some of the same information because you viewthe same data from a different place each time. If you add, change, or delete data on onepage, it will be added, changed, or deleted on other pages that contain the same field(s) ofdata.
Reports User Guide
Introduction © 2004 Apple Computer, Inc. All rights reserved. 8
• The reporting features described in this guide are some of the most important you will usein the system. A PowerSchool report is a statement of student or staff records that isproduced for viewing or printing and can include information text in addition to the reportlistings. PowerSchool reports include report cards, lists of class schedules, lunch balancesheets, mailing labels, lists of current staff members, and attendance records.
• Use PowerSchool to create numerous types of reports that pull selected data quickly andeasily. Select from a list of pre-configured reports that have preset parameters or create acustom report to include parameters needed for a specific task. You should read thesections "Custom Reports" and "Pre-Configured Reports" before creating a report.
Legend• This guide uses the > symbol to move down a menu path. Thus, if instructed to "Click File >
New > Window", begin by clicking the File menu. Then, click New and Window. The optionnoted after the > symbol will always be on the menu that results from your previousselection.
• It is easy to identify notes because they are indented and prefaced by the text Notes:.
AudienceThis document is intended for school administrators, office staff, and counselors.

Reports User Guide
Reports Menu © 2004 Apple Computer, Inc. All rights reserved. 9
Reports MenuPowerSchool includes two types of reports: custom and preconfigured. Custom reports includeform letters, mailing labels, report cards, and object reports. Preconfigured reports include reportsrelated to attendance, grades, membership and enrollment, statistics, and student listings. Use thereports menu to run any custom or traditional report. Access the reports menu from the start pageby clicking Reports. Limit the group of students to report on by selecting a group of studentsbefore accessing the reports menu.
Group Reports
How to Display the Reports MenuDisplay the reports menu without returning to the start page to select a group of students forwhom you want to run a report.
1. On the start page, select the group of students.
Note: Depending on the selection method you used, the Group Functions page appearseither immediately or after selecting students from the Student Selection page. If theStudent Selection page appears, choose the function in the next step from the groupfunctions pop-up menu.
2. Click Reports Menu. The reports menu displays all the reports on your school’s PowerSchoolsystem. For more information on how to create and work with reports, see the sections"Custom Reports" for the report setup items and "Preconfigured Reports" for the runreport items.
Report QueueUse the Report Queue to view, delete, cancel, and re-execute reports that you submit to the queue.When you submit a report request to the system, the system captures the report request andtransmits the job to the Report Queue. The Report Queue page displays the status of the report as itis processed by the system. The Report Queue also includes debugging tools and logs totroubleshoot problems with reports.
How to View the Report Queue Jobs1. On the Home page, click System. The System Administrator page displays.
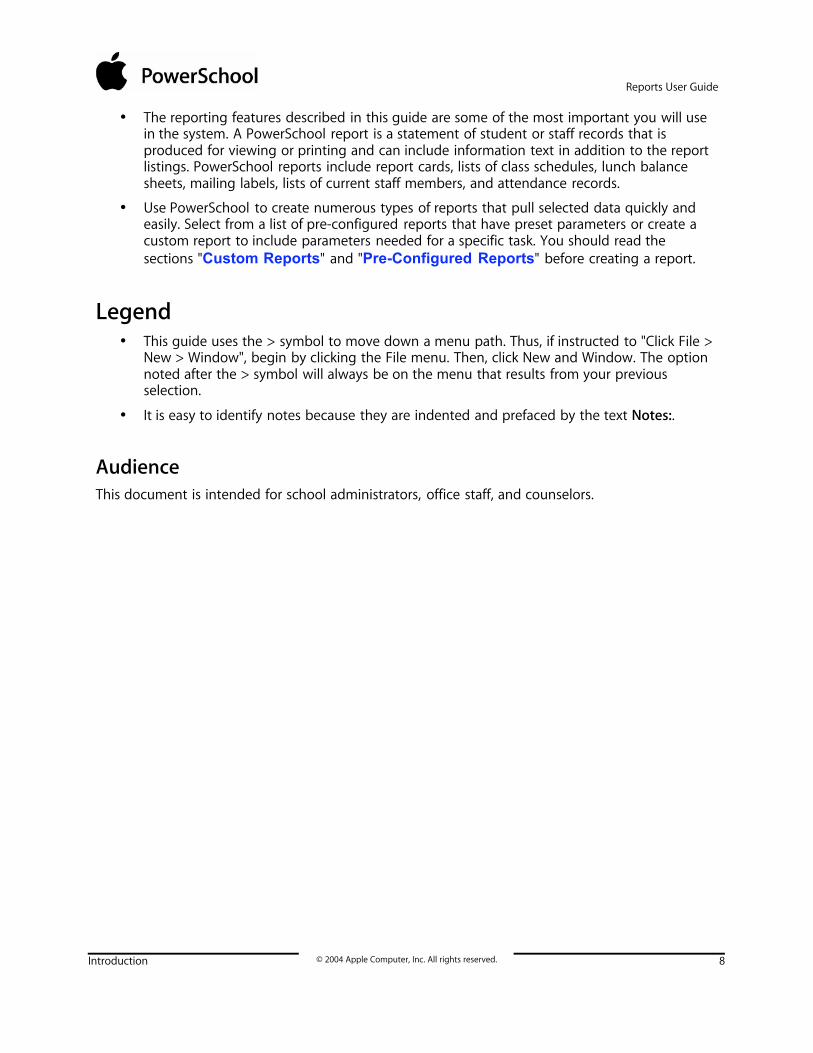
2. Click Report Queue Settings. The Report Queue Settings page displays.
Reports User Guide
Reports Menu © 2004 Apple Computer, Inc. All rights reserved. 10
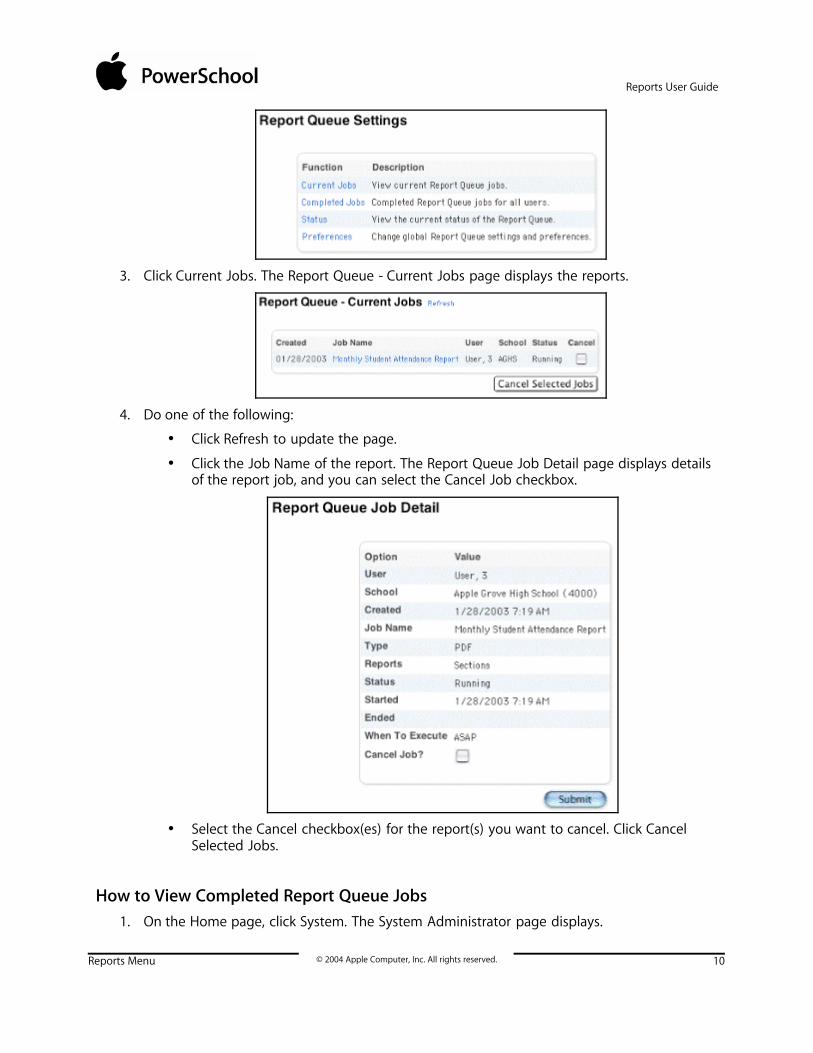
3. Click Current Jobs. The Report Queue - Current Jobs page displays the reports.
4. Do one of the following:
• Click Refresh to update the page.
• Click the Job Name of the report. The Report Queue Job Detail page displays detailsof the report job, and you can select the Cancel Job checkbox.
• Select the Cancel checkbox(es) for the report(s) you want to cancel. Click CancelSelected Jobs.
How to View Completed Report Queue Jobs1. On the Home page, click System. The System Administrator page displays.

Reports User Guide
Reports Menu © 2004 Apple Computer, Inc. All rights reserved. 11
2. Click Report Queue Settings. The Report Queue Settings page displays.
3. Click Completed Jobs. The Report Queue - Completed Jobs page displays the reports.
4. Do one of the following:
• Click Refresh to update the page.
• Click the Job Name of the report. The Report Queue Job Detail page displays detailsof the report job. Refer to the section “How to Understand Report Queue JobDetails.”
• Select the Result File to display the report.

Reports User Guide
Reports Menu © 2004 Apple Computer, Inc. All rights reserved. 12
How to Understand Report Queue Job DetailsWhen a report runs completely, view the job details. For details on running or pending reports,refer to the section “How to View Report Queue Jobs.”
1. On the Home page, click System. The System Administrator page displays.
2. Click Report Queue Settings. The Report Queue Settings page displays.
3. Click Completed Jobs. The Report Queue - Completed Jobs page displays the reports.
4. Click the Job Name of the report. The Report Queue Job Detail page displays.
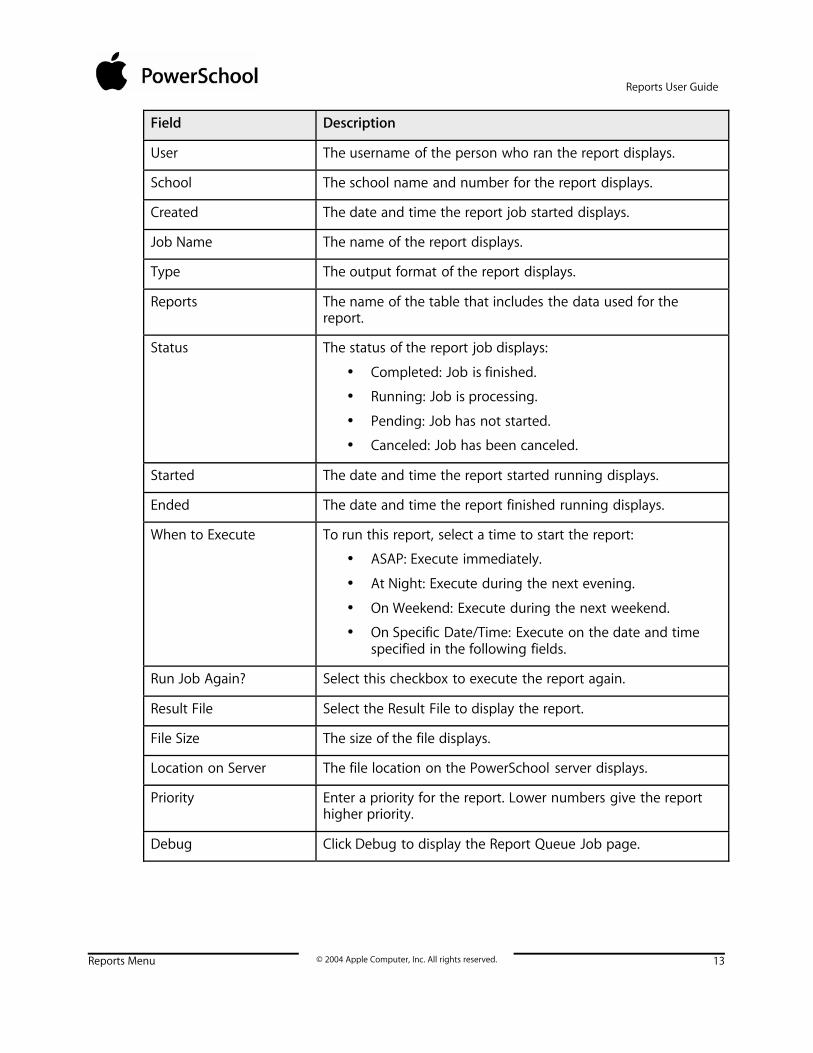
5. Use the following table to enter information in the fields:
Reports User Guide
Reports Menu © 2004 Apple Computer, Inc. All rights reserved. 13
Field Description
User The username of the person who ran the report displays.
School The school name and number for the report displays.
Created The date and time the report job started displays.
Job Name The name of the report displays.
Type The output format of the report displays.
Reports The name of the table that includes the data used for thereport.
Status The status of the report job displays:
• Completed: Job is finished.
• Running: Job is processing.
• Pending: Job has not started.
• Canceled: Job has been canceled.
Started The date and time the report started running displays.
Ended The date and time the report finished running displays.
When to Execute To run this report, select a time to start the report:
• ASAP: Execute immediately.
• At Night: Execute during the next evening.
• On Weekend: Execute during the next weekend.
• On Specific Date/Time: Execute on the date and timespecified in the following fields.
Run Job Again? Select this checkbox to execute the report again.
Result File Select the Result File to display the report.
File Size The size of the file displays.
Location on Server The file location on the PowerSchool server displays.
Priority Enter a priority for the report. Lower numbers give the reporthigher priority.
Debug Click Debug to display the Report Queue Job page.

Reports User Guide
Reports Menu © 2004 Apple Computer, Inc. All rights reserved. 14
Field Description
Click the Job ID to modify any details of the job record. If youwant to label this job, enter a name in the Job ID field and clickSubmit.
6. Click Submit to save your changes.
How to View the Report Queue StatusThe Report Queue Status page varies depending on the status of the report jobs. For example, youcan cancel any jobs with the status Pending or Running, whereas Canceled or Completed jobscannot be modified.
1. On the Home page, click System. The System Administrator page displays.
2. Click Status. The Report Queue Status page displays.

Reports User Guide
Reports Menu © 2004 Apple Computer, Inc. All rights reserved. 15
3. Use the following table to understand the fields in the Report Queue section:
Field Description
Current status The status of the report job displays:
• Completed: Job is finished.
• Running: Job is processing.
• Pending: Job has not started.
• Canceled: Job has been canceled.
Last restarted The date and time of the last time the job was restarteddisplays.
Number of reportprocesses
The number of report processes currently running inPowerSchool displays.
Automatically deletecompleted jobs after
The number of days that a job remains in the report queuedisplays. To modify this number, refer to the section “How toSet Report Queue Preferences.”
Maximum pending jobsper user
The most number of jobs any one user can have pending in thereport queue displays. To modify this number, refer to thesection “How to Set Report Queue Preferences.”
Result file location The file location on the PowerSchool server displays.
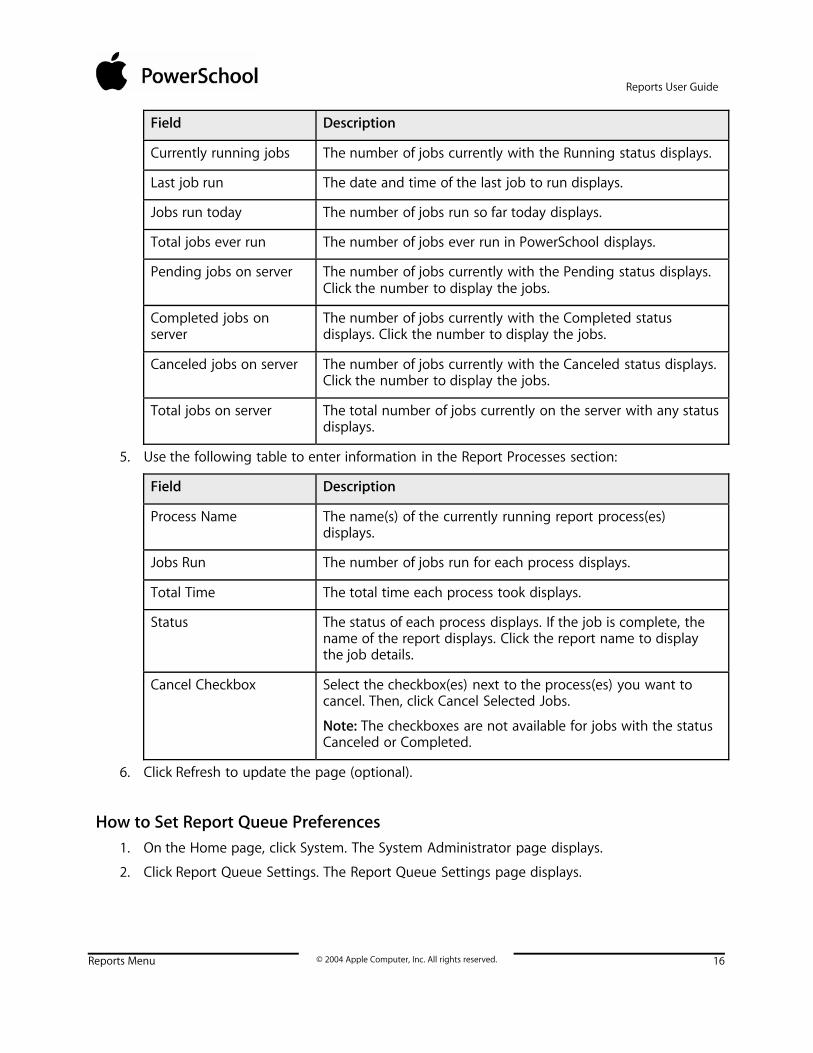
4. Use the following table to understand the fields in the Job Statistics section:
Reports User Guide
Reports Menu © 2004 Apple Computer, Inc. All rights reserved. 16
Field Description
Currently running jobs The number of jobs currently with the Running status displays.
Last job run The date and time of the last job to run displays.
Jobs run today The number of jobs run so far today displays.
Total jobs ever run The number of jobs ever run in PowerSchool displays.
Pending jobs on server The number of jobs currently with the Pending status displays.Click the number to display the jobs.
Completed jobs onserver
The number of jobs currently with the Completed statusdisplays. Click the number to display the jobs.
Canceled jobs on server The number of jobs currently with the Canceled status displays.Click the number to display the jobs.
Total jobs on server The total number of jobs currently on the server with any statusdisplays.
5. Use the following table to enter information in the Report Processes section:
Field Description
Process Name The name(s) of the currently running report process(es)displays.
Jobs Run The number of jobs run for each process displays.
Total Time The total time each process took displays.
Status The status of each process displays. If the job is complete, thename of the report displays. Click the report name to displaythe job details.
Cancel Checkbox Select the checkbox(es) next to the process(es) you want tocancel. Then, click Cancel Selected Jobs.
Note: The checkboxes are not available for jobs with the statusCanceled or Completed.
6. Click Refresh to update the page (optional).
How to Set Report Queue Preferences1. On the Home page, click System. The System Administrator page displays.
2. Click Report Queue Settings. The Report Queue Settings page displays.

Reports User Guide
Reports Menu © 2004 Apple Computer, Inc. All rights reserved. 17
3. Click Preferences. The Report Queue Preferences page displays.
4. Use the following table to enter information in the fields:
Field Description
Automatically deletecompleted jobs after
Enter the number of days each job remains in the report queue.After the specified number of days, PowerSchool automaticallydeletes the affected job.
Maximum pending jobsper user
Enter the maximum number of jobs each user can have in thereport queue at one time. To indicate no limit, enter zero.
Number of reportprocesses
Enter the maximum number of report processes, or number ofreports running at the same time. This setting does not takeeffect until the next time the PowerSchool server is restarted.
5. Click Submit to save your changes.
Report StatusView the status of your reports using the report queue. Use the report queue to view, delete,cancel, and re-execute reports that you submit to the queue. When you submit a report request tothe system, it captures that request and transmits the job to the report queue. The Report Queuepage displays the status of the report as it is processed by the system.

Reports User Guide
Reports Menu © 2004 Apple Computer, Inc. All rights reserved. 18
How to View Your Reports in the Report QueueYou must run a report before performing this procedure. For more information, see the sections"Custom Reports" and "Preconfigured Reports."
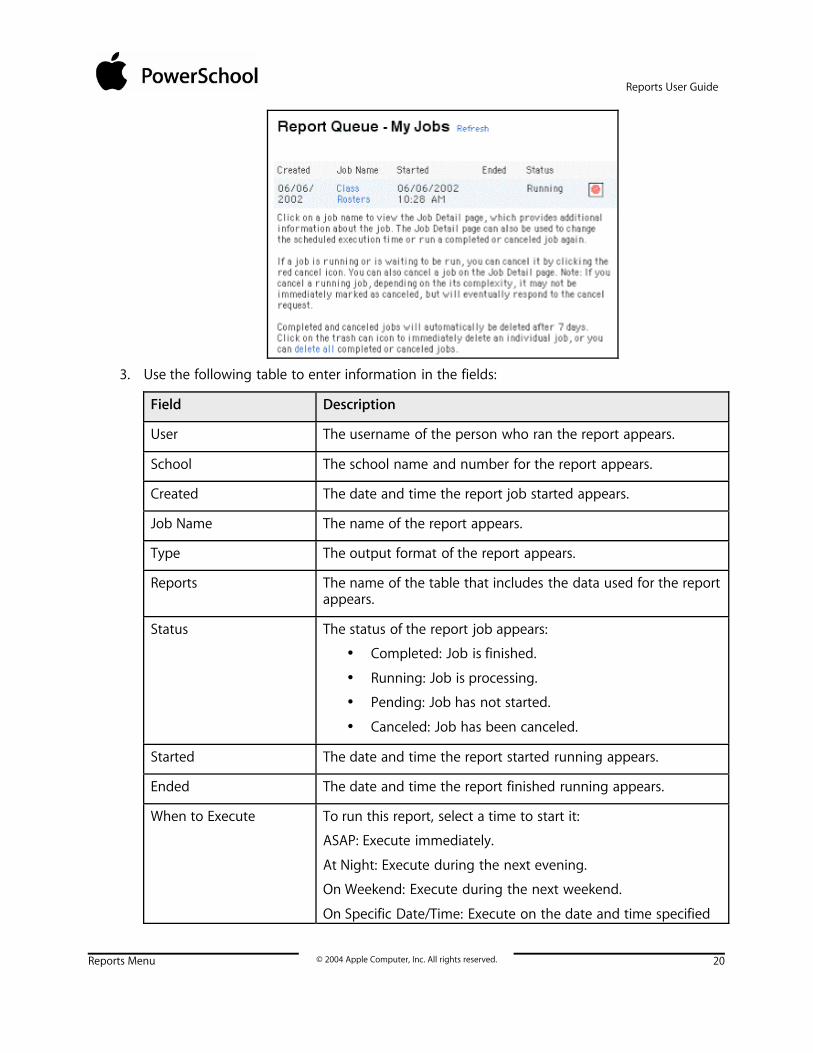
1. On the navigation bar, click the Report Queue icon . The Report Queue - My Jobs pagedisplays all your reports.
2. Do one of the following:
• Click Refresh to update the page.
• Click Completed to view the report.
• Click the job name of the report. The Report Queue Job Detail page displays detailsof the report job, and you can select either the Cancel Job or Run Job Againcheckbox, depending on whether the job has completed or not.

Reports User Guide
Reports Menu © 2004 Apple Computer, Inc. All rights reserved. 19
• Click Cancel for the report(s) you want to cancel.
How to View Your Completed Report DetailsWhen a report runs completely, view the job details. For details on reports that are running orpending, see the section "How to View Your Reports in the Report Queue."
1. On the start page, click the Report Queue icon . The Report Queue - My Jobs pagedisplays all your reports.
2. Click the job name of the report. The Report Queue Job Detail page appears.
Reports User Guide
Reports Menu © 2004 Apple Computer, Inc. All rights reserved. 20
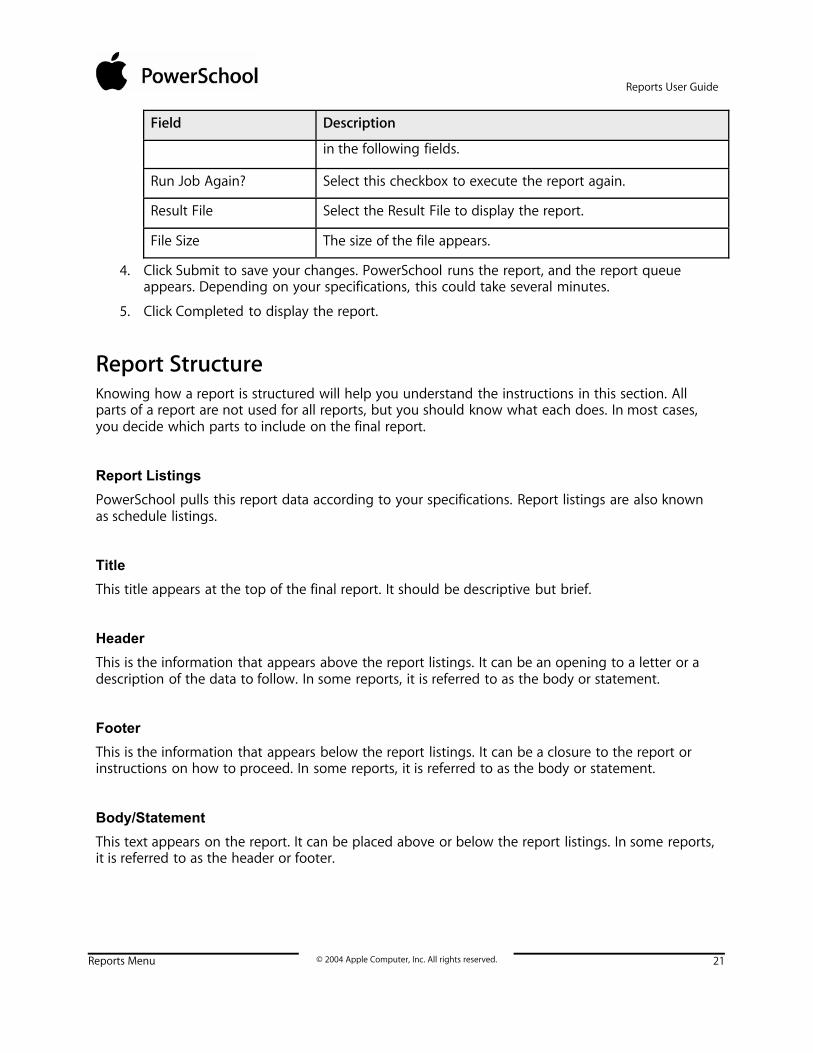
3. Use the following table to enter information in the fields:
Field Description
User The username of the person who ran the report appears.
School The school name and number for the report appears.
Created The date and time the report job started appears.
Job Name The name of the report appears.
Type The output format of the report appears.
Reports The name of the table that includes the data used for the reportappears.
Status The status of the report job appears:
• Completed: Job is finished.
• Running: Job is processing.
• Pending: Job has not started.
• Canceled: Job has been canceled.
Started The date and time the report started running appears.
Ended The date and time the report finished running appears.
When to Execute To run this report, select a time to start it:
ASAP: Execute immediately.
At Night: Execute during the next evening.
On Weekend: Execute during the next weekend.
On Specific Date/Time: Execute on the date and time specified
Reports User Guide
Reports Menu © 2004 Apple Computer, Inc. All rights reserved. 21
Field Description
in the following fields.
Run Job Again? Select this checkbox to execute the report again.
Result File Select the Result File to display the report.
File Size The size of the file appears.
4. Click Submit to save your changes. PowerSchool runs the report, and the report queueappears. Depending on your specifications, this could take several minutes.
5. Click Completed to display the report.
Report StructureKnowing how a report is structured will help you understand the instructions in this section. Allparts of a report are not used for all reports, but you should know what each does. In most cases,you decide which parts to include on the final report.
Report Listings
PowerSchool pulls this report data according to your specifications. Report listings are also knownas schedule listings.
Title
This title appears at the top of the final report. It should be descriptive but brief.
Header
This is the information that appears above the report listings. It can be an opening to a letter or adescription of the data to follow. In some reports, it is referred to as the body or statement.
Footer
This is the information that appears below the report listings. It can be a closure to the report orinstructions on how to proceed. In some reports, it is referred to as the body or statement.
Body/Statement
This text appears on the report. It can be placed above or below the report listings. In some reports,it is referred to as the header or footer.
Reports User Guide
Reports Menu © 2004 Apple Computer, Inc. All rights reserved. 22
HTML Tags
HTML stands for hypertext mark-up language, which is most often used to create web pages.Because PowerSchool is a web-based system, HTML is also used to format PowerSchool reports.HTML tags give special characteristics to text in your reports. You might employ HTML tags in aPowerSchool report to center, bold, or italicize text. The following are a few examples of commonlyused HTML tags:
• <b> = bold text
• <center> = center alignment
• <br> = inserts a line break
• <p> = paragraph break; inserts a space between reports
For a list of additional commonly used tags, visit the PowerSchool Customer Support web site athttps://www.powerschool.com/support/downloads/ and click PowerSchool Codes.
Note: This URL is case-sensitive. You need a username and password to view anything on thePowerSchool Customer Support web site. Contact your PowerSchool administrator for access.
For a beginner’s guide to HTML, visit the National Center for Supercomputing Applications (NCSA)web site at http://www.ncsa.uiuc.edu/General/Internet/WWW/HTMLPrimer.html.
PowerSchool Data Codes
PowerSchool data codes insert data into reports through a merge process similar to that used inword processing applications. You use the data codes to tell PowerSchool what fields you want inthe report. PowerSchool pulls the data from those fields for the selected student or group andinserts that data into the report. While HTML tags are programming codes, PowerSchool data codesare specific to PowerSchool and are used to merge data from the PowerSchool database. Thefollowing are some common PowerSchool data codes:
• ^(lastfirst) = student’s last name, first name
• ^(grade_level) = student’s grade level
• ^(*gpa;Q3) = student’s GPA for third quarter
Note: The asterisk (*) is used to indicate that data must be calculated.
For a complete list of data codes, visit the PowerSchool Customer Support web site athttps://www.powerschool.com/support/downloads/ and click PowerSchool Codes.
Note: This URL is case-sensitive. You need a username and password to view anything on thePowerSchool Customer Support web site. Contact your PowerSchool administrator for access.
Reports User Guide
Report Formatting © 2004 Apple Computer, Inc. All rights reserved. 23
Report FormattingMost PowerSchool reports are generated in your web browser application and are formatted foryou. However, some reports require formatting before PowerSchool can generate them. Modifiableparameters include header and footer text, margin size, font, line height, and gridlines. The goodnews is that you do not have to make any changes to the default values that appear when youopen a new template. If you are comfortable with technology, you have the option of changing theformat of certain reports.
When report formats can be altered, you have the option of changing some or all of the settings.When you change a setting, it becomes the default for anyone who uses the report unless youchange it back. Note that not all of the settings appear on every report, and that the following list isnot all-inclusive.
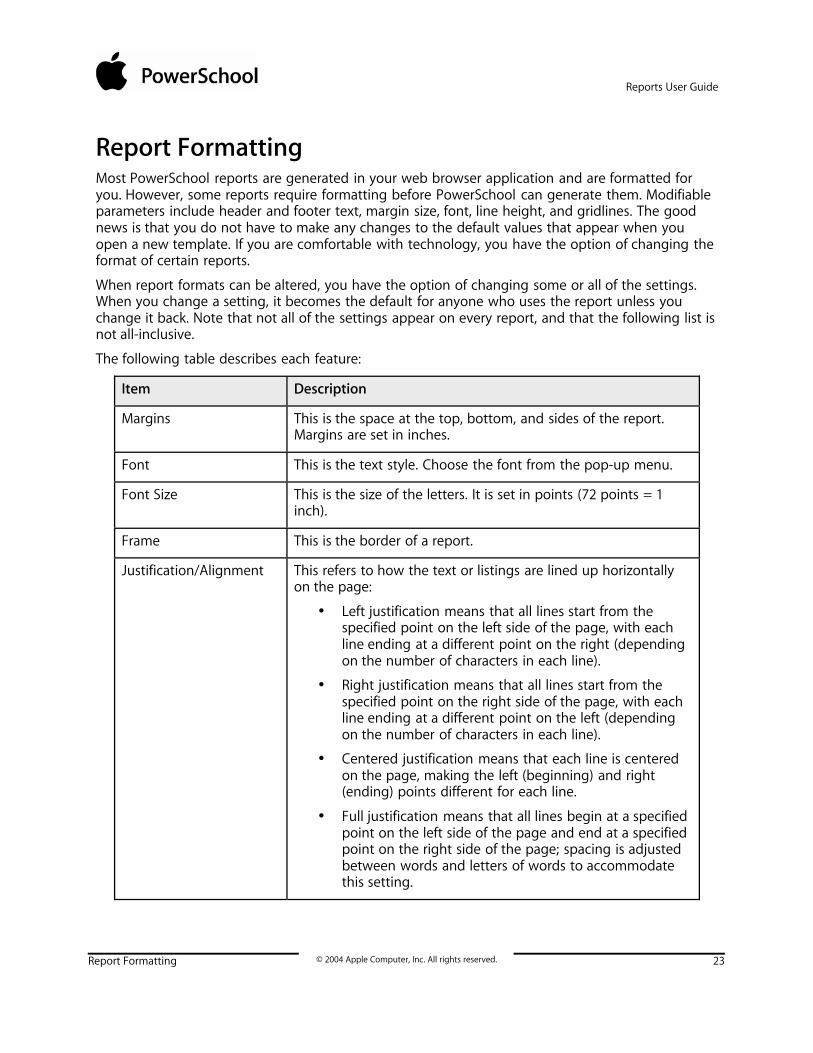
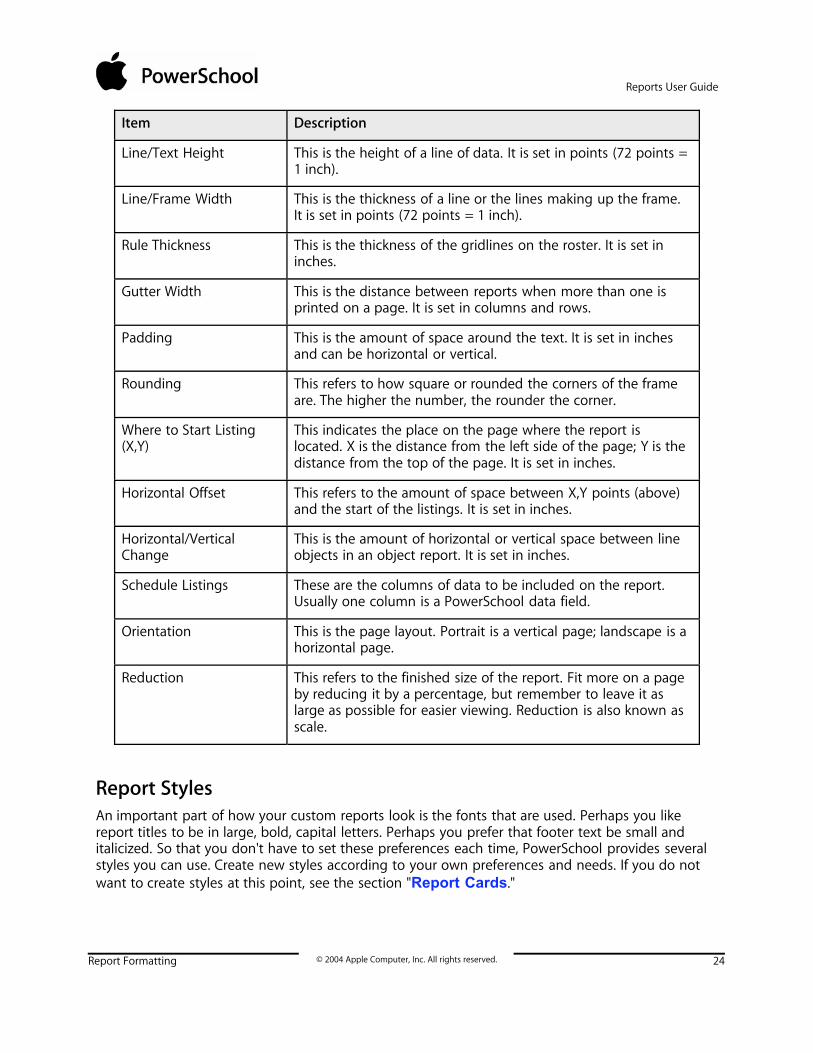
The following table describes each feature:
Item Description
Margins This is the space at the top, bottom, and sides of the report.Margins are set in inches.
Font This is the text style. Choose the font from the pop-up menu.
Font Size This is the size of the letters. It is set in points (72 points = 1inch).
Frame This is the border of a report.
Justification/Alignment This refers to how the text or listings are lined up horizontallyon the page:
• Left justification means that all lines start from thespecified point on the left side of the page, with eachline ending at a different point on the right (dependingon the number of characters in each line).
• Right justification means that all lines start from thespecified point on the right side of the page, with eachline ending at a different point on the left (dependingon the number of characters in each line).
• Centered justification means that each line is centeredon the page, making the left (beginning) and right(ending) points different for each line.
• Full justification means that all lines begin at a specifiedpoint on the left side of the page and end at a specifiedpoint on the right side of the page; spacing is adjustedbetween words and letters of words to accommodatethis setting.
Reports User Guide
Report Formatting © 2004 Apple Computer, Inc. All rights reserved. 24
Item Description
Line/Text Height This is the height of a line of data. It is set in points (72 points =1 inch).
Line/Frame Width This is the thickness of a line or the lines making up the frame.It is set in points (72 points = 1 inch).
Rule Thickness This is the thickness of the gridlines on the roster. It is set ininches.
Gutter Width This is the distance between reports when more than one isprinted on a page. It is set in columns and rows.
Padding This is the amount of space around the text. It is set in inchesand can be horizontal or vertical.
Rounding This refers to how square or rounded the corners of the frameare. The higher the number, the rounder the corner.
Where to Start Listing(X,Y)
This indicates the place on the page where the report islocated. X is the distance from the left side of the page; Y is thedistance from the top of the page. It is set in inches.
Horizontal Offset This refers to the amount of space between X,Y points (above)and the start of the listings. It is set in inches.
Horizontal/VerticalChange
This is the amount of horizontal or vertical space between lineobjects in an object report. It is set in inches.
Schedule Listings These are the columns of data to be included on the report.Usually one column is a PowerSchool data field.
Orientation This is the page layout. Portrait is a vertical page; landscape is ahorizontal page.
Reduction This refers to the finished size of the report. Fit more on a pageby reducing it by a percentage, but remember to leave it aslarge as possible for easier viewing. Reduction is also known asscale.
Report StylesAn important part of how your custom reports look is the fonts that are used. Perhaps you likereport titles to be in large, bold, capital letters. Perhaps you prefer that footer text be small anditalicized. So that you don't have to set these preferences each time, PowerSchool provides severalstyles you can use. Create new styles according to your own preferences and needs. If you do notwant to create styles at this point, see the section "Report Cards."
Reports User Guide
Report Formatting © 2004 Apple Computer, Inc. All rights reserved. 25
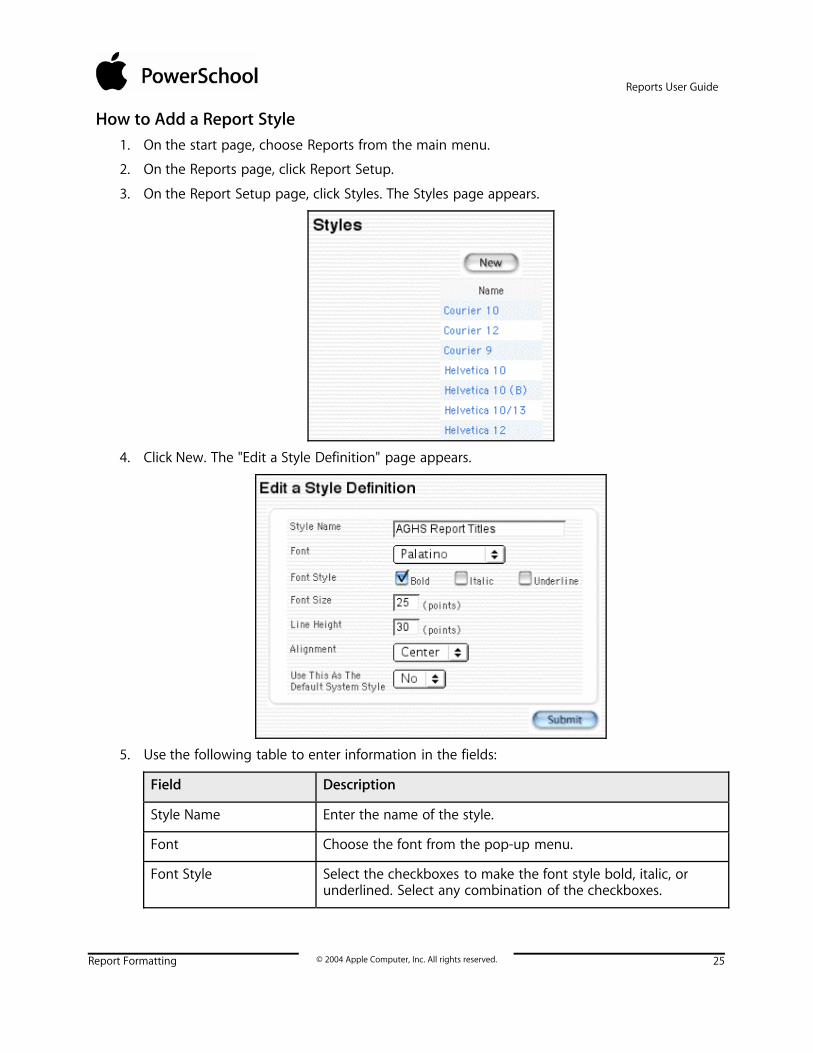
How to Add a Report Style1. On the start page, choose Reports from the main menu.
2. On the Reports page, click Report Setup.
3. On the Report Setup page, click Styles. The Styles page appears.
4. Click New. The "Edit a Style Definition" page appears.
5. Use the following table to enter information in the fields:
Field Description
Style Name Enter the name of the style.
Font Choose the font from the pop-up menu.
Font Style Select the checkboxes to make the font style bold, italic, orunderlined. Select any combination of the checkboxes.

Reports User Guide
Report Formatting © 2004 Apple Computer, Inc. All rights reserved. 26
Field Description
Font Size Enter the font size in points.
Note: One point is 1/72 of an inch.
Line Height Enter the height for the space between lines on the report inpoints.
Note: One point is 1/72 of an inch.
Alignment Choose the alignment from the pop-up menu.
Use This as the DefaultSystem Style
Use the pop-up menu to indicate if you want to want this styleto be the default system style by selecting Yes or No. If youselect Yes, the style will be used as the default font for allreports unless you specify otherwise.
6. Click Submit. The Styles page shows that the new style has been added to the list. You cancreate several styles or edit an existing one. All PowerSchool users have access to all styleson the list. Contact other users before changing the default style.
Run, Print, and Save ReportsThis section explains how to use a template to pull data from the PowerSchool system and print ahard copy. The instructions in the sections "Custom Reports" and "Report Templates" explainhow to create and import report templates.
How to Run a Report for a Single Student1. On the start page, select a student. For more information on how to select students, see the
section "Search and Select."
2. Choose Functions from the student pages menu. The Functions page appears.

Reports User Guide
Report Formatting © 2004 Apple Computer, Inc. All rights reserved. 27
3. Click Print Reports For This Student. The "Print a Report" page appears.
4. Use the following table to enter information in the fields:
Field Description
Print the report for The selected student appears.
Which report to print Choose the report from the pop-up menu.
If printing studentschedule, use...
Select an option to indicate enrollment specifications. If youselect the "enrollment as of" option, enter the enrollment datein the field using the format mm/dd/yyyy or mm-dd-yyyy. If youdo not use this format, an alert appears. If you submit the datewith an incorrect format, the date field will be submitted as ablank entry.

Reports User Guide
Report Formatting © 2004 Apple Computer, Inc. All rights reserved. 28
Field Description
If printing fee list, onlyinclude transactionsconducted during... (maybe overridden in reportsetup)
Choose the date range from the pop-up menu. If you select theDate Range, enter the beginning and ending dates in the fieldsusing the format mm/dd/yyyy or mm-dd-yyyy. If you do not usethis format, an alert appears. If you submit the date with anincorrect format, the date field will be submitted as a blankentry.
Watermark Text If you want to print text as a watermark on each page of thereport, use the pop-up menu to either choose one of thestandard phrases or choose Custom and enter the text youwant to print as a watermark in the field.
Watermark Mode Use the pop-up menu to determine how you want the text toprint. Watermark prints the text behind objects on the report,while Overlay prints the text over objects on the report.
When to print To run this report, select a time to start it:
• ASAP: Execute immediately.
• At Night: Execute during the next evening.
• On Weekend: Execute during the next weekend.
• On Specific Date/Time: Execute on the date and timespecified in the following fields using the formatmm/dd/yyyy or mm-dd-yyyy. If you do not use thisformat, an alert appears. If you submit the date with anincorrect format, the date field will be submitted as ablank entry.
5. Click Submit. The report queue appears.
6. Click Completed. The page displays a PDF file of the report. Review it from beginning to endto verify that the formatting and content are correct.
Reports User Guide
Report Formatting © 2004 Apple Computer, Inc. All rights reserved. 29
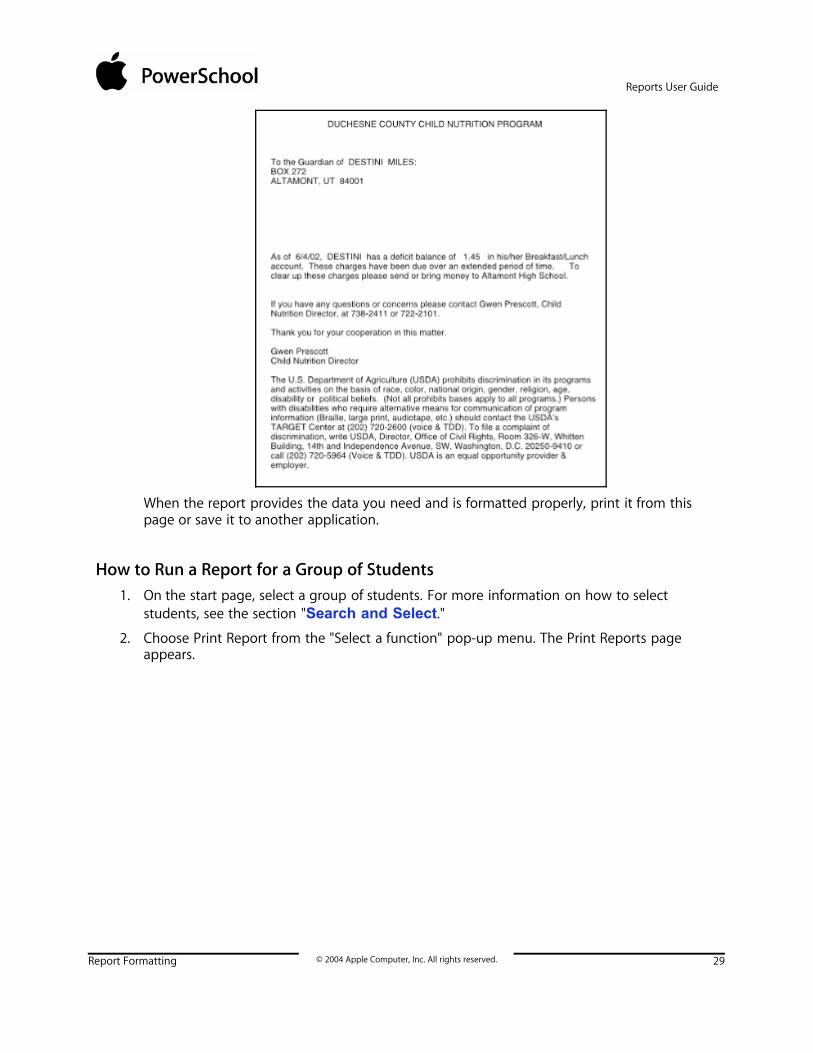
When the report provides the data you need and is formatted properly, print it from thispage or save it to another application.
How to Run a Report for a Group of Students1. On the start page, select a group of students. For more information on how to select
students, see the section "Search and Select."
2. Choose Print Report from the "Select a function" pop-up menu. The Print Reports pageappears.

Reports User Guide
Report Formatting © 2004 Apple Computer, Inc. All rights reserved. 30
3. Use the following table to enter information in the fields:
Field Description
Which report would youlike to print?
Choose the report from the pop-up menu.
For which students? Select the option to indicate the students for whom the reportwill be run, if necessary.
Print only the first Xpages
If you only want to print a limited number of pages, select thecheckbox and enter the number of pages. If you make noselections at the Which Students option, a report prints for eachstudent.
In what order? Select an option to indicate the sort order.

Reports User Guide
Report Formatting © 2004 Apple Computer, Inc. All rights reserved. 31
Field Description
If printing studentschedules, use...
Select an option to indicate enrollment specifications. If youselect the "enrollment as of" option, enter the enrollment datein the field using the format mm/dd/yyyy or mm-dd-yyyy. If youdo not use this format, an alert appears. If you submit the datewith an incorrect format, the date field will be submitted as ablank entry.
If printing fee list, onlyinclude transactionsconducted during... (maybe overridden in reportsetup)
Choose the date range from the pop-up menu. If you select theDate Range, enter the beginning and ending dates in the fieldsusing the format mm/dd/yyyy or mm-dd-yyyy. If you do not usethis format, an alert appears. If you submit the date with anincorrect format, the date field will be submitted as a blankentry.
Watermark Text If you want to print text as a watermark on each page of thereport, use the pop-up menu to either choose one of thestandard phrases or choose Custom and enter the text youwant to print as a watermark in the field.
Watermark Mode Use the pop-up menu to determine how you want the text toprint. Watermark prints the text behind objects on the report,while Overlay prints the text over objects on the report.
When to print To run this report, select a time to start it:
• ASAP: Execute immediately.
• At Night: Execute during the next evening.
• On Weekend: Execute during the next weekend.
• On Specific Date/Time: Execute on the date and timespecified in the following fields using the formatmm/dd/yyyy or mm-dd-yyyy. If you do not use thisformat, an alert appears. If you submit the date with anincorrect format, the date field will be submitted as ablank entry.
4. Click Submit. The report queue appears.
5. Click Completed. The page displays a PDF file of the report. Review it from beginning to endto verify that the formatting and content are correct.
Reports User Guide
Report Formatting © 2004 Apple Computer, Inc. All rights reserved. 32
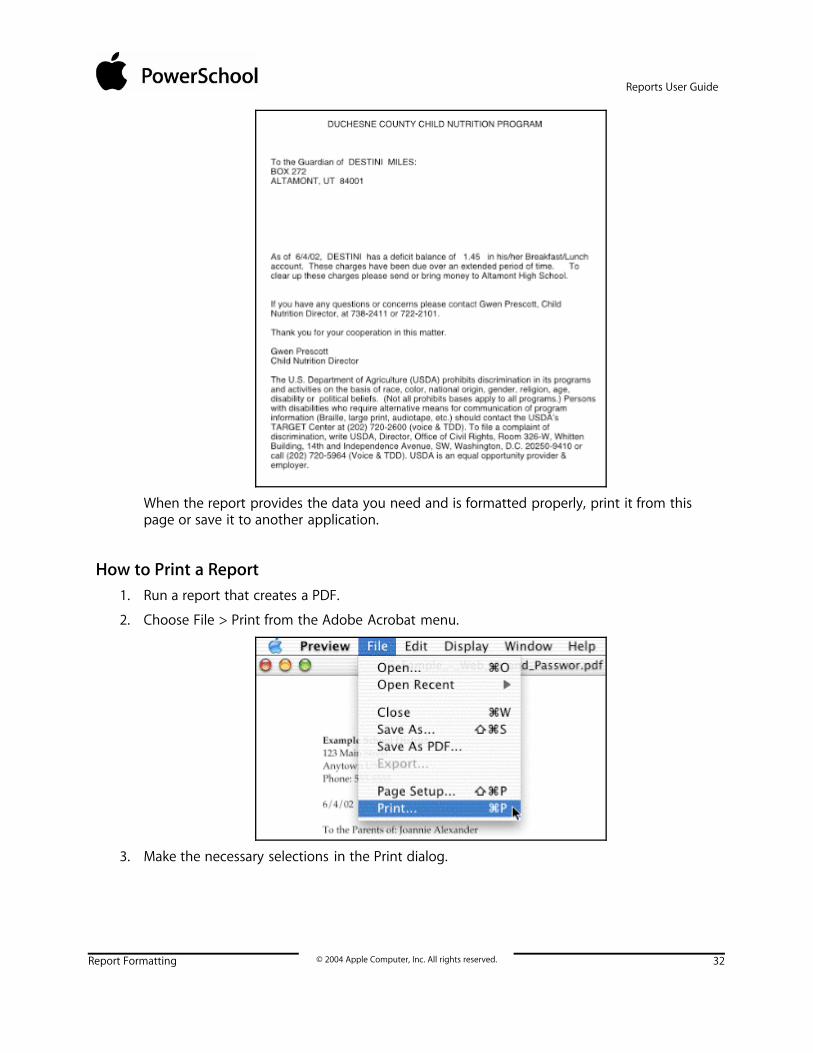
When the report provides the data you need and is formatted properly, print it from thispage or save it to another application.
How to Print a Report1. Run a report that creates a PDF.
2. Choose File > Print from the Adobe Acrobat menu.
3. Make the necessary selections in the Print dialog.
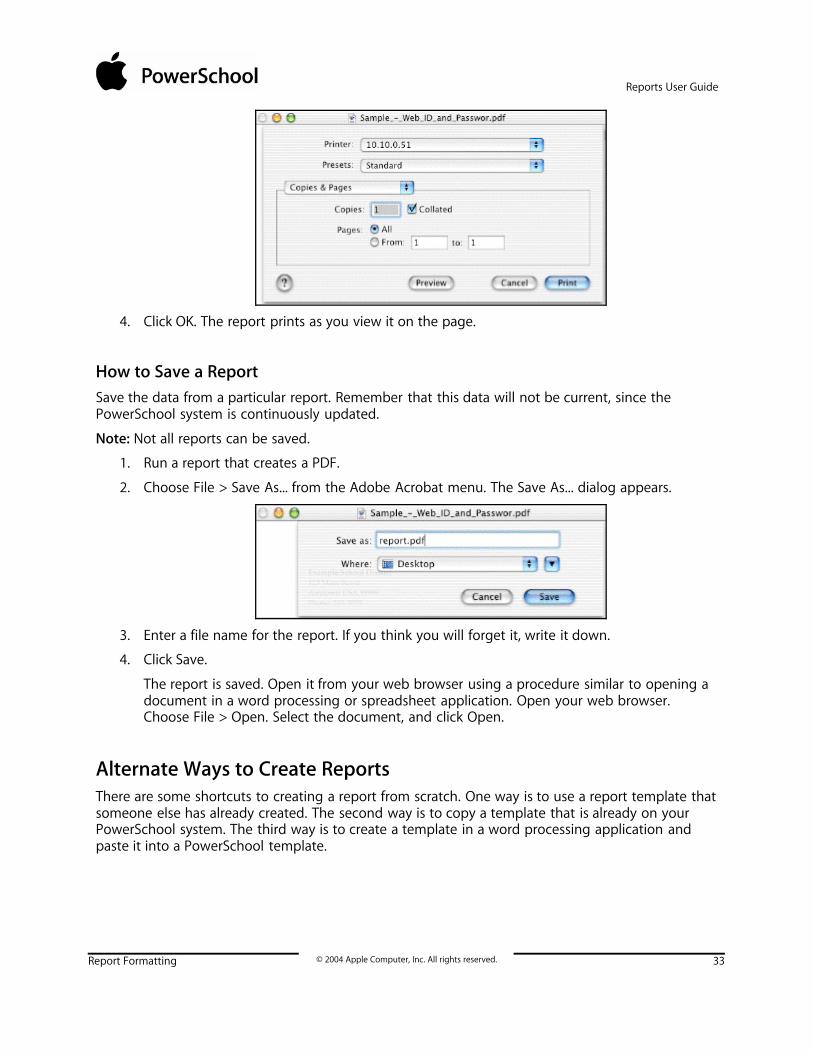
Reports User Guide
Report Formatting © 2004 Apple Computer, Inc. All rights reserved. 33
4. Click OK. The report prints as you view it on the page.
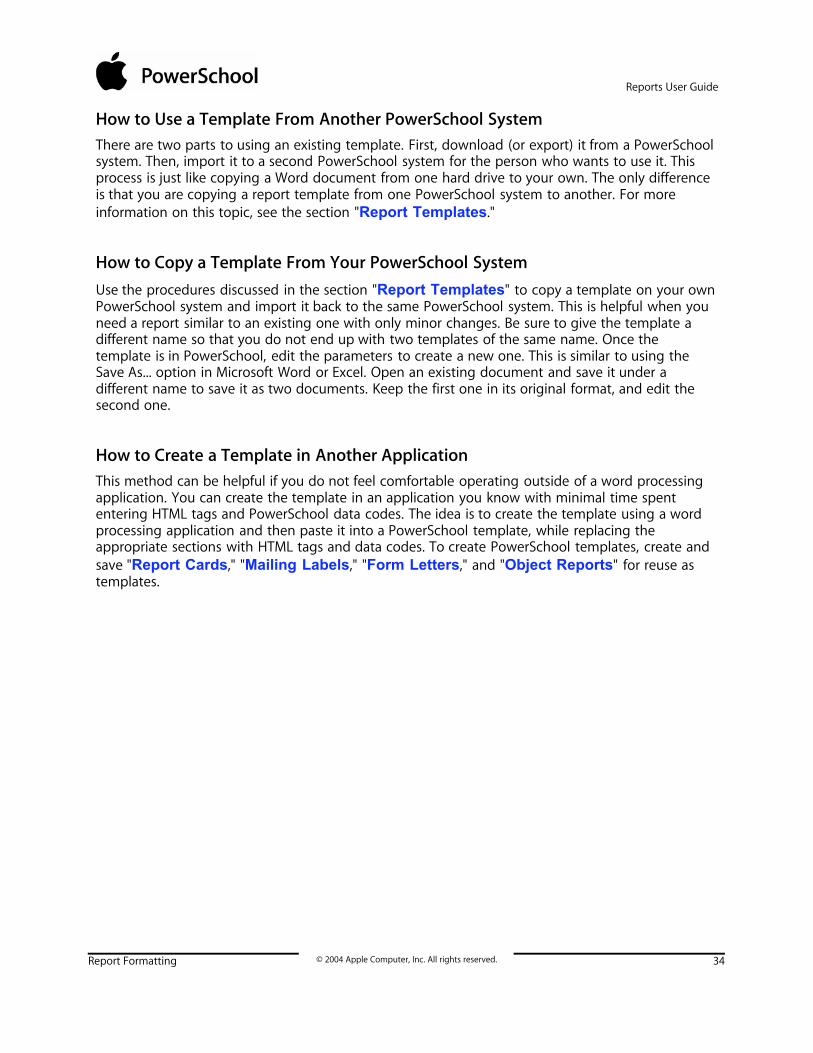
How to Save a ReportSave the data from a particular report. Remember that this data will not be current, since thePowerSchool system is continuously updated.
Note: Not all reports can be saved.
1. Run a report that creates a PDF.
2. Choose File > Save As... from the Adobe Acrobat menu. The Save As... dialog appears.
3. Enter a file name for the report. If you think you will forget it, write it down.
4. Click Save.
The report is saved. Open it from your web browser using a procedure similar to opening adocument in a word processing or spreadsheet application. Open your web browser.Choose File > Open. Select the document, and click Open.
Alternate Ways to Create ReportsThere are some shortcuts to creating a report from scratch. One way is to use a report template thatsomeone else has already created. The second way is to copy a template that is already on yourPowerSchool system. The third way is to create a template in a word processing application andpaste it into a PowerSchool template.
Reports User Guide
Report Formatting © 2004 Apple Computer, Inc. All rights reserved. 34
How to Use a Template From Another PowerSchool SystemThere are two parts to using an existing template. First, download (or export) it from a PowerSchoolsystem. Then, import it to a second PowerSchool system for the person who wants to use it. Thisprocess is just like copying a Word document from one hard drive to your own. The only differenceis that you are copying a report template from one PowerSchool system to another. For moreinformation on this topic, see the section "Report Templates."
How to Copy a Template From Your PowerSchool SystemUse the procedures discussed in the section "Report Templates" to copy a template on your ownPowerSchool system and import it back to the same PowerSchool system. This is helpful when youneed a report similar to an existing one with only minor changes. Be sure to give the template adifferent name so that you do not end up with two templates of the same name. Once thetemplate is in PowerSchool, edit the parameters to create a new one. This is similar to using theSave As... option in Microsoft Word or Excel. Open an existing document and save it under adifferent name to save it as two documents. Keep the first one in its original format, and edit thesecond one.
How to Create a Template in Another ApplicationThis method can be helpful if you do not feel comfortable operating outside of a word processingapplication. You can create the template in an application you know with minimal time spententering HTML tags and PowerSchool data codes. The idea is to create the template using a wordprocessing application and then paste it into a PowerSchool template, while replacing theappropriate sections with HTML tags and data codes. To create PowerSchool templates, create andsave "Report Cards," "Mailing Labels," "Form Letters," and "Object Reports" for reuse astemplates.

Reports User Guide
Custom Reports © 2004 Apple Computer, Inc. All rights reserved. 35
Custom ReportsUse PowerSchool to set up reusable report templates according to your individual needs. Theresulting reports provide you with customized views of the information stored in PowerSchool.Print the reports, save them, or use them as view-only tools. As the data stored on the systemchanges regularly, the report results will change every time you run a new report, even if you usethe same template.
While all reports can be run for all students, some can be run for a selected group of students. If thereport you chose allows this option, select the group of students and click the PowerSchool logo toreturn to the start page. PowerSchool remembers the group and will prompt you to select it at theproper time as you build the report template.
There are four styles of PowerSchool custom reports: report cards, mailing labels, form letters, andobject reports. Each can be created to meet your needs, and all four styles can be saved astemplates for reuse. For more information on report templates, see the section "ReportTemplates." For more information on other ways to create reports, see the section "AlternateWays to Create Reports."
Custom reports are different from preconfigured reports in that the user selects the reportparameters. You decide what information to include in the final report and how it will look.
Report CardsReport card reports produce much more than just standard end-of-the-term reports. You can alsouse them to create other types of documents, such as custom letters or progress reports. Any reportcard-style report can include text as well as fields from the PowerSchool system.
You can only create report cards for the term selected on the start page. To report on more thanone term, create an object-style report. For more information, see the section "Object Reports."
How to Open a Preview PageWhen creating custom reports, it is a good idea to preview them often as you work. Therefore,before you create any new reports, it is suggested that you open a preview (browser) page.
1. On the start page, search for and select any student.
2. Click the PowerSchool logo.
3. Choose Reports from the main menu.
4. On the Reports page, click Report Setup.
5. On the Report Setup page, click Form Letters. The Form Letters page appears.

Reports User Guide
Custom Reports © 2004 Apple Computer, Inc. All rights reserved. 36
6. Click Print. Leave the Print Reports page open as you create each type of report in a newweb browser window. You will return to it to review the report template as you work. Infuture instructions, this page is referred to as the preview page.
How to Add a Custom Report Card Template
Title
1. Open a second web browser to the PowerSchool start page.
2. Choose Reports from the main menu.
3. On the Reports page, click Report Setup.
4. On the Report Setup page, click Report Cards. The Report Cards page appears.

Reports User Guide
Custom Reports © 2004 Apple Computer, Inc. All rights reserved. 37
5. Click New. The Create New Report Card Format page appears.
6. Use the following table to enter information in the fields:
Field Description
Name of new report cardtemplate
Enter a name for the template.
Title Enter a title to print on the report card. Use data codes or HTMLtags in addition to text.
Title Style Choose a style from the pop-up menu. To configure the styles,see the section "System Styles."
7. Click Submit. The Report Cards page appears.
Reports User Guide
Custom Reports © 2004 Apple Computer, Inc. All rights reserved. 38
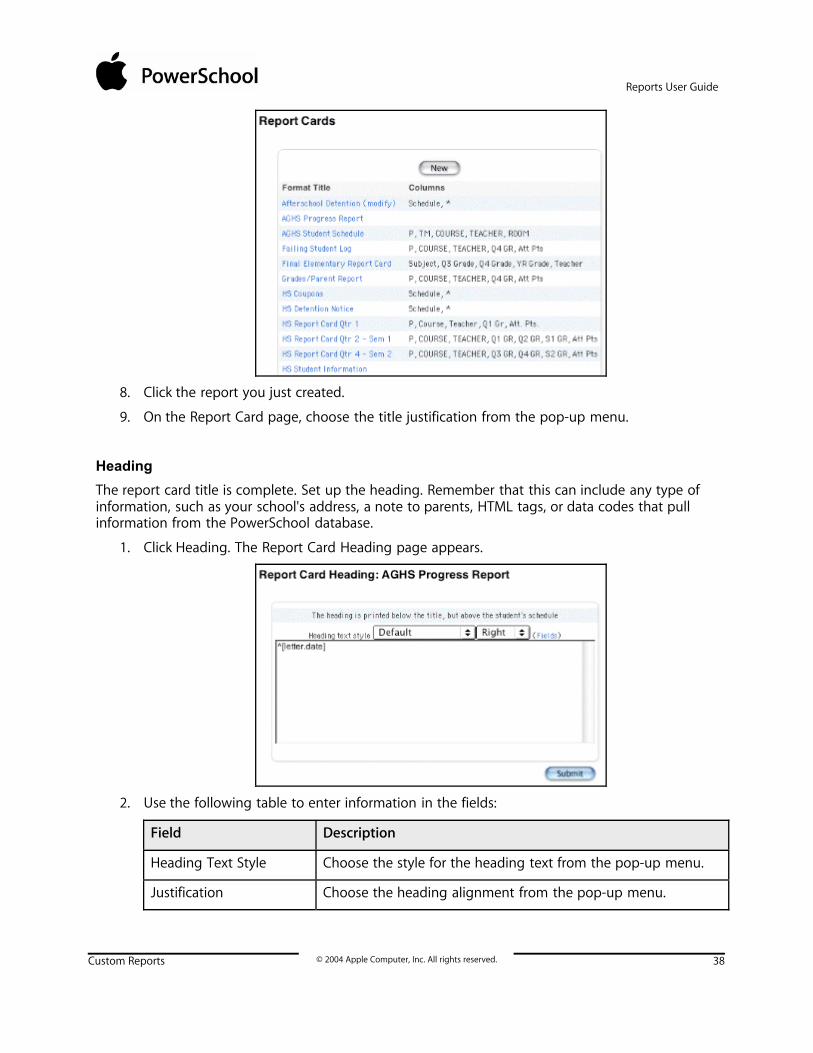
8. Click the report you just created.
9. On the Report Card page, choose the title justification from the pop-up menu.
Heading
The report card title is complete. Set up the heading. Remember that this can include any type ofinformation, such as your school's address, a note to parents, HTML tags, or data codes that pullinformation from the PowerSchool database.
1. Click Heading. The Report Card Heading page appears.
2. Use the following table to enter information in the fields:
Field Description
Heading Text Style Choose the style for the heading text from the pop-up menu.
Justification Choose the heading alignment from the pop-up menu.

Reports User Guide
Custom Reports © 2004 Apple Computer, Inc. All rights reserved. 39
3. Enter the content of the heading in the large white field using text, HTML tags, andPowerSchool data codes. For a complete list of data codes, visit the PowerSchool CustomerSupport web site at https://www.powerschool.com/support/downloads/ and clickPowerSchool Codes. For a complete list of field codes, click View Field List on thePowerSchool start page.
4. Click Submit.
Schedule Listing
The report card heading is created, and you return to the Report Card page. Format schedulelistings to display grades, citizenship, absences, tardies, and even scores for individual assignments.You are encouraged to experiment with the different options on the pop-up menus.
1. Click Schedule Listing. The Student Schedule Listing page appears.
2. Use the following table to enter information in the fields:
Field Description
Column Titles Style Choose a style for the column titles from the pop-up menu.
Class Listings Style Choose a style for the class listings from the pop-up menu.
Use Future Schedule Select this checkbox to use next year's student schedules. Touse this year's schedules, deselect the checkbox.
3. The remaining items on the first section concern the format of the report card. Completethem as necessary. Use the defaults by not making any changes to the formatting fields. Forfurther explanation of the fields, see the section "Report Formatting."
Select what data will make up the schedule listings (in the columns).
4. Use the following table to enter information in the fields:
Reports User Guide
Custom Reports © 2004 Apple Computer, Inc. All rights reserved. 40
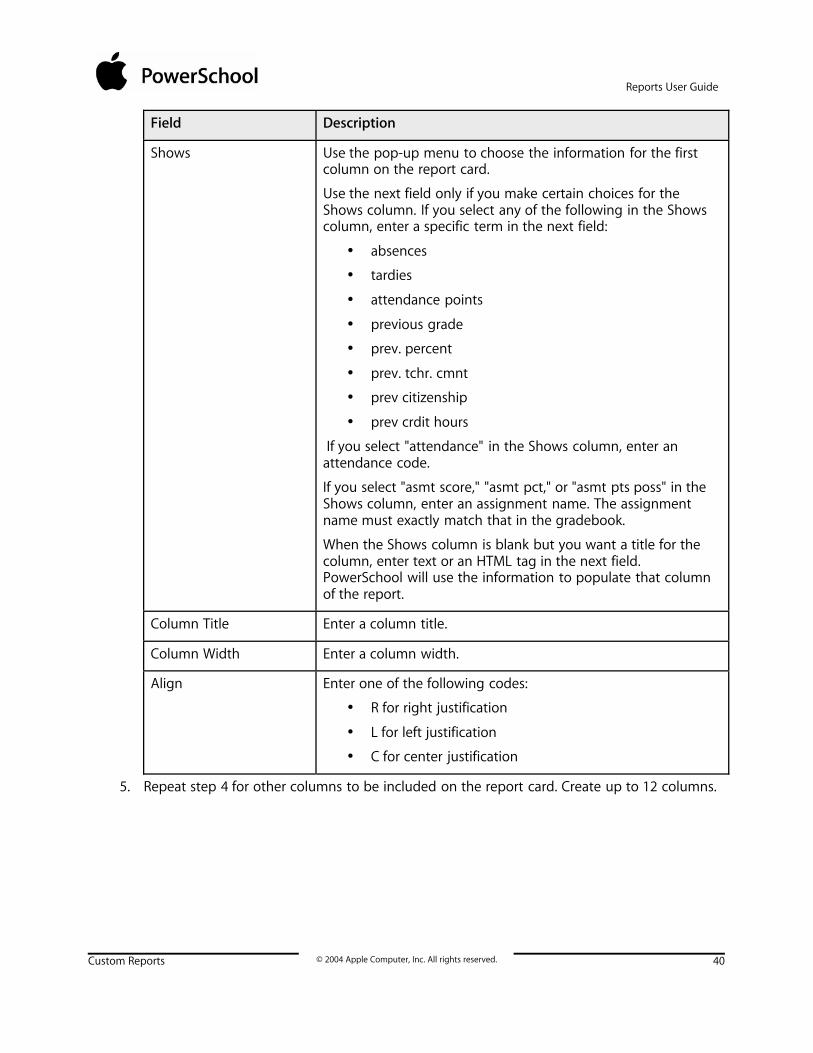
Field Description
Shows Use the pop-up menu to choose the information for the firstcolumn on the report card.
Use the next field only if you make certain choices for theShows column. If you select any of the following in the Showscolumn, enter a specific term in the next field:
• absences
• tardies
• attendance points
• previous grade
• prev. percent
• prev. tchr. cmnt
• prev citizenship
• prev crdit hours
If you select "attendance" in the Shows column, enter anattendance code.
If you select "asmt score," "asmt pct," or "asmt pts poss" in theShows column, enter an assignment name. The assignmentname must exactly match that in the gradebook.
When the Shows column is blank but you want a title for thecolumn, enter text or an HTML tag in the next field.PowerSchool will use the information to populate that columnof the report.
Column Title Enter a column title.
Column Width Enter a column width.
Align Enter one of the following codes:
• R for right justification
• L for left justification
• C for center justification
5. Repeat step 4 for other columns to be included on the report card. Create up to 12 columns.

Reports User Guide
Custom Reports © 2004 Apple Computer, Inc. All rights reserved. 41
6. Use the following table to enter information in the fields:
Field Description
Include Only ThoseClasses
Select this checkbox for the students who have final gradesrecorded in the specified term (optional). In the space provided,enter the term(s)/store code(s), such as Q1, Q2, and Q3. Thistells PowerSchool to list only classes for which there are storedgrades for the term(s) listed. When a student drops a class anddoes not receive a final grade, the class will not appear on thereport card.
Extended stored graderetrieval
Select this checkbox (optional). This is helpful when a studentswitches from one section of a course to another section of thesame course. The courses and grades appear on one row of thereport rather than different lines for each section.
7. Click Submit. The Report Card page appears.

Reports User Guide
Custom Reports © 2004 Apple Computer, Inc. All rights reserved. 42
Footer
The report card listings are complete, and you return to the Report Card page. Now, set up thefooter. The footer is exactly like the heading except that it appears below the schedule listings. Thiscan include any type of information, including your school's address, a note to parents, HTML tags,or PowerSchool data codes.
1. Click Footer. The Report Card Footer page appears.
2. Use the following table to enter information in the fields:
Field Description
Footer text style Choose the style for the footer text from the pop-up menu.
Justification Choose the footer alignment from the pop-up menu.
3. Enter the content of the footer in the large white field using text, HTML tags, andPowerSchool data codes. For a complete list of data codes, visit the PowerSchool CustomerSupport web site at https://www.powerschool.com/support/downloads/ and clickPowerSchool Codes. For a complete list of field codes, click View Field List on thePowerSchool start page.
4. Click Submit. The report card footer is created, and you return to the Report Card page.

Reports User Guide
Custom Reports © 2004 Apple Computer, Inc. All rights reserved. 43
5. Select an option to indicate which schools on the PowerSchool system will have access tothis report.
6. Select the checkbox if teachers can print this report.
Page Setup
Specify how the report fits on the page.
1. Click Margins & Page Setup. The Report Card Margins page appears.
2. Use the following table to enter information in the fields:
Field Description
Margins Enter the margins for the left, top, right, and bottom of thepage.

Reports User Guide
Custom Reports © 2004 Apple Computer, Inc. All rights reserved. 44
Field Description
Orientation Choose the orientation from the pop-up menu.
Reduction Enter a reduction scale (optional). This refers to the finished sizeof the report. Fit more on a page by reducing it by apercentage, but remember to leave it as large as possible foreasier viewing. Reduction is also known as scale.
3. Click Submit. The Report Card page appears.
Print Setup
Specify how the report will print.
1. Click Special Printing Options. The Special Printing Options page appears.
2. Use the following table to enter information in the fields:
Field Description
Multiple Reports perPage
Select the checkbox to create more than one report per page(optional). If you select this option, enter the number of reportsthat appear across the page and down each column.
Gutter Widths If you are printing multiple reports on each page, enter thegutter widths for the columns and rows.
Suppress column titleprinting
Select this checkbox to hide the column titles (optional).
3. Click Submit.
4. Click Submit again on the Report Card page to save the report template.

Reports User Guide
Custom Reports © 2004 Apple Computer, Inc. All rights reserved. 45
How to Preview a Report Card1. Return to the preview page.
2. Use the following table to enter information in the fields:
Field Description
Which report would youlike to print?
Choose the report card from the pop-up menu.
For which students? Select an option to indicate the students for whom the reportwill be run, if necessary.
Print only the first Xpages
If you only want to print a limited number of pages, select thischeckbox and enter the number of pages. If you make noselections at the Which Students option, a report prints for eachstudent.
In what order? Select an option to indicate the sort order.
If printing studentschedules, use...
Select an option to indicate enrollment specifications. If youselect the "enrollment as of" option, enter the enrollment datein the field.

Reports User Guide
Custom Reports © 2004 Apple Computer, Inc. All rights reserved. 46
Field Description
Watermark Text If you want to print text as a watermark on each page of thereport, use the pop-up menu to either choose one of thestandard phrases or choose Custom and enter the text youwant to print as a watermark in the field.
Watermark Mode Use the pop-up menu to determine how you want the text toprint. Watermark prints the text behind objects on the report,while Overlay prints the text over objects on the report.
When to print To run this report, select a time to start it:
• ASAP: Execute immediately.
• At Night: Execute during the next evening.
• On Weekend: Execute during the next weekend.
• On Specific Date/Time: Execute on the date and timespecified in the following fields.
3. Click Submit. The report appears with the specified parameters. Review the report frombeginning to end to verify that the formatting and content are correct.
How to Edit a Custom Report Card Template1. On the start page, choose Reports from the main menu.
2. On the Reports page, click Report Setup.
3. On the Report Setup page, click Report Cards. The Report Cards page appears.
Reports User Guide
Custom Reports © 2004 Apple Computer, Inc. All rights reserved. 47
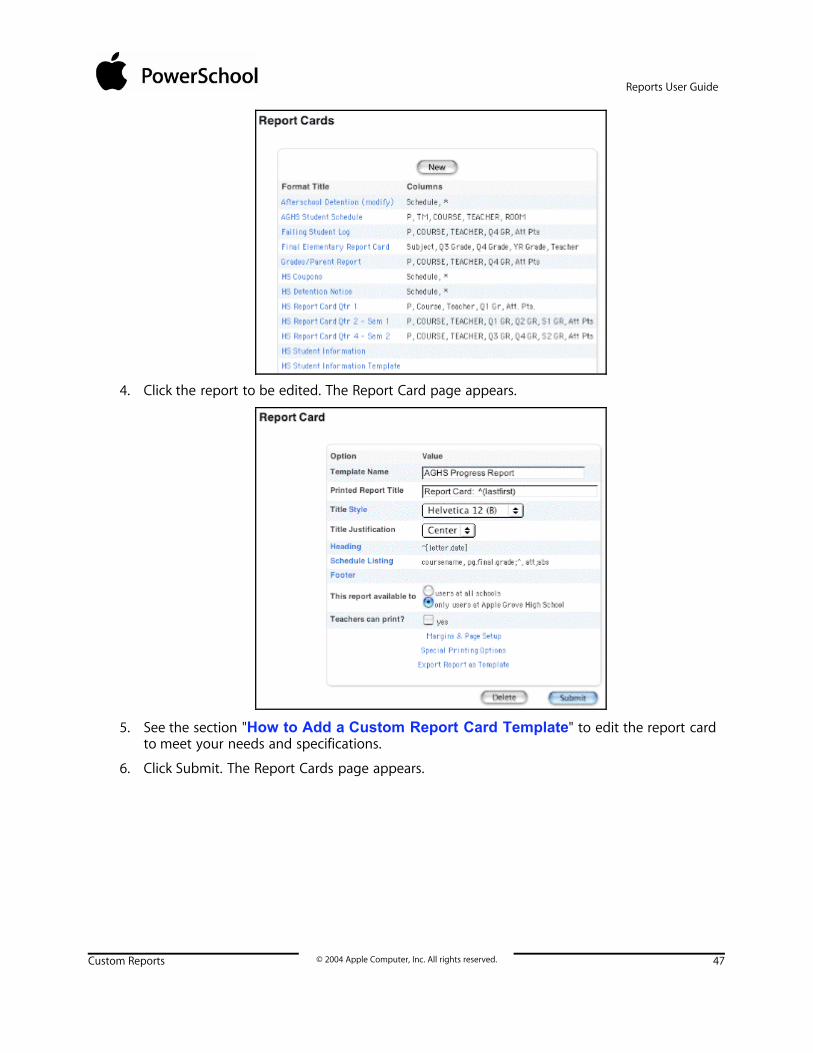
4. Click the report to be edited. The Report Card page appears.
5. See the section "How to Add a Custom Report Card Template" to edit the report cardto meet your needs and specifications.
6. Click Submit. The Report Cards page appears.
Reports User Guide
Custom Reports © 2004 Apple Computer, Inc. All rights reserved. 48
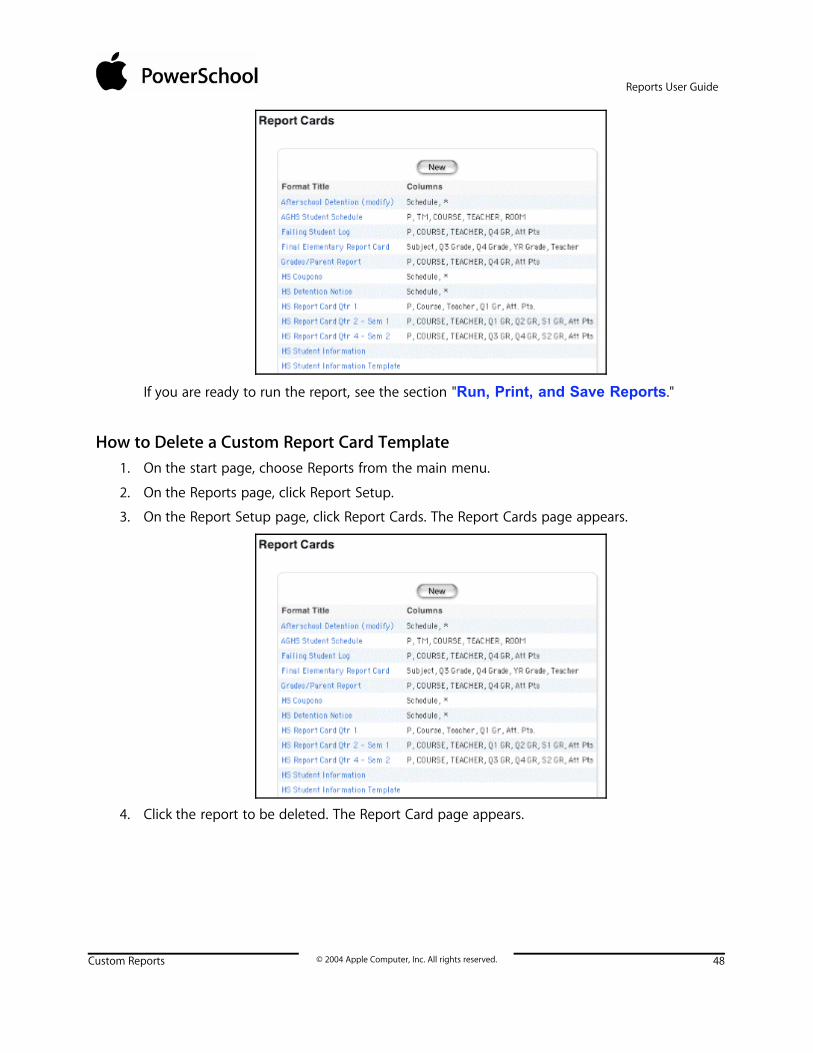
If you are ready to run the report, see the section "Run, Print, and Save Reports."
How to Delete a Custom Report Card Template1. On the start page, choose Reports from the main menu.
2. On the Reports page, click Report Setup.
3. On the Report Setup page, click Report Cards. The Report Cards page appears.
4. Click the report to be deleted. The Report Card page appears.

Reports User Guide
Custom Reports © 2004 Apple Computer, Inc. All rights reserved. 49
5. Click Delete. The Selection Deleted page appears.
Mailing LabelsUse mailing label reports to generate mailing labels to put on envelopes or letters. Include names,addresses, ID numbers, passwords, or even bar codes. For example, create mailing labels withbarcodes of students' lunch ID numbers to include on laminated lunch cards. For more information,see the section "How to Publish Lunch ID Numbers."
How to Open a Preview PageWhen creating custom reports, it is a good idea to preview them often as you work. So, before youcreate any new reports, open a preview page.
1. On the start page, search for and select any student.
2. Click the PowerSchool logo.
3. Choose Reports from the main menu.
4. On the Reports page, click Report Setup.
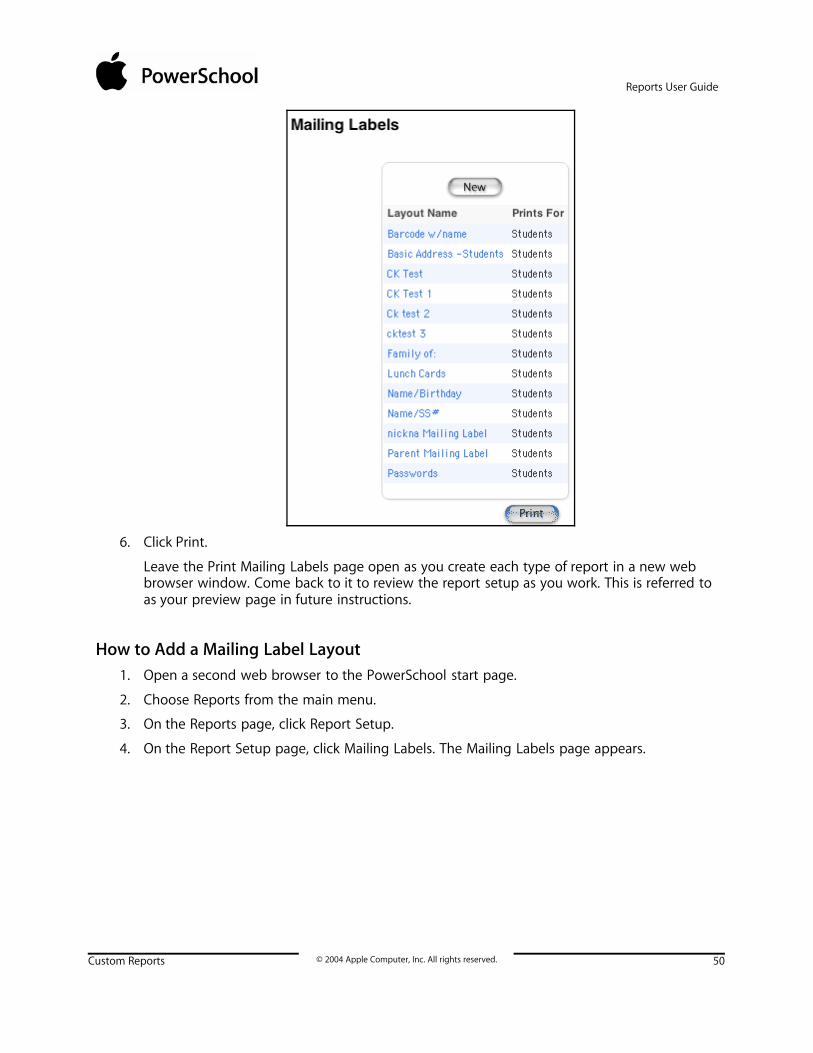
5. On the Report Setup page, click Mailing Labels. The Mailing Labels page appears.
Reports User Guide
Custom Reports © 2004 Apple Computer, Inc. All rights reserved. 50
6. Click Print.
Leave the Print Mailing Labels page open as you create each type of report in a new webbrowser window. Come back to it to review the report setup as you work. This is referred toas your preview page in future instructions.
How to Add a Mailing Label Layout1. Open a second web browser to the PowerSchool start page.
2. Choose Reports from the main menu.
3. On the Reports page, click Report Setup.
4. On the Report Setup page, click Mailing Labels. The Mailing Labels page appears.

Reports User Guide
Custom Reports © 2004 Apple Computer, Inc. All rights reserved. 51
5. Click New. The New Mailing Label Layout page appears.
Reports User Guide
Custom Reports © 2004 Apple Computer, Inc. All rights reserved. 52
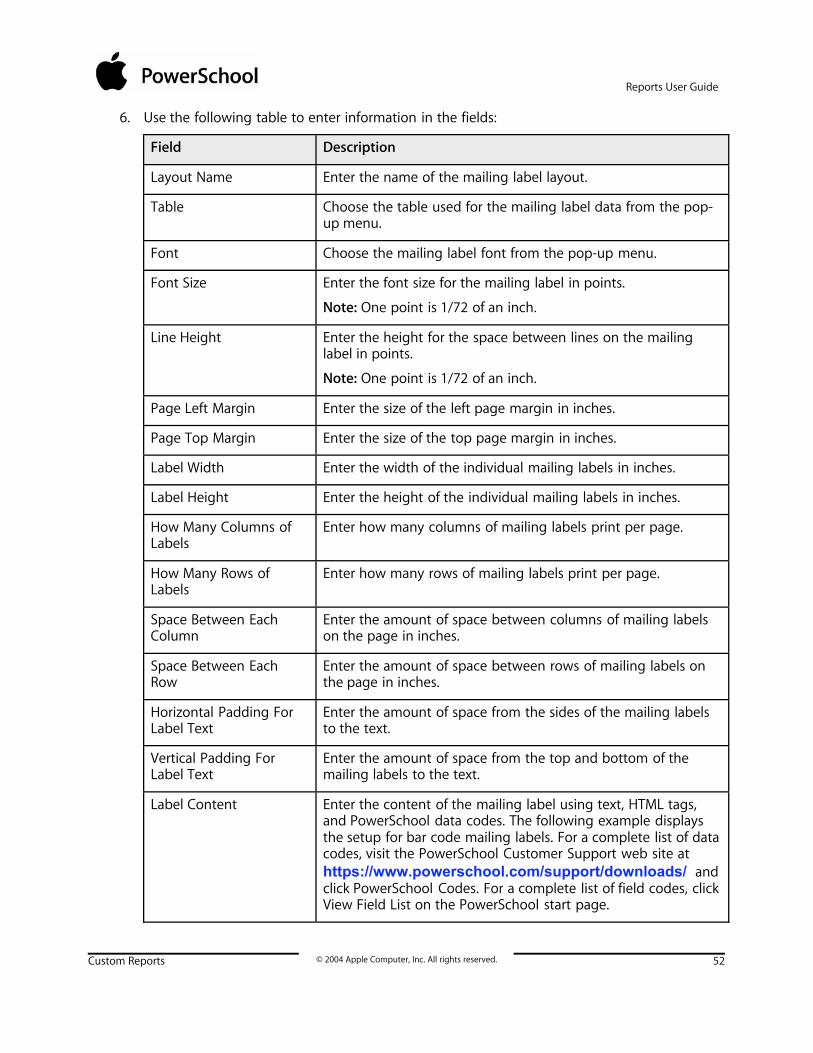
6. Use the following table to enter information in the fields:
Field Description
Layout Name Enter the name of the mailing label layout.
Table Choose the table used for the mailing label data from the pop-up menu.
Font Choose the mailing label font from the pop-up menu.
Font Size Enter the font size for the mailing label in points.
Note: One point is 1/72 of an inch.
Line Height Enter the height for the space between lines on the mailinglabel in points.
Note: One point is 1/72 of an inch.
Page Left Margin Enter the size of the left page margin in inches.
Page Top Margin Enter the size of the top page margin in inches.
Label Width Enter the width of the individual mailing labels in inches.
Label Height Enter the height of the individual mailing labels in inches.
How Many Columns ofLabels
Enter how many columns of mailing labels print per page.
How Many Rows ofLabels
Enter how many rows of mailing labels print per page.
Space Between EachColumn
Enter the amount of space between columns of mailing labelson the page in inches.
Space Between EachRow
Enter the amount of space between rows of mailing labels onthe page in inches.
Horizontal Padding ForLabel Text
Enter the amount of space from the sides of the mailing labelsto the text.
Vertical Padding ForLabel Text
Enter the amount of space from the top and bottom of themailing labels to the text.
Label Content Enter the content of the mailing label using text, HTML tags,and PowerSchool data codes. The following example displaysthe setup for bar code mailing labels. For a complete list of datacodes, visit the PowerSchool Customer Support web site athttps://www.powerschool.com/support/downloads/ andclick PowerSchool Codes. For a complete list of field codes, clickView Field List on the PowerSchool start page.

Reports User Guide
Custom Reports © 2004 Apple Computer, Inc. All rights reserved. 53
Field Description
Make this labelaccessible to
Select an option to determine which PowerSchool users canuse the mailing label.
Teachers can print? Select this checkbox if you want teachers to print this mailinglabel.
7. Click Submit.
8. Return to the preview page.
9. Use the following table to enter information in the fields:
Field Description
Print Mailing Labels for The selected number of students appears. For more informationon changing the selection of students, see the section "Searchand Select."
Mailing Label Layout Choose the layout from the pop-up menu.
How Many Pages Select an option to indicate the number of pages to print.
Sort Order Select an option to sort the mailing labels either by student'slast name or by zip code.
When to print To run this report, select a time to start it:
• ASAP: Execute immediately.
• At Night: Execute during the next evening.
• On Weekend: Execute during the next weekend.
• On Specific Date/Time: Execute on the date and time

Reports User Guide
Custom Reports © 2004 Apple Computer, Inc. All rights reserved. 54
Field Description
specified in the following fields.
10. Click Submit. PowerSchool runs the report, and the report queue appears. Depending onyour specifications, this could take several minutes.
11. Click Completed to display the report.
If you are ready to print the labels, see the section "Run, Print, and Save Reports."
How to Edit a Mailing Label Layout1. On the start page, choose Reports from the main menu.
2. On the Reports page, click Report Setup.
3. On the Report Setup page, click Mailing Labels. The Mailing Labels page appears.
4. Click the mailing label layout to be edited. The Edit Mailing Label Layout page appears.

Reports User Guide
Custom Reports © 2004 Apple Computer, Inc. All rights reserved. 55
5. Use the following table to edit information in the fields:
Field Description
Layout Name Edit the name of the mailing label layout.
Table The table used for the mailing label data appears.
Font Choose the mailing label font from the pop-up menu.
Font Size Edit the font size for the mailing label in points.
Note: One point is 1/72 of an inch.
Line Height Edit the height for the space between lines on the mailing labelin points.
Note: One point is 1/72 of an inch.
Page Left Margin Edit the size of the left page margin in inches.
Page Top Margin Edit the size of the top page margin in inches.
Label Width Edit the width of the individual mailing labels in inches.
Label Height Edit the height of the individual mailing labels in inches.
How Many Columns ofLabels
Edit how many columns of mailing labels print per page.
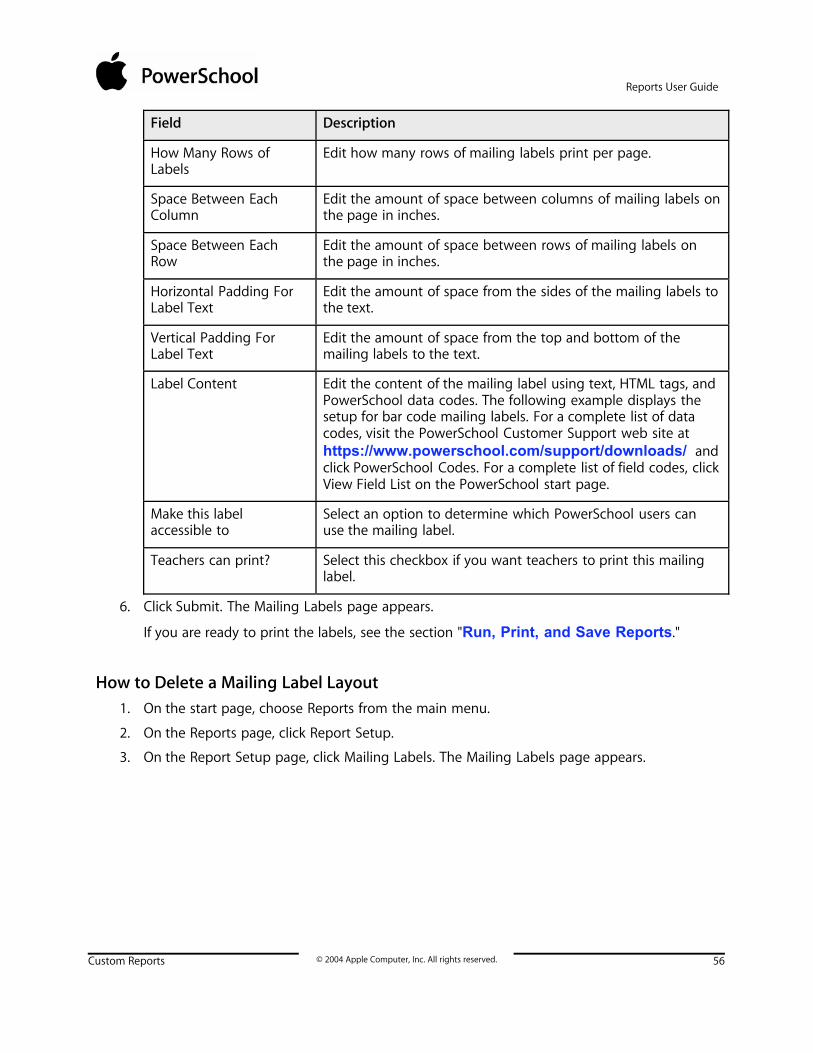
Reports User Guide
Custom Reports © 2004 Apple Computer, Inc. All rights reserved. 56
Field Description
How Many Rows ofLabels
Edit how many rows of mailing labels print per page.
Space Between EachColumn
Edit the amount of space between columns of mailing labels onthe page in inches.
Space Between EachRow
Edit the amount of space between rows of mailing labels onthe page in inches.
Horizontal Padding ForLabel Text
Edit the amount of space from the sides of the mailing labels tothe text.
Vertical Padding ForLabel Text
Edit the amount of space from the top and bottom of themailing labels to the text.
Label Content Edit the content of the mailing label using text, HTML tags, andPowerSchool data codes. The following example displays thesetup for bar code mailing labels. For a complete list of datacodes, visit the PowerSchool Customer Support web site athttps://www.powerschool.com/support/downloads/ andclick PowerSchool Codes. For a complete list of field codes, clickView Field List on the PowerSchool start page.
Make this labelaccessible to
Select an option to determine which PowerSchool users canuse the mailing label.
Teachers can print? Select this checkbox if you want teachers to print this mailinglabel.
6. Click Submit. The Mailing Labels page appears.
If you are ready to print the labels, see the section "Run, Print, and Save Reports."
How to Delete a Mailing Label Layout1. On the start page, choose Reports from the main menu.
2. On the Reports page, click Report Setup.
3. On the Report Setup page, click Mailing Labels. The Mailing Labels page appears.

Reports User Guide
Custom Reports © 2004 Apple Computer, Inc. All rights reserved. 57
4. Click the mailing label layout to be deleted. The Edit Mailing Label Layout page appears.

Reports User Guide
Custom Reports © 2004 Apple Computer, Inc. All rights reserved. 58
5. Click Delete. The Mailing Labels page appears without the deleted mailing label layout.
Print Mailing LabelsPrint mailing labels to address envelopes for student letters, create barcodes for lunch ID cards, orfor other purposes. This section assumes that the necessary mailing label layout is already createdand that you are familiar with its format and content. For information on creating mailing labels,see the section "Mailing Labels."
How to Print Mailing Labels1. On the start page, select a group of students.
Note: Depending on the selection method you used, the Group Functions page appearseither immediately or after selecting students from the Student Selection page. If theStudent Selection page appears, choose the function in the next step from the groupfunctions pop-up menu.
2. Click Print Mailing Labels. The Print Mailing Labels page appears.
3. Use the following table to enter information in the fields:
Field Description
Print Mailing Labels for The selected number of students appears. For more informationon changing the selection of students, see the section "Searchand Select."
Use this mailing labellayout
Choose the layout from the pop-up menu.
How Many Pages? Select an option to indicate the number of pages to print.

Reports User Guide
Custom Reports © 2004 Apple Computer, Inc. All rights reserved. 59
Field Description
Sort Order? Select an option to sort the mailing labels by student's lastname, mailing zip code, or address zip code.
When to print To run this report, select a time to start it:
• ASAP: Execute immediately.
• At Night: Execute during the next evening.
• On Weekend: Execute during the next weekend.
• On Specific Date/Time: Execute on the date and timespecified in the following fields.
4. Click Submit. PowerSchool runs the report, and the report queue appears. Depending onyour specifications, this could take several minutes.
5. Click Completed to display the report.
Note: Preview the labels before printing them. If you have trouble viewing this file, read thehelp topics that apply to your specific web browser and platform (Mac or Windows). If thereport is not formatted properly, retrace the steps above and make the necessary changes.When you are satisfied with the labels, put them in the printer tray and proceed to the nextstep.
6. Choose File > Print.
7. Make the necessary selections in the Print dialog.
8. Click OK. The mailing labels print.
Form LettersForm letter reports create custom letters that merge information from the PowerSchool databaseinto a letter. They are similar to report card reports in that you use HTML tags and PowerSchooldata codes. The difference is that a form letter report cannot include schedule listings.
When creating a form letter, there is no need to open a preview page. You can easily create thereport and preview it in the same web browser window.

Reports User Guide
Custom Reports © 2004 Apple Computer, Inc. All rights reserved. 60
How to Add a Custom Form Letter1. On the start page, choose Reports from the main menu.
2. On the Reports page, click Report Setup.
3. On the Report Setup page, click Form Letters. The Form Letters page appears.
4. Click New. The New Form Letter page appears.
5. Use the following table to enter information in the fields:
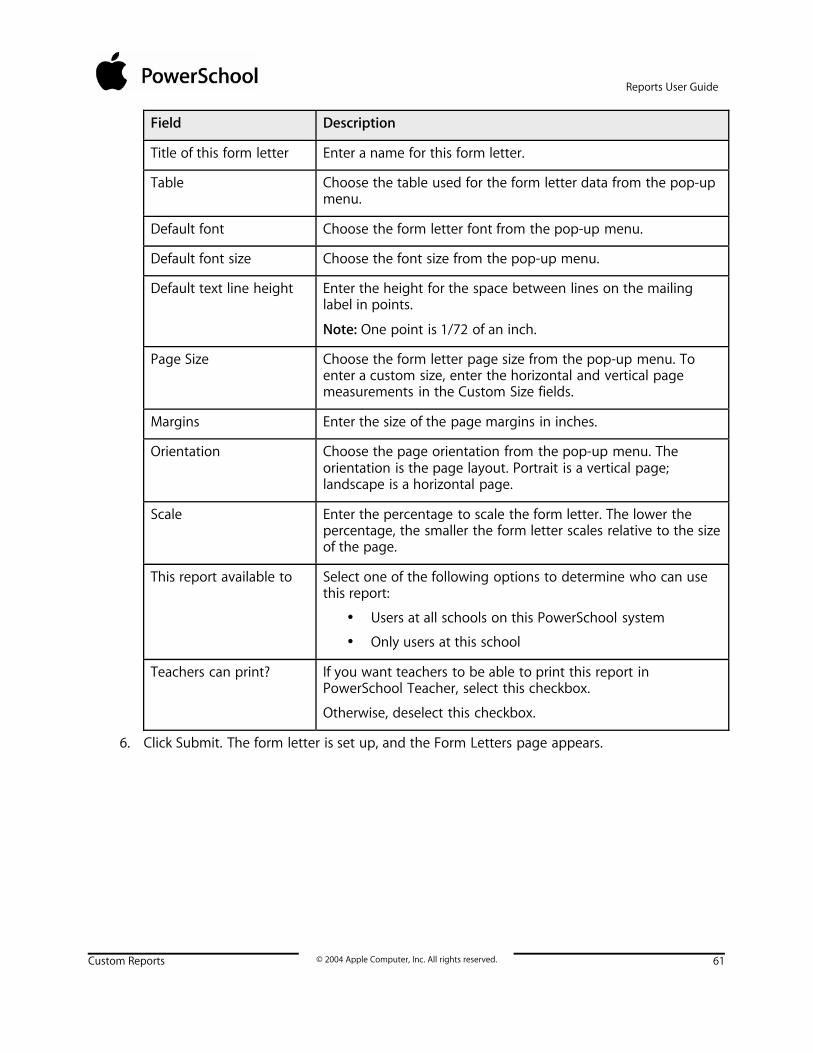
Reports User Guide
Custom Reports © 2004 Apple Computer, Inc. All rights reserved. 61
Field Description
Title of this form letter Enter a name for this form letter.
Table Choose the table used for the form letter data from the pop-upmenu.
Default font Choose the form letter font from the pop-up menu.
Default font size Choose the font size from the pop-up menu.
Default text line height Enter the height for the space between lines on the mailinglabel in points.
Note: One point is 1/72 of an inch.
Page Size Choose the form letter page size from the pop-up menu. Toenter a custom size, enter the horizontal and vertical pagemeasurements in the Custom Size fields.
Margins Enter the size of the page margins in inches.
Orientation Choose the page orientation from the pop-up menu. Theorientation is the page layout. Portrait is a vertical page;landscape is a horizontal page.
Scale Enter the percentage to scale the form letter. The lower thepercentage, the smaller the form letter scales relative to the sizeof the page.
This report available to Select one of the following options to determine who can usethis report:
• Users at all schools on this PowerSchool system
• Only users at this school
Teachers can print? If you want teachers to be able to print this report inPowerSchool Teacher, select this checkbox.
Otherwise, deselect this checkbox.
6. Click Submit. The form letter is set up, and the Form Letters page appears.
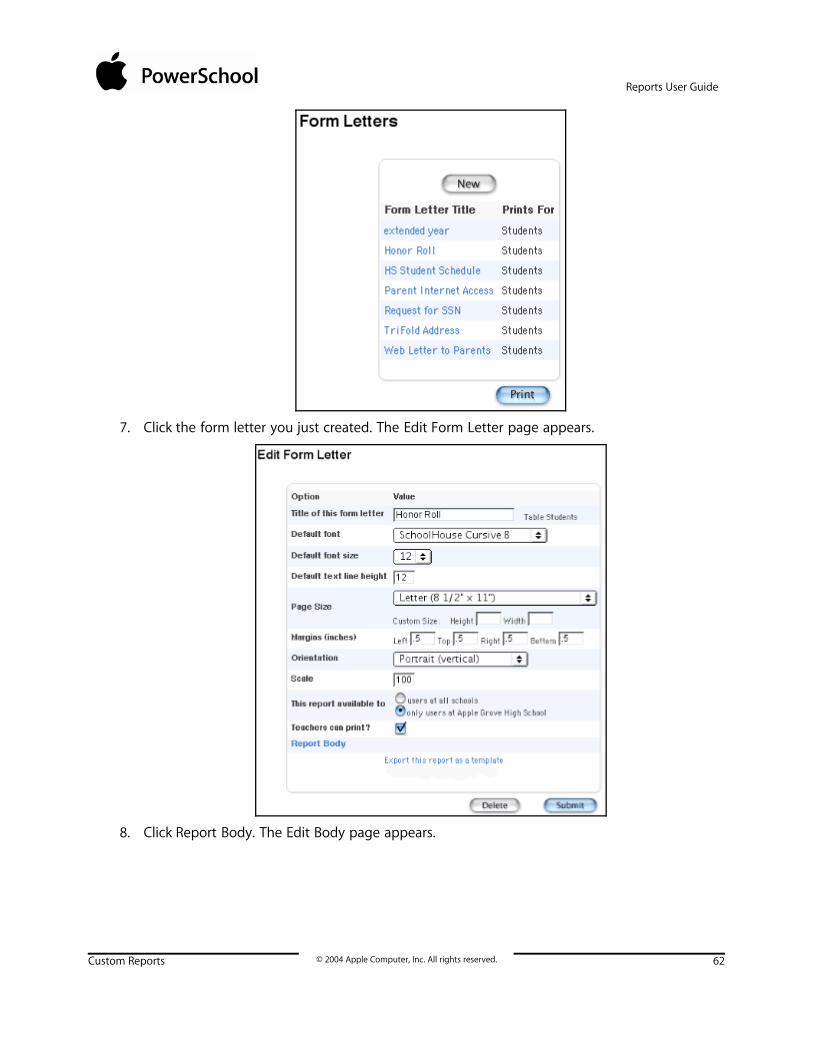
Reports User Guide
Custom Reports © 2004 Apple Computer, Inc. All rights reserved. 62
7. Click the form letter you just created. The Edit Form Letter page appears.
8. Click Report Body. The Edit Body page appears.

Reports User Guide
Custom Reports © 2004 Apple Computer, Inc. All rights reserved. 63
9. Enter the content of the letter in the large field using text, HTML tags, and PowerSchooldata codes as needed. For a complete list of data codes, visit the PowerSchool CustomerSupport web site at https://www.powerschool.com/support/downloads/ and clickPowerSchool Codes. For a complete list of field codes, click View Field List on thePowerSchool start page.
10. Click Submit. The Form Letters page appears.
11. Click Print. The Print Reports page appears.

Reports User Guide
Custom Reports © 2004 Apple Computer, Inc. All rights reserved. 64
12. Use the following table to enter information in the fields:
Field Description
Which report would youlike to print?
Choose the form letter from the pop-up menu.
For which students? Select an option to indicate the students for whom the reportwill be run, if necessary.
Print only the first Xpages
If you only want to print a limited number of pages, select thischeckbox and enter the number of pages. If you make noselections at the Which Students option, a report prints for eachstudent.
In what order? Select an option to indicate the sort order.
If printing studentschedules, use...
Select an option to indicate enrollment specifications. If youselect the "enrollment as of" option, enter the enrollment datein the field.
Watermark Text If you want to print text as a watermark on each page of thereport, use the pop-up menu to either choose one of thestandard phrases or choose Custom and enter the text youwant to print as a watermark in the field.

Reports User Guide
Custom Reports © 2004 Apple Computer, Inc. All rights reserved. 65
Field Description
Watermark Mode Use the pop-up menu to determine how you want the text toprint. Watermark prints the text behind objects on the report,while Overlay prints the text over objects on the report.
When to print To run this report, select a time to start it:
• ASAP: Execute immediately.
• At Night: Execute during the next evening.
• On Weekend: Execute during the next weekend.
• On Specific Date/Time: Execute on the date and timespecified in the following fields.
13. Click Submit. The report appears with the specified parameters. Review it from beginning toend to verify that the formatting and content are correct.
If you are ready to print the letters, see the section "Run, Print, and Save Reports."
How to Edit a Custom Form Letter1. On the start page, choose Reports from the main menu.
2. On the Reports page, click Report Setup.

Reports User Guide
Custom Reports © 2004 Apple Computer, Inc. All rights reserved. 66
3. On the Report Setup page, click Form Letters. The Form Letters page appears.
4. Click the form letter to be edited. The Edit Form Letter page appears.
5. Use the following table to edit information in the fields:
Field Description
Title of this form letter Edit this form letter's name.

Reports User Guide
Custom Reports © 2004 Apple Computer, Inc. All rights reserved. 67
Field Description
Table Choose the table used for the form letter data from the pop-upmenu.
Default font Choose the form letter font from the pop-up menu.
Default font size Choose the font size from the pop-up menu.
Default text line height Edit the height for the space between lines on the mailing labelin points.
Note: One point is 1/72 of an inch.
Page Size Choose the form letter page size from the pop-up menu. Toenter a custom size, enter the horizontal and vertical pagemeasurements in the Custom Size fields.
Margins Edit the size of the page margins in inches.
Orientation Choose the page orientation from the pop-up menu. Theorientation is the page layout. Portrait is a vertical page;landscape is a horizontal page.
Scale Edit the percentage to scale the form letter. The lower thepercentage, the smaller the form letter scales relative to the sizeof the page.
This report available to Select one of the following options to determine who can usethis report:
• Users at all schools on this PowerSchool system
• Only users at this school
Teachers can print? If you want teachers to be able to print this report inPowerSchool Teacher, select this checkbox. Otherwise, deselectthis checkbox.
6. Click Submit. The Form Letters page appears.

Reports User Guide
Custom Reports © 2004 Apple Computer, Inc. All rights reserved. 68
7. Click the form letter you just created. The Edit Form Letter page appears.
8. Click Report Body. The Edit Body page appears.

Reports User Guide
Custom Reports © 2004 Apple Computer, Inc. All rights reserved. 69
9. Enter the content of the letter in the large field using text, HTML tags, and PowerSchooldata codes as needed. For a complete list of data codes, visit the PowerSchool CustomerSupport web site at https://www.powerschool.com/support/downloads/ and clickPowerSchool Codes. For a complete list of field codes, click View Field List on thePowerSchool start page.
10. Click Submit. The Form Letters page appears.
11. Click Print. The Print Reports page appears.
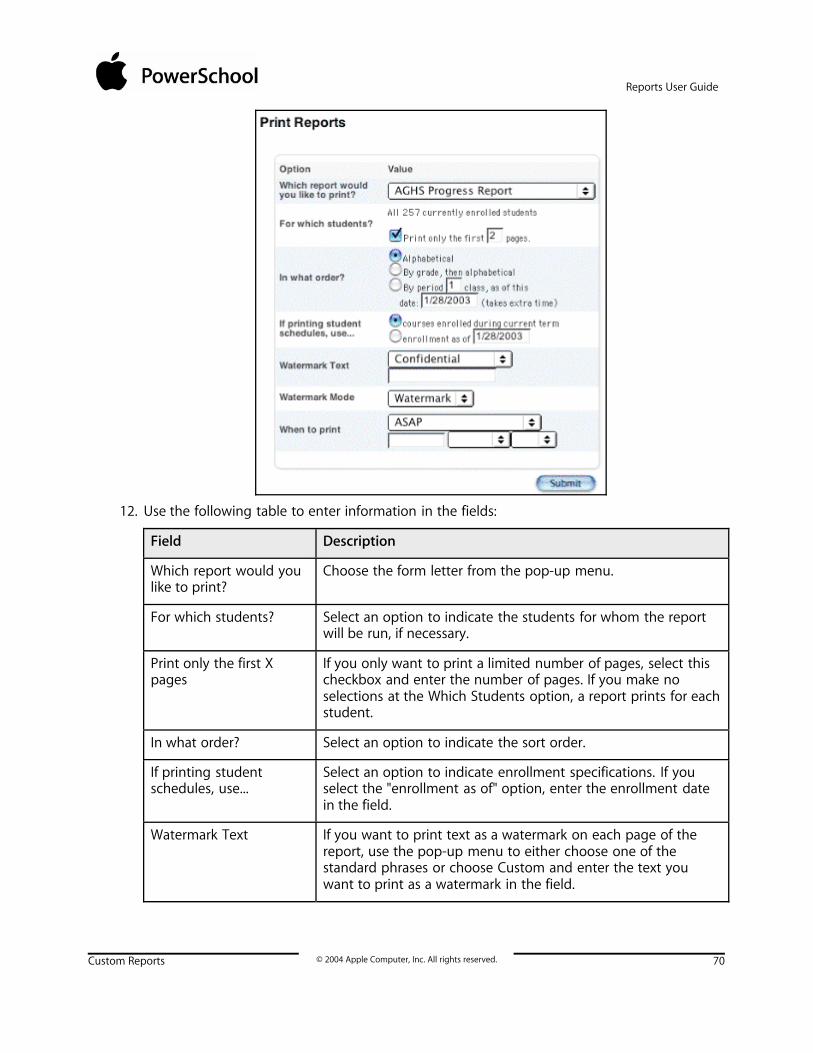
Reports User Guide
Custom Reports © 2004 Apple Computer, Inc. All rights reserved. 70
12. Use the following table to enter information in the fields:
Field Description
Which report would youlike to print?
Choose the form letter from the pop-up menu.
For which students? Select an option to indicate the students for whom the reportwill be run, if necessary.
Print only the first Xpages
If you only want to print a limited number of pages, select thischeckbox and enter the number of pages. If you make noselections at the Which Students option, a report prints for eachstudent.
In what order? Select an option to indicate the sort order.
If printing studentschedules, use...
Select an option to indicate enrollment specifications. If youselect the "enrollment as of" option, enter the enrollment datein the field.
Watermark Text If you want to print text as a watermark on each page of thereport, use the pop-up menu to either choose one of thestandard phrases or choose Custom and enter the text youwant to print as a watermark in the field.

Reports User Guide
Custom Reports © 2004 Apple Computer, Inc. All rights reserved. 71
Field Description
Watermark Mode Use the pop-up menu to determine how you want the text toprint. Watermark prints the text behind objects on the report,while Overlay prints the text over objects on the report.
When to print To run this report, select a time to start it:
• ASAP: Execute immediately.
• At Night: Execute during the next evening.
• On Weekend: Execute during the next weekend.
• On Specific Date/Time: Execute on the date and timespecified in the following fields.
13. Click Submit. The report appears with the specified parameters. Review it from beginning toend to verify that the formatting and content are correct.
If you are ready to print the letters, see the section "Run, Print, and Save Reports."
How to Delete a Custom Form Letter1. On the start page, choose Reports from the main menu.
2. On the Reports page, click Report Setup.

Reports User Guide
Custom Reports © 2004 Apple Computer, Inc. All rights reserved. 72
3. On the Report Setup page, click Form Letters. The Form Letters page appears.
4. Click the form letter to be deleted. The Edit Form Letter page appears.
5. Click Delete. The Form Letters page appears without the deleted form letter.

Reports User Guide
Custom Reports © 2004 Apple Computer, Inc. All rights reserved. 73
Object ReportsUse object reports to create and print official school reports and documents such as transcripts,scheduling forms, report cards, letters, and award certificates for students. The procedures in thissection provide instructions on how to create the base for the report and each of the objects. Youmust first create the report base and then insert objects in any order. When you are ready to createan object report, give yourself time to experiment.
These reports are called object reports because you can insert objects such as boxes, lines, circles,logos, and pictures into them. When you create each object, you determine where it appears on thereport in relation to the other objects. These objects appear on the electronic or paper outputaccording to the specifications you enter on each object's setup page. The best way to generate anobject report is to create a few objects and print a sample to ensure that it looks as it should. Formore information, see the section "Objects on an Object Report."
Use object reports to display information related to standards and tests. For more information, seethe sections "Object Reports With Standards Grades" and "Object Reports with TestTags," respectively.
Note: Open the preview page when you create an object report to view the report prior to printing.For more information, see the section "How to Open a Preview Page."
How to Open a Preview PageWhen creating custom reports—especially object reports—it is a good idea to preview themfrequently as you work. Therefore, before creating any new reports, open a preview page. You canpreview and print any type of custom report from the Print Reports page. For reports pertaining toa group of students, select a group of students and click Print Reports on the Group Functionspage.
Note: Reports created using the Log table are only accessible by clicking "Print a Report" on the LogEntry Functions page. For more information, see the section "Search Log Entries."
1. On the start page, search for and select any student.
2. Click the PowerSchool logo.
3. Choose Reports from the main menu.
4. On the Reports page, click Report Setup.
5. On the Report Setup page, click Form Letters. The Form Letters page appears.

Reports User Guide
Custom Reports © 2004 Apple Computer, Inc. All rights reserved. 74
6. Click Print.
Leave the Print Reports page open as you create each type of report. You will return to it toreview the report template as you work. In future instructions, this page is referred to as thepreview page.
How to Create an Object Report TemplateCreate an object report template to define the title of the report and other general settings such asmargins, font, and font size. Then, create each object you want to include on the report. After youcreate all of the objects on the report and are satisfied with their placement, use the object reporttemplate to print the report.
1. On the start page, choose Reports from the main menu.
2. On the Reports page, click Report Setup.
3. On the Report Setup page, click Object Reports. The Object Reports page displays the list ofany object report templates created for your school.

Reports User Guide
Custom Reports © 2004 Apple Computer, Inc. All rights reserved. 75
4. Click New. The New Object Report page appears.

Reports User Guide
Custom Reports © 2004 Apple Computer, Inc. All rights reserved. 76
5. Use the following table to enter information in the fields:
Field Description
Title of this report Enter the title of the report. Then, use the Table pop-up menuto choose one of the following tables for the report:
• Students
• Staff
• Log
Note: Selecting Log from the Table pop-up menu provides youaccess to the Log table from which you can select any field,including custom fields, you want to include in the report. Eachfield you want to include in the log object report must bespecified using the correct syntax in order to successfullydisplay the data. The text that precedes the syntax (separatedby a colon) can be modified (or deleted) based on your needs.For example, you could modify Name: ^([01]LastFirst) to appearas Student’s Last Name: ^([01]LastFirst).
The following are Log table student fields you can use in thereport:
• Name: ^([01]LastFirst)
• Grade: ^([01]Grade_Level)
• SN: ^([01]Student_Number)
• DOB: ^([01]DOB)
• SSN: ^([01]SSN)
• Ethnicity: ^([01]Ethnicity)
• Mailing City: ^([01]Mailing_City)
• Mailing Street: ^([01]Mailing_Street)
• Mailing State: ^([01]Mailing_State)
• Mailing Zip: ^([01]Mailing_Zip)
• Alert Discipline: ^([01]Alert_Discipline)
• State Student #: ^([01]State_StudentNumber)
The following are Log table discipline fields you can use in thereport:
• Entry Author: ~(Entry_Author)
• Entry Date: ~(Entry_Date)
• Entry Time: ~(Entry_Time)
• Title: ~(Subject)
• Entry Text: ~(Entry)

Reports User Guide
Custom Reports © 2004 Apple Computer, Inc. All rights reserved. 77
Field Description
• Log Type ID: ~(logtypeid)
• Subtype: ~(Subtype)
• Category: ~(Category)
• Consequence: ~(Consequence)
• Incident Type: ~(Discipline_IncidentType)
• Action Taken Detail: ~(Discipline_ActionTakenDetail)
• Incident Type Category:~(Discipline_IncidentTypeCategory)
• Action Taken End Date:~(Discipline_ActionTakenEndDate)
• Incident Type Detail: ~(Discipline_IncidentTypeDetail)
• Student Number: ~(Student_Number)
• Administrator ID: ~(Discipline_AdministratorID)
• Likely Injury Flag: ~(Discipline_LikelyInjuryFlag)
• Alcohol Related Flag: ~(Discipline_AlcoholRelatedFlag)
• Money Loss Value: ~(Discipline_MoneyLossValue)
• Drug Related: ~(Discipline_DrugRelatedFlag)
• Offender: ~(Discipline_Offender)
• Drug Type Detail: ~(Discipline_DrugTypeDetail)
• Police Involved: ~(Discipline_PoliceInvolvedFlag)
• Duration Actual: ~(Discipline_DurationActual)
• Reporter: ~(Discipline_Reporter)
• Duration Assigned: ~(Discipline_DurationAssigned)
• Reporter ID: ~(Discipline_ReporterID)
• Duration Change: ~(Discipline_DurationChangeSource)
• School Rules Vio Flag: ~(Discipline_SchoolRulesVioFlag)
• Duration Notes: ~(Discipline_DurationNotes)
• Sequence: ~(Discipline_Sequence)
• Felony Flag: ~(Discipline_FelonyFlag)
• Victim Type: ~(Discipline_VictimType)
• Gang Related Flag: ~(Discipline_GangRelatedFlag)
• Weapon Related: ~(Discipline_WeaponRelatedFlag)
• Hate Crime: ~(Discipline_HateCrimeFlag)
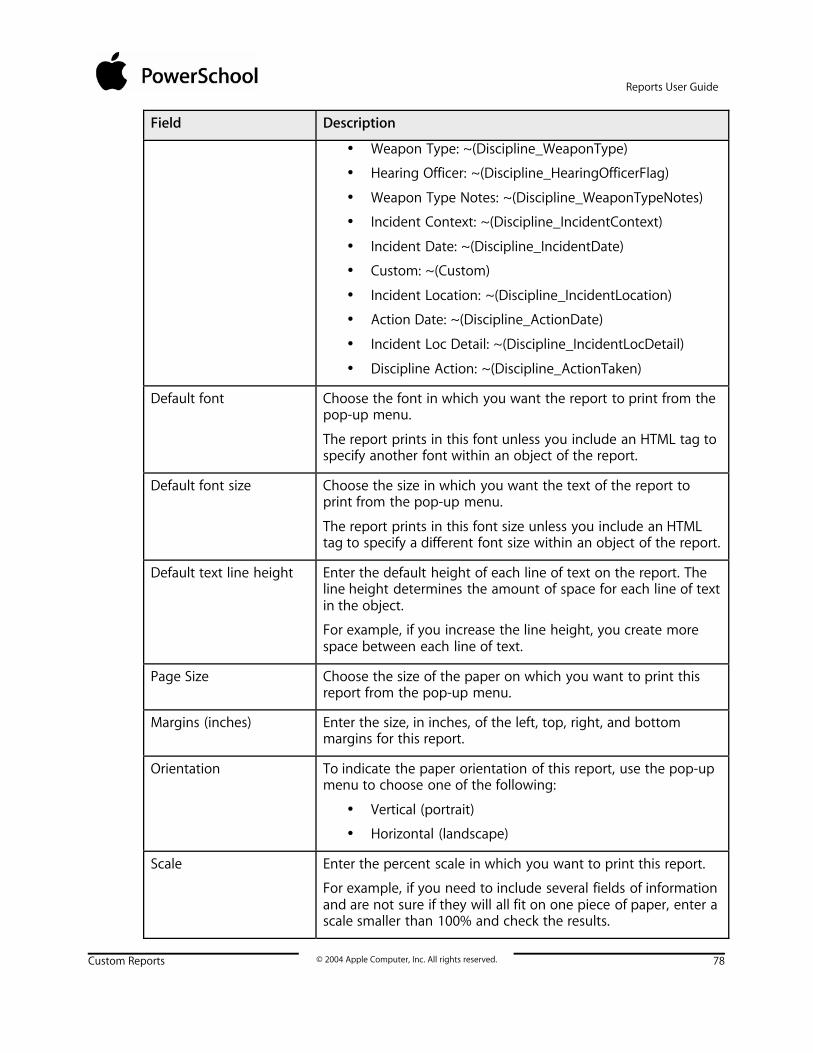
Reports User Guide
Custom Reports © 2004 Apple Computer, Inc. All rights reserved. 78
Field Description
• Weapon Type: ~(Discipline_WeaponType)
• Hearing Officer: ~(Discipline_HearingOfficerFlag)
• Weapon Type Notes: ~(Discipline_WeaponTypeNotes)
• Incident Context: ~(Discipline_IncidentContext)
• Incident Date: ~(Discipline_IncidentDate)
• Custom: ~(Custom)
• Incident Location: ~(Discipline_IncidentLocation)
• Action Date: ~(Discipline_ActionDate)
• Incident Loc Detail: ~(Discipline_IncidentLocDetail)
• Discipline Action: ~(Discipline_ActionTaken)
Default font Choose the font in which you want the report to print from thepop-up menu.
The report prints in this font unless you include an HTML tag tospecify another font within an object of the report.
Default font size Choose the size in which you want the text of the report toprint from the pop-up menu.
The report prints in this font size unless you include an HTMLtag to specify a different font size within an object of the report.
Default text line height Enter the default height of each line of text on the report. Theline height determines the amount of space for each line of textin the object.
For example, if you increase the line height, you create morespace between each line of text.
Page Size Choose the size of the paper on which you want to print thisreport from the pop-up menu.
Margins (inches) Enter the size, in inches, of the left, top, right, and bottommargins for this report.
Orientation To indicate the paper orientation of this report, use the pop-upmenu to choose one of the following:
• Vertical (portrait)
• Horizontal (landscape)
Scale Enter the percent scale in which you want to print this report.
For example, if you need to include several fields of informationand are not sure if they will all fit on one piece of paper, enter ascale smaller than 100% and check the results.

Reports User Guide
Custom Reports © 2004 Apple Computer, Inc. All rights reserved. 79
Field Description
This report available to Select one of the following options to determine who can usethis report:
• Users at all schools on this PowerSchool system
• Only users at this school
Teachers can print? If you want teachers to be able to print this report inPowerSchool Teacher, select this checkbox. Otherwise, deselectthis checkbox.
6. Click Submit to save the information. The report you created appears on the Object Reportspage.
7. Click the report name on the Object Reports page to create and format objects on thisreport. The Object Report page for that report appears.
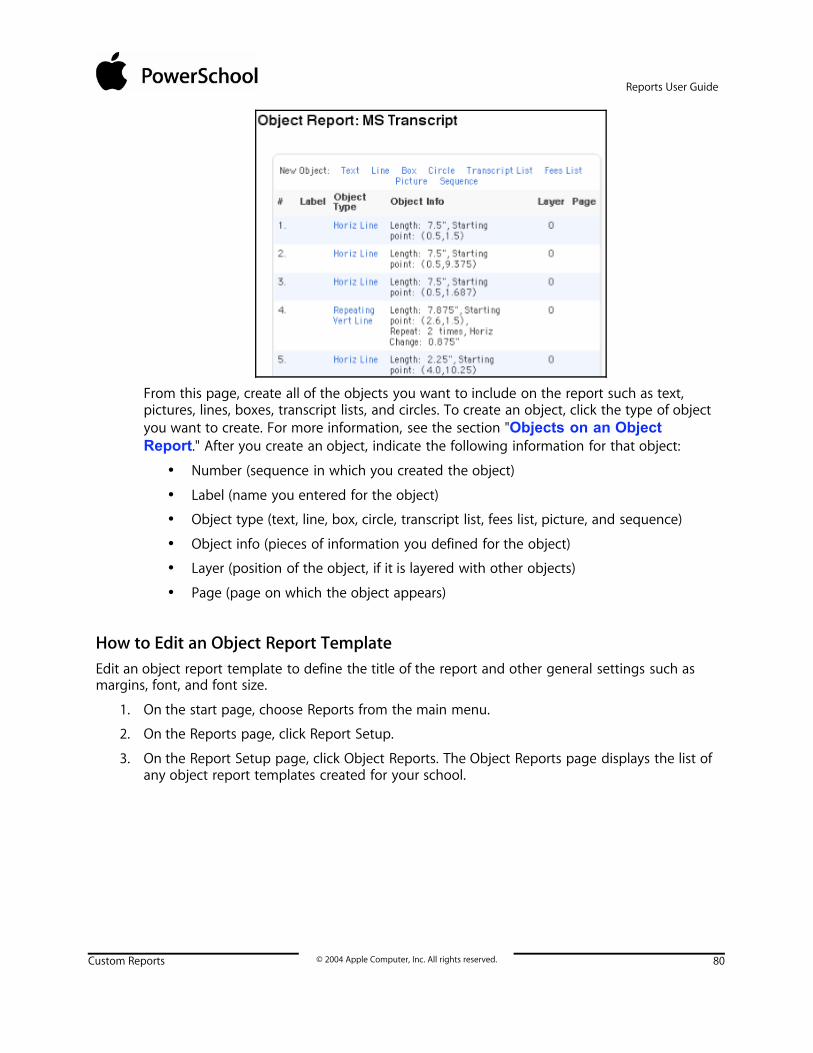
Reports User Guide
Custom Reports © 2004 Apple Computer, Inc. All rights reserved. 80
From this page, create all of the objects you want to include on the report such as text,pictures, lines, boxes, transcript lists, and circles. To create an object, click the type of objectyou want to create. For more information, see the section "Objects on an ObjectReport." After you create an object, indicate the following information for that object:
• Number (sequence in which you created the object)
• Label (name you entered for the object)
• Object type (text, line, box, circle, transcript list, fees list, picture, and sequence)
• Object info (pieces of information you defined for the object)
• Layer (position of the object, if it is layered with other objects)
• Page (page on which the object appears)
How to Edit an Object Report TemplateEdit an object report template to define the title of the report and other general settings such asmargins, font, and font size.
1. On the start page, choose Reports from the main menu.
2. On the Reports page, click Report Setup.
3. On the Report Setup page, click Object Reports. The Object Reports page displays the list ofany object report templates created for your school.
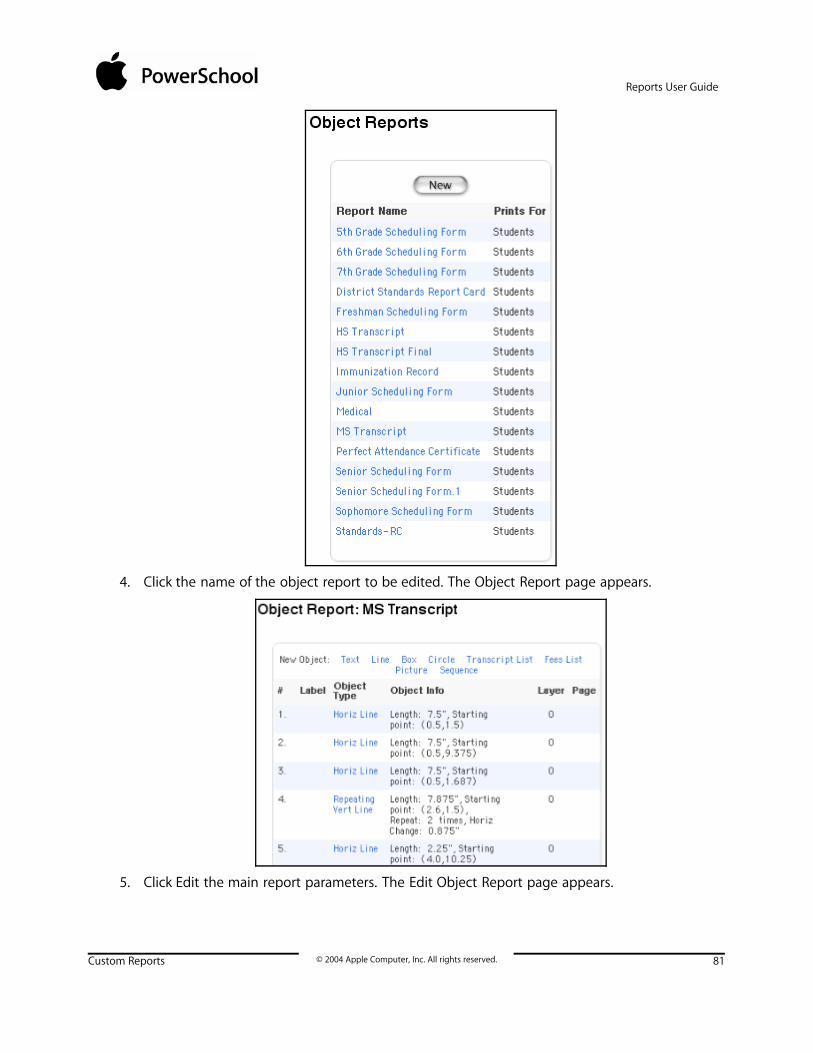
Reports User Guide
Custom Reports © 2004 Apple Computer, Inc. All rights reserved. 81
4. Click the name of the object report to be edited. The Object Report page appears.
5. Click Edit the main report parameters. The Edit Object Report page appears.
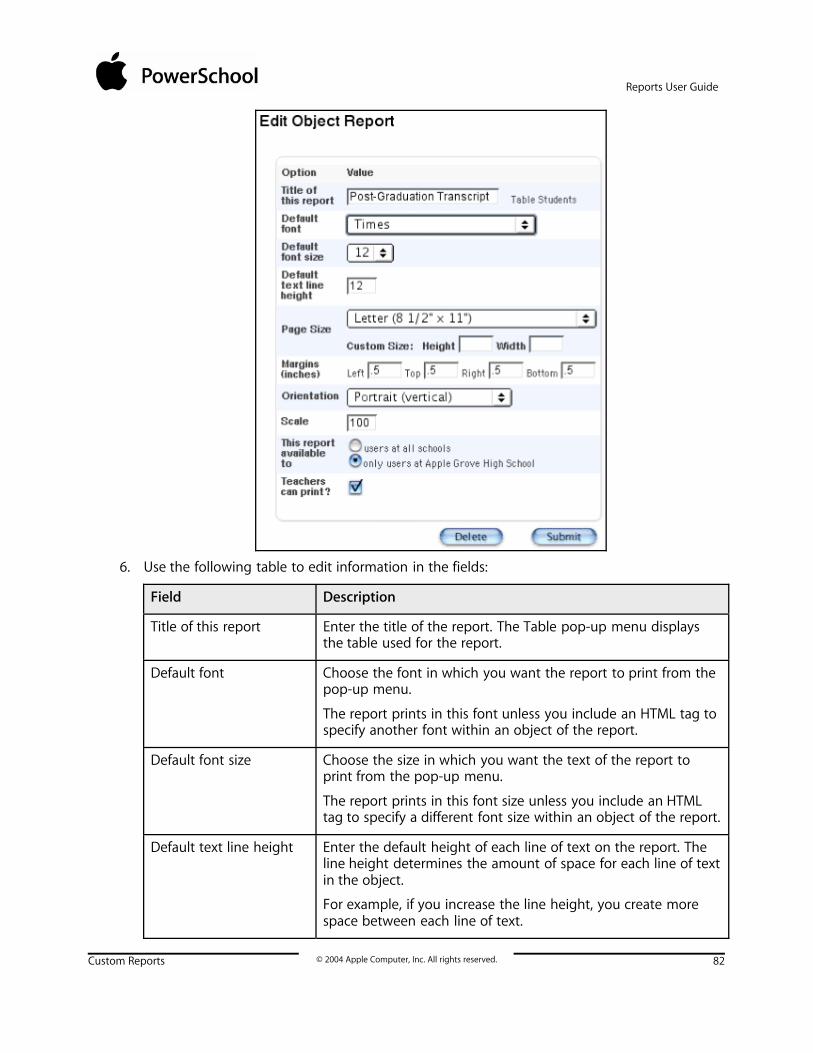
Reports User Guide
Custom Reports © 2004 Apple Computer, Inc. All rights reserved. 82
6. Use the following table to edit information in the fields:
Field Description
Title of this report Enter the title of the report. The Table pop-up menu displaysthe table used for the report.
Default font Choose the font in which you want the report to print from thepop-up menu.
The report prints in this font unless you include an HTML tag tospecify another font within an object of the report.
Default font size Choose the size in which you want the text of the report toprint from the pop-up menu.
The report prints in this font size unless you include an HTMLtag to specify a different font size within an object of the report.
Default text line height Enter the default height of each line of text on the report. Theline height determines the amount of space for each line of textin the object.
For example, if you increase the line height, you create morespace between each line of text.

Reports User Guide
Custom Reports © 2004 Apple Computer, Inc. All rights reserved. 83
Field Description
Page Size Choose the size of the paper on which you want to print thisreport from the pop-up menu.
Margins (inches) Enter the size, in inches, of the left, top, right, and bottommargins for this report.
Orientation To indicate the paper orientation of this report, use the pop-upmenu to choose one of the following:
• Vertical (portrait)
• Horizontal (landscape)
Scale Enter the percent scale in which you want to print this report.
For example, if you need to include several fields of informationand are not sure they will all fit on one piece of paper, enter ascale smaller than 100% and check the results.
This report available to Select one of the following options to determine who can usethis report:
• Users at all schools on this PowerSchool system
• Only users at this school
Teachers can print? If you want teachers to be able to have access to print thisreport in PowerSchool Teacher, select this checkbox. Otherwise,deselect this checkbox.
7. Click Submit to save the information. The report you edited appears on the Object Reportspage.
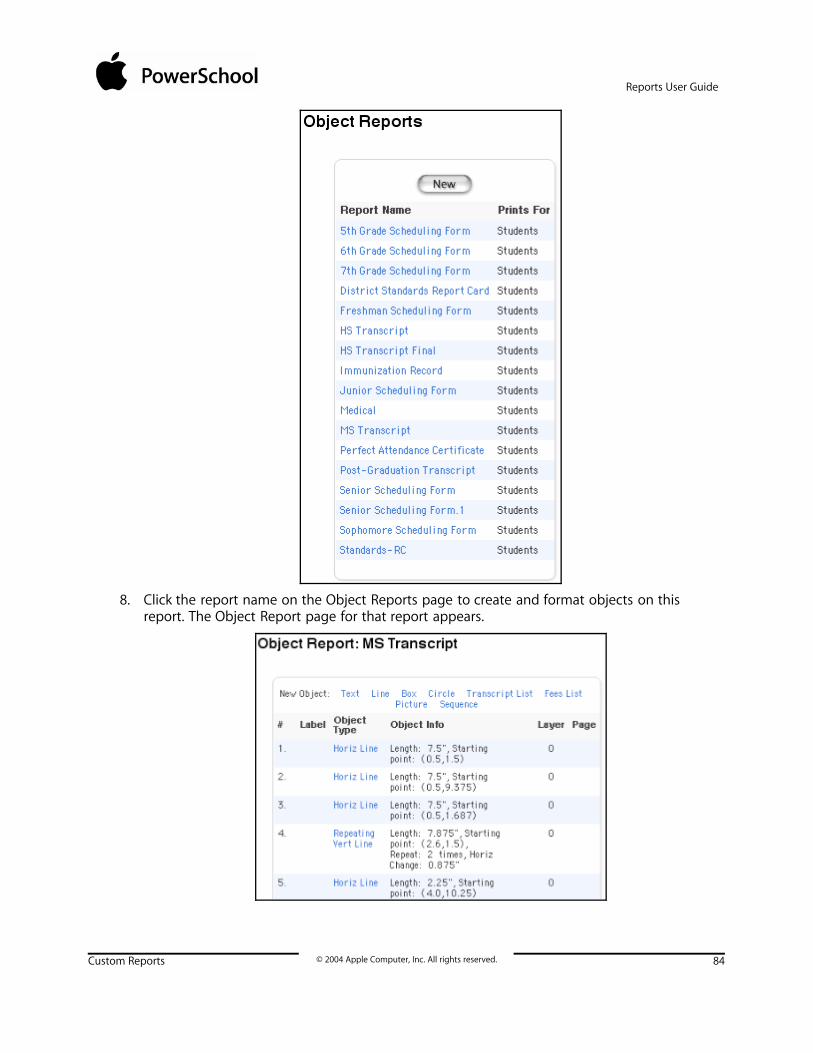
Reports User Guide
Custom Reports © 2004 Apple Computer, Inc. All rights reserved. 84
8. Click the report name on the Object Reports page to create and format objects on thisreport. The Object Report page for that report appears.

Reports User Guide
Custom Reports © 2004 Apple Computer, Inc. All rights reserved. 85
From this page, edit all of the objects you want to include on the report such as text,pictures, lines, boxes, transcript lists, and circles. For more information, see the section"Objects on an Object Report."
Objects on an Object ReportYou can create many types of objects to include on your object reports: text objects, line objects,transcript list objects, fees list objects, box objects, circle objects, picture objects, and sequenceobjects. You can create several objects on each object report. Create them in any order.
When you create an object, you define where you want it to appear on a page and on which pageof the report you want it to appear. To do this, define the coordinates of each object you create ininches on an X (horizontal) and Y (vertical) axis. Use a ruler and a piece of paper to determine thecoordinates of each object you create.
To enhance the appearance of the object reports, you can format many objects. For example,specify the color of a line object by clicking the Color link. The Object Report Colors page appears.
Each of the related procedures assume that you are on the Object Report page for the report youare creating. Either create a new report or edit an existing one. For more information, see thesection "Object Reports."
Use the Print Reports option on the Group Functions page to print a custom report for the selectedstudents. For information on creating reports, see the section "Custom Reports." For informationon printing an object report or any type of report, see the section "Run, Print, and SaveReports."
Text ObjectsText objects are boxes that contain text. Specify if you want the box to be framed or unframed.Within a text object, you can include two types of text:
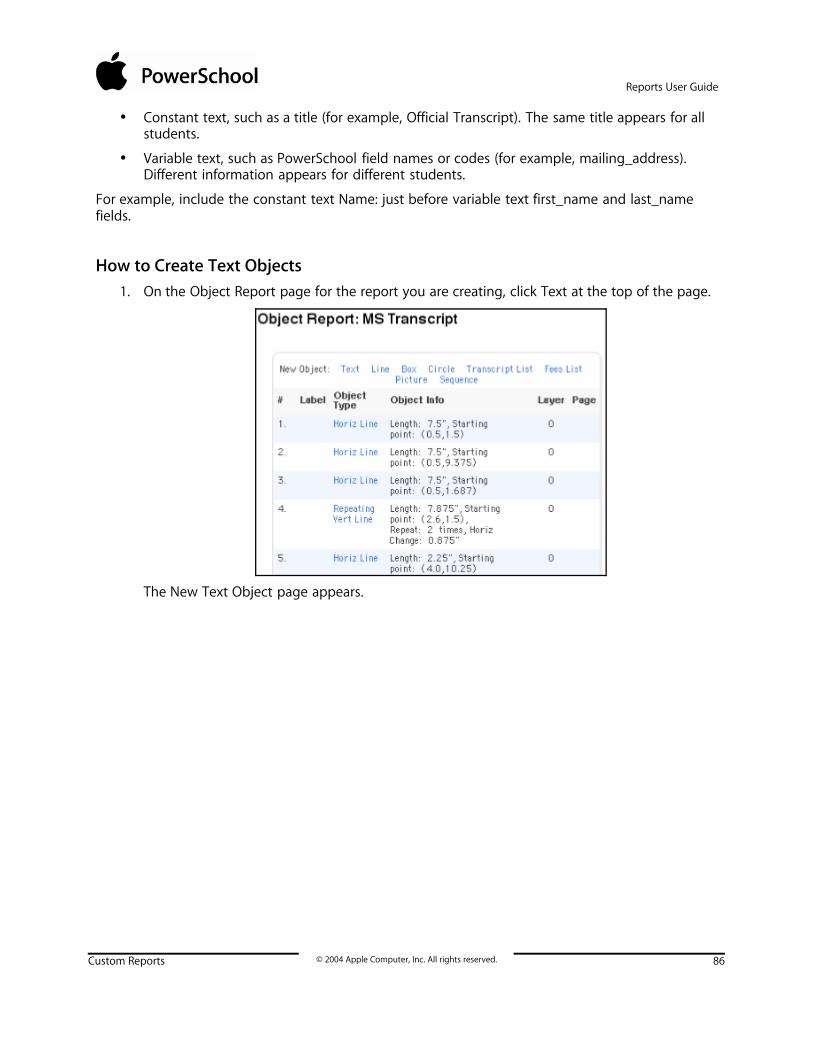
Reports User Guide
Custom Reports © 2004 Apple Computer, Inc. All rights reserved. 86
• Constant text, such as a title (for example, Official Transcript). The same title appears for allstudents.
• Variable text, such as PowerSchool field names or codes (for example, mailing_address).Different information appears for different students.
For example, include the constant text Name: just before variable text first_name and last_namefields.
How to Create Text Objects1. On the Object Report page for the report you are creating, click Text at the top of the page.
The New Text Object page appears.

Reports User Guide
Custom Reports © 2004 Apple Computer, Inc. All rights reserved. 87
2. Use the following table to enter information in the fields:
Field Description
Object Label Enter a name for the object.
Text Enter an unlimited amount of text to include in the text object.This can include constant text, PowerSchool field names,PowerSchool codes, and HTML formatting tags.
Note: You can use only style and font HTML tags.
Since text does not automatically wrap to the next line, usecarriage (hard) returns.
To create a carriage return, press and hold Command (Mac) orControl (Windows) and then the spacebar.
To include a PowerSchool field, use the following format: ^(fieldname)
For example, if you want to include each student’s name on thereport and center the information, you can create the following

Reports User Guide
Custom Reports © 2004 Apple Computer, Inc. All rights reserved. 88
Field Description
text object:
<center>^(first_name) ^(last_name)</center>
To include a tab, indicate the tab type and the number ofinches from the left side of the page. Tab types include:
• <tabc> for a centered tab
• <tabr> for a right-justified tab
• <tabl> for a left-justified tab
• <tabd> for a decimal-aligned tab
Create tab leaders by using characters such as the underscore(_) for a solid line or a period (.) for a dotted line. Include tableader characters at the end of the tab tag.
For example, <tabd 3.5 _> aligns a list of monetary amounts bytheir decimal places with a solid tab leader at 3.5 inches fromthe left side of the page.
To include a data code, use the following format: ^(*data code)
For example, if you want to include each student’s cumulativeGPA, enter ^(*gpa)
To view a complete list of data codes, visit the PowerSchoolCustomer Support web site athttps://www.powerschool.com/support/downloads/ andclick PowerSchool Codes.
Note: After you click Submit, the system changes the carets (^)in front of the field names and data codes to tildes (~).
Position Enter the number of inches from the left margin you want thetext object to begin to appear horizontally (X) and vertically (Y).
For example, enter 4.25 in the X field and 1 in the Y field toplace the object horizontally centered on an 8.5-inch page andvertically one inch from the top of the page.
Max Width Enter the maximum number of inches wide you want this textobject to print (optional).
To allow the text object to print the entire width of the page,enter 0.
If you do not define a maximum width, the system defaults tothe page width.
Max Height Enter the maximum number of inches high you want this textobject to print.
To allow the text object to print the entire length of the page,

Reports User Guide
Custom Reports © 2004 Apple Computer, Inc. All rights reserved. 89
Field Description
enter 0.
Font Choose the font of the text from the pop-up menu. The systemsetup determines the default font.
Style Select any combination of the following checkboxes todetermine the style of the text you enter in the Text field:
• Bold
• Italic
• Underline
Otherwise, do not select any checkboxes.
Size Enter the font size of the text.
Line Height Enter the height of the line. The line height determines theamount of space for each line of text in the object.
For example, if you increase the line height, you create morespace or padding between each line of text.
Color Enter the name of the color in which you want all text in thetext object to print.
Note: You can also specify specific colors for specific words orphrases using HTML in the Text field.
To view a list of color names, click the field name Color. A colorpalette appears. Copy the name of the color you want andpaste it into the Color field.
If you want the text to be black, leave this field blank.
Tint If you want to tint the color of the text, enter a percentage.
Otherwise, leave this field blank.
Rotation Enter the number of degrees you want to rotate the text objecton the page of the report.
Frame Width If you want the report to surround the text object with a lineframe, enter the number of points wide you want the frame toprint.
If you do not want the text object to print with a frame, leavethis field blank.
Frame Padding If you entered a frame width, enter the amount of space inpoints that you want between the text object and the frame.
For example, if you want the text object to print in the center ofthe frame, you need to adjust the padding.

Reports User Guide
Custom Reports © 2004 Apple Computer, Inc. All rights reserved. 90
Field Description
Frame Radius If you entered a frame width, enter a number of inches toindicate if you want the frame to print with rounded corners.
Special Select the "Move to next record after printing this text"checkbox if this text object is the last object the report printsbefore printing a new record.
Page Enter the page number of the report on which you want thistext object to print.
Layer If you want this object to appear behind or in front of anotherobject, choose the layer placement from the pop-up menu.
3. Click Submit to save the text object you create. When you print the report, the text objectprints according to your specifications.
Note: In the example above, assume a student does not have a Social Security number. Bydefault, the text box prints one blank space, then prints the birth date text directly next to it(SS# BIRTH DATE: 9/2/1984). If this causes alignment concerns in your text box, you can usethe <TABTO (inches)> HTML tag in your text object. Within the tag, before the text youwant to print in a specific space, enter the number of inches from the left margin that youwant to print the text. For example, if a student does not have a Social Security number, butyou still want the birth date to print 2.25 inches from the left margin, you can enter SS#^(ssn)<TABTO 2.25>^BIRTH DATE: ^(dob).
If the text object does not print correctly, edit it by clicking the object name on the ObjectReport page and repeating the procedure.
Line ObjectsCreate line objects to include horizontal and vertical lines on your object report. Lines can separateinformation and make it easier to read. For each line you create, you define the location, thickness,and number of times it appears.
Define line objects as if they were printing on a graph. For each line, you define the X and Ycoordinates in inches. The X coordinate is the horizontal point from the left margin at which youwant the line to print. The Y coordinate is the vertical point from the top margin at which you wantthe line to print.
Note: If the line is horizontal, the number you enter for the starting and ending Y points are thesame. If the line is vertical, the number you enter for the starting and ending X points are the same.
How to Create Line Objects1. On the Object Report page for the report you are creating, click Line.
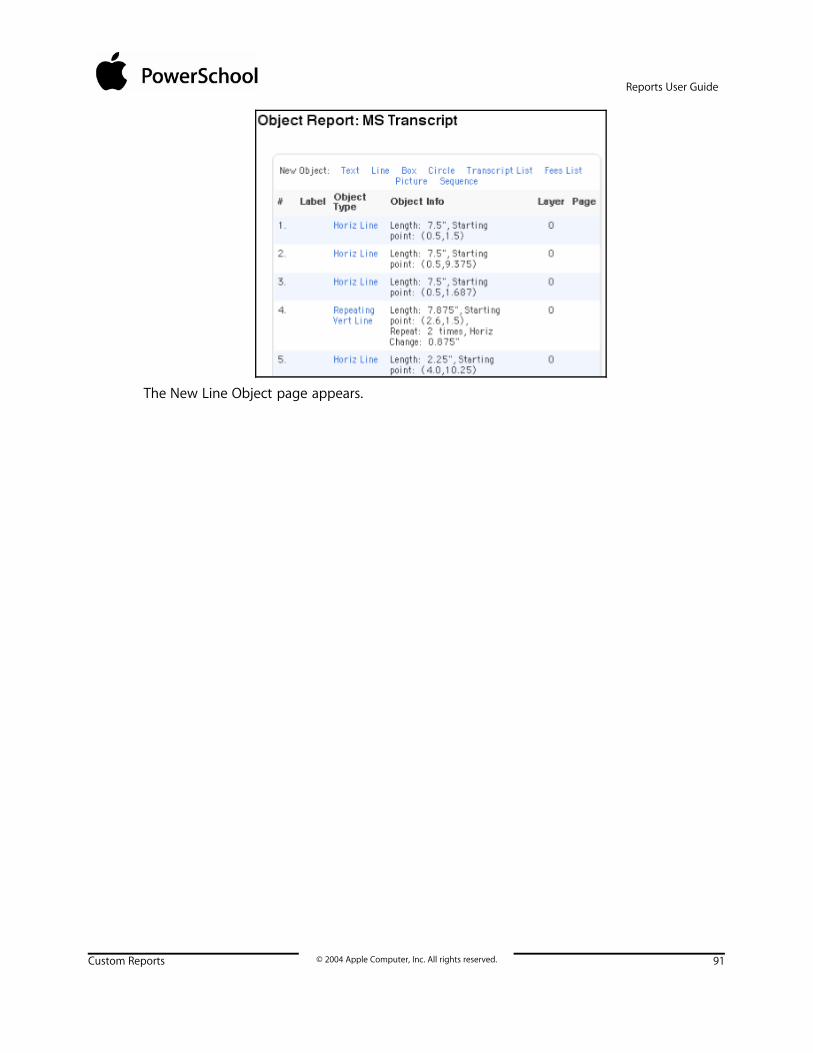
Reports User Guide
Custom Reports © 2004 Apple Computer, Inc. All rights reserved. 91
The New Line Object page appears.

Reports User Guide
Custom Reports © 2004 Apple Computer, Inc. All rights reserved. 92
2. Use the following table to enter information in the fields:
Field Description
Object Label Enter a name for the line object.
Starting point (X,Y) Enter the number of inches on the page to indicate the point atwhich you want the report to start the line horizontally (X) andvertically (Y).

Reports User Guide
Custom Reports © 2004 Apple Computer, Inc. All rights reserved. 93
Field Description
Ending point (X,Y) Enter the number of inches on the page to indicate the point atwhich you want the report to end the line horizontally (X) andvertically (Y).
Width Enter the width of the line in pixels.
Shading Enter a percentage to determine the shade of the line.
If you enter 100%, the line is black. If you enter 0%, the line iswhite. Therefore, you can enter percentages between 100 and 0to create a darker or lighter line.
Color Enter the name of the color in which you want the line to print.
To view a list of color names, click the field name Color.
If you want the line to be black, leave this field blank.
Tint If you want to tint the color of the line, enter a percentage.
Otherwise, leave this field blank.
Repeat If you want the line to print more than one time, enterinformation in the following fields:
• Times to Repeat.
• Horizontal Change (Enter the number of inches youwant between each line horizontally.)
• Vertical Change (Enter the number of inches you wantbetween each line vertically.)
Otherwise, leave these fields blank.
Line Style Select one of the options to indicate the style of the line.
Page Enter the page number of the report on which you want thisline to print.
Layer If you want this object to appear behind or in front of anotherobject, choose the layer placement from the pop-up menu.
3. Click Submit to save the line you create. When you print the report, the line object printsaccording to your specifications.
If the line does not print correctly, edit it by clicking the object name on the Object Reportpage and repeating the procedure.
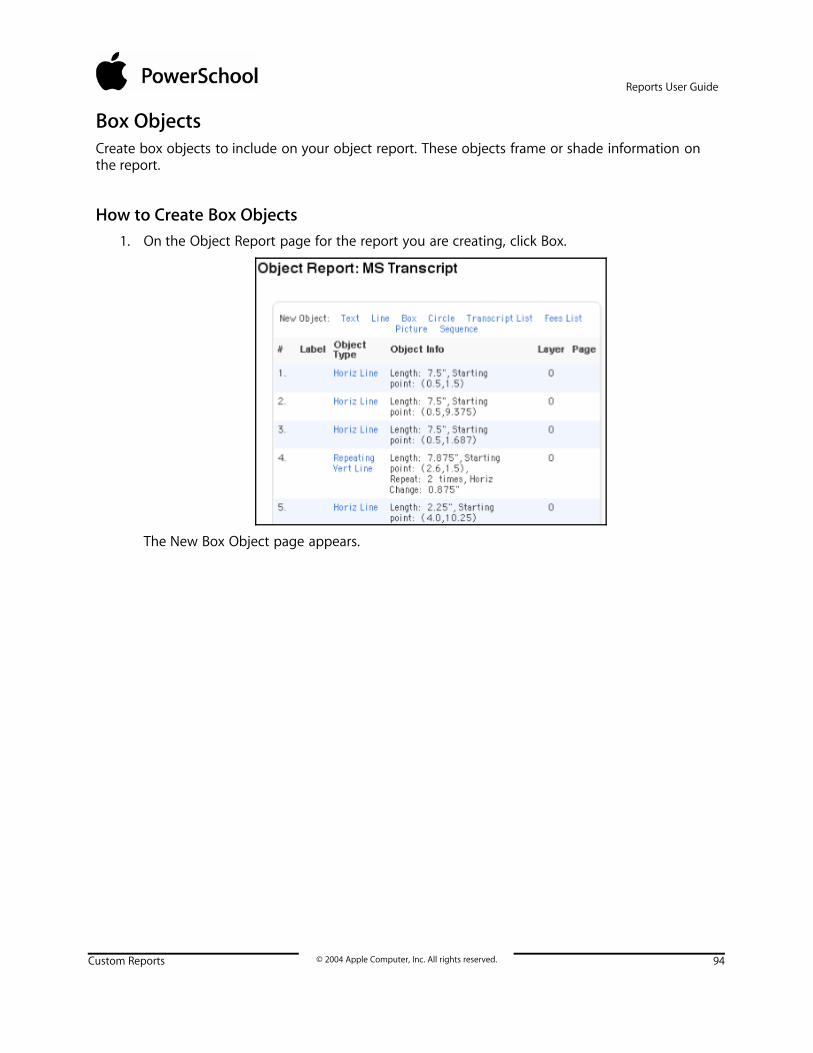
Reports User Guide
Custom Reports © 2004 Apple Computer, Inc. All rights reserved. 94
Box ObjectsCreate box objects to include on your object report. These objects frame or shade information onthe report.
How to Create Box Objects1. On the Object Report page for the report you are creating, click Box.
The New Box Object page appears.
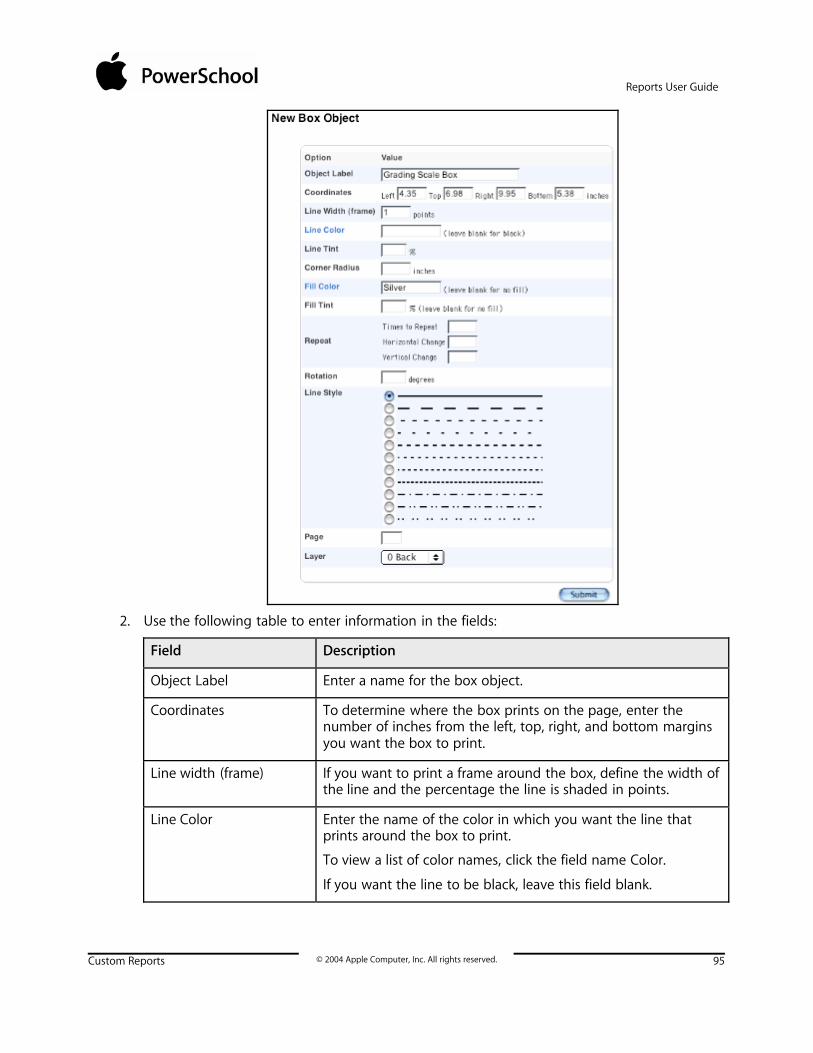
Reports User Guide
Custom Reports © 2004 Apple Computer, Inc. All rights reserved. 95
2. Use the following table to enter information in the fields:
Field Description
Object Label Enter a name for the box object.
Coordinates To determine where the box prints on the page, enter thenumber of inches from the left, top, right, and bottom marginsyou want the box to print.
Line width (frame) If you want to print a frame around the box, define the width ofthe line and the percentage the line is shaded in points.
Line Color Enter the name of the color in which you want the line thatprints around the box to print.
To view a list of color names, click the field name Color.
If you want the line to be black, leave this field blank.

Reports User Guide
Custom Reports © 2004 Apple Computer, Inc. All rights reserved. 96
Field Description
Line Tint If you want to tint the color of the line, enter a percentage.
Otherwise, leave this field blank.
Corner Radius Enter a number to indicate how round you want the corners ofthe box to be. The greater the number, the rounder the corners.
Fill Color If you want to shade or color inside the box, enter the name ofthe color.
To view a list of color names, click the field name Color.
Fill Tint If you want to tint the fill color of the box, enter a percentage.
Otherwise, leave this field blank.
Repeat If you want the box to print repeatedly, define information inthe following fields:
• Times to Repeat
• Horizontal Change (Enter the number of inches youwant between each box horizontally.)
• Vertical Change (Enter the number of inches you wantbetween each box vertically.)
Rotation If you want to rotate the box on the report, enter the numberof degrees you want it to rotate.
Line Style Select one of the options to indicate the style of the line thatsurrounds the box object.
Page Enter the page number of the report on which you want thisbox object to print.
Layer If you want this object to appear behind or in front of anotherobject, choose the layer placement from the pop-up menu.
3. Click Submit to save the box object you create. When you print the report, the box objectappears according to your specifications.
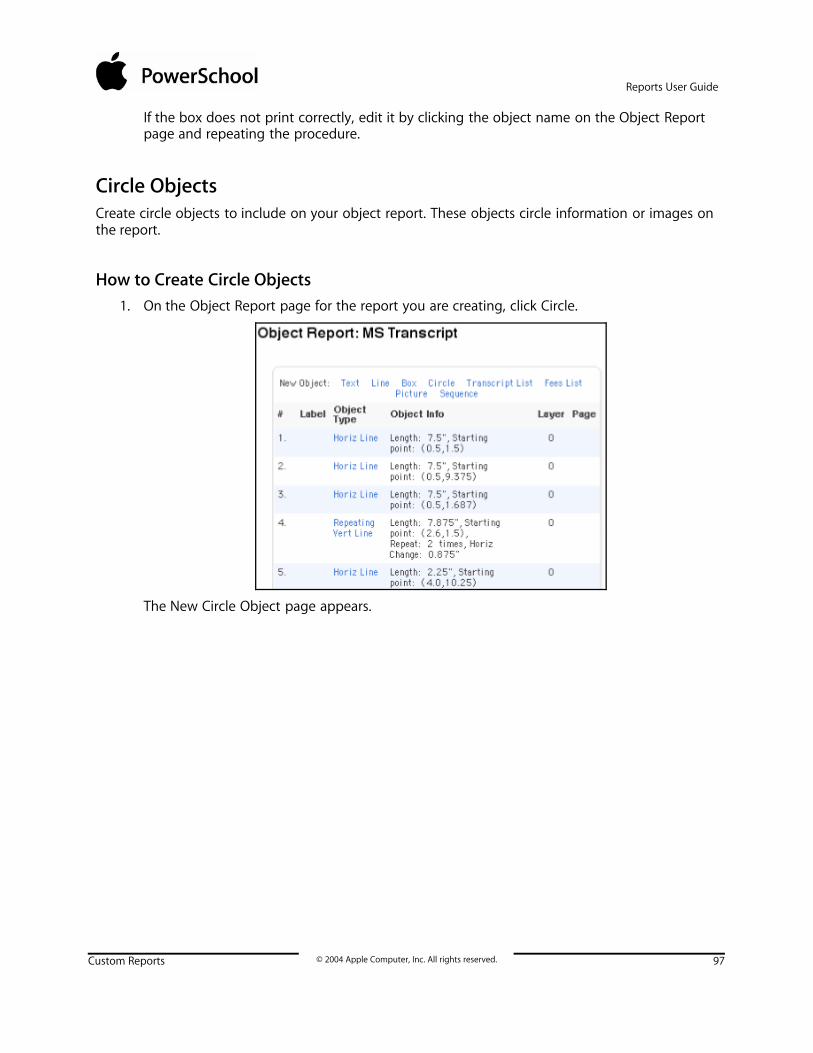
Reports User Guide
Custom Reports © 2004 Apple Computer, Inc. All rights reserved. 97
If the box does not print correctly, edit it by clicking the object name on the Object Reportpage and repeating the procedure.
Circle ObjectsCreate circle objects to include on your object report. These objects circle information or images onthe report.
How to Create Circle Objects1. On the Object Report page for the report you are creating, click Circle.
The New Circle Object page appears.

Reports User Guide
Custom Reports © 2004 Apple Computer, Inc. All rights reserved. 98
2. Use the following table to enter information in the fields:
Field Description
Object Label Enter a name for the circle object.
Center Point Enter the number of inches from the left margin you want thecenter point of the circle to print horizontally (X) and vertically(Y).

Reports User Guide
Custom Reports © 2004 Apple Computer, Inc. All rights reserved. 99
Field Description
Radius Enter the circle's radius, or the distance from the center of thecircle to its edge.
Line Width If you want to print a frame around the circle, define the widthof the line.
Line Color Enter the name of the color in which you want the line aroundthe circle to print.
To view a list of color names, click the field name Color.
If you want the line to be black, leave this field blank.
Line Tint If you want to tint the line, enter a percentage.
Otherwise, leave this field blank.
Fill Color If you want to shade or color inside the circle, enter the nameof the color.
To view a list of color names, click the field name Color.
Fill Tint If you want to tint the fill color of the circle, enter a percentage.
Otherwise, leave this field blank.
Starburst Points To create a starburst circle, enter the number of starburstpoints.
For example, you might create a starburst for a perfectattendance certificate.
Starburst Radius If you entered starburst points, enter the radius of the starburstin inches.
Repeat If you want the circle to print repeatedly, define information inthe following fields:
• Times to Repeat
• Horizontal Change (Enter the number of inches youwant between each circle horizontally.)
• Vertical Change (Enter the number of inches you wantbetween each circle vertically.)
Rotation If you want to rotate the circle on the report, enter the numberof degrees you want it to rotate.
Line Style Select one of the options to indicate the style of the line thatsurrounds the circle object.
Page Enter the page number of the report on which you want thiscircle object to print.
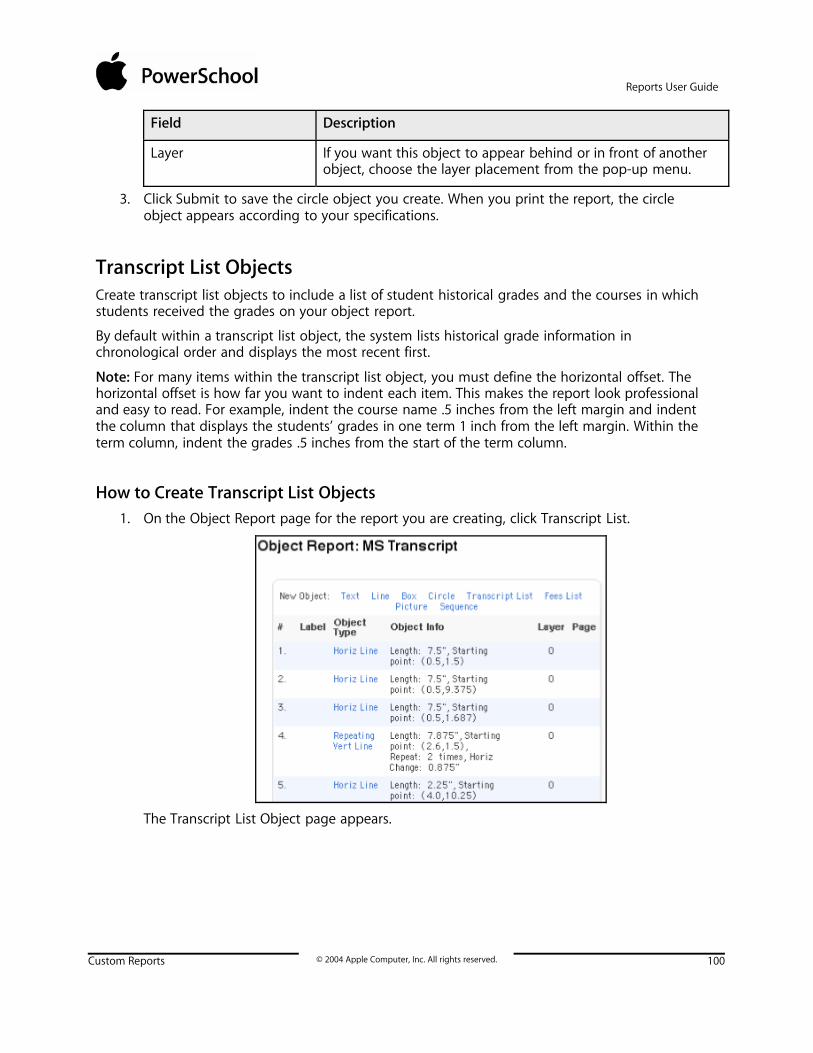
Reports User Guide
Custom Reports © 2004 Apple Computer, Inc. All rights reserved. 100
Field Description
Layer If you want this object to appear behind or in front of anotherobject, choose the layer placement from the pop-up menu.
3. Click Submit to save the circle object you create. When you print the report, the circleobject appears according to your specifications.
Transcript List ObjectsCreate transcript list objects to include a list of student historical grades and the courses in whichstudents received the grades on your object report.
By default within a transcript list object, the system lists historical grade information inchronological order and displays the most recent first.
Note: For many items within the transcript list object, you must define the horizontal offset. Thehorizontal offset is how far you want to indent each item. This makes the report look professionaland easy to read. For example, indent the course name .5 inches from the left margin and indentthe column that displays the students’ grades in one term 1 inch from the left margin. Within theterm column, indent the grades .5 inches from the start of the term column.
How to Create Transcript List Objects1. On the Object Report page for the report you are creating, click Transcript List.
The Transcript List Object page appears.

Reports User Guide
Custom Reports © 2004 Apple Computer, Inc. All rights reserved. 101
2. Use the following table to enter information in the fields:
Field Description
Define the box thatcontains the transcriptcourse listing
Enter the coordinates of the box in which the transcriptinformation prints. Use inches as the unit of measurement.
Determine how many inches from the top left of the page youwant the transcript list object to print. Indicate the left, top,right, and bottom coordinates of the transcript list object. Use aruler and a piece of paper to determine the coordinates, ifnecessary.
Term/school name font Choose the font in which the term and school informationprints from the pop-up menu.
Size, line height, style In the first field, enter the size of the font.
In the second field, enter the height of each line in the object(in points). The height determines the space between each linein the transcript list.
Course listing font Choose the font in which the transcript information prints fromthe pop-up menu.
Size, line height, style In the first field, enter the size of the font.
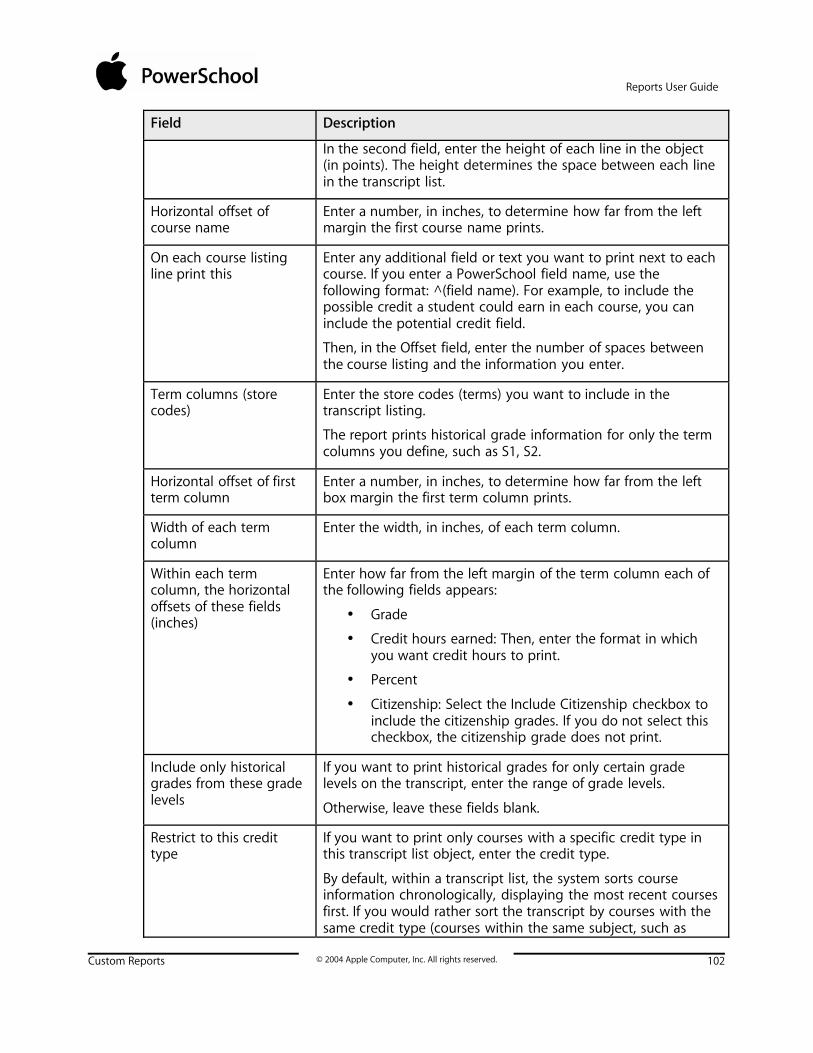
Reports User Guide
Custom Reports © 2004 Apple Computer, Inc. All rights reserved. 102
Field Description
In the second field, enter the height of each line in the object(in points). The height determines the space between each linein the transcript list.
Horizontal offset ofcourse name
Enter a number, in inches, to determine how far from the leftmargin the first course name prints.
On each course listingline print this
Enter any additional field or text you want to print next to eachcourse. If you enter a PowerSchool field name, use thefollowing format: ^(field name). For example, to include thepossible credit a student could earn in each course, you caninclude the potential credit field.
Then, in the Offset field, enter the number of spaces betweenthe course listing and the information you enter.
Term columns (storecodes)
Enter the store codes (terms) you want to include in thetranscript listing.
The report prints historical grade information for only the termcolumns you define, such as S1, S2.
Horizontal offset of firstterm column
Enter a number, in inches, to determine how far from the leftbox margin the first term column prints.
Width of each termcolumn
Enter the width, in inches, of each term column.
Within each termcolumn, the horizontaloffsets of these fields(inches)
Enter how far from the left margin of the term column each ofthe following fields appears:
• Grade
• Credit hours earned: Then, enter the format in whichyou want credit hours to print.
• Percent
• Citizenship: Select the Include Citizenship checkbox toinclude the citizenship grades. If you do not select thischeckbox, the citizenship grade does not print.
Include only historicalgrades from these gradelevels
If you want to print historical grades for only certain gradelevels on the transcript, enter the range of grade levels.
Otherwise, leave these fields blank.
Restrict to this credittype
If you want to print only courses with a specific credit type inthis transcript list object, enter the credit type.
By default, within a transcript list, the system sorts courseinformation chronologically, displaying the most recent coursesfirst. If you would rather sort the transcript by courses with thesame credit type (courses within the same subject, such as

Reports User Guide
Custom Reports © 2004 Apple Computer, Inc. All rights reserved. 103
Field Description
English, Mathematics, and Science), enter the credit type here.Then, you can create a transcript list object for each credit type.
Otherwise, leave this field blank.
Exclude blank grades? Select this checkbox if you do not want to display courses forwhich the student did not receive a grade.
For example, if your school schedules lunch as a course onstudent schedules, select this checkbox to not print lunch onstudent transcripts.
Include current grades? Select this checkbox to include grades from the current term onthe transcript.
Otherwise, deselect this checkbox.
Sort grades by Use this pop-up menu to determine the sort order of thegrades on the transcript list object:
• Course Name: Results descend by school year, thenascend by school name, and then ascend by coursename.
• Course Number: Results descend by school year, thenascend by school name, and then ascend by coursenumber.
• Credit Type: Results descend by school year, thenascend by school name, then ascend by credit type, andthen course name.
• Ascending by grade level, then course number: Resultsascend by grade level, then school year, then schoolname, then course number.
If listing overflows thisobject, start a newcolumn with thesemargins
If the transcript information for the terms you specified doesnot fit in the box for a student, do one of the following toindicate how you want the report to print this information:
• To finish printing the student’s transcript in anothercolumn on the same page, define the margins for thenext column.
• If the student’s transcript can continue on a new page,do not define any margins for the overflow box.
Page Enter the page number of the report on which you want thistranscript list object to print.
Layer If you want this object to appear behind or in front of anotherobject, choose the layer placement from the pop-up menu.
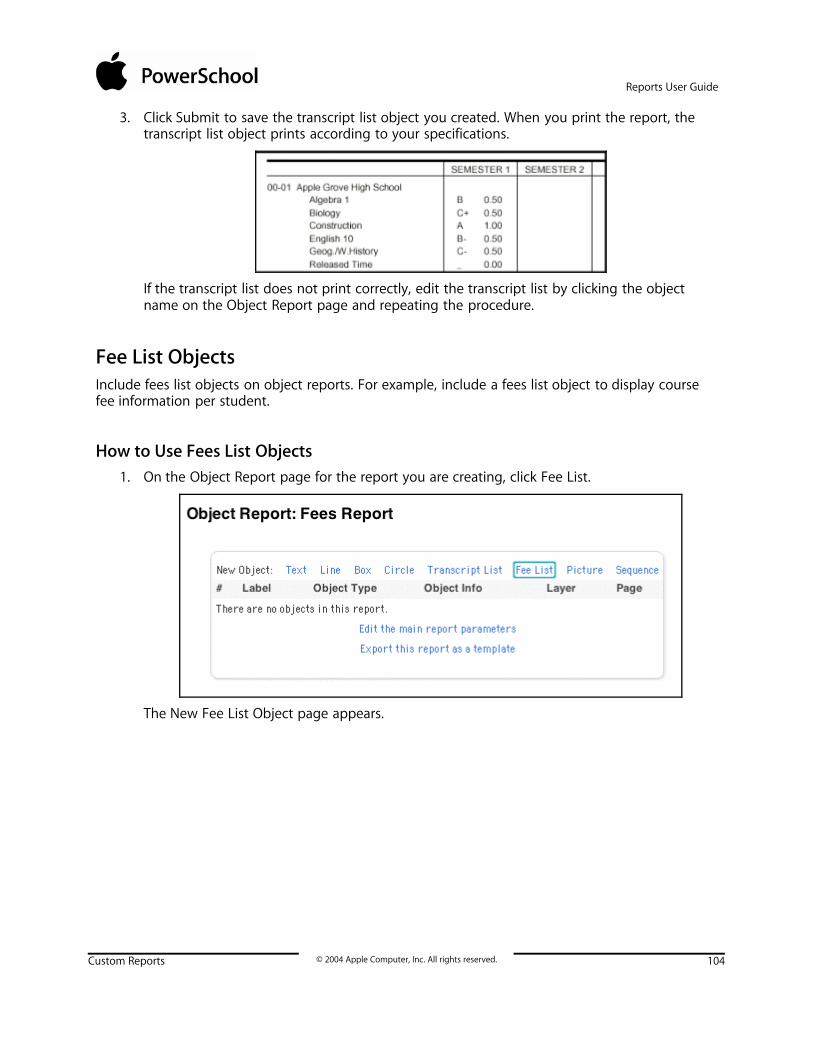
Reports User Guide
Custom Reports © 2004 Apple Computer, Inc. All rights reserved. 104
3. Click Submit to save the transcript list object you created. When you print the report, thetranscript list object prints according to your specifications.
If the transcript list does not print correctly, edit the transcript list by clicking the objectname on the Object Report page and repeating the procedure.
Fee List ObjectsInclude fees list objects on object reports. For example, include a fees list object to display coursefee information per student.
How to Use Fees List Objects1. On the Object Report page for the report you are creating, click Fee List.
The New Fee List Object page appears.
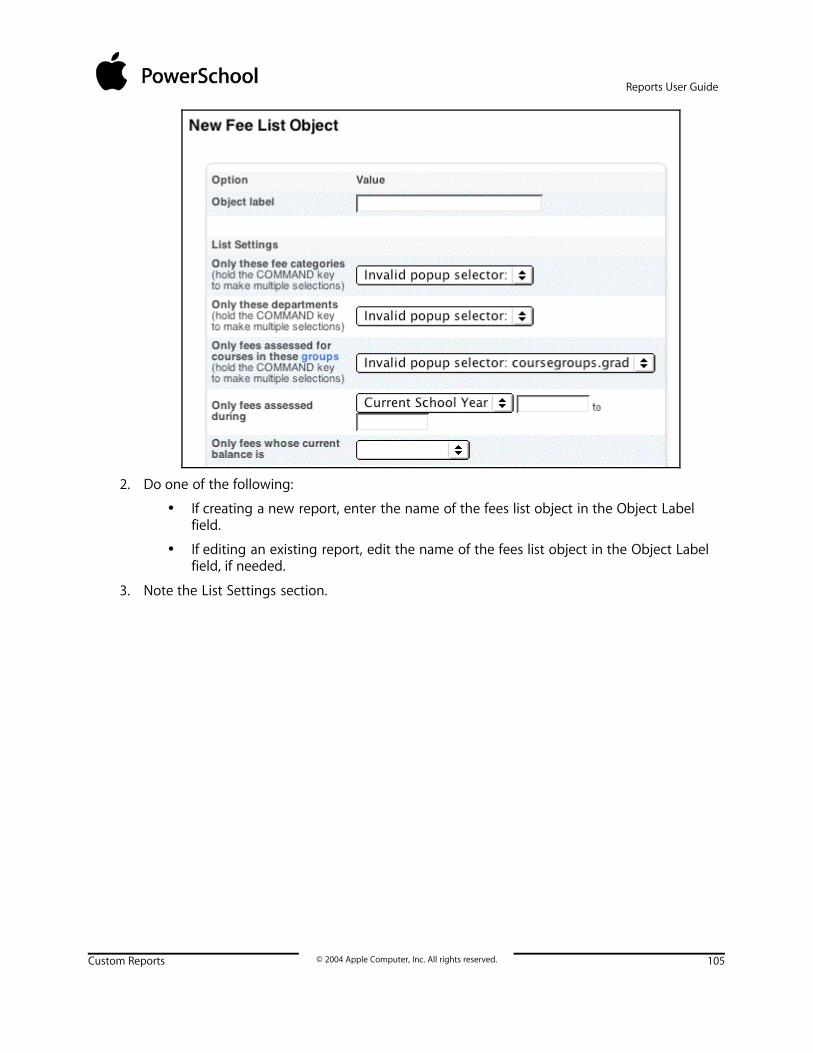
Reports User Guide
Custom Reports © 2004 Apple Computer, Inc. All rights reserved. 105
2. Do one of the following:
• If creating a new report, enter the name of the fees list object in the Object Labelfield.
• If editing an existing report, edit the name of the fees list object in the Object Labelfield, if needed.
3. Note the List Settings section.

Reports User Guide
Custom Reports © 2004 Apple Computer, Inc. All rights reserved. 106
4. Use the following table to enter List Settings information:
Field Description
Only these fee categories Select the fee categories by which you want to limit your reportparameters. Only those fee categories for your school appear.
Only these departments Select the departments by which you want to limit your reportparameters. Only those departments for your school appear.
Only fees assessed forcourse in these groups
Select the groups by which you want to limit your reportparameters. Only those groups for your school appear.
Only fees assessedduring
Choose the date range by which you want to limit your queryfrom the pop-up menu:
• Current School Year
• Current Term
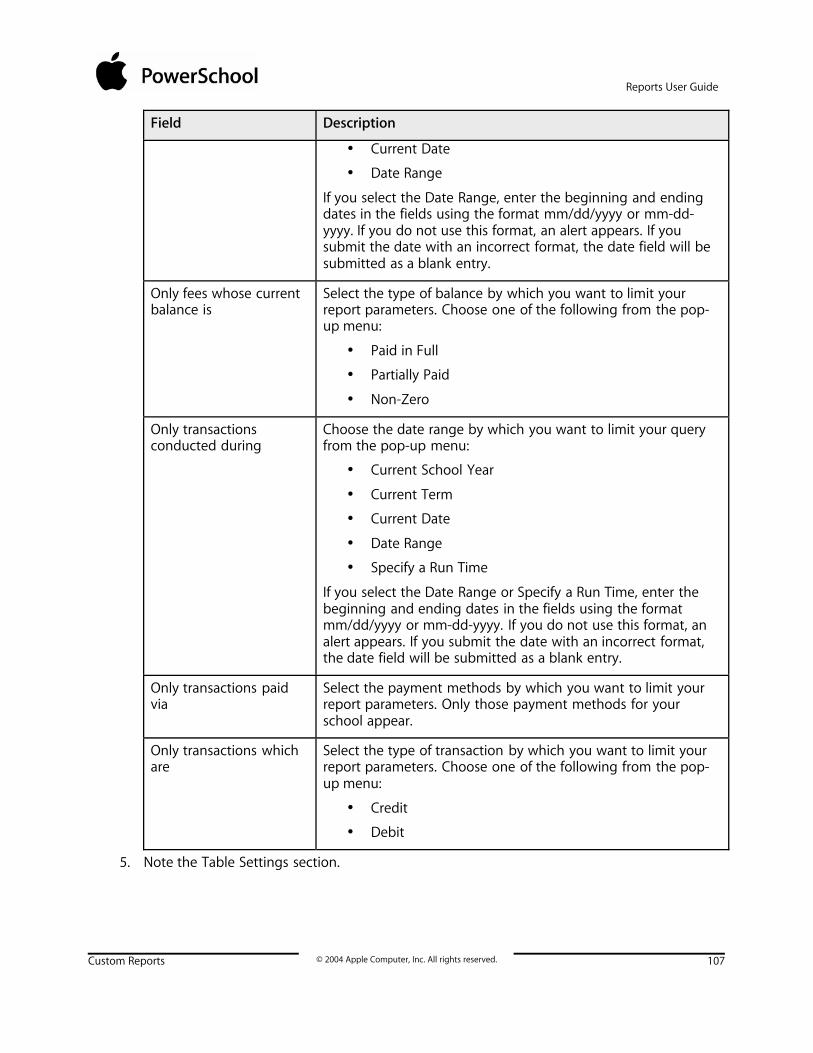
Reports User Guide
Custom Reports © 2004 Apple Computer, Inc. All rights reserved. 107
Field Description
• Current Date
• Date Range
If you select the Date Range, enter the beginning and endingdates in the fields using the format mm/dd/yyyy or mm-dd-yyyy. If you do not use this format, an alert appears. If yousubmit the date with an incorrect format, the date field will besubmitted as a blank entry.
Only fees whose currentbalance is
Select the type of balance by which you want to limit yourreport parameters. Choose one of the following from the pop-up menu:
• Paid in Full
• Partially Paid
• Non-Zero
Only transactionsconducted during
Choose the date range by which you want to limit your queryfrom the pop-up menu:
• Current School Year
• Current Term
• Current Date
• Date Range
• Specify a Run Time
If you select the Date Range or Specify a Run Time, enter thebeginning and ending dates in the fields using the formatmm/dd/yyyy or mm-dd-yyyy. If you do not use this format, analert appears. If you submit the date with an incorrect format,the date field will be submitted as a blank entry.
Only transactions paidvia
Select the payment methods by which you want to limit yourreport parameters. Only those payment methods for yourschool appear.
Only transactions whichare
Select the type of transaction by which you want to limit yourreport parameters. Choose one of the following from the pop-up menu:
• Credit
• Debit
5. Note the Table Settings section.

Reports User Guide
Custom Reports © 2004 Apple Computer, Inc. All rights reserved. 108
6. Use the following table to enter Table Settings information:
Field Description
Column title font Choose the style of font you want the column title to appear asfrom the pop-up menu. The system setup determines thedefault font.
If selecting a font other than the default, you may also selectthe formatting you want to use. For example, choose Bold tobold the column title font.
Size, line height, size Enter the column title font size and line height in points. Onepoint equals 1/72 of an inch.
Select the formatting checkbox(es) you want to use. Forexample, select the Bold checkbox to bold the column title.
Column Title BackgroundColor, Tint
Enter the name of the color in which you want the backgroundof the column title to appear. To view a list of color names, clickthe field name Color. A color palette appears. Copy the name ofthe color you want and paste it into the Color field Otherwise,leave this field blank.
If you want to tint the color, enter a percentage. Otherwise,leave this field blank.

Reports User Guide
Custom Reports © 2004 Apple Computer, Inc. All rights reserved. 109
Field Description
Print column titles on Choose which pages you want column titles to appear from thepop-up menu:
• All pages
• First page of list
• Do not print column titles
Print subtotal row on Choose whether or not you want the subtotal row to appearfrom the pop-up menu:
• Last page of line items
• Do not print subtotal row
Subtotal row label If you selected to print a subtotal row on the last page of lineitems, enter the heading you want to appear. Then, choose therow in which you want the heading to appear from the pop-upmenu.
Print grand total row on Choose whether or not you want the grand total row to appearfrom the pop-up menu:
• Last page of this fee list
• Do not print grand total row
Grand total row label If you selected to print a grand total row on the last page of thisfee list, enter the heading you want to appear. Then, choosethe column in which you want the heading to appear from thepop-up menu.
Coordinates To determine where the table prints on the page, enter thenumber of inches from the left, top, right, and bottom marginsyou want the table to print.
Rule width Enter the thickness in points of the vertical and horizontal lineson the report, as well as the outline of the entire report. Onepoint equals 1/72 of an inch.
Cell padding Enter the width of each cell and the amount of space from allsides of the cells to the text in points. One point equals 1/72 ofan inch.
7. Note the Line Item Settings section.

Reports User Guide
Custom Reports © 2004 Apple Computer, Inc. All rights reserved. 110
8. Use the following table to enter Line Item Settings information:
Field Description
Font Choose the style of font you want the column title to appear asfrom the pop-up menu. The system setup determines thedefault font.
If selecting a font other than the default, you may also selectthe formatting you want to use. For example, choose Bold tobold the column title font.
Size, line height, size Enter the column title font size and line height in points. Onepoint equals 1/72 of an inch.
Select the formatting checkbox(es) you want to use. Forexample, select the Bold checkbox to bold the column title.
Even row backgroundcolor, tint
Enter the name of the color in which you want thebackgrounds of the even rows to appear. To view a list of colornames, click the field name Color. A color palette appears. Copythe name of the color you want and paste it into the Color fieldOtherwise, leave this field blank.

Reports User Guide
Custom Reports © 2004 Apple Computer, Inc. All rights reserved. 111
Field Description
If you want to tint the color, enter a percentage. Otherwise,leave this field blank.
odd row backgroundcolor, tint
Enter the name of the color in which you want thebackgrounds of the odd rows to appear. To view a list of colornames, click the field name Color. A color palette appears. Copythe name of the color you want and paste it into the Color fieldOtherwise, leave this field blank.
If you want to tint the color, enter a percentage. Otherwise,leave this field blank.
Currency format Choose the format by which you want currency to appear fromthe pop-up menu.
Group line items by Choose the way in which you want line items to be groupedfrom the pop-up menu:
• Individual Fees
• Individual Transactions
• Fee Category
• Fee Type
• Payment Method
• Course Number
Width Enter the width, in inches, of each group line item column.
Title Enter the heading you want to appear for the grouped lineitems.
Title alignment Choose the title justification from the pop-up menu:
• Left
• Center
• Right
9. Note each of the Column sections.
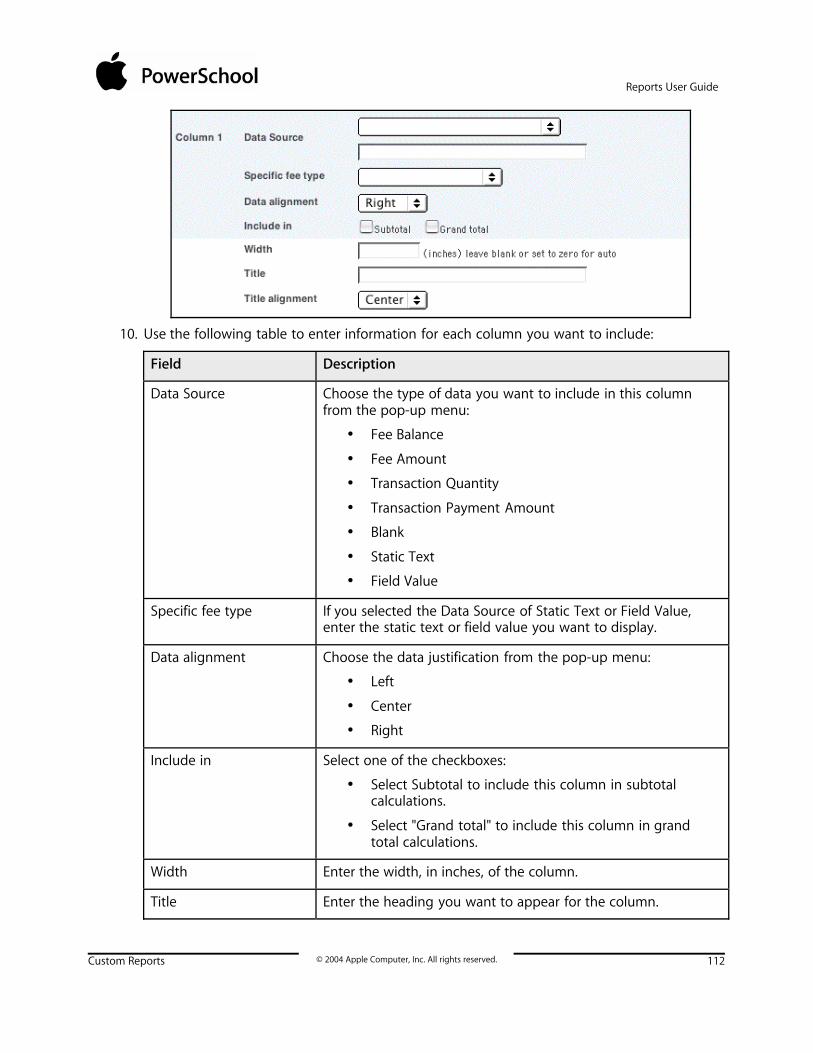
Reports User Guide
Custom Reports © 2004 Apple Computer, Inc. All rights reserved. 112
10. Use the following table to enter information for each column you want to include:
Field Description
Data Source Choose the type of data you want to include in this columnfrom the pop-up menu:
• Fee Balance
• Fee Amount
• Transaction Quantity
• Transaction Payment Amount
• Blank
• Static Text
• Field Value
Specific fee type If you selected the Data Source of Static Text or Field Value,enter the static text or field value you want to display.
Data alignment Choose the data justification from the pop-up menu:
• Left
• Center
• Right
Include in Select one of the checkboxes:
• Select Subtotal to include this column in subtotalcalculations.
• Select "Grand total" to include this column in grandtotal calculations.
Width Enter the width, in inches, of the column.
Title Enter the heading you want to appear for the column.

Reports User Guide
Custom Reports © 2004 Apple Computer, Inc. All rights reserved. 113
Field Description
Title alignment Choose the column title justification from the pop-up menu:
• Left
• Center
• Right
11. Note the Page Settings section.
12. Use the following table to enter Page Item Settings information:
Field Description
Split line items tomultiple pages
Select one of the following checkboxes to group information bypage based on your selection:
• By fee category
• By department
• By transaction date
• By receipt number
Page Enter the page number of the report on which you want thisfees list object to print.
Layer If you want this object to appear behind or in front of anotherobject, choose the layer placement from the pop-up menu.
13. Click Submit. When you print the report, the fees list object appears according to yourspecifications.
Fees List ObjectsInclude fees list objects on object reports. For example, include a fees list object to display coursefee information per student.
How to Use Fees List Objects1. On the Object Report page for the report you are creating, click Fees List.
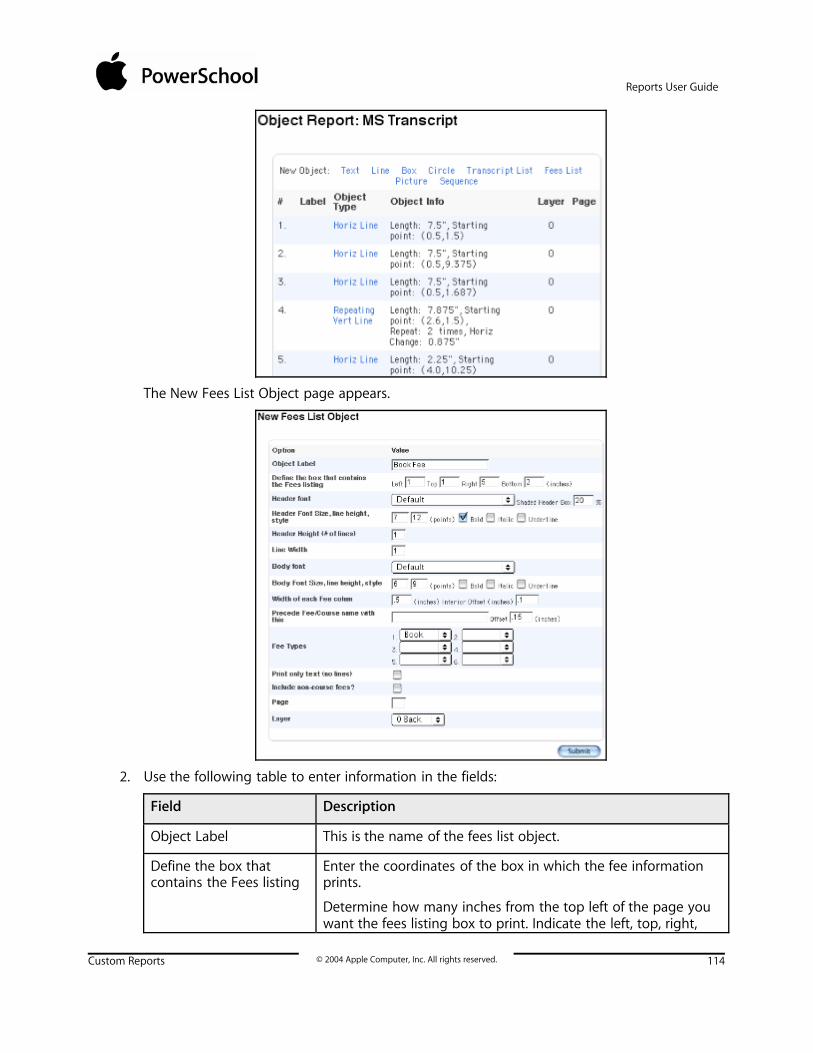
Reports User Guide
Custom Reports © 2004 Apple Computer, Inc. All rights reserved. 114
The New Fees List Object page appears.
2. Use the following table to enter information in the fields:
Field Description
Object Label This is the name of the fees list object.
Define the box thatcontains the Fees listing
Enter the coordinates of the box in which the fee informationprints.
Determine how many inches from the top left of the page youwant the fees listing box to print. Indicate the left, top, right,

Reports User Guide
Custom Reports © 2004 Apple Computer, Inc. All rights reserved. 115
Field Description
and bottom coordinates of the fees listing box. Use a ruler anda piece of paper to determine the coordinates, if necessary.
Header font Choose the font in which the fee information prints from thepop-up menu.
Shaded Header Box Enter a percentage to determine the shade of the header rowof the fees list object.
If you enter 100%, the header is black. If you enter 0%, theheader is white. Therefore, you can enter percentages between100 and 0 to create a darker or lighter header row.
Header Font Size, lineheight, style
In the first field, enter the size of the font.
In the second field, enter the height of each line in the object(in points). The height determines the space between each linein the fees list.
Select any combination of the following checkboxes todetermine the style of the font:
• Bold
• Italic
• Underline
Otherwise, do not select any checkboxes.
Header Height (# of lines) Enter the height of the header in number of lines. Use thisfunction if the text for the fee type does not fit in the columnheader.
Note: The first line of the header is centered and subsequentlines are right-justified.
Line Width Enter the width of the line. The lines will not print if the "Printonly text" checkbox is selected.
Body font Choose the font in which the fees on the Fees List print fromthe pop-up menu. These are course lines.
Body Font size, lineheight, style
In the first field, enter the size of the font.
In the second field, enter the height of each line in the object(in points). The height determines the space between each linein the fees list.
Select any combination of the following checkboxes todetermine the style of the font:
• Bold
• Italic

Reports User Guide
Custom Reports © 2004 Apple Computer, Inc. All rights reserved. 116
Field Description
• Underline
Otherwise, do not select any checkboxes.
Width of each Feecolumn
Enter a number, in inches, to determine the width of eachcolumn of the fees list.
Interior Offset Enter a number, in inches, to determine the left margin insideeach column of the fees list. This setting is also used in theTotals column on the right of the object.
Precede Fee/Coursename with this
Enter any additional field or text you want to print next to eachfee or course. If you enter a PowerSchool field name, use thefollowing format: ^(field name). For example, to include thepossible credit a student could earn in each course, you caninclude the potential credit field.
Then, in the Offset field, enter the width (in inches) betweenthe fee or course and the information you enter.
Fee Types Choose the types of fees to include on the fees list object fromthe pop-up menu. For more information on fee types, see thesection Fee Types.
Note: If you select three fee types, use the fee type pop-upmenus labeled 1, 2, and 3. Do not skip pop-up menus whenmaking your selections.
Print only text (no lines) Select this checkbox if you want to print only the text in thefees list object. Shaded boxes will also be omitted. To includelines, deselect this checkbox.
Include non-course fees? Select this checkbox if you want to print all student fees, notjust the course fees. The non-course fees appear in the Totalscolumn of the fees list object. To include only course fees,deselect this checkbox.
Page Enter the page number of the report on which you want thisfees list object to print.
Layer If you want this object to appear behind or in front of anotherobject, choose the layer placement from the pop-up menu.
3. Click Submit. When you print the report, the fees list object appears according to yourspecifications.

Reports User Guide
Custom Reports © 2004 Apple Computer, Inc. All rights reserved. 117
Picture ObjectsUse picture objects to include on your object report. For example, include a picture of your school’slogo on transcripts.
Note: Before creating a picture object, you must add the picture to your PowerSchool system. Formore information on adding pictures, see the section "Report Pictures."
How to Use Picture Objects1. On the Object Report page for the report you are creating, click Picture.
The New Picture Object page appears.

Reports User Guide
Custom Reports © 2004 Apple Computer, Inc. All rights reserved. 118
2. Use the following table to enter information in the fields:
Field Description
Object Label Enter a name for the picture object.
Picture Choose an available picture from the pop-up menu.
Coordinates Enter the number of inches you want the picture to print fromthe left, top, right, and bottom margins.
Scaling Option If you want to shrink or stretch the picture, choose a scale fromthe pop-up menu.
Rotation If you want to rotate the picture on the report, enter thenumber of degrees you want to rotate it.
Repeat If you want the picture to print repeatedly, define informationin the following fields:
• Times to Repeat
• Horizontal Change (Enter the number of inches youwant between each picture horizontally.)
• Vertical Change (Enter the number of inches you wantbetween each picture vertically.)
Page Enter the report page on which you want the picture object toprint.

Reports User Guide
Custom Reports © 2004 Apple Computer, Inc. All rights reserved. 119
Field Description
Layer If you want this object to appear behind or in front of anotherobject, choose the layer placement from the pop-up menu.
3. Click Submit to save the picture object. When you print the report, the picture objectappears according to your specifications.
Sequence ObjectsInclude sequence objects to print a numbered sequence on an object report. The sequence objectis designed to mimic a counter on a preprinted form. For example, use a sequence object on ascheduling form to track each form by its number in the sequence. Use only numbers for asequence object, and use a maximum of one sequence object per object report.
Sequences do not restart with each object report.
How to Use Sequence Objects1. On the Object Report page for the report you are creating, click Sequence.
The New Sequence Object page appears.

Reports User Guide
Custom Reports © 2004 Apple Computer, Inc. All rights reserved. 120
2. Use the following table to enter information in the fields:
Field Description
Object Label Enter a name for the sequence object.
Position Enter the position of the sequence object for the X (horizontal)and Y (vertical) axes.
Font Choose a font for the sequence object from the pop-up menu.
Style Select any combination of the following checkboxes todetermine the style of the font:
• Bold
• Italic
• Underline
Otherwise, do not select any checkboxes.
Size Enter the font size in inches.
Starting Number Enter the first number in the sequence object.

Reports User Guide
Custom Reports © 2004 Apple Computer, Inc. All rights reserved. 121
Field Description
Count Forward? Select this checkbox if the sequence is in ascending order, suchas 1, 2, and 3. To use descending order, deselect this checkbox.
Format String This is used to format the printed output of the sequenceobject. For example, if you enter a starting number of 10 and aformat string of 00000, the first item prints as 00010.
Color Enter the name of the color in which you want all text in thesequence object to print.
To view a list of color names, click the field name Color. A colorpalette appears. Copy the name of the color you want andpaste it into the Color field.
If you want the text to be black, leave this field blank.
Tint Enter a percentage to determine the shade of the sequence listobject.
If you enter 100%, the object is black. If you enter 0%, theobject is white. Therefore, you can enter percentages between100 and 0 to create a darker or lighter object.
Page Enter the report page on which you want the picture object toprint.
Layer If you want this object to appear behind or in front of anotherobject, choose the layer placement from the pop-up menu.
3. Click Submit. When you print the report, the sequence object appears according to yourspecifications.
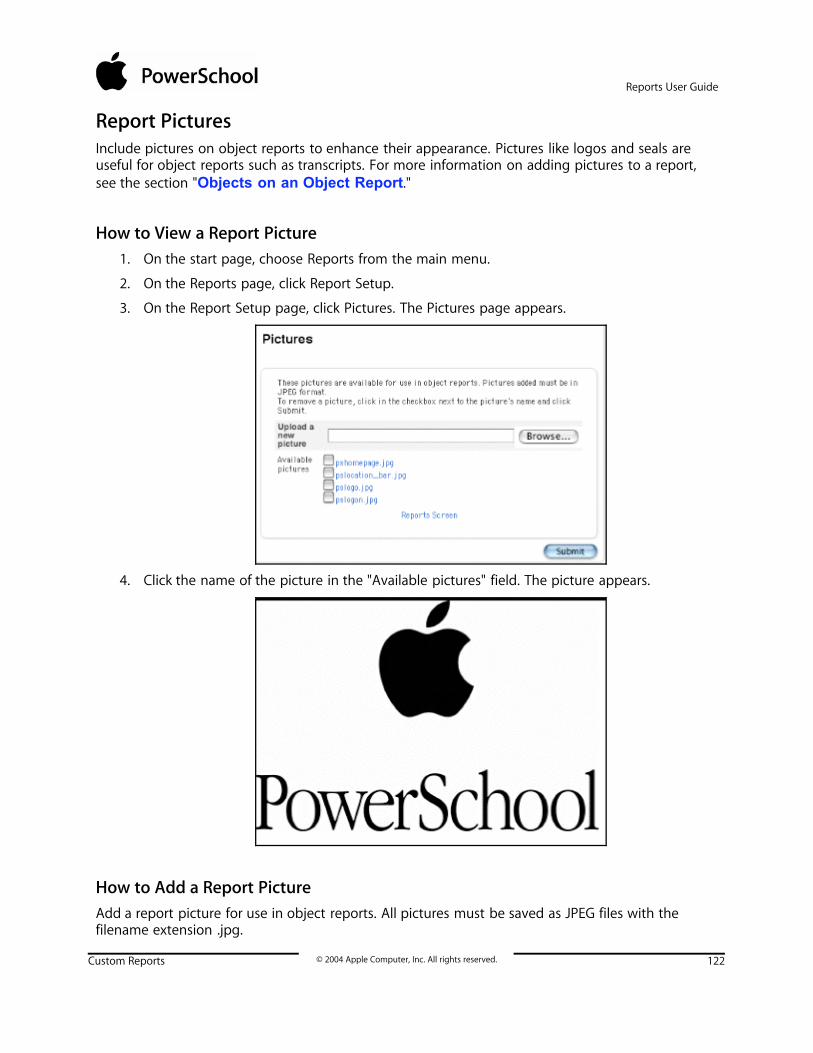
Reports User Guide
Custom Reports © 2004 Apple Computer, Inc. All rights reserved. 122
Report PicturesInclude pictures on object reports to enhance their appearance. Pictures like logos and seals areuseful for object reports such as transcripts. For more information on adding pictures to a report,see the section "Objects on an Object Report."
How to View a Report Picture1. On the start page, choose Reports from the main menu.
2. On the Reports page, click Report Setup.
3. On the Report Setup page, click Pictures. The Pictures page appears.
4. Click the name of the picture in the "Available pictures" field. The picture appears.
How to Add a Report PictureAdd a report picture for use in object reports. All pictures must be saved as JPEG files with thefilename extension .jpg.

Reports User Guide
Custom Reports © 2004 Apple Computer, Inc. All rights reserved. 123
1. On the start page, choose Reports from the main menu.
2. On the Reports page, click Report Setup.
3. On the Report Setup page, click Pictures. The Pictures page appears.
4. Enter the file path and name of the picture in the "Upload a new picture" field, or clickBrowse... to search for the file.
5. Click Submit. The Pictures page displays the new picture file name in the "Availablepictures" field.
How to Delete a Report PictureDelete a report picture when it is no longer needed to save system space and minimize possibleconfusion. For example, delete a picture when your school logo changes. Then, add the new logousing the procedure "How to Add a Report Picture."
1. On the start page, choose Reports from the main menu.
2. On the Reports page, click Report Setup.

Reports User Guide
Custom Reports © 2004 Apple Computer, Inc. All rights reserved. 124
3. On the Report Setup page, click Pictures. The Pictures page appears.
4. Select the checkbox next to the picture to be deleted.
5. Click Submit. The Pictures page appears without the deleted picture in the "Availablepictures" field.
Object Reports With Standards GradesObject reports can display standards scores. Use the following list of codes to generate objectreports with standards grades.
Current Standard
~(*std.[which];[identifier])
For example:
~(*std.avg;LA11.2.3)
~(*std.transhigh;M12.4.5)

Reports User Guide
Custom Reports © 2004 Apple Computer, Inc. All rights reserved. 125
~(*std.num;FL3)
Calculated Standard
~(*std.[which];[identifier];[request1]{;[request2]})
For example:
~(*std.transavg;LA11.2.3;8/1/2000;7/30/2001)
~(*std.avg;SC3.5.12;Q1,Q2)
~(*std.high;FL2.5;2,3,4;S1)
~(*std.num;FA5.12;1999)
Stored Standard
~(*std.stored.[which];[identifier];[storecode]{;[request]})
For example:
~(*std.stored.transavg;LA11.2.3;S1)
~(*std.stored.avg;SC3.5.12;Q4)
~(*std.stored.high;FL2.5;T1;1999)
~(*std.stored.num;FA5.12;S2;11)
For which the following can have 'score' suffixed (for example, averagescore):
• transhigh (translatedhigh)
• trans (transavg, translatedavg, translatedaverage)
• num (number, number, numberof)
• avg (average)
• high
• note (comment)
Standard Info
~(*std.info.[which];[identifier])
Which:
• name
• desc (description)
• level
• course (coursenumber, course_number)
• subj (subject, subjectarea)
• type
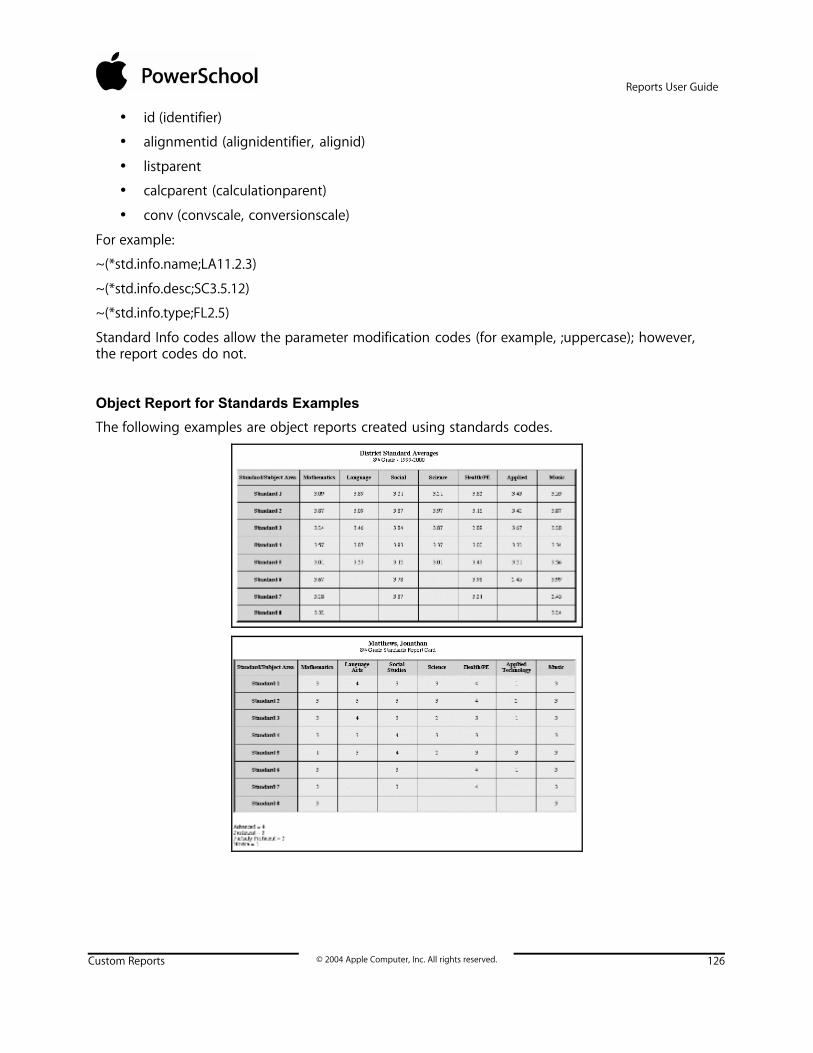
Reports User Guide
Custom Reports © 2004 Apple Computer, Inc. All rights reserved. 126
• id (identifier)
• alignmentid (alignidentifier, alignid)
• listparent
• calcparent (calculationparent)
• conv (convscale, conversionscale)
For example:
~(*std.info.name;LA11.2.3)
~(*std.info.desc;SC3.5.12)
~(*std.info.type;FL2.5)
Standard Info codes allow the parameter modification codes (for example, ;uppercase); however,the report codes do not.
Object Report for Standards Examples
The following examples are object reports created using standards codes.

Reports User Guide
Custom Reports © 2004 Apple Computer, Inc. All rights reserved. 127
Object Reports With Test TagsUse test tags to include student test results in outputs. An output is a PDF file (such as an objectreport), an export, or an HTML page. For example, use the following test tag on a progress report todisplay a student's midterm test score:
~(tests;name=midterm;score=total;which=current)
You can also use the test tag inside an IF tag, which is a tag used to evaluate a given condition. Forexample, use an IF tag to display the statement "This student may wish to retake the ACT" onstudents' Graduation Progress pages if they earn ACT composite scores of less than 25.
In addition, you can add formats to the result of the test tag. The following is an example of a testtag that includes a type value, result value, and format string:
~(tests;name=ACT;score=math;which=last;type=num;result=value;format=##0.00)
The first three parameters refine the selection, and the next three parameters determine itspresentation. If a student's last math ACT score was 23.14285, the result would be 23.14.
See the following table for parameter information:
Parameter Examples Notes
NAME ACT
SAT
No default.
Note: NAME and SCORE aredependent upon testsdefined on the particularPowerSchool system.
SCORE MATH
ENGLISH
SCIENCE
COMPOSITE
No default.
WHICH FIRST
LAST
BEST
CURRENT term
TERMID
GRADE
The default is LAST.
TYPE NUM
PERCENT
ALPHA
The default is NUM.
RESULT VALUE
SUM
The default is SUM.
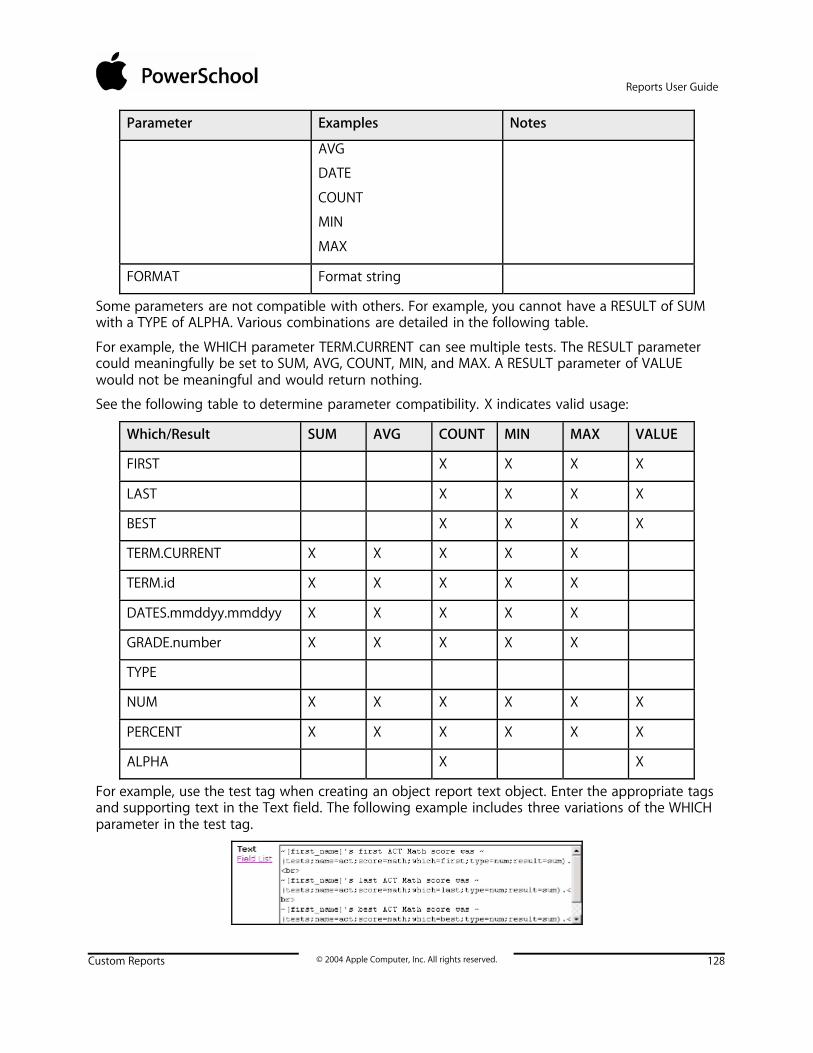
Reports User Guide
Custom Reports © 2004 Apple Computer, Inc. All rights reserved. 128
Parameter Examples Notes
AVG
DATE
COUNT
MIN
MAX
FORMAT Format string
Some parameters are not compatible with others. For example, you cannot have a RESULT of SUMwith a TYPE of ALPHA. Various combinations are detailed in the following table.
For example, the WHICH parameter TERM.CURRENT can see multiple tests. The RESULT parametercould meaningfully be set to SUM, AVG, COUNT, MIN, and MAX. A RESULT parameter of VALUEwould not be meaningful and would return nothing.
See the following table to determine parameter compatibility. X indicates valid usage:
Which/Result SUM AVG COUNT MIN MAX VALUE
FIRST X X X X
LAST X X X X
BEST X X X X
TERM.CURRENT X X X X X
TERM.id X X X X X
DATES.mmddyy.mmddyy X X X X X
GRADE.number X X X X X
TYPE
NUM X X X X X X
PERCENT X X X X X X
ALPHA X X
For example, use the test tag when creating an object report text object. Enter the appropriate tagsand supporting text in the Text field. The following example includes three variations of the WHICHparameter in the test tag.

Reports User Guide
Custom Reports © 2004 Apple Computer, Inc. All rights reserved. 129
The example above creates the following object report.

Reports User Guide
Preconfigured Reports © 2004 Apple Computer, Inc. All rights reserved. 130
Preconfigured ReportsPreconfigured reports are those that come with the PowerSchool system and include presetparameters. Created because they contain information that PowerSchool administrators need mostoften, they are generally easier to run than custom reports. However, preconfigured reports arelimited in the information they provide because you must select a preconfigured template from theavailable list. The only parameter you can select is which students to include on the report.
For details on all preconfigured reports, see the sections "Attendance Reports," "AttendanceCount and Audit Reports," "Discipline Log Reports," "Grade and Gradebook Reports,""Membership Reports," "Enrollment Reports," "Statistics," "Student Listings," "Standards Reports," and "Single Student Standards Report." and You are also encouragedto read the section "Custom Reports" before creating a report. Doing so will give you anunderstanding of the process, which will make it much easier.
While you can run all reports on individual students, you can also run some on a selected group ofstudents. If a report allows group reporting, first select the group of students as noted in othersections. Click the PowerSchool logo to return to the start page and begin work on a report.PowerSchool remembers the group and prompts you to select it when you enter the reportparameters.
Attendance ReportsAll of the reports in this section describe student attendance information. Before producing reports,you are encouraged to ask your PowerSchool administrator how your school calculates attendance.For example, does your school report how many days students are present or how many days theyare absent?
To search for students with perfect attendance, see the section "Advanced Search and Select."For more information on attendance count and audit reports, see the section "Attendance Countand Audit Reports."
To indicate a selection of students when running a report, select that group of students beforestarting any of the procedures in this section. If you select a group of students from the start page,the Group Functions page appears either immediately or after selecting students from the StudentSelection page.
For more information on attendance, see the section "Attendance Overview."
How to Run the Absentee ReportUse the Absentee report to generate single-day period-by-period attendance code information. Forexample, you can use this report to search for students who received an unexcused absence codefor the previous day. You can then telephone the students' guardian to verify whether or not thestudent actually has an excused absence.
Note: You can search on any absent or present attendance code that is stored in the database. Theonly code you cannot search for is the Present code because the absence of an attendance codeindicates a presence and thus it is not currently searchable in the database.

Reports User Guide
Preconfigured Reports © 2004 Apple Computer, Inc. All rights reserved. 131
Note: This report is also accessible from the navigation bar.
1. On the start page, choose Reports from the main menu. The Reports page appears.
2. Click Run Reports. The Run Reports page appears.
3. Click Absentee. The Absentee Report page appears.
4. Use the following table to enter information in the fields:
Field Description
Report Name The name of this report.
Description A description of this report's function.
Attendance Mode Use the pop-up menu to select one of the following attendancemodes for which you want to run this report:
• Choose Meeting to search and display report output byperiod.
• Choose Daily to search and display report output byday.
Attendance mode indicates the method by which attendance isrecorded. For more information, see the section "AttendanceOverview."
Note: Only the attendance modes selected in School Setup >Attendance > Preferences appear in the pop-up menu.
Students to Include Indicate which students you want to run the report for byselecting one of the following options:
• Select "The selected students only" to run the reportstudents in the current selection enrolled in the daterange specified.
• Select the "All students" to run the report for allstudents in the current school enrolled in the daterange specified.
Grades Select the checkbox(es) of the grade level(s) you want to scan.Doing so takes the selection of students selected in the“Students to Include” section and narrows the selection toinclude only those students having the same grade level asthose selected.
Alternatively, leave all the checkboxes blank to scan all gradelevel(s). Doing so includes all of the students selected in the“Students to Include” selection.

Reports User Guide
Preconfigured Reports © 2004 Apple Computer, Inc. All rights reserved. 132
Field Description
Attendance Codes Select the attendance code(s) for which you want to scan, orselect All Codes. To select multiple attendance codes, press andhold Command (Mac) or Control (Windows) as you click each ofthe attendance codes you want to scan.
Date to Scan Enter the date to scan using the format mm/dd/yyyy or mm-dd-yyyy. If you do not use this format, an alert appears. If yousubmit the date with an incorrect format, the date field will besubmitted as a blank entry.
Note: The date entered must fall within the selected schoolyear term.
Period(s) If Meeting has been chosen from the Attendance Mode pop-upmenu, select the checkbox(es) of the period(s) you want to scanor leave all the checkboxes blank to scan all periods.
Note: If Daily has been chosen from the Attendance Mode pop-up menu, Period(s) do not apply.
Include Student Number Select this checkbox to include the student number(s) on thereport.
Number of Blank LinesBelow Student Names
Enter the number of blank lines to include as separators aftereach student name.
Include Verification Line Select the checkbox to include one line for each student wherethe following can be recorded on the report: talked to,relationships, reason, verify date, and employee.
5. Click Submit. The report results display based on the parameters you selected. Dependingon your specifications, this could take several minutes.
6. Do one of the following:
• Click a name to open the student pages menu and work with that student.
• Click Functions at the bottom of the report to open the Group Functions page. Formore information on what you can do from that menu, see the section "Work WithGroups."
• Click Find to identify teachers who have not yet taken attendance. For moreinformation on this feature, see the section "How to Run the PowerGradeAttendance Report."
• Print the report from your web browser or save it to another application. For moreinformation, see the section "Run, Print, and Save Reports."

Reports User Guide
Preconfigured Reports © 2004 Apple Computer, Inc. All rights reserved. 133
How to Run the Consecutive Absences ReportUse the Consecutive Absences report to generate a report detailing consecutive student absencesby absence code. The report can be run in either daily or meeting mode. In daily mode, the reportsearches for students with consecutive absences codes in their daily attendance record. In meetingmode, the report searches each student’s attendance records period by period for consecutiveabsence codes.
1. On the start page, choose Reports from the main menu. The Reports page appears.
2. Click Run Reports. The Run Reports page appears.
3. Click Consecutive Absences. The Consecutive Absences Report page appears.
4. Use the following table to enter information in the fields:
Field Description
Report Name The name of this report.
Description A description of this report's function.
Attendance Mode Use the pop-up menu to select one of the following attendancemodes for which you want to run this report:
• Choose Meeting to search and display report output byperiod.
• Choose Daily to search and display report output byday.
Attendance mode indicates the method by which attendance isrecorded. For more information, see the section "AttendanceOverview."
Note: Only the attendance modes selected in School Setup >Attendance > Preferences appear in the pop-up menu.
Attendance Codes Select the attendance code for which you want to scan for thereport.
Note: Only one attendance code can be selected at a time.
Begin Date and EndingDate
Enter the beginning and ending date of the date range to scanusing the format mm/dd/yyyy or mm-dd-yyyy. If you do not usethis format, an alert appears. If you submit the date with anincorrect format, the date field will be submitted as a blankentry.
Note: The date entered must fall within the selected schoolyear term.
Number of ConsecutiveDays to Scan
Enter the number of consecutive days of an attendance codemust occur.

Reports User Guide
Preconfigured Reports © 2004 Apple Computer, Inc. All rights reserved. 134
Field Description
Scan Use the pop-up menu to indicate whether you want to run thereport for:
• All Enrollment Records - All students with an enrollmentrecord in the current school.
• Current Enrollment Records - Only students that areactively enrolled in the current school on the date thereport is run.
Include Student Number Select this checkbox to include the student number(s) on thereport.
Itemize by Day Select this checkbox to further parse the scan by cycle daysselected.
Note: This checkbox appears only for schools with multi-dayschedules.
5. Click Submit. The report results display based on the parameters you selected. Dependingon your specifications, this could take several minutes.
6. Do one of the following:
• Click a name to open the student pages menu and work with that student.
• Print the report from your web browser or save it to another application. For moreinformation, see the section "Run, Print, and Save Reports."
How to Run the Monthly Student Attendance ReportUse the Monthly Student Attendance report to display attendance per student per day, includingholidays. This report displays the days the student was not enrolled, absent, or in attendance. Thedays in session and carry forward, gains, losses, and ending enrollment appear at the end of thereport.
The codes and totals represent full days absences and attendance even if the school is set up withattendance conversions that count partial absences and attendance. When attendance is calculatedusing the Attendance Conversions defined in School Setup > Attendance Conversions it is possibleto get an attendance value of 1.5 for example for a two day period, meaning they were absent halfa day in those two day periods. But the Monthly Student Attendance report does not report a 1.5attendance. It reports 2 full days of attendance and 0 absences. It does not count half day absences.
1. On the start page, choose Reports from the main menu. The Reports page appears.
2. Click Run Reports. The Run Reports page appears.
3. Click Monthly Student Attendance. The Monthly Student Attendance Report page appears.
4. Use the following table to enter information in the fields:
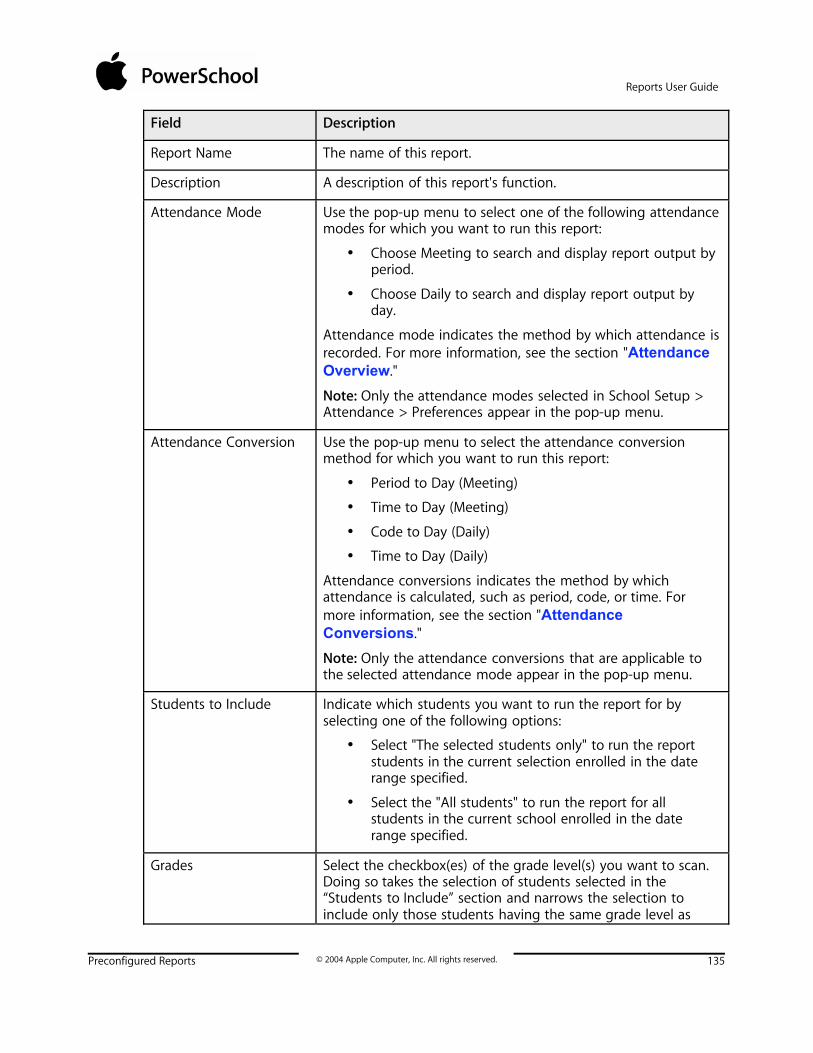
Reports User Guide
Preconfigured Reports © 2004 Apple Computer, Inc. All rights reserved. 135
Field Description
Report Name The name of this report.
Description A description of this report's function.
Attendance Mode Use the pop-up menu to select one of the following attendancemodes for which you want to run this report:
• Choose Meeting to search and display report output byperiod.
• Choose Daily to search and display report output byday.
Attendance mode indicates the method by which attendance isrecorded. For more information, see the section "AttendanceOverview."
Note: Only the attendance modes selected in School Setup >Attendance > Preferences appear in the pop-up menu.
Attendance Conversion Use the pop-up menu to select the attendance conversionmethod for which you want to run this report:
• Period to Day (Meeting)
• Time to Day (Meeting)
• Code to Day (Daily)
• Time to Day (Daily)
Attendance conversions indicates the method by whichattendance is calculated, such as period, code, or time. Formore information, see the section "AttendanceConversions."
Note: Only the attendance conversions that are applicable tothe selected attendance mode appear in the pop-up menu.
Students to Include Indicate which students you want to run the report for byselecting one of the following options:
• Select "The selected students only" to run the reportstudents in the current selection enrolled in the daterange specified.
• Select the "All students" to run the report for allstudents in the current school enrolled in the daterange specified.
Grades Select the checkbox(es) of the grade level(s) you want to scan.Doing so takes the selection of students selected in the“Students to Include” section and narrows the selection toinclude only those students having the same grade level as

Reports User Guide
Preconfigured Reports © 2004 Apple Computer, Inc. All rights reserved. 136
Field Description
those selected.
Alternatively, leave all the checkboxes blank to scan all gradelevel(s). Doing so includes all of the students selected in the“Students to Include” selection.
Reporting Segment orBegin Date and EndingDate
Select which date range to use for this report:
• Reporting Segment: Choose a reporting segment fromthe pop-up menu. For more information on reportingsegments, see the section "Reporting Segments."
• Begin Date and Ending Date: Specify a date range in theblank fields using the format mm/dd/yyyy or mm-dd-yyyy. If you do not use this format, an alert appears. Ifyou submit the date with an incorrect format, the datefield will be submitted as a blank entry.
Note: The date entered must fall within the selected schoolyear term.
Lines per page Enter the number of data rows you want to appear on eachpage of the report.
Starting Page Number Enter the page number from which you want the report tostart.
Include Student Number Select this checkbox to include the student number(s) on thereport.
5. Click Submit. The report results display based on the parameters you selected. Dependingon your specifications, this could take several minutes.
6. Print the report from your web browser or save it to another application. For moreinformation, see the section "Run, Print, and Save Reports."
How to Run the PowerGrade Attendance ReportUse the PowerGrade Attendance report to generate a list of which teachers have not takenattendance. Schools commonly use this report to verify that all teachers have taken attendance.
1. On the start page, choose Reports from the main menu. The Reports page appears.
2. Click Run Reports. The Run Reports page appears.
3. Click PowerGrade Attendance. The PowerGrade Attendance page appears.
4. Use the following table to enter information in the fields:
Field Description
Report Name The name of this report.

Reports User Guide
Preconfigured Reports © 2004 Apple Computer, Inc. All rights reserved. 137
Field Description
Description A description of this report's function.
Date to Scan Enter the date to scan using the format mm/dd/yyyy or mm-dd-yyyy. If you do not use this format, an alert appears. If yousubmit the date with an incorrect format, the date field will besubmitted as a blank entry.
Note: The date entered must fall within the selected schoolyear term.
Period(s) Select the checkbox(es) of the period(s) you want to scan orleave all the checkboxes blank to scan all periods.
Lines per page Enter the number of data rows you want to appear on eachpage of the report.
Starting Page Number Enter the page number from which you want the report tostart.
5. Click Submit. The report results display based on the parameters you selected. Dependingon your specifications, this could take several minutes.
Note: If you entered a date where school is not in session, the messages "School is not insession on date specified" appears. If all teachers have entered attendance, the messages"All teachers have taken attendance" appears.
6. Do one of the following:
• Click a meeting to get more details about the section. The Course Information pageappears.
• Print or save the report. For more information, see the section "Run, Print, andSave Reports."
How to Run the Weekly Attendance Summary ReportUse the Weekly Attendance Summary report to generate a weekly attendance summary by section.Schools commonly use this report to verify weekly attendance for each section. Teachers sign thereport to certify that the attendance they marked is accurate. You can also use this report togenerate a verification sheet for daily attendance for a specific week. Teachers sign the report tocertify the attendance they marked is accurate.
1. On the start page, choose Reports from the main menu. The Reports page appears.
2. Click Run Reports. The Run Reports page appears.
3. Click Weekly Attendance Summary. The Weekly Attendance Summary Report page appears.
4. Use the following table to enter information in the fields:
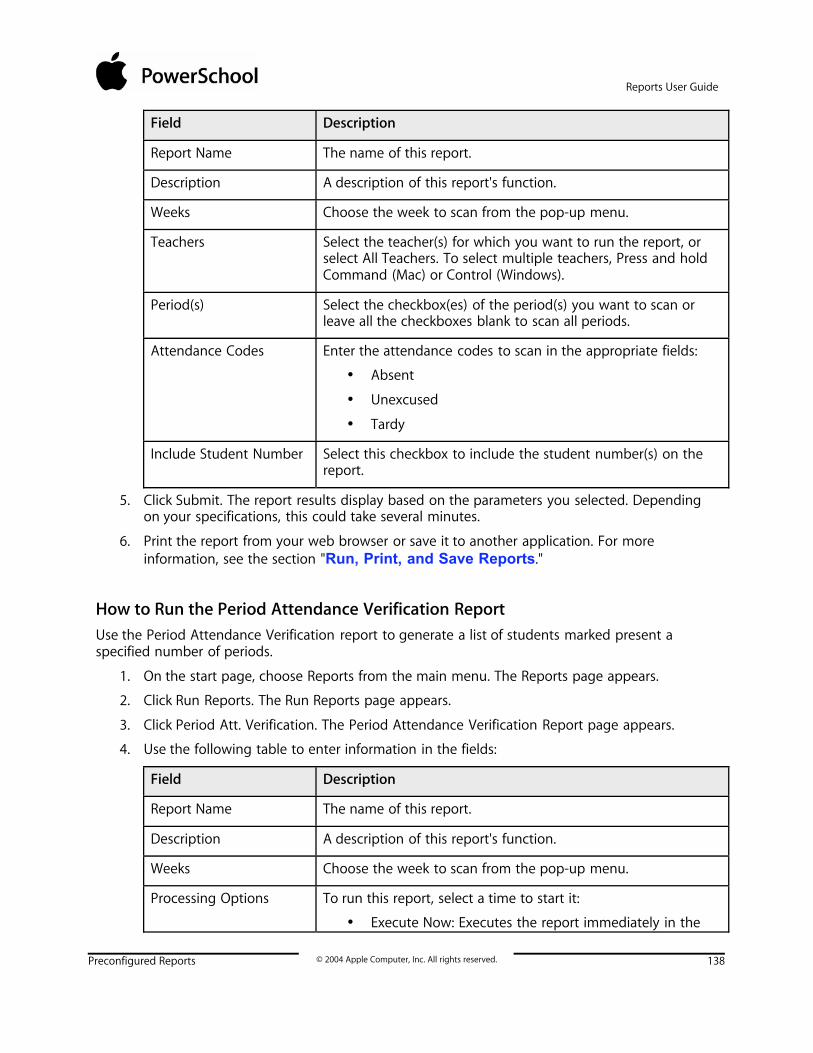
Reports User Guide
Preconfigured Reports © 2004 Apple Computer, Inc. All rights reserved. 138
Field Description
Report Name The name of this report.
Description A description of this report's function.
Weeks Choose the week to scan from the pop-up menu.
Teachers Select the teacher(s) for which you want to run the report, orselect All Teachers. To select multiple teachers, Press and holdCommand (Mac) or Control (Windows).
Period(s) Select the checkbox(es) of the period(s) you want to scan orleave all the checkboxes blank to scan all periods.
Attendance Codes Enter the attendance codes to scan in the appropriate fields:
• Absent
• Unexcused
• Tardy
Include Student Number Select this checkbox to include the student number(s) on thereport.
5. Click Submit. The report results display based on the parameters you selected. Dependingon your specifications, this could take several minutes.
6. Print the report from your web browser or save it to another application. For moreinformation, see the section "Run, Print, and Save Reports."
How to Run the Period Attendance Verification ReportUse the Period Attendance Verification report to generate a list of students marked present aspecified number of periods.
1. On the start page, choose Reports from the main menu. The Reports page appears.
2. Click Run Reports. The Run Reports page appears.
3. Click Period Att. Verification. The Period Attendance Verification Report page appears.
4. Use the following table to enter information in the fields:
Field Description
Report Name The name of this report.
Description A description of this report's function.
Weeks Choose the week to scan from the pop-up menu.
Processing Options To run this report, select a time to start it:
• Execute Now: Executes the report immediately in the

Reports User Guide
Preconfigured Reports © 2004 Apple Computer, Inc. All rights reserved. 139
Field Description
current window
• In Background Now: Executes the report immediately inthe Background.*
• ASAP: Executes the report in the order it is received inthe Report Queue.*
• At Night: Execute during the next evening.*
• On Weekend: Execute during the next weekend.*
• On Specific Date/Time: Execute on the date and timespecified in the Specific Date/Time fields.*
*After submitting this report, it will be processed in the reportqueue. On the navigation bar, click the Report Queue icon. TheReport Queue - My Jobs page displays all your reports.
Specific Date/Time If you selected On Specific Date/Time for Processing Output,enter the date to scan using the format mm/dd/yyyy or mm-dd-yyyy. If you do not use this format, an alert appears. If yousubmit the date with an incorrect format, the date field will besubmitted as a blank entry.
Use the pop-up menus to indicate hour and minute.
5. Click Submit. The report results display based on the parameters you selected. Dependingon your specifications, this could take several minutes.
6. Print the report from your web browser or save it to another application. For moreinformation, see the section "Run, Print, and Save Reports."
Attendance Count and Audit ReportsUse the Attendance Count and Attendance Audit reports to display instances of certain attendancecodes for a student, group of students, or class. For other attendance-related reports, see thesection "Attendance Reports."
To indicate a selection of students when running a report, select that group before starting any ofthe procedures in this section. If you select a group of students from the start page, the GroupFunctions page appears either immediately or after selecting students from the Student Selectionpage.
For more information on attendance, see the section "Attendance Overview."
How to Run the Attendance Count ReportUse the Attendance Count report to generate multi-day period-by-period attendance codeinformation.

Reports User Guide
Preconfigured Reports © 2004 Apple Computer, Inc. All rights reserved. 140
Note: You can search on any absent or present attendance code that is stored in the database. Theonly code you cannot search for is the Present code because the absence of an attendance codeindicates a presence and thus it is not currently searchable in the database.
1. On the start page, choose Reports from the main menu. The Reports page appears.
2. Click Run Reports. The Run Reports page appears.
3. Click Attendance Count. The Attendance Count Report page appears.
4. Use the following table to enter information in the fields:
Field Description
Report Name The name of this report.
Description A description of this report's function.
Attendance Mode Use the pop-up menu to select one of the following attendancemodes for which you want to run this report:
• Choose Meeting to search and display report output byperiod.
• Choose Daily to search and display report output byday.
Attendance mode indicates the method by which attendance isrecorded. For more information, see the section "AttendanceOverview."
Note: Only the attendance modes selected in School Setup >Attendance > Preferences appear in the pop-up menu.
Students to Include Indicate which students you want to run the report for byselecting one of the following options:
• Select "The selected students only" to run the reportstudents in the current selection enrolled in the daterange specified.
• Select the "All students" to run the report for allstudents in the current school enrolled in the daterange specified.
Grades Select the checkbox(es) of the grade level(s) you want to scan.Doing so takes the selection of students selected in the“Students to Include” section and narrows the selection toinclude only those students having the same grade level asthose selected.
Alternatively, leave all the checkboxes blank to scan all gradelevel(s). Doing so includes all of the students selected in the“Students to Include” selection.
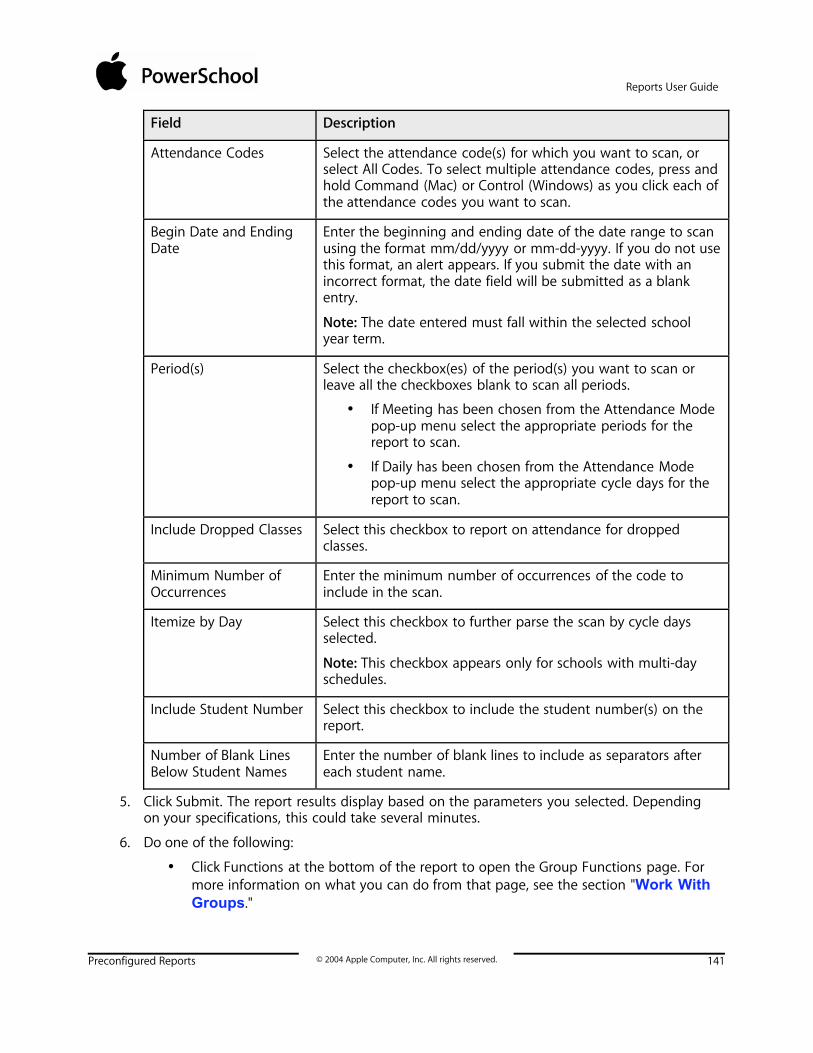
Reports User Guide
Preconfigured Reports © 2004 Apple Computer, Inc. All rights reserved. 141
Field Description
Attendance Codes Select the attendance code(s) for which you want to scan, orselect All Codes. To select multiple attendance codes, press andhold Command (Mac) or Control (Windows) as you click each ofthe attendance codes you want to scan.
Begin Date and EndingDate
Enter the beginning and ending date of the date range to scanusing the format mm/dd/yyyy or mm-dd-yyyy. If you do not usethis format, an alert appears. If you submit the date with anincorrect format, the date field will be submitted as a blankentry.
Note: The date entered must fall within the selected schoolyear term.
Period(s) Select the checkbox(es) of the period(s) you want to scan orleave all the checkboxes blank to scan all periods.
• If Meeting has been chosen from the Attendance Modepop-up menu select the appropriate periods for thereport to scan.
• If Daily has been chosen from the Attendance Modepop-up menu select the appropriate cycle days for thereport to scan.
Include Dropped Classes Select this checkbox to report on attendance for droppedclasses.
Minimum Number ofOccurrences
Enter the minimum number of occurrences of the code toinclude in the scan.
Itemize by Day Select this checkbox to further parse the scan by cycle daysselected.
Note: This checkbox appears only for schools with multi-dayschedules.
Include Student Number Select this checkbox to include the student number(s) on thereport.
Number of Blank LinesBelow Student Names
Enter the number of blank lines to include as separators aftereach student name.
5. Click Submit. The report results display based on the parameters you selected. Dependingon your specifications, this could take several minutes.
6. Do one of the following:
• Click Functions at the bottom of the report to open the Group Functions page. Formore information on what you can do from that page, see the section "Work WithGroups."

Reports User Guide
Preconfigured Reports © 2004 Apple Computer, Inc. All rights reserved. 142
• Click Find to identify teachers who have not yet taken attendance. For moreinformation on this feature, see the section "How to Run the PowerGradeAttendance Report."
• Print or save the report. For more information, see the section "Run, Print, andSave Reports."
How to Run the Class Attendance Audit ReportUse the Class Attendance Audit report to generate section-specific attendance roster.
1. On the start page, choose Reports from the main menu. The Reports page appears.
2. Click Run Reports. The Run Reports page appears.
3. Click Class Attendance Audit. The Class Attendance Audit Report page appears.
4. Use the following table to enter information in the fields:
Field Description
Report Name The name of this report.
Description A description of this report's function.
Begin Date and EndingDate
Enter the beginning and ending date of the date range to scanusing the format mm/dd/yyyy or mm-dd-yyyy. If you do not usethis format, an alert appears. If you submit the date with anincorrect format, the date field will be submitted as a blankentry.
Note: The date entered must fall within the selected schoolyear term.
Teachers Select the teacher(s) for which you want to run the report, orselect All Teachers. To select multiple teachers, Press and holdCommand (Mac) or Control (Windows).
Period(s) Select the checkbox(es) of the period(s) you want to scan orleave all the checkboxes blank to scan all periods.
• If Meeting has been chosen from the Attendance Modepop-up menu select the appropriate periods for thereport to scan.
• If Daily has been chosen from the Attendance Modepop-up menu select the appropriate cycle days for thereport to scan.
Vocational Classes Only Select this checkbox to limit the audit to just vocational classes.
Audit Students Use the pop-up menu to indicated whether you want to auditstudents who are "Currently Enrolled in Class" or were "Ever inClass."
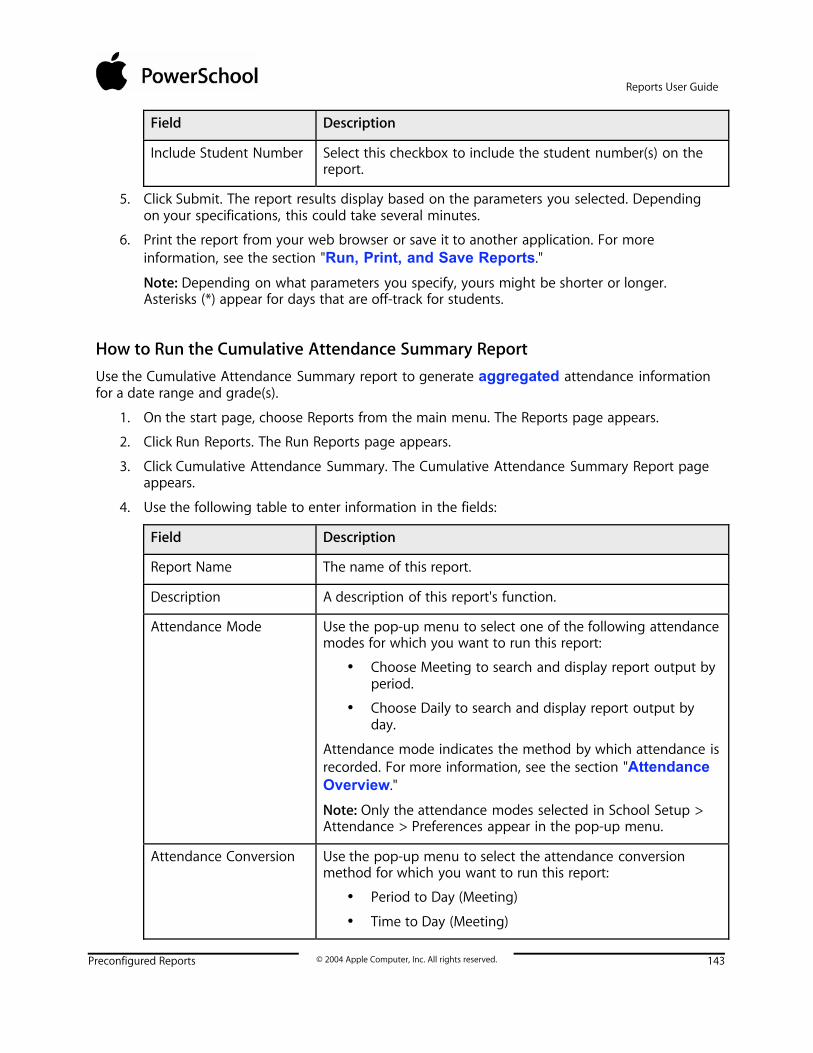
Reports User Guide
Preconfigured Reports © 2004 Apple Computer, Inc. All rights reserved. 143
Field Description
Include Student Number Select this checkbox to include the student number(s) on thereport.
5. Click Submit. The report results display based on the parameters you selected. Dependingon your specifications, this could take several minutes.
6. Print the report from your web browser or save it to another application. For moreinformation, see the section "Run, Print, and Save Reports."
Note: Depending on what parameters you specify, yours might be shorter or longer.Asterisks (*) appear for days that are off-track for students.
How to Run the Cumulative Attendance Summary ReportUse the Cumulative Attendance Summary report to generate aggregated attendance informationfor a date range and grade(s).
1. On the start page, choose Reports from the main menu. The Reports page appears.
2. Click Run Reports. The Run Reports page appears.
3. Click Cumulative Attendance Summary. The Cumulative Attendance Summary Report pageappears.
4. Use the following table to enter information in the fields:
Field Description
Report Name The name of this report.
Description A description of this report's function.
Attendance Mode Use the pop-up menu to select one of the following attendancemodes for which you want to run this report:
• Choose Meeting to search and display report output byperiod.
• Choose Daily to search and display report output byday.
Attendance mode indicates the method by which attendance isrecorded. For more information, see the section "AttendanceOverview."
Note: Only the attendance modes selected in School Setup >Attendance > Preferences appear in the pop-up menu.
Attendance Conversion Use the pop-up menu to select the attendance conversionmethod for which you want to run this report:
• Period to Day (Meeting)
• Time to Day (Meeting)

Reports User Guide
Preconfigured Reports © 2004 Apple Computer, Inc. All rights reserved. 144
Field Description
• Code to Day (Daily)
• Time to Day (Daily)
Attendance conversions indicates the method by whichattendance is calculated, such as period, code, or time. Formore information, see the section "AttendanceConversions."
Note: Only the attendance conversions that are applicable tothe selected attendance mode appear in the pop-up menu.
Grades Select the checkbox(es) of the grade level(s) you want to scan.Doing so takes the selection of students selected in the“Students to Include” section and narrows the selection toinclude only those students having the same grade level asthose selected.
Alternatively, leave all the checkboxes blank to scan all gradelevel(s). Doing so includes all of the students selected in the“Students to Include” selection.
Reporting Segment orBegin Date and EndingDate
Select which date range to use for this report:
• Reporting Segment: Choose a reporting segment fromthe pop-up menu. For more information on reportingsegments, see the section "Reporting Segments."
• Begin Date and Ending Date: Specify a date range in theblank fields using the format mm/dd/yyyy or mm-dd-yyyy. If you do not use this format, an alert appears. Ifyou submit the date with an incorrect format, the datefield will be submitted as a blank entry.
Note: The date entered must fall within the selected schoolyear term.
Special Programs Select the checkbox(es) for the program(s) to scan.
Report by Track Enter the track letters if you want to filter the report by track.
Note: If the field is blank, all tracks are considered. Once one ormore values are entered, only students assigned to those valueswill be considered.
Check for possibleconflicts
Click to check for possible track errors.
Display Audit Table Select this checkbox to display the audit table, which includesthe last grade and special program information.

Reports User Guide
Preconfigured Reports © 2004 Apple Computer, Inc. All rights reserved. 145
5. Click Submit. The report results display based on the parameters you selected. Dependingon your specifications, this could take several minutes. The following information appears inthe output file:
Column Name Description
Carry Forwards The number of students that were enrolled prior to thereporting period.
Gain The number of students that enrolled during the reportingperiod.
Multiple gain The number of students that had multiple enrollments duringthe reporting period (e.g. enrolled, withdrew, re-enrolled).
Loss The number of students that withdrew/transferred during thereporting period
Ending The number of students enrolled on the last day of thereporting period.
Actual Days Total number of student enrolled days in the reporting period.
OffTrack Number of days students were off track during the reportingperiod.
Days N/E Total number of days students were off the rolls during thereporting period.
Days Absent Total number of days students were absent during thereporting period.
Days Attd Total number of days of school attended by students, duringthe reporting period.
ADA Average daily attendance during the reporting period.
ADA % Average daily attendance percentage during the reportingperiod.
6. Print the report from your web browser or save it to another application. For moreinformation, see the section Use the Student Attendance Audit report to generate a rosterdetailing attendance by day and the average daily attendance and average dailymembership by date range.
How to Run the Student Attendance Audit ReportUse the Student Attendance Audit report to generate a roster detailing attendance by day and theaverage daily attendance and average daily membership by date range.
1. On the start page, choose Reports from the main menu. The Reports page appears.
2. Click Run Reports. The Run Reports page appears.

Reports User Guide
Preconfigured Reports © 2004 Apple Computer, Inc. All rights reserved. 146
3. Click Student Attendance Audit. The Student Daily Attendance Audit Report page appears.
4. Use the following table to enter information in the fields:
Field Description
Report Name The name of this report.
Description A description of this report's function.
Attendance Mode Use the pop-up menu to select one of the following attendancemodes for which you want to run this report:
• Choose Meeting to search and display report output byperiod.
• Choose Daily to search and display report output byday.
Attendance mode indicates the method by which attendance isrecorded. For more information, see the section "AttendanceOverview."
Note: Only the attendance modes selected in School Setup >Attendance > Preferences appear in the pop-up menu.
Attendance Conversion Use the pop-up menu to select the attendance conversionmethod for which you want to run this report:
• Period to Day (Meeting)
• Time to Day (Meeting)
• Code to Day (Daily)
• Time to Day (Daily)
Attendance conversions indicates the method by whichattendance is calculated, such as period, code, or time. Formore information, see the section "AttendanceConversions."
Note: Only the attendance conversions that are applicable tothe selected attendance mode appear in the pop-up menu.
Students to Include Indicate which students you want to run the report for byselecting one of the following options:
• Select "The selected students only" to run the reportstudents in the current selection enrolled in the daterange specified.
• Select the "All students" to run the report for allstudents in the current school enrolled in the daterange specified.

Reports User Guide
Preconfigured Reports © 2004 Apple Computer, Inc. All rights reserved. 147
Field Description
Grades Select the checkbox(es) of the grade level(s) you want to scan.Doing so takes the selection of students selected in the“Students to Include” section and narrows the selection toinclude only those students having the same grade level asthose selected.
Alternatively, leave all the checkboxes blank to scan all gradelevel(s). Doing so includes all of the students selected in the“Students to Include” selection.
Reporting Segment orBegin Date and EndingDate
Select which date range to use for this report:
• Reporting Segment: Choose a reporting segment fromthe pop-up menu. For more information on reportingsegments, see the section "Reporting Segments."
• Begin Date and Ending Date: Specify a date range in theblank fields using the format mm/dd/yyyy or mm-dd-yyyy. If you do not use this format, an alert appears. Ifyou submit the date with an incorrect format, the datefield will be submitted as a blank entry.
Note: The date entered must fall within the selected schoolyear term.
Lines per page Enter the number of data rows you want to appear on eachpage of the report.
Starting Page Number Enter the page number from which you want the report tostart.
Include Student Number Select this checkbox to include the student number(s) on thereport.
5. Click Submit. The report results display based on the parameters you selected. Dependingon your specifications, this could take several minutes. The following information appears inthe output file:
Column Name Description
Index Counter indicating the number of records that appear in thereport.
Student Name The name of the student.
Student Number The student's identification number.
Day A column for each day in the date range appears. Each daydisplays the student's attendance value for that day, a numericvalue, usually from 0 to 1.
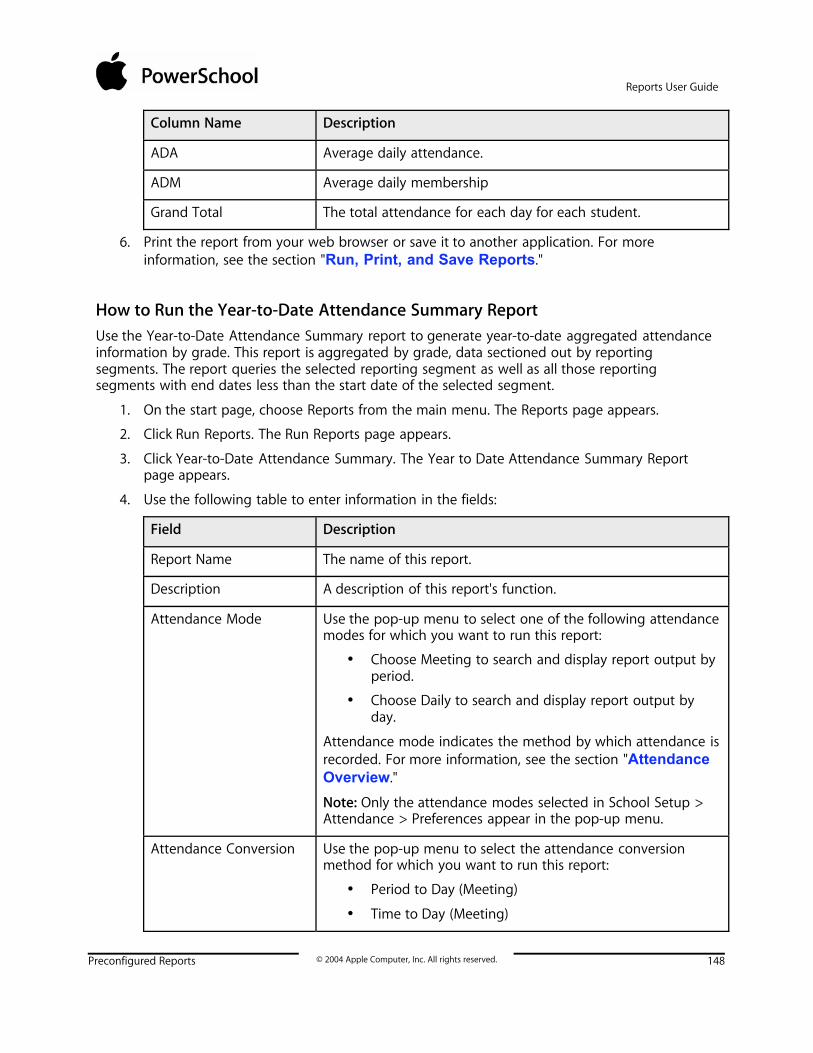
Reports User Guide
Preconfigured Reports © 2004 Apple Computer, Inc. All rights reserved. 148
Column Name Description
ADA Average daily attendance.
ADM Average daily membership
Grand Total The total attendance for each day for each student.
6. Print the report from your web browser or save it to another application. For moreinformation, see the section "Run, Print, and Save Reports."
How to Run the Year-to-Date Attendance Summary ReportUse the Year-to-Date Attendance Summary report to generate year-to-date aggregated attendanceinformation by grade. This report is aggregated by grade, data sectioned out by reportingsegments. The report queries the selected reporting segment as well as all those reportingsegments with end dates less than the start date of the selected segment.
1. On the start page, choose Reports from the main menu. The Reports page appears.
2. Click Run Reports. The Run Reports page appears.
3. Click Year-to-Date Attendance Summary. The Year to Date Attendance Summary Reportpage appears.
4. Use the following table to enter information in the fields:
Field Description
Report Name The name of this report.
Description A description of this report's function.
Attendance Mode Use the pop-up menu to select one of the following attendancemodes for which you want to run this report:
• Choose Meeting to search and display report output byperiod.
• Choose Daily to search and display report output byday.
Attendance mode indicates the method by which attendance isrecorded. For more information, see the section "AttendanceOverview."
Note: Only the attendance modes selected in School Setup >Attendance > Preferences appear in the pop-up menu.
Attendance Conversion Use the pop-up menu to select the attendance conversionmethod for which you want to run this report:
• Period to Day (Meeting)
• Time to Day (Meeting)

Reports User Guide
Preconfigured Reports © 2004 Apple Computer, Inc. All rights reserved. 149
Field Description
• Code to Day (Daily)
• Time to Day (Daily)
Attendance conversions indicates the method by whichattendance is calculated, such as period, code, or time. Formore information, see the section "AttendanceConversions."
Note: Only the attendance conversions that are applicable tothe selected attendance mode appear in the pop-up menu.
Grades Select the checkbox(es) of the grade level(s) you want to scan.Doing so takes the selection of students selected in the“Students to Include” section and narrows the selection toinclude only those students having the same grade level asthose selected.
Alternatively, leave all the checkboxes blank to scan all gradelevel(s). Doing so includes all of the students selected in the“Students to Include” selection.
Reporting Segment orBegin Date and EndingDate
Select which date range to use for this report:
• Reporting Segment: Choose a reporting segment fromthe pop-up menu. For more information on reportingsegments, see the section "Reporting Segments."
• Begin Date and Ending Date: Specify a date range in theblank fields using the format mm/dd/yyyy or mm-dd-yyyy. If you do not use this format, an alert appears. Ifyou submit the date with an incorrect format, the datefield will be submitted as a blank entry.
Note: The date entered must fall within the selected schoolyear term.
5. Click Submit. The report results display based on the parameters you selected. Dependingon your specifications, this could take several minutes. The following information appears inthe output file:
Column Name Description
App The total number of membership days by reporting segment.
Day The total number of in-session school days per segment
ADA Average daily attendance per segment.
6. Print the report from your web browser or save it to another application. For moreinformation, see the section "Run, Print, and Save Reports."
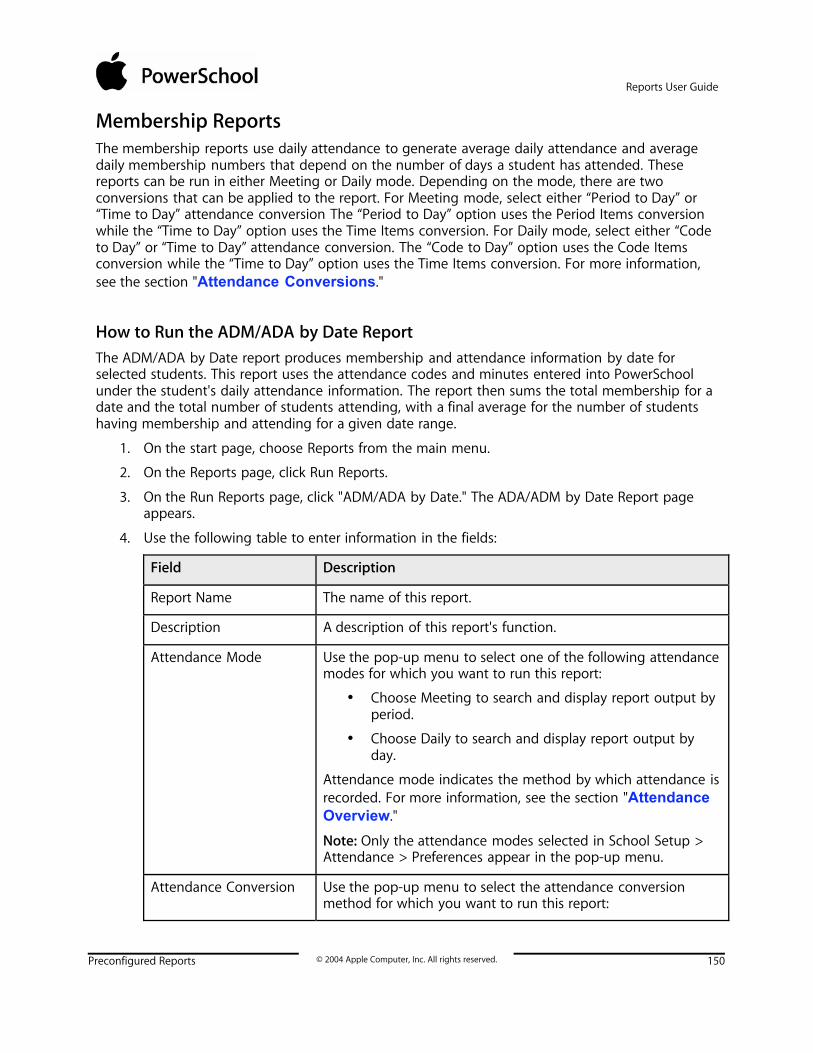
Reports User Guide
Preconfigured Reports © 2004 Apple Computer, Inc. All rights reserved. 150
Membership ReportsThe membership reports use daily attendance to generate average daily attendance and averagedaily membership numbers that depend on the number of days a student has attended. Thesereports can be run in either Meeting or Daily mode. Depending on the mode, there are twoconversions that can be applied to the report. For Meeting mode, select either “Period to Day” or“Time to Day” attendance conversion The “Period to Day” option uses the Period Items conversionwhile the “Time to Day” option uses the Time Items conversion. For Daily mode, select either “Codeto Day” or “Time to Day” attendance conversion. The “Code to Day” option uses the Code Itemsconversion while the “Time to Day” option uses the Time Items conversion. For more information,see the section "Attendance Conversions."
How to Run the ADM/ADA by Date ReportThe ADM/ADA by Date report produces membership and attendance information by date forselected students. This report uses the attendance codes and minutes entered into PowerSchoolunder the student's daily attendance information. The report then sums the total membership for adate and the total number of students attending, with a final average for the number of studentshaving membership and attending for a given date range.
1. On the start page, choose Reports from the main menu.
2. On the Reports page, click Run Reports.
3. On the Run Reports page, click "ADM/ADA by Date." The ADA/ADM by Date Report pageappears.
4. Use the following table to enter information in the fields:
Field Description
Report Name The name of this report.
Description A description of this report's function.
Attendance Mode Use the pop-up menu to select one of the following attendancemodes for which you want to run this report:
• Choose Meeting to search and display report output byperiod.
• Choose Daily to search and display report output byday.
Attendance mode indicates the method by which attendance isrecorded. For more information, see the section "AttendanceOverview."
Note: Only the attendance modes selected in School Setup >Attendance > Preferences appear in the pop-up menu.
Attendance Conversion Use the pop-up menu to select the attendance conversionmethod for which you want to run this report:

Reports User Guide
Preconfigured Reports © 2004 Apple Computer, Inc. All rights reserved. 151
Field Description
• Period to Day (Meeting)
• Time to Day (Meeting)
• Code to Day (Daily)
• Time to Day (Daily)
Attendance conversions indicates the method by whichattendance is calculated, such as period, code, or time. Formore information, see the section "AttendanceConversions."
Note: Only the attendance conversions that are applicable tothe selected attendance mode appear in the pop-up menu.
Students to Include Indicate which students you want to run the report for byselecting one of the following options:
• Select "The selected students only" to run the reportstudents in the current selection enrolled in the daterange specified.
• Select the "All students" to run the report for allstudents in the current school enrolled in the daterange specified.
Grades Select the checkbox(es) of the grade level(s) you want to scan.Doing so takes the selection of students selected in the“Students to Include” section and narrows the selection toinclude only those students having the same grade level asthose selected.
Alternatively, leave all the checkboxes blank to scan all gradelevel(s). Doing so includes all of the students selected in the“Students to Include” selection.
Begin Date and EndingDate
Enter the beginning and ending date of the date range to scanusing the format mm/dd/yyyy or mm-dd-yyyy. If you do not usethis format, an alert appears. If you submit the date with anincorrect format, the date field will be submitted as a blankentry.
Note: The date entered must fall within the selected schoolyear term.
Processing Options To run this report, select a time to start it:
• Execute Now: Executes the report immediately in thecurrent window
• In Background Now: Executes the report immediately inthe Background.*
• ASAP: Executes the report in the order it is received in

Reports User Guide
Preconfigured Reports © 2004 Apple Computer, Inc. All rights reserved. 152
Field Description
the Report Queue.*
• At Night: Execute during the next evening.*
• On Weekend: Execute during the next weekend.*
• On Specific Date/Time: Execute on the date and timespecified in the Specific Date/Time fields.*
*After submitting this report, it will be processed in the reportqueue. On the navigation bar, click the Report Queue icon . TheReport Queue - My Jobs page displays all your reports.
Specific Date/Time If you selected On Specific Date/Time for Processing Output,enter the date to scan using the format mm/dd/yyyy or mm-dd-yyyy. If you do not use this format, an alert appears. If yousubmit the date with an incorrect format, the date field will besubmitted as a blank entry.
Use the pop-up menus to indicate hour and minute.
5. Click Submit. The report results display based on the parameters you selected. Dependingon your specifications, this could take several minutes.
6. Print the report from your web browser or save it to another application. For moreinformation, see the section "Run, Print, and Save Reports."
How to Run the ADM/ADA by Minute ReportThe ADA/ADM by Minute report displays the total number of potential minutes for students; totalnumber of minutes missed, total number of minutes attended, and total percentage of each. Whenin Meeting mode, the system calculates the number of minutes the group of students has attendedby period. When in Daily mode, the system displays the number of minutes the group of studentshas attended by day.
1. On the start page, choose Reports from the main menu. The Reports page appears.
2. Click Run Reports. The Run Reports page appears.
3. Click "ADM/ADA by Minute." The ADA/ADM by Minute Report page appears.
4. Use the following table to enter information in the fields:
Field Description
Report Name The name of this report.
Description A description of this report's function.
Attendance Mode Use the pop-up menu to select one of the following attendancemodes for which you want to run this report:
• Choose Meeting to search and display report output byperiod.

Reports User Guide
Preconfigured Reports © 2004 Apple Computer, Inc. All rights reserved. 153
Field Description
• Choose Daily to search and display report output byday.
Attendance mode indicates the method by which attendance isrecorded. For more information, see the section "AttendanceOverview."
Note: Only the attendance modes selected in School Setup >Attendance > Preferences appear in the pop-up menu.
Attendance Conversion Use the pop-up menu to select the attendance conversionmethod for which you want to run this report:
• Period to Day (Meeting)
• Time to Day (Meeting)
• Code to Day (Daily)
• Time to Day (Daily)
Attendance conversions indicates the method by whichattendance is calculated, such as period, code, or time. Formore information, see the section "AttendanceConversions."
Note: Only the attendance conversions that are applicable tothe selected attendance mode appear in the pop-up menu.
Students to Include Indicate which students you want to run the report for byselecting one of the following options:
• Select "The selected students only" to run the reportstudents in the current selection enrolled in the daterange specified.
• Select the "All students" to run the report for allstudents in the current school enrolled in the daterange specified.
Grades Select the checkbox(es) of the grade level(s) you want to scan.Doing so takes the selection of students selected in the“Students to Include” section and narrows the selection toinclude only those students having the same grade level asthose selected.
Alternatively, leave all the checkboxes blank to scan all gradelevel(s). Doing so includes all of the students selected in the“Students to Include” selection.
Begin Date and EndingDate
Enter the beginning and ending date of the date range to scanusing the format mm/dd/yyyy or mm-dd-yyyy. If you do not usethis format, an alert appears. If you submit the date with anincorrect format, the date field will be submitted as a blank
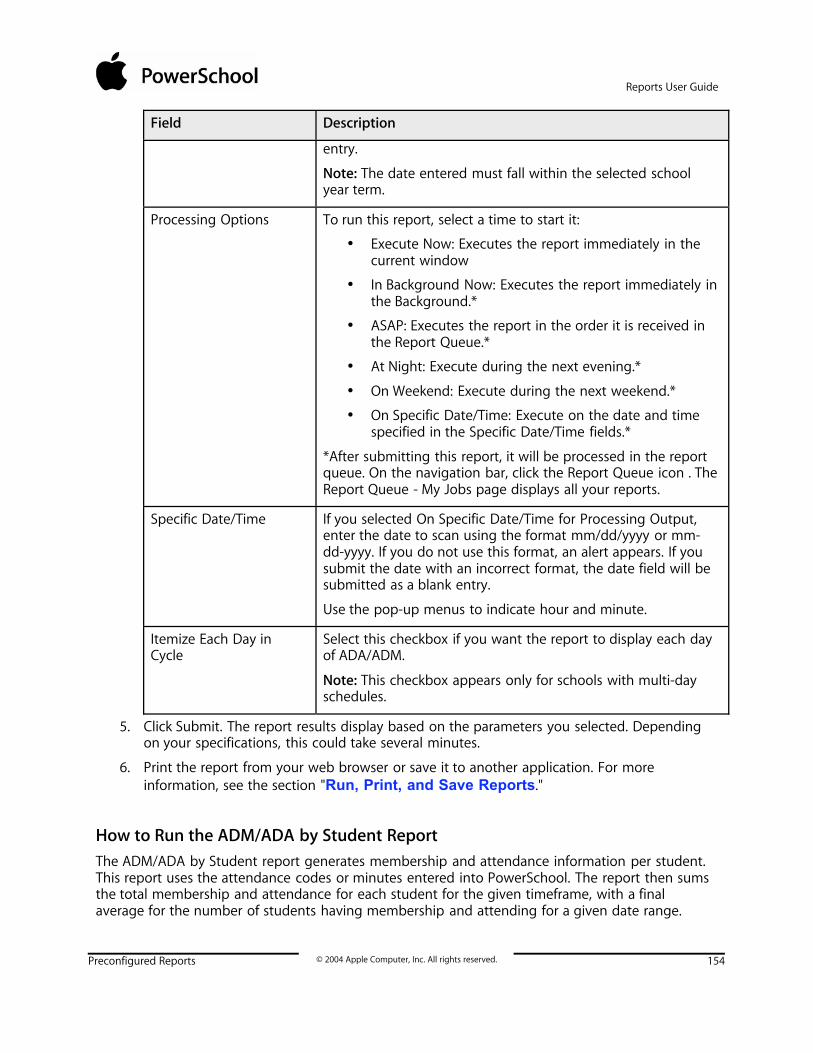
Reports User Guide
Preconfigured Reports © 2004 Apple Computer, Inc. All rights reserved. 154
Field Description
entry.
Note: The date entered must fall within the selected schoolyear term.
Processing Options To run this report, select a time to start it:
• Execute Now: Executes the report immediately in thecurrent window
• In Background Now: Executes the report immediately inthe Background.*
• ASAP: Executes the report in the order it is received inthe Report Queue.*
• At Night: Execute during the next evening.*
• On Weekend: Execute during the next weekend.*
• On Specific Date/Time: Execute on the date and timespecified in the Specific Date/Time fields.*
*After submitting this report, it will be processed in the reportqueue. On the navigation bar, click the Report Queue icon . TheReport Queue - My Jobs page displays all your reports.
Specific Date/Time If you selected On Specific Date/Time for Processing Output,enter the date to scan using the format mm/dd/yyyy or mm-dd-yyyy. If you do not use this format, an alert appears. If yousubmit the date with an incorrect format, the date field will besubmitted as a blank entry.
Use the pop-up menus to indicate hour and minute.
Itemize Each Day inCycle
Select this checkbox if you want the report to display each dayof ADA/ADM.
Note: This checkbox appears only for schools with multi-dayschedules.
5. Click Submit. The report results display based on the parameters you selected. Dependingon your specifications, this could take several minutes.
6. Print the report from your web browser or save it to another application. For moreinformation, see the section "Run, Print, and Save Reports."
How to Run the ADM/ADA by Student ReportThe ADM/ADA by Student report generates membership and attendance information per student.This report uses the attendance codes or minutes entered into PowerSchool. The report then sumsthe total membership and attendance for each student for the given timeframe, with a finalaverage for the number of students having membership and attending for a given date range.

Reports User Guide
Preconfigured Reports © 2004 Apple Computer, Inc. All rights reserved. 155
1. On the start page, choose Reports from the main menu. The Reports page appears.
2. Click Run Reports. The Run Reports page appears.
3. Click "ADM/ADA by Student." The ADA/ADM by Student Report pages appears.
4. Use the following table to enter information in the fields:
Field Description
Report Name The name of this report.
Description A description of this report's function.
Attendance Mode Use the pop-up menu to select one of the following attendancemodes for which you want to run this report:
• Choose Meeting to search and display report output byperiod.
• Choose Daily to search and display report output byday.
Attendance mode indicates the method by which attendance isrecorded. For more information, see the section "AttendanceOverview."
Note: Only the attendance modes selected in School Setup >Attendance > Preferences appear in the pop-up menu.
Attendance Conversion Use the pop-up menu to select the attendance conversionmethod for which you want to run this report:
• Period to Day (Meeting)
• Time to Day (Meeting)
• Code to Day (Daily)
• Time to Day (Daily)
Attendance conversions indicates the method by whichattendance is calculated, such as period, code, or time. Formore information, see the section "AttendanceConversions."
Note: Only the attendance conversions that are applicable tothe selected attendance mode appear in the pop-up menu.
Students to Include Indicate which students you want to run the report for byselecting one of the following options:
• Select "The selected students only" to run the reportstudents in the current selection enrolled in the daterange specified.
• Select the "All students" to run the report for allstudents in the current school enrolled in the date

Reports User Guide
Preconfigured Reports © 2004 Apple Computer, Inc. All rights reserved. 156
Field Description
range specified.
Grades Select the checkbox(es) of the grade level(s) you want to scan.Doing so takes the selection of students selected in the“Students to Include” section and narrows the selection toinclude only those students having the same grade level asthose selected.
Alternatively, leave all the checkboxes blank to scan all gradelevel(s). Doing so includes all of the students selected in the“Students to Include” selection.
Begin Date and EndingDate
Enter the beginning and ending date of the date range to scanusing the format mm/dd/yyyy or mm-dd-yyyy. If you do not usethis format, an alert appears. If you submit the date with anincorrect format, the date field will be submitted as a blankentry.
Note: The date entered must fall within the selected schoolyear term.
Processing Options To run this report, select a time to start it:
• Execute Now: Executes the report immediately in thecurrent window
• In Background Now: Executes the report immediately inthe Background.*
• ASAP: Executes the report in the order it is received inthe Report Queue.*
• At Night: Execute during the next evening.*
• On Weekend: Execute during the next weekend.*
• On Specific Date/Time: Execute on the date and timespecified in the Specific Date/Time fields.*
*After submitting this report, it will be processed in the reportqueue. On the navigation bar, click the Report Queue icon . TheReport Queue - My Jobs page displays all your reports.
Specific Date/Time If you selected On Specific Date/Time for Processing Output,enter the date to scan using the format mm/dd/yyyy or mm-dd-yyyy. If you do not use this format, an alert appears. If yousubmit the date with an incorrect format, the date field will besubmitted as a blank entry.
Use the pop-up menus to indicate hour and minute.
5. Click Submit. The report results display based on the parameters you selected. Dependingon your specifications, this could take several minutes.

Reports User Guide
Preconfigured Reports © 2004 Apple Computer, Inc. All rights reserved. 157
6. Print the report from your web browser or save it to another application. For moreinformation, see the section "Run, Print, and Save Reports."
How to Run the Aggregate Membership Audit ReportUse the Aggregate Membership Audit report to generate membership audit by section information.This report is similar to a class roster report. It lists the students that were enrolled or ever enrolledin the class/section and their membership.
1. On the start page, choose Reports from the main menu. The Reports page appears.
2. Click Run Reports. The Run Reports page appears.
3. Click Aggregate Membership Audit. The Aggregate Membership Audit Report page appears.
4. Use the following table to enter information in the fields:
Field Description
Report Name The name of this report.
Description A description of this report's function.
Lines per page Enter the number of data rows you want to appear on eachpage of the report.
Starting Page Number Enter the page number from which you want the report tostart.
Course Numbers Enter the course number(s). Separate multiple courses withcommas. Use a blank field to scan all courses.
Section Numbers Enter the section number(s) . Separate multiple sections withcommas. Use a blank field to scan all sections.
Term Select the term for which you want to run the report from thepop-up menu.
5. Click Submit. The report results display based on the parameters you selected. Dependingon your specifications, this could take several minutes.
6. The following information appears in the output file:
Column Name Description
Course Name The name of the course for the section.
Teacher The name of the teacher teaching the section ( Last, First,Middle).
Term The term the section is being taught.
Expression The section expression.

Reports User Guide
Preconfigured Reports © 2004 Apple Computer, Inc. All rights reserved. 158
Column Name Description
Section Number The section number of the section.
Student The name of the student ( Last, First, Middle).
Enrolled The date the student enrolled in the course.
Exited The date the student exited the course.
Membership Days The total number of days the student was enrolled in thecourse.
Total The total number of days students were enrolled in the course.
7. Print the report from your web browser or save it to another application. For moreinformation, see the section "Run, Print, and Save Reports."
Student ListingsStudent listing reports display lists of students, either by class or schedule.
How to Run the Class Rosters (PDF) ReportGenerate a class roster as a PDF file for the current term or previous terms.
1. On the start page, choose Reports from the main menu.
2. On the Reports page, click Run Reports.
3. On the Run Reports page, click Class Rosters (PDF). The Class Rosters (PDF) page appears.
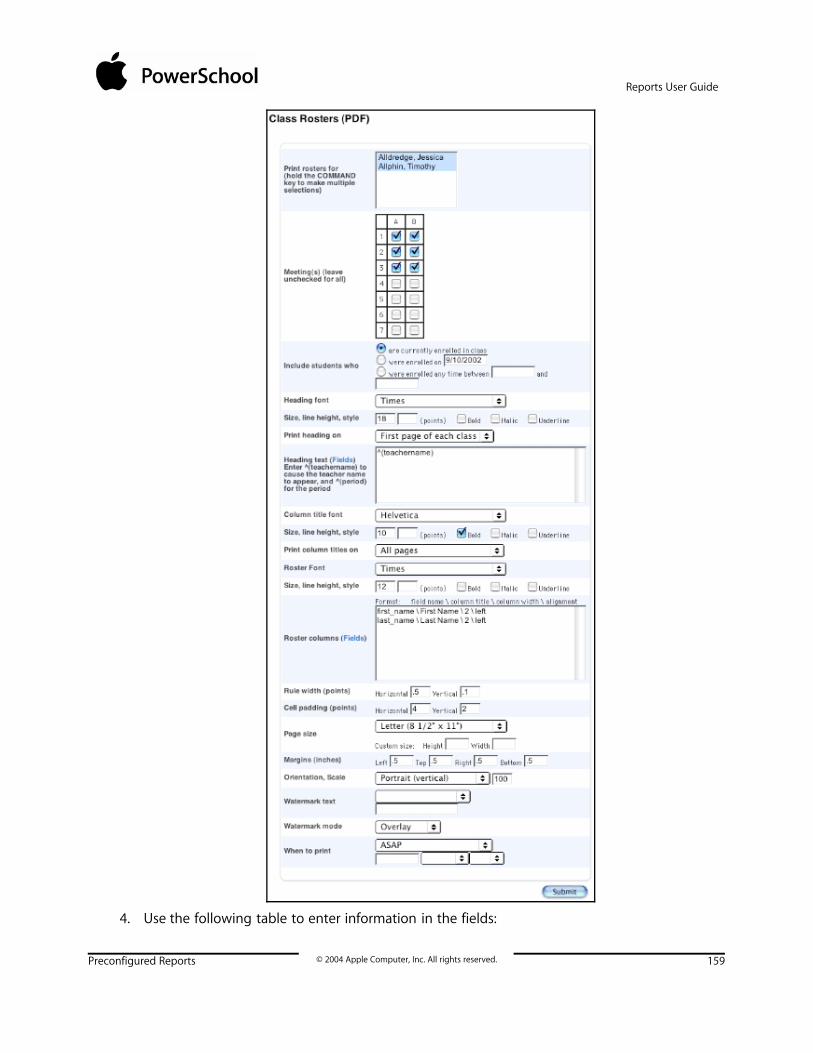
Reports User Guide
Preconfigured Reports © 2004 Apple Computer, Inc. All rights reserved. 159
4. Use the following table to enter information in the fields:

Reports User Guide
Preconfigured Reports © 2004 Apple Computer, Inc. All rights reserved. 160
Field Description
Print roster(s) for Select the teacher(s) whose attendance records are to beaudited. Press and hold Command (Mac) or Control (Windows)to select multiple teachers.
Meeting(s) Enter the meeting(s) to be audited in the second field. To auditall meetings, use a blank field.
Include students who Select an enrollment period option. Some options require youto enter a date or date range using the format mm/dd/yyyy ormm-dd-yyyy. If you do not use this format, an alert appears. Ifyou submit the date with an incorrect format, the date field willbe submitted as a blank entry.
Heading Font Choose the heading font from the pop-up menu.
Heading Style Enter the font size and line height in points. One point equals1/72 of an inch.
Select the Bold checkbox to bold the heading.
Print heading on Choose an option from the pop-up menu to determine howyou want the heading to print.
Heading Text Enter the content to include in the report heading using text,HTML tags, and PowerSchool data codes. For a complete list ofdata codes, visit the PowerSchool Customer Support web site athttps://www.powerschool.com/support/downloads/ andclick PowerSchool Codes. For a complete list of field codes, clickView Field List on the PowerSchool start page.
Roster Font Choose the roster listing font from the pop-up menu.
Roster Style Enter the font size and line height in points. One point equals1/72 of an inch.
Select the Bold checkbox to bold the roster listing.
Roster Columns Enter the content to include in the student listings columnsusing the format "field name \ column title \ column width \alignment." For a complete list of field codes, click Fields.
Rule Width Enter the thickness in inches of the vertical and horizontal lineson the report, as well as the outline of the entire report.
Cell Padding Enter the width of each cell and the amount of space from allsides of the cells to the text in points. One point equals 1/72 ofan inch.
Page size Choose a size for the report page from the pop-up menu. If youchoose a custom size, enter the size of the page in inches.

Reports User Guide
Preconfigured Reports © 2004 Apple Computer, Inc. All rights reserved. 161
Field Description
Margins Enter the size of the margins in inches.
Orientation, Scale Use the pop-up menu to choose the page layout. Portrait is avertical page; landscape is a horizontal page.
Scale is the finished size of the report. Fit more on a page byreducing it by a percentage, but remember to leave it as largeas possible for easier viewing.
Watermark Text If you want to print text as a watermark on each page of thereport, use the pop-up menu to either choose one of thestandard phrases or choose Custom and enter the text youwant to print as a watermark in the field.
Watermark Mode Use the pop-up menu to determine how you want the text toprint. Watermark prints the text behind objects on the report,while Overlay prints the text over objects on the report.
When to print To run this report, select a time to start it:
• ASAP: Execute immediately.
• At Night: Execute during the next evening.
• On Weekend: Execute during the next weekend.
• On Specific Date/Time: Execute on the date and timespecified in the following fields using the formatmm/dd/yyyy or mm-dd-yyyy. If you do not use thisformat, an alert appears. If you submit the date with anincorrect format, the date field will be submitted as ablank entry.
5. Click Submit. PowerSchool runs the report, and the report queue appears. Depending onyour specifications, this could take several minutes.
6. Click Completed to display the report.
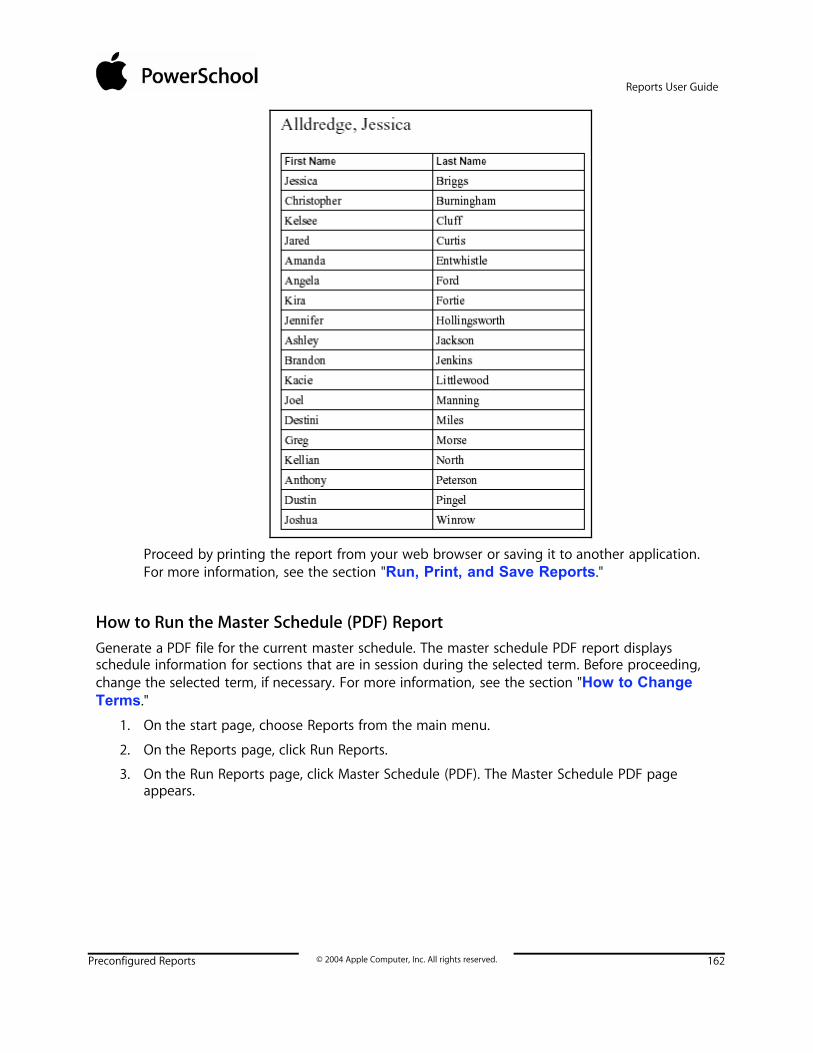
Reports User Guide
Preconfigured Reports © 2004 Apple Computer, Inc. All rights reserved. 162
Proceed by printing the report from your web browser or saving it to another application.For more information, see the section "Run, Print, and Save Reports."
How to Run the Master Schedule (PDF) ReportGenerate a PDF file for the current master schedule. The master schedule PDF report displaysschedule information for sections that are in session during the selected term. Before proceeding,change the selected term, if necessary. For more information, see the section "How to ChangeTerms."
1. On the start page, choose Reports from the main menu.
2. On the Reports page, click Run Reports.
3. On the Run Reports page, click Master Schedule (PDF). The Master Schedule PDF pageappears.

Reports User Guide
Preconfigured Reports © 2004 Apple Computer, Inc. All rights reserved. 163
4. Use the following table to enter information in the fields:
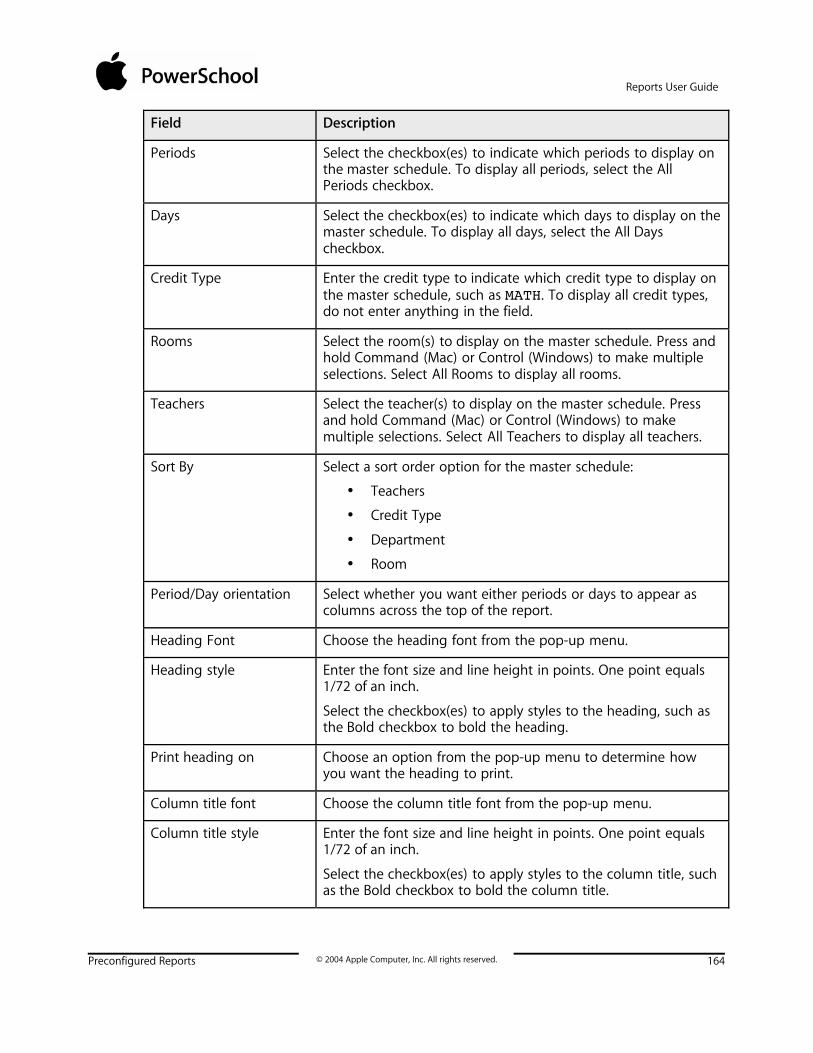
Reports User Guide
Preconfigured Reports © 2004 Apple Computer, Inc. All rights reserved. 164
Field Description
Periods Select the checkbox(es) to indicate which periods to display onthe master schedule. To display all periods, select the AllPeriods checkbox.
Days Select the checkbox(es) to indicate which days to display on themaster schedule. To display all days, select the All Dayscheckbox.
Credit Type Enter the credit type to indicate which credit type to display onthe master schedule, such as MATH. To display all credit types,do not enter anything in the field.
Rooms Select the room(s) to display on the master schedule. Press andhold Command (Mac) or Control (Windows) to make multipleselections. Select All Rooms to display all rooms.
Teachers Select the teacher(s) to display on the master schedule. Pressand hold Command (Mac) or Control (Windows) to makemultiple selections. Select All Teachers to display all teachers.
Sort By Select a sort order option for the master schedule:
• Teachers
• Credit Type
• Department
• Room
Period/Day orientation Select whether you want either periods or days to appear ascolumns across the top of the report.
Heading Font Choose the heading font from the pop-up menu.
Heading style Enter the font size and line height in points. One point equals1/72 of an inch.
Select the checkbox(es) to apply styles to the heading, such asthe Bold checkbox to bold the heading.
Print heading on Choose an option from the pop-up menu to determine howyou want the heading to print.
Column title font Choose the column title font from the pop-up menu.
Column title style Enter the font size and line height in points. One point equals1/72 of an inch.
Select the checkbox(es) to apply styles to the column title, suchas the Bold checkbox to bold the column title.

Reports User Guide
Preconfigured Reports © 2004 Apple Computer, Inc. All rights reserved. 165
Field Description
Print column titles on Choose an option from the pop-up menu to determine onwhich pages you want the column titles to appear.
Body Font Choose the body font from the pop-up menu.
Body Font style Enter the font size and line height in points. One point equals1/72 of an inch.
Select the checkbox(es) to apply styles to the body text, such asthe Bold checkbox to bold the body text.
Cell Padding Enter the width of each cell and the amount of space from allsides of the cells to the text in points. One point equals 1/72 ofan inch.
Page size Choose a size for the report page from the pop-up menu. If youchoose a custom size, enter the size of the page in inches.
Margins Enter the size of the margins in inches.
Orientation, Scale Use the pop-up menu to choose the page layout. Portrait is avertical page; landscape is a horizontal page.
Scale is the finished size of the report. Fit more on a page byreducing it by a percentage, but remember to leave it as largeas possible for easier viewing.
Watermark Text If you want to print text as a watermark on each page of thereport, use the pop-up menu to either choose one of thestandard phrases or choose Custom and enter the text youwant to print as a watermark in the field.
Watermark Mode Use the pop-up menu to determine how you want the text toprint. Watermark prints the text behind objects on the report,while Overlay prints the text over objects on the report.
When to print To run this report, select a time to start it:
• ASAP: Execute immediately.
• At Night: Execute during the next evening.
• On Weekend: Execute during the next weekend.
• On Specific Date/Time: Execute on the date and timespecified in the following fields using the formatmm/dd/yyyy or mm-dd-yyyy. If you do not use thisformat, an alert appears. If you submit the date with anincorrect format, the date field will be submitted as ablank entry.
5. Click Submit. PowerSchool runs the report, and the report queue appears. Depending onyour specifications, this could take several minutes.

Reports User Guide
Preconfigured Reports © 2004 Apple Computer, Inc. All rights reserved. 166
6. Click Completed to display the report.
Proceed by printing the report from your web browser or saving it to another application.For more information, see the section "Run, Print, and Save Reports."
How to Run the Student Schedule Listing ReportThis report provides a printout of students' classes and lets you know where they are during whichperiods.
1. On the start page, choose Reports from the main menu.
2. On the Reports page, click Run Reports.
3. On the Run Reports page, click Student Schedule Listing. The Student Schedule Listing pageappears.
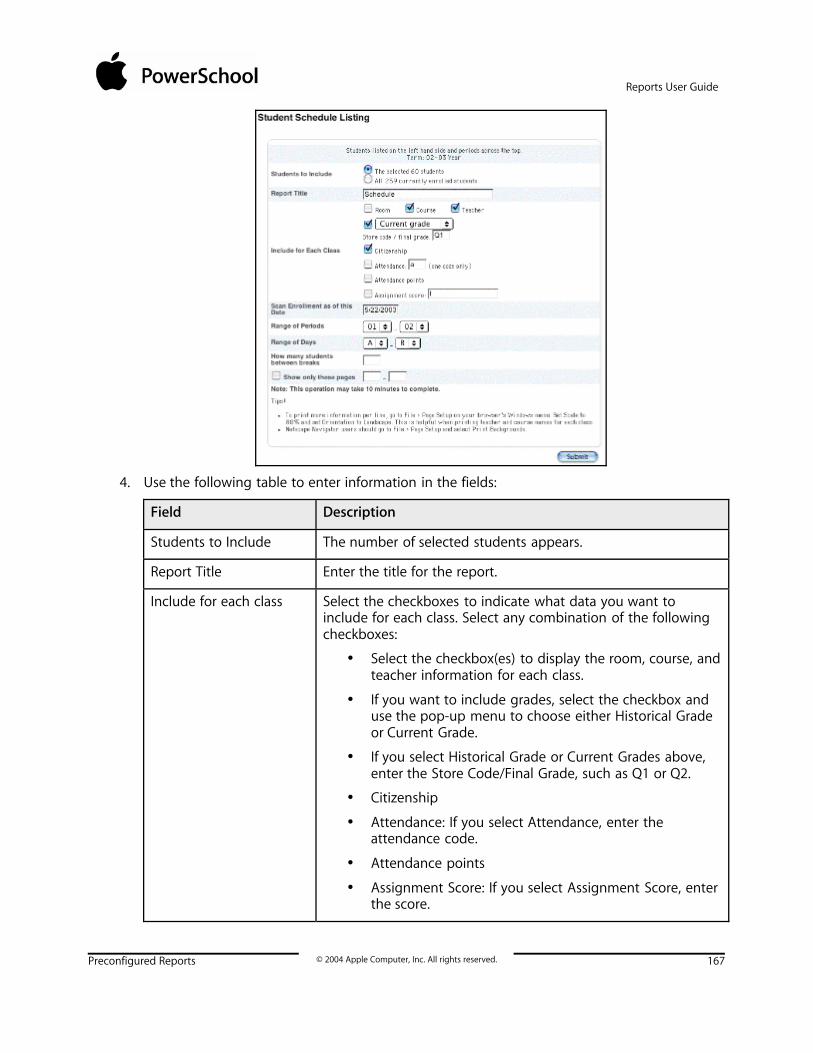
Reports User Guide
Preconfigured Reports © 2004 Apple Computer, Inc. All rights reserved. 167
4. Use the following table to enter information in the fields:
Field Description
Students to Include The number of selected students appears.
Report Title Enter the title for the report.
Include for each class Select the checkboxes to indicate what data you want toinclude for each class. Select any combination of the followingcheckboxes:
• Select the checkbox(es) to display the room, course, andteacher information for each class.
• If you want to include grades, select the checkbox anduse the pop-up menu to choose either Historical Gradeor Current Grade.
• If you select Historical Grade or Current Grades above,enter the Store Code/Final Grade, such as Q1 or Q2.
• Citizenship
• Attendance: If you select Attendance, enter theattendance code.
• Attendance points
• Assignment Score: If you select Assignment Score, enterthe score.

Reports User Guide
Preconfigured Reports © 2004 Apple Computer, Inc. All rights reserved. 168
Field Description
Scan Enrollment as ofthis Date
Enter the student enrollment dates to scan using the formatmm/dd/yyyy or mm-dd-yyyy. If you do not use this format, analert appears. If you submit the date with an incorrect format,the date field will be submitted as a blank entry.
Range of Periods Enter the range of periods to scan.
Range of Days Enter the range of days to scan.
How many studentsbetween breaks
Enter the number of student records to display before a breakin the report.
Show only these pages Select this checkbox to limit the number of pages to display. Ifyou select this checkbox, enter the page number range in thenext fields.
5. Click Submit. The resulting report displays students and their teachers for the selectedperiods.
Proceed by printing the report from your web browser or saving it to another application.For more information, see the section "Run, Print, and Save Reports."
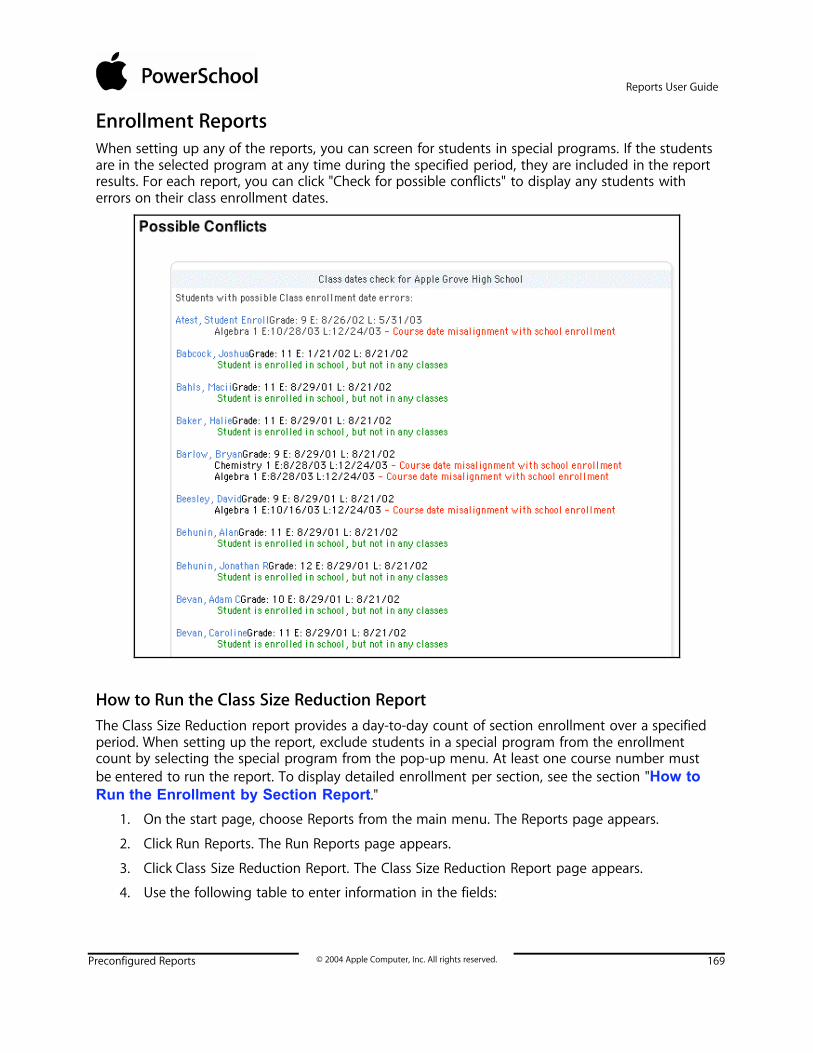
Reports User Guide
Preconfigured Reports © 2004 Apple Computer, Inc. All rights reserved. 169
Enrollment ReportsWhen setting up any of the reports, you can screen for students in special programs. If the studentsare in the selected program at any time during the specified period, they are included in the reportresults. For each report, you can click "Check for possible conflicts" to display any students witherrors on their class enrollment dates.
How to Run the Class Size Reduction ReportThe Class Size Reduction report provides a day-to-day count of section enrollment over a specifiedperiod. When setting up the report, exclude students in a special program from the enrollmentcount by selecting the special program from the pop-up menu. At least one course number mustbe entered to run the report. To display detailed enrollment per section, see the section "How toRun the Enrollment by Section Report."
1. On the start page, choose Reports from the main menu. The Reports page appears.
2. Click Run Reports. The Run Reports page appears.
3. Click Class Size Reduction Report. The Class Size Reduction Report page appears.
4. Use the following table to enter information in the fields:

Reports User Guide
Preconfigured Reports © 2004 Apple Computer, Inc. All rights reserved. 170
Field Description
Report Name The name of this report.
Description A description of this report's function.
Reporting Segment orBegin Date and EndingDate
Select which date range to use for this report:
• Reporting Segment: Choose a reporting segment fromthe pop-up menu. For more information on reportingsegments, see the section "Reporting Segments."
• Begin Date and Ending Date: Specify a date range in theblank fields using the format mm/dd/yyyy or mm-dd-yyyy. If you do not use this format, an alert appears. Ifyou submit the date with an incorrect format, the datefield will be submitted as a blank entry.
Note: The date entered must fall within the selected schoolyear term.
Lines per page Enter the number of data rows you want to appear on eachpage of the report.
Starting Page Number Enter the page number from which you want the report tostart.
Exclude counts forstudents enrolled in thisSpecial Program
Use the pop-up menu to indicate any special program youwant to exclude from being counted.
Sort By Select the sort order:
• Course Number
• Teacher Name
• Grade Level
Include only theseCourse Numbers
Enter the course number(s). Separate multiple courses withcommas. Use a blank field to scan all courses.
Include/Exclude SectionNumbers
Select the option to exclude or include any sections.
Section Numbers Enter the section number(s) to be included or excluded.Separate multiple sections with commas. Use a blank field toscan all sections.
5. Click Submit. The report results display based on the parameters you selected. Dependingon your specifications, this could take several minutes.
6. Print the report from your web browser or save it to another application. For moreinformation, see the section "Run, Print, and Save Reports."
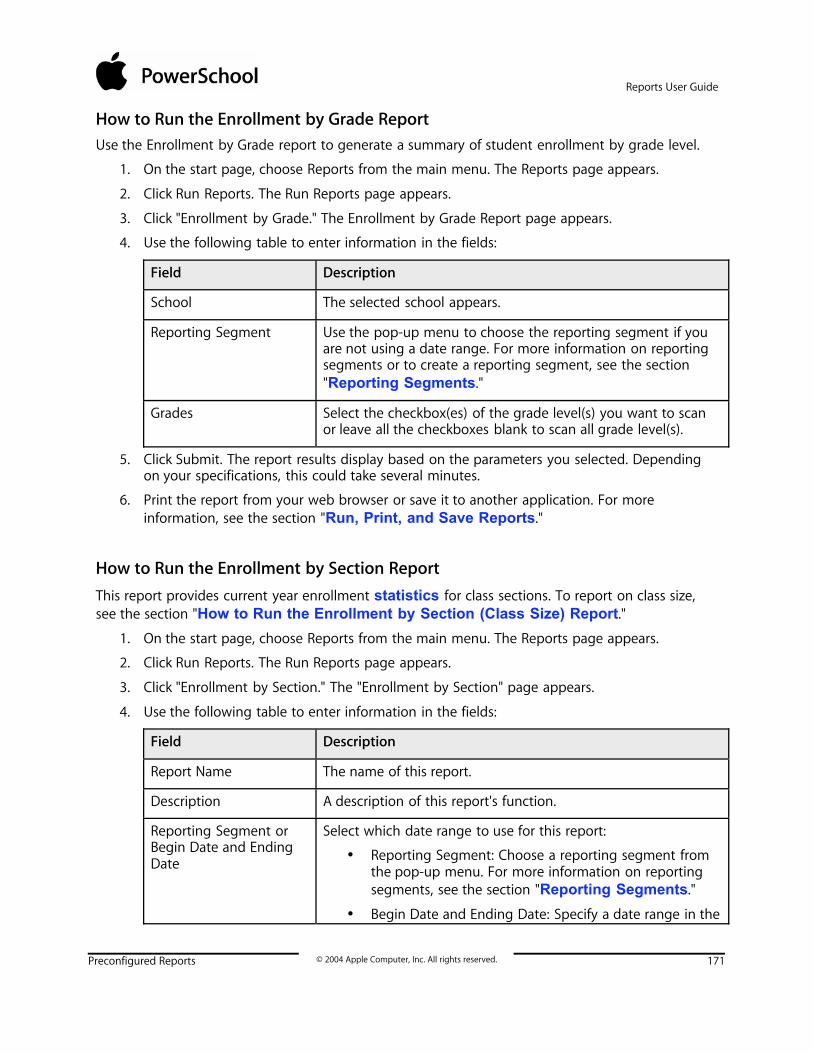
Reports User Guide
Preconfigured Reports © 2004 Apple Computer, Inc. All rights reserved. 171
How to Run the Enrollment by Grade ReportUse the Enrollment by Grade report to generate a summary of student enrollment by grade level.
1. On the start page, choose Reports from the main menu. The Reports page appears.
2. Click Run Reports. The Run Reports page appears.
3. Click "Enrollment by Grade." The Enrollment by Grade Report page appears.
4. Use the following table to enter information in the fields:
Field Description
School The selected school appears.
Reporting Segment Use the pop-up menu to choose the reporting segment if youare not using a date range. For more information on reportingsegments or to create a reporting segment, see the section"Reporting Segments."
Grades Select the checkbox(es) of the grade level(s) you want to scanor leave all the checkboxes blank to scan all grade level(s).
5. Click Submit. The report results display based on the parameters you selected. Dependingon your specifications, this could take several minutes.
6. Print the report from your web browser or save it to another application. For moreinformation, see the section "Run, Print, and Save Reports."
How to Run the Enrollment by Section ReportThis report provides current year enrollment statistics for class sections. To report on class size,see the section "How to Run the Enrollment by Section (Class Size) Report."
1. On the start page, choose Reports from the main menu. The Reports page appears.
2. Click Run Reports. The Run Reports page appears.
3. Click "Enrollment by Section." The "Enrollment by Section" page appears.
4. Use the following table to enter information in the fields:
Field Description
Report Name The name of this report.
Description A description of this report's function.
Reporting Segment orBegin Date and EndingDate
Select which date range to use for this report:
• Reporting Segment: Choose a reporting segment fromthe pop-up menu. For more information on reportingsegments, see the section "Reporting Segments."
• Begin Date and Ending Date: Specify a date range in the

Reports User Guide
Preconfigured Reports © 2004 Apple Computer, Inc. All rights reserved. 172
Field Description
blank fields using the format mm/dd/yyyy or mm-dd-yyyy. If you do not use this format, an alert appears. Ifyou submit the date with an incorrect format, the datefield will be submitted as a blank entry.
Note: The date entered must fall within the selected schoolyear term.
Processing Options To run this report, select a time to start it:
• Execute Now: Executes the report immediately in thecurrent window
• In Background Now: Executes the report immediately inthe Background.*
• ASAP: Executes the report in the order it is received inthe Report Queue.*
• At Night: Execute during the next evening.*
• On Weekend: Execute during the next weekend.*
• On Specific Date/Time: Execute on the date and timespecified in the Specific Date/Time fields.*
*After submitting this report, it will be processed in the reportqueue. On the navigation bar, click the Report Queue icon . TheReport Queue - My Jobs page displays all your reports.
Specific Date/Time If you selected On Specific Date/Time for Processing Output,enter the date to scan using the format mm/dd/yyyy or mm-dd-yyyy. If you do not use this format, an alert appears. If yousubmit the date with an incorrect format, the date field will besubmitted as a blank entry.
Use the pop-up menus to indicate hour and minute.
Sort By Select the sort order:
• Course
• Teacher
Include only theseCourse Numbers
Enter the course number(s). Separate multiple courses withcommas. Use a blank field to scan all courses.
Include/Exclude SectionNumbers
Select the option to exclude or include any sections.
Section Numbers Enter the section number(s) to be included or excluded.Separate multiple sections with commas. Use a blank field toscan all sections.
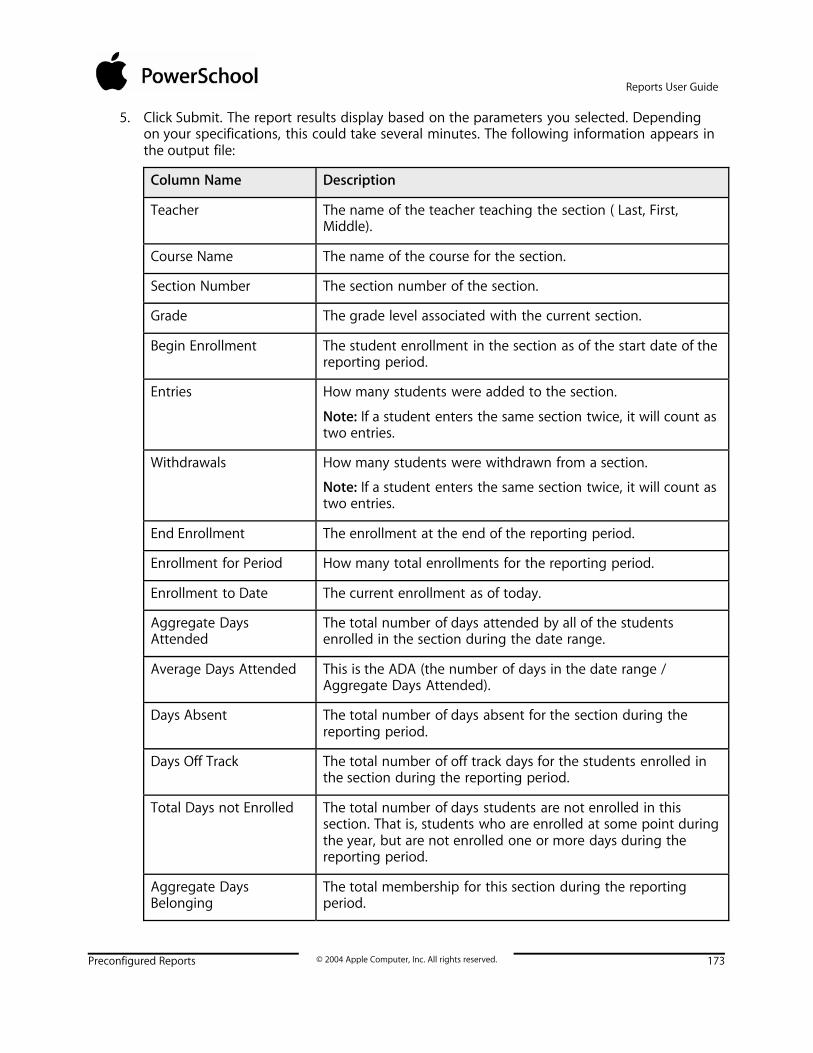
Reports User Guide
Preconfigured Reports © 2004 Apple Computer, Inc. All rights reserved. 173
5. Click Submit. The report results display based on the parameters you selected. Dependingon your specifications, this could take several minutes. The following information appears inthe output file:
Column Name Description
Teacher The name of the teacher teaching the section ( Last, First,Middle).
Course Name The name of the course for the section.
Section Number The section number of the section.
Grade The grade level associated with the current section.
Begin Enrollment The student enrollment in the section as of the start date of thereporting period.
Entries How many students were added to the section.
Note: If a student enters the same section twice, it will count astwo entries.
Withdrawals How many students were withdrawn from a section.
Note: If a student enters the same section twice, it will count astwo entries.
End Enrollment The enrollment at the end of the reporting period.
Enrollment for Period How many total enrollments for the reporting period.
Enrollment to Date The current enrollment as of today.
Aggregate DaysAttended
The total number of days attended by all of the studentsenrolled in the section during the date range.
Average Days Attended This is the ADA (the number of days in the date range /Aggregate Days Attended).
Days Absent The total number of days absent for the section during thereporting period.
Days Off Track The total number of off track days for the students enrolled inthe section during the reporting period.
Total Days not Enrolled The total number of days students are not enrolled in thissection. That is, students who are enrolled at some point duringthe year, but are not enrolled one or more days during thereporting period.
Aggregate DaysBelonging
The total membership for this section during the reportingperiod.

Reports User Guide
Preconfigured Reports © 2004 Apple Computer, Inc. All rights reserved. 174
Column Name Description
Average NumberBelonging
The Average Daily Membership for this section during thereporting period (Aggregate Days Belonging / number ofmeeting days in reporting period).
Percent Attendance Of the total potential Attendance for the Reporting Period,What is the Percent of the actual attendance? (Aggregate DaysAttended / Average Number Belonging)
6. Print the report from your web browser or save it to another application. For moreinformation, see the section "Run, Print, and Save Reports."
How to Run the Enrollment Summary by Date ReportThis report is the same as the Enrollment Summary except it can be run by a selected date insteadof just the current date. The resulting report displays a breakdown for the entire school. Columntitles describe the contents of each column. Row numbers indicate grade levels. The small bluenumbers (to the left of the slash) indicate male students; the small red numbers (to the right of theslash) indicate female students. Large, bold blue numbers indicate the total enrollment of male andfemale students for that classification
1. On the start page, choose Reports from the main menu. The Reports page appears.
2. Click Run Reports. The Run Reports page appears.
3. Click "Enrollment Summary by Date." The Enrollment Summary by Date page appears.
4. Enter the date as of which you want to calculate enrollments using the format mm/dd/yyyyor mm-dd-yyyy. If you do not use this format, an alert appears. If you submit the date withan incorrect format, the date field will be submitted as a blank entry.
Note: The date entered must fall within the selected school year term.
5. Click Submit. The report results display based on the parameters you selected. Dependingon your specifications, this could take several minutes.
6. Use the Vocational Courses Aggregate Membership report to generate a list of vocationalsections and their current membership totals. Print the report from your web browser orsave it to another application. For more information, see the section Use the AggregateMembership Audit report to generate membership audit by section information. "Run,Print, and Save Reports."
How to Run the Vocational Courses Aggregate Membership ReportUse the Vocational Courses Aggregate Membership report to generate a list of vocational sectionsand their current membership totals.
1. On the start page, choose Reports from the main menu. The Reports page appears.
2. Click Run Reports. The Run Reports page appears.
3. Click Voc. Courses Agg. Membership. The Vocational Courses Aggregate MembershipReport page appears.
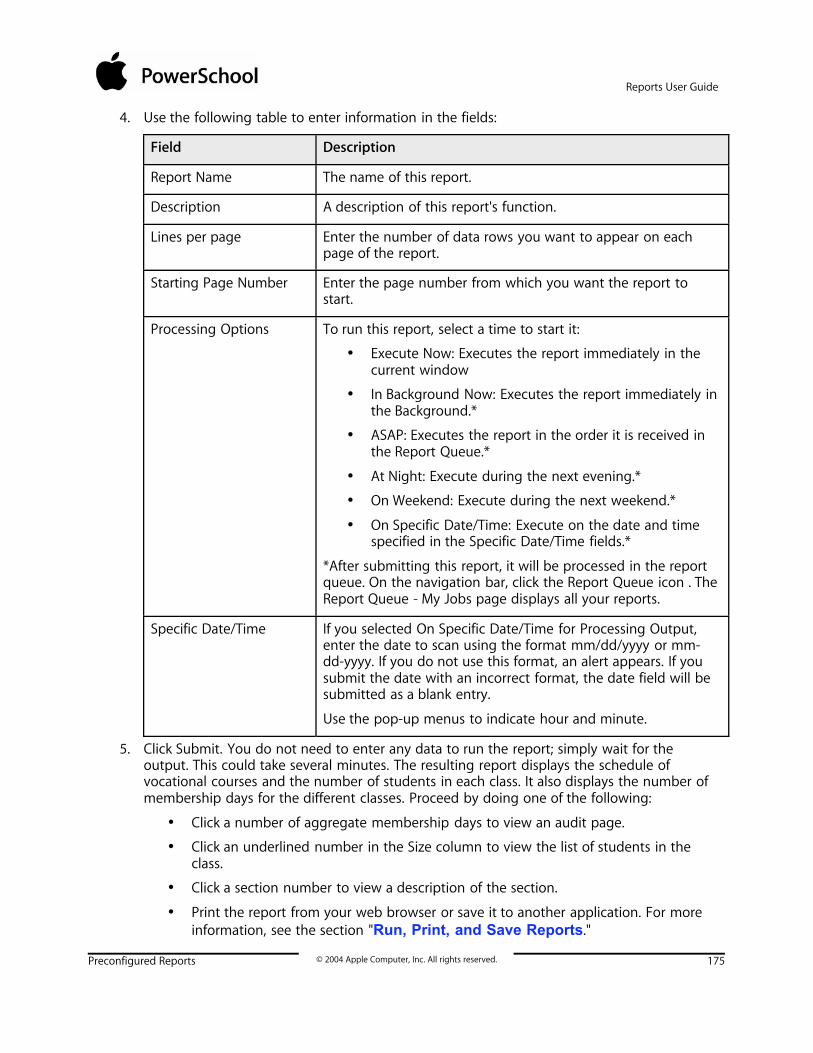
Reports User Guide
Preconfigured Reports © 2004 Apple Computer, Inc. All rights reserved. 175
4. Use the following table to enter information in the fields:
Field Description
Report Name The name of this report.
Description A description of this report's function.
Lines per page Enter the number of data rows you want to appear on eachpage of the report.
Starting Page Number Enter the page number from which you want the report tostart.
Processing Options To run this report, select a time to start it:
• Execute Now: Executes the report immediately in thecurrent window
• In Background Now: Executes the report immediately inthe Background.*
• ASAP: Executes the report in the order it is received inthe Report Queue.*
• At Night: Execute during the next evening.*
• On Weekend: Execute during the next weekend.*
• On Specific Date/Time: Execute on the date and timespecified in the Specific Date/Time fields.*
*After submitting this report, it will be processed in the reportqueue. On the navigation bar, click the Report Queue icon . TheReport Queue - My Jobs page displays all your reports.
Specific Date/Time If you selected On Specific Date/Time for Processing Output,enter the date to scan using the format mm/dd/yyyy or mm-dd-yyyy. If you do not use this format, an alert appears. If yousubmit the date with an incorrect format, the date field will besubmitted as a blank entry.
Use the pop-up menus to indicate hour and minute.
5. Click Submit. You do not need to enter any data to run the report; simply wait for theoutput. This could take several minutes. The resulting report displays the schedule ofvocational courses and the number of students in each class. It also displays the number ofmembership days for the different classes. Proceed by doing one of the following:
• Click a number of aggregate membership days to view an audit page.
• Click an underlined number in the Size column to view the list of students in theclass.
• Click a section number to view a description of the section.
• Print the report from your web browser or save it to another application. For moreinformation, see the section "Run, Print, and Save Reports."
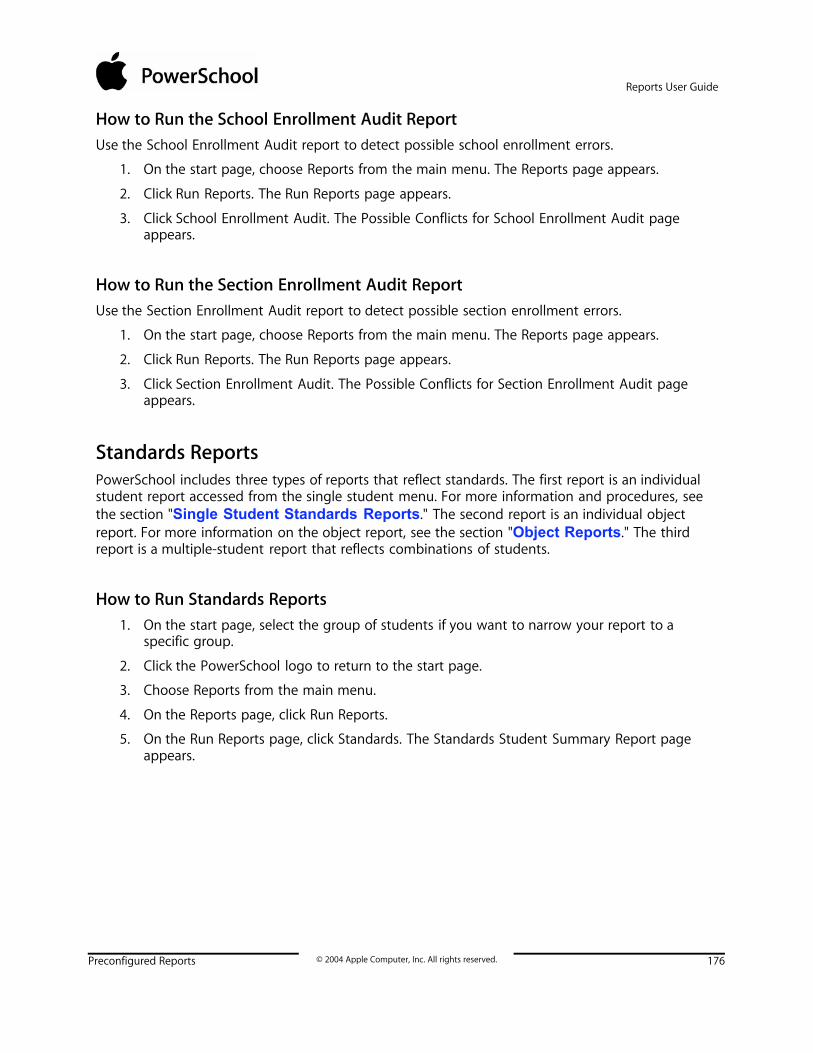
Reports User Guide
Preconfigured Reports © 2004 Apple Computer, Inc. All rights reserved. 176
How to Run the School Enrollment Audit ReportUse the School Enrollment Audit report to detect possible school enrollment errors.
1. On the start page, choose Reports from the main menu. The Reports page appears.
2. Click Run Reports. The Run Reports page appears.
3. Click School Enrollment Audit. The Possible Conflicts for School Enrollment Audit pageappears.
How to Run the Section Enrollment Audit ReportUse the Section Enrollment Audit report to detect possible section enrollment errors.
1. On the start page, choose Reports from the main menu. The Reports page appears.
2. Click Run Reports. The Run Reports page appears.
3. Click Section Enrollment Audit. The Possible Conflicts for Section Enrollment Audit pageappears.
Standards ReportsPowerSchool includes three types of reports that reflect standards. The first report is an individualstudent report accessed from the single student menu. For more information and procedures, seethe section "Single Student Standards Reports." The second report is an individual objectreport. For more information on the object report, see the section "Object Reports." The thirdreport is a multiple-student report that reflects combinations of students.
How to Run Standards Reports1. On the start page, select the group of students if you want to narrow your report to a
specific group.
2. Click the PowerSchool logo to return to the start page.
3. Choose Reports from the main menu.
4. On the Reports page, click Run Reports.
5. On the Run Reports page, click Standards. The Standards Student Summary Report pageappears.

Reports User Guide
Preconfigured Reports © 2004 Apple Computer, Inc. All rights reserved. 177
6. Use the following table to enter information in the fields:
Field Description
Report Title Enter a title for the report.
Which Students Select an option to run the report for all students on thesystem, all students for the selected school, or the selectedgroup of students.
Which Scores Select an option to scan for either all assignment scores orscores that you restrict to a particular date range. If using a daterange, enter the range in the fields using the formatmm/dd/yyyy or mm-dd-yyyy. If you do not use this format, analert appears. If you submit the date with an incorrect format,the date field will be submitted as a blank entry.
Which Standards Select an option to scan for certain standards or all standards.
Zero Scores Select the "Skip standards if no scores are found" checkbox toavoid null results.

Reports User Guide
Preconfigured Reports © 2004 Apple Computer, Inc. All rights reserved. 178
Field Description
Sort Order Use the pop-up menus to choose a primary, secondary, andtertiary sort order and the sort order operators.
Columns to Show Select the appropriate checkboxes to indicate which columnsto display.
7. Click Submit. The resulting report displays the average score for students who havecompleted the standard, the number of students who have completed it, and the translatedscore. This latter is derived by converting the gradebook score to a standard score that hasparameters set up by your PowerSchool administrator.
Proceed by printing the report from your web browser or saving it to another application.For more information, see the section "Run, Print, and Save Reports."
How to Run Teacher Gradebooks ReportsThis report prints assignment information from teachers’ PowerGrade data files for the specifiedperiod.
1. On the start page, choose Reports from the main menu.
2. On the Reports page, click Run Reports.
3. On the Run Reports page, click Teacher Gradebooks. The Teacher Gradebooks page appears.

Reports User Guide
Preconfigured Reports © 2004 Apple Computer, Inc. All rights reserved. 179
4. Use the following table to enter information in the fields:

Reports User Guide
Preconfigured Reports © 2004 Apple Computer, Inc. All rights reserved. 180
Field Description
Print Gradebooks for Select the teacher whose attendance records you want to scan.Press and hold Command (Mac) or Control (Windows) to selectmultiple teachers.
For classes during thisterm
The selected term appears.
Meeting(s) Select the checkbox(es) for the meetings to be scanned.
Don't print classes that Select the checkbox(es) to exclude classes that have nostudents or have no assignments.
Only assignments in thisDate Range
To limit the report to assignments within a specific date range,select this checkbox and enter the date range in the fields usingthe format mm/dd/yyyy or mm-dd-yyyy. If you do not use thisformat, an alert appears. If you submit the date with anincorrect format, the date field will be submitted as a blankentry.
Assignment header Select the content to include in the header for the assignments.
Print in name column Select the content to include in the column for students.
Print Final Grade(s) Enter final grade(s) to print (optional). If you enter grades, selecteither the Letter Grade, Percent, or both checkboxes todetermine how the final grades appear.
Print which assignmentscore?
Select an option to determine how assignment scores appear:
• Point Value
• Percent
• Letter Grade
Scores Listing Font Choose the scores listing font from the pop-up menu.
Scores Listing Style Enter the scores listing font size and line height in points.
Note: One point equals 1/72 of an inch.
Select the formatting checkbox(es) you want to use. Forexample, select the Bold checkbox to bold the scores listing.
Horizontal Cell Padding Enter the amount of space from the sides of the cells to the textin points.
Note: One point equals 1/72 of an inch.
Student Name ColumnWidth
Enter the width of the student name column in inches.

Reports User Guide
Preconfigured Reports © 2004 Apple Computer, Inc. All rights reserved. 181
Field Description
Assignment ColumnWidth
Enter the width of the assignment column in inches.
Background row shading Enter a percentage to determine the shade of the rows.
Page Size Use the pop-up menu to choose the size of the paper on whichyou want to print this report. To enter a custom size, enter thehorizontal and vertical page measurements in the Custom Sizefields.
Margins Enter the size of the margins in inches.
Orientation, Scale Choose the page layout from the pop-up menu. Portrait is avertical page; landscape is a horizontal page.
Scale is the finished size of the report. Fit more on a page byreducing it by a percentage, but remember to leave it as largeas possible for easier viewing.
Watermark Text If you want to print text as a watermark on each page of thereport, use the pop-up menu to either choose one of thestandard phrases or choose Custom and enter the text youwant to print as a watermark in the field.
Watermark Mode Use the pop-up menu to determine how you want the text toprint. Watermark prints the text behind objects on the report,while Overlay prints the text over objects on the report.
When to print To run this report, select a time to start it:
• ASAP: Execute immediately.
• At Night: Execute during the next evening.
• On Weekend: Execute during the next weekend.
• On Specific Date/Time: Execute on the date and timespecified in the following fields using the formatmm/dd/yyyy or mm-dd-yyyy. If you do not use thisformat, an alert appears. If you submit the date with anincorrect format, the date field will be submitted as ablank entry.
5. Click Submit. PowerSchool runs the report, and the report queue appears. Depending onyour specifications, this could take several minutes.
6. Click Completed to display the report. The resulting report shows assignments and gradesfor the selected time in the selected classes.
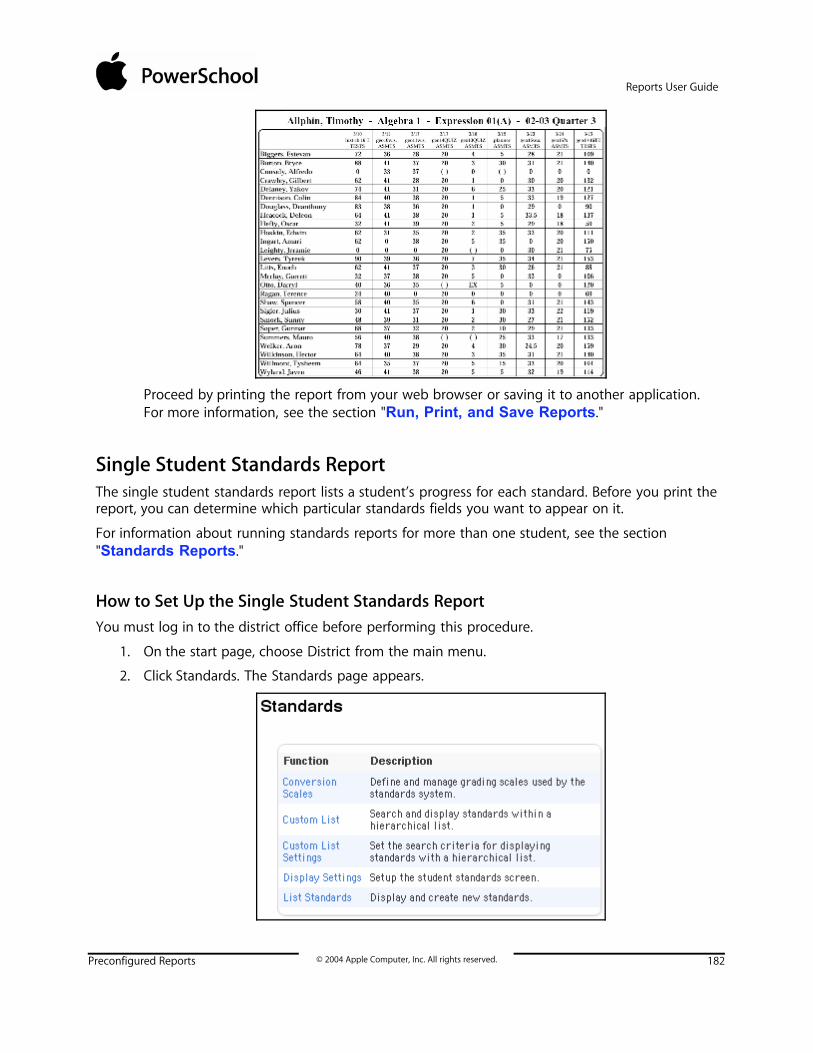
Reports User Guide
Preconfigured Reports © 2004 Apple Computer, Inc. All rights reserved. 182
Proceed by printing the report from your web browser or saving it to another application.For more information, see the section "Run, Print, and Save Reports."
Single Student Standards ReportThe single student standards report lists a student’s progress for each standard. Before you print thereport, you can determine which particular standards fields you want to appear on it.
For information about running standards reports for more than one student, see the section"Standards Reports."
How to Set Up the Single Student Standards ReportYou must log in to the district office before performing this procedure.
1. On the start page, choose District from the main menu.
2. Click Standards. The Standards page appears.
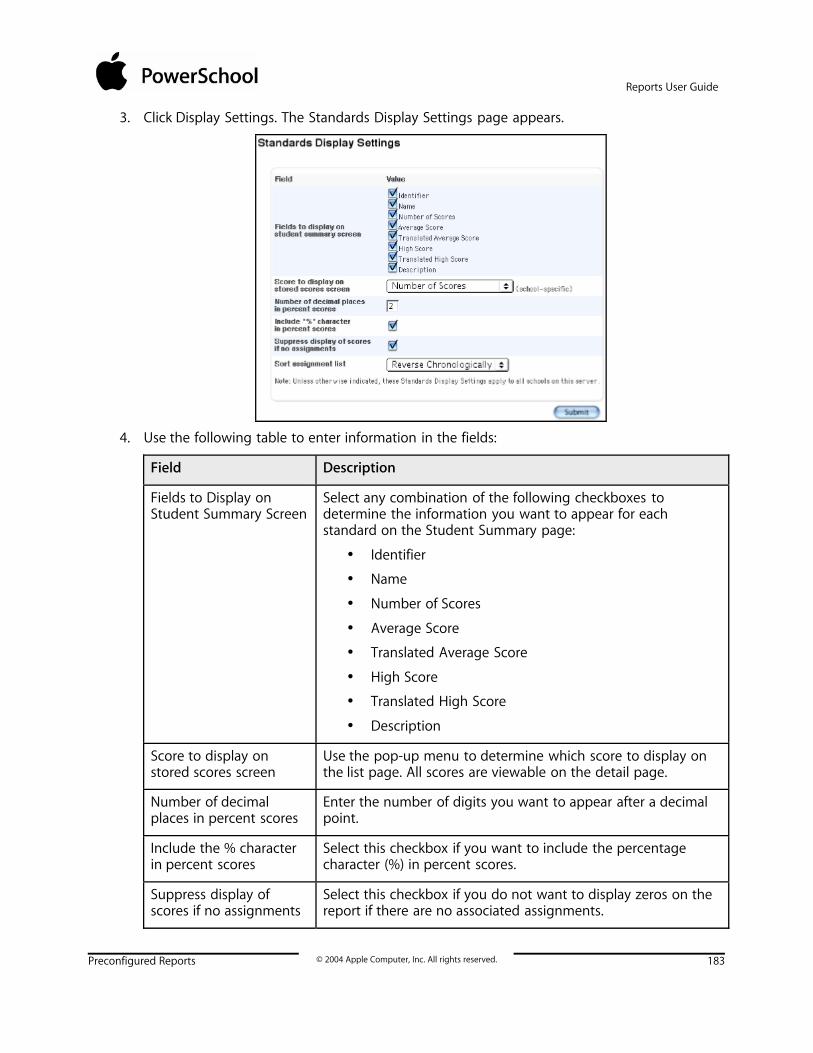
Reports User Guide
Preconfigured Reports © 2004 Apple Computer, Inc. All rights reserved. 183
3. Click Display Settings. The Standards Display Settings page appears.
4. Use the following table to enter information in the fields:
Field Description
Fields to Display onStudent Summary Screen
Select any combination of the following checkboxes todetermine the information you want to appear for eachstandard on the Student Summary page:
• Identifier
• Name
• Number of Scores
• Average Score
• Translated Average Score
• High Score
• Translated High Score
• Description
Score to display onstored scores screen
Use the pop-up menu to determine which score to display onthe list page. All scores are viewable on the detail page.
Number of decimalplaces in percent scores
Enter the number of digits you want to appear after a decimalpoint.
Include the % characterin percent scores
Select this checkbox if you want to include the percentagecharacter (%) in percent scores.
Suppress display ofscores if no assignments
Select this checkbox if you do not want to display zeros on thereport if there are no associated assignments.

Reports User Guide
Preconfigured Reports © 2004 Apple Computer, Inc. All rights reserved. 184
Field Description
Sort assignment list Use the pop-up menu to indicate the sort order of theassignment list:
• Chronologically
• Reverse Chronologically
5. Click Submit. The system saves your changes.
How to Access the Single Student Standards Report1. On the start page, search for and select the student.
2. Choose Standards from the student pages menu. The Standards page appears.
3. Click the triangles to access any level of standards where scores are reported.
4. Click the standard identifier when you reach the level you want.
Note: You can also view stored standard scores by clicking the scores stored on that line.
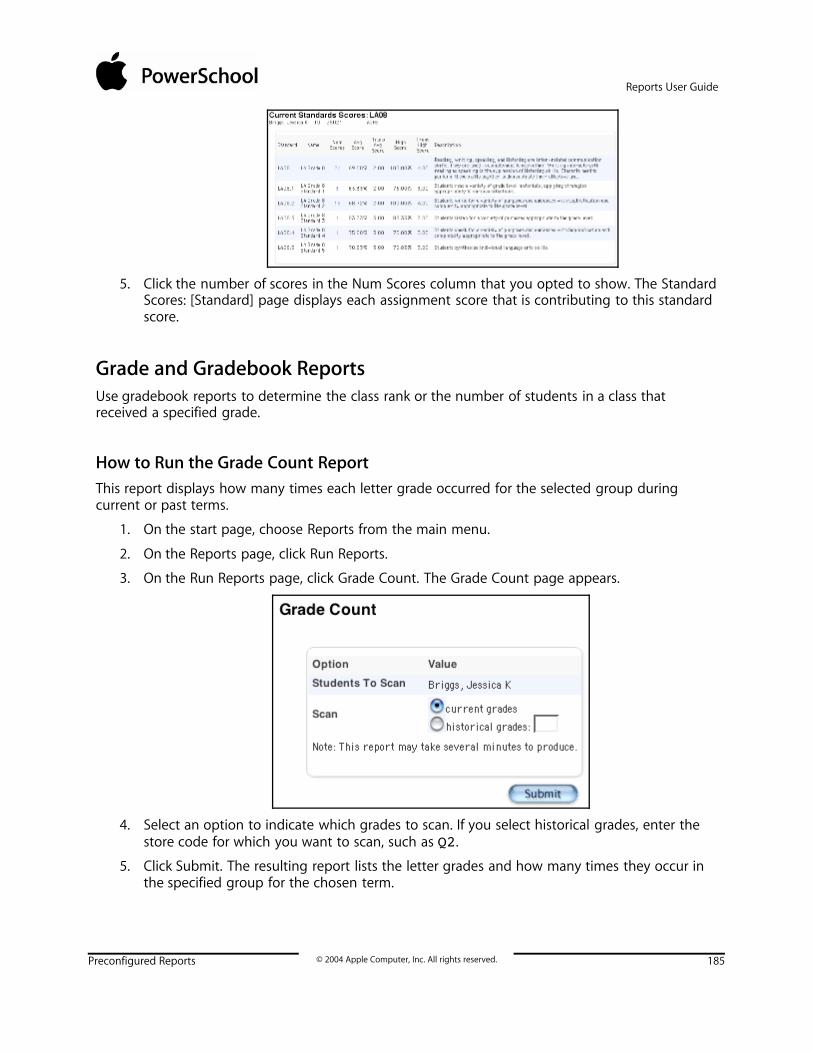
Reports User Guide
Preconfigured Reports © 2004 Apple Computer, Inc. All rights reserved. 185
5. Click the number of scores in the Num Scores column that you opted to show. The StandardScores: [Standard] page displays each assignment score that is contributing to this standardscore.
Grade and Gradebook ReportsUse gradebook reports to determine the class rank or the number of students in a class thatreceived a specified grade.
How to Run the Grade Count ReportThis report displays how many times each letter grade occurred for the selected group duringcurrent or past terms.
1. On the start page, choose Reports from the main menu.
2. On the Reports page, click Run Reports.
3. On the Run Reports page, click Grade Count. The Grade Count page appears.
4. Select an option to indicate which grades to scan. If you select historical grades, enter thestore code for which you want to scan, such as Q2.
5. Click Submit. The resulting report lists the letter grades and how many times they occur inthe specified group for the chosen term.

Reports User Guide
Preconfigured Reports © 2004 Apple Computer, Inc. All rights reserved. 186
Proceed by printing the report from your web browser or saving it to another application.For more information, see the section "Run, Print, and Save Reports."
How to Run the Grade Count By Teacher ReportLike the Grade Counts report, the Grade Count By Teacher report also displays how many timeseach letter grade occurred for the group during current or past terms. The only difference is thatthis report restricts the results to a single teacher.
1. On the start page, choose Reports from the main menu.
2. On the Reports page, click Run Reports.
3. On the Run Reports page, click "by Teacher" next to Grade Count. The Grade Count pageappears.
4. Use the following table to enter information in the fields:
Field Description
Scan by student Select an option to scan by either the selected students or allcurrently enrolled students. Refer to the following field to scanby teacher.
Scan by teacher Choose the teacher to scan from the pop-up menu. Refer to theprevious field to scan by student.
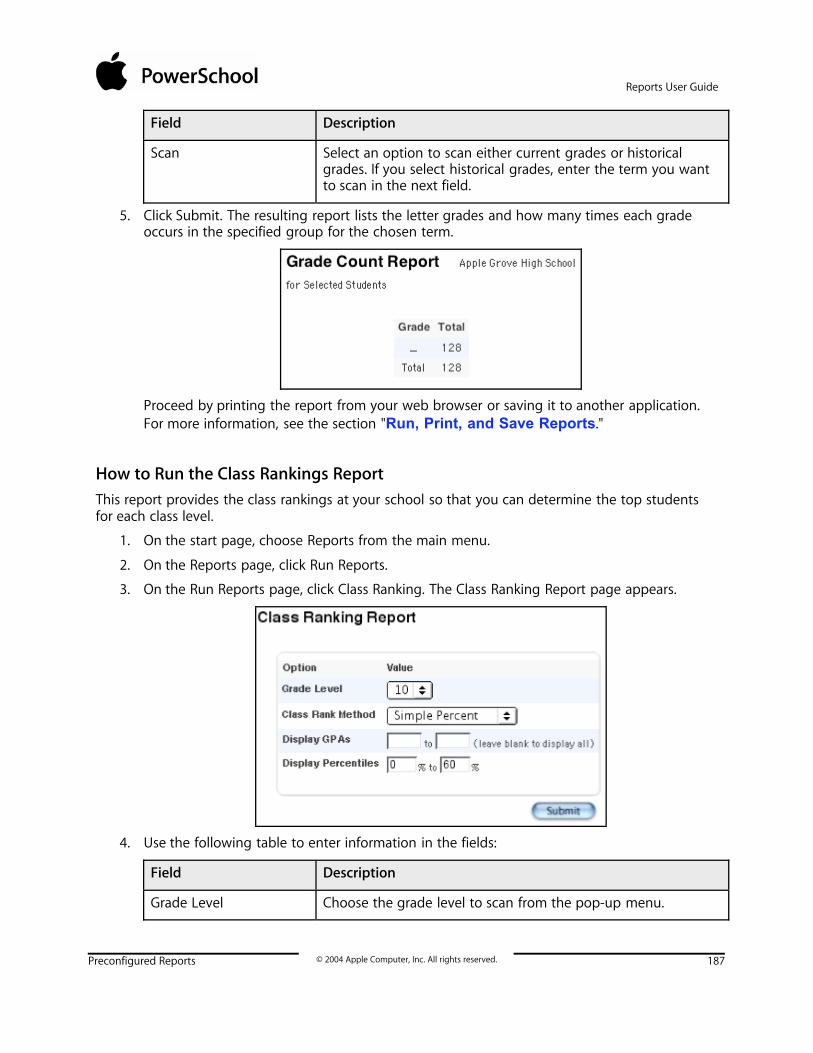
Reports User Guide
Preconfigured Reports © 2004 Apple Computer, Inc. All rights reserved. 187
Field Description
Scan Select an option to scan either current grades or historicalgrades. If you select historical grades, enter the term you wantto scan in the next field.
5. Click Submit. The resulting report lists the letter grades and how many times each gradeoccurs in the specified group for the chosen term.
Proceed by printing the report from your web browser or saving it to another application.For more information, see the section "Run, Print, and Save Reports."
How to Run the Class Rankings ReportThis report provides the class rankings at your school so that you can determine the top studentsfor each class level.
1. On the start page, choose Reports from the main menu.
2. On the Reports page, click Run Reports.
3. On the Run Reports page, click Class Ranking. The Class Ranking Report page appears.
4. Use the following table to enter information in the fields:
Field Description
Grade Level Choose the grade level to scan from the pop-up menu.

Reports User Guide
Preconfigured Reports © 2004 Apple Computer, Inc. All rights reserved. 188
Field Description
GPA Type Choose the type of GPA calculation from the pop-up menu.
Class Rank Method Choose the GPA calculation method to use for the class rankingfrom the pop-up menu.
Display GPAs To scan only a range of GPAs, enter the range in the fields.
Display Percentiles To scan a range of grade percentiles, enter the range in thefields.
5. Click Submit. The Class Ranking Report appears.
How to Run the Graduation Progress ReportThis report provides the graduation progress of the selected students.
1. On the start page, choose Reports from the main menu.
2. On the Reports page, click Run Reports.
3. On the Run Reports page, click Graduation Progress Report (PDF). The Graduation ProgressReport page appears.
4. Select which students to include in the report.
5. Click Submit. PowerSchool runs the report, and the report queue appears. Depending onyour specifications, this could take several minutes.
6. Click Completed to display the report.
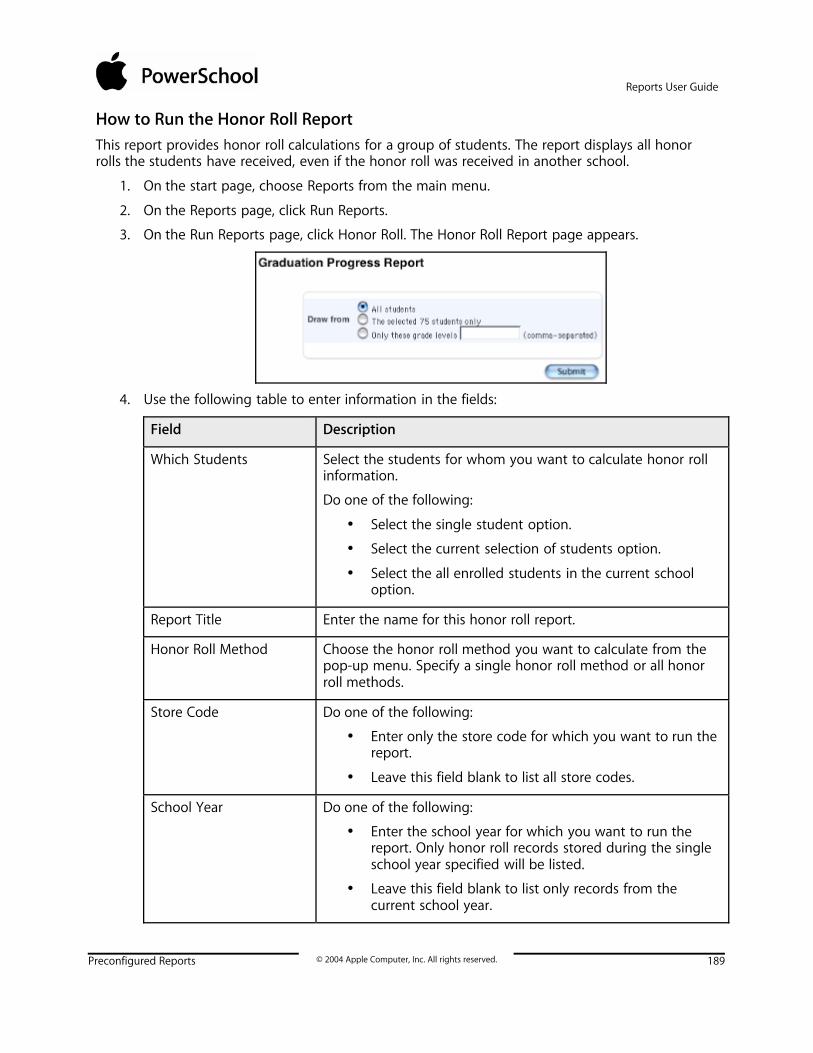
Reports User Guide
Preconfigured Reports © 2004 Apple Computer, Inc. All rights reserved. 189
How to Run the Honor Roll ReportThis report provides honor roll calculations for a group of students. The report displays all honorrolls the students have received, even if the honor roll was received in another school.
1. On the start page, choose Reports from the main menu.
2. On the Reports page, click Run Reports.
3. On the Run Reports page, click Honor Roll. The Honor Roll Report page appears.
4. Use the following table to enter information in the fields:
Field Description
Which Students Select the students for whom you want to calculate honor rollinformation.
Do one of the following:
• Select the single student option.
• Select the current selection of students option.
• Select the all enrolled students in the current schooloption.
Report Title Enter the name for this honor roll report.
Honor Roll Method Choose the honor roll method you want to calculate from thepop-up menu. Specify a single honor roll method or all honorroll methods.
Store Code Do one of the following:
• Enter only the store code for which you want to run thereport.
• Leave this field blank to list all store codes.
School Year Do one of the following:
• Enter the school year for which you want to run thereport. Only honor roll records stored during the singleschool year specified will be listed.
• Leave this field blank to list only records from thecurrent school year.

Reports User Guide
Preconfigured Reports © 2004 Apple Computer, Inc. All rights reserved. 190
Field Description
Historical Grade Level Do one of the following:
• Enter the grade level for which you want to run thereport. Only honor roll records the student earned whileat the single grade level specified will be listed.
• Leave this field blank to list all grade levels.
5. Click Submit. The Honor Roll report displays the following information:
• Title
• Student name
• Student number
• Grade level
• GPA
Click any of the student names to view detailed honor roll information for that student.
Statistics
How to Run the Parent Access Statistics ReportThis report tells you how often the parents of students at your school use PowerSchool to checktheir children's progress. The report provides information on all parents in general and not onspecific parents.
1. On the start page, choose Reports from the main menu.
2. On the Reports page, click Run Reports.
3. On the Run Reports page, click Parental Access Statistics. The Parental Access Statistics pageappears.
4. Enter the first and last days of the date range to scan using the format mm/dd/yyyy or mm-dd-yyyy. If you do not use this format, an alert appears. If you submit the date with anincorrect format, the date field will be submitted as a blank entry.
5. Click Submit. The resulting report displays how many times parents accessed studentrecords via the Internet, phone, and email. Raw data and percentages are provided.

Reports User Guide
Preconfigured Reports © 2004 Apple Computer, Inc. All rights reserved. 191
Proceed by printing the report from your web browser or saving it to another application.For more information, see the section "Run, Print, and Save Reports."
Discipline ReportsIn addition to the creating customized Log object reports by using the Objects reporting tool, youcan use the preconfigured Discipline Log report.
How to Run the Discipline Log ReportUse the Discipline Log report to generate a list of student discipline incidents by date range andsub-type.
1. On the start page, choose Reports from the main menu. The Reports page appears.
2. Click Run Reports. The Run Reports page appears.
3. Click Discipline Log. The Discipline Log Report page appears.
4. Use the following table to enter information in the fields:
Field Description
Report Name The name of this report.
Description A description of this report's function.
Use Use the pop-up menu to indicate whether you want to run thereport for the Current School Only or District Wide.

Reports User Guide
Preconfigured Reports © 2004 Apple Computer, Inc. All rights reserved. 192
Field Description
Students to Include Indicate which students you want to run the report for byselecting one of the following options:
• Select "The selected students only" to run the report forthe selected group of students.
• Select the "All students" to run the report for allstudents within the selected school.
Begin Date and EndingDate
Enter the beginning date and ending date of the date range toscan using the format mm/dd/yyyy or mm-dd-yyyy. If you donot use this format, an alert appears. If you submit the datewith an incorrect format, the date field will be submitted as ablank entry.
Note: The date range should fall within the current school year.
Discipline incidentsubtype to include
Use the pop-up menu to indicate which log subtype(s) forwhich you want to run the report. Select All Sub-types to notlimit your scan to just one subtype. For more information aboutlog subtypes, see Log Types.
5. Click Submit. PowerSchool runs the report, and the report queue appears. Depending onyour specifications, this could take several minutes.
6. Click Completed to display the report.
Proceed by printing the report from your web browser or saving it to another application. Formore information, see the section "Run, Print, and Save Reports."
PowerLunch ReportsPowerLunch’s reporting features are varied and useful. You will use them regularly to manage yourown books and to provide statistics to the state. For the most part, they are simple to produce andthe application is user-friendly. However, you are encouraged to read the sections "CustomReports" and "Preconfigured Reports" before trying to create reports.
Note: Click your web browser’s Back button anytime you get a report that does not provide youwith the proper information. Perhaps you needed another column, or maybe you selected thewrong date. This is not a problem; just back up and reset your specifications.
How to Run the Cash ReportThis report tells you how much cash each cashier took in on a selected day.
1. On the start page, choose PowerLunch from the main menu. The PowerLunch pageappears.
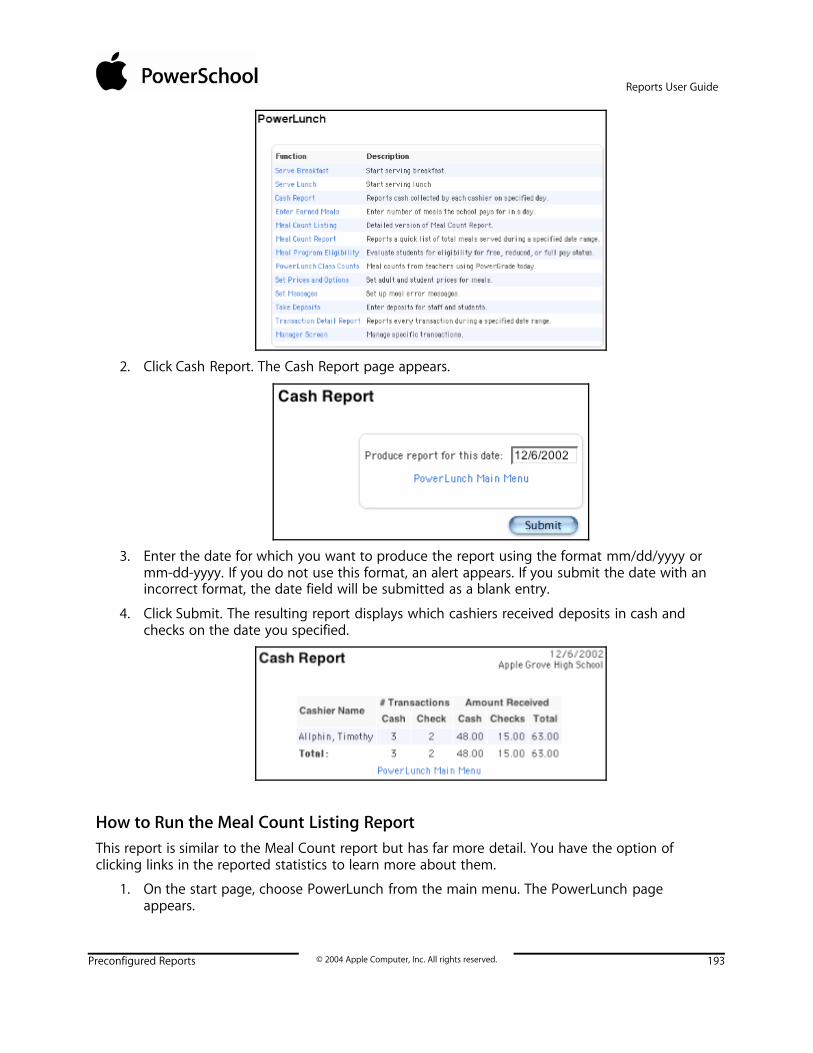
Reports User Guide
Preconfigured Reports © 2004 Apple Computer, Inc. All rights reserved. 193
2. Click Cash Report. The Cash Report page appears.
3. Enter the date for which you want to produce the report using the format mm/dd/yyyy ormm-dd-yyyy. If you do not use this format, an alert appears. If you submit the date with anincorrect format, the date field will be submitted as a blank entry.
4. Click Submit. The resulting report displays which cashiers received deposits in cash andchecks on the date you specified.
How to Run the Meal Count Listing ReportThis report is similar to the Meal Count report but has far more detail. You have the option ofclicking links in the reported statistics to learn more about them.
1. On the start page, choose PowerLunch from the main menu. The PowerLunch pageappears.

Reports User Guide
Preconfigured Reports © 2004 Apple Computer, Inc. All rights reserved. 194
2. Click Meal Count Listing. The Meal Count Listing page appears.
3. Use the following table to enter information in the fields:
Field Description
Date Range Enter the date range to be scanned using the formatmm/dd/yyyy or mm-dd-yyyy. If you do not use this format, analert appears. If you submit the date with an incorrect format,the date field will be submitted as a blank entry.
Meal Choose the meal from the pop-up menu.
Use school calendar Select this checkbox to use the school calendar when scanning.This function excludes any school holidays from the count.
4. Click Submit. The resulting report displays how many patrons there are in each category(the number in brackets) and how many meals were purchased by each category (theunderlined number).

Reports User Guide
Preconfigured Reports © 2004 Apple Computer, Inc. All rights reserved. 195
Click any of the underlined numbers to view the details of the transactions that make upthat number. For students, there are seven categories: free, reduced, paid, guest, exempt,earned, and additional. The seven categories are added in the total column. For adults,there are four categories: faculty, guest, earned, and additional. The four categories areadded in the total column. Both totals are added in the last total column on the right. Totalsfor multiple days appear at the bottom of each column.
How to Run the Meal Count ReportThis report provides a quick list of total meals served on the selected days. It displays thebreakdown by meal and lunch status.
1. On the start page, choose PowerLunch from the main menu. The PowerLunch pageappears.
2. Click Meal Count Report. The Meal Count Report page appears.
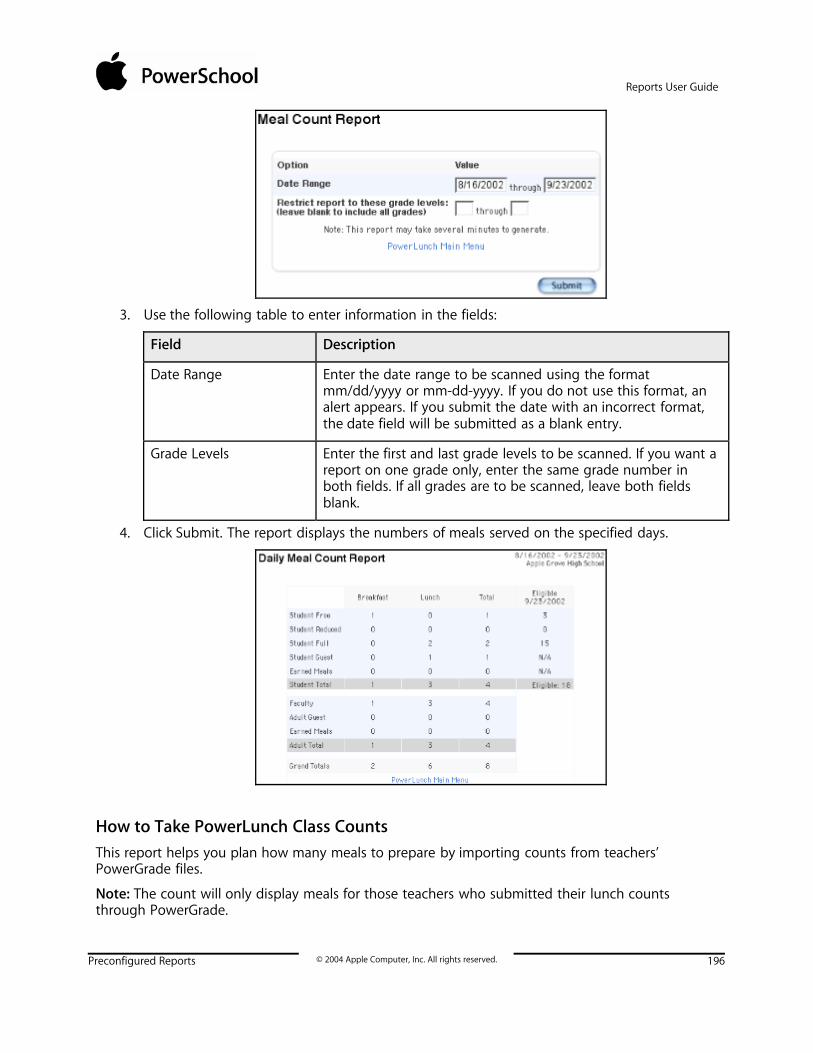
Reports User Guide
Preconfigured Reports © 2004 Apple Computer, Inc. All rights reserved. 196
3. Use the following table to enter information in the fields:
Field Description
Date Range Enter the date range to be scanned using the formatmm/dd/yyyy or mm-dd-yyyy. If you do not use this format, analert appears. If you submit the date with an incorrect format,the date field will be submitted as a blank entry.
Grade Levels Enter the first and last grade levels to be scanned. If you want areport on one grade only, enter the same grade number inboth fields. If all grades are to be scanned, leave both fieldsblank.
4. Click Submit. The report displays the numbers of meals served on the specified days.
How to Take PowerLunch Class CountsThis report helps you plan how many meals to prepare by importing counts from teachers’PowerGrade files.
Note: The count will only display meals for those teachers who submitted their lunch countsthrough PowerGrade.

Reports User Guide
Preconfigured Reports © 2004 Apple Computer, Inc. All rights reserved. 197
1. On the start page, choose PowerLunch from the main menu. The PowerLunch pageappears.
2. Click PowerLunch Class Counts. The PowerLunch Class Counts page appears.
The report displays today’s date at the top of the page, as well as the number of hot mealsand milk units students intend to purchase.
How to Run the Transaction Detail ReportThis report provides detailed information about transactions in a selected date range. You will findit very helpful because you select the information to be scanned, and then PowerLunch produces areport in your spreadsheet application. You can select to have almost any information pulled fromPowerLunch for any day.
1. On the start page, choose PowerLunch from the main menu. The PowerLunch pageappears.
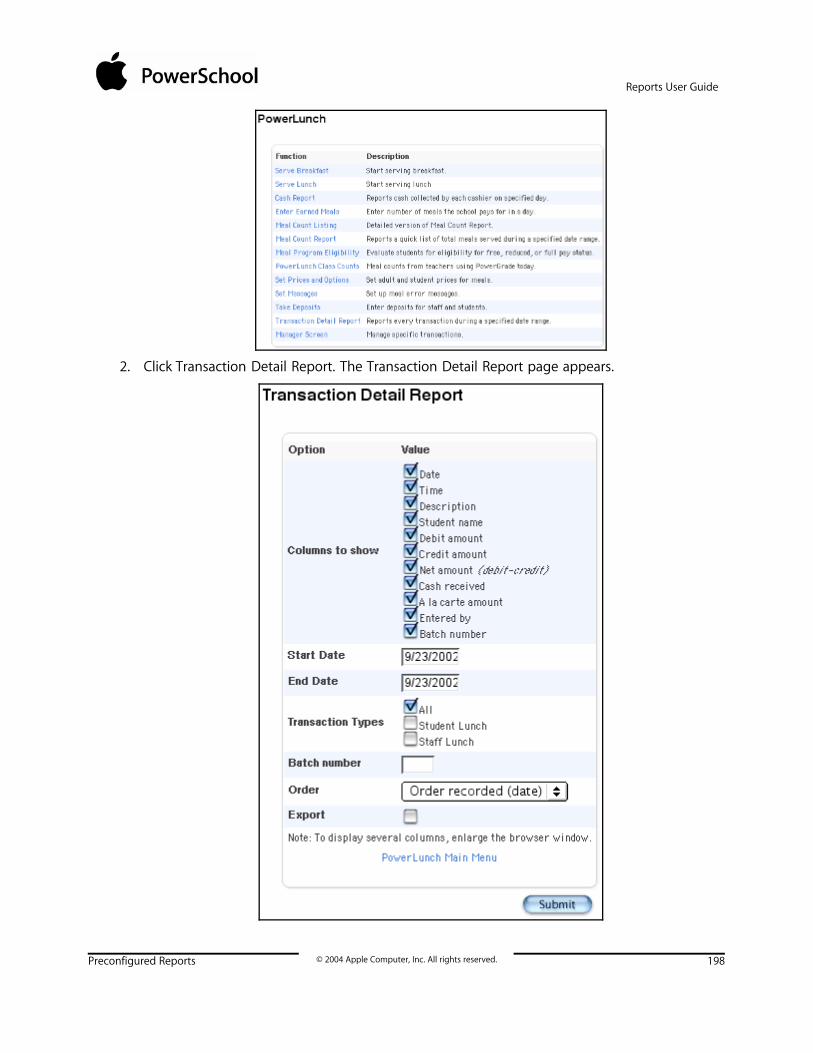
Reports User Guide
Preconfigured Reports © 2004 Apple Computer, Inc. All rights reserved. 198
2. Click Transaction Detail Report. The Transaction Detail Report page appears.

Reports User Guide
Preconfigured Reports © 2004 Apple Computer, Inc. All rights reserved. 199
3. Use the following table to enter information in the fields:
Field Description
Columns to show Select any combination of the checkboxes to indicate what todisplay.
Start Date Enter the start date of the report using the format mm/dd/yyyyor mm-dd-yyyy. If you do not use this format, an alert appears.If you submit the date with an incorrect format, the date fieldwill be submitted as a blank entry.
End Date Enter the end date of the report using the format mm/dd/yyyyor mm-dd-yyyy. If you do not use this format, an alert appears.If you submit the date with an incorrect format, the date fieldwill be submitted as a blank entry.
Transaction Types Select the checkbox next to the transaction type to display.
Batch number Enter a batch number to scan a specific batch. Separatemultiple batches with commas. A batch refers to a cashier’ssession for the day.
For example, if you have two cashiers for breakfast, the sessionsare batch numbers 1 and 2. Perhaps you have four cashiers forlunch on the same day. They would be batch numbers 3-6. Youcan prepare a report on the activities of certain staff members.
Order Choose the sort order from the pop-up menu. This refers to theorder of the listings on the report.
Export Select this checkbox to export the report to your spreadsheetapplication. If you do not select this checkbox, the reportappears in your web browser and you will not be able to formatit.
4. Click Submit. If you did not select the Export option, the report appears, including thecolumns you selected and cash totals. Print or save the report. If you save the reportwithout exporting it, you could lose some of the report’s format. For more information, seethe section "Run, Print, and Save Reports."

Reports User Guide
Preconfigured Reports © 2004 Apple Computer, Inc. All rights reserved. 200
If you chose the Export option, save the file. Continue to the next step for those instructions.
5. Choose File > Save As....
6. In the Save dialog, specify a name, location, and file type.
7. Click Save. Open the file using a spreadsheet or other application.