report.pdf - USGS Publications Repository
187
-
Upload
khangminh22 -
Category
Documents
-
view
0 -
download
0
Transcript of report.pdf - USGS Publications Repository


Front and back covers: A perspective view of the geology around Butte, Montana. The position and field of view of the observer are indicated by the triangle on the wire-frame rendition (above) and the geologic map (facing page). Inside front cover: Wire-frame rendition of the topographic data for a portion of the Butte, Montana, quadrangle.Facing page: Shaded relief image of the generalized geologic map for a portion of the Butte, Montana, quadrangle. The generalized geologic and topographic data were digitally merged to create this image. The data were further processed to create the view on the cover.

113°40'W 46°55'N
112°20'W
46°00' N
Key
20km
Quaternary Deposits
Tertiary Sedimentary Rocks
Tertiary-Cretaceous Intrusive and Volcanic Rocks Undifferentiated
Cretaceous-Jurassic Sedimentary Rocks
Cretaceous Augen Gneiss
Permian-Devonian Sedimentary Rocks
Cambrian Sedimentary Rocks
Cambrian-Proterozoic Rocks
Precambrian Undifferentiated Belt Supergroup
Tectonically Disturbed Rocks

U.S. GEOLOGICAL SURVEY
Dallas L. Peck, Director
United States Geological Survey Yearbook
ISSN 0892-3442
UNITED STATES GOVERNMENT PRINTING OFFICE: 1988
For sale by the Superintendent of Documents, U.S. Government Printing Office, Washington, DC 20402

United
States
Geological
Survey
Yearbook
Fiscal Year
1987

\

I -
CONTENTS
VII Message from the Director
1 Perspectives
1 International Cooperative Program Studies the Earth's Crust Beneath the Great Lakes
8 Cooperative Efforts in Ground-Water Protection A Connecticut History
19 Geographic Information System Applications in the Earth Sciences
23 Significant Accomplishments of Research Programs: 1987
45 National Mapping Program
55 Geologic Investigations
79 Water Resources Investigations
107 Information Systems Division
121 Administrative and Facilities Support
131 International Activities
143 U.S. Geological Survey Missions and Programs
S
Indiana Dunes National Lakeshore. (Photograph by Mark A. Hardy, U.S. Geological Survey.)
Contents

:*

Message from the Director
Each year as I review the highlights and accomplishments of the past 12 months for this introduction, I am reaffirmed in the basic commitment of the U.S. Geological Survey to provide "Earth Science in the Public Service." We are both proud of that motto and mindful of the vigilance and cooperation necessary to produce quality earth science that serves the public need and the public good.
It is easy sometimes for us as scien tists to get wrapped up in our research and investigations and to forget that we are public servants as well as scientists. We must be ready with our science and with our time to meet the needs of legislators, policymakers, and the public for earth sci ence information. Through this Yearbook, we have an opportunity to present our science as a public service and to fulfill our responsibility as public servants.
Perhaps the most telling theme of the pages in this volume is that of cooperation. Only by working together across lines of scientific disciplines and across lines of gov ernmental responsibility can we achieve the level of excellence needed to provide earth science for the common good.
Through our extensive cooperative efforts with more than 1,000 other agencies and organizations we achieved some im pressive results during the year. At the Federal level, we completed a four-year cooperative project between our bureau and the U.S. Bureau of the Census to help them prepare enumerator maps for the 1990 Decennial Census, and, in the process, we completed a computerized data base of our l:100,000-scale map series far ahead of scheduled expectations.
Our cooperative effort to provide the basic hydrologic information for Connecti cut's ground-water protection program, described in one of the lead essays, is just one example of how the Survey's broad- scale national earth-science programs also serve State and local needs.
The USGS also has a vital program of international cooperation. The essay that describes our efforts with Canada to under stand the geology beneath the Great Lakes
is an excellent example of how effectively science can reach across international bor ders. For nearly half a century now, the USGS has provided technical assistance in foreign countries and has conducted train ing in geology, hydrology, and cartography for visiting scientists from around the world. In the coming years, our interna tional view will become more intense as the United States hosts the 28th International Geological Congress in Washington, B.C., in July 1989, which will bring the most prestigious earth scientists from more than 100 nations to the United States. We are also looking forward to several new initia tives getting underway to provide scientific expertise and assistance to other nations in dealing with natural hazards and their effects on a worldwide scale.
Exciting new applications of geo graphic information systems have afforded us an opportunity to conduct cooperative science that crosses discipline and organi zational lines. Our geographic information systems laboratory has become an exciting arena where scientists from every field of the geosciences have access to an extensive array of earth-science data in computer- generated format for analyzing a host of natural-resource and land-use problems. Here too, cooperation has been the hall mark of this effort's success. We have conducted demonstration projects with several State agencies and have a regular program for training other interested agen cies in this new technology.
We continue to conduct research that is on the cutting edge of science seismic imaging that is revealing the structure of the deep crust of the Earth, advanced cartographic systems that are producing modern maps of incredible accuracy more rapidly than ever before, and complex com puter modeling and sampling of organic compounds in water that is giving us a much better and much needed understand ing of the fate and transport of these con stituents in water systems.
USGS research is also at the forefront of many issues of national concern assessing the Nation's strategic and critical
Message from the Director VII

minerals to help ensure our domestic eco nomic security, assessing the quality of the Nation's surface- and ground-water re sources, and applying our extensive knowl edge of cartography and remote sensing to develop innovative approaches to the solution of many land- and resource- management concerns.
Conducting the research and investi gations of our multidisciplinary programs is only half of our mission. Our work is not done until we disseminate the results of our investigations and research to those who need earth-science information to solve land-use problems, to better develop and manage the Nation's natural resources, and to understand and mitigate the effects of natural hazards. Through these efforts to effectively communicate earth-science information, the USGS remains committed to conducting science that serves the Nation.
Few Federal agencies can claim the longevity of service or the stability of mis sion of the U.S. Geological Survey. For 109
years now we have been the Nation's earth scientists, fulfilling our original mission to conduct systematic and scientific "classifi cation of the public lands, and examination of the geological structure, mineral resources, and products of the national domain." We are aware of the trust which has been placed in us by the taxpayers and legislators of this country to fulfill that mission.
With that primary mission and that trust in mind, the USGS dedicated itself during the year to the activities docu mented in the following pages. As much as this volume is an opportunity to look back, it is also a challenge to look to the future and to recommit ourselves and our science to providing to the Nation the information by which the public and its officials make informed decisions concerning the wise use of our Nation's resources. It is with pride of accomplishment and dedication of purpose that I present to you this Yearbook of the U.S. Geological Survey.
Dallas L. Peck Director
Lake Huron at Light House Park, Huron County, Michigan. (Photograph by Michael J. Sweat U.S. Geological Survey.)
VIII U.S. Geological Survey Yearbook 1987


Perspectives
International Cooperative Program Studies the Earth's Crust Beneath the Great LakesBy William F. Cannon
The Great Lakes cover about 98,000 square miles of the Earth's surface, an area approximately equal to the combined land areas of the States of Wisconsin and Mich igan. Because the waters of the lakes con ceal the bedrock beneath them from direct, conventional geologic mapping and study, the lakes represent a large gap in our understanding of the geologic nature and evolution of the central part of the North American Continent. Many major geologic features, well studied on land, project beneath the lakes, and many key areas where these major features meet or inter sect are beneath the lakes. Geologists and geophysicists have realized for many years that the geologic relationships hidden beneath the lake waters hold important keys to unraveling the geologic evolution of both the immediate region and the North American Continent in general.
In addition to the scientific questions, many practical problems can be better addressed by defining the geology beneath the lakes. Geological data can be used to identify the distribution and magnitude of energy and mineral resources, the location and severity of geologic hazards, and the suitability of areas for specialized develop ment, such as nuclear plants and toxic- waste isolation sites. All of these issues are major societal concerns, especially in view of the many large and expanding popula tion centers along the lake shores in both the United States and Canada. The geology beneath the lakes, immediately adjacent to these population centers, is probably the least well known of any place in the United States.
GLIMPCE
Because of these scientific and practi cal concerns, a consortium of U.S. and Canadian scientists was organized in November 1986 to renew efforts to study the subsurface beneath the Great Lakes. The consortium, called the Great Lakes International Multidisciplinary Program on Crustal Evolution-GLIMPCE, for short was organized by the U.S. Geolog ical Survey (USGS) and the Geological Sur vey of Canada (GSC). It includes a wide variety of earth scientists from the two organizing agencies, from State and Pro vincial geological surveys, and from many U.S. and Canadian universities. The mem bers represent an enormous source of infor mation and expertise on the geology sur rounding the lakes, as well as the geology as it is inferred beneath the lakes as a result of geophysical surveys. The mem bers have agreed to share existing ex pertise and, more significantly, to share capabilities, equipment, and costs for con ducting critically needed new surveys.
1986-87 Surveys
In August and September of 1986, the first major surveys of GLIMPCE were conducted. They consisted of "marine" seis mic surveys in Lake Superior, Lake Huron, and Lake Michigan, and aero- magnetic surveys of Lake Huron. Aero- magnetic surveys of Lake Superior were conducted in the summer of 1987.
Perspectives 1

Figure 1. Generalized geologic map of the Great Lakes region showing location of seismic re flection profiles in the lakes and location of stations where seismic refraction data were re corded on land and on the lake bottom. Surveys were designed to examine major crustal fea tures such as the Mid-Continent Rift (Lines C, B, A, F, G, H), the Grenville Front (line J), and the Penokean fold belt (lines H and I).
The USGS and GSC jointly contracted the services of a commercial seismic sur veying vessel that had been performing surveys off the Atlantic coast and brought it into the lakes. The ship acquired 850 miles of seismic reflection profiles (fig. 1). In this technique, air guns that release blasts of compressed air beneath the lake surface generate strong sound waves, which propagate to the lake bottom and are transmitted deep into and through the Earth's crust. Portions of these waves are reflected from contacts of rock bodies that have contrasting acoustic properties, and these "echoes" are recorded on a series of hydrophones towed behind the ship (fig. 2).
50'
48'
Sophisticated computer processing of these recorded echoes at USGS facilities in Denver, Colorado, and at GSC facilities in Ottawa, Ontario, reconstructed a picture of the distribution of rock bodies at depths as great as 36 miles. From this picture, scien tists were able to construct the first cross sections of the geology beneath the lakes.
At the same time the reflection pro files were being acquired, teams of geo- physicists were recording the air gun sig nals on the land around the lakes, on islands, and with special seismometers deployed on the lake bottom. This phase of the experiment was conducted by per-
46
0 100 200 300 MILES
EXPLANATION
PHANEROZOIC (570 m.y. ago to present)
Sedimentary Strata
MIDDLE PROTEROZOIC (1600-900 m.y. ago)
Grenville Province
Keweenawan rocks
EARLY PROTEROZOIC (2500-1600 m.y. ago)
Southern Province
ARCHEAN (before 2500 m.y. ago)
Superior Province
Reflection Line
Refraction Station
U.S. Geological Survey Yearbook 1987

Figure 2. A, Seismic "streamer" cable being deployed behind survey ship. The almost 2-mile- long cable contains a series of hydrophones, which record echoes of acoustic waves re flected from the lake bottom and from rock layers in the sub surface and transmit the signals to recording equipment onboard. B, The seismic- reflection surveying system in operation on Lake Superior. Air guns in four arrays marked by the orange floats are towed be hind the ship about 30 feet be neath the surface. Powerful blasts (equivalent to the deto nation of about 30 pounds of dynamite) of compressed air are released from the guns to gen erate sound waves. These sound waves, under suitable conditions, can penetrate to depths of 40 miles or more into the crust beneath the lakes and be reflected so that their ech oes are recorded by hydro phones along the streamer cable that stretches for almost 2 miles behind the ship about 30 feet below the surface. Large masses of bubbles visible just behind the orange floats mark the position of an air gun blast.
sonnel from the USGS, the GSC, and the universities of Wisconsin-Madison, Wisconsin-Oshkosh, Southern Illinois, Western Ontario, and Saskatchewan. In this case, the acoustic signals recorded from the air gun blasts were refracted waves, that is, waves that were bent and redirected by changes in acoustic velocities
in the subsurface and measured at dis tances as much as 120 miles laterally from the air gun. The refraction surveys provide important information on the velocity structure of the crust and, especially when used together with the reflection results, permit tightly constrained interpretations of the subsurface geology.
Perspectives

Figure 3. Aeromagnetic map of part of Lake Huron and surrounding areas prepared by the Geological Survey of Can ada. This map, which portrays the differing magnetic attraction of rocks in the subsurface, is colored so that areas of strong est attraction are shown in warm colors and areas of pro gressively lower attraction are shown by progressively cooler colors (see explanation on fac ing page; in nanoteslas). The data are further processed by computer to generate a false shaded-relief image in which areas of greatest attraction are shown as "hills" and "ridges" and areas of low attraction are shown as "valleys" and "basins." This "topography" is displayed as if it were being illuminated from the east. This technique enhances the visual display of the magnetic grain and gradients (slopes) in the magnetic field. Some of the more prominent features shown by the map are the Crenville Front, a major boundary be tween the Crenville Province on the east, about 7.7 billion years old, and older provinces on the west; major masses of intrusive granites (shown as outlined cir cular and elliptical features la beled CP) believed to have been formed about 7.5 billion years ago; and the boundary between the Hudsonian Prov ince and the Central Plains Province.
Aeromagnetic surveying over Lake Huron and Lake Superior was conducted by an aircraft system owned and operated by the GSC, with support by the USGS. This type of surveying detects subtle changes in the Earth's magnetic field caused by differing magnetic properties in rocks beneath the aircraft. An area is mapped as the plane flies a series of parallel traverses and the plane's location and the measured magnetic field are recorded on magnetic tape. Later, computer processing and plotting are used to produce maps (fig. 3). The magnetic properties and other geophysical information can be used to
infer the distribution of various rock types in the relatively near subsurface.
Results
Seismic Reflection Profiling
The seismic reflection profiling was successful in detecting structures both in the near subsurface and at great depth. In some areas, the profiles produced star- tlingly clear images of structures in great detail throughout the total crustal thick ness. In a profile from eastern Lake Supe rior (fig. 4; see fig. 1 for location), layered
4 U.S. Geological Survey Yearbook 1987

ABOVE1000.0750.0500.0400.0350,0300.0275.0250.0225.0200.0175.0150.0125.0100.075.050.025.00.0
-25.0-50.0-75.0
-100.0-125.0-150.0-175.0-200.0-225,0-250.0-275.0-300,0-325.0-350.0-400.0-500.0-750.0lOOOVO-1500.0BELOW
1500.0- 1500.0- 1000.0- 750.0- v 500 0- 400.0
350030002750250 0
-' 225.0
2000175.0150.0
- 125.0100.0
- 75.0- 50.0
25.00.0
- -25.0-500
- -75.0- -1000- -125.0- -1500 -1750- -200.0- -2250- -250.0--2750- -300.0- -3250- -350.0- -400 0- -500.0- -7500- -1000.0-15000
"packages" of reflective rock units were detected to depths as great as 18 miles.
Projection of these rock units onto land shows that they are volcanic flows of basalt alternating with layers of sedimentary rocks. Study of these units on land indi cates they were deposited in a feature known as the Mid-Continent Rift, a major continental-scale structure that curves in a broad arc from Kansas through Lake Supe rior and into southern Michigan. The rift formed about 1.1 billion years (b.y.) ago as the North American Continent began to break apart along a line coincident with the current location of the rift. Rocks older than 1.1 b.y. were thinned by stretching and fracturing, and the basalts and sedi ments were deposited into the resulting depressions. The rifting process, had it continued, would have caused total separa tion of the continent on either side of the rift and the formation of an ocean basin like the present-day Atlantic Ocean. For rea sons not yet fully understood, the rifting stopped before complete continental sepa ration occurred, and as a result, the proc ess of continental separation was "frozen into" the crust. Because of these circum stances, the seismic profiles not only are important in deciphering the geology of the immediate area but have much broader application in understanding the processes of continental rifting in general. The 18- mile-thick rift fill shown on figure 4 is the greatest thickness of such rocks ever iden tified anywhere on Earth, and, therefore, the area seems to represent a unique pre served example of the later stages of con tinental rifting.
A general interpretation of the rift shows that it formed in 2.6-b.y.-old Arch- ean rocks, which were originally about 25 miles thick but then were greatly thinned to current thicknesses of no more than 6 miles beneath the center of the rift (fig. 5). During attenuation, the enormous thick ness of basalt and sedimentary rocks was deposited into the developing rift basin. The contact between the crust and under lying mantle, called the Mohorovicic dis continuity (commonly referred to as "Moho"), is also well shown in this profile (fig. 4) as an essentially horizontal contact across the entire rift.
This profile and others in Lake Supe rior and northern Lake Michigan have pro vided remarkable new data on the struc ture of the rift. The ongoing interpretation of the data by a large number of partici pants in GLIMPCE is revolutionizing our
Perspectives

o0 Ulen
10I
20 MILES
10 20 30 KILOMETERS
Sedimentary rocks
Sedimentary rocks and interlayered basalt flows
Basalt flows and interlayered sedimentary rocks
Crust of Archean Superior province Granitic and metavolcanic rock near surface
Figure 4. A portion of seismic reflection section F (see fig. 7 for location) that crosses the Mid-Continent Rift. The heavy black lines represent locations of rock interfaces that strongly reflect sound waves. The data are recorded as travel times (left-hand scale) that indicate the elapsed time, in seconds, from an air-gun blast to the re corded echo. These times can be approximately converted to kilometers (right-hand scale) by assuming an average sonic ve locity of 6 kilometers per sec ond. The section reveals an enormous graben (down- dropped fault-bounded block) beneath the lake, far larger than previously predicted. The strong est reflections are caused by basalt flows and interlayered sedimentary rocks within the graben. Weaker but still promi nent reflections are caused by sedimentary rocks. The prerift Archean rocks are largely trans parent, producing strong reflec tions only locally. The crust- mantle boundary (Moho) is clearly visible as a band of nearly horizontal reflections about 25 miles (40 km) deep.
understanding both of the geologic history of the Lake Superior region and of conti nental rifts in general.
Aeromagnetic Mapping in Lake Huron
The geology of Precambrian (more than 570 million years old) rocks beneath Lake Huron is critical to understanding the evolution of the Precambrian basement in North America because three major geo logic provinces intersect beneath the lake. The Precambrian rocks are covered not only by the lake waters but also by a southwestward-thickening sheet of nearly flat-lying younger Paleozoic strata that increase in thickness from zero near the north shore to more than 9,000 feet in the southwest. Fortunately for our purposes, these rocks have almost no magnetic prop erties and are therefore "transparent" to the aeromagnetic technique. The strong magnetic character of rocks in Lake Huron (fig. 3), therefore, shows the nature of the underlying Precambrian rocks, although the general loss of detail toward the south west is caused by increasing thickness of Paleozoic rocks and the consequent greater vertical distance between magnetic rocks
and surveying instruments. The new aero magnetic map (fig. 3) clearly shows the boundaries of the three major provinces, as well as a variety of features within each province.
The Grenville Front, a sinuous north- south feature, separates the l.l-b.y.-old Grenville Province on the east from the Central Plains Province and Hudsonian Province on the west. The Central Plains Province underlies a large area of the mid- western United States but is nearly every where covered by younger strata. This province is generally poorly understood, because it has been studied only from drill cores and by aeromagnetic and other geophysical techniques. In general, it con sists of a variety of metamorphic and igne ous rocks roughly 1.7 b.y. old. Beneath Lake Huron, the Central Plains Province seems to be further complicated by the intrusion of large masses of granitic rocks that appear as circular to elliptical anoma lies on the aeromagnetic map (fig. 3). At the two northernmost anomalies, where Paleozoic strata are thin to absent, the bedrock has been known for many years to consist of granitic and related rocks about 1.5 b.y. old. Similar-appearing anomalies
6 U.S. Geological Survey Yearbook 1987

farther south are therefore interpreted to be similar bodies of 1.5-b.y.-old granite.
Along the northern shore of the lake, sedimentary rocks of the Huronian Super group, more than 2.2 b.y. old, are exposed in a fold belt known as the Hudsonian Province. These rocks are generally weak ly magnetic but, nevertheless, produce a distinct magnetic signature that can be traced southward beneath the lake. The contact between the Hudsonian and Cen tral Plains Provinces can be located by the distinct change in magnetic signature between the two provinces.
Thus, a first step has been made at constructing a geologic map of Precam- brian rocks beneath Lake Huron. Addi tional geologic and geophysical data gath ered during planned future surveys will add additional detail and constraints to the interpretations that are now based solely on the aeromagnetic data.
Further GLIMPCE Activities
GLIMPCE has made remarkable sci entific progress in its first full year of operations, largely because of outstanding cooperation and coordination of efforts among many government and academic institutions in both the United States and Canada. Much work remains for the future, however, in order to complete interpreta tions of existing data, as well as to perform new surveys and mapping. At a planning workshop with 75 participants, long-range research goals were identified, and plans and objectives are being developed. Future surveys could include additional seismic
EXPLANATION
__ _~ Post volcanic sedimentary rocks
"~ Sedimentary rocks with some interlayered ~ basalt flows
Basalt flows and interflow sedimentary rocks
Archean crystalline rocks
Fault
and aeromagnetic investigations and other types of geophysical surveys. Geological and geophysical studies are also needed on land to correlate exposed rocks near the shore with those inferred beneath the lakes in order to achieve a comprehensive under standing of the geologic evolution of the Great Lakes region.
Figure 5. Generalized sequence of events that formed the Mid-Continent Rift as it ap pears on line F. A, About 1.1 billion years ago, Archean rocks of the Superior Province, about 2.6 billion years old, began to pull apart laterally. Steep faults developed, and the area between the faults subsided. Eruption of large basalt flows began so that flows generally filled the graben as it subsided. B, The graben subsided uni formly for about 9 miles and was filled by basalt flows and interflow sedimentary rocks. C, The graben floor broke up as further subsidence continued so that older flows were folded and tilted. Volcanism ceased, but subsidence of as much as 6 miles continued as a thick, postvolcanic sedimentary sec tion filled the graben.
Perspectives 7

Cooperative Efforts in Ground-Water Protection A Connecticut HistoryBy Robert L. Melvin, Hugo F. Thomas, and Robert E. Moore
Ground water accounts for 12 percent (144 million gallons per day) of all fresh water withdrawals in Connecticut and sup plies drinking water to a third of the State's population (fig. 1). Water is withdrawn through 1,200 community wells (public supply), 3,300 non-community wells (res taurants, hospitals, schools, and so forth), and more than 250,000 individual home wells. Efforts to protect ground water go back at least 20 years to passage of the Connecticut Clean Water Act in 1967. Con necticut today has a comprehensive ground- water protection strategy. In developing this strategy, the State has relied heavily upon natural-resource information, largely developed through cooperative efforts with the U.S. Geological Survey (USGS). Mod ern topographic, geologic, and hydrologic maps, long-term basic data and statistics on water quality and use, quantitative eval-
42'
uations of aquifers, and process-oriented hydrologic research are essential compo nents of the natural-resource information base on which the State relies.
The goal of Connecticut's ground- water protection strategy is, wherever fea sible, to restore all ground water to or to maintain it at drinking-water quality with out treatment. The strategy for achieving this goal is based on a partnership between the State and its 169 municipalities for the management of this resource. The goal and strategy are derived from the Connecticut Clean Water Act of 1967, which mandated the prevention and control of water pollu tion through a system of water-quality standards and permit and enforcement authorities. The purpose of the Act is to protect and enhance the waters of the State for public health and welfare, water sup plies, fisheries, recreation, and all similar uses (fig. 2).
Figure 1. Population distribution in Connecticut. (Each dot repre sents 1,000 people.)
41°30
8 U.S. Geological Survey Yearbook 1987

Figure 2. Land-use diversity in Connecticut. A, The uplands of eastern and western Connecti cut consist mainly of undevel oped woodland. This view is of the Housatonic River Valley in northwestern Connecticut. (Photograph by Leslie Mehrhoff, Connecticut Department of En vironmental Protection.)
Figure 2B. The Connecticut Val ley Lowland contains some of the best agricultural land in New England. This scene of to bacco land (foreground) is rap idly disappearing in the face of urban development. Steep ba salt ridges within this lowland (background) remain undevel oped. (Photograph by Michael Bell, Connecticut Department of Environmental Protection.)
Perspectives 9

Figure 2C. The City of Hartford, adjacent to the Connecticut River, is typical of the State's urban areas. Land use includes commercial, industrial, institu tional, and residential. (Photo graph by Leslie Mehrhoff, Con necticut Department of Environmental Protection.)
Although the State's Clean Water Act was passed in 1967, a ground-water strat egy was not defined until 1980 when Con necticut's Water-Quality Standards and Classifications were revised. Until that time, information on the ground-water flow
system and other relevant factors, such as waste-disposal activities, was inadequate to develop an overall strategy and a state wide system of quality standards and clas sifications for ground water. Supported by State Drinking-Water Standards that
Drainage Divide Drainage Divide~_
MAJOR GROUND-WATER FLOW SYSTEM *-
Figure 3. Schematic diagram of ground-water circulation in stratified drift and bedrock in Connecticut. (Modified from Connecticut Water Resources Bulletin 21, p. 41.)
Stratified drift
EXPLANATION
Minor flow system
Direction of ground-water flow
Crystalline rocks
10 U.S. Geological Survey Yearbook 1987

define potability, the Water-Quality Stan dards are used to set and control water uses. Ground water in all areas of the State has been mapped and classified in one of four standards of use. This system is the keystone for all ground-water management programs. The system provides the highest levels of protection for over 90 percent of Connecticut's ground water, prohibits many activities in areas that overlie those waters, and establishes the basis for the siting and cleanup of land-based waste- disposal facilities. As a final key element, the ground-water strategy in Connecticut is not considered a distinct entity. Owing to the hydrologic setting, this strategy is looked upon as a component of a more comprehensive water-quality strategy that includes both ground water and surface water. The hydraulic connection between ground water and surface water, the local ized nature of most ground-water flow sys tems, and the fact that the divides between ground-water and surface-water drainage basins coincide in many areas have all played an important role in the develop ment of the State's ground-water protec tion programs (fig. 3).
The ground-water strategy developed from the Water Quality Standards encom passes a series of State- and locally- administered programs that were designed on the basis of the hydrogeology, potential pollution sources, and ground-water uses of the State. The management elements that are part of the strategy cover a broad range of activities. Most of these elements, how ever, rely to some degree on a general understanding of the probable impacts of different human activities on water qual ity; the relations between ground water and surface water; the hydrodynamics of ground-water flow, including the effects of pumping water from wells; and the trans port and fate of chemical substances in the saturated zone.
Resource Information
Today, in Connecticut, it is common practice for State and local agencies to support water-quality and related land-use decisions with a wealth of natural-resource information. Such information also pro vides the physical and conceptual frame work for most of the ground-water protec tion programs that have been developed
(fig. 4). The source of that wealth of infor mation can largely be attributed to almost a century of cooperation between the State and the USGS. Equally valuable contribu tions were also made through informal col laboration between the State, USGS, and the university community, including the first modern-era bedrock geologic map of Connecticut, compiled in 1907, and the first map of the glacial geology of the State, prepared in 1929.
Cooperative Programs
Connecticut State agencies had some of the earliest formal cooperative programs with the USGS. An agreement to produce topographic maps of the State was con cluded in 1890, and in 1911 a cooperative program to inventory ground-water re sources was initiated. In 1972, the State of Connecticut created the Department of Environmental Protection and formed a central unit, the Natural Resources Cen ter, to be responsible for the integration of all natural-resource data collection. Since then, this unit has been responsible for managing almost all cooperative programs and for disseminating the resulting infor mation to the user community. The natural- resource information most widely used in ground-water protection programs was largely obtained through mapping, moni toring, and process-oriented hydrologic re search conducted during the past 40 years.
It is only natural that the earliest cooperative program produced topographic maps of the State. Besides the inherent information on hydrography, relief, and culture, these maps provide the standard base necessary for resource inventories and field-oriented research.
In 1985, consistent with a philosophy that led to the partnership 95 years earlier, Connecticut entered into a cooperative agreement with the USGS to produce and maintain statewide coverage of standard digital data of the l:24,000-scale-series maps. The digital data will be used in a computerized geographic information sys tem that will serve as the predominant source of digital maps in Connecticut.
After nearly a half century of informal relations, the Connecticut Geological and Natural History Survey, USGS, and other members of the geological community met in 1948 to develop a unified long-range
Perspectives 11

Figure 4. Principal aquifers in Connecticut.
42°
41*30' -I
10
1Q 20
20 MILESI
130 KILOMETERS
EXPLANATION
Stratified-drift aquifers
Sedimentary-aquifer system Includes interbedded .sedimentary and volcanic rocks (basalt)
Crystalline-bedrock aquifer (noncarbonate rocks)
Carbonate-rock aquifer
program of geologic research. Seven years later, in 1955, a formal cooperative pro gram to conduct bedrock and surficial geo logic mapping of the State began. Over the next 30 years, Federal and State geolo gists, including several also affiliated with universities, worked to complete the pro gram, which led to publication in 1985 of a 1:125,000-scale bedrock geologic map of the State that synthesized the results of the bedrock mapping. Cooperative efforts are presently underway to digitize the geologic data and incorporate them in Connecticut's geographic information system.
The modern era of cooperative hydro- logic studies began in 1960 with State adop tion of the "Long Range Plan for Connect icut." This plan was prepared, at the request of the State, by the Connecticut Water Resources Division Council, and it called for a series of comprehensive hydrologic studies for each major drainage basin in the State. A cooperative program for these studies was initiated in 1961 and completed in 1975. In each basin, hydrolo-
gists defined streamflow and water-quality characteristics; mapped the extent, lithol- ogy, and hydraulic properties of stratified- drift aquifers; evaluated water quality in streams and aquifers; identified and described existing water-supply and waste- disposal systems; and analyzed the poten tial for additional development of surface- and ground-water resources. These in terdisciplinary basin studies benefited considerably from the modern topographic and geologic maps that were produced through the other cooperative programs. In turn, the hydrologic studies contributed to the completion of geologic mapping and set priorities for the revision of topographic maps.
Integrating Hydrogeologic Data To Protect Ground Water
Between 1970 and 1980, there was a significant transition in the USGS coopera tive programs in Connecticut. Although
12 U.S. Geological Survey Yearbook 1987

map inventories and research continued, a major part of the programs was devoted to interdisciplinary efforts to provide prod ucts that were directly applicable to land- use and related water-resources planning and management, including ground-water protection. This new direction had its roots in the 1960's, in response to increasing public demand that future development and growth should be in harmony with the environment. The State of Connecticut, which by 1980 had a relative abundance of natural-resource data, provided an ideal laboratory for determining how those data could be integrated into planning and man agement activities.
The Connecticut Geology-Soil Task Force, an informal volunteer group that included members of the USGS, U.S. Soil Conservation Service, and five State agen cies, was created in 1969 to "help resolve conflicts between limitations imposed by the natural environment and the require ments of our expanding population." As part of their activities, members of the Task Force selected the area covered by the Ellington 7.5-minute quadrangle map in north-central Connecticut as a demon stration area for studying ways to develop flexible interpretation systems for planners and those empowered to regulate land and water use. The report on this work showed how geologic, hydrologic, and soil data could be integrated to provide a base for land- and water-use planning and manage ment. Single-factor maps were the key tool used in evaluating intended land or water use. These maps, developed at a common scale, included existing inventory prod ucts, such as topographic maps, and deriv ative products, such as depth-to-bedrock maps, that aggregated information from soil surveys, geologic mapping, and hydro- logic studies (table 1). The Ellington exam ple demonstrated how the relevant single- factor maps could be selected from management guidelines or regulations and used, either singly or stacked together as overlays, in order to rule out areas unsuit able for a particular use or to locate areas where characteristics may be suitable or even ideal for a particular use. These single-factor maps were in a sense paper forerunners of the integrated, on-line data bases that form the geographic information system now being developed.
In 1971, the USGS began the Connect icut Valley Urban Area Project (CVUAP).
The goal, similar to that of the Connecticut Geology-Soils Task Force, was to provide "earth-resource information in a form that is readily understandable and readily avail able to planners and other decision makers responsible for land use and resource man agement." The CVUAP study area in cluded about 5,000 square miles in parts of Connecticut, Massachusetts, New Hamp shire, and Vermont, and was selected owing to the availability of natural- resources information (particularly in Con necticut) and the success of the methodol ogy developed for the Ellington area. The study was conducted in cooperation with the States of Connecticut and Massachu setts. During a 6-year period, more than 200 single-factor maps were produced. After 1976, in order to finish selected hydrologic products, the study was contin ued in Connecticut as part of that State's cooperative program. During the CVUAP, demonstrations on the applications of the map information were given continuously to groups of State, regional, and local plan ners in order to encourage the subsequent use of natural-resource information in deci- sionmaking. The NRC has continued this dialogue with the user community through workshops, guidebooks, and other out reach programs for local land-use commis sions.
The final phase of the integration proc ess, the use of natural-resource information in ground-water protection programs, began in 1977 with the State "208" pro gram, mandated by Section 208 of the Federal Clean Water Act. The Connecticut program included cooperative studies with the USGS to assess areas of existing and potential ground-water contamination and to develop methods for defining recharge areas of major aquifers and areas contrib uting flow to major pumping centers. This work used much of the information on ground-water flow systems and aquifer boundaries obtained through earlier coop erative inventories and hydrologic re search, the techniques of single-factor map production and aggregation developed by the CVUAP, and new techniques of simu lation modeling of stratified-drift aquifer systems that were developed through USGS research.
As an example of the use of natural- resource information for ground-water pro tection that was developed through the "208" program, researchers were able to
Perspectives 13

Table 1. Matrix of single-factor maps, used in the Ellington 7.5- minute quadrangle example, derived from basic-data sources. This example shows the types of single-factor maps used in planning for domestic municipal solid-waste disposal and placement of utility corri dors.
!
f»SOIL
^
-
fc[GEOLOGY
I
-,
T
Land And Water Planning
^^^
J r. ~-L% T ; -HYDROLOGY ... -L_ {fj-ia< 11 %
^=T?54 §LAND USE 2F
1 HI
t01
01
SINGLE-FACTOR MAPS w1. Topography2. General slope map3. Slope greater than 15%
4. Slope less than 3% and soil seldom saturated
5. Bedrock type
6. Structural characteristics of bedrock7. Outcrops
' 8. Depth to bedrock: 0-2 feet9. Depth to bedrock: 0-10 feet
10. Depth to bedrock: 50-foot intervals11. Unconsolidated materials12. Sand and gravel deposits13. Unified soil classification of substratum
14. Soil saturated with water within 3 feet of the surface for 2 to 12 months
15. Soil saturated with water within 3 feet of the surface for less than 2 months
16. Peat and muck deposits17. Percolation rate classes18. Agricultural land use capability19. Drainage areas20. Floodprone areas
21. Low flow of streams22. Saturated thickness of stratified
unconsolidated deposits23. Availability of ground water
24. Location of existing sanitary and water related facilities, services and uses
25. Land use: 197026. Zoning: 1970
1. Water supplies-surface
2. Water supplies-subsurface areas of
favorable supply
Domestic municipal solid waste disposal
co
>
Industrial and sanitary treatment plant wastes ,
t
On-site septic disposal sites
in
Injection well-liquid disposa
CO
Aggregate excavation
r^
Earth work uses
00
Economic deposits
O>
Density building development
o
Utility corridors*
.«-
2
2
1
1
1
1
2
2
1
1
1
3
3
2
1
2
2
1
1
1
1
Transportation corridors
CM
Recreation corridors and open space
CO
Recreation water impoundment
*t
opment
Recreation field devel
in
Agricultural uses
(O
* 1 = Primary importance; 2 = Secondary importance; 3 = Indirectly related
delineate the three land areas that are sources of recharge for a stratified-drift aquifer in western Connecticut (fig. 5). The first area includes land overlying the aquifer where recharge is derived from precipitation that percolates to the water table. The limits of this area were deter mined from surficial geologic maps and hydrogeologic maps. Adjacent till and bed rock areas that are not drained by peren nial streams also contribute recharge,
either from subsurface inflow or from infil tration of runoff near the margins of the aquifer. Finally, studies of this aquifer and others elsewhere in Connecticut show that they are hydraulically connected to the streams that traverse them. Pumping is therefore likely to induce recharge from the stream, and the entire upstream drain age area that contributes runoff will consti tute a third recharge area. The limits of this area can also be defined by the drain-
14 U.S. Geological Survey Yearbook 1987

age divides as determined from topo graphic maps. This three-fold division of recharge areas and the technique for esti mating their extent are applicable to most of the stratified-drift aquifers in Connecti cut, and this knowledge can provide a framework for local aquifer-protection pro grams. Many towns in Connecticut have adopted programs that regulate activities in the recharge areas through zoning and site-plan review. For large stratified-drift aquifers, flow modeling has been used to limit the protection to the area that con tributes flow to a specified pumping center.
The concepts and products developed from the CVUAP, the drainage-basin stud ies, and the "208" cooperative programs influenced the Department of Environmen tal Protection to extend standards and clas sifications to ground water. The drainage- area maps provided a suitable physical framework for classifying both surface and ground water in most of the State. Within each basin unit, existing information on aquifer boundaries, locations of public- supply wells and known or potential con taminant sources, water quality, and land use was plotted, tabulated, and updated where necessary. To identify areas of the State where hydrogeologic conditions were most favorable for the discharge of wastes, criteria were first developed for factors such as the lithology and thickness of mate rials above and below the water table and their proximity to ground-water discharge zones. Single-factor maps of these features were developed and used to aid in identify ing suitable areas.
Ground-Water Protection in the Future
Today Connecticut has a comprehen sive ground-water protection strategy, an abundance of natural-resources informa tion to aid in protecting this resource, and, in the State's Natural Resources Center (NRC), a central facility for disseminating this information to the user community. But where will the State go from here? What natural-resources information will be needed in the future? The general direction is clearly toward basinwide management of all water in order to satisfy competing demands for this resource. This demand for water will result in the continued integra tion of surface- and ground-water quality
protection programs and will require a thorough understanding of the hydrology of each major drainage basin.
Cooperative programs are continuing to move from natural-resource inventor ies to monitoring and process-oriented research. Current ground-water protec tion activities include monitoring of surface-water quality, streamflow, and ground-water levels to characterize dy namic changes; a comprehensive water-use program; investigations of the hydraulic characteristics of till; and studies of the occurrence of natural radionuclides and pesticides in ground water. In two other studies that are funded by the Federal program, hydrologists are investigating relations between ground-water quality
1 2 MILES
1 2 3 KILOMETERS
EXPLANATION
Aquifer area
Till and bedrock area that recharges the aquifer
Drainage area upstream of the aquifer
Figure 5. Delineation of recharge areas for a stratified- drift aquifer near Cannondale in southwestern Connecticut. (In formation retrieved and plotted through the Connecticut Geo graphic Information System.)
Perspectives 15

Figure 6. High- and moderate- yield aquifer areas. 42]
__________________73"
GRANBY
D a
ENFIELD
/FJU _____
SOWERS
,| f°
ELLINGTON
/^E^;
DUPPER
HOUSATONIC
0 n
SFARMINGTON
^ ..... .. n P| I I __ / / O i I i
n i i ° nwiLUMANTic n p. n-,U I__ISIMSBURY U C\ n / / KILLING!^
~ HAVON ^ k\ VJ^ DMANCHESTER \\ \\ Q rc . ITCQ
\l I I I \\\ \ CENTERV> \ \ VILLAGE
, / > I I n NATCHAUG\\ Q 1 D//PLAINVILLE U SHETUCKET \^ I I--""" ,
5n ROCK HILL ^ D / / CWYV| U-E,
D SOUTHINGTON GLASTONBURY NX. / mCKE LLlU I__I \> /\ p M U D
r~, pWATERBURY DART H YANTIC\\ g []
/ / HANOVER R 'SLANDl I I I i V ,POMPERAUG/ / pi pQ^o U /\ LJ^ I PAWCATUCK J
41°30'l / /NAUGATUCKy U ( X ^ ' ^| / / I I
M SEYMOUR I
D LP
DWALLINGFORD ^
NORTHL HAVEN
DD D
" AD n n 6LL\n \\ n LJRESERVOJR
D u A\ U L-1 ^.(JkTVxi
and land use in stratified-drift aquifers and the factors that control induced recharge.
Two State management programs that are in their infancy illustrate the general direction of future cooperative efforts to protect ground water. The development of an Aquifer-Wellhead Protection Program for high- and moderate-yield aquifers pro poses several management measures that range from land acquisition of well sites to regulatory prohibitions and zoning con trols. Successful implementation will be highly dependent upon hydrogeologic data, maps, and analytical methods for accu rately defining aquifer boundaries, areas of aquifers contributing water to pumped wells, potential well sites, and aquifer recharge areas. Some information exists for all of the 158 high- and moderate-yield stratified-drift aquifer areas identified in Connecticut (fig. 6), but this information is often insufficient to meet the needs of this program. Providing comprehensive scien tific information needed for each area in a reasonable time frame presents a signifi cant challenge. Through the cooperative program, new applications of geophysical methods for characterizing stratified-drift aquifers are presently being tested.
The State's Water Use and Allocation Program presents another challenge for the cooperative program. Competition for
EXPLANATION
Moderate-yield aquifer study area
High-yield aquifer study area
finite water resources has already caused degradation in the quality of surface waters in some basins to the extent that careful monitoring will be required to prevent fur ther degradation of these waters to the point where they fail to meet water-quality criteria. As more ground water that would normally discharge to these streams is diverted by pumping from wells, the water-quality problems will intensify. The Department of Environmental Protection (DEP) has instituted a permit system for water use and withdrawal in order to make the best use of the available resources. Permit decisions will rely heavily on flow models of stream-aquifer systems, long- term streamflow data (particularly low- flow characteristics), water-quality data, and predictive water-quality models. Water-use information will also be relied upon to quantify existing water use in each basin and to estimate future uses and demands.
The DEP, using data from USGS coop erative studies, has identified other major information needs that are essential for managing ground water and will develop a new long-range plan to meet these needs. Foremost among these are information on the nature of the ground-water flow system in fractured bedrock; relations between land use and ground-water quality in bed-
16 U.S. Geological Survey Yearbook 1987

72°37'30" 42°00'r
72°30'
41°52'30"
Figure 7. Map of the Broad Brook quadrangle in north-central Connecticut showing selected information for water-supply planning. (In formation retrieved and plotted through the Connecticut Geo graphic Information System.)
2 MILES
\ I1 2 KILOMETERS
EXPLANATION
Stratified drift-letter C indicates coarse grained (sand and gravel), letter F indicates fine grained (very fine sand, silt, and clay). Yellow overprint indicates areas with potential for large-scale ground-water development within the Enfield study area
Till
(I) Public-supply well
ffi Waste-disposal site
^-^^- Contact between unconsolidated units
rock aquifers; the transport and fate of chemical contaminants in the subsurface; and the suitability of fine-grained glacial deposits for waste disposal.
How will all the existing and new information be managed, analyzed, inte
grated, and disseminated? Through the cooperative program, a USGS/NRC pilot project in 1985 demonstrated the efficiency and flexibility of computerized geographic information systems for such tasks. This pilot project led to the creation of the
Perspectives 17

18 U.S. Geological Survey Yearbook 1987
Connecticut Geographic Information Sys tem, which is being developed by the NRC with support from the USGS and State agencies. The Connecticut Geographic In formation System is already being used for statewide water-supply planning and, when fully operational, is expected to be one of the most powerful tools for ground- water protection programs (fig. 7).
The USGS cooperative program will continue to provide the science, data man agement concepts, and predictive tools for Connecticut to further develop and fullv implement the ground-wate, programs that are essential elements ui uie State strategy for ground-water protec tion. The ground-water strategy that has been such a productive Federal-State coop erative effort in Connecticut may be a model for other States; perhaps it will serve as a springboard to other similar programs elsewhere in protecting the Nation's vital ground-water resources.
Robert L. Melvin, U.S. Geological Survey; Hugo F. Thomas, Connecticut State Geologist; and Robert E. Moore, Assistant Deputy Commissioner, Connecticut Department of Environmental Protec-

Geographic Information System Applications in the Earth SciencesBy John L Place and David A. Nystrom
Introduction
A geographic information system (GIS) is a computer hardware and software system designed to collect, manage, ana lyze, and display spatially referenced data. In the simplest sense, a GIS automates the manual process of gathering and analyzing the wide variety of data needed to make land-use and resource-management deci sions and solve earth-science problems.
Because GIS capabilities allow scien tists to process and interrelate many more kinds of data than before, it is now possible to examine problems and to broaden scien tific understanding in new ways. For exam ple, scientists might combine and analyze data on vegetation, soils, surficial geology, rainfall, and runoff measurements within the same hydrologic drainage basin to study soil permeability or soil erosion.
The growing urban population has placed increased demands on the Nation's natural resources and the environment. Frequently, Federal and State agencies must respond quickly to complicated prob lems involving the assessment and manage ment of natural resources or the monitor ing or mitigation of natural and manmade hazards. The U.S. Geological Survey, for example, is often called upon to provide earth-science information quickly to aid in mitigating the effects of hazards such as earthquakes and landslides. A GIS is a valuable tool that helps USGS scientists to provide this information more rapidly, effi ciently, and effectively.
Geographic Information Systems at the U.S. Geological Survey
The USGS and the State of Connecti cut initiated a joint demonstration project in 1984 to evaluate the effectiveness of using a GIS in ongoing data collection, maintenance, and analytical programs of the Connecticut Natural Resources Cen
ter. The project solved several problems related to the quality of existing digital and mapped data, the mechanics of processing large natural-resource data bases, and the compatibility of digital data among differ ent systems. The project successfully dem onstrated GIS effectiveness for industrial site selection and determination of ground- water availability.
Encouraged by the results of the Con necticut demonstration project and other application studies, the Director of the USGS issued a bureauwide GIS policy statement to establish a sound GIS re search base, to conduct cooperative appli cation projects, to exchange digital data bases, and to provide a funding mechanism for encouraging the use of this new tool in USGS investigations.
Specific goals in the policy statement include: GIS research Investigate advanced techniques to exchange digital spatial data; explore advanced computer-system archi tectures and techniques using improved data structures; apply knowledge-based inference models, expert systems, and nat ural query languages to multiple digital data bases and existing spatial data- handling techniques; and apply GIS tech nology to major missions of the Survey. Multidisciplinary demonstration proj ects Develop projects that involve the USGS and local, State, and other Federal agencies, and provide those agencies with training and assistance in GIS technology and applications. Implement interdivisional application projects within the Survey to broaden GIS expertise and expand the existing network of shared resources (hardware, software, and data bases) and technique development. Federal government coordination Encourage governmentwide GIS educa tion, technology transfer, and definition of GIS research requirements through com mittees such as the Interior Digital Cartog-
Facing page photograph by Mark A. Hardy, U.S. Geological Survey
Perspectives 19

Figure 1. The users' area of the U.S. Geological Survey CIS Re search Laboratory in Reston, Virginia. The laboratory is de signed for multidisciplinary co operative research.
raphy Coordinating Committee and the Federal Interagency Committee on Digital Cartography. Exchange of earth-science and other spatial data Develop automated inter faces among various earth-science data bases and GIS's and make it easier to access and exchange digital spatial data bases by developing standards for earth- science data.
In fiscal year 1987, the USGS estab lished a GIS Research Laboratory in Reston, Virginia (fig. 1), to provide an interdivisional, multidisciplinary environ ment for research, development, and appli cation of GIS technology. Additional GIS facilities are being established in Denver, Colorado, and Menlo Park, California, and capabilities are being increased in an exist ing facility in Sioux Falls, South Dakota. Future expansion of GIS capability is planned for Survey offices in Rolla, Mis souri, and Anchorage, Alaska. This concen tration of GIS technology and resources at key locations will make available a broader range of computer-based hardware and software than is now available at dispersed field locations.
Figure 2. Location of CIS projects underway in FY 1987.
At present, GIS activities in the Sur vey represent a broad-based, bureauwide approach to developing GIS technology in support of national earth-science informa tion needs. The Information Systems Divi sion is assessing GIS hardware capabilities and microcomputer applications, develop ing the Earth Science Information' Net work and the Earth Science Data Direc tory, and studying the merging of artificial intelligence and GIS technologies. The Geologic Division is using GIS software capabilities such as gridding, contouring, feature extraction, overlay, and display to manipulate and analyze geologic data. The Water Resources Division, the largest user, has GIS facilities in 40 of its State locations and has linked them with a dis tributed information system called GEO- NET. The National Mapping Division is developing advanced techniques for spatial data manipulation, analysis, and display.
Cooperative Projects Using Geo graphic Information Systems
In addition to the GIS projects under way within the Survey, the bureau is also working with other Federal and State agencies on a number of cooperative GIS projects (fig. 2). The projects are geo graphically dispersed and the objectives are varied, ranging from the study of pol lution in the Elizabeth River, Virginia, to the determination of potential landslide areas in California. The following descrip tions of several of the projects illustrate how GIS technology can be used to com bine, analyze, and display a variety of digital data to suit a broad range of objectives.
In the Elizabeth River Project, more than 30 earth-science and natural-resource data bases are being integrated in a GIS to study pollution problems in and near Nor folk, Virginia, in cooperation with the U.S. Environmental Protection Agency. The Elizabeth River basin, in southeastern Vir ginia, drains approximately 205 square miles of some of the most heavily industri alized and developed areas on the Chesa peake Bay watershed. A GIS will be used to study and analyze the interaction between the ground-water system and the river, including the relationship of ground- water flow to the potential movement of toxic chemicals.
20 U.S. Geological Survey Yearbook T987

The San Mateo County Project, on the San Francisco Peninsula, California, com bines geologic, hydrologic, cartographic, and geographic data to model changes in land use relative to geologic constraints. GIS technology will help scientists analyze the relationship of topography to landslides and other processes and develop methods to determine hydraulic and ridge-line net works. Using data on land use, debris flow susceptibility, rate of rainfall infiltration, slope, earth materials, transportation, and drainage, scientists will be able to identify areas in San Mateo County subject to potential flooding or landslide problems.
In a recently completed cooperative effort with the Bureau of Reclamation, specialized GIS software was used to manipulate digital elevation data to derive, display, and analyze hydrologic character istics in glaciated pothole terrain in North Dakota (fig. 3). The hydrologic characteris tics were incorporated into a watershed model that will allow the Bureau of Recla mation to compute the probable maximum flood volume for the James River basin upstream from the dam at Jamestown, North Dakota, and to evaluate the need for structural changes to the dam.
N47°38'45", W99»44'00
N47°37'10"
Elevation classes:
J|< 1585 ft. |Hj 1605 ft. [Jl625ft.
| 1590 ft. UJ1610 ft. Q1630 n-
S1595 ft. H 1615 ft - l~]1635 ft -
1600 ft. II1620 ft. Ol640 ft.
_ LEGEND: | _ | > 1645 ft. I Pothole locations
T Drainage basin bounds -N-
I Overflow points >
I' 1
POTHOLE DOWNSTREAM DEPTH POUR POINT POTHOLE VOLUME POTHOLE IN FEET ELEVATION IN FEET IN ACRE-FEET
83 100 3.9 1608.3 93.5 100 0 5.4 1606.3 110.9 121 83 5.8 1610.3 80.2 129 173 5.2 1612.2 55.6
Figure 3. Analysis of test site 3 from the James River Hydrology Project. Above, Computer- delineated potholes are shown in red draped on a shaded-relief presentation of elevation data. Below, Potholes that were se lected for runoff modeling are shown with their watersheds and pour points and sample tabular information.
Perspectives 21

Figure 4. Bedrock geologic map of test area in western Maine near Kingfield. Map was digi tized from the Maine Geologi cal Survey's 7985 Bedrock Geo logic Map of Maine.
Figure 5. Color composite im age of same area with digitized geologic contacts and faults su perimposed. The image, cen tered on the Lexington batho- lith, combines magnetic and gravity data to show subsurface details. Coincident magnetic and gravity lows produce blue or black areas, such as over the Lexington batholith. The batho- lith is probably thickest beneath the blue area. Coincident highs produce yellow or white areas and commonly indicate mafic rocks. Coincident magnetic highs and gravity lows produce magenta areas and commonly indicate pyrrhotite-rich meta- morphic rocks. The image rep resents one of many combina tions of geophysical and geologic data of the area.
The San Juan Basin Project, located in the Four Corners region of Arizona, New Mexico, Utah, and Colorado, will use GIS technology to develop the general auto mated data compilation, data analysis, and map-production capabilities needed for regional geologic and hydrologic resources studies. GIS capabilities will be applied specifically to complete the analysis of the San Juan basin regional aquifer system. The development of new GIS program interfaces to high-accuracy automated car tographic drafting systems also will allow direct generation of publication-quality car tographic products.
One of the objectives of the John Day River Basin Project in northeastern Ore
gon is the development of a prototype GIS for use by State agencies in the manage ment of water resources. A central reposi tory of spatial information about the river basin will provide query, analysis, and dis play capabilities for developing water- supply and water-management alterna tives. In a second phase, the GIS will be used to prepare a management document that will describe existing conditions of natural resources, predict future condi tions, and suggest management alterna tives for achieving various levels of devel opment in the basin.
The Quebec-Maine-Gulf of Maine Glo bal Geoscience Transect Project will use a number of different GIS's to integrate geo logic, topographic, magnetic, gravity, and seismic reflection and refraction data to create three-dimensional models of the Earth's crust. The transect is approxi mately 880 km (500 miles) long, 100 km (60 miles) wide, and as much as 50 km (30 miles) deep, beginning in southeastern Quebec, crossing Maine to Penobscot Bay, and continuing from Penobscot Bay across the Gulf of Maine to Georges Bank and the continental edge. Digital data for a test area approximately 50 by 75 km (30 by 45 miles) near Kingfield, Maine, have been used to evaluate the models and processes that will be applied to the larger study area (figs. 4, 5).
GIS for the Future
In addition to the projects mentioned, numerous other projects are underway, including the application of GIS technology to resource management in the greater Yellowstone area in Wyoming, Montana, and Idaho; the assessment of irrigation- drainage quality near Dakes, North Dakota; and the geochemical interpretation of soil, shallow aquifer material, and ground water in the Carson River basin, Nevada-California.
The powerful capabilities of GIS's offer new possibilities for integrating, analyzing, combining, and comparing earth-science data obtained from a variety of sources. The USGS will continue to investigate new ways to apply this tool in mission-oriented studies and in the generation of digital and graphic products to fulfill earth-science information needs.
22 U.S. Geological Survey Yearbook 1987

Significant Accomplishments
of Research Programs: 1987
Variability Within Ore-Deposit Models An Example From the Red Dog Zinc Deposit, Northwestern Alaska
By Jeanine M. Schmidt
The Red Dog deposit is the second largest known zinc deposit in the world, with announced reserves of 11 million met ric tons of 17.1 percent zinc, 5 percent lead, and 82 grams per metric ton of silver. When production begins in 1990, Red Dog will be the largest, predominantly base- metal lode mine operating in Alaska.
The discovery of the Red Dog deposit by I.L. Tailleur of the USGS was first published in 1970. The USGS, in coopera tion with the operating partners of the Red Dog deposit, Cominco American, Inc., has been conducting detailed geologic studies in the area since 1984. The Red Dog deposit, located about 85 miles north of Kotzebue in the DeLong Mountains of Alaska, is owned by the Northwest Alaska Native Corporation.
Red Dog is a member of the "sediment-hosted massive sulfide" or "sedex" zinc-lead class of deposits. The ore is stratabound and hosted in black shales and subordinate black limestones of Missis- sippian to Pennsylvanian age (290 to 360 million years (m.y.) old). The deposit was subjected to intense faulting and moderate folding during the Jurassic to Early Creta ceous (63 to 205 m.y. ago) formation of the Brooks Range fold-and-thrust belt. Because of this tectonic setting, previous geologic investigations focused on identify ing the local stratigraphic and structural complexities of the deposit and defining portions that are repeated by thrusting or removed by faulting and erosion. The USGS completed extensive relogging of
drill cores from the deposit in fiscal year 1987; petrographic, fluid-inclusion, and stable-isotope studies of the sulfide miner alization and host rocks in order to deter mine the mineralogy, textures, and genesis of the deposit are ongoing.
These new data suggest that Red Dog differs in many ways from a classic sedex model. In the classic model (fig. 1), sheet- like bodies of laminated, fine-grained and pyrite-rich massive sulfides, often with monomineralic layers, are usually thinly interbedded with sediment. In contrast, ore from the Red Dog Main deposit (fig. 2) is very rarely laminated, is low in pyrite, has very abundant finely dispersed silica gangue in a predominantly semimassive sulfide rock without significant sedimen tary interbeds, and is overlain by a thick and extensive barite layer.
Classic sedex deposits are interpreted to form directly on the sea floor by the exhalation of basinal brines or convected hydrothermal fluids into seawater. Precip itation and gravity settling of sulfides are produced by the mixing of this fluid with seawater near the vent area and subse quent dilution, pH change, and cooling. Subsurface mineralization in the sedex model shown on figure 1 is limited to minor iron-sulfide-rich stringers and veins within the vent area and minor associated silica or carbonate alteration of wall rocks. In con trast, the Red Dog deposit contains few sedimentary/clastic or exhalative type ores, and contains very common replace ment and multistage ore textures, in which earlier stages of sulfide mineralization are overprinted by sulfide veining and solution breccias. A zonation of ore types is observed in much of the main deposit, and a baritic cap, often containing sulfides in the lower portion, overlies siliceous semi- massive to massive sulfides. These latter sulfides laterally grade into silica rock con taining only disseminated sulfides and then outward into silicified shale. Diagenetic barite blades and nodules, carbonate rhombs, and radiolaria and sponge spicules (fossils) within the host shale are replaced
Significant Accomplishments of Research Programs: 1987 23

Figure 1. Idealized sec/ex (sediment-hosted massive sul- fide) deposit model.
Mixing with seawater
Zinc-lead ratio increases
^Cross-cuttingj-^j --feeder zprie,-^ r^_-brecciationr-_rV
r50 m
100m
by silica and (or) sulfides toward the center of the orebody. Preserved pyrite fram- boids, sponge and crinoid fragments, barite blade pseudomorphs, and other textures in the semimassive and massive ores suggest that a large portion of the deposit formed by growth in and replacement of unconso- lidated sediment, rather than by precipita tion of sulfides in the water column.
The unusually high lead and zinc grades and large size of the Red Dog deposit may be a direct result of processes
such as infiltration, dissolution and replace ment of sediment and early mineralization, and continued upward growth of the deposit beneath an impermeable barite cap. None of these characteristics or pro cesses, however, are considered to be typ ical of sedex lead-zinc deposits. Thus, the Red Dog deposit emphasizes the need for conducting detailed site investigations in order to construct deposit models that reflect the multitude of diversified features found in mineralized areas.
Seawater
Figure 2. Idealized model of Red Dog lead-zinc deposit, northwest Alaska.
\Silicified and mineralized host rock
24 U.S. Geological Survey Yearbook 1987

New Midcontinent Basement Geologic Map Provides Basis for
Evaluation of Hidden
Mineral Resources
By Paul K. Sims
Background
The midcontinent region of the United States is renowned for its world-class base- metal mining districts, including the Upper Mississippi Valley lead-zinc district, the Illinois-Kentucky fluorspar district, the Southeast Missouri lead-zinc district, and the Tri-State (Missouri-Kansas-Oklahoma) lead-zinc district. All these districts are hosted by flat-lying carbonate rocks of Paleozoic age (as old as 570 million years).
Hidden beneath these well-known mines may be mineral resources of compa rable value. The complex Precambrian rocks (more than 570 million years old), which come to the surface in Minnesota and Wisconsin and in the St. Francois Moun tains of southeastern Missouri, are now being investigated for their resource poten tial. The Precambrian rocks exposed in Minnesota and Wisconsin contain the famed iron ores of the Lake Superior dis trict and other valuable unmined metal deposits; those exposed in Missouri host significant iron ore bodies, some of which have associated base metals, principally copper. The rocks in these exposed seg ments extend into the subsurface. Drilling also has shown that the basement contains several other Precambrian terranes that have potential for other kinds of mineral deposits.
As part of the USGS Midcontinent Strategic and Critical Minerals Project, a Precambrian basement map of the north ern midcontinent was compiled in coopera tion with the Geological Surveys of Arkan sas, Illinois, Iowa, Kansas, Minnesota, Missouri, Nebraska, Oklahoma, South Dakota, Tennessee, and Wisconsin (fig. 3). The map is based primarily on rock types
encountered by 1,500 drill holes that pene trated the Precambrian basement. Good- quality aeromagnetic and gravity data, which generally were not available until fairly recently, were used to infer the structural trends, extent, and boundaries of the rock bodies identified in the drill holes. The geology was interpreted in terms of the tectonostratigraphic terrane concept, which has been successfully applied to delineate groups of closely related rocks in exposed areas in the Lake Superior region.
Known and potential mineral resources
The Precambrian basement of the northern midcontinent has a high potential for undiscovered mineral resources be cause many of the terranes are favorable for ore generation. Exposed parts of the region the Lake Superior district in the north and the southwest Missouri district in the southeast have a combined produc tion of iron and copper ores valued at several tens of billions of dollars. Recent discoveries of as yet unmined deposits that contain large zinc-copper and copper- nickel-cobalt-platinum resources in the Lake Superior region are further encour agement for exploration in this area. The relatively shallow depth of much of the buried basement in about two-thirds of the midcontinent area the basement is less than 3,000 feet below the surface is another positive factor.
Another intriguing possibility is that the Middle Proterozoic anorogenic St. Francois and Spavinaw granite-rhyolite terranes may contain deposits of the Olym pic Dam type. The Olympic Dam deposit, at Roxby Downs, South Australia, is one of the world's premier metal deposits, which is now being developed for production. It is reported to contain at least 2,000 million metric tons of ore that has an average grade of 1.6 percent copper, 0.06 percent uranium oxide, 0.6 grams per metric ton of gold, and 3.5 grams per ton of silver. The deposit occurs within an area dominated by Middle Proterozoic anorogenic magmatism, and the ores are hosted by coarse clastic sedimentary rocks, which are interpreted mainly as breccias. Such an ore-forming environment could be present in south western Missouri and adjacent parts of
Significant Accomplishments of Research Programs: 1987 25

Figure 3. Geologic map of base ment rocks in the midcontinent region. -Potential mineral resources are listed for specific major terranes.
100I
200,MILES
100 200 300.KILOMETERS
0 O O
a o Q i
MIDDLE PROTEROZOIC (1600-900 million years old)Midcontinent rift system (1.0-1.2 billion years old) Favorable for copper-nickel-platinum deposits and
petroleumRhyolite and granite (1.35-1.48 billion years old) Favorable for Olympic Dam-type iron-copper-
urahium-gold depositsAnorogenic anorthosite and rapakivi granite (1.48 billion years old)
EARLY PROTEROZOIC (2500-1600 million years old)Quartzite of "Baraboo interval" Favorable for unconformity-type uranium deposits
Metamorphic and granitoid rocks of Central Plains orogen
Rhyolite and granite(1.76 billion years old)
Granite and associated rocks (age uncertain)
Granite (1.8 billion years old)
Wisconsin magmatic terrane of Penokean orogen (1.8 2.1 billion years old) Favorable for copper-zinc deposits
ARCHEAN (2500 million years old and older)
Greenstone-granite terrane of Superior craton (2.6-2.75 billion years old)
Gneiss of central Wisconsin (2.8-3.0 billion years old)
Gneiss terrane (3.0-3.6 billion years ;old ); includes granite (2.6 billion years old)
Limit of outcrop Fault or shear zone
26 U.S. Geological Survey Yearbook 1987

Arkansas and Kansas. This area in partic ular and other areas in the granite-rhyolite terranes merit serious consideration for exploration.
Early Mesozoic Basins Workshop
By Gil pin R. Robinson, Jr., and Albert J. Froelich
Approximately 110 participants from government institutions, eastern universi ties, and the petroleum and mining indus tries gathered at a workshop on the geol ogy of the early Mesozoic (180-230 million years (m.y.) old) basins of eastern North America, held at the USGS National Cen ter during May 1987. The workshop was designed as a forum where scientists could meet to present results and exchange ideas, with the goal of developing a geo logic framework to support mineral and energy resource studies. Significant results include the following:
Organic geochemical analyses and thermal maturity indices of Mesozoic orgam'c-matter-rich shales show, in the Newark basin of New Jersey and Pennsyl vania, that Triassic shales (approximately 225 m.y. old) are overmature with respect to petroleum generation but that Jurassic shales (approximately 195 m.y. old) contain both mature and immature sections. Trias sic shales in the Taylorsville and Richmond basins of Virginia are mature with respect to hydrocarbon generation, and hydrocar bon shows are reported from oil test holes. Migration of liquid hydrocarbon in many other basins is directly indicated by its occurrence in fluid inclusions and as bitu men in veins. The basinwide continuity, thickness, and high organic-carbon content of the mature Triassic and Jurassic shales indicate a petroleum source of potential commercial interest in some cases. Strati- graphic and structural traps for hydrocar bons may be present in early Mesozoic basins buried beneath the Coastal Plain and Atlantic Continental Shelf and in some exposed basins.
Platinum-group-element chemistry has been measured in a number of Jurassic
diabase sheets. Results indicate that, under silicate fractionation conditions, plat inum (Pt) is enriched slightly relative to palladium (Pd) in the early cumulate stage, whereas Pd is enriched relative to Pt in late-stage differentiates. Late-stage ferrogabbro-ferrodiorite bodies in two dia base sheets in Pennsylvania and New Jer sey show anomalous Pd and chlorine (Cl) abundances that are an order of magnitude greater (as much as 207 parts per billion (ppb) Pd and 3,500 parts per million (ppm) Cl) than values in most other diabase bodies.
Some copper-rich hornfels associated with diabase sheets in Pennsylvania are reported to be enriched in gold (as much as 7 ppm) and other rare metals such as molybdenum, arsenic, and bismuth.
Sediment-hosted, stratabound base- metal enrichment (as much as 2.8 percent copper, 6,000 ppm zinc, 1,000 ppm lead, and 40 ppm silver) is observed in black root-disrupted mudstones, which underlie laminated lacustrine shales in the Culpeper basin of Virginia. This mineralization appears to be largely restricted to specific sedimentary fades that occur repetitively as part of sedimentary cycles that are con trolled, in part, by climatic variation. Four metal-enriched horizons have been identi fied from one locality in the Culpeper basin.
Epithermal base-metal and barite veins, which are associated with many of the early Mesozoic basins, are reported to have high silver contents. Fluid-inclusion, isotope, and other studies indicate that the veins are associated with the transport of moderate temperature (100-250 °Celsius) and salinity (10-16 weight percent sodium chloride) brines from within the basins and adjacent basement to shallow sites of min eral precipitation. Fluid migration may be due to a seismic pumping process that was active during the Middle Jurassic (about 175 m.y. ago) during the separation of North America from Africa.
40Ar/39Ar analyses of feldspar sepa rates from diabase bodies in the Culpeper basin, Virginia, and Newark basin, New Jersey, give argon closure ages of approx imately 175 m.y., which are at variance with the igneous crystallization age of approximately 200 m.y. The argon closure age represents the age at which all argon produced by radioactive decay of potassium remains trapped in the mineral and is not
Significant Accomplishments of Research Programs: 1987 27

Figure 4. Panorama of the plati num mining operation in the Stillwater Complex, Montana. Right foreground mine office; center foreground-tailings pond; lower left-mill and con centrator; three portals that pro vide access to the ore deposit are hidden by trees in the area to the right of the tailings pond.
lost by diffusion; this closure age is inter preted to be the age at which the mineral last cooled below a temperature at which argon diffusion is nil (approximately 200 °Celsius in this case). The 175 m.y. appar ent age of the feldspars is interpreted as being due to a heating event (>200 "Celsius), which affected these and proba bly the other basins. The most likely source of heat is hydrothermal fluids, possibly migrating in response to regional deforma tion. The 175-m.y. argon closure age may reflect the formation age of some of the vein and stratabound base-metal deposits described above.
Platinum Mining in the Stillwater Complex, Montana
By Norman J Page
The only mine for platinum-group met als in the United States, the Minneapolis Adit mine, shipped its first concentrate in March 1987. The ore to produce the concen trate comes from the J-M Reef of the Stillwater Complex, Montana, and is mined
by the Stillwater Mining Company, a joint venture of Chevron Corporation, Lac Min erals Limited, and Manville Corporation (fig. 4). The J-M Reef was discovered in 1973 and has been extensively explored since then. This reef is similar to the Merensky Reef of the Bushveld Complex in South Africa, which is the major supplier for the annual U.S. consumption of about 3.9 million ounces. Annual production from the mine is expected to be approximately 2.5 percent and 7.5 percent of the annual U.S. consumption of platinum and palla dium, respectively.
A cooperative study by the USGS and the Stillwater Mining Company was initi ated to examine the spatial geometry and geochemistry of platinum-group-element (PGE) mineralization of the J-M Reef by using drillhole and underground informa tion from the Minneapolis Adit mine. These investigations are in part continuations of many earlier investigations in various parts of the Stillwater Complex during the last century by the USGS, industry, and acade- mia. PGE mineralization in the J-M Reef appears to be very irregularly distributed. Characterizing and understanding the type of distribution are critical to mining and thus are being investigated by use of three- dimensional display systems and statistical analysis.
Detailed mineralogical studies of the residence of the platinum-group elements,
28 U.S. Geological Survey Yearbook 1987

using the scanning electron microscope in combination with other techniques, demon strated that minerals containing tellurium, arsenic, sulfur, antimony, bismuth, tin, and mercury are important in controlling the distribution of the platinum-group ele ments. In order to examine the relations of platinum-group minerals to their stratigra- phic setting, it was necessary to develop rapid, precise, and extremely sensitive analytical techniques. Two techniques were evaluated that determine tellurium down to 10 parts per billion in solid geolog ical samples. One of these techniques has an ion exchange preconcentration step, and the other has a solvent extraction precon centration step. Both of these techniques were followed by a graphite furnace atomic absorption measurement. Techniques to determine tin and bismuth at similar low levels are being developed based on the ion-exchange procedure. Procedures have also been developed for determining the lower limits of arsenic and antimony. The development of these techniques with lower levels of determination is necessary because the platinum-group elements that are being mined occur at the part per billion to part per million level. Preliminary eval uation of a limited data set indicates corre lations between the trace elements and platinum-group elements.
In addition to providing the data required for understanding the setting of the J-M Reef, these new techniques will increase the accuracy and reliability of other assessment programs for precious metals.
Answers from Deep Inside the Earth: Continental Scientific Drilling at Cajon Pass, California
By David P. Russ
Drilling of a 12,000-foot-deep scientific well has been completed at Cajon Pass in southern California to measure crustal
properties, to determine crustal structure, and to better understand the generation of earthquakes along the San Andreas fault. A joint effort of the National Science Foun dation (NSF) and the U.S. Geological Sur vey (USGS), the well was begun in Novem ber 1986, and is one of the first projects to be undertaken in the new national Conti nental Scientific Drilling Program. This program aims to enhance our knowledge of the composition, structure, dynamics, and evolution of the continental crust and of how these factors affect the origin and distribution of mineral and energy resources and natural phenomena such as volcanic eruptions and earthquakes.
Most of the world's earthquakes occur in relatively narrow bands that mark the boundaries between sections of the outer shell of the Earth. These sections, known as plates, are driven by the internal heat of the Earth and move slowly and inexorably with respect to one another. The boundary between the Pacific Plate and the North American Plate is located in California and forms the San Andreas fault system (fig. 5). The relative motion between these two plates is horizontal, and the rate of move ment is about 2 inches per year. In other words, each year Los Angeles moves about 2 inches closer to San Francisco. Along the San Andreas fault the plates move past each other at a steady rate, but at many places in the upper 5-10 miles of the crust the brittle character of the rocks causes the fault to lock, preventing motion and pro ducing a buildup of stresses. When the accumulating stress exceeds the strength of the rocks bounding the fault, the rocks suddenly slip. This slipping action allows the surface rocks to snap to a new position, in effect catching up with the subsurface rocks and, at the same time, producing the strong shaking that constitutes an earth quake.
Though field and laboratory studies of fault slip have been underway for years, the mechanics of the slip process are still not well understood. For instance, a long standing question exists concerning the significance of low levels of heat flow along the trace of the San Andreas fault where friction associated with fault motion might be expected to produce relatively higher geothermal levels than those measured from the rocks in the surrounding region. Generally referred to as the stress-heat- flow paradox, the measured levels of heat
Significant Accomplishments of Research Programs: 1987 29

Figure 5. (Above) Surface trace of the San Andreas fault in western California. Arrows show direction of plate motion. (Below) Parker Drilling Com pany rig on site at Cajon Pass.
Locked sections
Cape Mendocino
---- Free sections
-38° N
San Francisco Redwood Gt V NORTH . V-,\ . V AMERICAN
\T\ X 36° N
PACIFIC PLATE
0 100 200 MILESI h '
0 100 200 KILOMETERS
flow would suggest that the fault slips at low-shear stresses, on the order of 200 bars (1 bar is approximately equal to 1 atmo sphere) or less, thus implying a weak fault. Basic faulting theory, laboratory experi mentation, and in-situ stress measurement by the hydraulic fracturing method sug gest, in contrast, that the average shear stress resisting plate motion is about 750 bars, suggesting a strong fault.
Resolving this paradox is important to the fundamental understanding of the physics governing fault mechanics, the magnitude of the stresses that drive the crustal plates, and the generation of earth quakes. To address these and other scien
tific questions, NSF-supported university scientists and USGS scientists and engi neers are collaborating in a two-phase pro gram of deep drilling into rocks adjacent to the San Andreas fault at Cajon Pass, Cali fornia, northwest of San Bernardino (fig. 5). This location was chosen because of the availability of a site close to the fault with a relatively unfractured and unaltered body of rock in which to make important meas urements and because of its critical location as the end point of the fault rupture during the last great earthquake in southern Cal ifornia (1857).
Funds for the drilling and overall proj ect management were provided by Deep Observation and Sampling of the Earth's Continental Crust, Inc. (DOSECC), a non profit university consortium under contract to the National Science Foundation. The principal investigator for the project is Dr. Mark D. Zoback of Stanford University; co-investigators are from the USGS and other universities.
The first phase of drilling of the Cajon Pass well was completed in April 1987 at a depth of 6,938 feet. Samples of rock cut tings were collected every ten feet, and 33 rock cores, totaling 269.5 feet in length, were recovered (fig. 6). The USGS has provided sample and core handling, distri bution, and curatorial facilities and person nel. Working in an on-site laboratory con structed especially for this project, USGS technicians have marked and tested sam ples and photographed the rock core. Under the direction of the California Insti tute of Technology, scientists have pre pared a comprehensive descriptive log of the cuttings and core. Geophysical logs have been obtained through both commer cial contract and university and USGS researchers.
The logs and rock cuttings show that the well first penetrated 1,625 feet of sand stone, siltstone, and clay stone of Tertiary age (2-63 million years old), followed by a complex assortment of crystalline base ment rocks composed largely of sheared granite, granodiorite, and gneiss. Analyses of these rocks, of the geophysical logs, and of seismic-reflection profiles are central to broadening our understanding of the his tory and interrelationship of basement ter- ranes, particularly the nature and extent of
30 U.S. Geological Survey Yearbook T987

Figure 6. Rock cores are washed, measured, photo graphed, and slabbed at the USGS sample-handling facility at Cajon Pass, California. Seg ments of the core are distrib uted to university and govern ment scientists for analysis and testing, and the remainder of the core is shipped to the USCS Drill Core Repository in Lakewood, Colorado.
microplate accretion and associated low- angle structures along the western margin of North America and the degree of uplift and exposure of deeper levels of the crust in the California Transverse Ranges.
Hydrofracture stress measurements, conducted jointly by scientists and engi neers from the USGS and Stanford Univer
sity during phase one of the drilling, have resulted in the determination of in-situ stress magnitudes and orientations (fig. 7). The measurements show that the orienta tion of the maximum principal stress is perpendicular to the San Andreas fault and that there is a transition from a near- surface extensional stress regime to a more
Figure 7. In-situ measurements at the Earth's stress field at Ca jon Pass have required the de velopment of special high- pressure hydraulic equipment in order to artificially crack the rocks at depths of more than 10,000 feet. Stress measure ments made by the USCS and university scientists provide data for determining the strength of the San Andreas fault in the deep Earth zones where earthquakes begin.
Significant Accomplishments of Research Programs: 1987 31

compressional regime at depth. This stress orientation is quite different from that expected for a fault that slips horizontally, but it is consistent with the orientation of stress-induced borehole elongations identi fied in the well and with the orientation of stresses that have produced many of the recent earthquakes in the region. The stress orientation also accounts for the widespread occurrence of geologically youthful folds and reverse faults that par allel the San Andreas fault. Scientists pro pose that crustal compression perpendicu lar to the fault is the result of "extremely low shear strength of the San Andreas fault, consistent with the observation of low heat flow in the area of the fault. Temperature and heat-flow measurements have been made in the well and do not show a geothermal anomaly. Stress and heat- flow measurements will provide critical information for establishing data trends necessary to resolve the stress-heat-flow paradox.
In addition to stress and heat-flow studies, hydrologic and geochemical stud ies are being conducted on fluid samples collected in the well. Preliminary meas urements are being made of rock pore pressure and permeability. Analyses of the fluid samples indicate that the well has penetrated two separate fracture systems that are only slightly interconnected. Mea surement of fluid flow through the rocks will provide the data needed to determine the role of water in reducing the frictional resistance of rocks to faulting and in dissi pating subsurface heat generated by earth quakes.
Phase two drilling of the Cajon Pass well deepened the drillhole from 6,938 to about 12,000 feet. About 10 percent of the well will be cored at specified intervals, and more rock cuttings and fluid samples will be collected. Samples will be examined for evidence of subhorizontal faults and will be analyzed to reconstruct the area's geologic and tectonic history. Hydrofracture and holographic stress measurements will be made to calculate the amount of stress and to determine whether or not the orienta tion of the stress field changes with depth or has been affected by the presence of nearby shallow faults. Geological, hydro- logical, and geophysical measurements will continue to be made to resolve the many remaining scientific questions.
The USGS will assume control of the well sometime in the future and, in collab oration with university scientists, will begin to develop equipment to establish a permanent deep Earth observatory prima rily for earthquake prediction purposes. This monitoring will provide a long baseline of reliable scientific data valuable for iden tifying precursors of the next large south ern California earthquake.
International Inventory of Platinum-Group- Metals Resources and Production
By David Sutphin
In March 1987, the Minneapolis Adit mine began producing platinum-group met als from the Stillwater Complex in Mon tana. This mine, which is the first major platinum-group-metals mining operation in the United States, could eventually supply about 10 percent of annual U.S. consump tion of approximately 3.9 million ounces. The U.S. currently relies on foreign sources for 98 percent of this annual con sumption. The platinum-group metals, platinum, palladium, rhodium, ruthenium, iridium, and osmium, are of strategic importance to the Nation because their unique chemical, physical, and mechanical properties are essential to many industrial processes. The current U.S. dependence on foreign sources for these much-needed metals makes domestic resource research and production an important national priority.
The U.S. Geological Survey and the U.S. Bureau of Mines participated with earth-science and mineral-resource agen cies of Australia, Canada, Germany, South Africa, and the United Kingdom in a coop erative effort that reviewed worldwide platinum-group-metal resources and pro duction. This study was undertaken by the International Strategic Minerals Inventory (ISMI), which has as its goal the collection,
32 U.S. Geological Survey Yearbook 1987

analysis, and dissemination of information on major world deposits of selected strate gic mineral commodities. Through this effort, the six participating nations obtain reliable information on production and resources that improves the basis for sound policy decisions, avoids duplication of effort, and encourages scientific exchange between countries.
The study found that of the world's 23,000 metric tons of known economically minable resources of platinum-group met als, more than 98 percent are in South Africa and the Soviet Union. The U.S. and Canada combined have most of the remain der of the economic resources of these metals. Colombia and Zimbabwe also have economic deposits. Another 62,300 metric tons of platinum-group metals are esti mated to occur in deposits that are uneco nomic to recover or in less well-known extensions of identified deposits. Addi tional minor or less well-known deposits have been discovered in several countries including Australia, Brazil, Chile, China, Finland, and Zaire.
The platinum-group metals are chemi cally inert, have high melting points and high ductility, and exhibit extraordinary catalytic activity. They are used in process ing petroleum and other fossil fuels, in ammonium oxidation to produce nitric acid
for fertilizers, and in other chemical pro cessing, as well as in emission controls for automobiles and industrial processes. Other uses are in fuel cells, electrical and electronic hardware, jewelry, and medical and dental applications. Over 95 percent of these metals consumed in the U.S. are used for industrial applications. To date, the scientific effort that has gone into finding substitutes has met with little success, and demand for platinum-group metals is likely to increase as a result of Australia, Europe, and South Korea implementing automobile emission standards similar to those in the United States.
The world's most important deposits (fig. 8) of platinum-group metals are asso ciated with magmatic intrusions of mafic or ultramafic rocks and fall in three main categories: stratiform deposits such as the Bushveld Complex in South Africa and the Stillwater Complex in the U.S.; a unique intrusion at Sudbury, Canada, which was probably initiated by the impact of a mete orite; and nickel-copper-bearing dikes and sills, which are found in association with rift structures such as Noril'sk-Talnakh district in the Soviet Union. Placer depos its, such as those in the Upper San Juan and Atrato Rivers in Colombia, in the past contributed a major part of platinum-group metal production. Stratiform deposits are
f>.
SOVIET UNION Noril'sk-Talnakh district (1) Pechenga district (1)
. J,_>>;H_. i 'r/rx'-f V"*#
crV^^-0
Base Irom Bundesanstall liii Geowissenschalien und RohsioTI Boundary and names representation not necessarily aulhociiai
, SOUTH AFRICA Bushveld Complex (6)
NWltwatersrand (1)
Symbol
EXPLANATIONGeologic deposit type
PlacerResources (metric tons)
Unreported
Magmatic Symbol Resources (metric tons)
>10,000
1,000-10,000 <1,000
Figure 8. Location, deposit type, and estimated resources of ma jor platinum-group-metal de posits and districts in the world. Numbers in parentheses indi cate number of deposits and districts for each location.
Significant Accomplishments of Research Programs: 1987 33

mined principally for their platinum-group metals, with nickel, copper, and cobalt being by-products. In other deposit types, except for some placers, platinum-group metals are byproducts of nickel and copper mining.
The six countries having major platinum-group-metal deposits have ac counted for 99.5 percent of world produc tion of over 4,250 metric tons from 1735 to 1983 (the latest year for which interna tional production statistics are available). The Soviet Union has accounted for nearly one-half of this production and 56 percent of the 202 metric tons of platinum-group metals marketed in 1983. Soviet sales do not reflect world demand but do reflect the relative independence of the Soviet Union in the world market at a particular time. About one-third of cumulative production and 41 percent of 1983 production took place in South Africa.
Sharp increases in production from South Africa and the Soviet Union from 1940 to 1980 caused the proportion of platinum-group-metal production account ed for by other countries including Canada, Colombia, and the United States to fall from 53 percent in 1940 to 7 percent in 1980. Canada's proportion alone went from 43 percent in 1940 to 6 percent in 1980 despite a two-fold increase in output.
On the basis of identified resources, it is apparent that through the year 2020, the Sudbury Complex, NoriPsk-Talnakh dis trict, and Bushveld Complex will probably continue to be significant producers, and the Stillwater Complex will become a sig nificant producer. However, continued exploration and development of deposits, such as the Penikat layered intrusion (Fin land) and Jinchuan deposit (China), and the potential discovery of other stratiform deposits could dramatically change the sup ply situation by 2020.
Orthophotographs From Digitally Processed Images
By Leonard GaydosOrthophotographs combine the image
qualities of a photograph with the geomet ric qualities of a map and serve a variety of purposes, from interim maps to field refer ences for forest firefighters. Since 1985, the Survey has been developing a new method for producing Orthophotographs using completely digital techniques.
A digital image is created by scanning a color-infrared aerial photograph through blue, green, and red filters on a film scan ner. These data are matched with a digital elevation model of the same area. Com puter software then rectifies the image by comparing measurements from the original photograph and the digital elevation model data to remove relief displacement. The software used is DPSOR (Digital Photo- grammetric System Orthophoto), which is installed on a Gould 32/9780 computer at the Survey's Western Mapping Center in Menlo Park, California.
After rectification, the digital ortho- photographs are further processed at the Survey's Earth Resources Observation Systems Data Center in Sioux Falls, South Dakota. There, the images are enhanced to improve color balance, and the adjoining digital Orthophotographs are mosaicked together to complete map quadrangle cov erage. The final product is generated on film, then enlarged on a copy camera to either 1:12,000 or 1:24,000 scale.
Research continues into the use of the technology in the map revision process and as high-resolution multispectral data sources for geographic information systems.
34 U.S. Geological Survey Yearbook 1987

An example of an experimental digital orthophotograph pro duced by the U.S. Geological Survey. The area shown is in the southwest quarter of the McCall, Idaho, 7.5-minute quadrangle. The image is color infrared and shows the north fork of the Payette River flowing south out of Payette Lake. The McCall Airport south of the lake and the municipal golf course east of the lake are clearly visi ble. The wakes of many boats can be seen on the lake.
Significant Accomplishments of Research Programs: 1987 35

Geographic
Information Systems
Aid Mineral
Investigations
By John L. Place, Lawrence G. Batten, and Charles M. Trautwein
The U.S. Geological Survey has been automating its mapmaking procedures and in the process is creating base category data for inclusion in geographic information systems. A geographic information system is a computer hardware and software sys tem designed to collect, manage, analyze, and display spatially referenced data. Data features may be points (wells, schools), lines (roads, streams), or polygons (coun ties, forests).
There has been a marked increase in the use of geographic information systems for interdivisional research within the Sur vey. Recently, a 5-year program of re search, development, and application of geographic information systems for proc essing geoscience data was completed through a cooperative investigation con ducted by the Survey's Geologic and
National Mapping Divisions. The investiga tion required the definition and develop ment of sophisticated data processing algo rithms to digitally compile, analyze, and combine the various geological, geochem- ical, and geophysical data that are used to assess mineral resources. The resulting technology was then used to evaluate sev eral I°x2° quadrangles selected from the Conterminous United States Mineral Appraisal Program. In each of the quad rangles, quantitative models based on the characteristics of different types of mineral deposits and spatial relationships between the digitally compiled data sets and known mineral occurrences were used to describe favorable areas for the occurrence of addi tional reserves (fig. 9).
Geographic information systems are particularly useful in processing large amounts of geographically referenced earth-science data because of the systems' ability to efficiently analyze, overlay, and graphically display a variety of related data. In the cooperative investigation, USGS scientists were able to develop and successfully demonstrate the systems' automated, computer-based capabilities to (1) construct complex geoscience models that describe regional mineral resource potential; (2) apply mineral resource mod els to large, multivariate, digital data sets; (3) edit, modify, and reevaluate assessed mineral potential on the basis of updated or
Figure 9. Computer-generated map showing the results of modeling geological, geochem- ical, geophysical, and mineral- resource data within a geo graphic information system to describe favorable environ ments for base- and precious- metal mineralization in the Oil- Ion, Montana-Idaho, 7°x2° quadrangle. The color-coded summary classifies areas as hav ing very high (red), high (green), moderate (blue), or low (gray) potential for undiscov ered vein-type mineral deposits.
36 U.S. Geological Survey Yearbook 1987

new types of geoscience data; and (4) gen erate products in digital (computer- compatible), tabular, and cartographic formats.
On the basis of these findings and associated benefits, geographic information system technology is being installed at USGS regional centers for operational use in mineral-resource-related and allied geo science investigations.
Advancements In Data StructuresBy Stephen C. Cuptill
The keystone of making maps with computers lies in having a set of informa tion in the computer that represents, in a digital form, the information to be shown
Table 1. Example information for the map shown in figure 10
AreasID#
1 2 34 5 67
AttributeMap exterior Park
Null Null Null
Lake Null
LinesNode
ID#123456789
10111213141516
AttributeMap borderMap borderMap borderMap borderMap borderMap borderMap borderMap borderMap borderMap borderBoundaryRiverRoadRoadRiverShoreline
Coordinates5,65....,25,65...,35,65...,65,65...,65,53...,65,5....,55,5....,5,5.......5,23....,5,45....,25,65...,35,65...,5,23....,38,40....38,40...,35,55....
..25,65
..35,65,.65,65,.65,53..65,5..55,5
5 5..5,23,.5,45..5,65..5,45..38,40,.38,40,.65,53,.55,5,.35,55
Start123456789
10239
111114
End23456789
101
101111
57
14
AreaLeft
1111111111353577
Right2355774432234746
NodesID#
123456789
1011121314
AttributeNullNullNullNullNullNullNullNullNullNull
RiverHouseHouse
Null
Coordinates5,6525,6535,6565,6565,5365,555,55,55,235,4538,4028,2833,3135,55
Significant Accomplishments of Research Programs: 1987 37

Figure 10. A sample map is shown divided into its compo nent node, line, and area fea tures.
1 2 3
Table 2. Description of map features
FeaturesID#123456789
AttributeParkLakeRiverRoadShorelinePark boundaryMap borderHousesBridge
Composed ofArea 2Area 6Lines 12, 15Lines 13, 14Line 16Line 11Lines 1-10Nodes 12, 13Node 14
on a map. This set of information includes not only the coordinate data required to draw a graphic product but also informa tion about the various features shown on the map (for example, the number of lanes of a highway) and their relationships to each other (for example, that the railroad tracks lie between the stream and the highway). This collection of information forms the heart of a digital cartographic data base. Once the information is in the data base, computers provide the capabili ties to handle geographic data in ways that were previously impossible.
Mathematically, a map can be treated as a graph and the elements of that graph
can be defined using graph theory. The various elements of a map are subdivided into nodes, lines, and areas. Nodes repre sent the beginning or ending of every line in the graph and occur at the intersection of linear features. Lines are ordered sets of points that describe the location and shape of a linear feature or boundary on the map. Areas are portions of the map that are bounded by lines. Figure 10 illustrates these components, and table 1 lists the types of information that are encoded in a computer to represent these data. This example illustrates how information is stored in the present digital line graph data structure.
Recently some advancements have been made to the data structure. The changes involve removing the attribute information from the area, line, and node components and placing it with the feature. The features then describe the various components of which they are composed. Table 2 illustrates this.
The new design allows users of the data to more readily access the descriptions of the features contained in a cartographic data base. For example, the various parts of the feature "Potomac River," such as the Georgetown Channel, Tidal Basin, and Washington Channel, would all be retrieved when a user requested the Poto mac River.
Thematic Mapping Using Automated Processes
By Donald C. Orr
Information needs within the U.S. Geological Survey and the Department of the Interior require the ability to handle a wide variety of disparate data. Several cooperative projects are underway that make use of digital data bases, spatial data analysis techniques, and sophisticated automated systems to create thematic dis plays and custom products for a wide range of applications (fig. 11).
The Survey's National Mapping Divi sion and Water Resources Division have
38 U.S. Geological Survey Yearbook 1987

Geodata Sets
TopographicCartographicRemote SensorGeologicGeophysicalGeochemicalPedologicetc.
Digital Data Base Spatial Data Analysis Applications Evaluation of mineral
resource potential
Assessment of irrigation potential
Alternate management opportunities on arid lands
Wildlife habitat assessment
etc.
Figure 11. Flow diagram illustrat ing input of various types of data, development of a data base of registered data sets, and spatial data analysis used in generating thematic information and products for multiple applications.
been cooperating in the development of automated processing procedures for deriving hydrologically related terrain characteristics from digital elevation model data for an area in the James River basin in North Dakota. The high-resolution data were processed to identify surface depres sions, depth-area-volume relationships, drainage basin boundaries, drainage lines, and land surface elevations in glaciated pothole terrain for use in a rainfall runoff model being developed by the Bureau of Reclamation.
The USGS and the Soil Conservation Service are conducting a cooperative research project to incorporate the Soil Conservation Service's State General Soil Geographic data base (STATSGO) into a geographic information system to develop techniques and procedures to archive, reproduce, and distribute l:250,000-scale digital soils data. Other types of data being incorporated into the geographic informa tion system data base include land use and land cover data, hydrographic data, politi cal boundaries, transportation, and digital topographic data. The Chesapeake Bay watershed was selected as the study area to demonstrate the soils data base concept and to produce a variety of thematic dis plays and products.
During the past 5 years, the Survey's office in Anchorage, Alaska, has worked cooperatively with Federal and State resource management agencies to produce land cover and terrain maps for 245 million acres of Alaska. This land cover mapping effort integrates digital Landsat data, ter rain data, aerial photographs, and field data by using advanced spatial data proc essing techniques. The land cover and ter rain maps and associated data bases pro duced from this effort are used for resource assessment, management, and planning by the U.S. Fish and Wildlife Service, the U.S. Forest Service, the Bureau of Land Management, and the Alaska Department of Natural Resources. The digital data
bases are used in a variety of applications from comprehensive refuge planning to multiphase sampling procedures for state wide vegetation inventories.
HydrologicDevelopment of Playa Lake Basins in the Southern High Plains
By Warren W. Wood
Most of the more than 25,000 shallow playa lake basins on the southern High Plains of Texas and New Mexico probably have developed by subtle hydrologic proc esses of dissolution and micropiping (ero sion below the land surface that is caused by water moving through the aquifer). Recognition that these basins were devel oped by, and are related to, hydrologic processes illustrates the dynamic role of ground water in geomorphic processes and provides insight into mechanisms of recharge and potential contamination path ways of a major aquifer system in the United States.
Hypotheses about the origin of these playa lake basins include buffalo wallows, meteorite impacts, dissolution of deeply buried salt, and wind blowouts. Hydrolo- gists of the USGS studying geochemistry of gases in the unsaturated zone in the southern High Plains observed a carbon-dioxide-concentration distribution, a carbon-isotope composition, and carbon- dioxide outflow that could only be explained by particulate organic materials entering the unsaturated zone along with recharging surface water.
This conclusion ultimately led to a hypothesis that playa basins developed by
Significant Accomplishments of Research Programs: 1987 39

Aerial photograph of the p/aya lake area in the Southern High Plains of West Texas in early spring. (Photograph by Warren W. Wood, U.S. Geological Survey.)
movement of clay and silt-sized organic and inorganic material from the surface into the unsaturated zone, thus enlarging the vol ume of the basin. The organic material introduced into the unsaturated zone oxi dized to form carbon dioxide, which reacted with water to form carbonic acid. The acid in turn dissolved calcium carbonate cement in the aquifer. Dissolution of carbonate minerals provided additional void space for material transported from the surface and also caused the destabilization of the skel etal framework of the aquifer that pro motes subsidence and micropiping, which further enlarged the catchment area of the basin.
The proposed hydrologic model of the development of the basins explains their distinct alignment along lineaments, their presence in an active drainage system, their propensity to form a circular shape, and the lack of saline-mineral buildup in the lacustrine sediment. The model also explains their development anywhere on a hillslope, the absence of leeward dunes at most of the basins, the dissolution of caliche below many of the basins, and other fea tures that have been difficult to explain with other hypotheses.
The measurement of seemingly unre lated gases in the unsaturated zone has provided a solution to a vexing geomorphic problem and useful insight into the hydrol ogy of a major aquifer system. The recog nition that as much as 80 percent of the water that collects in the basin is recharged to the aquifer, rather than evaporating as had been previously assumed, provides insight on how the Ogallala aquifer receives recharge in the Texas-New Mexico area and calls for care in using playa lake basins for the disposal of waste products.
Earthquakes and Ground Water: Water Wells as Strainmeters
By John D. Bredehoeft
As part of an extensive earthquake prediction experiment that the U.S. Geo logical Survey is conducting in the Park-
40 U.S. Geological Survey Yearbook 1987

field, California, area, scientists drilled a network of water wells at seven sites in the vicinity of Parkfield to monitor water lev els. These wells, which are being continu ously monitored, have turned out to be very sensitive volume strainmeters.
At all of these sites, water levels are monitored at depths ranging from approx imately 289 to 820 feet. Six of the deeper wells show clearly identifiable tidal signals that range from one to several inches in amplitude. A shallower water level, less than 164 feet in depth, is also measured at five of the sites. At these seven sites, barometric pressure, rainfall, and water levels are measured every 15 minutes. Data are accumulated for 4 hours and then transmitted, via GOES satellite, over a USGS data network to the Survey offices in Menlo Park, California, where the data are analyzed with the intent of using this information as an indicator for predicting the next Parkfield earthquake, which has been forecast to occur between 1985 and 1993 and most probably in 1988.
The clearest tectonic event observed to date, using water-level data, was an earthquake at Kettleman Hills near Coa- linga, California, that occurred in August 1985. This earthquake epicenter was about 23 miles to the east of the four Parkfield wells that were in operation at the time. A coseismic drop in water level was observed in each of the four wells. Using a simple computer model, USGS hydrologists calcu lated what the expected water-level change would have been in the four wells. The simple-model calculations computed a response within a factor of 2 for all of the wells. This close correlation was a pleasant surprise, since the geology between Kett leman Hills and the four wells is quite complex; in fact, one of the wells is situated across the active trace of the San Andreas fault from Kettleman Hills.
In addition to the Kettleman Hills co seismic water-level changes, a number of water-level changes have been observed that correlate with observed surface-creep events. One of these events, in February 1987, was followed in the next 12 hours by a sequence of small earthquakes in the vicinity of the wells. These correlated events, along with similar well-documented experience of the Chinese and calculations from a number of fault-mechanics computer models, suggest strains may well be pre cursors to earthquakes. Interestingly, the
water-well strain information from several creep events suggests that the strains may be larger at depth than the surface creep- meters can register.
The water-well strain network at Parkfield is gradually being expanded. Four or five more wells, in addition to the seven currently being monitored, are planned for the network. One well, a 5,250- foot-deep exploratory oil well (no signifi cant oil found), is being reopened by the USGS. It is located less than a mile east of the fault near Parkfield. This well has a substantial well-head pressure of approxi mately 125 bars (1,800 pounds per square inch).
The water well is proving to be an interesting and sensitive volume strain- meter. Wells drilled in any number of geo logic settings can have good Earth-tide fluctuations, indicating good sensitivity to strain. The only requirement is a confined aquifer and enough permeability so that the well will fluctuate at tidal frequencies twice daily. The success of water wells as strainmeters is an encouraging and excit ing development for earthquake prediction, as well as for other aspects of engineering geology and rock mechanics.
Topographically Influenced Air Circulation in Open Boreholes at Yucca Mountain, Nevada
By Edwin P. Weeks
Topographically influenced air circula tion may occur through the fractures in unsaturated rocks that form Yucca Moun tain in Nevada. These highly fractured rocks are under consideration by the U.S. Department of Energy as the host medium for a potential high-level radioactive waste repository, and this circulation phenome non may affect their suitability for such usage.
During winter, cold, dry air enters the highly fractured outcrops along hillsides, picks up heat and moisture, and then exits through the hillcrests because the warm,
Significant Accomplishments of Research Programs: 1987 41

moist air in the rocks is less dense than the air in the surrounding atmosphere. During summer, the flow reverses to some extent, with hot, dry air entering the rocks at the hillcrest, losing heat to the cooler rocks, and exiting through the hillside outcrops. In each case, the air entering the mountain is generally drier than the air exiting, resulting in a net drying effect. This effect may be sufficient to dry the rocks to below the moisture content at which water drains by gravity, reducing the potential for deeply percolating water to leach radionu- clides from the wastes and transport them to the ground-water reservoir. A negative aspect of this air circulation process is that gaseous radionuclides would be trans ported to the atmosphere more quickly than if gaseous diffusion were the only transport mechanism for such releases.
The potential for this effect was first recognized from dramatic air exhaust observed in two boreholes drilled in unsa- turated rock at the crest of Yucca Moun tain. During winter, these wells typically discharge warm, moist air into the atmo sphere at a velocity of about 10 feet per second. These discharges varied with time but were continuous from the two wells to the atmosphere over a 10-day observation period in February 1986. Net water-vapor discharge from the formation through the wells was calculated to be about 66 gallons of water per day. Although summertime circulation was much less, oscillating between air intake to the wells and exhaust from the wells at velocities no greater than 5 feet per second, summer drying effects are substantial.
Research Related to
Radioactive-Waste Disposal in Bedded- Salt Environments
By Peter B. Davies
Current USGS research on radio active-waste disposal in bedded-salt envi ronments is focusing on understanding the ground-water flow system in the vicinity of a waste-repository site in southeastern New Mexico. The Waste Isolation Pilot
Plant (WIPP) is a U.S. Department of Energy project that is intended to provide a facility both for the permanent disposal of approximately 6 million cubic feet of trans- uranic waste from defense-related activi ties and for research on the interaction of high-level waste with a bedded-salt envi ronment. In the event of a repository breach, ground-water flow would provide the primary method for transporting radio nuclides beyond the immediate site area.
Ground-water flow in bedded-salt environments is complex. Dissolution of highly soluble evaporite minerals creates substantial spatial variation in fluid den sity. Under these conditions, ground-water flow is driven not only by fluid-pressure differentials but also by gravitational forces. Standard techniques for analyzing and simulating ground-water flow are based on the assumption that the effects of density-related gravity are insignificant.
Recent Survey research has produced an analytic technique for assessing the rel ative magnitude of such gravity effects in variable-density flow systems. Application of this new technique to the bedded-salt environment in the WIPP area, coupled with variable-density computer simula tions, has revealed significant errors in the flow patterns predicted by standard tech niques. In a critical area along the flow paths leaving the site, flow directions pre dicted in previous studies may be in error by as much as 170 degrees and flow mag nitudes may be underestimated by as much as a factor of 10.
The primary conduit for ground-water flow in the WIPP area is a 26-foot-thick dolomite unit. Until recently, this dolomite unit was thought to be vertically isolated from other components of the flow system. Transient cross-sectional flow simulations have demonstrated the importance of small but significant vertical fluxes in the dynam ics of flow within both the dolomite unit and the total flow system. In addition to simu lating ground-water flow, USGS personnel are currently assessing the geochemical characteristics of the ground-water flow system using a recently developed com puter program specifically designed to characterize chemical variations in the highly saline waters that are characteristic of bedded-salt environments.
As a result of the WIPP project research, techniques have been developed that have broader application to the under-
42 U.S. Geological Survey Yearbook 1987

standing of ground-water flow in other bedded-salt environments and to the com mercial radioactive-waste disposal pro gram. The research on variable-density ground-water flow also is applicable to the evaluation of localized hazardous-waste sites in which high concentrations of dissolved-waste constituents produce sig nificant changes in fluid density.
Removing Organic Contaminants from the Subsurface by Inducing Air-Phase Transport
By Arthur L Baehr
Toxic organic liquids such as gasoline and industrial solvents enter the subsur face in a variety of ways, including leakage from underground storage tanks and acci dents involving pipelines and tank trucks.
Release to atmosphere
Remedial action generally includes an effort to physically recover the spilled product; however, significant quantities of the spill can remain trapped between soil particles. Unfortunately, the threat posed to ground water may persist even if the organic liquid is immobilized in the unsatu- rated zone because the solubilized portion of the spill can later enter ground water during recharge or during high stages of a fluctuating water table. Thus, in environ mentally sensitive areas, a secondary recovery method is required to reduce the possibility of ground-water contamination.
Many organic substances exhibit sig nificant volatility; thus they could be removed by inducing air movement in the unsaturated zone. An air-flow field can be established in the unsaturated zone by using paired boreholes through which air can be injected and withdrawn. Air laden with organic vapors moves along the induced flow path toward boreholes where it is withdrawn, analyzed, treated, and (or) released to the atmosphere, thus removing the contaminant from the subsurface. This fledgling technology has been successfully used to remove gasoline hydrocarbons and chlorinated solvents from unconsolidated unsaturated zones. Further research is
Injected air
1,^-Ly) Injected Air
Immiscible plume
Vapor transport ''W#i
to' iiiiiiliii;!:;:;:;:;borehole
V- Water Schematic of an air venttable system.
Significant Accomplishments of Research Programs: 1987 43

required, however, to advance the under standing of processes that govern the transport of organic vapors, to predict cost effectiveness, and to design optimal vent ing systems.
The USGS is currently pursuing a col laborative research effort with the Depart ment of Civil Engineering at the Univer sity of Connecticut. Sand columns residually saturated with gasoline were vented under steady flow conditions. A mathematical-transport model analysis of the hydrocarbon removal rates from these columns supports the conclusion that the success of venting technology will not be limited by local rates of phase transfer (from a liquid to a vapor phase) but rather will ultimately depend on the ability to establish an air-flow field that intersects the distributed contaminant. A mathemat ical model of compressible-fluid flow through unsaturated porous media has been developed and is currently being applied to evaluate unsaturated-zone per meability so that design of optimal borehole configurations can be determined.
Portion of a color composite of Landsat Thematic Mapper bands 2, 4, and 7, showing area near Lake Powell, Arizona-Utah
44 U.S. Geological Survey Yearbook 1987

National Mapping Program
HighlightsDigital Mapping Supports the 1990 Census
By Patricia P. Dunham and Bruce Y. McKenzie
When the Nation's census takers set out to gather information for the 1990 Decennial Census of Population and Hous ing, they will be assisted by the results of a cooperative effort between the U.S. Geo logical Survey and the U.S. Bureau of the Census.
In June 1987, the Survey completed a 4-year cooperative effort with the Bureau of the Census to establish a l:100,000-scale digital cartographic data base of hydrogra phy and transportation information. The Bureau of the Census will use these digital cartographic data .files as the cartographic base for their automated geographic sup port system, the Topologically Integrated Geographic Encoding and Reference (TIGER) System, to support data collec tion for the 1990 Decennial Census. The TIGER System will also support future demographic and economic data collection, processing, and tabulation activities of the Bureau.
The Survey will make the 1:100,000- scale hydrography and transportation digi tal data available to users through the National Digital Cartographic Data Base. The completion by the Survey of the l:100,000-scale digital data provides a framework for use in other geographic information systems. The nationwide digi tal data coverage at this scale combines the qualities of sufficient detail and adequate content for use in regional applications, such as mineral resource analyses, hydro- logic analyses, and management planning. When the census information becomes available in the 1990's, researchers will also have access to vast amounts of socioeco- nomic data, which may serve as a catalyst
for the widespread use of geographic infor mation systems technology in the United States.
Preliminary discussions between the USGS and the Bureau of the Census began in late 1981, and, following a series of research projects, the Survey's 1:100,000- scale cartographic data in digital form was selected as the most suitable base for the Census enumerator data-collection maps (fig. 1). In early 1983, a cooperative digital pilot project was initiated that enabled the two agencies to develop and test new soft ware and equipment, expand production capacities, and enhance data processing techniques to collect and use the digital data. The success of the pilot project led to the commitment by both agencies to complete the collection of l:100,000-scale hydrography and transportation digital data for the conterminous United States by mid-1987. Meeting this stringent deadline required both agencies to implement com plementary digital production systems.
The base graphic product to be used for digital data collection was the Survey's l:100,000-scale map series. When the coop erative digital effort began in 1983, this series consisted predominantly of topo graphic (contour) editions, and only 960 of the required 1,823 maps were available for digitizing. To provide the remaining base maps, the compilation emphasis was shifted to produce planimetric (without contours) editions. This change, coupled with increased personnel resources, enabled conterminous United States l:100,000-scale planimetric coverage to be achieved in October 1986, 5 years ahead of the original goal for this map series.
To meet the digital production dead line, both agencies implemented high- volume digital production systems. The USGS had the responsibility for digitizing all hydrographic and transportation fea tures from the l:100,000-scale graphic maps and assigning feature classification codes to all data except roads. The Bureau of the Census was responsible for assigning feature classifications to roads. To handle
National Mapping Program 45

1990 DECENNIAL CENSUS PRELIST MAP ARA 1008
BASE MAP GENERATED USING DIGITAL DATA OBTAINED AT 1'100,000-SCALE THROUGH A COOPERATIVE PRDCRAr WITH THE UNITED STATES GEOLOGICAL SURVEY. DEPARTMENT OF THE INTERIOR.
MAP CREATED- 05-03-88
N
HOP 1600 laOO 2000 FEET ^-1 r I h-J > < I I" I-H h-J
ARA 1008D. 0. 2533BNA 9702Lagrange County (087)Indiana (18)SHEET I OF I
Figure 1. A section of a U.S. Geological Survey l:WO,000-scale base map and the corre sponding area on a Bureau of the Census enumerator map. The enumerator maps will be used by Census field staffs to construct the address lists and geographic codes re quired for distribution and tabulation of the 1990 Decennial Census questionnaires.
46 U.S. Geological Survey Yearbook 1987

the massive production workload, the Sur vey purchased, installed, and customized state-of-the-art automated digital carto graphic data collection systems in four regional mapping centers. Additionally, quality-control procedures were estab lished to ensure that the final digital prod uct met both the standards of the Bureau of the Census and the standards of the USGS for entry into the National Digital Carto graphic Data Base.
The cooperative effort was completed in mid-1987, and both agencies are using the digital data to meet individual short- and long-term national requirements. The successful completion of the effort, in which two agencies worked together to achieve an ambitious goal, represented Federal cooperation at its finest.
New AerialPhotography Program Underway
By Donald L Light
The growing interest in high- resolution, color-infrared photography for a wide variety of applications such as agri culture, forestry, soils, land and resource management, mapping, and numerous earth science studies has led to a reassess ment of Federal and State agency needs for this type of photography. As a result, a new program, called the National Aerial Photography Program (NAPP), was begun in 1987 to provide higher resolution and
larger scale photographs of uniform quality for the 48 conterminous United States.
A predecessor program, the National High-Altitude Aerial Photography Pro gram, was established in 1980 by Federal agencies to acquire l:80,000-scale black- and-white and l:58,000-scale color-infrared photography at a flying height of 40,000 feet. Aerial photography under this pro gram has now been acquired, and complete uniform coverage of the conterminous United States will be available in 1988.
Photography under the new program will be acquired from a flying height of 20,000 feet with a single 6-inch-focal-length camera exposing color-infrared film at a scale of 1:40,000. The resulting photo graphs will be centered on quarter sections of standard USGS 7.5-minute quadrangles. In 1987, eight contractors began to acquire 249,207 square miles of aerial photography in Maryland, Ohio, Kentucky, Pennsylva nia, Indiana, Nebraska, Utah, and Idaho. The first NAPP photographs became avail able in the fall of 1987.
A plan has been developed for acquir ing photographic coverage of a State or sector of a State approximately every 5 years (fig. 2). The intent of this 5-year cycle is to enable Federal and State agencies to acquire photographs to meet and maintain individual management goals. Some revi sions to the plan are anticipated depending on availability of funds and the priority expressed by State and Federal contribu tors to the program. The new program promises to meet the aerial photography needs of State and Federal organizations engaged in key projects of national interest.
Figure 2. National Aerial Photog raphy Program 5-year cycle. Col ors indicate the proposed fiscal year in which photography will be obtained.
National Mapping Program 47

Maps Of An Emerging
Nation
By John H. Wittmann
A special-edition map sheet was prepared to commemorate the bicentennial of the sign ing of the United States Constitution. The special edition includes, on one side, a map of the young Nation at about the time of the signing of the Constitution and, on the reverse side, a series of maps portraying the country's territorial development up to the present time.
U.S. Geological Survey researchers reviewed several historical maps in the collec tion of the Library of Congress' Geography and Map Division and sought recommenda tions from eminent historical cartographers for the most appropriate map to portray the
young Nation. The map published in 1784 by Abel Buell was chosen, primarily because it is the first map of the fledgling United States that was produced by an American. Only a few copies of Buell's water-colored map survive. The version selected for reproduction is in the collection of the New Jersey Historical Society.
A series of 14 maps recently produced as part of the USGS National Atlas was chosen to illustrate the territorial growth of the Nation. The maps show the extent of the British colo nies and the expansion of the United States, its possessions, and outlying areas for selected years between 1775 and 1987. A depiction of the flag of the United States appropriate to each year was added to the chronological series.
The special-edition map sheet was granted recognition by the Commission on the Bicentennial of the United States Constitution as a project of exceptional merit with national significance and substantial educational and historical value. It serves as the Survey's proud contribution to the celebration of this mile stone in American history.
-.EM ;/«,/,,« ,/.A/'.-MP
!V 11' ! : O S T A TT! S^ X- ,-. . ~N ^
48 U.S. Geological Survey Yearbook 1987

B
^T'Vl.N S I I,V A,-\' 1 A
1 I R \1 T 1 H' 1 R V. ( . ,. ^ . .' '--,, I ' *' j ' ' ' ';.
:'4"' ' '. -S: ' ''TV;/ «-'
A ';& 1 y/f>-
Maps of an emerging Nation. A, Portion of the Buell 1784 map. B, One of the series of 14 maps depicting the growth of the Nation.
National Mapping Program 49

Satellite Data Acquisition and Processing System Becomes Operational
By Wayne A. Miller
The U.S. Geological Survey, together with the National Oceanic and Atmospheric Administration (NOAA), has developed a system to receive, process, and archive Advanced Very High Resolution Radiome ter (AVHRR) data acquired from NOAA's series of polar-orbiting meteorological sat ellites. Located at the Survey's facility in Sioux Falls, South Dakota, the AVHRR Data Acquisition and Processing System became operational on May 15, 1987, and
has been routinely acquiring and process ing AVHRR data over the conterminous United States to support a variety of Fed eral research activities. The system can provide data that are screened for cloud cover, registered to various map projec tions, calibrated for brightness level and temperature, processed to calculate a greenness index, merged with other data or user-supplied line work, and shipped in digital form within 1 to 2 working days after acquisition and in photographic form within 7 to 10 working days after the data set is produced. All data acquisitions are archived temporarily for 90 days. A selected data set is permanently archived to support future research efforts.
Survey scientists have been investi gating various applications of AVHRR data to support a variety of Department of the Interior resource management and planning activities, such as fire-fuels map ping, image mapping, rainfall monitoring,
Figure 3. An AVHRR digital mosaic of the conterminous United States with State boundaries.
50 U.S. Geological Survey Yearbook 1987

and vegetation monitoring. The results of these studies have shown that analyses of AVHRR data can be used for monitoring seasonal changes in vegetation over large areas. AVHRR data have also been used successfully to map different types of fire fuels in support of the Bureau of Land Management's national fire management program. Investigations being conducted with the Bureau of Indian Affairs show that AVHRR-derived data of rangelands in the southwestern United States can be grouped into categories related to herbage production. In other studies, research con ducted with the Nebraska Forest Service found that AVHRR data can be used for computing fire-danger ratings to aid in fire prevention at the county or fire-district level. AVHRR data also have been useful in monitoring food and fiber production on range and agricultural lands in Montana and in monitoring floods in eastern South Dakota. In each of these research investi gations, the AVHRR data were merged with other types of data, such as USGS digital line graph data, arc-second digital terrain data, and other digitized map data.
A satellite-image mosaic of the conter minous United States (fig. 3) has been prepared using portions of 15 NOAA AVHRR images acquired over a 2-year period, 1984-1986. Large-area mosaicking software and a set of 200 ground-control points automatically generated for each image were used to digitally mosaic and register all 15 images to a 1,500-meter Albers Equal Area Grid. After the image was registered, mosaicked, smoothed, and enhanced, it was merged with a map collar containing the State boundaries and pro duced on film using a color-film recorder at a scale of 1:25,000,000. This effort has helped to define techniques for using AVHRR data for other continentwide image maps at scales of less than 1:2,000,000 and to guide future AVHRR research activities.
The system will continue to provide the Survey and other Federal agencies with ready access to AVHRR data for use in monitoring the growth of vegetation, mapping snow cover, producing enhanced image maps, and conducting time-series analysis to support a wide variety of geo logic, hydrologic, and land management applications.
AdvancedCartographic System Developments
By Paul E. Needham
The advent of the computer has changed the focus of mapping requirements in the United States. For more than 40 years, the U.S. Geological Survey has pro vided map users with primary topographic quadrangle map coverage of the United States at 1:24,000 scale in the lower 49 States and at 1:63,360 scale in Alaska. By the end of fiscal year 1987, primary quad rangle maps and related map products were available for about 93 percent of the country. Initial national coverage of these graphic map products is scheduled for com pletion by 1990. In recent years, however, it has become apparent that we must also produce digital versions of these graphic products to support the needs of our computer-oriented society.
In 1979, the Survey received funding appropriations that formally initiated the National Mapping Division's Digital Car tography Program. More recently, the Division began a major new development effort called Mark II that will implement both advanced cartographic technologies and production procedures to satisfy National Mapping Program requirements through the year 2000. By 2000, the National Digital Cartographic Data Base (NDCDB) is scheduled to contain digital data representing the content of the pri mary map series and other smaller scale series. This data base will serve two major functions: a central archive for the dissem ination of digital data to the user commu nity for information systems analysis, and a working data base for production of stan dard graphic map products. As initial cov erage of the Nation at 1:24,000 scale approaches completion and the need for map revision and digital cartographic data increases, the traditional National Mapping Program is in transition. With this transi tion come the attendant problems of imple menting new technologies and developing appropriate hardware and software to meet the mapping needs of the next century.
National Mapping Program 51

To achieve the digital data base goal by the year 2000, a number of development tasks must be accomplished. The Survey will need to expand and improve mass digitizing capabilities; modify data struc tures to support increased content and access requirements; develop digital revi sion capabilities; develop the capability to generate standard, derivative, and digital products; improve quality control; and sup port advanced analysis and applications.
Specific requirements for the NDCDB contents and related production processes were also identified. These requirements cover sources of data, categories of data, levels of data integration, data revision, data quality, and both digital and graphic products to be produced from the NDCDB.
To evaluate the existing systems and to facilitate the identification of new and improved capabilities, Mark II was divided into four functional components, each addressing a specific part of the production process. Each of the four components was further divided into a series of modules designed to develop a specific part of the production system.
The data-production component ad dresses all phases of data collection, edit ing, data processing, and quality control prior to entry into the NDCDB. The data base component is designed to develop two levels of data bases: an operational data base to support ongoing mapping center production and product-generation re quirements and an archival data base to provide a central repository for data to support the operational data bases. The product-generation component is designed to provide the cartographic products re quired to support the National Mapping Program, as well as to provide an interface between the production system and geographic information systems. The production-management component is de signed primarily as an interface between the production system and the National Mapping Program requirements and autho rization systems.
Implementation of digital revision and maintenance of primary quadrangle map ping through digital techniques will require major changes in the National Mapping Program production process. An overall production strategy has been developed, and efforts are now underway to meet identified goals.
Developing Digital Cartographic Data Standards
By Frank J. Beck
The U.S. Geological Survey has been developing digital techniques to collect, manipulate, analyze, and display carto graphic and geographic data. Part of this development effort has included defining and implementing digital standards. Standards-related activities can be sepa rated into two general types, those internal to the Survey or to other Federal agencies, and those at the national level affecting the public as well as government sectors.
The Survey established and published digital standards for cartographic data sev eral years ago as separate chapters in a circular (U.S. Geological Survey Circular 895,1983) that described various aspects of the digital cartography program and types of data being gathered, processed, stored, and distributed. The information contained in these chapters is being updated and separated into two distinct yet related series of documents. Information on data standards and specifications is being included in the Survey's National Mapping Division "Manual of Technical Instruc tions." Information on data characteristics or applications is being converted into a series of seven data users guides.
A Data Standards Committee within the USGS considers earth science data standards suggested by USGS divisions or other agencies. Standards adopted by the Survey are submitted to other standards groups, such as the National Bureau of Standards and the American National Standards Institute, for their consider ation. A Survey standard, "Representation of Geographic Point Locations for Informa tion Interchange," for example, has been recently adopted by both of these organiza tions.
The definition and application of digital standards for cartographic data within the Survey has had a significant impact on the map user community as well. A major effort to coordinate standards within the Federal government is underway in the Federal Interagency Coordinating Corn-
52 U.S. Geological Survey Yearbook 1987

mittee on Digital Cartography. This com mittee was chartered by the Office of Man agement and Budget to reduce the duplication of effort by Federal agencies in digitizing map data and developing geo graphic data files. The Department of the Interior chairs this committee through a representative from the Survey.
A Standards Working Group within the committee has been testing methods of exchanging digital data to help reduce or avoid unnecessary costs of data conversion. This working group has proposed the Fed eral Geographic Exchange Format as a standard format for the exchange of digital cartographic and geographic data among Federal agencies.
A National Committee for Digital Car tographic Data Standards, which includes representatives from Federal, State, and local governments and private companies, has been undertaking similar investiga tions at the national level. This committee, funded by the USGS, is under the auspices of a professional society, the American Congress on Surveying and Mapping. USGS representatives on this committee have served as a coordinating element between the national and Federal efforts.
During 1987, the digital standards activities of the Federal and national com mittees have been combined into a task force. The goal of the task force is to merge the draft proposed standard produced by the national committee and the data exchange format developed by the Federal committee. The merged document will be reviewed by both parent committees and then published for public review and com ment. After review and testing, the USGS will submit the standard through the for mal Federal Information Processing Stan dard approval process as defined by the National Bureau of Standards.
Progress in Ongoing Program Activities
Major activities in support of the National Mapping Program are: Primary mapping and revision, which include the production and revision of 7.5- minute l:24,000-scale topographic maps in the conterminous United States and Hawaii and 15-minute l:63,360-scale topo
graphic maps in Alaska. A few maps have been prepared at 1:25,000 scale in selected areas. During fiscal year 1987, about 1,190 revised and 1,050 new primary quadrangle maps were completed and made available. Topographic maps are available for about 96 percent of Alaska and for 92 percent of the other 49 States (fig. 4). Thirty-one States have complete 7.5-minute series map coverage. Intermediate-scale, small-scale, and special mapping, which includes the prepa ration of maps and map products from the intermediate-scale (1:50,000 and 1:100,000) series to the small-scale (1:250,000) series and other smaller scale U.S. base maps. Complete topographic coverage of the United States is available at 1:250,000 scale and in State base format (except for Alaska) at 1:500,000 scale. The State of Alaska is covered by four smaller scale State base maps ranging in scale from 1:1,584,000 to 1:12,000,000. Planimetric base coverage of the conterminous United States in quadrangle format at 1:100,000 scale became available in 1986. Topo graphic coverage is available for at least 50 percent of the conterminous United States and Hawaii in one or more of the following intermediate-scale series: l:50,000-scale quadrangle maps, 1:50,000- or 1:100,000- scale county maps, and 1:100,000-scale quadrangle maps (fig. 5). More than 200 topographic-bathymetric maps have been published for coastal area planning. Land use and land cover maps are complete for the conterminous United States and Hawaii and are available in the 1:250,000- scale or, in selected areas, in the 1:100,000- scale quadrangle format. Digital cartography, which includes the production of base categories of carto graphic data at standard scales, accuracies, and formats suitable for computer-based analyses. Categories include hypsography, hydrography, transportation, boundaries, Public Land Survey System, and digital elevation model data from 7.5-minute and 1:100,000-scale quadrangle maps; bound aries, census tracts, hydrologic units, Fed eral and State land ownership, land use and land cover, and digital elevation model data compiled at 1:250,000 scale; and bound aries, transportation, and hydrography data from l:2,000,000-scale National Atlas sectional maps. Information and data services, which include the acquisition and dissemination of
National Mapping Program 53

Figure 4. Status of availability of primary topographic quadrangle maps (1:24,000 scale; in Alaska, 1:63,360 scale). Some maps will initially be available in manu script form only.
Figure 5. Status of 1:100,000- scale topographic mapping pro gram (Hawaii not shown). Alaska and Puerto Rico are not currently included in the 1:100,000-scale program. Black areas indicate map availability.
information about U.S. maps, charts, aerial and space photographs and images, geo detic control, cartographic and geographic digital data, and other related information; distribution of earth science information to the public; and sale of maps and map- related products directly and through com mercial map dealers. Cartographic and geographic research and development, which include efforts to
improve the quality of standard products, to provide new products, to reduce costs and increase productivity, to acquire inno vative and more useful equipment, and to design and develop techniques and systems to advance the mapping of the country. International activities, which include the coordination of Division participation in international cartographic, geographic, surveying, remote sensing, and other map- related activities.
54 U.S. Geological Survey Yearbook 1987

Geologic Investigations
HighlightsApplications of Mineral Deposit Models to Resource Assessments
By Donald A. Singer and Dennis P. Cox
A major step in identifying and assess ing areas favorable for mineral resource exploration is the assembly of a compre hensive group of mineral deposit models. The U.S. Geological Survey, through its own conterminous U.S. and Alaska mineral assessment programs, and in cooperation with the U.S. Bureau of Land Management and the U.S. Forest Service, is continually working to improve its capabilities in min eral resource assessment.
Resource assessments are performed to help plan economic development, con sider alternative uses of land, plan explora tion, and estimate the availability of miner als. In order to respond to each of these diverse problems and to use a variety of information and resource assessment meth ods, a three-step assessment process, including the use of deposit models, is described below and in figure 1.
Step 1. Areas are delineated according to the types of deposits their geol ogy will permit;
Step 2. The number of deposits of each type within each delineated tract is estimated; and,
Step 3. The amount of metal and some characteristics of ore are esti mated by means of grade-tonnage models.
Areas or domains are delineated thatmay contain particular deposit types asinferred by analogy with deposits in similar
geologic settings elsewhere. In order to construct the boundaries, it is necessary to have a geologic map and it is desirable to have mineral-occurrence, geophysical, exploration, and geochemical information (fig. 2). This information must be inte grated with information about the geologic environment of different types of mineral deposits to perform the delineation. The keystone to combining the diverse informa tion is the mineral deposit model. Docu mented deposit models have been pub lished in USGS Bulletin 1693; this publication allows many geologists to link deposit types to geologic environments.
The Bulletin contains 87 descriptive models and 60 grade-tonnage models com piled by 38 authors. The models are based on data from over 3,900 individual deposits located in 110 countries. Because every mineral deposit, like every fingerprint, is different from every other in some way, models have to progress beyond the purely descriptive in order to represent more than single deposits. Deposits sharing a rela tively wide variety and large number of attributes come to be characterized as a "type," and a model representing that type can evolve. The organization of the models constitutes a classification of deposits. The arrangement used emphasizes easy access to the models by focusing on host-rock characteristics and tectonic setting the features most apparent to the geologist preparing a map.
The descriptive models have two parts. The first, the "Geological Environ ment," describes the environments in which the deposits are found. The headings "Rock Types" and "Textures" cover the favorable host rocks of deposits as well as source rocks believed responsible for some deposits. "Age" refers to the age of the event responsible for the formation of the deposit. "Tectonic Setting" is concerned with major features or provinces. "Associ ated Deposits" are listed as deposit types whose presence might indicate suitable conditions for deposits of the type
Geologic Investigations 55

Figure 1. The three-step process required to produce a mineral resource assessment.
Mineral Resource Map
STEP 1
Estimated Number of Undiscovered deposits
Tract 1
NUMBER OF DEPOSITS
STEP 2
Worldwide Data on Grade and Tonnage of Deposits
P Porphyry 1.0
-EK oopper g{2
E| 0.5o_ w
M100 1000
LLIONS METRIC TOf
UK Porphyry Copper 20
II
1.0
0
30.5
*5 °(
A\
A \-
1.2 0.6 1.8
/E. COPPER GRADE
STEP 3
portrayed by the model. Thus, this part uses information from the geologic map, the geophysical maps, and the known deposits and occurrences.
The second part of the descriptive model, the "Deposit Description," provides the identifying characteristics of the depos its themselves, particularly emphasizing aspects by which the deposits might be recognized through their geochemical and geophysical anomalies. For 25 models, a cartoon-style map or cross section illus trates ore controls, zoning patterns, or other features of the model. Thus this part is primarily used to classify the known deposits and occurrences in and near the area being assessed. In appendixes to the Bulletin, the models are extensively
MINERAL RESOURCE ASSESSMENT
TRACT DEPOSITS
PORPHYRY COPPEF
KUROKO
Landuse
decisions
Guidelines for new research
Explorationand
development strategy
indexed by frequency of occurrence of min erals and associated geochemical anoma lies. The 3,900 individual deposits referred to in the models are also indexed, and their model classification is shown.
Frequency distributions of tonnages and average grades of well-explored depos its of each type are employed as models for grades and tonnages of undiscovered deposits of the same type in geologically similar settings (fig. 2). These models are useful for correctly identifying known deposits in an area being assessed and for providing information about the potential value of undiscovered deposits in the area. The grade-tonnage models are presented in graphical format to make it easy to com pare deposit types and to display the data.
56 U.S. Geological Survey Yearbook 1987

GEOLOGIC MAP
KNOWN DEPOSITS AND OCCURRENCES
1
2 *5
'4 3
*6
7
GEOCHEMISTRY
Figure 2. Mineral deposit mod els and other sources of infor mation can be combined to produce a mineral resource map.
MINERAL DEPOSIT MODELS
GEOPHYSICS
Deposit EnvironmentFelsic intrusive
Porphyry copper Felsii
Mai Ki
Descriptive ModelslPorphyry Copper |
G D(
G( E>
Kur< Gi D(
Grade- Ptonnage Models orphyry Copper
\Tonnes
MINERAL RESOURCE MAP
EXPLORATION HISTORY
This publication (Bulletin 1693) represents the largest collection of models that can be used for resource assessments.
The current version of models has been used as a framework for organizing mineral deposit compilations and interpre tations for 2-degree quadrangles in Alaska and the conterminous United States. Explorationists have benefited by the new recognition of significant differences in some gold deposit types associated with volcanic rocks. The models are also provid ing a basis for economic analysis for land and policy planning in cooperative projects with other Federal agencies.
Deposit models tie together diverse information on geology, mineral occur rences, geochemistry, and geophysics that is used in mineral resource assessments. The Survey's ability to make better resource assessments, therefore, depends directly on the quality of the models avail able. The present 3-step mineral resource assessment mode represents an important step in the improvement of these models.
A New Approach to Determining How Much Coal is Available for Mining
By Jane R. Eggleston and M. Devereux Carter
According to many energy forecasts, the United States currently has over 400 billion tons of coal available for mining. This estimate was determined by applying bed thickness, mining depth, and reliability factors to a geologically derived coal- resource base. However, this methodology for calculating "available" coal, defined as coal which could be removed by mining, ignores many geologic, land-use, engineer ing, and economic factors that restrict the minability of coal. When these factors are
Geologic Investigations 57

considered, the forecast of a 200-year coal supply for the United States is overly opti mistic. Although some attempts have been made to quantify available coal, none have used a comprehensive geologic data base and considered all of the restrictions now placed on coal mining.
A new methodology is necessary to determine coal actually available for min ing. This methodology must be specific enough to consider the key factors that would limit coal mining but flexible enough to be applied in any coal region in the United States. The USGS is currently developing such a methodology, which relies on cooperative efforts with State geological surveys to develop a comprehen sive geologic data base. The National Coal Resource Data Base (NCRDS) is the repos itory for all data, in digital form, and these data can be manipulated to eliminate restricted coal and quantify that which is available for mining.
To test this methodology, a pilot study, in cooperation with the Kentucky Geological Survey, was conducted on the Mate wan quadrangle, Pike County, in east ern Kentucky (fig. 3). Restrictions that limit the availability of coal for surface and underground mining have been defined and mapped, and all data were entered in the NCRDS. For surface mining, environment- related restrictions are surface features that cannot be moved and generally re quired that barriers be left. These restric tions include (1) major powerlines and pipelines, (2) town and public buildings, (3) Federal highways, (4) cemeteries, (5) oil and gas wells, (6) railroads, and (7) environ mentally sensitive areas, such as endan gered species habitats, protected rivers, game lands, and parks. In addition, surface mining is restricted by economic factors,
UPPER ELKHORN NO. 2 RESOURCE SUMMARY
[mst = millions of short tons]
Table 1. Summary of Upper Elk- horn No. 2 resources, Matewan quadrangle, Kentucky
RESTRICTEDRESOURCES
(64 mst)
AVAILABLE
»
RESOURCES
DEEP* Q RESC
(5
SURFACE MINEABLERESOURCES
(23 mst)
which are indicated by the limiting strip ratio that can be achieved and still make a profit.
Restrictions on underground mining are primarily economic and technological, and a coal bed will not be mined when (1) it is too shallow or too deep, (2) it is within a certain distance above or below an aban doned mine or a coal bed that is more likely to be mined, (3) it is located in highly folded or faulted areas or areas where roof condi tions would be too problematic, or (4) it is too thin to be mined by conventional tech nology. Coal quality also may restrict coal availability if it does not meet compliance standards for sulfur or if it does not meet user specifications.
An accurate geologic base upon which to apply these restrictions is vital to the study. For the Mate wan quadrangle, the most recent geologic maps and data were supplied by Kentucky Geological Survey geologists familiar with the geology of the area. Coal map data in computerized form and sampling and drilling data were entered in the NCRDS, which supple mented data already in the system for this quadrangle. By combining these data with a computerized USGS digital elevation model for the quadrangle, original and remaining coal resources were mapped and calculated for the 22 major coal beds. Fig ure 4A shows the original extent of occur rence of one coal bed, the Elkhorn No. 2. Restrictions to surface and (or) deep min ing were then delineated on the basis of local environmental regulations and mining practices. By mapping these restrictions and applying them to maps of remaining coal resources, available coal was mapped and quantified for each of the coal beds. Figure 45 shows the coal available for surface and deep mining in the Upper Elk- horn No. 2 bed after restrictions were applied.
Calculations for the Upper Elkhorn No. 2 coal bed indicate that of the 92 million short tons of total coal resource remaining after subtracting what has already been mined, only 30 percent, or 28 million tons, is actually available for future mining (table 1). If recovery factors are applied to fu ture mining of this remaining available resource, the available coal would be fur-
58 U.S. Geological Survey Yearbook 1987

,-~--*.,^fS FA
* «?"« \
iC.f«»"y-oweN --<;' /*$&'* VEW1!
5^'^^«5¥5,_' N>-« i'a- II? 7- * I )LD«»WS.___ ,4- }f -^HiiVt'"" 1 ""^"'1
^>'?tpB»6c^.^«»,' S^rt,,. ., » *. ,.;.r. p ( , . RB '>^lO*.««>v.*I»^ifc
^ T* ~>^-.«-^.'.-.^ O-.vr^,..-, --. ,---'*. ^ BATH''-'.
r ^^.' tMMiKS ^^* V-.
KrffAtO / / M ON B O E Jfrc . f ,
Figure 3. Location map of Mate- wan quadrangle within the cen tral Appalachian region.
ther reduced. Additional studies will indi cate whether these preliminary calcula tions are representative of this coal region. If so, these results could dispel some of the optimism that is commonly engendered by coal resource forecasts that are expressed in billions and trillions of tons.
The data developed for a portion of Pike County may be extrapolated some distance provided the geologic conditions, the topography, and the general coal econ omy are relatively uniform. Coals are found in a variety of geologic settings, and it will therefore be necessary that similar studies be done in the other major coal-producing areas where coal characteristics differ sig nificantly from those in the area of the pilot study. Parts of southern West Virginia and
western Virginia may be well represented by the Pike County study. Conditions in other areas, some not too distant from Pike County, however, are sufficiently different that they must be individually investigated in order to evaluate available coal resources. Coal-producing regions of cen tral and northern West Virginia, Pennsyl vania, Ohio, and Alabama are among these economically competitive but geologically different locales. Investigations will also be required in the mid-continent and western United States in order to complete the study of the Nation's available coal resources, particularly the amount of avail able low-sulfur coal resources. Results of this continuing research could have far- reaching implications for United States coal policy and energy planning.
Geologic Investigations 59

Figure 4A. Original occurrence of the Upper Elkhorn No. 2 coal seam (colored area), Matewan quadrangle, Kentucky, before mining.
60 U.S. Geological Survey Yearbook 1987

Figure 4B. Areas where the Up per Elkhorn No. 2 coal seam is available for surface or under ground mining, after applying restrictions.
Surface Mineable
Underground Mineable
Geologic Investigations 61

62 U.S. Geological Survey Yearbook 1987

/.afce Huron near White Rock, Huron County, Michigan. (Pho tograph by Michael J. Sweat, U.S. Geological Survey.)
Geologic Investigations 63

Mapping the EEZ: The First Million Square Miles
By Bonnie A. McGregor
The USGS effort to map the seafloor of the U.S. Exclusive Economic Zone (EEZ) reached a major milestone in 1987. The GLORIA (Geologic Long-Range Inclined Asdic) sidescan sonar system has now mapped over a million square nautical miles of seafloor in 3 years. One-third of the EEZ has been mapped completely, including the seafloor adjacent to the lower 48 States, to Puerto Rico and the U.S. Virgin Islands, and to Alaska in the Bering Sea region (fig. 5). The mapping is continuing on the Research Vessel M/V Farnella. The EEZ south of Alaska and around the Hawaiian Islands will be completed next, which will culminate the EEZ mapping for the 50 States by 1990. Efforts will then focus on the U.S. territories and possessions in the Pacific.
The M/V Farnella began the mapping of the Bering Sea in summer 1986 and completed it in July 1987. As in earlier EEZ mapping ventures, the mosaics are showing scientists geologic features that they had not imagined. The sonar mosaic of the floor of the Bering Sea shows extensive dissection of the continental margin and the northern slope of the Aleutian Ridge by some of the largest submarine canyon sys tems ever identified. Large, well-defined channel systems that emanate from subma rine canyons in the southeastern corner of the.Bering Sea extend for several hundred miles across the abyssal plain. Flow pat terns on the seafloor appear to have formed by sheet flow as sediment is transported across the Aleutian Basin. The dominant erosional and transport processes active along the margins of the Bering Sea are a variety of types of mass movement ranging from small debris flows to massive subma rine landslides and slumps of blocks of sediment measuring miles in diameter and thickness. Within the Bering Sea, Bowers Ridge is a crescent-shaped ridge, which was believed to be inactive because of its lack of seismicity and its flat crest. GLO RIA images provided a new perspective of
Figure 5. Status of the GLORIA mapping program and location of CONMAP parcels.
UNITED STATES
-1864A
0 400 800 NAUTICAL MILES
EXPLANATION
Completed GLORIA surveys
Published GLORIA atlas, and number in USGS Miscellaneous Investigations Map Series
Continental Margin Map (CONMAP) Series panels BC Baltimore Canyon GB Georges Bank
- Exclusive Economic Zone (EEZ) boundary
64 U.S. Geological Survey Yearbook 1987

the ridge. Large (6-mile-wide) volcanoes, and what are interpreted as numerous smaller volcanic features, were identified as being associated with Bowers Ridge and its extension. Recent uplift is also occur ring along the ridge.
Besides providing new insights, the GLORIA data occasionally provide geolo gists with inexplicable puzzles. One of these is an interference pattern that resem bles the characteristic pattern light makes on taffeta cloth. Speculation on the origin of the interference ranges from density differ ences in the water column to correlation with subseafloor features; the latter seems the most likely. An area was resurveyed 1 year later, and almost the identical pattern was again present on the image, implying that the interference is not transient.
In February through May 1987, the East Coast GLORIA survey was com pleted except for a shallow-water southern portion of the Blake Plateau. Striking regional differences were identified all along the East Coast. The area south of Cape Hatteras on the Blake Plateau, which is composed of limestone rocks, shows a seafloor that has been eroded by the north- flowing Gulf Stream. Differences in the reflectivity can be correlated with the var ied rock units that crop out on the seafloor. The seaward edge of the plateau is marked by an escarpment having over 13,200 feet of relief that has been carved by ocean currents aided by biochemical erosion. North of Cape Hatteras to Long Island, the continental margin is cut by several large submarine canyons and channels that cross the EEZ for over 100 miles. Seaward of New Jersey, a vast dendritic pattern of canyons merge on the continental rise to form a single large channel that extends across the EEZ, and immense areas are marked by bottom failure and landslide deposits. A field of "mud waves" was mapped near the seaward edge of the EEZ, off North and South Carolina. The pres ence of these massive ripplelike features, 250 feet high with a spacing of 3 miles, suggests that some sediments in the deep water of the continental rise are being moved toward the northeast. Off Georges Bank, the GLORIA mosaic shows an extensively dissected continental slope with most canyons terminating in sheets of debris. Groups of canyons converge to form single channels; however, only six of the canyons that indent the shelf extend from
the upper slope to the outer margin of the EEZ. Mass movement of sediment has obliterated some channels, burying them in debris. Five of the New England sea- mounts show up strikingly, and it appears that they influence the paths of submarine channels and the distribution of sediments on the continental rise.
Image processing of the Bering Sea and East Coast GLORIA data is already underway. The data are being digitally mosaicked to produce the image maps for the respective atlases that will be pub lished for each area mapped. The second atlas of the EEZ was published in October 1987 as USGS Miscellaneous Investigations Map I-1864-A and I-1864-B. This atlas covers the EEZ in the Gulf of Mexico and around Puerto Rico and the U.S. Virgin Islands. The atlas presents sonar-imagery mosaics (25 maps, at 1:500,000 scale) of the EEZ seafloor, along with generalized geo logic interpretations and bathymetry, seismic-reflection-profile data collected during the surveys, and bathymetry and residual-magnetic-anomaly profiles in the survey areas.
The long-range- sidescan sonar (GLORIA) images provide a striking view of the seafloor in the deep water of the Gulf of Mexico and in the Puerto Rico-U.S. Virgin Islands area. A better understand ing of the morphology, surficial geology, and sedimentary processes is important for developing energy and mineral resources (fig. 6) and for siting seafloor structures. The GLORIA data provide information on depositional environments and geologic processes that is important in developing depositional models useful as analogs in understanding the rock record and re source distribution.
In the western Gulf of Mexico the most striking feature on the imagery is the
Figure 6. Photograph from Alvin of an active hypersaline seep from the fractured limestone in 10,000 feet of water at the base of the Florida Escarpment. Crabs, tube worms, mussels, and snails are part of the com munity of organisms living around the seeps. (Photograph by R.F. Commeau.)
Geologic Investigations 65

0 the MSI iktot. Qutttne >it imagery in tht.' w*r>
Figure 7. Digital mosaic of the GLORIA sidescan sonar data from the western Gulf of Mexico. Salt deformation controls the slope in the western Gulf. Numbered boxes refer to map sheets in the Atlas of the U.S. Exclusive Economic Zone Gulf of Mexico and Eastern Caribbean areas.
66 U.S. Geological Survey Yearbook 1987

MISSISSIPPI ALABAMA
ith jjixfi trf data tpprewnls 2flOm
Figure 8. Digital mosaic of the GLORIA sidescan sonar data from the eastern Gulf of Mexico. The Mississippi channel and fan are striking features on the floor of the eastern Gulf. Numbered boxes refer to map sheets in the Atlas of the U.S. Exclusive Economic Zone Gulf of Mexico and Eastern Caribbean areas.
Geologic Investigations 67

Sigsbee Escarpment, which marks the sea ward edge of the salt deformation province (fig. 7). The extensively deformed conti nental slope is an important frontier for oil and gas exploration. In the central Gulf, the Mississippi Canyon and fan system is the dominant morphologic feature (fig. 8). Understanding the processes contributing to the development of the modern Missis sippi Fan is important in developing explo ration models for ancient fan systems. The GLORIA data provide a unique regional perspective of a deep-water-frontier region important for its oil and gas resource potential.
The first prototype digital map in the Continental Margin Map (CONMAP) Series, a digital compilation of information on the EEZ (fig. 5), has been completed. The first sheet (topography/bathymetry) for the Baltimore Canyon Trough was pre pared by combining the coastline topogra phy in digital format from the National Oceanic and Atmospheric Administration with onshore topography data from the National Mapping Division of the USGS and digitized bathymetry data. The first thematic map (tectonic) for the Baltimore Canyon Trough area is in preparation. The first thematic map for the Georges Bank area, which depicts information on the sediments in the area, is in review, and a topography/bathymetry map for the Georges Bank area is presently being pre pared. The digital maps, of both the GLO RIA sonar imagery and the CONMAP the matic maps, provide a regional perspective of our knowledge of the EEZ the Nation's underwater frontier.
Hawaiian Volcano Observatory 75th Anniversary
By Thomas L Wright and Robert W. Decker
The 75th anniversary of the founding of the U.S. Geological Survey Hawaiian Volcano Observatory (HVO) was cele brated in January 1987. The festivities began on January 9 with the opening in
Hilo of a major exhibit at the Wailoa Center on the current work of HVO, its history, and its special relationship to the Hawaii Volcanoes National Park. In addition to spectacular photographs of volcanic activ ity and HVO fieldwork, the exhibit fea tured continuous showings of underwater footage taken during the recent eruptive activity (December 1986) and a computer monitor that displayed the island's earth quake activity in real time.
A new HVO facility and an adjoining Thomas A. Jaggar Museum (fig. 9) were dedicated by the U.S. Geological Survey and the National Park Service the follow ing week in an impressive ceremony marked by a Hawaiian oli (blessing) in honor of Pele, the Hawaiian volcano god dess. Dedication remarks were made by Wayne Marchant (Acting Assistant Secre tary for Water and Science), Dallas Peck (USGS Director), William Penn Mott, Jr. (National Park Service Director), Con gressman Daniel Akaka (Hawaii), Dante Carpenter (Mayor, County of Hawaii), and Gudmundur Sigvaldason (head of the World Organization of Volcano Observato ries; University of Iceland, Reykjavik). Additional remarks were made by Howard Mimaki, who represented Governor John Waihee of Hawaii, and by representatives of other members of Hawaii's congressional delegation (Senators Daniel Inouye and Spark Matsunaga and Representative Pat Saiki) and the Hawaii County Council. Gor don Eaton, former Scientist-in-Charge at HVO (now president of Iowa State Univer sity) delivered an inspiring keynote address, relating HVO and its work to the origins of the Hawaii-Emperor Volcano Chain. Thomas Wright, current HVO Scientist-in-Charge, presided. All of the former Scientists-in-Charge who are still living were in attendance (with the excep tion of Howard Powers, who was ill). The three deceased Scientists-in-Charge were all represented by a family member. The dedication was followed by a tour of HVO and the Jaggar Museum.
The following week (January 19-25, 1987), 420 scientists from 21 countries met in Hilo to discuss problems and the remark able progress in the discipline of volcanol- ogy at the Hawaii Symposium on "How Volcanoes Work." The convenors of the symposium were Robert Decker, Thomas Wright, and Reginald Okamura (all of the USGS) and Joseph Halbig and Richard
68 U.S. Geological Survey Yearbook 1987

Hazlett (University of Hawaii at Hilo). Sponsors of the meetings were the U.S. Geological Survey, University of Hawaii at Hilo, International Association of Volcanol- ogy and Chemistry of the Earth's Interior, Circum-Pacific Council for Energy and Mineral Resources, Hawaii Institute of Geophysics, American Geophysical Union, Geological Society of America, and World Organization of Volcano Observatories. The meeting began with a summary of Kilauea's current eruption; three other keynote speakers then presented their thoughts on subduction volcanoes, rift vol canoes, and hot-spot volcanoes.
Presentations at the Symposium rep resented the international character of the delegates and the worldwide concern for and interest in volcanoes and their effects:
Shigeo Aramaki (Earthquake Re search Institute, University of Tokyo, Japan), speaking about Japanese volca noes, noted that dehydration of the descending Pacific plate begins at a depth of about 62 miles. The volatiles and other elements leached from the descending slab contaminate a mantle layer above the slab, which at 80 to 110 miles depth begins to melt and forms diapirs that rise toward the Moho (the boundary that separates the Earth's crust from the underlying mantle). Basaltic liquids separate from the diapirs and accumulate in reservoirs in the lower crust. Magmas evolved from these deeper reservoirs rise periodically through the crust to form shallow magma chambers, from which periodic eruption of lavas and tephra of basaltic andesite, andesite, and dacite occur. Stress fields and subduction rates are the major factors affecting the character of volcanism at individual cen ters.
Sigvaldason (Iceland) noted that the velocity structure beneath Iceland differs from that at the Mid-Atlantic Ridge. He attributed this difference to diapiric rise of magma generated in the upper mantle into multiple horizontal reservoirs that are located within the thin crust beneath the young volcanic zones of Iceland. Sigvalda son pointed out that eruption rates in Ice land were higher near the beginning of Holocene time (10,000 years ago) and sug gested that removal of the ice load from Iceland and (or) rise in sea level around Iceland may have caused this increased eruptive activity.
Robert Christiansen (USGS, United States) proposed that the classification of volcanoes into two categories, those associ ated with converging or diverging plate margins and those found within plates, might be too simplistic. He suggested that the Earth's crust, upper mantle, and deeper mantle may interact as a dynamic feedback system that includes the genera tion and transport of fluid phases. Magmat- ism in the Earth's crust has long-term rates that appear to be coupled to tectonic dis placement rates. In addition, original magma composition, degree of partial melt ing, and changes in composition are all influenced by stress distributions and ascent rates. In this view, plate-margin processes may simply act to focus general magmatic processes of the same types that produce intraplate magmas. Christiansen also warned that the terms "hot spot" and "mantle plume" are becoming too closely associated. The cause of hot spots is still largely unknown.
Nearly 300 papers were presented on the following major topics: Conceptual models of how volcanoes work Internal and deep structure of vol canoes Physical and chemical dynamics of mag ma chambers Physical and chemical dynamics of intrusion and eruption processes Exploration of submarine volcanoes
Figure 9. (Above) The first Ha waiian Volcano Observatory (HVO), located near the site of the present Volcano House Ho tel, as it appeared around 1922. (Photographer unknown; cour tesy of the Bishop Museum, Honolulu, Hawaii.) (Below) HVO at its present site, after the addition of a new wing (with observation tower) and renovation in 1986. (Photograph byJ.D. Griggs.)
Geologic Investigations 69

Earthquakes and tremors related to volcanism Monitoring of volcanic activity Assessment of volcanic hazards Reduction of volcanic risk.
In addition to this formal program, the attendees viewed newly released sonar images of the 200-mile-wide underwater U.S. Exclusive Economic Zone bordering the island of Hawaii. Japanese scientists provided an update on the recent major eruption on Oshima, Japan; and there was a panel discussion on the 1986 gas cloud eruption in Cameroon.
Much progress has taken place in the study of volcanic processes in the past several years, but the symposium also served to emphasize that many problems remain. The symposium helped somewhat in removing the question mark in "How do volcanoes work?".
Assessing the Earthquake Hazards of Urban Areas
By Walter W. Hays, Paula L Cor/, and William J. Kockleman
Major urban areas in widely scattered geographic locations across the United States are at varying degrees of risk from earthquakes. The locations of these urban areas include Charleston, South Carolina; Memphis, Tennessee; St. Louis, Missouri; Salt Lake City, Utah; Seattle-Tacoma, Washington; Portland, Oregon; and Anchorage, Alaska; even Boston, Massa chusetts, and Buffalo, New York, have a history of large earthquakes. Cooperative research during the past decade has focused on assessing the nature and degree of the risk or seismic hazard in the broad geographic regions around each urban area. The strategy since the 1970's has been to bring together local, State, and Federal resources to solve the problem of assessing seismic risk. Successful coopera tive programs have been launched in the San Francisco Bay and Los Angeles
regions in California and the Wasatch Front region in Utah. In each of these areas the research efforts were directed to finding answers to the following questions: Where have earthquakes occurred in the past? Where are they occurring now? How often do moderate-, large-, and great-magnitude earthquakes occur? What physical effects (seismic hazards) have been triggered by past earthquakes, and what was the nature and extent of the losses they caused? What are the most effective options for mitigating losses from future earthquakes, as determined from the knowledge of past events and current technology?
The first phase of a 5-year program to assess the seismic hazards of the Wasatch Front, Utah, region, for example, was con cluded in fiscal year 1986. This assessment was conducted over a 3-year period and focused on the 10-county Brigham City- Salt Lake City-Ogden urban corridor. This urban corridor, with more than 1 million people and great building wealth, lies adja cent to the 220-mile-long active Wasatch fault zone (fig. 10). Scientists and engineers from the U.S. Geological Survey, the Utah Geological and Mineral Survey, universi ties, and the private sector joined together to estimate the recurrence rates and max imum size of potential earthquakes, to cal culate the nature and severity of the expected ground shaking, and to identify and map areas of potential surface fault rupture, landslides, liquefaction, and other ground failures. Their findings include the following: The Wasatch fault zone is composed of at least 10 segments (see fig. 10) having surface traces that are 9 to 36 miles in length. Each segment has been the source of repeated large-magnitude earthquakes, of about magnitude 6.5 to 7.5, occurring on the average every several hundred to sev eral thousand years. Ancient Lake Bonneville may have played an important role in increasing earthquake activity along the Wasatch fault. Recent studies of the slip rates on the Wasatch fault have revealed that the rate of earthquake activities accelerated with the formation of the Pleistocene-age lake and apparently has declined since its disap pearance. Measurements of small-amplitude ground motions, representing a low-strain
70 U.S. Geological Survey Yearbook 1987

environment at sites in the Salt Lake City- Ogden-Provo urban corridor underlain by soil and rock, showed that urban areas built in the middle of valleys filled with thick, soft deposits of clays and silts may experi ence severe levels of ground shaking in moderate- to large-magnitude earth quakes. These effects are 3 to 4 units of intensity (Modified Mercalli Intensity Scale) higher than those at sites on thin gravel and sand deposits on the edges of the valleys. Although these ground- shaking effects may not be as serious as those that produced damage in the lake-bed zone of Mexico City in the September 19, 1985, Mexico earthquake, they are signifi cant enough to be incorporated in the earthquake-resistant design of high- occupancy buildings and critical structures. Potential losses to buildings and life from ground shaking in future earthquakes in the Salt Lake City region may reach $1 billion (1985 dollars) or more, depending on the location of the earthquake relative to the urban area and the time of day the earthquake occurs. The potential for earthquake-induced liquefaction and landslides is high along the Wasatch Front. These phenomena will sig nificantly increase the overall loss. Geographic information system (GIS) technology was applied in a pilot study of the Sugar House 7.5-minute quadrangle and proved useful in managing and analyz ing multiple geologic and geophysical data bases required for assessing regional seis mic hazards.
In Utah, the USGS created strong partnerships with the Utah Geological and Mineral Survey; the Utah Division of Com prehensive Emergency Management; the counties of Weber, Davis, Salt Lake, and Utah; universities; the private sector; and the Federal Emergency Management Agency. These partnerships are being used to foster implementation of earthquake- preparedness plans and mitigation meas ures in Utah. This second phase of the 5-year program will receive high priority in fiscal years 1987 and 1988.
A new 5-year effort, identical to that along the Wasatch Front, was initiated in fiscal year 1987 in the Puget Sound, Washington-Willamette Valley, Oregon, region. Although the rate of damaging earthquakes in the Pacific Northwest appears to be low relative to that in Cali fornia, earthquakes of magnitude 7.1 in
44'114° 112° 110° W
__ IDAHO
40°
38'
Malad City
.Ogdenl
*tSalt Lake City
Provet
Nephi
Gunnison
WYOMING r
18
UTAHI ARIZONA
H-
100 I
200 MILES _I
100 200 KILOMETERS
1949 and magnitude 6.5 in 1965 caused damage collectively in excess of $200 mil lion (1984 dollars), many injuries, and 15 deaths. Both of these earthquakes occurred at intermediate depths. The potential for two other types of events shallow, moderate- to large-magnitude earthquakes on inland intraplate faults and a shallow, great-magnitude subduction zone event in the Cascadia subduction zone (fig. 11) is poorly understood. Three factors may change the current assessment of the earthquake risk in the Seattle-Portland region: A growing body of scientific data sug gests that great earthquakes may be possi ble in the Cascadia subduction zone. The population and urban development in the region have grown significantly; approximately 2.6 million people and about $93 billion in property are now vulnerable to the earthquake threat. The interplay between earthquake haz ards and secondary effects such as fires, chemical spills, and technological hazards may have significantly increased the poten tial for life and property loss.
Figure 10. Map showing the 220- mile-long Wasatch fault zone, a major zone of active normal faulting. The largest urban cen ters of Utah are located along the fault zone. Geologic and geomorphic evidence shows that earthquakes of magnitude 7 or greater have occurred on the fault in the past 10,000 years. One of the most impor tant recent research results indi cates that the fault may be composed of as many as 10 in dependent segments, each of which has been the source of repeated large-magnitude earth quakes.
Geologic Investigations 71

Figure 11. Schematic illustration of the physical processes taking place in a subduction zone where one tectonic plate is slowly being thrust over another. In the Puget Sound area, the North American plate is being thrust over the Juan de Fuca plate at a rate of approxi mately 7.2 inch/year. Many aspects of this process are still controversial. Technical issues that remain unresolved include (V the present rate of conver gence, (2) the physical features and seismic coupling of the Juan de Fuca and North Ameri can plates, (3) the capability of the subduction zone to rupture and produce large to great earthquakes, and (4) the range of magnitudes, recurrence inter vals, and physical effects of po tential earthquakes.
Trench\
Oceanic f lithosphere <
plate100-
Zone of easy shearing in rock near melting temperature
Plate sinks because it is relatively cool and dense
I Continental |-lithosphere
J plate
700-
To carry out the research and to foster implementation of earthquake prepared ness plans and mitigation measures in Washington and Oregon, the USGS has formed partnerships with the State Geolog ical Surveys, the State offices of emer gency services, universities, the private sector, and the Federal Emergency Man agement Agency. Efforts are being made to develop geographic information systems to manage and analyze geological, geophy sical, topographical, and land-use data cre ated by the various researchers. These efforts will collectively add to the knowl edge base and ultimately lead to enactment of damage- and loss-control measures appropriate for mitigating the seismic haz ard of the Pacific Northwest. In fiscal year 1990, another region of the United States will be selected for a comprehensive regional seismic hazard assessment.
Pacific Proving Grounds Revisited
By Thomas W. Henry
Atmospheric nuclear testing was con ducted by the United States Government
on isolated atolls in the Pacific Ocean from 1946 through 1958. The United States car ried out its only near-surface tests of megaton-range (high-yield), nuclear-fusion devices on Enewetak (fig. 12) and Bikini. Most of these shots were detonated on the small atoll islands, from towers, or from vessels anchored in the shallow lagoons. Most craters formed are now water filled, some of them with as much as 200 feet of water.
The U.S. Geological Survey completed in 1987 a cooperative, multidisciplinary program with the Defense Nuclear Agency (DNA) and other groups within the Department of Defense (DOD). The pro gram was designed to produce geologic, geophysical, and material-properties data and interpretations to resolve a series of critical questions involving the craters formed in the Pacific Proving Grounds (PPG). Known to the DOD by the acronym PEACE (Pacific Enewetak Atoll Crater Exploration), the program was part of a larger research initiative by the DNA to better understand high-yield, strategic- scale nuclear. bursts and how the PPG craters relate to the basing and targeting of nuclear-weapon systems and related national defense issues.
Beyond DOD's strategic concerns, data gathered during the Enewetak Pro gram are helping to address many subjects of broad concern, including the geologic
72 U.S. Geological Survey Yearbook 1987

- 11°40*
Bokaldrlk o,
TelteTrlpucchl (QENE Elugelab (FLORA)
Sanlldetowso (EDNA)LouJ
Klrunu Bokombako
Bokoluo (ALICE)
(HELEN)
Ooo oCM
Boken (IRENE) "*" Enjebl (JANET)
MlJIkadrek (KATE) Kldrlnen (LUCY)
Bokenelab (MARY) Elle (NANCY)
Aej (OLIVE)Lujor (PEARL)
Eleleron (RUBY) Aomon (SALLY) BIJIle (TILDA) Lojwa (URSULA) Alembel (VERA)
-Blllae (WILMA)
-» HAWAIIAN ± ENEWETAK ISLANDS
o oo o <o
f 160000wv
GRID (FT)
PREVAILING MIND
120000
Blken (LEROY)
SOUTHWEST
PASSAGE
11°20'
Kidrenen (KEITH)' Rlbewon (JAMES)'
Boken (IRWIN)-Mut (HENRYT /
Ikuren (GLENN)
Runlt (YVONNE)
' M* (ZONA)
Jlnedrol (ALVIN) f- 80000
Analj (BRUCE)
Jlmlnl (CLYDE)
Japtan (DAVID)
BAST (DEEP) CHANNEL
Medren (ELMER)
+ 40000
Enewetak (FRED)
30,000 I
50,000
J_____I
rNAUTICAL MILES
162°00'FEET KILOMETERS
162°10' 162°20' 162°30'
history and evolution of the west-central part of the Pacific Basin, the detailed struc ture and evolution of a coral atoll, the rise and fall of sea level in response to global climatic changes and the measurement of the magnitude of these events, speciation and migration of microscopic marine life, and chemical and physical changes in atoll carbonate rocks. In addition, data from this program are applicable to such practical issues as the potential use of an atoll as a safe repository for high-level nuclear waste.
Two submarine craters, KOA and OAK (fig. 12), that were formed in 1958 near the northern perimeter of Enewetak Atoll by 1.4- and 8.9-megaton bursts, respectively, were selected for the USGS to investigate. A basic problem in the investigation was that data from the PPG craters were sparse. The PPG high-yield craters appeared to differ in a number of
strategically critical ways from craters pro duced by both non-nuclear and low-yield nuclear bursts in dry, continental test sites, such as the Nevada Test Site. The high-yield craters appeared to have very broad, shallow saucer-shaped profiles and consequent large volumes of excavated materials. In contrast, the continental test craters, far easier to directly measure and sample, had smaller bowl-shaped profiles and small volumes of excavated materials. For many years, the conclusion generally was accepted that the high-yield devices were more efficient in the excavational process than the low-yield ones that formed the continental craters. However, research undertaken by the DNA in the 1970's sug gested that physical processes operating on a scale greater than hours and gravity effects in "special" geologic environments such as a coral atoll might play a more important role in the final crater size and
Figure 12. Map of Enewetak Atoll showing location of KOA, OAK, and MIKE craters, native names of principal islands (mili tary site names shown in capital letters in parentheses). Deep borehole drilled in 7952 used for pilot borehole gravity mea surements located on Medren Island. Location of Enewetak Atoll shown by asterisk on in dex map.
Geologic Investigations 73

Figure 13. View of starboard side of drill ship Knut Construc tor in OAK crater in June 7985.
morphology than in dry continental sites. By the end of the last decade, computa tional models were capable of simulating accurately an array of phenomena associ ated with high-explosive and low-yield nuclear shots. However, the PPG craters (as observed and measured) formed by the high-yield events and scaled to their conti nental and meteor-impact counterparts were anomalous and could not be modeled confidently. The marked difference be tween these simulations and existing observations from the PPG were of consid erable concern to the DOD. In fact, the lack of confidence in these data cast doubt on the DOD's ability to predict how effective nuclear weapons would be against hard ened targets and how well strategic defense systems would survive in the event of nuclear attack.
Participation of the USGS in fieldwork on Enewetak was divided into two major parts. The first, the marine phase, began in April of 1984 with a pilot borehole-gravity study by the USGS and DNA in a deep borehole drilled in 1952 on Medren Island (fig. 12). Most of the marine phase was conducted during the summer and early fall of 1984 by USGS personnel, but scientific advisors from DNA and logistic support from the Pacific Area Support Office of the Department of Energy (DOE) also partici pated in the marine phase. The second phase, the drilling phase, was conducted
from late winter through the summer of 1985 and was conducted jointly by person nel from the USGS, DNA, and DOE, which contracted the 245-foot drilling vessel, the Knut Constructor (fig. 13). The DOE also obtained necessary cooperation of the offi cials of the Republic of the Marshall Islands to conduct the fieldwork on Enewetak and to provide extensive logistic support.
The marine phase concentrated on mapping seafloor features and profiling subbottom characteristics of KOA and OAK using shipboard geophysical tech niques and scuba and submersible surveys (figs. 14, 15). Most of these analyses are reported in USGS Bulletin 1678. The geophysical studies incorporated data from sidescan-sonar images, single-channel and multichannel seismic surveys, and refrac tion surveys; the geologic investigations included seafloor observations, collection of bottom (benthic) samples, and shallow boreholes drilled by scuba teams.
Thirty-two deep boreholes were com pleted in the vicinity of KOA and OAK during the drilling phase. These provided information on the stratigraphic frame work of the upper 1,200 feet of the carbon ate cap of the atoll and ground-truth for the geophysical profiles and other marine phase data. The deepest hole was drilled about 1,800 feet below sea level in roughly 200 feet of water near OAK ground zero. Samples of rock and sediment from the
74 U.S. Geological Survey Yearbook 1987

500 METERS 8s
SCO FEET *> _J
ENHANCED SEAFLOOR IMAGE OAK CRATER
TERRACE
INNER TERRACES
OUTER TERRACES
I2SCJOO
CRATER FLOOR RIM SCARP
RIM SLOPI
: DEBRIS BLANKET
OUTER SLOPE " , -"
OUTER TERRACES '"'
DEBRIS BLANKET'>r /
PATCH REEFS"'
ZOOOO IVY...CRIO..(ftjI62"5'30"E I6E°6'E
3630 N
II-36N
Figure 14. Airbrush-enhanced sidescan-sonar image of water- filled OAK crater (lighting from southeast) showing major crater and natural features. Lagoon- ward edge of reef plate is darker gray area to northwest; natural lagoon floor (see arrow on southeast side of image) is about 150 feet deep with patch (pinnacle) reefs rising to nearly sea level; ground zero (CZ) is in almost 200 feet of water. (The imagery techniques and air brush enhancement employed by USCS laboratories at Flag staff were basically those devel oped by the USCS for the Na tional Aeronautics and Space Administration to process im ages from Mars.)
I62°6'30"E I62°7'E
boreholes were used for lithostratigraphic and biostratigraphic (geologic) analyses for strontium-isotope dating by the USGS, for stable carbon- and oxygen-isotope ana lyses (Brown University), for shock- metamorphic studies (California Institute of Technology), for material-properties (engineering) studies (DNA), and for radio- chemical analyses (DNA). Geophysical logs were run and shipboard gravity meas urements were made in selected boreholes on one of the OAK transects by DNA personnel cooperating with the USGS and Los Alamos National Laboratory.
The collaborating teams from the USGS, DNA, DOE, and McClelland Engi neers, Inc. (the drilling contractor), pro duced a number of major technologic and scientific "firsts": The first boreholes successfully drilled from shipboard through the highly dis
turbed materials within a high-yield nuclear crater. This was done with a high degree of recovery of sample and core. The first detailed biostratigraphic anal yses using microfossils (ostracodes and for- aminifers) of near-reef facies of an atoll, which provided the first demonstration that microfossils could be used to deter mine the depth of origin (provenance) and extent of mixing in the crater-fill materials of layers excavated by the nuclear device. This provided critical information about the chronology of the crater formation and its evolution since the nuclear tests. The first use of data from strontium- isotope geochemistry as a high-precision stratigraphic tool for atoll carbonates and its application to determine the source depths of crater debris and ejecta. The first sidescan sonar maps of a water-filled nuclear crater.
Geologic Investigations 75

Figure 75. Two-man research submersible Delta, operated by MARFAB, Inc., used extensively for direct observation and pho tography of crater features and surrounding area during both phases of the Enewetak Pro gram. Photograph taken in OAK crater in June 1985.
The first borehole gravity meas urements made on a coral atoll and the first successful application of a slimline borehole gravity tool from aboard ship. These meas urements provided essential bulk density and porosity data for the computational modeling.
The multidisciplinary approach con firmed that the original excavational cra ters of KOA and OAK were transient fea tures significantly smaller than originally thought and far more compatible with DOD predictions. Processes operating on a scale of hours to years greatly enlarged the size and modified the configuration of the initial craters in the water-saturated test beds. These processes included major failure of the sidewalls of the excavational crater, shock-induced liquefaction, consolidation, upward piping of material (partly from beds far below the excavational crater), and subsidence of the materials below and adjacent to the initial crater.
Federal/State Cooperative Geologic Mapping 1985-1987
By Wayne L. Newell
COGEOMAP, the Federal/State Coop erative Geologic Mapping program, is proving to be an effective program for providing geologic maps of high-priority areas in a timely manner that meet the varied needs of geologic map users. In its third year of activity in fiscal year 1987, COGEOMAP has grown to encompass 30 Federal/State cooperative projects (fig. 16). When the program began in fiscal year 1985, 18 State-proposed cooperative projects were accepted and funding was at the $1 million level. Congress increased funding to the $1.5 million level in fiscal year 1986 and fiscal year 1987.
During fiscal year 1987, major projects under the program included continuing work on new State geologic maps for Ari zona, Hawaii, Montana, New Hampshire, New Jersey, New Mexico, Virginia, and Washington. Detailed mapping projects were carried out in Alabama, Alaska, Arkansas, Idaho, Illinois, Indiana, Maine, Minnesota, Missouri, Nebraska, Nevada, North Carolina, North Dakota, Oklahoma, Oregon, Rhode Island, Tennessee, Texas, Utah, Vermont, Wisconsin, and Wyoming to identify mineral, energy, and water resources and delineate geological hazards. Significant results from the overall pro gram include Discovery of new high-BTU coal seams and fluorspar exploration targets in Illinois. Development of land-use plans for the southern coast of Maine that will protect ground water in this urbanized area.
76 U.S. Geological Survey Yearbook 1987

Completion of detailed geologic map ping of four mountain ranges in the Phoe nix, Arizona, region, which has stimulated mineral exploration and aided in the plan ning for construction of a major earth-fill dam. Stimulation of mineral exploration in the Wind River Mountains area of Wyo ming and of petroleum exploration in the Ouachita Mountains of Oklahoma and Arkansas.
Beginning in fiscal year 1988, the COGEOMAP program becomes a major component of the new National Geologic Mapping (NGM) program, which will seek to accelerate geologic mapping to meet the continuing strong demand for modern geo logic maps from the public and private sectors. Other major goals of the NGM program are Identifying, on a province-by-province basis, critical earth-science data needs that require new or additional intermediate- to large-scale geologic mapping. Establishing national geologic mapping priorities by province in order to focus future mapping on critical areas.
Increasing the coverage of the United States by intermediate- and large-scale geologic maps in provinces or portions of provinces of highest national priority. Coordinating and integrating subsur face studies, particularly geophysical, geo- chemical, and hydrologic investigations, with surface geologic mapping. Preparing and maintaining a system for an annual nationwide inventory of current geologic mapping and published map coverage. Encouraging greater production and public availability of geologic maps. Cooperating with the State geological surveys and the National Academy of Sci ences to set standards for future geologic maps. Evaluating and implementing new tech nologies and methodologies for geologic map compilation.
Within the broad program goals of NGM, COGEOMAP will continue to link USGS geologists possessing regional expe rience and technical expertise with the staffs of State geological surveys who pos sess detailed local information.
IBH i < /" LEGEND^^ / _ i _.__..\_ _ _. ; 4 I I State with project
"' '"''-- " ~" n ^- Location of activemapping
__ Location of E"1 completed
\ } mapping \j e%. State geologic
^d mapState geophysical maps Figure 16. Status of COGEO
MAP cooperative geologic map ping program, 1985 to early 7988.
Geologic Investigations 77

Lake Huron at a Delaware County park north of Forrestville, Sanilac County, Michigan. (Photograph by Michael /. Sweat, U.S. Geological Survey.)
78 U.S. Geological Survey Yearbook 1987

Water Resources
Investigations
HighlightsCreosoteContamination of a Surficial Sand Aquifer A Case Study
By Bernard J. Franks
Since 1982, teams of U.S. Geological Survey researchers have been studying selected ground-water contamination sites to advance the understanding of hydrologic processes affecting the movement of con taminants in ground water. Over 400 com mercial wood-treatment plants are active in the United States; many of them dis charge their wastes into onsite impound ments that, in turn, leak into underlying surficial aquifers. Contaminants commonly
stored in potentially leaky surface im poundments include organic chemicals from wood-preservative processes; most of these wastes contain creosote, a complex distil late of coal tar, and pentachlorophenol (PCP).
Owing to the large volume of creosote potentially contaminating local ground- water systems, a wood-preserving plant at Pensacola, Florida, was chosen by the USGS for detailed investigations (fig. 1). The plant was chosen because of its long uninterrupted history (from 1902 to 1981) of discharging wastewaters into unlined surface impoundments, the availability of preliminary data collected by the USGS in cooperation with the Florida Department of Environmental Regulation, and the high probability of transferring the findings to other sites where similar problems exist.
The plant site is located near down town Pensacola in Escambia County,
Figure 1. View of the wood- preserving plant at Pensacola, Florida, in 7987; onsite im poundments in the foreground. (Photograph by E. Michael Godsy, U.S. Geological Survey.)
Water Resources Investigations 79
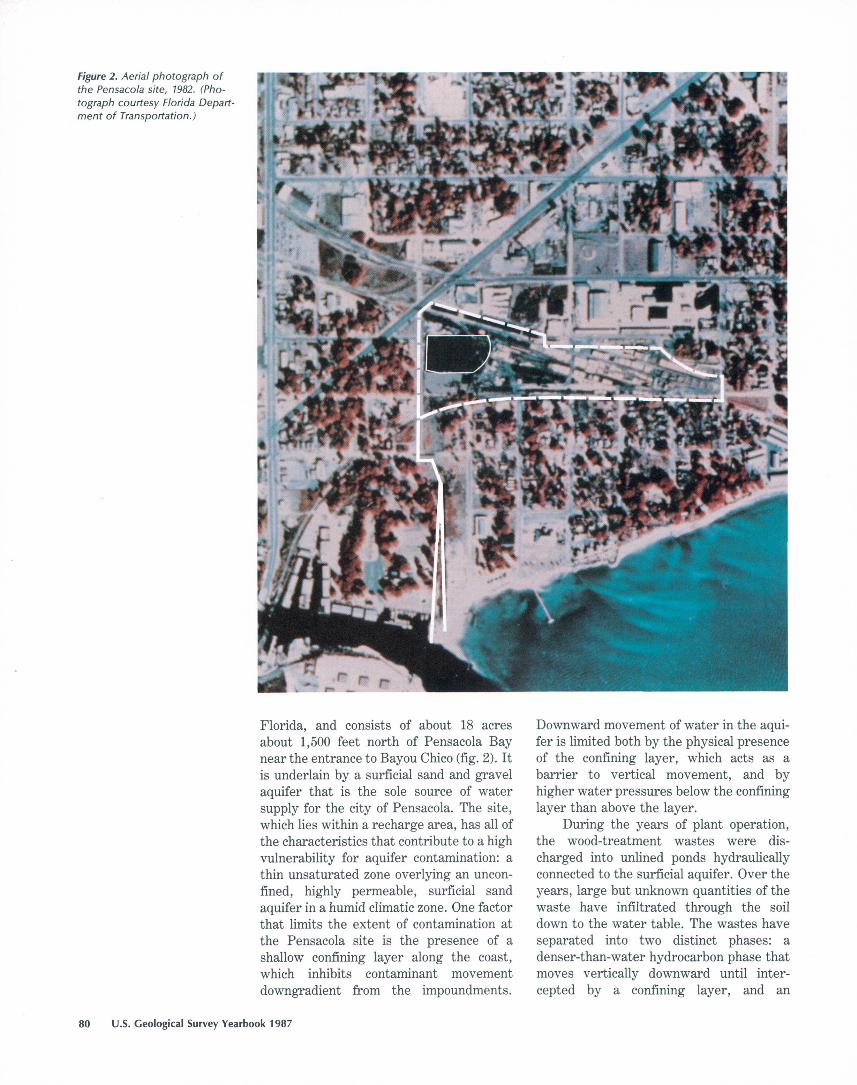
Figure 2. Aerial photograph of the Pensacola site, 7982. (Pho tograph courtesy Florida Depart ment of Transportation.)
Florida, and consists of about 18 acres about 1,500 feet north of Pensacola Bay near the entrance to Bayou Chico (fig. 2). It is underlain by a surficial sand and gravel aquifer that is the sole source of water supply for the city of Pensacola. The site, which lies within a recharge area, has all of the characteristics that contribute to a high vulnerability for aquifer contamination: a thin unsaturated zone overlying an uncon- fmed, highly permeable, surficial sand aquifer in a humid climatic zone. One factor that limits the extent of contamination at the Pensacola site is the presence of a shallow confining layer along the coast, which inhibits contaminant movement downgradient from the impoundments.
Downward movement of water in the aqui fer is limited both by the physical presence of the confining layer, which acts as a barrier to vertical movement, and by higher water pressures below the confining layer than above the layer.
During the years of plant operation, the wood-treatment wastes were dis charged into unlined ponds hydraulically connected to the surficial aquifer. Over the years, large but unknown quantities of the waste have infiltrated through the soil down to the water table. The wastes have separated into two distinct phases: a denser-than-water hydrocarbon phase that moves vertically downward until inter cepted by a confining layer, and an
80 U.S. Geological Survey Yearbook 1987

aqueous phase that includes the water- soluble components of creosote.
Movement of the water-soluble con taminants in the subsurface is controlled by ground-water flow that is generally directed southward toward Pensacola Bay. Flow velocities range from 0.1 to 3.0 feet per day. Flow paths and velocities are locally influenced by the distribution of the confining silts and clays. A small drainage ditch south of the two unlined impound ments intercepts shallow ground-water flow and has a marked effect on the config uration of the water-table surface and also on contaminant transport.
The U.S. Environmental Protection Agency included the Pensacola site on the Federal "Superfund" list of hazardous waste sites in 1982 owing to phenolic com pound concentrations in excess of 10 milli grams per liter (mg/L). In 1983, an EPA Emergency Response Team drained the ponds, treated the liquid, and placed a clay cap over the former impoundments (figs. 3, 4). This was done to alleviate a potential public health hazard caused by abnormally high water levels that caused contaminated water to spill over the embankments and flow southward along natural drainage paths, directly into Pensacola Bay. The primary source of subsurface contamina tion, the dense hydrocarbon phase that had already entered the aquifer, was not affected by this cleanup operation.
Extent and Character of Contamination
Contamination from the wood- preserving plant has resulted in the gener ation of anaerobic (oxygen-free) leachate that has had a significant effect on the water chemistry of the aquifer. In the contaminated water, the pH is about 5.4, the dissolved-solids concentration is about 350 mg/L, and many of the water-soluble components of creosote are found in con centrations near their limits of water solu bility. In addition, hydrogen sulfide, meth ane, ammonia, iron, nitrogen, and dissolved organic carbon all show marked increases in concentration in the aqueous phase downgradient from the impound ments. In contrast, the uncontaminated ground water has a pH of about 6.0, con centrations of dissolved solids generally less than 150 mg/L, and dissolved oxygen concentrations greater than zero. Unconta minated water is free of organic contami nants, hydrogen sulfide, methane, and ammonia and contains low concentrations of iron, nitrogen, and dissolved organic carbon.
Contamination exists in two of the three permeable zones present in the upper 300 feet of sediments. A plume in the water-table zone is 15 to 30 feet below land surface and above a shallow clay lens, and a
Figure 3. Part of the EPA Emer gency Response Team, shown flocculating the pond sediments after draining the impoundments before capping the ponds in 1983. (Photograph by Bernard J. Franks, U.S. Geo logical Survey.)
Water Resources Investigations 81

Figure 4. Clay cap overlying the dewatered impoundments. Since the photograph was taken, the cap has been sodded and revegetated. (Photograph by Bernard J. Franks, U.S. Geo logical Survey.)
Figure 5. Vertical extent of ground-water contamination, as measured by total phenol, in milligrams per liter, at the Pen sacola site.
deeper plume is 50 to 100 feet below land surface and below the clay lens (fig. 5). The contamination extends about 1,200 feet downgradient from the impoundments and includes the water-soluble components of creosote, as well as inorganic compounds and gases resulting from degradation of the organic compounds within the aquifer. The waste plumes are much less extensive, both areally and vertically, than expected from calculations based on measured ground-water gradients. For the plume in the water-table zone in particular, this attenuation is partly a result of ground water discharging into a drainage ditch that in turn discharges directly into Pensa cola Bay.
Ongoing research at the site includes evaluation of the hydrogeology and ground- water flow system, definition of the extent of organic compounds found in the aquifer, investigations of microbial and inorganic processes active in the subsurface, and a
>20f
0 500 1000 FEET I_____\_____l
1-20-<v1 .01-1
study of the effects of contaminants on the ecology of Pensacola Bay. These studies and concurrent Superfund-related activi ties at the site are being used to document the extent of contamination and to support discussion of feasible restoration activities at the site. Results to date include the following: The hydrogeology of the underlying aquifer can be represented by three hori zontal layers corresponding to permeable zones within the sand and gravel aquifer: a water-table zone, a shallow confined zone, and a deeper confined zone. Contamination is limited to the upper two zones because of a combination of the distribution of the clay layers and the upward hydraulic gradient that prevails near the coast south of the impoundments. The simulated movement of ground water is relatively rapid (as much as 3 feet per day) through the surficial sands. The aquifer is highly contaminated by organic compounds, including organic nitrogen compounds such as quinoline (as much as 90 mg/L), double-ring aromatic compounds such as naphthalene (as much as 15 mg/L), and phenolic compounds such as 3,5-dimethylphenol (as much as 13 mg/L). The organic nitrogen compounds undergo extremely rapid attenuation to virtually nondetectable levels (less than 0.01 mg/L) within 400 feet of the source. Most of the other compounds persist to
82 U.S. Geological Survey Yearbook 1987

about 1,200 feet downgradient before being eliminated from the aqueous phase. Microbial degradation processes, both aerobic and anaerobic, are probably the most significant mechanisms in contami nant attenuation. Sequential degradation of phenolic compounds has been docu mented, and continuing research is describ ing anaerobic degradation of the substi tuted aromatic compounds. Most of the compounds composing the water-soluble fraction of creosote appear to be degrad- able, through intermediate organic com pounds, into methane and carbon dioxide. Dissolved gases (methane and carbon dioxide) and inorganic constituents (hydro gen sulfide, ammonia, and iron) are indica tive of some of the byproducts resulting from breakdown of selected organic con taminants. In contaminated parts of the water-table zone, water is anaerobic within a few feet of the water table. Unusually high values of stable isotope ratios of car bon and sulfur are byproducts of microbial degradation. For instance, the lighter carbon-12 isotope preferentially forms methane (a gas), whereas the heavier carbon-13 enriches the inorganic carbon (aqueous) phase. The 13C/12C ratio is great est beneath the impoundments and decreases with distance away from the source of contamination. The presence of an iron-rich clay in the contaminated aqui fer possibly is a result of interactions between the clay and organic contami nants. Sorption does not appear to be a signif icant process in most of the aquifer, which is composed of clean quartz sands. Interac tions, including sorption, between minerals in the clay lenses and organic contaminants may be quite important in the attenuation of selected compounds. Organic compounds have been found in sediments beneath Pensacola Bay. Benthic organisms and sediments from near the site have been collected and analyzed for bioac- cumulation of organic compounds indicative of creosote contamination. Some evidence of bioaccumulation has been found, al though at very low concentrations.
Conclusions
Interrelated physical, chemical, and microbial processes must all be evaluated when attempting to understand and predict
the effects of contamination on the subsur face environment. Because some combina tion of these processes will occur in all aquifers, there may be significant transfer value from this investigation to other sites of ground-water contamination. Data on wastewater migration from surface im poundments into the subsurface clearly indicate that surficial aquifers are highly susceptible to contamination from a variety of sources. The wide variety of potential contaminants, combined with the locally complex subsurface geohydrologic envi ronment, however, results in uniquely contaminated systems that are difficult to document. After contaminants leak into a surficial aquifer (a relatively rapid process), the generally slow rates of atten uation, chemical reactions, and physical mixing, combined with the large volumes of contaminants in the subsurface, indicate that, after the source of contamination is removed, hundreds of years would pass before the water in the aquifer would be restored, by natural processes, to its pre- contamination quality. Both the investiga tion of the extent of organic contaminants in a contaminated ground-water system and the cleanup and restoration of that aquifer are complex and time-consuming tasks.
Fate and Transport of Organic Compounds in the Lower Calcasieu River, Louisiana
By Charles R. Demas
The presence and effects of hazardous organic compounds in the aquatic environ ment have been documented nationwide in recent years. These compounds are re leased to the environment from a variety of sources such as industry, agriculture, urban runoff, oil and gas exploration activ ities, and atmospheric fallout. The lower Calcasieu River in southwestern Louisiana (fig. 6) is a prime example of an aquatic system that has been affected by hazardous organic compounds.
Water Resources Investigations 83

The lower Calcasieu River is a tidally affected stream that lies within Louisiana's Coastal Plain. The upper reach of the Cal casieu River is characterized by hardwood forests, cypress, and related vegetation. Rice and soybeans are the principal crops grown in the upper and middle basin, including the upper part of the study area. Long-term water-quality data (1968 to present) collected at the National Stream Quality Assessment Network (NASQAN) site at Kinder (fig. 6) indicate that the upper reach of the Calcasieu River is a dilute, colored-water stream. Specific con ductance ranges from 13 to 187 microsie- mens per centimeter ((juS/cm) at 25°C. Dis solved organic carbon (DOC) concentra tions are 5 to 6 milligrams per liter (mg/L).
Streamflow at the Kinder site ranges from less than 200 to 182,000 cubic feet per second (ft3/s) and averages 2,500 ft3/s, October 1938 to present. Runoff of agricul tural chemicals into this reach of the river appears to be minor; however, some chlor- dane, diazinon, and aldrin have been detected in river water collected at the Kinder site.
The lower reaches of the Calcasieu River basin are bordered by swamp and marshland and can be subdivided into two sections. The first section is bordered upstream by a saltwater barrier and down stream by the Intracoastal Waterway. The Lake Charles urban and industrial complex dominates land use in this section of the study area. Approximately 32 industrial
93°30' 93°15' 93°00 : , 92°45'
Figure 6. Study area and water- quality sampling sites of the lower Calcasieu River, Louisiana.
30°30' -
30°15 : -
30°00' -
29°45'
10 15 MILES
10 15 KILOMETERS
84 U.S. Geological Survey Yearbook 1987

plants are located in this 14-mile section of the river. The specific conductance of river water in this section ranges from 200 to 33,000 nS/cm. The DOC ranges from 3 to 4 mg/L in the middle reach of the river. Petrochemical and agrichemical plants use the lower Calcasieu River in this section for water supply, navigation, and disposal of wastes. Byproducts such as oil and grease, phenols, and metals are discharged into the river by chemical industries in the Lake Charles area. The second section is bor dered upstream by the Intracoastal Water way and downstream by the Gulf of Mex ico. Commercial and sport fishing and oil
and gas drilling support facilities are major industries in this reach of the river.
Previous studies have attributed the occurrence of hazardous organic com pounds in the water, bottom material, and aquatic organisms of the lower Calcasieu River to industrial activity in the basin. However, none of the studies determined the processes that control the fate and transport of these organic compounds in relation to the physical characteristics of this river. The U.S. Geological Survey began a study in 1985 of the lower Calca sieu River, therefore, to determine the processes that control the fate and trans port of organic compounds in the industrial
Sediment Transport of Pollutants in the Mississippi River
A multidisciplinary project to investigate the movement, mixing, and storage of sediment-related pollutants in the Mississippi River was begun in 1987. This project is focused on the 1,243 miles of the river between St. Louis, Missouri, and New Orleans, Louisiana, and will require at least 3 years (1988-90) of intensive field sampling.
In addition to providing a comprehensive assessment of the water quality of the Missis sippi River, the project will improve under standing of the ways in which rivers process sediments and the pollutants associated with sediments. Among the specific research issues to be addressed are the partitioning of pollut ants between particulate, adsorbed, and dis solved phases; the mixing of different types of pollutants and mineral suites that are contrib uted by the major tributaries; and the storage and remobilization of sediments and their associated pollutants at seasonal and longer time scales.
Samples will be collected during repeated cruises that will begin at a section of the river above St. Louis and will cover a 1,119-mile reach of the Mississippi and its major tributar ies, including the Ohio. Laboratory analyses will be conducted on a wide range of organic and inorganic constituents (natural and pollut ants) of the suspended sediment as well as the river water. By repeating measurements and samplings every 4 months or so, data will be obtained on the downriver routing and mixing of water, sediment, and pollutants and on how water-quality conditions of the Mississippi River vary seasonally.
The Mississippi River drains about 40 per cent of the conterminous United States and discharges an average of 650,000 cubic feet per second (420,000 billion gallons per day) into the Gulf of Mexico. Nearly half of the water in
the system comes from the Ohio River drain age (and half of the Ohio contribution is provided by the combined discharges of the Tennessee, Cumberland, and Wabash Rivers). The Upper Mississippi and Missouri Rivers contribute only 10 to 15 percent each of the total water discharged to the Gulf. The most striking feature of the lowermost part of the Mississippi system is the diversion of part of the discharge out of the mainstem and down the Atchafalaya distributary. The proportion of the discharge that goes down the Atchafalaya is held at 30 percent of the total by the Old River Control Structures, completed by the U.S. Army Corps of Engineers in 1963 and 1987.
The present-day discharge of suspended sediment to the Gulf of Mexico by the Missis sippi River (including the Atchafalaya) aver ages about 210 million tons per year. Although most of the principal tributary sediment loads have been measured to a reasonable degree of accuracy, the estimate of the sediment dis charge of the Ohio River represents a major uncertainty. No comprehensive suspended- sediment data have ever been collected from the Ohio mainstem.
The sediment regime in the Mississippi has been altered drastically during the last 200 years, especially during the last 40 years when large dams were built across the major west ern tributaries. The greatest changes have been the reductions in the sediment loads of the Missouri, Arkansas, and Red Rivers that followed the construction of dams and reser voirs. The greatest apparent increase has been in the sediment load of the Ohio; if this increase is real, it may represent the acceler ated erosion brought about by deforestation, crop farming, and coal mining in the Ohio basin.
Water Resources Investigations 85

Figure 7. Concentration of bro- moform under moderate wind conditions, May 1985, and low wind conditions, August 1985, in the lower Calcasieu River.
1000
5ccO oc u. uj
UJozoo
50-
10 r
3-
EXPLANATIONWind speed, in miles per hour
15.3 7.5 (Moderate)(Low)
5678
SAMPLING SITE
reach and in the transition zones between brackish water and freshwater.
Two classes of organic compounds, volatiles and acid-base/neutral extract- ables, were selected for study on the basis of results of reconnaissance sampling trips at lower Calcasieu River sites completed in 1985 (sites sampled are listed in table 1). The two classes of organic compounds were found to move in distinctly different ways in the aquatic environment and were asso ciated with different media.
Volatile organic compounds (VOC's) were found primarily in the river water and were selected for study on the basis of the widespread odor of organic compounds detected in the air during the first recon naissance sampling trip. Detection of these compounds at low concentrations in water samples collected during this trip led the USGS to investigate the effects of wind speed, sampling techniques, and compound density on the presence and concentration of these compounds in the lower Calcasieu River. The presence and movement of VOC's in the lower Calcasieu River appear to be a function of wind speed and water density.
Analysis of river-water samples col lected under different wind conditions dur ing four sampling trips indicated that wind speed, and the turbulence it created, was a primary factor in controlling the concentra tions of VOC's. For example, water sam ples were collected during moderate (15.3
Table 7. Location of water-quality sampling sites for the lower Calcasieu River, Louisiana
Samplingsite no. Location
(See fig. 6)_______________________1 Calcasieu River east of Moss Bluff2 Bayou Serpent east of Moss Bluff3 West Fork Calcasieu River west-
northwest of Goosport4 Calcasieu River at Buoy 130 at
Lake Charles5 Calcasieu River at Buoy 114 at
Lake Charles6 Calcasieu River at Bayou d'lnde7 Calcasieu River 3.9 miles south of
Hollywood8 Calcasieu River at Burton Landing9 Calcasieu River at Devil's Elbow
10 Calcasieu Lake northeast of Hack- berry
11 Calcasieu River at buoy 47 south west of Cameron
12 Bayou d'lnde 0.25 mile upstream from an industrial outfall
13 Industrial outfall at Bayou d'lnde14 Bayou d'lnde 0.25 mile downstream
from an industrial outfall15 Bayou d'lnde 0.50 mile downstream
from an industrial outfall
miles per hour) and low .(7.5 miles per hour) wind conditions in May and August 1985 from a reach of the lower Calcasieu River extending from Lake Charles to Burton Landing (fig. 6). Samples were collected throughout the water column under similar temperature and specific-conductance pro files in the water column. Results showed that only four VOC's were detected at two sites (sites 5 and 6) during moderate wind conditions, compared with six compounds detected at four sites (sites 5 through 8) during low wind conditions. Also, VOC's such as bromoform (fig. 7), chloroform, 1,2-dichloroethane, and chlorodibromome- thane were found in concentrations as much as 5 times greater during low wind conditions than during moderate wind con ditions. Thus, sampling for volatile organ- ics during moderate to strong wind condi tions can lead to erroneous conclusions about the presence and potential impact of these compounds in the aquatic environ ment.
Water samples also were collected at different depths in the water column from the same reach to determine the effects of different densities of organic compounds and specific-conductance profiles on the distribution of VOC's in the lower Calca sieu River. This sampling was conducted to
86 U.S. Geological Survey Yearbook 1987

ascertain if the density of a VOC deter mines where in the water column that compound might be concentrated. Position of a compound in the water column is very important in determining the type of sam pling gear and methods needed to accu rately describe the presence and concentra tion levels of organic compounds in the river. For example, VOC's such as bromo- form, which has a density of 2.9, would be expected to be found in greater concentra tions lower in the water column than lighter VOC's such as 1,2-dichloroethane, which has a density of 1.3. If this in fact occurred in the river, then depth- integrated samples collected throughout the water column or from near the surface would indicate an abnormally low concen tration of bromoform in the river, while water samples collected at specific depths (point samples) would tell where the bro moform was concentrated in the water col umn and therefore would have the greatest environmental impact.
Accordingly, point samples were col lected in May 1986 during low wind condi tions (6.9 miles per hour) and April 1987 during moderate wind conditions (17.0 miles per hour). Results from the May 1986 sampling (fig. 8) indicated that the differ ent densities of organic compounds had little effect on the vertical distribution of these volatiles in the water column. Con centrations of VOC's at different depths were similar for the six sampling sites (fig. 8), except for site 4. Bromoform, for exam ple, showed vertical distribution similar to 1,2-dichloroethane and trichloroethylene (density 1.5) and occurred in similar con centrations at all three depths sampled. This observation indicates that, under most conditions, samples collected throughout the water column and from surface water can accurately represent the concentration levels of VOC's in the Calcasieu River.
The exception to the above observa tion occurred at site 4. Vertical differences in concentrations observed at site 4 can be explained by the results of flow, dye, and specific-conductance profile studies. Flow studies indicate that the slow-moving water currents in the river preclude much vertical mixing in the water column owing to the small vertical-velocity gradients. Therefore, during periods of saltwater intrusion, the denser saltwater moves almost exclusively near the bottom. The saltwater migrates some distance up
stream owing to the longitudinal salinity gradient between the relatively freshwater upstream and the denser saltwater in the Gulf of Mexico. Dye studies completed in 1979 and 1987 indicate slow vertical mixing in the water column when differences exist between surface and bottom specific- conductance values. These differences in specific-conductance profiles were most pronounced at site 4, where the bottom sample had the highest concentration of VOC's. This high concentration of volatiles occurred in a part of the water column that had a specific-conductance value (12,500 |xS/cm) similar to that of downstream sites. In contrast, surface samples that had lower concentrations of VOC's occurred in rela tively low specific-conductance water (2,500 (xS/cm) compared with downstream sites (sites 6, 13, and 14). This phenomenon also was observed in samples collected dur ing moderate wind conditions (17.0 miles per hour) in April 1987. These results indi cate that (1) longitudinal movement of VOC's occurs along the bottom when salin ity gradients exist in the lower Calcasieu River, (2) VOC's detected in the bottom water sample at site 4 originated down stream, and (3) presence of the salinity gradient at site 4 inhibited movement of VOC's from the bottom of the water col umn to the top of the water column. Data from dye and volatile-organic studies also indicate that salinity gradients inhibit ver tical movement of VOC's in the water col umn. Presence of VOC's at site 4 and their movement upstream with the salt wedge could not have been determined without point samples. Thus, sampling for VOC's in areas where salinity gradients exist, espe cially freshwater-saltwater, should include some point samples to determine an accu rate picture of the vertical distribution of these compounds in the water column.
Acid-base/neutral extractable organic compounds also were studied in the lower Calcasieu River. One group of compounds detected in water, bottom material, and biotic samples was the halogenated organic compounds (HOC's), which include the halo- arenes, a class of chlorinated aromatic com pounds that are hydrophobic (nearly insol uble in freshwater) and toxic to aquatic organisms. These compounds attach strongly to sedimentary organic material and accumulate in fatty tissues of aquatic organisms. Haloarenes are even less solu ble in saltwater and precipitate out as
Water Resources Investigations 87

Figure 8. Vertical distribution of four volatile organic com pounds of different densities collected in May 1986, lower Calcasieu River.
100
10:
5'-
1
05-
01
10,000
DENSITY OF 1.46
200 -cc Otr
HO <QC OCCJ
"
3 -
13 14
CC O ccLL. LUOb s-1Oo=CC LUm a.U. (/)
Z<
|g
52
zlLUuzz O
1000i
1001
50-
DENSITY OF 2.90
1
100
DENSITY OF 1.50
13 14
50-
§b 10
5 tt
CM (/)
U- DCOo
Ou
0.1
DENSITY OF 1.30
13 14 6 7
SAMPLING SITE
f 13 14 6 7
SAMPLING SITEEXPLANATION
DEPTH
Surface Mid-depth Near Bottom
salinity increases in the water in the lower Calcasieu River (a phenomenon termed "salting out").
Other organic compounds, such as nat urally occurring humic and fulvic com pounds, show similar "salting out" tenden cies. This is shown in the decrease in DOC from the freshwater reach of the river, where DOC values ranged from 5 to 6
mg/L, to the brackish and saltwater reaches of the river, where DOC values decreased to 3 to 4 mg/L. This decrease in DOC occurred in the fraction that has an affinity for suspended sediment, while the fraction that has an affinity for water remained constant. In the process of "salting out," the sediment-loving fraction of the DOC may also facilitate the removal
88 U.S. Geological Survey Yearbook 1987

of HOC's from the water column to bottom material by providing additional organic material for the HOC to attach to in the bottom material. Therefore, owing to the decrease in solubility of HOC's in saltwater and the presence of natural organic carbon, bottom material in the lower Calcasieu River serves as a major trap for these compounds.
The "salting-out" effect in the lower Calcasieu River also moderately enhances the concentration of the organic compounds into biota and bottom material. Concentra tions of HOC's in biota and water were well below their equilibrium values relative to concentrations in bottom material. This lack of equilibrium between HOC concen trations in bottom material and the water column suggests a limited amount of exchange that may result from the slow diffusion of the sorbed contaminants from bottom sediments. In contrast, HOC con centrations in water, biota, and suspended sediments were much closer to equilibrium values. Concentration factors of HOC's in four fish and shellfish species (Atlantic croakers, spotted sea trout, blue catfish, and blue crabs) indicated that these com pounds passively entered the tissues of the fish and shellfish, owing to diffusion of the compounds throughout their habitat. More information is needed, however, to deter mine if the compounds enter the tissues by
other routes, such as actively through the digestive tract of the species.
The molecular configuration of halo- arenes and hexachlorobutadiene also pro vides an explanation for the longitudinal differences in concentrations of compounds observed in bottom material collected from the lower Calcasieu River. The higher weight molecular compounds, such as hexachlorobenzene, are more insoluble in water, and readily adhere to particulate matter compared with the more soluble lighter weight molecular compounds such as 1,3-dichlorobenzene. Therefore, the more chlorinated compounds (hexachloro butadiene and hexachlorobenzene) accumu late in bottom material closer to the source than the less chlorinated compounds (di- chlorobenzenes and trichlorobenzenes) do. In both cases, however, solubilities are low and transport is localized, so distribution of these compounds in the lower Calcasieu River bottom material is not widespread.
Current (1987) work with organic com pounds includes studies of possible mecha nisms for remobilization of these com pounds into the water column from bottom material under different environmental conditions and of the long-term uptake of organic contaminants by aquatic organisms to determine the extent of passive uptake in these organisms. Results from the lower Calcasieu River project will provide State and Federal environmental agencies with
Appmaching storm in the Gulf of Mexico. (February 1987 pho tograph courtesy H. William Hadfield.)
Water Resources Investigations 89

the information necessary to assess per mit applications and formulate restora tion schemes for this complex aquatic environment.
Arsenic Contamination of the Cheyenne River System, Western South Dakota
By Kimball E. Goddard
The 1960's brought an awareness of the serious environmental hazards and eco nomic damage that could result if our Nation's rivers and streams continued to be used for disposal of waste. Resulting legis lation, such as the Federal Water Pollution Control Act Amendments of 1972 (P.L. 92-500), the Toxic Substances Control Act of 1976 (P.L. 94^69), and the National Pollutant Discharge Elimination System (NPDES) Permit Program, provided the impetus for a nationwide cleanup. As a result, the quality of the Nation's rivers and streams has improved substantially in several respects, reflected by increased dissolved-oxygen concentrations and de creased bacterial contamination. These improvements are largely attributable to measures for controlling point-source dis charges and the construction or improve ment of wastewater-treatment facilities. Numerous other water-quality issues re main, however, and the focus of concern is now shifting from sewage disposal to the control of potentially more hazardous wastes such as toxic metals and synthetic organic compounds.
Recent studies of the geochemical behavior of toxic metals and synthetic organic compounds in river and stream systems have demonstrated that these con stituents are commonly associated with river or stream sediments. The extremely low solubilities of some metals, such as mercury and lead, in stream water and the affinity of many synthetic organic com pounds to adhere to or adsorb to sediments generally result in undetectable dissolved concentrations of these constituents in sur
face water. At the same time, the geochem ical behavior of these constituents may cause large enough concentrations to accu mulate in bottom sediments that the con stituents can be absorbed and (or) ingested by aquatic plants, benthic organisms, or bottom-feeding fish. Although toxic con stituents concentrated and buried in bot tom sediments may be isolated from the environment for long periods, they can be resuspended into the water column and transported during floods. The adsorption of hazardous constituents onto channel- bottom sediments exacerbates the diffi culty of understanding the processes re sponsible for the movement and fate of these constituents in river systems.
In 1985, the USGS began to investi gate how hazardous substances associated with river sediments react in surface-water systems. The Cheyenne River System in western South Dakota was one area selected for detailed study (fig. 9). White- wood Creek and downstream reaches of the Belle Fourche and Cheyenne Rivers have been extensively contaminated by mine tailings and mill wastes from gold mining operations located in the northern Black Hills of South Dakota.
Gold was discovered in the Black Hills in 1874 and, by 1876, full-scale hardrock mining was underway. Although mining and milling technology have changed over the last 100 years, the basic approach remains the same: ore is pulverized to fine sand- and silt-size particles and then treated with elemental mercury or sodium cyanide solutions to remove the gold. The remaining tailings slurry, along with wastewater from the mills and water pumped from mines, is discharged to a stream. The practice of discharging mine and mill wastes to Whitewood Creek or its tributaries in the Lead and Deadwood area continued until 1977, when a tailings dam was completed. No tailings solids have been discharged to the streams since that time.
About 100 million tons of mill tailings are estimated to have been discharged to Whitewood Creek. The mill tailings were transported by natural surface-water flow down Whitewood Creek to the Belle Fourche River, to the Cheyenne River, and finally to the Missouri River. Alluvium in the channel and along the floodplains of Whitewood Creek and the downstream reaches of the Belle Fourche and Cheyenne
90 U.S. Geological Survey Yearbook 1987

Figure 9. Map showing the river system under investigation. The study area includes river reaches upstream from tailings- contaminated reaches in order to define background concen trations. The tailings were dis charged at Lead.
Rivers is contaminated by the mill tailings. Some alluvium is nearly 100 percent mill tailings. Although the tailings are com posed largely of silicate minerals, they also contain the metallic sulfide minerals pyrite, pyrrhotite, and arsenopyrite. The primary contaminant of interest is arsenic, derived from arsenopyrite, a matrix mineral com mon in the gold-bearing ore. Owing to the substantial concentrations of arsenopyrite present in the mill tailings, alluvium in the channels and along the floodplains of White- wood Creek and the downstream reaches of the Belle Fourche and Cheyenne Rivers contains large concentrations of arsenic, as much as 11,000 micrograms per gram (fjug/g). This contrasts with arsenic concen trations measured in uncontaminated sedi ments in the Cheyenne River basin that average about 10 |xg/g. Arsenic concentra tions measured in sediment samples ran domly collected from the floodplain of the downstream reach of the Belle Fourche River are shown in figure 10, and the marked contrast between the uncontamina ted (above Whitewood Creek) and contam inated reaches is apparent.
The large variation in arsenic concen trations within the contaminated reach of the Belle Fourche River floodplain demon strates the difficulty of studying the distri bution of contaminants associated with alluvium. That the collection of a few sam ples provides little information on how the contaminant (in this case arsenic) is distrib
uted in the system is clear. These varia tions are a cumulative result of physical dispersion of the mill tailings and their uneven intermixing with uncontaminated alluvium, geochemical transformations between various solid and aqueous phases of arsenic, bias caused by variations in grain-size distributions in individual sam ples, and analytical imprecision resulting from differences in mineral composition of individual samples.
Physical dispersion of the mill tailings is considered to be the primary cause of contaminant variation. During downstream transport, the mill tailings are intermixed with natural alluvium to varying degrees depending on flow regime and the tributary contribution of uncontaminated sediments. Deposits of intermixed mill tailings and natural sediments formed during periods of low discharge, when the concentration of naturally occurring suspended sediment is minimal, consist almost entirely of tailings. Conversely, deposits formed during flood flow, when huge quantities of natural sus pended sediment are available for inter mixing, contain only a small amount of tailings.
Geochemical transformations, between various solid forms of arsenic and between its solid and aqueous forms, create addi tional pathways for the transport of arsenic. Although the entire arsenic mass originally was present in the mineral arsenopyrite, onsite observations and
Water Resources Investigations 91

10V
Figure 10. Arsenic concentra tions measured in alluvium col lected from the floodplain of the Belle Fourche River. The sampling locations were setected following a stratified random sampling design. The expected background concen tration shown was evaluated by using a data set that included samples from the background reach of Whitewood Creek.
O)
gi-cc
z o oozLU C/5cc< 10
BELLE FOURCHE RIVER
WHITEWOOD . CREEK
« j5«-I :i:M ! - ; :' ;:i s ,
: . : : w & I: :' -?'
: V
Background
100 80i60 40'
FLOODPLAIN MILES ABOVE MOUTH
20
mineralogic data indicate that a substantial proportion of the existing arsenic copre- cipitated with or adsorbed onto iron oxide and other metallic oxides. The transforma tion from a reduced form (arsenopyrite) to an oxidized form (sorbed onto ferric hydroxide) determines the stability of arsenic in the environment.
Arsenopyrite is relatively unstable in an oxidizing environment, such as in active stream sediments or in shallow floodplain soils or sediments. In these environments, arsenopyrite will oxidize and form ferric hydroxide and arsenic ions. Arsenic ions produced by the oxidation of arsenopyrite will always be precipitated out or be sorbed by the ferric hydroxide and will not be available for solute transport. If deeply buried in floodplain deposits, however, arsenopyrite can remain unaltered for long periods.
Ferric hydroxide is quite stable in an oxidizing environment. If ferric hydroxide is buried in a reducing environment such as a thick, organic-rich floodplain deposit, however, it will dissolve and release sorbed arsenic into the ground water. Reducing conditions commonly exist in large deposits of contaminated sediment, suggesting that the reduction of ferric hydroxides, rather than the oxidation of arsenopyrite, causes the large dissolved-arsenic concentrations present in water in some alluvium.
Dissolution of ferric hydroxides in allu vium forms a pathway for arsenic migra tion. Instead of being adsorbed on solids,
the released arsenic moves with the ground water and eventually discharges to rivers and streams. The dissolved arsenic re leased to the rivers and streams is again adsorbed, this time onto sediments present in the active channel. The release of arsenic from floodplain deposits, arsenic transport through the ground-water system, and arsenic discharge to rivers and streams are currently (1987) under intensive investiga tion (fig. 11).
The occurrence and magnitude of arsenic contamination in Whitewood Creek and the Belle Fourche and Cheyenne Riv ers are now controlled by natural processes acting on the tailings-contaminated sedi ments. The contamination of alluvium affects the surface-water system by direct introduction of arsenic-rich sediments from bank collapse, from overland runoff, or from channel scouring. Transformations between solid and aqueous forms in the alluvial aquifer also contribute arsenic to rivers and streams and to active channel sediments. Although the contamination was caused originally by the direct dis charge of mill tailings to Whitewood Creek and its tributaries, which ceased 10 years ago, continued contamination of the rivers and streams cannot be completely miti gated. Unlike many surface-water contam ination problems of the past that have been mitigated or eliminated by controlling con taminant discharge and construction of new treatment facilities, widespread contami nation of river and stream sediments by
92 U.S. Geological Survey Yearbook 1987

toxic metals or nondegradable synthetic organic compounds is a long-term hazard. In this case, arsenic will continue to be a contaminant in the Cheyenne River basin for many years.
Great Lakes Water-Use Data Base Planning for the 21st Century
By Deborah S. Snavely
The Great Lakes form the largest vol ume of unfrozen freshwater in the world (5,000 cubic miles of water) and supply drinking water for 26 million people in the United States and Canada. This interna tional resource is important to the economy and the quality of life of millions of people. One-seventh of the total population of the United States and about one-third of the total population of Canada reside within the Great Lakes basin, and its people and
industries produce one-sixth of the United States' national income and nearly half of the Canadian national income. The Great Lakes have been the subject of numerous studies, many of which have led to the passage of local and Federal laws regulat ing lake-shore development and the stor age and discharge of toxic materials.
As the 21st century approaches, efforts to protect the water quality of the Great Lakes have been extended to include the issue of water quantity, to ensure an adequate supply of freshwater. One solu tion to local shortages is the interbasin diversion of water from the point of plenty to the point of need, but whether a large- scale diversion of Great Lakes waters for use in other regions could be adequately regulated through individual State laws, interstate compacts, or international trea ties is uncertain.
This realization prompted the eight States and two Canadian Provinces of the Great Lakes-St. Lawrence River basin to officially declare the Great Lakes an essen tial international resource and, by signing the Great Lakes Charter in February 1985, to implement a method of protecting the
Figure 11. U.S. Geological Sur vey hydrolog/sts collecting wa ter and alluvium samples from a large deposit of tailings along Whitewood Creek. Alluvial ground water containing large concentrations of arsenic and iron is discharging to White- wood Creek at the base of the deposit. (Photograph by Kimball E. Coddard, U.S. Geological Survey.)
Water Resources Investigations 93

quantity of water. This good-faith agree ment calls for equitable decisions between individual States and Provinces to preserve the region's ecological integrity, formulates procedures to determine water-data needs, and establishes communication and cooper ative programs among jurisdictions.
The Great Lakes Charter mandates collection of water-use data as a prerequi site to dialogue among authorities on the advisability of proposed water-use projects discussed in the context of regional inter ests. These data are to be stored in the Great Lakes Regional Water-Use Data Base, which was designed by the U.S. Geological Survey as part of a project out lined by the Great Lakes Charter and sup ported by the Council of Great Lakes Gov ernors.
The signing of the Great Lakes Char ter authorized formation of the Water Resources Management Committee, which is composed of representatives appointed by the governors and premiers of each Great Lakes State and Province. The Com mittee was charged with the responsibility of identifying specific common water-data needs; developing and designing a system for the collection and exchange of compara ble water-resources-management data; rec ommending institutional arrangements to facilitate the exchange and maintenance of
such information; and developing proce dures to implement the prior-notice and consultation process established in this Charter.
Economic Importance and Water Use
The drainage area of the Great Lakes-St. Lawrence River basin at the streamflow-gaging station on the St. Law rence River at Cornwall, Ontario (fig. 12), is 299,000 square miles. The drainage area of the St. Lawrence River upstream from Trois-Rivieres, Quebec, including 1 the Ottawa River, is 100,000 square miles. In the United States, the Great Lakes basin includes most of Michigan and parts of Minnesota, Wisconsin, Illinois, Indiana, Ohio, Pennsylvania, and New York. The Canadian part of the Great Lakes basin is entirely within the Province of Ontario. The St. Lawrence drainage includes the Province of Quebec.
Historically, the economy of the Great Lakes basin has been largely industrial. One-fifth of the United States' manufactur ing is based along Great Lakes shores, including 70 percent of the Nation's steel production, more than 50 percent of its automobile and machine-parts manufactur-
Figure 12. Major geographic fea tures of the Great Lakes-St. Lawrence River basin.
St. Paul*' WISCONSIN
TORONTO ^^--^..AC 1 X^ONTARIOJ ^'S
) \ ( Milwaukee
40V
/ /.____...___200 MILES V inr-^-*'0 100 200 300 KILOMETERS 1 / '
. \s-^
DRAINAGE ^""""^'BASIN BOUNDARY
Base from U.S. Geological Survey, The National Atlas, 1:7,500,000,1970.
94 U.S. Geological Survey Yearbook 1987

PUBLIC WATER SUPPLY 5,105 Mgal/d9.8%
THERMOELECTRIC POWER35,850 Mgal/d68.7%
THERMOELECTRIC POWER 8,820 Mgal/d59.5%
Figures may not add to totals because of independent rounding
ing, and more than 25 percent of its chem ical production. Almost 50 percent of the Canadian manufacturing is on the Great Lakes shoreline.
Power generation represents the larg est demand on water resources within the Great Lakes basin. In 1983, 23.7 billion kilowatt-hours of hydroelectric power were generated in the United States and another 20 billion in Ontario by water flowing through the lakes.
The Great Lakes-St. Lawrence Sea way is the world's largest and one of its most important waterways. It is navigable for 2,400 miles, from the Atlantic Ocean to the head of Lake Superior, and is being continually developed and maintained by both the United States and Canada.
The withdrawals of water in the United States and Ontario, by major water-use category (fig. 13), are presented only for general comparison. Water that is withdrawn can either be consumed or returned to the hydrologic system. Most of the water withdrawn to cool thermoelectric powerplants is returned, for example, whereas only a small percentage of that withdrawn for irrigation is returned (fig. 14).
"Consumptive use" means rendering water unavailable through evaporation, transpiration, incorporation into products, or removal from the water environment by other means. In the U.S. part of the Great Lakes basin (fig. 15), industrial water use, irrigation, and public supply each repre sent approximately equal amounts of con
sumptive use and together account for more than 80 percent of the total used.
Great Lakes Project
The Council of Great Lakes Governors in 1985 formally entered into a cooperative agreement with the U.S. Geological Sur vey to conduct the Great Lakes Project, the objectives of which are to: Analyze and describe the water-use data-collection activities in each State and Province in the Great Lakes-St. Lawrence River basin and describe the types of data collected and the methods of data collec tion, transfer, storage, and reporting; Design the Great Lakes Regional Water-Use Data Base by specifying the categories and determining the methods by which each State and Province could best transmit data to the data base; Identify gaps in each State's and Pro vince's data programs and document incon sistencies; and Suggest methods of collecting missing data, including institutional arrangements.
Design and Operation
The USGS Great Lakes project chief, based in Albany, New York, enlisted the support of USGS water-use specialists in the other Great Lakes States to document the programs in their State and to act as liaisons between the Great Lakes project chief and the agencies that collect water-
Figure 13. Total water withdraw als from the Great Lakes basin, 1980, by category: A, Entire ba sin; B, Province of Ontario. (Data from U.S. Geological Sur vey Circular 1001, 1983, and On tario Ministry of Natural Resources, 1984.)
Water Resources Investigations 95

go
n
c*
c
31~
- o
^
<t>
c
£*
? S
3-3
5 - I
- a -
31
I n
ta t
CO
5?
to
^
_
si
<p
**
c*sr
3 -
s* r-
§~-
_.
& -d
5 c 3 M 3 Q 3
O O
Q.
Q.
ey
re o Q Q.
(X)
3 a. 0> o c 3
Q.
a. >
$ $
8O
83
~
&
&
%"^
H
i O
<t>
Q;
cr o
*8
g-83
in
S-%
3
g w
S|l
^*
rv^
O
^2j
C^
~
C/-
<
>-«
65
cV
CO
otr
w
oO
M
i-
rtO
^f-
h
^»
si p
<rg
a a
s^ c
o £
CO
O
C
L
CO
83
Ha
OTQ
"*»
(D
>-.
g
C!
S* 2
co
£
O
co
rt>
CO
HH
83
P
Oy
n
Orq
Oj
O
""5
O
P
?8T
&
ZZ
&
g
^
co
'rS
CO
M
cr p
S'
83£L
>-s
<D
<Jo
co
p0Q
QT
Q /tS
* sJ
~O
H
>-5
^
S
3
S.
c! COcr
» cT1
sf ^
83
Q
i iT
'sB.
«
3
o
o
«-
I *
<D
83
o
3- Q
. n>
2
Si
S
5T3,
3 y
c; -J5
.0
0
PERCENTAGE OF WITHDRAWALS RETURNED
ro o0> o
00 o
o
o
m
DO m
O m
O
O 73
o?

The project chief also held interviews in each State and Province to verify that all appropriate agencies and ministries had been identified and that the data-collection programs were accurately described. A second questionnaire was circulated to obtain a description of how the data are entered in the agencies' computerized-data files.
Results
From the questionnaires, the USGS researchers learned that the data-collection programs in the participating States and Provinces differ widely in definitions of categories of water use and in methods of estimating data. The most complete data- collection records are in the category of public water supply; the least complete are for hydroelectric power generation and mining. Most agencies can provide esti mates of withdrawals in the categories of domestic self-supplied and agricultural, and a few have data-collection programs that document consumptive use. Estimates range from county or drainage basin at 5-year intervals to site-specific data collec tion yielding daily values.
Gaps and inconsistencies in data- collection programs were identified by water-use category for each State and Province, and methods of rectifying them were suggested. Institutional arrange ments were suggested as a method for various data-collection activities to comple ment one another.
The Great Lakes Charter mandates, as a goal, that each State and Province be able to supply the information required by the Great Lakes Regional Water-Use Data Base. Much remains to be done in meeting this goal; as of 1987, no State or Province could provide complete records in all water-use categories.
Great Lakes Regional Water-Use Data Base
The Great Lakes Charter states, in regard to the "common base of data," that "In order to provide accurate information as a basis for future water resources plan ning and management, each State and Province will establish and maintain a sys
tem for the collection of data on major water uses, diversions, and consumptive uses in the Basin."
Structure and Operation
The Great Lakes Regional Water-Use Data Base is designed to store withdrawal, diversion, and consumptive-use data for the following categories: public supply, hydroelectric power generation, domestic self-supplied, industrial self-supplied, irri gation, agricultural, thermoelectric power- plant cooling, commercial self-supplied, and mining. Data are to be updated annu ally and stored as an average daily amount for each category for the year, in million gallons per day. Other data to be submitted are type of withdrawal, level of data accu racy, drainage basin, level of data aggrega tion, annual amount of withdrawal, number of facilities withdrawing 100,000 gallons per day or more, amount diverted from Great Lakes basin, total amount with drawn by such facilities, and amount of diversion into Great Lakes basin.
The purpose of the data base is to provide the water-use information neces sary to make sound management decisions. The Charter requires that each State or Province develop the ability to provide accurate information on water withdrawals that average more than 100,000 gallons per day in any 30-day period. Initially, the data base will accept a wide variety of water-use data supplied by the participating States and Provinces.
Selection of Repository
More than 30 agencies and ministries were polled by letter to determine interest in writing, storing, and maintaining the regional data base. After review of the 11 proposals received, the Water Resources Management Committee recommended to the governors and premiers of the Great Lakes region that the Great Lakes Com mission in Ann Arbor, Michigan, be selected.
States and Provinces that do not have all of the required data are initiating pro grams or legislation to acquire such data. The ability to submit data at the 100,000 gallon-per-day trigger level is also one of two requirements for participation in the "Prior Notice and Consultation" process, described below.
Water Resources Investigations 97

Prior Notice and Consultation System
The Prior Notice and Consultation procedure (proposed by the Great Lakes Charter) would provide each State and Province in the basin an opportunity to review, discuss, and support or oppose any major new or increased diversion or con sumptive use of the water resources of the Great Lakes basin. The Prior Notice and Consultation rule would apply to any new or increased diversion or consumptive use of the Great Lakes basin water resources that exceeds 5 million gallons per day in any 30-day period. To participate in the process, the State or Province must have authority to manage (permit, regulate, or allocate) water withdrawals involving a total diversion or consumptive use of Great Lakes basin water in excess of 2 million gallons per day in any 30-day period. This is in addition to the ability to provide accu rate and comparable information on water withdrawals that average more than 100,000 gallons per day in any 30-day period. Since the Charter was signed, New York State, for example, has written legis lation to meet these criteria.
Applications
The regional water-use data base is designed to provide accurate and timely data on withdrawals, diversions, and con sumptive uses in the Great Lakes-St. Law rence River basin. It may also be used to predict the effects on lake levels of pro posed withdrawals, diversions, and con sumptive use. Hydrologic models currently operated by the U.S. Army Corps of Engi neers, Environment Canada, the Great Lakes Environmental Research Labora tory, and the University of Wisconsin, for example, could incorporate data from the regional data base for use in other predic tive studies. If the participants choose to develop the regional data base into a site- specific program, more options will be available for using the data base as a water- resources management tool.
Conclusions
The Great Lakes Charter is a signifi cant document that proclaims the joint desire of the United States and Canada to preserve, conserve, and manage the water
resources of the Great Lakes-St. Law rence River basin. This good-faith agree ment calls for use of the rights and respon sibilities of individual States and Provinces for the good of the whole region.
The proposed Prior Notice and Consul tation procedure would permit group review of major withdrawals and diver sions in relation to competing interests, future plans, and environmental consider ations. An integral part of this procedure, and also a prerequisite to participation, is the collection and transmittal of water-use data to the Great Lakes Regional Water- Use Data Base. The data base is intended to gradually become a reliable source of current water-use data available for water- resources planning, management, and fore casting.
Effects of Acid Rain on Limestone and Marble Building Materials at Research Sites in the Eastern United States
By Michael M. Reddy and Milan Pavich
Background
The various manmade and naturally occurring materials that are used in con struction are subjected to changing natural factors that include temperature, wind, humidity, rain, dew, snow, and solar radi ation, all of which may contribute to the gradual deterioration of these construction materials. At many locations, these mate rials are also subjected to varying quanti ties of pollutants, including oxidants (such as ozone), acid precursor gases (such as oxides of sulfur and nitrogen), particulate matter, and acid rain. Depending on their concentration, some of these pollutants may significantly increase the rate of dete rioration of certain materials. Damage to limestone and marble building materials by air pollution and acid rain has been
98 U.S. Geological Survey Yearbook 1987

reported by a number of investigators. Such damage may occur in many places in the Eastern United States. The balusters on the west face of the Pan American Union Building, located at 17th and C Streets Northwest, Washington, B.C., for exam ple, have been damaged by air pollution (fig. 16). On other parts of the west face of the Pan American Building that receive direct rainfall, rainfall appears to be dis solving the stone. This stone damage pro cess appears to be accelerated in areas affected by acid rain.
One major question that remains to be resolved is: What are the relative contribu tions of air pollution and acid rain to observed stone damage? In order to under stand and predict the pollution-caused damage, two tasks need to be addressed. First, the extent of damage to a particular material caused by exposure to pollutants needs to be measured during conditions that are equivalent to actual commercial and cultural use. Second, whether this effect causes earlier replacement than usual or frequent repair must be deter mined. If this is the case, an economic value can be placed on reducing the pollutant. This analysis is a complicated one and, to date (1987), has not been completed for any building material. The work of the U.S.
Geological Survey, in conjunction with the National Acid Precipitation Assessment Program's Materials Effects Task Group, primarily is to assess the incremental dam age to building materials caused by the presence of acid rain and oxidizing pollut ants. At present, scientists are unable to differentiate materials degradation caused by pollutants from that caused by natural weathering. Such information is essential to establish a satisfactory inventory of materials at risk and to analyze the eco nomic effect of materials degradation. The ultimate goal of the USGS contribution to the Materials Effects Task Group is to provide an understanding of the incremen tal damage of acidic pollutants.
Onsite Exposure Studies
During onsite experiments that be gan in 1982, all limestone and marble sam ples were subjected to similar exposure at five research sites: Research Triangle Park, North Carolina; Washington, B.C.; Chester, New Jersey; Newcomb, New York; and Steubenville, Ohio. In 1984, Indiana limestone and Vermont marble were added to the onsite study. A typical
Figure 16. Balusters on the west face of the Pan American Union Building, 17th and C Streets Northwest, Washington, D.C. Balusters are of Georgia marble and were installed in 7970. (September 1987 photograph by William A. Dize, Jr., U.S. Ceo- logical Survey.)
Water Resources Investigations 99

Figure 17. Research site located at the West End Library at 23rd and I Streets Northwest, Wash ington, D.C.
site, located in Washington, D.C., is shown in figure 17. A rack used to hold the exposed stone is illustrated in figure 18.
Material samples are analyzed annu ally by a variety of techniques to measure physical and chemical changes on the sam ple surfaces. In addition, runoff is collected from the limestone and marble (carbonate rocks) and roughened glass (control) sur faces. When rainfall runs off a marble sur face, minimal porosity restricts acid reac tion with the carbonate mineral to the surface moisture zone. Chemical analysis of the runoff water provides immediate meas urements of the material removed by dis solution of the stone sample. Chemical analysis of the runoff solution also provides a measure of the solubility of deposition and corrosion products under various envi ronmental conditions. Surface moisture
Figure 18. Isometric projection of a single stone-exposure rack; racks are mounted in pairs and there are four sets per research site.
alone may be a major factor in limestone and marble deterioration. Two other pro cesses, which also involve moisture on the stone surface, that may also be important are the direct dissolution of the stone sur face by sulfuric acid present in the rain and the adsorption of sulfur dioxide gas by the surface moisture layer and subsequent chemical reaction. Reactions of sulfur diox ide adsorbed at the stone surface are not well understood at the present time. The stone surface can be damaged by sulfur dioxide even before the gas oxidizes.
Air quality, meteorological conditions, chemical substances in rain, and chemical composition of particulate matter are mon itored simultaneously at all sites. Results of these measurements are added to a large data base. The data base will provide annual, monthly, and seasonal averages; maximum and minimum concentrations during storms; and hourly records of gas eous pollutants.
Damage to Stone Surfaces
The mineralogy of the limestone and marble samples used during the test pro gram has been determined by petrographic and surface chemical-analysis techniques. These techniques are used initially and again after each year of exposure to iden tify the reaction products (for example,
TOO U.S. Geological Survey Yearbook 1987

0.6
Ea.z"
g(/> toLUuLU QC
oU(Do
0.4
0.2
0.0
I I
Limestone, 39 cases
A Marble, 42 cases
t A AA
HYDROGEN ION LOADING, meq/m 2
gypsum) of limestone and marble and acidic pollutants. These techniques also provide information on the variation and depth of chemical change across the stone surface. The top and bottom surfaces of the stone specimens are sampled in 0.01-inch layers and are chemically analyzed to determine chemical changes caused by exposure to pollutants.
Gypsum forms on the stone surfaces when calcium in the stone reacts with sulfur-containing pollutants in the atmos phere. Initial onsite experiments indicate that little gypsum accumulates on the exposed upper surface; the amounts accu mulated probably represent only the most recent atmospheric conditions (since the last intense rain). Significant accumula tions of gypsum were observed on the sheltered underside of the test specimens. Mass-spectrographic analyses of the sulfur in the gypsum indicate that the sulfur resembles atmospheric sulfur, not sulfur indigenous to limestone and marble.
Chemical-dissolution effects are also determined by analyzing runoff collected from stone samples. The types and rates of reaction involved in the degradation of limestone and marble are being determined by collecting and chemically analyzing run off from slabs exposed at each of the research sites. Initial results indicate that increased dissolution depends on the vol ume and the hydrogen ion concentration of
the rain. The product of these two vari ables, hydrogen ion loading, can be expressed in milliequivalents of hydrogen ion deposited per unit area of stone surface. A plot of stone surface recession values (per rain event) as a function of hydrogen ion loading for both limestone and marble samples at the New York, New Jersey, and North Carolina research sites, acquired during summer and fall 1984, demonstrates the direct relation between surface reces sion and hydrogen ion loading (fig. 19). However, no differences in recession rate for the two types of stone could be dis cerned from these data. Weight-loss meas urements indicate that additional damage to limestone occurs because of granular disaggregation.
Limestone and marble exposed for 1 year and for several years are character ized as to weight loss and color change. These materials are also spectroscopically studied to determine surface recession and roughening caused by weathering. Initial experiments on freshly quarried stone indi cate surface recession rates ranging from 0.0004 to 0.0007 inch per year. These reces sion rates agree with mass-loss estimates inferred from runoff studies, specifically for marble, indicating that surface reces sion by mechanical grain loss is probably small compared with recession by chemical dissolution. These results were determined for materials exposed at the four research
Figure 19. Stone surface reces sion for limestone and marble versus hydrogen ion loading (in milliequivalents per square meter) at Newcomb, New York; Chester, New Jersey; and Re search Triangle Park, North Carolina, during summer and fall 1984.
Water Resources Investigations 101

sites (including Washington, B.C.) and are not indicative of the higher rates that might be expected in more polluted envi ronments.
Nondestructive near-infrared spectro- scopic methods have been developed for measuring gypsum accumulation on sur faces of buildings and monuments. The method has been calibrated by measuring the buildup of gypsum on the samples at the research sites. Measurements over the past 2 years have demonstrated that the technique can accurately measure the gyp sum accumulation on the protected sur faces of the test materials. This method ultimately can be used to assess the differ ential accumulation of gypsum on buildings and monuments and will be useful in trans lating the results from the onsite and labo ratory experimental program samples to verify measurements of gypsum on real structures.
An atmospheric reaction chamber is currently under construction to determine the environmental factors that influence the delivery of gaseous pollutants to car bonate stone. The chamber is designed to deliver radioactively labeled sulfur dioxide to stone surfaces under controlled condi tions of relative humidity, pollutant gas concentration, temperature, and gas-flow velocity. The chamber experiments should provide good estimates of the dry- deposition flux of sulfur dioxide to stone surfaces as a function of the controllable environmental parameters. The effects of changes in stone textures, composition, and weathering on the delivery of pollut ants to carbonate surfaces will also be determined. In the future, the experiment will expand to determine the dry- deposition flux of labeled nitrogen oxides.
The experimental investigations cur rently underway within USGS laboratories are expected to define mathematical rela tionships that quantify the effects of acid deposition on carbonate stone that are in addition to natural background rates of degradation. These functions are to be used for the development of an economic model for materials degradation as required by the National Acid Precipitation Assess ment Program, which ends in fiscal year 1990.
Concentrations, Sources, and Transport of Selenium in the San Joaquin River During Low Flow, October 1985 to January 1986
By Robert J. Gilliom
Introduction
Agricultural drainage problems in the western San Joaquin Valley of central Cal ifornia have attracted national attention since 1983, when selenium in water from subsurface tile-drain systems was found to have toxic effects on waterfowl at Kester- son Reservoir. Kesterson Reservoir re ceived drain water containing an average of about 300 micrograms per liter (jxg/L) of selenium from about 8,000 acres of tile- drained farmland from 1981 to 1986. Drain water from about 77,000 acres of additional tile-drained farmland, north of the area that contributed drain water to Kesterson, eventually flows to the San Joaquin River. Flow of this drain water to the river occurs mainly through two tributaries, Mud and Salt Sloughs. Recent U.S. Geological Sur vey studies indicate that water from indi vidual drainage systems, which discharge to waterways that eventually reach these sloughs or smaller tributaries, contains selenium concentrations ranging from less than 10 to 4,000 M-g/L, with mixtures of these waters containing concentrations generally ranging from 20 to 100 jj-g/L.
Future decisions on how to manage subsurface drain water in the area, and on how to protect the water quality of the San Joaquin River, depend on understanding the sources, concentrations, and transport of selenium in the river. This study, a first step toward achieving this goal, was done during low-flow conditions when dissolved contaminants, such as selenium, often have their greatest effect on water quality.
102 U.S. Geological Survey Yearbook 1987

Study Design and Methods
Below its Sierra Nevada headwaters, the San Joaquin River extends 192 miles from Friant Dam in the foothills, to Ver- nalis, just upstream from backwater influ ence of the Sacramento-San Joaquin Delta (fig. 20). The first 65 miles of river between Friant Dam and Mendota generally has intermittent flow, and often no river water at all reaches Mendota Pool near Mendota. Most of the next 67 miles of river between Mendota and Stevinson is also intermit tent. Flow in the remaining 60 miles of river from Stevinson to Vernalis is peren nial and increases downstream as Salt and Mud Sloughs enter from the west, the Merced, Tuolumne, and Stanislaus Rivers enter from the east, and smaller tributar ies, irrigation-return flows, and ground water enter along the entire reach. This study focused on the San Joaquin River between site 1 near Stevinson and site 11 at Vernalis.
During the study period, streamflow at Vernalis was below normal for October to January. The average of the monthly mean flows for October 1985 to January 1986 was in the lower 20 percent of flows for the same months for 1970-85. The
monthly mean flow at Vernalis was 2,126 cubic feet per second (ft3/s) in October, 1,892 ft3/s in November, 2,125 ft3/s in December, and 1,935 ft3/s in January.
Samples were collected twice monthly at each of the 11 study sites (fig. 20) for analysis of dissolved and total-recoverable selenium, as well as many other constitu ents. At each site, continuously recorded measurements were used to compute daily mean streamflow throughout the study period.
Selenium sources and transport were evaluated from selenium loads computed for each site and sampling. The method used to compute selenium load at each site is based on the concept of evaluating water at each site that will arrive at the farthest downstream site (Vernalis) at the same time as water from all other sites. Ideally, if the time of travel for water from each site to Vernalis were known, then samples could be collected at each site the same amount of time before the sample was collected at Vernalis. However, logistical constraints prevented this from being accomplished on a regular basis. Instead, the order of site sampling within each sam pling week was generally matched with the order of travel times. Travel times were
120°30'
37°30'
36M5' -
Firebaugh Friant Dam*(20 MILES)
endota Poo Location and study
site number
5 10 15 20 MILES I i____I I
0 5 10 15 20 25 KILOMETERS
Figure 20. Location of study sites along the San Joaquin River, central California.
Water Resources Investigations 103

Table 2. Site names and summary of dissolved-selenium concentrations
Dissolved selenium concentration (|xg/L)Site No.
123456789
1011
Site nameSan Joaquin River near StevinsonSalt Slough at State Highway 165San Joaquin River at Fremont Ford BridgeMud Slough near GustineMerced River near StevinsonSan Joaquin River near NewmanSan Joaquin River near PattersonTuolumne River at ModestoSan Joaquin River at Maze Road BridgeStanislaus River at RiponSan Joaquin River near Vernalis
Minimum0.11.4.9
1.1<.l
.6
.6<.l
.4<.l
.3
Median0.35.24.63.6
.12.41.6
.1
.9
.1
.8
Maximum2.3
169.9
13.2
5.44.2
.21.7
.21.4
estimated from measured velocities and distances between sites. Daily mean streamflow was determined for each site at the time necessary to result in the simulta neous arrival at Vernalis of water from all sites. We assumed that the selenium con centration was constant at each site during the typical 1- to 2-day period of time between the actual sampling date and the date on which the flow was measured.
The dissolved-selenium load was com puted at each site, for each sampling, by multiplying the flow at the time estimated for simultaneous arrival of water from all sites at Vernalis by the concentration meas ured in the sample collected the same week. By estimating the load in this way, the sum of selenium loads at each site on primary tributaries to Vernalis (sites 1, 2, 4, 5, 8, and 10) is expected to equal the selenium load computed for Vernalis, if there are no gains or losses of selenium between these sites and Vernalis. (Simi larly, loads from any other combination of upstream and downstream sites would be additive if there are no within-reach gains or losses.) In reality, analytical errors, errors in travel-time estimates, and natural variability will prevent perfect agreement between sites even when there are no within-reach changes. Therefore, such cal culations are best used to identify broad patterns of gains and losses and to estimate only the larger within-reach changes. Con sistent with these applications, median val ues of flows and loads relative to Vernalis are emphasized for characterizing sources and transport during the study period. Streamflow and selenium load for each site and sampling were divided by the corre sponding value at Vernalis and multiplied by 100 to convert to percentage, and then
the median percentage was used to charac terize the relative importance of each site.
Concentrations of Selenium
Selenium in samples from all sites gen erally was in dissolved forms, and there was usually no measurable amount in par- ticulate forms. Concentrations of dissolved selenium were highest in Salt and Mud Sloughs (sites 2 and 4), and in the San Joaquin River downstream of Salt Slough (site 3) (table 2, fig. 20). Among these three sites, median concentrations ranged from 3.6 to 5.2 |xg/L with a minimum of 0.9 |xg/L and a maximum of 16 |xg/L. Concentrations were lowest in the three eastside tributar ies, the Merced (site 5), Tuolumne (site 8), and Stanislaus (site 10) Rivers. The median dissolved-selenium concentrations in all three of these streams, which contribute most of the San Joaquin River streamflow during low flow, was 0.1 |xg/L. The mini mum was less than 0.1 jxg/L and the max imum was 0.2 jxg/L for all three sites. Selenium concentrations in the San Joaquin River at sites 6, 7, 9, and 11 decrease downstream of the Merced River as the selenium from Mud and Salt Sloughs is diluted by low-selenium water from the eastside tributaries. At Vernalis, the site farthest downstream, the median selenium concentration was 0.8 |xg/L, with a mini mum of 0.3 |JLg/L and a maximum of 1.4|JLg/L.
Sources and Transport
The sources and transport of selenium in the San Joaquin River depend on streamflow and dissolved-selenium concen-
104 U.S. Geological Survey Yearbook 1987

Site 10 EXPLANATION Figure 21. Streamf/ow anddissolved-selenium loads in the San Joaquin River, October 1985-January 7986. Values are the median percentage of streamflow and load at Vernalis (site 11).
tration, which determine selenium load. Figure 21 shows streamflow and selenium load at each site expressed as a median percentage of streamflow and load at Ver nalis, site 11. Some key relations for the study period shown by these data are given below: Most selenium loading to the San Joa quin River comes from Salt and Mud Sloughs. Salt Slough contributes about 55 percent and Mud Slough about 17 percent of the Vernalis selenium load, even though their combined flow was only about 9 per cent of the Vernalis flow; By the time flow reaches site 6, down stream of Salt and Mud Sloughs and other possible smaller sources of selenium, 88
percent of the selenium load at Vernalis is already present in the San Joaquin River. This selenium seems to be transported from site 6 to Vernalis with little or no within-stream loss along the way; The Merced, Tuolumne, and Stanislaus Rivers contribute about 57 percent of the Vernalis flow but only 7 percent of the selenium load at Vernalis; Within-reach gains of flow are substan tial, particularly between sites 6 and 9. In this area, irrigation-return flows and ground- water inflow appear to be substantial; and Within-reach gains of selenium down stream from the Merced River are small, as shown by the median values in figure 21.
Water Resources Investigations 105

Conclusions
Salt and Mud Sloughs were the main sources of selenium transported to the San Joaquin River from October 1985 to Janu ary 1986, even though they contributed less than 10 percent of the streamflow at Vernalis. Water flowing into the river downstream of Salt and Mud Sloughs
diluted selenium in the river from a median of about 5 jJLg/L between the sloughs to less than 1 jxg/L at Vernalis. Effective manage ment of selenium concentrations in the San Joaquin River depends on managing sources of both selenium and dilution water, which will require detailed informa tion on seasonal patterns and annual vari ability in streamflow and on the loading and transport of selenium.
Effects of Glen Canyon Dam Operations on Sand Bars and Rapids of the Colorado River in Grand Canyon National Park, Arizona
The USGS is carrying out a program of sediment studies, in cooperation with the U.S. Bureau of Reclamation and the National Park Service, designed to determine the effects of flow regulation at Glen Canyon Dam on the sediment-related resources of Grand Canyon National Park. Studies have defined geometric and hydraulic characteristics at major rapids, provided insight into the effects of debris flows in ungaged tributaries on sand supply and on changes in river form, led to a descrip tion of change in sand bars during various streamflow conditions, and provided an understanding of the controls on sand trans port and storage in the main channel.
Although sand bars (which are used as campsites) are less susceptible to erosion than are other types of deposits, all sand deposits in narrow reaches are very suscepti ble to erosion by high flows. Powerplant releases are generally less than 31,500 cubic feet per second; frequent flows higher than these will deplete the sand stored in the main
channel and will result in significant loss of sand from the bars. Sand bars probably will remain relatively stable as long as the flows remain within the powerplant-release range. Rapids, which are formed by coarse debris, change with the introduction of new debris and with the adjustment of older debris due to river flow. Therefore, rapids may become more difficult to navigate, because flows much greater than powerplant releases may be required to move the coarse debris that has been deposited by tributaries since construc tion of the dam.
These studies provide new insights into the behavior of both coarse and fine sediment in rivers in which much of the bed and banks are composed of boulders and bedrock. Results of these studies, together with results of studies of terrestrial and aquatic biology and recreation, will form a report that will be used as the basis for a Secretarial decision concerning future operations of the Glen Can yon Dam.
106 U.S. Geological Survey Yearbook 1987

Information Systems
Division
HighlightsCommunications
By Jim Hott and Dan Devereaux
Two major communications projects continued to grow during fiscal year 1987, in support of the U.S. Geological Survey mission: a local-area network, GEOLAN, began operation at Reston headquarters and the GEONET wide-area network came into use on a nationwide and department- wide basis.
GEOLAN was developed to promote standardized data bases and to share infor mation resources within USGS headquar ters through communication between com puters and computer systems. GEOLAN permits high-speed local area connections between terminals and between connected information resources such as minicomput ers. This technology permits independent heterogeneous local-area networks (LAN) that are part of GEOLAN to be combined via the common foundation of the Ethernet LAN protocol. As compatibility standards for LANs are refined and implemented, the USGS will be able to use a common elec tronic communicating vehicle to the maxi mum benefit in accomplishing its critical missions.
GEONET has replaced a number of services that formerly connected users in two locations. Now, users not only may use GEONET to communicate with a single destination site but may reach more than 140 Department of the Interior host com puters of various sizes, plus computers attached to various public networks. GEO NET has delivered to USGS users an unprecedented capability that can be used to accomplish everyday data processing
and mission-related responsibilities. GEO NET permits the Survey to save $1 million annually on data communications services, while providing a high degree of computer communications capability for the Survey and for other bureaus of the Department of the Interior. As more non-Survey activities use the network, the overall costs to the Survey, both for individual characters transmitted and total data transmitted, are declining.
GEONET also supports the electronic transfer of earth science information from the Earth Science Data Directory and Earth Science Information Network to var ious public sources. GEONET support also includes electronic transfer of information among other agencies, such as the National Oceanographic and Atmospheric Adminis tration and the National Aeronautics and Space Administration, and various State agencies.
Information Systems Division 107

Computing Technologies: The Role of Mainframe Computing in the U.S. Geological Survey
By Gayle Gordon, Tom Faulds, and Joe Aquilino
Mainframe computers have played a significant role in the U.S. Geological Sur vey since the first computing equipment was installed in 1947. That role has shifted over the years as new and powerful alter native computers have become available. Despite that shifting focus and the prolifer ation of minicomputers and desktop micro computers, the computing technology requirements study, conducted by the USGS in 1986-87, reaffirmed the bureau's continuing need for mainframe computers.
In 1956, the Survey procured its first mainframe computer to process scientific data. Over the years administrative appli cations, as well as scientific work, were transferred to computers, where the func tions could be performed faster. Research that had previously been laborious or even unimaginable was now possible. Comput ers were able to process large quantities of data, rapidly perform complex calculations, and provide storage and retrieval of large volumes of data. These same functions can be and are performed on the Survey's cur rent mainframe computer, but now they are done faster, and a significantly larger amount of data is processed and stored. Computer technology has changed so rap idly that today many microcomputers located on desktops throughout the organi zation can perform better than those first Survey computers, which occupied many square feet of space.
Large mainframe computers, how ever, still offer advantages to USGS scien tists and administrators. First, they have sophisticated software such as data base management systems that are able to take advantage of both the power of the main frame processor and its capacity to store and process large quantities of data. For example, the mainframes in the National
Center, Reston, provide storage and retrieval for two of the Survey's largest data bases, the Water Data Storage and Retrieval System and the National Digital Cartographic Data Base. Providing access to large data bases is a key role for the mainframe computers today and will prob ably continue to be so into the future. By having these data bases stored and main tained in a central location available through a communications network, scien tists and administrators throughout the organization are able to access the data and either manipulate the data on the central computer or download it to their own mini computers or microcomputers.
Mainframe computers provide high speed processing. A model that takes hours to run on a minicomputer or a microcom puter, for example, can often be run in a fraction of the time on a mainframe. Also, many jobs can be run at the same time without one affecting the performance of the others. During prime-time working hours, for example, the Reston mainframes average more than 50 concurrent interac tive sessions. The shift from the former single-job, batch processing to the current interactive computing is one of the most significant changes in the last ten years of mainframe computing, and its effect is expected to increase in the future.
Another glimpse into the future sug gests that even higher capacity storage devices will be added to mainframe com puters. In 1987, the Information Systems Division (ISD) installed a tape cartridge system on one of the mainframes. This technology is more reliable than magnetic tape and provides great savings in the amount of space required to store a compa rable amount of data. It is anticipated that in the future more powerful storage devices such as optical disks will be added to ISO's mainframe configuration. This example of sophisticated peripheral devices illustrates another advantage of centralized computing. That is, advanced and costly technology such as storage devices, print ers, and plotters can be made accessible to a large number of people through computer communications capabilities.
ISO's Data Center in Reston each month processes 35,000 jobs, mounts and processes 10,000 magnetic tapes, and prints and distributes 1 to 1.5 million pages of print. Because of a predicted 10-fold workload increase from 1987 to 1992, and
108 U.S. Geological Survey Yearbook 1987

because the existing systems are old and expensive to maintain, the bureau-wide Information Systems Council, with the con currence of the Director and Executive Committee, has agreed to proceed in fiscal year 1988 with the acquisition of a new computer processing unit to replace the existing systems. The new system will sig nificantly improve processing of today's workload and will help ISD support USGS computing needs in the future.
Applied Technology Activities
By Tod Huffman
An important aspect of the Informa tion Systems Division's support services is providing systems analysis and developing applications software to the U.S. Geologi cal Survey. During fiscal year 1987, ISD provided automated systems and technol ogy development services to the full range of administrative and scientific, research, and technical programs of the Survey. These automated systems and develop ment services included: Developing and implementing a nation wide automated system to initiate, monitor progress, and complete action for all Survey requests for Personnel Actions, SF-52's. Developing and implementing an auto mated system that permits the Survey's personnel office to compile a data base of nationwide vacancy announcement infor mation, and to index, query, and automat ically distribute those vacancy announce ments nationwide. Modelling the use of modern relational data base management systems for the storage, processing, and retrieval of National Mapping Division digital carto graphic index data and Geologic Division geophysical/geochemical coal resource data. Staffing and equipping the division's Graphics Laboratory, which provides the USGS with a wide selection of graphics hardware and software and offers support and consultation services on the use, design, and preparation of computer- related graphics.
Developing a system to provide de tailed tracking, accounting, and reporting of foreign travel for the Office of Interna tional Geology. Cooperating with other Department of the Interior bureaus on projects involving forestry management, environmental im pact, and safety management accounting and reporting. Providing continued assistance to the Department of the Interior Office of Sur face Mining Reclamation and Enforcement and their contractors in the application and use of the Model 204 data base manage ment system supporting Office of Surface Mining development of a large data base for lease applications, administration and control, and mining violations. Experimenting in the use of standard statistical and graphics software for per forming geographic information system manipulation and analysis of geographically referenced data, such as land use and land cover, and radon level measurements.
The Compact Disc Revolution
By Rick MacDonald
A remarkable new technology is about to revolutionize the way in which the U.S. Geological Survey disseminates its vast archives of earth-science data. That tech nology CD ROM (compact disc read-only memory) embodies some noteworthy char acteristics with respect to data storage and data distribution. First, the disc itself is small, compact, and virtually indestructi ble. It is physically identical to the audio compact disc, which is currently revolu tionizing the consumer audio marketplace. The disc itself can hold between 550 and 600 megabytes of data and can provide random access to any block of that data in less than a second. Figure 1 shows equivalent stor age capacities of the CD ROM and of more traditional media. The disc drive that holds the CD ROM disc can be physically con nected to a personal computer and costs between $500 and $600.
Data to be placed on the CD ROM can come from many sources. Data can be
Information Systems Division 109

Figure 1. Equivalent storage ca pacities of the CD ROM and traditional media.
created exclusively for it, scanned from non-magnetic documents or images, or cop ied from existing data sets that are cur rently processed by computers. The data, for example, can be text or byte data associated with cartographic products or seismological processes. The information is first accumulated onto magnetic tapes in a
Original Data
Data Presentation
Data Premastering
CD ROMMasterTape
Mini Computer
Disc Mastering
:::::::::::::::::::::::
CDMasterCodeCutter
Disc Replication
II^H8%a
IFigure 2. The overall process of mastering and duplicating.
CD ROM
prescribed format, then "mastered" onto a glass CD ROM disc (in much the same manner as an audio recording) at a cost of about $3000. Once the master is created, duplicate CD ROM discs can be "stamped out" at a cost ranging from $30 down to $5 each, depending on quantity. Both the mas tering and duplicating are available at over half a dozen CD ROM mastering plants open in the United States. The overall process is depicted in figure 2.
Several successful prototype projects conducted by the USGS over the past year have proven that CD ROM is a cost- effective means for distributing digital data. The first of these prototype projects was developed to assess the usefulness of CD ROM technology to a broad spectrum of users. The prototype CD ROM disc that the Survey produced contained samples of both administrative and scientific data bases, including the Cartographic Catalog, Earth Science Data Directory, Federal Information Resources Management Regu lations, Federal Acquisition Regulations, geographic reference database, Geographic Names Information System, geologic index, Geological Long-Range Inclined Asdic (GLORIA), Geographic Information System (GIS) Files, Mineral Resource Data System, National Uranium Resource Evaluation, PUBMANUS (listing of pub lished USGS reports and maps), Rock Analysis Sample System, Seismic Data, the USGS Manual, WRSIC (Water Resources Scientific Information Center abstracts), National Water Summary data, and streamflow gaging station data.
The USGS is currently investigating microcomputer-based search and retrieval software that lends itself to use with CD ROM. Related to this investigation, part of the first prototype CD ROM disc was devoted to testing a half dozen of the leading software products, all of which use the same pair of reference data bases pro vided by the General Services Administra tion. Both the data bases and the retrieval software packages were placed on the pro totype discs, which were then distributed, along with the necessary readers and instructions, to a broad cross section of USGS scientists and other professionals. Testimonial information was collected on the usefulness and effectiveness of this new technology.
This initial experience and the testimo nies from the users enabled the developers
no U.S. Geological Survey Yearbook 1987

of the prototype disc to establish some basic guidelines. If a data base is relatively large and relatively static, has a potentially large audience of users, and lends itself to processing on a microcomputer, it may be an excellent candidate for CD ROM tech nology. With these criteria in mind, marine geologists from the Survey's deep sea-floor mapping project agreed to place their data from the GLORIA sidescan sonar system onto a CD ROM disc for data access and distribution.
An important consideration in placing any scientific data base onto CD ROM is the potential market that can be created for the data. When the GLORIA data base of digitally captured sea floor mosaics is avail able on CD ROM, the potential community of users will no longer be restricted to those individuals or organizations who have access to minicomputers or mainframe computers but instead would also be open to those who have desktop microcomputer workstations.
The CD ROM that contains the GLO RIA data not only exhibits the ideal char acteristics of a candidate for this technol ogy but also exemplifies the opportunities for interagency cooperation afforded by such a large-capacity, inexpensive storage medium. The National Oceanic and Atmo spheric Administration is a welcome part ner in the project as they develop indexing software for the disc, and the National
Aeronautics and Space Administration has contributed image processing software to the effort.
As the USGS continued to develop its expertise in CD ROM, it became clear that other Federal agencies could benefit from the Survey's experience. Therefore, the USGS formed a special interest group called SIGCAT (Special Interest Group on CD ROM Applications and Technology) to pursue the many aspects of this technology and, in doing so, to establish a forum for the exchange of ideas, information, and experi ences for the benefit of all concerned.
SIGCAT, which held its first official meeting in 1986, now has close to 1,000 members, representing over 120 different Government organizations. About 75 per cent of the membership is from govern ment and 25 percent from private industry. Several individual working groups have been formed under SIGCAT to focus on the issues of search software, drives and media, library and educational applica tions, and CD ROM projects ongoing in the Federal sector. Recently, the USGS together with the National Bureau of Stan dards established a CD ROM Lab, where the organizations involved in SIGCAT can evaluate the various CD ROM hardware components available in the marketplace. Such evaluation should prove useful to agencies that are in the process of investi gating CD ROM technology.
Information Systems Division 111

Figure 3. An 8-bit RGB color space. A, Color cube for cube number 255. B, Color cube for cube number 727, which is the oretically inside cube number 255.
91
61
B
112 U.S. Geological Survey Yearbook 1987

A ColorCommunications Scheme for Digital Imagery
By Alex Acosta
Color pictures generated from digital images are frequently used by geologists, foresters, range managers, and other professionals. These color products are preferred over black-and-white pictures because the human eye is more sensitive to color differences than to various shades of gray.
s Color discrimination is a function of perception; because the colors in these color composites can be described subjec
tively, ambiguous color communication may result. Numerous color-coordinate systems are available that quantitatively relate amounts of red, green, and blue (RGB) in the form of digital triplets to the parameters of hue, saturation, and inten sity perceived by the eye. Most of these systems implement a complex transforma tion of the RGB parameters to a color space that is hard to visualize, thus making it difficult to relate the triplets to perception parameters. Research at the USGS ADP Service Center in Flagstaff, Arizona, has developed a color-communication scheme that allows for accurate color communica tion and easy association of RGB triplets to the color generated by these triplets.
The color-communication scheme trans forms RGB color space (fig. 3) into a chro- maticity diagram (fig. 4). The diagram uses the (x,y) chromaticity diagram coordinates along with a third coordinate, z=l-x-y,
Figure 4. Chromaticity diagram with "hue" and "saturation." The chromaticity diagram is the area enclosed by the right trian gle. The x chromaticity coordi nate ranges from 0 to 1.0 on the horizontal side of the triangle. The y chromaticity coordinate ranges from 0 to 1.0 on the ver tical side of the triangle. The hue is an angular value ranging clockwise from 0 to 360 degrees as indicated on the hue wheel. The hue wheel is centered at chromaticity coordinates (1/3,1/3). The saturation is a rel ative ratio measure along a hue spoke. Various values of satura tion are given for hue=240.
Information Systems Division 113

Figure 5. Color triangle for cube number 255.
Figure 6. Chromaticity color tri angle with "hue" and "satura tion ". This figure, called a CCTHS, enables the user to graphically associate perceived colors with quantitative parame ters (x,y,H,S). Grids are explained in figure 4.
114 U.S. Geological Survey Yearbook 1987

to generate a color triangle (fig. 5) and merges the color triangle, the chromaticity diagram, and a "hue" wheel, which is cen tered at chromaticity coordinates (1/3,1/3), to form a figure called a Chromaticity Color Triangle with Hue and Saturation (CCTHS) (fig. 6). This figure defines sev eral parameters (x, y, "hue", and "satura tion") that may be used in conjunction with other parameters (z and "cube number") to produce derivative digital images that can be used in various ways. For example, the (x,y,z) coordinates can be scaled in an 8-bit range to generate image files that produce enhanced color products (fig. 7). As another example, a fourth image file can
B
D
act as the associated "cube number" of an RGB color set to produce a color composite that depicts the merging of the fourth image with the color set (fig. 8).
Research in digital image color pro cessing that has led to the development of the CCTHS has given scientists a tool that can be used for color-composite analysis, accurate color communication, and im proved color processing. The CCTHS allows the user to relate graphically defined parameters to visually perceived colors. Because these parameters can be mathematically defined, they can be calcu lated and made available from RGB digital images for further processing.
Figure 7. Examples of color en hancement of a Landsat Multi- spectral Scanner subscene (ID 2279-19361) near McMurdo Sound, Antarctica, obtained October 18, 1975. Band 4 = blue, band 5 = green, and band 7= red. A, False-color composite. A 1-percent linear stretch (which linearly trans forms the original data between the 1-percent and 99-percent cumulative frequency points into the entire 8-bit data range (0-255)) was applied to the data to enhance the color. B, Each band was stretched with digital number (DN) 0 mapped to DN 63 in an attempt to lighten the dark areas. C, Cube number (C) image file of A was stretched with DN 0 mapped to DN 63; the result was recombined with the original data. D, The (x,y,z) parameter image files of A were stretched with a 1-percent linear stretch; the result was combined with the C image file used in C and inversely trans formed to RGB color space.
Information Systems Division 115

Figure 8. Image merging using the cube number parameter. A, Shuttle Imaging Radar-A image of the Eastern Sahara at Bir Saf- saf, Egypt. B, False-color com posite of Landsat Thematic Mapper scene 5025-80801; bands 1 (blue), 4 (green), and 7 (red). C, Landsat TM scene merged with the radar image. The radar image was used as the cube number of the false- color data sets.
B
%*.-, 'i.jr
Landsat Multispectral Images of Antarctica
By Baerbel K. Lucchitta and Jo-Ann Bowell
Scientists at the USGS Image Process ing Facility in Flagstaff, Arizona, are con ducting a program to provide enhanced multispectral scanner (MSS) Landsat images of Antarctica. From these images, the scientists will be able to furnish accu rate planimetric, false-color composite- image maps in polar stereographic projec tion. In turn, these image maps can be used to locate and delineate blue-ice areas for the collection of meteorites, to produce special-purpose maps showing selected fea tures, and to provide synoptic views that aid in the detection and interpretation of glaciological features associated with ice sheets, outlet glaciers, ice streams, and ice shelves. Researchers will also be able to monitor changes in coastlines and glacial features, to correlate different types of digital cartographic data, and to provide structural information in areas of limited bedrock outcrop to aid in regional geologic interpretation.
About 170 false-color composite images of Antarctica, covering Victoria Land, the coastline of West Antarctica, the Antarctic Peninsula, and other selected areas have been produced. These images cover about 10% of the continent. Digitally enhanced color images composed of bands 4, 5, and 7 of Landsat MSS data are supe rior to the commonly used black-and-white images of MSS band 7. The color images show considerably more detail of the land surface. The images have undergone rou tine geometric correction and some noise removal. Because the data in many scenes are saturated in bands 4 and 5, new algo rithms were devised to restore the satu rated snow and ice information and to
116 U.S. Geological Survey Yearbook 1987

Figure 9. Landsat 7 false-color image of Lambert Glacier (Path 135 Row 772 Scene ID 1236-03155 76 March 7973) showing restored saturated snow and ice formation and enhanced fine surface features.
enhance fine surface features (fig. 9). A six-image mosaic of the McMurdo Sound region, where the American station is located, has been prepared in Lambert Conformal projection. The mosaic covers five complete and three partial 1:250,000- scale topographic quadrangles. Addition ally, thematic maps were produced that show rock outcrops and blue-ice area of the Byrd Glacier region.
Managing and Accessing Geoscience Data Base Systems
By Denise A. Wiltshire
In today's information society, mas sive amounts of data are collected to
Information Systems Division T17

support scientific research. As an indica tion of the rapid proliferation of computer ized data bases, the 1987 Directory of Online Databases listed a total of 3,369 data bases accessible to the public through national and international telecommunica tions networks. The number of data bases listed has increased eightfold since the Directory was first published in 1980.
The U.S. Geological Survey itself has experienced a steady increase in the num ber of data bases designed and maintained by its employees to promote earth science research. In addition, many of the organi zations that conduct joint research projects with the USGS are experiencing a rapid growth in data bases of earth science infor mation. Sophisticated geographic informa tion systems (GIS) are being designed to collect, manage, and analyze large volumes of spatial data. Through the use of GIS technology, scientists are able to merge geologic, hydrologic, and cartographic data sets to study complex interrelationships and to solve vexing earth science problems. Before the tool of GIS technology can be used to its fullest extent, however, there must first be a means to locate the existing data sets that are needed. There also must be an efficient way to locate and access the data bases to reduce costs of geoscience investigations when possible.
Both the current trend in proliferating data bases and the emerging spatial-data analytical technologies, such as geographic information systems, have fostered a grow ing need for information-management
tools. The USGS continues to respond to this need by maintaining the Earth Science Data Directory. Created in 1985, the Earth Science Data Directory contains references to USGS data bases and a growing number of available data sources maintained by other Federal and State agencies, acade- mia, and the private sector. The Earth Science Data Directory is designed to assist researchers in identifying and locat ing data bases that are either automated or nonautomated and that contain natural- resources information. Each entry in the directory contains detailed information on the scope and availability of data bases. The information contained in the directory assists researchers in determining compat ibility of data sets for use with analytical tools such as geographic information systems.
The U.S. Geological Survey encour ages participation in the Earth Science Data Directory among the scientific com munity. Successful accomplishment of the Survey's mission to provide geologic, hydrologic, and topographic information that facilitates managing the Nation's nat ural resources requires state-of-the-art information-management technology. In addition to designing and maintaining a nationwide data directory, the Survey con tinues to investigate methods to make it easier to access major earth-science data bases.
Intermediary, front-end systems, com monly known as gateway systems, have emerged in the automation marketplace to
'ISO
EARTH SCIENCE DATA DIRECTORY (ESDD)
TO OTHER AGENCY INFORMATION SOURCES
ESIN USERS
'NMD
CARTOGRAPHIC CATALOG GEOGRAPHIC NAMES INFORMATIONSYSTEM
NATIONAL DIGITAL CARTOGRAPHICDATA BASE
AERIAL PHOTOGRAPHY SUMMARY RECORDSYSTEM
MAIN IMAGE FILEMAP AND CHART INFORMATION SYSTEM NATIONAL JRANiLjM RESOURCE EVALUATIONDATA BASE
'GD
LIBRARY SYSTEM 2OOO
WRD
NATIONAL WATER DATA EXCHANGE (NAWDEX)
' NATIONAL 'EARTHQUAKE INFORMATION SYSTEM
HOCK ANALYSIS SYSTEM
Figure 10. Earth Science Infor mation Network (ESIN).
NMD = NATIONAL MAPPING DIVISION GD = GEOLOGIC DIVISION WRD = WATER RESOURCES DIVISION ISO = INFORMATION SYSTEMS DIVISION
= ACCESS= INFORMATION ONLY
118 U.S. Geological Survey Yearbook 1987

assist users with the complex protocols for accessing data bases far and wide through telecommunications networks. The Survey has developed its own gateway system the Earth Science Information Network (fig. 10) which gives users easy access to seven major systems and data bases main tained by the USGS. These data bases and systems are Earth Science Data Directory (inventory of data bases), Cartographic Catalog (inventory of cartographic prod ucts), Digital Cartographic Data Base (dig ital elevation models and digital line graphs), Geographic Names Information System (cultural or physical geographic names), National Water Data Exchange (NAWDEX) (water data indexing service), News (news releases issued by the USGS Public Affairs Office), and U.S. Geological Survey Library System (automated card catalog).
In addition to the Earth Science Infor mation Network, the USGS maintains a computer software package that interfaces commercial information-retrieval systems. The Computer Systems Information Net work allows users to access seven major information-retrieval systems containing more than 250 data bases. The Computer Systems Information Network is an intelli gent interface, one that is designed to translate a user's request for bibliographic, factual/numeric, or chemical identification information into the appropriate computer language for searching complex information- retrieval systems with a minimum of effort and frustration for the user.
USGS information scientists are con tinuing this research on methods for pro moting easy access to complex, distribut ed data bases and information systems through the use of intelligent gateways like the Computer Systems Information Net work.
Information Systems Division 119

120 U.S. Geological Survey Yearbook 1987

Administrative and Facilities
Support
HighlightsFacilities Support of Mission Operations
For a scientific organization, such as the U.S. Geological Survey, the adequacy and availability of facilities are critical to the type and extent of research that can be conducted. It is difficult, for example, for hydrologic, geologic, and mapping field work teams to operate effectively when based in congested downtown locations. USGS reliance on large blocks of labora tory and other special-purpose space also creates special demands on facility support and program budgets. As a consequence, ongoing management efforts have focused on matching facilities to program needs within constrained budgets. Plans are for the USGS to assume greater facility man agement responsibilities over the next sev eral years in order to contain costs and improve responsiveness to earth-science program needs.
The USGS has begun a number of actions to consolidate and improve facilities in concert with the General Services Administration (GSA), which provides over ninety percent of USGS-occupied space.
Central Region Headquarters, Denver, Colorado
Major consolidations at the Denver Federal Center in Lakewood during the past 2 years have resulted in over 30 sepa rate transactions that, including space acquisitions and releases, accounted for a shift of over 1 million square feet of space. Consolidations of geologic core library and map and publications distribution opera tions into the Center and the long-awaited relocation of Geologic Division laboratories
into a refurbished Building 20 were com pleted during the year. The new laboratory provides state-of-the-art equipment and instrumentation housed in an equally mod ern facility with a full complement of opti mum safety and design features.
Changing and expanding mission pro grams are also affecting USGS space needs: Automation of traditional cartographic production functions at the Rocky Moun tain Mapping Center will require relocation to a 135,000-square-foot facility (one-third larger than the current location) that has a specialized structural design. Expansion of water-quality research programs at the USGS Central Laboratory at Arvada, Colorado, just outside of Den ver, will require an additional 100,000 square feet of laboratory, storage, and office space.
Western Region Headquarters, Menlo Park, California
Top priority in regional planning has been reducing dependence on leased space by replacing space in Palo Alto with new laboratory and support facilities con- .structed at the Government-owned Center on Middlefield Road in Menlo Park. The Center was established on a 17-acre site in the mid-1950's. Buildings 1 and 2 on 5 acres of the site were acquired by GSA. The USGS acquired 12 acres of adjoining Government-owned land and constructed Building 3 on the site. USGS in collabora tion with GSA and a professional services consultant developed a master plan and predesign program for completion of the Center.
Also dominant in the region's planning is movement toward an increased USGS role in the management of Center facilities, now a joint responsibility with GSA. Under
Photograph by Mark A. Hardy, U. S. Geological Survey
Administrative and Facilities Support 121

a delegation of authority from GSA, the USGS will assume direct management of facility operations and maintenance for GSA-owned buildings on the Center, and is pursuing other options with GSA to improve support services for these unique special-purpose scientific facilities.
National Center, Reston, Virginia
In August 1987, the USGS assumed responsibility from GSA for operation and maintenance of the National Center. This delegation from GSA involved the transfer of 19 employees and a budget of $4.2 million for operation and maintenance of the facil ity, which has over 1 million square feet of building space.
Major Facilities Improvements
Continuing studies have been under way at various USGS centers to provide the best and most efficient facilities in which to carry out the current and future goals and objectives of the Survey's mis sion. Included in these efforts are pro grams to make working conditions safe and
healthy and to develop short- and long- range programs to correct any deteriorat ing and malfunctioning facilities and to replace obsolete facilities. Eliminating fire hazards and unsafe and unhealthy working conditions continues to be a priority. Spe cial programs are also underway to design and implement aids for the handicapped. In keeping with its earth-science mission, the USGS is working to provide environmental controls at many of its facilities that elimi nate pollution hazards. The Survey is also replacing and updating mechanical and electrical systems in existing facilities to reduce the use and loss of energy.
The Hawaiian Volcano Observa tory (HVO)
The 75th anniversary of the founding of the Hawaiian Volcano Observatory, America's first and oldest volcano observa tory, was commemorated with the dedica tion of a new HVO building on January 10, 1987. The new HVO and renovated facility and the adjoining Thomas A. Jaggar Museum culminated a joint effort of the USGS and the National Park Service in planning, design, and construction.
The Observatory is operated by the U.S. Geological Survey and is located on the summit of Kilauea Volcano on the Island of Hawaii in Hawaii Volcanoes
New Hawaiian Volcano Observa tory building, dedicated January 10, 1987
122 U.S. Geological Survey Yearbook 1987

National Park. Scientists at the Observa tory monitor the active volcanoes of Hawaii, providing warnings of potential eruptions and conducting fundamental research on volcanic activity. The Hawai ian Volcano Observatory has been respon sible for the development of most of the volcano-monitoring techniques now used worldwide. In addition, the Observatory also has served as a training center for volcanologists from many countries.
Early in 1978, after an inspection and assessment of the overall condition of the HVO, its limitations in addressing the cur rent situation in monitoring the active vol canoes of Hawaii, and discussions with the National Park Service's local and national offices, the USGS entered into a Memoran dum of Agreement to develop a phased program for the upgrading and expansion of the HVO. Also, in the course of remod eling the old facility and constructing new facilities, the joint program was to address the preparation of comprehensive interpre tive displays and other explanatory mate rial, covering both the volcano and Obser vatory functions. The USGS provided funds for preliminary planning, followed by design and preparation of drawings and specifications. Through the joint efforts of USGS and the National Park Service, the Congress appropriated $5,000,000 for con struction in a Supplemental Appropriation in 1984.
In May 1985, the National Park Ser vice, in collaboration with the Survey, began construction of a new observatory at Uwekahuna. The new two-story building, with state-of-the-art instrumentation, offices, and an elevated tower to observe volcanic activity at Kilauea Volcano and neighboring Mauna Loa Volcano, was occu pied in April 1986.
The adjacent former observatory building has been remodeled as the Thomas A. Jaggar Museum, where the National Park Service presents the story of Hawai ian volcanism and volcano monitoring to the estimated 800,000 visitors who tour the park annually.
New Premises for the U.S. Geo logical Survey in Saudi Arabia
USGS personnel moved into the administrative offices, laboratories, and residential and recreational facilities of the
Front of main building of the new USCS Mission Center in Saudi Arabia
new Mission Center that supports the Sur vey's Mission in the Kingdom of Saudi Arabia.
The USGS Mission was established in Saudi Arabia in 1962 to assist the Saudi Government in the task of mapping and cataloging the mineral and other natural resources and geological strata of the coun try. The Mission works directly under the Saudi Ministry of Petroleum and Mineral Resources while sharing their work with geologists from France (Bureau de Recher- ches Geologiques et Minieres BRGM) and Britain (RIOFINEX). All three missions are coordinated by the Saudi Directorate General of Mineral Resources (DGMR).
The USGS Mission consists of the fol lowing technical departments: Geology, Geophysics, Petrology Laboratory, Topog raphy, Remote Sensing, and Computer. These departments are supported by a Technical Reports Unit, Field Operations Office and Warehouse, Library, and Elec tronics and Radio Laboratory.
The U.S., French, and British mis sions worked in various parts of Jeddah; however, with the expansion of the opera tions, the Ministry considered it preferable to locate the three missions in a single area for greater efficiency, cooperation, and ease of communications.
Atrium of main building of the new USCS Mission Center in Saudi Arabia
Administrative and Facilities Support 123

The new complex is self-contained, with Survey personnel and their families living and working on the site. The site has its own electric power generating plant and sewage treatment facilities. Water treat ment facilities have been designed and may be constructed later.
The new USGS Mission is about six miles northeast of the city center of Jed- dah, adjacent to the Jeddah By-Pass for the Mecca-Medina Road. The USGS Mission occupies roughly 24 acres of a 60-hectare master planned site that was developed for joint use by the USGS, the French, and the British. When planned, the USGS Mission had a total operating staff of 450, of whom 50 were U.S. citizens, while the others were Saudi citizens and other nationalities.
The principal facilities include: Two-story 78,000-square-foot Mission Center and administrative building with air conditioning, auditorium, computer room and related facilities, atrium, library, archives, clinic, radio room, and solar col lectors for water heating. Single-story laboratory building with 10,183 square feet of space for petrology laboratory, rock cutting and storage, X-ray laboratory, specimen preparation, geochem- ical laboratory, and spectrograph. Single-story warehouse and shops build ing with 19,343 square feet of space for carpenter shop, maintenance shop, air con ditioning and electrical repair shop, auto service shops, and field and housing storage. Two-level, 21-bedroom Temporary Duty Guest House with 13,524 square feet. Mosque of 2,734 square feet with pray er area, courtyard, and ceremonial ablution area. 10 single-family homes of 3,574 square feet each. Security: The business complex is sur rounded by a perimeter wall with two gatehouses admitting entry to the enclo sure. The residential and recreational area is also surrounded by a security wall out side the perimeter road, with a single gate house access, adjacent to the business com plex access. Power: The power generation plant, as designed, will permit adequate standby capacity for maintenance, possible break downs, and other forms of interruptions. When the city of Jeddah provides this power in the future, a transformer building will be required on site. Full backup gen
erating capacity is provided by three 625- kilowatt generators and a fourth machine for standby power. Water: A reliable water supply is not now available on site. Until connection can be made with the Jeddah water system, the facility requires a preengineered, package water-treatment plant capable of process ing 10,000 gallons per day to meet water- quality standards. Water intended for con sumption and recreational use will be delivered daily to the plant from remote sites in a pretreated state for final treat ment, which will include softening, chlori- nation, and cooling. Fully treated water is distributed throughout the facility under pressure in an underground system of plas tic pipes. A separate system is required to provide nonpotable water for all other pur poses, distributed under pressure in a sep arate underground system of plastic pipes. Sewage: The facility has a bioreactor waste-water-treatment system capable of treating 35,000 gallons per day of raw sanitary sewage or waste. No laboratory waste enters the system. Treated effluent, after being filtered and disinfected, is used to irrigate the landscaped areas in the compound. Gas: Gas service is tank stored, bottled, and supplied to housing and laboratories as needed.
EROS Data Center Energy Conservation
The EROS Data Center (EDC) contin ued to lead the way in the Department of the Interior's Energy Conservation pro gram. The EDC, located 16 miles northeast of Sioux Falls, South Dakota, was con structed in 1972-73. As designed, con structed, and operated with its own sup port systems, EDC closely conforms to current energy standards, which did not exist at the time of the Center's inception. Designed with energy conservation in mind, the Center is a highly sophisticat ed, special-purpose facility for receiving, processing, and disseminating remotely sensed high-altitude spacecraft and aircraft- acquired imagery. EDC also provides assistance in remote sensing applications to resource inventory, monitoring, and management.
Early in 1975, the EDC launched a vigorous energy-management program,
124 U.S. Geological Survey Yearbook 1987

EROS Data Center, Sioux Falls, South Dakota
which began with immediate action on the most obvious initiatives that could be implemented without added cost or replacement with updated systems, such as reduced interior and exterior lighting, modified zone thermostat settings, discon tinuance of snow melting systems, and optimum start/stop of heating, ventilating, and air conditioning fans during nonwork- ing hours. This was followed with an engi neering study of the building and its sys tems to identify cost-effective retrofit projects and development of an overall program to be implemented as funds become available. In addition, separate studies were made to determine the feasi bility of installing a solar system for heat ing water for the photolabs, which are large-volume users of tempered water. Also, because water is a critical resource in South Dakota, the feasibility of recycling waste water with treatment and filtration was studied. The EROS facility uses 1 million gallons of water per month. Both systems were proven to be cost-effective and were installed in 1979. The solar sys tem, with 510 flat plate collectors of 15 square feet each, is one of the largest in
use. In addition, the facility's computerized management system, a Honeywell Delta 2000, was upgraded with a Delta 1000 to enhance management and make possible additional savings in energy use.
Complementing an already successful 10-year energy management program, three new energy conservation projects are contributing to a 37.2% reduction in energy use. These projects are (1) a heat recovery system, which captures otherwise wasted heat from computers; (2) a trickledown wall solar collector connected to a radiant floor, which provides above-freezing tempera tures in the storage building for heavy road-maintenance equipment; and (3) a load shedding program to control demand peak on the electric boiler. Together these three programs resulted in a total annual BTU reduction of 19.5% and an estimated con tinuing annual savings of 4.6 million BTU's. The success of these innovations has led to the continuing investigation and implemen tation of other energy projects that will produce even greater energy savings in the future.
Two most recent innovations are (1) using the emergency diesel generator to
Administrative and Facilities Support 125

power one of the 250-ton centrifugal water chillers during a peak electric power alert and (2) replacing the 65-ton indoor cooling tower, used for the past 12 years for con denser water cooling in the computer room air conditioning, with a unit and system capable of shedding power demand during peak alert times by providing chilled water directly to all computer room air condition ers.
The EROS energy management pro gram launched in 1975 has not lost its momentum. There is continuing emphasis on fine-tuning the building systems to increase efficiency. Energy management is a high-priority consideration in the long- range repair and improvement program for the EROS center. National recognition of program achievements has furnished an added incentive in the search for new projects, as evidenced by the following recognition and illustrated by the selected program for 1987-88.
In addition to a Federal Energy Effi ciency Award in 1985, the EROS Data Center facility management has been the recipient of other State and national recog nition. The Heat Recovery Project received a Department of Energy award for design and installation. It also received a third place national award from the American Society of Heating, Refrigera tion and Air Conditioning Engineers (ASHRAE). Also, the EROS Data Center was selected by Honeywell to receive Hon- eywell's "Energy Management Achieve ment Award" for outstanding accomplish ment in controlling energy and reduction of facility operating costs. In addition, the Trickle Down Solar Wall/Deep Heat Radi ant Floor and Computerized Load Manage ment were two of six South Dakota energy conservation projects selected by the State to be entered into the Department of Energy's 1985 National Awards Program for Energy Innovation and were singled out for awards.
Top-priority projects in the fiscal year 1988 program include: Replace two computer room air condi tioners, which have reached the end of their lifecycle, with more efficient and higher capacity units. The added capacity will satisfy the need of the Advanced Very High Resolution Radiometer (AVHRR) computer and will insure the reliability of the computer room air conditioning.
Replace indoor cooling tower with a new 85-ton variable-frequency-drive cool ing tower. The tower would be installed with its own pump to provide redundant free cooling for the computer room. Also, the original pump will be free to provide heat recovery loop cooling through the heat exchanger. Shed outdoor lights during peak peri ods. Since the emergency generator is only used for lighting during power outages, it is available to use for limiting the demand charge. By installing a transfer switch from the generator to the existing panels, 105 kW could be dropped, which would save $1,184 per month. Place power roof ventilators on the cen tral building control system. Placing the control of power roof ventilators on the Honeywell Delta 1000 will enable the power roof ventilators to be cycled with the fans to prevent negative pressure in the building. Investigate the feasibility of converting the ventilation system from cold heat to a variable volume system using variable fre quency drives on the fan system.
Automation InitiativesImproving support services through
automation has been a major thrust of the U.S. Geological Survey as it seeks to im prove program efficiency and productivity.
The scientific program activities of the USGS require an efficient and responsive network of support services, in order to hire and train staff, procure supplies and services, and manage facilities and equip ment. These services, which are provided by the Administrative Division, are in creasingly being provided through auto mated systems. These systems are used to process internal transactions, to provide management information, and to meet ex ternal reporting requirements. The sys tems in operation include such administra tive support functions as personnel, space and personal property management, procurement, supply management, and accounting.
Four strategic goals are guiding the bureau's efforts to improve systems: sys tems should be easy to access and use, computerized processing should replace
126 U.S. Geological Survey Yearbook 1987

Exploring the use of automated technology to enhance work methods and procedures, the Computer Aided Design (CAD) system is shown in operation in the Western Region Manage ment Office. CAD captures data and produces graphic displays of facilities features, with high speed revision capability, in creasing productivity in space and facilities management activities.
paper processing wherever possible, proce dures should be streamlined and standard ized, and the various administrative systems should be interconnected to mini mize duplication.
Highlights of recent accomplishments include the following: The Survey's new Personnel Action System provides online processing for the preparation and routing of the Request for Personnel Action (Standard Form 52). The electronic alternative to the paper form used for all job actions (for example, recruitment, hiring, promotions, reassign- ments) eliminates duplicate data entry and paperwork and allows improved tracking of the status of personnel actions. This sys tem eventually will include performance standard and appraisal tracking, online model performance standards, online posi tion skill requirements, standard position descriptions, and processing of training forms. Job vacancy announcements are now transmitted automatically to USGS loca tions nationwide every week through the Automated Vacancy Announcement Distri bution System (AVADS), an electronic mail system. In addition to providing employees with information on job oppor tunities on a more timely basis, AVADS saves much of the cost of printing and mailing vacancy announcements.
USGS field offices can now transmit to the Survey's central finance office the information required to process and pay selected vendors' invoices. The Field Entry of Accounting Data (FEAD) project allows remote entry of Blanket Purchase Agree ment payment transactions to the bureau financial management system. This not only speeds processing, ensuring prompt payment of bills, but also increases internal controls over the payment process. Dupli cate data entry, mailing costs, and mail delays are reduced or eliminated as well. The Property Management System has been redesigned to improve the quality and timeliness of data pertaining to USGS equipment and vehicles. It will provide improved reporting capabilities to both administrative and program managers regarding inventories, transfers, and other information and will reduce the need for maintaining duplicate information through out the bureau. A selection of off-the-shelf software will improve procurement operations by allowing the rapid generation of solicitation and contract documents tailored to the spe cific requirements of each acquisition. Information processing and document as sembly functions will be combined with the automatic provision of relevant Federal Acquisition Regulation text in this system. This initiative will both reduce the lead
Administrative and Facilities Support T 27

As pan of the Administrative Division's efforts to replace pa per flows with data flows, the Field Entry of Accounting Data (FEAD) system was imple mented in 1987. By allowing data entry to the bureau finan cial management system from field locations, FEAD speeds the payment of Blanket Pur chase Agreement charges and increases quality control assurance.
time needed to produce a solicitation docu ment and improve the quality of contract documents.
USGS Leads the Way to NewDepartment-wide Financial System
In September 1987, the Department of the Interior announced the selection of an "off-the-shelf standardized financial management system to be used across the department, culminating more than a year of work led by the U.S. Geological Survey. The nearly $5 million, 10-year con tract will allow the Department of the Interior to consolidate ten existing ac counting and payment systems into one efficient system. The decision to seek this improvement was made after an extensive study of Interior financial systems found that most were labor-intensive and expen sive, used outmoded technology, and lacked compatibility.
The Department chose the USGS to lead the acquisition effort because of its own existing centralized financial manage ment system, its expertise in telecommuni cations, its experience with servicing widely varying requirements over geo graphically dispersed operations, and its proven track record in major ADP procure ments and automation of administrative activities. USGS staff were deeply in volved in the Department's review of its existing systems, assisting in the basic data collection and subsequent analysis of find ings and consultants' recommendations. The Survey was also instrumental in devel oping and evaluating alternative approach es once the decision was made to improve financial operations on a department-wide basis. Choices ranged from modifying an existing bureau system, to starting a new and major inhouse systems development effort, to turning to the private sector. The recommendation of the Survey-led team of bureau representatives was to investigate the availability of commercially available software designed for Federal Government accounting and payment operations. This team also developed detailed operating characteristics and requirements for a departmental system that could meet the
128 U.S. Geological Survey Yearbook 1987

needs of both large and small bureaus and carried out the market survey.
The Department of the Interior decided to procure a single department- wide accounting system based on commer cially available technology in December 1986. The USGS was designated to carry out the procurement. The resulting request for proposals, developed during early 1987, required potential contractors to undergo a rigorous 24-hour operational capabilities test to demonstrate that their systems could meet Interior's requirements; this was one of the most comprehensive evalu ation efforts ever conducted for such a system in the Federal Government.
The contract for the Department of the Interior financial management system was awarded, ahead of schedule, to American Management Systems, Inc. The USGS and the Bureau of Reclamation were the first Interior bureaus to begin implementing the new system in October 1987. The Survey is providing assistance to other Interior bureaus as they convert to the new system over a 2-year period. In addition to software, the contract provides for docu mentation; training of more than 1,000 accountants, technicians, and managers nationwide; maintenance and updates of the software over the system's 10-year life; and 47,000 hours of technical support services.
With this successful contract award, the Department of the Interior has taken an important step toward its goals of improving the efficiency of financial management operations, reducing the number of accounting systems, standardiz ing the processing of accounting data and payments, and reducing the cost of finan cial management operations within the Department.
Volunteer for Science Program Taking Pride by Taking Part
Over 300 volunteers contributed more than 62,000 hours of their time to the U.S. Geological Survey during fiscal year 1987. Some of these volunteers are retired USGS employees who wish to continue their asso ciation with the USGS and its programs. Other volunteers are teachers who spend their sabbaticals or summers with the USGS and contribute to scientific research. College students pursuing degrees in the earth sciences and other professional fields broaden their knowledge and experience as they work side by side with USGS person nel. While satisfying their curiosity about career possibilities, high-school students
Volunteers and Director Dallas Peck after special volunteer awards ceremony at USCS National Center, August 1987.
Administrative and Facilities Support 129

give valuable aid to scientists and adminis trators. Other community members volun teer their time and talents because of their interest in public service and in the earth- science mission of the USGS. The Volun teer for Science Program is a companion program to the national Take Pride in America public awareness campaign that encourages citizens to help take care of the public resources through volunteer efforts. After a modest beginning in 1986 with 55 volunteers, the program, by 1987, had quad rupled in size.
The program is of mutual benefit to the USGS and to the volunteers. Some volunteers welcome access to the equip ment and technology and the opportunity for field work because they love earth science. Students have been able to develop USGS work projects in coopera tion with academic institutions that have provided college credit in their pursuit of a degree. The benefits derived by the USGS are even more obvious. The volunteers have been involved in such major USGS projects as the Mineral Resources Ap praisal Project, the Glacier National Park Project, the radon project, and the Arctic Alaska Project. They have also performed project support assignments involving such duties as recording rainfall measurements, field mapping, constructing streamflow gaging stations, and preparing scientific reports.
In the first annual special volunteer awards ceremony at the National Center in August 1987, the Director presented Spe cial Award Certificates to 60 volunteers
who have worked on project assignments at the national headquarters of the USGS. Similar ceremonies of recognition will be held in major USGS field locations.
Pleased with the results of the pro gram so far, the USGS has plans not only to increase the number of volunteers but also to broaden the scope of their activities wherever possible. The U.S. Geological Survey is convinced that a quality corps of volunteers can make significant contribu tions to the earth sciences, while giving the volunteers the satisfaction of serving the public and being part of the Take Pride in America campaign.
Unit Award for Excellence of Service
Each year the Department of the Inte rior presents the Unit Award for Excel lence of Service to those bureaus and (or) offices that have either met or exceeded all of its business and economic development program goals. The award for fiscal year 1986 was presented to the Director, U.S. Geological Survey, by Secretary of the Interior Don Hodel in April 1987, for the introduction of new and innovative ideas and techniques in areas related to in creased staff training, concerted manage ment attention, and special outreach ef forts that resulted in significant progress in contracts awarded to small, disadvantaged- and women-owned business concerns.
130 U.S. Geological Survey Yearbook 1987

International Activities
HighlightsThe 1986 Gas Disaster at Lake Nyos, Cameroon, West Africa
By Michele L. Tuttle, John P. Lockwood, and William C. Evans
On August 21, 1986, a sudden release of gas from Lake Nyos in northwestern Cameroon, West Africa (fig. 1), caused the death of 1,700 people. Within days of the event, the U.S. Office of Foreign Disaster Assistance (OFDA) sent three USGS sci entists to investigate the geologic and geo- chemical aspects of the gas release. They
were accompanied by a medical team and, later, by a team of environmental special ists.
At 9:30 p.m. on Thursday, August 21, rumbling sounds that lasted 15-20 seconds were heard from Lake Nyos. In a valley below the lake, people in the Nyos village suddenly became unconscious. Only four of the 1,000 people in the village ever awak ened. Survivors in areas beyond Nyos vil lage who came out of their homes later reported they felt a warm sensation, smelled the odor of rotten eggs or gunpow der, and then fell unconscious. When they awakened, weak and confused, 6 to 36 hours later, they found family members and their animals dead. Deaths were reported as many as 11 miles north of the lake. Bird and insect life virtually disap peared for at least 48 hours but plant life remained largely unaffected.
Before the gas release, there were no apparent changes in Lake Nyos that might
--0°
A A "Cameroon Volcanic Line"
10'
Figure 1. Location of Cameroon, Lake Nyos, and the Cameroon Volcanic Line.
International Activities 131

have forewarned of the event. Afterward, however, the lake level was noted to have dropped about 3 feet, and there was also evidence that water had surged up along the southern lake shore ripping up or flat tening vegetation to a height of 80 feet. Water had apparently splashed over a 260- foot-high rock promontory on the south western side of the lake, and a small vol ume of water went over a spillway at the northern end of the lake.
By Saturday morning, the lake was calm but was rusty red in color due to a thin surface layer containing iron hydroxide; mats of vegetation that had been ripped up by the wave were floating on the surface (fig. 2). No seismic activity had been recorded at a seismic station 137 miles southwest of the lake. Household goods in the homes surrounding the lake were undisturbed, and rocks remained perched precariously on the cliffs above the lake.
It soon became apparent from field observations that the geologic setting of Lake Nyos held important clues to what had set the stage for the disaster. Lake Nyos occupies a shallow volcanic crater a "maar" that formed along a volcanic zone that bisects northwestern Cameroon. This "Cameroon Volcanic Line," a northeast- trending zone of crustal weakness, extends
1,000 miles from islands in the Atlantic Ocean, across northwestern Cameroon into northeastern Nigeria. Young basaltic vol canoes with cinder cones and lava flows along the numerous circular maars extend northeastward across Cameroon. Many of the features, including the Lake Nyos maar, are unweathered or little eroded, having erupted, perhaps, in the last several hundred years.
The geology of the region surrounding Lake Nyos attests to the violent formation of the maar and supports the hypothesis that the lake is underlain by a diatreme, a near-vertical pipelike conduit (fig. 3). The diatreme, filled with collapsed rock and permeable volcanic ash, represents the zone where a dike of ascending, gas-rich basaltic magma from the Earth's mantle intersected ground water. The interaction of hot lava with water produced a violent explosion that formed the maar.
Although the chemical and isotopic composition of the gas in Lake Nyos indi cates that the gas released on August 21 came from degassing magma, the gas is not volcanic. Volcanic gases contain sulfur and chlorine compounds and are associated with high-temperature, near-surface erup tions of magma. In contrast, the Lake Nyos gas contains extremely low concentrations
Figure 2. Lake Nyos 7 week after the disaster showing float ing mats of vegetation and the rusty-red color of the ferric-hydroxide surface layer. The lake is 6,316 feet in maxi mum length (elongated NW-SE), and 3,870 feet in maxi mum width. It is shallow at the southern end but drops off steeply to a large, flat plain at a depth of 682 feet. The spillway is on the northern end of the lake.
132 U.S. Geological Survey Yearbook 1987

of carbon monoxide, hydrogen, hydrogen sulfide, and sulfur dioxide. Aqueous spe cies of these gases are absent from the lake waters as well, and carbon dioxide (C02) forms 98 to 99 percent of the gas. The Nyos gas is cool; the lake-bottom temperature of 75 °F is no higher than those in other tropical lakes at similar elevation and lati tude.
Stratification in lakes is produced by a layer of less dense water overlying a layer of more dense water. Concentrations of dissolved substances in Lake Nyos waters show a definite increase with depth, imply ing that the lake was stratified and that the dissolved substances were stored in the bottom waters prior to the event. The high concentrations of dissolved ferrous iron (Fe2+ ) in the presence of bicarbonate (HCOJ) indicate that the lake waters were very acidic prior to the event; otherwise, the iron would have been removed by chemical precipitation of the mineral side- rite (FeC03). A large amount of dissolved C02 is the only likely candidate for produc ing the lake's acidity.
Oxygen and hydrogen isotopic compo sitions of Lake Nyos waters indicate that the solutes within the lake were not acquired through the normal process of evaporative concentration. The solutes, including the C02 , likely entered through springs near the bottom of the lake where confining pressures would be sufficient to keep the gas dissolved. The analytical data clearly indicate that the Nyos gas, although released from magma at great depths below the lake, had cooled and lost its reactive constituents (such as sulfur and chlorine compounds) as it moved upward through the permeable diatreme. The gas reached the lake as cool, essentially pure C02 .
Calculations show that Lake Nyos can hold more than a quarter of a cubic mile of dissolved C02 when fully saturated. Labo ratory measurements indicate that the lake currently holds 0.07 mi3 of C02 . The lake apparently released up to 0.29 mi3 of C02 , an amount sufficient to account for the deaths and the drop in lake level immedi ately following the event. The gas cloud most likely was produced by the rapid exsolution of large amounts of C02. The gas probably made an explosion-like noise and caused surface waves to form as it escaped from the lake. Because C02 is 1.5 times more dense than air, the gas cloud tended
Figure 3. Hypothesized sche matic cross section of the dia treme beneath Lake Nyos. This structure allowed magmatic gas to migrate into the lake where it was stored prior to its cata strophic release.
EXPLANATION
Lake sediments
Pyroclastic deposits
Breccia
Alkali basalts
Quartz monzonite
Fault showing movement
to maintain its integrity as it spilled over the crater rim into low-lying areas.
The mechanisms that may have caused the sudden release of the gas from the bottom waters of Lake Nyos include a small earthquake, a landslide into the lake, or the sudden addition of C02 in the bottom of the lake. Essentially any disturbance of the unstable, C02-charged bottom waters would cause a chain reaction that could result in the rapid exsolution and explosive release of the C02 .
The people and animals appeared to have died quickly of asphyxia (fig. 4). Very high concentrations of C02 cause paralysis of the respiratory centers in the brain. The description by many survivors of the odor of "rotten eggs" or "gunpowder," although usually associated with sulfur gases, is a common "olfactory hallucination" described by individuals exposed to high concentra tions of C02.
The results of this investigation pro vided unprecedented insight into the
International Activities 133

Figure 4. Dead cattle littered the hillsides around Lake Nyos after the event.
conditions associated with the release of lethal gas from crater lakes. This insight will have application to other crater lakes around the world that have the potential for similar disasters.
Costa Rican Mineral Resource Assessment Study
By Richard D. Krushensky
In 1987, the U.S. Geological Survey (USGS), the Direccion General de Minas e Hidrocarburos, and the Universidad de Costa Rica, Republic of Costa Rica, contin ued a project to assess the non-fuel mineral resources of Costa Rica. Grade and ton nage of known deposits were assessed, and the probability for the discovery, and grade, including quantity, were estimated for presently unknown deposits. Such esti mates are a major factor in the analysis of mineral commodities. The assessment was based on an evaluation of existing geologic, geochemical, and geophysical data as well as on new data gathered during intensive field studies. From these data, the team of scientists identified several areas, called "domains," where the geology is conducive to the development of one or more types of mineral deposits. Gold and silver are pres ently mined in Costa Rica. Occurrences of copper, lead, zinc, manganese, chromium, aluminum, and iron- and titanium-bearing sands are also present. Although some of these latter commodities have been mined in the past, none are now being mined.
Gold, the most important Costa Rican metallic mineral resource, is presently mined from veins and alluvial deposits. Two domains have been delineated for vein gold deposits and two for placer gold depos its. Gold production in Costa Rica has been primarily from veins emplaced near the Earth's surface. USGS scientists predict that there is a 90 percent chance of discov ering 4 additional but presently unknown vein gold deposits, and a 10 percent chance of discovering 17 vein gold deposits in a belt that extends from Canas, along the Cordil lera de Tilaran in the north, to Pueblo
134 U.S. Geological Survey Yearbook 1987

Figure 5. Location map of Costa Rica.
50 MILES
50 KILOMETERS
Nuevo, just within the Cordillera de Tala- manca, in the south (fig. 5).
Geologic study indicates a spatial and genetic relationship between the intrusion of rhyolite and vein gold deposits in the Santa Clara Mine. This study has also indicated many more rhyolitic intrusions than were previously known. As a result, the probability for the discovery of more vein gold in the Santa Clara deposit is greatly increased. Undiscovered vein gold deposits would be most likely to occur near rhyolitic intrusions, probably localized in quartz veins occupying shear or fault zones. Although domains for placer gold have been well explored in the area of the
Osa Peninsula, two newly delineated domains in this area have high potential for hosting fossil placer gold deposits.
The mineral resource assessment also indicated that resources of copper, lead, zinc, manganese, chromium, and aluminum also exist in Costa Rica, and domains for deposits of these commodities have been delineated. Small deposits of podiform chromite are known from the Santa Elena Peninsula in northwestern Costa Rica, and there is a 50 percent probability of 13 more and a 10 percent chance of 63 or more similar but undiscovered deposits in that same domain. Because all known chromite deposits in Costa Rica contain less than 43
International Activities 135

metric tonnes, it is assumed that any addi tional undiscovered deposits will also be small.
The study also indicates that there is a 50 percent probability for the discovery of at least three porphyry copper deposits in Costa Rica. Such deposits typically contain 140 million metric tonnes or more of ore that ranges from 0.15 to 2 percent copper. It is estimated that there is a 90 percent chance of one such deposit, a 50 percent chance of three, and a 10 percent chance of eight porphyry copper deposits being dis covered within one domain in the Cordil lera de Talamanca in southern Costa Rica. Detailed geologic mapping, rock and soil sampling, ground geophysical surveys, and drilling of defined target areas need to be carried out in order to identify these poten tial new deposits.
Volcanogenic manganese is known in more than 90 deposits in two domains in the Nicoya Peninsula, and undiscovered depos its like those known at the surface are believed to exist at depth. Bauxite, an ore of aluminum, has been thoroughly explored for in two domains in the area of the Valle General (valley of the Rio General) and southward, almost to the Panama border. There is a distinct possibility of additional undiscovered bauxite in a similar domain in the area of Guapiles in east-central Costa Rica. Three very small massive-sulfide deposits, with major copper and minor zinc content, occur in the Nicoya Peninsula; there is a 50 percent probability that one other such deposit exists in this same domain.
Other deposit types present in Costa Rica for which domains have not been identified include low-grade offshore placer iron (magnetite), polymetallic veins (veins with three or more metals), copper skarn (deposits formed at the contact between intrusive rocks and sedimentary country rock), lead-zinc skarn, and hot-spring sul fur deposits. The mineral-resource assess ment of Costa Rica was carried out with funds provided by the Agency for Interna tional Development through the Los Alamos National Laboratory. The assess ment supports the President's Caribbean Initiative whereby nonmilitary methods are sought to assist Central American countries in improving their economic conditions.
Coal Resource Assessment in Pakistan
Exploratory drilling during fiscal year 1987, as a part of the Coal Resource Explo ration and Assessment Program (COAL- REAP), has significantly increased knowl edge of the coal resource potential in the Sind Province in southern Pakistan. COALREAP is a technical assistance ven ture by the U.S. Geological Survey with the Geological Survey of Pakistan under the auspices of the Energy Planning and Development Project of the U.S. Agency for International Development (USAID). Drilling is done by a USAID-contracted Pakistani company, and geophysical log ging of holes is done by a U.S. company, also contracted by USAID.
Since April 1986, 32 holes, totaling 25,306 feet (53 percent cored), have been drilled and logged (fig. 6). The holes aver aged approximately 800 feet in depth; the deepest hole was 1,247 feet, the shallowest 423 feet. Coal beds that were penetrated by drilling range from a few inches to about 20 feet in thickness; however, in only one hole did a coal bed exceed 7 feet in thick ness. Coal beds more than 2 feet thick were drilled in 17 holes; 2 holes contained 4 such beds, 6 holes had 3. Samples of coal were collected from all beds that were a foot or more thick. In all, 141 coal samples were collected from 26 drill holes. The samples are presently being analyzed, but early analysis of the 20-foot-thick bed indicates that it is of good quality. The middle section of the 20-foot bed contains an average of 3.3 percent ash and 0.6 percent sulfur; the parts of the bed above and below contain somewhat higher ash and sulfur percent ages.
Preliminary interpretations of recent investigations suggest that: The presently known and mined coal fields (Lakhra, Sonda-Thatta, Meting- Jhimpir) are not isolated occurrences but rather are in a region apparently com pletely underlain by coal-bearing strata. Several exploratory drill holes did not penetrate coal, but regularly occurring delimitors for individual coal fields were not found. Most coal beds appear to be discontinu ous layers, and, although many different
136 U.S. Geological Survey Yearbook 1987

68W 68°30'
25°45' -
25°30' -
25°15' -
25W -
24°45' -
UAL-2 . , »
UAL-3 -UAL-6 UAL-9LOCATION MAP
fammu .and
Kashmir Islamabad
PAKISTAN
Study Area
Boundary representation is not necessarily authoritative
Tando Muhammed
EXPLANATION Drill hole
Village/City
Figure 6. General location of holes drilled during 1986-87 for the Coal Resource Exploration and Assessment Program in southern Pakistan.
coal beds within the region might be exploitable, this discontinuous nature will significantly affect development of large- scale mining. The area east of Sonda and Meting and continuing east of the Indus River to south of Tando Muhammed Khan appears to be the most promising for new coal potential because of the discovery of consistently thick (thicker than 3 feet) coal beds in holes of close proximity. Most potentially min- able coal beds in this area, however, are buried deeper than those presently being mined near Lakhra to the north.
The area between Hyderabad and Lakhra surely contains coal beds at min- able depths and should be explored. Anomalously shallow underground coal mines along the western and northwestern parts of the Lakhra area suggest strip- mine potential that merits exploration.
Compilation and analysis of all avail able coal geology and resource data, which are now underway, will improve current understanding of the regional and local relationships of stratigraphic and struc tural frameworks, thereby improving the efficiency of future exploration and devel opment of Pakistan's coal resources.
International Activities 137

In order to ensure Pakistan's eventual self-sufficiency in all aspects of coal explo ration, assessment, development, and pro duction, training and institutional support have been emphasized in the current COALREAP effort. Consequently, in addi tion to the intensive on-the-job training fostered by the close working relationships between the Geological Survey of Pakistan and U.S. Geological Survey counterparts, Pakistani scientists are participating in short-term and long-term training courses in the United States. To date, 31 Pakistani officers have participated in a coal geology and assessment course at the University of Southern Illinois. Two Pakistani geologists have served an 8-week temporary duty assignment at USGS offices to assist in the coal resource assessment of the Pakistan areas explored during this past year and, in the process, to gain familiarity with USGS coal-resource assessment procedures. Two Pakistani Survey coal petrographers are in long-term graduate training at the Univer sity of Southern Illinois.
Under the expert guidance of Geosci- ence Associates Inc., three Pakistani Sur vey and Pakistani Water and Power Devel opment Authority officers have been trained to conduct all aspects of geophy sical logging procedures for drill holes. Four additional trainees have partially completed a training program and have been certified as operators.
Pakistan presently has few private contractors knowledgeable in the tech niques to drill coal-bearing sediments suc cessfully. COALREAP, therefore, has been especially beneficial in encouraging private-sector participation in future coal exploration programs by contracting and training a corps of drillers.
Coal samples are presently being ana lyzed at USGS laboratories, but in the future all analytical work will be conducted in Pakistan. Consequently, chemists from both the Pakistan Geological Survey and the Pakistan Council for Scientific and Industrial Research are being trained in the United States to conduct up-to-date coal analyses. Pakistani laboratories are being equipped with the necessary analyt ical equipment to allow processing of the coal samples within the country.
A Pakistani Survey scientist received training in the U.S. to become a systems
analyst and computer specialist for a national geodata center, which is a central ized repository for earth-science informa tion that will be available to all. This spe cialist is now training several other computer technicians. Future training will include programs for a library information manager, a cartographer, a publications manager, and a remote-sensing specialist.
China Digital Seismograph Network
Under the auspices of the Protocol for Scientific and Technical Cooperation in Earthquake Studies between the People's Republic of China (PRC) and the United States, the USGS and the PRC State Seis- mological Bureau (SSB) have worked coop eratively to design, construct, install, oper ate, and maintain a nine-station digital seismographic network. The China Digital Seismograph Network is one of the most advanced seismic systems in the world and will provide valuable data for assessing the crustal structure and evolution of the Asian continent and the location and properties of Chinese earthquakes. The network will further our understanding of the global distribution of earthquakes and will pro vide important data for ongoing coopera tive USGS-SSB earthquake prediction studies in China. The data will also be incorporated on a continuous basis into the global seismic data base, which is distrib uted nationally and internationally by the USGS. The USGS designed and developed the hardware and software for the net work, including nine field systems, a data management system that is located in Bei- jing, and a depot maintenance center, and provided training for SSB engineers and technicians. The stations that constitute the network began initial operation and testing during the summer of 1986 and are located in Beijing, Lanzhou, Kunming, Mudanjiang, Hailar, Enshi, Sheshan (Shanghai), Qiongzhong (Hainan Island), and Urumqi.
138 U.S. Geological Survey Yearbook 1987

Antarctic Topographic Surveying and Mapping Program
The U.S. Geological Survey continued its geodetic and cartographic programs in Antarctica in support of the National Sci ence Foundation's U.S. Antarctic Research Program.
For the 15th year, the Survey sent a two-person team to the South Pole Station during the austral winter June through September 1987 to make observations and collect data in support of several long-term research projects. These included Doppler satellite observations to measure the pre cession of the Earth's axis at the Pole and the direction and magnitude of polar icecap movement and to support geodetic net works and provide positional data for cartographic purposes. Other activities included operation of the USGS World wide Standardized Seismological Network Station and gathering data for an earth tides and ultra-long-period seismic project for the University of California at Los Angeles.
Field surveys were conducted during the austral summer to obtain Doppler sat ellite data to recompute older existing geo detic networks on the World Geodetic Sys tem 1972 datum and to establish additional control for future l:50,000-scale topo graphic mapping projects in the Dry Valley-Minna Bluff-Ross Island area.
The Survey assisted the National Sci ence Foundation, in cooperation with the U.S. Navy, in obtaining aerial photography for mapping and for various research proj ects in the Antarctic.
Production of Advanced Very High Resolution Radiometer (AVHRR) and Landsat image maps continued during fis cal year 1987, and three 1:250,000-scale reconnaissance maps were submitted to the U.S. Board on Geographic Names through the Advisory Committee on Antarctic Names for names approval. Also, new offi cial Antarctic maps were distributed to member nations of the Scientific Commit tee for Antarctic Research for Geodesy and Cartography and to appropriate deposito ries in the United States.
United States/Mexico Border Mapping Project
When the current U.S./Mexico border mapping project is completed, there will be 203 color-image maps of the U.S./Mexico border from San Diego, California, to the Gulf Coast of Texas. Eighty-eight color- image maps have been published as of September 1987. Completion of the entire project is scheduled for June 1988.
The U.S. Geological Survey began the U.S./Mexico border mapping project at the request of the U.S. Customs Service in 1979. The goal of the project is to produce 1:25,000-scale U.S./Mexico border maps from high-altitude color-infrared aerial photographs. In 1981, a similar request was made by the International Boundary and Water Commission to meet its legisla tive requirements for updating map cover age of the international boundary along the Rio Grande and Colorado Rivers. To ac commodate the Commission's particular needs, the Survey is producing a separate, full-color edition.
The color-infrared images, which do not show colors in their "natural" state, are being enhanced to produce a simulated natural green that makes vegetation and other ground features easier to recognize. The published maps will provide about 3 miles of coverage on each side of the border.
Technology Transfer and Pan American Countries
Under the auspices of the Pan Ameri can Institute of History and Geography (PAIGH), the Survey continued to provide assistance in the transfer of cartographic, remote sensing, and geographic informa tion system (GIS) technology to Latin American member nations.
The PAIGH Test Program to evaluate remote sensing for cartographic applica tions in Latin America is one of the projects in which the Survey is playing a major role.
International Activities 139

The project involves the use of Landsat Thematic Mapper data, panchromatic data, and GIS techniques to produce an experi mental map of Viedma, the proposed new national capital of Argentina. Another PAIGH project in which the Survey has been actively involved is the multilingual "Glossary of Cartographic and Photogram- metric Terms." The glossary, published in 1987, contains approximately 1,700 techni cal terms, each translated into Spanish, English, French, and Portuguese.
Training Programs and Courses
The USGS planned and administered programs for 35 visiting scientists from 16 countries to conduct research at the USGS or at USGS-selected institutions. Formal training courses for 94 foreign nationals representing 26 countries were provided by the Survey during fiscal year 1987: "26th International Remote Sensing Workshop" in Sioux Falls, South Dakota (13 participants). "Techniques of Hydrologic Investiga tions" in Denver, Colorado (13 partici pants). "Training Course in Marine Geology" in Moss Landing, California (8 participants). On-the-job or academic training for 60 other foreign nationals either at the Survey or at other facilities on behalf of the Survey.
The countries where the USGS was active during fiscal year 1987 are shown in figure 7.
Miscellaneous International Activities A pilot project using AVHRR and other data was conducted to evaluate the location and magnitude of locust infestation in Bot swana. A l:50,000-scale experimental Landsat image map of Nairobi West in Kenya was prepared by the Environmental Research Institute of Michigan, Ann Arbor, Michi gan, and published by the USGS. Plans are underway for the Survey to prepare a series of 1:250,000-scale The matic Mapper image maps of western Sudan for a forest inventory project. Activities under the Protocol on Scien tific and Technical Cooperation in Survey ing and Mapping Studies between the PRC National Bureau of Surveying and Mapping (NBSM) and the USGS are continuing in accordance with the work plan for 1987. This plan was developed at the second meeting of the Joint Working Group in Beijing in October 1986. In accordance with the work plan for Annex II for developing geographic information systems, the NBSM and the USGS jointly developed and exchanged software packages for map digitizing and editing, image display and analysis, spatial data processing, and GIS applications.
140 U.S. Geological Survey Yearbook 1987

-
Jllllil
International Activities T41

Famine PredictionsThe U.S. Geological Survey, under aus
pices of the African Bureau in the Agency for International Development, is supporting the Famine Early Warning System (FEWS), a pro gram to monitor Africa and identify and alert populations at risk. The Survey assists in deter mining the system requirements and provides technical advice to implement the spatial data base and the geographic information systems technology that are used to compile and ana lyze data pertaining to physical resources, cli
mate and weather, spectral and related moni tored information, and health and nutrition in order to mitigate the effects of famine. Survey staff have formally assessed the FEWS and have assisted in designing a 5-year plan for its continued implementation. Individual coun tries, the first being Sudan, are being assisted by the Survey in design of systems that will integrate with FEWS and also provide for man agement of information on land assessment, land management, and resources monitoring.
Map showing the eight coun tries (stippled) covered by the Famine Early Warning System.
142 U.S. Geological Survey Yearbook 1987

U.S. Geological Survey
Missions and Programs
Missions
Our Nation faces some serious ques tions concerning the availability and use of land, water, energy, and mineral resources of the Earth. How can we ensure an ade quate supply of critical resources in the fiiture? In what ways are we irreversibly altering our natural environment when we use these resources? How can we predict, prevent, or mitigate the effects of natural hazards? Responses to these and similar questions depend on continually increasing the knowledge about the structure, re sources, and dynamics of the Earth. Col lecting, analyzing, and disseminating the scientific information necessary to answer these questions is the primary mission of the U.S. Geological Survey.
The U.S. Geological Survey was estab lished by an Act of Congress on March 3, 1879, to provide a permanent Federal agency to conduct the systematic and sci entific "classification of the public lands, and examination of the geological struc ture, mineral resources, and products of the national domain."
Since 1879, the research and factfind- ing role of the USGS has grown and has been modified to meet the changing needs of the Nation it serves. The USGS, how ever, has remained principally a scientific and technical agency rather than a devel opmental or regulatory one. Today's pro grams serve a diversity of needs and users. The current mission of the USGS is to provide geologic, topographic, and hydro- logic information that contributes to the wise management of the Nation's natural resources and that promotes the safety and well-being of the public. This information consists of maps, data bases, and descrip tions and analyses of the water, energy, and mineral resources, the land surface, the underlying geologic structure, and the dynamic processes of the Earth.
As the Nation's largest earth-science research agency, the USGS maintains a long tradition of providing accurate and impartial information to all, which under scores its continued dedication to "Earth Science in the Public Service."
OrganizationThe USGS is headquartered in
Reston, Virginia, near Washington, D.C. Its scientific programs are administered through the Geologic, Water Resources, and National Mapping Divisions, supported by the Administrative and Information Systems Divisions. The Survey conducts its research and investigations through an extensive organization of regional and field offices located throughout the 50 States, Puerto Rico, and the Trust Territories.
BudgetIn fiscal year 1987, the USGS had
obligational authority for $620.6 million, $432.1 million of which came from direct appropriations; $7.7 million came from esti mated receipts from map sales, and $180.8 million came from reimbursements. The
PERCENTAGE ALLOCATION OF FUNDS BY DIVISION
GENERALADMINISTRATION3
U.S. Geological Survey Missions and Programs 143

Survey was reimbursed for work per formed for other Federal, State, and local agencies whose needs for earth-science expertise complement USGS program ob jectives. Work for State, county, and municipal agencies is most often conducted on a cost-sharing basis.
Most of the appropriations and reim bursements received by the USGS in fiscal year 1987 were distributed to geologic, hydrologic, mapping, and administrative areas of responsibility. Budget tables appear at the end of this section.
Personnel
At the end of fiscal year 1987, the USGS had 8,192 permanent full-time employees. The Survey's diversified earth- science research programs and services are reflected in its workforce, more than half of which possesses a Bachelor's or higher
BY ORGANIZATION
DIRECTOR'S OFFICEANDADMINISTRATIVE DIVISION478
INFORMATION SYSTEMS DIVISION 148
level degree. Almost half of the USGS employees are professional scientists.
Permanent employees are supported by other-than-full-time permanent employ ees, including many university students and faculty members as well as part-time employees. This relationship with the aca demic community has made the expertise of many eminent scientists available to the USGS. Students have also proved valuable during times of increased workload, espe cially during the field season. Academic institutions have also provided a means of recruiting qualified young professionals for permanent full-time positions upon comple tion of their studies.
Awards and Honors
Each year, USGS employees receive awards that range from certificates of excellence and monetary awards to recog nition of their achievements by election to membership or office in professional societ ies. The large number of these awards attests to the high caliber of the Survey personnel. Of the many who received awards, the USGS is pleased to acknowl edge here those individuals who became members or officers in professional societ ies or who received awards from those organizations. Also acknowledged are those who received the Department of the Interior's highest honor, the Distinguished Service Award, and those in the Senior Executive Service who received manage ment awards.
BY OCCUPATION
OTHERPROFESSIONALS
276
GEOPHYSICISTS 260
CARTOGRAPHERS 500
WAGE BOARD 117
HonorsService in professional societies is one
of the most important contributions a sci entist can make. Societies play a fundamen tal role in disseminating knowledge as well as provide a forum in which new ideas are tested. The active participation of Survey scientists in professional societies attests to the scientific vitality of the bureau. The bureau is particularly proud of those indi viduals who have been elected to society presidencies or chairmanships of society committees by their professional peers.
144 U.S. Geological Survey Yearbook 1987

P. Robin Brett, Geologist, was named President of the Volcanology, Geochemi- stry and Petrology Section of the American Geophysical Union for the period 1986- 1988.Frederick J. Doyle, Research Cartogra pher, National Mapping Division, was appointed the Executive Director of the newly formed International Union for Sur veys and Mapping.Robert M. Hamilton, Geologist, was named President-Elect of the Seismology Section of the American Geophysical Union for the period 1986-1988. Stanley P. Sauer, Regional Hydrologist for the Northeastern Region, Water Re- sources Division, was named Engineer of the Year for the U.S. Geological Survey, Department of the Interior, by the Nation al Society of Professional Engineers.
Awards
E-an Zen, Geologist, was awarded the Day Medal by the Geological Society of America for his application of plate-tectonic theory to the geologic history of New England and his pioneering research in the field of geo chemistry.Joseph I. Ziony, Geologist, was awarded the E.B. Burwell, Jr., Award of the Engi neering Geology Division of the Geological Society of America for his work as editor of USGS Professional Paper 1360, Evaluat ing Earthquake Hazards in the Los Angleles Region An Earth-Science Per spective, an integrated set of studies describing methods for evaluating geologi cally controlled earthquake hazards as a basis for reducing future losses. Mary Lou Zoback, Geologist, was awarded the James B. Macelwane Medal by the American Geophysical Union for significant contributions to the geophysical sciences by a young scientist of outstanding ability.
Charles R. Bacon, Geologist, was awarded the Wager Prize by the Interna- tional Association of Volcanology and Chemistry of the Earth's Interior for his landmark work on the Coso Range and the Mt. Mazama-Crater Lake igneous systems. John A. Barren, Geologist, was awarded the Schuchert Award of the Geological Society of America for his work in biostra- tigraphy in solving a broad variety of geo logic, paleoceanographic, and paleoclimato- logic problems.Robert L. Smith, Geologist, was awarded the Thorarinsson Medal by the Interna- tional Association of Volcanology and Chemistry of the Earth's Interior for his contributions to understanding magma chamber processes and resurgent caldera eruptions.Alien H. Watkins, Chief of the Earth Resources Observation Systems Data Cen- ter, National Mapping Division, was awarded the 1986 William T. Pecora Award in recognition of his outstanding contribu- tions toward the understanding of the Earth in the field of satellite remote sens- ing. The award, which is sponsored jointly by the National Aeronautics and Space Administration and the U.S. Department of the Interior, was conferred at ceremo nies held during the Eleventh William T. Pecora Memorial Symposium on May 6, 1987.
Department of the Interior Distinguished Service Awards
The highest honor given by the Department of the Interior to its employ ees is the Distinguished Service Award. Symbolized by a gold medal, this award for outstanding achievement was presented by Secretary Donald Hodel to nine USGS employees:William Back, Research Hydrologist, for outstanding contributions in advancing the knowledge of complex geochemical pro cesses in ground-water systems. James E. Biesecker, Assistant Director for Information Systems and Chief of the Information Systems Division, for out standing leadership and contributions to the U.S. Geological Survey in the fields of scientific computing and telecommunica tions services.James L. Cook, Regional Hydrologist for the Southeastern Region, for exceptional achievements in program management. James F. Devine, Assistant Director for Engineering Geology, for outstanding con tributions to the solution of critical national problems as a scientist and administrator in the U.S. Geological Survey.
U.S. Geological Survey Missions and Programs 145

J. David Love, Geologist, for outstanding contributions to defining the geology of Wyoming and for his exceptional scientific leadership for research programs of the U.S. Geological Survey. David W. Moody, Chief of the Office of National Water Summary and Long Range Planning, for contributions to the programs of the U.S. Geological Survey through external liaison and water-resource assess ment activities.Donald R. Poch, a Personnel Management Specialist, for outstanding contributions to the personnel management program of the U.S. Geological Survey and of the Depart ment of the Interior.Keith V. Slack, Biologist, for an eminent career and outstanding service to the Nation as a research biologist in the field of aquatic biology.Merle E. Southern, Chief of the Rocky Mountain Mapping Center, in recognition of his achievements as an engineer, cartog rapher, manager, and administrator of the National Mapping Program.
Presidential Rank Awards
Several USGS managers were hon ored by the Office of Personnel Manage ment with Presidential Rank Awards for 1987 in recognition of prolonged high- quality accomplishments by career mem bers of the Senior Executive Service. The highest honor, the distinguished rank award, was given to Doyle G. Frederick, Associate Director. Meritorious rank awards were given to James F. Devine, Assistant Director for Engineering Geol ogy, and James L. Cook, Southeastern Region Hydrologist.
Information Dissemination
Along with its continuing commitment to meet the earth-science needs of the Nation, the USGS remains dedicated to its original mission to collect, analyze, inter
pret, publish, and disseminate information about the natural resources of the Nation. The results of USGS investigations are published in its scientific reports and in its topographic, geologic, and hydrologic maps. About 93,000 different maps and books are available for purchase. A series of general-interest publications is available to inform the public about USGS activities. Research results and investigations are also published in journals of technical and scientific organizations and in publications of cooperating Federal and State agencies. During fiscal year 1987, the USGS pro duced 5,252 new and revised topographic, geologic, and hydrologic maps; printed 14,196,626 copies of different maps; distrib uted 7,528,585 copies of maps; and sold 5,433,488 copies for $8,211,411. The num ber of reports approved for publication by the USGS in fiscal year 1987 was 5,041, with 69 percent designated for publication in professional journals and monographs outside the USGS and the remainder scheduled for publication by the Survey. In addition, 509,710 copies of technical reports were distributed, of which 44,176 were sold for $232,844; and 970 open-file reports were released, of which 17,062 copies were sold for $219,896. Of the 80 active titles in the USGS general-interest publications series, 355,469 copies were distributed during fis cal year 1987 to meet inquiries from the general public. Additionally, of the approx imately 8.6 million different aerial and space images available for sale, about 200,000 copies are sold annually. USGS maps are also currently available from more than 3,200 authorized commercial map dealers nationwide.
Program Descriptions
Geologic Division
Mission
The basic mission of the Geologic Divi sion is to evaluate the Nation's geologic
146 U.S. Geological Survey Yearbook 1987

structure and the geologic processes that have shaped it, to assess the Nation's min eral and energy resources, and to identify and investigate geologic hazards. Investigations of geologic hazards pro vide information for predicting and delin eating hazards from earthquakes and vol canoes and for identifying engineering problems related to ground failure hazards. Regional geologic studies provide geo logic maps and regional syntheses of detailed geologic data essential to mineral, energy, and hazard assessments. Offshore geologic studies identify and describe the mineral and petroleum resources of the offshore areas of the United States, including the Exclusive Economic Zone, an area one-third larger than the land area of the United States. Mineral resource investigations assess the distribution, quantity, and quality of the Nation's mineral resources, with par ticular emphasis on strategic and critical minerals. Surveys of energy resources provide assessments of the Nation's coal, petro leum, uranium, and geothermal resources and enhance capabilities to explore for and develop new sources of energy.
Organization
The headquarters office of the Geo logic Division is located in Reston, Vir ginia, and consists of the Office of the Chief Geologist and six subordinate offices: Earthquakes, Volcanoes, and Engineering; Regional Geology; Mineral Resources; Energy and Marine Geology; International Geology; and Scientific Publications. Assis tant Chief Geologists in the Eastern, Central, and Western Regions act for the Chief Geologist in carrying out general objectives, policies, and procedures for the Division. Project operations are conducted by personnel located principally in re gional centers at Reston, Virginia; Denver, Colorado; and Menlo Park, California; and at field centers in Flagstaff, Arizona; Anchorage, Alaska; and Woods Hole, Massachusetts.
Geologic Hazards Surveys
The Earthquake Hazards Reduction Program conducts a national research
effort to reduce hazards and risks from future earthquakes in the United States. Specific tasks include evaluation of earth quake potential for seismically active areas of the United States and operation of global seismic networks.
The Volcano Hazards Program con ducts research on volcanic processes to help reduce the loss of life, property, and natural resources that can result from vol canic eruptions and related hydrologic events. The Hawaiian Volcano Observa tory and the Cascades Volcano Observa tory are the principal field research centers for this program.
The Landslide Hazards Program em phasizes field and laboratory research into the active Earth processes that result in ground failures such as landslides, mud- flows, and debris flows.
Land Resource Surveys
The Geologic Framework Program conducts basic geologic research to acquire fundamental data on the Nation's geologic structure and the environmental and dynamic processes that have shaped it. Geologic mapping, geophysical research on the properties of Earth materials, age determinations of rocks, and deep conti nental studies to obtain information on the composition, structure, formation, and evo lution of the middle and lower crust and upper mantle of the Earth are key compo nents of this program.
The Geomagnetism Program measures and interprets changes in the strength and direction of the Earth's magnetic field. Eleven geomagnetic observatories provide data for continually updating global naviga tional charts and maps produced by various Federal agencies.
The Climate Change Program con ducts research on the natural variability of past climate, on the extent of human influ ence on natural patterns of change, and on the magnitude of climate change demon strated in the geologic record.
The Coastal Erosion Program pro vides geologic information on the nature, extent, and cause of coastal erosion that is used by various Federal and State agencies to mitigate coastal retreat and land loss.
U.S. Geological Survey Missions and Programs 147

Offshore Geologic Surveys
The Offshore Geologic Framework Program conducts scientific investigations to acquire an understanding of basic geo logic and geophysical characteristics of the continental margins, adjacent slope and deep-ocean areas, and the Exclusive Eco nomic Zone. Results of these studies and analysis of new information are essential for energy and mineral resource evaluation of these areas.
Mineral Resource Surveys
The National Mineral Resource Assessment Program provides comprehen sive scientific surveys to identify signifi cant new targets for industry exploration in the conterminous United States and Alaska, and also provides mineral resource information for planning the use of public lands.
The Strategic and Critical Minerals Program provides comprehensive informa tion on domestic and world resources of nonfuel minerals that are essential to a strong national economy and defense.
The Development of Assessment Techniques Program carries out basic and applied research on the origin and the geologic, geochemical, and geophysical characteristics of mineral deposit systems in order to develop concepts and techniques to improve the capability to identify and evaluate mineral resources.
The Oil Shale Investigations Program conducts research to assess the Nation's oil shale resources, including investigation of the structure and chemistry of oil shale deposits and identification of oil shale deposits suitable for exploitation under current environmental and technological constraints.
The Uranium/Thorium Investigations Program conducts basic research to deter mine the nature and distribution of ura nium and thorium resources, including newly forming uranium deposits and daughter products, such as radon, that may be health hazards.
The Geothermal Investigations Pro gram conducts basic research to determine the nature, distribution, and magnitude of the Nation's geothermal resources. These studies define the geologic and hydro- thermal regimes of the various classes of geothermal resources and identify the crustal, geochemical, and hydrothermal processes that produce geothermal sys tems.
The World Energy Resources Assess ment Program provides information on worldwide energy resources for use by other agencies in the development of national-energy, international-trade, and foreign policies.
Water Resources Division
Energy Geologic Surveys Mission
The Evolution of Sedimentary Basins Program studies the tectonic framework and depositional, thermal, and diagenetic processes of sedimentary basins in the United States to develop data essential to the successful exploration for and evalua tion of mineral and energy resources.
The Coal Investigations Program con ducts geologic, geophysical, and geochem ical research to develop scientifically based assessments of the quality, quantity, and availability of the Nation's coal resources.
The Oil and Gas Investigations Pro gram supports basic and applied research on the generation, migration, and entrap ment of petroleum and natural gas.
The USGS has the principal responsi bility within the Federal Government to provide the hydrologic information and understanding needed by others to achieve the best use and management of the Nation's water resources. To accomplish this mission, the Water Resources Divi sion, in cooperation with State, local, and other Federal agencies: Systematically collects and analyzes data to evaluate the quantity, quality, and use of the Nation's water resources and provides results of these investigations to the public. Conducts water-resource appraisals describing the occurrence, availability, and
148 U.S. Geological Survey Yearbook 1987

physical, chemical, and biological charac teristics of surface and ground water. Conducts basic and problem-oriented hydrologic and related research that aids in alleviating water-resources problems and provides an understanding of hydrologic systems sufficient to predict their response to natural or human-caused stress. Coordinates the activities of Federal agencies in the acquisition of water- resources data for streams, lakes, reser voirs, estuaries, and ground water. Provides scientific and technical assis tance in hydrologic fields to other Federal, State, and local agencies, to licensees of the Federal Energy Regulatory Commission, and to international agencies on behalf of the Department of State. Administers the State Water Re sources Research Institutes Program and the National Water Resources Research Grants Program.
Organization
Water Resources Division headquar ters is in Reston, Virginia. The Chief Hydrologist, the Associate Chief Hydrolo- gist, and four Assistant Chief Hydrologists are responsible for the overall direction of the Division. National water-research pro grams are developed at Division headquar ters under the direction of the Assistant Chief Hydrologist for Research and Exter nal Coordination.
General direction of the Division's field programs is conducted through four Regional Hydrologists, located in Reston, Virginia; Atlanta, Georgia; Denver, Colo rado; and Menlo Park, California. Forty- two District Offices carry out the water- resources investigations and data- collection programs of the Division in all 50 States, Puerto Rico, the Virgin Islands, and the Trust Territories.
National Water Summary Program
The National Water Summary Pro gram provides water information on a State-by-state and national basis to aid policymakers in the analysis and develop ment of water policies, legislation, and management actions. Changing patterns in availability, quantity, quality, and use of water resources are summarized for use by
Government officials, natural resources managers, and the general public.
The principal product of the program is an annual National Water Summary that describes hydrologic events and water con ditions for the water year and provides a State-by-state overview of specific water- related issues.
National Water-Quality Assess ment Program
The USGS began a National Water- Quality Assessment Program to (1) provide nationally consistent descriptions of the correct status of the quality of the Nation's water resources over a large, diverse, and geographically distributed portion of the country; (2) provide a baseline for evaluat ing future trends in water quality and, where possible, define trends in water quality over recent decades; and (3) pro vide an understanding of the factors influ encing water quality and thereby provide the basis to forecast change and evaluate the likely effect on water quality of various proposed remedial actions. Initial efforts involve four surface-water and three ground-water pilot studies.
Hazardous Waste Hydrology Programs
The USGS conducts research and investigations into the disposal and release of hazardous chemical and radioactive wastes to provide information that will help in alleviating their effects on the Nation's water resources. The Survey evaluates the existing and potential effects on water resources of earth-science considerations in hazardous-waste disposal and provides baseline data on the chemical contamina tion of surface and ground water to assist the Department of Energy in developing procedures and guidelines for identifying suitable waste-disposal sites. Radioactive- waste studies are conducted in the Nuclear Waste Hydrology Program, the principal emphasis of which is a better understand ing of radionuclide transport in ground- water systems. Nonradioactive wastes are the focus of the Toxic Substances Hydrol ogy Program, which provides research
U.S. Geological Survey Missions and Programs 149

data to mitigate existing and future con tamination problems.
Federal-State Cooperative Program
Regional Aquifer Systems Analysis Program
The Regional Aquifer Systems Analy sis Program is a systematic study of a number of regional ground-water systems that represent a significant part of the Nation's water supply. The program in cludes assessment of discharge-recharge dynamics, hydrogeologic and chemical con trols governing response of aquifer sys tems to stress, and development of com puter simulation models.
Acid Rain Program
The USGS provides information needed to improve the scientific under standing of the occurrence and effects of acid rain, so that judgments can be made about effective measures for controlling or alleviating the problem. Components of the acid rain research and monitoring program include determination of the effects of acid deposition on lakes, streams, and aquifers, operation of the National Trends Network, and research into more precise methods of measurement. The program is coordinated through the Interagency Task Force on Acid Precipitation.
Hydrologic Data Collection Program
The Hydrologic Data Collection Pro gram provides information on the quantity, quality, location, and use of the Nation's surface and ground water to support the needs of Federal, State, and local govern ments. Data collection stations are main tained at selected locations to provide records on streamflow, reservoir and lake storage, ground-water levels, and the qual ity of surface and ground water. These data form an information base that supports national and regional assessments of water resources.
The Federal-State Cooperative Pro gram, which comprises more than 40 per cent of overall Division activity, is a part nership for water-resources investigations involving 50-50 cost sharing between the USGS and State or local government agen cies. One of the program's unique charac teristics is that the USGS performs most of the work on behalf of the cooperators. A variety of hydrologic data-collection activi ties and water-resources investigations are included, for which the USGS represents national interests and more than 900 coop erating agencies represent State and local interests.
National Research Program
Basic research in the Water Resources Division focuses on increasing understand ing of the fundamental hydrologic pro cesses of the Nation's ground- and surface- water systems. Knowledge and techniques derived from these efforts are directed at solving current problems and anticipating future problems. Research studies are con centrated in surface-water hydrology, geo chemistry, ground-water hydrology, sedi ment transport and geomorphology, water chemistry, and ecology.
State Water Resources Research Institutes Program
The State Water Resources Research Institutes Program, the costs of which are shared by Federal and State governments, supports 54 Water Research Institutes at land-grant colleges or universities in the 50 States, the District of Columbia, Puerto Rico, the Virgin Islands, and Guam. Research projects at the institutes are car ried out in all water-related fields including engineering, and the physical, biological, and social sciences.
150 U.S. Geological Survey Yearbook 1987

Water Resources Research Grants Program
The Water Resources Research Grants Program supports research as de fined in the Water Resources Research Act of 1964. Competitive grants are awarded on a dollar-for-dollar matching basis to qualified educational institutions, founda tions, private firms, individuals, or agen cies of local or State governments. Re search is supported on water-resources- related problems of national interest.
National Mapping Division
departmental Board on Geographic Names. The USGS also compiles, publishes, and maintains the National Gazetteer of the United States of America and manages the National Geographic Names Data Base.
Organization
Division headquarters, located in Reston, Virginia, is composed of three pri mary organizational units: Plans and Oper ations, Research, and Information and Data Services. Four mapping centers (Reston, Virginia; Rolla, Missouri; Denver, Colorado; and Menlo Park, California) and the Earth Resources Observation Systems Data Center (Sioux Falls, South Dakota) perform the operational mapping, remote sensing, printing, product distribution, and data dissemination activities.
Mission Map Production
The primary mission of the National Mapping Division is to conduct the National Mapping Program. This program, which involves collecting, archiving, and disseminating cartographic, geographic, and remotely sensed data, produces maps and related cartographic information in graphic and digital form.
To accomplish this mission, the Divi sion: Collects, compiles, and analyzes infor mation about natural and manmade fea tures on the Earth's surface and documents changes in those features. Produces and maintains a series of accu rate, up-to-date, general-purpose base and thematic maps. Develops and applies advanced carto graphic techniques and systems to geo graphic information systems. Develops and maintains a digital carto graphic and geographic data base for vari ous purposes. Coordinates Federal mapping, digital cartographic, and remote sensing activities as designated by the Office of Management and Budget. Represents the national interest through participation in international map ping and training activities.
The USGS is responsible for all func tions that relate to domestic geographic names, including staff support to the inter-
The USGS prepares, prints, and dis tributes base, topographic, and selected thematic maps of the Nation that are used extensively for land planning, land man agement, and recreation purposes.
Primary topographic maps, including 7.5-minute maps mostly at 1:24,000 scale for almost all areas of the lower 49 States and 15-minute maps of Alaska at 1:63,360 scale, are especially useful where detailed information is needed for all types of land and resource management. These detailed maps are continually updated and revised. Current program emphasis is on the pro duction and maintenance of maps of urban areas and rapidly developing coastal areas, energy areas, and public lands.
Intermediate-scale maps prepared at 1:100,000 scale are used by the Bureau of Land Management for displaying resource inventories, by the Bureau of the Census for support of the 1990 Decennial Census, and by other agencies.
The 1:250,000-scale map series pro vides complete topographic coverage of the United States. These maps are widely used by Federal and State agencies for prepar ing other base and special-purpose maps. Other base maps are available, including 1:500,000-scale State base maps and smaller scale U.S. base maps.
The land use and land cover maps, produced in graphic and digital form
U.S. Geological Survey Missions and Programs 151

TOPOGRAPHIC MAP SERIES
Series
7.5-minute 15-minute Intermediate-scale
quadrangle
U.S. 1:250,0003
International Map of the World
Scale
1:24,000' l:62,500a 1:100,000
1:250,000
1:1,000,000
One Inch Represents
2,000 feet about 1 mile over 1.5 miles
about 4 miles
about 16 miles
Standard Quadrangle
Size (latitude & longitude)
7.5 x 7.5 min. 15 x 15 min. 30 min. x 1°
I°x2°
4°x6°
Quadrangle Area
(square miles)
49 to 71 197 to 282 1,145 to 2, 167
4,580 to 8,669
73,734 to 102,759
'For Alaska, the scale is 1:25,000 and for Puerto Rico, 1:20,000.2 For Alaska, the scale is 1:63,360 (1 inch represents 1 mile) and the quadrangle size is 15 x 20 to 36 minutes.3Maps of Alaska and Hawaii vary from these standards.
primarily at 1:250,000 scale and at 1:100,000 scale in selected areas, provide the only systematic nationwide inventory of land use and land cover data.
The National Atlas program provides 1:2,000,000- and l:7,500,000-scale maps and smaller scale maps, digital cartographic data, and other information on key physi cal, environmental, cultural, socioeco- nomic, and historical characteristics of the Nation.
Image Mapping
The USGS prepares photoimage prod ucts in response to specific requirements of Federal and State agencies, particularly the Bureau of Land Management, the Soil Conservation Service, the Forest Service, and the Customs Service. These products include: Orthophotoquads, produced from aerial photographs and prepared in standard scales and formats meeting National Map Accuracy Standards. Side-looking airborne radar data for use in image mapping, geologic mapping, and geologic resource surveys. Landsat Multispectral Scanner and Thematic Mapper satellite data for use in preparing image map products.
Since 1978, the USGS has served as the designated lead agency in a Federal multiagency National High-Altitude Pho tography Program to avoid duplication in contracting high-altitude photography and to achieve a consistent and systematic pho tographic data base of the conterminous United States. Photographic coverage under this program is now complete. In 1987, a new program, the National Aerial Photography Program, was initiated to
provide higher resolution and larger scale photographs of the conterminous United States.
Digital Cartography
The USGS continues to expand and improve the National Digital Cartographic Data Base to make cartographic and geo graphic data available in a form suitable for computer-based analyses. The Division is responsible for coordinating digital carto graphic activities throughout the Federal Government. The Division chairs the Fed eral Interagency Coordinating Committee on Digital Cartography, which is responsi ble for the exchange of information and ideas on technology and methods for man aging and using digital spatial data. Cur rent activities include digitizing geographic data from l:24,000-scale maps to meet new Federal and State needs and providing digital cartographic data for derivative maps.
Geographic Information Systems Research and Applications
The Division is working with the other Divisions in the bureau to establish a sound geographic information systems research base, to conduct applications projects, and to encourage USGS scientists to use this powerful tool in their investigations. Cur rent emphasis is on the application of new techniques in the generation of thematic maps, including microcomputer-based map compilation, color separation, and image processing. High priority is being given to the development of data standards, data exchange formats, data base management
152 U.S. Geological Survey Yearbook 1987

systems, and the definition of an advanced geographic information system for earth- science studies.
Earth Resources Observation Systems
Remotely sensed data are produced, archived, and distributed under the Earth Resources Observation Systems (EROS) Program. The largest users of the data are Government agencies and private firms involved with the exploration and assess ment of energy, mineral, and renewable resources. EROS scientists also conduct research leading to new and improved remote sensing and spatial data applications.
The EROS Data Center in Sioux Falls, South Dakota, serves as the repository and public distribution facility for a growing archive of over 8.6 million aerial photo graphs and side-looking radar images from various Federal programs. The center cooperates with the National Oceanic and Atmospheric Administration and the Earth Observation Satellite Company (the com mercial Landsat system operator) to per form final ground processing and distribu tion of Landsat satellite data.
National Mapping Research
The USGS has pioneered investiga tions that have led to major developments and significant changes in surveying and mapping. The Mapping Research Program, which is centered on geographic and carto graphic research, emphasizes spatial data analysis, applications of remote sensing and geographic information systems, and advanced techniques for producing digital cartographic data.
The Division has embarked on a major research and development plan (known as MARK II) to move from manual to digital production and revision of map products. The goals of MARK II are to implement the advanced cartographic systems and proce dures required to automate map production and to provide data for the National Digital Cartographic Data Base.
The USGS has expanded its produc tion of multicolor satellite image maps and, in cooperation with the Defense Mapping
Agency and the National Geodetic Survey, is developing applications of the NAV- STAR Global Positioning System, which is a satellite navigation and positioning sys tem for attaining positional data to geodetic standards.
Information Services
The USGS disseminates much of the Nation's earth-science information through its Public Inquiries Offices, National Car tographic Information Centers, and the Earth Resources Observation Systems Data Center. The information comes in many forms, from maps and books to computer-readable magnetic tapes. About 93,000 different maps and books and about 8.6 million aerial and space images are available for purchase. USGS maps are also currently available from more than 3,200 authorized commercial map dealers nation wide.
International ActivitiesThe U.S. Geological Survey has been
involved with earth-science studies in for eign countries for nearly 50 years. Autho rization is provided under the Organic Act, as revised, and the Foreign Assistance Act and related legislation when such studies are deemed by the Departments of the Interior and State to be in the interests of the U.S. Government. Current interna tional program efforts focus on technical assistance programs in developing coun tries and scientific cooperation and re search through agreements with other countries as an extension and enhancement of the Survey's domestic programs. Deci sions to undertake international scientific activities are based in part on these princi pal objectives: The opportunity for comparative stud ies of scientific phenomena abroad and domestically. The opportunity to obtain information on existing and potential foreign resources of interest to the United States. The opportunity to broaden the knowl edge, understanding, and expertise of USGS scientists.
U.S. Geological Survey Missions and Programs 153

The opportunity to develop and main tain relations with counterpart institutions and to conduct programs that improve sci entific cooperation and exchange of infor mation technology. The opportunity to support interna tional programs of other Federal agencies, particularly the U.S. Department of State, in political, economic, and strategic efforts that contribute to foreign policy objectives.
Technical assistance programs for for eign nationals use funds from other U.S. government agencies, international organi zations, or foreign governments for scien tific advice, training, demonstration, and collaboration. Scientific research with foreign counterpart organizations under Government-approved bilateral and multi lateral cooperative agreements uses both funds appropriated for USGS research and funds and other resources from the cooper ating countries or organizations to achieve common research objectives. Such cooper ative programs are ordinarily supported on the basis that each participant country pays its own expenses. Cooperative re search activities range from informal com munications between scientists, through formal, jointly staffed projects, to multi- nationally staffed and coordinated pro grams focused on particular problems or topics.
Related activities that are integral to the international programs include institu tional development, exchange of scientists, training of foreign nationals, and represen tation of the Survey or the U.S. Govern ment in international organizations and at international conferences and meetings.
tions, including personnel, manpower utili zation, finance, administrative manage ment systems, management analysis, records management, procurement and contract negotiation, property and facilities management, motor vehicle management, security, and safety. The Division also manages the development, maintenance, and operation of the financial management system for the entire Department of the Interior. These functions are carried out at the National Center in Reston, Virginia, and through Regional Management Offices in Denver, Colorado, and Menlo Park, California.
Organization
The Division is composed of five head quarters offices. Financial Management and Systems Management are centralized headquarters functions; Administrative Services, Personnel, and Procurement and Contracts provide operational support at headquarters and at USGS field units through the Regional Management Offices.
Information Systems Division
Mission
Administrative Division
Mission
The Administrative Division provides administrative direction and coordination in support of the scientific and technical programs of the U.S. Geological Survey. This support includes policy guidance and program direction and provides leadership and authority for various administrative management and technical support func-
The Information Systems Division provides support and advice to the Director of the U.S. Geological Survey, the other USGS Divisions, the Department of the Interior, and other government agencies on matters relating to information technol ogy and automated data processing (ADP). The Division operates the Survey's main frame computer located in Reston, as well as Technology Information Centers and minicomputers in four ADP Service Cen ters nationwide. The Division assists users in acquiring ADP and telecommunications equipment and software, coordinates and improves information systems through sys tem analysis and design, provides user training, and conducts research into better
154 U.S. Geological Survey Yearbook 1987

ways to use data processing technology to solve mission-related problems. The Divi sion is responsible for managing all voice, data-, and radio communications in the USGS.
Organization
The Information Systems Division has its headquarters office in Reston, Virginia. Service centers in Reston and in Menlo
Park, California, Denver, Colorado, and Flagstaff, Arizona, provide assistance to users.
The Assistant Director for Informa tion Systems chairs the Information Sys tems Council, which is composed of repre sentatives from each Division and each field region. The council recommends poli cies, coordinates computer science re search and technology, and provides guide lines for major computer systems and information management programs for the USGS.
Digitized perspective view of McCall, Idaho, from the National High-Altitude Photography Program
U.S. Geological Survey Missions and Programs 155

156 U.S. Geological Survey Yearbook 1987

Aspen grove near Bear Lake, Rocky Mountain National Park. (Photograph by Mark A. Hardy, U.S. Geological Survey.)
U.S. Geological Survey Missions and Programs 157

U.S. Geological Survey budget authority for fiscal year 1987, by appropriation for Surveys, Investigations, and Research
[Dollars in thousands]
Activity/Subactivity/Program E lementFiscal year
19871
enactedActivity/Subactivity/Program Element
Fiscal year19871
enactedNational Mapping, Geography, and Surveys.............
Primary Mapping and Revision..........................Digital Cartography........................................Small, Intermediate, and Special Mapping............
Intermediate-Scale Mapping.............................Small-Scale and Other Special Mapping................Federal Land Information .......................'........Land Use and Land Cover Mapping ...................Image Mapping............................................
Advanced Cartographic Systems.........................Earth Resources Observation Systems .................
Data Production and Dissemination ....................Applications and Research...............................
Cartographic and Geographic Information............Side-Looking Airborne Radar............................
Geologic and Mineral Resource Surveys and Mapping. Geologic Hazards Surveys.................................
Earthquake Hazards Reduction.........................Volcano Hazards...........................................Landslide Hazards ........................................
Land Resource Surveys....................................Geologic Framework......................................Geomagnetism .............................................Climate Change............................................Coastal Erosion............................................
Mineral Resource Surveys.................................National Mineral Resource Assessment Program....Strategic and Critical Minerals..........................Development of Assessment Techniques...............
Energy Geologic Surveys..................................Evolution of Sedimentary Basins .......................Coal Investigations........................................Oil and Gas Investigations ...............................Oil Shale Investigations..................................Geothermal Investigations...............................Uranium-Thorium Investigations.......................World Energy Resource Assessment...................
& 88,54234,42013,79414,1534,2382,9711,9511,5103,483
12,2108,9714,6004,3713,4941,500
169,02348,28335,35810,8092,116
24,50119,8112,1731,0111,506
45,08622,740
9,45112,89526,309
5,1536,1644,734
5705,9503,235
503
Offshore Geologic Surveys .................................. 24,844Offshore Geologic Framework............................. 24,844
Water Resources Investigations .............................. 141,227National Water Resources Research and Information
System Federal Program............................. 74,916Data Collection and Analysis .............................. 19,366National Water Data and Information Access Program. 1,932 Coordination of National Water Data Activities........ 981Regional Aquifer System Analysis ....................... 12,401Core Program Hydrologic Research...................... 8,479Improved Instrumentation................................. 1,688Water Resources Assessment............................. 1,371Toxic Substances Hydrology............................... 12,037Nuclear Waste Hydrology ................................. 4,389Acid Rain..................................................... 2,900Scientific and Technical Publications ..................... 2,233National Water-Quality Assessment Program.......... 7,139
National Water Resources Research and InformationSystem Federal-State Cooperative Program...... 55,170
Data Collection and Analysis, Areal Appraisals, and Special Hydrological Studies............................ 46,666
Water Use.................................................... 3,891Coal Hydrology.............................................. 4,613
National Water Resources Research and Information System State Research Institutes and Research Grants Program.......................................... 11,141
State Water Resources Research Institutes ............ 5,677National Water Resources Research and Technical
Development Grants Program.......................... 4,381Program Administration ................................... 1,083
General Administration ........................................ 17,084Executive Direction ........................................... 4,691Administrative Operations.................................... 10,324Reimbursements to the Department of Labor............. 2,069
Facilities.......................................................... 15,067National Center Standard Level User's Charge......... 12,175National Center Facilities Management.................. 2,892
Total.................................................. $430,943
funding shown represents appropriated dollars and does not include reimbursable funding from Federal, State, and other non-Federal sources.
158 U.S. Geological Survey Yearbook 1987

U.S. Geological Survey budget for fiscal years 1984 to 1987, by activity and sources of funds [Dollars in thousands; totals may not add because of rounding]
Budget activity 1984 1985 1986 1987
Total ....................................................... $596,177Direct program. ............................................... 423,885Reimbursable program. ........................................... 172,292
States, counties, and municipalities ................................... 55,801Miscellaneous non-Federal sources ................................... 21,142Other Federal agencies ......................................... 95,349
National Mapping, Geography, and Surveys .................................. 112,447Direct program. ............................................... 90,985Reimbursable program. ........................................... 21,462
States, counties, and municipalities ................................... 27,000Miscellaneous non-Federal sources ................................... 2,362Other Federal agencies ......................................... 16,400
Geologic and Mineral Resource Surveys and Mapping ............................ 217,584Direct program................................................ 164,354Reimbursable program............................................ 53,230
States, counties, and municipalities ................................... 988Miscellaneous non-Federal sources ................................... 15,030Other Federal agencies ......................................... 37,212
Water Resources Investigations. ........................................ 220,390Direct program. ............................................... 129,441Reimbursable program. ........................................... 90,949
States, counties, and municipalities ................................... 52,113Miscellaneous non-Federal sources ................................... 3,600Other Federal agencies ......................................... 35,236
General Administration ............................................. 15,962Direct program. ............................................... 15,642Reimbursable program (Federal) ...................................... 320
Miscellaneous non-Federal sources ................................... Other Federal agencies ......................................... 320
Facilities ..................................................... 10,608Direct program. ............................................... 10,463Reimbursable program............................................ 145
Miscellaneous services to other accounts. ................................... 6,186Reimbursable program. ........................................... 6,186
Miscellaneous non-Federal sources ................................... 150Other Federal agencies ......................................... 6,036
Barrow Area Gas Operations .......................................... 13,000Direct program. ............................................... 13,000
Operation and Maintenance of Quarters .................................... Direct program. ................................................______
'Direct program includes $430,943 for current year, $216 for Contributed Funds, $903 for last year's unobligated balance, and $52 for Operation and Maintenance of Quarters.
Includes $7,706 for map receipts previously shown under direct program column.
U.S. Geological Survey reimbursable program funds from other Federal agencies for fiscal years 1984 to 1987, by agency [Dollars in thousands]
$604,664417,021187,64359,45426,075
102,114115,15585,46929,686
1,9379,450
18,299216,921169,85147,070
1,01613,26132,793
238,131133,408104,72356,5003,327
44,89615,35415,244
110
11013,08913,049
406,0146,014
375,977
$600,852412,667188,18559,94512,111
116,129112,56284,11728,445
1,9759,568
16,902206,463165,58540,878
1,320348
39,210248,598135,152113,44656,6502,161
54,63514,51514,246
2691
26813,61513,567
485,0995,099
335,066
$620,585'432,114188,47163,08813,667
111,716118,46288,54229,921
1,841210,27617,804
209,553169,23940,314
1,365938
38,011254,288142,130112,15859,8822,437
49,83918,28517,084
1,2011
1,20015,10915,067
424,8354,835
154,820
5252
Budget activity 1984 1985 1986 1987
Department of Agriculture ...............Department of Commerce ...............
National Oceanic and Atmospheric Administration Department of Defense.................Department of Energy .................
Bonneville Power Administration .........Department of the Interior...............
Bureau of Indian Affairs ..............Bureau of Land Management ...........Bureau of Mines ..................Bureau of Reclamation...............Minerals Management Service ...........National Park Service ...............Office of the Secretary...............Office of Surface Mining ..............Fish and Wildlife Service .............
Department of State ..................Department of Transportation .............Environmental Protection Agency ...........National Aeronautics and Space Administration ....National Science Foundation ..............Nuclear Regulatory Commission ............Tennessee Valley Authority ..............Miscellaneous Federal agencies.............Miscellaneous services to other accounts ........
Total ....................
$ 2,770910
6,13933,70713,828
12016,1674,2993,446
563,524 2,347 1,037
24495
1,119700600
1,012 3,999
774 2,003
2506,3346,036
$95,349
$ 3,066617
6,87631,88315,893
13219,8595,5302,900
548,510
7441,122
1790
892619458
1,4763,979
2421,236
2479,5545,977
$102,114
$ 2,756104
8,67527,34324,341
17018,8525,0332,447
1228,734
3421,043
701129301
8,625133
1,8784,340
1621,154
26412,2645,066
$116,129
$ 1,247100
7,99330,55124,361
27414,7874,2801,748
146,647
125977538260198
4,740300
2,7264,380
4721,834
10113,0304,820
$111,716
U.S. Geological Survey Missions and Programs 159

OR
GA
NIZ
AT
ION
OF
TH
E U
.S.
GE
OLO
GIC
AL S
UR
VE
Y
De
pa
rtm
en
t of
the
In
terio
r
I -< I r
ASS
ISTA
NT
DIRE
CTO
RS
Eng
inee
ring
Geo
logy
Pro
gram
sA
dmin
istr
atio
nR
esea
rch
Info
rmat
ion
Syst
ems
Inte
rgov
ernm
enta
l Affa
irs
(MA
TE* M
SO
tMC
f S D
IVIS
ION
Chi
ef H
ydro
togl
st
Ass
ocia
te C
hief
Hyd
rolo
gist
Ass
ista
nt C
hief
Hyd
rolo
gist
lo
r O
pera
tions
Ass
ista
nt c
hie
f Hyd
rolo
gist
for
Res
earc
h an
d E
xter
nal
Coo
rdin
atio
n
Offi
ces
Hyd
rolo
gk R
esea
rch
Wat
er D
ata
Coo
rdin
atio
n Ex
tern
al R
esea
rch
Ass
ista
nt C
hief
Hyd
rolo
gist
fo
r S
cien
tific
Info
rmat
ion
___M
anagem
ent_
___
Ass
ista
nt C
hief
Hyd
rolo
gist
for
prog
ram
Coo
rdin
atio
nen
d Te
chni
cal S
uppo
rt
Offi
ces
Atm
osph
eric
Dep
ositi
onA
naly
sis
Gro
und
Wat
er
Sur
face
Wat
er
Wat
er Q
ualit
y N
atio
nal W
ater
Sum
mar
yan
d Lo
ng-R
ange
Pla
nnin
g
Geo
grap
hic
and
Car
togr
aphi
c R
esea
rch
Syst
ems
and
Tech
niqu
esD
evel
opm
ent
Ass
ista
nt D
ivis
ion
Chi
ef fo
rIn
form
atio
n a
nd D
ata
Ser
vice
s
Off
ices
Pro
duct
Dis
trib
utio
nPo
licy
Pub
licat
ions
Lia
ison
and
Rev
iew
N
atio
nal C
arto
grap
hic
Info
rmat
ion
Cen
ter
Pub
lic In
quiri
es
Reg
iona
l Offi
ces
Nor
thea
ster
n-R
esto
n. V
A
Sou
thea
ster
n-A
tlant
a, G
A
Cen
tral-D
enve
r, C
O
Wes
tern
-Men
Io P
ark,
CA
STA
f f O
FFIC
ES
Was
hing
ton
liais
on
Equ
al E
mpl
oym
ent
Opp
ortu
nity
C
ongr
essi
onal
Lia
ison
P
ubfic
Affa
irs
GEO
LOG
IC D
IVIS
ION
Chi
ef G
eolo
gist
Ass
ocia
te C
hief
Geo
logi
stA
ssis
tant
Chi
ef G
eolo
gist
for
Pro
gram
ffice
of S
cjen
tif tc
P
ublic
atio
ns
Bra
nche
s
Eas
tern
Tec
hnic
al R
epor
ts
Cen
tral T
echn
ical
Rep
orts
W
este
rn T
echn
ical
Rep
orts
Li
brar
y an
d In
form
atio
n Se
rvic
es
Offi
ce o
f Min
eral
Res
ourc
es
Ala
skan
Geo
logy
W
este
rn M
iner
al R
esou
rces
C
entra
l Min
eral
Res
ourc
es
Eas
tern
Min
eral
Res
ourc
es
Geo
chem
istry
G
eoph
ysic
s R
esou
rce
Ana
lysi
s
Bra
nche
s
Coa
l Geo
logy
P
etro
leum
Geo
logy
S
edim
enta
ry P
roce
sses
P
acifi
c M
arin
e G
eolo
gy
Atla
ntic
Mar
ine
Geo
logy
Reg
iona
l Offi
ces
Eas
tern
Map
ping
-Res
ton,
VA
M
id-C
ontin
ent M
tppi
ng-R
oHa.
MO
P
rintin
g a
nd D
istr
ibut
lon-
Rttt
on, V
A
Roc
ky M
ount
ain
Map
ping
-Den
ver,
CO
INFO
RM
ATI
ON
SYS
TEM
S D
IVIS
ION
Chi
ef
Dep
uty
Chi
ef
Ass
ista
nt C
hief
Geo
logi
sts
Eas
tern
Reg
ion
Cen
tral R
egio
n W
este
rn R
egio
n
AD
MIN
ISTR
ATI
VE D
IVIS
ION
Offi
ces
Man
agem
ent S
ervi
ces
Cus
tom
er S
ervi
ces
Com
pute
r and
Com
mun
icat
ions
Ser
vice
s

U.S. Geological Survey OfficesHeadquarters Offices
National Center12201 Sunrise Valley DriveReston, VA 22092
Central Region
Denver Federal Center Box 25046 Denver, CO 80225
Western Region
345 Middlefield Rd. Menlo Park, CA 94025
Office
Office of the DirectorDirectorAssociate DirectorSpecial Assistant (Washington Liaison) and Deputy
Ethics Counselor Assistant Director for Research Assistant Director for Engineering Geology Assistant Director for Administration Assistant Director for Programs Assistant Director for Intergovernme:ntal Affairs Assistant Director for Information Systems Director's Representative Central Region Director's Representative Western Region
Congressional Liaison OfficerChief, Public Affairs OfficeStaff Assistant (Special Issues)Special Assistant to the Director for Alaska
Administrative DivisionChiefProfessional Services SpecialistAdministrative Operations OfficerOffice of Personnel, ChiefOffice of Procurement and Contracts, ChiefOffice of Financial Management, ChiefOffice of Administrative Services, ChiefOffice of Systems Management, ChiefCentral Region Management OfficerWestern Region Management Officer
Information Systems DivisionChiefDeputy Assistant Director for Information SystemsOffice of Customer Services, ChiefOffice of Computer and Communications Services,
ChiefOffice of Management Services, Chief Office of Field Services, Chief
National Mapping DivisionChiefAssociate ChiefAssistant Division Chief for ResearchAssistant Division Chief for Plans and OperationsAssistant Division Chief for Information and Data
ServicesEastern Mapping Center, Chief Mid-Continent Mapping Center, Chief
Rocky Mountain Mapping Center, Chief
Name
Dallas L. Peck Doyle G. Frederick Jane H. Wallace
Bruce R. Doe James F. Devine Jack J. Stassi Peter F. Bermel John J. Dragonetti James E. Biesecker Harry Tourtelot George Gryc
Talmadge W. Reed Donovan B. Kelly Robert L. Houghton Philip A. Emery
Jack J. Stassi William A. Schmidt Timothy E. Calkins Maxine C. Millard Paul A. Denett Roy J. Heinbuch William F. Gossman, Jr. Phillip L. McKinney George A. Honold George F. Hargrove, Jr.
James E. Biesecker Douglas R. Posson Virginia L. Ross Gayle F. Gordon
Wendy A. Budd Fred B. Sower
Lowell E. Starr Roy R. Mullen Joel L. Morrison Richard E. Witmer Gary W. North
K. Eric Anderson Lawrence H. Borgerding
Merle E. Southern
Telephone A ,, XT . Address Number
(703) 648-7411 National Center, Stop 101 (703) 648-7412 National Center, Stop 102 (202) 343-3888 Rm. 2648, Interior Bldg.
Washington, DC 20240(703) 648-4450 National Center, Stop 104 (703) 648-4423 National Center, Stop 106 (703) 648-7200 National Center, Stop 201 (703) 648-4430 National Center, Stop 105 (703) 648-4427 National Center, Stop 109 (703) 648-7108 National Center, Stop 801 (303) 236-5438 Denver Federal Center, Stop 406 (415) 329-4002 Western Region Headquarters,
Stop 144(703) 648-4457 National Center, Stop 112 (703) 648-4460 National Center, Stop 119 (703) 648-7413 National Center, Stop 121 (907) 271^138 4230 University Drive, Suite 201
Anchorage, AK 99508
(703) 648-7200 National Center, Stop 201 (703) 648-7221 National Center, Stop 118 (703) 648-7204 National Center, Stop 203 (703) 648-7442 National Center, Stop 215 (703) 648-7373 National Center, Stop 205 (703) 648-7604 National Center, Stop 270 (703) 648-7338 National Center, Stop 207 (703) 648-7256 National Center, Stop 206 (303) 236-5900 Denver Federal Center, Stop 201 (415) 329-4150 Western Region Headquarters,
Stop 211
(703) 648-7108 National Center, Stop 801(703) 648-7106 National Center, Stop 801(703) 648-7178 National Center, Stop 805(703) 648-7157 National Center, Stop 807
(703) 648-7103 National Center, Stop 802(303) 236-4944 Denver Federal Center
(703) 648-5748 National Center, Stop 516(703) 648-5745 National Center, Stop 516(703) 648-4640 National Center, Stop 519(703) 64&4611 National Center, Stop 514(703) 648-5780 National Center, Stop 508
(703) 648-6002 National Center, Stop 567(314) 341-0880 1400 Independence Rd.,
Rolla, MO 65401 (303) 236-5825 Denver Federal Center, Stop 510
U.S. Geological Survey Missions and Programs 161

Office
Western Mapping Center, Chief Earth Resources Observation Systems Data Center,
Chief
Geologic DivisionChief GeologistAssociate Chief GeologistAssistant Chief Geologist for ProgramManpower Officer for Scientific PersonnelPolicy and Budget OfficerOffice of Scientific Publications, ChiefOffice of Regional Geology, ChiefOffice of Earthquakes, Volcanoes, and Engineering,
ChiefOffice of Energy and Marine Geology, Chief Office of Mineral Resources, Chief Office of International Geology, Chief Assistant Chief Geologist, Eastern Region Assistant Chief Geologist, Central Region Assistant Chief Geologist, Western Region
Water Resources DivisionChief HydrologistAssociate Chief Hydrologist, ActingAssistant Chief Hydrologist for Scientific Information
ManagementAssistant Chief Hydrologist for Research and
External CoordinationOffice of Hydrologic Research, ChiefOffice of Water Data Coordination, Chief, ActingOffice of External Research, Chief, Acting
Assistant Chief Hydrologist for Program Coordination and Technical Support
Office of Atmospheric Deposition Analysis, ChiefOffice of Ground Water, ChiefOffice of Surface Water, ChiefOffice of Water Quality, ChiefOffice of National Water Summary and Long-Range
Planning, Chief Assistant Chief Hydrologist for Operations
Northeastern Region, Chief
Southeastern Region, Chief
Central Region, Chief
Western Region, Chief
District Offices
Alabama
Alaska
Name
John R. Swinnerton Alien H. Watkins
Benjamin A. Morgan III William F. Cannon David P. Russ John D. McGurk Norman E. Gunderson John M. Aaron Eugene H. Roseboom, Jr. John R. Filson
Gary W. Hill Glenn H. Allcott A. Thomas Ovenshine Jack H. Medlin Harry A. Tourtelot Carroll A. Hodges
Philip Cohen James F. Daniel James F. Daniel
Marshall M. Moss
Roger G. Wolff Nancy C. Lopez Frank T. Carlson John N. Fischer
Ranard J. Pickering Eugene P. Patten, Jr. Verne R. Schneider David A. Rickert David W. Moody
William B. Mann IV
Stanley P. Sauer
James L. Cook
James F. Blakey
T. John Conomos
D. Briane Adams
Philip A. Emery
Telephone Number
(415) 329-4251 (605) 594-6511
(703) 648-6600 (703) 648-6601 (703) 648-6640 (703) 648-6628 (703) 648-6650 (703) 648-6077 (703) 648-6959 (703) 648-6714
(703) 648-6470 (703) 648-6100 (703) 648-6047 (703) 648-6660 (303) 236-5438 (415) 329-5101
(703) 648-5215 (703) 648-5216 (703) 648-5699
(703) 648-5041
(703) 648-5043 (703) 648-5019 (703) 648-6807 (703) 648-5229
(703) 648-6874 (703) 648-5001 (703) 648-5301 (703) 648-6862 (703) 648-6856
(703) 648-5031
(703) 648-5817
(404) 331-5174
Address
Western Region Headquarters EROS Data Center,
Sioux Falls, SD 57198
National Center, Stop 911 National Center, Stop 911 National Center, Stop 911 National Center, Stop 911 National Center, Stop 910 National Center, Stop 904 National Center, Stop 908 National Center, Stop 905
National Center, Stop 915 National Center, Stop 913 National Center, Stop 917 National Center, Stop 953 Denver Federal Center, Stop 911 Western Region Headquarters,
Stop 19
National Center, Stop 409 National Center, Stop 408 National Center, Stop 440
National Center, Stop 436
National Center, Stop 436 National Center, Stop 417 National Center, Stop 424 National Center, Stop 414
National Center, Stop 416 National Center, Stop 411 National Center, Stop 415 National Center, Stop 412 National Center, Stop 407
National Center, Stop 441
National Center, Stop 433
Richard B. Russell Federal Bldg.75 Spring St., SW, Suite 772 Atlanta, GA 30303
(303) 236-5920 Box 25046, Stop 406Denver Federal Center Denver, CO 80225
(415) 329^403 345 Middlefield Rd., Stop 470 Menlo Park, CA 94025
(205) 752-8104 520 19th Ave.Tuscaloosa, AL 35401
(907) 271-4138 4230 University Dr., Suite 201 Anchorage, AK 99508
162 U.S. Geological Survey Yearbook 1987

Office
Arizona
Arkansas
California
Colorado
Connecticut (See Massachusetts)
Delaware (See Maryland)
District of Columbia (See Maryland)
Florida
Georgia
Hawaii
Idaho
Illinois
Indiana
Iowa
Kansas
Kentucky
Louisiana
Maine (See Massachusetts)
Maryland
Massachusetts
Name
Robert D. Mac Nish
Ector E. Gann
John M. Klein
Charles A. Pascale
Irwin H. Kantrowitz
Jeffrey T. Armbruster
William Meyer
Dennis K. Stewart
Richard A. Engberg
Thomas L. Huntzinger, Acting
Alfred L. Knight
Darwin D. Knochenmus
Herbert J. Freiberger
Ivan C. James II
Telephone Number
(602) 629-6671
(501) 378-6391
(916) 978-4633
(303)
(904) 681-7620
(404) 331-4858
(808) 541-2653
(317) 290-3333
(319) 337-4191
(913) 864-4321
(502) 582-5241
(504) 389-0281
(301) 828-1535
(617) 565-6860
Address
Federal Bldg., FB-14 300 W. Congress St. Tucson, AZ 85701
2301 Federal Office Bldg. 700 W. Capitol Ave. Little Rock, AR 72201
Room W-2234 Federal Bldg. 2800 Cottage Way Sacramento, CA 95825
Box 25046, Stop 415 Denver Federal Center Denver, CO 80225
227 North Bronough St. Suite 3015 Tallahassee, FL 32301
6481-B Peachtree Industrial Blvd. Doraville, GA 30360
P.O. Box 50166300 Ala Moana Blvd., Rm. 6110Honolulu, HI 96850
Jerry L. Hughes
Larry G. Toler
(208) 334-1750
(217) 398-5353
230 Collins Road Boise, ID 83702
Champaign Coun102 E. Main St., 4th Floor Urbana, IL 61801
5957 Lakeside Blvd. Indianapolis, IN 46278
P.O. Box 1230 Room 269, Federal Bldg. 400 S. Clinton St. Iowa City, IA 52244
1950 Constant Ave. Campus West University of Kansas Lawrence, KS 66046
2301 Bradley Ave. Louisville, KY 40217
P.O. Box 66492 6554 Florida Blvd. Baton Rouge, LA 70896
208 Carroll Bldg. 8600 La Salle Rd. Towson, MD 21204
150 Causeway St., Suite 1309 Boston, MA 02114
U.S. Geological Survey Missions and Programs 163

Office
Michigan
Minnesota
Mississippi
Missouri
Montana
Nebraska
Nevada
New Hampshire (See Massachusetts)
New Jersey
New Mexico
New York
North Carolina
North Dakota
Ohio
Oklahoma
Oregon (See Washington)
Pennsylvania
Puerto Rico
Rhode Island (See Massachusetts)
Name
T. Ray Cummings
Donald R. Albin
Michael W. Gaydos
Daniel P. Bauer
Joe A. Moreland
William M. Kastner
William J. Carswell, Jr.
Donald E. Vaupel
Robert L. Knutilla
Lawrence A. Martens
James F. Turner
L. Grady Moore
Steven M. Hindall
Charles R. Burchett
David E. Click
Alien L. Zack
Telephone ... XT , Address Number
(517) 377-1608 6520 Mercantile Way, Suite 5 Lansing, MI 48911
(612) 229-2600 702 Post Office Bldg. St. Paul, MN 55101
(601) 965^600 Suite 710 Federal Bldg. 100 W. Capitol St. Jackson, MS 39269
(314) 341-0824 1400 Independence Rd. Mail Stop 200 Rolla, MO 65401
(406) 449-5263 Rm. 428 Federal Bldg. 301 S. Park Ave. Drawer 10076 Helena, MT 59626
(402) 437-5082 Rm. 406 Federal Bldg.100 Centennial Mall, North Lincoln, NE 68508
(702) 882-1388 Rm. 224 Federal Bldg. 705 N. Plaza St. Carson City, NV 89701
(609) 771-3900 Suite 206, Mountain View Office Park 810 Bear Tavern Rd. West Trenton, NJ 08628
(505) 262-6630 Pinetree Office Park, Suite 200 4501 Indian School Rd., N.E. Albuquerque, NM 87110
(518) 472-3107 P.O. Box 1669343 U.S. Post Office and Courthouse Albany, NY 12201
(919) 856^510 P.O. Box 2857, Rm. 436 Century Postal Station 300 Fayetteville Street Mall Raleigh, NC 27602
(701) 255^011, 821 Interstate Ave. ext. 601 Bismarck, ND 58501
(614) 469-5553 975 W. Third Ave. Columbus, OH 43212
(405) 231^256 Rm. 621, 215 Dean A. McGee Ave. Oklahoma City, OK 73102
(717) 782^4514 P.O. Box 1107, 4th FloorFederal Bldg., 228 Walnut St. Harrisburg, PA 17108
(809) 783^1660 GPO Box 4424Bldg. 652 GSA CenterHwy 28, Km. 7.2, Pueblo ViejoSan Juan, PR 00936
164 U.S. Geological Survey Yearbook 1987

Office
South Carolina
South Dakota
Tennessee
Texas
Utah
Vermont (See Massachusetts)
Virginia (See Maryland)
Washington
West Virginia
Wisconsin
Wyoming
Name
Rodney N. Cherry
Richard E. Fidler
Ferdinand Quinones-Mrquez
Charles W. Boning
Harvey L. Case
Garald G. Parker, Jr.
David H. Appel
Vernon W. Norman
James E. Kircher
Telephone Number
(803) 765-5966
(605) 353-7176
(615) 736-5424
(512) 482-5766
(801) 524-5663
(206) 593-6510
(304) 347-5130
(608) 274-3535
(307) 772-2153
Address
Suite 677A, 1835 Assembly St. Columbia, SC 29201
Rm. 317 Federal Bldg. 200 4th St., SW Huron, SD 57350
A-413 Federal Bldg. and U.S. Courthouse Nashville, TN 37203
649 Federal Bldg. 300 E. 8th St. Austin, TX 78701
Rm. 1016 Administration Bldg. 1745 W. 1700 South Salt Lake City, UT 84104
1201 Pacific Ave., Suite 600 Tacoma, WA 98402
603 Morris St. Charleston, WV 25301
6417 Normandy Ln. Madison, WI 53719
P.O. Box 11252120 Capitol Ave., Rm. 4006Cheyenne, WY 82003
U.S. Geological Survey Missions and Programs 165

Guide to U.S. Geological Survey Information and PublicationsTo buy maps of all areas of the United States and to request USGS catalogs, pamphlets, and leaflets (limited quantities free), write or visit:U.S. Geological SurveyDistribution BranchBuilding 810Denver Federal Center, Box 25286Denver, CO 80225
To buy Alaskan maps, residents of Alaska may write or visit:U.S. Geological Survey Alaska Distribution Section 101 12th Avenue, Box 12 Fairbanks, AK 99701
To buy USGS book publications, to request USGS circulars, or to obtain information on the availabil ity of microfiche or paper-duplicate copies of open- file reports, write:U.S. Geological Survey Books and Open-File Reports Section Federal Center, Box 25425 Denver, CO 80225
To get on the mailing list for the monthly list ofNew Publications of the U.S. Geological Survey(free), write:U.S. Geological SurveyDistribution Support Section582 National Center12201 Sunrise Valley DriveReston, VA 22092
To subscribe to Earthquakes and Volcanoes, write:Superintendent of Documents Government Printing Office Washington, DC 20402
To obtain information on programs, publications, and services or to obtain copies of reports and maps, visit the U.S. Geological Survey Public Inquiries Offices at the following addresses:Alaska:
Room 1014230 University Dr. Anchorage, AK 99508-4664
E-146 Federal Bldg. 701 C St. Anchorage, AK 99513
California: 7638 Federal Bldg. 300 N. Los Angeles St. Los Angeles, CA 90012
Rm. 3128 Bldg. 3, Stop 533 345 Middlefield Rd. Menlo Park, CA 94025
504 Custom House555 Battery St.San Francisco, CA 94111
Colorado: 169 Federal Bldg. 1961 Stout St. Denver, CO 80294
District of Columbia: 2650 Main Interior Bldg. 18th and ESts.,NW. Washington, DC 20240
Utah:8105 Federal Bldg. 125 S. State St. Salt Lake City, UT 84138
Virginia:1C402 National Center 12201 Sunrise Valley Dr. Reston, VA 22092
Washington: 678 U.S. Courthouse W. 920 Riverside Ave. Spokane, WA 99201
To obtain information on cartographic data, write or visit the U.S. Geological Survey National Carto graphic Information Centers (NCIC) in the follow ing States:Alaska:
U.S. Geological Survey National Cartographic Information Center 4230 University Dr. Anchorage, AK 99508-4664
California:Western Mapping Center National Cartographic Information Center 345 Middlefield Rd. Menlo Park, CA 94025
Colorado:Rocky Mountain Mapping Center National Cartographic Information Center Box 25046, Stop 504 Bldg. 25, Denver Federal Center Denver, CO 80225
Mississippi:National Space Technology Laboratories. National Cartographic Information Center U.S. Geological Survey, Bldg. 3101 NSTL Station, MS 39529
Missouri:Mid-Continent Mapping Center National Cartographic Information Center 1400 Independence Rd. Rolla, MO 65401
Virginia:National Cartographic Information Center 1C402 National Center, Stop 507 12201 Sunrise Valley Dr. Reston, VA 22092
To obtain information on aerial photographs and satellite and space images, write or visit:U.S. Geological Survey EROS Data Center Sioux Falls, SD 57198
To obtain assistance in locating sources of water data, identifying sites at which data have been collected, and specific data, write:U.S. Geological Survey National Water Data Exchange National Center, Stop 421 12201 Sunrise Valley Dr. Reston, VA 22092
To obtain information on ongoing and planned water-data acquisition activities of all Federal agencies and many non-Federal organizations, write:U.S. Geological Survey Office of Water Data Coordination National Center, Stop 417 12201 Sunrise Valley Dr. Reston, VA 22092
To obtain information on water resources in gen eral and about the water resources of specific areas of the United States, write:U.S. Geological Survey Hydrologic Information Unit National Center, Stop 419 12201 Sunrise Valley Dr. Reston, VA 22092
To obtain information on geologic topics such as earthquakes and volcanoes, energy and mineral resources, the geology of specific areas, and geo logic maps and mapping, write:U.S. Geological Survey Geologic Inquiries Group National Center, Stop 907 12201 Sunrise Valley Dr. Reston, VA 22092
166 U.S. Geological Survey Yearbook 1987

Cooperators and Other Financial Contributors
Cooperators listed are those with whom the U.S. Geological Survey had a written agreement cosigned by USGS officials and officials of the cooperating agency for financial cooperation in fiscal year 1987. Parent agencies are listed separately from their sub divisions whenever there are separate cooperative agreements for different projects with a parent agency and with a subdivision of it. Agencies with whom the USGS has research contracts and t;o whom it supplied research funds are not listed.
Cooperating office of the U.S. Geological Surveyg Geologic Divisionn National Mapping Divisionw Water Resources Division
AlabamaAlabama Department of
Environmental Management (w),Highways (w);
Alabama Surface Mining Commission (w); Alabaster, City of (w); Anniston, City of (w); Arab Water Works (w); Autauga County Commission (w); Birmingham, City of (w); Calhoun County Commission (w); Coffee County Commission (w); Dauphin Island Water Authority (w); Geological Survey of Alabama (g,n,w); Harvest-Monrovia Water and Fire Protection Author
ity (w);Heflin, City of (w); Huntsville, City of (w); Jefferson County Commission (w); Mobile, City of (w); Montgomery, City of (w); Reece City, Town of (w); Southwide Water Works (w); Tuscaloosa, City of (w); University of Alabama (w)
AlaskaAlaska Department of
Fish and Game (w),Military and Veterans Affairs, Division of Emer
gency Services (w),Natural Resources, Division of
Geological and Geophysical Surveys (g,w), Technical Services (w),
Transportation and Public Facilities (w); Alaska Power Authority (g,w); Anchorage, Municipality of
Department of Health and Human Services (w),Department of Solid Waste Services (w),Water and Wastewater Service (w);
Fairbanks North Star Borough (w); Juneau, City and Borough of (w); Kenai Peninsula Borough (w); Matanuska Susitna Borough (w); Sitka, City and Borough of (w)
American SamoaAmerican Samoa, Government of (n,w)
ArizonaArizona Bureau of Geology and Mineral Technology
(g);Arizona Department of Water Resources (w); Arizona Municipal Water Users Association (w); Arizona State Land Department (w); Arizona State University (g); Gila Valley Irrigation District (w); Maricopa County
Flood Control District (w),Municipal Water Conservation District No. 1 (w);
Metropolitan Water District of Southern California(w);
Pima County Flood Control District (w); Safford, City of (w);Salt River Valley Water Users Association (w); San Carlos Irrigation and Drainage District (w); Scottsdale, City of (w); Show Low Irrigation Company (w); The Tohono O'Odham Nation (w); Tucson, City of (w);University of Arizona Board of Regents (w); Yuma, City of (w)
ArkansasArkansas Department of Pollution Control and Ecol
ogy (w);Arkansas Game and Fish Commission, Fisheries Divi
sion (w);Arkansas Geological Commission (g,n,w);Arkansas Soil and Water Conservation Commission
(w);Arkansas State Highway and Transportation Depart
ment (w);Arkansas-Oklahoma: Arkansas River Compact Com
mission (w);Independence, County of (w)
CaliforniaAlameda County-
Flood Control and Water Conservation District(Hayward) (w),
Flood Control and Water Conservation District,Zone 7 (Pleasanton) (w),
Water District (w);Antelope Valley-East Kern Water Agency (w); California Coastal Conservancy (w); California Department of
Boating and Waterways (w), Conservation (g), Parks and Recreation (g,w), Water Resources
Central District (Sacramento) (w), Northern District (Red Bluff) (w), San Joaquin District (Fresno) (w);
California Office of Emergency Services (n); Carpinteria County Water District (w); Casitas Municipal Water District (w); Coachella Valley Water District (w); Contra Costa County Department of Health Services
(w);Contra Costa County Flood Control and Water Con
servation District (w);Crestline-Lake Arrowhead Water Agency (w); Desert Water Agency (w); East Bay Municipal Utility District (w); East Valley Water District (w);El Dorado, County of (w);Fr jsno Metropolitan Flood Control District (w); Georgetown Divide Public Utility District (w); Goleta County Water District (w); Humboldt Bay Municipal Water District (w); Imperial County Department of Public Works (w); Imperial Irrigation District (w);
Indian Wells Valley Water District (w); Inyo County Water Department (w); Kings River Conservation District (w); Los Angeles Department of Water and Power (w); Los Penasquitos Lagoon Foundation (w); Madera Irrigation District (w); Marin County Department of Public Works (w); Marin Municipal Water District (w); Merced, City of (w); Merced Irrigation District (w); Mojave Water Agency (w); Montecito County Water District (w); Monterey County Flood Control and Water Conser
vation District (w);Monterey Peninsula Water Municipal District (w); Oakdale-South San Joaquin Irrigation District (w); Orange County
Environmental Management Agency (w),Water District (w);
Oroville-Wyandotte Irrigation District (w); Rainbow Municipal Water District (w); Rancho California Water District (w); Regional Water Quality Lahonton Region (w); Riverside County Flood Control and Water Conser
vation District (w);Sacramento Department of Health Services (w); Sacramento Municipal Utility District (w); Sacramento Regional County Sanitation District,
.Department of Public Works (w); San Benito County Water Conservation and Flood
Control District (w);San Bernardino County Flood Control District (w); San Bernardino Valley Municipal Water District (w); San Diego, City of (w), Water Utility (w); San Diego, County of, Department of
Planning and Land Use (w),Public Works (w);
San Francisco, City and County of, Public UtilitiesCommission (w);
San Francisco Water Department (w); San Luis Obispo County Government Center (w); San Mateo County Department of Public Works (w); Santa Barbara, City of, Department of Public Works
(w); Santa Barbara County
Flood Control and Water Conservation District (w),
Water Agency (w);Santa Clara Valley Water District (w); Santa Cruz County Flood Control and Water Conser
vation District (w);Santa Maria Valley Water Conservation District (w); Santa Ynez River Water Conservation District (w); Scotts Valley Water District (w); Siskiyou County Flood Control and Water Conserva
tion District (w); Sonoma County
Planning Department (w),Water Agency (w);
Tahoe Regional Planning (w); Terra Bella Irrigation District (w); Tulare County Flood Control District (w); Turlock Irrigation District (w); United Water Conservation District (w); University of California
Berkeley (g),Cooperative Extension (w);
Ventura County Public Works Agency (w); Water Resources Control Board (w); Western Municipal Water District (w); Westlands Water District (w); Woodbridge Irrigation District (w); Yolo County Flood Control and Water Conservation
District (w); Yuba County Water Agency (w)
U.S. Geological Survey Missions and Programs 167

ColoradoArkansas River Compact Administration (w);Arvada, City of (w);Aspen, City of (w);Aurora, City of (w);Boulder, County of, Department of Public Works
(w);Breckenridge, Town of (w);Castle Rock, Town of (w);Cherokee Water and Sanitation District (w);Cherry Creek Basin Authority (w);Colorado Department of
Health (w), Natural Resources (w);
Colorado Division of Mined Land Reclamation (w), Water Resources, Office of the State Engineer
(w);Colorado Geological Survey (g,w);Colorado River Water Conservation District (w);Colorado Springs, City of
Department of Public Utilities (w), Office of the City Manager (w);
Delta County Board of County Commissioners (w);Denver, City and County, Board of Water Commis
sioners (w);Denver Regional Council of Governments (w);Eagle County Board of Commissioners (w);Englewood, City of, Wastewater Treatment Plant
(w);Evergreen Metro District (w);Fort Collins, City of (w);Fountain Valley Authority (w);Fruita, City of (w);Garfield, County of (w);Glendale, City of (w);Glenwood Springs, City of (w);Grand County Board of Commissioners (w);Larimer-Weld Regional Council of Governments (w);Longmont, City of (w);Lost Creek Ground Water Management District (w);Lower Fountain Water-Quality Management Associ
ation (w);Metropolitan Denver Sewage Disposal District No. 1
(w);Mineral, County of (w);Moffat, County of (w);Northern Colorado Water Conservancy District (w);North Kiowa-Bijou Ground Water Management Dis
trict (w);North LaJunta Water Conservancy District (w);Pikes Peak Area Council of Governments (w);Pikes Peak Regional Building Department (w);Pitkin County Board of Commissioners (w);Pueblo Board of Water Works (w);Pueblo Civil Defense Agency (w);Pueblo West Metropolitan District (w);Purgatoire River Water Conservancy District (w);Rio Blanco, County of (w);Rio Grande Water Conservation District (w);St. Charles Mesa Water District (w);Southeastern Colorado Water Conservancy District
(w);Southwestern Colorado Water Conservancy District
(w);Steamboat Springs, City of (w);Thornton, City of (w);Trinchera Conservancy District (w);Uncompahgre Valley Water Users Association (w);Upper Arkansas River Water Conservancy District
(w);Upper Black Squirrel Ground Water Management
District (w);Upper Yampa Water Conservancy District (w);Urban Drainage and Flood Control District (w);Water Users No. 1 (Rangely) (w);Yellow Jacket Water Conservancy District (w)
ConnecticutConnecticut Department of Environmental Protection
Fairfield, Town of, Conservation Commission (w); New Britain, City of, Board of Water Commissioners
(w); South Central Connecticut Regional Water Authority
(w); Torrington, City of (w)
DelawareDelaware Department of Natural Resources and
Environmental Control (w); Geological Survey (w)
District of ColumbiaDepartment of Public Works (w);Metropolitan Washington Council of Governments (w)
FloridaBoca Raton, City of (w);Bradenton, City of (w);Brevard County, Board of County Commissioners (w);Broward County
Environmental Quality Control Board (w),Water Resources Management Division (w);
Cape Coral, City of (w); Collier, County of (w); Collier Mosquito Control District (w); Cocoa, City of (w); Cottondale, City of (w); Daytona Beach, City of (w);Englewood Water District Board of Supervisors (w); Escambia County Board of County Commissioners
(w);Escambia County Utilities Authority (w); Florida Department of
Environmental Regulation, Bureau of Water Re sources Management (w),
Division of Recreation and Parks (Hope Sound) (w),
Division of Recreation and Parks (Tallahassee) (w),
Natural Resources (n), Division of Marine Re sources (w);
Transportation (w);Florida Institute of Phosphate Research (w); Florida Keys Aqueduct Authority (w); Fort Lauderdale, City of (w); Fort Walton Beach, City of (w); Game and Freshwater Fish Commission (w); Hallandale, City of (w); Highland Beach, Town of (w); Hillsborough, County of (w); Hollywood, City of (w); Indian River, County of (w); Jacksonville, City of (w); Jacksonville Electric Authority, Research and Envi
ronmental Affairs (w); Jacksonville Beach, City of (w); Lake County Board of County Commissioners (w); Lakeland, City of (w);Lee County Board of County Commissioners (w); Leon County
Courthouse (w),Department of Public Works (w);
Loxahatchee River Environmental Control District(w); :
Madison, City of (w);Manatee County Board of County Commissioners (w); Marion County Board of County Commissioners (w); Metropolitan Dade County Department of Environ
ment Resources Management (w); Miami-Dade Water and Sewer Authority (w); Northwest Florida Water Management District (w); Orange County Board of County Commissioners (w);
Palm Beach County Board of County Commissioners (w),Solid Waste Authority (w);
Perry, City of (w); Petersburg, City of (w); Pinellas, County of (w);Polk County Board of County Commissioners (w); Pompano Beach, City of, Water and Sewer Depart
ment (w);Quincy, City of (w);Reedy Creek Improvement District (w); Sanibel, City of (w); Sarasota, City of (w); Sarasota, County of (w);South Dade Soil and Water Conservation District (w); South Florida Water Management District (w); Southwest Florida Regional Planning Council (w); Southwest Florida Water Management District (w); St. Johns, County of (w); St. Johns River Water Management District (w); Stuart, City of (w); Sumter County Recreation and Water Conservation
and Control Authority (w); Suwannee River Authority (Trenton) (w); Suwannee River Water Management District (w); Tallahassee, City of-
Electric Department (w),Streets and Drainage (w),Underground Utilities (w),Water Quality Laboratory (w); '
Tampa, City of (w); Tampa Port Authority (w); University of Florida, Center for Wetlands (w); Walton, County of (w); West Coast Regional Water Supply Authority (w)
GeorgiaAlbany, City of, Water, Gas, and Light Commission
(w);Bibb County Board of County Commissioners (w); Brunswick, City of (w); Claytoh County Water Authority (w); Consolidated Government of Columbus (w); Covington, City of (w); Georgia Department of
Natural Resources Environmental Protection Division
Water Management Branch (w), Water Quality Support Program (w),
Geologic Survey (n,w); Transportation (w)
Materials and Research (w); Gwinnett, County of (w); Helena, City of (w);Macon-Bibb County Water and Sewage Authority (w); Moultree, City of (w); Thomaston, City of (w); Thomasville, City of (w); Valdosta, City of (w)
GuamGuam, Government of (w)
HawaiiHawaii Department of
Land and Natural Resources, Division of Water and Land Development (g,w),
Transportation (w); Honolulu, City and County of
Board of Water Supply (w),Department of Public Works (w)
Idaho 'Boise, City of (w);Burley Irrigation District (w);College of Southern Idaho (w);
168 U.S. Geological Survey Yearbook 1987

Idaho Department of Fish and Game (w),Health and Welfare (w),Lands (n),Water Resources (n,w);
Idaho Falls, City of (w); Idaho Geological Survey (g); Shoshone, County of (w);Shoshone-Bannock Tribes, Fort Hall Indian Reserva
tion (w);Southwest Irrigation District (w); Sun Valley Water & Sewer District (w); Teton County Board of Commissioners (w); Water District No. 01 (Idaho Falls) (w)
IllinoisAVM Lockport Division of Water Resources (w); Bloomington and Normal Sanitary District (w); Cook County Forest Preserve District (w); Decatur, City of (w); DeKalb, City of (w); DuPage County Forest Preserve (w); DuPage County Public Works (w); Illinois Department of
Energy and Natural Resources, State Water Sur vey Division (w),
Transportation, Division of Highways (n),Division of Water Resources (n,w);
Illinois Environmental Protection Agency, Division ofWater Pollution Control (w);
Illinois State Geological Survey (g,n); Metropolitan Sanitary District of Greater Chicago (w); Springfield, City of (w); University of Chicago (g)
IndianaCarmel, Town of (w);Elkhart, City of, Water Works (w);Indiana Department of
Environmental Management (w),Highways (w),Natural Resources (g,n), Division of Water (w);
Indianapolis, City of, Department of Public W orks (w)
IowaCedar Rapids, City of (w);Charles, City of (w);Clear Lake, City of (w);Des Moines, City of (w), Water Works (w);Fort Dodge, City of (w);Iowa Department of
Transportation, Highway Division (w), Natural Resources (w);
Iowa Geological Survey (n,w);Iowa State University (w);Marshalltown, City of (w);University of Iowa-
Institute of Hydraulic Research (w), Hygienic Laboratory (w), Physical Plant (w), Sewage Disposal Plant (w);
Sioux City, City of (w);Union Electric Company (w);Waterloo, City of (w)
KansasArkansas River Compact Administration (w); Equus Beds Groundwater Management District No. 2
(w);Hays, City of (w); Kansas Department of
Health and Environment (w),Transportation (w);
Kansas Corporation Commission (w);
Kansas Geological Survey (n,w);Kansas State Board of Agriculture, Division of Water
Resources (w);Kansas State University (w);Kansas Water Office (w);Northwest Kansas Groundwater Management Dis
trict No. 4 (w);Olathe, City of (w);Pawnee Watershed ; (w);Sedgwick, County of (w);Southwest Kansas Groundwater Management District
No. 3 (w);Western Kansas Groundwater Management District
No. 1 (w);Wichita, City of (w)
KentuckyElizabethtown, City of (w);Hardin County Water District (w);Jefferson, County of, Department of Public Works
and Transportation (w); Kentucky Department of Natural Resources and
Environmental Protection Cabinet (w); Lincoln Trail Health Department (w); University of Kentucky, Kentucky Geological Survey
(n,w); University of Louisville (w)
LouisianaAvoyelles Parish (w);Capital-Area Groundwater Conservation Commission
(w);East Baton Rouge Parish (w); Jefferson Parish Department of Public Utilities (w); Louisiana Department of
Natural Resources, Environmental Quality (w); Transportation and Development
Materials Lab (w), Office of Public Works (n,w);
Wildlife and Fisheries (w); Sabine River Compact Administration (w); Slidell, City of (w)
MaineAndroscoggin Valley Regional Planning Commission
(w);Cobbossee Watershed District (w); Maine Department of
Conservation, Geological Survey (g,n,w), Environmental Protection (w), Inland Fisheries and Wildlife (w);
North Kennebec Valley Regional Planning Commis sion (w)
MarylandAnne Arundel County Planning and Zoning Office (w); Baltimore County
Department of Permits and Licenses (w),Department of Public Works (w),Office of Planning and Zoning (w);
Calvert County Courthouse (w); Caroline County Courthouse (w); Howard County Department of Public Works (w); Maryland Department of Environment (w); Maryland Geological Survey (n,w); Maryland State Highway Administration (w); Maryland Water Resources Administration (w); Montgomery County
Department of Environmental Protection, Divi sion of Environmental Planning and Monitoring (w),
Storm Water Management (w); Poolesville, Town of (w); St. Marys County Commissioners (w);
Upper Potomac River Commission (w); Washington Suburban Sanitary Commission (w)
MassachusettsBarnstable County Commissioners (w); Brewster, Town of (w); Harwich, Town of (w); Massachusetts Department of
Environmental Management, Division of WaterResources (w),
Environmental Quality Engineering Division of Water Pollution Control (w), Division of Water Supply (w),
Fisheries, Wildlife, and Environmental Law En forcement, Division of Fisheries and Wildlife (w),
Hazardous Waste Facility, Site Safety Council(w);
Metropolitan District Commission, Water Division(w);
Woods Hole Oceanographic Institute (g)
MichiganAnn Arbor, City of (w);Battle Creek, City of (w);Cadillac, City of, Wastewater Treatment Plant (w);Clare, City of (w);Coldwater, City of, Board of Public Utilities (w);Elsie, Village of (w);Flint, City of, Department of Public Works and Util
ities (w);Genesee County Drain Commission, Division of Water
and Waste Services (w);Grand Traverse County Board of Commissioners (w);Huron-Clinton Metropolitan Authority (w);Imlay, City of (w);Kalamazoo, City of, Department of Public Utilities
(w);Kalamazoo County Board of Commissioners (w);Lansing, City of, Board of Water and Light, Water
and Stream Division (w);Macomb, County of (w);Mason, City of (w);Michigan Department of
Agriculture (w), Natural Resources (w), Transportation (w);
Oakland County Drain Commission (w);Otsego County Road Commission (w);Portage, City of (w);Wayne, County of, Division of Environmental Health
(w);Ypsilanti, City of (w)
MinnesotaBeltrami County SWCD (w);Elm Creek Conservation Commission (w);Fond Du Lac Reservation Business Committee (w);Leech Lake Reservation Business Committee (w);Lower Red River Watershed Management District
(w);Metropolitan Waste Control Commission (w); Mille Lacs Reservation Business Committee (w); Minneapolis Water Works (w); Minnesota Department of
Natural Resources, Division of Waters (w), Transportation (w);
Minnesota Geological Survey (g); Red Lake Tribal Reservation Business Committee
(w);Rochester Public Utilities (w); St. Paul, City of (w), Water Utility (w); University of Minnesota, Department of Soil Science
(w);
U.S. Geological Survey Missions and Programs 169

Wes Min Resource, Conservation and DevelopmentAssociation (w);
White Earth Reservation Business Community (w)
MississippiGulf Regional Planning Commission (w); Harrison, County of
Board of Supervisors (w),Development Commission (w);
Jackson, City of (w); Jackson, County of
Board of Supervisors (w),Port Authority (w);
Mississippi Department of Highways (w),Natural Resources
Bureau of Geology (w), Bureau of Land and Water Resources (w), Bureau of Pollution Control (w);
Mississippi Research and Development Center (n); Pat Harrison Waterway District (w); Pearl River Basin Development District (w); Pearl River Valley Water Supply District (w)
MissouriLittle River Drainage District (w); Missouri Department of
Conservation (w), Health (w), Natural Resources
Division of Environmental Quality (w), Division of Geology and Land Survey
(g,n,w),Land Reclamation Commission (w);
Missouri Highway and Transportation Commission
Springfield, City of, City Utilities, Engineering Department (w)
MontanaDaniels, County of (w);Fort Peck Tribes (w);Helena, City of (w);Montana Bureau of Mines and Geology (g,w);Montana Department of
Fish, Wildlife, and Parks (w),Health and Environmental Sciences (w),Highways (w),Natural Resources and Conservation (w).State Lands (w);
Montana State University (w); Salish and Kootenai Tribes of Flathead Reservation
(w); University of Montana (w)
NebraskaCentral Platte Natural Resources District (w);Kansas-Nebraska Big Blue River Compact Administration (w);Lincoln, City of (w);Little Blue Natural Resources District (w);Nebraska Department of
Environmental Control (w),Water Resources (w);
University of Nebraska, Conservation and Survey Division (g,w)
NevadaCarson City Department of Public Works (w); Clark County Department of Public Works (w); Clark County Regional Flood Control District (w); Douglas County Department of Public Works (w); Elko, County of (w); Las Vegas Valley Water District (g,w); Mackay School of Mines (w);
Nevada Bureau of Mines and Geology (g,n,w); Nevada Department of
Conservation and Natural Resources Division of Environmental Protection (w), Division of Water Resources (w),
Transportation (w);Nevada Senate Interim Finance Committee (w); Nye, County of (w); South Lake Tahoe, City of (w); South Lake Tahoe Public Utility District (w); Summit Lake Paiute Tribe (w); Tahoe Regional Planning Agency (w); University of Nevada Reno (w)
New HampshireNew Hampshire Department of Resources and Eco
nomic Development (g,w)
New JerseyBergen County Department of Public Works (w);Brick Township Municipal Utilities Authority (w);Camden County Board of Chosen Freeholders (w);Cape May, City of (w);Delaware River Basin Commission (w);Gloucester County Improvement Authority (w);Greenwich, Township of (w);Lower, Township of, Municipal Utilities Authority
(w);New Jersey Department of Environmental Protec
tion, Division of Water Resources (g,w);North Jersey District Water Supply Commission (w);Passaic Valley Water Commission (w);Somerset County Board of Chosen Freeholders (w);West Windsor Township Environmental Commission
(w);Wildwood, City of (w)
New MexicoAlamogordo, City of (w);Albuquerque, City of (w);Albuquerque Metropolitan Arroyo Flood Control
Authority (w);Canadian River Municipal Water Authority (w); Costilla Creek Compact Commission (w); El Paso Water Utility (w); Gallup, City of (w); Highlands University (w); Las Cruces, City of (w); Las Vegas, City of (w); Los Alamos, County of (w); Navajo Indian Nation (w); New Mexico Bureau of Mines and Mineral Resources
(g,w); New Mexico Environmental Improvement Division
(w);New Mexico Department of Highways (w); New Mexico Interstate Stream Commission (w); Office of the State Engineer (w); Pecos River Commission (w); Pueblo of Acoma (w); Pueblo of Laguna (w); Pueblo of Zuni (w); Raton, City of (w);Rio Grande Compact Commission (w); San Juan, County of (w); Santa Fe Metropolitan Water Board (w); Santa Rosa, City of (w); Veremejo Conservancy District (w)
New YorkAmherst, Town of, Engineering Department (w);Auburn, City of (w);Chautauqua, County of, Department of Planning and
Development (w); Cheektowaga, Town of (w);
Cornell University- Department of Natural Resources (w),Department of Utilities (w);
Dutchess, County of, Environmental Management(w);
Hudson-Black River Regulating District (w); Monroe, County of, Department of Health (w); Nassau, County of
Department of Health (w),Department of Public Works (w);
New York City Department of Environmental Protec tion, Air and Water Resources-Energy (w);
New York State Department of Environmental Conservation, Division of Water
(w),Transportation, Bridge and Construction Bureau
(w); New York State Energy Research and Development
Authority (w);New York State Power Authority (w); Nyack, Village of, Board of Water Commissioners (w); Onondaga, County of
Department of Drainage (w),Water Authority (w);
Orange, County of, Department of Public Works (w); Schuyler, County of (w); Suffolk, County of
Department of Health Services (w),Water Authority (w);
Tompkins, County of, Department of Planning (w); Ulster, County of, County Legislators (w); Westchester, County of
Department of Planning (w),Department of Public Works (w)
North CarolinaBethel, Town of (w);Brevard, City of (w);Chapel Hill, Town of (w);Charlotte, City of (w);Durham, City of, Department of Water Resources
(w);Greensboro, City of (w); Guilford County S.W.C.D. (w); Jacksonville, City of (w); North Carolina State Department of
Human Resources (w),Natural Resources and Community Development
(g,n,w),Transportation, Division of Highways (w);
North Carolina State University (w); Orange, County of, Water and Sewer Authority (w); Raleigh, City of (w); Rocky Mount, City of (w)
North DakotaDicMnson, City of (w);Lower Heart River Water Resources District (w);North Dakota Geological Survey (g,w);North Dakota State University (w);Oliver County Board of Commissioners (w);Public Service Commission (w);State Water Commission (w)
OhioAkron, City of (w);Canton, City of, Water Department (w);Columbus, City of (w);Eastgate Development and Transportation Agency
(w);Fremont, City of (w); Geauga County Planning Commission (w); Lucas, County of (w); Miami Conservancy District (w); Northwood, City of (w);
170 U.S. Geological Survey Yearbook 1987

Ohio Air Quality Development Authority (w); Ohio Department of
Natural Resources (w),Transportation (n,w);
Ohio Environmental Protection Agency (w); Ohio State University (w); Ohio Water Development Authority (w); Oregon, City of (w); Richwood, Village of (w); Ross, County of (w); Sandusky, County of (w); Seneca Soil and Water District (w); Wood, County of (w); Williams, County of (w)
OklahomaAda, City of (w);Altus, City of (w);Central Oklahoma Master Conservancy District (w);Fort Cobb Reservoir Master Conservancy District
(w);Foss Reservoir Master Conservancy District (w); Lawton, City of (w); Lugert-Altus Irrigation District (w); Mountain Park Master Conservancy District (w); Oklahoma City, City of (w); Oklahoma Department of Transportation (n); Oklahoma Geological Survey, University of Oklahoma
(g,n,w);Oklahoma State Health Department (w); Oklahoma Water Resources Board (w); Tulsa, City of (w)
OregonConfederated Tribes of
Umatilla Indian Reservation (w), Warm Springs Indian Reservation (w);
Coos Bay-North Bend Water Board (w);Douglas, County of, Department of Public Works (w);Eugene, City of, Water and Electric Board (w);McMinnville, City of, Water and Light Department
(w);Oregon Department of
Fish and Wildlife (w), Geology and Mineral Industries (g,n), Transportation, Highway Division (w), Water Resources (w);
Portland, City of, Bureau of Water Works (w)
PennsylvaniaAllentown, City of (w);Bethlehem, City of (w);Chester, County of, Water Resources Authority (w);Delaware River Basin Commission (w);Erie, County of, Department of Health (w);Harrisburg, City of, Department of Public Works (w);Indiana, County of (w);Lancaster County Planning Commission (w);Letort Regional Authority (w);Media Borough Water Department (w);Neshaminy Water Resources Authority (w);New York State Department of Environmental Con
servation (w);Philadelphia, City of, Water Department (w);Pennsylvania Department of Environmental Re
sources- Bureau of Mining and Reclamation (w), Bureau of Topographic and Geologic Survey
(g,n,w),Bureau of Water Quality Management (w), Office of Resources Management (w);
Susquehanna River Basin Commission (w);University Area Joint Authority (w);Williamsport, City of (w)
Puerto RicoPuerto Rico Aqueduct and Sewer Authority (w);Puerto Rico Department of
Agriculture (w), Natural Resources (g,w), Transportation and Public Works (w);
Puerto Rico Electric Power Authority (w);Puerto Rico Environmental Quality Board (w);Puerto Rico Industrial Development Company (w);Puerto Rico Mineral Resources Development Corpo
ration (g);University of Puerto Rico (w)
Rhode IslandNarragansett Bay Water Quality Commission (w);New Shoreham, Town of (w);Rhode Island State Department of Environmental
Management, Division of Water Resources (w); State Water Resources Board (w); University of Rhode Island, Geology Department (g)
South CarolinaCharleston Commission of Public Works (w); Cooper River Water Users Association (w); Grand Strand Water and Sewer Authority (w); Myrtle Beach, City of (w); Newberry, City of (w); South Carolina State
Department of Health and Environmental Con trol (w),
Department of Highways and Public Transporta tion (w),
Geological Survey (w),Public Service Authority (w),Water Resources Commission (w);
South Carolina Sea Grant Consortium (w); South Carolina Wildlife and Marine Resources De
partment (w);Spartanburg Sanitary Sewer District (w); Spartanburg Water System (w); University of South Carolina (w); . Waccamaw Regional Planning and Development Com
mission (w); Western Carolina Regional Sewer Authority (w)
South DakotaEast Dakota Water Development District (w); Ogallala Sioux Tribe (w); Rapid City, City of (w); Sioux Falls, City of (w); Sisston-Wahpeton Sioux Tribe (w); South Dakota Department of
Game, Fish and Parks (w),Transportation (w),Water and Natural Resources
Geological Survey Science Center (w), Water Quality Division (w), Water Rights Division (w);
South Dakota School of Mines and Technology (w); Watertown, City of (w); West Dakota Water Development District (w)
TennesseeAlcoa, City of (w);Bartlett, City of (w);Benton, Town of (w);Dickson, City of (w);Eastside Utility District (w);German Town, City of (w);Government of Nashville and Davidson County (w);Hyson Utility District (w);Jackson, City of (w);Lawrenceburg, City of (w);Lincoln, County of, Board of Public Utilities (w);
Memphis, City of Light, Gas, and Water Division (w), Public Works Division (w);
Murfreesboro Water and Sewer Department (w); North Stewart County Utility District (w); Shelby County Public Works (w); Spring Hill, Town of (w); Tennessee Department of
Conservation, Geology Division (g,w), Health and Environment (w)
Division of Superfund (w), Office of Groundwater Protection (w), Office of Surface Mining and Reclamation
(w),Office of Water Management (w),
Transportation, Division of Structures (w); Tennessee Technological University (w); Tennessee Wildlife Resources Agency (w); University of Tennessee, Water Resources Research
Center (w);Webb Creek Utility District (w); West Overton Utility District (w)
TexasAbilene, City of (w); Arlington, City of (w); Austin, City of (w);Bexar-Medina-Atascosa Counties, Water Improve
ment District No. 1 (w); Brazos River Authority (w); Carrollton, City of (w); Coastal Industrial Water Authority (w); Colorado River Municipal Water District (w); Corpus Christi, City of (g,w); Dallas, City of, Public Works Department (w); Dallas-Fort Worth Airport (w); Edwards Underground Water District (w); El Paso, City of, Public Service Board (w); Fort Bend, County of (w); Fort Stockton, City of (w); Franklin, County of, Water District (w); Gainesville, City of (w); Galveston, County of (w); Garland, City of (w); Georgetown, City of (w); Graham, City of (w); Greenbelt Municipal and Industrial Water Authority
(w);Guadalupe-Blanco River Authority (w); Harris, County of, Flood Control District (w); Harris-Galveston Coastal Subsidence District (w); Houston, City of (w); Lower Colorado River Authority (w); Lower Neches Valley Authority (w); Lubbock, City of (w); Nacogdoches, City of (w);North Central Texas Municipal Water Authority (w); Northeast Texas Municipal Water District (w); Orange, County of (w); Pecos River Commission (w); Red Bluff Water Power Control District (w); Runaway Bay, City of (w); Sabine River Authority of Texas (w); Sabine River Compact Administration (w); San Angelo, City of (w); San Antonio, City of
Department of Environmental Management (w),Public Service Board (w),Water Board (w);
San Antonio River Authority (w); San Jacinto River Authority (w); Tarrant, County of, Water Control and Improvement
District No. 1 (w);Texas Bureau of Economic Geology (g); Texas State Department of Highways (w); Texas Water Commission (n,w);
U.S. Geological Survey Missions and Programs 171

Texas Water Development Board (w);Titus, County of, Fresh Water Supply District No. 1
(w);Trinity River Authority (w); Upper Guadalupe River Authority (w); Upper Neches River Municipal Water Authority (w); Upper Trinity Basin Water Quality Compact (w); West Central Texas Municipal Water District (w); Wichita, County of, Water Improvement District No.
2(w); Wichita Falls, City of (w)
Trust Territory of the Pacific IslandsFederated States of Micronesia-
State of Korsae (w), State of Pohnpei (w), State of Truk (w), State of Yap (w);
Northern Mariana Islands, Government of (w);Republic of Palau (w)
UtahBear River Commission (w); Salt Lake, County of
Board of County Commissioners (w), Division of Flood Control and Water Quality (w);
Utah Department of Natural Resources
Geological and Mineral Survey (g,n,w), Oil, Gas and Mining Division (w), Water Resources Division (w), Water Rights Division (w), Wildlife Resources Division (w);
Transportation (w);Utah Health Department, Division of Environmental
Health (w)
VermontAgency of Environmental Conservation (n); Office of the State Geologist (g); Vermont Department of Water Resources and Envi
ronmental Engineering (w)
VirginiaAccomack, County of (w);Alexandria, City of, Department of Transportation
and Environmental Services (w);Clark, County of (w);James City, County of, Department of Public Works
(w);James City Service Authority (w);Lord Fairfax Planning District Commission (w);Newport News, City of, Department of Public Utili
ties (w);Northampton, County of (w);Northern Virginia Planning District Commission (w);Prince William Health District (w);Roanoke, City of, Utilities and Operations (w);Southeastern Public Service Authority of Virginia
(w);Southeastern Virginia Planning District Commission
(w);University of Virginia, Department of Environmental
Sciences (w);Virginia Department of
Conservation and Economic Development, Divi sion of Mineral Resources (g,n),
Highways and Transportation (w), Mines, Minerals, and Energy, Division of Mined
Land Reclamation (w);Virginia Beach, City of (w);Virginia Commonwealth University (w);Virginia State Water Control Board (w);Williamsburg, City of (w);York, County of (w)
WashingtonBellevue, City of, Public Works Department (w); Centralia, City of, Lights Department (w); Chelan, County of, Public Utility District No. 1 (w); Cowlitz County Board of Commissioners (w); Douglas, County of, Public Utility District No. 1 (w); Hoh Indian Tribe (w);Kitsap, County of, Public Utility District No. 1 (w); King, County of (w), Department of Public Works (w); King, County of, South, Regional Water Association
(w);Lewis, County of, Board of Commissioners (w); Municipality of Metropolitan Seattle (w); Pend Oreille, County of (w); Pierce, County of (w); Pullman, City of (w); Puyallup Indian Nation (w); Quinault Business Committee (w); San Juan County Board of Commissioners (w); Seattle, City of-
Department of Lighting (w),Department of Parks and Recreation (w);
Skagit, County of (w); Department of Public Works (w); Snohomish, County of (w); Tacoma, City of, Public Works Department (w); Yakima Tribal Council (w); Washington Department of
Ecology (g,w),Emergency Management (w),Fisheries (w),Natural Resources (g,n,w),Transportation (w);
University of Washington (g); Whatcom, County of, Department of Public Works (w)
West VirginiaMarshall County Commission (w); Morgantown, City of, Water Commission (w); Washington Public Service District (w); West Virginia Department of
Energy (w),Highways (w),Natural Resources, Division of Water Resources
(w);West Virginia Geological and Economic Survey (w); West Virginia Office of Community and Industrial
Development (w)
WisconsinBad River Tribal Council (w); Beaver Dam, City of (w);Chippewa, County of, Land Conservation Depart
ment (w); Dane, County of
Department of Public Works (w),Regional Planning Commission (w);
Delavan, Town of (w); Delavan Lake Sanitary District (w); Fond Du Lac, City of (w); Forest County Potawatomi Community (w); Fowler Lake Management District (w); Fox Valley Water Quality Planning Agency (w); Green Lake Sanitary District (w); Hillsboro, City of (w); Hills Lake Management District (w); Lac Courte Oreilles Governing Board (w); Little Muskego Lake District (w); Madison Metropolitan Sewage District (w); Medford, City of (w); Menominee Indian Tribe of Wisconsin (w); Middleton, City of (w); Morris Lake Management District (w); Noquebay Lake District (w); Norway-Wind Lake, Town of (w); Oconomowoc Lake, Village of (w); Okauchee Lake Management District (w);
Oneida Tribe of Indians (w); Park Lake Management District (w); Peshtigo, City of (w); Powers Lake, District of (w); Rock, County of (w); St. Croix Tribal Council (w); Sand Lake, Town of (w);Slinger, Village of, Wastewater Treatment Plant (w); Southeastern Wisconsin Regional Planning Commis
sion (w);Stockbridge-Munsee Tribal Council (w); Thorp, City of (w); University of Wisconsin, Extension, Geological and
Natural History Survey (g,n,w); Waupun, City of (w); Wisconsin Department of
Natural Resources (w),Transportation (n), Division of Highways (w);
Wolf Lake Management District (w)
WyomingAttorney General (w);Cheyenne, City of (w);Evanston, City of (w);Sublette, County of (w);Uinta, County of (w);Water Development Commission (w);Wyoming Department of
Agriculture (w),Economic Planning and Stabilization Board (w),Environmental Quality (w),Highways (w);
Wyoming Geological Survey (g); Wyoming State Engineer (n,w); Wyoming Water Research Center (w)
Federal Cooperators
Central Intelligence Agency (g)
Department of AgricultureAgricultural Stabilization and Conservation Service
(n);Forest Service (n,w); Agricultural Research Service (w); Soil Conservation Service (g,n,w); Statistical Reporting Service (n)
Department of the Air Force (w)Air Force Academy (w);Boiling Air Force Base (g);Hanscom Air Force Base (g);Headquarters, AFTAC/AC (g);Occupational and Environmental Health Laboratory
(w); Vandenberg Air Force Base (w)
Department of the Army (w)Aberdeen Proving Ground (w); Army Signals Warfare Laboratory (n); Avionics R and D Activity (g); Coastal Engineering Research Center (g); Corps of Engineers (g,w); Fort Carson Military Reservation (w); Mobility Equipment Research and Development Com
mand (g);Picatinny Arsenal (w); Research Office, Triangle Park, N.C. (g); Waterways Experiment Station, Vicksburg (g,w); White Sands Missile Range (w)
Department of CommerceBureau of the Census (n);Coastal Plains Regional Action Planning Commission
(g);
172 U.S. Geological Survey Yearbook 1987

National Bureau of Standards (g);National Ocean Survey (n);National Oceanic and Atmospheric Administration
. National Weather Service (g,n,w)
Department of Defense AgenciesDefense Advanced Research Projects Agency (g); Defense Logistics Agency (w); Defense Mapping Agency (g,n); Defense Nuclear Agency (g); Defense Intelligence Agency (g,n)
Department of Energy (w)Albuquerque Operations Office (g,w);Bonneville Power Administration (n,w);Chicago Operations Office (g,w);Idaho Operations Office (g,w);Los Alamos National Laboratory (g);Lawrence Livermore Laboratory (g);Nevada Operations Office (g,n,w);Oak Ridge Operations Office (g,w);Office of Energy Research (g);Procurement Operations Office (g);Richland Operations Office (g,w);San Francisco Operations (g);Sandia National Laboratories (g,w);Savannah River Operations Office (n,w);United States Arms Control and Disarmament
Agency (g); Western Area Power Administration (g,n,w)
Department of the InteriorBureau of Indian Affairs (g,n,w); Bureau of Land Management (g,n,w); Bureau of Mines (g,w); .Bureau of Reclamation (g,w); Minerals Management Service (g,n,w); National Park Service (g,w);
Office of the Secretary (g,w); Office of Surface Mining Reclamation and Enforce
ment (g,n,w);Smithsonian Institution (w); U.S. Fish and Wildlife Service (g,n,w)
Department of Justice (w)
Department of the Navy (w)Naval Explosive Ordnance Disposal Test Center (g);Naval Oceanographic Office (g);Naval Weapons Center, China Lake (g,w);Office of Naval Research (g);U.S. Marine Corps (w);U.S. Marine Corps, Installations and Logistics (n)
Department of StateAgency for International Development (g,w); International Boundary and Water Commission, U.S.
and Canada (n); International Boundary and Water Commission, U.S.
and Mexico (n,w); InternationalJoint Commission, U.S. and Canada (w)
Department of TransportationFederal Highway Administration (g,n,w); U.S. Coast Guard (g,w)
Department of TreasuryU.S. Customs Service (n)
Environmental Protection Agency (w)Corvallis Environmental Research Laboratory (w); Environmental Monitoring Systems Laboratory (g); Office of Administration and Resources Management
(n); Office of Environmental Engineering and Technology
(g);
Office of Pesticides Programs (w);Office of Waste Programs Enforcement (w)
Federal Emergency Management Agency (g,w)
Federal Energy Regulating Commission Licensees(w)
National Aeronautics and Space Administration(g,w)
National Research Council (n)
National Science Foundation (g,n,w)
Navajo and Hppi Indian Relocation Commission (g)
Nuclear Regulatory Commission (g,n)
Tennessee Valley Authority (n,w)
Veterans Administration (g,w)
Other Cooperators and Contributors
Government of Saudi Arabia (g,n,w)
People's Republic of China (g,w)
United NationsUnited Nations Development Program (g,w);UNESCO (w);World Meteorological Organization (w)
Use of trade names in this publication is for identification purposes only and does not constitute endorsement by the U.S. Geological Survey.
Yearbook StaffGail Wendt Kathleen Krafft Jewel Dickson Bonnie D'Agostino Sandye Holmes Eloise Byrd Marti Quigley Sandy Jefferson
Coordinating EditorEditorGraphic DesignerGeologic Division CoordinatorWater Resources Division CoordinatorNational Mapping Division CoordinatorInformation Systems Division CoordinatorAdministrative Division Coordinator
U.S. Geological Survey Missions and Programs 173

As the Nation's principal conservation agency the Department of the Interior has responsibility for most of our nationally owned public lands and natural resources. This includes fostering the wisest use of our land and water resources, protecting our fish and wildlife, preserving the environ mental and cultural values of our national parks and historical places, and providing for the enjoyment of life through outdoor recreation. The Depart ment assesses our energy and mineral resources and works to assure that their development is in the best interest of all our people. The Department also has a major responsibility for American Indian reservation communities and for people who live in Island Territories under U.S. Administration.
174 U.S. Geological Survey Yearbook 1987