Solitary, Explosive, Rational and Elliptic Doubly Periodic ...

PROJECT REPORT ON
SENSITIVITY ANALYSIS OF EEDs
Submitted by
GURMEET SINGH (B80228540)
PRATIK KUMAR (B80228537)
RAGHUVENDRA SINGH (B80228542)
in partial fulfillment for the award of the degree
of
Bachelor of Engineering
of
University of Pune
IN
INFORMATION TECHNOLOGY
Army Institute of Technology, Pune
2013-2014

PROJECT REPORT
ON
SENSITIVITY ANALYSIS OF EEDs
Submitted By
Gurmeet Singh (B80228540)
Pratik kumar (B80228537)
Raghuvendra Singh (B80228542)
Guided by
Prof. Savita Mangalore and
Dr. Virendra Kumar
DEPARTMENT OF INFORMATION TECHNOLOGY
ARMY INSTITUTE OF TECHNOLOGY,PUNE
UNIVERSITY OF PUNE
2013- 201 4

DEPARTMENT OF INFORMATION TECHNOLOGY
Certificate
This is to certify that,
B80228540: - Gurmeet Singh
B80228537: - Pratik Kumar
B80228542: - Raghuvendra Singh
have successfully completed this project report entitled “SENSITIVITY ANALYSIS OF EEDs”,
under my guidance in partial fulfillment of the requirements for the degree of Bachelor of
Engineering in Department o f Information Technology of University of Pune during the academic
year 2013-14.
Date: -
Place: -
Prof Savita Mangalore Prof. Sangeeta Jadhav
Guide Head of Department

Acknowledgement
We take this opportunity to thank our project guide Mrs.Savita Mangalore, Dr. Virendra
Kumar and Head of the Department Mrs. Sangeeta Jadhav for their valuable guidance and for
providing all the necessary facilities, which were indispensable in the completion of this project
report. We are also thankful to all the staff members of the Department of Information
Technology of Army Institute of Technology Pune for their valuable time, support, comments,
suggestions and persuasion. We would also like to thank the institute for providing the required
facilities, Internet access and important books.
Pratik Kumar
Gurmeet Singh
Raghuvendra Singh

ABSTRACT
The reliability determination of the electro-explosive devices is to be done before using any
such devices. For this their stimulus level i.e., the optimal current required for any particular
EED, is determined by suitable sensitivity tests. These sensitivity tests calculate different types
of currents viz. All Fire Current (AFC), No Fire Current (NFC), Recommended Fire Current
(RFC) involved in firing the Electro- Explosive Devices (EEDs). There are four major methods
or techniques to do so named as:
1. Bruceton Method
2. Langlie Test
3. Neyer’s Method
4. AD Optimal Method
In order to obtain these three currents, the calculations involving n, Σni, Σni2, mean, median,
standard deviation, variance etc. are to be performed which is a very laborious and tedious job,
which take even 5-6 hours also. So, the software being developed will be a user friendly and
menu driven software which will be able to calculate all three currents very precisely in less than
5 seconds. And the software will process the experimental data and perform all the complicated
statistical calculations in order to reduce manual errors to give the optimal results.

CONTENTS
1 Introduction 1
1.1 Need . . . . . . . . . . . . . . . . . . . . . . . . . . . . . . . . . . . . . . 1
1.2 Basic Concepts. . . . . . . . . . . . . . . . . . . . . . . . . . . . . . . . . . . . 2
1.3 Application . . . . . . . . . . . . . . . . . . . . . . . . . . . . . . . . . . 3
2 Literature Survey 4
2.1 Bruceton Method . . . . . . . . . . . . . . . . . . . . . . . . . . . . 4
2.2 Langlie Test . . . . . . . . . . . . . . . . . . . 4
2.3 Neyer’s Method. . . . . . . . . . . . . . . . . . . . . . . . . . . . . . . 5
2.4 AD Optimal Method . . . . . . . . . . . . . . . . . . . . . . . . . . 5
2.5 Flow chart . . . . . . . . . . . . . . . . . . . . . . . . . . . . . . . . . . . . .6
3 Project statement 10
3.1 Project statement . . . . . . . . . . . . . . . . . . . . . . . . . . . . . . . . . 10
3.2 Technology used 10
4 System requirement and specification.
4.1 Software Requirements . . . . . . . . . . . . . . . . . . . . . . . . . . . . . . . . . . . . .11
4.2 Hardware Requirement . . . . . . . . . . . . . . . . . . . . . . . . . . . . . . . . . . . . 11
5 Design
5.1 Data Flow Diagram . . . . . . . . . . . . . . . . . . . . . . . . . . . . . . . . . . . . . .12
5.2 UML Diagrams . . . . . . . . . . . . . . . . . . . . . . . . . . . . . . . . . . . . . . . . . 14
5.3 Output. . . . . . . . . . . . . . . . . . . . . . . . . . . . . . . . . . . . . . . . . . . . . . . . . . . . 16
6 TESTING
6.1 Login Test Case . . . . . . . . . . . . . . . . . . . .. . . . . . ….20
6.2 Main Menu Test Cases . . . . . . . . . . . . . . . . . . . . . . . …20
7 Planning and scheduling
6.1 Planning . . . . . . . . . . . . . . . . . . . . . . . . . . . . . . . . . . . 21
6.2 TIME LINE CHART . . . . . . . . . . . . . . . . . . . . . . . . ……….22
References 16

List of Figures
2.1 BRUCETON FLOW DIAGRAM . . . . . . . . . . . . . . . . . 7
2.2 LANGLIE FLOW CHART. . . . . . . . . . . . . . . . . . . . . . . . . . . . . .8
2.3 AD OPTIMAL . . . . . . . . . . . . . .. . . . . . . . . . . . . . . . . . . . . . . . .9
5.1 DFD LEVEL 0 DIAGRAM . . . . . . . . . . . . . . . . . . . . . . . . 12
5.2 DFD LEVEL 1 DIAGRAM . . . . . . . . . . . . . . . . . . . . . . . . .12
5.3 DFD LEVEL 2 DIAGRAM . . . . . . . . . . . . . . . . . . . . . . . . .13
5.4 USE CASE DIAGRAM . . . . . . . . . . . . . . . . . . . . . . . . . . . . . 14
5.5 CLASS DIAGRAM. . . . . . . . . . . . . . . . . . . . . . . . . . . . . . . . . 14
6.1 TIME LINE CHART . . . . . . . . . . . . . . . . . . . . . . . . . . . . . . . . . . . . . 15

CHAPTER 1
INTRODUCTION
Sensitivity tests are often used to estimate the parameters associated with latent continuous
variables that cannot be measured. For example, in testing the sensitivity of explosives to shock,
each specimen is assumed to have a critical stress level or threshold. Shocks larger than this level
will always explode the specimen, but smaller shocks will not lead to explosion. Repeated testing
of any one sample is not possible, because the stress that is not sufficient to cause explosion
nevertheless will generally damage the specimen.
To measure probability of response, samples are tested at various stress levels and the response
or lack thereof is noted.
1.1 NEED
Explosives designers are often interested in determining the all-fire level, usually defined as the
level of shock necessary to cause 99.9Explosive materials may be categorized by the speed at
which they expand. Materials that detonate (explode faster than the speed of sound) are said to
be ”high explosives” and materials that deflagrate are said to be ”low explosives”. Explosives
may also be categorized by their sensitivity. Sensitive materials that can be initiated by a
relatively small amount of heat or pressure are primary explosives and materials that are
relatively insensitive are secondary or tertiary explosives.
• The safety testing of explosives involves the determination of various properties of the different
energetic materials that are used in commercial, mining, and military applications. It is highly
desirable to measure the conditions under which explosives can be set off for several reasons,
including: Safety in handling, Safety in storage, Safety in use. The new sensitivity test based on a
known probability response curve. It has advantages over many previously described sensitivity
tests, especially if the parameters of the probability distribution are not well known in advance.
This procedure has a starting algorithm that quickly produces unique estimates of the parameters,
regardless of how close the parameters of the population are to the initial guesses. It uses a
design motivated by D-optimality considerations for the remaining samples to maximize
knowledge of the parameters of the curve. A c-optimal design would allow more precise
estimation of one quantile by concentrating the tests near the specified level. The estimate would
also be independent of the distribution. The c-optimal design, however, does not efficiently
provide knowledge of the form of the whole population. (A c-optimal design for estimating
quantiles in the tails of a distribution would concentrate tests at two points in the distribution. A
D-optimal design provides efficient estimates of the parameters of the distribution. It allows
relatively efficient determination of all quantiles of the population, but the estimates are
distribution dependent. A D-optimal design in many cases could be of more use to engineers than

a c-optimal design, even when the engineer is only interested in one extreme quintile. Suppose
an engineer wants to test new explosive mixtures for greater sensitivity. A c-optimal design
should allow the engineer to determine the all-fire level more efficiently than a D-optimal design.
The engineer could then restrict future study to mixtures with smaller thresholds. Knowledge of
the entire response curve, however, would allow the experimenter to further investigate
potentially promising mixtures. For example, a mixture with larger all-fire level but smaller scale
parameter might give insight into methods of improving process control. And a mixture with
lower mean but larger scale parameter might yield a lower all-fire level if the process could be
brought under better control.
1.2 BASIC CONCEPTS
What is an EED?
An explosive or pyrotechnic component that initiates an explosive, burning, electrical, or
mechanical train and is activated by the application of electrical energy. Electro-explosive
devices fundamentally convert electrical energy into thermal energy, to start off the explosive
chemical reaction. Obviously, the activation of those devices shall not happen by accident or,
even worse, by intentional exogenous influence.
All Fire Current(AFC)/No Fire Current:
The minimum current that will always fire the initiator or pyrotechnic device is defined by the
term “all-fire”, whereas “no-fire” is the term for the maximum current that may be applied for a
specified time period without firing the initiator or device.
What is sensitivity analysis of EED?
In testing the sensitivity of pyrotechnics to ignition, each specimen is assumed to have a critical
stress level or threshold. Ignition pulses larger than this level will always ignite the specimen,
while smaller pulses will not lead to ignition. Repeated testing of any one sample is not possible,
since the pulse that is not sufficient to cause ignition nevertheless will generally damage the
specimen. The sensitivity of the EEDs against different test levels is measured.
Tests for Sensitivity Analysis:
1. Bruceton Test
2. Langlie Test
3. Neyer’s Test
4. Neyer’s D-Optimal Test
1.3 APPLICATION
The project is useful for the following purposes to carry out:
• Medical: Drug Analysis

The sensitivity analysis plays an vital role in the medical science and because of the development
of both mathematics and computer has taken whole market era under his control and because of
this technology now it is possible to apply these things in our medical science also. Each human
body contains chemicals and for certain reaction to occur inside our body required minimum
amount of chemical to react with another chemical and produce the desired chemical. But if the
required amount of chemical is given less than the requirement or it is given more that the
requirement then it causes a heavy damages to our system. So here comes the need of analyzing
the drugs so the usage of medicine can be effective and in case of excess dosage it should not kill
the patient but it can save the life of that patient by using these techniques. Here comes the
sensitivity analysis part which plays an important role in analyzing the most effective amount of
drug and minimum effective amount of drug in medical science. So the chemical proportion can
maintain balanced and healthy.
• Soil: Minerals Analysis
The most amazing fact is that about these sensitivity analysis is that it provide wide range of
scope in various application in the area where we comes across in our day to day life. The
sensitivity analyses of soil can we done by finding the minimum amount of minerals required for
the land to grow the particular crop in that area. This test helps them to find amount of each
chemical they are using for spraying or mixing with soil to produce the desired environment
condition of soil. It should not happen that it is sprayed or mixed more than the requirement than
it will in case of saving spoil whole the things. Because of widen scope it used in the mineral
analysis of the soil to provide the minimum required amount for that component in the soil.
• Military: Explosive Weapon
An explosive weapon generally uses high explosive to project blast and/or fragmentation from a
point of detonation. Explosive weapons may be subdivided by their method of manufacture into
explosive ordnance and improvised explosive devices (IEDs). Sensitivity refers to the ease with
which an explosive can be ignited or detonated, i.e., the amount and intensity of shock, friction,
or heat that is required. When the term sensitivity is used, care must be taken to clarify what kind
of sensitivity is under discussion. The relative sensitivity of a given explosive to impact may
vary greatly from its sensitivity to friction or heat. Some of the test methods used to determine
sensitivity relate to: Impact Sensitivity is expressed in terms of the distance through which a
standard weight must be dropped onto the material to cause it to explode. Friction Sensitivity is
expressed in terms of what occurs when a weighted pendulum scrapes across the material (it may
snap, crackle, ignite, and/or explode).
• Civil: Explosive engineering
Development and characterization of new explosive materials in various forms. Analysis of the
physical process of detonation. Explosive generated shock waves and their effects on materials.
Safety testing of explosives. Analysis and engineering of rock blasting for mining.
• Safety: Explosive Safety

Explosives safety originated as a formal program in the United States in the aftermath of World
War I when several ammunition storage areas were destroyed in a series of mishaps. he most
serious occurred at Lake Denmark Naval Ammunition storage Depot, New Jersey, in July, 1926
when an electrical storm led to fires that caused explosions and widespread destruction. So it is
needed to investigate the disaster and determine if similar conditions existed at other ammunition
depots. For this purpose Ammunition and Explosives Safety Standards are needed to be set and
sensitivity test is used to set these standards for explosives. The scientific data is evaluated which
may adjust. Those standards, reviews and approves all explosives site plans for new construction,
and conducts worldwide visits to locations containing US title ammunitions. These all tests and
standards are set on the sensitivity of the explosive.
CHAPTER 2
LITERATURE SURVEY
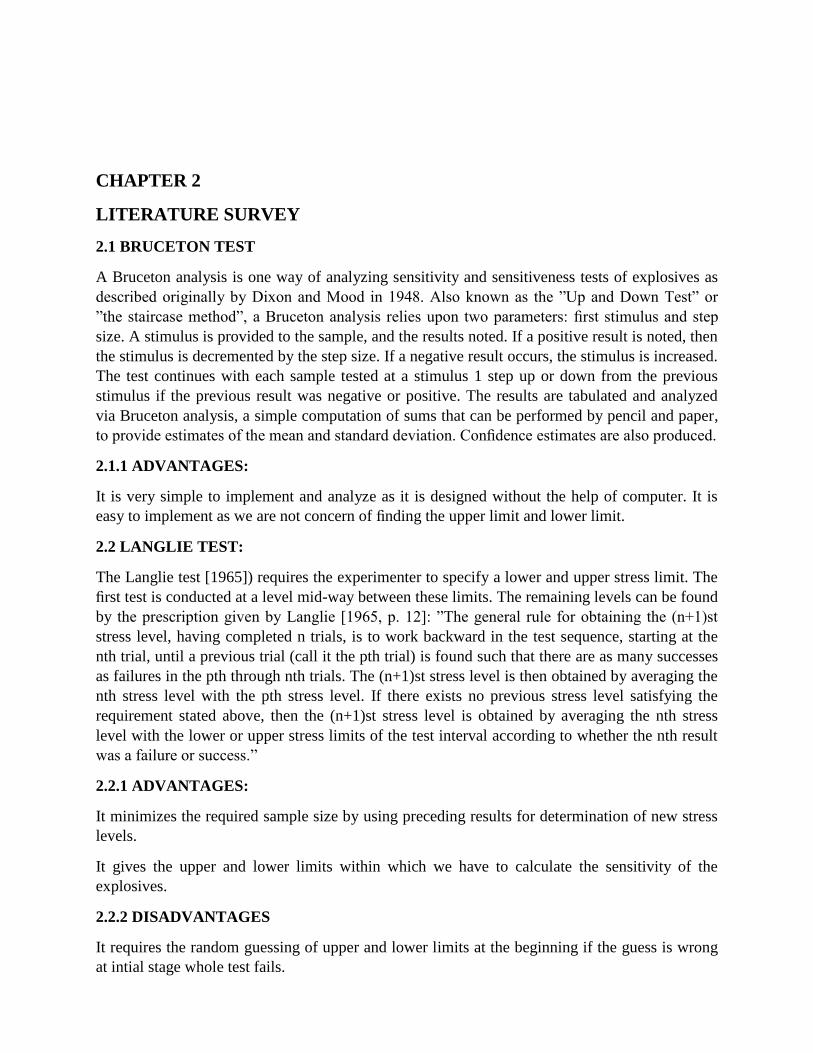
2.1 BRUCETON TEST
A Bruceton analysis is one way of analyzing sensitivity and sensitiveness tests of explosives as
described originally by Dixon and Mood in 1948. Also known as the ”Up and Down Test” or
”the staircase method”, a Bruceton analysis relies upon two parameters: first stimulus and step
size. A stimulus is provided to the sample, and the results noted. If a positive result is noted, then
the stimulus is decremented by the step size. If a negative result occurs, the stimulus is increased.
The test continues with each sample tested at a stimulus 1 step up or down from the previous
stimulus if the previous result was negative or positive. The results are tabulated and analyzed
via Bruceton analysis, a simple computation of sums that can be performed by pencil and paper,
to provide estimates of the mean and standard deviation. Confidence estimates are also produced.
2.1.1 ADVANTAGES:
It is very simple to implement and analyze as it is designed without the help of computer. It is
easy to implement as we are not concern of finding the upper limit and lower limit.
2.2 LANGLIE TEST:
The Langlie test [1965]) requires the experimenter to specify a lower and upper stress limit. The
first test is conducted at a level mid-way between these limits. The remaining levels can be found
by the prescription given by Langlie [1965, p. 12]: ”The general rule for obtaining the (n+1)st
stress level, having completed n trials, is to work backward in the test sequence, starting at the
nth trial, until a previous trial (call it the pth trial) is found such that there are as many successes
as failures in the pth through nth trials. The (n+1)st stress level is then obtained by averaging the
nth stress level with the pth stress level. If there exists no previous stress level satisfying the
requirement stated above, then the (n+1)st stress level is obtained by averaging the nth stress
level with the lower or upper stress limits of the test interval according to whether the nth result
was a failure or success.”
2.2.1 ADVANTAGES:
It minimizes the required sample size by using preceding results for determination of new stress
levels.
It gives the upper and lower limits within which we have to calculate the sensitivity of the
explosives.
2.2.2 DISADVANTAGES
It requires the random guessing of upper and lower limits at the beginning if the guess is wrong
at intial stage whole test fails.

2.3 NEYER’S METHOD
The Neyer D-Optimal Test is one way of analyzing a sensitivity test of explosives as described
by Barry T. Neyer in 1994. This method has replaced the earlier Bruceton analysis or ”Up and
Down Test” that was devised by Dixon and Mood in 1948 to allow computation with pencil and
paper. Samples are tested at various stimulus levels, and the results (response or no response)
noted. The Neyer Test guides the experimenter to pick test levels that provide the maximum
amount of information. Unlike previous methods that have been developed, this method requires
the use of a computer program to calculate the test levels. Although not directly related to the test
method, the likelihood ratio analysis method is often used to analyze the results of tests
conducted with the Neyer D-Optimal test. The combined test and analysis methods are
commonly known as the Neyer Test.
2.3.1 ADVANTAGES
The Neyer Test guides the experimenter to pick test levels that provide the maximum amount of
information by testing the samples at various levels and the response and no response is noted.
Computer calculations are used for accuracy and efficiency. This method is extended to deal with
situations which are not handled by previous algorithms, including extension from fully
sequential designs (updating the plan after each observation) to group-sequential designs (any
partition of the experiment to blocks of numerous observations). It uses binary search technique
(response) for any generalized linear model and from the univariate case to the treatment of
multiple predictors.
2.4 AD OPTIMAL METHOD
Sensitivity tests are often used to estimate the parameters associated with latent continuous
variables which cannot be measured. For example, each explosive specimen has a threshold. The
specimen will detonate if and only if an applied shock exceeds this value. Since there is no way
to determine the threshold of an individual, specimens are tested at various levels to determine
parameters of the population. A new test described here produces efficient estimates of the
parameters of the distribution, even with limited prior knowledge. This test efficiently
characterizes the entire distribution and desired percentiles of any population.
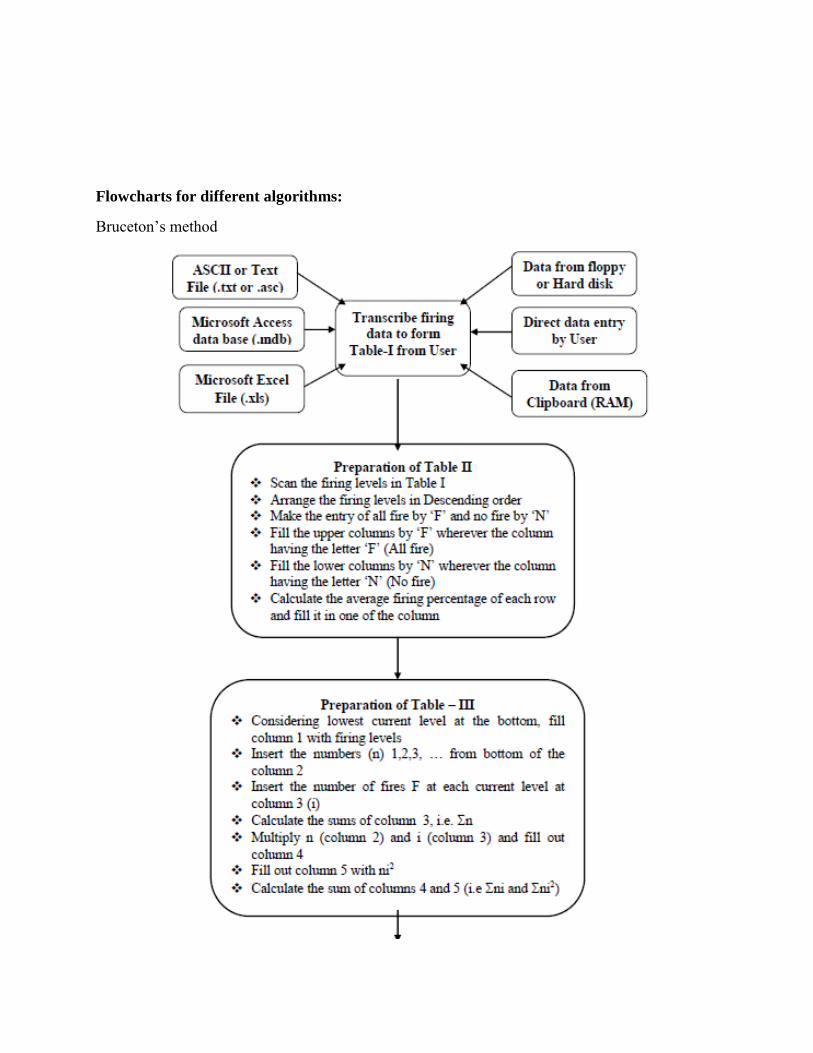
Flowcharts for different algorithms:
Bruceton’s method

FIG 2.1

FIG 2.2

AD Optimal Test
FIG 2.3

CHAPTER 3
3.1 PROJECT STATEMENT
To implement different sensitivity analysis methods for EEDs. The Bruceton test is already
implemented and in this project we are implementing the three new test which are explained by
Berry T Neyers but not yet implemented.The Other three methods including Bruceton are :
Langlie test, Neyers test and AD Optimal test. The theme of project is to develop a menu driven
software which contains all the four options of calculating the threshold value of all type of
explosives , by different methods.
3.2 TECHNOLOGY USED
There are four test method used to check their sensitivity and stored in the
database.
1.Java as interface
2.File as Database
3 Visual studio 2010
4.Platform as Eclipse.
FILE DATABASE

4. HARDWARE AND SOFTWARE SPECIFICATION
4.1 SOFTWARE REQUIREMENT
Java (JVM)
C++
OS(32 bit WINDOW 7)
4.2 HARDWARE REQUIREMENT
ATA HDD 7200 Rpm 40 GB
512 MB Ram
Colour Monitor
Processor above 1.7 Ghz

CHAPTER 5
DESIGN
5.1 DATA FLOW DIAGRAM
FIG 5.1 DFD LEVEL-0 DIAGRAM
FIG 5.2 DFD LEVEL-1 DIAGRAM

FIG 5.3 DFD LEVEL-03 DIAGRAM

5.2 UML DIAGRAM
FIG:5.4 USE CASE DIAGRAM
FIG: 5.5 CLASS DIAGRAM

Sequence diagram

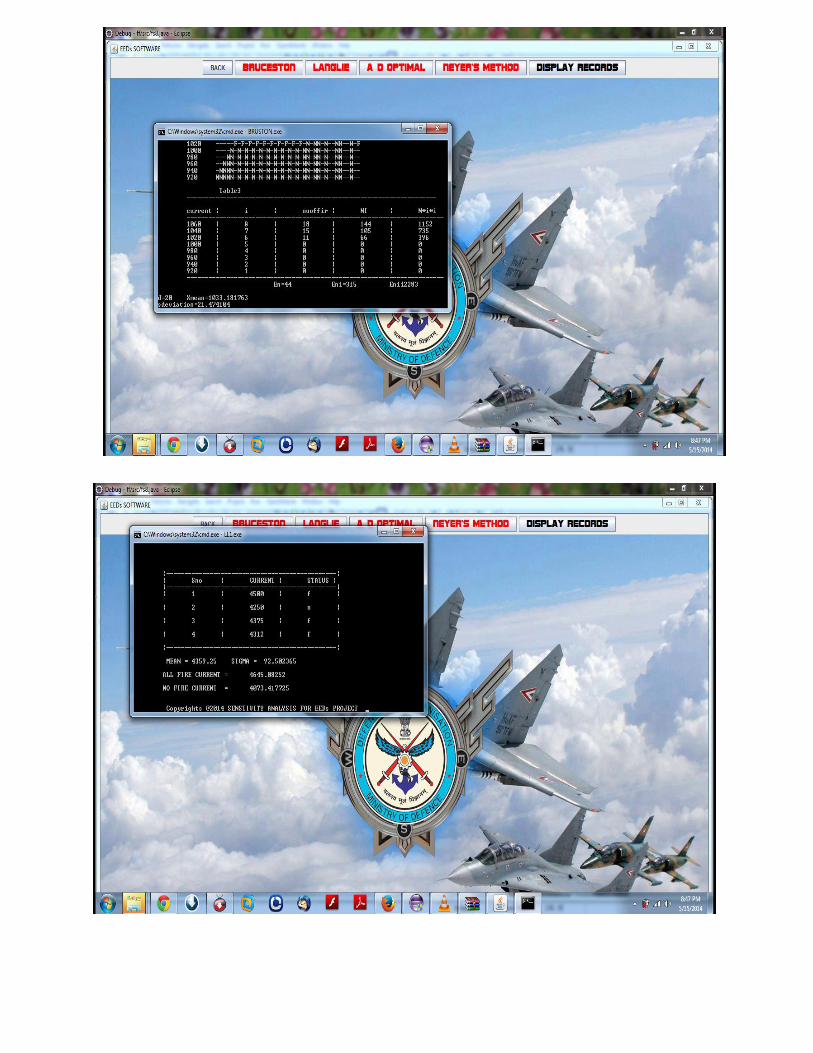
5.3 OUTPUT


6. TEST CASES
6.1 TEST CASES FOR LOGIN FORM
TEST-ID FLOW EXPECTED OUTPUT ACTUAL RESULT
1 USER ENTER DATA IN CORRECT FORMAT
LOGINED SUCCESSFUL LOGINED SUCCESSFUL
2 USER ENTER DATA INCORRECT FORMAT
PLEASE ENTER VALID PASSWORD
PLEASE ENTER VALID PASSWORD
3 IF NO PASSWORD IS ENTERED AND LOGIN BUTTON IS CLICKED
PASSWORD FIELD CANNOT BE BLANK
PASSWORD FIELD CANNOT BE BLANK
6.2 TEST CASE FOR MAIN WINDOW
TEST-ID FLOW EXPECTED OUTPUT ACTUAL RESULT
1 USER SELECT METHOD OPENS AN NEW WINDOW FOR THAT METHOD
OPENS AN NEW WINDOW FOR THAT METHOD
2 USER SELECT DISPLAY OPEN DISPLAY DIALOG AND ASK FOR FILE NAME
OPEN DISPLAY DIALOG AND ASK FOR FILE NAME
3 LOGOUT CLOSE THE WINDOW CLOSE THE WINDOW

7. PLANING AND SCHEDULING
7.1 SCHEDULE CHART
TASK TO BE DONE START DATE DURATION
Task Planning 15 Sep 13 10 Days
Hardware & software discussion 25 Sep 13 15 Days
Project Module division 10 Oct 13 20 Days
Planning for development & Design 30 Oct 13 45 Days
Developing Modules 16 Dec 13 45 Days
Testing & Integration 2 Feb 14 40 Days
Documentation 23 April 14 35 Days
Deploy Project with Report 28 May 14 3 Day
7.2 TIMELLINE CHART
REFERENCES
[1] SOFTWARE FOR ALL/NO FIRE CURRENT COMPUTATION FOR ELECTRO
EXPLOSIVE DEVICES by Virendra Kumar, H Muthurajan
[2] J. W. Dixon and A. M. Mood (1948), "A Method for Obtaining and Analyzing Sensitivity
Data," Journal of the American Statistical Association, 43, 109-126.
[3] B. T. Neyer (1994), "A D-Optimality-Based Sensitivity Test," Technometrics, 36, 61-70.
[4] B. T. Neyer (1992), “Analysis of Sensitivity Tests,” MLM-3736, EG&G Mound Applied
Technologies.
[5] H. J. Langlie (1965), "A Reliability Test Method For "One-Shot'" Items," Technical Report
U-1792, Third Edition, Aeronutronic Division of Ford Motor Company, Newport Beach, CA.
[6] Study on Sensitivity Test and Application of Neyer D-Optimal Method by Kirby.
Copyright © 2022 FDOKUMEN