Interstitial lung disease associated to erlotinib treatment: a case report
Upload
independentCategory
view
2download
0
1
1
AJP- Regulatory, Integrative and Comparative Physiology.
MS # R-00645-2006.R1
Renal angiotensin II concentration and interstitial infiltration of immune
cells are correlated with blood pressure levels in salt-sensitive
hypertension.
Martha Franco1, Flavio Martínez2, Yasmir Quiroz 3, Othir Galicia 2,
Rocio Bautista 1, Richard J. Johnson 4, Bernardo Rodríguez-Iturbe 3.
1 Department of Nephrology, Instituto Nacional de Cardiología Ignacio Chávez Mexico
City, Mexico; 2 Department of Pharmacology, UASLP, Mexico; 3 Hospital
Universitario Universidad del Zulia and Centro de Investigaciones Biomédicas, IVIC-
Zulia, Maracaibo, Venezuela and 4 Division of Nephrology, Hypertension and
Transplantation, University of Florida, Gainesville FL
Correspondence: Bernardo Rodríguez-Iturbe, Nephrology, Hospital Universitario,
Ave. Goajira s/n, Maracaibo, Estado Zulia, Venezuela. Email: [email protected]
Short Title: Renal angiotensin and salt-sensitive hypertension
Page 1 of 26Articles in PresS. Am J Physiol Regul Integr Comp Physiol (May 2, 2007). doi:10.1152/ajpregu.00645.2006
Copyright © 2007 by the American Physiological Society.

2
2
Abstract. (226 words)
Renal immune cell infiltration and cells expressing angiotensin II (AII) in
tubulointerstitial areas of the kidney are features of experimental models of salt
sensitive hypertension (SSHTN). A high salt intake tends to suppress circulating AII
levels but intrarenal concentrations of AII have not been investigated in SSHTN. This
study explored the relationship between these features to gain insight in the
pathophysiology of SSHTN. Plasma AII and renal interstitial AII (microdialysis
technique), and the infiltration of macrophages, lymphocytes and AII positive cells were
determined in SSHTN induced by 5 weeks of a high salt diet (HSD) after short-term
infusion of angiotensin in rats with (n=10) and without (n=11) treatment with
mycophenolate mofetil (MMF) and in control rats fed a high (n=7) and normal (n=11)
salt diet. As in previous studies, MMF did not affect AII-associated hypertension but
reduced the interstitial inflammation and the SSHTN in the post AII-period. During the
HSD period, the AII group untreated with MMF had low plasma (2.4±SD1.4 pg/ml) and
high interstitial AII concentration (1310±208 pg/ml); MMF treatment resulted in
significantly lower interstitial AII (454 ±128 pg/ml). Renal AII concentration and the
number of tubulointerstitial AII positive cells were correlated. Blood pressure
correlated positively with interstitial AII and negatively with plasma AII, thus giving
compelling evidence of the paramount role of the AII within the kidney in the AII-
induced model of salt-driven hypertension.
Key words: lymphocytes, macrophages, interstitial inflammation, immune cells, renal
hypertension.
Page 2 of 26

3
3
INTRODUCTION
A series of investigations have documented that infiltration of immune cells, oxidative
stress and increased numbers of infiltrating inflammatory cells and proximal tubular
cells that express angiotensin II (AII positive cells), are present in the kidney in
experimental models of salt sensitive hypertension (SSHTN). The functional relevance
of these findings is indicated by a series of experiments that demonstrate that
suppression of the inflammatory infiltrate or the oxidative stress result in amelioration
or prevention of hypertension (reviewed in 17, 26). It is well known that inflammatory
reactivity is inextricably linked with oxidative stress as these conditions induce and
maintain one another (13); however, the participation of intrarenal AII activity as an
integral part of the tubulointerstitial inflammatory reactivity in the pathophysiology of
SSHTN has not been investigated. Angiotensin II positive cells have been identified in
the models of salt sensitive hypertension and double staining studies have shown that
the cells staining positive for AII are both proximal tubular cells and infiltrating
immune cells (1, 12, 14). Based on this evidence, we have postulated that in models of
SSHTN, the tendency to salt retention is driven by the intrarenal inflammation,
oxidative stress and AII activity (13,17) and results from other laboratories have
confirmed that intrarenal inflammation plays a role in the pathogenesis of hypertension
in several experimental conditions (5, 8, 10, 24).
The relevance of the intrarenal AII activity in the pathogenesis of hypertension
has been emphasized in the experiments of Navar and his associates (reviewed in 7)
who have elegantly shown that intrarenal AII functions as a separate compartment that
is not physiologically modulated by influences, such as plasma volume expansion, that
reduce plasma AII levels (9). Investigations from our group in the cellophane-wrapped
Page kidney model (25) demonstrated the critical role of interstitial inflammation and
Page 3 of 26

4
4
intrarenal, rather than plasma, angiotensin II activity in the long-term maintenance of
hypertension and more recently, micropuncture studies (3) showed that interstitial
inflammation is likely responsible for the cortical vasoconstriction that is present in salt-
sensitive hypertension. While the accumulated evidence is compelling, a demonstration
that increased concentration of AII in the kidney is, in fact, correlated with the severity
of hypertension, with the increased numbers of AII positive cells and with immune cell
infiltration has been lacking. Furthermore, concomitant evaluation of the renal and the
plasma AII concentration in relation to the blood pressure levels has not been made in
experimental models of SSHTN.
Therefore, the present work was done to define the following questions: 1)
What is the relationship between blood pressure, renal AII and plasma AII
concentrations in the salt-driven hypertension that follows AII infusion?; 2) Is there an
association between the concentration of AII in the kidney, the number of AII positive
cells and the severity of the inflammatory infiltrate?
Our studies demonstrate that blood pressure levels are negatively correlated with
plasma AII and positively correlated with renal AII concentrations. In addition, we
found that renal AII concentration is correlated with the number of AII positive cells
and infiltrating immune cells in tubulointerstitial areas of the kidney in this
experimental model.
METHODS
Male Sprague-Dawley rats from the animal facilities of the Instituto Nacional de
Cardiología (Mexico, D.F) weighing (340-360g) were used in the experiments. The
animals were housed and handled in accordance with institutional guidelines of animal
care. The following groups of rats were studied:
Page 4 of 26

5
5
Post-AII infusion salt sensitive hypertension (AII-SSHTN group, n=10). These rats were
studied following a protocol used in previous publications from our group (4, 14).
Briefly, AII (Sigma, St. Louis, MO) was infused during 2 weeks by subcutaneously
implanted osmotic pumps (Alzet model 2002, Alza Corp. Palo Alto CA) at a rate of 435
ng/kg/min. At the end of 2 weeks, pumps were withdrawn and after a period a washout
of 5 days on a normal sodium diet (0.4% NaCl) they were placed in a high salt diet (4%
NaCl, Harlan Co.) for 5 weeks. At the end of this period, the rats were prepared for the
studies of interstitial AII concentration by microdialysis as described afterwards and
when those studies were concluded kidneys were harvested for immunohistology (see
later).
Mycophenolate mofetil (MMF) treated AII-infused rats (AII-MMF group, n=11).
These rats received the AII infusion as described in the AII-SSHTN group above and, in
addition received MMF (30 mg/kg/day by gastric gavage) during the 2 week period of
AII infusion as described in earlier studies (4, 14). The rest of the experiment was
similar to the AII group described above including the washout period and the 5 weeks
of high salt diet.
Control rats with a high salt diet (c-HSD group n=10). These rats were housed in
similar conditions and were fed a 4% salt rat diet for 5 weeks
Control rats with normal salt diet (c-NSD group, n=11). These rats were housed in
similar conditions and were given a normal (0.4%) salt diet for 5 weeks prior to the
studies.
Additional experiments were done to determine AII renal and plasma
concentrations after the AII infusion was discontinued and before the induction of
SSHTN with the administration of a HSD. These experiments were done 5 days after
Page 5 of 26

6
6
removal of the osmotic minipumps in 10 additional rats of the AII -SSHTN group and in
9 additional rats of the AII-MMF group. Control studies were done in 8 rats with NSD.
Blood pressure. Systolic blood pressure (SBP) measurements were performed at
baseline and every two weeks in conscious, restrained rats by tail-cuff plethysmography
(Narco Biosystems, Austin, TX). Prior to the studies, all rats were conditioned to the
procedure as described in previous communications (4, 14). Determinations of the SBP
at the time when the studies were done were used in the correlation analyses.
Plasma and Renal AII determinations. For determinations of renal AII, rats were
prepared as for micropuncture studies as described in previous communications (3, 4,
21). Rats were anesthetized with sodium pentobarbital (30 mg/kg, i.p., and
supplementary doses were administered as required). The rats were placed on a thermo-
regulated table, and the temperature was maintained at 37°C. The left kidney was
exposed, placed in a Lucite holder and mean arterial pressure was continuously
monitored with a pressure transducer placed in the femoral artery.
Renal AII concentration was determined in the renal cortex by a microdialysis
technique, as described by Nishiyama et al. (9) and Fox et al. (2) and Siragy et al (23)
and reported by our group in a previous communication (3). Preliminary studies were
done to test the microdialysis probe in vitro, testing AII concentrations from 2 to 10
nMol, and correlation coefficient was r2= 0.94. At a perfusion rate of 1, 5 µl/min, the
relative equilibrium rate was 66 ± 2%, which did not deteriorate with time. In vivo
calibrations were performed from 0 to 180 min to test the stability of the AII
concentrations according with the method described by Nishiyama et al (9). Thirty
minutes after implantation of the probe, the concentrations of AII reach a steady state
and remain stable up to 180 min. Previous studies have determined that AII derived
from tubular fluid does not contaminate the dialysate (9).
Page 6 of 26

7
7
For determination of AII, a 10-mm polysulfone microdialysis probe (Fresenius
Medical Care, USA) with a 33,000-D transmembrane diffusion cut-off was implanted
into the renal superficial cortex. Steel needles were inserted in both ends of the fiber.
The inflow of the probe was connected with a polyethylene tubing (PE-10) to a
microinfusion pump (Harvard apparatus, Holliston, MA). The probe was perfused with
Ringer´s solution containing 1% bovine serum albumin (pH 7.4), at a rate of 1.5 µl/min.
The dialysate was collected directly from the outflow steel tubing into a tube containing
a solution of inhibitors (30 µl of 500 mM EDTA, 15 µl of 1mM enalaprilat and 30 µl of
125 M o-phenantrolene and 0.2 mM pepstatin A in 95 % ethanol), to allow the
dialysate effluent to be immediately mixed with the inhibitors. After 90 min of the
microdialysis probe implantation, three 60-min sample collections were taken.
Immediately thereafter, each sample was vortex-mixed, and 100 µl of the solution was
transferred to a tube containing 1 ml chilled 100% methanol. Blood was collected at the
end of the experiment into a prechilled syringe containing the inhibitors solution. After
centrifugation at 4°C plasma was separated.
Angiotensin II Assay. Determination of plasma and interstitial fluid AII by enzyme-
linked competitive immunoassay using a commercial Kit (SPI Bio, Bertin Group,
France), following the procedure recommended by the manufacturer. All assays were
carried out by one researcher in order to avoid inter-observer variability.
The dialysate samples were reconstituted with 100 µl of 0.9% saline solution
and extracted with methanol. Methanol was evaporated to dryness with nitrogen;
samples were reconstituted in assay buffer, extracted in phenyl cartridges and assayed in
duplicate using an 8-point standard curve (125 pg/ml, 62.5 pg/ml, 31.25 pg/ml, 15.625
pg/ml, 7.81 pg/ml, 3.9 pg/ml, 1.95 pg/ml, and 0.98 pg/ml). Absorbance at 415 nm was
determined in a microplate reader (Bio-Rad Inc.; Hercules, CA, USA.). When AII
Page 7 of 26

8
8
concentration levels of the sample were above 125 pg/ml in the angiotensin standard
curve, dilutions (1:5, 1:10 and 1:25) were done in order to obtain lectures between 7.81
and 62.5 pg / ml.
Cross-reactivity with the following angiotensin peptides was determined:
angiotensin I (AI (1-9); Bachem, H-5038.0025), Angiotensin II (AII; Bachem, H-
1705.0025), , Angiotensin I -7 (A I/II (1-7); Bachem, H-1715.0025) and Angiotensin 3-
8 (A I/II (3-8); Bachem, H-8125.0025). A 100 pg/ml standard was prepared for each
peptide. Readings were done at 415 nm. Cross reactivity results were as follows:
Angiotensin I = <0.01%; Angiotensin II= 99.9%; Angiotensin 1-7= <0.01%,
Angiotensin 3-8= 34.2%. Cross-reactivity with Angiotensin III (H-Arg-Val-Tyr-Ile-
His-Pro-Phe-OH) was not tested because reagent was unavailable but is assumed to be
100% (Bachem Online Catalog) Results obtained in our laboratory shown above were
similar or better than those reported by the manufacturers of the commercial kit used in
these studies (SPI Bio, Bertin Group, France).
Recovery using 3[H]-AII was 88 ± 16 % in 6 samples (range from 82.16 to
94.23 %). The intra- and inter-assay variations (three different assays each one in
duplicate) were 3.93±0.56 and 10.7±0.58, respectively. The minimal detectable
concentration was 0.99 pg/ml.
Histological studies.
Coronal sections were used for histological studies. The fragments were fixed in
10% formalin and embedded in paraffin. Immunoperoxidase methodology was used to
identify lymphocytes (CD5 positive cells), macrophages (ED1 positive cells) as detailed
previously (11). Cellular infiltration was evaluated separately in the glomeruli and in
tubulointerstitial areas and expressed as positive cells per glomerular cross section (gcs)
or positive cells per mm2, respectively.
Page 8 of 26

9
9
The primary antibodies used were anti-CD5 (mouse monoclonal anti-rat
thymocytes and lymphocytes) and anti ED-1 (mouse monoclonal anti-rat monocytes
and macrophages), purchased from Biosource International (Camarillo, CA). Rabbit
anti-human angiotensin II antiserum with cross-reactivity to rat angiotensin II
(Peninsula Laboratories) was used to identify angiotensin II-positive cells. Specificity
of the AII staining was validated by the demonstration that staining was prevented by
pre-incubating the antibody with human angiotensin II. as described in a previous
communication (15). Secondary biotin-conjugated affinity-pure antibodies with
minimal reactivity to rat serum proteins were purchased from Accurate Chemical and
Scientific Co. Westbury, NY. Non-relevant antibodies were used for negative control
studies. Imunohistological techniques have been reported previously (1, 12, 15, 16).
Immunohistology was evaluated with an Olympus BX51 System Microscope
and DP70 microscope Digital camera, with Image Analysis software of Sigma Pro,
Leesburgh, VA, as described in previous communications (1, 15, 16).
Immunohistological analyses were done without previous knowledge of the
experimental group of the biopsy or the results of other determinations
Statistical Analysis. Differences between groups were examined with multigroup
analysis of variance and Tukey Kramer post-tests. Correlations between variables were
analyzed with Person’s tests. Data is shown as mean ± SD. Two-tailed p values <0.05
were considered statistically significant.
RESULTS.
The mean values of plasma AII, renal AII concentration, cellular immune
infiltration in tubulointerstitial areas and the SBP in the experimental groups are shown
in Table 1. CD5+ cells and ED1+ cells were rare (0-2/gcs) and AII+ cells were not
found in the glomeruli in all the experimental groups that were studied.
Page 9 of 26

10
10
As shown in Table 1, the experimental groups covered a range of blood pressure
that went from mean values of 160 mmHg in the SSHTN group to 118 mmHg in the c-
NSD group and all the experimental and control groups had mean blood pressure levels
significantly different from one another. Correspondingly, the mean values of plasma
and renal AII were significantly different from one another in all experimental groups.
The infiltrating CD5 (lymphocytes) and ED1 (macrophages) cells and AII positive cells
in tubulointerstitial areas were similar in the AII-MMF group and the c-HDS groups
who had blood pressures of 140 mmHg and 129 mmHg, respectively and significantly
different (p<0.001) in the SSHTN group and c-NSD groups between themselves and
from the rest (Table 1).
The plasma levels of AII were negatively correlated (p<0.0001) with the blood
pressure (Figure 1A) in sharp contrast with the positive correlation (p<0.0001) that
existed between renal AII and blood pressure (Figure 1B). Positive correlations also
existed between CD5 positive cells and blood pressure (Figure 2A) and ED1 positive
cells and blood pressure (Figure 2B). Renal AII concentration was correlated with the
intensity of the inflammatory ED1 infiltration (Figure 3A) and with the number of
tubulointerstitial cells that stained positive for AII (Figure 3B). All these correlations
were highly significant (p<0.0001). A representative microphotograph of AII positive
cells in the biopsy of a rat in the SSHTN group is shown in Figure 4. As shown in the
figure, both infiltrating cells and proximal tubular cells stain positive for AII in a pattern
that includes cell membrane and cytoplasm.
Table 2 shows SBP, plasma and interstitial AII, 5 days after AII infusion was
discontinued (osmotic minipumps removed) and before the induction of SSHTN with a
high salt diet. At this time, SBP and plasma AII had returned to normal while renal AII
Page 10 of 26

11
11
remains high in the AII-SSHTN group. In contrast, the AII-MMF group presents renal
AII concentration that is not significantly different from the control group.
DISCUSSION.
We had previously shown that experimental salt-sensitive hypertension is
associated with inflammatory infiltration and increased numbers of AII positive cells in
tubulointerstitial areas of the kidney (1, 3, 12, 14, 16). As in previous studies, we did
not find AII positive cells within the glomerular tuft, despite the fact that AII may be
produced in the glomerulus, albeit in lesser quantity than in tubulointerstitium. The
present studies demonstrated a relationship between increased intrarenal AII
concentration, the number of tubulointerstitial AII positive cells and the severity of the
inflammatory infiltration in the post-AII SSHTN model. The relationship between AII
positive cells and AII activity in interstitial fluid raises the possibility that they these
cells are potential sources of interstitial AII. Since both proximal tubular cells and
immune cells are capable of producing AII, it is conceivable that that AII produced by
infiltrating cells and by proximal tubular cells may be released in the interstitial fluid.
This possibility needs to be addressed in subsequent studies. However, it should be
noted that AII concentration in the kidney is modulated by physiologic mechanisms
independent of interstitial inflammation and, therefore, conclusions based on the
correlation with the immune cell accumulation are applicable only to the post-AII model
of SSHTN
Determinations of interstitial AII concentrations in the rats after the infusion of
angiotensin confirmed previous studies that showed that renal AII is increased after
exogenous angiotensin administration (27, 29). In fact, the values found 5 days after
AII infusion was stopped (Table 2) are higher than the values found 5 weeks later,
Page 11 of 26

12
12
during the period of SSHTN (Table 1). From these data is apparent that normal blood
pressure and high concentrations of renal AII coexist in the post-angiotensin infusion
period. Increased renal angiotensin concentration appears to be relevant to hypertension
specifically in the context of a high salt diet when a tendency to sodium retention would
result in SSHTN. Relevant to this issue, Kobori et al. (6) showed that intrarenal
angiotensinogen production is markedly increased in Dahl salt-sensitive hypertensive
rats, suggesting that augmentation of renal angiotensin activity may be involved in salt-
dependent hypertension. Of note, MMF treatment during the administration of
exogenous angiotensin prevented the increment in renal AII concentration induced by
exogenous AII (Table 2). The present studies do not allow discerning whether MMF is
suppressing AII production directly or as a result of the drug’s anti-inflammatory effects.
In order to study a wide range of values we choose to study experimental groups
in which we knew from previous studies (4, 14) that the immune cells infiltration, the
number of AII positive and blood pressure were significantly increased (AII infusion
model) and that all these characteristics were significantly reduced by MMF treatment
administered during AII infusion, prior to the SSHTN phase. In this manner, potential
direct effects of MMF on the experimental variables were unlikely since the drug was
stopped more than 5 weeks before the studies were done. Other investigators have
shown that AII infusion results in increased renal AII (20, 27, 28) and, in fact, 5 days
after the AII infusion was discontinued there was increased AII concentration in the
kidney (Table 2). It is undefined for how long the intrarenal AII remains elevated after
AII administration in the absence of a high salt diet but since AII infusion had been
stopped 40 days before the SSHTN studies were conducted (5 days of washout period
plus 5 weeks of high salt diet) it seems unlikely that intrarenal AII levels would be
solely due to a carried-over effect of exogenous angiotensin administration. MMF-
Page 12 of 26

13
13
treated rats were exposed to similar amounts of exogenous AII but had significantly less
intrarenal AII prior to and after SSHTN developed. Consequently, the findings in our
studies are likely independent of both exogenous AII and MMF.
The observation that plasma AII was suppressed whereas intrarenal AII was high
in SSHTN does not completely rule out the possibility that plasma AII is not
participating in this model, as it may not be suppressed as much as it should be from the
effects of the high salt diet and elevated blood pressure. Indeed, Sealey et al (22) have
proposed that intrarenal microvascular disease (which occurs in this model) may lead to
uneven renal perfusion (nephron heterogeneity) that may result in some nephrons to
overproduce renin whereas others may show an opposing effect. While we did not
measure renin levels, the observation that rats with SSHTN had lower (and not higher)
plasma AII than c-HSD rats suggests that plasma AII was even more suppressed in
SSHTN. Furthermore, the linear negative correlation between plasma AII and blood
pressure (Figure 1) would also argue against a pro-hypertensive role of incomplete
suppression of plasma AII since if such were the case, one would expect that the plasma
AII and blood pressure levels in the SSHTN rats would positively correlated..
The results of the present studies are in agreement with previous investigations
from our group, mentioned before, and others (5, 8, 10, 24), showing an association
between immune cell infiltration and the development of SSHTN. In fact, a recent
authoritative review suggests that the beneficial effects of AII blockers may be related
in part to anti-inflammatory effects (19). To be noted, the associations of blood
pressure levels with the intensity of the inflammatory infiltrate and the numbers of AII
positive cells are not evident in the middle range of the findings. As shown in Table 1,
the AII-MMF group and the c-HSD group do not differ significantly in the number of
infiltrating cells or in the number of AII positive cells and, nevertheless, these groups
Page 13 of 26

14
14
have significantly different mean blood pressure levels (140±8.4 mmHg and 129±4.7
mmHg, respectively, p<0.001 in Table 1). Consequently, other factors are also playing
a role in the development of SSHTN and it is reasonable to consider that these factors
are also responsible for driving the immune infiltrate from the low levels found in c-
NSD to the high levels found in the SSHTN group (Table 1). Among these conditions a
critical role is likely played by oxidative stress that is known to be inextricably
associated with both local inflammation and blood pressure (17, 26). Determination of
oxidative stress was not done in these experiments but in previous investigations we
have shown that antioxidant treatment reduces renal inflammatory infiltrate and
ameliorates hypertension (18).
Notwithstanding the findings in the middle range values shown in Table
1 and discussed above, the highly significant correlation between AII positive cells and
renal AII concentration (Figure 3B) is important and indicates that AII positive cells, if
overabundant, are likely associated with increased renal AII activity. To be sure, the
correlations found in these studies do not prove a causal relationship between
inflammatory infiltration and interstitial AII activity but this possibility is in line with
recent observations from our group in the same experimental model of SSHTN,
showing that blockade of angiotensin II type 1 receptor with candesartan and MMF-
induced reduction of interstitial inflammation have similar effects on glomerular
hemodynamics and blood pressure (3).
Finally, this work clearly demonstrates that plasma AII and renal AII
concentrations move in opposite directions in post-AII SSHTN and renal AII
concentrations have a direct and exquisite relationship with blood pressure levels in this
model of salt driven hypertension.
Page 14 of 26

15
15
Acknowledgements: This study was supported by grants 40943-M (M. Franco) from
the National Council of Science and Technology (CONACYT), Mexico, from NIH
grants HL68607 and DK52121 (R Johnson), and from FONACIT Grant 2005-000283,
Venezuela (B. Rodriguez-Iturbe). Dr Johnson is a consultant for and Nephromics Inc.
Page 15 of 26

16
16
REFERENCES.
1. Alvarez V, Quiroz Y, Nava M, Pons H, and Rodriguez-Iturbe B. Overload
proteinuria is followed by salt-sensitive hypertension caused by renal infiltration of
immune cells. Am J Physiol Renal Physiol. 283;F1132-141, 2002..
2. Fox J, Guan S, Hymel AA, and Navar LG. Dietary Na and ACE inhibition
effects on renal tissue angiotensin I and II and ACE activity in rats. Am J
Physiol Renal Phys 262:F902-F909, 1992..
3. Franco M, Martinez F, Rodriguez-Iturbe B, Johnson RJ, Santamaria J,
Montoya A, Nepomuceno T, Bautista R, Tapia E, and Herrera-Acosta J.
Angiotensin II, interstitial inflamation, and the pathogenesis of salt-sensitive
hypertension. Am J Physiol Renal Physiol 291; F1281-F1287
4. Franco M, Tapia E, Santamaría J, Zafra I, García-Torres R, Rodríguez-
Iturbe B, Gordon Kl, Johnson RJ, and Herrera-Acosta J. Renal cortical
vasoconstriction contributes to the development of salt-sensitive hypertension
after Angiotensin II exposure. J Amer Soc Nephrol. 12: 2263-2271, 2001.
5. Gu JW, Tian N, Shparago M, Tan W, Bailey AP, and Manning Jr RD.
Renal NF{kappa}B Activation and TNF{alpha} up-regulation correlate with
salt-sensitive hypertension in Dahl Salt-sensitive (SS) Rats. Am J Physiol Regul
Integr Comp Physiol. 291: R1817-R1824, 2006
6. Kobori H, Nishiyama A, Abe Y, and Navar LG. Enhancement of intrarenal
angiotensinogen in Dahl salt sensitive rats on high salt diet. Hypertension 41:
592-597, 2003.
7. Kobori H, Ozawa Y, Suzaki Y, Prieto-Carrasquero MC, Nishiyama A,
Shoji T, Cohen EP, and Navar LG. Young Scholars Award Lecture:
Page 16 of 26

17
17
Intratubular angiotensinogen in hypertension and kidney diseases. Am J
Hypertens 19:541-550, 2006.
8. Mattson Dl, James L, Berdan EA, and Meister CJ. Immune suppression
attenuates hypertension and renal disease in the Dahl salt-sensitive rat.
Hypertension 48: 149-156, 2006
9. Nishiyama A, Seth DM, and Navar LG. Renal interstitial fluid concentrations
of angiotensins I and II in anesthetized rats. Hypertension. 39:129-34, 2002.
10. Ozawa Y, Kobori H, Suzaki Y, and Navar LG. Sustained Renal Interstitial
Macrophage Infiltration Following Chronic Angiotensin II Infusions.
Am J Physiol Renal Physiol. 292: F330-F339, 2006.
11. Parra G, Moreno P, and Rodríguez-Iturbe B. Glomerular proliferative activity and
T lymphocyte infiltration in acute serum sickness. Clin Immunol Immunopathol 82:
299-302, 1997.
12. Quiroz Y, Pons H, Gordon Kl, Rincón J, Chávez M, Parra G, Herrera-Acosta J,
Gómez-Garre D, Largo R, Egido J, Johnson RJ, and Rodríguez-Iturbe B.
Mycophenolate mofetil prevents the salt-sensitive hypertension resulting from short-
term nitric oxide síntesis inhibition. Am J Physiol Renal Physiol 281:F38-F47, 2001.
13. Rodriguez-Iturbe B, and Johnson RJ. The role inflammatory cells in the
kidney in the induction and maintenance of hypertension. Nephrol Dial
Transplant 21: 260-263, 2006
14. Rodríguez-Iturbe B, Pons H, Quiroz Y, Gordon K, Rincón J, Chávez M, Parra G,
Herrera-Acosta J, Gomez-Garre D, Largo R, Egido J, and Johnson RJ.
Mycophenolate mofetil prevents salt-sensitive hypertension resulting from angiotensin
II exposure. Kidney Int 59: 2222-2232, 2001.
Page 17 of 26

18
18
15. Rodriguez-Iturbe B, Quiroz Y, Ferrebuz A, Parra G, and Vaziri ND.
Evolution of renal interstitial inflammation and NF-κB activation in
spontaneously hypertensive rats. Am J Nephrol 24: 587-594, 2004.
16. Rodriguez-Iturbe B, Quiroz Y, Nava M, Bonet L, Chavez M,. Herrera-Acosta J,
Johnson RJ, and Pons HA. Reduction of renal immune cell infiltration results in
blood pressure control in genetically hypertensive rats. Am J Physiol Renal Physiol.
282:F191-F201, 2002
17. Rodriguez-Iturbe B, Vaziri ND, Herrera-Acosta J, and Johnson RJ.
Oxidative stress, renal infiltration of immune cells and salt-sensitive
hypertension: All for one and one for all. Am J Physiol Renal Physiol 286:
F606-F616, 2004
18. Rodríguez-Iturbe B, Zhan Chang-De, Quiroz Y, Sindhu RK, and Vaziri ND.
Antioxidant-rich diet improves hypertension and reduces renal immune infiltration in
spontaneously hypertensive rats. Hypertension 41:341-346, 2003.
19. Ruiz-Ortega M, Esteban V, Ruperez M, Sanchez-Lopez E, Rodriguez-Vita
J, Carvajal G, and Egido J. Renal and vascular hypertension-induced
inflammation: role of angiotensin II. Curr Opin Nephrol Hypertens. 15: 159-
166, 2006.
20. Sadjadi J, Kramer Gl, Yu CH, Welborn MB 3rd, and Modrall JG.
Angiotensin II exerts positive feedback on the intrarenal renin-angiotensin
system by an angiotensin converting enzyme-dependent mechanism. J Surg Res.
129:272-277, 2005.
21. Sanchez-Lozada LG, Tapia E, Avila-Casado C, Soto V, Franco M,
Santamaria J, Nakagawa T, Rodriguez-Iturbe B, Johnson RJ, and Herrera-
Acosta J. Mild hyperuricemia induces glomerular hypertension in normal rats.
Am J Physiol Renal Physiol 283:F1105-1110, 2002.
Page 18 of 26

19
19
22. Sealey JE, Blumenfeld JD, Bell GM, Pecker MS, Sommers SC, and Laragh
JH. On the renal basis for essential hypertension: nephron heterogeneity with
discordant renin secretion and sodium excretion causing a hypertensive
vasoconstriction-volume relationship. J Hypertens 6: 763-777, 1988
23. Siragy HM, Howell NL, Ragsdale NV, and Carey RM. Renal interstitial fluid
angiotensin. Modulation by anesthesia, epinephrine, sodium depletion and renin
inhibition. Hypertension 25: 1021-1024, 1995.
24. Stewart T, Jung FF, Manning J, and Vehaskari VM. Kidney immune cell
infiltration and oxidative stress contribute to prenatally programmed
hypertension. Kidney Int 68: 2180-2188, 2005.
25. Vanegas V, Ferrebuz A, Quiroz Y, and Rodriguez-Iturbe B. Hypertension in
Page (cellophane wrapped) kidney is due to interstitial nephritis. Kidney Int 68:
1161-1170, 2005.
26. Vaziri ND, and Rodriguez-Iturbe B. Mechanisms of Disease: oxidative stress
and inflammation in the pathogenesis of hypertension. Nat Clin Pract Nephrol
2: 582-593, 2006.
27. Von Thun AM, Veri R, El Dahr SS, and Navar LG. Augmentation of
intrarenal angiotensin II levels by chronic angiotensin II infusion. Am J Physiol
Renal Physiol 266: F120-F128, 1994..
28. Wang CT, Navar LG, and Mitchell KD. Proximal tubular fluid angiotensin II
levels in angiotensin II-induced hypertensive rats. J Hypertens 21:353-360,
2003.
29. Zhou LX, Hymel A, Imig ID, and Navar LG. Renal accumulation of
circulating angiotensin II in angiotensin II-infused rats. Hypertension 27: 658-
662, 1996
Page 19 of 26

20
20
FIGURE LEGENDS.
Figure 1. Negative correlation between plasma AII (log 2 scale) and systolic blood
pressure in salt sensitive hypertension (1A) contrasting with the positive correlation
present between blood pressure and renal AII concentration (log 2 scale).
Figure 2. Systolic blood pressure is positively correlated with lymphocyte infiltration
(CD5 + cells, 2A) and macrophage infiltration (ED1 + cells, 2B) in tubulointerstitial
areas.
Figure 3. Tubulointerstitial inflammation, as represented by macrophage infiltration
(ED1 + cells) is correlated with renal AII concentration (3A). Correlation between the
renal AII concentration and the number of cells staining positive for AII in
tubulointerstitial areas.
Figure 4. Microphotographs showing angiotensin positive cells that are both proximal
tubular cells (arrow heads) as well as infiltrating interstitial cells (arrows). Positive
staining is observed in cell membranes and cytoplasm. Increased numbers of AII
positive cells are present in a biopsy from the SSHTN group (4A) in contrast with the
near absence of these cells in a biopsy of a rats from the NSD group. (imunoperoxidase
technique, original magnification x400)
Page 20 of 26

TABLE 1.
SSHTN group
(n=11)
AII-MMF
group (n=10)
c-HSD group
(n=10)
c-NSD group
(n11)
SBP (mmHg) *** 160±7.24 140±8.36 129±4.74 118±5.64
Plasma AII (pg/ml) α 2.37±1.38 4.20±1.94 40.74±31.12 114.4±54.4
Renal AII (pg/ml) § 1310±208.8 454±128.2 154.95±91.0 121±30.0
AII+ cells/mm2 ω 51.9±7.78 25.7±4.80 25.49±4. 22 10.9±2.17
CD5+ cells/mm2 γ 61.4±9.43 30.2±4.31 37.37±4.07 17.9±3.09
ED1+ cells/mm2 γ 34.6±5.73 18.9±2.86 24.18±3.64 10.7±1.40
SBP= Systolic Blood Pressure; AII+ cells, lymphocytes (CD5+ cells) and macrophages
(ED1+ cells) are given as positive cells for mm2 in cortical tubulointerstitial areas.
Plasma AII determinations were done in 9 rats from the AII group, 8 rats from the AII-
MMF group, 6 rats from the c-HSD group and 9 rats from the c-NSD group.
** experimental groups are p<0.01 or p<0.001 vs one another α experimental groups are p<0.01 to p<0.001 vs one another § experimental groups are p<0.001 vs one another except for HSD and NSD ω experimental groups are p<0.001 vs one another except for AII-MMF and HSD.γ experimental groups are p<0.001 vs one another except for AII-MMf vs HSD that are p<0.05
Page 21 of 26

Table 2. Systolic Blood Pressure and angiotensin II levels five days after angiotensin II
infusion and before the induction of salt-sensitive hypertension.
AII group
(n=10 )
AII+MMF group
(n=9)
cNSD group
(n=8)
SBP (mmHg) 138.1±20.8 126.7±12.9 126.0±7.35
Plasma AII (pg/ml) 115.1±48.4 (9) 111.8±23.4 116.3±42.0
Renal AII (pg/ml) 1637±345.0 (8)*** 359.7±153.2 (8)
147.8±107.2
***P<0.001 vs. AII+MMF and cNSD. Renal AII in the AII group is also higher
(p<0.05) than the value found at the end of the SSHTN period shown in Table 1.
Numbers in parenthesis indicate the number of animals studied when it was different
from that shown for the total group.
Page 22 of 26

0.25 0.5 1 2 4 8 16 32 64 128 256
100110120130140150160170180
HSDNSDSSHTNAII-MMF
r= 0.869p<0.0001
Plasma AII (pg/ml)
Sys
tolic
Blo
od P
ress
ure
mm
Hg)
64 128 256 512 1024 2048
100110120130140150160170180
r=0.887p<0.0001
HSDLSDAIIMMF
Renal AII (pg/ml)
Sys
tolic
Blo
od P
ress
ure
(mm
Hg)
Figure 1
1A
1B
Page 23 of 26

0 10 20 30 40 50 60 70 80100110120130140150160170180
HSDNSDSSHTNAII-MMF
r =0.818p<0.0001
CD5 + cells /mm2
Sys
tolic
Blo
od P
ress
ure
(mm
Hg)
0 10 20 30 40 50
100110120130140150160170180
HSD
r= 0.803p<0.001
NSDSSHTNAII-MMF
ED1+ cells/mm2
Sys
tolic
Blo
od P
ress
ure
(mm
Hg)
Figure 2
2A
2B
Page 24 of 26

0 10 20 30 40 50
0
500
1000
1500
2000HSD
r=0.750p<0.001
NSDSSHTNAII-MMF
ED1+ cells /mm2R
enal
AII
(pg/
ml)
64 128 256 512 1024 2048
010203040506070
HSDNSDSSHTNAII-MMF
r= 0.861p<0.0001
Renal AII (pg/ml)
Tub
uloi
nter
stiti
al
AII
+ c
ells
/mm
2
Figure 3
3A
3B
Page 25 of 26
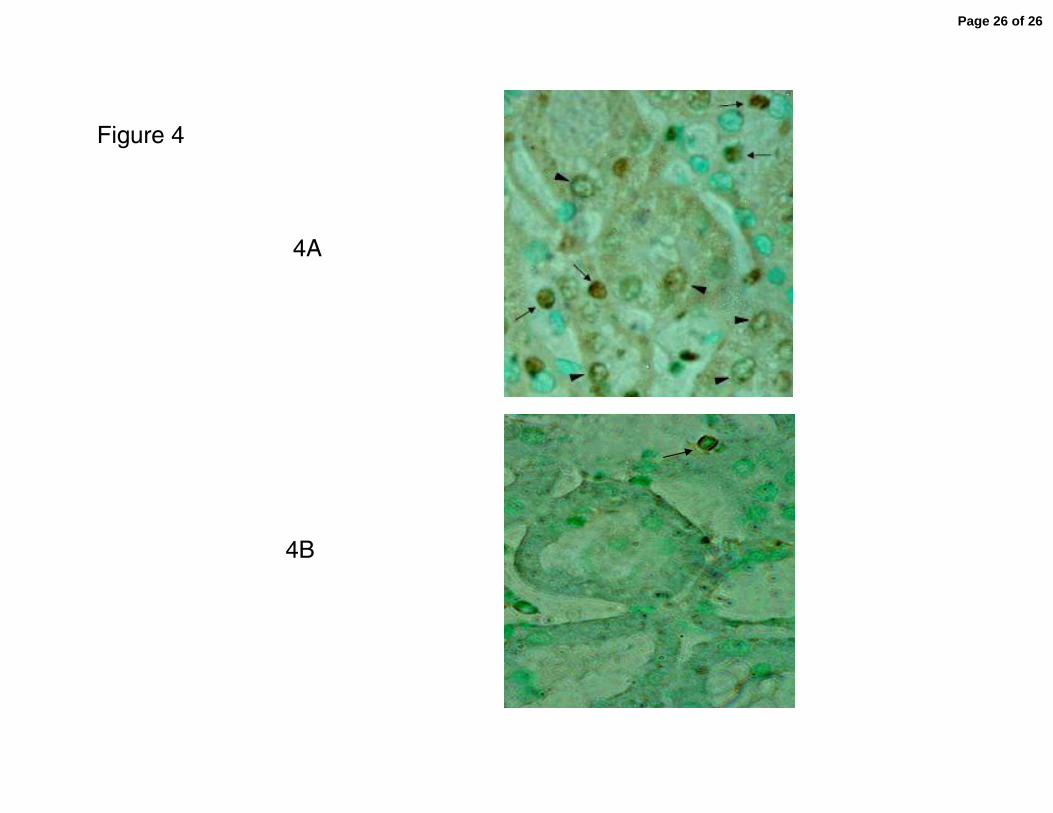
Figure 4
4A
4B
Page 26 of 26
Copyright © 2022 FDOKUMEN