Remnant cholesterol, low-density lipoprotein cholesterol, and blood pressure as mediators from...
34
665 I t has been shown previously that obesity is associated with increased risk of ischemic heart disease (IHD), 1–3 and that the association between obesity and IHD is likely to be caus- al 4 ; however, because it is probably not increased weight per se that leads to the increased risk, it is likely that this risk is mediated through variables such as lipoprotein levels, blood pressure, glucose levels, and inflammation. Obesity is an in- creasing problem for public health in many countries, and al- though elevated body mass index (BMI) is a modifiable risk factor, it is difficult to encourage individuals to lose weight and even more difficult to maintain weight loss. Therefore, it is important to delineate which of the intermediate variables from obesity to IHD are likely to be mediators. Editorial, see p 570 In this study, we use Mendelian randomization in the analy- sis of data from participants from the Copenhagen General Population Study (CGPS; n=69 535), the Copenhagen City Heart Study (n=10 099), and the Copenhagen Ischemic Heart Disease Study (n=5050) to test the hypothesis that the in- creased risk of IHD because of obesity is mediated through (1) elevated nonfasting remnant cholesterol, (2) reduced Clinical Track © 2014 American Heart Association, Inc. Circulation Research is available at http://circres.ahajournals.org DOI: 10.1161/CIRCRESAHA.116.304846 Rationale: Obesity leads to increased ischemic heart disease (IHD) risk, but the risk is thought to be mediated through intermediate variables and may not be caused by increased weight per se. Objective: To test the hypothesis that the increased IHD risk because of obesity is mediated through lipoproteins, blood pressure, glucose, and C-reactive protein. Methods and Results: Approximately 90 000 participants from Copenhagen were included in a Mendelian randomization design with mediation analyses. Associations were examined using conventional measurements of body mass index and intermediate variables and using genetic variants associated with these. During ≤22 years of follow-up 13 945 participants developed IHD. The increased IHD risk caused by obesity was partly mediated through elevated levels of nonfasting remnant cholesterol and low-density lipoprotein cholesterol, through elevated blood pressure, and possibly also through elevated nonfasting glucose levels; however, reduced high- density lipoprotein cholesterol and elevated C-reactive protein levels were not mediators in genetic analyses. The 3 intermediate variables that explained the highest excess risk of IHD from genetically determined obesity were low-density lipoprotein cholesterol with 8%, systolic blood pressure with 7%, and remnant cholesterol with 7% excess risk of IHD. Corresponding observational excess risks using conventional body mass index were 21%, 11%, and 20%, respectively. Conclusions: The increased IHD risk because of obesity was partly mediated through elevated levels of nonfasting remnant and low-density lipoprotein cholesterol and through elevated blood pressure. Our results suggest that there may be benefit to gain by reducing levels of these risk factors in obese individuals not able to achieve sustained weight loss. (Circ Res. 2015;116:665-673. DOI: 10.1161/CIRCRESAHA.116.304846.) Key Words: cardiovascular diseases ■ genetics ■ lipoproteins ■ Mendelian randomization analysis ■ myocardial ischemia ■ obesity ■ risk factors ■ triglycerides Original received July 18, 2014; revision received November 13, 2014; accepted November 19, 2014. In October, 2014, the average time from submission to first decision for all original research papers submitted to Circulation Research was 16 days. From the Department of Clinical Biochemistry (A.V., B.G.N.) and The Copenhagen General Population Study (A.V., M.B., A.T.-H., B.G.N.), Herlev Hospital, Copenhagen University Hospital, Herlev, Denmark; Faculty of Health and Medical Sciences, University of Copenhagen, Denmark (A.V., M.B., A.T.-H., B.G.N.); Department of Clinical Biochemistry, Gentofte Hospital, Copenhagen University Hospital, Hellerup, Denmark (M.B.); MRC Integrative Epidemiology Unit, Oakfield House, Oakfield Grove (G.D.S., N.J.T.) and School of Social and Community Medicine (G.D.S., N.J.T.), University of Bristol, United Kingdom; The Copenhagen City Heart Study, Frederiksberg Hospital, Copenhagen University Hospital, Frederiksberg, Denmark (A.T.-H., B.G.N.); and Department of Clinical Biochemistry, Rigshospitalet, Copenhagen University Hospital, Copenhagen, Denmark (A.T.-H.). The online-only Data Supplement is available with this article at http://circres.ahajournals.org/lookup/suppl/doi:10.1161/CIRCRESAHA. 116.304846/-/DC1. Correspondence to Børge G. Nordestgaard, MD, DMSc, Department of Clinical Biochemistry, Herlev Hospital, Copenhagen University Hospital, Herlev Ringvej 75, 2730 Herlev, Denmark. E-mail [email protected] Remnant Cholesterol, Low-Density Lipoprotein Cholesterol, and Blood Pressure as Mediators From Obesity to Ischemic Heart Disease Anette Varbo, Marianne Benn, George Davey Smith, Nicholas J. Timpson, Anne Tybjærg-Hansen, Børge G. Nordestgaard by guest on May 17, 2016 http://circres.ahajournals.org/ Downloaded from by guest on May 17, 2016 http://circres.ahajournals.org/ Downloaded from by guest on May 17, 2016 http://circres.ahajournals.org/ Downloaded from by guest on May 17, 2016 http://circres.ahajournals.org/ Downloaded from by guest on May 17, 2016 http://circres.ahajournals.org/ Downloaded from by guest on May 17, 2016 http://circres.ahajournals.org/ Downloaded from by guest on May 17, 2016 http://circres.ahajournals.org/ Downloaded from by guest on May 17, 2016 http://circres.ahajournals.org/ Downloaded from by guest on May 17, 2016 http://circres.ahajournals.org/ Downloaded from by guest on May 17, 2016 http://circres.ahajournals.org/ Downloaded from by guest on May 17, 2016 http://circres.ahajournals.org/ Downloaded from by guest on May 17, 2016 http://circres.ahajournals.org/ Downloaded from by guest on May 17, 2016 http://circres.ahajournals.org/ Downloaded from by guest on May 17, 2016 http://circres.ahajournals.org/ Downloaded from by guest on May 17, 2016 http://circres.ahajournals.org/ Downloaded from by guest on May 17, 2016 http://circres.ahajournals.org/ Downloaded from by guest on May 17, 2016 http://circres.ahajournals.org/ Downloaded from by guest on May 17, 2016 http://circres.ahajournals.org/ Downloaded from by guest on May 17, 2016 http://circres.ahajournals.org/ Downloaded from by guest on May 17, 2016 http://circres.ahajournals.org/ Downloaded from by guest on May 17, 2016 http://circres.ahajournals.org/ Downloaded from by guest on May 17, 2016 http://circres.ahajournals.org/ Downloaded from by guest on May 17, 2016 http://circres.ahajournals.org/ Downloaded from by guest on May 17, 2016 http://circres.ahajournals.org/ Downloaded from by guest on May 17, 2016 http://circres.ahajournals.org/ Downloaded from by guest on May 17, 2016 http://circres.ahajournals.org/ Downloaded from
-
Upload
independent -
Category
Documents
-
view
3 -
download
0
Transcript of Remnant cholesterol, low-density lipoprotein cholesterol, and blood pressure as mediators from...

665
It has been shown previously that obesity is associated with increased risk of ischemic heart disease (IHD),1–3 and that
the association between obesity and IHD is likely to be caus-al4; however, because it is probably not increased weight per se that leads to the increased risk, it is likely that this risk is mediated through variables such as lipoprotein levels, blood pressure, glucose levels, and inflammation. Obesity is an in-creasing problem for public health in many countries, and al-though elevated body mass index (BMI) is a modifiable risk factor, it is difficult to encourage individuals to lose weight and even more difficult to maintain weight loss. Therefore, it
is important to delineate which of the intermediate variables from obesity to IHD are likely to be mediators.
Editorial, see p 570In this study, we use Mendelian randomization in the analy-
sis of data from participants from the Copenhagen General Population Study (CGPS; n=69 535), the Copenhagen City Heart Study (n=10 099), and the Copenhagen Ischemic Heart Disease Study (n=5050) to test the hypothesis that the in-creased risk of IHD because of obesity is mediated through (1) elevated nonfasting remnant cholesterol, (2) reduced
Clinical Track
© 2014 American Heart Association, Inc.
Circulation Research is available at http://circres.ahajournals.org DOI: 10.1161/CIRCRESAHA.116.304846
Rationale: Obesity leads to increased ischemic heart disease (IHD) risk, but the risk is thought to be mediated through intermediate variables and may not be caused by increased weight per se.
Objective: To test the hypothesis that the increased IHD risk because of obesity is mediated through lipoproteins, blood pressure, glucose, and C-reactive protein.
Methods and Results: Approximately 90 000 participants from Copenhagen were included in a Mendelian randomization design with mediation analyses. Associations were examined using conventional measurements of body mass index and intermediate variables and using genetic variants associated with these. During ≤22 years of follow-up 13 945 participants developed IHD. The increased IHD risk caused by obesity was partly mediated through elevated levels of nonfasting remnant cholesterol and low-density lipoprotein cholesterol, through elevated blood pressure, and possibly also through elevated nonfasting glucose levels; however, reduced high-density lipoprotein cholesterol and elevated C-reactive protein levels were not mediators in genetic analyses. The 3 intermediate variables that explained the highest excess risk of IHD from genetically determined obesity were low-density lipoprotein cholesterol with 8%, systolic blood pressure with 7%, and remnant cholesterol with 7% excess risk of IHD. Corresponding observational excess risks using conventional body mass index were 21%, 11%, and 20%, respectively.
Conclusions: The increased IHD risk because of obesity was partly mediated through elevated levels of nonfasting remnant and low-density lipoprotein cholesterol and through elevated blood pressure. Our results suggest that there may be benefit to gain by reducing levels of these risk factors in obese individuals not able to achieve sustained weight loss. (Circ Res. 2015;116:665-673. DOI: 10.1161/CIRCRESAHA.116.304846.)
Key Words: cardiovascular diseases ■ genetics ■ lipoproteins ■ Mendelian randomization analysis ■ myocardial ischemia ■ obesity ■ risk factors ■ triglycerides
Original received July 18, 2014; revision received November 13, 2014; accepted November 19, 2014. In October, 2014, the average time from submission to first decision for all original research papers submitted to Circulation Research was 16 days.
From the Department of Clinical Biochemistry (A.V., B.G.N.) and The Copenhagen General Population Study (A.V., M.B., A.T.-H., B.G.N.), Herlev Hospital, Copenhagen University Hospital, Herlev, Denmark; Faculty of Health and Medical Sciences, University of Copenhagen, Denmark (A.V., M.B., A.T.-H., B.G.N.); Department of Clinical Biochemistry, Gentofte Hospital, Copenhagen University Hospital, Hellerup, Denmark (M.B.); MRC Integrative Epidemiology Unit, Oakfield House, Oakfield Grove (G.D.S., N.J.T.) and School of Social and Community Medicine (G.D.S., N.J.T.), University of Bristol, United Kingdom; The Copenhagen City Heart Study, Frederiksberg Hospital, Copenhagen University Hospital, Frederiksberg, Denmark (A.T.-H., B.G.N.); and Department of Clinical Biochemistry, Rigshospitalet, Copenhagen University Hospital, Copenhagen, Denmark (A.T.-H.).
The online-only Data Supplement is available with this article at http://circres.ahajournals.org/lookup/suppl/doi:10.1161/CIRCRESAHA. 116.304846/-/DC1.
Correspondence to Børge G. Nordestgaard, MD, DMSc, Department of Clinical Biochemistry, Herlev Hospital, Copenhagen University Hospital, Herlev Ringvej 75, 2730 Herlev, Denmark. E-mail [email protected]
Remnant Cholesterol, Low-Density Lipoprotein Cholesterol, and Blood Pressure as Mediators From Obesity to Ischemic
Heart DiseaseAnette Varbo, Marianne Benn, George Davey Smith, Nicholas J. Timpson,
Anne Tybjærg-Hansen, Børge G. Nordestgaard
by guest on May 17, 2016http://circres.ahajournals.org/Downloaded from by guest on May 17, 2016http://circres.ahajournals.org/Downloaded from by guest on May 17, 2016http://circres.ahajournals.org/Downloaded from by guest on May 17, 2016http://circres.ahajournals.org/Downloaded from by guest on May 17, 2016http://circres.ahajournals.org/Downloaded from by guest on May 17, 2016http://circres.ahajournals.org/Downloaded from by guest on May 17, 2016http://circres.ahajournals.org/Downloaded from by guest on May 17, 2016http://circres.ahajournals.org/Downloaded from by guest on May 17, 2016http://circres.ahajournals.org/Downloaded from by guest on May 17, 2016http://circres.ahajournals.org/Downloaded from by guest on May 17, 2016http://circres.ahajournals.org/Downloaded from by guest on May 17, 2016http://circres.ahajournals.org/Downloaded from by guest on May 17, 2016http://circres.ahajournals.org/Downloaded from by guest on May 17, 2016http://circres.ahajournals.org/Downloaded from by guest on May 17, 2016http://circres.ahajournals.org/Downloaded from by guest on May 17, 2016http://circres.ahajournals.org/Downloaded from by guest on May 17, 2016http://circres.ahajournals.org/Downloaded from by guest on May 17, 2016http://circres.ahajournals.org/Downloaded from by guest on May 17, 2016http://circres.ahajournals.org/Downloaded from by guest on May 17, 2016http://circres.ahajournals.org/Downloaded from by guest on May 17, 2016http://circres.ahajournals.org/Downloaded from by guest on May 17, 2016http://circres.ahajournals.org/Downloaded from by guest on May 17, 2016http://circres.ahajournals.org/Downloaded from by guest on May 17, 2016http://circres.ahajournals.org/Downloaded from by guest on May 17, 2016http://circres.ahajournals.org/Downloaded from by guest on May 17, 2016http://circres.ahajournals.org/Downloaded from

666 Circulation Research February 13, 2015
high-density lipoprotein (HDL) cholesterol, (3) elevated low-density lipoprotein (LDL) cholesterol, (4) elevated systolic blood pressure, (5) elevated diastolic blood pressure, (6) el-evated glucose levels, and (7) elevated C-reactive protein (CRP). In Mendelian randomization, the random assortment of alleles at conception is used to circumvent confounding and reverse causation that can bias observational associations. Assumptions for Mendelian randomization are first, that the genetic variants are associated with the phenotype; second, that the association between the genetic variants and the out-come is not confounded by the same factors that confound the observational association; third, that the genetic variants are not in linkage disequilibrium with other genetic variants asso-ciated with the outcome; and finally, that the genetic variants are not associated with the outcome through other ways than through the phenotype, that is, there is no pleiotropy.5
To assess potential benefits if these intermediate variables are targeted in obese individuals unable to obtain sustained weight loss, we also performed mediation analyses to assess how much
excess risk of IHD from obesity each intermediate variable me-diates. Besides conventional mediation analyses using obser-vational data, we used the novel approach of genetic mediation analyses to quantify how much of the risk of IHD, because of genetically determined obesity, is mediated through the differ-ent intermediate variables as this is presently not known. Each association was first examined in observational analyses, that is, analyses prone to confounding and reverse causation, and second in genetic analyses not prone to the same confounding and reverse causation as the observational studies.
MethodsStudies were approved by the Herlev Hospital and Danish ethical committees (H-KF-01-144/01; KF-100.2039/91; KF-01-144/01; KA-93125; and KA-99039) and were conducted according to the Declaration of Helsinki with informed consent from participants. All participants were white and of Danish descent, and none appeared in >1 study.
Nonstandard Abbreviations and Acronyms
BMI body mass index
CGPS Copenhagen General Population Study
CRP C-reactive protein
HDL high-density lipoprotein
IHD ischemic heart disease
LDL low-density lipoprotein
IncreasedBMI
MediatorsRemnant-C, HDL-C, LDL-C,
systolic and diastolicblood pressure, glucose,
and CRP
IHD
#1
#4a
Mediator genetic variants
BMIgenetic variants
#2 #3 #5a
Pa
Pb
#4b#5b
Figure 1. Observational and genetic associations/mediations investigated in this study. Arrows indicate the associations/mediations studied with number corresponding to the order of analyses in the text, and with P indicating the previously studied associations. Double-pointed arrows indicate observational analyses prone to confounding and reverse causation, whereas single-pointed arrows indicate genetic analyses not prone to confounding or reverse causation. Full lines indicate that participants from the Copenhagen General Population Study were included in the analyses, broken lines indicate that participants from the Copenhagen General Population Study and the Copenhagen City Heart Study were included in the analyses, and finally, dotted lines indicate that participants from the Copenhagen General Population Study, the Copenhagen City Heart Study, and the Copenhagen Ischemic Heart Disease Study were included in the analyses. BMI indicates body mass index; C, cholesterol; CRP, C-reactive protein; HDL, high-density lipoprotein; IHD, ischemic heart disease; and LDL, low-density lipoprotein.
Table. Characteristics of Participants in the 3 Studies
Copenhagen City Heart Study
Copenhagen General Population Study
Copenhagen Ischemic Heart Disease Study
N 10 099 69 535 5050
Women 5601 (55%) 38 468 (55%) 1486 (71%)
Age, y 58 (43–69) 58 (48–67) 64 (66–71)
Body mass index, kg/m2
25 (22–28) 26 (23–28) 27 (24–29)
Remnant cholesterol, mmol/L
0.7 (0.5–1.0) 0.6 (0.4–0.9) NA
HDL cholesterol, mmol/L
1.5 (1.2–1.8) 1.6 (1.2–1.9) NA
LDL cholesterol, mmol/L
3.6 (2.9–4.4) 3.2 (2.6–3.9) NA
Systolic blood pressure, mm Hg
135 (121–151) 140 (125–154) NA
Diastolic blood pressure, mm Hg
83 (75–91) 83 (76–90) NA
Glucose, mmol/L 5.4 (4.9–6.1) 5.1 (4.7–5.7) NA
C-reactive protein, mg/L
1.7 (1.2–3.0) 1.5 (1.1–2.4) NA
Diabetes mellitus 414 (4%) 2699 (4%) NA
Hypertension 4947 (50%) 39 695 (60%) NA
Smoking 4716 (47%) 13 799 (20%) NA
Menopausal status (women only)
3736 (67%) 25 537 (66%) NA
Lipid-lowering therapy
111 (1%) 7484 (11%) NA
Antihypertensive therapy
1136 (11%) 13 580 (20%) NA
Ischemic heart disease
2303 (23%) 6592 (9%) 5050 (100%)
Data are from the 1991 to 1994 or 2001 to 2003 examinations of the Copenhagen City Heart Study when DNA was collected, from study enrolment in 2003 to 2013 for the Copenhagen General Population Study and from study enrolment in 1991 to 2011 in the Copenhagen Ischemic Heart Disease Study. Values are median and interquartile range or number of participants and percentages. The number of participants varies slightly according to the availability of variables. HDL indicates high-density lipoprotein; and LDL, low-density lipoprotein.
by guest on May 17, 2016http://circres.ahajournals.org/Downloaded from

Varbo et al Mediators From Obesity to IHD 667
The CGPSThe CGPS is a prospective study of the general population initiated in 2003 with ongoing enrollment.4 Participants were randomly se-lected from the National Danish Civil Registration System to reflect the adult population aged 20 to ≥100 years. Data collection included a questionnaire, a physical examination, and blood sampling for bio-chemical analyses and DNA extraction.
The Copenhagen City Heart StudyThe Copenhagen City Heart Study is a prospective study of the gen-eral population initiated in 1976 to 1978 with follow-up examinations in 1981 to 1983, 1991 to 1994, and 2001 to 2003.6 Participants were recruited and examined exactly as in the CGPS. Blood samples for biochemical measurements and DNA extraction were drawn at the 1991 to 1994 and 2001 to 2003 examinations.
The Copenhagen Ischemic Heart Disease StudyThis study comprises 5050 patients referred for coronary angiogra-phy to Rigshospitalet, Copenhagen University Hospital during the period 1991 to 2011. Beside a diagnosis of IHD as described below, patients also had stenosis/atherosclerosis on coronary angiography and a positive exercise electrocardiography test.
Ischemic Heart DiseaseInformation on a diagnosis of IHD (International Classification of Diseases [ICD]-8: 410–414, ICD-10: I20–I25) was collected and ver-ified from 1977 until April 2013 by reviewing all hospital admissions and diagnoses entered in the National Danish Patient Registry and all causes of death entered in the National Danish Causes of Death Registry, as described.6 These registers contain information on all participants and none were lost to follow-up. During ≤22 years of follow-up 13 945 participants developed IHD.
Laboratory AnalysesStandard hospital assays measured nonfasting total cholesterol, tri-glycerides, HDL cholesterol, high-sensitivity CRP, and glucose
(Boehringer Mannheim, Dako, Dade Behring, and Konelab). LDL cholesterol was calculated using the Friedewald equation when plas-ma triglycerides were ≤4 mmol/L, and otherwise measured directly (Konelab). Nonfasting remnant cholesterol was nonfasting total cho-lesterol minus HDL cholesterol minus LDL cholesterol.6–8
GenotypesUsing information from our previous studies and from genome-wide as-sociation studies, we chose well-known genetic variants for each allele score so that the allele score was associated with BMI or the particular in-termediate variable of interest, and ideally with nothing else: (1) for BMI, we chose the 5 genetic variants, FTO rs9939609, MC4R rs17782313, TMEM18 rs6548238, BDNF rs10767664, and GNPDA2 rs10938397, with the largest reported effects on BMI.9; (2) for nonfasting remnant cholesterol, we chose TRIB1 rs2954029, GCKR rs1260326, and APOA5 rs6518217,10; (3) for HDL cholesterol, we chose LIPC −480C/T, ABCA1 N1800H, and ABCA1 R2144X7,11,12; (4) for LDL cholesterol, we chose APOB rs5742904, LDLR W23X, LDLR W66G, LDLR W556S, and PCSK9 rs115911477,13,14; (5) for systolic and diastolic blood pressures, we chose ATP2B1 rs2681472 and CYP17A1 rs1119154815; (6) for glu-cose, we chose GCK rs4607517, G6PC2 rs560887, ADCY5 rs11708067, DGKB rs2191349, and ADRA2A rs1088512216; and (7) for CRP, we chose CRP rs1205, CRP rs1130864, CRP rs3091244, and CRP rs3093077.17
Genotyping was by TaqMan (Applied Biosystems) or by restric-tion enzyme assays (details available in the Online Data Supplement). Genotypes were verified by genotyping of randomly selected samples of each variant by 2 different methods (TaqMan plus sequencing or restriction enzyme assay). Call rates for genotypes were >99% for all assays. ATP2B1 rs2681472 and CYP17A1 rs11191548 were de-termined by LGC Genomics using a competitive allele-specific poly-merase chain reaction system (KASPar).
Other CovariatesBMI was measured as weight (kg) divided by measured height squared (m2). Systolic and diastolic blood pressures were measured
Figure 2. Observational associations between body mass index (BMI) and intermediate variables. Levels of the intermediate variables for increasing BMI categories for 84 888 participants from the Copenhagen General Population Study. Values are median and interquartile range. P values for trend were estimated by Cuzick’s extension of a Wilcoxon rank-sum test. These analyses represent No. 1 in Figure 1. BP indicates blood pressure; CRP, C-reactive protein; HDL, high-density lipoprotein; and LDL, low-density lipoprotein.
by guest on May 17, 2016http://circres.ahajournals.org/Downloaded from
668 Circulation Research February 13, 2015
at study inclusion. Smokers were current smokers. Lipid-lowering therapy was self-reported.
Statistical AnalysisWe conducted analyses according to the order shown in Figure 1. We first analyzed the observational association between BMI and the 7 intermediate variables (Figure 1, No. 1). Second, we investigated how a BMI allele score associated causally with levels of the intermediate variables (Figure 1, No. 2). Third, we combined information from Nos. 1 and 2 in instrumental variable analyses, to examine whether observa-tional associations between BMI and intermediate variables are causal, and how large a difference in levels of intermediate variables an obser-vational and a causal 10 kg/m2 higher BMI was associated with, cor-responding to the difference between being normal weight and obese (Figure 1, No. 3). Fourth, using the genetic variants only associated with BMI as well as other well-known genetic variants associated only with individual intermediate variables, we investigated how much the obser-vational and causal change in the intermediate variable (caused by a 10 kg/m2 higher BMI) would translate into in observational and causal risk of IHD (Figure 1, No. 4a and b). Finally and fifth, we combined all information from Nos. 1 to 4 and previous knowledge from randomized clinical intervention trials to conduct observational and causal mediation analyses to examine how much excess risk of IHD caused by obesity is mediated through the 7 intermediate variables (Figure 1, No. 5a and b).
For a detailed description of the statistical analyses performed, please see the Online Data Supplement.
ResultsThe Table shows characteristics of 84 684 participants in the Copenhagen City Heart Study, CGPS, and CHIDS (Copenhagen Ischemic Heart Disease Study); however, the number of partici-pants varies between the different analyses according to the avail-ability of genotypes, intermediate variables, and covariates. Online Table II shows baseline characteristics of participants in the CGPS by genotypes and shows that the allele scores used as instruments for the different intermediate variables were not associated with other conventional risk factors for IHD, except for the expected associations of the remnant cholesterol allele score and the LDL cholesterol allele score with lipid-lowering therapy, that is, the al-lele scores were largely without pleiotropic effects on other cardio-vascular risk factors. Genotype distributions for all studies were in Hardy–Weinberg equilibrium (P values >0.1).
Observational and Genetic Associations: BMI and IHDAs described previously using the same studies,4 a 4 kg/m2 higher BMI was associated with increased risk of IHD with an observational odds ratio of 1.26 (95% CI, 1.19–1.34) and a ge-netically derived odds ratio of 1.52 (1.12–2.05), correspond-ing to an observational odds ratio of 1.78 (1.54–2.08) and a genetically derived odds ratio of 2.85 (1.33–6.02) for a 10 kg/m2 higher BMI. Also corresponding to the previous findings, BMI in quintiles was associated with a stepwise increased risk of IHD (Online Figure I, left), and the BMI allele score was associated with stepwise increased risk of IHD for increasing number of alleles (Online Figure I, right; Figure 1, Pa and Pb).
Observational Associations: BMI and Intermediate VariablesIncreasing BMI levels were observationally associated with higher levels of nonfasting remnant cholesterol, LDL cho-lesterol, glucose, and CRP, with higher systolic and diastolic blood pressures, and with lower levels of HDL cholesterol (Figure 1, No. 1; Figure 2).
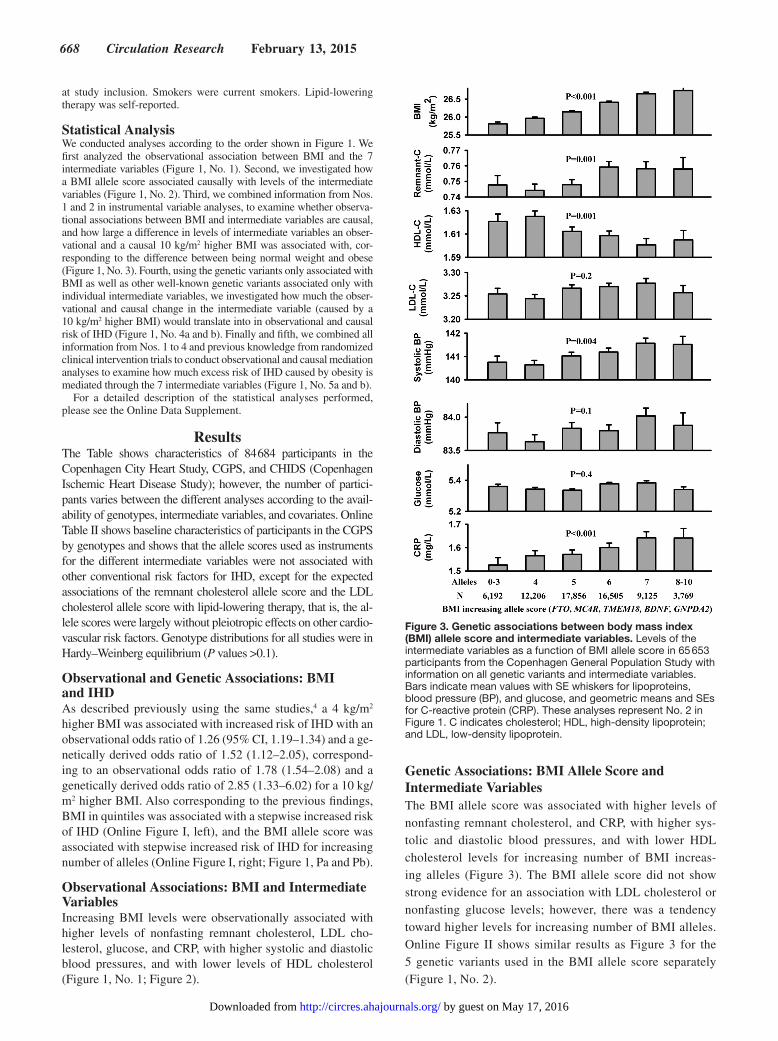
Genetic Associations: BMI Allele Score and Intermediate VariablesThe BMI allele score was associated with higher levels of nonfasting remnant cholesterol, and CRP, with higher sys-tolic and diastolic blood pressures, and with lower HDL cholesterol levels for increasing number of BMI increas-ing alleles (Figure 3). The BMI allele score did not show strong evidence for an association with LDL cholesterol or nonfasting glucose levels; however, there was a tendency toward higher levels for increasing number of BMI alleles. Online Figure II shows similar results as Figure 3 for the 5 genetic variants used in the BMI allele score separately (Figure 1, No. 2).
Figure 3. Genetic associations between body mass index (BMI) allele score and intermediate variables. Levels of the intermediate variables as a function of BMI allele score in 65 653 participants from the Copenhagen General Population Study with information on all genetic variants and intermediate variables. Bars indicate mean values with SE whiskers for lipoproteins, blood pressure (BP), and glucose, and geometric means and SEs for C-reactive protein (CRP). These analyses represent No. 2 in Figure 1. C indicates cholesterol; HDL, high-density lipoprotein; and LDL, low-density lipoprotein.
by guest on May 17, 2016http://circres.ahajournals.org/Downloaded from

Varbo et al Mediators From Obesity to IHD 669
Combined Observational and Genetic Associations: BMI and Intermediate VariablesFigure 4 shows that both an observational and a genetically determined 10 kg/m2 higher BMI was associated with higher levels of remnant cholesterol, LDL cholesterol, glucose, and CRP, with higher systolic and diastolic blood pressures, and with lower HDL cholesterol levels. Although P values for comparison showed significant differences between obser-vational and genetic estimates for remnant cholesterol, HDL cholesterol, and diastolic blood pressure, all genetic estimates were in the same direction as observational estimates indicat-ing causality (Figure 1, No. 3).
Online Figure III shows results for individuals with a BMI <30 kg/m2 and Online Figure IV results for those with a BMI >30 kg/m2.
Observational and Genetically Determined Changes in Intermediate Variables, Associated With a 10 kg/m2 Higher BMI, Translated Into Risk of IHDFigure 5 shows observational and genetic risk estimates for IHD for levels of the intermediate variables corresponding to the magnitude of the observational and genetic associations of
a 10 kg/m2 higher BMI with the intermediate variables shown in Figure 4, that is, Figure 5 shows what the difference in in-termediate variable associated with an observational or a ge-netically determined 10 kg/m2 higher BMI translated into in risk of IHD. For nonfasting remnant cholesterol and LDL cho-lesterol, both observational and genetic estimates for IHD risk were in the same direction indicating that the associations may be causal, with observational hazard ratios of 1.10 (1.08–1.11) and 1.05 (1.04–1.06) for remnant cholesterol and LDL choles-terol, respectively, and with corresponding genetically derived risk ratios of 1.20 (1.07–1.34) and1.28 (1.20–1.36), respective-ly. Genetic estimates were higher than observational estimates, which can probably be explained by genetic variants causing lifelong higher levels of remnant and LDL cholesterol, where-as observational estimates are based on a single measurement of remnant and LDL cholesterol (Figure 1, No. 4).
For HDL cholesterol levels, systolic and diastolic blood pressures, and for glucose levels, the observational estimates indicate increased IHD risk; however, the genetically derived risk ratios were not statistically different from 1 (Figure 5), indicating that the association may not be causal, and that the observational estimate may be confounded. For elevated CRP
Figure 4. Combined observational and genetic associations of a 10 kg/m2 higher body mass index (BMI) with levels of the intermediate variables. Observational and genetic associations were estimated in 65 653 participants from the Copenhagen General Population Study with information on all genetic variants and intermediate variables. F-statistics=59 and R2=0.5%. These analyses represent No. 3 in Figure 1. BP indicates blood pressure; C, cholesterol; CRP, C-reactive protein; HDL, high-density lipoprotein; and LDL, low-density lipoprotein.
by guest on May 17, 2016http://circres.ahajournals.org/Downloaded from

670 Circulation Research February 13, 2015
levels there was an increased observational risk of IHD, but the genetically derived risk ratio was in the opposite direction.
The allele scores for the intermediate variables were com-bined from genetic variants known to be associated with the intermediate variable of interest so that they had as large as possible an effect and with the effect mainly on the intermedi-ate variable of interest and not on the other intermediate vari-ables (Online Figure V).
All intermediate variables were associated observationally with risk of IHD (Online Figure VI); however, only allele scores for remnant cholesterol, LDL cholesterol, and glucose were associated with risk of IHD (Online Figure VII).
Observational and Genetic Mediation AnalysesFor all intermediate variables, the observational excess risk (Figure 6, left) was higher than the genetically determined excess risk (Figure 6, right). P values for comparison showed significant differences between observational and genetic es-timates for remnant cholesterol, LDL cholesterol, and dia-stolic blood pressure; however, estimates were in the same direction, and the differences between observational and genetic estimates could be explained by the genetic variants
explaining only part of the variation in the phenotypes and the observational estimates being prone to confounding. Genetically determined excess risk is only shown for the in-termediate variables with results suggesting genetically de-termined risk for IHD in Figure 5, except for blood pressure and glucose where previous randomized clinical intervention trials or Mendelian randomization studies suggest causal-ity,16,18,19 and where the lack of genetic association in Figure 5 may be explained by lack of power because of weak instru-ments. The 3 intermediate variables that explained the high-est excess risk of IHD from genetically determined obesity were LDL cholesterol with 8%, systolic blood pressure with 7%, and remnant cholesterol with 7% excess risk of IHD, with corresponding observational excess risks of 21%, 11%, and 20%, respectively. Results were similar when using the percent excess risk mediated method,20 except that the excess risk for LDL cholesterol was only 1% (Online Figure VIII; Figure 1, No. 5).
Online Table III shows P values for interaction between the intermediate variables and BMI or BMI allele score on pre-dicting risk of IHD. After correction for multiple comparisons,
Figure 5. Observational and genetically determined change in the intermediate variable, associated with a 10 kg/m2 higher body mass index (BMI), translated into risk of ischemic heart disease (IHD). Observational hazard ratios were estimated in 85 592 participants from the Copenhagen General Population Study and the Copenhagen City Heart Study combined. Genetically derived risk ratios were estimated in participants from the Copenhagen General Population Study, the Copenhagen City Heart Study, and the Copenhagen Ischemic Heart Disease Study combined with the number of participants varying according to availability of genotypes. Hazard ratios and genetically derived risk ratios are for the corresponding increase/decrease of the intermediate variable associated with a 10 kg/m2 higher observational or genetically determined BMI found in Figure 4. These analyses represent No. 4a and No. 4b in Figure 1. C indicates cholesterol; CRP, C-reactive protein; HDL, high-density lipoprotein; and LDL, low-density lipoprotein.
by guest on May 17, 2016http://circres.ahajournals.org/Downloaded from

Varbo et al Mediators From Obesity to IHD 671
there was a significant interaction between systolic blood pressure and BMI in the observational association.
DiscussionIn this study, we show that the previously established in-creased risk of IHD because of obesity4 is partly mediated through elevated levels of nonfasting remnant cholesterol and LDL cholesterol and through elevated blood pressure and possibly also through elevated nonfasting glucose levels; however, HDL cholesterol and CRP levels did not seem to be causal mediators.
We and others have examined previously the association between BMI and IHD and the association between BMI and some of the intermediate variables4,21–23; however, we now use the novel approach of genetic mediation analyses to quantify how much of the risk of IHD, because of genetically deter-mined obesity, is mediated through the different intermediate variables. Our data contribute important information because IHD is a growing problem worldwide, partly because of in-creased prevalence of obesity. BMI is a modifiable risk fac-tor, but it can be difficult to obtain sustained weight loss, and thus an alternative approach could be risk reduction of IHD by modifying the intermediate risk factors. Results from this study, integrating results from randomized intervention trials of blood pressure lowering,18 indicate that there may be a po-tential for reducing IHD risk by reducing levels of remnant cholesterol, LDL cholesterol, and blood pressure in obese in-dividuals unable to achieve sustained weight loss. Thereby, the findings from this study reinforce existing recommenda-tions on lowering of LDL cholesterol and blood pressure and stress the need for large clinical intervention trials examining whether a lowering of remnant cholesterol in individuals with elevated levels will reduce IHD risk.
Genetically elevated levels of nonfasting remnant and LDL cholesterol and genetically elevated blood pressure explained only 27% of the excess IHD risk from obesity in our study,
and most of the risk remained unexplained. This could be be-cause both the lipoprotein metabolism and the blood pressure control are complicated processes influenced by many dif-ferent pathways as well as by the environment, and although we carefully chose genetic variants associated with the phe-notypes, they only explained a small fraction of the overall phenotypes. The observational estimates for levels of nonfast-ing remnant and LDL cholesterol and elevated blood pressure explained a larger proportion of the mediated risk with 63% excess IHD risk; however, these estimates can be confounded by other cardiovascular risk factors correlated with the pheno-types and influenced by reverse causation.
Mechanistically, the explanation for elevated nonfasting remnant cholesterol and LDL cholesterol causing IHD most likely is that the lipoproteins enter and get trapped in the arteri-al wall,24–26 followed by cholesterol accumulation and develop-ment of atherosclerosis. Remnant cholesterol is the cholesterol content of the triglyceride-rich lipoproteins composed of very-LDLs and some intermediate-density lipoproteins in the fasting state and of these 2 lipoproteins together with chylo-micron remnants in the nonfasting state. We have previously found elevated levels of remnant cholesterol to be associated with elevated levels of CRP in both observational and genetic analyses.8 This is probably because remnant cholesterol causes low-grade inflammation in the arterial wall after accumulation in the arterial intima and elsewhere in the body.
Triglyceride and remnant cholesterol levels are highly cor-related.7 In this study, we calculate remnant cholesterol as nonfasting total cholesterol minus LDL and HDL cholester-ol. In participants with triglyceride levels <4 mmol/L, LDL cholesterol was calculated from the Friedewald equation and calculated remnant cholesterol is therefore a rescaling of tri-glycerides; however, in participants with triglyceride levels >4 mmol/L, LDL cholesterol was directly measured and the correlation between triglycerides and remnant cholesterol for these participants cannot be explained by this and is probably
Figure 6. Observational and genetic mediation analyses. Percent excess risk of ischemic heart disease (IHD) from observational and genetically determined obesity mediated by the intermediate variables was estimated in 70 743 participants from the Copenhagen General Population Study and the Copenhagen City Heart Study combined, using the product of coefficients method. Genetic estimates are shown for the intermediate variables with evidence suggesting genetically derived risk of IHD in Figure 5 and evidence from randomized clinical intervention trials suggesting causality. P values are for significance of the mediated effect (a×b) or for comparison of observational and genetic estimates. These analyses represent No. 5a and b in Figure 1. HDL indicates high-density lipoprotein; and LDL, low-density lipoprotein.
by guest on May 17, 2016http://circres.ahajournals.org/Downloaded from

672 Circulation Research February 13, 2015
explained by the composition of remnant; that is, that triglyc-erides and remnant cholesterol are part of the same molecules, that is, remnants. However, because most cells can degrade tri-glycerides, and no cells can degrade cholesterol, it is plausible that it is the cholesterol content of remnants that causes athero-sclerosis and IHD development. In the fasting state where there is little cholesterol in chylomicrons, the Friedewald equation estimates LDL cholesterol as total cholesterol minus HDL and estimated very-LDL cholesterol from triglycerides; however, participants in our study were nonfasting, which means that our estimation of remnant cholesterol as total cholesterol mi-nus LDL and HDL cholesterol also includes cholesterol in chy-lomicron remnants and also the part of intermediate-density lipoprotein cholesterol that is not included in the LDL fraction.
We found no genetic association of elevated systolic and diastolic blood pressure with increased risk of IHD; however, because randomized clinical trials have consistently shown that lowering of blood pressure is associated with reduced risk of IHD,18 lack of genetic association in this study was prob-ably explained by weak instruments. We chose 2 top-hits from genome-wide association studies,15 but they only explained a small fraction of the variation in blood pressure.
A potential limitation to our study is that results were re-ported for an increase in BMI of 10 kg/m2 as this corresponds to going from being normal weight to being obese. Another increase in BMI could have been chosen instead; however, this would not have changed the overall interpretation of the results, but only the scaling of results. Another potential limi-tation in our study is the adjustment for lipid-lowering therapy and antihypertensive therapy as categorical covariates. A more detailed adjustment for different types/doses of lipid-lowering therapy and antihypertensive therapy might have made our estimates more accurate. Also, repeated measures of the phe-notypes could have made our observational estimates more accurate, and this is why we also use genetic estimates that are presumably more accurate, because genetic variants are associated with lifelong altered levels of the phenotypes.
An assumption for mediation analysis is lack of interaction between exposure and mediators on the end point. We found an interaction between systolic blood pressure and BMI in the observational association, and estimates from the obser-vational mediation analysis for systolic blood pressure should therefore be interpreted with some caution.
Mendelian randomization studies are a way of circumvent-ing confounding and reverse causation seen in observational epidemiology; however, some limitations apply such as ca-nalization, population stratification, linkage disequilibrium, and pleiotropy.27 The most important for this study is plei-otropy, which is when the genetic variant used as an instru-ment for a given risk factor is associated with yet other risk factors. To minimize influence from pleiotropy, we carefully selected genetic instruments and used several genetic variants combined in allele scores for BMI and for the intermediate variables.28 However, because of the lipoprotein metabolism with many complex interactions, it is difficult to find genetic variants associated with a specific lipoprotein only. By com-bining several genetic variants for each type of lipoprotein cholesterol, we have minimized pleitropy on other types of
lipoprotein cholesterol, but not eliminated it completely; however, these pleitropic effects on other types of lipoprotein cholesterol were only small and can probably not explain our results. To avoid population stratification, we only studied white individuals of Danish descent, which potentially could affect the generalizability of our results; however, we are not aware of data, suggesting that our results should not apply to most races and countries where obesity is prevalent.
In conclusion, we found that the increased risk of IHD be-cause of genetically determined obesity was partly mediated through elevated levels of nonfasting remnant cholesterol and LDL cholesterol and through elevated blood pressure. This indicates that there may be benefit to gain by reducing levels of these risk factors in obese individuals not able to achieve sustained weight loss. Thereby, the findings from this study reinforce existing recommendations on lowering of LDL cho-lesterol and blood pressure and stress the need for large clinical intervention trials examining if lowering of remnant choles-terol in individuals with elevated levels will reduce IHD risk.
AcknowledgmentsWe are indebted to staff and participants of the Copenhagen General Population Study, Copenhagen City Heart Study, and Copenhagen Ischemic Heart Disease Study for their important contributions.
Sources of FundingThis study was supported by The Danish Council for Independent Research, Medical Sciences (FSS); The Danish Heart Foundation; Herlev Hospital, Copenhagen University Hospital; Copenhagen County Foundation; and Chief Physician Johan Boserup and Lise Boserup’s Fund, Denmark. G.D. Smith and N.J. Timpson work within a unit supported by the MRC and the University of Bristol (MC_UU_12013/1, MC_UU_12013/3). The funding sources of the study had no role in the study design, collection, analysis, or interpretation of data and had no role in writing of the article or the decision to submit the article for publication.
DisclosuresB.G. Nordestgaard has received lecture and consultancy honoraria from Omthera, Sanofi-Aventis/Regeneron, Aegerion, AstraZeneca, Merck, Pfizer, Fresenius, and ISIS Pharmaceuticals. G.D. Smith has received lecture/consultancy honoraria from Merck. The other au-thors report no conflicts.
References 1. Manson JE, Colditz GA, Stampfer MJ, Willett WC, Rosner B, Monson
RR, Speizer FE, Hennekens CH. A prospective study of obesity and risk of coronary heart disease in women. N Engl J Med. 1990;322:882–889. doi:10.1056/NEJM199003293221303.
2. Whitlock G, Lewington S, Sherliker P, Clarke R, Emberson J, Halsey J, Qizilbash N, Collins R, Peto R. Body-mass index and cause-specific mor-tality in 900 000 adults: collaborative analyses of 57 prospective studies. Lancet 2009;373:1083–1096.
3. Ni Mhurchu C, Rodgers A, Pan WH, Gu DF, Woodward M; Asia Pacific Cohort Studies Collaboration. Body mass index and cardiovascular disease in the Asia-Pacific Region: an overview of 33 cohorts involving 310 000 participants. Int J Epidemiol. 2004;33:751–758. doi:10.1093/ije/dyh163.
4. Nordestgaard BG, Palmer TM, Benn M, Zacho J, Tybjaerg-Hansen A, Davey Smith G, Timpson NJ. The effect of elevated body mass index on ischemic heart disease risk: causal estimates from a Mendelian randomisation ap-proach. PLoS Med. 2012;9:e1001212. doi:10.1371/journal.pmed.1001212.
5. Lawlor DA, Harbord RM, Sterne JA, Timpson N, Davey Smith G. Mendelian randomization: using genes as instruments for making causal inferences in epidemiology. Stat Med. 2008;27:1133–1163. doi:10.1002/sim.3034.
by guest on May 17, 2016http://circres.ahajournals.org/Downloaded from

Varbo et al Mediators From Obesity to IHD 673
6. Nordestgaard BG, Benn M, Schnohr P, Tybjaerg-Hansen A. Nonfasting triglyc-erides and risk of myocardial infarction, ischemic heart disease, and death in men and women. JAMA. 2007;298:299–308. doi:10.1001/jama.298.3.299.
7. Varbo A, Benn M, Tybjærg-Hansen A, Jørgensen AB, Frikke-Schmidt R, Nordestgaard BG. Remnant cholesterol as a causal risk factor for isch-emic heart disease. J Am Coll Cardiol. 2013;61:427–436. doi:10.1016/j.jacc.2012.08.1026.
8. Varbo A, Benn M, Tybjærg-Hansen A, Nordestgaard BG. Elevated rem-nant cholesterol causes both low-grade inflammation and ischemic heart disease, whereas elevated low-density lipoprotein cholesterol causes isch-emic heart disease without inflammation. Circulation. 2013;128:1298–1309. doi:10.1161/CIRCULATIONAHA.113.003008.
9. Speliotes EK, Willer CJ, Berndt SI, et al; MAGIC; Procardis Consortium. Association analyses of 249,796 individuals reveal 18 new loci associated with body mass index. Nat Genet. 2010;42:937–948. doi:10.1038/ng.686.
10. Jørgensen AB, Frikke-Schmidt R, West AS, Grande P, Nordestgaard BG, Tybjærg-Hansen A. Genetically elevated non-fasting triglycerides and cal-culated remnant cholesterol as causal risk factors for myocardial infarc-tion. Eur Heart J. 2013;34:1826–1833. doi:10.1093/eurheartj/ehs431.
11. Andersen RV, Wittrup HH, Tybjaerg-Hansen A, Steffensen R, Schnohr P, Nordestgaard BG. Hepatic lipase mutations, elevated high-density li-poprotein cholesterol, and increased risk of ischemic heart disease: the Copenhagen City Heart Study. J Am Coll Cardiol. 2003;41:1972–1982.
12. Frikke-Schmidt R, Nordestgaard BG, Stene MC, Sethi AA, Remaley AT, Schnohr P, Grande P, Tybjaerg-Hansen A. Association of loss-of-function mutations in the ABCA1 gene with high-density lipoprotein cholesterol levels and risk of ischemic heart disease. JAMA. 2008;299:2524–2532. doi:10.1001/jama.299.21.2524.
13. Tybjaerg-Hansen A, Steffensen R, Meinertz H, Schnohr P, Nordestgaard BG. Association of mutations in the apolipoprotein B gene with hyper-cholesterolemia and the risk of ischemic heart disease. N Engl J Med. 1998;338:1577–1584. doi:10.1056/NEJM199805283382203.
14. Benn M, Nordestgaard BG, Grande P, Schnohr P, Tybjaerg-Hansen A. PCSK9 R46L, low-density lipoprotein cholesterol levels, and risk of isch-emic heart disease: 3 independent studies and meta-analyses. J Am Coll Cardiol. 2010;55:2833–2842. doi:10.1016/j.jacc.2010.02.044.
15. Ehret GB, Munroe PB, Rice KM, et al. Genetic variants in novel path-ways influence blood pressure and cardiovascular disease risk. Nature 2011;478:103–109.
16. Benn M, Tybjaerg-Hansen A, McCarthy MI, Jensen GB, Grande P, Nordestgaard BG. Nonfasting glucose, ischemic heart disease, and myo-cardial infarction: a Mendelian randomization study. J Am Coll Cardiol. 2012;59:2356–2365. doi:10.1016/j.jacc.2012.02.043.
17. Zacho J, Tybjaerg-Hansen A, Jensen JS, Grande P, Sillesen H, Nordestgaard BG. Genetically elevated C-reactive protein and ischemic vascular dis-ease. N Engl J Med. 2008;359:1897–1908. doi:10.1056/NEJMoa0707402.
18. Whelton PK, He J, Appel LJ, Cutler JA, Havas S, Kotchen TA, Roccella EJ, Stout R, Vallbona C, Winston MC, Karimbakas J; National High Blood Pressure Education Program Coordinating Committee. Primary prevention of hypertension: clinical and public health advisory from The National High Blood Pressure Education Program. JAMA. 2002;288:1882–1888.
19. Ray KK, Seshasai SR, Wijesuriya S, Sivakumaran R, Nethercott S, Preiss D, Erqou S, Sattar N. Effect of intensive control of glucose on cardio-vascular outcomes and death in patients with diabetes mellitus: a meta-analysis of randomised controlled trials. Lancet. 2009;373:1765–1772. doi:10.1016/S0140-6736(09)60697-8.
20. MacKinnon DP, Fairchild AJ, Fritz MS. Mediation analy-sis. Annu Rev Psychol. 2007;58:593–614. doi:10.1146/annurev.psych.58.110405.085542.
21. Timpson NJ, Harbord R, Davey Smith G, Zacho J, Tybjaerg-Hansen A, Nordestgaard BG. Does greater adiposity increase blood pres-sure and hypertension risk?: Mendelian randomization using the FTO/MC4R genotype. Hypertension. 2009;54:84–90. doi:10.1161/HYPERTENSIONAHA.109.130005.
22. Timpson NJ, Nordestgaard BG, Harbord RM, Zacho J, Frayling TM, Tybjærg-Hansen A, Smith GD. C-reactive protein levels and body mass index: elucidating direction of causation through reciprocal Mendelian randomization. Int J Obes (Lond). 2011;35:300–308. doi:10.1038/ijo.2010.137.
23. Fall T, Hägg S, Mägi R, et al; European Network for Genetic and Genomic Epidemiology (ENGAGE) consortium. The role of adiposity in cardiometabolic traits: a Mendelian randomization analysis. PLoS Med. 2013;10:e1001474. doi:10.1371/journal.pmed.1001474.
24. Shaikh M, Wootton R, Nordestgaard BG, Baskerville P, Lumley JS, La Ville AE, Quiney J, Lewis B. Quantitative studies of transfer in vivo of low density, Sf 12-60, and Sf 60-400 lipoproteins between plasma and arterial intima in humans. Arterioscler Thromb. 1991;11:569–577.
25. Nordestgaard BG, Tybjaerg-Hansen A, Lewis B. Influx in vivo of low den-sity, intermediate density, and very low density lipoproteins into aortic intimas of genetically hyperlipidemic rabbits. Roles of plasma concentra-tions, extent of aortic lesion, and lipoprotein particle size as determinants. Arterioscler Thromb. 1992;12:6–18.
26. Nordestgaard BG, Wootton R, Lewis B. Selective retention of VLDL, IDL, and LDL in the arterial intima of genetically hyperlipidemic rabbits in vivo. Molecular size as a determinant of fractional loss from the intima-inner media. Arterioscler Thromb Vasc Biol. 1995;15:534–542.
27. Davey Smith G, Ebrahim S. ‘Mendelian randomization’: can genetic epi-demiology contribute to understanding environmental determinants of dis-ease? Int J Epidemiol 2003;32:1–22.
28. Smith GD, Timpson N, Ebrahim S. Strengthening causal inference in car-diovascular epidemiology through Mendelian randomization. Ann Med. 2008;40:524–541. doi:10.1080/07853890802010709.
What Is Known?
• Obesityisanincreasingprobleminmanycountries,anditisdifficulttoencourageindividualstoloseweightandevenmoredifficulttomain-tain weight loss.
• Obesityleadstoincreasedriskofischemicheartdisease(IHD).• However, it may not be obesity per se that causes IHD, but rather
changes in mediating factors such as levels of lipoproteins, blood pres-sure, glucose levels, and low-grade inflammation caused by obesity.
What New Information Does This Article Contribute?
• Inthisstudy,wecombineobservationalandgeneticevidencefrom≈90 000 individuals from the Danish general population to delineate which mediating factors contribute causally to the increased risk of IHD from obesity.
Obesityisagrowingproblemandalthoughelevatedbodymassindexisamodifiableriskfactor,itischallengingtoachieveper-sistent weight loss in obese individuals. It is therefore important
to delineate which intermediate factors from obesity to IHD that arecausaltobetreatedwithbenefit.Weusedthenovelapproachof combining observational analyses, Mendelian randomization, and observational and genetic mediation analyses to circumvent confounding and reverse causation, both of which are sources of bias in conventional observational epidemiology. The top 3 intermediate factors in this study that mediated the increased risk of IHD from obesity were elevated levels of low-density li-poprotein cholesterol, elevated levels of remnant cholesterol, and elevated blood pressure. Current guidelines on IHD preven-tion include recommendations for treatment of elevated levels of low-density lipoprotein cholesterol and elevated blood pressure; however, there is no consensus on whether elevated levels of remnant cholesterol should be treated, mainly because of a lack of evidence from randomized clinical intervention trials. Results from this study, combined with previous studies, highlights the need for randomized clinical intervention trials aimed at reducing levels of remnant cholesterol in individuals with elevated levels.
Novelty and Significance
by guest on May 17, 2016http://circres.ahajournals.org/Downloaded from

Tybjærg-Hansen and Børge G. NordestgaardAnette Varbo, Marianne Benn, George Davey Smith, Nicholas J. Timpson, Anne
Mediators From Obesity to Ischemic Heart DiseaseRemnant Cholesterol, Low-Density Lipoprotein Cholesterol, and Blood Pressure as
Print ISSN: 0009-7330. Online ISSN: 1524-4571 Copyright © 2014 American Heart Association, Inc. All rights reserved.is published by the American Heart Association, 7272 Greenville Avenue, Dallas, TX 75231Circulation Research
doi: 10.1161/CIRCRESAHA.116.3048462015;116:665-673; originally published online November 19, 2014;Circ Res.
http://circres.ahajournals.org/content/116/4/665World Wide Web at:
The online version of this article, along with updated information and services, is located on the
http://circres.ahajournals.org/content/suppl/2014/11/19/CIRCRESAHA.116.304846.DC1.htmlData Supplement (unedited) at:
http://circres.ahajournals.org//subscriptions/
is online at: Circulation Research Information about subscribing to Subscriptions:
http://www.lww.com/reprints Information about reprints can be found online at: Reprints:
document. Permissions and Rights Question and Answer about this process is available in the
located, click Request Permissions in the middle column of the Web page under Services. Further informationEditorial Office. Once the online version of the published article for which permission is being requested is
can be obtained via RightsLink, a service of the Copyright Clearance Center, not theCirculation Researchin Requests for permissions to reproduce figures, tables, or portions of articles originally publishedPermissions:
by guest on May 17, 2016http://circres.ahajournals.org/Downloaded from

1
Supplemental material
Remnant cholesterol, low-density lipoprotein cholesterol, and blood pressure as mediators
from obesity to ischemic heart disease
Anette Varbo, Marianne Benn, George Davey Smith, Nicholas J. Timpson, Anne Tybjærg-Hansen,
and Børge G. Nordestgaard.
3 Online Tables and 9 Online Figures

2
Detailed methods
Genotyping by restriction enzyme assays
Participants from the 1991-94 examination of the Copenhagen City Heart Study (CCHS) were
genotyped for genetic variants in LIPC1 and APOB
2 by restriction enzyme assays. Please see Online
Table I for information on assays.
Statistical analysis
We used Stata/S.E.12.0. Non-normally distributed variables were log-transformed to approach
normal distribution. Chi-square tests evaluated Hardy-Weinberg equilibrium. Participants with a
body mass index (BMI) <18.5 or >50 kg/m2 were excluded to approach linearity (Online Figure IX)
from all analyses (except for the observational association between BMI and mediators shown in
Figure 2).
Observational associations: BMI and intermediate variables (Figure 1, #1).
In Figure 2, levels of intermediate variables are median and interquartile range for increasing BMI
categories for 84,888 participants from the Copenhagen General Population Study (CGPS) with
information on BMI and all intermediate variables. P-values for trend were by Cuzick´s extension
of a Wilcoxon rank-sum test.
Genetic associations: BMI allele score and intermediate variables (Figure 1, #2).
In Figure 3, trend of level of the intermediate variables across BMI allele score were estimated by
Cuzick´s extension of a Wilcoxon rank-sum test in 65,653 participants from the CGPS with
information on BMI, intermediate variables, and BMI allele score. C-reactive protein (CRP) levels
were log-transformed to approach a normal distribution, and effect sizes in Figure 3 therefore

3
indicate mean and standard errors for lipoproteins, blood pressure, and glucose, and geometric
means and standard errors for CRP.
Combined observational and genetic associations: BMI and intermediate variables (Figure 1, #3).
In Figure 4, observational associations of a 10kg/m2 higher BMI with level of the intermediate
variables were estimated using linear regression in 65,653 participants from the CGPS. Genetic
associations were estimated in the same participants by two-stage least squares regression in an
additive model3 using the BMI allele score. Strength of the instrument was evaluated by F-statistics
from the first-stage regression where an F-statistic >10 has been used to indicate sufficient
instrument strength4. R
2 indicates the variation in BMI contributed by the BMI allele score.
P for comparison were estimated using the method of Bland and Altman5.
Observational and genetically determined changes in intermediate variables, associated with a
10kg/m2 higher BMI, translated into risk of ischemic heart disease (IHD) (Figure 1, #4a and #4b).
Hazard ratios and genetically derived risk ratios in Figure 5 are for the corresponding
increase/decrease of the intermediate variable associated with a 10kg/m2 higher observational or
genetically determined BMI found in Figure 4. Levels of triglycerides, remnant cholesterol, and
low-density lipoprotein (LDL) cholesterol in participants from the CGPS and CCHS using lipid-
lowering therapy were multiplied by 1.33, 1.33, and 1.43 respectively, corresponding to average
reductions of 25%, 25%, and 30% using common statin treatment regiments, as done previously6.
10mmHg was added to systolic blood pressure and 5mmHg to diastolic blood pressure in
participants from the CGPS and CCHS using antihypertensive medication, as done previously7.
Observational hazard ratios for IHD were estimated using Cox proportional hazards
regression models with age as time scale and with the use of left truncation and delayed entry in

4
85,592 participants with information on all intermediate variables and IHD from the CGPS and
CCHS combined. Participants diagnosed with an endpoint before study entry were excluded from
Cox regression analyses, and those dying during follow-up were censored at their death date.
Multivariable adjustment was for age, sex, and smoking. Median follow-up time was 6 years
(range: 0-22 years).
Genetically derived risk ratios for IHD were estimated by the multiplicative
generalised methods of moments estimator8 in participants from the CGPS, CCHS, and the
Copenhagen Ischemic Heart Disease Study (CIHDS) combined, and with genotypes included as
allele scores or genotype combinations. F-statistics and R2 were estimated from first-stage of a two-
stage least squares regression. For participants from the CIHDS where existing disease could
influence the risk factors (reverse causation), levels of intermediate variables entered into
instrumental variable analyses were derived from the known association from a first stage
regression between the different intermediate variable allele scores/genotype combinations with the
intermediate variables in the CGPS. The number of participants in instrumental variable analyses
varies corresponding to availability of the different genotypes.
P for comparison were estimated using the method of Bland and Altman.
Observational and genetic mediation analyses (Figure 1, #5a and #5b).
In Figure 6, genetic mediation analyses were carried out using the product of coefficients method9.
The excess risk mediated is the proportion of the indirect effect, also called the mediated effect, to
the total effect of the BMI allele score on IHD risk:
The excess risk mediated = (a*b) / (c´ + (a*b))
with regression coefficients a, b, and c´ derived from a) the association between the BMI allele
score and the intermediate variable estimated by linear regression (Figure 1, #2), b) the association

5
between the intermediate variable and risk of IHD, adjusted for the BMI allele score, estimated by
logistic regression (Figure 1, #4a), and c´) the association between the BMI allele score and IHD,
adjusted for the intermediate variable, estimated by logistic regression (Figure 1, Pb). All
regressions were adjusted for age, sex, and smoking.
The observational mediation analyses were done in exact the same way except for
using conventional BMI instead of the BMI allele score with regression coefficients a, b, and c´
derived from a) the association between conventional BMI and the intermediate variable estimated
by linear regression (Figure 1, #1), b) the association between the intermediate variable and risk of
IHD, adjusted for conventional BMI, estimated by logistic regression (Figure 1, #4b), and c´) the
association between conventional BMI and IHD, adjusted for the intermediate variable, estimated
by logistic regression(Figure 1, Pa). All regressions were adjusted for age, sex, and smoking.
Observational and genetic mediation analyses were done in 70,743 participants from
the CGPS and CCHS combined, with information on BMI, BMI allele score, intermediate variables,
and IHD status. P-values are for significance of the mediated effect a*b. P for comparison were
estimated using the method of Bland and Altman.
In sensitivity analyses, observational and genetic mediation analyses were also
conducted using the percent excess risk mediated (PERM) method (Online Figure VIII).

6
Supplemental references
1. Andersen RV, Wittrup HH, Tybjaerg-Hansen A, Steffensen R, Schnohr P, Nordestgaard BG.
Hepatic lipase mutations,elevated high-density lipoprotein cholesterol, and increased risk of
ischemic heart disease: the Copenhagen City Heart Study. J Am Coll Cardiol 2003;41:1972-
1982.
2. Tybjaerg-Hansen A, Steffensen R, Meinertz H, Schnohr P, Nordestgaard BG. Association of
mutations in the apolipoprotein B gene with hypercholesterolemia and the risk of ischemic
heart disease. N Engl J Med 1998;338:1577-1584.
3. Palmer TM, Sterne JA, Harbord RM, Lawlor DA, Sheehan NA, Meng S, Granell R, Davey
Smith G, Didelez V. Instrumental variable estimation of causal risk ratios and causal odds
ratios in Mendelian randomization analyses. Am J Epidemiol 2011;173:1392-1403.
4. Lawlor DA, Harbord RM, Sterne JA, Timpson N, Davey Smith G. Mendelian randomization:
using genes as instruments for making causal inferences in epidemiology. Stat Med
2008;27:1133-1163.
5. Altman DG, Bland JM. Interaction revisited: the difference between two estimates. BMJ
2003;326:219.
6. Varbo A, Benn M, Tybjaerg-Hansen A, Nordestgaard BG. Elevated Remnant Cholesterol
Causes Both Low-Grade Inflammation and Ischemic Heart Disease, While Elevated Low-
Density Lipoprotein Cholesterol Causes Ischemic Heart Disease without Inflammation.
Circulation 2013;128:1298-1309.
7. Timpson NJ, Harbord R, Davey Smith G, Zacho J, Tybjaerg-Hansen A, Nordestgaard BG.
Does greater adiposity increase blood pressure and hypertension risk?: Mendelian
randomization using the FTO/MC4R genotype. Hypertension 2009;54:84-90.
8. Nichols A. ivpois: Stata module for IV/GMM Poisson regression.
http://ideas.repec.org/c/boc/bocode/s456890.html. - 2007.
9. MacKinnon DP, Fairchild AJ, Fritz MS. Mediation analysis. Annu Rev Psychol 2007;58:593-
614.

7
Online Table I. Restriction enzyme assay information.
Gene Genetic variant Primers Restriction enzyme
LIPC
LIPC -480C/T
5´TCCTGGCCAGAAATCTCTTCT´3
5´GACTTGTGTCCATTTCTCCGT´3
NlaIII
APOB
APOB-3500 rs5742904
5´GACCACAAGCTTAGCTTGG´3
5´GGGTGGCTTTGCTTGTATG´3
5´TGCAGCTTCACTGAACACT´3
MspI

8
Online Table II. Characteristics of participants in the Copenhagen General Population Study by genotypes.
Alleles/
Combi-
nations
No. Age
years
Women
%
Diabetes
mellitus
%
Menopause,
women only
%
Hypertension
%
Anti-
hypertensive
medication %
Smoking
%
Lipid-
lowering
therapy %
BMI allelescore
FTO rs9939609 0-3 6,245 58(48-67) 55 4 67 59 19 19 11
MC4R rs17782313 4 12,331 58(48-67) 55 3 67 58 19 20 11
TMEM18 rs6548238 5 18,035 58(47-67) 55 4 66 60 20 19 11
BDNF rs10767664 6 16,638 58(48-67) 55 4 66 60 20 20 11
GNPDA2 rs10938397 7 9,206 58(48-67) 55 5 68 61 20 21 11
8-10 3,793 58(48-67) 55 4 66 61 21 22 11
P-trend 1.0 0.8 0.01 0.9 0.001 0.001 <0.001 0.6
Remnant-C allelescore
TRIB1 rs2954029 0-1 16,352 57(47-67) 55 4 66 60 19 23 9
GCKR rs1260326 2 16,445 57(47-67) 55 4 66 60 19 22 10
APOA5 rs651821 3-6 12,623 57(47-67) 55 3 65 60 19 22 10
P-trend 0.4 0.5 0.01 0.1 0.4 0.3 0.1 <0.001
HDL-C allelescore
LIPC -480C/T 0 2,052 58(47-67) 55 4 65 61 19 22 10
ABCA1 N1800H, R2144X 1 15,402 57(47-67) 55 4 65 60 19 23 10
2-3 27,966 57(47-67) 55 4 66 60 19 22 9
P-trend 0.7 0.7 0.8 0.6 0.9 0.9 0.2 0.6
LDL-C allelescore
APOB rs5742904 0-1 1,214 58(47-67) 54 3 64 60 19 21 5
LDLR W23X, W66G, W556S 2 44,149 57(47-67) 55 4 66 60 19 22 10
PCSK9 rs11591147 3 57 54(42-65) 51 2 62 56 16 18 60
P-trend 0.9 0.8 0.3 0.5 0.9 0.6 0.5 <0.001

9
Blood pressure
allelescore
ATP2B1 rs2681472 0-1 3,277 58(47-67) 55 4 66 58 17 22 9
CYP17A1 rs11191548 2 14,869 57(47-67) 55 4 65 59 19 22 10
3 27,274 57(47-67) 55 4 66 61 20 22 10
P-trend 0.8 0.5 1.0 0.9 <0.001 <0.001 0.9 0.5
Glucose allelescore
GCK rs4607517 0-3 1,366 57(47-66) 57 3 67 60 19 20 8
G6PC2 rs560887 4 4,355 57(47-67) 55 4 65 60 19 22 10
ADCY5 rs11708067 5 9,853 57(47-67) 55 4 65 60 19 22 10
DGKB rs2191349 6 13,438 57(47-67) 55 4 66 60 19 22 9
ADRA2A rs10885122 7 10,729 57(47-67) 55 4 66 60 19 23 10
8-10 5,679 57(47-67) 55 4 66 60 18 22 9
P-trend 0.5 0.6 0.07 0.3 1.0 0.7 0.3 0.4
C-reactive protein
allele combination 1 5,160 57(47-67) 56 4 64 59 18 23 9
CRP rs1205 2 9,253 57(47-67) 55 4 66 61 20 22 10
CRP rs1130864 3 4,096 57(47-67) 55 3 64 59 18 22 9
CRP rs3091244 4 9,442 58(47-67) 55 4 67 60 19 23 10
CRP rs3093077 5 8,657 57(47-67) 55 4 66 60 19 22 9
6 1,502 57(47-67) 55 4 65 59 20 22 9
7 4,595 58(47-67) 55 4 65 60 19 21 10
8 1,338 57(47-67) 54 3 63 62 19 23 10
9 1,377 58(47-68) 55 3 66 60 17 23 9
P-trend 0.3 0.2 0.03 0.7 0.8 0.6 0.5 0.9
Continuous values are median and interquartile range and categorical values are summarized in percent. P-values for trend are by Cuzick's
extension of a Wilcoxon rank-sum test. BMI=body mass index, C=cholesterol, HDL=high-density lipoprotein, LDL=low-density lipoprotein

10
Online Table III. P-values for interaction between the intermediate variables and body mass index or body mass index allele score
on predicting risk of ischemic heart disease.
Observational body mass index Body mass index allele score
Intermediate
variable
P-value for
interaction
P-value for interaction corrected for
multiple comparison (Bonferroni)
P-value for
interaction
P-value for interaction corrected for
multiple comparison (Bonferroni)
Remnant cholesterol 0.1 1.0 0.6 1.0
HDL cholesterol 0.1 1.0 0.1 1.0
LDL cholesterol 0.03 0.4 0.4 1.0
Systolic BP 4 x 10⁻⁸
6 x 10⁻⁷
0.5 1.0
Diastolic BP 0.005 0.1 0.6 1.0
Glucose 0.8 1.0 0.04 0.6
C-reactive protein 0.2 1.0 0.9 1.0
BP= blood pressure, HDL=high-density lipoprotein, LDL= low-density lipoprotein.

11
P for trend
1.0 1.5 2.0
Risk of ischemic heart disease
Odds ratio (95% CI)
(FTO, TMEM18, MC4R, BDNF, GNPDA2)
Genetic risk of ischemic heart disease by BMI allele score
<0.001
N total N cases
8,007 1,238
15,808 2,469
23,168 3,801
21,425 3,586
11,902 2,018
N alleles
0-3
4
5
6
7
P for trend
1.0 1.5 2.0
Risk of ischemic heart disease
Hazard ratio (95% CI)
Observational risk of ischemic heart disease by BMI in quintiles
<0.001
N total N cases
18,435 690
18,289 804
18010 921
17,835 1,162
17,606 1,279
Quintile
1
2
3
4
5
BMI kg/m2
18.5-22.7
22.7-24.7
24.7-26.6
26.6-29.3
29.3-50.0 4,866 8858-10
Online Figure I. Observational and genetic associations of body mass index with risk of ischemic heart disease. Observational hazard
ratios (left panel) for ischemic heart disease by body mass index quintiles were estimated using Cox proportional hazards regression models
with age as timescale adjusted for age, sex, and smoking in 90,175 participants from the Copenhagen General Population Study and the
Copenhagen City Heart Study combined with information on body mass index, covariates, and ischemic heart disease status. Participants
with an event before study entry were excluded. Mean follow-up time was 6 years (range 0-22 years). Genetic odds ratios (right panel) for
ischemic heart disease by increasing number of body mass index increasing alleles were estimated in 85,176 participants from the
Copenhagen General Population Study, the Copenhagen City Heart Study, and the Copenhagen Ischemic Heart Disease Study combined
using logistic regression. P-values for trend were estimated by Cuzick´s extension of a Wilcoxon rank-sum test. BMI=body mass index,
CI=confidence interval.

12
Rem
nan
t-C
(mm
ol/L
)
0.74
0.76
0.78
Glu
co
se
(mm
ol/L
)
5.28
5.32
5.36
CR
P(m
g/L
)
1.41.51.61.7
P=0.002 P=0.04
P=0.9
P=0.1
P=0.4
P<0.001
HD
L-C
(mm
ol/L
)
1.58
1.62
P<0.001 P=0.7
P=0.4
P=0.2
P=0.6
P=0.07
0
Systo
lic B
P(m
mH
g)
140
141
142
Dia
sto
lic B
P(m
mH
g)
83.5
84.0
84.5
P=0.07
P=0.4
P=0.01
P=0.2
P=0.04
P=0.1
BM
I
(kg
/m2)
26
27 P<0.001P<0.001 P<0.001
LD
L-C
(mm
ol/L
)
3.2
3.3
3.4 P=0.09 P=0.5P=0.3
TMEM18
rs6548238
FTO
rs9939609
MC4R
rs17782313
1 2
23,38
5
31,70
2
10,56
6
Alleles
N
0 1 2 0 1 2 0 1 2 0 1 2
BDNF
rs10767664
GNPDA2
rs10938397
37,12
5
24,47
5
4,053
1,832
18,56
3
45,25
8
3,486
23,06
7
39,10
0
23,28
3
31,56
8
10,80
2
P=0.4
P=0.5
P=0.001
P=0.2
P=0.3
P=0.2
P<0.001
P=0.4
P=0.3
P=0.1
P=0.2
P=0.3
P=0.03
P=0.08
P<0.001
P=0.6

13
Online Figure II. Levels of the intermediate variables as a function of FTO, MC4R, TMEM18,
BDNF, and GNPDA2 genotypes. Bars indicate mean values with standard error whiskers for
lipoproteins, blood pressure, and glucose, and geometric means and standard errors for C-reactive
protein in 65,653 participants from the Copenhagen General Population Study with information on all
genotypic variants and intermediate variables. P-values for trend were estimated by Cuzick´s
extension of a Wilcoxon rank-sum test. BMI=body mass index, BP=blood pressure, C=cholesterol,
CRP=C-reactive protein, HDL=high-density lipoprotein, LDL=low-density lipoprotein.

14
CRP change in %0 50 100 150 200
Observational
Genetic (FTO, MC4R, TMEM18,BDNF, GNPDA2)
Observational
Genetic (FTO, MC4R, TMEM18,BDNF, GNPDA2)
0.0 0.5 1.0
Glucose change in mmol/L
Observational
Lipoprotein change for a BMI increase of 10kg/m2
Genetic (FTO, MC4R, TMEM18,BDNF, GNPDA2)
-10 0 10 20BP change in mmHg
Glucose change for a BMI increase of 10kg/m2
CRP change for a BMI increase of 10kg/m2
Blood pressure change for a BMI increase of 10kg/m2
Observational
Genetic (FTO, MC4R, TMEM18,BDNF, GNPDA2)
Observational
Genetic (FTO, MC4R, TMEM18,BDNF, GNPDA2)
Observational
Genetic (FTO, MC4R, TMEM18,BDNF, GNPDA2)
Remnant-C
HDL-C
LDL-C
Systolic BP
Observational
Genetic (FTO, MC4R, TMEM18,BDNF, GNPDA2)
Diastolic BP
103.50(98.05-109.10)
153.98(42.24-353.49)
16.55(15.91-17.19)
10.97(-2.67-24.60)
0.28(0.25-0.32)
0.50(-0.24-1.23)
0.48(0.47-0.49)
0.19(-0.08-0.46)
-0.56(-0.57- -0.54)
-0.26(-0.59-0.07)
0.56(0.53-0.58)
0.41(-0.21-1.03)
9.25(8.91-9.59)
-2.01(-9.52-5.51)
-0.5 0.0 0.5 1.0
Lipoprotein cholesterol change in mmol/L
Change(mmol/L, mmHg or %)
Participants with BMI < 30 kg/m2 P forcomparison
0.02
0.04
0.3
0.2
0.002
0.3
0.3

15
Online Figure III. Combined observational and genetic associations of a 10kg/m2 higher body
mass index with levels of the intermediate variables in participants with BMI<30kg/m2.
Observational and genetic associations were estimated in 54,885 participants from the Copenhagen
General Population Study with a BMI<30kg/m2. F-statistics=24 and R
2=0.2%. BMI=body mass
index, BP=blood pressure, C=cholesterol, CRP=C-reactive protein, HDL=high-density lipoprotein,
LDL=low-density lipoprotein.

16
CRP change in %0 50 100 150 200
Observational
Genetic (FTO, MC4R, TMEM18,BDNF, GNPDA2)
Observational
Genetic (FTO, MC4R, TMEM18,BDNF, GNPDA2)
0.0 0.5 1.0
Glucose change in mmol/L
Observational
Lipoprotein change for a BMI increase of 10kg/m2
Genetic (FTO, MC4R, TMEM18,BDNF, GNPDA2)
-10 0 10 20BP change in mmHg
Glucose change for a BMI increase of 10kg/m2
CRP change for a BMI increase of 10kg/m2
Blood pressure change for a BMI increase of 10kg/m2
Observational
Genetic (FTO, MC4R, TMEM18,BDNF, GNPDA2)
Observational
Genetic (FTO, MC4R, TMEM18,BDNF, GNPDA2)
Observational
Genetic (FTO, MC4R, TMEM18,BDNF, GNPDA2)
Remnant-C
HDL-C
LDL-C
Systolic BP
Observational
Genetic (FTO, MC4R, TMEM18,BDNF, GNPDA2)
Diastolic BP
92.21(83.48-101.35)
38.30(-52.63-303.75)
5.66(4.46-6.85)
24.75(-3.82-53.32)
0.35(0.25-0.44)
1.09(-1.09-3.27)
0.08(0.05-0.11)
-0.34(-1.06-0.39)
-0.12(-0.15- -0.10)
-0.03(-0.62-0.55)
-0.07(-0.13- -0.02)
0.22(-1.12-1.57)
2.37(1.69-3.05)
13.70(-2.65-30.05)
-0.5 0.0 0.5 1.0
Lipoprotein cholesterol change in mmol/L
Change(mmol/L, mmHg or %)
Participants with BMI > / = 30 kg/m2 P forcomparison
0.1
0.4
0.3
0.1
0.1
0.3
0.3

17
Online Figure IV. Combined observational and genetic associations of a 10kg/m2 higher body
mass index with levels of the intermediate variables in participants with BMI≥30kg/m2.
Observational and genetic associations were estimated in 10,770 participants from the Copenhagen
General Population Study with a BMI≥30kg/m2. F-statistics=4 and R
2=0.2%. BMI=body mass index,
BP=blood pressure, C=cholesterol, CRP=C-reactive protein, HDL=high-density lipoprotein,
LDL=low-density lipoprotein.

18
Alleles
N
0.7
0.8
5.1
5.3
5.5
1.4
1.8
2.2
P=0.4
P=0.8
P=0.6
1.6
1.7
P=0.1
LDL-C allelescore
(APOB rs5742904, LDLR W23X, W66G,
W556S, PCSK9 rs11591147)
138
140
142
81
83
85
P=0.8
P=0.8
26
27 P=0.4
0-1 2 3
1,21
4
44,149 57
2
3
4
5 P<0.001
0.7
0.8
5.1
5.3
5.5
1.4
1.8
2.2
P<0.001
P=0.6
P=0.5
1.6
1.7
P<0.001
HDL-C allelescore
(LIPC -480C/T,
ABCA1 N1800H, R2144X)
138
140
142
81
83
85
P=0.5
P=0.9
26
27 P=0.9
0 1 2-3
2,05
2
15,402
27,966
2
3
4
5 P=0.7
0.7
0.8
5.1
5.3
5.5
1.4
1.8
2.2
P<0.001
P=0.1
P<0.001
1.6
1.7
P<0.001
Triglyceride/remnant-C allelescore
(TRIB1 rs2954029, GCKR rs1260326,
APOA5 rs651821)
138
140
142
81
83
85
P=0.7
P=0.7
26
27 P=0.5
0-1 2 3-6
16,352
16,445
12,623
2
3
4
5 P<0.001
Rem
nan
t-C
(mm
ol/L)
Glu
co
se
(mm
ol/L)
CR
P
(mg/L
)
HD
L-C
(mm
ol/L)
Systo
lic B
P
(mm
Hg
)
Dia
sto
lic B
P
(mm
Hg
)
BM
I
(kg
/m2)
LD
L-C
(mm
ol/L)
Online Figure V
part 1

19
Alleles
N
0.7
0.8
5.1
5.3
5.5
1.4
1.8
2.2
P=0.9
P=1.0
P<0.001
1.6
1.7
P=0.9
C-reactive protein genotype combination
(CRP rs1205, rs1130864,
rs3091244, rs3093077)
140
142
82
83
84
85
P=0.5
P=0.8
26
27 P=0.5
1 4 8
2
3
4
5 P=0.6
0.7
0.8
5.1
5.3
5.5
1.4
1.8
2.2
P=0.8
P<0.001
P=0.8
1.6
1.7
P=0.2
Glucose allelescore
(GCK rs4607517, G6PC2 rs560887,
ADCY5 rs11708067, DGKB rs2191349,
ADRA2A rs10885122)
140
142
82
83
84
85
P=0.8
P=0.8
26
27 P=0.3
0-3 6 7
1,36
6
4,35
5
9,85
3
2
3
4
5 P=0.2
0.7
0.8
5.1
5.3
5.5
1.4
1.8
2.2
P=0.7
P=0.1
P=0.7
1.6
1.7
P=0.7
Blood pressure allelescore
(ATP2B1 rs2681472, CYP17A1 rs11191548)
140
142
82
83
84
85
P<0.001
P<0.001
26
27 P=0.02
0-2 3
3,27
7
14,869
2
3
4
5 P=0.2
Rem
nan
t-C
(mm
ol/L)
Glu
co
se
(mm
ol/L)
CR
P
(mg/L
)
HD
L-C
(mm
ol/L)
Systo
lic B
P
(mm
Hg
)
Dia
sto
lic B
P
(mm
Hg
)
BM
I
(kg
/m2)
LD
L-C
(mm
ol/L)
27,274
13,438
10,729
5,67
9
5,16
0
9,25
3
4,09
6
9,44
2
8,65
7
1,50
2
4,59
5
1,33
8
1,37
7
4 5 8-104 Combi-
nation
2 3 965 7
Online Figure Vpart 2

20
Online Figure V. Levels of the intermediate variables as a function of allele scores and genotype
combinations for the intermediate variables. Bars indicate mean values with standard error
whiskers for lipoproteins, blood pressure, and glucose, and geometric means and standard errors for
C-reactive protein in 45,420 participants from the Copenhagen General Population Study with
information on body mass index, all intermediate variables, and all genotypic variants. Red color
indicates the intermediate variable that the allele score is used as an instrument for, and grey color
indicates the other intermediate variables that the allele score ideally should not be associated with. P-
values for trend were estimated by Cuzick´s extension of a Wilcoxon rank-sum test. BMI=body mass
index, BP=blood pressure, C=cholesterol, CRP=C-reactive protein, HDL=high-density lipoprotein,
LDL=low-density lipoprotein.

21
0.5 1.0 1.5 2.0
Hazard ratio for IHD (95% CI)
P-trend <0.001
N
total
N
cases
17,446 546
17,512 767
17,333 946
17,299 1,139
17,158 1,294
Remnant cholesterol
QuintileLipid level
(mmol/L)
1 <0.4
2 0.4-0.5
3 0.6-0.7
4 0.8-1.0
5 >1.0
0.5 1.0 1.5 2.0
Hazard ratio for IHD (95% CI)
P-trend <0.001
N
total
N
cases
17,172 719
17,624 863
17,162 809
17,345 1,153
17,445 1,148
High-density lipoprotein cholesterol
Quintile
Lipid level
(mmol/L)
5 >2.0
4 1.8-2.0
3 1.5-1.7
2 1.2-1.4
1 <1.2
0.5 1.0 1.5 2.0
Hazard ratio for IHD (95% CI)
P-trend <0.001
N
total
N
cases
16,131 626
19,190 763
17,822 869
16,735 953
16,870 1,481
Low-density lipoprotein cholesterol
QuintileLipid level
(mmol/L)
1 <2.4
2 2.4-3.0
3 3.1-3.5
4 3.6-4.1
5 >4.1
0.5 1.0 1.5 2.0
Hazard ratio for IHD (95% CI)
P-trend <0.001
N
total
N
cases
18,084 534
18,052 791
16,690 877
17,080 1,096
16,842 1,394
Systolic blood pressure
Quintile
BP level
(mmHg)
1 <122
2 122-134
3 135-144
4 145-158
5 >158
0.5 1.0 1.5 2.0
Hazard ratio for IHD (95% CI)
P-trend <0.001
N
total
N
cases
20,040 981
16,668 816
16,411 791
17,159 933
16,470 1,171
Diastolic blood pressure
BP level
(mmHg)
<75
75-80
81-86
87-93
>93
0.5 1.0 1.5 2.0
Hazard ratio for IHD (95% CI)
P-trend <0.001
N
total
N
cases
22,231 864
16,370 730
14,762 728
17,5401,040
15,8451,330
Glucose
Glucose level
(mmol/L)
<4.7
4.7-5.0
5.1-5.3
5.4-5.9
>5.9
0.5 1.0 1.5 2.0
Hazard ratio for IHD (95% CI)
P-trend <0.001
N
total
N
cases
16,655 429
17,684 683
17,724 852
17,5041,159
17,1751,568
C-reactive protein
CRP level
(mg/L)
<0.9
0.9-1.2
1.3-1.6
1.7-2.9
>2.9
Online Figure VI. Observational associations of the intermediate variables with risk of ischemic heart disease. Intermediate variables
are in quintiles in 86,748 participants from the Copenhagen General Population Study and the Copenhagen City Heart Study combined.
Hazard ratios were estimated using Cox proportional hazards regression models with age as timescale adjusted for age, sex, and smoking.
Participants with an event before study entry were excluded. Mean follow-up time was 6 years (range 0-22 years). P-values for trend were
estimated by Cuzick´s extension of a Wilcoxon rank-sum test. BP=blood pressure, CI=confidence interval, CRP=C-reactive protein,
IHD=ischemic heart disease.

22
CRP
P-value
0.8 1.0 1.2 1.4
TRIBGCKRAPOA5
Risk of ischemic heart disease
GCKG6PC2 ADCY5DGKB ADRA2A
Odds ratio (95% confidence interval)
Glucose
C-reative protein
LIPCABCA1
APOBLDLRPCSK9
Remnant-C
0.2HDL-C
LDL-C
->4.7 (3.2-7.0)
ATP2B1CYP17A1
Systolic/diastolicblood pressure
<0.001
<0.001
0.2
0.09
0.02
N total N cases
22,025 4,111
22,342 4,258
17,234 3,464
2,783 549
20,842 4,042
37,976 7,242
1,595 262
59,896 11,518
110 53
4,413 867
20,208 3,914
36,980 7,052
1,809 320
5,795 1,115
13,349 2,587
18,221 3,427
14,659 2,812
7,768 1,572
7,131 1,432
12,576 2,391
5,516 1,020
12,886 2,579
11,618 2,239
2,054 401
6,122 1,079
1,845 356
1,853 336
% changein co-variate
7%
15%
-5%
-8%
13%
60%
0.3%
1%
1%
2%
3%
3%
5%
7%
17%
18%
28%
29%
38%
39%
48%
N alleles
0-1
2
3-6
0
1
2-3
0-1
2
3
0-2
3
4
0-3
4
5
6
7
8-10
1
2
3
4
5
6
7
8
9
Allelescore
Genotypecombination
Online Figure VII. Associations of the allele scores or genotype combination for the
intermediate variables with risk of ischemic heart disease. Odds ratios were estimated in 61,601
participants from the Copenhagen General Population Study, the Copenhagen City Heart Study, and
the Copenhagen Ischemic Heart Disease Study combined, with information on all genotypic variants
and ischemic heart disease status using logistic regression. P-values for trend were estimated by
Cuzick´s extension of a Wilcoxon rank-sum test. C=cholesterol, CRP=C-reactive protein, HDL=high-
density lipoprotein, LDL=low-density lipoprotein.

23
Percent excess risk
0 10 20 30
Not causal
Genetic
Not causal
Remnant cholesterol
HDL cholesterol
LDL cholesterol
Systolic blood pressure
Diastolic blood pressure
Glucose
C-reactive protein
Percent excess risk
0 10 20 30
Observational
Percent Excess Risk Mediated (PERM)
21%
22%
16%
10%
10%
9%
8%
4%
1%
7%
4%
4%
Online Figure VIII. Observational and genetic mediation analyses. Percent excess risk of
ischemic heart disease was estimated in 70,743 participants from the Copenhagen General Population
Study and the Copenhagen City Heart Study combined using the percent excess risk mediated
(PERM) method. Body mass index, body mass index allele score, and intermediate variables were
standardized as Z-scores before logistic regression. Observational percent excess risk of ischemic
heart disease was estimated as: (the odds ratio of ischemic heart disease for a 1 Z-score higher body
mass index adjusted multivariably) minus (the odds ratio of ischemic heart disease for a 1 Z-score
higher body mass index adjusted multivariably with additional adjustment for the intermediate
variable), divided with (the odds ratio of ischemic heart disease for a 1 Z-score higher body mass
index adjusted multivariably) minus 1. Genetic excess risk was estimated in the same way except for
using the odds ratio for ischemic heart disease for a 1 Z-score higher genetic body mass index (using
the body mass index allele score) instead of observational body mass index. Participants with an
event before study entry were excluded to avoid reverse causation. HDL=high-density lipoprotein,
LDL=low-density lipoprotein.

24
Remnant cholesterol HDL cholesterol LDL cholesterol
Systolic BP Diastolic BP Glucose C-reactive protein
Body mass index (kg/m2)
Rem
na
nt-
C (
mm
ol/L
)
HD
L-C
(m
mo
l/L
)
Body mass index (kg/m2) Body mass index (kg/m2)
LD
L-C
(m
mo
l/L
)
Systo
lic B
P (
mm
Hg)
Body mass index (kg/m2) Body mass index (kg/m2)
Dia
sto
lic B
P (
mm
Hg)
Glu
co
se
(m
mo
l/L
)
Body mass index (kg/m2) Body mass index (kg/m2)
CR
P (
mg/L
)
10 20 30 40 50 6010 20 30 40 50 6010 20 30 40 50 60
10 20 30 40 50 60 10 20 30 40 50 60 10 20 30 40 50 60 10 20 30 40 50 60
0.5
1.0
1.5
2.0
2.5
1.0
1.5
2.0
2.5
3.0
1.0
2.0
3.0
4.0
5.0
100
120
140
160
180
60
80
100
120
4.5
5.0
5.5
6.0
6.5
7.0
0
5
10
15
Online Figure IX. Observational associations between body mass index and the intermediate variables. Dots are mean of intermediate
variable as a function of body mass index in steps of 1 kg/m2 estimated in 84,888 participants from the Copenhagen General Population
Study with information on body mass index and all intermediate variables. BP=blood pressure, C=cholesterol, HDL=high-density
lipoprotein, LDL=low-density lipoprotein.