CHOLESTEROL METABOLISM AS A TARGET IN CASTRATION ...
169
CHOLESTEROL METABOLISM AS A TARGET IN CASTRATION-RESISTANT PROSTATE CANCER by JACOB GORDON B.Sc. (Hons), Dalhousie University, 2012 A THESIS SUBMITTED IN PARTIAL FULFILLMENT OF THE REQUIREMENTS FOR THE DEGREE OF DOCTOR OF PHILOSOPHY in THE FACULTY OF GRADUATE AND POSTDOCTORAL STUDIES (Pharmaceutical Sciences) THE UNIVERSITY OF BRITISH COLUMBIA (Vancouver) July 2018 © Jacob Gordon, 2018
-
Upload
khangminh22 -
Category
Documents
-
view
0 -
download
0
Transcript of CHOLESTEROL METABOLISM AS A TARGET IN CASTRATION ...

CHOLESTEROL METABOLISM AS A TARGET IN CASTRATION-RESISTANT PROSTATE
CANCER
by
JACOB GORDON
B.Sc. (Hons), Dalhousie University, 2012
A THESIS SUBMITTED IN PARTIAL FULFILLMENT OF THE REQUIREMENTS FOR THE
DEGREE OF
DOCTOR OF PHILOSOPHY
in
THE FACULTY OF GRADUATE AND POSTDOCTORAL STUDIES
(Pharmaceutical Sciences)
THE UNIVERSITY OF BRITISH COLUMBIA
(Vancouver)
July 2018
© Jacob Gordon, 2018

ii
The following individuals certify that they have read, and recommend to the Faculty of Graduate and
Postdoctoral Studies for acceptance, the dissertation entitled:
Cholesterol Metabolism as a target in castration-resistant prostate cancer
submitted by Jacob Gordon in partial fulfilment of the requirements for
the degree of Doctor of Philosophy
in Pharmaceutical Sciences
Examining Committee:
Michael Cox, Pharmaceutical Sciences
Co-supervisor
Kishor Wasan, Pharmaceutical Sciences
Co-supervisor
Emma Guns, Experimental Medicine
Supervisory Committee Member
Vince Duronio, Experimental Medicine
University Examiner
William Wei-Guo Jia, Experimental Medicine
University Examiner
Additional Supervisory Committee Members:
Urs Hafeli, Pharmaceutical Sciences
Supervisory Committee Member
Abby Collier, Pharmaceutical Sciences
Supervisory Committee Member
iii
ABSTRACT
Despite clinical benefits of existing prostate cancer treatments, patients continue to develop
therapeutic resistance. Persistence of androgen receptor pathway activity is attributed to several
mechanisms associated with resistance, including intratumoral androgen receptor agonist synthesis from
the precursor cholesterol. Cholesterol has been correlated to poor outcomes in patients and clinically the
use of cholesterol synthesis inhibitors, statins, improves prostate cancer survival. The expression of the
high-density lipoprotein-cholesterol receptor, scavenger receptor B1 (SR-B1), is elevated in castration-
resistant prostate cancer models and has been linked to poor survival of patients. The overarching
hypothesis of this thesis is that cholesterol modulation, through either synthesis or uptake inhibition, will
impact essential signaling processes impeding the proliferation of prostate cancer. Clinically statin use
was found to improve the overall survival of metastatic castration-resistant prostate cancer patients
receiving the androgen synthesis inhibitor abiraterone. In vivo experiments demonstrated the ability of
statins to impede post-castration biochemical recurrence and reduce tumor growth and androgen receptor
agonist synthesis in LNCaP-derived xenograft tumors. SR-B1 was found to be overexpressed in clinical
samples from both local and metastatic prostate cancer. Antagonism of SR-B1 in steroid responsive C4-2
cells decreased cholesterol uptake and growth and induced cell cycle arrest. Initially attributed to an
observed decrease in de novo steroid synthesis and androgen receptor activity, the inability of exogenous
steroid to restore cellular proliferation or androgen receptor activity indicated steroid independent cellular
arrest. As such, cellular stress and nutrient deprivation responses were assessed and SR-B1 antagonism
was found to induce both autophagy and endoplasmic reticulum stress markers. Given the steroid-
independent manner of SR-B1 antagonism mediated cellular arrest, the effects of SR-B1 antagonism on
androgen independent PC-3 cells was assessed and found to result in robust cellular death in vitro and
decreased growth of xenograft tumors. These findings demonstrate that the reduction of cellular
cholesterol availability can impede prostate cancer proliferation through both decreased steroid-synthesis
and steroid-independent mechanisms providing a potential therapeutic target for the treatment of prostate
cancer.

iv
LAY SUMMARY
Prostate cancer is managed by therapies that block the production of androgen sex hormones, or
inhibit activation of the androgen receptor. Resistance to these therapies is inevitable due to several
adaptations, including the tumor acquiring the ability to produce its own androgens. In addition to the
production of androgens, cholesterol is essential for numerous cellular functions needed to maintain
metabolism for rapid tumor growth. The research described in this thesis demonstrates that antagonizing
the cancers ability to obtain cholesterol impedes tumor growth and the production of essential androgens,
while clinically cholesterol lowering drugs improve outcomes of patients with advanced stage prostate
cancer. Lastly a key protein for the import of cholesterol into the cell, scavenger receptor B1 is identified
as a novel therapeutic target in advanced prostate cancer. Highly expressed in prostate cancer, the
inhibition of scavenger receptor B1 reduces cancer growth through the reduction of androgens and other
mechanisms. In summary, the findings of this thesis highlight the potential of targeting cholesterol
metabolism as an approach to prostate cancer treatment.

v
PREFACE
This thesis was conducted at the University of British Columbia (UBC) and Vancouver Prostate
Centre (VPC) with support from clinicians and researchers at the British Columbia Cancer Agency
(BCCA). Contributions of collaborators are acknowledged below.
Chapter 2: The work assessing clinical outcomes of prostate cancer patients at the British
Columbia Cancer Agency has become a component of a multi-institutional international study recently
accepted for publication in the peer-reviewed journal Oncotarget. The British Columbia portion of the
study was carried out under the supervision of Dr. Bernhard J. Eigl (BCCA). Database construction was
performed by Dr. Jenn Locke (VPC) and myself. Univariate statistical analysis was performed by me and
multivariate statistical modelling was performed by Dr. Gregory Pond (McMaster University). Data
interpretation described herein is my own while interpretations found in the multi-institutional study were
collaborative among listed authors. All clinical work was carried out in accordance with human ethics
protocol: H13-01851 CRPC Retrospective Hormonal Agents Database.
The in vivo experiments described in the latter half of the chapter have been published and peer-
reviewed in the journal Prostate Cancer and Prostatic Diseases in the year 2016. All experiments were
designed and conducted by myself under the supervision of Dr. Kishor M. Wasan and Dr. Michael E.
Cox. General assistance was provided by Mr. Ankur Midha and Dr. Yubin Guo, while LC-MS assistance
was provided by Mr. Andras Szeitz and Mr. Hans Adomat under the supervision of Dr. Tara Klassen and
Dr. Emma S. Guns respectively. All animal experiments in this chapter were carried out in accordance
with UBC animal ethics protocol: UBC ACC A12-0211.
Publications:
Gordon JA, et al. (2018) Statin use and survival in patients with metastatic castration-resistant
prostate cancer treated with abiraterone or enzalutamide after docetaxel failure: the international
retrospective observational STABEN study. Oncotarget. (Accepted)
Gordon JA, et al. (2016) Oral simvastatin administration delays castration-resistant progression
and reduces intratumoral steroidogenesis of LNCaP prostate cancer xenografts. Prostate Cancer
and Prostatic Diseases. 19(1);21-27

vi
Chapter 3: The experiments assessing the therapeutic potential of targeting SR-B1 are currently
undergoing peer-review for publication. All experiments described in this chapter were designed and
conducted by myself under the supervision of Dr. Kishor M. Wasan and Dr. Michael E. Cox unless
otherwise stated. Immunohistochemical staining was conducted courtesy of Dr. Colm Morrissey and
scored by Dr. Gang Wang and Dr. Fatemah Derakshan. Access to the Shanghai Cohort mRNA expression
database was provided courtesy of Dr. Collin Collins and access to the Fred Hutchinson Rapid Autopsy
mRNA expression database courtesy of Dr. Colm Morrissey. Fluorescent imaging was conducted with the
assistance of Mr. Jonathan Frew.
Publications:
Gordon JA, et al. Targeting scavenger receptor B1 in castration-resistant prostate cancer. (2018,
Submitted)
Chapter 4: The work assessing BLT-1 use in vivo will in part be published alongside findings
from Chapter 3 currently undergoing peer-review for publication. All experiments were designed and
conducted by myself with assistance from Dr. Emma S. Guns under the supervision of Dr. Kishor M.
Wasan and Dr. Michael E. Cox. General animal support was provided by Ms. Mei Chin and LC-MS
support and expertise provided by Mr. Hans Adomat. All animal experiments in this chapter were carried
out in accordance with UBC animal ethics protocol: UBC ACC A16-0072.
Publications:
Gordon JA, et al. Targeting scavenger receptor B1 in castration-resistant prostate cancer. (2018,
Submitted)

vii
TABLE OF CONTENTS
ABSTRACT ................................................................................................................................................ iii
LAY SUMMARY ....................................................................................................................................... iv
PREFACE .................................................................................................................................................... v
TABLE OF CONTENTS ......................................................................................................................... vii
LIST OF TABLES ...................................................................................................................................... x
LIST OF FIGURES ................................................................................................................................... xi
LIST OF ABBREVIATIONS .................................................................................................................. xii
ACKNOWLEDGEMENTS .................................................................................................................... xvi
DEDICATION......................................................................................................................................... xvii
CHAPTER 1: INTRODUCTION .............................................................................................................. 1
1.1 Prostate cancer epidemiology .......................................................................................................... 1
1.2 Structure and development of the prostate .................................................................................... 2
1.3 Androgen receptor ............................................................................................................................ 2
1.4 Androgens and steroid hormones.................................................................................................... 3
1.5 Prostate cancer development ........................................................................................................... 5
1.6 Diagnosis, Gleason grading and staging of prostate cancer.......................................................... 6
1.7 Local therapies for prostate cancer................................................................................................. 8
1.8 Androgen deprivation therapy ........................................................................................................ 9
1.9 CRPC and mechanisms of progression ......................................................................................... 10
1.10 Other androgen receptor pathway targeted treatments ........................................................... 12
1.11 Chemotherapeutic approaches to CRPC treatment .................................................................. 16
1.12 Immunotherapies and other systemic treatments for CRPC ................................................... 17
1.13 Cholesterol structure and distribution ....................................................................................... 18
1.14 Cellular cholesterol metabolism .................................................................................................. 19
1.15 Scavenger Receptor B1 ................................................................................................................ 21
1.16 Lipoproteins and cholesterol transport ...................................................................................... 23
1.17 Cholesterol and prostate cancer .................................................................................................. 24
1.18 Research rationale ........................................................................................................................ 27
1.19 Hypothesis ..................................................................................................................................... 27
CHAPTER 2: THE IMPACT OF STATIN USE ON DE NOVO STEROIDOGENESIS AND
CLINICAL OUTCOMES OF CRPC PATIENTS RECEIVING ABIRATERONE .......................... 29
2.1 Specific aim and rationale .............................................................................................................. 29
2.2 Methods ........................................................................................................................................... 29 2.2.1 Analysis of abiraterone patients at the British Columbia Cancer Agency ................................ 29
2.2.2 LNCaP xenografts ..................................................................................................................... 30
2.2.3 Simvastatin and simvastatin hydroxy acid LC-MS ................................................................... 31
2.2.5 Alanine transaminase assay ....................................................................................................... 33
2.2.6 Cholesterol LC-MS ................................................................................................................... 33
2.2.7 Steroid LC-MS .......................................................................................................................... 34
2.2.8 Quantitative PCR....................................................................................................................... 34
2.3 Results .............................................................................................................................................. 35 2.3.1 Statin use improves the overall survival and PSA declines of men receiving abiraterone for
locally advanced or metastatic CRPC ................................................................................................ 35
2.3.2 Oral administration of simvastatin resulted in clinically relevant serum concentrations and
reduced serum cholesterol .................................................................................................................. 43

viii
2.3.3 Simvastatin administration does not result in overt toxicity ..................................................... 44
2.3.4 Simvastatin administration reduces tumor volume ................................................................... 44
2.3.5 Simvastatin treatment suppresses intratumoral androgen accumulation and alters androgen
receptor activity .................................................................................................................................. 47
2.3.6 Simvastatin treatment alters cholesterol metabolism ................................................................ 48
2.4 Discussion ........................................................................................................................................ 51
CHAPTER 3: SR-B1 A NOVEL TARGET FOR PROSTATE CANCER TREATMENT
THROUGH ANDROGEN RECEPTOR PATHWAY-DEPENDENT AND –INDEPENDENT
MECHANISMS......................................................................................................................................... 58
3.1 Specific aim and rationale .............................................................................................................. 58
3.2 Methods ........................................................................................................................................... 58 3.2.1 Immunohistochemical and mRNA expression analysis of clinical samples ............................. 58
3.2.2 Prostate cancer cell lines ........................................................................................................... 59
3.2.3 Antibodies ................................................................................................................................. 59
3.2.4 RNA-interference transfection protocol .................................................................................... 60
3.2.5 BLT-1 treatment protocol .......................................................................................................... 60
3.2.6 HDL-cholesterol uptake assay................................................................................................... 60
3.2.7 Quantitative PCR....................................................................................................................... 61
3.2.8 IncuCyte Zoom cellular growth assay ....................................................................................... 62
3.2.9 Live/Dead cytotoxicity assay .................................................................................................... 62
3.2.10 Cell cycle analysis ................................................................................................................... 63
3.2.11 Western blotting ...................................................................................................................... 63
3.2.12 Fluorescent microscopy ........................................................................................................... 64
3.2.13 Steroid analysis by LC-MS ..................................................................................................... 64
3.2.14 PSA secretion quantification ................................................................................................... 65
3.2.15 Statistical analyses ................................................................................................................... 65
3.3 Results .............................................................................................................................................. 65 3.3.1 SR-B1 is highly expressed in primary, metastatic and neuroendocrine prostate cancer ........... 65
3.3.2 SR-B1 antagonism alters cholesterol metabolism of castration-resistant C4-2 cells ................ 69
3.3.3 SR-B1 antagonism inhibits cellular proliferation of C4-2 cells ................................................ 70
3.3.4 SR-B1 antagonism can induce sub G0 and G0 – G1 cell cycle accumulation ............................ 73
3.3.5 SR-B1 antagonism reduces cellular androgen accumulation and AR activity in steroidogenic
C4-2 cells ........................................................................................................................................... 73
3.3.6 SR-B1 knockdown phenotype is not rescued by exogenous steroid ......................................... 75
3.3.7 SR-B1 antagonism induces cell stress and autophagy pathways .............................................. 77
3.3.8 SR-B1 antagonism reduces cholesterol uptake and induces robust cell death in androgen
independent PC-3 cells ....................................................................................................................... 80
3.3.9 SR-B1 co-targeting can amplify the effects of singular agents ................................................. 83
3.4 Discussion ........................................................................................................................................ 85
CHAPTER 4: EVALUATION OF BLT-1 AS AN IN VIVO INHIBITOR OF SR-B1 ....................... 92
4.1 Specific aim and rationale .............................................................................................................. 92
4.2 Methods ........................................................................................................................................... 92 4.2.1 Microsomal assay ...................................................................................................................... 92
4.2.2 Pharmacokinetic and toxicity analysis ...................................................................................... 92
4.2.3 BLT-1 analysis by LC-MS ........................................................................................................ 93
4.2.4 Xenograft experiments .............................................................................................................. 94
4.3 Results .............................................................................................................................................. 95 4.3.1 BLT-1 is rapidly metabolized by mouse liver microsomes ....................................................... 95
4.3.2 Oral administration of BLT-1 results in relevant serum concentrations ................................... 96
4.3.3 50 mg/kg BLT-1 induces overt toxicity in C4-2 tumor bearing mice ....................................... 97

ix
4.3.4 BLT-1 administration reduces PC-3 tumor growth ................................................................. 100
4.4 Discussion ...................................................................................................................................... 102
CHAPTER 5: DISCUSSION AND CONCLUSIONS ......................................................................... 107
5.1 Limitations and alternatives ........................................................................................................ 108 5.1.1 Pleiotropic effects of statin therapy ......................................................................................... 108
5.1.2 Alternative mechanisms of cholesterol targeting .................................................................... 109
5.1.3 Pleiotropic effects of SR-B1 antagonism ................................................................................ 109
5.2 Future directions ........................................................................................................................... 110 5.2.1 Statins and PCa........................................................................................................................ 110
5.2.2 SR-B1 and PCa........................................................................................................................ 111
5.3 Conclusions.................................................................................................................................... 117
References ................................................................................................................................................ 120

x
LIST OF TABLES
TABLE 2.1: COMORBIDITY SCORE WEIGHTING OF CHARLSON INDEX. ....................................................... 30 TABLE 2.2: BASELINE CHARACTERISTICS AND OUTCOMES OF BRITISH COLUMBIA ABIRATERONE
PATIENTS ............................................................................................................................................ 36 TABLE 2.3: OUTCOMES BY STATIN STATUS OF ABIRATERONE PATIENTS ................................................... 38 TABLE 2.4: PSA DECLINES OF >30% AND >50% BY STATIN STATUS OF ABIRATERONE PATIENTS ............ 38 TABLE 2.5: PROGNOSTIC FACTORS FOR OVERALL SURVIVAL DETERMINED BY MULTIVARIATE COX
REGRESSION ANALYSES FOR BRITISH COLUMBIA ABIRATERONE PATIENTS ...................................... 40 TABLE 2.6: PROGNOSTIC FACTORS FOR PSA RESPONSE (50% DECLINE FROM BASELINE) DETERMINED BY
MULTIVARIATE LOGISTIC REGRESSION ANALYSES FOR BRITISH COLUMBIA ABIRATERONE PATIENTS
............................................................................................................................................................ 41 TABLE 2.7: BREAKDOWN OF CHARLSON INDEX SCORING BY STATIN STATUS ........................................... 42 TABLE 2.8: BASELINE CHARACTERISTIC COMPARISON OF ABIRATERONE PATIENTS BY STATIN STATUS ... 42 TABLE 3.1: ANTIBODY SPECIFICATIONS FOR PRIMARY ANTIBODIES USED IN WESTERN BLOTTING ........... 59 TABLE 4.1 ASSESSMENT OF COMMON SERUM TOXICITY MARKERS FOLLOWING REPEATED BLT-1 DOSING
IN MICE ............................................................................................................................................... 99

xi
LIST OF FIGURES
FIGURE 1.1: PATHWAY OF TESTOSTERONE AND DHT SYNTHESIS ................................................................ 4 FIGURE 1.2: MECHANISMS OF CELLULAR CHOLESTEROL AND ANDROGEN METABOLISM IN CRPC ........... 13 FIGURE 2.1: STATIN USE PROLONGS SURVIVAL OF CRPC PATIENTS ON ABIRATERONE ............................. 38 FIGURE 2.2: ORAL SIMVASTATIN ADMINISTRATION RESULTS IN EFFICACIOUS AND CLINICALLY RELEVANT
SERUM CONCENTRATIONS IN THE ABSENCE OF TOXICITY .................................................................. 45 FIGURE 2.3: SIMVASTATIN SUPPRESSES POST-CASTRATION LNCAP XENOGRAFT GROWTH ...................... 46 FIGURE 2.4: SIMVASTATIN SUPPRESSES PSA PROGRESSION IN CASTRATED LNCAP XENOGRAFT MICE ... 47 FIGURE 2.5: SIMVASTATIN DOES NOT ALTER ANDROGEN PRECURSOR ACCUMULATION IN CASTRATED
LNCAP XENOGRAFT BEARING MICE .................................................................................................. 49 FIGURE 2.6: SIMVASTATIN SUPPRESSES INTRATUMORAL AND SERUM STEROID ACCUMULATION IN
CASTRATED LNCAP XENOGRAFT BEARING MICE .............................................................................. 50 FIGURE 2.7: SIMVASTATIN ADMINISTRATION ALTERS CHOLESTEROL METABOLISM IN THE ABSENCE OF
CHANGES TO AR EXPRESSION ............................................................................................................ 51 FIGURE 3.1: SR-B1 EXPRESSION IS INCREASED IN LOCAL AND METASTATIC PROSTATE CANCER .............. 67 FIGURE 3.2 SR-B1 EXPRESSION IS INCREASED IN PROSTATE CANCER ........................................................ 68 FIGURE 3.3 SR-B1 EXPRESSION IS INCREASED IN NEPC ............................................................................ 69 FIGURE 3.4 SR-B1 ANTAGONISM INHIBITS CHOLESTEROL UPTAKE AND INDUCES HMGCR EXPRESSION . 70 FIGURE 3.5 SR-B1 ANTAGONISM INHIBITS C4-2 CELL GROWTH ................................................................ 71 FIGURE 3.6 SR-B1 ANTAGONISM INDUCES CELL CYCLE ARREST AND DEATH ............................................ 72 FIGURE 3.7 SR-B1 ANTAGONISM REDUCES CELLULAR ANDROGEN ACCUMULATION AND AR ACTIVITY .. 75 FIGURE 3.8 ARRESTED SRBI KNOCKDOWN PHENOTYPE IS NOT RESCUED BY EXOGENOUS STEROID ......... 77 FIGURE 3.9 SR-B1 ANTAGONISM INDUCES CELL STRESS AND AUTOPHAGY PATHWAYS ............................ 78 FIGURE 3.10 COMPARISON OF PROTEIN QUANTIFICATION ASSAYS ............................................................ 80 FIGURE 3.11 SR-B1 ANTAGONISM INHIBITS CHOLESTEROL IN PC-3 CELLS ............................................... 81 FIGURE 3.12 SR-B1 ANTAGONISM INHIBITS CELL GROWTH IN PC-3 CELLS ............................................... 82 FIGURE 3.13 SR-B1 ANTAGONISM INDUCES ROBUST CELL CYCLE ARREST AND DEATH IN PC-3 CELLS .... 83 FIGURE 3.14 SR-B1 CO-TARGETING CAN AMPLIFY THE EFFECTS OF SINGULAR AGENTS ........................... 84 FIGURE 4.1 BLT-1 IS RAPIDLY METABOLIZED BY LIVER MICROSOMES ...................................................... 96 FIGURE 4.2 BLT-1 REDUCES SURVIVAL OF C4-2 XENOGRAFTS .................................................................. 97 FIGURE 4.3 BLT-1 REDUCES PC-3 XENOGRAFT TUMOR GROWTH ............................................................ 101

xii
LIST OF ABBREVIATIONS
Abbreviation Definition
4E-BP1/2 eIF-4E Binding Proteins
ABCA1 ATP-Binding Cassette Transporter A1
ABCG1 ATP-Binding Cassette Transporter G1
ACAT Acyl-CoA Cholesterol Acyltransferase
ACTH Adrenocorticotropin Hormone
ADT Androgen Deprivation Therapy
AKT Protein Kinase B
ALB Albumin
ALP Alkaline Phosphatase
ALT Alanine Transaminase
AMPK AMP-Activated Protein Kinase
AMY Amylase
ApoB Apolipoprotein B
AR Androgen Receptor
ARE Androgen Response Element
Atg12 Autophagy-related Protein 12
AUC Area Under Curve
BCR Biochemical Recurrence
BiP Binding Immunoglobulin Protein
BLT-1 Block Lipid Transport-1
BSA Bovine Serum Albumin
BUN Blood Urea Nitrogen
C/EBP Ccaat-Enhancer-Binding Proteins
CA Calcium
CaMKK-β Calmodulin-Dependent Protein Kinase Kinase 2
CAN Acetonitrile
CK Creatine Kinase
CLint-app Apparent Intrinsic Clearance
Clu Clusterin
Cmax Max Concentration
CRE Creatinine
CRPC Castration-Resistant Prostate Cancer
CTLA4 Cytotoxic T Lymphocyte-associated Antigen 4
DBD DNA Binding Domain
DHEA Dehydroepiandrosterone
DHEAS Dehydroepiandrosterone Sulfate
DHT Dihydrotestosterone
DiI 1,1′-dioctadecyl-3,3,3′,3′-tetramethylindocarbocyanine perchlorate
DMSO Dimethyl Sulfoxide
DRE Digital Rectal Exam
EBRT External Beam Radiation Therapy
xiii
EGFR Epidermal Growth Factor Receptor
eIF2α Eukaryotic Initiation Factor 2
eNOS Endothelial Nitric Oxide Synthase
ER Endoplasmic Reticulum
ETS E26 Transcription Specific
FACS Fluorescence Activated Cell Sorting
FGF Fibroblast Growth Factor
FPKM Fragments per Kilobase of Transcript per Million Mapped Reads
FSC Forward Scatter
FSH Follicle Stimulating Hormone
GLOB Globulin
GLU Glucose
GSK3 Glycogen Synthase Kinase 3
HDL High Density Lipoprotein
HIF1α Hypoxia-inducible Factor 1-alpha
HMGCR HMG-CoA Reductase
HSD Hydroxysteroid Dehydrogenase
IDL Intermediate Density Lipoprotein
IGF Insulin-like Growth Factor
IGFR Insulin-like Growth Factor 1 Receptor
IHC Immunohistochemical
INSIG Insulin Induced Gene 1
IRE1α Inositol-Requiring Enzyme 1 Alpha
IS Internal Standard
JNK C-Jun N-terminal Kinase
K+ Potassium
LBD Ligand Binding Domain
LC-MS Liquid Chromatography-Mass Spectrometry
LDL Low Density Lipoprotein
LDLr Low Density Lipoprotein Receptor
LH Luteinizing Hormone
LHRH Luteinizing Hormone-Releasing Hormone
LKB1 Liver Kinase B1
LXR Liver X Receptor
MDR1 P-glycoprotein
MTBE Methyl Tert-Butyl Ether
mTOR Mammalian Target of Rapamycin
Na+ Sodium
NAFLD Non-Alcoholic Fatty Acid Liver Disease
NC Negative Control RNAi duplex
NCCN National Comprehensive Cancer Network
NEPC Neuroendocrine Prostate Cancer
NF-kB Nuclear Factor Kappa-light-chain-enhancer of Activated B Cells

xiv
NO Nitric Oxide
NPC1 Niemann-Pick C1
NPC2 Niemann-Pick C2
NT Non-treated
NTD N-Terminal Domain
PAP Prostatic Acid Phosphatase
PBS Phosphate-Buffered Saline
PCa Prostate Cancer
PHOS Phosphorus
PI Propidium Iodide
PI3K Phosphoinositide 3-kinase
pRB Retinoblastoma protein
PSA Prostate Specific Antigen
PTEN Phosphatase and Tensin Homolog
RFU Corrected Florescence
RIPA Radioimmunoprecipitation Assay
S1P Site 1 Protease
S2P Site 2 Prostease
S6K1 S6 Kinase 1
SC Shanghai Cohort
SCAP SREBP Cleavage-activating Protein
SDS-PAGE SDS-Polyacrylamide Gel Electrophoresis
SF-1 Steroidogenic Factor-1
SHH Sonic Hedgehog
Sp1P Sphingosine-1-Phosphate
SQLE Squalene Monooxygenase
SR-B1 Scavenger Receptor B1
SRB1-KD Scavenger Receptor B1 Knock Down
SREBP Sterol Regulatory Element Binding Protein
SSC Side Scatter
StAR Steroidogenic Acute Regulatory Protein
TBIL Total Bilirubin
TBS-T Tris-buffered Saline, 0.1% Tween 20
TCGA The Cancer Genome Atlas-PRAD
TGFβ Transforming Growth Factor Beta
TNM Tumor-Node-Metastasis
TP Total Protein
TRAF2 TNF Receptor-Associated Factor 2
TRAMP TRansgenic Adenocarcinoma Mouse Prostate
UGE Urogenital Sinus Epithelium
UGM Urogenital Sinus Mesenchyme
UGS Urogenital Sinus
UGT UDP-glucuronosyltransferase

xv
ULDL Ultra Low Density Lipoprotein
ULK1/2 Unc-51 Like Autophagy Activating Kinase
UPR Unfolded Protein Response
UWRA University of Washington Rapid Autopsy
VLDL Very Low Density Lipoprotein
WC Weill Cornell
WGA Wheat Germ Agglutinin
XBP1 X-box Binding Protein 1

xvi
ACKNOWLEDGEMENTS
This thesis would not have been completed without the guidance and support of several
individuals. I would like to thank my supervisors Dr. Kishor Wasan and Dr. Michael Cox for their
continued mentorship from the start of my graduate studies both aiding in my development as an
academic. For Dr. Wasan providing me the opportunity to become a graduate student directly following
my undergraduate degree and introducing me to the world of pharmaceutical sciences and Dr. Cox
graciously accepting me into his laboratory and engaging the role of supervisor with full heart following
the departure of Dr. Wasan from the University of British Columbia. The members of the laboratory who
provided a friendly, supportive and engaging work environment, Dr. Mitali Pandey, Dr. Manju Sharma,
Dr. Yubin Guo, Jonathan Frew and Jake Noble and all of the members of the Vancouver Prostate Centre
and the Faculty of Pharmaceutical Sciences. Further, I would like to thank both the Prostate Cancer
Foundation of British Columbia and Prostate Cancer Canada providing me with financial support to
undertake my studies and the research within this thesis. Lastly, I am continually grateful to Dr. Jon
Campbell, Dr. Moe Wehbe and soon to be doctors Christian Buchwalder and Ankur Midha for their
support and comradery as we collectively went through our graduate studies.

xvii
DEDICATION
This work is dedicated to my loving parents John and Darlene, brothers Sam and Jonah,
partner Irene, grandparents Roy and Doreen, the farm girls Aunt Eileen and Aunt Sharon, the
Brodeur-Eyers and Afonsos and lastly my dearly departed grandparents Donald and Barbara.
Although she will never see the culmination of my years of graduate studies Grammy G’s loving
impact will forever be with me.

1
CHAPTER 1: INTRODUCTION
1.1 Prostate cancer epidemiology
An estimated 206,200 Canadians will have been diagnosed with new cases of cancer in 20171. Of
these new cases 21,300 will be cancers of the prostate accounting for 20.7% of the new cancers in men
and making prostate cancer (PCa) the 4th most diagnosed form of cancer following cancers of the lung,
colorectal region and breast. A vast majority of men diagnosed with the disease are over the age of 50
years (>99.9%) and approximately 85% of patients are diagnosed after the age of 65 years, while a
majority of men aged above 85 years show histological evidence of PCa2. The relative five and ten year
survival rates for prostate cancer are 99% and 96% respectively largely due to the near 100% survival
rates of those diagnosed with local disease3. However, those with distant disease have a relative 5 year
survival rate of only 29%. In total this translates to an expected 4,000 deaths due to prostate cancer in
2017 in Canada.
Both environmental and genetic factors have been deemed to play contributory roles in the risk of
developing PCa. The presence of PCa within the immediate family has been shown to increase the risk of
developing PCa, such that having one first-degree relative with the disease doubles PCa risk and two first-
degree relatives increasing risk by up to 11-fold2,4
. Racial and ethnic background further appears to have
association with PCa risk with African-Americans having amongst the highest rates and in general the
lowest rates being found among Asian populations. Although contributory effects of culture and
environment cannot be fully eliminated several potential genetic links have been identified5-7
.
Environmental factors can include diet, tobacco use and occupational exposure to chemicals such as
pesticides8,9
. Dietary studies have found a correlation between the consumption of red-meat as well as
high-fat diets to be positively associated with the development of PCa10-12
. While in contrast the
consumption of tomato and soy based products has been correlated to a reduction in the risk of
developing PCa2,13
.

2
1.2 Structure and development of the prostate
The prostate is an exocrine gland in the male reproductive system that functions to secrete
alkaline fluids contributing to the motility, and liquefaction of seminal fluids promoting successful
fertilization14,15
. The adult prostate consists of three regions, the central zone, the transition zone and the
peripheral zone each of different embryologic origin and structurally contains epithelial ductal regions
supported by smooth muscle stroma. The prostate gland originates from the urogenital sinus (UGS), in
contrast to the majority of male accessory sex gland that develop from the Wolffian ducts16
, and occurs
during the second and third trimester of pregnancy involving cross signaling between two components of
the UGS, the UGS mesenchyme (UGM) and the UGS epithelium (UGE)16,17
. Essential to the
differentiation and development of the prostate is the expression of the androgen receptor (AR), a nuclear
hormone receptor activated by natural ligands testosterone, and the more potent testosterone derivative
dihydrotestosterone (DHT). Produced predominantly in the testes of developed men, and to a smaller
extent by the adrenals and ovaries of women, androgen activation of the AR induces the expression of a
large number of genes18,19
.
Androgens initially act on the UGM, where AR activation initiates paracrine signaling that drives
the outgrowth of UGE derived epithelial buds into the surrounding UGM20
. The precise pattern of this
branching leads to the development of the mature glandular secretory epithelium21
. The developing UGE
will in turn promote UGM differentiation into the fibroblast and smooth muscle tissue observed in the
developed prostate. Several paracrine signaling pathways have been identified as playing important roles
in the development of the prostate including sonic hedgehog (SHH), fibroblast growth factor (FGF),
transforming growth factor beta (TGFβ) and insulin-like growth factor (IGF)16
.
1.3 Androgen receptor
Although not the primary focus of this thesis the AR is considered to be the central driver of PCa
and the focus of therapeutic approaches to disease management for patients with disseminated disease. In
brief, the AR belongs to the steroid hormone group of nuclear receptors which also includes the estrogen

3
receptor, and the glucocorticoid receptor among others22-24
. The 110 kDa protein, similar to other nuclear
receptor family members contains three major functional domains, the N-terminal domain (NTD), the
DNA binding domain (DBD) and the C-terminal ligand binding domain (LBD)22
. The NTD contains the
activation function -1 regions essential for AR transactivation, while the highly conserved DBD interacts
with the DNA promoter and the LBD provides a binding pocket for androgens25,26
. Once bound by DHT,
or other weaker activating androgens, displacing heat-shock proteins and binding importin-α the AR
translocates into the nucleus27,28
. Within the nucleus AR dimers bind to the androgen response element
(ARE) promoting the transcription of growth and survival genes28-31
.
1.4 Androgens and steroid hormones
Beyond the prostate, androgens and similar steroid hormones are an important part of the
endocrine system responsible for proper sexual development and function, metabolic homeostasis and
also help to regulate inflammation and immunity32,33
. Androgens are 19 carbon, four carbon ring
structures that are synthesized from the precursor cholesterol (Figure 1.1). Testosterone, containing a
ketone and hydroxyl functional group on opposing ends, is the primary circulating androgen in males
with significant levels of DHT and dehydroepiandrosterone sulfate (DHEAS) also being consistently
detectable34
. Controlled by the hypothalamic-pituitary-adrenal-gonadotropic axis, androgen production
takes place primarily in the Leydig cells of the testes with the adrenal cortex also producing DHEA35
.
Initially, the hypothalamus releases luteinizing hormone-releasing hormone (LHRH) which stimulates the
pituitary to in turn release luteinizing hormone (LH) and adrenocorticotropin hormone (ACTH). LH then
stimulates testosterone production in the testes while ACTH stimulates the adrenals to produce DHEA36
.
Testosterone is synthesized by the initial uptake of cholesterol into the mitochondria of steroidogenic cells
by steroidogenic acute regulatory protein (StAR) followed by side-chain cleavage of cholesterol into
pregnenolone by CYP11A1 (P450scc). This is followed by hydroxylase and lyase steps by CYP17A1 and
reduction steps by 3β-hydroxysteroid dehydrogenase (HSD) and 17β-HSD resulting in end product
testosterone36
.

4
Figure 1.1: Pathway of testosterone and DHT synthesis
The synthesis of AR-activating androgens testosterone and DHT from precursor cholesterol through the
standard (blue) and back-door pathways (red) displaying steroid structures and primary enzymes.
Circulating testosterone is mostly bound to serum sex hormone-binding globulin and albumin37,38
,
with debate surrounding the relative importance of free diffusion and protein bound endocytosed cellular
testosterone uptake39,40
. Once testosterone enters the prostate cell it is converted to the more potent AR
activating androgen DHT by 5α-reductase functioning to remove the Δ4,5 carbon double bond41
. Other

5
substrates for 5α-reductase include progesterone, androstenedione and aldosterone. 5α-reductase
inhibitors finasteride and dutasteride have been used to treat benign prostatic hyperplasia and hair loss in
men42,43
.
DHT is generally not highly excreted from tissue and is metabolized in the peripheral tissue in
which it is generated44,45
. Phase I metabolism of DHT by various isoforms of 3α/β-HSD and 17β-HSD
enzymes generates several constituents including androstenedione and androsterone46-48
. However,
potentially all of these tissues also possess the required HSD isoforms to convert the metabolized
constituents back into DHT and expression of phase I enzymes vary significantly between prostatic cell
types48-51
. It is believed that these constituents as well as DHT are capable of undergoing phase II
metabolism elimination. The UDP-glucuronosyltransferase (UGT) family of glucuronosyltransferases
catalyzes the transfer of glucuronic acid from UDP-glucuronic acid to various targeting molecules,
including androgens, generally resulting in a more polar and water soluble molecule for easy excretion.
The expression and role of individual UGTs in prostate cancer is still a debated topic with implicated
isoforms including UGT2B15 and UGT2B1752,53
.
1.5 Prostate cancer development
Tumorigenesis and malignant cancer development has long been understood to be a genetic
disease in which genetic mutations drive pre-malignant cells to overcome an inherent system of checks
and balances eventually leading to unabridged growth54
. Famously summarized by Hanahan and
Weinberg, these genetic mutations can be stratified into specific categories critical for malignant
transformation55,56
. Termed “Hallmarks of Cancer” these phenomena include sustained proliferative
signaling, evading growth suppressors, resisting cell death, enabling replicative immortality, inducing
angiogenesis and activating invasion and metastasis.
Although PCa is generally considered a cancer-type with low mutational burden and substantial
heterogeneity, several oncogenic mutations are consistently observed54
. In fact, recent sequencing efforts
have indicated that up 74% of primary prostate cancers can be stratified into one of seven subtypes
6
characterized by either gene fusions or mutations54
. Gene fusion events focus primarily on the E26
transcription specific (ETS) family of transcription factors (ERG, ETV1, ETV4, and FLI1) largely with
androgen regulated genes including TMPRSS2, SLC45A3, and NDRG154
. While common mutations
observed are SPOP, FOXA1, and IDH1. Other common, but not of the defined subtypes, drivers include
loss of functional phosphatase and tensin homolog (PTEN), p53 and retinoblastoma protein (pRB) tumor
suppressors54
. A vast majority of PCas including those with AR driven mutations and those with non-AR
related mutations express significant levels of the AR and validated AR target genes54
. This understanding
combined with the success of therapeutics that interrupt AR signaling and the mechanisms by which the
cancers evade these AR targeted therapies, discussed below, highlight the understanding that a majority of
PCas require sustained AR signaling to maintain proliferative signaling.
1.6 Diagnosis, Gleason grading and staging of prostate cancer
Initial PCa diagnosis generally consists of two important tests, the digital rectal exam (DRE) and
serum prostate specific antigen (PSA) measurement57
. A DRE allows for the detection of an enlarged
prostate and presence of abnormal nodules58
. The subjective nature of the test can lead to large amounts
of inter-examiner variability and is further limited due to it primarily addressing the dorsal prostate59
.
Serum PSA although used to aid in the diagnosis of PCa is primarily used to monitor changes in cancer
growth and progression as a correlate for monitoring tumor burden60
. PSA itself is an AR regulated serine
protease part of the kallikrein protease family, produced by prostatic epithelial tissue and secreted into the
lumen where it functions to cleave semenogelin I/II aiding in seminal fluid liquefaction61
. Normally
serum levels of PSA are low but can be elevated in response to several factors including PCa, benign
prostatic hyperplasia, prostatitis, urinary tract infection or trauma60
. Abnormal findings with these tests
are normally a precursor to a prostate biopsy for histopathological confirmation of cancer57
.
Originally developed in 1966 by Donald Gleason the Gleason grading system has since been used
to evaluate the prognosis of men diagnosed with PCa62
. Grading is based on the histological examination
of hematoxylin and eosin stained prostate biopsy specimens. The specimens are graded from 1,

7
characterized by a well-contained nodular lesion with well-differentiated glands, to grade 5 characterized
by poorly differentiated, stromal invasive cells often lacking glandular formation. As the obtained
specimens often harbor multiple Gleason patterns the Gleason scoring system was developed in which the
most common, primary, grade is combined with the second most common, secondary, grade yielding a
sum score with a higher number indicating a poorer prognosis62
. However, importantly the presence of
high-grade tertiary pattern is scored as the second component even if it is the third most present pattern.
Updates to the traditional Gleason grading system have been made, most notably in two distinct
forms. In 2005 the modified Gleason system was introduced by the International Society of Urologic
pathology. In summary the modified system essentially removed both 1 and 2 Gleason scores, citing low
reproducibility and inability to properly diagnose by needle biopsy and shifted certain growths including
cribriform growths from Gleason grade 3 to 462
. These changes led to an increase in the diagnosis of high
Gleason grade cancers and is generally considered to correlate better to clinical stage and patient
outcome63,64
. In 2016, the second major update to the Gleason grading system was proposed in which
patients are stratified into “Gleason grade groups” based on the correlation of specific Gleason scores to
progression free survival rates65
. The update included five groups of increasing odds of recurrence
following primary therapy. Grade group one includes all Gleason scores less than or equal to 6, grade
group two includes Gleason scores of 3 + 4 = 7, grade group three includes Gleason scores of 4 + 3 = 7,
Gleason group four includes Gleason scores equal to 8 and grade group five includes Gleason scores of 9
or higher. The five year biochemical recurrence free percentages following radical prostatectomy are 96%
for grade group one, 88% for grade group two, 63% for grade group three, 48% for grade group four and
26% for grade group five.
Beyond Gleason scoring the tumor-node-metastasis (TNM) staging system for the classification
of malignant tumors is a widely used standardized system for the classification of cancer66
. The system
describes the primary tumor (T) on a scale of 1 to 4 depending on the extent of external tissue invasion,
spread to the lymph node (N) generally ranked from 1 to 3 based on regional or distant lymph node
involvement and metastasis (M) present (1) or absent (0). The findings of this clinical staging process

8
combined with the Gleason scoring of the biopsy results provide critical information in guiding treatment
decisions and prognosis.
1.7 Local therapies for prostate cancer
Often times patients with low risk localized disease will defer active treatment opting instead for
an active surveillance approach involving increased frequency of PSA and DRE testing and prostate
biopsy67
. The increasing popularity of this approach has helped decrease instances of over-treatment and
the associated adverse effects. For local cancers considered too high risk for a surveillance approach,
based on factors described above, the potentially curative approaches of radical prostatectomy or radiation
therapy are generally considered. Radical prostatectomy involves the complete removal of the prostate
and surrounding tissues with the objective of removing all cancers tissue. This approach is generally
considered for lower risk patients with disease that remains encapsulated to the prostate due to concerns
over the ability to clear all cancerous tissue surgically in more disseminated disease68
. The procedure is
associated with a 10 year progression free survival rate of 88% in patients with low to intermediate risk
disease69
. Radiation therapy involves the use of ionizing radiation to kill malignant cells and is generally
considered for patients with extracapsular disease. External beam radiation therapy (EBRT), in which
ionizing radiation is externally applied to cancer, is associated with a 10 year progression free survival
rate of 90% and is the most common approach for intermediate to high risk PCa patients70
.
Brachytherapy, the insertion of sealed source radiation beads into or adjacent to the cancerous prostatic
tissue is also a treatment option for generally low-risk PCa patients.
For men with no evidence of metastatic disease these local therapies successfully remove or kill a
vast majority of the tumor leading to the observed high progression free survival rates. These numbers are
further bolstered by the heterogeneous nature of primary PCa tumors in that only an extremely limited
number of PCa cells possess the required mutations to escape the primary site and proliferate as a distant
metastasis71
. However, the highly unstable nature of these rapidly dividing cells drives genomic evolution
of populations of cells that not only display metastatic potential but also allow for the development of

9
therapeutic resistance72
. If these primary therapies fail to remove all cells with metastatic potential or if
metastatic populations already exist, whether dormant or of undetectable size, the likelihood of recurrence
is increased. For the approximately 20%-30% of surgery or radiation therapy patients that do eventually
recur following local treatment or those that present with high-risk localized or metastatic disease on
diagnosis systemic approaches are required73,74
.
1.8 Androgen deprivation therapy
Of those patients requiring systemic approaches, whether with confirmed metastatic disease or
progressed local disease, androgen deprivation therapy (ADT) has long been the mainstay approach,
functioning to reduce AR-mediated cell signaling through the reduction of circulating gonadal
testosterone57,75,76
. Used as a catch-all term for the reduction of circulating testosterone different
approaches have been used since the advent of the therapy. These approaches include surgically through
bilateral orchiectomy, or with small molecule LHRH agonist and antagonists75,76
. LHRH acting agents,
such as goserelin or leuprolide, decrease signaling through the hypothalamic-pituitary-adrenal-
gonadotropic axis leading to a near total reduction in testosterone production and similar or slightly
improved survival rates to orchiectomy but may result in increased adverse events77,78
. With the non-
invasive and reversible nature of small molecule approaches compared to surgery, LHRH agents are the
most common and preferred method of ADT.
ADT is believed to induce a therapeutic response in approximately 90% of patients and provide
varying progression-free and overall survival benefits depending on previous treatment and its use as a
primary, adjuvant or neoadjuvant therapy79
. In men with advanced disease ADT has approximate
progression free and overall survival times of 16 months and 36 months respectively, however beneficial
effects may be limited to quality of life improvements as opposed to true survival benefits75,80,81
.
However, when given as an adjuvant to EBRT, ADT has been shown to improve outcomes in a number
of studies68,75,82
, with increases in five year overall survival by up to 26% compared to solo radiation
therapy and increases in five year disease free rate of up to 37%. As such the National Comprehensive

10
Cancer Network (NCCN) recommends ADT plus EBRT for patients with high-risk disease75
. Despite
these described benefits ADT, when given alone or with EBRT, the approach is not considered curative as
a majority of patients will eventually suffer disease recurrence into what is termed castration-resistant
prostate cancer (CRPC)83
. Traditional findings place the median overall survival rate between 12 months
and 18 months for patients with CRPC84-86
, however recent investigations of the modern CRPC landscape
indicate median overall survival times could be up to 40 months or higher87-89
. This large improvement in
median overall survival is likely a result of the growing number of therapies available to CRPC patients
and the improved implementation of said therapies described below.
1.9 CRPC and mechanisms of progression
As described above PCas that fail primary ADT are termed CRPC. The multiple mechanisms by
which the cancer overcomes ADT are still being elucidated and remain an intense area of research90
. The
observed increase in PSA, an AR regulated protein, and the observed successes of abiraterone and
enzalutamide in castrate-resistant progression reflects the continued activation of the AR despite castrate-
level serum testosterone and as such a majority of CRPC mechanisms revolve around the AR axis91
.
Increased expression of the AR has been correlated to CRPC via gene amplification and may be
present in up to 30% of CRPCs92,93
. Further, increased activation and expression of the AR through the
loss of pRB has been demonstrated as a potential driver of castrate-resistant progression94
. pRB is a
critical negative regulator of tumor development through the suppression of cell cycle progression via
complex mechanisms including the suppression of activator E2Fs95,96
. The loss of pRB expression has
been demonstrated in up to 73% of CRPCs and is thought to both lead to increased AR-target gene
occupancy and AR mRNA dysregulation leading to increased AR expression94
. Efforts of impeding AR
activity directly have been made through the use of current generation AR antagonists, enzalutamide, and
traditional agents, such as flutamide and bicalutamide.
Several alterations directly to the AR have been proposed as drivers for castrate-resistant
progression. Thought to increase in frequency through the selective pressure of anti-androgens AR

11
mutations may be present in up to 50% of CRPCs97-99
. These mutations include alterations in the NTD
altering cofactor binding100
, and mutations in the LBD conferring a loss of ligand specificity97,101
. The
first described mutation to drive a loss in specificity was a threonine to alanine (T877A) substitution in
LNCaP based models which has since been confirmed in up to 30% of bone metastases97,101
. This
mutation allows for AR activation in response to estrogens, progestins and the activated form of
flutamide102
. Further mutations have since been documented allowing activation by alternative steroid
molecules, estrogens, corticosteroids and androgen precursor progesterone103,104
.
The identification of splice variants provided a further AR based explanation for the development
of CRPC105,106
. Several of these variants result in the deletion of the exons coding the LBD leading to a
constitutively active AR lacking the LBD107,108
. These splice variants are thought to be upregulated in the
presence of anti-androgens such as enzalutamide conferring resistance to multiple levels of androgen
targeted therapies109
. Further, AR based mechanisms include alterations in post-translational
modification110
and changes in co-regulator function111
. An in depth discussion of these mechanisms is
described by Karantanos et al.90
. Efforts to overcome these splice variants include the development of
DBD antagonists such as EPI-506 currently undergoing early clinical trials112
.
Several mechanisms of castration-resistant progression independent of AR pathway activity have
been proposed. C-myc expression is known to play a critical role in prostate cancer development113
, has
been shown to be amplified in up to 72% of CRPCs114
and prostate cancer cell growth under ADT
conditions has been correlated to c-myc expression115
. Alterations in the phosphoinositide 3-kinase
(PI3K) signaling pathway, notably PTEN loss, are also thought to play a role with very high incidence of
alterations in metastatic cancers116
and lead to alterations in protein kinase B (AKT) and mammalian
target of rapamycin (mTOR) signaling117-119
. Several compounds targeting these pathways have
progressed to early clinical trials, including PX-866 and GSK2636771 as PI3K inhibitors and
GSK2141795 and AZD5363 as AKT inhibitors, but to date none have achieved clinical success120
.
Despite the number of proposed mechanisms of castration-resistance, the concept of de novo
steroidogenesis has proven to be perhaps the most clinically validated and actionable. Despite continued
12
castrate serum levels of testosterone it has been found that intratumoral levels of both testosterone and
DHT remain similar to levels found in hormone-naïve cancers121
. Further, evidence suggests that essential
enzymes in the androgen synthesis pathway are stimulated within the tumor microenvironment and that
PCa bone metastases are capable of converting adrenal derived androgens to testosterone and DHT122-125
.
Mechanisms by which the tumor can synthesize DHT bypassing testosterone have also been identified
often referred to as the “backdoor pathway” (Figure 1.1)126,127
. From which precursor the late stage
androgens in CRPC are derived is currently a debated topic with likely multiple contributing pathways.
Testicular androgens have been demonstrated to potentially only account for as little as 60% of the total
androgen content of the prostate with the remainder likely a result of the conversion of adrenal derived
DHEA to testosterone and DHT (Figure 1.2)128-130
. This understanding has led to the belief that adrenal
derived DHEA is the predominant source of testosterone precursor following ADT131-133
. However, a
significant portion of the research describing the phenomenon of de novo steroidogenesis has been
performed in mouse based xenograft models123,126,134
. Mice are reported to not secrete DHEA or other
androgens from their adrenals which highlights the ability of testosterone production, at least in
experimental models, to be derived from precursor cholesterol within the tumor123,135-138
. While not fully
elucidated it appears likely that tumor testosterone production occurs from both cholesterol and adrenal
derived DHEA. The importance of these mechanisms is emphasized by the success of abiraterone
clinically, further described below139-141
.
1.10 Other androgen receptor pathway targeted treatments
In most cases advanced PCa is treated by an LHRH agent in concert with the use of an AR
inhibitor to reduce testosterone related side effects and further aid in the shutdown of AR
signaling57,75,76,142
. Common traditional AR inhibitors include flutamide and bicalutamide which
competitively bind to the LBD of the AR preventing activation and nuclear translocation. In theory the
addition of AR inhibitors to ADT prevent AR activation by remaining gonadal derived androgens, non-
gonadal derived androgens and mute any effects of the testosterone flair associated with LHRH agents.
13
However, the extent to which this combinatorial approach correspond to an improvement in overall
survival is minimal at best80,143-145
. The inability of these agents to improve the survival of men
undergoing ADT has been attributed primarily to both a lack of potency and concerns of partial agonism
of mutated AR146,147
Despite uncertainty surrounding survival benefits AR inhibitors are believed to aid in
pain relief and other side effects associated with testosterone flare148
. As such traditional AR antagonists
are still commonly prescribed, however with the recent successes of current generation AR antagonist
enzalutamide and CYP17A1 inhibitor abiraterone the treatment landscape is rapidly changing.
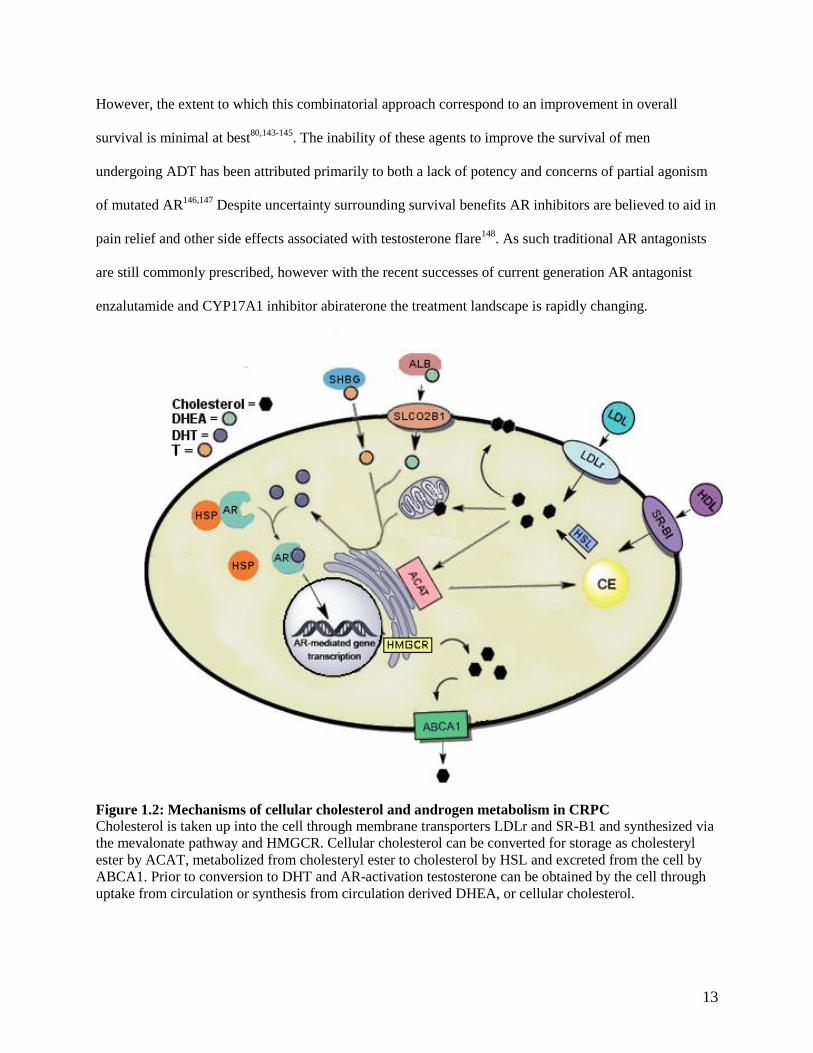
Figure 1.2: Mechanisms of cellular cholesterol and androgen metabolism in CRPC
Cholesterol is taken up into the cell through membrane transporters LDLr and SR-B1 and synthesized via
the mevalonate pathway and HMGCR. Cellular cholesterol can be converted for storage as cholesteryl
ester by ACAT, metabolized from cholesteryl ester to cholesterol by HSL and excreted from the cell by
ABCA1. Prior to conversion to DHT and AR-activation testosterone can be obtained by the cell through
uptake from circulation or synthesis from circulation derived DHEA, or cellular cholesterol.

14
Enzalutamide, first approved for clinical use in 2012, has come to represent the first of potentially
several current generation AR antagonists. Driving candidate selection for a novel AR antagonist was the
attempt to account for the shortcomings of traditional AR antagonists such that pre-clinically
enzalutamide (IC50: 36 nM) demonstrates at least four-fold higher binding affinity for the AR compared to
bicalutamide (IC50: 159 nM) and further impairs nuclear translocation and coactivator recruitment of the
AR appeasing concerns over agonist activity in mutated AR147
. Although improving on the potency of
traditional antagonists’ enzalutamide still pales in comparison to the potency of the primary AR activating
agonist DHT (IC50: 5.1 nM)147
. Clinically enzalutamide has been shown to significantly increase both the
progression free and overall survival of men with metastatic CRPC in both pre and post chemotherapy
settings149,150
. The AFFIRM trial showed an improved overall survival from 13.6 months to 18.4 months
with enzalutamide in metastatic CRPC patients that had previously received docetaxel chemotherapy
while the PREVAIL trial demonstrated a 51% increase in 12 month progression frees survival rate in
chemotherapy naïve metastatic CRPC patients receiving enzalutamide150,151
. As such enzalutamide is
seeing use in both pre-chemotherapy and post-chemotherapy patients. Clinical trials are ongoing testing
the effectiveness of enzalutamide for first line use alongside androgen deprivation therapy (ENZAMET,
NCT02446405).
Abiraterone is a current generation inhibitor of CYP17A1, thereby inhibiting the synthesis of AR
activating androgens. A pregnenolone analogue originally developed by the Institute of Cancer Research
in London following the limited success of the anti-fungal ketocanozole in the 1990s which demonstrated
limited inhibition of CYP17A1 abiraterone was abandoned due to the widespread belief that post-ADT
recurrent PCa, then referred to as hormone-refractory disease, proliferated independently of the need for
androgens and further concerns of adrenal insufficiency with the inhibition of CYP17A1. However, as the
community’s understanding of the continued importance of AR-mediated signaling in post-ADT recurrent
PCa evolved, interest returned and following changes in licensing and successful clinical trials,
abiraterone was approved for clinical use in 2011. Initially shown to improve the survival of men with
metastatic CRPC following chemotherapy, similarly to enzalutamide, it has since been demonstrated to be
15
efficacious in a pre-chemotherapy context75,141,151,152
. The COU-AA-301 trial demonstrated an
improvement in median survival of 15.8 months versus 11.2 months with the use of abiraterone in post-
chemotherapy metastatic PCa while the COU-AA-302 trial showed improved median progression free
survival of 16.5 months versus 8.3 months in chemotherapy naïve metastatic CRPC patients153-155
. As
such both abiraterone and enzalutamide are currently in use as late-stage agents for men suffering from
metastatic CRPC in both a pre- and post-chemotherapy setting. However, recent reports from the
STAMPEDE and LATITUDE trials have demonstrated the potential of abiraterone as an adjuvant agent
co-administered with LHRH agents. The STAMPEDE trial reported a 13.9 month improvement in mean
failure free survival time with abiraterone and ADT compared to ADT alone. While the LATITUDE trial
found an improvement of 18.2 months in median progression free survival time with the addition of
abiraterone to ADT in patients with advanced PCa139,140
. These promising results indicate that abiraterone
use at the time of ADT will likely soon see widespread implementation.
Despite the benefits observed with both enzalutamide and abiraterone several mechanisms of
resistance have been proposed for the eventual failure observed in several patients. These mechanisms
include the upregulation of CYP17A1 and the AR, as well as the proliferation of populations possessing
altered AR function including mutations allowing for activation by pre-CYP17A1 steroid precursors or
constitutively active AR splice variants156,157
. As with standard ADT, The potential role of constitutively
active AR splice variants, through the loss of the LBD, has been considered as a mechanism of
resistance158
. Interestingly recent evidence has demonstrated that patients possessing the constitutively
active AR splice variant AR-V7 can still show therapeutic response to both enzalutamide and abiraterone,
perhaps highlighting the heterogeneous nature of the disease159
. Although the improvements in survival
and quality of life seen with the current generation of AR pathway targeted therapeutics should not be
discounted, the continued inability to fully interrupt AR signaling despite the multiple approaches trialed
drives a need for further therapies.

16
1.11 Chemotherapeutic approaches to CRPC treatment
For patients that fail or are ineligible for AR targeted therapies the main approaches are anti-
neoplastic chemotherapeutic agents. Chemotherapeutic agents consist of a large family of anti-cancer
drugs used for a large range of cancer types and situations. Despite generally being considered poor
responders to chemotherapeutics, PCa patients do see limited benefit to specific agents making them
common clinical agents. Mitoxantrone, a topoisomerase inhibitor, was the first approved
chemotherapeutic for use in PCa in 1996. Although known to have little effect on overall survival
mitoxantrone was shown to provide palliative benefits and improved PSA response rates160,161
. In 2004
mitoxantrone was replaced after the taxane based docetaxel demonstrated improved overall survival in
patients with CRPC. In phase III trials the compound was shown to improve survival of patients by
approximately 3 months compared to mitoxantrone162-165
. Docetaxel, and other taxanes, function by
binding and stabilizing microtubule filaments which in turn physically prevent cellular division leading to
a forced mitotic arrest and cell death166
. The use of docetaxel with first-line ADT for highly advanced
PCa was demonstrated to improve median overall survival by more than 12 months in the CHAARTED
and STAMPEDE trials167,168
. As such, the NCCN now includes within its guidelines the use of docetaxel
with EBRT and ADT for fit men with high risk disease. Although docetaxel remains the most commonly
used chemotherapeutic for CRPC the second generation taxane cabazitaxel, designed for docetaxel-
resistant cancers, was approved in 2010. Unlike other taxanes cabazitaxel is not a substrate of p-
glycoprotein (MDR1) a known small molecule efflux protein driver of therapeutic resistance and has
demonstrated a survival benefit of approximately 2.4 months over mitoxantrone in CRPC patients
previously treated with docetaxel169-171
. Further chemotherapeutics such as platinum and anthracycline-
based compounds have shown little or no survival benefit in PCa and as such don’t see regular use in the
clinic172,173
.

17
1.12 Immunotherapies and other systemic treatments for CRPC
Beyond AR axis targeted therapies and chemotherapeutics a handful of other therapeutics have
been approved and seen sporadic use in the clinical treatment of CRPC. With bone being the most
common site for the development of metastatic lesions in PCa several bone targeted therapies have been
developed174
. These therapies are largely used in palliative approaches as bone metastasis often result in
severe pain alongside nerve compression and myelosuppression which can have significant impacts on
patient quality of life. These therapies include the RANKL targeted human monoclonal antibody,
denosumab, for bone loss and various radiopharmaceuticals. These radiopharmaceuticals include 89
Sr and
153Sm which emit β-particles and
223Ra which emits α-particles. Demonstrated to improve survival by
approximately three months and have comparably minimal side effects 223
Ra is the most commonly used
bone targeted agent for patients suffering from severe pain due to bone metastasis162,175,176
.
The recent advent of clinically approved immunotherapies has highlighted the ability to activate
the immune system to recognize cancer cell antigens and induce anti-tumor responses177,178
. Despite the
successes of immunotherapy treatment for other cancers to date only one immunotherapy has been
approved for the treatment and demonstrated improved survival of metastatic CRPC patients. The reason
for the relatively poor success of immunotherapies in PCa is not fully understood and likely varies
between the range of differing immunotherapy approaches but has been attributed to a highly
immunosuppressive tumor microenvironment and low mutational burden179
. Approved for minimally
asymptomatic metastatic patients by the FDA in 2010 and demonstrating an approximate four months
improvement on median survival, sipuleucel-T remains the only approved immunotherapy in PCa180
.
Using an autologous approach, blood mononuclear cells are transfected with recombinant human prostatic
acid phosphatase (PAP), an enzyme expressed in approximately 95% of prostate cancers, and
granulocyte-macrophage colony stimulating factor, a known immune cell activator181-184
. This process
results in active autologous antigen presenting cells and also contains T cells, B cells and natural killer
cells which are infused into the patient leading to an anti-PAP immune response181,185
.

18
Other immunotherapeutic approaches are being investigated for use in PCa. Cytotoxic T
lymphocyte-associated antigen 4 (CTLA4), an important negative regulator of regulatory T cell responses
which has demonstrated efficacy in melanoma, was trialed for use in PCa but did not show improvements
in overall survival despite initially promising effects on PSA declines and antitumor activity186-189
.
Programmed cell death protein 1 (PD-1), another immune checkpoint inhibitor, is currently being
investigated with tempered expectations following the failure of CTLA4 for use in PCa with similarly
mixed initial results190,191
. PROSTVAC is viral-based immunovaccine currently in phase III trials for use
in metastatic CRPC. The regimen includes the initial delivery of vaccinia vectors containing PSA and
immune stimulatory molecule transgenes followed by successive boost shots in a fowlpox vector192,193
.
This approach leads to a strong immune response to the viral proteins, including PSA, resulting in the
creation of anti-PSA cytotoxic T cells capable of attacking tumor cells. Phase II trials of PROSTVAC
demonstrated an 8.5 month improvement in median overall survival of patients with metastatic CRPC
compared to those receiving control empty vectors194
.
1.13 Cholesterol structure and distribution
As androgen axis targeting remains central to the management of CRPC the essential steroid
precursor, cholesterol, must be considered as part of a comprehensive understanding of the disease.
Cholesterol is a multifunctional lipid that plays numerous essential cellular functions including in the
context of CRPC serving as a precursor molecule for the synthesis of AR driving androgens. Consisting
of 4 hydrocarbon rings and a hydroxyl group and carbon chain on opposite ends, cholesterol is an
important component of the cellular membrane helping to regulate membrane fluidity and participates in
several membrane trafficking and signaling processes195
. Further, cholesterol functions as a precursor to
steroids, bile acids and vitamin D195
. Our understanding of cellular cholesterol trafficking by in large
comes from studies involving fibroblasts and only more recently have intercellular differences come to
light195
. The study of cholesterol transport in vertebrates has been, for the most part, conducted in mice or

19
rats, providing valuable insight but coming with significant caution due to the differing lipid profile
between mice, rats and humans196
.
Within the mammalian cell cholesterol is stored in the form of hydrophobic cholesteryl esters in
lipid droplets and non-ester cholesterol distributed heterogeneously between cellular membranes,
accounting for 20-25% of the membranes lipid content within the plasma membrane and similarly high
concentrations in the endocytic recycling compartment, trans-Golgi compartment and to a lesser extent
the endoplasmic reticulum (ER)197-199
. The rigid four ring sterol backbone of cholesterol results in its
positioning adjacently to saturated lipid chains in internal and external membranes, increasing lateral lipid
ordering resulting in a less fluidic section of the membrane200
. The clustering of these lipids and
cholesterol in small area make up important cell signaling interfaces known as lipid rafts195
. Lipid rafts
host numerous different proteins and cell signaling families including glycosylphosphatidylinositol-
anchored proteins, cholesterol-linked and palmitoylated proteins, such as hedgehog, and doubly acylated
proteins including Src-family kinases or the α-subunits of heterotrimeric G proteins201-203
. The presence of
the sterol sensing domain on several critical membrane embedded and anchored cholesterol regulatory
proteins including HMG-CoA reductase (HMGCR), sterol regulatory element-binding protein cleavage-
activating protein (SCAP) and Niemann-Pick C1 (NPC1) provides a binding site for cholesterol204
.
However, the promiscuous nature of the domain means that cholesterol may not be a common ligand and
only SCAP has been shown to specifically bind cholesterol205
.
1.14 Cellular cholesterol metabolism
Cells can obtain new cholesterol through two mechanisms, cholesterol synthesis through the
mevalonate pathway and the uptake of circulating cholesterol (Figure 1.2). The mevalonate pathway
functions to produce cholesterol, isoprenoids and other sterols from acetyl-CoA which itself is a result of
glucose, glutamine or acetate consumption206
. The rate limiting enzyme in the mevalonate pathway is the
integral ER membrane protein HMGCR, notably the target of the statin class of drug molecules207,208
.
HMGCR and other enzymes in the mevalonate pathway including HMG-CoA synthase and squalene

20
synthase are regulated at the transcriptional level by sterol regulatory element binding protein
(SREBP)209
. SREBP is itself is a membrane bound protein that resides in the ER and is transported to the
Golgi in sterol-deplete conditions bound to COPII vesicles210,211
. This translocation of SREBP is
prevented by sterol induced conformational changes in the SCAP and insulin induced gene 1 (INSIG)
chaperones, in which INSIG functions as an ER anchor while SCAP functions as an escort for SREBP to
the Golgi212,213
. Once within the Golgi SREBP is sequentially cleaved by the site 1 (S1P) and site 2 (S2P)
proteases which in turn release the NTD of SREBP allowing for its entrance into the nucleus and to
function as a transcription factor214
. Conversely the transcription factor liver x receptor (LXR) functions
to remove cholesterol from the cell increasing biliary sterol secretion. Active in the presence of oxysterols
LXR target genes include several important cholesterol metabolism proteins including ATP-binding
cassette transporter-A1 (ABCA1) and -G1 (ABCG1) which efflux cholesterol from the cell as well as
CYP7A1 the first and rate limiting enzyme in conversion of cholesterol into bile acids215,216
. Once
cholesterol is fully synthesized it is rapidly removed from the ER largely by non-vesicular mechanisms
that bypass the Golgi217,218
. The cholesterol can be targeted towards the plasma membrane, into the
mitochondria by the StAR protein for steroid synthesis, or esterified by acyl-CoA cholesterol
acyltransferase (ACAT) for storage in lipid droplets219-221
.
The inhibition of HMGCR, and thus cholesterol synthesis, by statins leads to increased tissue
uptake of circulating LDL and thus decreased circulating cholesterol. Initially isolated from the mold
Penicillium citrinum in the 1970s, the statin class of therapeutics now includes seven clinically used
agents that have become the most commonly used agents for the treatment of hypercholesterolemia222
. As
such these compounds have an established role in primary and secondary cardiovascular prevention being
shown to improve all-cause mortality and decrease the incidence of major coronary events223,224
. Beyond
the reduction of cholesterol production, the inhibition of HMGCR is known to result in a number of
unintended effects largely through the reduction of HMG-CoA-cholesterol intermediates. The inhibition
of HMGCR by statins results in reduced synthesis of mevalonate, the precursor for isoprenoid generation
including farnesyl pyrophosphate and geranyl pyrophosphate. These isoprenoids notably aid in the

21
anchoring of Ras and Rho proteins to the plasma membrane and help facilitate prostate cancer
proliferation225,226
.
The second mechanism by which cells obtain cholesterol is by uptake from circulating
lipoproteins largely through the low density lipoprotein receptor (LDLr) and scavenger receptor B1 (SR-
B1). The LDLr is a type I transmembrane protein which resides on the plasma membrane with an external
facing N-terminal ligand binding domain and a cytosol facing C-terminal domain that regulates
endocytosis and intracellular transport227
. Circulating LDL particles bind to the LDLr after which the
particle is endocytosed by clathrin coated vesicles and transported to acidic endocytic compartments
where acid lipase hydrolyses cholesteryl esters into free cholesterol which are then moved out of the
endosome by NPC1 and Niemann-Pick C2 (NPC2) proteins228,229
. The LDLr is regulated similarly to
HMGCR through SREBP and LXR mediated ubiquitination and lysosomal degradation and is
ubiquitously expressed with high expression in the liver and steroidogenic tissues230,231
.
1.15 Scavenger Receptor B1
Scavenger receptor class B type 1 (SR-B1), encoded by the SCARB1 gene, is a highly
glycosylated cell surface receptor that contains two transmembrane domains located near to the cytosolic
N- and C-terminal domains232-234
. Functioning to selectively uptake cholesterol from circulating high
density lipoprotein (HDL) SR-B1 is ubiquitously expressed, similarly to LDLr, but shows particularly
high expression in the liver as well as steroidogenic tissues including the adrenal glands, ovaries and
testes235,236
. Importantly with regard to the work described in this thesis, SR-B1 appears to be
differentially regulated between the liver and steroidogenic tissues. In steroidogenic cells SR-B1 appears
to be primarily regulated by trophic hormones (LH, follicle stimulating hormone [FSH], ACTH)232,233,236-
238. While the expression of SR-B1 in liver cells can be effected by dietary fats and pharmacologic agents
notably fibrates, on top of hormonal control236,239
. Prolonged adrenal stimulation by ACTH has been
shown to induce SR-B1 expression in adrenocortical cells and reduce hepatic expression in mice and rats
likely indicating a mechanism for preferential channeling of cholesterol to the adrenal tissue233,240,241
. On a

22
cellular level, SR-B1 has been shown to be regulated in rather a complex manner including genetic
transcription factor binding sites for SREBP, steroidogenic factor-1 (SF-1), LXR, liver receptor homolog
1 and others235,236,242,243
. Evidence demonstrates that SR-B1 regulation by trophic hormones may be
dependent on cAMP/protein kinase A signaling stimulating transcriptional function of SF-1 and Ccaat-
enhancer-binding proteins (C/EBP)244,245
, while cholesterol regulation of SR-B1 has also been
demonstrated through SREBP and LXR functions implicating multiple signaling pathways participation
in SR-B1 expression236
.
Beyond cholesterol uptake SR-B1 and HDL have been implicated in several cellular signaling
processes. SR-B1 has been shown as a critical receptor in the ability of HDL to induce activation of
endothelial nitric oxide synthase (eNOS) leading to, at least in part, the athero-protective effects
associated with HDL246-249
. The activation of eNOS in turn leads to increased concentrations of nitric
oxide (NO) known to have a number of effects leading to improved cardiovascular health including
vasodilation, endothelial regeneration, and inhibition of leukocyte chemotaxis250
. Further, the presence of
HDL and eNOS activation are thought to prevent SR-B1 mediated induction of apoptosis in endothelial
cells246,251
. Several pathways have been identified as potential mechanisms for this SR-B1 dependent
signaling. HDL is known to carry several lipids beyond cholesterol including lipid soluble vitamins and
sphingolipids246
. Although insufficient on its own, sphingosine-1-phosphate (Sp1P) when associated with
HDL has been shown to be involved in the activation of eNOS246,252-254
. The mechanism by which Sp1P
or other SR-B1 inducers drive eNOS activation is believed to be through the PI3K signaling pathway246
.
HDL binding to SR-B1 has been shown to lead to the activation of Src which in turn activates both the
PI3K/AKT and RAS/ERK1/2 pathways resulting in eNOS activation through serine 1179
phosphorylation255,256
. Although the relationship between SR-B1 and these signaling pathways has largely
only been established in endothelial cells, aberrations in the PI3K pathway and the RAS pathway, have
been identified and implicated in advanced PCa and highlight the importance of their consideration when
studying SR-B1 in the context of PCa116
.

23
1.16 Lipoproteins and cholesterol transport
Cholesterol is transported throughout the blood stream complexed within lipoproteins, both on
the surface as native cholesterol and within the core of these single phospholipid membrane structures, as
cholesteryl-ester, that function to transport hydrophobic constituents. Present on the membrane of
lipoproteins, apolipoproteins provide functional identity determining their roles within the human body
and although most lipoproteins carry multiple apolipoproteins only the primary functional constituents
will be discussed here. Lipoproteins are classified by the inverse relationship of size/density and are
generally classified as HDL, LDL, very low density lipoprotein (VLDL) and ultra low density lipoprotein
(ULDL), also known as chylomicrons. Cholesterol is taken up from the gut into enterocytes where it is
packaged into chylomicrons with other lipids before the chylomicrons enter the lacteals and the
bloodstream through the thoracic duct257
. These chylomicrons have the ApoB48 lipoprotein; a truncated
form of the apolipoprotein B (ApoB) and primarily consist of triglycerides. The triglyceride content of
these chylomicrons is metabolized by lipoprotein lipase resulting in circulating high cholesterol
chylomicron remnants which are then endocytosed by the liver258
. VLDL is secreted from the liver
containing similarly high levels of triglyceride and the LDLr recognized full form ApoB100257
. The
triglycerides within these particles are similarly metabolized by lipoprotein lipase resulting in smaller
particles sometimes referred to intermediate density lipoprotein (IDL) and eventually primarily
cholesterol containing LDL257,258
. These now smaller LDL particles, often oxidized, are considered
important factors in the development of atherosclerosis in which the particles are retained in the arterial
wall eliciting an immune response and leading to lesion development259
. The oxidation of either the lipid
or apolipoprotein constituents of LDL can lead to conformational changes preventing uptake via LDLr
and instead the uptake by scavenger receptors260,261
. This shift in lipoprotein-receptor interaction
manifests itself in the early stages of atherosclerosis as newly differentiated macrophages uptake large
quantities of oxidized-LDL derived cholesterol through highly expressed scavenger receptors, leading to
the creation of foam cells a fundamental part of atherosclerotic plaque formation260
.
24
The Apo-AI containing HDL plays a vital role in reverse cholesterol transport257,262
. The process
where in there is net cholesterol movement from peripheral tissues to the liver. Produced by the liver
HDL, in general, receives cholesterol through Apo-AI interaction with ABCA1 of peripheral tissues and
releases cholesterol to tissues expressing SR-B1, however SR-B1 has been demonstrated to facilitate
bidirectional flux of cholesterol under varying conditions262,263
. The mechanism of HDL-SR-B1 mediated
cholesterol uptake is not fully understood, but it was initially believed that the SR-B1, unlike LDL and the
LDLr, does not degrade HDL but does mediate selective cholesteryl ester uptake from HDL and in some
cases LDL in the absence of holo-HDL uptake264-266
. However, further study of the HDL-SR-B1
interaction has demonstrated that the HDL particle may be internalized in a non-clathrin-coated vesicle
manner in which cholesterol-deplete HDL is secreted after uptake267,268
.
1.17 Cholesterol and prostate cancer
Cholesterol has long been observed and studied in the field of cancer with first acknowledgments
of significant cholesterol accumulation taking place in the early 20th century and speculation of a role in
PCa malignancy beginning in 1940s by G. Swyer and colleagues269,270
. Further insights have since come
from a wealth of epidemiological evidence. Early studies produced confounding results with several
studies finding that cholesterol lowering in fact increased cancer incidence271,272
while others found no
association273,274
. K. Solomon and M. Freeman more recently reviewed fifty two population studies that
reported cholesterol and total cancer incidence or mortality275
. Thirty two of these studies found an
inverse association between cancer risk and cholesterol level while sixteen showed no association.
Interestingly the authors note that there did not appear to be an absolute level of cholesterol associated
with cancer but rather that the low cholesterol cohort, relative to cohort average, in any population has a
greater prevalence of cancer. Recent evidence has pointed towards a positive association between
cholesterol and PCa. Men with high blood-cholesterol levels have more recently been found to have an
increased risk of PCa276,277
and prostate cancer mortality278
. Further, cholesterol levels are elevated in
post-ADT patient serum279,280
. At issue is a distinction of cause and effect from these epidemiologic

25
observations and has led to the hypothesis that the presence of cancer reduces circulating cholesterol, as
opposed to the implication that low cholesterol somehow drives the development of cancer.
Investigations into understanding the specific alterations to cholesterol metabolism within the
tumor setting have generated evidence demonstrating that hypercholesterolemia is associated with
increased tumor growth, AKT activation and tumoral androgens in xenograft models281-283
, while
hypercholesterolemia was further found to increase tumor volume, progression, and incidence in the
TRansgenic Adenocarcinoma Mouse Prostate (TRAMP) model of spontaneous PCa284
. SR-B1
expression, for which elevated expression has previously been associated with aggressive characteristics
and poor prognosis of breast cancer285,286
, and clear cell renal carcinoma287
, may be a key alteration in the
development of PCa. Specifically SR-B1 expression has been found to be associated with high Gleason
grade primary cancers and that high expression was correlated with decreased disease-specific survival in
patients288
. Further, SR-B1 expression was correlated with androgen synthesis enzymes 3β-HSD and 17β-
HSD and mTOR complex 1 target ribosomal protein S6. Pre-clinically elevated SR-B1 expression is
observed in CRPC derivatives of LNCaP289,290
, and with western diet induced tumor development in the
TRAMP model284
. The siRNA silencing of SR-B1 has further been shown to decrease PSA secretion and
cell viability in C4-2 cells290
. These findings underlie the apparent potential in targeting cholesterol
metabolism as a mechanism for impeding the proliferation of PCa.
The popularity of the statin class of therapeutics used in a preventive fashion for cardiovascular
disease has allowed for fundamental clinical insight into their effect on PCa. The findings of several
studies have led to the belief that statins may also play a role as anti-cancer agents in PCa via both
cholesterol and pleiotropic non-cholesterol mediated effects291-294
. From an epidemiological perspective
several attempts have been made to understand the effect of statins on both the occurrence of PCa and the
clinical outcomes of those diagnosed with PCa293
. There is a vast body of literature with regards to total
PCa incidence producing conflicting results. Several studies have found an inverse association between
statin use and PCa risk295-301
but despite these findings a plurality of studies have found no association302-
310 and further three studies found a positive association
311-313. A recent meta-analysis of observational

26
studies found a 7% reduction in the risk of total PCa with statin use314
, while meta-analyses that included
randomized controlled trials of cardio-preventive statin use found no association between statin use and
overall PCa incidence315-317
. Concerns about diet interventions, statin choice and short follow-up time
have been raised as potential explanations for the difference between observational and randomized
trials293
.
Despite the uncertainty as to whether statins impact overall PCa incidence there is growing
evidence that statin use may reduce the incidence of advanced PCa. As with total incidence, there is
confounding evidence with regards to statins effect on advanced PCa. Studies finding a lack of
association308,309,318-321
and those finding an inverse association between advanced PCa and statin use have
been reported in numerous populations295-298,300,304,305,310,322,323
. A 2012 meta-analysis of observational
studies found that statin use was associated with a 20% reduction in risk of advanced PCa314
. Beyond the
potential impact of statins on PCa incidence and confounding results with regard to statins effect on time
to progression324-326
several studies have found that statins have a beneficial impact on the survival of
patients with PCa324,327-331
. One such study further noted that patients using statins prior to diagnosis
displayed a larger decrease in PCa mortality compared to those who initiated statin treatment post-
diagnosis (HR, 0.55; 95% CI, 0.41 to 0.74 vs HR, 0.82; 95% CI, 0.71 to 0.96)329
. In a preclinical setting,
simvastatin and lovastatin have been found to reduce cell viability through an induction of apoptosis and
G1 phase cell cycle arrest and induce AR-positive LNCaP and AR-negative PC-3 and DU145 cells. While
atorvastatin, simvastatin and rosuvastatin have all been shown to reduce the metastatic potential of PC-3
cells332,333
. Further, lovastatin reduced cellular adhesion through down-regulated Rho-signaling in colon
carcinoma and cerivastatin reduced tumor vascularization in a murine lung cancer model334,335
. Although
not without contradiction, the wealth of evidence including consistent preclinical findings appears to
demonstrate the possibility of targeting cholesterol metabolism, in this case through statins but also
potentially through other cholesterol metabolism proteins, as therapeutic target in PCa.

27
1.18 Research rationale
Despite successes of recent therapies, PCa remains a lethal disease. The understanding of the role
of de novo steroidogenesis, whether adrenally or tumor derived, from precursor cholesterol as a major
mechanism of resistance to ADT drove the creation novel AR-targeted therapies including abiraterone.
These findings combined with growing evidence of the importance of cholesterol in PCa development
and progression highlights a potential avenue for novel therapies in PCa. Statins have been shown to very
slightly reduce circulating testosterone336,337
, however, this decrease is thought to be negligible in the
context of non-inhibited gonadal production and other studies have demonstrated no effect338,339
. What is
not understood is whether statins directly affect CRPC steroidogenesis in the context of castrate levels of
circulating testosterone, particularly given that a high-fat, high cholesterol diet has been found to increase
intratumoral levels of androgens in LNCaP xenograft283
, or whether they potentiate the effect of other
steroidogenesis inhibitors. Given the clinically accessible and historically successful nature of statins, the
majority of research revolving around cholesterol-based therapeutics for PCa has focused on cholesterol
synthesis targeting. Alternatively, the role of SR-B1 in providing cholesterol for steroid synthesis and its
correlation to increased disease-specific PCa mortality provides an intriguing basis for its development as
a therapeutic target. As such developing a more in depth understanding of the clinical expression of SR-
B1 across the disease state and determining the effects of inhibition pre-clinically are essential initial
steps in determining whether SR-B1 is a viable target for future PCa treatments.
1.19 Hypothesis
Cholesterol modulation, through either synthesis or uptake inhibition, will impact essential signaling
processes impeding the growth of CRPC.
Specific Aims:
(1) Determine whether statins act synergistically with abiraterone in a clinical setting and whether
these compounds have the ability to impact de novo steroidogenesis.

28
(2) Assess the expression of SR-B1 across the PCa disease state and determine whether it is a viable
cholesterol metabolism target for PCa therapy through reduced de novo steroidogenesis or other
mechanisms.
(3) Assess the potential of the small molecule SR-B1 inhibitor BLT-1 as a potential basis for
therapeutic development.

29
CHAPTER 2: THE IMPACT OF STATIN USE ON DE NOVO STEROIDOGENESIS AND
CLINICAL OUTCOMES OF CRPC PATIENTS RECEIVING ABIRATERONE
2.1 Specific aim and rationale
As described above, there has been a vast amount of research on the effect of statins on PCa.
Clinically, statins are believed to improve PCa prognosis improving incidence of aggressive disease and
decreased mortality293,298,314,316,324,330
. Pre-clinically statins have been demonstrated to impede PCa
progression, including reduced PSA secretion340
, proliferation340,341
, adhesion334
and invasion333
. Now
seeing widespread clinical use, abiraterone is a known inhibitor of de novo steroidogenesis but recent
evidence into whether the use of concomitant statins improves outcomes for these patients is
inconclusive342,343
. Further, if statins do improve CRPC patient outcomes it was unknown whether this
effect would be solely due to established consequences of limiting cholesterol such as impacted
membrane synthesis and signaling or whether statins possessed the ability to directly impact the synthesis
of AR-driving steroids.
The studies described in this chapter aimed to elucidate the effect of statin use on the survival and
progression of metastatic CRPC patients receiving abiraterone therapy. To perform this research, a
database generated from the province-wide British Columbia Cancer Agency was analyzed for survival
and progression data. Further, the effect of statins on de novo steroidogenesis was assessed pre-clinically
using an LNCaP based xenograft mouse model. The progression and growth of castrate LNCaP tumors
were assessed alongside measurements for androgen production.
2.2 Methods
2.2.1 Analysis of abiraterone patients at the British Columbia Cancer Agency
Patient characteristics and response information was obtained from the British Columbia Cancer
Agency and used to generate a dataset of men being treated with abiraterone for locally advanced or
metastatic CRPC. Laboratory reports, British Columbia Cancer Agency pharmacy records and
consultation reports were used to generate the dataset. Information on statin use was obtained by patient
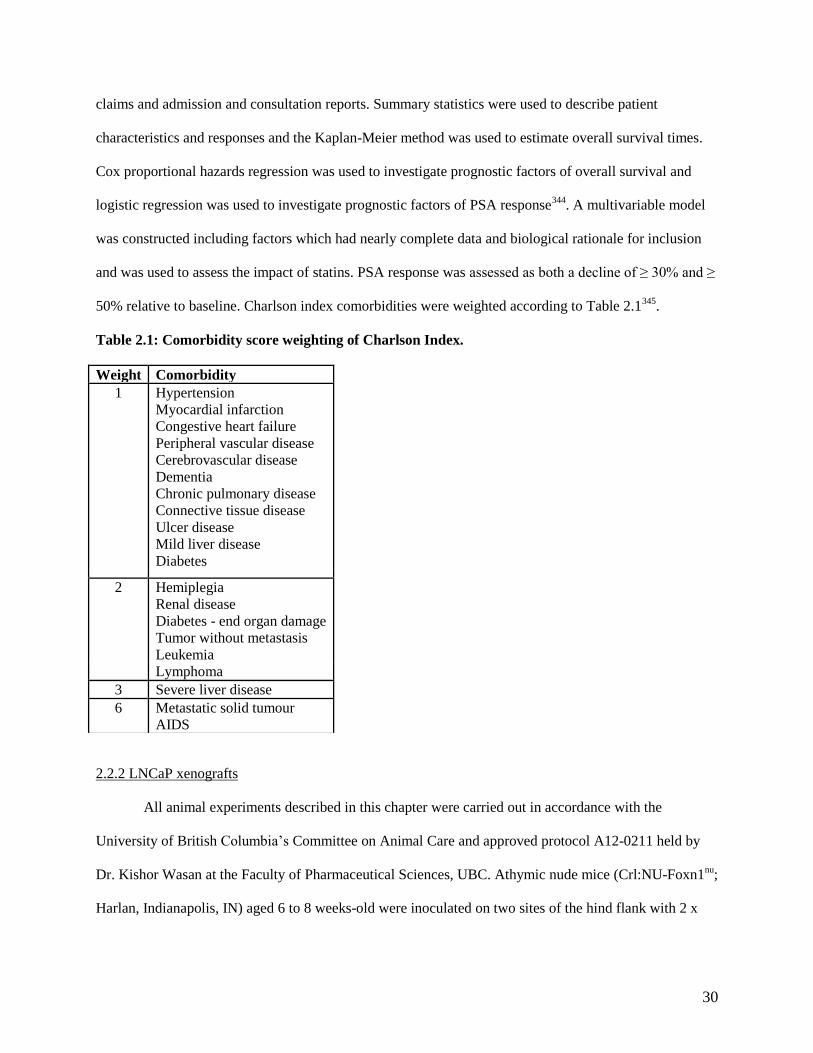
30
claims and admission and consultation reports. Summary statistics were used to describe patient
characteristics and responses and the Kaplan-Meier method was used to estimate overall survival times.
Cox proportional hazards regression was used to investigate prognostic factors of overall survival and
logistic regression was used to investigate prognostic factors of PSA response344
. A multivariable model
was constructed including factors which had nearly complete data and biological rationale for inclusion
and was used to assess the impact of statins. PSA response was assessed as both a decline of ≥ 30% and ≥
50% relative to baseline. Charlson index comorbidities were weighted according to Table 2.1345
.
Table 2.1: Comorbidity score weighting of Charlson Index.
2.2.2 LNCaP xenografts
All animal experiments described in this chapter were carried out in accordance with the
University of British Columbia’s Committee on Animal Care and approved protocol A12-0211 held by
Dr. Kishor Wasan at the Faculty of Pharmaceutical Sciences, UBC. Athymic nude mice (Crl:NU-Foxn1nu
;
Harlan, Indianapolis, IN) aged 6 to 8 weeks-old were inoculated on two sites of the hind flank with 2 x
Weight Comorbidity
1 Hypertension
Myocardial infarction
Congestive heart failure
Peripheral vascular disease
Cerebrovascular disease
Dementia
Chronic pulmonary disease
Connective tissue disease
Ulcer disease
Mild liver disease
Diabetes
2
Hemiplegia
Renal disease
Diabetes - end organ damage
Tumor without metastasis
Leukemia
Lymphoma
3 Severe liver disease
6
Metastatic solid tumour
AIDS

31
106 LNCaP cells (LNCaP cells cultured in RPMI + 10% FBS, 1% penicillin-streptomycin) in 100 µL
matrigel (BD Biosciences, Franklin Lakes, NJ).
Once weekly, serum PSA levels were measured using the ELISA-based Cobas e 411 analyzer
(Roche Diagnostics, Indianapolis, IN). Serum was obtained by performing tail vein bleeds with samples
being collected in hematocrit tubes and spun in a hematocrit centrifuge at 13,000 RPM for 4 min. 15 µL
of serum was diluted with 135 µL of phosphate-buffered saline (PBS) prior to performing the assay.
Once serum PSA exceeded 50 ng/mL, mice were castrated by an experienced animal technician
and randomized into control “standard” diet (Open Standard Diet containing 40 mg/kg cholesterol,
Research Diets Inc., New Brunswick, NJ), or a simvastatin diet (Open Standard Diet containing 0.1%
[w/w] simvastatin [Sanis, Dieppe, New Brunswick, Canada]). At 8 weeks post-castration, anesthetized
animals were exsanguinated by cardiac puncture to collect blood, from which serum was prepared, and
tumors were in part harvested, flash frozen with liquid nitrogen and in part fixed in 10% buffered
formalin solution over night before being transferred to 70% ethanol for long term storage. Throughout
the course of the experiment weekly measurements of body weight, tumor volume and PSA were
performed. PSA measurements were performed as described above and tumor volume was measured
using calipers and the equation: Tumor Volume = length x width x height x 0.5326 346
.
2.2.3 Simvastatin and simvastatin hydroxy acid LC-MS
50 µL of serum obtained via cardiac puncture was added to 200 uL of water with 50 µL of 10
ng/mL internal standard (lovastatin and lovastatin hydroxy acid, IS). This was extracted using 2 mL of
methyl tert-butyl ether (MTBE) and vortexed thoroughly. The samples were then placed in the -80 °C
freezer for 10 min to freeze the aqueous phase. The solvent phase was then decanted into separate tubes
and dried down using a nitrogen blow-down evaporator. The dried down sample was reconstituted in
30/70 water/methanol plus 5 mM ammonium acetate, for analysis of 20 µL injectable aliquot.
Simvastatin and simvastatin hydroxy acid were both quantitated using liquid chromatography-
mass spectrometry (LC-MS). This system consisted of an Agilent 1290 Infinity Binary Pump, a 1290

32
Infinity Sampler, a 1290 Infinity Thermostat and a 1290 Infinity Thermostatted Column Compartment
(Agilent, Mississauga, Ontario, Canada) connected to an AB Sciex QTrap® 5500 hybrid linear ion-trap
triple quadrupole mass spectrometer equipped with a Turbo Spray source (AB Sciex, Concord, Ontario,
Canada). Data was acquired using the Analyst 1.5.2 software. Separations were carried out using a Waters
Acquity UPLC C18 1.7 µm 2.1 x 100 mm column (Waters Corp., Milford, MA, USA) maintained at 30
°C and the autosampler tray temperature was maintained at 10 °C. The isocratic mobile phase consisted of
water (10%; Solvent A) and methanol (90%; Solvent B) with both solvents containing 5 mM ammonium
acetate. The flow rate was 0.2 mL/min and the run time 4.0 min. The mass spectrometer was operated in
multiple reaction monitoring (MRM) mode using polarity switching. Simvastatin and lovastatin were
monitored as their ammonium adducts in positive ionization (ES+) mode. The retention times for
simvastatin and lovastatin were 2.75 min and 2.53 min, respectively, and for simvastatin hydroxy acid
and lovastatin hydroxy acid 2.37 min and 2.25 min, respectively.
2.2.4 Creatine kinase assay
The creatine kinase fluorometric assay (Cat. #: 700630, Cayman Chemical, Ann Arbor, MI) was
performed according to manufacturer’s instructions. For each sample, standard, and control 10 µL of
serum obtained via cardiac puncture and 50 µL of diluted buffer was added to a well of the 96 well plate.
10 µL of ADP followed by 10 µL of “Enzyme Mixture” were then added to the well before initiating the
reaction with 20 µL of creatine phosphate. The plate was incubated for 15 min at 37°C, and followed by
the addition of 80 µL of ammonium acetate and 20 µL of formaldehyde detector. The plate was then
incubated for 15 min at room temperature and read on a plate reader (excitation wavelength: 365,
emission wavelength 465) to determine the average fluorescence of each standard, control and sample.
The fluorescent value for the 0 uM standard solution was subtracted from each of the standards,
controls and samples to produce the corrected florescence (RFU). The corrected fluorescence values for
each of the standards was plotted to create a standard curve. The creatine kinase activity of each sample
was then calculated using the following equation:

33
𝐶𝑟𝑒𝑎𝑡𝑖𝑛𝑒 𝐾𝑖𝑛𝑎𝑠𝑒 (𝑈 𝐿⁄ ) = [𝑅𝐹𝑈
𝑆𝑙𝑜𝑝𝑒 𝑜𝑓 𝑠𝑡𝑎𝑛𝑑𝑎𝑟𝑑 𝑐𝑢𝑟𝑣𝑒 (𝑅𝐺𝑈uM )
] 𝑥 𝑠𝑎𝑚𝑝𝑙𝑒 𝑑𝑖𝑙𝑢𝑡𝑖𝑜𝑛
2.2.5 Alanine transaminase assay
The alanine transaminase colorimetric assay (Cat. #: 700260, Cayman Chemical) was performed
according to manufacturer’s instructions. In each well of a 96 well plate 150 µL of “substrate”, 20 µL of
“cofactor” and 20 µL of sample or control were added. The plate was then incubated for 15 min at 37°C.
The reaction was then initiated by adding 20 µL of “ALT initiator” to each of the wells. The plate was
then immediately placed in a plate reader and each well measured at 340 nm every min for 5 min.
To determine the change in absorbance (A340) per min the absorbance values were plotted as a
function of time and the slope of the linear portion of the curve was used. The following equation was
then used to calculate ALT activity:
𝐴𝐿𝑇 𝑎𝑐𝑡𝑖𝑣𝑖𝑡𝑦 (𝑈 𝑚𝐿⁄ ) = [ΔA340 min 𝑥 0.21 𝑚𝐿⁄
4.11 𝑚𝑀−1 𝑥 0.02 𝑚𝐿] 𝑥 𝑠𝑎𝑚𝑝𝑙𝑒 𝑑𝑖𝑙𝑢𝑡𝑖𝑜𝑛
2.2.6 Cholesterol LC-MS
Cholesterol levels were assessed and quantified by LC-MS as previously described347
. Tumors
(50–150 mg) were homogenized (Precellys Tissue Homogenizer, Rockville, MD) for 2 x 20 sec at 6000
rpm in nine volumes of water. IS (deuterated cholesterol) was added and homogenates were extracted
twice with 90/10 MTBE/methanol. Extracts were dried and pooled under vacuum and reconstituted in 400
µL of 1/5 acetyl Cl/CHCl3. 50 µL serum samples were similarly processed without the initial
homogenization. These samples were then vortexed and dried down using a CentriVap (Labconco,
Kansas City, MO) before being dissolved in 70/30 methanol/CHCl3. All samples were analyzed using a
Waters Acquity UPLC Separations Module coupled to a Waters Quattro Premier XE Mass Spectrometer
(Waters, Milford, MA). Separations were carried out on a Waters 2.1x100mm BEH 1.7 µM C18 column
using an acetonitrile/0.1M ammonium acetate 9/1 isopropanol mobile phase gradient. Data was collected
in ES+ multiple reaction monitoring (MRM) mode and processed with Quanlynx (Waters) prior to

34
exporting to Excel (Microsoft, Redmond, WA) for additional normalization to weights and volumes as
required. Quantification was by area under curve (AUC) ratio of standard to IS.
2.2.7 Steroid LC-MS
Intratumoural and serum androgen levels were assessed and quantified by LC-MS as previously
described348
. Two volumes of water were added to tumours (50-150 mg) and homogenized (Precellys
Tissue Homogenizer) for 2 x 20 sec at 6000 rpm. IS (20 pg/40 pg deuterated testosterone/DHT; C/D/N
isotopes) was added and homogenates were twice extracted by 30 min vortexing with 2 mL of 60/40
hexane/ethyl acetate. Extracts were pooled, dried using a CentriVap, reconstituted in 50 µL of 50 mM
hydroxylamine and incubated 1 hour at 65˚C. 50 µL serum samples were similarly processed without the
initial homogenization. Resulting steroid-oxime derivatives were analyzed using a Waters Acquity UPLC
Separations Module coupled to a Waters Quattro Premier XE Mass Spectrometer (Waters). Separations
were carried out with a 2.1 x 100 mm BEH 1.7 µM C18 column, mobile phase water (A) and acetonitrile
(B) (gradient: 0.2 min, 25% B; 8 min, 70% B; 9-12 min, 98% B; 12.2 min, 25% B; 14 min run length).
Data was collected in ES+ by multiple reaction monitoring with instrument parameters optimized for the
mass-to-charge ratios and corresponding fragments of the oxime-steroids for all keto-steroids in the
androgen synthesis pathway. Data processing was done with Quanlynx (Waters) and exported to Excel
(Mircrosoft) for additional normalization to weights and volumes as required. Quantification was by AUC
ratio of standard to IS. Deuterated testosterone was used as the IS with all analytes other than DHT for
which deuterated DHT was used.
2.2.8 Quantitative PCR
RNA was isolated from homogenized (Precellys Tissue Homogenizer; 2 x 20sec, 6000 rpm)
tumors using a TRIzol (Life Technologies, Burlington, Ontario, Canada) chloroform extraction according
to manufacturer instructions. TRIzol (1 mL) was added to 50-100 mg of homogenized tissue and
incubated for 5 min after which 0.2 mL of chloroform was added and incubated for a further 3 min prior
to centrifugation for 15 min at 12,000 g, 4 °C. The aqueous phase was separated and incubated with 0.5

35
mL of isopropanol for 10 min prior to centrifugation for 10 min at 12,000 g, 4 °C. The pelleted RNA was
then washed with 1 mL 75% ethanol pelleted and suspended in 50 µL RNase-free water. cDNA was
synthesized from the RNA using a SuperScript® II Reverse Transcriptase kit (Life Technologies)
according to manufacturer instructions. First strand synthesis was carried out with 50 – 250 ng random
primers, 0.5 mM dNTP mix and 1 ng - 5 µg total RNA incubated at 65 °C for 5 min. Following this, 1x
First-strand buffer, 10 mM DTT and 40 U RNaseOUT were added to the mixture and incubated for 2 min
at 42 °C. 200 units of SuperScript® II Reverse Transcriptase was then added to the solution prior a 5 min
incubation at 42 °C followed by heat inactivation at 70 °C for 15 min. 2 U of RNase H was then added
and incubated at 37 °C for 20 min. Using this cDNA qPCR was performed on an ABI 7900HT (Life
Technologies) using FastStart Universal SyberGreen Master mix (Roche) and a Qiagen (Toronto, Ontario,
Canada) SYBR Green probe targeted to the gene of interest. The following thermocycler conditions were
used for qPCR: 50 °C for 2 min, 95 °C for 10 min, 40x: 95 °C for 15 sec, 60 °C for 1 min, 95 °C for 15
sec, 60 °C for 15 sec, 95 °C for 15 sec.
2.3 Results
2.3.1 Statin use improves the overall survival and PSA declines of men receiving abiraterone for locally
advanced or metastatic CRPC
There is limited and conflicting evidence as to the effect of statin use on the outcomes of patients
receiving abiraterone for CRPC. Analysis of existing clinical data retrospectively can provide valuable
insight into whether prospective studies are feasible. The British Columbia Cancer Agency is a
comprehensive cancer institute that provides cancer care through the operation of six regional centers to
the population of British Columbia. Data used to calculate patient survival, PCa progression and general
health was obtained from the British Columbia Cancer Agency and compared by statin status. In total 301
patients receiving abiraterone were included in the study of which 84 patients were statin users. The
specific statins used by these patients included 5 different types: atorvastatin (n = 45), lovastatin (n = 2),
pravastatin (n = 2), rosuvastatin (n = 24), simvastatin (n = 11). The patient median age was 74 and 68.6%

36
of which had a Gleason score of ≥ 8. Patients were maintained on abiraterone for a median time of 5.6
months and had a median overall survival time of 12.1 months. Further, information on the characteristics
of these patients can be found in the summary statistics (Table 2.2).
Table 2.2: Baseline characteristics and outcomes of British Columbia abiraterone patients
Statistic N Result
Concomitant Statins N (%) Yes
Atorovastin
Lovastatin
Pravastatin
Rosuvastatin
Simvastatin
301 84 (27.9)
45 (53.6)
2 (2.4)
2 (2.4)
24 (28.6)
11 (13.1)
Age at path. diagnosis Mean (std dev)
Med. (range)
300 66.1 (8.9)
65 (45, 95)
Age at Abi start date Mean (std dev)
Med.(range)
301 73.8 (9.8)
74 (45, 96)
Gleason Score N (%) ≥8 258 177 (68.6)
Charlson Score N (%) ≥7 298 156 (52.4)
PSA at Diagnosis Med. (range) 278 27 (0.2, 9832)
Alkaline Phosphatase Med. (range) 228 122 (8.9, 2189)
LDH Med. (range) 80 241 (108, 2598)
Albumin Med. (range) 102 3.7 (2.4, 5)
Neutrophils Med. (range) 291 4900 (100, 81500)
Lymphocytes Med. (range) 290 1135 (200, 30640)
Neutrophils/Lymphocyte Ratio Med. (range) 290 4.1 (0.19, 34.5)
Change in PSA, Diagnosis to Abi Med. (range) 276 48.3 (-6798, 7926)
Months, Diagnosis to Abi Med. (range) 300 71.2 (4.2, 324.5)
Months, Diagnosis to Metastases Med. (range) 236 43.5 (-6.3, 306.8)
Months, Diagnosis to CRPC Med. (range) 193 44.7 (2.5, 203.3)
Months, ADT to Abi Med. (range) 291 49.0 (1.1, 298.8)
Months, Metastases to Abi Med. (range)) 237 21.2 (0.2, 164.8)
Months, CRPC to Abi Med. (range) 193 23.1 (0.3, 183.5)
Months, Docetaxel to Abi Med. (range) 172 7.7 (-42.8, 86.5)
Months of ADT (1st line) Med. (range) 131 9.5 (0, 169.9)
Months of ADT (1st to last ever) Med. (range) 279 38.1 (0, 294.4)
Months, Docetaxel Duration Med. (range) 169 3.8 (0, 83.8)
Prior Prostatectomy N (%) Yes 290 53 (18.3)
Prior Radiation N (%) Yes 292 91 (31.2)
Opiates N (%) Yes 301 60 (19.9)
Metastases N (%) Any
Bone
Liver
Lung
Brain
LN
301 237 (78.7)
193 (64.1)
7 (2.3)
5 (1.7)
0 (0)
92 (30.6)

37
Table 2.2 Continued
Outcomes
Statistic N Result
Months, Duration of Abi Med. (range) 297 5.6 (0.3, 49.7)
PSA at Baseline Med. (range) 299 117.2 (0.2, 7938)
PSA at Week 4
Change
Med. (range) 249 92.0 (0.1, 5500)
-18.0 (-97.9, 1000)
PSA at Week 8
Change
Med. (range) 227 74.0 (0.01, 8800)
-23.4 (-99.6, 1041)
PSA at Week 12
Change
Med. (range) 213 67.6 (0.01, 6700)
-28.0 (-99.7, 1549)
Nadir PSA
Change
Med. (range) 213 66.1 (0.01, 6700)
-32.8 (-99.99, 1000)
Months to Nadir Med. (range) 291 1.8 (0, 17.4))
Overall Survival N (%) Deaths
Median (95% CI)
6-mo OS (95% CI)
1-year OS (95% CI)
2-year OS (95% CI)
301 289 (96.0)
12.1 (10.6, 13.8)
76.7 (71.5, 81.1)
50.7 (44.9, 56.2)
23.8 (19.1, 28.7)
A univariate analysis of statin vs non-statin use was performed to determine effects on overall
survival and PSA declines of patients taking abiraterone. Of the 217 non-statin users 5 patients were still
alive at the time of data collection while 7 of the statin patients remained alive. Statin users were found to
have improved overall survival having a median survival of 16.2 months compared to 11.3 months for
non-statin users (Hazard Ratio: 0.79, 95%CI = 0.62 – 1.02, log-rank test: p = 0.078; Gehan-Breslow-
Wilson Test: p = 0.022 Table 2.3, Figure 2.1). Although failing to reach statistical significance the
percentage of patients who saw a PSA response to abiraterone was increased in statin users (47.6%)
compared to non-statin users (37.6%, p = 0.10, Table 2.3). Time on abiraterone (Statin: 7.2 months; Non-
statin: 5.3 months; p = 0.078) and change in PSA at nadir (Statin: -41.0%; Non-statin: -30.1%; p = 0.086)
were also increased in statin users, but as with PSA response did not reach statistical significance (Table
2.3). Despite the difference in the number of PSA responders and the relative change in the response that
was observed with statin users, no difference was observed in the number of patients who saw borderline
PSA responses of >30% drop or robust PSA responses >50% drop in PSA at specific 4, 8 and 12 week
time points (Table 2.4).
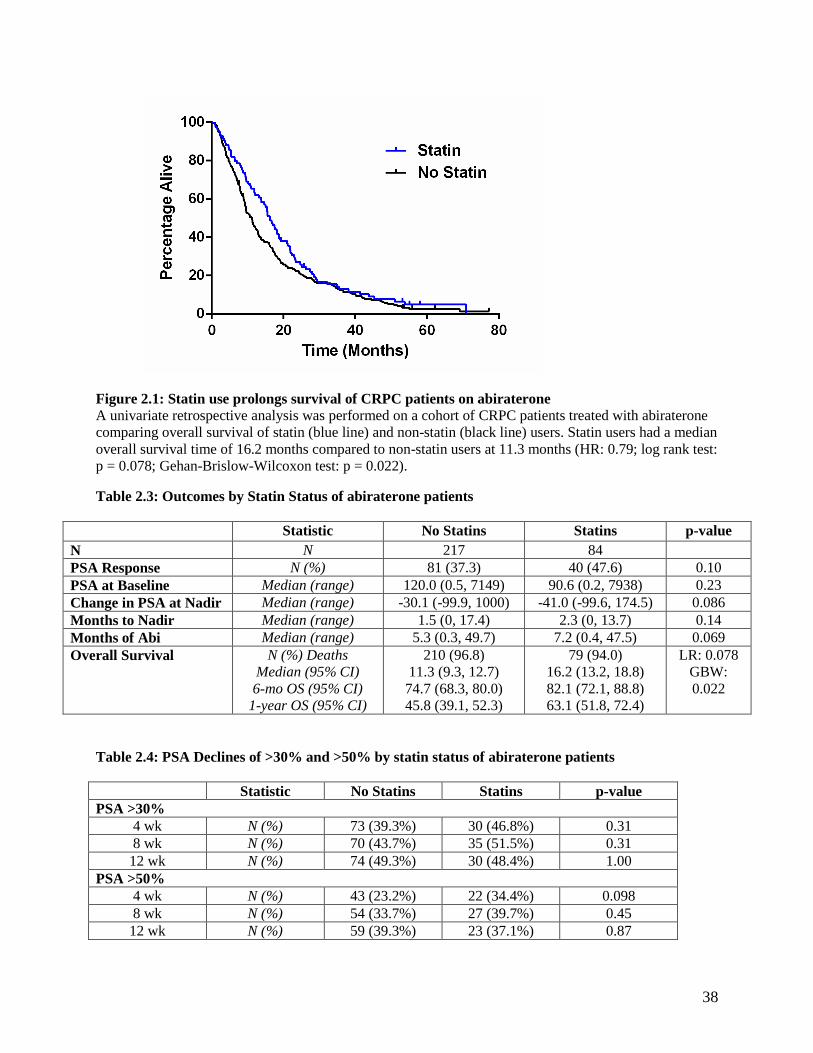
38
Figure 2.1: Statin use prolongs survival of CRPC patients on abiraterone
A univariate retrospective analysis was performed on a cohort of CRPC patients treated with abiraterone
comparing overall survival of statin (blue line) and non-statin (black line) users. Statin users had a median
overall survival time of 16.2 months compared to non-statin users at 11.3 months (HR: 0.79; log rank test:
p = 0.078; Gehan-Brislow-Wilcoxon test: p = 0.022).
Table 2.3: Outcomes by Statin Status of abiraterone patients
Statistic No Statins Statins p-value
N N 217 84
PSA Response N (%) 81 (37.3) 40 (47.6) 0.10
PSA at Baseline Median (range) 120.0 (0.5, 7149) 90.6 (0.2, 7938) 0.23
Change in PSA at Nadir Median (range) -30.1 (-99.9, 1000) -41.0 (-99.6, 174.5) 0.086
Months to Nadir Median (range) 1.5 (0, 17.4) 2.3 (0, 13.7) 0.14
Months of Abi Median (range) 5.3 (0.3, 49.7) 7.2 (0.4, 47.5) 0.069
Overall Survival N (%) Deaths
Median (95% CI)
6-mo OS (95% CI)
1-year OS (95% CI)
210 (96.8)
11.3 (9.3, 12.7)
74.7 (68.3, 80.0)
45.8 (39.1, 52.3)
79 (94.0)
16.2 (13.2, 18.8)
82.1 (72.1, 88.8)
63.1 (51.8, 72.4)
LR: 0.078
GBW:
0.022
Table 2.4: PSA Declines of >30% and >50% by statin status of abiraterone patients
Statistic No Statins Statins p-value
PSA >30%
4 wk N (%) 73 (39.3%) 30 (46.8%) 0.31
8 wk N (%) 70 (43.7%) 35 (51.5%) 0.31
12 wk N (%) 74 (49.3%) 30 (48.4%) 1.00
PSA >50%
4 wk N (%) 43 (23.2%) 22 (34.4%) 0.098
8 wk N (%) 54 (33.7%) 27 (39.7%) 0.45
12 wk N (%) 59 (39.3%) 23 (37.1%) 0.87

39
Multivariate analyses were performed to adjust for age, prior prostatectomy, radiation, time from
diagnosis, neutrophils-lymphocyte ratio and presence of metastases as prognostic factors for overall
survival and PSA response. The effect of statins on overall survival remained borderline by Cox
regression analysis (n = 279, hazard ratio = 0.78, 95% CI = 0.59-1.04, p = 0.087; Table 2.5). Interestingly
when Gleason score was included in the multivariate analysis, despite a smaller sample size, significant
improvement in overall survival for statin users was observed (n = 241, hazard ratio = 0.71, 95% CI =
0.52 – 0.96, p = 0.024). Similar to overall survival, the percentage of patients who saw PSA responses to
abiraterone with statin use trended towards improvement but remained borderline with regards to
statistical significance when assessed by a logistic regression analysis (multivariable odds ratio = 1.59,
95% CI = 0.91 - 2.78, p = 0.11, Table 2.6).
The Charlson Index was used to assess patient comorbidities and overall health. The total patient
dataset had 156 (52.4%) patients with a Charlson score of ≥7 (Table 2.2) with the most common
comorbidity, excluding the presence of metastasis, being hypertension effecting 140 (46%) patients
(Table 2.7). Statin users had a median Charlson score of 7, which was increased, compared to non-statin
users who had a median score of 6 (p < 0.001). Further, 87 (40.1%) non-statin users compared to 68
(80.9%) statin users had Charlson scores of seven or greater (p < 0.001) (Table 2.8). Specifically, statin
users had significantly increased rates of hypertension (statin: 61 [72.6%]; no statin: 79 [36.4%],
p<0.001), myocardial infarction (statin: 9 [10.7%]; no statin: 4 [1.8%], p = 0.002), peripheral disease
(statin: 12 [14.2%]; no statin: 4 [1.8%], p < 0.001), cerebrovascular disease (statin: 5 [6.0%]; no statin: 2
[0.9%], p=0.02), dementia (statin: 4 [4.76%]; no statin 1 [0.5%], p=0.02) and diabetes (statin: 25 [29.8%];
no statin: 16 [7.4%], p < 0.001, Table 2.7). The use of statins concomitantly with abiraterone indicated a
trend to improved prognosis, but failed to reach statistical significance in a number of categories. What
appears to be clear is that those patients taking statins are in considerably poorer health as measured by
the Charlson index, potentially acting as a confounding factor when attempting to determine effects on
overall survival.

40
Table 2.5: Prognostic factors for overall survival determined by multivariate Cox regression
analyses for British Columbia abiraterone patients
Type Hazard Ratio (95%CI) p-value
Age / decade 1.06 (0.94, 1.20) 0.32
Gleason Score ≥8 vs <8 1.20 (0.92, 1.58) 0.18
Prior Prostatectomy Y vs N 0.75 (0.55, 1.04) 0.081
Prior Radiation Y vs N 1.12 (0.87, 1.45) 0.36
Bone Metastases Y vs N 0.98 (0.77, 1.25) 0.88
Liver Metastases Y vs N 3.19 (1.49, 6.83) 0.003
Lung Metastases Y vs N 1.55 (0.64, 3.77) 0.33
Brain Metastases Y vs N - -
LN Metastases Y vs N 1.20 (0.93, 1.54) 0.16
Any Metastases Y vs N 1.01 (0.76, 1.33) 0.97
Opiates Y vs N 0.81 (0.61, 1.09) 0.16
Baseline PSA Log-transform 1.18 (1.10, 1.26) <0.001
Months of ADT Log-transform 0.73 (0.65, 0.83) <0.001
Months, Diagnosis to Abi Log-transform 0.81 (0.71, 0.92) 0.002
Alkaline Phosphatase Log-transform 1.55 (1.32, 1.82) <0.001
LDH Log-transform 3.13 (1.95, 5.04) <0.001
Albumin Log-transform 0.38 (0.25, 0.59) <0.001
Neutrophils Log-transform 1.75 (1.34, 2.28) <0.001
Lymphocytes Log-transform 0.66 (0.53, 0.82) <0.001
NL Ratio Log-transform 1.62 (1.36, 1.92) <0.001
Concomitant Statins Y vs N 0.79 (0.61, 1.03) 0.079
Multivariable – N=241
Age / decade 1.23 (1.05, 1.45) 0.013
Gleason Score ≥8 vs <8 0.89 (0.64, 1.23) 0.47
Prior Prostatectomy Y vs N 1.23 (0.80, 1.88) 0.36
Prior Radiation Y vs N 1.54 (1.09, 2.16) 0.015
Confirmed Metastases Y vs N 1.11 (0.79, 1.57) 0.54
Baseline PSA Log-transform 1.18 (1.09, 1.28) <0.001
Months, Diagnosis to Abi Log-transform 0.61 (0.49, 0.75) <0.001
NL Ratio Log-transform 1.63 (1.35, 1.97) <0.001
Concomitant Statins Y vs N 0.71 (0.52, 0.96) 0.024
Multivariable – N=279
Age / decade 1.29 (1.10, 1.50) 0.002
Prior Prostatectomy Y vs N 1.29 (0.88, 1.89) 0.20
Prior Radiation Y vs N 1.60 (1.17, 2.20) 0.004
Confirmed Metastases Y vs N 1.08 (0.80, 1.46) 0.60
Months, Diagnosis to Abi Log-transform 0.64 (0.53, 0.77) <0.001
NL Ratio Log-transform 1.60 (1.34, 1.91) <0.001
Concomitant Statins Y vs N 0.78 (0.59, 1.04) 0.087
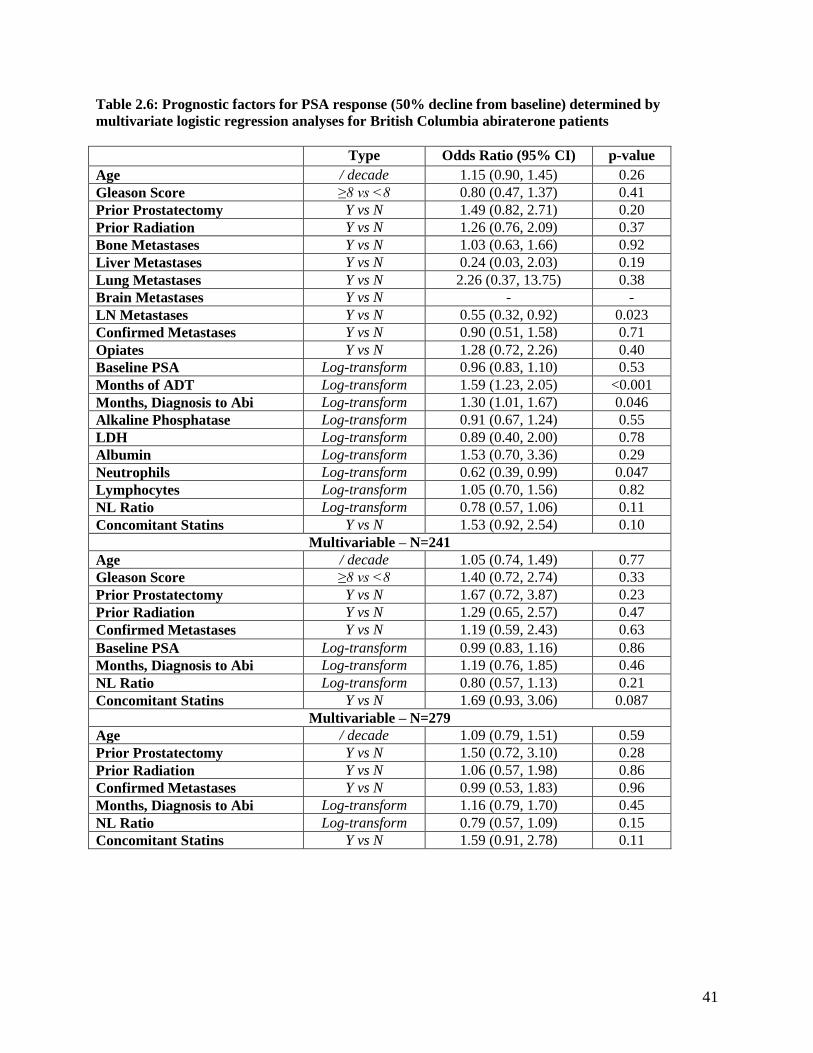
41
Table 2.6: Prognostic factors for PSA response (50% decline from baseline) determined by
multivariate logistic regression analyses for British Columbia abiraterone patients
Type Odds Ratio (95% CI) p-value
Age / decade 1.15 (0.90, 1.45) 0.26
Gleason Score ≥8 vs <8 0.80 (0.47, 1.37) 0.41
Prior Prostatectomy Y vs N 1.49 (0.82, 2.71) 0.20
Prior Radiation Y vs N 1.26 (0.76, 2.09) 0.37
Bone Metastases Y vs N 1.03 (0.63, 1.66) 0.92
Liver Metastases Y vs N 0.24 (0.03, 2.03) 0.19
Lung Metastases Y vs N 2.26 (0.37, 13.75) 0.38
Brain Metastases Y vs N - -
LN Metastases Y vs N 0.55 (0.32, 0.92) 0.023
Confirmed Metastases Y vs N 0.90 (0.51, 1.58) 0.71
Opiates Y vs N 1.28 (0.72, 2.26) 0.40
Baseline PSA Log-transform 0.96 (0.83, 1.10) 0.53
Months of ADT Log-transform 1.59 (1.23, 2.05) <0.001
Months, Diagnosis to Abi Log-transform 1.30 (1.01, 1.67) 0.046
Alkaline Phosphatase Log-transform 0.91 (0.67, 1.24) 0.55
LDH Log-transform 0.89 (0.40, 2.00) 0.78
Albumin Log-transform 1.53 (0.70, 3.36) 0.29
Neutrophils Log-transform 0.62 (0.39, 0.99) 0.047
Lymphocytes Log-transform 1.05 (0.70, 1.56) 0.82
NL Ratio Log-transform 0.78 (0.57, 1.06) 0.11
Concomitant Statins Y vs N 1.53 (0.92, 2.54) 0.10
Multivariable – N=241
Age / decade 1.05 (0.74, 1.49) 0.77
Gleason Score ≥8 vs <8 1.40 (0.72, 2.74) 0.33
Prior Prostatectomy Y vs N 1.67 (0.72, 3.87) 0.23
Prior Radiation Y vs N 1.29 (0.65, 2.57) 0.47
Confirmed Metastases Y vs N 1.19 (0.59, 2.43) 0.63
Baseline PSA Log-transform 0.99 (0.83, 1.16) 0.86
Months, Diagnosis to Abi Log-transform 1.19 (0.76, 1.85) 0.46
NL Ratio Log-transform 0.80 (0.57, 1.13) 0.21
Concomitant Statins Y vs N 1.69 (0.93, 3.06) 0.087
Multivariable – N=279
Age / decade 1.09 (0.79, 1.51) 0.59
Prior Prostatectomy Y vs N 1.50 (0.72, 3.10) 0.28
Prior Radiation Y vs N 1.06 (0.57, 1.98) 0.86
Confirmed Metastases Y vs N 0.99 (0.53, 1.83) 0.96
Months, Diagnosis to Abi Log-transform 1.16 (0.79, 1.70) 0.45
NL Ratio Log-transform 0.79 (0.57, 1.09) 0.15
Concomitant Statins Y vs N 1.59 (0.91, 2.78) 0.11

42
Table 2.7: Breakdown of Charlson Index scoring by statin status
Statistic No Statins Statins p-value
Charlson Score:
Hypertension N (%) 79 (36.4) 61 (72.6) <0.001
Myocardial Infarction N (%) 4 (1.8) 9 (10.7) 0.002
Congestive Heart Failure N (%) 3 (1.4) 3 (3.6) 0.35
Peripheral Disease N (%) 4 (1.8) 12 (14.2) <0.001
Cerebrovascular Disease N (%) 2 (0.9) 5 (6.0) 0.02
Dementia N (%) 1 (0.5) 4 (4.76) 0.02
Chronic Pulmonary
Disease
N (%) 7 (3.2) 0 (0.0) 0.20
Connective Tissue
Disease
N (%) 0 (0.0) 0 (0.0) -
Ulcer Disease N (%) 0 (0.0) 0 (0.0) -
Mild Liver Disease N (%) 0 (0.0) 1 (1.2) 0.28
Diabetes N (%) 16 (7.4) 25 (29.8) <0.001
Hemiplegia N (%) 0 (0.0) 0 (0.0) -
Renal Disease N (%) 4 (1.8) 2 (2.4) 0.67
Diabetes - organ damage N (%) 0 (0.0) 0 (0.0) -
Tumor without
metastasis
N (%) 0 (0.0) 0 (0.0) -
Leukemia N (%) 1 (0.5) 1 (1.2) 0.48
Lymphoma N (%) 0 (0.0) 0 (0.0) -
Sever Liver Disease N (%) 0 (0.0) 0 (0.0) -
Metastatic Solid Tumor N (%) 207 (95.4) 78 (92.8) 0.40
AIDS N (%) 0 (0.0) 0 (0.0) -
Table 2.8: Baseline characteristic comparison of abiraterone patients by statin status
Statistic No Statins Statins p-value
Age at path. diagnosis Mean (std dev)
Median (range)
65.3 (9.3)
65 (45, 95)
68.1 (7.7)
67 (53, 90)
0.018
Age at Abi start date Mean (std dev)
Median (range)
73 (10.2)
72 (45, 96)
77 (7.9)
77 (59, 94)
0.001
Gleason Score N (%) ≥8 127 (69.4) 50 (66.7) 0.90
Charlson Score N (%) ≥7 87 (40.1) 68 (80.9) <0.001
PSA at Diagnosis Median (range) 29 (0.2, 9832) 23 (0.65, 2000) 0.04
Alkaline Phosphatase Median (range) 121 (8.9, 2189) 122 (25, 1707) 0.53
LDH Median (range) 239 (108, 2598) 254 (142, 289) 0.54
Albumin Median (range) 4 (2, 4) 4 (3, 5) 0.54
Neutrophils Median (range) 4800 (400, 81500) 4900 (100, 10700) 0.62
Lymphocytes Median (range) 1130 (200, 30640) 1140 (200, 17400) 0.91
Neutrophils/Lymphocyte Ratio Median (range) 4.0 (0.2, 34.5) 4.4 (0.2, 33.5) 0.76

43
Abiraterone is an established inhibitor of androgen synthesis by CYP17A1 blockade, however,
the mechanism by which statins may potentiate the effect of abiraterone as described above or other PCa
treatments is yet to be fully understood. The ability of statins to reduce the availability of pre-cursor
cholesterol used for androgen synthesis would seem a natural mechanism for impeding castration-
resistance and potentiation of the effects of abiraterone but had yet to be empirically established. As such
the following research describes in vivo based experiments analyzing the effect of simvastatin on de novo
steroidogenesis and castration-resistant progression of an LNCaP-based xenograft model.
2.3.2 Oral administration of simvastatin resulted in clinically relevant serum concentrations and reduced
serum cholesterol
Crucial to the ability to make inferences from xenograft based mouse models on potential
therapeutics is the use of clinically relevant concentrations349
. In order to determine whether the levels of
simvastatin and it’s active metabolite simvastatin hydroxy acid were physiologically relevant to those
seen in humans receiving simvastatin the concentrations of both were measured via LC-MS from
castrated mice with established LNCaP xenograft tumors treated with or without simvastatin. Serum
assessed from the simvastatin diet cohort at 8 weeks post castration had an average simvastatin
concentration of 3.29 ± 5.03 ng/mL and simvastatin hydroxy acid of 19.36 ± 11.34 ng/mL (Figure 2.2A).
These levels were comparable to clinical levels of simvastatin in humans taking 40 mg P.O., which
ranged from 1.0–10.0 ng/mL350
.
As simvastatin is an established inhibitor of cholesterol synthesis to ensure efficacious
concentrations were achieved both circulating and tumor cholesterol was assessed. Circulating cholesterol
levels were decreased in the simvastatin group (3.50 ± 0.47 μg/ml) compared to the control diet group
(4.20 ± 0.62 μg/ml, p = 0.032, Figure 2.2B) while no change in tumor cholesterol was observed
(simvastatin: 1.98 ± 0.177 mg/g, Standard: 1.90 ± 0.176 mg/g, p > 0.05, Figure 2.2C). These findings
suggest that simvastatin reached clinically relevant and efficacious concentrations.

44
2.3.3 Simvastatin administration does not result in overt toxicity
Although robust toxicity would be unlikely at the described concentrations of simvastatin, to
ensure the absence of potentially confounding alterations in mouse dietary habits and statin induced
toxicity, body weights were monitored once weekly (Figure 2.2D) and common toxicity markers were
assessed at end point (Figure 2.2E,F). The average body weight of the simvastatin treated mice was ~7%
less than that of the control diet over the treatment period (1 to 8 weeks post-castration) but neither group
displayed progressive weight loss. The statin group had a linear regression slope of −0.177 ± 0.0847 g per
week and the control group of 0.037 ± 0.0648 g per week over the treatment period. These body weights
were within the range of historically measured weights of castrated tumor bearing nude mice351
.
The two most common toxicities associated with simvastatin are myopathy and liver
dysfunction352
. As such two common serum markers for these conditions were selected, creatine kinase
(CK) for myopathy and alanine transaminase (ALT) for liver dysfunction. For both CK (Statin: 289.51 ±
79.41 U/L vs. Control: 282.32 ± 36.79 U/L, Figure 2.2E) and ALT (Statin: 0.044 ± 0.027 U/mL vs. 0.053
± 0.026 U/mL, Figure 2.2F) levels were indistinguishable between mice receiving the statin diet and those
receiving the control diet. These combined results indicate that the mice were not suffering any overt
toxicity from the simvastatin treatment.
2.3.4 Simvastatin administration reduces tumor volume
To assess the in vivo efficacy of simvastatin administration on castration-resistant progression and
tumor growth LNCaP xenografts were established on two sites subcutaneously in nude mice. Weekly
tumor volume and PSA measurements were taken and mice were castrated once PSA exceeded 50 ng/ml.
Following castration mice were randomized into standard control or simvastatin diet cohorts and
maintained for an additional 8 weeks. Tumor volume measurements were normalized to body weight to
account for the ~7% difference in average body weight between the two groups (Figure 2.3A). The tumor
volume of the control diet group had increased by more than 2-fold at 6 weeks post-castration and 4-fold
at 8 weeks post castration compared to the tumor volume at the time of castration with an apparent

45
Figure 2.2: Oral simvastatin administration results in efficacious and clinically relevant serum
concentrations in the absence of toxicity
The impact of dietary simvastatin on serum statin and cholesterol levels, muscle and liver toxicity and
body weight was assessed. (A) Circulating simvastatin (SV) and the active metabolite simvastatin
hydroxy acid (SV-HA) levels were measured at experimental endpoint by LC-MS (mean ± SEM, n=9).
(B) Total serum cholesterol was measured at experimental endpoint by LC-MS. The simvastatin (statin)
diet group had significantly reduced serum cholesterol compared to the standard diet group (Standard,
simvastatin: n = 6, standard: n = 10, mean ± SEM, p = 0.032, T-Test). (C) Tumor cholesterol was
measured from flash frozen tumors obtained at experimental end point. Tumor cholesterol levels were
unchanged between the simvastatin diet group and the standard group (simvastatin: n = 10, standard n =
9, mean ± SEM, t-test p > 0.05, T-Test). (D) Weekly body weigh measurements were made during the
course of the experiment. The simvastatin diet group (open circles, n = 10) was ~7% lighter than the
standard diet group (closed circles; n = 11) however neither group displayed progressive weight loss over
the course of the experiment. (E) Serum creatine kinase activity was assessed by enzymatic assay as a
measure of muscle toxicity in terminal serum samples. No difference was observed between the standard
diet group (n = 11) and the simvastatin diet group (n = 9, mean ± SEM, p > 0.05, T-Test). (F) Alanine
transaminase (ALT) was assessed by enzymatic assay as a measure of liver toxicity. The simvastatin diet
group (n = 9) had slightly elevated levels of ALT but no significant difference was observed when
compared to the standard diet group (n = 11, mean ± SEM, p > 0.05, T-Test).

46
exponential increase observed starting at 5 weeks post-castration. In contrast, the statin treated group did
not reach a 2-fold increase of castration tumor volume until 8 weeks post-castration. Tumor volume
growth rates were assessed by log-transforming tumor volume measurements and fitted versus time by
linear regression (Figure 2.3B). The growth rate of LNCaP xenograft tumors in castrated mice were
significantly reduced in the simvastatin treated group (0.0648 log mm3/g per week ± 0.0061) compared to
the control diet group (0.0921 log mm3/g per week ± 0.0055, Figure 2.3C).
Figure 2.3: Simvastatin suppresses post-castration LNCaP xenograft growth
Weekly tumor volume measurements were conducted using calipers for 8 weeks after castration. Mice
were castrated (week 0) when serum PSA values exceeded 50 ng/mL (A) Weekly body weight-
normalized tumor volume measurements. Following castration mice were randomized to either
simvastatin diet (Statin, open circles, n = 10) or control diet (Standard, closed circles, n =11) for 8 weeks
(mean ± SEM). (B) Weekly tumor volume measurements (weeks 1 to 8) were log transformed and
assessed by linear regression to determine slope and extrapolate growth rate. Solid lines represent the best
linear fit of mean log-transformed tumor volume (control diet, y = 0.0921x + 0.9729, r2 = 0.978, slope =
0.0921 log mm3/week ± 0.0055; Simvastatin diet, y = 0.0648x + 0.9061, r
2 = 0.941, slope = 0.0648 log
mm3/week ± 0.0066). (C) The log10 body weight-normalized tumor volume (TV/BW (mm
3/g)) growth per
week (mean ± SEM) was calculated from linear regression of tumors from the simvastatin (Statin) diet or
control diet (Std) groups. The tumor volume growth rate was significantly reduced in the simvastatin
treated group compared to the statin group (p = 0.008, T-Test).

47
2.3.5 Simvastatin treatment suppresses intratumoral androgen accumulation and alters androgen receptor
activity
As the expression of PSA is regulated through AR activity and the androgen response element
(ARE), PSA is regularly used as marker for AR activity pre-clinically. Clinically serum PSA is an
accepted measure of tumor burden and disease progression in men being managed for prostate cancer.
Generally two successive PSA increases is deemed PSA progression clinically however a strict definition
has yet to be determined353
. Due to the high variability and rapid tumor growth and progression seen in
the LNCaP xenograft model this definition is not ideal. Therefore, here we define PSA progression as the
time to two doublings (400%) of nadir serum PSA for each respective mouse. By three weeks post
castration it was observed that 5 of 11 standard diet mice had reached PSA progression and 10 out of 11
mice reached PSA progression by 6 weeks post castration (Figure 2.4). Conversely, within the simvastatin
treated group only 1 of 10 mice had reached PSA progression at three weeks post castration, 6 out of 10
mice by 6 weeks post castration and 3 of 10 mice never reached PSA progression over the 8 week study
period (Figure 2.4). Performing a Kaplan-Meier analysis to statistically assess time to PSA progression
the standard diet group progressed significantly faster than the simvastatin diet group (hazard ratio = 0.45,
Figure 2.4).
Figure 2.4: Simvastatin suppresses PSA progression in castrated LNCaP xenograft mice
Time to PSA progression was defined as two PSA doublings (400%) of the nadir post-castration and
serum PSA levels were measured once weekly over the course of the study. PSA nadir was defined as the
lowest weekly serum PSA level following castration, which occurred at either one or two weeks post
castration. The fraction of the group yet to undergo PSA progression (percent below 400% nadir PSA)
over the 8-week post-castration time course are presented (statin = simvastatin diet group; standard =
48
control diet group). The simvastatin diet group had significantly prolonged time to recurrence compared
with the control diet group (Log-rank, p = 0.049, hazard ratio = 0.45).
In order to assess the effect of simvastatin on post castration de novo steroidogenesis the levels of
testosterone, DHT and cholesterol-androgen intermediates was assessed by LC-MS in serum and
xenograft tissue collected 8 weeks post castration (Figure 2.5 & Figure 2.6). The tumoral levels of
steroidal intermediates were indistinguishable between the standard and simvastatin diet groups except for
pregnenolone which was modestly increased (Figure 2.5). Despite this, intratumoral testosterone
(Standard: 0.28 ± 0.08 ng/mL, Simvastatin: 0.11 ± 0.03 ng/mL) and DHT (Standard: 0.55 ± 0.16 ng/mL,
Simvastatin: 0.21 ± 0.06 ng/mL) levels were significantly reduced in simvastatin treated mice compared
to the standard diet cohort (Figure 2.6A). Waterfall plot analysis of the testosterone and DHT results
highlight that the highest steroid levels observed in the simvastatin diet group were approximately
proportional to the median level in the standard diet group (Figure 2.6C,D). Paralleling the results of the
intratumoral steroid analysis the observed testosterone concentration in serum was half in the simvastatin
diet group compared to the standard diet group but did not reach statistical significance (Standard: 0.06 ±
0.02 ng/mL, Simvastatin: 0.03 ± 0.01 ng/mL, Figure 2.6B,C). Serum DHT levels were below the lower
limit of quantification.
The expression of AR mRNA was assessed through SYBR green qPCR at end point. The
simvastatin diet group appeared to trend toward reduced expression of AR, however, expression levels
were statistically indistinguishable from the standard diet group (Figure 2.7A). Taken in total, the reduced
intratumoral tumor androgen accumulation, and PSA secretion indicate that simvastatin may reduce
CRPC tumor growth through inhibitory effects on de novo steroidogenesis.
2.3.6 Simvastatin treatment alters cholesterol metabolism
Further to the assessment of circulating and tumor based cholesterol the expression of key
cholesterol metabolism proteins SR-B1 and HMGCR were assessed. The mRNA expression of HMGCR
and SR-B1 was assessed by SYBR green qPCR. The simvastatin diet and standard diet groups were

49
indistinguishable for HMGCR expression (Figure 2.7C). While SR-B1 expression was increased seven
fold in the simvastatin treated group compared to the standard diet group (Figure 2.7B).
Figure 2.5: Simvastatin does not alter androgen precursor accumulation in castrated LNCaP
xenograft bearing mice
Androgen levels were assessed from tumor homogenates via LC-MS in the simvastatin diet group (Statin,
n = 10) and the control diet (Standard, n = 10) group (Mean ± SEM). Concentration of pregnenolone was
modestly increased in the simvastatin diet group (p = 0.01, ANOVA with Sidak’s Test).
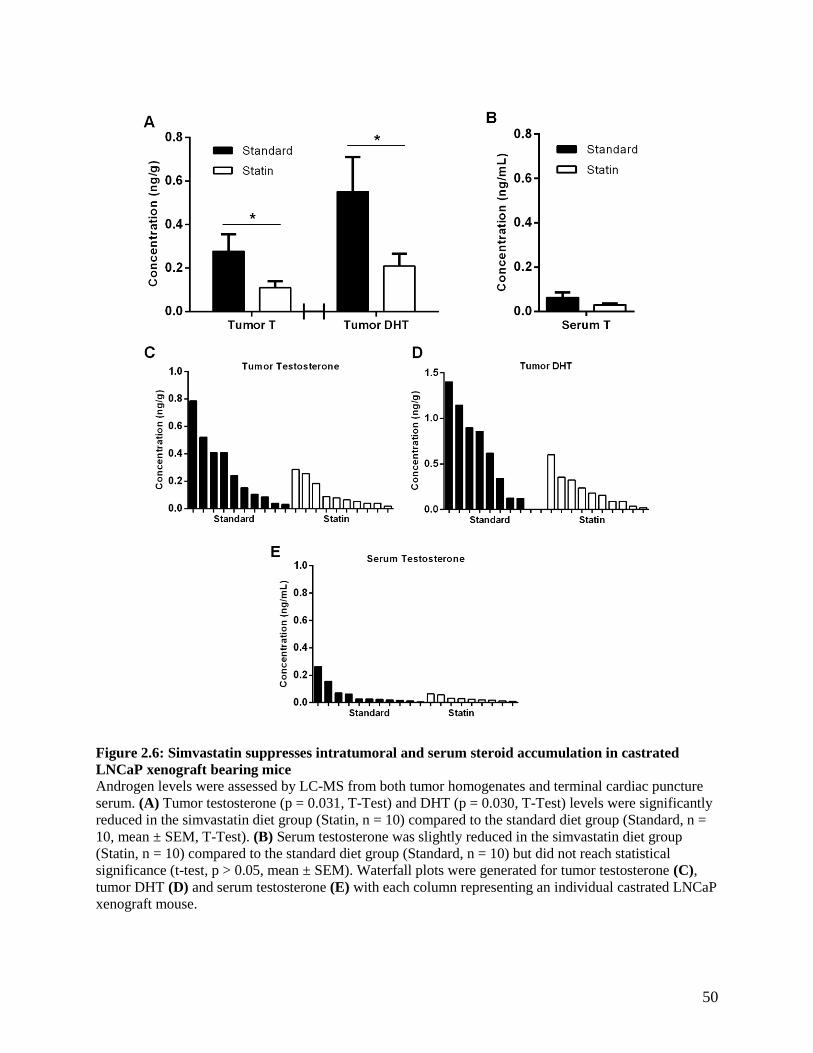
50
Figure 2.6: Simvastatin suppresses intratumoral and serum steroid accumulation in castrated
LNCaP xenograft bearing mice
Androgen levels were assessed by LC-MS from both tumor homogenates and terminal cardiac puncture
serum. (A) Tumor testosterone (p = 0.031, T-Test) and DHT (p = 0.030, T-Test) levels were significantly
reduced in the simvastatin diet group (Statin, n = 10) compared to the standard diet group (Standard, n =
10, mean ± SEM, T-Test). (B) Serum testosterone was slightly reduced in the simvastatin diet group
(Statin, n = 10) compared to the standard diet group (Standard, n = 10) but did not reach statistical
significance (t-test, p > 0.05, mean ± SEM). Waterfall plots were generated for tumor testosterone (C),
tumor DHT (D) and serum testosterone (E) with each column representing an individual castrated LNCaP
xenograft mouse.

51
Figure 2.7: Simvastatin administration alters cholesterol metabolism in the absence of changes to
AR expression
qPCR analysis was performed on tumors obtained at study end to assess AR, SR-B1 and HMGCR mRNA
expression. (A) AR expression showed a trend towards decreased expression in the simvastatin (statin)
group compared to the standard diet (standard) group but did not reach statistical significance (p > 0.05,
T-Test; mean ± SEM). (B) SR-B1 expression was significantly increased in the simvastatin diet group
compared to the standard diet group (p = 0.013, T-Test; mean ± SEM). (C) HMGCR expression was
highly variable but did not display any significant difference between the simvastatin and standard diet
groups (p > 0.05, T-Test; mean ± SEM).
2.4 Discussion
The use of the lipid-lowering class of therapeutic agents known as statins has been shown to
reduce risk of and mortality from cardiovascular disease224,354,355
. With this understanding statins continue
to be prescribed to millions of at risk North American men every year356
. With the significant
demographic overlap between those suffering from prostate cancer and those receiving statins, middle
aged to senior aged men, gaining an epidemiological perspective on the effect of these statins at first
glance appears straight forward. However, with the rapidly changing landscape of prostate cancer
treatment, including the advent of PSA screening, novel therapeutics and our further understanding of
treatment altering disease heterogeneity, the picture rapidly becomes obscured. This natural disease
heterogeneity and treatment induced heterogeneity alongside the risks and comorbidities that drive the
prescription of statins to patients are, perhaps, the reasons that more broad studies have failed to find any
association between statin use and risk of cancer development308,309
. Despite this, several studies have
consistently found that statin use correlates to significantly improved outcomes after the diagnosis of

52
prostate cancer293
. A meta-analysis of several of these studies concluded that statin use correlated to a
22% reduction in the risk of metastases (HR: 0.78), a 24% decrease in the risk of both all-cause and
prostate cancer specific mortality (HR: 0.76)357
.
The success of both abiraterone and enzalutamide to improve the survival of metastatic CRPC
patients brought the role of tumor based de novo steroidogenesis, whether from adrenally derived DHEA
or tumor cholesterol, as a mechanism of ADT resistance into the spotlight123,124,141,150,325
. This sentiment is
furthered by the recent findings of the LATITUDE and STAMPEDE clinical trials studying the use of
abiraterone at the beginning of ADT. In the LATITUDE clinical trial the median length of progression
free survival was 33.0 months in the abiraterone group and 14.8 months in the placebo group (HR:
0.47)140
. The STAMPEDE trial reported that the three year failure free survival rate was 75% in the
abiraterone group and 45% in the ADT-only group (HR: 0.29)139
. These findings emphasize the
realization that the deactivation of gonadal androgen synthesis through LHRH targeting therapeutics is
largely insufficient to fully inhibit the tumoral AR signaling axis and that the addition of further
steroidogenic inhibiting therapeutics is essential. Despite these benefits, resistance to abiraterone and
other androgen synthesis inhibitors is common place and thought to be largely due to amplification of
enzymes, namely CYP17A1, that result in intratumoral accumulation of higher order steroids156,358
.
Further, abiraterone-resistant CRPCs can gain CYP17A1-independence by becoming responsive to
steroid precursors such as pregnenolone and progesterone indicating that despite initial successes in
halting AR signaling the combination of ADT and abiraterone is again insufficient to continually inhibit
AR activation359,360
.
What is yet to be fully understood is whether statins, either by reducing the availability of the
primary steroid precursor cholesterol, or by other mechanisms, will potentiate the beneficial effects of
abiraterone through reduced steroidogenesis and AR activity or via other nutrient deprivation
mechanisms. A recent retrospective report of 187 patients in European Urology Focus found improved
overall survival times (HR: 0.51) for patients taking statins and abiraterone as well as increased PSA
declines compared to patients only taking abiraterone342
. The publication reported an increased percentage

53
of abiraterone patients saw PSA responses when using statins at 8 weeks, 12 weeks and 16 weeks
following the start of treatment. Further, a second retrospective study was published in mid-2017 in two
patient cohorts from the Dana-Farber Cancer Institute, 224 patients, and John’s Hopkins University, 270
patients343
. The Dana-Farber Cancer Institute cohort displayed a trend toward improved survival (HR:
0.79) but failed to reach statistical significance and the John’s Hopkins University showed no difference
with statin use (HR: 0.89) as described by the authors. Here we report a validation study on a cohort of
patients from the British Columbia Cancer Agency receiving abiraterone for metastatic or locally
advanced CRPC. A clear, however muted in comparison to the findings of Di Lorenzo et al. (2017),
improvement in survival was observed in the British Columbia cohort (HR: 0.79) reaching statistical
significance using the Gehan-Breslow-Wilcoxon test (p = 0.022) but not the log-rank test (p = 0.078).
This differences likely being a result of the Gehan-Breslow-Wilcoxon test being better powered to detect
early differences in survival distributions compared to the log-rank test361
. Complete records on 279
patients allowed for multivariable modeling adjusting for age, prostatectomy, radiation, time from
diagnosis, neutrophils-lymphocyte ratio and presence of metastases. The effect of statin use on overall
survival remained borderline when using this model (p = 0.087) and did achieve statistical significance
when assessing the 241 patients that had available Gleason grade information allowing for its inclusion in
the multivariate model (p = 0.024). Unlike the European Urology Focus report only a very minor increase
in the percentage of patients who saw PSA responses at 8 and 12 weeks were observed with statin use.
However, both the number of patients who saw PSA response at any time and relative extent of PSA
decline to nadir were increased but failed to reach statistical significance (p = 0.10 and p = 0.086).
When assessed in the multivariable model similar borderline effects were observed for the
ability of concomitant statin use to predict a PSA response in abiraterone patients. Taken as a whole these
findings appear to indicate a trend of improved outcomes for men taking statins concomitantly with
abiraterone although to a lesser extent than the patients observed by Di Lorenzo et al (2017)342
. The
reason for the observed differences between the two datasets is likely a result of several compounding
factors. Both are limited to a relatively small sample size and come from different population centers,

54
British Columbia versus Italy. Contributing factors could include differing standards of care, ethnic
backgrounds, economic status, and dietary habits (western diet vs Mediterranean diet). Further, there are
specific factors of note in the British Columbia dataset that could have confounded the potential benefits
of statins. The average age of statin users was 4 years older than that of non-statin users at the time of the
patient starting abiraterone. The statin treated group, perhaps expectedly due to their use of statins, had a
significantly higher comorbidity burden and were in general in poorer health as indicated by the Charlson
index scoring. Although, the individual aspects of the index are likely underpowered to make definitive
conclusions there is a clear trend towards poorer cardiovascular health through the increases in
hypertension, myocardial infarction, peripheral disease and diabetes in the statin treated population. These
factors although not directly related to prostate cancer specific mortality do play a role in patient overall
survival and should not be ignored when analyzing retrospective studies of this nature.
These confounding factors combined with the heterogeneity of the disease state likely act to
mute differences between statin and non-statin users likely requiring a high number of patients to
establish statistical significance. As such, the results described within this chapter were combined into a
larger multi-institutional study that has been published in the in the peer-reviewed journal Oncotarget362
.
This study assessed 598 patients across eight Centers receiving abiraterone or enzalutamide. The results
of the combined study found a statistically significant increase in median overall survival of 7.9 months.
Further, multivariate analysis found both a statistical significant decrease of 53% in the risk of death and
statistically significant increase of 63% in potential for a > 30% PSA decline within the first 12 months of
abiraterone treatment. These findings help to further validate the trends observed within the British
Columbia Cancer Agency cohort indicating the beneficial role of statins in patients undergoing
abiraterone treatment for metastatic CRPC. With the mounting evidence for the beneficial role for statins
in both prostate cancer and abiraterone treated prostate cancer a prospective clinical trial seems
warranted. This would importantly allow for the correction of the potential confounding variable
discussed above such as patient general health and treatment history and help garner a true understanding
of the potential role of statins in the prostate cancer therapeutic landscape.

55
As the effectiveness of statins on improving prostate cancer outcomes clinically is becoming
clearer the necessity to understand the mechanism by which statins impact prostate cancer becomes
evident. Several separate mechanisms have been proposed including the inhibition of SLCO2B1325
,
geranylgeranyl pyrophosphate and farnesyl pyrophosphate synthesis inhibition363
and a novel mechanism
described here in which reduced synthesis of precursor cholesterol impedes androgen synthesis and AR
activation in CRPC364
. In order to evaluate this mechanism of beneficial statin use in prostate cancer we
performed an LNCaP xenograft study assessing the effect of simvastatin administration on castration-
resistant progression. The validity of oral administration through diet incorporation of simvastatin was
assessed by measuring circulating concentrations of simvastatin and simvastatin hydroxy acid. Further,
the common simvastatin toxicity markers CK and ALT were assessed to measure liver and muscle
toxicities. The observed serum levels of simvastatin were proportional to those seen in humans taking a
relatively high but clinically acceptable dose of 40 mg daily simvastatin350
. The ability to obtain this dose
in the absence of significant changes in toxicity markers indicates that any changes in cancer progression
of the LNCaP xenografts occurred at clinically achievable doses.
The determination of the best animal model for studies of cholesterol and lipid metabolism has
been a debated topic with rabbits, rats and mouse models all having significantly differing lipid profiles to
that of humans196
. Mice specifically are known to have lipoprotein profiles primarily composed of
circulating HDL while the human lipoprotein profile is LDL dominant196
. Statin treatment in these mice
does not consistently alter circulating cholesterol levels but has been reported to lower cholesterol
production in peripheral tissues (reviewed by Solomon and Freeman365
). Undoubtedly these differing lipid
profiles handicap the ability of one to make clinically based inferences, however, despite these differences
a decrease in serum cholesterol was measured in the simvastatin diet group indicating that efficacious
levels of the drug were reached. The reduction of serum cholesterol did not translate to a reduction of
total tumor cellular cholesterol levels. This relatively unsurprising finding is likely due to the large
discrepancy in cellular free cholesterol and cholesterol otherwise sequestered in the plasma membrane. It
has been reported that up to 80% of cellular cholesterol resides in the plasma membrane and the majority

56
of the remainder being distributed among internal membranes leaving only a limited pool of free
cholesterol to be used as a precursor for other purposes including de novo steroidogenesis366
. Earlier work
studying the effect of simvastatin on PCa cells in vitro also did not report measurable changes in cellular
cholesterol340
.
Previously, Zheng et al. reported the ability of atorvastatin to decrease post-castration LNCaP
xenograft growth concluding that the decreased tumor growth was a result of increased apoptosis367
. Here
we report a reduction in the AR ligands testosterone and DHT and observe that the time to PSA
progression following castration was significantly increased in the simvastatin treated group. These
findings are indicative of repressed AR reactivation and signaling correlating to delayed castration-
resistant progression of the xenografts corroborating previously reported findings that simvastatin
treatment decreases PSA production in C4-2 cells in vitro340
. Conversely it has been shown that a
hypercholesterolemia diet in LNCaP xenograft mice promoted elevated circulating cholesterol levels that
was in turn correlated to increased de novo steroidogenesis through elevated intratumoral testosterone and
expression of CYP17A1283
. These findings correlate to clinical findings that suggest the capacity of
tumors to acquire de novo steroidogenic potential is increased in bone metastases by the increased
expression of the factors responsible for the uptake of cholesterol from high-density lipoprotein (SR-B1)
and low-density lipoprotein (LDLr) and steroid synthesis368
. Taken as a whole these studies indicate the
importance of cholesterol availability in promoting CRPC progression through intratumoral
steroidogenesis.
Despite these findings, we cannot rule out the potential anti-cancer activities of prolonged
reduction of cholesterol availability and simvastatin administration that may have impacted non-AR based
mechanisms including non-cholesterol mediated pleiotropic effects365
. The ability of tumors to synthesize
testosterone directly from an available cholesterol pool and our ability to modify that mechanism through
reduction of said cholesterol pool does not preclude the ability of these tumors to uptake testosterone
synthesis intermediates to drive AR reactivation and castration-resistant progression. A recent report
concluded that the beneficial effects seen clinically with statin use may be due to the ability of some statin

57
class molecules to inhibit the uptake of DHEAS through SLCO2B1325
. Although potentially clinically
important, adult mice do not produce adrenal DHEAS369
making it likely irrelevant in mouse based
xenograft studies and making the finding of reduced androgen accumulation in simvastatin treated mice
more consistent with a cholesterol depletion based phenomenon. Lastly, the nude mice used in these
studies generally have circulating serum testosterone levels of 0.1 – 0.4 ng/mL prior to castration and
undetectable levels post-castration347
. The ability of castration to deplete serum testosterone was
confirmed by the low levels observed in the castrated mice. The presence of still detectable concentrations
of serum testosterone in the castrated hosts was likely the result of leakage from the highly vascularized
and rapidly growing LNCaP xenografts present at the time of euthanasia.
The beneficial effect of statins in treating prostate cancer clinically would likely be due to a
combination of several mechanisms including both AR-dependent and independent mechanisms of
cellular homeostasis. These mechanisms are of relevance to the current landscape of prostate cancer
treatment with the potential of statins to interfere with various mechanisms of resistance to current
therapeutics including the shuttling of androgens through the “back-door” pathway for testosterone
synthesis and mutant AR activation by pregnenolone to overcome abiraterone treatment370,371
. The
findings described in this chapter demonstrate the potential of statins in treating CRPC alongside
currently in use second-line AR axis inhibitors. Statins are the most commonly used therapeutic method
of lowering cholesterol in the clinic. However, the upregulation of SR-B1 in response to statin
administration described here, as well as it’s upregulation in models of CRPC289,290
, highlight the
multifaceted approach of the cancer cell to obtain cholesterol and implicate SR-B1 as a major mechanism
of cholesterol regulation in PCa. As such, an alternative approach to targeting cholesterol through SR-B1
antagonism will be described in the following chapter.

58
CHAPTER 3: SR-B1 A NOVEL TARGET FOR PROSTATE CANCER TREATMENT
THROUGH ANDROGEN RECEPTOR PATHWAY-DEPENDENT AND –INDEPENDENT
MECHANISMS
3.1 Specific aim and rationale
In comparison to the body of research regarding statin use in PCa, our understanding of the
potential of SR-B1 targeting as a therapeutic approach to PCa treatment remains limited. Initial evidence
demonstrated the upregulation of SR-B1 with castrate-resistant progression of pre-clinical LNCaP
xenografts289
. Clinically SR-B1 has recently been associated with high Gleason grade primary cancers
and correlated with decreased disease-specific survival288
. Further, SR-B1 expression was correlated with
androgen synthesis enzymes 3β-HSD and 17-βHSD, and the mTOR target, ribosomal protein S6,
indicating potential links to de novo steroidogenesis and critical metabolism regulatory pathways.
Despite, encouraging initial clinical evidence, further research was needed to confirm and expand our
understanding of the expression of SR-B1 across the PCa landscape. As such, clinical tumor samples
were assessed for major cholesterol metabolism proteins by immunohistochemical (IHC) and mRNA
expression analysis. Preliminary work by the Wasan & Cox research groups targeting SR-B1 pre-
clinically indicated the ability to suppress PSA secretion and reduce viability of C4-2 CRPC cells290
.
Remaining unresolved was the impact of SR-B1 antagonism on critical proliferative cellular functions
such as androgen synthesis and nutrient homeostasis, or in which disease context would targeting SR-B1
be most effective. As such, the studies described in this chapter aimed to elucidate the effects of SR-B1
inhibition by both interfering RNA and small molecule techniques in both the steroidogenic and steroid-
independent models of PCa.
3.2 Methods
3.2.1 Immunohistochemical and mRNA expression analysis of clinical samples
IHC staining of the Prostate Cancer Donor Rapid Autopsy Program at the University of
Washington (UWRA, Seattle, WA)372
samples was performed courtesy of the Dr. Colm Morrissey group
in the Department of Urology at University of Washington, using a 1:500 dilution of SR-B1 primary

59
antibody (AB52629, Abcam, Cambridge, United Kingdom) and a pH 9.0 antigen retrieval process.
mRNA expression data for SCARB1 (SR-B1), LDLr and HMGCR was obtained from several databases
for assessment of general expression, and the comparison of expression between cancerous prostatic
tissue and normal prostatic tissue as well as CRPC and neuroendocrine prostate cancer (NEPC).
Expression data from the Shanghai cohort (SC) was obtained courtesy of Dr. Colin Collins (Vancouver
Prostate Centre) for 28 patients with paired normal prostatic tissue and localized cancerous samples373
.
Expression data from the The Cancer Genome Atlas-PRAD (TCGA) dataset was acquired through the
National Cancer Institute GDC Data Portal for 375 localized cancer patients and 48 samples of normal
prostatic tissue. Expression data from the UWRA was obtained courtesy of Dr. Colm Morrissey for 83
rapid autopsy patients. Expression data from the Weill Cornell (WC) dataset was acquired courtesy of Dr.
Himisha Beltran (Weill Cornell) for 78 advanced stage prostate cancer patients374,375
.
3.2.2 Prostate cancer cell lines
The human CRPC cell lines C4-2 and PC-3 were maintained in phenol red-free Roswell Park
Memorial Institute (RPMI) 1640 media (Life Technologies) supplemented with 5% fetal bovine serum
(FBS, Life Technologies) and Dulbecco's Modified Eagle Medium (DMEM, Life Technologies) with
10% FBS (Life Technologies) respectively in a 5% CO2/37 °C incubator.
3.2.3 Antibodies
Information on sources, species of origin, and dilutions primary antibodies used can be found in
Table 3.1.
Table 3.1: Antibody specifications for primary antibodies used in western blotting
Antigen Host Dilution Source
β-actin Mouse 1:10000 Sigma-Aldrich (A2228)
Vinculin Mouse 1:10000 Sigma-Aldrich (V4505)
SR-B1 Rabbit 1:1000 Novus Biologicals (NB400-104)
Clusterin Goat 1:1000 Santa Cruz (sc-6419)
Clusterin Rabbit 1:1000 Cell Signaling (4214S)
Phospho-mTOR Rabbit 1:1000 Cell Signaling (5536)
mTOR Rabbit 1:1000 Cell Signaling (2983)
BiP Rabbit 1:1000 Cell Signaling (3177)
IRE1α Rabbit 1:1000 Cell Signaling (3294)

60
3.2.4 RNA-interference transfection protocol
Cells were seeded into 6-welled plates unless stated otherwise and transfected two days post
seeding. The transfection media consisted of RPMI or DMEM +1%FBS. Lipofectamine RNAiMAX
transfection reagent and either Stealth RNAi duplexes targeting SR-B1 (SRB1-KD, Oligo ID
HSS101571: AUAAUCCGAACUUGUCCUUGAAGGG, Cat. No. 1299001) or Lo GC Negative Control
duplexes (NC, Cat. No. 12935-110) were combined in Opti-MEM I reduced serum media for 20 min prior
to addition to transfection media to a final concentration of 10 nM RNAi and 0.25% Lipofectamine (All
purchased from Life Technologies). Cells were incubated with transfection media for 5 h following which
cells were allowed to recover overnight in Opti-MEM I. The following day the media was changed to
either RPMI-1640 with 5% charcoal-dextran stripped FBS (CSS, Life Technologies) to replicate
androgen deprived conditions for C4-2 cells, or DMEM with 10% FBS for PC-3 cells376
. For experiments
containing DHEA, DHEA was added to the culture medium of cells transfected with either the negative
control or the SR-B1 targeted siRNA as described above 1 day post-transfection. Unless otherwise stated
all assays were conducted at 4 days post-transfection as a previously established time point for nadir of
SR-BI expression in C4-2 cells by the group377
.
3.2.5 BLT-1 treatment protocol
Cells were seeded into 6-welled plates unless stated otherwise. Three days post seeding the media
was transferred to either RPMI-1640 with 5% CSS for C4-2 cells or DMEM with 10% FBS for PC-3 cells
and either dimethyl sulfoxide (DMSO, vehicle) or the specified concentration of BLT-1 was added.
Unless otherwise specified all assays were conducted at 3 days post treatment initiation to mirror the
siRNA treatment method for time spent in CSS supplemented media and replicate as close as possible the
time of SR-B1 antagonism between the two methods.
3.2.6 HDL-cholesterol uptake assay
Studies performed to approximate the cellular uptake of HDL-derived cholesterol were conducted
using the fluorescent lipid 1,1′-dioctadecyl-3,3,3′,3′-tetramethylindocarbocyanine perchlorate (DiI,

61
excitation max: 549 nm, emission max: 565 nm) from labelled HDL particles (DiI-HDL) similar to
previously published methods378-381
. For siRNA treated cells the assay was performed 4 days post-
transfection while BLT-1 treated cells were treated overnight prior to assay start. Cells were incubated in
standard media containing 0.5% bovine serum albumin (BSA) and DiI-HDL (10 μg HDL protein per mL,
Alfa Aesar, Haverhill, MA) for 2 h in a tissue culture incubator (37 °C/5% CO2). Following incubation
cells were washed with PBS and harvested by trypsinization. Cells were then twice washed via
centrifugation (1,000 rpm, 5 min) and suspended in PBS prior to being subjected to fluorescence activated
cell sorting (FACS) analysis on a BD FACSCANTO II flow cytometer (Beckman, Dickinson &
Company, Mississauga, Canada). Excitation was performed using a 488 nm laser line and fluorescence
was detected using the PE channel (585/42 bandpass). Mean fluorescent intensity data were analyzed
using BD FACSDiva software (Beckman, Dickinson & Company). Gating was performed based on
forward (FSC) and side (SSC) scatter characteristics according to previously published methods382
. Mean
fluorescent intensity was normalized to the mean fluorescent intensity of non-treated cells incubated with
DiI-HDL.
3.2.7 Quantitative PCR
RNA was isolated from cells using a TRIzol (Life Technologies) chloroform extraction according
to manufacturer instructions. 1 mL of TRIzol was used to suspend cells and incubated for 5 min. 0.2 mL
of chloroform was then added and incubated for 3 min prior to centrifugation (15 min, 12,000 g, 4 °C).
The aqueous phase was separated and incubated with 0.5 mL of isopropanol for 10 min prior to
centrifugation (10 min, 12,000 g, 4 °C). The RNA precipitate was pelleted then washed with 1 mL 75%
ethanol, pelleted and suspended in 25 µL RNase-free water. cDNA was synthesized from the RNA using
a SuperScript® II Reverse Transcriptase kit (Life Technologies) according to manufacturer instructions.
First strand synthesis was carried out with 50 – 250 ng random primers, 0.5 mM dNTP mix and 1 ng - 5
µg total RNA, incubated at 65 °C for 5 min. 1x First-strand buffer, 10 mM DTT and 40 U RNaseOUT
were then added to the mixture and incubated for 2 min at 42 °C. 200 U of SuperScript® II Reverse

62
Transcriptase were added prior to 42 °C incubation for 5 min and inactivation by heating to 70 °C for 15
min. 2 U of RNase H was then added to each tube and incubated at 37 °C for 20 min. qPCR was
performed on an ABI 7900HT (Life Technologies) using FastStart Universal SyberGreen Master mix
(Roche) and commercially available Qiagen SYBR Green probes targeted to SR-BI (QT00033488),
HMGCR (QT00004081), PSA (QT00027713) and NKX3.1 (QT00202650). The following conditions
were used: 50 °C for 2 min, 95 °C for 10 min, 40x: 95 °C for 15 s, 60 °C for 1 min, 95 °C for 15 s, 60 °C
for 15 sec, 95 °C for 15 sec.
3.2.8 IncuCyte Zoom cellular growth assay
The Incucyte Zoom live-cell analysis system (Essen Bioscience, Ann Arbor, MI) consists of a
tissue culture incubator with built-in imaging equipment capable of imaging tissue culture plates
undisturbed and tracking cellular growth within individual plate wells383
. Cells were either siRNA
transfected two days post seeding or treated with BLT-1 three days post seeding. Plates were then placed
into the Incucyte Zoom incubator (Essen Bioscience) and phase contrast imaging with internal software
processing was used to generate confluency readings taken every 6 h. Confluency readings were then
used to generate cell growth curves over time.
3.2.9 Live/Dead cytotoxicity assay
The Live/Dead Cytotoxicity assay (Invitrogen, Carlsbad, CA) was carried out according to
manufacturer instructions. Following BLT-1 treatment or siRNA transfection cells were harvested with
trypsin, pelleted (1,000 rpm, 5 min) and suspended in PBS containing 100 nM calcein AM and 8 µM
ethidium homodimer-1. Cells were then incubated at room temperature, away from light for 20 min prior
to FACS analysis on a BD FACSCANTO II flow cytometer. Excitation was performed using a 488 nm
laser line, green fluorescence was detected using the FITC channel (530/30 bandpass) and red
fluorescence was detected using the 7-AAD channel (670 longpass). Data were obtained and analyzed
using BD FACSDiva software. Gating was performed based on FSC and SSC characteristics. Cells were
then stratified by quadrant gating into two categories: those who displayed high green fluorescence

63
indicating intracellular esterase activity (living cells), and those who displayed high red fluorescence
indicating damaged or permeable membranes (dead or dying cells).
3.2.10 Cell cycle analysis
Cell cycle analysis was performed using the propidium iodide (PI) based method as previously
described384-386
. Samples previously fixed with ethanol and washed in PBS were suspended in DNA
staining buffer (50 μg/mL PI, 0.1 mg/mL RNAse A, 0.05% Triton X-100, PBS) for one hour in the dark
at room temperature. Immediately after staining, samples were subjected to FACS analysis on a BD
FACSCANTO II flow cytometer (Beckman, Dickinson & Company). A 488 nm laser line was used for
excitation and fluorescence was detected using the PE channel (585/42 bandpass). Data were obtained
and analyzed using BD FACSDiva software (Beckman, Dickinson & Company). Gating was performed
based on FSC and SSC characteristics and interval gates were used to separate cell cycle phase fractions
by DNA content according to established methods386
.
3.2.11 Western blotting
Whole cell lysates were prepared by incubating cells with ice cold modified
radioimmunoprecipitation assay (RIPA) buffer supplemented with protease and phosphatase inhibitors
(Roche) for 5 min prior to collection using cell scrapper. Lysed cells in RIPA buffer were centrifuged
(8,000 g, 10 min) and the supernatant recovered. Protein concentrations of cell lysates were measured
using the Pierce BCA Protein Assay (Fisher, Hampton, NH) or Bradford Protein Assay (Bio-Rad,
Hercules, CA) according to manufacturer’s instructions. Samples were subjected to SDS-polyacrylamide
gel electrophoresis (SDS-PAGE) and proteins were transferred to polyvinylidene difluoride membranes
(Millipore, Burlington, MA) using a semi-dry transfer apparatus (Trans-Blot Turbo, Bio-Rad) in the
presence of Towbin transfer buffer (20% methanol supplemented running buffer). Following protein
transfer membrane blocking with 5% BSA in tris-buffered saline, 0.1% Tween 20 (TBS-T) for 1 hour at
room temperature was performed. Primary antibody incubation was carried out overnight at 4 °C and
followed by secondary antibody incubation (Anti-rabbit IgG, HRP-linked Antibody, Cell Signaling

64
[7074]; IRDye® 800CW Goat anti-Mouse IgG, Li-Cor [925-32210]) for 1 hour at room temperature. In
between each step post-transfer the membrane was washed 3 times for 5 min in TBS-T. Membranes
imaging was performed either by enhanced chemiluminescence detection (Supersignal West Pico,
Thermo Fisher, Waltham, MA) or on an Odyssey CLx infrared imaging system using Odyssey software
version 3.0 (LI-COR, Lincoln, NE).
3.2.12 Fluorescent microscopy
C4-2 cell morphology following siRNA transfection was examined by fluorescent microscopy.
Cells were cultured on coverslips (Fisher) in 6-well plates and transfected as described previously. Cells
were then washed with PBS and fixed with 10% buffered formalin (Fisher) for 15 min at 37 °C. Cells
were then washed again and blocked in 10% goat serum, TBS supplemented with background sniper
blocking reagent (Biocare Medical, Concord, CA) for 1 hour at room temperature. Cells were then stained
with wheat germ agglutinin (WGA) labeling to highlight membranous cellular organelles using WGA
from Triticum vulgaris conjugated to Alexa Fluor 647 (WGA-647, Life Technologies) at a final
concentration of 10 μg/mL. Cells were incubated in WGA-647 diluted in TBS-T for one hour at room
temperature, protected from light. Cells were then washed in TBS and coverslips were mounted and
counterstained with Vectashield antifade mounting medium with DAPI (Vector Laboratories, Burlington,
ON). Imaging was performed on the Zeiss 780 confocal microscope (Toronto, Canada).
3.2.13 Steroid analysis by LC-MS
Cellular androgen levels were assessed and quantified from ~100 mg cell pellets following either
transfection or BLT-1 treatment by LC-MS similar to previously described348
. To obtain sufficient
material for analysis cells were seeded into five T75 cell cultures flasks (~4.2 x 10⁹ cells) and treatment
groups merged prior to LC-MS analysis. Internal standard (20 pg/40 pg deuterated testosterone/DHT;
C/D/N isotopes, IS) was added and pellets were twice extracted by 30 min vortexing with 60/40
hexane/ethyl acetate. Extracts were pooled, dried using a CentriVap (Labconco), reconstituted in 50 µL of
50 mM hydroxylamine and incubated 1 hour at 65 °C. Resulting steroid-oxime derivatives were analyzed
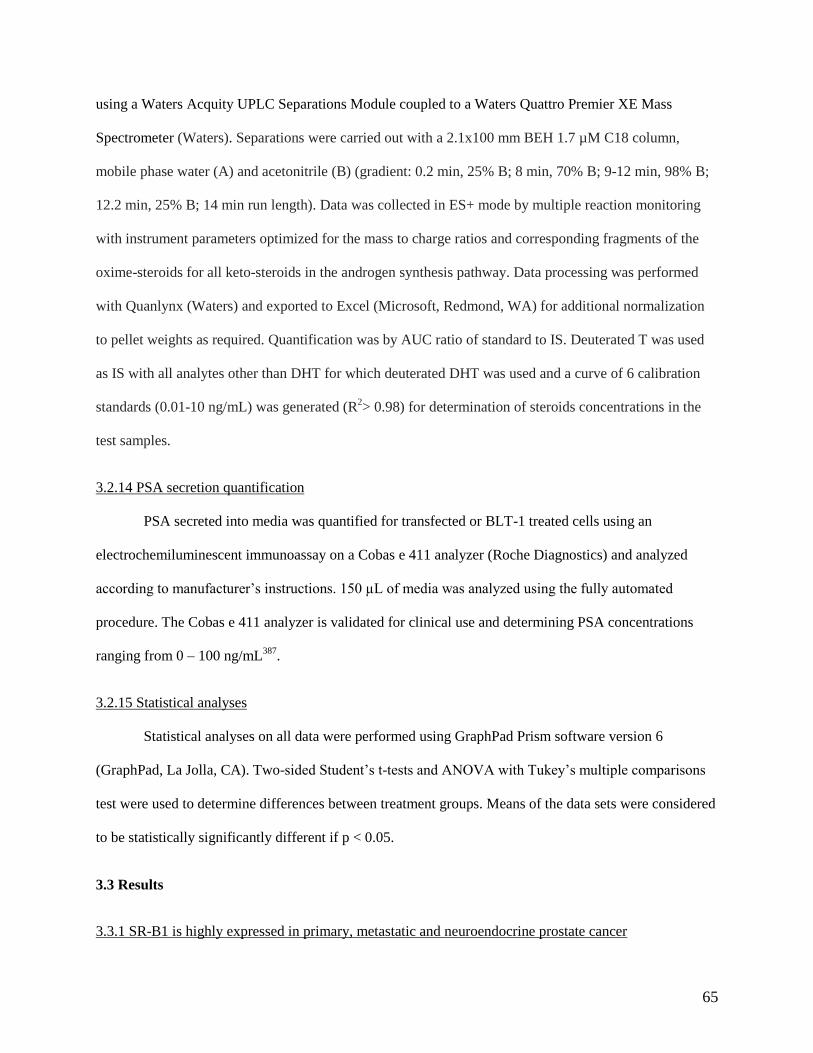
65
using a Waters Acquity UPLC Separations Module coupled to a Waters Quattro Premier XE Mass
Spectrometer (Waters). Separations were carried out with a 2.1x100 mm BEH 1.7 µM C18 column,
mobile phase water (A) and acetonitrile (B) (gradient: 0.2 min, 25% B; 8 min, 70% B; 9-12 min, 98% B;
12.2 min, 25% B; 14 min run length). Data was collected in ES+ mode by multiple reaction monitoring
with instrument parameters optimized for the mass to charge ratios and corresponding fragments of the
oxime-steroids for all keto-steroids in the androgen synthesis pathway. Data processing was performed
with Quanlynx (Waters) and exported to Excel (Microsoft, Redmond, WA) for additional normalization
to pellet weights as required. Quantification was by AUC ratio of standard to IS. Deuterated T was used
as IS with all analytes other than DHT for which deuterated DHT was used and a curve of 6 calibration
standards (0.01-10 ng/mL) was generated (R2> 0.98) for determination of steroids concentrations in the
test samples.
3.2.14 PSA secretion quantification
PSA secreted into media was quantified for transfected or BLT-1 treated cells using an
electrochemiluminescent immunoassay on a Cobas e 411 analyzer (Roche Diagnostics) and analyzed
according to manufacturer’s instructions. 150 µL of media was analyzed using the fully automated
procedure. The Cobas e 411 analyzer is validated for clinical use and determining PSA concentrations
ranging from 0 – 100 ng/mL387
.
3.2.15 Statistical analyses
Statistical analyses on all data were performed using GraphPad Prism software version 6
(GraphPad, La Jolla, CA). Two-sided Student’s t-tests and ANOVA with Tukey’s multiple comparisons
test were used to determine differences between treatment groups. Means of the data sets were considered
to be statistically significantly different if p < 0.05.
3.3 Results
3.3.1 SR-B1 is highly expressed in primary, metastatic and neuroendocrine prostate cancer
66
In order to assess the expression of SR-B1 across the PCa disease state IHC staining of rapid
autopsy specimens from the UWRA was performed and confirmed via analysis of multiple clinical
mRNA expression datasets372
. This included samples of cancerous prostate and patient matched adjacent
normal prostatic tissue from 127 patients as well as terminal rapid autopsy specimens of varying
metastatic sites including bone, lymph node, liver and lung from 71 patients. The tissue specimens
containing stromal and epithelial cells displayed a range of SR-B1 staining, with high expression samples
staining predominantly along the plasma membrane of epithelial cells with stromal adjacent epithelial
cells appearing to show the highest expression (Figure 3.1). Each sample was scored by an experienced
independent pathologist with a score between 0 and 3 (0 = no staining, 1 = low staining, 2 = moderate
staining, 3 = high staining). For normal prostatic tissue only 24% of samples were scored as moderate to
high staining for SR-B1 while 71% of local prostate cancer samples were scored as moderate to high
staining. Similarl to local PCa, metastatic samples showed high levels of SR-B1 staining. Moderate to
high staining of SR-B1 was scored in 57% of bone, 77% of liver, 84% of lymph node and 84% of lung
samples.
Clinical mRNA expression data for SCARB1 (SR-B1), LDLr and HMGCR was collected from
multiple datasets to analyze the expression level of important cholesterol metabolism proteins across the
disease state. In total four different datasets were analyzed, two allowed for the comparison of expression
levels in normal prostate to cancerous prostate (SC and TCGA datasets, Figure 3.2), one reporting
expression information from metastatic tumors (UWRA Dataset, Figure 3.2) and two allowing for the
comparison of CRPC to NEPC (UWRA and WC Datasets, Figure 3.3). Both databases assessed for the
comparison of normal prostatic tissue to cancerous prostatic tissue showed increased expression of SR-
B1, decreased expression of LDLr and a minor, but not significant, decrease in HMGCR in the cancerous
tissue (Figure 3.2A,B: SC: SCARB1: +18%; LDLr: -47%; HMGCR: -21%, n = 27; TCGA: SCARB1:
+68%; LDLr: -23%; HMGCR: -10%, normal n = 48, cancer n = 375). In these primary cancers SR-B1
expression was nearly double that of LDLr and four times HMGCR expression for the SC database (Mean
Counts: SCARB1: 2341, LDLr: 1267, HMGCR: 586, n = 27, Figure 3.2A) contrasting with the TCGA
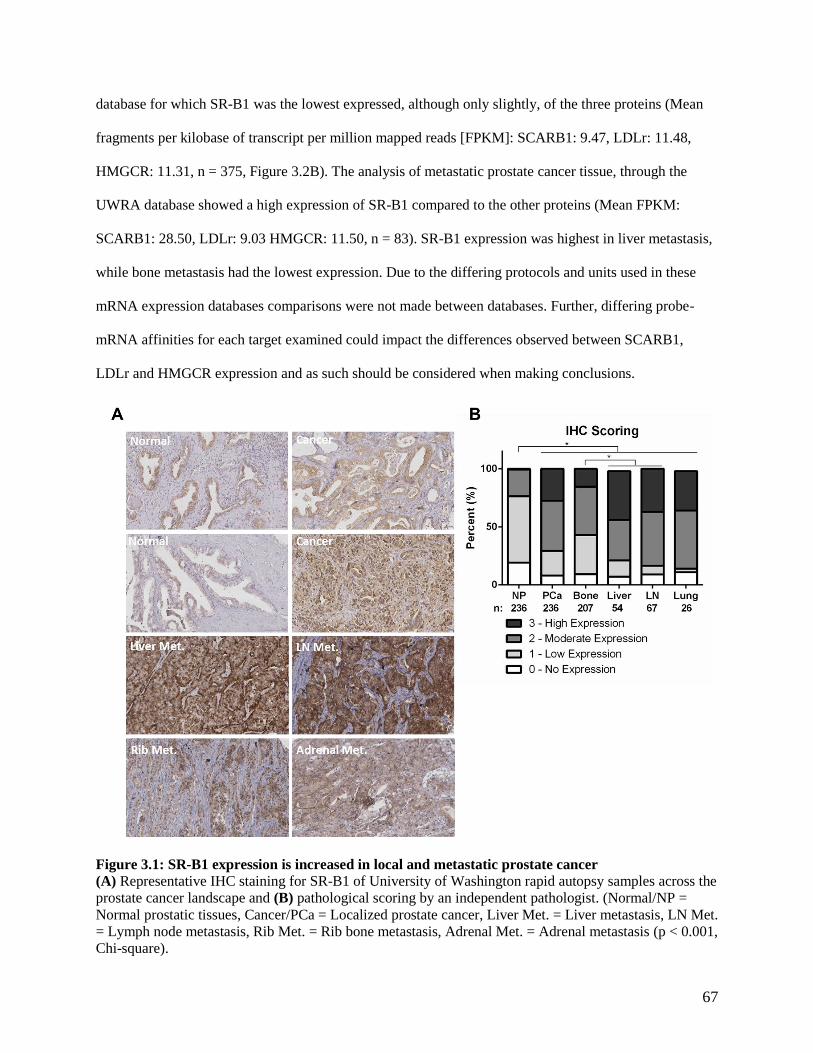
67
database for which SR-B1 was the lowest expressed, although only slightly, of the three proteins (Mean
fragments per kilobase of transcript per million mapped reads [FPKM]: SCARB1: 9.47, LDLr: 11.48,
HMGCR: 11.31, n = 375, Figure 3.2B). The analysis of metastatic prostate cancer tissue, through the
UWRA database showed a high expression of SR-B1 compared to the other proteins (Mean FPKM:
SCARB1: 28.50, LDLr: 9.03 HMGCR: 11.50, n = 83). SR-B1 expression was highest in liver metastasis,
while bone metastasis had the lowest expression. Due to the differing protocols and units used in these
mRNA expression databases comparisons were not made between databases. Further, differing probe-
mRNA affinities for each target examined could impact the differences observed between SCARB1,
LDLr and HMGCR expression and as such should be considered when making conclusions.
Figure 3.1: SR-B1 expression is increased in local and metastatic prostate cancer
(A) Representative IHC staining for SR-B1 of University of Washington rapid autopsy samples across the
prostate cancer landscape and (B) pathological scoring by an independent pathologist. (Normal/NP =
Normal prostatic tissues, Cancer/PCa = Localized prostate cancer, Liver Met. = Liver metastasis, LN Met.
= Lymph node metastasis, Rib Met. = Rib bone metastasis, Adrenal Met. = Adrenal metastasis (p < 0.001,
Chi-square).

68
Figure 3.2 SR-B1 expression is increased in prostate cancer
The mRNA expression levels of important cholesterol metabolism proteins were assessed from available
expression datasets. (A) normalized mRNA sequencing counts were analyzed from the Shanghai Cohort.
SR-B1 (SCARB1) was more highly expressed than both LDLr and HMGCR (Left, n = 27, p < 0.001,
ANOVA with Tukey’s Test) and cancerous prostatic tissue (PCa) had increased expression of SR-B1 (p <
0.001) and decreased expression of LDLr (p = 0.002) when compared to matched normal prostatic tissue
(Normal)(Right, n = 28, ANOVA with Sidak’s Test). (B) Analysis of the mRNA expression reads
(FPKM) from the TCGA database found that SR-B1 (SCARB1) expression was lower than that of LDLr
and HMGCR (Left, n = 375, p < 0.001, ANOVA with Tukey’s Test). The expression of SR-B1 (p <
0.001) was increased in cancerous prostatic tissue (PCa) and LDLr (p < 0.001) expression decreased
when compared to normal prostatic tissue (Normal)(Right, Cancer: n = 375, Normal: n = 48, ANOVA
with Sidak’s Test). (C) mRNA expression (FPKM) analysis of metastatic tumors from the University of
Washington rapid autopsy dataset SR-B1 (SCARB1) was more highly expressed than LDLr and HMGCR
(Left, n = 83, p < 0.001, ANOVA with Tukey’s Test). (Right) The expression of SR-B1 (SCARB1),
LDLr and HMGCR by site of metastasis. The expression of SR-B1 was higher in liver (p = 0.008) than

69
bone and lymph node (LN, p < 0.001) tissue (n = 83, ANOVA with Sidak’s Test). For box and whisker
plots: middle line = median, box = 25th to 75th percentile, bars = min. to max.
To assess SR-B1 expression in NEPC two databases were assessed, UWRA and WC datasets
which sequenced and stratified metastatic prostate cancer into adeno-CRPC and neuroendocrine-CRPC.
Both of the databases showed increased expression of SR-B1 in the absence of changes to LDLr and
HMGCR expression (UWRA: SCARB1: +49%; LDLr: -8%, HMGCR: -9%; CRPC n = 65, NEPC n = 18,
Figure 3.3A; WC: SCARB1: +66%; LDLr: -10%; HMGCR: -17%, CRPC n = 34, NEPC n =15, Figure
3.3B). These results taken as whole suggest an increased expression of SR-B1 in primary, metastatic and
neuroendocrine prostate cancers highlighting its potential as a therapeutic target in CRPC.
Figure 3.3 SR-B1 expression is increased in NEPC
The mRNA expression levels of important cholesterol metabolism proteins in CRPC and NEPC were
assessed from available expression datasets. (A) Using the University of Washington rapid autopsy
database SR-B1 expression was found to be increased in NEPC (CRPC: n = 65, NEPC: n = 18, p < 0.001,
ANOVA with Sidak’s Test). (B) Using the Weill Cornell database SR-B1 expression was found to be
increased in NEPC (CRPC: n = 34, NEPC: n = 15, p = 0.036, ANOVA with Sidak’s Test). For box and
whisker plots: middle line = median, box = 25th to 75th percentile, bars = min. to max.
3.3.2 SR-B1 antagonism alters cholesterol metabolism of castration-resistant C4-2 cells
As a preliminary assessment into the viability of targeting SR-B1 in PCa initial experiments were
performed to validate potential approaches to SR-B1 antagonism. Both siRNA knockdown and small
molecule inhibition with block lipid transport-1 (BLT-1) were assessed for their ability to reduce HDL-
derived cholesterol uptake by the uptake of fluorescent lipid-DiI with flow cytometry. In order to interpret
this effect each sample was normalized to the fluorescent uptake of non-treated (NT) cells and presented
as a percent change in uptake for treated cells. The SR-B1 targeted siRNA reduced fluorescent uptake by

70
39% (NC: 89.9 %MFI/NT, 55.0 %MFI/NT*100, n = 3, Figure 3.4A) and BLT-1 by 62% in C4-2 cells
(Veh: 90.07 %MFI/NT*100, BLT-1: 34.3 %MFI/NT*100, n =3, Figure 3.4A). To confirm the ability of
SR-B1 targeted siRNA to reduce expression SR-B1 mRNA expression was measured by qPCR in C4-2
cells. The targeted siRNA reduced mRNA expression by 65% compared to scramble control (n = 3,
Figure 3.4B). Further confirmation of the effect of the siRNA treatment on SR-B1 expression can be
found in the western blots seen in Figure 3.9B. Due to the ability of simvastatin to induce SR-B1
expression as described Chapter 2 (Figure 2.7B) the effect of SR-B1 knockdown on HMGCR expression
was assessed by qPCR. C4-2 SR-B1 knockdown cells had an increase of HMGCR mRNA of 217% (n =
3, Figure 3.4C). The induction of SR-B1 expression with HMGCR inhibition as described in Chapter 2
and the increase in HMGCR expression described here may indicate a compensatory mechanism by
which the cell shifts the pathway through which it obtains cholesterol.
Figure 3.4 SR-B1 antagonism inhibits cholesterol uptake and induces HMGCR expression
(A) SR-B1 siRNA silencing or BLT-1 treatment C4-2 cells followed by DiI-HDL incubation and mean
fluorescence measured using flow cytometry. siRNA knockdown (SRB1-KD) and BLT-1 treatment in
C4-2 cells (n = 3, siRNA: p = 0.019, BLT-1: p = 0.0013, ANOVA with Sidak’s Test, mean ± SEM)
reduced DiI-HDL uptake compared to negative siRNA control (NC) and DMSO vehicle (Veh.)
respectively. Expression of SR-B1 mRNA (B) (n = 3, p < 0.001, T-Test, mean ± SEM) assessed by
qPCR, was reduced and expression of HMGCR (C) (n = 3, p = 0.012, T-Test, mean ± SEM) increased
following anti-SR-B1 siRNA (SRB1-KD) treatment compared to negative control (NC) in C4-2 cells.
3.3.3 SR-B1 antagonism inhibits cellular proliferation of C4-2 cells
To determine if the effects on cholesterol metabolism described above affected the proliferation
of the prostate cancer cells an Incucyte Zoom based cellular growth assay was performed. The confluency
of plated cells treated with siRNA transfection or BLT-1 was measured every 6 h. C4-2 cells grew to

71
almost 30% confluency when treated with the scramble control (NC) and despite seeing modest growth
initially cells treated with the targeted siRNA rapidly arrested (Figure 3.5A). The respective growth rates
were 0.192 ± 0.012 %/hour and 0.030 ± 0.005 %/hour for the scramble and targeted siRNA respectively
(n = 3, Figure 3.5C). BLT-1 treated C4-2 cells displayed progressive growth arrest with increasing
concentrations of BLT-1. A treatment of 1 µM BLT-1 resulted in a slight decrease in cell growth (0.365 ±
0.007 %/hour), 10 µM resulted in only very modest growth (0.087 ± 0.004 %/hour) and 20 µM treatment
caused near total growth arrest (0.019 ± 0.005 %/hour) when compared to the vehicle (0.440 ± 0.015
%/hour, n = 3, Figure 3.5B,D).
Figure 3.5 SR-B1 antagonism inhibits C4-2 cell growth
C4-2 cells were (A) transfected with SR-B1 silencing siRNA (SRBI-KD) or negative control (NC) or
treated with (B) BLT-1 or vehicle (right) prior to incubation in the IncuCyte Zoom system. Confluency
measurements were taken every 6 hours (n = 3, mean ± SEM). Linear regression was used to calculate the
slope of each treatment in order to determine growth rate (C)(D). siRNA silencing (p = 0.0002, T-Test)
and BLT-1 (p = 0.0053, ANOVA with Tukey’s Test) at concentrations greater than 10 µM significantly
reduced cell growth.
To determine the phenotypic cause of the observed arrested growth, a Live/Dead cytotoxicity
assay was performed. The assay combined two fluorescent dyes, calcein AM and ethidium homodimer-1.
Calcein AM, a membrane penetrable dye, is rapidly converted into a fluorescent metabolite by cytosolic

72
esterases of living cells while ethidium homodimer-1, a membrane non-penetrable dye, becomes
fluorescent when binding cellular DNA of porous membraned dead cells. C4-2 cells did not exhibit a
significant decrease in calcein AM or increase in ethidium homodimer-1 staining indicating no induction
of cell death with SR-B1 silencing (NC: 17.6 ± 1.43%, KD: 24.3 ± 6.53%, n = 3, Figure 3.6A) but a
significant induction was observed with BLT-1 treatment at 10 µM (45 ± 3.54%) and 20 µM (79.2 ±
0.13%) compared to the vehicle control (27.5 ± 5.77%, n = 3, Figure 3.6A). The apparent lack of cell
death in response to SR-B1 silencing or low concentrations BLT-1 combined with significant decreases in
cell growth indicates the likely induction of cell cycle arrest while the observed cell death at higher
concentrations of BLT-1 appears to indicate either on-target or off-target toxicity.
Figure 3.6 SR-B1 antagonism induces cell cycle arrest and death
(A) C4-2 cells were transfected with SR-B1 silencing siRNA (KD) or negative control (NC) or treated
with BLT-1 (BLT) or vehicle (Veh.). Following treatment, incubation with the Live/Dead cytotoxicity kit
reagents was performed and measured using flow cytometry. The number of dead cells was significantly
increased at BLT-1 concentrations of 10 µM and 20 µM (n = 3, p < 0.001, ANOVA with Tukey’s Test,
mean ± SEM) but not with siRNA SR-B1 knockdown. The proportion of cells in different cell cycle
phases was determined by PI staining and flow cytometry. In C4-2 cells the (B) siRNA knockdown
induced an accumulation of cells in the G0-G1 phase (n = 3, p < 0.001, ANOVA with Sidak’s Test, mean
± SEM), while (C) BLT-1 treatment induced accumulation of cells in the sub G0 phase and a
corresponding decrease of cells in the G2-M phase (n = 3, p < 0.001, ANOVA with Sidak’s Test, mean ±
SEM).

73
3.3.4 SR-B1 antagonism can induce sub G0 and G0 – G1 cell cycle accumulation
To gain an understanding of the mitotically inactive but apparently intact and functioning cells as
described above cell cycle analysis was performed using a PI based cell cycle assay. In C4-2 cells, the
silencing of SR-B1 expression induced a modest but significant G0 – G1 phase accumulation (NC: 47.1 ±
1.48%, SRB1-KD: 58.1 ± 1.23%, n=3, Figure 3.6B) and an approximate doubling in sub G0 phase
accumulation but failed to reach statistical significance (NC: 2.33 ± 0.67%, SRB1-KD: 5.53 ± 1.36%,
n=3, Figure 3.6B). Treatment with BLT-1 induced an increasing sub G0 phase accumulation for cells
treated with 5 µM and 10 µM BLT-1 (Veh: 2.1 ± 0.39%, 5 µM BLT-1: 13.5 ± 5.83%, 10 µM BLT-1:
18.4 ± 5.73%, n = 4, Figure 3.6C). These results appear to confirm cytotoxicity as evidenced through sub
G0 accumulation with high concentration of BLT-1 while further suggesting a G0 – G1 cell cycle arrest
with siRNA silencing to explain the absence of mitotic activity observed in the growth assay.
3.3.5 SR-B1 antagonism reduces cellular androgen accumulation and AR activity in steroidogenic C4-2
cells
Given that ligand driven AR-activation is considered the primary driver of PCa proliferation and
that cholesterol serves as the primary upstream precursor for the synthesis of AR activating androgens
and de novo steroidogenesis, the effects of impaired cholesterol procurement on androgen accumulation
were assessed as a potential cause of the observed cell cycle arrest388,389
. The methods by which the cells
can obtain the cholesterol necessary for androgen synthesis include cellular cholesterol synthesis or
uptake from extracellular sources through LDLr and SR-B1. SR-B1 specifically is known to provide
HDL-cholesterol to steroidogenic tissues and previous work from our group has demonstrated a reduction
in PSA secretion following SR-B1 knockdown235,290
. In Chapter 2, the decreased accumulation of
testosterone and DHT in castrated LNCaP tumors with the inhibition of cholesterol synthesis by statins
was described (Figure 2.6)364
. As such, cellular androgen levels and markers of AR activation were
examined in C4-2 cells cultured in charcoal stripped media as a steroidogenic model390
. Testosterone and
DHT levels were measured by LC-MS. Testosterone levels were decreased by nearly 60% in SR-B1
knockdown cells compared to the scramble control (NC: 0.062 ± 0.0129 ng/mL/mg, SRB1-KD: 0.025 ±

74
0.0079 ng/mL/mg, n = 3, Figure 3.7A) while BLT-1 treatments of 5 µM and 10 µM reduced testosterone
by approximately 50% and 65% respectively but failed to reach statistical significance (Veh: 0.189 ±
0.0693 ng/mL/mg, 5 µM BLT-1: 0.091 ± 0.0287 ng/mL/mg, 10 µM BLT-1: 0.063 ± 0.0134, n =3, Figure
3.7A). DHT levels were significantly decreased with SR-B1 knockdown and BLT-1 treatment. The
knockdown resulted in a decreased concentration of DHT by more than 80% (NC: 0. 087 ± 0.0278
ng/mL/mg, SRB1-KD: 0.015 ± 0.0076, n = 3, Figure 3.7B) and decreases of 70% and 80% for 5 µM and
10 µM BLT-1 treatment respectively (Veh: 0.251 ± 0.0507 ng/mL/mg, 5 µM BLT-1: 0.076 ± 0.0149
ng/mL/mg, 10 µM BLT-1: 0.048 ± 0.0096 ng/mL/mg, n = 3, Figure 3.7B). These findings indicate,
similarly to cholesterol synthesis inhibition, that SR-B1 antagonism whether by siRNA or BLT-1
treatment can reduce the accumulation of the androgenic AR ligands testosterone and DHT. However,
whether the reduced cellular concentration of these androgens actually translated to reduced AR activity
needed to be confirmed.
The mRNA expression of PSA and NKX3.1, AR regulated genes, was assessed to determine
whether the decrease in cellular androgen levels translated to decreased activation of the AR. PSA mRNA
expression was reduced by 86% (n = 3) and NKX3.1 by 43% (n = 3) indicating decreased AR activation
likely due to the reduction in AR ligands (Figure 3.7C). This finding was further confirmed by a
significant decrease in PSA secretion for both the SR-B1 knockdown and dose dependent decrease with
BLT-1 reaching significance with 5 µM and 10 µM BLT-1 (NC: 0.0055 ± 0.00038 ng/mL/µg, SRB1-KD:
0.0011 ± 0.00013 ng/mL/µg, n = 3 BLT-1 IC50: 1.07 µM, n = 3 Figure 3.7D). The decreased expression
of AR regulated genes as well as decreased PSA secretion suggest that the decreased accumulation of
AR-activating androgens is in fact translating to decreased activation of the AR for both siRNA silencing
and BLT-1 treatment. Taken in total these findings indicate that SR-B1 antagonism negatively impacts
the ability of C4-2 cells to undergo de novo steroidogenesis and drive AR activation in the absence of
extracellular androgens.

75
Figure 3.7 SR-B1 antagonism reduces cellular androgen accumulation and AR activity
Alterations in androgen accumulation and AR activation were assessed in C4-2 cells. Testosterone (A)
and DHT (B) levels following siRNA transfection (left) or BLT-1 (right) treatment were measured by
LC-MS from ~100 mg cell pellets normalized to protein content. Testosterone accumulation was
significantly reduced with siRNA knockdown and trended towards decrease with BLT-1 treatment
(siRNA: n = 3, p = 0.0384, T-Test; BLT-1: n = 3, p = 0.1844, ANOVA with Tukey’s Test, mean ± SEM).
DHT accumulation was significantly reduced with both siRNA knockdown and BLT-1 treatment (siRNA:
n = 3, p = 0.0336, T-Test; BLT-1: n = 3, p = 0.0070, ANOVA with Tukey’s Test, mean ± SEM). (C)
Expression of AR regulated PSA and NKX3.1mRNA was assessed by qPCR. Both PSA (n = 3, p < 0.001,
T-Test, mean ± SEM) and NKX3.1 (n = 3, p < 0.001, T-Test, mean ± SEM) mRNA was significantly
reduced with SR-B1 knockdown. (D) PSA secretion into media was assessed using the Cobas e 411
analyzer. PSA secretion was significantly reduced with siRNA knockdown (n = 3, p < 0.001, t-test, mean
± SEM) and with 5 µM and 10 µM BLT-1 treatment (n = 3, p < 0.001, ANOVA with Tukey’s Test, mean
± SEM).
3.3.6 SR-B1 knockdown phenotype is not rescued by exogenous steroid
In order to determine whether the anti-proliferative effects of SR-B1 antagonism in C4-2 cells
were primarily a result of decreased presence of cellular AR activating androgens experiments were
performed in the presence of the exogenous steroid DHEA. DHEA is an androgen intermediate in the
testosterone synthesis pathway primarily produced by the adrenal glands. Although a weaker activator of
76
the AR than T or DHT, DHEA serves primarily as endogenous precursor to more potent AR activating
androgens, in theory replacing the need for pre-cursor cholesterol for androgen synthesis391
. The
knockdown of SR-B1 in the absence of DHEA resulted in a decrease of 80.1% in PSA secretion
compared to control (NC: 0.0055 ± 0.00038 ng/mL/µg, SRB1-KD: 0.0011 ± 0.00013 ng/mL/µg, n = 3
Figure 3.8A). A concentration of 2.5 µM DHEA was capable of inducing robust androgen receptor
activation in negative control treated cells as measured by PSA secretion (NC: 0.0055 ± 0.00038
ng/mL/µg, NC + DHEA: 0.0465 ± 0.00617 ng/mL/µg, n = 3, Figure 3.8A). The silencing of SR-B1
expression in the presence of DHEA resulted in a 74% decrease in PSA secretion compared to the
negative control treated cells in the presence of DHEA (SRB1-KD + DHEA: 0.0121 ± 0.00105
ng/mL/µg, Figure 3.8A). Although the addition of DHEA resulted higher absolute PSA secretion, as
would be expected from steroidogenic cells growing in otherwise androgen-replete medium, the relative
decrease in PSA secretion observed with SR-B1 silencing remained nearly unchanged (80% vs 74%
decrease) in the presence or absence of external steroid.
If AR activation is sufficient to drive C4-2 proliferation then the addition of exogenous steroid
with SR-B1 silencing should avert the induction of the G0 – G1 cell cycle arrest observed with SR-B1
silencing alone. SR-B1 cells in the absence of DHEA had an increase of 16% in the G0 – G1 phase
fraction, assessed by PI staining, compared to negative control whereas SR-B1 knockdown cells in the
presence of DHEA had an increase of 20% in the same fraction compared to negative control in the
presence of DHEA (G0 – G1 phase fraction: NC: 70.0 ± 0.96%, SRB1-KD: 86.4 ± 0.63%, NC + DHEA:
64.5 ± 1.25%, SRB1-KD + DHEA: 84.4 ± 1.05%, n = 3, Figure 3.8B). Lastly, clusterin (Clu), used as a
marker of autophagy described below, was assessed by immunoblotting and it was found that SRB1-KD
cells in the presence of DHEA still displayed a robust induction of Clu expression compared to the
negative control (Figure 3.8C). The induction of G0 – G1 cell cycle arrest in the presence and absence of
exogenous steroid indicates that AR activity alone is insufficient to drive C4-2 proliferation. The inability
of exogenous steroid to fully restore AR activation or prevent cell cycle arrest with SR-B1 silencing
suggests that the arrested phenotype is not solely driven by alterations to the AR axis.

77
Figure 3.8 Arrested SRBI knockdown phenotype is not rescued by exogenous steroid
siRNA-transfected C4-2 cells were cultured in the presence or absence of DHEA (2.5 μM). (A) PSA
secretion into media was assessed using the Cobas e 411 analyzer. PSA secretion was significantly
reduced with siRNA knockdown both in the presence and absence of DHEA (n = 3, p < 0.001, ANOVA
with Tukey’s Test, mean ± SEM). (B) The proportion of cells in different cell cycle phases was
determined by PI staining and flow cytometry. Similar levels of sub G0 and G0 – G1 accumulation were
observed in the presence and absence of DHEA (n = 3, p < 0.001, ANOVA with Tukey’s Test, mean ±
SEM). (C) Representative western blot analysis of autophagy pathway marker Clu. Clu expression was
increased in both the presence and absence of DHEA (n = 3).
3.3.7 SR-B1 antagonism induces cell stress and autophagy pathways
While consistently suppressing growth and androgen accumulation the addition of exogenous
steroid failed to reverse the SR-B1 antagonized phenotype, therefore other cell stress features that might
account for the growth suppression observed by both SR-B1 antagonizing methods were considered. As
such, induction of autophagy was considered as a potential mechanism for the observed growth arrest.
Cancer cells undergoing nutritional or other external stresses have been demonstrated to employ several
mechanisms to evolve and adapt388,392
. Autophagy, one such survival mechanism, is a process in which
the cell recycles and degrades unnecessary cellular constituents. Initial evidence of autophagy was
discovered serendipitously during the visualization of SR-B1 knockout cells by fluorescent microscopy

78
using WGA as a membrane stain. The silencing of SR-B1 expression appeared to induce the
accumulation of perinuclear vacuoles easily visible in Figure 3.9A. The presence of membranous
vacuoles has been demonstrated to be a hallmark of autophagy which functions as the center of lysosomal
degradation of cellular components392
. To further evaluate whether cells were undergoing autophagy the
induction of Clu expression was assessed as a validated molecular marker. Clu is a molecular chaperone
known to be upregulated during cellular stress that functions to prevent protein aggregation and assist in
LC3-I/II lipidation thereby promoting survival and autophagic flux392
. Mature Clu levels were robustly
induced by both the siRNA knockdown and the BLT-1 treatment indicating a strong induction of
autophagy (Figure 3.9B). Induction of an autophagic phenotype is further supported by work from Ankur
Midha who demonstrated increased LC3-I/II lipidation in response to SR-B1 knockdown377
.
Figure 3.9 SR-B1 antagonism induces cell stress and autophagy pathways
(A) C4-2 cells were transfected with SR-B1 siRNA (KD) or negative control (NC) and stained with wheat
germ agglutinin to image intracellular membrane structures by confocal microscopy and compare levels
of ER/Golgi blebbing and vacuole formation. (B) Representative western blot analysis of autophagy and
ER stress pathway markers following transfection as above, or BLT-1 (BLT) or DMSO vehicle (Veh)
treatment in C4-2 cells (n = 3).
Although independent mechanisms of autophagy regulation have been found mTOR is generally
considered to be the primary regulator393
. Within nutrient starved conditions the dephosphorylation and
therefore inactivation of mTOR leads to the downstream activation of autophagy pathways394
. As such,

79
the levels of mTOR phosphorylation were assessed through western blotting in C4-2 cells and were
noticeably decreased when cells were treated with SR-B1 targeted siRNA or treated with the BLT-1
compound (Figure 3.9B). There are several different types of cellular stress that can lead to mTOR
regulated autophagy including low glucose and ATP through AMPK 394
. Altered cholesterol metabolism
is known to be involved in ER stress mechanisms and disrupted lipid equilibriums have been shown to
induce the unfolded protein response (UPR) 395,396
. The UPR, generally in response to an accumulation of
misfolded proteins, activates adaptive pathways that attenuate general protein translation, increase
molecular chaperone expression and induce cell cycle arrest in an attempt to alleviate the ER stress397
.
This process has further been demonstrated to induce autophagic activity through both mTOR
mediated and mTOR independent pathways398,399
. As such, binding immunoglobulin protein (BiP) an
essential chaperone and regulator of ER stress was assessed alongside inositol-requiring enzyme 1 alpha
(IRE1α) a known inducer of ER stress chaperones through the unconventional splicing x-box binding
protein 1 (XBP1)400,401
. It was found that both siRNA knockdown and high concentrations of BLT-1 (10
µM and 20 µM) can induce BiP expression, while comparatively modest inductions of IREα were also
observed (Figure 3.9B). Taken as a whole these results appear to indicate that SR-B1 antagonism induces
a strong autophagic phenotype that is at least in part through the activation of ER stress pathways and the
inhibition of mTOR activity.
Due to the decreasing detection of the internal structural protein actin, used here as a loading
control, detected in Figure 3.9A, methods of protein quantification were compared to insure that
misleading results were not being obtained. The two compared methods were the Pierce BCA Protein
Assay Kit and the Bradford Protein Assay, both performed according to manufacturer instructions (Figure
3.10). The BCA protein assay indicated lower concentrations of protein than the Bradford assay at higher
concentrations of BLT-1 (5 µM, 10 µM and 20 µM) however neither assay showed a large progressive
decrease of protein concentration with increasing concentration of BLT-1 that could account for the large
decrease in actin expression. Further, 10 µM BLT-1 treatment leads to a large increase in detectable
levels of Clu despite the decrease in actin detection (Figure 3.9B). This indicates that the decreasing
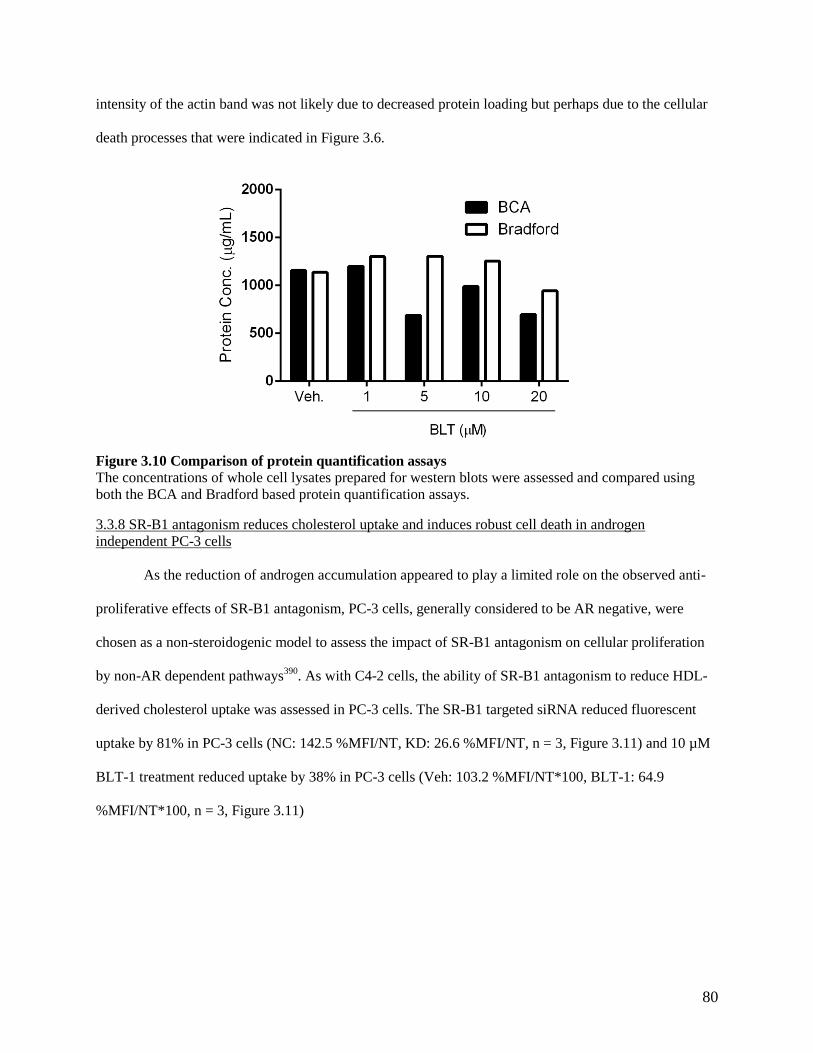
80
intensity of the actin band was not likely due to decreased protein loading but perhaps due to the cellular
death processes that were indicated in Figure 3.6.
Figure 3.10 Comparison of protein quantification assays
The concentrations of whole cell lysates prepared for western blots were assessed and compared using
both the BCA and Bradford based protein quantification assays.
3.3.8 SR-B1 antagonism reduces cholesterol uptake and induces robust cell death in androgen
independent PC-3 cells
As the reduction of androgen accumulation appeared to play a limited role on the observed anti-
proliferative effects of SR-B1 antagonism, PC-3 cells, generally considered to be AR negative, were
chosen as a non-steroidogenic model to assess the impact of SR-B1 antagonism on cellular proliferation
by non-AR dependent pathways390
. As with C4-2 cells, the ability of SR-B1 antagonism to reduce HDL-
derived cholesterol uptake was assessed in PC-3 cells. The SR-B1 targeted siRNA reduced fluorescent
uptake by 81% in PC-3 cells (NC: 142.5 %MFI/NT, KD: 26.6 %MFI/NT, n = 3, Figure 3.11) and 10 µM
BLT-1 treatment reduced uptake by 38% in PC-3 cells (Veh: 103.2 %MFI/NT*100, BLT-1: 64.9
%MFI/NT*100, n = 3, Figure 3.11)

81
Figure 3.11 SR-B1 antagonism inhibits cholesterol in PC-3 cells
SR-B1 siRNA silencing or BLT-1 treatment in PC-3 cells followed by DiI-HDL incubation and mean
fluorescence measured using flow cytometry. siRNA knockdown (SRB1-KD) and BLT-1 treatment in
PC-3 (n = 3, siRNA: p < 0.001, BLT-1: p = 0.021, ANOVA with Sidak’s Test, mean ± SEM) reduced
DiI-HDL uptake compared to negative siRNA control (NC) and DMSO vehicle (Veh.) respectively.
To again assess the effects of SR-B1 antagonism on cell growth an Incucyte Zoom based cellular
growth assay was performed. PC-3 cells transfected with the scramble control grew to nearly 80%
confluency over the time course of the experiment while cells treated with SR-B1 targeted siRNA showed
no growth over the same time course, never surpassing 20% confluency (Figure 3.12A). This translated to
a growth rate of 0.560 ± 0.096 %/hour for the scramble treated cells and -0.002 ± 0.009 %/hour for the
SR-B1 knockdown cells (n = 3, Figure 3.12C). When treated with BLT-1 PC-3 cells show a significant
and near complete growth arrest for each dose of BLT-1 tested including from the lowest dose tested at 1
µM BLT-1 (0.075 ± 0.002 %/hour) in comparison to the vehicle only treated cells which grew to
approximately 50% confluency by the end of the experiment (0.407 ± 0.018 %/hour, Figure 3.12B,D).
The silencing of SR-B1 expression in PC-3 cells resulted in the death of 78.0 ± 3.81% of cells
compared to only 11.1 ± 3.85% of scramble transfected cells (n = 3, Figure 3.13A) as assessed by
Live/Dead cytotoxicity assay. The BLT-1 treated cells did not display a significant induction of cell death
except for at 20 µM (29.0 ± 7.00%) when compared to the vehicle treated cells (3.6 ± 0.51%, n = 4,
Figure 3.13A). These findings translated to a large accumulation of cells in the sub-G0 phase (NC: 7.1 ±
0.56%, SRB1-KD: 66.5 ± 4.87%, n = 5, Figure 3.13B) consistent with the robust cell death observed in
Figure 3.13A as measured by cell cycle analysis. The BLT-1 treated cells displayed a significant
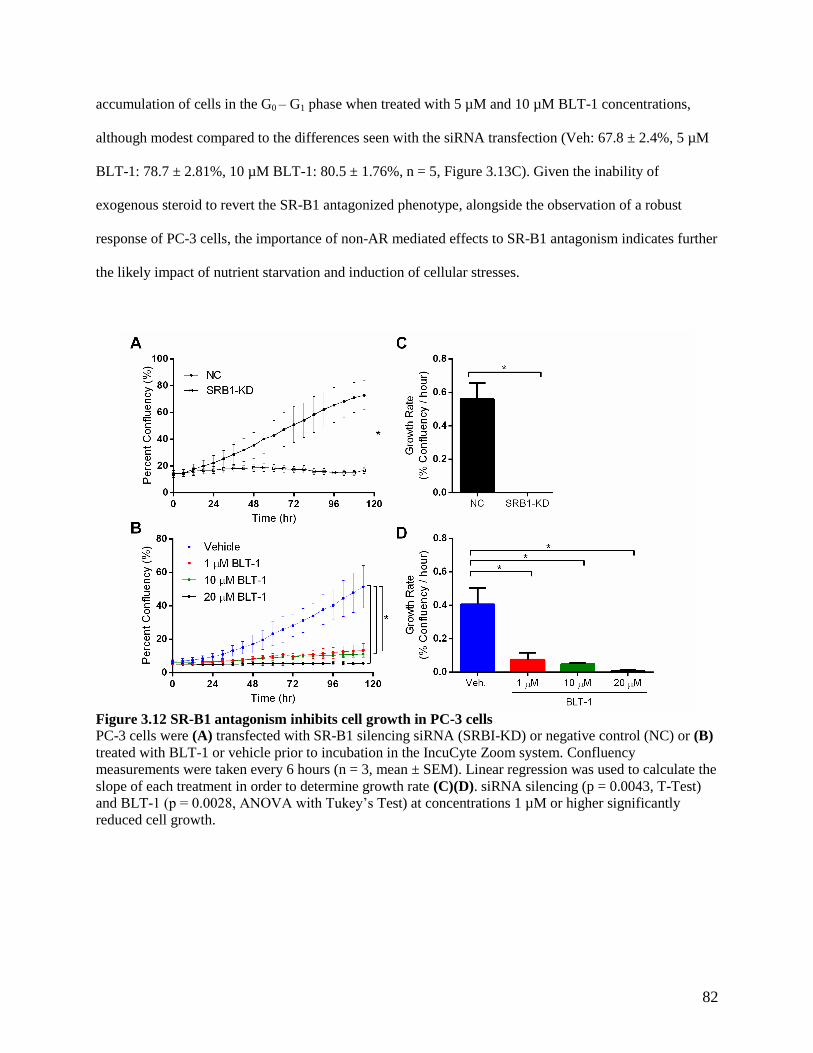
82
accumulation of cells in the G0 – G1 phase when treated with 5 µM and 10 µM BLT-1 concentrations,
although modest compared to the differences seen with the siRNA transfection (Veh: 67.8 ± 2.4%, 5 µM
BLT-1: 78.7 ± 2.81%, 10 µM BLT-1: 80.5 ± 1.76%, n = 5, Figure 3.13C). Given the inability of
exogenous steroid to revert the SR-B1 antagonized phenotype, alongside the observation of a robust
response of PC-3 cells, the importance of non-AR mediated effects to SR-B1 antagonism indicates further
the likely impact of nutrient starvation and induction of cellular stresses.
Figure 3.12 SR-B1 antagonism inhibits cell growth in PC-3 cells
PC-3 cells were (A) transfected with SR-B1 silencing siRNA (SRBI-KD) or negative control (NC) or (B)
treated with BLT-1 or vehicle prior to incubation in the IncuCyte Zoom system. Confluency
measurements were taken every 6 hours (n = 3, mean ± SEM). Linear regression was used to calculate the
slope of each treatment in order to determine growth rate (C)(D). siRNA silencing (p = 0.0043, T-Test)
and BLT-1 (p = 0.0028, ANOVA with Tukey’s Test) at concentrations 1 µM or higher significantly
reduced cell growth.

83
Figure 3.13 SR-B1 antagonism induces robust cell cycle arrest and death in PC-3 cells
PC-3 cells were transfected with SR-B1 silencing siRNA (KD) or negative control (NC) or treated with
BLT-1 (BLT) or vehicle (Veh.). (A) Following treatment, incubation with the Live/Dead cytotoxicity kit
reagents was performed and measured using flow cytometry. The number of dead cells was significantly
increased in the siRNA knockdown cells and at a BLT-1 concentration of 20 µM (n = 3, p < 0.001,
ANOVA with Tukey’s Test, mean ± SEM). The proportion of cells in different cell cycle phases was
determined by PI staining and flow cytometry. In PC-3 cells the (B) siRNA knockdown induced
accumulation of cells in the sub G0 phase and corresponding decrease of cells in the G0-G1 and G2-M
phases (n = 5, p < 0.001, ANOVA with Sidak’s Test, mean ± SEM), (C) while BLT-1 treatment induced
accumulation of cells in the G0-G1 phase and a corresponding decrease in the G2-M phase (n = 5, p <
0.001, ANOVA with Sidak’s Test, mean ± SEM).
3.3.9 SR-B1 co-targeting can amplify the effects of singular agents
As SR-B1 knockdown was demonstrated to induce expression of HMGCR (Figure 3.4C)
indicating a potential mechanism of compensation for the lost HDL-derived cholesterol the effect of co-
targeting SR-B1 and HMGCR was assessed. Simvastatin and BLT-1 were used in combination and the
effects on PSA secretion in C4-2 cells were assessed. Simvastatin concentrations of 1 µM and 10 µM did
not, by themselves, lead to a significant decrease in PSA secretion, although 10 µM simvastatin did

84
display a modest decrease (n = 3, Figure 3.14A). When combined with BLT-1, however, a near 50%
decrease in PSA secretion was observed with 0.1 µM BLT-1 in the presence of 1 µM simvastatin as
compared to the 1 µM BLT-1 required to reach a comparable decrease as a singular agent (n = 3, Figure
3.14A). These results demonstrate the essential role of these mechanisms to provide cholesterol as a
metabolite and indicate that targeting multiple mechanisms by which cells obtain cholesterol may
potentiate the effects of solo targeting.
Figure 3.14 SR-B1 co-targeting can amplify the effects of singular agents
Potential strategies for co-targeting SR-B1 were assessed. (A) PSA secretion with SR-B1 inhibition by
BLT-1 and HMGCR inhibition with simvastatin was measured by the Cobas e 411 analyzer. The addition
of simvastatin sensitized cells to BLT-1 treatment (right, n = 3, p < 0.001, Extra sum of squares F-test,
mean ± SEM) at concentrations of simvastatin that themselves did not decrease PSA (left, n = 3, p =
0.369, ANOVA, mean ± SEM). (B) The percentage of cells in the sub G0 phase following transfection
and treatment with autophagy inhibitor chloroquine (CQ) was assessed by propidium iodide staining and
flow cytometry. Cells transfected with SR-B1 knockdown showed significantly increased accumulation in
the sub G0 phase compared to the negative control at 80 µM and 100 µM CQ (n = 2, p < 0.001, ANOVA
with Sidak’s Test, mean ± SEM).
With the induction of autophagy and other cell stress mechanisms becoming a mainstay of
therapeutic resistance in oncology, methods of inhibition for these mechanisms are becoming more
prominent392
. Chloroquine, a small molecule lysosomal alkalizer known to inhibit the binding of the
lysosome and autophagosome, has been a staple in preclinical investigation of autophagy inhibition and
serves as an established agent for a proof-of-principle assessment in SR-B1 antagonized cells402
. To
determine whether the inhibition of autophagy would result in a more robust cellular death in SR-B1
knockdown C4-2 cells sub-G0 phase accumulation was measured with increasing concentrations of
chloroquine. The percentage of SR-B1 knockdown cells in the sub-G0 drastically increased with

85
increasing chloroquine concentration reaching 36% with 100 µM chloroquine (Figure 3.14B). Although,
modest increases in sub-G0 fraction were observed with negative control transfected cells the SR-B1
knockdown cells had a significantly higher percentage of cells in the sub-G0 phase at 80 µM and 100 µM
chloroquine (n =2). Although limited by replicate number these preliminary results indicate the ability to
induce a robust cell death response by inhibiting the autophagy response of SR-B1 antagonized cells.
3.4 Discussion
Selective cholesterol ester uptake through SR-B1 is a critical way cells acquire precursor
cholesterol for steroid hormone biosynthesis in steroidogenic tissues403
. The receptor further signals the
growth and survival of both non-steroidogenic endothelial cells and breast cancer cells255,256,404,405
.
Research into the role of SR-B1 in cancer has related its expression to aggressive characteristics in
multiple cancer types including breast cancer and clear cell renal carcinoma285,286
. In prostate cancer,
clinically elevated SR-B1 expression is correlated with high risk PCa and decreased disease-specific
survival288
. Further, elevated SR-B1 expression is observed in CRPC derivatives of LNCaP, and with
increased tumor growth in the TRAMP model284,289,290
. These results implicate SR-B1 as an actionable
target for managing CRPC.
In this thesis the increased expression of SR-B1 in the progression from normal prostatic tissue to
cancerous localized disease through both IHC analyses of radical prostatectomy specimens and available
expression databases is described. Specimens derived from radical prostatectomy allowed for matched
comparisons of cancerous tissue and adjacent-normal prostatic tissue. The SC dataset was generated from
the sequencing of paired samples of normal prostatic and cancerous tissue obtained from the same patient
similarly allowing for a direct comparison of expression between the tissues. Although conflicting on
which cholesterol metabolism protein was most highly expressed in localized disease both the SC and
TCGA datasets showed increased expression of SR-B1 in cancerous tissue, and perhaps just as
importantly, a stark decrease in LDLr expression indicating a potential shift in the mechanism by which
the cancerous prostatic tissue acquires cholesterol compared to non-cancerous prostatic tissue.

86
These findings, alongside the evidence of high expression of SR-B1 in metastatic tissues,
correlate with the findings by Schorghofer et al. who reported the high expression of SR-B1 in high
Gleason grade primary tumors from US Biomax (Rockville, MD) tissue samples288
. Together with the
understanding that cholesterol accumulation underlies prostate cancer aggressiveness, these findings
strongly implicate SR-B1 as a major factor in the progression of the disease270
. Notably however, a recent
2017 publication in Carcinogenesis correlated squalene monooxygenase (SQLE) with lethal prostate
cancers in the Health Professional Follow-up Study, the Physicians’ Health Study and the Swedish
Watchful Waiting Study406
. Although generally not considered to serve the same regulatory function as
SR-B1, LDLr or HMGCR, SQLE catalyzes an essential step, downstream of HMGCR, in cholesterol
synthesis and has been a target for the development of hypercholesterolemia therapeutics407
. Recently,
SQLE has been identified as a potential oncogenic driver of breast cancer407,408
. The growing number of
cholesterol metabolism proteins implicated in the proliferation of various cancers indicates that systems
or pathway approaches to analysis, such as gene set enrichment analysis, would provide valuable
understanding of global cholesterol metabolism alterations.
NEPC comprises a small, but highly aggressive and lethal, subset of PCa patients. Although a
strict definition is not agreed upon, NEPC is generally considered to take on small cell carcinoma like
features, may or may not express classical IHC markers (chromogranin, synaptophysin, etc.) and is often
AR negative409
. In rare cases de novo NEPC has been identified410
but in the context of modern PCa
management, a vast majority of cases arise as variant of recurrent CRPC including in response to current
generation androgen receptor pathway inhibitors enzalutamide and abiraterone409
. The mechanism by
which adenocarcinoma becomes NEPC remains a complex and unanswered question but several factors
and pathways have been implicated including MYCN, cAMP, BRN2 or loss of p53, pRB or REST374,411-
416. Here we report the increased expression of SR-B1 in post-ADT NEPC compared to standard CRPC as
assessed in both the UWRA and WC datasets. NE differentiated cells have been shown to have
accumulation of free cholesterol as well as close relationship between NE differentiation and cholesterol
rich lipid membranes417,418
. Whether the increased expression of SR-B1 is necessary for providing

87
cholesterol to facilitate essential NE differential signaling pathways, or a larger pool of available
cholesterol is required for the rapid cell division associated with aggressive prostate cancers such as
NEPC, or other undetermined reasons is unknown, but may provide an intriguing avenue for further
research419
.
The finding that SR-B1 antagonism leads to differential responses between PCa models belies the
heterogeneous nature of the disease. The cell lines used within represent, as far as a single immortalized
cell line can, two very different types of recurrent metastatic prostate cancer. The C4-2 cell line is a
derivative line of the well-known LNCaP cell line, itself taken from a biopsy of the left supraclavicular
lymph node of a 50-year-old Caucasian male with metastatic CRPC. C4-2 cells were generated through
the inoculation and growth of LNCaP cells in a castrated athymic mouse resulting in a line capable of
androgen independent growth420
. These cells are p53 positive and maintain AR activation and signaling
even in serum depleted conditions through de novo steroidogenesis358
. PC-3 cells were obtained from a
bone metastasis of a 62 year old Caucasian male421
. Unlike C4-2 and LNCaP cells, PC-3 cells do not
express the AR making them fully androgen-independent and further do not express functional p53422,423
.
Interestingly SR-B1 knockdown in PC-3 cells resulted in robust cellular death in contrast to C4-2 cells
which entered an autophagic phenotype. This finding would emphasize an extra-steroidal mechanism to
the effects seen.
Autophagy is a highly conserved mechanism by which cells regulate several homeostatic process
including the removal of protein aggregates and intracellular toxins as well regulating cytoplasmic
biomass424
. Autophagic responses to cancer treatments are a common survival mechanism employed by
cancer. This includes responses to ADT and androgen pathway inhibitors, taxanes and kinase
inhibitors425-428
. PC-3 cells are capable of entering into an autophagic state following treatment with direct
autophagy inducing agents including the proteasome inhibitor MG 132 and mTOR inhibitor rapamycin392
.
However, the strong induction of cell death as opposed to autophagy in PC-3 cells is likely a result of a
distinct regulatory environment compared to C4-2 cells429
. One major distinction between the two cell
lines is the absence of p53 in PC-3 cells, a transcription factor which is known to positively and

88
negatively regulate autophagy through, at this point, poorly understood mechanisms430
. Notably p53
activation inhibits mTOR, a master regulator of autophagy known to inhibit autophagy in its activated
state394,431,432
. Further, the effect of ER stress on p53 activation has been enigmatic with evidence
demonstrating both p53 activation and deactivation within ER stressed environments433,434
. Although
mechanistic understanding of the role of p53 in autophagy is poorly understood, the absence of p53 in
PC-3 may have impeded the cells ability to enter an autophagic state in a similar manner to C4-2 cells.
The lack of p53 or other regulatory alterations may be providing an opportunity to maintain a proliferative
state under impaired nutrient conditions due to SR-B1 loss. This would result in cells replicating and
dividing with insufficient nutrients to maintain viability leading to the robust cellular death response
observed. In contrast if C4-2 cells maintain a stronger nutrient regulatory environment, highlighted by
active p53, allowing them to enter into an autophagic state through functional stress response mechanisms
avoiding large amounts of cellular death. More general potential reasons for the differing responses to
SR-B1 antagonism may include the differing environment, treatment stage or progression status from
which the studied cell lines were obtained. In particular bone metastases, the origin site of PC-3, have
been noted for high levels of cholesterol and cholesterol metabolism proteins potentially indicating an
increased dependence on cholesterol368
.
BLT-1 is an established small molecule inhibitor of SR-B1. The molecule was first identified by
high-throughput screening of inhibition of SR-B1 selective lipid uptake using DiI-HDL435
. Interestingly
the compound was found not to inhibit, rather enhance, the binding of HDL to SR-B1 and in turn prevent
the transfer of cholesterol or cholesteryl ester across the membrane435
. The treatment of PC-3 and C4-2
cells with BLT-1 was able to successfully replicate the growth arrest observed with the siRNA
knockdown. However, different responses were observed with cell cycle and Live/Dead analysis both
within SR-B1 targeting methods of a single cell line and the cellular response to BLT-1 between C4-2 and
PC-3 cells. Interestingly the treatment of PC-3 cells with BLT-1 did not result in a similar robust cell
death as seen with SR-B1 knockdown. This is potentially explained by the inability of BLT-1 to fully shut
down the transfer of cholesterol by the SR-B1 receptor due to issues relating to affinity binding. Despite

89
this, BLT-1 does appear to induce autophagy in a similar manner to the siRNA knockdown in C4-2 cells,
as measured through decreased mTOR activation and increased Clu expression while also demonstrating
similar markers of ER stress. Further, BLT-1 had similar effects on cellular androgen accumulation
confirming the importance of SR-B1 derived cholesterol in androgen synthesis.
What cannot be fully accounted for when using a small molecule inhibitor such as BLT-1 is
potential off-target binding and effects. A notable potential off-target is CD36 also a member of the
Scavenger Receptor B family which has several natural ligands including oxidized phospholipids,
oxidized low-density lipoproteins and long chain fatty acids436
. The inhibition of CD36 could prevent the
accumulation of nutrients essential for proliferation, notably fatty acids, potentially resulting in a similar
nutrient deprived phenotype437
. CD36 and SR-B1 maintain a high level of structural homology including
similarities in the ligand binding area of the protein438
. The homology of SR-B1 and CD36 is such that
HDL can readily bind to CD36 receptors but lacks the structure to facilitate transport of HDL-derived
cholesterol439,440
. The cysteine 384 residue located in the tunnel domain of SR-B1 has been shown to be
essential for cholesterol uptake inhibition by BLT-1, a residue that is absent from CD36378
. Despite the
lack of cysteine 384 negating the ability of BLT-1 to inhibit cholesterol transfer, what is not known is the
ability of BLT-1 to bind CD36 or whether it impedes other CD36 functions such as long chain fatty acid
uptake. The potential off target effects described here or other unknown effects may be the reason for the
difference in response to BLT-1 as compared to the siRNA knockdown.
As described in Chapter 2 the success of both abiraterone and enzalutamide in managing
metastatic CRPC patients brought the role of de novo steroidogenesis in ADT resistance into the
spotlight141,150
. The initial success of these therapies, despite eventual resistance, displays the continued
potential of novel AR pathway therapies. Here we describe how SR-B1 inhibition reduces androgen
accumulation and AR activation in steroidogenic C4-2 cells. If the inhibition of HDL-derived cholesterol
uptake through SR-B1 was in fact impacting androgen accumulation by impeding de novo steroidogenesis
there would be high potential to overcome several proposed mechanisms of resistance to other androgen
pathway inhibitors. This would include amplification of enzymes, such as CYP17A1, that result in

90
intratumoral accumulation of higher order steroids and CYP17A1-independence by becoming responsive
to steroid precursors156,358-360
. However, the inability of DHEA to reverse the effects of SR-B1 knockdown
indicates that the observed effects are due in part to factors other than solely de novo steroidogenesis
antagonism. Specifically, the inability to return PSA secretion to levels seen in non-SR-B1 antagonized
cells may indicate that the reduction of androgens was not through reduction of precursor or that the
extra-steroidal effects of SR-B1 antagonism impede the ability of the cell to convert DHEA to more
potent androgenic AR ligands. The ability of androgens, through AR activation, to negatively regulate
autophagic activity under what would normally be considered sub-optimal environmental conditions, such
as culturing in charcoal stripped serum, was initially considered441,442
. The reduction of androgen
accumulation through de novo steroidogenesis antagonism could potentially have lead the induction of
autophagy. However, the inability of external steroid to revert said autophagy phenotype makes this
unlikely, and further provides evidence that the observed autophagy and anti-proliferative effects of SR-
B1 antagonism were largely external to the effects observed within the AR pathway.
The ability of prostate cancer cells obstructed from obtaining cholesterol to compensate via other
mechanistic sources provides an intriguing basis for combination therapy. As described in Chapter 2,
castrated mice bearing LNCaP xenografts being treated with simvastatin to inhibit HMGCR upregulate
SR-B1 and SR-B1 antagonized C4-2 cells similarly upregulate HMGCR expression. These changes in
expression, as well as the entrance of the cell into a nutrient deprived autophagic state, indicate that, at
least, the C4-2 cancer cell is able to detect cholesterol depleted conditions and attempt to induce
compensatory changes. Theoretically, therefore impeding the cells ability to use such compensatory
mechanisms by co-targeting both SR-B1 and HMGCR or other cholesterol metabolism proteins may
amplify the anti-proliferative effects seen with individual approaches. Here we describe early preliminary
data co-targeting SR-B1 and HMGCR to potentiate the anti-PSA effects seen with the individual
inhibitors. However, further studies are required to determine the effect of co-targeting on cellular
proliferation, cell death and autophagic induction.

91
The targeting of autophagy alongside autophagy-inducing primary treatment is a commonly
employed technique including, to date, unsuccessful attempts at the development of clinical stage
autophagy inhibitors for PCa treatment443
. Preclinical research has commonly used CQ as an autophagy
inhibitor, including co-targeting to induce more robust cell death effects in PCa444,445
. Here we show that
the inhibition of autophagy with cholesterol in SR-B1 antagonized cells can result in a robust cellular
death as measured through an accumulation of the sub G0 cell phase fraction. This result highlights
autophagy as a potential co-target with SR-B1 to significantly impair prostate cancer growth by reducing
the cells ability to overcome stress results in a more robust cellular death.
Although the two above described potential co-targets for SR-B1 have been rationally identified
and provide promising future avenues of investigation, the advent of modern high throughput techniques
allows for genomic screening for synergistically lethal targeting. With the advent of CRISPR/Cas9
silencing and the development of stable Cas9 expressing cell lines the potential of screening such libraries
for lethal co-targets of BLT-1 treated or SR-B1 knockdown cells is promising446,447
. In addition to
providing potential co-targets, these screening techniques would likely provide valuable insight into
which cell signaling pathways are perturbed through SR-B1 antagonism.
The findings presented in this chapter have identified the high likelihood of SR-B1 being an
important protein for the progression and survival of prostate cancer, the inhibition of which leads to
distinct anti-proliferative effects likely through both steroidal and non-steroidal mechanisms. Further
examination of the mechanisms altered by SR-B1 loss and the investigation of its potential as a
therapeutic target is warranted.

92
CHAPTER 4: EVALUATION OF BLT-1 AS AN IN VIVO INHIBITOR OF SR-B1
4.1 Specific aim and rationale
Central to the process of target evaluation and drug development is establishing the “drugability”
of the target in an in vivo setting. Such investigations generally involve research into the pharmacokinetic
and toxicity profiles of candidate compounds. As both interfering RNA and small molecule approaches to
targeting SR-B1 displayed high efficacy in vitro (Chapter 3), this chapter assessed the potential of the
small molecule inhibitor BLT-1 as candidate for both further research in vivo and as a proof of principal
for the development of SR-B1 targeted therapeutics. Specifically, the pharmacokinetic and toxicity
profiles of BLT-1 were assessed to determine whether potentially efficacious circulating concentrations
could be achieved in the absence of significant toxicity. These concentrations were then tested in
xenograft based efficacy studies to confirm the ability of BLT-1 to impede tumor growth in vivo.
4.2 Methods
4.2.1 Microsomal assay
Working stocks of BLT-1, VPC-13574 and enzalutamide were prepared in DMSO to 1 mM.
VPC-13574 is a compound originally designed as an inhibitor of the Binding Function 3 (BF3) domain of
the AR448,449
. For the purposes of this chapter it was used as an in house metabolically labile positive
control. Compounds were added to 100 mM potassium phosphate buffer (pH 7.4) to a final concentration
of 1 µM followed by the addition of mouse liver microsomes (Xenotech, Kansas City, KS) to a final
concentration of 0.15 mg/mL. “NADPH regenerating solution” (BD Biosciences, Franklin Lakes, NJ)
was then added and the incubation started in a 37 °C water bath. Aliquots were taken and combined with
stopping solution (Acetonitrile+0.05% formic acid) for analysis by LC-MS at specified time points.
4.2.2 Pharmacokinetic and toxicity analysis
All animal experiments in Chapter 4 were conducted in accordance with the University of British
Columbia’s Committee on Animal Care and approved protocol A16-0072 held by Dr. Emma Guns at the
Vancouver Prostate Centre.

93
Athymic nude mice (Crl:NU-Foxn1nu
; Harlan) were dosed by oral gavage with either 25 mg/kg or
50 mg/kg BLT-1. Due to the highly hydrophobic nature of BLT-1 propylene glycol was used, as a
previously established vehicle for hydrophobic compounds, to allow for complete dissolution of the
compound450
. Blood samples were obtained (approximately 50 µL per sample) via capillary collection of
tail vein bleeds at the following time points: 0, 0.5, 1, 1.5, 2, 4, 8 and 24 h post dosing. Capillaries were
spun by centrifuge at 3000 g for 10 min to isolate serum for analysis. Following the final tail vein bleed
mice were exsanguinated by cardiac puncture to collect blood from which serum was prepared, and
organs were in part flash frozen and in part fixed in 10% buffered formalin solution over night before
being transferred to 70% ethanol for long term storage.
Toxicity analysis was performed using collected terminal serum and the VetScan VS2 (Abaxis,
Union City, CA) and VetScan Comprehensive Diagnostic Profile (Abaxis) according to manufacturer
instructions451
. The Comprehensive Diagnostic Profile includes quantification of serum albumin (ALB),
alkaline phosphatase (ALP), alanine transaminase (ALT), amylase (AMY), total bilirubin (TBIL), blood
urea nitrogen (BUN), calcium (CA), phosphorus (PHOS), creatinine (CRE), glucose (GLU), sodium
(NA+), potassium (K+), total protein (TP), globulin (GLOB).
4.2.3 BLT-1 analysis by LC-MS
Serum samples for each of the time points collected were subjected to LC-MS analysis. Sample
extraction was performed in which 2 µL of 1 µM VPC-13226 IS was combined with 8 µL of serum and
22 µL of acetonitrile (ACN) prior to vortexing for 10 sec. Precipitate was pelleted by centrifugation at
20,000 g for 5 min and supernatant transferred to LC vials for analysis. Standards were prepared in a
similar fashion with standard/IS spiked mouse serum (2 µL standard/2µl IS/20µl ACN) while parallel
standards made up in 67% ACN were used to characterize matrix effects. Samples and standards were
analyzed using a Waters Acquity UPLC Separations Module coupled to a Waters Quattro Premier XE
Mass Spectrometer (Waters). Separations were carried out with a 2.1x100 mm BEH 1.7 µM C18 column
(Waters) and a 50-98% acetonitrile (ACN) gradient from 0.2-3 min (0.3 mL/min) used for separation

94
(with 1 min 98% ACN flush and a 2 min re-equilibration; 6 min run length; 0.1% formic acid
throughout). Data was collected in ES+ mode and compounds were detected by multiple reaction
monitoring with mass to charge (m/z) transitions of 242.1>166 and 242.1>95.9 for BLT1 and m/z
256.1>110.8 for IS. Retention times for BLT-1 and IS were 3.16 min and 2.83 min respectively. Data
analysis was performed with Quanlynx (Waters) with AUC of BLT-1 normalized to IS AUC.
Comparisons with acetonitrile based and serum based standard extracts indicated high extraction
efficiency (>90%) but substantial ion suppression with BLT-1 (~50%), therefore serum-based standards
were used for the generation of the standard curve with 7 calibration standards (4 nM to 4 µM, R2>0.99)
for the determination of BLT-1 concentration in test samples.
4.2.4 Xenograft experiments
For C4-2 xenografts, athymic nude mice (Crl:NU-Foxn1nu
; Age: 12 weeks; Harlan) were
surgically castrated and allowed to recover and for circulating testosterone to nadir for 2 weeks prior to
inoculation on two sites of the hind flank with 2 x 10⁶ C4-2 cells (cultured in RPMI + 5% FBS, 1%
penicillin/streptomycin) in 100 µL matrigel (BD Biosciences). Tumor volume was calculated by caliper
measurements and the equation: Tumor Volume = length x width x height x 0.5326. Once tumor volume
exceeded 100 mm3 mice were given 50 mg/kg BLT-1 (vehicle: propylene glycol) by oral gavage daily.
Treatment was continued for 6 weeks or until tumor burden exceeded 10% of body weight or weight loss
exceeding 20%. At the time of euthanasia, mice were exsanguinated by cardiac puncture following
cervical dislocation under CO2 to collect blood from which serum was prepared. Tumors were in part
flash frozen and in part fixed in 10% buffered formalin solution over night before being transferred to
70% ethanol for long term storage. Serum was isolated from whole blood as described above.
For PC-3 xenografts, athymic nude mice (Crl:NU-Foxn1nu
; Age: 16 weeks; Harlan) were
inoculated on one site of the hind flank with 2 x 10⁶ PC-3 cells (cultured in DMEM + 10% FBS, 1%
penicillin/streptomycin). Tumor volume measurements were taken twice weekly as described above and
once tumor volume exceeded 100 mm3 mice were treated with 25 mg/kg BLT-1(vehicle: propylene

95
glycol) by oral gavage daily. Treatment was continued for four weeks or until tumor burden exceeded
10% of body weight or weight loss exceeding 20%. Post-euthanasia treatment of animals was the same as
with C4-2 xenografts.
4.3 Results
4.3.1 BLT-1 is rapidly metabolized by mouse liver microsomes
Prior knowledge regarding the effects of BLT-1 use in vivo was limited to the reported ability of
1 mg/kg oral BLT-1 to impede chylomicron formation in Syrian golden hamsters which detailed no
pharmacokinetic or robust toxicity analysis452
. Given this paucity of available information initial
experiments were performed to gain an understanding of the stability of BLT-1 in vivo and further how
the compound would fair in use for xenograft experiments. A microsomal stability assay in which the
compound is incubated in the presence of mouse liver microsomes was performed (Figure 4.1).
Enzalutamide was used as a known metabolically stable control compound and was by in large not
metabolized by the microsomes as there was still 97.7% fraction remaining after 60 min incubation with
liver microsomes. VPC-13574 was rapidly metabolized with only 14.7% fraction remaining after 60 min
incubation, translating to a half-life of 22 min. In comparison BLT-1 was metabolized even more rapidly
than the VPC-13574 positive control with only 8.14% fraction remaining at 45 min incubation and having
a half-life of 8 min when incubated with the mouse liver microsomes. The apparent intrinsic clearance
(CLint-app) was estimated for each compound using the equation453
:
𝐶𝐿𝑖𝑛𝑡−𝑎𝑝𝑝 = (0.693
𝑡1/2) (
𝑉𝑜𝑙. 𝑜𝑓 𝑖𝑛𝑐𝑢𝑏𝑎𝑡𝑖𝑜𝑛
𝑚𝑔 𝑚𝑖𝑐𝑟𝑜𝑠𝑜𝑚𝑎𝑙 𝑝𝑟𝑜𝑡𝑒𝑖𝑛) (
𝑚𝑔 𝑜𝑓 𝑚𝑖𝑐𝑟𝑜𝑠𝑜𝑚𝑒
𝑔 𝑜𝑓 𝑙𝑖𝑣𝑒𝑟) (
𝑙𝑖𝑣𝑒𝑟 𝑤𝑒𝑖𝑔ℎ𝑡 (𝑔)
𝑏𝑜𝑑𝑦 𝑤𝑒𝑖𝑔ℎ𝑡 (𝑘𝑔))
Literature values of 45 mg/g for (mg of microsome / g of liver) and 87 g/kg of (liver weight / body
weight) were used, while the reaction volume was 0.5 mL with 0.075 mg microsomal protein453
. The
CLint-app of VPC-13574 was 822.12 mL/min/kg and 2260.92 mL/min/kg for BLT-1. Such a high CLint-app
would not be considered ideal for the development of the compound as a lead candidate, and indicate that
BLT-1 is likely not an ideal candidate for use in in vivo experiments. These results further indicate BLT-1

96
would require relatively high dosing to achieve the efficacious levels observed in the in vitro experiments,
approximately ~5 µM for C4-2 cells and ~1 µM for PC-3 cells as described in Chapter 3. However, the
microsomal stability assay works under the assumption that the compound is completely protein unbound
in serum and that the liver would have ample access to free compound, which is unlikely given the highly
hydrophobic nature of BLT-1454
. Given the limited alternative options and considerations to the
limitations of the microsomal study, mouse based pharmacokinetic studies were performed to determine if
sufficient circulating concentrations could be obtained for the purposes of pre-clinical study of SR-B1
inhibition.
Figure 4.1 BLT-1 is rapidly metabolized by liver microsomes
BLT-1 was incubated in the presence of mouse liver microsomes and concentration was measured over
time. Enzalutamide (Enza) and VPC-13574 were used as non-labile and labile controls, respectively (n =
1).
4.3.2 Oral administration of BLT-1 results in relevant serum concentrations
To determine if actionable levels of circulating BLT-1 could be achieved, despite the rapid
metabolism by mouse microsomes, mice were dosed with either 25 mg/kg or 50 mg/kg by oral gavage
and serum samples obtained to develop a pharmacokinetic profile. Mice dosed with 25 mg/kg BLT-1 had
a Cmax of 552.5 ng/mL (2.28 µM) at 0.5 hours post-dose the first measured dose (Figure 4.3A). The
elimination half-life was 10.4 hours with the final measured concentration at 24 hours post dose being

97
relatively low at 0.783 ng/mL (0.189 µM) resulting in an AUC0-∞ of 3971.2 ng*hr/mL. Mice dosed with
50 mg/kg had an only slightly higher Cmax of 640.1 ng/mL (2.65 µM) and a much longer absorption
phase reaching Cmax at 2 hours post-dose (Figure 4.2A). With 50 mg/kg oral dosing an elimination half-
life of 7.2 hours and an AUC0-∞ of 3913.5 ng*hr/mL was observed.
Figure 4.2 BLT-1 reduces survival of C4-2 xenografts
(A) Serum samples from mice dosed with 50 mg/kg BLT-1 were assessed for BLT-1 concentration over
time and used to calculate basic pharmacokinetic parameters (n = 3). C4-2 xenografts were established on
the hind flank of athymic nude mice. Mice were dosed with either 50 mg/kg BLT-1 (n = 9) or vehicle (n =
7) and body weight (B) and tumor measurements were taken weekly (C). (D) Survival of mice being
treated with vehicle and BLT-1. BLT-1 treated mice had significantly decreased survival time compared
to vehicle treated mice (Hazard Ratio = 0.16, 95%CI = 0.04 – 0.63, p = 0.009, Log-Rank).
4.3.3 50 mg/kg BLT-1 induces overt toxicity in C4-2 tumor bearing mice
The use of C4-2 xenograft mice would have provided an ideal model for the testing of BLT-1 in
vivo. Notably a majority of the SR-B1 targeted work has been within the C4-2 model resulting a larger
understanding of the cellular reaction to SR-B1 antagonism. Further, although the reduction of androgen

98
accumulation in C4-2 was found not to be a primary driver of the SR-B1 antagonized phenotype, an
understanding of the ability of BLT-1 to reduce tumoral androgen accumulation would still provide
valuable insight into placing SR-B1 among other successful AR-axis targeted therapeutics. However, the
minimum efficacious concentration of BLT-1 in C4-2 appears to be ~5 µM as described in Chapter 3. As
such the highest tested dose of 50 mg/kg (Cmax: 2.65 µM) was selected in order to achieve as close to
efficacious circulating concentrations as possible.
To best model the castration-resistant environment mice were castrated and allowed to recover
for two weeks in order to allow sufficient time for the metabolism of remaining serum testosterone prior
to tumor inoculation. Once tumor volume reached 100 mm3 treatments began for a planned six weeks. Of
the nine mice that started BLT-1 treatment, none survived past four weeks of treatment with only four of
the mice surviving to the four-week time point. One mouse was euthanized due to tumor volume size
approaching an inhumane limit while the eight remaining were euthanized due to body weight loss at
differing points over the four weeks. Of the seven mice treated with the vehicle four survived past the
four week time point with three having to be euthanized due to body weight loss. The effect of this body
weight loss on the overall survival of the two treatment groups is exemplified in Figure 4.2D. Both groups
showed a decrease of approximately 2 g mean body weight over the treatment period (Figure 4.2B).
However, the number of mice being euthanized due to body weight loss and removed from the pool over
the course of the experiment means that the mean body weight does not adequately represent the severe
body weight loss being observed. Terminal serum samples were used to complete a comprehensive
toxicity profile of 14 markers451
. The BLT-1 treated mice had significantly elevated levels of ALB, ALP,
ALT, TBIL and TP alongside significant decrease in GLU levels (Table 4.1). Altered serum
concentrations of these markers could indicate dysfunction among several organs and processes in the
body including kidney disease for ALB and TP, and diabetic and nutritional disorders with GLU and
TP451
. However, the group observed as a whole appears to indicate that mice treated with BLT-1 were
experiencing significant liver toxicity. Each of the significantly altered markers is known to be effected in

99
response to liver damage. In particular ALB, ALP and ALT are generally considered strong indicators of
liver dysfunction451,455
.
Table 4.1 Assessment of common serum toxicity markers following repeated BLT-1 dosing in mice
*CRE levels were only detectable at >18.0 mmol/L, as such 18 mmol/L was used to represent all values
less than or equal to 18 mmol/L. **K+ levels were only quantifiable at < 8.5 mmol/L, as such 8.5 mmol/L
was used to represent all values greater than or equal to 8.5 mmol/L.
Marker Vehicle (SD) 25 mg/kg BLT-1
(SD)
50 mg/kg BLT-1
(SD)
P - Value
ALB (g/L) 45.2 (3.69) 42.3 (2.06) 50.3 (5.35) 0.006
ALP (U/L) 42.7 (12.10) 45.2 (15.04) 86.1 (42.91) 0.004
ALT (U/L) 47.8 (15.41) 37.2 (12.12) 131.6 (141.46) 0.047
AMY (U/L) 1161.9 (489.96) 952.2 (180.25) 1243.0 (168.39) 0.387
TBIL (mmol/L) 4.8 (0.72) 4.6 (0.52) 6.3 (1.03) 0.001
BUN (mmol/L) 6.8 (0.93) 6.8 (0.64) 6.1 (1.26) 0.325
CA (mmol/L) 2.9 (0.23) 2.8 (0.13) 2.9 (0.18) 0.911
PHOS (mmol/L) 2.8 (0.66) 3.2 (0.24) 2.5 (0.77) 0.144
CRE (mmol/L) 18.7 (2.60)* 19.5 (3.67)* 18.0 (0.00)* 0.614*
GLU (mmol/L) 13.4 (2.44) 13.7 (2.21) 8.4 (2.00) <0.001
NA+ (mmol/L) 167.4 (5.95) 169.1 (6.18) 169.3 (1.03) 0.700
K+ (mmol/L) 8.5 (0.00)** 8.5 (0.00)** 8.5 (0.00)** ----**
TP (g/L) 58.8 (4.80) 57.6 (5.16) 67.6 (5.28) 0.003
GLOB (g/L) 14.0 (3.22) 15.5 (3.51) 17.3 (4.03) 0.183
Despite the obvious toxicity associated with 50 mg/kg dosing of BLT-1 tumor volumes were
assessed over the course of the treatment. Mice were randomized into treatment groups as tumors
exceeded 100 mm3 with both treatment groups having a median inoculation to treatment time of 5 weeks.
Retrospective comparison of initial and final tumor volume showed that mice undergoing vehicle
treatment had a mean initial tumor volume of 161.1 mm3 and grew to a mean of 1305.0 mm
3 by week
four of the treatment period. The BLT-1 treated mice had an initial mean tumor volume of 160.1 mm3 and
a mean tumor volume of 1925.8 mm3 four weeks into the treatment period (Figure 4.2C). The growth of
the tumors for both groups appeared to closely mirror each other for a majority of the experiment. To
confirm, linear regression analysis was performed on the two treatment groups to determine whether
growth rate was significantly impacted by BLT-1 administration. The observed growth rate of the BLT-1
treated group was slightly higher than the vehicle treated group however the two were statistically

100
indistinguishable (Vehicle: 310.0 ± 27.69 mm3/week; BLT-1: 364.7 ± 64.38 mm
3/week, p = 0.415).
Although the robust toxicity observed with 50 mg/kg oral administration of BLT-1 significantly hampers
the ability to reach sound conclusions on the effects of BLT-1 on tumor volume it appears unlikely that 50
mg/kg BLT-1 is sufficient to impede C4-2 tumor growth.
4.3.4 BLT-1 administration reduces PC-3 tumor growth
As 1 µM BLT-1 was sufficient to arrest in vitro PC-3 growth (Figure 3.5) and concerns of
toxicity at high concentrations of BLT-1, as observed with the 50 mg/kg dose in C4-2 tumor bearing mice
(Table 4.2), the lower dose of 25 mg/kg, which resulted in a potentially efficacious Cmax of 2.28 uM,
was selected for the PC-3 based xenograft experiments. Mice inoculated with PC-3 tumors began daily
oral dosing of 25 mg/kg BLT-1 when tumor volume reached 100 mm3. A majority of both BLT-1 (7 of 13
mice) and vehicle treated (7 of 12 mice) reached dosing tumor volume by one week post inoculation with
all mice starting treatment by 1.5 weeks post inoculation. Of the mice receiving vehicle treatment 10 of
12 successfully completed all four weeks on treatment. One mouse was euthanized after 2.5 weeks due to
body weight loss and another died of undetermined causes overnight 1.5 weeks into treatment. Of mice
receiving BLT-1 treatment 8 of 13 mice successfully completed all four weeks on treatment. One mouse
was euthanized after 3.5 weeks due to body weight loss, another at 2 weeks due to sickly appearance and
behaviour and one found dead of unknown causes after 2 weeks treatment. The remaining two mice were
sacrificed due to tumor ulceration and total tumor volume at 3 weeks and 2.5 weeks treatment
respectively. Mice treated with BLT-1 displayed an average body weight of ~2 g less than that of the
vehicle treated group but neither group displayed treatment wide progressive weight loss (Figure 4.3B).
As with the C4-2 xenografts, terminal serum samples were used to complete a comprehensive
toxicity profile of 14 common markers451
. Mice treated with 25 mg/kg BLT-1 did not display significantly
increased or decreased expression of any of the assessed markers (Table 4.1). These findings indicate that
likely only 3 of the BLT-1 treated mice, the two euthanized for body weight and sickly appearance and
the one mouse found dead, experienced major toxicities. However, in a similar manner two mice

101
receiving vehicle treatment, one euthanized due to body weight loss and one found dead, were also likely
experiencing toxicity. The similarity in toxicity rates indicate that BLT-1 was not inducing toxicity at 25
mg/kg and that the observed toxicities were probably due to vehicle based toxicity or issues related to the
presence of rapidly growing xenografts.
Figure 4.3 BLT-1 reduces PC-3 xenograft tumor growth
(A) Serum samples from mice dosed with 25 mg/kg BLT-1 were assessed for BLT-1 concentration over
time and used to calculate basic pharmacokinetic parameters (n = 3). PC-3 xenografts were established on
the hind flank of athymic nude mice. Mice were dosed with either 25 mg/kg BLT-1 (n = 13) or vehicle (n
= 12) and body weight (B) and tumor measurements were taken twice weekly (C). (D) Time to tumor
volume doubling in vehicle and BLT-1 treated tumors. BLT-1 tumors had significantly increased time to
tumor volume doubling (Hazard Ratio = 0.19, 95%CI = 0.06 – 0.60, p = 0.004, Log-Rank).
Mice receiving both vehicle and BLT-1 treatment displayed progressive tumor growth over the 4
week experiment (Figure 4.3C). Vehicle treated mice had a mean tumor volume of 106.8 mm3 at the start
of treatment and a four week tumor volume of 799.3 mm3 while BLT-1 treated mice had an initial mean

102
tumor volume of 103.25 mm3 and a four week tumor volume of 554.8 mm
3. While initial tumor volumes
were indistinguishable (p = 0.669), linear regression was performed to assess the growth rates of each
treatment group during treatment as previously published by our group and described in Chapter 2364
.
Mice receiving BLT-1 treatment had significantly reduced tumor growth rate compared to the vehicle
treatment group, growing approximately 30% slower (Vehicle: 156.6 ± 10.74 mm3/week; BLT-1: 110.3 ±
9.28 mm3/week, p = 0.005). Tumor volume doubling times were assessed between the two groups. BLT-1
treated mice had significantly longer tumor doubling times than vehicle treated mice (Hazard Ratio =
0.19, 95%CI = 0.06 – 0.60, Figure 4.3D). By one week of treatment 50% of mice treated with vehicle had
doubled in tumor volume with all mice in the group reaching double the initial tumor volume at 2 weeks
of treatment. In comparison, it took two weeks for 50% of mice treated with BLT-1 to reach double tumor
volume and not all mice reached this threshold until 4 weeks of treatment. These results indicate that
BLT-1 dosed at 25 mg/kg orally is capable of reducing PC-3 tumor volume growth in the absence of overt
toxicity.
4.4 Discussion
Despite a substantial number of publications on BLT-1 use in vitro, in vivo based publications
remain scarce452,456-458
. The apparently singular publication (Lino et. al, 2015) features the oral dosing of
BLT-1, likely as mixture rather than solution due to use of PBS as a vehicle given our anecdotal
experience finding an inability to solubilize BLT-1 in PBS, focused on the effects of BLT-1
administration on chylomicron formation from the gut and lacked any systemic analysis of BLT-1452
.
Here we report for the first time a drug metabolism – pharmacokinetic assessment of the compound as
well as studies into the efficacy of the compound in limiting xenograft tumor growth. BLT-1 is composed
of three structural features; the cyclopentyl, linear alkyl and thiosemicarbazone moieties454
. Both the
thiosemicarbazone and linear alkyl appear to be critical to the potency of the molecule while the
cyclopentyl moiety has little apparent impact on activity. The predictably high hydrophobicity (cLogP =
4.41) also appears to be essential for inhibitory activity454
. Although this high cLogP does not surpass the

103
outlined boundary of cLogP = 5 set out by Lipinski’s “rule of five”, the most general of guidelines for
determining drug like qualities of a molecule, it’s hydrophobicity does present potential issues with
regard to suitable vehicles and methods of delivery, absorption and free drug concentration459,460
. This
understanding highlighted the reasoning for using propylene glycol as a safe, miscible vehicle, as opposed
to the published PBS vehicle, in an effort to provide consistent dosing and ideal conditions for
absorption450,452
.
Microsomal stability assays are a commonly used component of the absorption, distribution,
metabolism and excretion (ADME) studies performed to assess a compounds potential in pre-clinical
drug discovery and development. The microsomal fraction of livers contains major drug metabolism
proteins including CYP and UGT enzymes and is commonly used to predict the intrinsic clearance of the
compound in humans461
. The extremely rapid metabolism and high intrinsic clearance of BLT-1 observed
following incubation in the presence of mouse liver microsomes indicates that the compound would likely
be similarly rapidly metabolized within the serum. Rapid hepatic metabolism is a common occurrence of
highly hydrophobic compounds a phenomenon observed here462
. Despite the rapid metabolism observed
within the microsomal study with 25 mg/kg and 50 mg/kg oral administration of BLT-1 sufficient peak
serum concentrations (>1 µM) were obtained in pharmacokinetic studies. Although at Cmax the required
concentration to inhibit PC-3 growth was observed the BLT-1 was fairly quickly removed from
circulation meaning that at once daily dosing the amount of time BLT-1 levels remained in the therapeutic
window were likely minimal. Serum concentrations never reached the required in vitro concentration to
fully arrest growth of C4-2 cells. Although potentially efficacious levels were reached for PC-3 cells,
even if only briefly, the protein unbound fraction is unknown.
Lipophilic compounds, like BLT-1, commonly display high amounts of protein binding462
. A high
level of protein binding could highlight several important implications from the observed data. If BLT-1
is highly protein bound the fraction available for the liver to rapidly metabolize would be minimal
compared to the microsomal assay, an assay based on the assumption that compound is completely
unbound. The inability of the liver to access unbound BLT-1 would in turn translate to slower metabolism

104
and increased half-life. Concurrent with reduced access of BLT-1 to metabolizing enzymes, access of
BLT-1 to tumor-based or other SR-B1 would be reduced. If this was the case the lack of available
unbound drug to act on and inhibit SR-B1 would have significant implications with regards to the
traditional understanding of the “free-drug hypothesis” which states only free unbound drug at the site of
action can act on target462
. However, the importance of low protein binding in candidate drugs is
increasingly being called into question463
. This would be further complicated by evidence that BLT-1 may
act in a largely irreversible manner on SR-B1378
.
The rapid metabolism observed with the microsomal assay and high hydrophobicity alongside the
ability to only briefly reach the potential therapeutic window in pharmacokinetic studies indicate that
BLT-1 is not an ideal candidate beyond in vitro studies for SR-B1 inhibition. However, the lack of well
classified options means that at the time it remained the best option for assessing in vivo efficacy by
xenograft experiments. Here we report for the first time the ability of SR-B1 antagonism through BLT-1
administration to reduce CRPC tumor growth as demonstrated in the PC-3 xenografts. The significant
reduction in tumor volume growth and increase in tumor volume doubling time was successfully achieved
but likely muted by the inability to achieve efficacious serum concentrations for extended period of time
with once daily dosing. Notably, however, the doubling of the dose to 50 mg/kg appeared to have a muted
effect on AUC0 - ∞ and Cmax but a significant induction of toxicity meaning that increasing a single daily
dose is likely impossible. Unknown is what level of toxicity would be observed in mice dosed twice daily
at 25 mg/kg or lower concentrations likely providing increased time in the potential therapeutic window.
What appears clear is that maximum tolerated dose of BLT-1 lies somewhere between 25 mg/kg and 50
mg/kg via oral gavage and that the apparent therapeutic window varies from narrow in the case of PC-3
xenografts to non-existent in the case of C4-2 xenografts.
The toxicity observed when mice were dosed with 50 mg/kg manifested both in significant
weight loss and alterations in circulating concentrations of several serum toxicity markers. The significant
increase in particularly ALT, ALP and TBIL indicate that liver toxicity is the primarily observed form of
toxicity and leading to significant weight loss in the mice. What is unknown is whether the toxicity is

105
related to on-target effects of SR-B1 inhibition or unrelated off-target effects. With the importance of the
liver for both drug metabolism and cholesterol metabolism determining the mechanism by which
hepatotoxicity occurred is likely an arduous task. The liver is considered to be one of the highest
expressers of SR-B1 where the membrane protein plays a critical role in reverse cholesterol transport
functioning to uptake cholesterol from circulating HDL for bile acid synthesis and redistribution236,464
.
The idea that the liver may therefore be suffering from a lack of cholesterol seems unlikely due to the
liver’s multiple mechanisms of obtaining cholesterol including direct blood flow from newly obtained
digestive cholesterol as well as cholesterol synthesis464
. What is perhaps more likely is an increase to
toxic levels of liver based cholesterol. Although generally observed for its ability to provide cholesterol to
the cell SR-B1 maintains bidirectional flux allowing for the uptake of cholesterol to HDL from cells with
high levels of cholesterol465,466
. Non-alcoholic fatty acid liver disease (NAFLD) is a common liver
disorder present in obese patients. The disease is characterized by the accumulation of fat in the liver and
is associated with hepatitis, fibrosis and cirrhosis, conditions which in turn often lead to the differential
expression of the toxicity markers observed with BLT-1 treatment467
. Although only corollary and
potentially only a side-effect of greater dyslipidemic processes, low-HDL has been associated with
NAFLD potentially indicating a role in HDL for helping to remove accumulating cholesterol in the
liver468
. It is possible that the inhibition of cholesterol flux to HDL with BLT-1 had similar effects to low
circulating HDL resulting in cholesterol accumulation and NAFLD-like toxicity in the liver.
BLT-1 itself appears to be a poor candidate for further work in animals or humans due to stability
and toxicity issues. However, the ability of the compound to impede PC-3 tumor growth in spite of the
issues highlights the potential and serves as a proof of principle for the targeting of SR-B1 clinically to
impede CRPC growth. As alluded to previously, despite BLT-1 being the most robustly studied inhibitor
of SR-B1 other compounds have recently been shown to inhibit HDL-derived cholesterol uptake through
SR-B1469,470
. Notably, ML278 was a recent result of a high-throughput screen and the development of a
structure activity relationship for compounds targeted to SR-B1469,470
. ML278 displays a ten-fold
increased potency for the inhibition of SR-B1 compared to BLT-1 and displays no significant toxicity in

106
Chinese hamster ovary (CHO) cells. Further, the compound appears to bind in reversible manner and
displays high selectivity to SR-B1 but does still does experience a high level of protein binding due to its
hydrophobicity. These improvements over the current most common inhibitor BLT-1 indicate that
ML278 may be an ideal option for further investigations into targeting SR-B1 in both in vitro and in vivo
settings.

107
CHAPTER 5: DISCUSSION AND CONCLUSIONS
Our understanding of cholesterol metabolism on both cellular and systemic levels remains a
continually evolving and complex facet of human biology257
. This fact combined with the now well-
developed appreciation for the heterogeneous nature of PCa and cancer in general drive the necessity for
cautious conclusions to the described findings. The overarching hypothesis of this thesis was that
cholesterol modulation, through either synthesis or uptake inhibition, will impact essential signaling
processes impeding the proliferation of CRPC.
To assess the effects of cholesterol synthesis inhibition on CRPC Chapter 2 focused the effects of
statin use with the current generation CRPC therapeutic abiraterone, alongside pre-clinical work assessing
the ability of statins to impede the accumulation of AR-activating androgens. In the BCCA patient cohort
receiving abiraterone, statin use was associated with a trend towards improved outcomes, however only
reaching statistical significance when merged into a larger multi-institutional study. Pre-clinically the
ability of statins to reduce the accumulation of AR-activating androgens in a castrated LNCaP xenograft
model was demonstrated. The central understanding derived from the chapter is that statins are capable of
impacting the ability of CRPC to drive AR activation and as such may provide a mechanism by which
statin use potentiates the beneficial effects of abiraterone or other AR axis targeted therapies.
The second portion of the thesis focused on the assessment of the expression cholesterol uptake
protein SR-B1 in PCa and the preclinical effects of SR-B1 antagonism in Chapter 3, while Chapter 4
contained an assessment of the in vivo potential of the small molecule SR-B1 inhibitor BLT-1 in CRPC. It
was found that SR-B1 was highly expressed in clinical prostate cancer and that pre-clinically inhibition
leads to distinct anti-proliferative effects likely occurring through both steroidal and non-steroidal
mechanisms and while BLT-1 itself may not serve as an ideal candidate for SR-B1 targeting due to
inherent dose limiting toxicity, it has the capacity to decrease in vivo tumor growth. Although the results
of both cholesterol synthesis and uptake inhibition are promising several limitations must be taken into
account when forming conclusions.

108
5.1 Limitations and alternatives
5.1.1 Pleiotropic effects of statin therapy
The most pressing limitations include the multiple effects of HMGCR inhibition through statin
use and the ability of statins to inhibit the DHEA transporter SLCO2B1. As described in Chapter 2, the
inhibition of HMGCR through statins reduces not only the ability of the cell to synthesize cholesterol but
also HMG-CoA-cholesterol intermediates. These include non-steroid isoprenoid intermediates such as
geranylgeranyl pyrophosphate and farnesyl pyrophosphate363
. Integral molecules for the post-translational
modifications of several proteins including GTP-bound proteins Ras and Ras-like proteins these
isoprenoids aid in sub-cellular localization and intracellular trafficking471
. These alterations in isoprenoid
synthesis are believed to be responsible for a number of the non-cholesterol mediated effects of statins.
This includes the induction of eNOS expression, activation of the PI3K/Akt pathway and modulation of
immune responses471-475
. These effects, if present, could result in unaccounted for pleiotropic effects when
using statins as a mechanism of cholesterol inhibition.
However, perhaps the most relevant pleiotropic effect of statins is their ability to reduce DHEA
uptake through the inhibition SLCO2B1, presenting an intriguing potential method by which statins may
impede steroidogenesis and AR activation by mechanisms superfluous to cholesterol synthesis. As
discussed in Chapter 2, it appears unlikely that this mechanism played a significant role in the xenograft
experiments as adult male mice are known to not produce DHEA369
. Yet, this mechanism must be
considered when attempting to dissect mechanisms for the observed benefits of statin use in PCa patients.
Pre-clinically alternative approaches to targeting cholesterol, such as SR-B1 antagonism, and non-
HMGCR cholesterol synthesis inhibition exist. The targeting of downstream enzymes in the mevalonate
pathway would in theory avoid interruptions in geranylgeranyl pyrophosphate and farnesyl pyrophosphate
production and potentially prevent confounding inhibition of SLCO2B1. The inhibitors of squalene
synthase, SQLE and oxidosqualene cyclase all present potential options for reducing cellular cholesterol
synthesis476
. SQLE, as described in Chapter 3, has been correlated to poor outcomes in breast and

109
PCa406,408
. Further, the inhibition of SQLE with terbinafine has been shown to decrease cell viability in a
number of breast cancer cell lines408
. These compounds would almost certainly present with their own set
of confounding factors but would provide valuable comparators to the effects seen with statins.
5.1.2 Alternative mechanisms of cholesterol targeting
Beyond targeting cholesterol synthesis, alternative mechanisms of cholesterol reduction have
been explored in this thesis through antagonism of SR-B1 as discussed in Chapter 3. However, further
mechanisms of cholesterol mediation are worthy of consideration. Clinically available cholesterol
modulators include fibrates, niacin and cholestyramine. Fibrates are known to activate peroxisome
proliferator-activated receptors leading to expression of lipid metabolism genes and have been shown to
have a neutral effect on cancer outcomes477
. Niacin functions through the G protein coupled receptors
niacin receptor 1/2 inhibiting cAMP production and leading to a reduction in liver derived lipoprotein
production478
and cholestyramine is a bile acid sequestering agent preventing gut reabsorption and leading
to increased bile acid synthesis from plasma cholesterol. Notably, each of these approaches is less direct
than either synthesis or uptake inhibition for reducing cholesterol and as such would likely come with
significant confounding variables.
5.1.3 Pleiotropic effects of SR-B1 antagonism
Although the effects of the inhibition of SR-B1 are less well understood than that of HMGCR
inhibition, there are still several potential limitations. The primary function of SR-B1 is the uptake of
extracellular cholesterol, but the protein further plays a functional role in cell signaling pathways such as
eNOS-mediated signaling which is in turn known to interact with established oncogenic pathways as
described in Chapter 1. Particularly the role of Src- and nuclear factor kappa-light-chain-enhancer of
activated B cells (NF-kB)-mediated signaling in cancer proliferation is well established479,480
and as such,
perturbations to these pathways via SR-B1 antagonism should be considered as mechanisms for the anti-
proliferative effects and warrant investigation with future work.

110
As detailed in Chapter 4, the use of BLT-1 comes with significant concerns for toxicity. Although
the on target effect of BLT-1 was confirmed through the inhibition of HDL-mediated cholesterol uptake
in Chapter 3 what is not known are sites of off-target binding and to what extent they influence the
observed results. Further, it is unknown if the observed toxicity is a result of on-target toxicity, likely due
to the high expression of SR-B1 in liver tissue, or off-targeted effects. In order to help understand the
contribution of on/off-target effects on both toxicity and efficacy the use of alternative small molecule
inhibitors, such as ML278 described in detail in Chapter 4, which share little structural similarity to BLT-
1 could be used in a similar fashion.
5.2 Future directions
The results described in this thesis provide a fundamental backbone for further investigation into
the potential of cholesterol based therapeutic targets in PCa and CRPC progression. This section will
outline potential future experiments which may provide answers to remaining questions and further build
on the knowledge developed within the literature and here.
5.2.1 Statins and PCa
As our understanding of the role of statins in a clinical setting continues to expand and evidence
continues to grow and dictate under which circumstances a clinical trial may prove successful the
continually changing landscape of PCa provides further avenues of investigation. With the success of
abiraterone administration alongside ADT in the STAMPEDE and LATITUDE trials the approach has
been approved for widespread use within the clinic. In Chapter 2, a trend towards improved outcomes was
observed with statin use alongside abiraterone in the post-ADT setting. Once combined into a larger
multi-institutional study both abiraterone and enzalutamide patients were found to have improved
outcomes with statin use. Investigation into the effects of statin use in the STAMPEDE and LATITUDE
trials may elucidate further benefits of statin use. Further, the strict inclusion and follow up criteria and
highly detailed medical record keeping associated with such clinical trials would provide an ideal dataset
for analysis.

111
The growing body of epidemiological research finding improved outcomes for patients receiving
statins across multiple stages of PCa emphasizes its potential clinical use. However, by nature
epidemiological studies are limited by the risk of systemic error, bias and inability to fully account for
confounding variables. This has led to calls for prospectively designed trials as an essential step prior to
the clinical introduction of statin use for PCa293,481
. Determining which disease state such a trial should
focus on remains an unanswered question. Recently, L. Mucci and P. Kantoff proposed initial
investigations in high-risk non-metastatic patients undergoing ADT, using primary endpoint as metastases
free survival as surrogate marker for overall survival481
. Although there is limited evidence demonstrating
prolonged time to progression with statin use at the time of ADT, the effect of statins on metastases free
survival is unknown and its rationale relies on its surrogacy for overall survival325,482
. This approach has
the advantage of having an anchored and rationalized start point for statin use while using metastases free
survival as opposed to overall survival expedites the evaluation of statins as an adjuvant therapy. With
increasing evidence, including the findings described here, that statin use may improve outcomes of
patients receiving abiraterone and enzalutamide an adjuvant post-ADT approach may provide an
alternative trial strategy. Due to the relatively short survival time of men on post-ADT abiraterone or
enzalutamide this approach would have a manageable time length while having overall survival as
primary endpoints, consistent with where statins appear to show the most dependable benefits. However,
the length of time required for a patient to see positive effects with statin use is unknown. It is possible
that prolonged statin use is required for beneficial effects which may be potentially unobtainable at such
late stage CRPC. Despite potential pitfalls of these approaches their undertaking would provide crucial
information to guide the use of statins as therapeutic agents in PCa.
5.2.2 SR-B1 and PCa
Despite the promising results obtained from quantifying SR-B1 expression clinically in Chapter 3
further analysis could be performed to validate and expand on the findings described here and the earlier
report that SR-B1 expression is elevated in high Gleason grade PCa and linked to decreased disease-free

112
survival288
. Analysis of the correlation of SR-B1 expression with patient outcomes could be performed
using one of the available predictive TMAs. These arrays include a Vancouver Prostate Centre in-house
designed TMA and the Canary Prostate Cancer Tissue Microarray designed to identify biomarkers for
recurrence-free survival483
. The arrays consist of radical prostatectomy derived specimens and
corresponding patient follow up allowing for direct comparison of protein expression to clinical outcome.
Specifically this would allow for the analysis of the role of cholesterol metabolism proteins in
biochemical recurrence as well as assessment of expression across the disease state.
In this thesis the results of targeting SR-B1 in two established PCa cell lines are described,
however, determining the expression of SR-B1 and the effects of targeting in further cell lines may
provide valuable insight into the role of SR-B1 in PCa. Models could include the AR driven, but
androgen-independent cell lines LN-AI, LN95 and 22Rv1. The androgen independence of these lines is
attributed to increased LBD-deficient AR splice variant, AR-V7, expression and should therefore not be
dependent on cholesterol for de novo steroidogenesis but remain AR driven484
. The apparent increased
expression of SR-B1 in NEPC mRNA datasets and sensitivity of PC-3 to antagonism described in
Chapter 3 provides an intriguing basis for further investigation for a role of SR-B1 in neuroendocrine
differentiation or proliferation. NEPC models: H660, and enzalutamide-resistant LNCaP-derived 42D and
42F cells415,485
can be used as both a direct test of the transcript predictions of increased SR-B1 expression
in NEPC and a model for analyzing SR-B1 antagonism in NEPC. Further, PCa cells that maintain
steroidogenic potential and AR expression such as VCaP would provide further context to effects on
steroidogenic potential358
. While the DU145 cell line is AR-negative, and despite expressing some NE
markers is considered a non-NE model which provides a comparative model to PC-3 cells486
.
Although the use of immortalized PCa cell lines provide valuable tools for evaluating potential
therapeutic targets these models are limited by selective pressures including adaptions to continued
proliferation in a non-tumor environment leading to poor correlation to clinical outcome487,488
. The advent
of patient derived xenografts maintained in murine hosts provides a powerful new approach to evaluating
therapeutic potential across the heterogeneity of the disease. These xenograft tumors, directly implanted

113
from patient to mouse, are thought to better replicate clinical PCa avoiding the genetic drift observed
within immortalized cell lines488
. Several research institutions have developed patient derived xenograft
programs, including the Vancouver Prostate Centre489
and the University of Washington490
, either of
which would be ideal candidates for experiments investigating SR-B1 antagonism. Examining the effects
of SR-B1 antagonism in either the cell lines described above or patient described derived xenografts
would provide insight into the role of SR-B1 in PCa and which PCa phenotype is most impacted by its
antagonism.
Beyond an understanding of where SR-B1 antagonism would be most significant further
investigation into the mechanism of the observed anti-proliferative effects is warranted for both
cholesterol synthesis and uptake inhibition. The findings in this thesis describe the ability to impede PCa
growth and progression through the limiting of cholesterol availability and propose a novel potential
contributory mechanism being reduced precursor availability for de novo steroidogenesis. However, the
inability of DHEA administration to revert the effects of SR-B1 antagonism indicates that although
reducing steroid availability, at least by SR-B1 antagonism, is not primarily responsible for the arrested
phenotype. This finding emphasized the potential impact of more general nutrient-deprived stress
mechanisms driven as a result of impacted cholesterol accumulation. In order to adapt to cellular stresses
such as nutrient deprivation both cancerous and non-cancerous cells employ several mechanisms of
adaptation allowing for continued survival in harsh tumor microenvironments. Specifically intracellular
cholesterol is generally regulated through SREBP which under cholesterol-deplete conditions induces the
expression of proteins responsible for cholesterol uptake and synthesis491
. Activity of SREBP pathway
should therefore be examined as the mechanism by which SR-B1-antagonized cells upregulate HMGCR
expression and vice versa with SR-B1 overexpression following statin inhibition of HMGCR. For cells
unable to replenish cholesterol cellular dysfunction could impact function through several processes
including impaired membrane synthesis and lipid-raft mediated signaling leading to the manifestation of
cell stress responses492-494
.
114
Autophagy functions as a robust mechanism by which PCa copes with several cellular stresses
including ADT, chemotherapy and nutrient deprivation which would otherwise be lethal424
. This thesis
describes what appears to be stark induction of autophagy in SR-B1 antagonized cells. Although initial
results indicate the role of reduced mTOR signaling as a driver of autophagic phenotype further
characterization of the mechanism of the observed stress should be investigated. These include
downstream mTOR signaling pathways including S6 Kinase 1 (S6K1), the eIF-4E binding proteins (4E-
BP1/2) or Unc-51 like autophagy activating kinase (ULK1/2) through which mTOR mediated signaling
drives its regulatory effects495
. External to mTOR–regulated autophagy AMP-activated protein kinase
(AMPK) is a critical energy/nutrient regulatory protein, which functions as a sensor to depleted ATP
conditions within the cell promoting catabolic processes to generate more ATP and has been connected to
metabolic processes including autophagy496
. Capable of activating autophagy through both ULK1
phosphorylation and mTOR inhibition AMPK activity has been shown to be reduced by androgen-driven
reduced expression of liver kinase B1 (LKB1) and could play a role in SR-B1 driven autophagy496,497
.
Autophagy can manifest in response to several disruptions to cellular signaling processes. This
thesis describes the apparent induction of ER-stress and the UPR in response to SR-B1 antagonism as
measured through increased expression of BiP and IRE1α. ER-stress is generally thought to be result off a
disruption of protein homeostasis but has also been demonstrated in response to disrupted lipid
homeostasis396
. Further, ER stress is known to induce autophagy which could mechanistically explain the
SR-B1 antagonized phenotype398
. There are several proposed mechanisms of ER stress mediated
autophagy that could be investigated to assess the connection including eukaryotic initiation factor 2
(eIF2α)-autophagy-related protein 12 (Atg12) expression, IRE1α-TNF receptor-associated factor 2
(TRAF2)- c-Jun N-terminal kinase (JNK) expression and measuring cellular Ca2+
and calmodulin-
dependent protein kinase kinase 2 (CaMKK-β).
Although generally considered to be cholesterol-poor, increased tumoral cholesterol has been
demonstrated in mitochondria and may indicate a role in sustained oncogenic signaling498
. It has been
postulated that this increased cholesterol plays a role in facilitating hypoxia-inducible factor 1-alpha

115
(HIF1α) activity and mitochondrial function in the hypoxic environment generally observed in cancer498
.
The loss of this cholesterol could result in decreased HIF1α signaling and increased hypoxic stress
leading to the observed induction of autophagy with SR-B1 antagonism498,499
. To assess this, general
measurements of mitochondrial function could be taken including ATP production and reactive oxygen
species concentration or more specific assessment of HIF1α signaling.
Cholesterol constitutes a critical component of lipid rafts, membrane domains essential for
several proliferative signaling pathways500
. These include receptor tyrosine kinases insulin-like growth
factor 1 receptor (IGFR) and epidermal growth factor receptor (EGFR) lipid raft signaling and the small
GTPase Ras family with established roles in prostate cancer proliferation500-503
. Both IGFR and EGFR are
known to induce cancer proliferation through PI3K/AKT and Ras/MAPK signaling pathways the
disruption of which can lead to the induction of autophagy504,505
. PI3K functions to phosphorylate
phosphatidylinositol 4,5-bisphosphate (PI[4,5]P2) to PI[3,4,5}P3 leading to a conformational change
inducing AKT binding and activation leading to a proliferative phenotype through many different
branches including increased growth through mTOR activation, increased nutrient metabolism through
the inhibition of glycogen synthase kinase 3 (GSK3), and decreased apoptotic signaling through NF-KB
activation506
. Ras is a small GTPase which in its active state recruits and activates a kinase signaling
cascade through RAF and MAPK kinases leading to the phosphorylation of numerous targets including
pro-proliferation transcription factors Fos, Jun and Myc507,508
. These pathways are considered some of the
most critical oncogenic pathways the disruption of which through impaired lipid raft formation could lead
to reduced proliferative signaling and the induction of autophagy. However, as described in Chapter 1,
SR-B1 is capable of inducing PI3K/AKT and Ras/MAPK signaling via Src independent of its effects on
cellular cholesterol255,256
. The examination of the activity of these pathways would provide insight into
their role in the induction of autophagy in SR-B1 antagonized cells however determining whether the
altered activity of these pathways is a result of cholesterol mediated or independent effects would be
necessary. Both fluorescent probe and detergent resistance assessment could be used to directly assess
membrane formation in SR-B1 antagonized cells509,510
. In general, understanding alterations in cellular

116
signaling processes that drive the observed autophagic phenotype in response to SR-B1 antagonism
provide not only valuable mechanistic insight into the role of SR-B1 in PCa but may also guide the design
of novel small molecule SR-B1 inhibitors and provide rational candidates for synthetic lethal co-targeting.
As described in Chapter 4, one of the major potential issues for further development of BLT-1 is
the significant toxicity associated with use in vivo. The identification of novel small-molecule inhibitors
of BLT-1 would therefore be of high priority. The recently established SR-B1 inhibitor ML278 presents
an intriguing option for this approach. Notably the likely reduction in toxicity and increase in potency
could significantly improve the therapeutic window over that observed with BLT-1 making ML278 more
suitable for use in vivo. Prior to use in vivo, however, ML278 or any other potential inhibitor would need
to be studied in vitro in a similar manner to the experiments described in Chapter 3.
Synthetic lethal co-targeting can be approached by either high-throughput identification or
rational design as a method to increase the cytotoxicity of individual cholesterol metabolism targeted
agents446,447
. In theory high-throughput approaches would employ genome-wide knockout libraries in
concert with SR-B1 antagonism to identify candidates resulting in robust cytotoxicity. While examples of
the potential of rationale co-targeting of SR-B1 with either HMGCR or autophagy inhibitors were
demonstrated in Figure 3.12. Chloroquine and hydroxychloroquine, clinically used prophylactically
against malaria, inhibit the lysosomal degradation of cellular components of autophagic vacuoles and are
commonly employed as an in vitro autophagy inhibitor511
. Clinically, a number of trials are currently
underway combining chloroquine or hydroxychloroquine with standard therapy in an effort to prevent
therapy induced autophagic resistance in several cancer types. Of those trials that have reported, largely in
limited numbers of glioblastoma multiforme patients, minimal to modest improvements in outcomes have
been reported512-519
. Although the clinical potential of chloroquine or hydroxychloroquine appears limited,
there use for pre-clinical proof of principal experiments would still be valuable. Further, more potent
autophagy inhibitors have been developed which may demonstrate superior co-targeting than traditional
agents520
. Notably, SR-B1 antagonized cells displayed significant upregulation of Clu (Figure 3.8). As
described previously, Clu is a stress-activated chaperone that regulates protein homeostasis by preventing
117
protein aggregation, and enhancing autophagosome biogenesis, inhibiting apoptosis and promoting
survival of PCa392,521
. In order to determine if Clu expression affects SR-B1-antagonism-induced cell
stress SR-B1 antagonized cells could be targeted with either Clu-targeted siRNA or OGX-011 antisense
oligonucleotide. Evaluating these co-targeting approaches or those identified through high-throughput
approaches in a similar manner to the experiments described in this thesis would likely provide
therapeutic options for inducing a more robust cytotoxic response in SR-B1 antagonized cells. The
research proposed here would further the understanding of the role and potential of targeting cholesterol
metabolism in PCa, through expanding both the knowledge of clinical expression and impact and effects
of targeting cholesterol metabolism pre-clinically.
5.3 Conclusions
For patients diagnosed with advanced local or metastatic CRPC the mainstay treatment remains
ADT generally through the use of LHRH targeting agents in combination with an AR inhibitor such as
bicalutamide. For those patients that recur following ADT treatment options remain limited. Currently
only the anti-androgens abiraterone and enzalutamide and chemotherapeutic docetaxel are in regular use
and providing significant although limited improvements in patient survival. With taxane-based
chemotherapies remaining the most commonly used non-AR axis based agent in PCa treatment the
discovery of the role of androgens and their use as a therapeutic target remains the central thesis in the
treatment of PCa. The success and failure of AR axis targeting agents in PCa has driven investigation into
the understanding of multiple complex mechanisms of therapeutic resistance, in turn leading to
modifications of approach in how novel AR axis therapeutics are developed. The continual success and
eventual failure of AR axis targeted therapeutics belays both the critical importance and the robust
adaptive potential of the pathway. The continued resistance to these therapies due to AR centered
mechanisms would in theory direct focus to targeting other PCa signaling pathways. However, the paucity
of non-AR axis targeted therapies highlights the difficulty of such approaches.
118
The multifunctional sterol, cholesterol, underlies several essential cellular processes and its role
in human disease is continually developing across multiple ailments. The role of cholesterol in cancer and
more specifically PCa is intently being investigated from multiple angles and appears to have an
important role in the aggressiveness and proliferation of the disease. Here a therapeutic approach where in
the multifaceted role of cholesterol in steroid driven and steroid independent cellular proliferation is
leveraged as a mechanism for halting CRPC growth. The ability of multiple approaches to cholesterol
targeting to impede steroid accumulation integrates the approach with other clinically successful AR axis
targeted therapies. This approach of limiting pre-cursor cholesterol for androgen synthesis would likely in
turn obstruct several mechanisms of resistance to existing AR-axis targeted therapies, including
CYP17A1 over expression and AR hypersensitivity and promiscuity. However, precursor reduction, as
with all clinically approved AR-axis therapies, would be limited by resistance mechanisms that preclude
steroid accumulation for AR activation or growth such as constitutively active AR splice variants and
neuroendocrine differentiation for which steroid reduction would be insufficient to impact CRPC growth.
This understanding emphasizes the importance of the findings described within this thesis that although
cholesterol targeting does reduce androgen accumulation, external mechanisms, likely revolving around
nutritional stress, significantly contribute to the arrest of CRPC growth. This is exemplified by both the
inability of exogenous steroid to reverse the cholesterol antagonized phenotype and the significant impact
of that antagonism in AR negative models of CRPC. This multifaceted approach to targeting CRPC
provides a unique opportunity to tackle a large subset of the heterogeneous recurrent CRPCs.
Beyond establishing the potential window in which cholesterol targeting may prove to be a viable
therapeutic target, by examining the outcomes of patients receiving abiraterone while on statins, this
thesis further attempts to confirm the “drugablility” of a novel therapeutic target in SR-B1. The
circulating concentrations of cholesterol, regularly at superfluous levels, observed in western populations
alongside its role in the development of atherosclerosis have driven the development of several
cholesterol targeted therapeutics, namely statins. Although often overstated, side effects of statin use do
exist but in general statins are considered to be safe for use and demonstrate the feasibility of targeting

119
cholesterol and more specifically HMGCR in a clinical setting224
. This clinical use of statins allows for
the relatively simple investigation of its effects on PCa outcomes as demonstrated here and provides the
ability to develop rationale and design for prospective clinical trials in a relatively straightforward
manner. If a positive role for statin use in PCa treatment was confirmed it would provide a low toxicity,
low cost method for improving the survival of PCa patients. However, statins do not necessarily provide
the best method of cholesterol antagonism for the treatment of PCa but rather the most convenient. The
apparent overexpression of SR-B1 in PCa, its correlation to survival and the comparative specificity of
expression versus HMGCR may indicate a more favorable target for cholesterol modulation in PCa
treatment. Here not only is the ability to impede PCa growth through SR-B1 antagonism demonstrated
but further the viability of SR-B1 targeting in vivo was assessed. Although issues of hydrophobicity and
toxicity at high concentrations were observed with the specific small molecule, BLT-1, the ability to
reach efficacious concentrations was demonstrated and highlights the potential for other SR-B1 targeted
small molecules.
The findings described here contribute to existing literature on the role of cholesterol metabolism
in PCa and can function as a base for further investigation into the topic. The targeting of cholesterol
metabolism for the treatment of PCa has the potential to provide a multifaceted approach to dealing with
the highly heterogeneous nature of the recurrent disease state.

120
References
1 Canadian Cancer Society’s Advisory Committee on Cancer Statistics. Canadian Cancer Statistics
2017. (Toronto, ON, 2017).
2 Gronberg, H. Prostate cancer epidemiology. Lancet 361, 859-864 (2003).
3 American Cancer Society. Cancer Facts & Figures. (Atlanta, GA, 2017).
4 Bratt, O. Hereditary prostate cancer: clinical aspects. J. Urol. 168, 906-913 (2002).
5 Kheirandish, P. & Chinegwundoh, F. Ethnic differences in prostate cancer. Br. J. Cancer 105,
481-485 (2011).
6 Ostrander, E. A. & Udler, M. S. The role of the BRCA2 gene in susceptibility to prostate cancer
revisited. Cancer Epidemiol. Biomarkers Prev. 17, 1843-1848 (2008).
7 Eeles, R. A. et al. Multiple newly identified loci associated with prostate cancer susceptibility.
Nat. Genet. 40, 316-321 (2008).
8 Huncharek, M., Haddock, K. S., Reid, R. & Kupelnick, B. Smoking as a risk factor for prostate
cancer: a meta-analysis of 24 prospective cohort studies. Am. J. Public Health 100, 693-701
(2010).
9 Silva, J. F., Mattos, I. E., Luz, L. L., Carmo, C. N. & Aydos, R. D. Exposure to pesticides and
prostate cancer: systematic review of the literature. Rev. Environ. Health 31, 311-327 (2016).
10 Giovannucci, E. et al. A prospective study of dietary fat and risk of prostate cancer. J. Natl.
Cancer Inst. 85, 1571-1579 (1993).
11 Wright, M. E., Bowen, P., Virtamo, J., Albanes, D. & Gann, P. H. Estimated phytanic acid intake
and prostate cancer risk: a prospective cohort study. Int. J. Cancer 131, 1396-1406 (2012).
12 Whittemore, A. S. et al. Prostate cancer in relation to diet, physical activity, and body size in
blacks, whites, and Asians in the United States and Canada. J. Natl. Cancer Inst. 87, 652-661
(1995).
13 Crawford, E. D. Epidemiology of prostate cancer. Urology 62, 3-12 (2003).
14 Veveris-Lowe, T. L., Kruger, S. J., Walsh, T., Gardiner, R. A. & Clements, J. A. Seminal fluid
characterization for male fertility and prostate cancer: kallikrein-related serine proteases and
whole proteome approaches. Semin. Thromb. Hemost. 33, 87-99 (2007).
15 Stewart, A. B. et al. Prostasomes: a role in prostatic disease? BJU Int. 94, 985-989 (2004).
16 Prins, G. S. & Putz, O. Molecular signaling pathways that regulate prostate gland development.
Differentiation 76, 641-659 (2008).
17 Cunha, G. R. et al. Hormonal, cellular, and molecular regulation of normal and neoplastic
prostatic development. J. Steroid Biochem. Mol. Biol. 92, 221-236 (2004).

121
18 Matsumoto, T. et al. The androgen receptor in health and disease. Annu. Rev. Physiol. 75, 201-
224 (2013).
19 Dehm, S. M. & Tindall, D. J. Androgen receptor structural and functional elements: role and
regulation in prostate cancer. Mol. Endocrinol. 21, 2855-2863 (2007).
20 Marker, P. C., Donjacour, A. A., Dahiya, R. & Cunha, G. R. Hormonal, cellular, and molecular
control of prostatic development. Dev. Biol. 253, 165-174 (2003).
21 Timms, B. G., Mohs, T. J. & Didio, L. J. Ductal budding and branching patterns in the
developing prostate. J. Urol. 151, 1427-1432 (1994).
22 Mangelsdorf, D. J. et al. The nuclear receptor superfamily: the second decade. Cell 83, 835-839
(1995).
23 Tsai, M. J. & O'Malley, B. W. Molecular mechanisms of action of steroid/thyroid receptor
superfamily members. Annu. Rev. Biochem. 63, 451-486 (1994).
24 Committee, N. R. N. A unified nomenclature system for the nuclear receptor superfamily. Cell
97, 161-163 (1999).
25 McEwan, I. J. Molecular mechanisms of androgen receptor-mediated gene regulation: structure-
function analysis of the AF-1 domain. Endocr Relat Cancer 11, 281-293 (2004).
26 He, B., Kemppainen, J. A., Voegel, J. J., Gronemeyer, H. & Wilson, E. M. Activation function 2
in the human androgen receptor ligand binding domain mediates interdomain communication
with the NH(2)-terminal domain. J. Biol. Chem. 274, 37219-37225 (1999).
27 Srinivas-Shankar, U. & Wu, F. C. Drug insight: testosterone preparations. Nat Clin Pract Urol 3,
653-665 (2006).
28 Shang, Y., Myers, M. & Brown, M. Formation of the androgen receptor transcription complex.
Mol. Cell 9, 601-610 (2002).
29 Dehm, S. M. & Tindall, D. J. Molecular regulation of androgen action in prostate cancer. J. Cell.
Biochem. 99, 333-344 (2006).
30 Wang, Q., Carroll, J. S. & Brown, M. Spatial and temporal recruitment of androgen receptor and
its coactivators involves chromosomal looping and polymerase tracking. Mol. Cell 19, 631-642
(2005).
31 Heinlein, C. A. & Chang, C. Androgen receptor in prostate cancer. Endocr. Rev. 25, 276-308
(2004).
32 Rousseau, G. G. Fifty years ago: the quest for steroid hormone receptors. Mol. Cell. Endocrinol.
375, 10-13 (2013).
33 Biddie, S. C., John, S. & Hager, G. L. Genome-wide mechanisms of nuclear receptor action.
Trends Endocrinol Metab 21, 3-9 (2010).
34 Hopper, B. R. & Yen, S. S. Circulating concentrations of dehydroepiandrosterone and
dehydroepiandrosterone sulfate during puberty. J. Clin. Endocrinol. Metab. 40, 458-461 (1975).

122
35 Rainey, W. E., Carr, B. R., Sasano, H., Suzuki, T. & Mason, J. I. Dissecting human adrenal
androgen production. Trends Endocrinol Metab 13, 234-239 (2002).
36 Miller, W. L. & Auchus, R. J. The molecular biology, biochemistry, and physiology of human
steroidogenesis and its disorders. Endocr. Rev. 32, 81-151 (2011).
37 Rosner, W., Hryb, D. J., Khan, M. S., Nakhla, A. M. & Romas, N. A. Sex hormone-binding
globulin: anatomy and physiology of a new regulatory system. J. Steroid Biochem. Mol. Biol. 40,
813-820 (1991).
38 Baker, M. E. Albumin, steroid hormones and the origin of vertebrates. J. Endocrinol. 175, 121-
127 (2002).
39 Mendel, C. M. The free hormone hypothesis: a physiologically based mathematical model.
Endocr. Rev. 10, 232-274 (1989).
40 Hammes, A. et al. Role of endocytosis in cellular uptake of sex steroids. Cell 122, 751-762
(2005).
41 Azzouni, F., Godoy, A., Li, Y. & Mohler, J. The 5 alpha-reductase isozyme family: a review of
basic biology and their role in human diseases. Adv Urol 2012, 530121 (2012).
42 Aggarwal, S., Thareja, S., Verma, A., Bhardwaj, T. R. & Kumar, M. An overview on 5alpha-
reductase inhibitors. Steroids 75, 109-153 (2010).
43 Wu, C. & Kapoor, A. Dutasteride for the treatment of benign prostatic hyperplasia. Expert Opin
Pharmacother 14, 1399-1408 (2013).
44 Horton, R. Dihydrotestosterone is a peripheral paracrine hormone. J. Androl. 13, 23-27 (1992).
45 Horton, R. & Lobo, R. Peripheral androgens and the role of androstanediol glucuronide. Clin.
Endocrinol. Metab. 15, 293-306 (1986).
46 Dufort, I., Labrie, F. & Luu-The, V. Human types 1 and 3 3 alpha-hydroxysteroid
dehydrogenases: differential lability and tissue distribution. J. Clin. Endocrinol. Metab. 86, 841-
846 (2001).
47 Labrie, F., Luu-The, V., Lin, S. X., Simard, J. & Labrie, C. Role of 17 beta-hydroxysteroid
dehydrogenases in sex steroid formation in peripheral intracrine tissues. Trends Endocrinol
Metab 11, 421-427 (2000).
48 Luu-The, V. Analysis and characteristics of multiple types of human 17beta-hydroxysteroid
dehydrogenase. J. Steroid Biochem. Mol. Biol. 76, 143-151 (2001).
49 Andersson, S. Steroidogenic enzymes in skin. Eur. J. Dermatol. 11, 293-295 (2001).
50 Huang, X. F. & Luu-The, V. Characterization of the oxidative 3alpha-hydroxysteroid
dehydrogenase activity of human recombinant 11-cis-retinol dehydrogenase. Biochim. Biophys.
Acta 1547, 351-358 (2001).
51 Huang, X. F. & Luu-The, V. Molecular characterization of a first human 3(alpha-->beta)-
hydroxysteroid epimerase. J. Biol. Chem. 275, 29452-29457 (2000).
123
52 Kpoghomou, M. A., Soatiana, J. E., Kalembo, F. W., Bishwajit, G. & Sheng, W. UGT2B17
Polymorphism and Risk of Prostate Cancer: A Meta-Analysis. ISRN Oncol 2013, 465916 (2013).
53 Belanger, A., Pelletier, G., Labrie, F., Barbier, O. & Chouinard, S. Inactivation of androgens by
UDP-glucuronosyltransferase enzymes in humans. Trends Endocrinol Metab 14, 473-479 (2003).
54 Cancer Genome Atlas Research Network. The Molecular Taxonomy of Primary Prostate Cancer.
Cell 163, 1011-1025 (2015).
55 Hanahan, D. & Weinberg, R. A. The hallmarks of cancer. Cell 100, 57-70 (2000).
56 Hanahan, D. & Weinberg, R. A. Hallmarks of cancer: the next generation. Cell 144, 646-674
(2011).
57 Heidenreich, A. et al. EAU guidelines on prostate cancer. part 1: screening, diagnosis, and local
treatment with curative intent-update 2013. Eur. Urol. 65, 124-137 (2014).
58 Hoffman, R. M. Clinical practice. Screening for prostate cancer. N. Engl. J. Med. 365, 2013-2019
(2011).
59 Smith, D. S. & Catalona, W. J. Interexaminer variability of digital rectal examination in detecting
prostate cancer. Urology 45, 70-74 (1995).
60 Simmons, M. N., Berglund, R. K. & Jones, J. S. A practical guide to prostate cancer diagnosis
and management. Cleve. Clin. J. Med. 78, 321-331 (2011).
61 Balk, S. P., Ko, Y. J. & Bubley, G. J. Biology of prostate-specific antigen. J. Clin. Oncol. 21,
383-391 (2003).
62 Chen, N. & Zhou, Q. The evolving Gleason grading system. Chin J Cancer Res 28, 58-64 (2016).
63 Helpap, B. & Egevad, L. Correlation of modified Gleason grading with pT stage of prostatic
carcinoma after radical prostatectomy. Anal. Quant. Cytol. Histol. 30, 1-7 (2008).
64 Naito, S. et al. Validation of Partin tables and development of a preoperative nomogram for
Japanese patients with clinically localized prostate cancer using 2005 International Society of
Urological Pathology consensus on Gleason grading: data from the Clinicopathological Research
Group for Localized Prostate Cancer. J. Urol. 180, 904-909; discussion 909-910 (2008).
65 Epstein, J. I. et al. A Contemporary Prostate Cancer Grading System: A Validated Alternative to
the Gleason Score. Eur. Urol. 69, 428-435 (2016).
66 Cheng, L., Montironi, R., Bostwick, D. G., Lopez-Beltran, A. & Berney, D. M. Staging of
prostate cancer. Histopathology 60, 87-117 (2012).
67 Klotz, L. Active surveillance for low-risk prostate cancer. Curr Opin Urol 27, 225-230 (2017).
68 Fang, L. C., Merrick, G. S. & Wallner, K. E. Androgen deprivation therapy: a survival benefit or
detriment in men with high-risk prostate cancer? Oncology (Williston Park) 24, 790-796, 798
(2010).

124
69 Han, M., Partin, A. W., Pound, C. R., Epstein, J. I. & Walsh, P. C. Long-term biochemical
disease-free and cancer-specific survival following anatomic radical retropubic prostatectomy.
The 15-year Johns Hopkins experience. Urol. Clin. North Am. 28, 555-565 (2001).
70 Demanes, D. J., Rodriguez, R. R., Schour, L., Brandt, D. & Altieri, G. High-dose-rate intensity-
modulated brachytherapy with external beam radiotherapy for prostate cancer: California
endocurietherapy's 10-year results. Int. J. Radiat. Oncol. Biol. Phys. 61, 1306-1316 (2005).
71 Langley, R. R. & Fidler, I. J. The seed and soil hypothesis revisited--the role of tumor-stroma
interactions in metastasis to different organs. Int. J. Cancer 128, 2527-2535 (2011).
72 Gundem, G. et al. The evolutionary history of lethal metastatic prostate cancer. Nature 520, 353-
357 (2015).
73 Freedland, S. J. et al. Time trends in biochemical recurrence after radical prostatectomy: results
of the SEARCH database. Urology 61, 736-741 (2003).
74 Brawer, M. K. Radiation therapy failure in prostate cancer patients: risk factors and methods of
detection. Rev Urol 4 Suppl 2, S2-S11 (2002).
75 Sharifi, N., Gulley, J. L. & Dahut, W. L. Androgen deprivation therapy for prostate cancer. JAMA
294, 238-244 (2005).
76 Connolly, R. M., Carducci, M. A. & Antonarakis, E. S. Use of androgen deprivation therapy in
prostate cancer: indications and prevalence. Asian J Androl 14, 177-186 (2012).
77 Kaisary, A. V., Tyrrell, C. J., Peeling, W. B. & Griffiths, K. Comparison of LHRH analogue
(Zoladex) with orchiectomy in patients with metastatic prostatic carcinoma. Br. J. Urol. 67, 502-
508 (1991).
78 Sun, M. et al. Comparison of Gonadotropin-Releasing Hormone Agonists and Orchiectomy:
Effects of Androgen-Deprivation Therapy. JAMA Oncol 2, 500-507 (2016).
79 Collette, L. et al. Is prostate-specific antigen a valid surrogate end point for survival in
hormonally treated patients with metastatic prostate cancer? Joint research of the European
Organisation for Research and Treatment of Cancer, the Limburgs Universitair Centrum, and
AstraZeneca Pharmaceuticals. J. Clin. Oncol. 23, 6139-6148 (2005).
80 Crawford, E. D. et al. A controlled trial of leuprolide with and without flutamide in prostatic
carcinoma. N. Engl. J. Med. 321, 419-424 (1989).
81 Loblaw, D. A. et al. Initial hormonal management of androgen-sensitive metastatic, recurrent, or
progressive prostate cancer: 2006 update of an American Society of Clinical Oncology practice
guideline. J. Clin. Oncol. 25, 1596-1605 (2007).
82 Bolla, M. et al. Improved survival in patients with locally advanced prostate cancer treated with
radiotherapy and goserelin. N. Engl. J. Med. 337, 295-300 (1997).
83 Labrie, F. Medical castration with LHRH agonists: 25 years later with major benefits achieved on
survival in prostate cancer. J. Androl. 25, 305-313 (2004).
125
84 Halabi, S. et al. Prognostic model for predicting survival in men with hormone-refractory
metastatic prostate cancer. J. Clin. Oncol. 21, 1232-1237 (2003).
85 Berry, W. R., Laszlo, J., Cox, E., Walker, A. & Paulson, D. Prognostic factors in metastatic and
hormonally unresponsive carcinoma of the prostate. Cancer 44, 763-775 (1979).
86 Scher, H. I. et al. Post-therapy serum prostate-specific antigen level and survival in patients with
androgen-independent prostate cancer. J. Natl. Cancer Inst. 91, 244-251 (1999).
87 Afshar, M., Evison, F., James, N. D. & Patel, P. Shifting paradigms in the estimation of survival
for castration-resistant prostate cancer: A tertiary academic center experience. Urol Oncol 33, 338
e331-337 (2015).
88 Sharifi, N. et al. A retrospective study of the time to clinical endpoints for advanced prostate
cancer. BJU Int. 96, 985-989 (2005).
89 Oefelein, M. G., Agarwal, P. K. & Resnick, M. I. Survival of patients with hormone refractory
prostate cancer in the prostate specific antigen era. J. Urol. 171, 1525-1528 (2004).
90 Karantanos, T., Corn, P. G. & Thompson, T. C. Prostate cancer progression after androgen
deprivation therapy: mechanisms of castrate resistance and novel therapeutic approaches.
Oncogene 32, 5501-5511 (2013).
91 Attard, G., Cooper, C. S. & de Bono, J. S. Steroid hormone receptors in prostate cancer: a hard
habit to break? Cancer Cell 16, 458-462 (2009).
92 Bubendorf, L. et al. Survey of gene amplifications during prostate cancer progression by high-
throughout fluorescence in situ hybridization on tissue microarrays. Cancer Res. 59, 803-806
(1999).
93 Visakorpi, T. et al. In vivo amplification of the androgen receptor gene and progression of human
prostate cancer. Nat. Genet. 9, 401-406 (1995).
94 Sharma, A. et al. The retinoblastoma tumor suppressor controls androgen signaling and human
prostate cancer progression. J. Clin. Invest. 120, 4478-4492 (2010).
95 Burkhart, D. L. & Sage, J. Cellular mechanisms of tumour suppression by the retinoblastoma
gene. Nat Rev Cancer 8, 671-682 (2008).
96 Whitaker, L. L., Su, H., Baskaran, R., Knudsen, E. S. & Wang, J. Y. Growth suppression by an
E2F-binding-defective retinoblastoma protein (RB): contribution from the RB C pocket. Mol.
Cell. Biol. 18, 4032-4042 (1998).
97 Taplin, M. E. et al. Mutation of the androgen-receptor gene in metastatic androgen-independent
prostate cancer. N. Engl. J. Med. 332, 1393-1398 (1995).
98 Taplin, M. E. et al. Selection for androgen receptor mutations in prostate cancers treated with
androgen antagonist. Cancer Res. 59, 2511-2515 (1999).
99 Shi, X. B., Ma, A. H., Xia, L., Kung, H. J. & de Vere White, R. W. Functional analysis of 44
mutant androgen receptors from human prostate cancer. Cancer Res. 62, 1496-1502 (2002).

126
100 Buchanan, G. et al. Structural and functional consequences of glutamine tract variation in the
androgen receptor. Hum. Mol. Genet. 13, 1677-1692 (2004).
101 Veldscholte, J. et al. The androgen receptor in LNCaP cells contains a mutation in the ligand
binding domain which affects steroid binding characteristics and response to antiandrogens. J.
Steroid Biochem. Mol. Biol. 41, 665-669 (1992).
102 Berrevoets, C. A., Veldscholte, J. & Mulder, E. Effects of antiandrogens on transformation and
transcription activation of wild-type and mutated (LNCaP) androgen receptors. J. Steroid
Biochem. Mol. Biol. 46, 731-736 (1993).
103 Zhao, X. Y. et al. Glucocorticoids can promote androgen-independent growth of prostate cancer
cells through a mutated androgen receptor. Nat. Med. 6, 703-706 (2000).
104 Culig, Z. et al. Mutant androgen receptor detected in an advanced-stage prostatic carcinoma is
activated by adrenal androgens and progesterone. Mol. Endocrinol. 7, 1541-1550 (1993).
105 Dehm, S. M. & Tindall, D. J. Alternatively spliced androgen receptor variants. Endocr Relat
Cancer 18, R183-196 (2011).
106 Li, Y. et al. AR intragenic deletions linked to androgen receptor splice variant expression and
activity in models of prostate cancer progression. Oncogene 31, 4759-4767 (2012).
107 Hu, R., Isaacs, W. B. & Luo, J. A snapshot of the expression signature of androgen receptor
splicing variants and their distinctive transcriptional activities. Prostate 71, 1656-1667 (2011).
108 Sun, S. et al. Castration resistance in human prostate cancer is conferred by a frequently
occurring androgen receptor splice variant. J. Clin. Invest. 120, 2715-2730 (2010).
109 Hu, R. et al. Distinct transcriptional programs mediated by the ligand-dependent full-length
androgen receptor and its splice variants in castration-resistant prostate cancer. Cancer Res. 72,
3457-3462 (2012).
110 Guo, Z. et al. Regulation of androgen receptor activity by tyrosine phosphorylation. Cancer Cell
10, 309-319 (2006).
111 Wang, Q. et al. Androgen receptor regulates a distinct transcription program in androgen-
independent prostate cancer. Cell 138, 245-256 (2009).
112 Antonarakis, E. S. et al. Targeting the N-Terminal Domain of the Androgen Receptor: A New
Approach for the Treatment of Advanced Prostate Cancer. Oncologist 21, 1427-1435 (2016).
113 Gurel, B. et al. Nuclear MYC protein overexpression is an early alteration in human prostate
carcinogenesis. Mod. Pathol. 21, 1156-1167 (2008).
114 Nupponen, N. N., Kakkola, L., Koivisto, P. & Visakorpi, T. Genetic alterations in hormone-
refractory recurrent prostate carcinomas. Am. J. Pathol. 153, 141-148 (1998).
115 Bernard, D., Pourtier-Manzanedo, A., Gil, J. & Beach, D. H. Myc confers androgen-independent
prostate cancer cell growth. J. Clin. Invest. 112, 1724-1731 (2003).

127
116 Taylor, B. S. et al. Integrative genomic profiling of human prostate cancer. Cancer Cell 18, 11-22
(2010).
117 Chee, K. G. et al. The AKT inhibitor perifosine in biochemically recurrent prostate cancer: a
phase II California/Pittsburgh cancer consortium trial. Clin Genitourin Cancer 5, 433-437 (2007).
118 Kinkade, C. W. et al. Targeting AKT/mTOR and ERK MAPK signaling inhibits hormone-
refractory prostate cancer in a preclinical mouse model. J. Clin. Invest. 118, 3051-3064 (2008).
119 Zhang, W. et al. Inhibition of tumor growth progression by antiandrogens and mTOR inhibitor in
a Pten-deficient mouse model of prostate cancer. Cancer Res. 69, 7466-7472 (2009).
120 Crumbaker, M., Khoja, L. & Joshua, A. M. AR Signaling and the PI3K Pathway in Prostate
Cancer. Cancers (Basel) 9 (2017).
121 Harris, W. P., Mostaghel, E. A., Nelson, P. S. & Montgomery, B. Androgen deprivation therapy:
progress in understanding mechanisms of resistance and optimizing androgen depletion. Nat Clin
Pract Urol 6, 76-85 (2009).
122 Mohler, J. L. et al. The androgen axis in recurrent prostate cancer. Clin. Cancer. Res. 10, 440-448
(2004).
123 Locke, J. A. et al. Androgen levels increase by intratumoral de novo steroidogenesis during
progression of castration-resistant prostate cancer. Cancer Res. 68, 6407-6415 (2008).
124 Montgomery, R. B. et al. Maintenance of intratumoral androgens in metastatic prostate cancer: a
mechanism for castration-resistant tumor growth. Cancer Res. 68, 4447-4454 (2008).
125 Stanbrough, M. et al. Increased expression of genes converting adrenal androgens to testosterone
in androgen-independent prostate cancer. Cancer Res. 66, 2815-2825 (2006).
126 Chang, K. H. et al. Dihydrotestosterone synthesis bypasses testosterone to drive castration-
resistant prostate cancer. Proc. Natl. Acad. Sci. U. S. A. 108, 13728-13733 (2011).
127 Stuchbery, R., McCoy, P. J., Hovens, C. M. & Corcoran, N. M. Androgen synthesis in prostate
cancer: do all roads lead to Rome? Nat Rev Urol 14, 49-58 (2017).
128 Labrie, F. et al. Gonadotropin-releasing hormone agonists in the treatment of prostate cancer.
Endocr. Rev. 26, 361-379 (2005).
129 Labrie, F. et al. Comparable amounts of sex steroids are made outside the gonads in men and
women: strong lesson for hormone therapy of prostate and breast cancer. J. Steroid Biochem.
Mol. Biol. 113, 52-56 (2009).
130 Labrie, F. Blockade of testicular and adrenal androgens in prostate cancer treatment. Nat Rev
Urol 8, 73-85 (2011).
131 Vermeulen, A., Schelfhout, W. & De Sy, W. Plasma androgen levels after subcapsular
orchiectomy or estrogen treatment for prostatic carcinoma. Prostate 3, 115-121 (1982).

128
132 Belanger, A., Dupont, A. & Labrie, F. Inhibition of basal and adrenocorticotropin-stimulated
plasma levels of adrenal androgens after treatment with an antiandrogen in castrated patients with
prostatic cancer. J. Clin. Endocrinol. Metab. 59, 422-426 (1984).
133 Nishii, M. et al. Luteinizing hormone (LH)-releasing hormone agonist reduces serum adrenal
androgen levels in prostate cancer patients: implications for the effect of LH on the adrenal
glands. J. Androl. 33, 1233-1238 (2012).
134 Locke, J. A. et al. Steroidogenesis inhibitors alter but do not eliminate androgen synthesis
mechanisms during progression to castration-resistance in LNCaP prostate xenografts. J. Steroid
Biochem. Mol. Biol. 115, 126-136 (2009).
135 van Weerden, W. M., Bierings, H. G., van Steenbrugge, G. J., de Jong, F. H. & Schroder, F. H.
Adrenal glands of mouse and rat do not synthesize androgens. Life Sci. 50, 857-861 (1992).
136 Perkins, L. M. & Payne, A. H. Quantification of P450scc, P450(17) alpha, and iron sulfur protein
reductase in Leydig cells and adrenals of inbred strains of mice. Endocrinology 123, 2675-2682
(1988).
137 Brock, B. J. & Waterman, M. R. Biochemical differences between rat and human cytochrome
P450c17 support the different steroidogenic needs of these two species. Biochemistry (Mosc). 38,
1598-1606 (1999).
138 Luu-The, V., Pelletier, G. & Labrie, F. Quantitative appreciation of steroidogenic gene expression
in mouse tissues: new roles for type 2 5alpha-reductase, 20alpha-hydroxysteroid dehydrogenase
and estrogen sulfotransferase. J. Steroid Biochem. Mol. Biol. 93, 269-276 (2005).
139 James, N. D. et al. Abiraterone for Prostate Cancer Not Previously Treated with Hormone
Therapy. N. Engl. J. Med. 377, 338-351 (2017).
140 Fizazi, K. et al. Abiraterone plus Prednisone in Metastatic, Castration-Sensitive Prostate Cancer.
N. Engl. J. Med. 377, 352-360 (2017).
141 de Bono, J. S. et al. Abiraterone and increased survival in metastatic prostate cancer. N. Engl. J.
Med. 364, 1995-2005 (2011).
142 Klotz, L. Maximal androgen blockade for advanced prostate cancer. Best Pract Res Clin
Endocrinol Metab 22, 331-340 (2008).
143 Dijkman, G. A., Janknegt, R. A., De Reijke, T. M. & Debruyne, F. M. Long-term efficacy and
safety of nilutamide plus castration in advanced prostate cancer, and the significance of early
prostate specific antigen normalization. International Anandron Study Group. J. Urol. 158, 160-
163 (1997).
144 Janknegt, R. A. et al. Orchiectomy and nilutamide or placebo as treatment of metastatic prostatic
cancer in a multinational double-blind randomized trial. J. Urol. 149, 77-82; discussion 83
(1993).
145 Group, P. C. T. C. Maximum androgen blockade in advanced prostate cancer: an overview of the
randomised trials. Prostate Cancer Trialists' Collaborative Group. Lancet 355, 1491-1498 (2000).

129
146 Kelly, W. K., Slovin, S. & Scher, H. I. Steroid hormone withdrawal syndromes. Pathophysiology
and clinical significance. Urol. Clin. North Am. 24, 421-431 (1997).
147 Tran, C. et al. Development of a second-generation antiandrogen for treatment of advanced
prostate cancer. Science 324, 787-790 (2009).
148 Thompson, I. M. Flare Associated with LHRH-Agonist Therapy. Rev Urol 3 Suppl 3, S10-14
(2001).
149 Greasley, R., Khabazhaitajer, M. & Rosario, D. J. A profile of enzalutamide for the treatment of
advanced castration resistant prostate cancer. Cancer Manag Res 7, 153-164 (2015).
150 Scher, H. I. et al. Increased survival with enzalutamide in prostate cancer after chemotherapy. N.
Engl. J. Med. 367, 1187-1197 (2012).
151 Beer, T. M. et al. Enzalutamide in metastatic prostate cancer before chemotherapy. N. Engl. J.
Med. 371, 424-433 (2014).
152 Grist, E. & Attard, G. The development of abiraterone acetate for castration-resistant prostate
cancer. Urol Oncol 33, 289-294 (2015).
153 Fizazi, K. et al. Abiraterone acetate for treatment of metastatic castration-resistant prostate
cancer: final overall survival analysis of the COU-AA-301 randomised, double-blind, placebo-
controlled phase 3 study. Lancet Oncol 13, 983-992 (2012).
154 Ryan, C. J. et al. Abiraterone in metastatic prostate cancer without previous chemotherapy. N.
Engl. J. Med. 368, 138-148 (2013).
155 Ryan, C. J. et al. Abiraterone acetate plus prednisone versus placebo plus prednisone in
chemotherapy-naive men with metastatic castration-resistant prostate cancer (COU-AA-302):
final overall survival analysis of a randomised, double-blind, placebo-controlled phase 3 study.
Lancet Oncol 16, 152-160 (2015).
156 Mostaghel, E. A. et al. Resistance to CYP17A1 Inhibition with Abiraterone in Castration-
Resistant Prostate Cancer: Induction of Steroidogenesis and Androgen Receptor Splice Variants.
Clin. Cancer. Res. 17, 5913-5925 (2011).
157 Giacinti, S. et al. Resistance to Abiraterone in Castration-resistant Prostate Cancer: A Review of
the Literature. Anticancer Res. 34, 6265-6269 (2014).
158 Wadosky, K. M. & Koochekpour, S. Androgen receptor splice variants and prostate cancer: From
bench to bedside. Oncotarget 8, 18550-18576 (2017).
159 Bernemann, C. et al. Expression of AR-V7 in Circulating Tumour Cells Does Not Preclude
Response to Next Generation Androgen Deprivation Therapy in Patients with Castration
Resistant Prostate Cancer. Eur. Urol. 71, 1-3 (2017).
160 Berry, W., Dakhil, S., Modiano, M., Gregurich, M. & Asmar, L. Phase III study of mitoxantrone
plus low dose prednisone versus low dose prednisone alone in patients with asymptomatic
hormone refractory prostate cancer. J. Urol. 168, 2439-2443 (2002).

130
161 Tannock, I. F. et al. Chemotherapy with mitoxantrone plus prednisone or prednisone alone for
symptomatic hormone-resistant prostate cancer: a Canadian randomized trial with palliative end
points. J. Clin. Oncol. 14, 1756-1764 (1996).
162 Lorente, D., Mateo, J., Perez-Lopez, R., de Bono, J. S. & Attard, G. Sequencing of agents in
castration-resistant prostate cancer. Lancet Oncol 16, e279-292 (2015).
163 Berthold, D. R. et al. Docetaxel plus prednisone or mitoxantrone plus prednisone for advanced
prostate cancer: updated survival in the TAX 327 study. J. Clin. Oncol. 26, 242-245 (2008).
164 Petrylak, D. P. et al. Docetaxel and estramustine compared with mitoxantrone and prednisone for
advanced refractory prostate cancer. N. Engl. J. Med. 351, 1513-1520 (2004).
165 Lorente, D. & De Bono, J. S. Molecular alterations and emerging targets in castration resistant
prostate cancer. Eur. J. Cancer 50, 753-764 (2014).
166 Martin, S. K. & Kyprianou, N. Exploitation of the Androgen Receptor to Overcome Taxane
Resistance in Advanced Prostate Cancer. Adv. Cancer Res. 127, 123-158 (2015).
167 James, N. D. et al. Addition of docetaxel, zoledronic acid, or both to first-line long-term hormone
therapy in prostate cancer (STAMPEDE): survival results from an adaptive, multiarm, multistage,
platform randomised controlled trial. Lancet 387, 1163-1177 (2016).
168 Sweeney, C. J. et al. Chemohormonal Therapy in Metastatic Hormone-Sensitive Prostate Cancer.
N. Engl. J. Med. 373, 737-746 (2015).
169 Petrioli, R. et al. Role of chemotherapy in the treatment of metastatic castration-resistant prostate
cancer patients who have progressed after abiraterone acetate. Cancer Chemother. Pharmacol.
76, 439-445 (2015).
170 de Bono, J. S. et al. Prednisone plus cabazitaxel or mitoxantrone for metastatic castration-
resistant prostate cancer progressing after docetaxel treatment: a randomised open-label trial.
Lancet 376, 1147-1154 (2010).
171 Paller, C. J. & Antonarakis, E. S. Cabazitaxel: a novel second-line treatment for metastatic
castration-resistant prostate cancer. Drug Des Devel Ther 5, 117-124 (2011).
172 Oh, W. K., Tay, M. H. & Huang, J. Is there a role for platinum chemotherapy in the treatment of
patients with hormone-refractory prostate cancer? Cancer 109, 477-486 (2007).
173 Harris, K. A., Harney, E. & Small, E. J. Liposomal doxorubicin for the treatment of hormone-
refractory prostate cancer. Clin Prostate Cancer 1, 37-41 (2002).
174 Body, J. J., Casimiro, S. & Costa, L. Targeting bone metastases in prostate cancer: improving
clinical outcome. Nat Rev Urol 12, 340-356 (2015).
175 El-Amm, J. & Aragon-Ching, J. B. Radium-223 for the treatment of castration-resistant prostate
cancer. Onco Targets Ther 8, 1103-1109 (2015).
176 Saad, F. et al. The 2015 CUA-CUOG Guidelines for the management of castration-resistant
prostate cancer (CRPC). Can Urol Assoc J 9, 90-96 (2015).
131
177 Dougan, M. & Dranoff, G. Immune therapy for cancer. Annu. Rev. Immunol. 27, 83-117 (2009).
178 Cavallo, F., De Giovanni, C., Nanni, P., Forni, G. & Lollini, P. L. 2011: the immune hallmarks of
cancer. Cancer Immunol. Immunother. 60, 319-326 (2011).
179 De Velasco, M. A. & Uemura, H. Prostate cancer immunotherapy: where are we and where are
we going? Curr Opin Urol 28, 15-24 (2018).
180 Kantoff, P. W. et al. Sipuleucel-T immunotherapy for castration-resistant prostate cancer. N.
Engl. J. Med. 363, 411-422 (2010).
181 Patel, P. H. & Kockler, D. R. Sipuleucel-T: a vaccine for metastatic, asymptomatic, androgen-
independent prostate cancer. Ann. Pharmacother. 42, 91-98 (2008).
182 Small, E. J. et al. Immunotherapy of hormone-refractory prostate cancer with antigen-loaded
dendritic cells. J. Clin. Oncol. 18, 3894-3903 (2000).
183 Burch, P. A. et al. Priming tissue-specific cellular immunity in a phase I trial of autologous
dendritic cells for prostate cancer. Clin. Cancer. Res. 6, 2175-2182 (2000).
184 Small, E. J. et al. Placebo-controlled phase III trial of immunologic therapy with sipuleucel-T
(APC8015) in patients with metastatic, asymptomatic hormone refractory prostate cancer. J. Clin.
Oncol. 24, 3089-3094 (2006).
185 Higano, C. S. et al. Sipuleucel-T. Nat Rev Drug Discov 9, 513-514 (2010).
186 Wing, K. et al. CTLA-4 control over Foxp3+ regulatory T cell function. Science 322, 271-275
(2008).
187 Small, E. J. et al. A pilot trial of CTLA-4 blockade with human anti-CTLA-4 in patients with
hormone-refractory prostate cancer. Clin. Cancer. Res. 13, 1810-1815 (2007).
188 Slovin, S. F. et al. Ipilimumab alone or in combination with radiotherapy in metastatic castration-
resistant prostate cancer: results from an open-label, multicenter phase I/II study. Ann. Oncol. 24,
1813-1821 (2013).
189 Kwon, E. D. et al. Ipilimumab versus placebo after radiotherapy in patients with metastatic
castration-resistant prostate cancer that had progressed after docetaxel chemotherapy (CA184-
043): a multicentre, randomised, double-blind, phase 3 trial. Lancet Oncol 15, 700-712 (2014).
190 Martin, A. M. et al. Paucity of PD-L1 expression in prostate cancer: innate and adaptive immune
resistance. Prostate Cancer Prostatic Dis 18, 325-332 (2015).
191 Graff, J. N. et al. Early evidence of anti-PD-1 activity in enzalutamide-resistant prostate cancer.
Oncotarget 7, 52810-52817 (2016).
192 Singh, P., Pal, S. K., Alex, A. & Agarwal, N. Development of PROSTVAC immunotherapy in
prostate cancer. Future Oncol 11, 2137-2148 (2015).
193 Yap, T. A. et al. Drug discovery in advanced prostate cancer: translating biology into therapy.
Nat Rev Drug Discov 15, 699-718 (2016).

132
194 Kantoff, P. W. et al. Overall survival analysis of a phase II randomized controlled trial of a
Poxviral-based PSA-targeted immunotherapy in metastatic castration-resistant prostate cancer. J.
Clin. Oncol. 28, 1099-1105 (2010).
195 Ikonen, E. Cellular cholesterol trafficking and compartmentalization. Nat Rev Mol Cell Biol 9,
125-138 (2008).
196 Yin, W. et al. Plasma lipid profiling across species for the identification of optimal animal models
of human dyslipidemia. J. Lipid Res. 53, 51-65 (2012).
197 Coxey, R. A., Pentchev, P. G., Campbell, G. & Blanchette-Mackie, E. J. Differential
accumulation of cholesterol in Golgi compartments of normal and Niemann-Pick type C
fibroblasts incubated with LDL: a cytochemical freeze-fracture study. J. Lipid Res. 34, 1165-1176
(1993).
198 Mukherjee, S., Zha, X., Tabas, I. & Maxfield, F. R. Cholesterol distribution in living cells:
fluorescence imaging using dehydroergosterol as a fluorescent cholesterol analog. Biophys. J. 75,
1915-1925 (1998).
199 Lange, Y. Disposition of intracellular cholesterol in human fibroblasts. J. Lipid Res. 32, 329-339
(1991).
200 Simons, K. & Vaz, W. L. Model systems, lipid rafts, and cell membranes. Annu. Rev. Biophys.
Biomol. Struct. 33, 269-295 (2004).
201 Brown, D. A. & London, E. Functions of lipid rafts in biological membranes. Annu. Rev. Cell
Dev. Biol. 14, 111-136 (1998).
202 Hooper, N. M. Detergent-insoluble glycosphingolipid/cholesterol-rich membrane domains, lipid
rafts and caveolae (review). Mol. Membr. Biol. 16, 145-156 (1999).
203 Resh, M. D. Fatty acylation of proteins: new insights into membrane targeting of myristoylated
and palmitoylated proteins. Biochim. Biophys. Acta 1451, 1-16 (1999).
204 Nohturfft, A., Brown, M. S. & Goldstein, J. L. Sterols regulate processing of carbohydrate chains
of wild-type SREBP cleavage-activating protein (SCAP), but not sterol-resistant mutants Y298C
or D443N. Proc. Natl. Acad. Sci. U. S. A. 95, 12848-12853 (1998).
205 Radhakrishnan, A., Sun, L. P., Kwon, H. J., Brown, M. S. & Goldstein, J. L. Direct binding of
cholesterol to the purified membrane region of SCAP: mechanism for a sterol-sensing domain.
Mol. Cell 15, 259-268 (2004).
206 Mullen, P. J., Yu, R., Longo, J., Archer, M. C. & Penn, L. Z. The interplay between cell
signalling and the mevalonate pathway in cancer. Nat Rev Cancer 16, 718-731 (2016).
207 Goldstein, J. L. & Brown, M. S. Regulation of the mevalonate pathway. Nature 343, 425-430
(1990).
208 Buhaescu, I. & Izzedine, H. Mevalonate pathway: a review of clinical and therapeutical
implications. Clin. Biochem. 40, 575-584 (2007).

133
209 Brown, M. S. & Goldstein, J. L. The SREBP pathway: regulation of cholesterol metabolism by
proteolysis of a membrane-bound transcription factor. Cell 89, 331-340 (1997).
210 Goldstein, J. L., DeBose-Boyd, R. A. & Brown, M. S. Protein sensors for membrane sterols. Cell
124, 35-46 (2006).
211 Xu, X., So, J. S., Park, J. G. & Lee, A. H. Transcriptional control of hepatic lipid metabolism by
SREBP and ChREBP. Semin. Liver Dis. 33, 301-311 (2013).
212 Radhakrishnan, A., Ikeda, Y., Kwon, H. J., Brown, M. S. & Goldstein, J. L. Sterol-regulated
transport of SREBPs from endoplasmic reticulum to Golgi: oxysterols block transport by binding
to Insig. Proc. Natl. Acad. Sci. U. S. A. 104, 6511-6518 (2007).
213 Sun, L. P., Seemann, J., Goldstein, J. L. & Brown, M. S. Sterol-regulated transport of SREBPs
from endoplasmic reticulum to Golgi: Insig renders sorting signal in Scap inaccessible to COPII
proteins. Proc. Natl. Acad. Sci. U. S. A. 104, 6519-6526 (2007).
214 Horton, J. D., Goldstein, J. L. & Brown, M. S. SREBPs: activators of the complete program of
cholesterol and fatty acid synthesis in the liver. J. Clin. Invest. 109, 1125-1131 (2002).
215 Edwards, P. A., Kennedy, M. A. & Mak, P. A. LXRs; oxysterol-activated nuclear receptors that
regulate genes controlling lipid homeostasis. Vascul Pharmacol 38, 249-256 (2002).
216 Lorbek, G., Lewinska, M. & Rozman, D. Cytochrome P450s in the synthesis of cholesterol and
bile acids--from mouse models to human diseases. FEBS J 279, 1516-1533 (2012).
217 Baumann, N. A. et al. Transport of newly synthesized sterol to the sterol-enriched plasma
membrane occurs via nonvesicular equilibration. Biochemistry (Mosc). 44, 5816-5826 (2005).
218 Heino, S. et al. Dissecting the role of the golgi complex and lipid rafts in biosynthetic transport of
cholesterol to the cell surface. Proc. Natl. Acad. Sci. U. S. A. 97, 8375-8380 (2000).
219 Lusa, S., Heino, S. & Ikonen, E. Differential mobilization of newly synthesized cholesterol and
biosynthetic sterol precursors from cells. J. Biol. Chem. 278, 19844-19851 (2003).
220 Prattes, S. et al. Intracellular distribution and mobilization of unesterified cholesterol in
adipocytes: triglyceride droplets are surrounded by cholesterol-rich ER-like surface layer
structures. J. Cell Sci. 113 ( Pt 17), 2977-2989 (2000).
221 Bose, H. S., Lingappa, V. R. & Miller, W. L. Rapid regulation of steroidogenesis by
mitochondrial protein import. Nature 417, 87-91 (2002).
222 Gu, Q., Paulose-Ram, R., Burt, V. L. & Kit, B. K. Prescription cholesterol-lowering medication
use in adults aged 40 and over: United States, 2003-2012. NCHS Data Brief, 1-8 (2014).
223 Naci, H. et al. Comparative benefits of statins in the primary and secondary prevention of major
coronary events and all-cause mortality: a network meta-analysis of placebo-controlled and
active-comparator trials. Eur J Prev Cardiol 20, 641-657 (2013).
224 Collins, R. et al. Interpretation of the evidence for the efficacy and safety of statin therapy. Lancet
388, 2532-2561 (2016).

134
225 Weber, M. J. & Gioeli, D. Ras signaling in prostate cancer progression. J. Cell. Biochem. 91, 13-
25 (2004).
226 Graaf, M. R., Richel, D. J., van Noorden, C. J. & Guchelaar, H. J. Effects of statins and
farnesyltransferase inhibitors on the development and progression of cancer. Cancer Treat. Rev.
30, 609-641 (2004).
227 Gent, J. & Braakman, I. Low-density lipoprotein receptor structure and folding. Cell. Mol. Life
Sci. 61, 2461-2470 (2004).
228 Goldstein, J. L., Anderson, R. G. & Brown, M. S. Receptor-mediated endocytosis and the cellular
uptake of low density lipoprotein. Ciba Found. Symp., 77-95 (1982).
229 Sturley, S. L., Patterson, M. C., Balch, W. & Liscum, L. The pathophysiology and mechanisms of
NP-C disease. Biochim. Biophys. Acta 1685, 83-87 (2004).
230 Attie, A. D. & Seidah, N. G. Dual regulation of the LDL receptor--some clarity and new
questions. Cell Metab 1, 290-292 (2005).
231 Zelcer, N., Hong, C., Boyadjian, R. & Tontonoz, P. LXR regulates cholesterol uptake through
Idol-dependent ubiquitination of the LDL receptor. Science 325, 100-104 (2009).
232 Landschulz, K. T., Pathak, R. K., Rigotti, A., Krieger, M. & Hobbs, H. H. Regulation of
scavenger receptor, class B, type I, a high density lipoprotein receptor, in liver and steroidogenic
tissues of the rat. J. Clin. Invest. 98, 984-995 (1996).
233 Rigotti, A. et al. Regulation by adrenocorticotropic hormone of the in vivo expression of
scavenger receptor class B type I (SR-BI), a high density lipoprotein receptor, in steroidogenic
cells of the murine adrenal gland. J. Biol. Chem. 271, 33545-33549 (1996).
234 Canton, J., Neculai, D. & Grinstein, S. Scavenger receptors in homeostasis and immunity. Nat
Rev Immunol 13, 621-634 (2013).
235 Krieger, M. Charting the fate of the "good cholesterol": identification and characterization of the
high-density lipoprotein receptor SR-BI. Annu. Rev. Biochem. 68, 523-558 (1999).
236 Rigotti, A., Miettinen, H. E. & Krieger, M. The role of the high-density lipoprotein receptor SR-
BI in the lipid metabolism of endocrine and other tissues. Endocr. Rev. 24, 357-387 (2003).
237 Gwynne, J. T. & Mahaffee, D. D. Rat adrenal uptake and metabolism of high density lipoprotein
cholesteryl ester. J. Biol. Chem. 264, 8141-8150 (1989).
238 Gwynne, J. T., Mahaffee, D., Brewer, H. B., Jr. & Ney, R. L. Adrenal cholesterol uptake from
plasma lipoproteins: regulation by corticotropin. Proc. Natl. Acad. Sci. U. S. A. 73, 4329-4333
(1976).
239 Shen, W. J., Hu, J., Hu, Z., Kraemer, F. B. & Azhar, S. Scavenger receptor class B type I (SR-
BI): a versatile receptor with multiple functions and actions. Metabolism 63, 875-886 (2014).
240 Gwynne, J. T., Hess, B., Hughes, T., Rountree, R. & Mahaffee, D. The role of serum high density
lipoproteins in adrenal steroidogenesis. Endocr. Res. 10, 411-430 (1984).

135
241 Galman, C., Angelin, B. & Rudling, M. Prolonged stimulation of the adrenals by corticotropin
suppresses hepatic low-density lipoprotein and high-density lipoprotein receptors and increases
plasma cholesterol. Endocrinology 143, 1809-1816 (2002).
242 Beaven, S. W. & Tontonoz, P. Nuclear receptors in lipid metabolism: targeting the heart of
dyslipidemia. Annu. Rev. Med. 57, 313-329 (2006).
243 Cao, G. et al. Structure and localization of the human gene encoding SR-BI/CLA-1. Evidence for
transcriptional control by steroidogenic factor 1. J. Biol. Chem. 272, 33068-33076 (1997).
244 Parker, K. L. The roles of steroidogenic factor 1 in endocrine development and function. Mol.
Cell. Endocrinol. 140, 59-63 (1998).
245 Lekstrom-Himes, J. & Xanthopoulos, K. G. Biological role of the CCAAT/enhancer-binding
protein family of transcription factors. J. Biol. Chem. 273, 28545-28548 (1998).
246 Al-Jarallah, A. & Trigatti, B. L. A role for the scavenger receptor, class B type I in high density
lipoprotein dependent activation of cellular signaling pathways. Biochim. Biophys. Acta 1801,
1239-1248 (2010).
247 Li, X. A. et al. High density lipoprotein binding to scavenger receptor, Class B, type I activates
endothelial nitric-oxide synthase in a ceramide-dependent manner. J. Biol. Chem. 277, 11058-
11063 (2002).
248 Mineo, C. & Shaul, P. W. HDL stimulation of endothelial nitric oxide synthase: a novel
mechanism of HDL action. Trends Cardiovasc. Med. 13, 226-231 (2003).
249 Yuhanna, I. S. et al. High-density lipoprotein binding to scavenger receptor-BI activates
endothelial nitric oxide synthase. Nat. Med. 7, 853-857 (2001).
250 Napoli, C. et al. Nitric oxide and atherosclerosis: an update. Nitric Oxide 15, 265-279 (2006).
251 Li, X. A., Guo, L., Dressman, J. L., Asmis, R. & Smart, E. J. A novel ligand-independent
apoptotic pathway induced by scavenger receptor class B, type I and suppressed by endothelial
nitric-oxide synthase and high density lipoprotein. J. Biol. Chem. 280, 19087-19096 (2005).
252 Nofer, J. R. et al. HDL induces NO-dependent vasorelaxation via the lysophospholipid receptor
S1P3. J. Clin. Invest. 113, 569-581 (2004).
253 Murata, N. et al. Interaction of sphingosine 1-phosphate with plasma components, including
lipoproteins, regulates the lipid receptor-mediated actions. Biochem. J. 352 Pt 3, 809-815 (2000).
254 Igarashi, J. & Michel, T. Sphingosine 1-phosphate and isoform-specific activation of
phosphoinositide 3-kinase beta. Evidence for divergence and convergence of receptor-regulated
endothelial nitric-oxide synthase signaling pathways. J. Biol. Chem. 276, 36281-36288 (2001).
255 Wood, P. et al. Ras/mitogen-activated protein kinase (MAPK) signaling modulates protein
stability and cell surface expression of scavenger receptor SR-BI. J. Biol. Chem. 286, 23077-
23092 (2011).

136
256 Mineo, C., Yuhanna, I. S., Quon, M. J. & Shaul, P. W. High density lipoprotein-induced
endothelial nitric-oxide synthase activation is mediated by Akt and MAP kinases. J. Biol. Chem.
278, 9142-9149 (2003).
257 Charlton-Menys, V. & Durrington, P. N. Human cholesterol metabolism and therapeutic
molecules. Exp. Physiol. 93, 27-42 (2008).
258 Feingold, K. R. & Grunfeld, C. Introduction to Lipids and Lipoproteins. (2000).
259 Gistera, A. & Hansson, G. K. The immunology of atherosclerosis. Nat Rev Nephrol 13, 368-380
(2017).
260 Gao, S. & Liu, J. Association between circulating oxidized low-density lipoprotein and
atherosclerotic cardiovascular disease. Chronic Dis Transl Med 3, 89-94 (2017).
261 Parthasarathy, S., Raghavamenon, A., Garelnabi, M. O. & Santanam, N. Oxidized low-density
lipoprotein. Methods Mol. Biol. 610, 403-417 (2010).
262 Zhou, L., Li, C., Gao, L. & Wang, A. High-density lipoprotein synthesis and metabolism
(Review). Mol Med Rep 12, 4015-4021 (2015).
263 Ji, A. et al. Scavenger receptor SR-BI in macrophage lipid metabolism. Atherosclerosis 217, 106-
112 (2011).
264 Rodrigueza, W. V. et al. Mechanism of scavenger receptor class B type I-mediated selective
uptake of cholesteryl esters from high density lipoprotein to adrenal cells. J. Biol. Chem. 274,
20344-20350 (1999).
265 Stangl, H., Hyatt, M. & Hobbs, H. H. Transport of lipids from high and low density lipoproteins
via scavenger receptor-BI. J. Biol. Chem. 274, 32692-32698 (1999).
266 Azhar, S., Nomoto, A., Leers-Sucheta, S. & Reaven, E. Simultaneous induction of an HDL
receptor protein (SR-BI) and the selective uptake of HDL-cholesteryl esters in a physiologically
relevant steroidogenic cell model. J. Lipid Res. 39, 1616-1628 (1998).
267 Silver, D. L., Wang, N., Xiao, X. & Tall, A. R. High density lipoprotein (HDL) particle uptake
mediated by scavenger receptor class B type 1 results in selective sorting of HDL cholesterol
from protein and polarized cholesterol secretion. J. Biol. Chem. 276, 25287-25293 (2001).
268 Rohrl, C. & Stangl, H. HDL endocytosis and resecretion. Biochim. Biophys. Acta 1831, 1626-
1633 (2013).
269 White, C. P. On the occurrence of crystals in tumours. The Journal of Pathology 13, 3-10 (1909).
270 Swyer, G. I. M. The cholesterol content of normal and enlarged prostates. Cancer Res. 2, 372-375
(1942).
271 Pearce, M. L. & Dayton, S. Incidence of cancer in men on a diet high in polyunsaturated fat.
Lancet 1, 464-467 (1971).
272 Muldoon, M. F., Manuck, S. B. & Matthews, K. A. Lowering cholesterol concentrations and
mortality: a quantitative review of primary prevention trials. BMJ 301, 309-314 (1990).

137
273 Ederer, F., Leren, P., Turpeine.O & Frantz, I. D. Cancer among Men on Cholesterol-Lowering
Diets - Experience from 5 Clinical Trials. Lancet 2, 203-& (1971).
274 Yusuf, S., Wittes, J. & Friedman, L. Overview of results of randomized clinical trials in heart
disease. II. Unstable angina, heart failure, primary prevention with aspirin, and risk factor
modification. JAMA 260, 2259-2263 (1988).
275 Solomon, K. R. & Freeman, M. R. The complex interplay between cholesterol and prostate
malignancy. Urol. Clin. North Am. 38, 243-259 (2011).
276 Bravi, F. et al. Self-reported history of hypercholesterolaemia and gallstones and the risk of
prostate cancer. Ann. Oncol. 17, 1014-1017 (2006).
277 Platz, E. A., Clinton, S. K. & Giovannucci, E. Association between plasma cholesterol and
prostate cancer in the PSA era. Int. J. Cancer 123, 1693-1698 (2008).
278 Batty, G. D., Kivimaki, M., Clarke, R., Smith, G. D. & Shipley, M. J. Modifiable risk factors for
prostate cancer mortality in London: forty years of follow-up in the Whitehall study. Cancer
Causes Control 22, 311-318 (2011).
279 Yannucci, J., Manola, J., Garnick, M. B., Bhat, G. & Bubley, G. J. The effect of androgen
deprivation therapy on fasting serum lipid and glucose parameters. J. Urol. 176, 520-525 (2006).
280 Mohamedali, H. Z., Breunis, H., Timilshina, N. & Alibhai, S. M. H. Changes in blood glucose
and cholesterol levels due to androgen deprivation therapy in men with non-metastatic prostate
cancer. Cuaj-Canadian Urological Association Journal 5, 28-32 (2011).
281 Zhuang, L., Kim, J., Adam, R. M., Solomon, K. R. & Freeman, M. R. Cholesterol targeting alters
lipid raft composition and cell survival in prostate cancer cells and xenografts. J. Clin. Invest.
115, 959-968 (2005).
282 Solomon, K. R. et al. Ezetimibe is an inhibitor of tumor angiogenesis. Am. J. Pathol. 174, 1017-
1026 (2009).
283 Mostaghel, E. A., Solomon, K. R., Pelton, K., Freeman, M. R. & Montgomery, R. B. Impact of
circulating cholesterol levels on growth and intratumoral androgen concentration of prostate
tumors. Plos One 7, e30062 (2012).
284 Llaverias, G. et al. A Western-type diet accelerates tumor progression in an autochthonous mouse
model of prostate cancer. Am. J. Pathol. 177, 3180-3191 (2010).
285 Li, J. et al. Up-regulated expression of scavenger receptor class B type 1 (SR-B1) is associated
with malignant behaviors and poor prognosis of breast cancer. Pathol. Res. Pract. 212, 555-559
(2016).
286 Yuan, B. et al. High scavenger receptor class B type I expression is related to tumor
aggressiveness and poor prognosis in breast cancer. Tumour Biol. 37, 3581-3588 (2016).
287 Xu, G. et al. Diagnostic and prognostic value of scavenger receptor class B type 1 in clear cell
renal cell carcinoma. Tumour Biol. 39, 1010428317699110 (2017).

138
288 Schorghofer, D. et al. The HDL receptor SR-BI is associated with human prostate cancer
progression and plays a possible role in establishing androgen independence. Reprod Biol
Endocrinol 13, 88 (2015).
289 Leon, C. G. et al. Alterations in Cholesterol Regulation Contribute to the Production of
Intratumoral Androgens During Progression to Castration-Resistant Prostate Cancer in a Mouse
Xenograft Model. Prostate 70, 390-400 (2010).
290 Twiddy, A. L., Cox, M. E. & Wasan, K. M. Knockdown of scavenger receptor Class B Type I
reduces prostate specific antigen secretion and viability of prostate cancer cells. Prostate 72, 955-
965 (2012).
291 Demierre, M. F., Higgins, P. D., Gruber, S. B., Hawk, E. & Lippman, S. M. Statins and cancer
prevention. Nat Rev Cancer 5, 930-942 (2005).
292 Papadopoulos, G., Delakas, D., Nakopoulou, L. & Kassimatis, T. Statins and prostate cancer:
molecular and clinical aspects. Eur. J. Cancer 47, 819-830 (2011).
293 Alfaqih, M. A., Allott, E. H., Hamilton, R. J., Freeman, M. R. & Freedland, S. J. The current
evidence on statin use and prostate cancer prevention: are we there yet? Nat Rev Urol 14, 107-
119 (2017).
294 Mucci, L. A. & Stampfer, M. J. Mounting evidence for prediagnostic use of statins in reducing
risk of lethal prostate cancer. J. Clin. Oncol. 32, 1-2 (2014).
295 Shannon, J. et al. Statins and prostate cancer risk: a case-control study. Am. J. Epidemiol. 162,
318-325 (2005).
296 Jespersen, C. G., Norgaard, M., Friis, S., Skriver, C. & Borre, M. Statin use and risk of prostate
cancer: a Danish population-based case-control study, 1997-2010. Cancer Epidemiol 38, 42-47
(2014).
297 Tan, N., Klein, E. A., Li, J., Moussa, A. S. & Jones, J. S. Statin use and risk of prostate cancer in
a population of men who underwent biopsy. J. Urol. 186, 86-90 (2011).
298 Farwell, W. R., D'Avolio, L. W., Scranton, R. E., Lawler, E. V. & Gaziano, J. M. Statins and
Prostate Cancer Diagnosis and Grade in a Veterans Population. J. Natl. Cancer Inst. 103, 885-892
(2011).
299 Murtola, T. J. et al. Prostate cancer and PSA among statin users in the Finnish prostate cancer
screening trial. Int. J. Cancer 127, 1650-1659 (2010).
300 Breau, R. H. et al. The association between statin use and the diagnosis of prostate cancer in a
population based cohort. J. Urol. 184, 494-499 (2010).
301 Lustman, A., Nakar, S., Cohen, A. D. & Vinker, S. Statin use and incident prostate cancer risk:
does the statin brand matter? A population-based cohort study. Prostate Cancer Prostatic Dis 17,
6-9 (2014).
302 Freedland, S. J. et al. Statin use and risk of prostate cancer and high-grade prostate cancer: results
from the REDUCE study. Prostate Cancer Prostatic Dis 16, 254-259 (2013).

139
303 Friis, S. et al. Cancer risk among statin users: a population-based cohort study. Int. J. Cancer 114,
643-647 (2005).
304 Platz, E. A. et al. Statin drugs and risk of advanced prostate cancer. J. Natl. Cancer Inst. 98,
1819-1825 (2006).
305 Jacobs, E. J. et al. Cholesterol-lowering drugs and advanced prostate cancer incidence in a large
U.S. cohort. Cancer Epidemiol. Biomarkers Prev. 16, 2213-2217 (2007).
306 Smeeth, L., Douglas, I., Hall, A. J., Hubbard, R. & Evans, S. Effect of statins on a wide range of
health outcomes: a cohort study validated by comparison with randomized trials. Br. J. Clin.
Pharmacol. 67, 99-109 (2009).
307 Hippisley-Cox, J. & Coupland, C. Unintended effects of statins in men and women in England
and Wales: population based cohort study using the QResearch database. BMJ 340, c2197 (2010).
308 Jacobs, E. J., Newton, C. C., Thun, M. J. & Gapstur, S. M. Long-term use of cholesterol-lowering
drugs and cancer incidence in a large United States cohort. Cancer Res. 71, 1763-1771 (2011).
309 Chan, J. M. et al. Statin use and risk of prostate cancer in the prospective Osteoporotic Fractures
in Men (MrOS) Study. Cancer Epidemiol. Biomarkers Prev. 21, 1886-1888 (2012).
310 Friedman, G. D. et al. Screening statins for possible carcinogenic risk: up to 9 years of follow-up
of 361,859 recipients. Pharmacoepidemiol Drug Saf 17, 27-36 (2008).
311 Murtola, T. J., Tammela, T. L., Lahtela, J. & Auvinen, A. Cholesterol-lowering drugs and
prostate cancer risk: a population-based case-control study. Cancer Epidemiol. Biomarkers Prev.
16, 2226-2232 (2007).
312 Chang, C. C., Ho, S. C., Chiu, H. F. & Yang, C. Y. Statins increase the risk of prostate cancer: a
population-based case-control study. Prostate 71, 1818-1824 (2011).
313 Haukka, J. et al. Incidence of cancer and statin usage--record linkage study. Int. J. Cancer 126,
279-284 (2010).
314 Bansal, D., Undela, K., D'Cruz, S. & Schifano, F. Statin Use and Risk of Prostate Cancer: A
Meta-Analysis of Observational Studies. Plos One 7 (2012).
315 Fulcher, J. et al. Efficacy and safety of LDL-lowering therapy among men and women: meta-
analysis of individual data from 174,000 participants in 27 randomised trials. Lancet 385, 1397-
1405 (2015).
316 Bonovas, S., Filioussi, K. & Sitaras, N. M. Statin use and the risk of prostate cancer: A
metaanalysis of 6 randomized clinical trials and 13 observational studies. Int. J. Cancer 123, 899-
904 (2008).
317 Kuoppala, J., Lamminpaa, A. & Pukkala, E. Statins and cancer: A systematic review and meta-
analysis. Eur. J. Cancer 44, 2122-2132 (2008).
318 Platz, E. A. et al. Statin drug use is not associated with prostate cancer risk in men who are
regularly screened. J. Urol. 192, 379-384 (2014).

140
319 Boudreau, D. M., Yu, O., Buist, D. S. & Miglioretti, D. L. Statin use and prostate cancer risk in a
large population-based setting. Cancer Causes Control 19, 767-774 (2008).
320 Coogan, P. F., Kelly, J. P., Strom, B. L. & Rosenberg, L. Statin and NSAID use and prostate
cancer risk. Pharmacoepidemiol Drug Saf 19, 752-755 (2010).
321 Fowke, J. H. et al. The associations between statin use and prostate cancer screening, prostate
size, high-grade prostatic intraepithelial neoplasia (PIN), and prostate cancer. Cancer Causes
Control 22, 417-426 (2011).
322 Flick, E. D. et al. Statin use and risk of prostate cancer in the California Men's Health Study
cohort. Cancer Epidemiol. Biomarkers Prev. 16, 2218-2225 (2007).
323 Kantor, E. D. et al. Statin use and risk of prostate cancer: Results from the Southern Community
Cohort Study. Prostate 75, 1384-1393 (2015).
324 Geybels, M. S. et al. Statin Use in Relation to Prostate Cancer Outcomes in a Population-based
Patient Cohort Study. Prostate 73, 1214-1222 (2013).
325 Harshman, L. C. et al. Statin Use at the Time of Initiation of Androgen Deprivation Therapy and
Time to Progression in Patients With Hormone-Sensitive Prostate Cancer. JAMA Oncol 1, 495-
504 (2015).
326 Park, H. S. et al. Statins and prostate cancer recurrence following radical prostatectomy or
radiotherapy: a systematic review and meta-analysis. Ann. Oncol. 24, 1427-1434 (2013).
327 Nielsen, S. F., Nordestgaard, B. G. & Bojesen, S. E. Statin use and reduced cancer-related
mortality. N. Engl. J. Med. 367, 1792-1802 (2012).
328 Grytli, H. H., Fagerland, M. W., Fossa, S. D. & Tasken, K. A. Association between use of beta-
blockers and prostate cancer-specific survival: a cohort study of 3561 prostate cancer patients
with high-risk or metastatic disease. Eur. Urol. 65, 635-641 (2014).
329 Yu, O. et al. Use of statins and the risk of death in patients with prostate cancer. J. Clin. Oncol.
32, 5-11 (2014).
330 Marcella, S. W., David, A., Ohman-Strickland, P. A., Carson, J. & Rhoads, G. G. Statin use and
fatal prostate cancer A Matched Case-Control Study. Cancer 118, 4046-4052 (2012).
331 Larsen, S. B. et al. Postdiagnosis Statin Use and Mortality in Danish Patients With Prostate
Cancer. J. Clin. Oncol. 35, 3290-3297 (2017).
332 Hoque, A., Chen, H. & Xu, X. C. Statin induces apoptosis and cell growth arrest in prostate
cancer cells. Cancer Epidemiol. Biomarkers Prev. 17, 88-94 (2008).
333 Brown, M. et al. The differential effects of statins on the metastatic behaviour of prostate cancer.
Br. J. Cancer 106, 1689-1696 (2012).
334 Nubel, T., Dippold, W., Kleinert, H., Kaina, B. & Fritz, G. Lovastatin inhibits Rho-regulated
expression of E-selectin by TNFalpha and attenuates tumor cell adhesion. FASEB J. 18, 140-142
(2004).

141
335 Weis, M., Heeschen, C., Glassford, A. J. & Cooke, J. P. Statins have biphasic effects on
angiogenesis. Circulation 105, 739-745 (2002).
336 Dobs, A. S. et al. Effects of high-dose simvastatin on adrenal and gonadal steroidogenesis in men
with hypercholesterolemia. Metabolism 49, 1234-1238 (2000).
337 Hyyppa, M. T., Kronholm, E., Virtanen, A., Leino, A. & Jula, A. Does simvastatin affect mood
and steroid hormone levels in hypercholesterolemic men? A randomized double-blind trial.
Psychoneuroendocrinology 28, 181-194 (2003).
338 Bohm, M., Herrmann, W., Wassmann, S., Laufs, U. & Nickenig, G. Does statin therapy influence
steroid hormone synthesis? Z. Kardiol. 93, 43-48 (2004).
339 Hall, S. A. et al. Do statins affect androgen levels in men? Results from the Boston area
community health survey. Cancer Epidemiol. Biomarkers Prev. 16, 1587-1594 (2007).
340 Kim, J. H., Cox, M. E. & Wasan, K. M. Effect of simvastatin on castration-resistant prostate
cancer cells. Lipids in Health and Disease 13 (2014).
341 Rao, S. et al. Lovastatin-mediated G1 arrest is through inhibition of the proteasome, independent
of hydroxymethyl glutaryl-CoA reductase. Proc. Natl. Acad. Sci. U. S. A. 96, 7797-7802 (1999).
342 Di Lorenzo, G. et al. Statin Use and Survival in Patients with Metastatic Castration-resistant
Prostate Cancer Treated with Abiraterone Acetate. Eur Urol Focus (2017).
343 Harshman, L. C. et al. The impact of statin use on the efficacy of abiraterone acetate in patients
with castration-resistant prostate cancer. Prostate 77, 1303-1311 (2017).
344 Bewick, V., Cheek, L. & Ball, J. Statistics review 12: survival analysis. Crit Care 8, 389-394
(2004).
345 Goyal, J. et al. Association of the Charlson comorbidity index and hypertension with survival in
men with metastatic castration-resistant prostate cancer. Urol Oncol 32, 36 e27-34 (2014).
346 Ibuki, N. et al. The tyrphostin NT157 suppresses insulin receptor substrates and augments
therapeutic response of prostate cancer. Mol Cancer Ther 13, 2827-2839 (2014).
347 Fokidis, H. B. et al. A low carbohydrate, high protein diet suppresses intratumoral androgen
synthesis and slows castration-resistant prostate tumor growth in mice. J. Steroid Biochem. Mol.
Biol. 150, 35-45 (2015).
348 Toren, P. J. et al. Anticancer activity of a novel selective CYP17A1 inhibitor in preclinical
models of castrate-resistant prostate cancer. Mol Cancer Ther 14, 59-69 (2015).
349 Yamazaki, S. Translational pharmacokinetic-pharmacodynamic modeling from nonclinical to
clinical development: a case study of anticancer drug, crizotinib. AAPS J 15, 354-366 (2013).
350 Backman, J. T., Kyrklund, C., Kivisto, K. T., Wang, J. S. & Neuvonen, P. J. Plasma
concentrations of active simvastatin acid are increased by gemfibrozil. Clin. Pharmacol. Ther. 68,
122-129 (2000).

142
351 Ibuki, N. et al. TAK-441, a novel investigational smoothened antagonist, delays castration-
resistant progression in prostate cancer by disrupting paracrine hedgehog signaling. Int. J. Cancer
133, 1955-1966 (2013).
352 Zocor (simvastatin) prescription notes. (Cramlington, Northumberland, UK, 2015).
353 Paller, C. J. & Antonarakis, E. S. Management of biochemically recurrent prostate cancer after
local therapy: evolving standards of care and new directions. Clin Adv Hematol Oncol 11, 14-23
(2013).
354 Tonelli, M. et al. Efficacy of statins for primary prevention in people at low cardiovascular risk: a
meta-analysis. CMAJ 183, E1189-1202 (2011).
355 Chou, R., Dana, T., Blazina, I., Daeges, M. & Jeanne, T. L. Statins for Prevention of
Cardiovascular Disease in Adults: Evidence Report and Systematic Review for the US Preventive
Services Task Force. JAMA 316, 2008-2024 (2016).
356 Adedinsewo, D. et al. Prevalence and Factors Associated With Statin Use Among a Nationally
Representative Sample of US Adults: National Health and Nutrition Examination Survey, 2011-
2012. Clin. Cardiol. 39, 491-496 (2016).
357 Raval, A. D. et al. Association between statins and clinical outcomes among men with prostate
cancer: a systematic review and meta-analysis. Prostate Cancer Prostatic Dis 19, 151-162
(2016).
358 Cai, C. et al. Intratumoral de novo steroid synthesis activates androgen receptor in castration-
resistant prostate cancer and is upregulated by treatment with CYP17A1 inhibitors. Cancer Res.
71, 6503-6513 (2011).
359 Taplin, M. E. et al. Androgen receptor mutations in androgen-independent prostate cancer:
Cancer and Leukemia Group B Study 9663. J. Clin. Oncol. 21, 2673-2678 (2003).
360 Nacusi, L. P. & Tindall, D. J. Androgen receptor abnormalities in castration-recurrent prostate
cancer. Expert Rev Endocrinol Metab 4, 417-422 (2009).
361 Flora M. Hammond, James F. Malec, Todd G. Nick & Buschbacher., R. M. Handbook for
clinical research : design, statistics, and implementation. (Demos Medical Publishing, 2015).
362 Gordon, J. A. et al. Statin use and survival in patients with metastatic castrationresistant prostate
cancer treated with abiraterone or enzalutamide after docetaxel failure: the international
retrospective observational STABEN study. Oncotarget 9, 19861-19873 (2018).
363 Roy, M., Kung, H. J. & Ghosh, P. M. Statins and prostate cancer: role of cholesterol inhibition vs.
prevention of small GTP-binding proteins. Am J Cancer Res 1, 542-561 (2011).
364 Gordon, J. A. et al. Oral simvastatin administration delays castration-resistant progression and
reduces intratumoral steroidogenesis of LNCaP prostate cancer xenografts. Prostate Cancer
Prostatic Dis 19, 21-27 (2016).
365 Solomon, K. R. & Freeman, M. R. Do the cholesterol-lowering properties of statins affect cancer
risk? Trends Endocrinol. Metab. 19, 113-121 (2008).

143
366 Maxfield, F. R. & Wustner, D. Intracellular cholesterol transport. J. Clin. Invest. 110, 891-898
(2002).
367 Zheng, X. et al. Atorvastatin and Celecoxib in Combination Inhibits the Progression of
Androgen-Dependent LNCaP Xenograft Prostate Tumors to Androgen Independence. Cancer
Prevention Research 3, 114-124 (2010).
368 Thysell, E. et al. Metabolomic characterization of human prostate cancer bone metastases reveals
increased levels of cholesterol. Plos One 5, e14175 (2010).
369 Bair, S. R. & Mellon, S. H. Deletion of the mouse P450c17 gene causes early embryonic
lethality. Mol. Cell. Biol. 24, 5383-5390 (2004).
370 Grigoryev, D. N., Long, B. J., Njar, V. C. & Brodie, A. H. Pregnenolone stimulates LNCaP
prostate cancer cell growth via the mutated androgen receptor. J. Steroid Biochem. Mol. Biol. 75,
1-10 (2000).
371 Attard, G. et al. Clinical and biochemical consequences of CYP17A1 inhibition with abiraterone
given with and without exogenous glucocorticoids in castrate men with advanced prostate cancer.
J. Clin. Endocrinol. Metab. 97, 507-516 (2012).
372 Don-Doncow, N. et al. Expression of STAT3 in Prostate Cancer Metastases. Eur. Urol. 71, 313-
316 (2017).
373 Ren, S. et al. Whole-genome and Transcriptome Sequencing of Prostate Cancer Identify New
Genetic Alterations Driving Disease Progression. Eur. Urol. (2017).
374 Beltran, H. et al. Molecular characterization of neuroendocrine prostate cancer and identification
of new drug targets. Cancer Discov 1, 487-495 (2011).
375 Beltran, H. et al. Divergent clonal evolution of castration-resistant neuroendocrine prostate
cancer. Nat. Med. 22, 298-305 (2016).
376 Pernicova, Z. et al. Androgen depletion induces senescence in prostate cancer cells through
down-regulation of Skp2. Neoplasia 13, 526-536 (2011).
377 Midha, A. Determining the Role of Scavenger Receptor Class B Type I as a Source of Cholesterol
for de novo Androgen Synthesis in Castration-resistant Prostate Cancer Master of Science thesis,
University of British Columbia, (2015).
378 Yu, M. et al. Exoplasmic cysteine Cys384 of the HDL receptor SR-BI is critical for its sensitivity
to a small-molecule inhibitor and normal lipid transport activity. Proc. Natl. Acad. Sci. U. S. A.
108, 12243-12248 (2011).
379 Yen, C. F. et al. Flow cytometric evaluation of LDL receptors using DiI-LDL uptake and its
application to B and T lymphocytic cell lines. J. Immunol. Methods 177, 55-67 (1994).
380 Pagler, T. A. et al. SR-BI-mediated high density lipoprotein (HDL) endocytosis leads to HDL
resecretion facilitating cholesterol efflux. J. Biol. Chem. 281, 11193-11204 (2006).

144
381 Stephan, Z. F. & Yurachek, E. C. Rapid fluorometric assay of LDL receptor activity by DiI-
labeled LDL. J. Lipid Res. 34, 325-330 (1993).
382 Tung, J. W. et al. Modern flow cytometry: a practical approach. Clin. Lab. Med. 27, 453-468, v
(2007).
383 EssenBioScience. IncuCyte ZOOM live cell imaging, <http://www.essenbioscience.com/essen-
products/incucyte/ > (2018).
384 Furukawa, J. et al. Antisense oligonucleotide targeting of insulin-like growth factor-1 receptor
(IGF-1R) in prostate cancer. Prostate 70, 206-218 (2010).
385 Riccardi, C. & Nicoletti, I. Analysis of apoptosis by propidium iodide staining and flow
cytometry. Nat Protoc 1, 1458-1461 (2006).
386 Nunez, R. DNA measurement and cell cycle analysis by flow cytometry. Curr Issues Mol Biol 3,
67-70 (2001).
387 Schambeck, C. M. Evaluation of the COBAS CORE Immunoassay for measuring prostate-
specific antigen (PSA)--multi-centre study results. The PSA Study Group. Eur. J. Clin. Chem.
Clin. Biochem. 33, 541-547 (1995).
388 Wyatt, A. W. & Gleave, M. E. Targeting the adaptive molecular landscape of castration-resistant
prostate cancer. EMBO Mol Med 7, 878-894 (2015).
389 Feldman, B. J. & Feldman, D. The development of androgen-independent prostate cancer. Nat
Rev Cancer 1, 34-45 (2001).
390 Chlenski, A., Nakashiro, K., Ketels, K. V., Korovaitseva, G. I. & Oyasu, R. Androgen receptor
expression in androgen-independent prostate cancer cell lines. Prostate 47, 66-75 (2001).
391 Chen, F. et al. Direct agonist/antagonist functions of dehydroepiandrosterone. Endocrinology
146, 4568-4576 (2005).
392 Zhang, F. et al. Clusterin facilitates stress-induced lipidation of LC3 and autophagosome
biogenesis to enhance cancer cell survival. Nat Commun 5, 5775 (2014).
393 Thorburn, A. Apoptosis and autophagy: regulatory connections between two supposedly different
processes. Apoptosis 13, 1-9 (2008).
394 Jung, C. H., Ro, S. H., Cao, J., Otto, N. M. & Kim, D. H. mTOR regulation of autophagy. FEBS
Lett. 584, 1287-1295 (2010).
395 Rohrl, C. et al. Endoplasmic reticulum stress impairs cholesterol efflux and synthesis in hepatic
cells. J. Lipid Res. 55, 94-103 (2014).
396 Hou, N. S. et al. Activation of the endoplasmic reticulum unfolded protein response by lipid
disequilibrium without disturbed proteostasis in vivo. Proc. Natl. Acad. Sci. U. S. A. 111, E2271-
2280 (2014).
397 Hetz, C. & Papa, F. R. The Unfolded Protein Response and Cell Fate Control. Mol. Cell 69, 169-
181 (2018).

145
398 Hoyer-Hansen, M. & Jaattela, M. Connecting endoplasmic reticulum stress to autophagy by
unfolded protein response and calcium. Cell Death Differ. 14, 1576-1582 (2007).
399 Rashid, H. O., Yadav, R. K., Kim, H. R. & Chae, H. J. ER stress: Autophagy induction, inhibition
and selection. Autophagy 11, 1956-1977 (2015).
400 Wang, M., Wey, S., Zhang, Y., Ye, R. & Lee, A. S. Role of the unfolded protein response
regulator GRP78/BiP in development, cancer, and neurological disorders. Antioxid Redox Signal
11, 2307-2316 (2009).
401 Chen, Y. & Brandizzi, F. IRE1: ER stress sensor and cell fate executor. Trends Cell Biol. 23, 547-
555 (2013).
402 Yang, Y. P. et al. Application and interpretation of current autophagy inhibitors and activators.
Acta Pharmacol Sin 34, 625-635 (2013).
403 Azhar, S. & Reaven, E. Scavenger receptor class BI and selective cholesteryl ester uptake:
partners in the regulation steroidogenesis. Mol. Cell. Endocrinol. 195, 1-26 (2002).
404 Grewal, T. et al. High density lipoprotein-induced signaling of the MAPK pathway involves
scavenger receptor type BI-mediated activation of Ras. J. Biol. Chem. 278, 16478-16481 (2003).
405 Danilo, C. et al. Scavenger receptor class B type I regulates cellular cholesterol metabolism and
cell signaling associated with breast cancer development. Breast Cancer Res 15, R87 (2013).
406 Stopsack, K. H. et al. Cholesterol uptake and regulation in high-grade and lethal prostate cancers.
Carcinogenesis 38, 806-811 (2017).
407 Belter, A. et al. Squalene monooxygenase - a target for hypercholesterolemic therapy. Biol.
Chem. 392, 1053-1075 (2011).
408 Brown, D. N. et al. Squalene epoxidase is a bona fide oncogene by amplification with clinical
relevance in breast cancer. Sci Rep 6, 19435 (2016).
409 Beltran, H. et al. Aggressive variants of castration-resistant prostate cancer. Clin. Cancer. Res.
20, 2846-2850 (2014).
410 Parimi, V., Goyal, R., Poropatich, K. & Yang, X. J. Neuroendocrine differentiation of prostate
cancer: a review. Am J Clin Exp Urol 2, 273-285 (2014).
411 Zhou, Z. et al. Synergy of p53 and Rb deficiency in a conditional mouse model for metastatic
prostate cancer. Cancer Res. 66, 7889-7898 (2006).
412 Cox, M. E., Deeble, P. D., Bissonette, E. A. & Parsons, S. J. Activated 3',5'-cyclic AMP-
dependent protein kinase is sufficient to induce neuroendocrine-like differentiation of the LNCaP
prostate tumor cell line. J. Biol. Chem. 275, 13812-13818 (2000).
413 Deeble, P. D., Murphy, D. J., Parsons, S. J. & Cox, M. E. Interleukin-6- and cyclic AMP-
mediated signaling potentiates neuroendocrine differentiation of LNCaP prostate tumor cells.
Mol. Cell. Biol. 21, 8471-8482 (2001).

146
414 Cox, M. E., Deeble, P. D., Lakhani, S. & Parsons, S. J. Acquisition of neuroendocrine
characteristics by prostate tumor cells is reversible: implications for prostate cancer progression.
Cancer Res. 59, 3821-3830 (1999).
415 Bishop, J. L. et al. The Master Neural Transcription Factor BRN2 Is an Androgen Receptor-
Suppressed Driver of Neuroendocrine Differentiation in Prostate Cancer. Cancer Discov 7, 54-71
(2017).
416 Zhang, X. et al. SRRM4 Expression and the Loss of REST Activity May Promote the Emergence
of the Neuroendocrine Phenotype in Castration-Resistant Prostate Cancer. Clin. Cancer. Res. 21,
4698-4708 (2015).
417 Cerasuolo, M. et al. Neuroendocrine Transdifferentiation in Human Prostate Cancer Cells: An
Integrated Approach. Cancer Res. 75, 2975-2986 (2015).
418 Kim, J., Adam, R. M., Solomon, K. R. & Freeman, M. R. Involvement of cholesterol-rich lipid
rafts in interleukin-6-induced neuroendocrine differentiation of LNCaP prostate cancer cells.
Endocrinology 145, 613-619 (2004).
419 Yue, S. et al. Cholesteryl ester accumulation induced by PTEN loss and PI3K/AKT activation
underlies human prostate cancer aggressiveness. Cell Metab 19, 393-406 (2014).
420 Horoszewicz, J. S. et al. LNCaP model of human prostatic carcinoma. Cancer Res. 43, 1809-
1818 (1983).
421 Kaighn, M. E., Narayan, K. S., Ohnuki, Y., Lechner, J. F. & Jones, L. W. Establishment and
characterization of a human prostatic carcinoma cell line (PC-3). Invest. Urol. 17, 16-23 (1979).
422 van Bokhoven, A. et al. Molecular characterization of human prostate carcinoma cell lines.
Prostate 57, 205-225 (2003).
423 Carroll, A. G., Voeller, H. J., Sugars, L. & Gelmann, E. P. p53 oncogene mutations in three
human prostate cancer cell lines. Prostate 23, 123-134 (1993).
424 Farrow, J. M., Yang, J. C. & Evans, C. P. Autophagy as a modulator and target in prostate cancer.
Nat Rev Urol 11, 508-516 (2014).
425 Nguyen, H. G. et al. Targeting autophagy overcomes Enzalutamide resistance in castration-
resistant prostate cancer cells and improves therapeutic response in a xenograft model. Oncogene
33, 4521-4530 (2014).
426 Bennett, H. L. et al. Does androgen-ablation therapy (AAT) associated autophagy have a pro-
survival effect in LNCaP human prostate cancer cells? BJU Int. 111, 672-682 (2013).
427 Kung, H. J. Targeting tyrosine kinases and autophagy in prostate cancer. Horm Cancer 2, 38-46
(2011).
428 Wu, Z. et al. Autophagy Blockade Sensitizes Prostate Cancer Cells towards Src Family Kinase
Inhibitors. Genes Cancer 1, 40-49 (2010).

147
429 Dozmorov, M. G. et al. Unique patterns of molecular profiling between human prostate cancer
LNCaP and PC-3 cells. Prostate 69, 1077-1090 (2009).
430 Levine, B. & Abrams, J. p53: The Janus of autophagy? Nat Cell Biol 10, 637-639 (2008).
431 Budanov, A. V. & Karin, M. p53 target genes sestrin1 and sestrin2 connect genotoxic stress and
mTOR signaling. Cell 134, 451-460 (2008).
432 Loayza-Puch, F. et al. p53 induces transcriptional and translational programs to suppress cell
proliferation and growth. Genome Biol 14, R32 (2013).
433 Lin, W. C. et al. Endoplasmic reticulum stress stimulates p53 expression through NF-kappaB
activation. Plos One 7, e39120 (2012).
434 Qu, L. et al. Endoplasmic reticulum stress induces p53 cytoplasmic localization and prevents
p53-dependent apoptosis by a pathway involving glycogen synthase kinase-3beta. Genes Dev. 18,
261-277 (2004).
435 Nieland, T. J., Penman, M., Dori, L., Krieger, M. & Kirchhausen, T. Discovery of chemical
inhibitors of the selective transfer of lipids mediated by the HDL receptor SR-BI. Proc. Natl.
Acad. Sci. U. S. A. 99, 15422-15427 (2002).
436 Park, Y. M. CD36, a scavenger receptor implicated in atherosclerosis. Exp. Mol. Med. 46, e99
(2014).
437 Wu, X., Daniels, G., Lee, P. & Monaco, M. E. Lipid metabolism in prostate cancer. Am J Clin
Exp Urol 2, 111-120 (2014).
438 Neculai, D. et al. Structure of LIMP-2 provides functional insights with implications for SR-BI
and CD36. Nature 504, 172-176 (2013).
439 Connelly, M. A., Klein, S. M., Azhar, S., Abumrad, N. A. & Williams, D. L. Comparison of class
B scavenger receptors, CD36 and scavenger receptor BI (SR-BI), shows that both receptors
mediate high density lipoprotein-cholesteryl ester selective uptake but SR-BI exhibits a unique
enhancement of cholesteryl ester uptake. J. Biol. Chem. 274, 41-47 (1999).
440 Gu, X. et al. The efficient cellular uptake of high density lipoprotein lipids via scavenger receptor
class B type I requires not only receptor-mediated surface binding but also receptor-specific lipid
transfer mediated by its extracellular domain. J. Biol. Chem. 273, 26338-26348 (1998).
441 Li, M. et al. Autophagy protects LNCaP cells under androgen deprivation conditions. Autophagy
4, 54-60 (2008).
442 Jiang, Q. et al. Targeting androgen receptor leads to suppression of prostate cancer via induction
of autophagy. J. Urol. 188, 1361-1368 (2012).
443 Beer, T. M. et al. Custirsen (OGX-011) combined with cabazitaxel and prednisone versus
cabazitaxel and prednisone alone in patients with metastatic castration-resistant prostate cancer
previously treated with docetaxel (AFFINITY): a randomised, open-label, international, phase 3
trial. Lancet Oncol (2017).

148
444 Lamoureux, F. et al. Blocked autophagy using lysosomotropic agents sensitizes resistant prostate
tumor cells to the novel Akt inhibitor AZD5363. Clin. Cancer. Res. 19, 833-844 (2013).
445 Kimura, T., Takabatake, Y., Takahashi, A. & Isaka, Y. Chloroquine in cancer therapy: a double-
edged sword of autophagy. Cancer Res. 73, 3-7 (2013).
446 Sajesh, B. V., Guppy, B. J. & McManus, K. J. Synthetic genetic targeting of genome instability in
cancer. Cancers (Basel) 5, 739-761 (2013).
447 Paul, J. M., Templeton, S. D., Baharani, A., Freywald, A. & Vizeacoumar, F. J. Building high-
resolution synthetic lethal networks: a 'Google map' of the cancer cell. Trends Mol Med 20, 704-
715 (2014).
448 Munuganti, R. S. et al. Identification of a potent antiandrogen that targets the BF3 site of the
androgen receptor and inhibits enzalutamide-resistant prostate cancer. Chem. Biol. 21, 1476-1485
(2014).
449 Lallous, N. et al. Targeting Binding Function-3 of the Androgen Receptor Blocks Its Co-
Chaperone Interactions, Nuclear Translocation, and Activation. Mol Cancer Ther 15, 2936-2945
(2016).
450 European Medicines Agency. Background review for the excipient propylene glycol. (European
Medicines Agency, 2014).
451 Abraxis Inc. VetScan Comprehensive Diagnostic Profile. (2015).
452 Lino, M. et al. Intestinal scavenger receptor class B type I as a novel regulator of chylomicron
production in healthy and diet-induced obese states. Am J Physiol Gastrointest Liver Physiol 309,
G350-359 (2015).
453 Huang, Z. et al. Characterization of preclinical in vitro and in vivo pharmacokinetics properties
for KBP-7018, a new tyrosine kinase inhibitor candidate for treatment of idiopathic pulmonary
fibrosis. Drug Des Devel Ther 9, 4319-4328 (2015).
454 Nieland, T. J. et al. Identification of the molecular target of small molecule inhibitors of HDL
receptor SR-BI activity. Biochemistry (Mosc). 47, 460-472 (2008).
455 Gowda, S. et al. A review on laboratory liver function tests. Pan Afr Med J 3, 17 (2009).
456 Sharma, M. et al. Lipoprotein (a) upregulates ABCA1 in liver cells via scavenger receptor-B1
through its oxidized phospholipids. J. Lipid Res. 56, 1318-1328 (2015).
457 de Beer, M. C. et al. The Impairment of Macrophage-to-Feces Reverse Cholesterol Transport
during Inflammation Does Not Depend on Serum Amyloid A. J Lipids 2013, 283486 (2013).
458 Beaslas, O. et al. Sensing of dietary lipids by enterocytes: a new role for SR-BI/CLA-1. Plos One
4, e4278 (2009).
459 Lipinski, C. A., Lombardo, F., Dominy, B. W. & Feeney, P. J. Experimental and computational
approaches to estimate solubility and permeability in drug discovery and development settings.
Adv Drug Deliv Rev 46, 3-26 (2001).

149
460 Savjani, K. T., Gajjar, A. K. & Savjani, J. K. Drug solubility: importance and enhancement
techniques. ISRN Pharm 2012, 195727 (2012).
461 Zhang, D., Luo, G., Ding, X. & Lu, C. Preclinical experimental models of drug metabolism and
disposition in drug discovery and development. Acta Pharmaceutica Sinica B 2, 549-561 (2012).
462 Smith, D. A., Di, L. & Kerns, E. H. The effect of plasma protein binding on in vivo efficacy:
misconceptions in drug discovery. Nat Rev Drug Discov 9, 929-939 (2010).
463 Liu, X., Wright, M. & Hop, C. E. Rational use of plasma protein and tissue binding data in drug
design. J. Med. Chem. 57, 8238-8248 (2014).
464 Phillips, M. C. Molecular mechanisms of cellular cholesterol efflux. J. Biol. Chem. 289, 24020-
24029 (2014).
465 Yancey, P. G. et al. High density lipoprotein phospholipid composition is a major determinant of
the bi-directional flux and net movement of cellular free cholesterol mediated by scavenger
receptor BI. J. Biol. Chem. 275, 36596-36604 (2000).
466 Rothblat, G. H. et al. Cell cholesterol efflux: integration of old and new observations provides
new insights. J. Lipid Res. 40, 781-796 (1999).
467 Benedict, M. & Zhang, X. Non-alcoholic fatty liver disease: An expanded review. World J
Hepatol 9, 715-732 (2017).
468 Trojak, A., Walus-Miarka, M., Wozniakiewicz, E., Malecki, M. T. & Idzior-Walus, B.
Nonalcoholic fatty liver disease is associated with low HDL cholesterol and coronary angioplasty
in patients with type 2 diabetes. Med Sci Monit 19, 1167-1172 (2013).
469 Faloon, P. W. et al. A Small Molecule Inhibitor of Scavenger Receptor BI-mediated Lipid Uptake-
Probe 1. (2010).
470 Dockendorff, C. et al. Indolinyl-Thiazole Based Inhibitors of Scavenger Receptor-BI (SR-BI)-
Mediated Lipid Transport. ACS Med Chem Lett 6, 375-380 (2015).
471 Wang, C. Y., Liu, P. Y. & Liao, J. K. Pleiotropic effects of statin therapy: molecular mechanisms
and clinical results. Trends Mol Med 14, 37-44 (2008).
472 Laufs, U., La Fata, V., Plutzky, J. & Liao, J. K. Upregulation of endothelial nitric oxide synthase
by HMG CoA reductase inhibitors. Circulation 97, 1129-1135 (1998).
473 Laufs, U. & Liao, J. K. Post-transcriptional regulation of endothelial nitric oxide synthase mRNA
stability by Rho GTPase. J. Biol. Chem. 273, 24266-24271 (1998).
474 Kureishi, Y. et al. The HMG-CoA reductase inhibitor simvastatin activates the protein kinase Akt
and promotes angiogenesis in normocholesterolemic animals. Nat. Med. 6, 1004-1010 (2000).
475 Kwak, B., Mulhaupt, F., Myit, S. & Mach, F. Statins as a newly recognized type of
immunomodulator. Nat. Med. 6, 1399-1402 (2000).
476 Trapani, L., Segatto, M., Ascenzi, P. & Pallottini, V. Potential role of nonstatin cholesterol
lowering agents. IUBMB Life 63, 964-971 (2011).

150
477 Bonovas, S., Nikolopoulos, G. K. & Bagos, P. G. Use of fibrates and cancer risk: a systematic
review and meta-analysis of 17 long-term randomized placebo-controlled trials. Plos One 7,
e45259 (2012).
478 Ganji, S. H., Kamanna, V. S. & Kashyap, M. L. Niacin and cholesterol: role in cardiovascular
disease (review). J Nutr Biochem 14, 298-305 (2003).
479 Baud, V. & Karin, M. Is NF-kappaB a good target for cancer therapy? Hopes and pitfalls. Nat
Rev Drug Discov 8, 33-40 (2009).
480 Kim, L. C., Song, L. & Haura, E. B. Src kinases as therapeutic targets for cancer. Nat Rev Clin
Oncol 6, 587-595 (2009).
481 Mucci, L. A. & Kantoff, P. W. Is the Evidence Sufficient to Recommend Statins for All Men
With Prostate Cancer? J. Clin. Oncol. 35, 3272-+ (2017).
482 Xie, W. et al. Metastasis-Free Survival Is a Strong Surrogate of Overall Survival in Localized
Prostate Cancer. J. Clin. Oncol. 35, 3097-3104 (2017).
483 Hawley, S. et al. A model for the design and construction of a resource for the validation of
prognostic prostate cancer biomarkers: the Canary Prostate Cancer Tissue Microarray. Adv. Anat.
Pathol. 20, 39-44 (2013).
484 Liu, L. L. et al. Mechanisms of the androgen receptor splicing in prostate cancer cells. Oncogene
33, 3140-3150 (2014).
485 Bishop, J. L. et al. PD-L1 is highly expressed in Enzalutamide resistant prostate cancer.
Oncotarget 6, 234-242 (2015).
486 Leiblich, A. et al. Human prostate cancer cells express neuroendocrine cell markers PGP 9.5 and
chromogranin A. Prostate 67, 1761-1769 (2007).
487 Daniel, V. C. et al. A primary xenograft model of small-cell lung cancer reveals irreversible
changes in gene expression imposed by culture in vitro. Cancer Res. 69, 3364-3373 (2009).
488 Tentler, J. J. et al. Patient-derived tumour xenografts as models for oncology drug development.
Nat Rev Clin Oncol 9, 338-350 (2012).
489 Davies, A. H., Wang, Y. & Zoubeidi, A. Patient-derived xenografts: A platform for accelerating
translational research in prostate cancer. Mol. Cell. Endocrinol. 462, 17-24 (2018).
490 Nguyen, H. M. et al. LuCaP Prostate Cancer Patient-Derived Xenografts Reflect the Molecular
Heterogeneity of Advanced Disease an--d Serve as Models for Evaluating Cancer Therapeutics.
Prostate 77, 654-671 (2017).
491 Shao, W. & Espenshade, P. J. Expanding roles for SREBP in metabolism. Cell Metab 16, 414-
419 (2012).
492 Subczynski, W. K., Pasenkiewicz-Gierula, M., Widomska, J., Mainali, L. & Raguz, M. High
Cholesterol/Low Cholesterol: Effects in Biological Membranes: A Review. Cell Biochem.
Biophys. 75, 369-385 (2017).

151
493 Sheng, R. et al. Cholesterol modulates cell signaling and protein networking by specifically
interacting with PDZ domain-containing scaffold proteins. Nat Commun 3, 1249 (2012).
494 Altman, B. J. & Rathmell, J. C. Metabolic stress in autophagy and cell death pathways. Cold
Spring Harb Perspect Biol 4, a008763 (2012).
495 Hsu, P. P. et al. The mTOR-regulated phosphoproteome reveals a mechanism of mTORC1-
mediated inhibition of growth factor signaling. Science 332, 1317-1322 (2011).
496 Mihaylova, M. M. & Shaw, R. J. The AMPK signalling pathway coordinates cell growth,
autophagy and metabolism. Nat Cell Biol 13, 1016-1023 (2011).
497 McInnes, K. J., Brown, K. A., Hunger, N. I. & Simpson, E. R. Regulation of LKB1 expression by
sex hormones in adipocytes. Int J Obes (Lond) 36, 982-985 (2012).
498 Ribas, V., Garcia-Ruiz, C. & Fernandez-Checa, J. C. Mitochondria, cholesterol and cancer cell
metabolism. Clin Transl Med 5, 22 (2016).
499 Papandreou, I., Lim, A. L., Laderoute, K. & Denko, N. C. Hypoxia signals autophagy in tumor
cells via AMPK activity, independent of HIF-1, BNIP3, and BNIP3L. Cell Death Differ. 15,
1572-1581 (2008).
500 de Laurentiis, A., Donovan, L. & Arcaro, A. Lipid rafts and caveolae in signaling by growth
factor receptors. Open Biochem J 1, 12-32 (2007).
501 Day, K. C. et al. HER2 and EGFR Overexpression Support Metastatic Progression of Prostate
Cancer to Bone. Cancer Res. 77, 74-85 (2017).
502 Wu, J. & Yu, E. Insulin-like growth factor receptor-1 (IGF-IR) as a target for prostate cancer
therapy. Cancer Metastasis Rev. 33, 607-617 (2014).
503 Mukherjee, R. et al. Upregulation of MAPK pathway is associated with survival in castrate-
resistant prostate cancer. Br. J. Cancer 104, 1920-1928 (2011).
504 Siddle, K. Molecular basis of signaling specificity of insulin and IGF receptors: neglected corners
and recent advances. Front Endocrinol (Lausanne) 3, 34 (2012).
505 Shanware, N. P., Bray, K. & Abraham, R. T. The PI3K, metabolic, and autophagy networks:
interactive partners in cellular health and disease. Annu. Rev. Pharmacol. Toxicol. 53, 89-106
(2013).
506 Liu, P., Cheng, H., Roberts, T. M. & Zhao, J. J. Targeting the phosphoinositide 3-kinase pathway
in cancer. Nat Rev Drug Discov 8, 627-644 (2009).
507 Molina, J. R. & Adjei, A. A. The Ras/Raf/MAPK pathway. J Thorac Oncol 1, 7-9 (2006).
508 Dhillon, A. S., Hagan, S., Rath, O. & Kolch, W. MAP kinase signalling pathways in cancer.
Oncogene 26, 3279-3290 (2007).
509 Klymchenko, A. S. & Kreder, R. Fluorescent probes for lipid rafts: from model membranes to
living cells. Chem. Biol. 21, 97-113 (2014).

152
510 Lingwood, D. & Simons, K. Detergent resistance as a tool in membrane research. Nat Protoc 2,
2159-2165 (2007).
511 Redmann, M. et al. Inhibition of autophagy with bafilomycin and chloroquine decreases
mitochondrial quality and bioenergetic function in primary neurons. Redox Biol 11, 73-81 (2017).
512 Briceno, E., Reyes, S. & Sotelo, J. Therapy of glioblastoma multiforme improved by the
antimutagenic chloroquine. Neurosurg Focus 14, e3 (2003).
513 Sotelo, J., Briceno, E. & Lopez-Gonzalez, M. A. Adding chloroquine to conventional treatment
for glioblastoma multiforme: a randomized, double-blind, placebo-controlled trial. Ann. Intern.
Med. 144, 337-343 (2006).
514 Briceno, E., Calderon, A. & Sotelo, J. Institutional experience with chloroquine as an adjuvant to
the therapy for glioblastoma multiforme. Surg. Neurol. 67, 388-391 (2007).
515 Rojas-Puentes, L. L. et al. Phase II randomized, double-blind, placebo-controlled study of whole-
brain irradiation with concomitant chloroquine for brain metastases. Radiat Oncol 8, 209 (2013).
516 Eldredge, H. B. et al. Concurrent Whole Brain Radiotherapy and Short-Course Chloroquine in
Patients with Brain Metastases: A Pilot Trial. J Radiat Oncol 2 (2013).
517 Kyle, R. A. et al. Mutiple myeloma resistant to melphalan (NSC-8806) treated with
cyclophosphamide (NSC-26271), prednisone (NSC-10023), and chloroquine (NSC-187208).
Cancer Chemother. Rep. 59, 557-562 (1975).
518 Rangwala, R. et al. Phase I trial of hydroxychloroquine with dose-intense temozolomide in
patients with advanced solid tumors and melanoma. Autophagy 10, 1369-1379 (2014).
519 Rosenfeld, M. R. et al. A phase I/II trial of hydroxychloroquine in conjunction with radiation
therapy and concurrent and adjuvant temozolomide in patients with newly diagnosed
glioblastoma multiforme. Autophagy 10, 1359-1368 (2014).
520 Chude, C. I. & Amaravadi, R. K. Targeting Autophagy in Cancer: Update on Clinical Trials and
Novel Inhibitors. Int J Mol Sci 18 (2017).
521 Jones, S. E. & Jomary, C. Clusterin. Int. J. Biochem. Cell Biol. 34, 427-431 (2002).