Reliability and psychometric properties of the Greek translation of the State-Trait Anxiety...
10
BioMed Central Page 1 of 10 (page number not for citation purposes) Annals of General Psychiatry Open Access Primary research Reliability and psychometric properties of the Greek translation of the State-Trait Anxiety Inventory form Y: Preliminary data Konstantinos N Fountoulakis*, Marina Papadopoulou, Soula Kleanthous, Anna Papadopoulou, Vasiliki Bizeli, Ioannis Nimatoudis, Apostolos Iacovides and George S Kaprinis Address: 3rd Department of Psychiatry, Aristotle University of Thessaloniki, Greece Email: Konstantinos N Fountoulakis* - [email protected]; Marina Papadopoulou - [email protected]; Soula Kleanthous - [email protected]; Anna Papadopoulou - [email protected]; Vasiliki Bizeli - [email protected]; Ioannis Nimatoudis - [email protected]; Apostolos Iacovides - [email protected]; George S Kaprinis - [email protected] * Corresponding author Abstract Background: The State-Trait Anxiety Inventory form Y is a brief self-rating scale for the assessment of state and trait anxiety. The aim of the current preliminary study was to assess the psychometric properties of its Greek translation. Materials and methods: 121 healthy volunteers 27.22 ± 10.61 years old, and 22 depressed patients 29.48 ± 9.28 years old entered the study. In 20 of them the instrument was re-applied 1– 2 days later. Translation and Back Translation was made. The clinical diagnosis was reached with the SCAN v.2.0 and the IPDE. The Symptoms Rating Scale for Depression and Anxiety (SRSDA) and the EPQ were applied for cross-validation purposes. The Statistical Analysis included the Pearson Correlation Coefficient and the calculation of Cronbach's alpha. Results: The State score for healthy subjects was 34.30 ± 10.79 and the Trait score was 36.07 ± 10.47. The respected scores for the depressed patients were 56.22 ± 8.86 and 53.83 ± 10.87. Both State and Trait scores followed the normal distribution in control subjects. Cronbach's alpha was 0.93 for the State and 0.92 for the Trait subscale. The Pearson Correlation Coefficient between State and Trait subscales was 0.79. Both subscales correlated fairly with the anxiety subscale of the SRSDA. Test-retest reliability was excellent, with Pearson coefficient being between 0.75 and 0.98 for individual items and equal to 0.96 for State and 0.98 for Trait. Conclusion: The current study provided preliminary evidence concerning the reliability and the validity of the Greek translation of the STAI-form Y. Its properties are generally similar to those reported in the international literature, but further research is necessary. Background The State-Trait Anxiety Inventory (STAI) – form Y is a brief self-rating scale for the assessment of state and trait anxi- ety, in adults. The concepts of state and trait anxiety were first introduced by Cattell [1-3] and have been further elaborated by Spielberger [4-7] Published: 31 January 2006 Annals of General Psychiatry 2006, 5:2 doi:10.1186/1744-859X-5-2 Received: 02 December 2005 Accepted: 31 January 2006 This article is available from: http://www.annals-general-psychiatry.com/content/5/1/2 © 2006 Fountoulakis et al; licensee BioMed Central Ltd. This is an Open Access article distributed under the terms of the Creative Commons Attribution License (http://creativecommons.org/licenses/by/2.0 ), which permits unrestricted use, distribution, and reproduction in any medium, provided the original work is properly cited.
-
Upload
independent -
Category
Documents
-
view
1 -
download
0
Transcript of Reliability and psychometric properties of the Greek translation of the State-Trait Anxiety...
BioMed CentralAnnals of General Psychiatry
ss
Open AccePrimary researchReliability and psychometric properties of the Greek translation of the State-Trait Anxiety Inventory form Y: Preliminary dataKonstantinos N Fountoulakis*, Marina Papadopoulou, Soula Kleanthous, Anna Papadopoulou, Vasiliki Bizeli, Ioannis Nimatoudis, Apostolos Iacovides and George S KaprinisAddress: 3rd Department of Psychiatry, Aristotle University of Thessaloniki, Greece
Email: Konstantinos N Fountoulakis* - [email protected]; Marina Papadopoulou - [email protected]; Soula Kleanthous - [email protected]; Anna Papadopoulou - [email protected]; Vasiliki Bizeli - [email protected]; Ioannis Nimatoudis - [email protected]; Apostolos Iacovides - [email protected]; George S Kaprinis - [email protected]
* Corresponding author
AbstractBackground: The State-Trait Anxiety Inventory form Y is a brief self-rating scale for theassessment of state and trait anxiety. The aim of the current preliminary study was to assess thepsychometric properties of its Greek translation.
Materials and methods: 121 healthy volunteers 27.22 ± 10.61 years old, and 22 depressedpatients 29.48 ± 9.28 years old entered the study. In 20 of them the instrument was re-applied 1–2 days later. Translation and Back Translation was made. The clinical diagnosis was reached withthe SCAN v.2.0 and the IPDE. The Symptoms Rating Scale for Depression and Anxiety (SRSDA)and the EPQ were applied for cross-validation purposes. The Statistical Analysis included thePearson Correlation Coefficient and the calculation of Cronbach's alpha.
Results: The State score for healthy subjects was 34.30 ± 10.79 and the Trait score was 36.07 ±10.47. The respected scores for the depressed patients were 56.22 ± 8.86 and 53.83 ± 10.87. BothState and Trait scores followed the normal distribution in control subjects. Cronbach's alpha was0.93 for the State and 0.92 for the Trait subscale. The Pearson Correlation Coefficient betweenState and Trait subscales was 0.79. Both subscales correlated fairly with the anxiety subscale of theSRSDA. Test-retest reliability was excellent, with Pearson coefficient being between 0.75 and 0.98for individual items and equal to 0.96 for State and 0.98 for Trait.
Conclusion: The current study provided preliminary evidence concerning the reliability and thevalidity of the Greek translation of the STAI-form Y. Its properties are generally similar to thosereported in the international literature, but further research is necessary.
BackgroundThe State-Trait Anxiety Inventory (STAI) – form Y is a briefself-rating scale for the assessment of state and trait anxi-
ety, in adults. The concepts of state and trait anxiety werefirst introduced by Cattell [1-3] and have been furtherelaborated by Spielberger [4-7]
Published: 31 January 2006
Annals of General Psychiatry 2006, 5:2 doi:10.1186/1744-859X-5-2
Received: 02 December 2005Accepted: 31 January 2006
This article is available from: http://www.annals-general-psychiatry.com/content/5/1/2
© 2006 Fountoulakis et al; licensee BioMed Central Ltd. This is an Open Access article distributed under the terms of the Creative Commons Attribution License (http://creativecommons.org/licenses/by/2.0), which permits unrestricted use, distribution, and reproduction in any medium, provided the original work is properly cited.
Page 1 of 10(page number not for citation purposes)
Annals of General Psychiatry 2006, 5:2 http://www.annals-general-psychiatry.com/content/5/1/2
State anxiety (S-Anxiety) refers to the subjective and tran-sitory feeling of tension, nervousness, worry and may becharacterized by activation of the autonomous nervoussystem, at a given moment. Trait anxiety (T-Anxiety) refersto relatively stable individual differences in anxiety prone-ness as a personality trait, that is, in the tendency to per-ceive and respond to stressfull situations with elevationsin the intensity of state anxiety (S-Anxiety) reactions.
In general, the STAI measures anxiety as a feature of thegeneral population, thus it is expected its scores to followthe normal distribution. However it is widely used in theassessment of patient populations.
The State-Trait Anxiety Inventory (STAI) is reported to bereliable and valid and has been used extensively inresearch and clinical practice. The development of STAIwas initiated in 1964 by C.D. Spielberger and R.L. Gor-such and STAI-Form X was published in 1970 [8]. On thebasis of accumulated knowledge gained from extensiveresearch with the STAI, a revision of the scale began in1979, and eventually Form Y was published in 1985. TheSTAI comprises separate self-report scales for measuringstate and trait anxiety, consistent with the definitionsgiven above. The S-Anxiety scale (STAI Form Y-1) consistsof twenty statements that evaluate how the respondentfeels "right now, at this moment". The T- Anxiety scale(STAI Form Y-2) consists of twenty statements that evalu-ate how the respondent feels "generally". In responding tothe S-Anxiety scale, the subjects choose the number thatbest describes the intensity of their feelings: (1) not at all,(2) somewhat, (3) moderately, (4) very much so. Inresponding to the T-Anxiety scale, subjects rate the fre-quency of their feelings on the following four-point scale:(1) almost never, (2) sometimes, (3) often, (4) almostalways. Each STAI item is given a weighted score of 1 to 4.
A rating of 4 indicates the presence of high levels of anxi-ety for ten S-Anxiety items (#3, 4, 6, 7, 9, 12, 13, 14, 17and 18) and eleven T-Anxiety items (#22, 24, 25, 28, 29,31, 32, 35, 37, 38, 40). A high rating indicates the absenceof anxiety for the remaining ten S-Anxiety items and nineT-Anxiety items. The scoring weights for the anxiety-present items are the same as the chosen numbers on thetest form. The scoring weights for the anxiety-absent itemsare reversed. Scores for both the S-Anxiety and the T-Anx-iety scales can vary from a minimum of 20 to a maximumof 80.
The aim of the current preliminary study was to assess thereliability and the psychometric properties of the Greektranslation of the State-Trait Anxiety Inventory (STAI) –form Y.
Materials and methodsThe present study included 121 healthy volunteers aged27.22 ± 10.61 years old, and 22 depressed patients aged29.48 ± 9.28 years old.
This mixed population was chosen because of the natureof the instrument. The STAI principally measures anxietyas a feature of the general population, so the main studysample to test the properties of the instrument should be'healthy normal subjects'. However it is also important totest the properties of the instrument in a population thatmanifests higher than normal levels of anxiety. Depressedpatients were chosen on the basis that this patients popu-lation was easier for the researchers to recruit taking intoconsideration practical issues.
Patients were physically healthy with normal clinical andlaboratory findings (Electroencephalogram, blood andbiochemical testing, thyroid function, test for pregnancy,B12 and folic acid). They came from the inpatient andoutpatient unit of the 3rd Department of Psychiatry, Aris-totle University of Thessaloniki, General Hospital AHEPA,Thessaloniki, Greece. They were consecutive cases andwere chosen because they fulfilled the above criteria.
The normal controls group was composed by members ofthe hospital staff, students and other volunteers. A clinicalinterview confirmed that they did not suffer from anymental disorder and their prior history was free frommental and thyroid disorder. They were free of any medi-cation for at least two weeks and were physically healthy.
All patients and controls provided written informed con-sent before participating in the study.
Translation and back translation were made by two ofthe authors; one of whom did the translation and theother who did not know the original English text did theback translation. The final translation was fixed by con-sensus of all authors.
The Greek translation along with the translated manual ofthe test will be available from the same publisher of theEnglish version of the test and manual.
Clinical diagnosis was reached with the Schedules forClinical Assessment in Neuropsychiatry (SCAN) version2.0 [9,10] and the International Personality DisordersExamination (IPDE) [11-14]. Both were applied by one ofthe authors (KNF) who has official training in a WorldHealth Organization Training and Reference Center. TheIPDE did not contribute to the clinical diagnosis of anxi-ety and/or depression, but was used in the frame of a glo-bal and comprehensive assessment of the patients. Thesecond examiner performed an unstructured interview.
Page 2 of 10(page number not for citation purposes)
Annals of General Psychiatry 2006, 5:2 http://www.annals-general-psychiatry.com/content/5/1/2
Page 3 of 10(page number not for citation purposes)
Distribution of the Trait and State scores of the STAI in normal subjectsFigure 1Distribution of the Trait and State scores of the STAI in normal subjects. State does not follow the normal distribution, on the contrast Trait follows it
10 15 20 25 30 35 40 45 50 55 60 65 70 75 80
Distribution of the total score for the State subscale of the STAI
0
2
4
6
8
10
12
14
16
18
20
22
24
26
28
30N
oof
ob
s
10 15 20 25 30 35 40 45 50 55 60 65
0
2
4
6
8
10
12
14
16
18
20
22
24
Distribution of the total score for the Trait subscale of the STAI
No
of
ob
s

Annals of General Psychiatry 2006, 5:2 http://www.annals-general-psychiatry.com/content/5/1/2
Page 4 of 10(page number not for citation purposes)
Axis x: average (test and retest) State and Trait STAI scales scoresFigure 2Axis x: average (test and retest) State and Trait STAI scales scores. Axis y: the mean difference concerning the State and Trait STAI scales between test and retest
0 10 20 30 40 50 60 70
averstate
-12
-10
-8
-6
-4
-2
0
2
4
6
8
10
12
14D
iffe
ren
ceb
etw
een
Sta
tete
stan
dre
test
10 20 30 40 50 60 70
Average Trait test-retest score
-8
-6
-4
-2
0
2
4
6
Dif
fere
nce
bet
wee
nT
rait
test
an
dre
test
Average State test-retest score
+2 sd
Mean
-2 sd
+2 sd
Mean
-2 sd
Annals of General Psychiatry 2006, 5:2 http://www.annals-general-psychiatry.com/content/5/1/2
The Symptoms Rating Scale for Depression and Anxiety(SRSDA) which provides an Anxiety index and a BeckDepression Inventory-21 score and the Eysenk PersonalityQuestionnaire (EPQ) were applied for cross-validationpurposes.
In 20 of the patients the instrument was re-applied 1–2days later
Statistical analysisAnalysis of Variance (ANOVA)[15], was used to search fordifferences between groups, with Scheffe test as the post-hoc test.
The Kolmogorov-Smirnov test was used to test whetherthe State and Trait subscales follow the normal distribu-tion in normal subjects (figure 1).
Principal Components Analysis (without and after Var-imax Normalized Rotation) was performed, and factorcoefficients and scores were calculated.
Item Analysis [16] was performed, and the value of Cron-bach's alpha (α) for each STAI subscale was calculated.
During both Principal Components Analysis and ItemAnalysis, all subjects (both normal volunteers anddepressed patients) were included and all the items scoreswere turned to the direction of the presence of anxiety.Principal Component Analysis was performed also withthe inclusion of normal subjects alone.
Reliability assessment (test-retest)The Spearman Rank Correlation Coefficient (rho) was cal-culated to assess the test-retest reliability. However, thecalculation of correlation coefficients is not a sufficientmethod to test reliability and reproducibility of a methodand its results, because it is an index of correlation and notan index of agreement [15,17,18]. The calculation ofmeans and standard deviations for each STAI item andtotal score during the 1st (test) and 2nd (retest) applica-
tions may provide an impression of the stability of resultsover time.
Also, the means and the standard deviations of the differ-ences concerning each STAI item between test and retestwere calculated and the plots of the test vs. retest and dif-ference vs. average value for each variable were created. Infact it is not possible to use statistics to define acceptableagreement [15]. However these plots may assist decision.It is not possible to show all of these plots, but therespected concerning the STAI State and Trait Scores isshown in figures 2. This method was used in previousstudies concerning the validation of scientific methods[19,20].
Also, the module of 'Process Analysis Gage Repeatabilityand Reproducibility' of the Statsoft-Statistica was used tofurther investigate the repeatability of the STAI with theuse of Analysis of Variance (ANOVA) [21]. The purpose ofthis analysis is to determine the proportion of measure-ment variability that is due to
1. the subjects being assessed
2. the STAI items (method) used for the measurement
3. the trials (in our case: test vs. retest)
In the ideal case, only a negligible proportion of the vari-ability will be due to trial-to-trial repeatability.
ResultsThe State score for the healthy volunteers was 24.95 ±11.36 and the Trait score was 27.88 ± 11.43. The respectedscores for the depressed patients were 44.91 ± 9.18 and43.50 ± 9.99 respectively (F = 55.58, df = 2, p < 0.001;post-hoc Scheffe test: p < 0.001 for both State and Traitsubscales). The Kolmogorov-Smirnov test with the use ofnormal subjects alone, revealed that State does not followthe normal distribution (p < 0.001); on the contrary, Traitfollows the normal distribution (p = 0.15; figure 1).
Cronbach's alpha was 0.93 for the State and 0.92 for theTrait subscale. The Spearman Rank Correlation Coeffi-cient between State and Trait subscales was 0.79. Bothsubscales correlated strongly with the anxiety subscale ofthe SRSDA, but also with the Beck Depression Inventory-21 and the EPQ dimensions (table 1)
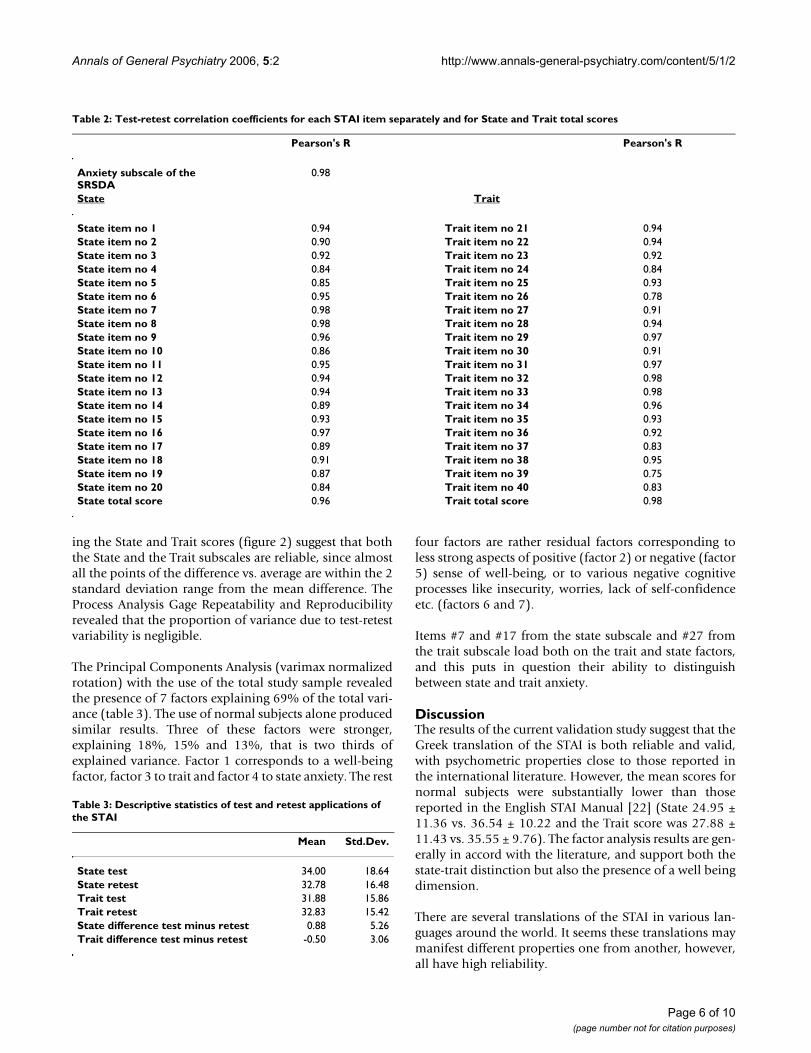
The test-retest reliability was excellent, with Pearson coef-ficient being between 0.75 and 0.98 for individual itemsand equal to 0.96 for State and 0.98 for Trait (table 2). Thedescriptive statistics of test vs. retest are shown in table 3.The bivariate scatterplots of the differences between meas-urements vs. the average value of measurements concern-
Table 1: Correlations of State and Trait subscales of the STAI to other psychometric scales
State Trait
Age -0.08 -0.11Years of education -0.21 -0.21Anxiety subscale of the SRSDA 0.79 0.72BDI-21 0.75 0.73EPQ P 0.22 0.26EPQ N 0.60 0.70EPQ E -0.35 -0.48EPQ L -0.13 -0.18
Page 5 of 10(page number not for citation purposes)
Annals of General Psychiatry 2006, 5:2 http://www.annals-general-psychiatry.com/content/5/1/2
ing the State and Trait scores (figure 2) suggest that boththe State and the Trait subscales are reliable, since almostall the points of the difference vs. average are within the 2standard deviation range from the mean difference. TheProcess Analysis Gage Repeatability and Reproducibilityrevealed that the proportion of variance due to test-retestvariability is negligible.
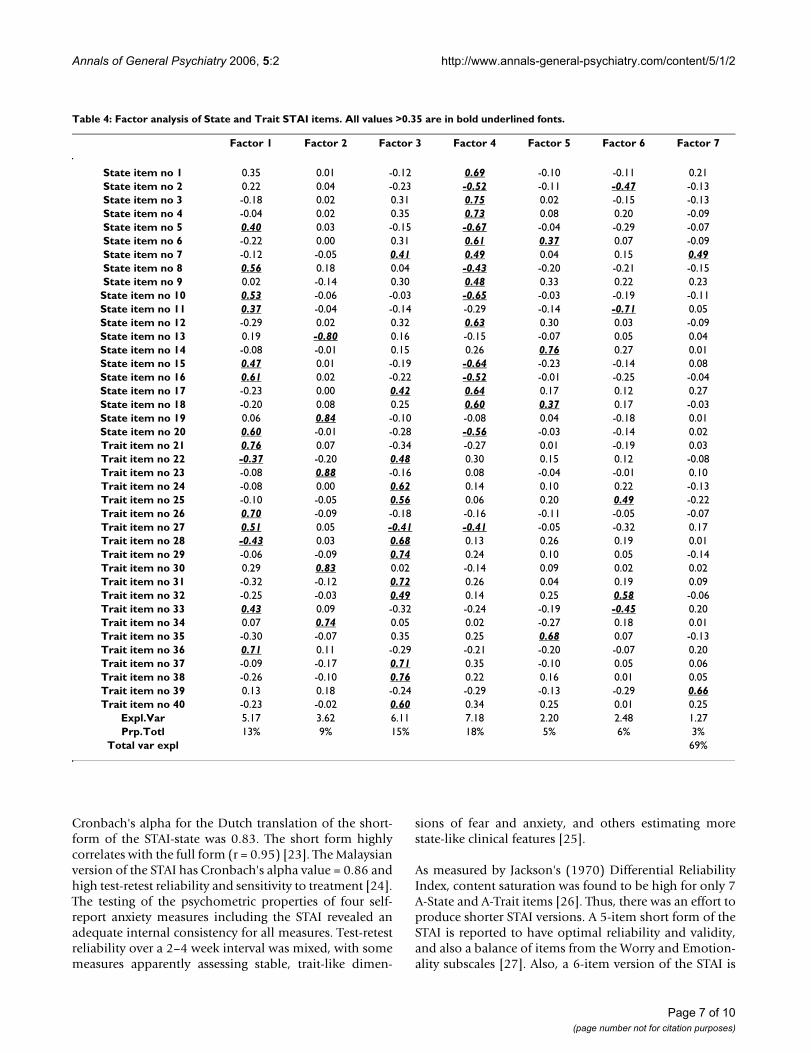
The Principal Components Analysis (varimax normalizedrotation) with the use of the total study sample revealedthe presence of 7 factors explaining 69% of the total vari-ance (table 3). The use of normal subjects alone producedsimilar results. Three of these factors were stronger,explaining 18%, 15% and 13%, that is two thirds ofexplained variance. Factor 1 corresponds to a well-beingfactor, factor 3 to trait and factor 4 to state anxiety. The rest
four factors are rather residual factors corresponding toless strong aspects of positive (factor 2) or negative (factor5) sense of well-being, or to various negative cognitiveprocesses like insecurity, worries, lack of self-confidenceetc. (factors 6 and 7).
Items #7 and #17 from the state subscale and #27 fromthe trait subscale load both on the trait and state factors,and this puts in question their ability to distinguishbetween state and trait anxiety.
DiscussionThe results of the current validation study suggest that theGreek translation of the STAI is both reliable and valid,with psychometric properties close to those reported inthe international literature. However, the mean scores fornormal subjects were substantially lower than thosereported in the English STAI Manual [22] (State 24.95 ±11.36 vs. 36.54 ± 10.22 and the Trait score was 27.88 ±11.43 vs. 35.55 ± 9.76). The factor analysis results are gen-erally in accord with the literature, and support both thestate-trait distinction but also the presence of a well beingdimension.
There are several translations of the STAI in various lan-guages around the world. It seems these translations maymanifest different properties one from another, however,all have high reliability.
Table 2: Test-retest correlation coefficients for each STAI item separately and for State and Trait total scores
Pearson's R Pearson's R
Anxiety subscale of the SRSDA
0.98
State Trait
State item no 1 0.94 Trait item no 21 0.94State item no 2 0.90 Trait item no 22 0.94State item no 3 0.92 Trait item no 23 0.92State item no 4 0.84 Trait item no 24 0.84State item no 5 0.85 Trait item no 25 0.93State item no 6 0.95 Trait item no 26 0.78State item no 7 0.98 Trait item no 27 0.91State item no 8 0.98 Trait item no 28 0.94State item no 9 0.96 Trait item no 29 0.97State item no 10 0.86 Trait item no 30 0.91State item no 11 0.95 Trait item no 31 0.97State item no 12 0.94 Trait item no 32 0.98State item no 13 0.94 Trait item no 33 0.98State item no 14 0.89 Trait item no 34 0.96State item no 15 0.93 Trait item no 35 0.93State item no 16 0.97 Trait item no 36 0.92State item no 17 0.89 Trait item no 37 0.83State item no 18 0.91 Trait item no 38 0.95State item no 19 0.87 Trait item no 39 0.75State item no 20 0.84 Trait item no 40 0.83State total score 0.96 Trait total score 0.98
Table 3: Descriptive statistics of test and retest applications of the STAI
Mean Std.Dev.
State test 34.00 18.64State retest 32.78 16.48Trait test 31.88 15.86Trait retest 32.83 15.42State difference test minus retest 0.88 5.26Trait difference test minus retest -0.50 3.06
Page 6 of 10(page number not for citation purposes)
Annals of General Psychiatry 2006, 5:2 http://www.annals-general-psychiatry.com/content/5/1/2
Cronbach's alpha for the Dutch translation of the short-form of the STAI-state was 0.83. The short form highlycorrelates with the full form (r = 0.95) [23]. The Malaysianversion of the STAI has Cronbach's alpha value = 0.86 andhigh test-retest reliability and sensitivity to treatment [24].The testing of the psychometric properties of four self-report anxiety measures including the STAI revealed anadequate internal consistency for all measures. Test-retestreliability over a 2–4 week interval was mixed, with somemeasures apparently assessing stable, trait-like dimen-
sions of fear and anxiety, and others estimating morestate-like clinical features [25].
As measured by Jackson's (1970) Differential ReliabilityIndex, content saturation was found to be high for only 7A-State and A-Trait items [26]. Thus, there was an effort toproduce shorter STAI versions. A 5-item short form of theSTAI is reported to have optimal reliability and validity,and also a balance of items from the Worry and Emotion-ality subscales [27]. Also, a 6-item version of the STAI is
Table 4: Factor analysis of State and Trait STAI items. All values >0.35 are in bold underlined fonts.
Factor 1 Factor 2 Factor 3 Factor 4 Factor 5 Factor 6 Factor 7
State item no 1 0.35 0.01 -0.12 0.69 -0.10 -0.11 0.21State item no 2 0.22 0.04 -0.23 -0.52 -0.11 -0.47 -0.13State item no 3 -0.18 0.02 0.31 0.75 0.02 -0.15 -0.13State item no 4 -0.04 0.02 0.35 0.73 0.08 0.20 -0.09State item no 5 0.40 0.03 -0.15 -0.67 -0.04 -0.29 -0.07State item no 6 -0.22 0.00 0.31 0.61 0.37 0.07 -0.09State item no 7 -0.12 -0.05 0.41 0.49 0.04 0.15 0.49State item no 8 0.56 0.18 0.04 -0.43 -0.20 -0.21 -0.15State item no 9 0.02 -0.14 0.30 0.48 0.33 0.22 0.23State item no 10 0.53 -0.06 -0.03 -0.65 -0.03 -0.19 -0.11State item no 11 0.37 -0.04 -0.14 -0.29 -0.14 -0.71 0.05State item no 12 -0.29 0.02 0.32 0.63 0.30 0.03 -0.09State item no 13 0.19 -0.80 0.16 -0.15 -0.07 0.05 0.04State item no 14 -0.08 -0.01 0.15 0.26 0.76 0.27 0.01State item no 15 0.47 0.01 -0.19 -0.64 -0.23 -0.14 0.08State item no 16 0.61 0.02 -0.22 -0.52 -0.01 -0.25 -0.04State item no 17 -0.23 0.00 0.42 0.64 0.17 0.12 0.27State item no 18 -0.20 0.08 0.25 0.60 0.37 0.17 -0.03State item no 19 0.06 0.84 -0.10 -0.08 0.04 -0.18 0.01State item no 20 0.60 -0.01 -0.28 -0.56 -0.03 -0.14 0.02Trait item no 21 0.76 0.07 -0.34 -0.27 0.01 -0.19 0.03Trait item no 22 -0.37 -0.20 0.48 0.30 0.15 0.12 -0.08Trait item no 23 -0.08 0.88 -0.16 0.08 -0.04 -0.01 0.10Trait item no 24 -0.08 0.00 0.62 0.14 0.10 0.22 -0.13Trait item no 25 -0.10 -0.05 0.56 0.06 0.20 0.49 -0.22Trait item no 26 0.70 -0.09 -0.18 -0.16 -0.11 -0.05 -0.07Trait item no 27 0.51 0.05 -0.41 -0.41 -0.05 -0.32 0.17Trait item no 28 -0.43 0.03 0.68 0.13 0.26 0.19 0.01Trait item no 29 -0.06 -0.09 0.74 0.24 0.10 0.05 -0.14Trait item no 30 0.29 0.83 0.02 -0.14 0.09 0.02 0.02Trait item no 31 -0.32 -0.12 0.72 0.26 0.04 0.19 0.09Trait item no 32 -0.25 -0.03 0.49 0.14 0.25 0.58 -0.06Trait item no 33 0.43 0.09 -0.32 -0.24 -0.19 -0.45 0.20Trait item no 34 0.07 0.74 0.05 0.02 -0.27 0.18 0.01Trait item no 35 -0.30 -0.07 0.35 0.25 0.68 0.07 -0.13Trait item no 36 0.71 0.11 -0.29 -0.21 -0.20 -0.07 0.20Trait item no 37 -0.09 -0.17 0.71 0.35 -0.10 0.05 0.06Trait item no 38 -0.26 -0.10 0.76 0.22 0.16 0.01 0.05Trait item no 39 0.13 0.18 -0.24 -0.29 -0.13 -0.29 0.66Trait item no 40 -0.23 -0.02 0.60 0.34 0.25 0.01 0.25
Expl.Var 5.17 3.62 6.11 7.18 2.20 2.48 1.27Prp.Totl 13% 9% 15% 18% 5% 6% 3%
Total var expl 69%
Page 7 of 10(page number not for citation purposes)
Annals of General Psychiatry 2006, 5:2 http://www.annals-general-psychiatry.com/content/5/1/2
reported to have high correlation with the full scale scoreand acceptable reliability and validity [28]. Additionally,several items of the STAI produce misfit responses and donot produce equal units of measurement. These findingsquestion the generalizability of the research on anxiety[29].
Another question concerns the reliability of the instru-ment when applied to special populations, especially theelderly. The STAI scale demonstrated high internal relia-bility when applied to elderly subjects [30].
The validity of the instrument when applied to elderlypatients is another question. A conspicuously high scoreon the state part of the STAI has been observed among ger-iatric inpatients which were neither demented nor criti-cally ill; 43% of them had a score that, according toSpielberger's criteria, would reflect clinically relevant anx-iety symptoms. High item-scores were more frequent onthe symptom-negative items than on the symptom-posi-tive items. The most probable explanation is that the STAIState score is a biased indicator of anxiety in geriatric inpa-tients owing to confounding by reduced well-being inthese patients [31].
The validation of the Portuguese version of the STAIreported mean scores for anxious patients equal to 52.8 ±11.4 and for depressed patients equal to 56.4 ± 10.5, andhigher than for the student sample which was 40.7 ± 8.6[32]. These results are different both from ours and fromthe US data, and normal students data are much higherthan expected. Several factors are reported to influence theSTAI score. Trait scores are reported to be higher forwomen, singles, those who work, and subjects under 30years old [33]. Apparent ethnic differences in anxiety lev-els may be due to causal variables related to other socio-demographic variables. Thus, using only a global STAIcomposite as a measure of anxiety will mask the differen-tial effects of the STAI factor scores [34]. For example,although mean scores for the state and trait anxiety-absentitems were comparable for Japanese students living inJapan and Japanese international students studying in theUnited States, the scores of both Japanese groups were sig-nificantly higher than those of American students. Thesedifferences were attributable to much higher scores of Jap-anese students on anxiety-absent items that correspondedto a lack of positive feelings. Japanese students had a ten-dency to inhibit positive (anxiety-absent) feelings, result-ing in higher anxiety scores [35]. Also, the mean STAIState and Trait anxiety scores of Japanese workers weresubstantially higher than those of American workersreported in the Manual, due primarily to the much higherscores of Japanese workers in responding to the anxiety-absent items. The correlations between the State and Traitanxiety-present scales and those of their anxiety-absent
scales' counterparts were higher than those between theState anxiety-present and -absent scales and those of theirTrait scales' counterparts. These findings suggested thatresponses to anxiety-present and -absent items should beconsidered independently in scoring the STAI scales inJapanese working adults [36].
An additional problem concerning the STAI scales validityis the fact that several researchers have found anxiety anddepression to be indistinguishable in non-clinical sam-ples and have suggested that both constructs may be com-ponents of a general psychological distress process [37].So, STAI may in fact measure this non-specific distress andnot pure anxiety per se. In accord with this is the reportthat in geriatric inpatients who are neither demented norcritically ill, multi-group factor analysis produced two fac-tors termed 'well-being' and 'nervousness', which had amoderate correlation (0.61)[31].
Factor analytic studies produce mixed results, others infavor and others against the state-trait distinction. The fac-tor analysis of the Japanese STAI extracted 3 factors, 'anxi-ety-absent', 'state anxiety-present' and 'trait anxiety-present' [38]. This analysis suggests that the three compo-nents were considered to reflect the "overall anxiety" com-ponent, the "presence-absence of anxiety (positive-negative)" component, and the "state-trait anxiety" com-ponent. The component related to presence or absence ofanxiety was larger than the state-trait anxiety component[39]. Confirmatory factor analytic methods suggested thata hierarchical solution could best fit the data, with oneoverall factor and two lower order factors. This paper sup-ports the notion that the trait scale of the STAI assessesdepression, as well as anxiety. One set of items appearedto assess anxiety and worry, whereas the other assessedsadness and self-deprecation. The two subscales correlateddifferentially with other measures of anxiety and depres-sion in a manner that was consistent with their content[40]. The STAI scale when applied to elderly subjects didnot manifested factorial validity, with analyses failing tosupport presence of state and trait anxiety factors [30].
Other factor analytic studies have provided support forthe concepts of state and trait anxiety. Some authors sug-gest that a two-factor state vs. trait solution is the mostappropriate, accounting for 41.1% of the variance [41].Others propose a solution with 2 trait factors and 4 tran-sient sources of true variance [42]. In a sample fromHawaii, a four-factor model (State-Anxiety Absent, State-Anxiety Present, Trait-Anxiety Absent, and Trait-AnxietyPresent) provided the best fit [43]. Another factor analysisof the Japanese STAI produced different results in contrastto previous studies [38,39] and reported a 4-factor solu-tion (positively and negatively worded state factors, posi-
Page 8 of 10(page number not for citation purposes)
Annals of General Psychiatry 2006, 5:2 http://www.annals-general-psychiatry.com/content/5/1/2
tively and negatively worded trait factors)[44], which is inaccord with the state-trait distinction.
ConclusionThe current study provided preliminary evidence concern-ing the reliability and the validity of the Greek translationof the STAI-form Y. Its properties are generally similar tothose reported in the international literature, but furtherresearch is necessary.
References1. Cattell RB: Patterns of change: Measurement in relation to
state dimension, trait change, lability, and process. In Hand-book of Multivariate Experimental Psychology Chicago, Rand McNally &Co; 1966.
2. Cattell RBSIH: The meaning and measurement of neuroticismand anxiety. New York, Romald Press; 1961.
3. Cattell RBSIH: Handbook for the IPAT Anxiety Scale. 2nd edi-tion. , Institute for Personality and Ability Testing,; 1963.
4. Spielberger CD: Theory and research on anxiety. In Anxiety andbehavior Edited by: Spielberger CD. New York, Academic Press; 1966.
5. Spielberger CD: Anxiety as an emotional state. In Anxiety: Currenttrends in theory and research Volume (Vol. 1). Edited by: (Ed.) CDS. NewYork, Academic Press; 1972.
6. Spielberger CD: The nature and measurement of anxiety. InCross-cultural anxiety Edited by: (Eds.) CDSRDG. Washington, D. C.,Hemisphere/Wiley; 1976.
7. Spielberger CD: Preliminary manual for the State-Trait Per-sonality Inventory (STPI). University of South Florida, ; 1979.
8. Spielberger CDGRLLRE: Manual for the State-Trait AnxietyInventory (Self-Evaluation Questionnaire). Palo Alto, CA,Consulting Psychologists press; 1970.
9. Wing JK, Babor T, Brugha T: SCAN: Schedules for ClinicalAssessment in Neuropsychiatry. Archives of General Psychiatry1990, 47:589-593.
10. WHO: Schedules for Clinical Assessment in Neuropsychia-try-SCAN version 2.0) Mavreas V: Greek Version. Athens,Research University Institute for Mental Health; 1995.
11. Loranger AW, Sartorious N, Andreoli A: The World HealthOrganisation/Alcohol, Drug Abuse and Mental HealthAdministration International Pilot Study of Personality Dis-orders. Archives of General Psychiatry 1994, 51:215-224.
12. WHO: International Personality Disorders Examination.Geneva, ; 1995.
13. WHO: International Personality Disorders Examination,Greek Edition. (Translation: Fountoulakis KN, Iacovides A,Kaprinis G, Ierodiakonou Ch). , 3rd Department of Psychiatry,Aristotle University of Thessaloniki Greece (unpublished).
14. Fountoulakis KN, Iacovides A, Ioannidou C, Bascialla F, Nimatoudis I,Kaprinis G, Janca A, Dahl A: Reliability and cultural applicabilityof the Greek version of the International Personality Disor-ders Examination. BMC Psychiatry 2002, 17:6.
15. Altman DG: Practical Statistics for Medical Research. London,Chapman and Hall; 1991.
16. Anastasi A: Psychological Testing. 6th edition. New York, Mac-millan Publishing Company; 1988:202-234.
17. Bland JM, Altman DG: Statistical Methods for Assessing Agree-ment between two methods of Clinical Measurement. Lancet1986, 1:307-310.
18. Bartko JJ, Carpenter W: On the Methods and Theory of Relia-bility. Journal of Nervous and Mental Disorders 1976, 163:307-317.
19. Fotiou F, Fountoulakis KN, Goulas A, Alexopoulos L, Palikaras A:Automated Standardized Pupilometry with Optical Methodfor Purposes of Clinical Practice and Research. Clinical Physiol-ogy 2000, 20:336-347.
20. Fountoulakis KN, Iacovides A, Kleanthous S, Samolis S, Gougoulias K,Tsiptsios I, Kaprinis G, Bech P: Reliability, validity and psycho-metric properties of the Greek translation of the MajorDepression Inventory. BMC Psychiatry 2003, 3:2.
21. Process Analysis. In STATISTICA Manual Volume III. , Statsoft Inc.;1994:3567-3613.
22. Spielberger CD: State-Trait Anxiety Inventory for Adults. Red-wood City California, Mind Garden; 2005.
23. van der Bij AK, de Weerd S, Cikot RJ, Steegers EA, Braspenning JC:Validation of the dutch short form of the state scale of theSpielberger State-Trait Anxiety Inventory: considerationsfor usage in screening outcomes. Community Genet 2003,6:84-87.
24. Quek KF, Low WY, Razack AH, Loh CS, Chua CB: Reliability andvalidity of the Spielberger State-Trait Anxiety Inventory(STAI) among urological patients: a Malaysian study. Med JMalaysia 2004, 59:258-267.
25. Stanley MA, Beck JG, Zebb BJ: Psychometric properties of fouranxiety measures in older adults. Behav Res Ther 1996,34:827-838.
26. Ramanaiah NV, Franzen M, Schill T: A psychometric study of theState-Trait Anxiety Inventory. J Pers Assess 1983, 47:531-535.
27. Taylor J, Deane FP: Development of a short form of the TestAnxiety Inventory (TAI). J Gen Psychol 2002, 129:127-136.
28. Marteau TM, Bekker H: The development of a six-item short-form of the state scale of the Spielberger State-Trait Anxi-ety Inventory (STAI). Br J Clin Psychol 1992, 31 ( Pt 3):301-306.
29. Tenenbaum G, Furst D, Weingarten G: A statistical reevaluationof the STAI anxiety questionnaire. J Clin Psychol 1985,41:239-244.
30. Kabacoff RI, Segal DL, Hersen M, Van Hasselt VB: Psychometricproperties and diagnostic utility of the Beck Anxiety Inven-tory and the State-Trait Anxiety Inventory with older adultpsychiatric outpatients. J Anxiety Disord 1997, 11:33-47.
31. Kvaal K, Laake K, Engedal K: Psychometric properties of thestate part of the Spielberger State-Trait Anxiety Inventory(STAI) in geriatric patients. Int J Geriatr Psychiatry 2001,16:980-986.
32. Gorenstein C, Andrade L: Validation of a Portuguese version ofthe Beck Depression Inventory and the State-Trait AnxietyInventory in Brazilian subjects. Braz J Med Biol Res 1996,29:453-457.
33. Andrade L, Gorenstein C, Vieira Filho AH, Tung TC, Artes R: Psy-chometric properties of the Portuguese version of the State-Trait Anxiety Inventory applied to college students: factoranalysis and relation to the Beck Depression Inventory. BrazJ Med Biol Res 2001, 34:367-374.
34. Hishinuma ES, Miyamoto RH, Nishimura ST, Nahulu LB: Differencesin State-Trait Anxiety Inventory scores for ethnically diverseadolescents in Hawaii. Cultur Divers Ethnic Minor Psychol 2000,6:73-83.
35. Iwata N, Higuchi HR: Responses of Japanese and American uni-versity students to the STAI items that assess the presenceor absence of anxiety. J Pers Assess 2000, 74:48-62.
36. Iwata N, Mishima N, Shimizu T, Mizoue T, Fukuhara M, Hidano T,Spielberger CD: The Japanese adaptation of the STAI Form Yin Japanese working adults--the presence or absence of anx-iety. Ind Health 1998, 36:8-13.
37. Endler NS, Cox BJ, Parker JD, Bagby RM: Self-reports of depres-sion and state-trait anxiety: evidence for differential assess-ment. J Pers Soc Psychol 1992, 63:832-838.
38. Iwata N, Mishima N, Shimizu T, Mizoue T, Fukuhara M, Hidano T,Spielberger CD: Positive and negative affect in the factorstructure of the State-Trait Anxiety Inventory for Japaneseworkers. Psychol Rep 1998, 82:651-656.
39. Iwata N, Mishima N, Okabe K, Kobayashi N, Hashiguchi E, Egashira K:Psychometric properties of the State-Trait Anxiety Inven-tory among Japanese clinical outpatients. J Clin Psychol 2000,56:793-806.
40. Bieling PJ, Antony MM, Swinson RP: The State-Trait AnxietyInventory, Trait version: structure and content re-exam-ined. Behav Res Ther 1998, 36:777-788.
41. Oei TP, Evans L, Crook GM: Utility and validity of the STAI withanxiety disorder patients. Br J Clin Psychol 1990, 29 ( Pt4):429-432.
42. Vautier S: A longitudinal SEM approach to STAI data:twocomprehensive multitrait-multistate models. J Pers Assess2004, 83:167-179.
43. Hishinuma ES, Miyamoto RH, Nishimura ST, Nahulu LB, Andrade NN,Makini GKJ, Yuen NY, Johnson RC, Kim SP, Goebert DA, GuerreroAP: Psychometric properties of the state-trait anxiety inven-
Page 9 of 10(page number not for citation purposes)
http://www.ncbi.nlm.nih.gov/entrez/query.fcgi?cmd=Retrieve&db=PubMed&dopt=Abstract&list_uids=2190539
http://www.ncbi.nlm.nih.gov/entrez/query.fcgi?cmd=Retrieve&db=PubMed&dopt=Abstract&list_uids=2190539
http://www.ncbi.nlm.nih.gov/entrez/query.fcgi?cmd=Retrieve&db=PubMed&dopt=Abstract&list_uids=8122958
http://www.ncbi.nlm.nih.gov/entrez/query.fcgi?cmd=Retrieve&db=PubMed&dopt=Abstract&list_uids=8122958
http://www.ncbi.nlm.nih.gov/entrez/query.fcgi?cmd=Retrieve&db=PubMed&dopt=Abstract&list_uids=8122958
http://www.ncbi.nlm.nih.gov/entrez/query.fcgi?cmd=Retrieve&db=PubMed&dopt=Abstract&list_uids=2097487
http://www.ncbi.nlm.nih.gov/entrez/query.fcgi?cmd=Retrieve&db=PubMed&dopt=Abstract&list_uids=2097487
http://www.ncbi.nlm.nih.gov/entrez/query.fcgi?cmd=Retrieve&db=PubMed&dopt=Abstract&list_uids=2097487
http://www.ncbi.nlm.nih.gov/entrez/query.fcgi?cmd=Retrieve&db=PubMed&dopt=Abstract&list_uids=2868172
http://www.ncbi.nlm.nih.gov/entrez/query.fcgi?cmd=Retrieve&db=PubMed&dopt=Abstract&list_uids=2868172
http://www.ncbi.nlm.nih.gov/entrez/query.fcgi?cmd=Retrieve&db=PubMed&dopt=Abstract&list_uids=8952126
http://www.ncbi.nlm.nih.gov/entrez/query.fcgi?cmd=Retrieve&db=PubMed&dopt=Abstract&list_uids=8952126
http://www.ncbi.nlm.nih.gov/entrez/query.fcgi?cmd=Retrieve&db=PubMed&dopt=Abstract&list_uids=6644527
http://www.ncbi.nlm.nih.gov/entrez/query.fcgi?cmd=Retrieve&db=PubMed&dopt=Abstract&list_uids=6644527
http://www.ncbi.nlm.nih.gov/entrez/query.fcgi?cmd=Retrieve&db=PubMed&dopt=Abstract&list_uids=1393159
http://www.ncbi.nlm.nih.gov/entrez/query.fcgi?cmd=Retrieve&db=PubMed&dopt=Abstract&list_uids=1393159
http://www.ncbi.nlm.nih.gov/entrez/query.fcgi?cmd=Retrieve&db=PubMed&dopt=Abstract&list_uids=1393159
http://www.ncbi.nlm.nih.gov/entrez/query.fcgi?cmd=Retrieve&db=PubMed&dopt=Abstract&list_uids=3980747
http://www.ncbi.nlm.nih.gov/entrez/query.fcgi?cmd=Retrieve&db=PubMed&dopt=Abstract&list_uids=3980747
http://www.ncbi.nlm.nih.gov/entrez/query.fcgi?cmd=Retrieve&db=PubMed&dopt=Abstract&list_uids=9131880
http://www.ncbi.nlm.nih.gov/entrez/query.fcgi?cmd=Retrieve&db=PubMed&dopt=Abstract&list_uids=9131880
http://www.ncbi.nlm.nih.gov/entrez/query.fcgi?cmd=Retrieve&db=PubMed&dopt=Abstract&list_uids=9131880
http://www.ncbi.nlm.nih.gov/entrez/query.fcgi?cmd=Retrieve&db=PubMed&dopt=Abstract&list_uids=8736107
http://www.ncbi.nlm.nih.gov/entrez/query.fcgi?cmd=Retrieve&db=PubMed&dopt=Abstract&list_uids=8736107
http://www.ncbi.nlm.nih.gov/entrez/query.fcgi?cmd=Retrieve&db=PubMed&dopt=Abstract&list_uids=8736107
http://www.ncbi.nlm.nih.gov/entrez/query.fcgi?cmd=Retrieve&db=PubMed&dopt=Abstract&list_uids=9473852
http://www.ncbi.nlm.nih.gov/entrez/query.fcgi?cmd=Retrieve&db=PubMed&dopt=Abstract&list_uids=9473852
http://www.ncbi.nlm.nih.gov/entrez/query.fcgi?cmd=Retrieve&db=PubMed&dopt=Abstract&list_uids=9473852
http://www.ncbi.nlm.nih.gov/entrez/query.fcgi?cmd=Retrieve&db=PubMed&dopt=Abstract&list_uids=1447695
http://www.ncbi.nlm.nih.gov/entrez/query.fcgi?cmd=Retrieve&db=PubMed&dopt=Abstract&list_uids=1447695
http://www.ncbi.nlm.nih.gov/entrez/query.fcgi?cmd=Retrieve&db=PubMed&dopt=Abstract&list_uids=1447695
http://www.ncbi.nlm.nih.gov/entrez/query.fcgi?cmd=Retrieve&db=PubMed&dopt=Abstract&list_uids=9621742
http://www.ncbi.nlm.nih.gov/entrez/query.fcgi?cmd=Retrieve&db=PubMed&dopt=Abstract&list_uids=9621742
http://www.ncbi.nlm.nih.gov/entrez/query.fcgi?cmd=Retrieve&db=PubMed&dopt=Abstract&list_uids=9621742
http://www.ncbi.nlm.nih.gov/entrez/query.fcgi?cmd=Retrieve&db=PubMed&dopt=Abstract&list_uids=9682533
http://www.ncbi.nlm.nih.gov/entrez/query.fcgi?cmd=Retrieve&db=PubMed&dopt=Abstract&list_uids=9682533
http://www.ncbi.nlm.nih.gov/entrez/query.fcgi?cmd=Retrieve&db=PubMed&dopt=Abstract&list_uids=9682533
http://www.ncbi.nlm.nih.gov/entrez/query.fcgi?cmd=Retrieve&db=PubMed&dopt=Abstract&list_uids=2289078
Annals of General Psychiatry 2006, 5:2 http://www.annals-general-psychiatry.com/content/5/1/2
Publish with BioMed Central and every scientist can read your work free of charge
"BioMed Central will be the most significant development for disseminating the results of biomedical research in our lifetime."
Sir Paul Nurse, Cancer Research UK
Your research papers will be:
available free of charge to the entire biomedical community
peer reviewed and published immediately upon acceptance
cited in PubMed and archived on PubMed Central
yours — you keep the copyright
Submit your manuscript here:http://www.biomedcentral.com/info/publishing_adv.asp
BioMedcentral
tory for Asian/Pacific-islander adolescents. Assessment 2000,7:17-36.
44. Suzuki T, Tsukamoto K, Abe K: Characteristics factor structuresof the Japanese version of the State-Trait Anxiety Inventory:coexistence of positive-negative and state-trait factor struc-tures. J Pers Assess 2000, 74:447-458.
Page 10 of 10(page number not for citation purposes)