Patterns of plant trait–environment relationships along a forest succession chronosequence
Upload
khangminh22Category
view
3download
0
For Peer Review
1
1 Functional trait relationships demonstrate life strategies in terrestrial prokaryotes.
2
3 Damien R. Finn1,2,3, Benoît Bergk-Pinto2, Christina Hazard2, Graeme W. Nicol2,
4 Christoph C. Tebbe3, Timothy M. Vogel2
5
6 1School of Agriculture and Food Sciences, University of Queensland, Brisbane,
7 Australia 4072;
8 2Environmental Microbial Genomics, Laboratoire Ampère, École Centrale de Lyon,
9 Université de Lyon, Écully, France 69134;
10 3Thünen Institut für Biodiversität, Johann Heinrich von Thünen Institut,
11 Braunschweig, Germany 38116.
12
13
14 Author correspondence:
15 Damien Finn; current address: Thünen Institut für Biodiversität, Braunschweig,
16 Germany 38116; email address: [email protected]
17
18 Keywords:
19 Theoretical ecology, niche differentiation, copiotroph-oligotroph, Random Forest
20 modelling
21
22
23 Abstract
24 Functional, physiological traits are the underlying drivers of niche differentiation. A
25 common framework related to niches occupied by terrestrial prokaryotes is based on
26 copiotrophy or oligotrophy, where resource investment is primarily in either rapid
27 growth or stress tolerance, respectively. A quantitative trait-based approach sought
28 relationships between taxa, traits and niche in terrestrial prokaryotes. With 175 taxa
29 from 11 Phyla and 35 Families (n = 5 per Family), traits were considered as discrete
30 counts of shared genome-encoded proteins. Trait composition strongly supported non-
31 random functional distributions as preferential clustering of related taxa via unweighted
32 pair-group method with arithmetic mean. Trait similarity between taxa increased as
33 taxonomic rank decreased. A suite of Random Forest models identified traits
34 significantly enriched or depleted in taxonomic groups. These traits conveyed functions
Page 2 of 147
ScholarOne Support 1-434/964-4100
FEMS Microbiology Ecology
123456789101112131415161718192021222324252627282930313233343536373839404142434445464748495051525354555657585960

For Peer Review
2
35 related to rapid growth, nutrient acquisition and stress tolerance consistent with their
36 presence in copiotroph-oligotroph niches. Hierarchical clustering of traits identified a
37 clade of competitive, copiotrophic Families resilient to oxidative stress versus
38 glycosyltransferase-enriched oligotrophic Families resistant to antimicrobials and
39 environmental stress. However, the formation of five clades suggested a more
40 nuanced view to describe niche differentiation in terrestrial systems is necessary. We
41 suggest considering traits involved in both resource investment and acquisition when
42 predicting niche.
43
44
45 1. Introduction
46 Niche differentiation, the process of physiologically distinct organisms adapting better
47 to certain conditions, is a contributing factor to the high biodiversity inherent in microbial
48 communities (Prosser, 2012). Such differentiation is likely an inevitable consequence
49 of the principles of competitive exclusion and natural selection working in tandem – no
50 two organisms can theoretically occupy the same niche, as the poorer competitor must
51 either adapt to a unique niche or be driven to extinction in that system (Gause, 1932,
52 Hutchinson, 1957, Leibold, 1995). The physiological traits driving niche differentiation
53 must have the capacity to convey an advantage to the organism’s ability to survive and
54 reproduce (i.e. fitness) and be inherited by successive generations (McGill et al., 2006).
55 Importantly, this implies that microbial communities are not only diverse in terms of
56 individual 16S rRNA gene sequences, commonly used to assess community diversity,
57 but also diverse in regard to their physiological traits.
58 Explaining niche differentiation through the functional, physiological traits present in
59 ecological community members has a long history in macroecology. For example,
60 differences between beak size and shape in Galápagos finches was instrumental in
61 Darwin’s hypothesis that a common ancestor had differentiated into multiple, island-
62 specific species. Within the past century, trait-based analyses have been particularly
63 predominant in plant ecology, with seed germination in submerged soil, salt tolerance,
64 carbon to nitrogen biomass stoichiometry, and leaf mass per unit area acting as
65 examples of traits linked to niche differentiation (Gleason, 1926, Grime, 1979, Keddy,
66 1992). In contrast, trait-based approaches to explain microbial ecology have only been
67 performed in few instances, such as conceptualizing niches of methanotrophs based
68 on abundance in high versus low methane environments or disturbed versus
Page 3 of 147
ScholarOne Support 1-434/964-4100
FEMS Microbiology Ecology
123456789101112131415161718192021222324252627282930313233343536373839404142434445464748495051525354555657585960

For Peer Review
3
69 undisturbed soils (Ho et al., 2013), correlating increasing growth rate with increasing
70 ribosomal gene and ribosome-associated gene copy number (Vieira-Silva & Rocha,
71 2010), deterministic modelling of nitrification rate based on ammonia and oxygen
72 uptake rate, temperature sensitivity and growth rate (Bouskill et al., 2012), defining
73 distinct niches of 32 marine microorganisms based on clustering of genome-encoded
74 functional proteins (Lauro et al., 2009), identifying habitat generalists and specialists
75 based on taxon co-occurrence patterns (Barbéran et al., 2012) and recently
76 comparisons of 23 ‘core’ traits (e.g. motility, carbon metabolism, optimal pH for growth)
77 across 15 000 diverse host-associated and environmental genomes (Madin et al.,
78 2020).
79 A consistent trend noted in macroecology is that traits linked to how carbon and
80 energy is processed and allocated to biomass can describe separate niches (Brown et
81 al., 2004). The canonical example are r and K strategists, where carbon and energy
82 are primarily invested in reproduction, or alternatively invested in tolerating biotic
83 and/or abiotic stressors, respectively (Grime, 1977). These dichotomous strategies
84 have been observed in microbial ecology: copiotrophs are considered as
85 microorganisms with relatively high growth rates that have relatively poor growth
86 efficiency (as carbon incorporated to biomass per unit resource), relatively high cell
87 maintenance energy costs, dependence on relatively high concentrations of organic
88 carbon in their environment, demonstrate rapid population blooms upon the addition of
89 organic matter and are not overly tolerant of abiotic stress (Semenov, 1991, Koch,
90 2001, Roller & Schmidt, 2015, Ho et al., 2017). Oligotrophs are considered as the
91 inverse – low growth rate, high growth efficiency, low cell maintenance energy
92 requirements, high substrate uptake affinity, slow growth yet at a consistent rate and
93 are resilient to abiotic stress. Although the niche concept in macroecology has a
94 formalized definition founded on where a taxon can maintain a stable population within
95 multi-dimensional environmental space (Leibold, 1995), in this study, niche is used
96 simply to distinguish between prokaryotes being relatively more copiotrophic versus
97 oligotrophic.
98 These distinct niches became associated with specific terrestrial taxa at high
99 taxonomic rank based on recent molecular analyses. In complex microbial
100 communities, the relative abundance of Gammaproteobacteria, Bacteroidetes and
101 Actinobacteria were correlated with rapid growth in response to the addition of labile
102 organic matter or nitrogen (copiotrophs) (Fierer et al., 2007, Goldfarb et al., 2011,
Page 4 of 147
ScholarOne Support 1-434/964-4100
FEMS Microbiology Ecology
123456789101112131415161718192021222324252627282930313233343536373839404142434445464748495051525354555657585960

For Peer Review
4
103 Fierer et al., 2012, Leff et al., 2015). Conversely, the Deltaproteobacteria,
104 Acidobacteria, Verrucomicrobia and Planctomycetes were negatively correlated with
105 the addition of organic matter or nitrogen (oligotrophs) (Fierer et al., 2007, Fierer et al.,
106 2012, Leff et al., 2015, Bastida et al., 2016). Conflicting reports exist of Beta- and
107 Alphaproteobacteria, with some studies describing them as copiotrophic and others as
108 oligotrophic highlighting that a consistent niche may not necessarily exist across
109 species within a large taxonomic group (Ho et al., 2017). A genomic basis for traits
110 associated with soils dominated by putative copiotrophs and oligotrophs has been
111 expertly reviewed elsewhere, and interested readers are referred to Trivedi et al.,
112 (2013) and references therein. Importantly, these observations suggest that specific
113 traits that allow terrestrial prokaryotes to occupy these two niches should (generally)
114 be associated with taxonomy. This is an example of ecological coherence at high
115 taxonomic rank, whereby members within a taxon tend to have similar life strategies,
116 niches and possess common traits compared to members of other taxa (Philippot et
117 al., 2010). While ecological coherence of taxa has been considered previously, the
118 shared, specific traits that drive niche differentiation in terrestrial prokaryotes remains
119 an open question.
120 To identify the traits that differ between terrestrial prokaryote taxonomic groups, and
121 whether these traits could describe the niches they occupy, a functional trait-based
122 approach was adopted here. We posited that a trait must: a) be associated with a
123 physiological process that conveys a fitness advantage under certain environmental
124 conditions; b) be measurable in well-defined units; and c) vary more between
125 taxonomic groups than within a taxonomic group (McGill et al., 2006, Kearney et al.,
126 2010). Traits were measured as discrete counts of chromosome-encoded proteins
127 shared between at least two of 175 terrestrial prokaryotes. Markov Chain clustering
128 (MCL) was used to group proteins as traits based on amino acid sequence similarity
129 (%) akin to a previous approach that confirmed close taxonomic relatives tend to share
130 functional traits in 1 374 genomes (Zhu et al., 2015). This was necessary to compare
131 highly similar (but non-identical) proteins from separate genomes that carry out the
132 same biological function. To better identify important, distinguishing traits of terrestrial
133 prokaryotes, this study differed from Zhu et al., by: a) comparing 175 publicly available
134 terrestrial prokaryote genomes from 35 Families (n = 5 each), from 11 Phyla and two
135 Kingdoms; b) selecting prokaryotes involved in terrestrial ecosystem processes of
136 interest, including organic matter decomposition, nitrogen fixation, nitrification,
Page 5 of 147
ScholarOne Support 1-434/964-4100
FEMS Microbiology Ecology
123456789101112131415161718192021222324252627282930313233343536373839404142434445464748495051525354555657585960
For Peer Review
5
137 denitrification, methane oxidation, plant-growth promotion, bioremediation of
138 pollutants, pathogenesis and methanogenesis; c) selecting taxa isolated from a wide
139 range of terrestrial environments, such as nutrient rich decomposing plant material and
140 rhizosphere, submerged wetland and rice paddy soils, polluted soils, and nutrient poor
141 hot and cold arid environments; and d) avoiding the inclusion of multiple subspecies
142 and/or strains of a single species to prevent biases in analyses where highly over-
143 represented species are compared with species that have fewer cultured
144 representatives. The taxonomic system used here is from the NCBI, which is built upon
145 a historical array of culture-dependent, physiological observations and genetic
146 similarity to cultured isolates as average nucleotide identity, DNA-DNA hybridisation or
147 16S rRNA gene homology (ncbi.nlm.nih.gov/Taxonomy/Browser). The use of this
148 classification system and comparison to others is discussed further below.
149 We hypothesised that: 1) traits are non-randomly distributed, with relatively closely
150 related taxa demonstrating greater similarity than unrelated taxa (ecological
151 coherence); 2) traits that are differentially enriched between taxonomic groups would
152 primarily be involved in metabolism, nutrient acquisition and/or tolerating
153 environmental stress; and 3) copiotrophic and oligotrophic taxonomic groups would
154 emerge based on collective trait enrichment.
155
156
157 2. Methodology
158 2.1 Collection of terrestrial prokaryote genomes
159 A collection of 175 sequenced and annotated genomes was collated (Supplementary
160 Table 1). Listed are the genome ID, phylogenetic lineage, role in an ecosystem process
161 if known, and isolation or genome sequencing reference. These genomes were
162 sourced from the National Centre for Biotechnology Information (NCBI) and Joint
163 Genome Institute (JGI) databases. Genomes were chosen based on several criteria:
164 a) five isolates per Family were chosen to have an equal minimum sample size per
165 group, with this sample size being constrained by sequenced genomes of under-
166 represented groups in public databases; b) only a single subspecies/strain per species
167 was included to avoid bias due to over-representation of some species in public
168 databases; c) an emphasis was placed to include isolates from diverse taxonomic
169 lineages involved in terrestrial ecosystem processes of interest, such as ammonia
170 oxidation and methanogenesis; and d) there was an emphasis to include taxonomic
Page 6 of 147
ScholarOne Support 1-434/964-4100
FEMS Microbiology Ecology
123456789101112131415161718192021222324252627282930313233343536373839404142434445464748495051525354555657585960

For Peer Review
6
171 groups frequently stated to be either copiotrophic (e.g. Actinobacteria,
172 Gammaproteobacteria) or oligotrophic (e.g. Acidobacteria, Planctomycetes) based on
173 observations from soil nutrient addition studies (Ho et al., 2017). Taxonomic
174 annotations for Phyla, Class, Order etc. were based on NCBI taxonomy as most
175 genomes were sourced there. The authors recognise that taxonomy is constantly
176 shifting, particularly so with the recent development of the Genome Taxonomy
177 Database (GTDB) (Parks et al., 2018). Of note is that the vast majority of taxa here
178 have the same taxonomy in NCBI as in GTDB, with the exceptions that GTDB
179 considers the Sporomusaceae as split into three separate Families, the
180 Leuconostocaceae to be Lactobacillaceae, the Promicromonosporaceae to be
181 Cellulomonadaceae, and the Bradyrhizobiaceae and Methylococcaceae have been
182 renamed as Xanthobacteraceae and Methylomonadaceae, respectively. Taxon
183 selection was constrained by availability of genomes for under-represented groups,
184 such as the Chloroflexi, Verrucomicrobia, Planctomycetes, Thaumarchaeota and
185 Euryarchaeota. To meet the n = 5 requirement for balanced statistical analyses, it was
186 necessary to consider these under-represented groups as ‘Families’. Furthermore, due
187 to the great diversity inherent within Proteobacterial Classes, Gamma-, Alpha-, Beta-
188 and Deltaproteobacteria were considered as independent ‘Phyla’ for statistical
189 analyses here. Indeed, GTDB now defines Deltaproteobacteria as its own Phylum,
190 while Betaproteobacteria are considered as the Burkholderiales Order within the
191 Gammaproteobacteria. The total of 175 genomes analysed here falls within the upper
192 range of previous hypothesis-driven trait-based studies which varies from 11 isolates
193 (Bouskill et al., 2012) to 214 genomes (Vieira-Silva & Rocha, 2010).
194
195
196 2.2 Functional trait clustering
197 A step-by-step walkthrough of reproducible code to perform the following analyses on
198 a subset of 12 genomes is available at: https://github.com/DamienFinn/Trait-
199 based_analyses. Firstly, a pairwise similarity comparison of all amino acid sequences
200 (964 951 sequences) across the 175 genomes was performed with the all versus all
201 basic local alignment tool function for proteins, BLAST-P (Altschul et al., 1990). Amino
202 acid sequences were subsequently clustered as traits via MCL weighted by pairwise
203 amino acid similarity (Enright et al., 2002). Functional traits were grouped at a cluster
204 value of 90.2, whereby > 65 is considered ‘fair’ and confidence in accurately separating
Page 7 of 147
ScholarOne Support 1-434/964-4100
FEMS Microbiology Ecology
123456789101112131415161718192021222324252627282930313233343536373839404142434445464748495051525354555657585960

For Peer Review
7
205 clusters cannot be higher than 100. The value of 90.2 is not chosen by the user but
206 rather is a reflection of the quality of clustering in a given dataset. The MCL identified
207 a total of 220 664 traits shared between at least two genomes. A random subset of
208 1700 amino acid sequences were selected and the similarity of each sequence within
209 its trait group (as determined by MCL) versus between other trait groups was visualised
210 as a box and whisker plot (Supplementary Figure 1) in R version 4.0.0 (R Core Team,
211 2013). 1 700 sequences were chosen to maximise comparisons between trait groups
212 under technical limitations, as increasing sequences led to exponential increases in
213 trait combinations. A Student’s T test was applied to determine whether sequences
214 were more similar within their trait group relative to between trait groups in R. Finally,
215 a matrix of genome x functional trait was generated in a two-step process by first
216 associating genome IDs to the MCL output with a novel script ‘MCLtoReshape2.py’
217 (available at the above Github address) and secondly by casting the long data format
218 to a wide data matrix with the ‘reshape2’ package in R (Wickham, 2007). Box and
219 whisker plots comparing counts of proteins per genome (input) and counts of functional
220 traits shared by at least two genomes (output of computational workflow), for the 35
221 Families, is presented as Figure 1.
222
223
224 2.3 UPGMA dendrogram of trait similarity between genomes
225 The unweighted pair group method with arithmetic mean (UPGMA) was chosen to
226 compare distance-based similarity between taxa based on discrete counts of individual
227 traits per genome. This method is more robust for comparing similarity between sample
228 units (i.e. taxa) based on discrete counts of variables (i.e. individual traits per taxon)
229 rather than neighbour joining or maximum likelihood methods better suited for DNA or
230 amino acid sequence comparisons (Weins, 1998). The UPGMA was performed in R
231 with the ‘phangorn’ package as described (Schliep et al., 2017) on a Bray-Curtis
232 transformed dissimilarity functional trait matrix, generated with the ‘vegdist’ function in
233 the ‘vegan’ package (Oksanen et al., 2013). To measure ecological coherence (C) of
234 taxa within shared Super Groups, Phyla and Families, a similarity index was adapted
235 from Levins’ Overlap (Finn et al., 2020a), which measures pairwise similarity in
236 distributions of taxa, as the following:
237
238 C = 1 – ( ) Equation 1.∑𝑏𝑖𝑗𝑛2
Page 8 of 147
ScholarOne Support 1-434/964-4100
FEMS Microbiology Ecology
123456789101112131415161718192021222324252627282930313233343536373839404142434445464748495051525354555657585960

For Peer Review
8
239
240 Where bij is the pairwise branch length between taxon i and j in the UPGMA tree,
241 measured here as Bray-Curtis dissimilarity, which is summed for each taxon and its
242 relatives within a shared Super Group, Phylum or Family, and where n is the number
243 of taxa being compared within a shared Super Group, Phylum or Family.
244 Furthermore, the full length 16S rRNA gene of each taxon was collated from NCBI.
245 Genes were aligned with MUSCLE (Edgar, 2004) and a neighbour joining phylogenetic
246 tree was constructed with the ‘phangorn’ package in R. Phylogenetic distance present
247 in taxonomic groups (P) was measured as per Equation 1., excepting that branch
248 length was in units of DNA sequence similarity as opposed to Bray-Curtis dissimilarity.
249 Finally, simple linear regression was used to test a relationship between P and C.
250
251
252 2.4 Functional trait annotation
253 To inform the biological process a functional trait facilitated, traits were annotated with
254 the Kyoto Encyclopedia of Genes and Genomes (KEGG) database. This was
255 performed in five steps: 1) a representative amino acid sequence from each trait was
256 extracted with the novel script ‘IdentifyTraits.py’; 2) these sequences were annotated
257 with KEGG Orthology (KO) terms using the BlastKOALA database algorithm with a bit
258 score cut-off value of 75 (Kanehisa et al., 2016); 3) BRITE functional heirarchies
259 associated with each KO term (e.g. KO1179 gene: endoglucanase, BRITE 1:
260 Metabolism, BRITE 2: Carbohydrate Metabolism, BRITE 3: Starch and Sucrose
261 Metabolism) were collected with the novel script ‘GetBRITEinfo.py’; 4) Genome ID, trait
262 ID, KO term and BRITE metadata were all collated with the novel script ‘MatchFCs.py’;
263 and 5) the ‘reshape2’ package in R was used to create matrices of genome x BRITE
264 hierarchy. Where KEGG was unable to annotate a trait, it was considered as
265 ‘Uncharacterised’. As above, all novel scripts and a step-by-step walkthrough of
266 reproducible code is available at: https://github.com/DamienFinn/Trait-
267 based_analyses.
268
269
270 2.5 Identifying traits differentially enriched in taxonomic groups
271 Random Forest classification was chosen as a non-linear, multivariate cluster-based
272 method capable of identifying numerous predictor variables (i.e. traits) that define
Page 9 of 147
ScholarOne Support 1-434/964-4100
FEMS Microbiology Ecology
123456789101112131415161718192021222324252627282930313233343536373839404142434445464748495051525354555657585960

For Peer Review
9
273 different classes of a response variable (i.e. taxonomic group). This was performed
274 with the ‘randomForest’ package as described (Liaw & Weiner, 2002). Discrete counts
275 of traits at BRITE level 3 were used (e.g. Starch and Sucrose Metabolism) as this level
276 had the most accurate resolution of biological processes facilitated by traits. A total of
277 six Random Forest models were optimised to classify taxonomic groups at the level of:
278 a) Phylum, with Proteobacteria Classes separated due to their extensive diversity (n =
279 14); b) Family (n = 35); c) specifically for Families in the Proteobacteria (n = 13); d)
280 Families in the Actinobacteria (n = 7); e) Families in the Firmicutes (n = 5); and f)
281 Families from ‘Under-represented’ groups, which were all other Families (n = 10).
282 Optimal numbers of trees grown for each model were: 300, 400, 320, 300, 300 and
283 400, respectively. Six traits were randomly selected at each branch. As the Random
284 Forest only identifies traits that best explain separation of taxonomic groups, and does
285 not show whether traits have positive or negative associations with groups, box and
286 whisker plots and Fisher’s Least Significant Difference (LSD) post hoc tests were
287 performed with the ‘agricolae’ package (de Mendiburu, 2014) to definitively state which
288 taxonomic groups were significantly enriched or depleted in traits identified via
289 Random Forest.
290
291
292 2.6 Hierarchical clustering of Families by defining traits
293 Finally, the relationship between Families based on similarity in counts of 60 traits was
294 assessed via hierarchical clustering. Traits were chosen based on being selected via
295 the above Random Forest models in this study, and from previous studies that
296 identified traits associated with copiotroph-oligotroph growth strategies in single
297 species or mixed communities (Lauro et al., 2009, Vieira-Silva & Rocha, 2010, Roller
298 & Schmidt, 2015, Pascual-Garcia & Bell, 2020). The mean of trait discrete counts in
299 the five Family members was used as representative of each Family. Comparing trait
300 means between Families was considered acceptable as prior LSD post hoc tests had
301 demonstrated significant differences between Families. As traits had highly variable
302 copy numbers per Family (e.g. ABC transporter trait copies ranged from 10 – 350,
303 while bacterial chemotaxis traits ranged from 0 – 15 copies) the trait copies were
304 normalised for more appropriate comparisons. Normalised variance was calculated
305 across the 35 Families for all traits with the ‘decostand’ function in the ‘vegan’ package
306 (Oksanen et al., 2013). Hierarchical clustering of Families based on normalised trait
Page 10 of 147
ScholarOne Support 1-434/964-4100
FEMS Microbiology Ecology
123456789101112131415161718192021222324252627282930313233343536373839404142434445464748495051525354555657585960

For Peer Review
10
307 counts was visualised with the ‘heatmap.2’ function in the ‘gplots’ package (Warnes et
308 al., 2019).
309
310
311 3. Results
312 3.1 Trait clustering and UPGMA
313 The 964 951 amino acid sequences encoded by the 175 genomes were clustered as
314 220 664 traits by MCL. A random subset of 1 700 traits showed that amino acid
315 sequence similarity within traits ranged from 62.4, 82.5 and 100% for the 1st quartile,
316 mean and 3rd quartile, respectively (Supplementary Figure 1). Amino acid sequence
317 similarity between traits ranged from 27.6, 34 and 37.8% for the 1st quartile, mean and
318 3rd quartile, respectively. A Student’s T test found that sequences grouped together as
319 a trait were significantly more similar to each other than to sequences grouped as
320 different traits (t value = 61.3, p = 2 x 10-16). Manual comparisons of amino acid
321 sequences within several traits supported clustering of proteins with identical biological
322 function based on KEGG annotation. Thus, the MCL was considered to perform well.
323 However, the minimum amino acid sequence similarity within traits was 23.27% and
324 maximum similarity between traits was 85.24%, indicating that across the 220 664
325 traits, a small proportion of dissimilar amino acid sequences were grouped as a trait
326 incorrectly, while some amino acid sequences that were highly similar were considered
327 different traits. This small number of incorrectly clustered sequences can be explained
328 by the MCL clustering efficiency being 90.2, out of a possible 100.
329 A comparison of the number of proteins per genome at the Family level (mean = 5
330 533), found that there were fewer functional traits per genome (mean = 4 240) (Figure
331 1). These represent the input number of proteins per genome before trait clustering
332 and the output number of traits after clustering, respectively. As only functional traits
333 shared between at least two genomes were considered here, the loss of highly
334 genome-specific traits that could not be compared between genomes was expected.
335 Despite this drop in average traits per genome, this initial approach serves as a proof
336 of concept to demonstrate that numbers of traits per genome at the Family level reflect
337 trends in proteins per Family, and thus the MCL was not distorting trait clustering
338 (Figure 1).
339 The UPGMA dendrogram comparing the 220 664 traits per genome showed that
340 trait compositions were non-randomly distributed (Figure 2a). Specifically,
Page 11 of 147
ScholarOne Support 1-434/964-4100
FEMS Microbiology Ecology
123456789101112131415161718192021222324252627282930313233343536373839404142434445464748495051525354555657585960

For Peer Review
11
341 Thaumarchaeota, Euryarchaeota, Acidobacteria, Betaproteobacteria,
342 Gammaproteobacteria, Alphaproteobacteria, Cyanobacteria, Verrucomicrobia,
343 Planctomycetes, Bacteroidetes, Actinobacteria, Firmicutes and Deltaproteobacteria
344 clustered together preferentially. The Chloroflexi were split into two clusters: one
345 Dehalococcoides and one Ktedonobacter/Herpetosiphon/Anaerolinea cluster. Several
346 prokaryotes did not cluster with their high taxonomic rank, including a Planctomycetes
347 bacterium, Polyangium brachysporum (Deltaproteobacteria), Agreia pratensis
348 (Actinobacteria) and Sporomusa ovata (Firmicutes). Also of interest was that, in regard
349 to distance between terminal nodes (as noted by the scale bar), the Betaproteobacteria
350 and Gammaproteobacteria were more similar to each other than the
351 Alphaproteobacteria, which formed its own large, diverse clade. A neighbour joining
352 tree of full length 16S rRNA genes showed that all taxa clustered preferentially based
353 on their taxonomic nomenclature at high taxonomic rank, including the Chloroflexi,
354 indicating that the discrepancies in the UPGMA were not due to misclassification of the
355 individual taxa (Supplementary Figure 2a).
356 A simple index to measure trait similarity, as ecological coherence (C), within groups
357 was devised (Equation 1). C increased as taxonomic rank decreased: Super Group <
358 Phylum < Family (Figure 2b). C was lowest for the larger, more diverse Proteobacteria
359 and Terrabacteria (Super Group), and Firmicutes and Actinobacteria (Phylum). As the
360 number of taxa being compared at the Super Group (e.g. Terrabacteria = 70 versus
361 Acidobacteria = 10) and Phylum (e.g. Actinobacteria = 35 versus Thaumarchaeota =
362 5) were variable, the most meaningful comparisons between groups are at the Family
363 level (n = 5 each). With the exception of the highly divergent ‘Acidobacteria Lineage’,
364 all Families had a C greater than 0.3, with certain groups in the Alphaproteobacteria
365 (Beijerinckiaceae), Firmicutes (Bacillaceae and Leuconostocaceae) and
366 Actinobacteria (Promicromonosporaceae) being highly coherent (C > 0.55). Indeed, all
367 individual Proteobacterial Families had C > 0.4, indicating that all five taxa within each
368 of these Families had similar trait compositions. Despite not truly belonging to the same
369 Family as per NCBI taxonomy, the C > 0.33 of the five Cyanobacteria,
370 Thaumarchaeota and the Methanogen Lineage taxa was similar to other Families from
371 the Bacteroidetes and Firmicutes. Thus, the UPGMA demonstrated that taxonomic
372 relatives at the Phylum level tended to cluster with each other preferentially based on
373 trait composition, and secondly that while similarity was broadly highest at low
374 taxonomic rank, some Families were more coherent than others.
Page 12 of 147
ScholarOne Support 1-434/964-4100
FEMS Microbiology Ecology
123456789101112131415161718192021222324252627282930313233343536373839404142434445464748495051525354555657585960

For Peer Review
12
375 Phylogenetic distance (P) of each taxonomic group increased with decreasing
376 taxonomic rank, and was highest in Proteobacteria, Actinobacteria and Firmicutes
377 Families (Supplementary Figure 2b). There was a strong positive linear relationship
378 between P and C (y = 0.86x – 0.25, R2 = 0.39, p < 0.001) supporting the result that
379 taxonomic groups of closer related taxa tended to share more similar compositions of
380 traits.
381
382
383 3.2 Random Forest trait identification
384 The KEGG annotated traits belonged to 260 different BRITE 3 categories. The
385 percentage of traits that could not be annotated (and were termed ‘Uncharacterised’)
386 ranged from 28 – 65% per genome, being particularly high in the Archaea. On average,
387 47% of traits per genome were Uncharacterised with a standard deviation of 9.5%.
388 Of the 260 BRITE 3 categories, the 60 most important traits in separating all Phyla
389 and Families are ranked by importance measured as Mean Decrease in Accuracy
390 (MDA) of the Random Forest models (Figure 3). This is a measure of the average
391 increase in classification error during permutation of trees (n = 300 – 400) when that
392 particular trait is missing from the tree. For example, the accuracy of classifying
393 Families was most improved by inclusion of the ABC transporters trait. Based on the
394 identified traits, the Phylum model was capable of successfully classifying 81.14% of
395 individual taxa. The Family model was capable of successfully classifying 71.43% of
396 individual taxa. Confusion matrices for both models are presented as Supplementary
397 Tables 2 – 4, and show that classification was particularly difficult for Chloroflexi and
398 Planctomycetes (classification error > 80%) in the Phylum model and for
399 Cellulomonadaceae and the divergent Acidobacteria Lineage (classification error >
400 80%) in the Family model. Random Forest models were robust against variation in P
401 within Families, for example the nine families with all taxa perfectly classified ranged
402 in P from the lowest (0.68) to highest (0.9).
403 The important traits in classifying the taxonomic groups were involved in: a)
404 metabolism and nutrient acquisition (oxidative phosphorylation, tricarboxylic acid
405 (TCA) cycle, glyoxylate/decarboxylate, thermogenesis, propanoate, starch/sucrose,
406 nitrogen, methane metabolism, synthesis of antioxidants such as glutathione, ATP-
407 binding cassette (ABC) transporters, sugar uptake via phosphotransferase systems
408 (PTS)); b) responding to environmental cues and stressors (protein kinases, two-
Page 13 of 147
ScholarOne Support 1-434/964-4100
FEMS Microbiology Ecology
123456789101112131415161718192021222324252627282930313233343536373839404142434445464748495051525354555657585960

For Peer Review
13
409 component systems, transcription factors, proteasome, protein chaperones, RNA
410 transport, chromosome repair via non-homologous DNA end joining); c) core cell
411 physiology (flagella assembly, chemotaxis, sporulation, lipopolysaccharide (LPS),
412 peptidoglycan, glycerolipid, sphingolipid and lipoarabinomannan (LAM) biosynthesis);
413 and d) cell-cell interactions (beta-Lactam resistance, general secretion systems and
414 Type IV secretion systems). Box and whisker plots of discrete counts of identified traits,
415 and LSD results, are provided as Supplementary Figures 4 – 7. The Families
416 significantly enriched and depleted in these traits are listed in Table 1. The Phyla
417 significantly enriched and depleted in identified traits are listed in Supplementary Table
418 9.
419 To better identify the more subtle differences between Families in the
420 Proteobacteria, Actinobacteria, Firmicutes and the ‘Under-represented’ Phyla,
421 individual Random Forest models were constructed for each of the four groups. The
422 successful classification rates were 72.31, 74.29, 76 and 72%, respectively. Confusion
423 matrices for each model are presented as Supplementary Tables 5 – 8. The models
424 were unable to reliably classify Bradyrhizobiaceae and the divergent Acidobacteria
425 Lineage (classification error > 80%).
426 Supplementary Figure 8 shows the most important traits in classifying the four
427 groups. Unique traits not identified in the prior Phylum and Family models were: a) for
428 Proteobacteria, glycosyltransferases, butanoate metabolism, aminotransferases,
429 ribosome biogenesis, mRNA biogenesis and degradation; b) for Actinobacteria,
430 porphyrin and chlorophyll synthesis, pyruvate metabolism, aminotransferases, fatty
431 acid and aliphatic hydrocarbon metabolism, polyketide and Type II polyketide
432 biosynthesis, antimicrobial resistance genes; c) for Firmicutes, lysine, folate and varied
433 amino acid synthesis, porphyrin and chlorophyll synthesis, DNA replication, bacterial
434 toxins, penicillin and cephalosporin synthesis; and d) for the ‘Under-represented’ taxa,
435 glycosyltransferases, peptidases and inhibitors, photosynthesis and AMP-activated
436 protein kinases. Box and whisker plots of discrete counts of identified traits, and LSD
437 results, are provided as Supplementary Figures 9 – 12. Tables summarising Families
438 enriched and depleted in these traits are included as Supplementary Tables 10 and
439 11.
440
441
442 3.3 Hierarchical clustering of defining traits
Page 14 of 147
ScholarOne Support 1-434/964-4100
FEMS Microbiology Ecology
123456789101112131415161718192021222324252627282930313233343536373839404142434445464748495051525354555657585960

For Peer Review
14
443 Hierarchical clustering based on 60 traits, identified from Random Forest in this study
444 and by previous copiotroph-oligotroph studies, indicated five general clades. The
445 dendrogram on the y axis of Figure 4 shows clustering of taxa as these five clades.
446 The dendrogram on the x axis shows clustering of co-occurring traits. Clade I consisted
447 of Proteobacteria, specifically the Pseudomonadaceae, Burkholderiaceae,
448 Rhodospirillaceae, Bradyrhizobiaceae and Rhizobiaceae. These Families were
449 uniquely enriched in flagellar assembly, chemotaxis, pyruvate metabolism, glutathione
450 metabolism, ABC transporters, benzoate metabolism, transcription factors, glyoxylate
451 and fatty acid metabolism. Clade II, also Proteobacteria, included Nitrosomonadaceae,
452 Neisseriales Lineage, Methylocystaceae, Beijerinckiaceae, Methylococcaceae and
453 Moraxellaceae. These Families clustered based on being enriched in Clade I traits, but
454 to a lesser degree than the Pseudomonadaceae, Burkholderiaceae,
455 Rhodospirillaceae, Bradyrhizobiaceae and Rhizobiaceae. Exceptions included the
456 absence of benzoate metabolism and enrichment of methane metabolism in several
457 Clade II Families.
458 Clade III, a diverse collection of Bacteroidetes (Chitinophagaceae, Cytophagaceae),
459 Verrucomicrobia, Planctomycetes, divergent Acidobacteria Lineage and the
460 Deltaproteobacteria (Polyangiaceae, Myxococcaceae), shared enrichment of
461 sphingolipid metabolism, beta-Lactam resistance, penicillin and cephalosporin
462 biosynthesis, LPS biosynthesis, glycosyltransferases and starch/sucrose metabolism.
463 Many of these Families shared Clade I and II traits, including Type IV secretion system,
464 oxidative phosphorylation, TCA cycle, PTS, nitrogen and glycerophospholipid
465 metabolism. The absence of glutathione in non-Deltaproteobacterial Clade III Families
466 was notable.
467 The three Actinobacteria Families in Clade IV, Mycobacteriaceae, Frankiaceae and
468 Streptomycetaceae, were highly similar to each other because they were enriched in
469 Type II polyketide biosynthesis. They also shared some Clade I traits (ABC
470 transporters, transcription factors, pyruvate, benzoate and fatty acid metabolism) and
471 Clade III traits (membrane trafficking, transcription machinery, polyketide biosynthesis
472 and starch/sucrose metabolism). Similar to Clade III, these Actinobacteria were also
473 depleted in glutathione traits.
474 Finally, taxa within Clade V were similar to each other due to being depleted in traits
475 shared among the other clades. Cyanobacteria were the only taxa that possessed
476 photosynthesis traits. Lactic acid bacteria (Lactobacillaceae and Leuconostocaceae)
Page 15 of 147
ScholarOne Support 1-434/964-4100
FEMS Microbiology Ecology
123456789101112131415161718192021222324252627282930313233343536373839404142434445464748495051525354555657585960

For Peer Review
15
477 were enriched in Unclassified nucleotide metabolism. The Archaea (Thaumarchaeota
478 and Methanogen Lineage) shared eukaryote-like traits, proteasome, basal
479 transcription factors and RNA transport. The Archaea were enriched in carbon fixation
480 traits. Methanogens were also enriched in methane metabolism. Ammonia oxidising
481 Thaumarchaeota were not enriched in nitrogen metabolism, however they were
482 enriched in traits annotated by KEGG as Global maps only (unclassified metabolism).
483 Further analysis found this to be the fpr gene, encoding a ferredoxin-flavodoxin NADP+
484 reductase (K00528). Non-lactic acid bacteria of the Firmicutes (Bacillaceae,
485 Sporomusaceae and Clostridiaceae) were enriched in sporulation and motility traits.
486
487
488 4. Discussion
489 4.1 Non-random trait clustering demonstrates ecological coherence of taxa
490 A trait-based approach to investigate taxonomic relationships and potential biological
491 function was carried out with a collection of 175 terrestrial prokaryotes. We
492 hypothesised that traits would be non-randomly distributed amongst taxonomic groups,
493 supported by previous observations that noted closely related taxa are isolated from
494 similar habitats (Philippot et al., 2010). Similarity in the composition of 220 664 traits,
495 within 175 taxa, demonstrated strong agreement with established taxonomy at high
496 (Phyla) and low (Family) rank (Figure 2a). The exceptions to this ecological coherence
497 at high rank were the division of the Chloroflexi and an individual from each of the
498 Planctomycetes, Deltaproteobacteria, Actinobacteria and Firmicutes clustering with
499 unrelated Phyla. These taxa were not mischaracterised, as based on phylogenetics of
500 the full length 16S rRNA gene (Supplementary Figure 2a). Trait similarity between
501 related taxa, measured as C, tended to be highest at low rank (Figure 2b). Uneven
502 sample sizes between groups within Super Group and Phyla make comparisons at this
503 level difficult – the inclusion of many diverse Firmicutes and Actinobacteria likely drove
504 C to be lower here than in Thaumarchaeota and Euryarchaeota. However, equal
505 comparisons at the Family level demonstrated interesting variability in coherence. All
506 Proteobacterial Families had relatively high coherence (C = 0.4 – 0.6). The high C in
507 Beijerinckiaceae is of particular interest as this group contained both specialist
508 methanotroph (Methylocapsa, Methylocella), methylotroph (Methyloferula) and
509 generalist heterotroph (Beijerinckia spp.) taxa. With such varied metabolic traits, one
510 could reasonably expect C to be relatively low within this Family. The Beijerinckiaceae
Page 16 of 147
ScholarOne Support 1-434/964-4100
FEMS Microbiology Ecology
123456789101112131415161718192021222324252627282930313233343536373839404142434445464748495051525354555657585960

For Peer Review
16
511 appear to have evolved from a common methylotrophic ancestor and still share traits
512 for nitrogen fixation and tolerance for low pH soils (Tamas et al., 2014), and the high
513 C measured here indicates that many additional shared traits remain. Both the
514 relatively recent divergence of Families from a common ancestor and the higher
515 number of shared traits are likely causes of the higher C observed at low taxonomic
516 rank. The differing values of C for Methanogen and photosynthetic Cyanobacteria
517 functional groups (0.33 and 0.44, respectively) is also worthy of note. Despite all five
518 taxa in each group performing the same core role in a community, the individual
519 isolates came from varying environments. The methanogens were isolated from a
520 range of geographically separate wetlands, rice paddy soil and farm slurry and, while
521 the Cyanobacteria were also isolated from geographically separate environments, they
522 were all from sandy deserts or other nutrient poor, arid soils (Supplementary Table 1
523 and references therein). Ultimately a taxon’s trait composition will be affected by its
524 functional role in a community, its evolutionary life-history (e.g. Beijerinckiaceae
525 described above) and its local environment.
526 However, these results are dependent on accurate taxonomic classification, and the
527 C of Sporomusaceae, relatively low compared to other Families here, supports splitting
528 this group into Sporomusaceae, Anaeromusaceae and Pelosinaceae by GTDB (Parks
529 et al., 2018). Finally worth noting, some groups at high rank were considered as
530 ‘Families’ here due to the number of available terrestrial genomes, e.g. Cyanobacteria
531 and Chloroflexi. Even so, Cyanobacteria demonstrated a higher C than many
532 taxonomically-defined Families, perhaps due to their common role as primary
533 colonisers of nutrient-poor soils (Garcia-Pichel et al., 2001). The number of Families
534 are too numerous to discuss each at length here, but C was an effective means of
535 measuring and comparing coherence between groups in the UPGMA tree.
536 While the method of comparing taxa here differs from other studies, the results were
537 not surprising as many 16S rRNA gene surveys of terrestrial systems consistently
538 demonstrate ecological coherence at high rank. For example, independent studies of
539 increasing agricultural intensity in soils show reductions in Actinobacteria abundance
540 (Philippot et al., 2009, Jangid et al., 2011). Nitrogen addition to soils frequently enriches
541 numerous taxa within the Actinobacteria and Proteobacterial Classes while negatively
542 affecting taxa within the Verrucomicrobia and Planctomycetes (Wessen et al., 2010,
543 Fierer et al., 2012, Leff et al., 2015, Bastida et al., 2016). Arid, nutrient poor
544 environments select for Actinobacteria-dominated communities (Cary et al., 2010,
Page 17 of 147
ScholarOne Support 1-434/964-4100
FEMS Microbiology Ecology
123456789101112131415161718192021222324252627282930313233343536373839404142434445464748495051525354555657585960

For Peer Review
17
545 Crits-Christoph et al., 2013) and, in the absence of other primary producers, allow
546 biological soil crust forming Cyanobacterial taxa to establish (Garcia-Pichel et al.,
547 2001). Anoxic wetland and rice paddy environments support diverse communities of
548 anaerobic Firmicutes, Chloroflexi and methanogenic Archaea (He et al., 2019, Finn et
549 al., 2020b). These trends were noted prior to bioinformatic advances of metagenome
550 assembled genomes (MAGs) that allow for the specific comparison of individual traits
551 between uncultured environmental prokaryote genomes (Hug et al., 2013). The
552 generation of MAGs has emerged as a useful tool for identifying traits necessary for
553 life in such environments, and particularly for expanding knowledge of severely under-
554 represented, difficult to culture taxonomic groups. For example, the recent
555 reconstruction of 52 515 MAGs from a wide range of host-associated and
556 environmental metagenomes was able to increase genomic information of
557 Planctomycetes and Verrucomicrobia by 79% and 68%, respectively (Nayfach et al.,
558 2021). Importantly, both 16S rRNA gene surveys and MAGs demonstrate that some
559 functional traits that facilitate life under certain environmental conditions are
560 intrinsically linked to taxonomy.
561 The ecological coherence observed in Figure 2 does not imply that closely related
562 taxa (e.g. Bacillus velezensis LS69 and Bacillus amyloliquefaciens plantarum FZB42)
563 have identical phenotypes. Close relatives possess a combination of core and
564 accessory genes (traits) and the presence of even a single accessory gene is sufficient
565 to dramatically alter a strain’s phenotype (van Rossum et al., 2020). Rather, our results
566 (Figure 2) demonstrate that the composition of core and accessory traits in
567 alphaproteobacterial Beijerinckiaceae are most similar to each other, relative to
568 alphaproteobacterial Rhizobiaceae or to Actinobacteria, Firmicutes etc.
569
570
571 4.2 What can the Random Forests tell us?
572 The Random Forest works by identifying the traits that are most reliable in classifying
573 individual Phyla and Families. It selects traits that tend to be: a) of equal copy number
574 per genome within a taxonomic group; and b) that differ markedly in copy number
575 between taxonomic groups, since distinct separation of copies will maximise
576 successful classification. A clear example of this is the consistent identification of
577 eukaryote-like basal transcription factors, proteasome and RNA transport present in
578 the Thaumarchaeota and Euryarchaeota, since they are absent from the majority of
Page 18 of 147
ScholarOne Support 1-434/964-4100
FEMS Microbiology Ecology
123456789101112131415161718192021222324252627282930313233343536373839404142434445464748495051525354555657585960
For Peer Review
18
579 Bacterial Phyla. The binary nature of these traits (yes Archaea, no Bacteria) make
580 them strong indicators. The presence of these and more eukaryote-like vesicular
581 trafficking and actin traits have been noted in the Archaeal TACK super-phylum
582 previously, and lend credence to the hypothesis that eukaryotes are descended from
583 Archaea (Embley & Martin, 2006, Spang et al., 2015). However, the Random Forest
584 will not identify a trait unique to Can. Nitrosotalea devanterra that is absent from other
585 Thaumarchaeota, as this single trait will not improve classification of the group as a
586 whole. Consequently, the traits identified via Random Forest all tended to be core,
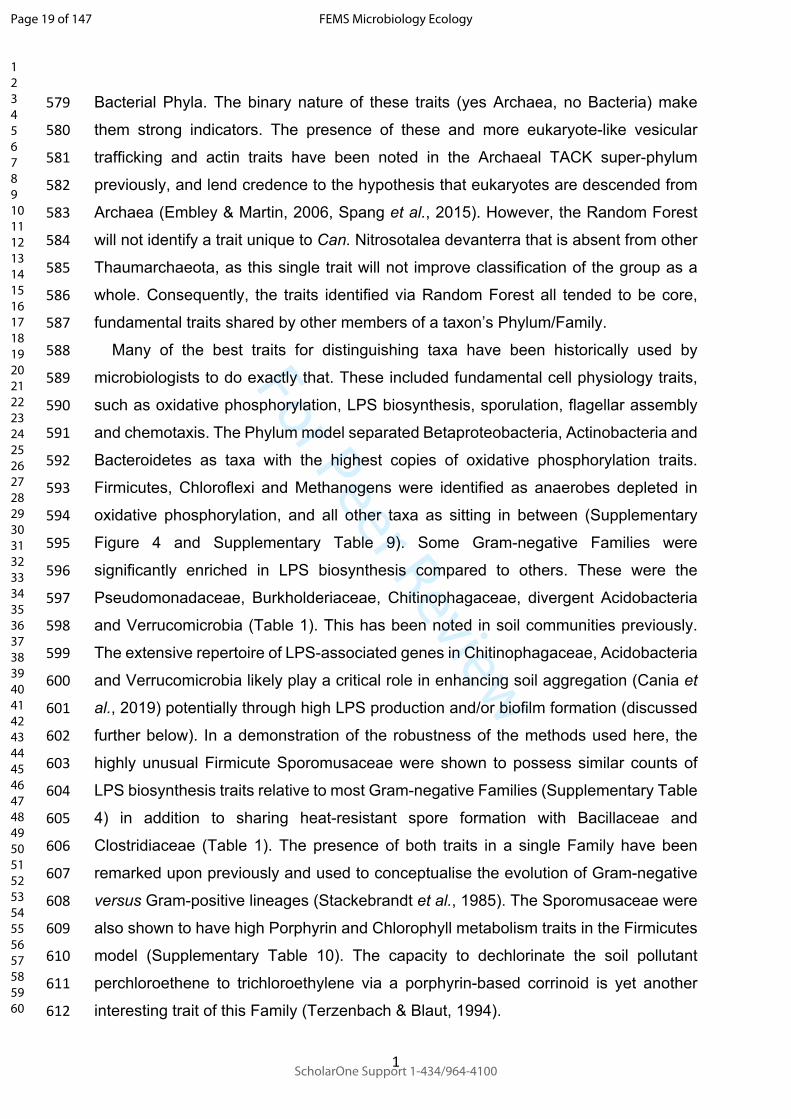
587 fundamental traits shared by other members of a taxon’s Phylum/Family.
588 Many of the best traits for distinguishing taxa have been historically used by
589 microbiologists to do exactly that. These included fundamental cell physiology traits,
590 such as oxidative phosphorylation, LPS biosynthesis, sporulation, flagellar assembly
591 and chemotaxis. The Phylum model separated Betaproteobacteria, Actinobacteria and
592 Bacteroidetes as taxa with the highest copies of oxidative phosphorylation traits.
593 Firmicutes, Chloroflexi and Methanogens were identified as anaerobes depleted in
594 oxidative phosphorylation, and all other taxa as sitting in between (Supplementary
595 Figure 4 and Supplementary Table 9). Some Gram-negative Families were
596 significantly enriched in LPS biosynthesis compared to others. These were the
597 Pseudomonadaceae, Burkholderiaceae, Chitinophagaceae, divergent Acidobacteria
598 and Verrucomicrobia (Table 1). This has been noted in soil communities previously.
599 The extensive repertoire of LPS-associated genes in Chitinophagaceae, Acidobacteria
600 and Verrucomicrobia likely play a critical role in enhancing soil aggregation (Cania et
601 al., 2019) potentially through high LPS production and/or biofilm formation (discussed
602 further below). In a demonstration of the robustness of the methods used here, the
603 highly unusual Firmicute Sporomusaceae were shown to possess similar counts of
604 LPS biosynthesis traits relative to most Gram-negative Families (Supplementary Table
605 4) in addition to sharing heat-resistant spore formation with Bacillaceae and
606 Clostridiaceae (Table 1). The presence of both traits in a single Family have been
607 remarked upon previously and used to conceptualise the evolution of Gram-negative
608 versus Gram-positive lineages (Stackebrandt et al., 1985). The Sporomusaceae were
609 also shown to have high Porphyrin and Chlorophyll metabolism traits in the Firmicutes
610 model (Supplementary Table 10). The capacity to dechlorinate the soil pollutant
611 perchloroethene to trichloroethylene via a porphyrin-based corrinoid is yet another
612 interesting trait of this Family (Terzenbach & Blaut, 1994).
Page 19 of 147
ScholarOne Support 1-434/964-4100
FEMS Microbiology Ecology
123456789101112131415161718192021222324252627282930313233343536373839404142434445464748495051525354555657585960

For Peer Review
19
613 Finally, flagella assembly and chemotaxis traits identified Alphaproteobacteria,
614 Betaproteobacteria and Acidobacteria as Phyla that were particularly enriched with this
615 mechanism of motility, while bacterial Actinobacteria, Bacteroidetes, Cyanobacteria,
616 Chloroflexi and Verrucomicrobia were depleted (Supplementary Table 9). The
617 Proteobacteria, Firmicutes and Under-represented models were better suited for
618 identifying specific Families homogenously enriched or depleted in bacterial flagella
619 and chemotaxis (Supplementary Tables 10 and 11). Enriched Families included the
620 Rhodospirillaceae, Nitrosomonadaceae, Neisseriales lineage, divergent Acidobacteria
621 lineage, Sporomusaceae, Bacillaceae, Clostridiaceae and Planctomycetes. Other
622 forms of motility such as twitching and gliding have been noted in the
623 Pseudomonadaceae, Myxococcaceae and Cyanobacteria (McBride, 2001) but these
624 traits were not identified by the Random Forest as being homogenously enriched in
625 any Families. Furthermore, while Thaumarchaeota and Methanogens were both
626 identified as being depleted in bacterial flagella assembly and chemotaxis traits
627 (Supplementary Table 9 and 11), Archaea possess a structurally distinct flagellum
628 more similar to the Type IV bacterial pilus (Jarrell and Albers, 2012). These taxa were
629 not enriched with Type IV pilus, either, and it is possible that archaeal flagella may
630 have failed proper characterisation by KEGG. Thus, while some Families were
631 relatively enriched/depleted in bacterial flagella and chemotaxis traits, specific taxa
632 depleted in these are not necessarily non-motile.
633 In summary, while the Random Forests may overlook certain traits in individual taxa,
634 the models were highly robust in detecting conserved, shared traits within a
635 Phylum/Family. Here the ‘depth’ of shared traits is limited by the number of taxa that
636 could be considered as Phylum or Family. In future, if five (or more) taxa belonging to
637 the same Genus or even Species could be compared, unique traits would be observed
638 to explain how these subgroups have evolved from their respective Families to occupy
639 distinct niches. Ideally the selection of individual taxa within groups for such future
640 comparative analyses would also be standardised based on phylogenetic distance,
641 either with P or a similar method, that would improve the robustness of trait-based
642 comparisons at such a fine taxonomic level.
643
644
645 4.3 Plant-derived carbon metabolism and nutrient acquisition
Page 20 of 147
ScholarOne Support 1-434/964-4100
FEMS Microbiology Ecology
123456789101112131415161718192021222324252627282930313233343536373839404142434445464748495051525354555657585960

For Peer Review
20
646 Secondly, we hypothesised that the traits differentially enriched between taxonomic
647 groups would largely reflect those associated with copiotrophs or oligotrophs, namely
648 metabolism, nutrient acquisition and environmental stress response and tolerance. Of
649 fundamental interest to soil microbiologists is the decomposition of plant biomass. This
650 is the primary source of organic carbon to non-arid terrestrial systems (Kögel-Knabner,
651 2002) and the transformation of plant material to substrates bioavailable for
652 microorganisms is essential for community growth and activity. The traits involved in
653 plant material catabolism belonged to the BRITE categories ‘Starch and Sucrose
654 Metabolism’ (e.g. extracellular cellobiosidases, endoglucanases, glucosidases,
655 trehalases, amylases) and ‘Glycosyltransferases’, all of which are carbohydrate
656 activated enzymes (CAZy). The Families particularly enriched in these traits were the
657 Polyangiaceae, Myxococcaceae, Rhizobiaceae, Streptomycetaceae,
658 Mycobacteriaceae, Frankiaceae and Verrucomicrobia (Table 1, Supplementary Table
659 11). Genomic and culture-dependent analyses support Sorangium cellulosum
660 (Polyangiaceae), Streptomyces coelicolor A3(2) (Streptomycetaceae) and
661 Chthoniobacter flavus (Verrucomicrobia) as having particularly large genomes with
662 extensive repertoires for cellulose, hemicellulose, pectin and lignin degradation
663 (Bentley et al., 2002, Sangwan et al., 2004, Schneiker et al., 2007). Comparative
664 genomics analyses have also identified Actinobacteria, Acidobacteria and
665 Verrucomicrobia as being enriched in numerous enzymes for cellulose, hemicellulose
666 and starch catabolism (Trivedi et al., 2013). In situ these Families likely play a critical
667 role in making organic carbon bioavailable as di- and monosaccharides for the
668 microbial community.
669 The Families equipped with many copies of high-affinity sugar uptake
670 ‘Phosphotransferase systems’ (3 – 14 copies) did not necessarily correspond to those
671 enriched with CAZy – only the Myxococcaceae and Verrucomicrobia were enriched in
672 both. Pseudomonadaceae, Rhodospirillaceae, Neisseriales lineage and
673 Clostridiaceae were only enriched in PTS. Despite being enriched in CAZy, the
674 Frankiaceae were simultaneously depleted in PTS. The complex interplay between
675 taxa capable of producing extracellular CAZy and competitors that rapidly scavenge
676 available di- and monosaccharides has been well described by models that predict
677 such competitive interactions exert important controls on the growth rate of the
678 community as a whole (Freilich et al., 2011) and may even act to aid terrestrial carbon
679 storage and limit carbon dioxide emissions from microbial respiration (Kaiser et al.,
Page 21 of 147
ScholarOne Support 1-434/964-4100
FEMS Microbiology Ecology
123456789101112131415161718192021222324252627282930313233343536373839404142434445464748495051525354555657585960

For Peer Review
21
680 2015). Here, we identified the ‘specialist’ Families enriched in CAZy traits versus the
681 ‘opportunists’ scavenging for sugars via PTS (Table 1, Supplementary Table 11).
682 ABC transporters facilitate the ATP-dependent uptake of soluble compounds across
683 membranes or export waste metabolites, extracellular enzymes and toxins (Young &
684 Holland, 1999, Higgins, 2001). This means of active transport allows microorganisms
685 to acquire nutrients with high affinity at concentrations of 5 – 500 µg carbon L-1 versus
686 the less efficient diffusion of nutrients across membranes, dependent on extracellular
687 concentrations of 0.5 – 5 mg carbon L-1 (Kuznetsov et al., 1979). In the spatially
688 heterogenous soil environment where the concentration of bioavailable carbon
689 substrate often limits growth (Blagodatsky & Richter, 1998), possession of high affinity
690 transporters likely provides a competitive advantage. The rhizosphere-associated
691 Rhodospirillaceae, Rhizobiaceae and Burkholderiaceae tended to have the highest
692 trait copies of ABC transporters (100 – 350 copies per genome, Supplementary Figure
693 4). The diverse, non-rhizospheric Deltaproteobacteria, Actinobacteria, Firmicutes,
694 Cyanobacteria and Verrucomicrobia all had greater than 50 copies per genome,
695 highlighting the importance of these traits in soil. The particularly high gene copy
696 number in rhizosphere-associated taxa from presumably nutrient-rich environments
697 contrasts the assumption that ABC transporters are considered to play a greater role
698 in nutrient-poor environments (Lauro et al., 2009). Comparative genomics analyses of
699 soil bacteria have also found putatively copiotrophic Proteobacteria and Firmicutes to
700 be particularly enriched in PTS and ABC transporters (Trivedi et al., 2013). In this
701 study, the transporters enriched in rhizosphere-associated taxa were primarily aimed
702 at scavenging maltose, phosphate, amino acids, oligopeptides and export of LPS, and
703 these results suggest that these traits are not only for survival in nutrient-poor
704 environments but also likely confer a competitive advantage in the rhizosphere. As
705 prokaryotes compete simultaneously with other prokaryotes and plants for nitrogen
706 and phosphorus in the rhizosphere, the high affinity acquisition of such nutrients is
707 likely critical for growth.
708
709
710 4.4 Nitrogen and methane metabolism
711 The BRITE category ‘Nitrogen metabolism’ encompasses nitrogen fixation,
712 denitrification, ammonia oxidation and synthesis of glutamate/glutamine which are
713 critical amino acids for peptide synthesis. Since nitrogen limitation acts as an important
Page 22 of 147
ScholarOne Support 1-434/964-4100
FEMS Microbiology Ecology
123456789101112131415161718192021222324252627282930313233343536373839404142434445464748495051525354555657585960

For Peer Review
22
714 control on soil microbial activity, these traits are also of interest to soil microbiologists.
715 Three Proteobacterial Families, Rhodospirillaceae, Bradyrhizobiaceae and
716 Burkholderiaceae, were particularly enriched in these traits. Genomic and culture-
717 dependent analyses show these Families to be free-living or symbiotic diazotrophs in
718 soil and freshwater environments (Madigan et al., 1984, Itakura et al., 2009, de los
719 Santos et al., 2018). Given their significantly greater copies of nitrogen-fixing genes,
720 these Families may be a particularly important source of organic nitrogen for soil
721 communities. Saprotrophic Mycobacteriaceae genomes, also identified as nitrogen
722 cyclers, tend to have many copies of genes involved in ammonia uptake and glutamate
723 synthesis (Amon et al., 2010). This taxon may play an alternative role in converting
724 mineral nitrogen to biomass where organic nitrogen as protein in excreted products or
725 necromass can undergo proteolysis and uptake between other community members.
726 The identification of Sporomusaceae as enriched in ‘Nitrogen metabolism’ traits is
727 unusual as these obligate anaerobic fermenters cannot use nitrate as an electron
728 acceptor (Möller et al., 1984). Nor were the Sporomusaceae enriched in ammonia
729 uptake or glutamate synthesis genes (data not shown), and so it is uncertain what role
730 this Family plays in nitrogen cycling. Thaumarchaeota and Nitrosomonadaceae, known
731 ammonia oxidisers, were not enriched in ‘Nitrogen metabolism’ traits relative to other
732 Families (Supplementary Figure 5) despite Nitrosomonadaceae possessing multiple
733 copies of the operon responsible for ammonia oxidation (Klotz & Norton, 1998).
734 Specific traits may be overlooked here if the BRITE category includes many diverse
735 KOs (e.g. ammonia oxidation, nitrogen fixation, glutamate synthesis etc).
736 Another specialised metabolic pathway of interest involves ‘Methane metabolism’
737 that includes production and oxidation of a potent greenhouse gas. Unsurprisingly, the
738 Methanogens and methanotrophic Methylococcaceae, Beijerinckiaceae,
739 Methylocystaceae were all enriched in traits involved in methane metabolism. While
740 methane oxidation can be present in some taxa from the Verrucomicrobia (Op den
741 Camp et al., 2009) the above proteobacterial representatives act as the primary
742 terrestrial methane sink (Dunfield, 2007, Conrad, 2009).
743
744
745 4.5 Sensing, responding and tolerating the environment
746 A particularly interesting divergence of traits were involved in how taxa detect and
747 respond to environmental stimuli. Gram-negative Pseudomonadaceae,
Page 23 of 147
ScholarOne Support 1-434/964-4100
FEMS Microbiology Ecology
123456789101112131415161718192021222324252627282930313233343536373839404142434445464748495051525354555657585960

For Peer Review
23
748 Rhodospirillaceae, Bradyrhizobiaceae and Myxococcaceae were enriched in two-
749 component systems. These membrane-bound histidine kinases respond rapidly to
750 extracellular stimuli (Galperin, 2005) and these traits were primarily involved in
751 nitrogen, potassium, initiating chemotaxis and C4-dicarboxylate responses. Families
752 enriched in transcription factors were the Myxococcaceae, Polyangiaceae,
753 Streptomycetaceae, Mycobacteriaceae and Frankiaceae. These factors regulate
754 transcription in response to intracellular cues and here these factors were primarily
755 rpoD (housekeeping), rpoH (heat-shock/protein damage), rpoE (extra-cellular
756 cytoplasmic stress) and rpoS (starvation) responses (Shimada et al., 2017). The
757 genomes of these taxa are also heavily enriched in regulatory genes for complex
758 developmental stages, fruiting bodies and/or filamentous branching growth in soils
759 (Bentley et al., 2002, Gao et al., 2006, Schneiker et al., 2007). Thus, certain taxa may
760 respond primarily to extracellular cues while others strictly monitor and respond to
761 changes in cell homeostasis. This trend has been noted previously – in 167 genomes
762 across various Bacteria and Archaea, Proteobacteria had a higher ratio of sensors for
763 external versus internal stimuli and were considered ‘extroverts’, while Cyanobacteria
764 were considered strong ‘introverts’ focussed on responding to internal stimuli
765 (Galperin, 2005).
766 As mentioned above, Archaea exhibited unique traits in basal transcription and
767 protein regulation via proteasome. These transcription factors were primarily involved
768 in identifying DNA damage and excision repair: TFII-B, TFII-D, ERCC-2 and ERCC-3.
769 DNA repair differs markedly between Bacteria and Archaea/eukaryotes. Specifically,
770 Bacteria excise 12 nucleotides around a damaged site with a 3 polypeptide system
771 whereas Archaea excise 24 – 32 nucleotides with a 13 – 16 polypeptide system
772 (Sancar, 1996). The use of ubiquitin-labelling and proteasome degradation of
773 misfolded or ‘old’ proteins is arguably a more efficient system for recycling amino acids
774 and regulating the ‘lifespan’ of a protein in eukaryotes, however, Bacteria are still fully
775 capable of regulating protein misfolding or proteolysis with RpoH (and others) induced
776 upon environmental stress (Goldberg, 2003). From an ecological perspective, it is
777 difficult to discern if these eukaryote-like traits confer any sort of competitive advantage
778 to Archaea. They may simply be examples of convergent evolution for dealing with
779 environmental stress.
780 Finally, most microbial cells likely exist within complex biofilms and/or assemblages
781 adhered to surfaces with excreted exopolysaccharides, DNA and protein that serve to
Page 24 of 147
ScholarOne Support 1-434/964-4100
FEMS Microbiology Ecology
123456789101112131415161718192021222324252627282930313233343536373839404142434445464748495051525354555657585960

For Peer Review
24
782 protect from adverse environmental factors (Flemming & Wingender, 2010). Families
783 with high copy numbers of exopolysaccharide biosynthesis and secretion systems may
784 act as integral members of soil communities by predominantly contributing to
785 biofilm/aggregate formation. The ‘LPS biosynthesis’ and ‘Starch and sucrose
786 metabolism’ BRITE categories can synthesise N-acetyl glucosamine-based and
787 cellulose-based exopolysaccharides, respectively. Taxa enriched in both these
788 categories and secretion systems were the Polyangiaceae and Burkholderiaceae
789 (Table 1), and in the refined ‘Under-represented’ model, Acidobacteria and
790 Verrucomicrobia (Supplementary Table 11).
791
792
793 4.6 Direct cell-cell interactions
794 Type IV secretion systems were another important trait identified in the Random Forest
795 models. These were enriched in Pseudomonadaceae and Myxococcaceae (Table 1)
796 and Acidobacteria, Planctomycetes and Verrucomicrobia (Supplementary Table 11).
797 These are highly specialised exporters that deliver DNA and/or toxins directly to other
798 bacterial or plant cells, however, their role in ecology is poorly understood beyond root
799 galls induced by Agrobacterium tumefaciens (Christie & Vogel, 2000). These taxa
800 should be explored for whether they utilise these traits for horizontal gene transfer or
801 to inject toxins directly into other prokaryotes, and thus potentially provide a selective
802 advantage for colonisation and competition.
803 Another archetypal trait for interactions between community members are
804 production of antimicrobials and antimicrobial resistance genes. Penicillin and
805 cephalosporin synthesis were enriched in the Sporomusaceae and Bacillaceae relative
806 to other Firmicutes. Polyketide and Type II polyketide syntheses were important for
807 separating Frankiaceae and Streptomycetaceae from other Actinobacteria
808 (Supplementary Table 10). The Streptomycetaceae have a long history of use in
809 biotechnology as prolific antimicrobial producers (Bentley et al., 2002). Bacillaceae (in
810 particular Bacillus subtilis species) are also well known producers of a wide variety of
811 antimicrobials (Caulier et al., 2019), but we noted that Sporomusaceae have an even
812 greater number of these traits (Supplementary Figure 9). To the authors’ knowledge,
813 antibiotic production in Sporomusaceae has not been investigated thoroughly and this
814 may be a consequence of its obligate anaerobic nature and difficulties in culturing. In
815 addition to prolific Type II polyketide producers, Streptomycetaceae were also enriched
Page 25 of 147
ScholarOne Support 1-434/964-4100
FEMS Microbiology Ecology
123456789101112131415161718192021222324252627282930313233343536373839404142434445464748495051525354555657585960

For Peer Review
25
816 in antimicrobial resistance genes, while Bacteroidetes, Planctomycetes and
817 Verrucomicrobia were specifically enriched in beta-Lactam resistance (Supplementary
818 Tables 9 and 10).
819
820
821 4.7 Life strategies emerge from differentially enriched traits
822 We hypothesised that taxa would emerge as being inherently copiotrophic or
823 oligotrophic based on trends in their enriched traits. Traits were chosen based on
824 identification via Random Forest and identification as associated with copiotroph-
825 oligotroph species or in mixed communities as described previously (Lauro et al., 2009,
826 Vieira-Silva & Rocha, 2010, Roller & Schmidt, 2015, Pascual-Garcia & Bell, 2020).
827 Rhizosphere-associated Gamma-, Alpha- and Betaproteobacteria in Clade I fit the
828 assumptions of a copiotrophic niche that invests in high metabolic rate – these taxa
829 were uniquely enriched in competing for nutrient uptake via high-affinity ABC
830 transporters, and energy generation from pyruvate, fatty acids, benzoate and
831 glyoxylate carbon sources. Clade I was also enriched in glutathione metabolism, which
832 acts as the major antioxidant for reducing intracellular free radicals produced during
833 central carbon metabolism (Smirnova & Oktyabrsky, 2005). Antioxidants have been
834 hypothesised as an essential function for copiotrophs to survive their high metabolic
835 rates (Koch, 2001). All five Clade I Families were enriched in oxidative phosphorylation.
836 The oxidative phosphorylation traits encompass a wide variety of electron transport
837 chain proteins (oxidoreductases, dehydrogenases, cytochromes and ATPases) and
838 are crucial for efficient energy production (Brochier-Armanet et al., 2009). All five
839 Families were also enriched in nitrogen metabolism, which included both nitrogen
840 fixation and glutamate (i.e. protein) synthesis. Nitrogen fixation is an energy intensive
841 process requiring 20 – 30 ATP per reduced N2 (Burris & Roberts, 1993) and may be
842 intrinsically linked to taxa with high oxidative phosphorylation. Finally, Clade I also
843 shared motility and chemotaxis, which are also energy intensive traits. Clade II
844 consisted of the remaining Gamma-, Alpha- and Betaproteobacteria, yet these were
845 relatively less enriched in Clade I ‘copiotroph’ traits. These particular taxa may be
846 responsible for the lack of a consistent copiotrophic response upon nutrient addition in
847 Proteobacteria (Ho et al., 2017).
848 Clade III was comprised of taxa generally considered as oligotrophs (Ho et al., 2017)
849 with the exception of Bacteroidetes (Fierer et al., 2007). These taxa possessed high
Page 26 of 147
ScholarOne Support 1-434/964-4100
FEMS Microbiology Ecology
123456789101112131415161718192021222324252627282930313233343536373839404142434445464748495051525354555657585960

For Peer Review
26
850 LPS and sphingolipid synthesis that can defend against desiccation and antimicrobials
851 through biofilm and capsule/slime production (Flemming & Wingender, 2010), beta-
852 Lactam resistance, penicillin biosynthesis and several members had high pentose
853 phosphate pathway for efficient carbon metabolism under starvation (Hodgson, 2000).
854 Clade III also possessed high CAZy traits, which Clade I largely lacked, and is
855 consistent with observations of oligotrophs being primarily responsible for catabolising
856 relatively recalcitrant plant material (Goldfarb et al., 2011). While Clade III were equally
857 enriched in oxidative phosphorylation as Clade I, with the exception of the
858 Deltaproteobacteria, these taxa were depleted in glutathione metabolism. The low
859 copies per genome of this trait would explain why the abundance of oligotrophs drop
860 rapidly in nutrient addition studies as they would be either out-competed by
861 glutathione-rich taxa capable of exploiting plentiful nutrients or will lyse if their
862 metabolic rate exceeds capacity to reduce free radicals (Koch, 2001). Taken together,
863 all of these traits indicate Clade III lead oligotrophic lifestyles whereby they are tolerant
864 to adverse environmental conditions, can acquire carbon from recalcitrant plant
865 material, and are incapable of rapid growth rates.
866 These results support previous observations that Rhodospirillaceae,
867 Bradyrhizobiaceae, Burkholderiaceae, Pseudomonadaceae and Rhizobiaceae are
868 copiotrophic, while Planctomycetes, Verrucomicrobia, Myxococcaceae,
869 Polyangiaceae and Acidobacteria are oligotrophic (Ho et al., 2017 and references
870 therein). As has been proposed previously, the dominance of these groups in certain
871 soils can provide inferences for ecosystem processes in that system, for example soils
872 dominated by Verrucomicrobia, Planctomycetes and Acidobacteria will have greater
873 capacity to degrade complex plant material while retaining most catabolised carbon in
874 biomass (i.e. high growth or carbon use efficiency) or excreted byproducts that assist
875 in soil aggregation (e.g. high LPS production) (Trivedi et al., 2013). Conversely, soils
876 dominated by copiotrophic Proteobacteria Families will be systems primarily
877 dependent on labile di- and monosaccharides that demonstrate low carbon use
878 efficiency.
879 Streptomycetaceae, Mycobacteriaceae and Frankiaceae in Clade IV shared
880 enrichment of several Clade I copiotroph traits. As mentioned above in Section 4.5,
881 these Actinobacteria invest carbon and energy into complex filamentous growth and
882 developmental cycles. They demonstrate classic copiotrophic responses to nutrient
883 addition (Goldfarb et al., 2011, Leff et al., 2015) and their enriched ABC transporters,
Page 27 of 147
ScholarOne Support 1-434/964-4100
FEMS Microbiology Ecology
123456789101112131415161718192021222324252627282930313233343536373839404142434445464748495051525354555657585960

For Peer Review
27
884 pyruvate, glyoxylate, benzoate and fatty acid metabolism all likely contribute to
885 generating energy for complex lifecycles. Simultaneously, their enrichment of Clade III
886 oligotroph traits for CAZy metabolism in addition to many traits for producing and
887 resisting antimicrobials indicate a unique niche for these Actinobacteria that does not
888 necessarily fall within the classical copiotroph-oligotroph framework.
889 Clade V differed markedly from all other clades and mostly consisted of ‘specialist’
890 metabolic functional groups involved in photosynthesis, ammonia oxidation,
891 methanogenesis, lactic acid production and other fermentation. Similar to Clade III,
892 these taxa would also be expected to have relatively low metabolic rates due to
893 depletion of copiotroph traits associated with rapid metabolism and energy generation.
894 Unlike Clade III, these taxa seemed to lack consistent mechanisms for stress
895 tolerance. Thus, while certain taxa did invest in traits for rapid metabolic rate (Clades I
896 and IV) and others primarily in stress tolerance (Clades III and IV), some taxa lacked
897 these approaches altogether and pursued entirely distinct niches (Clade V). As an
898 average of 47% of traits within each genome were Uncharacterised, Clade V is an
899 over-simplification and that if novel, currently uncharacterised proteins and the traits
900 they fulfil were incorporated into hierarchical clustering, this clade would separate more
901 meaningfully.
902 If one were to consider taxa within the one-dimensional copiotroph-oligotroph
903 spectrum, Clade I would represent one extreme, Clades III and V another, with Clades
904 II and IV falling in between. Figure 5a is a conceptual diagram where these Clades
905 have been placed on a singular axis of ‘resource investment’, with the niche space of
906 Clades enriched in traits associated with rapid growth (e.g. glutathione) toward the
907 ‘copiotrophy’ pole while Clades enriched in stress tolerance traits (e.g. LPS production)
908 are placed toward the ‘oligotrophy’ pole. However, this approach overlooks the diverse
909 functional potentials (and distinct niches) for carbon and energy metabolism
910 associated with the various Clades. Furthermore, the large overlaps in niche space
911 between Clades would suggest taxa from each group could not co-exist if ‘resource
912 investment’ was the only important consideration (Gause, 1932, Hutchinson, 1957,
913 Leibold, 1995). A more meaningful perspective would be to consider the additional role
914 of ‘resource acquisition’ that incorporates multiple axes for the life strategies identified
915 via hierarchical clustering of traits. Figure 5b is a conceptual diagram of niche space
916 where clades have been further separated along additional dimensions based on their
917 enrichment of traits involved in competition, degradation or specialised metabolic
Page 28 of 147
ScholarOne Support 1-434/964-4100
FEMS Microbiology Ecology
123456789101112131415161718192021222324252627282930313233343536373839404142434445464748495051525354555657585960

For Peer Review
28
918 pathways. The BRITE categories listed on the various axes are chosen to be useful
919 markers in predicting the niche of a taxon. This expanded niche space would suggest
920 taxa in Clade I are well equipped for nutrient acquisition (primarily, but not limited to,
921 di- and monosaccharides), rapid growth and oxidative stress regulation as
922 ‘copiotrophic competitors’. Clade II, which may not be capable of competing directly
923 with Clade I for carbon and energy, may thus occupy the niche space of specialist
924 Proteobacterial methylotrophs, methane and ammonia oxidisers so as to be
925 ‘copiotrophic metabolic specialists’. The strategy of Clade III would be to decompose
926 plant material via diverse CAZy and possess a variety of environmental stress
927 tolerance traits as ‘oligotrophic degraders’. Clade IV, which include for example
928 Actinobacteria that share traits for competition, degradation and oligotrophy, could thus
929 occupy niche space between Clades I and III. Finally, the strategy of Clade V would
930 be to fill highly specialised, unrelated metabolic niches reliant on completely distinct
931 carbon sources to other taxa. The large space conceptualised for Clade V in Figure
932 5b, which does not imply either copiotrophic or oligotrophic resource investment, is an
933 oversimplification and with improved understanding of traits in these taxa it may be
934 possible to fracture and further separate them into more detailed groups. This would
935 prove particularly beneficial for the poorly characterised Archaea.
936 Moving beyond a one-dimensional r-K spectrum to accommodate additional trait-
937 driven life strategies has been proposed in plant ecology (Grime, 1977). Specifically,
938 Grime argued that plant taxa fall within a multi-dimensional space defined by extremes
939 on three axes: ‘competitors’ that acquire nutrients, light, water etc. more effectively
940 than neighbouring taxa in the same environment, ‘stress tolerators’ that are long-lived,
941 slow growing taxa that resist desiccation, alkaline soils etc., and ‘ruderals’ that have
942 very brief lifecycles between periods of disturbance and invest in environmentally
943 hardy seeds. Despite these varied strategies for resource investment, plants are
944 unified in that photosynthesis is their primary form of acquiring carbon and energy. The
945 diversity of microbial strategies for acquiring carbon and energy enables them to
946 explore a greater range of potential niche space, and in addition to growth traits that
947 allow for a relatively more copiotrophic or oligotrophic investment of those resources,
948 likely contributes to the high diversity of co-existing taxa observed in soil microbial
949 communities.
950 However, to truly unravel differentiated niches and general microbial life strategies,
951 two limitations must be overcome. Firstly, a better understanding of the many
Page 29 of 147
ScholarOne Support 1-434/964-4100
FEMS Microbiology Ecology
123456789101112131415161718192021222324252627282930313233343536373839404142434445464748495051525354555657585960

For Peer Review
29
952 ‘Uncharacterised’ traits in environmental isolates is required. For example, the recent
953 large-scale MAG study by Nayfach et al., (2021) identified 5.8 million protein clusters
954 (traits), of which over 75% could not be annotated meaningfully by current protein
955 databases. Secondly, robust trait-based analyses down to the finer scale of distinct
956 genomes will likely be necessary to consider how individual taxonomic members of a
957 community have either differentiated in order to co-exist or are in the throes of
958 competition that will ultimately exclude one of the competitors.
959
960
961 5. Conclusion
962 In a collection of 175 terrestrial prokaryotes that possess 220 664 traits shared
963 between at least two taxa, concepts in niche differentiation were explored. Non-random
964 trait distributions were shown as preferential clustering of related taxa within most
965 Phyla with a general trend of highest similarity at the level of Family. This strongly
966 supported ecological coherence of shared traits within close relatives. Random Forest
967 models successfully identified BRITE 3 categories that best explained differing traits
968 between taxonomic groups. These traits were involved in a wide range of biological
969 functions, including core physiological traits used historically to categorise taxa. Many
970 traits were also involved in functions often associated with copiotrophs and oligotrophs,
971 namely metabolism, nutrient acquisition and environmental stress tolerance.
972 Hierarchical clustering of differential traits formed five distinct clusters, with Clade I
973 representing the classical copiotrophic niche, Clades III and V as oligotrophic, and
974 Clades II and IV in between. A more refined perspective would be to consider each
975 Clade as its own life strategy in a niche space that considers both resource investment
976 and acquisition simultaneously; for example, the strategy of Clade I is to invest in
977 competition and rapid growth, while Clade V pursue highly distinct, specialised
978 metabolic functions. The trait-based analyses here were effective in identifying general
979 trends in potential function of terrestrial microbial taxa at the Phylum and Family level.
980 Further investigation will be necessary to identify traits that give rise to niche
981 differentiation at lower taxonomic ranks and, ultimately, the importance of this for
982 ecosystem processes of interest.
983
984
985 Acknowledgements
Page 30 of 147
ScholarOne Support 1-434/964-4100
FEMS Microbiology Ecology
123456789101112131415161718192021222324252627282930313233343536373839404142434445464748495051525354555657585960

For Peer Review
30
986 The authors wish to thank the Australian Government Endeavour research program
987 ID: 6123_2017 for funding D.R. Finn. Funding support for B. Bergk-Pinto came from
988 the European Union’s Horizon 2020 research and innovation program under the Marie
989 Sklodowska-Curie ITN 675546-MicroArctic. The authors also wish to thank the
990 microbiologists involved in the isolation and genome sequencing of the taxa studied
991 here; it is hoped the majority of those involved are cited within the Supplementary
992 Material. Without this diligent culture-dependent work by the scientific community, the
993 theoretical ecology performed here would not be possible.
994
995 Conflict of Interest
996 The authors declare no conflict of interest regarding this study or its outcomes.
997
998 References
999 Altschul SF, Gish W, Miller W, Myers EW & Lipman DJ (1990) Basic Local Alignment Search 1000 Tool. Journal of Molecular Biology 215: 403-410.1001 Amon J, Titgemeyer F & Burkovski A (2010) Common patterns - unique features: nitrogen 1002 metabolism and regulation in Gram-positive bacteria. FEMS Microbiology Reviews 34: 588-1003 605.1004 Barbéran A, Bates ST, Casamayor EO & Fierer N (2012) Using network analysis to explore co-1005 occurrence patterns in soil microbial communities. The ISME Journal 6: 343-351.1006 Bastida F, Torres IF, Moreno JL, et al. (2016) The active microbial diversity drives ecosystem 1007 multifunctionality and is physiologically related to carbon availability in Mediterranean semi-1008 arid soils. Molecular Ecology 25: 4660-4673.1009 Bentley SD, Chater KF, Cerdeno-Tarraga AM, et al. (2002) Complete genome sequence of the 1010 model actinomycete Streptomyces coelicolor A3(2). Nature 417: 141-147.1011 Blagodatsky SA & Richter O (1998) Microbial growth in soil and nitrogen turnover: A 1012 theoretical model considering the activity state of microorganisms. Soil Biology & Biochemistry 1013 30: 1743-1755.1014 Bouskill NJ, Tang J, Riley WJ & Brodie EL (2012) Trait-based representation of biological 1015 nitrification: model development, testing, and predicted community composition. Frontiers in 1016 Microbiology 3: 364.1017 Brochier-Armanet C, Talla E & Gribaldo S (2009) The Multiple Evolutionary Histories of 1018 Dioxygen Reductases: Implications for the Origin and Evolution of Aerobic Respiration. 1019 Molecular Biology and Evolution 26: 285-297.1020 Brown JH, Gillooly JF, Allen AP, Savage VM & West GB (2004) Toward a metabolic theory of 1021 ecology. Ecology 85: 1771-1789.1022 Burris RH & Roberts GP (1993) Biological nitrogen fixation. Annual Reviews Nutrition 13: 317-1023 335.1024 Cania B, Vestergaard G, Krauss M, Fliessbach A, Schloter M & Schulz S (2019) A long-term field 1025 experiment demonstrates the influence of tillage on the bacterial potential to produce soil 1026 structure-stabilizing agents such as exopolysaccharides and lipopolysaccharides. 1027 Environmental Microbiome 14: 1-14.
Page 31 of 147
ScholarOne Support 1-434/964-4100
FEMS Microbiology Ecology
123456789101112131415161718192021222324252627282930313233343536373839404142434445464748495051525354555657585960

For Peer Review
31
1028 Cary SC, McDonald IR, Barrett JE & Cowan DA (2010) On the rocks: the microbiology of 1029 Antarctic Dry Valley soils. Nature Reviews Microbiology 8: 129-138.1030 Caulier S, Nannan C, Gillis A, Licciardi F, Bragard C & Mahillon J (2019) Overview of the 1031 antimicrobial compounds produced by members of the Bacillus subtilis group. Frontiers in 1032 Microbiology 10: 302.1033 Christie PJ & Vogel JP (2000) Bacterial type IV secretion: conjugation systems adapted to 1034 deliver effector molecules to host cells. Trends in Microbiology 8: 354-360.1035 Conrad R (2009) The global methane cycle: recent advances in understanding the microbial 1036 processes involved. Environmental Microbiology Reports 1: 285-292.1037 Crits-Christoph A, Robinson CK, Barnum T, Fricke WF, Davila AF, Jedynak B, McKay CP & 1038 DiRuggiero J (2013) Colonization patterns of soil microbial communities in the Atacama 1039 Desert. Microbiome 1: 28.1040 de los Santos PE, Palmer M, Chávez-Ramirez B, Beukes C, Steenkamp ET, Briscoe L, Khan N, 1041 Maluk M et al., (2018) Whole genome analyses suggests that Burkholderia sensu lato contains 1042 two additional novel genera (Mycetohabitans gen. nov., and Trinickia gen. nov.): implications 1043 for the evolution of diazotrophy and nodulation in the Burkholderiaceae. Genes 9: 1044 doi:10.3390/genes9080389.1045 de Mendiburu F (2014) Agricolae: statistical procedures for agricultural research. 1046 http://cran.r-project.org/web/packages/agricolae/index.html.1047 Dunfield PF (2007) The Soil Methane Sink. Greenhouse Gas Sinks 152-170.1048 Embley TM & Martin W (2006) Eukaryotic evolution, changes and challenges. Nature Reviews 1049 440: 623-630.1050 Edgar RC (2004) MUSCLE: multiple sequence alignment with high accuracy and high 1051 throughput. Nucleic Acid Research 32: 1792-1797.1052 Enright AJ, Van Dongen S & Ouzounis CA (2002) An efficient algorithm for large-scale detection 1053 of protein families. Nucleic Acids Research 30: 1575-1584.1054 Fierer N, Bradford MA & Jackson RB (2007) Toward an ecological classification of soil bacteria. 1055 Ecology 88: 1354-1364.1056 Fierer N, Lauber CL, Ramirez KS, Zaneveld J, Bradford MA & Knight R (2012) Comparative 1057 metagenomic, phylogenetic and physiological analyses of soil microbial communities across 1058 nitrogen gradients. The ISME Journal 6: 1007-1017.1059 Finn DR, Yu J, Ilhan ZE, Fernandes VMC, Penton CR, Krajmalnik-Brown R, Garcia-Pichel F & 1060 Vogel TM (2020a) MicroNiche: an R package for assessing microbial niche breadth and overlap 1061 from amplicon sequencing data. Fems Microbiology Ecology 96: fiaa131.1062 Finn DR, Ziv-el M, van Haren J, Park JG, del Aguila-Pasquel J, Urquiza-Munoz JD & Cadillo-1063 Quiroz H (2020b) Methanogens and methanotrophs show nutrient-dependent community 1064 assemblage patterns across tropical peatlands of the Pastaza-Maranon Basin, Peruvian 1065 Amazonia. Frontiers in Microbiology 11: 746.1066 Flemming HC & Wingender J (2010) The biofilm matrix. Nature Reviews Microbiology 8: 623-1067 633.1068 Freilich S, Zarecki R, Eilam O, Segal ES, Henry CS, Kupiec M, Gophna U, Sharan R & Ruppin E 1069 (2011) Competitive and cooperative metabolic interactions in bacterial communities. Nature 1070 Communications 2.1071 Galperin MY (2005) A census of membrane-bound and intracellular signal transduction 1072 proteins in bacteria: bacterial IQ, extroverts and introverts. BMC Microbiology 5: 1073 doi:10.1186/1471-2180-1185-1135.
Page 32 of 147
ScholarOne Support 1-434/964-4100
FEMS Microbiology Ecology
123456789101112131415161718192021222324252627282930313233343536373839404142434445464748495051525354555657585960

For Peer Review
32
1074 Gao B, Paramanathan R & Gupta RS (2006) Signature proteins that are distinctive 1075 characteristics of Actinobacteria and their subgroups. Antonie Van Leeuwenhoek International 1076 Journal of General and Molecular Microbiology 90: 69-91.1077 Garcia-Pichel F, Lopez-Cortes A & Nübel U (2001) Phylogenetic and morphological diversity of 1078 Cyanobacteria in soil desert crusts from the Colorado Plateau. Applied and Environmental 1079 Microbiology 67: 1902-1910.1080 Gause GF (1932) Experimental studies on the struggle for existence I Mixed population of two 1081 species of yeast. Journal of Experimental Biology 9: 389-402.1082 Gleason HA (1926) The individualistic concept of the plant association. Bull Torrey Botany Club 1083 53: 7-26.1084 Goldberg AL (2003) Protein degradation and protection against misfolded or damaged 1085 proteins. Nature 426: 895-890.1086 Goldfarb KC, Karaoz U, Hanson CA, Santee CA, Bradford MA, Treseder KK, Wallenstein MD & 1087 Brodie EL (2011) Differential growth responses of soil bacterial taxa to carbon substrates of 1088 varying chemical recalcitrance. Frontiers in Microbiology 2.1089 Grime JP (1977) Evidence for the existence of three primary strategies in plants and its 1090 relevance to ecological and evolutionary theory. The American Naturalist 111: 1169-1194.1091 Grime JP (1979) Plant strategies and vegetation processes. Wiley, Chichester, UK.1092 He M, Zhang J, Shen L, et al. (2019) High-throughput sequencing analysis of microbial 1093 community diversity in response to indica and japonica bar-transgenic rice paddy soils. PLOS 1094 One 14: e0222191.1095 Higgins CF (2001) ABC transporters: physiology, structure and mechanism - an overview. 1096 Research in Microbiology 152: 205-210.1097 Ho A, Paolo Di Lonardo D & Bodelier PL (2017) Revisiting life strategy concepts in 1098 environmental microbial ecology. FEMS Microbiology Ecology 93: 1-14.1099 Ho A, Kerckhof FM, Luke C, Reim A, Krause S, Boon N & Bodelier PL (2013) Conceptualizing 1100 functional traits and ecological characteristics of methane-oxidizing bacteria as life strategies. 1101 Environmental Microbiology Reports 1102 5: 335-345.1103 Hodgson DA (2000) Primary metabolism and its control in streptomycetes: A most unusual 1104 group of bacteria. Advances in Microbial Physiology, Vol 42, Vol. 42 (Poole RK, ed.) p.^pp. 47-1105 238.1106 Hug LA, Castelle CJ, Wrighton KC, Thomas BC, Sharon I, Frischkorn KR, Williams KH, Tringe SG 1107 & Banfield JF (2013) Community genomic analyses constrain the distribution of metabolic 1108 traits across the Chloroflexi phylum and indicate roles in sediment carbon cycling. Microbiome 1109 1.1110 Hutchinson GL (1957) Concluding remarks Cold Spring Harbor Symposia on Quantitative 1111 Biology 22: 415-427.1112 Itakura M, Saeki K, Omori H, Yokoyama T, Kaneko T, Tabata S, Ohwada T, Tajima S & . ea (2009) 1113 Genomic comparison of Bradyrhizobium japonicum strains with different symbiotic nitrogen-1114 fixing capabilities and other Bradyrhizobiaceae members. The ISME journal 3: 326-339.1115 Jangid K, Williams MA, Franzluebbers A, Schmidt TM, Coleman DC & Whitman WB (2011) 1116 Land-use history has a stronger impact on soil microbial community composition than 1117 aboveground vegetation and soil properties. Soil Biol Biochem 43: 2184-2193.1118 Jarrell KF, Albers SV (2012) The archaellum: an old motility structure with a new name. Trends 1119 Microbiol 20: 307-312.
Page 33 of 147
ScholarOne Support 1-434/964-4100
FEMS Microbiology Ecology
123456789101112131415161718192021222324252627282930313233343536373839404142434445464748495051525354555657585960

For Peer Review
33
1120 Kaiser C, Franklin O, Richter A & Dieckmann U (2015) Social dynamics within decomposer 1121 communities lead to nitrogen retention and organic matter build-up in soils. Nature 1122 Communications 6.1123 Kanehisa M, Sato Y, Kawashima M, Furumichi M & Tanabe M (2016) KEGG as a reference 1124 resource for gene and protein annotation. Nucleic Acids Research 44: D457-D462.1125 Kearney M, Simpson SJ, Raubenheimer D & Helmuth B (2010) Modelling the ecological niche 1126 from functional traits. Philosophical Transactions of the Royal Society B-Biological Sciences 1127 365: 3469-3483.1128 Keddy PA (1992) Assembly and response rules - two goals for predictive community ecology. 1129 Journal of Vegetation Science 3: 157-164.1130 Klotz MG & Norton JB (1998) Multiple copies of ammonia monooxygenase (amo) operons 1131 have evolved under biased AT/GC mutational pressure in ammonia-oxidizing autotrophic 1132 bacteria. Fems Microbiology Letters 168: 303-311.1133 Koch AL (2001) Oligotrophs versus copiotrophs. BioEssays 23: 657-661.1134 Kögel-Knabner I (2002) The macromolecular organic composition of plant and microbial 1135 residues as inputs to soil organic matter. Soil Biol Biochem 34: 139-162.1136 Kuznetsov SI, Dubinina GA & Lapteva NA (1979) Biology of oligotrophic bacteria. Annual 1137 Review of Microbiology 33: 377-387.1138 Lauro FM, McDougald D, Thomas T, et al. (2009) The genomic basis of trophic strategy in 1139 marine bacteria. Proceedings of the National Academy of Sciences of the United States of 1140 America 106: 15527-15533.1141 Leff JW, Jones SE, Prober SM, et al. (2015) Consistent responses of soil microbial communities 1142 to elevated nutrient inputs in grasslands across the globe. Proceedings of the National 1143 Academy of Sciences of the United States of America 112: 10967-10972.1144 Leibold MA (1995) The niche concept revisited: mechanistic models and community context. 1145 Ecology 76: 1371-1382.1146 Liaw A & Weiner M (2002) Classification and regression by randomForest. R News 2: 18-22.1147 Madigan M, Cox SS & Stegeman RA (1984) Nitrogen fixation and nitrogenase activities in 1148 members of the Family Rhodospirillaceae. Journal of Bacteriology 157: 73-78.1149 Madin JS, Nielsen DA, Brbic M, Corkrey R, Danko D, Edwards K et al., (2020) A synthesis of 1150 bacterial and archaeal phenotypic trait data. Nature Scientific Data 7: 170.1151 McBride MJ (2001) Bacterial gliding motility: mechanisms for cell movement over surfaces. 1152 Annual Review of Microbiology 55: 49-75.1153 McGill BJ, Enquist BJ, Weiher E & Westoby M (2006) Rebuilding community ecology from 1154 functional traits. Trends in Ecology & Evolution 21: 178-185.1155 Möller B, Oßmer R, Howard BH, Gottschalk G & Hippe H (1984) Sporomusa, a new genus of 1156 Gram-negative anaerobic bacteria including Sporomusa sphaeroides spec. nov. and 1157 Sporomusa ovata spec. nov. Archives of Microbiology 139: 388-396.1158 Nayfach S, Roux S, Seshadri R, Udwary D, Varghese N, Schulz F et al., (2021) A genomic catalog 1159 of Earth’s microbiomes. Nature Biotechnology 39: 499-509.1160 Oksanen J, Guillaume Blanchet F, Kindt R, et al. (2013) Vegan: Community Ecology Package. R 1161 package version 2.0-10. http://CRAN.R-project.org/package=vegan.1162 Op den Camp HJM, Islam T, Stott MB, Harhangi HR, Hynes A, Schouten S, Jetten MSM, 1163 Birkeland N-K, Pol A & Dunfield PF (2009) Environmental, genomic and taxonomic perspectives 1164 on methanotrophic Verrucomicrobia. Environmental Microbiology Reports 1: 293-306.1165 Parks DH, Chuvochina M, Waite DW, Rinke C, Skarshewski A, Chaumeil PA & Hugenholtz P 1166 (2018) A standardized bacterial taxonomy based on genome phylogeny substantially revises 1167 the tree of life. Nature Biotechnology 36: 996-1004.
Page 34 of 147
ScholarOne Support 1-434/964-4100
FEMS Microbiology Ecology
123456789101112131415161718192021222324252627282930313233343536373839404142434445464748495051525354555657585960

For Peer Review
34
1168 Pascual-Garcia A & Bell T (2020) Community-level signatures of ecological succession in 1169 natural bacterial communities. Nature Communications 11: 2386.1170 Philippot L, Bru D, Saby NPA, Cuhel J, Arrouays D, Simek M & Hallin S (2009) Spatial patterns 1171 of bacterial taxa in nature reflect ecological traits of deep branches of the 16S rRNA bacterial 1172 tree. Environmental Microbiology 11: 3096-3104.1173 Philippot L, Andersson SGE, Battin TJ, Prosser JI, Schimel JP, Whitman WB & Hallin S (2010) 1174 The ecological coherence of high bacterial taxonomic ranks. Nature Reviews Microbiology 8: 1175 523-529.1176 Prosser JI (2012) Ecosystem processes and interactions in a morass of diversity. Fems 1177 Microbiology Ecology 81: 507-519.1178 R Core Team (2013) R: A language and environment for statistical computing. R Foundation 1179 for statistical computing, Vienna, Austria.1180 Roller BRK & Schmidt TM (2015) The physiology and ecological implications of efficient 1181 growth. The ISME journal 9: 1481-1487.1182 Sancar A (1996) DNA excision repair. Annual Review of Biochemistry 65: 43-81.1183 Sangwan P, Chen XL, Hugenholtz P & Janssen PH (2004) Chthoniobacter flavus gen. nov., sp 1184 nov., the first pure-culture representative of subdivision two, Spartobacteria classis nov., of 1185 the phylum Verrucomicrobia. Applied and Environmental Microbiology 70: 5875-5881.1186 Schliep KP, Potts AJ, Morrison DA & Grimm WA (2017) Intertwining phylogenetic trees and 1187 networks. . Methods in Ecology and Evolution 8: 1212-1220.1188 Schneiker S, Perlova O, Kaiser O, Gerth K, Alici A, Altmeyer MO, Bartels D, Bekel T et al., (2007) 1189 Complete genome of the myxobacterium Sorangium cellulosum. Nature Biotechnology 25: 1190 1281-1290.1191 Semenov AM (1991) Physiological bases of oligotrophy of microorganisms and the concept of 1192 microbial community. Microbial Ecology 22: 239-247.1193 Shimada T, Tanaka K & Ishihama A (2017) The whole set of the constitutive promoters 1194 recognized by four minor sigma subunits of Escherichia coli RNA polymerase. Plos One 12: 1195 e0179181.1196 Smirnova GV & Oktyabrsky ON (2005) Glutathione in Bacteria. Biochemistry 70: 1199-1211.1197 Spang A, Poehlein A, Offre P, Zumbrägel S, Haider S, Rychlik N, Nowka B et al., (2012) The 1198 genome of the ammonia-oxidizing Candidatus Nitrososphaera gargensis: insights into 1199 metabolic versatility and environmental adaptations. Environmental Microbioloogy 14(12): 1200 3122-3145.1201 Spang A, Saw JH, Jorgensen SL, Zaremba-Niedzwiedzka K, Martijn J, Lind AE, van Eijk R, 1202 Schleper C, Guy L & Ettema TJG (2015) Complex archaea that bridge the gap between 1203 prokaryotes and eukaryotes. Nature 521: 173-185.1204 Stackebrandt E, Pohla H, Kroppenstedt RM, Hippe H & Woese CR (1985) 16S rRNA analysis of 1205 Sporomusa, Selenomonas and Megasphaera: on the phylogenetic origin of Gram-positive 1206 Eubacteria. Archives of Microbiology 143: 270-276.1207 Tamas I, Smirnova AV, He Z & Dunfield PF (2014) The (d)evolution of methanotrophy in the 1208 Beijerinckiaceae - a comparative genomics analysis. The ISME journal 8: 369-382.1209 Terzenbach DP & Blaut M (1994) Transformation of tetrachloroethylene to trichloroethylene 1210 by homoacetogenic bacteria. Fems Microbiology Letters 123: 213-218.1211 Trivedi P, Anderson IC & Singh BK (2013) Microbial modulators of soil carbon storage: 1212 integrating genomic and metabolic knowledge for global prediction. Trends in Microbiology 1213 21: 641-651.1214 van Rossum T, Ferretti P, Maistrenko OM & Bork P (2020) Diversity within species: interpreting 1215 strains in microbiomes. Nature Reviews Microbiology 18: 491-506.
Page 35 of 147
ScholarOne Support 1-434/964-4100
FEMS Microbiology Ecology
123456789101112131415161718192021222324252627282930313233343536373839404142434445464748495051525354555657585960

For Peer Review
35
1216 Vieira-Silva S & Rocha EPC (2010) The systemic imprint of growth and its uses in ecological 1217 (meta)genomics. Plos Genetics 6: e1000808.1218 Warnes GR, Bolker B, Bonebakker L, et al. (2019) gplots: various R programming tools for 1219 plotting data. https://cran.r-project.org/web/packages/gplots/index.html.1220 Weins JJ (1998) Testing phylogenetic methods with tree congruence: phylogenetic analysis of 1221 polymorphic morphological characters in Phrynosomatid lizards. Systematic Biology 47: 427-1222 444.1223 Wessen E, Hallin S & Philippot L (2010) Differential responses of bacterial and archaeal groups 1224 at high taxonomical ranks to soil management. Soil Biol Biochem 42: 1759-1765.1225 Wickham H (2007) Reshaping data with the reshape package. Journal of Statistical Software 1226 21: 1-20.1227 Young J & Holland IB (1999) ABC transporters: bacterial exporters-revisited five years on. 1228 Biochimica Et Biophysica Acta-Biomembranes 1461: 177-200.1229 Zhu CS, Delmont TO, Vogel TM & Bromberg Y (2015) Functional Basis of Microorganism 1230 Classification. Plos Computational Biology 11.
Page 36 of 147
ScholarOne Support 1-434/964-4100
FEMS Microbiology Ecology
123456789101112131415161718192021222324252627282930313233343536373839404142434445464748495051525354555657585960

For Peer Review
36
Page 37 of 147
ScholarOne Support 1-434/964-4100
FEMS Microbiology Ecology
123456789101112131415161718192021222324252627282930313233343536373839404142434445464748495051525354555657585960

For Peer Review
37
Page 38 of 147
ScholarOne Support 1-434/964-4100
FEMS Microbiology Ecology
123456789101112131415161718192021222324252627282930313233343536373839404142434445464748495051525354555657585960

For Peer Review
1 Figure Legends:
2 Figure 1. Box and whisker plots of the raw counts of proteins per genome beside the
3 counts of shared functional traits per genome derived from MCL. Taxa n = 5 per
4 Family.
5
6 Figure 2. a) Unweighted pair group method with arithmetic mean (UPGMA)
7 dendrogram comparing similarity in composition of 220 664 traits across the 175
8 terrestrial microbial taxa. The Phylum of each taxon is highlighted. The scale bar units
9 represent Bray-Curtis dissimilarity. b) Comparisons of ecological coherence (C)
10 between taxa belonging to the same Super Group, Phylum and Family. C, which varies
11 between 0 and 1, was measured from branch lengths in a). Values of C approaching
12 1 indicate an ecologically coherent group with a similar composition of traits. Super
13 groups were as follows: Proteobacteria, all Gamma-, Alpha-, Beta- and
14 Deltaproteobacteria; Terrabacteria, all Actinobacteria, Firmicutes, Chloroflexi and
15 Cyanobacteria; FCB were Bacteroidetes; Acidobacteria, all Acidobacteria; PVC,
16 Verrucomicrobia and Planctomycetes; TACK were Thaumarchaeota; Euryarchaeota
17 were Euryarchaeota.
18
19
20 Figure 3. Random Forest identified traits that best explain separation of taxa groups
21 at Phylum and Family taxonomic rank. Mean Decrease in Accuracy (MDA) is a
22 measure of the average increase in classification error during permutation of trees if
23 the trait is not included in the model. For example, the Family Random Forest was
24 most accurate when ABC transporters were included in the model.
25
26
27 Figure 4. Hierarchical clustering of Families based on 60 traits selected from Random
28 Forest and previously identified copiotroph-oligotroph traits. Families are clustered
29 along the y axis, and specific co-occurring traits are clustered on the x axis. Five
30 general Clades were identified based on Family clustering. Units are normalised
31 variance in mean counts of traits per Family.
32
33
Page 39 of 147
ScholarOne Support 1-434/964-4100
FEMS Microbiology Ecology
123456789101112131415161718192021222324252627282930313233343536373839404142434445464748495051525354555657585960

For Peer Review
34 Figure 5: A conceptual diagram of overlapping life strategies between the five
35 functional clades identified in this study. a) the classical copiotroph-oligotroph
36 dichotomy whereby the five clades are placed on a singular axis of ‘resource
37 investment’, where growth strategies are either relatively more targeted toward rapid
38 growth (copiotroph) or toward stress tolerance (oligotroph). BRITE categories are
39 given as examples of functional traits contributing to either axis pole. The space
40 occupied by clades along this axis is dependent on enrichment or depletion of these
41 traits. All clades exhibit a great deal of overlap and certain clades, such as IV
42 (including, for example, Actinobacteria), are hard to identify as either copiotroph or
43 oligotroph. b) a multidimensional concept where three axes for ‘resource acquisition’
44 are added, further separating taxa as either ‘competitors’, ‘degraders’ or ‘metabolic
45 specialists’. Again, BRITE categories are provided as examples of traits contributing
46 to the additional axes and space occupied by clades is dependent on enrichment or
47 depletion of these traits. These extra dimensions would suggest the niche space of
48 clade IV exists between ‘copiotrophic competitors’ (I) and ‘oligotrophic degraders’ (III),
49 potentially allowing IV to co-exist alongside both.
50
Page 40 of 147
ScholarOne Support 1-434/964-4100
FEMS Microbiology Ecology
123456789101112131415161718192021222324252627282930313233343536373839404142434445464748495051525354555657585960

For Peer Review
Figure 1
268x157mm (300 x 300 DPI)
Page 41 of 147
ScholarOne Support 1-434/964-4100
FEMS Microbiology Ecology
123456789101112131415161718192021222324252627282930313233343536373839404142434445464748495051525354555657585960

For Peer Review
Figure 2
232x172mm (300 x 300 DPI)
Page 42 of 147
ScholarOne Support 1-434/964-4100
FEMS Microbiology Ecology
123456789101112131415161718192021222324252627282930313233343536373839404142434445464748495051525354555657585960

For Peer Review
Figure 3
338x170mm (300 x 300 DPI)
Page 43 of 147
ScholarOne Support 1-434/964-4100
FEMS Microbiology Ecology
123456789101112131415161718192021222324252627282930313233343536373839404142434445464748495051525354555657585960

For Peer Review
Figure 4
327x212mm (300 x 300 DPI)
Page 44 of 147
ScholarOne Support 1-434/964-4100
FEMS Microbiology Ecology
123456789101112131415161718192021222324252627282930313233343536373839404142434445464748495051525354555657585960

For Peer Review
Figure 5
203x134mm (300 x 300 DPI)
Page 45 of 147
ScholarOne Support 1-434/964-4100
FEMS Microbiology Ecology
123456789101112131415161718192021222324252627282930313233343536373839404142434445464748495051525354555657585960

For Peer Review
Table 1: Summary of traits significantly enriched and depleted in the Family Random Forest model.BRITE 1 BRITE 3 Significantly enriched Significantly depleted
Metabolism00540 LPS biosynthesis
Pseudomonadaceae, Burkholderiaceae, Chitinophagaceae, Acidobacteria Lineage, Verrucomicrobia
Leuconostocaceae, Clostridiaceae, Lactobacillaceae, Bacillaceae, all Actinobacteria, Chloroflexi, Thaumarchaeota, Methanogen Lineage
01040 Biosynthesis of unsaturated fatty acids Mycobacteriaceae, Frankiaceae, Pseudomonadaceae
Leuconostocaceae, Clostridiaceae, Lactobacillaceae, Bacillaceae, Cyanobacteria, Chloroflexi, Thaumarchaeota, Methanogen lineage
00561 Glycerolipid metabolism Myxococcaceae, Mycobacteriaceae, Frankiaceae Thaumarchaeota, Methanogen Lineage00571 LAM biosynthesis Streptomycetaceae, Mycobacteriaceae, Frankiaceae All other Families
00600 Sphingolipid metabolism
Myxococcaceae, Chitinophagaceae, Planctomycetaceae, Verrucomicrobia
All Gammaproteobacteria, Rhodospirillaceae, Bradyrhizobiaceae, Neisseriales Lineage, Nitrosomonadaceae, Sporomusaceae, Leuconostocaceae, Lactobacillaceae, Cellulomonadaceae, Chloroflexi, Thaumarchaeota, Methanogen Lineage
00500 Starch and sucrose metabolism
Polyangiaceae, Streptomycetaceae, Mycobacteriaceae, Frankiaceae, Verrucomicrobia Moraxcellaceae, Thaumarchaeota, Methanogen Lineage
04714 Thermogenesis
Methylocystaceae, Rhodospirillaceae, Bradyrhizobiaceae, Beijerinckaceae, Mycobacteriaceae All other Families
00640 Propanoate metabolism Burkholderiaceae, Mycobacteriaceae, Frankiaceae Methylococcaceae, Leuconostocaceae, Lactobacillaceae, Thaumarchaeota00910 Nitrogen metabolism
Rhodospirillaceae, Bradyrhizobiaceae, Burkholderiaceae, Sporomusaceae, Mycobacteriaceae Leuconostocaceae, Lactobacillaceae, Chloroflexi
00680 Methane metabolism Methylococcaceae, Methylocystaceae, Methanogen Lineage Leuconostocaceae, Lactobacillacaceae99982 Unclassified energy metabolism
Rhodospirillaceae, Beijerinckiaceae, Mycobacteriaceae, Frankiaceae
Leuconostocaceae, Lactobacillaceae, Microbacteriaceae, Promicromonosporaceae, Cellulomonadaceae, Chloroflexi, Planctomycetales, Thaumarchaeota
09113 Global maps only (unclassified metabolism) Pseudomonadaceae, Mycobacteriaceae
Methylococcaceae, Beijerinckiaceae, Nitrosomonadaceae, Leuconostocaceae, Bacillaceae, Cytophagaceae, Acidobacteriaceae, Cyanobacteria, Verrucomicrobia
00480 Glutathione metabolism
Rhizobiaceae, Bradyrhizobiaceae, Myxococcaceae, Polyangiaceae, Burkholderiaceae
All Firmicutes, Acidobacteriaceae, Chloroflexi, Planctomycetales, Verrucomicrobia, Thaumarchaeota, Methanogen Lineage
00281 Geraniol degradation Moraxellaceae, Myxococcaceae, Mycobacteriaceae
Methylococcaceae, Pseudomonadaceae, Rhizobiaceae, Beijerinckiaceae, Neisseriales Lineage, Nitrosomonadaceae, all Firmicutes, Streptomycetaceae, Promicromonosporaceae, Cellulomonadaceae, Acidobacteriaceae, Cyanobacteria, Chloroflexi, Planctomycetaceae, Verrucomicrobia, Thaumarchaeota, Methanogen Lineage
Environmental Information Processing
01001 Protein kinases Myxococcaceae, Polyangiaceae, Frankiaceae Lactobacillaceae02010 ABC transporters Rhodospirillaceae, Rhizobiaceae, Burkholderiaceae Acidobacteriaceae, Thaumarchaeota, Methanogen Lineage02020 Two component system
Pseudomonadaceae, Rhodospirillaceae, Bradyrhizobiaceae, Myxococcaceae
Leuconostocaceae, Lactobacillaceae, Bacillaceae, Promicromonosporaceae, Cellulomonadaceae, Chloroflexi, Thaumarchaeota
02060 Phosphotransferase system (PTS)
Pseudomonadaceae, Rhodospirillaceae, Myxococcaceae, Neisseriales lineage, Clostridiaceae, Verrucomicrobia
Methylococcaceae, Frankiaceae, Acidobacteria Lineage, Thaumarchaeota, Methanogen Lineage
Page 46 of 147
ScholarOne Support 1-434/964-4100
FEMS Microbiology Ecology
123456789101112131415161718192021222324252627282930313233343536373839404142434445464748495051525354555657585960

For Peer Review
03070 Bacterial secretion system Polyangiaceae, Myxococcaceae, Burkholderiaceae
Leuconostocaceae, Lactobacillaceae, Bacillaceae, Streptomycetaceae, Mycobacteriaceae, Chloroflexi, Thaumarchaeota, Methanogen lineage
02044 Type IV secretion system Pseudomonadaceae, Myxococcaceae Leuconostocaceae, all Bacteroidetes, Thaumarchaeota
Genetic Information Processing
03021 Transcription machinery
Myxococcaceae, Polyangiaceae, Streptomycetaceae, Mycobacteriaceae, Frankiaceae
Methylocystaceae, Rhizobiaceae, Bradyrhizobiaceae, Beijerinckiaceae, Leuconostocaceae, Lactobacillaceae, Thaumarchaeota, Methanogen lineage
99973 Unclassified transcription factors
Pseudomonadaceae, Rhizobiaceae, Myxococcaceae, Streptomycetaceae
Chitinophagaceae, Cyanobacteria, Chloroflexi, Planctomycetaceae, Verrucomicrobia
03022 Basal transcription factors Thaumarchaeota, Methanogen Lineage All other Families03013 RNA transport (eukaryote-like) Myxococcaceae, Thaumarchaeota, Methanogen Lineage All other Families03019 Messenger RNA biogenesis (degradation) Myxococcaceae, Burkholderiaceae
Methylocystaceae, Rhizobiaceae, Bradyrhizobiaceae, Beijerinckiaceae, Cyanobacteria, Chloroflexi, Thaumarchaeota
03450 Non-homologous end joining Rhizobiaceae, Streptomycetaceae, Verrucomicrobia
Moraxellaceae, Methylococcaceae, Neisseriales Lineage, Leuconostocaceae, Clostridaceae, Lactobacillaceae, Cyanobacteria
03050 Proteasome
Micrococcaceae, Streptomycetaceae, Mycobacteriaceae, Frankiaceae, Promicromonosporaceae, Cellulomonadaceae, Thaumarchaeota, Methanogen Lineage All other families
03051 Prokaryote 20S Proteasome
Micrococcaceae, Streptomycetaceae, Mycobacteriaceae, Frankiaceae All other Families
Signalling and Cellular Processes
99978 Cell growth (sporulation) Sporomusaceae, Clostridiaceae, Bacillaceae All other families
Not included in pathway or BRITE
99984 Unclassified nucleotide metabolism Leuconostocaceae, Lactobacillaceae, Micrococcaceae
Moraxellaceae, Methylococcaceae, Methylocystaceae, Rhodospirillaceae, Bradyrhizobiaceae, Beijerinckiaceae, all Deltaproteobacteria, all Betaproteobacteria, Sporomusaceae, Clostridiaceae, Streptomycetaceae, Frankiaceae, all Bacteroidetes, all Acidobacteria, Chloroflexi, Planctomycetes, Thaumarchaeota, Methanogen Lineage
Page 47 of 147
ScholarOne Support 1-434/964-4100
FEMS Microbiology Ecology
123456789101112131415161718192021222324252627282930313233343536373839404142434445464748495051525354555657585960

For Peer Review
Supplementary Material
Supplementary Table 1: List of microorganisms utilised in this study.ID Phylum Class Order Family Genus Species Strain
Ecosystem Processa Reference
Ga0074846_101 Firmicutes Bacilli Bacillales Bacillaceae Terribacillus saccharophilus DSM21619 ND (An et al 2007b)
Ga0067102_11 Firmicutes Bacilli Bacillales Bacillaceae Bacillus amyloliquefaciens
Plantarum FZB42 Rhizosphere (Chen et al 2007)
Ga0077930_11 Firmicutes Bacilli Bacillales Bacillaceae Bacillus anthracis BA1015 Pathogen
(Helgason et al 2000)
Ga0175433_11 Firmicutes Bacilli Bacillales Bacillaceae Bacillus subtilis KH2 ND
(Graham and Istock 1978)
CP015911 Firmicutes Bacilli Bacillales Bacillaceae Bacillus velezensis LS69 Rhizosphere (Liu et al 2017)LAC_LBA_DRAFT__cont
ig00001 Firmicutes Bacilli Lactobacillales Lactobacillaceae Lactobacillus plantarum Rhizosphere (Chen et al 2005)Ga0106160
_101 Firmicutes Bacilli Lactobacillales Lactobacillaceae Lactobacillus composti DSM18527 Rhizosphere(Endo and Okada
2007)Ga0106062
_101 Firmicutes Bacilli Lactobacillales Lactobacillaceae Lactobacillus floricola DSM23037 Rhizosphere(Kawasaki et al
2011)
1423745 Firmicutes Bacilli Lactobacillales Lactobacillaceae Lactobacillus florum F91 Rhizosphere (Endo et al 2010)
1670446 Firmicutes Bacilli Lactobacillales Lactobacillaceae Lactobacillus herbarum ND (Mao et al 2015)Ga0126468
_101 Firmicutes Bacilli Lactobacillales Leuconostocaceae Leuconostoc mesenteroides 213MO Rhizosphere (Chen et al 2005)Ga0106620
_101 Firmicutes Bacilli Lactobacillales Leuconostocaceae Weissella confusa DSM20196 Rhizosphere (Chen et al 2005)Ga0114202
_101 Firmicutes Bacilli Lactobacillales Leuconostocaceae Fructobacillus sp EFBN1 Decomposition (Endo et al 2009)
155866 Firmicutes Bacilli Lactobacillales Leuconostocaceae Weissella soli Rhizosphere(Magnusson et al
2002)
907931 Firmicutes Bacilli Lactobacillales Leuconostocaceae Leuconostoc fallax KCTC3537 Rhizosphere(Barrangou et al
2002)BO10DRAFT_scf7180000000004_q
uiver.1 Firmicutes Clostridia Clostridiales Clostridiaceae Clostridium phytofermentans KNHs212 Decomposition (Warnick et al 2002)CLOBI_conti
g000001 Firmicutes Clostridia Clostridiales Clostridiaceae Clostridium beijerinckii A21 Rhizosphere (Johnson et al 1997)
Page 48 of 147
ScholarOne Support 1-434/964-4100
FEMS Microbiology Ecology
123456789101112131415161718192021222324252627282930313233343536373839404142434445464748495051525354555657585960

For Peer Review
ct454_454454contig000
01 Firmicutes Clostridia Clostridiales Clostridiaceae Clostridium tetani ATCC454 Pathogen (Cohen et al 2017)
1121919 Firmicutes Clostridia Clostridiales Clostridiaceae Geosporobacter subterraneus DSM17957 ND (Klouche et al 2007)
857293 Firmicutes Clostridia Clostridiales Clostridiaceae Caloramator australicus RC3 ND(Ogg and Patel
2009)GCA_90047
6375.1 Firmicutes Negativicutes Selenomonadales Sporomusaceae Lucifera butyrica ND(Sanchez-Andrea et
al 2018)NZ_CP0109
78.1 Firmicutes Negativicutes Selenomonadales Sporomusaceae Pelosinus fermentans JBW45 Decomposition (de Leon et al 2012)
16187 Firmicutes Negativicutes Selenomonadales Sporomusaceae Sporomusa ovata DSM2662 ND (Möller et al 1984)
51809 Firmicutes Negativicutes Selenomonadales Sporomusaceae Sporomusa sphaeroides DSM2875 ND (Möller et al 1984)GCA_00043
0605.1 Firmicutes Negativicutes Selenomonadales Sporomusaceae Anaeroarcus burkinensis DSM6283 Rhizosphere (Strömpl et al 1999)Ga0074713
_11 Actinobacteria Actinobacteria Actinomycetales Micrococcaceae Arthrobacter chlorophenolicus DSM12829 Bioremediation(Westerberg et al
2000)Ga0067230
_11 Actinobacteria Actinobacteria Actinomycetales Micrococcaceae Arthrobacter aurescens TC1 Bioremediation(Mongodin et al
2006)
1531955 Actinobacteria Actinobacteria Actinomycetales Micrococcaceae Sinomonas mesophila MPKL26 ND (Prabhu et al 2015)
378753 Actinobacteria Actinobacteria Actinomycetales Micrococcaceae Kocuria rhizophila DC2201 Rhizosphere(Takarada et al
2008)
574650 Actinobacteria Actinobacteria Actinomycetales Micrococcaceae Micrococcus terreus ND (Zhang et al 2010)Ga0080924
_101 Actinobacteria Actinobacteria Actinomycetales Mycobacteriacaea Mycobacterium chlorophenolicum DSM43826 Bioremediation (Das et al 2015)Ga0124153
_1001 Actinobacteria Actinobacteria Actinomycetales Mycobacteriacaea Mycobacterium fortuitum ATCC6841 Bioremediation(Nohynek et al
1993)Ga0056865
_101 Actinobacteria Actinobacteria Actinomycetales Mycobacteriacaea Mycobacterium austroafricanum DSM44191 Bioremediation (Leys et al 2005)
443218 Actinobacteria Actinobacteria Actinomycetales Mycobacteriacaea Hoyosella subflava DQS39A1 Bioremediation (Hamada et al 2016)
1440774 Actinobacteria Actinobacteria Actinomycetales Mycobacteriacaea Mycobacterium aromaticivorans JCM16368 Bioremediation(Hennessee et al
2009)
NC_014151 Actinobacteria Actinobacteria Actinomycetales Cellulomonadaceae Cellulomonas flavigena DSM20109 Decomposition (Abt et al 2010)Ga0128466
_10001 Actinobacteria Actinobacteria Actinomycetales Cellulomonadaceae Cellulomonas chitinilytica JCM16927 Decomposition (Yoon et al 2008)Ga0128457
_10001 Actinobacteria Actinobacteria Actinomycetales Cellulomonadaceae Cellulomonas xylanilytica JCM14281 Decomposition (Rivas et al 2004a)
862422 Actinobacteria Actinobacteria Actinomycetales Cellulomonadaceae Actinotalea fermentans DSM3133 Decomposition (Bagnara et al 1985)
Page 49 of 147
ScholarOne Support 1-434/964-4100
FEMS Microbiology Ecology
123456789101112131415161718192021222324252627282930313233343536373839404142434445464748495051525354555657585960

For Peer Review
948458 Actinobacteria Actinobacteria Actinomycetales Cellulomonadaceae Actinotalea ferrariae CF54 ND (Li et al 2013)Ga0057460
_1001 Actinobacteria Actinobacteria Actinomycetales Streptomycetaceae Streptomyces scabiei NCPPB4086 Pathogen (Dees et al 2013)Ga0057466_gi6723671
50.1 Actinobacteria Actinobacteria Actinomycetales Streptomycetaceae Streptomyces lividans TK24 Decomposition (Ruckert et al 2015)Ga0076575
_11 Actinobacteria Actinobacteria Actinomycetales Streptomycetaceae Streptomyces coelicolor A3(2) Decomposition (Bentley et al 2002)
105422 Actinobacteria Actinobacteria Actinomycetales Streptomycetaceae Streptacidiphilus carbonis DSM41754 Decomposition (Kim et al 2003)
1348663 Actinobacteria Actinobacteria Actinomycetales Streptomycetaceae Kitasatospora cheerisanensis KCTC2395 ND (Hwang et al 2015)
326424 Actinobacteria Actinobacteria Frankiales Frankiaceae Frankia alni ACN14a Nitrogen fixation(Normand and Lalonde 1982)
106370 Actinobacteria Actinobacteria Frankiales Frankiaceae Frankia casuarinae CcI3 Nitrogen fixation(Normand et al
2007)
298654 Actinobacteria Actinobacteria Frankiales Frankiaceae Frankia inefficax EuI1c ND (Nouioui et al 2017)
656024 Actinobacteria Actinobacteria Frankiales Frankiaceae Frankia spDatisca
symbiont Nitrogen fixation (Persson et al 2015)
222534 Actinobacteria Actinobacteria Frankiales Frankiaceae Frankia elaeagni BMG512 Nitrogen fixation (Nouioui et al 2016)
15565 Actinobacteria Actinobacteria MicrococcalesPromicromonospora
ceae Cellulosimicrobium cellulans J36 Decomposition(Schumann et al
2001)
75317 Actinobacteria Actinobacteria MicrococcalesPromicromonospora
ceae Cellulosimicrobium terreum Decomposition (Yoon et al 2007)NC_013530.
1 Actinobacteria Actinobacteria MicrococcalesPromicromonospora
ceae Xylanimonas cellulosilytica DSM15894 Decomposition (Rivas et al 2003)
16475 Actinobacteria Actinobacteria MicrococcalesPromicromonospora
ceae Promicromonospora sukumoe 327MFSha3.1 Decomposition(Takahashi et al
1987)
76147 Actinobacteria Actinobacteria MicrococcalesPromicromonospora
ceae Xylanibacterium ulmi Decomposition (Rivas et al 2004b)
50964 Actinobacteria Actinobacteria Micrococcales Microbacteriaceae Agromyces cerinus ND(Zgurskaya et al
1992)
16552 Actinobacteria Actinobacteria Micrococcales Microbacteriaceae Agromyces subbeticus DSM16689 ND (Jurado et al 2005)
54323 Actinobacteria Actinobacteria Micrococcales Microbacteriaceae Agreia pratensis Rhizosphere(Schumann et al
2003)
16541 Actinobacteria Actinobacteria Micrococcales Microbacteriaceae Agrococcus lahaulensis DSM17612 ND (Mayilraj et al 2006)
16623 Actinobacteria Actinobacteria Micrococcales Microbacteriaceae Humibacter albus DSM18994 Decomposition(Vaz-Moreira et al
2008)Ga0065637
_11 Acidobacteria Acidobacteria Acidobacteriales AcidobacteriaceaeCandidatus Koribacter versatilis Ellin345 Decomposition (Ward et al 2009)
Page 50 of 147
ScholarOne Support 1-434/964-4100
FEMS Microbiology Ecology
123456789101112131415161718192021222324252627282930313233343536373839404142434445464748495051525354555657585960

For Peer Review
Terro_Contig51.1 Acidobacteria Acidobacteria Acidobacteriales Acidobacteriaceae Terriglobus roseus DSM18391 Decomposition (Eichorst et al 2007)
Ga0133452_11 Acidobacteria Acidobacteria Acidobacteriales Acidobacteriaceae Luteitalea pratensis DSM100886 Decomposition (Vieira et al 2017)
863522 Acidobacteria Acidobacteria Acidobacteriales Acidobacteriaceae Bryocella elongata DSM22489 Decomposition (Dedysh et al 2012)
1121860 Acidobacteria Acidobacteria Acidobacteriales Acidobacteriaceae Edaphobacter aggregans DSM19364 Decomposition (Koch et al 2008)
234267 Acidobacteria Acidobacteria Solibacteriales
Divergent Acidobacteria
lineageCandidatus Solibacter usitatus Ellin6076 Decomposition (Ward et al 2009)
1340493 Acidobacteria Acidobacteria Solibacteriales
Divergent Acidobacteria
lineage Bryobacter aggregatus MPL3 Decomposition(Kulichevskaya et al
2010)
454194 Acidobacteria Acidobacteria Blastocatellales
Divergent Acidobacteria
lineage Pyrinomonas methylaliphatogenes K22 Decomposition (Crowe et al 2014)
903818 Acidobacteria Acidobacteria Holophagales
Divergent Acidobacteria
lineage Holophaga foetida DSM6591 ND (Liesack et al 1994)
1660251 Acidobacteria AcidobacteriaUnclassified
Acidobacterium
Divergent Acidobacteria
lineage Acidobacteria bacterium Mor1 Rhizosphere (Tanaka et al 2017)Ga0077356
_1001 Proteobacteria Beta Burkholderiales Burkholderiaceae Burkholderia pseudomallei TSV44 Pathogen (Brook et al 1997)Ga0065534
_11 Proteobacteria Beta Burkholderiales Burkholderiaceae Burkholderia xenovorans LB400 Rhizosphere (Chain et al 2006)Ga0056711
_1001 Proteobacteria Beta Burkholderiales Burkholderiaceae Burkholderia terrae NBRC100964 Rhizosphere (Yang et al 2006)
1121278 Proteobacteria Beta Burkholderiales Burkholderiaceae Chitinimonas koreensis DSM17726 ND (Kim et al 2006)
1040978 Proteobacteria Beta Burkholderiales Burkholderiaceae Cupriavidus taiwanensis STM6018 Nitrogen fixation (Chen et al 2001)Ga0105865
_101 Proteobacteria Beta Nitrosomonadales Nitrosomonadaceae Nitrosomonas europaea Nm50 Nitrification (Koops et al 1991)Ga0105862
_1001 Proteobacteria Beta Nitrosomonadales Nitrosomonadaceae Nitrosomonas communis Nm2 Nitrification (Koops et al 1991)Ga0105869
_101 Proteobacteria Beta Nitrosomonadales Nitrosomonadaceae Nitrosomonas eutropha Nm56 Nitrification (Koops et al 1991)
1266925 Proteobacteria Beta Nitrosomonadales Nitrosomonadaceae Nitrosospira briensis C128 Nitrification (Rice et al 2016)
323848 Proteobacteria Beta Nitrosomonadales Nitrosomonadaceae Nitrosospira multiformis ATCC25196 Nitrification (Norton et al 2008)
Page 51 of 147
ScholarOne Support 1-434/964-4100
FEMS Microbiology Ecology
123456789101112131415161718192021222324252627282930313233343536373839404142434445464748495051525354555657585960

For Peer Review
G520DRAFT_scaffold00
001.1 Proteobacteria Beta Neisseriales Neisseriales_lineage Paludibacterium yongneupense DSM19731 ND (Kwon et al 2008)Ga0077161
_101 Proteobacteria Beta Neisseriales Neisseriales_lineage Chromobacterium subtsugae F49 ND (Soby et al 2013)Ga0080895
_101 Proteobacteria Beta Neisseriales Neisseriales_lineage Chromobacterium violaceum GN5 Pathogen(Koburger and May
1982)
1121274 Proteobacteria Beta Neisseriales Neisseriales_lineage Chitinibacter tainanensis DSM15459 Decomposition (Chern et al 2004)
1120999 Proteobacteria Beta Neisseriales Neisseriales_lineage Andreprevotia chitinilytica DSM18519 Decomposition (Weon et al 2007)Ga0077767
_1001 Proteobacteria Gamma Pseudomonadales Pseudomonadacaea Pseudomonas putida SF1 Rhizosphere (Tikariha et al 2016)Ga0061119_scaffold000
01.1 Proteobacteria Gamma Pseudomonadales Pseudomonadacaea Azotobacter beijerinckii DSM373 Nitrogen fixation (Lipman 1904)Ga0129289
_101 Proteobacteria Gamma Pseudomonadales Pseudomonadacaea Pseudomonas oryzihabitans H72 Rhizosphere(Lymperopoulou et
al 2017)
289370 Proteobacteria Gamma Pseudomonadales Pseudomonadacaea Pseudomonas argentinensis CECT7010 Rhizosphere (Peix et al 2005)
1292027 Proteobacteria Gamma Pseudomonadales Pseudomonadacaea Pseudomonas azotifigens DSM17556 Nitrogen fixation(Hatayama et al
2005)Ga0044516
_101 Proteobacteria Gamma Pseudomonadales Moraxellaceae Acinetobacter soli ND (Kim et al 2008)Ga0080829
_1001 Proteobacteria Gamma Pseudomonadales Moraxellaceae Acinetobacter baumannii Pathogen(Davenport et al
2014)Q337DRAF
T_scaffold00010.10 Proteobacteria Gamma Pseudomonadales Moraxellaceae Alkanindiges illinoisensis DSM15370 Bioremediation (Bogan et al 2003)
1217715 Proteobacteria Gamma Pseudomonadales Moraxellaceae Acinetobacter bohemicus ANC3994 ND (Krizova et al 2014)
1217660 Proteobacteria Gamma Pseudomonadales Moraxellaceae Acinetobacter indicus ANC4215 Bioremediation (Malhotra et al 2012) GY38DRAFT_scf7180000000021_q
uiver.1 Proteobacteria Gamma Methylococcales Methylococcaceae Methylobacter whittenburyi ACM3310Methane oxidation
(Whittenbury et al 1970)
MetmiDRAFT_scaffold1.
1 Proteobacteria Gamma Methylococcales Methylococcaceae Methylovulum miyakonense HT12Methane oxidation (Iguchi et al 2011)
MetluDRAFT_scaffold1.
1 Proteobacteria Gamma Methylococcales Methylococcaceae Methylobacter luteus IMVB3098Methane oxidation
(Whittenbury et al 1970)
1132443 Proteobacteria Gamma Methylococcales Methylococcaceae Methylosarcina fibrata AMLC10Methane oxidation (Wise et al 2001)
Page 52 of 147
ScholarOne Support 1-434/964-4100
FEMS Microbiology Ecology
123456789101112131415161718192021222324252627282930313233343536373839404142434445464748495051525354555657585960

For Peer Review
493385 Proteobacteria Gamma Methylococcales Methylococcaceae Methylogaea oryzae JCM16910Methane oxidation
(Geymonat et al 2011)
Ga0061138_scaffold000
01.1 Proteobacteria Alpha Rhodospirillales Rhodospirillaceae Azospirillum brasiliense DSM1690 Nitrogen fixation(Kuklinsky-Sobral et
al 2004)Ga0048939
_110 Proteobacteria Alpha Rhodospirillales Rhodospirillaceae Azospirillum oryzae A2P Nitrogen fixation(Xie and Yokota
2005a)Ga0048941
_11 Proteobacteria Alpha Rhodospirillales Rhodospirillaceae Azospirillum lipoferum R1C Nitrogen fixation (Van et al 1997)
570967 Proteobacteria Alpha Rhodospirillales Rhodospirillaceae Fodinicurvata fenggangensis DSM21160 ND (Wang et al 2009)
1003237 Proteobacteria Alpha Rhodospirillales Rhodospirillaceae Nitrospirillum amazonense Y2 Nitrogen fixation(Magalhaes et al
1983)DL88DRAFT_scaffold000
01.1 Proteobacteria Alpha Rhizobiales Beijerinckiaceae Beijerinckia mobilis DSM2326 Nitrogen fixation (Derx 1950)
182677003 Proteobacteria Alpha Rhizobiales Beijerinckiaceae Beijerinckia indica ATCC9039 Nitrogen fixation (Derx 1950)
217976201 Proteobacteria Alpha Rhizobiales Beijerinckiaceae Methylocella silvestris BL2Methane oxidation (Dunfield et al 2003)
395964 Proteobacteria Alpha Rhizobiales Beijerinckiaceae Methylocapsa acidiphila B2Methane oxidation (Dedysh et al 2002)
876269 Proteobacteria Alpha Rhizobiales Beijerinckiaceae Methyloferula stellata AR4Methane oxidation (Vorobev et al 2011)
A3OODRAFT_scaffold1.
1 Proteobacteria Alpha Rhizobiales Methylocystaceae Methylocystis rosea SV97TMethane oxidation
(Wartiainen et al 2006)
MettrDRAFT_Contig106 Proteobacteria Alpha Rhizobiales Methylocystaceae Methylosinus trichosporium OB3b
Methane oxidation
(Whittenbury et al 1970)
A3OUDRAFT_chromoso
me1.1 Proteobacteria Alpha Rhizobiales Methylocystaceae Methylopila sp M107Methane oxidation
(Chistoserdova 2011)
1122963 Proteobacteria Alpha Rhizobiales Methylocystaceae Pleomorphomonas oryzae DSM16300 Nitrogen fixation(Xie and Yokota
2005b)
1122962 Proteobacteria Alpha Rhizobiales Methylocystaceae Pleomorphomonas koreensis DSM23070 Nitrogen fixation (Im et al 2006)Ga0065594
_11 Proteobacteria Alpha Rhizobiales Bradyrhizobiaceae Nitrobacter winogradskyi Nb255 Nitrification(Starkenburg et al
2006)Ga0098245
_11 Proteobacteria Alpha Rhizobiales Bradyrhizobiaceae Bradyrhizobium japonicum E109 Nitrogen fixation (Brunel et al 1988)Ga0077765
_1001 Proteobacteria Alpha Rhizobiales Bradyrhizobiaceae Rhodopseudomonas palustris 42OL Bioremediation (Larimer et al 2004)
1031710 Proteobacteria Alpha Rhizobiales Bradyrhizobiaceae Oligotropha carboxidovorans OM4 Decomposition (Volland et al 2011)
Page 53 of 147
ScholarOne Support 1-434/964-4100
FEMS Microbiology Ecology
123456789101112131415161718192021222324252627282930313233343536373839404142434445464748495051525354555657585960

For Peer Review
1123229 Proteobacteria Alpha Rhizobiales Bradyrhizobiaceae Salinarimonas rosea DSM21201 ND (Liu et al 2010)Ga0127029
_101 Proteobacteria Alpha Rhizobiales Rhizobiaceae Agrobacterium tumefaciens B6 Rhizosphere (Levanon 1978)EW91DRAFT_scaffold00
001.1 Proteobacteria Alpha Rhizobiales Rhizobiaceae Rhizobium leguminosarum CF307 Nitrogen fixation (Naeem et al 2004)Ga0174993
_11 Proteobacteria Alpha Rhizobiales Rhizobiaceae Sinorhizobium americanum CFNEI73 Rhizosphere (Toledo et al 2003)
1028800 Proteobacteria Alpha Rhizobiales Rhizobiaceae Neorhizobium galegae HAMBI540 Nitrogen fixation(Osterman et al
2014)
1764550 Proteobacteria Alpha Rhizobiales Rhizobiaceae Rhizobium aegyptiacum 1010 Nitrogen fixation(Shamseldin et al
2016)Ga0128794
_10470 Proteobacteria Delta Myxococcales Polyangiaceae Sorangium cellulosum So0149 Decomposition (Li et al 2014)Ga0098230
_11 Proteobacteria Delta Myxococcales Polyangiaceae Chondromyces crocatus Cmc5 ND(Zaburannyi et al
2016)Ga0081738
_11 Proteobacteria Delta Myxococcales Polyangiaceae Polyangium brachysporum DSM7029 ND (Tang et al 2015)
1192034 Proteobacteria Delta Myxococcales Polyangiaceae Chondromyces apiculatus DSM436 ND(Kleinig and
Reichenbach 1973)Ga0128396
_10001 Proteobacteria Delta Myxococcales Polyangiaceae Byssovorax cruenta ND(Reichenbach et al
2006)Ga0131205
_101 Proteobacteria Delta Myxococcales Myxococcaceae Myxococcus xanthus DSM16526 ND(Voelz and Dworkin
1962)Ga0070493
_101 Proteobacteria Delta Myxococcales Myxococcaceae Myxococcus virescens DSM2260 ND (Lang et al 2008)Ga0131203
_101 Proteobacteria Delta Myxococcales Myxococcaceae Myxococcus fulvus DSM16525 ND (Jahn 1911)
1144275 Proteobacteria Delta Myxococcales Myxococcaceae Corallococcus coralloides DSM2259 ND (Huntley et al 2012)
1189310 Proteobacteria Delta Myxococcales Myxococcaceae Myxococcus macrosporus DSM14697 ND(Lang and
Stackebrandt 2009)
NC_013132 Bacteroidetes Bacteroidetes Chitinophagales Chitinophagaceae Chitinophaga pinensis DSM2588 Decomposition(Sangkhobol and Skerman 1981)
B154DRAFT_scaffold_0.
1 Bacteroidetes Bacteroidetes Chitinophagales Chitinophagaceae Segetibacter koreensis DSM18137 ND (An et al 2007a)H608DRAFT_scaffold000
01.1 Bacteroidetes Bacteroidetes Chitinophagales Chitinophagaceae Terrimonas ferruginea DSM30193 ND(Xie and Yokota
2006)
551991 Bacteroidetes Bacteroidetes Chitinophagales Chitinophagaceae Arachidicoccus rhizosphaerae Vu144 Rhizosphere(Madhaiyan et al
2015)
929713 Bacteroidetes Bacteroidetes Chitinophagales Chitinophagaceae Niabella soli DSM19437 ND (Weon et al 2008)
Page 54 of 147
ScholarOne Support 1-434/964-4100
FEMS Microbiology Ecology
123456789101112131415161718192021222324252627282930313233343536373839404142434445464748495051525354555657585960

For Peer Review
2506615776 Bacteroidetes Sphingobacteria Sphingobacteriales Cytophagaceae Niastella koreensis GR2010 ND (Weon et al 2006)Ga0066359
_101 Bacteroidetes Sphingobacteria Sphingobacteriales Cytophagaceae Cytophaga hutchinsonii DSM1761 Decomposition (Xie et al 2007)Ga0116983
_11 Bacteroidetes Sphingobacteria Sphingobacteriales Cytophagaceae Pontibacter indicus LP100 Bioremediation (Singh et al 2014)
1750698 Bacteroidetes Sphingobacteria Sphingobacteriales Cytophagaceae Arsenicibacter rosenii SM1 Bioremediation (Huang et al 2017)
1121373 Bacteroidetes Sphingobacteria Sphingobacteriales Cytophagaceae Cytophaga aurantiaca DSM3654 Decomposition (Winogradsky 1929)Ga0056857
_1001 Verrucomicrobia Verrucomicrobiae VerrucomicrobialesVerrucomicrobia
lineage Verrucomicrobium sp BvORR106 Rhizosphere UnpublishedGa0056855
_1001 Verrucomicrobia Verrucomicrobiae VerrucomicrobialesVerrucomicrobia
lineage Verrucomicrobium sp BvORR034 Rhizosphere Unpublished
182411827 Verrucomicrobia Verrucomicrobiae VerrucomicrobialesVerrucomicrobia
lineage Opitutus terrae PB90 ND (Chin et al 2001)
690879 Verrucomicrobia Verrucomicrobiae VerrucomicrobialesVerrucomicrobia
lineage Terrimicrobium sacchariphilum NM5 ND (Qiu et al 2014)
497964 Verrucomicrobia Verrucomicrobiae VerrucomicrobialesVerrucomicrobia
lineage Chthoniobacter flavus Ellin428 ND(Sangwan et al
2004)Ga0154327
_1001 Planctomycetes Planctomycetia PlanctomycetalesPlanctomycetales
lineage Planctomyces sp GWA2407 ND UnpublishedGa0111584
_101 Planctomycetes Planctomycetia PlanctomycetalesPlanctomycetales
lineage Planctomicrobium piriforme DSM26348 ND(Kulichevskaya et al
2015)Ga0198709
_11 Planctomycetes Planctomycetia PlanctomycetalesPlanctomycetales
lineage Paludisphaera borealis PX4 ND(Kulichevskaya et al
2016)
1123242 Planctomycetes Planctomycetia PlanctomycetalesPlanctomycetales
lineage Schlesneria paludicola DSM18645 ND(Kulichevskaya et al
2007)
886293 Planctomycetes Planctomycetia PlanctomycetalesPlanctomycetales
lineage Singulisphaera acidiphila DSM18658 ND(Kulichevskaya et al
2008)GCA_00021
4075.2 Cyanobacteria Cyanobacteria Oscillatoriales Microcoleaceae Microcoleus vaginatus FGP-2 Phototroph(Starkenburg et al
2011)
Cyanobacteria Cyanobacteria Nostocales Nostocaceae Nostoc punctiforme PCC73102 Phototroph(Rippka and
Herdman, 1992)
67533 Cyanobacteria CyanobacteriaChroococcidiopsidal
esChroococcidiopsidac
eae Chroococcidiopsis cubana Phototroph(Komarek and Hindak, 1975)
74975 Cyanobacteria Cyanobacteria Nostocales Calotrichaceae Calothrix desertica Phototroph (Schwabe, 1960)GCA_00163
7395.1 Cyanobacteria Cyanobacteria Synechoccales Leptolyngbyaceae Leptolyngbya valderiana BDU20041 Phototroph(Anagnostidis and Komarek, 1988)
NC-002936.3 Chloroflexi Dehalococcoidia Dehalococcoidales
Dehalococcoidaceae Dehalococcoides mccartyi CG5 Bioremediation (He et al 2003)
50999 Chloroflexi Ktedonobacteria Ktedonobacterales Ktedonobacteraceae Ktedonobacter Sp. ND Unpublished
Page 55 of 147
ScholarOne Support 1-434/964-4100
FEMS Microbiology Ecology
123456789101112131415161718192021222324252627282930313233343536373839404142434445464748495051525354555657585960
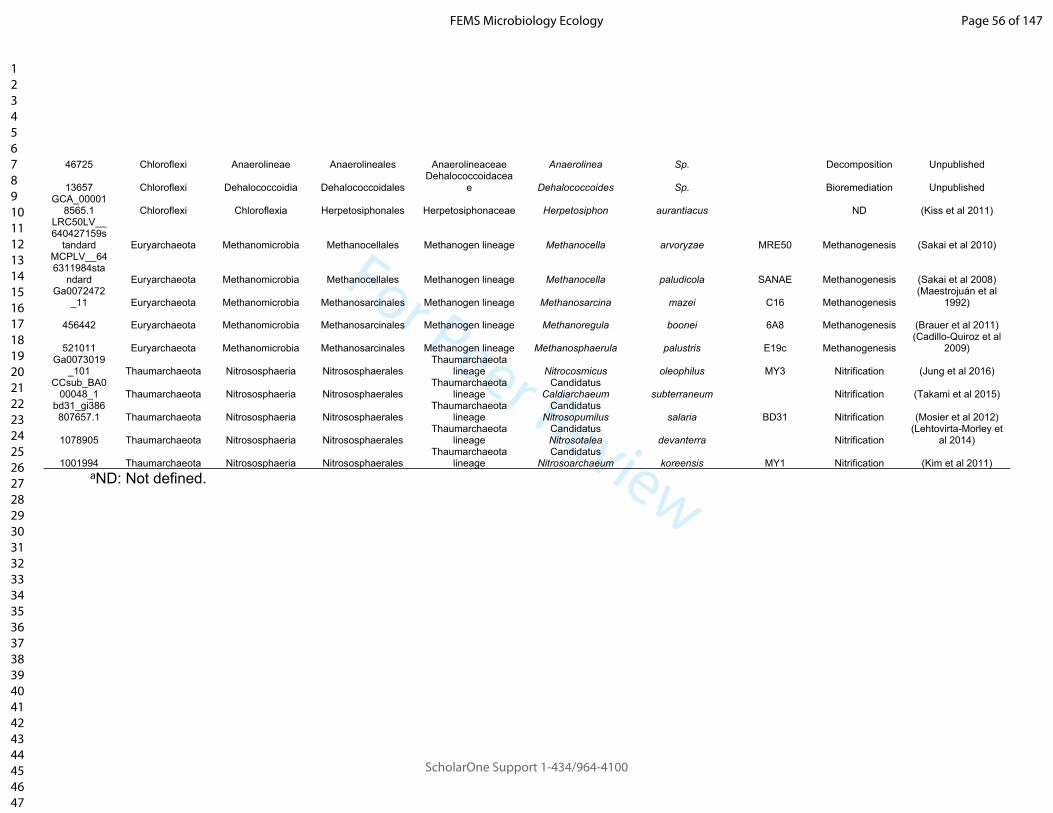
For Peer Review
46725 Chloroflexi Anaerolineae Anaerolineales Anaerolineaceae Anaerolinea Sp. Decomposition Unpublished
13657 Chloroflexi Dehalococcoidia DehalococcoidalesDehalococcoidacea
e Dehalococcoides Sp. Bioremediation UnpublishedGCA_00001
8565.1 Chloroflexi Chloroflexia Herpetosiphonales Herpetosiphonaceae Herpetosiphon aurantiacus ND (Kiss et al 2011)LRC50LV__640427159s
tandard Euryarchaeota Methanomicrobia Methanocellales Methanogen lineage Methanocella arvoryzae MRE50 Methanogenesis (Sakai et al 2010)MCPLV__646311984sta
ndard Euryarchaeota Methanomicrobia Methanocellales Methanogen lineage Methanocella paludicola SANAE Methanogenesis (Sakai et al 2008)Ga0072472
_11 Euryarchaeota Methanomicrobia Methanosarcinales Methanogen lineage Methanosarcina mazei C16 Methanogenesis(Maestrojuán et al
1992)
456442 Euryarchaeota Methanomicrobia Methanosarcinales Methanogen lineage Methanoregula boonei 6A8 Methanogenesis (Brauer et al 2011)
521011 Euryarchaeota Methanomicrobia Methanosarcinales Methanogen lineage Methanosphaerula palustris E19c Methanogenesis(Cadillo-Quiroz et al
2009)Ga0073019
_101 Thaumarchaeota Nitrososphaeria NitrososphaeralesThaumarchaeota
lineage Nitrocosmicus oleophilus MY3 Nitrification (Jung et al 2016)CCsub_BA0
00048_1 Thaumarchaeota Nitrososphaeria NitrososphaeralesThaumarchaeota
lineageCandidatus
Caldiarchaeum subterraneum Nitrification (Takami et al 2015)bd31_gi386807657.1 Thaumarchaeota Nitrososphaeria Nitrososphaerales
Thaumarchaeota lineage
Candidatus Nitrosopumilus salaria BD31 Nitrification (Mosier et al 2012)
1078905 Thaumarchaeota Nitrososphaeria NitrososphaeralesThaumarchaeota
lineageCandidatus Nitrosotalea devanterra Nitrification
(Lehtovirta-Morley et al 2014)
1001994 Thaumarchaeota Nitrososphaeria NitrososphaeralesThaumarchaeota
lineageCandidatus
Nitrosoarchaeum koreensis MY1 Nitrification (Kim et al 2011)aND: Not defined.
Page 56 of 147
ScholarOne Support 1-434/964-4100
FEMS Microbiology Ecology
123456789101112131415161718192021222324252627282930313233343536373839404142434445464748495051525354555657585960
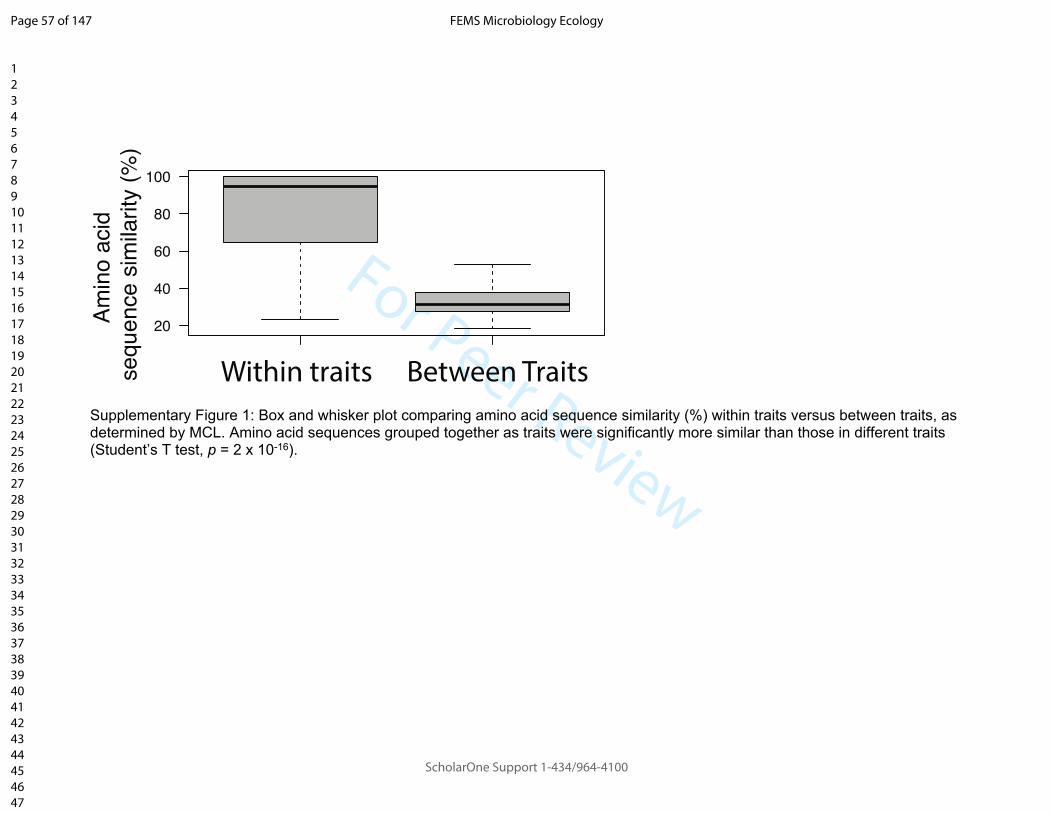
For Peer ReviewSupplementary Figure 1: Box and whisker plot comparing amino acid sequence similarity (%) within traits versus between traits, as determined by MCL. Amino acid sequences grouped together as traits were significantly more similar than those in different traits (Student’s T test, p = 2 x 10-16).
Page 57 of 147
ScholarOne Support 1-434/964-4100
FEMS Microbiology Ecology
123456789101112131415161718192021222324252627282930313233343536373839404142434445464748495051525354555657585960

For Peer Review
Page 58 of 147
ScholarOne Support 1-434/964-4100
FEMS Microbiology Ecology
123456789101112131415161718192021222324252627282930313233343536373839404142434445464748495051525354555657585960

For Peer Review
Supplementary Figure 2: a) Neighbour joining tree of full length 16S rRNA genes of taxa analysed in this study. b) Phylogenetic distance (P) of each taxonomic group, ranging between 0.6 (dissimilar) and 0.9 (similar) determined from branch lengths of 16S rRNA gene analysis in a). P was calculated as ecological coherence (Eq 1.) excepting that branch lengths are in units of gene sequence similarity and not Bray-Curtis distance (C).
Supplementary Figure 3: a) Linear correlation between Phylogenetic Distance (P) derived from 16S rRNA genes and ecological coherence (C) of functional traits present in Phyla analysed in this study. b) Linear correlation at the level of Family.
Page 59 of 147
ScholarOne Support 1-434/964-4100
FEMS Microbiology Ecology
123456789101112131415161718192021222324252627282930313233343536373839404142434445464748495051525354555657585960

For Peer Review
Supplementary Table 2: Confusion matrix of Phylum level predictions based on Random Forest selection of important traits.Successful classifications
Acid. Actino. Alpha. Bacter. Beta. Chloro. Cyano. Delta. Eury. Firm. Gamma. Planc. Thaum. Verruc. Success rate (%)
Acidobacteria 6 1 1 2 60
Actinobacteria 33 1 1 95
Alphaproteobacteria 25 100
Bacteroidetes 9 1 90
Betaproteobacteria 2 11 2 74
Chloroflexi 1 0 3 1 0
Cyanobacteria 1 3 1 60
Deltaproteobacteria 1 1 8 80
Euryarchaeota 5 100
Firmicutes 2 23 92
Gammaproteobacteria 1 1 1 12 80
Planctomycetes 2 1 1 1 20
Thaumarchaeota 1 4 80
Verrucomicrobia 1 2 2 40
Page 60 of 147
ScholarOne Support 1-434/964-4100
FEMS Microbiology Ecology
123456789101112131415161718192021222324252627282930313233343536373839404142434445464748495051525354555657585960

For Peer Review
Supplementary Table 3: Confusion matrix of Family level predictions.Phylum Family Mor. Methyloc. Pseu. Methylocy. Rhod. Rhiz. Brad. Beij. Myxo. Poly. Neis. Nitr. Burk. Spor. Leuc. Clos. Lact. Bac. Micrococ. Microbac.
Success Rate (%)
Gammaproteobacteria Moraxellaceae 5 100
Methylococcaceae 4 80
Pseudomonadaceae 4 1 80
Alphaproteobacteria
Methylocystaceae 3 2 60
Rhodospirillaceae 1 4 80
Rhizobiaceae 4 1 80Bradyrhizobiac
eae 2 1 2 40Beijerinckiacea
e 1 4 80Deltaproteobact
eriaMyxococcacea
e 5 100
Polyangiaceae 1 3 1 60Betaproteobact
eriaNeisseriales
Lineage 5 100Nitrosomonada
ceae 1 4 80Burkholderiace
ae 1 1 3 60
FirmicutesSporomusacea
e 2 40Leuconostocac
eae 5 100
Clostridiaceae 4 1 80Lactobacillacea
e 2 3 60
Bacillaceae 1 4 80
ActinobacteriaMicrococcacea
e 3 60Microbacteriace
ae 1 4 80Streptomycetac
eae 1 60Mycobacteriace
ae 100
Frankiaceae 60Promicromonos
poraceae 100
Page 61 of 147
ScholarOne Support 1-434/964-4100
FEMS Microbiology Ecology
123456789101112131415161718192021222324252627282930313233343536373839404142434445464748495051525354555657585960

For Peer Review
Cellulomonadaceae 1 20
Bacteroidetes Cytophagaceae 40Chitinophagace
ae 40
AcidobacteriaDivergent
Acidobacteria 1 1 1 0Acidobacteriac
eae 100
Cyanobacteria Cyanobacteria 100
Chloroflexi Chloroflexi 1 80
PlanctomycetesPlanctomycetal
es Lineage 1 40Verrucomicrobi
aVerrucomicrobi
a Lineage 80Thaumarchaeot
aThaumarchaeot
a Lineage 80
EuryarchaeotaMethanogen
Lineage 100
Supplementary Table 4: Confusion matrix of Family level predictions.Phylum Family Strep. Myco. Fran. Prom. Cell. Cyto. Chitin. Acido.Lin. Acido. Cyano. Chloro. Planc. Verru. Thaum. Methan.
Success Rate (%)
Gammaproteobacteria Moraxellaceae 100
Methylococcaceae 1 80
Pseudomonadaceae 80
Alphaproteobacteria Methylocystaceae 60
Rhodospirillaceae 80
Rhizobiaceae 80
Bradyrhizobiaceae 40
Beijerinckiaceae 80
Deltaproteobacteria Myxococcaceae 100
Polyangiaceae 60
Betaproteobacteria Neisseriales Lineage 100
Page 62 of 147
ScholarOne Support 1-434/964-4100
FEMS Microbiology Ecology
123456789101112131415161718192021222324252627282930313233343536373839404142434445464748495051525354555657585960

For Peer Review
Nitrosomonadaceae 80
Burkholderiaceae 60
Firmicutes Sporomusaceae 1 1 1 40
Leuconostocaceae 100
Clostridiaceae 80
Lactobacillaceae 60
Bacillaceae 80
Actinobacteria Micrococcaceae 1 1 60
Microbacteriaceae 80
Streptomycetaceae 3 1 60
Mycobacteriaceae 5 100
Frankiaceae 1 1 3 60
Promicromonosporaceae 5 100
Cellulomonadaceae 2 1 1 20
Bacteroidetes Cytophagaceae 2 3 40
Chitinophagaceae 3 2 40
Acidobacteria Divergent Acidobacteria 0 1 1 0
Acidobacteriaceae 5 100
Cyanobacteria Cyanobacteria 5 100
Chloroflexi Chloroflexi 4 80
PlanctomycetesPlanctomycetales
Lineage 1 1 2 40
Verrucomicrobia Verrucomicrobia Lineage 1 4 80
ThaumarchaeotaThaumarchaeota
Lineage 1 4 80
Euryarchaeota Methanogen Lineage 5 100
Page 63 of 147
ScholarOne Support 1-434/964-4100
FEMS Microbiology Ecology
123456789101112131415161718192021222324252627282930313233343536373839404142434445464748495051525354555657585960

For Peer Review
Supplementary Table 5: Confusion matrix of Proteobacterial Family predictions.Successful classifications
Beij. Brady. Burkh. Methylococ. Methylocys. Morax. Myxo. Neiss. Nitroso. Polyan. Pseudo. Rhizo. Rhodo. Success rate (%)
Beijerinckiaceae 5 100
Bradyrhizobiaceae 1 2 1 1 20
Burkholderiaceae 4 1 80
Methylococcaceae 4 1 80
Methylocystaceae 3 2 40
Moraxellaceae 4 1 80
Myxococcaceae 5 100
Neisseriales lineage 4 1 80
Nitrosomonadaceae 4 1 80
Polyangiaceae 1 1 3 60
Pseudomonadaceae 1 3 1 60
Rhizobiaceae 1 4 80
Rhodospirillaceae 1 4 80
Page 64 of 147
ScholarOne Support 1-434/964-4100
FEMS Microbiology Ecology
123456789101112131415161718192021222324252627282930313233343536373839404142434445464748495051525354555657585960

For Peer Review
Supplementary Table 6: Confusion matrix of Actinobacterial Family predictions.Successful classifications
Cellu. Frank. Microbac. Micrococ. Mycobac. Promicro. Strepto. Success rate (%)Cellulomonadaceae 2 1 1 1 40
Frankiaceae 3 1 1 60Microbacteriaceae 1 3 1 60
Micrococcaceae 4 1 80Mycobacteriaceae 5 100
Promicromonosporaceae 5 100Streptomycetaceae 1 4 80
Supplementary Table 7: Confusion matrix of Firmicutes Family predictions.Successful classifications
Bacill. Clostrid. Lacto. Leuco. Sporo. Success rate (%)Bacillaceae 4 1 80
Clostridiaceae 1 3 1 60Lactobacillaceae 4 1 80
Leuconostocaceae 5 100Sporomusaceae 1 1 3 60
Page 65 of 147
ScholarOne Support 1-434/964-4100
FEMS Microbiology Ecology
123456789101112131415161718192021222324252627282930313233343536373839404142434445464748495051525354555657585960

For Peer Review
Supplementary Table 8: Confusion matrix of ‘Under-represented’ Family predictions.Successful classifications
Acid. Chitin. Chloro. Cyano. Cytoph. Acido. Lin. Methan. Plancto. Thaum. Verruc.Success rate (%)
Acidobacteriaceae 5 100Chitinophagaceae 3 2 60
Chloroflexi 4 1 80Cyanobacteria 5 100Cytophagaceae 2 3 60Acidobacteria
Lineage 1 2 2 0Methanogen
Lineage 5 100Planctomycetales 1 1 3 60Thaumarchaeota 1 4 80Verrucomicrobia 1 4 80
Page 66 of 147
ScholarOne Support 1-434/964-4100
FEMS Microbiology Ecology
123456789101112131415161718192021222324252627282930313233343536373839404142434445464748495051525354555657585960

For Peer Review
Supplementary Figure 4: Box and whisker plots of functional traits present in Phyla. Traits were selected based on being selected by the Phylum Random Forest model. Letters indicate significantly high or low (p < 0.05) counts based on LSD post hoc tests.
Page 67 of 147
ScholarOne Support 1-434/964-4100
FEMS Microbiology Ecology
123456789101112131415161718192021222324252627282930313233343536373839404142434445464748495051525354555657585960

For Peer Review
Supplementary Figure 5: Box and whisker plots of functional traits present in Phyla. Traits were selected based on being selected by the Phylum Random Forest model. Letters indicate significantly high or low (p < 0.05) counts based on LSD post hoc tests.
Page 68 of 147
ScholarOne Support 1-434/964-4100
FEMS Microbiology Ecology
123456789101112131415161718192021222324252627282930313233343536373839404142434445464748495051525354555657585960

For Peer Review
Supplementary Figure 6: Box and whisker plots of functional traits present in Families. Traits were selected based on being selected by the Family Random Forest model. Letters indicate significantly high or low (p < 0.05) counts based on LSD post hoc tests.
Page 69 of 147
ScholarOne Support 1-434/964-4100
FEMS Microbiology Ecology
123456789101112131415161718192021222324252627282930313233343536373839404142434445464748495051525354555657585960

For Peer Review
Supplementary Figure 7: Box and whisker plots of functional traits present in Families. Traits were selected based on being selected by the Family Random Forest model. Letters indicate significantly high or low (p < 0.05) counts based on LSD post hoc tests.
Page 70 of 147
ScholarOne Support 1-434/964-4100
FEMS Microbiology Ecology
123456789101112131415161718192021222324252627282930313233343536373839404142434445464748495051525354555657585960

For Peer Review
Supplementary Figure 8: Important predictor traits in classifying subgroups of Families as selected by the Proteobacteria, Actinobacteria, Firmicutes and Others model. Traits are ranked in order of decreasing Mean Decrease in Accuracy (MDA) of the four models.
Page 71 of 147
ScholarOne Support 1-434/964-4100
FEMS Microbiology Ecology
123456789101112131415161718192021222324252627282930313233343536373839404142434445464748495051525354555657585960

For Peer Review
Supplementary Figure 9: Box and whisker plots of functional traits present in Proteobacterial Families. Traits were selected based on being selected by the Proteobacteria Family Random Forest model. Letters indicate significantly high or low (p < 0.05) counts based on LSD post hoc tests.
Page 72 of 147
ScholarOne Support 1-434/964-4100
FEMS Microbiology Ecology
123456789101112131415161718192021222324252627282930313233343536373839404142434445464748495051525354555657585960

For Peer Review
Supplementary Figure 10: Box and whisker plots of functional traits present in Actinobacterial Families. Traits were selected based on being selected by the Actinobacterial Family Random Forest model. Letters indicate significantly high or low (p < 0.05) counts based on LSD post hoc tests.
Page 73 of 147
ScholarOne Support 1-434/964-4100
FEMS Microbiology Ecology
123456789101112131415161718192021222324252627282930313233343536373839404142434445464748495051525354555657585960

For Peer Review
Supplementary Figure 11: Box and whisker plots of functional traits present in Firmicutes Families. Traits were selected based on being selected by the Firmicutes Family Random Forest model. Letters indicate significantly high or low (p < 0.05) counts based on LSD post hoc tests.
Page 74 of 147
ScholarOne Support 1-434/964-4100
FEMS Microbiology Ecology
123456789101112131415161718192021222324252627282930313233343536373839404142434445464748495051525354555657585960

For Peer Review
Supplementary Figure 12: Box and whisker plots of functional traits present in Under-represented Families. Traits were selected based on being selected by the Under-represented Family Random Forest model. Letters indicate significantly high or low (p < 0.05) counts based on LSD post hoc tests.
Page 75 of 147
ScholarOne Support 1-434/964-4100
FEMS Microbiology Ecology
123456789101112131415161718192021222324252627282930313233343536373839404142434445464748495051525354555657585960

For Peer Review
Supplementary Table 9: Summary of traits significantly enriched and depleted in the Phylum Random Forest model. Model BRITE 1 BRITE 3 Significantly enriched Significantly depleted
Phylum Metabolism 00020 TCA cycle
Gammaproteobacteria, Deltaproteobacteria, Betaproteobacteria, Actinobacteria, Bacteroidetes, Verrucomicrobia Firmicutes, Euryarchaeota
00190 Oxidative phosphorylation Betaproteobacteria, Actinobacteria, Bacteroidetes Firmicutes, Chloroflexi, Euryarchaeota
00480 Glutathione metabolism Alphaproteobacteria, Deltaproteobacteria, CyanobacteriaFirmicutes, Chloroflexi, Planctomycetales, Verrucomicrobia, Thaumarchaeota, Euryarchaeota
00910 Nitrogen metabolismGammaproteobacteria, Alphaproteobacteria, Actinobacteria, Cyanobacteria Chloroflexi
00540 LPS biosynthesis Gammaproteobacteria, Bacteroidetes, VerrucomicrobiaFirmicutes, Actinobacteria, Chloroflexi, Thaumarchaeota, Euryarchaeota
01011 Peptidoglycan biosynthesis, degradation
Gammaproteobacteria, Deltaproteobacteria, Betaproteobacteria
Firmicutes, Chloroflexi, Planctomycetales, Thaumarchaeota, Euryarchaeota
01001 Protein kinases Deltaproteobacteria, PlanctomycetalesAlphaproteobacteria, Firmicutes, Thaumarchaeota, Euryarchaeota
01040 Biosynthesis of unsaturated fatty acids Deltaproteobacteria, Actinobacteria Firmicutes, Chloroflexi, Thaumarchaeota, Euryarchaeota09113 Global maps only (unclassified metabolism) Gammaproteobacteria, Actinobacteria, Thaumarchaeota
Firmicutes, Bacteroidetes, Acidobacteria, Cyanobacteria, Chloroflexi, Planctomycetales, Verrucomicrobia
04614 Renin-angiotensin system Deltaproteobacteria, Bacteroidetes Gammaproteobacteria, Firmicutes, Thaumarchaeota00572 Arabinogalactan biosynthesis Actinobacteria, Planctomycetales
Gammaproteobacteria, Alphaproteobacteria, Chloroflexi, Euryarchaeota
00561 Glycerolipid metabolism Deltaproteobacteria, Actinobacteria, Verrucomicrobia Thaumarchaeota, Euryarchaeota00360 Phenylalanine metabolism Gammaproteobacteria, Actinobacteria Firmicutes, Acidobacteria, Cyanobacteria, Chloroflexi00960 Tropane, piperidine and pyridine alkaloid biosynthesis Alphaproteobacteria, Betaproteobacteria, Euryarchaeota Firmicutes, Planctomycetales00630 Glyoxylate and dicarboxylate metabolism Alphaproteobacteria, Acidobacteria Firmicutes, Chloroflexi, Thaumarchaeota, Euryarchaeota
Environmental Information Processing 02010 ABC transporters Alphaproteobacteria, Actinobacteria Thaumarchaeota
02020 Two component system Alphaproteobacteria, Deltaproteobacteria Chloroflexi, Thaumarchaeota03070 Bacterial secretion system
Gammaproteobacteria, Deltaproteobacteria, Betaproteobacteria, Verrucomicrobia
Firmicutes, Actinobacteria, Cyanobacteria, Chloroflexi, Thaumarchaeota, Euryarchaeota
02044 Type IV secretion system
Gammaproteobacteria, Deltaproteobacteria, Betaproteobacteria, Verrucomicrobia Firmicutes, Bacteroidetes, Chloroflexi, Thaumarchaeota
Genetic Information Processing
03013 RNA transport (eukaryote-like) Thaumarchaeota, Euryarchaeota All other phyla
Page 76 of 147
ScholarOne Support 1-434/964-4100
FEMS Microbiology Ecology
123456789101112131415161718192021222324252627282930313233343536373839404142434445464748495051525354555657585960

For Peer Review
03022 Basal transcription factors Thaumarchaeota, Euryarchaeota All other phyla
03050 Proteasome Actinobacteria, Thaumarchaeota, Euryarchaeota All other phyla
03110 Chaperones and folding Gammaproteobacteria, Deltaproteobacteria Firmicutes, Chloroflexi
03051 proteasome 20S subunit Deltaproteobacteria, Actinobacteria All other phyla03019 mRNA biogenesis (degradation) Gammaproteobacteria, Deltaproteobacteria
Alphaproteobacteria, Cyanobacteria, Chloroflexi, Thaumarchaeota, Euryarchaeota
Signaling and Cellular Processes 99978 Cell growth (sporulation) Firmicutes All other phyla
01501 beta-Lactam resistance Bacteroidetes, VerrucomicrobiaFirmicutes, Actinobacteria, Acidobacteria, Chloroflexi, Thaumarchaeota, Euryarchaeota
02040 Flagellar assembly Alphaproteobacteria, Betaproteobacteria, AcidobacteriaActinobacteria, Bacteroidetes, Cyanobacteria, Chloroflexi, Verrucomicrobia, Thaumarchaeota, Euryarchaeota
02030 bacterial chemotaxis Alphaproteobacteria, Betaproteobacteria Actinobacteria, Chloroflexi, Thaumarchaeota
Not included in pathway or BRITE
99992 Unclassified structural proteins Gammaproteobacteria, Betaproteobacteria
Firmicutes, Actinobacteria, Chloroflexi, Thaumarchaeota, Euryarchaeota
Page 77 of 147
ScholarOne Support 1-434/964-4100
FEMS Microbiology Ecology
123456789101112131415161718192021222324252627282930313233343536373839404142434445464748495051525354555657585960

For Peer Review
Supplementary Table 10: Summary of traits significantly enriched and depleted in Firmicutes and Actinobacteria models. Model BRITE 1 BRITE 3 Significantly high Significantly low
Firmicutes Metabolism 00540 LPS biosynthesis Sporomusaceae All other families
00020 Citrate cycle (TCA cycle) Sporomusaceae, Bacillaceae All other families99985 Unclassified amino acid metabolism Clostridiaceae Leuconostocaceae, Lactobacillaceae
00300 Lysine biosynthesis All equal All equal
00790 Folate biosynthesis Bacillaceae Leuconostocaceae, Lactobacillaceae00400 Phenylalanine, tyrosine and tryptophan biosynthesis Sporomusaceae Leuconostocaceae99982 Unclassified energy metabolism Sporomusaceae Leuconostocaceae, Lactobacillaceae00860 Porphyrin and chlorophyll metabolism Sporomusaceae Leuconostocaceae, Lactobacillaceae
Genetic Information Processing 03000 Transcription factors Sporomusaceae, Bacillaceae Leuconostocaceae
03030 DNA replication All equal All equalSignaling and Cellular Processes 02040 Flagellar assembly
Sporomusaceae, Clostridiaceae, Bacillaceae Leuconostocaceae, Lactobacillaceae
99978 Cell growth (sporulation) Bacillaceae Leuconostocaceae, Lactobacillaceae
02042 Bacterial toxins Sporomusaceae Lactobacillaceae00311 Penicillin and cephalosporin biosynthesis Sporomusaceae, Bacillaceae Leuconostocaceae, Lactobacillaceae, Clostridiaceae
Enzymes 99980 Enzymes with EC numbersSporomusaceae, Clostridiaceae, Bacillaceae Leuconostocaceae
Actinobacteria Metabolism 00571 LAM biosynthesis Mycobacteriaceae, Frankiaceae Microbacteriaceae, Cellulomonadaceae
01004 Lipid biosynthesis proteins MycobacteriaceaeMicrococcaceae, Microbacteriaceae, Promicromonosporaceae, Cellulomonadaceae
00860 Porphyrin and chlorophyll metabolism
Streptomycetaceae, Mycobacteriaceae, Frankiaceae All other families
01007 Amino acid related enzymes (aminotransferases) Frankiaceae
Micrococcaceae, Microbacteriaceae, Streptomycetaceae, Cellulomonadaceae
00071 Fatty acid degradation Mycobacteriaceae, Frankiaceae All other families00903 Limonene and pinene degradation Mycobacteriaceae
Micrococcaceae, Microbacteriaceae, Streptomycetaceae, Promicromonosporaceae, Cellulomonadaceae
00630 Glyoxylate and dicarboxylate metabolism
Streptomycetaceae, Mycobacteriaceae, Frankiaceae Promicromonosporaceae, Cellulomonadaceae
Page 78 of 147
ScholarOne Support 1-434/964-4100
FEMS Microbiology Ecology
123456789101112131415161718192021222324252627282930313233343536373839404142434445464748495051525354555657585960

For Peer Review
00620 Pyruvate metabolism MycobacteriaceaeMicrococcaceae, Microbacteriaceae, Promicromonosporaceae, Cellulomonadaceae
99982 Unclassified energy metabolism Mycobacteriaceae, Frankiaceae All other families
01008 Polyketide biosynthesis FrankiaceaeMicrococcaceae, Microbacteriaceae, Promicromonosporaceae, Cellulomonadaceae
01057 Type II polyketide biosynthesis Streptomycetaceae, Frankiaceae All other familiesEnvironmental Information Processing 02020 Two component system Streptomycetaceae Promicromonosporaceae, CellulomonadaceaeGenetic Information Processing 03021 Transcription machinery Streptomycetaceae
Micrococcaceae, Microbacteriaceae, Promicromonosporaceae, Cellulomonadaceae
Signaling and Cellular Processes 01504 Antimicrobial resistance genes Streptomycetaceae Frankiaceae
Uncharacterised UncharacterisedStreptomycetaceae, Mycobacteriaceae, Frankiaceae All other families
Page 79 of 147
ScholarOne Support 1-434/964-4100
FEMS Microbiology Ecology
123456789101112131415161718192021222324252627282930313233343536373839404142434445464748495051525354555657585960

For Peer Review
Supplementary Table 11: Summary of traits significantly enriched and depleted in Proteobacteria and Others models. Model BRITE 1 BRITE 3 Significantly high Significantly low
Proteobacteria Metabolism 00540 LPS biosynthesis Pseudomonadaceae, Burkholderiaceae Beijerinckiaceae, Nitrosomonadaceae
01003 GlycosyltransferasesRhizobiaceae, Myxococcaceae, Polyangiaceae Moraxellaceae
00650 Butanoate metabolismRhodospirillaceae, Rhizobiaceae, Burkholderiaceae Methylococcaceae, Nitrosomonadaceae
00600 Sphingolipid metabolism MyxococcaceaeAll Gammaproteobacteria, Rhodospirillaceae, Bradyrhizobiaceae, Neisseriales Lineage, Nitrosomonadaceae
01007 Amino acid related enzymes (aminotransferases)
Pseudomonadaceae, Rhodospirillaceae, Polyangiaceae, Burkholderiaceae Myxococcaceae
Environmental Information Processing 02010 ABC transporters
Pseudomonadaceae, Rhizobiaceae, Burkholderiaceae
Moraxellaceae, Methylococcaceae, Beijerinckiaceae, Nitrosomonadaceae
03070 Bacterial secretion systems Myxococcaceae, Polyangiaceae
Methylocystaceae, Rhodospirillaceae, Bradyrhizobiaceae, Beijerinckiaceae, Nitrosomonadaceae
Genetic Information Processing 03021 Transcription machinery Polyangiaceae All other families
99974 Unclassified translation Pseudomonadaceae, Beijerinckiaceae Moraxellaceae, Neisseriales Lineage03019 Messenger RNA biogenesis (degradation)
Pseudomonadaceae, Myxococcaceae, Burkholderiaceae
Methylocystaceae, Rhizobiaceae, Bradyrhizobiaceae, Beijerinckiaceae
03009 Ribosome biogenesis Myxococcaceae Methylococcaceae, all Alphaproteobacteria, Nitrosomonadaceae
03013 RNA transport Pseudomonadaceae, Myxococcaceae Rhodospirillaceae, Rhizobiaceae, BeijerinckiaceaeSignaling and Cellular Processes 02030 Bacterial chemotaxis Rhodospirillaceae Moraxellaceae
02040 Flagellar assembly Rhodospirillaceae, Neisseriales Lineage, Nitrosomonadaceae99995 Unclassified signaling proteins Pseudomonadaceae Methylocystaceae, Bradyrhizobiaceae, Beijerinckiaceae
Other Metabolism 00540 LPS biosynthesisChitinophagaceae, Acidobacteria Lineage, Planctomycetales, Verrucomicrobia Chloroflexi, Thaumarchaeota, Methanogen Lineage
01003 Glycosyltransferases Acidobacteria Lineage, Verrucomicrobia Chloroflexi, Thaumarchaeota, Methanogen Lineage99981 Unclassified carbohydrate metabolism
Chitinophagaceae, Acidobacteria Lineage, Planctomycetales Thaumarchaeota, Methanogen Lineage
01002 Peptidases, inhibitors Chitinophagaceae, Acidobacteria Lineage Thaumarchaeota, Methanogen Lineage
00195 Photosynthesis Cyanobacteria All other families
00680 Methane metabolism Methanogen Lineage All other familiesEnvironmental Information Processing 02010 ABC transporters Cyanobacteria, Verrucomicrobia
Acidobacteriaceae, Chloroflexi, Thaumarchaeota, Methanogen Lineage
Page 80 of 147
ScholarOne Support 1-434/964-4100
FEMS Microbiology Ecology
123456789101112131415161718192021222324252627282930313233343536373839404142434445464748495051525354555657585960

For Peer Review
02060 PTS Planctomycetales, Verrucomicrobia All other families
04152 AMPK signaling Thaumarchaeota, Methanogen Lineage All other families03070 Bacterial secretion system Acidobacteriaceae, Verrucomicrobia Chloroflexi, Thaumarchaeota, Methanogen Lineage02044 Type IV Secretion system
Acidobacteria Lineage, Planctomycetales, Verrucomicrobia
Cytophagaceae, Chitinophagaceae, Chloroflexi, Thaumarchaeota
Genetic Information Processing 99974 Unclassified translation Thaumarchaeota Cyanobacteria, VerrucomicrobiaSignaling and Cellular Processes 02030 Bacterial chemotaxis Acidobacteria Lineage, Planctomycetales
Cyanobacteria, Chloroflexi, Thaumarchaeota, Methanogen Lineage
01501 beta-Lactam resistanceCytophagaceae, Chitinophagaceae, Planctomycetales, Verrucomicrobia Chloroflexi, Thaumarchaeota, Methanogen Lineage
99995 Unclassified signaling proteins Cyanobacteria Chloroflexi
ReferencesAbt B, Foster B, Lapidus A, Clum A, Sun H, Pukall R et al (2010). Complete genome sequence of Cellulomonas flavigena type strain (134(T)). Standards in Genomic Sciences 3: 15-25.
An DS, Lee HG, Im WT, Liu OM, Lee ST (2007a). Segetibacter koreensis gen. nov., sp nov., a novel member of the phylum Bacteroidetes, isolated from the soil of a ginseng field in South Korea. International Journal of Systematic and Evolutionary Microbiology 57: 1828-1833.
An SY, Asahara M, Goto K, Kasai H, Yokota A (2007b). Terribacillus saccharophilus gen. nov., sp nov and Terribacillus halophilus sp nov., spore-forming bacteria isolated from field soil in Japan. International Journal of Systematic and Evolutionary Microbiology 57: 51-55.
Anagnostidis K, Komarek J (1988). Modern approach to the classification system of cyanophytes. 3. Oscillatoriales. Archiv für Hydrobiologie, Supplement 80: 327-472.
Bagnara C, Toci R, Gaudin C, Belaich JP (1985). Isolation and characterization of a cellulolytic microorganism, Cellulomonas-fermentans sp-nov. International Journal of Systematic Bacteriology 35: 502-507.
Page 81 of 147
ScholarOne Support 1-434/964-4100
FEMS Microbiology Ecology
123456789101112131415161718192021222324252627282930313233343536373839404142434445464748495051525354555657585960

For Peer Review
Barrangou R, Yoon SS, Breidt F, Fleming HP, Klaenhammer TR (2002). Identification and characterization of Leuconostoc fallax strains isolated from an industrial sauerkraut fermentation. Applied and Environmental Microbiology 68: 2877-2884.
Bentley SD, Chater KF, Cerdeno-Tarraga AM, Challis GL, Thomson NR, James KD et al (2002). Complete genome sequence of the model actinomycete Streptomyces coelicolor A3(2). Nature 417: 141-147.
Bogan BW, Sullivan WR, Kayser KJ, Derr KD, Aldrich HC, Peterek JR (2003). Alkanindiges illinoisensis gen. nov., sp nov., an obligately hydrocarbonoclastic, aerobic squalane-degrading bacterium isolated from oilfield soils. International Journal of Systematic and Evolutionary Microbiology 53: 1389-1395.
Brauer SL, Cadillo-Quiroz H, Ward RJ, Yavitt JB, Zinder SH (2011). Methanoregula boonei gen. nov., sp. nov., an acidiphilic methanogen isolated from an acidic peat bog. International Journal of Systematic and Evolutionary Microbiology 61: 45-52.
Brook MD, Currie B, Desmarchelier PM (1997). Isolation and identification of Burkholderia pseudomallei from soil using selective culture techniques and the polymerase chain reaction. Journal of Applied Microbiology 82: 589-596.
Brunel B, Cleyetmarel JC, Normand P, Bardin R (1988). Stability of Bradyrhizobium-japonicum inoculants after introduction into soil. Applied and Environmental Microbiology 54: 2636-2642.
Cadillo-Quiroz H, Yavitt JB, Zinder SH (2009). Methanosphaerula palustris gen. nov., sp nov., a hydrogenotrophic methanogen isolated from a minerotrophic fen peatland. International Journal of Systematic and Evolutionary Microbiology 59: 928-935.
Chain PSG, Denef VJ, Konstantinidis KT, Vergez LM, Agullo L, Reyes VL et al (2006). Burkholderia xenovorans LB400 harbors a multi-replicon, 9.73-Mbp genome shaped for versatility. Proceedings of the National Academy of Sciences of the United States of America 103: 15280-15287.
Chen WM, Laevens S, Lee TM, Coenye T, De Vos P, Mergeay M et al (2001). Ralstonia taiwanensis sp nov., isolated from root nodules of Mimosa species and sputum of a cystic fibrosis patient. International Journal of Systematic and Evolutionary Microbiology 51: 1729-1735.
Page 82 of 147
ScholarOne Support 1-434/964-4100
FEMS Microbiology Ecology
123456789101112131415161718192021222324252627282930313233343536373839404142434445464748495051525354555657585960

For Peer Review
Chen XH, Koumoutsi A, Scholz R, Eisenreich A, Schneider K, Heinemeyer I et al (2007). Comparative analysis of the complete genome sequence of the plant growth-promoting bacterium Bacillus amyloliquefaciens FZB42. Nature Biotechnology 25: 1007-1014.
Chen YS, Yanagida F, Shinohara T (2005). Isolation and identification of lactic acid bacteria from soil using an enrichment procedure. Letters in Applied Microbiology 40: 195-200.
Chern LL, Stackebrandt E, Lee SF, Lee FL, Chen JK, Fu HM (2004). Chitinibacter tainanensis gen. nov., sp nov., a chitin-degrading aerobe from soil in Taiwan. International Journal of Systematic and Evolutionary Microbiology 54: 1387-1391.
Chin KJ, Liesack W, Janssen PH (2001). Opitutus terrae gen nov, sp nov, to accommodate novel strains of the division 'Verrucomicrobia' isolated from rice paddy soil. International Journal of Systematic and Evolutionary Microbiology 51: 1965-1968.
Chistoserdova L (2011). Methylotrophy in a Lake: from Metagenomics to Single-Organism Physiology. Applied and Environmental Microbiology 77: 4705-4711.
Cohen JE, Wang R, Shen RF, Wu WW, Keller JE (2017). Comparative pathogenomics of Clostridium tetani. Plos One 12.
Crowe MA, Power JF, Morgan XC, Dunfield PF, Lagutin K, Rijpstra IC et al (2014). Pyrinomonas methylaliphatogenes gen. nov., sp. nov., a novel group 4 thermophilic member of the phylum Acidobacteria from geothermal soils (vol 64, pg 220, 2014). International Journal of Systematic and Evolutionary Microbiology 64: 1074-1074.
Das S, Pettersson BMF, Behra PRK, Ramesh M, Dasgupta S, Bhattacharya A et al (2015). Characterization of Three Mycobacterium spp. with Potential Use in Bioremediation by Genome Sequencing and Comparative Genomics. Genome Biology and Evolution 7: 1871-1886.
Davenport KW, Daligault HE, Minogue TD, Bruce DC, Chain PSG, Coyne SR et al (2014). Draft genome assembly of Acinetobacter baumannii ATCC 19606. Genome Announcements 2: e00832-00814.
Page 83 of 147
ScholarOne Support 1-434/964-4100
FEMS Microbiology Ecology
123456789101112131415161718192021222324252627282930313233343536373839404142434445464748495051525354555657585960

For Peer Review
Dedysh SN, Khmelenina VN, Suzina NE, Trotsenko YA, Semrau JD, Liesack W et al (2002). Methylocapsa acidiphila gen. nov., sp nov., a novel methane-oxidizing and dinitrogen-fixing acidophilic bacterium from Sphagnum bog. International Journal of Systematic and Evolutionary Microbiology 52: 251-261.
Dedysh SN, Kulichevskaya IS, Serkebaeva YM, Mityaeva MA, Sorokin VV, Suzina NE et al (2012). Bryocella elongata gen. nov., sp nov., a member of subdivision 1 of the Acidobacteria isolated from a methanotrophic enrichment culture, and emended description of Edaphobacter aggregans Koch et al. 2008. International Journal of Systematic and Evolutionary Microbiology 62: 654-664.
Dees MW, Sletten A, Hermansen A (2013). Isolation and characterization of Streptomyces species from potato common scab lesions in Norway. Plant Pathology 62: 217-225.
De Leon KB, Young ML, Camilleri LB, Brown SD, Skerker JM, Deutschbauer AM et al (2012). Draft genome sequence of Pelosinus fermentans JBW45, isolated during in situ stimulation for Cr(VI) reduction. Journal of Bacteriology 194: 5456-5457.
Derx HG (1950). Beijerinckia, a new genus of nitrogen-fixing bacteria in tropical soils. Repr Meded Konink Ned Akad Wetens 53: 140-147.
Dunfield PF, Khmelenina VN, Suzina NE, Trotsenko YA, Dedysh SN (2003). Methylocella silvestris sp nov., a novel methanotroph isolated from an acidic forest cambisol. International Journal of Systematic and Evolutionary Microbiology 53: 1231-1239.
Eichorst SA, Breznak JA, Schmidt TM (2007). Isolation and characterization of soil bacteria that define Teniglobus gen. nov., in the phylum Acidobacteria. Applied and Environmental Microbiology 73: 2708-2717.
Endo A, Okada S (2007). Lactobacillus composti sp nov, a lactic acid bacterium isolated from a compost of distilled shochu residue. International Journal of Systematic and Evolutionary Microbiology 57: 870-872.
Endo A, Futagawa-Endo Y, Dicks LMT (2009). Isolation and characterization of fructophilic lactic acid bacteria from fructose-rich niches. Systematic and Applied Microbiology 32: 593-600.
Page 84 of 147
ScholarOne Support 1-434/964-4100
FEMS Microbiology Ecology
123456789101112131415161718192021222324252627282930313233343536373839404142434445464748495051525354555657585960

For Peer Review
Endo A, Futagawa-Endo Y, Sakamoto M, Kitahara M, Dicks LMT (2010). Lactobacillus florum sp. nov., a fructophilic species isolated from flowers. International Journal of Systematic and Evolutionary Microbiology 60: 2478-2482.
Geymonat E, Ferrando L, Tarlera SE (2011). Methylogaea oryzae gen. nov., sp nov., a mesophilic methanotroph isolated from a rice paddy field. International Journal of Systematic and Evolutionary Microbiology 61: 2568-2572.
Graham JB, Istock CA (1978). Genetic exchange in Bacillus-subtilis in soil. Molecular & General Genetics 166: 287-290.
Hamada M, Shibata C, Sakurai K, Hosoyama A, Oji S, Teramoto K et al (2016). Reclassification of Amycolicicoccus subflavus as Hoyosella subflava comb. nov and emended descriptions of the genus Hoyosella and Hoyosella altamirensis. International Journal of Systematic and Evolutionary Microbiology 66: 4711-4715.
Hatayama K, Kawai S, Shoun H, Ueda Y, Nakamura A (2005). Pseudomonas azotifigens sp nov., a novel nitrogen-fixing bacterium isolated from a compost pile. International Journal of Systematic and Evolutionary Microbiology 55: 1539-1544.
He J, Ritalahti KM, Yang KL, Koenigsberg SS, Loffler FE (2003). Detoxification of vinyl chloride to ethene coupled to growth of an anaerobic bacterium. Nature 424: 62-65.
Helgason E, Okstad OA, Caugant DA, Johansen HA, Fouet A, Mock M et al (2000). Bacillus anthracis, Bacillus cereus, and Bacillus thuringiensis - One species on the basis of genetic evidence. Applied and Environmental Microbiology 66: 2627-2630.
Hennessee CT, Seo JS, Alvarez AM, Li QX (2009). Polycyclic aromatic hydrocarbon-degrading species isolated from Hawaiian soils: Mycobacterium crocinum sp nov., Mycobacterium pallens sp nov., Mycobacterium rutilum sp nov., Mycobacterium rufum sp nov and Mycobacterium aromaticivorans sp nov. International Journal of Systematic and Evolutionary Microbiology 59: 378-387.
Huang K, Xu Y, Zhang J, Chen C, Gao F, Zhao FJ (2017). Arsenicibacter rosenii gen. nov., sp. nov., an efficient arsenic methylating and volatilizing bacterium isolated from an arsenic-contaminated paddy soil. International Journal of Systematic and Evolutionary Microbiology 67: 3186-3191.
Page 85 of 147
ScholarOne Support 1-434/964-4100
FEMS Microbiology Ecology
123456789101112131415161718192021222324252627282930313233343536373839404142434445464748495051525354555657585960

For Peer Review
Huntley S, Zhang Y, Treuner-Lange A, Kneip S, Sensen CW, Sogaard-Andersen L (2012). Complete Genome Sequence of the Fruiting Myxobacterium Corallococcus coralloides DSM 2259. Journal of Bacteriology 194: 3012-3013.
Hwang JY, Kim SH, Oh HR, Kwon E, Nam DH (2015). Analysis of a draft genome sequence of Kitasatospora cheerisanensis KCTC 2395 producing bafilomycin antibiotics. Journal of Microbiology 53: 84-89.
Iguchi H, Yurimoto H, Sakai Y (2011). Methylovulum miyakonense gen. nov., sp. nov., a type I methanotroph isolated from forest soil. International Journal of Systematic and Evolutionary Microbiology 61: 810-815.
Im WT, Kim SH, Kim MK, Ten LN, Lee ST (2006). Pleomorphomonas koreensis sp nov., a nitrogen-fixing species in the order Rhizobiales. International Journal of Systematic and Evolutionary Microbiology 56: 1663-1666.
Jahn E (1911). Myxobacteriales. In: Kryptogamenflora der Mark Brandenburg und angrenzender Gebiete, Vol V, pp 187-206 Leipzig: Borntraeger.
Johnson JL, Toth J, Santiwatanakul S, Chen JS (1997). Cultures of ''Clostridium acetobutylicum'' from various collections comprise Clostridium acetobutylicum, Clostridium beijerinckii, and two other distinct types based on DNA-DNA reassociation. International Journal of Systematic Bacteriology 47: 420-424.
Jung MY, Kim JG, Damste JSS, Rijpstra WIC, Madsen EL, Kim SJ et al (2016). A hydrophobic ammonia-oxidizing archaeon of the Nitrosocosmicus clade isolated from coal tar-contaminated sediment. Environmental Microbiology Reports 8: 983-992.
Jurado V, Groth I, Gonzalez JM, Laiz L, Saiz-Jimenez C (2005). Agromyces subbeticus sp. nov., isolated from a cave in southern Spain. International Journal of Systematic and Evolutionary Microbiology 55: 1897-1901.
Kawasaki S, Kurosawa K, Miyazaki M, Yagi C, Kitajima Y, Tanaka S et al (2011). Lactobacillus floricola sp nov., lactic acid bacteria isolated from mountain flowers. International Journal of Systematic and Evolutionary Microbiology 61: 1356-1359.
Page 86 of 147
ScholarOne Support 1-434/964-4100
FEMS Microbiology Ecology
123456789101112131415161718192021222324252627282930313233343536373839404142434445464748495051525354555657585960

For Peer Review
Kim BK, Jung MY, Yu DS, Park SJ, Oh TK, Rhee SK et al (2011). Genome Sequence of an Ammonia-Oxidizing Soil Archaeon, "Candidatus Nitrosoarchaeum koreensis" MY1. Journal of Bacteriology 193: 5539-5540.
Kim BY, Weon HY, Yoo SH, Chen WM, Kwon SW, Go SJ et al (2006). Chitinimonas koreensis sp nov., isolated from greenhouse soil in Korea. International Journal of Systematic and Evolutionary Microbiology 56: 1761-1764.
Kim D, Baik KS, Kim MS, Park SC, Kim SS, Rhee MS et al (2008). Acinetobacter soli sp nov., isolated from forest soil. Journal of Microbiology 46: 396-401.
Kim SB, Lonsdale J, Seong CN, Goodfellow M (2003). Streptacidiphilus gen. nov., acidophilic actinomycetes with wall chemotype I and emendation of the family Streptomycetaceae (Waksman and Henrici (1943)(AL)) emend. Rainey et al. 1997. Antonie Van Leeuwenhoek International Journal of General and Molecular Microbiology 83: 107-116.
Kiss H, Nett M, Domin N, Martin K, Maresca JA, Copeland A et al (2011). Complete genome sequence of the filamentous gliding predatory bacterium Herpetosiphon aurantiacus type strain (114-95T). Standards in Genomic Sciences 5: 356-370.
Kleinig H, Reichenbach H (1973). New carotenoid glucoside ester from Chondromyces-apiculatus. Phytochemistry 12: 2483-2485.
Klouche N, Fardeau ML, Lascourreges JF, Cayol JL, Hacene H, Thomas P et al (2007). Geosporobacter subterraneus gen. nov., sp nov., a spore-forming bacterium isolated from a deep subsurface aquifer. International Journal of Systematic and Evolutionary Microbiology 57: 1757-1761.
Koburger JA, May SO (1982). Isolation of Chromobacterium spp from foods, soil, and water. Applied and Environmental Microbiology 44: 1463-1465.
Koch IH, Gich F, Dunfield PF, Overmann J (2008). Edaphobacter modestus gen. nov., sp nov., and Edaphobacter aggregans sp nov., acidobacteria isolated from alpine and forest soils. International Journal of Systematic and Evolutionary Microbiology 58: 1114-1122.
Page 87 of 147
ScholarOne Support 1-434/964-4100
FEMS Microbiology Ecology
123456789101112131415161718192021222324252627282930313233343536373839404142434445464748495051525354555657585960

For Peer Review
Komarek J, Hindak F (1975). Taxonomy of the new isolated strains of Chroococcidiopsis (Cyanophyceae). Archiv für Hydrobiologie 13: 311-329.
Koops HP, Bottcher B, Moller UC, Pommereningroser A, Stehr G (1991). Classification of 8 new species of Ammonia-Oxidizing bacteria - Nitrosomonas-communis sp-nov, Nitrosomonas-ureae sp-nov, Nitrosomonas-aestuarii sp-nov, Nitrosomonas-marina sp-nov, Nitrosomonas-nitrosa sp-nov, Nitrosomonas-eutropha sp-nov, Nitrosomonas-oligotropha sp-nov and Nitrosomonas-halophila sp-nov. Journal of General Microbiology 137: 1689-1699.
Krizova L, Maixnerova M, Sedo O, Nemec A (2014). Acinetobacter bohemicus sp nov widespread in natural soil and water ecosystems in the Czech Republic. Systematic and Applied Microbiology 37: 467-473.
Kuklinsky-Sobral J, Araujo WL, Mendes R, Geraldi IO, Pizzirani-Kleiner AA, Azevedo JL (2004). Isolation and characterization of soybean-associated bacteria and their potential for plant growth promotion. Environmental Microbiology 6: 1244-1251.
Kulichevskaya IS, Ivanova AO, Belova SE, Baulina OI, Bodelier PLE, Rijpstra WIC et al (2007). Schlesneria paludicola gen. nov., sp nov., the first acidophilic member of the order Planctomycetales, from Sphagnum-dominated boreal wetlands. International Journal of Systematic and Evolutionary Microbiology 57: 2680-2687.
Kulichevskaya IS, Ivanova AO, Baulina OI, Bodelier PLE, Damste JSS, Dedysh SN (2008). Singulisphaera acidiphila gen. nov., sp nov., a non-filamentous, Isosphaera-like planctomycete from acidic northern wetlands. International Journal of Systematic and Evolutionary Microbiology 58: 1186-1193.
Kulichevskaya IS, Suzina NE, Liesack W, Dedysh SN (2010). Bryobacter aggregatus gen. nov., sp nov., a peat-inhabiting, aerobic chemo-organotroph from subdivision 3 of the Acidobacteria. International Journal of Systematic and Evolutionary Microbiology 60: 301-306.
Kulichevskaya IS, Ivanova AA, Detkova EN, Rijpstra WIC, Damste JSS, Dedysh SN (2015). Planctomicrobium piriforme gen. nov., sp nov., a stalked planctomycete from a littoral wetland of a boreal lake. International Journal of Systematic and Evolutionary Microbiology 65: 1659-1665.
Page 88 of 147
ScholarOne Support 1-434/964-4100
FEMS Microbiology Ecology
123456789101112131415161718192021222324252627282930313233343536373839404142434445464748495051525354555657585960

For Peer Review
Kulichevskaya IS, Ivanova AA, Suzina NE, Rijpstra WIC, Damste JSS, Dedysh SN (2016). Paludisphaera borealis gen. nov., sp nov., a hydrolytic planctomycete from northern wetlands, and proposal of Isosphaeraceae fam. nov. International Journal of Systematic and Evolutionary Microbiology 66: 837-844.
Kwon SW, Kim YY, Kim WG, Yoo KH, Yoo SH, Son JA et al (2008). Paludibacterium yongneupense gen. nov., sp nov., isolated from a wetland, Yongneup, in Korea. International Journal of Systematic and Evolutionary Microbiology 58: 190-194.
Lang E, Kroppenstedt RM, Straubler B, Stackebrandt E (2008). Reclassification of Myxococcus flavescens Yamanaka et al. 1990(vp) as a later synonym of Myxococcus virescens Thaxter 1892(AL). International Journal of Systematic and Evolutionary Microbiology 58: 2607-2609.
Lang E, Stackebrandt E (2009). Emended descriptions of the genera Myxococcus and Corallococcus, typification of the species Myxococcus stipitatus and Myxococcus macrosporus and a proposal that they be represented by neotype strains. Request for an Opinion. International Journal of Systematic and Evolutionary Microbiology 59: 2122-2128.
Larimer FW, Chain P, Hauser L, Lamerdin J, Malfatti S, Do L et al (2004). Complete genome sequence of the metabolically versatile photosynthetic bacterium Rhodopseudomonas palustris. Nature Biotechnology 22: 55-61.
Lehtovirta-Morley LE, Ge CR, Ross J, Yao HY, Nicol GW, Prosser JI (2014). Characterisation of terrestrial acidophilic archaeal ammonia oxidisers and their inhibition and stimulation by organic compounds. Fems Microbiology Ecology 89: 542-552.
Levanon D (1978). Isolation and properties of cell-walls from Agrobacterium-tumefaciens-B6. Experientia 34: 354-356.
Leys NM, Ryngaert A, Bastiaens L, Wattiau P, Top EM, Verstraete W et al (2005). Occurrence and community composition of fast-growing Mycobacterium in soils contaminated with polycyclic aromatic hydrocarbons. Fems Microbiology Ecology 51: 375-388.
Li SG, Zhao L, Han K, Li PF, Li ZF, Hu W et al (2014). Diversity of epothilone producers among Sorangium strains in producer-positive soil habitats. Microbial Biotechnology 7: 130-141.
Page 89 of 147
ScholarOne Support 1-434/964-4100
FEMS Microbiology Ecology
123456789101112131415161718192021222324252627282930313233343536373839404142434445464748495051525354555657585960
For Peer Review
Li YZ, Chen F, Dong K, Wang GJ (2013). Actinotalea ferrariae sp nov., isolated from an iron mine, and emended description of the genus Actinotalea. International Journal of Systematic and Evolutionary Microbiology 63: 3398-3403.
Liesack W, Bak F, Kreft JU, Stackebrandt E (1994). Holophaga foetida gen-nov, sp-nov, a new, homoacetogenic bacterium degrading methoxylated aromatic-compounds. Archives of Microbiology 162: 85-90.
Lipman JG (1904). Further contributions to the physiology and morphology of members of the Azotobacter group. New Jersey Agricultural Experimental Station 25th Annual Report, pp 237-289.
Liu GQ, Kong YY, Fan YJ, Geng C, Peng DH, Sun M (2017). Whole-genome sequencing of Bacillus velezensis LS69, a strain with a broad inhibitory spectrum against pathogenic bacteria. Journal of Biotechnology 249: 20-24.
Liu JH, Wang YX, Zhang XX, Wang ZG, Chen YG, Wen ML et al (2010). Salinarimonas rosea gen. nov., sp nov., a new member of the alpha-2 subgroup of the Proteobacteria. International Journal of Systematic and Evolutionary Microbiology 60: 55-60.
Lymperopoulou DS, Coil DA, Schichnes D, Lindow SE, Jospin G, Eisen JA et al (2017). Draft genome sequences of eight bacteria isolated from the indoor environment: Staphylococcus capitis strain H36, S. capitis strain H65, S. cohnii strain H62, S. hominis strain H69, Microbacterium sp strain H83, Mycobacterium iranicum strain H39, Plantibacter sp strain H53, and Pseudomonas oryzihabitans strain H72. Standards in Genomic Sciences 12.
Madhaiyan M, Poonguzhali S, Senthilkumar M, Pragatheswari D, Lee JS, Lee KC (2015). Arachidicoccus rhizosphaerae gen. nov., sp nov., a plant-growth-promoting bacterium in the family Chitinophagaceae isolated from rhizosphere soil. International Journal of Systematic and Evolutionary Microbiology 65: 578-586.
Maestrojuán GM, Boone JE, Mah RA, Mienaia JAGF, Sachs MS, Boone DR (1992). Taxonomy and halotolerance of mesophilic Methanosarcina strains, assignment of strains to species, and synonymy of Methanosarcina mazei and Methanosarcina frisia. International Journal of Systematic Bacteriology 42: 561-567.
Page 90 of 147
ScholarOne Support 1-434/964-4100
FEMS Microbiology Ecology
123456789101112131415161718192021222324252627282930313233343536373839404142434445464748495051525354555657585960

For Peer Review
Magalhaes FM, Baldani JI, Souto SM, Kuykendall JR, Dobereiner J (1983). A new acid-tolerant Azospirillum species. Anais Da Academia Brasileira De Ciencias 55: 417-430.
Magnusson J, Jonsson H, Schnurer J, Roos S (2002). Weisselia soli sp nov., a lactic acid bacterium isolated from soil. International Journal of Systematic and Evolutionary Microbiology 52: 831-834.
Malhotra J, Anand S, Jindal S, Rajagopal R, Lal R (2012). Acinetobacter indicus sp nov., isolated from a hexachlorocyclohexane dump site. International Journal of Systematic and Evolutionary Microbiology 62: 2883-2890.
Mao YJ, Chen M, Horvath P (2015). Lactobacillus herbarum sp nov., a species related to Lactobacillus plantarum. International Journal of Systematic and Evolutionary Microbiology 65: 4682-4688.
Mayilraj S, Suresh K, Schumann P, Kroppenstedt RM, Saini HS (2006). Agrococcus lahaulensis sp. nov., isolated from a cold desert of the Indian Himalayas. International Journal of Systematic and Evolutionary Microbiology 56: 1807-1810.
Möller B, Ossmer R, Howard BH, Gottschalk G, Hippe H (1984). Sporomusa, a new genus of Gram-negative anaerobic bacteria including Sporomuusa sphaeroides spec. nov. and Sporomusa ovata spec. nov. Archives of Microbiology 139: 388-396.
Mongodin EF, Shapir N, Daugherty SC, Deboy RT, Emerson JB, Shvartzbeyn A et al (2006). Secrets of soil survival revealed by the genome sequence of Arthrobacter aurescens TC1. Plos Genetics 2: 2094-2106.
Mosier AC, Allen EE, Kim M, Ferriera S, Francis CA (2012). Genome Sequence of "Candidatus Nitrosopumilus salaria" BD31, an Ammonia-Oxidizing Archaeon from the San Francisco Bay Estuary. Journal of Bacteriology 194: 2121-2122.
Naeem FI, Ashraf MM, Malik KA, Hafeez FY (2004). Competitiveness of introduced Rhizobium strains for nodulation in fodder legumes. Pakistan Journal of Botany 36: 159-166.
Page 91 of 147
ScholarOne Support 1-434/964-4100
FEMS Microbiology Ecology
123456789101112131415161718192021222324252627282930313233343536373839404142434445464748495051525354555657585960

For Peer Review
Nohynek LJ, Haggblom MM, Palleroni NJ, Kronqvist K, Nurmiaholassila EL, Salkinojasalonen M (1993). Characterization of a Mycobacterium-fortuitum strain capable of degrading polychlorinated phenolic-compounds. Systematic and Applied Microbiology 16: 126-134.
Normand P, Lalonde M (1982). Evaluation of Frankia strains isolated from provenances of 2 Alnus species. Canadian Journal of Microbiology 28: 1133-1142.
Normand P, Lapierre P, Tisa LS, Gogarten JP, Alloisio N, Bagnarol E et al (2007). Genome characteristics of facultatively symbiotic Frankia sp strains reflect host range and host plant biogeography. Genome Research 17: 7-15.
Norton JM, Klotz MG, Stein LY, Arp DJ, Bottomley PJ, Chain PSG et al (2008). Complete genome sequence of Nitrosospira multiformis, an ammonia-oxidizing bacterium from the soil environment. Applied and Environmental Microbiology 74: 3559-3572.
Nouioui I, Ghodhbane-Gtari F, Montero-Calasanz MD, Goker M, Meier-Kolthoff JP, Schumann P et al (2016). Proposal of a type strain for Frankia alni (Woronin 1866) Von Tubeuf 1895, emended description of Frankia alni, and recognition of Frankia casuarinae sp nov and Frankia elaeagni sp nov. International Journal of Systematic and Evolutionary Microbiology 66: 5201-5210.
Nouioui I, Ghodhbane-Gtari F, Montero-Calasanz MD, Rohde M, Tisa LS, Gtari M et al (2017). Frankia inefficax sp nov., an actinobacterial endophyte inducing ineffective, non nitrogen-fixing, root nodules on its actinorhizal host plants. Antonie Van Leeuwenhoek International Journal of General and Molecular Microbiology 110: 313-320.
Ogg CD, Patel BKC (2009). Caloramator australicus sp nov., a thermophilic, anaerobic bacterium from the Great Artesian Basin of Australia. International Journal of Systematic and Evolutionary Microbiology 59: 95-101.
Osterman J, Marsh J, Laine PK, Zeng Z, Alatalo E, Sullivan JT et al (2014). Genome sequencing of two Neorhizobium galegae strains reveals a noeT gene responsible for the unusual acetylation of the nodulation factors. Bmc Genomics 15.
Page 92 of 147
ScholarOne Support 1-434/964-4100
FEMS Microbiology Ecology
123456789101112131415161718192021222324252627282930313233343536373839404142434445464748495051525354555657585960

For Peer Review
Peix A, Berge O, Rivas R, Abril A, Velazquez E (2005). Pseudomonas argentinensis sp nov., a novel yellow pigment-producing bacterial species, isolated from rhizospheric soil in Cordoba, Argentina. International Journal of Systematic and Evolutionary Microbiology 55: 1107-1112.
Persson T, Battenberg K, Demina IV, Vigil-Stenman T, Heuvel BV, Pujic P et al (2015). Candidatus Frankia Datiscae Dg1, the Actinobacterial Microsymbiont of Datisca glomerata, Expresses the Canonical nod Genes nodABC in Symbiosis with Its Host Plant. Plos One 10.
Prabhu DM, Quadri SR, Cheng J, Liu L, Chen W, Yang Y et al (2015). Sinomonas mesophila sp nov., isolated from ancient fort soil. Journal of Antibiotics 68: 318-321.
Qiu YL, Kuang XZ, Shi XS, Yuan XZ, Guo RB (2014). Terrimicrobium sacchariphilum gen. nov., sp nov., an anaerobic bacterium of the class 'Spartobacteria' in the phylum Verrucomicrobia, isolated from a rice paddy field. International Journal of Systematic and Evolutionary Microbiology 64: 1718-1723.
Reichenbach H, Lang E, Schumann P, Sproer C (2006). Byssovorax cruenta gen. nov., sp nov., nom. rev., a cellulose-degrading myxobacterium: rediscovery of 'Myxococcus cruentus' Thaxter 1897. International Journal of Systematic and Evolutionary Microbiology 56: 2357-2363.
Rice MC, Norton JM, Valois F, Bollmann A, Bottomley PJ, Klotz MG et al (2016). Complete genome of Nitrosospira briensis C-128, an ammonia-oxidizing bacterium from agricultural soil. Standards in Genomic Sciences 11.
Rippka R, Herdman M (1992). Pasteur Culture Collection of Cyanobacterial Strains in Axenic Culture, Catalogue and Taxonomic Handbook. Institut Pasteur, Paris. 103 pp.
Rivas R, Sanchez M, Trujillo ME, Zurdo-Pineiro JL, Mateos PF, Martinez-Molina E, Velazquez E (2003). Xylanimonas cellulosilytica gen. nov., sp. nov., a xylanolytic bacterium isolated from a decayed tree (Ulmus nigra). International Journal of Systematic and Evolutionary Microbiology 53: 99-103.
Page 93 of 147
ScholarOne Support 1-434/964-4100
FEMS Microbiology Ecology
123456789101112131415161718192021222324252627282930313233343536373839404142434445464748495051525354555657585960

For Peer Review
aRivas R, Trujillo ME, Mateos PF, Martinez-Molina E, Velazquez E (2004). Cellulomonas xylanilytica sp nov., a celluloytic and xylanolytic bacterium isolated from a decayed elm tree. International Journal of Systematic and Evolutionary Microbiology 54: 533-536.
bRivas R, Trujillo ME, Schumann P, Kroppenstedt RM, Sanchez M, Mateos PF et al (2004). Xylanibacterium ulmi gen. nov., sp. nov., a novel xylanolytic member of the family Promicromonosporaceae. International Journal of Systematic and Evolutionary Microbiology 54: 557-561.
Ruckert C, Albersmeier A, Busche T, Jaenicke S, Winkler A, Friojonsson OH et al (2015). Complete genome sequence of Streptomyces lividans TK24. Journal of Biotechnology 199: 21-22.
Sanchez-Andrea I, Florentino AP, Semerel J, Strepis N, Sousa DZ, Stams AJM (2018). Co-culture of a novel fermentative bacterium, Lucifera butyrica gen. nov. sp. nov., with the sulfur reducer Desulfurella amilsii for enhanced sulfidogenesis. Frontiers in Microbiology 9: 3108.
Sakai S, Imachi H, Hanada S, Ohashi A, Harada H, Kamagata Y (2008). Methanocella paludicola gen. nov., sp nov., a methane-producing archaeon, the first isolate of the lineage 'Rice Cluster I', and proposal of the new archaeal order Methanocellales ord. nov. International Journal of Systematic and Evolutionary Microbiology 58: 929-936.
Sakai S, Conrad R, Liesack W, Imachi H (2010). Methanocella arvoryzae sp nov., a hydrogenotrophic methanogen isolated from rice field soil. International Journal of Systematic and Evolutionary Microbiology 60: 2918-2923.
Sangkhobol V, Skerman VBD (1981). Chitinophaga, a new genus of chitinolytic Myxobacteria. International Journal of Systematic Bacteriology 31: 285-293.
Sangwan P, Chen XL, Hugenholtz P, Janssen PH (2004). Chthoniobacter flavus gen. nov., sp nov., the first pure-culture representative of subdivision two, Spartobacteria classis nov., of the phylum Verrucomicrobia. Applied and Environmental Microbiology 70: 5875-5881.
Schumann P, Weiss N, Stackebrandt E (2001). Reclassification of Cellulomonas cellulans (Stackebrandt and Keddie 1986) as Cellulosimicrobium cellulans gen. nov., comb. nov. International Journal of Systematic and Evolutionary Microbiology 51: 1007-1010.
Page 94 of 147
ScholarOne Support 1-434/964-4100
FEMS Microbiology Ecology
123456789101112131415161718192021222324252627282930313233343536373839404142434445464748495051525354555657585960

For Peer Review
Schumann P, Behrendt U, Ulrich A, Suzuki K (2003). Reclassification of Subtercola pratensis Behrendt et al. 2002 as Agreia pratensis comb. nov. International Journal of Systematic and Evolutionary Microbiology 53: 2041-2044.
Schwabe GH (1960). Zur autotrophen vegetation in ariden Böden. Blaualgen und Lebensraum IV. Österreichische Botanische Zeitschrift 107: 281-309.
Shamseldin A, Carro L, Peix A, Velazquez E, Moawad H, Sadowsky MJ (2016). The symbiovar trifolii of Rhizobium bangladeshense and Rhizobium aegyptiacum sp nov nodulate Trifolium alexandrinum in Egypt. Systematic and Applied Microbiology 39: 275-279.
Singh AK, Garg N, Lata P, Kumar R, Negi V, Vikram S et al (2014). Pontibacter indicus sp nov., isolated from hexachlorocyclohexane-contaminated soil. International Journal of Systematic and Evolutionary Microbiology 64: 254-259.
Soby SD, Gadagkar SR, Contreras C, Caruso FL (2013). Chromobacterium vaccinii sp nov., isolated from native and cultivated cranberry (Vaccinium macrocarpon Ait.) bogs and irrigation ponds. International Journal of Systematic and Evolutionary Microbiology 63: 1840-1846.
Starkenburg SR, Chain PSG, Sayavedra-Soto LA, Hauser L, Land ML, Larimer FW et al (2006). Genome sequence of the chemolithoautotrophic nitrite-oxidizing bacterium Nitrobacter winogradskyi Nb-255. Applied and Environmental Microbiology 72: 2050-2063.
Starkenburg SR, Reitenga KG, Freitas T, Joohnsoon S, Chain PSG, Garcia-Pichel F, Kusek CR (2011). Genome of the Cyanobacterium Microcoleus vaginatus FGP-2, a photosynthetic ecosystem engineer of arid land soil biocrusts worldwide. Journal of Bacteriology doi.org/10.1128/JB.05138-11.
Strömpl C, Tindall BJ, Jarvis GN, Lünsdorf H, Moore ERB, Hippe H (1999). A re-evaluation of the taxonomy of the genus Anaerovibrio, with the reclassification of Anaerovibrio glycerini as Anaerosinus glycerini gen. nov., comb. Nov., and Anaerovibrio burkinabensis as Anaeroarcus burkinensis [corrig.] gen. nov., comb. Nov. International Journal of Systematic Bacteriology 49: 1861-1872.
Page 95 of 147
ScholarOne Support 1-434/964-4100
FEMS Microbiology Ecology
123456789101112131415161718192021222324252627282930313233343536373839404142434445464748495051525354555657585960

For Peer Review
Takahashi Y, Tanaka Y, Iwai Y, Omura S (1987). Promicromonospora sukumoe sp. nov., a new species of the Actinomycetales. Journal of General and Applied Microbiology 33: 507-519.
Takami H, Arai W, Takemoto K, Uchiyama I, Taniguchi T (2015). Functional Classification of Uncultured "Candidatus Caldiarchaeum subterraneum" Using the Maple System. Plos One 10.
Takarada H, Sekine M, Kosugi H, Matsuo Y, Fujisawa T, Omata S et al (2008). Complete genome sequence of the soil actinomycete Kocuria rhizophila. Journal of Bacteriology 190: 4139-4146.
Tanaka Y, Matsuzawa H, Tamaki H, Tagawa M, Toyama T, Kamagata Y et al (2017). Isolation of Novel Bacteria Including Rarely Cultivated Phyla, Acidobacteria and Verrucomicrobia, from the Roots of Emergent Plants by Simple Culturing Method. Microbes and Environments 32: 288-292.
Tang B, Yu YC, Zhang YM, Zhao GP, Ding XM (2015). Complete genome sequence of the glidobactin producing strain Polyangium brachysporum DSM 7029. Journal of Biotechnology 210: 83-84.
Tikariha H, Pal RR, Qureshi A, Kapley A, Purohit HJ (2016). In silico analysis for prediction of degradative capacity of Pseudomonas putida SF1. Gene 591: 382-392.
Toledo I, Lloret L, Martinez-Romero E (2003). Sinorhizobium americanus sp nov., a new Sinorhizobium species nodulating native Acacia spp. in Mexico. Systematic and Applied Microbiology 26: 54-64.
Van VT, Ngoke S, Berge O, Faure D, Bally R, Hebbar P et al (1997). Isolation of Azospirillum lipoferum from the rhizosphere of rice by a new, simple method. Canadian Journal of Microbiology 43: 486-490.
Vaz-Moreira I, Nobre MF, Ferreira ACS, Schumann P, Nunes OC, Manaia CM (2008). Humibacter albus gen. nov., sp. nov., isolated from sewage sludge compost. International Journal of Systematic and Evolutionary Microbiology 58: 1014-1018.
Page 96 of 147
ScholarOne Support 1-434/964-4100
FEMS Microbiology Ecology
123456789101112131415161718192021222324252627282930313233343536373839404142434445464748495051525354555657585960

For Peer Review
Vieira S, Luckner M, Wanner G, Overmann J (2017). Luteitalea pratensis gen. nov., sp nov a new member of subdivision 6 Acidobacteria isolated from temperate grassland soil. International Journal of Systematic and Evolutionary Microbiology 67: 1408-1414.
Voelz H, Dworkin M (1962). Fine structure of Myxococcus xanthus during morphogenesis. Journal of Bacteriology 84: 943-&.
Volland S, Rachinger M, Strittmatter A, Daniel R, Gottschalk G, Meyer O (2011). Complete Genome Sequences of the Chemolithoautotrophic Oligotropha carboxidovorans Strains OM4 and OM5. Journal of Bacteriology 193: 5043-5043.
Vorobev AV, Baani M, Doronina NV, Brady AL, Liesack W, Dunfield PF et al (2011). Methyloferula stellata gen. nov., sp nov., an acidophilic, obligately methanotrophic bacterium that possesses only a soluble methane monooxygenase. International Journal of Systematic and Evolutionary Microbiology 61: 2456-2463.
Wang YX, Liu JH, Zhang XX, Chen YG, Wang ZG, Chen Y et al (2009). Fodinicurvata sediminis gen. nov., sp nov and Fodinicurvata fenggangensis sp nov., poly-beta-hydroxybutyrate-producing bacteria in the family Rhodospirillaceae. International Journal of Systematic and Evolutionary Microbiology 59: 2575-2581.
Ward NL, Challacombe JF, Janssen PH, Henrissat B, Coutinho PM, Wu M et al (2009). Three Genomes from the Phylum Acidobacteria Provide Insight into the Lifestyles of These Microorganisms in Soils. Applied and Environmental Microbiology 75: 2046-2056.
Warnick TA, Methe BA, Leschine SB (2002). Clostridium phytofermentans sp nov., a cellulolytic mesophile from forest soil. International Journal of Systematic and Evolutionary Microbiology 52: 1155-1160.
Wartiainen I, Hestnes AG, McDonald IR, Svenning MM (2006). Methylocystis rosea sp nov., a novel methanotrophic bacterium from Arctic wetland soil, Svalbard, Norway (78 degrees N). International Journal of Systematic and Evolutionary Microbiology 56: 541-547.
Weon HY, Kim BY, Yoo SH, Lee SY, Kwon SW, Go SJ et al (2006). Niastella koreensis gen. nov., sp nov and Niastella yeongjuensis sp nov., novel members of the phylum Bacteroidetes, isolated from soil cultivated with Korean ginseng. International Journal of Systematic and Evolutionary Microbiology 56: 1777-1782.
Page 97 of 147
ScholarOne Support 1-434/964-4100
FEMS Microbiology Ecology
123456789101112131415161718192021222324252627282930313233343536373839404142434445464748495051525354555657585960

For Peer Review
Weon HY, Kim BY, Yoo SH, Joa JH, Kwon SW, Kim WG (2007). Andreprevotia chitinilytica gen. nov., sp nov., isolated from forest soil from Halla Mountain, Jeju Island, Korea. International Journal of Systematic and Evolutionary Microbiology 57: 1572-1575.
Weon HY, Kim BY, Joa JH, Kwon SW, Kim WG, Koo BS (2008). Niabella soli sp nov., isolated from soil from Jeju Island, Korea. International Journal of Systematic and Evolutionary Microbiology 58: 467-469.
Westerberg K, Elvang AM, Stackebrandt E, Jansson JK (2000). Arthrobacter chlorophenolicus sp nov., a new species capable of degrading high concentrations of 4-chlorophenol. International Journal of Systematic and Evolutionary Microbiology 50: 2083-2092.
Whittenbury R, Phillips KC, Wilkinso J (1970). Enrichment, isolation and some properties of Methane-utilizing bacteria. Journal of General Microbiology 61: 205-&.
Winogradsky S (1929). Études sur la microbologie du sol - sur la dégradation de la cellulose dans le sol. Annales de l'Institut Pasteur 43: 549-633.
Wise MG, McArthur JV, Shimkets LJ (2001). Methylosarcina fibrata gen. nov., sp nov and Methylosarcina quisquiliarum sp nov., novel type I methanotrophs. International Journal of Systematic and Evolutionary Microbiology 51: 611-621.
Xie CH, Yokota A (2005a). Azospirillum oryzae sp nov., a nitrogen-fixing bacterium isolated from the roots of the rice plant Oryza sativa. International Journal of Systematic and Evolutionary Microbiology 55: 1435-1438.
Xie CH, Yokota A (2005b). Pleomorphomonas oryzae gen. nov., sp nov., a nitrogen-fixing bacterium isolated from paddy soil of Oryza sativa. International Journal of Systematic and Evolutionary Microbiology 55: 1233-1237.
Xie CH, Yokota A (2006). Reclassification of Flavobacterium ferrugineum as Terrimonas ferruginea gen. nov., comb. nov., and description of Terrimonas lutea sp nov., isolated from soil. International Journal of Systematic and Evolutionary Microbiology 56: 1117-1121.
Xie G, Bruce DC, Challacombe JF, Chertkov O, Detter JC, Gilna P et al (2007). Genome sequence of the cellulolytic gliding bacterium Cytophaga hutchinsonii. Applied and Environmental Microbiology 73: 3536-3546.
Page 98 of 147
ScholarOne Support 1-434/964-4100
FEMS Microbiology Ecology
123456789101112131415161718192021222324252627282930313233343536373839404142434445464748495051525354555657585960

For Peer Review
Yang HC, Im WT, Kim KK, An DS, Lee ST (2006). Burkholderia terrae sp nov, isolated from a forest soil. International Journal of Systematic and Evolutionary Microbiology 56: 453-457.
Yooon JH, Kang SJ, Schumann P, Oh TK (2007). Cellulosimicrobium terreum sp. nov., isolated from soil. International Journal of Systematic and Evolutionary Microbiology 57: 2493-2497.
Yoon MH, Ten LN, Im WT, Lee ST (2008). Cellulomonas chitinilytica sp nov., a chitinolytic bacterium isolated from cattle-farm compost. International Journal of Systematic and Evolutionary Microbiology 58: 1878-1884.
Zaburannyi N, Bunk B, Maier J, Overmann J, Muller R (2016). Genome Analysis of the Fruiting Body-Forming Myxobacterium Chondromyces crocatus Reveals High Potential for Natural Product Biosynthesis. Applied and Environmental Microbiology 82: 1945-1957.
Zhang JY, Liu XY, Liu SJ (2010). Agrococcus terreus sp nov and Micrococcus terreus sp nov., isolated from forest soil. International Journal of Systematic and Evolutionary Microbiology 60: 1897-1903.
Zgurskaya HI, Evtushenko LI, Akimov VN, Voyevoda HV, Dobrovolskaya TG, Lysak LV et al (1992). Emended description of the genus Agromyces and description of Agromyces cerinus subsp. cerinus sp. nov., subsp. nov., Agrocymces cerinus subsp. nitratus sp. nov., subsp. nov., Agromyces fucosus subsp. fucosus sp. nov., subsp. nov., and Agromyces fucosus subsp. nov., and Agromyces fucosus subsp. hippuratus sp. nov., subsp. nov. International Journal of Systematic Bacteriology 42: 635-641.
Page 99 of 147
ScholarOne Support 1-434/964-4100
FEMS Microbiology Ecology
123456789101112131415161718192021222324252627282930313233343536373839404142434445464748495051525354555657585960

For Peer Review
Manuscript id: FEMSEC-21-01-0026Title: Functional trait relationships demonstrate generalisable life strategies in terrestrial prokaryotes.Authors: Finn, Damien; Bergk-Pinto, Benoit; Hazard, Christina; Nicol, Graeme; Tebbe, Christoph; Vogel, Tim
Reviewers' Comments to Authors:
Reviewer: 1Comments to the AuthorReview of the paper: Functional trait relationships demonstrate generalisable life strategies in terrestrial prokaryotes.This paper aims at identifying copiotrophic vs oligotrophic strategies among 170 species of bacteria and archea by comparing their similarity in their traits (based on clustering of functionally similar amino acid sequences). Instead of finding two clear cluster reflecting copiotrophic-oligotrophic framework, they identify 5 clusters. Only one of these clusters can be fit as copiotrophic. All other ones, reflect, as the author suggest, unique life-history strategies on their own.I really like the paper and I think it is worth publication for two reasons: 1) It challenges simplistic views that entire kingdoms (or other higher taxa) of microorganisms can placed along a unique axis of energy use. 2) the method they use will surely be used by other researchers. I also send my kudos to the authors to develop a step-by-step repo explaining their method. Doing so, not only ensures reproducibility but also encourage other scientist to test similar questions with their approach.I like it as it is. However, I want to acknowledge that I cannot judge on the information of the natural history and ecology of many of the taxa included.
Comment:My only major suggestion is to make more explicit the way they test hypothesis 3: “copiotrophic and oligotrophic groups would emerge based on trait enrichment”. (L149.150)From what I understood in the method section (283-287) that hypothesis was tested by subsetting 60 traits that emerge from their random forest clustering that are “associated with copiotroph-oligotroph growth strategies”. This association is based “previous studies”. Since this is a major hypothesis in the paper, I suggest to summarize the traits as a table (at least in the supplementary) where it is indicated which ones are expected to belong in copiotroph-oligotroph axis. Even better, it would be great to have them grouped as a figure. A way to simplify this large number of traits in a figure would be to group them according the Brite categories. Ultimately, I am talking about some conceptual figure that shows the idealized clustering of copiotroph-oligotroph based exactly on the 60 traits you use.
Response:
Page 100 of 147
ScholarOne Support 1-434/964-4100
FEMS Microbiology Ecology
123456789101112131415161718192021222324252627282930313233343536373839404142434445464748495051525354555657585960

For Peer Review
The authors would like to thank the reviewer for their incredibly generous comments and the suggestion to create a conceptual figure summarising the Brite category clustering per Family. Indeed, by trying to consider the best way to communicate our results it has helped us to further synthesise them. Figure 5 is now a conceptual diagram that attempts to show how the five identified clades overlap based on their trait composition. This is either as a) a one-dimensional axis of ‘resource investment’, analogous to the classical dichotomy of copiotroph-oligotroph, and b) a multi-dimensional space where clades are further separated based on traits for both ‘resource investment’ and different means of ‘resource acquisition’. By considering both investment and acquisition together, we hope to show that the clades show less overlap in space, which would theoretically allow them to occupy separate niches and co-exist. We do not include all 60 Brite categories in this figure, but rather have chosen some select traits (14 in total) that may be useful in demonstrating our point e.g. if a taxon possesses many glycosyltransferases in addition to spore formation or antimicrobial resistance genes it could be considered an ‘oligotrophic degrader’. The 14 traits were partially chosen based on a comment from Reviewer 2, which suggested to name major functional markers that could be used to predict a taxon’s niche. Section 4.7 has been updated to incorporate and explain Figure 5 in the context of our results. We are acutely aware that this conceptual figure may be met with criticism from the scientific community, and we are more than happy to modify, adjust or otherwise take on board any further constructive comments from the reviewer.
Minor commentL40-42. I think you can be bolder. I think your study shows that the copio-oligotroph view is to simplistic and that more life-history strategies emerge once you compare species based on their traits and not pre-conceived ideas of how microorganisms should behave. I think that stating that the study “warrants a more nuanced view of life-histories” is too soft and vague.
Response:The concluding sentences of the abstract have been amended to emphasise that the copiotroph-oligotroph framework is insufficient to describe prokaryote niche, and that we suggest considering traits involved in growth and resource acquisition in tandem when predicting niche:
“However, the formation of five clades suggested a more nuanced view to describe niche differentiation in terrestrial systems is necessary. We suggest considering traits involved both in resource investment and acquisition when predicting niche.”
Reviewer: 2Comments to the AuthorI reviewed the manuscript “Functional trait relationships demonstrate generalisable
Page 101 of 147
ScholarOne Support 1-434/964-4100
FEMS Microbiology Ecology
123456789101112131415161718192021222324252627282930313233343536373839404142434445464748495051525354555657585960

For Peer Review
life strategies in terrestrial prokaryotes” by Finn et al. The objective of the manuscript is to identify the traits within soil bacterial and archaeal species that can distinguish their lifestyle and niche occupancy. Genome sequence of 175 taxa from 11 Phyla and 35 Families were used for analysis. The findings strongly suggested a non-random distribution of traits across phylogenetic lineages. Random forest analysis further identified traits that were directly related to niche colonization, substrate use efficiency and metabolism within phylogenetic lineages. I enjoyed reading the manuscript. The manuscript fits very well within the scope of journal. Proper statistical tests have been performed to reach the conclusions. Manuscript is very well written and presented. I have few suggestions that will further strengthen the manuscript.
Comment:1. There has been some work that has explored the genomic basis of tropic lifestyle in soil bacteria. This work should be cited and discussed appropriately.e.g. Trivedi et al. 2013. Trends in Microbiology.
Response:The authors would like to thank the reviewer for their generous comments. In regard to this specific comment, references and discussions of Trivedi et al., 2013 have been incorporated several times throughout the manuscript, for example:
Ln 121: “A genomic basis for traits associated with soils dominated by putative copiotrophs and oligotrophs has been expertly reviewed elsewhere, and interested readers are referred to Trivedi et al., 2013 and references therein.”
Ln 639: “Comparative genomics analyses have also identified Actinobacteria, Acidobacteria and Verrucomicrobia as being enriched in numerous enzymes for cellulose, hemicellulose and starch catabolism (Trivedi et al., 2013).”
And Ln 674: “Comparative genomics analyses of soil bacteria have also found putatively copiotrophic Proteobacteria and Firmicutes to be particularly enriched in PTS and ABC transporters (Trivedi et al., 2013).”
Furthermore, the study by Barbéran et al., 2012 to define ‘generalist’ and ‘specialist’ soil taxa based on co-occurrence has been incorporated in the Introducion:
Ln 86: “… identifying habitat generalists and specialists based on taxon co-occurrence patterns (Barbéran et al., 2012) …”
Comment:2. Only five strains from family level classification were selected. Authors have mentioned multiple times that some families will have a significant phylogenetic
Page 102 of 147
ScholarOne Support 1-434/964-4100
FEMS Microbiology Ecology
123456789101112131415161718192021222324252627282930313233343536373839404142434445464748495051525354555657585960

For Peer Review
diversity within strains, while for others, it will be restricted. How do these differences impact overall results? What was the criteria of selecting only 5 and not more?
Response:A minimum of five genomes per taxonomic group were selected to accommodate Thaumarchaeota, Verrucomicrobia Chloroflexi and some others, which had the least number of publicly available sequenced genomes of soil taxa. We specifically wanted to avoid generating a dataset which favoured frequently isolated and sequenced soil organisms (e.g. Bacilli, Rhizobia) and thus five genomes per group were used to balance statistical analyses. This is mentioned at line 177 in the Methods section, under Collection of terrestrial prokaryote genomes.
Questions 2 and 3 from the reviewer have prompted additional analyses to quantify the phylogenetic (dis)similarity of taxonomic groups based on full length 16S rRNA genes, and to compare this to trait similarity (C). The 16S genes were aligned with MUSCLE, simple Neighbour Joining trees were constructed in R with ape/phangorn packages, and phylogenetic distance (P) calculated as per Equation 1, excepting that P is in units of gene sequence similarity as opposed to Bray-Curtis distance for trait similarity (C). Important considerations between P and C are as follows:
1) Taxa were originally chosen in the hope of maximising P (and presumably C) per Family by choosing different Genera where possible. This was not always possible, and ultimately choices were constrained by what genomes were publicly available. However, looking at values of P per Phylum and Family (Supplementary Figure 2), there does not appear to be a consistent relationship between Families where different Genera were included and P. For example, Lactobacillaceae consisted of 5 Lactobacillus spp. (P of 0.772) whereas the Beijerinckiaceae consisted of 4 different genera that appear to be actually more similar to each other in regard to the 16S rRNA gene (P of 0.852). In retrospect this lack of consistent variation in phylogenetic distance between taxa based on pre-existing nomenclature should not be a surprise at it is the reason for the efforts of the researchers involved with the Genome Taxonomy Database who seek to standardise the current state of microbial taxonomy.
2) There is a very nice linear relationship between P and C when considering taxa at both the Phyla and Family levels (Supplementary Figure 3). As implied by the reviewer, this will mean any Families that consist of more closely related taxa (i.e. high P) will be more likely to be similar in regard to their traits.
3) The importance of this underlying relationship between the variation in phylogenetic distance between taxa in a group and the results of the Random Forest models is, however, uncertain. Supplementary Table 3 shows the Confusion Matrix for the Family level Random Forest. Some Families with the poorest predictive capacity (< 50% taxa correctly predicted) had quite high P (> 0.8), e.g. Bradyrhizobiaceae, Cellulomonadaceae. Some Families with low P (< 0.7) had poor predictive capacity,
Page 103 of 147
ScholarOne Support 1-434/964-4100
FEMS Microbiology Ecology
123456789101112131415161718192021222324252627282930313233343536373839404142434445464748495051525354555657585960

For Peer Review
e.g. Divergent Acidobacteria. Conversely, Families that had the highest predictive capacity (100%) ranged in P from 0.68 – 0.9. It is the opinion of the authors that the presence of specific, unique and consistent traits in a taxonomic group is far more important for the RF results than the underlying relationship between phylogenetic distance and trait composition. For example, the five Methanogen taxa had very low phylogenetic distance (0.68) yet the RF was perfectly accurate in classifying them, probably due to their methanogen metabolism and Eukaryote-like genetic traits.
Nevertheless, we feel the reviewer raises a very important point when considering taxon selection for these types of comparative genomic analyses, and in future studies we shall place emphasis on standardising phylogenetic distance within groups. The following has been added to the manuscript to highlight this:
In the Methods section 2.3 discussing UPGMA of trait similarity analysis:Ln 291: “Furthermore, the full length 16S rRNA gene of each taxon was collated from NCBI. Genes were aligned with MUSCLE (Edgar, 2004) and a Neighbour-Joining phylogenetic tree was constructed with the ‘phangorn’ package in R. Phylogenetic distance present in taxonomic groups (P) was measured as per Equation 1., excepting that branch length was in units of DNA sequence similarity as opposed to Bray-Curtis dissimilarity. Finally, simple linear regression was used to test a relationship between P and C.”
In the Results section discussing the UPGMA trait tree and RF models:Ln 364: “A Neighbour-Joining tree of full length 16S rRNA genes showed that all taxa clustered preferentially based on their taxonomic nomenclature at high taxonomic rank, including the Chloroflexi, indicating that the discrepancies in the UPGMA were not due to misclassification of the individual taxa (Supplementary Figure 2a).”
Ln 388: “Phylogenetic distance (P) of each taxonomic group increased with decreasing taxonomic rank, and was highest in Proteobacteria, Actinobacteria and Firmicutes Families (Supplementary Figure 2b). There was a strong positive linear relationship between P and C (y = 0.86x – 0.25, R2 = 0.39, p < 0.001) demonstrating that taxonomic groups of closer related taxa tended to share more similar compositions of traits.”
Ln 412: “Random Forest models were robust against variation in P within Families, for example the nine families with 0% classification error ranged in P from the lowest (0.68) to highest (0.9).”
And finally in the Discussion section in regard to the robustness and interpretation of the Random Forest approach:
Ln 643: “Ideally the selection of individual taxa within groups for such future comparative analyses would also be standardised based on phylogenetic distance,
Page 104 of 147
ScholarOne Support 1-434/964-4100
FEMS Microbiology Ecology
123456789101112131415161718192021222324252627282930313233343536373839404142434445464748495051525354555657585960
For Peer Review
either with P or a similar method, which would improve the robustness of trait-based comparisons at such a fine taxonomic level.”
Comment:3. What were the criteria of selection of 5 species within a family e.g., phylogenetic distance?
Response:As mentioned above, the selection criteria of the five taxa per Family was based primarily on public availability of genomes. However, the authors acknowledge and fully agree with the reviewers point that phylogenetic distance should be considered as a means to standardise selection of taxa. While we are confident that our methods are robust to the underlying relationship between P and C in the coarse Phyla and Family taxonomic groups analysed here, we will incorporate a method for standardising taxon selection in future studies that consider a finer detail of niche differentiation between closely related Species and Strains.
Comment:4. Lines 165-166: I like the idea of choosing strains that perform particular functions. However, these functions are performed by specific bacterial lineages. My question is whether these biased selections for traits inflate the closeness within a group. Or in other words, if the other members within the families of the selected functional groups were selected, do the results would have been the same?
Response:This is an interesting question, and fortunately our results have several functional groups that can be compared to address it. For example, to our knowledge, all characterised members of Nitrosomonadaceae are chemolithoautotrophic nitrifiers while the Cyanobacteria perform photosynthesis. Thus, the relatively high value of C measured here for these groups that share common functions is not surprising. However, trait variation certainly exists within other functional groups, for example the five Methanogens (isolated from diverse anaerobic habitats including rice rhizosphere, tropical and boreal wetlands) had an intermediate value of C. Perhaps the best example is that the inclusion of functionally distinct methanotrophs, methylotrophs and heterotrophs within the Beijerinckiaceae did not have a negative effect on its C, which yielded one of the highest values (discussed at Ln 524). Ultimately trait composition will be influenced by a taxon’s functional group (e.g. ammonia oxidiser, heterotroph, etc), its evolutionary life-history (as a very general example Bacteria, Archaea) and the environment from where the taxon was isolated.
We have included a statement this effect in the Discussion, which is an interesting and important concept to consider:
Page 105 of 147
ScholarOne Support 1-434/964-4100
FEMS Microbiology Ecology
123456789101112131415161718192021222324252627282930313233343536373839404142434445464748495051525354555657585960

For Peer Review
Ln 569: “The differing values of C for Methanogen and photosynthetic Cyanobacteria functional groups (0.33 and 0.44, respectively) is also worthy of note. Despite all five taxa in each group performing the same core role in a community, the individual isolates came from varying environments. The methanogens were isolated from a range of geographically separate wetlands, rice paddy soil and farm slurry and, while the Cyanobacteria were also isolated from geographically separate environments, they were all from sandy deserts or other nutrient poor, arid soils (Supplementary Table 1 and references therein). Ultimately a taxon’s trait composition will be affected by its functional role in a community, its evolutionary life-history (e.g. Beijerinckiaceae described above) and its local environment.”
Comment:5. Like Lauro et al. 2009, is there a way to do a self-organizing map or a constrained analysis showing the separation of different phylogenetic groups according to the traits?
Response:The constrained analyses of Lauro et al., 2009 revolved around the a priori classification of one genome as ‘copiotrophic’ and one genome as ‘oligotrophic’. Unknown genomes were then placed somewhere between these two based on similarity of shared traits. In this study we specifically sought to avoid any preconceived a priori assumptions of ‘taxon A is a copiotroph’, and instead opted for unconstrained, exploratory cluster-based statistical techniques (e.g. dendrograms, Random Forest) that would let the data speak for itself. We hoped that the UPGMA dendrogram (Figure 2a) would be the simplest and most flexible way to demonstrate relationships between different phylogenetic groups and their trait composition, while the clustering of taxonomic groups based on the counts of specific copiotroph-oligotroph traits would validate whether certain taxa could be considered copiotrophic (Figure 4).
Comment:6. Based on the results, can you substantiate the phylogenetic grouping of copiotroph/oligotroph groups? I think yes, there is much information, but I would like to have a strong statement suggesting that based on the results, the inclusion of X, Y, and Z phylum as copiotroph was validated. Then can you resolve the debate about the inclusion of groups such as Alpha and betaproteobacteria as copiotroph/oligotroph (Lines 104-105). See 5 as the analysis suggested there can help you to address this question. This information will help the researchers that want to link microbial community composition to soil processes, particularly soil C cycling.
Response:
Page 106 of 147
ScholarOne Support 1-434/964-4100
FEMS Microbiology Ecology
123456789101112131415161718192021222324252627282930313233343536373839404142434445464748495051525354555657585960

For Peer Review
A definitive statement outlining which groups were confirmed as copiotrophs and oligotrophs has been included in the Discussion. This also explicitly links to how these results can give insight into soil processes such as C cycling:
Ln 872: “These results support previous observations that Rhodospirillaceae, Bradyrhizobiaceae, Burkholderiaceae, Pseudomonadaceae and Rhizobiaceae are copiotrophic, while Planctomycetes, Verrucomicrobia, Myxococcaceae, Polyangiaceae and Acidobacteria are oligotrophic (Ho et al., 2017 and references therein). As has been proposed previously, the dominance of these groups in certain soils can provide inferences for ecosystem processes in that system, for example soils dominated by Verrucomicrobia, Planctomycetes and Acidobacteria will have greater capacity to degrade complex plant material while retaining most catabolised carbon in biomass (i.e. high growth or carbon use efficiency) or excreted byproducts that assist in soil aggregation (e.g. high LPS production) (Trivedi et al., 2013). Conversely, soils dominated by copiotrophic Proteobacteria Families will be systems primarily dependent on labile di- and monosaccharides that demonstrate low carbon use efficiency.”
Resolving the outstanding question of taxonomic groups that do not fit into the classical copiotroph-oligotroph framework is addressed further below as a conceptual figure (Comment 11).
Comment:7. One important trait that distinguish copiotrophs/oligotrophs is the carbon use efficiency (CUE). There have been some efforts to incorporate microbial CUE to parameterize models for soil carbon. While CUE's topic is touched briefly in Introduction, it has not been explicitly discussed in later sections.
Response:Carbon use efficiency has now been mentioned in regard to the specific copiotrophic/oligotrophic taxonomic groups that will have a high CUE (please see the above response to Comment 6).
Comment:8. Authors talk about MAGs in the discussion section. It will be worth discussing how MAGs will help to elaborate similar studies that is reported. Where we are and what needs to be done further?
Response:The authors agree that this is worth expanding upon. The following two statements have been added to the Discussion to better incorporate the value of MAGs and current gaps for trait-based analyses:
Page 107 of 147
ScholarOne Support 1-434/964-4100
FEMS Microbiology Ecology
123456789101112131415161718192021222324252627282930313233343536373839404142434445464748495051525354555657585960

For Peer Review
Ln 560: “The generation of MAGs has emerged as a useful tool for identifying traits necessary for life in such environments, and particularly for expanding knowledge of severely under-represented, difficult to culture taxonomic groups. For example, the recent reconstruction of 52, 515 MAGs from a wide range of host-associated and environmental metagenomes was able to increase genomic information of Planctomycetes and Verrucomicrobia by 79% and 68%, respectively (Nayfach et al., 2021). Importantly, both 16S rRNA gene surveys and MAGs demonstrate that some functional traits that facilitate life under certain environmental conditions are intrinsically linked to taxonomy.”
Ln 970: “However, to truly unravel differentiated niches and general microbial life strategies, two limitations must be overcome. Firstly, a better understanding of the many ‘Uncharacterised’ traits in environmental isolates is required. For example, the recent large-scale MAG study by Nayfach et al., (2021) identified 5.8 million protein clusters (traits), of which over 75% could not be annotated meaningfully by current protein databases. Secondly, robust trait-based analyses down to the finer scale of distinct genomes will likely be necessary to consider how individual members of a community have either differentiated in order to co-exist or are in the throes of competition that will ultimately exclude one of the competitors.”
Comment:9. Based on the results, where will you fit archaea (copiotrophs or oligotrophs)?
Response:The authors are hesitant to place Archaea as either copiotrophs or oligotrophs as we consider the one-dimensional framework to be insufficient for describing niche. Please see further below for a detailed response (Comment 11).
Comment:10. How this type of data will be used to distill the complexity within the soil microbiome functions? Can we use the functional signatures to determine the metabolic potential of microbial communities from metagenome data? How can this information help us to incorporate microbial activities into process models? I suggest touching on these in conclusions.
Response:Again, this will be addressed further in Comment 11.
Comment:11. One of the hallmarks of impactful papers is to move beyond information to
Page 108 of 147
ScholarOne Support 1-434/964-4100
FEMS Microbiology Ecology
123456789101112131415161718192021222324252627282930313233343536373839404142434445464748495051525354555657585960

For Peer Review
knowledge. Can you think of making a conceptual figure showing different genes and how they are responsible for different lifestyles or niche colonization? This is just a thought as I understand how difficult it can be.
Response:The authors particularly appreciated this comment, and in particular the expression ‘moving beyond information to knowledge’! Indeed, our attempts to consider a conceptual figure that conveys our results in a simple manner has been extremely helpful in further synthesising them.
Figure 5 is now a conceptual diagram that attempts to show how the five identified clades overlap based on their trait composition. This is either as a) a one-dimensional axis of ‘resource investment’, analogous to the classical dichotomy of copiotroph-oligotroph, and b) a multi-dimensional space where clades are further separated based on traits for both ‘resource investment’ and different means of ‘resource acquisition’. By considering both investment and acquisition together, we hope to show that the clades show less overlap in space, which would theoretically allow them to occupy separate niches and co-exist. The final section of the Discussion, from Ln 916, has been expanded to discuss this figure and its significance for interpreting microbial niche.
In regard to Comment 10, which asks how our results may provide signatures for process-based models or linking to community function, we have chosen the BRITE categories in Figure 5 to act as signatures for defining, for example, Rhizobiaceae as ‘copiotrophic competitors’. This is explicitly stated:
Ln 929: “Figure 5b is a conceptual diagram of niche space where clades have been further separated along additional axes based on their enrichment of traits involved in competition, degradation or specialised metabolic pathways. The BRITE categories listed on the various axes are chosen to be useful markers in predicting the niche of a taxon. This expanded niche space would suggest taxa in Clade I are well equipped for nutrient acquisition (primarily, but not limited to, di- and monosaccharides), rapid growth and oxidative stress regulation as ‘copiotrophic competitors’. …”
And finally, specifically in regard to whether Archaea should be copiotrophs or oligotrophs:
Ln 956: “The large space conceptualised for Clade V in Figure 5b, which does not imply either copiotrophic or oligotrophic resource investment, is an oversimplification and with improved understanding of traits in these taxa it may be possible to fracture and further separate them into more detailed groups. This would prove particularly beneficial for the poorly characterised Archaea.”
Page 109 of 147
ScholarOne Support 1-434/964-4100
FEMS Microbiology Ecology
123456789101112131415161718192021222324252627282930313233343536373839404142434445464748495051525354555657585960

For Peer Review
Comment:12. I appreciate the authors of acknowledging the tedious work of other researchers on culturing. This is very important.
Response:Of course we are happy to do so, as it is essential work.
Page 110 of 147
ScholarOne Support 1-434/964-4100
FEMS Microbiology Ecology
123456789101112131415161718192021222324252627282930313233343536373839404142434445464748495051525354555657585960

For Peer Review
1
1 Functional trait relationships demonstrate generalisable life strategies in terrestrial
2 prokaryotes.
3
4 Damien R. Finn1,2,3, Benoît Bergk-Pinto2, Christina Hazard2, Graeme W. Nicol2,
5 Christoph C. Tebbe3, Timothy M. Vogel2
6
7 1School of Agriculture and Food Sciences, University of Queensland, Brisbane,
8 Australia 4072;
9 2Environmental Microbial Genomics, Laboratoire Ampère, École Centrale de Lyon,
10 Université de Lyon, Écully, France 69134;
11 3Thünen Institut für Biodiversität, Johann Heinrich von Thünen Institut,
12 Braunschweig, Germany 38116.
13
14
15 Author correspondence:
16 Damien Finn; current address: Thünen Institut für Biodiversität, Braunschweig,
17 Germany 38116; email address: [email protected]
18
19 Keywords:
20 Theoretical ecology, niche differentiation, copiotroph-oligotroph, Random Forest
21 modelling
22
23
24 Abstract
25 Functional, physiological traits are the underlying drivers of niche differentiation. A
26 common framework related to niches occupied by terrestrial prokaryotes is based on
27 copiotrophy or oligotrophy, where genomic resource investment is primarily in either
28 metabolism rapid growth or stress tolerance, respectively. A quantitative trait-based
29 approach was employed to demonstrate quantitativesought relationships between
30 taxa, traits and niche in terrestrial prokaryotes. With 175 taxa from 11 Phyla and 35
31 Families (n = 5 per Family), traits were considered as discrete counts of shared
32 genome-encoded proteins. The composition of 220 664 traitsTrait composition strongly
33 supported non-random trait functional distributions as preferential clustering of related
34 taxa via unweighted pair-group method with arithmetic mean. Trait similarity between
Page 111 of 147
ScholarOne Support 1-434/964-4100
FEMS Microbiology Ecology
123456789101112131415161718192021222324252627282930313233343536373839404142434445464748495051525354555657585960

For Peer Review
2
35 taxa increased as taxonomic rank decreased. A suite of Random Forest models
36 identified traits significantly enriched or depleted in taxonomic groups. Many
37 traitsThese traits conveyed functions related to metabolismrapid growth, nutrient
38 acquisition and stress tolerance consistent with their presence in copiotroph-oligotroph
39 niches. Finally, hHierarchical clustering of these traits identified a clade of competitive,
40 copiotrophic Families resilient to oxidative stress versus glycosyltransferase-enriched
41 oligotrophic Families resistant to antimicrobials and environmental stress. However,
42 the formation of five clades, including an Actinobacteria and ‘specialised metabolic
43 function’ clade, warrants suggested a more nuanced view of ‘life strategies’ to describe
44 niche differentiation in terrestrial systems is necessary. We suggest considering traits
45 involved in both resource investment and acquisition when predicting niche.
46
47
48 1. Introduction
49 Niche differentiation, the process of physiologically distinct organisms adapting better
50 to certain conditions, is a contributing factor to the high biodiversity inherent in microbial
51 communities (Prosser, 2012). Such differentiation is likely an inevitable consequence
52 of the principles of competitive exclusion and natural selection working in tandem – no
53 two organisms can theoretically occupy the same niche, as the poorer competitor must
54 either adapt to a unique niche or be driven to extinction in that system (Gause, 1932,
55 Hutchinson, 1957, Leibold, 1995). The physiological traits driving niche differentiation
56 must have the capacity to convey an advantage to the organism’s ability to survive and
57 reproduce (i.e. fitness) and be inherited by successive generations (McGill et al., 2006).
58 Importantly, this implies that microbial communities are not only diverse in terms of
59 individual 16S rRNA gene sequences, commonly used to assess community diversity,
60 but also diverse in regard to their physiological traits.
61 Explaining niche differentiation through the functional, physiological traits present in
62 ecological community members has a long history in macroecology. For example,
63 differences between beak size and shape differed betweenin Galápagos finches was
64 instrumental in Darwin’s hypothesis that a common ancestor had differentiated into
65 multiple, island-specific species. Within the past century, trait-based analyses have
66 been particularly predominant in plant ecology, with seed germination in submerged
67 soil, salt tolerance, carbon to nitrogen biomass stoichiometry, and leaf mass per unit
68 area acting as examples of traits linked to niche differentiation (Gleason, 1926, Grime,
Page 112 of 147
ScholarOne Support 1-434/964-4100
FEMS Microbiology Ecology
123456789101112131415161718192021222324252627282930313233343536373839404142434445464748495051525354555657585960

For Peer Review
3
69 1979, Keddy, 1992). In contrast, trait-based approaches to explain microbial ecology
70 have only been performed in few instances, such as conceptualizing niches of
71 methanotrophs based on abundance in high versus low methane environments or
72 disturbed versus undisturbed soils (Ho et al., 2013), correlating increasing growth rate
73 with increasing ribosomal gene and ribosome-associated gene copy number (Vieira-
74 Silva & Rocha, 2010), deterministic modelling of nitrification rate based on ammonia
75 and oxygen uptake rate, temperature sensitivity and growth rate (Bouskill et al., 2012),
76 defining distinct niches of 32 marine microorganisms based on clustering of genome-
77 encoded functional proteins (Lauro et al., 2009), identifying habitat generalists and
78 specialists based on taxon co-occurrence patterns (Barbéran et al., 2012) and recently
79 comparisons of 23 ‘core’ traits (e.g. motility, carbon metabolism, optimal pH for growth)
80 across 15 000 diverse host-associated and environmental genomes (Madin et al.,
81 2020).
82 A consistent trend noted in macroecology is that traits linked to how carbon and
83 energy is processed and allocated to biomass can describe separate niches (Brown et
84 al., 2004). The canonical example are r and K strategists, where carbon and energy
85 are primarily invested in reproduction, or alternatively invested in tolerating biotic
86 and/or abiotic stressors, respectively (Grime, 1977). These dichotomous strategies
87 have been observed in microbial ecology: copiotrophs are considered as
88 microorganisms with relatively high growth rates that have relatively poor growth
89 efficiency (as carbon incorporated to biomass per unit resource), relatively high cell
90 maintenance energy costs, dependence on relatively high concentrations of organic
91 carbon in their environment, demonstrate rapid population blooms upon the addition of
92 organic matter and are not overly tolerant of abiotic stress (Semenov, 1991, Koch,
93 2001, Roller & Schmidt, 2015, Ho et al., 2017). Oligotrophs are considered as the
94 inverse – low growth rate, high growth efficiency, low cell maintenance energy
95 requirements, high substrate uptake affinity, slow growth at a slow yet at a consistent
96 rate and are resilient to abiotic stress. Although the niche concept in macroecology has
97 a formalized definition founded on where a taxon can maintain a stable population
98 within multi-dimensional environmental space (Leibold, 1995), in this study, niche is
99 used simply to distinguish between prokaryotes being relatively more copiotrophic
100 versus oligotrophic.
101 These distinct niches became associated with specific terrestrial taxa at high
102 taxonomic rank based on recent molecular analyses. In complex microbial
Page 113 of 147
ScholarOne Support 1-434/964-4100
FEMS Microbiology Ecology
123456789101112131415161718192021222324252627282930313233343536373839404142434445464748495051525354555657585960

For Peer Review
4
103 communities, the relative abundance of Gammaproteobacteria, Bacteroidetes and
104 Actinobacteria were correlated with rapid growth in response to the addition of labile
105 organic matter or nitrogen (copiotrophs) (Fierer et al., 2007, Goldfarb et al., 2011,
106 Fierer et al., 2012, Leff et al., 2015). Conversely, the Deltaproteobacteria,
107 Acidobacteria, Verrucomicrobia and Planctomycetes were negatively correlated with
108 the addition of organic matter or nitrogen (oligotrophs) (Fierer et al., 2007, Fierer et al.,
109 2012, Leff et al., 2015, Bastida et al., 2016). Conflicting reports exist of Beta- and
110 Alphaproteobacteria, with some studies describing them as copiotrophic and others as
111 oligotrophic highlighting that a consistent niche may not necessarily exist across
112 species within a large taxonomic group (Ho et al., 2017). A genomic basis for traits
113 associated with soils dominated by putative copiotrophs and oligotrophs has been
114 expertly reviewed elsewhere, and interested readers are referred to Trivedi et al.,
115 (2013) and references therein. Importantly, these observations suggest that specific
116 traits that allow terrestrial prokaryotes to occupy these two niches should (generally)
117 be associated with taxonomy. This is an example of ecological coherence at high
118 taxonomic rank, whereby members within a taxon tend to have similar life strategies,
119 niches and possess common traits compared to members of other taxa (Philippot et
120 al., 2010). While ecological coherence of taxa has been considered previously, the
121 shared, specific traits that drive niche differentiation in terrestrial prokaryotes remains
122 an open question.
123 To identify the traits that differ between terrestrial prokaryote taxonomic groups, and
124 whether these traits could describe the niches they occupy, a functional trait-based
125 approach was adopted here. We posited that a trait must: a) be associated with a
126 physiological process that conveys a fitness advantage under certain environmental
127 conditions; b) be measurable in well-defined units; and c) vary more between
128 taxonomic groups than within a taxonomic group (McGill et al., 2006, Kearney et al.,
129 2010). Traits were measured as discrete counts of chromosome-encoded proteins
130 shared between at least two of 175 terrestrial prokaryotes. Markov Chain clustering
131 (MCL) was used to group proteins as traits based on amino acid sequence similarity
132 (%) akin to a previous approach that confirmed close taxonomic relatives tend to share
133 functional traits in 1, 374 genomes (Zhu et al., 2015). This was necessary to compare
134 highly similar (but non-identical) proteins from separate genomes that carry out the
135 same biological function. To better identify important, distinguishing traits of terrestrial
136 prokaryotes, this study differed from Zhu et al., by: a) comparing 175 publicly available
Page 114 of 147
ScholarOne Support 1-434/964-4100
FEMS Microbiology Ecology
123456789101112131415161718192021222324252627282930313233343536373839404142434445464748495051525354555657585960

For Peer Review
5
137 terrestrial prokaryote genomes from 35 Families (n = 5 each), from 11 Phyla and two
138 Kingdoms; b) the selecting prokaryotes selected are all involved in terrestrial
139 ecosystem processes of interest, including organic matter decomposition, nitrogen
140 fixation, nitrification, denitrification, methane oxidation, plant-growth promotion,
141 bioremediation of pollutants, pathogenesis and methanogenesis; c) selected selecting
142 taxa were isolated from a wide range of terrestrial environments, such as nutrient rich
143 decomposing plant material and rhizosphere, submerged wetland and rice paddy soils,
144 polluted soils, and nutrient poor hot and cold arid environments; and d) avoiding the
145 inclusion of multiple subspecies and/or strains of a single species was specifically
146 avoided to prevent biases in analyses where highly over-represented species are
147 compared with species that have fewer cultured representatives. The taxonomic
148 system used here is from the NCBI, which is built upon a historical array of culture-
149 dependent, physiological observations and genetic similarity to cultured isolates as
150 average nucleotide identity, DNA-DNA hybridisation or 16S rRNA gene homology
151 (ncbi.nlm.nih.gov/Taxonomy/Browser). The use of this classification system and
152 comparison to others is discussed further below.
153 We hypothesised that: 1) traits are non-randomly distributed, with relatively closely
154 related taxa demonstrating greater similarity than unrelated taxa (ecological
155 coherence); 2) traits that are differentially enriched between taxonomic groups would
156 primarily be involved in metabolism, nutrient acquisition and/or tolerating
157 environmental stress; and 3) copiotrophic and oligotrophic taxonomic groups would
158 emerge based on collective trait enrichment.
159
160
161 2. Methodology
162 2.1 Collection of terrestrial prokaryote genomes
163 A collection of 175 sequenced and annotated genomes was collated (Supplementary
164 Table 1). Listed are the genome ID, phylogenetic lineage, role in an ecosystem process
165 if known, and isolation or genome sequencing reference. These genomes were
166 sourced from the National Centre for Biotechnology Information (NCBI) and Joint
167 Genome Institute (JGI) databases. Genomes were chosen based on several criteria:
168 a) five isolates per Family were chosen to have an equal minimum sample size per
169 group, with this sample size being constrained by sequenced genomes of under-
170 represented groups in public databases; b) only a single subspecies/strain per species
Page 115 of 147
ScholarOne Support 1-434/964-4100
FEMS Microbiology Ecology
123456789101112131415161718192021222324252627282930313233343536373839404142434445464748495051525354555657585960

For Peer Review
6
171 was included to avoid bias due to over-representation of some species in public
172 databases; c) an emphasis was placed to include isolates from diverse taxonomic
173 lineages involved in terrestrial ecosystem processes of interest, such as ammonia
174 oxidation and methanogenesis; and d) there was an emphasis to include taxonomic
175 groups frequently stated to be either copiotrophic (e.g. Actinobacteria,
176 Gammaproteobacteria) or oligotrophic (e.g. Acidobacteria, Planctomycetes) based on
177 observations from soil nutrient addition studies (Ho et al., 2017). Taxonomic
178 annotations for Phyla, Class, Order etc. were based on NCBI taxonomy as most
179 genomes were sourced there. The authors recognise that taxonomy is constantly
180 shifting, particularly so with the recent development of the Genome Taxonomy
181 Database (GTDB) (Parks et al., 2018). Of note is that the vast majority of taxa here
182 have the same taxonomy in NCBI as in GTDB, with the exceptions that GTDB
183 considers the Sporomusaceae as split into three separate Families, the
184 Leuconostocaceae to be Lactobacillaceae, the Promicromonosporaceae to be
185 Cellulomonadaceae, and the Bradyrhizobiaceae and Methylococcaceae have been
186 renamed as Xanthobacteraceae and Methylomonadaceae, respectively. Taxon
187 selection was constrained by availability of genomes for under-represented groups,
188 such as the Chloroflexi, Verrucomicrobia, Planctomycetes, Thaumarchaeota and
189 Euryarchaeota. To meet the n = 5 requirement for balanced statistical analyses, it was
190 necessary to consider these under-represented groups as ‘Families’. Furthermore, due
191 to the great diversity inherent within Proteobacterial Classes, Gamma-, Alpha-, Beta-
192 and Deltaproteobacteria were considered as independent ‘Phyla’ for statistical
193 analyses here. Indeed, GTDB now defines Deltaproteobacteria as its own Phylum,
194 while Betaproteobacteria are considered as the Burkholderiales Order within the
195 Gammaproteobacteria. The total of 175 genomes analysed here falls within the upper
196 range of previous hypothesis-driven trait-based studies which varies from 11 isolates
197 (Bouskill et al., 2012) to 214 genomes (Vieira-Silva & Rocha, 2010).
198
199
200 2.2 Functional trait clustering
201 A step-by-step walkthrough of reproducible code to perform the following analyses on
202 a subset of 12 genomes is available at: https://github.com/DamienFinn/Trait-
203 based_analyses. Firstly, a pairwise similarity comparison of all amino acid sequences
204 (964 951 sequences) across the 175 genomes was performed with the all versus all
Page 116 of 147
ScholarOne Support 1-434/964-4100
FEMS Microbiology Ecology
123456789101112131415161718192021222324252627282930313233343536373839404142434445464748495051525354555657585960

For Peer Review
7
205 basic local alignment tool function for proteins, BLAST-P (Altschul et al., 1990). Amino
206 acid sequences were subsequently clustered as traits via MCL weighted by pairwise
207 amino acid similarity (Enright et al., 2002). Functional traits were grouped at a cluster
208 value of 90.2, whereby > 65 is considered ‘fair’ and confidence in accurately separating
209 clusters cannot be higher than 100. The value of 90.2 is not chosen by the user but
210 rather is a reflection of the quality of clustering in a given dataset. The MCL identified
211 a total of 220 664 traits shared between at least two genomes. A random subset of
212 1700 amino acid sequences were selected and the similarity of each sequence within
213 its trait group (as determined by MCL) versus between other trait groups was visualised
214 as a box and whisker plot (Supplementary Figure 1) in R version 4.0.0 (R Core Team,
215 2013). 1 700 sequences were chosen to maximise comparisons between trait groups
216 under technical limitations, as increasing sequences led to exponential increases in
217 trait combinations. A Student’s T test was applied to determine whether sequences
218 were more similar within their trait group relative to between trait groups in R. Finally,
219 a matrix of genome x functional trait was generated in a two-step process by first
220 associating genome IDs to the MCL output with a novel script ‘MCLtoReshape2.py’
221 (available at the above Github address) and secondly by casting the long data format
222 to a wide data matrix with the ‘reshape2’ package in R (Wickham, 2007). Box and
223 whisker plots comparing counts of proteins per genome (input) and counts of functional
224 traits shared by at least two genomes (output of computational workflow), for the 35
225 Families, is presented as Figure 1.
226
227
228 2.3 UPGMA dendrogram of trait similarity between genomes
229 The unweighted pair group method with arithmetic mean (UPGMA) was chosen to
230 compare distance-based similarity between taxa based on discrete counts of individual
231 traits per genome. This method is more robust for comparing similarity between sample
232 units (i.e. taxa) based on discrete counts of variables (i.e. individual traits per taxon)
233 rather than neighbour joining or maximum likelihood methods better suited for DNA or
234 amino acid sequence comparisons (Weins, 1998). The UPGMA was performed in R
235 with the ‘phangorn’ package as described (Schliep et al., 2017) on a Bray-Curtis
236 transformed dissimilarity functional trait matrix, generated with the ‘vegdist’ function in
237 the ‘vegan’ package (Oksanen et al., 2013). To measure ecological coherence (C) of
238 taxa within shared Super Groups, Phyla and Families, a similarity index was adapted
Page 117 of 147
ScholarOne Support 1-434/964-4100
FEMS Microbiology Ecology
123456789101112131415161718192021222324252627282930313233343536373839404142434445464748495051525354555657585960

For Peer Review
8
239 from Levins’ Overlap (Finn et al., 2020a), which measures pairwise similarity in
240 distributions of taxa, as the following:
241
242 C = 1 – ( ) Equation 1.∑𝑏𝑖𝑗𝑛2
243
244 Where bij is the pairwise branch length between taxon i and j in the UPGMA tree,
245 measured here as Bray-Curtis dissimilarity, which is summed for each taxon and its
246 relatives within a shared Super Group, Phylum or Family, and where n is the number
247 of taxa being compared within a shared Super Group, Phylum or Family.
248 Furthermore, the full length 16S rRNA gene of each taxon was collated from NCBI.
249 Genes were aligned with MUSCLE (Edgar, 2004) and a neighbour joining phylogenetic
250 tree was constructed with the ‘phangorn’ package in R. Phylogenetic distance present
251 in taxonomic groups (P) was measured as per Equation 1., excepting that branch
252 length was in units of DNA sequence similarity as opposed to Bray-Curtis dissimilarity.
253 Finally, simple linear regression was used to test a relationship between P and C.
254
255
256 2.4 Functional trait annotation
257 To inform the biological process a functional trait facilitated, traits were annotated with
258 the Kyoto Encyclopedia of Genes and Genomes (KEGG) database. This was
259 performed in five steps: 1) a representative amino acid sequence from each trait was
260 extracted with the novel script ‘IdentifyTraits.py’; 2) these sequences were annotated
261 with KEGG Orthology (KO) terms using the BlastKOALA database algorithm with a bit
262 score cut-off value of 75 (Kanehisa et al., 2016); 3) BRITE functional heirarchies
263 associated with each KO term (e.g. KO1179 gene: endoglucanase, BRITE 1:
264 Metabolism, BRITE 2: Carbohydrate Metabolism, BRITE 3: Starch and Sucrose
265 Metabolism) were collected with the novel script ‘GetBRITEinfo.py’; 4) Genome ID, trait
266 ID, KO term and BRITE metadata were all collated with the novel script ‘MatchFCs.py’;
267 and 5) the ‘reshape2’ package in R was used to create matrices of genome x BRITE
268 hierarchy. Where KEGG was unable to annotate a trait, it was considered as
269 ‘Uncharacterised’. As above, all novel scripts and a step-by-step walkthrough of
270 reproducible code is available at: https://github.com/DamienFinn/Trait-
271 based_analyses.
272
Page 118 of 147
ScholarOne Support 1-434/964-4100
FEMS Microbiology Ecology
123456789101112131415161718192021222324252627282930313233343536373839404142434445464748495051525354555657585960

For Peer Review
9
273
274 2.5 Identifying traits differentially enriched in taxonomic groups
275 Random Forest classification was chosen as a non-linear, multivariate cluster-based
276 method capable of identifying numerous predictor variables (i.e. traits) that define
277 different classes of a response variable (i.e. taxonomic group). This was performed
278 with the ‘randomForest’ package as described (Liaw & Weiner, 2002). Discrete counts
279 of traits at BRITE level 3 were used (e.g. Starch and Sucrose Metabolism) as this level
280 had the most accurate resolution of biological processes facilitated by traits. A total of
281 six Random Forest models were optimised to classify taxonomic groups at the level of:
282 a) Phylum, with Proteobacteria Classes separated due to their extensive diversity (n =
283 14); b) Family (n = 35); c) specifically for Families in the Proteobacteria (n = 13); d)
284 Families in the Actinobacteria (n = 7); e) Families in the Firmicutes (n = 5); and f)
285 Families from ‘Under-represented’ groups, which were all other Families (n = 10).
286 Optimal numbers of trees grown for each model were: 300, 400, 320, 300, 300 and
287 400, respectively. Six traits were randomly selected at each branch. As the Random
288 Forest only identifies traits that best explain separation of taxonomic groups, and does
289 not show whether traits have positive or negative associations with groups, box and
290 whisker plots and Fisher’s Least Significant Difference (LSD) post hoc tests were
291 performed with the ‘agricolae’ package (de Mendiburu, 2014) to definitively state which
292 taxonomic groups were significantly enriched or depleted in traits identified via
293 Random Forest.
294
295
296 2.6 Hierarchical clustering of Families by defining traits
297 Finally, the relationship between Families based on similarity in counts of 60 traits was
298 assessed via hierarchical clustering. Traits were chosen based on being selected via
299 the above Random Forest models in this study, and from previous studies that
300 identified traits associated with copiotroph-oligotroph growth strategies in single
301 species or mixed communities (Lauro et al., 2009, Vieira-Silva & Rocha, 2010, Roller
302 & Schmidt, 2015, Pascual-Garcia & Bell, 2020). The mean of trait discrete counts in
303 the five Family members was used as representative of each Family. Comparing trait
304 means between Families was considered acceptable as prior LSD post hoc tests had
305 demonstrated significant differences between Families. As traits had highly variable
306 copy numbers per Family (e.g. ABC transporter trait copies ranged from 10 – 350,
Page 119 of 147
ScholarOne Support 1-434/964-4100
FEMS Microbiology Ecology
123456789101112131415161718192021222324252627282930313233343536373839404142434445464748495051525354555657585960

For Peer Review
10
307 while bacterial chemotaxis traits ranged from 0 – 15 copies) the trait copies were
308 normalised for more appropriate comparisons. Normalised variance was calculated
309 across the 35 Families for all traits with the ‘decostand’ function in the ‘vegan’ package
310 (Oksanen et al., 2013). Hierarchical clustering of Families based on normalised trait
311 counts was visualised with the ‘heatmap.2’ function in the ‘gplots’ package (Warnes et
312 al., 2019).
313
314
315 3. Results
316 3.1 Trait clustering and UPGMA
317 The 964 951 amino acid sequences encoded by the 175 genomes were clustered as
318 220 664 traits by MCL. A random subset of 1 700 traits showed that amino acid
319 sequence similarity within traits ranged from 62.4, 82.5 and 100% for the 1st quartile,
320 mean and 3rd quartile, respectively (Supplementary Figure 1). Amino acid sequence
321 similarity between traits ranged from 27.6, 34 and 37.8% for the 1st quartile, mean and
322 3rd quartile, respectively. A Student’s T test found that sequences grouped together as
323 a trait were significantly more similar to each other than to sequences grouped as
324 different traits (t value = 61.3, p = 2 x 10-16). Manual comparisons of amino acid
325 sequences within several traits supported clustering of proteins with identical biological
326 function based on KEGG annotation. Thus, the MCL was considered to perform well.
327 However, the minimum amino acid sequence similarity within traits was 23.27% and
328 maximum similarity between traits was 85.24%, indicating that across the 220 664
329 traits, a small proportion of dissimilar amino acid sequences were grouped as a trait
330 incorrectly, while some amino acid sequences that were highly similar were considered
331 different traits. This small number of incorrectly clustered sequences can be explained
332 by the MCL clustering efficiency being 90.2, out of a possible 100.
333 A comparison of the number of proteins per genome, per Family at the Family level
334 (mean = 5 533), found that there were fewer functional traits per genome (mean = 4
335 240) (Figure 1). These represent the input number of proteins per genome before trait
336 clustering and the output number of traits after clustering, respectively. As only
337 functional traits shared between at least two genomes were considered here, the loss
338 of highly genome-specific traits that could not be compared between genomes was
339 expected. Despite this drop in average traits per genome, this initial approach serves
340 as a proof of concept to demonstrate that numbers of traits per genome at the Family
Page 120 of 147
ScholarOne Support 1-434/964-4100
FEMS Microbiology Ecology
123456789101112131415161718192021222324252627282930313233343536373839404142434445464748495051525354555657585960

For Peer Review
11
341 level reflect trends in proteins per Family, and thus the MCL was not distorting trait
342 clustering (Figure 1).
343 The UPGMA dendrogram comparing the 220 664 traits per genome showed that
344 trait compositions were non-randomly distributed (Figure 2a). Specifically,
345 Thaumarchaeota, Euryarchaeota, Acidobacteria, Betaproteobacteria,
346 Gammaproteobacteria, Alphaproteobacteria, Cyanobacteria, Verrucomicrobia,
347 Planctomycetes, Bacteroidetes, Actinobacteria, Firmicutes and Deltaproteobacteria
348 clustered together preferentially. The Chloroflexi were split into two clusters: one
349 Dehalococcoides and one Ktedonobacter/Herpetosiphon/Anaerolinea cluster. Several
350 prokaryotes did not cluster with their high taxonomic rank, including a Planctomycetes
351 bacterium, Polyangium brachysporum (Deltaproteobacteria), Agreia pratensis
352 (Actinobacteria) and Sporomusa ovata (Firmicutes). Also of interest was that, in regard
353 to distance between terminal nodes (as noted by the scale bar), the Betaproteobacteria
354 and Gammaproteobacteria were more similar to each other than the
355 Alphaproteobacteria, which formed its own large, diverse clade. A neighbour joining
356 tree of full length 16S rRNA genes showed that all taxa clustered preferentially based
357 on their taxonomic nomenclature at high taxonomic rank, including the Chloroflexi,
358 indicating that the discrepancies in the UPGMA were not due to misclassification of the
359 individual taxa (Supplementary Figure 2a).
360 A simple index to measure trait similarity, as ecological coherence (C), within groups
361 was devised (Equation 1). C increased as taxonomic rank decreased: Super Group <
362 Phylum < Family (Figure 2b). C was lowest for the larger, more diverse Proteobacteria
363 and Terrabacteria (Super Group), and Firmicutes and Actinobacteria (Phylum). As the
364 number of taxa being compared at the Super Group (e.g. Terrabacteria = 70 versus
365 Acidobacteria = 10) and Phylum (e.g. Actinobacteria = 35 versus Thaumarchaeota =
366 5) were variable, the most meaningful comparisons between groups are at the Family
367 level (n = 5 each). With the exception of the highly divergent ‘Acidobacteria Lineage’,
368 all Families had a C greater than 0.3, with certain groups in the Alphaproteobacteria
369 (Beijerinckiaceae), Firmicutes (Bacillaceae and Leuconostocaceae) and
370 Actinobacteria (Promicromonosporaceae) being highly coherent (C > 0.55). Indeed, all
371 individual Proteobacterial Families had C > 0.4, indicating that all five taxa within each
372 of these Families had similar trait compositions. Despite not truly belonging to the same
373 Family as per NCBI taxonomy, the C > 0.335 of the five Cyanobacteria,
374 Thaumarchaeota and the Methanogen Lineage taxa was similar to other Families from
Page 121 of 147
ScholarOne Support 1-434/964-4100
FEMS Microbiology Ecology
123456789101112131415161718192021222324252627282930313233343536373839404142434445464748495051525354555657585960

For Peer Review
12
375 the Bacteroidetes and Firmicutes. Thus, the UPGMA demonstrated that taxonomic
376 relatives at the Phylum level tended to cluster with each other preferentially based on
377 trait composition, and secondly that while similarity was broadly highest at low
378 taxonomic rank, some Families were more coherent than others.
379 Phylogenetic distance (P) of each taxonomic group increased with decreasing
380 taxonomic rank, and was highest in Proteobacteria, Actinobacteria and Firmicutes
381 Families (Supplementary Figure 2b). There was a strong positive linear relationship
382 between P and C (y = 0.86x – 0.25, R2 = 0.39, p < 0.001) supporting the result that
383 taxonomic groups of closer related taxa tended to share more similar compositions of
384 traits.
385
386
387 3.2 Random Forest trait identification
388 The KEGG annotated traits belonged to 260 different BRITE 3 categories. The
389 percentage of traits that could not be annotated (and were termed ‘Uncharacterised’)
390 ranged from 28 – 65% per genome, being particularly high in the Archaea. On average,
391 47% of traits per genome were Uncharacterised with a standard deviation of 9.5%.
392 Of the 260 BRITE 3 categories, the 60 most important traits in separating all Phyla
393 and Families are ranked by importance measured as Mean Decrease in Accuracy
394 (MDA) of the Random Forest models (Figure 3). This is a measure of the average
395 increase in classification error during permutation of trees (n = 300 – 400) when that
396 particular trait is missing from the tree. For example, the accuracy of classifying
397 Families was most improved by inclusion of the ABC transporters trait. Based on the
398 identified traits, the Phylum model was capable of successfully classifying 81.14% of
399 individual taxa. The Family model was capable of successfully classifying 71.43% of
400 individual taxa. Confusion matrices for both models are presented as Supplementary
401 Tables 2 – 4, and show that classification was particularly difficult for Chloroflexi and
402 Planctomycetes (classification error > 80%) in the Phylum model and for
403 Cellulomonadaceae and the divergent Acidobacteria Lineage (classification error >
404 80%) in the Family model. Random Forest models were robust against variation in P
405 within Families, for example the nine families with all taxa perfectly classified ranged
406 in P from the lowest (0.68) to highest (0.9).
407 The important traits in classifying the taxonomic groups were involved in: a)
408 metabolism and nutrient acquisition (oxidative phosphorylation, tricarboxylic acid
Page 122 of 147
ScholarOne Support 1-434/964-4100
FEMS Microbiology Ecology
123456789101112131415161718192021222324252627282930313233343536373839404142434445464748495051525354555657585960

For Peer Review
13
409 (TCA) cycle, glyoxylate/decarboxylate, thermogenesis, propanoate, starch/sucrose,
410 nitrogen, methane metabolism, synthesis of antioxidants such as glutathione, ATP-
411 binding cassette (ABC) transporters, sugar uptake via phosphotransferase systems
412 (PTS)); b) responding to environmental cues and stressors (protein kinases, two-
413 component systems, transcription factors, proteasome, protein chaperones, RNA
414 transport, chromosome repair via non-homologous DNA end joining); c) core cell
415 physiology (flagella assembly, chemotaxis, sporulation, lipopolysaccharide (LPS),
416 peptidoglycan, glycerolipid, sphingolipid and lipoarabinomannan (LAM) biosynthesis);
417 and d) cell-cell interactions (beta-Lactam resistance, general secretion systems and
418 Type IV secretion systems). Box and whisker plots of discrete counts of identified traits,
419 and LSD results, are provided as Supplementary Figures 42 – 75. The Families
420 significantly enriched and depleted in these traits are listed in Table 1. The Phyla
421 significantly enriched and depleted in identified traits are listed in Supplementary Table
422 9.
423 To better identify the more subtle differences between Families in the
424 Proteobacteria, Actinobacteria, Firmicutes and the ‘Under-represented’ Phyla,
425 individual Random Forest models were constructed for each of the four groups. The
426 successful classification rates were 72.31, 74.29, 76 and 72%, respectively. Confusion
427 matrices for each model are presented as Supplementary Tables 5 – 8. The models
428 were unable to reliably classify Bradyrhizobiaceae and the divergent Acidobacteria
429 Lineage (classification error > 80%).
430 Supplementary Figure 86 shows the most important traits in classifying the four
431 groups. Unique traits not identified in the prior Phylum and Family models were: a) for
432 Proteobacteria, glycosyltransferases, butanoate metabolism, aminotransferases,
433 ribosome biogenesis, mRNA biogenesis and degradation; b) for Actinobacteria,
434 porphyrin and chlorophyll synthesis, pyruvate metabolism, aminotransferases, fatty
435 acid and aliphatic hydrocarbon metabolism, polyketide and Type II polyketide
436 biosynthesis, antimicrobial resistance genes; c) for Firmicutes, lysine, folate and varied
437 amino acid synthesis, porphyrin and chlorophyll synthesis, DNA replication, bacterial
438 toxins, penicillin and cephalosporin synthesis; and d) for the ‘Under-represented’ taxa,
439 glycosyltransferases, peptidases and inhibitors, photosynthesis and AMP-activated
440 protein kinases. Box and whisker plots of discrete counts of identified traits, and LSD
441 results, are provided as Supplementary Figures 97 – 120. Tables summarising
Page 123 of 147
ScholarOne Support 1-434/964-4100
FEMS Microbiology Ecology
123456789101112131415161718192021222324252627282930313233343536373839404142434445464748495051525354555657585960

For Peer Review
14
442 Families enriched and depleted in these traits are included as Supplementary Tables
443 10 and 11.
444
445
446 3.3 Hierarchical clustering of defining traits
447 Hierarchical clustering based on 60 traits, identified from Random Forest in this study
448 and by previous copiotroph-oligotroph studies, indicated five general clades. The
449 dendrogram on the y axis of Figure 4 shows clustering of taxa as these five clades.
450 The dendrogram on the x axis shows clustering of co-occurring traits. Clade I consisted
451 of Proteobacteria, specifically the Pseudomonadaceae, Burkholderiaceae,
452 Rhodospirillaceae, Bradyrhizobiaceae and Rhizobiaceae. These Families were
453 uniquely enriched in flagellar assembly, chemotaxis, pyruvate metabolism, glutathione
454 metabolism, ABC transporters, benzoate metabolism, transcription factors, glyoxylate
455 and fatty acid metabolism. Clade II, also Proteobacteria, included Nitrosomonadaceae,
456 Neisseriales Lineage, Methylocystaceae, Beijerinckiaceae, Methylococcaceae and
457 Moraxellaceae. These Families clustered based on being enriched in Clade I traits, but
458 to a lesser degree than the Pseudomonadaceae, Burkholderiaceae,
459 Rhodospirillaceae, Bradyrhizobiaceae and Rhizobiaceae. Exceptions included the
460 absence of benzoate metabolism and enrichment of methane metabolism in several
461 Clade II Families.
462 Clade III, a diverse collection of Bacteroidetes (Chitinophagaceae, Cytophagaceae),
463 Verrucomicrobia, Planctomycetes, divergent Acidobacteria Lineage and the
464 Deltaproteobacteria (Polyangiaceae, Myxococcaceae), shared enrichment of
465 sphingolipid metabolism, beta-Lactam resistance, penicillin and cephalosporin
466 biosynthesis, LPS biosynthesis, glycosyltransferases and starch/sucrose metabolism.
467 Many of these Families shared Clade I and II traits, including Type IV secretion system,
468 oxidative phosphorylation, TCA cycle, PTS, nitrogen and glycerophospholipid
469 metabolism. The absence of glutathione in non-Deltaproteobacterial Clade III Families
470 was notable.
471 The three Actinobacteria Families in Clade IV, Mycobacteriaceae, Frankiaceae and
472 Streptomycetaceae, were highly similar to each other because they were enriched in
473 Type II polyketide biosynthesis. They also shared some Clade I traits (ABC
474 transporters, transcription factors, pyruvate, benzoate and fatty acid metabolism) and
475 Clade III traits (membrane trafficking, transcription machinery, polyketide biosynthesis
Page 124 of 147
ScholarOne Support 1-434/964-4100
FEMS Microbiology Ecology
123456789101112131415161718192021222324252627282930313233343536373839404142434445464748495051525354555657585960

For Peer Review
15
476 and starch/sucrose metabolism). Similar to Clade III, these Actinobacteria were also
477 depleted in glutathione traits.
478 Finally, taxa within Clade V were similar to each other due to being depleted in traits
479 shared among the other clades. Cyanobacteria were the only taxa that possessed
480 photosynthesis traits. Lactic acid bacteria (Lactobacillaceae and Leuconostocaceae)
481 were enriched in Unclassified nucleotide metabolism. The Archaea (Thaumarchaeota
482 and Methanogen Lineage) shared eukaryote-like traits, proteasome, basal
483 transcription factors and RNA transport. The Archaea were enriched in carbon fixation
484 traits. Methanogens were also enriched in methane metabolism. Ammonia oxidising
485 Thaumarchaeota were not enriched in nitrogen metabolism, however they were
486 enriched in traits annotated by KEGG as Global maps only (unclassified metabolism).
487 Further analysis found this to be the fpr gene, encoding a ferredoxin-flavodoxin NADP+
488 reductase (K00528). Non-lactic acid bacteria of the Firmicutes (Bacillaceae,
489 Sporomusaceae and Clostridiaceae) were enriched in sporulation and motility traits.
490
491
492 4. Discussion
493 4.1 Non-random trait clustering demonstrates ecological coherence of taxa
494 A trait-based approach to investigate taxonomic relationships and potential biological
495 function was carried out with a collection of 175 terrestrial prokaryotes. We
496 hypothesised that traits would be non-randomly distributed amongst taxonomic groups,
497 supportive ofsupported by previous observations that noted closely related taxa are
498 isolated from similar habitats (Philippot et al., 2010). Similarity in the composition of
499 220 664 traits, within 175 taxa, demonstrated strong agreement with established
500 taxonomy at high (Phyla) and low (Family) rank (Figure 2a). The exceptions to this
501 ecological coherence at high rank were the division of the Chloroflexi and an individual
502 from each of the Planctomycetes, Deltaproteobacteria, Actinobacteria and Firmicutes
503 clustering with unrelated Phyla. It is possible that these four individual taxa have
504 beenThese taxa were not mischaracterised, as based on phylogenetics of the full
505 length 16S rRNA gene (Supplementary Figure 2a). Trait similarity between related
506 taxa, measured as C, tended to be highest at low rank (Figure 2b). Uneven sample
507 sizes between groups within Super Group and Phyla make comparisons at this level
508 difficult – the inclusion of many diverse Firmicutes and Actinobacteria likely drove C to
509 be lower here than in Thaumarchaeota and Euryarchaeota. However, equal
Page 125 of 147
ScholarOne Support 1-434/964-4100
FEMS Microbiology Ecology
123456789101112131415161718192021222324252627282930313233343536373839404142434445464748495051525354555657585960
For Peer Review
16
510 comparisons at the Family level demonstrated interesting variability in coherence. All
511 Proteobacterial Families had relatively high coherence (C = 0.4 – 0.6). The high C in
512 Beijerinckiaceae is of particular interest as this group contained both specialist
513 methanotroph (Methylocapsa, Methylocella), methylotroph (Methyloferula) and
514 generalist heterotroph (Beijerinckia spp.) taxa. With such varied metabolic traits, one
515 could reasonably expect C to be relatively low within this Family. The Beijerinckiaceae
516 appear to have evolved from a common methylotrophic ancestor and still share traits
517 for nitrogen fixation and tolerance for low pH soils (Tamas et al., 2014), and the high
518 C measured here indicates that many additional shared traits remain. Both the
519 relatively recent divergence of Families from a common ancestor and the higher
520 number of shared traits are likely causes of the higher C observed at low taxonomic
521 rank. The differing values of C for Methanogen and photosynthetic Cyanobacteria
522 functional groups (0.33 and 0.44, respectively) is also worthy of note. Despite all five
523 taxa in each group performing the same core role in a community, the individual
524 isolates came from varying environments. The methanogens were isolated from a
525 range of geographically separate wetlands, rice paddy soil and farm slurry and, while
526 the Cyanobacteria were also isolated from geographically separate environments, they
527 were all from sandy deserts or other nutrient poor, arid soils (Supplementary Table 1
528 and references therein). Ultimately a taxon’s trait composition will be affected by its
529 functional role in a community, its evolutionary life-history (e.g. Beijerinckiaceae
530 described above) and its local environment.
531 However, these results are dependent on accurate taxonomic classification, and the
532 C of Sporomusaceae, relatively low compared to other Families here, supports splitting
533 this group into Sporomusaceae, Anaeromusaceae and Pelosinaceae by GTDB (Parks
534 et al., 2018). Finally worth noting, some groups at high rank were considered as
535 ‘Families’ here due to the number of available terrestrial genomes, e.g. Cyanobacteria
536 and Chloroflexi. Even so, Cyanobacteria demonstrated a higher C than many
537 taxonomically-defined Families, perhaps due to their common role as primary
538 colonisers of nutrient-poor soils (Garcia-Pichel et al., 2001). The number of Families
539 are too numerous to discuss each at length here, but C was an effective means of
540 measuring and comparing coherence between groups in the UPGMA tree.
541 While the method of comparing taxa here differs from other studies, the results were
542 not surprising as many 16S rRNA gene surveys of terrestrial systems consistently
543 demonstrate ecological coherence at high rank. For example, independent studies of
Page 126 of 147
ScholarOne Support 1-434/964-4100
FEMS Microbiology Ecology
123456789101112131415161718192021222324252627282930313233343536373839404142434445464748495051525354555657585960

For Peer Review
17
544 increasing agricultural intensity in soils show reductions in Actinobacteria abundance
545 (Philippot et al., 2009, Jangid et al., 2011). Nitrogen addition to soils frequently enriches
546 numerous taxa within the Actinobacteria and Proteobacterial Classes while negatively
547 affecting taxa within the Verrucomicrobia and Planctomycetes (Wessen et al., 2010,
548 Fierer et al., 2012, Leff et al., 2015, Bastida et al., 2016). Arid, nutrient poor
549 environments select for Actinobacteria-dominated communities (Cary et al., 2010,
550 Crits-Christoph et al., 2013) and, in the absence of other primary producers, allow
551 biological soil crust forming Cyanobacterial taxa to establish (Garcia-Pichel et al.,
552 2001). Anoxic wetland and rice paddy environments support diverse communities of
553 anaerobic Firmicutes, Chloroflexi and methanogenic Archaea (He et al., 2019, Finn et
554 al., 2020b). These trends were noted prior to bioinformatic advances of metagenome
555 assembled genomes (MAGs) that allow for the specific comparison of individual traits
556 between uncultured environmental prokaryote genomes (Hug et al., 2013). The
557 generation of MAGs has emerged as a useful tool for identifying traits necessary for
558 life in such environments, and particularly for expanding knowledge of severely under-
559 represented, difficult to culture taxonomic groups. For example, the recent
560 reconstruction of 52 515 MAGs from a wide range of host-associated and
561 environmental metagenomes was able to increase genomic information of
562 Planctomycetes and Verrucomicrobia by 79% and 68%, respectively (Nayfach et al.,
563 2021). I but importantly, both 16S rRNA gene surveys and MAGs the earlier studies
564 demonstrated that some functional traits that facilitate life under certain environmental
565 conditions are intrinsically linked to taxonomy.
566 The ecological coherence observed in Figure 2 does not imply that closely related
567 taxa (e.g. Bacillus velezensis LS69 and Bacillus amyloliquefaciens plantarum FZB42)
568 have identical phenotypes. Close relatives possess a combination of core and
569 accessory genes (traits) and the presence of even a single accessory gene is sufficient
570 to dramatically alter a strain’s phenotype (van Rossum et al., 2020). Rather, our results
571 (Figure 2) demonstrate that the composition of core and accessory traits in
572 alphaproteobacterial Beijerinckiaceae are most similar to each other, relative to
573 alphaproteobacterial Rhizobiaceae or to Actinobacteria, Firmicutes etc.
574
575
576 4.2 What can the Random Forests tell us?
Page 127 of 147
ScholarOne Support 1-434/964-4100
FEMS Microbiology Ecology
123456789101112131415161718192021222324252627282930313233343536373839404142434445464748495051525354555657585960

For Peer Review
18
577 The Random Forest works by identifying the traits that are most reliable in classifying
578 individual Phyla and Families. It selects traits that tend to be: a) of equal copy number
579 per genome within a taxonomic group; and b) that differ markedly in copy number
580 between taxonomic groups, since distinct separation of copies will maximise
581 successful classification. A clear example of this is the consistent identification of
582 eukaryote-like basal transcription factors, proteasome and RNA transport present in
583 the Thaumarchaeota and Euryarchaeota, since they are absent from the majority of
584 Bacterial Phyla. The binary nature of these traits (yes Archaea, no Bacteria) make
585 them strong indicators. The presence of these and more eukaryote-like vesicular
586 trafficking and actin traits have been noted in the Archaeal TACK super-phylum
587 previously, and lend credence to the hypothesis that eukaryotes are descended from
588 Archaea (Embley & Martin, 2006, Spang et al., 2015). However, it must be noted that
589 the Random Forest will not identify a trait unique to Can. Nitrosotalea devanterra, and
590 that is absent from other Thaumarchaeota, as this single trait will not improve
591 classification of the group as a whole. Consequently, the traits identified via Random
592 Forest all tended to be core, fundamental traits shared by other members of a taxon’s
593 Phylum/Family.
594 Many of the best traits for distinguishing taxa have been historically used by
595 microbiologists to do exactly that. These included fundamental cell physiology traits,
596 such as oxidative phosphorylation, LPS biosynthesis, sporulation, flagellar assembly
597 and chemotaxis. The Phylum model separated Betaproteobacteria, Actinobacteria and
598 Bacteroidetes as taxa with the highest copies of oxidative phosphorylation traits.
599 Firmicutes, Chloroflexi and Methanogens were identified as anaerobes depleted in
600 oxidative phosphorylation, and all other taxa as sitting in between (Supplementary
601 Figure 42 and Supplementary Table 9). Some Gram-negative Families were
602 significantly enriched in LPS biosynthesis compared to others. These were the
603 Pseudomonadaceae, Burkholderiaceae, Chitinophagaceae, divergent Acidobacteria
604 and Verrucomicrobia (Table 1). This has been noted in soil communities previously.
605 The extensive repertoire of LPS-associated genes in Chitinophagaceae, Acidobacteria
606 and Verrucomicrobia likely play a critical role in enhancing soil aggregation (Cania et
607 al., 2019) potentially through high LPS production and/or biofilm formation (discussed
608 further below). In a demonstration of the robustness of the methods used here, the
609 highly unusual Firmicute Sporomusaceae were shown to possess similar counts of
610 LPS biosynthesis traits relative to most Gram-negative Families (Supplementary Table
Page 128 of 147
ScholarOne Support 1-434/964-4100
FEMS Microbiology Ecology
123456789101112131415161718192021222324252627282930313233343536373839404142434445464748495051525354555657585960

For Peer Review
19
611 4) in addition to sharing heat-resistant spore formation with Bacillaceae and
612 Clostridiaceae (Table 1). The presence of both traits in a single Family have been
613 remarked upon previously and used to conceptualise the evolution of Gram-negative
614 versus Gram-positive lineages (Stackebrandt et al., 1985). The Sporomusaceae were
615 also shown to have high Porphyrin and Chlorophyll metabolism traits in the Firmicutes
616 model (Supplementary Table 10). The capacity to dechlorinate the soil pollutant
617 perchloroethene to trichloroethylene via a porphyrin-based corrinoid is yet another
618 interesting trait of this Family (Terzenbach & Blaut, 1994).
619 Finally, flagella assembly and chemotaxis traits identified Alphaproteobacteria,
620 Betaproteobacteria and Acidobacteria as Phyla that were particularly enriched with this
621 mechanism of motility, while bacterial Actinobacteria, Bacteroidetes, Cyanobacteria,
622 Chloroflexi and Verrucomicrobia were depleted (Supplementary Table 9). The
623 Proteobacteria, Firmicutes and Under-represented models were better suited for
624 identifying specific Families homogenously enriched or depleted in bacterial flagella
625 and chemotaxis (Supplementary Tables 10 and 11). Enriched Families included the
626 Rhodospirillaceae, Nitrosomonadaceae, Neisseriales lineage, divergent Acidobacteria
627 lineage, Sporomusaceae, Bacillaceae, Clostridiaceae and Planctomycetes. Other
628 forms of motility such as twitching and gliding have been noted in the
629 Pseudomonadaceae, Myxococcaceae and Cyanobacteria (McBride, 2001) but these
630 traits were not identified by the Random Forest as being homogenously enriched in
631 any Families. Furthermore, while Thaumarchaeota and Methanogens were both
632 identified as being depleted in bacterial flagella assembly and chemotaxis traits
633 (Supplementary Table 9 and 11), Archaea possess a structurally distinct flagellum
634 more similar to the Type IV bacterial pilus (Jarrell and Albers, 2012). These taxa were
635 not enriched with Type IV pilus, either, and it is possible that archaeal flagella may
636 have failed proper characterisation by KEGG. Thus, while some Families were
637 relatively enriched/depleted in bacterial flagella and chemotaxis traits, specific taxa
638 depleted in these are not necessarily non-motile.
639 In summary, while the Random Forests may overlook certain traits in individual taxa,
640 the models were highly robust in detecting conserved, shared traits within a
641 Phylum/Family. Here the ‘depth’ of shared traits is limited by the number of taxa that
642 could be considered as Phylum or Family. In future, if five (or more) taxa belonging to
643 the same Genus or even Species could be compared, unique traits would be observed
644 to explain how these subgroups have evolved from their respective Families to occupy
Page 129 of 147
ScholarOne Support 1-434/964-4100
FEMS Microbiology Ecology
123456789101112131415161718192021222324252627282930313233343536373839404142434445464748495051525354555657585960

For Peer Review
20
645 distinct niches. Ideally the selection of individual taxa within groups for such future
646 comparative analyses would also be standardised based on phylogenetic distance,
647 either with P or a similar method, that would improve the robustness of trait-based
648 comparisons at such a fine taxonomic level.
649
650
651 4.3 Plant-derived carbon metabolism and nutrient acquisition
652 Secondly, we hypothesised that the traits differentially enriched between taxonomic
653 groups would largely reflect those associated with copiotrophs or oligotrophs, namely
654 metabolism, nutrient acquisition and environmental stress response and tolerance. Of
655 fundamental interest to soil microbiologists is the decomposition of plant biomass. This
656 is the primary source of organic carbon to non-arid terrestrial systems (Kögel-Knabner,
657 2002) and the transformation of plant material to substrates bioavailable for
658 microorganisms is essential for community growth and activity. The traits involved in
659 plant material catabolism belonged to the BRITE categories ‘Starch and Sucrose
660 Metabolism’ (e.g. extracellular cellobiosidases, endoglucanases, glucosidases,
661 trehalases, amylases) and ‘Glycosyltransferases’, all of which are carbohydrate
662 activated enzymes (CAZy). The Families particularly enriched in these traits were the
663 Polyangiaceae, Myxococcaceae, Rhizobiaceae, Streptomycetaceae,
664 Mycobacteriaceae, Frankiaceae and Verrucomicrobia (Table 1, Supplementary Table
665 11). Genomic and culture-dependent analyses support Sorangium cellulosum
666 (Polyangiaceae), Streptomyces coelicolor A3(2) (Streptomycetaceae) and
667 Chthoniobacter flavus (Verrucomicrobia) as having particularly large genomes with
668 extensive repertoires for cellulose, hemicellulose, pectin and lignin degradation
669 (Bentley et al., 2002, Sangwan et al., 2004, Schneiker et al., 2007). Comparative
670 genomics analyses have also identified Actinobacteria, Acidobacteria and
671 Verrucomicrobia as being enriched in numerous enzymes for cellulose, hemicellulose
672 and starch catabolism (Trivedi et al., 2013). In situ these Families likely play a critical
673 role in making organic carbon bioavailable as di- and monosaccharides for the
674 microbial community.
675 The Families equipped with many copies of high-affinity sugar uptake
676 ‘Phosphotransferase systems’ (3 – 14 copies) did not necessarily correspond to those
677 enriched with CAZy – only the Myxococcaceae and Verrucomicrobia were enriched in
678 both. Pseudomonadaceae, Rhodospirillaceae, Neisseriales lineage and
Page 130 of 147
ScholarOne Support 1-434/964-4100
FEMS Microbiology Ecology
123456789101112131415161718192021222324252627282930313233343536373839404142434445464748495051525354555657585960

For Peer Review
21
679 Clostridiaceae were only enriched in PTS. Despite being enriched in CAZy, the
680 Frankiaceae were simultaneously depleted in PTS. The complex interplay between
681 taxa capable of producing extracellular CAZy and competitors that rapidly scavenge
682 available di- and monosaccharides has been well described by models that predict
683 such competitive interactions exert important controls on the growth rate of the
684 community as a whole (Freilich et al., 2011) and may even act to aid terrestrial carbon
685 storage and limit carbon dioxide emissions from microbial respiration (Kaiser et al.,
686 2015). Here, we identified the ‘specialist’ Families enriched in CAZy traits versus the
687 ‘opportunists’ scavenging for sugars via PTS (Table 1, Supplementary Table 11).
688 ABC transporters facilitate the ATP-dependent uptake of soluble compounds across
689 membranes or export waste metabolites, extracellular enzymes and toxins (Young &
690 Holland, 1999, Higgins, 2001). This means of active transport allows microorganisms
691 to acquire nutrients with high affinity at concentrations of 5 – 500 µg carbon L-1 versus
692 the less efficient diffusion of nutrients across membranes, dependent on extracellular
693 concentrations of 0.5 – 5 mg carbon L-1 (Kuznetsov et al., 1979). In the spatially
694 heterogenous soil environment where the concentration of bioavailable carbon
695 substrate often limits growth (Blagodatsky & Richter, 1998), possession of high affinity
696 transporters likely provides a competitive advantage. The rhizosphere-associated
697 Rhodospirillaceae, Rhizobiaceae and Burkholderiaceae tended to have the highest
698 trait copies of ABC transporters (100 – 350 copies per genome, Supplementary Figure
699 4). The diverse, non-rhizospheric Deltaproteobacteria, Actinobacteria, Firmicutes,
700 Cyanobacteria and Verrucomicrobia all had greater than 50 copies per genome,
701 highlighting the importance of these traits in soil. The particularly high gene copy
702 number in rhizosphere-associated taxa from presumably nutrient-rich environments
703 contrasts the assumption that ABC transporters are considered to play a greater role
704 in nutrient-poor environments (Lauro et al., 2009). Comparative genomics analyses of
705 soil bacteria have also found putatively copiotrophic Proteobacteria and Firmicutes to
706 be particularly enriched in PTS and ABC transporters (Trivedi et al., 2013). In this
707 study, tThe transporters enriched in these rhizosphere-associated taxa were primarily
708 aimed at scavenging maltose, phosphate, amino acids, oligopeptides and export of
709 LPS, and these results suggest that these traits are not only for survival in nutrient-
710 poor environments but also likely confer a competitive advantage in the rhizosphere.
711 As prokaryotes compete simultaneously with other prokaryotes and plants for nitrogen
Page 131 of 147
ScholarOne Support 1-434/964-4100
FEMS Microbiology Ecology
123456789101112131415161718192021222324252627282930313233343536373839404142434445464748495051525354555657585960

For Peer Review
22
712 and phosphorus in the rhizosphere, the high affinity acquisition of such nutrients is
713 likely critical for growth.
714
715
716 4.4 Nitrogen and methane metabolism
717 The BRITE category ‘Nitrogen metabolism’ encompasses nitrogen fixation,
718 denitrification, ammonia oxidation and synthesis of glutamate/glutamine which are,
719 critical amino acids for peptide synthesis. Since nitrogen limitation acts as an important
720 control on soil microbial activity, these traits are also of interest to soil microbiologists.
721 Three Proteobacterial Families, Rhodospirillaceae, Bradyrhizobiaceae and
722 Burkholderiaceae, were particularly enriched in these traits. Genomic and culture-
723 dependent analyses show these Families to be free-living or symbiotic diazotrophs in
724 soil and freshwater environments (Madigan et al., 1984, Itakura et al., 2009, de los
725 Santos et al., 2018). Given their significantly greater copies of nitrogen-fixing genes,
726 these Families may be a particularly important source of organic nitrogen for soil
727 communities. Saprotrophic Mycobacteriaceae genomes, also identified as nitrogen
728 cyclers, tend to have many copies of genes involved in ammonia uptake and glutamate
729 synthesis (Amon et al., 2010). This taxon may play an alternative role in converting
730 mineral nitrogen to biomass where organic nitrogen as protein in excreted products or
731 necromass can undergo proteolysis and uptake between other community members.
732 The identification of Sporomusaceae as enriched in ‘Nitrogen metabolism’ traits is
733 unusual as these obligate anaerobic fermenters cannot use nitrate as an electron
734 acceptor (Möller et al., 1984). Nor were the Sporomusaceae enriched in ammonia
735 uptake or glutamate synthesis genes (data not shown), and so it is uncertain what role
736 this Family plays in nitrogen cycling. Thaumarchaeota and Nitrosomonadaceae, known
737 ammonia oxidisers, were not enriched in ‘Nitrogen metabolism’ traits relative to other
738 Families (Supplementary Figure 5) despite Nitrosomonadaceae possessing multiple
739 copies of the operon responsible for ammonia oxidation (Klotz & Norton, 1998).
740 Specific traits may be overlooked here if the BRITE category includes many diverse
741 KOs (e.g. ammonia oxidation, nitrogen fixation, glutamate synthesis etc).
742 Another specialised metabolic pathway of interest involves ‘Methane metabolism’
743 that includes production and oxidation of a potent greenhouse gas. Unsurprisingly, the
744 Methanogens and methanotrophic Methylococcaceae, Beijerinckiaceae,
745 Methylocystaceae were all enriched in traits involved in methane metabolism. While
Page 132 of 147
ScholarOne Support 1-434/964-4100
FEMS Microbiology Ecology
123456789101112131415161718192021222324252627282930313233343536373839404142434445464748495051525354555657585960

For Peer Review
23
746 methane oxidation can be present in some taxa from the Verrucomicrobia (Op den
747 Camp et al., 2009) the above proteobacterial representatives act as the primary
748 terrestrial methane sink (Dunfield, 2007, Conrad, 2009).
749
750
751 4.5 Sensing, responding and tolerating the environment
752 A particularly interesting divergence of traits were involved in how taxa detect and
753 respond to environmental stimuli. Gram-negative Pseudomonadaceae,
754 Rhodospirillaceae, Bradyrhizobiaceae and Myxococcaceae were enriched in two-
755 component systems. These membrane-bound histidine kinases respond rapidly to
756 extracellular stimuli (Galperin, 2005) and these traits were primarily involved in
757 nitrogen, potassium, initiating chemotaxis and C4-dicarboxylate responses. Families
758 enriched in transcription factors were the Myxococcaceae, Polyangiaceae,
759 Streptomycetaceae, Mycobacteriaceae and Frankiaceae. These factors regulate
760 transcription in response to intracellular cues and here these factors were primarily
761 rpoD (housekeeping), rpoH (heat-shock/protein damage), rpoE (extra-cellular
762 cytoplasmic stress) and rpoS (starvation) responses (Shimada et al., 2017). The
763 genomes of these taxa are also heavily enriched in regulatory genes for complex
764 developmental stages, fruiting bodies and/or filamentous branching growth in soils
765 (Bentley et al., 2002, Gao et al., 2006, Schneiker et al., 2007). Thus, certain taxa may
766 respond primarily to extracellular cues while others strictly monitor and respond to
767 changes in cell homeostasis. This trend has been noted previously – in 167 genomes
768 across various Bacteria and Archaea, Proteobacteria had a higher ratio of sensors for
769 external versus internal stimuli and were considered ‘extroverts’, while Cyanobacteria
770 were considered strong ‘introverts’ focussed on responding to internal stimuli
771 (Galperin, 2005).
772 As mentioned above, Archaea exhibited unique traits in basal transcription and
773 protein regulation via proteasome. These transcription factors were primarily involved
774 in identifying DNA damage and excision repair: TFII-B, TFII-D, ERCC-2 and ERCC-3.
775 DNA repair differs markedly between Bacteria and Archaea/eukaryotes. Specifically,
776 Bacteria excise 12 nucleotides around a damaged site with a 3 polypeptide system
777 whereas Archaea excise 24 – 32 nucleotides with a 13 – 16 polypeptide system
778 (Sancar, 1996). The use of ubiquitin-labelling and proteasome degradation of
779 misfolded or ‘old’ proteins is arguably a more efficient system for recycling amino acids
Page 133 of 147
ScholarOne Support 1-434/964-4100
FEMS Microbiology Ecology
123456789101112131415161718192021222324252627282930313233343536373839404142434445464748495051525354555657585960

For Peer Review
24
780 and regulating the ‘lifespan’ of a protein in eukaryotes, however, Bacteria are still fully
781 capable of regulating protein misfolding or proteolysis with RpoH (and others) induced
782 upon environmental stress (Goldberg, 2003). From an ecological perspective, it is
783 difficult to discern if these eukaryote-like traits confer any sort of competitive advantage
784 to Archaea. They may simply be examples of convergent evolution for dealing with
785 environmental stress.
786 Finally, most microbial cells likely exist within complex biofilms and/or assemblages
787 adhered to surfaces with excreted exopolysaccharides, DNA and protein that serve to
788 protect from adverse environmental factors (Flemming & Wingender, 2010). Families
789 with high copy numbers of exopolysaccharide biosynthesis and secretion systems may
790 act as integral members of soil communities by predominantly contributing to
791 biofilm/aggregate formation. The ‘LPS biosynthesis’ and ‘Starch and sucrose
792 metabolism’ BRITE categories can synthesise N-acetyl glucosamine-based and
793 cellulose-based exopolysaccharides, respectively. Taxa enriched in both these
794 categories and secretion systems were the Polyangiaceae and Burkholderiaceae
795 (Table 1), and in the refined ‘Under-represented’ model, Acidobacteria and
796 Verrucomicrobia (Supplementary Table 11).
797
798
799 4.6 Direct cell-cell interactions
800 Type IV secretion systems were another important trait identified in the Random Forest
801 models. These were enriched in Pseudomonadaceae and Myxococcaceae (Table 1)
802 and Acidobacteria, Planctomycetes and Verrucomicrobia (Supplementary Table 11).
803 These are highly specialised exporters that deliver DNA and/or toxins directly to other
804 bacterial or plant cells, however, their role in ecology is poorly understood beyond root
805 galls induced by Agrobacterium tumefaciens (Christie & Vogel, 2000). These taxa
806 should be explored for whether they utilise these traits for horizontal gene transfer or
807 to inject toxins directly into other prokaryotes, and thus potentially provide a selective
808 advantage for colonisation and competition.
809 Another archetypal trait for interactions between community members are
810 production of antimicrobials and antimicrobial resistance genes. Penicillin and
811 cephalosporin synthesis were enriched in the Sporomusaceae and Bacillaceae relative
812 to other Firmicutes. Polyketide and Type II polyketide syntheses were important for
813 separating Frankiaceae and Streptomycetaceae from other Actinobacteria
Page 134 of 147
ScholarOne Support 1-434/964-4100
FEMS Microbiology Ecology
123456789101112131415161718192021222324252627282930313233343536373839404142434445464748495051525354555657585960

For Peer Review
25
814 (Supplementary Table 10). The Streptomycetaceae have a long history of use in
815 biotechnology as prolific antimicrobial producers (Bentley et al., 2002). Bacillaceae (in
816 particular Bacillus subtilis species) are also well known producers of a wide variety of
817 antimicrobials (Caulier et al., 2019), but we noted that Sporomusaceae have an even
818 greater number of these traits (Supplementary Figure 9). To the authors’ knowledge,
819 antibiotic production in Sporomusaceae has not been investigated thoroughly and this
820 may be a consequence of its obligate anaerobic nature and difficulties in culturing. In
821 addition to prolific Type II polyketide producers, Streptomycetaceae were also enriched
822 in antimicrobial resistance genes, while Bacteroidetes, Planctomycetes and
823 Verrucomicrobia were specifically enriched in beta-Lactam resistance (Supplementary
824 Tables 9 and 10).
825
826
827 4.7 LGeneralisable life strategies emerge from differentially enriched traits
828 We hypothesised that taxa would emerge as being inherently copiotrophic or
829 oligotrophic based on trends in their enriched traits. Traits were chosen based on
830 identification via Random Forest and identification as associated with copiotroph-
831 oligotroph species or in mixed communities as described previously (Lauro et al., 2009,
832 Vieira-Silva & Rocha, 2010, Roller & Schmidt, 2015, Pascual-Garcia & Bell, 2020).
833 Rhizosphere-associated Gamma-, Alpha- and Betaproteobacteria in Clade I fit the
834 assumptions of a copiotrophic niche that invests in high metabolic rate – these taxa
835 were uniquely enriched in competing for nutrient uptake via high-affinity ABC
836 transporters, and energy generation from pyruvate, fatty acids, benzoate and
837 glyoxylate carbon sources. Clade I was also enriched in glutathione metabolism, which
838 acts as the major antioxidant for reducing intracellular free radicals produced during
839 central carbon metabolism (Smirnova & Oktyabrsky, 2005). Antioxidants have been
840 hypothesised as an essential function for copiotrophs to survive their high metabolic
841 rates (Koch, 2001). All five Clade I Families were enriched in oxidative phosphorylation.
842 The oxidative phosphorylation traits encompass a wide variety of electron transport
843 chain proteins (oxidoreductases, dehydrogenases, cytochromes and ATPases) and
844 are crucial for efficient energy production (Brochier-Armanet et al., 2009). All five
845 Families were also enriched in nitrogen metabolism, which included both nitrogen
846 fixation and glutamate (i.e. protein) synthesis. Nitrogen fixation is an energy intensive
847 process requiring 20 – 30 ATP per reduced N2 (Burris & Roberts, 1993) and may be
Page 135 of 147
ScholarOne Support 1-434/964-4100
FEMS Microbiology Ecology
123456789101112131415161718192021222324252627282930313233343536373839404142434445464748495051525354555657585960

For Peer Review
26
848 intrinsically linked to taxa with high oxidative phosphorylation. Finally, Clade I also
849 shared motility and chemotaxis, which are also energy intensive traits. Clade II
850 consisted of the remaining Gamma-, Alpha- and Betaproteobacteria, yet these were
851 relatively less enriched in Clade I ‘copiotroph’ traits. These particular taxa may be
852 responsible for the lack of a consistent copiotrophic response upon nutrient addition in
853 Proteobacteria (Ho et al., 2017).
854 Clade III was comprised of taxa generally considered as oligotrophs (Ho et al., 2017)
855 with the exception of Bacteroidetes (Fierer et al., 2007). These taxa possessed high
856 LPS and sphingolipid synthesis that can defend against desiccation and antimicrobials
857 through biofilm and capsule/slime production (Flemming & Wingender, 2010), beta-
858 Lactam resistance, penicillin biosynthesis and several members had high pentose
859 phosphate pathway for efficient carbon metabolism under starvation (Hodgson, 2000).
860 Clade III also possessed high CAZy traits, which Clade I largely lacked, and is
861 consistent with observations of oligotrophs being primarily responsible for catabolising
862 relatively recalcitrant plant material (Goldfarb et al., 2011). While Clade III were equally
863 enriched in oxidative phosphorylation as Clade I, with the exception of the
864 Deltaproteobacteria, these taxa were depleted in glutathione metabolism. The low
865 copies per genome of this trait would explain why the abundance of oligotrophs drop
866 rapidly in nutrient addition studies as they would be either out-competed by
867 glutathione-rich taxa capable of exploiting plentiful nutrients or will lyse if their
868 metabolic rate exceeds capacity to reduce free radicals (Koch, 2001). Taken together,
869 all of these traits indicate Clade III lead oligotrophic lifestyles whereby they are tolerant
870 to adverse environmental conditions, can acquire carbon from recalcitrant plant
871 material, and are incapable of rapid growth rates.
872 These results support previous observations that Rhodospirillaceae,
873 Bradyrhizobiaceae, Burkholderiaceae, Pseudomonadaceae and Rhizobiaceae are
874 copiotrophic, while Planctomycetes, Verrucomicrobia, Myxococcaceae,
875 Polyangiaceae and Acidobacteria are oligotrophic (Ho et al., 2017 and references
876 therein). As has been proposed previously, the dominance of these groups in certain
877 soils can provide inferences for ecosystem processes in that system, for example soils
878 dominated by Verrucomicrobia, Planctomycetes and Acidobacteria will have greater
879 capacity to degrade complex plant material while retaining most catabolised carbon in
880 biomass (i.e. high growth or carbon use efficiency) or excreted byproducts that assist
881 in soil aggregation (e.g. high LPS production) (Trivedi et al., 2013). Conversely, soils
Page 136 of 147
ScholarOne Support 1-434/964-4100
FEMS Microbiology Ecology
123456789101112131415161718192021222324252627282930313233343536373839404142434445464748495051525354555657585960

For Peer Review
27
882 dominated by copiotrophic Proteobacteria Families will be systems primarily
883 dependent on labile di- and monosaccharides that demonstrate low carbon use
884 efficiency.
885 Streptomycetaceae, Mycobacteriaceae and Frankiaceae in Clade IV shared
886 enrichment of several Clade I copiotroph traits. As mentioned above in Section 4.5,
887 these Actinobacteria invest carbon and energy into complex filamentous growth and
888 developmental cycles. They demonstrate classic copiotrophic responses to nutrient
889 addition (Goldfarb et al., 2011, Leff et al., 2015) and their enriched ABC transporters,
890 pyruvate, glyoxylate, benzoate and fatty acid metabolism all likely contribute to
891 generating energy for complex lifecycles. Simultaneously, their enrichment of Clade III
892 oligotroph traits for CAZy metabolism in addition to many traits for producing and
893 resisting antimicrobials indicate a unique niche for these Actinobacteria that does not
894 necessarily fall within the classical copiotroph-oligotroph framework.
895 Clade V differed markedly from all other clades and mostly consisted of ‘specialist’
896 metabolic functional groups involved in photosynthesis, ammonia oxidation,
897 methanogenesis, lactic acid production and other fermentation. Similar to Clade III,
898 these taxa would also be expected to have relatively low metabolic rates due to
899 depletion of copiotroph traits associated with rapid metabolism and energy generation.
900 Unlike Clade III, these taxa seemed to lack consistent mechanisms for stress
901 tolerance. Thus, while certain taxa did invest in traits for rapid metabolic rate (Clades I
902 and IV) and others primarily in stress tolerance (Clades III and IV), some taxa lacked
903 these approaches altogether and pursued entirely distinct niches (Clade V). As an
904 average of 47% of traits within each genome were Uncharacterised, Clade V is an
905 over-simplification and that if novel, currently uncharacterised proteins and the traits
906 they fulfil were incorporated into hierarchical clustering, this clade would separate more
907 meaningfully.
908 If one were to consider taxa within the one-dimensional copiotroph-oligotroph
909 spectrum, Clade I would represent one extreme, Clades III and V another, with Clades
910 II and IV falling in between. Figure 5a is a conceptual diagram where these Clades
911 have been placed on a singular axis of ‘resource investment’, with the niche space of
912 Clades enriched in traits associated with rapid growth (e.g. glutathione) toward the
913 ‘copiotrophy’ pole while Clades enriched in stress tolerance traits (e.g. LPS production)
914 are placed toward the ‘oligotrophy’ pole. However, this approach overlooks the diverse
915 functional potentials (and distinct niches) for carbon and energy metabolism in Clade
Page 137 of 147
ScholarOne Support 1-434/964-4100
FEMS Microbiology Ecology
123456789101112131415161718192021222324252627282930313233343536373839404142434445464748495051525354555657585960

For Peer Review
28
916 Vassociated with the various Clades. Furthermore, the large overlaps in niche space
917 between Clades would suggest taxa from each group could not co-exist if ‘resource
918 investment’ was the only important consideration (Gause, 1932, Hutchinson, 1957,
919 Leibold, 1995). A more meaningful perspective would be to consider the additional role
920 of ‘resource acquisition’ that incorporates multiple axes for the life strategies identified
921 via hierarchical clustering of traits. Figure 5b is a conceptual diagram of niche space
922 where clades have been further separated along additional dimensions based on their
923 enrichment of traits involved in competition, degradation or specialised metabolic
924 pathways. The BRITE categories listed on the various axes are chosen to be useful
925 markers in predicting the niche of a taxon. This expanded niche space would suggest
926 hierarchical clustering in Figure 4 with each clade as its own ‘life strategy’. The strategy
927 of taxa in Clade I follow that of classical ‘copiotrophs’ andI are well equipped for nutrient
928 acquisition (primarily, but not limited to, di- and monosaccharides), rapid growth and
929 oxidative stress regulation as ‘copiotrophic competitors’. Clade II, which may not be
930 capable of competing directly with Clade I for carbon and energy, and perhaps the
931 evolution ofmay thus occupy the niche space of specialist Proteobacterial
932 methylotrophs, methane and ammonia oxidisers may be a responseso as to avoid
933 competition over saccharidesbe ‘copiotrophic metabolic specialists’. The strategy of
934 Clade III is would be to specialise in decomposingdecompose plant material via diverse
935 CAZy and possess a variety of environmental stress tolerance traits as ‘oligotrophic
936 degraders’. Clade IV, which include for example are unique Actinobacteria that share
937 traits for competition, degradation and oligotrophy, could thus occupy niche space
938 between Clades I and III traits, yet likely fill a distinct niche due to complex
939 developmental cycles and filamentous growth. Finally, the strategy of Clade V is would
940 be to fill highly specialised, unrelated metabolic niches reliant on completely distinct
941 carbon sources to other taxa. The large space conceptualised for Clade V in Figure
942 5b, which does not imply either copiotrophic or oligotrophic resource investment, is an
943 oversimplification and with improved understanding of traits in these taxa it may be
944 possible to fracture and further separate them into more detailed groups. This would
945 prove particularly beneficial for the poorly characterised Archaea. and are unified by
946 an absence of classical copiotroph and oligotroph traits.
947 Moving beyond a one-dimensional r-K spectrum to accommodate additional trait-
948 driven life strategies has been proposed in plant ecology (Grime, 1977). Specifically,
949 Grime argued that plant taxa fall within a multi-dimensional space defined by extremes
Page 138 of 147
ScholarOne Support 1-434/964-4100
FEMS Microbiology Ecology
123456789101112131415161718192021222324252627282930313233343536373839404142434445464748495051525354555657585960

For Peer Review
29
950 on three axes: ‘competitors’ that acquire nutrients, light, water etc. more effectively
951 than neighbouring taxa in the same environment, ‘stress tolerators’ that are long-lived,
952 slow growing taxa that resist desiccation, alkaline soils etc., and ‘ruderals’ that have
953 very brief lifecycles between periods of disturbance and invest in environmentally
954 hardy seeds. Despite these varied strategies for resource investment, plants are
955 unified in that photosynthesis is their primary form of acquiring carbon and energy. The
956 diversity of microbial strategies for acquiring carbon and energy enables them to
957 explore a greater range of potential niche space, and in addition to growth traits that
958 allow for a relatively more copiotrophic or oligotrophic investment of those resources,
959 likely contributes to the high diversity of co-existing taxa observed in soil microbial
960 communitiescomplexity of co-occurring traits across microbial Families indicate more
961 generalisable life strategies than the copiotroph-oligotroph spectrum are needed.
962 However, to truly unravel differentiated niches and general microbial life
963 strategieswithin these generalisable life strategies, two limitations must be overcome.
964 Firstly, will require a better understanding of the many ‘Uncharacterised’ traits in
965 environmental isolates, in addition to robust trait-based analyses at the Species or
966 even Strain taxonomic levelis required. For example, the recent large-scale MAG study
967 by Nayfach et al., (2021) identified 5.8 million protein clusters (traits), of which over
968 75% could not be annotated meaningfully by current protein databases. Secondly,
969 robust trait-based analyses down to the finer scale of distinct genomes will likely be
970 necessary to consider how individual taxonomic members of a community have either
971 differentiated in order to co-exist or are in the throes of competition that will ultimately
972 exclude one of the competitors.
973
974
975 5. Conclusion
976 In a collection of 175 terrestrial prokaryotes that possess 220 664 traits shared
977 between at least two taxa, concepts in niche differentiation were explored. Non-random
978 trait distributions were shown as preferential clustering of related taxa within most
979 Phyla with a general trend of highest similarity at the level of Family. This strongly
980 supported ecological coherence of shared traits within close relatives. Random Forest
981 models successfully identified BRITE 3 categories that best explained differing traits
982 between taxonomic groups. These traits were involved in a wide range of biological
983 functions, including core physiological traits used historically to categorise taxa. Many
Page 139 of 147
ScholarOne Support 1-434/964-4100
FEMS Microbiology Ecology
123456789101112131415161718192021222324252627282930313233343536373839404142434445464748495051525354555657585960

For Peer Review
30
984 traits were also involved in functions often associated with copiotrophs and oligotrophs,
985 namely metabolism, nutrient acquisition and environmental stress tolerance.
986 Hierarchical clustering of differential traits formed five distinct clusters, with Clade I
987 representing the classical copiotrophic niche, Clades III and V as oligotrophic, and
988 Clades II and IV in between. A more refined perspective would be to consider each
989 Clade as its own generalisable life strategy in a niche space that considers both
990 resource investment and acquisition simultaneously; for example, the strategy of Clade
991 I is to invest in competition and rapid growth, while Clade V pursue highly distinct,
992 specialised metabolic functions. The trait-based analyses here were effective in
993 identifying general trends in potential function of terrestrial microbial taxa at the Phylum
994 and Family level. Further investigation will be necessary to identify traits that give rise
995 to niche differentiation at lower taxonomic ranks and, ultimately, the importance of this
996 for ecosystem processes of interest.
997
998
999 Acknowledgements
1000 The authors wish to thank the Australian Government Endeavour research program
1001 ID: 6123_2017 for funding D.R. Finn. Funding support for B. Bergk-Pinto came from
1002 the European Union’s Horizon 2020 research and innovation program under the Marie
1003 Sklodowska-Curie ITN 675546-MicroArctic. The authors also wish to thank the
1004 microbiologists involved in the isolation and genome sequencing of the taxa studied
1005 here; it is hoped the majority of those involved are cited within the Supplementary
1006 Material. Without this diligent culture-dependent work by the scientific community, the
1007 theoretical ecology performed here would not be possible.
1008
1009 Conflict of Interest
1010 The authors declare no conflict of interest regarding this study or its outcomes.
1011
1012 References
1013 Altschul SF, Gish W, Miller W, Myers EW & Lipman DJ (1990) Basic Local Alignment Search 1014 Tool. Journal of Molecular Biology 215: 403-410.1015 Amon J, Titgemeyer F & Burkovski A (2010) Common patterns - unique features: nitrogen 1016 metabolism and regulation in Gram-positive bacteria. FEMS Microbiology Reviews 34: 588-1017 605.1018 Barbéran A, Bates ST, Casamayor EO & Fierer N (2012) Using network analysis to explore co-1019 occurrence patterns in soil microbial communities. The ISME Journal 6: 343-351.
Page 140 of 147
ScholarOne Support 1-434/964-4100
FEMS Microbiology Ecology
123456789101112131415161718192021222324252627282930313233343536373839404142434445464748495051525354555657585960

For Peer Review
31
1020 Bastida F, Torres IF, Moreno JL, et al. (2016) The active microbial diversity drives ecosystem 1021 multifunctionality and is physiologically related to carbon availability in Mediterranean semi-1022 arid soils. Molecular Ecology 25: 4660-4673.1023 Bentley SD, Chater KF, Cerdeno-Tarraga AM, et al. (2002) Complete genome sequence of the 1024 model actinomycete Streptomyces coelicolor A3(2). Nature 417: 141-147.1025 Blagodatsky SA & Richter O (1998) Microbial growth in soil and nitrogen turnover: A 1026 theoretical model considering the activity state of microorganisms. Soil Biology & Biochemistry 1027 30: 1743-1755.1028 Bouskill NJ, Tang J, Riley WJ & Brodie EL (2012) Trait-based representation of biological 1029 nitrification: model development, testing, and predicted community composition. Frontiers in 1030 Microbiology 3: 364.1031 Brochier-Armanet C, Talla E & Gribaldo S (2009) The Multiple Evolutionary Histories of 1032 Dioxygen Reductases: Implications for the Origin and Evolution of Aerobic Respiration. 1033 Molecular Biology and Evolution 26: 285-297.1034 Brown JH, Gillooly JF, Allen AP, Savage VM & West GB (2004) Toward a metabolic theory of 1035 ecology. Ecology 85: 1771-1789.1036 Burris RH & Roberts GP (1993) Biological nitrogen fixation. Annual Reviews Nutrition 13: 317-1037 335.1038 Cania B, Vestergaard G, Krauss M, Fliessbach A, Schloter M & Schulz S (2019) A long-term field 1039 experiment demonstrates the influence of tillage on the bacterial potential to produce soil 1040 structure-stabilizing agents such as exopolysaccharides and lipopolysaccharides. 1041 Environmental Microbiome 14: 1-14.1042 Cary SC, McDonald IR, Barrett JE & Cowan DA (2010) On the rocks: the microbiology of 1043 Antarctic Dry Valley soils. Nature Reviews Microbiology 8: 129-138.1044 Caulier S, Nannan C, Gillis A, Licciardi F, Bragard C & Mahillon J (2019) Overview of the 1045 antimicrobial compounds produced by members of the Bacillus subtilis group. Frontiers in 1046 Microbiology 10: 302.1047 Christie PJ & Vogel JP (2000) Bacterial type IV secretion: conjugation systems adapted to 1048 deliver effector molecules to host cells. Trends in Microbiology 8: 354-360.1049 Conrad R (2009) The global methane cycle: recent advances in understanding the microbial 1050 processes involved. Environmental Microbiology Reports 1: 285-292.1051 Crits-Christoph A, Robinson CK, Barnum T, Fricke WF, Davila AF, Jedynak B, McKay CP & 1052 DiRuggiero J (2013) Colonization patterns of soil microbial communities in the Atacama 1053 Desert. Microbiome 1: 28.1054 de los Santos PE, Palmer M, Chávez-Ramirez B, Beukes C, Steenkamp ET, Briscoe L, Khan N, 1055 Maluk M et al., (2018) Whole genome analyses suggests that Burkholderia sensu lato contains 1056 two additional novel genera (Mycetohabitans gen. nov., and Trinickia gen. nov.): implications 1057 for the evolution of diazotrophy and nodulation in the Burkholderiaceae. Genes 9: 1058 doi:10.3390/genes9080389.1059 de Mendiburu F (2014) Agricolae: statistical procedures for agricultural research. 1060 http://cran.r-project.org/web/packages/agricolae/index.html.1061 Dunfield PF (2007) The Soil Methane Sink. Greenhouse Gas Sinks 152-170.1062 Embley TM & Martin W (2006) Eukaryotic evolution, changes and challenges. Nature Reviews 1063 440: 623-630.1064 Edgar RC (2004) MUSCLE: multiple sequence alignment with high accuracy and high 1065 throughput. Nucleic Acid Research 32: 1792-1797.1066 Enright AJ, Van Dongen S & Ouzounis CA (2002) An efficient algorithm for large-scale detection 1067 of protein families. Nucleic Acids Research 30: 1575-1584.
Page 141 of 147
ScholarOne Support 1-434/964-4100
FEMS Microbiology Ecology
123456789101112131415161718192021222324252627282930313233343536373839404142434445464748495051525354555657585960

For Peer Review
32
1068 Fierer N, Bradford MA & Jackson RB (2007) Toward an ecological classification of soil bacteria. 1069 Ecology 88: 1354-1364.1070 Fierer N, Lauber CL, Ramirez KS, Zaneveld J, Bradford MA & Knight R (2012) Comparative 1071 metagenomic, phylogenetic and physiological analyses of soil microbial communities across 1072 nitrogen gradients. The ISME Journal 6: 1007-1017.1073 Finn DR, Yu J, Ilhan ZE, Fernandes VMC, Penton CR, Krajmalnik-Brown R, Garcia-Pichel F & 1074 Vogel TM (2020a) MicroNiche: an R package for assessing microbial niche breadth and overlap 1075 from amplicon sequencing data. Fems Microbiology Ecology 96: fiaa131.1076 Flemming HC & Wingender J (2010) The biofilm matrix. Nature Reviews Microbiology 8: 623-1077 633.10781079 Finn DR, Ziv-el M, van Haren J, Park JG, del Aguila-Pasquel J, Urquiza-Munoz JD & Cadillo-1080 Quiroz H (2020b) Methanogens and methanotrophs show nutrient-dependent community 1081 assemblage patterns across tropical peatlands of the Pastaza-Maranon Basin, Peruvian 1082 Amazonia. Frontiers in Microbiology 11: 746.1083 Flemming HC & Wingender J (2010) The biofilm matrix. Nature Reviews Microbiology 8: 623-1084 633.1085 Finn DR, Yu J, Ilhan ZE, Fernandes VMC, Penton CR, Krajmalnik-Brown R, Garcia-Pichel F & 1086 Vogel TM (2020) MicroNiche: an R package for assessing microbial niche breadth and overlap 1087 from amplicon sequencing data. Fems Microbiology Ecology 96: fiaa131.1088 Flemming HC & Wingender J (2010) The biofilm matrix. Nature Reviews Microbiology 8: 623-1089 633.1090 Freilich S, Zarecki R, Eilam O, Segal ES, Henry CS, Kupiec M, Gophna U, Sharan R & Ruppin E 1091 (2011) Competitive and cooperative metabolic interactions in bacterial communities. Nature 1092 Communications 2.1093 Galperin MY (2005) A census of membrane-bound and intracellular signal transduction 1094 proteins in bacteria: bacterial IQ, extroverts and introverts. BMC Microbiology 5: 1095 doi:10.1186/1471-2180-1185-1135.1096 Gao B, Paramanathan R & Gupta RS (2006) Signature proteins that are distinctive 1097 characteristics of Actinobacteria and their subgroups. Antonie Van Leeuwenhoek International 1098 Journal of General and Molecular Microbiology 90: 69-91.1099 Garcia-Pichel F, Lopez-Cortes A & Nübel U (2001) Phylogenetic and morphological diversity of 1100 Cyanobacteria in soil desert crusts from the Colorado Plateau. Applied and Environmental 1101 Microbiology 67: 1902-1910.1102 Gause GF (1932) Experimental studies on the struggle for existence I Mixed population of two 1103 species of yeast. Journal of Experimental Biology 9: 389-402.1104 Gleason HA (1926) The individualistic concept of the plant association. Bull Torrey Botany Club 1105 53: 7-26.1106 Goldberg AL (2003) Protein degradation and protection against misfolded or damaged 1107 proteins. Nature 426: 895-890.1108 Goldfarb KC, Karaoz U, Hanson CA, Santee CA, Bradford MA, Treseder KK, Wallenstein MD & 1109 Brodie EL (2011) Differential growth responses of soil bacterial taxa to carbon substrates of 1110 varying chemical recalcitrance. Frontiers in Microbiology 2.1111 Grime JP (1977) Evidence for the existence of three primary strategies in plants and its 1112 relevance to ecological and evolutionary theory. The American Naturalist 111: 1169-1194.1113 Grime JP (1979) Plant strategies and vegetation processes. Wiley, Chichester, UK.
Page 142 of 147
ScholarOne Support 1-434/964-4100
FEMS Microbiology Ecology
123456789101112131415161718192021222324252627282930313233343536373839404142434445464748495051525354555657585960

For Peer Review
33
1114 He M, Zhang J, Shen L, et al. (2019) High-throughput sequencing analysis of microbial 1115 community diversity in response to indica and japonica bar-transgenic rice paddy soils. PLOS 1116 One 14: e0222191.1117 Higgins CF (2001) ABC transporters: physiology, structure and mechanism - an overview. 1118 Research in Microbiology 152: 205-210.1119 Ho A, Paolo Di Lonardo D & Bodelier PL (2017) Revisiting life strategy concepts in 1120 environmental microbial ecology. FEMS Microbiology Ecology 93: 1-14.1121 Ho A, Kerckhof FM, Luke C, Reim A, Krause S, Boon N & Bodelier PL (2013) Conceptualizing 1122 functional traits and ecological characteristics of methane-oxidizing bacteria as life strategies. 1123 Environmental Microbiology Reports 1124 5: 335-345.1125 Hodgson DA (2000) Primary metabolism and its control in streptomycetes: A most unusual 1126 group of bacteria. Advances in Microbial Physiology, Vol 42, Vol. 42 (Poole RK, ed.) p.^pp. 47-1127 238.1128 Hug LA, Castelle CJ, Wrighton KC, Thomas BC, Sharon I, Frischkorn KR, Williams KH, Tringe SG 1129 & Banfield JF (2013) Community genomic analyses constrain the distribution of metabolic 1130 traits across the Chloroflexi phylum and indicate roles in sediment carbon cycling. Microbiome 1131 1.1132 Hutchinson GL (1957) Concluding remarks Cold Spring Harbor Symposia on Quantitative 1133 Biology 22: 415-427.1134 Itakura M, Saeki K, Omori H, Yokoyama T, Kaneko T, Tabata S, Ohwada T, Tajima S & . ea (2009) 1135 Genomic comparison of Bradyrhizobium japonicum strains with different symbiotic nitrogen-1136 fixing capabilities and other Bradyrhizobiaceae members. The ISME journal 3: 326-339.1137 Jangid K, Williams MA, Franzluebbers A, Schmidt TM, Coleman DC & Whitman WB (2011) 1138 Land-use history has a stronger impact on soil microbial community composition than 1139 aboveground vegetation and soil properties. Soil Biol Biochem 43: 2184-2193.1140 Jarrell KF, Albers SV (2012) The archaellum: an old motility structure with a new name. Trends 1141 Microbiol 20: 307-312.1142 Kaiser C, Franklin O, Richter A & Dieckmann U (2015) Social dynamics within decomposer 1143 communities lead to nitrogen retention and organic matter build-up in soils. Nature 1144 Communications 6.1145 Kanehisa M, Sato Y, Kawashima M, Furumichi M & Tanabe M (2016) KEGG as a reference 1146 resource for gene and protein annotation. Nucleic Acids Research 44: D457-D462.1147 Kearney M, Simpson SJ, Raubenheimer D & Helmuth B (2010) Modelling the ecological niche 1148 from functional traits. Philosophical Transactions of the Royal Society B-Biological Sciences 1149 365: 3469-3483.1150 Keddy PA (1992) Assembly and response rules - two goals for predictive community ecology. 1151 Journal of Vegetation Science 3: 157-164.1152 Klotz MG & Norton JB (1998) Multiple copies of ammonia monooxygenase (amo) operons 1153 have evolved under biased AT/GC mutational pressure in ammonia-oxidizing autotrophic 1154 bacteria. Fems Microbiology Letters 168: 303-311.1155 Koch AL (2001) Oligotrophs versus copiotrophs. BioEssays 23: 657-661.1156 Kögel-Knabner I (2002) The macromolecular organic composition of plant and microbial 1157 residues as inputs to soil organic matter. Soil Biol Biochem 34: 139-162.1158 Kuznetsov SI, Dubinina GA & Lapteva NA (1979) Biology of oligotrophic bacteria. Annual 1159 Review of Microbiology 33: 377-387.
Page 143 of 147
ScholarOne Support 1-434/964-4100
FEMS Microbiology Ecology
123456789101112131415161718192021222324252627282930313233343536373839404142434445464748495051525354555657585960

For Peer Review
34
1160 Lauro FM, McDougald D, Thomas T, et al. (2009) The genomic basis of trophic strategy in 1161 marine bacteria. Proceedings of the National Academy of Sciences of the United States of 1162 America 106: 15527-15533.1163 Leff JW, Jones SE, Prober SM, et al. (2015) Consistent responses of soil microbial communities 1164 to elevated nutrient inputs in grasslands across the globe. Proceedings of the National 1165 Academy of Sciences of the United States of America 112: 10967-10972.1166 Leibold MA (1995) The niche concept revisited: mechanistic models and community context. 1167 Ecology 76: 1371-1382.1168 Liaw A & Weiner M (2002) Classification and regression by randomForest. R News 2: 18-22.1169 Madigan M, Cox SS & Stegeman RA (1984) Nitrogen fixation and nitrogenase activities in 1170 members of the Family Rhodospirillaceae. Journal of Bacteriology 157: 73-78.1171 Madin JS, Nielsen DA, Brbic M, Corkrey R, Danko D, Edwards K & ...et al., (2020) A synthesis of 1172 bacterial and archaeal phenotypic trait data. Nature Scientific Data 7: 170.1173 McBride MJ (2001) Bacterial gliding motility: mechanisms for cell movement over surfaces. 1174 Annual Review of Microbiology 55: 49-75.1175 McGill BJ, Enquist BJ, Weiher E & Westoby M (2006) Rebuilding community ecology from 1176 functional traits. Trends in Ecology & Evolution 21: 178-185.1177 Möller B, Oßmer R, Howard BH, Gottschalk G & Hippe H (1984) Sporomusa, a new genus of 1178 Gram-negative anaerobic bacteria including Sporomusa sphaeroides spec. nov. and 1179 Sporomusa ovata spec. nov. Archives of Microbiology 139: 388-396.1180 Nayfach S, Roux S, Seshadri R, Udwary D, Varghese N, Schulz F et al., (2021) A genomic catalog 1181 of Earth’s microbiomes. Nature Biotechnology 39: 499-509.1182 Oksanen J, Guillaume Blanchet F, Kindt R, et al. (2013) Vegan: Community Ecology Package. R 1183 package version 2.0-10. http://CRAN.R-project.org/package=vegan.1184 Op den Camp HJM, Islam T, Stott MB, Harhangi HR, Hynes A, Schouten S, Jetten MSM, 1185 Birkeland N-K, Pol A & Dunfield PF (2009) Environmental, genomic and taxonomic perspectives 1186 on methanotrophic Verrucomicrobia. Environmental Microbiology Reports 1: 293-306.1187 Parks DH, Chuvochina M, Waite DW, Rinke C, Skarshewski A, Chaumeil PA & Hugenholtz P 1188 (2018) A standardized bacterial taxonomy based on genome phylogeny substantially revises 1189 the tree of life. Nature Biotechnology 36: 996-1004.1190 Pascual-Garcia A & Bell T (2020) Community-level signatures of ecological succession in 1191 natural bacterial communities. Nature Communications 11: 2386.1192 Philippot L, Bru D, Saby NPA, Cuhel J, Arrouays D, Simek M & Hallin S (2009) Spatial patterns 1193 of bacterial taxa in nature reflect ecological traits of deep branches of the 16S rRNA bacterial 1194 tree. Environmental Microbiology 11: 3096-3104.1195 Philippot L, Andersson SGE, Battin TJ, Prosser JI, Schimel JP, Whitman WB & Hallin S (2010) 1196 The ecological coherence of high bacterial taxonomic ranks. Nature Reviews Microbiology 8: 1197 523-529.1198 Prosser JI (2012) Ecosystem processes and interactions in a morass of diversity. Fems 1199 Microbiology Ecology 81: 507-519.1200 R Core Team (2013) R: A language and environment for statistical computing. R Foundation 1201 for statistical computing, Vienna, Austria.1202 Roller BRK & Schmidt TM (2015) The physiology and ecological implications of efficient 1203 growth. The ISME journal 9: 1481-1487.1204 Sancar A (1996) DNA excision repair. Annual Review of Biochemistry 65: 43-81.1205 Sangwan P, Chen XL, Hugenholtz P & Janssen PH (2004) Chthoniobacter flavus gen. nov., sp 1206 nov., the first pure-culture representative of subdivision two, Spartobacteria classis nov., of 1207 the phylum Verrucomicrobia. Applied and Environmental Microbiology 70: 5875-5881.
Page 144 of 147
ScholarOne Support 1-434/964-4100
FEMS Microbiology Ecology
123456789101112131415161718192021222324252627282930313233343536373839404142434445464748495051525354555657585960

For Peer Review
35
1208 Schliep KP, Potts AJ, Morrison DA & Grimm WA (2017) Intertwining phylogenetic trees and 1209 networks. . Methods in Ecology and Evolution 8: 1212-1220.1210 Schneiker S, Perlova O, Kaiser O, Gerth K, Alici A, Altmeyer MO, Bartels D, Bekel T & . eaet al., 1211 (2007) Complete genome of the myxobacterium Sorangium cellulosum. Nature Biotechnology 1212 25: 1281-1290.1213 Semenov AM (1991) Physiological bases of oligotrophy of microorganisms and the concept of 1214 microbial community. Microbial Ecology 22: 239-247.1215 Shimada T, Tanaka K & Ishihama A (2017) The whole set of the constitutive promoters 1216 recognized by four minor sigma subunits of Escherichia coli RNA polymerase. Plos One 12: 1217 e0179181.1218 Smirnova GV & Oktyabrsky ON (2005) Glutathione in Bacteria. Biochemistry 70: 1199-1211.1219 Spang A, Poehlein A, Offre P, Zumbrägel S, Haider S, Rychlik N, Nowka B et al., (2012) The 1220 genome of the ammonia-oxidizing Candidatus Nitrososphaera gargensis: insights into 1221 metabolic versatility and environmental adaptations. Environmental Microbioloogy 14(12): 1222 3122-3145.1223 Spang A, Saw JH, Jorgensen SL, Zaremba-Niedzwiedzka K, Martijn J, Lind AE, van Eijk R, 1224 Schleper C, Guy L & Ettema TJG (2015) Complex archaea that bridge the gap between 1225 prokaryotes and eukaryotes. Nature 521: 173-185.1226 Stackebrandt E, Pohla H, Kroppenstedt RM, Hippe H & Woese CR (1985) 16S rRNA analysis of 1227 Sporomusa, Selenomonas and Megasphaera: on the phylogenetic origin of Gram-positive 1228 Eubacteria. Archives of Microbiology 143: 270-276.1229 Tamas I, Smirnova AV, He Z & Dunfield PF (2014) The (d)evolution of methanotrophy in the 1230 Beijerinckiaceae - a comparative genomics analysis. The ISME journal 8: 369-382.1231 Terzenbach DP & Blaut M (1994) Transformation of tetrachloroethylene to trichloroethylene 1232 by homoacetogenic bacteria. Fems Microbiology Letters 123: 213-218.1233 Trivedi P, Anderson IC & Singh BK (2013) Microbial modulators of soil carbon storage: 1234 integrating genomic and metabolic knowledge for global prediction. Trends in Microbiology 1235 21: 641-651.1236 van Rossum T, Ferretti P, Maistrenko OM & Bork P (2020) Diversity within species: interpreting 1237 strains in microbiomes. Nature Reviews Microbiology 18: 491-506.1238 Vieira-Silva S & Rocha EPC (2010) The systemic imprint of growth and its uses in ecological 1239 (meta)genomics. Plos Genetics 6: e1000808.1240 Warnes GR, Bolker B, Bonebakker L, et al. (2019) gplots: various R programming tools for 1241 plotting data. https://cran.r-project.org/web/packages/gplots/index.html.1242 Weins JJ (1998) Testing phylogenetic methods with tree congruence: phylogenetic analysis of 1243 polymorphic morphological characters in Phrynosomatid lizards. Systematic Biology 47: 427-1244 444.1245 Wessen E, Hallin S & Philippot L (2010) Differential responses of bacterial and archaeal groups 1246 at high taxonomical ranks to soil management. Soil Biol Biochem 42: 1759-1765.1247 Wickham H (2007) Reshaping data with the reshape package. Journal of Statistical Software 1248 21: 1-20.1249 Young J & Holland IB (1999) ABC transporters: bacterial exporters-revisited five years on. 1250 Biochimica Et Biophysica Acta-Biomembranes 1461: 177-200.1251 Zhu CS, Delmont TO, Vogel TM & Bromberg Y (2015) Functional Basis of Microorganism 1252 Classification. Plos Computational Biology 11.
Page 145 of 147
ScholarOne Support 1-434/964-4100
FEMS Microbiology Ecology
123456789101112131415161718192021222324252627282930313233343536373839404142434445464748495051525354555657585960

For Peer Review
36
Page 146 of 147
ScholarOne Support 1-434/964-4100
FEMS Microbiology Ecology
123456789101112131415161718192021222324252627282930313233343536373839404142434445464748495051525354555657585960

For Peer Review
37
Page 147 of 147
ScholarOne Support 1-434/964-4100
FEMS Microbiology Ecology
123456789101112131415161718192021222324252627282930313233343536373839404142434445464748495051525354555657585960
Copyright © 2022 FDOKUMEN