Patterns of plant trait–environment relationships along a forest succession chronosequence
11
Agriculture, Ecosystems and Environment 145 (2011) 38–48 Contents lists available at ScienceDirect Agriculture, Ecosystems and Environment journa l h o me pa ge: www.elsevier.com/locate/agee Patterns of plant trait–environment relationships along a forest succession chronosequence Giandiego Campetella a,∗ , Zoltán Botta-Dukát b , Camilla Wellstein c , Roberto Canullo a , Simone Gatto a , Stefano Chelli a , Ladislav Mucina d , Sándor Bartha b a Department of Environmental Science, Botany & Ecology Section, University of Camerino, Via Pontoni, 5, I-62032 Camerino, MC, Italy b Institute of Ecology & Botany, Hungarian Academy of Science, H-2163 Vácrátót, Hungary c Department of Biogeography, University of Bayreuth, Universitätsstr. 30, D-95440 Bayreuth, Germany d Curtin Institute for Biodiversity & Climate, Department of Environment & Agriculture, Curtin University, GPO Box U1987, Perth, WA 6845, Australia a r t i c l e i n f o Article history: Received 7 May 2010 Received in revised form 9 June 2011 Accepted 29 June 2011 Available online 27 July 2011 Keywords: Community assembly Environment–species–trait relationship Habitat filtering Forest management Herb layer Land-use change Model-Based Recursive Partitioning MOB Plant functional traits Resource acquisition Vegetative mobility a b s t r a c t Land-use change due to socioeconomic factors leads to the abandonment of traditional intensive cop- pice management in large areas of the mountainous landscapes of the Apennines (Italy). In this study we explored the multivariate relationship between plant species traits, stage of forest succession and environmental gradients. We focused on community-level patterns in plant traits of the vegetation of beech forest understory along the regeneration chronosequence initiated after cessation of coppicing. We hypothesized that the correlations between the traits and environmental factors should increase with succession age due to the decreasing role of chance. Landscape-level heterogeneity, i.e. changing elevation, slope, exposition, bedrock and forest stand age was assessed using a stratified random sampling design. Sixty sites were sampled for stand structure and species composition. We focused on 14 plant traits related to persistence, growth and dispersal. The recently developed data-analytical method, Model-Based Recursive Partitioning, was used to disentangle the relationships between patterns of plant traits and environmental gradients. About half (seven) of the studied plant traits showed significant correlations with succession stand age, elevation, inclination, heat index and bedrock. Contrary to the low number of trait–environment correlations in early succession, eight traits showed significant relationships with one or more abiotic factors in older stages of the post-coppice development. Stand age had the highest independent explana- tory power, explaining 40% of variance of SLA, more than 17% of variance of short-distance seed dispersal and more than 15% of variance of both long-term connection and extensive perennial root. Among the other abiotic factors, elevation explained 27% of variance of SLA, inclination explained 6–8% of variance of long-term connection, extensive perennial root, thickening and large bud bank. The observed trait–environmental relationship is assumed to be driven by various environmental factors operating at various levels of complexity. While forest succession in relatively homogeneous landscapes might be driven mainly by environmental factors related to forest succession itself and asso- ciated abiotic changes (such as changes in light and soil moisture patterns), in heterogeneous landscapes the succession pathways may be structured by landscape-level environmental factors such as inclination. However, in the present study, forest stand age had the highest explanatory power for most of the investi- gated traits, supporting the assumption of the overall strong impact of succession-driven environmental factors in trait–environment relationships. © 2011 Elsevier B.V. All rights reserved. ∗ Corresponding author. Tel.: +39 0737404517/03; fax: +39 0737404508. E-mail addresses: [email protected] (G. Campetella), [email protected] (Z. Botta-Dukát), [email protected] (C. Wellstein), [email protected] (R. Canullo), [email protected] (S. Gatto), [email protected] (S. Chelli), [email protected] (L. Mucina), [email protected] (S. Bartha). 1. Introduction Vegetation changes, omnipresent at all temporal and spatial scales, are a result of aging and death of species, species inter- actions with the environment and changes in land management (Koniak and Noy-Meir, 2009). Although these causal relationships are undoubtedly true and corroborated, the underlying ecolog- ical and physiological processes driving these patterns are not 0167-8809/$ – see front matter © 2011 Elsevier B.V. All rights reserved. doi:10.1016/j.agee.2011.06.025
Transcript of Patterns of plant trait–environment relationships along a forest succession chronosequence

Pc
GSa
b
c
d
a
ARRAA
KCEHFHLMPRV
(cCL
0d
Agriculture, Ecosystems and Environment 145 (2011) 38– 48
Contents lists available at ScienceDirect
Agriculture, Ecosystems and Environment
journa l h o me pa ge: www.elsev ier .com/ locate /agee
atterns of plant trait–environment relationships along a forest successionhronosequence
iandiego Campetellaa,∗ , Zoltán Botta-Dukátb , Camilla Wellsteinc , Roberto Canulloa , Simone Gattoa ,tefano Chelli a, Ladislav Mucinad, Sándor Barthab
Department of Environmental Science, Botany & Ecology Section, University of Camerino, Via Pontoni, 5, I-62032 Camerino, MC, ItalyInstitute of Ecology & Botany, Hungarian Academy of Science, H-2163 Vácrátót, HungaryDepartment of Biogeography, University of Bayreuth, Universitätsstr. 30, D-95440 Bayreuth, GermanyCurtin Institute for Biodiversity & Climate, Department of Environment & Agriculture, Curtin University, GPO Box U1987, Perth, WA 6845, Australia
r t i c l e i n f o
rticle history:eceived 7 May 2010eceived in revised form 9 June 2011ccepted 29 June 2011vailable online 27 July 2011
eywords:ommunity assemblynvironment–species–trait relationshipabitat filteringorest managementerb layerand-use changeodel-Based Recursive Partitioning MOB
lant functional traitsesource acquisitionegetative mobility
a b s t r a c t
Land-use change due to socioeconomic factors leads to the abandonment of traditional intensive cop-pice management in large areas of the mountainous landscapes of the Apennines (Italy). In this studywe explored the multivariate relationship between plant species traits, stage of forest succession andenvironmental gradients. We focused on community-level patterns in plant traits of the vegetation ofbeech forest understory along the regeneration chronosequence initiated after cessation of coppicing. Wehypothesized that the correlations between the traits and environmental factors should increase withsuccession age due to the decreasing role of chance.
Landscape-level heterogeneity, i.e. changing elevation, slope, exposition, bedrock and forest stand agewas assessed using a stratified random sampling design. Sixty sites were sampled for stand structureand species composition. We focused on 14 plant traits related to persistence, growth and dispersal. Therecently developed data-analytical method, Model-Based Recursive Partitioning, was used to disentanglethe relationships between patterns of plant traits and environmental gradients.
About half (seven) of the studied plant traits showed significant correlations with succession standage, elevation, inclination, heat index and bedrock. Contrary to the low number of trait–environmentcorrelations in early succession, eight traits showed significant relationships with one or more abioticfactors in older stages of the post-coppice development. Stand age had the highest independent explana-tory power, explaining 40% of variance of SLA, more than 17% of variance of short-distance seed dispersaland more than 15% of variance of both long-term connection and extensive perennial root. Among theother abiotic factors, elevation explained 27% of variance of SLA, inclination explained 6–8% of varianceof long-term connection, extensive perennial root, thickening and large bud bank.
The observed trait–environmental relationship is assumed to be driven by various environmentalfactors operating at various levels of complexity. While forest succession in relatively homogeneous
landscapes might be driven mainly by environmental factors related to forest succession itself and asso-ciated abiotic changes (such as changes in light and soil moisture patterns), in heterogeneous landscapesthe succession pathways may be structured by landscape-level environmental factors such as inclination.However, in the present study, forest stand age had the highest explanatory power for most of the investi-gated traits, supporting the assumption of the overall strong impact of succession-driven environmentalfactors in trait–environment relationships.© 2011 Elsevier B.V. All rights reserved.
∗ Corresponding author. Tel.: +39 0737404517/03; fax: +39 0737404508.E-mail addresses: [email protected]
G. Campetella), [email protected] (Z. Botta-Dukát),[email protected] (C. Wellstein), [email protected] (R.anullo), [email protected] (S. Gatto), [email protected] (S. Chelli),[email protected] (L. Mucina), [email protected] (S. Bartha).
167-8809/$ – see front matter © 2011 Elsevier B.V. All rights reserved.oi:10.1016/j.agee.2011.06.025
1. Introduction
Vegetation changes, omnipresent at all temporal and spatialscales, are a result of aging and death of species, species inter-
actions with the environment and changes in land management(Koniak and Noy-Meir, 2009). Although these causal relationshipsare undoubtedly true and corroborated, the underlying ecolog-ical and physiological processes driving these patterns are not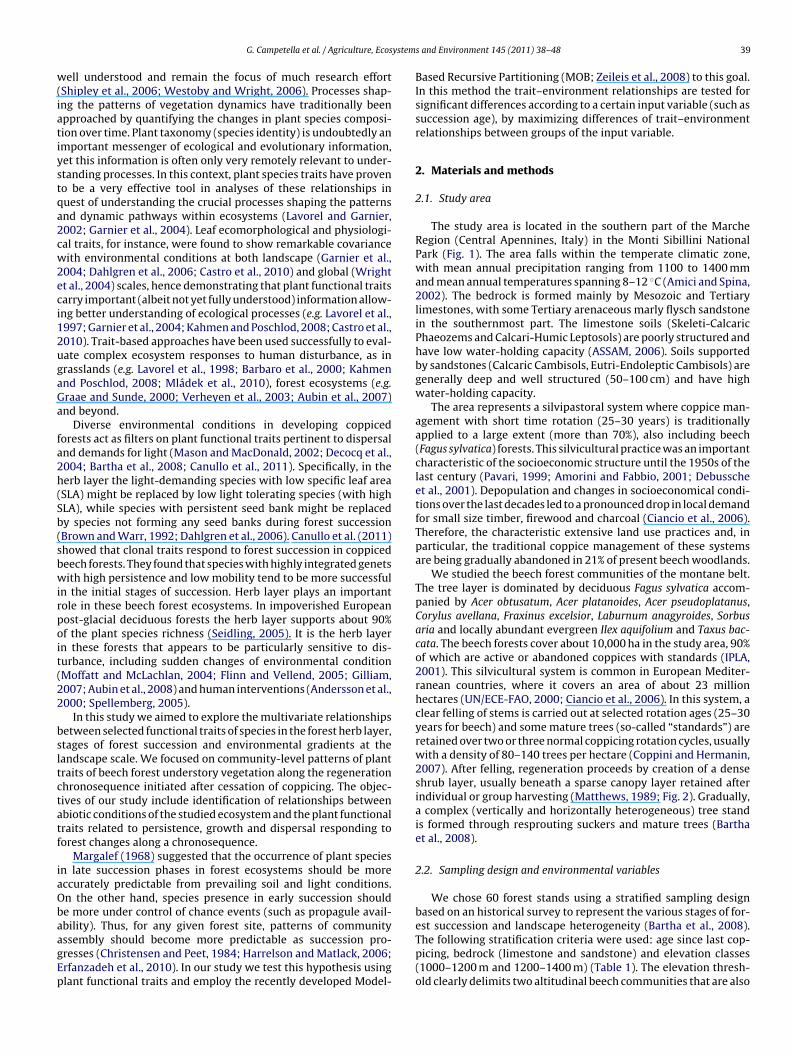
ystem
w(iatiystqa2cw2eci12ugaGa
fa2h(Sb(sbwirpoit(22
bsltctatf
iaObaagEp
G. Campetella et al. / Agriculture, Ecos
ell understood and remain the focus of much research effortShipley et al., 2006; Westoby and Wright, 2006). Processes shap-ng the patterns of vegetation dynamics have traditionally beenpproached by quantifying the changes in plant species composi-ion over time. Plant taxonomy (species identity) is undoubtedly anmportant messenger of ecological and evolutionary information,et this information is often only very remotely relevant to under-tanding processes. In this context, plant species traits have proveno be a very effective tool in analyses of these relationships inuest of understanding the crucial processes shaping the patternsnd dynamic pathways within ecosystems (Lavorel and Garnier,002; Garnier et al., 2004). Leaf ecomorphological and physiologi-al traits, for instance, were found to show remarkable covarianceith environmental conditions at both landscape (Garnier et al.,
004; Dahlgren et al., 2006; Castro et al., 2010) and global (Wrightt al., 2004) scales, hence demonstrating that plant functional traitsarry important (albeit not yet fully understood) information allow-ng better understanding of ecological processes (e.g. Lavorel et al.,997; Garnier et al., 2004; Kahmen and Poschlod, 2008; Castro et al.,010). Trait-based approaches have been used successfully to eval-ate complex ecosystem responses to human disturbance, as inrasslands (e.g. Lavorel et al., 1998; Barbaro et al., 2000; Kahmennd Poschlod, 2008; Mládek et al., 2010), forest ecosystems (e.g.raae and Sunde, 2000; Verheyen et al., 2003; Aubin et al., 2007)nd beyond.
Diverse environmental conditions in developing coppicedorests act as filters on plant functional traits pertinent to dispersalnd demands for light (Mason and MacDonald, 2002; Decocq et al.,004; Bartha et al., 2008; Canullo et al., 2011). Specifically, in theerb layer the light-demanding species with low specific leaf areaSLA) might be replaced by low light tolerating species (with highLA), while species with persistent seed bank might be replacedy species not forming any seed banks during forest successionBrown and Warr, 1992; Dahlgren et al., 2006). Canullo et al. (2011)howed that clonal traits respond to forest succession in coppicedeech forests. They found that species with highly integrated genetsith high persistence and low mobility tend to be more successful
n the initial stages of succession. Herb layer plays an importantole in these beech forest ecosystems. In impoverished Europeanost-glacial deciduous forests the herb layer supports about 90%f the plant species richness (Seidling, 2005). It is the herb layern these forests that appears to be particularly sensitive to dis-urbance, including sudden changes of environmental conditionMoffatt and McLachlan, 2004; Flinn and Vellend, 2005; Gilliam,007; Aubin et al., 2008) and human interventions (Andersson et al.,000; Spellemberg, 2005).
In this study we aimed to explore the multivariate relationshipsetween selected functional traits of species in the forest herb layer,tages of forest succession and environmental gradients at theandscape scale. We focused on community-level patterns of plantraits of beech forest understory vegetation along the regenerationhronosequence initiated after cessation of coppicing. The objec-ives of our study include identification of relationships betweenbiotic conditions of the studied ecosystem and the plant functionalraits related to persistence, growth and dispersal responding toorest changes along a chronosequence.
Margalef (1968) suggested that the occurrence of plant speciesn late succession phases in forest ecosystems should be moreccurately predictable from prevailing soil and light conditions.n the other hand, species presence in early succession shoulde more under control of chance events (such as propagule avail-bility). Thus, for any given forest site, patterns of community
ssembly should become more predictable as succession pro-resses (Christensen and Peet, 1984; Harrelson and Matlack, 2006;rfanzadeh et al., 2010). In our study we test this hypothesis usinglant functional traits and employ the recently developed Model-s and Environment 145 (2011) 38– 48 39
Based Recursive Partitioning (MOB; Zeileis et al., 2008) to this goal.In this method the trait–environment relationships are tested forsignificant differences according to a certain input variable (such assuccession age), by maximizing differences of trait–environmentrelationships between groups of the input variable.
2. Materials and methods
2.1. Study area
The study area is located in the southern part of the MarcheRegion (Central Apennines, Italy) in the Monti Sibillini NationalPark (Fig. 1). The area falls within the temperate climatic zone,with mean annual precipitation ranging from 1100 to 1400 mmand mean annual temperatures spanning 8–12 ◦C (Amici and Spina,2002). The bedrock is formed mainly by Mesozoic and Tertiarylimestones, with some Tertiary arenaceous marly flysch sandstonein the southernmost part. The limestone soils (Skeleti-CalcaricPhaeozems and Calcari-Humic Leptosols) are poorly structured andhave low water-holding capacity (ASSAM, 2006). Soils supportedby sandstones (Calcaric Cambisols, Eutri-Endoleptic Cambisols) aregenerally deep and well structured (50–100 cm) and have highwater-holding capacity.
The area represents a silvipastoral system where coppice man-agement with short time rotation (25–30 years) is traditionallyapplied to a large extent (more than 70%), also including beech(Fagus sylvatica) forests. This silvicultural practice was an importantcharacteristic of the socioeconomic structure until the 1950s of thelast century (Pavari, 1999; Amorini and Fabbio, 2001; Debusscheet al., 2001). Depopulation and changes in socioeconomical condi-tions over the last decades led to a pronounced drop in local demandfor small size timber, firewood and charcoal (Ciancio et al., 2006).Therefore, the characteristic extensive land use practices and, inparticular, the traditional coppice management of these systemsare being gradually abandoned in 21% of present beech woodlands.
We studied the beech forest communities of the montane belt.The tree layer is dominated by deciduous Fagus sylvatica accom-panied by Acer obtusatum, Acer platanoides, Acer pseudoplatanus,Corylus avellana, Fraxinus excelsior, Laburnum anagyroides, Sorbusaria and locally abundant evergreen Ilex aquifolium and Taxus bac-cata. The beech forests cover about 10,000 ha in the study area, 90%of which are active or abandoned coppices with standards (IPLA,2001). This silvicultural system is common in European Mediter-ranean countries, where it covers an area of about 23 millionhectares (UN/ECE-FAO, 2000; Ciancio et al., 2006). In this system, aclear felling of stems is carried out at selected rotation ages (25–30years for beech) and some mature trees (so-called “standards”) areretained over two or three normal coppicing rotation cycles, usuallywith a density of 80–140 trees per hectare (Coppini and Hermanin,2007). After felling, regeneration proceeds by creation of a denseshrub layer, usually beneath a sparse canopy layer retained afterindividual or group harvesting (Matthews, 1989; Fig. 2). Gradually,a complex (vertically and horizontally heterogeneous) tree standis formed through resprouting suckers and mature trees (Barthaet al., 2008).
2.2. Sampling design and environmental variables
We chose 60 forest stands using a stratified sampling designbased on an historical survey to represent the various stages of for-est succession and landscape heterogeneity (Bartha et al., 2008).
The following stratification criteria were used: age since last cop-picing, bedrock (limestone and sandstone) and elevation classes(1000–1200 m and 1200–1400 m) (Table 1). The elevation thresh-old clearly delimits two altitudinal beech communities that are also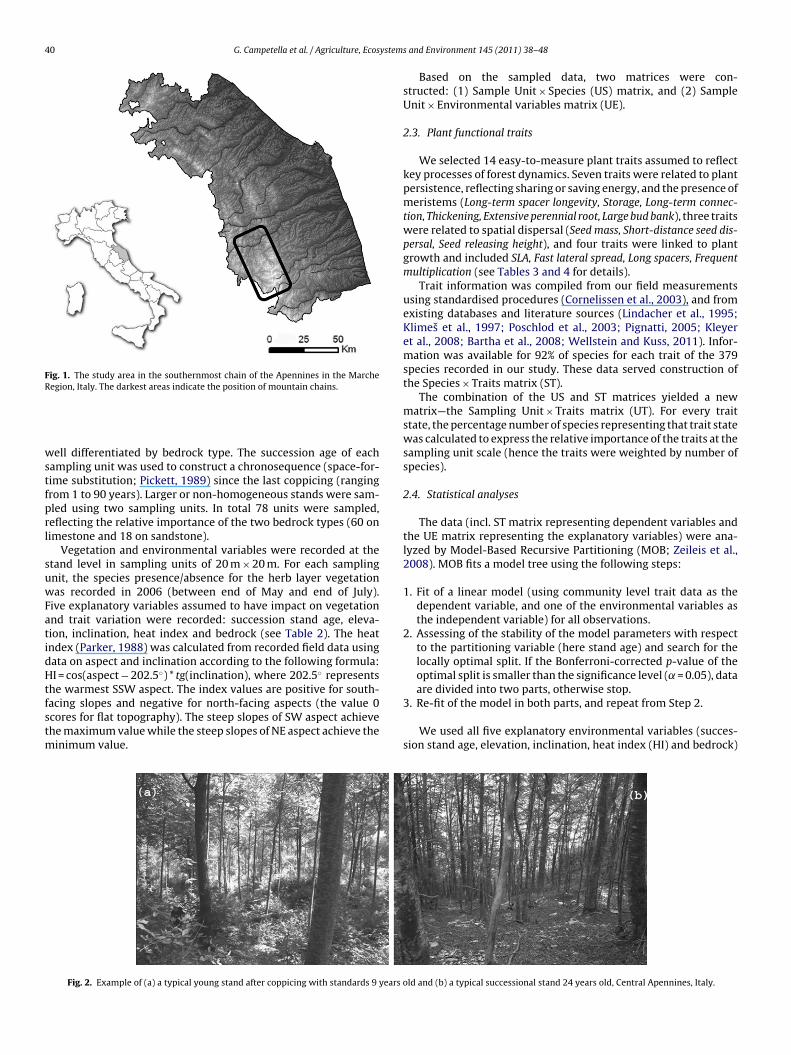
40 G. Campetella et al. / Agriculture, Ecosystem
Fig. 1. The study area in the southernmost chain of the Apennines in the MarcheRegion, Italy. The darkest areas indicate the position of mountain chains.
wstfprl
suwFatidHtfstm
3. Re-fit of the model in both parts, and repeat from Step 2.
We used all five explanatory environmental variables (succes-
ell differentiated by bedrock type. The succession age of eachampling unit was used to construct a chronosequence (space-for-ime substitution; Pickett, 1989) since the last coppicing (rangingrom 1 to 90 years). Larger or non-homogeneous stands were sam-led using two sampling units. In total 78 units were sampled,eflecting the relative importance of the two bedrock types (60 onimestone and 18 on sandstone).
Vegetation and environmental variables were recorded at thetand level in sampling units of 20 m × 20 m. For each samplingnit, the species presence/absence for the herb layer vegetationas recorded in 2006 (between end of May and end of July).
ive explanatory variables assumed to have impact on vegetationnd trait variation were recorded: succession stand age, eleva-ion, inclination, heat index and bedrock (see Table 2). The heatndex (Parker, 1988) was calculated from recorded field data usingata on aspect and inclination according to the following formula:I = cos(aspect − 202.5◦) * tg(inclination), where 202.5◦ represents
he warmest SSW aspect. The index values are positive for south-acing slopes and negative for north-facing aspects (the value 0cores for flat topography). The steep slopes of SW aspect achievehe maximum value while the steep slopes of NE aspect achieve the
inimum value.
Fig. 2. Example of (a) a typical young stand after coppicing with standards 9 years o
s and Environment 145 (2011) 38– 48
Based on the sampled data, two matrices were con-structed: (1) Sample Unit × Species (US) matrix, and (2) SampleUnit × Environmental variables matrix (UE).
2.3. Plant functional traits
We selected 14 easy-to-measure plant traits assumed to reflectkey processes of forest dynamics. Seven traits were related to plantpersistence, reflecting sharing or saving energy, and the presence ofmeristems (Long-term spacer longevity, Storage, Long-term connec-tion, Thickening, Extensive perennial root, Large bud bank), three traitswere related to spatial dispersal (Seed mass, Short-distance seed dis-persal, Seed releasing height), and four traits were linked to plantgrowth and included SLA, Fast lateral spread, Long spacers, Frequentmultiplication (see Tables 3 and 4 for details).
Trait information was compiled from our field measurementsusing standardised procedures (Cornelissen et al., 2003), and fromexisting databases and literature sources (Lindacher et al., 1995;Klimes et al., 1997; Poschlod et al., 2003; Pignatti, 2005; Kleyeret al., 2008; Bartha et al., 2008; Wellstein and Kuss, 2011). Infor-mation was available for 92% of species for each trait of the 379species recorded in our study. These data served construction ofthe Species × Traits matrix (ST).
The combination of the US and ST matrices yielded a newmatrix—the Sampling Unit × Traits matrix (UT). For every traitstate, the percentage number of species representing that trait statewas calculated to express the relative importance of the traits at thesampling unit scale (hence the traits were weighted by number ofspecies).
2.4. Statistical analyses
The data (incl. ST matrix representing dependent variables andthe UE matrix representing the explanatory variables) were ana-lyzed by Model-Based Recursive Partitioning (MOB; Zeileis et al.,2008). MOB fits a model tree using the following steps:
1. Fit of a linear model (using community level trait data as thedependent variable, and one of the environmental variables asthe independent variable) for all observations.
2. Assessing of the stability of the model parameters with respectto the partitioning variable (here stand age) and search for thelocally optimal split. If the Bonferroni-corrected p-value of theoptimal split is smaller than the significance level ( = 0.05), dataare divided into two parts, otherwise stop.
sion stand age, elevation, inclination, heat index (HI) and bedrock)
ld and (b) a typical successional stand 24 years old, Central Apennines, Italy.

G. Campetella et al. / Agriculture, Ecosystems and Environment 145 (2011) 38– 48 41
Table 1Stratified sampling design based on bedrock, elevation class (m) and successional age (years since last coppicing). The stratification used for successional age is based on thepractice of regional forestry distinguishing post-coppice (0–10 years), intermediate successional (11–30 years) and late successional stages (>31 years) of forest development.
Bedrock Elevation class (m) Age No. of sampling units
Limestone
1000–12000–10 511–30 13>31 9
1200–14000–10 311–30 11>31 19
Sandstone
1000–12000–10 311–30 3>31 2
1200–14000–10 411–30 2>31 4
Table 2List of environmental variables, type of scales, units of measurement and sources and methods of recording.
No Code Variable Scale Unit Range/states Methods/techniques of recording
1 Age Age Continuous year 1–90 Forestry records2 Brk Bedrock Binary p/a Limestone; Sandstone Geological map3 Elev Elevation Continuous m 975–1510 GPS/Altimeter4 Incl Inclination Continuous degree 20–45 Clinometer
nsion
tlbtcoaiH
TL
5 HI Heat Index Continuous dime
hat are presumed to affect trait–environment relationships at theandscape scale. Prior to the analyses we checked the correlationetween environmental variables and found (Appendix A) that onlyhe correlation between inclination and HI proved to be signifi-ant. This can be explained by the slightly higher plot frequency
n north-facing aspects than those on south-facing ones (if allspects were equally represented, with the same distribution ofnclinations, inclination and HI would have become uncorrelated).owever, this low (r2 = 0.27), albeit significant, correlation exertedable 3ist and description of targeted plant traits.
Process Plant traits
Persistence Long-term spacer longevity
Storage
Long-term connection
Special bud protection
Thickening
Extensive perennial root
Large bud bank
Dispersal Seed mass
Short-distance seed dispersal
Seed releasing height
Growth SLA
Fast lateral spread
Long spacers
Frequent multiplication
less 0.661–0.832 Parker (1988)
no significant influence on the results. If the aspect varies consider-ably (as in our case), inclination and HI do show different patterns(Parker, 1988).
Continuous environmental variables were centred prior to anal-ysis. Hence the intercept parameter of the model can be interpreted
as expected community weighted trait value for a given mean valueof the respective environmental variable. This transformation doesnot influence the slope of the regression line. MOB tests the param-eters of the fitted model’s within-age categories by a usual way usingDescription
Long term (>2 years) duration of the spacer between ramets(CLOPLA1; Klimes et al., 1997)Presence of storage organs (CLOPLA1; Klimes et al., 1997)Long term (>2 years) duration (or persistence) of theconnection between parent and offspring shoots (Kleyer et al.,2008)Buds protected by specialised scale leaves (CLOPLA1; Klimeset al., 1997)Presence of secondary thickening in the clonal organ(CLOPLA1; Klimes et al., 1997)Presence of extensive perennial root system (CLOPLA1; Klimeset al., 1997)>10 buds per clonal organ (Kleyer et al., 2008)
Also called “Seed size”, is the oven-dry mass of an average seedof a species (Cornelissen et al., 2003)Epizoochor by invertebrates, endozoochor by invertebrates,dysochor by invertebrates, autochor (included barochor),nautochor (Kleyer et al., 2008)The highest point of a plant where flowers occur (andsubsequently seeds or fruits). Often seed releasingheight = plant height (Kleyer et al., 2008)
One sided area of a fresh leaf divided by its oven-dry dry mass(Cornelissen et al., 2003)Vegetative spreading can be fast and cover several metres peryear (CLOPLA1; Klimes et al., 1997)Internodes are usually >10 cm long (CLOPLA1; Klimes et al.,1997)Numerous ramets produced every year (CLOPLA1; Klimeset al., 1997)

42 G. Campetella et al. / Agriculture, Ecosystems and Environment 145 (2011) 38– 48
Table 4Details on the plant traits and relevant processes (incl. type of scale, units of measurement, attributes and data sources).
Process Plant trait Code Scale Unit/attributes % ofmissingvalues
Source
Persistence Long-term spacer longevity Llong Binary 0: No; 1: Yes 0 CLOPLA1, Klimes et al.(1997)
Storage Storage Binomial 0: No; 1: Yes 0 CLOPLA1, Klimes et al.(1997)
Long-term connection Clong Binomial 0: No; 1: Yes 0 CLOPLA1, Klimes et al.(1997)
Special bud protection BudProt Binomial 0: No; 1: Yes 0 CLOPLA1, Klimes et al.(1997)
Thickening 2nd th Binomial 0: No; 1: Yes 0 CLOPLA1, Klimes et al.(1997)
Extensive perennial root exProot Binomial 0: No; 1: Yes 0 CLOPLA1, Klimes et al.(1997)
Large bud bank BBLarge Binomial 0: No; 1: Yes 0 CLOPLA1, Klimes et al.(1997)
Dispersal Seed mass SM Continuous Weighted averages(mg)
39 Kleyer et al. (2008),Poschlod et al. (2003),Wellstein and Kuss(2011)
Short-distance seed dispersal SDD+ Binary 0: No; 1: Yes 13 Kleyer et al. (2008),Lindacher et al. (1995)
Seed releasing height HREL Continuous Weighted averages(m/s)
27 Kleyer et al. (2008)
Growth SLA SLA Continuous Weighted averages(mm2/mg)
22 Kleyer et al. (2008),Wellstein and Kuss(2010), Fieldmeasurements
Fast lateral spread SprFast Binary 0: No; 1: Yes 0 CLOPLA1, Klimes et al.(1997)
Long spacers Slong Binary 0: No; 1: Yes 0 CLOPLA1, Klimes et al.(1997)
ry
tilyeeewHnebwri
udfim
(e(
3
l(c
Frequent multiplication MultFreq Bina
-tests. In our case it means testing departure of slopes from zeron the case of continuous variables and testing differences betweenimestone and sandstone in the case of bedrock. After MOB anal-sis, the same parameters (i.e. intercepts, slopes and means inach bedrock) between-age categories were compared by fitting lin-ar models. For these tests, we do not apply correction of Type Irror (e.g. sequential Bonferroni correction), because it is dubioushich tests belong to the same “experiment” (see Moran, 2003).owever, to avoid the over-interpretation of the results, = 1% sig-ificant level was used instead of the widely used = 5%. Variationxplained by environmental factors, age categories and their com-inations (including interaction between age and environment)ere measured by R2 values of the linear models including envi-
onmental variable only, age categories only and both with theirnteractions.
Spatial autocorrelation of residuals was checked in each modelsing Moran’s I correlogram (Dormann et al., 2007), testing theeparture from independence using a Monte Carlo test. Since weound no significant spatial autocorrelation in any model, apply-ng methods that could consider the spatial structure (e.g. mixed
odels; Zuur et al., 2009) was not deemed necessary.All statistical analyses were undertaken in R 2.11.1 environment
R Development Core Team, 2010), using party package (Zeileist al., 2008) for Model-Based Recursive Partitioning and ncf packageBjørnstad, 2009) for checking spatial autocorrelation.
. Results
About half of the plant traits showed significant corre-ations with the explanatory abiotic environmental variablesTables 5 and 6). Most of these trait–environment relationshipshanged significantly between the age groups revealed by MOB.
0: No; 1: Yes 0 CLOPLA1, Klimes et al.(1997)
This confirms the tested assumption that significant changes intrait–environment relationships occur along the forest successionchronosequence. In all cases of age group differentiation (except forSLA with respect to inclination) MOB divided data into two parts:early successional stages (where either 14, 16 or 19 years were thethresholds), and the older successional stages.
We found one almost significant (p = 0.016) relationship (thatbetween Large bud bank and inclination), which remained invariantalong the complete chronosequence. However, except for Large budbank, no significant relationships were found between the planttraits and the environmental variables during the early stages ofbeech coppice regeneration.
Contrary to the low number of trait–environment correlations inearly succession, seven traits showed significant relationships withone or more abiotic variables in older stages of forest succession.The age where MOB divided data varied but most splits appearedaround 14 years (Tables 5 and 6). SLA and Short-distance seed dis-persal were larger in stands older than 16 years, while Frequentmultiplication was more frequent in stands older than 19 years.Four traits (Long-term connection, Extensive perennial root, Thick-ening, Fast later spread) showed lower values in stages older than14 years.
There was a significant positive correlation between SLA andelevation in sites older than 16 years. In younger sites there wasno significant correlation (Table 5). Significant positive correlationbetween SLA and inclination could be detected at sites older than31 years while no significant correlation appeared in younger sites(Table 5 and Fig. 3).
Positive correlations were found between inclination and Long-term connection, Extensive perennial root and Thickening in sitesolder than 14 years. These traits were strongly correlated (R2 > 0.5)among each other and with Long-term spacer longevity and Large

G. Campetella et al. / Agriculture, Ecosystems and Environment 145 (2011) 38– 48 43
Table 5Results of MOB for continuous environmental variables. The results of the between-age-category comparisons indicated by letters in superscript (using a and b for intercept,and A and B for slope). Values sharing the same letter do not differ significantly at 1% significance level. For codes of environmental variables and traits see Tables 2 and 4,respectively.
Process Traits Environmental variables Age (splitting) Intercept Slope Non-zero slope sig.
Persistence Llong Elev Whole range 50.061 0.006 0.358Incl Whole range 50.061 0.195 0.149HI Whole range 50.061 −4.88 0.051
Storage Elev Whole range 72.525 0.009 0.187Incl Whole range 72.525 0.292 0.041HI Whole range 72.525 −2.48 0.356
Clong Elev Whole range 57.973 −0.009 0.186Incl ≤14 63.261a 0.050A 0.706
14< 55.913b 0.570A 0.003HI ≤14 63.569a −5.081A 0.083
14< 55.748b −6.241A 0.050BudProt Elev Whole range 5.238 0.001 0.218
Incl Whole range 5.238 −0.014 0.785HI Whole range 5.238 −0.098 0.918
2nd th Elev Whole range 54.706 −0.004 0.605Incl ≤14 58.939a 0.052A 0.714
14< 53.062b 0.662A 0.001HI Whole range 54.706 −5.022 0.055
exProot Elev ≤14 63.666a 0.004A 0.59414< 56.244b −0.008A 0.363
Incl ≤14 63.490a 0.045A 0.71714< 56.144b 0.585A 0.003
HI ≤14 63.792a −4.980A 0.07014< 55.980b −6.206A 0.057
BBlarge Elev Whole range 57.806 −0.011 0.110Incl Whole range 57.806 0.326 0.016HI Whole range 57.806 −3.579 0.162
Dispersal SM Elev Whole range 65.1 −0.042 0.157Incl Whole range 65.1 −0.47 0.426HI Whole range 65.1 8.344 0.449
SDD+ Elev Whole range 11.139 0.007 0.091Incl ≤16 8.100a 0.045A 0.516
16< 12.568b 0.141A 0.255HI ≤16 8.069a 0.803A 0.601
16< 12.598b 1.534A 0.453HREL Elev Whole range 2.83 −0.001 0.161
Incl Whole range 2.83 −0.031 0.115HI Whole range 2.83 0.5 0.170
Growth SLA Elev ≤16 26.885a 0.001A 0.66716< 31.395b 0.014B 0.000
Incl ≤16 26.820a 0.067AB 0.13516–31 30.834b −0.183A 0.17131< 32.395b 0.224B 0.006
HI ≤16 26.834a −0.655A 0.51316< 31.797b 0.045A 0.971
SprFast Elev Whole range 28.945 −0.012 0.039Incl Whole range 28.945 0.114 0.348HI Whole range 28.945 3.315 0.140
Slong Elev Whole range 23.809 −0.002 0.695Incl Whole range 23.809 −0.005 0.967HI Whole range 23.809 0.427 0.845
WholWholWhol
babu
cmosoSnBs
MultFreq Elev
Incl
HI
ud bank (see Appendix B). Two traits (Short-distance seed dispersalnd Frequent multiplication) showed difference between bedrocksut only in older successional sites. Both traits showed higher val-es on limestone (Table 6).
Stand age had the highest independent explanatory power ofonditions of sites for average species trait values. Age explainedore than 40% of variance of SLA and more than 15% of variance
f Short distance seed dispersal, Long-term connection and Exten-ive perennial root (Table 7). Comparing the relative importancef abiotic traits, elevation explained almost 27% of the variance in
LA and inclination explained 6–8% of variance in Long-term con-ection, Extensive perennial root, Thickening, and Large bud bank.edrock had a lower explanatory power while the HI showed noignificant relationship with any of the traits. Small correlationse range 69.372 0.003 0.621e range 69.372 0.236 0.084e range 69.372 −1.531 0.551
were found between explanatory variables and these correlationsdecreased with increasing stand age (Appendix A). Low correlationsbetween stand age and abiotic variables explain the similar patternsin explanatory power for the interactions of abiotic variables andstand age compared to independent factors.
4. Discussion
4.1. Relative importance of environmental variables
Although elevation, inclination and bedrock explained someportion of the trait variability, stand age proved to be the mostpowerful explanatory variable. Correlations among environmentalvariables did not constrain our results since they were very small

44 G. Campetella et al. / Agriculture, Ecosystem
Fig. 3. Illustration of the results of Model-Based Recursive Partitioning showing ther
(is
wwas2vntb
14, 16 and 19 years of age according to MOB-revealed thresh-olds), the disturbance caused by felling increases species richness
TRba
elationship between inclination and SLA, using age as a splitting variable.
e.g. stand age >16 years with elevation R2 < 0.05; Appendix A) andn case of the only strong correlation (i.e. inclination and HI) noignificant trait–environment relationships were recorded.
Half of the 14 investigated traits showed significant changesith changing abiotic factors and varying stand ages and this resultill be discussed in detail in the following paragraphs. The invari-
nt traits may not be important regarding adaptation in the forestuccession context and the respective species (see Canullo et al.,011) may be well equipped to face a multitude of environmentalariability found in our study sites. However, in this study we didot measure the fine-scale light, soil and microclimatic conditions
hat may have reflected microscale environmental conditions andiotic feedbacks.able 6esults of MOB for bedrock as environmental variables. t-Statistic and p-value are related
etween age categories within bedrocks are indicated by superscripts (a and b for limestot 1% significance level. See Table 4 for trait codes.
Process Traits Age Lime
Persistence Llong Whole range 49.89Storage Whole range 73.50Clong ≤14 63.35
14< 56.05BudProt Whole range 5.352nd th ≤14 59.08
14< 53.35exProot ≤14 63.68
14< 56.49BBlarge Whole range 57.91
Dispersal SM Whole range 61.37SDD+ ≤16 7.55
16< 13.46HREL Whole range 2.90
Growth SLA ≤16 26.4016< 32.00
SprFast ≤14 34.2214< 28.07
Slong Whole range 24.67MultFreq ≤19 65.51
19< 72.95
s and Environment 145 (2011) 38– 48
4.2. The chronosequence of trait–environment relationships
The distributions of trait values along the investigated chronose-quence of beech coppice stands were non-random, suggesting animportant role of traits in the mechanisms of habitat filtering (sensuDíaz et al., 1998) along environmental gradients (Cornwell andAckerly, 2009). We found evidence of species assembly and habi-tat filtering for seven traits, namely Short-distance seed dispersal,SLA, Long-term connection, Large bud bank, Extensive perennial root,Thickening, and Frequent multiplication (Tables 5 and 6).
We hypothesized that the correlations between traits and envi-ronmental factors would increase with succession age due to thedecreasing role of chance factors. Our results lend support to thishypothesis. Only one trait (Large bud bank) showed correlationwith one abiotic factor in sites younger than 14 years, while eighttraits showed correlations with three environmental factors inolder stages. According to the classic theory of vegetation suc-cession (see Glenn-Lewin, 1980) the predictive power of abioticfactors increases over time with a decreasing role of chance factors.Even in a very simple situation with constant environmental filter-ing, the correlation between vegetation and environment shouldincrease along the assembly process due to the cumulative effectof pattern selection. Probably, the underlying mechanism for thetrait–environment relationship reported in the present study isthe relative role of species replacement and intraspecific plasticity(Givnish et al., 2004). We argue that species turnover probably playsan important role in determining the directional shift in trait valuesacross sites and along gradients (Bartha et al., 2008; Cornwell andAckerly, 2009). In fact, in a plant-diversity focused chronosequencestudy in the same area, Bartha et al. (2008) found considerablespecies turnover along the chronosequence of post-coppice for-est regeneration showing a clear trend—forest specialists increasedwhereas non-forest species decreased.
The studied abiotic explanatory variables (elevation, inclination,heat index (HI), bedrock) represented some invariant aspects of theenvironment. However, the effective environment changed in oursystem due to biotic feedbacks. In open post-logged stands (below
(recruiting many species with contrasting ecological preferences;Bartha et al., 2008), and consequently the level of variability of
to comparison between bedrocks within age categories. Results of the comparisonsne; A and B for sandstone). Values sharing the same letter do not differ significantly
stone Sandstone t-Statistic p-Value
9 50.601 0.319 0.7513 69.267 1.848 0.0699a 63.101A 0.105 0.9172b 55.17A 0.296 0.76826 4.8571 0.602 0.5498a 58.688A 0.149 0.8837a 51.588A 0.57 0.5718a 63.155A −0.23 0.8205b 54.424A 0.682 0.4984 57.446 0.209 0.835
8 77.507 1.712 0.09109a 9.0614A 1.258 0.22179b 8.2109A 2.95 0.00562 2.5743 1.047 0.298
62a 27.5351A 1.456 0.15983b 30.7591A 1.076 0.2878a 30.891A 1.047 0.30793b 23.9745A 1.789 0.0793 20.9283 2.018 0.0473a 67.486A 0.759 0.4542b 64.745A 2.736 0.009

G. Campetella et al. / Agriculture, Ecosystem
Tab
le
7Pe
rcen
tage
of
vari
atio
n
exp
lain
ed
(100
* R2) b
y
lin
ear
mod
els
incl
ud
ing
only
envi
ron
men
tal v
aria
bles
, on
ly
age
cate
gori
es
or
both
wit
h
thei
r
inte
ract
ion
as
ind
epen
den
t var
iabl
es. S
ince
the
age
cate
gori
es
resu
lted
by
MO
B, i
n
trai
ts,
wh
ere
ther
e
are
no
sign
ifica
nt
spli
t
acco
rdin
g
to
stan
d
age
(i.e
. th
ere
are
only
one
age
cate
gory
),
only
mod
els
incl
ud
ing
envi
ron
men
tal v
aria
bles
wer
e
calc
ula
ted
. See
Tabl
e
4
for
the
cod
es
of
the
trai
ts.
Proc
ess
Trai
ts
Age
tres
hol
d
(yea
r)
Age
Elev
atio
n
Incl
inat
ion
Hea
t
ind
ex
Bed
rock
Elev
atio
n
&
age
Incl
inat
ion
&
age
Hea
t
&
age
Bed
rock
&
age
Pers
iste
nce
Llon
g
–
–
1.11
2.72
4.91
0.13
–
–
–
–St
orag
e
–
–
2.28
5.4
1.12
4.3
–
–
–
–C
lon
g
14
15.8
4
2.29
6.74
4.64
0.22
17.7
5
27
22.5
1 15
.96
Bu
dPr
ot
–
–
0.06
0.1
0.01
0.47
–
–
– –
2nd
th
14
9.86
0.35
8.65
4.77
<0.0
1
10.4
5
24.4
7
16.4
3
10.3
3ex
Proo
t
14
15.4
9
1.93
6.81
4.44
<0.0
1
16.7
8
26.9
8
21.9
1
16.1
6B
Bla
rge
–
–
3.32
7.36
2.56
0.06
–
–
–
–
Dis
per
sal
SM
–
–
2.62
0.83
0.76
3.71
–
–
–
–SD
D+
16
17.3
8
3.72
1.72
0.46
7.47
18.1
1
19.4
18.3
1
28.5
7H
REL
–
–
2.57
3.23
2.46
1.42
–
–
–
–
Gro
wth
SLA
16
(16
&
31)
40.8
1
26.6
5
1.55
0.35
2.5
57.3
5
42.1
9 (5
2.24
)
40.9
6
42.6
4(4
3.86
)Sp
rFas
t14
12.4
7
5.51
1.16
2.85
2.07
15.7
5
15.2
1
18.0
4
17.2
6Sl
ong
–
–
0.2
<0.0
1
0.05
5.09
–
–
–
–M
ult
Freq
19
9.9
0.32
3.88
0.47
4.72
10.5
13.6
6
9.95
19.7
4
s and Environment 145 (2011) 38– 48 45
traits increases and no correlations with environmental characterscould be detected (except for the almost significant score reportedby Large bud bank). Available light, soil moisture and microcli-mate change considerably during forest succession (Gondard andDeconchat, 2003; Canullo et al., 2011) filtering out species that arenot meeting these environmental challenges.
MOB analysis was effective in detecting the resulting changesin plant trait–environment relationships and revealing temporalthresholds. Local silvicultural practice distinguished between post-logged and recovering forest stages in coppice succession (Canulloet al., 2011). According to the field experience of foresters, standsyounger than 10 years were classified as post-logged stage (Ash andBarkham, 1976; Decocq et al., 2004; Canullo et al., 2011) and thelimit of 30 years represents the common age for coppicing in thestudy area (Canullo et al., 2011). The biological threshold revealedfor trait–environment relationships in our data analysis (14 and 31years, but the latter only for SLA) largely reflected these stages ofthe silvicultural cycle. The slight differences between the biologicalthresholds revealed by MOB analysis and the thresholds used bythe silvicultural practice can be explained by time lags due to someinertia (i.e. a tendency of some species to persist for a time contraryto the adverse conditions).
4.3. The ecology of trait–environment relationships
Our results suggest an increasing importance of Short-distanceseed dispersal with progressing forest succession, specifically instands older than 16 years. Short-distance dispersal is mainly dueto vectors such as invertebrates and to autochory. Species withsuch dispersal (dis)ability are usually shade-tolerant, spring- orsummer-flowering native perennials. Several possess elaiosomesand are myrmecochorous (Beattie, 1985). Some have low seedoutput (Aubin et al., 2007). Here our results support previousstudies. Increase of shade-tolerant geophytes dispersed by antswas reported for natural unmanaged forests and ancient forests(Froborg and Eriksson, 1997; Verheyen et al., 2003; Aubin et al.,2009). Following previous studies, Seed mass (a dispersal-relatedtrait) was also expected to show a differentiated response along thechronosequence. Graae and Sunde (2000) and Aubin et al. (2008)found that species with heavy seeds were more common in ancientforests. However, our insignificant results may be accounted for bymissing values for this trait in 39% of the species (Table 4).
Persistence-related traits that support plant survival in habitatswith stressful abiotic conditions (heat or cold stresses) wereexpected to have a prevailing importance in early stages of suc-cession. A Large bud bank, for example, enables effective “releasegrowth” of plant species after disturbance (Canullo et al., 2011).As a consequence of coppicing that opens the canopy closure,young post-logged stands are exposed to stronger drought andfrost stresses and soil erosion (Ciancio et al., 2006), associatedwith relative changes in bulk density or porosity and depletionof the soil organic matter and other nutrient pools (Rubio andEscudero, 2003). Generally, our results support the previousassumption since the persistence-related traits such as Long-termconnection, Large bud bank, Extensive perennial root and Thickeningwere of higher relative importance in earlier stages of succession(for instance those younger than 14 years) and their importancedecreased along the chronosequence. Probably in young openstages of coppices, the ecological meaning of inclination is mainlyrelated to erosion mechanisms while the overruling importanceof the stress produced by open canopy (light, temperature regimechanges) is equally strong at all inclinations. During the subsequent
post-coppice forest regeneration these stresses may decrease asthe canopy becomes more tightly closed and available lightdecreases, while soil fertility and soil moisture increase (Barthaet al., 2008). However, the decease was less for steep slopes (higher
4 ystem
irso
csPmms(sfTelsbe
snys(fsp1nadst2rhl
wpr2PLrcg
TSt
6 G. Campetella et al. / Agriculture, Ecos
nclination) compared to less inclined ones and, in line with thisesult, the trait–environment relationship of most of these traitshowed significant positive correlation with inclination in standslder than 14 years.
With respect to growth-related plant traits we consideredlonal traits to be effective in fine-scale spatial resource acqui-ition (with fast, frequent and long-distance vegetative spread).revious research (Canullo et al., 2011) suggested that clones wereore mobile in late-successional forests. In our study, Frequentultiplication showed significant increase and Fast lateral spread
howed significant decrease in older forest stands on limestonestages older than14 years) while no evidence appeared for Longpacer. The prevalence of Fast lateral spread in young post-loggedorest stands is congruent with findings of Canullo et al. (2011).his trait is mainly related to clonal growth organs (CGO; Klimest al., 1997) of root origin—root resprouters that are more preva-ent in early successional stages. The increased mobility in lateuccessional stages does not refer to these root-derived CGOut to stem-derived CGO, namely hypogeogenous rhizomes asmphasized by Canullo et al. (2011).
SLA was investigated as a plant-growth related trait. Our resultsuggest a strong trait–environment relationship for SLA due to sig-ificant positive correlations with elevation at sites older than 16ears and with inclination at sites older than 31 years. In previoustudies SLA proved to be variable along environmental gradientsGarnier et al., 2004; Givnish et al., 2004). Dahlgren et al. (2006)ound SLA to respond in the forest succession context—whichupports results in our study. Large SLA is associated with highhotosynthetic capacity and short leaf turnover time (Reich et al.,997, 2003), which may allow a plastic response to light patchi-ess (Westoby, 1998; Poorter, 2009) and appears to be particularlydvantageous in a late-succession forest ecosystem. However,uring the coppice forest regeneration, increasing abundance ofpecies with large SLA after 16 years seems likely to be a responseo a low-light environment (Wilson et al., 1999; Dahlgren et al.,006). Biological and ecological traits such as lower transpirationates, higher moisture and lower wind influence in shaded habitats,ave been suggested to explain why individual plants respond to
ow light levels with an increase in SLA (Givnish et al., 2004).In our study, the elevation gradient, albeit covering only 400 m,
as underpinned by significant changes in both temperature andrecipitation. There is large body of evidence suggesting that SLAesponds to water availability (Reich et al., 1999; Wright et al.,001; Ackerly and Cornwell, 2007; Cornwell and Ackerly, 2009;ellissier et al., 2010) and air temperature (Rebetzke et al., 2004).
arger SLA at higher elevations could be important for amelioratingesource acquisition, to optimize carbon gain by producing low-ost leaves and therefore overcome the constraints of a shorterrowing season (Gonzalo-Turpin and Hazard, 2009). The lack ofable A1quared correlation coefficients (R2) between environmental variables (including standrait–environment correlations were found.
Entire data set Age
>14 Y
Age Elevation 0.0930 0.107Inclination 0.0012 0.000Heat 0.0014 0.002Bedrock 0.0352 0.005
Elevation Inclination 0.0051 0.004Heat 0.0079 0.002Bedrock 0.0278 0.007
Inclination Heat 0.1402 0.262Bedrock 0.0195 0.001
Heat Index Bedrock 0.0093 0.018
s and Environment 145 (2011) 38– 48
this positive correlation in young stands is probably due to higherevapotranspiration and run-off and more fluctuations in tempera-ture that probably mask the elevation effects. The effect of elevationon SLA was very meaningful in our data since this factor explained27% of the variance in this trait. The effect of inclination on SLAseems negligible since the explained variance is only 1.55%.
5. Conclusions
Three main conclusion might be drawn from our study:
(1) Abandonment of coppicing leads to decrease of species diver-sity (Bartha et al., 2008) but at the same time to a selectionof species with larger SLA, more frequent multiplication andShort-distance seed dispersal ability—all of which are traits andsyndromes related to beech forest species specialists (Barthaet al., 2008; Canullo et al., 2011).
(2) Since the important splits by the MOB method appearedaround 14 years within the coppice cycle, no large changesin vegetation–environment relationships are expected by theabandonment of coppicing.
(3) The observed trait–environment relationship may be drivenby relative strength of specific environmental factors. Whileforest succession in relatively homogeneous landscapes mightbe driven mainly by environmental factors related to for-est succession itself, such as light and soil moisture, inheterogeneous landscapes the succession pathways may bedifferentiated according to the landscape-level variance ofenvironmental factors such as inclination. However, in theMediterranean silvipastoral mountainous landscapes as inves-tigated in our study, age had the highest explanatory powerfor most of the investigated traits confirming the overallstrong impact of succession-driven environmental factors fortrait–environment relationships.
Acknowledgements
We thank Oliver Tackenberg for support with compiling the seedtrait data. This research was partially supported by funds from theMontagna di Torricchio Nature Reserve and the Hungarian NationalScience Foundation (OTKA K 72561 for S.B. and OTKA K 83595 forZ.B.D.). Ministero delle Politiche Agricole Alimentari e Forestali,S.I.A. Office, the Corpo Forestale dello Stato of the Marche Region,and the authorities of the Monti Sibillini National Park kindly pro-vided important information. Gael Campbell-Young (Perth, AU)kindly corrected the English of the final version of our manuscript.
Appendix A.
See Table A1.
age) for the whole data set, and separately for the older ages where significant
ears >16 Years >19 Years >32 Years
1 0.0498 0.0509 0.01251 0.0001 0.0128 0.01032 0.0002 0.0274 0.00822 0.0023 0.0155 0.0003
4 0.0020 0.0083 0.02137 0.0001 0.0001 0.00458 0.0192 0.0181 0.0987
1 0.2721 0.2716 0.10474 0.0004 0.0025 0.0130
7 0.0379 0.0279 0.0021

G. Campetella et al. / Agriculture, Ecosystems and Environment 145 (2011) 38– 48 47
Table B1Squared correlation coefficients (R2) between the community-level trait values. Note: 100 * R2 = variation explained in one variable by the other variable. See Table 4 for traitcodes.
SM SLA SDD+ HREL Slong SprFast BudProt Clong BBlarge exProot 2nd th Llong Storage MultFreq
SM 1.000 0.198 0.116 0.160 0.057 0.027 0.003 0.037 0.037 0.040 0.102 0.127 0.351 0.211SLA 0.198 1.000 0.251 0.008 0.126 0.003 0.013 0.039 0.000 0.029 0.004 0.079 0.226 0.227SDD+ 0.116 0.251 1.000 0.027 0.166 0.006 0.040 0.014 0.001 0.010 0.000 0.033 0.203 0.186HREL 0.160 0.008 0.027 1.000 0.036 0.021 0.000 0.295 0.180 0.297 0.344 0.293 0.270 0.125Slong 0.057 0.126 0.166 0.036 1.000 0.237 0.020 0.013 0.068 0.016 0.034 0.097 0.284 0.289SprFast 0.027 0.003 0.006 0.021 0.237 1.000 0.041 0.183 0.248 0.190 0.255 0.021 0.162 0.178BudProt 0.003 0.013 0.040 0.000 0.020 0.041 1.000 0.014 0.023 0.012 0.083 0.000 0.022 0.002Clong 0.037 0.039 0.014 0.295 0.013 0.183 0.014 1.000 0.805 0.977 0.887 0.557 0.247 0.230BBlarge 0.037 0.000 0.001 0.180 0.068 0.248 0.023 0.805 1.000 0.809 0.755 0.644 0.305 0.424exProot 0.040 0.029 0.010 0.297 0.016 0.190 0.012 0.977 0.809 1.000 0.866 0.560 0.288 0.2632nd th 0.102 0.004 0.000 0.344 0.034 0.255 0.083 0.887 0.755 0.866 1.000 0.552 0.307 0.267Llong 0.127 0.079 0.033 0.293 0.097 0.021 0.000 0.557 0.644 0.560 0.552 1.000 0.393 0.487
2
2
A
R
A
A
A
A
A
A
A
A
A
B
B
B
B
B
C
C
C
C
C
C
Storage 0.351 0.226 0.203 0.270 0.284 0.162 0.02MultFreq 0.211 0.227 0.186 0.125 0.289 0.178 0.00
ppendix B.
See Table B1.
eferences
ckerly, D.D., Cornwell, W.K., 2007. A trait-based approach to community assembly:partitioning of species trait values into within and among community compo-nents. Ecology Letters 10, 135–145.
mici, M., Spina, R., 2002. Campo medio della precipitazione annuale e stagionalesulle Marche per il periodo 1950-2000. Protezione Civile Marche, OsservatorioGeofisico Sperimentale Macerata.
morini, E., Fabbio, G., 2001. La gestione del bosco ceduo nelle aree protette. Infor-matore Botanico Italiano 33, 164–168.
ndersson, F., Fuhrer, E., Farrell, E.P., 2000. Pathways to the wise management offorest in Europe. Forest Ecology and Management 132, 3–4.
sh, J.E., Barkham, J.P., 1976. Changes and variability in the field layer of a coppicedwoodland in Norfolk, England. Journal of Ecology 64, 697–712.
SSAM (Agenzia Servizi Settore Agroalimentare delle Marche), 2006. Suoli e pae-saggi delle Marche. Errebi Grafiche Ripesi, Ancona.
ubin, I., Gachet, S., Messier, C., Bouchard, A., 2007. How resilient are northern hard-wood forests to human disturbance? An evaluation using a plant functionalgroup approach. Ecoscience 14, 259–271.
ubin, I., Messier, C., Bouchard, A., 2008. Can plantations develop understorybiological and physical attributes of naturally regenerated forests? BiologicalConservation 141, 2462–2476.
ubin, I., Ouellette, M.H., Legendre, P., Messier, C., Bouchard, A., 2009. Compari-son of two plant functional approaches to evaluate natural restoration along anold-field—deciduous forest chronosequence. Journal of Vegetation Science 20,185–198.
arbaro, L., Corcket, E., Dutoit, T., Peltier, J.-P., 2000. Responses fonctionnelles descommunautés de pelouses calcicoles aux facteurs agro-ecologiques dans lesPrealpes franc aises. Canadian Journal of Botany 78, 1010–1020.
artha, S., Merolli, A., Campetella, G., Canullo, R., 2008. Changes of vascular plantdiversity along a chronosequence of beech coppice stands, Central Apennines,Italy. Plant Biosystems 142, 572–583.
eattie, A.J., 1985. The Evolutionary Ecology of Ant–Plant Mutualisms. CambridgeUniversity Press, Cambridge.
jørnstad, O.N., 2009. Ncf: Spatial Nonparametric Covariance Functions,http://CRAN.R.project.org/packageDncf. R package version 1.1-3 (accessed12.12.10).
rown, A.H.F., Warr, S.J., 1992. The effects of changing management on seed bankin ancient coppice. In: Buckley, G.P. (Ed.), Ecology and Management of CoppiceWoodlands. Chapman & Hall, London, pp. 147–166.
anullo, R., Campetella, G., Mucina, L., Chelli, S., Wellstein, C., Bartha, S., 2011. Pat-terns of clonal growth modes along a chronosequence of post-coppice forestregeneration in beech forests of Central Italy. Folia Geobotanica 46, 271–288.
astro, H., Lehsten, V., Lavorel, S., Freitas, H., 2010. Functional response traits inrelation to land use change in the Montado. Agriculture, Ecosystems and Envi-ronment 137, 183–191.
hristensen, N.L., Peet, R.K., 1984. Convergence during secondary forest succession.Journal of Ecology 72, 25–36.
iancio, O., Corona, P., Lamonaca, A., Portoghesi, L., Travaglini, D., 2006. Conversionof clearcut beech coppices into high forests with continuous cover: a case studyin central Italy. Forest Ecology and Management 224, 235–240.
oppini, M., Hermanin, L., 2007. Restoration of selective beech coppices: a case study
in the Apennines (Italy). Forest Ecology and Management 249, 18–27.ornelissen, J.H.C., Lavorel, S., Garnier, E., Díaz, S., Buchmann, N., Gurvich, D.E., Reich,P.B., ter Steege, H., Morgan, H.D., van der Heijden, M.G.A., Pausas, J.G., Poorter,H., 2003. A handbook of protocols for standardised and easy measurement ofplant functional traits worldwide. Australian Journal of Botany 51, 335–380.
0.247 0.305 0.288 0.307 0.393 1.000 0.7950.230 0.424 0.263 0.267 0.487 0.795 1.000
Cornwell, W.K., Ackerly, D.D., 2009. Community assembly and shifts in plant traitdistributions across an environmental gradient in coastal California. EcologicalMonographs 79, 109–126.
Dahlgren, J.P., Eriksson, O., Bolmgren, K., Strindell, M., Ehrlen, J., 2006. Specific leafarea as a superior predictor of changes in field layer abundance during forestsuccession. Journal of Vegetation Science 17, 577–582.
Debussche, M., Debussche, G., Lepart, J., 2001. Changes in vegetation of Quercuspubescens woodland after cessation of coppicing and grazing. Journal of Veg-etation Science 12, 81–92.
Decocq, G., Aubert, M., Dupont, F., Alard, D., Saguez, R., Wattez-Franger, A., de Fou-cault, B., Delelis-Dusollier, A., Bardat, J., 2004. Plant diversity in a managedtemperate deciduous forest: understory response to two silvicultural systems.Journal of Applied Ecology 41, 1065–1079.
Díaz, S., Cabido, M., Casanoves, F., 1998. Plant functional traits and environmentalfilters at a regional scale. Journal of Vegetation Science 9, 113–122.
Dormann, C.F., McPherson, J.M., Araújo, M.B., Bivand, R., Bolliger, J., Carl, G., Davies,R.G., Hirzel, A., Jetz, W., Kissling, W.D., Kühn, I., Ohlemüller, R., Peres-Neto, P.R.,Reineking, B., Schröder, B., Schurr, F.M., Wilson, R., 2007. Methods to account forspatial autocorrelation in the analysis of species distributional data: a review.Ecography 30, 609–628.
Erfanzadeh, R., Pétillon, J., Maelfait, J.-P., Hoffmann, M., 2010. Environmentaldeterminism versus biotic stochasticity in the appearance of plant species insalt-marsh succession. Plant Ecology and Evolution 143, 43–50.
Flinn, K.M., Vellend, M., 2005. Recovery of forest plant communities in post-agricultural landscapes. Frontiers in Ecology and the Environment 3, 243–250.
Froborg, H., Eriksson, O., 1997. Local colonization and extinction of field layer plantsin a deciduous forest and their dependence upon life history features. Journal ofVegetation Science 8, 395–400.
Garnier, E., Cortez, J., Billè, G.S., Navas, M.L., Roumet, C., Debussche, M., Laurent,G., Blanchard, A., Aubry, D., Bellmann, A., Neill, C., Toussaint, J.P., 2004. Plantfunctional markers capture ecosystem properties during secondary succession.Ecology 85, 2630–2637.
Gilliam, F.S., 2007. The ecological significance of the herbaceous layer in temperateforest ecosystems. BioScience 57, 845–857.
Givnish, T.J., Montgomery, R.A., Goldstein, G., 2004. Adaptive radiation of photosyn-thetic physiology in the Hawaiian lobeliads: light regimes, static light responses,and whole plant compensation points. American Journal of Botany 91, 228–246.
Glenn-Lewin, D.C., 1980. The individualistic nature of plant community develop-ment. Vegetatio 43, 141–146.
Gondard, H., Deconchat, M., 2003. Effects of soil surface disturbances after loggingon plant functional types. Annals of Forest Science 60, 725–732.
Gonzalo-Turpin, H., Hazard, L., 2009. Local adaptation occurs along altitudinal gra-dient despite the existence of gene flow in the alpine plant species Festuca eskia.Journal of Ecology 97, 742–751.
Graae, B.J., Sunde, P.B., 2000. The impact of forest continuity and management onforest floor vegetation evaluated by species traits. Ecography 23, 720–730.
Harrelson, S.M., Matlack, G.R., 2006. Influence of stand age and physical environ-ment on the herb composition of second-growth forest, Strouds Run, Ohio, USA.Journal of Biogeography 33, 1139–1149.
IPLA, 2001. I tipi forestali delle Marche. Inventario e Carta Forestale della RegioneMarche. Regione Marche. Diffusioni Grafiche, Torino.
Kahmen, S., Poschlod, P., 2008. Effects of grassland management on plantfunctional trait composition. Agriculture, Ecosystems and Environment 128,137–145.
Kleyer, M., Bekker, R.M., Knevel, I.C., Bakker, J.P., Thompson, K., Sonnenschein, M.,Poschlod, P., van Groenendael, J.M., Klimes, L., Klimesová, J., Klotz, S., Rusch,G.M., Hermy, M., Adriaens, D., Boedeltje, G., Bossuyt, B., Dannemann, A., Endels,
P., Götzenberger, L., Hodgson, J.G., Jackel, A.-K., Kühn, I., Kunzmann, D., Ozinga,W.A., Römermann, C., Stadler, M., Schlegelmilch, J., Steendam, H.J., Tackenberg,O., Wilmann, B., Cornelissen, J.H.C., Eriksson, O., Garnier, E., Peco, B., 2008. TheLEDA Traitbase: a database of life-history traits of Northwest European flora.Journal of Ecology 96, 1266–1274.
4 ystem
K
K
L
L
L
L
M
M
MM
M
M
P
PP
P
P
P
P
R
8 G. Campetella et al. / Agriculture, Ecos
limes, L., Klimesová, J., Hendriks, R., van Groenendael, J., 1997. Clonal plant archi-tectures: a comparative analysis of form and function. In: de Kroon, H., vanGroenendael, J. (Eds.), The Ecology and Evolution of Clonal Plants. BackhuysPublishers, Leiden, pp. 1–29.
oniak, G., Noy-Meir, I., 2009. A hierarchical, multi-scale, management-responsivemode of Mediterranean vegetation dynamics. Ecological Modelling 220,1148–1158.
avorel, S., McIntyre, S., Landsberg, J., Forbes, T.D.A., 1997. Plant functional classifica-tions: from general groups to specific groups based on response to disturbance.Trends in Ecology and Evolution 12, 474–478.
avorel, S., Touzard, B., Lebreton, J.D., Clément, B., 1998. Identifying functionalgroups for response to disturbance in an abandoned pasture. Acta Oecologica19, 227–240.
avorel, S., Garnier, E., 2002. Predicting changes in community composition andecosystem functioning from plant traits: revisiting the Holy Grail. FunctionalEcology 16, 545–556.
indacher, R., Böcker, R., Bemmerlein-Lux, F.A., Kleemann, A., Haas, S., 1995. PHA-NART Datenbank der Gefäßpflanzen Mitteleuropas, Erklärung der Kennzahlen,Aufbau und Inhalt, vol. 125. Veröffentlichungen des Geobotanischen Institutesder ETH, Stiftung Rübel, Zürich, pp. 1–436.
argalef, R., 1968. Perspectives in Ecological Theory. University of Chicago Press,Chicago.
ason, C.F., MacDonald, S.M., 2002. Responses of ground flora to coppice manage-ment in an English woodland – a study using permanent quadrats. Biodiversityand Conservation 11, 1773–1789.
atthews, J.D., 1989. Silvicultural Systems. Clarendon Press, Oxford.ládek, J., Hejcman, M., Hejduk, S., Duchoslav, M., Pavlu, V., 2010. Community sea-
sonal development enables late defoliation without loss of forage quality in lowproductive semi-natural grasslands. Folia Geobotanica 46, 17–34.
offatt, S.F., McLachlan, S.M., 2004. Understory indicators of disturbance for riparianforests along an urban–rural gradient in Manitoba. Ecological Indicators 4, 1–16.
oran, M.D., 2003. Arguments for rejecting the sequential Bonferroni in ecologicalstudies. Oikos 100, 403–405.
arker, K.C., 1988. Environmental relationships and vegetation associates of colum-nar cacti in the northern Sonoran Desert. Vegetatio 78, 125–140.
avari, A., 1999. Il problema dei boschi cedui in Italia. Monti e Boschi 6, 17–26.ellissier, L., Fournier, B., Guisan, A., Vittoz, P., 2010. Plant traits co-vary with altitude
in grasslands and forests in the European Alps. Plant Ecology 211, 351–365.ickett, S.T.A., 1989. Space-for-time substitution as an alternative to long-term stud-
ies. In: Likens, G.E. (Ed.), Long-term Studies in Ecology. Springer, New York, pp.110–135.
ignatti, S., 2005. Valori indicatori delle piante vascolari della flora d’Italia. Braun-Blanquetia 39, 1–100.
oorter, L., 2009. Leaf traits show different relationships with shade tolerance inmoist versus dry tropical forests. New Phytologist 181, 890–900.
oschlod, P., Kleyer, M., Jackel, A.K., Dannemann, A., Tackenberg, O., 2003. BIOPOP –
a database of plant traits and Internet application for nature conservation. FoliaGeobotanica 38, 263–271.Development Core Team, 2010. R: A Language and Environment for StatisticalComputing. R Foundation for Statistical Computing, Wien, URL http://www.R-project.org (accessed 03.12.10).
s and Environment 145 (2011) 38– 48
Rebetzke, G.J., Botwright, T.L., Moore, C.S., Richards, R.A., Condon, A.G., 2004. Geno-typic variation in specific leaf area for genetic improvement of early vigour inwheat. Field Crops Research 88, 179–189.
Reich, P.B., Walters, M.B., Ellsworth, D.S., 1997. From tropics to tundra: global con-vergence in plant functioning. Proceedings of the National Academy of Sciencesof the USA 94, 13730–13734.
Reich, P.B., Ellsworth, D.S., Walters, M.B., Vose, K., Gresham, C., Volin, J.C., Bow-man, W.D., 1999. Generality of leaf traits relationships: a test across six biomes.Ecology 80, 1955–1969.
Reich, P.B., Wright, I.J., Cavender-Bares, J., Craine, J.M., Oleksyn, J., Westoby, M., Wal-ters, M.B., 2003. The evolution of plant functional variation: traits, spectra andstrategies. International Journal of Plant Sciences 164, S143–S164.
Rubio, A., Escudero, A., 2003. Clear-cut effects on chestnut forest soils under stressfulconditions: lengthening of time-rotation. Forest Ecology and Management 183,195–204.
Seidling, W., 2005. Ground floor vegetation assessment within the intensive (Level II)monitoring of forest ecosystems in Germany: chances and challenges. EuropeanJournal of Forest Research 124, 301–312.
Shipley, B., Vile, D., Garnier, E., 2006. From plant traits to plant communities: astatistical mechanistic approach to biodiversity. Science 314, 812–814.
Spellemberg, I.F., 2005. Monitoring Ecological Change. Cambridge University Press,Cambridge.
UN/ECE-FAO, 2000. Forest Resources of Europe, CIS, North America, Australia, Japanand New Zealand. Geneva Timber and Forest Study Papers 17. UN/ECE-FAO,Geneva.
Verheyen, K., Honnay, O., Motzkin, G., Hermy, M., Foster, D.R., 2003. Response of for-est plant species to land-use change: a life-history trait-based approach. Journalof Ecology 91, 563–577.
Wellstein, C., Kuss, P., 2011. Diversity and frequency of clonal traits along naturaland land-use gradients in grasslands of the Swiss Alps. Folia Geobotanica 46,255–270.
Westoby, M., 1998. A leaf-height-seed (LHS) plant ecology strategy scheme. Plantand Soil 199, 213–227.
Westoby, M., Wright, I.J., 2006. Land-plant ecology on the basis of functional traits.Trends in Ecology and Evolution 21, 261–268.
Wilson, P.J., Thompson, K., Hodgson, J.G., 1999. Specific leaf area and leaf dry mat-ter content as alternative predictors of plant strategies. New Phytologist 143,155–162.
Wright, I.J., Reich, P.B., Westoby, M., 2001. Strategy shifts in leaf physiology, structureand nutrient content between species of high- and low-rainfall and high- andlow-nutrient habitats. Functional Ecology 15, 423–434.
Wright, I.J., Reich, P.B., Westoby, M., Ackerly, D.D., Baruch, Z., Bongers, F., Cavender-Bares, J., Chapin, T., Cornelissen, J.H.C., Diemer, M., Flexas, J., Garnier, E., Groom,F.K., Gulias, J., Hikosaka, K., Lamont, B.B., Lee, T., Lee, W., Lusk, C., Midgley, J.J.,Navas, M.-L., Niinemets, Ü., Oleksyn, J., Osada, N., Poorter, H., Poot, P., Prior, L.,Pyankov, V.I., Roumet, C., Thomas, S.C., Tjoelker, M.G., Veneklaas, E.J., Villar, R.,
2004. The leaf economics spectrum worldwide. Nature 428, 821–827.Zeileis, A., Hothorn, T., Hornik, K., 2008. Model-based recursive partitioning. Journalof Computational and Graphical Statistics 17, 492–514.
Zuur, A.F., Ieno, E.N., Walker, N.J., Saveliev, A.A., Smith, G.M., 2009. Mixed EffectsModels and Extensions in Ecology with R. Springer, New York.