They are laughing at me: cerebral mediation of cognitive biases in social anxiety
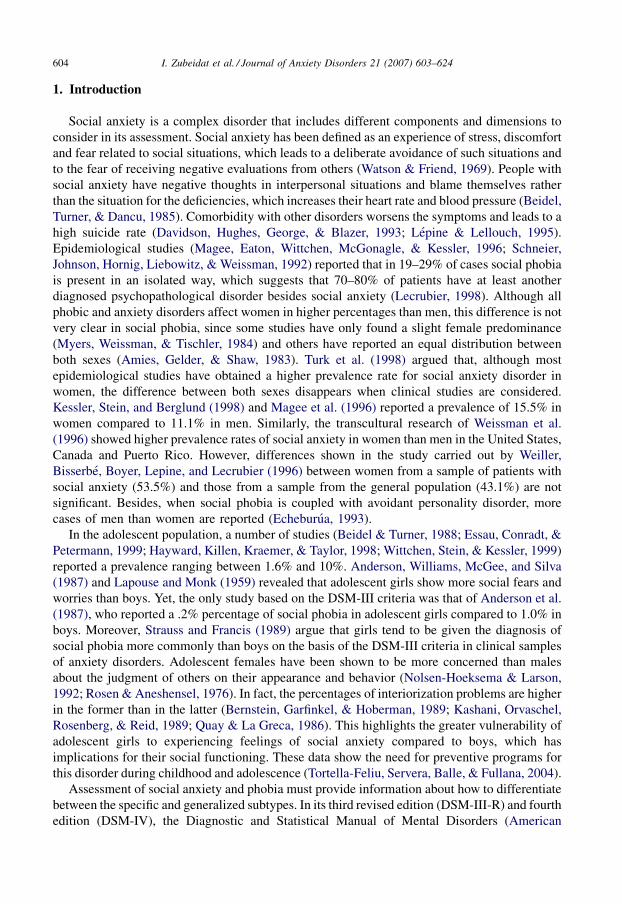
Psychometric properties of the Social Interaction
Anxiety Scale and separation criterion between
Spanish youths with and without subtypes
of social anxiety
Ihab Zubeidat a, Jose Marıa Salinas b,*, Juan Carlos Sierra a,Antonio Fernandez-Parra a
a Department of Personality, Assessment and Psychological Treatment,
University of Granada, Spainb Department of Social Psychology and Methodology of Behavioral Sciences,
University of Granada, Spain
Received 22 June 2006; received in revised form 11 July 2006; accepted 22 September 2006
Abstract
In this study, we analyzed the reliability and validity of the Social Interaction Anxiety Scale (SIAS) and
propose a separation criterion between youths with specific and generalized social anxiety and youths
without social anxiety. A sample of 1012 Spanish youths attending school completed the SIAS, the
Liebowitz Social Anxiety Scale, the Social Avoidance and Distress Scale, the Fear of Negative Evaluation
Scale, the Youth Self-Report for Ages 11–18 and the Minnesota Multiphasic Personality Inventory-
Adolescent. The factor analysis suggests the existence of three factors in the SIAS, the first two of which
explain most of the variance of the construct assessed. Internal consistency is adequate in the first two
factors. The SIAS features an adequate theoretical validity with the scores of different variables related to
social interaction. Analysis of the criterion scores yields three groups pertaining to three clearly differ-
entiated clusters. In the third cluster, two of social anxiety groups – specific and generalized – have been
identified by means of a quantitative separation criterion.
# 2006 Elsevier Ltd. All rights reserved.
Keywords: Social anxiety; Social Interaction Anxiety Scale; Spanish youths; Psychometric properties
Journal of Anxiety Disorders 21 (2007) 603–624
* Corresponding author. Departamento de Psicologıa Social y Metodologıa, Facultad de Psicologıa, Universidad de
Granada, 18071 Granada, Spain.
E-mail address: [email protected] (J.M. Salinas).
0887-6185/$ – see front matter # 2006 Elsevier Ltd. All rights reserved.
doi:10.1016/j.janxdis.2006.09.010
1. Introduction
Social anxiety is a complex disorder that includes different components and dimensions to
consider in its assessment. Social anxiety has been defined as an experience of stress, discomfort
and fear related to social situations, which leads to a deliberate avoidance of such situations and
to the fear of receiving negative evaluations from others (Watson & Friend, 1969). People with
social anxiety have negative thoughts in interpersonal situations and blame themselves rather
than the situation for the deficiencies, which increases their heart rate and blood pressure (Beidel,
Turner, & Dancu, 1985). Comorbidity with other disorders worsens the symptoms and leads to a
high suicide rate (Davidson, Hughes, George, & Blazer, 1993; Lepine & Lellouch, 1995).
Epidemiological studies (Magee, Eaton, Wittchen, McGonagle, & Kessler, 1996; Schneier,
Johnson, Hornig, Liebowitz, & Weissman, 1992) reported that in 19–29% of cases social phobia
is present in an isolated way, which suggests that 70–80% of patients have at least another
diagnosed psychopathological disorder besides social anxiety (Lecrubier, 1998). Although all
phobic and anxiety disorders affect women in higher percentages than men, this difference is not
very clear in social phobia, since some studies have only found a slight female predominance
(Myers, Weissman, & Tischler, 1984) and others have reported an equal distribution between
both sexes (Amies, Gelder, & Shaw, 1983). Turk et al. (1998) argued that, although most
epidemiological studies have obtained a higher prevalence rate for social anxiety disorder in
women, the difference between both sexes disappears when clinical studies are considered.
Kessler, Stein, and Berglund (1998) and Magee et al. (1996) reported a prevalence of 15.5% in
women compared to 11.1% in men. Similarly, the transcultural research of Weissman et al.
(1996) showed higher prevalence rates of social anxiety in women than men in the United States,
Canada and Puerto Rico. However, differences shown in the study carried out by Weiller,
Bisserbe, Boyer, Lepine, and Lecrubier (1996) between women from a sample of patients with
social anxiety (53.5%) and those from a sample from the general population (43.1%) are not
significant. Besides, when social phobia is coupled with avoidant personality disorder, more
cases of men than women are reported (Echeburua, 1993).
In the adolescent population, a number of studies (Beidel & Turner, 1988; Essau, Conradt, &
Petermann, 1999; Hayward, Killen, Kraemer, & Taylor, 1998; Wittchen, Stein, & Kessler, 1999)
reported a prevalence ranging between 1.6% and 10%. Anderson, Williams, McGee, and Silva
(1987) and Lapouse and Monk (1959) revealed that adolescent girls show more social fears and
worries than boys. Yet, the only study based on the DSM-III criteria was that of Anderson et al.
(1987), who reported a .2% percentage of social phobia in adolescent girls compared to 1.0% in
boys. Moreover, Strauss and Francis (1989) argue that girls tend to be given the diagnosis of
social phobia more commonly than boys on the basis of the DSM-III criteria in clinical samples
of anxiety disorders. Adolescent females have been shown to be more concerned than males
about the judgment of others on their appearance and behavior (Nolsen-Hoeksema & Larson,
1992; Rosen & Aneshensel, 1976). In fact, the percentages of interiorization problems are higher
in the former than in the latter (Bernstein, Garfinkel, & Hoberman, 1989; Kashani, Orvaschel,
Rosenberg, & Reid, 1989; Quay & La Greca, 1986). This highlights the greater vulnerability of
adolescent girls to experiencing feelings of social anxiety compared to boys, which has
implications for their social functioning. These data show the need for preventive programs for
this disorder during childhood and adolescence (Tortella-Feliu, Servera, Balle, & Fullana, 2004).
Assessment of social anxiety and phobia must provide information about how to differentiate
between the specific and generalized subtypes. In its third revised edition (DSM-III-R) and fourth
edition (DSM-IV), the Diagnostic and Statistical Manual of Mental Disorders (American
I. Zubeidat et al. / Journal of Anxiety Disorders 21 (2007) 603–624604
Psychiatric Association, 1987, 1994) specifies the number of situations that generate fear in
subjects with social phobia, which has led to the designation of a specific subtype of social phobia
as opposed to a generalized type. Consequently, there have been several attempts to differentiate
between both forms of social anxiety. Heimberg, Hope, Dodge, and Becker (1990) and Turner,
Beidel, and Townsley (1992) consider that people who are most affected by situations related to
personal performance may be more likely to complain of a more limited number of so-called non-
generalized fears. There are other proposals to classify social anxiety subtypes (Heimberg, Holt,
Schneier, Spitzer, & Liebowitz, 1993; Olivares, Rosa, & Garcıa-Lopez, 2004; Stein, 1997).
However, the problem posed by this division is the lack of an exact quantification of the
expression ‘‘most situations’’ used in the DSM-IV (Holt, Heimberg, & Hope, 1992; Schneier,
Spitzer, Gibbon, Fyer, & Liebowitz, 1991). Such confusion affects not only the adult population
but also the adolescent one, for which there is little data available. According to Hofmann et al.
(1999), each researcher applies the expression ‘‘most situations’’ based on the estimation he or
she considers to be most appropriate. The distinction between the generalized form of social
anxiety and other forms specifically mentioned in the DSM-III-R and DSM-IV seems to be a
matter of degrees, i.e. the differences are quantitative. Heimberg, Liebowitz, Hope, and Schneier
(1995), Hofmann (2000) and McNeil (2001) argue that the difference between both subtypes of
social anxiety is quantitative and that instead of being differentiated by categories, there is a
continuum of severity. However, Hooke and Valentiner (2002) state that the separation between
generalized and specific social anxiety is qualitative; according to them, generalized social
phobia is understood as the fear of situations that involve interaction with others, whereas specific
social phobia is understood as the fear of a specific performance situation. This approach matches
that of Stemberger, Turner, Beidel, and Calhoun (1995). In turn, a distinction is made between
fears related to interaction and performance (Mattick & Clarke, 1998), which consistently
correlate with those related to generalized and specific social anxiety, respectively (Hooke,
Valentiner, & Kim, 2000). Moreover, people with generalized social anxiety have been shown to
report more social avoidance (Herbert, Hope, & Bellack, 1992; Holt et al., 1992), exaggerated
fears concerning negative evaluation (Holt et al., 1992), major social skills deficits (Tran &
Chambless, 1995) and more overall social anxiety (Turner, Beidel, Cooley, Woody, & Messer,
1994) than subjects with specific social anxiety.
There are currently few studies available on the distinction between generalized and specific
social anxiety in the adult population, and even fewer in the adolescent population. Therefore, there
is a need to carry out epidemiological studies on social anxiety to increase our knowledge about the
distinction between its two subtypes. Moreover, the few studies available are based on a strictly
quantitative separation criterion between both forms of social anxiety and the use of non-clinical
samples. In the adolescent population, most studies have involved English-speaking samples,
except for some carried out in Spanish-speaking populations, as is the case of Garcıa-Lopez (2000),
Olivares (2004), Ramos (2004) and Ruiz (2003). For this reason, research is needed to answer the
questions raised about the differences and similarities between the proposed subtypes of social
anxiety – the specific and the generalized subtypes, in particular – in this population. The scarcity of
studies carried out on this issue is due to several reasons. One of them is the fact that there are few
specific assessment instruments capable of distinguishing between specific and generalized social
anxiety in both the adult and the adolescent population. Yet, there are many social anxiety self-
report assessment tools available for these two populations in scientific literature, such as the Fear of
Negative Evaluation Scale (FNE) and the Social Avoidance and Distress Scale (SAD) (Watson &
Friend, 1969), the Social Phobia Anxiety Inventory (SPAI) (Turner, Beidel, Dancu, & Stanley,
1989), the Social Phobia Scale (SPS) and the Social Interaction Anxiety Scale (SIAS) (Mattick &
I. Zubeidat et al. / Journal of Anxiety Disorders 21 (2007) 603–624 605
Clarke, 1998), the Liebowitz Social Anxiety Scale (LSAS) (Liebowitz, 1987), the Social Anxiety
Scale for Adolescents (SAS-A) (La Greca & Lopez, 1998), the Social Interaction Self-Statement
Test (SISST) (Glass, Merluzzi, Biever, & Larsen, 1982), the Davidson Brief Social Phobia Scale
(BSPS) (Davidson et al., 1991), the Interaction Anxiousness Scale (IAS) and the Audience
Anxiousness Scale (AAS) (Leary, 1983) and the Personal Report of Confidence as a Speaker
(PRCS) (Gilkinson, 1942; Paul, 1966). Although all these tests have adequate psychometric
properties, most of them have been unable to distinguish between the specific and generalized
forms of social anxiety because they lack separation criteria.
The Social Interaction Anxiety Scale (SIAS) (Mattick & Clarke, 1998) is an easy and quick
instrument to use and includes 20 items that measure anxiety experienced by people in social
interaction situations. It must be clarified that the SIAS and the SPS are used simultaneously to
measure complementary aspects of the concept of social anxiety. Although, it has been stated that
the former distinguishes best between the specific and generalized forms of social anxiety
(Heimberg, Mueller, Holt, Hope, & Liebowitz, 1992), the separation criterion between people with
specific and generalized social anxiety proposed by these authors is not fully clear. Some studies
(e.g., Habke, Hewitt, Norton, & Asmundson, 1997; Olivares, Garcıa-Lopez, & Hidalgo 2001;
Safren, Turk & Heimberg, 1998) have explored the factor structure of the SIAS and the SPS jointly,
with the purpose of verifying the two-factor model proposed by the original authors of such scales
(Mattick & Clarke, 1998), conferring a unidimensional character to each of them. Yet, the
psychometric properties of the SIAS have never been studied separately, since the studies
mentioned above analyzed a total of 40 items from both scales (SIAS and SPS). Besides, all these
studies were carried out with samples of the adult population, for which no separation criterion has
been presented that clearly distinguishes between different forms of social anxiety, and there is no
information available on this issue in adolescents. This, along with the need of instruments with
adequate psychometric characteristics to assess social anxiety in the Spanish population (Garcıa-
Lopez, Olivares, & Hidalgo, 2005), justifies our need to carry out a study on the psychometric
properties of the SIAS and propose a separation criterion based on the high scores obtained by
youths in this scale. Such criterion should allow us to detect different subtypes of social anxiety, and
will facilitate the study of the features of each of the mentioned groups separately.
In this instrumental study (Carretero-Dios & Perez, 2005; Montero & Leon, 2005), we
explored the psychometric properties of the 20 items of the SIAS in a sample of young Spanish
students. First of all, we examined the factor structure, reliability and construct and discriminant
validity; second, we aimed to establish a separation criterion capable of distinguishing between
youths with specific and generalized social anxiety and youths without social anxiety.
2. Method
2.1. Participants
The sample was selected by incidental sampling and included 1012 young secondary
education students from Granada (Spain); there were 430 males and 582 females, with an age
range between 13 and 19 (M = 15.80, S.D. = 1.48). Almost two thirds of the youths (n = 654)
were in second, third and fourth year of compulsory secondary education (Educacion Secundaria
Obligatoria); the rest were distributed similarly between students in first and second year of non-
compulsory secondary education (Bachillerato) (n = 187) and others that followed different
vocational training courses (Ciclos Formativos) (n = 171), such as cookery, hairdressing, etc.
Although most of the youths were only students, very few of them had a job as well. Almost one
I. Zubeidat et al. / Journal of Anxiety Disorders 21 (2007) 603–624606
third of the participants in the study had a boyfriend/girlfriend, although due to the age of the
subjects they were not legally recognized stable relationships.
2.2. Measures
2.2.1. Social Interaction Anxiety Scale (SIAS)
The SIAS (Mattick & Clarke, 1998) includes 20 items that are meant to be answered following a
5-point Likert scale. It has a high internal consistency (alpha = .93) and a 1-month test–retest
correlation coefficient above .90. Ries et al. (1998) revealed that the SIAS discriminates between
the generalized and specific subtypes of social phobia. Habke et al. (1997) reported three factors. In
Spain, Olivares et al. (2001) reported an internal consistency of .89 and obtained two factors that
explain 40.11% of thevariance. Nevertheless, the confirmatory factor analysis supported the single-
factor model and saturated all the items into a single one called ‘‘interaction social anxiety’’.
2.2.2. Liebowitz Social Anxiety Scale (LSAS)
The LSAS (Liebowitz, 1987) consists of 24 items that assess social or performance situations
by evaluating two components: the degree of fear or anxiety experienced and the degree of
avoidance reported by the subjects. Cox, Ross, Swinson, and Direnfeld (1998) reported high
internal consistency coefficients for the subscales social fear and social avoidance (alpha = .90);
similar data were reported by Heimberg et al. (1999). In Spain, Bobes et al. (1999) found internal
consistency coefficient values above .73 for all the LSAS scales; the intraclass correlation
coefficients found in the 2 weeks test–retest studies reported values above .82 for all subscales.
2.2.3. Social Avoidance and Distress Scale (SAD)
TheSAD (Watson & Friend, 1969) contains 28 items, half of which refer to subjective discomfort
in social situations and the other half of which refer to the active avoidance of such situations. This
scale has shown an internal consistency of .94 and a 1-month test–retest reliability of .68 (Watson &
Friend, 1969). Hofmann, DiBartolo, Holaway, and Heimberg (2004) reported a Cronbach’s alpha of
.93. In Spain, the reliability of the avoidance subscalewas .87, whereas that of social anxiety was .85
(Comeche, Dıaz, & Vallejo, 1995). In the study carried out by Garcıa-Lopez et al. (2001) on an
adolescent sample, a 10 days test–retest reliability of .85 was reported for the SAD.
2.2.4. Fear of Negative Evaluation Scale (FNE)
The FNE (Watson & Friend, 1969) assesses the degree of intensity with which individuals
experience fear of being negatively evaluated by others. Watson and Friend (1969) reported an
internal consistency coefficient of .94 and a 1-month test–retest reliability of .78. In Spain, an
internal consistency of .94 and .90 was obtained in the original version and the short version of the
scale, respectively. Garcıa-Lopez et al. (2001) reported a 10-day test–retest reliability equal to .84.
2.2.5. Youth Self-Report for Ages 11–18 (YSR)
The YSR (Achenbach, 1991; Achenbach & Edelbrock, 1978) consists of two parts; the first
one includes 17 items that assess the psycosocial skills of youths and the second one contains 112
items. Out of these items, 96 evaluate a number of problematic behaviors and the rest focuses on
prosocial behaviors. The study carried out by Verhulst, van der Ende, and Koot (1997) features
sound reliability and validity data. In the Spanish validation made by Lemos, Fidalgo, Calvo, and
Menendez (1992a, 1992b, 1992c) girls scored higher in internalized behaviors, whereas boys
scored higher in externalized ones (Lemos et al., 1992a). Abad, Forns, Amador, and Martorell
I. Zubeidat et al. / Journal of Anxiety Disorders 21 (2007) 603–624 607
(2000) showed that internal consistency is more homogeneous and higher in internalized and
externalized syndromes than in narrowband ones. In the present study, we considered the
variables anxiety problems, anxiety/depression, withdrawal/depression, social problems,
internalizing syndromes and externalizing syndromes because they relate to social relations
of youths and because of their possible relation with social anxiety.
2.2.6. Minnesota Multiphasic Personality Inventory-Adolescent (MMPI-A)
The MMPI-A (Butcher et al., 1992) was adapted to the Spanish context by Jimenez-Gomez &
Avila-Espada. Butcher, Dahlstrom, Graham, Tellegen, and Kaemmer (1989) reported good
internal consistency values in the different scales. The scales depression (D), social introversion
(Si), anxiety (ANX), depression (DEP), alienation (ALN), low self-esteem (LSE) and social
discomfort (SOD) were used in this study because of their possible relation with interpersonal
relations and social anxiety in youths.
2.3. Procedure
The incidental sample of adolescents came from 13 secondary education schools of the
province of Granada (Spain). After obtaining consent from the teachers and the parents of the
youths, the students were assessed during a 4-month period. The self-reports were completed
collectively in the classroom in two 75-min sessions led by a single examiner. All the participants
were given the same instructions to answer, and participation was totally voluntary. In fact, 15
subjects refused to answer the self-reports and 9 dropped out after the sessions had started. The
subjects were never paid for participating.
3. Results
3.1. Descriptive statistics
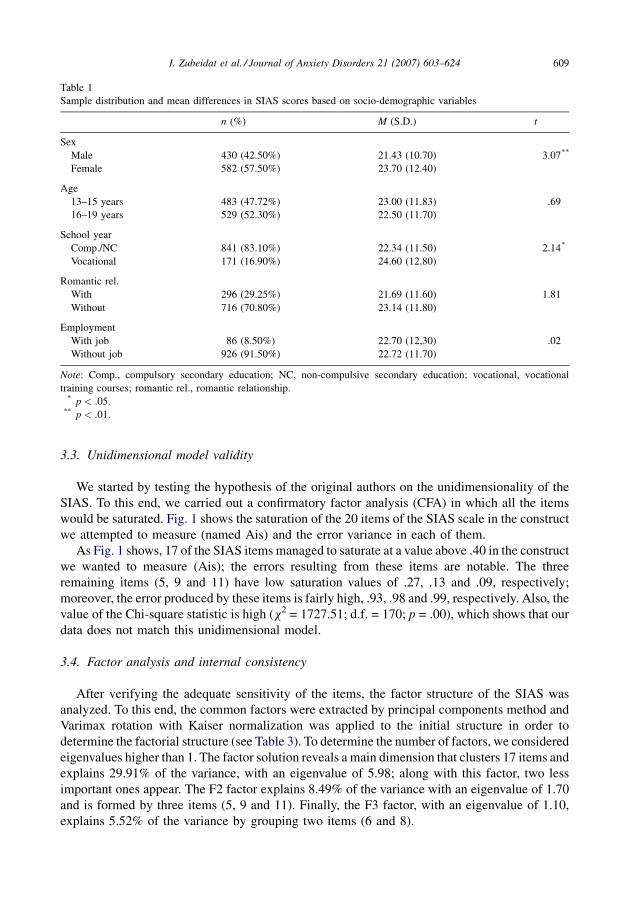
In the SIAS, the mean of the youths of the total sample was 22.72 and the standard deviation
was 11.75. Table 1 summarizes the differences in the distribution of scores in the SIAS based on
sex, age, school year, romantic relationship and employment of the 1012 youths that participated
in the study.
In the SIAS scores, the difference between the means was only found to be significant in two
variables: sex (t = �3.07; p < .001) and school year (t = �2.14; p < .05). The mean of females’
scores in the SIAS was slightly higher than that of males. Similarly, the youths following
vocational training courses obtained mean SIAS scores that were slightly higher than those of the
group formed by adolescents in academic compulsory and non-compulsory education.
3.2. SIAS item characteristics
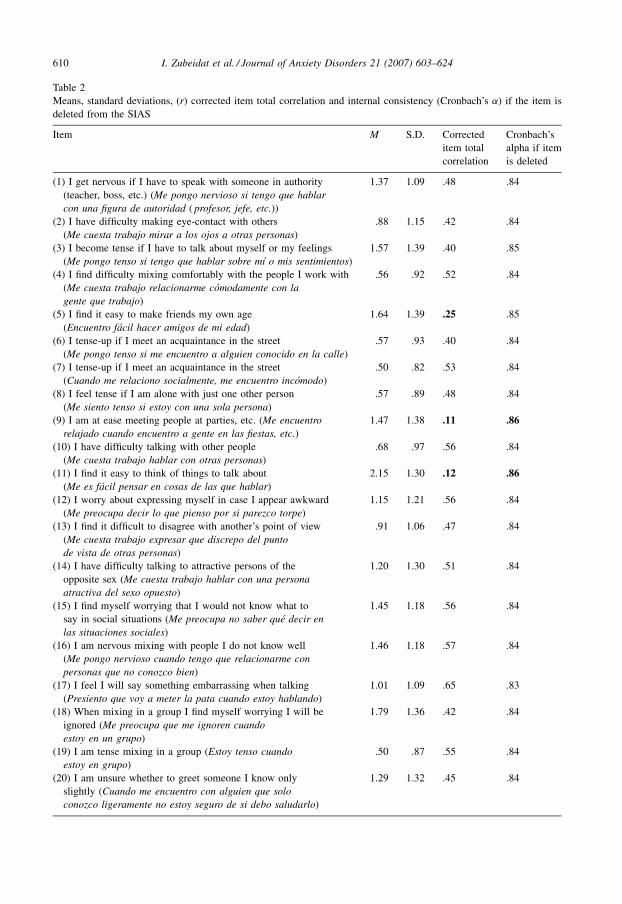
Table 2 shows data from the item analysis carried out for the SIAS, under the assumption of the
unidimensionality of the scale. It includes the mean, standard deviation, corrected item total
correlation and Cronbach’s alpha, if the item was deleted. The scale has a Cronbach’s alpha of .85.
As can be seen, the mean of the answers to the items is around 1.13 and the mean dispersion of
the answers to the items is 1.14. In all cases, the response range was 0–4. There were no items for
which none of the response options was chosen. The corrected item total correlation data
highlights the low correlation of items 5, 9 and 11 compared to the remaining items.
I. Zubeidat et al. / Journal of Anxiety Disorders 21 (2007) 603–624608
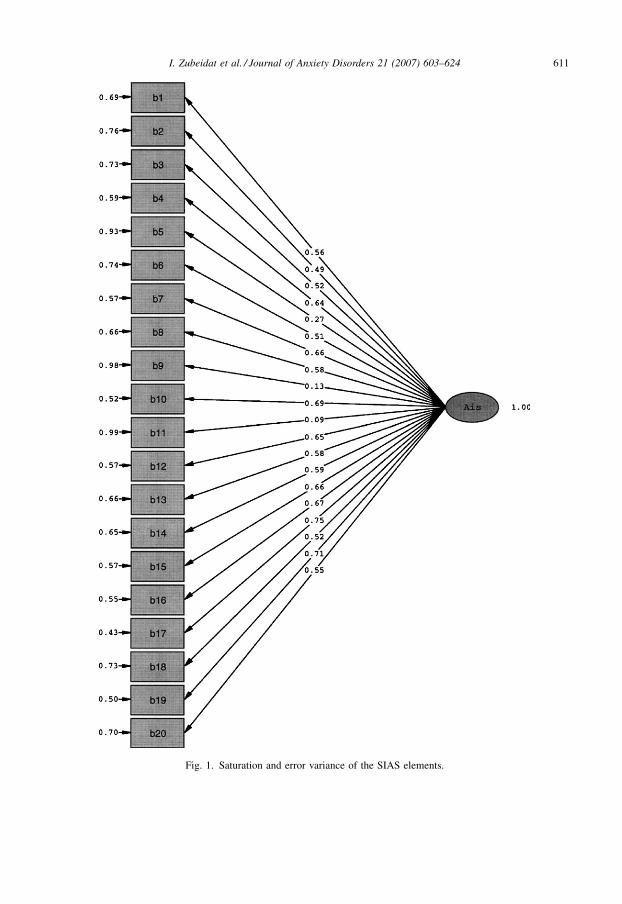
3.3. Unidimensional model validity
We started by testing the hypothesis of the original authors on the unidimensionality of the
SIAS. To this end, we carried out a confirmatory factor analysis (CFA) in which all the items
would be saturated. Fig. 1 shows the saturation of the 20 items of the SIAS scale in the construct
we attempted to measure (named Ais) and the error variance in each of them.
As Fig. 1 shows, 17 of the SIAS items managed to saturate at a value above .40 in the construct
we wanted to measure (Ais); the errors resulting from these items are notable. The three
remaining items (5, 9 and 11) have low saturation values of .27, .13 and .09, respectively;
moreover, the error produced by these items is fairly high, .93, .98 and .99, respectively. Also, the
value of the Chi-square statistic is high (x2 = 1727.51; d.f. = 170; p = .00), which shows that our
data does not match this unidimensional model.
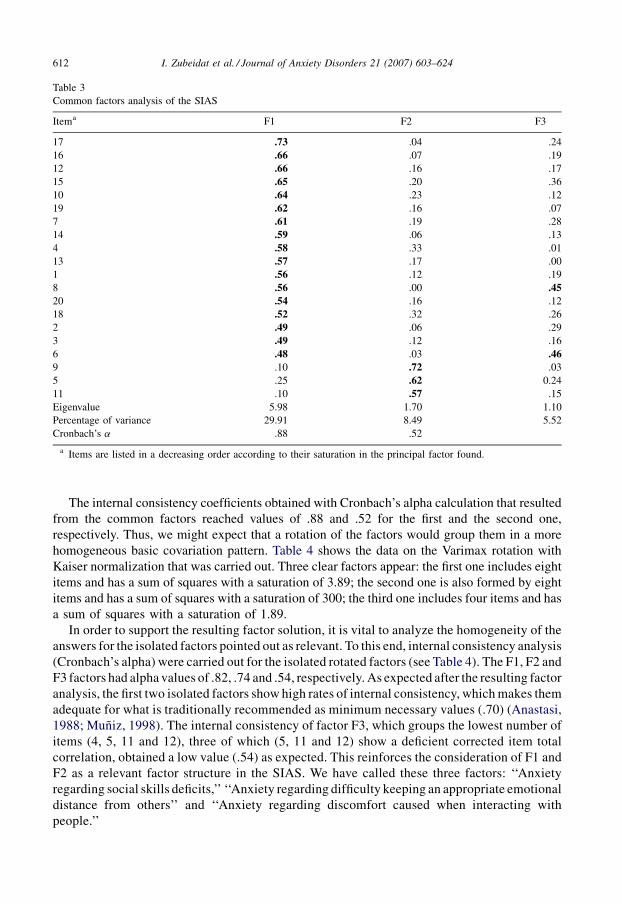
3.4. Factor analysis and internal consistency
After verifying the adequate sensitivity of the items, the factor structure of the SIAS was
analyzed. To this end, the common factors were extracted by principal components method and
Varimax rotation with Kaiser normalization was applied to the initial structure in order to
determine the factorial structure (see Table 3). To determine the number of factors, we considered
eigenvalues higher than 1. The factor solution reveals a main dimension that clusters 17 items and
explains 29.91% of the variance, with an eigenvalue of 5.98; along with this factor, two less
important ones appear. The F2 factor explains 8.49% of the variance with an eigenvalue of 1.70
and is formed by three items (5, 9 and 11). Finally, the F3 factor, with an eigenvalue of 1.10,
explains 5.52% of the variance by grouping two items (6 and 8).
I. Zubeidat et al. / Journal of Anxiety Disorders 21 (2007) 603–624 609
Table 1
Sample distribution and mean differences in SIAS scores based on socio-demographic variables
n (%) M (S.D.) t
Sex
Male 430 (42.50%) 21.43 (10.70) �3.07**
Female 582 (57.50%) 23.70 (12.40)
Age
13–15 years 483 (47.72%) 23.00 (11.83) .69
16–19 years 529 (52.30%) 22.50 (11.70)
School year
Comp./NC 841 (83.10%) 22.34 (11.50) �2.14*
Vocational 171 (16.90%) 24.60 (12.80)
Romantic rel.
With 296 (29.25%) 21.69 (11.60) �1.81
Without 716 (70.80%) 23.14 (11.80)
Employment
With job 86 (8.50%) 22.70 (12,30) �.02
Without job 926 (91.50%) 22.72 (11.70)
Note: Comp., compulsory secondary education; NC, non-compulsive secondary education; vocational, vocational
training courses; romantic rel., romantic relationship.* p < .05.
** p < .01.
I. Zubeidat et al. / Journal of Anxiety Disorders 21 (2007) 603–624610
Table 2
Means, standard deviations, (r) corrected item total correlation and internal consistency (Cronbach’s a) if the item is
deleted from the SIAS
Item M S.D. Corrected
item total
correlation
Cronbach’s
alpha if item
is deleted
(1) I get nervous if I have to speak with someone in authority
(teacher, boss, etc.) (Me pongo nervioso si tengo que hablar
con una figura de autoridad ( profesor, jefe, etc.))
1.37 1.09 .48 .84
(2) I have difficulty making eye-contact with others
(Me cuesta trabajo mirar a los ojos a otras personas)
.88 1.15 .42 .84
(3) I become tense if I have to talk about myself or my feelings
(Me pongo tenso si tengo que hablar sobre mı o mis sentimientos)
1.57 1.39 .40 .85
(4) I find difficulty mixing comfortably with the people I work with
(Me cuesta trabajo relacionarme comodamente con la
gente que trabajo)
.56 .92 .52 .84
(5) I find it easy to make friends my own age
(Encuentro facil hacer amigos de mi edad)
1.64 1.39 .25 .85
(6) I tense-up if I meet an acquaintance in the street
(Me pongo tenso si me encuentro a alguien conocido en la calle)
.57 .93 .40 .84
(7) I tense-up if I meet an acquaintance in the street
(Cuando me relaciono socialmente, me encuentro incomodo)
.50 .82 .53 .84
(8) I feel tense if I am alone with just one other person
(Me siento tenso si estoy con una sola persona)
.57 .89 .48 .84
(9) I am at ease meeting people at parties, etc. (Me encuentro
relajado cuando encuentro a gente en las fiestas, etc.)
1.47 1.38 .11 .86
(10) I have difficulty talking with other people
(Me cuesta trabajo hablar con otras personas)
.68 .97 .56 .84
(11) I find it easy to think of things to talk about
(Me es facil pensar en cosas de las que hablar)
2.15 1.30 .12 .86
(12) I worry about expressing myself in case I appear awkward
(Me preocupa decir lo que pienso por si parezco torpe)
1.15 1.21 .56 .84
(13) I find it difficult to disagree with another’s point of view
(Me cuesta trabajo expresar que discrepo del punto
de vista de otras personas)
.91 1.06 .47 .84
(14) I have difficulty talking to attractive persons of the
opposite sex (Me cuesta trabajo hablar con una persona
atractiva del sexo opuesto)
1.20 1.30 .51 .84
(15) I find myself worrying that I would not know what to
say in social situations (Me preocupa no saber que decir en
las situaciones sociales)
1.45 1.18 .56 .84
(16) I am nervous mixing with people I do not know well
(Me pongo nervioso cuando tengo que relacionarme con
personas que no conozco bien)
1.46 1.18 .57 .84
(17) I feel I will say something embarrassing when talking
(Presiento que voy a meter la pata cuando estoy hablando)
1.01 1.09 .65 .83
(18) When mixing in a group I find myself worrying I will be
ignored (Me preocupa que me ignoren cuando
estoy en un grupo)
1.79 1.36 .42 .84
(19) I am tense mixing in a group (Estoy tenso cuando
estoy en grupo)
.50 .87 .55 .84
(20) I am unsure whether to greet someone I know only
slightly (Cuando me encuentro con alguien que solo
conozco ligeramente no estoy seguro de si debo saludarlo)
1.29 1.32 .45 .84
I. Zubeidat et al. / Journal of Anxiety Disorders 21 (2007) 603–624 611
Fig. 1. Saturation and error variance of the SIAS elements.
The internal consistency coefficients obtained with Cronbach’s alpha calculation that resulted
from the common factors reached values of .88 and .52 for the first and the second one,
respectively. Thus, we might expect that a rotation of the factors would group them in a more
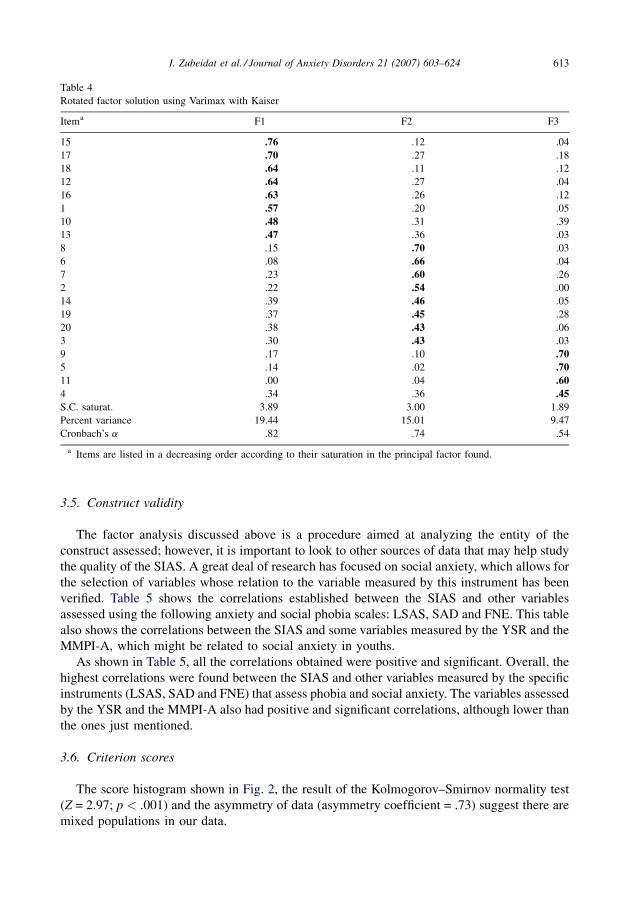
homogeneous basic covariation pattern. Table 4 shows the data on the Varimax rotation with
Kaiser normalization that was carried out. Three clear factors appear: the first one includes eight
items and has a sum of squares with a saturation of 3.89; the second one is also formed by eight
items and has a sum of squares with a saturation of 300; the third one includes four items and has
a sum of squares with a saturation of 1.89.
In order to support the resulting factor solution, it is vital to analyze the homogeneity of the
answers for the isolated factors pointed out as relevant. To this end, internal consistency analysis
(Cronbach’s alpha) were carried out for the isolated rotated factors (see Table 4). The F1, F2 and
F3 factors had alpha values of .82, .74 and .54, respectively. As expected after the resulting factor
analysis, the first two isolated factors show high rates of internal consistency, which makes them
adequate for what is traditionally recommended as minimum necessary values (.70) (Anastasi,
1988; Muniz, 1998). The internal consistency of factor F3, which groups the lowest number of
items (4, 5, 11 and 12), three of which (5, 11 and 12) show a deficient corrected item total
correlation, obtained a low value (.54) as expected. This reinforces the consideration of F1 and
F2 as a relevant factor structure in the SIAS. We have called these three factors: ‘‘Anxiety
regarding social skills deficits,’’ ‘‘Anxiety regarding difficulty keeping an appropriate emotional
distance from others’’ and ‘‘Anxiety regarding discomfort caused when interacting with
people.’’
I. Zubeidat et al. / Journal of Anxiety Disorders 21 (2007) 603–624612
Table 3
Common factors analysis of the SIAS
Itema F1 F2 F3
17 .73 �.04 �.24
16 .66 �.07 �.19
12 .66 �.16 �.17
15 .65 �.20 �.36
10 .64 .23 �.12
19 .62 .16 .07
7 .61 .19 .28
14 .59 �.06 .13
4 .58 .33 �.01
13 .57 �.17 .00
1 .56 �.12 �.19
8 .56 .00 .4520 .54 �.16 .12
18 .52 �.32 �.26
2 .49 �.06 .29
3 .49 �.12 .16
6 .48 .03 .469 .10 .72 .03
5 .25 .62 �0.24
11 .10 .57 .15
Eigenvalue 5.98 1.70 1.10
Percentage of variance 29.91 8.49 5.52
Cronbach’s a .88 .52
a Items are listed in a decreasing order according to their saturation in the principal factor found.
3.5. Construct validity
The factor analysis discussed above is a procedure aimed at analyzing the entity of the
construct assessed; however, it is important to look to other sources of data that may help study
the quality of the SIAS. A great deal of research has focused on social anxiety, which allows for
the selection of variables whose relation to the variable measured by this instrument has been
verified. Table 5 shows the correlations established between the SIAS and other variables
assessed using the following anxiety and social phobia scales: LSAS, SAD and FNE. This table
also shows the correlations between the SIAS and some variables measured by the YSR and the
MMPI-A, which might be related to social anxiety in youths.
As shown in Table 5, all the correlations obtained were positive and significant. Overall, the
highest correlations were found between the SIAS and other variables measured by the specific
instruments (LSAS, SAD and FNE) that assess phobia and social anxiety. The variables assessed
by the YSR and the MMPI-A also had positive and significant correlations, although lower than
the ones just mentioned.
3.6. Criterion scores
The score histogram shown in Fig. 2, the result of the Kolmogorov–Smirnov normality test
(Z = 2.97; p < .001) and the asymmetry of data (asymmetry coefficient = .73) suggest there are
mixed populations in our data.
I. Zubeidat et al. / Journal of Anxiety Disorders 21 (2007) 603–624 613
Table 4
Rotated factor solution using Varimax with Kaiser
Itema F1 F2 F3
15 .76 .12 .04
17 .70 .27 .18
18 .64 .11 �.12
12 .64 .27 .04
16 .63 .26 .12
1 .57 .20 .05
10 .48 .31 .39
13 .47 .36 �.03
8 .15 .70 .03
6 .08 .66 .04
7 .23 .60 .26
2 .22 .54 .00
14 .39 .46 .05
19 .37 .45 .28
20 .38 .43 �.06
3 .30 .43 �.03
9 �.17 .10 .705 .14 �.02 .7011 .00 �.04 .604 .34 .36 .45S.C. saturat. 3.89 3.00 1.89
Percent variance 19.44 15.01 9.47
Cronbach’s a .82 .74 .54
a Items are listed in a decreasing order according to their saturation in the principal factor found.

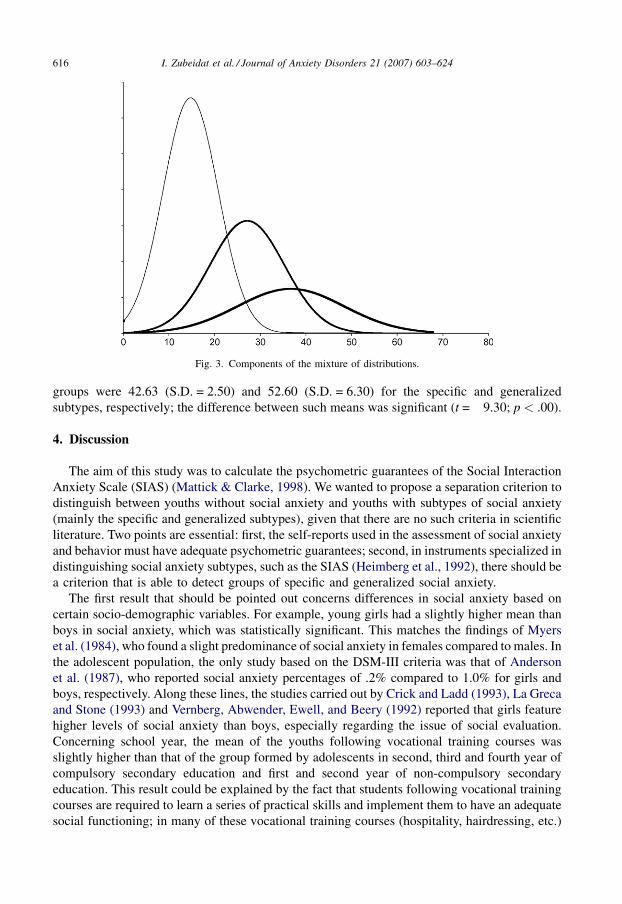
To separate such populations, we used the method of maximum likelihood and estimated the
parameters of a mixture of three normal distributions with Normix22 software (Wolfe, 1970).
Table 6 shows the estimates obtained for the three distributions.
Fig. 3 provides the graphic representation of the three distributions that led to the joint
distribution.
Table 7 shows the descriptive data of the three clusters we formed by assigning each individual to
the group he or she was most likely to belong to. We identified the groups that corresponded to the
I. Zubeidat et al. / Journal of Anxiety Disorders 21 (2007) 603–624614
Table 5
Pearson correlations between the SIAS scores and those of other variables
Variables Correlation with SIAS Confidence intervals
Anxiety of public performance .60 (.56–.64)
Avoidance of public situations .59 (.55–.63)
Anxiety in social interaction situations .47 (.42–.52)
Avoidance of social interaction situations .48 (.43–.53)
Total of social anxiety .62 (.58–.66)
Total of social avoidance .49 (.44–.54)
Total of social anxiety and avoidance .60 (.56–.64)
Social avoidance and distress .65 (.61–.68)
Fear of negative evaluation .48 (.43–.53)
Anxiety problems .40 (.35–.45)
Anxious/depressed .45 (.40–.50)
Withdrawn/depressed .44 (.39–.49)
Social problems .44 (.39–.49)
Internal syndromes .45 (.40–.50)
External syndromes .07 (.01–.13)
Depression (D) .22 (.16–.28)
Social introversion (Si) .39 (.34–.44)
Anxiety (ANX) .30 (.24–.36)
Depression (DEP) .32 (.26–.38)
Alienation (ALN) .31 (.25–.37)
Low self-esteem (LSE) .38 (.33–.43)
Social discomfort (SOD) .43 (.38–.48)
Negative treatment indicators (TRT) .31 (.25–.37)
Table 6
Parameters of the mixture of distributions
Distribution 1 Distribution 2 Distribution 3
Probability .50 .32 .18
Mean 14.75 27.14 36.70
Standard deviation 6.05 8.16 11.71
Table 7
Description of the clusters obtained
Cluster 1 Cluster 2 Cluster 3
No. of cases 568 340 104
Mean 14.33 29.52 46.27
Standard deviation 5.16 4.50 6.43
Value range 0–22 23–38 39–68
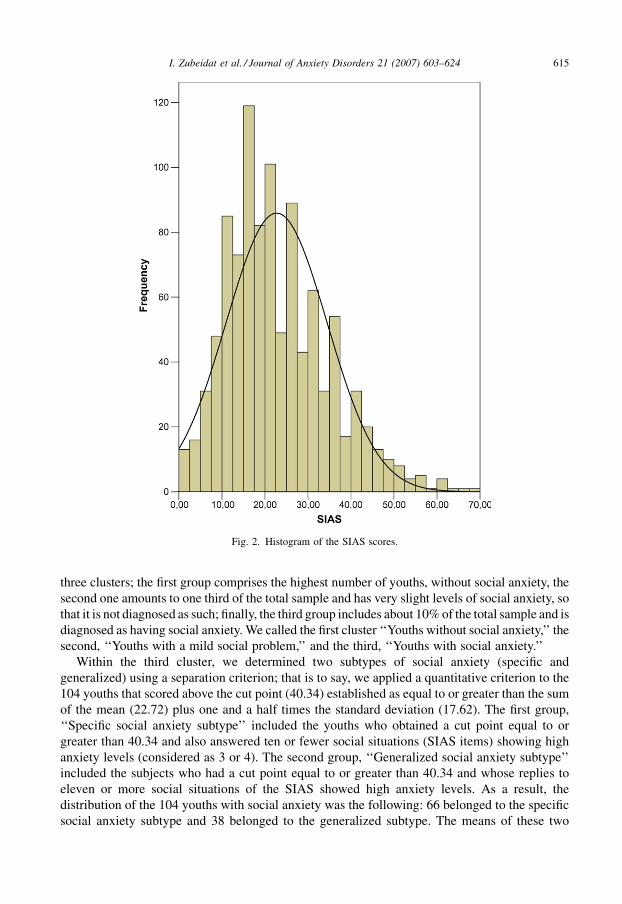
three clusters; the first group comprises the highest number of youths, without social anxiety, the
second one amounts to one third of the total sample and has very slight levels of social anxiety, so
that it is not diagnosed as such; finally, the third group includes about 10% of the total sample and is
diagnosed as having social anxiety. We called the first cluster ‘‘Youths without social anxiety,’’ the
second, ‘‘Youths with a mild social problem,’’ and the third, ‘‘Youths with social anxiety.’’
Within the third cluster, we determined two subtypes of social anxiety (specific and
generalized) using a separation criterion; that is to say, we applied a quantitative criterion to the
104 youths that scored above the cut point (40.34) established as equal to or greater than the sum
of the mean (22.72) plus one and a half times the standard deviation (17.62). The first group,
‘‘Specific social anxiety subtype’’ included the youths who obtained a cut point equal to or
greater than 40.34 and also answered ten or fewer social situations (SIAS items) showing high
anxiety levels (considered as 3 or 4). The second group, ‘‘Generalized social anxiety subtype’’
included the subjects who had a cut point equal to or greater than 40.34 and whose replies to
eleven or more social situations of the SIAS showed high anxiety levels. As a result, the
distribution of the 104 youths with social anxiety was the following: 66 belonged to the specific
social anxiety subtype and 38 belonged to the generalized subtype. The means of these two
I. Zubeidat et al. / Journal of Anxiety Disorders 21 (2007) 603–624 615
Fig. 2. Histogram of the SIAS scores.
groups were 42.63 (S.D. = 2.50) and 52.60 (S.D. = 6.30) for the specific and generalized
subtypes, respectively; the difference between such means was significant (t = �9.30; p < .00).
4. Discussion
The aim of this study was to calculate the psychometric guarantees of the Social Interaction
Anxiety Scale (SIAS) (Mattick & Clarke, 1998). We wanted to propose a separation criterion to
distinguish between youths without social anxiety and youths with subtypes of social anxiety
(mainly the specific and generalized subtypes), given that there are no such criteria in scientific
literature. Two points are essential: first, the self-reports used in the assessment of social anxiety
and behavior must have adequate psychometric guarantees; second, in instruments specialized in
distinguishing social anxiety subtypes, such as the SIAS (Heimberg et al., 1992), there should be
a criterion that is able to detect groups of specific and generalized social anxiety.
The first result that should be pointed out concerns differences in social anxiety based on
certain socio-demographic variables. For example, young girls had a slightly higher mean than
boys in social anxiety, which was statistically significant. This matches the findings of Myers
et al. (1984), who found a slight predominance of social anxiety in females compared to males. In
the adolescent population, the only study based on the DSM-III criteria was that of Anderson
et al. (1987), who reported social anxiety percentages of .2% compared to 1.0% for girls and
boys, respectively. Along these lines, the studies carried out by Crick and Ladd (1993), La Greca
and Stone (1993) and Vernberg, Abwender, Ewell, and Beery (1992) reported that girls feature
higher levels of social anxiety than boys, especially regarding the issue of social evaluation.
Concerning school year, the mean of the youths following vocational training courses was
slightly higher than that of the group formed by adolescents in second, third and fourth year of
compulsory secondary education and first and second year of non-compulsory secondary
education. This result could be explained by the fact that students following vocational training
courses are required to learn a series of practical skills and implement them to have an adequate
social functioning; in many of these vocational training courses (hospitality, hairdressing, etc.)
I. Zubeidat et al. / Journal of Anxiety Disorders 21 (2007) 603–624616
Fig. 3. Components of the mixture of distributions.
the examinations of students involve a public display of such skills. Besides knowledge, it is
important to show certain interpersonal skills, which may lead these students to be seen as
sensitive to the evaluation when they answer the questionnaires. Magee et al. (1996) also found
differences in social anxiety based on education level.
The analysis carried out on the quality of the items raises certain doubts, since three items (5, 9
and 11) out of the 20 that form the SIAS showed a very low correlation with the rest of the items
of the scale. This matches the study of Olivares et al. (2001). Moreover, if items 9 or 11 were
eliminated, Cronbach’s alpha would increase to .86. In these last two items and the fifth one, data
are problematic and should be taken into account when interpreting the reliability of the scale and
the factor structure. Cronbach’s alpha is decreased by eliminating the remaining items, except in
the case of 5, when it stays the same. In fact, the low corrected item total correlation of these three
items can be interpreted in two ways. The first interpretation refers to the fact that such items are
worded differently than the rest. That is to say, items 5, 9 and 11 of the SIAS are positively
worded and have to be inverted for their score to be considered, whereas the remaining 17 items
are negatively worded. The second interpretation relates to the content of such items. The items
in question refer to discomfort in social interaction situations, whereas the remaining ones
measure anxiety experienced in such situations. It must be stated that no studies in scientific
literature have attempted to analyze the behavior of SIAS items separately. Instead, the different
studies carried out (Habke et al., 1997; Heimberg et al., 1992; Mattick & Clarke, 1998; Olivares
et al., 2001; Safren et al., 1998) have analyzed the 40 items of the SIAS and the SPS jointly. In any
case, future studies should include more items – at least three – with a positive format in order to
reach a balance between positive and negative items and reduce any possible biases.
If the SIAS is considered to be unidimensional, we found that the internal consistency
(Cronbach’s alpha) has a value of .85. This reliability index is adequate and close to the one (.86)
found by Heimberg et al. (1992). Moreover, these two values are close to the one (.93) found by
the authors of the SIAS scale (Mattick & Clarke, 1998). Nevertheless, the doubts mentioned
above concerning the quality of the items led us to carry out a confirmatory analysis of the
construct measured to test the unidimensionality of the SIAS argued by Mattick and Clarke
(1998). Again, we obtained evidence on the low saturation in the construct and the high degree of
error produced by items 5, 9 and 11. Apart from this, the value of the Chi-square statistic obtained
was high, highlighting the incongruence between our data and the unidimensional model
proposed by such authors. These first findings highlight the need to carry out an independent
factor analysis of the SIAS, without considering the SPS jointly. Results of the principal
unrotated factor analysis reveal the existence of two factors. The third factor will not be taken into
consideration because its eigenvalue is not significantly greater than one (1.03) and its items
reach a higher factor saturation in F1. This matches the confirmatory factor analysis, which
rejected the single-factor model. That is to say, we find a first dominant factor that groups 17 out
of the 20 items of the SIAS and a second one formed by the three positive items (5, 9 and 11).
These first data suggest that the SIAS assesses mainly, but not only, a dimension that refers to the
physiological anxiety experienced in social interaction situations that could be called ‘‘Anxiety
regarding social interaction.’’ However, there seems to be another less relevant dimension than
the first one that refers to the discomfort experienced by people in social situations, which could
be called ‘‘Discomfort regarding social interaction.’’ This result suggests that the factor structure
found for the SIAS does not reflect one single dimension as reported by Mattick and Clarke
(1998), and that the elements included in this scale must be carefully examined. Only the first
factor has a good internal consistency (an alpha value of .88). Moreover, all the items included in
the first factor feature a correlation with the rest that is equal to or higher than .40, which confers
I. Zubeidat et al. / Journal of Anxiety Disorders 21 (2007) 603–624 617
an adequate consistency and quality to the items of this factor. As regards the second factor, apart
from having an inadequate internal consistency (.52), its items show a correlation with the rest of
items that is lower than .30. If other studies eventually confirm the existence of this second factor,
we believe the scale should be modified and include more items to assess this dimension with an
adequate reliability.
All this highlights the complexity of the construct we are evaluating and the need to carry out
an orthogonal rotation of these three factors found in order to be certain about the factor structure
of the SIAS. To this end, the Varimax rotation with Kaiser normalization procedure was carried
out to find possible covariations that may support the lack of unidimensionality of the SIAS.
Again, the results highlight the existence of more than one factor measured by this scale. This
time, three factors were identified which cluster 8, 8 and 4 items for factors F1, F2 and F3,
respectively. The saturation of these items in each factor was fairly high, and the internal
consistency coefficients (Cronbach’s alpha) had adequate values for the first two factors and
inadequate ones for the third one. Analyzing the items included in each of these three factors, it
can be seen that the first one contains elements that mainly refer to anxiety experienced in
interaction situations that involved implementing certain social skills, such as ‘‘I get nervous if I
have to speak with someone in authority (teacher, boss, etc.)’’ (item 1), ‘‘I worry about
expressing myself in case I appear awkward’’ (item 12), ‘‘I find it difficult to disagree with
another’s point of view’’ (item 13) or ‘‘I feel I’ll say something embarrassing when talking’’
(item 17). The second factor clusters items that refer to anxiety produced by interaction in social
situations that require reducing emotional distance or establishing ties of affection with others,
including items, such as ‘‘I become tense if I have to talk about myself or my feelings’’ (item 3),
‘‘I tense-up if I meet an acquaintance in the street’’ (item 6), ‘‘I feel tense if I am alone with just
one other person’’ (item 8) or ‘‘I have difficulty talking to attractive persons of the opposite sex’’
(item 14). Finally, the third factor groups items that refer to the discomfort felt in situations that
involve relating to people and includes the following items: ‘‘I find difficulty mixing
comfortably with the people I work with’’ (item 4), ‘‘I find it easy to make friends my own age’’
(item 5), ‘‘I am at easy meeting people at parties, etc.’’ (item 9), ‘‘I find it easy to think of things to
talk about’’ (item 11). Thus, we could call the first factor ‘‘Anxiety related to social skills
deficits,’’ the second one, ‘‘Anxiety regarding difficulty keeping an appropriate emotional
distance from others,’’ and the third one, ‘‘Anxiety regarding discomfort caused when
interacting with people.’’ In terms of the number of factors, this finding matches those of Habke
et al. (1997) and Safren et al. (1998), who also described three factors. However, their analysis
was based on the joint study of the 40 items of the SPS and SIAS scales. Thus, the three factors
we have found in our study are a relevant novelty regarding the review of the factor structure of
the SIAS. Other studies carried out on this issue (for example, Heimberg et al., 1992; Olivares
et al., 2001) did not provide data on the possible bidimensionality or tridimensionality of the
SIAS. Instead, their results responded to the unidimensionality proposed by the original authors
of the scale (Mattick & Clarke, 1998).
Apart from the factor analysis, there are other sources possible to study the quality of the
SIAS; one of them is to analyze its correlation with other variables. The results show that the
SIAS has significant correlations with the following variables assessed by specialized
instruments to measure social anxiety and phobia (LSAS, SAD and FNE): anxiety of public
performance, avoidance of public situations, anxiety in social interaction situations, avoidance of
social interaction situations, total of social anxiety, total of social avoidance, total of social
anxiety and avoidance, social avoidance and distress, fear of negative evaluation. Moreover,
significant correlations were shown, on one side, between the SIAS and some variables measured
I. Zubeidat et al. / Journal of Anxiety Disorders 21 (2007) 603–624618
by the YSR/11-18, such as anxiety problems, anxious/depressed, withdrawn/depressed, social
problems, internal syndromes and external syndromes; and, on the other side, between the SIAS
and others assessed by the MMPI-A, such as depression (D), social introversion (Si), anxiety
(ANX), depression (DEP), alienation (ALN), low self-esteem (LSE), social discomfort (SOD)
and negative treatment indicators (TRT). Furthermore, the highest correlations were found
precisely between the SIAS scores and social anxiety and avoidance. Similarly, it has been found
that individuals with generalized social anxiety report more social avoidance (Herbert et al.,
1992; Holt et al., 1992), an exaggerated fear of negative evaluation (Holt et al., 1992), major
social skills deficits (Tran & Chambless, 1995) and more overall social anxiety (Herbert et al.,
1992; Holt et al., 1992; Turner et al., 1994) than individuals with specific social anxiety, which
matches our findings. In the same way, Mennin, Heimberg, and Jack (2000) reported that patients
with generalized social anxiety obtain highly severe measures in social anxiety and avoidance,
general anxiety, cognitive symptoms of anxiety, and depressive mood. Finally, interaction
anxiety has been found to be associated with continuous indices of low self-esteem, trait anxiety
and shyness (Hooke et al., 2000).
Finally, we suggest that, as the histogram shows, the SIAS scores do not form one single
distribution. We believe that, instead, they reflect the mixed distributions that highlight the
existence of three groups of youths; the second of which has some kind of social problem but is
considered different from the third group called, ‘‘Youths with social anxiety.’’ This finding is
new compared to the ones currently seen in scientific literature, since most studies (Stein,
McQuaid, Laffaye, & McCahill, 1999; Stein, Walker, & Forde, 1996; Weiller et al., 1996;
Wittchen et al., 1999) do not mention this second group, although they identify a group with
social anxiety, whose percentage matches that of our third group (about 10%). These studies
show that social phobia has a prevalence ranging between 2% and 16%. Recently, a prevalence
rate of 8.2% has been found in a community sample of adolescents in the South-East of Spain
(Olivares, 2004). Understood in this way, subjects with social anxiety are not those with extreme
scores in a normal distribution. Instead, they make up a clearly differentiated population with its
own features, whose scores in the questionnaire partially overlap with those of the other groups.
Of all the different procedures we used to differentiate the mixed populations – K-means
cluster means, two-stage cluster, mixture of distributions that always suggested the existence of
three different groups of youths – we chose to present the results obtained in the mixture of
distributions estimation. We did so because the estimations obtained from the parameters will
allow other researchers to set the most adequate cut points on a case by case basis depending on
their interests and objectives. In our case, facing the lack of separation criteria to distinguish
between the two forms–specific and generalized – of social anxiety, we attempted to determine
social anxiety subtypes within the third established group of the 104 youths with social anxiety
that had obtained a mean in the SIAS above the cut point (38) found. To do so, we applied a
quantitative separation criterion to this third group. Thus, the youths that showed high anxiety
levels (3 or 4) in more than half (10) of the situations of the SIAS were assigned to the generalized
social anxiety subtype. The others – those whose answered showed a high level of anxiety in 10 or
fewer situations – were assigned to the specific social anxiety subtype. Both subtypes of youths
with specific and generalized social anxiety obtained by applying this separation criterion
included 66 and 38 subjects, respectively. About two thirds (63%) corresponded to the
generalized subtype and one third (37%) involved the specific subtype. Our separation criterion
between both forms of social anxiety may be just as valid as any other criterion used by different
studies (Furmark, Tillfors, Stattin, Ekselius, & Fredrikson, 2000; Heimberg & Holt, 1989;
Kessler et al., 1994; Mannuzza et al., 1995; Quero, Banos, Botella, & Gallardo, 2003; Stein,
I. Zubeidat et al. / Journal of Anxiety Disorders 21 (2007) 603–624 619
Torgrud, & Walter, 2000). In these instances of research, as in our study, all the criteria used were
quantitative, although there were variations in the number of subtypes with social anxiety found
among the different studies. For example, the qualitative criterion used in the present study
partially matches the studies carried out by Quero et al. (2003) and Stein et al. (2000). The former
defined social anxiety groups through the cluster analysis of the situations of the Anxiety
Disorders Interview Schedule-Revised (ADIS-R) (Di Nardo & Barlow, 1988). The latter,
however, proposed a quantitative criterion based on the DSM-IV criteria (especially concerning
the conceptualization of generalized social anxiety as the ‘‘fear of most social situations’’). It
included people in the category of generalized social anxiety when they expressed fear of 7 or
more social situations out of 12 (half of them were performance situations, whereas the other half
were interactional situations) and in another non-generalized group, which comprised the rest of
individuals. Heimberg and Holt (1989) classified social phobia subtypes into three kinds:
generalized (defined as the fear of most social situations), circumscribed (fear of a limited
number of discrete situations) and non-generalized (fear of a limited number of social interaction
situations with or without fear in specific performance situations). Likewise, Furmark et al.
(2000) clearly distinguished between a generalized subtype (with high scores), a non-generalized
subtype (with medium scores) and discrete social anxiety (with low scores).
In short, based on the previous studies we cannot talk about clearly differentiated social
anxiety categories in the general population, although such distinction between subtypes can be
used in the clinical practice. Moreover, it must be pointed out that most of the above-mentioned
studies were carried out on the adult population, whereas research on adolescents is still very
scarce.
5. Conclusions
The review of the psychometric properties of the SIAS must explore its items separately in
order to obtain information about their character and features. It would also be convenient to add
more items to the SIAS scale, especially positively worded ones. The reason for this is that it
currently includes only three items of this kind, which show very low correlations with the
remaining items and low reliability. Therefore, future studies should focus on modifying this
scale, formulating new positively worded items that belong to a possible second dimension and
leading to new studies that aim at reviewing the psychometric characteristics of the SIAS.
Likewise, the factor analysis of the SIAS should be made with the 20 elements it contains in order
to obtain evidence on the possible bidimensionality or tridimensionality of this scale, given that
the confirmatory factor analysis rejects the single-factor model put forward by the original
authors of the scale. Moreover, the SIAS seems to assess specific dimensions that differ from the
social anxiety construct, which highlights the complexity of the construct measured. Such
dimensions may refer to anxiety experienced by people due to the lack of social skills, to the
possible inadequate estimation of emotional distance with respect to others, and to the discomfort
experienced in social interaction situations. Along these lines, it is expected that the SIAS will
correlate significantly with different variables related to the field of interpersonal relations,
especially with those related to social anxiety and avoidance. Future studies would then identify
these possible dimensions in populations of adults and adolescents.
Apart from this, it seems, the distributions of the SIAS scores does not show one single
population, but rather mixed populations where different groups can be distinguished. The
distinction between the possible groups always depends on the separation criterion used and
applied by each researcher depending on his or her interests and objectives. Thus, it is possible to
I. Zubeidat et al. / Journal of Anxiety Disorders 21 (2007) 603–624620
determine social anxiety subtypes with the SIAS scale by applying mainly quantitative criteria,
although quite often the distinction between groups is not completely clear. Perhaps future
studies should consider not only quantitative but also qualitative criteria when establishing
groups with specific and generalized social anxiety that differ from other groups without social
anxiety for both the adult and adolescent populations.
References
Abad, J., Forns, M., Amador, J. A., & Martorell, B. (2000). Fiabilidad y validez del Youth Self Report en una muestra de
adolescentes. Psicothema, 12, 49–54.
Achenbach, T. M. (1991). Manual for the self-report and 1991 YSR profile. Burlington, TV: University of Vermont,
Department of Psychiatry.
Achenbach, T. M., & Edelbrock, C. S. (1978). The classification of child psychopathology: A review and analysis of
empirical efforts. Psychological Bulletin, 85, 1275–1301.
American Psychiatric Association (1987). Diagnostic and statistical manual of mental disorders (3rd ed., rev.).
Washington, DC: Author.
American Psychiatric Association (1994). Diagnostic and statistical manual of mental disorders (4rth ed.). Washington,
DC: Author.
Amies, P. L., Gelder, M. G., & Shaw, P. M. (1983). Social phobia: A comparative clinical study. British Journal of
Psychiatry, 142, 174–179.
Anastasi, A. (1988). Psychological testing (6a ed.). New York: MacMillan.
Anderson, J. C., Williams, S., McGee, R., & Silva, P. A. (1987). DSM-III disorders in preadolescent children. Archives of
General Psychiatry, 44, 69–76.
Ballenger, J. C., Davidson, J. R. T., Lecrubier, Y., Nutt, D. J., Bobes, J., Beidel, D. C., et al. (1998). Consensus statement
on panic disorder from the International Consensus Group on Depression and Anxiety. Journal of Clinical Psychiatry,
59, 54–60.
Beidel, D. C., & Turner, S. M. (1988). Comorbidity of test anxiety and other anxiety disorders in children. Journal of
Abnormal Child Psychology, 16, 275–287.
Beidel, D. C., Turner, S. M., & Dancu, C. V. (1985). Physiological, cognitive and behavioral aspects of social anxiety.
Behaviour Research and Therapy, 23, 109–117.
Bernstein, G. A., Garfinkel, B. D., & Hoberman, H. M. (1989). Self-reported anxiety in adolescents. American Journal of
Psychiatry, 146, 384–386.
Bobes, J., Badıa, X., Luque, A., Garcıa, M., Gonzalez, M. P., Dal-Re, R., et al. (1999). Validacion de las versiones en
espanol de los cuestionarios Liebowitz Social Anxiety Scale, Social Anxiety and Distress Scale y Sheenan Disability
Inventory para la evaluacion de la fobia social. Medicina Clınica, 112, 530–538.
Butcher, J. N., Dahlstrom, W. G., Graham, J. R., Tellegen, A. & Kaemmer, B. (1989). Minnesota Multiphasic Personality
Inventory-2 (MMPI-2): Manual for administation and scoring. Minneapolis: University of Minnesota Press.
Butcher, J. N., Williams, C. L., Graham, J. R., Archer, R. P., Tellegen, A., Ben-Porath, Y. S., et al. (1992). MMPI-A,
Minnesota Multiphasic Personality Inventory-Adolescent. Minneapolis: University of Minnesota Press.
Carretero-Dios, H., & Perez, C. (2005). Normas para el desarrollo y revision de estudios instrumentales. International
Journal of Clinical and Health Psychology, 5, 521–551.
Comeche, M. I., Dıaz, M. I., & Vallejo, M. A. (1995). Cuestionarios, inventarios y escalas. Madrid: Fundacion
Universidad-Empresa.
Cox, B. J., Ross, L., Swinson, R. P., & Direnfeld, D. M. (1998). A comparison of social phobia autcome measures in
cognitive-behavioral group therapy. Behavior Modification, 22, 285–297.
Crick, N. R., & Ladd, G. W. (1993). Children’s perceptions of their peer experiences: Attributions, loneliness, social
anxiety, and social avoidance. Developmental Psychology, 29, 244–254.
Davidson, J. R. T., Hughes, D. C., George, L. K., & Blazer, D. G. (1993). The boundary of social phobia: Exploring the
threshold. Archives of General Psychiatry, 51, 975–983.
Davidson, J. R. T., Potts, N. L. S., Richichi, E. A., Krishnan, R., Ford, S. M., Smith, R. D., et al. (1991). The Brief Social
Phobia Scale. Journal of Clinical Psychiatry, 52, 48–51.
Di Nardo, P. A., & Barlow, D. H. (1988). The Anxiety Disorders Interview Schedule—revised (ADIS-R). Albany, NY:
Graywind.
Echeburua, E. (1993). Fobia social. Barcelona: Martınez Roca.
I. Zubeidat et al. / Journal of Anxiety Disorders 21 (2007) 603–624 621

Essau, C. A., Conradt, J., & Petermann, R. (1999). Frecuency and comorbidity of social phobia and social fears in
adolescents. Behavior Research and Therapy, 37, 831–843.
Furmark, T., Tillfors, M., Stattin, H., Ekselius, L., & Fredrikson, M. (2000). Social phobia subtypes in the general
population revealed by cluster analysis. Psychological Medicine, 30, 1335–1344.
Garcıa-Lopez, L. J. (2000). Un estudio de la eficacia entre tres modalidades de tratamiento para poblacion adolescente
con fobia social. Unpublished doctoral thesis. Facultad de Psicologıa. Universidad de Murcia.
Garcıa-Lopez, L. J., Olivares, J., & Hidalgo, M. D. (2005). A pilot study on sensitivity of outcome measures for
treatment of generalized social phobia in adolescents. International Journal of Clinical and Health Psychology, 5,
385–392.
Garcıa-Lopez, L. J., Olivares, J., Hidalgo, M. D., Beidel, D. C., & Turner, S. M. (2001). Psychometric properties of the
Social Phobia and Anxiety Inventory, the Social Anxiety Scale for Adolescents, the Fear of Negative Evaluation Scale
and the Social Avoidance Distress Scale in an adolescent Spanish speaking population. Journal of Psychopathology
and Behavioral Assessment, 23, 51–59.
Gilkinson, H. (1942). Social fears as reported by students in college speech classes. Sepech Monographs, 9, 141–160.
Glass, C. R., Merluzzi, T. V., Biever, J. L., & Larsen, K. H. (1982). Cognitive assessment of social anxiety: Development
and validation of a self-statement questionnaire. Cognitive Therapy and Research, 6, 37–55.
Habke, A. M., Hewitt, P. L., Norton, G. R., & Asmundson, G. (1997). The Social Phobia and Social Interaction Anxiety
Scales: An exploration of the dimensions of social anxiety and sex differences in structure and relations with
pathology. Journal of Psychopathology and Behavioral Assessment, 19, 21–39.
Hayward, C., Killen, J., Kraemer, H. C., & Taylor, C. B. (1998). Linking self-reported childhood behavioral inhibition to
adolescent phobia. Journal of American Academy Child and Adolescence Psychiatry, 37, 1308–1316.
Heimberg, R. G., Hope, D. A., Dodge, C. A., & Becker, R. E. (1990). DSM-III-R subtypes of social phobia: Comparison
of generalized social phobics and public speaking phobics. Journal of Nervous and Mental Disease, 178, 172–179.
Heimberg, R. G., Horner, K. J., Juster, H. R., Safren, S. A., Brown, E. J., Schneier, F. R., et al. (1999). Psychometric
properties of the Liebowitz Social Anxiety Scale. Psychological Medicine, 29, 199–212.
Heimberg, R. G., & Holt, C. S. (1989). The issue of subtypes in the diagnosis of social phobia: A report to the social
phobia subgroup for DSM-IV. Unpublished manuscript.
Heimberg, R. G., Holt, C. S., Schneier, F. R., Spitzer, R. L., & Liebowitz, M. R. (1993). The issue of subtypes in the
diagnosis of social phobia. Journal of Anxiety Disorders, 7, 249–269.
Heimberg, R. G., Liebowitz, M. R., Hope, D. A., & Schneier, F. (1995). Social phobia: Diagnosis, assessment, and
treatment. New York: Guilford Press.
Heimberg, R. G., Mueller, G. P., Holt, C. S., Hope, D. A., & Liebowitz, M. R. (1992). Assessment of anxiety in social
interaction and being observed by others: The Social Interaction Anxiety Scale and the Social Phobia Scale. Behavior
Therapy, 23, 53–73.
Herbert, J. D., Hope, D. A., & Bellack, A. S. (1992). Validity of the distinction between generalized social phobia and
avoidant personality disorders. Journal of Abnormal Psychology, 101, 332–339.
Hofmann, G. S. (2000). Treatment of social phobia: Potential mediators and moderators. Clinical Psychology: Science
and Practice, 7, 3–16.
Hofmann, S. G., Albano, A. M., Heimberg, R. G., Tracey, S., Chorpita, B. F., & Barlow, D. H. (1999). Subtypes of social
phobia in adolescents. Depression and Anxiety, 9, 15–18.
Hofmann, S. G., DiBartolo, P. M., Holaway, R. M., & Heimberg, R. G. (2004). Scoring error of Social Avoidance and
Distress Scale and its psychometric implications. Depression and Anxiety, 19, 197–198.
Holt, C. S., Heimberg, R. G., & Hope, D. A. (1992). Avoidant personality disorder and the generalized subtype in social
phobia. Journal of Abnormal Psychology, 101, 318–325.
Hooke, J. N., & Valentiner, D. P. (2002). Are specific and generalized social phobias qualitatively distinct? Clinical
Psychology: Science and Practice, 9, 379–395.
Hooke, J. N., Valentiner, D. P., & Kim, H. (2000). Distinction of social phobia subtypes. Poster accepted in the 34 of the
Annual Convention of the Association of the Advancement of Behavior Therapy, New Orleans: LA.
Kashani, J. H., Orvaschel, H., Rosenberg, T. K., & Reid, J. C. (1989). Psychopathology in a community sample of children
and adolescents: A developmental perspective. Journal of the American Academy of Child and Adolescent Psychiatry,
28, 701–706.
Kessler, R., McGonagle, K. A., Zhao, S., Nelson, C. B., Hughes, M., Eshleman, S., et al. (1994). Lifetime and 12-month
prevalence of DSM-III psychiatric disorders in the United States: Results from the National Comorbidity Survey.
Archives of General Psychiatry, 51, 8–19.
Kessler, R. C., Stein, M. B., & Berglund, P. (1998). Social phobia subtypes in the National Comorbidity Survey. Archives
of General Psychiatry, 155, 613–619.
I. Zubeidat et al. / Journal of Anxiety Disorders 21 (2007) 603–624622
La Greca, A. M., & Lopez, N. (1998). Social anxiety among adolescents: Linkages with peer relations and friendships.
Journal of Abnormal Child Psychology, 26, 83–94.
La Greca, A. M., & Stone, W. L. (1993). Social Anxiety Scale for Children-Revised: Factor structure and concurrent
validity. Journal of Clinical Child Psychology, 22, 17–27.
Lapouse, R., & Monk, M. A. (1959). Fears and worries in a representative sample of children. American Journal of
Orthopsychiatry, 29, 803–818.
Leary, M. R. (1983). Social anxiousness: The construct and its measurement. Journal of Personality Assessment, 47,
66–75.
Lecrubier, Y. (1998). Comorbidity in social anxiety disorder: Impact on disease burden and management. Journal of
Clinical Psychiatry, 59, 33–38.
Lemos, S. G., Fidalgo, A. M., Calvo, P., & Menendez, P. (1992a). Salud mental de los adolescentes asturianos.
Psicothema, 4, 21–48.
Lemos, S. G., Fidalgo, A. M., Calvo, P., & Menendez, P. (1992b). Estructura factorial de la prueba YSR y su utilidad en
psicopatologıa infanto-juvenil. Analisis y Modificacion de Conducta, 18, 883–905.
Lemos, S. G., Fidalgo, A. M., Calvo, P., & Menendez, P. (1992c). Validacion de la escala de psicopatologıa infanto-juvenil
YSR. Clınica y Salud, 3, 183–194.
Lepine, J. P., & Lellouch, J. (1995). Diagnosis and epidemiology of agoraphobia and social phobia. Clinical
Psychopharmacology, 18, S15–S26.
Liebowitz, M. R. (1987). Social phobia. Modern Problems in Pharmacopsychiatry, 22, 141–173.
Magee, W. J., Eaton, W. W., Wittchen, H. U., McGonagle, K. A., & Kessler, R. C. (1996). Agoraphobia, simple phobia,
and social phobia in the National Comorbidity Survey. Archives of General Psychiatry, 53, 159–168.
Mattick, R. P., & Clarke, J. C. (1998). Development and validation of measures of social phobia scrutiny fear and social
interaction anxiety. Behavior Research and Therapy, 36, 455–470.
McNeil, D. W. (2001). Terminology and evolution of construct in social anxiety and social phobia. In: S. G. Hofmann y, &
P. M. DiBartolo (Eds.), From social anxiety to social phobia: Multiple Perspectives (pp. 8–19). Needham Heights,
MA: Allyn and Bacon.
Mennin, D. S., Heimberg, R. G., & Jack, M. S. (2000). Comorbid generalized anxiety disorder in primary social
phobia: Symptom severity, functional impairment, and treatment response. Journal of Anxiety Disorders, 14, 325–
343.
Montero, I., & Leon, G. O. (2005). Sistema de clasificacion del metodo en los informes de investigacion en Psicologıa.
Internacional Journal of Clinical and Health Psychology, 5, 115–127.
Muniz, J. (1998). Teorıa Clasica de los Tests. Madrid: Piramide.
Myers, J. K., Weissman, M. M., & Tischler, G. L. (1984). Six-month prevalence of psychiatric disorders in three
communities. Archives of General Psychiatry, 41, 959–967.
Nolsen-Hoeksema, S., & Larson, J. (1992). The worries of adolescent males and females. Umpublished manuscript.
Stanford, CA: Stanford University.
Olivares, J. (2004). Introduccion. In: J. Olivares (Ed.), Programa IAFS. Protocolo para el tratamiento de la fobia social en
la adolescencia (pp. 9–13). Madrid: Piramide.
Olivares, J., Garcıa-Lopez, L. G., & Hidalgo, M. D. (2001). The Social Phobia Scale and the Social Interaction Anxiety
Scale: Factor structure and reliability in a Spanish-speaking population. Journal of Psychoeducational Assessment,
19, 69–80.
Olivares, J., Rosa, A. I., & Garcıa-Lopez, L. J. (2004). Fobia social en la adolescencia. El miedo a relacionarse y a actuar
ante los demas. Madrid: Piramide Ediciones.
Paul, G. (1966). Insight vs. desesibilization in psychotherapy. Satanford, CA: Stanford University Press.
Quay, H. C., & La Greca, A. M. (1986). Disorders of anxiety, withdrawal, and dysphoria. In: H. C. Quay, & J. S. Werry
(Eds.), Psychopathological disorders of childhood (3rd ed., pp. 73–110). New York: John Wiley and Sons.
Quero, S., Banos, R. M., Botella, C., & Gallardo, M. (2003). Delimitacion de subtipos clınicos en la fobia social.
Psicologıa Conductual, 11, 429–458.
Ramos, V. (2004). Efecto de la retroalimentacion audiovisual en la eficacia del IAFS. Unpublished doctoral thesis.
Murcia: Facultad de Psicologıa, Universidad de Murcia.
Ries, B. J., McNeil, D. W., Boone, M. L., Turk, C. L., Carter, L. E., & Heimberg, R. G. (1998). Assessment of
contemporary social phobia verbal report instruments. Behaviour Research and Therapy, 36, 983–994.
Rosen, B. C., & Aneshensel, C. S. (1976). The chameleon syndrome: A social psychological dimension of the female sex
role. Journal of Marriage and the Family, 38, 605–617.
Ruiz, J. (2003). Efecto del tamano del grupo en la eficacia del IAFS. Unpublished doctoral thesis. Facultad de Psicologıa.
Murcia: Universidad de Murcia.
I. Zubeidat et al. / Journal of Anxiety Disorders 21 (2007) 603–624 623
Safren, S. A., Turk, C. L., & Heimberg, R. G. (1998). Factor structure of the Social Anxiety Scale and the Social Phobia
Scale. Behaviour Research and Therapy, 36, 443–453.
Schneier, F. R., Johnson, J., Hornig, C. D., Liebowitz, M. R., & Weissman, M. M. (1992). Social phobia: Comorbidity and
morbidity in an epidemiological sample. Archives of General Psychiatry, 49, 282–288.
Schneier, F. R., Spitzer, R. L., Gibbon, M., Fyer, A., & Liebowitz, M. R. (1991). The relationship of social phobia subtypes
and avoidant personality disorder. Comprehensive Psychiatry, 32, 496–502.
Stein, M. B. (1997). Phenomenology and epidemiology of social phobia. International Clinical Psychopharmacology, 12,
S23–S26.
Stein, M. B., McQuaid, J. R., Laffaye, C., & McCahill, M. E. (1999). Social phobia in the primary care medical setting.
Journal of Family Practice, 48, 514–519.
Stein, M. B., Torgrud, L. J., & Walker, J. R. (2000). Social phobia symptoms, subtypes, and severity. Archives of General
Psychiatry, 57, 1046–1052.
Stein, M. B., Walker, J. R., & Forde, D. R. (1996). Public-speaking fears in a community sample. Prevalence, impact on
functioning, and diagnostic classification. Archives of General Psychiatry, 53, 169–174.
Stemberger, R., Turner, S. M., Beidel, D. C., & Calhoun, K. S. (1995). Social phobia: An analysis of possible
developmental factors. Journal of Abnormal Psychology, 104, 526–531.
Strauss, C. C., & Francis, G. (1989). Phobic disorders. In: C. G. Last, & M. Hersen (Eds.), Handbook of child psychiatric
diagnosis (pp. 170–190). New York: John Wiley and Sons.
Tortella-Feliu, M., Servera, M., Balle, M., & Fullana, M. A. (2004). Viabilidad de un programa de prevencion selectiva de
los problemas de ansiedad en la infancia aplicado en la escuela. International Journal of Clinical and Healht
Psychology, 4, 371–387.
Tran, G. Q., & Chambless, D. L. (1995). Psychopathology of social phobia: Effects of subtype and of avoidant personality
disorder. Journal of Anxiety Disorders, 9, 489–501.
Turk, C. L., Heimberg, R. G., Orsillo, S. M., Holt, C. S., Gitow, A., Street, L. L., et al. (1998). An investigation of gender
differences in social phobia. Journal of Anxiety Disorders, 12, 209–223.
Turner, S. M., Beidel, D. C., Cooley, M. R., Woody, S. R., & Messer, S. C. (1994). A multicomponent behavioral treatment
of social phobia: Social effectiveness therapy. Behaviour Research and Therapy, 32, 381–390.
Turner, S. M., Beidel, D., Dancu, C. V., & Stanley, M. A. (1989). An empirically derived inventory to measure social fears
and anxiety: The Social Phobia and Anxiety Inventory. Psychological Assessment, 1, 35–40.
Turner, S. M., Beidel, D. C., & Townsley, R. M. (1992). Social phobia: A comparison of specific and generalized subtypes
and avoidant personality disorder. Journal of Abnormal Psychology, 101, 326–331.
Verhulst, F. C., van der Ende, J., & Koot, H. M. (1997). Handleiding voor de Youth Self-Report (YSR) {Manual for the
Youth Self-Report}. Rotterdam, the Netherlands: Erasmus University/Sophia Children’s Hospital.
Vernberg, E. M., Abwender, D. A., Ewell, K. K., & Beery, S. H. (1992). Social anxiety and peer relationships in early
adolescence: A prospective analysis. Journal of Clinical Child Psychology, 33, 448–457.
Watson, D., & Friend, R. (1969). Measurement of social evaluative anxiety. Journal of Consulting and Clinical
Psychology, 33, 448–457.
Weiller, E., Bisserbe, J. C., Boyer, P., Lepine, J. P., & Lecrubier, Y. (1996). Social phobia in general health care: An
unrecognized undertreated disabiling disorder. British Journal of Psychiatry, 168, 169–174.
Weissman, M. M., Bland, R. C., Canino, G. L., Greenwald, S., Lee, C. K., Newman, S. C., et al. (1996). The cross-national
epidemiology of social phobia: A preliminary report. International Clinical Psychopharmacology, 11, 9–14.
Wittchen, H. U., Stein, M. B., & Kessler, R. C. (1999). Social fears and social phobia in a community sample of
adolescents and young adults: Prevalence, risk factors and comorbidity. Pschological Medicine, 29, 309–323.
Wolfe, J. H. (1970). Pattern clustering by multivariate mixture analysis. Multivariate Behavioral Research, 5, 329–350.
I. Zubeidat et al. / Journal of Anxiety Disorders 21 (2007) 603–624624
Copyright © 2022 FDOKUMEN