They are laughing at me: cerebral mediation of cognitive biases in social anxiety
10
They Are Laughing at Me: Cerebral Mediation of Cognitive Biases in Social Anxiety Benjamin Kreifelts 1 , Carolin Bru ¨ ck 1 , Jan Ritter 1 , Thomas Ethofer 1,2 , Martin Domin 3 , Martin Lotze 3 , Heike Jacob 1 , Sarah Schlipf 1 * . , Dirk Wildgruber 1. 1 Department of Psychiatry and Psychotherapy, Eberhard Karls University of Tu ¨ bingen, Tu ¨ bingen, Germany, 2 Department of Biomedical Magnetic Resonance, Eberhard Karls University of Tu ¨ bingen, Tu ¨ bingen, Germany, 3 Department for Diagnostic Radiology and Neuroradiology, University of Greifswald, Greifswald, Germany Abstract The fear of embarrassment and humiliation is the central element of social anxiety. This frequent condition is associated with cognitive biases indicating increased sensitivity to signals of social threat, which are assumed to play a causal role in the maintenance of social anxiety. Here, we employed laughter, a potent medium for the expression of acceptance and rejection, as an experimental stimulus in participants selected for varying degrees of social anxiety to identify cerebral mediators of cognitive biases in social anxiety using functional magnetic resonance imaging in combination with mediation analysis. We directly demonstrated that cerebral activation patterns within the dorsal attention network including the left dorsolateral and dorsomedial prefrontal cortex mediate the influence of social anxiety on laughter perception. This mediation proved to be specific for social anxiety after correction for measures of general state and trait anxiety and occurred most prominently under bimodal audiovisual laughter presentation when compared with monomodal auditory or visual laughter cues. Considering the possibility to modulate cognitive biases and cerebral activity by neuropsychological trainings, non-invasive electrophysiological stimulation and psychotherapy, this study represents a starting point for a whole line of translational research projects and identifies promising targets for electrophysiological interventions aiming to alleviate cognitive biases and symptom severity in social anxiety. Citation: Kreifelts B, Bru ¨ ck C, Ritter J, Ethofer T, Domin M, et al. (2014) They Are Laughing at Me: Cerebral Mediation of Cognitive Biases in Social Anxiety. PLoS ONE 9(6): e99815. doi:10.1371/journal.pone.0099815 Editor: Kevin Paterson, University of Leicester, United Kingdom Received February 3, 2014; Accepted May 20, 2014; Published June 11, 2014 Copyright: ß 2014 Kreifelts et al. This is an open-access article distributed under the terms of the Creative Commons Attribution License, which permits unrestricted use, distribution, and reproduction in any medium, provided the original author and source are credited. Funding: This work was supported by grants of the Fortu ¨ ne-Program of the University of Tu ¨ bingen (fortu ¨ ne 1997-0-0, and fortu ¨ ne 2140-0-0), by the Deutsche Forschungsgemeinschaft and the Open Access Publishing Fund of Tu ¨ bingen University. The funders had no role in study design, data collection and analysis, decision to publish, or preparation of the manuscript. Competing Interests: The authors have declared that no competing interests exist. * E-mail: [email protected] . These authors contributed equally to this work. Introduction Social anxiety (SA), in its core, is the fear of embarrassment and humiliation in social situations. It is found in a spectrum of varying severity in the population [1]. The pathological end of this spectrum is called social anxiety disorder (SAD) and represents one of the most prevalent psychiatric conditions [1,2]. It causes a severe loss of quality of life [3] and high economical costs [4]. Moreover, SA is associated with biased cognition. An attention bias with faster responses to socially threatening cues [5,6] and a negative interpretation bias for facial [7] and vocal [8] expressions are among the most well known cognitive biases in SA. Critically, these biases are thought to play a causal role in the maintenance of clinical anxiety [9,10]. Despite this assumed pivotal role of cognitive biases in SA, their neural underpinnings are still not well understood. While neuroimaging studies in SA revealed predominantly increased cerebral activation to facial [11–15] and vocal [16] expressions signaling social threat in the limbic system [12–15], as well as increased activation of secondary visual cortices [12,15], the mediofrontal cortex [11,12,14] and the orbitofrontal cortex for threatening voices [16], still none of the associated cognitive biases have been explicitly investigated in neuroimaging studies on SA based on their behavioral correlates. First evidence from studies in healthy participants [17] as well as patients with generalized anxiety disorder [18–20], posttraumatic stress disorder [21], or panic disorder [22] suggests an involvement of dorsolateral [17,19–21], dorsomedial [21], and ventrolateral [18,21,22] aspects of the prefrontal cortex in the processing of the attention bias towards threat-related stimuli. Of these, solely the study by Browning et al. (2010) directly focused on the cerebral correlates of the attention bias itself and demonstrated decreased prefrontal activation to attended threat-signaling faces after induction of an attention bias towards such stimuli. It was, thus, the aim of the present functional magnetic resonance imaging (fMRI) study to reveal the cerebral mediators of threat-related cognitive biases in SA using audiovisual recordings of laughter as a novel symptom-provoking tool. Laughter represents a primordial social communication signal which is already present in non-human primates [23]. It offers an excellent opportunity to investigate cognitive biases in SA as it evolved into different laughter types in humans which can serve group bonding [24] (e.g. joyful laughter with a positive valence) but also social segregation [25] (e.g. taunting laughter with a negative valence). In contrast to these evolutionary younger laughter types, tickling laughter serves the enforcement of play PLOS ONE | www.plosone.org 1 June 2014 | Volume 9 | Issue 6 | e99815
-
Upload
greifswald -
Category
Documents
-
view
2 -
download
0
Transcript of They are laughing at me: cerebral mediation of cognitive biases in social anxiety
They Are Laughing at Me: Cerebral Mediation ofCognitive Biases in Social AnxietyBenjamin Kreifelts1, Carolin Bruck1, Jan Ritter1, Thomas Ethofer1,2, Martin Domin3, Martin Lotze3,
Heike Jacob1, Sarah Schlipf1*., Dirk Wildgruber1.
1 Department of Psychiatry and Psychotherapy, Eberhard Karls University of Tubingen, Tubingen, Germany, 2 Department of Biomedical Magnetic Resonance, Eberhard
Karls University of Tubingen, Tubingen, Germany, 3 Department for Diagnostic Radiology and Neuroradiology, University of Greifswald, Greifswald, Germany
Abstract
The fear of embarrassment and humiliation is the central element of social anxiety. This frequent condition is associatedwith cognitive biases indicating increased sensitivity to signals of social threat, which are assumed to play a causal role inthe maintenance of social anxiety. Here, we employed laughter, a potent medium for the expression of acceptance andrejection, as an experimental stimulus in participants selected for varying degrees of social anxiety to identify cerebralmediators of cognitive biases in social anxiety using functional magnetic resonance imaging in combination with mediationanalysis. We directly demonstrated that cerebral activation patterns within the dorsal attention network including the leftdorsolateral and dorsomedial prefrontal cortex mediate the influence of social anxiety on laughter perception. Thismediation proved to be specific for social anxiety after correction for measures of general state and trait anxiety andoccurred most prominently under bimodal audiovisual laughter presentation when compared with monomodal auditory orvisual laughter cues. Considering the possibility to modulate cognitive biases and cerebral activity by neuropsychologicaltrainings, non-invasive electrophysiological stimulation and psychotherapy, this study represents a starting point for awhole line of translational research projects and identifies promising targets for electrophysiological interventions aiming toalleviate cognitive biases and symptom severity in social anxiety.
Citation: Kreifelts B, Bruck C, Ritter J, Ethofer T, Domin M, et al. (2014) They Are Laughing at Me: Cerebral Mediation of Cognitive Biases in Social Anxiety. PLoSONE 9(6): e99815. doi:10.1371/journal.pone.0099815
Editor: Kevin Paterson, University of Leicester, United Kingdom
Received February 3, 2014; Accepted May 20, 2014; Published June 11, 2014
Copyright: � 2014 Kreifelts et al. This is an open-access article distributed under the terms of the Creative Commons Attribution License, which permitsunrestricted use, distribution, and reproduction in any medium, provided the original author and source are credited.
Funding: This work was supported by grants of the Fortune-Program of the University of Tubingen (fortune 1997-0-0, and fortune 2140-0-0), by the DeutscheForschungsgemeinschaft and the Open Access Publishing Fund of Tubingen University. The funders had no role in study design, data collection and analysis,decision to publish, or preparation of the manuscript.
Competing Interests: The authors have declared that no competing interests exist.
* E-mail: [email protected]
. These authors contributed equally to this work.
Introduction
Social anxiety (SA), in its core, is the fear of embarrassment and
humiliation in social situations. It is found in a spectrum of varying
severity in the population [1]. The pathological end of this
spectrum is called social anxiety disorder (SAD) and represents one
of the most prevalent psychiatric conditions [1,2]. It causes a
severe loss of quality of life [3] and high economical costs [4].
Moreover, SA is associated with biased cognition. An attention
bias with faster responses to socially threatening cues [5,6] and a
negative interpretation bias for facial [7] and vocal [8] expressions
are among the most well known cognitive biases in SA. Critically,
these biases are thought to play a causal role in the maintenance of
clinical anxiety [9,10]. Despite this assumed pivotal role of
cognitive biases in SA, their neural underpinnings are still not
well understood.
While neuroimaging studies in SA revealed predominantly
increased cerebral activation to facial [11–15] and vocal [16]
expressions signaling social threat in the limbic system [12–15], as
well as increased activation of secondary visual cortices [12,15],
the mediofrontal cortex [11,12,14] and the orbitofrontal cortex for
threatening voices [16], still none of the associated cognitive biases
have been explicitly investigated in neuroimaging studies on SA
based on their behavioral correlates. First evidence from studies in
healthy participants [17] as well as patients with generalized
anxiety disorder [18–20], posttraumatic stress disorder [21], or
panic disorder [22] suggests an involvement of dorsolateral
[17,19–21], dorsomedial [21], and ventrolateral [18,21,22] aspects
of the prefrontal cortex in the processing of the attention bias
towards threat-related stimuli. Of these, solely the study by
Browning et al. (2010) directly focused on the cerebral correlates of
the attention bias itself and demonstrated decreased prefrontal
activation to attended threat-signaling faces after induction of an
attention bias towards such stimuli.
It was, thus, the aim of the present functional magnetic
resonance imaging (fMRI) study to reveal the cerebral mediators
of threat-related cognitive biases in SA using audiovisual
recordings of laughter as a novel symptom-provoking tool.
Laughter represents a primordial social communication signal
which is already present in non-human primates [23]. It offers an
excellent opportunity to investigate cognitive biases in SA as it
evolved into different laughter types in humans which can serve
group bonding [24] (e.g. joyful laughter with a positive valence)
but also social segregation [25] (e.g. taunting laughter with a
negative valence). In contrast to these evolutionary younger
laughter types, tickling laughter serves the enforcement of play
PLOS ONE | www.plosone.org 1 June 2014 | Volume 9 | Issue 6 | e99815
behavior [26] and is confined to the context of bodily contact. It
has been demonstrated that different laughter types are distin-
guishable based on the vocal signal [27] and cerebral activation
patterns [28,29].
Taken together, in the context of SA where central fears pertain
to humiliation, criticism and rejection, and where laughter has
been shown to exhibit phobogenic properties [30], laughter
represents an ideal stimulus to evoke typical behavioral correlates
of SA.
Twenty-four participants with a broad spectrum of SA severity
ranging from very low to clinical social anxiety (i.e., SAD) took
part in the present study. They were confronted with different
laughter types (i.e., joyful, taunting and tickling laughter) and
asked to rate to which degree the laughter was socially inclusive or
exclusive on a four-point scale.
Based on previous findings obtained for facial expressions [5,6],
we hypothesized a linear relationship between SA and faster
response times to socially exclusive taunting laughter than to
socially inclusive joyful laughter. Moreover, we expected that,
joyful and taunting laughter would be rated as more socially
rejecting with increasing severity of SA, while no such effect would
occur for the reflex-like tickling laughter due to its lack of social
communicative functions outside the context of direct bodily
contact during play behavior.
To evaluate potential effects of the sensory modality of cue
presentation, the experimental design included auditory, visual,
and audiovisual trials. Laughter ratings and response times were
recorded as behavioral outcome parameters. The Liebowitz Social
Anxiety Scale (LSAS) was used as measure of SA while the State-
Trait-Anxiety-Inventory (STAI) was employed to capture general
anxiety as a control variable.
The main goal of the present study was to establish the
associations between SA (as obtained by the Liebowitz Social
Anxiety Scale), behavioral correlates of cognitive biases during
laughter perception and cerebral activation using mediation
analysis. This technique which has been recently introduced in
imaging neuroscience [31] allows the clarification of causal
inferences on the relationship of behavioral dispositions, brain
activity and behavior.
To this end, we first investigated the influence of SA on laughter
ratings and response times. Then, we identified cerebral structures
in which activation alterations reflected changes in these
behavioral measures. Based on the study by Browning et al.
(2010) on the cerebral correlates of the attention bias towards
threatening faces and the neuroimaging studies evidencing bias-
congruent decreased activation of the prefrontal cortex (PFC) cues
in patients with different anxiety disorders [18–22] described
above, we hypothesized a positive correlation between faster
responses and decreased activation to taunting as compared to
joyful laughter in the PFC.
Subsequently, it was tested if regions with a significant
relationship between cerebral activation and SA-associated cogni-
tive biases also exhibited a significant linear association of their
activation with the severity of SA.
Finally, we performed a mediation analysis to clarify the
interdependency of the severity of SA, cognitive biases, and
cerebral activation within these brain areas. Validation analyses
included a bootstrapping approach controlling for effects of
general anxiety as well as an investigation of effects of cue
presentation modality on the relationships between cognitive
biases as well as SA and cerebral activation patterns to detect
potential modality-dependent dissociations between behavior,
cerebral activation patterns and SA.
Materials and Methods
Ethics StatementThis study was reviewed and approved by the University of
Tubingen ethical review board before the study began. The study
was performed in accordance with the Code of Ethics of the World
Medical Association (Declaration of Helsinki), and all participants
gave written informed consent according to the guidelines of the
University of Tubingen ethical review board prior to their
inclusion in the study. The individual in this manuscript has
given written informed consent (as outlined in the PLOS consent
form) to publish her picture which is a still image taken from the
employed stimulus material.
ParticipantsBased on the observation that the severity of SA and its
transition into SAD represent a continuum in the population
rather than categories of non-clinical and clinical anxiety [32,33],
a single group of participants with a wide variation of SA severity
ranging from minimal SA to severe SAD was included in the
present study.
Twenty-four volunteers (11 male, 13 female, mean age 25.3, SD
3.4 years) were recruited for the study through advertisement
bulletins. All participants were native German speakers and were
right-handed, as assessed with the Edinburgh Inventory [34].
None of the participants had a history of neurological or
psychiatric illness, substance abuse or impaired hearing, or was
on any medication. Vision was normal or corrected to normal.
Before inclusion in the study all participants were screened for
psychiatric disorders by a psychiatrist (S.S.) using the Structured
Clinical Interview for DSM-IV [35] screening questions. In cases
where at least one screening questions was answered in the
affirmative, the full interview was administered. LSAS [36],
German self-report version, was used to measure severity of SA.
The six participants with the highest LSAS self-ratings fulfilled the
clinical criteria of SAD. General anxiety was assessed using the
State-Trait-Anxiety-Inventory (STAI, German version [37]. The
‘‘Mehrfachwahl-Wortschatz-Intelligenz-Test’’ (MWT-B, [38]) was
applied to measure premorbid intelligence. The socio-demograph-
ic and psychometric study population data are given in Table 1.
Stimuli and TaskSixty short video portrayals (1.5 s) of laughter (i.e. laughing
faces) were used as stimulus material. The stimuli were part of a
larger corpus of video portrayals (187 sequences) including three
types of laughter (joyful/friendly [JOY], tickling [TIC] and
taunting/unfriendly [TAU] laughter). The stimuli were produced
by eight professional actors using a script-based auto-induction
technique. The video footage was post-processed to ensure a
comparable video (Adobe Premiere, Pro CS3, Adobe Systems,
Inc., San Jose, CA, USA) and sound (PRAAT, 5.1.07) quality
across recordings. Audio recordings were normalized for mean
acoustic energy, and videos were post-processed so that the facial
symmetry axis was vertical, and head size was comparable across
videos.
The post-processed stimuli were evaluated in two behavioral
prestudies by healthy participants with regard to the categorical
recognizability of the expressed laughter type (n = 14, mean age
24.4, SD 2.4 years) and authenticity (n = 14, mean age 24.3, SD
3.5 years). Only stimuli with recognition rates exceeding chance
level and with at least average authenticity ratings (i.e., .3.0 on a
9-point-scale; mean authenticity 5.1, SD 1.4) were selected for the
fMRI study. The stimulus set was balanced for laughter type and
gender of the speakers (JOY = 8 m/10 f, TIC = 9 m/11 f,
Laughter Perception in Social Anxiety
PLOS ONE | www.plosone.org 2 June 2014 | Volume 9 | Issue 6 | e99815
TAU = 10 m/12 f), as well as the recognition rates of the three
laughter types (unbiased hit rates [39]: JOY = 0.52, TIC = 0.54,
TAU = 0.53; paired t-tests: t(13) #0.5, P$0.6).
During the fMRI experiment all sixty stimuli were presented
under three different conditions (auditory [A], visual [V] and
audiovisual [AV]; total number of stimuli = 180) within an event-
related design. The experiment consisted of three runs with 60
stimuli each. The runs were balanced for laughter type and
presentation modality (A, V, AV). The stimulus sequence within
each run was randomized, and the sequence of the runs was
balanced across the participants.
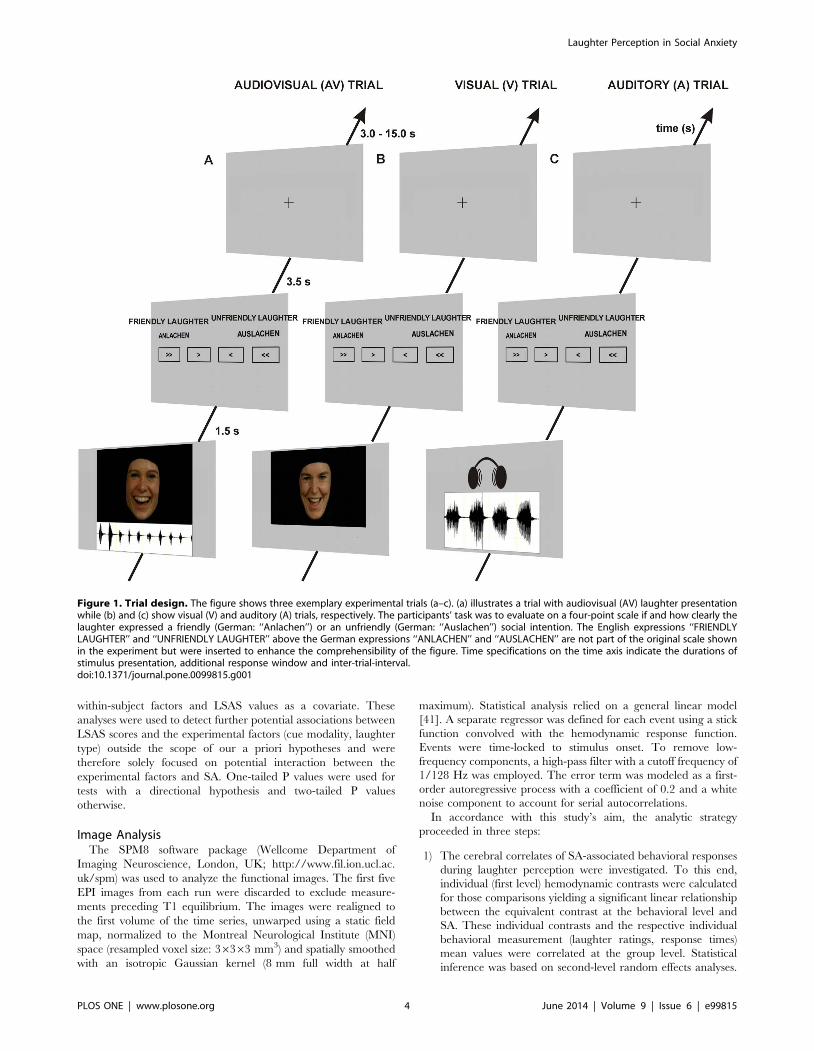
Each trial (see Figure 1) began with the presentation of a
laughter sequence. It was the participants’ task to decide if the
laughter sequence bore a friendly or an unfriendly social intention.
They were instructed to imagine that the laughter was directed at
them by the laughing person they saw and/or heard. Furthermore,
the participants were instructed not to laugh during the
experiment. To prevent a central tendency, responses were given
on a 4-point scale (see Figure 1) with the symbols ‘‘..’’, ‘‘.’’, ‘‘,
’’, ‘‘,,’’ and the German words ‘‘Anlachen’’ (friendly laughter)
and ‘‘Auslachen’’ (unfriendly laughter) at opposite ends of the
scale. ‘‘..’’ indicated the decision that the laughter clearly
belonged to the laughter category the name of which the open
sides of the symbols were pointing to. ‘‘.’’ indicated that the
participants judged the laughter sequence as rather belonging to
the respective category but were not sure. To avoid effects
attributable to the arrangement of response alternatives, the
response scale was flipped horizontally for half of the participants.
The participants were instructed to give their response as quickly
as possible by pressing one of four buttons on a fiber optic response
system (LUMItouch, Photon Control, Inc., Burnaby, BC, Canada)
placed under their right hand. Responses were required within a
time frame of 5 s following stimulus onset. ‘‘Presentation’’
(Neurobehavioral Systems, Inc., Albany, CA, USA) was used as
software for stimulus delivery. Video sequences employed in the
present study were back-projected onto a screen placed in the
magnet bore behind the participant’s head and viewed by the
participant through a mirror system mounted onto the head coil.
Laughter sounds were presented via MR compatible headphones
(MR confon GmbH, Magdeburg, Germany). The onsets of the
stimuli were jittered relative to the scan onsets in steps of 500 ms
(1/4 of the repetition time (TR) = 2000 ms) to reduce effects of
stimulus expectancy. Null events with durations of 10 s were
randomly inserted in the trial sequence with the frequency of one
null event per 10 trials.
Image AcquisitionA Siemens MAGNETOM Verio 3-Tesla whole-body MRI
scanner (Siemens AG, Erlangen, Germany) was used for the MR
measurements. For functional imaging an echo-planar imaging
(EPI) sequence (TR = 2000 ms, echo time [TE] = 30 ms, flip
angle = 90u, field of view = 1926192 mm2, 64664 matrix, 34
slices, 3 mm slice thickness, 1 mm gap, orientated along the
anterior commissure-posterior commisure plane) was employed.
For the anatomical reference high-resolution T1-weighted images
a magnetization-prepared rapid acquisition gradient echo se-
quence (TR = 1900 ms, TE = 2.52 ms, 176 slices, 1 mm thickness)
was used. For the off-line correction of EPI image distortions, a
static fieldmap (34 slices, TR = 488 ms, TE1 = 4.92 ms, TE (2)
= 7.38 ms, a= 60u) was acquired.
Analysis of Study Population Data and Behavioral DataIBM SPSS Statistics Version 19 (IBM Corp., Armonk, NY,
USA) was used for statistical analyses. Analogue behavioral ratings
were transformed to numerical values between 1 (clearly
‘‘Auslachen’’, i.e. unfriendly laughter) and 4 (clearly ‘‘Anlachen’’,
i.e. friendly laughter). In order to avoid biases in the response time
data due to extreme outliers based on inattention, all responses
above two standard deviations from the individual mean response
time were excluded from further analysis of the response time
data. A normal distribution of behavioral data and population
parameters was ascertained using the Kolmogorov-Smirnov test
(with the exception of gender). LSAS scores were tested for a linear
association with the other population parameters (age, gender,
years of education, MWT-B and STAI-X1/X2) using bivariate
correlation analyses. Based on the specific hypotheses of the
present study, linear regression analyses investigating the following
linear associations were performed:
a) LSAS and mean overall laughter ratings as well as the
laughter ratings for the separate laughter types and
b) LSAS and mean response time differences between JOY and
TAU.
Then it was tested if the linear relationship between SA and
mean ratings differed between the three laughter types using the
approach described by Meng et al. [40] and if the linear
association between SA and laughter ratings was significant for
the separate laughter types. The approach of Meng et al. [40] was
also used to investigate if the strengths of any observed linear
relationships between SA and behavioral measures were depen-
dent on the modality of cue presentation (A, V, AV) and if this
association was significant for each and every cue presentation
modality. Here, the results were Bonferoni-corrected due to the
lack of a priori hypotheses. These analyses were supplemented by
two exploratory analyses of variance (ANOVA) with laughter
ratings and response times as dependent variables and cue
modality (A, V, AV) and laughter type (JOY, TIC, TAU) as
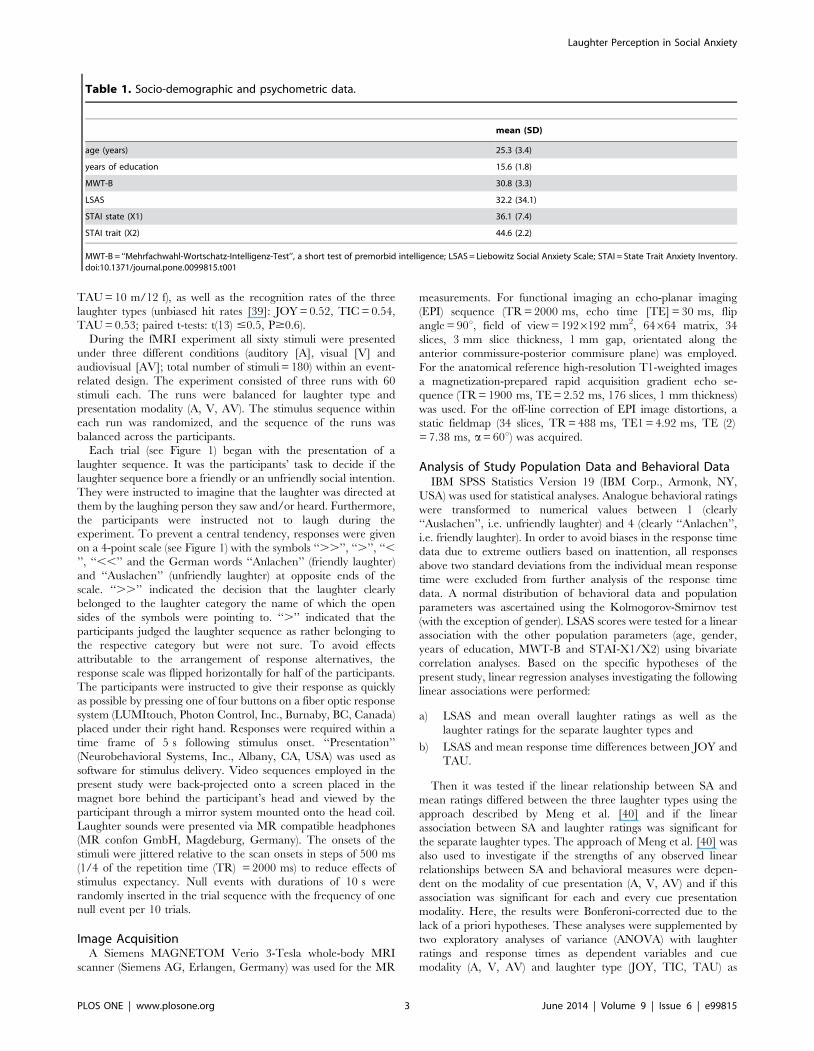
Table 1. Socio-demographic and psychometric data.
mean (SD)
age (years) 25.3 (3.4)
years of education 15.6 (1.8)
MWT-B 30.8 (3.3)
LSAS 32.2 (34.1)
STAI state (X1) 36.1 (7.4)
STAI trait (X2) 44.6 (2.2)
MWT-B = ‘‘Mehrfachwahl-Wortschatz-Intelligenz-Test’’, a short test of premorbid intelligence; LSAS = Liebowitz Social Anxiety Scale; STAI = State Trait Anxiety Inventory.doi:10.1371/journal.pone.0099815.t001
Laughter Perception in Social Anxiety
PLOS ONE | www.plosone.org 3 June 2014 | Volume 9 | Issue 6 | e99815
within-subject factors and LSAS values as a covariate. These
analyses were used to detect further potential associations between
LSAS scores and the experimental factors (cue modality, laughter
type) outside the scope of our a priori hypotheses and were
therefore solely focused on potential interaction between the
experimental factors and SA. One-tailed P values were used for
tests with a directional hypothesis and two-tailed P values
otherwise.
Image AnalysisThe SPM8 software package (Wellcome Department of
Imaging Neuroscience, London, UK; http://www.fil.ion.ucl.ac.
uk/spm) was used to analyze the functional images. The first five
EPI images from each run were discarded to exclude measure-
ments preceding T1 equilibrium. The images were realigned to
the first volume of the time series, unwarped using a static field
map, normalized to the Montreal Neurological Institute (MNI)
space (resampled voxel size: 36363 mm3) and spatially smoothed
with an isotropic Gaussian kernel (8 mm full width at half
maximum). Statistical analysis relied on a general linear model
[41]. A separate regressor was defined for each event using a stick
function convolved with the hemodynamic response function.
Events were time-locked to stimulus onset. To remove low-
frequency components, a high-pass filter with a cutoff frequency of
1/128 Hz was employed. The error term was modeled as a first-
order autoregressive process with a coefficient of 0.2 and a white
noise component to account for serial autocorrelations.
In accordance with this study’s aim, the analytic strategy
proceeded in three steps:
1) The cerebral correlates of SA-associated behavioral responses
during laughter perception were investigated. To this end,
individual (first level) hemodynamic contrasts were calculated
for those comparisons yielding a significant linear relationship
between the equivalent contrast at the behavioral level and
SA. These individual contrasts and the respective individual
behavioral measurement (laughter ratings, response times)
mean values were correlated at the group level. Statistical
inference was based on second-level random effects analyses.
Figure 1. Trial design. The figure shows three exemplary experimental trials (a–c). (a) illustrates a trial with audiovisual (AV) laughter presentationwhile (b) and (c) show visual (V) and auditory (A) trials, respectively. The participants’ task was to evaluate on a four-point scale if and how clearly thelaughter expressed a friendly (German: ‘‘Anlachen’’) or an unfriendly (German: ‘‘Auslachen’’) social intention. The English expressions ‘‘FRIENDLYLAUGHTER’’ and ‘‘UNFRIENDLY LAUGHTER’’ above the German expressions ‘‘ANLACHEN’’ and ‘‘AUSLACHEN’’ are not part of the original scale shownin the experiment but were inserted to enhance the comprehensibility of the figure. Time specifications on the time axis indicate the durations ofstimulus presentation, additional response window and inter-trial-interval.doi:10.1371/journal.pone.0099815.g001
Laughter Perception in Social Anxiety
PLOS ONE | www.plosone.org 4 June 2014 | Volume 9 | Issue 6 | e99815
Activations are reported at a height threshold of P,0.001,
uncorrected, and an extent threshold of k.10 voxels.
Significance was assessed at the cluster level with an extent
threshold of P,0.05 (corresponding to a minimal cluster size
of 60 voxels), FWE corrected for multiple comparisons across
the whole brain.
2) The mean contrast estimates were extracted from clusters
with a significant linear relationship between SA-associated
behavioral measures during laughter perception and the
respective cerebral hemodynamic activation. Then, it was
tested whether cerebral responses in these clusters are also
correlated with SA, as obtained by LSAS scores. Additionally,
it was investigated if observed associations between the
cerebral activation contrasts, on the one hand, and the
behavioral correlates of cognitive biases during laughter
perception as well as SA depended on the cue presentation
modality. The approach suggested by Weaver and Wuensch
[42] for comparing two non-independent correlations with no
variables in common was used for testing the potential impact
of cue modality on the linear relationship between cerebral
activation and cognitive biases while the Meng test [40] was
used to investigate cue modality effects on the relationship
between SA and cerebral activation contrasts. All tests where
Bonferoni-corrected for the number of performed compari-
sons (3).
3) In clusters where SA, behavioral responses and cerebral
responses were all significantly intercorrelated, the Sobel test
[43] was employed to test a potential mediation of the
association of SA and behavioral responses through the
respective cerebral responses during laughter perception. SA
was defined as the independent variable X while the
associated behavioral responses during laughter perception
were defined as the dependent variable Y. The mean contrast
estimates from the cluster of interest were entered as the
potential mediator M. The total effect of X on Y was termed c,
while c’ was the direct effect of X on Y. The effects of X on the
potential mediator M was termed a, and that of the potential
mediator on Y was termed b. Thus, the indirect effect of X on
Y through the potential mediator M was calculated as ab. This
analysis was validated by a bootstrapping approach [44] (5000
resamples) which does not rely on the assumption of a normal
distribution of the data. Here, results are given as 95%
confidence intervals (CI) of the estimated indirect, i.e.
mediated, effect. To investigate if any observed mediation
effects were specific for SA, a post-hoc mediation analyses
were performed where general state (STAI-X1) and trait
(STAI-X2) anxiety were included as covariate of no interest.
To determine if the results of this analysis were valid for each
and every cue presentation modality, it was repeated for each
separate cue modality and results were Bonferoni-corrected
(3).
Results
Population ParametersSA (as determined by LSAS scores) exhibited a significant
positive correlation with general state (STAI-X1; r = 0.62,
P = 0.001) and trait (STAI-X2; r = 0.42, P = 0.04) anxiety but
not with any of the other population parameters (all r#0.38; P.
0.05).
Behavioral ResponsesLaughter ratings. SA was positively correlated with an
increasing tendency to rate laughter as unfriendly (b= 20.006,
t(22) = 4.5, P,0.001, mean overall laughter rating 6 SEM:
2.3860.06). This linear relationship was significant for all three
laughter types (all b#20.006, all t(22) $1.7, all P,0.05, mean
ratings 6 SEM: JOY: 2.0060.05, TIC: 2.2560.12, TAU:
2.9060.06) and cue modalities (all b#20.006, t(22) $3.0, P#
0.018, mean ratings 6 SEM: A: 2.3060.07, V: 2.5960.07, AV:
2.2660.07), and there were no significant differences in this
association between the different cue presentation modalities (all
Z#1.3, all P.0.05). However, the negative linear relationship
between laughter ratings and SA was stronger for both TAU and
JOY as compared to TIC (Z$2.1, P#0.016). The additional
exploratory ANOVA did not reveal any significant interactions
between the experimental factors and LSAS scores with regard to
laughter ratings (all F#1.2, all P.0.05).
Response times. A positive linear relationship between
increasing SA and mean response time differences of JOY and
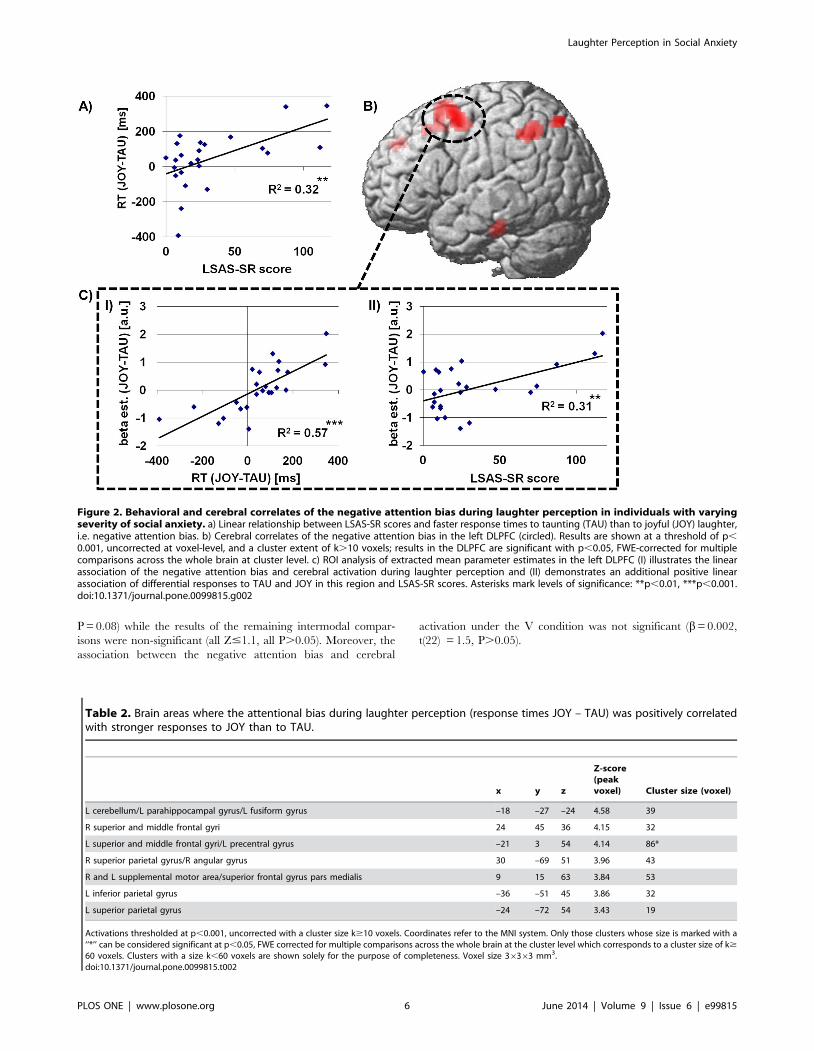
TAU was observed (b= 2.7, t(22) = 3.2, P = 0.004, see Figure 2-a;
mean response time difference 6 SEM: 45 ms633 ms). No such
association was observed for mean overall response times (b= 2.5;
t(22) = 1.0, P.0.05, mean overall response time 6 SEM:
2354 ms682 ms), mean response times for the different laughter
types (all b#3.8, all t(22) #1.7, all P.0.05, mean response times
6 SEM: JOY: 2353 ms680 ms, TIC: 2398 ms693 ms, TAU:
2309 ms679 ms), cue modalities (all b#3.0, all t(22) #1.3, all P,
mean response times 6 SEM: A: 2449 ms686 ms, V:
2312 ms683 ms, AV: 2300 ms680 ms) or other mean response
time differences (i.e. between TIC and TAU or JOY or between A,
V and AV (all b#1.6, all t(22) #1.4, all P.0.05). Also, the
exploratory ANOVA with response times as dependent variable
did not reveal any significant interactions between the experimen-
tal factors and LSAS scores (all F#3.2, all P.0.05).
Cerebral ResponsesRelationship of SA-associated behavioral responses and
cerebral responses. For the SA-associated response time
differences between JOY and TAU the whole-brain analysis
revealed a significant positive linear relationship with the cerebral
responses (contrast of interest: JOY – TAU) in the left dorsolateral
prefrontal cortex (DLPFC; see Table 2 and Figure 2-b and 2-c-I).
The investigation of a linear relationship of overall mean
laughter ratings with the respective cerebral responses to laughter
did not yield any significant results (see Table S1).
Relationship of SA and cerebral responses. The regres-
sion analysis of the cerebral activation patterns of the DLPFC on
the LSAS scores indicated that differential cerebral responses to
JOY and TAU were positively associated with the severity of SA
across participants (DLPFC: b= 0.14, t(22) = 3.2, P = 0.005, see
Figure 2-c-II).
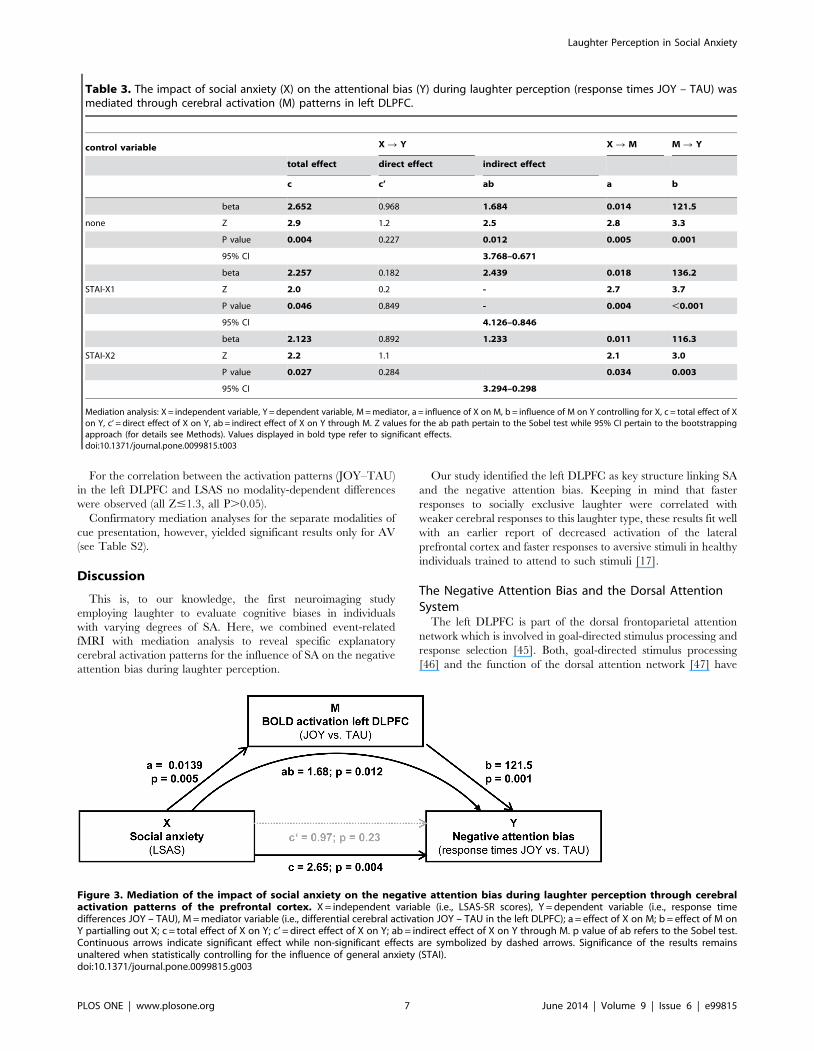
Mediation analyses. The conducted mediation analysis
demonstrated that cerebral activation patterns within the left
DLPFC mediated the relationship between SA and the negative
attention bias during laughter perception even when general trait
(STAI-X2) or state (STAI-X1) anxiety were included in the model
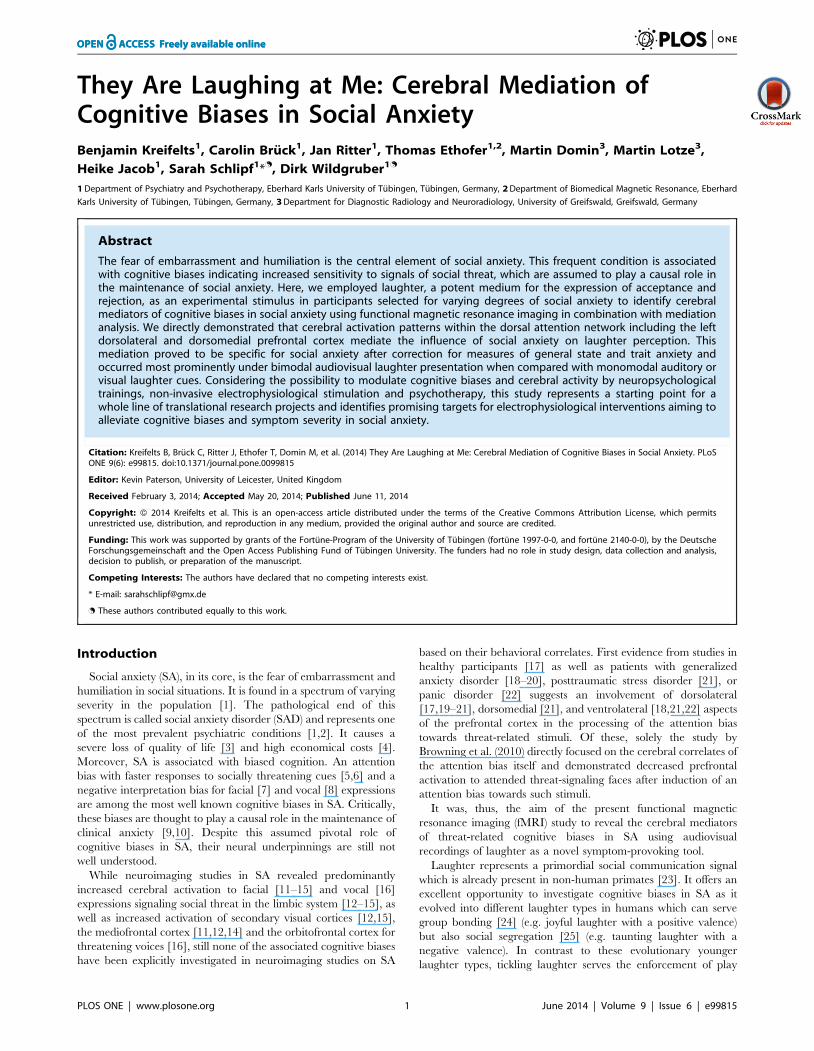
as covariates of no interest (see Figure 3 and Table 3).
Effects of cue modality on the relationships between
cerebral and behavioral responses as well as SA. The
decomposition of the linear associations between SA-related
behavioral responses and cerebral responses across cue presenta-
tion modalities revealed a tendency towards a stronger association
between the negative attention bias and the respective cerebral
activation patterns under AV than under V stimulation (Z = 2.2,
Laughter Perception in Social Anxiety
PLOS ONE | www.plosone.org 5 June 2014 | Volume 9 | Issue 6 | e99815
P = 0.08) while the results of the remaining intermodal compar-
isons were non-significant (all Z#1.1, all P.0.05). Moreover, the
association between the negative attention bias and cerebral
activation under the V condition was not significant (b= 0.002,
t(22) = 1.5, P.0.05).
Figure 2. Behavioral and cerebral correlates of the negative attention bias during laughter perception in individuals with varyingseverity of social anxiety. a) Linear relationship between LSAS-SR scores and faster response times to taunting (TAU) than to joyful (JOY) laughter,i.e. negative attention bias. b) Cerebral correlates of the negative attention bias in the left DLPFC (circled). Results are shown at a threshold of p,0.001, uncorrected at voxel-level, and a cluster extent of k.10 voxels; results in the DLPFC are significant with p,0.05, FWE-corrected for multiplecomparisons across the whole brain at cluster level. c) ROI analysis of extracted mean parameter estimates in the left DLPFC (I) illustrates the linearassociation of the negative attention bias and cerebral activation during laughter perception and (II) demonstrates an additional positive linearassociation of differential responses to TAU and JOY in this region and LSAS-SR scores. Asterisks mark levels of significance: **p,0.01, ***p,0.001.doi:10.1371/journal.pone.0099815.g002
Table 2. Brain areas where the attentional bias during laughter perception (response times JOY – TAU) was positively correlatedwith stronger responses to JOY than to TAU.
x y z
Z-score(peakvoxel) Cluster size (voxel)
L cerebellum/L parahippocampal gyrus/L fusiform gyrus –18 –27 –24 4.58 39
R superior and middle frontal gyri 24 45 36 4.15 32
L superior and middle frontal gyri/L precentral gyrus –21 3 54 4.14 86*
R superior parietal gyrus/R angular gyrus 30 –69 51 3.96 43
R and L supplemental motor area/superior frontal gyrus pars medialis 9 15 63 3.84 53
L inferior parietal gyrus –36 –51 45 3.86 32
L superior parietal gyrus –24 –72 54 3.43 19
Activations thresholded at p,0.001, uncorrected with a cluster size k$10 voxels. Coordinates refer to the MNI system. Only those clusters whose size is marked with a‘‘*’’ can be considered significant at p,0.05, FWE corrected for multiple comparisons across the whole brain at the cluster level which corresponds to a cluster size of k$
60 voxels. Clusters with a size k,60 voxels are shown solely for the purpose of completeness. Voxel size 36363 mm3.doi:10.1371/journal.pone.0099815.t002
Laughter Perception in Social Anxiety
PLOS ONE | www.plosone.org 6 June 2014 | Volume 9 | Issue 6 | e99815
For the correlation between the activation patterns (JOY–TAU)
in the left DLPFC and LSAS no modality-dependent differences
were observed (all Z#1.3, all P.0.05).
Confirmatory mediation analyses for the separate modalities of
cue presentation, however, yielded significant results only for AV
(see Table S2).
Discussion
This is, to our knowledge, the first neuroimaging study
employing laughter to evaluate cognitive biases in individuals
with varying degrees of SA. Here, we combined event-related
fMRI with mediation analysis to reveal specific explanatory
cerebral activation patterns for the influence of SA on the negative
attention bias during laughter perception.
Our study identified the left DLPFC as key structure linking SA
and the negative attention bias. Keeping in mind that faster
responses to socially exclusive laughter were correlated with
weaker cerebral responses to this laughter type, these results fit well
with an earlier report of decreased activation of the lateral
prefrontal cortex and faster responses to aversive stimuli in healthy
individuals trained to attend to such stimuli [17].
The Negative Attention Bias and the Dorsal AttentionSystem
The left DLPFC is part of the dorsal frontoparietal attention
network which is involved in goal-directed stimulus processing and
response selection [45]. Both, goal-directed stimulus processing
[46] and the function of the dorsal attention network [47] have
Table 3. The impact of social anxiety (X) on the attentional bias (Y) during laughter perception (response times JOY – TAU) wasmediated through cerebral activation (M) patterns in left DLPFC.
control variable X R Y X R M M R Y
total effect direct effect indirect effect
c c’ ab a b
beta 2.652 0.968 1.684 0.014 121.5
none Z 2.9 1.2 2.5 2.8 3.3
P value 0.004 0.227 0.012 0.005 0.001
95% CI 3.768–0.671
beta 2.257 0.182 2.439 0.018 136.2
STAI-X1 Z 2.0 0.2 - 2.7 3.7
P value 0.046 0.849 - 0.004 ,0.001
95% CI 4.126–0.846
beta 2.123 0.892 1.233 0.011 116.3
STAI-X2 Z 2.2 1.1 2.1 3.0
P value 0.027 0.284 0.034 0.003
95% CI 3.294–0.298
Mediation analysis: X = independent variable, Y = dependent variable, M = mediator, a = influence of X on M, b = influence of M on Y controlling for X, c = total effect of Xon Y, c’ = direct effect of X on Y, ab = indirect effect of X on Y through M. Z values for the ab path pertain to the Sobel test while 95% CI pertain to the bootstrappingapproach (for details see Methods). Values displayed in bold type refer to significant effects.doi:10.1371/journal.pone.0099815.t003
Figure 3. Mediation of the impact of social anxiety on the negative attention bias during laughter perception through cerebralactivation patterns of the prefrontal cortex. X = independent variable (i.e., LSAS-SR scores), Y = dependent variable (i.e., response timedifferences JOY – TAU), M = mediator variable (i.e., differential cerebral activation JOY – TAU in the left DLPFC); a = effect of X on M; b = effect of M onY partialling out X; c = total effect of X on Y; c’ = direct effect of X on Y; ab = indirect effect of X on Y through M. p value of ab refers to the Sobel test.Continuous arrows indicate significant effect while non-significant effects are symbolized by dashed arrows. Significance of the results remainsunaltered when statistically controlling for the influence of general anxiety (STAI).doi:10.1371/journal.pone.0099815.g003
Laughter Perception in Social Anxiety
PLOS ONE | www.plosone.org 7 June 2014 | Volume 9 | Issue 6 | e99815
been found to be impaired in highly anxious individuals. The
hypothesis that the observed behavioral alterations in individuals
with pronounced SA are related to the dorsal attention system is
further supported by additional, even though not significant in the
whole-brain analysis, linear associations of the attention bias and
cerebral activation in areas adjacent to the bilateral intraparietal
sulci (see Table 2) also part of the dorsal attention system. A
question arising from the present findings is how the association of
faster response times to socially rejecting laughter and decreased
cerebral activation can be related to the function of the underlying
network. Presumably, the observed reduced cerebral activation to
threatening stimuli in high SA individuals reflects less effortful
processing of such stimuli due to increased expectation of
threatening social signals in high SA individuals. Furthermore,
bearing in mind that the contrast of interest in the present study
also contained positive social stimuli, a recently demonstrated
tendency in SA to allocate attention away from such stimuli [48]
could offer an additional or alternative explanation of the observed
behavioral and neuronal effects.
Translational PerspectivesAs the negative attention bias in SA is thought to play a causal
role in the maintenance of clinically relevant anxiety, it is of
paramount importance to identify the involved cerebral structures
for translational research.
On the one hand, the present study defines clear cut regions of
interest for further studies on the cerebral mechanisms underlying
neuropsychological attention trainings which both modify such
cognitive biases and alleviate the symptoms in anxiety disorders
[49]. In a similar way, the present findings may also bear relevance
for future research on the neural underpinnings of cognitive
behavioral therapy (CBT), the psychological gold standard therapy
for anxiety disorders [50], as CBT reduces the attentional bias in
anxiety disorders [51]. As the self-efficacy of cognitive reappraisal
has been identified as mediator of CBT effects in SAD [52],
studies investigating the effects of cognitive reappraisal on
cognitive biases and their neural mediators in SA appear
warranted to expand the scientific groundwork for further studies
on the neural mediators of effective CBT for SAD.
Also, recently, it was demonstrated that a non-invasive
electrophysiological intervention (i.e., anodal transcranial direct
current stimulation (tDCS) applied to the left DLPFC impacts on
processing of emotional cues in healthy subjects [53,54] and, more
importantly, reduces the attentional bias for emotional informa-
tion in depression [55]. Moreover, a recent meta-analysis
indicated a positive effect of left DLPFC tDCS on symptom
reduction in depression [56]. Thus, the results of the present study
represents a promising starting point for further research using
laughter perception as an experimental probe to clarify the causal
relationships between SA symptoms, attentional biases and the
therapeutic effects of attention trainings, CBT and potentially
tDCS.
Finally, Hofmann et al. [57] suggested modifying the activity of
limbic and prefrontal brain areas using neurofeedback techniques
in order to reduce anxious symptoms. In this context, the
prefrontal brain regions identified in the present study represent
a spatially well-defined target for the modification of both
attention bias and SA via neurofeedback.
Although this study focused on SA, the localization of cerebral
structures mediating cognitive biases may also be relevant for
research on other psychiatric disorders as it has been shown that
cognitive biases occur also in other anxiety disorders as well as
depression [58], schizophrenia [59] and addiction [60].
Another outcome of the present study is the validation of a
cognitive bias in SA during perception of nonverbal social signals
using dynamic and multimodal cues. At the behavioral level, the
lack of significant differences in the association of SA and the
cognitive biases for different modalities of cue presentation fits
with the observation of such biases both in the nonverbal [5–8]
and verbal [61] domain of information processing and further
supports the hypothesis that cognitive biases in SA solely depend
on their relation to social threat and generalize across sensory
modalities. Broadening the perspective to the neural mediators of
aforesaid cognitive biases, differences between the cue presenta-
tion modalities become apparent: Our results demonstrate that the
mediating effect left DLPFC activation is most prominently driven
by patterns of activity occurring under bimodal (i.e., audiovisual)
stimulation.
It is conceivable that this is due to the redundancy of social
information from the auditory and visual channels in the bimodal
cues which might help to shape more distinct cerebral activation
patterns associated with this social information in supramodal
frontal brain regions.
Apart from the fact that this stimulation condition approximates
most closely natural social communication conditions, this finding
additionally advocates the use of dynamic multimodal stimuli in
social communication research.
Somewhat surprisingly, there was no significant association of
the interpretation bias and cerebral activation patterns. From a
conceptual point of view, it seems unlikely that the general
interpretation bias during laughter perception should not have any
neuronal correlate. There may, however, be a methodological
reason for this negative result: Due to the lack of differences in the
interpretation bias across the experimental conditions (i.e. laughter
types and cue modalities), the analysis of its neuronal correlates
was based on the fMRI main effect of laughter perception. This
main effect, however, is contrasted against an implicit baseline and
may therefore contain a greater amount of error variance than
differential activations between laughter types, thus rendering the
respective statistical analysis less sensitive. Here, the introduction
of a suitable experimental baseline condition (e.g., filtered and
unrecognizable laughter stimuli with preserved basic visual and
auditory features) could represent a solution for this problem in
future studies. Finally, while only a design with explicit social
evaluation of the stimulus material allows the simultaneous rating-
based and response time-based assessments of the relationship of
SA and interpretation as well as attention biases, it may be useful
in future studies to employ experimental designs with implicit (i.e.,
task-irrelevant) processing of social stimuli as these are known to
elicit even more robust attention biases in SA.
Limitations
Although mediation analysis affords a stronger basis for model-
based causal inferences than ‘‘simple’’ correlational statistical
approaches, it is nevertheless based on regression analysis and not
completely free from the limitations bound to this type of analysis.
Therefore, the verification of the causal nature of the observed
activation patterns of DLPFC in future studies employing non-
invasive electrophysiological and behavioral neuromodulatory
techniques to actively modify cognitive biases in combination
with fMRI appears as a logical and necessary extension of the
present study.
A second limitation for the interpretability of our results can be
found in the characteristics of the participant population.
Although social anxiety typically has an early onset in life, the
age distribution of the present sample as well as its high
Laughter Perception in Social Anxiety
PLOS ONE | www.plosone.org 8 June 2014 | Volume 9 | Issue 6 | e99815
educational level somewhat limit the generalizability of our
findings with respect to these parameters. Finally, the exclusion
of psychiatric disorders other than SAD prevents the generaliz-
ability of the present results regarding individuals with comorbid
forms of SAD.
Conclusion
In summary, the novel application of laughter as a symptom
provoking stimulus in SA and mediation analysis of fMRI data in
the present study strongly supports the notion that altered
functioning of the dorsal attention system represents the cerebral
mediator of the negative attention bias in SA. Therefore, the
present study can serve as a very useful basis for future
investigations employing psychotherapeutic, neuropsychological,
or electrophysiological interventions with influence on cognitive
biases to clarify the causal relationships between psychiatric
conditions, cognitive biases and altered cerebral functioning
possibly even beyond the domain of anxiety disorders.
Supporting Information
Table S1 Brain areas where mean laughter ratings werenegatively associated with mean cerebral responsesduring laughter perception.(DOC)
Table S2 Exclusive significant mediation effect ofcerebral activation patterns in the left DLPFC for theimpact of social anxiety on the attentional bias duringlaughter perception (response times JOY – TAU) underbimodal (AV) stimulation in contrast to monomodalstimulation (A, V).(DOC)
Author Contributions
Conceived and designed the experiments: BK CB SS DW. Performed the
experiments: CB JR MD ML SS. Analyzed the data: BK CB JR TE ML
HJ. Contributed reagents/materials/analysis tools: BK JR HJ. Wrote the
paper: BK CB JR TE MD ML HJ SS DW.
References
1. Stein DJ, Ruscio AM, Lee S, Petukhova M, Alonso J, et al. (2010) Subtyping
social anxiety disorder in developed and developing countries. Depress Anxiety
27: 390–403.
2. Stein MB, Stein DJ (2008) Social anxiety disorder. Lancet 371: 1115–1125.
3. Mendlowicz MV, Stein MB (2000) Quality of life in individuals with anxiety
disorders. Am J Psychiatry 157: 669–682.
4. Lipsitz JD, Schneier FR (2000) Social phobia. Epidemiology and cost of illness.
Pharmacoeconomics 18: 23–32.
5. Gilboa-Schechtman E, Foa EB, Amir N (1999) Attentional biases for facial
expressions in social phobia: The effects of target and distractor in ‘‘face-in-the-
crowd’’ task. Cogn Emot 13: 305–318.
6. Mogg K, Bradley BP (2002) Selective orienting of attention to masked threat
faces in social anxiety. Behav Res Ther 40: 1403–1414.
7. Machado-de-Sousa JP, Arrais KC, Alves NT, Chagas MH, de Meneses-Gaya C,
et al. (2010) Facial affect processing in social anxiety: tasks and stimuli. J Neurosci
Methods 193: 1–6.
8. Quadflieg S, Wendt B, Mohr A, Miltner WH, Straube T (2007) Recognition and
evaluation of emotional prosody in individuals with generalized social phobia: a
pilot study. Behav Res Ther 45: 3096–3103.
9. Clark DM, Wells A (1995) A cognitive model of social phobia. In: R. G
Heimberg, Liebowitz MR, Hope DA, Schneier FR, editors. Social phobia:
Diagnosis, assessment, and treatment. New York: Guilford Press. 69–93.
10. Rapee RM, Heimberg RG (1997) A cognitive-behavioral model of anxiety in
social phobia. Behav Res Ther 35: 741–756.
11. Amir N, Klumpp H, Elias J, Bedwell JS, Yanasak N, et al. (2005) Increased
activation of the anterior cingulate cortex during processing of disgust faces in
individuals with social phobia. Biol Psychiatry 57: 975–981.
12. Goldin PR, Manber T, Hakimi S, Canli T, Gross JJ (2009) Neural bases of social
anxiety disorder: emotional reactivity and cognitive regulation during social and
physical threat. Arch Gen Psychiatry 66: 170–180.
13. Phan KL, Fitzgerald DA, Nathan PJ, Tancer ME (2006) Association between
amygdala hyperactivity to harsh faces and severity of social anxiety in
generalized social phobia. Biol Psychiatry 59: 424–429.
14. Stein MB, Goldin PR, Sareen J, Zorrilla LT, Brown GG (2002) Increased
amygdala activation to angry and contemptuous faces in generalized social
phobia. Arch Gen Psychiatry 59: 1027–1034.
15. Straube T, Kolassa IT, Glauer M, Mentzel HJ, Miltner WH (2004) Effect of task
conditions on brain responses to threatening faces in social phobics: an event-
related functional magnetic resonance imaging study. Biol Psychiatry 56: 921–
930.
16. Quadflieg S, Mohr A, Mentzel HJ, Miltner WH, Straube T (2008) Modulation
of the neural network involved in the processing of anger prosody: the role of
task-relevance and social phobia. Biol Psychol 78: 129–137.
17. Browning M, Holmes EA, Murphy SE, Goodwin GM, Harmer CJ (2010)
Lateral prefrontal cortex mediates the cognitive modification of attentional bias.
Biol Psychiatry 67: 919–925.
18. Monk CS, Nelson EE, McClure EB, Mogg K, Bradley BP, et al. (2006)
Ventrolateral prefrontal cortex activation and attentional bias in response to
angry faces in adolescents with generalized anxiety disorder. Am J Psychiatry
163: 1091–1097.
19. Price RB, Eldreth DA, Mohlman J (2011) Deficient prefrontal attentional
control in late-life generalized anxiety disorder: an fMRI investigation. Transl
Psychiatry 1: e46.
20. Telzer EH, Mogg K, Bradley BP, Mai X, Ernst M, et al. (2008) Relationshipbetween trait anxiety, prefrontal cortex, and attention bias to angry faces in
children and adolescents. Biol Psychol 79: 216–222.
21. Fani N, Jovanovic T, Ely TD, Bradley B, Gutman D, et al. (2012) Neuralcorrelates of attention bias to threat in post-traumatic stress disorder. Biol
Psychol 90: 134–142.
22. Dresler T, Hindi Attar C, Spitzer C, Lowe B, Deckert J, et al. (2012) Neural
correlates of the emotional Stroop task in panic disorder patients: an event-related fMRI study. J Psychiatr Res 46: 1627–1634.
23. Davila Ross M, Owren MJ, Zimmermann E (2009) Reconstructing the evolution
of laughter in great apes and humans. Curr Biol 19: 1106–1111.
24. Provine RR (2013) Laughing, grooming, and pub science. Trends Cogn Sci 17:9–10.
25. Eibl-Eibesfeldt I (1970) Ethology: The biology of behavior. New York: Holt,
Rinehart & Winston.
26. Panksepp J, Burgdorf J (2003) ‘‘Laughing’’ rats and the evolutionary antecedentsof human joy? Physiol Behav 79: 533–547.
27. Szameitat DP, Alter K, Szameitat AJ, Darwin CJ, Wildgruber D, et al. (2009)
Differentiation of emotions in laughter at the behavioral level. Emotion 9: 397–
405.
28. Szameitat DP, Kreifelts B, Alter K, Szameitat AJ, Sterr A, et al. (2010) It is notalways tickling: Distinct cerebral responses during perception of different
laughter types. Neuroimage 53: 1264–1271.
29. Wildgruber D, Szameitat DP, Ethofer T, Bruck C, Alter K, et al. (2013)Different types of laughter modulate connectivity within distinct parts of the
laughter perception network. PLoS One 8: e63441.
30. Edwards KR, Martin RA, Dozois DJA (2010) The fear of being laughed at,social anxiety, and memories of being teased during childhood. Psychological
Test and Assessment Modeling 52: 94–107.
31. Weinstein S, Woodward TS, Ngan ET (2007) Brain activation mediates the
association between structural abnormality and symptom severity in schizo-phrenia. Neuroimage 36: 188–193.
32. Stein MB, Torgrud LJ, Walker JR (2000) Social phobia symptoms, subtypes, and
severity: findings from a community survey. Arch Gen Psychiatry 57: 1046–1052.
33. Vriends N, Becker ES, Meyer A, Michael T, Margraf J (2007) Subtypes of social
phobia: are they of any use? J Anxiety Disord 21: 59–75.
34. Oldfield RC (1971) The assessment and analysis of handedness: the Edinburghinventory. Neuropsychologia 9: 97–113.
35. Wittchen HU, Zaudig M, Fydrich T (1997) Strukturiertes Klinisches Interview
fur DSM-IV. Gottingen: Hogrefe.
36. Heimberg RG, Horner KJ, Juster HR, Safren SA, Brown EJ, et al. (1999)
Psychometric properties of the Liebowitz Social Anxiety Scale. Psychol Med 29:199–212.
37. Laux L, Glanzmann P, Schaffner P, Spielberger CD (1981) Das State-Trait-
Angstinventar. Weinheim: Beltz.
38. Lehrl S (2005) Mehrfachwahl-Wortschatz-Intelligenztest MWT-B. Balingen:Spitta Verlag.
39. Wagner HL (1993) On measuring performance in category judgment studies of
nonverbal behavior. Journal of Nonverbal Behavior 17: 3–28.
40. Meng X, Rosenthal R, Rubin D (1992) Comparing Correlated CorrelationCoefficients. Psychol Bull 111: 172–175.
41. Friston K, Holmes AP, Worsley KJ, Poline J-P, Frith CD, et al. (1995) Statistical
parametric maps in neuroimaging: A general linear approach. Hum Brain Mapp
2: 189–210.
Laughter Perception in Social Anxiety
PLOS ONE | www.plosone.org 9 June 2014 | Volume 9 | Issue 6 | e99815
42. Weaver B, Wuensch KL (2013) SPSS and SAS programs for comparing Pearson
correlations and OLS regression coefficients. Behav Res Methods 45: 880–895.43. Sobel ME (1982) Asymptotic confidence intervals for indirect effects in structural
equations models. In: Leinhart S, editor. Sociological methodology. San
Francisco: Jossey-Bass. 290–312.44. Preacher KJ, Hayes AF (2008) Asymptotic and resampling strategies for
assessing and comparing indirect effects in multiple mediator models. Behav ResMethods 40: 879–891.
45. Corbetta M, Shulman GL (2002) Control of goal-directed and stimulus-driven
attention in the brain. Nat Rev Neurosci 3: 201–215.46. Eysenck MW, Derakshan N, Santos R, Calvo MG (2007) Anxiety and cognitive
performance: attentional control theory. Emotion 7: 336–353.47. Sylvester CM, Corbetta M, Raichle ME, Rodebaugh TL, Schlaggar BL, et al.
(2012) Functional network dysfunction in anxiety and anxiety disorders. TrendsNeurosci 35: 527–535.
48. Taylor CT, Bomyea J, Amir N (2010) Attentional bias away from positive social
information mediates the link between social anxiety and anxiety vulnerability toa social stressor. J Anxiety Disord 24: 403–408.
49. Hakamata Y, Lissek S, Bar-Haim Y, Britton JC, Fox NA, et al. (2010) Attentionbias modification treatment: a meta-analysis toward the establishment of novel
treatment for anxiety. Biol Psychiatry 68: 982–990.
50. Hofmann SG, Smits JA (2008) Cognitive-behavioral therapy for adult anxietydisorders: a meta-analysis of randomized placebo-controlled trials. J Clin
Psychiatry 69: 621–632.51. Tobon JI, Ouimet AJ, Dozois DJA (2011) Attentional bias in anxiety disorders
following cognitive behavioral treatment. J Cognit Psychother 25: 114–129.
52. Goldin PR, Ziv M, Jazaieri H, Werner K, Kraemer H, et al. (2012) Cognitive
reappraisal self-efficacy mediates the effects of individual cognitive-behavioraltherapy for social anxiety disorder. J Consult Clin Psychol 80: 1034–1040.
53. Nitsche MA, Koschack J, Pohlers H, Hullemann S, Paulus W, et al. (2012)
Effects of frontal transcranial direct current stimulation on emotional state andprocessing in healthy humans. Front Psychiatry 3: 58.
54. Pena-Gomez C, Vidal-Pineiro D, Clemente IC, Pascual-Leone A, Bartres-Faz D(2011) Down-regulation of negative emotional processing by transcranial direct
current stimulation: effects of personality characteristics. PLoS One 6: e22812.
55. Wolkenstein L, Plewnia C (2013) Amelioration of cognitive control in depressionby transcranial direct current stimulation. Biol Psychiatry 73: 646–651.
56. Kalu UG, Sexton CE, Loo CK, Ebmeier KP (2012) Transcranial direct currentstimulation in the treatment of major depression: a meta-analysis. Psychol Med
42: 1791–1800.57. Hofmann SG, Ellard KK, Siegle GJ (2012) Neurobiological correlates of
cognitions in fear and anxiety: a cognitive-neurobiological information-
processing model. Cogn Emot 26: 282–299.58. Mathews A, MacLeod C (2005) Cognitive vulnerability to emotional disorders.
Annu Rev Clin Psychol 1: 167–195.59. Moritz S, Laudan A (2007) Attention bias for paranoia-relevant visual stimuli in
schizophrenia. Cogn Neuropsychiatry 12: 381–390.
60. Field M, Cox WM (2008) Attentional bias in addictive behaviors: a review of itsdevelopment, causes, and consequences. Drug Alcohol Depend 97: 1–20.
61. Amir N, Weber G, Beard C, Bomyea J, Taylor CT (2008) The effect of a single-session attention modification program on response to a public-speaking
challenge in socially anxious individuals. J Abnorm Psychol 117: 860–868.
Laughter Perception in Social Anxiety
PLOS ONE | www.plosone.org 10 June 2014 | Volume 9 | Issue 6 | e99815