Evidence of frontotemporal structural hypoconnectivity in social anxiety disorder: A quantitative...
10
r Human Brain Mapping 00:00–00 (2011) r Evidence of Frontotemporal Structural Hypoconnectivity in Social Anxiety Disorder: A Quantitative Fiber Tractography Study Volker Baur, 1 * Annette Beatrix Bru ¨ hl, 2 Uwe Herwig, 2 Tanja Eberle, 1 Michael Rufer, 3 Aba Delsignore, 3 Lutz Ja ¨ncke, 1,4,5 and Ju ¨ rgen Ha ¨nggi 1 1 Division Neuropsychology, Institute of Psychology, University of Zurich, Switzerland 2 Clinic for General and Social Psychiatry, Psychiatric University Hospital, University of Zurich, Switzerland 3 Department of Psychiatry and Psychotherapy, University Hospital Zurich, University of Zurich, Switzerland 4 Center for Integrative Human Physiology, University of Zurich, Switzerland 5 International Normal Aging and Plasticity Imaging Center (INAPIC), University of Zurich, Switzerland r r Abstract: Investigation of the brain’s white matter fiber tracts in social anxiety disorder (SAD) may pro- vide insight into the underlying pathophysiology. Because models of pathological anxiety posit altered frontolimbic interactions, the uncinate fasciculus (UF) connecting (orbito-) frontal and temporal areas including the amygdala is of particular interest. Microstructural alterations in parts of the UF have been reported previously, whereas examination of the UF as discrete fiber tract with regard to more large- scale properties is still lacking. Diffusion tensor imaging was applied in 25 patients with generalized SAD and 25 healthy control subjects matched by age and gender. By means of fiber tractography, the UF was reconstructed for each participant. The inferior fronto-occipital fasciculus (IFOF), originating from the frontal cortex similarly to the UF, was additionally included as control tract. Volume and frac- tional anisotropy (FA) were compared between the groups for both tracts. Volume of left and right UF was reduced in patients with SAD, reaching statistical significance for the left UF. Bilateral IFOF volume was not different between groups. A similar pattern was observed for FA. Reduced volume of the left UF in SAD fits well into pathophysiological models of anxiety, as it suggests deficient structural connec- tivity between higher-level control areas in the orbitofrontal cortex and more basal limbic areas like the amygdala. The results point to a specific role of the left UF with regard to altered white matter volume in SAD. However, results should be replicated and functional correlates of altered UF volume be deter- mined in future studies. Hum Brain Mapp 00:000–000, 2011. V C 2011 Wiley Periodicals, Inc. Key words: social anxiety disorder; diffusion tensor imaging; quantitative fiber tractography; white matter connectivity; uncinate fasciculus; volume r r Additional Supporting Information may be found in the online version of this article. Contract grant sponsor: University of Zurich (to L.J.) and Swiss National Foundation (to U.H.); Contract grant number: 120518. *Correspondence to: Volker Baur, Institute of Psychology, University of Zurich, Binzmu ¨ hlestrasse 14/25, CH-8050 Zurich, Switzerland. E-mail: [email protected] Received for publication 29 April 2011; Revised 8 July 2011; Accepted 29 July 2011 DOI: 10.1002/hbm.21447 Published online in Wiley Online Library (wileyonlinelibrary. com). V C 2011 Wiley Periodicals, Inc.
Transcript of Evidence of frontotemporal structural hypoconnectivity in social anxiety disorder: A quantitative...

r Human Brain Mapping 00:00–00 (2011) r
Evidence of Frontotemporal StructuralHypoconnectivity in Social Anxiety Disorder:A Quantitative Fiber Tractography Study
Volker Baur,1* Annette Beatrix Bruhl,2 Uwe Herwig,2 Tanja Eberle,1
Michael Rufer,3 Aba Delsignore,3 Lutz Jancke,1,4,5 and Jurgen Hanggi1
1Division Neuropsychology, Institute of Psychology, University of Zurich, Switzerland2Clinic for General and Social Psychiatry, Psychiatric University Hospital, University of Zurich, Switzerland
3Department of Psychiatry and Psychotherapy, University Hospital Zurich, University of Zurich,Switzerland
4Center for Integrative Human Physiology, University of Zurich, Switzerland5International Normal Aging and Plasticity Imaging Center (INAPIC), University of Zurich, Switzerland
r r
Abstract: Investigation of the brain’s white matter fiber tracts in social anxiety disorder (SAD) may pro-vide insight into the underlying pathophysiology. Because models of pathological anxiety posit alteredfrontolimbic interactions, the uncinate fasciculus (UF) connecting (orbito-) frontal and temporal areasincluding the amygdala is of particular interest. Microstructural alterations in parts of the UF have beenreported previously, whereas examination of the UF as discrete fiber tract with regard to more large-scale properties is still lacking. Diffusion tensor imaging was applied in 25 patients with generalizedSAD and 25 healthy control subjects matched by age and gender. By means of fiber tractography, theUF was reconstructed for each participant. The inferior fronto-occipital fasciculus (IFOF), originatingfrom the frontal cortex similarly to the UF, was additionally included as control tract. Volume and frac-tional anisotropy (FA) were compared between the groups for both tracts. Volume of left and right UFwas reduced in patients with SAD, reaching statistical significance for the left UF. Bilateral IFOF volumewas not different between groups. A similar pattern was observed for FA. Reduced volume of the leftUF in SAD fits well into pathophysiological models of anxiety, as it suggests deficient structural connec-tivity between higher-level control areas in the orbitofrontal cortex and more basal limbic areas like theamygdala. The results point to a specific role of the left UF with regard to altered white matter volumein SAD. However, results should be replicated and functional correlates of altered UF volume be deter-mined in future studies. Hum Brain Mapp 00:000–000, 2011. VC 2011 Wiley Periodicals, Inc.
Keywords: social anxiety disorder; diffusion tensor imaging; quantitative fiber tractography; whitematter connectivity; uncinate fasciculus; volume
r r
Additional Supporting Information may be found in the onlineversion of this article.
Contract grant sponsor: University of Zurich (to L.J.) and SwissNational Foundation (to U.H.); Contract grant number: 120518.
*Correspondence to: Volker Baur, Institute of Psychology,University of Zurich, Binzmuhlestrasse 14/25, CH-8050 Zurich,Switzerland. E-mail: [email protected]
Received for publication 29 April 2011; Revised 8 July 2011;Accepted 29 July 2011
DOI: 10.1002/hbm.21447Published online in Wiley Online Library (wileyonlinelibrary.com).
VC 2011 Wiley Periodicals, Inc.
INTRODUCTION
Social anxiety disorder (SAD) involves intense fear andavoidance of social situations, e.g. being in focus of atten-tion of others, with about one of ten in the general popula-tion meeting criteria for SAD during life-time [Kessleret al., 1994]. Hyperactive limbic and paralimbic areas likethe amygdala and insula are central to the pathophysiol-ogy across a range of anxiety disorders including SAD,post-traumatic stress disorder and specific phobia [Etkinand Wager, 2007]. The amygdala has a pivotal role in sali-ence processing with a particular relatedness to social cues[Adolphs, 2003b] and is, therefore, of special importanceregarding social anxiety [Cannistraro and Rauch, 2003].Beyond hyperactivity of basal affective systems, alterationsin SAD have also been shown in frontal cortical activityrelevant for cognitive control processes [Goldin et al.,2009], for example in the orbitofrontal cortex (OFC). Mod-els of pathological anxiety posit impaired functional dia-logue between basal affective and higher-order controlsystems [Akirav and Maroun, 2007; Bishop, 2007; Canni-straro and Rauch, 2003], which may underlie the observedfunctional alterations in limbic and frontal areas in SAD.
The specific features of white matter (WM) architecturein SAD, especially with regard to important fiber bundles,have not been studied extensively so far. However, a moredetailed examination of these anatomical features couldhelp understand the neural underpinnings of SAD. Theuncinate fasciculus (UF) connects the OFC with limbic/paralimbic regions including amygdala and the anteriortemporal lobe [Ebeling and von Cramon, 1992; Petridesand Pandya, 2007]. Hereby, the UF may provide the ana-tomical connection underlying the functional dialoguebetween higher-order control and basal affective brain sys-tems. Given also the particular relatedness of amygdalaand OFC function to social processes [Adolphs, 2003a]and, thus, social anxiety, the UF is a main fiber tract of in-terest for the investigation of SAD pathophysiology. Initialevidence points to local microstructural alterations in partsof the right UF in patients with SAD [Phan et al., 2009],underlining our focus on the UF in the present investiga-tion. Examination of the UF as discrete fiber tract withregard to more large-scale properties such as volume isstill lacking in the literature.
There are different approaches to study the WM archi-tecture in SAD. Previously [Baur et al., in press], wefocused on fractional anisotropy (FA), a measure modu-lated by fiber directedness. Assessing FA, it is possible toestimate fiber disorganization and demyelination in SADon a micro-/mesoscopic level. Here, we used an alterna-tive approach in the same subjects: Diffusion tensor imag-ing (DTI) quantitative fiber tractography allows for thereconstruction and quantification of whole fiber bundleswithin the individual brain’s WM [Mori and van Zijl,2002]. Because the prominent, well-known WM fiber tractsfacilitate functional interactions between distant brainregions, they may also support integration of different
modalities (e.g., sensory, cognitive, and emotional proc-esses). For instance, the UF might facilitate cognitive-emo-tional interactions by enabling communication between theOFC and the amygdala, that is, between higher-level con-trol and basal affective areas. Implications from UF trac-tography may therefore refer to a more large-scale levelregarding the pathophysiology of SAD. Here, we focusedon large-scale aspects of the UF and hypothesized reducedUF volume in SAD, corresponding to deficient frontolim-bic interactions. To examine whether possible volume dif-ferences in the UF could be attributed to unspecific orglobal effects, we included the inferior fronto-occipital fas-ciculus (IFOF) interconnecting frontal and occipital lobesas control tract for fiber tracking and statistical analysis.The UF and the IFOF share a common trajectory in thefrontal lobe [Catani et al., 2002] (see also Fig. 1) and sepa-rate in more posterior regions to follow their own trajecto-ries terminating in the temporal and occipital lobe,respectively. For the IFOF, we did not expect any groupdifferences since there is no direct evidence that this tractis involved in the pathophysiology of SAD. In addition tovolume, we assessed mean FA of each reconstructed tract.Analogously, we expected reduced FA of the UF, but notof the IFOF, in SAD.
MATERIALS AND METHODS
Subjects
For the study, 27 outpatients with current diagnosis ofgeneralized SAD were recruited from the outpatient clinicat the Department of Psychiatry and Psychotherapy of theUniversity Hospital Zurich, Switzerland. Due to severeartifacts in DTI images, two patients with SAD had to beexcluded from further analyses. In addition to the remain-ing 25 patients, 25 healthy control subjects were recruitedvia direct address and email-advertisement. Patient andcontrol groups were matched by age and gender (seeTable I). All subjects were consistently right-handedaccording to the procedure provided by Annett [1970]. Di-agnosis of generalized SAD and current and previouscomorbid Axis-I diagnoses were established in the patientsgroup using the Mini-International Neuropsychiatric Inter-view for DSM-IV [Sheehan et al., 1998] (German version[Ackenheil et al., 1999]). SAD was the primary diagnosisin all patients, five fulfilled criteria for comorbidities (for-mer depressive episode (remitted) in one patient, currentdepressive episode/major depressive disorder in threepatients, alcohol dependency (remitted) in one patient).Nine patients were taking antidepressant medication dueto reactive depressive symptoms (selective serotonin reup-take inhibitors in five patients, selective serotonin/norepi-nephrine reuptake inhibitors in two patients, mirtazapinein one patient, and clomipramine/zolpidem in anotherpatient). Two of these patients were additionally takinglithium, one quetiapin. Dose of drugs had been stable formore than one month in all nine patients when
r Baur et al. r
r 2 r

participating in the study. Healthy control subjects werefree of current or past psychiatric disorders and of medica-tion (except for oral contraceptives in females), as deter-mined in a semistructured clinical interview according toDSM-IV. Neurological disorders, head trauma, pregnancy,excessive consummation of drugs (alcohol, nicotine, caf-feine), and further contraindications against magnetic reso-
nance imaging served as exclusion criteria for the study.For assessment of general anxiety, all participants com-pleted the trait version of the Spielberger State-Trait Anxi-ety Inventory (STAI [Spielberger et al., 1970], Germanversion [Laux et al., 1981]). Social anxiety was assessed inpatients with the self-rating version of the Liebowitz SocialAnxiety Scale (LSAS [Liebowitz, 1987], German version[Stangier and Heidenreich, 2005]). Degree of depression inpatients with SAD was assessed with Beck’s DepressionInventory (BDI; [Beck et al., 1961], German version [Haut-zinger et al., 1994]). In addition, patients were asked to ret-rospectively state the onset of their symptoms. Themajority of patients (88.9%) reported a positive family his-tory of psychiatric disorders (mostly SAD and depression,information available in only 18 patients). After completedescription of the study to the subjects, written informedconsent was obtained. The study was approved by thelocal ethics committee.
DTI Data Acquisition
DTI scans were acquired on a 3.0 T whole-body scanner(GE Medical Systems, Milwaukee) equipped with a stand-ard 8-channel head coil. One diffusion-weighted spin-echoecho-planar imaging (EPI) scan was obtained from all par-ticipants. Slices were acquired sequentially in transversalorientation (matrix 256 � 256 pixels, 39 slices, slice thick-ness 3.2 mm, field of view (FOV) ¼ 240 � 240 mm2, in-plane spatial resolution 0.94 � 0.94 mm2). Further imagingparameters were: echo time (TE) ¼ 87.8 ms, repetition
Figure 1.
The uncinate fasciculus (red) and the inferior fronto-occipital fasciculus (yellow): Example of their
relative locations, shown for one subject, lateral view onto the left hemisphere. [Color figure
can be viewed in the online issue, which is available at wileyonlinelibrary.com.]
TABLE I. Demographic, psychometric, and clinical
measures
SAD HC
ta PMean SD Mean SD
Age (yrs) 31.6 10.4 32.3 10.1 0.24 0.82STAI 50.2b 11.1 33.2c 7.4 6.38 <0.001LSAS 66.0 23.0BDI 15.2 11.0Age of
onset (yrs)d15.1 6.0
Duration ofsymptoms(yrs)d
15.5 10.9
Sex Male, 18 Female, 7 Male, 18 Female, 7
aSAD vs. HC, according to an independent t-test.bCorresponds to increased values [Laux et al., 1981].cCorresponds to normal values [Laux et al., 1981].dAvailable in 20 patients. SAD: patients with social anxiety disor-der, HC: healthy controls, SD: standard deviation, STAI: Spiel-berger State-Trait Anxiety Inventory (trait version), LSAS:Liebowitz Social Anxiety Scale, BDI: Beck’s Depression Inventory.
r Tractography in Social Anxiety Disorder r
r 3 r
time (TR) ¼ 12,000 ms. Diffusion sensitization wasachieved with two balanced diffusion gradients centeredon the 180� radio-frequency pulse. Diffusion was meas-ured in 21 noncollinear directions with a b-value of b ¼1,000 s/mm2. Five additional interleaved nondiffusion-weighted volumes (b ¼ 0 s/mm2) served as reference vol-umes. Scan time was about 6 min. In addition to DTI, T1-,and T2-weighted images were acquired to exclude possibleT1-/T2-sensitive abnormalities.
Data Preprocessing and Fiber Tractography
Preprocessing was done with FMRIB Software Library(FSL) Version 4.1.6 [Smith et al., 2004] (available at:
www.fmrib.ox.ac.uk/fsl) and comprised the followingsteps: (1) segregation of brain tissue from non-brain tissueusing the Brain Extraction Tool [Smith, 2002]; (2) Eddycurrent and head movement correction using EDDYCOR-RECT from FMRIB’s Diffusion Toolbox [Smith et al., 2004];(3) rotation of the gradients according to the corrected pa-rameters from step (2); (4) local fitting of diffusion tensorsand construction of individual FA maps using DTIFITfrom FMRIB’s Diffusion Toolbox [Smith et al., 2004].
For fiber tracking, Diffusion Toolkit 0.5 and TrackVis0.5.1 were used [Wang et al., 2007] (available at:www.trackvis.org). The preprocessed data from FSL werefurther processed with Diffusion Toolkit. For each subject,the diffusion tensors were estimated according to the
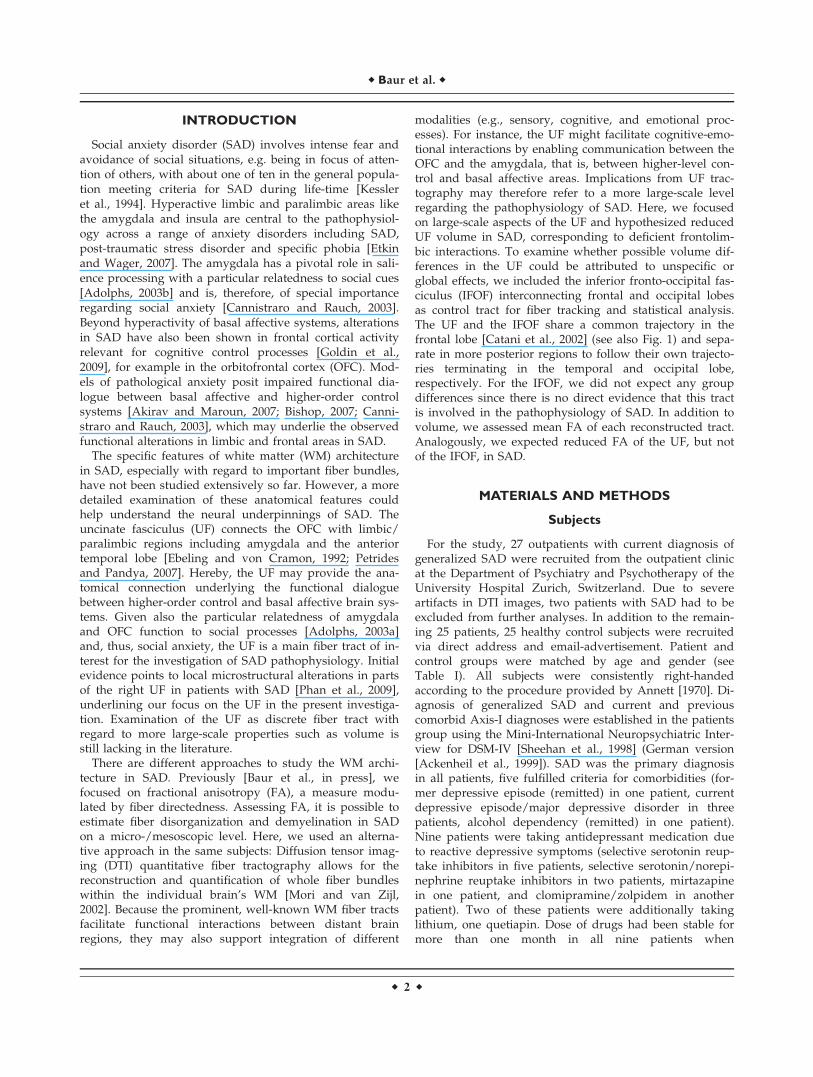
Figure 2.
Tracking procedure and examples. A. Tracking of the uncinate
fasciculus (UF): Placement of ROIs within one coronal slice (left)
and localization of this slice in a lateral view (right) are shown.
For illustration purposes, six examples of the left UF are shown
in red. B. Tracking of the inferior fronto-occipital fasciculus
(IFOF): Placement of ROIs within two different coronal slices
(left) and respective localization of these slices in a lateral view
(right) are shown. For illustration purposes, three examples of
the left IFOF are shown in yellow. [Color figure can be viewed
in the online issue, which is available at wileyonlinelibrary.com.]
r Baur et al. r
r 4 r
corrected gradients. Deterministic fiber tracking was per-formed with the ‘‘brute-force’’ approach [Huang et al.,2004], an automatic procedure commonly used to recon-struct fibers across the whole WM by tracking fibers from
each voxel in the brain. The fiber assignment continuoustracking (FACT) algorithm [Mori et al., 1999] was used.Accordingly, fibers were reconstructed by TrackVis alongthe principal eigenvector of each voxel’s diffusion tensor.Tracking termination criteria were angle > 45� and FA< 0.2 [Mori and van Zijl, 2002] (individual FA mapderived from FSL’s DTIFIT was used as mask image inDiffusion Toolkit). Fiber tracking was performed succes-sively in each subject’s native space. Color-coded FA mapsderived from the principal eigenvector of the diffusion ten-sor in each voxel were used for region-of-interest (ROI)drawing in TrackVis. ROIs were drawn large-sized toinclude the entirety of the tract of interest and avoid false-negative fibers [Yasmin et al., 2009] (see also Fig. 2). Allfiber tracts were obtained through a two-ROI approach(seed ROI and target ROI) with logical AND concatenation[Catani et al., 2002; Wakana et al., 2007] of the two ROIs,such that only fibers that passed both ROIs were includedin the reconstructed tract. Obviously spurious fibers wereremoved from the fiber tract by using an additional avoid-ance ROI (logical NOT operation) [Wakana et al., 2007].For the UF, both the seed and the target ROI was placedin the same coronal slice where the anterior-posteriorfibers (coded in green) of the frontal and the temporal lobewere visible at the most posterior point (see Fig. 2A forillustration of the ROI placement and tractography exam-ples for the UF, see also [Wakana et al., 2007]). For theIFOF, the seed ROI was placed in the occipital lobe accord-ing to Wakana et al. [2007]. The target ROI was placed atthe densest portion of the fiber bundle projecting anteri-orly (coded in green, anterior floor of the external capsule
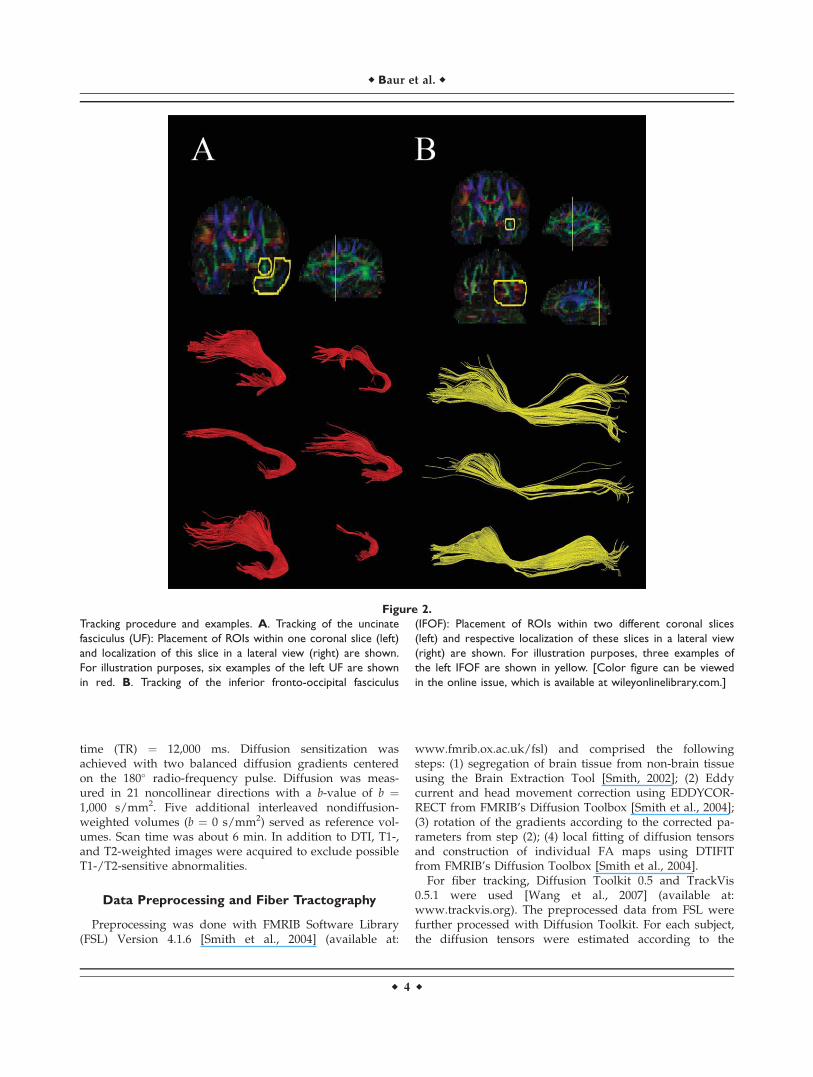
TABLE II. Tract-specific and global measures of interest
SAD HC
ta P dbMean SD Mean SD
Volume (ml) UF Left 4.51 2.39 5.77 2.03 2.03 0.024d 0.61Right 5.01 1.69 5.60 1.45 1.37 0.088d 0.40pc 0.25 0.51
IFOF Left 8.54 2.27 9.49 3.63 0.91 0.37 0.29Right 8.41 2.37 8.75 2.23 0.22 0.82 0.06pc 0.77 0.19
Global WM 730.2 81.7 739.7 65.0 0.46 0.65 0.13
Mean FA UF Left 0.445 0.027 0.464 0.023 1.68 0.0495d 0.49Right 0.452 0.025 0.455 0.023 0.81 0.21d 0.23pc 0.17 <0.05
IFOF Left 0.524 0.022 0.532 0.022 0.34 0.73 0.10Right 0.517 0.028 0.524 0.025 0.32 0.75 0.09pc 0.07 <0.05
Global WM 0.487 0.013 0.496 0.013 2.39 0.021 0.69
aSAD vs. HC, according to an independent t-test contrasting relative values for UF and IFOF (local tract value divided by global WMvalue).bCohen’s d (effect size).cLeft vs. right, according to a paired t-test.dOne-tailed, corresponding to a corrected a ¼ 0.025 according to Bonferroni. UF: uncinate fasciculus, IFOF: inferior fronto-occipital fasci-culus, FA: fractional anisotropy, SAD: patients with social anxiety disorder, HC: healthy controls, WM: white matter.
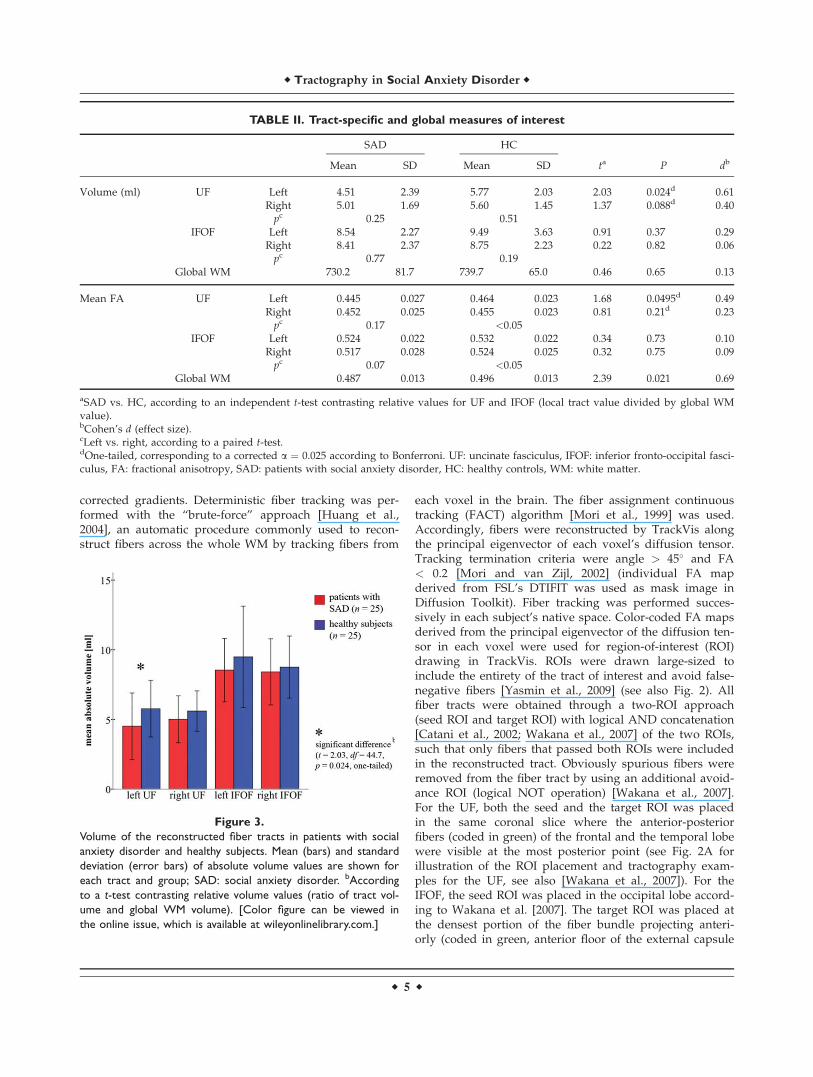
Figure 3.
Volume of the reconstructed fiber tracts in patients with social
anxiety disorder and healthy subjects. Mean (bars) and standard
deviation (error bars) of absolute volume values are shown for
each tract and group; SAD: social anxiety disorder. bAccording
to a t-test contrasting relative volume values (ratio of tract vol-
ume and global WM volume). [Color figure can be viewed in
the online issue, which is available at wileyonlinelibrary.com.]
r Tractography in Social Anxiety Disorder r
r 5 r

[Catani et al., 2002]), typically located in the coronal slicethat dissects the middle of the corpus callosum body (seeFig. 2B for illustration of the ROI placement and tractogra-phy examples for the IFOF). Each tract was reconstructedin both hemispheres, and tracking was randomly per-formed either first in the left or in the right hemisphere ineach subject. After tractography, each individual tract wasvisually inspected for plausibility with regard to its struc-ture based on general anatomical knowledge and previ-ously published tractography studies [Catani et al., 2002;Mori et al., 2002; Wakana et al., 2007]. For each tract, anyvoxel touched by a fiber was counted by TrackVis. Assuch, volume values were obtained by accumulating allvoxels belonging to the respective tract.
Tractography was performed by two investigators (VBand TE) blinded to group affiliation of the subjects. Bothinvestigators did exactly the same steps (ROI placementetc.) of the tracking procedure as described above. Track-ing results from the first investigator were used for statisti-cal analysis. The second investigator reconstructed alltracts for 16 randomly chosen subjects (eight belonging tothe patients group and eight to the control group). Thevalues obtained for these tracts were used to determineinter-rater reliability.
Statistical Analysis
For each subject and each reconstructed fiber tract (leftUF, right UF, left IFOF, right IFOF), the following variableswere extracted from TrackVis: volume (in ml), mean FA,mean fiber length (in mm), and fiber count (artificial unit fornumber of fibers). In addition, global (whole-brain) valuesaccording to the ‘‘brute-force’’ tracking approach deliveredby TrackVis were obtained for each of these measures. Sta-tistical analysis was done with IBM SPSS Statistics (Version19, SPSS Inc, an IBM company, Armonk, NY).
Demographic and psychometric group differences wereexamined using independent two-tailed t-tests (P < 0.05).Inter-rater reliability was assessed by calculating the intra-class correlation coefficient on absolute volume and abso-lute FA values for the tracts of 16 subjects measured byboth raters. For examination of normal distribution, Kol-mogorov-Smirnov test was used.
Group differences of the UF and IFOF with regard to vol-ume and FA were assessed with independent t-tests contrast-ing the relative tract measures (tract volume divided byglobal WM volume; tract mean FA divided by global meanFA). Our focus was on UF volume, for which we had a direc-tional hypothesis of reduced volume in patients with SADcompared with healthy subjects. Because we tested both leftand right UF, cumulation of alpha error was controlled forby applying Bonferroni correction resulting in a corrected a¼ 0.025 for the left and right UF, respectively. Significancetests related to the IFOF were performed thereafter under thehypothesis not to see group differences. Thus, Bonferroni cor-rection was applied solely for tests related to the UF. Analysis
of FA was done accordingly. To assess possible medication-related effects of volume and FA, post-hoc, univariate analy-sis of covariance (ANCOVA) was used with status of medica-tion as between-subjects factor (n ¼ 9 vs. n ¼ 16) and withthe respective global measure, trait anxiety (differencebetween SAD subgroups at P < 0.05), and age (differencebetween SAD subgroups at P ¼ 0.11) as covariates of no in-terest. To assess possible comorbidity-related effects of vol-ume and FA, post-hoc, ANCOVA comprised status ofcomorbidity as between-subjects factor (n ¼ 5 vs. n ¼ 20)with respective global measures as covariates of no interest.Further post-hoc analysis related to volume was done investi-gating relative mean fiber length and relative number offibers (independent t-tests and Pearson correlation). Dimen-sional associations of relative tract volume as well as relativetract mean FA with trait anxiety (STAI) and social anxiety(LSAS) were examined with Pearson’s correlation. P-valuesrelated to UF volume and FA were one-tailed (corrected formultiple comparisons), whereas all other P-values were two-tailed (uncorrected). Additionally, effect sizes (Cohen’s d)were determined.
RESULTS
General Measures, Inter-Rater Reliability, and
Normal Distribution
Demographic, psychometric and clinical measures aresummarized in Table I. Intra-class correlation coefficientswere > 0.92 for absolute volume and > 0.95 for absolutemean FA, indicating excellent reproducibility for the mainmeasures of interest for each reconstructed fiber tract. Kol-mogorov-Smirnov tests yielded normal distributions foreach fiber tract, with regard to both relative volume (eachP > 0.57) and relative FA (each P > 0.90).
Volume and Fractional Anisotropy Associated
With Social Anxiety Disorder
Tractography was successful for all tracts and all subjects.Absolute volume and FA values for the reconstructed tractsand global WM are shown in Table II, separately forpatients with SAD and for healthy subjects, including meas-ures of the respective statistical comparisons.
As the main result, patients with SAD had a signifi-cantly lower relative volume of the left UF compared withhealthy subjects (PBonferroni ¼ 0.024). Volume of the rightUF was also reduced in SAD, however, without reaching astatistical significance or trend (PBonferroni ¼ 0.088). For theleft and right IFOF and global WM, no significant differen-ces were observed (see Table II, Fig. 3). There were no cor-relations of volume with psychometric and clinicalmeasures (see Supporting Information, Table S1). Post-hocanalysis related to left UF volume yielded no significantdifferences, for neither medication (F ¼ 2.34, P ¼ 0.14) norcomorbidity (F ¼ 0.65, P ¼ 0.80). Further post-hoc
r Baur et al. r
r 6 r
examination related to left UF volume (summarized inSupporting Information, Table S2) yielded significantlyreduced mean fiber length compared with healthy sub-jects, whereas fiber count was not significantly differentbetween groups. However, variance in left UF volume wasrather explained by fiber count (87%) as compared withfiber length (61%).
Beyond examination of volume, patients with SAD hadlower relative mean FA than healthy subjects of the leftUF at a trend level (PBonferroni ¼ 0.0495), whereas for theother tracts, no significant differences or trends wereobserved (see Table II, Supporting Information, Fig. S3).Global mean FA was significantly reduced in patients withSAD. A correlation of relative FA with trait anxiety wasobserved for the left UF and right IFOF in SAD, but not inhealthy subjects (see Supporting Information, Table S1 andSupporting Information, Fig. S4). There were no correla-tions with social anxiety. Post-hoc analysis related to leftUF FA yielded neither medication-related (F ¼ 1.82, P ¼0.19) nor comorbidity-related (F ¼ 1.38, P ¼ 0.25) effects.
DISCUSSION
We used quantitative fiber tractography to investigatedifferences of volume and FA between patients with SADand healthy subjects in two fiber tracts originating in thefrontal cortex. Our main finding was reduced volume ofthe left UF in SAD, which accords with our hypothesis.There were no statistically significant group differences forthe right UF and bilaterally for the IFOF. WM fiber tractsin the brain provide the anatomical basis for direct func-tional interactions between distant brain regions, facilitat-ing also integrative processes. The UF connects frontalcortices including OFC with anterior temporal areas andwith the amygdala [Ebeling and von Cramon, 1992; Pet-rides and Pandya, 2007] and may therefore facilitate fron-tolimbic interactions. In anxiety disorders, activation oflimbic/paralimbic areas as the amygdala and insula isincreased [Cannistraro and Rauch, 2003; Etkin and Wager,2007], and models of exaggerated anxiety additionally im-plicate deficient prefrontal control mechanisms in anxioussubjects [Bishop, 2007, 2009; Freitas-Ferrari et al., 2010].Being faced with social situations, patients with SAD ex-hibit strong emotional responding, which may correspondto exaggerated activity of the amygdala and diminishedprefrontal cognitive control. Cognitive-emotional integra-tion such as emotion regulation strategies may be crucialfor dealing with stressors and tends to be disturbed inanxiety disorders like SAD [Salters-Pedneault et al., 2006;Turk et al., 2005]. If control/evaluative systems (OFC) andsalience/affective systems (amygdala, insula) lackexchange of information, limbic circuits will possibly de-velop ‘‘a life of its own’’ leading to exaggerated arousalstates [Freitas-Ferrari et al., 2010] which are frequent inSAD. Since the UF may be the main tract facilitating directfunctional interactions between the OFC and the amygdala
[Ebeling and von Cramon, 1992; Petrides and Pandya,2007], which may involve top-down inhibition [Ghash-ghaei and Barbas, 2002], reduced volume of the left UF fitswell into models of SAD pathophysiology. Reduced vol-ume in the left UF suggests structural hypoconnectivitybetween grey matter areas in the frontal and anterior tem-poral lobe, which may yield implications for neuronalcommunication encompassed by these areas. For instance,functional connectivity between the OFC and the amyg-dala has been shown to be crucial for cognitive reappraisalof negative stimuli [Kanske et al., 2011] and capable ofdecreasing negative affect [Banks et al., 2007]. Both struc-tures are implicated in evaluation of significance of stim-uli, fear extinction, and decision making based on theirfunctional dialogue [Dolan, 2007]. Furthermore, they mayunderlie approach and avoidance behavior [Aupperle andPaulus, 2010]. Recently, effective connectivity between theOFC and the amygdala has been shown to be increased inSAD bidirectionally [Liao et al., 2010]. In the light of ourpresent results, this would point to compensatory mecha-nisms on a functional level due to a structural ‘‘deficit.’’Evidence of compensatory mechanisms in SAD comes fromanother recent study assessing a relationship betweenreduced grey matter volume in temporal cortices andincreased functional connectivity with these areas [Liaoet al., 2011]. Besides hyperactivity of the amygdala [Canni-straro and Rauch, 2003; Etkin and Wager, 2007], under-recruitment of the OFC associated with social anxiety hasbeen shown in functional neuroimaging studies [Bruhlet al., 2011; Tillfors et al., 2001; Zhou et al., 2011]. The factthat we found no correlations with measures reflectingsocial anxiety challenges the notion whether reduced UFvolume is of specific relevance for SAD. Rather, the presentresults might point to a pathophysiologic characteristicunderlying abnormal anxiety or mood regulation in gen-eral. This is supported by studies that have identified WMalterations in the UF in mood disorders and schizophrenia[Kawashima et al., 2009; McIntosh et al., 2008], suggestingin turn a role of the UF in processes modulated by commonrisk factors of several psychiatric disorders, such as early-life stress. Comparative studies across different psychiatricdisorders would be necessary to address this issue.
On a morphometric level, we consider three possibilitiesthat may explain the reported volume difference of the leftUF between patients with SAD and healthy subjects. First,fiber loss and thus reduced fiber density may lead toreduced volume in SAD. This might also explain the find-ing of reduced FA within the left UF. Second, there aremore large-scale interconnected and/or a higher numberof involved grey matter areas associated with the UF inhealthy subjects, reflected by thinner and/or shorter UFtracts in SAD. Third, it is a mixture of both. Indeed, ourpost-hoc analysis yielded reduced mean fiber length of theleft UF in SAD and 87% explained variance of left UF vol-ume by fiber count. This indicates that both the length andpure presence of fibers have contributed to the effect ofreduced volume.
r Tractography in Social Anxiety Disorder r
r 7 r
Analysis of FA yielded a similar pattern as for volume:patients with SAD had reduced mean FA of the left UF(statistical trend with moderate effect size), whereas for theother reconstructed tracts, there were no differences com-pared to healthy subjects. This points to micro-/mesoscopicalterations in WM along or in distinct portions of the leftUF, for example changes in fiber orientation and/or organi-zation, and partially confirms a previous study in whichreduced FA in SAD was identified in a part of the right UF[Phan et al., 2009]. Further findings of the present studywere reduced global mean FA in SAD and a negative corre-lation of left UF FA and trait anxiety in patients with SAD,but not in healthy subjects. A detailed discussion of FAalterations in this sample of patients with SAD and a moredetailed comparison with findings by Phan et al. can befound in our previous report [Baur et al., in press].
Reduced global mean FA in SAD is in contrast to globalWM volume, for which we did not find group differences.Possibly, FA is reduced in a spatially more diffuse man-ner, whereas WM volume is reduced more specifically(e.g., in the left UF). It was not within the scope of thepresent study to assess associations between FA and vol-ume for individual fiber tracts or globally for the brain’sWM. Future studies have to address this question explic-itly. Although our results indicate that WM alterations inSAD relate to volume in addition to FA, it may be of notethat the reported volumes are related to the applied trac-tography preprocessing steps (see also [Wakana et al.,2007]). We used an FA threshold of 0.2 as recommendedand used in other tractography studies as well [Mori andvan Zijl, 2002; Rodrigo et al., 2007; Wakana et al., 2007].Thus, volume values refer to white matter in which FA isgreater than 0.2. The two ROIs used for tractography ofthe UF were located in the same coronal slice slightly ante-rior to the temporal horn (see Fig. 2A). Hence, there maybe more tolerance for variance in fiber length in the frontalpart as compared with the temporal part of the UF. Sincemean UF fiber length was reduced in SAD besides evi-dence of reduced FA in SAD in orbitofrontal/frontopolarWM according to previous reports [Baur et al., in press;Phan et al., 2009], we cannot completely rule out that thevolume effect in the left UF is partially influenced by casesin the SAD group with some voxels in the left frontopolararea having FA smaller than 0.2 but still belonging to UFWM. This would, however, in turn suggest impaired in-tegrity of fibers in the left UF, probably involving a lack offrontopolar links to more posterior and temporal parts(like the insula, amygdala, and temporal pole) in SAD (seeSupporting Information, animated picture S5). Three issuessupport the present approach: First, setting the thresholdmore liberally (e.g., 0.1) would have resulted in includingmore spurious and false-positive fibers and, thus, ham-pered the tractography process. Second, having identifiedglobally reduced FA in SAD but not globally reduced vol-ume suggests that reduced volume of the UF is not just a‘‘covered’’ effect of reduced FA. Third, fiber count heavilycontributed to the finding of reduced left UF volume.
It may be worth to point out that within our samplethere were no downward statistical outliers for left UF vol-ume in the SAD group. Although there was a high varia-tion related to volume and shape in the reconstructedtracts, our UF volume mean and standard deviation valuesof the healthy subjects are in line with those reported byHasan et al. [2009]. We included each tract as it was ini-tially reconstructed after the tracking procedure (see meth-ods), for the reason that this might reveal potentialfeatures of underlying SAD pathophysiology. However,our finding needs to be replicated. The choice of includingthe IFOF as control tract stems from the fact that, just likethe UF, it originates in the frontopolar cortex. As in thefrontal lobe the IFOFs trajectory runs at close quarters tothe UF (see Fig. 1), inspection of IFOF trajectory served asa means to rule out possible biases related to data acquisi-tion (e.g., frontal signal drop-outs). With regard to con-tents, both tracts mediate intrahemispheric communicationwith frontal cortices, which stand for complex humanprocesses like worrying and thus may be one source ofanxiety disorders [Berkowitz et al., 2007].
Limitations
Nine of 25 patients in the present study sample weretaking medication, which represents a certain limitation.We decided to include the medicated patients for threereasons. First, other DTI studies in anxiety disorders useda similar strategy [Ha et al., 2009; Phan et al., 2009], whichmakes the present study comparable to those studies. Sec-ond, long-term effects of antidepressant medication onbrain structure due to plasticity, however, may rather leadto adaptation towards healthy subjects’ brain morphology[Castren, 2005], not biasing the volume effect found in thepresent study. Third, medicated patients had significantlyhigher anxiety levels than those without medication. Sincethe volume effect of the left UF disappears when contrast-ing medication-free patients (n ¼ 16) versus healthy sub-jects, it is likely that inclusion of the medicated patientsfavored the detection of volume alterations in SAD thatmay be related to elevated anxiety. This reflects an area ofconflict between the missing of real effects due to exclu-sion and the detection of biased effects due to inclusion ofmedicated patients. The latter seems unlikely according tothe applied post-hoc examination focusing on the left UFrevealing neither statistical significance nor trends of pos-sible medication-related effects. However, the potentialinfluence of medication on WM structure in generalshould be paid attention on by researchers in clinical neu-roscience, even more unless there are studies that explic-itly investigate dose-dependent impact of antidepressantson WM. Because, to the best of our knowledge, this is thefirst tractography study in anxiety disorders, we believethat the present approach may be perceived as justifiedand be of importance for future studies applying thismethod to patients with anxiety disorders.
r Baur et al. r
r 8 r

A methodological limitation relates to DTI data acquisi-tion: Here, in-plane resolution was high (< 1 mm2),whereas resolution along the z-axis was relatively low(> 3 mm). Because isometric voxel sizes are generally rec-ommended for DTI tractography studies, this promptsadditional caution in interpreting the results of UF fibertracking.
Implications of the present results for WM structure inSAD can only bear on, and thus are limited to, the actualreconstructed tracts, namely the UF and IFOF. Examina-tion of further prominent fiber tracts with regard to vol-ume would have been beyond the scope of our presentstudy. Global WM volume not being significantly reducedin SAD (see Table II), however, is in favor of the view thatvolume reduction in SAD may indeed be specific to theleft UF. Yet, further well-known fiber tracts may beincluded in future tractography studies in SAD.
CONCLUSION
To the best of our knowledge, this is the first studyreporting on fiber tract volume alterations in SAD. Quanti-tative fiber tractography may be a useful tool to investi-gate anatomical WM connectivity within well-known fibertracts in SAD. We were able to show smaller volume andFA values in patients with SAD for the left UF, but not forthe right UF and the IFOF. This suggests particular impor-tance of frontotemporal WM presence concerning thepathophysiology of SAD, possibly because of the facilita-tion of cognitive-emotional interactions between the OFCand the amygdala through the UF. Three topics of signifi-cance beyond SAD may emerge from the present resultsand guide future studies: (1) identification of functionalcorrelates of UF volume alterations, (2) characterization ofthe relationship between FA and WM volume, and (3)comparative investigation of the UF’s role in/across differ-ent psychiatric disorders.
ACKNOWLEDGMENTS
The authors thank Beat Werner, University Children’sHospital Zurich, for technical assistance with DTI dataacquisition.
REFERENCES
Ackenheil M, Stotz-Ingenlath G, Dietz-Bauer R, Vossen A (1999):M.I.N.I. Mini International Neuropsychiatric Interview, Ger-man Version 5.0.0 DSM-IV. Munchen: Psychiatrische Universi-tatsklinik Munchen.
Adolphs R (2003a): Cognitive neuroscience of human socialbehaviour. Nat Rev Neurosci 4:165–178.
Adolphs R (2003b): Is the human amygdala specialized for proc-essing social information? Ann NY Acad Sci 985:326–340.
Akirav I, Maroun M (2007): The role of the medial prefrontal cor-tex-amygdala circuit in stress effects on the extinction of fear.Neural Plast 2007:30873.
Annett M (1970): A classification of hand preference by associa-tion analysis. Br J Psychol 61:303–321.
Aupperle RL, Paulus MP (2010): Neural systems underlyingapproach and avoidance in anxiety disorders. Dialogues ClinNeurosci 12:517–531.
Banks SJ, Eddy KT, Angstadt M, Nathan PJ, Phan KL (2007):Amygdala-frontal connectivity during emotion regulation. SocCogn Affect Neurosci 2:303–312.
Baur V, Hanggi J, Rufer M, Delsignore A, Jancke L, Herwig U,Bruhl AB: White matter alterations in social anxiety disorder. JPsychiatr Res (in press).
Beck AT, Ward CH, Mendelson M, Mock J, Erbaugh J (1961): An in-ventory for measuring depression. Arch Gen Psychiatry 4:561–571.
Berkowitz RL, Coplan JD, Reddy DP, Gorman JM (2007): Thehuman dimension: How the prefrontal cortex modulates thesubcortical fear response. Rev Neurosci 18:191–207.
Bishop SJ (2007): Neurocognitive mechanisms of anxiety: An inte-grative account. Trends Cogn Sci 11:307–316.
Bishop SJ (2009): Trait anxiety and impoverished prefrontal con-trol of attention. Nat Neurosci 12:92–98.
Bruhl AB, Rufer M, Delsignore A, Kaffenberger T, Jancke L, Her-wig U (2011): Neural correlates of altered general emotionprocessing in social anxiety disorder. Brain Res 1378:72–83.
Cannistraro PA, Rauch SL (2003): Neural circuitry of anxiety: Evi-dence from structural and functional neuroimaging studies.Psychopharmacol Bull 37:8–25.
Castren E (2005): Is mood chemistry? Nat Rev Neurosci 6:241–246.
Catani M, Howard RJ, Pajevic S, Jones DK (2002): Virtual in vivointeractive dissection of white matter fasciculi in the humanbrain. Neuroimage 17:77–94.
Dolan RJ (2007): The human amygdala and orbital prefrontal cor-tex in behavioural regulation. Philos Trans R Soc Lond B BiolSci 362:787–799.
Ebeling U, von Cramon D (1992): Topography of the uncinate fas-cicle and adjacent temporal fiber tracts. Acta Neurochir (Wien)115:143–148.
Etkin A, Wager TD (2007): Functional neuroimaging of anxiety: Ameta-analysis of emotional processing in PTSD, social anxietydisorder, and specific phobia. Am J Psychiatry 164:1476–1488.
Freitas-Ferrari MC, Hallak JE, Trzesniak C, Filho AS, Machado-de-Sousa JP, Chagas MH, Nardi AE, Crippa JA (2010): Neuroimag-ing in social anxiety disorder: A systematic review of the litera-ture. Prog Neuropsychopharmacol Biol Psychiatry 34:565–580.
Ghashghaei HT, Barbas H (2002): Pathways for emotion: Interac-tions of prefrontal and anterior temporal pathways in theamygdala of the rhesus monkey. Neuroscience 115:1261–1279.
Goldin PR, Manber T, Hakimi S, Canli T, Gross JJ (2009): Neuralbases of social anxiety disorder: Emotional reactivity and cog-nitive regulation during social and physical threat. Arch GenPsychiatry 66:170–180.
Ha TH, Kang DH, Park JS, Jang JH, Jung WH, Choi JS, Park JY,Jung MH, Choi CH, Lee JM, Ha K, Kwon JS (2009): White mat-ter alterations in male patients with obsessive-compulsive dis-order. Neuroreport 20:735–739.
Hasan KM, Iftikhar A, Kamali A, Kramer LA, Ashtari M, CirinoPT, Papanicolaou AC, Fletcher JM, Ewing-Cobbs L (2009): De-velopment and aging of the healthy human brain uncinate fas-ciculus across the lifespan using diffusion tensor tractography.Brain Res 1276:67–76.
Hautzinger M, Bailer M, Worall H, Keller F. 1994. Beck-Depres-sions-Inventar (BDI). Bearbeitung der deutschen Ausgabe, Tes-thandbuch. Bern, Gottingen, Toronto, Seattle: Huber.
r Tractography in Social Anxiety Disorder r
r 9 r

Huang H, Zhang J, van Zijl PC, Mori S (2004): Analysis of noiseeffects on DTI-based tractography using the brute-force andmulti-ROI approach. Magn Reson Med 52:559–565.
Kanske P, Heissler J, Schonfelder S, Bongers A, Wessa M (2011):How to regulate emotion? Neural networks for reappraisaland distraction. Cereb Cortex 21:1379–1388.
Kawashima T, Nakamura M, Bouix S, Kubicki M, Salisbury DF,Westin CF, McCarley RW, Shenton ME (2009): Uncinate fasciculusabnormalities in recent onset schizophrenia and affective psycho-sis: A diffusion tensor imaging study. Schizophr Res 110:119–126.
Kessler RC, McGonagle KA, Zhao S, Nelson CB, Hughes M, Esh-leman S, Wittchen HU, Kendler KS (1994): Lifetime and 12-month prevalence of DSM-III-R psychiatric disorders in theUnited States. Results from the National Comorbidity Survey.Arch Gen Psychiatry 51:8–19.
Laux L, Glanzmann P, Schaffner P, Spielberger CD. 1981. DasState-Trait-Angstinventar (Testmappe mit Handanweisung,Fragebogen STAI-G Form X 1 und Fragebogen STAI-G Form X2). Weinheim: Beltz Testgesellschaft.
Liao W, Qiu C, Gentili C, Walter M, Pan Z, Ding J, Zhang W,Gong Q, Chen H (2010): Altered effective connectivity networkof the amygdala in social anxiety disorder: A resting-stateFMRI study. PLoS One 5:e15238.
Liao W, Xu Q, Mantini D, Ding J, Machado-de-Sousa JP, HallakJE, Trzesniak C, Qiu C, Zeng L, Zhang W, Crippa JA, Gong Q,Chen H (2011): Altered gray matter morphometry and resting-state functional and structural connectivity in social anxietydisorder. Brain Res 1388:167–177.
Liebowitz MR (1987): Social phobia. Mod Probl Pharmacopsychia-try 22:141–173.
McIntosh AM, Munoz Maniega S, Lymer GK, McKirdy J, Hall J,Sussmann JE, Bastin ME, Clayden JD, Johnstone EC, LawrieSM (2008): White matter tractography in bipolar disorder andschizophrenia. Biol Psychiatry 64:1088–1092.
Mori S, Crain BJ, Chacko VP, van Zijl PC (1999): Three-dimen-sional tracking of axonal projections in the brain by magneticresonance imaging. Ann Neurol 45:265–269.
Mori S, Kaufmann WE, Davatzikos C, Stieltjes B, Amodei L, Fred-ericksen K, Pearlson GD, Melhem ER, Solaiyappan M, Ray-mond GV, Moser HW, van Zijl PC (2002): Imaging corticalassociation tracts in the human brain using diffusion-tensor-based axonal tracking. Magn Reson Med 47:215–223.
Mori S, van Zijl PC (2002): Fiber tracking: principles and strat-egies—A technical review. NMR Biomed 15:468–480.
Petrides M, Pandya DN (2007): Efferent association pathwaysfrom the rostral prefrontal cortex in the macaque monkey. JNeurosci 27:11573–11586.
Phan KL, Orlichenko A, Boyd E, Angstadt M, Coccaro EF, Liber-zon I, Arfanakis K (2009): Preliminary evidence of white mat-ter abnormality in the uncinate fasciculus in generalized socialanxiety disorder. Biol Psychiatry 66:691–694.
Rodrigo S, Oppenheim C, Chassoux F, Golestani N, Cointepas Y,Poupon C, Semah F, Mangin JF, Le Bihan D, Meder JF (2007):Uncinate fasciculus fiber tracking in mesial temporal lobe epi-lepsy. Initial findings. Eur Radiol 17:1663–1668.
Salters-Pedneault K, Roemer L, Tull MT, Rucker L, Mennin DS(2006): Evidence of broad deficits in emotion regulation associ-ated with chronic worry and generalized anxiety disorder.Cogn Ther Res 30:469–480.
Sheehan DV, Lecrubier Y, Sheehan KH, Amorim P, Janavs J, Weil-ler E, Hergueta T, Baker R, Dunbar GC (1998): The Mini-Inter-national Neuropsychiatric Interview (M.I.N.I.): Thedevelopment and validation of a structured diagnostic psychi-atric interview for DSM-IV and ICD-10. J Clin Psychiatry59:22–33.
Smith SM (2002): Fast robust automated brain extraction. HumBrain Mapp 17:143–155.
Smith SM, Jenkinson M, Woolrich MW, Beckmann CF, BehrensTE, Johansen-Berg H, Bannister PR, De Luca M, Drobnjak I,Flitney DE, Niazy RK, Saunders J, Vickers J, Zhang Y, De Ste-fano N, Brady JM, Matthews PM (2004): Advances in func-tional and structural MR image analysis and implementationas FSL. Neuroimage 23(Suppl 1):S208–S219.
Spielberger CD, Gorsuch RL, Lushene RE. 1970. State-Trait Anxi-ety Inventory, Manual for the State-Trait Anxiety Inventory.Palo Alto, CA: Consulting Psychologist Press.
Stangier U, Heidenreich T (2004): Liebowitz Soziale Angst-Skala.In: Collegium Internationale Psychiatriae Scalarum (CIPS)(eds.). Weinheim: Beltz.
Tillfors M, Furmark T, Marteinsdottir I, Fischer H, Pissiota A,Langstrom B, Fredrikson M (2001): Cerebral blood flow in sub-jects with social phobia during stressful speaking tasks: A PETstudy. Am J Psychiatry 158:1220–1226.
Turk CL, Heimberg RG, Luterek JA, Mennin DS, Fresco DM(2005): Emotion dysregulation in generalized anxiety disorder:A comparison with social anxiety disorder. Cogn Ther Res29:89–106.
Wakana S, Caprihan A, Panzenboeck MM, Fallon JH, Perry M, Gol-lub RL, Hua K, Zhang J, Jiang H, Dubey P, Blitz A, van Zijl P,Mori S (2007): Reproducibility of quantitative tractographymeth-ods applied to cerebral whitematter. Neuroimage 36:630–644.
Wang R, Benner T, Sorensen AG, Wedeen VJ (2007): Diffusiontoolkit: A software package for diffusion imaging data proc-essing and tractography. Proc Intl Soc Mag Reson Med15:3720.
Yasmin H, Aoki S, Abe O, Nakata Y, Hayashi N, Masutani Y,Goto M, Ohtomo K (2009): Tract-specific analysis of white mat-ter pathways in healthy subjects: A pilot study using diffusiontensor MRI. Neuroradiology 51:831–840.
Zhou W, Hou P, Zhou Y, Chen D (2011): Reduced recruitment oforbitofrontal cortex to human social chemosensory cues insocial anxiety. Neuroimage 55:1401–1406.
r 10 r
r Baur et al. r