A Study of the Relationship Between perceived Realism and ...
Upload
khangminh22Category
view
4download
0
Relationship between social anxiety and perceived trustworthiness
I n a u g u r a l - D i s s e r t a t i o n
zur
Erlangung des Doktorgrades
der Humanwissenschaftlichen Fakultät
der Universität zu Köln
vorgelegt von
Ruth Cooper aus Münster
Köln 2012

1. Berichterstatter: Prof. Dr. Alexander L. Gerlach (Köln)
2. Berichterstatter: Prof. Dr. Jutta Stahl (Köln)
Tag der mündlichen Prüfung: 10.04.2013

Table of Contents
Abstract................................................................................................................ p. 1
1 Introduction......................................................................................................... p. 2
2 Social Anxiety Disorder...................................................................................... p. 4
2.1 Prevalence rates and demographics...................................................................... p. 6
2.2 Cross-cultural, international data.......................................................................... p. 7
2.3 Comorbidity........................................................................................................... p.10
2.4 Etiological considerations..................................................................................... p. 11
2.5 Cognitive models of social anxiety....................................................................... p. 13
2.6 Cognitive biases in face processing....................................................................... p. 15
3 Interpretation of facial expressions in social anxiety....................................... p. 19
3.1 Biased interpretation of negative facial expressions............................................. p. 20
3.2 Biased interpretation of neutral facial expressions................................................ p. 22
3.3 Biased interpretation of positive facial expressions.............................................. p. 24
3.4 Discussion and integration of results to date......................................................... p. 25
4 Testing hypotheses or testing the data?............................................................. p. 28
4.1 The principle of falsification................................................................................. p. 28
4.2 Null hypothesis significance testing...................................................................... p. 32
4.3 Bayesian evaluation of informative hypotheses.................................................... p. 39
5 Experimental investigation................................................................................. p. 43
5.1 Method................................................................................................................... p. 45
5.2 Results.................................................................................................................... p. 52
5.3 Discussion.............................................................................................................. p. 55
6 References............................................................................................................. p. 59
7 List of Figures...................................................................................................... p. 77
8 List of Tables........................................................................................................ p. 78
9 Appendices............................................................................................................ p. 79

1
Abstract
Background and Objectives: Given that the correct interpretation of emotional facial
expressions is an essential social skill, it has been repeatedly tested if socially anxious
persons show an interpretational bias for emotional faces. Studies examining interpretational
biases have revealed inconsistent findings, resulting in four possible bias patterns. However,
the assessment may have been hampered by employing more general ratings that arguably are
less able to reflect processing of social information.
We examined the relationship between social anxiety and face ratings for perceived
trustworthiness given that trustworthiness is an inherently socially relevant construct.
Improving on earlier analytical strategies, we directly evaluated the four bias patterns using a
Bayesian approach to test informative hypotheses.
Method: Ninety-eight undergraduates rated 198 face stimuli on perceived
trustworthiness and intelligence, the latter serving as a control condition. Subsequently,
participants completed a set of questionnaires.
Results: It was three times more likely that social anxiety does not influence
trustworthiness judgments than assuming any kind of negative interpretation bias in social
anxiety. Also, this independence model reached the best fit for perceived intelligence,
indicating that social anxiety does not have a prominent influence on intelligence ratings.
Limitations: Since we did not assess the participant’s diagnostic status, we cannot
generalize our findings to clinical levels of social anxiety.
Conclusions: We conclude that the deviant interpretation of facial characteristics is
not a relevant aspect in social anxiety.

2
1 Introduction
Social anxiety disorder is an impairing mental condition that is above all characterized
by the fear of being evaluated negatively (D. M. Clark & Wells, 1995). Social fears are quite
common in the general population and can range from simple and clear-cut situational
performance fears, such as being afraid to publicly speak in front of a larger audience, to
clinically relevant anxiety and avoidance behavior regarding a huge variety of basically all
types of social situations (Ruscio et al., 2008). A clear sign of disapproval or rejection in all
sorts of social situations is a negative or threatening facial expression (Öhman, 1986).
Consequently, negative facial expressions have been hypothesized to function as anxiety
provoking cues for persons which are especially concerned about being evaluated in a
negative way (Rapee & Heimberg, 1997). However, the notion of a specific salience towards
negative facial expressions can be explained by multiple different and distinct cognitive
processing mechanisms. For instance, it can be assumed that socially anxious persons differ
in their allocation of visual attention in response to threatening facial expressions. Another
possible cause for the presumed sensitivity lies in a different perception of negative facial
expressions in the way that socially anxious persons may recognize threatening faces faster,
more frequently, or even more accurate as compared to controls. Furthermore, socially
anxious persons might interpret the same facial expressions as more negative or threatening
relative to persons without social fears. Finally, it can be assumed that socially anxious
persons show a memory bias towards negative facial expressions in the way that these might
be remembered better or more often. On the other hand, other accounts for social anxiety
(Trower & Gilbert, 1989) claim that social fears may be particularly related to overlooking or
ignoring signs for secure interactions, such as positive facial expressions.

3
Considering the vast possibilities of how and where biases related to social anxiety
emerge in facial processing, the aim of this study is to give an overview of the current state of
research of specifically interpretational biases concerning negative, neutral, and positive
facial expressions: Does social anxiety lead to a more negative interpretation of negative
facial expressions? Or do social fears attenuate positive evaluations of positive expressions?
Or is it perhaps neither of the two, and instead social fears go together with an especially
negative interpretation of a neutral facial expression? Or can it simply be that there is no
interpretational bias of facial expressions in social anxiety?
The experimental part of this thesis will try to answer these four questions by
employing a novel analytical approach. The empirical support for each of the questions will
be directly compared to find the most likely answer. Thus, in order to shed some light on the
inconclusive results to date, this study will investigate the intriguing issue of how social
anxiety is related to interpretational biases of facial expressions.

4
2 Social Anxiety Disorder
Fear and anxiety in the context of social situations have been noted throughout
history, but the notion of social anxiety disorder (SAD) as it is known today dates back to
1966 when Marks and Gelder described a psychopathological syndrome characterized by
anxiety experienced while performing specific social tasks, and while potentially being
scrutinized by others. It wasn’t until 1980, however, when the American Psychiatric
Association issued the third edition of the Diagnostic and Statistical Manual of Mental
Disorders (DSM-III; American Psychiatric Association), that SAD was officially
acknowledged as a diagnostic entity of its own.
The most recent iteration of the DSM (DSM-IV-TR, American Psychiatric
Association, 2000) identifies five criteria as essential for a diagnosis of SAD. First, SAD’s
core diagnostic feature (Criterion A) is a marked or persistent fear of one or more social or
performance situations that are characterized by exposure to unfamiliar people and possible
scrutiny. This fear may be experienced in settings that involve formal evaluations, such as job
interviews, or generalize to situations in which any form of social contact needs to be
initiated or maintained. Thus, even mundane situations (e.g., eating in a restaurant, reading
and writing in front of others) or social mishaps (e.g., spilling a drink) can create severe
concerns for persons with SAD. Some SAD patients’ fears are limited to specific settings or
situations, such as being afraid of giving a speech in front of a larger audience (i.e.,
nongeneralized or circumscribed SAD), whereas others fear nearly any situation involving
social interaction (i.e., generalized SAD).
The second diagnostic criterion, Criterion B, states that exposure to a feared social
situation almost invariably provokes anxiety or even a full-blown panic attack. The

5
experience of anxiety may include typical symptoms of sympathetic arousal, such as heart
palpitations, sweating, shaking, and shortness of breath. Individuals suffering from SAD
often have some degree of insight into their condition, such as recognizing that their fear is
excessive or unreasonable (Criterion C); however, despite these insights SAD patients’
cognitions are often distorted and maladaptive and therefore seem critical to both the
development and maintenance of the disorder. Similar to their fear of negative evaluation,
SAD patients often assume that others are making critical judgments about them (e.g. “He
thinks that I am stupid”). Maladaptive cognitions of this kind may occur before, during, or
after feared social situations, and play an important role in reinforcing fear and promoting
avoidant behavior.
Similar to individuals with specific phobias, who go to great lengths to avoid contact
with a feared object or situation, people with SAD often try to avoid feared social or
performance situations. Avoidance can take on many different forms, not all of which are
readily identifiable. While it often manifests as an unwillingness to enter into certain
situations and environments, subtler forms of avoidance (e.g., talking on a cell phone or
drinking alcohol in social situations) are quite common among SAD patients. When avoidant
behavior is not possible, people with SAD often experience great distress and physiological
arousal (Criterion D). Avoidance of feared settings and situations critically contributes to the
maintenance of SAD, as it supports and reinforces the notion that individuals cannot handle
situations on their own and that the situations themselves warrant trepidation. In addition,
avoidance prevents people from experiencing positive outcomes incongruent with their
maladaptive beliefs and cognitions.
The last diagnostic criterion, Criterion E, states that symptoms must significantly
interfere with the affected person’s normal routine, or their occupational and social

6
functioning. Given the pernicious nature of SAD symptomatology, as well as the ubiquity of
social interaction, the disorder often has a profound effect on patients’ overall functioning.
For instance, unemployment rates are especially high among individuals with SAD and cause
marked financial disadvantages (Moitra, Beard, Weisberg, & Keller, 2011). Similarly,
educational attainment rates appear particularly low within this population (Wittchen &
Fehm, 2001). In addition, disruptions in social functioning often cause individuals with SAD
to have limited social circles and inadequate support networks (Furmark et al., 1999).
2.1 Prevalence rates and demographics
An important source of information concerning the prevalence of mental disorders in
the United States is the National Comorbidity Survey (NCS, Kessler et al., 1994) and its
replication (NCS-R, Kessler, Chiu, Demler, Merikangas, & Walters, 2005b). Results from
these methodologically sound and large-scale epidemiological studies suggest that
approximately 6.8 percent of individuals within the U.S. general population have met
diagnostic criteria for SAD in the past year, making it one of the most prevalent mental
disorders depicted in the DSM-IV. Estimates of lifetime prevalence suggest that roughly one
in eight people (12.1 percent) will, at some point, develop SAD (Kessler et al., 2005a).
Despite the general similarity in prevalence rates for SAD across various western societies,
including Sweden (Furmark et al., 1999), the Netherlands (Acarturk, de Graaf, van Straten,
Have, & Cuijpers, 2008), and Canada (Offord et al., 1996), there is a remarkable range in
prevalence among countries in other parts of the world (see Furmark, 2002 for a review),
even those with similar cultural backgrounds.

7
SAD has a similar prevalence across the life span, ranging from early adolescence
into adulthood (e.g., Chavira, Stein, Bailey, & Stein, 2004). The average age of onset
associated with the disorder is 13 years (Kessler et al., 2005a). Many people who receive a
diagnosis of SAD later in life have a history of other related impairments, such as mutism,
separation anxiety, behavioral inhibition, and shyness (Chavira & Stein, 2005). Findings from
epidemiological studies indicate that, if left untreated, SAD is typically chronic and
unremitting and will lead to substantial impairment in vocational and social functioning
(Davidson, Hughes, George, & Blazer, 1993; Stein & Kean, 2000).
With regards to sex, evidence from community studies indicates that men and women
are affected similarly by the disorder (Moutier & Stein, 1999); although, results from the
NCS-R suggest that prevalence rates may be slightly higher among women (Kessler et al.,
2005a). Research examining differences in prevalence across race in the U.S. (Breslau et al.,
2006; Grant et al., 2005) suggests that Native Americans are at particularly high risk for
SAD, whereas Hispanics and non-Hispanic African Americans seem to be at comparatively
lower risk.
2.2 Cross-cultural, international data
Given that one defining criterion of SAD is the fear of being scrutinized by others,
social norms inherent to different societies could, in principle, produce culturally specific
varieties of the disorder. For instance, differences in cognitive styles, (e.g. analytic versus
holistic, Nisbett, Peng, Choi, & Norenzayan, 2001) have been noted when comparing
Western and East-Asian societies, and suggest that cognition is intimately connected to
culture. Furthermore, a recent cross-cultural study showed that collectivistic countries are

8
more accepting toward socially reticent and withdrawn behaviors than was the case in
individualistic countries (Heinrichs, Rapee, Alden, Bögels, Hofmann, Oh, & Sakano, 2006).
Moreover, this study found that collectivistic countries reported greater levels of social
anxiety and more fear of blushing than individualistic countries.
In the context of SAD, questions of cultural influence can be addressed from different
perspectives. One approach is to ask whether the diagnostic criteria included in the DSM-IV
have equal validity across cultures. This approach is strongly connected to the previously
discussed literature concerning cross-cultural prevalence rates of SAD, which reports
inconsistent results. Although some consistency has been observed among several western
societies, significantly lower lifetime prevalence rates (around 0.5 %) have been found
elsewhere, such as in Taiwan (Hwu, Yeh, & Chang, 1989) and Korea (Lee et al., 1990). It
remains unclear what mechanisms are responsible for these differences in prevalence.
A second approach to studying SAD cross-culturally is to identify variations in
presentation among different populations. In line with this approach, researchers have given
attention to the condition Taijin kyofusho (TKS). TKS is found primarily within the context
of Japanese and Korean culture, and is characterized by the experience of a single
circumscribed fear. The nature of this fear (i.e., the feared object) may change over time for
an individual. Examples include blushing, staring, offending others with one’s body odors,
and presenting an inadequate facial expression or physical deformity (Takahashi, 1989).
Although similar to SAD, it has been argued that some aspects of TKS significantly differ.
For instance, the TKS “offensive subtype” is characterized by an external focus (i.e. fear of
offending others), which contrasts with the internal focus of SAD, in which a fear of being
embarrassed is most prominent.

9
Despite these differences, however, several studies point to an interrelation between
SAD and TKS (e.g. Choy, Schneier, Heimberg, Oh, & Liebowitz, 2008; Kleinknecht, Dinnel,
Kleinknecht, Natsuki, & Harada, 1997). Kleinknecht et al. (1997) found a significant overlap
between SAD and TKS symptoms when assessing American and Japanese students.
Similarly, Choy and colleagues (2008) found that 75% of participants recruited from the US
and Korea, and diagnosed with SAD, endorsed at least one of the five symptoms comprising
the TKS offensive subtype. Taken together, these findings suggest that, as a construct, SAD
generalizes to other cultures, albeit in culturally-nuanced ways. Further research is therefore
needed to examine and elucidate other culturally-specific forms of SAD.
In addition to the work being done on TKS, other research efforts have started
exploring the impact of several cultural variables (e.g., social norms, gender roles, and self-
construals) on the manifestation of SAD symptomatology. Reminiscent of the
“analytic/holistic” distinction mentioned earlier, differences in terms of “independent” versus
“interdependent” self-construals (Markus & Kitayama, 1991) have been described in the
SAD literature. Individuals in Western societies are more likely to have an independent self-
concept, whereas members of Eastern cultures are more likely to endorse interdependent self-
construals. Cross-cultural research comparing these constructs in relation to SAD (e.g.
Okazaki, 1997) suggests that interdependence may be more associated with symptom
severity. The relationship of self-construal and social anxiety appears to be further influenced
by gender. In men, interdependence and independence has been found to predict levels of
social anxiety positively and negatively, respectively, whereas these patterns of association
were reversed in women (Moscovitch, Hofmann, & Litz, 2005).

10
2.3 Comorbidity
Evidence indicates that the vast majority of individuals suffering from SAD are
diagnosed with additional mental disorders. For example, results from the NCS-R (Ruscio et
al., 2008) indicate that a lifetime diagnosis of SAD significantly increases the likelihood of
meeting criteria for a broad range of other DSM axis-I disorders, most notably other anxiety
disorders. Data from the NCS-R suggest that individuals with SAD are between 3 to 9 times
more likely to develop a second anxiety disorder at some point in their lives, and appear to be
at particularly high risk for agoraphobia without panic; odds ratios comparisons suggest that
SAD patients are up to 22 times more likely to develop this particular disorder. Given the
prominent role that avoidance plays in the maintenance of SAD, and the tendency for
avoidance to progressively worsen over time, it seems that agoraphobic symptoms are
conceptually consistent with the phenomenology of SAD.
Interestingly, results from the NCS-R also suggest that risk for comorbidity
significantly relates to the number of social fears endorsed. Approximately 63% of
individuals endorsing 1-4 fears met criteria for at least one additional lifetime disorder, while
roughly 75% of participants endorsing 5-7 fears, and 82% endorsing 8-10 fears, reported
comorbid conditions.
One explanation for the considerable amount of comorbidity among SAD patients is
the relatively early age of onset associated with the disorder, and the maladaptive coping
strategies often employed by individuals with SAD. Patients suffering from SAD commonly
report “self-medication” through the use of alcohol and other psychotropic drugs (Bolton,
Cox, Clara, & Sareen, 2006). Using substances such as these to help manage anxiety
symptoms can potentially lead to clinically significant levels of substance abuse and

11
dependence. Prospective studies examining the temporal onset of SAD and substance use
disorders have found SAD to significantly predict subsequent alcohol disorders
(Zimmermann et al., 2003). In addition, other prospective studies have found SAD to be
predictive of various depressive disorders (Bittner et al., 2004). Additional longitudinal
research examining the temporal onset of common comorbid conditions is necessary in order
to elucidate the causal relationship between SAD and various other forms of
psychopathology.
2.4 Etiological considerations
As is the case with most forms of psychopathology, the etiology of SAD appears quite
complex, as it seems to be influenced by a number of environmental and genetic factors.
Some authors have proposed that, similar to the development of specific phobias, SAD might
develop, in part, as a result of experiencing aversive and traumatic incidents. Examples
include experiencing perceived social defeats or abasements and being subjected to ridicule
and criticism. In addition, evidence suggests that social fears may be learned vicariously by
witnessing others’ aversive incidents (Öst & Hugdahl, 1981; Stemberger, Turner, Beidel, &
Calhoun, 1995). In line with behavioral conditioning theories, these studies reported that
between 56% and 58% of individuals meeting criteria for SAD believe that traumatic social
incidents contributed to the development of their feared situations. Another 13% attributed
their fears to some sort of vicarious learning experience. Thus, it appears that some degree of
SAD etiology can be attributed to environmental influences. However, other results question
the notion that conditioning experiences play a significant role in the etiology of SAD. For

12
example, an analysis of the time line suggests that in most cases, the traumatic experience
occurs many years after the onset of SAD (Hofmann, Ehlers, & Roth, 1995).
Evidence for a biological predisposition for and genetic contribution to SAD comes
from family studies (Fyer, Mannuzza, Chapman, Liebowitz, & Klein, 1993; Fyer, Mannuzza,
Chapman, Martin, & Klein, 1995). These show that having relatives diagnosed with SAD
significantly increases one’s risk of developing pathological social fears. In one study, 23%
of adolescents aged 12-18, whose parents met criteria for SAD, were found to have such fears
(Mancini, VanAmeringen, Szatmari, Fugere, & Boyle, 1996), suggesting significant levels of
heritability. In addition, evidence collected as part of a large-scale study using female twins
(Kendler, Neale, Kessler, Heath, & Eaves, 1992) suggests that approximately 30% of the
variance within social-fear-onset can be explained by genetic predisposition, which again
stresses the genetic influence for SAD.
Interestingly, while the genetic contributions to social anxiety are often discussed in a
nonspecific manner, research suggests that certain heritable temperamental traits are more
specifically related to SAD development. For example, one longitudinal study (Chronis-
Tuscano et al., 2009) assessing behavioral inhibition (a temperamental style frequently
involving distress or fear in reaction to unfamiliar stimuli, such as peers) among children
aged 14 months to 7 years at initial assessment revealed that children who were consistently
classified as behaviorally inhibited endorsed significantly higher rates of SAD by age 15.
Thus, while social fear and anxiety appear moderately heritable, mediating factors such as
temperament may play a more important indirect role in SAD morbidity.
Looking at SAD from an evolutionary perspective, it has been suggested that social
fears results from a biologically determined preparedness to readily connect fear with
negative facial expressions, such as anger, rejection, and criticism (Öhman, Dimberg, & Öst,

13
1985). Consistent with this perspective, scientists have observed the use of threatening facial
expressions in the social rituals of hierarchically-structured animal groups (Öhman &
Dimberg, 1978). Encounters among these animals often involve displays of anger and
threatening facial expressions by dominant group members, as well as fearful and submissive
grimaces by defeated counterparts. Social fears are thought to have evolved partly as a by-
product of the social rituals used by animal groups to assign their members to various levels
of dominance hierarchies. Interestingly, as noted above, the average age of SAD onset occurs
during adolescence, which coincidentally is the developmental stage in which dominance-
conflicts are most prominent. Consequently, social anxiety has often been proposed as
resulting from a biologically grounded hypersensitivity towards negative facial expressions
(Lundh & Öst, 1996; Mogg & Bradley, 2002).
2.5 Cognitive models of social anxiety
More recently, researchers have been paying close attention to cognitive factors in the
development and maintenance of social anxiety (e.g., D. M. Clark & Wells, 1995; Rapee &
Heimberg, 1997; Trower & Gilbert, 1989). These models identify a range of biases and
distortions in information processing, thoughts, attitudes, and beliefs concerning socially
relevant information (for an overview, see D. M. Clark & McManus, 2002). The cognitive
model proposed by Clark and Wells (1995) illustrates the processes suggested to occur when
a socially anxious person enters into a feared situation. According to this model, individuals
develop various assumptions and beliefs as a result of prior negative social experiences.
These beliefs often include expectations that one will behave in an inappropriate manner, and
that such behaviors will lead to ridicule, rejection, or loss of status. Consequently, social

14
situations are perceived as dangerous and fear-provoking and often result in the activation of
sympathetic arousal. This, in turn, is followed by the perception of various somatic
symptoms, such as blushing and rapid heartbeat, which exacerbate feelings of fear. As
arousal occurs, attention is shifted inward, away from the external situation and towards the
self. As a result, individuals with SAD often miss various social cues within their
environment, and interpret this in addition to the catastrophic interpretation of somatic
symptoms as further evidence of threat and social failure, which in turn increases the
activation of the sympathetic nervous system (see Figure 1). Consequently, to interrupt this
vicious circle and to prevent further increases of state anxiety, feared situations are likely to
be left and more generally avoided, which in turn leads to increased anticipatory anxiety
towards social situations in the future and thus maintains and increases existing social fears in
the long term.
Figure 1
Vicious circle of social anxiety
Note: adapted from Gerlach (2005)

15
Evidence for cognitive appraisal models comes from several sources. For example, it
has been shown that SAD patients show socially relevant judgmental biases prior to
treatment, which were attenuated following treatment (Foa, Franklin, Perry, & Herbert,
1996). In particular, individuals with SAD exaggerate the negative consequences of social
mishaps (i.e., the social cost). Similarly, Papageorgiou and Wells (2002) found that, while
experiencing symptoms of sympathetic arousal, socially anxious individuals have a tendency
to negatively overestimate others’ judgments of them. A study conducted by Mulkens and
colleagues (1999) suggests that arousal severity may itself be overestimated by socially
anxious individuals. In addition, Mellings and Alden (2000) found that socially anxious
participants were more likely to focus attention inward while in anxiety-provoking situations.
More specifically, it has been found that individuals with SAD show heightened negative
self-focused attention (Hofmann, 2000) and negative self-perception (Hofmann, Moscovitch,
Kim, & Taylor, 2004) that changes with successful treatment. Thus, it appears that a number
of predictive cognitive processes contribute to SAD patients’ fear responses and
interpretations in social situations.
2.6 Cognitive biases in face processing
In addition to offering explanations of the nature and relationship regarding cognitive
processes and physiological reactions within a given feared situation, cognitive models of
SAD also suggest more general mechanisms and attributes that lead to the onset and
maintenance of social fears. Similar to the evolutionary account for social anxiety (Öhman,
1986) that proposes an underlying hypersensitivity towards specifically negative facial
expressions in individuals with SAD (Lundh & Öst, 1996; Mogg & Bradley, 2002), cognitive

16
models of SAD also imply an underlying biased processing of facial expressions in social
anxiety. For instance, Clark and Wells (1995) state that, due to the highly threatening
character of negative evaluation for individuals with SAD, respective individuals are strongly
motivated to search for information and cues of how other persons view them in a given
moment. Since affective states and attitudes are rarely communicated verbally but rather
conveyed via facial expressions (Patterson, 1999), the faces of others are perceived as a valid
indicator of social acceptance or rejection. Clark and Wells (1995) now argue that an
attentional bias towards social threat exists because of the preoccupation with negative self-
evaluation in SAD. Furthermore, due to the activated negative self-schemata, ambiguous
social information will more likely be interpreted in a negative manner, resulting in an
additional interpretational bias in social anxiety. Consequently, according to Clark and Wells’
model, specifically ambiguous facial expressions should be interpreted more negatively in
social anxiety.
However, other cognitive models propose different interpretational biases. Trower
and Gilbert (1989) argue that social anxiety does not only manifest itself in a constant
monitoring of one’s own behavior but also in a lack of the ability to recognize reassurance
and safety signals from others which are intended to increase approach behavior. In other
words, socially anxious persons may not optimally perceive signals and hints for safe and
cooperative interactions, such as smiles and greetings, and are therefore also more prone to
lose “the potentially positive reinforcing and enjoyable attributes of social interaction”
(Trower & Gilbert, 1989, p. 22) as compared to non-anxious persons. Consequently, positive
facial expressions should be interpreted as less positive by individuals with SAD.
Lastly, Rapee and Heimberg (1997) stress the importance of attentional mechanisms
in social anxiety and distinguish between externally and internally focused attention. In their

17
view, an individual with SAD is constantly monitoring a given social situation for possible
threats. However, although facial expressions such as frowns are clearly relevant indicators
for actual social threats, Rapee and Heimberg specifically emphasize the role of internal cues
in social anxiety. According to their model, the sensations of internal autonomic changes
(e.g. noticing an increase of the heart rate or feelings of heat) are overestimated in their
perceived visibility and interpreted as publicly visible signs of failure, weakness, or
incompetence. Moreover, due to the arguably greater objectivity of external information that
in turn is less prone to catastrophic misinterpretation, the authors state that external cues for
social threat are perceived as less negative and therefore are less relevant for increases in
anxiety as compared to internal cues. Consequently, Rapee and Heimberg state the internal
focus of attention and the subsequent catastrophic interpretation of bodily signs of arousal as
the main mechanism in the development and maintenance of social anxiety disorder.
Therefore, face perception and interpretation should not differ as a function of social anxiety
levels.
In sum, three different interpretational biases have been suggested in social anxiety to
contribute to the development and maintenance of social fears: first, there is the notion of an
exaggerated hypersensitivity and a more negative interpretation of especially negative facial
expressions in social anxiety (Öhman, 1986); second, an interpretational bias that especially
ambiguous faces should be interpreted more negatively (D. M. Clark & Wells, 1995); and,
third, a proposed bias the way that socially anxious individuals should interpret positive facial
expressions as more negative (Trower & Gilbert, 1989). In addition, one model suggests that
social anxiety may not be characterized by a biased interpretation of facial expressions at all
since especially internal cues and their subsequent interpretation are proposed to mainly
contribute to increases in anxiety (Rapee & Heimberg, 1997).

18
Considering that the investigation of interpretational biases of facial expressions in
social anxiety does not require invasive procedures or unrealistic setups but instead poses an
economically rather feasible design, it is not surprising that many studies to date tried to
answer the obvious and intriguing question: “So, which bias is it now”? The following
section will give an overview concerning previous research on interpretational biases of facial
expressions of social anxiety.

19
3 Interpretation of facial expressions in social anxiety
To date, the processes of recognition, classification and interpretation as well as more
covert behaviors, such as the reallocation of attention to and physiological activation in
reaction to various facial expressions, have been investigated extensively with regard to
social anxiety (for an overview, see Heinrichs & Hofmann, 2001; Staugaard, 2010).
However, no conclusive results have been obtained to support the notion of a negative
interpretation bias for faces as a relevant mechanism in social anxiety. To date, altogether 26
investigations examined possible interpretational biases in samples of socially anxious
participants or SAD patients. Interestingly, only four out of these studies found evidence that
negative facial expressions were rated as more negative, arousing, unfriendly or unpleasant in
the socially anxious groups when compared to non-anxious control participants (Amir,
Najmi, Bomyea, & Burns, 2010; Dimberg & Christmanson, 1991; Schofield, Coles, & Gibb,
2007; Straube, Kolassa, Glauer, Mentzel, & Miltner, 2004). Two additional studies suggested
an interpretational bias in socially anxious individuals such that explicitly positive facial
expressions were rated as being less friendly or approachable (Campbell et al., 2009;
Dimberg, 1997). Finally, three investigations reported findings that socially anxious
participants judged neutral faces as more negative or less friendly (Amir et al., 2005; Stevens,
Gerlach, & Rist, 2008; Yoon & Zinbarg, 2007). However, the majority of results did not
suggest an interpretational bias in the judgment of facial expressions, as thirteen of the 26
studies did not find any group differences on valence ratings when negative, neutral, or
positive facial expressions were evaluated by socially anxious and control participants (Coles
& Heimberg, 2005; de Jong, Merckelbach, Bogels, & Kindt, 1998; Evans et al., 2008; Heuer,
Rinck, & Becker, 2007; Lange et al., 2011; Lange, Keijsers, Becker, & Rinck, 2008; Lissek

20
et al., 2008; Merckelbach, Vanhout, Vandenhout, & Mersch, 1989; Mühlberger et al., 2009;
Stein, Goldin, Sareen, Zorrilla, & Brown, 2002; Vrana & Gross, 2004; Wieser, McTeague, &
Keil, 2011; Wieser, Pauli, Weyers, Alpers, & Mühlberger, 2009). A summary of these
patterns can be inspected in Table 1. The following sections will give a more detailed
description of the respective results and corresponding experimental paradigms used in the
individual investigations.
Table 1
Ratings of facial expressions: replicated group effects between HSA and controls to date
Pattern 1 Pattern 2 Pattern 3 Pattern 4
Negative facial expressions HSA: more
negative n.s. n.s. n.s.
Neutral facial expressions n.s. HSA: more
negative n.s. n.s.
Positive facial expressions n.s. n.s. HSA: more
negative n.s.
Number of studies that found
this pattern 4 3 2 13
3.1 Biased interpretation of negative facial expressions in
social anxiety
As one of the first studies assessing interpretational biases of facial expressions in
social anxiety, Dimberg and Christmanson (1991) investigated samples high and low fearful
public speaking individuals and asked them to rate the emotional valence, friendliness,

21
hostility, and directedness of facial pictures. As stimuli, the authors chose the happy and
angry faces from a widely used picture set generated by Ekman and Friesen (1976). This
larger database, the so-called “Pictures of Facial Affect”, consists of grey-scaled photographs
capturing the faces of five men and six women, all of them Caucasian, who display each of
the six basic facial expressions (happiness, sadness, anger, fear, disgust, and surprise; Ekman
& Friesen, 1971) and a neutral expression. Interestingly, Dimberg and Christmanson (1991)
found participants with self-reported high fears of public speaking to rate specifically angry
faces as more negative as compared to the low-anxious control group.
Similarly, Straube and coauthors (2004) assessed SAD patients and mentally healthy
control participants by employing ratings of valence and arousal towards facial expressions.
In this investigation, neutral and angry expressions of nine male and nine female Caucasian
individuals were used as facial stimuli. Both SAD patients and control subjects rated angry
faces as more arousing and unpleasant as compared neutral faces. Furthermore, an interaction
of group and facial expression was revealed the way that SAD patients rated angry faces as
more arousing as non-anxious participants did.
Schofield and colleagues (2007) investigated students with high and low fears of
negative evaluation. As stimuli, the authors implemented happy, disgust, and neutral pictures
from Matsumoto and Ekman’s (1988) Japanese and Caucasian Facial Expressions of
Emotions. To allow for more variation in emotion intensity, the authors created morphed
images that combined a neutral and an emotional expression to a predefined degree; e.g. a
respective stimulus could represent a neutral expression to 30% and a disgust expression to
70%. Participants were asked to identify the respective emotion and to rate the emotional cost
for a hypothesized social interaction by indicating “what it would be like to interact with
someone looking at me this way” on a scale ranging between the anchors “it would be very

22
bad for me” and “it would be very good for me”. Although high and low fear of negative
evaluation groups did not differ in their accuracy of emotion identification, high fear subjects
rated the hypothesized social interactions with specifically disgust expressions as more
negative. This effect was found to be independent of actual emotion intensity of the facial
expression.
In the same vein, Amir and coauthors (2010) assessed valence ratings towards disgust
and anger expressions in samples of socially anxious participants, non-anxious controls, and a
generally dysphoric and anxious (but not socially anxious) group that matched the socially
anxious sample in terms of trait anxiety and depression. Similar to the findings of Schofield
and colleagues (2007), the disgust faces were rated more negatively by the socially anxious
participants whereas the control groups did not differ in their ratings for the disgust and anger
faces.
3.2 Biased interpretation of neutral facial expressions in
social anxiety
In contrast to the reported findings of a negative bias regarding specifically facial
expressions of disgust in social anxiety (Amir et al., 2010; Schofield et al., 2007), a previous
study conducted by Amir and colleagues (2005) did not find a more negative interpretation of
disgust expressions. The authors assessed eleven treatment-seeking patients with SAD and
eleven mentally healthy control subjects by presenting facial expressions of disgust and
neutral faces. Participants rated the emotional valence of each stimulus. However, although
the SAD group was generally faster in rating disgust expressions as compared to the control

23
group, no difference in the ratings of emotional valence emerged between the groups. Instead,
the SAD group was found to rate specifically neutral faces as more negative.
Yoon and Zinbarg (2007) chose different experimental methods for assessing
interpretational biases of facial expressions in social anxiety. First, the authors implemented a
correlational approach and included 51 unselected students in their investigation. To obtain
an index of social anxiety, participants were asked to complete respective questionnaires at
the beginning of the experiment. Second, the study task differed from the previously
described investigations insofar that participants were asked to make up short stories in their
response to facial stimuli. Pictures of angry, disgust, happy and neutral faces (Ekman &
Friesen, 1976) were used in the investigation. Response stories had to contain the feeling of
the person in the picture (i.e., he looks happy because he got a good grade). Interestingly, a
significant correlation was revealed for the interpretation of specifically neutral stimuli and
social anxiety: the higher participants scored on social anxiety measures, the more
threatening were their interpretations of the neutral stimuli.
Lastly, Stevens, Gerlach, and Rist (2008) found a negative interpretation bias of
neutral facial expressions in social anxiety. The authors included 40 treatment-seeking SAD
patients and 40 mentally healthy control participants in their study. As stimuli, happy, angry,
and neutral facial expressions adapted from Lundqvist, Flykt, and Öhman (1998) were used.
In addition, the authors implemented morphed pictures that blended 33% of the respective
emotional expression with 66% of a neutral expression. Participants were instructed to
imagine the respective stimuli in a conversational situation and were told to indicate how
friendly (versus rejecting) they perceived the individual faces. However, groups were not
found to differ in their interpretation of any morphed condition. Instead, SAD patients were

24
shown to rate neutral faces as less friendly (or more rejecting) as compared to the control
group.
3.3 Biased interpretation of positive facial expressions in
social anxiety
An interpretational bias the way that safety signals and, in consequence, positive
facial expressions, are overlooked or ignored in social anxiety disorder, as proposed by
Trower and Gilbert (1989), was revealed by two studies to date. First, Dimberg (1997)
investigated low and high fear of public speaking groups by gathering their ratings of anger,
hostility, happiness, friendliness, and directedness towards angry and happy facial
expressions (Ekman & Friesen, 1976). Both groups rated happy expressions as appearing
more happy and friendly whereas angry faces were perceived as more angry and hostile.
However, the high fearful group rated the happy expressions as less happy and friendly as
compared to the low fearful group. In addition, high fearful subjects rated happy faces as
significantly more hostile as compared to the low fearful participants.
A similar result was obtained by Campbell and colleagues (2009). The authors
assessed twelve SAD patients and 28 mentally healthy control participants. The task in this
investigation consisted in rating facial expressions of happiness, disgust, and anger
(Matsumoto & Ekman, 1988) on approachability (i.e., “rate how likely you are to approach
and engage the presented person (face) in a social interaction”). A significant main effect of
group indicated that the SAD sample rated all stimuli as less approachable than the control
group. In addition, a significant interaction between group and emotional expression was

25
found. Post-hoc tests revealed that the SAD group rated specifically happy faces as less
approachable as compared to healthy control participants.
3.4 Discussion and integration of results to date
Taken together, most of the research conducted on interpretation of emotional facial
expressions did not reveal a specific interpretation bias in social anxiety. Two further studies
(not included in Table 1) found a generally more negative evaluation of facial expressions in
socially anxious individuals (Furmark et al., 2009; Goldin, Manber, Hakimi, Canli, & Gross,
2009); however, no control condition was implemented in these two investigations. Also, a
study conducted by Dimberg and Thunberg (2007) revealed a significant interaction of social
anxiety and facial expression on subjects’ ratings of disgust and unpleasantness, which,
however, were not statistically followed up any further. Finally, Straube et al. (2005) reported
a deviant result in that socially anxious participants evaluated happy faces as more pleasant as
compared to non-anxious control persons.
Unfortunately, the majority of these ratings was gathered as a subsequent add-on to a
more extensive experiment or in the context of measurements of physiological parameters
(Staugaard, 2010). For example, some authors implemented the self-ratings as an addition to
a functional magnetic resonance imaging (fMRI) task (Evans et al., 2008; Stein et al., 2002;
Straube et al., 2004; Straube et al., 2005) or to a study collecting electromyogram (EMG) or
electroencephalogram (EEG) data (Dimberg & Thunberg, 2007; Mühlberger et al., 2009;
Wieser et al., 2011). Upon completing the physiological recordings, the same stimuli used in
the main task were then presented to the participants again to gather reports of perceived
valence. Obviously, such a sequential procedure has a number of disadvantages. For example,

26
after engaging in long protocols, participants may have experienced fatigue and their waning
attention could have impacted the rating task. Furthermore, the repeated exposure to the same
faces may have led to habituation that might have affected these ratings.
Nonetheless, the overall picture does not become more consistent when focusing on
studies without more invasive physiological procedures. For instance, Yoon and Zinbarg
(2007) as well as Stevens and co-authors (2008), revealed a more negative interpretation of
neutral faces in socially anxious participants and SAD patients, while Lange and colleagues
(2008) did not show any effects of social anxiety on self-rated valence and arousal in
response to emotional face stimuli. Amir and coauthors (2010) found that socially anxious
participants were more likely to rate facial expressions of disgust as more negative than
control participants, yet another pattern of results.
Another shortcoming of previous studies may be related to the type of rating that
participants were required to give in the respective investigations. Many studies asked for
simple ratings of valence and/or arousal (Amir et al., 2005; Amir et al., 2010; Evans et al.,
2008; Heuer et al., 2007; Merckelbach et al., 1989; Mühlberger et al., 2009; Straube et al.,
2004; Wieser et al., 2011; Wieser et al., 2009). From a psychopathological perspective, these
judgments may not necessarily tap into the phenomenology of social anxiety. Arguably, it
would be preferable to obtain ratings of face stimuli on a dimension with direct relevance for
the social context, not just a general rating of valence or arousal. However, only few studies
tested differences on such a dimension: For example, Campbell and co-authors (2009) asked
participants to rate the “approachability” of facial pictures with various emotional
expressions and found patients diagnosed with SAD to rate happy faces as less approachable
than non-anxious controls. Similarly, Stevens and colleagues (2008) investigated ratings of
perceived friendliness toward the observer.

27
Taken together, the research of interpretational biases in social anxiety disorder might
benefit from implementing a design that allows for the assessment of interpretations without
too tedious, invasive, or time-consuming protocols in order to minimize habituation and
fatigue of participants. Second, the assessment of a more socially relevant characteristic
seems promising: instead of implementing valence or arousal judgments, the assessment and
examination of a dimension that relates more directly to social approach or avoidance
behavior may be helpful in order to clarify the heterogeneity of previous results.

28
4 Testing hypotheses or testing the data?
A broader and more general shortcoming of the previously mentioned results lies in
the testing strategy that the respective studies applied. The so-called “Null Hypothesis
Significance Testing” (NHST; Cohen, 1994) that is inherent to the vast majority of
commonly conducted and reported statistical inference tests, such as ANOVA and regression
designs, “has not only failed to support the advantage of psychology as a science but also has
seriously impeded it” (Cohen, 1994, p. 997). To understand the reasons for applying NHST in
the first place and to comprehend the issues and problems related to its current use, the next
sections will give a short excursus into this matter and also introduce a theoretical basis for an
analytical framework that tries to work around the known shortcomings of NHST.
4.1 The principle of falsification
The strength and the core reason for today’s use of NHST lies in its original function
to validly demarcate science from pseudoscience and is therefore applied to promote and
expand scientific knowledge. The scientific-philosophical basis for NHST was created by
Karl Raimund Popper (1902-1994) who introduced the concept of “critical rationalism”
(Popper, 1935) in response to earlier accounts of philosophy of science, most importantly the
“logical empiricism”, as was advocated by the Vienna Circle (see also the Tractatus,
Wittgenstein, 1921). Logical empiricists argued that a scientific theory can be validated only
by verification, which means gathering observable evidence in order to induce a more general
or abstract rule. Consequently, scientific progress results from the degree of verification of a
given hypothesis: the more empirical support can be found for a specific hypothesis, the
higher is its prognostic value and validity in relation to future observations. Popper now

29
criticizes the actual validity of the induction principle by stating this often cited example
(Popper, 1935, p. 3): regardless of how many white swans have been observed, one can never
arrive at the general rule “all swans are white” since the existence of one single black swan
suffices to disprove this rule – and black swans do indeed exist. Consequently, even if
uncountable observations exist in favor of a specific theory, they won’t suffice to verify a
theory since there is always the possibility of deviant observations. In other words, it is
logically impossible to induce the validity or truth of a given hypothesis. Obviously, the
problem arising from the deficiency of the induction principle lies in the now recurrent need
to demarcate empirical scientific theories from non-empirical or non-scientific theories, such
as mathematical and logical statements as well as metaphysical assumptions and claims.
Popper’s own approach, as he states himself, is “in schärfstem Widerspruch zu allen
induktionslogischen Versuchen” (approximately: in the strongest conflict to all attempts of
induction; Popper, 1935, p. 5), in which he is advocating the deductive method of
investigation. Within his philosophical-scientific framework, Popper first introduced four
more general guidelines as propositions for the logical and empirical testing of theories and
hypotheses. According to Popper, the sound investigation of theories should always be
conducted in four different directions: (1) the logical consequences of a given theory should
be compared so that contradictions within the theory can be investigated; (2) the logical form
of the theory should be investigated with respect to its empirical-scientific claim (that is, the
theory under investigation should not be tautological); (3) the theory under investigation
should be compared to other theories with respect to the question whether the new theory
actually marks scientific progress; and (4), the core feature of Popper’s deductive approach,
the theory should be investigated by empirical applications of its deduced implications. The
following section will explain the logical rationale of the deductive empirical investigation in

30
more detail. However, it is important to note that even if a theory passes all these tests, it is
considered to be only preliminary validated or, otherwise, falsified. According to Popper, any
form of validation can only be preliminary. Theories can never be proven to be definitely
true, valid, or even likely.
The formal notion of testing the deduced application can be expressed in terms of
propositional logic: a prognosis or prediction P is deduced from a theory or hypothesis T so
that when T is true, also the statement T → P is true and T thus implies P. Now an
observation of “not-P” (⌐P) is made, which implies “not-T” (⌐T). An example for this is T: it
is raining; and P: the street is wet. Now it is observed that the street is dry, which is ⌐P.
Consequently, it does not rain, ⌐T. This specific rule of inference, “T → P implies ⌐P →
⌐T”, is called modus tollens. The important point here is that one cannot simply imply from
an observation P that also T is valid: based on the fact that the street is wet, it cannot be
concluded that it is raining. The street could also be splashed by someone or something else.
Spoken more generally, different scenarios or theories can also imply the prognosis P. The
only logical inference can be made from ⌐P to ⌐T. This issue constitutes the formal
background for the cardinal impossibility of the induction principle and, in consequence,
accounts for the impossibility of verifying a theory. According to Popper, the only way of
scientific progress consists in the falsification of deduced hypotheses.
In summary, the main conclusions resulting from Popper’s theoretical considerations
are the following:
1. It is simple to obtain confirmation or verification for nearly all theories
if one is specifically looking for confirmation.
2. Confirmations should only count if they emerge as a result from risky
observations, that is, if an outcome is expected that is incompatible

31
with the theory. For example, risky observations may result from novel
and thus tentative applications of the theory, whereas replicating a
previous result is not considered to be a risky observation. The
compatible outcome of a risky observation then falsifies the
expectancy and in turn preliminary validates the theory.
3. Every “good” theory is prohibition: it prohibits the occurrence of
specific observations and thus consists of actual testable statements
and claims. The more a theory prohibits the better (for) the theory
since its empirical applications can be tested more widely.
4. A theory that cannot be falsified is nonscientific. Infallibility is not a
virtue but a vice.
5. Every real test of a theory is an attempt to falsify it. Testability is
falsifiability, but there are various degrees of testability. Some theories
are more testable and are thus more objected to falsification as others.
These theories have a higher risk.
6. Verifying or confirming evidence has no meaning unless it is resulting
from a real test of the theory. This evidence is then the result of a
legitimate but unsuccessful attempt to falsify it.
7. Some actually testable theories are often kept by their advocates
although they have been falsified. To save the respective theory, some
ad-hoc statements are introduced that make the theory seem
compatible with the data, or the theory is interpreted in a different way
to appear compatible to the data. According to Popper, ad-hoc

32
adjustments are always possible, but they eradicate the scientific status
of the theory.
Popper argues that Albert Einstein’s theory of relativity (1916) is a good example of a
proper (that is, well testable) scientific theory. Based on the theory, Einstein predicted that
light is distracted as a result from the sun’s gravitational effects (see also Einstein, 1911). In
1919, Arthur Eddington travelled to Principe (Gulf of Guinea, West Africa) to observe an
eclipse and to investigate whether the positions of the stars indeed deviated as predicted by
Einstein’s theory. In fact, the observed deviations corresponded with the prediction (Dyson,
Eddington, & Davidson, 1920). Popper stresses that this test constituted a high risk for the
theory: if the proposed deviation was not observed, the theory had to be condemned because
it had been incompatible with possible results from empirical observations. However, note
that this observation does not result in the ultimate verification of Einstein’s theory.
Moreover, Popper argues that Einstein’s theory is just preliminary validated and still should
be condemned if future observations indeed deviate from the hypothesized predictions.
According to Popper, a scientific theory is not considered good because it is not rejected;
moreover, a good scientific theory is characterized by a high degree of testability and its
permission for risky observations.
4.2 Null hypothesis significance testing
Resulting from Popper’s notion of falsification being the only means of enabling
scientific progress, today’s empirical sciences heavily rely on this concept and
operationalized Popper’s rather philosophical thoughts into inference statistical methods that
explicitly test a given theory: let H0 be a specific hypothesis and let H1 be the antithesis that

33
implies the invalidity of H0. Now the actual validity (or better: the likelihood of the
invalidity) of H0 has to be determined by empirical observation. However, to the extent that
H1 and H0 transcend the data, this decision cannot be made with absolute certainty.
Moreover, two kinds of wrong decisions can be made. First, one can reject the H0 and in turn
choose H1 although H0 is actually true, which is called Type I error or alpha error. Second,
the H0 can be kept and accepted as being true although it is in fact false, which is a Type II or
beta error. Alpha and beta indicate the likelihood for making the specific error (therefore, the
expressions “alpha and beta error” can be misleading) whose precise values are determined
by both the data and a decision criterion. The decision criterion in turn is a result of
probabilistical and thus mathematical considerations on the one hand, and considerations
regarding the implications of an erroneous decision on the other hand. In empirical sciences,
the decision criterion is usually set to an alpha level of 0.05, indicating that the likelihood of
falsely rejecting the H0 is five per cent at the most.
The practice of null hypothesis significance testing (NHST) has been criticized for
quite essential reasons. Already in 1966, Bakan pointed out that NHST’s actual use is “hardly
original” and mostly used to statistically account for well-known facts, therefore leading to
stagnation of the scientific progress. In the same vein but more metaphorically, Meehl (1967)
described NHST to be “a potent but sterile intellectual rake who leaves in his merry path a
long train of ravished maidens but no viable scientific offspring” (p. 265). In addition, the
common conclusion that the rejection of establishes the actual theory (i.e., the ) is
critical when reflecting the logical impossibility of verifying a hypothesis. Note that this
statement does not contradict the validity of Popper’s approach of falsification: according to
Popper, the H0 should reflect the theory to be tested so that valid conclusions can be drawn
regarding its (non-)application on the given data. This, however, is hardly ever done in

34
psychological research where the H1 usually constitutes the actual theory and the H0 reflects a
more or less meaningless counterpart.
Nonetheless, the maybe most important problem lies in the research question asked by
the vast majority of empirical studies: “Given these data (D), what is the probability that H0 is
true?”(Cohen, 1994, p. 997), which can be written as P(H0|D). Although Cohen points out
that this indeed is the crucial research question every scientist wants to answer, he states that
NHST is not the means to obtain it. Moreover, NHST gives an answer to the following
question: “Given that H0 is true, what is the probability of these (or more extreme) data?”,
which is P(D| H0). This common confusion leads to a major difference in the statistical
reasoning process. To clarify this issue, consider the following example of an experimental
study of individuals with high and low levels of social anxiety who rated facial stimuli, just
as reviewed in the previous chapter. Obviously, the null hypothesis constitutes the
independence between facial evaluation and social anxiety scores while the H1 states an
effect of social anxiety on facial ratings:
H0: Individuals high and low in social anxiety do not differ in their interpretation of
facial stimuli.
H1: Individuals high and low in social anxiety do differ in their interpretation of facial
stimuli.
Now imagine that indeed a statistically significant difference between the two groups
was obtained, which can be written as P (Dobserved| H0) < .05 . To put in other words, this
finding means that given that H0 (both groups do not differ) is true, the occurrence of the
specific result D (the observed difference on facial ratings between the groups) is very
unlikely. However, this interpretation will not be made. Moreover, the researcher wants to
reject the H0 (and not the data!) in the way that the observed result will be interpreted as

35
follows: given these results, the validity of H0 is unlikely and therefore differences between
high and low anxious individuals exist. This, however, is the inverse probability P
(H0|Dobserved). And unfortunately, the two different probabilities P (Dobserved| H0) and P
(H0|Dobserved) are not the same in neither their arithmetical procedures nor their
interpretational conclusions. Mathematically, the relationship between the general forms of
these probabilities can be expressed with the following equation, which is also known as the
Bayes’ theorem (Jeffreys, 1935):
( | ) ( ) ( | )
( )
The terms ( ) and ( ) reflect the so-called “prior probabilities”, or the initial
degrees of belief, in the Null hypothesis ( ), and in a significant outcome ( ) Because H0
and H1 are complementary events, this equation can be further specified with respect to the
unknown parameter ( ):
( | ) ( ) ( | )
( ) ( | ) ( ) ( | )
Usually, the probabilities of the prior hypotheses ( ) and ( ) are unknown as
well. However, to highlight the problems of the common NHST interpretation, consider the
following numerical example by estimating ( ) and ( ) from the previous research on
this specific topic: nine out of 22 studies found a difference between socially anxious and
non-anxious participants in facial interpretations, resulting in ( )
. In
addition, 13 of the 22 studies did not find a significant difference on the same research
question, therefore leading to ( )
.
In addition, ( | ) and ( | ) can be estimated by assuming the sensitivity and
specificity parameters for the used methodology. Since the sensitivity of a test indicates the

36
probability of rejecting H0 given that H1 is actually true, the term ( | ) equals this
definition exactly. On the other hand, the specificity of a given test is defined by the
probability of keeping the H0 given that H0 is actually valid, which is expressed as ( | )
where means “not-D”, that is, a negligible and thus non-significant difference between
the respective groups. Since and are complementary events, ( | ) ( | )
and therefore ( | ) ( | ); in other words: ( | ) can be calculated by
subtracting the test’s specificity from 1.
To follow the numerical example, assume a sensitivity of ( | ) , which is a
reasonable value since experimental study designs and tasks usually have a quite high
sensitivity (or a high power, which is mathematically the same). On the other hand, and due
to the interdependence of alpha and beta errors, the specificity of experimental tests is often
smaller. Therefore, let the specificity of the test be ( | ) so that ( | )
( | ) as well.
With now all unknown variables set or estimated, the equation in order to obtain
( | ) can be solved:
( | ) ( ) ( | )
( ) ( | ) ( ) ( | )
( | )
( | )
In other words, this numerical example implies that when obtaining a significant
difference between socially high and low anxious participants regarding interpretation of
facial stimuli so that ( | ) , it can be interpreted the way that this result is very
unlikely given that is true. However, given this example, the likelihood that the null
hypothesis is actually true is in fact quite substantial because ( | ) ! This contrast

37
highlights the obviously problematic but very common interpretation of ( | ) and thus
questions more generally the inferences and implications of NHST. According to Cohen
(1994), especially when the equals the theory or the outcome that the researcher wishes to
observe (and which is in contrast to Popper’s original use of falsification, where the
constitutes the theory), Bayesian priors should always be taken into account when inferring
the appliance of .
Another broad concern results from the operational definition of commonly used null
hypotheses. Usually, the null hypothesis simply states the complete absence of any
relationships or dependences between IVs and DVs so that the respective effect size is set to
ES = 0 (Cohen, 1994). Cohen points out that this zero-parameterization of the commonly
leads to rejection, even when implementing only small samples. Moreover, as Lykken
mentioned already in 1968 , “Unless one of the variables is wholly unreliable so that the
values obtained are strictly random, it would be foolish to suppose that the correlation
between any two variables is identically equal to 0.0000… (or that the effect of some
treatment or the difference between two groups is exactly zero).” (pp. 152-153).
Consequently, due to random influences and measurement errors, an “ambient noise level” of
shared variance between the supposedly unrelated variables will be detected (see also Meehl,
1990). Especially when implementing larger samples, these small correlations will quite
likely emerge as significantly different from a specified of r = 0, which is nonetheless a
meaningless result. Thus, more specified null hypotheses (such as : r < .2) instead of the
simple “nil hypothesis” of ES = 0 (Cohen, 1994) should be investigated in order to obtain
more profound and interpretable results.
Another important criticism regarding the common practice of accepting or rejecting
the null hypothesis is based on the dichotomous criterion value, which is usually set to p <

38
.05. As pointed out by Rosnow and Rosenthal (1989), “God loves the .06 nearly as much as
the .05. Can there be any doubt that God views the strength of evidence for or against the null
as a fairly continuous function of the magnitude of p?” (p.1277). In the same vein, Tukey
(1969) argues that the progress of science is based upon piling up amounts, and not just
directions, of empirical evidence. As Cohen puts it, “But if all we, as psychologists, learn
from research that A is larger than B (p < .01), we have not learned very much. And this is
typically all we learn.” However, to address this problem, the notion of effect sizes in
addition to the NHST’s mere p value has become an essential requirement for psychological
publications in the recent past (APA, 2010). Nonetheless, as pointed out by Kelley and
Preacher (2012), the term effect size is still used inconsistently, and reported effect sizes are
often interpreted insufficiently.
To summarize the critical aspects of NHST, it has been reviewed that
1) Bayesian priors should be implemented in the statistical process to arrive at a
proper interpretation of statistical inferences,
2) Null hypotheses should specify concrete and non-zero parameters since the
absolute independence between variables is highly improbable.
3) A proper description and interpretation of the amount of evidence is as important
as its direction.
The next paragraph will give a brief overview of a new statistical method that tries to
work around the known shortcomings of NHST and thus provides a different approach to test
the magnitude of relationships between IVs and DVs: the Bayesian evaluation of informative
hypotheses (Hoijtink, 2012).

39
4.3 Bayesian evaluation of informative hypotheses
The Bayesian method of “significance testing” was first introduced by Sir Harold
Jeffreys (1935, 1961). His work offered a new approach of testing two specific hypotheses
against each other by employing the so-called Bayes Factor (BF), which can be interpreted as
a quantitative representation of the degree of evidence in favor of a respective hypothesis.
The mentioned Bayes’ theorem constitutes a major aspect of its mathematical basis. In more
detail, the BF for two competing hypotheses H1 and H2 in an empirical dataset D is defined as
the quotient of the probability densities pr that indicate the degree of evidence in the data
according to each of the hypotheses (Kass & Raftery, 1995):
( | )
( | )
When reviewing the Bayes’ theorem and assigning probability densities pr instead of
fixed P values, the multiplication of the Bayes’ theorem with the BF leads to the following
equation:
( | )
( | ) ( )
( )
To illuminate the interpretation, the Bayes factor can be considered as the ratio of the
posterior odds ( | ) to its respective prior odds ( ) with k = (1, 2). In the case that
the prior odds of the two hypotheses are equal, the BF can be derived directly from the
respective posterior odds. However, note that this approach specifically incorporates the
possibility of unequal (and thus to be considered!) priors, as was neglected and consequently
criticized in NHST’s methodology. The BF is then obtained by integrating the densities
( | ) and ( ) over the parameter space. For a more detailed description of how the

40
parameters are estimated, see Hojitink (2012) and van den Schoot and colleagues (2011) for
comprehensive overviews.
Another important difference to NHST is that the BF allows for the simultaneous
comparison of multiple specific, or informative, hypotheses (van de Schoot et al., 2011) so
that pre-defined constraints can be implemented on the parameters of interest (such as H1: µ1
< µ2 < µ3 = µ4 versus H2: µ1 = µ2 > µ3 = µ4) which can be tested directly against each other.
Also, note that the hypotheses under investigation do not have to be mutually exclusive. On
the other hand, in NHST, only unconstrained hypothesis can be tested against its logical
counterpart (such as H0: µ1 = µ2 versus H1: µ1 ≠ µ2). Although employing contrasts is a
helpful strategy to test more informative constraints within NHST (Rosenthal, Rosnow, &
Rubin, 2000), still only one single hypothesis can be tested at a time and thus leads to
problems such as the need for corrections regarding multiple testing and comparability
difficulties in designs comparing multiple hypotheses (Cooper, 2012).
As Kass and Raftery (1995) state, “the Bayes factor is a summary of the evidence
provided by the data in favor of one scientific theory, represented by a statistical model, as
opposed to another” (p. 777). In Table 2, Kass’s and Raftery’s guidelines for interpreting the
size of the BF can be depicted. However, it is important to note that these guidelines,
although they have an intuitive appeal, are not well founded (see also De Santis, 2004;
Garcia-Donato & Chen, 2005). Also, Hoijtink (2012) argues that the categories of the degree
of evidence are rather fuzzy. Nonetheless, these guidelines might be helpful in terms of
roughly describing and comparing the amount of evidence obtained by the BF.

41
Table 2
Interpretation guidelines for Bayes Factors
Size of BF Degree of evidence
1 – 3 Not worth more than a bare mention
3 – 20 Positive
20 – 150 Strong
> 150 Very strong
Note: Adapted from Kass and Raftery, 1995 (p. 777).
However, from a philosophical background, it can be argued that the Bayesian
approach, and especially the interpretation of the BF as the degree of evidence in favor of a
specific theory, incorporates inductive inferences and thus follows the verification
“principle”. This, as noted above, has been proven to omit a solid logical foundation (Popper,
1935). Jeffreys (1961) now argues that NHST is certainly applicable in cases that a clear-cut
theory, like Einstein’s relativity theory, is tested for its empirical relevance. Nonetheless, a
rigid rejection in case that the data “falsifies” the theory also leads to problems when
considering the scientific progress: “Is it of the slightest use to reject a hypothesis until we
have some idea of what to put in its place? If there is no clearly stated alternative, and the null
hypothesis is rejected, we are simply left without any rule at all, whereas the null hypothesis,
though not satisfactory, may at any rate show some sort of correspondence with the facts.”(p.
390). Moreover, Jeffrey argues that the scientific progress builds on imperfect theories which
do indeed deviate from empirical observations. Nonetheless, as far as the deviations are
considered sufficiently minor and are thus irrelevant for all present practical applications, the
theories are accepted for a given period of time and are used for prognoses regarding new

42
phenomena. Eventually, these imperfect theories are replaced by newer theories that deviate
less from empirical observations. Consequently, introducing the degree of empirical support
for a specific theory may be more beneficial for the scientific progress as compared to plainly
stating and following the common NHST’s accept/reject-decision.

43
5 Experimental investigation
In order to investigate interpretational biases of facial expressions in social anxiety,
the present study assessed trustworthiness judgments towards facial stimuli. The judgment of
trustworthiness can be hypothesized to entail a more directly socially relevant component, as
compared to valence or arousal ratings. For example, Fenske and co-authors (Fenske,
Raymond, Kessler, Westoby, & Tipper, 2005) found that ratings of trustworthiness are
associated with (induced) previous approach behavior towards the respective faces.
Interestingly, bilateral amygdala damage impairs the ability to discriminate between
trustworthy and untrustworthy faces in humans (Adolphs, Tranel, & Damasio, 1998) and
alters social approach behavior in primates (Amaral, 2002; Emery et al., 2001). Furthermore,
ratings of facial trustworthiness of experimental partners are correlated with cooperative
social behavior towards the same partners (van't Wout & Sanfey, 2008). Finally,
trustworthiness judgments reflect the detection of subtle facial features that serve as cues for
approach or avoidance responses (Todorov, 2008). In summary, ratings of trustworthiness
appear especially promising for an experimental investigation of associations between ratings
of facial stimuli and social anxiety.
The current study was planned to test the association between ratings of socially
relevant facial features and social anxiety. Specifically, ratings of attributed trustworthiness
towards facial stimuli were investigated. Participants were asked to rate the perceived
trustworthiness of untrustworthy, neutral, and trustworthy faces. Thus, by incorporating three
distinct stimulus conditions, this design allowed for the evaluation of specific interpretation
biases as found in previous research (see Table 1).

44
In addition to the trustworthiness ratings of facial pictures, participants were asked to
rate the same stimuli on attributed intelligence, which implied to a lesser degree social
approach or avoidance behavior as compared to trustworthiness ratings. This control
condition therefore enabled to explore the specificity of any finding for the perceived
dimension of trustworthiness. Moreover, in contrast to the previously mentioned group
studies, a correlational approach was implemented to better grasp the dimensional
conceptualization and empirical understanding of social anxiety (e.g., Ruscio et al., 2008) by
recruiting a sufficiently large sample of unselected undergraduate students.
Based on the current inconsistent state of research on facial expressions and self-
ratings in social anxiety, the classical NHST-approach of testing H1 (“in at least one stimulus
category, social anxiety influences the ratings”) versus H0 (“social anxiety does not influence
the ratings in any category”) may not be the appropriate strategy for analyzing data looking at
this association. When merely testing the plausibility of the classical unconstrained H0, the
four previously reported response patterns (compare Table 1) remain unrecognized within
this approach. However, for the present purposes, it is not the overall probability of one
single H0 that is of interest (see also Cohen, 1994). Instead, a test of the different models
provides a more comprehensive and elaborate answer of how likely or unlikely a specific
response pattern is for a given dataset (Klugkist, van Wesel, & Bullens, 2011). Accordingly,
the most appropriate analytic strategy is to test the four response patterns by converting them
into informative hypotheses (Hoijtink, 2012), which implement the specific constraints on the
parameters of interest. Consequently, a Bayesian evaluation was implemented that allowed
for direct tests of the empirical support in order to compare the four informative hypotheses
(Hoijtink, 2012; Kluytmans, Van De Schoot, & Hoijtink, 2012). This new data analytic

45
approach has been developed very recently and has been applied, so far, only once in the field
of abnormal psychology (Vossbeck-Elsebusch & Gerlach, 2012).
5.1 Method
5.1.1 Participants
Participants were recruited from undergraduate psychology classes at Boston
University and received three hours of credit towards the Psychology 101 research
participation requirement as compensation. All subjects willing to participate underwent a
short initial phone screening to ensure that only individuals with normal or corrected to
normal vision participated in the experiment. Only female individuals were recruited. The
study was approved by the Institutional Review Board of Boston University.
Participants were screened for current psychosis and substance use with a structured
clinical interview (SCID; First, Spitzer, Gibbon, & Williams, 2002). None of the participants
were found to suffer from psychotic symptoms or severe substance use which would have led
to exclusion from the study. Informed consent was obtained from 101 participants who all
matched the inclusion criteria. Data from three participants were missing due to equipment
failure, yielding a final sample of N = 98. The subject’s mean age was 18.7 years (SD = 1.0).
Regarding the ethnic background of our sample, 49 participants (50%) identified themselves
as White, 27 participants were Asian (28%), ten participants (10%) were Hispanic, 3
participants (3%) were African American, and the remaining 9 subjects (9%) identified
themselves as belonging to a different ethnic group.
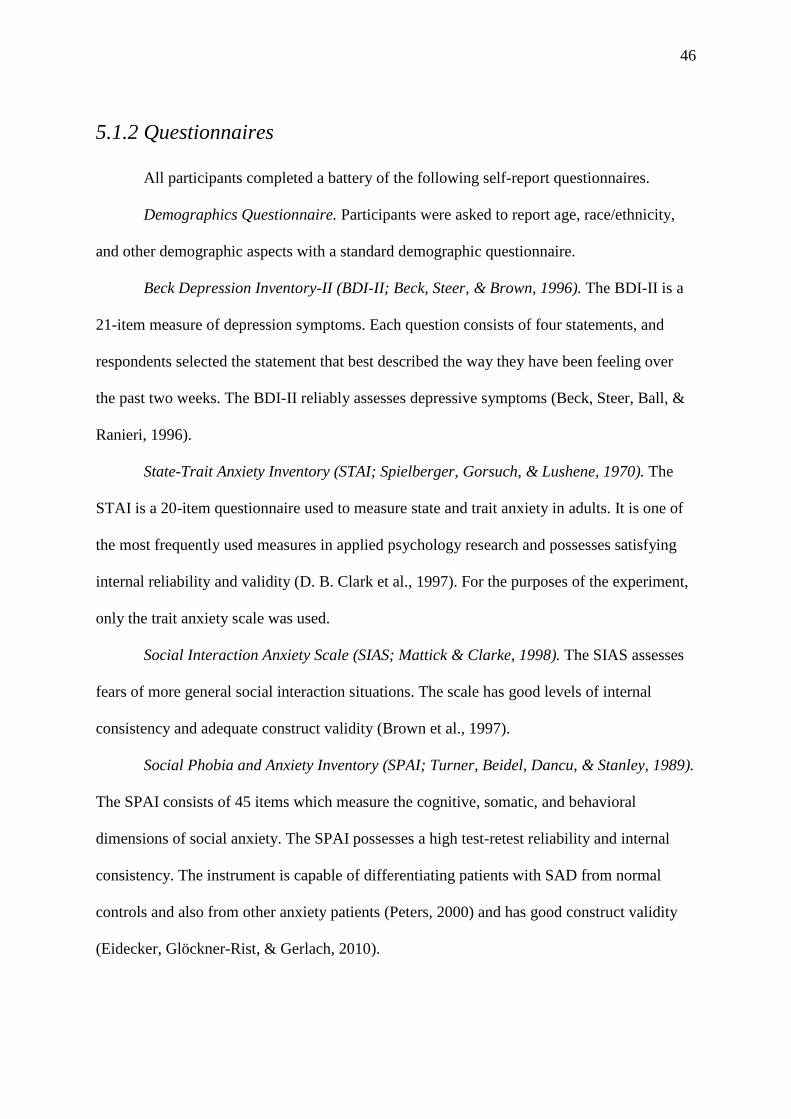
46
5.1.2 Questionnaires
All participants completed a battery of the following self-report questionnaires.
Demographics Questionnaire. Participants were asked to report age, race/ethnicity,
and other demographic aspects with a standard demographic questionnaire.
Beck Depression Inventory-II (BDI-II; Beck, Steer, & Brown, 1996). The BDI-II is a
21-item measure of depression symptoms. Each question consists of four statements, and
respondents selected the statement that best described the way they have been feeling over
the past two weeks. The BDI-II reliably assesses depressive symptoms (Beck, Steer, Ball, &
Ranieri, 1996).
State-Trait Anxiety Inventory (STAI; Spielberger, Gorsuch, & Lushene, 1970). The
STAI is a 20-item questionnaire used to measure state and trait anxiety in adults. It is one of
the most frequently used measures in applied psychology research and possesses satisfying
internal reliability and validity (D. B. Clark et al., 1997). For the purposes of the experiment,
only the trait anxiety scale was used.
Social Interaction Anxiety Scale (SIAS; Mattick & Clarke, 1998). The SIAS assesses
fears of more general social interaction situations. The scale has good levels of internal
consistency and adequate construct validity (Brown et al., 1997).
Social Phobia and Anxiety Inventory (SPAI; Turner, Beidel, Dancu, & Stanley, 1989).
The SPAI consists of 45 items which measure the cognitive, somatic, and behavioral
dimensions of social anxiety. The SPAI possesses a high test-retest reliability and internal
consistency. The instrument is capable of differentiating patients with SAD from normal
controls and also from other anxiety patients (Peters, 2000) and has good construct validity
(Eidecker, Glöckner-Rist, & Gerlach, 2010).

47
Social Phobia Inventory (SPIN; Connor et al., 2000).The SPIN is a 17-item measure
to assess symptoms of SAD and has been shown to have satisfactory psychometric properties
(Antony, Coons, McCabe, Ashbaugh, & Swinson, 2006).
5.1.3 Facial stimuli
The 198 computer-generated face stimuli used in the experiment were taken from a
larger publicly available database created at Princeton University
(http://webscript.princeton.edu/~tlab/databases/database-6-trustworthiness-dataset/). The
software FaceGen 3.1 was used for generating the stimuli. All faces in this database were
presented with gaze directed at the participant in front of a black background. In order to
reduce possibly confounding effects of gender, race and paraphernalia, all facial stimuli were
male, Caucasian, and bald. Faces were created to display three levels of trustworthiness with
a procedure that is described in more detail by Oosterhof and Todorov (2008). The respective
categories comprised of “not trustworthy”, “neutral”, and “trustworthy” facial characteristics.
The facial stimuli used in the protocol consisted of 66 different facial identities with
each three degrees of trustworthiness, resulting in a total of 198 stimuli. The size of each
stimulus was 400 x 477 pixels, resulting in a measurable size of 141.11 x 168.27 mm on the
computer screen. An example of one identity in its various degrees of trustworthiness is
shown in Figure 2.

48
Figure 2
Facial stimuli
(A)
(B)
(C)
Note: (A), untrustworthy face; (B), neutral face; (C), trustworthy face.
5.1.4 Procedure
After obtaining informed consent, participants were seated in front of a 15 inch
cathode ray tube monitor with an attached keyboard. The computerized experimental
procedure was programmed with the software E-Prime® (Psychology Software Tools, Inc.;
Sharpsburg, PA, USA). The experimental task began with a short training block with twelve
different stimuli in order to ensure that participants gave their response as quickly as possible.
For the main experiment, only ratings that were given no later than 1000 ms after stimulus
onset were included in the analyses in order to capture the participants’ immediate judgment
of facial trustworthiness. Only during the training trials did subjects receive feedback about
whether they were responding quickly enough. Participants were instructed to indicate their
judgment of facial trustworthiness by pressing one of three buttons, 1 (“not trustworthy”), 2
(“neither trustworthy nor untrustworthy”) or 3 (“trustworthy”), for each of the 198 presented
stimuli.

49
Additionally, a control condition was implemented in which participants were asked
to rate all facial stimuli regarding attributed intelligence. The same buttons, 1 (“not
intelligent”), 2 (“neither intelligent nor unintelligent”), and 3 (“intelligent”), were used in the
control condition. Again, only ratings given within 1000 ms after stimulus onset were entered
in the analyses.
Face stimuli were presented in six blocks with 66 pictures each. Conditions
(trustworthiness or intelligence ratings) were randomized between blocks but fixed within
each block, so that all 66 subsequently presented stimuli of a respective block had to be rated
on the same dimension. Thus, participants rated facial trustworthiness in three of the blocks
and facial intelligence in the other three blocks, while the order of blocks was randomized.
Also, the 198 facial stimuli that had to be rated in each of the two conditions were randomly
assigned to one of the three respective blocks. To reduce fatigue, participants could pause as
long as they wanted before starting the next block.
Each of the 66 rating trials within a block commenced with a reminder of which
attribute was to be rated. The respective condition (“Trustworthiness” or “Intelligence”) was
on display for 1000 ms with white text on a black background in the center of the screen.
Following this, a white fixation cross was shown for another 1000 ms after which the face
stimulus was displayed for 500 ms. Subsequently, the monitor went black for 2000 ms, after
which the next trial commenced. For a graphical description of the procedure, see Figure 3.

50
Figure 3
Procedure for each of the 396 rating trials.
5.1.5 Data preparation
We first calculated the correlations between the various social anxiety questionnaires
to explore the possibility of aggregating these scores into a single principal component.
Correlations between the SIAS, SPAI and SPIN scores ranged between r = .79 and r = .84
and were thus sufficiently high to extract a composite score of social anxiety. We therefore
conducted a Principal Component Analysis on the SIAS, SPAI and SPIN mean scores and
obtained a standardized Social Anxiety (SA) score that we used in the main analyses.
Regarding the face stimuli ratings, we calculated mean scores for each facial category
(untrustworthy, neutral, and trustworthy) and condition (trustworthiness and intelligence
Trustworthiness
+
Condition reminder; 1000 ms
Fixation cross; 1000 ms
Face stimulus; 500 ms
Blank black screen; 3000 ms

51
ratings). Therefore, six dependent variables were further analyzed for each participant: mean
trustworthiness ratings for each the untrustworthy, neutral, and trustworthy faces, and mean
intelligence ratings for the same face categories.
5.1.6 Data analysis
We analyzed the data using a Bayesian evaluation of informative hypotheses
(Hoijtink, 2012) and tested four result patterns, found previously in similar studies (compare
Table 1). More specifically, we first transformed the group results into correlational patterns
(see also Table 4), which were then entered as models in the analyzing software, BIEMS
(Mulder, Hoijtink, & de Leeuw, 2012; Mulder, Hoijtink, & Klugkist, 2010; Mulder et al.,
2009). The model selection criterion or test statistic in this kind of analyses was the Bayes
factor (BF), which refers to the calculated amount of support in the data for each of the
previously entered models, compared to a model without constraints on the correlations. In
other words, the BF is a quantification of the degree of evidence in the data in favor of each
of the hypotheses of interest. Therefore, and in contrast to classical testing approaches, this
does not create an index of the overall “unlikeliness” of H0 but rather individual likelihoods
of our various informative H1s. As noted above, although classificatory interpretations and
guidelines for the size of the BF are not well founded and somewhat arbitrary, there have
been some suggestions for interpreting the magnitude of the effects (Jeffreys, 1961; Kass &
Raftery, 1995). For example, a BF larger than three is considered to be positive evidence in
favor of the model entertained. In other words, the model entertained is three times more
likely than the model without constraints on the correlations.
In addition to the BF, we also report the posterior model probabilities (PMP). These
simply standardized the specific BF by the sum of BFs, therefore allowing a direct

52
comparison of the support in the data for each of the models. Accordingly, PMPs ranges
between 0 (the model is unlikely) and 1 (the model is the most likely).
Regarding the stability of the obtained results, additional analyses were included.
Data were simulated for four same-size samples (N = 98) that were fitted perfectly after the
restrictions of each one of the models, respectively. Subsequently, these “perfect matches”
were analyzed with the same procedures as for the empirical data. Consequently, descriptive
comparisons between observed and simulated BFs are possible in order to estimate the
stability of the results.
5.2 Results
Sample characteristics including means and ranges of scores for the self-report
measures are listed in Table 3.

53
Table 3
Sample characteristics
Range Mean (SD)
BDI-II 0 – 33 8.8 (6.7)
STAI 40 – 61 51.5 (3.5)
SIAS 0 – 62 21.9 (14.6)
SPAI 2 – 152 54.7 (30.9)
SPIN 0 – 54 16.4 (11.8)
SA -1.5 – 3.1 0 (1.0)
Note: BDI-II, Beck Depression Inventory II; STAI, State-Trait Anxiety Inventory; SIAS, Social
Anxiety Interaction Scale; SPAI, Social Phobia and Anxiety Inventory; SPIN, Social Phobia
Inventory; SA, Social Anxiety principal component (see data preparation section).
The Bayesian evaluation of the model comparisons on attributed trustworthiness and
social anxiety, BFs and PMPs are largest for Model 1, which assumes independence of social
anxiety and trustworthiness ratings for all categories (see Table 4). The second best fit is
found for Model 3, which assumes a negative bias of social anxiety regarding the evaluation
of neutral faces. Smaller BFs and PMPs are obtained for Model 2 that assumes a more
negative evaluation of specifically untrustworthy faces in social anxiety, and for Model 4,
which assumes a negative bias for trustworthy faces.
For the intelligence ratings, Model 1, which assumes independence of intelligence
ratings and social anxiety, yielded again the largest BF and PMP. The second best fit was
found for Model 2, that assumes a less positive rating of intelligence of untrustworthy faces
in individuals with higher social anxiety scores. Models 3 and 4, which assume negative

54
biases of intelligence ratings on respectively neutral or trustworthy faces, were found to have
lower BFs and PMPs.
Additional analyses regarding the data simulated after each of the models’ constraints
can be found in Table 5. On an ordinal descriptive level, the pattern of results that best
approximates the empirical data is the one simulated after Model 1.
Table 4
Model evaluation of facial ratings and social anxiety
Model 1 Model 2 Model 3 Model 4
Untrustworthy faces r = 0 r < 0* r = 0 r = 0
Neutral faces r = 0 r = 0 r < 0* r = 0
Trustworthy faces r = 0 r = 0 r = 0 r < 0*
DV: Trustworthiness ratings
BF 34.79 7.31 11.69 5.29
PMP 0.58 0.12 0.19 0.09
DV: Intelligence ratings
BF 35.65 22.05 4.63 6.56
PMP 0.51 0.32 0.07 0.09
Note: * Higher levels of social anxiety are associated with lower values on the facial ratings.
BF, Bayes Factor; PMP, posterior model probability.

55
Table 5
Bayes factors simulated data
Model 1 Model 2 Model 3 Model 4
BF(M1) 76.47 18.46 17.92 19.30
BF(M2) 0.02 35.47 0.01 0.01
BF(M3) 0.03 0.01 40.94 0.01
BF(M4) 0.00 0.02 0.00 57.15
Note: Models were simulated by assuming a moderate effect R2 = .15; BF, Bayes Factor; PMP,
posterior model probability; BF(M1), Bayes Factor obtained by data simulated after Model 1.
5.3 Discussion
The best fitting model for the relationship of social anxiety and attributed facial
trustworthiness was defined by the complete independence of self-ratings and social anxiety.
According to the analysis, it is three times more likely that social anxiety does not influence
trustworthiness judgments of faces than assuming any kind of negative interpretation bias
being associated with social anxiety. The same result was true for attributed intelligence: the
best fit was found for the independence model of social anxiety and judgments of facial
intelligence. Nonetheless, for the remaining models, the fits differed between trustworthiness
and intelligence ratings, indicating that, indeed, ratings of distinct characteristics were
gathered instead of a more global judgment of the presented stimuli.
To give an estimation regarding the stability of the results, data were simulated
according to each of the models’ restrictions and analyzed the same way than the observed
data to enable comparisons between the respective Bayes Factors (see Table 4 and Table 5).

56
Especially the comparison between the original results and the data simulated after Model 1
is of interest: although the BF (M1) for Model 1 is almost twice as high as the BF found for
Model 1 in the observed data, the pattern of the four BF(M1) matches the original results best
when compared to the patterns of BF obtained by the remaining simulated data sets.
Consequently, for the observed data, Model 1 is not a perfect fit, but it is nonetheless the
most likely model having generated the empirical data, therefore indicating the stability of the
empirically derived results.
The outcomes were much in line with previous results on self-ratings of facial
expressions in social anxiety as presented in Table 1. Although a judgment of a more social
characteristic was implemented and also the task load for the participants was minimized, the
magnitude of social anxiety effects on ratings of facial expressions were minimal. This was
true for both the rating dimension of trustworthiness and intelligence. The notion of
hypersensitivity towards negative facial expressions in social anxiety (Lundh & Öst, 1996;
Mogg & Bradley, 2002; Rapee & Heimberg, 1997) presumably reflecting a general
biologically prepared reaction towards threatening social cues (Öhman, 1986; Seligman,
1971) was not confirmed by the results. In addition, social anxiety did not seem to be
characterized by a specific neglect of safety and cooperation cues, as was proposed by
Trower and Gilbert (1989): Model 4, which specifically supported a negative bias for
trustworthy faces in social anxiety, received the least amount of support in our data.
Furthermore, the findings are also consistent with the sometimes-reported differences
found between participants with high and low levels of social anxiety. These models do have
some empirical support in our data set and should not simply be classified as “wrong”; they
are, however, less likely when compared to the independence model. This suggests that the
effect size of such rating biases, if existent, may be small in size. Note, that the statistical

57
power was often too low in previous studies to find small effects. Considering that positive
findings are more likely to be published than findings without significant effects (file drawer
problem), and based on the present results, it can be hypothesized that approximately more
than twice the number of studies on emotional expressions and social anxiety were actually
conducted but have never been published due to non-significant results.
Major limitations of this study relate to restrictions with regard to the generalizability
of the presented results. Since participant’s diagnostic status was not assessed, the findings
cannot be generalized to levels of clinical social anxiety. However, the sample’s score ranges
on the social anxiety questionnaires indicated pathological levels of social fears in at least
some participants. Regarding responses on the SIAS, Mattick and Clarke (1998), as well as
Heimberg and coauthors (1992), reported a cut-off score of 34, which was exceeded by 21
participants (21.4%). In addition, 35 subjects (35.7%) scored above the proposed SPIN cut-
off score of 19 (Connor et al., 2000), which has been used to distinguish between a clinical
population of SAD and community and psychiatric communities without social fears. Even
when applying a more conservative cut-off score of 25 (Ranta, Kaltiala-Heino, Rantanen,
Tuomisto, & Marttunen, 2007; Sosic, Gieler, & Stangier, 2008), 19 participants (19.4%)
scored above this threshold.
When considering the results in the broader framework of contemporary models of
social anxiety, the implications are interesting. As mentioned earlier, Rapee and Heimberg
(1997) propose two parallel attentional mechanisms that generate and maintain anxiety in a
given social situation. One path referred to attention allocated to external indicators of
negative evaluation (such as a frowning audience), the other one comprised of an increased
focus of attention towards internal cues (e.g., feeling oneself blushing). Rapee and Heimberg
(1997) argue that the focus on internal cues in a feared situation would enhance state levels of

58
social anxiety, whereas focusing on external cues (which are most likely less threatening than
the distorted internal representations) would reduce social fears. Consequently, focusing on
and further processing of internal cues and interoceptive information in contrast to external
characteristics of the situation may be the more relevant mechanism in the pathology of SAD
(see also D. M. Clark & Wells, 1995; Spurr & Stopa, 2002). The present results support this
notion insofar that a biased interpretation of external characteristics was not revealed;
however, the experiment was not conducted in an actual fear-relevant situation since
participants were alone in the room while they worked on a clearly non-evaluative task.
Nonetheless, especially when considering the intensity of the fear to show signs of anxiety in
social situations (Bögels & Reith, 1999; Fahlén, 1996), the feared visibility of somatic
symptoms (Gerlach, Mourlane, & Rist, 2004), and the efficacy of task concentration tasks
and trainings in socially anxious patients and participants (Chaker, Hofmann, & Hoyer, 2010;
Woody, 1996), the investigation of attentional, cognitive, and interpretational processes
regarding internal cues in social anxiety may be more promising.
Taken together, the results replicate the finding that social anxiety does not influence
ratings of facial expressions and critically evaluated its likelihood in relation to other
previously proposed effects of social anxiety on ratings of face stimuli. The outcome of the
Bayesian analysis suggests that previous reports of biased face processing in social anxiety
may have reflected more extreme (and less likely) outcomes and thus might have
overestimated the size and presence of an actual effect. Consequently, for the majority of
individuals suffering from social anxiety, facial expressions or other external cues in actual
social situations may be less fear relevant as compared to internal cues of anxiety for the
development and maintenance of social fears.

59
6 References
Acarturk, C., de Graaf, R., van Straten, A., Have, M. T., & Cuijpers, P. (2008). Social phobia
and number of social fears, and their association with comorbidity, health-related
quality of life and help seeking: a population-based study. Social Psychiatry and
Psychiatric Epidemiology 43(4), 273-279.
Adolphs, R., Tranel, D., & Damasio, A. R. (1998). The human amygdala in social judgment.
Nature, 393(6684), 470-474.
Amaral, D. G. (2002). The primate amygdala and the neurobiology of social behavior:
Implications for understanding social anxiety. Biological Psychiatry, 51(1), 11-17.
American Psychiatric Association. (1980). Diagnostic and statistical manual of mental
disorders (3 ed.). Washington, DC: American Psychiatric Association.
American Psychiatric Association. (2000). Diagnostic and Statistical Manual of Mental
Disorders (4 ed.). Washington, D.C.: American Psychiatric Association.
Amir, N., Klumpp, H., Elias, J., Bedwell, J. S., Yanasak, N., & Miller, L. S. (2005). Increased
activation of the anterior Cingulate cortex during processing of disgust faces in
individuals with social phobia. Biological Psychiatry, 57(9), 975-981. doi: DOI
10.1016/j.biopsych.2005.01.044
Amir, N., Najmi, S., Bomyea, J., & Burns, M. (2010). Disgust and Anger in Social Anxiety.
International Journal of Cognitive Therapy, 3(1), 3-10.
Antony, M. M., Coons, M. J., McCabe, R. E., Ashbaugh, A., & Swinson, R. P. (2006).
Psychometric properties of the social phobia inventory: Further evaluation. Behaviour
Research and Therapy, 44(8), 1177-1185. doi: DOI 10.1016/j.brat.2005.08.013

60
Association, A. P. (2010). Publication manual of the American Psychological Association (6
ed.). Washington, DC.
Bakan, D. (1966). Test of Significance in Psychological Research. Psychological Bulletin,
66(6), 423-&.
Beck, A. T., Steer, R. A., Ball, R., & Ranieri, W. F. (1996). Comparison of Beck Depression
Inventories-IA and -II in psychiatric outpatients. Journal of Personality Assessment,
67(3), 588-597.
Beck, A. T., Steer, R. A., & Brown, G. K. (1996). Manual for the Beck Depression Inventory-
II. San Antonio, TX: Psychological Corporation.
Bittner, A., Goodwin, R. D., Wittchen, H. U., Beesdo, K., Hofler, M., & Lieb, R. (2004).
What characteristics of primary anxiety disorders predict subsequent major depressive
disorder? Journal of Clinical Psychiatry, 65(5), 618-626.
Bögels, S. M., & Reith, W. (1999). Validity of two questionnaires to assess social fears: The
Dutch Social Phobia and Anxiety Inventory and the Blushing, Trembling and
Sweating Questionnaire. Journal of Psychopathology and Behavioral Assessment,
21(1), 51-66.
Bolton, J., Cox, B., Clara, I., & Sareen, J. (2006). Use of alcohol and drugs to self-medicate
anxiety disorders in a nationally representative sample. Journal of Nervous and
Mental Disease, 194(11), 818-825.
Breslau, J., Aguilar-Gaxiola, S., Kendler, K. S., Su, M., Williams, D., & Kessler, R. C.
(2006). Specifying race-ethnic differences in risk for psychiatric disorder in a USA
national sample. Psychological Medicine, 36(1), 57-68.

61
Brown, E. J., Turovsky, J., Heimberg, R. G., Juster, H. R., Brown, T. A., & Barlow, D. H.
(1997). Validation of the social interaction anxiety scale and the social phobia scale
across the anxiety disorders. Psychological Assessment, 9(1), 21-27.
Campbell, D. W., Sareen, J., Stein, M. B., Kravetsky, L. B., Paulus, M. P., Hassard, S. T., &
Reiss, J. P. (2009). Happy but Not So Approachable: The Social Judgments of
Individuals with Generalized Social Phobia. Depression and Anxiety, 26(5), 419-424.
doi: Doi 10.1002/Da.20474
Chaker, S., Hofmann, S. G., & Hoyer, J. (2010). Can a one-weekend group therapy reduce
fear of blushing? Results of an open trial. Anxiety, Stress & Coping: An International
Journal, 23(3), 303-318.
Chavira, D. A., & Stein, M. B. (2005). Childhood social anxiety disorder: from understanding
to treatment. Child and Adolescent Psychiatric Clinics of North America, 14(4), 797-
818, ix.
Chavira, D. A., Stein, M. B., Bailey, K., & Stein, M. T. (2004). Child anxiety in primary care:
prevalent but untreated. Depression and Anxiety, 20(4), 155-164.
Choy, Y., Schneier, F. R., Heimberg, R. G., Oh, K. S., & Liebowitz, M. R. (2008). Features
of the offensive subtype of Taijin-Kyofu-Sho in US and Korean patients with DSM-
IV social anxiety disorder. Depression and Anxiety, 25(3), 230-240.
Chronis-Tuscano, A., Degnan, K. A., Pine, D. S., Perez-Edgar, K., Henderson, H. A., Diaz,
Y., . . . Fox, N. A. (2009). Stable Early Maternal Report of Behavioral Inhibition
Predicts Lifetime Social Anxiety Disorder in Adolescence. Journal of the American
Academy of Child and Adolescent Psychiatry, 48(9), 928-935.

62
Clark, D. B., Feske, U., Masia, C. L., Spaulding, S. A., Brown, C., Mammen, O., & Shear, M.
K. (1997). Systematic assessment of social phobia in clinical practice. [Review].
Depression and Anxiety, 6(2), 47-61.
Clark, D. M., & McManus, F. (2002). Information processing in social phobia. Biological
Psychiatry, 51(1), 92-100.
Clark, D. M., & Wells, A. (1995). A cognitive model of social phobia. In R. G. Heimberg, M.
R. Liebowitz, D. A. Hope & F. R. Schneier (Eds.), Social phobia: diagnosis,
assessment, and treatment. New York, London: The Guilford Press.
Cohen, J. (1994). The Earth Is Round (p < .05). American Psychologist, 49(12), 997-1003.
Coles, M. E., & Heimberg, R. G. (2005). Recognition bias for critical faces in social phobia:
a replication and extension. Behaviour Research and Therapy, 43(1), 109-120. doi:
DOI 10.1016/j.brat.2003.12.001
Connor, K. M., Davidson, J. R. T., Churchill, L. E., Sherwood, A., Foa, E., & Weisler, R. H.
(2000). Psychometric properties of the Social Phobia Inventory (SPIN) - New self-
rating scale. British Journal of Psychiatry, 176, 379-386.
Cooper, R. (2012). Original thought. Retrieved 7/25/2012, from Own Brain.
Davidson, J. R., Hughes, D. L., George, L. K., & Blazer, D. G. (1993). The epidemiology of
social phobia: findings from the Duke Epidemiological Catchment Area Study.
Psychological Medicine, 23(3), 709-718.
de Jong, P. J., Merckelbach, H., Bogels, S., & Kindt, M. (1998). Illusory correlation and
social anxiety. Behaviour Research and Therapy, 36(11), 1063-1073.
De Santis, F. (2004). Statistical evidence and sample size determination for Bayesian
hypothesis testing. Journal of Statistical Planning and Inference, 124(1), 121-144.
doi: Doi 10.1016/S0378-3758(03)00198-8

63
Dimberg, U. (1997). Social fear and expressive reactions to social stimuli. Scandinavian
Journal of Psychology, 38(3), 171-174.
Dimberg, U., & Christmanson, L. (1991). Facial Reactions to Facial Expressions in Subjects
High and Low in Public Speaking Fear. Scandinavian Journal of Psychology, 32(3),
246-253.
Dimberg, U., & Thunberg, M. (2007). Speech anxiety and rapid emotional reactions to angry
and happy facial expressions. Scandinavian Journal of Psychology, 48(4), 321-328.
doi: DOI 10.1111/j.1467-9450.2007.00586.x
Dyson, F. W., Eddington, A. S., & Davidson, C. (1920). A Determination of the Deflection of
Light by the Sun's Gravitational Field, from Observations Made at the Total Eclipse
of May 29, 1919. Philosophical Transactions of the Royal Society of London. Series
A, Containing Papers of a Mathematical or Physical Character, 220, 291-333.
Eidecker, J., Glöckner-Rist, A., & Gerlach, A. L. (2010). Dimensional structure of the Social
Interaction Anxiety Scale according to the analysis of data obtained with a German
version. Journal of Anxiety Disorders, 24(6), 596-605. doi: DOI
10.1016/j.janxdis.2010.03.020
Einstein, A. (1911). Einfluss der Schwerkraft auf die Ausbreitung des Lichtes. Annalen der
Physik, 35(1911), 898-908.
Einstein, A. (1916). Die Grundlage der allgemeinen Relativitätstheorie. Annalen der Physik,
49, 769-822.
Ekman, P., & Friesen, W. V. (1971). Constants across Cultures in Face and Emotion. Journal
of Personality and Social Psychology, 17(2), 124-&.
Ekman, P., & Friesen, W. V. (1976). Pictures of facial affect. Palo Alto, CA: Consulting
Psychologists Press.

64
Emery, N. J., Capitanio, J. P., Mason, W. A., Machado, C. J., Mendoza, S. P., & Amaral, D.
G. (2001). The effects of bilateral lesions of the amygdala on dyadic social
interactions in rhesus monkeys (Macaca mulatta). Behavioral Neuroscience, 115(3),
515-544.
Evans, K. C., Wright, C. I., Wedig, M. M., Gold, A. L., Pollack, M. H., & Rauch, S. L.
(2008). A functional MRI study of amygdala responses to angry schematic faces in
social anxiety disorder. Depression and Anxiety, 25(6), 496-505. doi: Doi
10.1002/Da.20347
Fahlén, T. (1996). Core symptom pattern of social phobia. Depression and Anxiety, 4(5),
223-232.
Fenske, M. J., Raymond, J. E., Kessler, K., Westoby, N., & Tipper, S. P. (2005). Attentional
inhibition has social-emotional consequences for unfamiliar faces. Psychological
Science, 16(10), 753-758.
First, M. B., Spitzer, R. L., Gibbon, M., & Williams, J. B. W. (2002). Structured Clinical
Interview for DSM-IV-TR Axis I Disorders, Research Version, Patient Edition With
Psychotic Screen (SCID-I/P W/ PSY SCREEN). New York: Biometrics Research,
New York State Psychiatric Institute.
Foa, E. B., Franklin, M. E., Perry, K. J., & Herbert, J. D. (1996). Cognitive biases in
generalized social phobia. Journal of Abnormal Psychology, 105(3), 433-439.
Furmark, T. (2002). Social phobia: overview of community surveys. Acta Psychiatrica
Scandinavica, 105(2), 84-93.
Furmark, T., Henningsson, S., Appel, L., Ahs, F., Linnman, C., Pissiota, A., . . . Fredrikson,
M. (2009). Genotype over-diagnosis in amygdala responsiveness: affective processing
in social anxiety disorder. Journal of Psychiatry & Neuroscience, 34(1), 30-40.

65
Furmark, T., Tillfors, M., Everz, P., Marteinsdottir, I., Gefvert, O., & Fredrikson, M. (1999).
Social phobia in the general population: prevalence and sociodemographic profile.
Social Psychiatry and Psychiatric Epidemiology, 34(8), 416-424.
Fyer, A. J., Mannuzza, S., Chapman, T. F., Liebowitz, M. R., & Klein, D. F. (1993). A Direct
Interview Family Study of Social Phobia. Archives of General Psychiatry, 50(4), 286-
293.
Fyer, A. J., Mannuzza, S., Chapman, T. F., Martin, L. Y., & Klein, D. F. (1995). Specificity
in Familial Aggregation of Phobic Disorders. Archives of General Psychiatry, 52(7),
564-573.
Garcia-Donato, G., & Chen, M. H. (2005). Calibrating Bayes factor under prior predictive
distributions. Statistica Sinica, 15(2), 359-380.
Gerlach, A. L. (2005). Angst vor körperlichen Symptomen im Rahmen der Sozialen
Angststörung: Ursachen und Behandlung. In N. Vriends & J. Margraf (Eds.), Soziale
Kompetenz, Sozilae Unsicherheit, Soziale Phobie: Verstehen und Verändern (3 ed.).
Baltmannsweiler: Schneider Verlag Hohengehren.
Gerlach, A. L., Mourlane, D., & Rist, F. (2004). Public and Private Heart Rate Feedback in
Social Phobia: A Manipulation of Anxiety Visibility. Cognitive Behaviour Therapy,
33(1), 36-45.
Goldin, P. R., Manber, T., Hakimi, S., Canli, T., & Gross, J. J. (2009). Neural Bases of Social
Anxiety Disorder: Emotional Reactivity and Cognitive Regulation During Social and
Physical Threat. Archives of General Psychiatry, 66(2), 170-180.
Grant, B. F., Hasin, D. S., Blanco, C., Stinson, F. S., Chou, S. P., Goldstein, R. B., . . .
Huang, B. (2005). The epidemiology of social anxiety disorder in the United States:

66
results from the National Epidemiologic Survey on Alcohol and Related Conditions.
Journal of Clinical Psychiatry, 66(11), 1351-1361.
Heimberg, R. G., Mueller, G. P., Holt, C. S., Hope, D. A., & Liebowitz, M. R. (1992).
Assessment of Anxiety in Social-Interaction and Being Observed by Others - the
Social-Interaction Anxiety Scale and the Social Phobia Scale. Behavior Therapy,
23(1), 53-73.
Heinrichs, N., & Hofmann, S. G. (2001). Information processing in social phobia: A critical
review. Clinical Psychology Review, 21(5), 751-770.
Heuer, K., Rinck, M., & Becker, E. S. (2007). Avoidance of emotional facial expressions in
social anxiety: The Approach-Avoidance Task. Behaviour Research and Therapy,
45(12), 2990-3001. doi: DOI 10.1016/j.brat.2007.08.010
Hofmann, S. G. (2000). Treatment of social phobia: Potential mediators and moderators.
Clinical Psychology-Science and Practice, 7(1), 3-16.
Hofmann, S. G., Ehlers, A., & Roth, W. T. (1995). Conditioning Theory - a Model for the
Etiology of Public Speaking Anxiety. Behaviour Research and Therapy, 33(5), 567-
571.
Hofmann, S. G., Moscovitch, D. A., Kim, H. J., & Taylor, A. N. (2004). Changes in self-
perception during treatment of social phobia. Journal of Consulting and Clinical
Psychology, 72(4), 588-596. doi: Doi 10.1037/0022-0006x.72.4.588
Hoijtink, H. (2012). Informative Hypotheses: Theory and Practice for Behavioral and Social
Scientists. Boca Raton, FL: CRC Press, Taylor & Francis Group.
Hwu, H. G., Yeh, E. K., & Chang, L. Y. (1989). Prevalence of psychiatric disorders in
Taiwan defined by the Chinese Diagnostic Interview Schedule. Acta Psychiatrica
Scandinavica, 79(2), 136-147.

67
Jeffreys, H. (1935). Some Tests of Significance, Treated by the Therory of Probability.
Proceedings of the Cambridge Philosophy Society, 31, 203-222.
Jeffreys, H. (1961). Theory of Probability (3 ed.). Oxford: Oxford University Press.
Kass, R. E., & Raftery, A. E. (1995). Bayes Factors. Journal of the American Statistical
Association, 90(430), 773-795.
Kelley, K., & Preacher, K. J. (2012). On Effect Size. Psychological Methods, 17(2), 137-152.
doi: Doi 10.1037/A0028086
Kendler, K. S., Neale, M. C., Kessler, R. C., Heath, A. C., & Eaves, L. J. (1992). The Genetic
Epidemiology of Phobias in Women - the Interrelationship of Agoraphobia, Social
Phobia, Situational Phobia, and Simple Phobia. Archives of General Psychiatry,
49(4), 273-281.
Kessler, R. C., Berglund, P., Demler, O., Jin, R., Merikangas, K. R., & Walters, E. E.
(2005a). Lifetime prevalence and age-of-onset distributions of DSM-IV disorders in
the National Comorbidity Survey Replication. Archives of General Psychiatry, 62(6),
593-602.
Kessler, R. C., Chiu, W. T., Demler, O., Merikangas, K. R., & Walters, E. E. (2005b).
Prevalence, severity, and comorbidity of 12-month DSM-IV disorders in the National
Comorbidity Survey Replication. Archives of General Psychiatry, 62(6), 617-627.
Kessler, R. C., McGonagle, K. A., Zhao, S., Nelson, C. B., Hughes, M., Eshleman, S., . . .
Kendler, K. S. (1994). Lifetime and 12-month prevalence of DSM-III-R psychiatric
disorders in the United States. Results from the National Comorbidity Survey.
Archives of General Psychiatry, 51(1), 8-19.

68
Kleinknecht, R. A., Dinnel, D. L., Kleinknecht, E. E., Natsuki, H. M. S., & Harada, N. B. A.
(1997). Cultural factors in social anxiety: a comparison of social phobia symptoms
and Taijin kyofusho. Journal of Anxiety Disorders, 11(2), 157-177.
Klugkist, I., van Wesel, F., & Bullens, J. (2011). Do we know what we test and do we test
what we want to know? International Journal of Behavioral Development, 35(6),
550-560. doi: Doi 10.1177/0165025411425873
Kluytmans, A., Van De Schoot, R., & Hoijtink, H. (2012). Illustrating Bayesian evaluation of
informative hypotheses for regression models. [Methods]. Frontiers in Psychology, 3.
doi: 10.3389/fpsyg.2012.00002
Lange, W. G., Heuer, K., Langner, O., Keijsers, G. P. J., Becker, E. S., & Rinck, M. (2011).
Face value: Eye movements and the evaluation of facial crowds in social anxiety.
Journal of Behavior Therapy and Experimental Psychiatry, 42(3), 355-363. doi: DOI
10.1016/j.jbtep.2011.02.007
Lange, W. G., Keijsers, G., Becker, E. S., & Rinck, M. (2008). Social anxiety and evaluation
of social crowds: Explicit and implicit measures. Behaviour Research and Therapy,
46(8), 932-943. doi: DOI 10.1016/j.brat.2008.04.008
Lee, C. K., Kwak, Y. S., Yamamoto, J., Rhee, H., Kim, Y. S., Han, J. H., . . . Lee, Y. H.
(1990). Psychiatric epidemiology in Korea. Part II: Urban and rural differences.
Journal of Nervous and Mental Disease, 178(4), 247-252.
Lissek, S., Levenson, J., Biggs, A. L., Johnson, L. L., Arneli, R., Pine, D. S., & Grillon, C.
(2008). Elevated fear conditioning to socially relevant unconditioned stimuli in social
anxiety disorder. American Journal of Psychiatry, 165(1), 124-132.
Lundh, L. G., & Öst, L. G. (1996). Recognition bias for critical faces in social phobics.
Behaviour Research and Therapy, 34(10), 787-794.

69
Lundqvist, D., Flykt, A., & Öhman, A. (1998). The karolinska directed emotional faces -
KDEF: CD-ROM from Department of Clinical Neuroscience, Psychology section,
Karolinska Institute.
Lykken, D. T. (1968). Statistical Significance in Psychological Research. Psychological
Bulletin, 70(3p1), 151-&.
Mancini, C., VanAmeringen, M., Szatmari, P., Fugere, C., & Boyle, M. (1996). A high-risk
pilot study of the children of adults with social phobia. Journal of the American
Academy of Child and Adolescent Psychiatry, 35(11), 1511-1517.
Marks, I. M., & Gelder, M. G. (1966). Different ages of onset in varieties of phobia.
American Journal of Psychiatry, 123(2), 218-221.
Markus, H. R., & Kitayama, S. (1991). Culture and the self: Implications for cognition,
emotion, and motivation. Psychological Review, 98, 224-253.
Matsumoto, D., & Ekman, P. (1988). Japanese and caucasian facial expressions of emotion
and neutral faces. San Francisco, CA: San Francisco State University.
Mattick, R. P., & Clarke, J. C. (1998). Development and validation of measures of social
phobia scrutiny fear and social interaction anxiety. Behaviour Research and Therapy,
36(4), 455-470.
Meehl, P. E. (1967). Theory-Testing in Psychology and Physics - Methodological Paradox.
Philosophy of Science, 34(2), 103-115.
Meehl, P. E. (1990). Why Summaries of Research on Psychological Theories Are Often
Uninterpretable. Psychological Reports, 66(1), 195-244.
Mellings, T. M. B., & Alden, L. E. (2000). Cognitive processes in social anxiety: the effects
of self-focus, rumination and anticipatory processing. Behaviour Research and
Therapy, 38(3), 243-257.

70
Merckelbach, H., Vanhout, W., Vandenhout, M. A., & Mersch, P. P. (1989).
Psychophysiological and Subjective Reactions of Social Phobics and Normals to
Facial Stimuli. Behaviour Research and Therapy, 27(3), 289-294.
Mogg, K., & Bradley, B. P. (2002). Selective orienting of attention to masked threat faces in
social anxiety. Behaviour Research and Therapy, 40(12), 1403-1414.
Moitra, E., Beard, C., Weisberg, R. B., & Keller, M. B. (2011). Occupational impairment and
social anxiety disorder in a sample of primary care patients. Journal of Affective
Disorders, 130(1-2), 209-212. doi: 10.1016/j.jad.2010.09.024
Moutier, C. Y., & Stein, M. B. (1999). The history, epidemiology, and differential diagnosis
of social anxiety disorder. Journal of Clinical Psychiatry, 60 Suppl 9, 4-8.
Mühlberger, A., Wieser, M. J., Herrmann, M. J., Weyers, P., Troger, C., & Pauli, P. (2009).
Early cortical processing of natural and artificial emotional faces differs between
lower and higher socially anxious persons. Journal of Neural Transmission, 116(6),
735-746. doi: DOI 10.1007/s00702-008-0108-6
Mulder, J., Hoijtink, H., & de Leeuw, C. (2012). BIEMS: A Fortran 90 Program for
Calculating Bayes Factors for Inequality and Equality Constrained Models. Journal of
Statistical Software, 46(2), 1-39.
Mulder, J., Hoijtink, H., & Klugkist, I. (2010). Equality and inequality constrained
multivariate linear models: Objective model selection using constrained posterior
priors. Journal of Statistical Planning and Inference, 140(4), 887-906. doi: DOI
10.1016/j.jspi.2009.09.022
Mulder, J., Klugkist, I., van de Schoot, R., Meeus, W. H. J., Selfhout, M., & Hoijtink, H.
(2009). Bayesian model selection of informative hypotheses for repeated

71
measurements. Journal of Mathematical Psychology, 53(6), 530-546. doi: DOI
10.1016/j.jmp.2009.09.003
Mulkens, S., de Jong, P. J., Dobbelaar, A., & Bögels, S. M. (1999). Fear of blushing: fearful
preoccupation irrespective of facial coloration. Behaviour Research and Therapy,
37(11), 1119-1128.
Nisbett, R. E., Peng, K., Choi, I., & Norenzayan, A. (2001). Culture and systems of thought:
holistic versus analytic cognition. Psychological Review, 108(2), 291-310.
Offord, D. R., Boyle, M. H., Campbell, D., Goering, P., Lin, E., Wong, M., & Racine, Y. A.
(1996). One-year prevalence of psychiatric disorder in Ontarians 15 to 64 years of
age. Canadian Journal of Psychiatry, 41(9), 559-563.
Öhman, A. (1986). Face the Beast and Fear the Face - Animal and Social Fears as Prototypes
for Evolutionary Analyses of Emotion. Psychophysiology, 23(2), 123-145.
Öhman, A., & Dimberg, U. (1978). Facial Expressions as Conditioned Stimuli for
Electrodermal Responses - Case of Preparedness. Journal of Personality and Social
Psychology, 36(11), 1251-1258.
Öhman, A., Dimberg, U., & Öst, L. G. (1985). Animal and social phobias: Biological
constraints on the learned fear response. In S. Reiss & R. Bootzin (Eds.), Theoretical
issues in behavior therapy (pp. 123-175). New York: Academic Press.
Okazaki, S. (1997). Sources of ethnic differences between Asian American and White
American college students on measures of depression and social anxiety. Journal of
Abnormal Psychology, 106, 52-60.
Oosterhof, N. N., & Todorov, A. (2008). The functional basis of face evaluation. Proceedings
of the National Academy of Sciences of the United States of America, 105(32), 11087-
11092. doi: DOI 10.1073/pnas.0805664105

72
Öst, L. G., & Hugdahl, K. (1981). Acquisition of Phobias and Anxiety Response Patterns in
Clinical Patients. Behaviour Research and Therapy, 19(5), 439-447.
Papageorgiou, C., & Wells, A. (2002). Effects of heart rate information on anxiety,
perspective taking, and performance in high and low social-evaluative anxiety.
Behavior Therapy, 33(2), 181-199.
Patterson, M. L. (1999). The evolution of a parallel process model of non-verbal
communication. In P. Philippot, R. S. Feldman & E. J. Coats (Eds.), Nonverbal
behavior in social context (pp. 317-347). New York: Cambridge University Press.
Peters, L. (2000). Discriminant validity of the Social Phobia and Anxiety Inventory (SPAI),
the Social Phobia Scale (SPS) and the Social Interaction Anxiety Scale (SIAS).
Behaviour Research and Therapy, 38(9), 943-950.
Popper, K. R. (1935). Logik der Forschung. Wien.
Ranta, K., Kaltiala-Heino, R., Rantanen, P., Tuomisto, M. T., & Marttunen, M. (2007).
Screening social phobia in adolescents from general population: The validity of the
Social Phobia Inventory (SPIN) against a clinical interview. European Psychiatry,
22(4), 244-251. doi: DOI 10.1016/j.eurpsy.2006.12.002
Rapee, R. M., & Heimberg, R. G. (1997). A cognitive-behavioral model of anxiety in social
phobia. Behaviour Research and Therapy, 35(8), 741-756.
Rosenthal, R., Rosnow, R., & Rubin, D. (2000). Contrasts and effect sizes in behavioral
research: A correlational approach. Cambridge, UK: Cambridge University Press.
Rosnow, R. L., & Rosenthal, R. (1989). Statistical Procedures and the Justification of
Knowledge in Psychological Science. American Psychologist, 44(10), 1276-1284.

73
Ruscio, A. M., Brown, T. A., Chiu, W. T., Sareen, J., Stein, M. B., & Kessler, R. C. (2008).
Social fears and social phobia in the USA: results from the National Comorbidity
Survey Replication. Psychological Medicine, 38(1), 15-28.
Schofield, C. A., Coles, M. E., & Gibb, B. E. (2007). Social anxiety and interpretation biases
for facial displays of emotion: Emotion detection and ratings of social cost. Behaviour
Research and Therapy, 45(12), 2950-2963. doi: DOI 10.1016/j.brat.2007.08.006
Seligman, M. E. (1971). Phobias and Preparedness. Behavior Therapy, 2(3), 307-320.
Sosic, Z., Gieler, U., & Stangier, U. (2008). Screening for social phobia in medical in- and
outpatients with the German version of the Social Phobia Inventory (SPIN). Journal
of Anxiety Disorders, 22(5), 849-859. doi: DOI 10.1016/j.janxdis.2007.08.011
Spielberger, C. D., Gorsuch, R. L., & Lushene, R. E. (1970). State-Trait Anxiety Inventory.
Palo Alto, CA: Consulting Psychologists Press.
Spurr, J. M., & Stopa, L. (2002). Self-focused attention in social phobia and social anxiety.
Clinical Psychology Review, 22(7), 947-975.
Staugaard, S. R. (2010). Threatening faces and social anxiety: A literature review. Clinical
Psychology Review, 30(6), 669-690. doi: DOI 10.1016/j.cpr.2010.05.001
Stein, M. B., Goldin, P. R., Sareen, J., Zorrilla, L. T. E., & Brown, G. G. (2002). Increased
amygdala activation to angry and contemptuous faces in generalized social phobia.
Archives of General Psychiatry, 59(11), 1027-1034.
Stein, M. B., & Kean, Y. M. (2000). Disability and quality of life in social phobia:
epidemiologic findings. American Journal of Psychiatry, 157(10), 1606-1613.
Stemberger, R. T., Turner, S. M., Beidel, D. C., & Calhoun, K. S. (1995). Social phobia: An
analysis of possible developmental factors. Journal of Abnormal Psychology, 104(3),
526-531.

74
Stevens, S., Gerlach, A. L., & Rist, F. (2008). Effects of alcohol on ratings of emotional
facial expressions in social phobics. Journal of Anxiety Disorders, 22(6), 940-948.
doi: 10.1016/j.janxdis.2007.09.007
Straube, T., Kolassa, I. T., Glauer, M., Mentzel, H. J., & Miltner, W. H. R. (2004). Effect of
task conditions on brain responses to threatening faces in social phobics: An event-
related functional magnetic resonance Imaging study. Biological Psychiatry, 56(12),
921-930. doi: DOI 10.1016/j.biopsych.2004.09.024
Straube, T., Mentzel, H. J., & Miltner, W. H. R. (2005). Common and distinct brain
activation to threat and safety signals in social phobia. Neuropsychobiology, 52(3),
163-168. doi: Doi 10.1159/000087987
Takahashi, T. (1989). Social phobia syndrome in Japan. Comprehensive Psychiatry, 30, 45-
52.
Todorov, A. (2008). Evaluating faces on trustworthiness - An extension of systems for
recognition of emotions signaling approach/avoidance behaviors. Year in Cognitive
Neuroscience 2008, 1124, 208-224. doi: DOI 10.1196/annals.1440.012
Trower, P., & Gilbert, P. (1989). New Theoretical Conceptions of Social Anxiety and Social
Phobia. Clinical Psychology Review, 9(1), 19-35.
Tukey, J. W. (1969). Analyzing Data - Sanctification or Detective Work. American
Psychologist, 24(2), 83-&.
Turner, S. M., Beidel, D. C., Dancu, C. V., & Stanley, M. A. (1989). An empirically derived
inventory to measure social fears and anxiety: The Social Phobia and Anxiety
Inventory. Psychological Assessment: A Journal of Consulting and Clinical
Psychology, 1(1), 35-40.

75
van't Wout, M., & Sanfey, A. G. (2008). Friend or foe: The effect of implicit trustworthiness
judgments in social decision-making. Cognition, 108(3), 796-803. doi: DOI
10.1016/j.cognition.2008.07.002
van de Schoot, R., Mulder, J., Hoijtink, H., Van Aken, M. A. G., Dubas, J. S., de Castro, B.
O., . . . Romeijn, J.-W. (2011). An introduction to Bayesian model selection for
evaluating informative hypotheses. European Journal of Developmental Psychology,
8(6), 713-729. doi: 10.1080/17405629.2011.621799
Vossbeck-Elsebusch, A. N., & Gerlach, A. L. (2012). The relation between disgust-
sensitivity, blood-injection-injury fears and vasovagal symptoms in blood donors:
Disgust sensitivity cannot explain fainting or blood donation-related symptoms.
Journal of Behavior Therapy and Experimental Psychiatry, 43(1), 607-613. doi: DOI
10.1016/j.jbtep.2011.08.005
Vrana, S. R., & Gross, D. (2004). Reactions to facial expressions: effects of social context
and speech anxiety on responses to neutral, anger, and joy expressions. Biological
Psychology, 66(1), 63-78. doi: DOI 10.1016/j.biopsycho.2003.07.004
Wieser, M. J., McTeague, L. M., & Keil, A. (2011). Sustained Preferential Processing of
Social Threat Cues: Bias without Competition? Journal of Cognitive Neuroscience,
23(8), 1973-1986.
Wieser, M. J., Pauli, P., Weyers, P., Alpers, G. W., & Mühlberger, A. (2009). Fear of
negative evaluation and the hypervigilance-avoidance hypothesis: an eye-tracking
study. Journal of Neural Transmission, 116(6), 717-723. doi: DOI 10.1007/s00702-
008-0101-0

76
Wittchen, H.-U., & Fehm, L. (2001). Epidemiology, patterns of comorbidity, and associated
disabilities of social phobia. Psychiatric Clinics of North America, 24(4), 617-641.
doi: 10.1016/s0193-953x(05)70254-9
Wittgenstein, L. (1921). Logisch-philosophische Abhandlung. In W. Ostwald (Ed.), Annalen
der Naturphilosophie (Vol. 14).
Woody, S. R. (1996). Effects of focus of attention on anxiety levels and social performance
of individuals with social phobia. Journal of Abnormal Psychology, 105(1), 61-69.
Yoon, K. L., & Zinbarg, R. E. (2007). Threat is in the eye of the beholder: Social anxiety and
the interpretation of ambiguous facial expressions. Behaviour Research and Therapy,
45(4), 839-847. doi: DOI 10.1016/j.brat.2006.05.004
Zimmermann, P., Wittchen, H. U., Hofler, M., Pfister, H., Kessler, R. C., & Lieb, R. (2003).
Primary anxiety disorders and the development of subsequent alcohol use disorders: a
4-year community study of adolescents and young adults. Psychological Medicine,
33(7), 1211-1222.

77
7 List of Figures
Figure 1. Vicious circle of social anxiety........................................................... p. 14
Figure 2. Facial stimuli...................................................................................... p. 48
Figure 3. Procedure for each of the 396 rating trials........................................ p. 50

78
8 List of Tables
Table 1. Ratings of facial expressions................................................................ p. 20
Table 2. Interpretation guidelines for Bayes Factors........................................ p. 41
Table 3. Sample characteristics......................................................................... p. 53
Table 4. Model evaluation of facial ratings and soical anxiety......................... p. 54
Table 5. Bayes factors for simulated data.......................................................... p. 55

79
9 Appendices
Recruitement flyer
Informed Consent
Structured Clinician Interview for DSM (SCID; parts B/C, E.1 and E.9/10)
Demographics Questionnare
Beck Depression Inventory-II (BDI-II)
State-Trait Anxiety Inventory (STAI)
Social Interaction Anxiety Scale (SIAS)
Social Phobia and Anxiety Inventory (SPAI)
Social Phobia Inventory (SPIN)

Looking for Participants (Prof. Hofmann’s Lab):
Face Perception Study
Are you female and at least 18 years old? – Then
you are invited to participate in a study
combining physiological and behavioral aspects
of face perception using various computer-based
tasks. We will measure your responses to face
stimuli presented on a computer screen and
measure your skin conductance during different
experimental conditions.
You will receive 3 hours worth of credit towards
your Psych 101 course research participation
requirement.
If you are interested in participating, please send
an email to [email protected] to
schedule an appointment.
Thank you!

BOSTON UNIVERSITY
Informed Consent
Physiological indices and self-reports of facial trustworthiness judgments in high and low socially anxious subjects Purpose: You are asked to join a research study on the judgment of facial trustworthiness because you are a woman over the age of 18. The reason for this study is to assess the effects of specific facial features on your attribution of trustworthiness and intelligence to computer-presented faces. Furthermore, an additional goal of this study is to see whether relative levels of oxytocin or use of hormone-based birth control (“the Pill”) has any influence on your perception of trustworthiness and intelligence in a series of pictures of men. The investigation will take approximately 3 hours, for which you will receive course credit. The study will be conducted at the Center for Anxiety and Related Disorders, 648 Beacon Street, Boston, MA 02215. Procedures: By signing this document, you are indicating that you understand that the current study will involve three experimental tasks. You are also asked to undergo a brief psychological interview (approximately 10 minutes) prior to the experimental tasks. During the first experimental task, you are asked to wear two sensors on one of your hand’s inner surfaces to record your skin conductance in response to the face stimuli. After the sensors are attached, you are asked to just sit in a chair for 2 minutes. Afterwards, you are asked to watch pictures of 15 computer-generated faces on a computer screen and provide ratings about how trustworthy you think the respective person is. These face images will be separated by longer periods in which you will see only meaningless patterns. The experimenter will remove the sensors from your hand subsequently. The first experimental task, including attachment and detachment from the electrodes, will take approximately 35 minutes. During the second experimental task, you are asked to watch and rate 200 computer-generated faces, which will be presented more rapidly this time. You are asked to rate how trustworthy and also how intelligent you think the respective person is. During the second task, you will not wear any sensors. After every 50 faces you rated, you will have a break from the task. You can decide on your own how long the break will be. The second experimental task will take about 40 minutes. During the third experimental task, you are asked to complete several questionnaires. This task will take 90 minutes at the most.

In the event that medical or psychological assistance is required, help is readily available by calling Stefan G. Hofmann, Ph.D. at the Center for Anxiety and Related Disorders (617) 353-9610. This number will be answered directly during weekdays from 8 a.m. to 8 p.m. After hours there will be an answering machine that will be checked frequently. In the event that injury occurs as a result of the research procedures, medical treatment will be available at the Center for Anxiety and Related Disorders at Boston University or, if you are a BU student, at the Boston University Student Health Service (881 Commonwealth Avenue). However, no special provision will be made for compensation or for payment for treatment solely because of your participation in this experiment. This paragraph is a statement of Boston University’s policy and does not waive any of your legal rights. Duration The experiment will take 3 hours at the most. Cost There are no costs to you for participating in this study. Potential Benefits There are no direct benefits for the participation in this experiment. However, participation in this experiment can be of educational value for you. In addition, the results of this study may help other people in the future by increasing scientific knowledge. Risks and Discomforts You might experience some boredom during conducting the experimental tasks. You may also experience some discomfort when completing the questionnaires and when conducting the psychological interview. Also, you might experience some discomfort and minor skin irritation while you are wearing the physiological sensors on your hand. However, any discomfort is likely to end after finishing the investigation. Also, you are able to stop participation at any time you wish. To minimize skin irritation, you will be provided with a cleaning solution and a body lotion to treat your skin after removing the electrodes. In order to minimize the risks, a member of the research staff will attend the experiment. After the session, he/she will be available to talk with you about any discomfort you may experience while participating. You are also able to stop participation at any time you wish. Confidentiality All of your responses to the tasks, questionnaires, and interviews will be anonymous, and your name will not appear in any of the results. No individual responses will be reported in any publication, only group findings will be reported. All data, identified only by subject code number, will be stored in a locked file cabinet at the Center for Anxiety and Related Disorders at Boston University. Your participation in this project will remain strictly confidential to the extent allowed by law. All data, including the audiotapes that are collected as part of this study, will be destroyed within 5 years after study completion. Contact Information If you have any questions regarding the research or your participation in it, either now or any time in the future, please feel free to ask them. The research team, particularly Ruth Hueweler, who may be reached at (617) 353-9610, will be happy to answer any questions you may have. You may obtain further information about your rights as a research subject by going to the

Boston University Institutional Review Board website www.bu.edu/irb<http://www.bu.edu/irb> or calling Debora Perez, the IRB Coordinator of the Boston University Institutional Review Board, at (617) 358-6115. If any problems arise as a result of your participation in this study, including research-related injuries, please call the Principal Investigator, Dr. Stefan G. Hofmann, at (617) 353-9610 immediately. Consent I understand that my participation in the study is completely voluntary. Refusal to participate will involve no penalty or loss of benefits to which I would be otherwise entitled, and I may discontinue participation at any time without penalty or loss of benefits to which I may be otherwise entitled. I have received a copy of this consent statement. Signature of Person Obtaining Consent Date Name of Participant (please print) Date Signature of Participant


Code:
Date:
Demographic Information
Please answer the following questions (all information is kept strictly confidential).
How old are you?
What is your ethnic background? Hispanic / Latino
White
Black or African American
Native Hawaiian or other Pacific Islander
Native American / Alaska native
Other:
What is your marital status? Single
Living with partner
Married
Divorced
Widowed
Separated
What is your highest educational level? Postgraduate
College Graduate
Partial College
High School Graduate
Partial High School
Junior High School
Less than 7 years of school
What is/was your highest occupational level? Executive
Manager/Professional
Administrative
Clerical
Skilled
Semi-skilled
Unskilled

Code:
Date:
What is your height? (feet and inches)
What is your weight? (pounds)
At what date did your last menstrual cycle start? ____________
Do you currently use hormonal contraceptives (birth control pill)? _____________
Please list the type and amount of medications that you are currently using:
What is your current living situation? Urban
Suburban
Rural
What is your current income level? 0 – $4,999
$5,000 – $9,999
$10,000 – $14,999
$15,000 – $24,999
$25,000 – $34,999
$35,000 – $49,999
$50,000 – $74,999
$75,000 and higher
What is your present occupational status? Full-time employment
Part-time employment
Unemployed
Student

BDI-II Date: Code:
This questionnaire consists of 21 groups of statements. Please read each group of statements carefully, and
then pick out the one statement in each group that best describes the way you have been feeling during the
past two weeks, including today. Circle the number beside the statement you have picked. If several
statements in the group seem to apply equally well, circle the highest number for that group. Be sure that you
do not choose more than one statement for any group, including Item 16 (Changes in Sleeping Pattern) or Item
18 (Changes in Appetite).
1. Sadness
0 I do not feel sad.
1 I feel sad much of the time.
2 I am sad all the time.
3 I am so sad or unhappy that I
can’t stand it.
2. Pessimism
0 I am not discouraged about my
future.
1 I feel more discouraged about my
future than I used to be.
2 I do not expect things to work out
for me.
3 I feel my future is hopeless and
will only get worse.
3. Past Failure
0 I do not feel like a failure.
1 I have failed more than I should
have.
2 As I look back, I see a lot of
failures.
3 I feel I am a total failure as a
person.
4. Loss of Pleasure
0 I get as much pleasure as I ever
did from the things I enjoy.
1 I don’t enjoy things as much as I
used to.
2 I get very little pleasure from the
things I used to enjoy.
3 I can’t get any pleasure from
things I used to enjoy.
5. Guilty Feelings
0 I don’t feel particularly guilty.
1 I feel guilty over many things I
have done or should have done.
2 I feel guilty most of the time.
3 I feel guilty all of the time.
6. Punishment Feelings
0 I don’t feel I am being punished.
1 I feel I may be punished.
2 I expect to be punished.
3 I feel I am being punished.
7. Self-Dislike
0 I feel the same about myself as
ever.
1 I have lost confidence in myself.
2 I am disappointed in myself.
3 I dislike myself.
8. Self-Criticalness
0 I don’t criticize or blame myself
more than usual.
1 I am more critical of myself than I
used to be.
2 I criticize myself for all of my
faults.
3 I blame myself for everything bad
that happens.
9. Suicidal Thoughts or Wishes
0 I don’t have any thoughts of
killing myself.
1 I have thoughts of killing myself,
but I would not carry them out.
2 I would like to kill myself.
3 I would like to kill myself if I had
the chance.
10. Crying
0 I don’t cry anymore than I used
to.
1 I cry more than I used to.
2 I cry over every little thing.
3 I feel like crying, but I can’t.
11. Agitation
0 I am no more restless our wound
up than usual.
1 I feel more restless or wound up
than usual.
2 I am so restless or agitated that
it’s hard to stay still.
3 I am so restless or agitated that I
have to keep moving or doing
something.

BDI-II Date: Code:
12. Loss of Interest
0 I have not lost interest in other
people or activities.
1 I am less interested in other
people or things.
2 I have lost most of my interest in
other people or things.
3 It’s hard to get interested in
anything.
13. Indecisiveness
0 I make decisions about as well as
ever.
1 I find it more difficult to make
decisions than usual.
2 I have much greater difficulty in
making decisions than I used to.
3 I have trouble making any
decisions.
14. Worthlessness
0 I do not feel worthless.
1 I don’t consider myself as
worthwhile and useful as I used
to.
2 I feel more worthless as
compared to other people.
3 I feel utterly worthless.
15. Loss of Energy
0 I have as much energy as ever.
1 I have less energy than I used to
have.
2 I don’t have enough energy to do
very much.
3 I don’t have enough energy to do
anything.
16. Changes in Sleeping Pattern
0 I have not experienced any
change in my sleeping pattern.
1a I sleep somewhat more than
usual.
1b I sleep somewhat less than usual.
2a I sleep a lot more than usual.
2b I sleep a lot less than usual.
3a I sleep most of the day.
3b I wake up 1-2 hours early and
can’t get back to sleep.
17. Irritability
0 I am no more irritable than usual.
1 I am more irritable than usual.
2 I am much more irritable than
usual.
3 I am irritable all the time.
18. Changes in Appetite
0 I have not experienced any
change in my appetite.
1a My appetite is somewhat less
than usual.
1b My appetite is somewhat greater
than usual.
2a My appetite is much less than
before.
2b My appetite is much greater than
usual.
3a I have no appetite at all.
3b I crave food all the time.
19. Concentration Difficulty
0 I can concentrate as well as ever.
1 I can’t concentrate as well as
usual.
2 It’s hard to keep my mind on
anything for very long.
3 I find I can’t concentrate on
anything.
20. Tiredness or Fatigue
0 I am no more tired or fatigued
than usual.
1 I get more tired or fatigued more
easily than usual.
2 I am too tired or fatigued to do a
lot of the things I used to do.
3 I am too tired or fatigued to do
most of the things I used to do.
21. Loss if Interest in Sex
0 I have not noticed any recent
change in my interest in sex.
1 I am less interested in sex than I
used to be.
2 I am much less interested in sex
now.
3 I have lost interest in sex
completely.
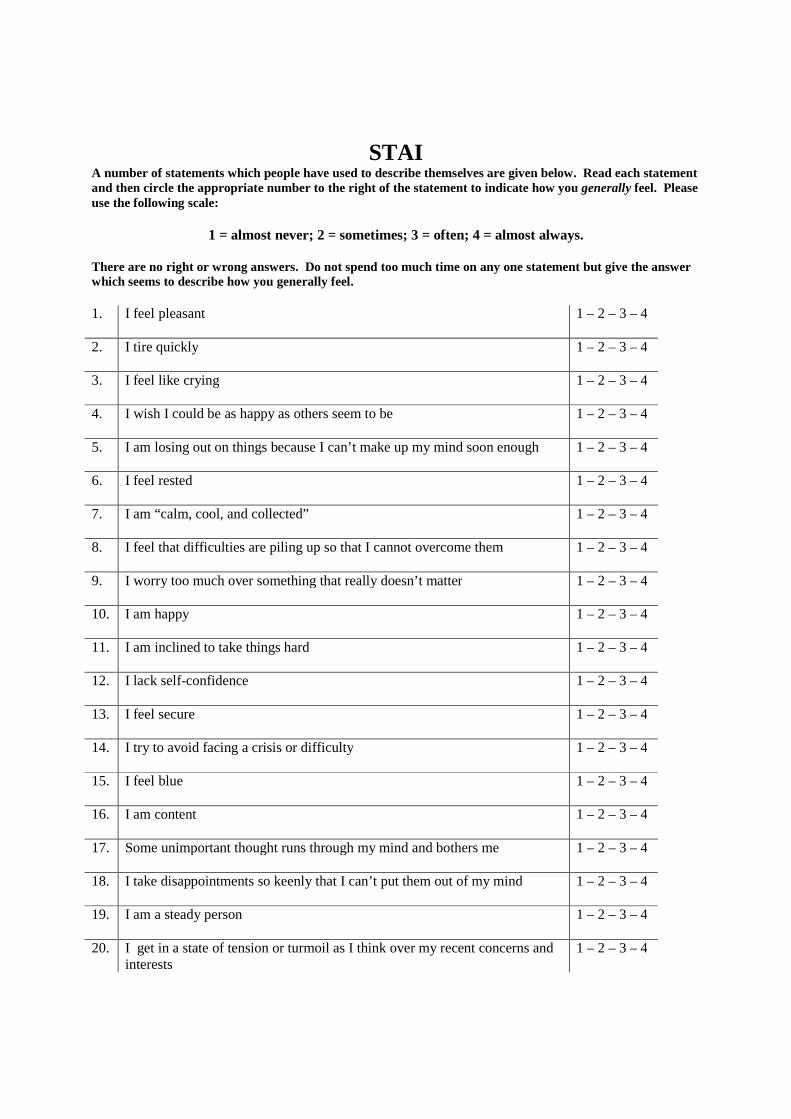
STAI A number of statements which people have used to describe themselves are given below. Read each statement and then circle the appropriate number to the right of the statement to indicate how you generally feel. Please use the following scale:
1 = almost never; 2 = sometimes; 3 = often; 4 = almost always.
There are no right or wrong answers. Do not spend too much time on any one statement but give the answer which seems to describe how you generally feel. 1. I feel pleasant 1 – 2 – 3 – 4
2. I tire quickly 1 – 2 – 3 – 4
3. I feel like crying 1 – 2 – 3 – 4
4. I wish I could be as happy as others seem to be 1 – 2 – 3 – 4
5. I am losing out on things because I can’t make up my mind soon enough 1 – 2 – 3 – 4
6. I feel rested 1 – 2 – 3 – 4
7. I am “calm, cool, and collected” 1 – 2 – 3 – 4
8. I feel that difficulties are piling up so that I cannot overcome them 1 – 2 – 3 – 4
9. I worry too much over something that really doesn’t matter 1 – 2 – 3 – 4
10. I am happy 1 – 2 – 3 – 4
11. I am inclined to take things hard 1 – 2 – 3 – 4
12. I lack self-confidence 1 – 2 – 3 – 4
13. I feel secure 1 – 2 – 3 – 4
14. I try to avoid facing a crisis or difficulty 1 – 2 – 3 – 4
15. I feel blue
1 – 2 – 3 – 4
16. I am content
1 – 2 – 3 – 4
17. Some unimportant thought runs through my mind and bothers me
1 – 2 – 3 – 4
18. I take disappointments so keenly that I can’t put them out of my mind
1 – 2 – 3 – 4
19. I am a steady person
1 – 2 – 3 – 4
20. I get in a state of tension or turmoil as I think over my recent concerns and interests
1 – 2 – 3 – 4

19Document is in the public domain. Duplicating this material for personal or group use is permissible.
CO-OCCURRING DISORDERS PROGRAM: SCREENING AND ASSESSMENT
Social Interaction Anxiety Scale (SIAS)
Page 1 of 1
Instructions: For each item, please circle the number to indicate the degree to which you feel the statement
is characteristic or true for you. The rating scale is as follows:
0 = Not at all characteristic or true of me.
1 = Slightly characteristic or true of me.
2 = Moderately characteristic or true of me.
3 = Very characteristic or true of me.
4 = Extremely characteristic or true of me.
SLIGHTLYNOT AT ALLCHARACTERISTIC MODERATELY VERY EXTREMELY
1. I get nervous if I have to speak with someone in authority (teacher, boss, etc.). 0 1 2 3 4
2. I have difficulty making eye contact with others. 0 1 2 3 4
3. I become tense if I have to talk about myself or my feelings. 0 1 2 3 4
4. I find it difficult to mix comfortably with the people I work with. 0 1 2 3 4
5. I find it easy to make friends my own age. 0 1 2 3 4
6. I tense up if I meet an acquaintance in the street. 0 1 2 3 4
7. When mixing socially, I am uncomfortable. 0 1 2 3 4
8. I feel tense if I am alone with just one other person. 0 1 2 3 4
9. I am at ease meeting people at parties, etc. 0 1 2 3 4
10. I have difficulty talking with other people. 0 1 2 3 4
11. I find it easy to think of things to talk about. 0 1 2 3 4
12. I worry about expressing myself in case I appear awkward. 0 1 2 3 4
13. I find it difficult to disagree with another’s point of view. 0 1 2 3 4
14. I have difficulty talking to attractive persons of the opposite sex. 0 1 2 3 4
15. I find myself worrying that I won’t know what to say in social situations. 0 1 2 3 4
16. I am nervous mixing with people I don’t know well. 0 1 2 3 4
17. I feel I’ll say something embarrassing when talking. 0 1 2 3 4
18. When mixing in a group, I find myself worrying I will be ignored. 0 1 2 3 4
19. I am tense mixing in a group. 0 1 2 3 4
20. I am unsure whether to greet someone I know only slightly. 0 1 2 3 4
Patient Name: ___________________________________________________________________ Date: ___________________

SPAI
Developed by S. M. Turner, C. V. Dancu, and D. C. Beidel
Below is a list of behaviors that may or may not be relevant for you. Based on your personal experience, please indicate how frequently you experience these feelings and thoughts in social situations. A social situation is defined as gathering of two or more people. For example: A meeting; a lecture; a party; bar or restaurant; conversing with one other person or group of people, etc. FEELING ANXIOUS IS A MEASURE OF HOW TENSE, NERVOUS OR UNBOMFORTABLE YOU ARE DURING SOCIAL ENCOUNTERS. Please use the scaled list below and circle the number which best reflects how frequently you experience these responses.
Never
1
Very infrequent
2
Infrequent
3
Sometimes
4
Frequent
5
Very frequent
6
Always
7
1. I feel anxious when entering social situations where there is a small group……………………………………………………………………
1
2
3
4
5
6
7
2. I feel anxious when entering social situations where there is a large group……………………………………………………………………
1
2
3
4
5
6
7
3. I feel anxious when I am in an social situation and I become the center of attention……………………………………………………………..
1
2
3
4
5
6
7
4. I feel anxious when I am in a social situation and I am expected to engage in some activity………………………………………………..
1
2
3
4
5
6
7
5. I feel anxious when making a speech in front of an audience…….. 1 2 3 4 5 6 7
6. I feel anxious when speaking in a small informal meeting…………. 1 2 3 4 5 6 7
7. I feel so anxious about attending social gatherings that I avoid these situations……………………………………………………………….
1
2
3
4
5
6
7
8. I feel so anxious in social situations that I leave the social gathering…. 1 2 3 4 5 6 7
9. I feel anxious when in a small gathering with: strangers……………………………………………………………….. authority figures……………………………………………………… opposite sex…………………………………………………………… people in general………………………………………………………
1 1 1 1
2 2 2 2
3 3 3 3
4 4 4 4
5 5 5 5
6 6 6 6
7 7 7 7
10. I feel anxious when in a large gathering with: strangers……………………………………………………………….. authority figures……………………………………………………… opposite sex…………………………………………………………… people in general………………………………………………………
1 1 1 1
2 2 2 2
3 3 3 3
4 4 4 4
5 5 5 5
6 6 6 6
7 7 7 7
11. I feel anxious when in a bar or restaurant with: strangers……………………………………………………………….. authority figures……………………………………………………… opposite sex…………………………………………………………… people in general………………………………………………………
1 1 1 1
2 2 2 2
3 3 3 3
4 4 4 4
5 5 5 5
6 6 6 6
7 7 7 7

Never
1
Very infrequent
2
Infrequent
3
Sometimes
4
Frequent
5
Very frequent
6
Always
7
12. I feel anxious and I do not know what to do when in a new situation
with: strangers……………………………………………………………….. authority figures……………………………………………………… opposite sex…………………………………………………………… people in general………………………………………………………
1 1 1 1
2 2 2 2
3 3 3 3
4 4 4 4
5 5 5 5
6 6 6 6
7 7 7 7
13. I feel anxious and I do not know what to do when in a situation involving confrontation with: strangers……………………………………………………………….. authority figures……………………………………………………… opposite sex…………………………………………………………… people in general………………………………………………………
1 1 1 1
2 2 2 2
3 3 3 3
4 4 4 4
5 5 5 5
6 6 6 6
7 7 7 7
14. I feel anxious and I do not know what to do when in an embarrassing situation with: strangers……………………………………………………………….. authority figures……………………………………………………… opposite sex…………………………………………………………… people in general………………………………………………………
1 1 1 1
2 2 2 2
3 3 3 3
4 4 4 4
5 5 5 5
6 6 6 6
7 7 7 7
15. I feel anxious when discussing intimate feelings with: strangers……………………………………………………………….. authority figures……………………………………………………… opposite sex…………………………………………………………… people in general………………………………………………………
1 1 1 1
2 2 2 2
3 3 3 3
4 4 4 4
5 5 5 5
6 6 6 6
7 7 7 7
16. I feel anxious when stating an opinion to: strangers……………………………………………………………….. authority figures……………………………………………………… opposite sex…………………………………………………………… people in general………………………………………………………
1 1 1 1
2 2 2 2
3 3 3 3
4 4 4 4
5 5 5 5
6 6 6 6
7 7 7 7
17. I feel anxious when talking about business with: strangers……………………………………………………………….. authority figures……………………………………………………… opposite sex…………………………………………………………… people in general………………………………………………………
1 1 1 1
2 2 2 2
3 3 3 3
4 4 4 4
5 5 5 5
6 6 6 6
7 7 7 7
18. I feel anxious when approaching and/or initiating a conversation with: strangers……………………………………………………………….. authority figures………………………………………………………. opposite sex…………………………………………………………… people in general……………………………………………………….
1 1 1 1
2 2 2 2
3 3 3 3
4 4 4 4
5 5 5 5
6 6 6 6
7 7 7 7

Never
1
Very infrequent
2
Infrequent
3
Sometimes
4
Frequent
5
Very frequent
6
Always
7
19. I feel anxious when having to interact for longer than a few minutes with: strangers……………………………………………………………….. authority figures……………………………………………………… opposite sex…………………………………………………………… people in general………………………………………………………
1 1 1 1
2 2 2 2
3 3 3 3
4 4 4 4
5 5 5 5
6 6 6 6
7 7 7 7
20. I feel anxious when drinking (any type of beverage) and/or eating in front of: strangers……………………………………………………………….. authority figures……………………………………………………… opposite sex…………………………………………………………… people in general………………………………………………………
1 1 1 1
2 2 2 2
3 3 3 3
4 4 4 4
5 5 5 5
6 6 6 6
7 7 7 7
21. I feel anxious when writing or typing in front of: strangers……………………………………………………………….. authority figures……………………………………………………… opposite sex…………………………………………………………… people in general………………………………………………………
1 1 1 1
2 2 2 2
3 3 3 3
4 4 4 4
5 5 5 5
6 6 6 6
7 7 7 7
22. I feel anxious when speaking in front of: strangers……………………………………………………………….. authority figures……………………………………………………… opposite sex…………………………………………………………… people in general………………………………………………………
1 1 1 1
2 2 2 2
3 3 3 3
4 4 4 4
5 5 5 5
6 6 6 6
7 7 7 7
23. I feel anxious when being criticized or rejected by: strangers……………………………………………………………….. authority figures……………………………………………………… opposite sex…………………………………………………………… people in general………………………………………………………
1 1 1 1
2 2 2 2
3 3 3 3
4 4 4 4
5 5 5 5
6 6 6 6
7 7 7 7
24. I attempt to avoid social situations where there are: strangers……………………………………………………………….. authority figures……………………………………………………… opposite sex…………………………………………………………… people in general………………………………………………………
1 1 1 1
2 2 2 2
3 3 3 3
4 4 4 4
5 5 5 5
6 6 6 6
7 7 7 7
25. I leave social situations where there are: strangers……………………………………………………………….. authority figures……………………………………………………… opposite sex…………………………………………………………… people in general………………………………………………………
1 1 1 1
2 2 2 2
3 3 3 3
4 4 4 4
5 5 5 5
6 6 6 6
7 7 7 7
26. Before entering a social situation I think about all the things that can go wrong. The types of thoughts I experience are: Will I be dressed properly? …………………………………………. I will probably make a mistake and look foolish……………………… What will I do if no one speaks to me? …………………………….. If there is a lag in the conversation what can I talk about? …………..
1 1 1 1
2 2 2 2
3 3 3 3
4 4 4 4
5 5 5 5
6 6 6 6
7 7 7 7

Never
1
Very infrequent
2
Infrequent
3
Sometimes
4
Frequent
5
Very frequent
6
Always
7
People will notice how anxious I am………………………………… 1 2 3 4 5 6 7
27. I feel anxious before entering a social situation……………………….. 1 2 3 4 5 6 7
28. My voice leaves me or changes when I am talking in a social situation……………………………………………………………….
1
2
3
4
5
6
7
29. I am not likely to speak to people until they speak to me…………… 1 2 3 4 5 6 7
30. I experience troublesome thoughts when I am in a social setting. For example: I wish I could leave and avoid the whole situation………………….. If I mess up again I will really lose my confidence………………… What kind of impression am I making? ……………………………. Whatever I say it will probably sound stupid………………………..
1 1 1 1
2 2 2 2
3 3 3 3
4 4 4 4
5 5 5 5
6 6 6 6
7 7 7 7
31. I experience the following prior to entering a social situation: sweating………………………………………………………………. frequent urge to urinate……………………………………............... heart palpitations………………………………………………………
1 1 1
2 2 2
3 3 3
4 4 4
5 5 5
6 6 6
7 7 7
32. I experience the following in a social situation: sweating……………………………………………………………… blushing……………………………………………………………… shaking……………………………………………………………….. frequent urge to urinate……………………………………………… heart palpitations……………………………………………………..
1 1 1 1 1
2 2 2 2 2
3 3 3 3 3
4 4 4 4 4
5 5 5 5 5
6 6 6 6 6
7 7 7 7 7
33. I feel anxious when I am home alone…………………………………. 1 2 3 4 5 6 7
34. I feel anxious when I am in a strange place………………………..... 1 2 3 4 5 6 7
35. I feel anxious when I am on any form of public transportation (i.e., bus, train, airplane)………………………………………………………...
1
2
3
4
5
6
7
36. I feel anxious when crossing streets…………………………………. 1 2 3 4 5 6 7
37. I feel anxious when I am in crowded public places (i.e., stores, church, movies, restaurants, etc.)……………………………………………..
1
2
3
4
5
6
7
38. Being in large open spaces makes me feel anxious…………………. 1 2 3 4 5 6 7
39. I feel anxious when I am in enclosed places (elevators, tunnels, etc.)…. 1 2 3 4 5 6 7
40. Being in high places makes me feel anxious (i.e., tall buildings)…… 1 2 3 4 5 6 7
41. I feel anxious when waiting in a long line…………………………… 1 2 3 4 5 6 7
42. There are times when I feel like I have to hold on things because I am afraid I will fall………………………………………………………
1
2
3
4
5
6
7
43. When I leave home and go to various public places, I go with a family member or friend………………………………………………………
1
2
3
4
5
6
7
44. I feel anxious when riding a car…………………………………….. 1 2 3 4 5 6 7
45. There are certain places I do not go to because I may feel trapped…. 1 2 3 4 5 6 7

PLEASE COMPLETE IN BLACK INK ONLY.
Page 1 of 1 4/30/02
age marital statusmarried widowed
divorcedseparated
never married refusedprotocol number
gendermalefemale race or ethnic origin
white, not Hispanic origin black, not Hispanic origin HispanicAsian Native American or Alaskan native other unsure
initials ID # date / / visit
Social Phobia Inventory (SPIN)
not at all a little somewhat very much extremely
1 I am afraid of people in authority. 0 1 2 3 4
2 I am bothered by blushing in front of people. 0 1 2 3 4
3 Parties and social events scare me. 0 1 2 3 4
4 I avoid talking to people I don't know. 0 1 2 3 4
5 Being criticized scares me a lot. 0 1 2 3 4
6 Fear of embarrassment causes me toavoid doing things or speaking to people.
0 1 2 3 4
7 Sweating in front of people causes medistress.
0 1 2 3 4
8 I avoid going to parties. 0 1 2 3 4
9 I avoid activities in which I am the centerof attention.
0 1 2 3 4
10 Talking to strangers scares me. 0 1 2 3 4
11 I avoid having to give speeches. 0 1 2 3 4
12 I would do anything to avoid being criticized. 0 1 2 3 4
13 Heart palpitations bother mewhen I am around people.
0 1 2 3 4
14 I am afraid of doing things when peoplemight be watching.
0 1 2 3 4
15 Being embarrassed or looking stupid isamong my worst fears.
0 1 2 3 4
16 I avoid speaking to anyone in authority. 0 1 2 3 4
17 Trembling or shaking in front of others isdistressing to me.
0 1 2 3 4
INSTRUCTIONSPlease indicate how much the following problems have bothered youduring the past week. Mark only one box for each problem, and be sure toanswer all items.
55596
Copyright Jonathan Davidson, 1995
Copyright © 2022 FDOKUMEN