relationship between mathematics anxiety and problem ...
120
RELATIONSHIP BETWEEN MATHEMATICS ANXIETY AND PROBLEM SOLVING ABILITY IN MATHEMATICS AMONG UPPER PRIMARY SCHOOL STUDENTS MUHSINA E. K. FAROOK TRAINING COLLEGE UNIVERSITY OF CALICUT 2018
-
Upload
khangminh22 -
Category
Documents
-
view
1 -
download
0
Transcript of relationship between mathematics anxiety and problem ...

RELATIONSHIP BETWEEN MATHEMATICS ANXIETY AND
PROBLEM SOLVING ABILITY IN MATHEMATICS
AMONG UPPER PRIMARY SCHOOL STUDENTS
MUHSINA E. K.
FAROOK TRAINING COLLEGE UNIVERSITY OF CALICUT
2018

DECLARATION
I, MUHSINA E.K., do hereby declare that this dissertation entitled
RELATIONSHIP BETWEEN MATHEMATICS ANXIETY AND
PROBLEM SOLVING ABILITY IN MATHEMATICS
AMONG UPPER PRIMARY SCHOOL STUDENTS has not been
submitted by me for the award of any Degree, Diploma, Title or Recognition before.
Farook College
Date: MUSHINA E.K

Mr.RISHAD KOLATHUMTHODI
Assistant Professor
Farook Training College
Calicut
CERTIFICATE
I, Mr.RISHAD KOLOTHUMTHODI, do hereby certify that the
dissertation titled, RELATIONSHIP BETWEEN MATHEMATICS
ANXIETY AND PROBLEM SOLVING ABILITY IN MATHEMATICS
AMONG UPPER PRIMARY SCHOOL STUDENTS is a record of
bonafide study and research carried out by MUHSINA E.K., under my supervision
and guidance, has not been submitted by her for the award of any Degree, Diploma,
Title of Recognition before.
Farook College Mr.RISHAD KOLOTHUMTHODI,
Date: Supervising Teacher


CONTENTS
LIST OF TABLES
LIST OF APPENDICES
Chapters Title Page No.
I INTRODUCTION 1 – 11
II REVIEW OF RELATED LITERATURE 12 – 29
III METHODOLOGY 30 – 49
IV ANALYSIS 50 – 68
V SUMMARY, FINDINGS, CONCLUSION AND
SUGGESTIONS
69 – 77
BIBLIOGRAPHY 78 – 86
APPENDICES

LIST OF TABLES
Table
No. Title
Page
No.
1 Breakup of the sample 35
2. Component wise classification of draft tool 40
3. Scores of Response 41
4. Critical Ratio of items 42
5. Component wise Classification of Selected item to final tool 45
6. List of Institutions of data collected. 47
7. Preliminary Analysis of the Variables Mathematics Anxiety
and Problem Solving Ability among Upper Primary School
Students for the Total Sample and Relevant Sub Samples
52
8 Level of Mathematics Anxiety among Upper Primary School
students 55
9. Level of Problem Solving Ability among Upper Primary
School students 57
10. Difference of Mathematical Anxiety of Boys and Girls among
Upper Primary School 59
11. Difference of Mathematical Anxiety of Government and
Aided Upper Primary School students. 61
12. Difference of Problem Solving Ability of Boys and Girls
among Upper Primary School. 63
13. Difference of Problem Solving Ability of Government and
Aided Upper Primary School students 65
14. Correlation between Mathematics Anxiety and Problem
Solving Ability in Mathematics among Upper Primary School
Students
67

LIST OF FIGURES
Table
No. Title
Page
No.
1 The Math Avoidance Cycle 16
2. Graphical representation of Mathematics Anxiety 53
3 Graphical representation of Problem Solving Ability 54
4 Pie diagram of the Mathematics Anxiety among Upper
Primary School students 56
5 Pie diagram of the level Problem Solving Ability among
Upper Primary School students 58
6 Graphical representation of difference of Mathematics
Anxiety between Boys and Girls among Upper Primary
level. 60
7 Graphical representation of mean difference of
Mathematics Anxiety between Government and Aided
Upper primary school students 62
8 Graphical representation of mean difference of Problem
Solving Ability between boys and girls among Upper
Primary School Students. 64
9 Graphical representation of difference of Problem Solving
Ability between Government and Aided Upper Primary
School students . 66

LIST OF APPENDICES
Appendix
No. Title
I Copy of Problem Solving Ability Test
II Draft Copy of Mathematics Anxiety Rating Scale
III Copy of Mathematics Anxiety Rating Scale

CHAPTER-1
INTRODUCTION

Education has its root in the pre-historic period. In the ancient time, the pre-
literate society gained knowledge and values through orally, imitation and
storytelling from their forefathers and it passed from generation to generation.
Eventually, the society and culture developed and the formal system of education
was established.
“The principal goal of education in the school should be creating men and
women who are capable of doing new things, not simply repeating what other
generation have done” (Piaget,1970). In wider sense, education is a life-long process
and aims at total development of the individual.
It is assumed that the most fascinating of all knowledge and the most phobia
generating subject in the school curriculum is mathematics. Mathematics education
in the school is more emphasized as it improves concept development, foster
higher cognitive abilities, skills and also the development of critical thinking,
logical-analytical thinking and reasoning power. Also it encourages educational
values such as practical or utilitarian value , disciplinary value ,economy value,
punctuality, cultural value and patience etc.. Mathematics has played a decisive role
in the building up of our civilization and is a fundamental part of science education.
It is very essential and useful subject for most vocations and higher specialized
courses of learning. Thus mathematics becomes a compulsory subject in the school
curriculum.
Problem Solving Ability in mathematics is the capacity of the students being
able to solve mathematical problems in the area of mathematical formulations,
2
arithmetic, reasoning, numerical ability and non-verbal problems quickly and
correctly within the prescribed time. Mathematical Problem Solving Ability is one
of the most important skill to be acquired. Our present scientific age needs people
who can apply their understanding of mathematics to new and unsolved problems in
physics, biology, astronomy, social science and other problems still to be identified.
To apply mathematics or to invent new, one must develop skill in problem solving.
So in addition to learning mathematical facts and content, students should learn how
to use these facts to develop their thinking skill and solving skill. The ability to solve
a problem will depend on the clarity of the goals as well as the situation or
circumstances in which the person find himself. When one faced with a Math
problem that he does not understand, the child suffering from Mathematics Anxiety
fills his head with negativism and focus on that, distract himself from attempting to
work through the problem in front of him. Furthermore, this distraction can start a
negative cycle in which the same child rushes through the problem and makes a
mistake because he is not focusing on the problem itself.
According to Spicer (2004) Mathematics Anxiety is an emotion that blocks a
persons‟ reasoning ability when confronted with a mathematical situation. Students
are coming from different cultural and social background and also each and every
students are individually different in the aspect of intelligence, creativity,
personality, skill, emotion. So their academic performance is also different. After all
stresses and problems are associates of modern and post modern era of living and
management. All the challenges, problems put the human being into stress and that
result anxiety. There are two general forms of anxiety namely trait and state anxiety.
3
Mathematics Anxiety is a type of state anxiety. “A feeling of tension, apprehension
or fear that interferes with math performance is termed as mathematics anxiety
(Ashcraft&Kirt-2001). Mathematics anxiety is debilitating emotional reaction to
mathematics. Beyond this the pressure caused by time limits on tests, the fear of
public embarrassment, lack of self confidence, a feeling of permanency, feeling of
being alone, passive behavior and unusual nervousness when doing or thinking
about math. A person suffering from Math Anxiety usually experiences the physical
signs having a phobia or anxiousness: increased heart rate, sweating stomach
discomfort, trembling and weakness within the body. Much of this anxiety happens
in the class room due to the lack of consideration of different learning styles of
student. It can cause one to forget and lose one‟s self confidence and it may lead to
the failure of solving mathematical problems in academic situation and in wide
variety of ordinary life.
Need and significance of the Study
National curriculum frame work (2005) observes that “Developing children‟s
abilities for mathematisation is the main goal of mathematics education. The narrow
aim of school mathematics is to develop useful capabilities, particularly those
relating to numeracy-numbers, number operations, measurements, decimals and
percentages. The higher aim is to develop the child‟s resources to think and reason
mathematically, to pursue assumptions to their logical conclusion and to handle
abstraction. It includes a way of doing things, and the ability and the attitude to
formulate and solve problems”.

4
Mathematics, like any other subject, is important to the extent to which it
supports and contributes to the purpose of general education. Present-age provides
much significance for skill development and innovations. The more mathematical
we are in our approach, the more successful we will be. Mathematics is the cradle of
all creations, without which the world can‟t move. Mathematical education helps to
develop student‟s critical thinking, reasoning power, analytical mind.
Mathematical achievement is greatly influenced by the students‟ ability of
solving mathematical problems. The main goal of teaching mathematical problem
solving is that develop students own generic ability to solve real life problems and
mathematics in real life situation. The primary purpose of mathematical problem
solving instruction is not to equip students with collection of skills and process, but
rather than enable them to think for themselves.
Mathematics Anxiety has been defined as “feeling of apprehension and
tension concerning manipulation of numbers and completion of mathematical
problems in various contexts. (Richardson&Suinn-1972). The educators must know
crucial factors that affect students learning and build a bridge between goals and
students performance. Identifying these factors will help to utilize limited resources
including financial resources and time more effectively. (Libieski & Guiieres. 2008)
From the related literature it is found that the variables anxiety and achievement
have great relationship. A student having moderate anxiety shows high achievement
and who have high/low anxiety shows low achievement. But it has been seen that
even rote memorization of subject leads to achievement and hence anxiety leads to
rote memorization. In the contemporary situation students require more practical

5
math. Therefore students must be engaged in exploring, conjecturing and thinking
rather than engaged only in rote learning of rules and procedures. So to become a
real problem solver, there should not be any external influence. In addition,
childhood being a period of rapid change, may be a time when anxiety is especially
evident. Although attitudes may depend or change throughout school, generally once
formed, negative attitudes and anxiety are difficult to change and may persist into
adult life, with far reading consequences.
Most previous studies of Mathematics Anxiety have focused on high school
students and adults, while mathematics may also provoke strong and adverse
reaction in children ( E.g the Cockcroft report in 1982). Hence the study of influence
of Mathematics Anxiety in the Problem Solving Ability of the students and the
effect of anxiety in Problem Solving Ability is more relevant and significant. This
prompted the investigator to conduct a study on the topic “relationship between
Mathematics Anxiety and Problem Solving Ability in mathematics among upper
primary school students”. As well as many variables have long been studied as
predictors of mathematics achievement. However, gender issues on math
achievement are studied most frequently by researches. For instance, a study
through a meta analysis reveals that males tend to do better on mathematics test that
involve problem solving ( Hyde, Fennem and Lamon, 1990), and there is a notion
that Government and Aided schools are differ in stress. The difference in facilities of
both schools is considered as a reason for imbalance. This lead the investigator to
take gender and type of management as the sub samples of the study.

6
Statement of the Problem
The proposed study is entitled as “RELATIONSHIP BETWEEN
MATHEMATICS ANXIETY AND PROBLEM SOLVING ABILITY IN
MATHEMATICS AMONG UPPER PRIMARY SCHOOL STUDENTS.”
Definition of Key Terms
Mathematics Anxiety:
“A feeling of tension, apprehension, or fear that interferes with math
performance” (Ashcraft & Kirk-2001).
Problem Solving Ability in Mathematics:
Problem Solving Ability in mathematics can be operationally defined as the
capacity of the students being able to solve the mathematical problems quickly and
correctly within the prescribed time. Here students getting a specific score and
above in the Problem Solving Ability Test prepared by Jidhina & Vijayakumari
(2017) are considered as students having Problem Solving Ability.
Upper Primary School students:
The term refers to the students studying in the class V, VI and VII of the
recognized schools in Kerala.
Variables of the Study
Mathematics Anxiety and Problem Solving Ability are selected as the
variables of the study.

7
Objective of the Study
1. To find out the level of Mathematics Anxiety among Upper Primary School
students.
2. To find out the level of Problem Solving Ability among Upper Primary
School students.
3. To find out whether there exit significant difference in the level of
Mathematics Anxiety among Upper Primary School students based on
i. Gender
ii. Type of Management
4. To find out whether there exit significant difference in the level of Problem
Solving Ability among Upper Primary School students based on
i. Gender
ii. Type of Management.
5. To find out there exist significant relationship between Mathematics Anxiety
and Problem Solving Ability among Upper Primary School students.
Hypotheses of the Study
1. There exists significant difference in the level of Mathematics Anxiety
among Upper Primary School students based on
i. Gender
ii. Type of Management
8
2. There exists significant difference in the level of Problem solving ability
among Upper Primary School students based on
i. Gender
ii. Type of Management.
3. There exists significant relationship between Mathematics Anxiety and
Problem Solving Ability among Upper Primary School students
Methodology
Method
The proposed study adopts survey method to understand the relationship
between Mathematics Anxiety and Problem Solving Ability in mathematics among
Upper Primary School students
Sample used for the Study
The study will be conducted on a sample of 600 students of Upper Primary
School students from Malappuram and Kozhikode districts. The sample selection
was done using Stratified Random Sampling Technique giving due representation to
Gender of the students and Type of Management of the institution
Tools used for the Study
1. Problem Solving Ability Test (Jithina & Vijayakumari, 2017)
2. Math Anxiety Rating Scale ( Muhsina & Risahad,2018)

9
Statistical Techniques
Preliminary Analysis
Measures of central tendency- Mean, Median, Mode
Standard Deviation, Skewness, Kurtosis
Major Analysis
Percentage Analysis
Two-tailed test of significance of difference between mean scores for large
independent sample (t-test)
Pearson‟s Product Moment Coefficient of correlation
Scope of the Study
The present study is an attempt to find out the level of Mathematics Anxiety
and Problem Solving Ability in mathematics among Upper Primary School students.
It is also intends to find out the relationship between Mathematics Anxiety and
Problem Solving Ability and the differences between the relevant sub-sample based
on gender, type of management. The study will be conducted on a representative
sample of 600 upper primary students drawn from the schools in Malappuram and
Kozhikode districts.
For this purpose the investigator prepared Mathematics Anxiety Rating Scale
with the help of supervising teacher to asses Mathematics Anxiety and adopted a
Problem Solving Ability test for assessing Problem Solving in Mathematics.

10
Appropriate statistical techniques are used to analyse the data. The findings
of the study will be a well built message educational sector to be aware of the
importance of Mathematics Anxiety and its effect in the ability of Problem Solving
in mathematics.
Though the investigator will make the study precise, there are some
unavoidable limitations.
Limitations of the study
1. Since the study was conducted partial fulfillment of post-graduate course –
investigator has de-limited present study only in the area of Malappuram
and Kozhikode districts.
2. The study was confined to upper primary students of Government and aided
schools in Malappuram and Kozhikode districts of Kerala
3. The study was conducted only on a sample of 600 students only.
The time limit was main obstacle to increase the number of samples of the
study. In spite of all these limitation, the investigator expects that the result obtained
will be reliable and have a genaralised nature. It is also believe that the findings of
the study will help to bring about clear picture of relationship between Mathematics
Anxiety and Problem Solving Ability in mathematics among Upper Primary School
students.

11
Organization of the Report
The report of the study has been presented in five chapters.
Chapter 1: Introduction
This chapter deals with a brief introduction to the problem, need and
significance of the study, statement of the problem, definition of key terms,
objective of the study, methodology, scope and limitation of the study.
Chapter 2: Review of Related Literature
This chapter contains theoretical overview summary of the related studies of
the variables Mathematics Anxiety and Problem Solving Ability.
Chapter 3: Methodology
It includes the methodology of the study. This take in a discussion of the
variables, tools used for the study, selection of samples, administration of the tools,
consolidation of data and statistical techniques used for analysis.
Chapter 4: Analysis and Interpretation of the Data
It presents the analysis of the data, interpretations, and discussion of the
result with graphs.
Chapter 5: Summary, Findings and Suggestions
It covers the major findings of the study, tenability of hypotheses,
educational implication and suggestion for further research.

CHAPTER 2
REVIEW OF RELATED
LITERATURE

REVIEW OF RELATED LITERATURE
Review of related literature is an inseparable part of any research. It is an
important pre-requisites to actual planning and execution of any research. Review of
related literature gives the comprehensive development of the background of the
problem. It designate what has already been studied by other researchers which have
a bearing upon the study.
The present study is an attempt to find out the relationship between
Mathematics Anxiety and Problem Solving Ability in mathematics of Upper
Primary School students. To have an understanding of the nature of the study in
these areas, the investigator has gone through relevant literatures both theoretical
and empirical. The review has been presented under the following headings.
Theoretical overview of Mathematics Anxiety
Studies related to Mathematics Anxiety
Theoretical overview of Problem Solving Ability
Studies related to Problem Solving Ability
Conclusion
Theoretical overview of Mathematics Anxiety
Mathematics is one of the core subject taught in school curriculum.
Knowingly or unknowingly everybody use mathematics in everyday facet of life.
From young age children must learn the basic concepts of mathematics in order to
function well in their everyday life (Lebens&Mayer,2011) However majority of the

13
students dislike mathematics. There number of reasons for this hatredness including
lack of stimulation, student-teacher relationship, students self expectation, drill over
kill, social stigma and isolation, incomplete instruction, curricular isolation, obscure
vocabulary, teacher assumption, negative attitude of students, congested classes,
lack of teaching materials and Mathematics Anxiety ( Brightmath, 2016)
Mathematics Anxiety is a psychological status, which come forth in people
when dealing with mathematical content whether in teaching and learning situation
or in solving mathematical behaviour ( Alam al Hoda, 2000). In a research
conducted by Paeinkerton (2005) states that Mathematic Anxiety develop in children
before school by parents and school by teaching methods. Many students who suffer
from Mathematics Anxiety have little confidence in their ability to do mathematics
and tend to take the minimum number of required mathematics courses, which
greatly limited their career choice options (Garry, 2005). Reported consequences of
being anxious towards mathematics include the avoidance of mathematics and the
decline in mathematics achievement. This kind of anxiety is first detected in the late
1950s. Closer examination of Mathematics Anxiety reveals two general forms
anxiety: trait and state (Miller&Bischel, 2004) trait anxiety describes the
vulnerability to stress that an individual brings to a situation. State anxiety refers to
the actual situational stress experienced that is specific to personally stressful or
fearful circumstances. Mathematics Anxiety is a type State anxiety.
POTENTIAL ORIGINS OF MATHS ANXIETY
Mathematics Anxiety can have multiple origins and, as noted by Shields
(2005), can be perpetuated in the home, society, and the classroom.
14
The home
In the home, parents who themselves suffer Mathematics Anxiety can
unintentionally transfer such anxiety to their children. In the context of doing
mathematics, the emotions expressed by one will inevitably and reciprocally
shape the other within parent-child interactions (Else-Quest, Hyde, & Hejmadi,
2008). For example, children who are reproached for their errors may develop a
fear of taking risks and exploring new possibilities, and may start hating
mathematics. Parental disappointment and despair are especially demoralising
due to the value placed on the high positive regard of parents by children
(Dossel, 1993), while parents giving mathematics low status or applying
pressure to children may also contribute to the development of Mathematics Anxiety
(Fraser & Honeyford, 2000).
Society
Social factors such as mathematical myths may also induce or reinforce
Mathematics Anxiety for some students. For example, the myth that boys are better
than girls in mathematics and that only some people have a „math mind‟ can
undermine positive self-efficacy beliefs. Too often, situations are encountered in
which it is „cool‟ to hate mathematics, with people readily stating, with some
pride, „I‟m no good at mathematics‟, as though displaying a badge of honor or
promoting membership to the I Hate Maths „Facebook‟ group. As a subject
mathematics is unique as embarrassment often does not result from failure. A
study involving over 1000 undergraduate students in the United States affirms
the view that failure at mathematics is socially acceptable – the participants
15
were less embarrassed in relation to lack of mathematical skills compared with
language skills (Latterell, 2005).
The Classroom
Despite young children starting school having, for the most part, a well
developed, informal competence in mathematics, it is apparent that the
classroom is also a place where Mathematics Anxiety can develop and flourish.
Research studies (e.g., Vinson, 2001) suggest that, in combination with the
parental and societal factors, Mathematics Anxiety may have its roots in teaching
and teachers, with math anxious teachers resulting in math anxious students at
times. Teaching by math anxious teachers is charecterised by an over-reliance
on traditional instructional activities such as: drills, flash cards, and work sheets;
assigning the same work for everyone; teaching to the textbook; insisting on
only one correct way to complete a problem; concentrating more on basic skills
rather than concepts; and, whole class instruction (Gurganus, 2007). Despite
New Zealand‟s systemic attempts to reform primary mathematics programmes
(Higgins & Parson, 2009), we have „a long tail of underachievement in
mathematics‟ (Neill, Fisher, & Dingle, 2010, p. 1) and traditional ways of
learning mathematics continue to be present within our schools (YoungLoveridge,
Taylor, Sharma, & Hāwera, 2006).
While traditional instruction may contribute to math anxiety, so too does
the culture of the classroom. Classroom culture can be defined as the
behaviours and norms that guide classroom interactions. Experiences of
learning mathematics in structured, rigid classrooms include little opportunity for

16
debate or discussion, focus on searching for the one right answer, offer limited
encouragement to reflect on thinking, expect quick answers, and emphasise
timed tests (Shields, 2005). In such classrooms, it is likely both overt and covert
teacher behaviours are implicated in fostering students‟ math anxiety (Brown,
2003). These behaviours include: unrealistic expectations of students; gender
bias; giving poor explanations; hostility, anger or intimidation; embarrassing
students in front of peers if a concept is not understood; and, an insensitive or
uncaring attitude (Shields, 2005).
In most of the cases, Mathematics Anxiety is the result of previous
embarrassing experiences or moment of failure involving mathematics. Like other
forms of Anxiety, students may feel thir heart beat more quickly or strongly, they
may believe they are not capable of completing mathematical problems, or they may
avoid attempting math courses ( Sheffield&Hunt,2006)
The Math Avoidance Cycle
Fig. 1: The Math Avoidance Cycle
Negative math
experience
Maths avoidance
and procrastination
Poor preparation
Poor math
performance

17
Theories Related to Mathematics Anxiety
Traditional Arousal Theory
The traditional arousal theorists says that there exists an optimal level of
arousal around the middle of the arousal dimension. This idea is graphically
represented as an inverted U curve depicting a curve linear relationship between
anxiety and performance. Thus this arousal theory indicates that some anxiety
beneficial to performance, but after a certain point it undermines performance (Ma,
1999)
Two Factor Theory of Test Anxiety
Liebert and Morris (1967) were the first to propose a two factor model of test
anxiety that distinguish between an affective „emotionally and a cognitive worry
dimension of test anxiety
Affective Test Anxiety
Refers to the emotionally component of anxiety displayed through feelings
of nervousness, tension, dread, fear and unpleasant physiological reactions to testing
situations.
Cognitive Anxiety
Refers to the worry component of anxiety, which is often displayed through
negative expectations.
This two factor model that taps both affective and cognitive dimensions has
also been found to be relevant to Mathematics Anxiety.

18
Symptoms
There are four symptoms that are most common: panic, paranoia, passive behavior,
and lack of confidence.
Panic: The student or adult has a feeling of helplessness that will not go
away. It feels like a wave of terror has washed over their body.
Paranoia: The student or adult thinks they are the only person not capable of
completing the math, even if it is a very complicated math such as calculus.
Passive Behavior: The student or adult decides they will never understand or
be comfortable with math, so they actively decide they will do nothing about
their problem.
Lack of Confidence: The student or adult anticipate the feeling of
helplessness and expect to never know the answer to the problem. They also
second guess their math work. They rely on other people in their life to help
them complete math functions such as balancing their checkbook.
Since Mathematics Anxiety does produce real symptoms and emotions
within people, it is important for parents to distinguish these characteristics within
their children when they happen and to recognize their child is experiencing math
anxiety.
Many students and adults do not understand why they experience Math
Anxiety. They automatically assume that it is because they are unintelligent or were
born without a talent for mathematics. This simply is not true. Even the most

19
accomplished mathematicians and college level professors sometimes experience
symptoms related to Mathematics Anxiety
Consequences of Mathematics Anxiety
Some of the consequences that results from being mathematics anxious as
opposed to mathematics confident include
a) The fear to perform task that are mathematically related to real life incidents
b) Avoidance of mathematics classes
c) Belief that it is alright to fail or dislike mathematics
d) Feelings of physical illness, faintness, fear or panic
e) An inability to perform in a test or test- like situations
f) The utilization of tutoring sessions that provide little success.
(Vinson, Haynes, Sloan and Gresham, (1997)
What to Do About Mathematics Anxiety
Math anxiety is a learned psychological response to math, which interferes
with a student‟s ability to perform math. It is not a reflection of a student‟s true
ability in math. There are a number of strategies a student can use to overcome the
anxiety response. Some of the primary strategies are described here.
Review and learn basic arithmetic principles and methods.
Many students, perhaps because of early negative experiences, never really
developed a solid foundation in basic arithmetic, particularly multiplication and
fractions. Because math is an accumulative discipline, that is complex concepts are

20
built cumulatively on more simple concepts, a student who has not
developed a solid arithmetic foundation will have trouble learning higher order
math. A remedial course or short course in arithmetic is often a significant first step
in reducing the anxiety response to math.
Be aware of thoughts, feelings, and actions as they are related to math
Mathematics anxiety affects different students in different ways. It‟s
important to be familiar with the thoughts you have about yourself and the situation
when you encounter math. If you are aware of unrealistic or irrational thoughts you
can work to replace those thoughts with more positive and realistic ones.
Seek help
Mathematics anxiety is learned and reinforced over a long period of time and
therefore is not quickly eliminated. A student can reduce the anxiety response more
effectively with the help of a number of different services. Staff psychologists and
counselors in the Student Counseling Services can help students analyze their
psychological response to math, learn anxiety management skills, and develop
effective coping strategies.
Learn the vocabulary of mathematics.
One of the problems students have with math is understanding the terms and
vocabulary. Math often uses words in a completely different way than they are used
in other subject. The term “factor” is an example. Students often confuse lack of
understanding of terms and vocabulary with math ability.

21
Learn anxiety reduction and anxiety management techniques.
Anxiety can greatly interfere with concentration, clear thinking, attention and
memory. Students can learn relaxation anxiety management techniques that are very
effective in controlling the emotional and physical characteristics of anxiety that are
interfering with mental processing capabilities.
Work on having a positive attitude about math.
Having a positive attitude will build self confidence and thus reduce anxiety.
Learn positive self-talk.
Giving yourself positive self-talk helps to counter and overcome your
belief in the math myths or to stop playing mind games on yourself. Positive self-
talk is effective in replacing negative thoughts, which create anxiety with positive
thoughts that reduce anxiety
Studies related to Mathematics Anxiety
Ashcraft, Kirk& Elizabeth (2001) conducted a study on “relationship among
working memory, math anxiety and performance”. The result demonstrated that an
individual difference variable, math anxiety, affects, on-line performance in math
related tasks and that this effect is a transitory disruption of working memory.
Sloan and Daane (2002) conducted a study on “mathematics anxiety and
learning styles : What is the relationship in elementary pre- service teachers? “ on a
sample of 72 pre- service teachers . Findings revealed a low but significant positive
correlation between mathematics anxiety and global learning style

22
Cates and Rhymer (2003) examined “The relationship between mathematics
anxiety and mathematics performance : an instructional hierarchy perspective”
among college students. The result suggested that the higher mathematics anxiety
group had significant lower fluency level across all mathematical operations tests.
However, there were no significant difference error rates between the two groups
across any of the prober suggesting that a is more related to higher levels of learning
than to the initial acquisition stage of learning.
Zaharia and Nordin (2008) checked the effect of mathematics anxiety on
matriculation students as related motivation and achievement on a sample of 88
students. The findings revealed that there exists a low significant negative
correlation between mathematics anxiety and achievement and also a strong
significant negative correlation between mathematics anxiety and motivation. The
study also revealed a significant low positive correlation between motivation and
achievement.
Bekdemir (2008) conducted a study on “The pre-service teachers
mathematics anxiety related to depth of negative experiences in mathematics
classroom while they were students.” On a sample of 167 senior elementary pre-
service teachers. The findings shows that many pre-service teachers have
mathematics anxiety and that the worst experience and the most troublesome
mathematics classroom experience have a direct influence on mathematics anxiety
in pre-service teachers. Also, the majority of instances of participants mathematics
anxiety are caused by the teacher, their behaviour of teaching approaches in their
past.
23
Karimi and Venkatesan (2009) conducted a study on “ mathematics anxiety,
mathematics performance and academic hardiness in high school students” on
sample of 284 tenth grade high school students. The result revealed that mathematics
anxiety has significant correlation with mathematics performance but no significant
correlation is detected with academic hardiness. It also found that the gender
difference in mathematics anxiety significant where as no significant difference are
detected between boys and girls in mathematics performance and academic
hardiness
Ali (2013) studied mathematics anxiety viz-A-viz motivation, performance
approach orientation, problem solving and impact of pedagogical intervention with
sample of 46 pre-service teachers of Delhi. The result of the study was mathematics
anxiety and motivation in mathematics of pre-service teachers of Delhi are
negatively correlated. Further it was revealed that mathematics anxiety does not
have a significant correlation with performance approach orientation, problem
solving and test on fractions of pre-service teachers of Delhi
Barwal and Sharma (2013) conducted a study on academic achievement of
high school students in relation to their mathematics anxiety with a sample of 200
high school students belonging to Mandhi districts of Himachal Pradesh. The result
of the study indicated that there exists highly significant relationship between
academic achievement and mathematics anxiety of high school students
Abbasi, Samadzadeh and Shahbazzadegan(2013) studied mathematics
anxiety in high school students and its relationship with self-esteem and teachers
personality charecteristics. The findings of the study were, there exists a negative

24
significant relationship between the student‟s mathematics anxiety and their self
esteem and there exists a significant relationship between student‟s mathematics
anxiety and their teacher‟s personality characteristics.
Ali and Mutawa (2015) conducted a study on “ the influence mathematics
anxiety in middle and High school students mathe achievement “ the result from this
study show the statistically significant grade level difference
Mehar and sanwal (2017) examined the effect of inquiry training model on
achievement in mathematics in relation to mathematics anxiety. The results shows
that there is a significant interaction effect was found between inquiry training
model and mathematics anxiety group.
Theories related to Problem Solving
Many learning theories emphasize problem solving and some major works
are explained below
Gagne’s Theory of Hierarchy of Learning
Gagne (1965) proposed a hierarchy of learning in the order signal learning,
stimulus response learning, chaining, verbal association, multiple discrimination,
concept learning, principle learning and problem solving. According to him problem
solving is the highest position or form of learning. If a person need to accomplish
learning at the level of problem solving he must be successfully pass or overcome
the underlying forms. That is successful accomplishment of all the seven stages lead
to the final stage of hierarchy i.e., problem solving.

25
Piaget’s stages of Cognitive Development
Piaget (1971) developed a theory of intellectual development and proposed
four stages of cognitive development, as sensory motor, preoperational, concrete
operational and formal operational. According to him after the concrete operational
stage (i.e., during the formal operational stage) students develop ability to solve a
problem or students begin to think abstractly and reason about hypothetical
problems.
Space theory of Problem Solving
Newell and Simon (1972) proposed the theory of problem solving which
explains solving of problem as searching a problem space by people. The problem
space consists of the current state, the goal state and all possible states in between.
Problem space can be more the key issue is how people move through possibilities,
given their limited working memory capacities or how do they choose actions to
move from one state to another (operators).For many problems domain knowledge
helps a person to decide what to do. But for a new or novel problem they proposed
that operator‟s selection is guided by cognitive shorts cuts (known as heuristics)
Methods for Solving Problems
According to Baron and Misra (2014) some methods for Problem Solving
are trial and error, algorithm, analogy and Meta cognitive process. Trial and error is
a method of Problem Solving in which possible solutions are tried until one
succeeds. Algorithm is a rule that guarantees a solution to specific type of problem.
Analogy stands for a strategy for solving problems based on applying solutions that

26
were previously successful with other problems similar in underlying structure
Metacognitive process involves expanding our level of awareness in a sense ,
observing ourselves engaged in the Problem Solving process. Meta cognition seem
to promote cognitive activities that lead to more effective problem solution, such as
a focus on the actual Problem Solving process.
According to Sternberg (2007) a well structured problem can be solved by
using algorithms and humans are more likely to use informal heuristics such as
means ends analysis, working forward, working backward, and generate and test.
For solving ill structured problems people may insight.
Logical Steps in Problem Solving
Aware of difficulty
Identifying the problem
Assembling and Classifying data and formulating Hypotheses.
Accepting or rejecting tentative hypotheses
Formulating conclusions and evaluating them Dewey(1910, as cited in
Ornstein), 1990)
Obstacles to Effective Problem Solving
Baron and Misra (2014) pointed out functional fixedness and mental sets as
the factors that can interfere with the effective Problem Solving. Functional
fixedness is the tendency to think of using objects only as they have been used
before and the later is the tendencies to stick with familiar methods.

27
Studies related to Problem Solving Ability in Mathematics
Jose and Thomas(2011) measured the relationship between problem solving
ability and scholastic achievement of secondary school students. It find out that there
exist no significant difference in the relationship between the two variables
Bindu (2011) studied the effectiveness of discovery learning approach on
problem solving ability at primary level. It was revealed that the discovery learning
enhances the problem solving ability.
Usha and Devi (2014) conducted a study on „gain on problem solving skill
through peer mentoring- a study on higher secondary school students‟. Effect size
analysis shows that peer mentoring strategy has a significant effect on enhancing
problem solving skill of higher secondary school students and academic
achievement.
Asharani and francis (2015) checked the effect of Vedic mathematics on
speed and accuracy in problem solving ability in mathematics among secondary
school students. The result found that Vedic mathematics method is comparatively
more effective than activity oriented method in developing speed and accuracy of
problem solving ability in mathematics
Tyagi (2015) examined the relationship between mathematical creativity and
mathematical problem solving ability in a sample of 480 8th
grade students. The
result of the study indicated that there exists a positive significant relationship
between mathematical problem solving performance and mathematical creativity
28
Muthuchamy and Joseph (2015)studied the relationship between creativity
and problem solving skills among B.ed trainees in Mysore. The result says that there
exists significant positive relationship between creativity and problem solving skill
among B.ed trainees
Sood and Richa(2015) conducted a study on “ Do gender difference exist in
scientific attitude and problem solving ability among adolescents?” . The finding
reveals that there exists significant difference between scientific attitude and
problem solving ability of adolescent boys and girls
Dhadhich(2016) conducted a study on problem solving ability of 9th
standard
students. The result shows that there is significant difference between problem
solving ability of boys and girls of 9th
standard students.
Vidya and Malini (2016) studied the relationship between critical thinking
skills and problem solving ability among adolescents. The result reveals that there
exists significant relationship between critical thinking skills and problem solving
skills
Lizzie (2017) conducted a study on problem solving ability in mathematics
in relation to their academic achievement among higher secondary school students.
The finding of the study was there exists a positive relationship between problem
solving ability in mathematics and achievement
Sonia and Bindu (2017) conducted a study on relationship between problem
solving ability in mathematics and numerical ability of secondary level students. The
result of the study revealed that there is a positive significant relationship between
29
problem solving ability in mathematics and numerical ability of secondary school
students.
Sharm and Sood(2015) conducted a study on “Cognitive styles in relation to
problem solving ability among adolescents”. The result reveals that there exists a
significant positive relationship between cognitive style and problem solving ability
of adolescents.
Rani and Begam(2016) studied the relationship between problem solving
ability and emotional intelligence of higher secondary school students and the result
of the study was there exists significant relationship between problem solving ability
and emotional intelligence
Begam and Devi(2016) conducted a study on “Relationship between problem
solving ability and achievement in mathematics of XI students. The result reveals
that there exists positive significant relationship between problem solving ability and
achievement in mathematics.
Conclusion
The review of related literature related on the variable Mathematics Anxiety
and Problem Solving Ability shows that there are number of studies conducted on
the relationship between Mathematics Anxiety and Achievement in Kerala and
outside Kerala. But studies did as finding the relationship between Mathematics
Anxiety and Problem Solving Ability are rare.

CHAPTER 3
METHODOLOGY
METHODOLOGY
Methodology is an inevitable part of research study which describes the way
and procedure that the researcher follows to find the solution for the research
problem.
The present study was an attempt to find out the relationship between
mathematics anxiety and problem solving ability among upper primary school
students. The method used in this study was survey method and the sample consists
of 600 upper primary school students from Malappuram and Calicut districts.
The methodology used in the present study is described in this chapter under
the following heads.
Variables of the Study
Objective of the Study
Hypotheses
Sample selected for the Study
Tools used
Scoring and Consolidation of data
Statistical Techniques used
Variables
The present study was conducted to find out the significant relationship
between Mathematics anxiety and Problem Solving Ability. The major variables
included in the study are;

33
Mathematics Anxiety
Problem Solving Ability
The sub sample selected for the study are Gender of the students (Boys
,Girls), Type of Management of the institution (Government, Aided).
Objective of the Study
1. To find out the level of Mathematics Anxiety among Upper Primary School
students.
2. To find out the level of Problem Solving Ability among Upper Primary
School students.
3. To find out whether there exit significant difference in the level of
Mathematics Anxiety among Upper Primary School students based on
i. Gender
ii. Type of Management
4. To find out whether there exit significant difference in the level of Problem
Solving Ability among Upper Primary School students based on
i. Gender
ii. Type of Management.
5. To find out there exist significant relationship between Mathematics Anxiety
and Problem Solving Ability among Upper Primary School students.
34
Hypotheses of the Study
1. There exists significant difference in the level of Mathematics Anxiety
among Upper Primary School students based on
i. Gender
ii. Type of Management.
2. There exists significant difference in the level of Problem solving ability
among Upper Primary School students based on.
i. Gender
ii. Type of Management.
3. There exists significant relationship between Mathematics Anxiety and
Problem Solving Ability among Upper Primary School students
Sample selected for the Study
Sampling is the process by which a relatively small number of individuals,
objects, or events is selected and analysed in order to find out something about the
entire population from which it was selected (Koul, 2002).
A sample forms a small proportion of the total population that is selected for
the study. Stratified random sampling technique was used in this study for the
selection of sample. Total number of 600 samples were collected from Government
and Aided schools from Malappuram and Kozhikode districts. Factors represented;
35
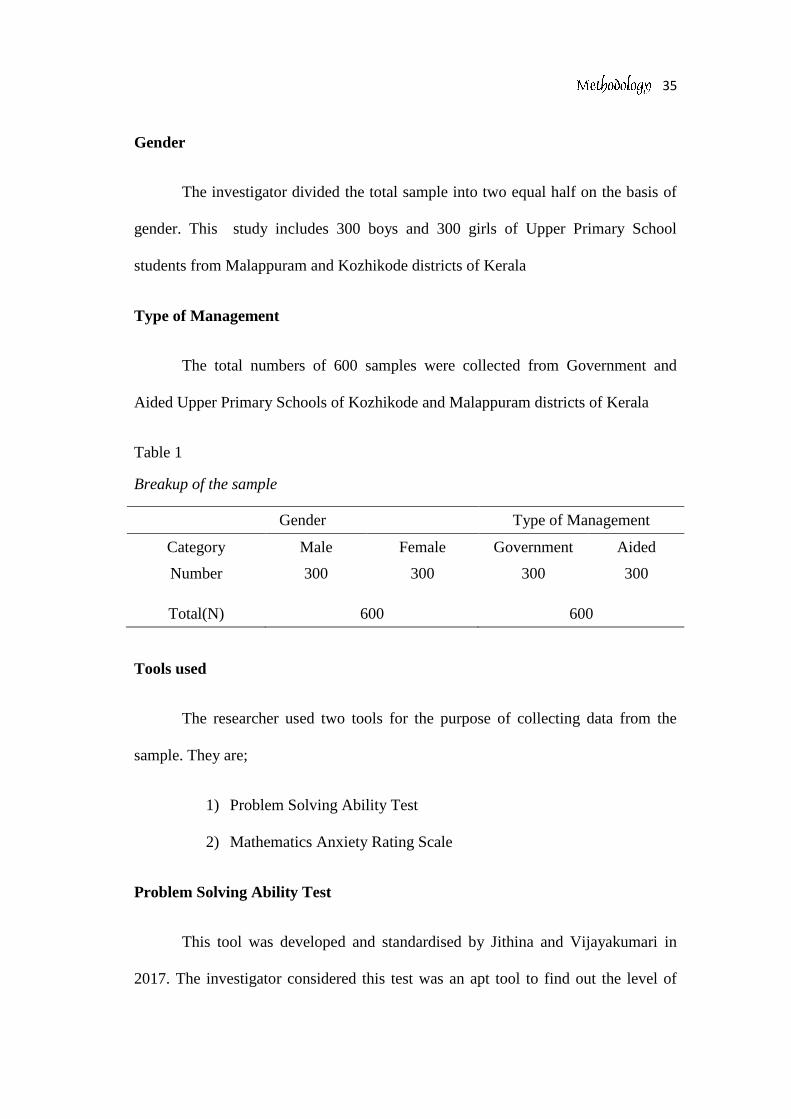
Gender
The investigator divided the total sample into two equal half on the basis of
gender. This study includes 300 boys and 300 girls of Upper Primary School
students from Malappuram and Kozhikode districts of Kerala
Type of Management
The total numbers of 600 samples were collected from Government and
Aided Upper Primary Schools of Kozhikode and Malappuram districts of Kerala
Table 1
Breakup of the sample
Gender Type of Management
Category Male Female Government Aided
Number 300 300 300 300
Total(N) 600 600
Tools used
The researcher used two tools for the purpose of collecting data from the
sample. They are;
1) Problem Solving Ability Test
2) Mathematics Anxiety Rating Scale
Problem Solving Ability Test
This tool was developed and standardised by Jithina and Vijayakumari in
2017. The investigator considered this test was an apt tool to find out the level of

36
Problem Solving Ability among Upper Primary School students. This test consists of
35 item which is objective type questions in nature. The area include this test are;
Arithmetic, Geometry and Algebra. The subunits included in the test are; numbers,
fractions, decimal fractions, average, percentage, area, perimeter and volume. There
are four different choices (answers) are available in this test for respondents to
respond them.
A copy of Problem Solving Ability test given as Appendix No. 1
Mathematics Anxiety Rating Scale
As the objective of the study is to find out Mathematics Anxiety among
Upper Primary School students, for this purpose the investigator developed and
standardised a tool entitled as Mathematics Anxiety Rating Scale for systematic and
scientific assessment of Mathematics Anxiety among Upper Primary School
students. On the basis of various theories and principles the investigator include four
dimensions of Mathematics Anxiety as the component Mathematics Anxiety Rating
Scale. They are;
General Anxiety towards mathematics
Performance Anxiety Related to Mathematics
Mathematical Test Anxiety
Anxiety Towards Mathematical Symbols
Brief description of components are ;

37
General Anxiety towards Mathematics
General anxiety means more chromic, exaggerated worry and tension that is
unfounded or much severe than normal anxiety most people experience. When these
extra tension and worry is in the case of mathematics subject, Mathematics teacher,
mathematics class room etc.,. It is the general anxiety towards mathematics.
Mathematics anxiety is not restricted to tests or classroom settings. It may
generalize to various real world situations with the consequence that otherwise
perfectly intelligent and capable persons develop a severe avoidance of situations
involving any kinds of mathematics, even extending to not choosing the career
which include applications of mathematics.
A major factor in the development of Mathematics Anxiety and dislike
towards mathematics in students is the way the teacher feel about mathematics. It is
well known that good teacher love the subject they are teaching on the other hand, if
the teacher feels negative towards mathematics, it probably shows up when in his or
her teaching and affects the students similarly.
Performance Anxiety
An individual with Mathematics Anxiety does not necessarily lack Ability in
mathematics, rather they can‟t perform to their full potential due to the interfering
symptoms of their Anxiety. A study using functional magnetic resonance imaging of
the brain found neurological evidence of anxiety negatively impacting on
mathematics performance prior to completion of a mathematics task, when students
were anticipating the mathematics task ahead of them (Layons&beilock,2011).
38
Mathematics Anxiety manifests itself in a variety of ways, including physical,
psychological and behavioral symptoms that can all disrupt a student‟s mathematical
performance.
Math anxiety is simply a proxy for poor math performance. It is associated with
difficulties in basic numeral processing, which is thought to perform the building
blocks of more advanced math skill. The debilitating anxiety model suggests that the
link between math anxiety and math performance is driven by anxiety‟s divesting
consequence on learning and recalling math skills. People with math anxiety are less
willing to engage with math tasks at all, they are less likely to enroll in math classes,
and have a tendency to answer questions quickly but inaccurately.
Mathematical Test Anxiety
One of the most common forms of math anxiety is mathematical test
anxiety. Math test anxiety most often appears initially as a mental block on a
particular problem. Often that one student knew how to do moments before the test.
Worry over the original problem can load to more generalized worry and negative
self-talk, which can sabotage the students overall test performance. Verma and
Gupta (1990) explored the causes of basic academic pressure burdening the school
going adolescence. Results revealed that academic stress was caused due to
examination system burden of home work and attitudes of parents and teachers.
Test anxiety is a learned behavior. It can come from a feeling of lack of
control. It can be caused by a teacher embarrassing a student and also the association
of grades and personal worth. Test anxiety develops from fear of alienation from

39
parents, family and friends due to poor grade and also it can be caused by timed test
and the fear of not finishing the tests, even if one can do all the problems.
Anxiety towards Mathematical Symbols
Mathematics is abstract it does not have a shape and children cannot see it
they need to visualize properly for solving a mathematical problem converting word
problem into mathematical equations requires a good understanding of the language
and math fundamentals.
Fundamentals are still taught in old fashioned way in the school. Teachers
teach fundamentals without much of illustration. Therefore students are not able to
visualize the problem when they face it. They try to learn mathematics much like
other subject where they memorize facts and figures. It will be later caused to
anxiety about mathematical subject.
Preparation of Draft Tool Mathematics Anxiety Rating Scale
Based on the discussions and instructing gained from the experts the
investigator developed the Mathematics Anxiety Rating Scale. It consists of 53
items. There are 15, 16, 14, and 8 items from General Anxiety towards mathematics,
Math Performance Anxiety, Math Test Anxiety and Anxiety towards Mathematical
Symbols respectively. There are both positive and negative items are included in the
Scale.
The classification of component wise item both positive and negative items
are listed in table 2.

40
Table 2
Component wise classification of draft tool
S.L.
No. Components
Number of
Positive Items
Number of
Negative Items Total
1 General Anxiety towards
Mathematics 9 6 15
2 Performance Anxiety 5 11 16
3 Math Test Anxiety 7 7 14
4 Anxiety towards
Mathematical Symbols 4 4 8
Total 25 28 53
A copy of draft tool of Mathematics Anxiety Rating Scale attached at
Appendix No. II.
Scoring of Data
Each item of the Mathematics anxiety Rating Scale has five responses.
Subjects have to decide how far each statement in the scale is true to their case.
Responses can be made in five point scale as Always, Often, Sometimes, Rarely,
Never.

41
Table 3
Scores of Response
S.L
No. Responds For Positive Item For Negative Item
1 Always 0 4
2 Often 1 3
3 Sometimes 2 2
4 Rarely 3 1
5 Never 4 0
Try out
Try out of the draft scale is carried out to select the items for final scale is by
empirically test the item characteristics. For this the Draft Scale consisting 53 items
was administered to a sample of 100 Upper Primary School students from
Malappuram and Kozhikode districts, using Stratified Random Sampling Technique
giving due representation to gender (Boys and Girls) of the pupil and type of
management of the institution (Government and Aided).
Item Analysis
Item analysis is done to select valid item in the final scale by empirically
testing the item characteristics.
The procedure of analysis was discussed below.
The responses of 100 Upper Primary School students were scored according
to the scoring procedure. Then these responses were arranged in ascending order of
the total score. The scores obtained by the top 27 students (27%) and bottom 27
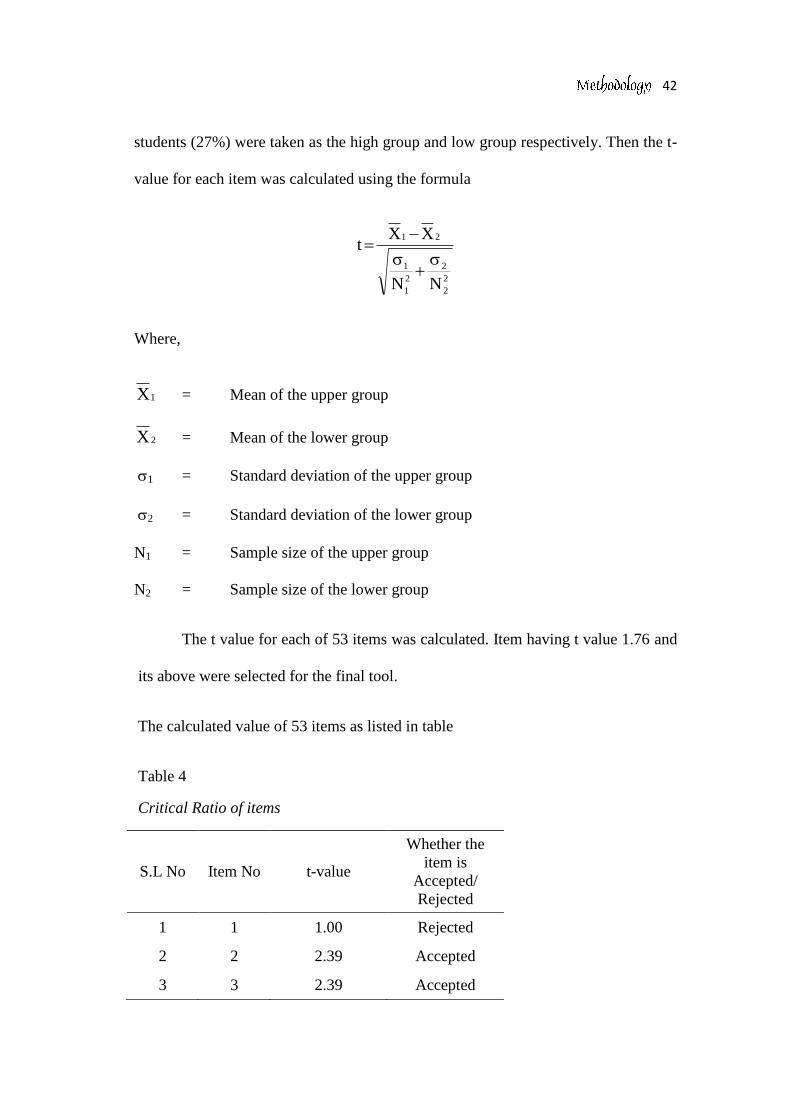
42
students (27%) were taken as the high group and low group respectively. Then the t-
value for each item was calculated using the formula
2
2
2
2
1
1
21
NN
XXt
Where,
1X = Mean of the upper group
2X = Mean of the lower group
1 = Standard deviation of the upper group
2 = Standard deviation of the lower group
N1 = Sample size of the upper group
N2 = Sample size of the lower group
The t value for each of 53 items was calculated. Item having t value 1.76 and
its above were selected for the final tool.
The calculated value of 53 items as listed in table
Table 4
Critical Ratio of items
S.L No Item No t-value
Whether the
item is
Accepted/
Rejected
1 1 1.00 Rejected
2 2 2.39 Accepted
3 3 2.39 Accepted

43
S.L No Item No t-value
Whether the
item is
Accepted/
Rejected
4 4 4.26 Accepted
5 5 2.96 Accepted
6 6 3.52 Accepted
7 7 4.09 Accepted
8 8 3.90 Accepted
9 9 4.16 Accepted
10 10 2.00 Accepted
11 11 1.94 Accepted
12 12 4.08 Accepted
13 13 2.70 Accepted
14 14 4.21 Accepted
15 15 4.40 Accepted
16 16 2.27 Accepted
17 17 3.11 Accepted
18 18 0.44 Rejected
19 19 2.12 Accepted
20 20 3.35 Accepted
21 21 4.88 Accepted
22 22 3.42 Accepted
23 23 3.45 Accepted
24 24 4.61 Accepted
25 25 6.41 Accepted
26 26 3.46 Accepted
27 27 1.06 Rejected
28 28 2.18 Accepted
29 29 1.98 Accepted
30 30 0.90 Rejected
31 31 3.49 Accepted
32 32 4.88 Accepted

44
S.L No Item No t-value
Whether the
item is
Accepted/
Rejected
33 33 2.51 Accepted
34 34 4.76 Accepted
35 35 3.22 Accepted
36 36 4.59 Accepted
37 37 0.27 Rejected
38 38 5.52 Accepted
39 39 0.25 Rejected
40 40 0.39 Rejected
41 41 1.76 Accepted
42 42 7.35 Accepted
43 43 5.56 Accepted
44 44 1.93 Accepted
45 45 6.00 Accepted
46 46 0.42* Rejected
47 47 0.86* Rejected
48 48 1.87 Accepted
49 49 3.35 Accepted
50 50 1.99 Accepted
51 51 0.65* Rejected
52 52 0.46* Rejected
53 53 5.87 Accepted
From the table-x, it is revealed that out 53 items in the Draft Tool, 42 items
are selected to final. This tool was adopted collection of data for this study.
Final tool
Out of 53 items, 42 items with critical ratio greater than or equal to 1.76 is
selected for the final scale. The 11 items with critical ratio less than 1.76 were
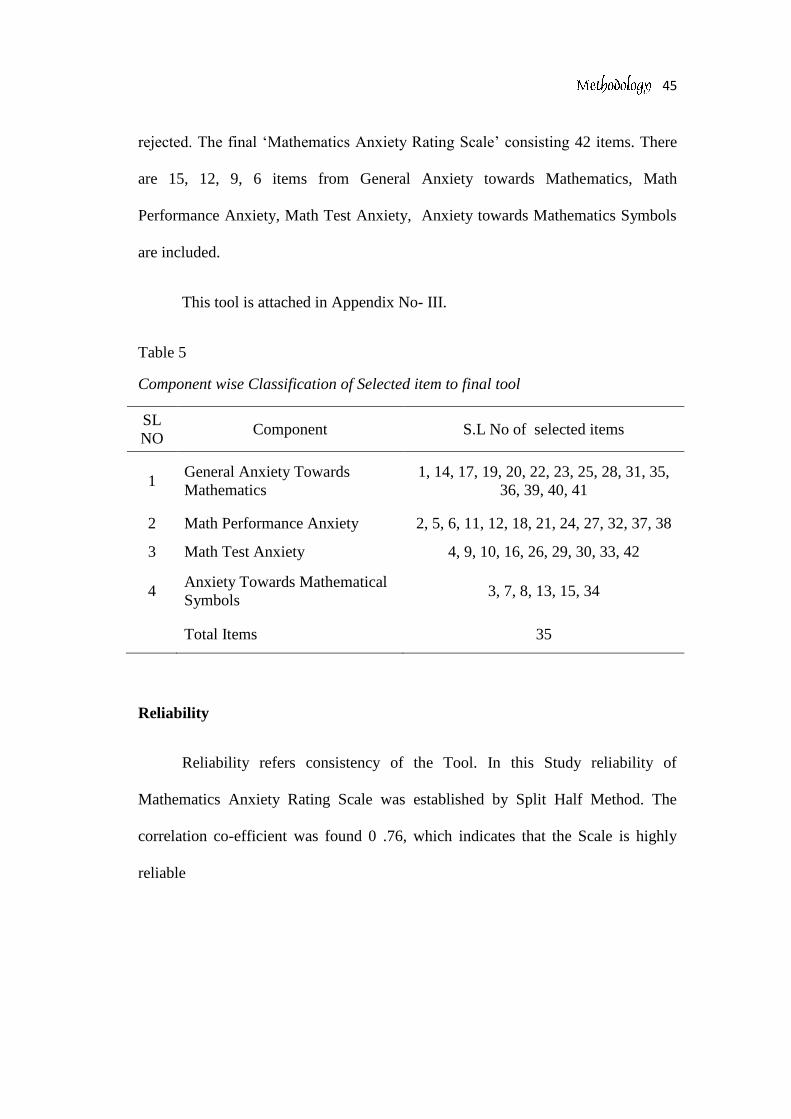
45
rejected. The final „Mathematics Anxiety Rating Scale‟ consisting 42 items. There
are 15, 12, 9, 6 items from General Anxiety towards Mathematics, Math
Performance Anxiety, Math Test Anxiety, Anxiety towards Mathematics Symbols
are included.
This tool is attached in Appendix No- III.
Table 5
Component wise Classification of Selected item to final tool
SL
NO Component S.L No of selected items
1 General Anxiety Towards
Mathematics
1, 14, 17, 19, 20, 22, 23, 25, 28, 31, 35,
36, 39, 40, 41
2 Math Performance Anxiety 2, 5, 6, 11, 12, 18, 21, 24, 27, 32, 37, 38
3 Math Test Anxiety 4, 9, 10, 16, 26, 29, 30, 33, 42
4 Anxiety Towards Mathematical
Symbols 3, 7, 8, 13, 15, 34
Total Items 35
Reliability
Reliability refers consistency of the Tool. In this Study reliability of
Mathematics Anxiety Rating Scale was established by Split Half Method. The
correlation co-efficient was found 0 .76, which indicates that the Scale is highly
reliable

46
Validity
Validity of a research tool refers to how well an instrument as measures what
it is intended to measure. The validity of the scale is ensured using face validity and
content validity. For this investigator consulted three experts in the field of
education. Thus face validity and content validity ensured.
Administration of the Tool
The investigator identified 9 Government and 8 Aided schools from
Malappuram and Kozhikode. With the permission of the head of the concerned
school, investigator distributed the sufficient copies of tools and response sheets
among the students. After given general instruction and method of responses of
each tool was explained. The students were directed to identify the correct answer
involved in the Problem Solving Ability Test and put tick mark (√) against suitable
response in the Mathematics Anxiety Rating Scale.

47
Table 6
List of Institutions of data collected.
Scoring and Consolidation of Data
The investigator checked out the response sheet and scored according to the
scoring procedure.
Statistical Techniques employed for the Study
Based on the objectives and hypotheses of the study, the following statistical
techniques were used to analyse data.
SL NO Name of the schools Type of Management
1 VMC Higher Secondary School Wandoor Government
2 GHS Vaniyambalam Government
3 GHS Neelngeri Government
4 GHS Anchachavidi Government
5 GGHS wandoor Government
6 GHSS Cheruvannoor Government
7 GHS Pantheengavu Government
8 GHS Petta Government
9 Ganapath Government vocational higher
secondary School farook Government
10 Ganapath AUPBS Ramanattukara Aided
11 AUPS Eriyad Aided
12 HMYHSS Manjeri Aided
13 AUPS Pattarkulam Aided
14 HMS AUPS Thurakkal Aided
15 AUPS pantheeragavu Aided
16 Higher secondary school Farook Aided
48
Preliminary Analysis ( Mean, Median, Mode, SD, Skewness and
Kurtosis)
Pecentage Analysis
t-test
Pearson‟s Product Moment Co-efficient of correlation
Preliminary Analysis
To know the nature of data, Mean, Median, Mode, Skewness and Kurtosis
were calculated for the total sample and sub sample based on Gender of the student
and Type of Management of the institution.
Percentage Analysis
Levels of Mathematics Anxiety and Problem Solving Ability among Upper
Primary School students of were calculated by percentage analysis.
Test of significance of difference between mean ( t- test)
The statistical technique, test of significance of difference between means for
different categories was used to find out significant difference between
Mathematics Anxiety and Problem Solving Ability in mathematics among Upper
Primary School students based on gender and type of management using the
formula,
2
2
2
2
1
1
21
NN
XXt

49
Where,
1X = Mean of the upper group
2X = Mean of the lower group
1 = Standard deviation of the upper group
2 = Standard deviation of the lower group
N1 = Sample size of the upper group
N2 = Sample size of the lower group
Pearson’s Product Moment Co-efficient of Correlation
The statistical technique, Pearson‟s Product Moment Co-efficient of
Correlation was used to estimate the relationship between Mathematics Anxiety and
Problem Solving Ability in Mathematics among upper primary school students
2222 )Y()YN)X(XN
)Y()X(XYNr
Where,
X = Sum of the X scores
Y = Sum of the Y scores
X2 = Sum of the squares of X scores
y2 = Sum of the Squares of Y scores
XY = Sum of the product of Y scores
N = Number paired scores

CHAPTER 4
ANALYSIS AND INTERPRETATION
OF DATA

ANALYSIS AND INTERPRETATION OF THE
DATA
Analysis is a systematic process of selecting, categorising, comparing,
synthesizing and interpreting the data. The Study was to find out the relationship
between Mathematics Anxiety and Problem Solving Ability in mathematics among
upper primary school students.
Objective of the Study
1. To find out the level of Mathematics Anxiety among Upper Primary School
students.
2. To find out the level of Problem Solving Ability among Upper Primary
School students.
3. To find out whether there exit significant difference in the level of
Mathematics Anxiety among Upper Primary School students based on
i. Gender
ii. Type of Management.
4. To find out whether there exit significant difference in the level of Problem
Solving Ability among Upper Primary School students based on
i. Gender
ii. Type of Management.

51
5. To find out there exist significant relationship between Mathematics
Anxiety and Problem Solving Ability among Upper Primary School students.
Hypotheses of the Study
1. There exists significant difference in the level of Mathematics Anxiety
among Upper Primary School students based on
i. Gender
ii. Type of Management
2. There exists significant difference in the level of Problem solving ability
among Upper Primary School students based on
i. Gender
ii. Type of Management.
3. There exists significant relationship between Mathematics Anxiety and
Problem Solving Ability among Upper Primary School students
Preliminary Analysis
In preliminary analysis the distribution of the obtained scores of each
variables were examined. Mean, Median, Mode, standard Deviation, Skewness and
Kurtosis were computed for the total sample and the relevant sub samples. These
values are represented in the table as M.A and P.S.A for Mathematics Anxiety and
Problem Solving Ability respectively.

52
Table 7
Preliminary Analysis of the Variables Mathematics Anxiety and Problem Solving
Ability among Upper Primary School Students for the Total Sample and Relevant
Sub Samples
Sample Category Variable Mean Median Mode SD Skewness Kurtosis
N=600
Boys M.A
P.S.A
90.60
17.93
94.00
17.00
108
17
20.208
5.341
-0.458
-0.393
0.321
-0.435
Girls M.A
P.S.A
97.13
16.91
99.50
17.00
107
17
21.122
5.504
-0.428
0.237
-0.240
-0.811
Government M.A
P.S.A
92.87
17.56
95.50
17.00
99
17
21.642
5.457
-3.42
0.284
-0.138
-0.807
Aided
M.A
P.S.A
94.87
17.28
97.00
17.00
99 ͣ
17
20.137
5.435
-0.464
0.314
0.183
-0.381
Total
M.A
P.S.A
93.87
17.42
97.00
17.00
99
17
20.910
5.443
-0.405
0.298
0.002
-0.601
From the table-x it is found that there is not much variation between values
of three measures of central tendencies viz., mean, median and mode of variables.
The values of coefficient of skewness and measures of kurtosis for the variables
depart slightly from that of normality. This indicates that the selected variables of
the study do not exactly fulfill the properties of normal distribution.
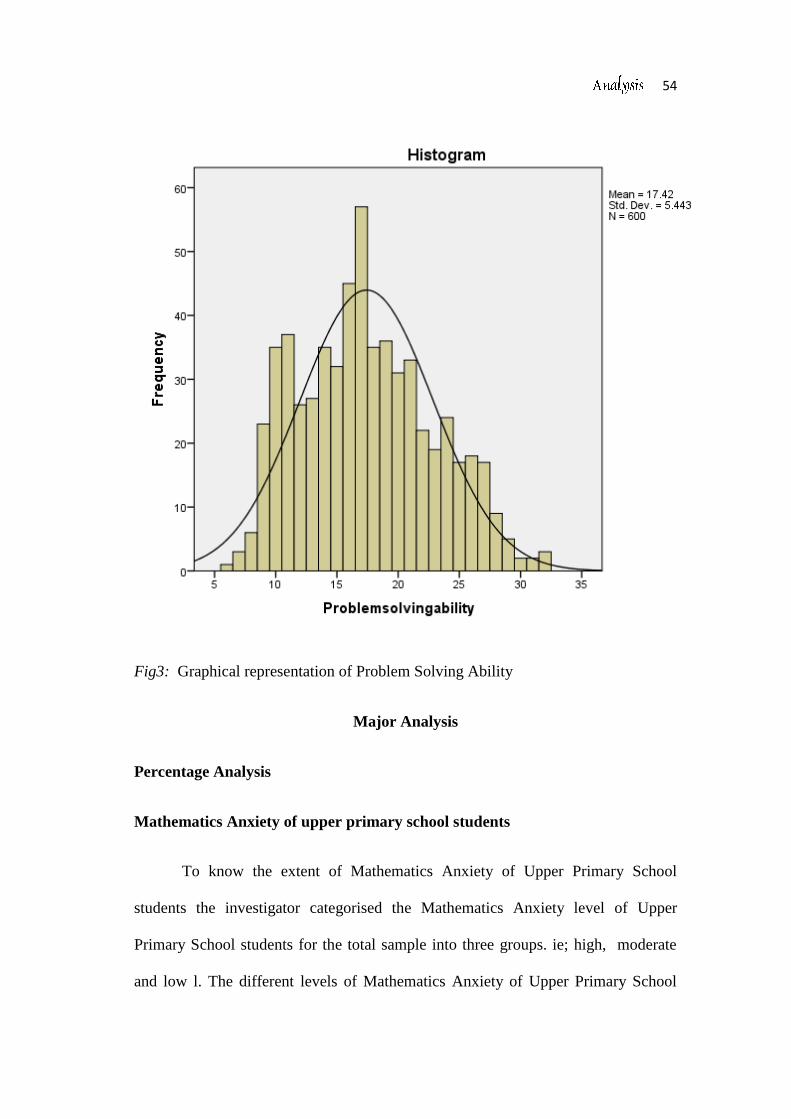
The distribution of the scores of the variables Mathematics Anxiety and
Problem Solving Ability of upper primary school students for the total sample as
graphically plotted was shown below.

53
Fig-2: Graphical representation of Mathematics Anxiety
54
Fig3: Graphical representation of Problem Solving Ability
Major Analysis
Percentage Analysis
Mathematics Anxiety of upper primary school students
To know the extent of Mathematics Anxiety of Upper Primary School
students the investigator categorised the Mathematics Anxiety level of Upper
Primary School students for the total sample into three groups. ie; high, moderate
and low l. The different levels of Mathematics Anxiety of Upper Primary School
55
students was determined by classifying the whole sample into three groups- high,
moderate and low in the conventional procedure of finding Ϭ distance from the
mean µ. The standard deviation (Ϭ) and mean (µ) of the scores are found to be
20.910 and 93.87 respectively. Students who obtained scores above the value of µ+1
Ϭ were considered as the high level and who obtained scores below the value of µ-1
Ϭ were considered as the low level. The students whose score lie between the values
µ-1 Ϭ and µ+1 Ϭ were considered as the moderate level anxiety group. The
percentage of the total sample falling into the three levels (high, moderate and low)
is given in table x.
Table 8
Level of Mathematics Anxiety among Upper Primary School students
Variable Group score N %
Mathematics
Anxiety
High ≥114.78 85 14.16
Moderate 114.78-72.863 420 70
Low ≤72.863 95 15.83
Discussion and Interpretation
Table-x shows level of Mathematics Anxiety of upper primary school
students for the total sample. From table-x it was evidenced that 14.16 percent of the
total sample has high level of Mathematics Anxiety, 70 percent upper primary
school students have moderate level of Mathematics Anxiety and 15.83 percents has
low level Mathematics Anxiety. The graphical representation of the distribution of
the total sample in different levels of Mathematics Anxiety of upper primary school
students are given in fig- x

56
Fig 4: Pie diagram of the Mathematics Anxiety among Upper Primary School
students
Graphical representation of the Mathematics Anxiety level of upper primary
school students shows that majority of upper primary school students‟ having
moderate level of Mathematics Anxiety. The remaining can be classified
approximately equal under high and low level Mathematics Anxiety category.
Problem Solving Ability of upper primary school students
To know the extent of Problem Solving Ability of upper primary school
students the investigator categorised the Problem Solving Ability level of total
sample into three groups. Ie; high, average and low levels. The different levels of
Problem Solving Ability of upper primary school students was determined by
classifying the whole sample into three groups- high, average and low in the
conventional procedure of finding Ϭ distance from the mean µ. The standard
deviation (Ϭ) and mean (µ) of the scores are found to be 5.443 and 17.42
High
Moderate
Low

57
respectively. Students who obtained scores above the value of µ+1 Ϭ were
considered as the high group and who obtained scores below the value of µ-1 Ϭ
were considered as the low group. The students whose score lie between the values
µ-1 Ϭ and µ+1 Ϭ were considered as the average level group. The percentage of the
total sample falling into the three groups (high, average and low) is given in table x
Table 9
Level of Problem Solving Ability among Upper Primary School students
Variable Group Score N %
Problem
Solving
Ability
High ≥22.863 138 23
Average 11.977-22.863 357 59.5
Low ≤11.977 105 17.5
Discussion and Interpretation
Table-x shows the level of Problem Solving Ability among Upper Primary
School students for the total sample. From table-x it was evidenced that 23 percent
of the total sample has high level o Problem Solving Ability, 59.5 percent upper
primary school students has average level of Problem Solving Ability and 15.83
percents has low level Problem Solving Ability. The graphical representation of the
distribution of the total sample in different levels of Problem Solving Ability among
Upper Primary School students are given in fig 5.

58
Fig. 5 : Pie diagram of the level Problem Solving Ability among Upper Primary
School students
Graphical representation of the Problem Solving Ability of Upper Primary
School students shows that majority of upper primary school students have average
level of Problem Solving Ability.
Test of significance of mean difference of Mathematics Anxiety of upper
primary school students between Boys and Girls
To find out whether there is any significant difference of Mathematics
Anxiety among Upper Primary School students based on gender, the mean scores of
Boys and Girls has been compared. The critical ratio is given in the table
High
Average
Low

59
Table 10
Difference of Mathematical Anxiety of Boys and Girls among Upper Primary
School
Category Mean SD t-value Level of
Significance
Boys 90.60 20.208 3.867 .01
Girls 97.13 21.122
*significant at 0.01 level
Discussion and interpretation
From the table-x it shows that the mean scores Boys of and Girls of Upper
Primary level is 90.60 and 97.13 respectively and standard Deviation of Boys and
Girls of Upper primary level 20.208 and 21.12 respectively.
The score obtained for Mathematics Anxiety among Upper Primary School
students based on gender is 3.867 which is a higher value than 2.58, the table value
for significance at 0.01 level. This indicates that there is significant difference in

60
Mathematics Anxiety between Boys and Girls among Upper Primary level.
Figure 6: Graphical representation of difference of Mathematics Anxiety between
Boys and Girls among Upper Primary level.
Test of significance of mean of difference of Mathematics Anxiety of Upper
Primary School students Between Government and Aided school
To find out whether there is any significant difference of Mathematics
Anxiety among Upper Primary School students based on type of management. Their
mean scores of Government and Aided has been compared. The critical ratio is
given in the table
878889909192939495969798
Boy GirlSeries1 90.6 97.13
Ma
hem
ati
cs A
nxie
ty
Chart Title

61
Table 11
Difference of Mathematical Anxiety of Government and Aided Upper Primary
School students.
Category Mean SD t-value Level of
significance
Government 92.87 21.642 -1.172 Not significant
Aided 94.87 20.137
Discussion and Interpretation
From the table-x it shows that the Mean scores of Government Upper
Primary School students is 92.87 and Standard Deviation is 21.642 and that of
Aided Upper Primary School students is 94.87 and Standard Deviation is 20.137
respectively.
The scores of Mathematics Anxiety of Upper Primary School students based
on Type of Management is 1.172 which is a smaller value than 1.96, the table value
for significance at 0.05 level. This indicates that there is no significant difference
between Mean scores of Mathematics Anxiety of Upper Primary School students
based on Type of Management of the institution.
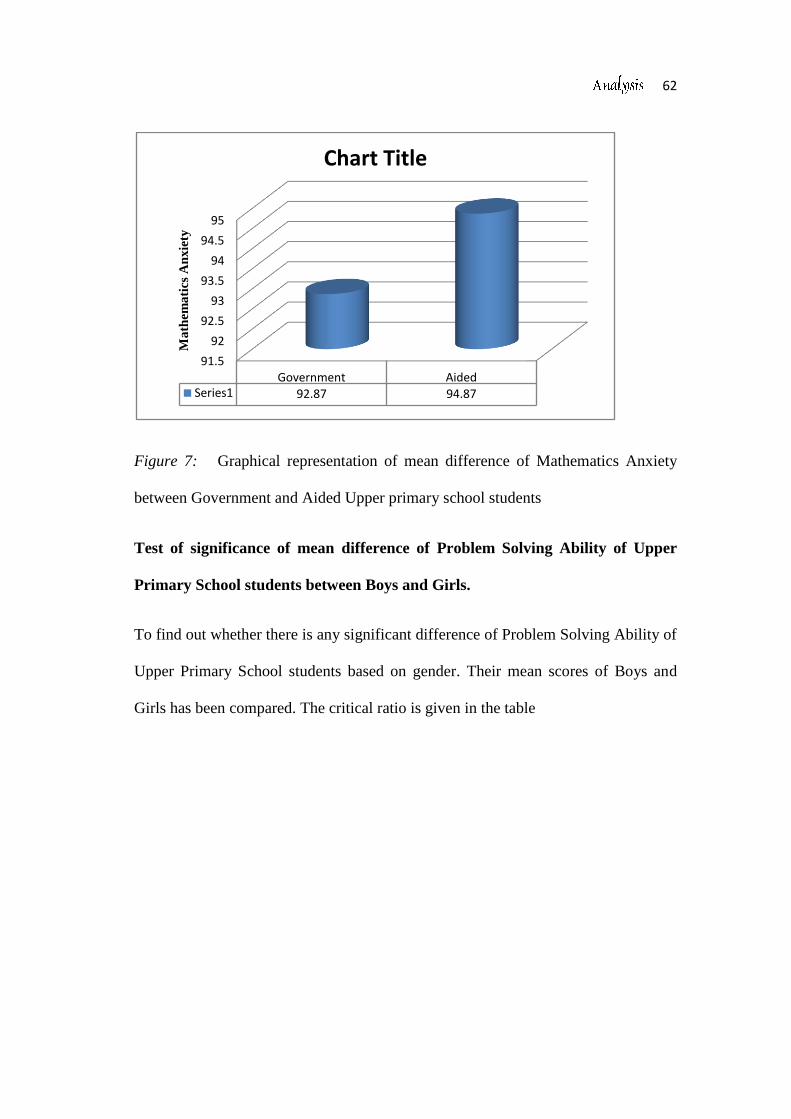
62
Figure 7: Graphical representation of mean difference of Mathematics Anxiety
between Government and Aided Upper primary school students
Test of significance of mean difference of Problem Solving Ability of Upper
Primary School students between Boys and Girls.
To find out whether there is any significant difference of Problem Solving Ability of
Upper Primary School students based on gender. Their mean scores of Boys and
Girls has been compared. The critical ratio is given in the table
91.5
92
92.5
93
93.5
94
94.5
95
Government AidedSeries1 92.87 94.87
Ma
them
ati
cs A
nxie
ty
Chart Title

63
Table 12
Difference of Problem Solving Ability of Boys and Girls among Upper Primary
School.
Category Mean SD t-value Level of
significance
Boys 17.93 5.341
2.319
0.05 Girls 16.91 5.504
* Significant at 0.05 level
Discussion and Interpretation
From the table-x it found that the mean scores of Problem Solving Ability of
Boys of Upper Primary School is 17.93 and Standard Deviation is 5.34 and that of
Girls of Upper Primary School is 16.91 and Standard Deviation is 5.504
respectively.
The scores of Problem Solving Ability of Upper Primary School students
based on gender is 2.319 which is a higher value than 1.96, the table value for
significance at 0.05 level. This suggests s that there is significant difference between
mean scores of Problem Solving Ability of Upper Primary School students based on
gender.

64
Fig. 8: Graphical representation of mean difference of Problem Solving Ability
between boys and girls among Upper Primary School Students.
Test of significance of mean difference of Problem Solving Ability of Upper
Primary School students between Government and Aided schools.
To find out whether there is any significant difference of Problem Solving
Ability of upper primary school students based on type of management. Their mean
scores of Government and Aided has been compared. The critical ratio is given in
the table
16.4
16.6
16.8
17
17.2
17.4
17.6
17.8
18
Boy GirlSeries1 17.93 16.91
Pro
ble
m S
olv
ing
Ab
ilit
yChart Title

65
Table 13
Difference of Problem Solving Ability of Government and Aided Upper Primary
School students
Category Mean SD t-value Level of
significance
Government 17.56 5.457 .615 Not significant
Aided 17.28 5.435
Discussion and Interpretation
From the table-x it can be observed that the Mean scores of Problem Solving
Ability of Government Upper Primary School students is 17.56 and Standard
Deviation is 5.457 and that of Aided Upper Primary School students is 17.28 and
Standard Deviation is 5.435 respectively.
The t-value obtained in the case of Problem Solving Ability of Upper
Primary School students based on Type of Management is 0.615 which is a smaller
value than 1.96, the table value for significance at 0.05 level. This indicates s that
there is no significant difference between mean scores of Problem Solving Ability of
Upper Primary School students based on type of management.
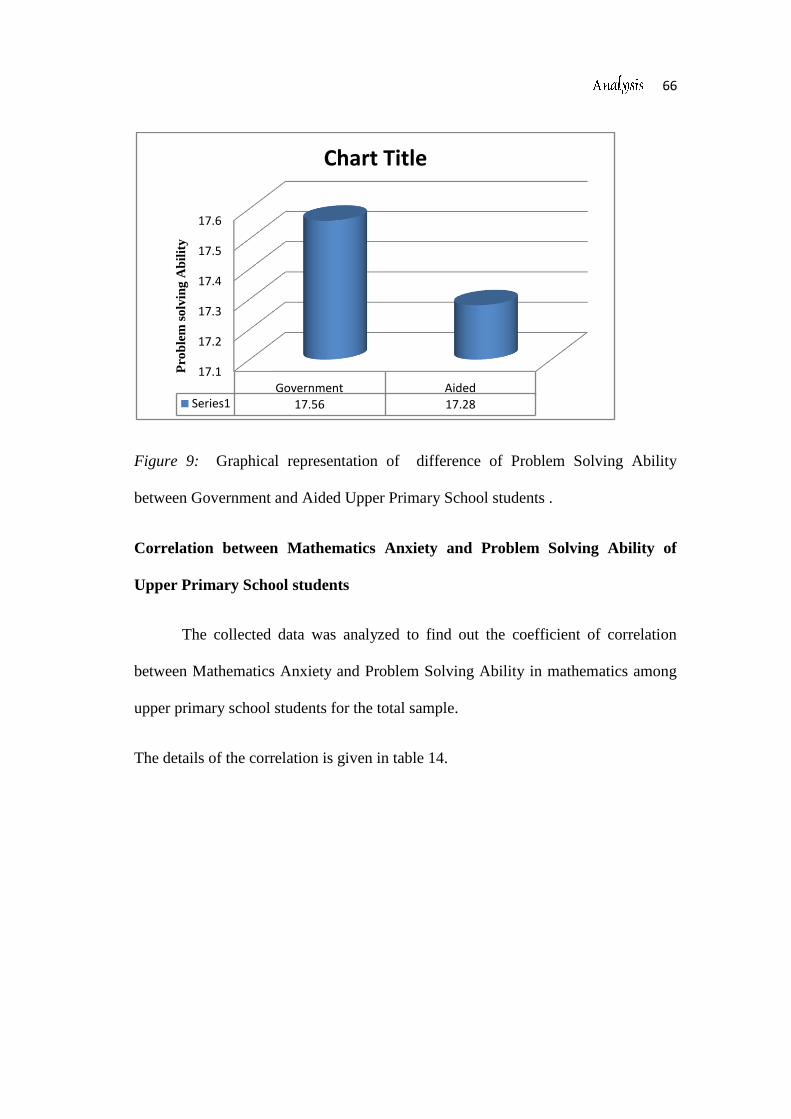
66
Figure 9: Graphical representation of difference of Problem Solving Ability
between Government and Aided Upper Primary School students .
Correlation between Mathematics Anxiety and Problem Solving Ability of
Upper Primary School students
The collected data was analyzed to find out the coefficient of correlation
between Mathematics Anxiety and Problem Solving Ability in mathematics among
upper primary school students for the total sample.
The details of the correlation is given in table 14.
17.1
17.2
17.3
17.4
17.5
17.6
Government AidedSeries1 17.56 17.28
Pro
ble
m s
olv
ing
Ab
ilit
y
Chart Title

67
Table 14
Correlation between Mathematics Anxiety and Problem Solving Ability in
Mathematics among Upper Primary School Students
Variables related Mean SD N
Co-efficient
of
correlation
Level of
significance
Mathematics Anxiety 93.87 20.910 600
-.182
0.01 Problem Solving
Ability 17.42 5.443 600
Discussion and Interpretation
From the table-x it shows that the co-efficient correlation between
Mathematics Anxiety and Problem Solving Ability in mathematics among Upper
Primary School students in the total sample
The co-efficient of correlation obtained for the total sample is -.182.The
value obtained suggests that the relation between the variables is significant at0.01
level as the „r‟ is greater than the table value required for significance at 0.01 level.
The magnitude and direction of „r‟ indicates the existence of negligible negative
relationship between variables. Hence it can be concluded that there exists a
significant negligible and negative relationship between the variables Mathematics
Anxiety and Problem Solving Ability for the total sample.

68
Conclusion
From the analysis the investigator reached the conclusion, there is significant
negligible negative relationship between Mathematics Anxiety and Problem Solving
Ability in mathematics among Upper Primary School students for the total sample.

CHAPTER- 5
SUMMARY, FINDINGS,
CONCLUSION AND SUGGESTION

SUMMARY, FINDINGS, CONCLUSION AND
SUGGESTION
This chapter focuses the important stages of the study and their findings,
educational implications and suggestions for further research
Study in Retrospect
The various aspects related to the present study like problem, variables,
objectives, hypotheses, methodology are following in brief.
Restatement of the Problem
RELATIONSHIP BETWEEN MATHEMATICS ANXIETY AND
PROBLEM SOLVING ABILITY IN MATHEMATICS AMONG UPPER
PRIMARY SCHOOL STUDENTS.
Variables of the Study
The main variables involved in the study are
1) Mathematics Anxiety
2) Problem Solving Ability
Gender and type of management treated as the categorical variables

70
Objective of the Study
1. To find out the level of Mathematics Anxiety among Upper Primary School
students.
2. To find out the level of Problem Solving Ability among Upper Primary
School students.
3. To find out whether there exit significant difference in the level of
Mathematics Anxiety among Upper Primary School students based on
i. Gender
ii. Type of Management.
4. To find out whether there exit significant difference in the level of Problem
Solving Ability among Upper Primary School students based on
i. Gender
ii. Type of Management.
5. To find out there exist significant relationship between Mathematics Anxiety
and Problem Solving Ability among Upper Primary School students.
Hypotheses of the Study
1. There exists significant difference in the level of Mathematics Anxiety
among Upper Primary School students based on
i. Gender
ii. Type of Management.

71
2. There exists significant difference in the level of Problem solving ability
among Upper Primary School students based on
i. Gender
ii. Type of Management.
3. There exists significant relationship between Mathematics Anxiety and
Problem Solving Ability among Upper Primary School students
Methodology of the Study
It deals with the brief description of sample, tools and statistical techniques
used for the study.
Sample
The sample selected for the study contains 600 Upper Primary School
students belonging to Malappuram and Kozhikode districts. The sample selected
using stratified random sampling techniques giving due representation to gender and
type of management.
Tools used for the Study
1. Mathematics Anxiety Rating Scale (Muhsina&Rishad, 2018)
2. Problem Solving Ability Test (Jithina&Vijayakumari)

72
Statistical Techniques
Preliminary Analysis
Measures of central tendency- mean, median, mode
Standard deviation, skewness, kurtosis
Major Analysis
Percentage analysis
Two-tailed test of significance of difference between mean scores for large
independent sample( t-test)
Pearson‟s Product Moment Co-efficient of correlation
Major Findings of the Study
Percentage of the different levels of Mathematics Anxiety among Upper
Primary School Students falling into high, moderate and low group as 16.16,
70, 15.83 respectively
Percentage of the different levels of Problem Solving Ability in mathematics
among Upper Primary School students falling into high, average and low as
23, 59.5 and 17.5 respectively
The t-value obtained in the case of Mathematics Anxiety of Upper Primary
School students based on gender is 3.87 which is higher value than 2.58, the
table value for significance at 0.01 level. Hence there is significant difference

73
between mean scores of Mathematics Anxiety of Upper Primary School
students based on gender.
The t-value obtained in the case of Mathematics Anxiety of Upper Primary
School students based on type of management is 1.172 which is smaller
value than 1.96, the table value for significance at 0.05 level. This indicates
that there is no significant difference between mean scores of Mathematics
Anxiety of upper primary school students based on type of management of
the institution
The t-value obtained in the case of Problem Solving Ability of upper primary
school students based on gender is 2.319 which is higher value than 1.96,
the table value for significance at 0.05 level. This suggests that there is
significant difference between mean scores of Problem Solving Ability of
upper primary school students based on gender
The t-value obtained in the case of Problem Solving Ability of upper primary
school students based on type of management is 0.615 which is smaller value
than 1.96, the table value for significance at 0.05 level. This indicates that
there is no significant difference between mean scores of Problem Solving
Ability of upper primary school students based on type of management of the
institution
The co-efficient of correlation (r= -0.182) obtained for the total sample
shows that there is significant negligible relationship between Mathematics

74
Anxiety and Problem Solving Ability in mathematics among Upper Primary
School students
Tenability of hypotheses
Based on the findings the tenability of the hypotheses of the study was
reviewed
The first hypothesis states that “there exists significant difference in the
level of Problem Solving Ability among upper primary school students based
on gender and type of management”. The finding says that there exists
significant difference between mean scores of Mathematics Anxiety of upper
primary school students based on gender but there exists no significant
difference between mean scores of Mathematics Anxiety of upper primary
school students based on type of management. So the first hypothesis is
partially substantiated
The second hypothesis states that “There exists significant difference in the
level problem solving ability among upper primary school students based on
gender and type of management”. The findings shows that there exists
significant difference between mean scores Problem Solving Ability of upper
primary school students based on gender and type of management. So the
fourth hypothesis is accepted.
The Third hypothesis states that “There exists significant relationship
between Mathematics Anxiety and Problem Solving Ability among upper
primary school students. It was found that there is negligible negative

75
relationship between these two variables. So the fifth hypothesis is
substantiated.
Conclusion
The study was conducted with the objective of finding the relationship
between Mathematics Anxiety and Problem Solving Ability in mathematics among
upper primary school students. This was studied using statistical techniques like
Pearson‟s Product moment coefficient of correlation „r‟
Based on the analysis the investigator reached the following conclusions.
There exists a negligible negative relationship between Mathematics Anxiety and
Problem Solving Ability in mathematics among upper primary school students.
Significant difference does not exist in the mean scores of Mathematics Anxiety and
Problem Solving Ability in mathematics among upper primary school students based
on the sub sample type of management. Though significant difference exists in the
mean scores of Mathematics Anxiety and Problem Solving Ability in mathematics
among upper primary school students based on the sub sample gender.
Educational Implication of the Study
The study was intended to find out whether there is any significant
relationship between the Mathematics Anxiety and Problem Solving Ability in
mathematics among upper primary school students. The study reveals that there
exists a negligible negative relationship between Mathematics Anxiety and Problem
Solving Ability in mathematics among upper primary school students.

76
1. Mathematics is regarded as most anxious school subject to the majority of
students. This study enlighten the causes of this anxiety and suggest some
practical measures to resolve Mathematics Anxiety
2. Developing Problem Solving Ability is considered as one of the prime
objective of education. These studies emphasise and analyse various factors
that foster Problem Solving ability of learners.
3. Majority of students facing various forms anxiety and it will be a major
threaten to their academic achievement. Through this investigation the
researcher was analysed the practical solution for this anxiety to an extent
4. Researcher strongly believe that findings of this study will definitely help to
create interest and motivation in learning mathematics by removing Anxiety
towards Mathematics
5. There is no doubt that the various stakeholders of education that is students,
teachers, educational administrators, policy makers etc. will help this study
to maximize mathematical achievement of the society.
Suggestion for Further Research
1. A parallel study can conducted to find out the relationship between
Mathematics Anxiety and Problem Solving Ability among Secondary school
students and Higher Secondary School students.
2. It will be worthy to conduct a study to explore the relationship between
Mathematics Anxiety and logical thinking ability
3. An exploratory study may be conducted to know how scientific temper will
influence Problem Solving Ability of a learner

77
4. A descriptive study may be conducted by incorporating more dimensions in
Mathematics Anxiety
5. The researcher highly recommends for an attempt to develop an instructional
strategy to remove Mathematics anxiety.

BIBLIOGRAPHY
Abbasi,m.,Smadzadeh,m.&Shahbazzadigan.(2013).Study of Mathematics Anxiety in
High School students and its Relationship with self-esteem and Teachers
Personality Charecteristics
Alam al-Hoda H, (2000). Mathematics anxiety. Journal of Psychology and
Educational Sciences, 5(1)
Ali,M.&Mutawah,A.(2015).The influence of Mathematics Anxiety in middle and
High School Students Math Achievement. International educational Studies
8(11).239-251.doi:10.5539/ies.v8nIIp239
Ali,S.(2013).Mathematics Anxiety viz-A-viz Motivation, Perfomance Approach
Orientation, Problem Solving and Impact of Pedagogical Intervention: A
Study among Perspective Teachers of Delhi. Indian Journal of Teache
Education Anweshika. 8 (1), 36-48.
Asharani,K.& Anu Francis (2015).Effect of Vedic Mathematics on speed and
Accuracy in Problem Solving Ability in Mathematics among Upper Primary
Secondary Level. Journal of research and Extension in Education.10(1),8-
16.
Ashcraft,M.H.,&Kirk,E.P.(2001),The relationship among working memory,math
anxiety,and performance.Journal of experimental psychology
:Genaral,130(224-).doi:10.1037/0096-3445.130.2.224
Ashcraft,Kirk,m,&Elizabeth,P.(2001).The Relationship among Working Memory,
Math Anxiety and Perfomance.Journal of Experimental
Psychology.130(2),224-237.

79
Baron, R.A., & Misra, G. (2014). Psychology. New Delhi: Dorling Kindersly.
Cockcroft,W.H.(1982) Mathematics Counts: Report of the Commission of Inquiry
into the Teaching of Mathematics in Schools, Majesty's Office, London
Barwal,s,K.&Sharma,p.(2013).Academic Achievement of High School Students in
Relation to their Mathematics Anxiety. Eduresearch 4 (1), 47-52.
Beegum,F.,& Devi,S.N. (2016).Relationship between problem solving ability and
mathematic anxiety in X standard students. Journal of educational research
and extension,53(4),5-13.
Layon, S.C&Beilock,S.L(2011). Female Teachrs Mathematics Anxiety Effect and
Girls Mathematics Achievement. Proceedings of National Academy of
Science, 107(5), 1760-1863.
Bekdemir,m.(2010).The Pre-service Teachers Mathematics Anxiety Related to
Depth of Negative Experiences in Mathematics Classroom While they were
Students.Educational Studies in Mathematics.75(3), 311-32
Bindu,M,P.(2011).Effectiveness of discovery Learning Approach on Problem
Solving Ability at Primary Level. Journal of Studies in Teacher Education.
4(1).29-37.
Brown,K.E.,Mcswain,E.T.,Gundlach,B.H.,Cooke,R.J.(Eds).(1963).Mathematics:Am
erica:Laidlaw brothers.

80
Cates,G,L.& Rhymer,K,N.(2003).Examining the Relationship BetweenMathematics
Anxiety and Mathematics Perfomance: An InstructionalHeirarchy
Perspective.Journal of Behavioural Education.12(1),23-24.
Dhadhich,A.(2016).A study of Problem Solving Ability of IX STD Students.
Journal of Educational & Psychological Research.6(1),82-84
Dossel, S. (1993). Maths anxiety. The Australian Mathematics Teacher, 49(1),
4-8.
Else-Quest, N. M., Hyde, J. S., & Hejmadi, A. (2008). Mother and child
emotions during mathematics homework. Mathematical Thinking and
Learning, 10(1), 5-35.
Gagne, R.M.(1965). The Conditions of Learning.New York: Holt, Rinehart&
Winson. Retrieved from http://ocw.metudu.tr/pluginfile.php/9013/
modresorce/sontent/driscoll-ch10%20%281%29pdf
Garry VS 2005. The Effect of Mathematics Anxiety on theCourse and Career Choice
of High School. Ph. D.Thesis (Unpublished), Philadelphia: DrexelUniversity
Gurganus, S. P. (2007). Math instruction for students with learning problems.
Boston: Pearson Education
Higgins, J., & Parsons, R. (2009). A successful professional development model
in mathematics: A systemwide New Zealand case. Journal of Teacher
Education, 60(3), 231-242.
81
Hyde, J.s, Fennem& Lamon,S(1990). Gender Difference Mathematics Perfomance:
A Meta analysis. Psychological Bulletin 107(2),139. Retrieved
from.https/www.Research gate.net.
Jidhina,k.,Vijayakumari,k.(2017).Problem solving ability in mathematics among
upper primary school students of Kerala.(unpublished master‟s
thesis).Farook training college,Calicut.
Jose,N,M.&Thomas,R,P.(2011).Problem Solving Ability and Scholastic
Achievement of Secondary School Students.GCTE Journal of research and
Extension in Education.6(1),141-144.
Karimi,A.& Venkatesan,S.(2009).Mathematics Anxiety, Mathematics performance
and academic Hardiness in High School Students.International Journal of
Educational Science.1(1),33-37.
Koul,L.(2014).Methodology of Eucational Research.New Delhi:Vikas publication.
Latterell, C. M. (2005). Social stigma and mathematical ignorance. Academic
Exchange Quarterly, 9(3), 167-171.
Lebens, M., Graff, M., & Mayer, P. (2010). The affective dimensions of
mathematical difficulties in schoolchildren. Education Research
International, 2011
Liebert,R.M&Morris,L.W(1967). Cognitive and Emotional component of Test
Anxiety: A distinction and some initial Data. Sage Journal. 4(7). Doi:
10.2466/pro.1967.20.3.975

82
Lizzie,J.(2017).ProblemSolving Ability in Mathematics in Relation to their
Academic Achievement among higher Secondary School Students. Journal
of Educational & Psychological Research .7(1),36-40.
Ma, X. (1999). A meta-analysis of the relationship betweenanxiety toward
mathematics and achievement in mathematics. Journal for research in
mathematics education,30(5),520-540
Mehar,R.&Sanwal,N.(2017).Effect of Inquiry Training Model on Achievement in
Mathematics in Relation to Mathematics Anxiety.Journal of
Education&psychology.7(2),174-181.
Miller, H., & Bichsel, J. (2004). Anxiety, working memory, gender, and math
performance. Personality and Individual Differences, 37(3), 591-606.
Muthuchamy& Joseph,M,U,C. (2015). Relationship Between Creativity and
Problem Solving Skills among B.Ed.Trainees in Mysore.Educational
Extracts 3(2), 74-78.
National Curriculum Framework.(2005).National Council of Educational Research
and Training.Retrieved from http://www.ncert.nic.in/rightside/link/pdf/
framework/english nf 2005.pdf
Neill, A., Fisher, J., & Dingle, R. (2010). Exploring mathematics interventions:
Exploratory evaluation of the accelerating learning in mathematics pilot
study. Wellington: NZCER.
83
Newell , A.,& Simon, H.(1972). Retrived from Cognitive Psychology.
Wikidot.Icom/cognition:problem-solving
Ornstein, A.C.(1990). Institutionalised learning in America. New
Brunwick:Transaction. Retrieved from http://books.google.lco.in/books
///////.?isbn=142826349
Parvathy,K.(2002). A study of problem solving ability in mathematics of X
standard students of Palakkad district.(unpublished master‟s thesis).Farook
training college, Calicut
Piaget, J.(1971)The theory of Stages in Cognitive Development. In D.R.Green, M.P
Ford, & G. B. Flamer (Eds.) , Measurement and Piaget. New York:
McGraw-Hill.
Piaget, J.(1970). Science of education and Psychology of learning child. New York:
Vyking
Paeinkerton, S.P. (2005). Attention Deficits and Hyperactivity in children. ASGE
publications
Rani,B,G.& Begum,F,A.(2016). Problem Solving Ability and Emotional intelligence
of Higher secondary School Students. Journal of educational Research and
Extension 53(1),47-57
Richardson,F.C.,& Suinn,R.N.(1972)The mathematics anxiety rating scale,Journal
of councelling, 19(551-554).doi:10.1037/h0033456.

84
Sameena,M.A.(2008). Interaction effect of classroom climate and learning
strategies on mathematical problem solving ability of secondary school
students.(unpublished master‟s thesis). Farook training college, Calicut
Sharma,S & Sood,S (2015).Cognitive Styles in Relation to Problem Solving ability
among adolescence. Journal of Psychological Research. 5(1),106-109.
Sheffield, D. & Hunt, T. (2006) How does anxiety influence methods performance
and what can we do about it? MSOR Connections, 6 (4) 19-23
Sloan,t,& Daane,C,J. (2002). Mathematics Anxiety and Learning Style: What is the
Relationship in Elementary Pre-service Teachers?.School Science and
Mathematics. 102(2), 84-87.doi:org/10.1111/j.1949-8594.2002.tb17897.x.
Sood,S., & Richa (2015). Do Gender Difference Exists in Scientific attitude and
Problem Solving Ability among Adolescence. Educational and
Psychological Research. 5(1), 65-68.
Sonia,R.S.R., & Bindu,R.L.(2017).Relationship Between Problem Solving Ability in
Mathematics and Numerical Ability of Secondary Level Students. GCTE
Journal of research and Extension in Education 12(1),62-66.
Shields, D. J. (2005). Teachers have the power to alleviate math anxiety.
Academic Exchange Quarterly, 9(3), 326-330
Spicer, J. (2004). Resources to combat math anxiety. Eisenhower National
Clearinghouse Focus 12(12).
Sternberg, R.J. (2007) Cognitive Psychology. New Delhi: Akash

85
Tewari,A.d.(1990). Reasoning abilities and achievement in mathematics.New Delhi:
common wealth publishers.
Tyagi,T,K.(2015). Relationship Between Journal of Educational & Psychological
Research Mathematical Creativity and Mathematical Problem-Solving
Performance. Journal of Indian Education. 39(3),80-89.
Usha,P.Devi,S,M.B.Gain in Problem solving Ability Through Peer Mentoring- A
Study on Higher Secondary School Students. Journal of Studies in Teacher
education. 7(2),70-77.
Verma, B.P. & Gupta,R.(1990). A Study of Relationship of cognitive style with
anxiety and academic achievement. The journal of educational psychology.,
48 (3-4):156-161
Vidya,R,R.& Malin,P.M.(2016). A Study on the relationship between Critical
Thinking Skills and Problem Solving Ability among Adolescence.GCTE
Journal of research and Extension in Education. 11(2).62-66.
Vinson, B. M. (2001). A comparison of preservice teachers‟ mathematics
anxiety before and after a methods class emphasizing manipulatives.
Early Childhood Education Journal, 29(2), 89-94
Young-Loveridge, J., Taylor, M., Sharma, S., & Hāwera, N. (2006). Students‟
perspectives on the nature of mathematics. In P. Grootenboer, R.
Zevenbergen & M. Chinnappan (Eds.), Identities, cultures, and learning
spaces (Proceedings of the 29th Annual Conference of the Mathematics

86
Education Research Group of Australasia, pp. 583-590). Retrieved from
http://www.merga.net.au/documents/RP682006.pdf
Zaharia,E & Nordin,N,M(2008).The Effect of Mathematics Anxiety on
Matriculation Students as related to motivation and achievement. Eurasia
Journal of Mathematics,. Science and Technology Education. 4(1), 27-30.
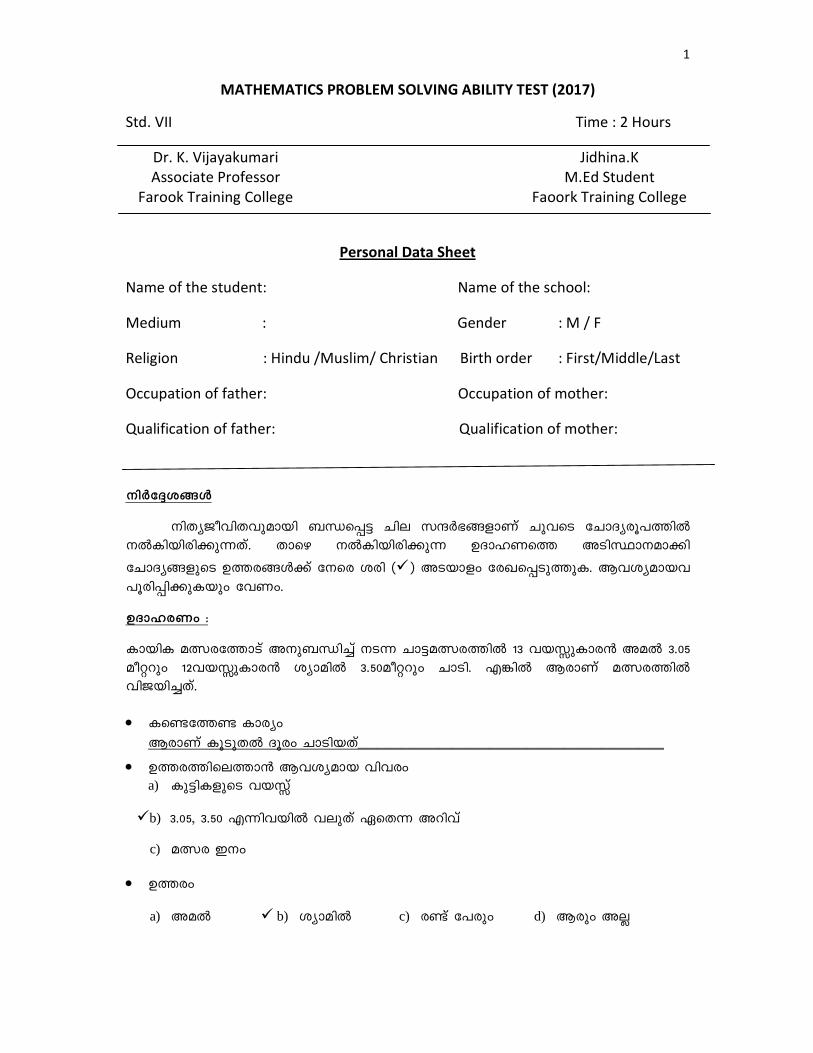
1
MATHEMATICS PROBLEM SOLVING ABILITY TEST (2017)
Std. VII Time : 2 Hours
Dr. K. Vijayakumari Jidhina.K
Associate Professor M.Ed Student
Farook Training College Faoork Training College
Personal Data Sheet
Name of the student: Name of the school:
Medium : Gender : M / F
Religion : Hindu /Muslim/ Christian Birth order : First/Middle/Last
Occupation of father: Occupation of mother:
Qualification of father: Qualification of mother:
\nÀt±i§Ä
\nXyPohnXhpambn _Ôs¸« Nne kµÀ`§fmWv NphsS tNmZycq]¯n \ÂInbncn¡p¶Xv. Xmsg \ÂInbncn¡p¶ DZmlWs¯ ASnØm\am¡n
tNmZy§fpsS D¯c§Ä¡v t\sc icn (�) ASbmfw tcJs¸Sp¯pI. Bhiyambh ]qcn¸n¡pIbpw thWw.
DZmlcWw :
ImbnI aÕct¯mSv A\p_Ôn v̈ \S¶ Nm«aÕc¯n 13 hbÊpImc³ Aa 3.05 aoädpw 12hbÊpImc³ iyman 3.50aoädpw NmSn. F¦n BcmWv aÕc¯n hnPbn¨Xv.
• Is−t¯− Imcyw BcmWv IqSpXÂ Zqcw NmSnbXv_________________________________________________
• D¯c¯nse¯m³ Bhiyamb hnhcw a) Ip«nIfpsS hbÊv
�b) 3.05, 3.50 F¶nhbn hepXv GsX¶ Adnhv
c) aÕc C\w
• D¯cw
a) Aa � b) iyman c) c−v t]cpw d) Bcpw AÃ
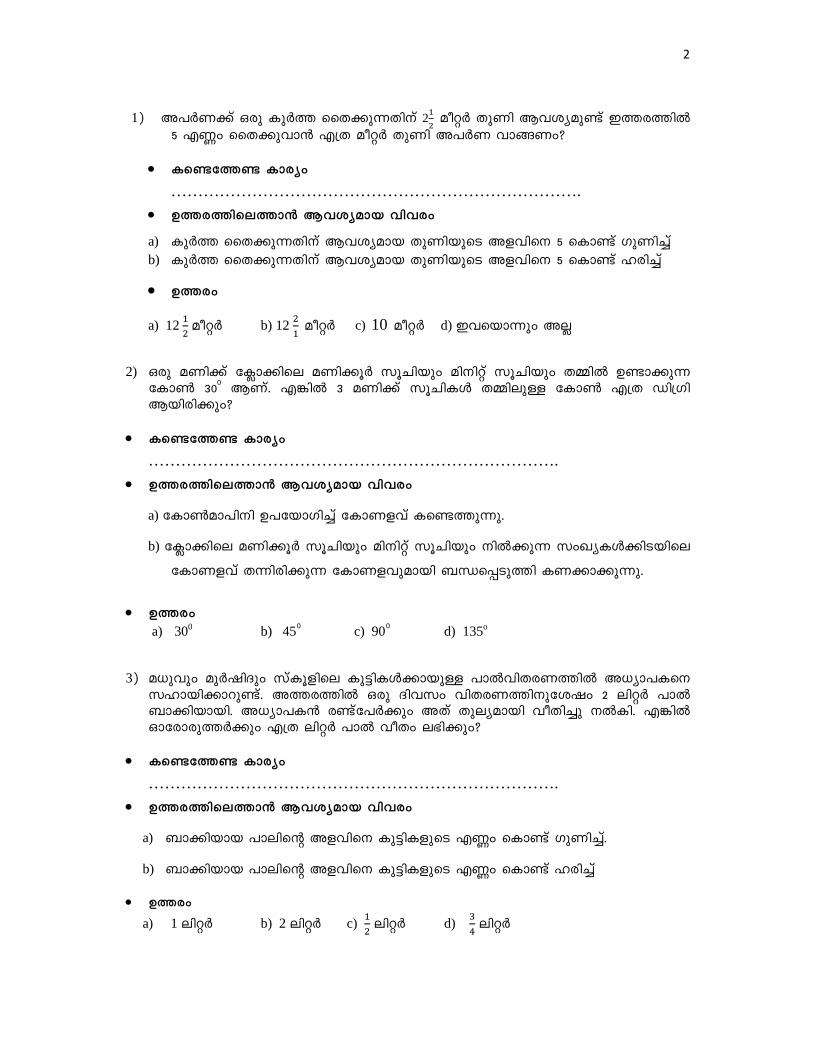
2
1) A]ÀW¡v Hcp IpÀ¯ ssX¡p¶Xn\v 2�
� aoäÀ XpWn Bhiyap−v C¯c¯nÂ
5 F®w ssX¡phm³ F{X aoäÀ XpWn A]ÀW hm§Ww?
• Is−t¯− Imcyw
………………………………………………………………….
• D¯c¯nse¯m³ Bhiyamb hnhcw
a) IpÀ¯ ssX¡p¶Xn\v Bhiyamb XpWnbpsS Afhns\ 5 sIm−v KpWn¨v b) IpÀ¯ ssX¡p¶Xn\v Bhiyamb XpWnbpsS Afhns\ 5 sIm−v lcn¨v
• D¯cw
a) 12�
�aoäÀ b) 12
�
� aoäÀ c) 10 aoäÀ d) Chsbm¶pw AÃ
2) Hcp aWn¡v t¢m¡nse aWn¡qÀ kqNnbpw an\näv kqNnbpw X½n D−m¡p¶ tIm¬ 300 BWv. F¦n 3 aWn¡v kqNnIÄ X½nepÅ tIm¬ F{X Un{Kn Bbncn¡pw?
• Is−t¯− Imcyw
………………………………………………………………….
• D¯c¯nse¯m³ Bhiyamb hnhcw
a) tIm¬am]n\n D]tbmKn v̈ tImWfhv Is−¯p¶p.
b) t¢m¡nse aWn¡qÀ kqNnbpw an\näv kqNnbpw \n¡p¶ kwJyIÄ¡nSbnse
tImWfhv X¶ncn¡p¶ tImWfhpambn _Ôs¸Sp¯n IW¡m¡p¶p.
• D¯cw
a) 300 b) 450 c) 900 d) 135o
3) a[phpw apÀjnZpw kvIqfnse Ip«nIÄ¡mbpÅ ]mÂhnXcW¯n A[ym]Is\ klmbn¡mdp−v. A¯c¯n Hcp Znhkw hnXcW¯n\ptijw 2 enäÀ ]m _m¡nbmbn. A[ym]I³ c−vt]À¡pw AXv Xpeyambn hoXn¨p \ÂIn. F¦n Hmtcmcp¯À¡pw F{X enäÀ ]m hoXw e`n¡pw?
• Is−t¯− Imcyw
………………………………………………………………….
• D¯c¯nse¯m³ Bhiyamb hnhcw
a) _m¡nbmb ]mensâ Afhns\ Ip«nIfpsS F®w sIm−v KpWn v̈.
b) _m¡nbmb ]mensâ Afhns\ Ip«nIfpsS F®w sIm−v lcn v̈
• D¯cw
a) 1 enäÀ b) 2 enäÀ c) �
� enäÀ d)
�
� enäÀ

3
4) dloansâ ho«n \n¶pw 8.5 IntemaoäÀ Zqcap−v Ah³ ]Tn¡p¶ kvIqfnte¡v F¶pw BZys¯ Ipd v̈ Zqcw ssk¡nfnepw ]n¶oSv 5.4 IntemaoäÀ _ÊnepamWv Ah³ bm{X sN¿mdpÅXv. F¦n F{X IntemaoädmWv dlow ssk¡nfn k©cn¡p¶Xv?
• Is−t¯− Imcyw
………………………………………………………………….
• D¯c¯nse¯m³ Bhiyamb hnhcw
a) BsI k©cn¨ Zqchpw _kn k©cn¨ Zqchpw ]cnKWn¨v
b) BsI k©cn¨ Zqcw am{Xw ]cnKWn¨v
• D¯cw
a) 13.9 IntemaoäÀ b) 3 IntemaoäÀ c) 31 IntemaoäÀ d) 3.1 IntemaoäÀ
5) Akva, AYo\ F¶nhÀ Ab¡mcmWv. IqSmsX Hmtcm Ab¡q«¯nse AwK§fpw CSbv¡nSbv¡v ChÀ Ab¡q«¯n \n¶pw ]Ww ISw hm§m dp−v. Hcn¡Â ISw hm§nb XpIbn Akva 5000 cq]bpw AYo\, Akva \ÂIm\pÅ XpIbpsS 3 aS§pw Xncn v̈ sImSp¡Ww. F¦n F{X cq] AYo\ Xncn v̈ \ÂIWw?
Is−t¯− Imcyw
………………………………………………………………….
• D¯c¯nse¯m³ Bhiyamb hnhcw
a) Akva \ÂIm\pÅ XpItbmSv 3 Iq«nbXv
b) Akva \ÂIm\pÅ XpIsb 3 sIm−v KpWn v̈
c) Akva \ÂIm\pÅ XpIsb 3 sIm−v lcn¨v
• D¯cw
a) Rs.1,667 b) Rs.1,845 c) Rs.5,003 d) Rs.15,000
6) kvIqÄ ItemÂkh¯nsâ `mKambn {][m\thZnbn Ip«nIÄ¡mbn Ccn¡m³ 100 _©pIfpw 50 ItkcIfpw D−v. Hmtcm _©nepw 4 Ip«nIÄ hoXw Ccn¡p ¶p. _m¡n DÅhÀ ItkcIfnepw IqSmsX Øew e`yaÃm¯Xn\m 20 t]À \n¶p ]cn]mSn ho£n¡p¶p. F¦n {][m\thZnbn BsI F{X Ip«nIÄ¡v ]cn]mSn ho£n¡m\mhpw?
• Is−t¯− Imcyw
………………………………………………………………….
• D¯c¯nse¯m³ Bhiyamb hnhcw
a) (100 × 4) + 50 + 20 b) 100 × (4 + 50) + 20
• D¯cw a) 7400 b) 470 c) 5420 d) Chsbm¶pw AÃ

4
7) tdj³ ISbn \n¶v 4 Intem{Kmw hoXw e`n¡p¶ tKmX¼v hm§m³ 8 ho«pImÀ H¶n v̈ F¯n. ISbn 30 Intem{Kmw tKmX¼v am{Xta At¸mÄ D−mbncp¶pÅp. AXv Xpeyambn hoXn v̈ Hmtcmcp¯À¡pw IS¡mc³ \ÂIn. F¦n Hmtcm ho«pImÀ¡pw F{X Intem{Kmw tKmX¼v In«pw?
• Is−t¯− Imcyw
………………………………………………………………….
• D¯c¯nse¯m³ Bhiyamb hnhcw
a) BsIbpÅ tKmX¼nsâ Afhns\ ho«pImcpsS F®w sIm−v lcn v̈
b) BsIbpÅ tKmX¼nsâ Afhns\ Hmtcmcp¯À¡pw e`n¡p¶ hnlnXw sIm−v lcn¨v
• D¯cw
a) 3 �
� b) 3
�
� c) 3
�
�
d) 3 �
�
8) Hcp kvIqfnse 5-þB bn \n¶v 14 t]cpw aäp ¢mÊpIfn \n¶mbn 216 t]cpw D¨`£Ww Ign¡p¶p−v. Kh¬saâv Hcp Ip«n¡v 150 {Kmw AcnbmWv \ÂIp¶Xv. F¦n Hcp Znhkw BsI F{X Intem{Kmw Acn kvIqfn\v Bhiyap−v?
• Is−t¯− Imcyw
………………………………………………………………….
• D¯c¯nse¯m³ Bhiyamb hnhcw
a) kvIqfn \n¶v D¨`£Ww Ign¡p¶ Ip«nIfpsS BsI F®s¯ 150 sIm−v lcn v̈
b) kvIqfn \n¶v D¨`£Ww Ign¡p¶ Ip«nIfpsS BsI F®s¯ 150 sIm−v KpWn v̈
• D¯cw
a) 34.5 In.{Kmw. b) 3.45 In.{Kmw c) 345 In.{Kmw d) Chsbm¶pw AÃ
9) t\m«v ]pkvXI¯nsâ Hcp t]Pns\ tImtWmSp tIm¬ apdn v̈ 2 IjvW§Ä B¡nbm In«p¶ Hmtcm `mK¯nsâbpw BIrXn F´mWv?
• Is−t¯− Imcyw
………………………………………………………………….
• D¯c¯nse¯m³ Bhiyamb hnhcw
a) t\m«v ]pkvXI¯nse t]Pnsâ BIrXn NXpcamWv F¶Xv ]cnKWn v̈.
b) t]Pnsâ BIrXn kaNXpcamWv F¶Xv ]cnKWn v̈.
• D¯cw
a) NXpcw b) kaNXpcw c) {XntImWw d) Chsbm¶pw AÃ

5
10) kvIqÄ Xpd¡p¶Xnt\mS\p_Ôn¨v A½ s_ävkn, s_\ne, s_\nä F¶nhÀ
¡mbn 6 aoäÀ dnº¬ hm§n. F¶n«v AXns\ �
� aoäÀ \ofapÅ IjW§Ä B¡n
Xpeyambn hoXn v̈ FSp¡m³ Bhiys¸«p. F¦n �
� aoäÀ \ofapÅ F{X
IjvW§Ä D−mIpw?
• Is−t¯− Imcyw
………………………………………………………………….
• D¯c¯nse¯m³ Bhiyamb hnhcw
a) BsI hm§nb dnºWnsâ \ofs¯ �
� sIm−v KpWn v̈.
b) BsI hm§nb dnºWnsâ \ofs¯ �
�sIm−v lcn v̈.
• D¯cw
a) 9 b) 7 c) 10 d) 8
11) ]©mb¯nse 7þmw hmÀUn BsI 2000 thm«Àamcp−v. AXn Ignª \nbak` XncsªSp¸n\v 65% t]À thm«v tcJs¸Sp¯n. F¦n F{X BfpIÄ At¶Znhkw thm«v sNbvXp?
• Is−t¯− Imcyw
………………………………………………………………….
• D¯c¯nse¯m³ Bhiyamb hnhcw
a) BsI thm«ÀamcpsS ��
� `mKw F{Xsb¶v I−v
a) BsI thm«ÀamcpsS ��
� `mKw F{Xsb¶v I−v
• D¯cw
a) 1400 b) 700 c) 1200 d) 1300
12) daokv Xsâ _Ôp hoSpIfnte¡v sIm−v t]mIp¶Xn\mbn �
� Intem{Kmw
`mcapÅ 3 IjvWw X®na¯³ hm§n. daoknsâ ssIhiw BsI F{X Intem{Kmw X®na¯³ D−mIpw?
• Is−t¯− Imcyw
………………………………………………………………….
• D¯c¯nse¯m³ Bhiyamb hnhcw
a) IjvW§fpsS F®s¯ �
� Intem{Kmw sIm−v KpWn v̈.
b) IjvW§fpsS F®s¯ �� Intem{Kmw sIm−v lcn¨v.
• D¯cw
a) 2 Intem{Kmw b) 2 �
� Intem{Kmw c) 2
�
� Intem{Kmw d) 2
�
�Intem{Kmw.

6
13) 20 Nm¡v knaânsâ Xq¡w 1000 Intem{Kmw BWv. F¦n 16 Nm¡v knaânsâ Xq¡w F{X?
• Is−t¯− Imcyw
………………………………………………………………….
• D¯c¯nse¯m³ Bhiyamb hnhcw
a) Hcp Nm¡v knaânsâ Xq¡w I−v AXns\ 16 sIm−v KpWn¨v
b) 16s\ BsI X¶ncn¡p¶ Xq¡w sIm−v KpWn¨v
• D¯cw
a) 16 Intem {Kmw b) 800 Intem {Kmw c) 16,000 Intem {Kmw d) Chsbm¶paÃ
14) kvIqfnse ^pSvt_mÄ ]cnioe\¯n\v BsI 110 Ip«nIÄ t]cv \ÂIn. AXn \n¶pw kv{Io\n§n\v tijw 77 t]sc Hgnhm¡n. _m¡nbpÅhsc 11 t]À hoXapÅ {Kq¸pIfm¡n Xncn v̈ ]cnioe\w \ÂIm³ Xocpam\n¨p. F¦n BsI F{X {Kq¸pIÄ D−mhpw?
• Is−t¯− Imcyw
………………………………………………………………….
• D¯c¯nse¯m³ Bhiyamb hnhcw a) BsI t]cv \ÂInbhcpsS F®s¯ {Kq¸nse AwK§fpsS F®w sIm−v lcn¨v b) kv{Io\n§n\v tijw Hgnhm¡nbhcpsS F®s¯ {Kq¸nse AwK§fpsS F®w sIm−v lcn v̈ c) kv{Io\n§neqsS XncsªSp¯hcpsS F®s¯ {Kq¸v AwK§fpsS F®w
sIm−v lcn¨v
• D¯cw
a) 3 b) 7 c) 11 d) 4
15) aIsâ hbÊnsâ aq¶v aS§nt\mSv c−v Iq«nbm AÑsâ hbÊv In«pw. AÑsâ hbÊv F{X?
• Is−t¯− Imcyw
………………………………………………………………….
• D¯c¯nse¯m³ Bhiyamb hnhcw
a) aIsâ hbÊv x F¶v ]cnKWn v̈ AÑsâ hbÊv b) AÑsâ hbÊv x F¶v ]cnKWn¨v AXnsâ 3 aS§nt\mSv 2 Iq«n
• D¯cw
a) AÑsâ hbÊv = x ÷ 3+2 b) AÑsâ hbÊv = 3x+2 c) 3x-2 d) Chsbm¶paÃ

7
16) kvIqÄ {]thit\mÕht¯mSv A\p_Ôn¨v tXmcWw D−m¡m³ hnhn[
\nd¯nepÅ 30 aoäÀ dnºWpIÄ hm§n. CXn �
�aoäÀ \of¯n Nph¸pw
�
�
aoäÀ \of¯n shÅbpw �
� aoäÀ \of¯n ]¨ dnºWpw _m¡nbmbn. F¦nÂ
BsI F{X aoäÀ dnº¬ _m¡n D−mIpw?
• Is−t¯− Imcyw
………………………………………………………………….
• D¯c¯nse¯m³ Bhiyamb hnhcw
a) BsI \of¯n \n¶v �
�,�
�,�
� F¶nhbpsS XpI Ipd v̈
b) �
�,�
�,�
�, ChbpsS XpI I−v
• D¯cw
a) 28 �
� aoäÀ b) 1 aoäÀ c) 2 aoäÀ d) 1
�
� aoäÀ
17) t\m«v ]pkvXI¯nse Hcp t]Pnsâ 4 aqeIfnsebpw tImWfhpIÄ F{X Un{Kn
hoXamWv?
• Is−t¯− Imcyw
………………………………………………………………….
• D¯c¯nse¯m³ Bhiyamb hnhcw
a) NXpc¯nse 4 tImWpIÄ Xpeyhpw a«tImWpw BsW¶ Adnhv.
b) NXpc¯nsâ FXnÀ tImWpIÄ A\p]qcIamWv F¶dnhv.
• D¯cw
a) 900 b) 450 c) 1300 d) 500
18) NXpcmIrXnbnepÅ Hcp ]pcbnS¯nsâ Hcp hi¯nsâ \ofw x aoädpw hoXn y aoädpw Bbm ]pcbnS¯n\v NpäpapÅ thenbpsS \ofw F{X?
• Is−t¯− Imcyw
………………………………………………………………….
• D¯c¯nse¯m³ Bhiyamb hnhcw
a) \ofw x hoXn y F¶v ]cnKWn v̈ ]c¸fhv I−v
b) \ofw x hoXn y F¶v ]cnKWn v̈ Npäfhv I−v
• D¯cw
a) thenbpsS \ofw = xy b) thenbpsS \ofw = 2(x+y)
c) thenbpsS \ofw = 2x+y d) thenbpsS \ofw = x+2y

8
19) CãnI sIm−v D−m¡nb Hcp Sm¦nsâ AIs¯ \ofw 3 aoädpw hoXn 1.5 aoädpw BWv. Sm¦n\v 1.6 aoäÀ Dbcw D−v. F¦n Sm¦n F{X shÅw sImÅpw?
Is−t¯− Imcyw
………………………………………………………………….
• D¯c¯nse¯m³ Bhiyamb hnhcw
a) Sm¦nsâ ]c¸fhv I−v
b) Sm¦nsâ DÅfhv I−v
c) Sm¦nsâ Npäfhv I−v
• D¯cw
a) 720 b) 7.2 c) 0.72 d) 72
20) _mephn\v AS¡ I¨hSamWv. C¯hW Intem{Kman\v 145.50cq] {]Imcw 5.2 Intem{Kmw AS¡ _mep hnäp. F¦n AS¡hnä C\¯n F{X cq] _mephn\v In«pw?
• Is−t¯− Imcyw
………………………………………………………………….
• D¯c¯nse¯m³ Bhiyamb hnhcw
a) Hcp Intem{Kmw AS¡bpsS hnesb 5.2 sIm−v KpWn v̈
b) Hcp Intem{Kmw AS¡bpsS hnesb 5.2 sIm−v lcn v̈
• D¯cw a) Rs.279.8 b) Rs.7566 c) Rs.756.6 d) Rs.2798
21) 10 cq] _Êv NmÀPv \ÂIp¶Xn\p ]Icw \nJne 100 cq]bpsS t\m«mWv \ÂIn
bXv. AXn 10 cq] NmÀPv C\¯n FSp¯ tijw _m¡n 50 cq]bpsS Hcp t\m«pw 10 cq]bpsS t\m«pIfpw I−ÎÀ Xncn v̈ \ÂIn. F¦n AXn F{X 10 cq] t\m«pIÄ D−mbncn¡pw.
• Is−t¯− Imcyw
………………………………………………………………….
• D¯c¯nse¯m³ Bhiyamb hnhcw
a) \qdv cq]bnÂ\n¶v 50 cq] Ipd¨v In«p¶ kwJysb 10 sIm−v lcn v̈
b) \qdv cq]bn \n¶v 50 cq]bpw _Êv NmÀPpw Ipd v̈ In«p¶ kwJysb 10 sIm−v lcn¨v
• D¯cw a) 5 b) 6 c) 4 d) 3
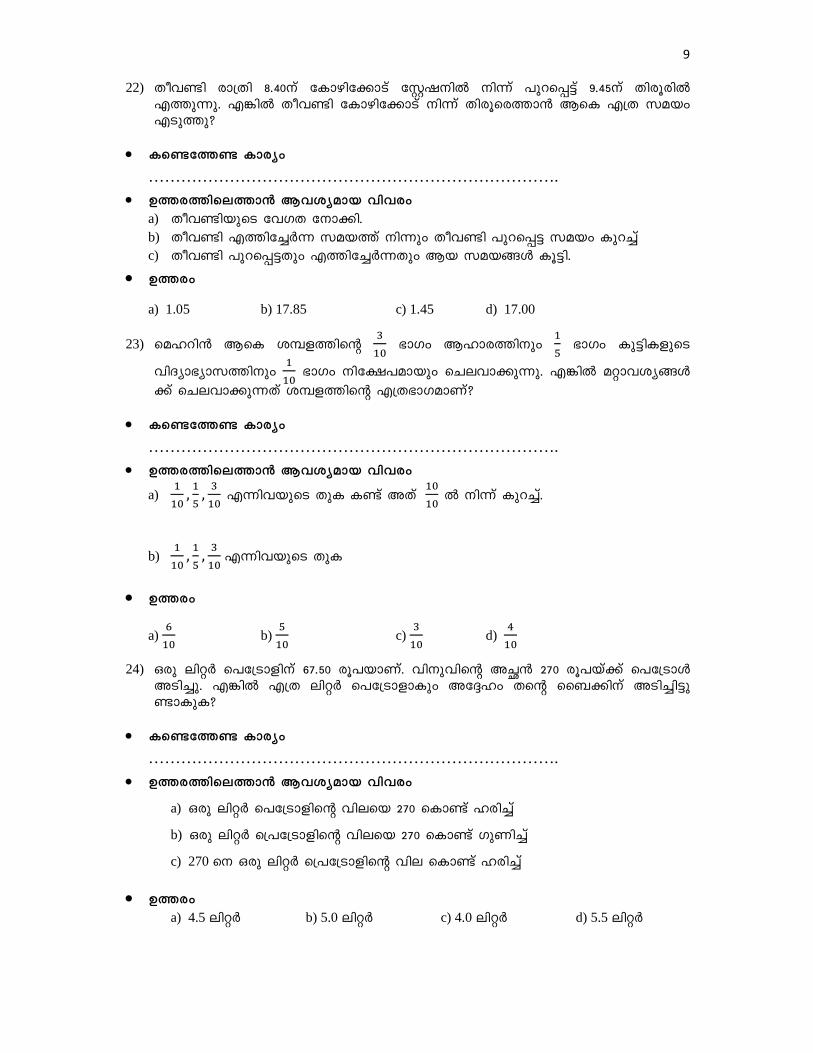
9
22) Xoh−n cm{Xn 8.40\v tImgnt¡mSv tÌj\n \n¶v ]pds¸«v 9.45\v Xncqcn F¯p¶p. F¦n Xoh−n tImgnt¡mSv \n¶v Xncqsc¯m³ BsI F{X kabw FSp¯p?
• Is−t¯− Imcyw
………………………………………………………………….
• D¯c¯nse¯m³ Bhiyamb hnhcw
a) Xoh−nbpsS thKX t\m¡n. b) Xoh−n F¯nt¨À¶ kab v̄ \n¶pw Xoh−n ]pds¸« kabw Ipd v̈ c) Xoh−n ]pds¸«Xpw F¯nt¨À¶Xpw Bb kab§Ä Iq«n.
• D¯cw
a) 1.05 b) 17.85 c) 1.45 d) 17.00
23) saldn³ BsI i¼f¯nsâ �
� `mKw Blmc¯n\pw
�
� `mKw Ip«nIfpsS
hnZym`ymk¯n\pw �
� `mKw \nt£]ambpw sNehm¡p¶p. F¦n aämhiy§Ä
¡v sNehm¡p¶Xv i¼f¯nsâ F{X`mKamWv?
• Is−t¯− Imcyw
………………………………………………………………….
• D¯c¯nse¯m³ Bhiyamb hnhcw
a) �
�,�
�,�
� F¶nhbpsS XpI I−v AXv
�
� Â \n¶v Ipd v̈.
b) �
�,�
�,�
�F¶nhbpsS XpI
• D¯cw
a) �
� b)
�
� c)
�
� d)
�
�
24) Hcp enäÀ s]t{Smfn\v 67.50 cq]bmWv. hn\phnsâ Aѳ 270 cq]bv¡v s]t{SmÄ ASn¨p. F¦n F{X enäÀ s]t{SmfmIpw At±lw Xsâ ss_¡n\v ASn¨n«p −mIpI?
• Is−t¯− Imcyw
………………………………………………………………….
• D¯c¯nse¯m³ Bhiyamb hnhcw
a) Hcp enäÀ s]t{Smfnsâ hnesb 270 sIm−v lcn¨v
b) Hcp enäÀ s{]t{Smfnsâ hnesb 270 sIm−v KpWn v̈
c) 270 s\ Hcp enäÀ s{]t{Smfnsâ hne sIm−v lcn¨v
• D¯cw a) 4.5 enäÀ b) 5.0 enäÀ c) 4.0 enäÀ d) 5.5 enäÀ
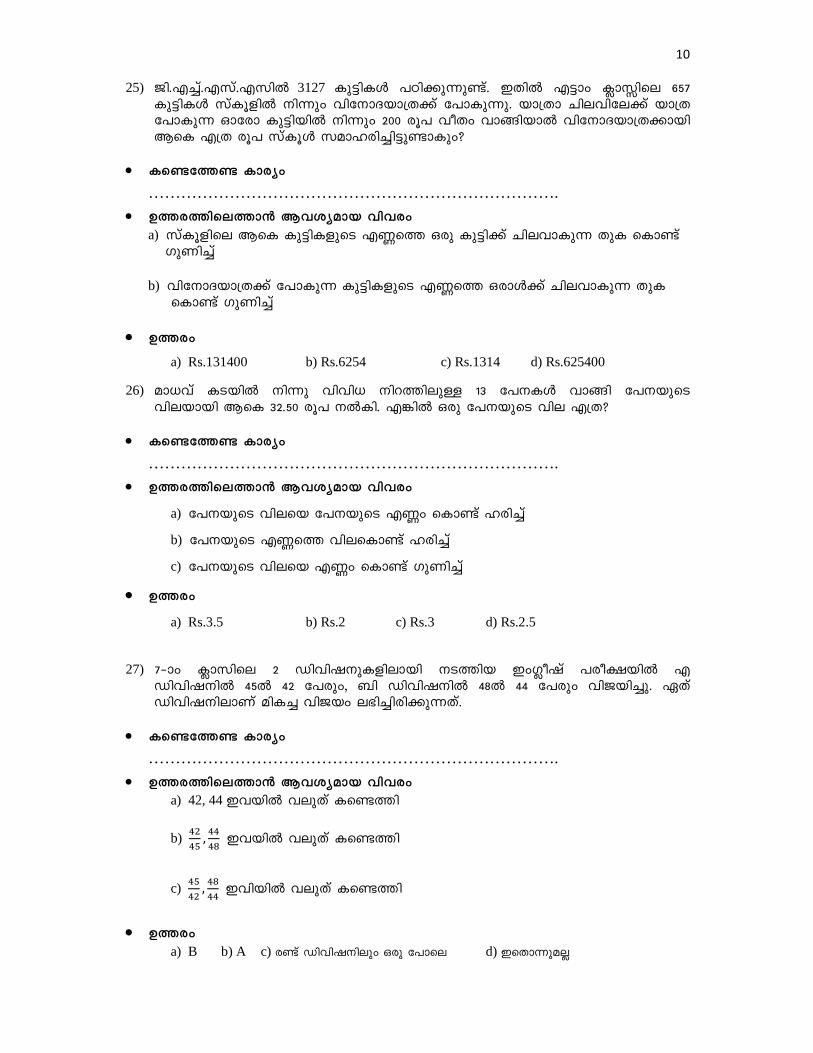
10
25) Pn.F v̈.Fkv.Fkn 3127 Ip«nIÄ ]Tn¡p¶p−v. CXn F«mw ¢mÊnse 657 Ip«nIÄ kvIqfn \n¶pw hnt\mZbm{X¡v t]mIp¶p. bm{Xm Nnehnte¡v bm{X t]mIp¶ Hmtcm Ip«nbn \n¶pw 200 cq] hoXw hm§nbm hnt\mZbm{X¡mbn BsI F{X cq] kvIqÄ kamlcn¨n«p−mIpw?
• Is−t¯− Imcyw
………………………………………………………………….
• D¯c¯nse¯m³ Bhiyamb hnhcw
a) kvIqfnse BsI Ip«nIfpsS F®s¯ Hcp Ip«n¡v NnehmIp¶ XpI sIm−v KpWn v̈ b) hnt\mZbm{X¡v t]mIp¶ Ip«nIfpsS F®s¯ HcmÄ¡v NnehmIp¶ XpI sIm−v KpWn v̈
• D¯cw
a) Rs.131400 b) Rs.6254 c) Rs.1314 d) Rs.625400
26) am[hv ISbn \n¶p hnhn[ \nd¯nepÅ 13 t]\IÄ hm§n t]\bpsS hnebmbn BsI 32.50 cq] \ÂIn. F¦n Hcp t]\bpsS hne F{X?
• Is−t¯− Imcyw
………………………………………………………………….
• D¯c¯nse¯m³ Bhiyamb hnhcw
a) t]\bpsS hnesb t]\bpsS F®w sIm−v lcn v̈
b) t]\bpsS F®s¯ hnesIm−v lcn¨v
c) t]\bpsS hnesb F®w sIm−v KpWn v̈
• D¯cw
a) Rs.3.5 b) Rs.2 c) Rs.3 d) Rs.2.5
27) 7þmw ¢mknse 2 Unhnj\pIfnembn \S¯nb Cw¥ojv ]co£bn F Unhnj\n 45 42 t]cpw, _n Unhnj\n 48 44 t]cpw hnPbn¨p. GXv Unhnj\nemWv anI¨ hnPbw e`n¨ncn¡p¶Xv.
• Is−t¯− Imcyw
………………………………………………………………….
• D¯c¯nse¯m³ Bhiyamb hnhcw
a) 42, 44 Chbn hepXv Is−¯n
b) ��
��,��
�� Chbn hepXv Is−¯n
c) ��
��,��
�� Chnbn hepXv Is−¯n
• D¯cw a) B b) A c) c−v Unhnj\nepw Hcp t]mse d) CsXm¶paÃ

11
28) ASp¡ft¯m«¯n ]mhen\v ]´Â CSp¶Xn\mbn sshjvWhv 13.5 aoäÀ IbÀ hm§n. CXns\ 1.5 aoäÀ \of¯n apdn v̈ IjvW§fm¡nbmWv ]´Â Hcp¡nbXv. F¦n 1.5 aoäÀ \of¯nepÅ F{X IjvWw IbÀ e`n¡pw?
• Is−t¯− Imcyw
………………………………………………………………….
• D¯c¯nse¯m³ Bhiyamb hnhcw
a) BsI hm§nb Ibdnsâ \ofs¯ 1.5 sIm−v lcn v̈
b) Hcp IjvW¯nsâ \ofs¯ BsI Ibdnsâ \ofw sIm−v lcn v̈
• D¯cw
a) 6 aoäÀ b) 7 aoäÀ c) 8 aoäÀ d) 9 aoäÀ
29) dn¸»nIv Zn\t¯mS\p_Ôn v̈ kvIqfn \ÂIp¶Xn\mbn 2000 anTmbnIÄ hm§n Ahsb 40 F®w hoXapÅ hnhn[ ]m¡äpIfm¡nbmWv ¢mkpIfnte¡v hnXcWw sNbvXXv. F¦n A¯cw F{X ]m¡äpIÄ D−mImw?
• Is−t¯− Imcyw
………………………………………………………………….
• D¯c¯nse¯m³ Bhiyamb hnhcw
a) anTmbnIfpsS F®s¯ 40 sIm−v KpWn¨v
b) BsI anTmbnIpfsS F®s¯ Hcp ]m¡änse anTmbnIfpsS F®w sIm−v lcn¨v.
c) Hcp ]m¡änse anTmbnIfpsS F®s¯ BsI anTmbnIfpsS F®w sIm−v lcn¨v.
• D¯cw
a) 500 b) 1000 c) 50 d) 80000
30) ]mÀÆXn Intem{Kman\v 32.50 {]Imcw 6 In.{Kmw Acnbpw 28.50 {]Imcw 2 In.{Kmw ]©kmcbpw hm§n. F¦n BsI F{X cq] km[\§Ä¡mbn ]mÀÆXn Nnehm¡nbn«p−mIpw?
• Is−t¯− Imcyw
………………………………………………………………….
• D¯c¯nse¯m³ Bhiyamb hnhcw
a) 1 In.{Kmw. ]©kmcbpsSbpw AcnbpsSbpw hneIÄ Iq«n
b) Bdv sIm−v Hcp In.{Kmw AcnbpsS hne KpWn¨v AXns\ 2 sIm−v KpWn¨ Hcp In.{Kmw ]©kmcbpsS hne Iq«n
• D¯cw
a) Rs.248 b) Rs.61 c) Rs.252 d) Rs.65

12
31) a\p Xsâ tkhnwKvkv t_mIvkv (lp−nI) s]m«n¨t¸mÄ AXn 50 ss]kbpsS 30 \mWb§fpw 1 cq]bpsS 40 \mWb§fpw 2 cq]bpsS 15 \mWb§fpw 5 cq]bpsS 14 \mWb§fpw 10 cq]bpsS 5 \mWb§fpw D−mbncp¶p. F¦n BsI F{X cq] a\phnsâ ]¡ep−mIpw?
• Is−t¯− Imcyw
………………………………………………………………….
• D¯c¯nse¯m³ Bhiyamb hnhcw
a) \mWb§fpsS F®s¯ AXnsâ aqeyw sIm−v KpWn v̈ XpI ImWÂ
b) \mWb§fpsS BsI aqeyw I−v
c) \mWb§fpsS F®w Iq«n.
• D¯cw
a) Rs.205 b) Rs.230 c) Rs.104 d) Rs.220
32) 6þmw ¢mkv hnZymÀ°nIfmb amb, amkn, KmZ F¶nhcpsS Dbcw NphsS sImSp¡p¶p. 140.01 skâoaoäÀ, 140.40 skâoaoäÀ, 140.05 skâoaoäÀ Dbc {Ia¯n ChÀ Akw»n¡v \n¡pIbmsW¦n F§s\bmIpw \n¡pI?
• Is−t¯− Imcyw
………………………………………………………………….
• D¯c¯nse¯m³ Bhiyamb hnhcw
a) Zimwi kwJyIsf AhtcmlW{Ia¯nsegpXn
b) Zimwi kwJyIsf BtcmlW{Ia¯nsegpXn
• D¯cw a) amb, KmZ, amkn b) KmZ, amkn, amb c) amkn, amb, KmZ d) amb, amkn, KmZ
33) tZhnIbpsSbpw ^m¯nabpsSbpw hoSpIfnse Ignª 4 amks¯ sshZypXn D]tbmKw (bqWnänÂ) NphsS sImSp¡p¶p.
amkw hyàn G{]n sabv Pq¬ Pqembv
tZhnI 85 77 80 78 ^m¯na 78 89 70 80
Chcn BcpsS IpSpw_amWv aäpÅhÀ¡v amXrIbmIpw hn[w icmicn sshZypXn D]tbmKw \nb{´n¡p¶Xv?
• Is−t¯− Imcyw
…………………………………………………………………. • D¯c¯nse¯m³ Bhiyamb hnhcw
a) sshZypX D]t`mK¯nsâ icmicn I−v b) Hmtcm amks¯bpw sshZypXn D]t`mKw XmcXayw sNbvXv
• D¯cw
a) ̂ m¯na b) tZhnI c) c−v t]mcpw d) Bcpw Xs¶bnÃ
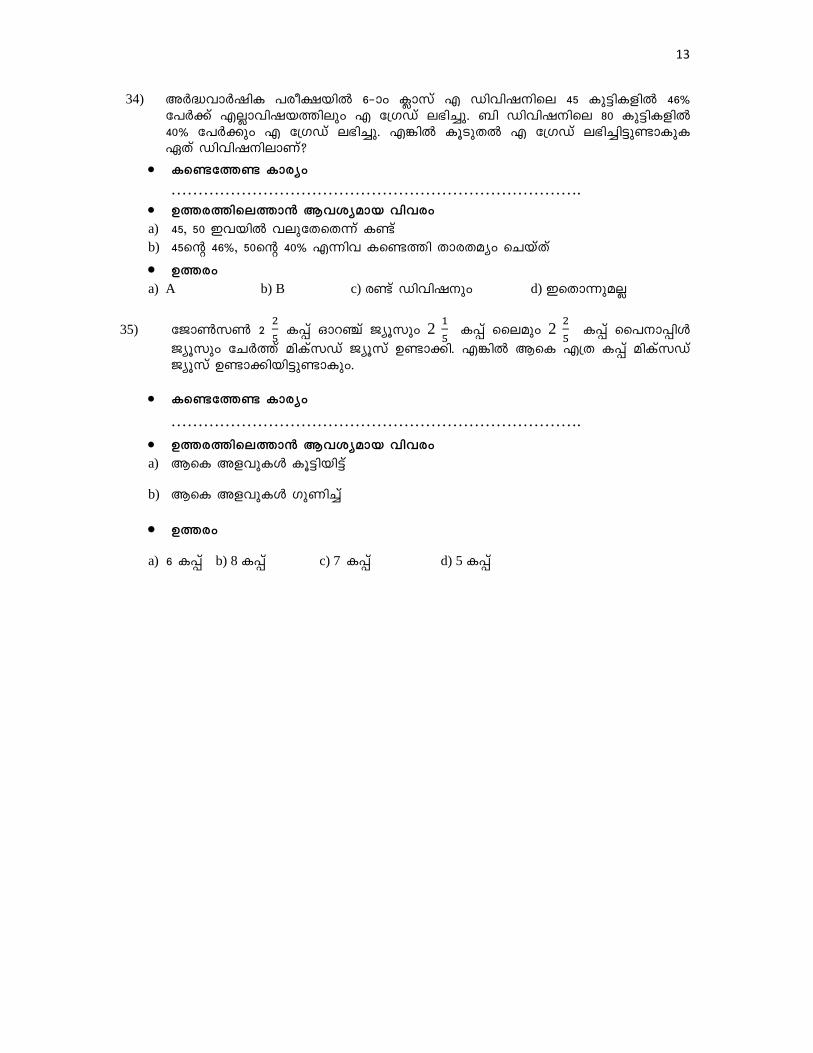
13
34) AÀ²hmÀjnI ]co£bn 6þmw ¢mkv F Unhnj\nse 45 Ip«nIfn 46% t]À¡v FÃmhnjb¯nepw F t{KUv e`n¨p. _n Unhnj\nse 80 Ip«nIfn 40% t]À¡pw F t{KUv e`n¨p. F¦n IqSpX F t{KUv e`n¨n«p−mIpI GXv Unhnj\nemWv?
• Is−t¯− Imcyw
…………………………………………………………………. • D¯c¯nse¯m³ Bhiyamb hnhcw
a) 45, 50 Chbn heptXsX¶v I−v b) 45sâ 46%, 50sâ 40% F¶nh Is−¯n XmcXayw sNbvXv
• D¯cw a) A b) B c) c−v Unhnj\pw d) CsXm¶paÃ
35) tPm¬k¬ 2 �
� I¸v Hmd©v Pyqkpw 2
�
� I¸v sseapw 2
�
� I¸v ss]\m¸nÄ
Pyqkpw tNÀ¯v anIvkUv Pyqkv D−m¡n. F¦n BsI F{X I¸v anIvkUv Pyqkv D−m¡nbn«p−mIpw.
• Is−t¯− Imcyw
………………………………………………………………….
• D¯c¯nse¯m³ Bhiyamb hnhcw
a) BsI AfhpIÄ Iq«nbn«v
b) BsI AfhpIÄ KpWn¨v
• D¯cw
a) 6 I¸v b) 8 I¸v c) 7 I¸v d) 5 I¸v

FAROOK TRAINING COLLEGE
MATHAMATICS ANXIETY RATING SCALE RISHAD. KOLOTHUMTHODI
Assistant Professor
Name of the student :
Name of the school :
Type management : Govt/Aided
\nÀ-t±-i§Ä:
Xm-sg sIm-Sp-¯n-cn-¡p-¶ {]-im-kv-{Xhpambn _-Ô-s¸-«-XmWv. Hmtcm {]F-{X-am-{Xw i-cn-bm-sW-¶v Xo-cpFÃmbvt¸mgpw, 2).]et¸mgpw, 3).Nnet¸mÄ, 4). A]qÀÆ
{]-kv-Xm-h-\-IÄ-¡v t\-sc-bpÅ tImD]tbm-Kn-¨v tc-J-s¸-Sp¯pI. FÃm {]{]-tXy-Iw {i-²n-¡p-I. Hcp {]kv-Xm]m-SnÃ
{Ia-\
¼À
{]kv-Xm
1 1.��������� ���� ���� ������� ��� ������������ ��!
2 "�! ������ �#�$�� %�&� '�&�( )�*�+ �,-�)�.�'�/ ����0
3 1����� ',- 2�3�24 �56-�������� �"���7���� 2����� %��*4 2�8��+ ��9��� ��!
4 �:��)�2;*4 %������$( �56-� �5�<;*=�/ �"��(
5 ���� 1�>��24 "3���?�.����� �8(.
6 ����1���� �$ ��� ������ �5�<;*4�( �"��( �)���� %��0 "�2�+ ��9��� ��!
7 ������� @�+ anSp¡fpw A-[ym-]-Icpw A
FAROOK TRAINING COLLEGE
MATHAMATICS ANXIETY RATING SCALE RISHAD. KOLOTHUMTHODI MUHSINA. E.K
M.Ed Student
Gender: M/F
Locale : Urban/Rural
: Govt/Aided
¶ {]-kv-Xm-h-\-IÄ {i-²m-]qÀ-Æw hm-bn-¡p-I. AXmWv. Hmtcm {]-kv-Xm-h-\-bpw \n§-sf kw-_-Ôn
cp-am-\n-¡p-I. \n-§-fp-sS Xo-cp-am-\w A-©v X-cFÃmbvt¸mgpw, 2).]et¸mgpw, 3).Nnet¸mÄ, 4). A]qÀÆambn, 5). Hcn¡epanÃ.
bpÅ tIm-f-¯n \n§-fp-sS {]-Xn-IcWw "Sp¯pI. FÃm {]-kv-Xm-h-\-IÄ¡pw {]-Xn-Ic-Ww tc-J
Xm-h-\¡pw H-¶n Iq-Sp-X {]-Xn-I-c-W-§Ä tc
Xm-h-\IÄ
FÃ
mbvt¸
mgpw
]e
t¸mg
pw
Nne
t¸mÄ
��������� ���� ���� ������� ��� ������������ ��!.
������ �#�$�� %�&� '�&�( )�.�'�/ ����0.
���� ',- 2�3�24 �56-�������� ���� 2����� %��*4
��9��� ��!.
�:��)�2;*4 %������$( �56-� �"��( 2:�����A0.
���� 1�>��24 "3��)���� ���
����1���� �$ ��� ������ �5�<;*4�( �"��( �)���� %��0
��9��� ��!
anSp-¡-\m-sW-¶v kp-lr-̄ p-A-̀ n-{]m-b-s¸-Sm-dp−v
MUHSINA. E.K
M.Ed Student
Locale : Urban/Rural
I. A-h KWnX Ôn-̈ n-S-t¯m-fw c-̄ n-em-Imw.1).
ambn, 5). Hcn¡epanÃ. AXXv
' A-S-bm-fw J-s¸-Sp-̄ p-hm³
§Ä tc-J-s¸-Sp-̄ m³
Nne
t¸mÄ
A]
qÀÆ
amb
n
Hcn¡
epa
nÃ

{Ia-\
¼À
{]kv-Xm-h-\IÄ
FÃ
mbvt¸
mgp
w
]e
t¸mg
pw
Nne
t¸mÄ
A]
qÀÆ
amb
n
Hcn¡
epa
nÃ
8 �:��)�2;*=�� %��������� 5�B*=-0 5�*=-0 �?��"���!�0 �:5������� ��( ����$ ������"�� �:��)�2;*�=�C �"��( ��'�/.
9 2���� D��� 2:���� �:��)�2;*4 �#����E�4 �"��( ��'�/.
10 ������ �'��( )�.�)�'��� FG��3��!�� 2��;*4 @�+ 5�?��� ��!.
11 2������ �5�<;��� ��� �5�<;*4 '"�������H�I�� ���C �"��( ���� ����� ��!.
12 2����� �5�<;*4�( %��0 ������� )��� J����2'�� F�K�'�3-24 �"��)���� �8(.
13 �������� Fsâ ��:&�'�� � �)�24 �����0 @�+ ��LM���4�( � I� �2����� �8(.
14 2����� �5�<;*4 �56-�E�4 %��������8 �:��)�2;*4 �$& � �����"� �2�0 �7�0 2�8�� �56�"���"���A0
15 ���"�3�2 � ����� 2���0 �����2��24 �:&�'���+ ��9����!��!� �� ���� ����� �8(.
16 �����9;��2&�( �� �:��)�2;*4 N&���)��+ �,-���*�"���( @�"��J���� �8(
17 �������L�=�� "�����"��� 2&�J����� �9;��2& )��������0 Fsâ ���� F�9��� ��!
18 Fsâ 2:3-2�& ���� ���� 2� �$( O2���������?�"����( @�+ 5�?��� �8(.
19 ����1����������E�4 �#"��)&�"*=�� �JK �2�P2����+ �"��( ��9��� ��!

{Ia-\
¼À
{]kv-Xm-h-\IÄ
FÃ
mbvt¸
mgpw
]e
t¸mg
pw
Nne
t¸mÄ
A]
qÀÆ
amb
n
Hcn¡
epa
nÃ
20 ������� ��� �L������ ��LM���4 �)9���)��� ��� F�9��� �8(.
21 ���#;�� ��)&�"*4 ���� ���Q�� )���'�( @�+ O��L��� �8(
22 ����)�'��� FG��3 ���#;�� ��)&�"*=�/ �"��( 2:���� RA0.
23 2����� �5�<;*4��S %��0 ���$( 2H�I��@�"��sâ 2M�;� )8�0 )8�0 ����J�9��� �8(.
24 ���� ��)&�"*4 "���� �56-�)�� '���0 �$& ���������� ��� ������������ �8(.
25 �$& 1���� �56��"���$ 2���24�( �� �' �5�<;*4 2�8�� �56��""���A'�/.
26 2��( �$ �sâ ��J0� ��������"��� 2:3-������4 �)���� �5�<;*=-�� %��0 2�8�� �8(.
27 �:��)�2;*4 '"T��#'������"� �2�0 '"������ �#���+ �J'��� �8(.
28 U�0��F�4 ����J�9���� �'��( ���� <�)�0 ����'���!�( 2����E�4 )�.'0 ����� �8(
29 "�&�<J�$ �'���"�S�� ���� �� �H��� �&��"�)��'� �� ��0 2���0 �� %��*=-0 ��,� ���)� �8(.
30 2���24 �56-���"����� �$& )H�� � I�� ��� F�9��� ��!.
31 "��;V)����� 2���'��� FG��3 �5�<;*4 O��W���0 �5�<�$�� %��0 ��,����)��'� �� ��0 ����� �8(
32 );X'�� %��0 ������ )�.�'����"�� ',- )�.�*�=��4 2���/ �"���A0.
33 �������� 2� �$-S ��0 2���0 ������ ��� <�)�*=�� % �0 J����)� ��!.
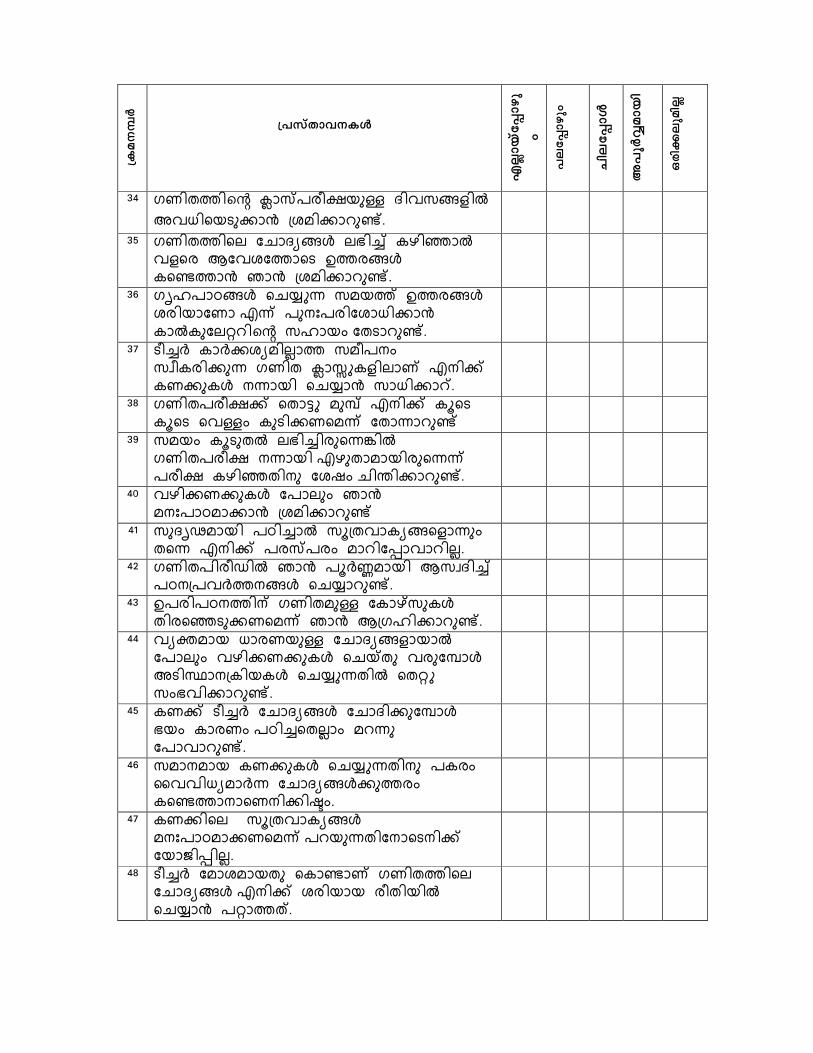
{Ia-\
¼À
{]kv-Xm-h-\IÄ
FÃ
mbvt¸
mgp
w
]e
t¸mg
pw
Nne
t¸mÄ
A]
qÀÆ
amb
n
Hcn¡
epa
nÃ
34 ������sâ 1�>����S <�)�*=�� �)9�������+ �J'��� �8(.
35 �������� �5�<;*4 ���$( 2H�I�� )=�� O�)J����� %��*4 2�8��+ @�+ �J'��� �8(.
36 �ML��#*4 �56-� �'��( %��*4 J������� ��( ��"T����J�9���+ 2��2���, �sâ �L��0 ���� �8(.
37 �$& 2�&�J;'��!�� �'�"0 �72����� ���� 1�Y-2=���/ �"��( 2���24 "���� �56�+ ��9���Z.
38 �������( ���3- '�E( �"��( 2:�� 2:�� �)S0 2������'�( ����� �8(
39 �'�0 2:���� ���$�����W�� ������ "���� �H���'��������( �� 2H�I��"� �J.0 5�?��� �8(.
40 )H�����24 �����0 @�+ '"T��#'���+ �J'��� �8(
41 ��<M['��� �#�$�� �:��)�2;*�=���0 ��� �"��( ��>��0 '� ����)� ��!.
42 �������Q�� @�+ �:&\'��� O�7<�$( �#"��)&�"*4 �56� �8(.
43 %����#"��] ����'�S �2����24 ����I�����'�( @�+ O��L��� �8(.
44 );X'�� 9�����S �5�<;*=���� �����0 )H�����24 �5^�� )���E�4 ���_�"�2��24 �56-���� ��,- �0�)��� �8(.
45 2��( �$& �5�<;*4 �5�<����E�4 ��0 2���0 �#�$���!�0 ' �� ���)� �8(.
46 �'�"'�� 2���24 �56-���"� �2�0 U))�9;'�&� �5�<;*4����0 2�8��"���"���A0.
47 2����� �:��)�2;*4
'"T��#'����'�( � ������"���"��( ���V����!.
48 �$& �'�J'���� �2�8�/ �������� �5�<;*4 �"��( J����� ������ �56�+ �,���.

49 �������� �ML��#*4�( %��0 ������� )���E�4 @�+ )3�� )H��8��� �8(.
50 ����0 F�K�'�3-S D�� )�.�'��� ����� ��!.
51 �)��"�$ ������2�=�� �$( ���C @�+ 5�?��� ��!
52 ���� ����� '�&�( 2� I� ������ )3�� "���8�����)�� )H���" @�+ ���� ��!.
53 ',- 2�3�2�= ����$( ������� @�+ �� 2����� ���)��'� �� ��0 ����� �8(.

FAROOK TRAINING COLLEGE
MATHAMATICS ANXIETY RATING SCALE RISHAD. KOLOTHUMTHODI
Assistant Professor
Name of the student :
Name of the school :
Type management : Govt/Aided
\nÀ-t±-i§Ä:
Xm-sg sIm-Sp-¯n-cn-¡p-¶ {]-im-kv-{Xhpambn _-Ô-s¸-«-XmWv. Hmtcm {]F-{X-am-{Xw i-cn-bm-sW-¶v Xo-cpFÃmbvt¸mgpw, 2).]et¸mgpw, 3).Nnet¸mÄ, 4). A]qÀÆ
{]-kv-Xm-h-\-IÄ-¡v t\-sc-bpÅ tImD]tbm-Kn-¨v tc-J-s¸-Sp¯pI. FÃm {]{]-tXy-Iw {i-²n-¡p-I. Hcp {]kv-Xm]m-SnÃ
{Ia-\
¼À
{]kv-Xm
1 ��� ����� ��� � ��� ����� ����� ����
������ �����. 2 �!�"� ��� #$%�#& "'(���$)��"�
*���� )��+� #���"� �+��& #",+�� !�-���.���
3 !/0���#1�& ��)��� � "'(�� )'�21�3��
*���� #/4$���5�. 4 ���� �6���7#& ��%�
!)8���9���.$,�. 5 ���� �!� 4� .$"4 :0���7��
)'�21�&�� *���� )��+� �+�� �#�� !�-���.���
6 ����+� ;�� anSp¡fpw A-[ym- ]-Icpw A
FAROOK TRAINING COLLEGE
MATHAMATICS ANXIETY RATING SCALE RISHAD. KOLOTHUMTHODI MUHSINA. E.K
M.Ed Student
Gender: M/F
Locale : Urban/Rural
: Govt/Aided
¶ {]-kv-Xm-h-\-IÄ {i-²m-]qÀ-Æw hm-bn-¡p-I. AXmWv. Hmtcm {]-kv-Xm-h-\-bpw \n§-sf kw-_-Ôn
cp-am-\n-¡p-I. \n-§-fp-sS Xo-cp-am-\w A-©v X-cFÃmbvt¸mgpw, 2).]et¸mgpw, 3).Nnet¸mÄ, 4). A]qÀÆambn, 5). Hcn¡epanÃ.
bpÅ tIm-f-¯n \n§-fp-sS {]-Xn-IcWw "Sp¯pI. FÃm {]-kv-Xm-h-\-IÄ¡pw {]-Xn-Ic-Ww tc-J
Xm-h-\¡pw H-¶n Iq-Sp-X {]-Xn-I-c-W-§Ä tc
Xm-h-\IÄ
FÃ
mbvt¸
mgpw
]e
t¸mg
pw
Nne
t¸mÄ
����� ��� � ��� �����
!�"� ��� #$%�#& "'(���$)��"� )��+� #���"� �+��&
!�-���.���.
!/0���#1�& ��)��� � "'(��
���� �6���7#& ��%�"��$�< *"�
���� �!� 4� .$"4 :0���7�� )'�21�&�� *���� )��+� �+��
anSp-¡-\m-sW-¶v kp-lr-̄ p-A-̀ n-{]m-b-s¸-Sm-dp−v
MUHSINA. E.K
M.Ed Student
Locale : Urban/Rural
I. A-h KWnX Ôn-̈ n-S-t¯m-fw c-̄ n-em-Imw.1).
ambn, 5). Hcn¡epanÃ. AXXv
' A-S-bm-fw J-s¸-Sp-̄ p-hm³
§Ä tc-J-s¸-Sp-̄ m³
Nne
t¸mÄ
A]
qÀÆ
amb
n
Hcn¡
epa
nÃ

{Ia-\
¼À
{]kv-Xm-h-\IÄ
FÃ
mbvt¸
mgpw
]e
t¸mg
pw
Nne
t¸mÄ
A]
qÀÆ
amb
n
Hcn¡
epa
nÃ
7 !/0���#1�3� ��)����$� '�=�3�� '��3�� *8�"�"���� !/'�9��$�$ *�� ���� .��+���� !/0���#1�)3�> *���� ?���.
8 #��� @�� #/4$� !/0���#1�& ����$)A�& *���� ?���.
9 �������7 !�+� ����$���
BC"9%����+ #��1�& ;�� '�8���.���.
10 #��$���7� )'�21)�9.�"� )'�21�& ��!������D�E� ����> *���� )�4� )����.���.
11 #���"� )'�21�&�� �+�� �?���"� ��� F�����#�� B$G��$%�#& :�$?�"94�.$,�.
12 ����+�"� Fsâ :�/���� :.��$#& )���$� ;�� !$HI+$�&�� �.E$ "#�4$��.$,�.
13 #���"� )'�21�& "'(�)A�& ��)���)�, !/0���#1�& 4� � �.$����$ �#�� !J� #",+� "'(���"�����5�
14 �$��9%�# :.��+< #���� ����0#�#& �/������� !�-�����)��� *� )�4� )����.$,�.
15 �����-1��#��� �� !/0���#1�& K�+$"���� ����"��"�"�� ;����F���.$,�
16 �������7�H�3� ����7�+���� #��F���� :-1��#� ��$�"���$� Fsâ ���7" B�-���.���
17 ���� �!������$)A�& ���0���+��3� 0FG )#0L�#����� *���� !�-���.���
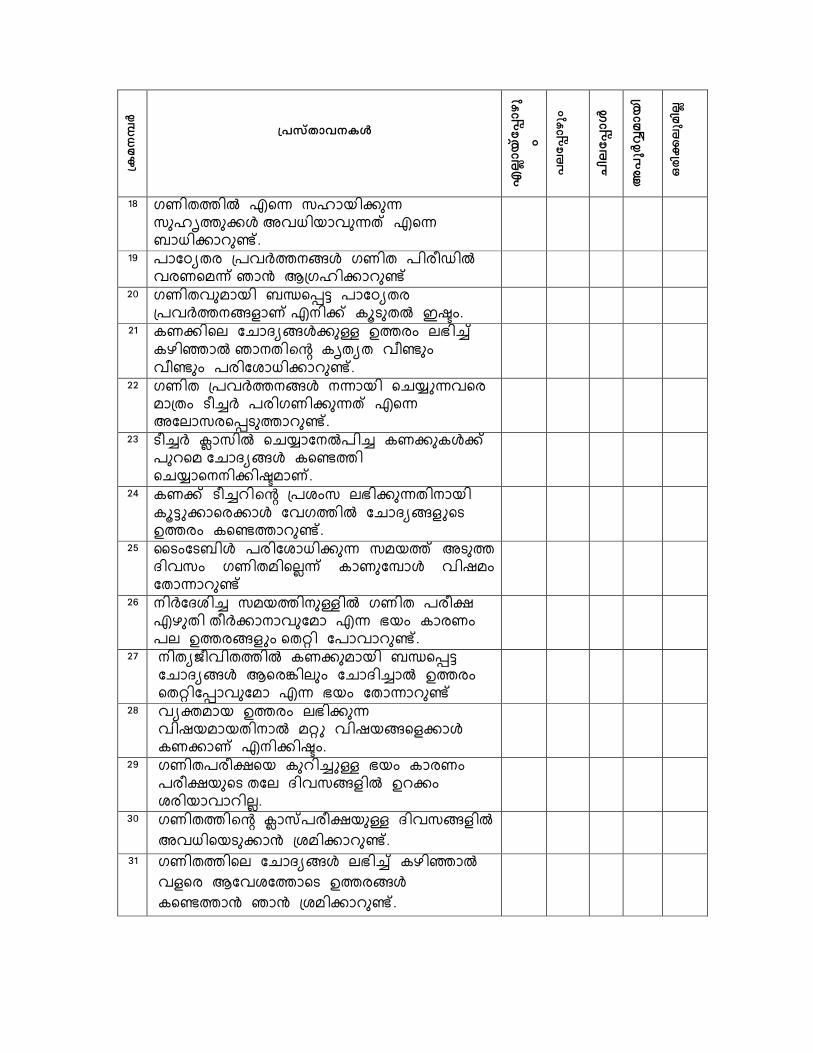
{Ia-\
¼À
{]kv-Xm-h-\IÄ
FÃ
mbvt¸
mgp
w
]e
t¸mg
pw
Nne
t¸mÄ
A]
qÀÆ
amb
n
Hcn¡
epa
nÃ
18 ����+� *"� !H���$� !$HI+$�& :�-���$�< *"� B�-���.$,�.
19 ��)�1�� 0���+��& ���� ����M� ���"��� ;�� N0�H���.$,�
20 �����$��� BC"9% ��)�1�� 0���+��3�� *���� #/4$� O5�.
21 #���"� )'�21�&�$P �+�� �?� � #D�E� ;����sâ #I�1� ��,$� ��,$� ���)F�-���.$,�.
22 ���� 0���+��& ���� "'(���"� ��0�� 4� � �������$�< *"�
:)��!�"94$+�.$,�.
23 4� � �!� "'(�)��� #��$#&�� �$."� )'�21�& #",+� "'(�"�����5���.
24 #��� 4� .�sâ 0�F�! �?��$������ #/%���"���& )��+� )'�21�3�"4 �+�� #",+�.$,�.
25 Q4�)4B�& ���)F�-��$� !�+� :4$+ 2��!� ������"���� #��$)A�& ����� )����.$,�
26 ���)2F� !�+��$P� ���� ���7 *D$�� ��������$)�� *� ?� #���� �� �+��3�� "��� )����.$,�.
27 ���1R����+� #��$��� BC"9% )'�21�& N"�S��$� )'�2� � �+�� "���)9��$)�� *� ?� )����.$,�
28 �1T�� �+�� �?��$� ��������� ��� ����"3��& #���� *����5�.
29 �������7" #$.� �P ?� #���� ���7$"4 �)� 2��!�3� �.�� F�����.���.
30 ����+�sâ �6���7$P 2��!�3� :�-�"4$��� 0F����.$,�.
31 ����+�"� )'�21�& �?� � #D�E� �3"� N)�F)+�"4 �+��& #",+�� ;�� 0F����.$,�.
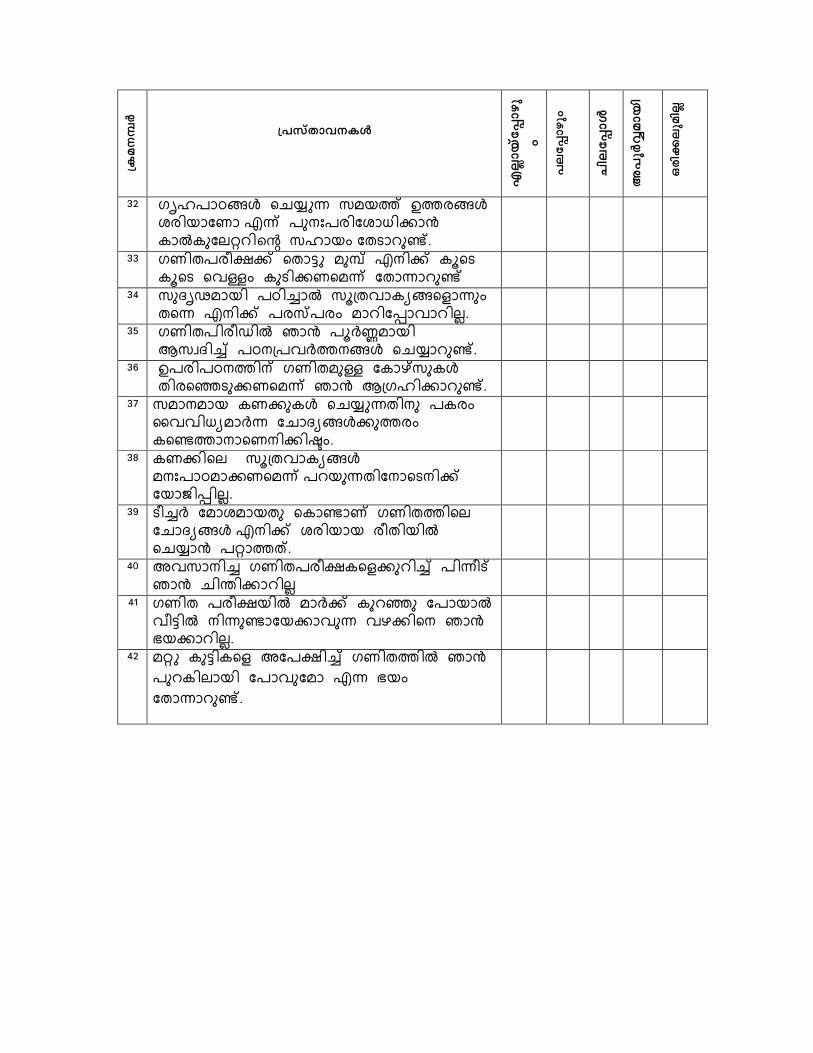
{Ia-\
¼À
{]kv-Xm-h-\IÄ
FÃ
mbvt¸
mgp
w
]e
t¸mg
pw
Nne
t¸mÄ
A]
qÀÆ
amb
n
Hcn¡
epa
nÃ
32 �IH����& "'(�� !�+� �+��& F���)�� *�� �$�U���)F�-���� #�#$)��.�sâ !H�� )�4�.$,�.
33 �������7�� "��%� �$A� *���� #/"4 #/"4 "�P� #$4���"��� )����.$,�
34 !$2IV��� ��� � !/0���#1�"3��$� �"� *���� ��6��� ��.�)9���.���.
35 ��������M� ;�� �/�W��� N!J2� � ���0���+��& "'(�.$,�.
36 �������+�X �����$P )#�Y!$#& ���"E4$��"��� ;�� N0�H���.$,�.
37 !����� #��$#& "'(�����$ �#�� Q���-1���� )'�21�&�$+�� #",+���"�����5�.
38 #���"� !/0���#1�& ��U�������"��� �.$���)��"4���� )�R�9���.
39 4� � )��F���$ "#�,�� ����+�"� )'�21�& *���� F��� ����� "'(�� ���+<.
40 :�!��� �������7#"3�$.� � ����> ;�� '�8���.���
41 ���� ���7� ����� #$.E$ )��� ��%� ���$,�)���$� �D��"� ;�� ?��.���.
42 ��� #$%�#"3 :)�7� � ����+� ;�� �$.#���� )���$)�� *� ?� )����.$,�.


![Computer Problem Solving.[and] Iteration and Computer Problem Solving. Computer Science/Algorithms. Modules and Monographs in Undergraduate Mathematics …](https://static.fdokumen.com/doc/165x107/6343e5a61872f6db4f100338/computer-problem-solvingand-iteration-and-computer-problem-solving-computer.jpg)