Mathematics - CiteSeerX
416
Proceedings of the 21st biennial conference of the Australian Association of Mathematics Teachers Inc. Edited by K. Milton, H. Reeves & T. Spencer
-
Upload
khangminh22 -
Category
Documents
-
view
3 -
download
0
Transcript of Mathematics - CiteSeerX
Proceedings of the 21st biennial conference of the
Australian Association of Mathematics Teachers Inc.
Edited by K. Milton, H. Reeves & T. Spencer
Mathematics: Essential for Learning, Essential for Life
Edited by K. Milton, H. Reeves & T. Spencer
ISBN 978-1-875900-63-3
© The Australian Association of Mathematics Teachers Inc. 2007
Published byThe Australian Association of Mathematics Teachers Inc.GPO Box 1729 Adelaide SA 5001PHONE 08 8363 0288FAX 08 8362 9288EMAIL [email protected] www.aamt.edu.au
© The Australian Association of Mathematics Teachers Inc.
iii
Contents
Preface........................................................................................................................................... vi
Review process ............................................................................................................................ vii
Keynotes
Mathematicians, mathematics and mathematics teaching: Personal perspectives ...................... 2Susie Groves
Developing spatial mathematics.................................................................................................. 12Richard Lehrer
Mathematics is essential in maths education, but what mathematics is then essential? ........... 23John Mason
Addressing the needs of low-achieving mathematics students:Helping students “trust their heads”............................................................................................ 33
John Pegg & Lorraine Graham
Major presentations
Learning difficulties in middle years mathematics:Teaching approaches to support learning and engagement........................................................ 47
Judy Anderson
From here to there: The path to computational fluency with multi-digit multiplication .......... 53Janette Bobis
Collaborative development of a framework for numeracy: A case study ................................. 60Natalie Brown, Pat Rothwell & Scott Taylor
An investigative approach to teaching secondary school mathematics ..................................... 68Merrilyn Goos
Adventure and adolescence: Learner-generated examples in secondary mathematics............. 75Anne Watson
Linking the big ideas in middle school mathematics ................................................................. 82Jane Watson
Bush tucker: Nourishing early mathematics learning in arural school through a variety of forms of curriculum integration ............................................ 95
Karen Wood & Sandra Frid

Mathematics: Essential for Learning, Essential for Life
© The Australian Association of Mathematics Teachers Inc.
iv
Seminars
Using concept maps and vee diagrams to interpret “area” syllabus outcomes and problems.................................................................................................................................................... 102
Karoline Afamasaga-Fuata’i
Concept maps and vee diagrams as tools to understand better the “division” concept inprimary mathematics ................................................................................................................. 112
Karoline Afamasaga-Fuata’i & Laura Cambridge
Sketching graphs from verbal, rather than numerical, information ......................................... 121Tony Bill
Quality teaching of mathematics: Common threads and cultural differences......................... 130Rosemary Callingham
Year 7 students’ understanding of area measurement.............................................................. 136Michael Cavanagh
Students constructing interactive learning objects for conceptual development inmathematics ............................................................................................................................... 144
Paul Diete, Rodney Anderson, Peter Fas, Darren McGregor, Avril Najman
Chameleons in the classroom: Middle years teachers of mathematics.................................... 149Brian Doig
The games we play: Assessing algebraic thinking through arithmetic activities .................... 155Judith Falle
Preservice teachers’ perceptions of their mentoring in primary mathematics teaching.......... 163Peter Hudson & Sue Hudson
Is our mathematics program working? How do we know?...................................................... 173Ken Lountain
Planning Professional Learning using the AAMT Standards: The PLUMS Project .............. 179Leonie Macgregor & Rosemary Callingham
Mathematical literacy: It’s all Greek to me!............................................................................. 185Sue McDonald
A grassroots approach to improving numeracy........................................................................ 194Carolyn Mildrum, Rosemary Callingham & Barbara Hickling
The reality of intellectual quality in mathematics classrooms ................................................. 201Kay Owens
Who’s doing whose mathematics?............................................................................................ 208Noemi Reynolds & Steve Thornton
Cooperating to learn mathematics: Some lessons from Year 7 ............................................... 215Annette Scarlett & Rosemary Callingham
Concept exploration in mathematics using Spinnamaths on an interactive whiteboard ......... 221Ed Staples
Challenges in formulating an extended modelling task at Year 9 ........................................... 224Gloria Stillman & Jill Brown
Exploring the relationships between student achievement in Working Mathematically andthe scope and nature of the classroom practices....................................................................... 232
Elena Stoyanova
ALL is happening with numeracy:A new international survey of adults’ numeracy and mathematics skill levels....................... 241
Dave Tout
Mathematics: Essential for Learning, Essential for Life
© The Australian Association of Mathematics Teachers Inc.
v
A classroom exploration of Benford’s Law and some error finding tricks in accounting ...... 250Paul Turner
Bibliotherapy, a powerful tool to alleviate mathematics anxietyin pre-service primary teachers: A reflective report................................................................. 260
Sue Wilson
Using the history of mathematics for mentoring gifted students: Notes for teachers ............. 267Oleksiy Yevdokimov
Working smarter, not harder ..................................................................................................... 276Alexander Young
Workshops
Mathematics extension groups at Melbourne High School ..................................................... 286Ian Bull
Out of the square, into reality: Bringing mathematics and science into the real world .......... 293Terry Byers & Les Dawes
MathBusters (apologies to MythBusters) ................................................................................. 300Jill Cheeseman
Reflective teaching + connective teaching = effective teaching.............................................. 307Chris Hurst
Teaching algebra using instructional games............................................................................. 314Jane Irvin
Mathematics and food: Essentials for life................................................................................. 322Marian Kemp
Spreadsheets, graphics calculators and mathematics education .............................................. 331Barry Kissane
Mathematics websites................................................................................................................ 340David Leigh-Lancaster & Antje Leigh-Lancaster
Mathematics in the primary years: Mechanisms of change ..................................................... 346Diane Mellowship
Using Dimensions of Learning to increase student autonomy................................................. 352Lyn Nothdurft
Mathematics curriculum in the age of modern technology: Changes and challenges ............ 361Karim Noura
Mathematics through learning inclusion: Learning inclusion through mathematics .............. 371Barbara Reinfeld
Mathematics to motivate ........................................................................................................... 375Pauline Rogers
Incorporating dynamic geometry software within a teaching framework............................... 382Penelope Serow
Magic maths moments: The power of dynamic and effective numeracy classrooms............. 390Jane Skalicky, Julie Mitchell & Janet Boucher
The Context Rich Integrated Mathematics and Science (CRIMS) projects ............................ 398Sue Wilson
Mathematics through movement:An investigation of the links between kinaesthetic and conceptual learning .......................... 404
Karen Wood

© The Australian Association of Mathematics Teachers Inc.
vi
Preface
The twenty-first biennial conference of The Australian Association of MathematicsTeachers is aptly titled Mathematics: Essential for learning, essential for life.
Mathematics is an old and respected discipline of knowledge which has proved itselfto be an essential component of school, college and university curricula over a longperiod of time and in a variety of national and international settings. This has been, andcontinues to be, in recognition that the content and procedures comprising the disciplinehave cultural, aesthetic, intellectual and utilitarian values which enrich the lives andpursuits of individuals, communities and nations, be it by making contributions to otherdisciplines of knowledge or applied to professions and trades.
This conference has brought together teachers, mathematicians, teacher educatorsand researchers from all states and territories of Australia and from other countries todemonstrate a variety of facets and perspectives of teaching and learning mathematicsand to give living proof that mathematics is definitely essential to both learning and life,particularly and generally.
This publication, comprising papers presented at the conference as keynote, majorpresentations, and seminar or workshop offerings, shows the range, nature and qualityof the work which many of our colleagues have been prepared to share with us all. Weare grateful to them for this.
Editors: Ken Milton, Howard Reeves, Toby Spencer
© The Australian Association of Mathematics Teachers Inc.
vii
Review process
Presentations at AAMT 2007 were selected in a variety of ways. Keynotes and majorpresentations were invited to be part of the conference and to have papers published inthese proceedings. A call was made for other presentations in the form of either aseminar or a workshop. Seminars and workshops were selected as suitable for theconference based on presenters’ application of a formal abstract and further explanationof the proposed presentation.
Seminar and workshop proposals that were approved for presentation at theconference were also invited to submit a written paper to be included in theseproceedings, with the possibility of the paper being subjected to peer review. Papersthat requested peer review were scrutinised blind by at least two reviewers. Papers thatpassed this review process have been identified in these proceedings as “accepted bypeer review”. Papers that were submitted to the proceedings but did not request peerreview were accepted as suitable for publication by the editors.
The panel of people to whom papers were sent for peer review was extensive and theeditors wish to thank them all:
Judy AndersonMary BarnesDawn BartlettJanette BobisGeorge BookerChris BoylesElizabeth BurnsJohn CartyJill CheesemanMary CouplandJudith Falle
Rhonda FaragherVince GeigerPeter GouldMarian KempBarry KissaneJohn MackDavid MartinMal McLeanTracey MuirDenise NealSteve Nisbet
Kay OwensCath PearnBob PerryThelma PersoCyril QuinlanLen SparrowPaul SwanJenny TaylerSteve ThorntonVern TreilibsMichael Wheal
Editors: Ken Milton, Howard Reeves, Toby Spencer


© The Australian Association of Mathematics Teachers Inc.
1
Keynotes
© The Australian Association of Mathematics Teachers Inc.
2
Mathematicians, mathematics andmathematics teaching: Personal perspectives+
Susie Groves
Deakin University
How can we enrich the mathematical experiences of our students? This paperattempts to explore ways in which a consideration of the work of contemporarymathematicians, and the applications of contemporary mathematics, can be used toenhance the learning and teaching of mathematics. It also looks briefly at HannaNeumann’s contribution to mathematics education.
Introduction
Mathematics is sometimes thought of as a great entity, like a tree, branching offinto several large chunks of mathematics which themselves branch off intospecialised fields, until the very ends of the tree are reached, where the blossomsand the fruit are found. (Tao, 1992, p. 65)
The tree and branch analogy for mathematics and its disciplines is probably a familiarone for most people, even in the wider community. However, I suspect few people thinkabout the blossoms and the fruit — the place where new mathematics grows — and thateven fewer think about the people who create this new mathematics — themathematicians.
At the time when I was asked to choose a title for this Hanna Neumann MemorialLecture, Terence Tao had just been awarded the Fields Medal — the equivalent of theNobel Prize in mathematics. At about the same time, one of my doctoral students, LindaDarby, was telling me that one of the major differences she had found, in her work withteachers of mathematics and science, was the much more frequent use of narrative inscience teaching than in mathematics (Darby, 2005). Yet, there are so many stories totell — not just the ones from the history of mathematics books — and so many ways touse them.
In this paper, I will try to use some of these stories to illustrate what I believe aresome important ways in which mathematics teaching can be enhanced by their use.
I am honoured and delighted to have been asked to present this Hanna NeumannMemorial Lecture. While Hanna needs no introduction, and I am sure someone else willintroduce her life and work at the lecture, I will, nevertheless, begin by saying a littleabout Hanna herself.
Hanna Neumann
Hanna Neumann was born in Berlin in February 1914. She lived a remarkably full andprolific life until her unexpected death in November 1971 while on a lecture tour inCanada. Hanna married Bernhard Neumann in Cardiff in 1939. She had left Germany in + Invited paper

Mathematics: Essential for Learning, Essential for Life
© The Australian Association of Mathematics Teachers Inc.
3
1938 to join Bernhard, who had left Germany five years earlier to escape the Nazis.Together they had five children, two of whom, Peter and Walter, also became wellknown mathematicians, while two others, Daniel and Barbara, completed degrees inmathematics, with Barbara also teaching mathematics.
Hanna completed her D Phil at Oxford in 1943, writing her thesis largely bycandlelight in a caravan. She was often seen transporting her two small children aroundOxford in a side-car attached to her bicycle. After an active academic life in Britain,which unfortunately meant that she and Bernhard frequently needed to live apart, Hannaand Bernhard were both offered prestigious positions at the Australian NationalUniversity (ANU). Bernhard was asked to set up and head a research department inmathematics, while Hanna’s position, which she took up in 1963 a year after Bernhardcame to Australia, soon became a Chair in Pure Mathematics and head of thedepartment of Pure Mathematics in the undergraduate part of the university.
I was fortunate to know both Hanna and Bernhard from early 1970 when I started asa doctoral student in pure mathematics at the Australian National University, under thesupervision of M. F. (Mike) Newman and Laci Kovacs. In their comprehensiveobituary, which pays tribute to Hanna’s life and work, Newman and Wall (1974)describe Hanna as “enthusiastic, inspiring, energetic, firm, tactful, sympathetic efficient,patient, shrewd, humble, peace-loving, courageous, gracious …” (p. 1). For me, each ofthese words evokes vivid memories of Hanna.
However, this is not intended to be an historical or personal account of Hanna’s life.Rather, I would like to explore, however briefly, some of her views about, andcontributions to, mathematics education. Newman and Wall (1974) capture not only thejoy that Hanna found in mathematics, but also her frustration with curriculum andpedagogy that failed to reveal what she saw as the nature of mathematics — especiallythe fact that “doing and thinking mathematics can be joyous human activities” (p. 11)— and its many applications to a wide range of areas in everyday and professional life.
While still in Britain, Hanna attempted to introduce more modern pure mathematicsto her university course, which she described rather scathingly as spending so muchtime “on enabling students to solve problems — or perhaps: so much more care is takento turn out students not worried by an integral or a differential equation” (cited inNewman & Wall, 1974, p. 6). Almost 60 years later, this complaint could perhaps stillbe made of many mathematics courses in Australian schools and universities!
During her time in Manchester from 1958 to l 963, Hanna had the opportunity todevelop and teach courses more in tune with her view of what mathematics is reallyabout. She was able to use concrete examples to help students access abstract ideas inher undergraduate algebra courses, as well as illustrate to students that areas ofmathematics, other than calculus, have applications in real life.
In Australia, Hanna soon became involved in secondary school mathematics. Shegave lectures and in-service courses for teachers in and around Canberra. She wasactive in the Canberra Mathematical Association, critiquing the proposed new syllabusand working hard to persuade the community that mathematics is not something to befeared. Her involvement led her to be elected as one of the foundation Vice-Presidentsof the Australian Association of Mathematics Teachers (AAMT) in 1966, the firstPresident of AAMT being Bernhard Neumann. She gave lectures to school students inCanberra and was an enthusiastic supporter and contributor to the ANU-AAMTNational Summer School for talented high school students, which was started in 1969.
Hanna published over 30 papers in mathematics, as well as a highly regardedpamphlet on probability for teachers (Neumann, 1996) and an article on teaching
Mathematics: Essential for Learning, Essential for Life
© The Australian Association of Mathematics Teachers Inc.
4
undergraduate students, published after her death in the Australian MathematicsTeacher (Neumann, 1973).
In my opinion, Hanna’s life and work show that mathematicians and mathematicsteachers can work together productively to enhance the teaching of mathematics inschools — something that is sometimes obscured by events such as the recent US“Maths Wars”. Hanna’s vision of school mathematics, and mathematics in general, wasthat of a joyful activity (which is necessarily done by real people), rather than the rotelearning of rules and procedures. She had a vision of contemporary mathematics havinga significant place in the curriculum, together with the need to show the wide range ofapplications of pure mathematics to our students. Even now, 35 years after her death,the realisation of Hanna’s vision is as important a goal as it was in the late 1960s.
We will now look very briefly at the life and work of another mathematician, CherylPraeger, who not only had strong connections with Hanna Neumann, but whose workallows us an opportunity to explore a relatively simple application of pure mathematics.
Cheryl Praeger
Cheryl Praeger was born in Toowoomba in 1948 to parents who, having come frompoor backgrounds with no chance of going to university, encouraged their children to doso (MacTutor History of Mathematics archive, 2006). While completing her B Sc at theUniversity of Queensland, Cheryl spent eight weeks at the Australian NationalUniversity on a summer research scholarship (after her third year), working on aproblem suggested to her by Bernhard Neumann, which resulted in a published paper(Praeger, 1970). After completing her undergraduate course, Cheryl went to Oxford ona Commonwealth Scholarship to study for her doctorate in finite permutation groupsunder the supervision of Peter Neumann, Hanna and Bernhard’s son. In 1973, Cherylwas appointed to a three year postdoctoral fellowship at ANU, with her time thereoverlapping briefly with mine as a doctoral student.
Cheryl has been at the University of Western Australia since 1976, where she hasbeen Professor of Mathematics since 1983. She is a Fellow of the Australian Academyof Science, former president of the Australian Mathematical Society, and a member ofthe Order of Australia. Like Hanna Neumann, Cheryl exudes joy in her work as amathematician, looks for the applications of pure mathematics, and takes a keen interestin mathematics education. Her work on combinatorial designs led her to explore theirapplication to experimental layouts for agricultural experiments, in order to helpstatisticians understand the symmetry groups involved. She has over 300 publications,including four books, over 250 research papers in mathematics, and a number of articlesabout mathematics education or for teachers.
One of Cheryl’s most popular lecture topics, aimed at school level, has been on themathematics of weaving. One of her three papers on this topic is published as part ofThe Hanna Neumann Memorial Lectures at ICME 5 (see Praeger, 1986). In this paper,Cheryl describes how several problems in weaving materials can be solved usingmathematics. She firstly explains how a real woven fabric can be modelled with the useof binary matrices representing a fundamental block (or smallest repeating block in thepattern). A problem in weaving is to determine which patterns produce fabrics that hangtogether — that is, which patterns produce fabrics where the warp and weft threads donot have subsets that can completely lift off the fabric. It can be shown that fabrics willnot hang together exactly when the binary matrix representing the fundamental block ofthe pattern can be transformed by rearranging its rows and columns, in such a way, as toget a matrix of the form
Mathematics: Essential for Learning, Essential for Life
© The Australian Association of Mathematics Teachers Inc.
5
YJ
X 0
where 0 is a matrix with all entries zero, and J is a matrix with all entries one.However, finding out whether or not the matrix representing the fundamental block
of the pattern can be transformed in such a way would take far too long, when the sizeof the matrix is large. In her paper, Praeger describes different algorithms that can beused to decide whether or not woven fabrics represented by a particular fundamentalblock would hang together, as well as the way in which the factorisation of binarymatrices can be used to set up a loom to weave the fabric, represented by such afundamental block.
Applications such as these go along way towards answering the perennial studentquestion of “Why are we learning this?” even though we do not expect every student tobecome a weaver of fabric!
This focus on the applications of pure mathematics is also taken up by anotherAustralian mathematician of world renown, Terence Tao.
Terence Tao
Readers of most Australian newspapers would be aware that in August 2006 TerenceTao became the first Australian mathematician to be awarded the Fields Medal (see, forexample, Cauchi, 2006). In further recognition of his outstanding work, Terence Taowas also named South Australia's Australian of the Year for 2006 (see, for example,Novak, 2006) and elected as a Fellow of the Royal Society in May 2007.
Aged 31, Terence Tao has been a full professor of mathematics at UCLA since 2000,and has long been regarded as likely to win the Fields Medal, which is awarded everyfour years (UCLA College, 2005). He has over 80 published papers and has worked,with more than 30 collaborators, on an amazingly wide range of mathematicalproblems.
One of the highlights of Terence Tao’s work has been his work with Ben Green on aclassical question regarding prime numbers (for a simple explanation of the result, seeRoss & Polster, 2007). Tao is also credited with having extraordinary abilities inassembling and managing world-class teams of mathematicians to work on problems.
Terence Tao was born in Adelaide in 1975. In April 1983, when Terence was sevenyears old, the Adelaide Advertiser carried an article entitled Tiny Terence, 7, is HighSchool Whiz (cited in Clements, 1984). At that time, Dr M. A. (Ken) Clements, who isnow at Illinois State University, was undertaking a bible college course in Adelaideafter having “given up” mathematics education following eight years in the Faculty ofEducation at Monash University, and many years as a teacher of secondary schoolmathematics. Nevertheless, when asked by Terence’s father to assess his son’smathematical abilities, Ken, who had a long-standing interested in mathematicallygifted students, found he could not refuse. This began a relatively long associationbetween Terence and Ken. Terence, at age seven, was exceptionally gifted. He wasspending the equivalent of two days a week at high school studying Year 11mathematics and physics, and the rest of his time at his local primary school, beinghappy and well accepted in both places. In 1986, at age ten, Terence became theyoungest participant in the International Mathematical Olympiads, winning a bronze,silver and gold medal in 1986, 1987 and 1988 respectively. He graduated with abachelor and master’s degree from Flinders University at age 17 and a Ph D fromPrinceton at age 20, joining the UCLA Faculty that year.
Mathematics: Essential for Learning, Essential for Life
© The Australian Association of Mathematics Teachers Inc.
6
After several years working as a missionary in India, Ken Clements (whom I haveknown for over 30 years) returned to Australia and joined Deakin University. In 1992,Terence Tao published his first book (Tao, 1992), a monograph commissioned by KenClements and Nerida Ellerton to form part of the study materials for the DeakinUniversity unit Teaching Mathematics Through a Problem Solving Approach. Themanuscript for this book was prepared in early 1991, when Terence was 15 years old.The monograph, which was used for a number of years by various Deakin staff,including myself, in a number of units about problem solving, was reprinted by OxfordUniversity Press in 2006.
Regarding the applications of pure mathematics, Terence Tao has this to say:
Mathematicians often work on pure problems that may not have applications for 20years — and then a physicist or computer scientist or engineer has a real-lifeproblem that requires the solution of a mathematical problem, and finds thatsomeone already solved it 20 years ago… When Einstein developed his theory ofrelativity, he needed a theory of curved space. Einstein found that a mathematicianhad devised exactly the theory he needed more than 30 years earlier.(UCLA College, 2005)
It is easy to believe that pure mathematics in general, and number theory inparticular, are all very well as genteel pastimes, but have no use in the real world. Infact, nothing could be further from the truth. In the chapter Examples in number theory,Tao (1992) writes: “Basic number theory is a pleasant backwater of mathematics. Butthe applications that stem from the basic concepts of integers and divisibility areamazingly diverse and powerful” (p. 8). To illustrate this, we will take a tiny glimpse atthe way in which mathematics has been used in recent history in the design andbreaking of codes.
Public-key cryptography
Codes are used when we want to transmit (secret) messages which are in danger ofbeing intercepted. Alan Turing, who was one of the most influential figures in thedevelopment of the electronic computer, was also the presiding mathematical genius atBletchley Park during World War II where he, more than any other person, madepossible the breaking of the Enigma codes. The operations of the mathematicians,linguists and other scientists at Bletchley Park formed the basis, some years ago, for aspellbinding British documentary series The Secret War, which some of you may haveseen, when it was shown on ABC television.
It is easy to think of codes and code breaking as only being of use in war-time, butcodes are also essential when we want to store and transmit electronic data —something which happens now in every facet of life, from banking totelecommunications, to the storage of personal information on citizens, to purchasingproducts on eBay, all of which we want to make sure is secure. (You will all have seenmessages regarding the security status of web pages you are viewing — for example,alerting you that you are leaving a page that supports encryption.)
In traditional coding systems, the key to encode a message can also be used todecode it. Therefore, this (single) key must be kept secret and only made available topeople with whom you are communicating — hence, the importance of breaking codessuch as the Enigma code in World War II.
In everyday modern life, however, there is such a vast amount of data handlingwhich involves the need for security, that it certainly would not be practicable to use
Mathematics: Essential for Learning, Essential for Life
© The Australian Association of Mathematics Teachers Inc.
7
traditional codes, which, apart from anything else, need the key to be agreed on betweenthe users of the code.
It turns out that the ease with which primes can be multiplied together, comparedwith the enormous difficulty of factorising a number when we do not know its factors,can be used to create a new type of coding or encryption which is called public-keycryptography.
In public-key cryptography, the key for decoding a message cannot be deduced fromthe key for encoding it — at least not in a feasible amount of time. This allows peopleto send secure messages, electronically, to a destination which can publicly advertisethe encoding key — hence, the name public-key cryptography. All of these systemsdepend on the fact that, while it is theoretically possible to deduce the decoding keyfrom the encoding key (for example, as a last resort, by encoding every possiblemessage of the same length as the one intercepted and seeing which message encodes tothe message received), it is not feasible to do so in the time available.
A useful metaphor is to think about a traditional cryptosystem as a safe with acombination lock that, when you know the combination, allows you to both lock andunlock the safe, while in a public-key system the safe has two separate combinationlocks: one that locks the safe and another that unlocks it. Such codes are also sometimescalled trapdoor codes: one where it is very easy to do something (encode a message)but very hard to undo it (decode the message).
One of the earliest public-key cryptosystems, the so-called RSA system, was devisedby Ted Rivest, Adi Shamir and Leonard Adleman (see, for example, Hellman, 1978 fora description of several systems, including RSA). The RSA system depends on thedifficulty of factorising large numbers, as well as making use of modular arithmetic,and some fairly elementary results from number theory. The system can be described,briefly, as follows:
Setting up the system
Select two large primes, p and q, each about 100 digits long. (These primes will remainsecret.)
Let n = p q. (The number n will be made public, but knowing n will not make itpossible for you to determine p and q because of the difficulty of factorising a number.)
The Euler function (n) = (p – 1)(q – 1) is the number of integers between 1 and nthat are relatively prime to n; that is, the number of integers whose only common factorwith n is 1. The Euler function (n) has the property that for any integer a between 0and n – 1,
a1 + k. (n) = a mod n .
Choose a random positive integer E < (n) , such that E is relatively prime to (n).E, like n, will be made public: together n and E make up the public key.
Since the person setting up the code knows the secret primes p and q, they also knowthe value of (n) = (p – 1)(q – 1), but this remains a secret for the public. So, for theperson setting up the code, it is easy to find the inverse of E modulo (n); that is, thenumber D such that
D . E 1 mod (n),
that is, the number D such that
D . E = 1 + k. (n) for some integer k.
Mathematics: Essential for Learning, Essential for Life
© The Australian Association of Mathematics Teachers Inc.
8
This number D also remains secret.Summing up this stage, we have the following:• secret: p, q, (n), D;
• public: n, E.
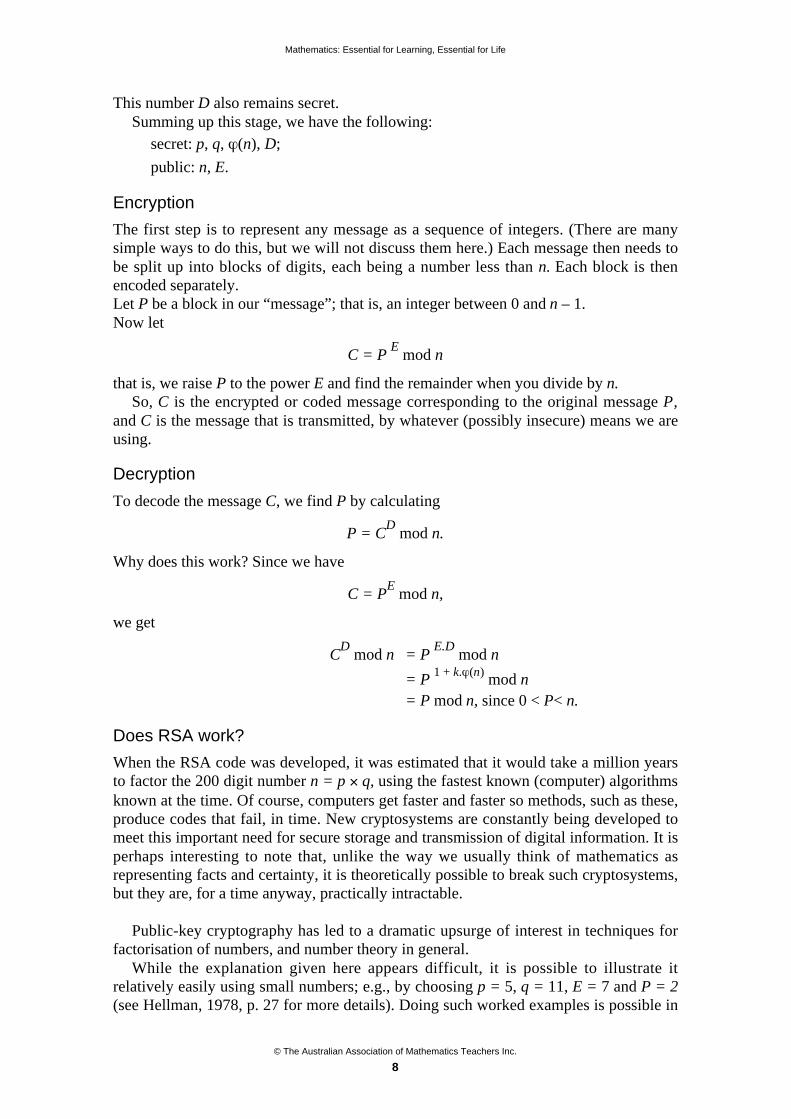
Encryption
The first step is to represent any message as a sequence of integers. (There are manysimple ways to do this, but we will not discuss them here.) Each message then needs tobe split up into blocks of digits, each being a number less than n. Each block is thenencoded separately.Let P be a block in our “message”; that is, an integer between 0 and n – 1.Now let
C = P E mod n
that is, we raise P to the power E and find the remainder when you divide by n.So, C is the encrypted or coded message corresponding to the original message P,
and C is the message that is transmitted, by whatever (possibly insecure) means we areusing.
Decryption
To decode the message C, we find P by calculating
P = CD
mod n.
Why does this work? Since we have
C = PE mod n,
we get
CD
mod n = P E.D
mod n
= P 1 + k. (n) mod n= P mod n, since 0 < P< n.
Does RSA work?
When the RSA code was developed, it was estimated that it would take a million yearsto factor the 200 digit number n = p q, using the fastest known (computer) algorithmsknown at the time. Of course, computers get faster and faster so methods, such as these,produce codes that fail, in time. New cryptosystems are constantly being developed tomeet this important need for secure storage and transmission of digital information. It isperhaps interesting to note that, unlike the way we usually think of mathematics asrepresenting facts and certainty, it is theoretically possible to break such cryptosystems,but they are, for a time anyway, practically intractable.
Public-key cryptography has led to a dramatic upsurge of interest in techniques forfactorisation of numbers, and number theory in general.
While the explanation given here appears difficult, it is possible to illustrate itrelatively easily using small numbers; e.g., by choosing p = 5, q = 11, E = 7 and P = 2(see Hellman, 1978, p. 27 for more details). Doing such worked examples is possible in
Mathematics: Essential for Learning, Essential for Life
© The Australian Association of Mathematics Teachers Inc.
9
secondary mathematics classes, but even primary children can be exposed to some ofthe general principles involved and the fact that factorisation, and the use of divisibilitytests, have significant contemporary applications.
We will conclude our examples of the applications of mathematics by consideringthe role of mathematics in one branch of art and design.
M. C. Escher and George Pólya
The famous Dutch artist M. C Escher lived from 1898 to 1972. There are numerousexamples of Escher’s work, most of which is highly mathematical, available in books,on T-shirts, the “fifteen puzzle”, coffee mugs, jigsaw puzzles, to name just a few.
One of Escher’s major preoccupations was with producing space-filling designs ortessellations of the plane. He derived much of his inspiration for this in his first visit tothe Alhambra in Spain in 1922, where he studied the truly stunning Moorish mosaics onthe walls and floors. However, unlike the Moors, who were forbidden to use “gravenimages” and who therefore only made tiling patterns with geometric shapes, Escherattempted to completely cover the plane (i.e. create tessellations) with shapes thatrepresented objects, such as animals or birds.
I was lucky enough to visit the Alhambra in 1996. Not only was I totallyoverwhelmed by the tiles and patterns, but it was easy to see how Escher had beeninfluenced by the designs and used these as scaffolds for his plane tessellations.
Ernst (1994) discusses Escher’s early (and largely unsuccessful) attempts atproducing space-filling designs, based on recognisable objects. He also alludes to someof the mathematical ideas underlying Escher’s work and mentions links withcrystallography.
Schattschneider (1990), in her magnificent book Visions of symmetry: Notebooks,periodic drawings and related work of M. C. Escher, describes, in great detail, Escher’s“route to regular divisions” and the role that mathematics played. Escher’s earlyunsuccessful attempts at regular divisions of the plane, using recognisable objects, wereproduced during the five years after his first visit to the Alhambra in 1922. In 1936,Escher revisited the Alhambra in Granada and La Mezquita in Córdoba. He used hiscollection of detailed sketches of the geometric designs he had seen to provide thescaffold for his interlocking designs.
The geometric tilings copied in the Alhambra yielded many new insights to Escher,who found himself not just tinkering with the polygon shapes to derive new motifs,but also trying to discover the distinct ways in which individual figures couldinterlock with adjacent copies of themselves. (Schattschneider, 1990, pp. 19–20)
While this was the beginning, Escher was still struggling to produce the types ofdesigns he desired. He described his explorations as follows:
I saw a high wall and as I had a premonition of an enigma, something that might behidden behind the wall, I climbed over with some difficulty. However, on the otherside I landed in a wilderness and had to cut my way through with great effort until— by a circuitous route — I came to the open gate, the open gate of mathematics.From there, well-trodden paths lead in every direction, and since then I have oftenspent time there. Sometimes I think I have covered the whole area. I think I havetrodden all the paths and admired all the views, and then I suddenly discover a newpath and experience fresh delights. (Escher, cited in Schattschneider, 1990, p. 21)

Mathematics: Essential for Learning, Essential for Life
© The Australian Association of Mathematics Teachers Inc.
10
The “open gate of mathematics” came to Escher via his half brother B. G. (Beer)Escher, a professor of geology, who, on being shown Escher’s work, recognised that hewas applying some form of two-dimensional crystallography and provided him with anumber of papers published in Zeitschrift für Kristallographie between 1911 and 1933.Of these, the one that had a profound influence on the work of Escher was Pólya’s(1924) paper that classified the 17 plane symmetry groups (also known as the wallpapergroups). While this result — that there are just 17 different essentially different ways torepeat a design in the plane — was known, Pólya provided an illustration for each of the17 possible tilings, including four of his own design (Schattschneider, 1987, 1990).Escher copied Pólya’s article in full and studied the illustrations to understand theirgeometric structure, and how “these tilings could be colored with a minimum number ofcolors in a way that was compatible with the symmetries of the tiling” (Schattschneider,1987, p. 295). Pólya and Escher corresponded, but Pólya left the correspondence behindwhen he departed from Zurich in 1940. Schattschneider found Escher’s notebook withthe single word “Pólya” written on the cover in a museum in The Hague in 1976. Shesent her photograph of it to Pólya, who then told her of his correspondence with Escher(Schattschneider, 1987).
Given Escher’s huge popularity, it is not surprising that almost all students arefascinated by his work. They may also have heard about Pólya, often referred to as “thefather of modern problem solving”. At the same time, much of the mathematics that isso superbly illustrated by Escher’s work occurs frequently in school mathematicscurricula. For example, in Victoria, the Victorian Essential Learning Standards —VELS (Victorian Curriculum and Assessment Authority, 2005) refers to various aspectsof symmetry, transformations and tessellations at every level from Level 2 to Level 6.As Mottershead (1977) so beautifully illustrates, the learning of geometry can betremendously enriched by exposing students to Escher’s work, and the underlyingmathematical concepts.
Conclusion
In this paper, I am not trying to advocate adopting a history of mathematics approach tothe teaching of mathematics, but rather to encourage us all to attempt to contextualisethe mathematics that we teach, to show the links to its applications and the connectionsbetween various aspects, and to reveal the people, who create the mathematics, to ourstudents. For most students, it is a surprise to hear that mathematics is actually createdby people — some of whom are alive, or have only recently died.
While none of the examples used here are new they, nevertheless, illustrate someways in which contemporary mathematics can be, and is, used in real life. We talk a lotabout the importance of making mathematics relevant for students, but often this isunderstood to mean that the mathematics should be used by students in everyday life —a hard ask that often leads to a trivialisation of the mathematics we teach. Of course,assembling such examples, and adapting them to an appropriate level to suit students inone’s class, is not easy. However, we do not need to develop examples for every topic.Instead, I believe that we should take the opportunity, every now and then, to look atsome genuine applications in some depth. Such examples also allow us to makeconnections between different areas of mathematics (for example, prime numbers,factorisation and modular arithmetic, in the case of public-key cryptography). They alsoshow the essential nature of mathematics and just how widespread its applications are(for example, the “open gate of mathematics” that enabled Escher to develop hiswonderful designs for regular divisions of the plane).

Mathematics: Essential for Learning, Essential for Life
© The Australian Association of Mathematics Teachers Inc.
11
Most of all, this paper attempts to persuade teachers of mathematics to convey totheir students the joy of mathematical discovery — something that is often forgotten ata time when there is a real crisis in the number of students wanting to pursue higherstudies in mathematics and, when, it is becoming increasingly difficult to find teachersfor those students who do wish to pursue such studies.
References
Cauchi, S. (2006, August 22). It’s prime time as numbers man Tao tops his field. The Age. Retrieved9 September 2006 from: http://www.theage.com.au/articles/2006/08/22/1156012542775.html
Clements, M.A. (1984). Terence Tao. Educational Studies in Mathematics, 15(3), 213–238.
Darby, L. (2005, July). Having Stories to Tell: Negotiating Subject Boundaries in Mathematics andScience. Paper presented at the Australasian Association for Research in Science Education,Hamilton, NZ.
Ernst, B. (1994). The Magic Mirror of M. C. Escher. New York: Barnes & Noble.
Hellman, M. E. (1978). An overview of Public-Key Cryptography, IEEE Communications SocietyMagazine, 16, 24–32. Retrieved 20 September 2006 from:http://www-ee.stanford.edu/~hellman/publications.html
Motttershead, L. (1977). Metamorphosis: A Source Book of Mathematical Discovery. Sydney: JohnWiley & Sons.
Neumann, H. (1966). Probability. Pamphlets for Teachers, 2. Canberra: Canberra MathematicalAssociation.
Neumann, H. (1973). Teaching first year undergraduates: Fads and fancies, The Australian MathematicsTeacher, 29, 23–28.
Newman, M. F. & Wall, G. E. (1974). Hanna Neumann. Journal of the Australian Mathematical Society,17, 1–28.
Novak, L. (2006, December 6). SA honours maths genius. The Advertiser. Retrieved 6 December 2006from: http://www.news.com.au/adelaidenow/story/0,22606,20879093-910,00.html
Pólya, G. (1924). Über die Analogie der Kristallsymmetrie in der ebene. Zeitschrift für Kristallographie,60, 278–282.
Praeger, C. E. (1970). Note on a functional equation, Aeq. Math. 4, 353–357.
Praeger, C. E. (1986). Mathematics and weaving, in M. F. Newman (Ed.), The Hanna NeumannMemorial Lectures at ICME 5, Notes on Pure Mathematics, 13, pp. 61–74. Canberra: AustralianNational University.
Ross, M. & Polster, B. (2007). MathSnacks: Terry Tao — Terrific! Vinculum, 44(2), 26.
Schattschneider, D. (1987). The Pólya-Escher connection. Mathematics Magazine, 60(5), 292–298.Retrieved 14 May 2007 from: http://www.jstor.org/view/0025570x/di021152/02p0140d/0
Schattschneider, D. (1990). Visions of symmetry: Notebooks, Periodic Drawings and Related Work of M.C. Escher. New York: W. H. Freeman.
Tao, T. C. S. (1992). Solving Mathematical Problems: A Personal Perspective. Geelong, Vic: DeakinUniversity Press.
The MacTutor History of Mathematics archive (2006). Cheryl Elisabeth Praeger. St Andrews: School ofMathematics and Statistics, University of St Andrews, Scotland. Retrieved 6 December 2006 from:http://www-groups.dcs.st-and.ac.uk/~history/Biographies/Praeger.html
UCLA College (2005, November 9). Terence Tao: The “Mozart of Math”. ULCLA News About TheCollege. Retrieved 9 September 2006 from:http://www.college.ucla.edu/news/05/terencetaomath.html
Victorian Curriculum and Assessment Authority (2005). Victorian Essential Learning Standards – VELS.Melbourne: Author. Retrieved 14 May 2007 from: vels.vcaa.vic.edu.au/essential/

© The Australian Association of Mathematics Teachers Inc.
12
Developing spatial mathematics+
Richard Lehrer
Vanderbilt University
Spatial mathematics is ordinarily neglected in K–6 education. I suggest twocompelling reasons for restoring the mathematics of space to the curriculum. First,developing spatial mathematics provides many opportunities to cultivatemathematical habits of mind. I exemplify several habits of mind drawing on thework of children and their teachers. These include generalisation and its cousin,proof, as well as learning to seek invariance and to see relations. Second,developing spatial mathematics provides many opportunities to establishconnections with related forms of thinking, such as those of modelling in scienceand of representing data in mathematics.
Introduction
Spatial mathematics is comparatively neglected in the K–8 mathematics curriculum.Most emphasis is placed on number and arithmetic, and when there is a pedagogicalurge to go beyond arithmetic, the role of generalised arithmetic as the foundation ofalgebra receives the most attention. Yet, attention to spatial mathematics can yield richrewards for a general mathematics education, partly because the mathematics of spacehas a long and rich heritage that ought not be neglected in mathematics education(Lehrer and Chazan, 1998), and partly because developing the mathematics of space isan ideal incubator for developing mathematical habits of mind (Goldenberg, Cuoco &Mark, 1998, p. 3). Mathematical habits of mind are practices that are important to theeveryday conduct of mathematics but that go beyond mere instrumentalism to capturesomething important about mathematical knowing — what makes knowingmathematics different than, say, knowing other important things, such as how to tellstories. When one learns to reason in a manner consistent with a mathematical habit ofmind, one is also learning something about what it means to think like a mathematician.Furthermore, neglect of the heritage of the mathematics of space is not simply neglectof some properties of shape or some obscure theorems about form. The real danger isthe loss of connection between mathematics and other forms of mathematical andscientific endeavour.
In the sections that follow, I first describe some candidates for mathematical habitsof mind, and then go on to exemplify these habits of mind in the work of childrenthroughout the early and middle years of schooling (K–6 span). I conclude, again, withexamples from children’s work, with connections between spatial mathematics andother ways of knowing, especially in social and natural sciences.
+ Invited paper
Mathematics: Essential for Learning, Essential for Life
© The Australian Association of Mathematics Teachers Inc.
13
Developing mathematical habits of mind
Any suggestion of a definitive list of mathematical habits of mind would betray somemixture of hubris and ignorance. The tact I take is to suggest some candidates that Ibelieve are accessible to children. The treatment of these habits of mind is genetic, inthe sense intended by Piaget (1970), in that the form and content of knowledge isdetermined by its developmental history. Hence, my orientation is to focus on forms ofreasoning that could, conceivably, serve as seeds for later development. When I suggesta habit of mind, I am considering its embryonic form, not its mature form in currentmathematical practice.
Generalisation
When we make generalisations in everyday thinking, we are referring to dispositionsand propensities. In mathematics, we up the ante. Dispositions are replaced bycertainties. Certainty is grounded in understanding of the structure and behaviour of themathematical system. Hence, a generalisation is a claim about the functioning of amathematical system. Some generalisations are so well understood, that they merit anadditional claim: One can explain the system with sufficient detail and clarity to meritcertainty about one’s claims. Stated another way, one can prove. Although the tightrelation between proof and explanation is well understood in the mathematicalcommunity, it is often misplaced in school mathematics. This has been the subject of anumber of studies, all of which suggest the need for a tighter linkage between proof andexplanation. As I suggested previously, a sensible approach to this problem is not tobegin frantic reform in the years of secondary schooling. Instead, we need to think ofgentle introductions to generalisation and knowing. I propose a few forms ofintroduction to generalisation that have shown to be fruitful pathways for children.
Definition
Definition is at the heart of developing mathematical objects that can participate inlarger systems of relation. Hence, definitions are important building blocks ofmathematical reasoning. All too often, these building blocks are denied to children,who, instead, are asked to use mathematical objects, such as the number sequence, thathave either not been defined or that are expected to be somehow apprehended directlythrough experience. There are some notable exceptions to this in the literature,particularly around the definition of odd and even numbers, but perhaps one reason forthe notoriety of these examples is the paucity of alternatives. Thinking about space, incontrast, is more accessible to children, and here we can take opportunities to involvechildren in the definition of nearly any space figure. Definition of a space figure, suchas square or triangle, involves children in the important habit-of-mind of generalisation(when we say square, we do not mean only this square), and it invites too closerexamination of the qualities of space, such as “straight,” or “angle.”
Figure 1 displays a second grader’s proposal of a triangle that she claimed met theconsensus reached by the class that a triangle had “3 sides and 3 corners.” Her class didnot want to accept this figure as a triangle. Their teacher invited them to consider howthey might wish to modify their definition to exclude it. For this class, what becamecontested was the nature of side.

Mathematics: Essential for Learning, Essential for Life
© The Australian Association of Mathematics Teachers Inc.
14
Figure 1. A drawing depicting triangle consistent with definition.
In another third-grade class, definition of a triangle suggested contest about thenature of “tips”, in figures that children saw in their textbooks. This gave rise todiscussion of the meaning of connected, as is evident upon inspection of Figure 2,which illustrates part of the class investigation.
Figure 2. Investigating qualities of “tips” (connectedness).
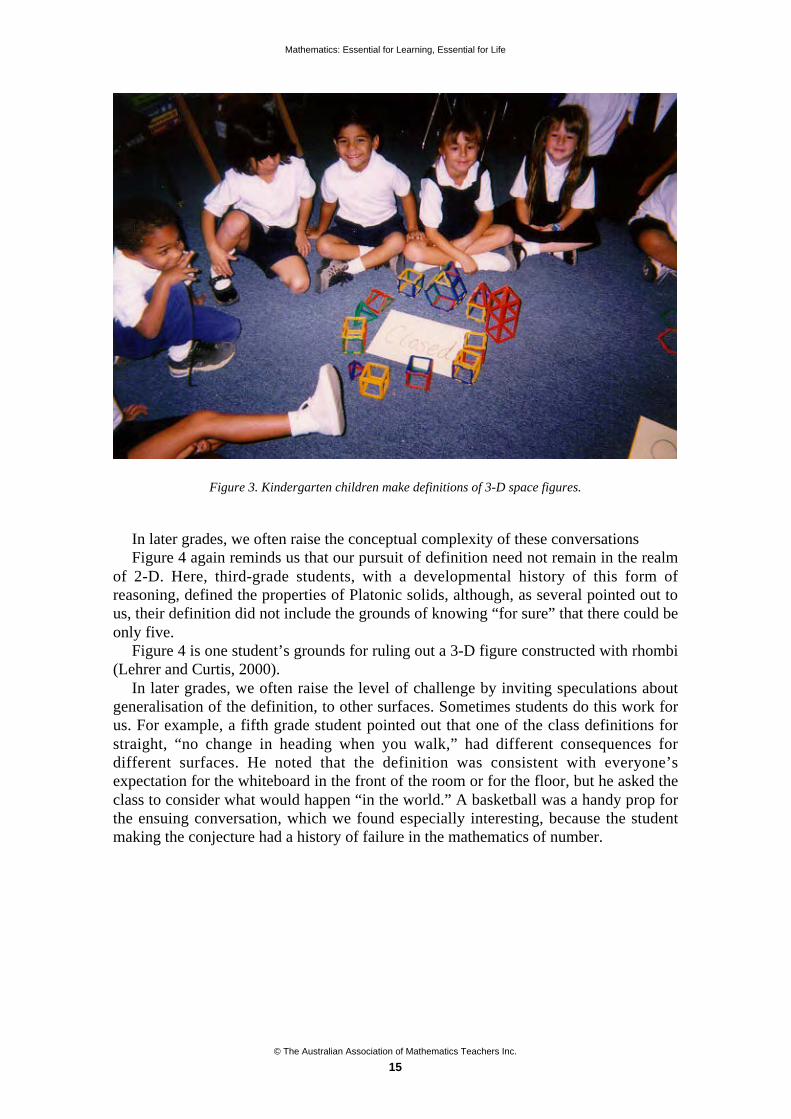
Of course, it is never too early to begin to initiate children in definition.Figure 3 displays the results of investigations of 3-D structures by 4- and 5-year old
children. It parallels the investigation of connectedness in 2-D, conducted by the third-grade children. The lesson to be drawn is that we do not believe that definition is toocomplicated a matter for younger children but, instead, that it is our role as teachers tofind forms that challenge children, yet remain solidly within their grasp.
Mathematics: Essential for Learning, Essential for Life
© The Australian Association of Mathematics Teachers Inc.
15
Figure 3. Kindergarten children make definitions of 3-D space figures.
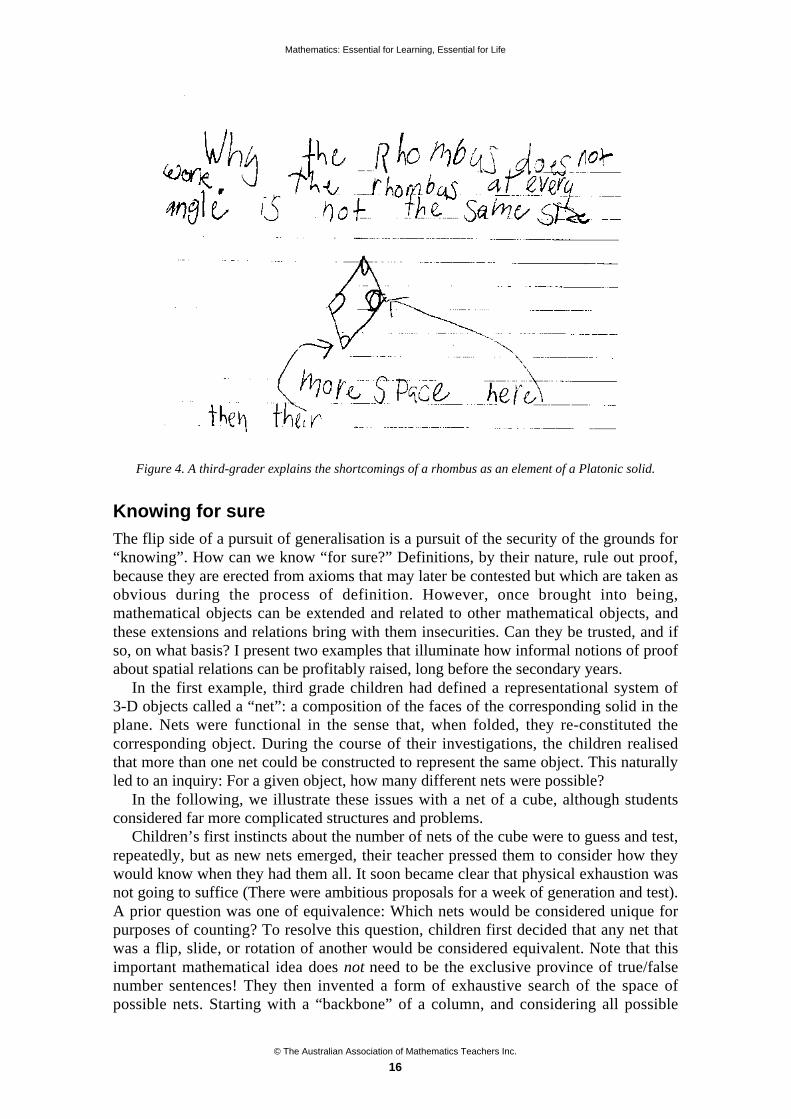
In later grades, we often raise the conceptual complexity of these conversationsFigure 4 again reminds us that our pursuit of definition need not remain in the realm
of 2-D. Here, third-grade students, with a developmental history of this form ofreasoning, defined the properties of Platonic solids, although, as several pointed out tous, their definition did not include the grounds of knowing “for sure” that there could beonly five.
Figure 4 is one student’s grounds for ruling out a 3-D figure constructed with rhombi(Lehrer and Curtis, 2000).
In later grades, we often raise the level of challenge by inviting speculations aboutgeneralisation of the definition, to other surfaces. Sometimes students do this work forus. For example, a fifth grade student pointed out that one of the class definitions forstraight, “no change in heading when you walk,” had different consequences fordifferent surfaces. He noted that the definition was consistent with everyone’sexpectation for the whiteboard in the front of the room or for the floor, but he asked theclass to consider what would happen “in the world.” A basketball was a handy prop forthe ensuing conversation, which we found especially interesting, because the studentmaking the conjecture had a history of failure in the mathematics of number.
Mathematics: Essential for Learning, Essential for Life
© The Australian Association of Mathematics Teachers Inc.
16
Figure 4. A third-grader explains the shortcomings of a rhombus as an element of a Platonic solid.
Knowing for sure
The flip side of a pursuit of generalisation is a pursuit of the security of the grounds for“knowing”. How can we know “for sure?” Definitions, by their nature, rule out proof,because they are erected from axioms that may later be contested but which are taken asobvious during the process of definition. However, once brought into being,mathematical objects can be extended and related to other mathematical objects, andthese extensions and relations bring with them insecurities. Can they be trusted, and ifso, on what basis? I present two examples that illuminate how informal notions of proofabout spatial relations can be profitably raised, long before the secondary years.
In the first example, third grade children had defined a representational system of3-D objects called a “net”: a composition of the faces of the corresponding solid in theplane. Nets were functional in the sense that, when folded, they re-constituted thecorresponding object. During the course of their investigations, the children realisedthat more than one net could be constructed to represent the same object. This naturallyled to an inquiry: For a given object, how many different nets were possible?
In the following, we illustrate these issues with a net of a cube, although studentsconsidered far more complicated structures and problems.
Children’s first instincts about the number of nets of the cube were to guess and test,repeatedly, but as new nets emerged, their teacher pressed them to consider how theywould know when they had them all. It soon became clear that physical exhaustion wasnot going to suffice (There were ambitious proposals for a week of generation and test).A prior question was one of equivalence: Which nets would be considered unique forpurposes of counting? To resolve this question, children first decided that any net thatwas a flip, slide, or rotation of another would be considered equivalent. Note that thisimportant mathematical idea does not need to be the exclusive province of true/falsenumber sentences! They then invented a form of exhaustive search of the space ofpossible nets. Starting with a “backbone” of a column, and considering all possible
Mathematics: Essential for Learning, Essential for Life
© The Australian Association of Mathematics Teachers Inc.
17
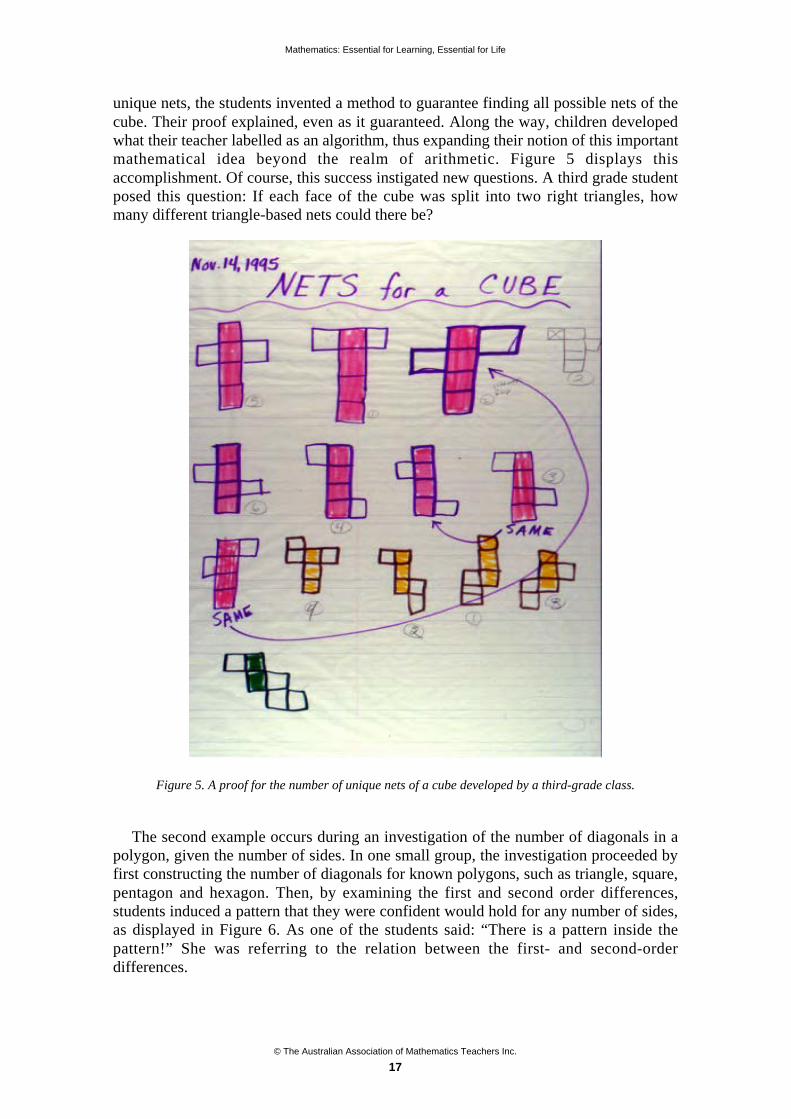
unique nets, the students invented a method to guarantee finding all possible nets of thecube. Their proof explained, even as it guaranteed. Along the way, children developedwhat their teacher labelled as an algorithm, thus expanding their notion of this importantmathematical idea beyond the realm of arithmetic. Figure 5 displays thisaccomplishment. Of course, this success instigated new questions. A third grade studentposed this question: If each face of the cube was split into two right triangles, howmany different triangle-based nets could there be?
Figure 5. A proof for the number of unique nets of a cube developed by a third-grade class.
The second example occurs during an investigation of the number of diagonals in apolygon, given the number of sides. In one small group, the investigation proceeded byfirst constructing the number of diagonals for known polygons, such as triangle, square,pentagon and hexagon. Then, by examining the first and second order differences,students induced a pattern that they were confident would hold for any number of sides,as displayed in Figure 6. As one of the students said: “There is a pattern inside thepattern!” She was referring to the relation between the first- and second-orderdifferences.

Mathematics: Essential for Learning, Essential for Life
© The Australian Association of Mathematics Teachers Inc.
18
Figure 6. Exploring relations between the number of sides and the number of diagonals of a polygon.
Other students found an algebraic expression that fit this pattern: “number of sidesdivided by 2 times the number of sides minus 3”. But, when the group that discoveredthe pattern, or those who had succeeded in creating an algebraic expression was pressedby their classmates to explain the basis of the pattern, all were stumped. The expressionseemed to work and the reasoning about difference appeared sound, but what couldaccount for it? A classmate proposed an alternative way of viewing the diagonals of apolygon, what we might call a “directed graph.” His proposal was: what was importantto consider was the number of vertices that could be “reached” from a given vertex.With this in mind, the number of vertices that could be reached was equivalent to thenumber of sides less the neighbouring sides (2) and the vertex itself (1), yielding theexpression (n – 3). One could visit from each and every vertex, yielding n (n – 3).Since each path was directed but direction did not matter (vertex 1 vertex 3 was thesame as the path traced by vertex 3 vertex 1), the same algebraic expression wasrecovered, but now it could be explained, so the basis of the generalisation was secured.

Mathematics: Essential for Learning, Essential for Life
© The Australian Association of Mathematics Teachers Inc.
19
Invariance
The remaining candidates for habits-of-mind are important servants of generalisationand proof. One is the notion that when conducting an investigation, look for what staysthe same when something changes. As re-consideration of some of the previousexamples suggests, spatial mathematics affords many opportunities for children to seethe pay off for thinking in this way. Consider, for example, the problem of defininguniqueness in the informal proof of the number of nets of a cube, or the invariance ofthe second difference during the investigation of the number of diagonals of a polygon.One of my favourite examples comes from a unit developed by Dan Watt that exploresmathematics via artistic design. Children design quilts by considering motions of units(“core squares”) on the plane, as exemplified in Figure 7.
COPY
CORE
SIDE-
WAYS
FLIP
UP-
DOWN
FLIP
TURN
RIGHT
1/2
Figure 7. Exploring relations between motion and design.
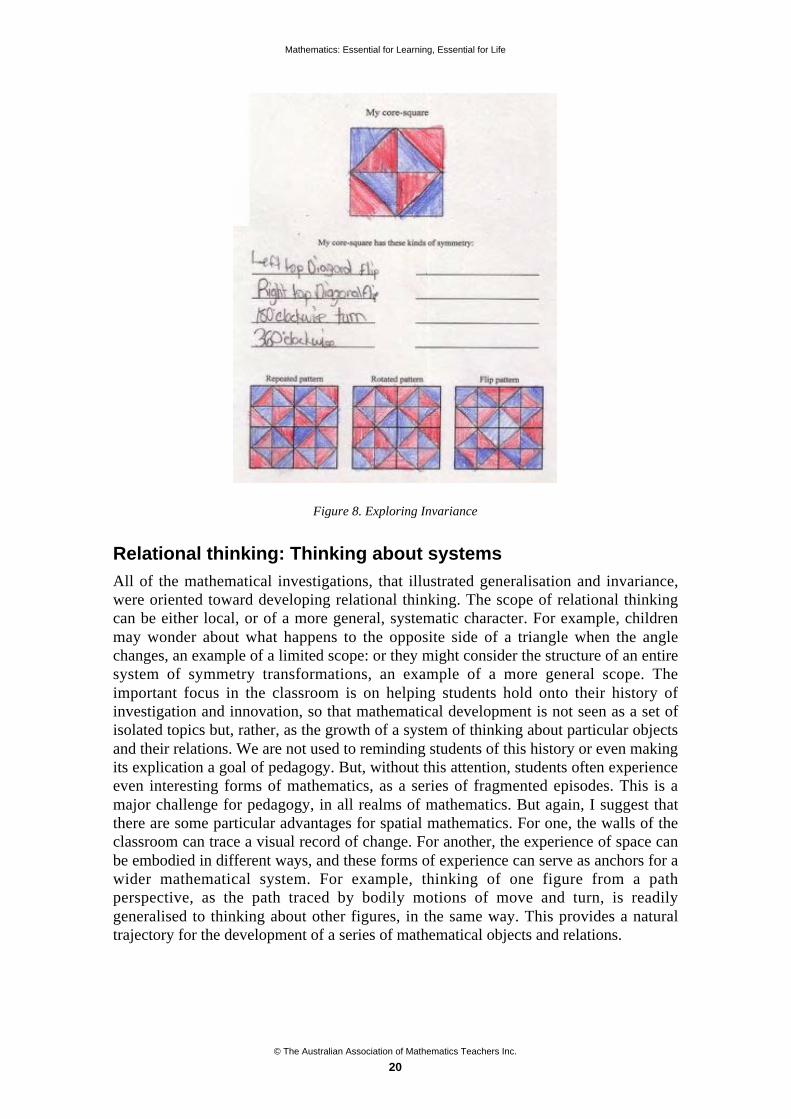
When we begin the unit, we provide children with Polydrons that they can use toenact the motions literally. They quickly come to realise that the result of a “right” and“left” flip is the same, so they unify both as “sideways” flips. Of course, the very idea ofsymmetry is one of invariance: Symmetries are those motions that do not result inchange, as illustrated by one child’s work, depicted in Figure 8 (thanks to JamesHamblin and Mazie Jenkins).
Mathematics: Essential for Learning, Essential for Life
© The Australian Association of Mathematics Teachers Inc.
20
Figure 8. Exploring Invariance
Relational thinking: Thinking about systems
All of the mathematical investigations, that illustrated generalisation and invariance,were oriented toward developing relational thinking. The scope of relational thinkingcan be either local, or of a more general, systematic character. For example, childrenmay wonder about what happens to the opposite side of a triangle when the anglechanges, an example of a limited scope: or they might consider the structure of an entiresystem of symmetry transformations, an example of a more general scope. Theimportant focus in the classroom is on helping students hold onto their history ofinvestigation and innovation, so that mathematical development is not seen as a set ofisolated topics but, rather, as the growth of a system of thinking about particular objectsand their relations. We are not used to reminding students of this history or even makingits explication a goal of pedagogy. But, without this attention, students often experienceeven interesting forms of mathematics, as a series of fragmented episodes. This is amajor challenge for pedagogy, in all realms of mathematics. But again, I suggest thatthere are some particular advantages for spatial mathematics. For one, the walls of theclassroom can trace a visual record of change. For another, the experience of space canbe embodied in different ways, and these forms of experience can serve as anchors for awider mathematical system. For example, thinking of one figure from a pathperspective, as the path traced by bodily motions of move and turn, is readilygeneralised to thinking about other figures, in the same way. This provides a naturaltrajectory for the development of a series of mathematical objects and relations.

Mathematics: Essential for Learning, Essential for Life
© The Australian Association of Mathematics Teachers Inc.
21
Bridging the mathematics of space to related endeavours
Modelling
The essence of modelling is having one system of objects and relations stand in foranother that is the object of scrutiny. Modelling is a scientific habit of mind that can besupported by the development of the mathematical habits of mind. Modelling, like othermathematical habits of mind, should be introduced gently and with an eye on itspotential for development. In one first-second grade classroom, the teacher, ElizabethPenner, was playing a game of tag with her children called “Mother, May I?”. Sheasked children to configure themselves, literally, to ensure a “fair” game (Penner andLehrer, 2000). The move to modelling occurred when the teacher asked students if theirliteral configuration could be modelled, using familiar objects of geometry: points andlines. Children initially thought that the configuration modelled by Figure 9 wouldsuffice. But, much to their consternation, it did not. Eventually, by exploring propertiesof figures, children arrived at the fairest form of all, depicted in Figure 10. Along theway, children learned important lessons both about modelling situation with shape andform and, also, about properties of these forms that they had never suspected!
Figure 9. Initial model of fairness.
Figure 10. Many revisions later, the fairest model of all.
Mathematics: Essential for Learning, Essential for Life
© The Australian Association of Mathematics Teachers Inc.
22
Representing data
The use of spatial metaphors and relations is so ubiquitous, in data representation andanalysis, that it is largely uncommented upon. We forget that these metaphoricalextensions may not be obvious to children. When we forget, children learn to representby ritual, and so forego the development of representational competence. Byrepresentational competence, I mean understanding how a representation goes about itsbusiness of representing: what it shows and what it hides about data. In my work withmy colleague, Leona Schauble, we seek to make these grounds visible to children and,during the presentation, I propose to illustrate how learning about space bootstrapschildren’s invention and reasoning about data (Lehrer & Schauble, 2002).
Discussion
To briefly recap, I propose that we, as a community, revisit our neglect of thedevelopment of spatial mathematics, a children’s geometry. Although one can arguethat the important business of early mathematics education is number, and thus justifyattention to space as a matter of luxury and convenience, this view is not supported byattention to the foundational nature of space. Spatial mathematics ideas are widelyemployed in related realms of endeavour, such as modelling natural systems orrepresenting data. Apart from these relations, developing spatial mathematics is anatural pathway for developing important forms of mathematical reasoning that servewell across mathematical domains. These habits-of-mind find ready expression and areaccessible, even to young children, when developed in contexts of reasoning aboutspace.
References
Goldenberg E. P., Cuoco A. A. & Mark J. (1998). A role for geometry in general education? In R. Lehrer& D. Chazan (Eds), Designing Learning Environments for Developing Understanding of Space andGeometry (pp. 3–44). Hillsdale, NJ: Lawrence Erlbaum Associates.
Lehrer, R. & Chazan, D. (1998, Eds). Designing Learning Environments for Developing Understandingof Geometry and Space. Mahwah, NJ: Lawrence Erlbaum Associates.
Lehrer, R. & Curtis, C. L. (2000) Why are some solids perfect? Conjectures and experiments by thirdgraders. Teaching Children Mathematics, 6, 324–329.
Lehrer, R. & Schauble, L. (2002, Eds). Investigating Real Data in the Classroom: Expanding Children'sUnderstanding of Math and Science. New York: Teachers College Press.
Penner, E. & Lehrer, R. (2000). The shape of fairness. Teaching Children Mathematics, 7(4), 210–214.
Piaget, J. (1970). Genetic Epistemology. New York: Norton.
© The Australian Association of Mathematics Teachers Inc.
23
Mathematics is essential in maths education,but what mathematics is then essential?+
John Mason
Open University, University of Oxford
As I approach retirement, I find myself marking twenty-one years of further thinkingsince my previous visit to AAMT1. It seems appropriate, therefore, to look back in orderto look forward. I will indulge myself in contemplating what it is that we, as acommunity, and I as an individual, have learned over that time, and where we mightexpect to look in the future. Participants will certainly be invited to engage in somemathematical thinking, and to ponder and re-articulate, not only why it is important foryou to continue to work on mathematics when working with others on issues in teachingand learning mathematics, but what mathematics it is essential to continue to re-experience.
Introduction
I looked back at the paper that accompanied my talk at AAMT in 1986, twenty-oneyears ago. I have to say, I thought it was one of my better papers. I still agree witheverything I wrote, and I have rarely, if ever, been so fluent in expressing it! I choose,therefore, to ask myself the questions of my title, by asking myself, “What have welearned as a community over twenty-one years?”
Of course, no matter how hard I try to be objective, this question is necessarily aprojection of the question, “What have I learned over twenty-one years?” onto mybiased view of the community as a whole, and which includes “what I wish colleagueshad learned”!
In this way I anticipate revealing some of the essential components of effectivemathematics education, and so to approach the question of what the essence is. You willnot be surprised to learn that I reach similar conclusions to those of my original paper,and I end by reflecting on this observation.
What have we learned as a community?
One thing that I hope is being relearned in each generation, is that you cannot discussissues in teaching and learning mathematics without being firmly and solidly groundedin mathematics. Put another way, as the acting director of our relatively new NationalCentre for Excellence in Teaching Mathematics has said, every session, every meetingought to include some mathematics. I take, therefore, as axiomatic that (working on)mathematics is essential in, to, and for, mathematics education.
So saying, here are some things for you to work on. I have chosen them because Ithink they highlight, or afford opportunity to be reminded about, many of the things that + Invited paper1 See Mason (1986).
Mathematics: Essential for Learning, Essential for Life
© The Australian Association of Mathematics Teachers Inc.
24
we can say we have learned as a community and that we can agree are both essential to,and an essential part of, mathematics education. The presentation at the conference willuse different tasks.
Two mixturesYou have a cask not quite full of wine, and a barrel not quite full of water. Youalso have a jug. You take a jug of wine from the cask and add it to the barrel,mixing thoroughly; then you take a jug of the mixture and add it to the cask. Isthere more wine in the barrel or water in the cask?Someone has already done this sort of transferring several times. When you nowdo it with your jug, is there more wine in the barrel or water in the cask?What can be said about the relative concentrations of wine in the cask and water inthe barrel?Suppose there are two people, one with a jug and one with a small bucket. The jugperson transfers from the cask to the barrel and then back again; the bucket personthen transfers from the barrel to the cask, and then back again. Would it make adifference if they had acted in the opposite order?What other variations can you think of?
Comment
I like these tasks because it seems (so far) to be rather difficult to “see directly” what isgoing on. The first parts depend on the “law of the excluded middle”: something iseither true or false. In this case, water is either in the barrel or in the cask and what isnot wine is water. Two-ness has a very special dyadic quality. The extensions afford anopportunity to use symbols not to represent specific numbers so much as unspecifiedbut identifiable amounts. Intuition does not seem to be a good guide, always, butcommutativity emerges. In fact, it can all be accounted for within the language of grouptheory.
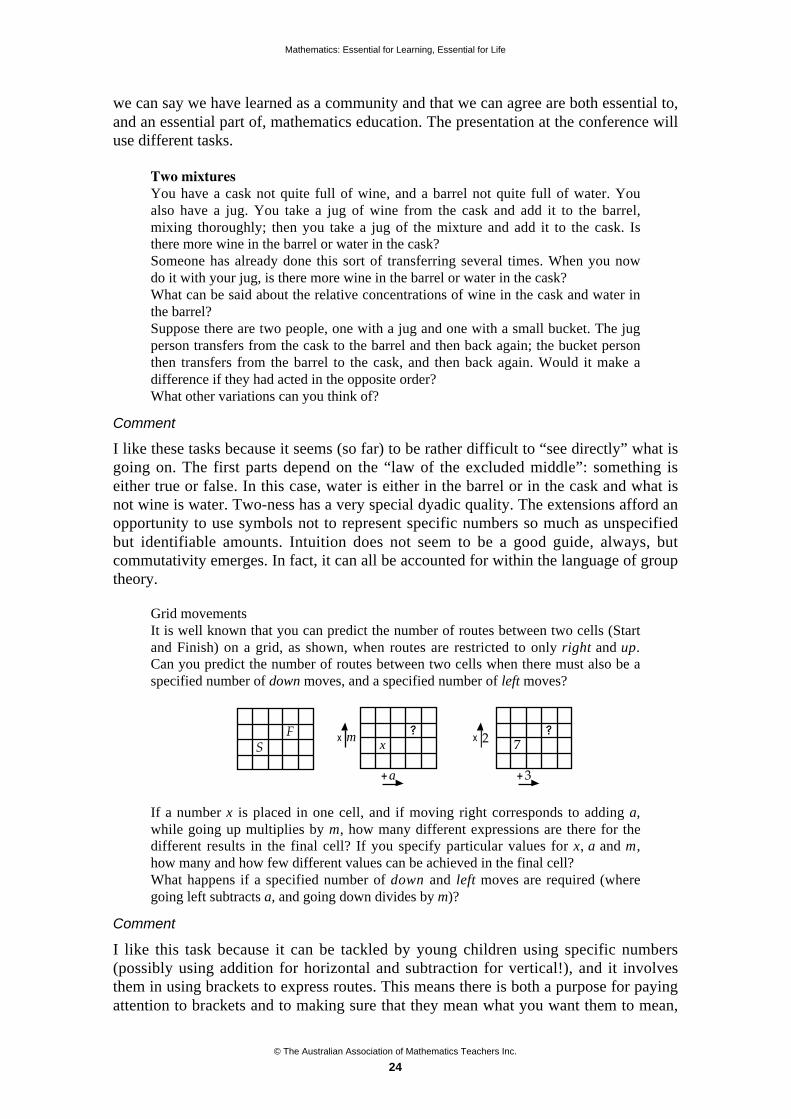
Grid movementsIt is well known that you can predict the number of routes between two cells (Startand Finish) on a grid, as shown, when routes are restricted to only right and up.Can you predict the number of routes between two cells when there must also be aspecified number of down moves, and a specified number of left moves?
SF
x?
a
mx
+
?x
+
7
3
2
If a number x is placed in one cell, and if moving right corresponds to adding a,while going up multiplies by m, how many different expressions are there for thedifferent results in the final cell? If you specify particular values for x, a and m,how many and how few different values can be achieved in the final cell?What happens if a specified number of down and left moves are required (wheregoing left subtracts a, and going down divides by m)?
Comment
I like this task because it can be tackled by young children using specific numbers(possibly using addition for horizontal and subtraction for vertical!), and it involvesthem in using brackets to express routes. This means there is both a purpose for payingattention to brackets and to making sure that they mean what you want them to mean,

Mathematics: Essential for Learning, Essential for Life
© The Australian Association of Mathematics Teachers Inc.
25
and a utility (Ainley & Pratt 2002) concerning the use of notation in mathematics.Extending to a specified number of backward movements introduces the possibility ofchoosing to ignore consecutive occurrences of left and right or up and down movementswhen considering what counts as “different”. Again, the whole can be cast in thelanguage of group theory.
For me, trying to prove the somewhat surprising conjectures about commutativitywhich I unearthed in the case of the mixtures, and in the grid movements, trying toaccount for differences between the number of distinct routes, the number of distinctexpressions, and the number of distinct values in particular cases, produced lengthystruggle and rethinking. In both cases, trying to find a suitable encompassing theoryproduced a good deal of struggle to make symbols do what I wanted them to do, and toexpress generalities and particularities in insightful ways. I am confident that thesemirror learners’ struggles in classrooms.
Scotch fountainThe atrium of the teacher’s block at ScotchCollege in Melbourne has a fountainconsisting of six nozzles which rotate asthey spout.What might you expect to see?How do you account for the curves in thesnapshot apparently traced by waterdroplets?
Comment
As with any modelling task, the issues that arise are often to do with selecting what ismathematically significant and expressing it in some mathematically tractable form.Although my natural propensity is for modelling structure within mathematics, ratherthan for modelling material world phenomena, sensitising yourself to opportunities touse mathematical thinking in order to make sense of the world is a vital part ofbecoming mathematical.
Why engage in mathematics ourselves?
What do you gain from working on mathematics, whether for and by yourself, or withothers? What evidence might you put forward that it was worthwhile, perhaps topersuade colleagues or administrators? What evidence would you seek that it improvedthe experience of learners?
These are non-trivial questions, and I do not have really good answers. I know frommy own experience that constantly working on problems, exploring ideas and,particularly, generalising and extending problems, provides me with a focus. It feedsand amplifies a desire to know more, to understand more fully, to appreciate moredeeply, to make direct contact with structure and to notice and make sense ofphenomena, both in the material world and in the world of mathematical structure. Iconfess, I am a structuralist at heart, a student of Bourbaki. The various constructivismsprovide discourses for trying to express aspects of my experience, but the core of mybeing is structuralist.
Working on mathematics for, and often by, myself also affords me insight into theuse of mathematical powers (what in the 1980s we used to call the “processes of
Mathematics: Essential for Learning, Essential for Life
© The Australian Association of Mathematics Teachers Inc.
26
thinking mathematically”) and the pervasiveness of mathematical themes2. It enablesme to re-experience, freshly and repeatedly, the struggles to get a sense of somesituation and to express that sense in mathematically meaningful ways. It also gives mepleasure, and this feeds me energy that can communicate itself to others. I have found itnot simply illuminating but vital for me to experience the struggle to express nascentrelationships and properties whether conceptual or as part of modelling, to becomeaware of the use of powers and themes, and to experience again the frisson of havingthings fall into place or encompassing apparently disparate particulars into a singlegenerality. All this helps to sensitise me to notice opportunities to direct learners’attention to useful things and in useful ways. In the final analysis, it seems to me thatwhat teachers can do is direct learner attention, both directly and indirectly, throughstructuring experiences.
Since I reject cause-and-effect (especially single cause and single effect) as a usefulmechanism for describing education and learning, I neither can, nor wish to try to, pointto effects which can be unambiguously and definitively linked to my mathematicalthinking as their cause. However, I can point to the energy that I am able to displaywhen working on mathematics with others, which I associate with the enthusiasm andpleasure I get from working on similar or parallel problems, if not actually thoseproblems themselves, and I like to think that I have developed some sensitivity tolearners’ struggle to appreciate and express mathematical relationships and properties.
Metaphors for mathematics education as a discipline
One thing we have learned, I hope, is that the metaphor for knowledge of laying layerupon layer so as to build up an edifice, is completely inappropriate. For example, we areon the edge of losing the expertise gained from “teaching mathematics investigatively”and “100% coursework”3. This includes, not only task construction and teacher–learnerinteraction in an exploratory mode, but also appropriate assessment. In one instance, incomplete ignorance of the recent past, it was asserted at a recent national meeting that“we do not know how to assess coursework the way art students are assessed”. In fact“we” do know, or have known, rather more!
I am thrown back on a statement made in my original paper, “each generation needsto re-express the same truths in new vocabulary and new settings,” but that most of theissues and concerns go back at least as far as Plato, and probably much earlier. In otherwords, the essence of mathematics education is unchanged. It is a dynamic of enquiryand challenge in order to be awake to the current situation, in order to be open and freshto learners as they are, now. In other words, teaching mathematics is both a caringprofession and a discipline. It is necessary to refresh both the mathematics and thesensitivity to learners so that we can “be mathematical with and in front of learners”.
Contribution to policy
Have we significantly influenced policy generation? In the short term, I think there isplenty of evidence of influence. Government policy documents often pick up ontechnical terms, such as learning styles, discussion, assessment for learning,constructivism, problem solving, course work, and so on. However, their use in policydocuments is usually at best problematic. What we have definitely learned is that once 2 See for example Mason & Johnston-Wilder (2004/2006 or 2004).3 Boaler (1997) studied a comparison with more traditional teaching; Ollerton & Watson (2001) described some of
the practices and approaches.

Mathematics: Essential for Learning, Essential for Life
© The Australian Association of Mathematics Teachers Inc.
27
policy documents take up technical terms, their usefulness goes into immediate decline.People naturally adopt meanings that are compatible with their own way of thinking, sothe import of technical terms is very quickly watered down or, in some cases, becomesso extreme as to be quickly replaced. I have in mind the temporary phenomenon ofadvisory teachers in the UK advocating “never telling learners anything, neveraddressing them in plenary.” It was quite quickly counteracted by an insistence on theuse of black (now white, smart and interactive) boards and plenary sessions at thebeginning and end of most lessons. I also have in mind the insertion of the “three-part-lesson” into primary and then secondary classrooms, which was at first taken up bysome as a fresh idea, but by many as a rephrasing of what they were already doing.
I would like to believe that in Australia you have been much more successful ataltering vocabulary, without losing its essence. I note, however, that the problem-solving initiative, which began with introducing exploratory problems at VCE level, hasbeen changed to much more directive tasks. Coursework in the UK degenerated so fullythat many of us are pleased that it is now to be abandoned. It is reappearing in a freshform, as ministers warm to the idea of thematic work in both primary and secondaryschool: what further evidence does one need of cycles in educational values?
In my view, we have a responsibility as a community to construct fresh terms for anyterms taken up by policy makers, in order not to lose the substance, the distinctionsafforded by those technical terms. Put another way, we do not seem to have learnedhow to engineer the use of effective fresh vocabulary in a large community. Perhapsthis is just as well!
Despite, or perhaps because of, some short-term successes in influencing policy, wedo not seem to have learned how to influence long term policy. Perhaps it is notpossible, because politics works on short cycles of ministerial careers and elections. Themovement towards evidence-based action in the professions is certainly gaining ground,despite the fact that even medicine is already discovering that the particularities of theindividual often outweigh the generalities of the evidence-base: trying to mechanisechoices does not lead to effective practice. This leads me to another set of observations.
Search for an El Dorado of a simple “fix”
One thing I think we can say the community could learn, even if it has not as a wholeyet grasped the implications, is that education in general, and mathematics education inparticular, is a complex system. Reductionist attempts to locate a principle cause which,if modified would produce a sizeable effect and “fix” things simply, cannot succeed. Ihave in my time seen groups of researchers focusing their attention on a sequence ofcomponents:
learner misconceptionsteacher beliefslearner beliefslearner motivation (including realistic and authentic mathematical contexts)use of apparatus and manipulativesteacher questioningteaching for understandingassessment for learningtask design (including researched and engineered tasks)modes of interaction (especially “discussion”)
Mathematics: Essential for Learning, Essential for Life
© The Australian Association of Mathematics Teachers Inc.
28
situated cognition and distributed cognition4
learning stylessemioticsreification and proceptssymbolic interactionbehavioural, cognitive and affect psychologypsychological constructivism, radical constructivism, social and socio-culturalconstructivism, socio-cultural-historical perspective…
In each case, research focusing on one element reads as though people hope thatsomehow the essential problem can be identified and fixed. As a community, our centreof gravity keeps shifting. In an almost mythical quest for the holy grail, for el Dorado,for Shangri La, we hope that the next perspective will resolve the problem and fixeverything. In our search for the essential core, the underlying cause for why learnersfail to appreciate and learn mathematics adequately, we seek something fresh:psychology, hermeneutics, affect and beliefs, sociologies of various kinds,anthropology, semiotics, and so on. We explore and develop the new perspective,promote it to teachers, and often see it become the zeitgeist for a time. But it tooeventually fails. Dissatisfaction returns and the search begins again.
Such a search is hopeless. As long as our research efforts remain fragmented then,despite refinements in what we can discern, in relationships we can come to recognise,and in properties we can come to perceive as applying more generally, we are doomedto revolve in repeated cycles of change of focus, without contacting an essence ofteaching and learning mathematics. Some people may wish to conclude that there is noessence. I choose to try to access essence through recognising and maintainingcomplexity, while at the same time trying to penetrate beneath the surface. As ItaloCalvino observed: “It is only after you come to know the surface of things that youventure to see what is underneath; but the surface of things is inexhaustible,” (Calvino,1983).
It must be clear by now that human beings are complex entities. They have enactive,affective and cognitive aspects which interweave in complex ways, interacting withboth attention and will. I note that this is the essence of the ancient metaphor in theUpanishads, for human beings as a chariot or carriage: “The carriage or chariot is thebody (enaction); the horses are the affect (motivation, drive, energy); the driver is theintellect (cognition, awareness, attention); the reins are mental imagery; the shafts arefeelings; the owner is the will,” (Zaehner, 1966, p. 176).
A metaphor is useful only if it informs action or awareness. Much can be derivedfrom this metaphor about the functioning of human beings in general and, moreparticularly, about learners encountering mathematics. For example, it led me to theGattegno-based “three onlys”: “Only behaviour is trainable; only emotion isharnessable; only awareness is educable,” (Mason, 1994; Mason & Johnston-Wilder,2004/2006), which help me to integrate a range of perspectives, to structure the aspectswhich make up a mathematical topic, and to make choices while interacting withlearners. It certainly makes no claim to do the whole job!
4 You cannot imagine how grateful I am that the pilots of the planes we have taken to get here had more than
‘participation in distributed cognition’ of how to fly a plane!
Mathematics: Essential for Learning, Essential for Life
© The Australian Association of Mathematics Teachers Inc.
29
The procedural–conceptual divide
Plato inveighs against Greek education for failing to use apparatus the way theEgyptians did, as a means for developing conceptual understanding; Cicero railedagainst the students of his time who only wanted to be taught procedures, rather than tothink for themselves; governmental reports have almost always had something to sayabout the difference between rote learning of procedures and conceptual understanding.Richard Skemp (1976) used the language of relational and instrumental understanding(inspired, he said, by an idea of Stieg Mellin-Olsen) to express much the same idea, andthe phrase “teaching for understanding” has been used, as if, as David Wheeler pointedout, anyone ever taught for anything else: either you understand in the relational senseof multiple connections and the possibility of re-constructing things for yourself, or inthe instrumental sense of “understand what to do” to use a technique. Of course, thisthen raises the thorny issue of what kind of knowing is available: knowing how,knowing what, knowing that, knowing about, or knowing to act suitably in a freshsituation, are different states. Another way of describing the same notion is todistinguish between syntactic knowledge of how to behave (manipulate symbols, spoutslogans, display practices demonstrated by others) and semantic comprehension whichis based on awareness of relationships, connections and structure and which, in turn,enable reconstruction and regeneration of requisite facts and techniques when required.
There is nothing new about a procedural-conceptual divide. In a culture whichstresses behaviour over being, action over reflection, production over process, instantgratification over Puritan work ethic, cheapness over quality, exploitation of resourcesover husbandry, it is not surprising that it is an uphill struggle to engage people intaking initiative, in valuing participation in process as well as, and as part ofcontributing to, a quality product. Fortunately, there are, and always have been, peoplewho respond to quality, to process, to being encouraged to use their own powers ratherthan having things done for them. It is just that sometimes it seems possible to lose sightof them!
All of this is manifested clearly in the ongoing struggle to engage learners inunderstanding and appreciating, rather than simply mastering examinable behaviours. Inmany ways, I think we are much more articulate about this endemic tension, and aboutthe forces and tensions which underpin and feed it. For example, the didactictransposition, the didactic contract, and the didactic tension are useful as reminders ofthe endemic tensions (Brousseau, 1997; see also Mason & Johnston-Wilder, 2004). Atthe same time, the cultural ethos of short-term targets set by others and the pervasiveinfluence through the media of short-term satisfactions over long-term aims, isexacerbating the tension for teachers and learners. It seems to me that I am hearingmore and more about learners who are accustomed to doing what they are told ratherthan thinking for themselves, and who not only do not respond with alacrity to beinggiven opportunities to think and to make significant mathematical choices forthemselves, but actively even sometimes reject these opportunities. As a community wehave enormous distributed intelligence about how, as a caring profession, it is possibleto counteract these cultural pressures. Whether it is possible to engineer effectiveinroads, or whether this is part of the ongoing personal reconstruction and developmentin which each teacher is engaged as a career long process, I am not sure. My suspicionslie with the latter rather than the former.
Mathematics: Essential for Learning, Essential for Life
© The Australian Association of Mathematics Teachers Inc.
30
What have I learned over twenty-one years?
At various times I have kept notebooks of my reflections on events and otherstimulations, such as reading and conversations. Every so often I look back throughthem, and each time I am astonished to find that the issue which is uppermost in mymind currently actually appears in my notes five, ten and more years previously. Itwould be tempting to ask whether I have learned anything at all, or whether I am simplyrecirculating and re-expressing old ideas, failing to recognise that current insights areneither new to me nor to the community at large.
I will confess that I have noticed more and more at international meetings that peopleraise questions which I recall having addressed in the past and often, to my mind, moreeffectively then than now. I am minded to take this as evidence that it is time for me toretire and leave the field to younger and more agile minds. I confess to sometimesfeeling that we seem not to have learned from the past, and I wonder if we arecondemned to cyclic repetitions of the past. As I wrote once: “One thing we do notseem to learn from experience is that we do not often learn from experience alone.”Later it was pointed out that this mirrors a statement about history by GeorgeSantayana: “Those who cannot remember the past are condemned to repeat it,”(Santayana, 1905, p. 284).
But I have learned. I feel as though I have learned a great deal. However, in ourevidence-based culture, my feelings are not enough. I must address the question of whatevidence I can put forward.
I can honestly say that I have access to a much wider technical vocabulary foraspects of teaching and learning. I refer here to a whole range of pedagogical constructssuch as situated cognition, ZPD, the onion model of understanding in mathematics and,of course, the structure of attention. These enable me to make finer distinctions thanwithout them, whether in planning, in conducting sessions, or in analysing data andtheorising about teaching and learning. Of course, many of these distinctions wereelaborated before 1986 but, over time, I believe that I am more effective in interweavingpedagogical constructs and mathematics and as evidence I put forward (Mason et al.,2004; Johnston-Wilder & Mason, 2005; Mason & Johnston-Wilder, 2004/2006).
Final reflections and pre-flections
What emerges from these contemplations, for me, is that mathematics education can bea life-transforming, life-enhancing discipline grounded in the experience of thinkingmathematically. I say life-transforming because, as I said in 1986, to be engaged as anactively enquiring teacher my perceptions, the details I discern and distinguish in myprofessional and personal life are constantly under scrutiny and challenge, and sodeveloping. I am kept on my toes, alive to the worlds in which I am operating, throughbeing challenged and stimulated. To be alive as a professional teacher I need to be re-searching. It is not always necessary to search in new domains: sometimes re-searching,revisiting old constructs, old distinctions reveals fresh, if not deeper, insights.
The essence of mathematics education is that each teacher needs to re-articulate, forthemselves, the truths of the past, especially those concerning mathematics,mathematical pedagogy, and mathematical didactics, not just once, but in an ongoingprocess of reconsideration. It is essential as a functioning teacher alive to one’sprofessionalism to make informed, even principled choices with increasing sensitivity.
Mathematics: Essential for Learning, Essential for Life
© The Australian Association of Mathematics Teachers Inc.
31
This means noticing opportunities to act freshly, and fresh actions to initiate, so as toguide and support learners’ attention5.
There are no shortcuts, no standing on the shoulders of giants. Yes, there areshoulders on which to stand, but care must be taken that in perching on one set ofshoulders, other perspectives available from other standpoints are not overlooked.Complexity must be retained in order not to become lost in local dead ends of enquiryand policy.
Mathematics education is never going to “solve” the problems which teachers andlearners face. But it can provide a discipline within which a there is a supportive andproductive environment in which personal and collective development is encouraged,fostered and sustained. One way in which I have tried to contribute to this is byinitiating a wiki for mathematical pedagogy (http://ncetm.gov.uk) through which thecommunity (national and international) can refine articulations, focus on precisemeanings and details, and support each other in making informed pedagogical anddidactical choices in the future.
A plausible, fascinating, and rather informative conjecture is that, just as the thingswe dislike most in others are often qualities which we dislike about ourselves, so too thethings we choose to research or enquire into are what is particularly problematic forourselves. It is important to bear this in mind then, as I draw these reflections to a closewith some conjectures about important topics for the future.
I am convinced that “maintaining complexity” could be a useful watchword for thefuture. To my mind, co-emergence6 is a much more fruitful metaphor for how learningtakes place than the mechanisms of cause-and-effect. I am also more than everconvinced that where learners are induced and empowered to make use of their ownnatural powers (of course through and within their socio-cultural-historical milieu), tomake significant and pertinent mathematical choices, they are more likely to engagewith mathematical thinking than to be content merely with mastering procedures.
I am convinced that school mathematics revolves around the expression andconsequent manipulation of generality as a means to make sense of, and to organise ourexperience of, the many worlds which we inhabit. This, for me, is and remains theessence of mathematics and of what it is essential learners encounter in mathematicslessons. Our failure to awaken this in all learners who get to school is a cultural andsocial tragedy, as well as being disempowering for the individuals.
I am also convinced that whatever else is going on in a classroom, however learnersand teacher are interacting, and mediated by whatever cultural tools, the structure ofteacher and learner attention is of vital importance: how is attention attenuated andamplified, focused and dispersed? — but then, given my interest and background, Iwould think this, wouldn’t I?
5 This is the aim and purpose of the Discipline of Noticing (Mason 2002) whose articulation begun a at ICME
1984 in Adelaide.6 Varela et al. (1991); Davis et al. (1996)
Mathematics: Essential for Learning, Essential for Life
© The Australian Association of Mathematics Teachers Inc.
32
References
Ainley, J. & Pratt, D. (2002). Purpose and Utility in Pedagogic Task design. In A. Cockburn & E. Nardi(Eds) Proceedings of the 26th Annual Conference of the International Group for the Psychology ofMathematics Education, Vol. 2, pp. 17–24.
Boaler, J. (1997). Experiencing School Mathematics: Teaching Styles, Sex and Setting. Buckingham:Open University Press.
Brousseau, G. (1997). Theory of Didactical Situations in Mathematics: Didactiques des Mathématiques,1970-1990, Balacheff, N. Cooper, M. Sutherland, R. and Warfield, V. (trans.), Kluwer, Dordrecht.
Calvino, I. (1983). Mr Palomar. London: Harcourt, Brace & Jovanovitch.
Davis, B., Summara, D. & Kieren, T. (1996). Cognition, co-emergence, curriculum. Journal ofCurriculum Studies, 28 (2), 151–169.
Mason, J. (1986). Challenge to Change: to stay alive every teacher must be a researcher. In ChallengeFor Change (Proceedings of 11th Biennial Conference of The Australian Association of MathematicsTeachers, pp. 9–30). Brisbane: AAMT.
Mason, J. (2002). Researching Your own Practice: The Discipline of Noticing. London: RoutledgeFalmer
Mason, J. & Johnston-Wilder, S. (2004). Fundamental Constructs in Mathematics Education. London:RoutledgeFalmer.
Mason, J. & Johnston-Wilder, S. (2004; 2006). Designing and Using Mathematical Tasks. MiltonKeynes: Open University. St. Albans: Tarquin.
Ollerton, M. & Watson, A. (2001). Inclusive Mathematics: 11–18, London: Sage.
Santayana, G. (1905). Life of Reason. New York: Scribner.
Skemp , R. (1976). Relational and Instrumental Understanding. Mathematics Teaching, 77, 20–26.
Varela, F. , Thompson, E. & Rosch, E. (1991). The Embodied Mind: Cognitive Science and HumanExperience. Cambridge: MIT Press.
Zaehner, R. (Trans.) (1966). Hindu Scriptures. New York: Dent & Sons.
© The Australian Association of Mathematics Teachers Inc.
33
Addressing the needs oflow-achieving mathematics students:Helping students “trust their heads”+
John Pegg & Lorraine Graham
SiMERR National Centre, University of New England
This paper is based on a national intervention and research program. Theprogram has the generic title QuickSmart because it aimed to teach students howto become quick (and accurate) in response speed and smart in strategy use. Thisintervention seeks to improve automaticity in students’ responses, which isoperationalised as students’ fluency and facility with basic academic facts andprocedures in mathematics. This is achieved by reducing working-memorydemands on routine tasks, and freeing cognitive resources for higher-orderprocessing, using mathematical procedures and problem solving.The QuickSmart program supports those students in their middle years ofschooling identified as consistently low-achieving. The program runs forapproximately thirty weeks with pairs of students involved in three thirty-minutesessions per week. Results of the program indicate that students decrease theiraverage response times significantly, correct inaccurate or inefficient strategies,and develop less error-prone retrieval actions. The results also indicate that by theend of the program these students exhibited strong gains on standardised testscores of higher-order thinking, as well as improvements on State-wide testingmeasures neither of which were the focus of instruction. Finally, there is evidencethat the results are sustained at least 24 months after the intervention.This paper provides the background, theoretical basis and description, of theprogram, as well as findings from 2006. Four important aspects of the programthat we believe: contribute to its success; have important implications forclassroom practice; that are most likely to facilitate improvements in students’learning; and highlight the practical and theoretical significance of havingstudents “trust their head”, are also discussed.
Background
Students who experience ongoing failure in school face a myriad of difficulties inachieving long-term employment, and useful and fulfilling occupations. Those whoexhibit consistent weaknesses in basic skills, such as the recall of number facts andother basic mathematics skills, are particularly vulnerable.
National test data provide a compelling case for the need to develop programs thatimprove numeracy outcomes for students, who are performing at or below the NationalLiteracy and Numeracy Benchmarks. There is a specific need for such programs to beeffective for Indigenous and rural students, and those with a language background otherthan English. In addition, national data identify a substantial systemic decline in boththe number and percentage of students achieving Numeracy Benchmarks in Year 3,
+ Invited paper

Mathematics: Essential for Learning, Essential for Life
© The Australian Association of Mathematics Teachers Inc.
34
Year 5 and Year 7. This trend needs to be attended to as a matter of urgency. It is ourcontention that, by the time these students reach Year 5, it is particularly difficult tobring about sustainable change within “normal” classroom environments. Consequently,there is a need for educational researchers to design and investigate interventions thatsupport students who experience these difficulties.
QuickSmart (Pegg, Graham and Bellert, 2005) is an example of an evolutionaryprogram of research that is having a strong impact with low-achieving students. Theresearch program associated with QuickSmart is one of a few programmaticinterventions conducted in Australian schools. The development and monitoring of theprogram has been supported by a number of different funding sources over the pastseven years. Initially in 2001, the Commonwealth Government funded QuickSmart forone year, under its innovative project scheme. Subsequently, the collection of follow-updata during 2002, 2003 and 2004 found that these students had maintained theirperformance improvements 24 months after they completed the intervention program.
Because of the very positive results of the initial QuickSmart program, and the dataindicating its continued effectiveness, an Australian Research Council Discovery grantby Pegg, Graham, and Royer (2003–2005), “Enhancing basic academic skills of low-achieving students: The role of automaticity in numeracy, reading and comprehension”,allowed important aspects of the program to be researched and refined.
In 2006, with support from the federal Department of Education Science andTraining, and the Department of Transport and Regional Services, the programcomprising two aspects was extended to 12 schools. The first aspect involvedimproving basic mathematics skill levels in 11 top-end schools in the NorthernTerritory. A detailed analysis of the results indicated the effectiveness of the program.As a result the NT DEET is conducting a more intensive program in 2007 involving 20schools. The second aspect concerned a disadvantaged rural school with large numbersof persistently low-achieving students (students below national benchmarks innumeracy and literacy). The program involved 87 students and constituted the largestsingle student cohort, within a single school, to be involved in the QuickSmart programof research. Impressive gains in student performance during 2006 were evident andplaced the school among the best in NSW, in terms of value-added results for the Year7–8 cohort.
Purpose of QuickSmartT
The underlying purpose of the QuickSmart program is to reverse the trend of ongoingpoor academic performance for students who have been struggling at school, and arecaught in a cycle of continued failure. These students experience significant andsustained learning difficulties in basic mathematics, and had been resistant toimprovement despite attempts to overcome their learning problems. They were unableto draw benefits from other in-class, and withdrawal, instructional activities.
An additional purpose of the program is for classroom teachers, special needssupport teachers and teacher aides (referred to below by the generic term “teachers”), tolearn how to work with and significantly improve the learning outcomes in basicmathematics skills, of underachieving students, in the middle years of schooling. Theprogram offers professional learning and support for teachers to work in a small classinstructional setting, with two students, using a specially constructed teaching programsupported by extensive material and computer-based resources.

Mathematics: Essential for Learning, Essential for Life
© The Australian Association of Mathematics Teachers Inc.
35
Theoretical underpinnings of QuickSmart
The QuickSmart assessment and intervention approach is an innovative instructionalmethod informed by research findings (e.g., Baker, Gersten, and Lee, 2003; McMaster,Fuchs, Fuchs, and Compton, 2005; Royer, Tronsky, and Chan, 1999). Underpinning theprogram is the establishment of a motivational learning environment, which places anemphasis on fluency, automatic recall of basic skill information, strategy use, and timedand strategic practice. The aim of the program is to improve students’ informationretrieval times to levels that free working-memory capacity from an excessive focus onmundane or routine tasks. In this way, students become better resourced to undertakehigher-order mental processing and to develop age-appropriate basic mathematics (andliteracy) skills.
There are theoretical and pragmatic reasons that support the importance of basicinformation retrieval to both basic mathematics (and literacy) skills. First, it is generallyaccepted that the cognitive capacity of humans is limited; i.e., working memory hasspecific constraints on the amount of information that can be processed (Anderson,1983). As such, there is a strong theoretical basis upon which to expect that improvingthe processing speed of basic skills frees up capacity, which is, then, available for thecognitive processing of higher-order problem-solving tasks.
Research has already indicated that the ability to recall information quickly is oftennot subject to conscious control and, subsequently, uses minimal cognitive capacity(Ashcraft, Donely, Halas, and Vakali, 1992; Hanley, 2005; Zbrodoff and Logan, 1996).Another reason why automaticity in basic information retrieval is of prime importanceis that it allows for small decreases in “time to accrue” in undertaking sub-tasksassociated with a question, again, freeing up working memory. Even small decreases inthe time taken to process information in working memory during basic problem-solvingsituations can be significant. Thus, speed of information retrieval plays an importantrole in determining the success or otherwise of students undertaking basic mathematics(and literacy) tasks.
The QuickSmart Program
In order to contextualise the importance and effectiveness of the QuickSmart program,it is necessary to describe the intervention, in some detail. Individually designedintervention programs are developed and implemented as part of QuickSmart , in orderto strengthen students’ problematic skills: e.g., recall of number facts, strategy use, andbasic computation. The program is intensive and requires students to work in pairs withan adult instructor, for three 30-minute lessons each week for about 30 weeks.
The QuickSmart program:
• is designed to improve students’ information retrieval times;
• frees working-memory capacity from an excessive focus on routine tasks;
• fosters automaticity in basic tasks;
• utilises explicit teaching based on understanding, not rote learning, and deliberatepractice;
• has time (as well as accuracy) as a dimension of learning;
• integrates assessment tasks into each lesson with a focus on individualimprovement;
• maximises student on-task time in a structured but flexible lesson format;
Mathematics: Essential for Learning, Essential for Life
© The Australian Association of Mathematics Teachers Inc.
36
• provides extensive materials including teaching resources, speedsheets,flashcards; and
• incorporates a computer program called the Cognitive Aptitude AssessmentSystem (CAAS).
In addition to specially developed paper and material resources, QuickSmart utilisesa Cognitive Aptitude Assessment System (CAAS) to support learning, and to assist withobtaining reliable assessments of student performance. This system was developed atthe Laboratory for the Assessment and Training of Academic Skills (LATAS) in theUniversity of Massachusetts (e.g., Royer and Tronsky, 1998). The CAAS system isinstalled on a laptop computer and enables precise measurements of students’ accuracyand information retrieval times on numeracy tasks. Importantly, the assessment tasksused are designed and sequenced in order to help identify particular obstacles that mayimpede student learning (Royer, 1996).
Specifically, when a stimulus is presented to a student who responds into themicrophone, the system records vocalisation latency and a scorer pushes one of the twobuttons on the computer, to record the accuracy of the response. At the end of a task, thesoftware computes a mean and a standard deviation for response latencies. Also, thesoftware automatically cleans the data by eliminating, as outliers, responses twostandard deviations from the mean, such as impossibly fast or unusually slow scores.When the student is finished, the percentage of correct responses, as well as the meanand standard deviation are immediately available and can be recorded and shared withthe student. These data are also retained to assist, in part, in the analysis of change instudents.
The professional development program accompanying QuickSmart is focused onsupporting teachers to understand and provide:
• effective instruction that maximises student on-task time, and provides learningscaffolds to ensure students experience improvement and success;
• deliberate practice that is integral to every lesson, allows for success and isfocused on providing targeted feedback to improve learning;
• guided and independent timed practice activities;
• strategy instruction and concept development;
• confidence to their students by encouraging a “can do” attitude;
• appropriate teacher and peer modelling; and
• motivational academic activities that are opportunities for modelling and todevelop fluency.
As a consequence of the project, and professional development experiences, teacherslearn to:
• use time as a dimension of learning and practice;
• incorporate concepts of automaticity (Quick) and accuracy (Smart) regularly intheir teaching;
• structure learning activities built around deliberate practice to help encouragesuccess;
• address individual student needs in their planning over an extended period;
• assess and monitor student needs, unobtrusively, in their teaching programs;
• create a highly motivational learning environment for students;

Mathematics: Essential for Learning, Essential for Life
© The Australian Association of Mathematics Teachers Inc.
37
• integrate assessment tasks into each lesson, alongside a non-competitive focus onindividual improvement; and
• design and develop activities that improve students’ information processingabilities by freeing up working memory.
Also teachers come to experience:
• how automaticity requires conceptual understanding and efficient, effectivestrategy use; and
• how assessment provides formative information relevant to the progress anddesign of each individual’s program.
QuickSmart results from 2006
In 2006, with Federal Government support, the QuickSmart program was expanded andapproximately 300 students undertook the program in the Northern Territory (NT) andNew South Wales (NSW). In the NT, 203 students were in the program and there were111 comparison students. In NSW at Orara High School 87 Year 7 students (over 60%of the Year 7 students), who were identified as not meeting national benchmarks, tookpart in the program. In both settings, many of these students were Indigenous.
The graph below prepared by John Bradbury, Curriculum Officer Numeracy,Teaching, Learning and Standards Division NT (2006) compares pre- and post-scoreson a basic skills test for the QuickSmart cohort and groups of comparison students.
QS vs Comparison Cohort - Change in Mean Student Test Score (paired data
only)
22
23
24
25
26
27
28
29
30
31
Pre Post
Me
an
Te
st
Sc
ore
QuickSmart Cohort
Comparison Cohort
Northern Territory results on 2006 intervention
The graph illustrates the gains made by the QuickSmart group of students, ascompared to their average-achieving peers. The two cohorts were statisticallysignificantly different at the start of the program from the comparison students, andwere not statistically different on the post-test.
Mathematics: Essential for Learning, Essential for Life
© The Australian Association of Mathematics Teachers Inc.
38
In the case of Orara students: they attempted the State-wide Secondary NumeracyAssessment Program (SNAP) in Years 7 and 8. The results were summarised in anarticle written in a NSW DET by Cotton (p.5, 2006) in Side-by-Side. The first threeparagraphs are reproduced below and report the gains made at Orara High School:
It’s not often that a school records a meteoric rise in student performance over asingle year. So when Orara High School recorded the highest growth in its historyfor Year 8 literacy and numeracy, the principal, Graham Mosey, summed it up inthree words: “We were thrilled!”Last year almost half of the school’s Year 7 cohort was under the nationalbenchmark for literacy and numeracy. But in 2006, all of the students, now in Year8, performed above the benchmarks — almost doubling the state average growth intheir English Language and Literacy Assessment results, and more than doublingthe state average growth in writing. Similar results were brought home for theSecondary Numeracy Assessment Program.“Anecdotally, we’d been told things were really improving, but it was good to getsome data that confirmed that was the case,” Mr Mosey said.
Both sets of results point to how QuickSmart helped “narrow the gap”. Analysis hasidentified impressive statistically significant gains that mirror the qualitativeimprovements reported by teachers and parents.
Finally, it is worth reporting on the parents’ perceptions of the program, in order to“bring to life” the results already presented. Parents were interviewed about how theyfelt their children reacted to the QuickSmart program. In all cases their views werepositive. Examples of parents’ comments are included below:
Parent 1: Our daughter thought she learnt heaps. It helped her greatly. Weappreciated the opportunity the program offered and we believe thebenefits for our child were great.
Parent 2: He told me how well he was doing and how he was improving. Hisspeeds were getting better and so was his accuracy. He enjoyed thework on the laptop. Yes, it was a good experience for my son and heis a lot more confident in his approach and more willing to take riskswith his maths.
Parent 3: Joe told us about his lessons. He is very proud of his progress. It is agood program and should continue for a longer period.
Parent 4: My daughter has improved her basic maths knowledge. She no longeruses her fingers. I believe she has learnt a lot. She enjoys maths in thenormal classroom now.
These comments indicate that parents perceived improvements in their children’smathematical skills that went far beyond accuracy and retrieval times for number facts.Many of the parents commented on an increase in personal confidence that theirchildren felt, as a consequence of the QuickSmart intervention. The realisation bystudents that they can learn mathematics, and that they can play an active and positiverole in the classroom, was routinely commented upon by students and their parents.Towards the end of the QuickSmart program, for example, one particular studentobserved that he could “now think like the brainy kids.” It is comments such as this thatimply the greatest possible long-term value of the QuickSmart program: it brings aboutchanges in self efficacy for students based upon their realisation that they have made(and can feel) genuine improvements in their learning, and understanding of theirlearning.

Mathematics: Essential for Learning, Essential for Life
© The Australian Association of Mathematics Teachers Inc.
39
Overall, QuickSmart has accrued an extensive evidence base, covering several years,showing that there is an alternative to failure for many middle-school students who arenot meeting National Benchmarks. The program provides a fourth, and potentially last,phase intervention that will enable students to proceed satisfactorily with their studies,for the remainder of their schooling. Many teachers who have been involved in theprogram believe that QuickSmart is their last realistic chance of being able to help low-achieving students in a sustained and, for students, in a sustainable way.
Four features of learning
This section reports on four features that have emerged from our observations ofstudents and teachers within the QuickSmart program. These features — studentcharacteristics, cognitive processing, deliberate practice, and feedback — areparticularly relevant to the target group of low-achieving students in the middle years ofschooling, but are also relevant to other groups of students who are not reaching theirlearning potentials. At the basis of these four aspects lies the notion of developing,within students, the ability to “trust their head”.
Student characteristics
Students who are persistently low achieving in mathematics exhibit a number of similarcharacteristics. They utilise inefficient and error-prone approaches to learning andrecalling information. Effortful calculation of basic arithmetic facts precludes focus onprocedures and problem solving. Often finger strategies dominate simple tasks and thiscompounds poor speed and accuracy with “the basics”. Geary (2004), is but one of agrowing group of researchers, who suggests that disruptions in the ability to retrievebasic facts from long-term memory might be considered a defining feature ofmathematics learning disability.
These students also have learning gaps or misconceptions that impact on their classor test performance. This translates in performances below national benchmark figures.As a result they report not having a feeling of control over their learning. Compoundingfeelings of low self efficacy is the fact that, by the time some students are in the middleyears of schooling, they have been targeted for support in various forms for many years,without success. These students could be described as “treatment resistant”. This is anunfortunate term, but one that focuses attention on the grave plight, and difficult-to-reverse situation, in which these students find themselves.
This point highlights what research has been telling us that low-achievers inmathematics have considerable difficulty in developing automaticity in their numberfacts. However, if this situation is not addressed, then the achievement “gap” betweenthese students and average achievers gets wider. Really, students need to be proficientor fluent in basic mathematics before the end of primary education (when they arearound 11 or 12 years of age). Any real chance of students developing number sense, orforms of mathematical reasoning in secondary school, depends on this occurring.
While poor self efficacy is prevalent, these students can also be described as“classwise”. This term (Pegg & Graham, 2007) is analogous to people being describedas “streetwise”. It highlights how these students have become familiar with the ways ofthe classroom and how to “survive” within it. Characteristics of this form of studentbehaviour include the ability to have their lack of learning and understanding become“invisible” to the teacher. For example, students may conceal their lack of basic skills
Mathematics: Essential for Learning, Essential for Life
© The Australian Association of Mathematics Teachers Inc.
40
through various behaviours like copying and denial, so that neither the teacher nor peersare fully aware of their academic difficulties.
What features bring about change? The salient points related to QuickSmartinstruction were addressed earlier, however, a few need to be emphasised. Studentsneed time to acquire the desired skill and understanding level, and time to establish newneural pathways. They need to be aware that during changes to cognitive functioning,particularly early in the process, people are extremely vulnerable as they let go offamiliar routines and embrace new ones. Motivation is a key factor underpinning thewill of the student to try again because they want to improve their performance andbecause they realise that simply doing what was unsuccessful before is not the bestapproach. Improvement requires a genuine cognitive reorganisation of the processingunderlying the skill needed. One catalyst QuickSmart uses to bring about this change isusing time as a dimension of learning to build students’ awareness of their progress andpossibilities for improvement: i.e., through feedback and deliberate (systematic)practice that is targeted at particular goals that are achievable and understandable for thestudents such as between 35 to 40 flashcards correct in one minute.
Cognitive processing
There are three elements to this discussion of the role of cognitive processing inlearning. The first is about the meaning and functioning of working memory; the secondconcerns the importance of automaticity, and; the third discusses how these ideas areoperationalised through the theoretical frame of the SOLO (Structure of the ObservedLearning Outcome) model (Biggs and Collis, 1991; Pegg 2003).
Our view on mental activity is guided by Baddeley (1986) and his co-workers whointroduced the notion of working memory. Working memory is defined as a processingresource, of limited capacity, involved in the preservation of information whilesimultaneously processing the same and/or other information (Baddeley and Logie,1999). This differs from long-term memory in which procedural and declarativeinformation is stored for long periods of time, and short-term memory where smallamounts of material are held passively and reproduced in an identical form to whichthey were encoded. Activation of short-term memory draws upon minimal resources inlong-term memory.
Working memory is considered by Baddeley (1986) to have three components. Theseare: a central executive system that interacts with two subsidiary storage systems: aspeech-based phonological loop for storage of verbal information and: a visual-spatialsketchpad that is involved in the generation and manipulation of mental images. Thecentral executive system coordinates these two subsidiary systems, as well as activatinginformation from the long-term memory. Swanson and Siegel (2001) stated that there isalso a mental work space that has limited resources and has a combined processing andstorage facility that is under the control of the central executive system, and can operatein a distinct fashion from the two subsidiary systems.
We believe that difficulty with working memory capacity underlies many of theproblems low-achieving students experience in acquiring mathematical competence, orundertaking more difficult mathematics tasks. Hence, a critical step in supporting thesestudents is to provide them with experiences that enable them to reduce the cognitiveload of processing basic skills. Similarly, if we can support students to replace effortful(high cognitive load) strategies with more strategic, and less demanding, approachesthen their performances in mathematics will improve. One approach to reducing

Mathematics: Essential for Learning, Essential for Life
© The Australian Association of Mathematics Teachers Inc.
41
cognitive load and, hence, free working memory space is to develop automaticresponses in routine tasks.
It is our belief that automaticity in basic mathematics facts and skills is fundamentalto a student being mathematically proficient, and able to achieve success in highermathematics. Hence, an important part of teaching is helping students reduce thecognitive load associated with basic and routine tasks to facilitate deeper mathematicalexperiences. There are large processing demands associated with inefficient methodsand finger counting strategies, etc., as opposed to direct retrieval approaches.
The SOLO model offers us a potential framework to consider when and howteaching might facilitate student development. In particular, SOLO can provide ideas onwhere direct teaching, explicit teaching, and drill and practice are more appropriate thanindirect teaching where problem-solving inquiry, and reflective discussion, might bemore useful.
The SOLO model posits that there is a learning cycle comprised of a focus on asingle aspect (referred to as unistructural), followed by a focus on several independentaspects (referred to as multistructural) and subsequently a focus on the integration of theindividual aspects (referred to as relational). This unistructural, multistructural andrelational cycle repeats itself with the acquisition of new ideas and concepts as well asadapting to accommodate the growing abstraction of ideas.
QuickSmart is primarily focused on unistructural elements of learning where studentsare helped to understand separate individual aspects related to basic mathematical factsand, then, provided with an opportunity to focus directly on these specific aspectsthrough deliberate practice. The purpose of focusing on these unistructural elements isto reduce working memory demands that, in turn, frees working memory resources andfacilitates the development of multistructural thinking. At the multistructural level,students have sufficient working memory space to access several aspects separately andto undertake sequential procedures that do not require interconnections among theaspects to be utilised.
Hence, for both the unistructural and multistructural levels, directed learning orexplicit teaching is beneficial, and required, to help students come to know theindividual elements needed and to practice and consolidate their understandings.Instruction that targets the integration of ideas, and attempts to move students into therelational level, is more about creating an environment for students to make the linksthemselves through their own motivation and understandings.
Deliberate practice
Practice, in terms of repeating similar procedures or exercises, has value in terms ofestablishing routines for certain activities and, hence, reducing cognitive load. However,in terms of moving students beyond their current state of performance, practice canactually limit what can be achieved in education. Most practice, even when engaged inover a long period of time, leads to plateaus or ceilings in performance. The amount ofpractice, past a certain point, does not necessarily lead to ongoing improvement inperformance. The reasons for this is that if students are to improve they must eitherthink differently about situations or replace inefficient strategy use. To obtainimprovement in performance there needs to be a cognitive reorganisation of the skill,which is accomplished through targeted practice activities. This is achieved by applyingdeliberate effort (or practice) to improve performance.
We use the term “deliberate practice” drawn from research that has explored andattempted to explain expert performance in a range of areas outside of education
Mathematics: Essential for Learning, Essential for Life
© The Australian Association of Mathematics Teachers Inc.
42
(Ericsson, Krampe, and Tesch-Romer, 1993). For us, deliberate practice within aneducation context takes four key positions. It:
• is a highly structured activity that has been specifically designed to improve thecurrent level of performance;
• allows for repeated experiences in which the individual can attend to criticalaspects of tasks;
• involves specific tasks that are used to overcome weaknesses; and
• enables performance to be monitored carefully to provide feedback.
Students are motivated to exert effort to improve because focused practice improvestheir performance. Evidence of this improvement is available to all observers, and to thestudents themselves. In QuickSmart deliberate practice takes the form of consistently-encountered, supported and timed tasks that are graduated in terms of difficulty andcognitive demands.
Feedback
Like practice, feedback is a complex feature of teaching and learning that isfundamental to improvements in student achievement. However, there are some featuresof feedback that make it particularly effective. We draw on the work of Hattie and hiscolleagues (e.g., Hattie and Timperley, 2007) to explore these ideas.
Feedback needs to be carefully defined and used thoughtfully as an integral part ofinstruction in order to engender student improvement. Hattie identified four levels offeedback:1. Feedback about the self unrelated to performance on a task.2. Feedback on self-regulation so that the student knows how to complete the task
with less effort and more success.3. Feedback aimed at how the task is completed. This includes feedback on strategic
levels of understanding and how to process information required to complete thetask.
4. Feedback about the task that allows students to acquire more, different, orimproved information.
Hattie’s argument is that these levels of feedback are least effective at the first level,powerful at the second and third levels in terms of deep processing and task mastery,and most powerful at the fourth level when information is used to improve strategicprocessing.
With regards to QuickSmart, feedback is continuous — even relentless. It is ourbelief that, without adequate feedback, students will not automatically improve. Weprovide feedback in the form of praise when both the teacher and student can see thatthere are genuine improvements in understanding or performance. However, themajority of feedback is focused at a more strategic level. Feedback on activitiescompleted as part of the QuickSmart program provides information to students on whatthey understand or do not understand, why the student is correct or incorrect, whatneeds to be changed or improved, and what information needs to be focused on orpracticed in order to improve.
This form of feedback is linked to formative assessment practices, where the teacheruses assessment information to focus and guide teaching approaches. Formativeassessment concerns finding out what the student understands and can do, during theteaching/learning process as students are forming their ideas. It is this information,

Mathematics: Essential for Learning, Essential for Life
© The Australian Association of Mathematics Teachers Inc.
43
when shared with students, that seems to have the greatest possible effect in terms ofbringing about real change in student learning.
There are three further important characteristics of feedback. Firstly, feedback needsto provide information to the student on the substance of their performance and, at thesame time, be supportive, yet challenging, to students. Secondly, feedback needs to bedelivered in such a way that it sets a context that will move students on, from theircurrent performance to the attainment of improved performance. Thirdly, feedback isinstrumental in allowing teachers and students to set realistic and attainable goals thatare clearly-defined, shared and continually move students towards improvedperformance.
Within QuickSmart the process of effective feedback is facilitated because of thesmall class instruction mode of delivery that enables and expects the teacher to monitorand react quickly to students’ approaches to tasks, their understandings and errors.Small class instruction provides a context for immediate feedback to students, while theconsistent lesson structure of QuickSmart allows teachers the time and space to followthe performance of students, through repeated trials (what we refer to as deliberatepractice) over an extended period of time.
It is possible that one important reason for low-achieving students’ poor performanceis that, in large class instructional settings, these students have not been able to receivesufficient feedback on their performance to enable them to make the changes necessaryto improve their performance in mathematics.
Conclusion
In short, the QuickSmart program represents an innovative direction for supporting bothbasic mathematics (and literacy) skills development. Our monitoring and evaluation ofthe QuickSmart instructional approach since 2001, using quantitative and qualitativeindications, have already established that this program significantly improves basicmathematical (and literacy) outcomes for educationally disadvantaged students (e.g.,Graham, Bellert, Thomas, and Pegg, in press).
Since its inception in 2001, approximately 800 students have been involved in theQuickSmart program. Without doubt, the focus of this work on changing theperformances of low-achieving students is an important one in school education. It isalso particularly important, in terms of intervention research, that findings arerigorously evaluated because the student population targeted in this work is among themost vulnerable in our education system (Dobson, 2001; Fuchs and Fuchs, 2005). It isobvious that educationally disadvantaged students should only participate ininterventions that are accepted as educationally sound. Interventions, based onunsubstantiated ideas, have the potential to take up these students’ valuable instructionaltime and result in little, or no, maintained gains in performance (Strain and Hoyson,2000).
Central to the research and ideas reported in this paper is the belief that carefullyobtained data collected over time are powerful in determining the robustness and utilityof educational interventions. In the case of QuickSmart our research has providedadditional insights concerning the role of working-memory and automaticity ininformation processing. It also has highlighted the need for further research.
This work is not easy. There are no quick fixes for students who have significantdifficulties in mathematics. For example, it takes considerable financial and humanresources to run the QuickSmart program and it is difficult to obtain sufficient funds toprovide a robust intervention to a sample population sufficiently large, so that statistical

Mathematics: Essential for Learning, Essential for Life
© The Australian Association of Mathematics Teachers Inc.
44
procedures can be appropriately employed. The importance of control and comparisongroups adds further to the cost and complexity of intervention research. However, suchwork must be pursued so that an important avenue of help for low-achieving students isnot lost, but carefully explored and fully justified.
The benefits for students are immense. Programs such as QuickSmart changestudents’ lives in profound ways. They allow students, who are consistently achievingpoor results in their classrooms, a chance to become active participants in the “maingame” of mathematics. Students who have been involved in QuickSmart report thatthey:
• come to understand and are able to talk about their own learning as the programprogresses;
• are able to establish goals and targets for their learning;
• begin to feel they can perform “just like the good kids”; and
• experience genuine improvement and success that encourages them to expendmore effort to improve — they are motivated from within.
Most importantly, students who have participated in QuickSmart begin to embody anew confidence in what they have learnt, based on genuine observable improvementsthat are obvious to their peers, parents, teachers and themselves. As students gainconfidence and become active contributors to their own mathematics learning, theybegin to succeed in ways that surprise themselves and that they can build on theirdeveloped foundation to achieve further classroom success. QuickSmart students reportthat they come to “Trust their heads” as effective learners of mathematics.
References
Anderson, J. R. (1983). The Architecture of Cognition. Cambridge, MA: Harvard University Press.
Ashcraft, M. H., Donely, R. D., Halas, M. A. & Vakali, M. (1992). Working memory, automaticity, andproblem difficulty. In J. I. D. Campbell (Ed.), Advances in Psychology 1991: The Nature and Originsof Mathematical Skills (pp. 301–329). Amsterdam, The Netherlands: Elsevier.
Baddeley A. D. & Logie, R. H. (1999). Working memory: The multiple component model. In A. Miyake& P. Shah (Eds), Models of Working Memory: Mechanisms of Active Maintenance and ExecutiveControl (pp. 28–61). New York: Cambridge University Press.
Baddeley A. D. (1986). Working Memory. London: Oxford University Press.
Baker, S., Gersten, R. & Lee, D. S. (2002). A synthesis of empirical research on teaching mathematics tolow-achieving students. The Elementary School Journal, 103 (1), 51–73.
Biggs, J. & Collis, K. (1991). Multimodal learning and the quality of intelligent behaviour. In H. Rowe(Ed.), Intelligence: Reconceptualisation and Measurement (pp. 56–76). Melbourne: ACER.
Cotton, K. (2006). Students hardwired for future success. Side-by-Side (p. 5). NSW Department ofEducation.
Dobson, P.J. (2001). Longitudinal case research: A critical perspective. Systemic Practice and ActionResearch, 14 (3), 283–296.
Ericsson, K. A., Krampe, R. T. & Tesch-Romer, C. (1993). The role of deliberate practice in theacquisition of expert performance. Psychological Review, 100 (3), 363–406.
Fuchs, L. S. & Fuchs, D. (2005). Enhancing mathematical problem solving for students with disabilities.Journal of Special Education, 39 (1), 45–57.
Geary, D. C. (2004). Children’s Mathematical Development. Washington, DC: American PsychologicalAssociation.
Graham, L., Bellert, A., Thomas, J. & Pegg, J. (in press). QuickSmart: A basic academic skillsintervention for middle-years students with learning difficulties. Journal of Learning Disabilities, 40(5).

Mathematics: Essential for Learning, Essential for Life
© The Australian Association of Mathematics Teachers Inc.
45
Hanley, T.V. (2005). Commentary on early identification and interventions for students withmathematical difficulties: make sense-do the math. Journal of Learning Disabilities, 38 (4), 346–349.
Hattie J. & Timperley, H. (2007) The power of feedback. Review of Educational Research, 77 (1),81–112.
McMaster, K. L., Fuchs, D., Fuchs, L. S. & Compton, D. L. (2005). Responding to nonresponders: Anexperimental field trial of identification and intervention methods. Exceptional Children, 71 (4),445–463.
Pegg, J. (2003). Assessment in mathematics: A developmental approach. In M. Royer (Ed.),Mathematical Cognition (pp. 227–259). Greenwich, Conneticut: Information Age Publishing.
Pegg, J. & Graham, L. (2007). Narrowing the Gap: QuickSmart offering students a new chance toacquire basic academic skills. Keynote address to the Narrowing the Gap Conference, University ofNew England, Armidale NSW, April, 2007.
Pegg, J., Graham, L. & Bellert, A. (2005). The effect of improved automaticity and retrieval of basicnumber skills on persistently low-achieving students. In H. L. Chick & J. L. Vincent (Eds),Proceedings of the 29th Conference of the International Group for the Psychology of MathematicsEducation, Vol. 4 (pp. 49–56).
Royer, J. M. (1996). Cognitive assessment of reading competencies: Diagnosis and prescription. In G. D.Phye (Ed.), Handbook of Academic Learning (pp. 199–234). San Diego, CA: Academic Press.
Royer, J. M. & Tronsky, L. N. (1998). Addition practice with math disabled students improvessubtraction and multiplication performance. Advances in Learning and Behavioural Disabilities, 12,185–217.
Royer, J. M., Tronsky, L. N. & Chan, Y. (1999). Math-fact retrieval as the cognitive mechanismunderlying gender differences in math test performance. Contemporary Educational Psychology, 24,181–266.
Strain, P. S. & Hoyson, M. (2000). The need for longitudinal intervention: Follow-up outcomes forchildren. Topics in Early Childhood Special Education, 20 (2), 116–122.
Swanson, H.L. & Siegel, L. (2001). Learning disabilities as a working memory deficit. Issues inEducation, 7(1), 1–48.
Zbrodoff, N. J. & Logan, G. D. (1986). On the autonomy of mental processes: A case study of arithmetic.Journal of Experimental Psychology: General, 115, 118–130.

© The Australian Association of Mathematics Teachers Inc.
46
Major presentations
© The Australian Association of Mathematics Teachers Inc.
47
Learning difficulties in middle yearsmathematics: Teaching approaches to support
learning and engagement+
Judy Anderson
The University of Sydney
Excellent teachers of mathematics seek to support all students in their classrooms(AAMT, 2006a). This aim can be challenged when teachers are confronted with aclass of 30 students from diverse backgrounds, with varying levels ofunderstanding, and in some cases, particular learning needs. In addition, studentdisengagement in mathematics adds another layer of challenge. This papersummarises findings from the literature into learning difficulties in mathematicsand presents a range of modifications and accommodations for the middle yearsclassroom. While targeting students with special needs, all students can benefitfrom the recommended teaching approaches.
The AAMT communiqué Quality Mathematics in the Middle Years (AAMT, 2006b)highlights the importance of supporting students at this critical time in their schooling.
[Students] experience mathematics as a coherent, meaningful and purposefulaspect of their schooling that is connected to their lives as learners and asadolescents developing into adults. Teachers gain great satisfaction from meetingthe intellectual and professional challenges they face, and working with colleaguesand the community to turn into a reality their belief that all students can learn, doand enjoy mathematics (p. 5).
Most teachers are familiar with the experience of students in their classrooms whohave difficulty learning mathematics. These students often require considerableassistance from the teacher and yet they still seem to have problems retaininginformation and improving their knowledge and understanding. The types of learningdifficulties in mathematics are many and varied, all requiring specific modifications andaccommodations to support student learning. Individualised instructional materials,withdrawal schemes and other special programs are all attempts to try to overcome theburden placed on teachers. While there may be some advantages in using these supportprocedures, teachers of mathematics are often best placed to support their students’learning by selecting teaching strategies suitable to their needs (Westwood, 2000).
Appropriate assessment and early identification of students with specific learningneeds are critical. In this paper, identification of these students is discussed andaccommodations, which relate to good teaching practice are outlined. Some studentswho are identified as having learning difficulties are actually disengaged for otherreasons, which need to be considered and addressed by teachers. The importance of
+ Invited paper

Mathematics: Essential for Learning, Essential for Life
© The Australian Association of Mathematics Teachers Inc.
48
addressing language difficulties in the learning of mathematics is highlighted followedby a range of appropriate teaching approaches.
Identification of students with learning difficulties
The focus of this paper is to consider strategies for supporting those students who arehaving difficulty comprehending and retaining information in mathematics lessons, andfor those who are generally disengaged. Students with learning difficulties inmathematics usually have processing problems that could include visual, auditory,motor or memory problems (Steele, 2004). These difficulties may then affect visualprocessing such as difficulty copying work from the board, auditory processing such asdifficulty interpreting oral instructions or general task-related behaviours such asinsecurity and lack of confidence. In addition, language difficulties can interfere withreading, vocabulary, listening and making sense of new ideas (Bley & Thornton, 2001).The discussion in this paper does not include those students who have special needssuch as the hearing impaired, sight impaired, emotionally disturbed or whosedevelopment is severely handicapped.
Students with learning difficulties in mathematics classrooms may be readilyidentified as they can exhibit one or more of the following behaviours: disruptive orwithdrawn; ask many questions to the point of being a nuisance; leave books andequipment at home or lack general organisation; have a very short attention span;readily forget the work from yesterday’s lesson; have trouble finding the questions inthe textbook, or confuse the meanings of symbols and words in mathematics. Targeteddiagnosis is necessary and may be facilitated by the special needs teacher at your schoolor the school counsellor. Interview protocols or specifically designed tests are alsoavailable for this purpose (e.g., Booker, 1994). However, when attempting to diagnosethe nature of students’ difficulties, Geary (1994) notes the following word of caution.
In our studies, roughly half of the children who had been identified as having alearning problem in mathematics did not show any form of cognitive deficit…These children probably perform poorly in mathematics because of a lack ofexperience, poor motivation, or anxiety… (p. 157)
The real issue then becomes one of deciding exactly what can be done in theclassroom to help support the disengaged students as well as the students with learningdifficulties as they attempt to learn mathematics. Consideration needs to be given toenhancing engagement and motivation as a first priority through the provision of asupportive learning environment and opportunities for success, as well as to exploringthe possible modifications and accommodations which address learning difficulties. Sowhat advice is provided for teachers in the literature about student engagement andlearning difficulties in the middle years of schooling?
Recommended teaching approaches
Excellent teachers make “a positive difference to the learning outcomes, both cognitiveand affective, of the students they teach” (AAMT, 2006a, p. 4). To meet the needs ofthe full range of students, teaching practices should incorporate a range of approachesand accommodations to promote attitudes and engagement as well as understanding andmeaning making of mathematics. These accommodations can involve changes inteaching style which could include variations to the pace of instruction, increased use of
Mathematics: Essential for Learning, Essential for Life
© The Australian Association of Mathematics Teachers Inc.
49
suitable materials and a wider variety of activities, and changes in the curriculum toinclude problem solving as well as consolidation (Chinn, 2004; Steele, 2004;Westwood, 2000).
Addressing attitudes and engagement
Engagement is an important element of quality teaching and learning which helps topromote working mathematically (Anderson, 2005). Lack of engagement may beevidence of a poor attitude which interferes with learning. What causes such attitudes isan important consideration when planning for quality teaching and learning. Studentswill often develop a poor attitude if they see mathematics lessons as boring, the work asdifficult or irrelevant, or if they continually fail assessment tasks. Certainly studentsneed to become competent in carrying out basic numerical operations but if theseprocedures are rehearsed daily using the same teaching strategies then it is notsurprising that many students will describe mathematics lessons as boring. Review isimportant and consolidation is necessary to enhance recall and support automaticity buta diet of pure arithmetic is hardly inspiring, particularly if this rehearsal is continuallyperformed alone from sheets or textbooks. A variety of teaching strategies includingcooperative learning activities, games, prompts, demonstrations and concrete materialsmay assist. However, organisation, planning and structure are still important.
Students with learning difficulties need teachers to spend most of their time teachingwithin a positive, orderly and predictable classroom (Spencer, 1994). Students shouldknow exactly what is required of them and be given clear direction before independentpractice. Identifying errors in work samples helps to highlight misconceptions andallows for targeted practise and a focused teaching approach (Anderson, 1996). Regularand consistent feedback is necessary and students need to be aware that they can learnfrom errors.
For those students who have only ever received poor marks in mathematics, theexpectation of continued failure is enough to destroy any interest or enthusiasm to learnand may result in lack of participation and disengagement. This can then lead to anxietyabout mathematics with a fear of taking examinations. Praise and positive support arecritical so that students believe they can be successful and will be prepared to bechallenged and even take some risks. Martin (2003) recommends the use of PBs(personal bests) so that students set goals and aim to improve their individualperformance. Keeping a track of performance through charts and graphs (Steele, 2004)or personal logs (Martin, 2003) assists goal setting and enhances motivation andengagement. Building sound relationships between teacher and student helps to enhancea positive self-concept and the feeling that improvements are possible and worthwhileaiming for.
Addressing learning difficulties
A range of modifications in practice can be used to address specific learning difficulties(Steele, 2004). For example, advance organisers help students keep track of lessons.Noting on the side of the whiteboard the steps in a lesson at the beginning helpsstudents follow the progression of the teaching sequence. If new work is presented tooquickly with not enough time for students to think and absorb the information or if theprerequisite skills have not been developed then it is also not surprising thatmathematics is seen as a difficult subject. This problem is further compounded if eachlesson represents a new and unique idea with few connections made to existingknowledge.

Mathematics: Essential for Learning, Essential for Life
© The Australian Association of Mathematics Teachers Inc.
50
Students learn at different rates and many students are exposed to abstract conceptswell before they can make sense of these ideas (Westwood, 2000). Bley and Thornton(2001) emphasise the use of concrete experiences for all new concepts. However, ifstudents experience motor problems, the materials may not be easy to handle. Somestudents may be distracted by the materials and may not be able to make the necessarylinks to the mathematical concepts being portrayed (Steele, 2004).
If necessary, tasks need to be modified by altering quantity, level of difficulty,presentation, or the time allowed (Spencer, 1994). Tasks become more manageable bybreaking them down into subtasks. When asking questions, students with learningdifficulties need a longer wait time. Spencer surveyed students who reported that theylearn better if they are given one instruction at a time, they have more time, they can seea purpose in the learning, and if the teacher helps them to organise their work. Studentsneed to be taught how to organise themselves as well as how to summarise, revise work,study for a test, and sit for an examination.
Language difficulties in learning mathematics
Language helps students organise knowledge in both written and oral form (MacGregor& Moore, 1991). To that end, students need opportunities to read mathematics, to writeabout mathematics, and to talk about mathematics using their own language. For somestudents, language difficulties interfere with their learning as they attempt to makesense of new language demands. For example, students may experience difficultyconverting between words to numbers (Miller & Mercer, 1993). In addition, thevocabulary of mathematics can create problems for students (Chinn, 2004; MacGregor& Moore, 1991). Students who have difficulty with reading and comprehensionexperience problems when mathematics is presented in real contexts, frequently withmuch information to comprehend and interpret (Newman, 1983).
Many students have difficulties with the technical as well as the symbolic languageof mathematics and reading mathematical textbooks is challenging. The vocabulary,symbol system and technical language confronted in textbooks must be discussed withthe students (Shield, 1991). Textbooks should be read aloud in class so that studentspractise saying mathematical terms, they ask questions to clarify understanding, andbecome familiar with the language used in problems and exercises. Students oftenreport that they did not do set homework because they could not interpret the questionsor instructions. Extra time in class needs to be allocated to reading the homeworkexercise particularly for the benefit of those students who experience reading andcomprehension difficulties.
Investigations and projects require clear communication of mathematical thinking.Writing activities support the development of students’ use of mathematical language(MacGregor & Moore, 1991). However, higher-order thinking skills are required andthis can be extremely difficult for students with learning difficulties. Allowing studentsto work in mixed-ability groups to complete writing tasks will help to reduce anxietyand give students the opportunity to share and clarify understandings (Ridlon, 2004).Suitable writing tasks include writing prompts, open-ended questions, and journalwriting.
Supporting problem solving
Many students perceive that school mathematics is totally irrelevant and does not haveany application to their future aspirations. Achieving good grades in externalexaminations may be the only motivation to try to understand the concepts confronted
Mathematics: Essential for Learning, Essential for Life
© The Australian Association of Mathematics Teachers Inc.
51
in each lesson. Mathematics would be seen as more useful if connections were madewith problem-solving situations related to everyday experiences.
Ridlon (2004) explored the impact of a problem-centred mathematics curriculum on26 low-achieving Grade 6 students over a nine-week period, and compared theirlearning to a control group who were taught the same concepts using a more traditionaltextbook approach. She reported significant improvements in both attitudes andachievement for the experimental group citing evidence from the students, their parents,and an independent observer in the classroom who could not believe they were the “lowachievers”.
Modelling the process of problem solving and providing prompts helps students toask the right questions and organise their thinking. Another useful strategy is to useacronym mnemonics, which help students to remember the steps in the problem-solvingprocess. One example is SOLVE (Miller & Mercer, 1993) where each letter stands for aseparate step:
1. Study the problem.2. Organise the facts.3. Line up a plan.4. Verify your plan with computation.5. Examine your answer. (p. 80)
This strategy helps those students with memory deficits although all students willbenefit from using this organiser as it promotes the use of metacognitive strategies.Awareness of one’s own thinking is critical in the problem-solving process as it givesthe student control and helps them to organise and plan a solution. Not understandingwhat the problem is about and misinterpreting the language used in mathematicalproblems can lead many students to additional difficulties in mathematics (Newman,1983).
While these recommendations are not new and represent good teaching practice,many teachers still spend a disproportionate amount of time on the practice ofcomputation skills without trying to develop understanding or without giving studentsthe opportunity to think mathematically. Problem solving is accessible to these studentsprovided the teacher chooses the right problems. Open-ended problems are ideal for usein mixed-ability classrooms as they allow all students the opportunity to make anattempt at the problem. Sullivan, Zevenbergen and Mousley (2005) have used open-ended tasks with enabling prompts for students who experience difficulty making a starton the problem.
Conclusion
In this paper, many issues related to teaching students with learning difficulties havebeen outlined as well as a range of recommended teaching approaches to supportlearning. Critical to this support is the provision of a classroom environment whichsupports the learning of all students. Often this will mean addressing poor studentattitudes and disengagement, possibly resulting from continued failure. Providingopportunities for success in a positive, non-threatening classroom will do much to helpmany students begin to want to learn and enjoy mathematics.
Other important modifications may be required to support the learning needs ofparticular students. The difficulties which these students experience can be a result ofineffective processing of information, poor retrieval skills or language problems
Mathematics: Essential for Learning, Essential for Life
© The Australian Association of Mathematics Teachers Inc.
52
Suggestions have been made to help mathematics teachers in their endeavour to teachthese students. These are worth considering as all students may in fact benefit from thevariety of new teaching strategies.
Finally, good teaching practice provides opportunities for students with learningdifficulties to experience success. Teacher expectations can strongly influence theperformance of these students and so teachers are encouraged to reflect on theirattitudes towards learning difficulties students. There is evidence that teachers tend todemand less work, give less feedback, ask fewer questions, criticise more often andhave less friendly interactions with low achieving students (Brophy & Good, 1987). It isimportant that all students are supported to improve their knowledge, skills andunderstanding in mathematics by focusing on effort to enhance students’ self-esteem(Martin, 2003).
References
AAMT (2006a). Standards for Excellence in Teaching Mathematics in Australian Schools. Adelaide, SA:AAMT.
AAMT (2006b). Quality Mathematics in the Middle Years Communiqué. Adelaide, SA: AAMT.Anderson, J. (1996). Where did I go wrong? : Teachers’ and students’ strategies to correct
misconceptions in secondary mathematics classrooms. In H. Forgasz, T. Jones, G. Leder, K. Maguire& C. Pearn (Eds), Mathematics: Making Connections (Proceedings of the 33rd Annual Conference ofthe Mathematical Association of Victoria, pp. 1–11). Brunswick, Vic: MAV.
Anderson, J. (2005). Working mathematically in NSW classrooms: An opportunity to implement qualityteaching and learning. In M. Coupland, J. Anderson & T. Spencer (Eds), Making Mathematics Vital(Proceedings of the 20th biennial conference of the Australian Association of Mathematics Teachers,pp. 53–59). Adelaide: AAMT.
Bley, N. S. & Thornton, C. A. (2001). Teaching Mathematics to Students with Learning Disabilities.Austin: Pro-Ed.
Booker, G. (1994). Booker Profiles in Mathematics. Melbourne: ACER.Brophy, J. E. & Good, T. L. (1987). Looking in Classrooms. New York: Harper & Row.Chinn, S. (2004). The Trouble with Maths: A Practical Guide to Helping Learners with Numeracy
Difficulties. London: RoutledgeFalmer.Geary, D.C. (1994). Children’s Mathematical Development — Research and Practical Applications.
Washington: American Psychological Association.MacGregor, M. & Moore, R. (1991). Teaching Mathematics in the Multicultural Classroom. Melbourne:
University of Melbourne.Martin, A. J. (2003). How to Motivate Your Child for School and Beyond. Sydney: Bantam.Miller, S. P. & Mercer, C. D. (1993). Mnemonics: Enhancing the math performance of students with
learning difficulties. Intervention in School and Clinic, 29(2), 78–82.Newman, M. A. (1983). The Newman Language of Mathematics Kit. Sydney: Harcourt, Brace and
Jovanovich.Ridlon, C. L. (2004). The effect of a problem centred approach to mathematics in low-achieving sixth
graders. Focus on Learning Problems in Mathematics, 26(2), 18–48.Shield, M. (1991). Mathematics textbooks: Much maligned, much neglected. The Australian Mathematics
Teacher, 47(3), 24–27.Spencer, K. (1994). Helping Students with Learning Difficulties Through Adaptations and
Accommodations. Sutherland: Learning Difficulties Coalition.Steele, M. M. (2004). A review of literature on mathematics instruction for elementary students with
learning disabilities. Focus on Learning Problems in Mathematics, 26(2), 62–67.Sullivan, P., Zevenbergen, R. & Mousley, J. (2005). Planning and teaching mathematics lessons as a
dynamic, interactive process. In H. L. Chick & J. L. Vincent (Eds), Proceedings of the 29thConference of the International Group for the Psychology of Mathematics Education, Vol. 4 (pp.249–256). Melbourne: PME.
Westwood, P. (2000). Numeracy and Learning Difficulties: Approaches to Teaching and Assessment.Camberwell, Vic: ACER
© The Australian Association of Mathematics Teachers Inc.
53
From here to there: The path to computationalfluency with multi-digit multiplication+
Janette Bobis
University of Sydney
Drawing upon research, theory, classroom and personal experiences, this paperfocuses on the development of primary-aged children's computational fluency withmulti-digit multiplication. Getting children from 'here' (current strategy use) to'there' (a more efficient strategy) is often not a straight-forward path. The criticallinks between number sense and a child’s ability to perform mental and writtencomputation with ease are examined.
Many readers will know the story of the famous mathematician Johann Carl FriedrichGauss (1777–1855). As a young boy he was prone to daydream in class. One day histeacher decided to punish him for not paying attention. He was asked to add all thenumbers from 1 to 100. Much to the annoyance of the teacher, young Carl was able toderive the correct answer in seconds. Fortunately for Carl, he knew a short-cut. Herealised that adding pairs of numbers (e.g., 1 + 100, 2 + 99, etc.) all equalled the samenumber: 101. He figured that there were 50 such pairs, so calculated the total to equal50 101 or 5050.
Recently I related this story to a group of primary-school teachers. One teacherimmediately asked, “But who taught him that?” This question sparked a discussionabout the critical relationship between a person’s understanding of mathematics andtheir computational fluency. The teachers agreed that Carl’s in-depth understanding ofmathematics enabled him to see patterns and relationships that made the computationmore manageable, but that his knowledge of basic facts and the fluency with which hecould compute were equally important. The teachers concluded that understandingwithout fluency can inhibit the problem solving process.
This paper focuses on the development of primary-aged children’s computationalfluency. It emphasises the critical links between number sense and a child’s ability toperform mental and written computation. The case of multi-digit multiplication is usedto illustrate these important links.
Computational fluency:Number sense and the standard algorithm
The idea of teaching mathematics for understanding and for meaningful learning tooccur has been advocated for over half a century (Brownell, 1935). However, it was notuntil the 1980s that the term “number sense” was first used to refer to those who had adeep understanding of numbers. The focus on number sense is manifested in the recentand on-going emphasis in international curriculum and policy documents on mental
+ Invited paper
Mathematics: Essential for Learning, Essential for Life
© The Australian Association of Mathematics Teachers Inc.
54
computation (e.g., Australian Education Council, 1991; National Council of Teachers ofMathematics, 2000). Research has shown that those who are good at mentalcomputation possess a well-developed sense of number (McIntosh & Dole, 2000).
The increased emphasis on mental computation and number sense has seen acorresponding de-emphasis in curricula on standard algorithms. An algorithm is aspecified multi-step procedure that produces an answer for any given set of problemsand is characterised by long-term practice. While still recognised as important, someAustralian state syllabus documents have delayed the introduction of standardalgorithms for around two years to allow a focus on mental strategies for as long aspossible (e.g., Board of Studies, New South Wales [BOSNSW], 2002). The worry withan early emphasis on standard algorithms is that students will shift their focus toexecuting convenient procedures rather than on understanding the mathematics.
A concern is that educators will view the development of number sense and fluencyin written and mental computation as separate bodies of knowledge requiring separateinstruction. In fact, computational fluency, whether employing mental or writtenmethods, and number sense are intertwined and should be developed together. The aimof the following sections is to examine how children develop proficiency in theircomputational methods while instruction remains focused on learning withunderstanding.
Understanding the development of children’s strategies
While a number of research-based “frameworks” provide excellent descriptions oflearning pathways by which children’s computational strategies develop, they fail to tellus about how children progress to use a more efficient strategy in preference to anotherless efficient one. It is imperative that teachers understand how children make this shift.
As children become more competent mathematicians, they develop a variety ofthinking strategies for solving mathematical problems. Generally, children initiallyapply basic counting strategies to help them solve simple numerical problems beforemoving onto using more complex non-counting strategies. While the strategies thatdevelop usually become more sophisticated as children learn more efficient ways ofdoing mathematics, it is now well acknowledged that at any one time, a child will use amultiplicity of strategies and that often these strategies will not be the most efficientones a child is capable of performing. Such inefficient strategies persist because whilethey may be slow, they eventually yield the correct answer (Gould, 2000). When a childis placed under some form of cognitive demand, such as an imposed time limit, mentalfatigue or even boredom, they will often revert to a less sophisticated strategy that theyknow well and can perform with minimal effort. A nine year old explained this to meonce while I questioned her about her strategies for addition:
I know when I just have to add a small number—say five or less—then its fast forme to count by ones. But if its 20 or 30 to add, then I will stop and think of a betterway that does not use just ones because I know it will take me too long to countthat many. Sometimes I just want to count by ones because it’s too hard to think ofanother way.
I learnt from this little girl that children modify their strategy use according to atleast two things: the demands of the mathematical problem and the limitations of theirknowledge. Another influence on children’s choice of strategy that I have observedduring my time in schools is that of textbooks or even teachers themselves. In the

Mathematics: Essential for Learning, Essential for Life
© The Australian Association of Mathematics Teachers Inc.
55
attempt to introduce students to a variety of mental and written methods, instructionalmaterial may overemphasise or specify the use of a particular strategy or scaffold (e.g.,the empty number line) when students are already working beyond what is specified(see Bobis & Bobis, 2005). The challenge for teachers is to encourage the developmentof, and consistent use of, more efficient and appropriate strategies for solvingmathematical problems without it being “too hard” for children. To do this, it isimperative that teachers not only understand what these strategies are, but how a moreefficient strategy becomes a student’s preferred strategy even when placed in a stressfulsituation. The diagrammatic representation of Siegler’s (2000) overlapping wave theoryhas helped further my own understanding of how this can be achieved (see Figure 1). Ihave shared Siegler’s theory with practicing and prospective teachers and found itbeneficial in explaining how a more efficient strategy can become a child’s preferredstrategy.
Siegler’s (2000) overlapping wave theory is based on three assumptions: (1) childrentypically use a multiplicity of strategies to solve a single problem; (2) less and moreefficient strategies may coexist over prolonged periods of time and not just for shortperiods of transition; and (3) the relative reliance on existing and more efficientstrategies can be changed given appropriate experiences. The first two assumptions arerepresented diagrammatically in Figure 1. The third assumption is addressed later in thispaper.
Figure 1. Diagram representing Siegler’s overlapping waves model.
It can be seen from Figure 1 that at any one point in time, a student may use a rangeof strategies. However, the relative frequency with which particular strategies are usedover time may vary continuously, with new strategies becoming more prevalent andsome more inefficient strategies stopping. By following the path of a single strategy, itcan illustrate how some strategies will often be used for a prolonged period of time evenafter more efficient strategies have been introduced. This can be exemplified by astudent who uses counting-on by ones to solve simple addition problems such as 7 + 2as a 5 year old, and who continues to use the same strategy to solve 47 + 12 as a 10 yearold. Siegler suggests that as a child progressively learns more efficient strategies theypass through four dimensions or components of change. These components range fromthe initial use of the strategy, which in some cases may at first be used at anunconscious level, to a stable, precise and efficient use of the strategy. The fourdimensions along which learning occurs include:1. The acquisition or introduction of a more advanced strategy;
Mathematics: Essential for Learning, Essential for Life
© The Australian Association of Mathematics Teachers Inc.
56
2. An increased reliance or frequency of use of the new strategy within the set of thechild’s existing strategies;
3. An increased appropriate choice of the strategy; and4. An improved execution of the more advanced strategy that can lead to it
becoming increasingly automated.While this model for strategy development is based on the assumption that childrenlearn by doing, it is important to emphasise that simply drilling the strategies is notenough. Understanding is also crucial. We know that the greater the degree ofunderstanding, the less practice that is required to obtain fluency and to sustain thechange in strategy use. Additionally, each new strategy competes for a long time withmore familiar strategies, so it may not be used consistently as their preferred strategyfor some time and there may be occasions when a child seems to regress in theirstrategy use. In other words, getting children to move from their current array ofpreferred strategies (the “here” strategies) to a more efficient strategy (the “there”strategies) is not a straightforward process.
The case of Crystal and multi-digit multiplication
I first met Crystal when her Year 6 teacher asked me to assist with the development ofan intervention program for a small group of students in her class. These students wereexperiencing difficulty with the algorithm for multi-digit multiplication and the teacherwas unsure what remediation was needed. This section details the journey tocomputational fluency of one child from that group.
Frameworks describing developmental pathways of children’s thinking strategies foraddition, subtraction and single digit multiplication are now quite common (see, Bobis,Clarke, Clarke, Thomas, Young-Loveridge, Wright & Gould, 2005) and some areactually embedded into curricula (e.g., BOSNSW, 2002; Van den Heuvel-Panhuizen,2001). However, much less is known about multi-digit multiplication. Fuson (2003)reports preliminary research that reveals children use a progression of strategies from(a) direct modelling with concrete materials or semi-abstract drawings, to (b) methodsinvolving repeated addition, such as doubling, to (c) partitioning methods. Partitioningstrategies normally include the partitioning of one number or both numbers into tensand ones or partitioning by a number other than 10.
The standard algorithm for multi-digit multiplication most commonly used in NSWprimary schools requires a number of steps involving multiplication and addition. It alsorelies on the answers at each step being properly aligned according to their correct placevalue. Such alignments can be accomplished without any understanding of a number’strue value. In Crystal’s case, errors in her multi-digit multiplication were the result of arange of factors. The single-digit multiplication work samples in Figure 2 indicate thatCrystal could efficiently solve single-digit computations when multiplying by numbersless than 7. However, she did not know all her multiplication facts from 7 onwards, thushindering her computational fluency. This was later confirmed in an interview withCrystal. She had memorised most facts to 6 10, but seemed unaware of thecommutative property of multiplication. Hence, she was unable to see that 6x8 was thesame as 8x6. In addition, the work samples indicate that Crystal was not only makingprocedural errors when carrying, but that she had little understanding of place valuewhen multiplying by tens. This is a very common error in students’ execution of thealgorithm for multi-digit multiplication and is generally a result of learning theprocedure by rote. To overcome these procedural and conceptual errors, Crystal neededto understand the distributive property of multiplication.

Mathematics: Essential for Learning, Essential for Life
© The Australian Association of Mathematics Teachers Inc.
57
Figure 2. Examples of Crystal’s single digit and multi-digit multiplication.
A program of work starting with Crystal’s understanding of the commutativeproperty of multiplication was implemented by the classroom teacher. It was decided tostrengthen Crystal’s knowledge base of single-digit multiplication before moving to themore difficult multi-digit multiplication computations. While this initial instructionspanned a few weeks, it is the understanding of the mathematics underlying multi-digitmultiplication that is my focus here. It was during our search for a strategy to helpCrystal understand the underlying mathematics that the classroom teacher and I learntmost about Crystal’s mathematical abilities and about teaching multi-digitmultiplication via a number sense approach.
We soon learnt that if Crystal was going to develop an understanding of thedistributive property of multiplication, it needed to be presented in a visual form. Earlyattempts to explain this property through purely abstract means (e.g., 14 5 = 10 5 +4 5) had little success. Visual representations of double-digit numbers became verycumbersome and messy for Crystal, thus making the learning and teaching tedious. Itwas at this point that we encountered a method involving partitioning of numbersaccording to their place value and a convenient visual model (Fuson, 2003). We startedby introducing Crystal to array’s incorporating tens and ones (see Figure 4 for anexpanded and abbreviated model of an array). The visual representation supportedCrystal’s understanding of multiplying all the combinations in two double-digitnumbers.
Figure 4. Array structures used to model all combinations in multi-digit multiplication.

Mathematics: Essential for Learning, Essential for Life
© The Australian Association of Mathematics Teachers Inc.
58
The array models scaffolded the introduction of mental strategies involvingpartitioning, and at the same time provided a convenient representation of thedistributive property of multiplication. Within two weeks of instruction, the visualrepresentation of the array was unnecessary and Crystal was able to record her thinkingnumerically (see Figure 5). As she gained more confidence with this process, Crystaleventually took short-cuts and discarded recordings to the right of the algorithm.
Figure 5. The distributive property is emphasised to assist understanding of the algorithm.
While this sequence of instruction was first introduced to cater for the needs ofCrystal and a few other students in the class, the teacher decided to integrate the arraymodel into her regular classroom teaching of multi-digit multiplication. Afterwitnessing the benefits of this process of instruction the teacher interviewed morestudents from her class to determine their level of understanding of multi-digitmultiplication. She was alarmed to find many other students implementing the standardalgorithm correctly, but without understanding the underlying mathematics.
Conclusion
High levels of efficiency in computation remain a goal of our mathematics curricula; theprocess by which it is achieved needs to take account of how students develop a senseof number. The path to computational fluency is not a straight-forward one for moststudents. However, it is clear that the promotion of number sense is critical to a basicunderstanding of mathematics and to a child’s ability to compute easily.
References
Australian Education Council (1991). A National Statement on Mathematics for Australian Schools.Melbourne: Curriculum Corporation.
Australian Association of Mathematics Teachers (1997). Numeracy = Everyone’s Business: The Reportof the Numeracy Education Strategy Development Conference. Adelaide: AAMT.
Board of Studies, New South Wales (2002). K–6 Mathematics Syllabus, Sydney: BOSNSW.
Bobis, J. & Bobis, E. (2005). The empty number line: Making children’s thinking visible. In M.Coupland, J. Anderson & T. Spencer (Eds), Making Mathematics Vital (Proceedings of the 20thbiennial conference of the Australian Association of Mathematics Teachers, pp. 66–72). Sydney:AAMT.

Mathematics: Essential for Learning, Essential for Life
© The Australian Association of Mathematics Teachers Inc.
59
Brownell, W. (1935). Psychological consideration in the learning and the teaching of arithmetic. In TheTenth Yearbook of the National Council of Teachers of Mathematics (pp. 1–31). New York: TeachersCollege, Columbia University.
Fuson, K. (2003). Toward computational fluency in multi-digit multiplication and division. TeachingChildren Mathematics, 9 (6), 300–305.
Gould, P. (2000). Count Me In Too: Creating a choir in the swamp. Australian Council for EducationalResearch, Improving Numeracy Learning: What Does the Research Tell Us? (Proceedings of theACER research conference 2000, pp. 23–26). Camberwell: ACER.
McIntosh, A. & Dole, S. (2000). Number sense and mental computation: Implications for numeracy.Australian Council for Educational Research, Improving Numeracy Learning: What Does theResearch Tell Us (Proceedings of the ACER Research conference 2000, pp. 34–37). Camberwell:ACER.
National Council of Teachers of Mathematics (2000). Principles and Standards for School Mathematics.Reston, Va.: NCTM.
Siegler, R. (2000). The rebirth of children’s learning, Child Development, 71 (1), 26–35.
Van den Heuvel-Panhuizen, M. (2001). Children Learn Mathematics: A Learning-Teaching Trajectorywith Intermediate Attainment Targets for Calculation with Whole Numbers in Primary School.Utrecht: Freudenthal Institute, Utrecht University/SLO.
© The Australian Association of Mathematics Teachers Inc.
60
Collaborative development of a framework fornumeracy: A case study+
Natalie Brown
University of Tasmania
Pat Rothwell
Department of Education
Scott Taylor
University of Tasmania
A major curriculum reform in Tasmania has provided the impetus for teachers toreconsider the place of numeracy in the curriculum. As one of the Key Elements inan Essential Learnings Curriculum, “Being Numerate” has been the focus ofprofessional learning throughout the state, addressing teaching, learning andassessment. This paper describes a project implemented at one primary schoolwhere teachers negotiated with researchers to develop a framework for theteaching of numeracy in the school, drawing on curriculum support materials andteachers’ understanding of the school context.
Introduction
Curriculum reform in Tasmanian schools has centred around the implementation of anEssential Learnings framework (Department of Education, Tasmania (DoET, 2002;2003). This framework has provided a catalyst for professional learning programs andthe development of centrally produced support materials designed to assist teachers inimplementing the new values-based curriculum.
Being Numerate is recognised in this curriculum framework as a cross-curricularunderstanding, and one that is important for development in all students:
Being numerate involves having those concepts and skills of mathematics that arerequired to meet the demands of everyday life. It includes having the capacity toselect and use them appropriately in real life settings. Being truly numeraterequires the knowledge and disposition to think and act mathematically and theconfidence and intuition to apply particular principles to everyday problems.(DoET, 2002, p.21)
This shift in emphasis, together with a set of defined outcomes and standards (DoET,2003) has required teachers to reconsider the teaching of numeracy, in a climate wherethey have been met with a number of other challenges. These challenges have includedthe need to adopt different planning practices — using the features of the Teaching forUnderstanding (TfU) framework (Blythe, 1998) and where possible to plan cross-curricular and collaborative units. Teachers have also needed to think outside of thetraditional Key Learning Areas as organisers and, with content not prescribed, considerwhat they will teach and importantly, why they are teaching it. This is then linkedclosely with how the teaching will occur — closely matching purposes with appropriateteaching, learning and assessment activities.
The MARBLE (Mathematics in Australian Reform Based Learning Environments)research project was conceived in the context of this curriculum reform, focussing on + Invited paper
Mathematics: Essential for Learning, Essential for Life
© The Australian Association of Mathematics Teachers Inc.
61
the Middle Years (5–8). Recognising this as a critical time to support teachers as theywork through the challenges outlined above, the project aims to improve studentnumeracy outcomes through provision of teacher Professional Learning. Theimportance of paying attention to teaching and learning practices required for thesuccess of curriculum innovation is not new. The work of Fullan (1993) addressed thisin the broader context of Educational reform, with Clarke (1994) specifically addressingthis need with respect to supporting reform amongst mathematics teachers.
The researchers recognised that there are a number of important factors thatcontribute to successful Professional Learning. Two key features that have beenidentified in the seminal work by Hawley and Valli (1999) are the involvement ofteachers in the identification of what they need to learn, the process to be used and thefacilitation of collaborative problem solving. In terms of mathematics, Schifter (1998)found that professional learning experiences in which teachers were engaged with thecontent of the mathematics curriculum that they taught, in ways that challenged anddeepened their own mathematical understandings, assisted them to make significantchanges in their classroom practice. The importance of involving teachers in theprofessional learning process, and the need for collaboration is further borne out in thereview of Ewing et al. (2004).
In order to address specific areas of concern for individual teachers and schoolsinvolved in the MARBLE project, in the manner described above, schools were invitedto participate in school-based case studies. The focus of these was negotiated betweenteachers in schools and the researchers. In the present study, teachers expressed a needfor a whole school framework for the teaching of numeracy consistent with the newcurriculum outcomes and standards. It was agreed that the development of thisframework was to take into account both the curriculum documents and the teachers’own knowledge of context and current practice.
Method
The underpinnings to this research lie at the intersection of pragmatic and participatoryresearch paradigms (Creswell, 2003). Steeped in the “real world” of the teacher makingeveryday decisions about curriculum content, the researchers have adopted acollaborative approach with the teacher participants, involving them in design,collection of data and data analysis. The final phase of the project will involve teachersand researchers producing a document that can be used to outline a scope and sequencefor the teaching of numeracy in the school.
Consistent with a case study approach, the project was sited in a single school whichconforms to Stake’s description of a “bounded system” that is “complex” and“dynamic” (Stake, 1980). The study took place at Valleyfield Primary School, agovernment K–6 school situated in a rural area in Southern Tasmania.
The project consisted of the following phases:1. Identification of the school focus through consultation between teachers and the
researchers. A key participant in this stage was the coordinating teacher at theschool who worked as part of the research team.
2. Preparation, by the researchers, of rubrics describing teaching emphases at eachstandard for each strand of the numeracy/mathematics curriculum. These rubricsused the strands defined by National Statements on Mathematics for AustralianSchools (Curriculum Corporation, 1990) and the curriculum support document“Teaching Emphases” prepared by the School Education Division of the DoET,(DoET, 2005). The latter outlines the teaching and learning focus for each of the

Mathematics: Essential for Learning, Essential for Life
© The Australian Association of Mathematics Teachers Inc.
62
strands at each of the developmental standards. For the primary school, StandardsOne to Three are appropriate for most students, with each standard being dividedinto three divisions (lower, middle and upper). An example of the audit rubric isreproduced in Figure 1 .
3. The undertaking of an audit of numeracy teaching and learning in the schoolagainst the rubric by all staff at the school. This occurred after the documentswere introduced by the researchers at a staff meeting. Teachers were invited totake away all rubrics that were relevant to the students in their classes. In additionto the audit, teachers were invited to add any teaching and learning activities theyhad found to be particularly successful or relevant and any resources that wereuseful.
Standard/Progression
3 Middle
Thinking and actingmathematically
Focusing on reflecting, refining and sharing strategies for problem solving.Using different strategies to comparing strategies to determine efficiency.Continuing to build specific mathematical terminology and recoding methods.Developing confidence with mathematical language and recording methods to communicatingtheir numerical understandings to a wider audience.
Number Continuing to focus on mental computation with multiplication and division.Focusing on refining and sharing mental computation strategies in addition, subtraction,multiplication and division.Building a deep understanding of common fractions through the use of a wide range ofapproaches (not over emphasising “pizza” fractions for example) including an explicit focus onpartitioning. *Beginning to independently select a strategy to selecting the most efficient mentalcomputation strategies and justifying their choice.Exploring a range of informal written computation methods for addition and subtraction of 2digit numbers to establishing a secure written method for addition and subtraction
Measurement Developing skills in measuring length, mass, time, angle and capacityProviding opportunities to quantify attributes [length, mass, time, angle, volume (capacity) andtemperature] for the purpose of comparing and/or ordering.Using formal measurement units (and tools) with teacher guidance to using the appropriateunit (or tool) for length, mass, time, angle, volume (capacity) and temperature moreindependently
Patterning and algebra Making predictions based on the growth of a pattern e.g. ‘If one costs fifty cents, then I canfind how much it costs to buy 20 by multiplying fifty cents by 20. So, 10 lots of $0.50 is $5 andI can double thatMaking predictions using simple patterns based on costs to making predictions using abroader set of contexts.Systematically recording patterns in a table to connecting how a table, a set of diagrams andwords can represent the same pattern.
Proportional reasoning
Space Focusing on how 3D objects are constructed from 2D nets.Identifying shapes to constructing and deconstructing shapes and objects based on specificattributes e.g., “What shapes would I need to make a model lighthouse?”Reading maps to constructing simple maps taking into account orientation.
Data and chance Exposing students to a range of ways to record data and developing their confidence toconstruct different graphs and charts.Collecting and representing data in simple bar graphs and charts to using an increasing rangeof data representations — stacked dot plots and pictographs (including use of technology).Interpreting data in order to quantify differences between items in the data set.Analysing data to locate measures of centre (median and mode) and spread (range) withteacher support.Exploring fairness through experiences with chance devices such as spinners, dice, cards,etc.
Figure 1. Example rubric used for audit.
1. Initial analysis of the audit was used to produce a summary of teaching andlearning in the schools and which was subsequently presented to staff forcomment.
Mathematics: Essential for Learning, Essential for Life
© The Australian Association of Mathematics Teachers Inc.
63
2. Supplementation of the audit data through individual staff interviews.3. Analysis of data by Strand and Grade and preparation of a draft document.4. Presentation of Draft sequence to staff for further refinement and for reference to
revised curriculum being produced through the DoE.
Results
The initial audit completed by the teachers was analysed against the “TeachingEmphases” document based on the Being Numerate Outcomes and Standards (DoET,2004). The results are summarised in Figure 2. This graphic representation indicates theproportion of each of the strands (represented by colours consistent with the auditdocuments) covered in each of the grades at Valleyfield Primary.
Analysis of the audit indicated that the majority of the curriculum for Standard 1 wascovered by the Prep teachers. Grades 1–2 appeared to concentrate on curriculum focifor Standard 2 (Lower), Grades 3–4 on Standard 2 (Upper) and Standard 3 (Lower) andGrades 4, 5 and 6 covering material predominantly from Standard 3. Interestingly, thetwo teachers with composite Grade 5 and 6 classes indicated they also covered materialfrom Standard 2 (Upper).
The extent to which teachers provided additional information in the audit processvaried, however the Prep teachers provided comprehensive information on bothteaching and learning activities and resources that they had found useful. Nevertheless,many teachers took this opportunity to share resources, and in some cases noted units orcross-curriculum contexts for numeracy that they had found to be successful:
Where is number in our world?AttendanceHouse numbersTelephone
Measurement: Use with integrated unitsGrowing plantsBody measurements
Two significant findings from this audit concern what had been indicated as notcovered by the teachers. No teacher had indicated coverage of the curriculumdesignated at the Standard 2 (Middle) level. Additionally, there were substantial areasof the curriculum that did not appear to be covered. Very little Pattern and Algebra waslisted as being taught above Standard 2 (Upper). Similarly aspects of Number andThinking Mathematically were not covered in either grades 4, 5 or 6.
Raising alarm bells, these findings were looked at more closely with a view touncovering reasons for gaps in the curriculum. It became clear that not all teachers hadreturned their audit rubrics, and in some shared classes, only one of the teachers hadcompleted the audit. In the latter instance, teachers had under-reported what the classhad covered, documenting only material taught during their teaching time. Inconsultation with the coordinating teacher, it was decided to present the data and askteachers how best they believed we could address the issue of missing data.
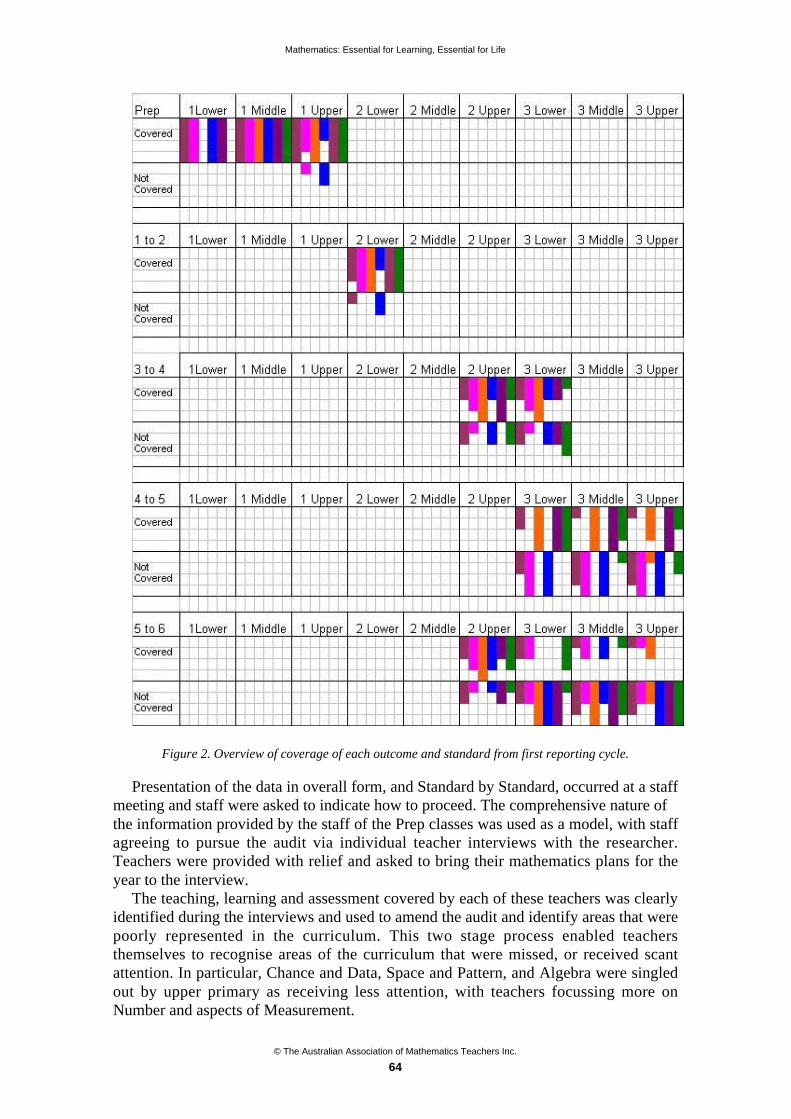
Mathematics: Essential for Learning, Essential for Life
© The Australian Association of Mathematics Teachers Inc.
64
Figure 2. Overview of coverage of each outcome and standard from first reporting cycle.
Presentation of the data in overall form, and Standard by Standard, occurred at a staffmeeting and staff were asked to indicate how to proceed. The comprehensive nature ofthe information provided by the staff of the Prep classes was used as a model, with staffagreeing to pursue the audit via individual teacher interviews with the researcher.Teachers were provided with relief and asked to bring their mathematics plans for theyear to the interview.
The teaching, learning and assessment covered by each of these teachers was clearlyidentified during the interviews and used to amend the audit and identify areas that werepoorly represented in the curriculum. This two stage process enabled teachersthemselves to recognise areas of the curriculum that were missed, or received scantattention. In particular, Chance and Data, Space and Pattern, and Algebra were singledout by upper primary as receiving less attention, with teachers focussing more onNumber and aspects of Measurement.

Mathematics: Essential for Learning, Essential for Life
© The Australian Association of Mathematics Teachers Inc.
65
In addition to informing the audit process, the teacher interviews provided valuablesupplementary data to the researchers. This included an insight into the issues faced byteachers in this context and informative comments on the process used during theprofessional learning program. All teachers interviewed could see the value in a schoolwide document outlining the numeracy curriculum. In particular, teachers of the highergrades faced with struggling students saw value in knowing what material had beencovered previously, and how this had been covered. Teachers new to the school alsofound it difficult to plan their mathematics program in the absence of any whole schoolplan.
In terms of the process of data collection, one teacher commented that he had foundthe process valuable because he “was put on the spot.” The opportunity to reflect on hisown mathematics plan, and its implementation, was clearly personally valued. Althoughtiming of the interviews (in the last full week of the school year) was slightlyproblematic, all teachers indicated they found the process straightforward and thoughtthe exercise worthwhile. Teachers also indicated support of the structure of theprofessional learning program MARBLE, seeing the individual school Case Study ascomplementing the cluster-wide professional learning days. Indeed, all teachersindicated that they had successfully incorporated ideas and activities from these daysinto their classrooms.
The amended audit, including teaching and learning ideas and teacher resources, wasthen used by the researchers to construct a draft framework. The curriculum documents“Teaching Emphases” (DoET, 2005) and the Outcomes and Standards for BeingNumerate (DoET, 2004) were used as a basis and interwoven with the teachers’ ownteaching emphasis for each grade. Further consultation with Tasmanian curriculumdocuments “K–8 guidelines” (Department of Education and the Arts Tasmania [DEAT],1992) and the Margate Primary School Whole School Plan (athttp://ltag.education.tas.gov.au/focus/beingnumerate/Margateplan.doc) allowed thedevelopment of Key Understandings in each of the strands for each grade. Theunderstandings have been presented in conjunction with the relevant teaching emphasesfor the grade together with possible activities. These activities were primarily drawnfrom teachers' reports of their own classroom activities, with additional activitiessourced from the K–8 Guidelines (DEAT, 1992), where necessary. An example of theformat is reproduced in Figure 3.
Year: Five to SixKey UnderstandingUnderstands how to select and justify effective mathematical strategies and choose the mostappropriate strategy for communicating information and solving problems in a variety of situations.Possible ActivitiesMathleticsProblem solving – set formulae10 mental maths problems first thing each lessonHeads and Tails –lesson 41 (Maths300)Farmyard Friends –lesson 47 (Maths300)Links to Numeracy Standards: Teaching Emphases
3 Lower 3 Middle 3 Upper• Focusing on building the
‘mathematician’s tool box’ [SeeAddendum] of strategies to usewhen attempting a problem.
• Explicitly teaching problemsolving strategies will be a majorteaching focus throughoutstandard 3.
• Teaching of mathematicalterminology and recordingmethods.
• Focusing on reflecting,refining and sharing strategies forproblem solving.
• Continuing to build specificmathematical terminology andrecoding methods.
•
• Consol idat ing students’problem solving strategies.
• Refining and extendingmathematical terminology andrecording methods.
• Giving opportunities forstudent’s to challenge eachother’s thinking.
•
Figure 3. Excerpt from framework document: Thinking and Acting Mathematically, Grades 5/6.
Mathematics: Essential for Learning, Essential for Life
© The Australian Association of Mathematics Teachers Inc.
66
Discussion
The numeracy teaching framework has been produced in collaboration with the teachersat the Valleyfield Primary School, in response to a perceived need for a school wideprogression document. The progressions, based on the teachers' own reporting of theirnumeracy practices in their own classrooms, have been divided into strands and linkedto the Tasmanian Being Numerate standards (DoET, 2004).
The document has been presented in two ways: by strand and by year group. Eachyear and progression has a Key Understanding, representing the primary numeracyconcept for each year and numeracy strand. Following this are some possible activitiesthat may aid development of this understanding. Presenting the results by year/classgroup provides a 'one stop' resource for teachers to plan their numeracy units across theyear. As these are primarily based on teachers' current numeracy plans, this does notradically change the emphasis of their present teaching and recognises their expertise inthe context in which they are working.
The alternative presentation, by strand, provides the opportunity for teachers to seethe progression of students’ understanding through the primary years of schooling.Firstly, this provides an expectation of knowledge and understandings for teachers atthe beginning of the academic year. Secondly, by looking at earlier and later yeargroups it provides a resource identifying possible activities for those students that maybe falling behind the majority of their class, for classes finding a concept difficult tograsp, and for those exceeding standard expectations. In this format, teachers can usethe document to ensure their students continually improve and extend their numeracyskills.
Clearly, the linking to particular numeracy standards can be seen as a limitation.Since beginning this project a new Education Minister has mandated a revision of thecurriculum delivered in Tasmania government schools, and a refinement of curriculumis currently underway. However, the use of Key Understandings-supported numeracystandards is a model that can be adjusted to incorporate future changes in numeracyoutcomes. This document, therefore, should be viewed as a work in progress.
This school-based project, driven by pragmatic needs of teachers, has beenenthusiastically received by the teaching staff. The planning has been aligned with therecommendations of Hawley and Valli (1999), involving teachers in identification ofissues and in collaborative problem solving. Not withstanding the support from theteachers, this Case Study has also uncovered the importance of the context ininfluencing school based research. In this case, the broader context of curriculumreform at state level has provided both the impetus for the project and barriers to itsprogress. Introduction of a new (refined) curriculum at the concluding stages has haltedthe implementation phase with researchers waiting for an opportunity to align this workwith the new documentation.
The context of the school itself is also of interest. External projects, regardless ofrelevance, impinge on the time of teachers who, in Tasmania at present, are feeling thestrain of a major reform process. Using an interview process where teachers werereleased from class (and teaching relief supplied) proved to be an effective way ofinvolving teachers in the project without undue additional work. As well as providinginformation with respect to teaching and learning, the interview process itself was ableto uncover aspects of context which are useful in planning support for teachers. AtValleyfield Primary, issues such as removal of teachers from class for administrativeduties, and the appointment of short term contract and permanent replacement teacherswere clearly seen by the teachers themselves as impacting on the program for students.
Mathematics: Essential for Learning, Essential for Life
© The Australian Association of Mathematics Teachers Inc.
67
These particular contextual issues provided even greater support for the objectives ofthis particular project, as a way of addressing the needs of teachers in planning forquality teaching and learning.
Conclusion
The documents produced to date are seen as important works in progress that will berefined by the teachers and researchers during the current school year. At time ofwriting, a revised curriculum for Tasmanian schools is being written for implementationin 2008. As a first step, key ideas in the draft document are being reviewed in light ofthe revised Numeracy curriculum document. Following this process, teachers will beasked to critique and amend the document. The updated version of the framework,together with an outline of this refinement process will be presented in July.
Acknowledgements
This research was funded by ARC Linkage Grant LP0560543. The authors would liketo acknowledge the staff of the school for their participation in the project and toProfessor Jane Watson and Mrs Lynda Kidd for critical comments on the manuscript.
References
Blythe, T. (1998). The Teaching for Understanding Guide. San Francisco: Jossey-Bass.
Clarke, D. (1994). Ten key principles from research for the professional development of mathematicsteachers. In D. B. Aichele & A. F. Coxfors (Eds), Professional Development for Teachers ofMathematics (Yearbook of the National Council of Teachers of Mathematics, pp. 37–48). RestonVA:NCTM
Creswell, J. (2003). Research Design Qualitative, Quantitative and Mixed Methods Approaches.Thousand Oaks, Calif.: Sage.
Curriculum Corporation (1990). A National Statement on Mathematics for Australian Schools.Melbourne: Author.
Department of Education and the Arts, Tasmania (1992). Mathematics Guidelines K–8. Hobart: Author.
Department of Education Tasmania.(2005). Teaching Emphases. Retrieved March 3, 2006 fromhttp://www.ltag.education.tas.gov.au/assessingresources/Beingnumeratesupport.doc
Department of Education Tasmania (2004) Outcomes and Standards. Hobart: Author
Department of Education Tasmania (2003). Essential Learnings Framework 2. Hobart: Author.
Department of Education Tasmania (2002). Essential Learnings Framework 1. Hobart: Author.
Ewing, R., Smith, D., Anderson, M., Gibson, R. & Manuel, J. (2004). Teachers as Learners. AustralianGovernment Quality Teacher Program Action Learning for School Teams Project Evaluation Report.Sydney: Sydney and Wollongong Universities.
Fullan, M. (1993) Change Forces: Probing the Depths of Educational Reform. London: The FalmerPress.
Hawley, W. D. & Valli, L. (1999). The essentials of effective professional development. In L. Darling-Hammond & G. Sykes (Eds), Teaching as the Learning Profession. San Francisco: Jossey-Bass.
Schifter, D. (1998). Learning mathematics for teaching: From a teachers' seminar to the classroom.Journal of Mathematics Teacher Education, 1, 55–87.
Stake, R. (1980). Case study methods in educational research. In R. M. Jaeger (Ed.), AlternativeMethodologies in Educational Research. Washington: American Educational Research Association.
© The Australian Association of Mathematics Teachers Inc.
68
An investigative approach to teachingsecondary school mathematics+
Merrilyn Goos
The University of Queensland
A new syllabus for mathematics in Years 1–10 was launched in Queensland in2004. The challenge for teachers implementing this syllabus lies not only in using anew structure for curriculum planning, but also in designing learning experiencesthat take an investigative approach to “working mathematically”. This paperdescribes a professional development project that supported a group of secondarymathematics teachers in implementing the new syllabus. A case study of one pair ofteachers shows how they developed their planning, pedagogy and assessment toengage students in meaningful mathematical investigations.
Queensland’s new Mathematics Years 1–10 Syllabus (Queensland Studies Authority,2004) has an outcomes focus that gives it a different structure from syllabusespreviously developed in this state. Instead of specifying what should be learned inparticular years or grades of school, the mathematics syllabus is organised around keylearning area outcomes that describe how students think, reason, and workmathematically, and core learning outcomes that describe what students should knowand do with what they know in the strands of Number, Patterns and Algebra,Measurement, Chance and Data, and Space.
The challenge for teachers implementing the new syllabus lies not only in using thenew structure for curriculum planning, but also in designing learning experiences andassessment tasks that take an investigative approach to “working mathematically”. Thiswas the focus of a professional development project commissioned by the QueenslandDepartment of Education and the Arts and undertaken by researchers from TheUniversity of Queensland from October 2005 to February 2006 in conjunction withteachers from secondary schools in the Mackay District. The main aim of the projectwas to explore the potential for the new syllabus to support improved classroompractices by documenting innovative aspects of, as well as hindrances to, successfulimplementation.
This paper describes the professional development program and its impact on a pairof teachers in one school. The purpose of the paper is to give these teachers a voice inreflecting on their own professional growth and to identify issues that are critical to thesuccess of professional development initiatives such as this. The next section takes aresearch perspective on factors that influence professional learning. This is followed bya brief outline of the professional development program in which the teachers andresearchers jointly engaged. A case study of the pair of teachers shows how theydeveloped their planning, pedagogy and assessment to engage students in meaningfulmathematical investigations. Implications are then considered for extending similar
+ Invited paper

Mathematics: Essential for Learning, Essential for Life
© The Australian Association of Mathematics Teachers Inc.
69
professional development opportunities to secondary mathematics teachers in otherschools.
Teacher professional learning
Researchers have identified a range of factors that influence teacher professionallearning. Rather than considering each separately, it is helpful to organise these factorsinto three “zones of influence”. The first zone represents teacher knowledge and beliefs,and includes teachers’ disciplinary knowledge, pedagogical content knowledge(knowledge of how to represent concepts and to use examples and analogies, asdescribed by Shulman, 1986), and beliefs about their discipline and how it is best taughtand learned. The second zone represents constraints within the professional context.These may include teacher perceptions of student background, ability and motivation,curriculum and assessment requirements, access to resources, organisational structuresand cultures, and parental and community attitudes to curriculum and pedagogicalchange. The third zone represents the sources of assistance available to teachers thatdefine which teaching actions are specifically promoted. This assistance is typicallyprovided by colleagues and mentors in a school or by formal professional developmentactivities.
Figure 1. Three “zones of influence” in teacher professional learning.
To understand teacher learning we need to investigate relationships between thesethree zones (represented by the overlapping circles in Figure 1). Professional learningmay be most effective when teachers experience enough challenge to disturb thebalance between their existing beliefs and practices, but also enough support to thinkthrough the dissonance experienced and either develop a new repertoire of practice or anew way of interpreting their professional context that fits with their newunderstanding.
The professional development program
Four pairs of teacher from four schools in the Mackay region volunteered to participatein the project. Two schools were in Mackay, one was in a small rural town, while thefourth school was located on the coast approximately 125 km from Mackay. Theuniversity-based researchers made three visits to Mackay to work with the whole groupof teachers, each time for two consecutive days. During these visits we gatheredinformation on the teachers’ knowledge and beliefs and their professional contexts (seeFigure 1) via questionnaires and structured group discussions.
Teacher knowledge& beliefs Sources of assistance
Professional context

Mathematics: Essential for Learning, Essential for Life
© The Australian Association of Mathematics Teachers Inc.
70
As a source of assistance that was deliberately promoting new teaching approaches(see Figure 1), the professional development program recognised the importance ofproviding teachers with authentic, practice-based learning opportunities that includedexamples of mathematical investigations, opportunities to experience theseinvestigations as learners themselves before planning their own investigations andtrying them out with their students, and opportunities to share their ideas andexperiences with colleagues, including the challenges encountered and their insightsinto the process. An action research approach (Loucks-Horsley, Love, Stiles, Mundry &Hewson, 2003) was adopted to provide for iterative cycles that would allow the teachersto reflect on the initial experience teaching their investigative unit and apply thoseexperiences and learning to a second iteration, and for an on-site visit to each teacher’sclassroom to gain insight into their classroom and school context.
The case study that follows illustrates how relationships between these three “zonesof influence” shaped the professional learning experiences of one pair of teachers.
Sugartown7 State High School: Engaging learners
Skye and Chris had been teaching for only three years. Skye qualified as a middle yearsteacher and taught primary school for eighteen months before moving to the secondaryschool so she could specialise in mathematics teaching. She was motivated to volunteerfor this project because she was assigned to teach a new subject, Practical Mathematics,designed for Year 8 students who were not achieving success in regular mathematicsclassrooms. Chris had completed a degree in secondary mathematics teaching, andpreviously had almost always taught senior mathematics classes. He volunteered for theproject because he was looking for help in planning new programs and devising newforms of assessment.
Knowledge, beliefs, professional context
Skye’s and Chris’s questionnaire responses showed they held very similar beliefs aboutthe nature of mathematics, and mathematics teaching and learning. For example, theyboth agreed that there are many ways of interpreting and solving a problem. However,Skye also agreed with more traditional views that in mathematics something is eitherright or wrong, and solving a problem usually involves using a rule or formula. Bothexpressed agreement with strategies such as showing students many ways of looking ata question and negotiating meanings through class discussion. Yet they also saw theirrole as showing students the proper procedures for answering questions. Both agreedwith emphasising understanding rather than getting the right answer, encouragingstudents to build their own mathematical ideas, and using manipulatives and real lifeexamples; but they were uncertain about the benefits of more traditional approachessuch as memorisation and practice. These responses suggest that Skye and Chris wereinterested in moving towards more student-centred, investigative teaching practices, andthat they needed to try out these practices with their own classes to find out whether thiswould lead to improved learning.
Skye and Chris considered their students’ mathematics achievement and socialbackground to be the key characteristics influencing their professional learning goals.Many students entering Year 8 were achieving at below the Year 7 numeracybenchmark, and both teachers were very concerned that these students “had no ideaabout a lot of things” when they started secondary school. Both teachers also referred to 7 Names of schools and teachers are pseudonyms.

Mathematics: Essential for Learning, Essential for Life
© The Australian Association of Mathematics Teachers Inc.
71
the students’ family and community context. In common with many small ruralcommunities, Sugartown was experiencing social and economic challenges exacerbatedby the town’s proximity to the thriving city of Mackay. Many students also came fromlow socio-economic status, single parent families, and the teachers felt that, on thewhole, parents did not care much whether their children were learning anything atschool. In these circumstances, they struggled to interest students in academic work.
Sugartown State High is a medium sized school with about 600 students. The Headof the Mathematics Department was very supportive of Skye and Chris’s desire to beinvolved in this project, organising their timetables so they had spare periods at thesame time that they could use for collaborative planning.
Goals
Skye and Chris agreed that the most frustrating obstacle in their professional contextwas the students themselves, and their apparent lack of interest in learning. This wasevident, for example, in their disruptive and uncooperative behaviour, and theirfrequently stated belief that they were “dumb” and simply could not do mathematics.These teachers’ personal histories and the experience of teaching unmotivated studentsled them to formulate a goal of engaging learners, or, as Skye explained, “for them tolearn maths without being terrified of it”. Both teachers saw investigations as a way ofpresenting mathematics differently that would allow them to make mathematics moreinteresting for students by engaging them in purposeful tasks with real world relevance.
Skye and Chris planned and implemented two units of work with Year 8 PracticalMathematics classes. For the first unit, taught towards the end of 2005, Chrisvolunteered to give up one of the spare lines in his timetable to work with Skye in teamteaching her Year 8 class. Together they planned and taught a unit on Shoppinginvolving operations with whole numbers, common and decimal fractions, and money.The following year, Chris asked to be given his own Year 8 Practical Mathematicsclass, and both teachers team-taught the two classes. The first unit they taught together,“School Rage”, asked students to design and administer a survey to find the school’sfavourite top 20 songs.
Shopping investigation
In developing this first investigation, Skye and Chris decided that the most importantaspects to consider were the students’ previous experiences in learning mathematics,and the school’s geographical and social contexts. They drew on the experience offamilies having to travel to Mackay to do their grocery shopping. The task was toinvestigate which situation is more economical, purchasing groceries in the localsupermarket in Sugartown or driving to Mackay to buy groceries. In their final report onthe investigation, students had to include a supermarket shopping list of at least 20items that their family would normally purchase, a price list for these items from thelocal supermarket in Sugartown and a supermarket in Mackay, a price comparisonbetween the two supermarkets, a calculation of the cost of fuel in driving to Mackay,and a comparison of advantages and disadvantages of shopping at the two chosensupermarkets.
Although Skye and Chris saw evidence that around half the students were muchmore engaged with the mathematics and more willing to persist with tasks thanpreviously, they were not entirely satisfied with this investigation because they realisedthat the topic of “grocery shopping” was not of much interest to young adolescents.

Mathematics: Essential for Learning, Essential for Life
© The Australian Association of Mathematics Teachers Inc.
72
This meant that many students did not complete the investigation and did not hand inthe final report.
“School Rage” investigation
For their next attempt, Skye and Chris took advantage of local resources in the form ofthe school based radio station and their students’ universal interest in popular music. Inthe “School Rage” investigation students had to create a Top 20 song list for the schoolradio station, based on a survey of fellow Sugartown State High School students. Tomake the task more realistic, Sky and Chris gave students a letter from the “radio stationmanager” (in reality one of the mathematics teachers) asking them for their assistance inproviding input into the design of a new radio program similar to the Rage Top 20. Theteachers also told their classes that the group submitting the best quality report wouldhave their Top 20 songs played on the radio station during a designated lunchtime. Thusthe task had an authentic purpose and a real audience comprising the entire schoolcommunity.
Core learning outcomes demonstrated through successful completion of this taskwere related to designing and carrying out data collections to investigate their own andothers’ questions, using data record templates, organising data and creating suitabledisplays, making comparisons about the data, and working with whole numbers,fractions and percentages.
Classroom observation confirmed Skye and Chris’s judgment that students were verymuch engaged in the investigation. For example, although the desks were arranged inrows, students formed informal groups to discuss wording of survey questions andsampling techniques and often moved around the room to speak to other peers or one ofthe two teachers. The teachers listened to conversations between students, andintervened where necessary to answer questions, repair faulty understanding, or offersuggestions. Skye also brought her laptop computer to the classroom with severalrelevant websites saved so that students could browse them offline (as there was no liveInternet connection available): she suggested they could find out which songs werecurrently topping the charts based on CD sales or polling of radio station listeners.
Evaluation
Students’ comments during lessons showed they recognised the difference betweeninvestigations and the more traditional, teacher and textbook centred lessons they wereaccustomed to. The following exchange, overheard during my visit to the school toobserve a “School Rage” lesson, is typical of students’ response to the new approachadopted by Chris and Skye:
Student: Why are we doing this? This isn’t maths!Chris: What do you mean?Student: It’s like we’re doing SOSE (Study of Society and Environment) —
this isn’t like a normal maths classroom.Chris: Is that a negative thing?Student: No, I normally hate maths but I don’t mind doing this.
The teachers’ own evaluation of the investigative units identified not only thebenefits for the students (engagement, confidence, alternative opportunities todemonstrate their learning) but also the challenges the teachers faced and how theyovercame them. They were now spending more of their time in class responding to theunanticipated ways in which students tackled investigations, often by asking questions
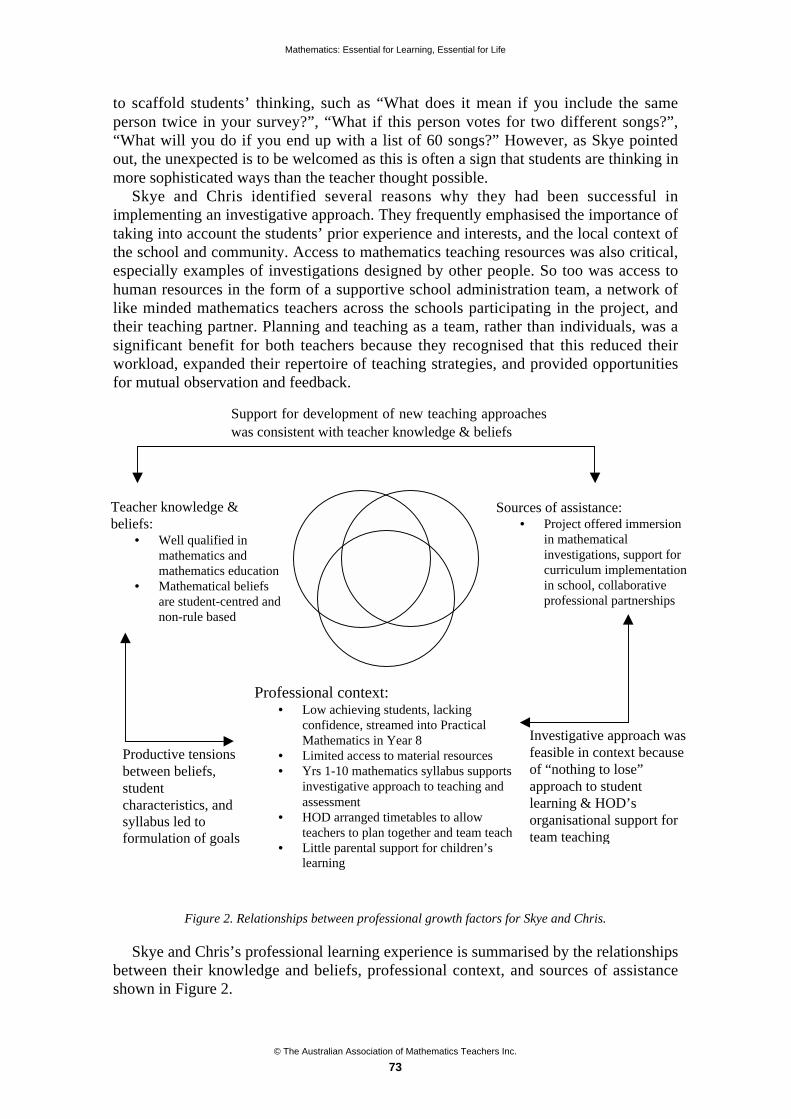
Mathematics: Essential for Learning, Essential for Life
© The Australian Association of Mathematics Teachers Inc.
73
to scaffold students’ thinking, such as “What does it mean if you include the sameperson twice in your survey?”, “What if this person votes for two different songs?”,“What will you do if you end up with a list of 60 songs?” However, as Skye pointedout, the unexpected is to be welcomed as this is often a sign that students are thinking inmore sophisticated ways than the teacher thought possible.
Skye and Chris identified several reasons why they had been successful inimplementing an investigative approach. They frequently emphasised the importance oftaking into account the students’ prior experience and interests, and the local context ofthe school and community. Access to mathematics teaching resources was also critical,especially examples of investigations designed by other people. So too was access tohuman resources in the form of a supportive school administration team, a network oflike minded mathematics teachers across the schools participating in the project, andtheir teaching partner. Planning and teaching as a team, rather than individuals, was asignificant benefit for both teachers because they recognised that this reduced theirworkload, expanded their repertoire of teaching strategies, and provided opportunitiesfor mutual observation and feedback.
Figure 2. Relationships between professional growth factors for Skye and Chris.
Skye and Chris’s professional learning experience is summarised by the relationshipsbetween their knowledge and beliefs, professional context, and sources of assistanceshown in Figure 2.
Teacher knowledge &beliefs:
• Well qualified inmathematics andmathematics education
• Mathematical beliefsare student-centred andnon-rule based
Sources of assistance:• Project offered immersion
in mathematicalinvestigations, support forcurriculum implementationin school, collaborativeprofessional partnerships
Professional context:• Low achieving students, lacking
confidence, streamed into PracticalMathematics in Year 8
• Limited access to material resources• Yrs 1-10 mathematics syllabus supports
investigative approach to teaching andassessment
• HOD arranged timetables to allowteachers to plan together and team teach
• Little parental support for children’slearning
Support for development of new teaching approacheswas consistent with teacher knowledge & beliefs
Productive tensionsbetween beliefs,studentcharacteristics, andsyllabus led toformulation of goals
Investigative approach wasfeasible in context becauseof “nothing to lose”approach to studentlearning & HOD’sorganisational support forteam teaching

Mathematics: Essential for Learning, Essential for Life
© The Australian Association of Mathematics Teachers Inc.
74
Implications and critical issues
Each of our case studies documented a different configuration of teacher knowledge andbeliefs, professional contexts, and sources of assistance that came together to shapeopportunities for professional learning that involved an investigative approach to“working mathematically”. Although the four pairs of teachers worked in differentprofessional contexts that offered both support for, and hindrances to, innovation, theywere able to draw on their knowledge and beliefs and the sources of assistance availableto them to plan and implement teaching approaches consistent with the intent of the newsyllabus.
There are several critical issues that must be taken into account when consideringhow to extend similar professional development opportunities to secondarymathematics teachers in other schools (Loucks-Horsley et al., 2003). One issueconcerns the need for building a professional culture characterised by a strong vision oflearning and collegial interactions between teachers. A second issue involvesdeveloping leadership in teachers who have the capacity to improve the quality ofteaching and learning in their schools. Often the most powerful leadership exercised byteachers is simply in modelling new practices for colleagues to demonstrate that theyactually work with students. Building capacity for sustainability is necessary to ensurethat any changes achieved within the life of a professional development project aresustained after it ends. Similarly, scaling up is a vital concern for education systems asteachers and school districts implement new teaching and learning approaches. Finally,gaining public support for mathematics education is necessary for building consensusaround curriculum and pedagogical reform, thus leading to a more informed publicunderstanding of effective methods for teaching mathematics and of the role ofmathematics in preparing young people for productive work, leisure, and citizenship.
Acknowledgements
This project was funded by the Queensland Department of Education and the Arts. Thecontributions of participating teachers and schools and project team members ShelleyDole, Katie Makar, and Grant Neilson are gratefully acknowledged.
References
Loucks-Horsley, S., Love, N., Stiles, K., Mundry, S. & Hewson, P. (2003). Designing ProfessionalDevelopment for Teachers of Science and Mathematics (2nd ed.). Thousand Oaks, CA: Corwin Press.
Queensland Studies Authority (2004). Mathematics Years 1–10 Syllabus. Brisbane: Author.
Shulman, L. (1986). Those who understand: Knowledge growth in teaching. Educational Researcher,15(2), 4–14.

© The Australian Association of Mathematics Teachers Inc.
75
Adventure and adolescence: Learner-generatedexamples in secondary mathematics+
Anne Watson
University of Oxford
The Tasmanian document “Essential Learnings” offers opportunities to changeradically the teaching and learning of mathematics. In my talk I draw on thelearning theories of Vygotsky, and on the psychology of adolescence, to giveexamples of tasks which afford the generation of abstract mathematical conceptsand simultaneously enhance adolescents' feelings of self worth and autonomy. Ishall show how even the most esoteric mathematics can be taught in ways thatinclude all students, and that adhere to the principle of essential learning, without“dumbing down” the subject.
In this paper I will show how adventure in mathematical learning relates to theadolescent project of negotiating adulthood. Further, I will relate this to some of the“essential learnings” identified by Tasmanian educational policy-makers by illustratinghow autonomous thinking might be embedded in the teaching and learning ofmathematics.
This kind of comment is usually taken to mean that mathematical tasks need to be“relevant.” Then the word “relevant” is often taken to mean that adolescent interests,(such as music, skateboarding and pocket money), should provide contexts formathematical tasks — otherwise they will not be interested. The consequence of thisline of thought can be that mathematical calculations are dressed up in artificialcontexts, yet adolescent students are not fooled by this. A more interesting consequenceis that students can be asked to solve “real life” problems in the classroom in the hopethat through this process they will learn some mathematics. Thus they calculate battingaverages, compare journeys to school, divide n dollars between m people, but theseexperiences do not necessarily lead to further knowledge of means, graphs, gradients, orratio.
We know, thanks to the work of Freudenthal, that we can explain this problem not interms of poor teaching or lack of learning effort but in terms of the difficulty (Lavewould say the impossibility (Lave & Wenger, 1991)) of lifting the ways we think in onecontext and applying them in other contexts (Freudenthal, 1973, p. 130). When wecompare pocket money we are in the world of money and adolescent notions offairness, not in the abstract world of ratio; when we compare journeys to school we areimagining ourselves and our mates arriving at the school gate, not constructing imagesof time-distance relationships (Coleman & Hendry, 1990, p. 48). Shifts from proximal,ad hoc, methods of solution to abstract concepts are hard to make and need deliberatesupport — indeed this is what is at the heart of Vygotsky’s insistence that talk is anecessary aspect of learning “scientific” concepts (1978, p. 131), otherwise one gets
+ Invited paper
Mathematics: Essential for Learning, Essential for Life
© The Australian Association of Mathematics Teachers Inc.
76
stuck with intuitive and everyday notions such as “multiplication makes things bigger”or “the bigger the perimeter the bigger the area” (Fischbein, 1987). This shift towardsseeing abstract patterns and structures within a complex world is typical of adolescentdevelopment (Coleman & Hendry, 1990, p. 47) but the verbal and kinaestheticsocialised responses to sensory stimuli (including mathematics questions) which havesatisfied teachers at elementary level have to be put to one side.
Realistic tasks — tasks that mimic the ways we think in complex, messy, everydaysituations — can provide contexts in which mathematics can be learnt, so long as theideas encountered while doing the tasks can then be related to overarching mathematicalideas and universal structures through paying attention to patterns, properties andrelationships. This is what (Treffers, 1987) has called “vertical mathematising.”Furthermore, the processes of working with such tasks appeal to adolescents becausethey provide room for adolescent concerns about identity, belonging, being heard, beingin charge, being supported, feeling powerful, understanding the world, and being able toargue in ways which make adults listen (Boaler, 1997).
Such tasks can indeed provide contexts for inquiry, as defined in the Tasmaniancurriculum document, which includes “identifying and clarifying issues, and gathering,organising, interpreting and transforming information. It encompasses the processes ofcreatively, imaginatively and inquisitively thinking about possibilities; analysing,synthesising and evaluating proposed solutions; and explaining and justifying decisions.The skills of inquiry can be used to clarify meaning, draw appropriate comparisons andmake considered decisions.”
Historically, mathematics has been inspired by observable phenomena, andmathematicians develop new ideas by exploring and inquiring. It is also possible toconjecture relationships from experience with examples, and thus getting to know aboutgeneral behaviour. But mathematics is not essentially an empirical subject at schoollevel. Its strength and power are in its abstractions, its reasoning, and its hypothesisingabout objects which only exist in the mathematical imagination. Many secondary schoolconcepts are beyond observable manifestations, and beyond intuition. Indeed, thosewhich cause most difficulty for learners and teachers are those which require rejectionof intuitive sense and reconstruction of new concept-based images and understandings.Examples of these problematic topics include probability, proportional relationships,non-linear sequences, symbolic representations and the wretched adding of fractions. Inmathematics, inquiry alone cannot fully justify results and relationships, nor candecisions be validated by inquiry alone.
I could argue that, for the adolescent, this can be the beginning of the end ofmathematical engagement. If I cannot understand the subject by seeing what it does andwhere it is and how it works, but instead have to believe some higher abstract authoritythat I do not understand, then it holds nothing for me. But this misses the point. Theauthority of mathematics does not reside in teachers or textbook writers but in the waysin which minds work with mathematics itself (Freudenthal, 1973, p. 147; Vergnaud,1997). For this reason, mathematics, like some of the creative arts, can be an arena inwhich the adolescent mind can have some control, can validate its own thinking, andcan appeal to a constructed, personal, authority. In mathematics, I can always supportmy thinking by looking at my work in a different way and adjusting it if necessary orseeking help on my own terms. Thus, in mathematics, there is always the possibilitythat learners can be absolutely sure they are right, and have grounds to argue with. By“sure” I do not necessarily mean the use of mathematical proof — although if a learnerunderstands a proof, this is one way to be sure. Instead I mean that they can back their
Mathematics: Essential for Learning, Essential for Life
© The Australian Association of Mathematics Teachers Inc.
77
arguments with demonstration, generalities, counter-examples and other tools ofintellectual expertise.
Jenny Houssart, in her research with pre-adolescents, spotted some students whowere rapidly becoming disaffected in the classroom, with a hostile atmosphere betweenthem and the teacher. One feature of this deteriorating relationship was that they weresometimes right about mathematics when the teacher was wrong, but their commentswere ignored, sidelined, or even punished by the teacher (2004).
By contrast, students whose ideas and thinking are valued explicitly in lessons aremore likely to feel and behave as if they belong. Thus some adolescent boys arrangethemselves to be directly in the teacher’s line of vision and make sure she knows thatthey know the answers, or that they understand what is going on. As the Tasmaniancurriculum document says: “People who have a sense of competence in their ability tothink and learn… will be eager to pursue questions that really matter.”
Those whose thinking never quite matches what the teacher expects, but who neverhave the space, support and time to explore why, can become disaffected at worst, andat best come to rely on algorithms. While all mathematics students and mathematiciansrely on algorithmic knowledge sometimes, to have that as the only option placeslearners totally at the mercy of the authority of the teacher, textbooks, websites andexaminers for affirmation. Since a large part of the adolescent project is thedevelopment of autonomous identity, albeit in relation to other groups, something has tobreak this tension — and that can be a loss of self-esteem, rejection of the subject, ordisruptive behaviour (Coleman & Hendry, 1990, pp. 70, 155). I would argue thatpresenting mathematics in imaginary contexts does not necessarily touch their need forself-actualisation; nor do contrived references to what might be useful in futureemployment. What is required instead are ways to engage the person as they are hereand now in the human activity of doing mathematics using their own thinking. Thismight include contexts of genuine interest, and information about how human beingsdeveloped the subject by asking pertinent and curious questions, but it could alsoinclude intriguing and puzzling situations, unanswerable questions, ways to use whatthey already know to generate new big ideas.
My aim is to develop ways in which all students, not just those whose arm-wavingattracts the teacher’s positive attention, can be engaged in mathematics for its own sakeand thus begin to see that mathematical thinking is a part of who they are, and mightform a part of who they become. In the development of adolescent identity, I suspectthat using football as a context for mathematics affirms the identity of football fans;using the school disco affirms the identity of organisers and music freaks. The ability ofthe stronger mathematicians to take over such contexts and claim ownership canexclude and deskill and therefore further dishearten some of the students whom thecontext was supposed to help. In addition, Cooper and Dunne’s finding that context canconfuse students from disadvantaged groups because it supplies a layer of necessarydiscernment about what is, and is not relevant (2000). Instead, there is a mathematicalcomponent of identity — the human capacity to reason spatially, numerically andlogically, which can be nurtured by participation in mathematics, by having one’sthinking valued, and by having some autonomous control over the locus ofmathematical understanding in lessons.
I shall now give some examples of tasks which generate and nurture this aspect ofidentity, and which fit very well into Tasmania’s description of “essential learnings”.Each task is of a type that can be applied to many mathematical contexts. I am notclaiming these task-types are new, but representing them as tools for engaging

Mathematics: Essential for Learning, Essential for Life
© The Australian Association of Mathematics Teachers Inc.
78
adolescents into personal engagement with mathematics, and ceding authority andvalidation to their relationship with mathematics.
Learner-generated examples
Students in a lesson were familiar with multiplying numbers and binomials by a gridmethod:
X 20 7 X z +350 1000 350 2z 2z2 6z9 180 63 –1 –z –3
They had been introduced to numbers of the form a ± b. The teacher then askedthem to choose pairs of values for a and b, and to use the grid method to multiply suchnumbers to try to get rational answers. Students worked together and began to explore.At the very least they practised multiplying irrationals of this form. Gradually, studentschose to limit their explorations to focus on numbers like 2 and 3 and, by doing so,some realised that they did not need explicit numbers but something more structuralwhich would “get rid of” the roots through multiplication. Although during the lessonnone found a way to do this, many carried on with their explorations over the next fewdays in their own time.
Tasks in which students gain technical practice while choosing their own examples,with the purpose of finding a particular property or relationship, can be adapted to mostmathematical topics. During the work there are many non-trivial features of theirthinking that are valuable and can be praised: exemplifying, controlling variables,conjecturing, limiting the range of variation used, observing and testing special cases,designing spreadsheets to carry out the task, seeing implications of some results,generalising and so on.
Equivalence
Shifting the focus of lessons from finding answers to generating equivalence alters thelocus of power in lessons. Here are two examples:
Given a point on a number line drawn on grid paper, how many ways ofrepresenting it as a fraction can you find?
This reverses questions which ask people to reduce fractions to their simplest form. Italso gives each student a set of fractions they can use for future activity, augmented byeach other’s findings — a kit of examples for demonstrating and validating futurecalculations.
Given y = 5, how many equations can you write in which y is secretly 5, but thisfact is hidden, such as in 17 = 3y + 2?
This task generates a set of questions which everyone can then try to answer; theclass has created its own practice exercise.

Mathematics: Essential for Learning, Essential for Life
© The Australian Association of Mathematics Teachers Inc.
79
Another and another…
Ask students to give you examples of something they know fairly well, then keepasking for more and more until they are pushing up against the limits of what theyknow.
Give me a number between zero and a half; and another; and another… Now giveme one which is between zero and the smallest number you have given me; andanother; and another…
Each student works on a personally generated patch, or in a place agreed by a pair orgroup. Teachers ensure there are available tools to aid the generation; in this case somekind of “zooming-in” software, or mental imagery, would help.
This approach recognises their existing knowledge, and where they drawdistinctions; it then offers them opportunity to add more things to their personalexample spaces, either because they have to make new examples in response to yourprompts, or because they hear each other’s ideas (Watson & Mason, 2006). Self esteemcomes at first from the number of new examples generated, then from being able todescribe them as a generality, and finally from being able to split them into distinctclasses.
Putting exercise in its place
If getting procedural answers to exercises in textbooks is the focus of students’mathematical work (whether that was what the teacher intended or not) then shifts canbe made to use this as merely the generation of raw material for future reflection. Manyadolescents have their mathematical identities tied up with feeling good when theyfinish such work quickly, neatly and more or less correctly; others reject such work bydelaying starting it, working slowly, losing their books and so on. Restructuring theirexpectations is, however, easy to do if new kinds of goal are explicated which expectreflective engagement, rather than finishing, so that new mathematical identities candevelop more in tune with the self-focus of early adolescence (Dweck 1999).
Examples of different ways to use exercises are:
Do as many of these as you need to learn three new things; make up examples toshow these three new things.
At the end of this exercise you have to show the person next to you, with anexample, what you learnt.
Before you start, predict the hardest and easiest questions and say why; when youfinish, see if your prediction was correct; make up harder ones and easier ones.
When you were doing question N, did you have to think more about: method,negative signs, correct arithmetical facts, or what? Can you make up exampleswhich show that you understand the method without getting tied up with negativesigns and arithmetic?
Since the Tasmanian “essential learnings” have been written to cover all subjects,many of the special features of mathematical thinking are only hinted at. “Activereflection” it says “enables connections to be made between different types of subjectmatter, and this enhances the likelihood of knowledge being transferable to new
Mathematics: Essential for Learning, Essential for Life
© The Australian Association of Mathematics Teachers Inc.
80
situations.” This is true, of course, but the active reflection I describe here does more: itenables connections to be made within particular concepts and methods, so that learnersbecome better at developing critical relational knowledge. It is this recognition ofmethods at a structural, rather than operational, level that makes adaptable andtransformable understanding more likely.
Rules versus tools
“Learning is more effective, interesting and relevant when learners consciously chooseand use particular methodologies, devise their own strategies to deal with challenges,”says the Tasmanian document.
Student-centred approaches often depend on choice of method, and this, of course,celebrates autonomy. However, mathematics is characterised by, among many otherthings, variation in the efficiency and relevance of methods. For example, “putting azero on the end when multiplying by ten” is fine so long as you are working with wholenumbers — and mathematicians do not abandon that way of seeing it. Rather than itbeing a rule it becomes a tool to be used when appropriate. Adolescents often cannotsee why they should abandon methods which have served them well in the past(repeated addition for multiplication; guessing and checking “missing numbers”; and soon) to adopt complex algorithms or algebraic manipulations. One way to work on this isto give a range of inputs and to ask students to decide which of their methods worksbest in which situation, and why. This leads to identifying methods which work in thegreatest range of cases, and the hardest cases. “Supermethods” need to be rehearsed sothat they are ready to use when necessary, and have the status of tools, rather than rules.
In all of the above types of task, students create input which affects the direction ofthe lesson and enhances the direction of their own learning. I see this as an adventure,since they are each starting out from the safe ground of their own knowledge-so-far andmoving elsewhere within a mathematical community. Classrooms in which these kindsof task are the norm provide recognition and value for the adolescent, a sense of placewithin a community, and a way to get to new places which can be glimpsed, but canonly be experienced with help. To use the “zone” metaphor, these tasks suggest thatmathematical development, relevance, experience and conceptual understanding are allproximal zones, and that moves to more complex places can be scaffolded incommunities by the way teachers set mathematical tasks.
References
Boaler, J. (1997). Experiencing School Mathematics: Teaching Styles, Sex and Setting. Buckingham:Open University Press.
Coleman, J. & Hendry, L. (1990). The Nature of Adolescence (3rd edition). London: Routledge.
Cooper, B. & Dunne, M. (2000). Assessing Children’s Mathematical Knowledge: Social Class, Sex andProblem-solving. Buckingham: Open University Press.
Dweck, C. (1999). Self-Theories: Their Role in Motivation, Personality and Development. Philadelphia:Psychology Press.
Fischbein, E. (1987). Intuition in Science and Mathematics: An Educational Approach. Dordrecht:Reidel.
Freudenthal, H. (1973). Mathematics as an Educational Task. Dordrecht: Kluwer.
Houssart, J. (2004). Low Attainers in Primary Schools: The Whisperers and the Maths Fairy. London:RoutledgeFalmer.
Lave, J. & Wenger, E. (1991). Situated Learning. Legitimate Peripheral Participation. Cambridge:University of Cambridge Press.

Mathematics: Essential for Learning, Essential for Life
© The Australian Association of Mathematics Teachers Inc.
81
Treffers, A. (1987). Three Dimensions: A Model of Goal and Theory Description in MathematicsEducation: The Wiskobas Project. Dordrecht: Kluwer.
Vergnaud, G. (1997). The nature of mathematical concepts. In T. Nunes & P. Bryant, Learning andTeaching Mathematics: An International Perspective. London: Psychology Press.
Vygotsky, L. (1978). Mind and Society: The Development of Higher Psychological Processes.Cambndge, Mass.: Harvard University Press.
Watson, A. & Mason, J. (2006). Mathematics as a Constructive Activity. Mahwah, NJ.: Erlbaum.
© The Australian Association of Mathematics Teachers Inc.
82
Linking the big ideas inmiddle school mathematics+
Jane Watson
University of Tasmania
This paper considers three mathematical settings from the middle years ofschooling and some links that may help to motivate both teachers and students.Nearly everyone agrees that proportional thinking is the most fundamentalbuilding block in the middle school mathematics curriculum. The transition fromadditive to multiplicative reasoning requires much time and many variedexperiences. Three types of experience are suggested: links between percent anddata handling, proportional links between geometry and algebra, and linksbetween rates and quantitative literacy.
Introduction
Van de Walle (2007) is among many writers for preservice teachers to stress theimportance of proportional reasoning, devoting an entire chapter of his latest edition toit (Chapter 19): “The development of proportional reasoning is one of the mostimportant goals of the 5–8 curriculum… Proportional reasoning is indeed thecornerstone of a wide variety of topics in the middle and high school curriculum”(p. 353). He goes on to list the topics of fractions, algebra, similarity, data graphs, andprobability, each of which is considered as part of a separate chapter.
Two questions arise from acceptance of Van de Walle’s views and abundance ofassociated material and suggestions. How is enough time to be found in preserviceteacher education programs for primary, middle school, and secondary preserviceteachers to understand and absorb the topics, as well as learn to teach them effectively?How can inservice teachers be brought up-to-date on the importance of focussing onproportional reasoning and the links across the mathematics curriculum that willreinforce understanding?
The goal of this paper is to address in a small way the second question. It is likelythat many inservice teachers had experiences similar to the author in learning aboutproportional reasoning: tables relating the cost of various numbers of balloons(multiples of 3) if 3 balloons cost 5¢. This progressed to the famous “cross-multiply”algorithm that allowed for finding any one of the four values of a, b, c, or d, if the otherthree were known:
a
b=
c
d implies a d = b c.
Large arrows connecting a and d, and b and c, helped one to remember the rule. An offshoot of this was the adaptation for percent problems that solved the three types ofmissing value problems:
+ Invited paper
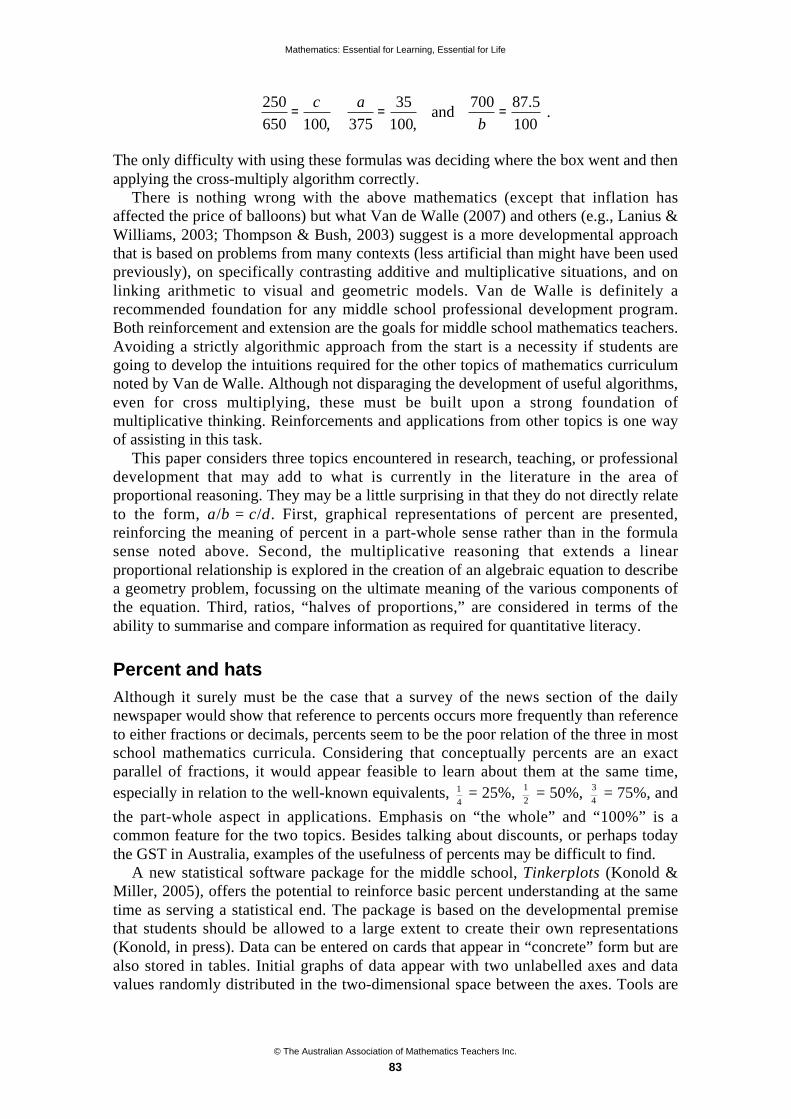
Mathematics: Essential for Learning, Essential for Life
© The Australian Association of Mathematics Teachers Inc.
83
250
650=
c
100,
a
375=
35
100, and
700
b=
87.5
100 .
The only difficulty with using these formulas was deciding where the box went and thenapplying the cross-multiply algorithm correctly.
There is nothing wrong with the above mathematics (except that inflation hasaffected the price of balloons) but what Van de Walle (2007) and others (e.g., Lanius &Williams, 2003; Thompson & Bush, 2003) suggest is a more developmental approachthat is based on problems from many contexts (less artificial than might have been usedpreviously), on specifically contrasting additive and multiplicative situations, and onlinking arithmetic to visual and geometric models. Van de Walle is definitely arecommended foundation for any middle school professional development program.Both reinforcement and extension are the goals for middle school mathematics teachers.Avoiding a strictly algorithmic approach from the start is a necessity if students aregoing to develop the intuitions required for the other topics of mathematics curriculumnoted by Van de Walle. Although not disparaging the development of useful algorithms,even for cross multiplying, these must be built upon a strong foundation ofmultiplicative thinking. Reinforcements and applications from other topics is one wayof assisting in this task.
This paper considers three topics encountered in research, teaching, or professionaldevelopment that may add to what is currently in the literature in the area ofproportional reasoning. They may be a little surprising in that they do not directly relateto the form, a/b = c/d. First, graphical representations of percent are presented,reinforcing the meaning of percent in a part-whole sense rather than in the formulasense noted above. Second, the multiplicative reasoning that extends a linearproportional relationship is explored in the creation of an algebraic equation to describea geometry problem, focussing on the ultimate meaning of the various components ofthe equation. Third, ratios, “halves of proportions,” are considered in terms of theability to summarise and compare information as required for quantitative literacy.
Percent and hats
Although it surely must be the case that a survey of the news section of the dailynewspaper would show that reference to percents occurs more frequently than referenceto either fractions or decimals, percents seem to be the poor relation of the three in mostschool mathematics curricula. Considering that conceptually percents are an exactparallel of fractions, it would appear feasible to learn about them at the same time,especially in relation to the well-known equivalents, 1
4 = 25%, 1
2 = 50%, 3
4 = 75%, and
the part-whole aspect in applications. Emphasis on “the whole” and “100%” is acommon feature for the two topics. Besides talking about discounts, or perhaps todaythe GST in Australia, examples of the usefulness of percents may be difficult to find.
A new statistical software package for the middle school, Tinkerplots (Konold &Miller, 2005), offers the potential to reinforce basic percent understanding at the sametime as serving a statistical end. The package is based on the developmental premisethat students should be allowed to a large extent to create their own representations(Konold, in press). Data can be entered on cards that appear in “concrete” form but arealso stored in tables. Initial graphs of data appear with two unlabelled axes and datavalues randomly distributed in the two-dimensional space between the axes. Tools are
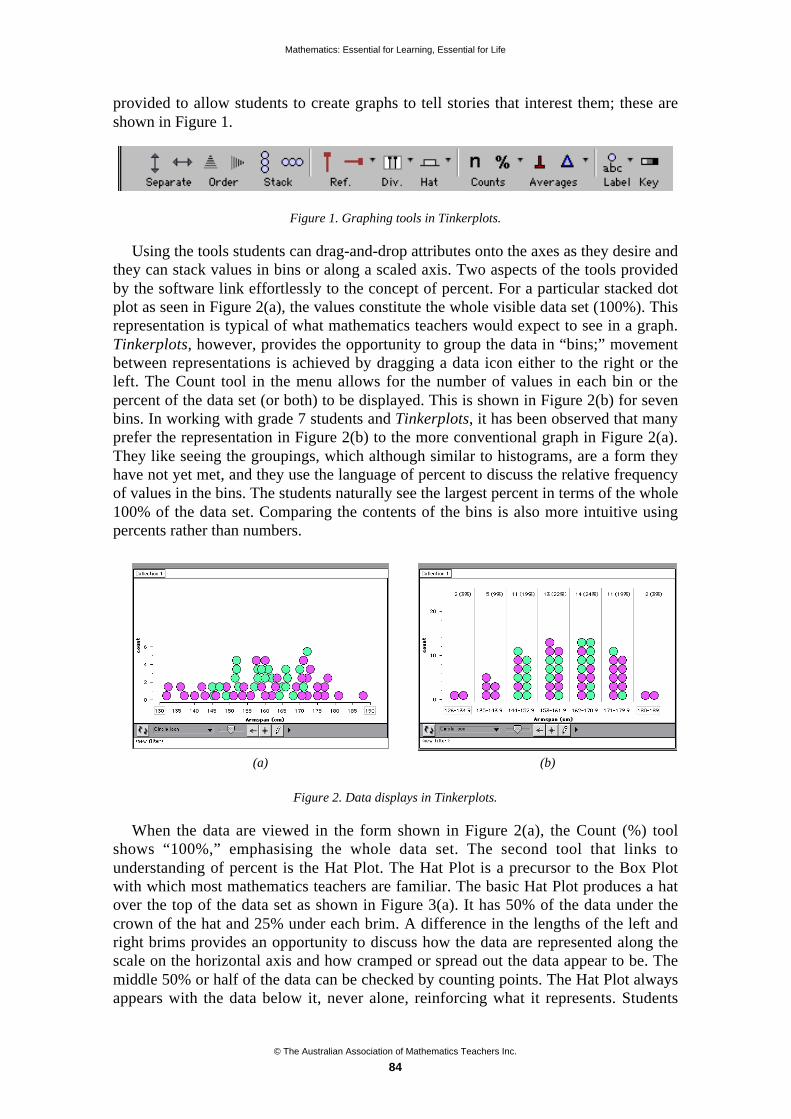
Mathematics: Essential for Learning, Essential for Life
© The Australian Association of Mathematics Teachers Inc.
84
provided to allow students to create graphs to tell stories that interest them; these areshown in Figure 1.
Figure 1. Graphing tools in Tinkerplots.
Using the tools students can drag-and-drop attributes onto the axes as they desire andthey can stack values in bins or along a scaled axis. Two aspects of the tools providedby the software link effortlessly to the concept of percent. For a particular stacked dotplot as seen in Figure 2(a), the values constitute the whole visible data set (100%). Thisrepresentation is typical of what mathematics teachers would expect to see in a graph.Tinkerplots, however, provides the opportunity to group the data in “bins;” movementbetween representations is achieved by dragging a data icon either to the right or theleft. The Count tool in the menu allows for the number of values in each bin or thepercent of the data set (or both) to be displayed. This is shown in Figure 2(b) for sevenbins. In working with grade 7 students and Tinkerplots, it has been observed that manyprefer the representation in Figure 2(b) to the more conventional graph in Figure 2(a).They like seeing the groupings, which although similar to histograms, are a form theyhave not yet met, and they use the language of percent to discuss the relative frequencyof values in the bins. The students naturally see the largest percent in terms of the whole100% of the data set. Comparing the contents of the bins is also more intuitive usingpercents rather than numbers.
(a) (b)
Figure 2. Data displays in Tinkerplots.
When the data are viewed in the form shown in Figure 2(a), the Count (%) toolshows “100%,” emphasising the whole data set. The second tool that links tounderstanding of percent is the Hat Plot. The Hat Plot is a precursor to the Box Plotwith which most mathematics teachers are familiar. The basic Hat Plot produces a hatover the top of the data set as shown in Figure 3(a). It has 50% of the data under thecrown of the hat and 25% under each brim. A difference in the lengths of the left andright brims provides an opportunity to discuss how the data are represented along thescale on the horizontal axis and how cramped or spread out the data appear to be. Themiddle 50% or half of the data can be checked by counting points. The Hat Plot alwaysappears with the data below it, never alone, reinforcing what it represents. Students
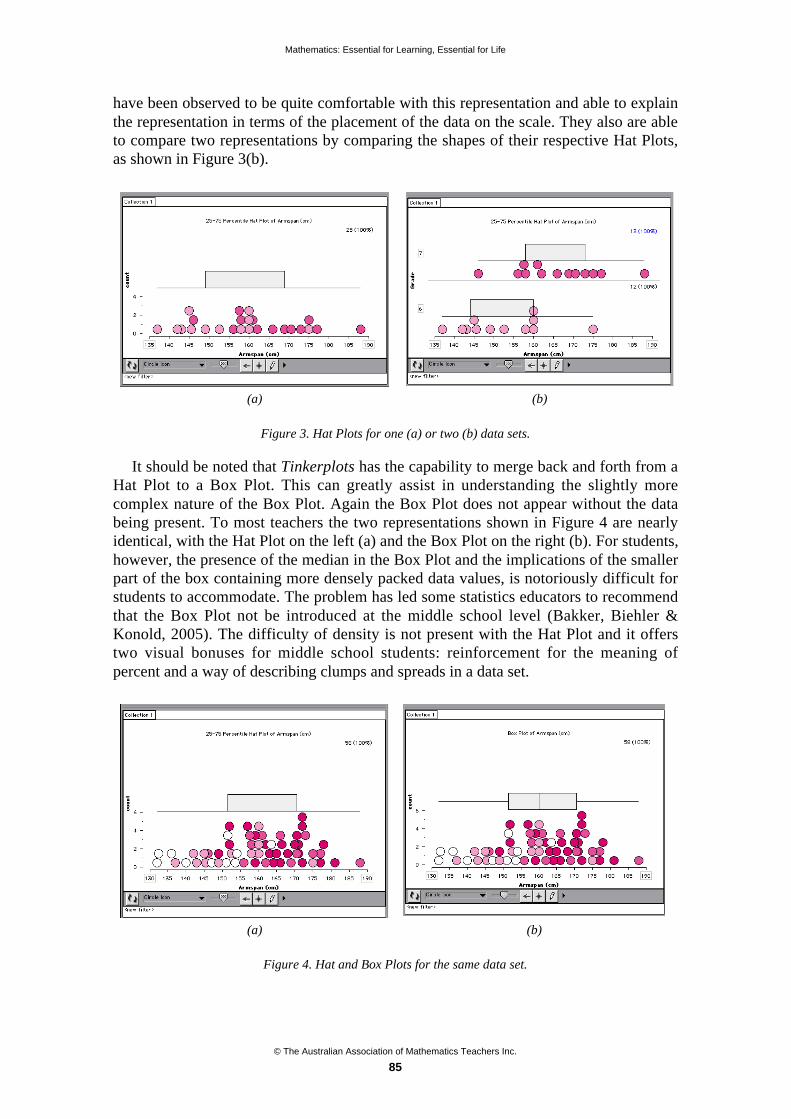
Mathematics: Essential for Learning, Essential for Life
© The Australian Association of Mathematics Teachers Inc.
85
have been observed to be quite comfortable with this representation and able to explainthe representation in terms of the placement of the data on the scale. They also are ableto compare two representations by comparing the shapes of their respective Hat Plots,as shown in Figure 3(b).
(a) (b)
Figure 3. Hat Plots for one (a) or two (b) data sets.
It should be noted that Tinkerplots has the capability to merge back and forth from aHat Plot to a Box Plot. This can greatly assist in understanding the slightly morecomplex nature of the Box Plot. Again the Box Plot does not appear without the databeing present. To most teachers the two representations shown in Figure 4 are nearlyidentical, with the Hat Plot on the left (a) and the Box Plot on the right (b). For students,however, the presence of the median in the Box Plot and the implications of the smallerpart of the box containing more densely packed data values, is notoriously difficult forstudents to accommodate. The problem has led some statistics educators to recommendthat the Box Plot not be introduced at the middle school level (Bakker, Biehler &Konold, 2005). The difficulty of density is not present with the Hat Plot and it offerstwo visual bonuses for middle school students: reinforcement for the meaning ofpercent and a way of describing clumps and spreads in a data set.
(a) (b)
Figure 4. Hat and Box Plots for the same data set.

Mathematics: Essential for Learning, Essential for Life
© The Australian Association of Mathematics Teachers Inc.
86
Cubes, constants and variables
The following comment is from a preservice primary teacher: “I’m really nervous aboutteaching algebra. You know all those equations? I never know which letters aresupposed to be constants and which are variables and why. Everything seems to vary,take y = mx + c.” This dilemma is reminiscent of a comment made years ago by acolleague impressing listeners about how students must view the mathematics teacherwho says, “Let x be a number,” when x is obviously not a number. It would be like anEnglish teacher announcing, “Let 4 be a letter.” What would the class say to that?
An equation such as y = 2x + 3 expresses both a multiplicative and an additiverelationship, whereas y = 2x is itself a multiplicative proportional statement. Theequation y = 3x represents a different proportion, as does y = 5x or c = 2 r. This last chowever is a variable, whereas the c in the above paragraph represents a constant, butone that may be changed (or varied). For students who try to regurgitate and manipulatethe expressions with no conceptual understanding, it is no wonder they suffer frustrationand often fail.
Strangely, or perhaps not, given the connections among mathematical concepts, ageometry puzzle may offer some clues as to the potential meaning for variables and asto when multiplicative thinking can be useful. The problem presented in Figure 5 is onethat has been used in research to explore students’ ability to visualise and manipulategeometric objects to solve a problem (e.g., Campbell, Watson & Collis, 1995). In theresearch setting students are asked to describe verbally what they do in their minds tosolve the problem without any other aids such as pencil and paper. This is also a usefulclassroom exercise perhaps with students describing their thinking to a partner. Theproblem, however, has even greater potential for exploring patterns and relationships.
Problem to visualise
A cube that is 3 cm by 3 cm by 3 cm was dipped ina bucket of red paint so that all of the outside wascovered with paint. After the paint dried, the cubewas cut into 27 smaller cubes, each measuring 1cm on each edge. Some of the smaller cubes hadpaint on 3 faces, some on 2 faces, some on only 1face, and some had no paint on them at all. Find outhow many of each kind of smaller cube there were.
Figure 5. The painted cube problem.
In justifying solutions to the problem various facts about numbers and cubes arelikely to be employed: 3 3 3 = 33 = 27; a cube has 8 corners; a cube has 12 edges;and a cube has 6 faces. Each corner mini-cube has paint on three sides, each “edge”mini-cube that is not a corner has paint on two sides, each “face” mini-cube that is notan edge or a corner mini-cube has paint on one side, and there may be cubes in themiddle of the cube with no paint at all. To find this out a check that all 27 cubes areaccounted for can be made: 8 corner mini-cubes + 12 edge mini-cubes + 6 face mini-cubes = 26 mini-cubes, so there must be one left in the centre with no paint. Manypeople do not have to carry out the subtraction but “see” the central mini-cube with nopaint.
Now the problem becomes more interesting: imagine a larger painted cube 4 cm by 4cm by 4 cm, again cut into smaller mini-cubes with 1 cm on each side. The same
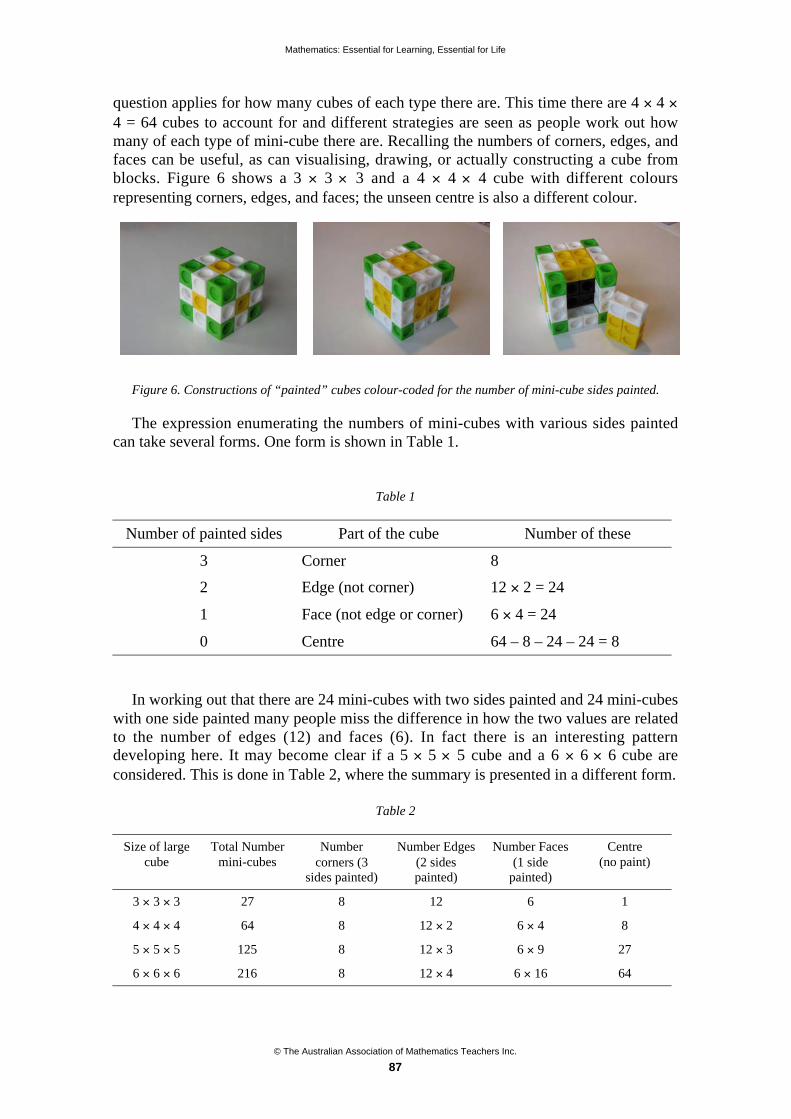
Mathematics: Essential for Learning, Essential for Life
© The Australian Association of Mathematics Teachers Inc.
87
question applies for how many cubes of each type there are. This time there are 4 4 4 = 64 cubes to account for and different strategies are seen as people work out howmany of each type of mini-cube there are. Recalling the numbers of corners, edges, andfaces can be useful, as can visualising, drawing, or actually constructing a cube fromblocks. Figure 6 shows a 3 3 3 and a 4 4 4 cube with different coloursrepresenting corners, edges, and faces; the unseen centre is also a different colour.
Figure 6. Constructions of “painted” cubes colour-coded for the number of mini-cube sides painted.
The expression enumerating the numbers of mini-cubes with various sides paintedcan take several forms. One form is shown in Table 1.
Table 1
Number of painted sides Part of the cube Number of these
3 Corner 8
2 Edge (not corner) 12 2 = 24
1 Face (not edge or corner) 6 4 = 24
0 Centre 64 – 8 – 24 – 24 = 8
In working out that there are 24 mini-cubes with two sides painted and 24 mini-cubeswith one side painted many people miss the difference in how the two values are relatedto the number of edges (12) and faces (6). In fact there is an interesting patterndeveloping here. It may become clear if a 5 5 5 cube and a 6 6 6 cube areconsidered. This is done in Table 2, where the summary is presented in a different form.
Table 2
Size of largecube
Total Numbermini-cubes
Numbercorners (3
sides painted)
Number Edges(2 sidespainted)
Number Faces(1 side
painted)
Centre(no paint)
3 3 3 27 8 12 6 1
4 4 4 64 8 12 2 6 4 8
5 5 5 125 8 12 3 6 9 27
6 6 6 216 8 12 4 6 16 64
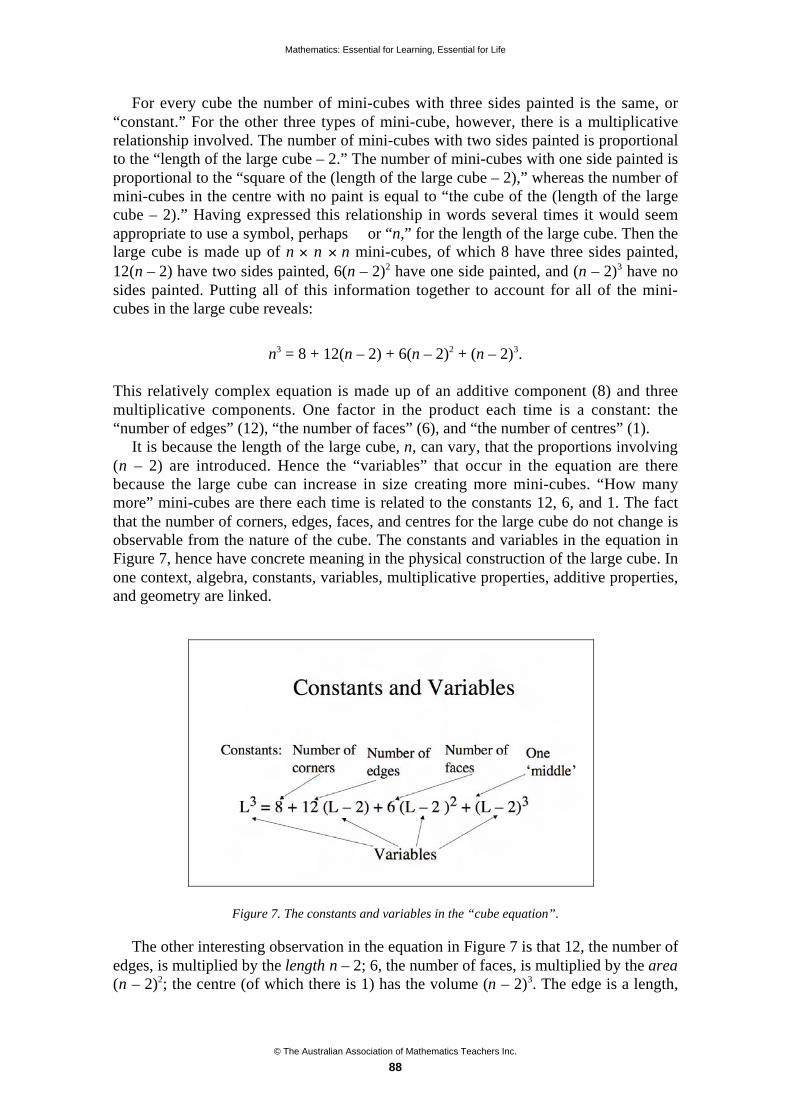
Mathematics: Essential for Learning, Essential for Life
© The Australian Association of Mathematics Teachers Inc.
88
For every cube the number of mini-cubes with three sides painted is the same, or“constant.” For the other three types of mini-cube, however, there is a multiplicativerelationship involved. The number of mini-cubes with two sides painted is proportionalto the “length of the large cube – 2.” The number of mini-cubes with one side painted isproportional to the “square of the (length of the large cube – 2),” whereas the number ofmini-cubes in the centre with no paint is equal to “the cube of the (length of the largecube – 2).” Having expressed this relationship in words several times it would seemappropriate to use a symbol, perhaps or “n,” for the length of the large cube. Then thelarge cube is made up of n n n mini-cubes, of which 8 have three sides painted,12(n – 2) have two sides painted, 6(n – 2)2 have one side painted, and (n – 2)3 have nosides painted. Putting all of this information together to account for all of the mini-cubes in the large cube reveals:
n3 = 8 + 12(n – 2) + 6(n – 2)2 + (n – 2)3.
This relatively complex equation is made up of an additive component (8) and threemultiplicative components. One factor in the product each time is a constant: the“number of edges” (12), “the number of faces” (6), and “the number of centres” (1).
It is because the length of the large cube, n, can vary, that the proportions involving(n – 2) are introduced. Hence the “variables” that occur in the equation are therebecause the large cube can increase in size creating more mini-cubes. “How manymore” mini-cubes are there each time is related to the constants 12, 6, and 1. The factthat the number of corners, edges, faces, and centres for the large cube do not change isobservable from the nature of the cube. The constants and variables in the equation inFigure 7, hence have concrete meaning in the physical construction of the large cube. Inone context, algebra, constants, variables, multiplicative properties, additive properties,and geometry are linked.
Figure 7. The constants and variables in the “cube equation”.
The other interesting observation in the equation in Figure 7 is that 12, the number ofedges, is multiplied by the length n – 2; 6, the number of faces, is multiplied by the area(n – 2)2; the centre (of which there is 1) has the volume (n – 2)3. The edge is a length,
Mathematics: Essential for Learning, Essential for Life
© The Australian Association of Mathematics Teachers Inc.
89
the face is an area, and the centre is a volume, so these algebraic representations withthe exponents (1, 2, and 3) fit the geometry of the large cube.
An interesting special case to consider is when n = 2. Students who understand whathas been happening in this development should be able to explain coherently about the8 corner mini-cubes accounting for the entire cube (cf. Reys, 1988).
Observations: some primary and middle school preservice teachers completing thisactivity claimed they had never before appreciated what constants and variables were inalgebra.
Rates and risk
Rates are examples of ratios that are useful in a huge number of contexts. A rate is aratio that compares two measurements in different units, for example kilometres perhour (km/hr), price per kilogram ($/kg), and passengers per busload. This representationis different from the part-whole ratio of a fraction where like units are being compared,e.g., girl students to all students or the number of points in a chance event to the numberof points in an entire sample space (probability as a fraction ratio). It is also possible tohave part-part ratios, for example Liberals to Labor, or chances for and against winning(odds in probability). All three types of ratios, as well as “famous ratios,” such as ,need attention. This section focuses on the rate in the context of measuring risk.
Among the goals of the middle school curriculum is to prepare students to use thecontent they learn in the world around them. In relation to mathematics this is oftentermed quantitative literacy and proponents such as Lynn Arthur Steen (2001) advocatethat it is an essential contributor to the success of a democracy.
Quantitatively literate citizens need to know more than formulas and equations.They need a predisposition to look at the world through mathematical eyes, to seethe benefits (and risks) of thinking quantitatively about commonplace issues, andto approach complex problems with confidence in the value of careful reasoning.(p. 2)
The examples presented in this final section are intended to motivate teachers andstudents to think quantitatively with the concept of ratio in authentic contexts. Similarcontexts from newspapers have been used by Watson (2004) to exemplify theimportance of understanding terminology, appreciating it in context, and becomingcritical thinkers where necessary to question or interpret claims.
One aspect of quantitative literacy that is prominent in many aspects of life is that ofrisk. Risks are well known in all phases of life, from walking across a busy street todrowning in the bath tub. The school curriculum acknowledges the need to addressstudents’ decision-making ability in situations of risk (AEC, 1994). Of concern forexample are substance use, sexual practices, road behaviour, suicide, and dietary habits.Outside of these there are also concerns about risks from pollution, bird flu, globalwarming, playground equipment, terrorism, and lightning strikes. How is it possible tocompare and contrast these risks? Why do some of them bother people and others donot?
Sandman (1993) made an interesting observation about the public’s perception ofrisk. He claimed
Perceived Risk = f (Hazard, Outrage).

Mathematics: Essential for Learning, Essential for Life
© The Australian Association of Mathematics Teachers Inc.
90
The hazard component is made up of the mathematical risk usually expressed in theform of a rate, such as 45 000 Americans die per year in motor-vehicle accidents,whereas about 82 die per year in commercial airplane accidents. Outrage, however, is apsychological perception that can be manipulated by other factors than the statistics.The media may at times contribute to such perceptions by the desire to make headlinesand sell stories. Over half of the deaths from disease in the US each year are caused byheart disease and cancer (1.2 million deaths), whereas exotic diseases, like avian flu andmad cow disease, prevalent in the media, have so far killed none.
It would appear that middle school mathematics can contribute directly to theassessment of the Hazard component of the Perceived Risk equation through anappreciation of rates. The issue of Outrage is a cross-curricular one to which criticalliteracy can contribute. The two combined should be the goal of critical quantitativeliteracy. Kluger (2006) recently wrote a well-titled report for Time magazine: “Why weworry about the things we shouldn’t… and ignore the things we should.” Includingmany examples of relative risk, Kluger considered factors that influence people’sassessment of risk, such as evolutionary development, dread of death, immediacy ofthreat, and comfort associated with control. In questioning how improvements can bemade in people’s perceptions of risk, he detailed (i) difficulties in people’s intuitions ininterpreting percents, (ii) deliberate stating of numerical values rather than percents bythose who want to increase perception of hazard, and (iii) the need for people “to learnmore about the real odds” (p. 45). In considering risks, “If you can just get people tocompare… then you’re in a situation where you can get them to make reasonedchoices” (p. 45). These points are related to the critical quantitative literacy skillsrequired across the curriculum based on rates as ratios.
What are the kinds of rates used to quantify risk? Consider a few examples. A recentsnippet in The Weekend Australian (“Nature wild about elephants,” 2006) broughtattention to attacks by elephants that had killed people, for example, “In the Indian stateof Jharkhand, near the western border of Bangladesh, 300 people were killed byelephants between 2000 and 2004” (p. 32). This translates to “75 deaths byelephant/year,” quite impressive for Australians. This sounds more hazardous forexample than fatal shark and crocodile attacks (e.g., Cribb & O’Brien, 1995). Between1980 and 1990 for example there were 8 accidental deaths caused by crocodiles and 11caused by sharks in Australia. When a person is killed by a shark or crocodile (or stingray) the event is likely to attract headlines. The statistics imply that this is because ofthe low occurrence of shark attacks rather than their high frequency: low Hazard buthigh Outrage. During the same period (1980–1990), when 1.1 people/year were killedby sharks and 0.8 people/year killed by crocodiles, 3277 people/year were killed in carsmashes in Australia. Yet very often a single fatality gets little more than a cursorymention in the local media: high Hazard but low Outrage.
How can the risks reported be compared? Certainly the death rate for elephants is notrelevant in Australia. What about sharks or cars in India? From this point the criticalaspects of quantitative literacy come to the fore. It is the integration of knowledge aboutwhat rates as ratios represent with the context of the information to be compared thatforms the foundation for making critical decisions about risk. What are the significantquestions that need to be asked in gathering information and then in making personaljudgments about risk? These should be canvassed in the classroom and students need tobe involved in contributing suggestions not just presented with a list of questions. Someof the suggestions should be the following.

Mathematics: Essential for Learning, Essential for Life
© The Australian Association of Mathematics Teachers Inc.
91
• Over what period of time were data collected? How long is reasonable?
• Have conditions changed over that period of time?
• What parts of the world are the data relevant for? Is geography important?
• For what population of people are the data relevant?
• If based on a sample, what is its size and how was it collected?
• What comparisons should be made? Which can legitimately be made and whichcannot?
These questions often will lead to a discussion of conditional risk.Data on risk and hazard appear in many forms. Sometimes the method of
representation is chosen in absolute numerical terms and sometimes it is relative interms of multiples. This can be misleading, whether done inadvertently or on purpose.Consider the variety of ways in which hazard can be reported.
Males from 17–22 are 21.9 percent more likely to have multi-vehicle crashes thanfemales of the same age. (“Females come out best,” 2006)Smokers in their 30s and 40s have five times as many heart attacks as non smokersa study of more than 10,000 UK heart attack survivors reveals. (“Heart attackrisks,” 1995)Driving 10 km/h over the speed increased the risk of a casualty crash fourfold.(Molloy, 1998)Australian Bureau of Statistics figures on bee/wasp sting mortality show theaverage incidence of death is 0.084 per one million population each year. (Carter,2007)Tasmania’s rate of deaths arising from transport-related injuries in 2003/04 was 13per 100,000 people, or 50 percent higher than the national average. (Martain, 2007)
In the last two examples the absolute hazard is quantified. For the final one, if this werestated as a probability of death for an individual in this period, it would be incrediblysmall, 0.00013. This then presents a problem in attracting attention of readers. “Fiftypercent” more than the national average, however, sounds more impressive. This makesthe national average 8.7 deaths per 100 000 people; and incidentally this is a nice littleproportion problem for students to work out from the information given (cf., Tabart,Skalicky & Watson, 2005). These extracts should lead to questions about how the datawere gathered, from where were they gathered, and what would the sets of numberslook like? These are all legitimate quantitative literacy questions for class discussionand exploration.
Collating information on relative risk should take into account the above questionsand make comparisons of risk as transparent as possible. Consider for exampleinformation from the International Shark Attack File (2005) indicating that between1580 and 2005, there were 468 confirmed shark attack deaths worldwide. This is anaverage of 1.1 deaths/year, the same as Australia over the 10 years 1980–1990. Howcan these be compared? For many of the 425 years there were no figures collected bythe aboriginal occupants of Australia; but even if the worldwide data were for theshorter period of time, Australia being a relatively small subset of the world, wouldpose a much greater threat of shark attack. Another source (Burgess, 2006) suggests acurrent rate of 5–15 deaths from shark attacks per year worldwide. Comparing Australiawith the rest of the world, perhaps deaths per 10 million people would be reasonable,since Australia’s population is about 20 million. Given the approximate worldpopulation of 6.5 billion, the comparison still makes Australia “above the world
Mathematics: Essential for Learning, Essential for Life
© The Australian Association of Mathematics Teachers Inc.
92
average,” with 0.55 deaths/10-million-people/year, compared with 0.0077–0.023deaths/10-million-people/year worldwide. There are quite a few context based reasonsfor this difference and students can be encouraged to write reports to show their criticalliteracy, as well as quantitative, skills. One can imagine a headline like: “Shark attackdeaths 25–70 times more likely in Australia.” What would this do for the touristindustry trying to attract Scandinavians to Australia’s beaches?!
Unfortunately it appears to be difficult to find information on the worldwide deathrate by elephant attack. Following up on The Australian elephant story leads to the NewYork Times Magazine (Siebert, 2006), which contains some further data on thebehaviour of elephants. “In the past 12 years, elephants have killed 605 people inAssam, a state of north-eastern India, 239 of them since 2001; 265 elephants have diedin that same period, the majority of them as a result of retaliation by angry villagers,who have used everything from poison-tipped arrows to laced food to exact theirrevenge.” Although data were not provided, the report also notes conflict betweenhumans and elephants across Africa from Zambia to Tanzania and from Uganda toSierra Leone. What about the rest of the world? Among the anecdotes in the article arethe stories of Mary, a circus elephant in Tennessee who killed a hotel janitor and Topsy,a circus elephant in Coney Island who killed three trainers. Both were eventually killedby authorities. In fact a recent children’s book in Australia tells the story of Queenie, anelephant at Melbourne Zoo who suffered a similar fate after killing her keeper (Fenton,2006). These “sample of size one” Outrage stories make excellent media headlines butcontribute little to the appreciation of death rates from elephant attacks worldwide.Deaths by shark attack are familiar to Australian students, whereas deaths by elephantattack are unlikely to be. Project work comparing the two could produce some excellentexamples of quantitative literacy.
In the social sciences, risk may reflect more qualitative than quantitativeunderstandings, especially in the advocacy of strongly held causes. Students need tomove from the mathematics classroom armed with an understanding of rates and theiruse in contexts so that they can question every assertion of outrage and demand accurateassessments of hazard.
Conclusion
Many other illustrations of proportional reasoning exist in text books and the NationalCouncil of Teachers of Mathematics recognised its importance in a focus issue ofMathematics Teaching in the Middle School in 2003. Besides setting the sceneinformally (e.g., Lanius & Williams, 2003; Thompson & Bush, 2003), formal links toa /b = c/d were developed (Chapin & Anderson, 2003), as well as ratios linked topolygons (Dwyer, Causey-Lee & Irby, 2003) and a focus on context (Sharp & Adams,2003). Watson and Shaughnessy (2004) followed up with a consideration of probabilitysampling and comparing two data sets in linking proportional reasoning to the chanceand data curriculum and Austin, Thompson and Beckmann (2006) offered a tantalisingexposé on locusts also employing proportional reasoning. The topic of risk andquantitative literacy was further explored by Watson (1998) using a newspaper articleclaiming that smoking a pack of cigarettes a day for more than 50 years increased therisk of premature wrinkling by 4.7 times. There is no lack of resources for approachingproportional reasoning in intriguing and challenging ways. All of these examples andlinks contribute to the goal of Quality Mathematics in the Middle Years (AAMT, 2006).
Mathematics: Essential for Learning, Essential for Life
© The Australian Association of Mathematics Teachers Inc.
93
References
Austin, R.A., Thompson, D.R. & Beckmann, C.E. (2006). Locusts for lunch: Connecting mathematics,science, and literature. Mathematics Teaching in the Middle School, 12, 182–187.
Australian Association of Mathematics Teachers, Inc. (2006). Quality Mathematics in the Middle Years:Communique. Adelaide, SA: Author.
Australian Education Council. (1994). A Statement on Health and Physical Education for AustralianSchools. Carlton, Vic: Curriculum Corporation.
Bakker, A., Biehler, R. & Konold, C. (2005). Should young students learn about box plots? In G. Burrill& M. Camden (Eds), Curricular Development in Statistics Education: International Association forStatistical Education (IASE) Roundtable, Lund, Sweden, 28 June–3 July 2004 (pp. 163–173).Voorburg, The Netherlands: International Statistical Institute.
Burgess, G.H. (2006). How, when and where sharks attack. International Shark Attack File. Retrieved 18December 2006 from http://www.flmnh.uf1.edu/Fish/sharks/attacks/howwhen.htm
Campbell, K. J., Collis, K. F. & Watson, J. M. (1995). Visual processing during mathematical problemsolving. Educational Studies in Mathematics, 28, 177–194.
Carter, P. (2007, January 20). Bee sting fatalities rare. The Mercury (Hobart, Tasmania), p. 22.
Chapin, S.H. & Anderson, N. C. (2003). Crossing the bridge to formal proportional reasoning.Mathematics Teaching in the Middle School, 8, 420–425.
Cribb, J. & O’Brien, N. (1995, September 14). Call to protect great white shark. The Australian, p. 5.Retrieved 24 November 2006 fromhttp://ink.news.com.au/mercury/mathguys/articles/1995/950914a1.htm
Dwyer, N. K., Causey-Lee, B. J. & Irby, N. M. (2003). Conceptualizing ratios with look-alike polygons.Mathematics Teaching in the Middle School, 8, 426–431.
Females come out best in young driver stats. (2006, October/November). RACT Motor News, p. 12.
Fenton, C. (2006). Queenie: One Elephant’s Story. Fitzroy, Vic: Black Dog.
Heart attack risks up for middle-age smokers. (1995, August 15) The Mercury (Hobart, Tasmania), p. 16.
International Shark Attack File (2005). Retrieved 18 December 2006 fromhttp://www.infoplease.com/spot/sharks1.html
Kluger, J. (2006, December 4). Why we worry about the things we shouldn’t… and ignore the things weshould. Time, No. 48, 40–45.
Konold, C. (In press). Designing a Data Analysis Tool for Learners. In M. Lovett & P. Shah (Eds),Thinking with Data: The 33rd Annual Carnegie Symposium on Cognition. Hillside, NJ: LawrenceErlbaum Associates.
Konold, C. & Miller, C.D. (2005). Tinkerplots: Dynamic Data Exploration. [Computer software]Emeryville, CA: Key Curriculum Press.
Lanius, C. S. & Williams, S. E. (2003). Proportionality: A unifying theme for the middle grades.Mathematics Teaching in the Middle School, 8, 392–396.
Nature wild about elephants. (2006, October 14–15). The Weekend Australian, p. 32.
Martain, T. (2007, January, 13). The unsafe state… The Mercury (Hobart, Tasmania), p. 11.
Molloy, P. (1998, June, 11). Perils of extra 5kmh. The Mercury (Hobart, Tasmania), p. 3.
Reys, R. (1988). Discovery with cubes. Mathematics Teacher, 81, 377–381.
Sandman, P.M. (1993). Responding to Community Outrage: Strategies for Effective Risk Communication.Fairfax, VA: American Industrial Hygiene Association.
Sharp, J. M. & Adams, B. (2003). Using a pattern table to solve contextualized proportion problems.Mathematics Teaching in the Middle School, 8, 432–439.
Siebert, C. (2006, October 8). An elephant crackup? The New York Times Magazine. Retrieved 23November 2006 from https//www.nytimes.com/2006/10/8/magazine/08elemephant.html?emc=eta1
Steen, L. A. (Ed.). (2001). Mathematics and Democracy: The Case for Quantitative Literacy.Washington, DC: Woodrow Wilson National Fellowship Foundation.
Tabart, P., Skalicky, J. & Watson, J. (2005). Modelling proportional thinking with threes and twos.Australian Primary Mathematics Classroom, 10(3), 27–32.

Mathematics: Essential for Learning, Essential for Life
© The Australian Association of Mathematics Teachers Inc.
94
Thompson, C. S. & Bush, W. S. (2003). Improving middle school teachers’ reasoning about proportionalreasoning. Mathematics Teaching in the Middle School, 8, 398–403.
Van de Walle, J.A. (2007). Elementary and Middle School Mathematics: Teaching Developmentally (6thed.). Boston: Pearson Education.
Watson, J. M. (2004). Quantitative literacy in the media: An arena for problem solving. AustralianMathematics Teacher, 69(1), 34–40.
Watson, J. M. (1998). The role of statistical literacy in decisions about risk: Where to start. For theLearning of Mathematics, 18(3), 25–27.
Watson, J. M. & Shaughnessy, J.M. (2004). Proportional reasoning: Lessons from research in data andchance. Mathematics Teaching in the Middle School, 10, 104–109.
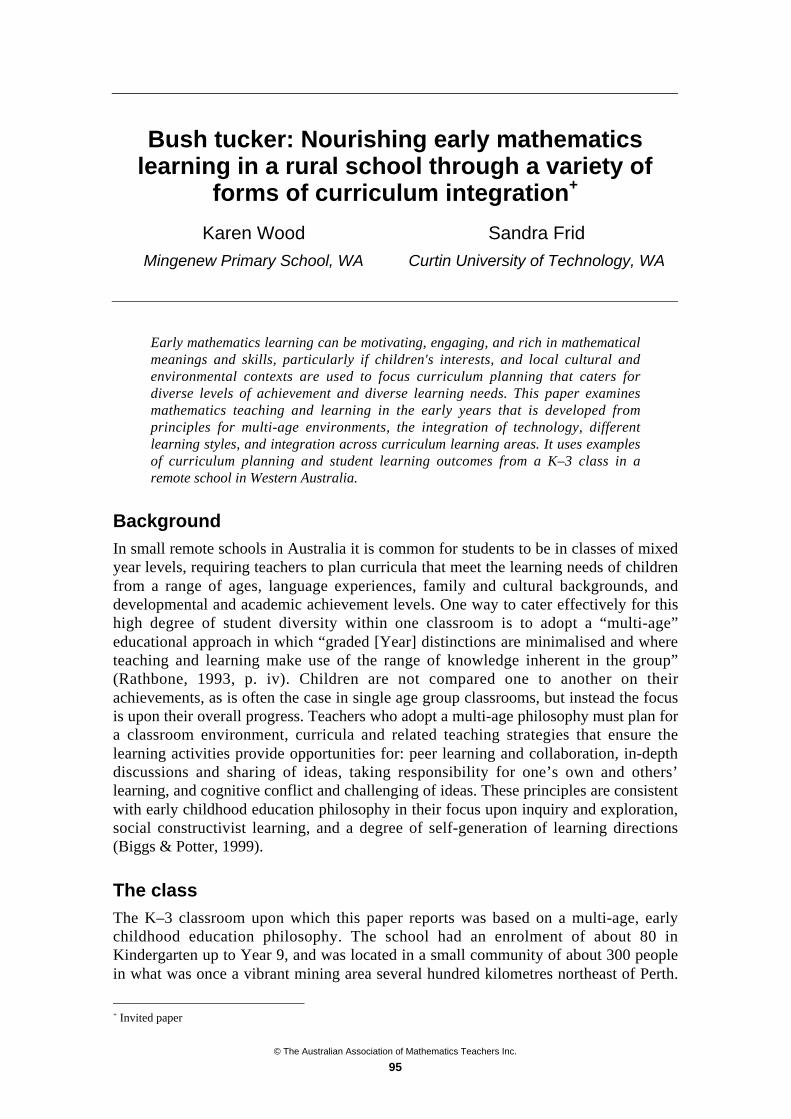
© The Australian Association of Mathematics Teachers Inc.
95
Bush tucker: Nourishing early mathematicslearning in a rural school through a variety of
forms of curriculum integration+
Karen Wood
Mingenew Primary School, WA
Sandra Frid
Curtin University of Technology, WA
Early mathematics learning can be motivating, engaging, and rich in mathematicalmeanings and skills, particularly if children's interests, and local cultural andenvironmental contexts are used to focus curriculum planning that caters fordiverse levels of achievement and diverse learning needs. This paper examinesmathematics teaching and learning in the early years that is developed fromprinciples for multi-age environments, the integration of technology, differentlearning styles, and integration across curriculum learning areas. It uses examplesof curriculum planning and student learning outcomes from a K–3 class in aremote school in Western Australia.
Background
In small remote schools in Australia it is common for students to be in classes of mixedyear levels, requiring teachers to plan curricula that meet the learning needs of childrenfrom a range of ages, language experiences, family and cultural backgrounds, anddevelopmental and academic achievement levels. One way to cater effectively for thishigh degree of student diversity within one classroom is to adopt a “multi-age”educational approach in which “graded [Year] distinctions are minimalised and whereteaching and learning make use of the range of knowledge inherent in the group”(Rathbone, 1993, p. iv). Children are not compared one to another on theirachievements, as is often the case in single age group classrooms, but instead the focusis upon their overall progress. Teachers who adopt a multi-age philosophy must plan fora classroom environment, curricula and related teaching strategies that ensure thelearning activities provide opportunities for: peer learning and collaboration, in-depthdiscussions and sharing of ideas, taking responsibility for one’s own and others’learning, and cognitive conflict and challenging of ideas. These principles are consistentwith early childhood education philosophy in their focus upon inquiry and exploration,social constructivist learning, and a degree of self-generation of learning directions(Biggs & Potter, 1999).
The class
The K–3 classroom upon which this paper reports was based on a multi-age, earlychildhood education philosophy. The school had an enrolment of about 80 inKindergarten up to Year 9, and was located in a small community of about 300 peoplein what was once a vibrant mining area several hundred kilometres northeast of Perth.
+ Invited paper

Mathematics: Essential for Learning, Essential for Life
© The Australian Association of Mathematics Teachers Inc.
96
Key aspects of early childhood education emphasised by the teacher included: usinghands-on learning activities, encouraging children to be inquisitive and questioning oftheir experiences with the world around them, and finding out things for themselvesrather than being given facts by the teacher. However, to ensure all children madeprogress in their learning, particularly within literacy and numeracy, there was alsoexplicit, direct instruction by the teacher. The teacher also had to plan for catering formuch diversity in achievement levels and rates of progress in learning because thechildren had numerous social challenges that acted as inhibitors to learning. The 90%indigenous population in the class included children who had not attended schoolregularly, or who had little language development before beginning school, or who hadlittle social and emotional skill development to support classroom learning.
Planning for an “integrated” curriculum
The outcomes focused, integrated curriculum approach adopted by the teacher wasconsistent with both early childhood and multi-age educational philosophies, andthereby necessitated curriculum content and assessment practices that were relevant andcontextual within the environment of that community and the children’s interests. Thus,through a reflective practice approach to long and short term programming, along withongoing formative assessment of children’s learning, the teacher developed andimplemented an “integrated” learning program that included mathematics as a focus.How this program was designed, and samples of some of the learning activities andrelated student learning outcomes are outlined next.
Initial planning via a “theme”
Each term the class picks a “theme” that is a topic of interest to them. For example,China, Fantasy, the Circus, The Man from Snowy River, and Aliens are recent themeschosen by the children. The teacher then does an initial “mind map” of ideas for howthe theme might be used to address specific learning outcomes across the eight learningareas of the Western Australian Curriculum Framework (Curriculum Council, 1998)and the six early childhood learning domains. Formal assessment and reportingrequirements of the state Department of Education are also consulted in this initialprocess (e.g. Schedule A), so that the emphases for required learning area content andprocesses are met. To plan within a specific learning area, for example mathematics, amatrix outlining content strands and related targeted outcomes is then constructed sothat possible theme-oriented learning activities can be included.
Figure 1 shows some initial ideas for addressing specific mathematics learningoutcomes related to the Aliens theme. Specifically, the plan outlines how shapes will beexplored through the use of big fabric stretchy body bags. The children don the bags astheir alien skin and then create shapes such as triangles, rectangles, squares, pentagons,and other polygons. The activity can then be extended to integrate with the ArtsLearning Area by using dance and movement to explore how the body can be used tocreate shapes. When put to music this activity can then be used for counting beats andbars of music, or for simple fraction concepts related to music such as whole, half, andquarter.
Initial planning for curriculum integration
Thus, “integration” is achieved in that more than one strand within mathematics isaddressed (e.g., space, number, and measurement), and at least one other learning area
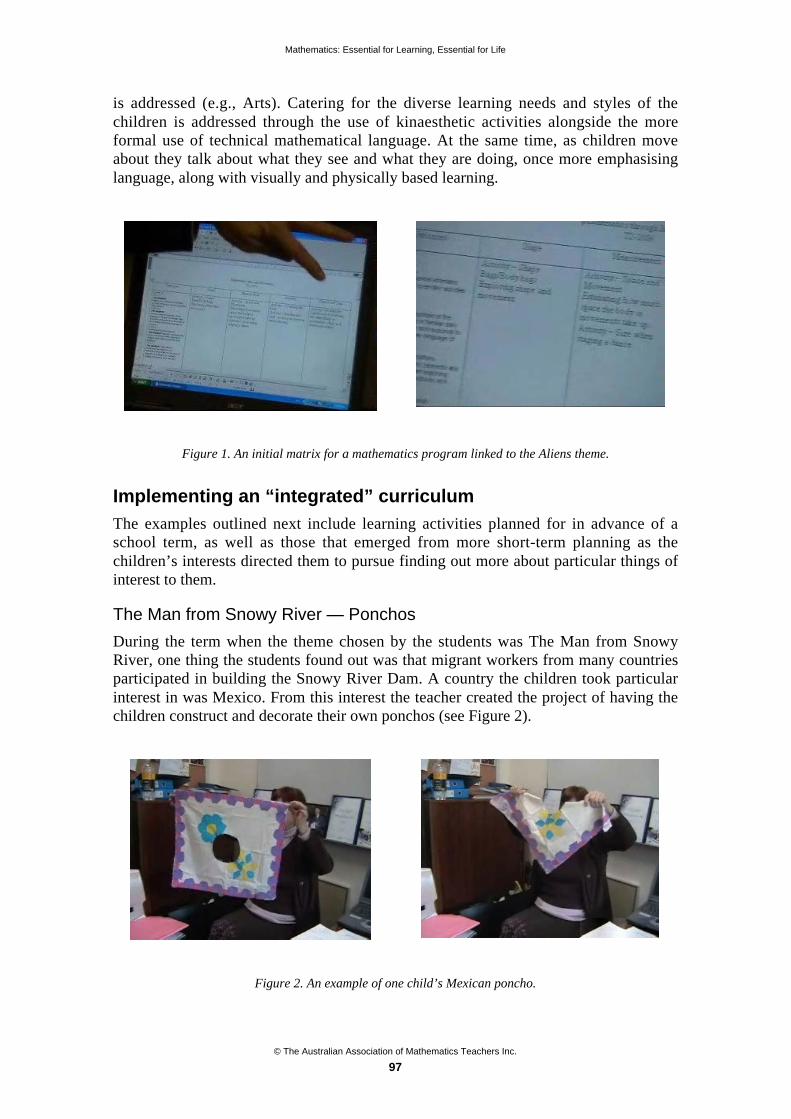
Mathematics: Essential for Learning, Essential for Life
© The Australian Association of Mathematics Teachers Inc.
97
is addressed (e.g., Arts). Catering for the diverse learning needs and styles of thechildren is addressed through the use of kinaesthetic activities alongside the moreformal use of technical mathematical language. At the same time, as children moveabout they talk about what they see and what they are doing, once more emphasisinglanguage, along with visually and physically based learning.
Figure 1. An initial matrix for a mathematics program linked to the Aliens theme.
Implementing an “integrated” curriculum
The examples outlined next include learning activities planned for in advance of aschool term, as well as those that emerged from more short-term planning as thechildren’s interests directed them to pursue finding out more about particular things ofinterest to them.
The Man from Snowy River — Ponchos
During the term when the theme chosen by the students was The Man from SnowyRiver, one thing the students found out was that migrant workers from many countriesparticipated in building the Snowy River Dam. A country the children took particularinterest in was Mexico. From this interest the teacher created the project of having thechildren construct and decorate their own ponchos (see Figure 2).
Figure 2. An example of one child’s Mexican poncho.

Mathematics: Essential for Learning, Essential for Life
© The Australian Association of Mathematics Teachers Inc.
98
The poncho activity involved a range of mathematics skills and processes, including:
• deciding how big to make the initial square of fabric, and then measuring thesquare;
• deciding how to cut a suitable hole for the head (e.g., folding the shape in half tocreate a triangle;
• deciding how big to cut a semi-circular shape in the “middle,” and then actuallymeasuring and constructing the circular hole;
• designing a pattern to go around the edge (with a requirement that they must use areflection (“flip”) to create the line pattern, and it must also have a colour pattern);
• designing a pattern to go on the front and the back of the poncho (with arequirement that it must using rotation of a shape and must have a colour pattern).
At the end of the poncho project the children learned the Mexican Hat Dance, andthen wore their ponchos to perform the dance as a group. Thus, the project was thenfollowed on with a link to physical education and cultural learning outcomes.
Medieval murals
Some of the things the children learned about during the term when the theme wasFantasy were knights and dragons, and this then led to learning about castles inmedieval times: how they were built, what shapes were involved, and how they werefurnished and decorated. They found out that wall hangings were often used in castles,so the teacher set a mathematics project for the children to create their own wallhangings by making use of 2-dimensional shapes. The Years 1and 2 children chose tomake a knight (Figure 3). They designed their knight on paper before constructing thewall hanging with fabric. The mathematics involved included:
• identifying what 2-dimensional shapes can be used and positioned to build animage of a knight;
• deciding upon the needed sizes of the shapes, overall and relative to one another,and then measuring and cutting out the shapes; and
• using 2-dimensional shapes to build a border pattern.
Figure 3. Year1/2 wall hanging of a knight.
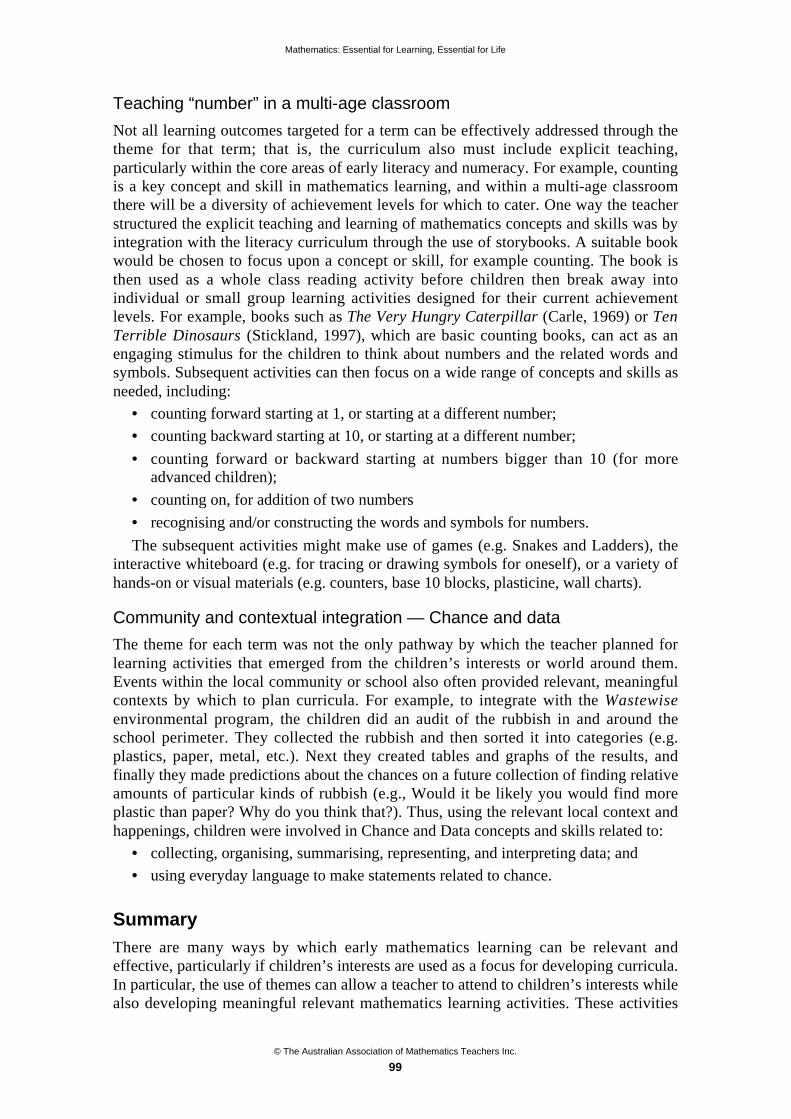
Mathematics: Essential for Learning, Essential for Life
© The Australian Association of Mathematics Teachers Inc.
99
Teaching “number” in a multi-age classroom
Not all learning outcomes targeted for a term can be effectively addressed through thetheme for that term; that is, the curriculum also must include explicit teaching,particularly within the core areas of early literacy and numeracy. For example, countingis a key concept and skill in mathematics learning, and within a multi-age classroomthere will be a diversity of achievement levels for which to cater. One way the teacherstructured the explicit teaching and learning of mathematics concepts and skills was byintegration with the literacy curriculum through the use of storybooks. A suitable bookwould be chosen to focus upon a concept or skill, for example counting. The book isthen used as a whole class reading activity before children then break away intoindividual or small group learning activities designed for their current achievementlevels. For example, books such as The Very Hungry Caterpillar (Carle, 1969) or TenTerrible Dinosaurs (Stickland, 1997), which are basic counting books, can act as anengaging stimulus for the children to think about numbers and the related words andsymbols. Subsequent activities can then focus on a wide range of concepts and skills asneeded, including:
• counting forward starting at 1, or starting at a different number;
• counting backward starting at 10, or starting at a different number;
• counting forward or backward starting at numbers bigger than 10 (for moreadvanced children);
• counting on, for addition of two numbers
• recognising and/or constructing the words and symbols for numbers.
The subsequent activities might make use of games (e.g. Snakes and Ladders), theinteractive whiteboard (e.g. for tracing or drawing symbols for oneself), or a variety ofhands-on or visual materials (e.g. counters, base 10 blocks, plasticine, wall charts).
Community and contextual integration — Chance and data
The theme for each term was not the only pathway by which the teacher planned forlearning activities that emerged from the children’s interests or world around them.Events within the local community or school also often provided relevant, meaningfulcontexts by which to plan curricula. For example, to integrate with the Wastewiseenvironmental program, the children did an audit of the rubbish in and around theschool perimeter. They collected the rubbish and then sorted it into categories (e.g.plastics, paper, metal, etc.). Next they created tables and graphs of the results, andfinally they made predictions about the chances on a future collection of finding relativeamounts of particular kinds of rubbish (e.g., Would it be likely you would find moreplastic than paper? Why do you think that?). Thus, using the relevant local context andhappenings, children were involved in Chance and Data concepts and skills related to:
• collecting, organising, summarising, representing, and interpreting data; and
• using everyday language to make statements related to chance.
Summary
There are many ways by which early mathematics learning can be relevant andeffective, particularly if children’s interests are used as a focus for developing curricula.In particular, the use of themes can allow a teacher to attend to children’s interests whilealso developing meaningful relevant mathematics learning activities. These activities
Mathematics: Essential for Learning, Essential for Life
© The Australian Association of Mathematics Teachers Inc.
100
can often be planned to integrate across more than one content strand withinmathematics, and they generally lend themselves, due to their real-world contexts, tointegration with other learning areas such as English, science, or the arts. At the sametime, the use of, investigations, open-ended as well as more directed activities, hands-onmaterials, visual and/or kinaesthetic experiences, and discussion and talking aboutlearning caters for diverse learning styles. The range of developmental and achievementlevels found in most classrooms, and especially in a multi-age classroom, are also ableto be well catered for by the use of these forms of curriculum integration.
References
Biggs, F. & Potter, G. (1999). The Early Years of Schooling Teaching and Learning. Frenchs Forest,NSW: Longman.
Carle, E. (1969). The Very Hungry Caterpillar. Camberwell, Victoria: Puffin Books.
Curriculum Council of Western Australia (1998). Curriculum Framework for Kindergarten to Year 12Education in Western Australia. Osborne Park, WA: Author.
Rathbone, C. (Ed.) (1993). Multiage Portraits: Teaching and Learning in Mixed-age Classrooms.Peterborough, NH: Crystal Springs Books.
Stickland, P. (1997). Ten Terrible Dinosaurs. Mascot, NSW: Koala Books.

© The Australian Association of Mathematics Teachers Inc.
101
Seminars

© The Australian Association of Mathematics Teachers Inc.
102
Using concept maps and vee diagramsto interpret “area” syllabusoutcomes and problems*
Karoline Afamasaga-Fuata’i
University of New England
Data presented is from a case study, which investigated a primary studentteacher’s developing expertise concept mapping syllabus outcomes andconstructing vee diagrams of problems. Findings suggest the student teacherdeveloped enhanced skills to critically analyse syllabus outcomes and a relatedproblem, competently justify multiple methods using principles and effectivelycommunicate mathematical ideas, and as a result, developed a deeper, conceptualunderstanding of the developmental and sequential nature of the sub-strand acrossdifferent stages. Implications for teaching primary mathematics are provided.
Student teachers need to develop deep knowledge and understanding of the conceptsthey are expected to teach their future students (AAMT, 2006). The New South WalesBoard of Studies (NSWBOS, 2002) encourages teachers to develop students’conceptual understanding through investigation and implementation of workingmathematically strategies. This paper proposes that the metacognitive tools, hierarchicalconcept maps (cmaps) and vee diagrams (v-diagrams), and the innovative processes ofconcept mapping and constructing vee diagrams can influence the (a) development ofstudents’ conceptual understanding and (b) dynamics of working mathematically withina social setting.
Ausubel’s cognitive theory of meaningful learning underpins the process ofconstructing cmaps/v-diagrams. Meaningful learning takes place by linking newknowledge to old knowledge via progressive differentiation (reorganisation of existingknowledge under more general ideas) and/or integrative reconciliation (merging manyideas into one or two when apparent contradictory ideas are reconciled) (Novak &Canãs, 2006; Novak & Gowin, 1984). Through social interactions while critiquingcmaps/v-diagrams, teacher and students engage in critical thinking, reasoning andcommunicating mathematically (Afamasaga-Fuata’i. 2005, 2006).
Cmaps are hierarchical networks of interconnecting nodes, representing concepts ofa knowledge domain, with linking words describing the interrelationships of connectednodes to form valid propositions. For example, given
Scatterplot may be used to estimate correlation
the proposition is, “Scatterplot may be used to estimate correlation”. V-diagrams, incontrast, are heuristics that illustrate the epistemological, conceptual andmethodological frameworks of a phenomenon (Novak & Canãs, 2006; Novak & Gowin, * Paper accepted by peer review
Mathematics: Essential for Learning, Essential for Life
© The Australian Association of Mathematics Teachers Inc.
103
1984). Gowin’s epistemological vee was later modified for solving mathematicsproblems (Afamasaga-Fuata’i, 2005) (examples are discussed later).
Research examined the usefulness of cmaps/v-diagrams in the sciences (Novak &Canãs, 2006; Brown, 2000; Mintzes, Wandersee & Novak, 2000) and mathematics(Afamsaga-Fuata’i, 2005, 2004; Williams, 1998), and recently in teacher education withprimary (Schmittau, 2004) and secondary student teachers (Afamasaga-Fuata’i, 2006,Brahier, 2005) and with teachers (Liyanage & Thomas, 2002). Three main uses arerelevant to this paper. These are as (a) learning tools for individual learners to makesense of a knowledge domain, (b) analytical tools to analyse the structure of knowledgein a topic; and (c) pedagogical tools to guide the planning of learning activities.
The paper’s focus question is: In what ways do hierarchical concept maps and veediagrams facilitate the preparation of primary student teachers for teaching mathematicsmore conceptually? Presented here is the case study of a BEd (Primary) student teacher(Susan), who constructed cmaps/v-diagrams over a semester, in her third year electiveunit.
Methodology
Susan was introduced to constructing cmaps/v-diagrams using simple topics/problems.The unit’s main project was the construction of a comprehensive topic cmap in threephases. The topic was to be selected from primary mathematics. Susan was alsorequired to construct v-diagrams of problems, which demonstrate the applications of themapped concepts. The first phase required that Susan compile an initial list of conceptsto construct an initial topic cmap and v-diagrams of two related problems. These werepresented and critiqued in class before further revision and expansion. The secondphase involved the presentation of a more structurally complex, expanded cmap and v-diagrams of more problems. These were socially critiqued and returned for furtherrevision and expansion. The third phase was the final submission of a morecomprehensive, hierarchical topic cmap and more v-diagrams of related problems,which extend upon previous work and incorporating comments from previous critiques,and including a reflection journal.
Cmaps/v-diagrams were collected from the familiarisation phase and the mainproject including a reflection journal. This paper presents Susan’s work to illustrate theapplication of cmaps/v-diagrams as analytical and pedagogical tools.
Results
Sample cmaps are presented to display Susan’s conceptual analyses of the Area syllabusoutcomes from Early Stage One through to Stage 3 (NSWBOS, 2002) followed by anexample v-diagram. The latter demonstrates her understanding of area concepts andtheir applications in problem solving. The final data are excerpts from the reflectionjournal.
Concept maps of syllabus outcomes
The cmaps are presented in the order of the staged outcomes to illustrate their use asanalytical and pedagogical tools in teacher education.

Mathematics: Essential for Learning, Essential for Life
© The Australian Association of Mathematics Teachers Inc.
104
Early Stage One MES1.2 syllabus outcome
Susan’s conceptual analysis (Figure 1) showed main concepts such as area and closedshapes, and strategies such as covering surfaces and direct comparison. Illustrativeexamples of concepts/strategies are provided.
Figure 1. Area - Early Stage One concept map.
Progressive differentiating links from direct comparison show different strategiesappropriate for this stage (order three or more areas, one inside the other, cut andpasted on, superimposing). Also displayed are links to record area and describe area.Whilst differentiating links from the former node display different ways of recording,those from the latter differentiate between comparative language and everydaylanguage with further links showing examples. Some displayed propositions include“Early Stage One MES1.2 looks at the measure of the amount of surface Area” and“Area is found by using informal units and covering surfaces.”

Mathematics: Essential for Learning, Essential for Life
© The Australian Association of Mathematics Teachers Inc.
105
Stage One MS1.2 syllabus outcome
Susan’s conceptual analysis (Figure 2) identified main concepts (surface, area,constant) and strategies (measured; estimated, compared and ordered; compared).
Figure 2. Area - Stage One concept map.
Mathematics: Essential for Learning, Essential for Life
© The Australian Association of Mathematics Teachers Inc.
106
Progressive differentiating links from measured display different strategies, which ifread horizontally (left to right), indicate an increasingly sophisticated trend frominformal counting of whole parts (and) left-over through drawing grids (spatialstructure of repeated units), to using identical informal units in rows and columns; thelatter is linked to tessellations. Integrative reconciliation links from tessellations anddrawing grids merge at the diagram of a 2-by-7 grid. To the left is a contrasting grid ofrepeated units with gaps.
Consolidating strategies encountered at Early Stage One is described by the secondand third sub-branches (left to right) of the area branch. However, new strategies areevident by the next two area sub-branches with repeated addition and number and typeof the appropriate unit. The former links to rhythmic counting while the latter connectsto size and number. Each sub-branch terminates with an example.
A comparison of Figures 1 and 2 highlights the progressive development of mainconcepts and strategies from the concrete and informal to the increasingly more formalrhythmic counting in row-and-column arrays. The cmap ends with the selection of unitsappropriate to the object’s size. Nodes are colour coded to indicate connections to priorknowledge.
Stage Two MS2.2 syllabus outcome
Susan’s conceptual analysis (Figure 3) showed that formal units of measuring area areintroduced at this stage, namely, squared centimetre and squared metre (symbolised ascm2 and m2 respectively). An extended proposition is, “Squared centimetre is used toformally estimate, measure, compare and record a variety of areas by applying (a)variety of strategies such as using a 10 cm 10 cm tile grid to determine areas that aresame as 100 cm2, greater than, (or) less than.”
A crosslink between two nodes forms the proposition, “Squared centimetre is oneten-thousandth of a squared metre.” Another proposition is “Squared metre which neednot be an exact square, for example 2 m 0.5 m.” A crosslink to the next cmap isvisible at the top right of Figure 3 (discussed next). Yellow coding indicatesconsolidation of prior knowledge. A comparison of Figures 1 to 3 indicates increasinglysophisticated means of measuring area and formalisation of units.
Stage Three MS3.2 Syllabus Outcome
Susan’s conceptual analysis (Figure 4) identified a new unit (squared kilometre) andarea formulas are introduced at this stage. Some displayed propositions include “MS3.2discovers the need for the squared kilometre and looks at where it is used for examplescales and everyday situations which students then interpret” and “MS3.2 is concernedwith the surface area of rectangular prisms found by centimetre grids or units whichleads to the formula how many rows number in each row”. The rightmost propositionsare “MS3.2 discovers the need for a convenient unit to use, the hectare which is thesame as 10 000 m2” and “hectare which is abbreviated to ha”. To the left of hectare arevariations of constant rectangular areas with different perimeters, and extensions ofareas to surface areas of rectangular prisms. Visible at the top left is an incomingcrosslink from squared metre (Figure 3) to squared kilometre (Figure 4) explicitlyconnecting two staged outcomes. Purple coding a node also reinforces a connection toprevious knowledge.
In summary, the four hierarchical cmaps highlight developmental and progressivelysophisticated means of measuring and recording area. Colour coding indicatesconnections to prior knowledge distinguishing them from new knowledge within stage.

Mathematics: Essential for Learning, Essential for Life
© The Australian Association of Mathematics Teachers Inc.
107
Figure 3. Area - Stage two concept map.
Vee diagram of a problem
Figure 5 shows a v-diagram with a conceptual Thinking Side on the left and amethodological Doing Side on the right. The vee is contextualised in the Problem to besolved with the focus question under What is the question I need to answer? Theconceptual analysis of a problem and the relevant mathematical principles required tosolve it are displayed as responses to What do I know already? (mathematical

Mathematics: Essential for Learning, Essential for Life
© The Australian Association of Mathematics Teachers Inc.
108
principles) and What are the main ideas? (main concepts). A statement of mathematicalbeliefs is a response to Why I like mathematics?
Figure 4. Area - Stage three concept map.
On the Doing Side, the given information is under What is the information given?and the methods under How do I find my answers? Critical reflections are as responsesto What are the most useful things I learnt? Once the mathematics problem is identified,
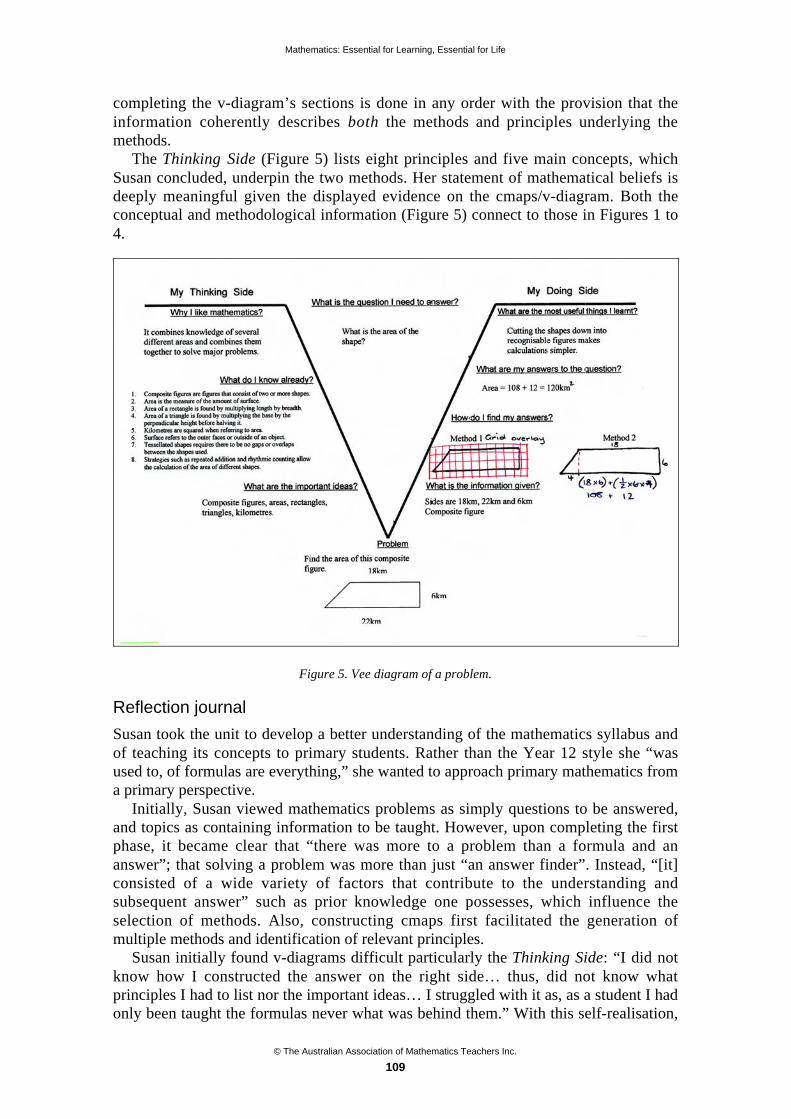
Mathematics: Essential for Learning, Essential for Life
© The Australian Association of Mathematics Teachers Inc.
109
completing the v-diagram’s sections is done in any order with the provision that theinformation coherently describes both the methods and principles underlying themethods.
The Thinking Side (Figure 5) lists eight principles and five main concepts, whichSusan concluded, underpin the two methods. Her statement of mathematical beliefs isdeeply meaningful given the displayed evidence on the cmaps/v-diagram. Both theconceptual and methodological information (Figure 5) connect to those in Figures 1 to4.
Figure 5. Vee diagram of a problem.
Reflection journal
Susan took the unit to develop a better understanding of the mathematics syllabus andof teaching its concepts to primary students. Rather than the Year 12 style she “wasused to, of formulas are everything,” she wanted to approach primary mathematics froma primary perspective.
Initially, Susan viewed mathematics problems as simply questions to be answered,and topics as containing information to be taught. However, upon completing the firstphase, it became clear that “there was more to a problem than a formula and ananswer”; that solving a problem was more than just “an answer finder”. Instead, “[it]consisted of a wide variety of factors that contribute to the understanding andsubsequent answer” such as prior knowledge one possesses, which influence theselection of methods. Also, constructing cmaps first facilitated the generation ofmultiple methods and identification of relevant principles.
Susan initially found v-diagrams difficult particularly the Thinking Side: “I did notknow how I constructed the answer on the right side… thus, did not know whatprinciples I had to list nor the important ideas… I struggled with it as, as a student I hadonly been taught the formulas never what was behind them.” With this self-realisation,
Mathematics: Essential for Learning, Essential for Life
© The Australian Association of Mathematics Teachers Inc.
110
Susan chose to challenge herself in subsequent activities, “Before finding the answer…I would look only at the question and think about what I need to know about it before Iactually solved the problem.”
Susan admitted, “I always had difficulty in explaining what I wanted them to do… itfrustrated me that they did not understand when I explained it the first time.” By the endof the semester, her “communication skills verbally [had] been assisted greatly by [her]written communication in both cmaps and v-diagrams.” She claimed “I now have thebasic [information] written before me and because it was me that had to construct thewritten version I was able to explain what I did verbally better than I had done before.”
Susan’s cmap/v-diagram experiences made her realise that a topic has a number ofmain and relevant concepts and recommended strategies that must be introduced,consolidated and extended through a suitable sequence of learning activities to ensuredevelopment of deep understanding. Summarising, she said, “[the Area sub-strand] hasmany connections that linked across a broad range of subjects and through theconstruction of cmaps and v-diagrams a deep understanding of the topic was achieved.”
Over the semester, Susan developed critical (i) proficiency completing the ThinkingSide of v-diagrams “as quickly and as effectively as the [Doing Side]” and (ii) analyticalskills: “I am now able to see where a problem is going before the actual completion…there are problems I can work backwards [from solution to principles] to see where I amgoing.” She also found cmaps useful guides for completing v-diagrams: “I could see thelinks and the next step [more clearly] in the solving of problems in relation to the sub-strand.”
Discussion
Findings suggest Susan became competent and confident in her critical abilities toanalyse syllabus outcomes and problems using cmaps/v-diagrams. She analysed thesyllabus outcomes for key concepts, strategies and illustrative examples before placingthe results in a conceptual, developmental order within each stage from left to right oncmaps. Making connections between stages was achieved by colour coding nodes (andcrosslink) to differentiate between prior and new knowledge within a stage. Using a v-diagram, she systematically analysed a problem to make explicit both the conceptualand methodological information involved in generating plausible solutions.
Communicating effectively with her audience was enhanced through cmaps/v-diagrams. Because she individually constructed them, she is in a better position toexplain and justify her ideas publicly, “I had to critically think of the reasons of whyeach map or diagram is constructed in the way that it is.” By the third phase, Susanrealised that she could “see the connections that infiltrated the topic” more clearly,consequently gaining a better understanding of how to sequence activities, “I nowunderstand what needs to be taught first and where I need to go from there” byfollowing the visual connections.
Finally, Susan concluded that constructing cmaps/v-diagram had begun “a newchapter in (her) understanding and teaching of mathematics.” She felt confident and herunderstanding of the sub-strand had deepened particularly in “how each and every oneof [the concepts and strategies] builds upon the prior knowledge of the last”. Findingsfrom this case study contribute knowledge to the development of primary teachers’ deepunderstanding of mathematics and the pedagogical use of cmaps/v-diagrams.
Mathematics: Essential for Learning, Essential for Life
© The Australian Association of Mathematics Teachers Inc.
111
Implications
Constructing cmaps engenders a deep understanding of how concepts andrecommended strategies are developmentally progressed and consolidated across thestages. Constructing v-diagrams enhances critical synthesis of the relevant mathematicalprinciples and procedures in generating solutions to problems. These findings imply thatcmaps/v-diagrams are potentially useful tools for primary students to use inmathematics learning and problem solving. This is an area worthy of furtherinvestigation.
References
Afamasaga-Fuata’i, K. (2006). Innovatively developing a teaching sequence using concept maps. In A.Canãs & J. Novak (Eds), Concept Maps: Theory, Methodology, Technology. Proceedings of theSecond International Conference on Concept Mapping, Vol. 1 (pp. 272–279). San Jose, Costa Rica:Universidad de Costa Rica.
Afamasaga-Fuata’i, K. (2005). Students’ conceptual understanding and critical thinking? A case forconcept maps and vee diagrams in mathematics problem solving. In M. Coupland, J, Anderson & T.Spencer (Eds), Making Mathematics Vital (Proceedings of the Twentieth Biennial Conference of theAustralian Association of Mathematics Teachers, pp. 43–52). Adelaide: AAMT.
Afamasaga-Fuata’i, K. (2004). Concept maps and vee diagrams as tools for learning new mathematicstopics. In A. J. Canãs, J. D. Novak & Gonázales (Eds), Concept Maps: Theory, Methodology,Technology (Proceedings of the First International Conference on Concept Mapping September, pp.13–20). Dirección de Publicaciones de la Universidad Pública de Navarra, Spain.
Australian Association of Mathematics Teachers (2006). Standards for Excellence in TeachingMathematics in Australian Schools. Retrieved 12 February 2006 fromhttp://www.aamt.edu.au/standards/standxtm.pdf.
Brahier, D. J. (2005). Teaching Secondary and Middle School Mathematics (2nd Ed.). New York:Pearson Education.
Brown, D. S. (2000). The effect of individual and group concept mapping on students’ conceptualunderstanding of photosynthesis and cellular respiration in three different levels of biology classes.Dissertation Abstracts International AADAA-I9970734. Kansas City: University of Missouri.
Liyanage, S. & Thomas, M. (2002). Characterising secondary school mathematics lessons using teachers’pedagogical concept maps. In Proceedings of the 25th annual conference of the MathematicsEducation Research Group of Australasia (MERGA-25, pp. 425–432), University of Auckland, NewZealand.
Mintzes, J. J., Wandersee, J. H. & Novak, J. D. (Eds) (2000). Assessing Science Understanding: AHuman Constructivist View. San Diego, California, London: Academic.
New South Wales Board of Studies (NSWBOS) (2002). K–6 Mathematics Syllabus. Sydney, Australia:NSWBOS.
Novak, J. D. & Canãs, A. J. (2006). The theory underlying concept maps and how to construct them.Technical Report IHMC Cmap Tools 2006-01, Florida Institute for Human and Machine Cognition,2006, available at:http://cmap.ihmc.us/publications/ResearchPapers/TheoryUnderlyingConceptMaps.pdf.
Novak, J. D. & Gowin, D. B. (1984). Learning How to Learn. Cambridge University Press.
Schmittau, J. (2004). Uses of concept mapping in teacher education in mathematics. In A. J. Canãs, J. D.Novak & Gonázales (Eds), Concept Maps: Theory, Methodology, Technology. Proceedings of theFirst International Conference on Concept Mapping September 14–17, 2004 (pp. 571–578). Navarra:Dirección de Publicaciones de la Universidad Pública de Navarra, Spain.
Williams, C. G. (1998). Using concept maps to assess conceptual knowledge of function. Journal forResearch in Mathematics Education, 29, (4), 414–421.
© The Australian Association of Mathematics Teachers Inc.
112
Concept maps and vee diagrams as toolsto understand better the “division” concept
in primary mathematics*
Karoline Afamasaga-Fuata’i
University of New England
Laura Cambridge
University of New England
The paper presents a case study, which investigated a primary student teacher’sdeveloping proficiency with constructing concept maps and vee diagrams as toolsto guide the analyses of syllabus outcomes and to facilitate the design of activitiesthat develop deep understanding of mathematics concepts. Findings suggest thestudent teacher developed a deeper understanding of the developmental nature ofthe division concept as outlined in syllabus outcomes, which empowered her toconfidently provide mathematical justifications for strategies to solve problems.
Introduction
The Australian Association of Mathematics Teacher’s Standards for Excellence inTeaching Mathematics in Australian Schools (AAMT, 2006) identified the need forknowledge of conceptual understanding, and the ability to plan learning sequences todevelop students’ understanding, as essential to achieve excellence in teachingmathematics. Thus, student teachers need to develop deep understanding of conceptsthey are expected to teach their future students. The underlying philosophy andtheoretical principles of the New South Wales Board of Studies’ K–10 MathematicsSyllabus (NSWBOS, 2002) also encourage the development of students’ conceptualunderstanding through an appropriate sequencing of learning activities andimplementation of working and communicating mathematically strategies. This paperargues for the application of the metacognitive tools, hierarchical concept maps (cmaps)and vee diagrams (v-diagrams), and the innovative processes of concept mapping andvee diagramming as viable strategies (a) for developing students’ conceptualunderstanding and (b) for facilitating the design of learning activities.
Literature review of concept mapping and vee diagrams
Ausubel’s theory of meaningful learning underpins concept mapping particularly itsprinciple that learners’ cognitive structures are hierarchically organised with moregeneral, superordinate concepts subsuming less general and more specific concepts.Linking new concepts to existing cognitive structures may occur via progressivedifferentiation (reorganisation of existing knowledge under more general ideas) and/orintegrative reconciliation (synthesising many ideas into one or two when apparentcontradictory ideas are reconciled) (Ausubel, 2000; Novak & Canãs, 2006). Byconstructing cmaps/v-diagrams, students illustrate publicly their interpretation andunderstanding of topics/problems. Hierarchical cmaps were first introduced by Novak
* Paper accepted by peer review
Mathematics: Essential for Learning, Essential for Life
© The Australian Association of Mathematics Teachers Inc.
113
as a research tool to illustrate the hierarchical interconnections between main concepts(nodes) in a knowledge domain with descriptions of the interrelationships (linkingwords) on the connecting lines. The basic semantic unit (proposition) describes ameaningful relationship as shown by the triad
valid nodevalid linking words valid node
(Novak & Canãs, 2006; Novak & Gowin, 1984). V-diagrams, in contrast, wereintroduced by Gowin as an epistemological tool, in the shape of a vee that iscontextualised in the phenomenon to be analysed. The vee’s left side depicts thephilosophy and theoretical framework, which drive the analysis to answer the focusquestion. On the vee’s right side are the records, methods of transforming the records toanswer the focus question and value claims. The epistemological vee was later modified(Afamasaga-Fuata’i, 1998, 2005) to one that is focussed on guiding the thinking andreasoning involved in solving a mathematics problem (an example is discussed later).
Numerous studies examined the use of cmaps and/or v-diagrams as assessment toolsof students’ conceptual understanding over time in the sciences (Novak & Canãs, 2004;Brown, 2000; Mintzes, Wandersee & Novak, 2000) and mathematics (Afamasaga-Fuata’i, 2004; Schmittau, 2004; Liyanage & Thomas, 2002; Williams, 1998). Forexample, investigations of the usefulness of cmaps/v-diagrams to illustrate universitystudents’ evolving understanding of mathematics topics found students’ mappedknowledge structure became increasingly complex and integrated as a consequence ofmultiple iterations of the processes of presentation critique revisions presentation over the semester (Afamasaga-Fuata’i, 2004). Two primary studentteachers receiving the same instruction on the historical and conceptual development of“multiplication”, each constructed vastly different cmaps, “one internalised the conceptin its systemic interconnections, while the other continued to see it through formalisticlens” (Schmittau, 2004, p. 576). Others also demonstrated the value of cmaps aspedagogical planning tools to provide an overview of a topic (Brahier, 2005) or toanalyse mathematics lessons (Liyanage & Thomas, 2002). As a consequence of in-classconcept mapping activities, presentations and critiques and independent practice, asecondary student teacher constructed topic cmaps, which explicitly illustrated both theconceptual development of derivatives and an implicit sequence of lessons (Afamasaga-Fuata’i, 2006). Research also demonstrated the usefulness of v-diagrams to scaffoldstudents’ thinking and reasoning and to illustrate their understanding of theinterconnections between theory and application in mathematics problem solving(Afamasaga-Fuata’i, 2005), scientific inquiry (Mintzes, Wandersee & Novak, 2000) andepistemological analysis (Novak & Gowin, 1984, Chang, 1994). In summary, theliterature shows three uses of cmaps/v-diagrams that are relevant to teacher education.Firstly, cmaps/v-diagrams as learning tools to illustrate students’ evolving knowledgeand understanding of a content domain. Secondly, cmaps/v-diagrams as analytical toolsto scaffold the content analysis of topics or problems. Thirdly, cmaps/v-diagrams aspedagogical tools to organise and sequence teaching and learning activities using theresults from the content analyses of syllabus outcomes.
• Learning tools. Individuals construct cmaps/v-diagrams to prompt thedevelopment of deeper understanding of the conceptual structure of mathematicstopics and the reinforcement of connections between mathematical principles andtheir applications in problem solving. The constructive activities can result in asingle cmap/v-diagram, which is a visual snapshot of a student’s knowledge,

Mathematics: Essential for Learning, Essential for Life
© The Australian Association of Mathematics Teachers Inc.
114
understanding and skills at that time. Alternatively, the activities may be repeatedover a period of time, with social critiques and revisions in-between presentations.The resulting parade of progressive cmaps/v-diagrams, records the developmentaltrend of students’ increasingly sophisticated knowledge, understanding and skills.Having school students individually or collaboratively construct cmaps/v-diagrams is a viable “assessment for learning” and “assessment of learning”strategy.
• Analytical tools. Student teachers construct cmaps/v-diagrams to visually displaytheir interpretations and content analyses of syllabus outcomes. The displayedlanguage, principles, concepts, methods and interconnections should bedevelopmentally appropriate to be commensurate with the staged outcomes of therelevant syllabus.
• Pedagogical tools. Student teachers construct cmaps/v-diagrams to plan teachingand learning sequences, by distinguishing between prior, new and futureknowledge to facilitate developmental teaching and learning approaches. Teacher-constructed cmaps/v-diagrams (of topics, problems or activities) can be used asadvance organisers to scaffold instruction and assessment.
The focus question for this paper is: In what ways do hierarchical concept maps andvee diagrams facilitate the development of primary student teachers’ deepunderstanding of mathematics? Figure 1 shows a hierarchical cmap which describes thepaper’s main ideas. The data presented is from a case study of a BEd (Primary) studentteacher (Susan) who was concept mapping and vee diagramming over a semester, in herthird year mathematics education unit.
Methodology
The case study started with a familiarisation phase in which Susan was introduced to themetacognitive strategies of concept mapping and vee diagramming using simple topicssuch as fractions and operations with fractions. The main project for the unit requiredSusan to construct a comprehensive, hierarchical cmap of a mathematics topic to beselected from the primary mathematics syllabus, and v-diagrams of related problems,which demonstrate the applications of the mapped concepts. There were three phases tothe project. The first phase required Susan to compile an initial list of concepts, basedon a content analysis of the relevant syllabus outcomes, to construct an initial topiccmap and v-diagrams of two problems. These were presented and critiqued in classbefore further revision and expansion. The second phase involved the presentation of amore structurally complex, expanded cmap and v-diagrams of more problems. Thesewere socially critiqued and returned for further revision and expansion. The third phasewas the final submission of a more comprehensive, hierarchical topic cmap and more v-diagrams of related problems and activities, which extend previous work andincorporate comments from previous critiques, and a reflection journal of her cmap andv-diagram experiences. Data collected included cmaps/v-diagrams from thefamiliarisation phase and three phases of the main project including a reflection journal.This paper presents samples of Susan’s submitted work to illustrate the application ofcmaps and v-diagrams as analytical and pedagogical tools for the topic “division”.

Mathematics: Essential for Learning, Essential for Life
© The Australian Association of Mathematics Teachers Inc.
115
Findings
Samples of Susan’s individually constructed cmaps/v-diagrams are shown to indicateher interpretations of the relevant syllabus outcomes and her conceptual understandingof division problems.
Figure 1. A hierarchical concept map of the paper.

Mathematics: Essential for Learning, Essential for Life
© The Australian Association of Mathematics Teachers Inc.
116
Shown in Figure 2 is Susan’s v-diagram of a problem “What is 4263 divided by 9?”.The v-diagram’s left side is called the Thinking Side while the right side is the DoingSide. The latter displays the given information, methods, and answer to the focusquestion including useful things learnt or potential directions for future extension whilethe former illustrates the relevant conceptual information (mathematical principles andmain concepts) and including statements of one’s mathematical beliefs.
Figure 2. Susan’s vee diagram of a division problem.
Displayed in Figure 2 are the results of Susan’s content analysis of the relevantsyllabus outcomes on the Thinking Side in terms of the mathematical principles fordivision of 4 digit numbers (underneath What do I know already?). These principlesunderpin the two methods of solutions displayed on the Doing Side (underneath How doI find my answers?). The main and relevant concepts (i.e., What are the importantideas?) are listed as “division (and) remainders”. At the tip of the vee is the mainlearning activity, namely, the given problem statement. Moving onto the right side ofthe vee, the given information is “4263 ÷ 9” (underneath What is the informationgiven?) and the answer “
3
247342639 = ” (underneath What are my answers to the
question?). At the top right corner are Susan’s perceptions of What are the most usefulthings I learnt?, or, alternatively, Where do I go from here? or What is the futurelearning? as a result of solving the problem. These are “remainders as decimals ratherthan fractions” and “short division”, as potential topics for future learning activities.Directly on the opposite side of the v-diagram are Susan’s mathematical beliefs (Why Ilike mathematics?) as contextualised in this particular problem, namely, “It incorporatesseveral concepts i.e., multiplication, division and remainders.” In summary, the v-diagram displays, on the left, the relevant mathematical principles and concepts,expressed in the appropriate language for primary students at Stage 3 (10–11 year-oldstudents) (NSWBOS, 2002) with the two methods of solving the problem on the right.Susan’s mathematical beliefs are on the left with suggestions for future learning on theright.

Mathematics: Essential for Learning, Essential for Life
© The Australian Association of Mathematics Teachers Inc.
117
A cmap of the problem (Figure 3) was constructed using the theoretical informationdisplayed on the Thinking Side, namely, the entries for What do I know already? andWhat are the important ideas?
Figure 3. Susan’s concept map of the division problem.
Constructing a cmap challenged Susan to meaningfully organise the nodes (concepts)to demonstrate her deep understanding of their interconnectedness and of theirapplications in solving the problem. The cmap’s focus question was “What is 4263divided by 9?” The cmap illustrates the process of finding an answer to the problem andincluding the relevant syllabus indicator (division of a 4 digit number by a 1 digit
Mathematics: Essential for Learning, Essential for Life
© The Australian Association of Mathematics Teachers Inc.
118
number), main concepts (mental strategy, written strategy, breaking down, shortdivision, long division, and remainder), relevant concepts (fractions, decimals,equivalent/simple fraction), and various illustrative examples; e.g.,
9 426633
473 69
) and 69
.
The top two-thirds of the cmap illustrates the process and linked concepts (from therelevant syllabus outcomes) with rich descriptions of interconnections before merging atnode “
3
2473 ”, which thereafter shows the relevant concepts “fractions” and “decimals”
applied to the “remainder”. The latter was flagged in the “future learning” section (topright of the Doing Side) of the v-diagram, as a potential extension to the current divisionproblem. The conceptual meaning of remainder and its different representations arefurther encapsulated by the second principle (underneath What do I know already?) onthe v-diagram. In summary, the cmap illustrates the connections between different typesof strategies and methods, illustrative examples of strategies and concepts, and types ofrepresentations of the remainder. Further to showing the two methods on the v-diagram,the cmap also includes “future learning”, namely, a third method (short division) anddecimal representations of the remainder and final answer.
Evidently, the combined usage of a v-diagram and cmap to analyse a problem(guided by the relevant syllabus outcomes), was an effective combination to cogentlycommunicate the richness of meanings that exist between mathematics principles, mainconcepts and methods. Susan’s v-diagram and cmap of the simple division problemrepresent the “expert” view of division in primary mathematics and the teacher’sconceptual view of the division curriculum to be taught.
Discussion
The presented data is only a sample of Susan’s work over the semester. However, itvisually illustrated the richness of information that can be captured by the combinedusage of cmaps and v-diagrams in analysing syllabus outcomes and mathematicalproblem solving. Through her statements of mathematical principles using theappropriate mathematical language (v-diagram), Susan captured the conceptual anddevelopmental essence of division as recommended in the syllabus outcomes. The cmapon the other hand, visually illustrated the two strategies to be promoted in primarymathematics, as well as making explicit visual connections between division, remainderand relevant prior knowledge. Future extensions of the current problem are displayed asdecimal representation of the remainder and the short division method. The rich linkingwords describing the nature of the interrelationships between nodes resulted in validpropositions. The latter converted the hierarchical cmap into a network of meaningful,interconnecting propositions that coherently describe an answer to the cmap’s focusquestion.
Susan’s cmap/v-diagram both demonstrated that a deep understanding of the divisionconcept can be developed and reinforced. The v-diagram structure provided not only thespace to express one’s mathematical beliefs and critical reflections, but also projectionsfor future learning as evident from Susan’s rationale for an activity sequence. Overall,constructing cmaps/v-diagrams evidently encouraged Susan to move beyond aprocedural view to a more conceptually based justification of methods and a purposefuland clearer understanding of sequencing prior, new and future learning activities tominimise student confusion. Findings from this paper contributes knowledge to the
Mathematics: Essential for Learning, Essential for Life
© The Australian Association of Mathematics Teachers Inc.
119
literature on (a) the pedagogical use of concept mapping in mathematics as a means ofdeveloping deep understanding of mathematics concepts and (b) the innovative use ofv-diagrams to display prior and new knowledge and future learning directions.
Implications
The visual display of the theoretical and procedural information of a problem, on acmap and a v-diagram, effectively encapsulated the interconnection between theKnowledge and Skills and Working Mathematically Syllabus Outcomes. This suggeststhe potential educational value of regularly exposing primary students to the strategiesof concept mapping and vee diagramming to enhance and develop both their conceptualand procedural understanding of mathematics. Doing so would necessarily enableworking and communicating mathematically amongst students in the classroom. Havingstudents construct their own cmaps and v-diagrams before and after a topic, as part oftheir normal mathematics classroom practices, is an area worthy of furtherinvestigation.
References
Afamasaga-Fuata’i, K. (2006). Innovatively developing a teaching sequence using concept maps. In A.Canãs & J. Novak (Eds), Concept Maps: Theory, Methodology, Technology. Proceedings of theSecond International Conference on Concept Mapping, Volume 1, (pp. 272–279). San Jose, CostaRica: Universidad de Costa Rica.
Afamasaga-Fuata’i, K., (2005). Students’ conceptual understanding and critical thinking? A case forconcept maps and vee diagrams in mathematics problem solving. In M. Coupland, J, Anderson & T.Spencer, (Eds), Making Mathematics Vital. Proceedings of the Twentieth Biennial Conference of theAustralian Association of Mathematics Teachers (pp. 43–52). Adealide: AAMT.
Afamasaga-Fuata’i, K. (2004). Concept maps and vee diagrams as tools for learning new mathematicstopics. In A. J. Canãs, J. D. Novak & Gonázales (Eds), Concept Maps: Theory, Methodology,Technology (Proceedings of the First International Conference on Concept Mapping September14–17, 2004, pp. 13–20). Dirección de Publicaciones de la Universidad Pública de Navarra, Spain.
Afamasaga-Fuata’i, K. (1998). Learning to Solve Mathematics Problems Through Concept Mapping &Vee Mapping. National University of Samoa.
Australian Association of Mathematics Teachers (2006). Standard for Excellence in TeachingMathematics in Australian Schools. Retrieved on 12 February 2006 fromhttp://www.aamt.edu.au/standards/standxtm.pdf.
Ausubel, D. P. (2000). The Acquisition and Retention of Knowledge: A Cognitive View. Dordrecht;Boston: Kluwer Academic Publishers.
Brahier, D. J. (2005). Teaching Secondary and Middle School Mathematics (2nd Ed). New York: PearsonEducation.
Brown, D. S. (2000). The effect of individual and group concept mapping on students’ conceptualunderstanding of photosynthesis and cellular respiration in three different levels of biology classes.Dissertation Abstracts International AADAA-I9970734, University of Missouri, Kansas City.
Chang, T. (1994). Taiwanese students’ epistemological commitments and research knowledgeconstruction (Chinese). Dissertation Abstracts International AAD94-16683, Cornell University, NewYork.
Liyanage, S. & Thomas, M. (2002). Characterising secondary school mathematics lessons using teachers’pedagogical concept maps. Proceedings of the 25th annual conference of the Mathematics EducationResearch Group of Australasia (pp. 425–432). University of Auckland, New Zealand.
Mintzes, J. J., Wandersee, J. H. & Novak, J. D. (Eds) (2000). Assessing Science Understanding: AHuman Constructivist View. San Diego, California, London: Academic.
New South Wales Board of Studies (NSWBOS) (2002). K–6 Mathematics Syllabus. Sydney, Australia:NSWBOS.

Mathematics: Essential for Learning, Essential for Life
© The Australian Association of Mathematics Teachers Inc.
120
Novak, J. D. & Canãs, A. J. (2006). The theory underlying concept maps and how to construct them.Technical Report IHMC Cmap Tools 2006-01, Florida Institute for Human and Machine Cognition,2006, available at:http://cmap.ihmc.us/publications/ResearchPapers/TheoryUnderlyingConceptMaps.pdf.
Novak, J. D. & Gowin, D. B. (1984). Learning How to Learn. Cambridge University Press.
Schmittau, J. (2004). Uses of concept mapping in teacher education in mathematics. In A. J. Canãs, J. D.Novak & Gonázales (Eds), Concept Maps: Theory, Methodology, Technology. Proceedings of theFirst International Conference on Concept Mapping September 14–17, 2004 (pp. 571–578). Navarra:Dirección de Publicaciones de la Universidad Pública de Navarra, Spain.
Williams, C. G. (1998). Using concept maps to assess conceptual knowledge of function. Journal forResearch in Mathematics Education, 29, (4), 414–421.
© The Australian Association of Mathematics Teachers Inc.
121
Sketching graphs from verbal,rather than numerical, information*
Tony Bill
University of Tasmania
Contemporary statistics education research emphasises the development ofintuitions and sense-making and the cultivation of students’ ability to communicateorally, in writing, numerically, and using graphs. Tasks with data-free scenariosprovide students with an opportunity to look beyond procedures and themechanical aspects of data-processing. This article describes a series of threetasks in which students sketched graphs directly from verbal, rather thannumerical, information. The tasks also allowed students to develop a deeperunderstanding of the purpose of creating a graph. The performance of the studentswas superior to that reported by other researchers.
Introduction
A criticism of traditional statistics education is the emphasis on calculation andprocedural competence at the expense of the development of intuitions and sense-making. Influential statistics education researchers (Mokros & Russell, 1995; Garfield& Ben-Zvi, 2004) have argued that traditional teaching actively interfered withstudents’ natural intuitive sense and obscured “the big ideas of statistics”.
A key recommendation of current statistics education research is that teachers shouldfacilitate the development of a classroom culture where students communicate theirunderstanding through class discussion, written work, numerically, and the focus of thisarticle: graphs.
To encourage the development of intuitive notions and to shift teaching practicesaway from procedures, Garfield (2003) recommended the inclusion of data-freescenarios when teaching statistics. Bakker and Gravemeijer (2004) recommendedstudents should be given the opportunity to construct their own representations ofinformation. Mevarech and Kramarsky (1997), in a study of Year 8 students, reportedthat only one quarter of students could create what they considered a robust graphicalrepresentation directly from verbal information. Rossman and Chance (cited in Garfield,2003) reversed the traditional sequence of students’ statistical analysis, and providedstudents with tasks matching verbal descriptions to plots of data. Friel et al. (2001), in astudy of critical factors in comprehension of graphs, recommended tasks where studentswere encouraged to “read the data, read between the data, and finally, to read beyondthe data”. The use of graphical representations may also provide an alternative learningpathway, particularly for visual learners.
* Paper accepted by peer review
Mathematics: Essential for Learning, Essential for Life
© The Australian Association of Mathematics Teachers Inc.
122
Method and results
The three tasks were part of a two-week research study of the statistical concept ofdistribution. The study was conducted with a Year 9 class of 29 students in a Hobartmetropolitan co-education high school.
The first of the three tasks was highly “scaffolded” and conducted in a conventionalclassroom, where students were supported by teacher instruction, classroom discussion,and interaction with their peers. The statistics education software Fathom, a product ofKey Curriculum Press, was used as a teaching aid. In tasks two and three studentsworked independently under traditional examination conditions.
A principal objective of the research study was the introduction of continuousdistributions as a foundation for the study of normal distributions, in more senior years.All three tasks were selected to provide a familiar context for students. The researcheremphasised to students that the graphs they sketched should “tell a story”. All tasksallowed for a wide-range of responses — all students submitted graphs — but morecapable students were able to demonstrate their understanding by producing a moresophisticated response.
Task 1: Cross country run
The Cross-country Run task was based upon a task developed by Bakker andGravemeijer (2004).
Scaffolding and cues for the task was provided by an introductory exerciseexamining the “Murders in Chicago” dataset, supplied with the education statisticssoftware Fathom. A data projector displayed a Fathom-generated dot-plot as an imageon a whiteboard. The relatively large database of 1670 sample points allowed theconstruction of a smoothed continuous curve. The task was constructed in three stages.Firstly, a whole-class discussion of the dot-plot representation of the “Murders inChicago” data set identified the key features of the distribution. Secondly, the studentswere asked to copy the distribution from the whiteboard. Copying a 1670 sample pointdistribution is clearly impracticable, and the class responded accordingly. Theresearcher sketched an outline of the dot-plot to demonstrate that a smoothed curve canaccurately convey the essential features of a distribution. Finally, the “Cross-countryrun” worksheet was distributed to the students. Students were asked to sketch the threedistributions demonstrating how the performance of a class of students, as shown by thetime taken to complete a 5 km run, had improved through training. Additionalscaffolding was provided by aligning the “set of three” axes vertically to allow easiercomparison of the three graphs. The researcher again emphasised that the graphs should“tell a story.”
A Year 9 group is training for a school 5 km cross-country race. The race is to beheld in 6 weeks time. The students have decided to train for an hour, 3 days everyweek leading up to the race. The training program includes a 5 km run every week.To monitor their improvement, they want to make three graphs: one before thetraining program starts, one halfway through the training program and the thirdgraph at their final training session three days before the cross-country race.Draw three graphs that “tell” the following story:Graph 1: Before training started, some students were slow and some students werealready very fast. The fastest ran the 5 km in 22 minutes. Most of the students wereon the slow side.
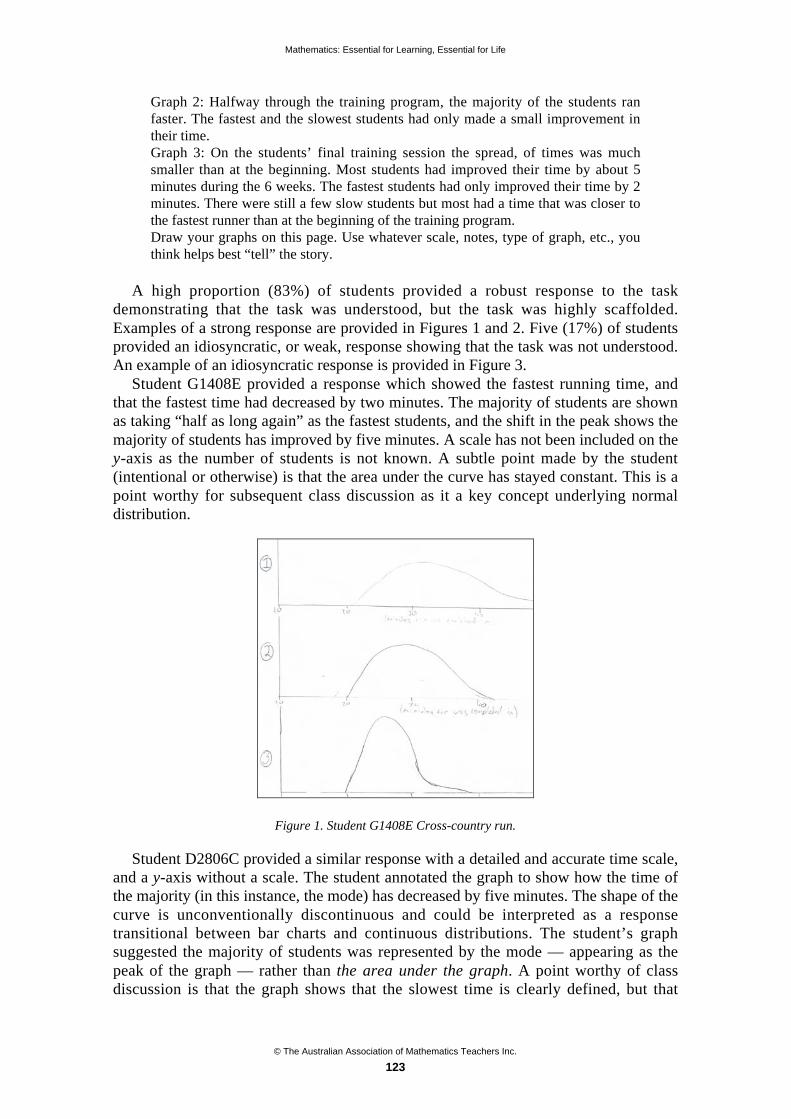
Mathematics: Essential for Learning, Essential for Life
© The Australian Association of Mathematics Teachers Inc.
123
Graph 2: Halfway through the training program, the majority of the students ranfaster. The fastest and the slowest students had only made a small improvement intheir time.Graph 3: On the students’ final training session the spread, of times was muchsmaller than at the beginning. Most students had improved their time by about 5minutes during the 6 weeks. The fastest students had only improved their time by 2minutes. There were still a few slow students but most had a time that was closer tothe fastest runner than at the beginning of the training program.Draw your graphs on this page. Use whatever scale, notes, type of graph, etc., youthink helps best “tell” the story.
A high proportion (83%) of students provided a robust response to the taskdemonstrating that the task was understood, but the task was highly scaffolded.Examples of a strong response are provided in Figures 1 and 2. Five (17%) of studentsprovided an idiosyncratic, or weak, response showing that the task was not understood.An example of an idiosyncratic response is provided in Figure 3.
Student G1408E provided a response which showed the fastest running time, andthat the fastest time had decreased by two minutes. The majority of students are shownas taking “half as long again” as the fastest students, and the shift in the peak shows themajority of students has improved by five minutes. A scale has not been included on they-axis as the number of students is not known. A subtle point made by the student(intentional or otherwise) is that the area under the curve has stayed constant. This is apoint worthy for subsequent class discussion as it a key concept underlying normaldistribution.
Figure 1. Student G1408E Cross-country run.
Student D2806C provided a similar response with a detailed and accurate time scale,and a y-axis without a scale. The student annotated the graph to show how the time ofthe majority (in this instance, the mode) has decreased by five minutes. The shape of thecurve is unconventionally discontinuous and could be interpreted as a responsetransitional between bar charts and continuous distributions. The student’s graphsuggested the majority of students was represented by the mode — appearing as thepeak of the graph — rather than the area under the graph. A point worthy of classdiscussion is that the graph shows that the slowest time is clearly defined, but that
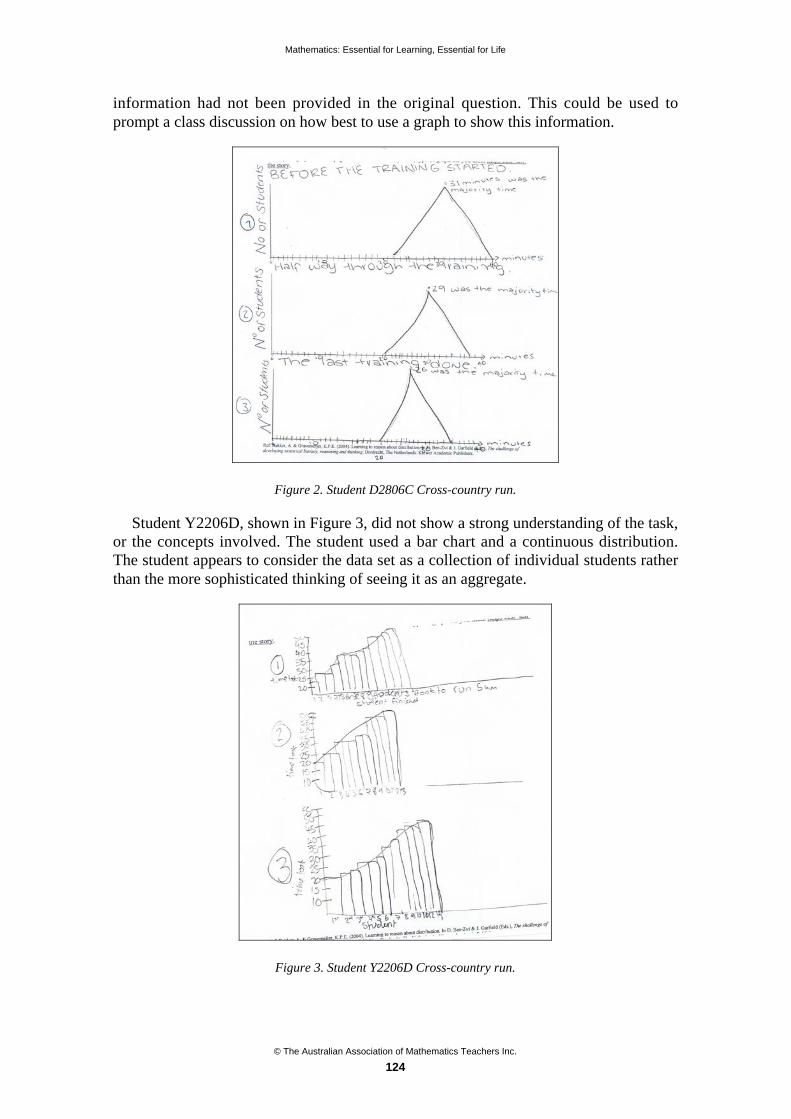
Mathematics: Essential for Learning, Essential for Life
© The Australian Association of Mathematics Teachers Inc.
124
information had not been provided in the original question. This could be used toprompt a class discussion on how best to use a graph to show this information.
Figure 2. Student D2806C Cross-country run.
Student Y2206D, shown in Figure 3, did not show a strong understanding of the task,or the concepts involved. The student used a bar chart and a continuous distribution.The student appears to consider the data set as a collection of individual students ratherthan the more sophisticated thinking of seeing it as an aggregate.
Figure 3. Student Y2206D Cross-country run.
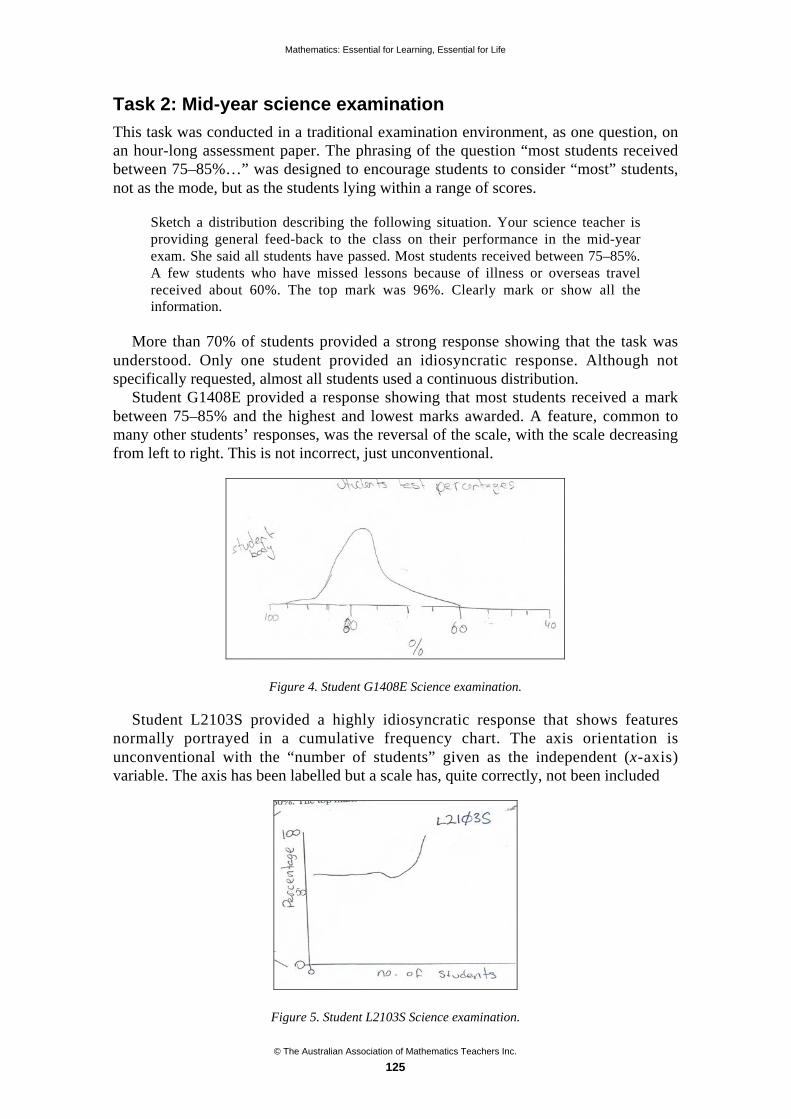
Mathematics: Essential for Learning, Essential for Life
© The Australian Association of Mathematics Teachers Inc.
125
Task 2: Mid-year science examination
This task was conducted in a traditional examination environment, as one question, onan hour-long assessment paper. The phrasing of the question “most students receivedbetween 75–85%…” was designed to encourage students to consider “most” students,not as the mode, but as the students lying within a range of scores.
Sketch a distribution describing the following situation. Your science teacher isproviding general feed-back to the class on their performance in the mid-yearexam. She said all students have passed. Most students received between 75–85%.A few students who have missed lessons because of illness or overseas travelreceived about 60%. The top mark was 96%. Clearly mark or show all theinformation.
More than 70% of students provided a strong response showing that the task wasunderstood. Only one student provided an idiosyncratic response. Although notspecifically requested, almost all students used a continuous distribution.
Student G1408E provided a response showing that most students received a markbetween 75–85% and the highest and lowest marks awarded. A feature, common tomany other students’ responses, was the reversal of the scale, with the scale decreasingfrom left to right. This is not incorrect, just unconventional.
Figure 4. Student G1408E Science examination.
Student L2103S provided a highly idiosyncratic response that shows featuresnormally portrayed in a cumulative frequency chart. The axis orientation isunconventional with the “number of students” given as the independent (x-axis)variable. The axis has been labelled but a scale has, quite correctly, not been included
Figure 5. Student L2103S Science examination.

Mathematics: Essential for Learning, Essential for Life
© The Australian Association of Mathematics Teachers Inc.
126
Task 3: Metro bus-service
This task was also conducted under traditional examination conditions, and included inthe same examination paper as Task 2.
Sketch a distribution describing the following situation. As the principal privatesecretary to the Minister of Transport, you have been asked to sketch a distributionof the performance of the Metro bus service. Your minister is keenly aware that thevoting public expect the buses to run on time.By definition, any bus arriving more than 4 minutes behind schedule is late.Almost all buses arrive within 4 minutes of the scheduled time. About 5 percentarrive late and a few buses in non-peak times arrive early. Occasionally buses donot arrive at all. Clearly mark or show all the information.
This is a more complex task designed to extend students to the limit of theirknowledge and skill. Students provided a rich range of responses including continuousdistributions (45%), bar charts (36%), dot plots and tally sheets, and idiosyncraticresponses that appear to be based upon cumulative frequency graphs. The use of barcharts was an unintended outcome, as the research study had focussed on continuousdistributions. The strong response of students using bar charts showed that manystudents had made a considered decision as how best to represent the information.
A significant and sophisticated feature of one student’s response (Figure 6) was theuse of negative numbers to describe buses that had arrived early. A point worthy ofclass discussion is that the distribution shows buses are as likely to arrive early as late,but this is entirely consistent with the statement “almost all buses arrive within fourminutes of the scheduled time.”
Figure 6. Student G1408E Metro bus-service.
Several students used bar charts, but in two distinctly different ways. StudentL2103S used time as the independent x-axis, but was then faced with the problem ofhow to include buses that “did not arrive at all”; i.e., at infinity. This student resolvedthis difficulty by including this information as a separate category in the top left handcorner of the chart. This was a far superior response to ignoring or not including thiscategory of responses. The time axis showed the student using negative number todescribe buses that arrived early.

Mathematics: Essential for Learning, Essential for Life
© The Australian Association of Mathematics Teachers Inc.
127
Figure 7. Student L2103S Metro bus-service.
Student N2208B used a bar chart, but the bars represent categories of whether thebus had arrived early, on-time, late, or not at all. On reflection, this chart mostaccurately, concisely and effectively portrays the information provided in the question.
Figure 8. Student N2208B Metro bus-service.
Student N1902P provided a sophisticated response which sought to convey busarrival times at various times of the day. The area of the discs represents the number orfrequency of buses, and the student is clearly intending to show that, in non-peak timesof morning and afternoon, buses are likely to arrive early.

Mathematics: Essential for Learning, Essential for Life
© The Australian Association of Mathematics Teachers Inc.
128
Figure 9. Student N1902P Metro bus-service.
Discussion
The first task, the cross-country run, was a complex task. To successfully complete thetask students identified the key information, and simultaneously addressed the rangeand the area beneath the distribution representing the majority of the student times. Thethree component graphs must also be addressed simultaneously, as the three graphsmust be linked to demonstrate the decrease in students’ running times.
Tasks 2 and 3 were less complex, but were also less supported. Neither of the twotasks required students to make a comparison between graphs.
All three tasks involved constructing graphs without using data. To complete thetasks, students needed to convey a deeper understanding of the information, rather thanconstructing the graph applying a set procedure to a data-set. “Sense-making” hasapplication in statistics, algebra and mathematical modelling.The range of student responses provided a rich resource for subsequent class discussion.
The tasks did not allow student development to be demonstrated, as the first task wasthe most complex, but also the most highly supported. Tasks 2 and 3 were conducted intraditional examination conditions where students worked independently.
Students’ performance on this series of tasks — although assessed under differentcriteria — may have been superior to that found by other researchers. The study ofMevarech and Kramarsky (1997) found a quarter of students correctly transform tographic representation; this study showed three-quarters of Year 9 students couldconstruct another representation.
A key recommendation of contemporary statistics education research is thecultivation of students’ ability to communicate their understanding of key statisticalconcepts. This understanding can be communicated in a number of ways. Students whoare not confident writers could convey their understanding in classroom discussion;students who do not have the self-confidence to participate in classroom discussion,may prefer to give a written explanation; and visual learners might find graphicalrepresentations effective.
A goal of the research teaching unit was to encourage a shift in students thinkingfrom discrete, to continuous, distributions. This was designed to provide an essentialfoundation step for the introduction of continuous normal distribution, at more seniorschool years. Students’ responses indicated that the first tentative steps to anunderstanding of continuous distributions were being taken, and that the construction

Mathematics: Essential for Learning, Essential for Life
© The Australian Association of Mathematics Teachers Inc.
129
and interpretation of continuous distributions were being added to students’ repertoireof skills.
The use of the bar chart in Task 3 — not the intention of the task — was note-worthy. The students had made a conscious decision to use a type of graph introducedoutside the study unit, and used in earlier school years. If an indicator of deepunderstanding is the ability to apply principles to a variety of tasks, then deepunderstanding had been demonstrated.
Recommendation for teaching
• Include data-free, or largely data-free, scenarios when teaching statistics.
• Cultivate a sense that a graph must “tell a story”.
• Use students’ work as a resource for class discussion.
References
Bakker, A. & Gravemeijer, K. P. E. (2004). Learning to reason about distribution. In D. Ben-Zvi & J.Garfield (Eds), The Challenge of Developing Statistical Literacy, Reasoning and Thinking (pp.146–168). Dordrecht, The Netherlands: Kluwer Academic Publishers.
Friel, S. N., Curcio, F. R. & Bright, G. W. (2001) Making sense of graphs: critical factors influencingcomprehension and instructional implications. Journal for Research in Mathematics Education, 32(2), 124–158
Garfield, J. (2003). Assessing statistical reasoning. Statistics Education Research Journal. 2(1), 22–38.
Garfield, J. & Ben-Zvi, D. (2004). Research on statistical literacy, reasoning, and thinking: issues,challenges, and implications. In D. Ben-Zvi & J. Garfield (Eds), The Challenge of DevelopingStatistical Literacy, Reasoning and Thinking (pp. 397–410). Dordrecht, The Netherlands: KluwerAcademic Publishers.
Mevarech, Z. R. & Kramarsky, B. (1997) From verbal descriptions to graphical representation: stabilityand change in students’ alternative conceptions. Educational Studies in Mathematics, 32, 229–263.
Mokros, J. & Russell, S. J. (1995). Children’s concept of average and representativeness. Journal forResearch in Mathematics Education 26, 20–39.
© The Australian Association of Mathematics Teachers Inc.
130
Quality teaching of mathematics:Common threads and cultural differences*
Rosemary Callingham
University of New England
It is well established that Asian students achieve highly in international monitoringtests such as PISA and TIMMS. This finding has led to a considerable interest inidentifying factors that contribute towards this performance, including teachingapproaches. Two lessons observed in Chinese schools are analysed using theframework provided by the AAMT Standards and the New South Wales model ofQuality Teaching. The lessons observed shared many of the characteristicsidentified as exemplary mathematics teaching in the Australian context, althoughthere were also some differences attributable to the cultural context. Theimplications of these findings for Australian teachers are discussed.
During the development of the AAMT Standards for Excellence in TeachingMathematics, teachers from all over Australia proposed three domains of practice thatthey believed identified highly accomplished teachers of mathematics. These domains,Professional Knowledge, Professional Practice and Professional Attributes, address thediverse knowledge, skills and understanding that characterise quality teaching.Professional Knowledge is concerned with understanding students, mathematics andhow students learn mathematics; Professional Practice deals with those day-to-dayaspects of teaching such as planning and assessment; Professional Attributes focuses onthe behaviour of teachers with respect to their colleagues, the school and widercommunity. The attributes identified in the AAMT Standards are applied to individualteachers, at a personal level.
A number of studies in Australia have attempted to identify quality in teaching at theclassroom level, that is, what it is that good teachers do in their classrooms to developstudents’ understanding and develop learning e.g., Queensland School ReformLongitudinal Study, (2001); Department of Education, Science and Training; NewSouth Wales et al., (2004). In New South Wales, a model of quality teaching is used asa tool for analysing lessons with the aim of improving teacher standards and students’learning [Professional Support & Curriculum Directorate, (2003)]. This model has threedimensions, and a number of elements within each dimension, that provide a frameworkfor considering classroom practices. These are summarised in Table 1.
* Paper accepted by peer review

Mathematics: Essential for Learning, Essential for Life
© The Australian Association of Mathematics Teachers Inc.
131
Table 1. Dimensions and elements of the NSW Model of Quality Teaching.
Dimension Intellectual Quality Q u a l i t y l e a r n i n genvironment
Significance
Elements Deep knowledge Explicit quality criteria Backgroundknowledge
Deep understanding Engagement Cultural knowledge
Problematic knowledge High expectations Knowledge integration
Higher-order thinking Social support Inclusivity
Metalanguage Students’ self-regulation Connectedness
Substantivecommunication
Student direction Narrative
When the elements of the NSW model are considered against the framework of theAAMT standards, it appears that all the characteristics of highly accomplishedmathematics teachers would be called upon to deliver lessons that addressed all threedimensions, in some way. For example, planning lessons that address problematicknowledge and substantive communication requires understanding of how students’learn mathematics; engagement and explicit quality criteria implies good planning forlearning; and connectedness and cultural knowledge suggests community involvement.All of these aspects are underpinned by knowledge of, and interest in, mathematicsitself. In other words, teachers who operate in ways that meet the expectations of theQuality Teaching model, will also demonstrate many of the personal characteristicsidentified in the AAMT Standards.
There is also, currently, considerable interest in learning from Asian countriesfollowing the high performance of students from Hong Kong and Korea, for example,in international programs such as PISA [Organisation for Economic Cooperation andDevelopment, (2004)] and TIMMS [Mullis, Martin, Gonzales & Chrostowski, (2004)].Western countries are interested in understanding what teachers in these countries do toachieve such high results. Popular perception of teaching in Asian countries is that it isteacher-centred and based on “chalk-and-talk” approaches. These methods would be theantithesis of the features of exemplary teaching identified in the AAMT Standards andthe NSW model.
There are many studies attempting to characterise mathematics classrooms in diversecultural settings e.g., Clarke & Keitel, (2006). The small scale study reported here wasopportunistic, based on lessons observed during overseas travel in Hong Kong andChina. As such, it is not generalisable, nor necessarily representative of mathematicslessons in these countries. Nevertheless, it does provide an insight into what Chineseteachers perceive as quality teaching, given that in both instances the teachers wereaware of visitors to their classrooms.

Mathematics: Essential for Learning, Essential for Life
© The Australian Association of Mathematics Teachers Inc.
132
The lessons
Two lessons are described, one in a primary classroom and one in a high school.
The primary classroom lesson
The primary lesson was a demonstration lesson, focussing on technology use in amathematics classroom. The students were around 9- or 10-years old, and the lessonaddressed early ideas of permutations and combinations through a problem involvingchoosing different ways of combining teddy bear clothing.
Before the lesson started, the teacher was laughing and joking with the students as hechecked the various bits of equipment that he was going to use. The desks werearranged in rows, and each place had a set of three small teddy bears dressed in differentcoloured jumpers, together with two small teddy-sized bags in two more colours. Thechildren were excited, chattering and rushing around. Then the lesson began. Theteacher bowed formally to the children and they bowed back, sat down with their armsfolded and focussed all their attention on him. This position they maintained for thenext 40 minutes or so.
The lesson started with a short video of Deng Deng, a cartoon cat obviously familiarto the children, trying to choose a teddy bear with a bag. He had three different colouredjumpers and two bags to choose from, exactly as the children had on their desks. Theteacher obviously asked children, “What would you choose?” As the childrenresponded, they stood up, the teacher acknowledged their answer, clearly making thepoint that different combinations were possible. He then looked puzzled. How manydifferent choices were possible? He placed large cut out teddies and bags randomly onthe board, as a prompt. The class quietly began working on the problem, individually.Some used the teddies on the desks, others were getting out coloured pencils. Each childrecorded an answer in a way that appeared to make sense to them.
The teacher quickly moved round the room and chose several children to show theirsolutions on the blackboard. He had obviously chosen a variety of solutions, includingsome that would not lead to a correct response. One child was drawing each teddy,others were using coloured chalks, making lists and so on. At this point there wasclearly a discussion about the solutions and each child explained the thinking behindtheir response. Skilfully, the teacher selected two approaches and then demonstratedhow these could lead to a generalisable approach, using both the teddies he hadpreviously placed on the board and then a computer animation to illustrate a tree-diagram approach to the problem. He then posed the extension problem of adding in anextra bear. The children quickly responded as a class. Several related problems werethen shown: routes from school to home via the park or the temple, food choices fordinner, and so on. In each case the solution was sought from the group rather than fromindividuals. The lesson ended with the teacher asking the children if they had enjoyedthemselves, to which they responded enthusiastically. The formal end of the lessoncame when the teacher and children bowed and thanked each other. At this point, thechildren lost their serious demeanour and began chattering and laughing with eachother.
The secondary classroom lesson
This lesson took place in a government secondary school in Hong Kong, in a secondyear classroom. The school was a participant in a learning oriented assessment projectthat aimed to develop teachers’ assessment skills. The lesson focus was rates and ratios,

Mathematics: Essential for Learning, Essential for Life
© The Australian Association of Mathematics Teachers Inc.
133
and three teachers chose to team teach it, an unusual situation for the class. The start ofthe lesson included a formal greeting and a brief explanation of why there were threeteachers. An initial problem was posed:
I took 1.5 hours to run 16.5 km on one day and 2 hours to run 20 km on the nextday. Had my performance improved? Explain your answer.
The students were unused to being asked to explain their thinking and it was obviousthat, for some, this was difficult. After some time in which each student worked on theproblem in silence, the teacher collected the responses and then chose several studentsto explain their responses. The students’ answers varied. One student admitted he hadno idea how to do the problem; another pointed out that it was unrealistic because no-one could maintain the same rate for two hours; others explained their response in termsof the amount of time taken or the distance run; and others used rates as a justification.The teacher asked students to comment on these responses, gradually establishing theidea of a rate.
A second teacher then took over the class. He extended the idea of a rate into thetopic of apartment rentals. In Hong Kong, apartments are measured in square feet so thestudents were asked to work on several problems, from their text book, that involvedcomparing cost per square foot. This involved some large numbers! Very little time wasgiven for completing the problems before the solutions were given and discussed.
At this point the class was beginning to be restless, shown by yawning and shufflingfeet. There was no disruptive behaviour. The third teacher took over. He was thespecialist physics teacher and showed a video comparing the speed of a snake attackwith that of a Kung Fu master. The students were engaged immediately. They sat upand watched the video with great concentration. Finally, the data shown on the videowas used to emphasise the concept of a rate and the comparison worked out formally onthe board. Incidentally, the Kung Fu Master was quicker. The lesson ended at this pointwith homework being set and a formal completion to the class time.
Discussion
Both lessons were impressive to watch. The students were engaged and workeddiligently on the problems posed, but also appeared to enjoy themselves. Therelationships between the teachers and the students were relaxed and it was evident thatstudents had no fear of making mistakes in the ways that they responded to thequestions. The subject matter presented was appropriate for the students concerned andthe stimulus material, such as the cartoon and the teddies and the video, certainly strucka chord in the students. In terms of the model of Quality Teaching, both lessons hadSignificance, characterised by the Background Knowledge (the cartoon, video),Connectedness (using familiar situations such as food for dinner and rental rates) andsome elements of narrative (the story of the cat). A Quality Learning Environment wasalso evident in the students’ Engagement, which appeared genuine. The HighExpectations and the Social Support ,that was implicit in the way that the studentsanswered questions, also suggested a Quality Learning Environment. In terms ofIntellectual Quality the lessons were impressive. Both lessons had a single focus(permutations and combinations; rates and ratios) and this was explored in differentways showing Deep Knowledge. Both lessons centred on Problematic Knowledge,through their starting points, and Substantive Communication was also present.
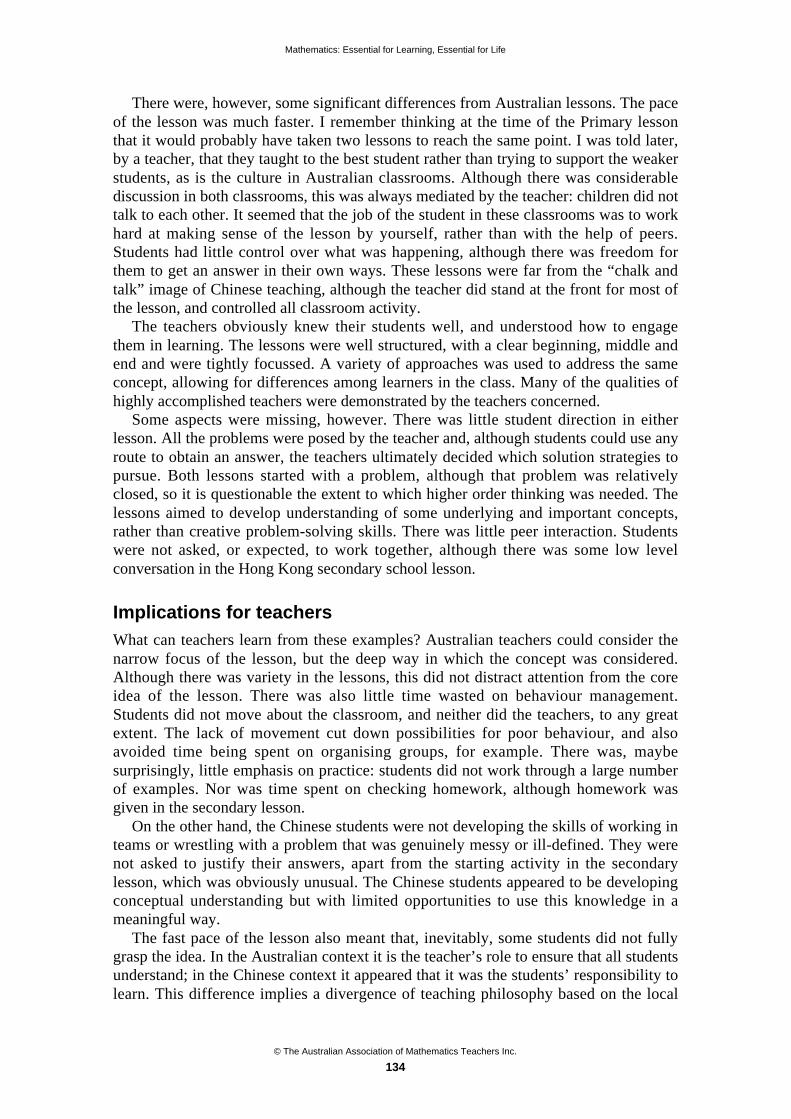
Mathematics: Essential for Learning, Essential for Life
© The Australian Association of Mathematics Teachers Inc.
134
There were, however, some significant differences from Australian lessons. The paceof the lesson was much faster. I remember thinking at the time of the Primary lessonthat it would probably have taken two lessons to reach the same point. I was told later,by a teacher, that they taught to the best student rather than trying to support the weakerstudents, as is the culture in Australian classrooms. Although there was considerablediscussion in both classrooms, this was always mediated by the teacher: children did nottalk to each other. It seemed that the job of the student in these classrooms was to workhard at making sense of the lesson by yourself, rather than with the help of peers.Students had little control over what was happening, although there was freedom forthem to get an answer in their own ways. These lessons were far from the “chalk andtalk” image of Chinese teaching, although the teacher did stand at the front for most ofthe lesson, and controlled all classroom activity.
The teachers obviously knew their students well, and understood how to engagethem in learning. The lessons were well structured, with a clear beginning, middle andend and were tightly focussed. A variety of approaches was used to address the sameconcept, allowing for differences among learners in the class. Many of the qualities ofhighly accomplished teachers were demonstrated by the teachers concerned.
Some aspects were missing, however. There was little student direction in eitherlesson. All the problems were posed by the teacher and, although students could use anyroute to obtain an answer, the teachers ultimately decided which solution strategies topursue. Both lessons started with a problem, although that problem was relativelyclosed, so it is questionable the extent to which higher order thinking was needed. Thelessons aimed to develop understanding of some underlying and important concepts,rather than creative problem-solving skills. There was little peer interaction. Studentswere not asked, or expected, to work together, although there was some low levelconversation in the Hong Kong secondary school lesson.
Implications for teachers
What can teachers learn from these examples? Australian teachers could consider thenarrow focus of the lesson, but the deep way in which the concept was considered.Although there was variety in the lessons, this did not distract attention from the coreidea of the lesson. There was also little time wasted on behaviour management.Students did not move about the classroom, and neither did the teachers, to any greatextent. The lack of movement cut down possibilities for poor behaviour, and alsoavoided time being spent on organising groups, for example. There was, maybesurprisingly, little emphasis on practice: students did not work through a large numberof examples. Nor was time spent on checking homework, although homework wasgiven in the secondary lesson.
On the other hand, the Chinese students were not developing the skills of working inteams or wrestling with a problem that was genuinely messy or ill-defined. They werenot asked to justify their answers, apart from the starting activity in the secondarylesson, which was obviously unusual. The Chinese students appeared to be developingconceptual understanding but with limited opportunities to use this knowledge in ameaningful way.
The fast pace of the lesson also meant that, inevitably, some students did not fullygrasp the idea. In the Australian context it is the teacher’s role to ensure that all studentsunderstand; in the Chinese context it appeared that it was the students’ responsibility tolearn. This difference implies a divergence of teaching philosophy based on the local

Mathematics: Essential for Learning, Essential for Life
© The Australian Association of Mathematics Teachers Inc.
135
culture. Whether that philosophy is transferable, or even whether transfer is desirable, isa matter for debate.
It seems clear, however, that many of the qualities of exemplary teaching identifiedin both the AAMT Standards and the Quality Teaching model are found in goodteachers and exciting classrooms in other cultures. Those aspects that were not observedmay be so culturally bound that they are applicable only in a specific context. Thisthought reminds us that we should beware of making simplistic judgements aboutteachers and teaching. All teachers, in whatever cultural situation, should avoid pressureto adopt a particular teaching style because it is apparently linked to high achievement.Teaching is a more subtle, and messier, task than such simplistic approaches imply.
References
Clarke, D. & Keitel, (Eds) (2006). Mathematics Classrooms in Twelve Countries. Rotterdam: SensePublishers.
Department of Education, Science and Training; New South Wales Department of Education andTraining; Catholic Education Commission, New South Wales; The Association of IndependentSchools of New South Wales (2004). What’s ‘Making the Difference’? Achieving OutstandingNumeracy Outcomes in NSW Primary Schools — Main Report. Canberra: Australian GovernmentDepartment of Education, Science and Technology. Availablehttp://www.dest.gov.au/sectors/school_education/publications_resources/profiles/making_the_difference_main_report.htm#publication
Lingard, B. & Ladwig, J. (2001). Queensland School Reform Longitudinal Study. Brisbane: State ofQueensland.
Mullis, I. V. S., Martin, M. O., Gonzales, E. J. & Chrostowski, S. J. (2004). TIMSS 2003 InternationalMathematics Report. Findings from IEA’s Trends in International Mathematics and Science Study atthe Fourth and Eighth Grades. Chestnut Hill, MA: Boston College
Organisation for Economic Cooperation and Development (OECD) (2004). Learning for Tomorrow’sWorld. First Results from PISA 2003. Paris: Author.
Professional Support & Curriculum Directorate, (2003). Quality Teaching in NSW Public Schools.Discussion Paper. Sydney: Author.
© The Australian Association of Mathematics Teachers Inc.
136
Year 7 students’ understandingof area measurement*
Michael Cavanagh
Macquarie University
This paper reports on a study of Year 7 students’ understanding of areameasurement. 43 students completed a written test just before and immediatelyafter studying areas of rectangles and triangles. Twelve of these students,representing the range of ability in the sample, were interviewed as they solvedthree area tasks. Results indicate that many students confuse area and perimeter,use slant and perpendicular height interchangeably, and do not understand thebasis of the formula for the area of a triangle. Implications for teaching arediscussed.
Introduction
Area measurement is an important topic in school mathematics. It has numerous real-life applications and can be applied to mathematical concepts like multiplication offractions, enlargement and similarity. Area measurement is also used by many teachersand textbooks to demonstrate number properties such as the commutative law ofmultiplication and algebraic results like the expansion of binomial expressions (Schultz,1991). A good understanding of area concepts is also essential when learning integralcalculus.
Area measurement is based on partitioning a region into equally sized units whichcompletely cover it without gaps or overlaps. Although the idea of a unit isfundamental, it is often neglected as teaching tends to focus on numerical results,ignoring the spatial relationships involved in measuring areas (Kordaki & Portari,2002). However, students need substantial experience in covering regions by drawingunit squares and noting the regularities that occur (Outhred & Mitchelmore, 2000). Withpractice, students can recognise that the array of rows (or columns) are necessarilyequivalent and can therefore be regarded as a composite unit so that rows (or columns)can be repeated instead of drawing each individual square.
It cannot be assumed that the row-column structure of rectangular arrays isautomatically recognised and understood by all students (Battista, Clements, Arnoff,Battista & Borrow, 1998). However, many textbooks either pay little attention tocovering activities or provide regions which are already partitioned, so that all studentshave to do is count the squares (Carpenter, Coburn, Reys & Wilson, 1975). Such taskscan be easily done by simple addition and obscure the essential multiplicativerelationship of the rectangle’s length and width to its area (Battista, 2003). But theprocess of tessellating a region with a unit must be well understood if students are todevelop a relational understanding of area measurement, especially in the correctapplication of the area formulae (Woodward & Byrd, 1983).
* Paper accepted by peer review

Mathematics: Essential for Learning, Essential for Life
© The Australian Association of Mathematics Teachers Inc.
137
Researching students’ understanding of area concepts
Students at all levels experience difficulties in dealing with area concepts, aphenomenon documented in research with primary children (e.g., Reynolds &Wheatley, 1996), middle school students (e.g., Comiti & Moreira Baltar, 1997) and pre-service teachers (e.g., Baturo & Nason, 1996). Studies have sought to identifymisconceptions associated with area measurement. Hirstein, Lamb and Osborne (1978)interviewed 106 elementary grade children. They observed five commonly held areamisconceptions, including: a tendency to make judgments about the area of a rectangleby examining the length of one of its sides; basing conclusions on informal observationswhen partitioning and recombining shapes to compare their areas; point-counting, orcounting all regions equally regardless of their geometrical shape when using a grid;double-counting units around the corner of a rectangle; and counting tick marks ratherthan counting units.
Dickson (1989) interviewed 20 students aged 9 to 13 on four separate occasions,before and after a teaching program, about their understanding of area concepts andtheir ability to find the area of rectangles. She reported that most students couldcorrectly describe the meaning of the word “area” and that just over one third of thestudents, who already knew the formula wlA = , used it almost exclusively, evenwhen it was inappropriate to do so. Another third learnt the result during instruction,and the remaining students continued to use non-multiplicative approaches, despitehaving been taught the area formula.
Kidman (1999) interviewed 36 students, 12 each from Years 4, 6 and 8 to investigatestrategies used in area measurement. She found that many confused area and perimeter:19 students used additive approaches and perceived the area of a rectangle as the sum ofits dimensions, a phenomenon that was consistent across all grades. Students whoemployed additive rules used a number of strategies when comparing the areas of tworectangles during the interviews including an insistence on using a ruler to measuresides, and a preference for vertical rather than horizontal alignment of rectangles. Thosewho used additive rules also mistakenly believed that doubling the length of both sidesof a rectangle would double its area.
Method
The present study uses a multi-method design combining written pre- and post-testswith a semi-structured clinical interview. The sample consisted of two Year 7 classes,one each from two coeducational, comprehensive high schools in middle-incomesuburbs of Sydney. In one school, the class was of mixed ability, with 21 students,while in the other, the class of 22 students was the bottom set of 6 classes. Each classteacher chose 6 students (3 boys and 3 girls) to reflect the spread of ability and these 12students constituted the interview sample.
The written tests
All 43 students completed a 20-minute written test of five questions on two separateoccasions, just prior to being taught the area topic and immediately afterwards. A 30 cmruler and a transparent, square-centimetre grid sheet were made available to students butcalculators were not permitted. Students were expected to record their calculations andexplain their thinking throughout the test.
Question 1 asked for a definition of the word “area”. Question 2 displayed a 5 cm by3 cm rectangle with tick marks each centimetre around its perimeter and students had to

Mathematics: Essential for Learning, Essential for Life
© The Australian Association of Mathematics Teachers Inc.
138
find its area and explain their method. Question 3 showed a right-angled triangle ofsides 3 cm, 4 cm, and 5 cm with tick marks at 1 cm intervals along the twoperpendicular sides and students had to calculate its area and justify their solutionstrategy. Question 4 gave an L-shaped figure, labelled “not to scale”, with integervalues given for 4 of the 6 sides. Students had to calculate its area, setting out theirworking. Question 5 required students to make an accurate drawing of two shapes witharea 24 cm2, one a rectangle and the other not.
The interviews
Semi-structured clinical interviews were videotaped immediately after the area topic.Each student was interviewed individually for approximately 15 minutes while theyattempted two tasks. First, the interviewer (author) gave each student a 10 cm by 8 cmcardboard rectangle and asked them to find its area, explaining their method. Studentscould use a 30 cm ruler and a transparent, plastic grid. In task 2, the ruler and grid wereremoved and the interviewer gave the students two more cardboard shapes (a right-angled triangle of sides 10 cm, 12 cm and approximately 15.5 cm, and a parallelogramof base 10 cm and perpendicular height 8 cm) and asked them to predict whether eithershape had the same area as the rectangle. The students were encouraged to explain theirreasoning and the triangle and parallelogram were discussed in the order which thestudents considered them.
When discussing the triangle and rectangle, the interviewer asked how the studentscould compare the two areas. Students typically suggested superimposing the shapes,aligning their edges, or measuring them. The interviewer allowed the students to trytheir chosen method and interpret their results. When discussing the parallelogram andrectangle, the interviewer again began by asking how the students could compare theareas. Those who wanted to superimpose the shapes were asked for alternative ideas,while those who wished to align or measure the sides were permitted to do so andinterpret their measurements. The interviewer next asked if there was another way tocompare the areas without measuring them and students who now suggestedsuperimposing the shapes were permitted to do so and talk about what they saw. A pairof scissors was provided for students to cut and recombine the parallelogram and placeit over the rectangle. Having done so, the interviewer asked students to explain whatthey saw.
Results
The results of the written tests and the interviews are reported separately.
The written tests
Most students defined area as the “space inside” a figure (pre-test = 53%; post-test =72%). Others expressed similar ideas, including “how big a shape is” (14%; 5%) and“how many units [cm, m, etc.] fit into it” (5%; 5%). However some described area as“length times width” (19%; 12%), or defined it in terms of perimeter (7%; 5%). Mostcould calculate the area of the rectangle in question 2 (72%; 93%) by measuring thesides or counting the tick marks and multiplying the numbers (53%; 47%), drawing agrid inside the rectangle (19%; 44%), or using the transparent grid to add squares (9%;5%). In question 3, about half the students were correct (44%; 49%) while those whowere not drew a grid inside the shape and added the squares, but could not count the
Mathematics: Essential for Learning, Essential for Life
© The Australian Association of Mathematics Teachers Inc.
139
fractional parts that resulted (21%; 40%). Some failed to divide by 2 (12%; 5%), andsome multiplied all of the side lengths together (12%; 0%).
Question 4 proved more difficult with few achieving the right answer (14%; 23%)and many finding the perimeter; some did so correctly (5%; 37%), but others omittedthe lengths of the two unlabelled sides (30%; 21%), or did not attempt the task (19%;2%). Most students accurately drew the rectangle in question 5 (58%; 79%), while somedid not measure the sides correctly (7%; 7%) and, as in question 4, others drew arectangle with perimeter 24cm (19%; 14%). Drawing a non-rectangular shape was moredifficult; those who were correct (26%; 30%) drew a right-angle triangle or created acomposite shape by drawing 24 unit squares one row at a time, but many who triedwere unable to do so accurately (33%; 14%). Here too, students’ predilection forperimeter persisted (21%; 30%).
The interviews
All students found the area of the rectangle in task 1, either by measuring andmultiplying its sides (6 students) or by overlaying the grid, counting squares along twoadjacent edges and multiplying (6 students). Only one student could explain withoutassistance why multiplying length by width guaranteed the correct answer; two morestudents were eventually able to explain it after prompting, but the remaining nine couldnot. For task 2, five students correctly stated that the area of the triangle was smallerthan the rectangle. They superimposed the shapes and described how the protrudingpieces of the triangle could be cut off and repositioned inside the rectangle withoutcovering the entire space. Three students claimed the triangle was larger “because itlooks bigger” but, after superimposing, they explained the task. Two students wereconvinced that the triangle was larger “because it’s taller” and the remaining twostudents could not decide: one because he claimed he first needed to measure eachshape, and the other “because they’re different shapes”.
Seven students stated that the parallelogram “looks about the same size” as therectangle, while the others were unsure. The students either aligned the correspondingedges (7 students) or measured the sides (5 students). However, in doing so, all studentscompared the slant height of the parallelogram with the perpendicular height of therectangle, thereby falsely concluding that the parallelogram had a greater area. Whenthey recombined the parallelogram to fit it exactly over the rectangle, only four studentscould eventually explain what had occurred; the other eight remained completelymystified.
Discussion
Three closely related misconceptions which emerged from analysis of the test andinterview data are now discussed.
Area–perimeter confusion
Students often confuse area and perimeter (Kouba, Brown, Carpenter, Lindquist, Silver& Swafford, 1988). In test question 1, students labelled the rectangle’s sides 5 cm2 or3 cm2 or, more commonly, gave its area in linear units as 15 cm. They confounded theirlanguage during the interviews and spoke of perimeter when they should have referredto area, and vice versa. For example, students referred to the “area of a side” or said thatthe side was “eight square centimetres long”. Sometimes the students would correct

Mathematics: Essential for Learning, Essential for Life
© The Australian Association of Mathematics Teachers Inc.
140
their words, but often they gave the impression that they did not realise what they hadsaid.
Many based their written answers on perimeter rather than area. This occurred inquestions 2 and 3, but was more prevalent in questions 4 and 5, which had a greaterdegree of difficulty. Students tried various methods to calculate the perimeter of therectangle: some measured the sides and added the lengths; others used a variation ofcounting around the corner (Hirstein, Lamb & Osborne, 1978) in which they omittedthe corner squares and obtained only 12 cm; and some simply counted the tick marks.Similar approaches were applied to the triangle in question 3.
In question 4, the more complex L-shaped figure was too demanding and manyreverted to perimeter, sometimes accounting for the missing sides but often simplyadding the given lengths, as shown in Figure 1. In question 5, they drew shapes with aperimeter of 24cm rather than an area of 24cm2. These students may be relying on whatTierney, Boyd and Davis (1990) call signposts, or familiar ideas on which to focuswhen they feel disoriented by strange mathematical settings, even if the signpost(perimeter) is irrelevant to the task (finding area).
Figure 1. Area–perimeter confusion.
Perpendicular-slant height confusion
Related to area–perimeter confusion was the students’ inclination to make decisionsabout areas by comparing any height, regardless of whether it was at right-angles to theadjacent side or not. For instance, some thought that the parallelogram in interview task2 was larger than the rectangle because it had a longer side, but they contrasted theperpendicular height of the rectangle with the slant height of the parallelogram. Therewas also some confusion about the precise meaning of “height” and it seemed a flexiblenotion for some because they focused solely on the edges of the shape.
Interviewer: Do they have the same height, those two shapes [the rectangle andparallelogram]?
Student: When it’s like that [slant height of parallelogram aligned withperpendicular height of rectangle], it’s a bit bigger. But when it’s likethat [parallelogram recombined to form a rectangle], it does.
Interviewer: So what would you say, the rectangle and parallelogram, they do orthey don’t have the same height?
Student: The height, they do now, but they didn’t before.
Mathematics: Essential for Learning, Essential for Life
© The Australian Association of Mathematics Teachers Inc.
141
Responses to interview task 2 revealed that students did not appreciate theimportance of using perpendicular height to calculate areas of triangles andparallelograms, and this made it difficult for them to understand how two shapes,despite ostensibly having different dimensions, could still have the same area.
Student: That’s difficult! Well, it’s still 10 at the bottom and 8 [perpendicular]at the sides, but it was 9 [slant] before. Somehow the area lookedbigger before, but now it’s smaller. [Pause] I don’t know, that’sdifficult, I can’t think of an answer for that. That piece that we took [aright triangle cut from one end of the parallelogram and recombined toform a rectangle], we made the height straight so that we could makea rectangle but I still don’t understand how it got back to 80, we lost10. [The student then measured the perpendicular height of theparallelogram] That’s 8, so when I measured it there [slant height] itwas 9. So we’ve kind of cut off a centimetre and put it over there.
Interviewer: So it’s 9 on the edge and 8 in the middle. Can you explain that?Student: It’s just how the shape is, I guess.Interviewer: Can you explain it?Student: No.
The student is confounded by the “loss” of 1 centimetre as the parallelogram (of slantheight 9cm) is recombined to form a rectangle (of perpendicular height 8cm). Thisperpendicular-slant height confusion is probably the reason why so many students couldnot explain how the two shapes had the same area because it seemed to them that thedimensions of the parallelogram were greater than the rectangle.
The students’ exclusive reliance on the slant height of the parallelogram forcalculating its area might also be interpreted as an over-generalisation of the wlA =
formula. As Tierney et al. (1990) found, many students do not recognise the underlyingarray structure of the formula and often apply it indiscriminately. For example, somemultiplied all of the lengths together to find an area—perhaps another feature ofarea–perimeter confusion—while others found the area of the triangle by multiplying 3by 4 by 5. In the interviews, some students claimed that it did not matter which sides ofthe triangle were used to calculate its area, so long as any two lengths were multipliedtogether and the result halved. It is worth noting that students who arbitrarily multipliedthe lengths of shapes like this tended to define area as “length times width” in the test.
Poor grasp of the rectangle–triangle relationship
Those who were prepared to multiply any two lengths of the triangle to find its areamay also have been exhibiting a limited understanding of the fact that the area of atriangle is half that of the rectangle which shares its base and perpendicular height. Thefollowing exchange took place after a student had correctly calculated the area of thetriangle in interview task 2.
Interviewer: Why do you halve it? [The product base height for the area]Student: I was taught that way.Interviewer: Would it matter which lengths you multiply?Student: I’m not sure.Interviewer: Why did you choose those lengths?Student: I don’t know.
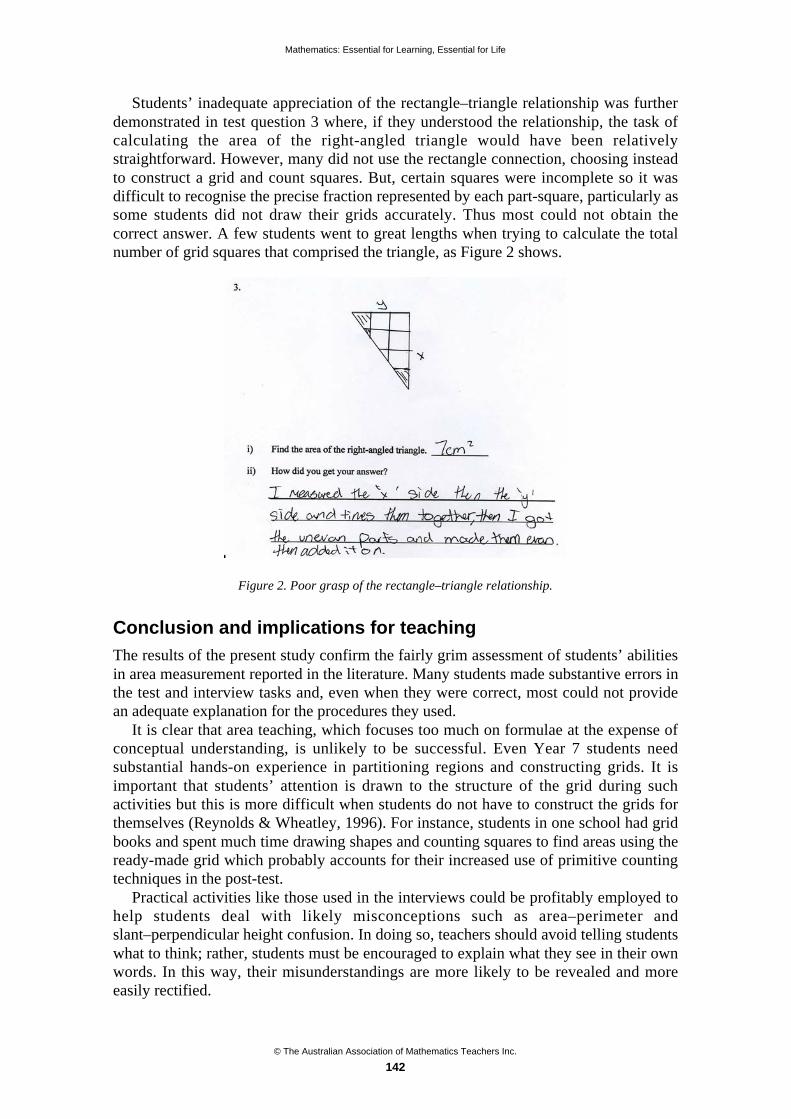
Mathematics: Essential for Learning, Essential for Life
© The Australian Association of Mathematics Teachers Inc.
142
Students’ inadequate appreciation of the rectangle–triangle relationship was furtherdemonstrated in test question 3 where, if they understood the relationship, the task ofcalculating the area of the right-angled triangle would have been relativelystraightforward. However, many did not use the rectangle connection, choosing insteadto construct a grid and count squares. But, certain squares were incomplete so it wasdifficult to recognise the precise fraction represented by each part-square, particularly assome students did not draw their grids accurately. Thus most could not obtain thecorrect answer. A few students went to great lengths when trying to calculate the totalnumber of grid squares that comprised the triangle, as Figure 2 shows.
Figure 2. Poor grasp of the rectangle–triangle relationship.
Conclusion and implications for teaching
The results of the present study confirm the fairly grim assessment of students’ abilitiesin area measurement reported in the literature. Many students made substantive errors inthe test and interview tasks and, even when they were correct, most could not providean adequate explanation for the procedures they used.
It is clear that area teaching, which focuses too much on formulae at the expense ofconceptual understanding, is unlikely to be successful. Even Year 7 students needsubstantial hands-on experience in partitioning regions and constructing grids. It isimportant that students’ attention is drawn to the structure of the grid during suchactivities but this is more difficult when students do not have to construct the grids forthemselves (Reynolds & Wheatley, 1996). For instance, students in one school had gridbooks and spent much time drawing shapes and counting squares to find areas using theready-made grid which probably accounts for their increased use of primitive countingtechniques in the post-test.
Practical activities like those used in the interviews could be profitably employed tohelp students deal with likely misconceptions such as area–perimeter andslant–perpendicular height confusion. In doing so, teachers should avoid telling studentswhat to think; rather, students must be encouraged to explain what they see in their ownwords. In this way, their misunderstandings are more likely to be revealed and moreeasily rectified.

Mathematics: Essential for Learning, Essential for Life
© The Australian Association of Mathematics Teachers Inc.
143
References
Battista, M. T. (2003). Understanding students’ thinking about area and volume measurement. In D. H.Clements & G. Bright (Eds), Learning and Teaching Measurement (pp. 122–142). Reston, VA:National Council of Teachers of Mathematics.
Battista, M. T., Clements, D. H., Arnoff, J., Battista, K. & Borrow, C. V. A. (1998). Students’ spatialstructuring of 2D arrays of squares. Journal for Research in Mathematics Education, 29(5), 503–532.
Baturo, A. & Nason, R. (1996). Student teachers’ subject matter knowledge within the domain of areameasurement. Educational Studies in Mathematics, 31, 235–268.
Carpenter, T. P., Coburn, T. G., Reys, R. E. & Wilson & J. W. (1975). Notes from the NationalAssessment: Basic concepts of area and volume. Arithmetic Teacher, 22, 501–507.
Comiti, C. & Moreira Baltar, P. (1997). Learning process for the concept of area of planar regions in12–13 year-olds. In E. Pehkonen (Ed.), Proceedings of the 21st PME Conference Vol. 3 (pp.264–271). Lahti, Finland: Program Committee of the 21st PME Conference.
Dickson, L. (1989). The area of a rectangle. In K. Hart, D. Johnson, M. Brown, L. Dickson & R. Clarkson(Eds), Children’s Mathematical Frameworks 8–13: A Study of Classroom Teaching. London: NFER-Nelson.
Hirstein, J. J., Lamb, C. E. & Osborne, A. (1978). Student misconceptions about area measure. ArithmeticTeacher, 25(6), 10–16.
Kidman, G. C. (1999). Grade 4, 6 and 8 students’ strategies in area measurement. In J. M. Truran & K.M. Truran (Eds), Making the Difference (Proceedings of the 22nd annual conference of theMathematics Education Research Group of Australasia, pp. 298–305). Adelaide: MERGA.
Kordaki, M. & Potari, D. (2002). The effect of area measurement tools on student strategies: The role of acomputer microworld. International Journal of Computers for Mathematical Learning, 7, 65–100.
Kouba, V. L., Brown, C. A., Carpenter, T. P., Lindquist, M. M., Silver, E. A. & Swafford, J. O. (1988).Results of the Fourth NAEP Assessment of Mathematics: Measurement, geometry, data interpretation,attitudes and other topics. Arithmetic Teacher, 35(9), 10–16.
Outhred, L. N. & Mitchelmore, M. C. (2000). Young children’s intuitive understanding of rectangulararea measurement. Journal for Research in Mathematics Education, 31(2), 144–167.
Reynolds, A. & Wheatley, G. H. (1996). Elementary students’ construction and coordination of units inan area setting. Journal for Research in Mathematics Education, 27(5), 564–581.
Schultz, J. E. (1991) Area models: Spanning the mathematics of grades 3–9. Arithmetic Teacher, 39(2),42–46.
Tierney, C., Boyd, C. & Davis, G. (1990). Prospective primary teachers’ conceptions of area. In G.Booker, P. Cobb & T. N. de Mendicutti (Eds), Proceedings of the 14th PME Conference Vol. 2 (pp.307–314). Oaxtepec, Mexico: PME.
Woodward, E. & Byrd, F. (1983). Area: Included topic, neglected concept. School Science andMathematics, 83(4), 343–347.
© The Australian Association of Mathematics Teachers Inc.
144
Students constructinginteractive learning objects for
conceptual development in mathematics
Paul Diete, Rodney Anderson, Peter Fas,Darren McGregor, Avril Najman
Somerville House
The following paper provides an outline of an ASISTM project involvingSomerville House, Moreton Bay College, Brisbane State High School, ClayfieldCollege, Anglican Church Grammar School, Queensland University of Technologyand The University of Queensland. This project aims to enhance studentengagement in mathematics and technology through the creation of interactivemathematics learning devices. Integral to the project is the students constructingInteractive Learning Objects for conceptual development in mathematics. Thestudents are taking a topic in mathematics and developing an interactive LearningObject to demonstrate and deepen or consolidate their understanding of this topic.In taking on the role of the teacher, the students will create objects in order toinstruct and assist other students in the learning of specific mathematics content.What the students create will also be used as an indication of their preferredlearning style. This will support teacher reflection upon their own pedagogyleading to better connection between teaching and learning. Identification anddevelopment of preferred mathematical learning styles underpin the project, as dothe principles of collaboration amongst peers in order to engage a more variedpedagogy in the classroom.
Introduction and background
In understanding and accepting the simple premise that everybody is active sometimes,and reflective sometimes, it follows that it may be in the best interest of students andteachers of mathematics to seek to incorporate these values into learning, planning andpedagogy. This ASISTM project aims to do so by asking students to be more active intheir learning of a mathematical concept and by being even more active indemonstrating that knowledge. Subsequently, the teacher and the student are bothrequired to be reflective of the process and the resultant models, and be mindful of howthis may affect teaching and learning of mathematics into the future.
There is no doubt that individuals have the capacity to see and experience the worldin different ways. Howard Gardiner’s much talked about Multiple Intelligences is oneframework which may be used to understand that persons learn and act in differingways. Focusing on children in the middle years of schooling, some of theseintelligences seem to be more prominent than others. A quick survey of 106 11–13year-old females at Somerville House showed that the Interpersonal, Musical andBodily Kinesthetic were the most used Intelligences, with Intrapersonal andMathematical/Logical being the least favoured. Contrasting to this would be thegenerally accepted presumption that much mathematics teaching in Years 7–12 focuses
Mathematics: Essential for Learning, Essential for Life
© The Australian Association of Mathematics Teachers Inc.
145
on a style that predates even our own generations: one that is founded on didacticismand rigor. The intention of this project is not to dismiss the traditional modes ofteaching and learning mathematics, but rather to investigate whether there are alsoalternatives to cater to the immediate needs of the current generation. The concept oflearning styles, particularly mathematical learning styles, addresses this question as wemay gain valuable insight as to how our students think and how they would prefer tolearn. The idea that individuals learn differently is not new but can still be ignored inmany mathematical classrooms. The use of the very student-friendly MultipleIntelligences framework allows students to understand that they have preferred ways ofthinking and expressing themselves. We can then open up to the students the possibilitythat these learning styles are linked indelibly to their personalities. Once this isachieved, we can encourage students to think about how they may use this knowledgeto help them understand mathematics or, indeed, any subject.
For the purposes of this project, Learning Objects can be described as any resourcethat can be used in the teaching of concepts or content. These objects can be created, asin the case of this project, by using technology and involve platforms such as Excel,MovieMaker, Word, Dreamweaver, PowerPoint or Esiteach. However, they can be assimple as an instructional poster, booklet or model. Learning Objects may provide away for students to express their own preferred learning styles. For example, use ofauditory material may suggest that the students have a preference for the Musicalintelligence while the use of numerous pictorials may indicate a strong visual learningstyle. In this project, students will create Learning Objects for a particular mathematicstopic, with the focus on technology as the method, or pathway, of creation.
Assuming that any Learning Object created by students is a reflection of how theyunderstand particular mathematical concepts, it may be a logical step to also assumethat this may be useful to the teacher in determining their own pedagogy. Whilst wehave a class full of individuals, it is also safe to say that these individuals fit into certaincategories, from academic to social. Collection of data pertaining to how a certain groupof students best learn a mathematical concept may have benefits for the teacher whennext approaching a similar cohort with the same, or related, content matter. It is the aimof this project to determine how individuals and groups of students, in their ownestimation, best learn mathematics and, then, to adjust teaching styles accordingly inorder to become better, and more relevant, mathematics teachers.
An identified need in the teaching profession is the area of greater peer collaboration,support, and sharing of information and resources. The ASISTM project aims todevelop ties between schools and universities, as well as creating links to theprofessional world. The project relies heavily on the interaction between the clusterschools and the sharing of teaching ideas and experience in order for any data to berelevant beyond the bounds of each specific class. There is also a pressing need to makemathematics more relevant to the changing world and the potential career opportunitiesthat exist. The creation of stronger links with tertiary education and the IT communitymay assist in this area.
The teaching program
The project is a team effort where all cluster schools take part in its complete life-cycle.After the initial concept development, each school will trial, or is already trialing, theprogram as outlined with a specified cohort (Year 7–10). The cluster schools willsubmit the data and resultant student work for viewing by all partner schools. Feedbackand professional development will be shared across academic staff, both relative to the
Mathematics: Essential for Learning, Essential for Life
© The Australian Association of Mathematics Teachers Inc.
146
student work and, subsequently, as to how this will affect future pedagogy. The finalresource bank website will be able to be accessed and added to by each cluster school asdetermined by their specific needs and work. Consideration of each participating schoolnow follows.
Somerville House
Somerville House is running the program across the entire Year 7 cohort. There are fivephases as follows:
1. Teacher professional development including, learning styles, assessment ofmathematics and learning styles as well as the use of IT (Excel, Moviemaker,Flash, Esiteach, PowerPoint) in the mathematics classroom. ProfessionalDevelopment was undertaken as part of the cluster or within the Somervillecommunities follows:(a) Learning Styles — Shelley Dole (University of Queensland)(b) Mathematics Assessments and Rubrics — Shelley Dole(c) Use and creation of IT — Greg Egan (industry professional), Sally Mack
(IT/Science/Mathematics teacher and independent creator of LearningObjects using IT — Somerville House)
2. Introduction of students to possible software that they may use in the creation oftheir Learning Objects. Students will be provided with an overview of eachprogram so that they have the scope to choose the format of delivery that bestsuits their needs. Each platform can be taught separately from mathematicscurriculum, or can incorporate the teaching of mathematical content.
3. Introduction of students to the concept of Multiple Intelligences. Students areencouraged to identify their personality traits that may influence their learning atschool and to link these to Howard Gardiners’ 8 Multiple Intelligences(Logical/Mathematical, Verbal/Linguistic, Bodily/Kinesthetic, Visual/Spatial,Intrapersonal, Interpersonal, Musical, Natural). The students take an online test,then observe and log how they may “use” their top three resultant Intelligences inthe learning, or understanding, of particular topics.
4. The students must create a Learning/Teaching Object focusing on such abstractmathematical questions as: “Why do we flip and multiply?”, “What does theequals sign mean?”, “What is a percentage?”. From recommendations of ourSenior School teachers, these notions were highlighted as areas that require moredepth of understanding, amongst our mathematics students, in later years.
5. The completed Learning Objects will be evaluated in two ways. For students theLearning Objects will be assessed to measure the extent to which students haveconsolidated, or gained, a deeper understanding of the mathematical content. Forteachers the Objects will be viewed with the intention of determining whetherthere are possible “better” ways to teach this content, to other groups of studentsin the future.
Mathematics: Essential for Learning, Essential for Life
© The Australian Association of Mathematics Teachers Inc.
147
Brisbane State High School
Ten classes in Year 10 at Brisbane State High School have undergone a seven weekproject in their mathematics classes. The project aimed to produce a Learning Object ina mathematical area of their choice. Students were encouraged to select a topic that waseither being studied currently in Yr 8 or Yr 9, or an area of mathematics that they didnot fully understand, but which they wanted to know more about. Each class was givenexamples of Learning Objects in both Vegas and PowerPoint application format. Theywere then given an opportunity to build a simple Learning Object in each medium andtaught the basic ICT skills required with using this software.
Students were able to work individually or in groups of up to three people. Eachstudent completed a learning log which detailed their activity in each lesson. Studentsalso provided a concept map of how they intended to get across their message, beforethey began making the Learning Object. Students were expected to have at least 3–5minutes of footage if they chose to use the Vegas format. Students were given a fourweek period in order to put together the Learning Object. The quality of the LearningObject was judged predominantly on how effectively they conveyed the mathematicsand success of the project will be determined by the increased perceived level ofunderstanding within the mathematical area chosen.
Moreton Bay College
Moreton Bay College is implementing the ASISTM project in one Year 10 PreparatoryMathematics B class and one Year 9 Extension Mathematics class.
1. As with all schools involved in the project, Moreton Bay College took part inprofessional development that included:(a) IT (Word, Excel, PowerPoint, Easiteach, Flash, MovieMaker)(b) learning styles(c) interactive whiteboard and associated software (TeamBoard)(d) assessment of mathematics.
2. Students are to be introduced to the various software that will be utilised in thecreation of Learning Objects. Students will be introduced to each piece ofsoftware in their mathematics class or be introduced to it in other subjects,particularly IT. Interactive Whiteboards will be extensively used in class. Thestudents will be able to choose which software will be used in the creation of theirLearning Object. The students, then, have a choice of whether to use the samesoftware, or use another piece of software, in developing another Learning Object.
3. Students are to be introduced to the concept of Multiple Intelligences and how thismay affect their learning. They are to undertake an online quiz and use the resultsof identifying their favoured learning styles, and choice of relevant software, todevelop Learning Objects.
4. The students are to pick a mathematical concept that they are interested in anddevelop a Learning Object based on this choice. The audience of the LearningObject is their peers. However, students may also choose the alternative ofcreating a Learning Device to teach the topic to a younger age group.
Mathematics: Essential for Learning, Essential for Life
© The Australian Association of Mathematics Teachers Inc.
148
5. The major focus of the assessment of the Learning Object is whether the intendedaudience obtained an understanding of the mathematical concepts that weredelivered in the Learning Object. In addition, do the developers of the LearningObject also have a deeper understanding of the mathematical concepts? Finally,would the teachers of the students who developed the Learning Objects changetheir methodology with future classes of students?
Clayfield College
As part of their study in ITS (Information Technology Studies), Year 11 studentsdevelop ICT products for identified clients and their needs. Such products are usuallydeveloped using Macromedia Flash. Hence, in the interests of cross-curriculacooperation, the ITS staff are directing and assisting their students to develop products(Learning Objects) for Year 8 mathematics students (the clients). Thus, the needs fortwo subject disciplines, and their respective stakeholders, are being met by means of theone project.
Conclusion
Currently, the cluster schools are carrying out the project in the varied forms but arecontinually meeting and sharing their experiences. Some of the key points of interestthus far are:
1. The varying degrees of student motivation according to their age and gender.
2. Convincing students, teachers, parents and administrators of the value of theproject and of the possible future benefits of not only improving mathematicalunderstanding but also of improving mathematical pedagogy, students’ academicself-awareness and collegial links.
3. Finding the time in the already crowded curriculum to deliver the project.
4. Deciding how to best assess the success of the project on an individual studentbasis as well as within an overall framework.
5. Teachers understanding the required IT well enough to assist the students in thecreation of their modules.
Further dialogue between the cluster schools is essential for the success of thisproject, but the value has already been seen in the intellectual sharing of ideas from thefive main participants. It is anticipated that this may be the cornerstone of a movement,in at least one school (Somerville House), toward a school program that deals withteaching our students how to think and learn more effectively, according to theirindividual strengths and weaknesses.
© The Australian Association of Mathematics Teachers Inc.
149
Chameleons in the classroom:Middle years teachers of mathematics
Brian Doig
Deakin University
What are the practices of effective teachers of mathematics? and What are thecharacteristics of effective mathematics teachers? are questions that have becomeprominent in recent times, particularly with respect to the Middle Years. In thispaper some of the research that provides directions to possible answers to thesequestions is described. It is intended that the paper provides educators with anoverview of the findings of research that have the potential to impact favourably onstudent outcomes in the Middle Years of schooling. The paper also raises the issueof how much change can be expected realistically: does the classroom chameleonexist?
Studies of effective teachers of mathematics
Several studies have identified characteristics that are linked with being effective as ateacher of mathematics, as well as other subjects. As part of the AAMT professionaldevelopment strategy, a paper focussing on these characteristics was commissioned(Doig, 2005), in part, to assist teachers explore their own practice. In a similar vein, theImproving Middle Years Mathematics and Science (IMYMS) project (an ARC linkageproject with the Victorian Department of Education and Training as a partner) wasdeveloped out of the School Innovation in Science (SIS) initiative (Department ofEducation and Training Victoria, 2004) (see, Tytler, 2004, for details of these projects).IMYMS is extending the SIS strategy to mathematics, and includes an explicitframework of effective teaching and learning, based on an extensive review of theliterature on effective teachers of mathematics (Doig, 2003). While these strategies areboth within Australia, interest in the effective teacher is not confined to this country,and the following section provides a brief overview of the international research in thisarea.
Practice issues
A seminal study of effective mathematics teachers, the Effective Teachers of NumeracyStudy (Askew, Brown, Rhodes, Johnson & Wiliam, 1997) found that the effectivemathematics teachers had a “particular set of coherent beliefs and understandings whichunderpinned their teaching of numeracy. Their beliefs related to (a) what it means to benumerate, (b) the relationship between teaching and pupil's learning of numeracy, (c)presentation and intervention strategies” (p. 1).
Teachers in the Askew et al. study were interviewed about their educationalorientations to teaching, mathematics and styles of interaction with students. The resultsof these interviews led to the defining of three models of orientation that explained howteachers approached the teaching of mathematics. These orientations wereConnectionist, Transmission, and Discovery. All but one of the highly effective teachers

Mathematics: Essential for Learning, Essential for Life
© The Australian Association of Mathematics Teachers Inc.
150
were classified as connectionist, while teachers holding other orientations were allclassified as being only moderately effective.
Connectionist teachers were those who had beliefs and practices based on valuingstudents’ methods, using students’ understandings, and placing emphasis on makingconnections within mathematics. These highly effective teachers believe that pupilsdevelop mathematically by being challenged to think, through explaining, listening, andproblem solving.
In relation to teaching, the effective, connectionist teachers believed that discussionof concepts and images is important in exemplifying the teacher's network ofknowledge and skills, and in revealing pupils' thinking, and that it is the teacher'sresponsibility to intervene to assist the pupil to become more efficient in the use ofcalculating strategies. The highly effective teachers in this study believed that beingnumerate requires a rich network of connections between different mathematical ideasand an ability to select and use strategies that are both efficient and effective. They alsobelieved that: almost all pupils are able to become numerate, and that pupils developmathematically by being challenged to think, through explaining, listening, and problemsolving.
The study also found that teachers' beliefs and understandings of the mathematicaland pedagogical purposes of classroom practices were more important than the actualpractices themselves, and that having an A-level or a degree in mathematics was notassociated with being highly effective. The study confirmed other UK and US researchthat suggested neither mathematical qualifications nor initial training are factorsstrongly correlated to highly effective teachers of mathematics and this also wasconfirmed later by the Leverhulme Numeracy Research Programme (Brown, 2000) inthe UK.
Background issues
The Third International Mathematics and Science Study (TIMSS) conducted in1995–1996 collected both achievement data from students, and background informationfrom school principals, teachers, and students. These data were linked so that theinfluences on the high-achieving students could be isolated. One group of students inthe TIMSS was those in the middle years: that is, those who were 14-years-old. Martinand his colleagues (2000) reported comprehensively on the findings of this investigationand, in summary, their findings were that home background factors (for example,parents’ levels of education, student aspirations to attend university) were the mostsignificant distinguishing difference between high- and low-achieving students.However, factors that relate directly to the student’s school experience were also strongindicators of the student’s likely success on the TIMSS items. In Australia,Hollingsworth and her colleagues (2003) reported that a lack of emphasis on complexcontent matter in the syllabus was hampering student higher achievement.
Classroom issues
Research indicates that there exists a small set of classroom factors that appear toprovide effective learning and work consistently across countries. The most striking ofthese factors would appear to be that “Schools [sic] where eighth-grade students wereexpected to spend time on homework in a range of subjects had higher averageachievement in science and mathematics” (Cogan & Schmidt, 2003, p. 11). In theirrecommendations for reform of United States middle schools, based on the TIMSSresults, Cogan and Schmidt (2003) make these five points:

Mathematics: Essential for Learning, Essential for Life
© The Australian Association of Mathematics Teachers Inc.
151
1. That the curriculum should be coherent across the grades for all topics;2. Fewer topics should be taught in the middle school;3. Topics for study should be taught at an appropriate grade level;4. Teachers should have clear and coherent standards of achievement to which to
teach; and5. Review and repetition in lessons should be reduced.
Policy issues
Several studies confirm that improving teacher quality is the most effective option forpolicy seeking to improve student learning outcomes (e.g. Darling-Hammond & Ball,1998). Wenglinsky (2002) used NAEP data to examine factors affecting studentlearning in eighth-grade mathematics. He found that the factors included studentbackground, teacher quality (e.g. a major in mathematics, professional development,classroom practices) and class size. Unlike Martin et al. (2000), Wenglinsky concludedthat the impact of teaching can be said to equal SES, and even possibly somewhatgreater.
Wenglinsky’s research indicates that there is more return from investments thatimprove teacher quality and capacity than in reducing class size, such as attracting well-qualified mathematics teachers, preparing them well in methods for teachingmathematics and providing high-quality continuing professional learning. In Australia,Monk (1994) used the LSAY database to look at the effects of subject matterpreparation of secondary mathematics and science teachers on student performancegains. Teacher content preparation was positively related to student learning gains. Theeffects of content knowledge were strengthened when accompanied by course work inpedagogy, leading Monk to state that “it would appear that a good grasp of one’ssubject area is a necessary but not sufficient condition for effective teaching” (p. 142).The implications of this research are clear, yet there have been indications that somestates and some Australian universities have, in fact, been reducing subject matterpreparation requirements in their teacher education courses over recent years.
A related message from international research on system factors is that the greatestreturn, in terms of impact on student learning outcomes, comes when policy makersgive priority to investments that directly influence teacher quality and professionaldevelopment.
Darling-Hammond (2000) found that variation in mathematics achievement onNAEP tests across the 50 US states was attributable more to variations in policiesaffecting teacher quality, than factors such as student demographic characteristics, classsize, overall spending levels, or teacher salaries. The major policy variations affectingteacher quality were state requirements for teachers to be licensed and to have a majoror minor in mathematics from university. She claimed that:
the effects of well-prepared teachers on student achievement can be stronger thanthe influences of student background factors, such as poverty, languagebackground, and minority status. And, while smaller class sizes appear tocontribute to student learning … the gains are most likely to be realised when theyare accompanied by the hiring of well-qualified teachers. (p. 39)
Further, after a major review of research on factors affecting student learningoutcomes, the highly influential report of the National Commission on Teaching andAmerica’s Future, What Matters Most (1996), had come to the conclusion that the most
Mathematics: Essential for Learning, Essential for Life
© The Australian Association of Mathematics Teachers Inc.
152
important influence on what students learn is what their teachers do. Its centralrecommendations for systemic reform called for:1. the development of a new infrastructure for professional learning organised
around standards for teaching;2. new career paths that reward teachers for evidence of professional development;
and3. a focus on creating school conditions that enable teachers to teach well.
The characteristics
From the short overview above it is clear that, despite minor differences in emphases,there is agreement internationally about what are the characteristics of effective schools,teachers, and classrooms. The issue is, of course, that is it possible for any one teacher,or school, to have all the identified characteristics? To demonstrate the enormity of theanswer to this question, the following lists contain the key, common, characteristics ofeffective teachers, grouped by who or what is being asked to change.
Teachers
The characteristics common to effective teachers are that they:1. have sound content knowledge;2. view assessment as a key facet of their teaching and learning programs;3. model enthusiasm and interest in their subject by example;4. value students’ methods, and use students’ understandings;5. provide choice, share control; and6. exhibit a caring attitude to students.
Teacher actions
The points below are the actions that effective teachers take more often than other, lesseffective, teachers. Effective teachers:1. explain the rationale for tasks and assignments;2. use a variety of teaching strategies;3. engage students in making sense of what they are learning;4. use both cognitive and affective teaching methods;5. use advance organisers, and provide opportunities for practice;6. create and implement sequences of lessons rather than single one-off activities;7. place emphasis on making connections within and across learning areas;8. continually audit their students’ needs;9. interrelate different modes of assessment with decisions about curriculum and
instruction; and10. include values, beliefs and social structures as part of their teaching.
Classroom environment
As outlined earlier, classroom environments affect student outcomes, and the effectiveclassroom has identifiable qualities. That is to say, classrooms of effective teachers areplaces where students:1. have focussed, sustained, and in-depth opportunities to learn;2. are challenged to think through explaining, listening, and problem solving;3. are encouraged to be autonomous and self-regulatory;4. have varied structure, form, and context of their learning experiences;
Mathematics: Essential for Learning, Essential for Life
© The Australian Association of Mathematics Teachers Inc.
153
5. are provided with appropriate feedback;6. are engaged in their own learning; and7. the classroom is linked to the broader community.
Other issues
Not all aspects of effectiveness are the sole responsibility of the classroom teacher:some responsibility rests within the school environment in which teachers work. Thetwo major aspects that research suggests are the most important are leadership and theschool’s professional community. The characteristics of effective leadership andprofessional community are expanded bellow.
Leadership
Effective teachers are supported by their school leadership, and the characteristics ofschool leadership that encourages effective teaching are where it:1. is transformational;2. provides vision and facilitation;3. provides a positive working environment for teachers;4. facilitates organised collective learning;5. employs a whole-school approach to school policies and practices;6. communicates school policies and practices to the wider community;7. informs and involves parents and the wider community;8. provides a coherent program from primary through to secondary school;9. encourages staff professional development; and10. provides time for staff to plan.
Professional community
Those teachers who are deemed effective have at least some of the followingcharacteristics in their daily practice with colleagues. They endeavour to:1. support their colleagues;2. collaborate with colleagues;3. share their norms and values;4. engage in reflective dialogue;5. share clear and coherent standards of achievement; and6. engage in professional development activities.
Conclusion
While not exhaustive, the lists of characteristics of effective teachers, and their practice,given above, are certainly exhausting! Who among us could claim all the “good”features? What would such a pedagogical paragon be like? Can we be expected tobecome classroom chameleons, and change readily?
It is my belief that if we examine ourselves, and our practice, many of these“effective features” are already present; but some are not, and some are not possible forus to change. However, as professionals, we need to be ever working towards moreeffective practice. So, what is the solution? Perhaps we need to push for policyinitiatives, such as those outlined earlier, which would help us become more effective?And, perhaps, we can use the notion of Merrily Malin (1998), who suggested that themost effective teachers are those who know their students well.

Mathematics: Essential for Learning, Essential for Life
© The Australian Association of Mathematics Teachers Inc.
154
References
Askew, M., Brown, M., Rhodes, V., Johnson, D. & Wiliam, D. (1997). Effective Teachers of Numeracy.Final Report. London: King's College.
Brown, M. (2000, June 4). Effective teaching of numeracy. Paper presented at the High Expectations –Outstanding Achievement. The Early Years of Schooling P – 4 Conference, Melbourne.
Cogan, L. & Schmidt, W. H. (2003). What We've Learned From TIMSS: Middle School Math Reform.Middle Matters. Retrieved 26 June 2003 from: http://timss.msu.edu/midmathreform.html
Department of Education and Training Victoria (2004). Science in Schools. Retrieved 17 March 2007from: http://www.scienceinschools.org
Doig, B. (2003). Quality Learning Communities: Effective Practices in the Middle Years of Schooling(Report prepared for the Middle Years Pedagogy Research and Development Project). Melbourne:Deakin University Consultancy and Development Unit.
Doig, B. (2005). Research Pointers to Practice: A Review of Research to Inform Middle YearsMathematics Teaching and Learning. Adelaide: Australian Association of Mathematics Teachers.
Hollingsworth, H., Lokan, J. & McCrae, B. (2003). Teaching Mathematics in Australia: Results from theTIMSS 1999 Video Study. Camberwell: The Australian Council for Educational Research.
Malin, M. (1998). Aboriginal education, policy and teaching. In E. Hatton (Ed.), UnderstandingTeaching: Curriculum and the Social Context of Schooling (2nd ed.). Sydney: Harcourt Brace.
Martin, M. O., Mullis, I. V. S., Gregory, K. D., Hoyle, C. & Shen, C. (2000). Effective Schools in Scienceand Mathematics. Chestnut Hill, MA: International Study Centre, Boston College.
Monk, D. H. (1994). Subject matter preparation of secondary mathematics and science teachers andstudent achievement. Economics of Education Review, 13(2), 125–145.
Tytler, R. (2004, July, 2004). Science, maths, everything: Generic vs. subject specific versions ofpedagogy. Paper presented at the Annual Conference of the Australasian Science Education ResearchAssociation, Armadale, New South Wales.
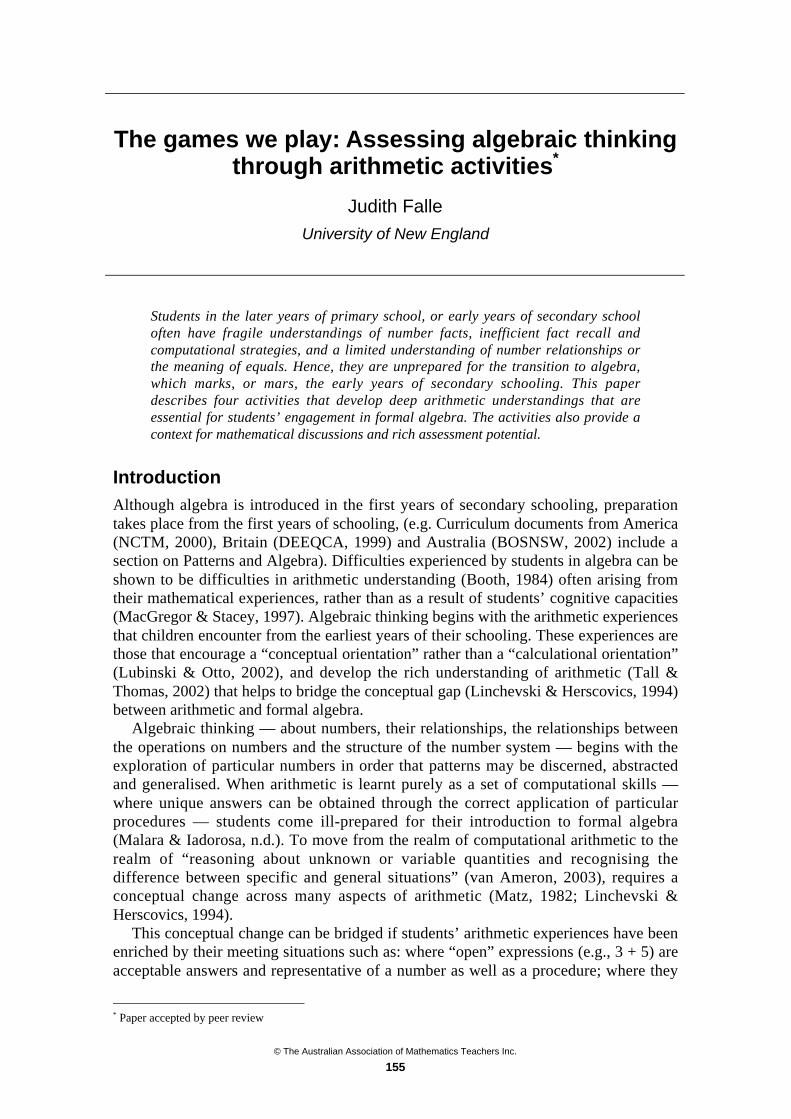
© The Australian Association of Mathematics Teachers Inc.
155
The games we play: Assessing algebraic thinkingthrough arithmetic activities*
Judith Falle
University of New England
Students in the later years of primary school, or early years of secondary schooloften have fragile understandings of number facts, inefficient fact recall andcomputational strategies, and a limited understanding of number relationships orthe meaning of equals. Hence, they are unprepared for the transition to algebra,which marks, or mars, the early years of secondary schooling. This paperdescribes four activities that develop deep arithmetic understandings that areessential for students’ engagement in formal algebra. The activities also provide acontext for mathematical discussions and rich assessment potential.
Introduction
Although algebra is introduced in the first years of secondary schooling, preparationtakes place from the first years of schooling, (e.g. Curriculum documents from America(NCTM, 2000), Britain (DEEQCA, 1999) and Australia (BOSNSW, 2002) include asection on Patterns and Algebra). Difficulties experienced by students in algebra can beshown to be difficulties in arithmetic understanding (Booth, 1984) often arising fromtheir mathematical experiences, rather than as a result of students’ cognitive capacities(MacGregor & Stacey, 1997). Algebraic thinking begins with the arithmetic experiencesthat children encounter from the earliest years of their schooling. These experiences arethose that encourage a “conceptual orientation” rather than a “calculational orientation”(Lubinski & Otto, 2002), and develop the rich understanding of arithmetic (Tall &Thomas, 2002) that helps to bridge the conceptual gap (Linchevski & Herscovics, 1994)between arithmetic and formal algebra.
Algebraic thinking — about numbers, their relationships, the relationships betweenthe operations on numbers and the structure of the number system — begins with theexploration of particular numbers in order that patterns may be discerned, abstractedand generalised. When arithmetic is learnt purely as a set of computational skills —where unique answers can be obtained through the correct application of particularprocedures — students come ill-prepared for their introduction to formal algebra(Malara & Iadorosa, n.d.). To move from the realm of computational arithmetic to therealm of “reasoning about unknown or variable quantities and recognising thedifference between specific and general situations” (van Ameron, 2003), requires aconceptual change across many aspects of arithmetic (Matz, 1982; Linchevski &Herscovics, 1994).
This conceptual change can be bridged if students’ arithmetic experiences have beenenriched by their meeting situations such as: where “open” expressions (e.g., 3 + 5) areacceptable answers and representative of a number as well as a procedure; where they
* Paper accepted by peer review
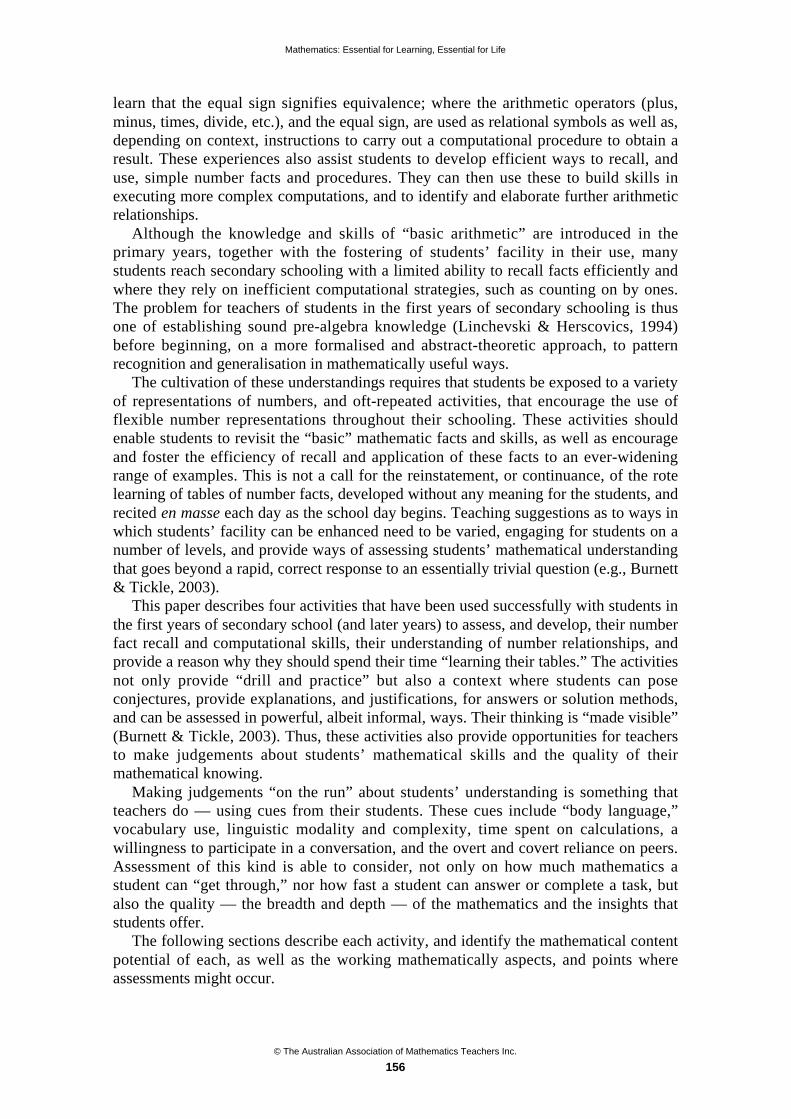
Mathematics: Essential for Learning, Essential for Life
© The Australian Association of Mathematics Teachers Inc.
156
learn that the equal sign signifies equivalence; where the arithmetic operators (plus,minus, times, divide, etc.), and the equal sign, are used as relational symbols as well as,depending on context, instructions to carry out a computational procedure to obtain aresult. These experiences also assist students to develop efficient ways to recall, anduse, simple number facts and procedures. They can then use these to build skills inexecuting more complex computations, and to identify and elaborate further arithmeticrelationships.
Although the knowledge and skills of “basic arithmetic” are introduced in theprimary years, together with the fostering of students’ facility in their use, manystudents reach secondary schooling with a limited ability to recall facts efficiently andwhere they rely on inefficient computational strategies, such as counting on by ones.The problem for teachers of students in the first years of secondary schooling is thusone of establishing sound pre-algebra knowledge (Linchevski & Herscovics, 1994)before beginning, on a more formalised and abstract-theoretic approach, to patternrecognition and generalisation in mathematically useful ways.
The cultivation of these understandings requires that students be exposed to a varietyof representations of numbers, and oft-repeated activities, that encourage the use offlexible number representations throughout their schooling. These activities shouldenable students to revisit the “basic” mathematic facts and skills, as well as encourageand foster the efficiency of recall and application of these facts to an ever-wideningrange of examples. This is not a call for the reinstatement, or continuance, of the rotelearning of tables of number facts, developed without any meaning for the students, andrecited en masse each day as the school day begins. Teaching suggestions as to ways inwhich students’ facility can be enhanced need to be varied, engaging for students on anumber of levels, and provide ways of assessing students’ mathematical understandingthat goes beyond a rapid, correct response to an essentially trivial question (e.g., Burnett& Tickle, 2003).
This paper describes four activities that have been used successfully with students inthe first years of secondary school (and later years) to assess, and develop, their numberfact recall and computational skills, their understanding of number relationships, andprovide a reason why they should spend their time “learning their tables.” The activitiesnot only provide “drill and practice” but also a context where students can poseconjectures, provide explanations, and justifications, for answers or solution methods,and can be assessed in powerful, albeit informal, ways. Their thinking is “made visible”(Burnett & Tickle, 2003). Thus, these activities also provide opportunities for teachersto make judgements about students’ mathematical skills and the quality of theirmathematical knowing.
Making judgements “on the run” about students’ understanding is something thatteachers do — using cues from their students. These cues include “body language,”vocabulary use, linguistic modality and complexity, time spent on calculations, awillingness to participate in a conversation, and the overt and covert reliance on peers.Assessment of this kind is able to consider, not only on how much mathematics astudent can “get through,” nor how fast a student can answer or complete a task, butalso the quality — the breadth and depth — of the mathematics and the insights thatstudents offer.
The following sections describe each activity, and identify the mathematical contentpotential of each, as well as the working mathematically aspects, and points whereassessments might occur.

Mathematics: Essential for Learning, Essential for Life
© The Australian Association of Mathematics Teachers Inc.
157
The games we play: Activities 1 and 2
Activity 1
Here is a number. It can be written in many ways. List as many as you can.
Students work in groups, probably no more than 4 to a group. Groups can be arrangedby ability, mixes of ability, or socially. Different groupings promote different learningexperiences that teachers can control, according to the values and relationships, as wellas the educational, outcomes they wish to achieve. The same number can be given toeach group — or different numbers. Time limits may be imposed explicitly, or left tothe teacher’s assessment of the situation as the progress of each group is monitored.
Students do not use calculators, in the initial stages. It may then be suggested thatcalculators be used in order that students discover more inventive representations.
This activity has been tried with first year pre-service teachers, as well as withstudents in upper primary, and junior high school. Often the first responses are to list aseries of addition pairs, and then a series of subtraction pairs. Suggestions to individualgroups ,as to other possible representations, are often needed to move students beyondmechanical repeating the same of arithmetic operations. In many cases this thenprompts far more original thinking.
In the form described, this activity poses an “open question,” much like Sullivan’ssuggestion of taking an answer and asking for the possible question that could result inthat answer (Sullivan & Lilburn, 1997). Often, such open questions may have either toobroad a scope, or serve only to accommodate too narrow a range of different responsesfor students to perceive the mathematical connections intended by the teacher (Watson,2005). Putting conditions on the question by suggesting that students developexpressions using two, three, or all four basic arithmetic operations, encourages furtherexploration. Many students then ask if they may use square roots, powers, fractions,brackets, demonstrating a wide repertoire of mathematical operations. Here is where acalculator may prove useful, even if not “broken”8.
Students then share their responses. If the responses are written on large sheets ofpaper they can be displayed around the classroom and added to over a period of time.Students, of course, need to check the work of their peers; no-one is allowed to getaway with an error! This then encourages debates as requests for justifications occur.
Activity 2: Five ways (adapted from Kirkby, 1994)
Given five digits (selected from digits 1–9 inclusive) arrange some, or all, in anexpression to obtain a given number (usually two-digit). No digit can be used more thanonce in any particular expression. This is a more constrained version of the first activity.Similar classroom organisation can be used and similar mathematical ideas are neededby the students, and can be assessed by the teacher.
Discussion of Activity 1 and Activity 2
These two activities involve the students on three levels, each level being indicative ofthe quality of mathematical understanding.
The first level is the knowing and recalling of number facts, and the appropriate useof mathematical operations. Here, the teacher can discern whether students are using
8 There are many versions of this; e.g., Duncan Keith’s interactive site:
http://www.woodlands-junior.kent.sch.uk/maths/broken-calculator

Mathematics: Essential for Learning, Essential for Life
© The Australian Association of Mathematics Teachers Inc.
158
efficient strategies for mental computations — or the inefficient pen-tapping, finger-counting-by-ones strategies, that often go undetected.
The second level involves the demonstration or the development of number sense —the fact that numbers can be represented in different, unclosed ways — and theequivalence meaning of the equal sign. These activities may be the first time studentshave encountered the idea that an open expression is a way of writing a number, andeven, that numbers can be written in many different ways.
The third level is the extension of students’ knowledge to the use of a wider varietyof mathematical operations (e.g., squaring, square roots, even factorials), differentnumber patterns and the relationships between numbers, and the subtleties ofmathematical syntax (e.g. the surface rearrangement of expressions such as 3 + 5 – 8 +1= 1 – 8 + 5 + 3 but not 1 + 3 – 5 + 8).
All of these understandings are necessary before students can access more formalalgebra, which relies, in part, on the manipulation of expressions to obtain newmathematical insights. Students at this third level, or who begin to work at this level,once being introduced to it through these activities, can demonstrate their mathematicalcreativity, and begin to explore the number system in imaginative ways. Here is whenconjecturing, explaining and justifying ideas begins in earnest. For the teacher listeningto students articulating their ideas reveals the quality — the depth and breadth — oftheir understanding.
The games we play: Activities 3 and 4
The next two activities described are more “game-like” in that they involve an explicitelement of competition. The focus is particularly on addition, subtraction, place valueand estimation. Computational techniques employed, strategies for estimating the largeror smaller of two numbers and, often most significantly, what students do when addingor subtracting decimals can be observed, and hence assessed, “on the run.”
Activity 3: Multi-digit (Goddard, Marr & Martin, 1994)
This activity requires a little more elaborate preparation than the first two activities.Each student needs a photocopied sheet (Figure 1), and the teacher needs a ten-sided die(or equivalent random-number generator). The aim of the game is to obtain the largestpossible total, by recording the results of each throw of the die in each column of eachrow, in successive rows. Once one row is complete, the numbers are recorded in thenext row. Each column represents the usual units, tens, hundreds, thousands, etc. Asshown in Figure 1, there is a small version and a large version. After the totals havebeen added, students are asked for the largest obtained. Near totals, especially thosefrom the large version, are written on the board for discussion and decision-making.These big numbers offer a further challenge in their naming.
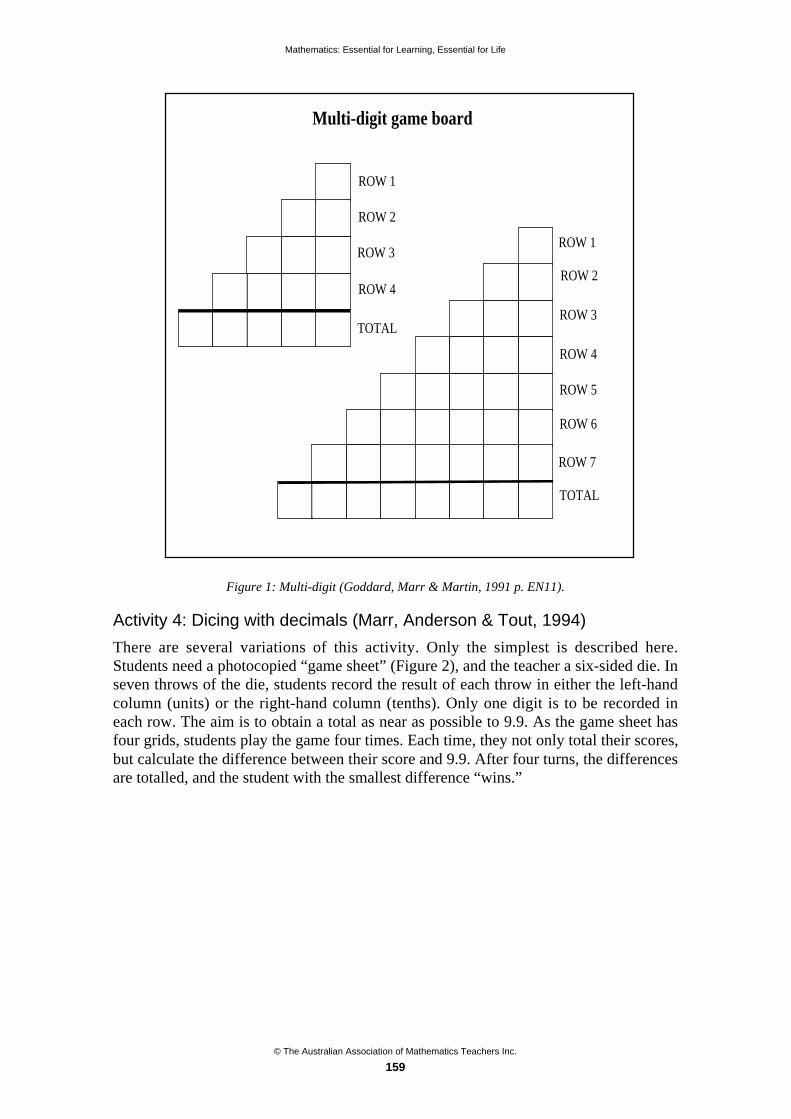
Mathematics: Essential for Learning, Essential for Life
© The Australian Association of Mathematics Teachers Inc.
159
Multi-digit game board
ROW 1
ROW 2
ROW 3
ROW 4
TOTAL
ROW 1
ROW 2
ROW 3
ROW 4
ROW 5
ROW 6
ROW 7
TOTAL
Figure 1: Multi-digit (Goddard, Marr & Martin, 1991 p. EN11).
Activity 4: Dicing with decimals (Marr, Anderson & Tout, 1994)
There are several variations of this activity. Only the simplest is described here.Students need a photocopied “game sheet” (Figure 2), and the teacher a six-sided die. Inseven throws of the die, students record the result of each throw in either the left-handcolumn (units) or the right-hand column (tenths). Only one digit is to be recorded ineach row. The aim is to obtain a total as near as possible to 9.9. As the game sheet hasfour grids, students play the game four times. Each time, they not only total their scores,but calculate the difference between their score and 9.9. After four turns, the differencesare totalled, and the student with the smallest difference “wins.”
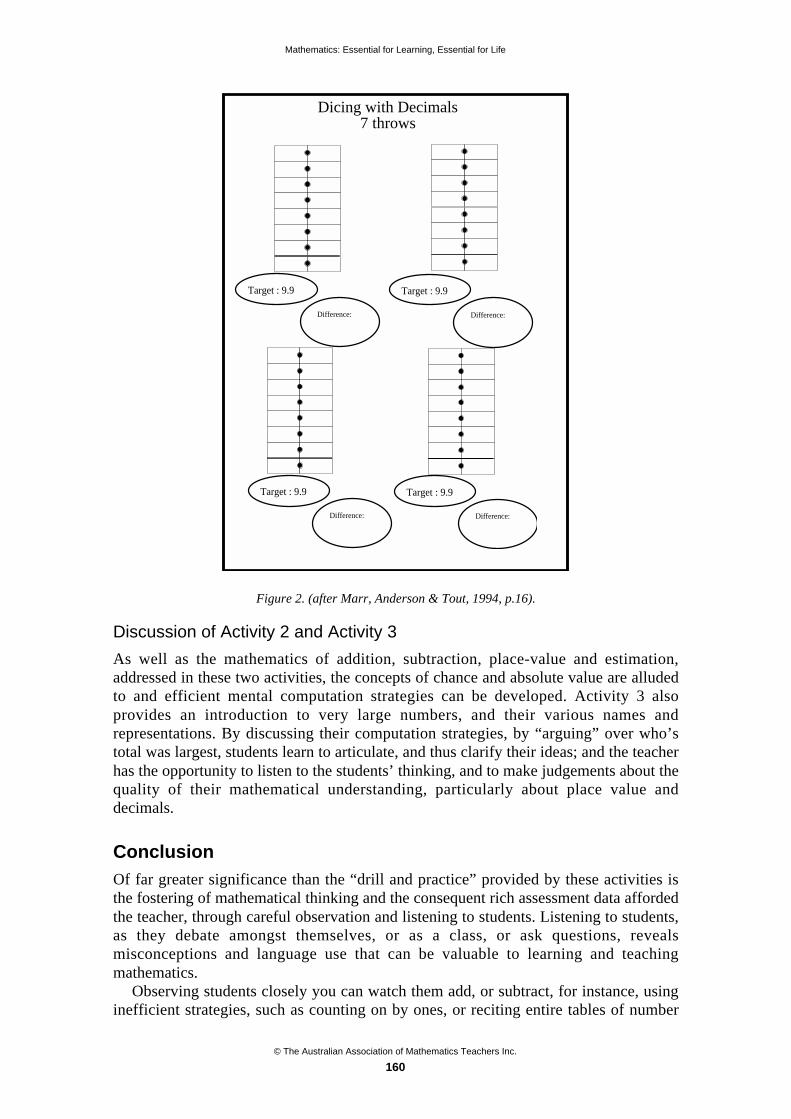
Mathematics: Essential for Learning, Essential for Life
© The Australian Association of Mathematics Teachers Inc.
160
Target : 9.9
Difference:
Target : 9.9
Difference:
Target : 9.9
Difference:
Target : 9.9
Difference:
Dicing with Decimals7 throws
Figure 2. (after Marr, Anderson & Tout, 1994, p.16).
Discussion of Activity 2 and Activity 3
As well as the mathematics of addition, subtraction, place-value and estimation,addressed in these two activities, the concepts of chance and absolute value are alludedto and efficient mental computation strategies can be developed. Activity 3 alsoprovides an introduction to very large numbers, and their various names andrepresentations. By discussing their computation strategies, by “arguing” over who’stotal was largest, students learn to articulate, and thus clarify their ideas; and the teacherhas the opportunity to listen to the students’ thinking, and to make judgements about thequality of their mathematical understanding, particularly about place value anddecimals.
Conclusion
Of far greater significance than the “drill and practice” provided by these activities isthe fostering of mathematical thinking and the consequent rich assessment data affordedthe teacher, through careful observation and listening to students. Listening to students,as they debate amongst themselves, or as a class, or ask questions, revealsmisconceptions and language use that can be valuable to learning and teachingmathematics.
Observing students closely you can watch them add, or subtract, for instance, usinginefficient strategies, such as counting on by ones, or reciting entire tables of number

Mathematics: Essential for Learning, Essential for Life
© The Australian Association of Mathematics Teachers Inc.
161
facts, instead of their being able to recall instantly one specific fact. These are usuallythe students who are slow to complete their totals, who rely on others to help, or whoreally miss their calculator. Discussing mental strategies, and ways to remember andrecall number facts, helps these students improve these skills, over time. Theirdevelopment may become apparent during repeated sessions of the activity. Studentsare often willing to ask how others arrived at their total quickly. This gives students theopportunity to articulate their own understandings, evaluate those of others, and soprovide a context for mathematical debate.
Although each of the activities is competitive to some extent, students appear verywilling to help each other out. This is particularly true of activities 3 and 4, where,because of the chance element, there is no guarantee that the same student will win eachtime: a student who “always gets the right answer” can make a bad decision aboutplacing a number (particularly in the larger format of Activity 3) and not get the highesttotal! There is also opportunity with these activities for students to participate bybecoming the die-thrower — time-out from the mental effort, but still being part of theclass. The teacher can also become a participant and, of course, need not win — muchto the delight of the students!
With all of the activities, debates ensue about results of calculations — whether ornot a particular result is possible. Calculators are best avoided, but do help resolve somearguments, particularly when the teacher leaves most of the adjudicating to the class, oras a way of having the less confident students enter the debate. One knows that theactivities appeal to students when they want to complete a game — even after the recessbell has sounded!
References
Board of Studies NSW (BOSNSW) (2002). Mathematics 7–10 Syllabus. Sydney: BOSNSW.
Board of Studies NSW (BOSNSW) (2002). Mathematics K–6 Syllabus. Sydney: BOSNSW
Booth, L. (1984). Algebra: Children’s strategies and errors. A Report of the Strategies and Errors inSecondary Mathematics Project. NFER – Nelson: Windsor, UK.
Burnett, J. & Tickle, B. (2003). Fundamentals. Narangba: Origo Press
Department for Education and Employment Qualifications and Curriculum Authority, (DEEQCA)(1999). Mathematics: The National Curriculum for England. London: DEEQCA
Goddard, R., Marr B. & Martin, J. (1991). Strength in Numbers. Eastern Metropolitan Council of FurtherEducation: Victoria
Kirkby, D. & Short, G. (1994). Maths Investigations: Number Skills Book 2. Longman: Melbourne.
Linchevski, L. & Herscovics, N. (1994). Cognitive obstacles in pre-algebra. In Proceedings of the 18th
International Conference for the Psychology of Mathematics Education. Lisbon.
Lubinski, C. & Otto, A. (2002) Meaningful mathematical representations and early algebraic reasoning.In Teaching Children Mathematics. Reston.
Malara, N. & Iodorosa, R. (n.d.). The interweaving of arithmetic and algebra: Some questions aboutsyntactic and structural aspects and their teaching and learning. Proceedings of Conference ofEuropean Research in Mathematics Education: Group 6. Accessed 3 March 2007 fromhttp://www.fmd.uni-osnabrueck.de/ebooks/erme/cerme1-proceedings.html
Marr B., Anderson & Tout, D. (1994). Numeracy on the Line. Stevenenge: Avanti Books.
National Council of Teachers of Mathematics (NCTM) (2000). Principles and Standards for SchoolMathematics. Reston, VA: NCTM
Sullivan, P. & Lilburn, P. (1997). Open-ended Maths Activities: Using ‘Good’ Questions to EnhanceLearning. Melbourne; OUP
Mathematics: Essential for Learning, Essential for Life
© The Australian Association of Mathematics Teachers Inc.
162
Tall, D. (1992). The transition from arithmetic to algebra: Number patterns, or proceptual programming?In From Numeracy to Algebra: Research Workshop on Mathematics Teaching and Learning.Brisbane.
Tall, D. & Thomas, M. (2002). The long-term cognitive development of symbolic algebra. In B. Barton,K. Irwin, M. Pfannkuch & M. Thomas (Eds), Mathematics Education in the South Pacific.Proceedings of the 25th Annual Conference of the Mathematics Education Research Group ofAustralasia. Auckland: MERGA.
van Ameron, B., (2003). Focusing on informal strategies when linking arithmetic to early algebra.Educational Studies in Mathematics, 54, 63–75.
Watson, A., (2005). Opportunities to learn mathematics. In L. Bragg, C. Campbell, G. Herbert and J.Mousley (Eds), MERINO — Mathematics Education, Research, Innovation, Networking. Proceedingsof the 26th Annual Conference of the Mathematics Education Research Group of Australasia.Melbourne: MERGA.

© The Australian Association of Mathematics Teachers Inc.
163
Preservice teachers’ perceptions of theirmentoring in primary mathematics teaching*
Peter Hudson
Queensland University of Technology
Sue Hudson
Queensland University of Technology
A literature-based instrument gathered 147 final-year preservice teachers’perceptions of their mentors’ practices related to primary mathematics teaching.The five factors that characterise effective mentoring practices in primarymathematics teaching had acceptable Cronbach alphas, that is, PersonalAttributes (mean scale score=3.97, S D [standard deviation]=0.81), SystemRequirements (mean scale score=2.98, SD=0.96), Pedagogical Knowledge (meanscale score=3.61, SD=0.89), Modelling (mean scale score=4.03, SD=0.73), andFeedback (mean scale score=3.80, SD=0.86) were .91, .74, .94, .89, and .86respectively. This survey instrument may have applications for mentoring insecondary mathematics and can be re-designed to investigate mentoring practicesin other key learning areas.
Mentoring is prominent in education systems throughout the world (Hawkey, 1997;Power, Clarke & Hine, 2002; Starr-Glass, 2005) and mentors (i.e., supervising teachersor cooperating teachers) in professional experience settings (i.e., practicum, fieldexperiences, internships) are well positioned to assist preservice teachers in developingtheir practices (Crowther & Cannon, 1998). Mentors’ responsibilities for developingpreservice teachers’ practices are increasing as mentoring continues to amplify itsprofile in education (Sinclair, 1997). Primary (elementary) teachers in Australiagenerally work across all key learning areas (KLAs) and hence, in their roles asmentors, are expected to facilitate quality mentoring to preservice teachers across theseKLAs. However, primary teachers will not be experts in all KLAs as research showssome areas receive considerably less attention than others (e.g., science [Goodrum,Hackling & Rennie, 2001] and art [Eisner, 2001]). As the curriculum is so diverse forprimary teachers, they may need assistance in their roles as mentors with particularmentoring practices focused on subject-specific areas (Hodge, 1997; Hudson, 2004a, b,2005; Jarvis, McKeon, Coates & Vause, 2001), which also appears to be the case formentoring in mathematics education (Jarworski & Watson, 1994; Peterson & Williams,1998).
Similar to teaching practices, professional development in mentoring practices mayenhance the mentor’s knowledge and skills. Also, similar to teaching practices, mentorsoperate in their own environment, where they may or may not receive further ideas fordeveloping their practices. Yet, mentoring cannot be left to chance (Ganser, 1996) andneeds to be purposeful in order to be more effective with explicit practices (Gaston &Jackson, 1998; Giebelhaus & Bowman, 2002; Jarworski & Watson, 1994; Jonson,2002). Guidelines for subject-specific mentoring can aid the mentor’s development by
* Paper accepted by peer review
Mathematics: Essential for Learning, Essential for Life
© The Australian Association of Mathematics Teachers Inc.
164
increasing confidence for raising issues, and providing topics for discussion andobservation of specific teaching practices (e.g., see Jarvis et al., 2001; Hudson &McRobbie, 2003). Although there are various models for mentoring (Allsop & Benson,1996; Colley, 2003; Jarworski & Watson, 1994; Jonson, 2002; Herman & Mandell,2004), there is little literature on subject-specific mentoring in mathematics educationfor preservice teachers.
A five-factor model for mentoring has previously been identified, namely, PersonalAttributes, System Requirements, Pedagogical Knowledge, Modelling, and Feedback(Hudson & Skamp, 2003), and items associated with each factor have also beenidentified and justified with the literature (see Hudson, Skamp & Brooks, 2005). Thefive factors, and the development of the MEPST instrument, are well articulated in theliterature (see Hudson et al., 2005) for which this survey (Appendix 1) provides a directlink.
This study explores and describes 147 Australian preservice teachers’ perceptions oftheir mentors’ practices in primary mathematics education within the abovementionedfive factors linked to a literature-based instrument (Appendix 1). This study aims todetermine the transferability of the science mentoring instrument (Hudson et al., 2005)to the development of an instrument for mentoring preservice teachers in primarymathematics teaching. It also aims to articulate existing mentoring practices linked tothis instrument on preservice teachers’ mentoring of primary mathematics teaching.
Data collection method and analysis
The “Mentoring for Effective Mathematics Teaching” (MEMT) survey instrument(Appendix 1) in this study evolved through a series of preliminary investigations onMentoring for Effective Primary Science Teaching (MEPST; Hudson, 2003; Hudson &Skamp, 2003; Hudson, 2004a, b; Hudson et al., 2005), which also identified the linkbetween the literature and the items on the survey instrument. The MEPST surveyinstrument, which focused on the five factors (i.e., Personal Attributes, SystemRequirements, Pedagogical Knowledge, Modelling, and Feedback), was altered toreflect mentoring in primary mathematics. That is, the word “science” was replaced bythe word “mathematics”. A pilot study was conducted on 29 final-year preserviceteachers by administering the MEMT survey instrument at the conclusion of theirprofessional experiences (Hudson & Peard, 2005). Analysis of this pilot test indicatedthe possibility of a relationship between the MEPST instrument and the MEMTinstrument; however further investigation was needed to verify results. For this study,147 preservice teachers’ perceptions of their mentoring were obtained from the five-partLikert scale (i.e., strongly disagree=1, disagree=2, uncertain=3, agree=4, stronglyagree=5) MEMT instrument. The data provided descriptive statistics for each variable,which also provided an indication of the statistical relationship between variables andwithin each of the factors.
The preservice teachers’ completed responses (n=147) represented 64% of the totalcohort within a mathematics course at a Queensland university. Cronbach alpha scores(acceptable if >.70; see Kline, 1998), mean scale scores (i.e., mean scores of each itemassociated with each factor and then computed with a factor mean score; see SPSS13),and eigenvalues using SPSS factor reduction, which indicated the number of possiblecomponents (factors; i.e., eigenvalues >1; see Kline, 1998) and percentage of variationfor each eigenvalue, aided in determining reliability and the potential transferability ofthe MEPST instrument to the MEMT instrument.

Mathematics: Essential for Learning, Essential for Life
© The Australian Association of Mathematics Teachers Inc.
165
Results and discussion
These preservice teacher responses (109 female; 38 male) provided descriptors of theparticipants (mentors and mentees) and data on each of the five factors and associatedattributes and practices. Responses were gathered at the conclusion of their finalprofessional experience (i.e., practicum, field experience).
Backgrounds of participants
Twenty-five percent of these mentees (n=147) entered teacher education straight fromhigh school, with 93% completing mathematics units in their final two years of highschool (i.e., Years 11 & 12). Seventy-seven percent of mentees had completed two ormore mathematics methodology units at university, and 86% had completed three ormore block professional experiences (practicums) with 54% completing fourprofessional experiences. There were no professional experiences under three-weeks.Ninety percent of mentees taught at least four mathematics lessons during their lastpracticum with 81% indicating they had taught 6 or more lessons. Most of theclassrooms for the mentoring in mathematics were in the city or city suburbs (69%)with 31% in regional cities and in rural towns or isolated areas.Mentees estimated that most mentors (male=22, female=125) were over 40 years of age(55%) with 28% between 30 to 39 years of age, and 16% under 30. Mentees also notedthat 86% of mentors modelled one or more mathematics lessons during their mentees’professional experiences, with 59% modelling five or more lessons during that period.Finally, 41% of mentees perceived that mathematics was their mentors’ strongestsubject in the primary school setting.
Five factors for effective mentoring in mathematics
Each of the five factors had acceptable Cronbach alpha scores greater than .70 (Kline,1998), that is, Personal Attributes (mean scale score=3.96, S D [standarddeviation]=0.91), System Requirements (mean scale score=3.31, SD=0.90), PedagogicalKnowledge (mean scale score=3.58, SD=0.94), Modelling (mean scale score=4.01,SD=0.78), and Feedback (mean scale score=3.76, SD=0.88) were .91, .77, .95, .90, and.86 respectively (Table 1). Data from items associated with each factor were entered inSPSS13 factor reduction, which extracted one component only for each factor.Associated eignevalues accounted for 59–69 percentage of variance on each of thesescales.
Table 1. Confirmatory Factor Analysis for Each of the Five Factors (n=147)
Factor Eigenvalue*Percentageof variance
Mean scalescore SD
Cronbachalpha
Personal Attributes 4.13 69 3.96 0.81 .91System Requirements 2.05 68 3.31 0.90 .77Pedagogical Knowledge 7.19 65 3.58 0.94 .95Modelling 4.70 59 4.01 0.78 .90Feedback 3.64 61 3.76 0.88 .86* Only one component extracted for each factor with an eigenvalue >1.
The following provides further insight into specific data on the attributes andpractices associated with each factor.

Mathematics: Essential for Learning, Essential for Life
© The Australian Association of Mathematics Teachers Inc.
166
Personal attributes
When analysing the mentees’ responses on their mentors’ “personal attributes,” amajority of mentors (89%) were supportive towards their mentees’ primarymathematics teaching. In addition, 86% of mentors appeared comfortable in talkingabout mathematics teaching (Table 2).
Table 2. “Personal Attributes” for Mentoring Primary Mathematics Teaching (n=147)
Mentoring Practices %* M SDSupportive 89 4.35 0.85Comfortable in talking 86 4.25 0.88Assisted in reflecting 73 3.87 1.01Instilled positive attitudes 69 3.92 0.88Listened attentively 67 3.67 1.07Instilled confidence 64 3.75 1.08
* %=Percentage of mentees who either “agreed” or “strongly agreed” their mentor provided thatspecific mentoring practice.
However, less than one quarter of mentees believed that the mentor aided thementee’s reflection on teaching practices (73% agreed or strongly agreed to thispractice), instilled positive attitudes (69%), and listened attentively to their mentees(67%) and instilled confidence (64%) for teaching primary mathematics. Table 2provides mean item scores (range: 3.67 to 4.35; SD range: 0.85 to 1.08) and percentageson mentees’ perceptions of their mentors’ Personal Attributes in rank order.
System requirements
Items displayed under the factor “System Requirements” presented a different picturefrom the previous factor. The percentages of mentees’ perceptions of their primarymathematics mentoring practices associated with System Requirements were all below50%, that is, 44% of mentors discussed the aims of mathematics teaching, 41% ofmentors discussed the school’s mathematics policies with the mentee, and only 29%outlined mathematics curriculum documents (Table 3). Implementing departmentaldirectives and primary mathematics education reform needs to also occur at theprofessional experience level, yet the data indicated (mean item scores range: 2.71 to3.15; SD range: 1.14 to 1.24, Table 3) that many preservice teachers may not beprovided these mentoring practices on System Requirements within the school setting.
Table 3. “System Requirements” for Mentoring Primary Mathematics Teaching
Mentoring Practices %* M SDDiscussed aims 44 3.15 1.14Discussed policies 41 3.06 1.18Outlined curriculum 29 2.71 1.24
%=Percentage of mentees who either “agreed” or “strongly agreed” their mentor provided thatspecific mentoring practice.
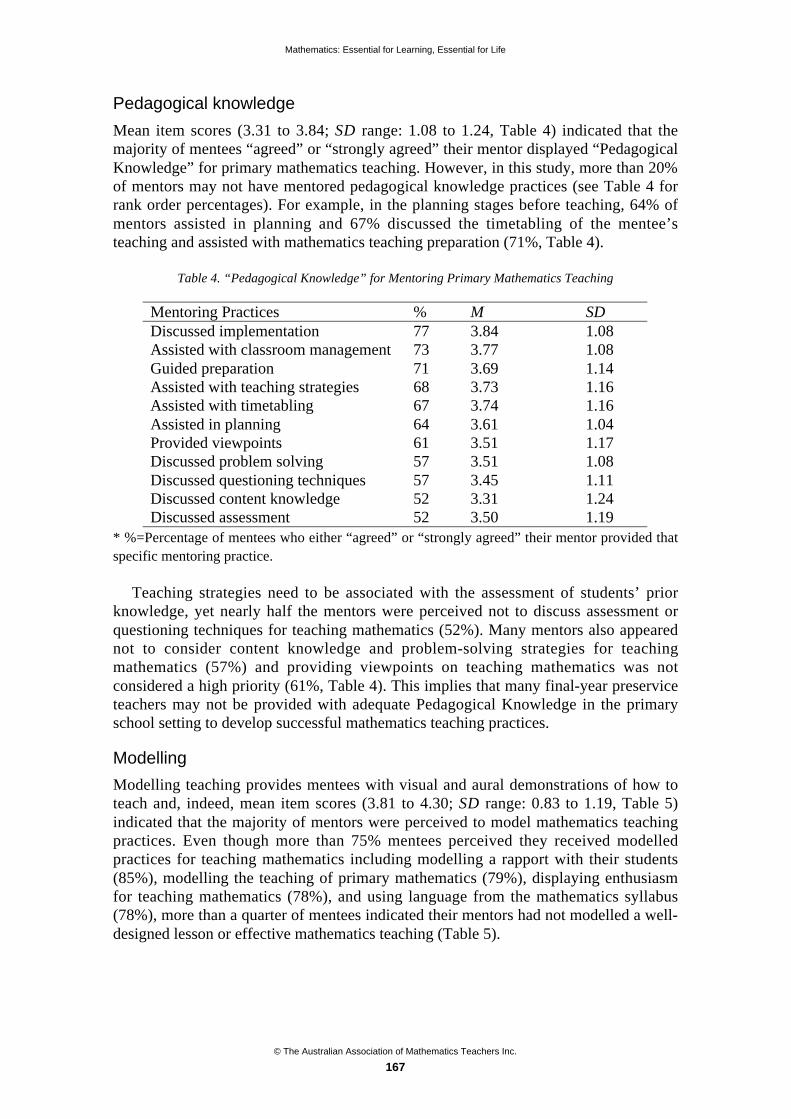
Mathematics: Essential for Learning, Essential for Life
© The Australian Association of Mathematics Teachers Inc.
167
Pedagogical knowledge
Mean item scores (3.31 to 3.84; SD range: 1.08 to 1.24, Table 4) indicated that themajority of mentees “agreed” or “strongly agreed” their mentor displayed “PedagogicalKnowledge” for primary mathematics teaching. However, in this study, more than 20%of mentors may not have mentored pedagogical knowledge practices (see Table 4 forrank order percentages). For example, in the planning stages before teaching, 64% ofmentors assisted in planning and 67% discussed the timetabling of the mentee’steaching and assisted with mathematics teaching preparation (71%, Table 4).
Table 4. “Pedagogical Knowledge” for Mentoring Primary Mathematics Teaching
Mentoring Practices % M SDDiscussed implementation 77 3.84 1.08Assisted with classroom management 73 3.77 1.08Guided preparation 71 3.69 1.14Assisted with teaching strategies 68 3.73 1.16Assisted with timetabling 67 3.74 1.16Assisted in planning 64 3.61 1.04Provided viewpoints 61 3.51 1.17Discussed problem solving 57 3.51 1.08Discussed questioning techniques 57 3.45 1.11Discussed content knowledge 52 3.31 1.24Discussed assessment 52 3.50 1.19
* %=Percentage of mentees who either “agreed” or “strongly agreed” their mentor provided thatspecific mentoring practice.
Teaching strategies need to be associated with the assessment of students’ priorknowledge, yet nearly half the mentors were perceived not to discuss assessment orquestioning techniques for teaching mathematics (52%). Many mentors also appearednot to consider content knowledge and problem-solving strategies for teachingmathematics (57%) and providing viewpoints on teaching mathematics was notconsidered a high priority (61%, Table 4). This implies that many final-year preserviceteachers may not be provided with adequate Pedagogical Knowledge in the primaryschool setting to develop successful mathematics teaching practices.
Modelling
Modelling teaching provides mentees with visual and aural demonstrations of how toteach and, indeed, mean item scores (3.81 to 4.30; SD range: 0.83 to 1.19, Table 5)indicated that the majority of mentors were perceived to model mathematics teachingpractices. Even though more than 75% mentees perceived they received modelledpractices for teaching mathematics including modelling a rapport with their students(85%), modelling the teaching of primary mathematics (79%), displaying enthusiasmfor teaching mathematics (78%), and using language from the mathematics syllabus(78%), more than a quarter of mentees indicated their mentors had not modelled a well-designed lesson or effective mathematics teaching (Table 5).
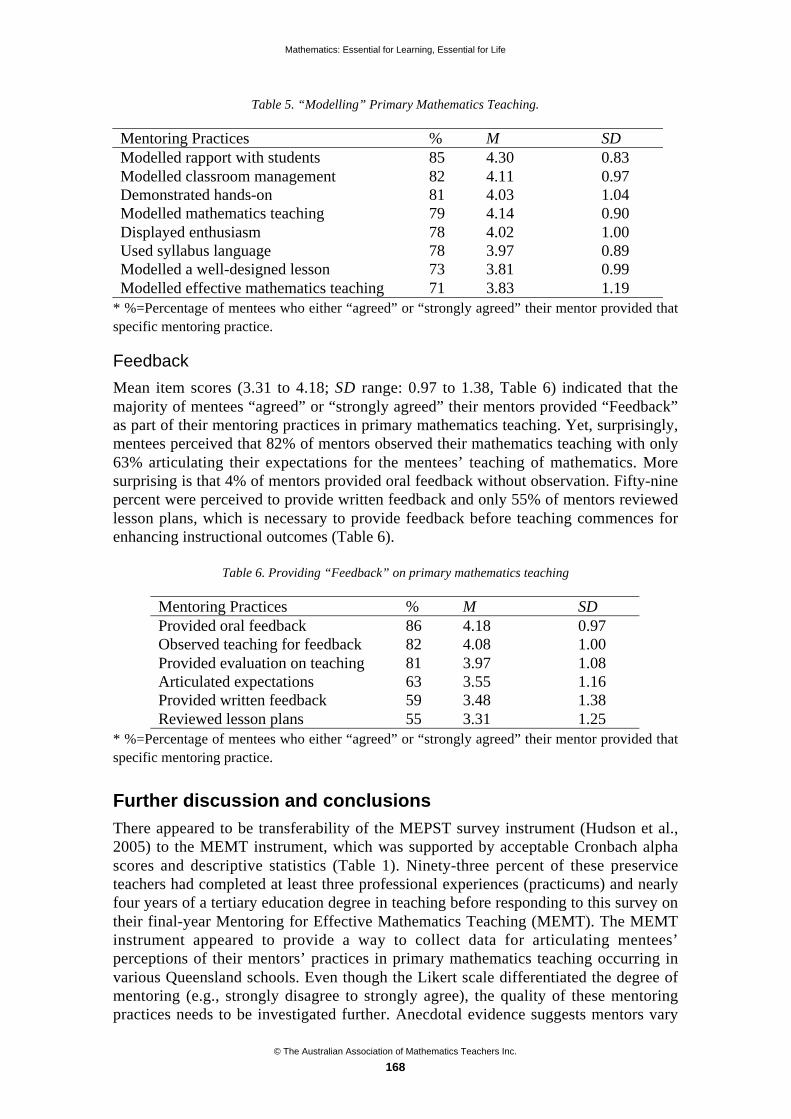
Mathematics: Essential for Learning, Essential for Life
© The Australian Association of Mathematics Teachers Inc.
168
Table 5. “Modelling” Primary Mathematics Teaching.
Mentoring Practices % M SDModelled rapport with students 85 4.30 0.83Modelled classroom management 82 4.11 0.97Demonstrated hands-on 81 4.03 1.04Modelled mathematics teaching 79 4.14 0.90Displayed enthusiasm 78 4.02 1.00Used syllabus language 78 3.97 0.89Modelled a well-designed lesson 73 3.81 0.99Modelled effective mathematics teaching 71 3.83 1.19
* %=Percentage of mentees who either “agreed” or “strongly agreed” their mentor provided thatspecific mentoring practice.
Feedback
Mean item scores (3.31 to 4.18; SD range: 0.97 to 1.38, Table 6) indicated that themajority of mentees “agreed” or “strongly agreed” their mentors provided “Feedback”as part of their mentoring practices in primary mathematics teaching. Yet, surprisingly,mentees perceived that 82% of mentors observed their mathematics teaching with only63% articulating their expectations for the mentees’ teaching of mathematics. Moresurprising is that 4% of mentors provided oral feedback without observation. Fifty-ninepercent were perceived to provide written feedback and only 55% of mentors reviewedlesson plans, which is necessary to provide feedback before teaching commences forenhancing instructional outcomes (Table 6).
Table 6. Providing “Feedback” on primary mathematics teaching
Mentoring Practices % M SDProvided oral feedback 86 4.18 0.97Observed teaching for feedback 82 4.08 1.00Provided evaluation on teaching 81 3.97 1.08Articulated expectations 63 3.55 1.16Provided written feedback 59 3.48 1.38Reviewed lesson plans 55 3.31 1.25
* %=Percentage of mentees who either “agreed” or “strongly agreed” their mentor provided thatspecific mentoring practice.
Further discussion and conclusions
There appeared to be transferability of the MEPST survey instrument (Hudson et al.,2005) to the MEMT instrument, which was supported by acceptable Cronbach alphascores and descriptive statistics (Table 1). Ninety-three percent of these preserviceteachers had completed at least three professional experiences (practicums) and nearlyfour years of a tertiary education degree in teaching before responding to this survey ontheir final-year Mentoring for Effective Mathematics Teaching (MEMT). The MEMTinstrument appeared to provide a way to collect data for articulating mentees’perceptions of their mentors’ practices in primary mathematics teaching occurring invarious Queensland schools. Even though the Likert scale differentiated the degree ofmentoring (e.g., strongly disagree to strongly agree), the quality of these mentoringpractices needs to be investigated further. Anecdotal evidence suggests mentors vary
Mathematics: Essential for Learning, Essential for Life
© The Australian Association of Mathematics Teachers Inc.
169
their mentoring practices considerably, and as there are national standards for teachingand assessing mathematics (e.g., NCTM, 1989, 1991, 1992, 1995), a set of standards formentoring practices for mathematics appears a logical sequence.
The growing literature is more clearly defining mentoring practices (e.g., Colley,2003; Christensen, 1991; Jarworski & Watson, 1994; Jarvis et al., 2001; Jonson, 2002;Herman & Mandell, 2004; Wilkin, 1992), with mentees claiming that the in-schoolcontext is pivotal to their development as teachers (Gaffey, Woodward & Lowe, 1995;Jasman, 2002). “Generalist” primary teachers will not be experts in all subjects inprimary school, and some may not have adequate knowledge, skills, or confidence forteaching primary mathematics. Mathematics education is considered a priority byAustralian education departments (e.g., Education Queensland; NSW Department ofEducation and Training [DET]); yet there are primary teaching mentors who may eithernot have the skills for effective mathematics teaching to mentor effectively or lackknowledge of effective mentoring strategies. There should be more emphasis on thementoring of mathematics particularly as considerable importance is placed on this keylearning area.
For mentees to receive equitable mentoring in primary mathematics teaching requiresthe provision of a set of specific mentoring attributes and practices for mentors. Such aset of “standards” may aid mentors to focus more specifically on their mentoring andmay aid mentees in determining what to expect from their mentors. It may furtherpromote the specific development of mentor-mentee relationships. However, mentorsand mentees must work together and negotiate their roles and responsibilities (Jonson,2002; Nolder, Smith & Melrose, 1994), and such standards would need to be flexible inorder to cater for the diversity of practices and needs. Just as teachers can alwaysimprove their methods of teaching, so too can mentors improve their methods ofmentoring (Boss, 2001; NSW DET, 2003), and those who receive professionaldevelopment on mentoring have a greater impact on their mentees (Giebelhaus &Bowman, 2002). If preservice teachers are to receive quality mentoring in primarymathematics teaching then many teachers, in their roles as mentors, will require furtherprofessional development. The form this education takes will require rethinking, asexperienced primary teachers can be reluctant to be educated on their mentoringpractices (e.g., Hulshof & Verloop, 1994).
The mentoring indicated in this study only focused on the mentors’ practices andattributes, therefore, further research would be needed on mentees’ involvement in thementoring processes. Nevertheless, the inadequate mentoring outlined in this study maybe initially addressed through specific mentoring interventions that focus on effectivementoring (i.e., attributes and practices associated with the five factors: PersonalAttributes, System Requirements, Pedagogical Knowledge, Modelling, and Feedback;e.g., science mentoring intervention [Hudson & McRobbie, 2003]). As each itemassociated with the MEMT instrument (Appendix 1) is linked to the literature, amentoring intervention can be based around these items. A well-constructed mentoringintervention may provide professional development for mentors to enhance not onlytheir own mentoring practices but also their teaching practices. A mentoringintervention may aid induction processes for early career mathematics teachers,particularly for those who do not receive adequate mentoring support for their teachingof mathematics (e.g., Luft & Cox, 2001). Additionally, the MEMT instrument can beused (by tertiary institutions or departments of education) to gauge the degree ofmentoring in primary mathematics and, as a result of diagnostic analysis, plan andimplement mentoring programs that aim to address the specific needs of mentors inorder to enhance the mentoring process. Although the MEMT instrument was
Mathematics: Essential for Learning, Essential for Life
© The Australian Association of Mathematics Teachers Inc.
170
administered to preservice primary mathematics teachers, it has the potential to gatherdata about mentoring practices for preservice secondary mathematics teachers.
Utilising the mentor’s time efficiently is crucial for developing the mentee’spractices for effective primary mathematics teaching, and this is further justification foreducating mentors. The mentor’s involvement in facilitating the mentee’s learning formore effective primary mathematics teaching cannot be a random process; instead itmust be predetermined and sequentially organised so that the mentor’s objectives arefocused, specific, and obtainable. This means educating mentors on such practiceswhether for a preservice teacher level or a beginning teacher induction level. This studyoutlines that in broad terms, effective mentoring requires mentors to: display personalattributes, provide guidance on system requirements, model effective mentoring (whichalso requires modelling effective teaching practices), and provide pedagogicalknowledge and feedback towards enhancing teaching practices. Educating mentors aimsat ultimately targeting the development of preservice teachers’ practices, and hence away to enhance primary students’ learning experiences and opportunities towardsdeveloping higher standards of mathematics education.
References
Agresti, A. & Finlay, B. (1997). Statistical Methods for the Social Sciences. Englewood Cliffs, NewJersey: Prentice-Hall.
Allsop, T. & Benson, A. (Eds) (1996). Mentoring for Science Teachers. Bristol, PA: Open UniversityPress.
Boss, S. (2001). Building a teacher’s “repertoire” takes time, training. Northwest Education, 7(2), 10–11.
Christensen, L. (1991). Empowerment of Preservice Teachers through Effective Mentoring: CourseRequirements. Alabama: University of Alabama.
Colley, H. (2003). Mentoring for Social Inclusion: A Critical Approach to Nurturing MentorRelationships. London: RoutledgeFalmer.
Crowther, D. T. & Cannon, J. R. (1998, January). How Much is Enough? Preparing Elementary ScienceTeachers through Science Practicums. Paper presented at the Annual Meeting of the Association forthe Education of Teachers of Science. Minneapolis, MN.
Eisner, E. W. (2001). Should we create new aims for art education? Art Education 54(5), 6–10.
Gaffey, C. S., Woodward, H. & Lowe, K. (1995). Improving school experience: An Australianperspective. Action in Teacher Education, 17(2), 7–17.
Ganser, T. (1996). Preparing mentors of beginning teachers: An overview for staff developers. Journal ofStaff Development, 17(4), 8–11.
Gaston, J. S. & Jackson, J. F. (1998). Mentoring and its Implications. Idaha, US. (ERIC DocumentReproduction Service No. ED 426 990)
Giebelhaus, C. R. & Bowman, C. L. (2002). Teaching mentors: Is it worth the effort? Journal ofEducational Research, 95(4), 246–254.
Goodrum, D., Hackling, M. & Rennie, L. (2001). The Status and Quality of Teaching and Learning inAustralian Schools. Canberra, Australia: Department of Education, Training and Youth Affairs.
Hawkey, K. (1997). Roles, responsibilities, and relationships in mentoring: A literature review andagenda for research, Journal of Teacher Education, 48(5), 325–336.
Herman, L. & Mandell, A. (2004). From Teaching to Mentoring: Principles and Practice, Dialogue andLife in Adult Education. London: RoutledgeFalmer.
Hodge, S. R. (1997). Mentoring: Perspectives of physical education graduate students from diversecultural backgrounds. Physical Educator, 54(4), 181–195.
Hudson, P. (2003). Mentoring first-year preservice teachers. Action in Teacher Education: The Journal ofthe Association of Teacher Educators, 15(3), 91–99.
Hudson, P. (2004a). Specific mentoring: A theory and model for developing primary science teachingpractices. European Journal of Teacher Education, 27(2), 139–146.
Mathematics: Essential for Learning, Essential for Life
© The Australian Association of Mathematics Teachers Inc.
171
Hudson, P. (2004b). Toward identifying pedagogical knowledge for mentoring in primary scienceteaching. Journal of Science Education and Technology, 13(2), 215–225.
Hudson, P. & Peard, R. (2005, November). Mentoring for effective mathematics teaching. Paperpresented at the Eight International Conference, Johor Bharu, Malaysia.
Hudson, P. & McRobbie, C. (2003, November). Evaluating a specific mentoring intervention forpreservice teachers of primary science. Paper presented at the annual meeting of the AustralianAssociation of Research in Education (AARE) Conference, Auckland, NZ.
Hudson, P. & Skamp, K. (2003). Mentoring preservice teachers of primary science. The ElectronicJournal of Science Education, 7(1). Retrieved 2 August 2006 fromhttp://unr.edu/homepage/jcannon/ejse/ejse.html
Hudson, P., Skamp, K. & Brooks, L. (2005). Development of an instrument: Mentoring for effectiveprimary science teaching. Science Education, 89(4), 657–674.
Hulshof, H. & Verloop, N. (1994). The collaborating teacher as co-educator in teacher education.Australian Journal of Teacher Education, 19(2), 25–29.
Jarvis, T., McKeon, F., Coates, D. & Vause J. (2001). Beyond generic mentoring: Helping traineeteachers to teach primary science. Research in Science and Technological Education, 19(1), 5–23.
Jarworski, B. & Watson, A. (Eds). (1994). Mentoring in Mathematics Teaching. London: Falmer Press.
Jasman, A. (2002, October). Initial teacher education: Changing curriculum, pedagogies and assessment.Paper presented at the Challenging Futures Conference. University of New England, Armidale,Australia.
Jonson, K. F. (2002). Being an Effective Mentor: How to Help Beginning Teachers Succeed. ThousandOaks, CA: Corwin Press Inc.
Luft, J. A. & Cox, W. E. (2001). Investing in our future: A survey of support offered to beginningsecondary mathematics and science teachers. Science Educator, 10(1), 1–9.
National Council of Teachers of Mathematics (NCTM) (1989). Curriculum and Evaluation Standards forSchool Mathematics. Reston, VA: Author.
National Council of Teachers of Mathematics (NCTM) (1991). Professional Standards for TeachingMathematics. Reston, VA: Author.
National Council of Teachers of Mathematics (NCTM) (1992). Curriculum and Evaluation Standards forSchool Mathematics Addenda series, Grades K–6 Sixth-grade Book. Reston, VA: Author.
National Council of Teachers of Mathematics (NCTM) (1995). Assessment Standards for SchoolMathematics. Reston, VA: Author.
New South Wales Department of Education and Training (NSW DET) (2003). Mentoring the Mentors.Retrieved 2 August 2006 from http://www.det.nsw.edu.au/newsroom/yr2003/mar/mentor.htm.
Nolder, R., Smith, S. & Melrose, J. (1994). Working together: Roles and relationships in the mentoringprocess. In B. Jarworski & A. Watson (Eds), Mentoring in Mathematics Teaching. London: FalmerPress.
Peterson, B. E. & Williams S. R. (1998). Mentoring beginning teachers. Mathematics Teacher, 91(8),730–734.
Power, A., Clarke, M. & Hine, A. (2002, February). The internship: A journey of professional learningthrough reflection. Paper presented at ‘Challenging Futures Conference’. University of New England,Armidale, Australia.
Sinclair, C. (1997). Redefining the role of the university lecturer in school-based teacher education. Asia-Pacific Journal of Teacher Education, 25(3), 309–324.
Starr-Glass, D. (2005). From teaching to mentoring: Principles and practice, dialogue and life in adulteducation. Journal of Transformative Education, 3, 185–189.
Wilkin, M. (Ed.). (1992). Mentoring in Schools. London: Kogan Page.

Mathematics: Essential for Learning, Essential for Life
© The Australian Association of Mathematics Teachers Inc.
172
Appendix 1. Mentoring for effective mathematics teaching
The following statements are concerned with your mentoring experiences in mathematics teaching duringyour last field experience (practicum). Please indicate the degree to which you disagree or agree witheach statement below by circling only one response to the right of each statement.
KeySD = Strongly Disagree
D = Disagree
U = Uncertain
A = Agree
SA = Strongly Agree
During my last field experience (i.e., practicum) in mathematics teaching my mentor:1. was supportive of me for teaching mathematics. SD D U A SA
2. used mathematics language from the current mathematics syllabus. SD D U A SA
3. guided me with mathematics lesson preparation. SD D U A SA
4. discussed with me the school policies used for mathematics teaching. SD D U A SA
5. modelled mathematics teaching. SD D U A SA
6. assisted me with classroom management strategies for mathematics teaching. SD D U A SA
7. had a good rapport with the students learning mathematics. SD D U A SA
8. assisted me towards implementing mathematics teaching strategies. SD D U A SA
9. displayed enthusiasm when teaching mathematics. SD D U A SA
10. assisted me with timetabling my mathematics lessons. SD D U A SA
11. outlined state mathematics curriculum documents to me. SD D U A SA
12. modelled effective classroom management when teaching mathematics. SD D U A SA
13. discussed evaluation of my mathematics teaching. SD D U A SA
14. developed my strategies for teaching mathematics. SD D U A SA
15. was effective in teaching mathematics. SD D U A SA
16. provided oral feedback on my mathematics teaching. SD D U A SA
17. seemed comfortable in talking with me about mathematics teaching. SD D U A SA
18. discussed with me questioning skills for effective mathematics teaching. SD D U A SA
During my last field experience (i.e., practicum) in mathematics teaching my mentor:19. used hands-on materials for teaching mathematics. SD D U A SA
20. provided me with written feedback on my mathematics teaching. SD D U A SA
21. discussed with me the knowledge I needed for teaching mathematics. SD D U A SA
22. instilled positive attitudes in me towards teaching mathematics. SD D U A SA
23. assisted me to reflect on improving my mathematics teaching practices. SD D U A SA
24. gave me clear guidance for planning to teach mathematics. SD D U A SA
25. discussed with me the aims of mathematics teaching. SD D U A SA
26. made me feel more confident as a mathematics teacher. SD D U A SA
27. provided strategies for me to solve my mathematics teaching problems. SD D U A SA
28. reviewed my mathematics lesson plans before teaching mathematics. SD D U A SA
29. had well-designed mathematics activities for the students. SD D U A SA
30. gave me new viewpoints on teaching mathematics. SD D U A SA
31. listened to me attentively on mathematics teaching matters. SD D U A SA
32. showed me how to assess the students’ learning of mathematics. SD D U A SA
33 clearly articulated what I needed to do to improve my mathematics teaching. SD D U A SA
34. observed me teach mathematics before providing feedback? SD D U A SA

© The Australian Association of Mathematics Teachers Inc.
173
Is our mathematics program working?How do we know?
Ken Lountain
Department of Education and Children’s Services, SA
Programs designed to improve mathematics learning are sometimes hindered by alack of evidence about their effectiveness. Too often, evaluation is “tacked on” inthe latter stages of projects or after their completion. Maths for Learning Inclusionis a South Australian program aimed at improving mathematics curriculum. Theprogram operates in eight clusters of schools, supported by specialist teachers inprimary mathematics. Maths for Learning Inclusion features a mixed-methodevaluation which is investigating not just “whether” but “how” and “in whatcontexts” the program is effective. This seminar will examine the development andimplementation of the program evaluation plan and explain why variouscomponents; teacher questionnaires, focus groups, interviews, student learningoutcomes; were included and how they contribute to a picture of the program’simpact on mathematics teaching and learning in the primary years.
Introduction
Programs designed to improve mathematics learning are sometimes hindered by a lackof evidence about their effectiveness. Too often, evaluation is “tacked on” in the latterstages of projects or after their completion.
Maths for Learning Inclusion is a South Australian program aimed at improvingmathematics curriculum. The program operates in 8 clusters of schools, supported byspecialist teachers in primary mathematics. Maths for Learning Inclusion features amixed-method evaluation which is investigating not just “whether” but “how” and “inwhat contexts” the program is effective. The Program was developed and is coordinatedby the Learning Inclusion Team within Curriculum Services in the South AustralianDepartment of Education and Children’s Services (DECS).
A rigorous ongoing evaluation of the Program has been in place from the beginningand has provided the program management team, the cluster coordinators, schoolleaders and teachers, and school communities with valuable ongoing information thathas helped shape the direction of the Program.
The evaluation component of Maths for Learning Inclusion is an intrinsic element ofthe Program design which is contributing to a culture of critical reflection andresponsive action across the Learning Inclusion Team, the eight clusters, and 44 schoolsof over 200 teachers and nearly 4000 students.
Evaluation of the program is being supported by an Evaluation Consultant, GillWesthorpe who specialises in a form of evaluation called realist evaluation. In basicterms, Realist Evaluation processes enable evaluators to focus on the question: Whichelements of the program are having which effects in which circumstances?
Mathematics: Essential for Learning, Essential for Life
© The Australian Association of Mathematics Teachers Inc.
174
How does the program work?
The Maths for Learning Inclusion Program is aiming to systematically improve theengagement and learning outcomes of learners from low socio-economic backgrounds,and Aboriginal learners, through enhancing the capacity of primary teachers in theeffective and inclusive teaching of mathematics.
The project also sought to test a specific program model — the provision of a fulltime Cluster Coordinator to a cluster of relatively disadvantaged schools — and to usethe opportunity to learn as much as possible about how that model worked to createchange.
In program logic terms, the structure of Maths for Learning Inclusion suggests that:
• employing a Coordinator to work with a cluster of schools, and
• supporting the Coordinator and the staff with centrally-provided professionaldevelopment programs will
• lead to a local plan being developed, which will
• underpin a range of program activities within the cluster, and that those activitieswill
• lead to changes in teachers’ attitudes, confidence and skills (these are programmechanisms at the teacher level), which will
• underpin changes in teachers’ teaching behaviours (which are both short termteacher-level outcomes and mechanisms for change in student learningbehaviours), which will
• lead to improved student engagement (which is a primary mechanism at thestudent level), which will
• underpin improved student learning outcomes.
The program was initially funded for 18 months, commencing in mid 2005 andconcluding at the end of 2006. It has since been extended for a further 12 months.
Why are we evaluating the program?
Program model and objectives
The central point of the evaluation is to find out whether the logic upon which theprogram is based is supported by what actually happens; i.e., is progess being madetowards the stated objectives of the program? Is the appointment of eight specialistteachers in mathematics, to work across clusters of disadvantaged schools andsupported by a professional learning program, resulting in positive change for teachersand improved experiences and outcomes for students?
Within this central evaluation concern, there are several subsets:
Accountability for resources
The program is funded using Commonwealth resources that are intended to improvelearning outcomes for learners from low socio-economic backgrounds. Decisions abouthow to use such funding are taken very seriously. The program is funded usingsignificant resources — almost $2.1m over 2.5 years — and it is important that we tryto gauge the effectiveness of the Program’s various components and are able to report toall stakeholders about the Program’s effects.

Mathematics: Essential for Learning, Essential for Life
© The Australian Association of Mathematics Teachers Inc.
175
Enabling responsiveness
Programs that engage in evaluation only after a program is completed or in the finalstages are unable to change what they are doing to respond to the data they collect. Theongoing Maths for Learning Inclusion evaluation has been designed to enable decisionsabout central elements of the program — how the cluster coordinators are working inschools, the content of professional learning for cluster coordinators and teachers, theallocation of resources to various priorities, the hiring of cluster coordinators, the use ofassessment mechanisms — to be made on a dynamic and responsive basis.
Learning more about addressing educational disadvantage
In learning about which aspects of Maths for Learning Inclusion are having whicheffects, for whom, and in which contexts, we can increase the education community’sknowledge about the interventions that are likely to have positive effects on, forexample;
• teachers’ attitudes towards, and expectations of, learners from low socio-economic backgrounds and Aboriginal learners;
• teachers’ confidence in their ability to make a difference;
• teachers’ ability to work effectively with a curriculum framework for planning,programming and assessment;
• teacher pedagogies that engage, and improve outcomes for, learners from lowsocio-economic backgrounds;
• teachers’ and students’ attitudes towards mathematics learning
• the learning outcomes of students from low socio-economic backgrounds andAboriginal students
This is a rare opportunity for the information from one program to benefit policy-makers, district and school leaders, teachers and students across our public system.
Applying what we learn to future initiatives
Too often, there is a risk that what we learn is not applied to what we do in the future.While Realist Evaluation emphasises the importance of context and — in thisevaluation we are being cautious about making causal links — we are beginning tolearn about which elements of the program are having which effects in whichcircumstances.
This is knowledge that can be applied to the design of other programs, intended tobring about curriculum change and the improvement of learning outcomes for studentsfrom low socio-economic backgrounds and Aboriginal students. The Learning InclusionTeam is working with the Curriculum Superintendent, Primary Years and otherstakeholders in Curriculum Services, on planning how to use evaluation data fromMaths for Learning Inclusion in systematic ways to inform other curriculum initiatives,especially those directed to improving the equity as well as the quality of teaching andlearning in DECS schools.
How does the evaluation work?
The evaluation design is a mixed methods case study drawing on two evaluationapproaches: realist evaluation (what works, for whom, in what contexts, and how) andprogram logic (specifying a logical sequence of steps in program implementation andthe ways that these are expected to result in desired program outcomes). The evaluationalso uses the notion of “program contrasts” (elements of program context, design or

Mathematics: Essential for Learning, Essential for Life
© The Australian Association of Mathematics Teachers Inc.
176
service delivery which vary between clusters and which are hypothesised to make adifference to program outcomes).
Data sources for the first full year of the evaluation include:
• PATMaths tests administered to students in Grades 3, 4 and 5 in Terms 1 and 4;
• a Pre- and Post-Program Questionnaire for teachers, addressing aspects of teacherknowledge, skill and attitude, their perceptions of leadership participation andsupport, Cluster Coordinators expertise, and access to professional developmentand peer support, again administered in Terms 1 and 4;
• a shorter term-by-term questionnaire for teachers, collecting data about theirparticipation in project activities;
• a term-by-term questionnaire for Cluster Coordinators, providing informationabout their activities, the adequacy of resources available to them, their approachto their role, and their perceptions of leadership participation and support;
• a Leadership questionnaire, seeking their perspectives in relation to their ownparticipation in the project, the extent of leadership support for the project acrossthe cluster, the adequacy of resources for the project, and relationships across theproject;
• a focus group with leadership representatives from the eight clusters;
• a focus group with the eight Cluster Coordinators;
• “Most Significant Change” stories written by teachers in some clusters.
What are we finding out?
So far, the analysis of evaluation data has yielded clear evidence to support most stepsof the project logic chain, including evidence to support:
• the viability of using Cluster Coordinators with groups of schools;
• the quality and variety of professional development programs provided throughthe Project;
• the value of a mentoring model at cluster level;
• variability of activity at local level, suggesting responsiveness to local needs andresources;
• increased confidence on the part of at least some teachers and more positiveattitudes to teaching mathematics;
• changed pedagogies on the part of at least some teachers, using more activity-based and group-based learning strategies supported by concrete materials. Thereis also evidence of increased frequency of understanding students (their learninginterests and styles, their emotional responses to learning tasks, and the contextsof their daily lives), increased use assessment for planning and for monitoringprogress, and involving individual students and classes in planning andnegotiating learning strategies;
• increased engagement of students in mathematics;
• improved performance on PATMaths tests for the vast majority of students by theend of the academic year.
Among the “lessons learned” so far are the following:
• Security of funding provision over a longer time period than was originallyenvisaged for this project is likely to increase staffing stability, increase the

Mathematics: Essential for Learning, Essential for Life
© The Australian Association of Mathematics Teachers Inc.
177
“reach” of the project (as new staff move into participating schools) and allow forchanges to be embedded within schools and within teachers’ practice.
• The quality of professional development, provision of training at local levels,planning for a variety of professional development approaches to meet differentteachers’ learning needs, and planning for follow-up of professional developmentat local level within a few days, all contribute to the acceptability and/oreffectiveness of professional development activities.
• Funding release time for teachers supports their participation in project activities,which, in turn, contributes to project outcomes.
• Providing a range of strategies and supports at least enhances teacher confidenceand appears to enhance teacher skills, in some cases.
• It is possible to change teacher pedagogies. Observing others using effectivestrategies, supported by a variety of ideas from a variety of sources, buildsmotivation to try changed practice. Experiences of success then reinforce changedpractice.
• Changes in attitude, skill and confidence follow from, rather than precede,changed practice.
• Activity based learning, group based learning, use of concrete materials, and afocus on the process of problem-solving, help build student engagement.
There is also some evidence to support particular hypotheses that were incorporatedwithin the overall logic model, including the value of mentoring, the importance of thecredibility of mentors, the value of supportive leadership, and the value of positiverelationships at a variety of levels within the project.
How evaluation data is shaping program directions:
The collection of evaluation data from the very outset of the program has enabledresponsive and collaborative decision-making that has modified, re-emphasised and re-orientated key features of the program as work has progressed.
The initial Program timeline of 18 months was related to funding and structuralissues within DECS. The resolution of these issues, and the data drawn from the firstyear of the program, enabled the important decision to extend the Program for 2007, inrecognition of both the progress already made and of the time that it takes to build realcurriculum change.
Evaluation data has also guided the professional learning program: both the2005–2006 focus on mathematics planning and programming because of the needsteachers identified in this area, and the 2007 emphases of inclusive curriculum practiceand assessment.
Issues of central/local ownership and responsibility, identified in evaluation data,have been able to be addressed when personnel changes, among the cluster coordinatorgroup, have created opportunities for local capacity-building and shifting keyresponsibilities from central to local level. Responses to such issues as the role ofprincipals in the program, the initiation of cluster-based professional learning and thedevelopment of teacher networks in and across clusters have also been guided by theanalysis of evaluation data.
The development of key program frameworks — the Key Goals and LearningInclusion Indicators — was due to evaluation data that emphasised the need forresources that would help clusters sharpen their focus on learning inclusion in 2007.
Mathematics: Essential for Learning, Essential for Life
© The Australian Association of Mathematics Teachers Inc.
178
Evaluation directions in 2007
The MLI Project is now well into its second calendar year of operation. Someevaluation strategies are being maintained in the second year, notably the Teacher Pre-Post Questionnaire and the student PATMaths tests. Efforts will be made in the secondyear to link student PATMaths data to particular teachers, with a view to exploringcorrelations between teacher practice and student learning outcomes in more detail. Arevised Leadership Questionnaire, focusing on different areas, will again beadministered.
The Term-by-Term questionnaires will not be used again, partly in an effort toreduce “respondent burden” and partly because the data obtained was not as useful inidentifying “program contrasts” as had been hoped.
There will be a much greater emphasis on qualitative data collection in the secondyear of the project. Cluster Coordinators will be invited to take part in individualinterviews in order to gain more detailed understanding of their strategies at Clusterlevel. Focus groups will also be held with groups of teachers, structured around thedifferences in outcomes identified in quantitative data collection in the first year (bygender, years of experience, “effective teacher” status, and so on). These groups willseek to explore both the reasons for differences in outcomes and perhaps, moreimportantly, the strategies that particular groups found most effective in supporting theirquests to enhance their practice in teaching mathematics and supporting learninginclusion.
References
Westhorp, G. (2007). Mathematics for Learning Inclusion Interim Project Report. (Draft).
Pawson, R. & Tilley, P. (1997). Realistic Evaluation. Sage.

© The Australian Association of Mathematics Teachers Inc.
179
Planning Professional Learning using the AAMTStandards: The PLUMS Project*
Leonie Macgregor
Armidale City Public School, NSW
Rosemary Callingham
University of New England
Professional Learning Using the Mathematics Standards (PLUMS) aimed todemonstrate the utility of the AAMT standards as a basis for developingprofessional learning plans for teachers and schools. Teams of teachers from eightschools, four primary and four high schools, planned and implemented a programof professional learning based on their own school’s needs. The teachers weresupported by a team of Academic Partners. From the perspective of the AcademicPartner, this role can be problematic. Some of the difficulties are discussed andsome ways of working productively within this framework are considered.
The purpose of the PLUMS project was to explore the use of the AAMT Standards forExcellence in Teaching Mathematics in Australian Schools (AAMT, 2002) as aframework for professional learning. These standards resulted from a research studythat aimed to identify what teachers across Australia believed defined excellence inteaching mathematics. Funding for PLUMS was provided by the National Institute ofQuality Teaching and School Leadership (now called Teaching Australia) to exploreways in which the AAMT Standards could provide a useful background for teacherprofessional development that met schools’ requirements as well as individual teachers’needs.
The National Centre of Science, Information and Communication Technology andMathematics Education for Rural and Regional Australia (SiMERR) at the Universityof New England coordinated the project, and Academic Partners (the authors) camefrom the UNE School of Education. An independent evaluation of PLUMS wasundertaken by Monash University (Bishop, Clarke & Morony, 2006).
Schools were chosen according to several criteria:
• likely willingness to participate based on the Academic Partners’ prior knowledgeof local schools;
• the nature of the school in order to provide a range of school contexts; and
• proximity to UNE to ensure reasonable contact.
Schools were contacted by one of the Academic Partners and invited to participate.Several schools initially contacted were interested in the project but felt unable to takepart because of prior commitments. Eventually eight schools agreed to becomeinvolved, including schools from public, independent and Catholic sectors.
* Paper accepted by peer review

Mathematics: Essential for Learning, Essential for Life
© The Australian Association of Mathematics Teachers Inc.
180
PLUMS activities
The PLUMS project commenced with an initial conference held at UNE, and attendedby participants from seven of the eight schools. The final school, a small two teacherschool, could not obtain a casual teacher and could not, therefore, attend. BothAcademic Partners, the AAMT project manager and the independent evaluator werepresent.
At the initial gathering, participants were introduced to the Standards using a processpreviously developed by the AAMT Professional Officer. In particular the focus was onthe domains of “Professional Knowledge” and “Professional Practice” as providing themost suitable framework for whole school planning. Teachers used a self-assessmentform to identify areas that appeared under-developed. These self-assessments provideda basis for collaborating with other teachers to identify an approach that would be usedwithin their schools.
The second part of the day gave school based teams opportunities to begin planningtheir projects. No limitations were placed on the nature of schools’ activities, other thanthat they had to involve the Standards in some way, although practical limitations wereinevitably present.
Following this initial planning day, school teams returned to their schools tocomplete their own school plans. The schools’ identified priorities provided the basisfor each school’s focus, and the self assessment approach from the Standardsconference provided a framework in which the focus could be addressed. The primaryschools generally addressed a particular strand of mathematics, such as measurement,identified as needing attention from statewide testing. Two high schools focussed on theuse of technology in the classroom, particularly graphing calculators. Another wanted toconsider a wider range of assessment processes with a focus on assessment for learning.Despite the diversity, it was possible to relate the plans to the Standards in ways thatprovided coherence.
Each school implemented its own project in a different way. Some schools called onthe Academic Partners extensively to provide support and direction. This was greatlyhelped by one partner (the first author) being seconded to UNE for the year whichadded credibility to the support offered. Others requested some support to provideinitial impetus to their project, while others worked independently. During the projectall schools received visits from an Academic Partner and the AAMT ProfessionalOfficer. The extent and focus of these visits varied from school to school. The projectculminated in a final conference in December, also held at UNE at which teacherspresented the outcomes of their work to the rest of the group.
Outcomes from PLUMS
Seven of the eight schools reported successful outcomes. The eighth school, a small twoteacher school, was unable to complete the intended project successfully, largelybecause of the lack of casual staff and the pressure of day to day work in a very small,isolated school.
School plans
Many schools used the self assessment process that had been used in the workshop. Allappropriate teachers completed this activity and identified aspects of their work thatthey felt needed attention. Teachers collaboratively decided what direction theirlearning would take within the context of the schools’ needs.

Mathematics: Essential for Learning, Essential for Life
© The Australian Association of Mathematics Teachers Inc.
181
The school project plans varied in both emphasis and detail. Assessment was a focusin four of the eight schools, possibly reflecting publication of assessment documents inNSW, or a “trickle down” effect of recent changes to HSC assessment that raisedawareness of its importance throughout the system. In three primary schools, the centreof attention of this assessment activity was on the Measurement strand of the syllabus,which had been identified as a weakness in recent Basic Skills Test results. Two highschools chose the use of technology to improve pedagogy as the starting point.Technology use, specifically graphing calculators and dynamic geometry software, hadbeen identified as an area in which teachers lacked confidence, but was of recognisedimportance. The final primary school wanted to improve student “tracking” with theaim of improving the Year 6/Year 7 transition and the other high school project aimedto improve the learning experience for junior high school students through open-endedactivities. The plans developed addressed schools’ identified needs but were focussedand refined by the use of the Standards in the planning process.
Interaction with the Academic Partners
Although they had access to the expertise of the Academic Partners, some schoolspreferred to work without this support. The two schools that focused on technologycombined resources to bring an acknowledged expert in the use of graphing calculatorsand other specialised programs to provide professional development. Other schoolscalled on the Academic Partners extensively, particularly the seconded teacher who waswell known and respected in the education community.
The most effective work with the Academic Partners came about when schools had avery clear idea of what they wanted to do. They were able to articulate their needsclearly in a way that allowed the Academic Partners to support them appropriately. Forexample, one large primary school decided to use one of its professional developmentdays working with both Academic Partners and the District Numeracy Officer onlinking assessment and teaching in the measurement strand.
In another example, one high school particularly wanted ideas for alternativeassessment. Following a full day’s work with the Academic Partners at which a numberof ideas and suggestions for their use were shared, this school embedded practices suchas mathematics journals in its programs in ways that made a considerable difference tothe students. The school only needed the initial impetus provided by access to somelocal expertise to get under way with one of the most successful projects.
There was fairly frequent contact among the schools and the Academic Partners,although much of this happened informally. In a small community, it is inevitable thatcasual meetings occur, in the supermarket for example, and these often became anopportunity for updating and exchange of ideas. Through both formal and informalcontact the Academic Partners were able to keep in touch with most schools. Withoutthis informal contact, keeping in touch may have become problematic. Little use wasmade of email contact by teachers. Where email was used, it was usually from a privateaddress rather than a school. Classroom teachers in public schools in NSW did not, atthat time, have personal email addresses, and it seems that the culture of email use hasnot yet become a part of teachers’ working life. Phone contact with schools is alwaysproblematic, and often several messages were needed, by which time the issue had beendealt with in other ways. Communication between schools and Academic Partners wasmost successful when it involved face-to-face meetings and a block of time.
Mathematics: Essential for Learning, Essential for Life
© The Australian Association of Mathematics Teachers Inc.
182
Teachers’ content knowledge
Several of the project schools indicated that teachers’ content knowledge had increased.In the primary area, this was in the area of some mathematics, especially the focus areaidentified in the projects, usually measurement. In high schools, content knowledgereferred to familiarity with ICT resources, rather than the mathematics. Several schoolsalso explicitly reported that their staff were keen to extend what they had learned intoother areas of mathematics. The knowledge referred to was often linked to teaching,Shulman’s (1986) Pedagogical Content Knowledge, but also addressed themathematical underpinnings, especially in the primary area.
Teachers’ pedagogical knowledge
Improved pedagogical approaches were reported by all schools. Statements aboutincreased teacher confidence were often included in the comments, despite the fact thatall the teachers involved in the project were very experienced. One teacher in one of thehigh schools that had technology as its focus, in an informal follow-up discussion,stated how she felt that the influence had been far greater than she had expected, andthat technology was now being used extensively in all mathematics classrooms fromYear 7 to Year 12.
Factors contributing to success
There were a number of common features reported by schools that appeared tocontribute to their success. All schools reported an increased awareness of theStandards, which in itself was a desirable outcome. Prior to the PLUMS project allteachers had some background knowledge of teaching standards through theProfessional Teaching Standards (NSW Institute of Teachers, 2005) that had beenrecently released but engagement with a set of sharply focused subject-based standardsappeared to provide teachers with a basis for considering teaching standards in generalterms, and their potential use, rather than seeing standards as solely an accountabilitytool. The use of the Standards provided a context in which teachers could reflect ontheir practice with purpose.
Several schools also reported that they had a “product” at the end of the project: abank of assessment tasks or teaching materials, for example. These were shared amongother teachers within the school. Having such an outcome both legitimised the projectfor the teachers involved and extended its usefulness to other teachers.
Most notably, the Standards provided a common language that allowed dialogue.The improved communication was important within schools to keep the project moving,but also across schools. The eight schools involved were dramatically different in theircontexts, approaches and organisation. Nevertheless, they were able to share their ideaswith other project members. This sharing was particularly evident when the primary andhigh schools came together at the final conference where they were able to discusspedagogical issues using the same language.
Implications arising from PLUMS
Although overall the PLUMS project provided some insights into the ways in which theStandards could add value to teachers’ professional learning, there are a number ofissues that arose. In particular the role and place of Academic Partners deserves someattention. There are several programs where the presence of a “Critical Friend” or

Mathematics: Essential for Learning, Essential for Life
© The Australian Association of Mathematics Teachers Inc.
183
Academic Partner is a requirement but the PLUMS experience suggests that there aresome aspects that require further consideration to make the experience a useful andproductive one for all.
The role of an Academic Partner or Critical Friend is a difficult one. It becomes abalance between support and direction and depends greatly on the personal relationshipsbetween the school-based and non-school based people involved. This project wasgreatly aided by the fact that one of the Academic Partners was seconded from a school,and was well known and respected in the local education community. The secondpartner had also worked with several of the teachers involved.
The failure of one school to complete its project, however, raises the issue of theextent to which the Academic Partner can, or should, make demands on a school inorder to keep the project moving. Too much intervention can damage the relationshipbetween the partner and the school and result in the school losing control over itsproject. Too little intervention, however, can result in stagnation.
Another issue for the Academic Partner is the boundary of responsibility, especiallyafter the project has ended. If there has been a productive partnership, both schools andacademics are likely to want this to continue. Reality, however, is that academics arenot able to continue to support every school. There are funding issues as well as time.This reality can lead to some stress on both academics and schools.
Following the PLUMS project, the following suggestions are made about developingproductive partnerships between school and non-school based project partners.1. Make contact early on the project.
The responsibility for early contact is a shared one. Who should initiate this isirrelevant but making sure that it happens will help the project to run smoothly.
2. Establish clear understanding about the extent and parameters of the partnership.Clarifying what the expectations are of all parties will help to avoid someproblems and unrealistic ideas. Role statements were developed for PLUMS butthey were general in nature and did not specify realistic demands. It is alsoimportant that all parties recognise the limitations of their roles. Partners cannot(and should not) drive the project.
3. Ensure adequate time to work with the partner.A block of time is more useful than a 10-minute visit.
4. If you want a partner to take on some specific task, make it clear what your needsare.Partners will do everything they can to support and help but can only be effectiveif what they do meets the needs of the school or teachers.
5. Keep open communication channels.It is easier said than done when everyone is leading a busy professional life tomaintain communication. It can, however, prevent a project from foundering. Thepartner is there to act as a sounding board, and will usually be happy to hear whatyou are doing and to share ideas with you.
6. Recognise that the end of the project means the end of the formal partnership.If both parties want to continue their professional relationship that is wonderful,but this should not be seen as a requirement on either side.
Concluding thoughts
The PLUMS project demonstrated the utility of the Standards at all levels of schoolingas a framework for professional learning. This went beyond their use for accreditation,and potentially provides a route to improving mathematics education without the
Mathematics: Essential for Learning, Essential for Life
© The Australian Association of Mathematics Teachers Inc.
184
personal demands of the HAToM process. Many teachers who would not considerworking towards becoming a Highly Accomplished Teacher of Mathematics willhappily engage with the Standards as a support for professional learning that meets theirschool’s needs.
In addition, working with an Academic Partner or Critical Friend can become arewarding experience for all parties if some guidelines are laid down early on in theproject. Using the Standards can provide a framework and a common language for allparties to use to establish goals and expectations.
PLUMS indicates that the mathematics education community has only begun toscratch the surface of using the Standards. With the increased interest in teachingstandards and teacher registration we should be promoting the Standards as a usefultool for setting expectations and goals for professional learning.
References
Australian Association of Mathematics Teachers (2002). Standards for Excellence in TeachingMathematics in Australian Schools. Adelaide: AAMT.
Bishop, A., Clarke, B. & Morony, W. (2006). Professional Learning Using the Mathematics Standards.Melbourne: Teaching Australia.
NSW Institute of Teachers (2005). Professional Teaching Standards. Sydney: Author.
Shulman, L. S. (1986). Those who understand: Knowledge growth in teaching. Educational Researcher,15(2), 4–14.

© The Australian Association of Mathematics Teachers Inc.
185
Mathematical literacy: It’s all Greek to me!*
Sue McDonald
Brisbane Catholic Education
Teacher-practitioners of mathematics, by virtue of their interactions with theirstudents, tempered by their own beliefs about mathematics and mathematicsteaching and learning, are powerful agents for the development of their students’mathematical literacy. Traditionally mathematics has been taught to students whowere well-grounded in English (often Latin as well), with English as their mothertongue. How times have changed! This paper examines some of the issues thathave arisen in the acquisition and use of mathematical language, and describes anumber of strategies that may assist teachers to improve the reading, writing,listening and speaking skills of their mathematics students.
Introduction
“Mathematical literacy” in the context of this paper (throughout Australia and theUnited Kingdom) does not refer to the meaning generated in the United States; that is,what we call “numeracy”. Mathematical literacy is the ability to use and make meaningof mathematical language, text types, terms and symbols with clarity and precisionthrough (and when) speaking, listening, reading and writing within a variety ofcontexts. Student access to and engagement with mathematics is a direct result of theirlevel of mathematical literacy.
I am a product of Dutch immigrant parents, a childhood and adolescence spentlearning four musical instruments as well as music theory, and teacher-training andtertiary studies in mathematics and French. My approach to teaching mathematics isvery much a language acquisition approach, focussing on the necessary coding anddecoding: akin to foreign languages and music.
The language of mathematics has many of the attributes of a foreign language. Therole of “teachers” may be described as “cultural brokers” (Delpit, 2006) who have theresponsibility and opportunity to help make the connections between the familiar andthe unknown. To be “maths-literate”, students need to de-code as well as construct forthemselves the language of reasoning, the language of the mathematics curriculum andactivity-specific language (or language of the classroom) (Gawned, 1990).
The language of reasoning is the ultimate goal of mathematics teaching and learning.It refers to the language that the teacher and the students use in mathematics-basedproblem-solving contexts, and it develops out of the language of reflection and onlyafter descriptive and comparative language is well-established. Causal relationships arecentral to the language of reasoning, so such language may include comparisons,predictions, inferences, considerations as well as the verbs and adverbs of possibility(might, maybe, if … then, suppose).
The language of the mathematics curriculum is the language, often symbolic, that isspecific to the discipline of mathematics, and can only be learned in the context of
* Paper accepted by peer review
Mathematics: Essential for Learning, Essential for Life
© The Australian Association of Mathematics Teachers Inc.
186
mathematics. Students need to learn this language in order for them to succeed inmathematics.
Activity-specific language is based in one or two predominant language genres; thatis, descriptive and procedural. A classification activity may require students to userequisite labels, terms, definitions or properties: all elements of the descriptive genre.However, if the students were asked how and why they classified as they did, then theprocedural genre would be used, employing sequencing steps and explaining andjustifying the outcomes of the task.
The language of mathematics is not “natural” language, in that it is not a “nativetongue”. It does not operate within the same semantic or syntactic scheme required toprocess everyday speech and it does not use the same grapho-phonetic system. Theexample below (from Simpson, 2003) illustrates particular mathematical semantics, an“unnatural” syntax and the use of English, Hindu-Arabic and Greek in combination.
Sketch the graph of y = sin4
for 0 2 .
When analysed, as suggested by (Bechervaise, 1994), the language of mathematicsincorporates:
• some words that are sourced from “real world” language (e.g., add, shape, size,match)
• some words that have a redefined meaning in mathematics (e.g., table, index,multiply, volume, root, differentiate), and
• others that are specifically mathematical (e.g. intercept, logarithm, sine) .
(Donovon, 1990) observed that the beginning of mathematical understandingcommences at birth, and develops as children experience their world as a place of order,pattern or prediction (or the converse for many children who find themselves inenvironments that lack order and predictability). In these pre-school years, usuallythrough the medium of play, the children become involved in activities such aslabelling, sorting, classifying, sequencing, comparing, measuring and problem solving.The Early Years Phase Descriptors (Early Years Curriculum Materials: PhaseDescriptors, 2006) reflect these activities in the development of early mathematicalunderstandings; “Investigating and communicating ideas about: quantities and theirrepresentations, and attributes of objects and collections; position, movement anddirection; and order, sequence and pattern.” (p. 20).Unfortunately this prior knowledgeis often segmented into distinct, often unrelated units of mathematical learning when thechild begins “formal” education; and the total concept of mathematics, particularly thelanguage of mathematics, as being a functional part of everyday life is destroyed.
Strategies
Our challenge and obligation as teachers is to support the use and understanding ofmathematical language rather than oversimplifying or overgeneralising and “de-maths-ing” the language. This may require approaching the teaching of mathematical languagefrom a LOTE (language other than English) perspective; that is, explicitly investigatingvocabulary, syntax and semantics in context. “The current best practice in secondlanguage teaching suggests that language should be taught in context when it is needed

Mathematics: Essential for Learning, Essential for Life
© The Australian Association of Mathematics Teachers Inc.
187
for communication. This means that the language of mathematics should beconcurrently taught with the mathematics.” (Moore, n.d.)
Modelling the use, both oral and written, of correct mathematical language is themost effective strategy for teachers to use to ensure the development of themathematical literacy of their students. Moore (n.d.) emphasised that not only doteachers need to provide a model for mathematical language; they also need to provideopportunities for students to practise it. Initially this practice will involve only a smallinput from the student. The amount of input will increase until students are reading,writing and speaking about mathematics thereby practising the newly acquiredlanguage. Teachers need to be aware of the pitfalls associated with early foreignlanguage development, particularly the temptation to make literal translations. Forexample, “sacré bleu!” a French exclamation of incredulity, literally translates to“sacred blue”, which does little to assist in the meaning-making of a particular text.Similarly, when students come across the instruction “construct a table”, the literaltranslation does little to support the student to collect and handle data appropriately.
Another commonly identified language acquisition problem (for both English as amother tongue and foreign languages) is the over-generalising of “rules”; for example,“I baked you a cookie but I eated it” which can lead to over-generalisations inmathematical language such as “square rooting”, “timesing” and “plussing”. This use oflanguage is not cute or acceptable, and the appropriate language should be modelled in apositive fashion; for example, responding “Oh, you baked me a cookie but you ate it?Dear me.” or “So you multiplied the amount by four?”. This phenomenon of over-generalising can also occur when students use symbolic mathematical language; forexample, 4 + 3 = 3 + 4 so 4 – 3 = 3 – 4. This misunderstanding needs to be quicklyaddressed, and the use of calculators can be quite convincing to students in showing thatthe two expressions are not equivalent.
An emerging phenomenon, particularly in secondary schools, is the infiltration of“texting language” as an alternative written vernacular of the classroom. I had a Year 11Mathematics A student write an entire budgeting assignment using text “lingo”, such as:“Ill budget $20 ea wk 4 trnsprt” = “I will budget $20 each week for transport.” Ratherthan embracing this written form, teachers need to explicitly teach the language ofmathematics: “find the value of x” rather than “fnd d valU of x”. Although this textinglanguage is widely accepted and understood amongst students in their “real” world ithas no place in the discipline of mathematics.
Writing tasks in mathematics are valuable for both teacher and learner. However, itis the type of task that determines whether or not any mathematics learning takes place.(Pengelly, 1990) strongly advocated that “mathematics is not about writing journals,reading books or describing what was done in a mathematics session. Mathematicallearning comes about as a result of engaging in the mathematising process.” (p. 15).There is little value in using a learning journal for mathematics when entries resemblethese:
“We did group work for some of the lesson, and then exercise 3B”.“We did integers today.”The kinds of writing tasks that foster mathematics learning are those that expose
misconceptions and gaps in understanding when the learner tries to write a definition oran explanation (or the question style is altered). In this way, the “learner is engaged inhigh-level thinking and the active construction of meaning.” (MacGregor, 1990).
The following student samples were selected from the trial of test items for mydoctoral study. The wording of these tasks and the subsequent student responsesprovide a greater insight into the students’ understanding of concepts (misconceptions
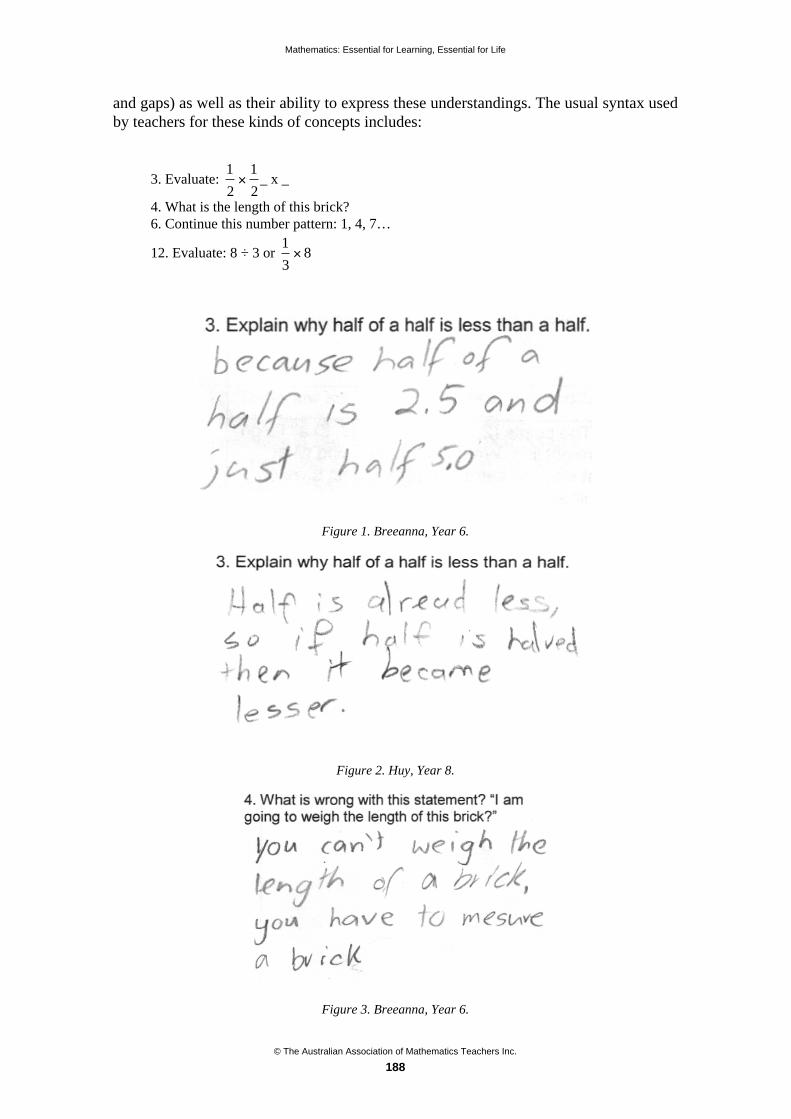
Mathematics: Essential for Learning, Essential for Life
© The Australian Association of Mathematics Teachers Inc.
188
and gaps) as well as their ability to express these understandings. The usual syntax usedby teachers for these kinds of concepts includes:
3. Evaluate: 1
2
1
2_ x _
4. What is the length of this brick?6. Continue this number pattern: 1, 4, 7…
12. Evaluate: 8 ÷ 3 or 1
38
Figure 1. Breeanna, Year 6.
Figure 2. Huy, Year 8.
Figure 3. Breeanna, Year 6.

Mathematics: Essential for Learning, Essential for Life
© The Australian Association of Mathematics Teachers Inc.
189
Figure 4. Tara, Year 6.
Figure 5. Daniel, Year 8.
Figure 6. Tim, Year 7.
Figure 7. Breeanna, Year 6.

Mathematics: Essential for Learning, Essential for Life
© The Australian Association of Mathematics Teachers Inc.
190
Figure 8. Huy, Year 8.
Figure 9. Heather, Year 7
Morgan (as cited in Wagner, 2004, p.409), as a result of her extensive study ofsecondary school mathematics writing, identified the need for students to become moreaware of their language practice. Typical students’ mathematical writing tends to be apoor reflection of their mathematics, even if they are proficient users of mathematics.
Story (word) problems bring natural and mathematical language structures togetherand require students to operate in both representational systems simultaneously. Whenengaged with, these word problems need to be analytically read. This is not an intuitiveskill, and students need to have modelled for them and have opportunity to practisestrategies for doing this analysis. The typical use of complex sentences, conjunctionsand natural language in word problems can often lead to ambiguity. However, whenstudents in the class come up with different interpretations of a problem statement, thiscan become a “teachable moment” engendering discussion that focuses on both thelanguage and the mathematics involved. (Mitchell, 2001) The increased need forexplicitness in written language is one reason writing is seen to be useful for theteaching or learning of mathematics — the process of developing clear communicationusing written words forms a bridge to the use of mathematical symbolic expressions. Incontrast with natural language, mathematical representations achieve their value mainlyfrom their precision, their (relative) lack of ambiguity. When a type of mathematicalobject is defined, it must be clear for any given object whether or not it is an instance ofthat type — otherwise the type is not well defined. Mathematical expressions in generalmust be well-defined and in part derive their analytical power (as well as theirlimitations) from this precision (Mitchell, 2001).
For instance, a class is given a task as follows:

Mathematics: Essential for Learning, Essential for Life
© The Australian Association of Mathematics Teachers Inc.
191
Draw a diagram to illustrate each of these words:Quadrilateral, parallelogram, rhombus, rectangle, square.
One student draws a square for each word. Are they incorrect? What did the teacherreally have in mind? To what extent did the combination of natural and mathematicallanguage contribute to the mismatch of student performance and teacher expectation?
The mathematical literacy challenges that students face in reading and writingmathematics are also evident in oral communication and interpreting spokenmathematical language. As with foreign language acquisition, engagement in oral andaural language demands point-in-time decoding and coding. When using the languageof mathematics, this situation can be further complicated by the use of homophonessuch as discrete and discreet, and “shine x” and sinhx. Easdown (2006) described atechnique called “spotlighting” the purpose of which is to “prime students” and to givethem an “appropriate frame of reference”. The aim of spotlighting is to avoid evenmomentary confusion because that can mean that some students are not activelylistening to the important material (development of new concepts) and they lose thethread of the lesson. Thoughtful spotlighting takes little time and saves confusion. Forexample; “You will be collecting and displaying discrete data. Remember that meansthat it represents categories such as eye colour.”
Another area that causes confusion with students is the apparent anomalies in thewritten and spoken versions of index notation. For example, 62 is often said as “sixsquared”. The confusion arises when students investigate area and vocalise (or havemodelled to them by their teacher) 6 cm2 as “six centimetres squared” rather than thecorrect version “six square centimetres”. As shown in Figure 10, these expressionsrepresent two different quantities. This kind of accuracy is important in retaining theunambiguous nature of mathematical language.
“six square centimetres”
“six centimetres squared”
Figure 10

Mathematics: Essential for Learning, Essential for Life
© The Australian Association of Mathematics Teachers Inc.
192
Some early mathematical conceptual understandings are confused by theinappropriate use of language. In particular, incorrect oral language used to vocalisedecimal and common fractions. For example, many teachers verbalise 2.6 as “two pointsix”. There is no such number. What they have communicated are the words associatedwith the symbolic representation of the number “two and sixth-tenths”. The use of“point” does little to foster place value facility. Another example of unhelpful teacher
modelling is when common fractions such as 3
8 are verbalised as “three over eight”.
This refers to the positioning of the numerals not the fraction being represented which is“three-eighths”.
The aim of using the correct terminology and modelling descriptive and procedurallanguage in mathematics is that teachers and students will be able to engage inmathematics discourse, thereby raising the intellectual quality in the classroom. Thelanguage specific to a given subject is termed the “discourse” of the subject.Mathematics classroom discourse is about whole-class discussions in which studentstalk about mathematics in such a way that they reveal their understanding of concepts.Underlying the use of discourse in the mathematics classroom is the idea thatmathematics is primarily about reasoning and not memorisation. “Mathematics is notabout remembering and applying a set of procedures but about developingunderstanding and explaining the processes used to arrive at solutions.” (MathematicalClassroom Discourse, n.d.). The NCTM (as cited in Wimer, Ridenour, Thomas &Place, 2001, p. 90) suggested that teachers could encourage student participation inclassroom discourse through (a) using higher-order questioning (those that promoteanalysis, synthesis and evaluation), (b) explicitly asking for students’ clarification andjustification of their ideas, (c) appropriate use of mathematical language, and (d)listening and responding to students’ ideas.
Ferreira and Presmeg (2004) contended that the language used inside the classroomhas a significant influence on what students learn, and the oral communication betweenteacher and students plays a crucial role in this regard. While classroom “discussions”are nothing new, the theory behind classroom discourse stems from socialconstructionist views of learning where knowledge (new understandings) is createdinternally through interaction with other students and the teacher. Teachers’questioning, listening and responding approaches in the classroom have been suggestedto characterise their pedagogical practices, and to reflect their beliefs about mathematicsand its teaching and learning. Ernest (as cited in Ferreira and Presmeg, 2004) suggestedthat teachers holding “instrumentalist” beliefs perceive mathematics as an accumulatedset of facts and utilitarian rules and skills; instrumentalist teachers see themselves asinstructors. “Platonist” teachers view mathematics as a static and unified body ofknowledge that is discovered, not created; Platonist teachers see their role as that of anexplainer. Teachers holding a “problem-solving” perspective of mathematics perceive itas “a dynamic, continually expanding field of human creation and invention” (Ernest, ascited in Ferreira and Presmeg, 2004). One would be hard-pressed to find instrumentalistor Platonist mathematics teachers (in the majority?) who would be effectively utilisingclassroom discourse due to the nature of their beliefs and their resultant practice.

Mathematics: Essential for Learning, Essential for Life
© The Australian Association of Mathematics Teachers Inc.
193
Conclusion
The quest for “mathematically literate” students is neither unreasonable norunattainable. Every discipline has specific language demands and mathematics, scienceand music also have a repertoire of symbolic representations that students need to useand interpret in order to learn aspects of those disciplines. The use of discipline-specificlanguage needs to be explicitly taught within the context of the discipline because theambiguous nature of natural (everyday) language can lead to misunderstandings. Forexample, imagine if an experiment had as part of the procedure to add “a bit of acid”.This ambiguity could have series consequences as there is quite a difference between “2ml dilute hydrochloric acid” and “5 ml concentrated sulphuric acid”.
The responsibility of teachers of mathematics is to model correct terminology andlanguage of reasoning, and to encourage (insist) students to use the same in theirteacher-student and peer interactions. Our aim is to scaffold students to develop theirmathematical language from novice usage to, at least, apprentice usage. The language ofmathematics may have the hallmarks of a foreign language yet it can and should belearned.
References
Bechervaise, N. (1994). Mathematics: a foreign language? In Issues in Mathematics Education for theMiddle School. Adelaide: Department for Education and Children’s Services.
Delpit, L. (2006). Lessons from teachers. Journal of Teacher Education, 57(3), 220–231.
Donovon, M., Blamey, C., George, E., Bishop, M., Crookham, J., Gyford, A., Manook, G., Strang, W. &Leitao, S. (1990). The development of mathematical understanding. In J. Bickmore-Brand (Ed.),Language in Mathematics (pp. 59–73). Melbourne: Australian Reading Association.
Early Years Curriculum Materials: Phase Descriptors (2006). Brisbane: Queensland Studies Authority.
Easdown, D. (2006). Teaching Mathematics, The Gulf between Semantics (Meaning) and Syntax (Form).Retrieved 12 January 2007 from www.maths.usyd.edu.au/u/SemConf/sutmeg.html
Gawned, S. (1990). The emerging model of the language of mathematics. In J. Bickmore-Brand (Ed.),Language in Mathematics (pp. 27–42). Melbourne: Australian Reading Association.
MacGregor, M. (1990). Reading and writing in mathematics. In J. Bickmore-Brand (Ed.), Language inMathematics (pp. 100–108). Melbourne: Australian Reading Association.
Mathematical Classroom Discourse. (n.d.). Retrieved 22 December 2006 fromhttp://arb.nzcer.org.nz/nzcer3/strategies/mcd.htm
Mitchell, J. (2001). Interactions between natural language and mathematical structures: The case of‘wordwalking’. Mathematical Thinking and Learning, 3(1), 29–52.
Moore, R. (n.d.). Teaching Language and Mathematics. Retrieved 20 December 2006 fromhttp://www.vatme.vic.edu.au/resources/teachers/across_kla/Teaching_Lang_Math.htm
Pengelly, H. (1990). Acquiring the language of mathematics. In J. Bickmore-Brand (Ed.), Language inMathematics (pp. 10–26). Melbourne: Australian Reading Association.
Simpson, N. R. R. (2003). Maths Quest 12B. Brisbane: John Wiley and Sons Australia.
© The Australian Association of Mathematics Teachers Inc.
194
A grassroots approach to improving numeracy*
Carolyn Mildrum
Reynella Primary
School, SA
Rosemary Callingham
University of
New England
Barbara Hickling
Coorara Primary
School
Following a successful approach to improving literacy, a group of schools in onedistrict in South Australia developed a plan to raise numeracy outcomes amongtheir students. The three-year Southern Numeracy Initiative was plannedcollaboratively by teachers in the district. Changes in performance were monitoredacross the years of the project to provide feedback to schools and to the system.Despite transfers of teaching staff and changes in the schools involved there wassignificant improvement in numeracy performance across every grade. Strengthsand weaknesses of this grassroots approach to improving standards will bediscussed.
The Southern Numeracy Initiative (SNI) began with district discussions in 2003. At thattime all the leaders in the Southern Vales district, an area south of Adelaide coveringschools from the beach to the hills, were asked to determine, “What are the big rocks inour schools?” Numeracy became one of the areas pinpointed and interested leaderscame together initially through the auspices of the Quality Teacher Program to look athow we could and would address our Numeracy concerns.
These discussions led us to look at models of success across the world and a range ofassessment strategies that we could possibly use to determine if we were making adifference. Many of our schools had been involved in the Southern Vales Early LiteracyProject and liked the model developed by Hill and Crevola (1998). It was important tous that all schools had the same aims and ideals so we eventually developed thefollowing statement for the participating schools:
The aims of the Southern Numeracy Research Initiative are:• To develop and implement successful teaching and learning practises to
improve numeracy.• To focus on the pedagogy of explicit teaching balanced with open-ended tasks.• To challenge teachers to explore their beliefs and understandings about how
children develop their understanding of mathematics, and how this can besupported through the teaching program.
• To implement the design elements as part of the school's mathematics program.
The Southern Numeracy Initiative framework will be based on the nine designelements for effective teaching and learning (Hill and Crevola, 1998) underpinned bythe model of Towards a Profile for Numeracy Improvement (Smyth, McInerney &Hattam, 2004), as used in the recent South Australia research projects. The nine designelements are shown in Figure 1.
* Paper accepted by peer review
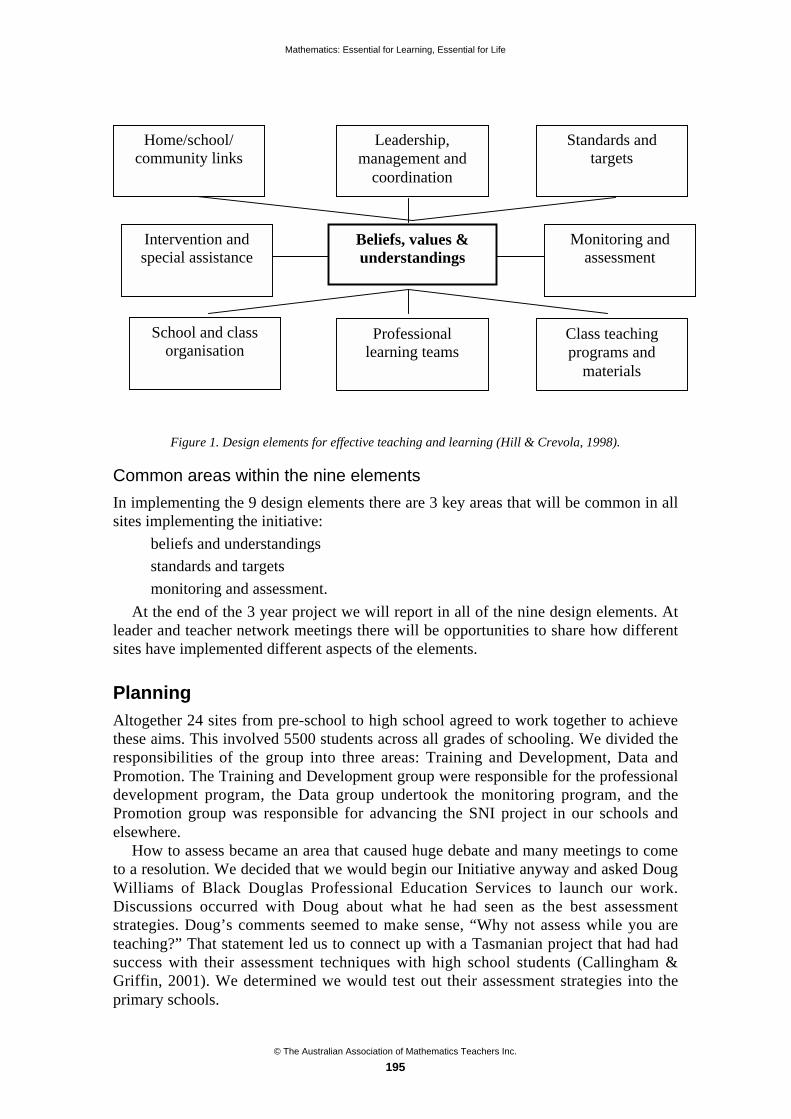
Mathematics: Essential for Learning, Essential for Life
© The Australian Association of Mathematics Teachers Inc.
195
Figure 1. Design elements for effective teaching and learning (Hill & Crevola, 1998).
Common areas within the nine elements
In implementing the 9 design elements there are 3 key areas that will be common in allsites implementing the initiative:
• beliefs and understandings
• standards and targets
• monitoring and assessment.
At the end of the 3 year project we will report in all of the nine design elements. Atleader and teacher network meetings there will be opportunities to share how differentsites have implemented different aspects of the elements.
Planning
Altogether 24 sites from pre-school to high school agreed to work together to achievethese aims. This involved 5500 students across all grades of schooling. We divided theresponsibilities of the group into three areas: Training and Development, Data andPromotion. The Training and Development group were responsible for the professionaldevelopment program, the Data group undertook the monitoring program, and thePromotion group was responsible for advancing the SNI project in our schools andelsewhere.
How to assess became an area that caused huge debate and many meetings to cometo a resolution. We decided that we would begin our Initiative anyway and asked DougWilliams of Black Douglas Professional Education Services to launch our work.Discussions occurred with Doug about what he had seen as the best assessmentstrategies. Doug’s comments seemed to make sense, “Why not assess while you areteaching?” That statement led us to connect up with a Tasmanian project that had hadsuccess with their assessment techniques with high school students (Callingham &Griffin, 2001). We determined we would test out their assessment strategies into theprimary schools.
Beliefs, values &understandings
Leadership,management and
coordination
Home/school/community links
Professionallearning teams
Monitoring andassessment
Standards andtargets
Class teachingprograms and
materials
Intervention andspecial assistance
School and classorganisation

Mathematics: Essential for Learning, Essential for Life
© The Australian Association of Mathematics Teachers Inc.
196
We set up an assessment regime whereby the end of the project we would be able tocompare students’ growth over two years. This meant we assessed each Year 3, Year 5,Year 7 and Year 9 student, once a year in term 2 for the period of the Initiative. Toassess our Junior Primary students we used I Can Do Maths (Doig & De Lemos, 2000)and the Preschool Directors began work on creating and collecting Learning Stories(Harley, Perry & Hentschke, 2006) and in turn a matrix of development. To add to thesedata sets we engaged the help of the Manager of Student Achievement Information inDECS, to help us crunch the data from our “I Can Do” tests as well as attitudinal andschool audits, which were conducted yearly.
To manage all of this we developed a document that showed what commitment wasexpected from project participants. This included expectations for schools, the district,leadership and teachers, as well as a list of the data that would be collected. The purposewas to ensure that all schools and participants received the same message. The initialExpectations and the Protocols are shown in the Appendix
Activities
Supporting teachers was a key feature of the Initiative. We asked teachers what theywanted and tried to find people who could run workshops and professional developmentdays to address these needs. Over the three years we engaged many different speakers totalk to staff and leaders of current thinking in Numeracy and how to improve studentoutcomes. These people came from around the country as well as South Australia, andwere based in universities, consulting services and the South Australian Department ofEducation and Children’s Services.
Teachers liked hands on activities and ideas for teaching. Over the years weaddressed topics such as ideas for teaching number, financial literacy, robotics,assessment processes and intervention strategies. Intervention became a particular focusin the final year of the project. Nearly 20 different presenters were involved, some morethan once, across the period of the project.
Each year we also held a celebration where schools could showcase what they weredoing. This was held at the local football club and the party pies and spring rollsbecame quite famous! These celebrations were well attended and schools went toconsiderable trouble to showcase their work, with displays and demonstrations bystudents. We invited members of the DECS hierarchy to speak to the group as well,which helped to make teachers feel that what they were doing was recognised.
Outcomes
Because we collected a considerable amount of data along the way, we were able totrack progress from year to year. All Year 3, Year 5, Year 7 and Year 9 studentscompleted at least one assessment task as part of their classroom activity each year. Wechose Street Party and Come in Spinner (Callingham & Griffin, 2000 ) as appropriatetasks. These were modified for Year 3 students but some questions were the sameacross all the tasks to allow for a single scale across every grade. The tasks were markedby the students’ own teachers and each school entered its data into a spreadsheet thatwas then sent to a central location for collation and analysis.
Over the period of the SNI, results varied from year to year. The best results overallwere obtained in the Round 3 assessments, when the project had been running for twoyears, probably reflecting a peak in enthusiasm. From the first round of results to thelast, however, there was a sustained improvement across all grades, shown in Figure 2.

Mathematics: Essential for Learning, Essential for Life
© The Australian Association of Mathematics Teachers Inc.
197
-2
-1.5
-1
-0.5
0
0.5
1
Gr3ALL Gr5ALL Gr7ALL Gr9ALL Overall
Round 1 Round 2 Round 3 Round 4
Figure 2. Results by grade and overall for four testing periods of SNI.
Successes and difficulties throughout the initiative
Although we saw an overall improvement, this was only part of the story. Our successesand difficulties were many.
One of our initial difficulties was a changing district. At the beginning of 2004 ourdistrict was split in two with two new District Directors leading these districts. Losingone main leader who had worked to develop the Initiative and then getting two newleaders on board was a challenge.
Changing staff always creates difficulties in a long term project, and changingleaders in our schools also created turmoil. Every year we had to contend with new staffand new school leaders but a positive from these changes was the commitment fromexisting leaders who were able to talk about the changes in their sites and why they feltSNI was a valuable group to be a part of. Some people from within the SNI werepromoted to other positions both in and out of DECS. Where the promotion occurredwithin the District this did not pose a problem, but we did lose some key people alongthe way. The good thing was that there were others waiting to take over the roles,helping to build management capacity in the District.
Running the project was not always easy, however. The SNI was run by teacherswith no additional time release. Data collection and entry was undertaken by schooladministrative assistants on top of their own work. On the other hand, we were in aposition to understand our own schools’ needs and to try to be responsive to these. Wecould not impose anything, and adherence to the expectations and protocols wasobtained by the enthusiasm of committed teachers. The early development of a strongframework, and the expectations and protocols were essential to keep us on track overthe three years of the SNI.
One of the biggest challenges was the implementation of the assessment tasks. Thetasks had been deliberately chosen to support the teaching approaches we wanted to see.In schools where the leaders did not see this connection, and in turn the teachers did notsee the connection, the tasks became an arduous task that lost all their potential.
Mathematics: Essential for Learning, Essential for Life
© The Australian Association of Mathematics Teachers Inc.
198
Conversely when the tasks were used as part of the teaching program and teachersunderstood their importance, the results were fantastic! In the high schools, timetablingwas an issue and which students would complete the assessment. Many high schoolteachers could not come to grips with the thought that everyone was involved inteaching numeracy no matter what the curriculum area.
There were, however, also many successes at all levels. At the district level, theimprovement in Numeracy was reflected to some extent in the State Literacy andNumeracy testing. At the site level many teachers commented on the improved level oftheir students. At the student level there were many stories like this personal experienceof a 10-year old boy who hated numeracy with a passion and felt he was no good at all.After working with the teacher and putting in place the hands-on assessment tasks, anddemonstrating to the teacher the usefulness of the tasks, the child’s attitudes turnedaround. He can do mathematics and loves it!
Overall on reflection of the Southern Numeracy Initiative, much was achieved.Numeracy became a much needed focus in our schools. Teachers were exposed to arange of top quality training and development that, but for SNI, would not haveoccurred. As individual sites we were able to reflect on our site’s results and, in someinstances, where money was available to set up intervention programs that have reallymade a difference to our students and our teachers’ views of teaching mathematics.Despite the difficulties and the very hard work involved in driving a large project fromwithin schools we feel that the Southern Numeracy Initiative was very worthwhile.
References
Callingham, R. & Griffin, P. (2000). Towards a framework for numeracy assessment. In J. Bana & A.Chapman (Eds), Mathematics Education Beyond 2000. (Proceedings of the 23rd Annual Conferenceof the Mathematics Education Research Group of Australasia, pp. 134–141). Sydney: MERGA.
Callingham, R. & Griffin, P. (2001). Shaping assessment for effective intervention. In MathematicsShaping Australia. (Proceedings of the 18th Biennial Conference of the Australian Association ofMathematics Teachers). Adelaide: AAMT.
Doig, B. & De Lemos, M. (2000). I Can Do Maths (ICDM). Melbourne: ACER Press.
Harley, E., Pewrry, B. & Hentschke, N. (2007). Using Children’s Learning Stories to Assess theirMathematics Learning in Preschools and Schools. Paper presented at the 2006 Annual Conference ofthe Australian Association for Research in Education, Adelaide. Available athttp://www.aare.edu.au/06pap/har06339.pdf
Hill, P. & Crevola, C. (1998). Characteristics of an effective literacy strategy. Unicorn 24(2), 74–85.
Smyth, J., McInerney, P. & Hattam, R. (2004). Towards a Profile for Numeracy Improvement. Adelaide:DECS and South Australian Primary Principals Association. Availablehttp://www.thenetwork.sa.edu.au/phna/Resources/Overview.pdf

Mathematics: Essential for Learning, Essential for Life
© The Australian Association of Mathematics Teachers Inc.
199
Appendix
Southern Numeracy InitiativeOverview of Expectations for 2004
2003 Preliminary investigations occur across the Southern Vales District
Individual sites commit to Southern Numeracy Project
2004–2005 Participate in Southern Numeracy Project
1. School Structures:• Identify Numeracy as a priority within the strategic plan and resource accordingly (HR & assets)• Timetable for staff to attend one professional development day in Week 0, 2004 (Wednesday,
Thursday or Friday) with Doug Williams.• Commit one pupil free day (June 3 or 4) to professional development with Doug Clark.• Assign a minimum of five staff meetings per year to numeracy professional development.• Form an internal numeracy management team.• Collect and collate data as per project outline.
2. District Commitment• Learning Band Coordinators will be involved in the project
3. Leadership Commitment:• Nominate one leadership person to be part of the site’s management team.• Nominate a leader to attend Southern Numeracy Project meetings once a term.• Attend minimum of two professional days per year.• Encourage staff to join professional discussion sessions.
Please note: small sites and preschools may choose to combine and have one/two representatives torepresent the entire group.
4. Teachers:• Attend Southern Numeracy Professional Development sessions (minimum of 2 days)• Attend numeracy/cluster staff meetings with a numeracy focus (minimum of 5 per year)• Participate in Southern Numeracy Professional Discussion sessions as appropriate• Collect and collate data as per project outline.• Maintain on-going data collection and observations of individual’s progress
5. Data
The following Data will be collected for this project• LaNS• “I Can Do” assessment — Rec, Yr 2• Street Party — Yr 5, Yr7, Yr9• Attitudinal audit — staff and students
PROTOCOLS FOR SOUTHERN NUMERACY INITIATIVE
The overarching purpose of the Southern Numeracy Initiative is:IMPROVING NUMERACY OUTCOMES FOR ALL STUDENTS
• The impetus for this Initiative is shared between a group of schools and preschools south ofAdelaide, and will involve schools and preschools from Wallara Outer South and SouthernSea and Vines.
• Leaders of these preschools and schools are committed to the purpose of the Initiative, anddemonstrate this by providing release time for personnel involved.
• The organisation of the Initiative is managed by the Numeracy Management Group, whichconsists of teaching and leadership representatives from all schools and preschoolsinvolved in the Initiative.
• A Code of Cooperation exists for ensuring the processes involved are representative of allstakeholders.

Mathematics: Essential for Learning, Essential for Life
© The Australian Association of Mathematics Teachers Inc.
200
CODE OF COOPERATION• The Management Group is responsible to Wallara Outer South and Southern Sea and
Vines LLEG.• Meetings for all stakeholders are held at least once per term.• Decision making by stakeholders will be by consensus, either at the whole group meetings,
or by e-mail response.• A Numeracy Management Group exists to facilitate communication processes for all
stakeholders, and various organisational tasks as required.• Representatives on the Numeracy Management Group will consist of a chair of group, chair
of each subcommittee, a Learning Band Coordinator from each district, Recorder,representation from Preschool sector, Primary and Secondary. Representation on thisgroup will be shared across the two districts. District Directors will be asked to join thisgroup at least once per term.
COMMUNICATION• Communication between all stakeholders is primarily through:
MeetingsMinutes of these meetings, circulated to all stakeholdersE-mail via [email protected],
• At meetings of all Initiative site representatives a range of tools**, will be used to ensure thevoices of all stakeholders are heard, and decisions made reflect shared understandings andcommitment.
• All representatives will work proactively to resolve grievances as they arise. Wheregrievances remain unresolved, a District Officer will lead the resolution process.
DATA• All Data will be managed according to DECS and State Government policies and directives.• No aggregated data relating to schools or the Numeracy Initiative will be published or
released to other bodies (including project schools) without the expressed permission of theparties concerned.
• All Initiative representatives will act respectfully and maintain confidentiality of sensitiveinformation (e.g., data from schools, individual students).
WORKING PARTIES• As the Initiative develops, non-exclusive working parties will be established to focus on
different aspects. These working parties will exist for the duration of their responsibilities, asdecided by a full meeting of the Initiative representatives.
• Working parties are responsible for keeping all stakeholders informed [email protected] to foster collective ownership of the various aspects of theInitiative
• Working parties will report to the Numeracy Management Group meetings** David Langford tools, the protocol tool, etc.This Code of Cooperation was developed by the Protocol Working Party in 2003 and
ratified by all representative stakeholders Feb, 2004, updated 2005
© The Australian Association of Mathematics Teachers Inc.
201
The reality of intellectual qualityin mathematics classrooms*
Kay Owens
Charles Sturt University
Preservice teachers evaluated their teaching of space lessons in early primaryschool by focussing on three aspects of the Intellectual Quality guidelines from theQuality Teaching and Learning in NSW Public Schools document: substantivecommunication, deep knowledge and deep understanding. The impact of expectedclass behaviour, the learning experiences as planned, and the age of the studentsformed the reality of the classroom. The teachers struggled with the guidelines interms of their relevance for the stage of the students. However, the teachers’expectations limited their effectiveness. This case study informs our understandingof activity theory and argumentation in primary mathematics classrooms.
Classroom communication
Mathematics lessons are frequently seen as a time for students to open a textbook andanswer the questions. Few students are satisfactorily challenged by textbook exercises(Bell & Birks, 1990). They are regurgitating a method told to them by the teacher orthey cannot make sense of the questions. The alternative is quality learning withstudents constructing their own knowledge. The reality of this approach is much morerelated to the cognitive challenges that students meet. These challenges need to bepresented to students in a way that they will develop positive affective responses(Goldin, 2004; William, 2002). To achieve this positive response, classroomcommunication is critical. Both the teacher and the other students need to engage inconversations about problems. Teachers need to provide adequate support in terms ofreviewing relevant approaches to the problem solving, assisting students to make linksto existing knowledge and strategies, and setting up group support that will engagestudents and encourage students.
We would assume that in many classrooms, there has been a shift from the abovedescription given by Bell and Birks (1991) and, indeed, Johnson and Cupitt (2004) didfind that many teachers were using group activities and concrete materials. However,they found that engaging students in mathematical inquiry and investigation is muchmore challenging for teachers. Teachers need to develop skills to increasecommunication through open-ended questioning, setting appropriately structured tasks,and developing group discussion that leads to students developing the concepts.Students should be initiating conversations, making comparisons, asking the hardquestions, justifying their answers and explaining more thoroughly. Successful teacherscarefully followed students’ descriptions of their thinking, and encouraged morecomplete explanations and deeper thinking. Teachers allowed for interruptions from
* Paper accepted by peer review
Mathematics: Essential for Learning, Essential for Life
© The Australian Association of Mathematics Teachers Inc.
202
students when explaining in order for students to explain, or to own, new strategies(Hufferd-Ackles, Fuson & Sherin, 2004).
Classroom communication patterns (Bauersfeld, 1988; Clarke, 2004) that are notvery effective are those in which the teacher asks a question, the student respondsbriefly and the teacher immediately praises (or otherwise evaluates) the response (NSWDET, 2003). One successful approach is to provide an initial task that gets all studentsstarted, then tasks that encourage all students to present what they know, or could easilydevelop, and for others to query their ideas before giving the students a harder challenge(Williams, 2002).
Wood (2003) considered teachers’ questions to be critical during periods in classwhen students were reporting back after the task. The reporting back should not just bea report of what the students found out. It should be strategy reporting. Wood (2003)recommended that questions such as “How did you decide this? Are there patterns? Isthere a different way you can do this?” encouraged strategy reporting. More successfulmathematics lessons required inquiry and argument. These communication tools couldbe prompted by questions such as “How are the two things the same? Does this makesense? Does it always work? Why does this happen?” The conversations in theclassroom need to be about the substance of the lesson and be about makingdistinctions, critically examining each others’ ideas, forming generalisations and askingquestions (NSW DET, 2003).
Communication and culture are central to activity which starts with the child. Mellin-Olsen (1987), in his classical discussion of activity in mathematics education, referredto students’ thinking-tools and communicative tools used to investigate and thusdevelop mathematical concepts and processes. This mental activity belongs toindividuals and signals of the activities guide teachers to provide the students witheducational tasks. The study reported here attempted to consider some of these tools,and how teachers may generate their use to achieve learning.
The study
We provided preservice teachers with exemplar lessons that were expected to changethe classroom communication rules, the means of learning, and the fine grain intentionof the lessons from focussing on knowing shape names to explaining classifications ofshapes (Cole & Engeström, 1991). The teachers participated in conversations aboutquality constructivist teaching as presented above and were given copies of thereferences. The focus of this study was to analyse what two of the preservice teachersconsidered critical aspects of the classroom learning experiences, and what they viewedas bringing about change in the rules of the classroom.
The two preservice teachers (I will refer to them as teachers) taught a Kindergartenclass as a team over nine sessions, spread over a number of weeks. Six months later, Iobserved one of the students teaching and asked whether she felt the experience ofconcentrating on substantive communication had affected her teaching. Evidence for theemerging communication patterns and their thinking are supported by quotes from theteachers’ reflective journals.
Teacher analysis of the classroom communication
The teachers pre-assessed the students’ shape recognition during the first activity, inwhich the students were making pictures with shapes. The teachers asked questions like,“What shapes do you think you will use to make a motorbike?” They noted that

Mathematics: Essential for Learning, Essential for Life
© The Australian Association of Mathematics Teachers Inc.
203
students were able to trace around a shape in a picture, identify shapes in theirclassroom environment, and they made “complex and highly different pictures.”Teachers were aware of their use of praise. They commented: “teachers providedfeedback and elaborated on students’ answers and teachers attempted to fosterdiscussion with students without much success”.
In the second lesson on shapes in the environment, the teachers said they gave goodexamples and a variety of explanations of the activity, and they made it sound excitingto do the rubbings of shapes in their environment. Their questions during the conclusionwere: “Where did you find this shape? Did anyone else find this shape? Tell me aboutthe shape.” The teachers responded to the finding of a hexagon, which was a new shapeto the students, “by listening and drawing the hexagon on the board and discussing itwith the students.” They noted that few students would respond to the question “Tell meabout it” and that they rarely communicated with each other or asked each otherquestions. They felt this was reflective of the general classroom milieu of sittingquietly, listening, and putting up your hand to answer the classroom teacher’s questionas well as lack of group work.
They decided that students should be introduced to the trapezium, rhombus andhexagon next lesson. Students made shapes with their bodies. The teachers noted that:
students were… actively engaged in the activity making their bodies into the formsof shapes, correctly displaying the appropriate number of sides and corners… Thestudents were self correcting by standing back and observing… [During the wholeclass reporting session] communication was one sided with the teacher providinginformation to students and asking questions… One child appeared to dominate thedirection the shapes took, and other students took on a passive role in shapemaking. IRE [initiate, respond, evaluate] communication took place during thewhole lesson.
The teachers recognised a continuing lack of substantive communication.The fourth lesson was introduced by revising the names and basic properties for the
rhombus, hexagon and trapezium using shape cards. No one could say what thehexagon was, so the teacher named it and described its basic properties (e.g. number ofsides and corners). Then the rhombus was held up and the conversation betweenchildren (C) and teacher (T) continued:
C1: It’s like the bottom of the chairC2: The signs, the lollipop ladies signs.T: (holds up rhombus). What do we call this shape?C3: It’s a square.C4: It’s a rectangle.T: That’s great but this shape is called a rhombus (describes properties)
Then the teacher demonstrated making shapes with plasticene snakes including “MsB’s Wageagon” (the name given by the teacher to an unusual shape). With the plasticinesnakes, “students created complex shapes giving them names that related directly to theshape as in a ZigZagagon” which the child said was because of its “head and legs …curved ones and sigsgs and bumpy”. However, the lack of substantive communicationmeant the teachers set their goal to considering a different questioning technique in thenext lesson.
Mathematics: Essential for Learning, Essential for Life
© The Australian Association of Mathematics Teachers Inc.
204
During the fifth lesson, students created their own triangles by drawing lines(intervals) radiating from a central point, joining the ends of the intervals, colouring inthe triangles, cutting them out and pasting onto another sheet. The teachers reported thatthey “modelled open-ended questions and encouraged the students to discuss triangles’,shapes and sizes with the students at their tables. It was noted that some students havelittle to no understanding of triangles and their properties, and so further development isneeded”. Some students did not notice the quadrilaterals drawn on their paper.However, “students were observed discussing their work with others at their table …each student contributed to the discussion; however most students accepted what theywere being told, rather than offering their own insight into the problem”. Students werebeginning to communicate about the mathematics:
C1: How many triangles do you have?C2: FourC1: You didn’t make all trianglesC2: Yes I didC1: This one has four sidesC1: Triangles have three sides.
However, the notes on the lesson showed that despite their good intentions, theteachers continued to ask closed questions with only one open-ended question, “Whatabout this one?” They used some harder questions such as, “Can you point to the largesttriangle on your page?” but without following up the question or having a clear purposefor the question.
The next lesson consisted of students making shapes with a piece of string. Theteacher demonstrated, but the class were hard to get on track outside. However, thestudents began to pose questions. In the following lesson, the students cut up a largetriangle into several triangles. During the explanation at the start of the lesson, one childdrew a line and formed a quadrilateral. The teacher asked her to have another go andwhen she completed the triangle the teacher said, “Well done!” This individual activityseemed to inhibit discussion. Some students found it hard to draw triangles on the sheet.The teachers were still asking the questions and students were beginning to give shortsentence answers. Some children cut any shape. Others explored the properties oftriangles by making smaller triangles. The teachers also realised that “some closedquestions were given, resulting in yes or no answers… The communication that wasevident appeared to occur between one child and the teacher, rather than a groupdiscussion.” At this point the teachers were further focussed on questioning to fostercommunication.
The eighth lesson started successfully with a clear explanation, in which the studentswere involved in making an example picture from tangram pieces, for the whole class toobserve. The students’ attention was gained. Working in pairs, “some children wereable to express their knowledge as they manipulated shapes in various orientations tocreate the correct representation of the tangram.” (Some) children expressed knowledgeas they realised they had misplaced shapes in their creation, and moved shapes to fit thedesign, so they were responsible for their own self regulation. Some “worked welltogether, offering ideas to each other and exploring their thoughts.” During theconclusion, the class made the picture of a runner, as a whole class, except that thepreservice teacher put some pieces in the wrong place. The students identified how theteacher needed to place it. For example, a child said, “Turn it around so that it points tothe top.”

Mathematics: Essential for Learning, Essential for Life
© The Australian Association of Mathematics Teachers Inc.
205
The last lesson was an assessment: (a) the teachers asked the students to draw eachof the named shapes, one at a time; (b) the students were given a sheet of shapes andasked to colour all of the named shape they could see with a specific colour, before theteacher named another shape and colour. The teachers summarised the students’achievement pointing out the variance in communication, recognition of shapeproperties, and seeing shapes in different orientations or when “stretched.” The teachersconcluded that:
Aspects of the NSW Quality teaching framework may not have been developedsuccessfully due to the following factors:
• the level of understanding and learning the students were at, being the lowerlevel Year 1 mathematics group;
• teacher questioning needed to be further developed, and aimed more atgetting the students to collaborate and contribute towards discussions;
• teacher questioning needed to be more focused on developing and enhancingupon the knowledge that children already displayed on the content areas;
• students were observed to be in the routine of IRE question sequence and, asthe teachers, we found it hard to break the students out of this, and get themto elaborate on the questions we asked them;
• students were not used to generating their own discussions and offering newideas and found it uneasy to do so when asked;
• some of the lessons were based on individual completion of activities. Giventhe classroom setting, it may have been more beneficial for us to completethese in group work scenarios, where deep understanding can be fosteredand expressed more clearly;
• students were used to completing worksheets and blackline masters and so,with our lessons being based on hands on exploration activities without theuse of handouts, students may have been put off: they were not used to doingmathematics in this way (and had no routines for this);
• during the teaching of the nine lesson plan sequences, the class had threerelief teachers (not including both of us), which affected the children’sregular routine and classroom patterns.
When one of the teachers was teaching in another school, some months later, Iobserved that she praised students readily and kept students on task by this technique,and by keeping the class moving. She quickly had them working in groups and thestudents knew the purpose of the group activity. The teacher described her teaching asusing students’ prior knowledge and expanding on it a little bit: “When they are doinggroup work, I am observing how students are interacting with each other, but there isnot so much collaboration… There is not much of taking ideas from each other. I allowthem to reflect and vocalise how they learnt in other areas of my teaching but not inmathematics lessons.”
Discussion and conclusion
To assist in activities, students have tools: thinking tools and communicative tools(Mellin-Olsen, 1987). The thinking tools allow the student to explore or investigateexamples and associated rules that make knowledge a familiar process. In this study, thethinking tools were encouraged by the wide range of open-ended physical activitiessuch as making shapes with string, their bodies, and other equipment and by cutting ashape into pieces. It meant students were directing their understanding of the conceptand developing a metaconcept of shapes and types of shapes. The concept involved the
Mathematics: Essential for Learning, Essential for Life
© The Australian Association of Mathematics Teachers Inc.
206
shape in different orientations and with different lengths. The teachers extended therange of shapes from circle, triangle, square and rectangle to incorporate the hexagon,rhombus and trapezium, as well as shapes with made-up names. The words were madeavailable by the teachers but it was necessary for the students to adequately match thewords and their schema or metaconcepts. The communication from the teachers aboutthe shapes was limited to names and the properties related to type of lines, number ofsides and corners, but student descriptions were also admissible especially in describingthe shapes in different orientations and when shapes were given non-geometrical names.Students were using thinking tools but there were mixed motives (developing their ownconcepts about shapes and using teachers’ labels). Furthermore, the contextualinfluences of classroom routines, the extensive use of praise upon students’ answers,and the teachers’ attention to recognising and naming shapes, limited communication(Mason, 2003; Owens & Clements, 1998).
While teachers tended to use the symbols (shape names) from the start, this was agiven rule limiting the degree of construction of the thinking rule by the studentsthemselves. However, the naming of their own shapes, helped students to realise thatshapes were part of a bigger group but, even then, the shapes were expected to havenames, another rule imposed by the teachers. There were some examples given wherestudents told each other whether a shape was acceptable as an example of the symbol(shape name). However, continuing conversation about the shapes did not develop asexpected if the second child was exploring and devising their own sign system. Therewas a lack of discussion and self-developed description by students due, apparently, tothe well established routine that the teacher asks the question, the student answers(usually with a single word), followed by praise, while the rest of the class remainssilent and does not interrupt or express their own thoughts. Students, largely, feltcomfortable about having a go at answering questions but their skill in workingcooperatively in small groups, or talking with neighbours, was subdued. Mellin-Olsen(1987) warned against the control of language. Immediate praise, while it may havecreated some positive affect, restricted conversation and reduced the positive affectinherent in the mental activities of problem solving (Goldin, 2004).
This paper illustrates the struggle of two preservice teachers to achieve their goal ofsubstantive communication and deep understanding, and the restrictions that the milieuof the classroom and their own limited pedagogical and mathematical knowledge hadon achieving their goal. Nevertheless, their action research and reflective teachingbegan to bring about change in their teaching, and in the students’ ways of learning.Consequently, there was an improvement in the students’ knowledge. As teachers, weare challenged to implement learning experiences that create substantivecommunication for the early years of school.
References
Bauersfeld, H. (1988). Interaction, construction, and knowledge: Alternative perspectives for mathematiceducation. In D. Grouws, T. Cooney & D. Jones (Eds), Perspectives on Research on EffectiveMathematics Teaching, Vol. 1 (pp. 27–45). Reston, VA: Lawrence Erlbaum & National Council ofTeachers of Mathematics.
Bell, A. & Birks, D. (1990). Diagnosis and response in teaching transformation geometry. In G. Booker,P. Cobb & T. N. de Mendicuti (Eds), Proceedings of the 14th Conference of the International Groupfor the Psychology of Mathematics Education, Vol. 2 (pp. 219–226). Mexico: PME.
Clarke, D. (2004). Patterns of participation in mathematics classrooms. In M. Hoines & A. FuglestadProceedings of 28th conference of the International Group for the Psychology of MathematicsEducation, Vol. 2 (pp. 231–238). Bergen, Norway: PME.

Mathematics: Essential for Learning, Essential for Life
© The Australian Association of Mathematics Teachers Inc.
207
Cole, M. & Engeström, Y. (1991). A cultural-historical approach to distributed cognition. In G. Salmon(Ed.), Distributed Cognition. Cambridge: Cambridge University Press.
Goldin, G. (2004). Affect and problem-solving. Paper presented to Affect Working Group, 28th
Conference of the International Group for the Psychology of Mathematics Education. Bergen,Norway.
Hufferd-Ackles, K., Fuson, K. & Sherin, M. (2004). Describing levels and components of a math-talklearning community. Journal for Research in Mathematics Education, 25(2), 81–116.
Johnson, K. & Cupitt, G. (2004). Quality teaching in mathematics K–6: Perspectives on classroom-basedresearch and teacher professional learning in PSFP primary schools. Paper presented to the annualconference of Australian Association for Research in Education, Melbourne.
Mason, J. (2003). Practitioner research as an extension of professional development. In I. Holden (Ed.),Utivikling av Matematik kundervisning I Samspill mellom Praksis of Forskning, Skriftserie forNasjonalt Senter for Mathematik, I Opplaeringen (1), Trondeim, pp. 181–192.
Mellin-Olsen, S. (1987). The Politics of Mathematics Education. Dortrecht, The Netherlands: ReidelKluwer.
NSW Department of Education and Training (2003). Quality Teaching in NSW Public Schools: AClassroom Practice Guide. Sydney: NSW DET.
Owens, K. & Clements, M. A. (1998). Representations used in spatial problem solving in the classroom,Journal of Mathematical Behavior, 17(2), 197–218.
Williams, G. (2002). Associations between mathematically insightful collaborative behaviour andpositive affect. In A. Cockburn & E. Nardi (Eds), Proceedings of the 26th Conference of InternationalGroup for Psychology of Mathematics Education, Vol. 2 (pp. 401–408). Norwich, England: PME.
Wood, T. (2003). Complexity in teaching and children’s mathematical thinking. In N. Pateman, B. J.Doherty & J. Zilliox (Eds), Proceedings of the 27th Conference of the International Group for thePsychology of Mathematics Education, Vol. 4 (pp. 435–442). Hawaii: PME.
Acknowledgements
I wish to thank the preservice teachers who participated in this collaborative actionresearch project and the school where they carried out their teaching.
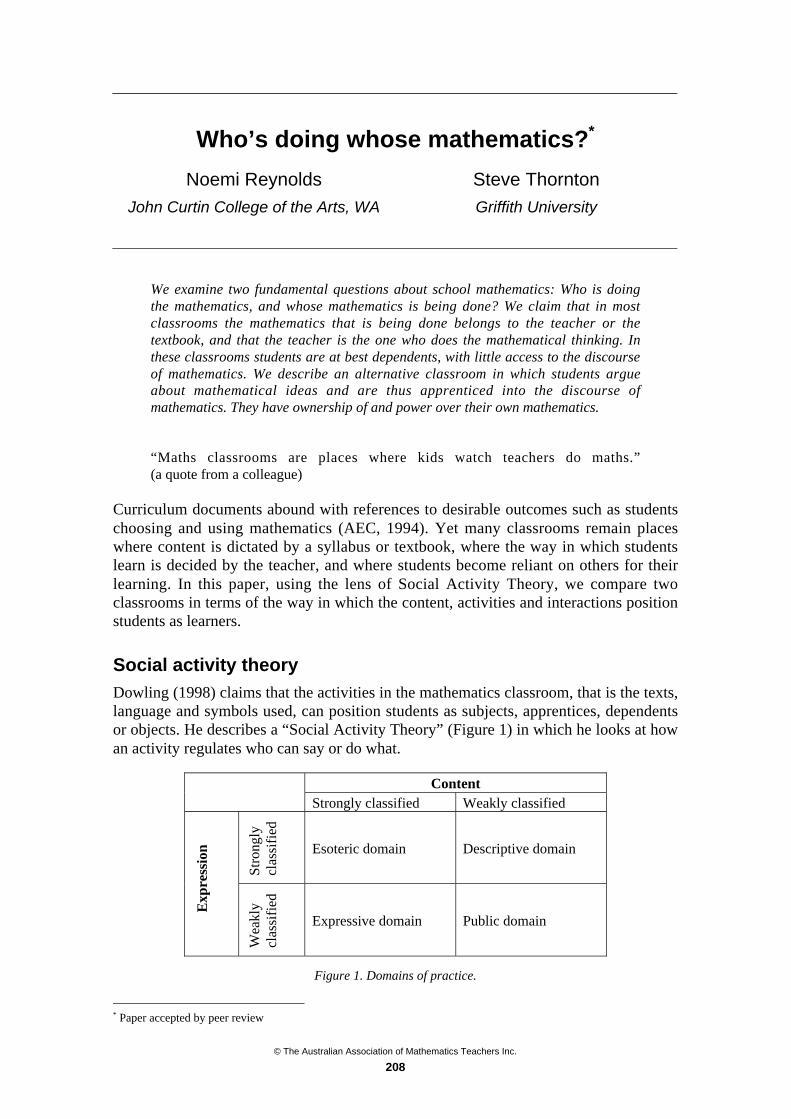
© The Australian Association of Mathematics Teachers Inc.
208
Who’s doing whose mathematics?*
Noemi Reynolds
John Curtin College of the Arts, WA
Steve Thornton
Griffith University
We examine two fundamental questions about school mathematics: Who is doingthe mathematics, and whose mathematics is being done? We claim that in mostclassrooms the mathematics that is being done belongs to the teacher or thetextbook, and that the teacher is the one who does the mathematical thinking. Inthese classrooms students are at best dependents, with little access to the discourseof mathematics. We describe an alternative classroom in which students argueabout mathematical ideas and are thus apprenticed into the discourse ofmathematics. They have ownership of and power over their own mathematics.
“Maths classrooms are places where kids watch teachers do maths.”(a quote from a colleague)
Curriculum documents abound with references to desirable outcomes such as studentschoosing and using mathematics (AEC, 1994). Yet many classrooms remain placeswhere content is dictated by a syllabus or textbook, where the way in which studentslearn is decided by the teacher, and where students become reliant on others for theirlearning. In this paper, using the lens of Social Activity Theory, we compare twoclassrooms in terms of the way in which the content, activities and interactions positionstudents as learners.
Social activity theory
Dowling (1998) claims that the activities in the mathematics classroom, that is the texts,language and symbols used, can position students as subjects, apprentices, dependentsor objects. He describes a “Social Activity Theory” (Figure 1) in which he looks at howan activity regulates who can say or do what.
ContentStrongly classified Weakly classified
Stro
ngly
clas
sifi
ed
Esoteric domain Descriptive domain
Exp
ress
ion
Wea
kly
clas
sifi
ed
Expressive domain Public domain
Figure 1. Domains of practice.
* Paper accepted by peer review

Mathematics: Essential for Learning, Essential for Life
© The Australian Association of Mathematics Teachers Inc.
209
Building on Bernstein’s (1996) theory of classification he describes four domains ofpractice:
• The esoteric domain is strongly classified with respect to both content andexpression. That is, it consists of mathematical topics such as algebra, arithmeticand Euclidean geometry rather than real-life contexts and, within those topics, thespecialised language of mathematics is used. In the school mathematics classroomit could be described as “pure mathematics”.
• The public domain is weakly classified with respect to both content andexpression. It focuses on everyday contexts using everyday language. It is themathematics that people do outside school, much of which is often not recognisedas mathematics (Hogan & Morony, 2000)
• The expressive domain is strongly classified with respect to content, but weaklyclassified with respect to expression. That is, it focuses on content found withinmathematics, such as algebra, but expresses it in everyday language and symbols.Bernstein calls this process one of recontextualisation. The idea of a “functionmachine” (AEC, 1991, p.197) is an example of recontextualising purelymathematical content (linear functions) into a more familiar setting, using theeveryday metaphor of a machine.
• The descriptive domain is strongly classified with respect to expression, butweakly classified with respect to content. That is, it recontextualises an everydaysituation using mathematical terms and symbols. Solving word problems usingalgebraic equations is an example of the descriptive domain.
Dowling (1998, p. 136) claims that the domain of practice in the classroom partiallydetermines the positions that can be occupied by students. Where practice is restrictedto the public domain, students have no access to the valued discourse of mathematics,and, hence, cannot be apprenticed into the discipline. He claims that this has thepotential to objectify the students, denying them power and agency (Boaler, 2003) overtheir own mathematics. In classrooms in which the teacher frequently recontextualisesmathematical content into the everyday, as occurs in the expressive domain, studentsare likely to become dependents, again being denied access to the valued discourse ofmathematics. In order for students to become positioned as apprentices or subjects (thatis to have maximum control over their mathematics), they must be able to operatewithin the esoteric domain.
At a textual level, message and voice correspond to the practices and positionsdescribed above (Dowling, 1998, p. 142). The range of voices in the classroom reflects,and produces, the range of positions in the classroom. An authorial voice is indicative ofmaximum subjectivity, in which the author or speaker has control of the mathematicalactivity of the classroom. Typically, this is the voice of the textbook or the teacher. Theauthorial voice may construct readers’ or listeners’ voices as apprenticed, dependent orobjectified voices, depending upon the relationship being established by the author.Thus, a teacher who stands at the front of a classroom explaining a mathematicalprocess, positions herself as author and her students as receivers. The extent to whichthe authorial voice invites students into the discourse of the activity will determinewhether they are positioned as apprentices or dependents. A teacher who restrictsactivity to the public domain, and does not invite recontextualisation, objectifies thereceivers.
The message of the text or spoken word is distributed via the strategies employed bythe author. Expanding strategies, such as generalisation, broaden the range of the

Mathematics: Essential for Learning, Essential for Life
© The Australian Association of Mathematics Teachers Inc.
210
message, while limiting strategies, such as specialisation or localisation, narrow themessage. A focus on principles abstracts the discourse of the classroom, while a focuson procedures tends to particularise the discourse. The degree to which the distributingstrategies expand or narrow the range and abstract or particularise the discourse willdetermine the degree to which students can be apprenticed into the discourse ofmathematics. Thus, expanded range and abstract discourse will invite students into thediscourse of mathematics as apprentices or subjects, while limited range andparticularised discourse exclude students from this discourse, and construct them asdependents or objects.
Dowling’s work focused on school textbooks. He analysed the School MathematicsProject (SMP) texts written for students of different “abilities”, and discussed how thecontent, written text, pictures, drawings and symbols used in the text positionedstudents. He found that the texts, written for supposedly more able students, had astrong focus on the esoteric domain, invited students to express ideas mathematicallyand discussed general principles. In this way, the text positioned students asapprentices. Texts written for less able students positioned them as dependents. Theyfocused on the public domain, containing a large number of pictures and cartoons ratherthan mathematical symbols and they focused on particular procedures rather thangeneral principles.
In this paper we apply the ideas of Social Activity Theory to interactions in themathematics classroom. We look at extracts from two classrooms and examine theclassroom conversations in terms of domain, voice and message and, hence, discusshow students are positioned within the two classrooms.
Classroom 1
The extract below is taken from a publicly available video of an Australian Year 8mathematics lesson filmed during the TIMSS study (Hollingsworth, Lokan & McCrae,2003). The students have been given an exercise to investigate the conditions forcongruency of triangles. They are working in groups, and have each constructed atriangle using ruler, compasses and protractor, then written down a set of instructions bywhich others in the group could construct the triangle. The aim is to find a particular setof minimum conditions that will guarantee that the other students in the group constructan identical triangle. In this way, the class are to discover the four conditions forcongruency.
This episode occurs approximately twenty minutes into the lesson. The particulargroup of students speaking have completed the task, and each has successfully drawnthe triangle described by the other students in the group.
SN: Miss what should we do now?T: Pardon?S: What should we do now?T: Have you done all of them have you?S: Yep.SN: Yeah.T: Well, did you end up working out how many instructions you actually
needed for each one?SN: Yep, I needed four.T: You needed four, what were they?S: Um, interval AB is vertical and measures five centimetres. Interval AC is
horizontal (inaudible).

Mathematics: Essential for Learning, Essential for Life
© The Australian Association of Mathematics Teachers Inc.
211
T: So if it's saying horizontal it's saying it's at an angle aren't you?S: Yeah.T: So we're saying one's vertical and one's horizontal.S: Yeah and you um…T: Then you're defining the angle between them aren't you?S: Mm, I'm saying it's a right angle.T: Yes.S: Because interval… interval ABC is a right angle.T: Right, so did they need all those instructions to finish your triangle?S: Yes.T: Yes.
Classroom 2
The extract below is also taken from a Year 8 lesson. The students are exploring themathematical concept of gradient, and attempting to discover, for themselves, the effectof changing a in the equation y = ax + b. They have drawn graphs using two or threenumerical values, and are reporting to other students in the class on their findings.Students take it in turns to walk to the front of the class and sketch graphs on thewhiteboard, explaining to other students what they have discovered, and responding towhat other students have said.
Class: Go CarlyCarly: Um, I think that what Catherine said makes sense but I think that
when it comes to the values that you go up by on the graph it’s reallyup to you and it’s what you think will best show the lines on thegraph. But what I found with a is that the higher the value of a themore acute the angle will be compared to the y-axis. So say, um, itwas 4x then it will be closer to the y-axis than 2x. ’Cause 2x will behere the 4x will be here. I found that the lower the value the closer itwas to the x-axis. But the higher the value the closer it was to the y-axis. [Applause and a “whoo”]
Sarah: Just a question. I was wondering do you even need the, um … thenumbers. ’Cause where it says 5a don’t, can’t you just go like 7a + 2or something. Like can we represent the numbers on the y and x-axiswith something else? [Laughs]
Class: [Laughter, murmurs.]Cameron: Like shapes? [Laughter] So you could like do like squares, circles,
triangles…Sarah: Yeah but this is just more easy. [Inaudible]Teacher: One at a time please. Could we just have one at a time? Kate, what did
you just say?Kate: I was saying that if you replace the numbers with like shapes and
letters and stuff it’s just a complicating thing ’cause we all know thenumber system and it’s simpler for us than all these other symbols.
Sarah: Yeah, but what I’m saying is, like, if, why we’re using the numbersystem we’re really, um, pinpointing the graph ’cause then we’resaying … one, one and y one, sorry, and we’re just, you know, we’rereally pinpointing, I mean using numbers and if we like, if we can finda way to represent it with letters then we’d be able to make it wholeinfinity, infinity instead of just drawing on the graph. Does that makesense?
Class: [Muttering, faint “No”]Teacher: That might be something for people to have a think about.
Mathematics: Essential for Learning, Essential for Life
© The Australian Association of Mathematics Teachers Inc.
212
The domain of practice
The content in both classrooms is strongly classified. In classroom 1 the focus is oncongruent triangles, in classroom 2 it is on graphs of straight lines. In classroom 1 thestudents use the terms “horizontal” and “vertical”. The teacher intervenes at this pointand suggests to the students that they are saying it is “at an angle, aren’t you?” She isintervening to encourage the students to move their expression from the everyday(horizontal and vertical) into the mathematical (right angle). However, she does notexplain to students, nor invite students to see for themselves, that the reason why it isbetter to use the term right angle is that a triangle may have any orientation. Inclassroom 2, the students discuss whether or not it is possible to use shapes rather thannumbers on the x and y-axes. Although it is not readily apparent in this short extract, thestudents are suggesting that the relationships they have observed are more general thanmight be expressed via actual numerical values. In this way, they are recontextualisingmathematics into everyday expression. The teacher responds, at the end of this part ofthe discussion, by suggesting that people “have a think about” an idea. In this way, sheis explicitly inviting students into the discourse of mathematics.
Voice
In classroom 1 the students adopt, and are compelled by the teacher to adopt, a receptivevoice. The initial question, “Miss, what do we do now?” indicates that students positionthemselves as dependents. Every subsequent student utterance is in direct response to ateacher question. The teacher recontextualises on behalf of the students, using phrasessuch as, “Then you’re defining the angle between them, aren’t you?”
In classroom 2 the students adopt, and are encouraged to adopt by the teacher, anauthorial voice. They use phrases such as “I think”, “What I was saying” and “I waswondering” frequently, suggesting that they have personal ownership of the ideas theyare discussing. The teacher intervenes only to maintain order, and to suggest that theymight think further about an idea. The students’ utterances are long and detailed, andtheir struggle to personally recontextualise partially-formed mathematical ideas intomathematical language is apparent.
Message
In classroom 1, the focus of the activity is for students to discover and to generalise theminimum number of conditions for congruency, which would appear to be anexpanding strategy. However, rather than discussing the concept of congruency, thestudents’ aim appears to be procedural, to complete the task and for the entire group tosuccessfully draw each other’s triangles. Later in the lesson one student claims “I won”,while the other students say “We all won”, meaning that they had been successful incopying each other’s triangles, rather than in identifying mathematical principles. Asdescribed above the teacher attempts to move the students’ language from the particular(horizontal and vertical) to the general (right angle) but does not discuss with studentswhy this language is more general.
In classroom 2, the students’ explicit aim is to generalise. The discussion focuses onprinciples rather than procedures, with Carly stating that she found “the lower the valuethe closer it was to the x-axis”. Sarah says that “if we can find a way to represent it withletters then we’d be able to make it whole infinity”. By using an expanded range andabstract, if somewhat ill-expressed discourse, students attempt to enter the valueddiscourse of mathematics.
Mathematics: Essential for Learning, Essential for Life
© The Australian Association of Mathematics Teachers Inc.
213
Conclusions
This brief discussion of two classrooms indicates that Social Activity Theory (Dowling,1998) can provide a powerful framework with which to examine the enacted discourseof the mathematics classroom. By looking at two quite distinct classrooms, we wereable to observe clear differences in the way in which students were positioned. Whereasboth classrooms focused on abstract mathematical ideas and involved a high level ofverbal interaction, in classroom 2 students were invited into the esoteric domain ofschool mathematics, used authorial voice, and engaged expanding strategies such as afocus on principles. In classroom 1, on the other hand, students were asked to usemathematical language without seeing why this was more powerful than everydaylanguage, positioned themselves as dependents responding to teacher questioning, andsaw the activity as a procedure rather than as a discovery of principles.
We suggest that a coherent theory of classroom interactions, such as Social ActivityTheory, is a powerful way in which teachers can analyse and improve the discourse oftheir own classroom. In particular it can address the question of “Who’s doing whosemathematics?” by giving students an authorial voice and positioning them as subjects orapprentices rather than dependents or objects. In this way the students are doing theirmathematics rather than watching while the teacher does his or her mathematics.
The teacher of classroom 2 describes the way in which she endeavours to givestudents this voice in the following way:
My aim in my mathematics classroom is for students to regard mathematics as anart which belongs to them, a means of regarding and interpreting the world, a toolfor manipulating their understandings, and a language with which they can sharetheir understandings. My students’ aim is to have fun and to feel in control.At the start of each year group responsibilities are established by class discussionand generally include rules such as every member is responsible for the actions ofthe other members of their group (this includes all being rewarded when one makesa significant contribution to the class and all sharing the same sanction when onemisbehaves), members are responsible for ensuring everyone in their groupunderstands what is going on at all times and students have some say in the makeup of their groups .My role is primarily that of observer, recorder, instigator of activities, occasionalprompter and resource for students to access. Most importantly, I provide thestimulus for learning what students need, while most of the direct teaching is doneby the students themselves, generally through open discussion. Less obvious to thecasual observer is my role of ensuring that students have the opportunities to learnall that they need to achieve required outcomes. It is crucial that I, as their teacher,let go of control of the class and allow students to make mistakes and then correctthem themselves. An essential criteria for defining one of my lessons as successfulis that I do less than 10% of the talking in the whole lesson.”

Mathematics: Essential for Learning, Essential for Life
© The Australian Association of Mathematics Teachers Inc.
214
References
AEC (1994). Mathematics: A Curriculum Profile for Australian Schools. Carlton, Vic.: CurriculumCorporation.
AEC (1991). A National Statement on Mathematics for Australian Schools. Carlton, Vic.: CurriculumCorporation.
Bernstein, B. (1996). Pedagogy, Symbolic Control and Identity: Theory, Research Critique. London:Taylor & Francis.
Boaler, J. (2003). Studying and capturing the complexity of practice — the case of the “dance of agency”.Paper presented at the Proceedings of the 2003 Joint Meeting of PME and PMENA, Honolulu, HI.
Dowling, P. (1998). The Sociology of Mathematics Education: Mathematical Myths/Pedagogic Texts.London: Farmer Press.
Hogan, J. & Morony, W. (2000). Classroom teachers doing research in the workplace. In A. Bessot and J.Ridgeway (Eds), Education for Mathematics in the Workplace (pp. 101–114). Dordrecht: Kluwer.
Hollingsworth, H., Lokan, J. & McCrae, B. (2003). Teaching Mathematics in Australia: Results from theTIMSS 1999 Video Study. Camberwell, Vic: Australian Council for Educational Research.
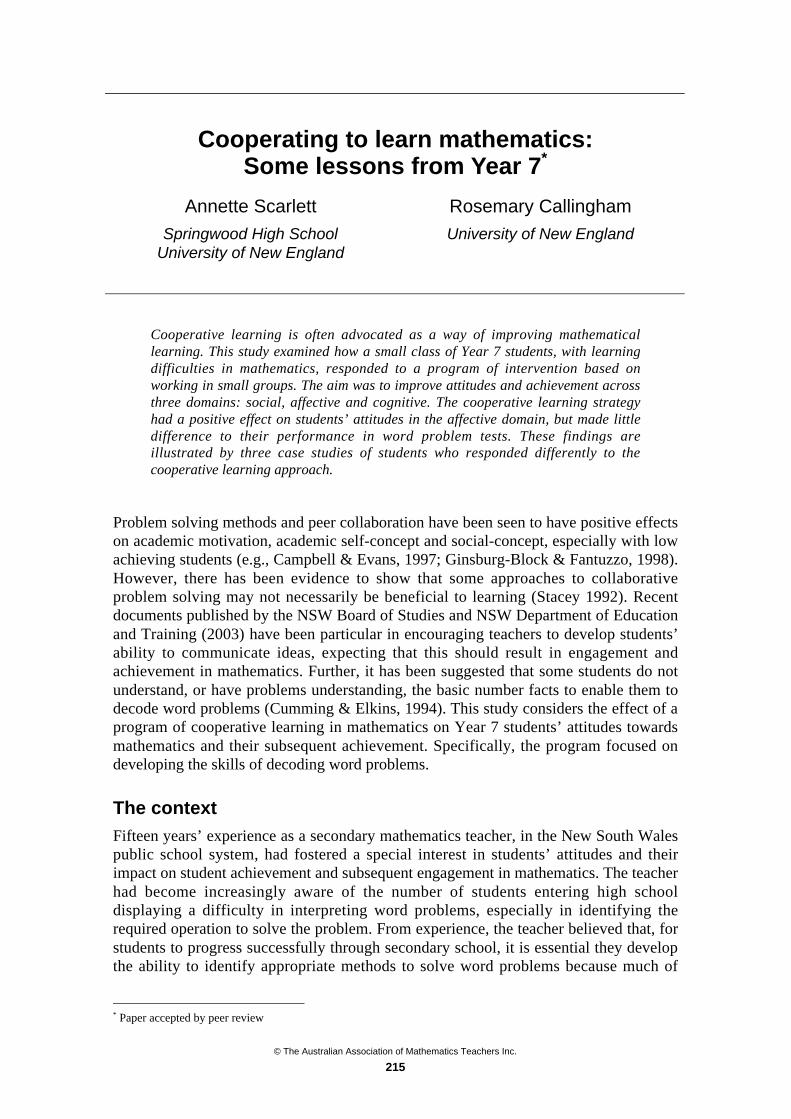
© The Australian Association of Mathematics Teachers Inc.
215
Cooperating to learn mathematics:Some lessons from Year 7*
Annette Scarlett
Springwood High School
University of New England
Rosemary Callingham
University of New England
Cooperative learning is often advocated as a way of improving mathematicallearning. This study examined how a small class of Year 7 students, with learningdifficulties in mathematics, responded to a program of intervention based onworking in small groups. The aim was to improve attitudes and achievement acrossthree domains: social, affective and cognitive. The cooperative learning strategyhad a positive effect on students’ attitudes in the affective domain, but made littledifference to their performance in word problem tests. These findings areillustrated by three case studies of students who responded differently to thecooperative learning approach.
Problem solving methods and peer collaboration have been seen to have positive effectson academic motivation, academic self-concept and social-concept, especially with lowachieving students (e.g., Campbell & Evans, 1997; Ginsburg-Block & Fantuzzo, 1998).However, there has been evidence to show that some approaches to collaborativeproblem solving may not necessarily be beneficial to learning (Stacey 1992). Recentdocuments published by the NSW Board of Studies and NSW Department of Educationand Training (2003) have been particular in encouraging teachers to develop students’ability to communicate ideas, expecting that this should result in engagement andachievement in mathematics. Further, it has been suggested that some students do notunderstand, or have problems understanding, the basic number facts to enable them todecode word problems (Cumming & Elkins, 1994). This study considers the effect of aprogram of cooperative learning in mathematics on Year 7 students’ attitudes towardsmathematics and their subsequent achievement. Specifically, the program focused ondeveloping the skills of decoding word problems.
The context
Fifteen years’ experience as a secondary mathematics teacher, in the New South Walespublic school system, had fostered a special interest in students’ attitudes and theirimpact on student achievement and subsequent engagement in mathematics. The teacherhad become increasingly aware of the number of students entering high schooldisplaying a difficulty in interpreting word problems, especially in identifying therequired operation to solve the problem. From experience, the teacher believed that, forstudents to progress successfully through secondary school, it is essential they developthe ability to identify appropriate methods to solve word problems because much of
* Paper accepted by peer review

Mathematics: Essential for Learning, Essential for Life
© The Australian Association of Mathematics Teachers Inc.
216
their formal, external mathematics assessment is presented in this format. The teacheralso observed that students faced with word problems, and lacking the skills to decodethem, in later years seem to lose the motivation to succeed. Such students perceivemathematics as difficult and irrelevant. They avoid the challenge to succeed student andare content to copy information from the board, or from a friend, believing this is“work.” Further, they avoid taking the risks of attempting to formulate their ownanswers for fear of failing, yet again, resulting in an attitude of “not caring.” At thisstage, students often become disruptive and a behaviour problem in the classroom.These students, like all others, have the right to enjoy and succeed in mathematics.Rather than allow them to progress through the system without intervention,unsuccessful students should have the opportunity to develop skills in solving wordproblems in Year 7, in order to help develop a positive attitude to mathematics as theyprogress through their high school years.
The study was carried out in a government co-educational, comprehensive highschool located in a town in the Blue Mountains, 80 km from Sydney. The class chosenfor the study consisted of ten students, formed from funding provided by a newlydeveloped departmental initiative for students with mild disabilities who requiredspecial attention to integrate into secondary school from primary school. In theclassroom, the teacher had alternated between the pair seating arrangement, the blocksof four seating arrangements, and the horse-shoe arrangement. The teacher hadconsidered the paired arrangement the most appropriate for maximum classroommanagement. The familiar classroom strategies incorporated teacher-focused studentquestioning, with theory presented on the overhead projector and exercises presented onworksheets.
The program
The program took place over a seven week period. Students undertook a word-problemtest and an attitude survey at the beginning and end of the teaching intervention. Afurther test was conducted after the Christmas holiday break to determine the extent ofretention. Table 1 provides an overview of the activities which occurred during weeksone to seven and eight weeks after the initial collecting period.
Table 1 Overview of the data collecting period.
Week 1 2 3 4 5 6 7 15Cooperative
LearningProgram 1
(CL1)
CooperativeLearning
Program 2(CL2)
CooperativeLearning
Program 3(CL3)
CooperativeLearning
Program 4(CL4)
Activity Questionaire
Test
Introduceaudio-tape
Coolingoff
period
WordMatching
Squaresaw One-stepWord
Problems
Two-stepWord
Problems
Questionnaire
Test
Test
The program consisted of five stages. The first stage involved a questionnaire, todetermine students’ attitudes towards mathematics and a word-problems test, toevaluate mathematical achievement, both administered during one classroom period.The second stage was a one week familiarisation period. During this time, studentscontinued with the normal classroom routine following the program devised from thesyllabus. The third stage consisted of a four-week period where one teaching period

Mathematics: Essential for Learning, Essential for Life
© The Australian Association of Mathematics Teachers Inc.
217
each week focussed on a cooperative learning lesson to develop word problem skills.This followed usual group work procedures with specific word problem teachingstrategies. The students were divided into two groups with the teacher working with onegroup and the teacher’s aide working with the other, alternating each lesson. Thegroups’ discussions were audio-taped and observations noted by both the teacher andthe teacher’s aide. The fourth stage consisted of re-administering the originalquestionnaire and test immediately after the teaching intervention. The final stageinvolved the administration of the original test, approximately eight weeks after the endof the teaching sequences, after the Christmas break.
Cooperative Learning Activities
Four different strategies were used with a focus on word problems.
Cooperative Learning Program 1 (CLP 1) — Word matching
The teacher initially introduced the students to targeted words, synonyms for thearithmetic operations, by placing the symbols +, –, , ÷ at the top of four columns andshowing these on the overhead projector. Each word was then displayed for the studentsto read, and then indicate to which column the word belonged. The teacher practicedthese targeted words until the students became familiar with the process.
The students were divided into two groups. Each group was given a set of 76 wordcards, which were divided evenly between each member of the group. Each student inturn placed a card on the appropriate symbol. When they completed this task, theteacher then allowed the group to play a game of dominoes placing similar wordstogether.
Cooperative Learning Program 2 (CLP 2) — Square-saw
A square-saw is a word matching activity where a grid has questions and matchingsolutions are placed on adjacent sides of the squares (tiles). The grid is cut out andshuffled. The students are required to reassemble the grid, so that the questions matchthe answers. The students were shown how to complete a square-saw and then dividedinto groups to work together to complete the square-saws.
Cooperative Learning Program 3 (CLP 3) — Word problems
In this lesson, the teacher explained to the students that each group would be given anenvelope containing a number of word problems and a table for recording the answersto the word problems. It was stressed that the aim of the exercise was to decide on theoperation used in each question rather than answering every question quickly. Thisoperation was first recorded for all problems, and then students used their calculators towork out their answers.
Cooperative Learning Program 4 (CLP 4) — Two-step word problems
This lesson was similar to CLP3, except that the problems consisted of two steps. Bothoperations had to be identified before the students attempted to work out the answers.
The outcomes
The questionnaire focused on the cognitive, affective and social domain. From thebeginning of the program to the end of the cooperative learning lessons, analysis of theresponses showed a significant positive change in the affective domain, while thecognitive and the social domains showed no significant change.

Mathematics: Essential for Learning, Essential for Life
© The Australian Association of Mathematics Teachers Inc.
218
The word problem test concentrated on the operations of addition, subtraction andmultiplication. Analysis showed the students had a good knowledge of the oneoperation involving either addition or subtraction, and this showed little change. Boththe operation of multiplication and the two mixed operations of addition, subtractionand multiplication showed a short term improvement after the cooperative learningprogram, although this was not statistically significant.
When audiotapes of the cooperative learning lessons were analysed the studentsresponded well to activities which they perceived as the more traditional mathematicslesson. The analysis also demonstrated interesting aspects of individual students whichled the researcher to consider three students as case studies. The first case studyfocussed on B, who did not wish to work in a group work situation. The second casestudy profiled Je, who benefited from the program. The final case study considered N,who did not perform well under the cooperative learning conditions.
Individual students
Of the students, B was the most reluctant to work in a cooperative learningenvironment. From the very start he displayed no interest in being involved, to theextent that he endeavoured to undermine the lessons by hiding tiles and makinginappropriate comments. Most of his comments were negative, ranging from, “Shutup,” to his peers to, ‘This is boring,’ when commenting about the activities. He requireda lot of coaxing from the facilitator to answer questions. He generally repeated words ormade silly comments, unrelated to the question. This attitude resulted in disrupting thelesson, by unsettling the other students and creating a negative quality in the classroom.He particularly unsettled E who was very keen on doing her best in the activities, to theextent that E had to leave the group and work on her own. Interestingly, E could havequite happily worked in a group situation or on her own, as she seemed to “switch off”to the others in the group and work by herself or with the facilitator. B’s involvementsocially did not change throughout the course of the cooperative learning activities. Hisbehaviour demonstrated that this type of learning strategy was not appropriate at thisstage for B, or that a different kind of group structure might have been moreappropriate.
J provided the total antithesis to B in the social domain. Having presented herself inthe traditional classroom environment as a quiet worker who very rarely made anycontribution to classroom discussion, this student excelled. She was keen to organiseher group, displaying leadership skills. She worked well with the other students andhelped them where she could and also gave them encouragement. At the end of thecooperative learning program her answers to the questionnaires which were focused onthe social domain had become more positive. This demonstrates that for some students acooperative learning program can be positive.
In comparing the responses to the questionnaires, N began the cooperative learningprogram with a more positive attitude to her social interaction than at the end. Eventhough N still likes to “be” in the mathematics classroom she definitely does not wantstudents to think she is smart or to help her peers. This is interesting since N alwaysappeared to be an outward going student who had plenty to say. The transcripts showedthat in the last two cooperative learning lessons, N became quite determined in herresponses, displaying irritation with her peers when she could not answer questionscorrectly. With N, the cooperative learning program allowed her to see her learningdifficulties against the other members of her group.
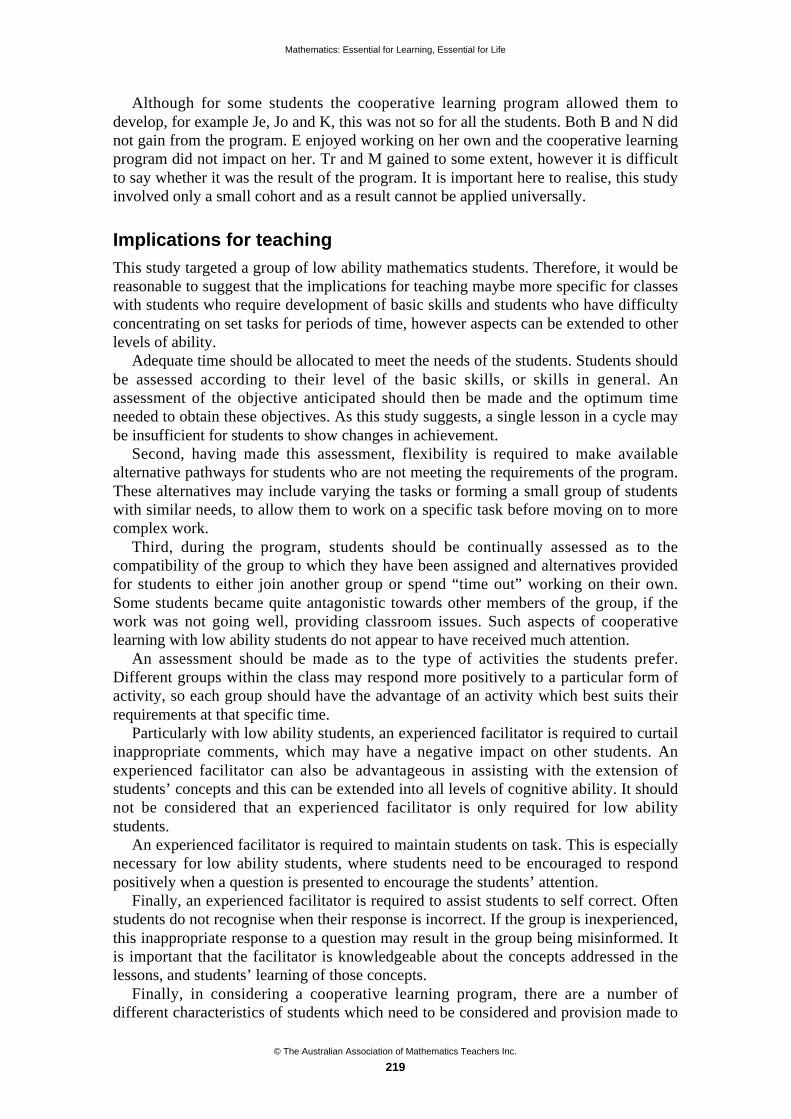
Mathematics: Essential for Learning, Essential for Life
© The Australian Association of Mathematics Teachers Inc.
219
Although for some students the cooperative learning program allowed them todevelop, for example Je, Jo and K, this was not so for all the students. Both B and N didnot gain from the program. E enjoyed working on her own and the cooperative learningprogram did not impact on her. Tr and M gained to some extent, however it is difficultto say whether it was the result of the program. It is important here to realise, this studyinvolved only a small cohort and as a result cannot be applied universally.
Implications for teaching
This study targeted a group of low ability mathematics students. Therefore, it would bereasonable to suggest that the implications for teaching maybe more specific for classeswith students who require development of basic skills and students who have difficultyconcentrating on set tasks for periods of time, however aspects can be extended to otherlevels of ability.
Adequate time should be allocated to meet the needs of the students. Students shouldbe assessed according to their level of the basic skills, or skills in general. Anassessment of the objective anticipated should then be made and the optimum timeneeded to obtain these objectives. As this study suggests, a single lesson in a cycle maybe insufficient for students to show changes in achievement.
Second, having made this assessment, flexibility is required to make availablealternative pathways for students who are not meeting the requirements of the program.These alternatives may include varying the tasks or forming a small group of studentswith similar needs, to allow them to work on a specific task before moving on to morecomplex work.
Third, during the program, students should be continually assessed as to thecompatibility of the group to which they have been assigned and alternatives providedfor students to either join another group or spend “time out” working on their own.Some students became quite antagonistic towards other members of the group, if thework was not going well, providing classroom issues. Such aspects of cooperativelearning with low ability students do not appear to have received much attention.
An assessment should be made as to the type of activities the students prefer.Different groups within the class may respond more positively to a particular form ofactivity, so each group should have the advantage of an activity which best suits theirrequirements at that specific time.
Particularly with low ability students, an experienced facilitator is required to curtailinappropriate comments, which may have a negative impact on other students. Anexperienced facilitator can also be advantageous in assisting with the extension ofstudents’ concepts and this can be extended into all levels of cognitive ability. It shouldnot be considered that an experienced facilitator is only required for low abilitystudents.
An experienced facilitator is required to maintain students on task. This is especiallynecessary for low ability students, where students need to be encouraged to respondpositively when a question is presented to encourage the students’ attention.
Finally, an experienced facilitator is required to assist students to self correct. Oftenstudents do not recognise when their response is incorrect. If the group is inexperienced,this inappropriate response to a question may result in the group being misinformed. Itis important that the facilitator is knowledgeable about the concepts addressed in thelessons, and students’ learning of those concepts.
Finally, in considering a cooperative learning program, there are a number ofdifferent characteristics of students which need to be considered and provision made to

Mathematics: Essential for Learning, Essential for Life
© The Australian Association of Mathematics Teachers Inc.
220
meet the needs of these students. In particular in this study there were students whowere:
• keen to take leadership and respond to the facilitator;
• keen, but who did not have the maturity to understand their strengths andweaknesses;
• keen, but who found the work too demanding and as a result developednegativity;
• capable of working quietly and competently within the group;
• able to work competently but who required direction;
• explicit in their wish to work on their own;
• not interested in group work and either disrupted others or refused to participate.
This provides some examples of the characteristics which could present in acooperative learning program, and should be considered.
Concluding thought
The research discussed in this study has described the ways a program of targetedintervention using cooperative learning strategies to aid the decoding of word problemscould influence students’ achievement on tests of mathematical word problems andattitudes to mathematics in the cognitive, affective and social domains.
This study has drawn attention to the vast and distinctive conditions which must beconsidered when designing a cooperative learning program in the classroom. Moreinvestigation is needed in the achievements and attitudes of students who aremathematically challenged and who have difficulty with the type of collaborativeproblem solving approaches promoted by educational institutions. If this is done,collaborative problem solving could be of significant value to a much broader schoolpopulation and not be seen as merely lip service to a departmental initiative.
References
Campbell, K. T. & Evans, C. (1997). Gender issues in the classroom: a comparison of mathematicsanxiety. Education, 117, 332–339.
Cobb, P., Wood, T., Yackel, E. & Perlwitz, M. (1992). A follow-up assessment of second-grade problem-centred mathematics project. Educational Studies in Mathematics, 23, 483–504.
Cumming, J. J & Elkins, J. (1994). Are any errors careless? Focus on Learning Problems in Mathematics,16, 21–30
Ginsburg-Block, M. D. & Fantuzzo, J. W. (1998). An evaluation of the relative effectiveness of NCTMstandards-based interventions for low-achieving urban elementary students. Journal of EducationalPsychology, 90(3) 560–569.
New South Wales Department of Education and Training (2003). Quality Matters. Revitalising Teaching:Critical Times, Critical Choices. Sydney: New South Wales Department of Education.
Stacey, K. (1992). Mathematical problem solving in groups: Are two heads better than one? Journal ofMathematical Behavior, 11, 261–275.
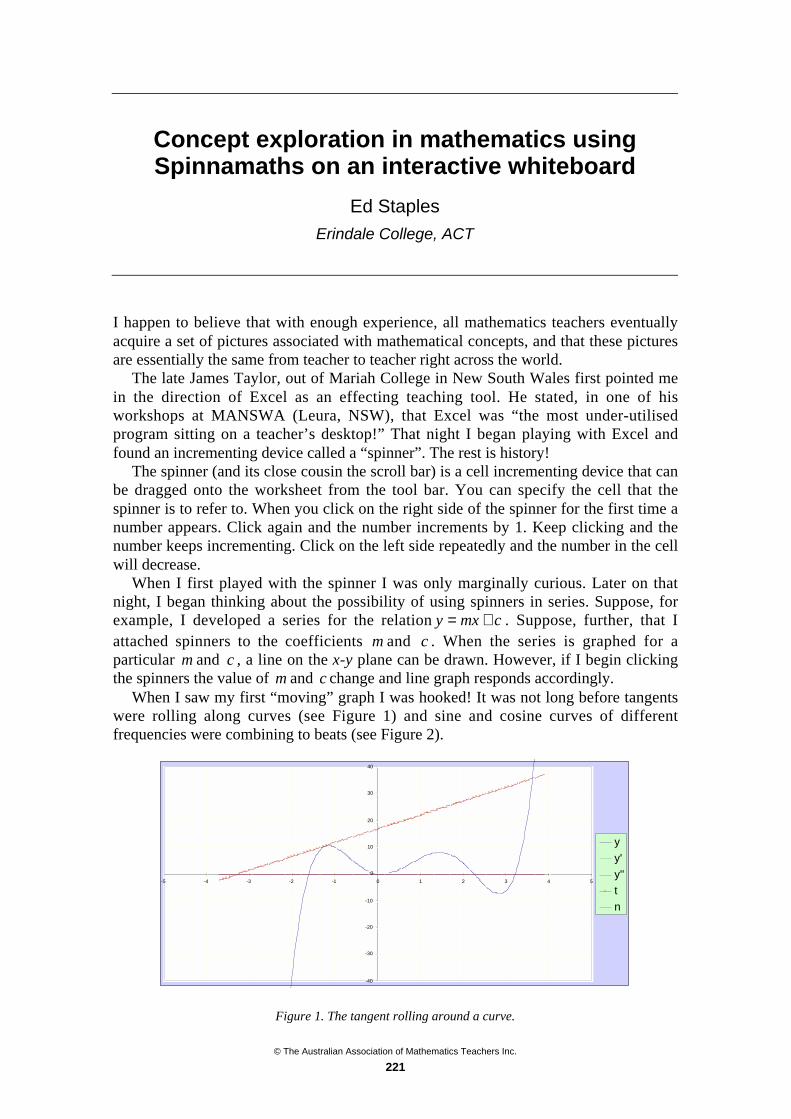
© The Australian Association of Mathematics Teachers Inc.
221
Concept exploration in mathematics usingSpinnamaths on an interactive whiteboard
Ed Staples
Erindale College, ACT
I happen to believe that with enough experience, all mathematics teachers eventuallyacquire a set of pictures associated with mathematical concepts, and that these picturesare essentially the same from teacher to teacher right across the world.
The late James Taylor, out of Mariah College in New South Wales first pointed mein the direction of Excel as an effecting teaching tool. He stated, in one of hisworkshops at MANSWA (Leura, NSW), that Excel was “the most under-utilisedprogram sitting on a teacher’s desktop!” That night I began playing with Excel andfound an incrementing device called a “spinner”. The rest is history!
The spinner (and its close cousin the scroll bar) is a cell incrementing device that canbe dragged onto the worksheet from the tool bar. You can specify the cell that thespinner is to refer to. When you click on the right side of the spinner for the first time anumber appears. Click again and the number increments by 1. Keep clicking and thenumber keeps incrementing. Click on the left side repeatedly and the number in the cellwill decrease.
When I first played with the spinner I was only marginally curious. Later on thatnight, I began thinking about the possibility of using spinners in series. Suppose, forexample, I developed a series for the relation cmxy += . Suppose, further, that Iattached spinners to the coefficients m and c . When the series is graphed for aparticular m and c , a line on the x-y plane can be drawn. However, if I begin clickingthe spinners the value of m and c change and line graph responds accordingly.
When I saw my first “moving” graph I was hooked! It was not long before tangentswere rolling along curves (see Figure 1) and sine and cosine curves of differentfrequencies were combining to beats (see Figure 2).
-40
-30
-20
-10
0
10
20
30
40
-5 -4 -3 -2 -1 0 1 2 3 4 5
y
y'
y''
t
n
Figure 1. The tangent rolling around a curve.
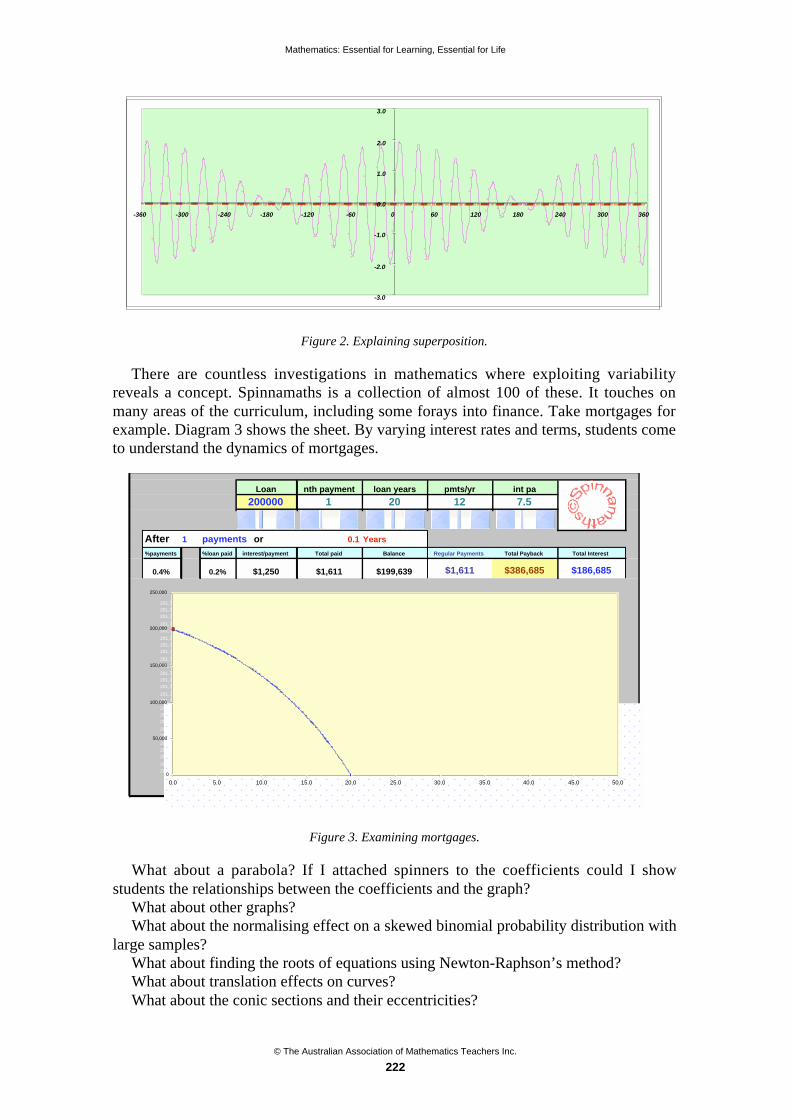
Mathematics: Essential for Learning, Essential for Life
© The Australian Association of Mathematics Teachers Inc.
222
-3.0
-2.0
-1.0
0.0
1.0
2.0
3.0
-360 -300 -240 -180 -120 -60 0 60 120 180 240 300 360
Figure 2. Explaining superposition.
There are countless investigations in mathematics where exploiting variabilityreveals a concept. Spinnamaths is a collection of almost 100 of these. It touches onmany areas of the curriculum, including some forays into finance. Take mortgages forexample. Diagram 3 shows the sheet. By varying interest rates and terms, students cometo understand the dynamics of mortgages.
Loan nth payment loan years pmts/yr int pa
200000 1 20 12 7.5750
After 1 payments or 0.1 Years
%payments %loan paid interest/payment Total paid Balance Regular Payments Total Payback Total Interest
0.4% 0.2% $1,250 $1,611 $199,639 $1,611 $386,685 $186,685
201,768 ###### 201,768 201,768 201,768 201,768 201,768 201,768 201,768
201,768 ###### 201,768 201,768 201,768 201,768 201,768 201,768 201,768
201,768 ###### 201,768 201,768 201,768 201,768 201,768 201,768 201,768
201,768 ###### 201,768 201,768 201,768 201,768 201,768 201,768 201,768
201,768 ###### 201,768 201,768 201,768 201,768 201,768 201,768 201,768
201,768 ###### 201,768 201,768 201,768 201,768 201,768 201,768 201,768
201,768 ###### 201,768 201,768 201,768 201,768 201,768 201,768 201,768
201,768 ###### 201,768 201,768 201,768 201,768 201,768 201,768 201,768
201,768 ###### 201,768 201,768 201,768 201,768 201,768 201,768 201,768
201,768 ###### 201,768 201,768 201,768 201,768 201,768 201,768 201,768
201,768 ###### 201,768 201,768 201,768 201,768 201,768 201,768 201,768
201,768 ###### 201,768 201,768 201,768 201,768 201,768 201,768 201,768
201,768 ###### 201,768 201,768 201,768 201,768 201,768 201,768 201,768
201,768 ###### 201,768 201,768 201,768 201,768 201,768 201,768 201,768
201,768 ###### 201,768 201,768 201,768 201,768 201,768 201,768 201,768
201,768 ###### 201,768 201,768 201,768 201,768 201,768 201,768 201,768
201,768 ###### 201,768 201,768 201,768 201,768 201,768 201,768 201,768
201,768 ###### 201,768 201,768 201,768 201,768 201,768 201,768 201,768
201,768 ###### 201,768 201,768 201,768 201,768 201,768 201,768 201,768
201,768 ###### 201,768 201,768 201,768 201,768 201,768 201,768 201,768
201,768 ###### 201,768 201,768 201,768 201,768 201,768 201,768 201,768
201,768 ###### 201,768 201,768 201,768 201,768 201,768 201,768 201,768
201,768 ###### 201,768 201,768 201,768 201,768 201,768 201,768 201,768
201,768 ###### 201,768 201,768 201,768 201,768 201,768 201,768 201,768
201,768 ###### 201,768 201,768 201,768 201,768 201,768 201,768 201,7680
50,000
100,000
150,000
200,000
250,000
0.0 5.0 10.0 15.0 20.0 25.0 30.0 35.0 40.0 45.0 50.0
Figure 3. Examining mortgages.
What about a parabola? If I attached spinners to the coefficients could I showstudents the relationships between the coefficients and the graph?
What about other graphs?What about the normalising effect on a skewed binomial probability distribution with
large samples?What about finding the roots of equations using Newton-Raphson’s method?What about translation effects on curves?What about the conic sections and their eccentricities?
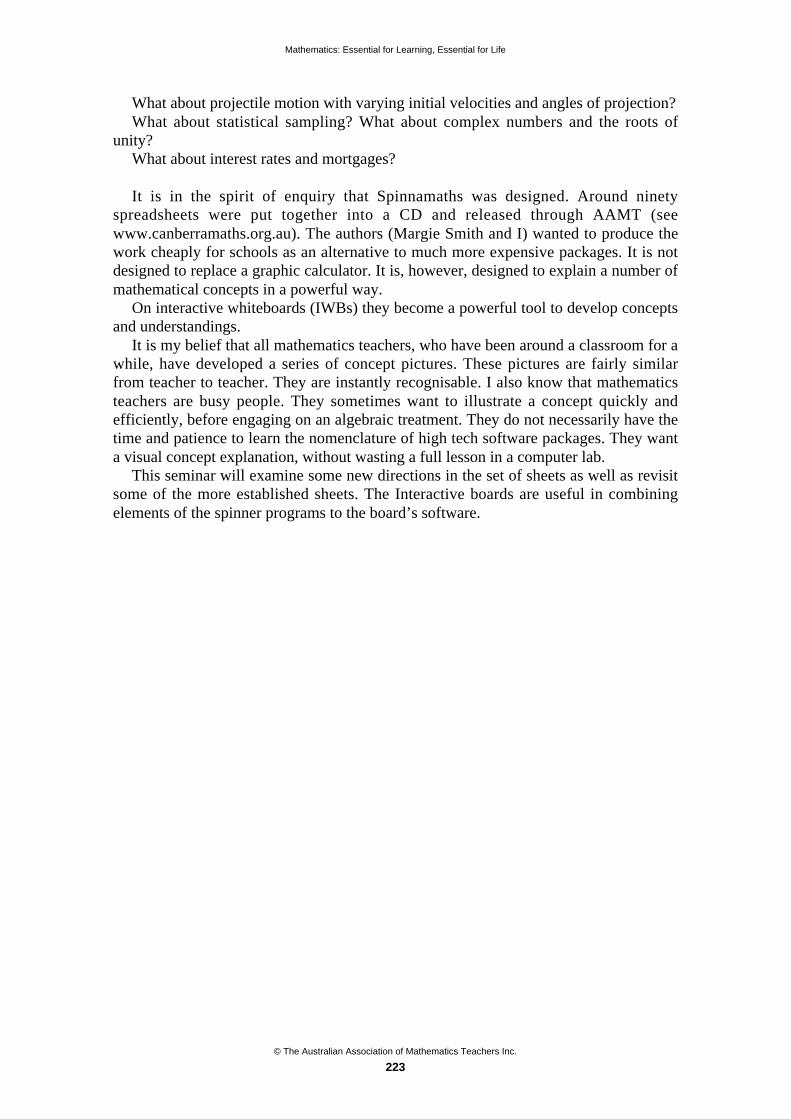
Mathematics: Essential for Learning, Essential for Life
© The Australian Association of Mathematics Teachers Inc.
223
What about projectile motion with varying initial velocities and angles of projection?What about statistical sampling? What about complex numbers and the roots of
unity?What about interest rates and mortgages?
It is in the spirit of enquiry that Spinnamaths was designed. Around ninetyspreadsheets were put together into a CD and released through AAMT (seewww.canberramaths.org.au). The authors (Margie Smith and I) wanted to produce thework cheaply for schools as an alternative to much more expensive packages. It is notdesigned to replace a graphic calculator. It is, however, designed to explain a number ofmathematical concepts in a powerful way.
On interactive whiteboards (IWBs) they become a powerful tool to develop conceptsand understandings.
It is my belief that all mathematics teachers, who have been around a classroom for awhile, have developed a series of concept pictures. These pictures are fairly similarfrom teacher to teacher. They are instantly recognisable. I also know that mathematicsteachers are busy people. They sometimes want to illustrate a concept quickly andefficiently, before engaging on an algebraic treatment. They do not necessarily have thetime and patience to learn the nomenclature of high tech software packages. They wanta visual concept explanation, without wasting a full lesson in a computer lab.
This seminar will examine some new directions in the set of sheets as well as revisitsome of the more established sheets. The Interactive boards are useful in combiningelements of the spinner programs to the board’s software.

© The Australian Association of Mathematics Teachers Inc.
224
Challenges in formulating anextended modelling task at Year 9*
Gloria Stillman
University of Melbourne
Jill Brown9
Australian Catholic University
The formulation phase of an extended modelling task can present many challengesfor beginning modellers especially those at Year 9. However, teacher support tomeet these challenges allows students to engage meaningfully with such tasks andto experience first hand how mathematical modelling is an essential form ofreasoning about real situations. Data from the RITEMATHS project are used toexamine teacher and student moves in successfully negotiating the formulationphase during a modelling task. In the classes where the majority of students hadless difficulty with formulation, the teacher used a combination of physicaldemonstrations and dynamic computer simulations.
Teachers of mathematical modelling at university level possess a worldviewrecognising “the power of mathematics to describe, explain, predict and control realphenomena [and appreciate] that mathematics is indispensable as a way of knowingabout the world in which they live… [For them,] ‘everything turns into mathematics.’On the other hand, for many students at the tertiary level ‘it is nearly impossible toadopt this new way of looking at the world so late in one’s education’” (Lamon, Parker& Houston, 2003, p. ix). It is thus important that students develop awareness of thisfundamentally different way of perceiving the world, whilst in primary and secondaryschool. To Mason (2001, p. 43), “exposing students to mathematical modelling is notjust a form of teaching applications of mathematics, nor of illuminating the mathematicsbeing applied. It is equipping students with the power to exercise a fundamental duty”as a citizen to appreciate, critique and use the models and modelling that permeate ourmodern world. Only then can students fully appreciate that mathematics is “a way oflife”: essential for learning, essential for life.
Data for this paper have been generated within RITEMATHS, an AustralianResearch Council funded Linkage project (http://extranet.edfac.unimelb.edu.au/DSME/RITEMATHS/). The research was undertaken as design based research (Wang &Hannafin, 2005). This research is focussed at the level of teacher action and studentlearning, in particular, teacher facilitation of students’ developing their modellingcompetencies as they engage with an extended task in classrooms where electronictechnologies are available to teachers and students. This paper is limited to theformulation phase of modelling and student and teacher moves during this.
The formulation stage of mathematical modelling separates a modelling approachfrom an applications approach, where real world situations are introduced merely toillustrate the applicability of mathematics (Stillman, 2004). In a modelling approach themathematisation of the real situation, by the students using their knowledge of * Paper accepted by peer review9 Jill was a doctoral student of the University of Melbourne when these data were collected.

Mathematics: Essential for Learning, Essential for Life
© The Australian Association of Mathematics Teachers Inc.
225
mathematical models and techniques, is of interest. Model formulation is the first phaseof modelling covering the process from the simplification, structuring and idealising ofthe real situation (Maa, 2006), through to translation into a mathematical model. Theimportance of this crucial phase of modelling of real world situations has been knownfor some time (e.g., Voskoglou, 1995) but it is still often neglected in teaching despite(or, perhaps, because of) it being shown to be the very difficult for students (Crouch &Haines, 2004).
The study
The part of the study reported here involved implementation of one task in three Year 9classes (14–15 year olds), each from a different school B, C, or D. The teachers in theseclasses have been developing a lower secondary mathematics curriculum, providingopportunities for engagement in extended modelling. Intensive data were generated inthe form of student scripts, video and audio recordings of the teacher, whole class andsmall group collaborative activity, and post-task interviews. In order to identify anddocument characteristic actions and the respective interactions between modelling,mathematical content, and technology, these data were entered into a NUD.ISTdatabase (QSR, 1997) and analysed through intensive data scrutiny, to develop andrefine categories related to these themes. Illustrations are drawn from the analysis of theimplementation of the task, Shot on Goal (Figure 1). In all three implementations ourfocus is on the formulation phase. However, this phase is revisited by some studentsseveral times after they have done some calculations using formulations, which theythen decide need revision.
In Shot on Goal, the cognitive demand required for task formulation by Year 9students is high, potentially leading to a blockage in this early phase of the solution ifstudents find the level of challenge too high for them to engage with the task. To helpovercome this, teachers from different schools used a variety of methods to ensurestudents did not have difficulty interpreting the situation. At all schools, students wereasked to write, in their own words, what they thought the aim of the task was and thenspecify this in terms of a problem that could be solved mathematically. Peter, theteacher from school B, anticipated that specifying the aim of the task and the angleinvolved would be a challenge for many students. He provided a supporting physicaldemonstration in the classroom, involving throwing a tennis ball, from various angles,through two goal posts. Class members either watched or participated to help clarifytheir thinking. For example, here are the words of student Sandra:
Sandra: It helped to explain like what we hoped to find out. Like I didn't reallyget what we were trying to do. And that kind of explained what angleswe were trying to find.
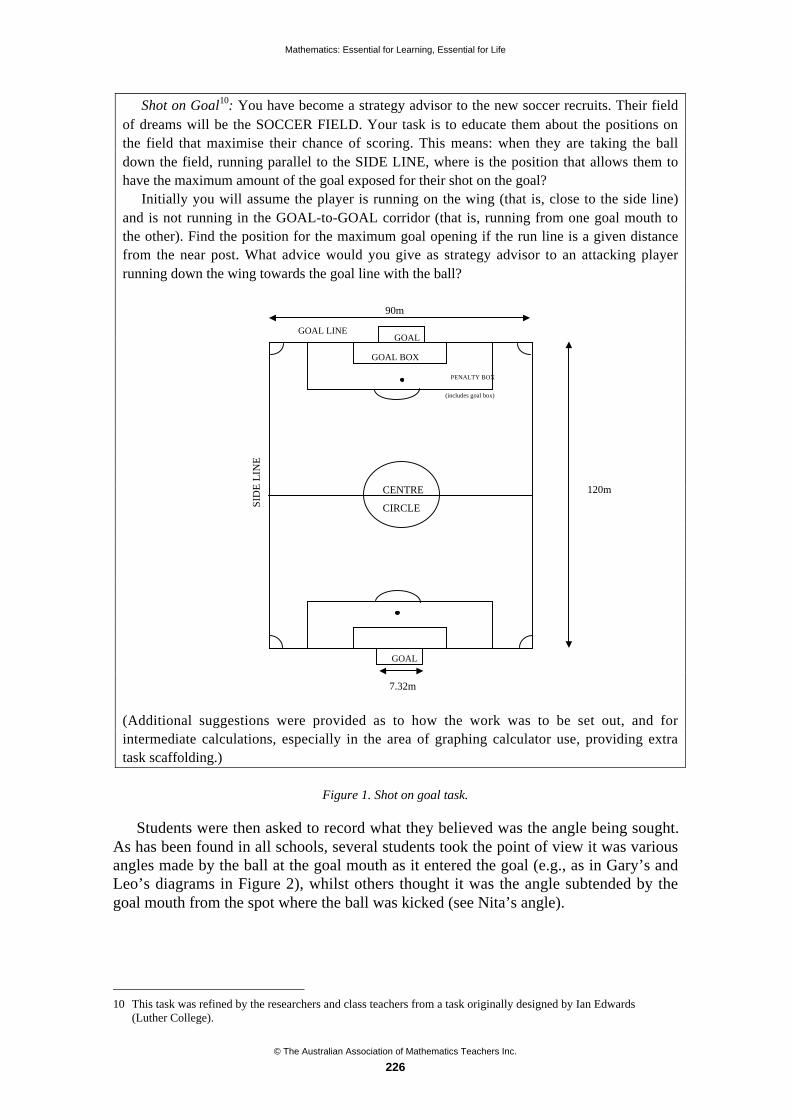
Mathematics: Essential for Learning, Essential for Life
© The Australian Association of Mathematics Teachers Inc.
226
Shot on Goal10: You have become a strategy advisor to the new soccer recruits. Their fieldof dreams will be the SOCCER FIELD. Your task is to educate them about the positions onthe field that maximise their chance of scoring. This means: when they are taking the balldown the field, running parallel to the SIDE LINE, where is the position that allows them tohave the maximum amount of the goal exposed for their shot on the goal?
Initially you will assume the player is running on the wing (that is, close to the side line)and is not running in the GOAL-to-GOAL corridor (that is, running from one goal mouth tothe other). Find the position for the maximum goal opening if the run line is a given distancefrom the near post. What advice would you give as strategy advisor to an attacking playerrunning down the wing towards the goal line with the ball?
(Additional suggestions were provided as to how the work was to be set out, and forintermediate calculations, especially in the area of graphing calculator use, providing extratask scaffolding.)
Figure 1. Shot on goal task.
Students were then asked to record what they believed was the angle being sought.As has been found in all schools, several students took the point of view it was variousangles made by the ball at the goal mouth as it entered the goal (e.g., as in Gary’s andLeo’s diagrams in Figure 2), whilst others thought it was the angle subtended by thegoal mouth from the spot where the ball was kicked (see Nita’s angle).
10 This task was refined by the researchers and class teachers from a task originally designed by Ian Edwards
(Luther College).
90m
PENALTY BOX
(includes goal box)
120mCENTRE
CIRCLE
GOAL
7.32m
GOAL LINE
SID
E L
INE
GOAL BOX
GOAL
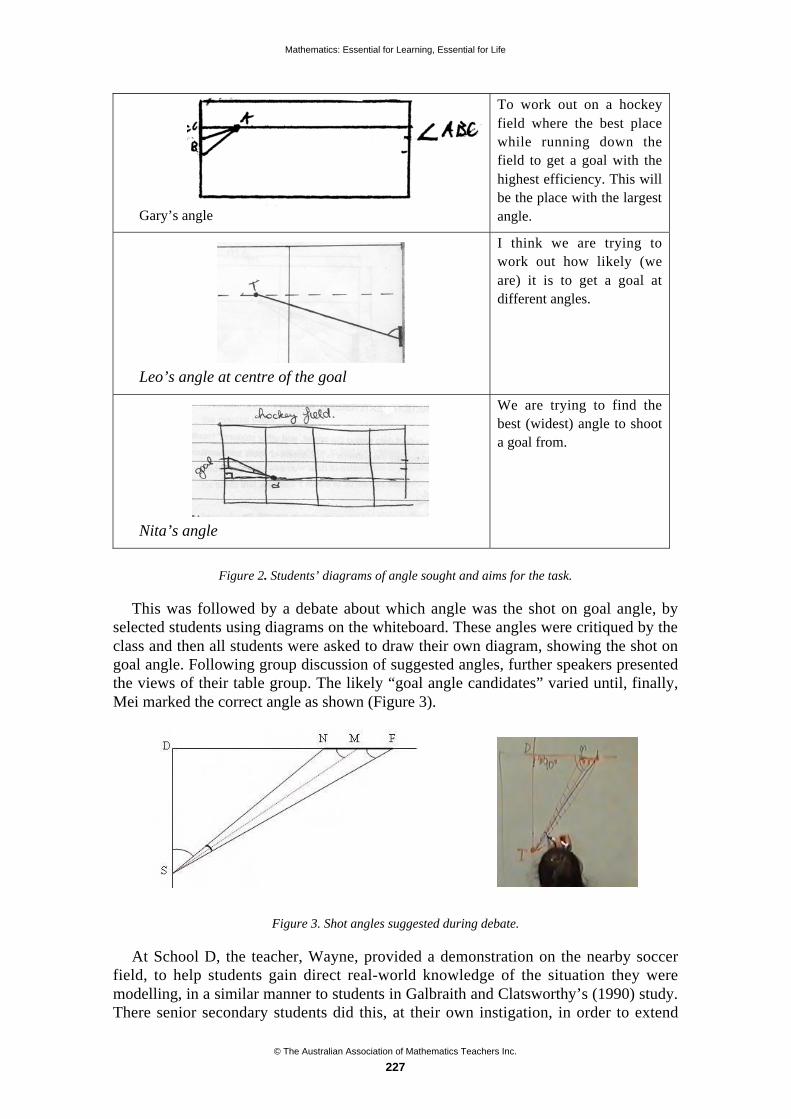
Mathematics: Essential for Learning, Essential for Life
© The Australian Association of Mathematics Teachers Inc.
227
Gary’s angle
To work out on a hockeyfield where the best placewhile running down thefield to get a goal with thehighest efficiency. This willbe the place with the largestangle.
Leo’s angle at centre of the goal
I think we are trying towork out how likely (weare) it is to get a goal atdifferent angles.
Nita’s angle
We are trying to find thebest (widest) angle to shoota goal from.
Figure 2. Students’ diagrams of angle sought and aims for the task.
This was followed by a debate about which angle was the shot on goal angle, byselected students using diagrams on the whiteboard. These angles were critiqued by theclass and then all students were asked to draw their own diagram, showing the shot ongoal angle. Following group discussion of suggested angles, further speakers presentedthe views of their table group. The likely “goal angle candidates” varied until, finally,Mei marked the correct angle as shown (Figure 3).
Figure 3. Shot angles suggested during debate.
At School D, the teacher, Wayne, provided a demonstration on the nearby soccerfield, to help students gain direct real-world knowledge of the situation they weremodelling, in a similar manner to students in Galbraith and Clatsworthy’s (1990) study.There senior secondary students did this, at their own instigation, in order to extend

Mathematics: Essential for Learning, Essential for Life
© The Australian Association of Mathematics Teachers Inc.
228
their knowledge of modelling artefacts, such as speed bumps. For students to be able touse knowledge of real situations, previous studies (e.g., Stillman, 2000) suggest thatdirect, rather than vicarious, experiences of real world situations are more effective inallowing this to occur. Some students actively participated in the soccer demonstration,whilst others watched. Wayne used a rope to indicate a particular run line to thestudents and asked them, one at a time, to run down the run line and stop when thatthought they had the best chance of scoring a goal (see Figure 4). Students were thenasked to explain why they stopped where they did. For example, student Mark stated:
Mark: To start with, it was closer than everyone else was but I still had a fairchance of scoring, a fair angle I could get the ball in.
Wayne: What do you mean by a fair angle?Mark: If I had gone further the goal wouldn’t have been as big as that further
down the field.
A second group of students then repeated the demonstration for a run line closer tothe goal.
Figure 4. Teacher moves supporting formulation of the situation.
During the post-task interview, students agreed that the soccer demonstration was aneffective teacher move to help their interpreting the task situation and formulating amathematical model. Raza’s response was typical:
Raza: It was, sort of, I guess, a way of understanding the task better…because some people like to have it, you know, instead of on paper inreal life, to help them see what they are talking about.
Inteviewer: Did you find this increased your understanding of the task?Raza: Yeah, I guess it probably did. Just that it translated [it] from paper to
real life better.
In the classroom, as further support for mathematising the situation, Wayne showedthe class an animated two-dimensional representation of the task, using a dynamicgeometry application (Figure 4). This further clarified students’ thinking about the task.
Raza: Well it sort of showed us, the way that, this, this is the angle to find.And it showed us (it didn’t specifically say this is the way), it just sortof helped us along to figure that ourselves.
Despite this, three groups of students, including Raza’s group, considered the angleat the centre of the goal mouth as a possibility but this was quickly dismissed by all butone group, who persisted with this thinking. This last group initially found the angle at

Mathematics: Essential for Learning, Essential for Life
© The Australian Association of Mathematics Teachers Inc.
229
the shot spot between the run line and the near post ( ASB in Figure 5). However, theincreasing size of this angle as the shot spot approached the goal line puzzled them, asthey expected “the angle size would reduce because, as much of the goal wouldn’t befacing me, it would be more of an acute angle.” It also did not mesh with Mia’sexperience during the on-field soccer demonstration. After much discussion, theyagreed that this was because they “were aiming not at the centre of the goal” and therequired angle should be given by ( ASG – ASB) (Figure 5). This group persistedwith this formulation for most of the modelling task, despite consulting the dynamicgeometry model on the whiteboard many times, during their discussions over the threelessons. It was only after discussion with Wayne, in the third and final lesson, that theydecided to double their angle calculations, to find the full angle subtended at the goalmouth. They realised that this formulation was not exactly correct, but it would allowthem to progress.
Figure 5. Mia’s diagram.
Ned and Len also began by attempting to find the angle of the shot at the shot spot,as the angle from the run line to the line to the near goal post. They mixed the adjacentand opposite sides of the triangle they were using, calculating the angle at the near post.The decreasing size of the shot angle, as they calculated it from various positions on therunline closer to the goal line, did not make them question the angle they werefocussing on or their calculations. It was not until Ned was mulling over the task, at thebeginning of the second lesson, that it occurred to him “there is no way it could be awhole 50° angle… when the goal isn’t that wide.” The importance of allowing studentsthe time to reflect, and self-regulate, their modelling process is crucial as students movefrom teacher orchestrated modelling to independent modelling (Lei , 2006).
The mathematising of the run line, as a straight line parallel to the side line,presented little difficulty for all but the most lateral thinkers. Instead of advancing downtheir specified run line in 1 m intervals to collect data showing the variation in the anglesize with the distance the shot was taken from the goaline, Ben and Ken from School Btook a stepped trajectory towards the goal.
Once the desired angle was known in Shot on Goal, students had to work out howthey might find this angle geometrically, in order to apply formulae to carry out theircalculations. The calculations were considered far less difficult, if not routine, bystudents who had studied the techniques involved relatively recently as in Schools Band C. However, establishing which geometrical relationships were the focus provedproblematic, particularly for many students at School C. Even when they hadascertained that they were to focus on a shot angle, several students thought they shouldbe finding a distance using Pythagoras’ theorem, but could not see how this led tofinding an angle. This arose as they could not decide which geometrical elements wouldspecify the angle. Difficulties continued for many of these students as they tried to

Mathematics: Essential for Learning, Essential for Life
© The Australian Association of Mathematics Teachers Inc.
230
apply trigonometric formulae, since flaws in their formulation meant they did not haveright angled triangles in their representation of the required angle.
In the third school, choosing between Pythagoras and trigonometry was potentiallymore of a challenge, as it was some time since students had studied trigonometry. Insome groups, the possibility of using Pythagoras’ theorem was raised but this wasreadily dismissed in favour of trigonometry, as students quickly specified the elementsof a geometrical representation of the situation.
Finding the required angle involved a decomposition of the angles from the shot spotto the near and far goal posts into component parts. The vast majority of students usedthe method of subtracting the angles from the shot spot between the near post and therun line and between the far post and the run line, that is, ( BEP – BEC) in Nita’sdiagram (Figure 6a). This method was promoted by all teachers. Sandra, however,described her alternative method as finding “the extra two”. She partitioned therectangle made by the run line, goal line, and line segments parallel to these (as inFigure 6b) into three triangles, two of which contained the extra bit of the angle whichwould not result in a successful shot. These the measures of the extra angles were thenadded and subtracted from 90° to find the shot angle.
(a) (b)
Figure 6. (a) Nita’s diagram. (b) Sandra’s diagram.
A third method was observed at both Schools B and D. At the latter, Christine andMolly found the angles created at each of the goal posts ( A and B in Figure 7). Bysubtracting A from 180°, they found D. Finally, they had a triangle containing twoknown angles and the shot on goal angle. Subtracting the two known angles, B and
D, from 180° produced the measure of the required angle.
Figure 7. Alternative specification of the shot angle.

Mathematics: Essential for Learning, Essential for Life
© The Australian Association of Mathematics Teachers Inc.
231
Conclusion
As Voskoglou (2006, p. 58) points out, “formulation of the problem involves… a deepabstracting process, which is not always an easy thing to do for a non expert” such as alower secondary student. However, as has been shown, the difficulty is not aninsurmountable one and teachers should, and can, support students effectively inmeeting the challenges of the formulation stage of mathematical modelling. We are inagreement with Lei (2006) that it is necessary for teachers to ensure that beginningmodellers “put themselves mentally into the situation” (p. 87) as this facilitates theirdevelopment, and refinement, of a suitable mathematical model for the situation.Mathematical modelling is an essential form of reasoning about the world which allstudents should experience and be encouraged to develop.
References
Crouch, R. & Haines, C. (2004). Mathematical modelling: Transitions between the real world and themathematical model. International Journal of Mathematical Education in Science and Technology,35, 197–206.
Galbraith, P. & Clatworthy, N. (2001). Beyond standard models: Meeting the challenge of modelling.Educational Studies in Mathematics, 21, 137–163.
Lamon, S., Parker, W. & Houstoun, K. (Eds) (2003). Mathematical Modelling: A Way of Life. Chichester,UK: Horwood.
Lei, D. (2006). Teacher intervention versus self-regulated learning? Teaching Mathematics and itsApplications, 24(2/3), 75–89.
Maa, K. (2006). What are modelling competencies? ZDM, 38(2), 113–142.
Mason, J. (2001). Modelling modelling: Where is the centre of gravity of-for-when teaching modelling?In J. Matos, W. Blum, K. Houston & S. Carreira (Eds), Modelling and Mathematics Education.Chichester, UK: Horwood.
QSR (1997). Non-numerical Unstructured Data Indexing Searching and Theorizing (NUD*IST) v.4[Computer Software]. Melbourne, Australia: QSR.
Stillman, G, A. (2000). Impact of prior knowledge of task context on approaches to applications tasks.Journal of Mathematical Behavior, 19(3), 333–361.
Stillman, G. (2004). Strategies employed by upper secondary students for overcoming or exploitingconditions affecting accessibility of applications tasks. Mathematics Education Research Journal,16(1), 41–71.
Voskoglou, M. G. (1995). Measuring mathematical model building abilities. International Journal ofMathematical Education in Science and Technology, 26, 29–35.
Voskoglou, M. G. (2006). The use of mathematical modelling as a tool for learning mathematics.Quaderni di Ricerca in Didattica, 16, 53–60.
Wang, F. & Hannafin, M. (2005). Design-based research and technology-enhanced learningenvironments. Educational Technology Research and Development, 53(4), 5–23.

© The Australian Association of Mathematics Teachers Inc.
232
Exploring the relationships between studentachievement in Working Mathematically and the
scope and nature of the classroom practices*
Elena Stoyanova
Department of Education and Training of Western Australia
The focus of Monitoring Standards in Education 2004 random sample assessmentprogram was on student achievement in Working Mathematically. For the purposeof the study, innovative assessment tasks were developed to embed WorkingMathematically into the mathematics content. Samples of students were drawn atrandom from Years 3, 7 and 10 in government schools throughout WesternAustralia. A survey of teacher Working Mathematically practices in schools wasalso conducted. Possible associations between curriculum exposure, teacher’sbackground, teaching strategies and teacher’s beliefs about student’s potential towork mathematically, and the levels of student achievement, were investigated. Theaim of the paper is to outline the nature of the instruments used and the WorkingMathematically activities associated with statistically significant effect on studentachievement.
Introduction
The Monitoring Standards in Education (MSE) Program is an ongoing programestablished by the Department of Education and Training of Western Australia, toprovide the community with information about the level of student achievement. TheMSE 2004 program was the third project assessing student achievement in WorkingMathematically and followed similar assessments in 2000 (Education Department ofWestern Australia, 2002) and in 2002 (Department of Education and Training ofWestern Australia, 2004).
Methodology
The MSE 2004 instruments
The main focus of the program was on assessing Years 3, 7 and 10 studentachievements in Working Mathematically. As a part of the program, relationshipsbetween the nature and scope of Working Mathematically activities, and the level ofstudent achievement, were explored. For the purpose of the program, innovativeassessment tasks and a teacher questionnaire were designed and a teacher survey wasconducted.
Assessment tasks
The assessment instrument reflected the Western Australian Outcomes and StandardsFramework (1998). Opinions of teachers and educators were canvassed about which * Paper accepted by peer review
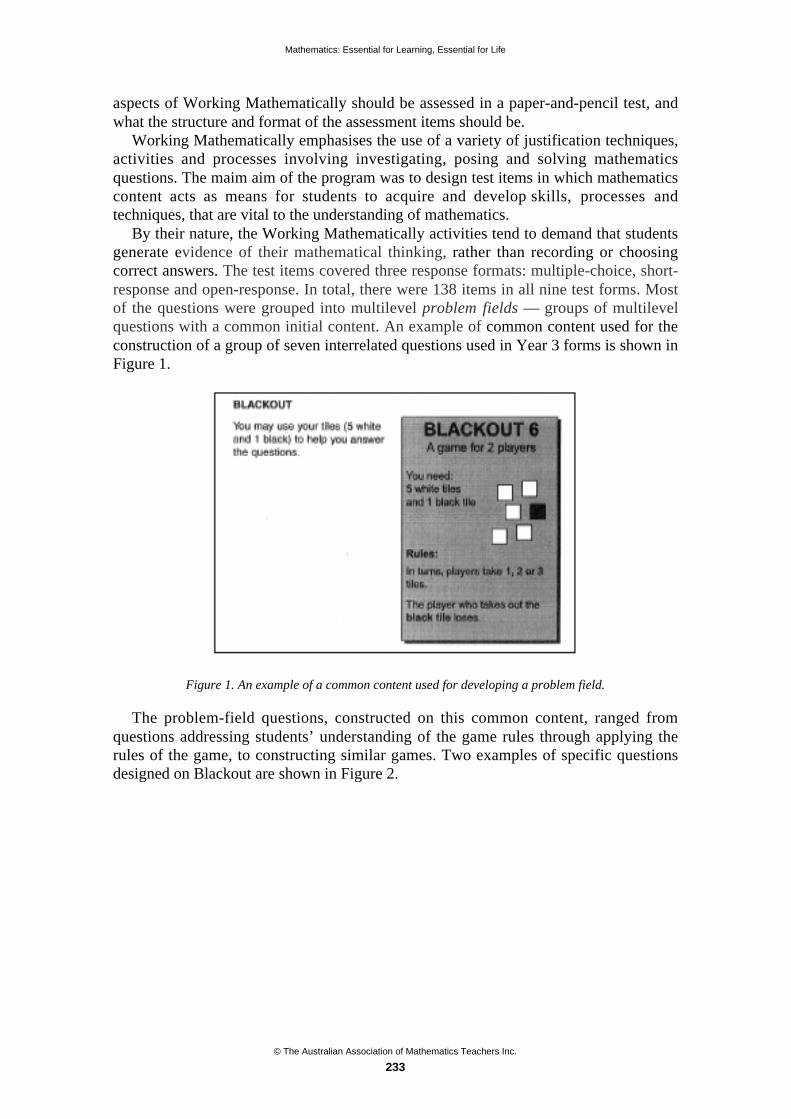
Mathematics: Essential for Learning, Essential for Life
© The Australian Association of Mathematics Teachers Inc.
233
aspects of Working Mathematically should be assessed in a paper-and-pencil test, andwhat the structure and format of the assessment items should be.
Working Mathematically emphasises the use of a variety of justification techniques,activities and processes involving investigating, posing and solving mathematicsquestions. The maim aim of the program was to design test items in which mathematicscontent acts as means for students to acquire and develop skills, processes andtechniques, that are vital to the understanding of mathematics.
By their nature, the Working Mathematically activities tend to demand that studentsgenerate evidence of their mathematical thinking, rather than recording or choosingcorrect answers. The test items covered three response formats: multiple-choice, short-response and open-response. In total, there were 138 items in all nine test forms. Mostof the questions were grouped into multilevel problem fields — groups of multilevelquestions with a common initial content. An example of common content used for theconstruction of a group of seven interrelated questions used in Year 3 forms is shown inFigure 1.
Figure 1. An example of a common content used for developing a problem field.
The problem-field questions, constructed on this common content, ranged fromquestions addressing students’ understanding of the game rules through applying therules of the game, to constructing similar games. Two examples of specific questionsdesigned on Blackout are shown in Figure 2.

Mathematics: Essential for Learning, Essential for Life
© The Australian Association of Mathematics Teachers Inc.
234
Figure 2. Examples of two questions that belong to the same problem field.
Teacher questionnaire
In order to explore the links between student achievement and the scope and nature ofWorking Mathematically activities used in the classrooms, a teacher questionnaire wasdesigned and a teacher survey was conducted. Mathematics teachers, of all studentsselected to participate in the random sample program, were asked to complete aquestionnaire: 198 primary and 376 secondary teachers did so (over 98%). The surveyobtained information about teachers’ background characteristics and beliefs, the scopeand nature of their teaching and assessment practices, their knowledge andunderstanding of Working Mathematically, their professional development, and the useof Working Mathematically resources.
Sample
Samples of students were drawn at random from Years 3, 7 and 10 in governmentschools throughout Western Australia. Because the Years 3 and 7 test materials requireda preliminary whole-class activity, the Years 3 and 7 sample selections occurred in twostages: firstly, a random selection of 75 schools; and secondly, selection of the classwith the largest number of students enrolled in each of these 75 schools. The sampledesign for selecting Year 10 students followed the procedure used in previous MSEprojects: that is, a simple random sample of students (not schools) was drawn across theState. A total of 1600 students was selected for each year sample. For all year groups, ahigher proportion of Aboriginal and Torres Strait Islander students was sampled toprovide better estimates of achievement. The final analysis of the data was completed,in such a way, that unbiased estimates for the total population could be produced.
Data collection and data analysis
Students’ papers were marked by experienced primary and secondary teachers whowere provided with extensive 2-day training. Data were analysed by using the Raschmeasurement. This allowed a large sample of the population to be scaled against each

Mathematics: Essential for Learning, Essential for Life
© The Australian Association of Mathematics Teachers Inc.
235
other and against the range of the assessment questions. Common questions linked thenine tests forms to the historical (WAMSE) scale. By using Rasch measurement theitem difficulties and students’ achievements on the WAMSE scale were estimated.
To determine whether the difference between the mean scores of the groups is arandom variation or evidence of an underlying trend, a test of the statistical significanceof the difference at the 0.05 level has been applied. In addition, a multilevel modeling ofthe data, taking into account its hierarchical structure, made it possible to answerquestions on the statistical significance of differences in sub-group achievement throughthe effect of explanatory variables at the school level and the student level.
Results
The following teacher background characteristics and classroom activities wereassociated with statistically significant effects on student achievement:
Number of years of teaching experience
About 40% of primary teachers and 34% of the secondary teachers surveyed had morethan 20 years of teaching practice. The number of years of teaching experience waspositively associated with student achievement in Years 7 and 10. Year 3 students ofteachers who had 11–15 years of teaching experience had the highest meanperformance.
Mathematics as a field of study
Nearly 70% of primary teachers surveyed had studied core mathematics during theirteacher training and 75% of secondary teachers had studied mathematics for at least twoyears during university education. Being taught by teachers with mathematics major atundergraduate level was positively associated with student achievement in Year 10.
Teacher beliefs
About 25% of primary and 17% of secondary teachers believed that at least 80% oftheir students were capable of achieving Working Mathematically outcomes appropriatefor their Year levels. Teacher belief in student ability to Work Mathematically waspositively associated with Years 7 and 10 student achievement.
It should be noted that 97% of primary and 88% of secondary teachers surveyedbelieved that students’ ability to Work Mathematically could be improved throughexplicit teaching of problem solving. No relationship was established between teacherbeliefs in explicit teaching of Working Mathematically and student achievement acrossthe three year levels.
Using Working Mathematically
Nearly 98% of the teachers surveyed reported using Working Mathematically in theirregular teaching. About 36% and 44% respectively of primary and secondary teachersreported that they integrated Working Mathematically into the content (Space,Measurement, Number, Chance & Data and Algebra) outcomes.
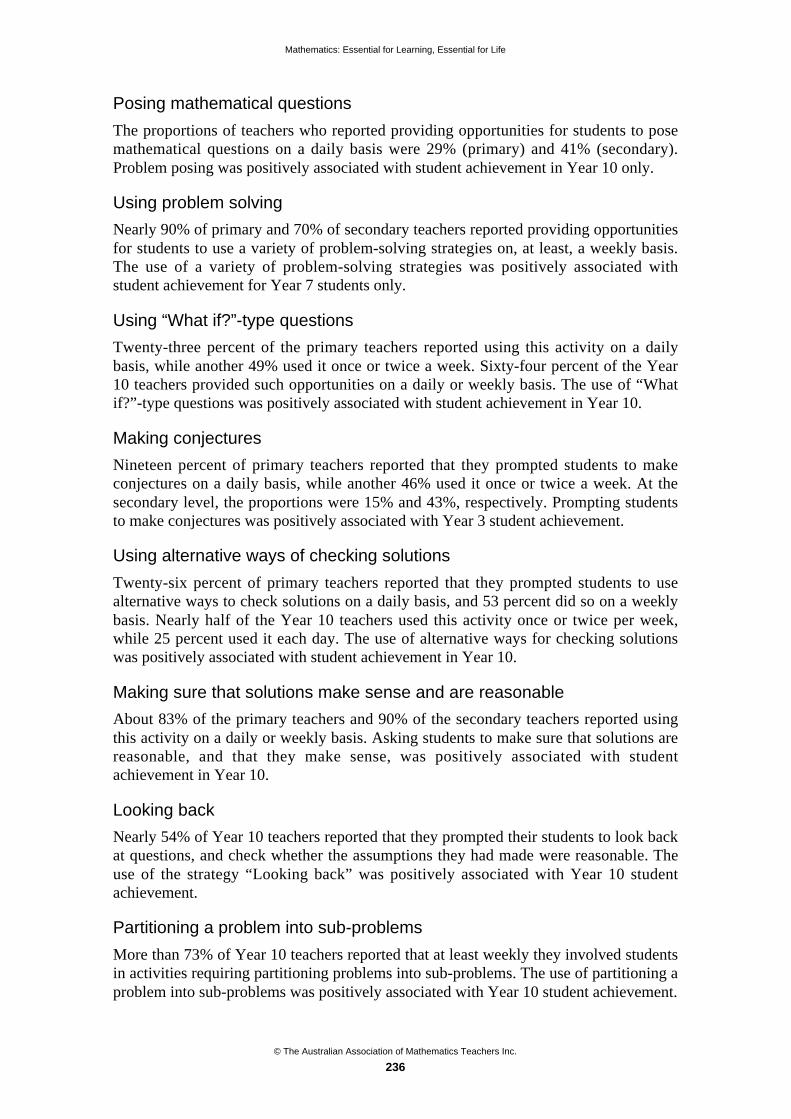
Mathematics: Essential for Learning, Essential for Life
© The Australian Association of Mathematics Teachers Inc.
236
Posing mathematical questions
The proportions of teachers who reported providing opportunities for students to posemathematical questions on a daily basis were 29% (primary) and 41% (secondary).Problem posing was positively associated with student achievement in Year 10 only.
Using problem solving
Nearly 90% of primary and 70% of secondary teachers reported providing opportunitiesfor students to use a variety of problem-solving strategies on, at least, a weekly basis.The use of a variety of problem-solving strategies was positively associated withstudent achievement for Year 7 students only.
Using “What if?”-type questions
Twenty-three percent of the primary teachers reported using this activity on a dailybasis, while another 49% used it once or twice a week. Sixty-four percent of the Year10 teachers provided such opportunities on a daily or weekly basis. The use of “Whatif?”-type questions was positively associated with student achievement in Year 10.
Making conjectures
Nineteen percent of primary teachers reported that they prompted students to makeconjectures on a daily basis, while another 46% used it once or twice a week. At thesecondary level, the proportions were 15% and 43%, respectively. Prompting studentsto make conjectures was positively associated with Year 3 student achievement.
Using alternative ways of checking solutions
Twenty-six percent of primary teachers reported that they prompted students to usealternative ways to check solutions on a daily basis, and 53 percent did so on a weeklybasis. Nearly half of the Year 10 teachers used this activity once or twice per week,while 25 percent used it each day. The use of alternative ways for checking solutionswas positively associated with student achievement in Year 10.
Making sure that solutions make sense and are reasonable
About 83% of the primary teachers and 90% of the secondary teachers reported usingthis activity on a daily or weekly basis. Asking students to make sure that solutions arereasonable, and that they make sense, was positively associated with studentachievement in Year 10.
Looking back
Nearly 54% of Year 10 teachers reported that they prompted their students to look backat questions, and check whether the assumptions they had made were reasonable. Theuse of the strategy “Looking back” was positively associated with Year 10 studentachievement.
Partitioning a problem into sub-problems
More than 73% of Year 10 teachers reported that at least weekly they involved studentsin activities requiring partitioning problems into sub-problems. The use of partitioning aproblem into sub-problems was positively associated with Year 10 student achievement.
Mathematics: Essential for Learning, Essential for Life
© The Australian Association of Mathematics Teachers Inc.
237
Testing conjectures
Eleven percent of Year 10 teachers reported involving students in the testing ofconjectures on a daily basis and about 36% reported using the activity once or twice aweek. Testing-conjectures activities were positively associated with Year 10 studentachievement.
Sharing strategies as a whole class
About 72% of the primary teachers and 37% of the secondary teachers reportedallowing their students to share and discuss Working Mathematically strategies, as awhole class, on a daily or weekly basis. Sharing strategies as a whole class waspositively associated with student achievement in Year 3.
Drawing attention to a list of problem-solving strategies
Sixty-three percent of the primary teachers and 32% of the secondary teachers reportedthat they drew students’ attention to lists of known problem-solving strategies on a dailyor weekly basis. Drawing students’ attention to a list of problem-solving strategies waspositively associated with Year 3 student achievement.
Telling students how to proceed when stuck
Nearly 80% of primary and secondary teachers reported that they told students, on adaily or a weekly basis, how to proceed when stuck on a problem. Telling students howto proceed when stuck was positively associated with Year 3 student achievement.
Asking students to explain and justify their reasoning
About 83% of primary and 70% of secondary teachers reported asking students, on adaily or weekly basis, to explain and justify solutions. Asking students to explain andjustify their reasoning was positively associated with Year 10 student achievement.
Asking students to persist with problem solving
More than 80% of primary and about 65% of secondary teachers reported that theyencouraged students, on a daily or weekly basis, to persist with problem solving. Askingstudents to refocus on problem solving was positively associated with studentachievement in Year 10.
Using a substantial Working Mathematically task
About 40% of primary, and 22% of secondary teachers, reported that they began orended lessons with a substantial (a task that takes a considerable amount of time)Working Mathematically task on a daily or weekly basis. The use of a substantialWorking Mathematically task was positively associated with Year 7 studentachievement.
Relating mathematics to the real world
Nearly 50% of primary teachers, and about 40% of secondary teachers, reported thatthey used activities to relate mathematics to the real world on a daily basis. Relatingmathematics to the real world was positively associated with Year 3 studentachievement, but it was negatively associated with Year 10 student achievement.
Mathematics: Essential for Learning, Essential for Life
© The Australian Association of Mathematics Teachers Inc.
238
Assessment practices
About 70% of primary, and 54% of secondary teachers, reported feeling confident orvery confident in identifying the Working Mathematically levels at which their studentsworked. The frequency categories with which teachers assessed WorkingMathematically were: each day; once or twice a week; once or twice a month; once ortwice a term; less than once a month; and never. Six specific categories of assessmentwere linked to the levels of student achievement: ongoing observations, checklists ornotes; separate tests or tasks on Working Mathematically only; content tests and taskswith some Working Mathematically aspects; content tests and tasks with no WorkingMathematically aspects; student self-assessment; and peer assessment.
Using ongoing observations, checklists or notes
Nearly 55% of primary teachers, and 40% of secondary teachers, reported usingobservations, checklists or notes on a daily or weekly basis to assess the levels at whichtheir students were located. The use of ongoing observations and checklists forassessing Working Mathematically was negatively associated with Year 10 studentachievement.
Using separate tests or tasks on aspects of Working Mathematically only
About 12% of primary, and 5% of secondary teachers, used separate tests or tasks onaspects of Working Mathematically only, on a daily or weekly basis. Fourteen percentof primary and 26% of secondary teachers, stated that they had never used such tasks.Using separate tests or tasks on aspects of Working Mathematically only, wasassociated positively with Year 3 student achievement.
Teachers’ knowledge and understanding of Working Mathematically
Teachers were asked how they would describe their knowledge and understanding, atthe levels appropriate for students they teach, of each of the three aspects: MathematicalStrategies, Reason Mathematically, and Apply and Verify.
Nearly 65% of primary and 38% of secondary teachers reported “good” or “verygood” levels of knowledge and understanding of the nature of Working Mathematically.Teacher knowledge and understandings in the three aspects of Working Mathematicallywere positively associated with Years 3 and 7 student achievement.
Teacher professional development
Teacher professional development was addressed through several questions that drewon the frequency of attending specific professional development forms such as: meetinginformally with colleagues, participating in action learning projects, attending a relevantprofessional development seminar or workshop, observing other teachers, sharingresources and collaborative planning.
More than 61% of primary, and 53% of secondary teachers, reported that they attendrelevant professional development at least once every three years. Attending relevantprofessional development about Working Mathematically was positively associatedwith Years 3 and 7 student achievement.

Mathematics: Essential for Learning, Essential for Life
© The Australian Association of Mathematics Teachers Inc.
239
Working Mathematically resources
Teachers were asked to name up to three of their favourite Working Mathematicallyresources. The resources were then classified into four categories: specific publications(content); policy documents; teachers’ own prepared materials; and Internet resources.Specific publications were used most frequently, followed by teachers’ own preparedmaterials, policy documents and Internet resources.
Teachers’ preferences for six particular types of Working Mathematically resourceswere linked to the level of students’ performance. The six categories were: sets of tasksready for use by students; ideas for tasks but not in a form ready for use by students;guidelines for teachers on how to develop their own tasks; a range of typical studentresponses to tasks at each level; assessment criteria and keys; and online/Internetresources.
Nearly half of the teachers reported that they were aware of the existence of sets oftasks ready for use by students, and that they were helpful. Use of WorkingMathematically tasks ready for use by students was positively associated with Year 10student achievement. Use of guidelines on developing own assessment tasks in WorkingMathematically was negatively associated with Year 10 student achievement.
Implications for teaching and learning
The study suggests that Working Mathematically is associated with a significantpositive effect on student achievement at both primary and secondary levels. And, moreimportantly, the progression of students’ achievement in Working Mathematicallyacross Years 3, 7 and 10 implies that, as the content skills, student’s WorkingMathematically skills and processes develop during the years of schooling, it is vitalthat appropriate Working Mathematically activities to be used in the classrooms.
It should be noted that, while student achievement at primary level benefits fromteacher professional development in Working Mathematically, the study suggests that atsecondary level students benefit from being taught by teachers who have a backgroundin mathematics.
The study indicates that some types of Working Mathematically activities are moreappropriate, than others, for primary students. For example, Year 3 students benefitfrom explicit teaching of specific types of problem-solving techniques. Their learningbenefits also from teachers prompting students to make conjectures and from relatingmathematics concepts to the real world. Telling students how to proceed with achallenging task, and asking them to explain the solution strategy used, were alsoassociated with a significant positive effect on student achievement.
The study suggests that Year 7 students benefit from being taught by teachers whobelieve in student’s ability to Work Mathematically. Their learning benefits, also, ifteachers use a variety of problem-solving strategies and substantial WorkingMathematically tasks.
At secondary level, classroom activities such as partitioning a problem into sub-problems, posing questions, using alternative ways for checking solutions, justifyingand making sense of the solutions are associated with a significant positive effect onYear 10 student achievement. The study suggests that using checklists, ongoingobservations, substantial Working Mathematically tasks, or questions that relatemathematics to the real world, need to be used cautiously in the mathematicsclassrooms. The negative associations identified between these activities and studentachievements need further research.
Mathematics: Essential for Learning, Essential for Life
© The Australian Association of Mathematics Teachers Inc.
240
References
Education Department of Western Australia (1998). Outcomes and Standards Framework: StudentOutcome Statements Mathematics. Perth: Education Department of Western Australia.
Education Department of Western Australia (2002). Student Achievement in Mathematics: WesternAustralian Government Schools 2000. Perth: Department of Education.(www.det.wa.edu.au/education/mse/pdfs/mathsbook.pdf)
Department of Education and Training of Western Australia (2004). Student Achievement inMathematics: Western Australian Government Schools 2002. Perth: Department of Education andTraining.www.det.wa.edu.au/education/mse/pdfs/Student%20Achievement%20in%20Mathematics.pdf
Department of Education and Training of Western Australia (2006). Student Achievement inMathematics: Working Mathematically: Western Australian Public Schools 2004. Perth: WesternAustralian Department of Education and Training.(www.det.wa.edu.au/education/mse/pdfs/StudentAchievement%20WorkingMathematically.pdf).

© The Australian Association of Mathematics Teachers Inc.
241
ALL is happening with numeracy: A newinternational survey of adults’ numeracy and
mathematics skill levels
Dave Tout
Centre for Adult Education, Vic.
An international survey of the numeracy abilities of adults was part of the AdultLiteracy and Lifeskills (ALLS) survey conducted in Australia in 2006 and the startof 2007. This presentation will include information on the construct behind thenumeracy component of the survey, including the complexity scheme that attemptsto predict the difficulty of test items, and report on the initial data from the firstwave of countries, highlighting the important role that numeracy plays in bothhuman and social capital terms. First Australian results are due out in late 2007.
Introduction
The Adult Literacy and Life Skills survey (ALLS) took place across Australia betweenJuly 2006 and January 2007. This comparative survey has been jointly developed byStatistics Canada and the United States’ National Center for Education Statistics(NCES), in cooperation with the Organisation for Economic Cooperation andDevelopment (OECD). Its implementation in Australia is being co-funded by theAustralian Bureau of Statistics (ABS) and the Department of Education, Science andTraining (DEST), with support from the Department of Employment and WorkplaceRelations (DEWR). First results of the Australian ALLS are expected to be available inOctober 2007. The first wave of international data collection for ALLS has already beenundertaken, and a number of national and international reports resulting from this firstwave are already available. The first wave countries were: Canada, Italy, Norway, theUSA, Nuevo Leon (Mexico), Switzerland and Bermuda. Countries participating in thesecond wave of ALLS, alongside Australia, are: Hungary, the Netherlands, NewZealand, and South Korea.
The Adult Literacy and Lifeskills (ALLS) Survey is a large-scale, comparativesurvey that goes beyond previous international adult literacy studies. In addition to theliteracy skills measured in the previous International Adult Literacy Survey (IALS),ALLS is designed to identify and measure a broader range of skills in the adultpopulation in each participating country. The skills directly measured are:
• prose literacy
• document literacy
• numeracy
• problem solving.
The first international comparative report from the survey was published in May 2005(Desjardins, Murray, Clermont and Werquin, 2005).
Mathematics: Essential for Learning, Essential for Life
© The Australian Association of Mathematics Teachers Inc.
242
A first for adult numeracy
In an important step forward for the field of adult numeracy, numeracy was given theopportunity to be part of the ALLS. To make it through to be part of the final surveywas no simple task. It is required of all domains of the survey to first develop aconceptual framework or construct for their domain and prove that this construct issound and can produce a range of assessment tasks that fit the construct, and that thesetasks will stand thorough statistical analysis in a number of trial surveys. Only then isthe 'new' domain able to take its place in the final survey. The ALLS Numeracy teamsucceeded in this task and the numeracy domain is now part of the final ALLS.
Why was numeracy considered for inclusion? In recent years, many countries haveincreasingly attended to the need to improve workplace efficiency, promote properutilisation of public and health care services, and ensure informed civic participation.While literacy skills have been shown to contribute to adults’ ability to effectivelyfunction in modern society, adults’ numeracy has been a neglected, but critical, factor inthis regard. In the home, workplace, or community, adults often need to manage varioustypes of quantitative situations or interpret information that may involve numbers,measurements, probabilities, shapes, statistical information, or quantitative arguments.Numeracy skills: help adults to keep up with a rapidly changing world; underlieindependent functioning and action as a parent, citizen or worker; are a gatekeeper forentrance into further education in many technical and other occupational areas; criticallyaffect employability and career options.
Why not continue with the previous quantitative literacy scale?
One of the scales of the International Adult Literacy Survey (IALS), the QuantitativeLiteracy Scale, was a measurement of the respondent’s ability to apply arithmeticoperations to numbers embedded in diverse texts. [For an analysis of Australia'sperformance in the Quantitative Literacy (QL) scale, see Cumming's article 'TheQuantitative Literacy Performance of Australians: Implications of Low Skill Levels'(Cummings, 1997).] While this scale produced useful data, survey developersrecognised that it was limited in scope. The numeracy scale of ALLS is designed to goabove and beyond the QL Scale. While there is a clear connection and relationshipbetween numeracy and Quantitative Literacy, there are significant differences withnumeracy covering a wider breadth of mathematical skills and, also, not being heavilydependent in all cases on literacy skills by having tasks embedded in text, as shown inFigure 1.
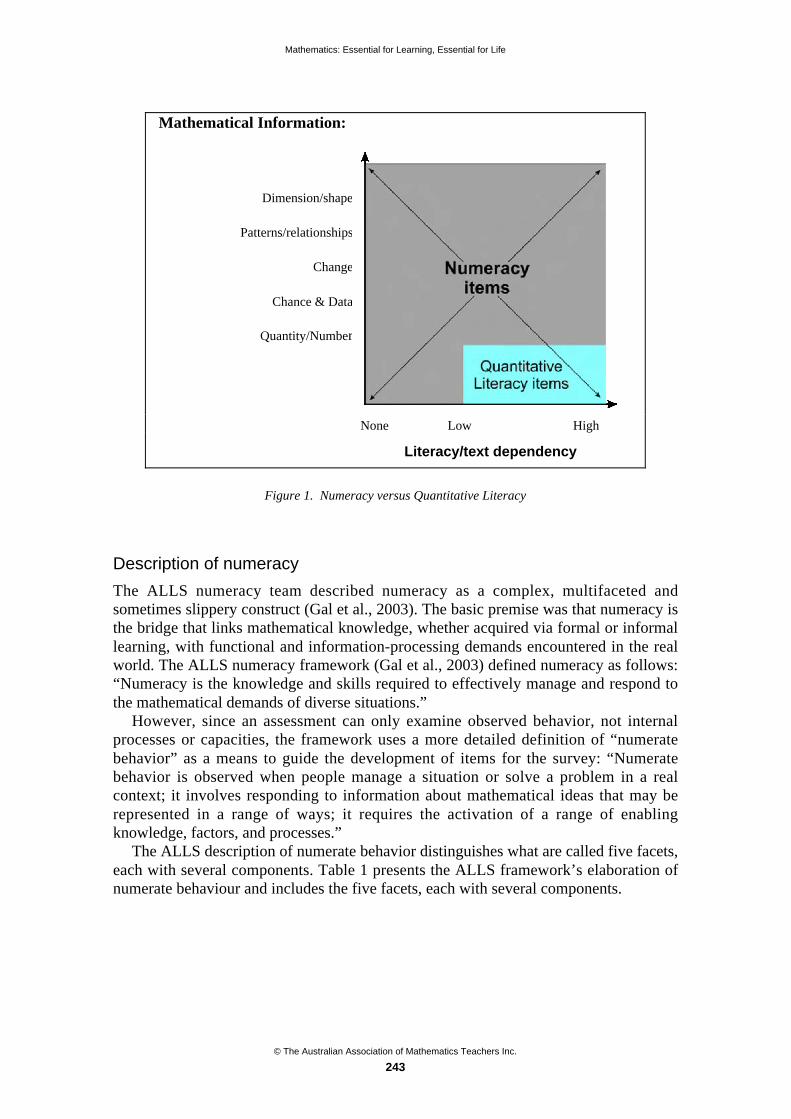
Mathematics: Essential for Learning, Essential for Life
© The Australian Association of Mathematics Teachers Inc.
243
Mathematical Information:
Dimension/shape
Patterns/relationships
Change
Chance & Data
Quantity/Number
None Low High
Literacy/text dependency
Figure 1. Numeracy versus Quantitative Literacy
Description of numeracy
The ALLS numeracy team described numeracy as a complex, multifaceted andsometimes slippery construct (Gal et al., 2003). The basic premise was that numeracy isthe bridge that links mathematical knowledge, whether acquired via formal or informallearning, with functional and information-processing demands encountered in the realworld. The ALLS numeracy framework (Gal et al., 2003) defined numeracy as follows:“Numeracy is the knowledge and skills required to effectively manage and respond tothe mathematical demands of diverse situations.”
However, since an assessment can only examine observed behavior, not internalprocesses or capacities, the framework uses a more detailed definition of “numeratebehavior” as a means to guide the development of items for the survey: “Numeratebehavior is observed when people manage a situation or solve a problem in a realcontext; it involves responding to information about mathematical ideas that may berepresented in a range of ways; it requires the activation of a range of enablingknowledge, factors, and processes.”
The ALLS description of numerate behavior distinguishes what are called five facets,each with several components. Table 1 presents the ALLS framework’s elaboration ofnumerate behaviour and includes the five facets, each with several components.

Mathematics: Essential for Learning, Essential for Life
© The Australian Association of Mathematics Teachers Inc.
244
Table 1. Numerate Behaviour and its Facets.
Numerate behavior involves:managing a situation or solving a problem in a real contexteveryday life
work
societal
further learning
by respondingidentifying or locating
acting upon:
• order/sort
• count
• estimate
• compute
• measure
• model
interpreting
communicating about
to information about mathematical ideasquantity & number
dimension & shape
pattern and relationships
data & chance
change
that is represented in a range of waysobjects & pictures
numbers & symbols
formulae
diagrams & maps
graphs
tables
texts
and requires activation of a range of enabling knowledge,behaviors, and processesmathematical knowledge and understanding
mathematical problem-solving skills
literacy skills
beliefs and attitudes.
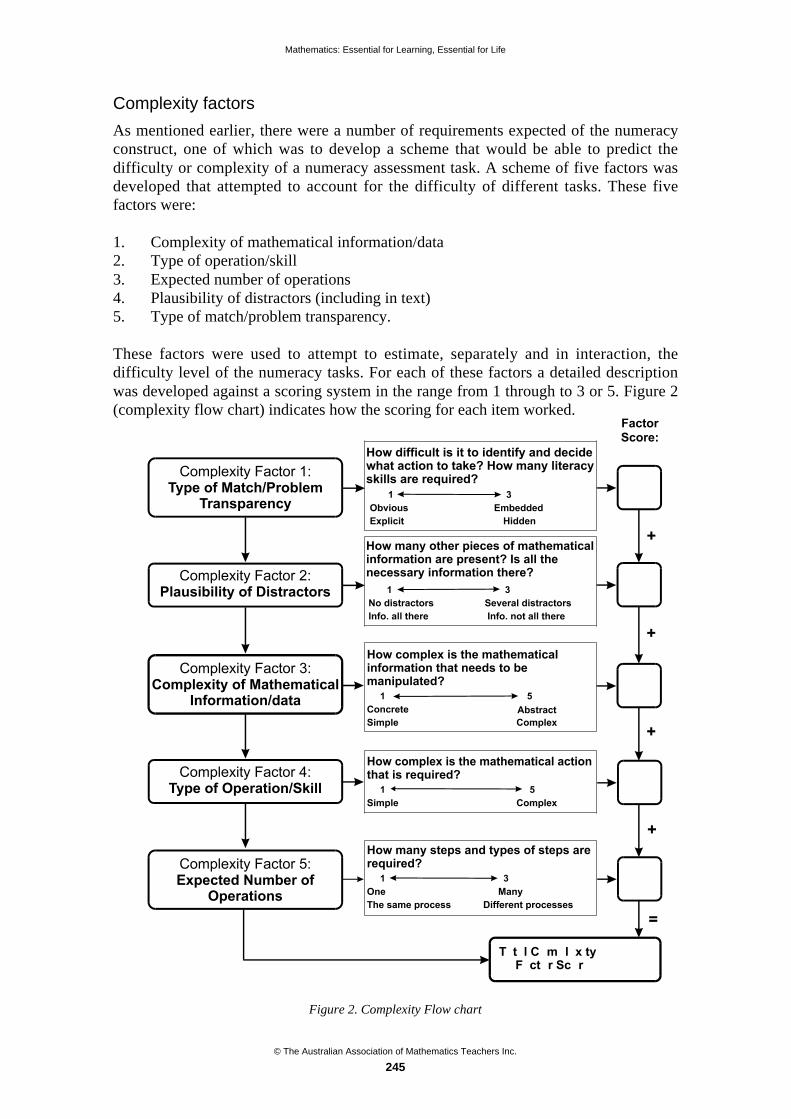
Mathematics: Essential for Learning, Essential for Life
© The Australian Association of Mathematics Teachers Inc.
245
Complexity factors
As mentioned earlier, there were a number of requirements expected of the numeracyconstruct, one of which was to develop a scheme that would be able to predict thedifficulty or complexity of a numeracy assessment task. A scheme of five factors wasdeveloped that attempted to account for the difficulty of different tasks. These fivefactors were:
1. Complexity of mathematical information/data2. Type of operation/skill3. Expected number of operations4. Plausibility of distractors (including in text)5. Type of match/problem transparency.
These factors were used to attempt to estimate, separately and in interaction, thedifficulty level of the numeracy tasks. For each of these factors a detailed descriptionwas developed against a scoring system in the range from 1 through to 3 or 5. Figure 2(complexity flow chart) indicates how the scoring for each item worked.
Figure 2. Complexity Flow chart

Mathematics: Essential for Learning, Essential for Life
© The Australian Association of Mathematics Teachers Inc.
246
Each of these five factors was developed in detail; the draft developed is included inAdult numeracy and its assessment in the ALL survey: A conceptual framework andpilot results (Gal et al., 2003).
The numeracy scale and methodology
As in IALS, literacy and numeracy ability will be expressed as a score on a scaleranging from 0–500 points. The score is the point at which a person has an 80% chanceof successfully performing tasks at that level. The design ensures that the results can bereported on the full scale for each domain. This methodology is unique in that anindividual respondent is not given a score or a mark: the items themselves are scoredand placed on the continuum of difficulty.
The assessment items
A pool of items was developed that attempted to satisfy the breadth of the conceptualframework and the facets described above. The items attempted to be as realistic aspossible, but there are restrictions on developing items for a large scale survey that is tobe delivered to 1000s of people, in all participating countries. The items are based uponsimulated texts such as advertisements, newspaper articles, maps, diagrams and plans,photos, etc. A ruler and a calculator are provided to all respondents.
Based on the conceptual framework, over 100 test items were developed and testedin feasibility studies in the U.S. and the Netherlands. A pool of 80 items was thenselected that included tasks at diverse levels of difficulty and that covered key facets ofthe conceptual framework for numeracy. For those 80 items, the theoretical factors thatwere predicted to account for task difficulty strongly correlated with the observeddifficulty of items and, therefore, provided initial support for the content validity andthe construct validity of the numeracy scale. In 2002 large pilot surveys were conductedin a range of countries and the majority of the numeracy items performed well, and thenumeracy domain was accepted as a directly assessed component of the final ALLSsurvey. Based on the performance of the 80 items, 40 items were chosen to beadministered in the final ALLS survey.
Administration of the survey
Using household survey methods, respondents are first asked a series of backgroundquestions and then presented with a screening booklet containing a small number ofsimple (level 1) tasks. If the respondent fails to complete two or more of these taskscorrectly, the interview is concluded. If the respondent completes two or more taskscorrectly, they are given a separate booklet which contains a selection of the assessmenttasks. Respondents can solve the problems in any way they choose. There is no timelimit and respondents are urged to try each question.
The background questionnaire
The ALLS not only tests skills directly across the four different domains, it also collectsbackground information (almost 300 different questions), including details ofparticipation in education and learning; educational attainment; parental education,languages spoken; labour force status and occupation; respondents' literacy andnumeracy practices at work and elsewhere; social capital and well-being; use ofinformation and communications technology; income; and other socio-demographicinformation. It is the linking and correlations of this background data with the
Mathematics: Essential for Learning, Essential for Life
© The Australian Association of Mathematics Teachers Inc.
247
performances of respondents that allows for a wide ranging and comprehensive analysisof the abilities of adults and the different factors that impact on, and influence,performance.
Implications for Australian research, policy and practice
Despite limitations of such large scale assessments, there is valuable data within andbehind ALLS that should be utilised when the results are released. The data and theresults will be made available by ABS and should be of interest to:
• policy makers and governments (State, Federal and Industry bodies)
• researchers
• teachers and practitioners.
Initial messages regarding numeracy from the first wave of results
In the initial analysis and results coming out from the first wave of the 2003 ALLScountries, the data seems to be indicating that numeracy plays a more important role ineconomic returns for individuals than do prose or document literacy, and seems toconfirm that men outperform women on the numeracy scale. Some of the outcomes andpossible questions stemming from the results, that will be of interest, when theAustralian results are released include:
• The overlap between respondents’ abilities in literacy and numeracy was lowerthan expected.
• Early school leavers are much more likely to score at low levels of numeracy inall countries: e.g., in the US those without a secondary diploma are 26 times morelikely to score at levels 1 and 2 than those who have completed an educationallevel “higher than upper secondary”.
• The individual economic returns to increases in numeracy skill was larger than forthe prose and document skills.
• There are indications that numeracy skills are more important than literacy atwork, and skills deficit is greater for numeracy.
• Men performed better on the numeracy scale in all countries.
• From IALS research it is known that the proportion of individuals with Level 1skills exerts a strong negative drag on growth in GDP per capita: so, one couldrealise quite large economic gains by investing in the bottom. IALS research alsoindicated that the skill levels of women seem to matter more to the growth in GDPthan those of men. So, from ALLS, with its highlighted economic importance ofnumeracy, what does this mean about increasing the numeracy competence ofwomen?
The initial ALLS data supports other research data from the UK that indicates thestrong role numeracy plays in both human and social capital terms:
People without numeracy skills suffered worse disadvantage in employment thanthose with poor literacy skills alone… Women with numeracy difficulties appearedespecially vulnerable to exclusion from the clerical and sales jobs to which theyaspired (Bynner & Parsons, 1997, p. 27).
For women, while the impact of low literacy and low numeracy is substantial, lownumeracy has the greatest negative effect, even when it is combined with
Mathematics: Essential for Learning, Essential for Life
© The Australian Association of Mathematics Teachers Inc.
248
competent literacy… Poor numeracy skills make it difficult to function effectivelyin all areas of modern life, particularly for women. (Bynner & Parsons, 2005, p. 7)
The potential for researching and analysing the Australian results
Some potential questions that could be analysed include:
At the policy level
• What is the profile for the distribution of numeracy in the adult population, andwhat is the inter-relationship of these skills to prose literacy, document literacyand other measured skills?
• What is the numeracy distribution among males and females and how can this beexplained? Are the results for adults consistent with PISA findings (and nowinitial ALL findings) that boys are likely to score better in mathematics/numeracywhile girls score higher in reading? Is this trend consistent from country tocountry or within countries? Does it vary across different age groups or differenteducational groups?
• What is the numeracy distribution among the working age population? Is thisdistribution in synch with labour market sectoral demand? Where are theshortages? Where is the excess?
• Do the outcomes of IALS (and now ALL), in relation to numeracy versus literacyand the differences in performance of women versus men in conjunction with theeconomic returns, have implications for policies regarding the mathematical andnumeracy competence and engagement of women?
• What is numeracy distribution among different age groups? Do the new cohortsentering the work force have better numeracy proficiency than the current workforce, thereby raising national proficiency levels?
• We need to research more closely the association between the indicators from theBQ and Numeracy skill level — what more can we learn? For example, what arethe correlations between use and familiarity with mathematics tasks in the homeor workplace with numeracy competence?
• What are the population characteristics associated with persons with lownumeracy? Are these the same as for literacy? Is low numeracy concentratedamong some population groups?
• What are educational outcomes for those with low numeracy? What are theaverage numeracy scores for populations with different levels of educationalattainment? Do those with low numeracy use training after initial education?
• What are the labour market outcomes for those with low numeracy? Are theyconcentrated in certain occupations? Industrial sectors? Are they more likely to beunemployed? Have low incomes?
At the research and educational level
• Literacy versus numeracy: is it an equal partnership at the funding level? At thedelivery and curriculum level?
• Do numeracy skills wane with age, as has been shown for literacy?
• Using the theoretical constructs behind the literacy and numeracy domains, howare the cognitive processes for numeracy different from those used in literacy?What are the links or connections between literacy and numeracy?
Mathematics: Essential for Learning, Essential for Life
© The Australian Association of Mathematics Teachers Inc.
249
• In terms of ethno-mathematical research, what is the relationship between formal,or school-based, mathematics and informal, “real life”, mathematics learningexperiences? What counts most? What do adults use the most?
• What are the implications for vocational and workplace education, training andcurriculum? What are the implications for school mathematics curriculum,standards and learning and teaching?
• What is harder for (some) people and easier for others?
• What factors make items more difficult?
• What factors impact on success in numeracy?
Conclusion
It is hoped that Australia’s investment in ALLS will result in valuable data andoutcomes for all interested in improving the numeracy skills of the Australianpopulation — including governments, policy and program makers, educationalorganisations, researchers, teachers and trainers.
References
Bynner, J. & Parsons, S. (2005). Does Numeracy Matter More? London: National Research andDevelopment Centre for Adult Literacy and Numeracy (NRDC).
Bynner, J. & Parsons, S. (1997). Does Numeracy Matter? Evidence from the National Child DevelopmentStudy on the Impact of Poor Numeracy on Adult Life. London: Basic Skills Agency.
Castleton, G. (2000). ‘Adult Literacy in Australia: Reading Beyond the Figures’ in The AustralianJournal of Language and Literacy, 23 (1).
Coulombe, S., Tramblay, J.-F. & Marchand, S. (2004). Literacy Scores, Human Capital and Growthacross Fourteen OECD Countries. Ottawa: Statistics Canada.
Cummings, J. (1997). The quantitative literacy performance of Australians: Implications of low skilllevels. In Aspects of Literacy: Assessed Skill Levels Australia 1996. Canberra: Australian Bureau ofStatistics.
Desjardins, R., Murray, S., Clermont, Y. & Werquin, P. (2005). Learning a Living: First Results of theAdult Literacy and Life Skills Survey. Ottawa: Statistics Canada. (Available at:http://www.statcan.ca/bsolc/english/bsolc?catno=89-603-XWE)
Gal, I., Tout, D., van Groenestijn, M., Schmitt, M. J., Manly, M. & Clermont, Y. (2003). Adult Numeracyand its Assessment in the ALL Survey: A Conceptual Framework and Pilot Results. Statistics Canadaand the United States National Center for Education Statistics. (Available as part of the ALLSFramework paper from: http://www.statcan.ca/cgi-bin/downpub/listpub.cgi?catno=89-552-MIE2005013)

© The Australian Association of Mathematics Teachers Inc.
250
A classroom exploration of Benford’s Law andsome error finding tricks in accounting
Paul Turner
Erindale College, ACT
In this talk, two mathematical ideas are presented — one small and one big — thathave applications in the world of finance and accounting and which can be made thebasis of effective high school lesson plans.
As a warm-up task, try this:
You are the treasurer of your local Mathematical Association and you are trying toget the known expenditure amount for the year ($11483) to balance the list ofexpenditure items ($12365). Whichever brand of calculator you use, you cannotescape the conclusion that the known expenditure seems to be $882 less than thetotal of the list of items. There must be a mistake somewhere. Is there a clue hiddenin the number 882?
The smaller of the two ideas involves number theory, specifically divisibility bycertain integers. To begin, the “slightly special” property of the $882 is its divisibilityby 9. To an accountant this would be a clue that a transposition error might haveoccurred, although not necessarily.
Fun can be had in the classroom through specific examples:
The difference between $3947 and $3497 is $450 and the difference, 450, isdivisible by 9. By experiment students can check that whenever adjacent digits aretransposed, the difference between the resulting number and the original isdivisible by 9.
When the transposition is between non-adjacent digits separated by one digit, thedifference between the original number and the corrupted version is divisible by both 9and 11. If there are two digits separating the transposed digits, the difference will bedivisible by 111 as well as 9.
The explanation is straightforward: Let a and b be digits in a numeral. The differencebetween, say, ab45 and ba45 is
1000(a b) +100(b a) = 900(a b)
and this is clearly divisible by 9 (and a power of 10).Also, the difference between, say, 4a5b and 4b5a is
100(a b) + (b a) = 99(a b)
and this is divisible by 9 and 11.How then might the discrepancy of $882 be explained? It cannot be the result of a
single transposition error because the difference (a b)between digits is confined to theset {1,2,3,4,5,6,7,8,9}and none of these numbers multiplied by 9 or 90 or 99 will give

Mathematics: Essential for Learning, Essential for Life
© The Australian Association of Mathematics Teachers Inc.
251
882. However, there are many ways by which the difference 882 could arise as acombination of several transposition errors.
For example: in two numerals, 2901 2091 and 2591 2519, with discrepanciesof 810 and 72; or in three numerals, 1911 1191 with a discrepancy of 720, 54544 54445, with a discrepancy of 99, and 22281 22218 with a discrepancy of 63.
In the classroom, ideas about implication could be introduced at this point.Transposition errors imply divisibility by nine but divisibility by nine does not implytransposition errors. It might also be useful to note that “not divisible by nine” implies“not a transposition error.”
An accountant would be happiest to find a discrepancy that could be obtained bymultiplying 9, 90, 99, 900, etc. by a single digit, because this could be explained by justone transposition error. A discrepancy like my $882 requires at least two transpositionerrors, which would be a less likely occurrence than a single error, and so could haveother explanations.
Benford’s Law
The second idea involves much more sophisticated mathematics if one is beingrigorous, but aspects of it can be explored and comprehended by high school students.
Astronomer Simon Newcomb, in 1881, noticed that numbers found in statistical dataor in tables of physical constants were more likely to begin with a smaller digit than alarger one. Dr Frank Benford, a physicist working for the General Electric Company,rediscovered this strange fact in 1938 and it came to be known as Benford’s Law. Asatisfactory explanation for Benford’s Law was worked out only as recently as 1996 byTheodore P. Hill.
Forensic accountants now use Benford’s Law as a tool in the detection of fraud.As Newcomb and Benford discovered, for many naturally-occurring sets of data, the
distribution of the init ial digits is given by the functionPd = log(1+ d 1), d {1,2,3,...,9}. Fraudsters who have not heard of Benford’s Lawtend to concoct data that does not follow the logarithmic distribution and so leavethemselves open to investigation.
Senior students would be able to verify that the functionf (d) = log(1+ d 1),d {1,2,3,...,9} does indeed define a probability distribution.
log(1+ d 1)d =1
9
= log(d +1
d) = log(
2
1
3
2...
9
8
10
9) = log10 =1
It is also true that if we let d2 be a two-digit number, then, by the same reasoning as
in the single digit case, f (d2) = log(1+ d21),d2 {10,11,12,13,...,99} is a probability
distribution.Indeed, if dk is a k-digit string, then
f (dk ) = log(1+ dk1),dk {10k 1,10k 1
+1,10k 1+ 2,...,10k 1}
is a more general form of the Benford distribution involving the first k digits of anumeral.
It is interesting to note that, to use a particular example, the sum of the probabilitiesof the two-digit strings beginning with, say, four is
log(1+ d 1)d = 40
49
= log(d +1
d) = log(
41
40
42
41...
49
48
50
49) = log
5
40.097
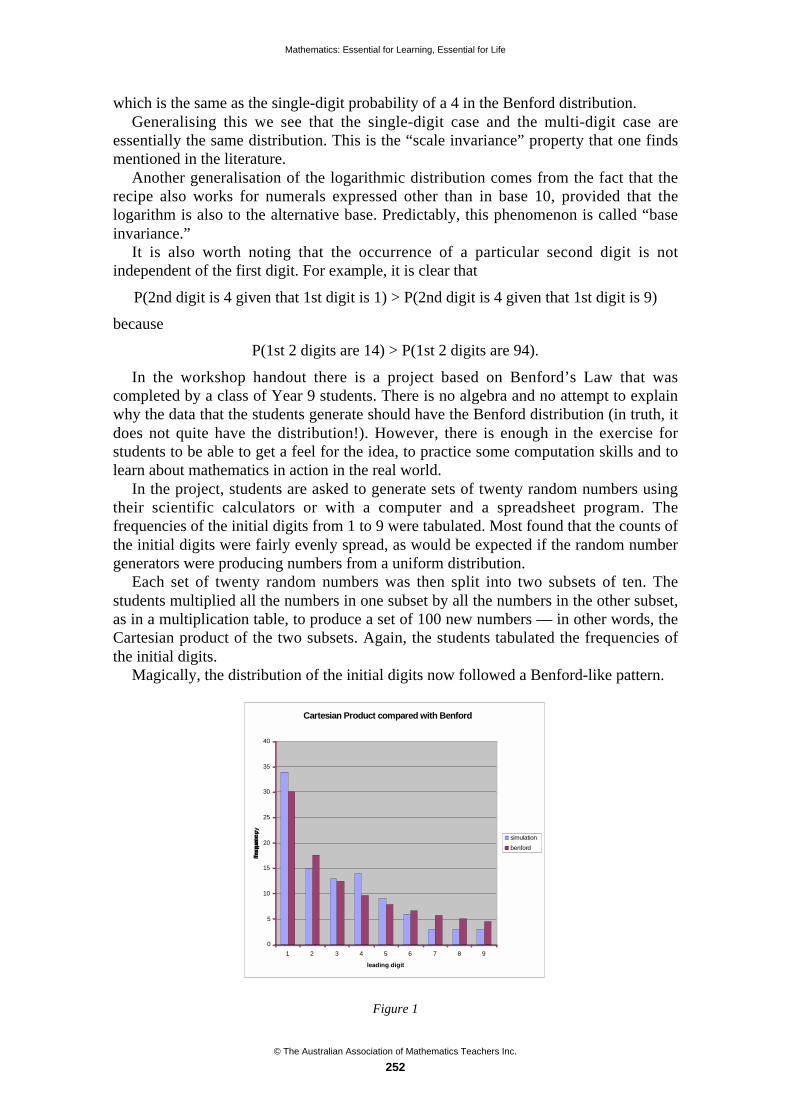
Mathematics: Essential for Learning, Essential for Life
© The Australian Association of Mathematics Teachers Inc.
252
which is the same as the single-digit probability of a 4 in the Benford distribution.Generalising this we see that the single-digit case and the multi-digit case are
essentially the same distribution. This is the “scale invariance” property that one findsmentioned in the literature.
Another generalisation of the logarithmic distribution comes from the fact that therecipe also works for numerals expressed other than in base 10, provided that thelogarithm is also to the alternative base. Predictably, this phenomenon is called “baseinvariance.”
It is also worth noting that the occurrence of a particular second digit is notindependent of the first digit. For example, it is clear that
P(2nd digit is 4 given that 1st digit is 1) > P(2nd digit is 4 given that 1st digit is 9)
because
P(1st 2 digits are 14) > P(1st 2 digits are 94).
In the workshop handout there is a project based on Benford’s Law that wascompleted by a class of Year 9 students. There is no algebra and no attempt to explainwhy the data that the students generate should have the Benford distribution (in truth, itdoes not quite have the distribution!). However, there is enough in the exercise forstudents to be able to get a feel for the idea, to practice some computation skills and tolearn about mathematics in action in the real world.
In the project, students are asked to generate sets of twenty random numbers usingtheir scientific calculators or with a computer and a spreadsheet program. Thefrequencies of the initial digits from 1 to 9 were tabulated. Most found that the counts ofthe initial digits were fairly evenly spread, as would be expected if the random numbergenerators were producing numbers from a uniform distribution.
Each set of twenty random numbers was then split into two subsets of ten. Thestudents multiplied all the numbers in one subset by all the numbers in the other subset,as in a multiplication table, to produce a set of 100 new numbers — in other words, theCartesian product of the two subsets. Again, the students tabulated the frequencies ofthe initial digits.
Magically, the distribution of the initial digits now followed a Benford-like pattern.
Cartesian Product compared with Benford
0
5
10
15
20
25
30
35
40
1 2 3 4 5 6 7 8 9
leading digit
fre
qu
en
cy
simulation
benford
Figure 1
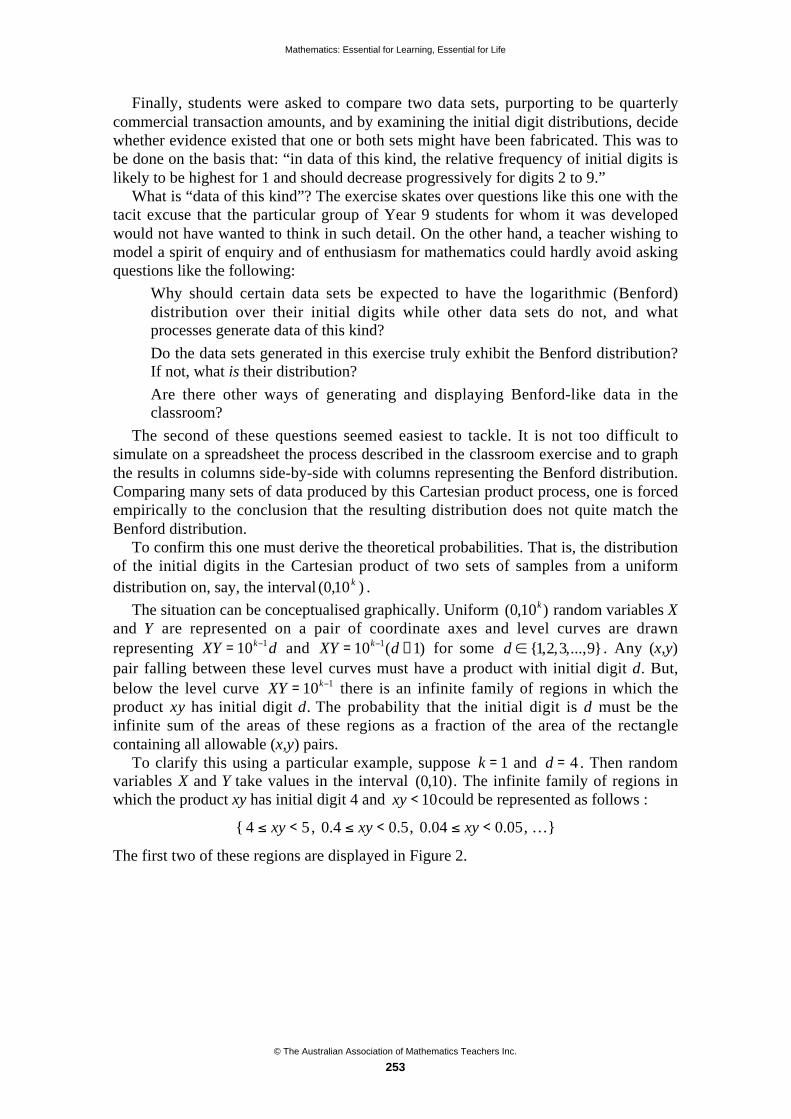
Mathematics: Essential for Learning, Essential for Life
© The Australian Association of Mathematics Teachers Inc.
253
Finally, students were asked to compare two data sets, purporting to be quarterlycommercial transaction amounts, and by examining the initial digit distributions, decidewhether evidence existed that one or both sets might have been fabricated. This was tobe done on the basis that: “in data of this kind, the relative frequency of initial digits islikely to be highest for 1 and should decrease progressively for digits 2 to 9.”
What is “data of this kind”? The exercise skates over questions like this one with thetacit excuse that the particular group of Year 9 students for whom it was developedwould not have wanted to think in such detail. On the other hand, a teacher wishing tomodel a spirit of enquiry and of enthusiasm for mathematics could hardly avoid askingquestions like the following:
• Why should certain data sets be expected to have the logarithmic (Benford)distribution over their initial digits while other data sets do not, and whatprocesses generate data of this kind?
• Do the data sets generated in this exercise truly exhibit the Benford distribution?If not, what is their distribution?
• Are there other ways of generating and displaying Benford-like data in theclassroom?
The second of these questions seemed easiest to tackle. It is not too difficult tosimulate on a spreadsheet the process described in the classroom exercise and to graphthe results in columns side-by-side with columns representing the Benford distribution.Comparing many sets of data produced by this Cartesian product process, one is forcedempirically to the conclusion that the resulting distribution does not quite match theBenford distribution.
To confirm this one must derive the theoretical probabilities. That is, the distributionof the initial digits in the Cartesian product of two sets of samples from a uniformdistribution on, say, the interval )10,0(
k .
The situation can be conceptualised graphically. Uniform (0,10k ) random variables Xand Y are represented on a pair of coordinate axes and level curves are drawnrepresenting XY =10k 1d and XY =10k 1(d +1) for some d {1,2,3,...,9} . Any (x,y)pair falling between these level curves must have a product with initial digit d. But,below the level curve XY =10k 1 there is an infinite family of regions in which theproduct xy has initial digit d. The probability that the initial digit is d must be theinfinite sum of the areas of these regions as a fraction of the area of the rectanglecontaining all allowable (x,y) pairs.
To clarify this using a particular example, suppose k =1 and d = 4 . Then randomvariables X and Y take values in the interval (0,10). The infinite family of regions inwhich the product xy has initial digit 4 and xy <10could be represented as follows :
{ 4 xy < 5 , 0.4 xy < 0.5, 0.04 xy < 0.05, …}
The first two of these regions are displayed in Figure 2.
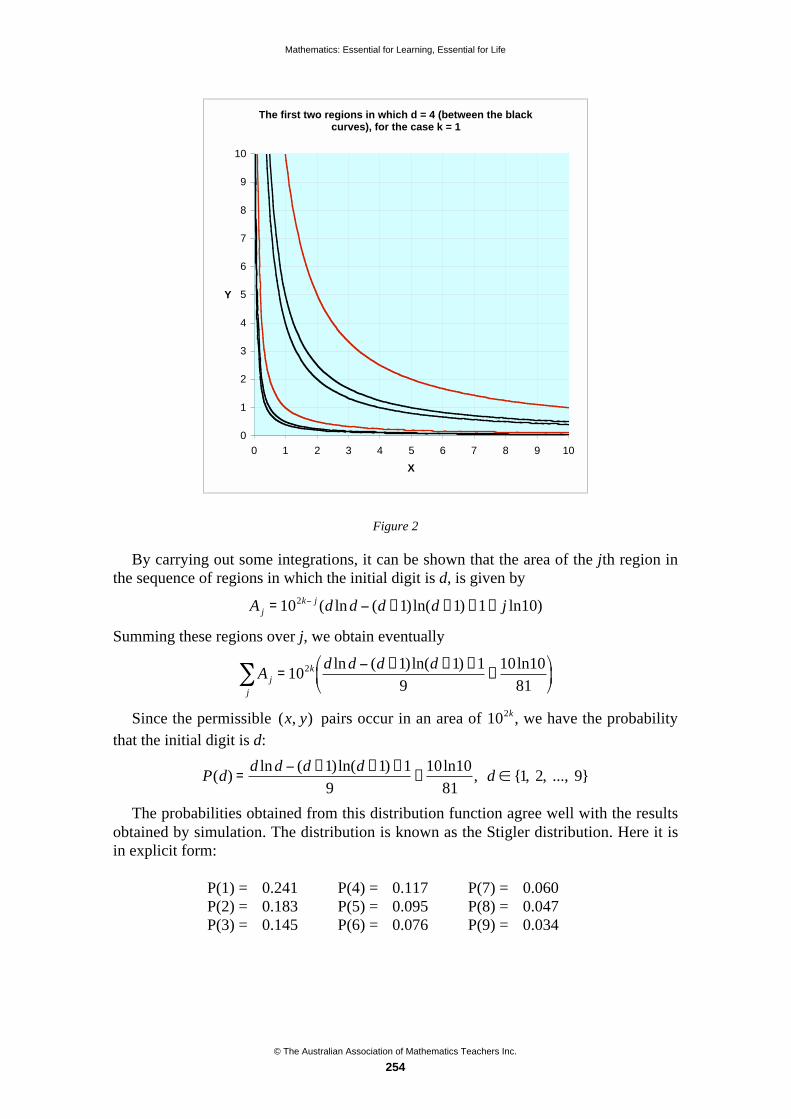
Mathematics: Essential for Learning, Essential for Life
© The Australian Association of Mathematics Teachers Inc.
254
The first two regions in which d = 4 (between the black curves), for the case k = 1
0
1
2
3
4
5
6
7
8
9
10
0 1 2 3 4 5 6 7 8 9 10
X
Y
Figure 2
By carrying out some integrations, it can be shown that the area of the jth region inthe sequence of regions in which the initial digit is d, is given by
A j =102k j (d lnd (d +1)ln(d +1) +1+ j ln10)
Summing these regions over j, we obtain eventually
A j =102k d lnd (d +1)ln(d +1) +1
9+
10ln10
81
j
Since the permissible ),( yx pairs occur in an area of 102k , we have the probabilitythat the initial digit is d:
P(d) =d lnd (d +1)ln(d +1) +1
9+
10ln10
81, d {1, 2, ..., 9}
The probabilities obtained from this distribution function agree well with the resultsobtained by simulation. The distribution is known as the Stigler distribution. Here it isin explicit form:
P(1) = 0.241 P(4) = 0.117 P(7) = 0.060P(2) = 0.183 P(5) = 0.095 P(8) = 0.047P(3) = 0.145 P(6) = 0.076 P(9) = 0.034

Mathematics: Essential for Learning, Essential for Life
© The Australian Association of Mathematics Teachers Inc.
255
Stigler distribution compared with Cartesian product
simulation
0.000
0.050
0.100
0.150
0.200
0.250
0.300
1 2 3 4 5 6 7 8 9
initial digit
rela
tiv
e f
req
ue
nc
y
Stigler
Simulation
Figure 3
A partial answer to the third question on the list above, “Are their other ways ofgenerating and displaying Benford-like data in the classroom?” presented itself whileexperimenting with spreadsheet simulations.
Sets of numbers can be produced, each element being the product of three uniformlydistributed random numbers. In this process, the initial digit distributions are muchcloser to the logarithmic distribution — at least on the evidence of simulated data.
Leading digit frequencies for products of three random
numbers
0
0.05
0.1
0.15
0.2
0.25
0.3
0.35
1 2 3 4 5 6 7 8 9
Leading digit
Pro
po
rtio
n
Benford
RAND()*RAND()*RAND()
Figure 4

Mathematics: Essential for Learning, Essential for Life
© The Australian Association of Mathematics Teachers Inc.
256
In a paper titled: “Benford’s Law As The Property Of The Truly Random Number”,A. E. Kossovsky relates a fable that illustrates another way in which logarithmic initialdigit data might be generated. To paraphrase Kossovsky:
Members of an ancient society were permitted to have at most 9 gods, 8 olive trees, 7fruits, 6 chickens, 5 sheep, 4 dogs, 3 slaves, 2 houses and 1 wife, and they had to haveat least one of each. In conversations among the members of the community mentioningcounts of these things, it is likely that the number 1 would be mentioned most because itcan come up in relation to any of the objects. ‘Nine’, on the other hand would only arisein relation to one kind of object: gods, and so would be mentioned least. It isconceivable that the probabilities would be determined as in the following table:
Object Maximumnumberpermitted
P(1) P(2) P(3) P(4) P(5) P(6) P(7) P(8) P(9)
Wife 1 1/1 0 0 0 0 0 0 0 0
House 2 1/2 1/2 0 0 0 0 0 0 0
Slave 3 1/3 1/3 1/3 0 0 0 0 0 0
Dog 4 1/4 1/4 1/4 1/4 0 0 0 0 0
Sheep 5 1/5 1/5 1/5 1/5 1/5 0 0 0 0
Chicken 6 1/6 1/6 1/6 1/6 1/6 1/6 0 0 0
Fruit 7 1/7 1/7 1/7 1/7 1/7 1/7 1/7 0 0
Olive 8 1/8 1/8 1/8 1/8 1/8 1/8 1/8 1/8 0
God 9 1/9 1/9 1/9 1/9 1/9 1/9 1/9 1/9 1/9
Average probabilityover 9 topics
0.314 0.203 0.148 0.111 0.083 0.061 0.042 0.026 0.012
Benford probabilities 0.301 0.176 0.125 0.097 0.078 0.067 0.058 0.051 0.046
It can be seen that the probabilities averaged over the nine topics of conversationclosely resemble the Benford distribution.
This idea suggests more realistic scenarios like the following: Suppose there are fortycategories of payments to be made. Each category has a randomly chosen upper boundbetween $100 and $10000. Within each category several payments are to be made. Theyare assumed to be uniformly distributed on the interval from $100 to the upper boundfor the category. Such a scenario can be simulated readily by spreadsheet (Figure 5).

Mathematics: Essential for Learning, Essential for Life
© The Australian Association of Mathematics Teachers Inc.
257
0
0.05
0.1
0.15
0.2
0.25
0.3
0.35
1 2 3 4 5 6 7 8 9
Figure 5
In this diagram, the right hand column in each pair represents a simulation, with theBenford distribution on the left. Not all trials produce as good a fit as this one but theshapes are usually similar to the Benford shape.
The scenario just described seems to accord with the explanation for the Benforddistribution given by Theodore P. Hill. In his 1996 paper “A Statistical Derivation ofthe Significant-Digit Law”, Hill introduces his main theorem, his log-limit law forsignificant digits, with the claim: Roughly speaking, this law says that if probabilitydistributions are selected at random, and random samples are then taken from each ofthese distributions in any way so that the overall process is scale (or base) neutral, thenthe significant digit frequencies of the combined sample will converge to thelogarithmic distribution.
The first question on the list, “Why should certain data sets be expected to have thelogarithmic (Benford) distribution over their initial digits while other data sets do not,and what processes generate data of this kind?” is probably the most difficult to answer.
In essence it is this question that the paper by Hill addressed and his explanation isconsidered to be the first satisfactory one. In one sense the question is outside the realmof mathematics. Mathematicians have described processes that would generate data setswith initial digits following the logarithmic distribution and they have demonstratedsome special properties like scale and base invariance that the distribution should have,but little can be said a priori about whether a given set of data should display theBenford distribution.
In the end, observation must be the best recourse. If a given data set is seen as asample from a particular distribution, we assume it will have the characteristics of thepopulation from which it was drawn. So, if samples of a given type of data usuallydisplay the Benford distribution, we suspect that a sample that does not have thatdistribution may be from a different population and therefore deserves furtherinvestigation. Thus we must take the scientific approach in these matters rather than thepurely mathematical.

Mathematics: Essential for Learning, Essential for Life
© The Australian Association of Mathematics Teachers Inc.
258
Appendix 1: Year 9 level 2 in-class assignment
Detecting fraud with probability
Marks: /35 There are seven sections, each worth 5 marks.Your teacher will arrange for you to complete this assignment either in class or in a computerlab session. You will use a scientific calculator or an Excel spreadsheet to manipulate sets ofrandom numbers.
1. Generate twenty random numbers.On a calculator this is done using the [rnd#] button. In Excel, just copy the formula ‘=RAND()’into twenty cells arranged in two rows of ten as below.Copy the first three significant digits of each random number into a table:
2. Look at the initial digit of each number in your table. By counting the number of occurrencesof each numeral 1–9, write down fractions representing the estimated probability that each willoccur as the initial digit in a random number. Use this table:
Numeral: 1 2 3 4 5 6 7 8 9Frequency:Proportion:
3. Next, multiply each of the numbers in row 1 of your table in question 1 by each of thenumbers in row 2. Use the following grid to make sure each of the 100 multiplications is carriedout. (You can do the multiplications quickly in Excel by copying formulas like ‘=C$2*$B3 intoa block of cells.) Now, instead of writing the products in the following grid cells, write theinitial digits only.
Row 1
Row 2
4. Do step 2 again, this time looking at the initial digits in your table of products.
Numeral: 1 2 3 4 5 6 7 8 9Frequency:Proportion:
5. Compare the results of step 2 and step 4. Comment on any difference you observe in the waysthe estimated probabilities are distributed._______________________________________________________________________________________________________________________________________________________________________________________________________________________________________

Mathematics: Essential for Learning, Essential for Life
© The Australian Association of Mathematics Teachers Inc.
259
A true storyAstronomer Simon Newcomb, in 1881, noticed that numbers found in statistical data or intables of physical constants were more likely to begin with a smaller digit than a larger one. DrFrank Benford, a physicist working for the General Electric Company, rediscovered this strangefact in 1938 and it came to be known as Benford’s Law. A satisfactory explanation forBenford’s Law was worked out only as recently as 1996 by Theodore P. Hill.Benford’s Law is now used by auditors and forensic accountants to help detect fraud.
6. Analyse the distribution of initial digits in the following data sets. To do this, you shouldcomplete the frequency tables, as you did for steps 2 and 4.
Data set 1: Transactions July 1 – September 30, $’000, subject A80 207 505 646 627 138 618 585 907 82294 977 698 385 618 280 8 391 280 62131 626 658 486 656 88 843 703 786 911812 787 907 950 293 538 753 600 931 97
Initial digit frequenciesNumeral: 1 2 3 4 5 6 7 8 9Frequency:Proportion:
Data set 2: Transactions July 1 – September 30, $’000, subject B192 201 205 232 210 261 131 95 232 273161 168 172 194 176 218 110 79 194 478498 510 575 521 648 325 235 575 292 329285 298 370 186 134 329 409 427 437 493
Initial digit frequenciesNumeral: 1 2 3 4 5 6 7 8 9Frequency:Proportion:
7. Benford’s law says that, in data of this kind, the relative frequency of initial digits is likely tobe highest for 1 and should decrease progressively for digits 2 to 9. On this basis is there anyevidence that one or more of the above data sets could be fraudulent? Explain.
__________________________________________________________________________________________________________________________________________________________

© The Australian Association of Mathematics Teachers Inc.
260
Bibliotherapy, a powerful tool to alleviatemathematics anxiety in pre-service primary
teachers: A reflective report*
Sue Wilson
ACU National
This reflective report synthesises the research background that has informed recentresearch on bibliotherapy as a tool in teacher education. Bibliotherapy provides astructure and language for educators to help pre-service teachers to reconstructtheir own school experiences and reinterpret their views of themselves as learnersof mathematics while studying school students’ experiences. Bibliotherapysimultaneously addresses affective and cognitive domains and has the power toencourage pre-service teachers to change their image of themselves as students,and their assessment of their capacity to learn and teach mathematics. This paperalso identifies potential directions for future research.
Introduction
Recent research in mathematics teacher education concluded that bibliotherapy is aprocess that shows potential as an innovative way of eliciting and structuring pre-service teachers’ affective responses (Wilson and Thornton, 2005a, 2005b),acknowledged the importance of the dual nature (affective and cognitive) of thesereflections, and provided a framework and shared language for teacher educators toanalyse them (Wilson and Thornton, 2006, 2007).
Aims
This paper aims to provide a synthesis of the theoretical framework and researchbackground that has informed preliminary research into the application of the techniqueof bibliotherapy to primary pre-service teachers suffering from mathematics anxiety;and reflect on the results of these studies and to indicate potential directions for futureresearch.
Scope
This report is limited to the investigation of the use of the technique of bibliotherapy inteacher education, how it has potential to address mathematics anxiety in pre-serviceteachers, and to consider the associated theoretical framework and research background.
Limitations
This report does not address other areas of primary pre-service teachers’ education, suchas anxiety about science education, secondary pre-service teacher education, teacher in-service, or how bibliotherapy might be used with school students or their parents;
* Paper accepted by peer review

Mathematics: Essential for Learning, Essential for Life
© The Australian Association of Mathematics Teachers Inc.
261
although all are important issues and bibliotherapy has existing or potential applicationsin all these areas.
Mathematics anxiety
Dossel (1993) identified that, for many children, mathematics anxiety is a specificlearning difficulty, characterised by a belief that mathematics cannot make sense and afeeling of helplessness and lack of control over one’s learning. Stigler and Hiebert,(1992) suggested factors in this anxiety were inappropriate teaching practices, and acommon belief that success in mathematics is predetermined by ability.
Mathematics anxiety in pre-service teachers
Mathematics anxiety is a phenomenon which is particularly significant in pre-serviceteacher education. Many pre-service primary or early childhood teachers have a fear ofmathematics, and see themselves as unable to learn effectively (Haylock, 2001).Hembree’s (1990) meta-analysis of research studies found that the level of mathematicsanxiety of pre-service elementary teachers was the highest of any course major group onuniversity campuses. Trujillo and Hadfield (1999) attempted to trace the roots ofmathematics anxiety in American pre-service primary teachers. In a study of pre-serviceteachers, Uusimaki and Nason (2004) found that most of their mathematics anxietycould be attributed to experiences in primary school. Mathematics anxiety in pre-serviceteachers has been associated with low levels of confidence to teach mathematics (Bursaland Paznokas, 2006) and low mathematics teacher efficacy (Swars, Daane and Giesen,2006).
Research has identified the factors contributing to anxiety about mathematics(Hadfield and McNeill 1994) and its impact on teaching practices. The impact ofteachers’ beliefs about mathematics and learning on their teaching is widely recognised(Schuck and Grootenboer, 2004; Thompson, 1992). Askew, Brown, Rhodes, Johnsonand Wiliam (1997) found evidence that teachers’ perceptions of mathematics, and howit is learned, were more important in promoting positive outcomes for students thandifferent teaching methods or ways of organising classrooms.
Pre-service teacher education
A significant area of research in recent years has been the role of reflection in teacherprofessional learning. Mathematical autobiographies have been used as a tool toencourage reflection by pre-service teachers (Ellsworth and Buss, 2000; Sliva andRoddick, 2001). Bibliotherapy has close links with these reflective practices.
Pre-service teacher education and mathematics anxiety
Research investigating how studying subjects at university might impact upon thisanxiety has focused on teaching mathematics to assist students to develop deeperknowledge (Chick, 2000), emphasising the use of manipulatives in a methods class(Vinson, 2001) or on how studying mathematics teaching strategies impact on pre-service teachers’ beliefs and attitudes (Frid, 2000). Bibliotherapy offers a new andradically different approach.

Mathematics: Essential for Learning, Essential for Life
© The Australian Association of Mathematics Teachers Inc.
262
Bibliotherapy
Bibliotherapy is a technique developed in psychology and library science. Hendricks(1999) traces the development of the process and its applications. Bibliotherapy aims toassist individuals to overcome negative emotions related to a real-life problem byguided reading about the situation of a third person, or a fictional animal. It is adynamic process during which people bring their own needs and problems to thereading activity, identify with the protagonist and interpret the words according to theirown experiences. Bibliotherapy can be described as: “a process of dynamic interactionbetween the personality of the reader and literature — interaction which may be utilisedfor personality assessment, adjustment and growth” (Cornett and Cornett, 1980, p. 8).The reader is less confronted and able to experience the problem more objectively,because the situation is about a third person. Reading is followed by individual or groupdiscussion in a non-threatening environment. From this, the reader can develop self-awareness, an enhanced self-concept and improved personal and social judgement.(Hebert and Furner, 1997).
The process of bibliotherapy involves four stages: identification (the reader identifieswith the protagonist), catharsis (the reader becomes emotionally involved and releasespent-up emotions ), insight (the reader becomes aware that their problems might also beaddressed or solved.) and universalisation (the reader realises that the problem is sharedby others).
The technique has been used to help high ability students to overcome mathematicsanxiety. “Bibliotherapy is a therapeutic, discussion-generating technique which offerseducators appropriate affective strategies for dealing with mathematics anxiety insecondary math classrooms so that students achieve success” (Hebert & Furner, 1997,p. 170).
Bibliotherapy in pre-service teacher education
Morawski (1997) suggested that bibiliotherapy can “play an instrumental role in helpingboth beginning and experienced teachers think about their professional practice” (p.243). She emphasised practical applications in pre-service education in units aboutteaching reading and teaching students with special needs, and stressed the need forteachers to “gain an understanding of their perceptions as well as the influence thatthese perceptions can have on their attitudes and actions in the education setting” (p.256)
One of the purposes of bibliotherapy ,in some pre-service education courses, hasbeen to change attitudes towards students with issues. Marlowe and Maycock (2000)reported on the use of bibliotherapy in preparing pre-service teachers to teach studentswith emotional and behavioural disorders. They reported a decrease in punitiveness inpre-service teachers who read and discussed stories of how teachers dealt with suchstudents “within the mechanics of group bibliotherapy” (p. 325). In this research, thepre-service teachers identified with the teacher, but an alternative approach is toencourage pre-service teachers to identify with the learner.
Bibliotherapy as a tool to addressmathematics anxiety in pre-service teachers
The technique of bibliotherapy has been used as a tool to address mathematics anxietyin secondary students (Furner and Duffy, 2002; Hebert & Furner, 1997). In pre-serviceteacher education courses it has been reported to help pre-service teachers construct

Mathematics: Essential for Learning, Essential for Life
© The Australian Association of Mathematics Teachers Inc.
263
knowledge and practice (Morawski, 1997) and change pre-service teachers’ attitudestowards their students with behavioural difficulties (Marlowe & Maycock). Makingconnections between these studies gives rise to the idea that bibliotherapy has potentialas a technique to address mathematics anxiety in pre-service primary teachers.
Research investigating the effect that pre-service teachers’ reflections on students’difficulties in learning mathematics, including mathematics anxiety, had on theirperceptions of themselves as learners of mathematics has provided evidence that thetechnique of bibliotherapy may enable pre-service teachers to reconstruct their ownexperiences, and re-evaluate themselves as learners of mathematics. In addition, theirreflections may also produce a greater insight into how children’s anxiety aboutmathematics can be minimised by teachers (Wilson & Thornton, 2005a). The researchattempted to identify the way pre-service teachers envisaged themselves as learners, anddoers, of mathematics and how they might reassess their capacity to learn and teachmathematics as a result of guided reflections. Themes of the role of the teacher, thecycle of fear, failure and avoidance, the pre-service teachers’ perceptions of the natureof mathematics, and their self-image as a learner of mathematics, were identified.(Wilson & Thornton, 2005b). Enhancing pre-service teachers’ self-image contributed totheir developing the capacity to see mathematics as making connections, to seeinglearning as developing deep knowledge, to seeing their role as teachers as being toprovide opportunities for school students to solve rich and complex problems, and toadopting a view that all students can learn mathematics (AAMT, 2002).
Bibliotherapy was proposed as an innovative technique to assist pre-service teachersto examine their attitudes towards their own learning in mathematics. The researchersidentified how a pre-service teacher’s journal reflections related to the stages ofbibliotherapy and suggested this technique has potential to enhance pre-serviceteachers’ confidence for teaching primary school mathematics (Wilson & Thornton,2006). The bibliotherapy approach used in this research differed from other approachesto addressing mathematics anxiety in pre-service teachers, in that it simultaneouslyaddressed affective and cognitive domains and, in the process, provided pre-serviceteachers with the opportunity to reconfigure their identity as future teachers ofmathematics. The journal entries provided evidence that students experienced the stagesof the process:
• Identification
The pre-service teachers’ reflections showed that they identified with thecharacter (in this case the students in the articles) and the situations in which theyfound themselves.
• Catharsis
Through their reading of the articles, the pre-service teachers became emotionallyinvolved and shared and released pent-up emotions.
• Insight
Through their readings and discussion, the pre-service teachers became aware thattheir problems might also be addressed or solved.
• Universalisation
Using their reflections on the readings, and sharing of their experiences, pre-service teachers were able to connect with each other and find that they were notalone in their feelings and experiences (Wilson & Thornton, 2006).
Wilson and Thornton (2007) identified a fifth stage in pre-service teachers:projection. Pre-service teachers’ added insight into their own circumstances was
Mathematics: Essential for Learning, Essential for Life
© The Australian Association of Mathematics Teachers Inc.
264
followed by a consideration of what this could mean for the future. The pre-serviceteachers discussed the implications of the readings for themselves, as teachers, andidentified specific strategies that they might adopt in their teaching. The study presentedalternate conceptions of the nature of mathematics which influenced the way the pre-service teachers envisaged themselves as potential as teachers of mathematics.
A recent pilot study by Wilson (2007), currently under review, investigated the useof the bibliotherapy technique with pre-service primary teachers in a unit where thefocus was on mathematics learning, and not learning difficulties, and found that a pre-service teacher, who expressed anxiety about mathematics, exhibited some of the stagesof bibliotherapy.
Discussion and conclusions
The bibliotherapy process is an innovative way of eliciting pre-service teacherreflections. One of the salient features of the process was the emotional responses of thepre-service teachers. Its power is in the way that pre-service teachers’ cognitiveresponses are allied with their emotional response. In comparison to other reflectivepractices, the potential of bibliotherapy lies in the opportunity for the process to changethe way pre-service teachers feel. An explicit focus on learning difficulties, through theprocess of bibliotherapy, may be a powerful force in addressing some of themathematics anxiety felt by many pre-service teachers, and thus be a powerful tool inhealing (Wilson & Thornton, 2006). There is evidence that this may be achieved, tosome extent, even if this is not the teaching or assessment focus of the unit (Wilson,2007).
Bibliotherapy provides a new framework for looking at pre-service teacherreflections, that has much to offer. It is an effective way of thinking about their priorexperiences and looking at the reflective process. It gives teachers a framework, andlanguage, to talk about the process. It provides educators with a shared language to talkabout students’ emotional responses in terms of the processes of identification,catharsis, insight, universalisation and projection (Wilson & Thornton 2006). It is,therefore, possible that, if one of the parts of the process is missing, educators can selectreadings to promote the entire process.
It seems reasonable to conclude that overcoming mathematical anxiety among pre-service teachers is important for them to become effective teachers of mathematics. Theresearch suggests that it will help many pre-service primary teachers studyingmathematics education to go through a carefully constructed bibliotherapy process.Bibliotherapy provides a process that others could adopt, so is very practical in itspotential applications. This process may be at least as important as learningmathematics or how to plan lessons because it has potential to change the way studentsfeel about themselves, and think about themselves, as learners and potential teachers.Ultimately, the power of the bibliotherapy technique lies in its potential to heal andenthuse students (Wilson & Thornton, 2006).
Implications and recommendations
The preliminary research indicates that bibliotherapy has potential to impact positivelyon outcomes for both beginning primary school teachers and their students in theirmathematics classes. An immediate research focus would be the identification ofreading materials that impact substantially on pre-service teachers, and some effective
Mathematics: Essential for Learning, Essential for Life
© The Australian Association of Mathematics Teachers Inc.
265
strategies for incorporating this technique into teacher education units, particularlythose which have a different content focus.
The potential of individual teachers to have a lasting influence, and the pre-serviceteacher’s awareness that there are alternatives to the approaches that they experienced,were common insights developed by the pre-service teachers. These studies cannotreliably predict how these pre-service teachers will actually teach mathematics in theclassroom. A direction for future studies is to research the teaching practices of thesepre-service teachers. Follow-up longitudinal workplace-based studies investigatingbibliotherapy ,and the change in pre-service teachers’ beliefs, and their effectiveness asteachers of mathematics to young children, would provide potential further researchcontexts.
Future research could also investigate the application of the techniques used in thestudy, such as critical incident analysis and bibliotherapy through guided reading andjournal writing, to investigate their potential to combat mathematics anxiety in primaryand high school students. Although pre-service education is the focus of this particularpaper, the technique of bibliotherapy has been used already, to an extent, with schoolstudents. It has potential to be used to alleviate mathematics anxiety in school students,particularly with the number of children’s books that have mathematics as a particularfocus.
There is the opportunity to transfer the process to other learning areas, and use it toaddress issues other than mathematics anxiety. This report does not address teacher in-service, other areas such as primary pre-service teachers’ anxiety about scienceeducation, secondary pre-service teacher education or parental beliefs and actions,although it recognises that all are important areas for further research, that could beaddressed by the bibliotherapy process.
References
AAMT (2002). Standards for Excellence in Teaching Mathematics in Australian Schools. Retrieved 6October 2006 from http://www.aamt.edu.au/standards/
Askew, M., Brown, M., Rhodes, V., Johnson, D. & Wiliam, D. (1997). Effective Teachers of Numeracy(Final Report). London: King’s College.
Bursal, M. & Paznokas, L. (2006). Mathematics anxiety and preservice elementary teachers’ confidenceto teach mathematics and science. School Science and Mathematics, 106 (4) 173–180.
Chick, H. (2002). Evaluating pre-service teachers’ understanding of middle school mathematics. In B.Barton, K. Irwin, M. Pfannkuch & M. Thomas (Eds), Mathematics Education in the South Pacific:Proceedings of the 25th Annual Conference of the Mathematics Education Research Group ofAustralasia, Auckland (179–186). Auckland, NZ: MERGA.
Cornett, C. & Cornett, C. (1980) Bibliotherapy: The Right Book at the Right Time. Bloomington, Ind.: PhiDelta Kappa Educational Foundation.
Dossel, S. (1993). Maths anxiety. The Australian Mathematics Teacher, 49(1) 4–8.
Ellsworth, J. & Buss, A. (2000). Autobiographical stories from preservice elementary mathematics andscience students: Implications for K–16 teaching. School Science and Mathematics, 100 (7), 355.
Frid, S. (2000). Constructivism and reflective practice in practice: challenges and dilemmas of amathematics educator. Mathematics Teacher Education and Development, 2, 17–34.
Haylock, D. (2001). Mathematics Explained for Primary Teachers. London: Paul Chapman.
Hebert, T. & Furner, J. (1997). Helping high ability students overcome maths anxiety throughbibliotherapy. Journal of Secondary Gifted Education, 8 (4), 164–179.
Hembree, R. (1990). The nature, effects and relief of mathematics anxiety. Journal for Research inMathematics Education, 21, 33–46.

Mathematics: Essential for Learning, Essential for Life
© The Australian Association of Mathematics Teachers Inc.
266
Hendricks, C., Hendricks, J. & Cochran, L. (1999). Using literacy conversations for healing: Thesignificant conversationalists. American Reading Forum Online Yearbook, Vol. 19. Retrieved 8 March2007 from http://www.americanreadingforum.org/99_yearbook/pdf/8_hendricks_99.pdf
Marlowe, M. & Maycock, G. (2000) Phenomenology of bibliotherapy in modifying teacher punitiveness.Journal of Genetic Psychology, 161 (3) 325–336.
Schuck, S. & Grootenboer, P. (2004). Affective issues in mathematics education. In B. Perry, G. Anthony& C. Diezmann (Eds), Research in Mathematics Education in Australasia (pp. 53–74). Flaxton, Qld:Post Pressed.
Sliva, J. & Roddick, C. (2001). Mathematics autobiographies: A window into beliefs, values, and pastmathematics experiences of preservice teachers. Academic Exchange Quarterly, Summer 5(2), 101.
Stigler, J & Hiebert, J. (1992). The Teaching Gap — Best Ideas from the World’s Teachers for ImprovingEducation in the Classroom. New York: Free Press.
Swars, S., Daane, C. & Giesen, J. (2006) Mathematics anxiety and mathematics teacher efficacy: What isthe relationship in elementary preservice teachers? School Science and Mathematics, 106 (7),306–315.
Thompson, A. (1992). Teachers’ beliefs and conceptions: A synthesis of the research. In D. Grouws(Ed.), Handbook of Research on Mathematics Teaching and Learning (pp. 127–146). New York:Macmillan.
Trujillo, K. & Hadfield, O. (1999). Tracing the roots of mathematics anxiety through in-depth interviewswith pre-service elementary teachers. College Student Journal, 33 (2), 219–232.
Uusimaki, L. & Nason, R. (2004) Causes underlying pre-service teachers’ negative beliefs and anxietiesabout mathematics. Proceedings of the 28th Conference of the International Group for the Psychologyof Mathematics Education, Vol. 4 (pp. 369–376).
Vinson, B. (2001). A comparison of preservice teachers’ mathematics anxiety before and after a methodsclass emphasising manipulatives. Early Childhood Education Journal, 29 (2), 89–94.
Wilson, S. (2007). My struggle with maths may not have been a lonely one: Bibliotherapy in a teachereducation number theory unit. Proceedings of the 22nd Biennial Conference of the AustralianAssociation of Mathematics Teachers (under review).
Wilson, S. & Thornton, S. (2005a). The year in which my love of maths changed: Pre-service primaryteachers’ self-image as mathematicians, In M. Coupland, J. Anderson & T. Spencer (Eds), MakingMathematics Vital (Proceedings of the 20th Biennial Conference of the Australian Association ofMathematics Teachers, pp. 268–274). Adelaide: Australian Association of Mathematics Teachers.
Wilson, S. & Thornton, S. (2005b). I am really not alone in this anxiety: Bibliotherapy and pre-serviceprimary teachers’ self-image as mathematicians. In P. Clarkson, A. Downton, D. Gronn, M. Horne, A.McDonough, R. Pierce & A. Roche (Eds) Building Connections: Research, Theory and Practice.Proceedings of the annual conference held at RMIT, Melbourne (pp. 791–798). Sydney: MERGA.
Wilson, S. & Thornton, S. (2006). To heal and enthuse: Developmental bibliotherapy and pre-serviceprimary teachers' reflections on learning and teaching mathematics. Identities, Cultures and LearningSpaces: Proceedings of the 29th annual conference of the Mathematics Education Research Group ofAustralasia, (pp. 36–44). Canberra: MERGA.
Wilson, S. & Thornton, S. (2007 in press). “The factor that makes us more effective teachers”: Two pre-service primary teachers’ experience of bibliotherapy. Mathematics Teacher Education andDevelopment.

© The Australian Association of Mathematics Teachers Inc.
267
Using the history of mathematics for mentoringgifted students: Notes for teachers*
Oleksiy Yevdokimov
University of Southern Queensland
The paper presents a theoretical framework, methodology and practicalimplications for the work with gifted students using history of mathematics. Ateaching-learning model, where history of mathematics is integrated in problem-solving activities, is described. Didactical material based on the concepts oftriangle geometry is given in the scope of this model. A beautiful and intriguingpiece of geometry — the Lemoine point — is the focus of consideration. Itsproperties are investigated through appropriately designed activities for students.Different examples show the importance of history of mathematics for thedevelopment of students’ mathematical thinking.
Introduction
Have your students ever asked you about the geometry of the triangle and whatArchimedes could have discovered using dynamic geometry software? History ofmathematics connects the content of mathematics with its past and can be a source forfurther reflections on the ways of teaching and learning mathematics from primary totertiary levels. Nowadays, there is a consensus that the history of mathematics is nolonger a remote or tangential issue to the mathematics curriculum and deserves asignificant role. Hayes (1991) stated: “I believe that it is a grave mistake and error ofstrategy to attempt to teach mathematics without reference to its cultural, social,philosophical and historical background.”
Undoubtedly, most teachers are aware of the importance of integrating the history ofmathematics in the teaching process and many of them successfully use at least someelements in their work. But, how can this best be done in different classroom situations,with different teachers’ expectations and students’ beliefs? Undoubtedly, the questionneeds further specification. The main issue we would like to focus on is integration ofhistory of mathematics, in particular with respect to triangle geometry , in classroominquiry activities of gifted in mathematics students. This paper is written for teachersand has two main aims:
• to provide teachers with practical advice on how challenging material can beorganised in a constructivist framework using history of mathematics;
• to attract teachers’ attention to the importance of linkage between mathematicaland pedagogical content and demonstrate how difficult or challengingmathematical problems can be addressed through their historical backgroundusing generalisation, visualisation and systematisation.
We will describe a fragment of a teaching-learning model, where the Lemoine pointtakes a central place. The Lemoine point is not the end in itself but a means to show the * Paper accepted by peer review
Mathematics: Essential for Learning, Essential for Life
© The Australian Association of Mathematics Teachers Inc.
268
huge potential in teaching challenging material. It can be presented by the teacher, andseen by students, as a chain of logical reasoning based on the geometry curriculum. Wehope teachers will find this paper and the didactical material helpful, either as a directguide in mentoring gifted students, or as an example to help produce their ownmaterials bringing together history and mathematics.
Theoretical framework
Gray et al. (1999) pointed out that “didactical reversal — constructing a mental objectfrom ‘known’ properties, instead of constructing properties from ‘known’ objectscauses new kinds of cognitive difficulty” (p.117). We used the idea of “didacticalreversal” with respect to historical context of mathematical content. We called itdidactical chronology of a concept, i.e. we proposed students to build up a successivechain of their argumentation, which would lead them to the discovery of a certainproperty. In other words, we modelled the same timeline situation as it happenedhundreds years ago and modified it slightly so that the final result, i.e. mathematicalproperty, could be discovered. We considered a concept in the context of its historical-mathematical sense (Yevdokimov, 2006a):
• When was a concept posed in a certain problem for the first time?
• Who was the author, and did that author prove/solve the problem on his/her own?
• What other famous mathematicians were interested in the same problem and why?
• How long was that problem known as an unsolved one?
• and the most important issue: How it could be solved.
We called this stage initial problem situation. When the initial problem had beensolved the next stage began — to find out more what was going on around the contextof the problem:
• Which mathematical objects could be taken into further consideration?
• How could those mathematical objects be related to each other?
• Which properties could be suggested to or made known to for students? Or morespecifically: Did a certain property follow from the initial problem? How could itbe proved?
• Could students introduce some auxiliary elements in order to make the initialproblem applicable to a range of situations? (Stoyanova, 2000);
We called this stage advanced search over situation. Following Brown and Walter(1990) we proposed a "situation" to mean a localised area of inquiry, within a givenhistorical context, with features that can be taken as given or challenged and modified.We would like to note that there were different directions of students’ inquiry work inthis stage. To assist the teacher control a “situation” we used Mercer’s idea (1995) of“the sensitive, supportive intervention of a teacher in the progress of a learner, who isactively involved in some specific task, but who is not quite able to manage the taskalone”. We followed Edwards’ idea of conceptual territory before proof (1997) inconducting the process of students’ inquiry activities through historical context in aclassroom and took into account that students’ exploration and teacher’s explanationconstituted the main elements that preceded students’ discoveries in the scope ofinquiring activities.
Mathematics: Essential for Learning, Essential for Life
© The Australian Association of Mathematics Teachers Inc.
269
As advocated by Kronfellner (1996) we distinguished similar patterns in thehistorical development of the concepts, which could be used to identify the direction ofstudents’ inquiry activities in a classroom:
• Implicit use before explicit definition;
• Changeability of mathematical concepts;
• Understandable modification of concepts.
We chose triangle geometry to demonstrate our approach to mentoring giftedstudents for the following reasons:
• There are more than one hundred distinguished objects ( such as points, lines,circles and conics) of a triangle, many of them related to each other (Davis, 1991).Some elements were studied in antiquity.
• Histories of some identifiable objects were recorded and written over a hundredyears ago (Mackay, 1892).
• Using technology gives opportunity to model mathematical experimentationthrough visualisation.
Methodology
All students’ activities were carried out as a part of the six months enrichment programfor Year 11 students. Fifteen (15) students were selected by their school mathematicsteachers to be involved in the program. All students were identified, by their teachers asgifted or, at least, as very good mathematics students. No additional confirmation of thatstatus of each student was required. The teaching experiment was designed for teachersto provide their feedback on the proposed program and encourage them to use thesimilar ideas in their further work. The methodology consisted of interactions betweenresearcher and teachers, researcher and students. These interactions included interviewswith teachers and teaching episodes with students. This teaching experiment wasconducted in four parts: observation part, interview part, teaching part, and analysispart. Below we provide the brief details for each part of the experiment.
Observation part
For six months 7 high school mathematics teachers observed 12 teaching episodescarried out with the group of 15 selected students. Teachers were asked to make theirnotes on 4 different criteria of the program: complexity for teachers, complexity forstudents, development of students’ conceptual constructions, and importance of thehistorical context. The scale from 1 (strongly disagree) to 10 (fully agree) marks foreach index was used. The lowest and the highest marks were removed in eachassessment criterion, average values were calculated in the end. Also, we used this partto establish a collaborative relationship with the teachers and the whole class.
Interview part
During the last two months of the program each of the seven teachers was individuallyquestioned in 30 minute interviews. The goal of the interviews was to find out moreabout teachers’ expectations with respect to students’ conceptual constructions andproblem solving strategies, when history of mathematics was integrated into theteaching process and students were met with challenging problems. In particular, weasked teachers how they could identify that a problem was likely to be hard for studentsand how historical context could be used in the most effective way in problem solving.
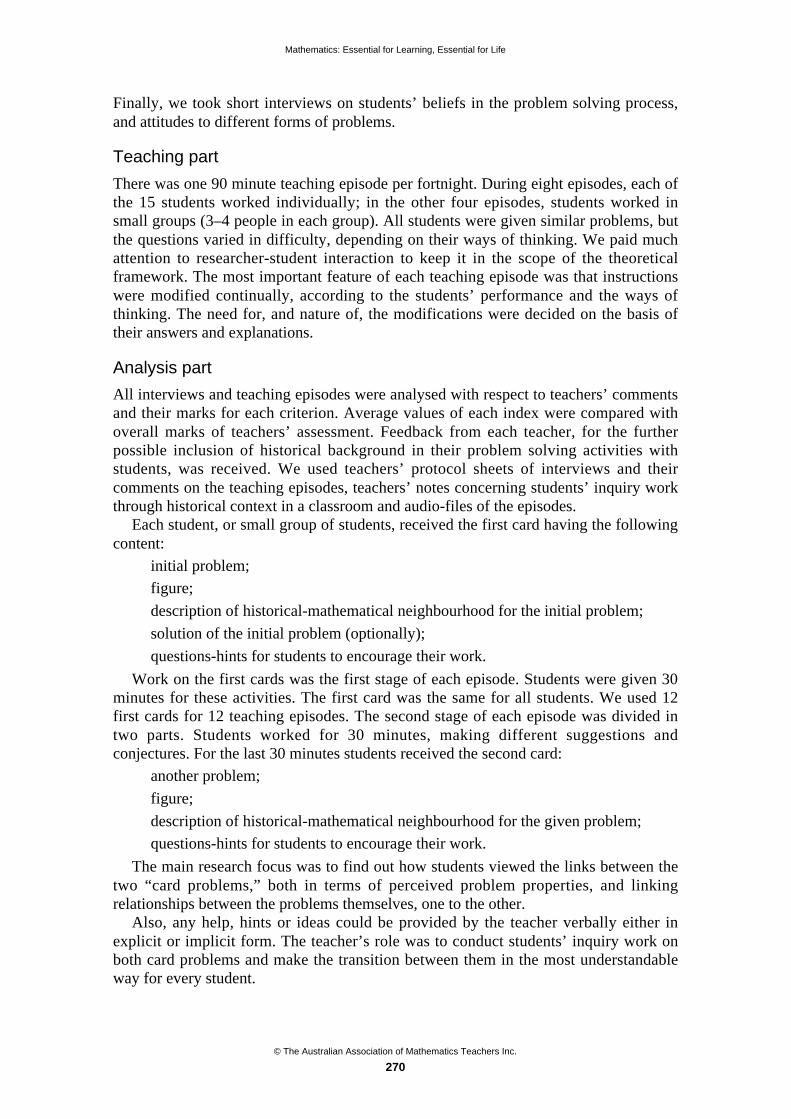
Mathematics: Essential for Learning, Essential for Life
© The Australian Association of Mathematics Teachers Inc.
270
Finally, we took short interviews on students’ beliefs in the problem solving process,and attitudes to different forms of problems.
Teaching part
There was one 90 minute teaching episode per fortnight. During eight episodes, each ofthe 15 students worked individually; in the other four episodes, students worked insmall groups (3–4 people in each group). All students were given similar problems, butthe questions varied in difficulty, depending on their ways of thinking. We paid muchattention to researcher-student interaction to keep it in the scope of the theoreticalframework. The most important feature of each teaching episode was that instructionswere modified continually, according to the students’ performance and the ways ofthinking. The need for, and nature of, the modifications were decided on the basis oftheir answers and explanations.
Analysis part
All interviews and teaching episodes were analysed with respect to teachers’ commentsand their marks for each criterion. Average values of each index were compared withoverall marks of teachers’ assessment. Feedback from each teacher, for the furtherpossible inclusion of historical background in their problem solving activities withstudents, was received. We used teachers’ protocol sheets of interviews and theircomments on the teaching episodes, teachers’ notes concerning students’ inquiry workthrough historical context in a classroom and audio-files of the episodes.
Each student, or small group of students, received the first card having the followingcontent:
• initial problem;
• figure;
• description of historical-mathematical neighbourhood for the initial problem;
• solution of the initial problem (optionally);
• questions-hints for students to encourage their work.
Work on the first cards was the first stage of each episode. Students were given 30minutes for these activities. The first card was the same for all students. We used 12first cards for 12 teaching episodes. The second stage of each episode was divided intwo parts. Students worked for 30 minutes, making different suggestions andconjectures. For the last 30 minutes students received the second card:
• another problem;
• figure;
• description of historical-mathematical neighbourhood for the given problem;
• questions-hints for students to encourage their work.
The main research focus was to find out how students viewed the links between thetwo “card problems,” both in terms of perceived problem properties, and linkingrelationships between the problems themselves, one to the other.
Also, any help, hints or ideas could be provided by the teacher verbally either inexplicit or implicit form. The teacher’s role was to conduct students’ inquiry work onboth card problems and make the transition between them in the most understandableway for every student.

Mathematics: Essential for Learning, Essential for Life
© The Australian Association of Mathematics Teachers Inc.
271
Didactical implications
In this part of the paper we describe four characteristic examples, which were identifiedby the teachers as the most important. Also, we give short descriptions of two cards ofthe teaching episode, where the Lemoine point was investigated.
The following two key ideas are the fundamental ones for understanding the natureof students’ inquiry activities in a classroom.
Diversity in forms
A mathematical statement (conjecture, question) can be presented in different forms.
Example A: Three forms of the same statement
1. Find all nontrivial integer solutions for the Diophantine equation x2+y2=z2.2. Find all points, which have rational coordinates and lie on a unit circle x2+y2=1.3. Find all right-angled triangles, for which lengths of hypotenuses and both sides
are integers (Pythagoras triplets).
It is important to note that the first form relates to analytical interpretation of thestatement, while the second and third show visual interpretation of the same statement.Teachers should take into account the impact of these interpretations on students’abilities to distinguish different forms of a statement. Moreover, this example showshow different areas of mathematics are intertwined: the first form is taken from thetheory of numbers, the second relates to analytical theory of the second order curves andthe third form presents particular cases of the famous Pythagoras theorem in geometry.
Our previous research (Yevdokimov, 2003; 2006b) showed that gifted students, inmost cases, were successful in making transition from one form of a statement toanother in the problem solving process. Nevertheless, one of the teacher’s main tasksremained to develop students’ abilities to identify and analyse different forms correctly.
The second key idea (property) is more complex: and incorporates the first property:
Diversity in properties
A concept of a mathematical object (point, line, function, etc.) can be developed to getdifferent properties, related or otherwise.
The teacher’s role was to develop students’ mathematical thinking and theirinquiring abilities. Students were taught to find some properties, and their possiblerelations to each other, through the appropriate model of teaching environment.Additionally, we considered this idea through its historical context. See Example B.
Example B: Short history of the Lemoine point
In 1809 the French mathematician L’Huillier tried to find a point inside a triangle suchthat the sum of the squares of distances from this point to the sides of the triangle is theleast. In 1820s Gauss was interested in the properties of this point in relation to hismethod of the least squares. Later German mathematician Groebe (1847) and Frenchmathematician Aussart (1848) discovered new properties of the same point.
In 1852 Belgian mathematician Catalan was investigating the properties of a point,which was the centre of gravity of the triangle MNL. He proved that the distances fromthis point to the sides of the triangle ABC are proportional to the lengths of these sides(Figure 1).

Mathematics: Essential for Learning, Essential for Life
© The Australian Association of Mathematics Teachers Inc.
272
a
b
c
xy
z
BA
C
D
M
N
L
E
G
F
Figure 1
In 1860 the German mathematician Schlomilch proved that if lines are drawnthrough the mid-points of the triangle’s sides and the mid-points of the correspondingheights, these three lines would intersect in the same point.
Finally in 1873 the French mathematician Lemoine discovered that L’Huillier,Groebe, Aussart, Catalan, Schlomilch and other mathematicians were investigating thesame point of a triangle! Since that time it was known as the Lemoine point (Cajori,1907).
This example shows there is a variety of didactical situations in which a certain pointinside a triangle can be investigated.
Inquiry activities, in a constructivist framework, are one of the most effective formsin working with gifted students. Many beautiful results in geometry can be discoveredusing different kinds of generalisation, both visual and analytical. Understanding howdifferent famous historical theorems and facts can be linked to each other through thedifferent kinds of generalisations is important, and can be developed in a classroom. Seeexample C.
Example C: Visual and analytic generalisations for bisectors’ property
We would like to demonstrate how the same geometrical object can be a source forvisual and analytic extension and generalisations. Consider the angle bisector CD(Figure 2a). If “angle bisector” is changed to “angle trisector” and appropriateintersection points joined, we have as result an equilateral triangle (MKL) known asMorley’s triangle (Gambier, 1954; Figure 2b).
On the other hand, we can make an analytic generalisation with respect to the pointD of bisector CD. We can use the well-known bisector’s property: “A bisector of atriangle divides the opposite side onto the parts, which are proportional to thecorresponding adjoining sides of this triangle”.
For generalising we consider the case, when the parts of each side of a triangle areproportional to the squares of the corresponding adjoining sides of this triangle. Theresult is the Lemoine point of a triangle, which is a point of intersection ofsymmedians.11 Construction is shown in Figure 2c.
11 A symmedian of a triangle is called a segment inside a triangle, which is symmetric to the median with respect to
the corresponding bisector and going through the same vertex of a triangle.
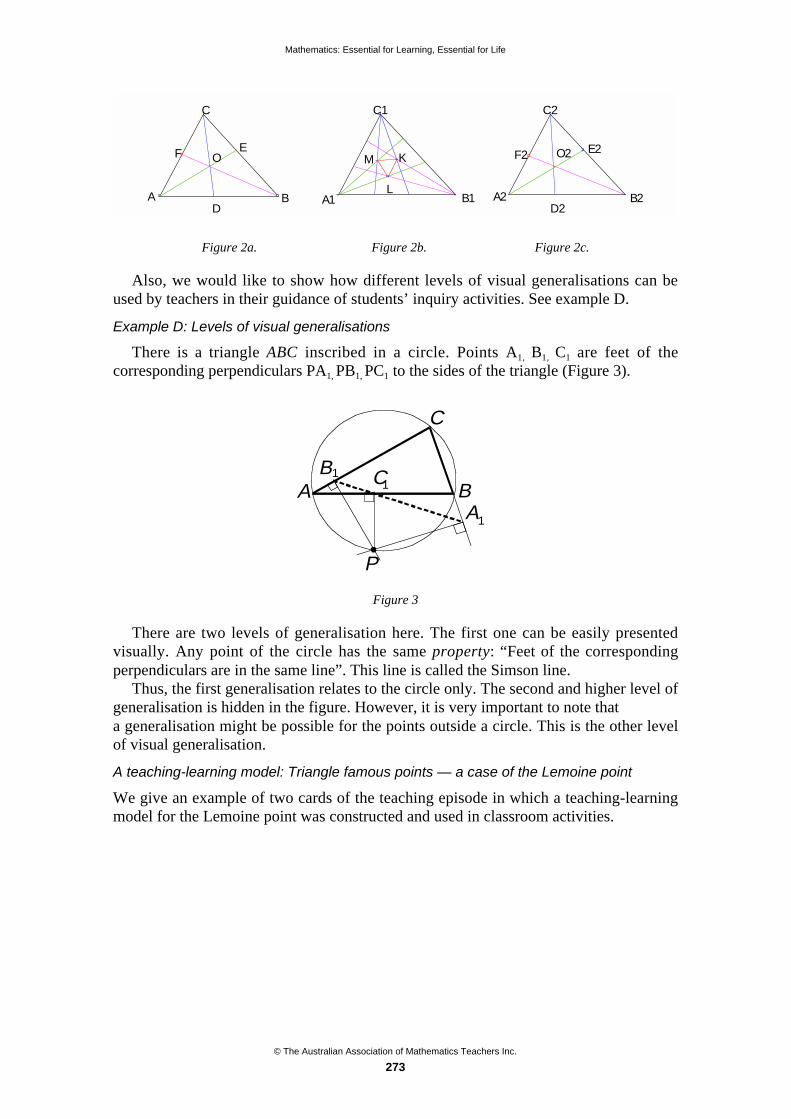
Mathematics: Essential for Learning, Essential for Life
© The Australian Association of Mathematics Teachers Inc.
273
A B
C
FE
D
O
A1 B1
C1
L
M K
A2 B2
C2
D2
F2E2O2
Figure 2a. Figure 2b. Figure 2c.
Also, we would like to show how different levels of visual generalisations can beused by teachers in their guidance of students’ inquiry activities. See example D.
Example D: Levels of visual generalisations
There is a triangle ABC inscribed in a circle. Points A1, B1, C1 are feet of thecorresponding perpendiculars PA1, PB1, PC1 to the sides of the triangle (Figure 3).
A B
C
C1
A1
B1
P
Figure 3
There are two levels of generalisation here. The first one can be easily presentedvisually. Any point of the circle has the same property: “Feet of the correspondingperpendiculars are in the same line”. This line is called the Simson line.
Thus, the first generalisation relates to the circle only. The second and higher level ofgeneralisation is hidden in the figure. However, it is very important to note thata generalisation might be possible for the points outside a circle. This is the other levelof visual generalisation.
A teaching-learning model: Triangle famous points — a case of the Lemoine point
We give an example of two cards of the teaching episode in which a teaching-learningmodel for the Lemoine point was constructed and used in classroom activities.

Mathematics: Essential for Learning, Essential for Life
© The Australian Association of Mathematics Teachers Inc.
274
The first cardInitial problem (L’Huillier): Find a point inside a triangle such that the sum of thesquares of distances from this point to the sides of the triangle is the least.
ab
c
xy
z
BA
C
D
M
N
L
Figure 4.
Very brief description of historical-mathematical neighbourhood was given inExample B.Questions-hints for students:
• What is the aim of the problem?
• The sum of the squares of distances from this point to the sides of the triangleshould be the least. We should find the point. How can we find it?
• What should we begin with?
• “To find a point” means to specify its location with respect to at least two sides ofa triangle;
• “To find a point” means to analyse an expression x2+ y2+ z2 for a minimal value.
The second cardProblem (Lemoine): A segment BK is called a symmedian if BK is symmetrical to themedian BM with respect to the bisector BL and going through the same vertex B. Showthat all symmedians intersect in the same point.
A very brief description of historical-mathematical context was given in Example B.
B
A CMK L
Figure 5
Questions-hints for students:
• How does the area of the triangle depend on the expressions x2+y2+z2 and a2+b2+c2
from the first card, if x, y, z are distances from the Lemoine point to the sides ofthe triangle and a, b, c are lengths of the sides of the triangle?
Mathematics: Essential for Learning, Essential for Life
© The Australian Association of Mathematics Teachers Inc.
275
• Draw the lines connecting corresponding vertices of a triangle with the Lemoinepoint. How do these lines divide the sides of a triangle?
Concluding remarks
Summing up the results of teachers’ response on the enrichment activities we canconfirm that almost all teachers approved the program and expressed interest indeveloping classroom inquiry work within an historical context. Teachers supported theidea that an historical perspective can help us in the work with gifted students. It wasfound that mentoring gifted students looks very promising and easy to follow, if we usea teaching-learning environment, which provides a logical structure and historicalbackground for inquiry activities.
More activity development and research is needed, and more is planned.
References
Brown, S. I. & Walter, M. I. (1990). The art of problem posing. Mahwah, New Jersey: LEA.
Cajori, F. (1907). A history of elementary mathematics, New York: Macmillan.
Davis, P. J. (1995). The Rise, fall and possible transfiguration of triangle geometry: A mini-history, TheAmerican Mathematical Monthly, Vol.102, No.3, 204–214.
Edwards, L. (1997). Exploring the territory before proof: Students’ generalizations in a computermicroworld for transformation geometry. International Journal of Computers for MathematicalLearning, 2, 187–215.
Gray, E., Pinto, M., Pitta, D., Tall, D. (2000). Knowledge construction and diverging thinking inelementary and advanced mathematics. Educational Studies in Mathematics, 38, 111–133.
Hayes, R. L. (1991). History — a way back to mathematics, History and Pedagogy of MathematicsNewsletter, 22, 10–12.
Kronfellner, M. (1996). The history of the concept of function and some implications for classroomteaching. Vita Mathematica. Historical research and integration with teaching, in R.Calinger (Ed.),MAA, 317–321.
Mackay, J. S. (1982–3). Early history of the symmedian point, Proc. Edin. Math. Soc., Vol.11, 92–103.
Mercer, N. (1995). The guided construction of knowledge: Talk amongst teachers and learners. Toronto:Multilingual Matters Ltd.
Stoyanova, E. (2000). Empowering students’ problem solving via problem posing: The art of framing“good” questions, Australian Mathematics Teacher, Vol.56, No.1, 33–37.
Yevdokimov, O. (2003). Intuitive proofs as a tool for development of student’s creative abilities whilesolving and proving. In N. A. Pateman, B. J. Doherty & J. Zilliox (Eds), Proc. 27th Conf. of the Int.Group for the Psychology of Mathematics Education (Vol. 1, p. 264). Honolulu, USA: PME.
Yevdokimov, O. (2006a). Using materials from the history of mathematics in discovery-based learning,Proceedings of the ICME-10 Satellite Meeting of the International Study Group on the Relationsbetween the History and Pedagogy of Mathematics (HPM), Revised Edition, 306–314.
Yevdokimov, O. (2006b). Inquiry activities in a classroom: Extra-logical processes of illumination vslogical process of deductive and inductive reasoning. A case study, Proceedings of the 30th
Conference of the International Group for the Psychology of Mathematics Education (PME), v.5,441–448.
© The Australian Association of Mathematics Teachers Inc.
276
Working smarter, not harder
Alexander Young
Society’s pressure on schools to widen the school curriculum has meant thatteachers have come under increasing pressure to work even harder. Whether thepoor performance of Australian students’ in the 2002 TIMSS tests are, in part,related to this, is unclear. The aim of this paper is to demonstrate how teacherscan work smarter, not harder to achieve considerable improvement in studentoutcomes.This paper will show it is possible to process the responses of 30 students’ work inless than 2 minutes using AutoMarque software. This computer software programtransfers paper-based multiple choice responses to computer using a photocopieror sheet fed scanner. Within two minutes AutoMarque will:• reveal the quality of prior teaching by providing the results per question and
the class performance per strand of learning.• indicate the quality of each question.• expose gaps in individual student learning which usually go unnoticed when
assessing for learning.• supply “weighted student results” by taking into account the difficulty of each
question.
Introduction
Most of my work over the last five years can be summed up in Gullick’s comment that:“research shows the only thing proven to improve students’ learning was improvingteaching — not smaller classes, charter schools, vouchers, smaller learningcommunities or even curriculum reforms” (Gullick, p. 1). Therefore, if we are to helpteachers to improve their teaching, helping them to work smarter, and not harder, shouldbe the way ahead.
Frequent formative assessment is often both time-consuming and frustrating. Thisneed not be the case. Assessment for learning, once set in place, can be easily andquickly achieved, resulting in improved student outcomes.
This paper is designed to demonstrate that teachers can:
• easily achieve quantified self analysis of their teaching
• save considerable time in assessment for learning
• identify previously undisclosed gaps in student learning
• quantify the quality of their questions and the overall reliability of assessments
• obtain weighted and non weighted student results.
In the current climate, where government driven summative assessment is sweepingthe Western World, the education profession has responded, in many instances, byhaving teachers work even harder as a UK study found: “Teachers and headteacherswork more intensive weeks than other comparable managers and professionals”(Pricewaterhouse Coopers, p.1).

Mathematics: Essential for Learning, Essential for Life
© The Australian Association of Mathematics Teachers Inc.
277
At best, summative assessment can be seen as a post course marker. Assessment forlearning, or formative assessment, is seen as the path to learning achievement.Broadfoot states “Genuine improvement in the effectiveness of learning actuallyrequires a major rethink in the way assessment is used.”
Therefore, systems which are based on a summative assessment are “fundamentallyflawed in that they do not take into account the relationship between assessment andlearning” (Broadfoot, p. 24)
The Australian House of Representatives Standing Committee on Education andVocational Training (2007), in its report “Top of the Class,” listed the features of highquality teaching practice. A high quality teaching practice: “integrates theoreticalknowledge and professional practice across the three domains of a teacher educationprogram; ‘content’ knowledge gained through a liberal education, professionalknowledge, pedagogical skills and insights” and “assesses against clear delineations ofpurposes, roles and expectations of TEI student activity and performance” (House ofRepresentatives Standing Committee on Education and Vocational Training, pp.73–74).
In his book “Evidence Based Teaching,” Petty cites Hattie as an international pioneerand world expert on successful learning. He quotes Hattie as subscribing to threeprinciples:
• Achievement is enhanced to the degree that students and teachers set andcommunicate appropriate, specific and challenging goals.
• Achievement is enhanced as a function of feedback.• Increases in student learning involve … reconceptualisation of learning (Petty
p. 63).
It appears clear that if teachers can adopt Hattie’s methodology their teachingeffectiveness will improve. In other words, successful learning:
• sets out a series of “mile posts” (challenging goals) in their teaching plan
• verifies student achievement through frequent feedback, and
• reconceptualises their teaching as a result of this feedback
Revealing that which would otherwise not be known
Broadfoot asserts that “Teachers’ professional understanding in relation to assessmenthas typically been one of the least well-developed aspects of their expertise” (p. 35).The best teaching practice is limited, especially when dealing with students whose basicgrounding is missing. This is a major cause of student disenchantment, disruptivebehaviour, absenteeism and early drop out from school.
One of the contributing factors to this state of affairs has been our profession’sinability to identify specific gaps in student learning that were not diagnosed oraddressed, early in a student’s education. Consequently, the classroom teacher is facedwith this dilemma: “Where do I start to try and fill in the gaps in students’ grounding,when they are moved up the ladder of schooling regardless of their level of success?”
Given the results from the House of Representatives Standing Committee onEducation and Vocational Training, the PriceWaterHouse Coopers UK study, andHattie/Petty’s research, educators need to have time-saving and insightful resources.These would assist them to be efficient and effective practitioners rather than justoverworked and bogged down with unrealistic expectations of the general public.
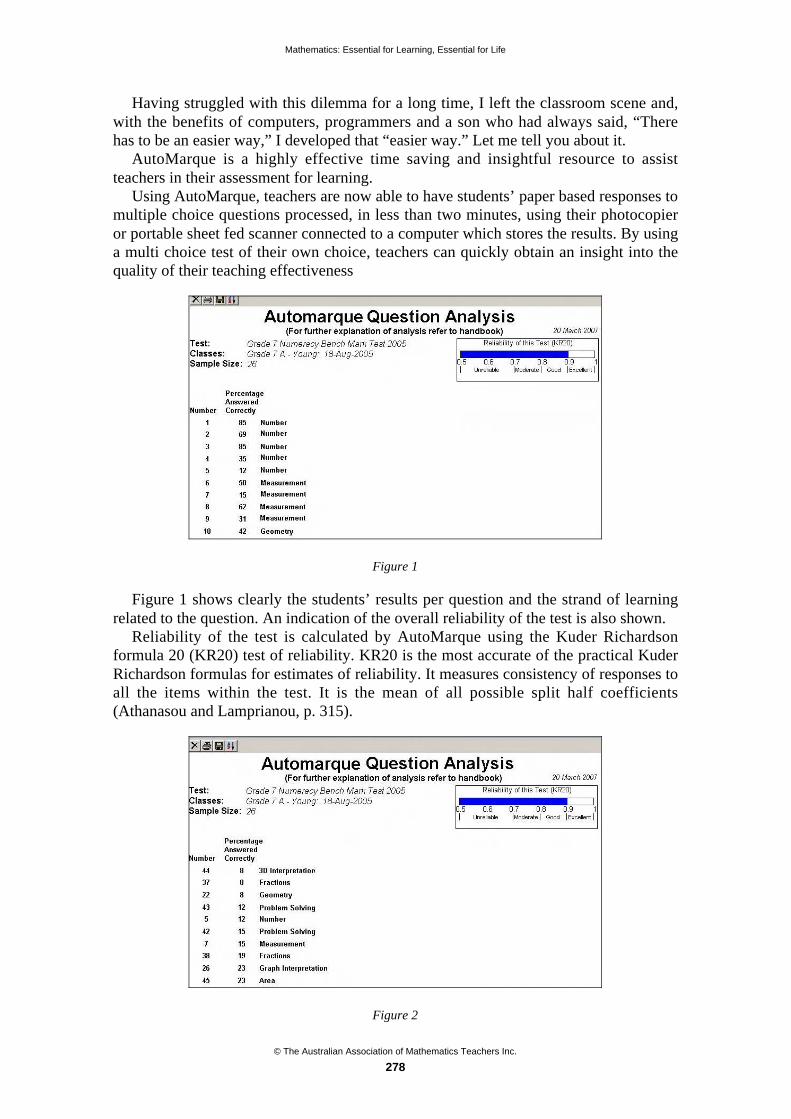
Mathematics: Essential for Learning, Essential for Life
© The Australian Association of Mathematics Teachers Inc.
278
Having struggled with this dilemma for a long time, I left the classroom scene and,with the benefits of computers, programmers and a son who had always said, “Therehas to be an easier way,” I developed that “easier way.” Let me tell you about it.
AutoMarque is a highly effective time saving and insightful resource to assistteachers in their assessment for learning.
Using AutoMarque, teachers are now able to have students’ paper based responses tomultiple choice questions processed, in less than two minutes, using their photocopieror portable sheet fed scanner connected to a computer which stores the results. By usinga multi choice test of their own choice, teachers can quickly obtain an insight into thequality of their teaching effectiveness
Figure 1
Figure 1 shows clearly the students’ results per question and the strand of learningrelated to the question. An indication of the overall reliability of the test is also shown.
Reliability of the test is calculated by AutoMarque using the Kuder Richardsonformula 20 (KR20) test of reliability. KR20 is the most accurate of the practical KuderRichardson formulas for estimates of reliability. It measures consistency of responses toall the items within the test. It is the mean of all possible split half coefficients(Athanasou and Lamprianou, p. 315).
Figure 2
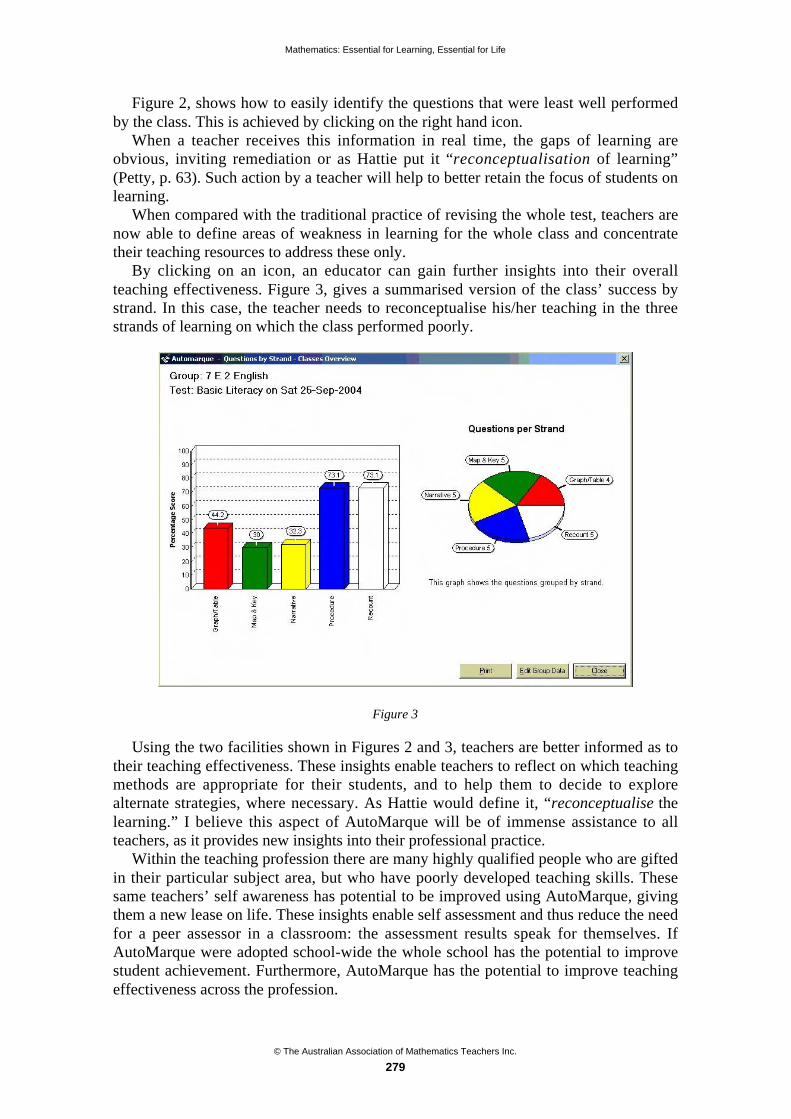
Mathematics: Essential for Learning, Essential for Life
© The Australian Association of Mathematics Teachers Inc.
279
Figure 2, shows how to easily identify the questions that were least well performedby the class. This is achieved by clicking on the right hand icon.
When a teacher receives this information in real time, the gaps of learning areobvious, inviting remediation or as Hattie put it “reconceptualisation of learning”(Petty, p. 63). Such action by a teacher will help to better retain the focus of students onlearning.
When compared with the traditional practice of revising the whole test, teachers arenow able to define areas of weakness in learning for the whole class and concentratetheir teaching resources to address these only.
By clicking on an icon, an educator can gain further insights into their overallteaching effectiveness. Figure 3, gives a summarised version of the class’ success bystrand. In this case, the teacher needs to reconceptualise his/her teaching in the threestrands of learning on which the class performed poorly.
Figure 3
Using the two facilities shown in Figures 2 and 3, teachers are better informed as totheir teaching effectiveness. These insights enable teachers to reflect on which teachingmethods are appropriate for their students, and to help them to decide to explorealternate strategies, where necessary. As Hattie would define it, “reconceptualise thelearning.” I believe this aspect of AutoMarque will be of immense assistance to allteachers, as it provides new insights into their professional practice.
Within the teaching profession there are many highly qualified people who are giftedin their particular subject area, but who have poorly developed teaching skills. Thesesame teachers’ self awareness has potential to be improved using AutoMarque, givingthem a new lease on life. These insights enable self assessment and thus reduce the needfor a peer assessor in a classroom: the assessment results speak for themselves. IfAutoMarque were adopted school-wide the whole school has the potential to improvestudent achievement. Furthermore, AutoMarque has the potential to improve teachingeffectiveness across the profession.

Mathematics: Essential for Learning, Essential for Life
© The Australian Association of Mathematics Teachers Inc.
280
Students at the centre
Assessment of and for learning, as detailed above, has great potential to assist teachersimprove the quality of their teaching, but will not necessarily deliver insights intoindividual student needs. Individual student results, by strand of learning, comparedwith their peer group are obtained on the click of a mouse (Figure 4). This provides apowerful insight into an individual student’s needs. In this instance the child’s teacherwas not aware that this gap existed. As Chris had out performed his peer group in all theother strands of learning, his deficiency was masked.
How many other students’ needs are going un-noticed?
Figure 4
AutoMarque’s student strand analysis result sheet is of great assistance whencounselling a student, his/her parents and the teacher’s supervisor, that intervention isrequired. As AutoMarque stores test results, a history of student achievement is readilyretrievable and student progress easily, and clearly, demonstrated.
If the teacher knows the school, state or national average achievement per strand of astandardised test, the teacher can edit the group data so the individual student’s resultscan be compared with that group.
Identification of quality questions
There are considerable resources available on the Internet, often in PDF format, forteachers to acquire. The quality of these questions can be assessed by AutoMarque.AutoMarque requires a minimum of 100 students to have completed an identical testbefore the question quality analysis can take place.
In Figure 5, five classes have completed an identical test. As the group using the testexceeds 100, there is an analysis of each question for 130 candidates as well as anindication of the test’s reliability.
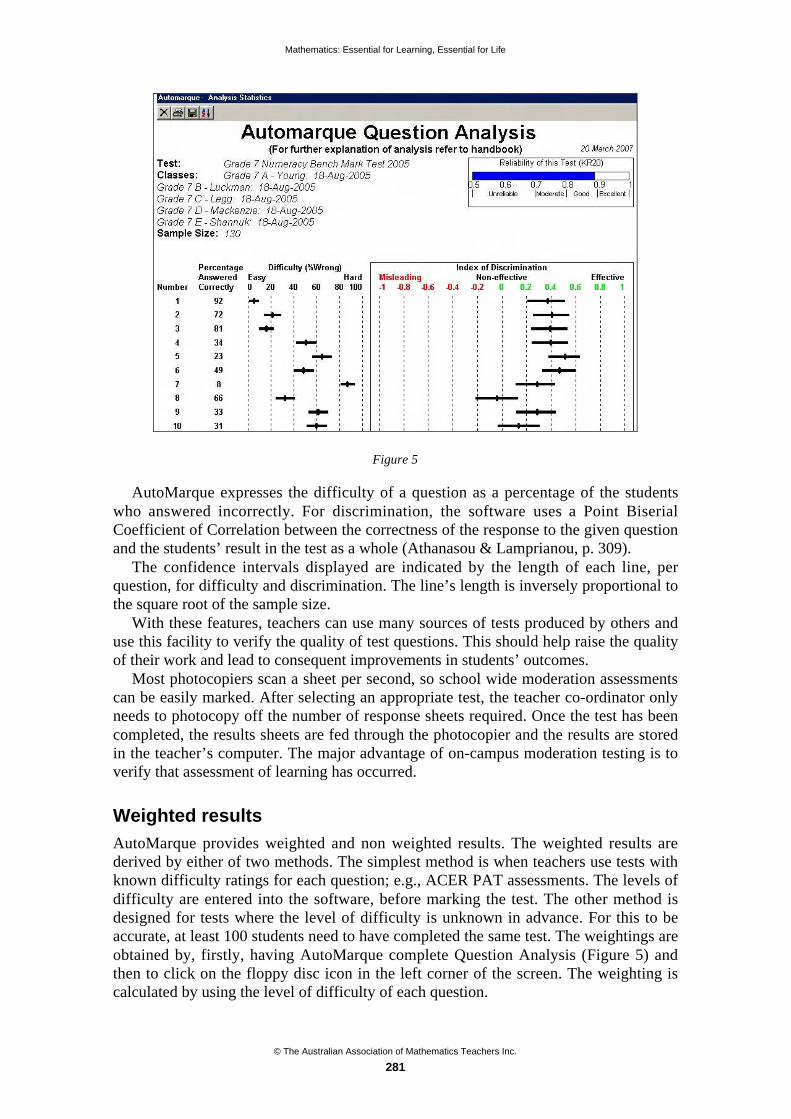
Mathematics: Essential for Learning, Essential for Life
© The Australian Association of Mathematics Teachers Inc.
281
Figure 5
AutoMarque expresses the difficulty of a question as a percentage of the studentswho answered incorrectly. For discrimination, the software uses a Point BiserialCoefficient of Correlation between the correctness of the response to the given questionand the students’ result in the test as a whole (Athanasou & Lamprianou, p. 309).
The confidence intervals displayed are indicated by the length of each line, perquestion, for difficulty and discrimination. The line’s length is inversely proportional tothe square root of the sample size.
With these features, teachers can use many sources of tests produced by others anduse this facility to verify the quality of test questions. This should help raise the qualityof their work and lead to consequent improvements in students’ outcomes.
Most photocopiers scan a sheet per second, so school wide moderation assessmentscan be easily marked. After selecting an appropriate test, the teacher co-ordinator onlyneeds to photocopy off the number of response sheets required. Once the test has beencompleted, the results sheets are fed through the photocopier and the results are storedin the teacher’s computer. The major advantage of on-campus moderation testing is toverify that assessment of learning has occurred.
Weighted results
AutoMarque provides weighted and non weighted results. The weighted results arederived by either of two methods. The simplest method is when teachers use tests withknown difficulty ratings for each question; e.g., ACER PAT assessments. The levels ofdifficulty are entered into the software, before marking the test. The other method isdesigned for tests where the level of difficulty is unknown in advance. For this to beaccurate, at least 100 students need to have completed the same test. The weightings areobtained by, firstly, having AutoMarque complete Question Analysis (Figure 5) andthen to click on the floppy disc icon in the left corner of the screen. The weighting iscalculated by using the level of difficulty of each question.

Mathematics: Essential for Learning, Essential for Life
© The Australian Association of Mathematics Teachers Inc.
282
Some of the results per student are shown (Figure 6) with weighted results shown as“W%”. This column of results will change to unweighted when one “double clicks” onits title. There were 30 students in the class shown and the software automaticallyaveraged the results.
Figure 6
Research using AutoMarque software has found that when weighted scores are used,the spread of student results usually increases.
The work of Thomson and Fleming has demonstrated that Australia has a “large tail”of intermediate and low performing students in the TIMSS 2002 tests. This “tail”appears to be larger than many nations (Figure 7). In this case it is dramatic comparedwith Singapore.
Figure 7 (from Thomson & Fleming, p. 68).
There may be many reasons for this, two being of prime importance. These are:
• society’s pressure on schools to widen the curriculum has meant that teachers arerequired to address a variety of issues, traditionally not the role of the teacher;
• teachers have not had insightful tools available for their use to conduct assessmentfor learning, quickly — this appears to have resulted in large numbers of studentneeds not being addressed.
The potential benefit of AutoMarque’s weighted results is that the less wellperforming students will stand out more readily, as shown in Figure 4. In this way, their
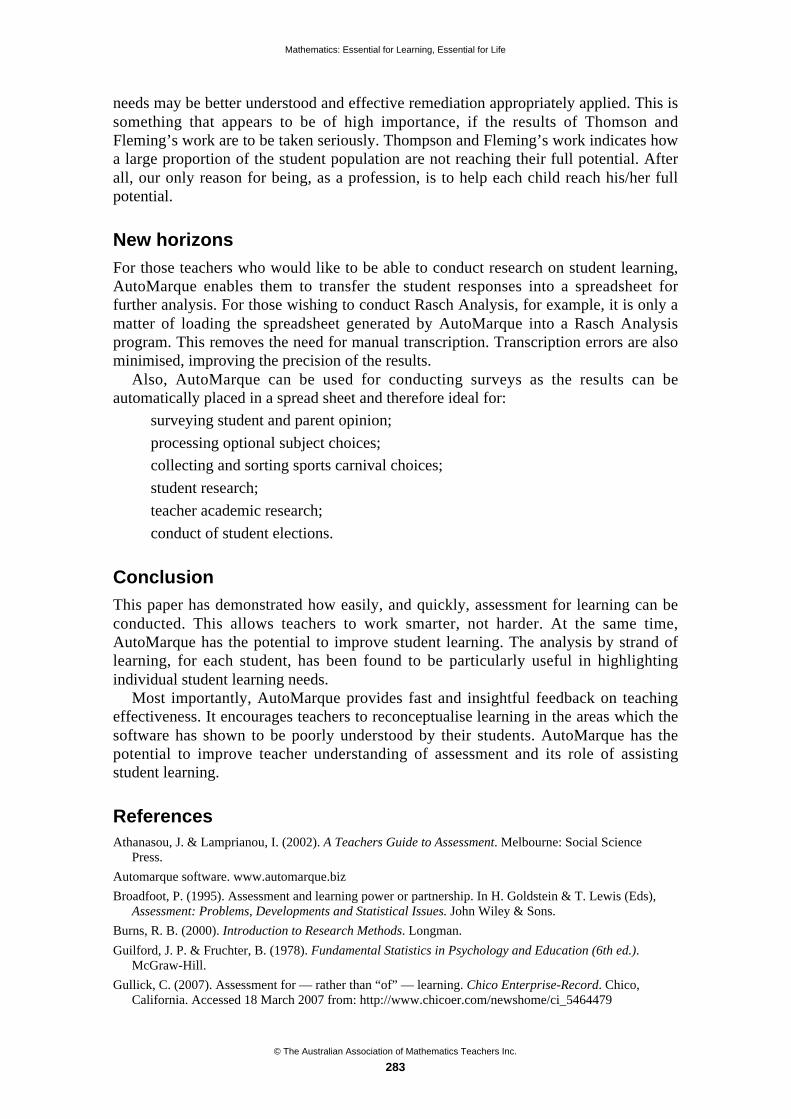
Mathematics: Essential for Learning, Essential for Life
© The Australian Association of Mathematics Teachers Inc.
283
needs may be better understood and effective remediation appropriately applied. This issomething that appears to be of high importance, if the results of Thomson andFleming’s work are to be taken seriously. Thompson and Fleming’s work indicates howa large proportion of the student population are not reaching their full potential. Afterall, our only reason for being, as a profession, is to help each child reach his/her fullpotential.
New horizons
For those teachers who would like to be able to conduct research on student learning,AutoMarque enables them to transfer the student responses into a spreadsheet forfurther analysis. For those wishing to conduct Rasch Analysis, for example, it is only amatter of loading the spreadsheet generated by AutoMarque into a Rasch Analysisprogram. This removes the need for manual transcription. Transcription errors are alsominimised, improving the precision of the results.
Also, AutoMarque can be used for conducting surveys as the results can beautomatically placed in a spread sheet and therefore ideal for:
• surveying student and parent opinion;
• processing optional subject choices;
• collecting and sorting sports carnival choices;
• student research;
• teacher academic research;
• conduct of student elections.
Conclusion
This paper has demonstrated how easily, and quickly, assessment for learning can beconducted. This allows teachers to work smarter, not harder. At the same time,AutoMarque has the potential to improve student learning. The analysis by strand oflearning, for each student, has been found to be particularly useful in highlightingindividual student learning needs.
Most importantly, AutoMarque provides fast and insightful feedback on teachingeffectiveness. It encourages teachers to reconceptualise learning in the areas which thesoftware has shown to be poorly understood by their students. AutoMarque has thepotential to improve teacher understanding of assessment and its role of assistingstudent learning.
References
Athanasou, J. & Lamprianou, I. (2002). A Teachers Guide to Assessment. Melbourne: Social SciencePress.
Automarque software. www.automarque.biz
Broadfoot, P. (1995). Assessment and learning power or partnership. In H. Goldstein & T. Lewis (Eds),Assessment: Problems, Developments and Statistical Issues. John Wiley & Sons.
Burns, R. B. (2000). Introduction to Research Methods. Longman.
Guilford, J. P. & Fruchter, B. (1978). Fundamental Statistics in Psychology and Education (6th ed.).McGraw-Hill.
Gullick, C. (2007). Assessment for — rather than “of” — learning. Chico Enterprise-Record. Chico,California. Accessed 18 March 2007 from: http://www.chicoer.com/newshome/ci_5464479

Mathematics: Essential for Learning, Essential for Life
© The Australian Association of Mathematics Teachers Inc.
284
House of Representatives Standing Committee on Education and Vocational Training (2007). ‘Top of theClass’, Report on the Inquiry into Teacher Education. Canberra: The Parliament of theCommonwealth of Australia.
Petty, G. (2006). Evidence Based Teaching. Nelson Thornes.
Popham, W. J. & Sirotnik, K. A. (1973). Educational Statistics Use and Interpretation (2nd ed.). Harper& Row.
Pricewaterhouse Coopers (2001). Teacher Workload Study.
Richardson, M. W. & Kuder, G. F. (1939). The calculation of test reliability coefficients based upon themethod of rational equivalence. Journal of Educational Psychology, 30, 681–687.
Thomson, S. & Fleming, N. (2002). Summing it up. Mathematics Achievement in Australian Schools inTIMSS: (TIMSS Australia Monograph No. 6). ACER.

© The Australian Association of Mathematics Teachers Inc.
285
Workshops
© The Australian Association of Mathematics Teachers Inc.
286
Mathematics extension groupsat Melbourne High School*
Ian Bull
Melbourne High School
Melbourne High School (boys only) is one of two select-intake government schoolsin Victoria where students achieve outstanding results across all studies. As thecoordinator of the High Achieving Student Program, I have had the privilege ofworking with the mathematically elite in the school at Years 9 and 10 for manyyears. I have devised materials that are undertaken by students, chosen toparticipate in the program, with such questions as: “If a capacity crowd at theMCG was to be evacuated onto the playing surface of the ground, would they fit?”Given neither dimensions nor formulae is a favourite and frees up the minds ofstudents to discussion/argument. All aspects of the program will be discussed.
Melbourne High School (boys only, Years 9 to 12) is one of two select-intakegovernment schools in Victoria. Melbourne High School’s curriculum is derived fromthe fact that at Year 9 students arrive after satisfying the standards of the entranceexamination at a number of different, albeit a high, set of different levels. The generalcurriculum offering at Years 9 and 10 is designed to address transition issues and isbased on the expectation that students will have the ability, and the desire, to bechallenged through a broad education. It is school policy that students not beaccelerated beyond their current year level; that is Year 9 and 10 students studyconcepts suitable to those levels, however, given the level of performance of thestudents at these levels, the mathematics faculty supplies additional enrichment materialthroughout the courses designed to apply the concepts to more complex tasks. This isdelivered via the text series: Maths Dimensions 9 and 10 (Pearson) where anenrichment section follows each chapter.
In addition, the mathematics program targets the top 10% of the students in Years 9and 10 to undertake further tasks of a more challenging nature. These “high-achieving”students are presented with a program of non-routine tasks. The groups are called theYear 9 and Year 10 maths extension groups, respectively.
The mathematics extension groups
As a lover of mathematics, along with the language of logic, the opportunity to workwith students of a high calibre is a fantastic opportunity for advancement to allinvolved. To work with these students, where they argue and fight over the finer pointsof mathematical thought, is a special experience.
* Paper accepted by peer review

Mathematics: Essential for Learning, Essential for Life
© The Australian Association of Mathematics Teachers Inc.
287
Picture a room full of students from Years 9 or 10: assembled separately once afortnight, working – thinking – arguing – seemingly fighting (intellectually) and thereyou have it. The students engage in a mathematical jousting match either teaming upwith others or working alone to tackle the current fortnightly challenging problem(s).For these boys mathematical conundrums are the vehicle for discussion, exploration andlearning. A difference of mathematical opinion is an occasion for open debate — a freefor all — a time to convince other participants of the validity of the logical conclusionsof their solution. This is the ultimate meeting of mathematical minds, where all arechallenged to reach their potential.
Structuring the mathematics extension programs
Operating the Year 9 and 10 programs requires the selection of appropriate students, tofind a time that suits all participants, to provide interesting material and, finally, to havethe energy and belief to oversee such a program. Let me examine each dimensionseparately.
Selecting the students
Student selection into the program needs to be fair and open to all students in the yearlevel. It must not be subject to any form of favouritism. A method of selecting studentsto participate in the program is done by:
• undertaking a series of tests — IQ, reference to entrance exam data, otherexternally derived tests;
• teacher recommendation — this is a very accurate indication but needs to happenafter a number of weeks in to the semester. The mathematically elite studentsshow themselves to their teachers in the classroom environment — it is the mostefficient way to find them.
Finding a time for the program
In general, school programs are under continual pressure, where the time required foradditional programs such as drug education, pastoral care, work education, workexperience, sex education, driver education, and so on, impinge on the time thatmathematics occupies in the curriculum. Time for a program such as this cannot easilybe found within the normal teaching program. At Melbourne High School the only timeto run this program is a negotiated fortnightly lunchtime, as the timetable operates on aten day cycle, which suits all selected students.
Having students commit to the program
Students can start off well committing to the program, however, this initial enthusiasmcan ebb away. Students need to commit to the full program and this is ensured by thecompletion of a contract whereby the supervising teacher and each student, and theirparents, sign an agreement detailing aspects of content, assessment requirements andthe date or timing of the program. This process formalises the program and overcomesproblems later when students withdraw from it, yet claim credit for the part that theyhave completed. My time is valuable and I require a full commitment from theparticipating students to complete the program and show their work in progress for eachtask. This is an attempt to overcome plagiarism of others’ work where students showtheir initial response to the problem.

Mathematics: Essential for Learning, Essential for Life
© The Australian Association of Mathematics Teachers Inc.
288
Sample contract
Melbourne High School High Achieving Students Program, 2007STUDENT NAME: Thomas Ng-Santomartino FORM: 10H
SUBJECT/COURSE AREA: Mathematics
SUPERVISING STAFF MEMBER: Mr BullThe content to be coveredThomas has been selected into the Year 10 Maths Extension Group which will meetonce a fortnight at lunchtime during Terms 2 and 3. Eight challenging questions will bedistributed during these sessions covering a wide variety of unusual and non-routineMaths topics.Assessment methodTo obtain a satisfactory grading:• A complete response to the eight extension questions needs to be submitted including
a reflection statement for each task.• All work is to be submitted in a bound workbook with an index showing the
placement of all questions undertaken.• Parents/guardians need to sign the beginning and end of each task in the workbook to
show that they have seen the work undertaken by the student.• The supervising staff member the student and their parent/guardian need to provide
comments on the completion and reflection of their work both before and at thecompletion of their work and sign the following relevant sections.
Date for submission of workAll work needs to be submitted at the end of Term 3.BEFORE WORK ON THE UNIT OF WORKSTUDENT STATEMENT:I am pleased to be selected into this group of the best maths students in Year 10 and willwork through all the work that is expected.
Signature:PARENT STATEMENT:We will track the progress of Thomas as he works through the tasks given to him.
Signature:
AT THE CONCLUSION OF THE EXTENSION UNIT:STAFF COMMENT:Thomas Ng-Santomartino completed all the questions required on time showing a fullrange of sophisticated methods of solution. Well done, you are a talented student andyour enthusiastic approach shows that you enjoyed the challenge.STUDENT COMMENT:The work was at times challenging but I enjoyed working through each question.PARENT COMMENT:Thomas Ng-Santomartino worked through this work with us looking over it. We arepleased to see the school providing him with work of a more difficult nature and havelooked through his bookwork.
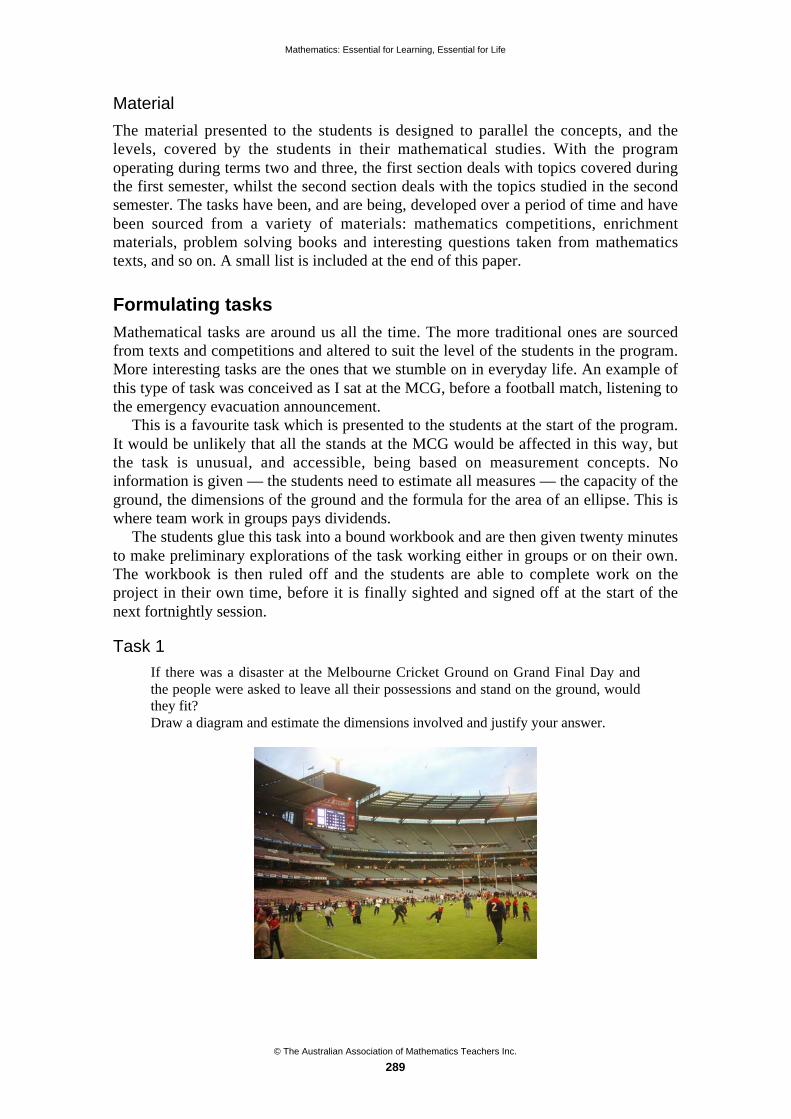
Mathematics: Essential for Learning, Essential for Life
© The Australian Association of Mathematics Teachers Inc.
289
Material
The material presented to the students is designed to parallel the concepts, and thelevels, covered by the students in their mathematical studies. With the programoperating during terms two and three, the first section deals with topics covered duringthe first semester, whilst the second section deals with the topics studied in the secondsemester. The tasks have been, and are being, developed over a period of time and havebeen sourced from a variety of materials: mathematics competitions, enrichmentmaterials, problem solving books and interesting questions taken from mathematicstexts, and so on. A small list is included at the end of this paper.
Formulating tasks
Mathematical tasks are around us all the time. The more traditional ones are sourcedfrom texts and competitions and altered to suit the level of the students in the program.More interesting tasks are the ones that we stumble on in everyday life. An example ofthis type of task was conceived as I sat at the MCG, before a football match, listening tothe emergency evacuation announcement.
This is a favourite task which is presented to the students at the start of the program.It would be unlikely that all the stands at the MCG would be affected in this way, butthe task is unusual, and accessible, being based on measurement concepts. Noinformation is given — the students need to estimate all measures — the capacity of theground, the dimensions of the ground and the formula for the area of an ellipse. This iswhere team work in groups pays dividends.
The students glue this task into a bound workbook and are then given twenty minutesto make preliminary explorations of the task working either in groups or on their own.The workbook is then ruled off and the students are able to complete work on theproject in their own time, before it is finally sighted and signed off at the start of thenext fortnightly session.
Task 1
If there was a disaster at the Melbourne Cricket Ground on Grand Final Day andthe people were asked to leave all their possessions and stand on the ground, wouldthey fit?Draw a diagram and estimate the dimensions involved and justify your answer.

Mathematics: Essential for Learning, Essential for Life
© The Australian Association of Mathematics Teachers Inc.
290
Solution: Task 1
The initial estimate required is that of the dimensions of the ground. The fifty metre linemarked at each end of the ground could be used as a guide.The Melbourne Cricket Ground is in an elliptical shape as shown.
The area of an ellipse is as follows:
Area = ab
The accurate area of this ellipse is: Area = 74.5 86.5 20 245 m2
The next question then is to estimate the number of people that could fit into onesquare metre. It would perhaps be reasonable to suggest that 4 people could fit into onesquare metre or that each person would take up 0.25 m2 of space.
This would certainly be true if some of the people were children, although the issueof children keeping still, whilst packed tight on the ground with the emergency going onaround them, could be debated.
Theoretically then, 4 20 245 = 80 980 people.Mathematical arguments — such as to the reasonableness of this estimate or to how
people could be assembled on the surface to enable such packing — are invited andwould need to be made in order to justify the solution; it is up to the students to justifytheir solution.

Mathematics: Essential for Learning, Essential for Life
© The Australian Association of Mathematics Teachers Inc.
291
Case study — formulation of an extension task, Task 2
Often in our teaching of classes at a higher level interesting questions are raised whichcan be adapted to tasks of lower levels.
This task grew out of a question asked by a Year 11 student whilst working throughthe topic of sequences and series in a General Specialist Mathematics class from the textGeneral Maths Dimensions — An Advanced Course (Bull & Nolan). Often questionsand tasks examined at a higher level can be repackaged into a task suitable for use in theMaths Extension Program.
Task 2
An arithmetic sequence is a set of numbers which continues in a pattern by addinga constant difference to generate the next term. The terms of an arithmeticsequence with a first term of a and a common difference of d is:{a, a + d, a + 2d, a + 3d,…).The symbols for the first term is t1, t2, t3 with tn being the nth term in the sequence.(a) Show that the nth term of an arithmetic sequence is given by tn = a + (n–1)d,
hence find an expression for (i) 1n
t+ (ii)
a
d
t (iii) a
d
t .
The sum of n terms of an arithmetic sequence is given the symbol Sn.
The general rule for the sum of n terms is: Sn =n
22a + (n 1)d( ) .
(b) The sum of an arithmetic sequence is 2n 2. Using the methods (i) ofgenerating the sum of terms in the sequence and (ii) using algebra find thevalues of a and d hence find the first three terms of the sequence.
Solution: Task 2
(a) t1 = a, t2 = a + d, t3 = a + 2d, t4 = a + 3d,… so by observation the coefficient of d isone less than the term number, i.e., n. Hence(i) tn +1 = a + n +1 1( )d = a + nd
(ii) t a
d
= a +a
d1
d = a + a d = 2a + d
(iii) t a
d
= a +a
d1
d = a a d = d
(b) This produces an interesting mathematical scenario.(i) S1 = t1 = 2(1)2 = 2
S2 = t1 + t2 = 2(2)2 = 8, t2 = 8 – t1 = 8 – 2 = 6, so the sequence is (2, 6)S3 = t1 + t2 + t3 = 2(3)2 = 18, t3 = 18 – (t1 – t2) = 18 – 8 = 10, so thesequence is (2, 6, 10)Hence a = 2 and d = 4.
(ii) Sn =n
22a + (n 1)d( ) = an +
dn2
2
dn
2= 2n2
Equating coefficients:
n2: d
2= 2 , d = 4
n1: ad
2= 0 , for d = 4, a – 2 = 0 a = 2
The sequence using the first term of a with a common difference d of 4: (2, 6, 10)
Mathematics: Essential for Learning, Essential for Life
© The Australian Association of Mathematics Teachers Inc.
292
In this task for part (b) a Year 11 student approached the question from a formulaapproach — because for him the solution of mathematics problems was based about theapplication of a suitable formula.
Reaching the step: an +dn2
2
dn
2= 2n2, with one equation and three unknowns, this
working step stopped this student in his tracks. I showed him the Part (b) (i) approachwhich required him to think of the information in a different way — using a problemsolving approach and then wondered why his algebraic approach had met a dead end. Ithen saw the algebraic line in terms of powers of n and achieved a solution by equatingthe coefficients of n as shown in the solution above.
This example was presented to the class, where they were led through thinkingprocesses highlighting where, if a problem can be appreciated from various views,multiple solution processes can be applied. This led to a discussion of the power ofmathematics as a problem solving tool — an algebraic or “apply the formula” approachis a disappointing simple method which most students depend on to solve the type ofquestions that we often manufacture.
Often in the traditional, mainstream, classroom with time restrictions and so on,mathematics is reduced to the use of formulae. The strength of this Extension Programis to present students with a series of non-routine, thought providing, experiences whichare intriguing and require the students to be adaptable thinkers, according to theproblem situation.
Reference materials
These are best collected over time from a variety of sources, both local and overseas. Ashort list might be:Mathematics competitions such as
• Australian Mathematics Competition: AMT• University of NSW: ICAS• Maths Challenge: AMT• Maths enrichment stages: AMT• IBM – Melbourne University Maths competition
Useful reference materials• Set of books: Can you solve these: Tarquin publications• Edwards, King O’Halloran. All the best from the Australian Maths Competition.
Australian Mathematics Trust.• Soifer. Mathematics as Problem Solving.• Canadian Mathematics Competition. Problems, Problems, Problems. University
of Waterloo.• Bull (2001). Maths practice and tests 7&8. Melbourne: Phoenix Education• Bull (2007). Extension Maths for Years 9 and 10. Melbourne: Phoenix Education.• O’Halloran, Pollard, Taylor (1985–1991). Australian Mathematics Competition
Books 1&2. Australian Mathematics Trust.• Bull (2005). General maths dimensions: an advanced course. Units 1&2. Pearson
Education Australia.• Bull Ian (2006). Maths dimension 9, 10: essential learning. Pearson Education
Australia
Reference
Bull & Nolan. General Maths Dimensions — An Advanced Course. Pearson Education.
© The Australian Association of Mathematics Teachers Inc.
293
Out of the square, into reality: Bringingmathematics and science into the real world*
Terry Byers
West Moreton Anglican College
Les Dawes
Queensland University of Technology
The project “Out of the Square and into Reality” is a dynamic and collaborativepartnership between the Queensland University of Technology, five Brisbaneschools (West Moreton Anglican College, St Peters Lutheran College, KelvinGrove State College, Marsden State High School and Moreton Bay College),private industry and a state government agency. The project has been selected as aparticipant in the Australian School Innovation in Science, Technology andMathematics (ASISTM) project, which is funded by the CommonwealthGovernment through the Department of Education, Science and Technology.
Introduction
The project’s creation and its collaborative nature are an attempt to arrest the significantproblem facing secondary schools, universities and industry of attracting and retaininghigh quality and appropriately prepared individuals (Hylton & Otoupal, 2005; Orlich,Thomson & Zollars, 2005; Zarske, Kotys-Schwartz, Sullivan & Yowell, 2005). Theproblem begins in secondary school, with a declining number of students, particularlygirls, studying senior mathematics and science subjects (Felder & Brent, 2005;Goodrum, Hackling & Rennie, 2000; Orlich et al., 2005). The underlying issues for thispredicament include: deteriorating school student interest; negative student perceptionstowards gender difference; perceptions of students who study mathematics and scienceas being “nerdy”; and competition from a new wave of business subjects andhistorically “female-friendly” humanity subjects (Hylton & Otoupal, 2005; Jolly, Goos& Smith, 2005). This is further exacerbated by students lacking information about thediverse and important roles undertaken in the world by engineers, mathematicians andscientists. With their teachers, parents and peers as the only available informationsources, secondary students have scant appreciation for these professions (Millican,Richards & Mann, 2005). Consequently, this has a flow-on effect for tertiaryinstitutions, which compete with other faculties for a dwindling pool of appropriatelyprepared students who can make a successful transition to tertiary study. Furthermore,the problem is compounded by a declining youth interest in the professions (Goodrumet al., 2000; Zarske et al., 2005). Finally, industry competes for the resulting shortage ofcapable and qualified individuals, thereby inheriting the problem (Hylton & Otopul,2005). Coupled with the current global resource and industrial booms, have increasedthe demand for these professionals, the significance of the problem becomes quite clear.
These complex and interwoven problems facing secondary schools, universities andindustry, form the basis of the project’s aims to:
* Paper accepted by peer review
Mathematics: Essential for Learning, Essential for Life
© The Australian Association of Mathematics Teachers Inc.
294
• enhance student interest and engagement in mathematics, science andengineering;
• increase the real-world practicality and enhance the pedagogy and perception ofsenior mathematics, science and engineering subjects in secondary schools;
• increase secondary student participation and success in studying seniormathematics, science and engineering subjects;
• develop the ability of students to be innovative and “think outside the square”;
• assist students to gain an appreciation of the important role that engineers,mathematicians and scientists play in today’s and tomorrow’s world;
• facilitate the opportunity for teachers to work collaboratively with and learn fromreal-world academics and professionals;
• foster quality teaching through improved approaches and techniques, whilstattracting and revitalising quality teachers;
• increase the number of quality and appropriately prepared secondary studentsmaking the successful transition to tertiary study.
Project’s theoretical basis
Current pedagogical theory and practices have informed and inspired the project’sdevelopment. The theoretical basis for the project’s teaching and learning isconstructivism. Constructivism asserts that students assimilate new information to buildon their existing knowledge and understanding, thereby constructing knowledge.Accordingly, this knowledge is not passively received from the teacher (Al-Weher,2004; Cobern, 1995; Lesh & Doerr, 2003). Furthermore, each individual’s process oflearning is different, as each individual builds their own understanding, based on theirown interpretation of the situation, along with their pre-existing knowledge andunderstanding (Watts, 1999). Consequently, this view of learning requires the roles ofstudents and teachers to change. Students need to actively participate in and direct theirlearning process, so that they are able to construct new and improved knowledgethrough problem solving, discussions, and the design and implementation of projects(Al-Weher, 2004; Cobern, 1995). Conversely, teachers need to move away from theirtraditional position as “transmitters of information” and the conventional application ofa “linear sequenced approach” to instruction. Instead, teachers should move to afacilitating role, arranging suitable conditions to enable students to be involved and todirect their learning process (Hand & Treagust, 1994).
Constructivist theory has significantly influenced the design aspects of our project.This is evident in the combination of student-directed, inter-disciplinary, hands-onactivity kits with learning from and communicating with real-world professionals. Thekits will give students control of their learning process, and require them to assimilateexisting and new knowledge, through both problem-solving and extension activities.Students will work together in small peer-directed, collaborative groups, instead ofthrough the traditional independent and individual approach. The potential benefits ofsuch a move include the powerful effects of students giving and receiving help andexplanations, to and from their peers (Webb, Troper & Fall, 1995; Yackel, Cobb,Wheatley & Merkel, 1991). Also, this group approach encourages the importantlearning processes of: clarifying and recognising information in new ways; recognisingand filling gaps in understanding; developing new and improved perspectives;constructing more elaborate conceptualisations; strengthening the connections between
Mathematics: Essential for Learning, Essential for Life
© The Australian Association of Mathematics Teachers Inc.
295
new and previous information; and improving problem solving skills (Webb et al.,1995; Yackel et al., 1991). In contrast, teachers and participating real-worldprofessionals, together, assume the role of facilitators. Their roles are to create a non-threatening learning environment, in which students are in control of their learning andare able to take risks (Al-Weher, 2004).
Project components
The development and teaching team aspires to instil an understanding in students and topromote an appreciation of engineering, science and mathematics as both a rewardingcareer and a means to benefit society. Combining the talents of engineering, science andeducational professionals in cross-curriculum design will allow students to experiencethese subjects in ways that are meaningful to them in their daily lives. The activities aredesigned to introduce curriculum concepts in a fun and engaging manner, anddemonstrate the student’s potential to understand and enjoy mathematics, engineeringand science.
The initial phase of the project will be the development of the hands-on activitybased kits mapped to educational curricula. They will comprise hands-on activities thatsimulate the work of a real-world professional, and will require students to makeconnections between the activities and what they have learnt in the classroom toactively construct new and improved knowledge. In addition, each kit will includeextension exercises, assignment and examination questions, created in line with currentsenior syllabi and common curriculum elements, to extend student learningopportunities. The activity kits will emphasise authentic experiences, encourage creativeproblem solving skills, and prepare students for advanced education. Kit design andimplementation will be developed along similar strategies as Rhoads et al. (2005) whoreports on a National Science Foundation initiative, describing authentic learningexperiences that engage students in personal construction of new knowledge; result instudents conducting disciplined inquiry; and have value beyond the classroom.Therefore, students apply their knowledge to their everyday lives. Hylton and Otoupal(2005) support these strategies by using an approach called “Mathematics with RealWorld Correlation”, and established that when student paradigms are connected toscience and mathematics concepts through authentic exposure, student learningbecomes meaningful in a way that it otherwise would not. Their study showed asubstantial increase in understanding engineering concepts (46%) as well as animprovement in the comprehension of mathematics concepts (21%).
A Steering Group comprising a school representative, relevant Teacher Associates(university, industry and government agency) and a Critical Friend (supplied byASISTM) will create the kits, to ensure that they meet the identified needs andoutcomes of students and teachers and fit into the curriculum. The Steering Group willalso allow the workload to be shared among the cluster. The kits will be progressivelycreated across the 18-month period, with at least three developed initially. This processwill enable the Steering Group to reflect on the process and use this to improve thisprocess for the remaining kits. The development (and trial) of the kits, complementedby the involvement of real-world professionals will improve student interest, learningoutcomes, and ability to think outside the square.
The project coordinators (the authors of this paper) act as a medium between schoolsand non-school organisations and administer the project. Initially, the schools will workclosely with the coordinators and non-school organisations to develop and createactivity kits that meet identified teacher and student needs. The schools will integrate

Mathematics: Essential for Learning, Essential for Life
© The Australian Association of Mathematics Teachers Inc.
296
the kits within the curriculum, and will evaluate their impact, in consultation with thecoordinators. The main role of the non-school partners is to enrich the kits during thetrial phase through guest lectures, mentoring, university staff and student-led seminars,and laboratory and test site visits.
As a result, partnerships will be created between the schools, enabling teachers andstudents to work directly with each other. For example, students from the variousschools will form affiliations based on shared interests, and can then contact practisingprofessionals from one of the non-school organisations to foster their interests.Partnerships will also be created between the schools and non-school organisations,enhancing student prospects of a successful transition to university study and futurecareer opportunities. This could include scholarships, work experience and placementswhere small groups of students undertake university subjects as part of the new SeniorCertificate.
Stakeholder benefits
The project is orientated towards achieving a number of sustainable benefits for each ofits key stakeholders, including Queensland secondary students, teachers and schools,QUT, and the engineering professional body. A majority of these benefits have beennoted in the related corpus of literature, including Brown (2005), Crouch and Haines(2004), Davies and Heath (2004), Fabijan and Pope (2005), Orlich et al. (2005), Zarskeet al. (2005). In most cases, however, the benefits are specifically focused at particularstakeholders and/or areas of need. In contrast, this project will work towards achievingseveral identified benefits in one package focusing on each of the key stakeholders. Theparticular benefit for each of the identified key stakeholders follows.
Benefits for secondary students
The intended benefits for all students, who use the project resources, are derived fromthe enhanced learning outcomes in the specified subjects using a constructivistperspective teaching methodology. The benefits are also derived from the use of activitykits related to real-world disciplines to stimulate their learning. In addition, students willhave an increased capacity for innovation, by learning in an environment that requiresthem to connect classroom learning with its real-world application. Finally, by taking onthe role of scientists and engineers, and communicating with, and learning from, bothtertiary educators and engineering professionals, students will appreciate engineeringand science as potential careers. They will also understand the important roleundertaken by engineers and scientists in the world today and into the future.Consequently, it is foreseen that increased student engagement and interest in studyingmathematics, science and engineering technology in their senior years of schooling willstimulate their progress into future study and careers in these areas.
Benefits for secondary teachers
Benefits to secondary teachers are fashioned from fostering a culture of innovationwithin the teaching fraternity. This will stem from the opportunity for secondaryteachers to work with, and learn from, tertiary educators and practising professionals indeveloping, implementing and reviewing the project and its effects on student learning.Consequently, obstacles between teachers from different schools and education sectorswill be removed, allowing them to work together in an environment focused onimproving student learning and achievement across their schools. This will lead to a
Mathematics: Essential for Learning, Essential for Life
© The Australian Association of Mathematics Teachers Inc.
297
dynamic professional network between these schools, assisting teachers to gainimproved teaching approaches and techniques, and new resources to positivelyinfluence their students, including students outside of the project. This network alsoaims to revitalise, retain and attract quality teachers to this dynamic environment withinthe cluster schools.
Benefits for secondary schools
The benefits for secondary schools are derived from the benefits that it provides for itsteachers and students. Students who perform at a higher cognitive level in mathematicsand science will improve overall academic results for the school, thereby improvingschool marketability and attracting new students. Furthermore, for schools that canrevitalise, retain and attract quality teachers, this brings with it the associated benefits ofimproved instructional practices and quality learning resources. This ultimately resultsin improved student learning outcomes and results. Finally, project involvement givesschools an opportunity to leverage the collaborative relationship between other schools,a leading tertiary institution and industry, in the interests of many other benefits. Thesebenefits do not necessarily need to be confined to the areas of engineering, science andmathematics. They can apply to, and be used in, any school area to improve anyexisting programs.
Project progression
As outlined earlier, the initial phase of “Out of the Square and into Reality” will be thedevelopment of the hands-on activity based kits. The first three kits are an Ergonomicskit, Materials and Alloys kit, Rocket kit and finally an Engineering kit. The Ergonomicskit will be used across Mathematics A and Technology Studies subjects. Here, studentswill integrate several learning exercises across survey design, data collection andinterpretation (statistics), drawing scale diagrams, constructing a scale model and,finally, evaluation of an ergonomic cardboard chair. The Materials and Alloys kits willbe used across Mathematics B and C, Physics and Engineering Technology and focusedon recording the cooling curves of various alloys and materials and then modellingthese curves with mathematical models. The Rocket kit will focus on simulating flightdata. This data will be recorded and automatically logged for further manipulation andused in Mathematics and Physics subjects. The Engineering Kit will focus on utilisingthe mathematical concepts of complex numbers, vectors and calculus (integration andderivatives) in applicable fields of engineering. At different stages within the project’sdevelopment, various activity kits will be implemented.
Once developed, the kits will be implemented within the cluster schools’ curriculum.The Teacher Associates, Queensland University of Technology fourth year students,who have expertise in each kit’s discipline, will facilitate and manage this process.Their role will be to enhance student learning experiences by: engaging with students indiscussion about the relevance of the activity to its real world context and future studyand career options; assisting with the hands-on aspects of the activity; and acting as rolemodels and mentors for students. The role of the classroom teacher during theuniversity students’ visit is to facilitate a safe learning environment and assist students,where needed.
Mathematics: Essential for Learning, Essential for Life
© The Australian Association of Mathematics Teachers Inc.
298
Successes to date
The project has been extremely successful to date, due to the hard and dedicated workof Steering Group. The successes to date for the Out of the Square into Reality projectinclude:
• successfully attaining a BP Education Grant for the development of the project’sinteractive website, www.realitysquare.com.au. This website has beensuccessfully launched and is focused on disseminating the project’s ideas,resources and professional development opportunities throughout Australia andthe world. It also facilitates the opportunity for teachers to safely share theirresources online, through the development of a password projected “Teacher’sAccess Area”;
• significantly increasing the number of secondary schools utilising the project’sactivity kits;
• increasing the scope of existing kits to be used in other subject disciplines, such asBusiness Education;
• forging links with the Queensland Association of Mathematics Teachers and theScience Teachers Association of Queensland to develop professional development“Showcase Days”. These professional development days will focus on teachersworking with and learning from real-world professionals and tertiary students andeducators, in gaining a greater appreciation and understanding of contextual basedteaching and the development of resources to be utilised in participants’ schools;
• disseminating information about the project through conferences, such as theAustralasian Association for Engineering Educators Conference in Auckland andthe Queensland Association of Mathematics Teachers May Day Conference;
• forging new partnerships with the Engineering Link Group, Central QueenslandUniversity, James Cook University and secondary schools in Townsville, Cairnsand Rockhampton, to extend the real-world and interdisciplinary ideas of theproject into middle school mathematics and science. The aim of these newpartnerships is to increase the number of students taking senior mathematics andscience in secondary schools.
Conclusion
It is imperative that secondary students be not only be well informed about the careeroptions available to them within engineering, but that they also see the links betweenengineering and the secondary school subjects of mathematics and science. Thepromotion of engineering as a career in schools needs to make the connection betweenwhat students are learning in theory, and what happens in real life in the provision ofengineered products, services and infrastructure. We need to demonstrate, in interestingand exciting ways, the value and importance of the work of engineers to people’s everyday lives, and to the environment. We need to engage students, their teachers and careercounsellors, in activities that are part of or linked to the work of the engineering team.In addition, the programs should integrate with existing elements within the schoolcurriculum, provide appropriate resources for teaching staff and assist in theirprofessional development, and foster links with partner organisations.
It is envisaged that there will be a follow-up article to report on the progress andsuccess of our project through the development and implementation phase of its life. Inthis article we plan to focus on the actual outcomes achieved by the project’s key
Mathematics: Essential for Learning, Essential for Life
© The Australian Association of Mathematics Teachers Inc.
299
stakeholders (secondary students, teachers and schools, tertiary students and institutionsand the professional body. These outcomes will be identified through the analysedresults of student and teacher surveys, which will accompany the activity kits duringimplementation in participating schools.
References
Al-Weher, M. (2004). The effects of a training course based on constructivism on student teachers’perceptions of the teaching/learning process. Asia-Pacific Journal of Teacher Education, 32(2),171–184.
Cobern, W. W. (1995). Constructivism for science teachers. Science Education International, 6, 8–12.
Felder, R. & Brent, R. (2005). Understanding student differences. Journal of Engineering Education,94(1).
Goodrum, D., Hackling, M. & Rennie, L. (2000). The Status and Quality of Teaching and Learning ofScience in Australian Schools. Perth: Edith Cowan University, Curtin University of Technology.
Hand, H. & Treagust, D. F. (1994). Teachers’ thoughts about changing to a constructivistteaching/learning approaches within junior secondary science classroom. Journal of Education forTeaching, 20, 97–113.
Hylton, P. & Otopul, W. (2005). Coupling math and engineering concepts in a K–12 classroomenvironment. In D. Radcliffe, & J. Humphries (Eds), Proceedings of the 2005 ASEE/AaeE 4th GlobalColloquium. Sydney, Australia: ASEE/AaeE.
Jolly, L., Goos, M. & Smith, A. (2005). Mathematics in school and community in the primary years:possible effects on choosing engineering as a career. In D. Radcliffe, & J. Humphries (Eds),Proceedings of the 2005 ASEE/AaeE 4th Global Colloquium. Sydney, Australia: ASEE/AaeE.
Lesh, R. & Doerr, H. M. (2003). Beyond constructivism. Mathematical Thinking and Learning, 5(2&3),211–223.
Millican, G., Richards, P. & Mann, L. (2005). The engineering link project: Learning about engineeringby becoming an engineer. In D. Radcliffe & J. Humphries (Eds), Proceedings of the 2005 ASEE/AaeE4th Global Colloquium. Sydney, Australia: ASEE/AaeE.
Orlich, D. C., Thomson, W. J. & Zollars, R. L. (2005). Linking middle school and high schools withengineering programs. In D. Radcliffe & J. Humphries (Eds), Proceedings of the 2005 ASEE/AaeE4th Global Colloquium. Sydney, Australia: ASEE/AaeE.
Rhoads, T. R., Nanny, M. A., O’Hair, M. J., Murphy, T. J. & Walden, S. E. (2005). After the fundingsustaining an NSF outreach initiative. In D. Radcliffe & J. Humphries (Eds), Proceedings of the 2005ASEE/AaeE 4th Global Colloquium. Sydney, Australia: ASEE/AaeE.
Watts, M. (1999). A course for critical constructivism through action research: A case study frombiology. Research in Science and Technical Education, 17, 5–18.
Webb, N. M., Troper, J. D. & Fall, R. (1995). Constructive activity and learning in collaborative smallgroups. Journal of Educational Psychology, 87(3), 406–423.
Yackel, E., Cobb, P., Wheatley, G. & Merkel, G. (1990). The importance of social interaction inchildren’s construction of mathematical knowledge. In T. J. Cooney & C. R. Hirsch (Eds), Teachingand Learning Mathematics in the 1990s (pp. 12–21). Reston, VA: National Council of Teachers ofMathematics.
Zarske, M. S., Kotys-Schwartz, D., Sullivan, J. F. & Yowell, J. L. (2005). Creative engineering: Helpingninth-grade students discover engineering. Proceedings of the 2005 ASEE Annual Conference andExposition. Portland, Oregon: ASEE.
Acknowledgements
The authors would like to acknowledge the Department of Education, Science andTechnology for their generous support of the project along with all schools involved.Special thanks to all teachers who have committed extra time and effort to get theproject up and running.
© The Australian Association of Mathematics Teachers Inc.
300
MathBusters (apologies to MythBusters)*
Jill Cheeseman
Monash University
This paper looks at some of the urban myths surrounding mathematics education.Several of these myths are held up to scrutiny and submitted to the rigours ofcomparison with classroom practice and research findings. Most myths are“busted”, but not all of them.
The popular television program MythBusters is a show where truth is separated fromurban legend and folklore. The cast and crew use science to test the veracity of popularbeliefs. This idea prompted me to think about mathematical myths and use modern-dayscience (mathematics education research) to show what is real and what is fiction.Using thorough investigation and a bit of “trial and error” I will seek to examine thetruth or otherwise of these common mathematical myths.1. Maths is boring.2. Calculator use “rots children’s brains”.3. You never use the maths you learn in school.4. Some people just don’t have a maths brain5. Maths is hard.I will take this folklore and examine each idea then decide whether the myths areCONFIRMED or BUSTED. Taking one myth at a time, I will look at some classroomactivities and research findings that test the myth, then strategies to try to address eachmyth will be offered to the reader.
Myth 1. Maths is boring
For many “people in the street”, mathematics lessons probably were boring. In the pastthe format of mathematics lessons was fairly predicable: the teacher demonstrated somenew skill or procedure — often on a blackboard — then the students were required tocomplete similar exercises from the textbook. These practice exercises were correctedand another set was given as homework. Few practical applications were used in classand the relevance of the lessons was often not clear to students. It must be said, though,that the same adults who think maths is boring seldom stop to consider the mathematicsinvolved in everyday life when they go shopping, fill the petrol tank, back into aparking space, withdraw money from an electronic teller and so on.
The good news is that times have changed and mathematics lessons are now variedand interesting (or they can be!) However, if the students you inherit come to schoolwith a slightly jaded view of mathematics lessons, I have some ways to encourage themto think again.
* Paper accepted by peer review
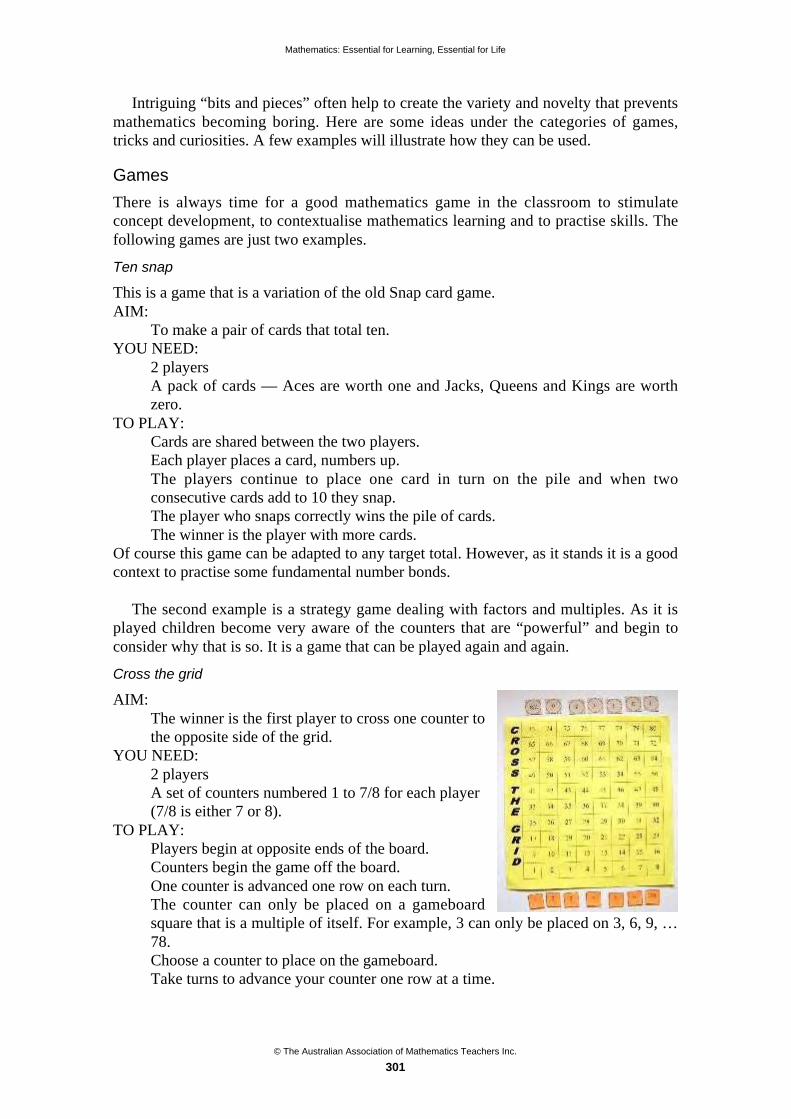
Mathematics: Essential for Learning, Essential for Life
© The Australian Association of Mathematics Teachers Inc.
301
Intriguing “bits and pieces” often help to create the variety and novelty that preventsmathematics becoming boring. Here are some ideas under the categories of games,tricks and curiosities. A few examples will illustrate how they can be used.
Games
There is always time for a good mathematics game in the classroom to stimulateconcept development, to contextualise mathematics learning and to practise skills. Thefollowing games are just two examples.
Ten snap
This is a game that is a variation of the old Snap card game.AIM:
To make a pair of cards that total ten.YOU NEED:
2 playersA pack of cards — Aces are worth one and Jacks, Queens and Kings are worthzero.
TO PLAY:Cards are shared between the two players.Each player places a card, numbers up.The players continue to place one card in turn on the pile and when twoconsecutive cards add to 10 they snap.The player who snaps correctly wins the pile of cards.The winner is the player with more cards.
Of course this game can be adapted to any target total. However, as it stands it is a goodcontext to practise some fundamental number bonds.
The second example is a strategy game dealing with factors and multiples. As it isplayed children become very aware of the counters that are “powerful” and begin toconsider why that is so. It is a game that can be played again and again.
Cross the grid
AIM:The winner is the first player to cross one counter tothe opposite side of the grid.
YOU NEED:2 playersA set of counters numbered 1 to 7/8 for each player(7/8 is either 7 or 8).
TO PLAY:Players begin at opposite ends of the board.Counters begin the game off the board.One counter is advanced one row on each turn.The counter can only be placed on a gameboardsquare that is a multiple of itself. For example, 3 can only be placed on 3, 6, 9, …78.Choose a counter to place on the gameboard.Take turns to advance your counter one row at a time.
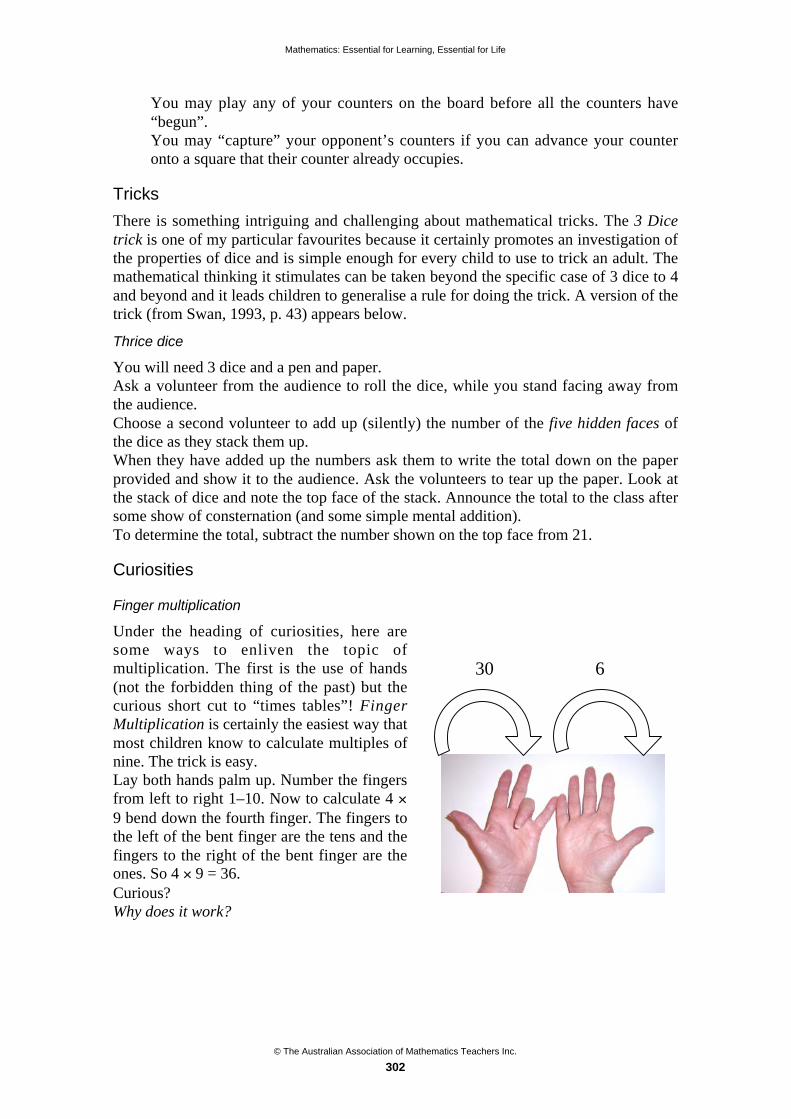
Mathematics: Essential for Learning, Essential for Life
© The Australian Association of Mathematics Teachers Inc.
302
You may play any of your counters on the board before all the counters have“begun”.You may “capture” your opponent’s counters if you can advance your counteronto a square that their counter already occupies.
Tricks
There is something intriguing and challenging about mathematical tricks. The 3 Dicetrick is one of my particular favourites because it certainly promotes an investigation ofthe properties of dice and is simple enough for every child to use to trick an adult. Themathematical thinking it stimulates can be taken beyond the specific case of 3 dice to 4and beyond and it leads children to generalise a rule for doing the trick. A version of thetrick (from Swan, 1993, p. 43) appears below.
Thrice dice
You will need 3 dice and a pen and paper.Ask a volunteer from the audience to roll the dice, while you stand facing away fromthe audience.Choose a second volunteer to add up (silently) the number of the five hidden faces ofthe dice as they stack them up.When they have added up the numbers ask them to write the total down on the paperprovided and show it to the audience. Ask the volunteers to tear up the paper. Look atthe stack of dice and note the top face of the stack. Announce the total to the class aftersome show of consternation (and some simple mental addition).To determine the total, subtract the number shown on the top face from 21.
Curiosities
Finger multiplication
Under the heading of curiosities, here aresome ways to enliven the topic ofmultiplication. The first is the use of hands(not the forbidden thing of the past) but thecurious short cut to “times tables”! FingerMultiplication is certainly the easiest way thatmost children know to calculate multiples ofnine. The trick is easy.Lay both hands palm up. Number the fingersfrom left to right 1–10. Now to calculate 4 9 bend down the fourth finger. The fingers tothe left of the bent finger are the tens and thefingers to the right of the bent finger are theones. So 4 9 = 36.Curious?Why does it work?
30 6

Mathematics: Essential for Learning, Essential for Life
© The Australian Association of Mathematics Teachers Inc.
303
Weird and quirky things that happen with numbers sometimes motivate and intriguechildren. For example (from Swan, 1994):
Double up
Enter a 3-digit number on your calculator.Multiply by 7.Multiply by 11.Multiply by 13.What has happened? Discuss with your neighbour.Try using other 3-digit numbers.Try using numbers where the digits are all the same; e.g., 222, 555, 888.Try using numbers with trailing zeros; e.g., 100, 400, 700.Write about what you notice.Does the order in which you multiply matter?Try multiplying by 13, then 11 and then 7.What happens?Try using a different order.Try to explain why it happens.
The lovely little investigation posed in Double up touches on some very powerfulmathematical ideas. These include the commutative property of multiplication (theorder of the factors is irrelevant to the product) and the place value effect of multiplyingby powers of ten. The best aspect of the task is that it has children puzzling over what isgoing on with the numbers.
Strategies that will stop mathematics being boring:
• Get the level of challenge right.
• Allow for some student choice.
• Use intriguing and sometimes quirky content to help create variety.
• Pose problems and initiate investigations that capture children’s imagination.
Myth 2. Calculator use “rots children’s brains”
Although calculators have been recommended as a tool for the teaching and learning ofmathematics for decades, there has been the view in the community that they makechildren dependent on them and stop children thinking for themselves.
Research findings
The consistent pattern in research findings for more than two decades has been thedemonstration that calculators do no harm to children’s acquisition of computationalskills (Groves 1994). Britain’s Calculator Aware Number project found that childrenusing calculators developed a wide range of strategies for carrying out calculations and,in general, reached a high level of numeracy for their age. In Australia, the Calculatorsin Primary Mathematics Project reported that; the calculator provides
a rich mathematical environment for children to explore and promotes thedevelopment of number sense by removing previous restrictions on the types ofnumbers children use, by exposing children to written symbols which they caneasily record and manipulate, and by facilitating sharing and discussion (Stacey &Groves, 1998).

Mathematics: Essential for Learning, Essential for Life
© The Australian Association of Mathematics Teachers Inc.
304
The project investigated the effects of the introduction of calculators on the learningand teaching of primary mathematics. Classroom observation revealed that childrenwere dealing with larger numbers than would normally be expected, as well as, in manycases, negative numbers and, to a lesser extent, decimals. After long-term experience ofcalculators children performed better than children without such experience on a rangeof computational and estimation tasks and some “real world” problems. They had abetter knowledge of number, particularly place value, decimals and negative numbers.They were more able to choose appropriate calculating devices, and were better able tointerpret their answers when using calculators. No detrimental effects of calculator usewere identified. In fact results confirmed the anecdotal evidence from projectclassrooms and “supported the assertion that the presence of calculators provides alearning environment to promote number sense” (Groves, 1994).
As well as having effects on children’s learning, calculators influence teachingapproaches that could also be said to promote number sense in young learners (Beeby &Cheeseman, 1991). They stimulated some teachers to use more problem solving, tointegrate mathematics with other areas and to use more open-ended discovery learning.
Kilpatrick (2001) in a study synthesising the research literature in America said, “it isclear that the question is no longer whether calculators should be used, but how.”
Australian research used classroom observation to document the major ways teachersand children used calculators. Illustrations of these uses can be seen in the videotapeYoung Children Using Calculators (Groves & Cheeseman, 1993). Calculators wereused as an object of investigation, to generate patterns, to stimulate discussion, as arecording device, to count, to solve problems, to calculate, and to stimulate mentalcomputation.
For young children calculators are manipulatives that foster experimentation andinvestigation with number. They are a toy and a tool that stimulates curiosity andsupports rich mathematical environment for conjecture and discovery (Groves &Stacey, 1998; Huinker, 2002).
Some ideas for investigation
• Which would take you longer: to count from 1 to 100 by 1s or to count from10 000 to 1 000 000 by 10 000s on your calculator? Why?
• Can you find 2 without using the square root key? How?
• How many ways can you find to constantly add a number to generate a display of1 on your calculator?
• How does the percent button work on the calculator? Can you teach someone?
• Find the counting pattern with the longest repeating sequence in the units column.
• What is the largest number (and smallest number) you can enter on the calculator?
Strategies that will eradicate the myth that calculators harm children’s number sense:
• Use calculators as a teaching and a learning tool.
• Know the research evidence to be sure of your facts.
• Be prepared to address parents’ concerns.
• Choose tasks carefully to demonstrate the potential of the calculator to stimulateconceptual development.
• Support calculator use with an increased emphasis on mental computation andstrong teaching tactics for understanding the number system, especially decimals.
Mathematics: Essential for Learning, Essential for Life
© The Australian Association of Mathematics Teachers Inc.
305
Myth 3. You never use the maths you learn in school
These days more and more of the mathematics that children meet in classroomsconnects to their lives. When I get the opportunity to visit mathematics lessons, I try towrite accounts of the problems I see the children tackle. Two examples spring to mind.The story of “A Bag of Apples” first appeared in Australian Primary MathematicsClassroom (Cheeseman & Ward, 2001) and was subsequently published in theNetherlands in Volgens Bartjens (2004/2005). This lesson challenged children to posequestions about the bag of apples that they could use mathematics to answer. The mainfocus became the question, “How long is an apple peel?” The second lesson concernedthe design and testing of “Hermit Crab Trays” and is described in full in Prime Number(Cheeseman & Bergfeld, 2006). In each of these lessons problems were solved. Theseproblems connected the children’s interests with the teacher’s mathematical agenda.
Strategies that will help to “bust” the myth that school mathematics is not useful:
• Connect the mathematics in school to the lives of your students.
• Use contexts that show mathematics “in action”; e.g., scoring divingcompetitions.
• Engage students in investigations and problem solving.
• Invite parents in to school to talk about their use of mathematics in the workplace.
Myth 4. Some people just don’t have a maths brain
Sometimes you hear a parent (more often a mother) say, “I don’t really have a mathsbrain; I was never any good at maths at school either,” as an excuse for their child’slack of progress (particularly daughters’ lack of progress). This idea that you either canor cannot do mathematics is patently false. Everyone can learn mathematics.
Part of the book How People Learn was devoted to how children learn. The authorsreflected on new conceptions of the learning process and the development of competentperformance. Children were described as dynamic learners where, “in particulardomains, such as biological and physical causality, number, and language, infants andyoung children have strong dispositions to learn rapidly and readily” (Bransgrove,Brown and Cocking, 1999, p. xiv). These authors also stated that children lackknowledge and experience but not reasoning ability. They went on to say that childrenare both problem solvers and problem generators who seek novel challenges. It is clearthat children from early infancy have the disposition and ability to learn mathematics.So, rather than offering up empty excuses, adults need to support children’s curiosityand persistence, and structure their learning experiences.
Strategies that will help to counteract the view that some people cannot learnmathematics:
• Actively dispute this myth as everyone can learn mathematics.
• Be conscious of choosing tasks that appeal to both boys and girls.
• Support and arouse children’s mathematical curiosity.
• Structure learning experiences where children experience success.
Mathematics: Essential for Learning, Essential for Life
© The Australian Association of Mathematics Teachers Inc.
306
Myth 5. Maths is hard
This myth is one that may not be able to be “busted” but that might have to be“confirmed”. Doing mathematics is challenging and sometimes really difficult but, withperseverance and persistence, it can be wonderfully rewarding to meet the challenge.
• Keep the challenge of the task almost within reach to that its achievement will bean exciting reward (hard but not too hard!).
• Develop the attitude within the class that nothing is accomplished without astruggle; i.e., it is supposed to be hard, it is good to “think hard” and figure thingsout — that is what gives children such satisfaction.
In conclusion
Popular myths abound in mathematics education. Here I have examined a few and mostof them have been “busted”!
References
Beeby, T. & Cheeseman, J. (1991). Calculators as an Agent for Change: The Victoria College CalculatorProject. Paper presented at the 14th Annual Conference of Mathematics Education Research Group ofAustralasia Perth, June.
Bransford, J., Brown, A. & Cocking, R. (1999). How People Learn: Brain, Mind, Experience, andSchool. Washington: National Academy Press.
Cheeseman, J. (2004/2005). Met jou heb ik een appeltje te schillen. Volgens Bartjens, Jaargang 24 nr.4.
Cheeseman, J. & Bergfeld, S. (2006). Hermit crabs. Prime Number, 21 (3).
Cheeseman, J. & Ward, J. (2001). A bag of apples. Australian Primary Mathematics Classroom, 6 (4).
Groves, S. (1994). Calculators: A Learning Environment to Promote Number Sense. Paper presented atthe Annual Meeting of the American Research Association. New Orleans.
Groves, S. & Cheeseman, J. (1993). Young Children Using Calculators. Videotape Deakin University.
Groves, S. & Stacey, K. (1998). Calculators in primary mathematics: Exploring number before teachingalgorithms. In L. Morrow (Ed.), Calculators in Mathematics Education (pp. 120–129). Reston:NCTM.
Huinker, D. (2002). Calculators as learning tools for young children’s exploration of number. TeachingChildren Mathematics. Reston: NCTM.
Kilpatrick, J. (2001). Understanding mathematical literacy: The contribution of research. EducationalStudies in Mathematics, 47(1), 101–116.
Swan, P. (1993). Number Novelties. Perth: A–Z Type.
Swan, P. (1994). Mathematical Novelties. Perth: A–Z Type.
© The Australian Association of Mathematics Teachers Inc.
307
Reflective teaching + connective teaching= effective teaching*
Chris Hurst
Curtin University, WA
Reflective teachers consider reasons for their students failing to like and learnmathematics. Connective teachers see links between different aspects ofmathematics, between mathematics and other learning areas, and betweenmathematics and the “real world”. They also engender such “link-making” in thethinking of their students. Two aspects of mathematical learning of particularimportance are the use of “real” problems, as opposed to contrived problems, andthe role of language in the understanding of mathematics. Recent researchsuggests that teachers can motivate students towards learning mathematics byusing strategies to help them connect their mathematical learning more effectively.
Considering the problem
Reflective teaching
Have we turned students off mathematics? Have we “demotivated” them aboutmathematics and even contributed to the development of a phobia of mathematics? Doour students see a real purpose in learning mathematics? If we think that “Yes” mightbe an appropriate answer for any of those three questions, then we need to look forcauses. Perhaps one factor might be that we have made mathematical learning moredifficult than it needs to be and have ignored some obvious links that could makemathematics more interesting, understandable and applicable for our students.
Burns (1998) suggested that one of the reasons for students developing a dislike andeven a fear of mathematics is that it has often been taught in isolation from any realcontext and that there is no substitute for the experience of learning about concepts insituations in which they are actually applied. Burns used several analogies to illustrateher point, including learning how to effectively play games like Monopoly throughactually playing them, and learning to play a musical instrument through playing music,as opposed to endless theory lessons. Learning our language is the same in that “weacquired the skill from being immersed in the real purpose of using language tocommunicate” (Burns, 1998, p. 67).
Burns added that “skills should be learned in the context of problems and situationsand should not exist isolated from the problems and situations that give them theirpurpose” (1998, p. 69). In this, she is suggesting that mathematics is best learned byimmersing children in activities, explorations and experiments, and letting them learn inthe context of thinking, reasoning and solving problems.
Parkin and Hayes (2006) raised a number of issues related to literacy in theirconsideration of why students, particularly those from indigenous or ethnic
* Paper accepted by peer review
Mathematics: Essential for Learning, Essential for Life
© The Australian Association of Mathematics Teachers Inc.
308
backgrounds, experienced difficulty with solving worded problems. They viewed thelinguistic demands of the mathematics curriculum as being one of three aspects: generallanguage demands, the language of textbooks, and the language of worded problems.They also noted that “it is important that we can articulate what may need to beexplicitly taught if students are to access the language in maths” (2006, p. 23). Whilethe three part distinction is clear, it could be more effective and engaging if thelanguage was taught through the experience of doing the problem, along the lines of the“immersion” that Burns suggested. Some examples of how this might occur aredescribed later in this paper.
Parkin and Hayes also noted that one of the first issues for students to deal with whensolving worded problems is “the need to suspend disbelief” (2006, p. 26) as the contextof the problem may be foreign to their experience. This can lead to a feeling of futilityand questioning as to whether there is any real point in working out a problem that bearsno relation to them. Indeed, a common reaction may be, “Who cares?” While Parkinand Hayes described the situation with respect to indigenous and ethnic students,teachers who reflect on their experience with most classes would most likely recognisethe same reaction to solving worded problems.
The language of worded problems was also identified by Carnellor (2004) inconsidering difficulties faced by students with learning difficulties. Indeed, “problemsfor these students can also become more prevalent and understanding more complicatedwhen we consider that very often the grammatical structure of mathematical wordproblems takes on a much more complex form than the students would be likely toencounter in oral language or reading activities” (Carnellor, 2004, p. 87). Carnelloradvocated the use of “normal language” in the context of everyday mathematicalexperiences as being better, as well as the use of a constructivist approach wherestudents are engaged through skilful questioning and meaningful discussion. Also,learning is more effective when “mathematical language is embedded in thedevelopment of many everyday verbal communication skills” (Carnellor, 2004, p. 88)and when fostered in natural settings.
This was supported by Trafton (1999) who claimed that teachers, in their attempts toenhance mathematical learning, often took the reality out of potentially rich learningsituations by simplifying them too much. He argued that children prefer to work withproblems that are “messy” and involve numbers that do not, for instance, divide evenlywith no remainder. Trafton claimed that learning can be highly effective if teachers posea problem and “let children work with others to solve it in ways that make sense tothem; they let children take ownership of it” (Trafton, 1999, p. 10). This seems to implythat it is important to use the “natural language” of the context in which the problemoccurs, rather than couch it in complex mathematical terms.
Connective teaching
So, what do “connective teachers” do and how can they make learning more enjoyableand effective? Askew, Brown, Rhodes, Wiliam and Johnson (1997) found that the mosteffective teachers of numeracy, in terms of gains made by their students, were thoseteachers whom they described as having a “connectionist” orientation. They identified anumber of features of the beliefs and practices of such teachers including the following:
• emphasis on linking different aspects of the mathematics curriculum;
• encouragement of students to draw on their own mathematical understanding tosolve realistic problems;
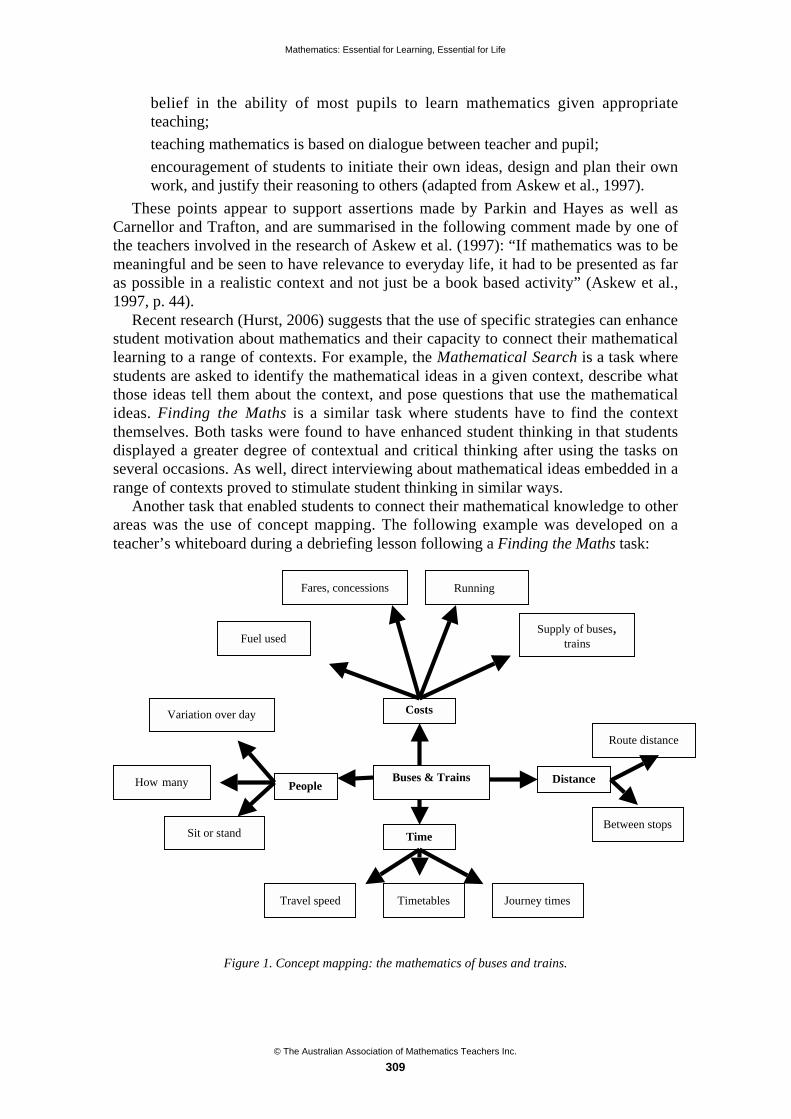
Mathematics: Essential for Learning, Essential for Life
© The Australian Association of Mathematics Teachers Inc.
309
• belief in the ability of most pupils to learn mathematics given appropriateteaching;
• teaching mathematics is based on dialogue between teacher and pupil;
• encouragement of students to initiate their own ideas, design and plan their ownwork, and justify their reasoning to others (adapted from Askew et al., 1997).
These points appear to support assertions made by Parkin and Hayes as well asCarnellor and Trafton, and are summarised in the following comment made by one ofthe teachers involved in the research of Askew et al. (1997): “If mathematics was to bemeaningful and be seen to have relevance to everyday life, it had to be presented as faras possible in a realistic context and not just be a book based activity” (Askew et al.,1997, p. 44).
Recent research (Hurst, 2006) suggests that the use of specific strategies can enhancestudent motivation about mathematics and their capacity to connect their mathematicallearning to a range of contexts. For example, the Mathematical Search is a task wherestudents are asked to identify the mathematical ideas in a given context, describe whatthose ideas tell them about the context, and pose questions that use the mathematicalideas. Finding the Maths is a similar task where students have to find the contextthemselves. Both tasks were found to have enhanced student thinking in that studentsdisplayed a greater degree of contextual and critical thinking after using the tasks onseveral occasions. As well, direct interviewing about mathematical ideas embedded in arange of contexts proved to stimulate student thinking in similar ways.
Another task that enabled students to connect their mathematical knowledge to otherareas was the use of concept mapping. The following example was developed on ateacher’s whiteboard during a debriefing lesson following a Finding the Maths task:
Figure 1. Concept mapping: the mathematics of buses and trains.
Costs
Buses & Trains Distance
Sit or stand
How many People
Journey timesTravel speed
Time
Timetables
Between stops
Route distance
Fares, concessions Running
Fuel used
Variation over day
Supply of buses,trains
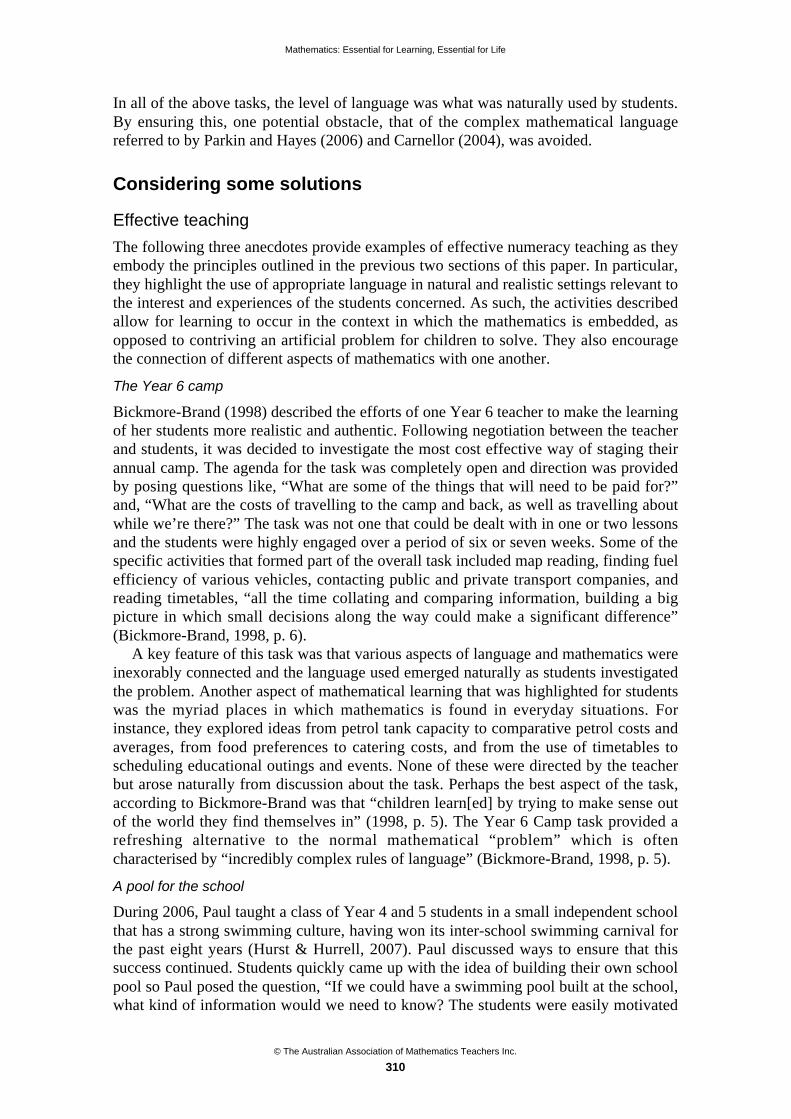
Mathematics: Essential for Learning, Essential for Life
© The Australian Association of Mathematics Teachers Inc.
310
In all of the above tasks, the level of language was what was naturally used by students.By ensuring this, one potential obstacle, that of the complex mathematical languagereferred to by Parkin and Hayes (2006) and Carnellor (2004), was avoided.
Considering some solutions
Effective teaching
The following three anecdotes provide examples of effective numeracy teaching as theyembody the principles outlined in the previous two sections of this paper. In particular,they highlight the use of appropriate language in natural and realistic settings relevant tothe interest and experiences of the students concerned. As such, the activities describedallow for learning to occur in the context in which the mathematics is embedded, asopposed to contriving an artificial problem for children to solve. They also encouragethe connection of different aspects of mathematics with one another.
The Year 6 camp
Bickmore-Brand (1998) described the efforts of one Year 6 teacher to make the learningof her students more realistic and authentic. Following negotiation between the teacherand students, it was decided to investigate the most cost effective way of staging theirannual camp. The agenda for the task was completely open and direction was providedby posing questions like, “What are some of the things that will need to be paid for?”and, “What are the costs of travelling to the camp and back, as well as travelling aboutwhile we’re there?” The task was not one that could be dealt with in one or two lessonsand the students were highly engaged over a period of six or seven weeks. Some of thespecific activities that formed part of the overall task included map reading, finding fuelefficiency of various vehicles, contacting public and private transport companies, andreading timetables, “all the time collating and comparing information, building a bigpicture in which small decisions along the way could make a significant difference”(Bickmore-Brand, 1998, p. 6).
A key feature of this task was that various aspects of language and mathematics wereinexorably connected and the language used emerged naturally as students investigatedthe problem. Another aspect of mathematical learning that was highlighted for studentswas the myriad places in which mathematics is found in everyday situations. Forinstance, they explored ideas from petrol tank capacity to comparative petrol costs andaverages, from food preferences to catering costs, and from the use of timetables toscheduling educational outings and events. None of these were directed by the teacherbut arose naturally from discussion about the task. Perhaps the best aspect of the task,according to Bickmore-Brand was that “children learn[ed] by trying to make sense outof the world they find themselves in” (1998, p. 5). The Year 6 Camp task provided arefreshing alternative to the normal mathematical “problem” which is oftencharacterised by “incredibly complex rules of language” (Bickmore-Brand, 1998, p. 5).
A pool for the school
During 2006, Paul taught a class of Year 4 and 5 students in a small independent schoolthat has a strong swimming culture, having won its inter-school swimming carnival forthe past eight years (Hurst & Hurrell, 2007). Paul discussed ways to ensure that thissuccess continued. Students quickly came up with the idea of building their own schoolpool so Paul posed the question, “If we could have a swimming pool built at the school,what kind of information would we need to know? The students were easily motivated
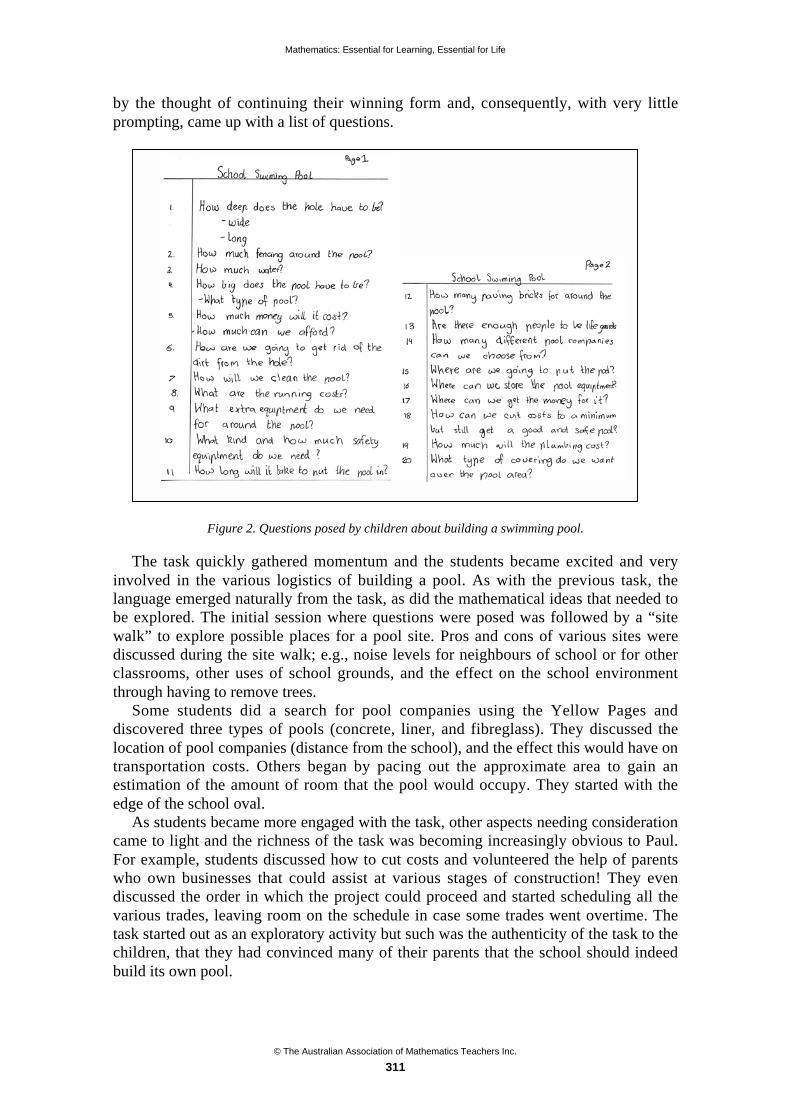
Mathematics: Essential for Learning, Essential for Life
© The Australian Association of Mathematics Teachers Inc.
311
by the thought of continuing their winning form and, consequently, with very littleprompting, came up with a list of questions.
Figure 2. Questions posed by children about building a swimming pool.
The task quickly gathered momentum and the students became excited and veryinvolved in the various logistics of building a pool. As with the previous task, thelanguage emerged naturally from the task, as did the mathematical ideas that needed tobe explored. The initial session where questions were posed was followed by a “sitewalk” to explore possible places for a pool site. Pros and cons of various sites werediscussed during the site walk; e.g., noise levels for neighbours of school or for otherclassrooms, other uses of school grounds, and the effect on the school environmentthrough having to remove trees.
Some students did a search for pool companies using the Yellow Pages anddiscovered three types of pools (concrete, liner, and fibreglass). They discussed thelocation of pool companies (distance from the school), and the effect this would have ontransportation costs. Others began by pacing out the approximate area to gain anestimation of the amount of room that the pool would occupy. They started with theedge of the school oval.
As students became more engaged with the task, other aspects needing considerationcame to light and the richness of the task was becoming increasingly obvious to Paul.For example, students discussed how to cut costs and volunteered the help of parentswho own businesses that could assist at various stages of construction! They evendiscussed the order in which the project could proceed and started scheduling all thevarious trades, leaving room on the schedule in case some trades went overtime. Thetask started out as an exploratory activity but such was the authenticity of the task to thechildren, that they had convinced many of their parents that the school should indeedbuild its own pool.
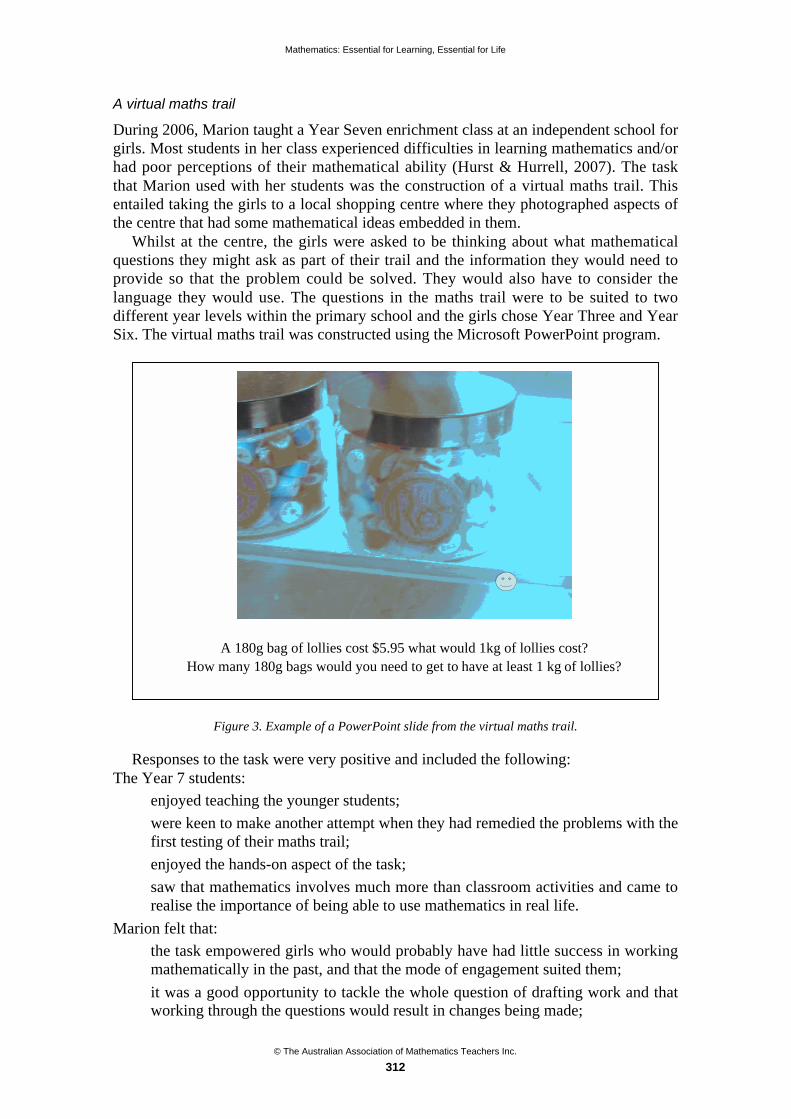
Mathematics: Essential for Learning, Essential for Life
© The Australian Association of Mathematics Teachers Inc.
312
A virtual maths trail
During 2006, Marion taught a Year Seven enrichment class at an independent school forgirls. Most students in her class experienced difficulties in learning mathematics and/orhad poor perceptions of their mathematical ability (Hurst & Hurrell, 2007). The taskthat Marion used with her students was the construction of a virtual maths trail. Thisentailed taking the girls to a local shopping centre where they photographed aspects ofthe centre that had some mathematical ideas embedded in them.
Whilst at the centre, the girls were asked to be thinking about what mathematicalquestions they might ask as part of their trail and the information they would need toprovide so that the problem could be solved. They would also have to consider thelanguage they would use. The questions in the maths trail were to be suited to twodifferent year levels within the primary school and the girls chose Year Three and YearSix. The virtual maths trail was constructed using the Microsoft PowerPoint program.
Figure 3. Example of a PowerPoint slide from the virtual maths trail.
Responses to the task were very positive and included the following:The Year 7 students:
• enjoyed teaching the younger students;
• were keen to make another attempt when they had remedied the problems with thefirst testing of their maths trail;
• enjoyed the hands-on aspect of the task;
• saw that mathematics involves much more than classroom activities and came torealise the importance of being able to use mathematics in real life.
Marion felt that:
• the task empowered girls who would probably have had little success in workingmathematically in the past, and that the mode of engagement suited them;
• it was a good opportunity to tackle the whole question of drafting work and thatworking through the questions would result in changes being made;
A 180g bag of lollies cost $5.95 what would 1kg of lollies cost?How many 180g bags would you need to get to have at least 1 kg of lollies?
Mathematics: Essential for Learning, Essential for Life
© The Australian Association of Mathematics Teachers Inc.
313
• the exercise proved to have positive spin offs in so much as it allowed students towork in different parts of the school;
• the cross-school liaison between students was matched by liaison between staff.
As with the previous two tasks, the virtual maths trail was highly engaging forstudents not considered to be strong in mathematical ability. The language andmathematical concepts emerged during the course of constructing the trail and weremeaningful for the girls as they were embedded in an authentic context.
Conclusion
Researchers such as Haylock (1991) have mentioned the importance of using “real” and“authentic” contexts to enhance student learning and this seems to be a significant partof the issue of motivating students towards learning about and applying mathematics.However, it is also important that teachers are constantly reflective about what theirstudents are thinking and doing so that they are in a better position to provide the sort oflearning experiences that are relevant to the learning and use of mathematics in themodern world. Specifically, teachers should consider whether or not they are providinglearning situations that genuinely allow students to connect their mathematical learningto a range of applied situations. In particular, it is important to consider if we are puttingbarriers in the way of our students in the form of unnecessarily complicated andcumbersome language as opposed to allowing them to develop mathematical ideas inthe context of their own everyday language.
References
Askew, M., Brown, M., Rhodes, V., Wiliam, D. & Johnson, D. (1997). Effective Teachers of Numeracyin Primary Schools: Teacher Beliefs, Practices and Pupil Learning. London: King’s College London.
Bickmore-Brand, J. (1998). Whose questions are being answered in the mathematics classroom?Australian Primary Mathematics Classroom, 3(1), 4–8.
Burns, M. (1998). Math: Facing an American Phobia. Sausalito, California: Maths Solutions.
Carnellor, Y. (2004). Encouraging Mathematical Success for Children with Learning Difficulties.Southbank, Victoria: Social Science Press.
Haylock, D. (1991). Teaching Mathematics to Low Attainers 8–12. London: Paul Chapman Publishing.
Hurst, C. (2006). Numeracy in Action: Students Connecting Mathematical Knowledge to a Range ofContexts. Unpublished doctoral thesis. Curtin University.
Hurst, C. & Hurrell, D. (2007). Connecting Mathematics. Osborne Park: Association of IndependentSchools of Western Australia. (AISWA).
Parkin, B. & Hayes, J. (2006). Scaffolding the language of maths. Literacy Learning: The Middle Years14 (1), 23–35.
Trafton, P. (1999). Make mathematics messy. Australian Primary Mathematics Classroom, 4(1), 9–12.

© The Australian Association of Mathematics Teachers Inc.
314
Teaching algebra using instructional games*
Jane Irvin
Deception Bay SHS
The teaching of algebraic understandings through instructional games provides arich program with students and teachers gaining expertise on many levels. Thispaper will present a framework and examples to show how students work frompractice and consolidation of skills through to a deep understanding of theconcepts and how teachers, through planning within the framework and theinteractions with students during game play, gain insight into where the studentsare in their learning, and have the opportunity to move them forward when theyare ready. The teaching of important interpersonal skills will also be discussed.
Instructional games
There are many definitions of instructional games used in mathematics. Gough (2000)defines a mathematics game as “something you play to learn or practise mathematics.”Ainley (1990) refines this by distinguishing the effective game as being born out of, andinherently relying on, mathematical ideas and understanding in order to run. There aremany examples of using instructional games for numeration concepts (Booker et al.2004; Booker 2004; Booker 2000; Ortiz 2003; Gough 2000; Onslow 1990; Pearn &Merrifield 2004; Randel et al. 1992; Rowe 2001; Schmidt & Ellen 1995).
The research
The research is overwhelmingly in favour of using instructional games in themathematics classroom. Randel et al. (1992) reviewed the literature and they present apowerful case for changing the mode of instruction in the mathematics class. Theyfound that the use of games in teaching mathematics is superior to traditional instructionin terms of achievement, retention and motivation for learning. For students usinginstructional games in the classroom, the literature shows an increase in achievement,improved retention of information, heightened motivation to learn, greater participation,increased opportunities to learn, more complete engagement in the task, greater interest,improved confidence and more risk taking/problem solving (Booker et al., 2004;Booker, 2004a; Booker, 2000; Ortiz, 2003; Gough, 2000; Onslow, 1990; Pearn &Merrifield, 2004; Randel et al., 1992; Rowe, 2001; Schmidt & Ellen, 1995). Pearn andMerrifield (2004) based their effective intervention program on the use of games. Theywanted the students to be actively engaged in the program and found that gamesprovided this. The benefits of positive cooperative social interactions are also welldocumented (Booker, 2000; Ortiz, 2003; Rowe, 2001).
The positives for teachers focus on the benefits to students. Booker (2000) alsomentions increased opportunities for teachers to communicate with students, one on
* Paper accepted by peer review
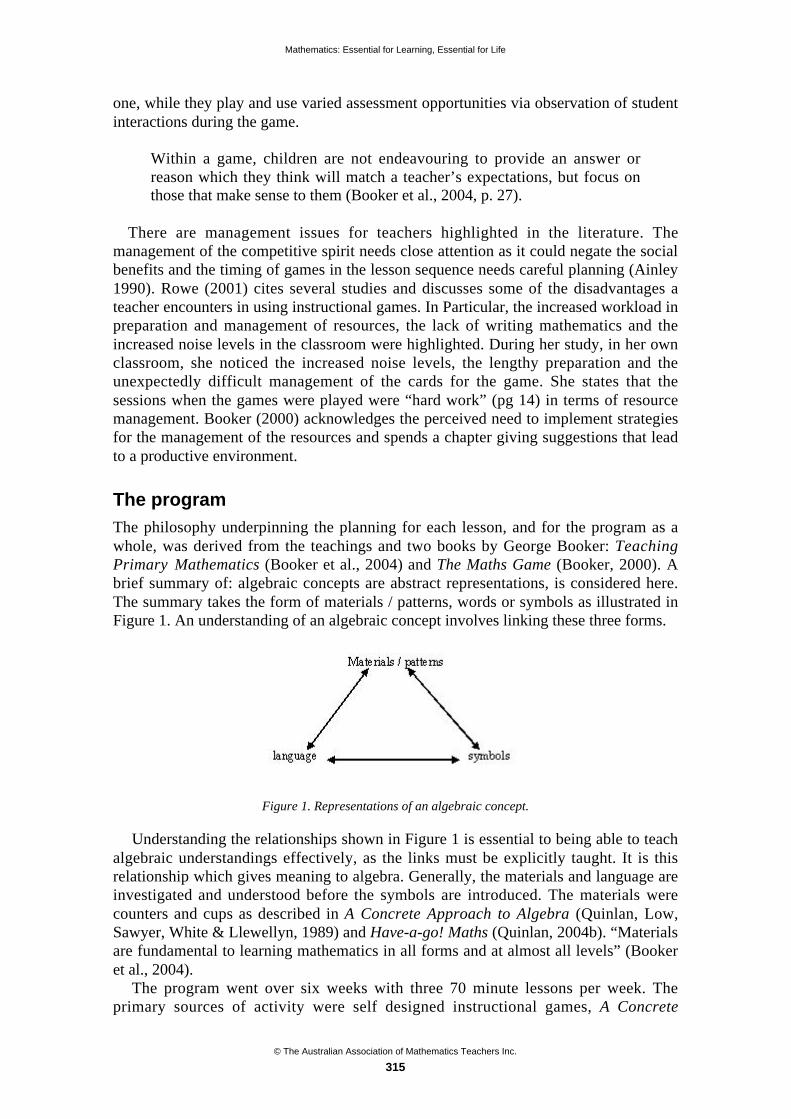
Mathematics: Essential for Learning, Essential for Life
© The Australian Association of Mathematics Teachers Inc.
315
one, while they play and use varied assessment opportunities via observation of studentinteractions during the game.
Within a game, children are not endeavouring to provide an answer orreason which they think will match a teacher’s expectations, but focus onthose that make sense to them (Booker et al., 2004, p. 27).
There are management issues for teachers highlighted in the literature. Themanagement of the competitive spirit needs close attention as it could negate the socialbenefits and the timing of games in the lesson sequence needs careful planning (Ainley1990). Rowe (2001) cites several studies and discusses some of the disadvantages ateacher encounters in using instructional games. In Particular, the increased workload inpreparation and management of resources, the lack of writing mathematics and theincreased noise levels in the classroom were highlighted. During her study, in her ownclassroom, she noticed the increased noise levels, the lengthy preparation and theunexpectedly difficult management of the cards for the game. She states that thesessions when the games were played were “hard work” (pg 14) in terms of resourcemanagement. Booker (2000) acknowledges the perceived need to implement strategiesfor the management of the resources and spends a chapter giving suggestions that leadto a productive environment.
The program
The philosophy underpinning the planning for each lesson, and for the program as awhole, was derived from the teachings and two books by George Booker: TeachingPrimary Mathematics (Booker et al., 2004) and The Maths Game (Booker, 2000). Abrief summary of: algebraic concepts are abstract representations, is considered here.The summary takes the form of materials / patterns, words or symbols as illustrated inFigure 1. An understanding of an algebraic concept involves linking these three forms.
Figure 1. Representations of an algebraic concept.
Understanding the relationships shown in Figure 1 is essential to being able to teachalgebraic understandings effectively, as the links must be explicitly taught. It is thisrelationship which gives meaning to algebra. Generally, the materials and language areinvestigated and understood before the symbols are introduced. The materials werecounters and cups as described in A Concrete Approach to Algebra (Quinlan, Low,Sawyer, White & Llewellyn, 1989) and Have-a-go! Maths (Quinlan, 2004b). “Materialsare fundamental to learning mathematics in all forms and at almost all levels” (Bookeret al., 2004).
The program went over six weeks with three 70 minute lessons per week. Theprimary sources of activity were self designed instructional games, A Concrete

Mathematics: Essential for Learning, Essential for Life
© The Australian Association of Mathematics Teachers Inc.
316
Approach to Algebra (Quinlan, Low, Sawyer, White & Llewellyn, 1989) and Access toAlgebra Book 2 (Lowe, Johnston, Kissane & Willis, 1993).
Specific games
Several instructional games were used in the teaching of the program. In this paper,three will be discussed in detail. They demonstrate the philosophy of the course, thestyle of teaching, and some of the different game genre that can be used in theclassroom. The games are best used as an integral part of the lesson. The games allowthe teacher to differentiate the learning for students in their class. Students can move onfrom where they are in their understanding by playing the game they are ready for.Teachers can have several different games being played at the same time within theirclassroom, and work with each group as the need arises. The small group is lessthreatening to students and they are more likely to risk-take and ask questions of eachother.
Throughout all the game playing, links are made between symbols and language andbetween materials and language. The students are required to read the “question” outloud and verbalise their response. The renaming aspect involved in all the gamesdiscussed here encourages students to compare various possible responses. Theparticular algebraic language of variable, constant, collecting like terms, simplifying,expanding brackets are explicitly introduced during the teaching, and reinforced in thegame playing.
Dolphin Magic
This game explicitly teaches the link between materials and symbols. Also, the conceptof the difference between a variable and a constant is reinforced and the concept ofrenaming is taught through the game play. The sectors of the spinner have cup picturesrepresenting cups that have y counters in them and large dots representing countersoutside the cups. The spinner has six sectors each with a different combination of cupswith y counters in them and counters outside. The track has multiple symbolicrepresentations of each combination. The player has to move to the closest position onthe track with a symbolic representation of the sector spun on the spinner. The playersare given the concrete materials to engage with. An example of a sector of the spinner isshown in Figure 2. This group of materials can be written in symbols as 3y + 4 or as y +y + y + 4 or as y + 1 + y +1 + y + 1 + 1 or as 2y + y + 4 and each of these “names” canbe found on the track. In this ways students learn that there are several ways tosymbolically represent this group of materials and that each way is equivalent to theother ways: that is, they learn renaming. After this, the concept of simplifying wastaught.
Figure 2. An example of a sector of the spinner.
Renaming using brackets (i.e., the distributive property) is a natural inclusion at thispoint in the students’ learning. Students are very comfortable, from the outset, with
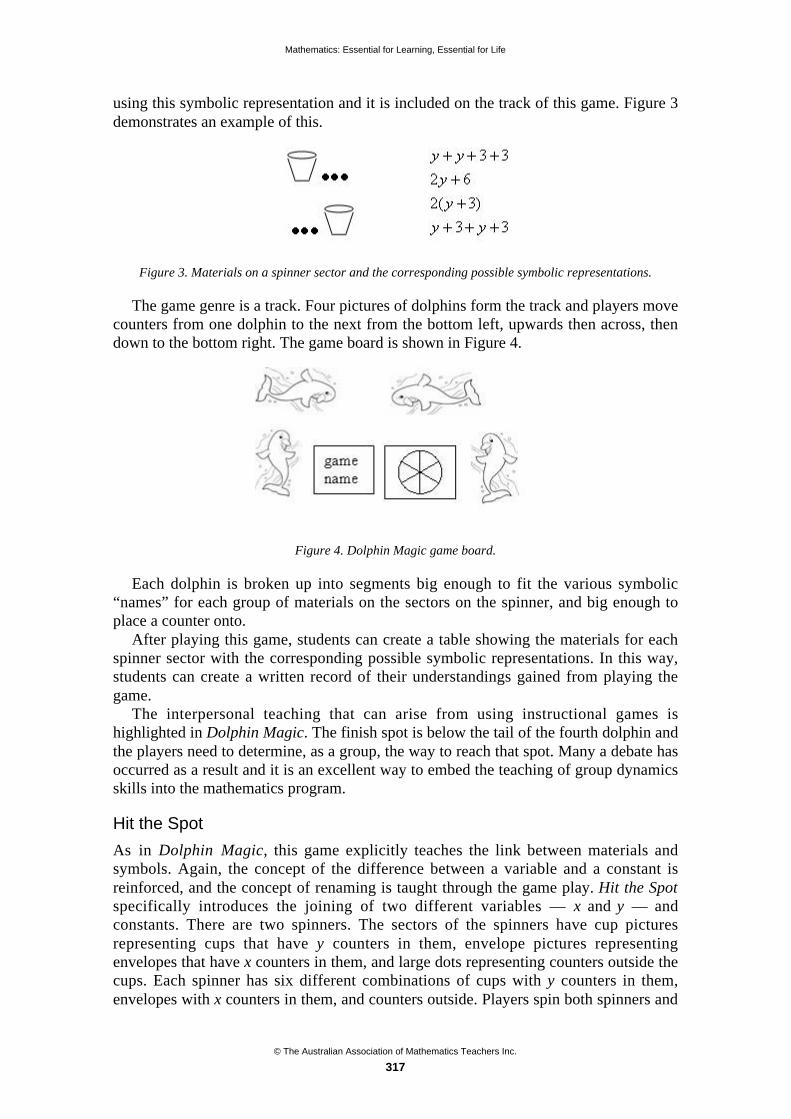
Mathematics: Essential for Learning, Essential for Life
© The Australian Association of Mathematics Teachers Inc.
317
using this symbolic representation and it is included on the track of this game. Figure 3demonstrates an example of this.
Figure 3. Materials on a spinner sector and the corresponding possible symbolic representations.
The game genre is a track. Four pictures of dolphins form the track and players movecounters from one dolphin to the next from the bottom left, upwards then across, thendown to the bottom right. The game board is shown in Figure 4.
Figure 4. Dolphin Magic game board.
Each dolphin is broken up into segments big enough to fit the various symbolic“names” for each group of materials on the sectors on the spinner, and big enough toplace a counter onto.
After playing this game, students can create a table showing the materials for eachspinner sector with the corresponding possible symbolic representations. In this way,students can create a written record of their understandings gained from playing thegame.
The interpersonal teaching that can arise from using instructional games ishighlighted in Dolphin Magic. The finish spot is below the tail of the fourth dolphin andthe players need to determine, as a group, the way to reach that spot. Many a debate hasoccurred as a result and it is an excellent way to embed the teaching of group dynamicsskills into the mathematics program.
Hit the Spot
As in Dolphin Magic, this game explicitly teaches the link between materials andsymbols. Again, the concept of the difference between a variable and a constant isreinforced, and the concept of renaming is taught through the game play. Hit the Spotspecifically introduces the joining of two different variables — x and y — andconstants. There are two spinners. The sectors of the spinners have cup picturesrepresenting cups that have y counters in them, envelope pictures representingenvelopes that have x counters in them, and large dots representing counters outside thecups. Each spinner has six different combinations of cups with y counters in them,envelopes with x counters in them, and counters outside. Players spin both spinners and

Mathematics: Essential for Learning, Essential for Life
© The Australian Association of Mathematics Teachers Inc.
318
join the two sectors spun to form one symbolic representation. The players are given theconcrete materials to engage with. Figure 5 shows an example from the game. The useof the addition symbol for joining variables with variables and variables with constantsneeds to be made explicit to the students, and the use of the materials helps to show this.This physical demonstration of addition helps the students to form it as a separateconcept from multiplication. This is essential for success in further algebra, particularlywith the distributive property.
Figure 5. Materials on two spinners and the corresponding possible symbolic representations
The game genre is a grid board. The game is for two players, or pairs of players. Theboard has forty squares each being large enough to hold a counter. The possiblesymbolic representations from the spinners are in the squares. The player places acounter on a square with a symbolic representation of the joining of the sectors spun onthe spinners. The first player, or pair of players, to have four connected spaces on theboard is the winner. For this grid board, there are four squares as free choice or “wild”squares. They have a picture of a butterfly on them instead of algebraic symbols and canbe accessed by the players, at their discretion.
In Hit the Spot there is also the opportunity to teach interpersonal skills, with groupdiscussion occurring over game etiquette. Players are given the suggested definition of“four connected spaces” on the instruction sheet yet there is room to enhance this if thegroup desires. This genre has the added dimension of strategic placement of counters, asa feature, and this can lead the players to discuss if removing an already placed counterfor strategic reasons is allowed, and to decide on the criteria for accessing the “wild”squares.
Renaming with algebra — expanding brackets
This game is a rich exploration of the distributive property — the algebraic renamingprocess of “expanding brackets.” The game explicitly teaches the link between patternand symbols. Spinners are used to generate random expressions, with brackets writtenwith algebraic symbols, and students are required to expand the brackets. The teacherhas several different game boards available to issue to students. Figure 6 shows threepossible game boards. The boards are increasing in difficulty and the teacher can choosewhich board to give, dependent on where the students are in their learning. Each boardhas three blank spaces to be filled by each of the three identical spinners on the spinnerboard. One of the spinners is shown in Figure 7. The spinners each have four integersand two letters. Thus, there are 147 different possible expressions per game board.
( + )
( n + )
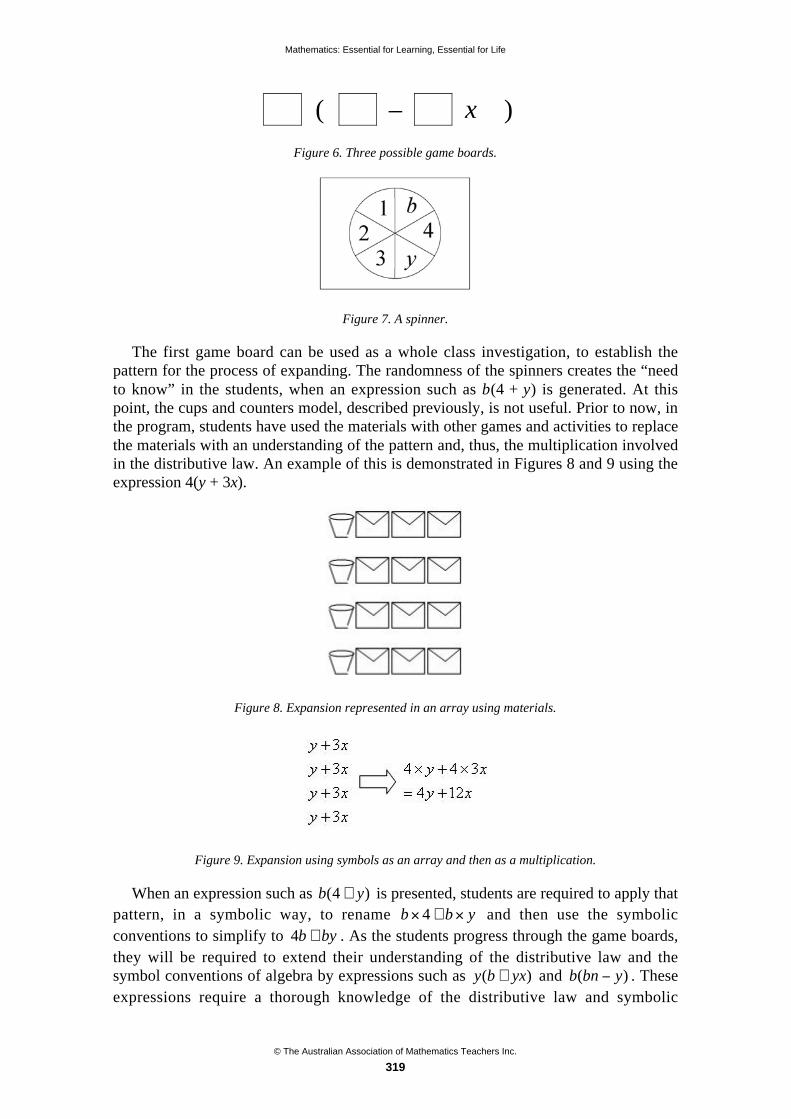
Mathematics: Essential for Learning, Essential for Life
© The Australian Association of Mathematics Teachers Inc.
319
( – x )
Figure 6. Three possible game boards.
Figure 7. A spinner.
The first game board can be used as a whole class investigation, to establish thepattern for the process of expanding. The randomness of the spinners creates the “needto know” in the students, when an expression such as b(4 + y) is generated. At thispoint, the cups and counters model, described previously, is not useful. Prior to now, inthe program, students have used the materials with other games and activities to replacethe materials with an understanding of the pattern and, thus, the multiplication involvedin the distributive law. An example of this is demonstrated in Figures 8 and 9 using theexpression 4(y + 3x).
Figure 8. Expansion represented in an array using materials.
Figure 9. Expansion using symbols as an array and then as a multiplication.
When an expression such as )4( yb + is presented, students are required to apply thatpattern, in a symbolic way, to rename ybb +4 and then use the symbolicconventions to simplify to byb +4 . As the students progress through the game boards,they will be required to extend their understanding of the distributive law and thesymbol conventions of algebra by expressions such as )( yxby + and )( ybnb . Theseexpressions require a thorough knowledge of the distributive law and symbolic

Mathematics: Essential for Learning, Essential for Life
© The Australian Association of Mathematics Teachers Inc.
320
convention knowledge such as yy is written as 2y not yy and by is generally
written as by not yb.The game genre is a concept game, in that it is used to introduce and explore a new
understanding. To create the competition element inherent in games, it uses a genericgrid board shown in table 1. Each square is blank and large enough for a counter to beplaced on it. Similar interpersonal issues can arise as in Hit the Spot.
When a player gets a question
correct, the player places a
marker on the grid game board
anywhere they choose.
The first player or pair of
players to have 4 connected
spaces on the board is the
winner.
Table 1. Generic grid board.
Conclusion
Using instructional games in the teaching of algebraic understandings, is a rewardingexperience for both the teacher and the students. The students gain insight at manylevels, from reinforcement of concepts, through to a thorough understanding of complexconcepts together with interpersonal skills. The teacher is given flexibility in themanagement of the classroom and is readily able to meet the learning needs of thestudents. Groups work from where they are at in their learning. Planning the programwithin the framework discussed in this paper, so as to explicitly teach the links betweensymbols and materials, symbols and language, and materials and language, ensures theteaching is about understanding as opposed to procedural knowledge. The managementof the physical resource of the games, in terms of time taken in preparation, can bemade easier through the use of computer generated game boards. The classroomenvironment is different to that of a traditional worksheet or textbook lesson, as thestudents willingly engage with the activities, discuss their mathematics and negotiateprocesses which are meaningful to them. At the same time, the teacher gains insight intothe students’ thinking that informs the planning of future teaching and learningpathways.
Mathematics: Essential for Learning, Essential for Life
© The Australian Association of Mathematics Teachers Inc.
321
References
Ainley, J. (1990). Playing games and learning mathematics. In L. Steffe & T. Wood (Eds), TransformingChildren’s Mathematics Education: International Perspectives. Hillsdale NJ: Lawrence Earlbaum.
Booker, G., Bond, D., Sparrow, L. & Swan, P. (2004). Teaching Primary Mathematics (3rd ed.). Sydney:Pearson Education Australia
Booker, G. (2004). Playing to win: Using games for motivation and the development of mathematicalthinking. In A. Rogerson (Ed.), The Future of Mathematics Education (Proceedings of theMathematics into the 21st Century International Conference, pp. 16–20). Ciechocinek, Poland.
Booker, G. (2000). The Maths Game: Using Instructional Games to Teach Mathematics. Wellington:New Zealand Council for Educational Research
Gough, J. (2000). Game, Set and Match — Maths! Adelaide: The Australian Association of MathematicsTeachers.
Lowe, I., Johnson, J., Kissane, B. & Willis, S. (1993). Access to Algebra: Book 2. Carlton: CurriculumCorporation.
Onslow, B. (1990). Overcoming conceptual obstacles: The qualified use of a game. School Science andMathematics, 90(7), 581–592.
Ortiz, E. (2003). Research findings from games involving basic fact operations and algebraic thinking at aPDS. Tabletop presentation, The Holmes Partnership Seventh Annual Conference. Washington, D.C.
Pearn, C. & Merrifield, M. (2004). Strategies for classroom teachers — A lesson from mathematicsintervention, La Trobe University, Boroondara Park Primary School. The Collaborative Group forResearch in Mathematics Education (CRME). University of Southampton, UK. Retrieved fromhttp://www.crme.soton.ac.uk/publications/gdpubs/cath.html
Quinlan, C., Low, B., Sawyer, T., White, P. & Llewellyn, B. (1987). A Concrete Approach to Algebra.Darlinghurst NSW: Algebra Research Group.
Quinlan, C. (2004a). Reflections on the Third International Maths and Science Study (TIMMS) Thinking,Reasoning and Working Mathematically. Proceedings of the 2nd ACU Conference for Primary andSecondary Teachers of Mathematics. Brisbane, Australia.
Quinlan, C. (2004b). Have-a-go! Maths. Westmead, Australia. http://www.cyrilq.net
Randel, J., Morris, B., Wetzel, C. & Whitehill, B. (1992). The effectiveness of games for educationalpurposes: A review of recent research. Simulation and Gaming, 23(3), 261–276.
Rowe, J. (2001). An experiment in the use of games in the teaching of mental arithmetic. Philosophy ofMathematics Education, 14, May.
Schmidt, M. (1995). Mathematics intervention: Second grade place value concepts. Education, 116 (2).
van Kraayenoord, C. & Elkins, J. (2004). Learning difficulties in numeracy in Australia. Journal ofLearning Disabilities, 37(1), 32–41.

© The Australian Association of Mathematics Teachers Inc.
322
Mathematics and food: Essentials for life*
Marian Kemp
Murdoch University, WA
This paper focuses on the interpretation of tables as an essential skill needed inour everyday lives. There are two main kinds of tables: firstly, the tables accessedfor specific information such as those on food or medicine packets and transporttimetables and, secondly, tables of data such as those on environmental and socialissues. This paper will highlight the mathematical concepts and skills which can bedeveloped in the mathematics curriculum and that are needed for interpreting bothtypes of tables. It will also describe how a Five Step Framework can be used inprimary, secondary and tertiary mathematics education to help students developtheir skills in the interpretation of tables of data.
Introduction
Advances in technology and communications have increased the extent to which peopleworldwide are exposed to quantitative information in text, graphs and tables. Over thelast twenty years, more attention has been given to the development of the numeracyand statistical literacy of citizens (Gal, 2003).
There is a wide range of issues (e.g., pollution, terrorism, traffic accidents, logging,nuclear power) in which informed decisions need to be made at national or local levelsand for which some understanding of mathematical concepts and skills is essential. Thecontext chosen for this paper concerns food and health but the choice of context is quitearbitrary and the ideas presented are relevant to other contexts of contemporaryrelevance.
There is growing public concern about health issues such as obesity, lack of exercise,high alcohol consumption, smoking, diabetes and cardiovascular diseases. In countriessuch as Australia and the USA there is concern about the increase in the percentage ofoverweight and obese children and the associated risk of diabetes. The media give us analmost daily update from nutritionists, environmental health experts, fast foodcompanies, school principals and parents on the social, economic and environmentaleffects with respect to the perceived impact of the consumption of various kinds offood.
To make informed decisions in this area of food health, the general public need to beable to interpret the quantitative information they encounter in text, graphs or tablespublished in magazines and newspapers, on the television, in films and on the Internet.School and university students also use sources such as textbooks, health reports,environmental health reports and academic journals.
Much of the information people encounter is in graphical form. The literatureprovides a rich source of information concerning considerable research on theadvantages of graphical representations (e.g., Tufte, 1983; Wainer, 1992) and on waysthat these graphical displays can be misleading (e.g., Dewdney, 1993). It is common
* Paper accepted by peer review
Mathematics: Essential for Learning, Essential for Life
© The Australian Association of Mathematics Teachers Inc.
323
practice in schools and universities for students to examine graphs and look for suchaspects as incomplete, inaccurate or missing scales. As well, it has been suggested byWainer (1992) that “there is ample evidence that the ability to understand graphicallypresented material is hard-wired in” (p.18).
On the other hand, research into the interpretation and construction of tables is muchmore limited and probably reflects the limited emphasis given to the developing andapplying skills of interpreting and constructing tables in the education system (Koschat,2005). However, Mosenthal and Kirsh (1998) have made significant contributions to thefield through their work in the 1980’s on three interrelated constructsProse/Document/Quantitative Literacy, which informed the large-scale NAAL study inthe USA (OECD, 2003).
Two kinds of tables
There are two main kinds of tables. Firstly, the kind consulted for specific information,referred to by Mosenthal and Kirsch (1998, p. 639) as reading-to-do. Examples of theseare found on medicine, food and health supplement packages and on bus, train andflight timetables that require some understanding of travel on specific days such asSundays, and crossing of time zones.
Secondly, there is the kind of table that includes collected, produced and collateddata that can be used to develop an understanding of the associated context. This is thekind of table referred to by Mosenthal and Kirsch (1998, p. 639) as reading-to-comprehend. Examples of this kind of table include those with data on unemployment,traffic statistics, poverty, disease, and educational achievement that would be found innewspapers, journals and reports. It is unlikely that people consult this kind of tablesimply for a particular value; they are more likely to want to make comparisons, to lookfor trends over time, and to draw conclusions.
Being able to interpret both kinds of tables is important. The interpretation ofreading-to-do tables receives some attention at the school level but the reading-to-comprehend much less so (Kemp & Kissane, 1990). The interpretation of both kinds oftables will be considered in this paper in the context of food and health, and the use of aFive Step Framework, to help students build up strategies for interpreting reading-to-comprehend tables, will be described in some detail. The importance of the carefulconstruction of both kinds of tables is closely associated with the interpretation oftables, but addressing this is beyond the scope of this paper. The work of Mosenthal andKirsch with their IKIRSCH/PMOSE readability analysis (Mosenthal & Kirsch, 1998)and associated papers is useful in this area.
Tables for specific information
In this section the context of food has been chosen to illustrate the processes needed toread tables for specific information. In the current climate of concern aboutunderweight, overweight and obese young people there is a need for information aboutwhat is contained in the foods that they are consuming, and what they should be eatingfor a healthy life. There are many books and resources on the Internet that can beconsulted to find out about such things as suitable kilojoule intake, proportions of fat,sugar and salt, servings of meat, fish, vegetables and grains, many of which present theinformation in tabular form.
A specific example of the relationship between food consumption and healthconcerns the incidence of Diabetes type 2 in young people, which has been increasing
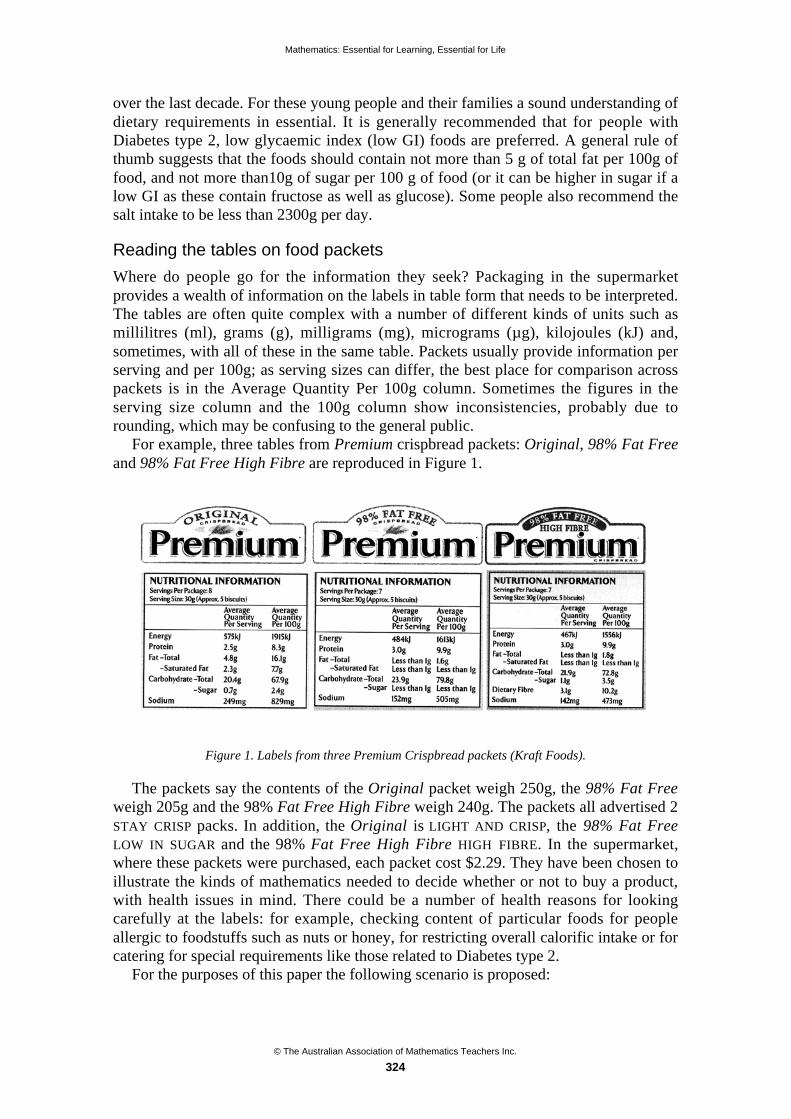
Mathematics: Essential for Learning, Essential for Life
© The Australian Association of Mathematics Teachers Inc.
324
over the last decade. For these young people and their families a sound understanding ofdietary requirements in essential. It is generally recommended that for people withDiabetes type 2, low glycaemic index (low GI) foods are preferred. A general rule ofthumb suggests that the foods should contain not more than 5 g of total fat per 100g offood, and not more than10g of sugar per 100 g of food (or it can be higher in sugar if alow GI as these contain fructose as well as glucose). Some people also recommend thesalt intake to be less than 2300g per day.
Reading the tables on food packets
Where do people go for the information they seek? Packaging in the supermarketprovides a wealth of information on the labels in table form that needs to be interpreted.The tables are often quite complex with a number of different kinds of units such asmillilitres (ml), grams (g), milligrams (mg), micrograms (µg), kilojoules (kJ) and,sometimes, with all of these in the same table. Packets usually provide information perserving and per 100g; as serving sizes can differ, the best place for comparison acrosspackets is in the Average Quantity Per 100g column. Sometimes the figures in theserving size column and the 100g column show inconsistencies, probably due torounding, which may be confusing to the general public.
For example, three tables from Premium crispbread packets: Original, 98% Fat Freeand 98% Fat Free High Fibre are reproduced in Figure 1.
Figure 1. Labels from three Premium Crispbread packets (Kraft Foods).
The packets say the contents of the Original packet weigh 250g, the 98% Fat Freeweigh 205g and the 98% Fat Free High Fibre weigh 240g. The packets all advertised 2STAY CRISP packs. In addition, the Original is LIGHT AND CRISP, the 98% Fat FreeLOW IN SUGAR and the 98% Fat Free High Fibre HIGH FIBRE. In the supermarket,where these packets were purchased, each packet cost $2.29. They have been chosen toillustrate the kinds of mathematics needed to decide whether or not to buy a product,with health issues in mind. There could be a number of health reasons for lookingcarefully at the labels: for example, checking content of particular foods for peopleallergic to foodstuffs such as nuts or honey, for restricting overall calorific intake or forcatering for special requirements like those related to Diabetes type 2.
For the purposes of this paper the following scenario is proposed:
Mathematics: Essential for Learning, Essential for Life
© The Australian Association of Mathematics Teachers Inc.
325
A shopper looking to buy a packet of crispbread suitable for a person with Diabetestype 2 observes that for this brand there are three versions: Original, 98% Fat Freeand 98% Fat Free High Fibre. Which one (if any) would you choose and why?
Firstly, the consumer needs to compare each packet with the dietary requirements forDiabetes type 2 and, then, make comparisons between the packets. This involveslooking at the headings, the lists of ingredients and the columns that indicate servingsize and information per 100g. When comparing three products, the consumer needs tomake multiple comparisons, the number depending on the nature and complexity of theinformation they seek. In addition, any comparisons are probably made in thesupermarket itself in practice, at least at first.
Under NUTRITIONAL INFORMATION the first observation concerns the number ofservings per package and the serving size. The Original has 8 servings of 30g (approx 5biscuits) which multiplies to 240g (although the packet says 250g), the 98% Fat Freehas 7 servings of 30g (approx 5 biscuits) which multiplies to 210g (although the packetsays 205g) and the 98% Fat Free High Fibre has 7 servings of 30g (approx 5 biscuits)which multiplies to 210g (although the packet says 240g). There are someinconsistencies here in weight and cost per biscuit!
To investigate the weights, the biscuits were taken out of the packaging and weighed.For the three packets purchased the actual weights were: Original: 266g which is 6%more than the packet states, 98% Fat Free: 228g which is 11% more than the packetstates, and 98% Fat Free High Fibre: 273g which is 14% more than the packet states.This sample of one set of three packets has highlighted the variation and could lead tosome investigation of variation in the average weights of the biscuits in the packets.People will no doubt interpret the average as the mean but some discussion about theways that the term average is used in everyday life would be useful, in this context. It ishelpful to have the number of servings per package but the manufacturers often omit thenumber of items per serve, choosing instead to indicate only the weight of the servingsize, without the number of pieces.
For the scenario above, the essential information concerns the total fat content andthe sugar content per 100g, both of which need to be located in the table, amidst theother information provided. In this instance the sodium content will just be noted.Premium Original (LIGHT AND CRISP)
The total fat content of 16.1g is above the 5g per 100g requirement and so is toohigh, but the sugar at 2.4g per 100 g falls into the guidelines of less than 10g per 100g.The product is not suitable for the Diabetes type 2 diet (sodium 829mg per 100g).Premium 98% Fat Free (LOW IN SUGAR)
The total fat content of 1.6g per 100g confirms the claim on the packet of being 98%fat free. The sugar content is less than 1g per 100g and the product is acceptable for theDiabetes type 2 diet (sodium 505mg per 100g).Premium 98% Fat Free High Fibre (HIGH FIBRE)
The total fat content of 1.8g per 100g confirms the claim on the packet of being 98%fat free. The sugar content is 3.5g per 100g and , thus, the product is acceptable for theDiabetes type 2 diet. However, it may be noted that this is an increase of 1.1g of sugarper 100g on the Original version (sodium 473mg per 100g).
None of the packets claims to be “low-salt” and so there is no need to conform to therequirement of not more than 120mg of sodium per 100g; nevertheless, it can be seenthat the sodium content decreases from Original (829mg) to 98% Fat Free (505mg) andto 98% Fat Free High Fibre (473mg).
Which product should we choose? This everyday decision requires a good deal ofskill at extracting and interpreting information from the tables. None of the products is
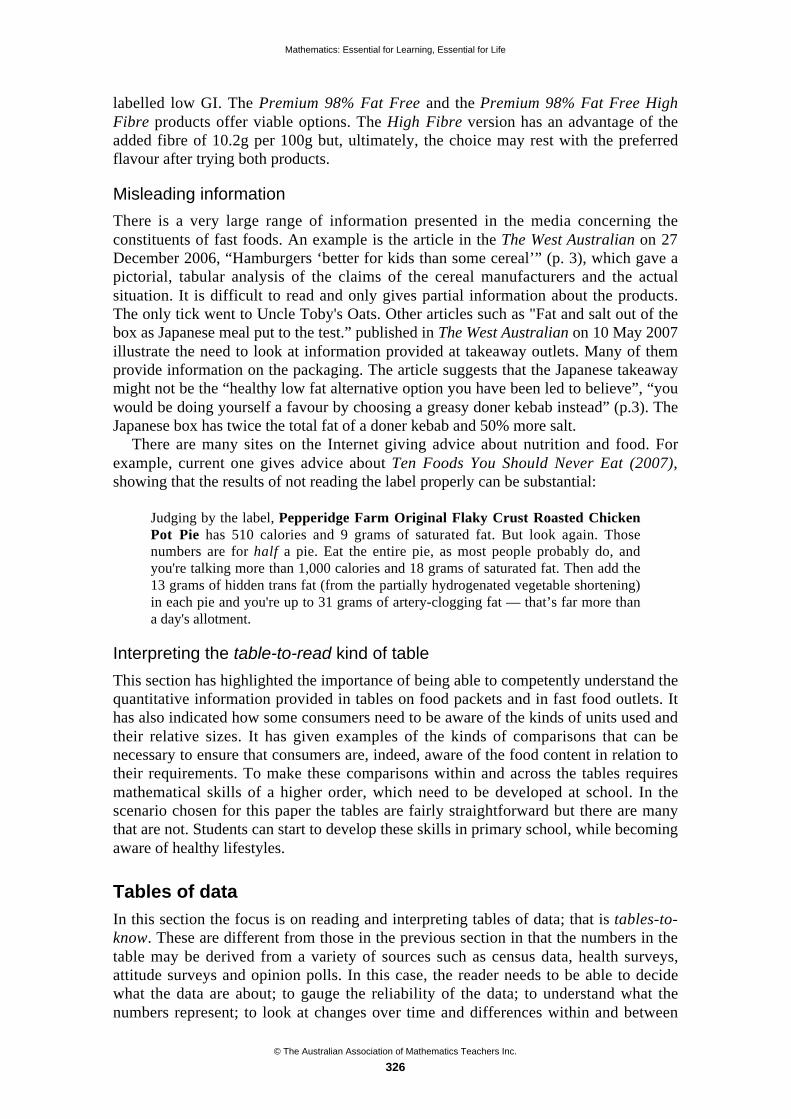
Mathematics: Essential for Learning, Essential for Life
© The Australian Association of Mathematics Teachers Inc.
326
labelled low GI. The Premium 98% Fat Free and the Premium 98% Fat Free HighFibre products offer viable options. The High Fibre version has an advantage of theadded fibre of 10.2g per 100g but, ultimately, the choice may rest with the preferredflavour after trying both products.
Misleading information
There is a very large range of information presented in the media concerning theconstituents of fast foods. An example is the article in the The West Australian on 27December 2006, “Hamburgers ‘better for kids than some cereal’” (p. 3), which gave apictorial, tabular analysis of the claims of the cereal manufacturers and the actualsituation. It is difficult to read and only gives partial information about the products.The only tick went to Uncle Toby's Oats. Other articles such as "Fat and salt out of thebox as Japanese meal put to the test.” published in The West Australian on 10 May 2007illustrate the need to look at information provided at takeaway outlets. Many of themprovide information on the packaging. The article suggests that the Japanese takeawaymight not be the “healthy low fat alternative option you have been led to believe”, “youwould be doing yourself a favour by choosing a greasy doner kebab instead” (p.3). TheJapanese box has twice the total fat of a doner kebab and 50% more salt.
There are many sites on the Internet giving advice about nutrition and food. Forexample, current one gives advice about Ten Foods You Should Never Eat (2007),showing that the results of not reading the label properly can be substantial:
Judging by the label, Pepperidge Farm Original Flaky Crust Roasted ChickenPot Pie has 510 calories and 9 grams of saturated fat. But look again. Thosenumbers are for half a pie. Eat the entire pie, as most people probably do, andyou're talking more than 1,000 calories and 18 grams of saturated fat. Then add the13 grams of hidden trans fat (from the partially hydrogenated vegetable shortening)in each pie and you're up to 31 grams of artery-clogging fat — that’s far more thana day's allotment.
Interpreting the table-to-read kind of table
This section has highlighted the importance of being able to competently understand thequantitative information provided in tables on food packets and in fast food outlets. Ithas also indicated how some consumers need to be aware of the kinds of units used andtheir relative sizes. It has given examples of the kinds of comparisons that can benecessary to ensure that consumers are, indeed, aware of the food content in relation totheir requirements. To make these comparisons within and across the tables requiresmathematical skills of a higher order, which need to be developed at school. In thescenario chosen for this paper the tables are fairly straightforward but there are manythat are not. Students can start to develop these skills in primary school, while becomingaware of healthy lifestyles.
Tables of data
In this section the focus is on reading and interpreting tables of data; that is tables-to-know. These are different from those in the previous section in that the numbers in thetable may be derived from a variety of sources such as census data, health surveys,attitude surveys and opinion polls. In this case, the reader needs to be able to decidewhat the data are about; to gauge the reliability of the data; to understand what thenumbers represent; to look at changes over time and differences within and between

Mathematics: Essential for Learning, Essential for Life
© The Australian Association of Mathematics Teachers Inc.
327
categories, and to consider implications of the information in the light of priorknowledge. Experience has shown that many students skim over these kinds of tables,relying on the possibly biased interpretations of the authors of the accompanying text.Concern about the lack of engagement of first year students studying to be primaryteachers led to an empirical study to investigate the effectiveness of an interventionworkshop, using a Five Step Framework (Kemp, 2006) (see Table 1) and a follow upstudy with first year science students (Kemp & Bradley, 2006).
Table 1. Five Step Framework.
Step 1: Getting started
Look at the title, axes, headings, legend, footnotes and source to find out the context and expectedreliability of the data.
Step 2: WHAT do the numbers mean?
Make sure you know what all the numbers (percentages, ’000s, etc.) represent. Look for the largestand smallest values in one or more categories or years to get an idea of the range of the data.
Step 3: HOW do they change or differ?
Look at the differences in the values of the data in a single data set, a row, column or part of agraph. Repeat this for other data sets. This may involve changes over time, or comparisons withincategories, such as male and female, at any given time.
Step 4: WHERE are the differences?
What are the relationships in the table that connect crime, ages and gender? Use your ideas fromStep 3 to help you make comparisons between columns or rows in a table or parts of a graph tolook for similarities and differences.
Step 5: WHY do they change?
Look for reasons for the relationships in the data you have found by considering societal,environmental and economic factors. Think about sudden or unexpected changes in terms of state,national and international policies or major events.
The Five Step Framework was designed to help students develop strategies tointerpret tables of data. Both the framework, and the measuring instrument, were basedon the SOLO taxonomy (Biggs & Collis, 1982) and the measuring instrument, whichrated the responses in terms of the SOLO levels (unistructural, multistructural,relational and extended abstract) was refined using Rasch analysis (Rasch, 1960). Usingdependent t-tests it was found that there was a significant improvement (p<0.001) inperformance on a table interpretation task as a result of completing the workshop usingthe framework with the students.
The interactive workshop was designed to use this framework as a basis fordeveloping skills to interpret tables by applying it to a specific table, providing studentswith a set of questions relating to the table, and encouraging them to think criticallyabout what the data tell them.
In the original workshop students examined the table Proportion of selected riskfactors by quintile of relative socio-economic disadvantage of area, 1995 concernedwith health risks by quintile from the Australian Bureau of Statistics Yearbook 1999.Students examined the figures for each quintile and risks for the average wage earners.They discussed, and thought critically about, the relative occurrence of people at riskand the possible social, economic and environmental influences in society.

Mathematics: Essential for Learning, Essential for Life
© The Australian Association of Mathematics Teachers Inc.
328
Subsequent workshops, that have not been in the study, have used different tablesdepending on the context of the students’ studies. They have included ones onenvironmental concerns, on poverty, on crime and punishment and so on. They arealways conducted with the students in groups and incorporating interpretation of thedata together with critical discussion about the issues. An example of such a workshopon changing food consumption, which has been used both with upper primary schooland university students, is included here. The level of sophistication of the questionscan be adjusted according to the level of sophistication of the students. Table 2 is basedon Table 16.19 from the Australian Bureau of Statistics Yearbook 2003 and Table 3includes some of questions from the workshop concerned with changing Australianfood consumption over the 20th century.
Table 2. Apparent Per Capita Consumption of Foodstuffs
Commodity Units 1939 1949 1959 1969 1979 1989 1999Beef Kg 63.6 49.5 56.2 40.0 64.8 40.0 36.3Mutton Kg 27.2 20.5 23.1 18.8 3.6 7.3 5.4Lamb Kg 6.8 11.4 13.3 20.5 14.4 14.9 11.3Bacon/Ham Kg 4.6 5.3 3.2 3.6 6.0 6.9 8.6Chicken Kg NA NA NA 8.3 17.1 24.1 29.4Milk & products L 106.4 138.7 128.7 128.2 100.5 101.7 103.2Cheese Kg 2.0 2.5 2.6 3.5 5.3 8.8 10.7Margarine Kg 2.2 2.8 NA 4.9 8.5 9.0 6.6Butter Kg 14.9 11.2 12.3 9.8 5.1 3.2 2.8Tea Kg 3.1 2.9 2.7 2.3 1.7 1.2 0.8Coffee Kg 0.3 0.5 0.6 1.2 1.6 2.0 2.2Beer L 53.2 76.8 99.7 113.5 133.2 113.1 94.4Wine L 2.7 5.9 5.0 8.2 14.7 20.2 19.5Australian Bureau of Statistics Year Book 2003. The Australian Bureau of Statistics has calculatedthe average amounts of food eaten per person over about the last 70 years. They calculate the foodproduction in Australia, subtract exports, add the imports and divide the total by the number ofpeople living in Australia for that year.
This paper does not present an extensive discussion of student responses to this tableand the use of the Framework in Table 3; only a few observations can be made here.Typically, students do not notice, at first, whether the numbers are in percentages or‘000s and so on. In this table, students need to realise that the values in the table do notshow the total food that an actual person eats but, rather, the average of the availablefood after adjustment for imports; in doing this, they begin to recognise the importanceof reading footnotes and headings.
Students have difficulty in deciding how big a change needs to be, if it is to besignificant; whether, for example, there is much change in mutton consumption from1939 to 1969, or whether the fluctuations are normal variation. The comparisons acrosstwo rows are quite complex and need to be built up to slowly by making comparisons oftwo years in two rows initially, then expanding further. The younger students needprompting to consider what has happened over the years, while mature age studentsremember the phasing out of free school milk, for example.

Mathematics: Essential for Learning, Essential for Life
© The Australian Association of Mathematics Teachers Inc.
329
Table 3. Use of the Five Step Framework for Interpreting Table 2
Step 1: Getting startedQ1: What is the table about?
Q2: What is meant by NA?
Q3: What is meant by per capita?Step 2: WHAT do the numbers mean?Q1: What does the number 27.2 in the first column of the table for mutton represent?Q2: What does the 103.2 in the last column of the table represent?Step 3: HOW do they change?Q1: For which year was the consumption of mutton the least? _____the most? ______
How does the consumption of beef change between 1939 and 1999?
Q2: For which year was the consumption of lamb the least? _____the most? ______
How does the consumption of bacon and ham change between 1939 and 1999?
Q 3 : For which year was the consumption of tea the least? _____the most? ______
How does the consumption of tea change between 1939 and 1999?
Q4: For which year was the consumption of coffee the least? _____the most? ______
How does the consumption of coffee change between 1938 and 1999?
Q5: For which year was the consumption of beer the least? _____the most? ______
How does the consumption of beer change between 1939 and 1999?
Q6: For which year was the consumption of wine the least? _____the most? ______
How does the consumption of wine change between 1939 and 1999?Step 4: WHERE are the differences?Q1: Compare the consumption of mutton with lamb from 1939 to 1999
Q2: Compare the consumption of tea with coffee from 1939 to 1999
Q3: Compare the consumption of beer with wine from 1939 to 1999
Step 5: WHY do they change?Q1: Overall how have the diets of Australians changed?
Q2: What kinds of influences in society and the environment might explain the changes?
The experience of students, generally, is that the support provided by the Frameworkfor tables of this kind is both necessary and helpful. Once students become accustomedto considering the statistics in terms of external factors, they usually become interestedin the research necessary to make connections. Hopefully, they carry these skills toother areas of study.
Interpreting the table-to-comprehend kind of table
When effectively interpreting these kinds of tables, students can use the kinds of stepsin the framework to help them to consider the kind of sampling used in the collection ofthe data, to consider the variation in the data and to think about these in context of thetable. Students need to develop critical thinking skills to analyse the data in terms ofsocial, environmental and economic factors. This context encourages students toexamine the influences which have impacted on our changing diets over the lastcentury. A logical step next is to make comparisons across countries using internationaldata. For younger students the interpretation of the numbers needs more scaffolding.Some of this is on the current Australian Bureau of Statistics website in the Statsercises.
Mathematics: Essential for Learning, Essential for Life
© The Australian Association of Mathematics Teachers Inc.
330
Implications for the mathematics learning area
The tables that students encounter, such as those presented in this paper, are related toour everyday lives. Starting from a context, students can see why they need themathematical and statistical skills necessary to make sense of the tables. Watson (2006)has examined the links connecting those components of schools chance and datacurricula, in accordance with the National Statement on Mathematics for AustralianSchools (AEC,1991), and concludes that in terms of mathematical skills students need“an understanding of rates, percents and part-whole relationships generally” and forstatistical skills “an understanding and calculation of averages, basic numericalprobabilities and probabilities of compound independent events” as well as anunderstanding of basic terms (p.249).
The development of the mathematical concepts and skills necessary to competentlyinterpret both kinds of tables should be done in contexts relevant to the students. Theability to interpret tables of data can be developed using the Five Step Frameworkwhich can be used to encourage students to gain a deep understanding of the data and tothink critically about the associated social, environmental and economic issues. Ideally,students will transfer this approach to other areas in the curriculum, resulting indeveloping critically thinking people who can make informed decisions in essential areaof their lives.
References
Australian Bureau of Statistics. (1999; 2003). Yearbook Australia. Australian Bureau of Statistics{http://www.abs.gov.au/}.
Australian Education Council (1991). A National Statement of Mathematics for Australian Schools.Carlton: Curriculum Corporation.
Biggs, J. B. & Collis, K. F. (1982). Evaluating the Quality of Learning: The SOLO Taxonomy (Structureof the Observed Learning Outcome). New York: Academic Press.
Dewdney, A. K. (1993). 200% of Nothing. New York: John Wiley.
Gal, I. (2003). Expanding conceptions of statistical literacy: An analysis of products from statisticalagencies. Statistical Education Research Journal, 2(1), 3–21.
Kemp, M., (2006) Developing Critical Numeracy at the Tertiary Level. Unpublished EdD dissertation,Murdoch University, Western Australia. http://wwwlib.murdoch.edu.au/adt/
Kemp, M. & Bradley, B. (2006) Developing Statistical Literacy Across the University Curriculum.ICTM3 Turkey.
Kemp, M. & Kissane, B. (1990). Numeracy: a tool for learning. In K. Milton & H. McCann (Eds),Mathematical Turning Points: Strategies for the 1990s (pp. 366–375). Hobart: The AustralianAssociation of Mathematics Teachers.
Koschat, M. (2005). A case for simple tables. The American Statistician, 59(1), 31–40.
Mosenthal, P.B. & Kirsch, I. (1998). A new measure for assessing document complexity: ThePMOSE/IKIRSCH document readability formula. Journal of Adolescent and Adult Literacy 41(8),638–657.
OECD/UNESCO. (2003). Literacy Skills for the World of Tomorrow: Further Results fromPISA 2000. Paris, France: OECD & UNESCO Institute for Statistics.
Rasch, G. (1960; 1980). Probabilistic Models for Some Intelligence and Attainment Tests. Chicago:University of Chicago Press.
Tufte, E. R. (1983). The Visual Display of Quantitative Information. Cheshire, Conn: Graphics.
Wainer, H. (1992). Understanding graphs and tables. Educational Researcher, 21(1), 14–23.
Watson, J. (2006). Statistical Literacy at School: Growth and Goals. Lawrence Erlbaum Associates,London.
Ten Foods You Should Never Eat {http://cspinet.org/nah/10foods_bad.html. accessed13 3 2007}
© The Australian Association of Mathematics Teachers Inc.
331
Spreadsheets, graphics calculatorsand mathematics education*
Barry Kissane
Murdoch University
Over recent years, spreadsheets have been increasingly recognised as having arole in teaching and learning mathematics, but have continued to suffer thelimitation of requiring access to computers. This paper summarises some of thepotential benefits of spreadsheet use and briefly assesses some of the availableresearch about it in schools. A spreadsheet application for a calculator isdescribed and interpreted in terms of its capacity to handle the essential features ofspreadsheets. The comparative merits of calculator and computer spreadsheets arediscussed. Some ways in which calculator spreadhseets might be used for teachingand learning mathematics are outlined.
Introduction
While originally developed for the business world, spreadsheets continue to be used forpurposes of mathematics education in secondary school. While this can be explainedpartly because of their widespread availability on personal computers in schools, homesand businesses, it is also a consequence of their particular suite of capabilities, whichlend themselves to some kinds of mathematical work. Access to a spreadsheet hasremained dependent on access to a computer, until fairly recently. In this paper, we firstidentify the features of spreadsheets likely to be of benefit to teaching, learning anddoing mathematics, and then consider the prospects of a spreadsheet on a graphicscalculator having significance for school mathematics.
Features of spreadsheets
This section describes briefly the key features of spreadsheets from a mathematicalperspective, particularly with inexperienced readers in mind. Several useful links toaugment this information considerably are provided on the web (Kissane, 2007). Someof these are exceptionally useful for inexperienced spreadsheet users.
Essential features
A spreadsheet comprises a matrix of cells that can contain either numerical or textualinformation. Data in the cells can either be entered directly by a user or can becalculated by the spreadsheet itself, with appropriate instructions from the user stored inthe cell with a formula. The use of formulas allows some numerical values in aspreadsheet to depend on values elsewhere in the spreadsheet, effectively allowing anumber of calculations throughout the spreadsheet to be completed simultaneously.Although other spreadsheets exist, Microsoft’s Excel is in such widespread use on
* Paper accepted by peer review
Mathematics: Essential for Learning, Essential for Life
© The Australian Association of Mathematics Teachers Inc.
332
personal computers that it is almost universally relevant, and will be used here as thearchetypal spreadsheet, without further direct reference. Other spreadsheets (such asthose included in ClarisWorks and AppleWorks) are very similar at the level of basicoperations: differences appear only at the more sophisticated end, which is not ofparticular interest in this paper.
Spreadsheet formulas generally look a little different from typical algebraicformulas, although they have the same function. A spreadsheet formula uses a celladdress (typically a letter that references a column and a number referencing a row,such as B3) to refer to the number in a cell, rather than the single letter characteristic ofalgebraic representation (such as x). Spreadsheet formulas are recognisable inspreadsheets as they start with an equal sign and refer to some other cells. Thus theformula, =A1+3, stored in cell A2 would calculate three more than the value in cell A1and store it in cell A2. In conventional algebraic representation, if the value in cell A1was represented by x, this formula would calculate the value x + 3 and store this in cellA2.
As well as direct arithmetical relationships, modern spreadsheets include a number(in fact, a large number) of mathematical, statistical and other functions that can be usedin formulas and abbreviated ways of referring to sets of arguments of the functions. Asan elementary example, the formula, =AVERAGE(A1:A20), calculates the average ofthe values in the twenty cells, A1, A2, A3, …, A20. If this formula were stored into cellA22, the spreadsheet would display the mean of the column of values in A1 to A20. Ifany of the values in the column were changed, the mean would be changed accordingly(when the spreadsheet is set to recalculate automatically). Formulas provide a means ofconstructing mathematical relationships of various kinds, and thus generating them canbe thought of as a kind of programming.
A powerful feature of spreadsheets concerns filling a formula, which allows forequivalent formulae to be constructed automatically by the software, rather than havingto be entered manually. To illustrate this, the average formula above could be readilyfilled across into row 22 of columns B to D; the effect of this would be to automaticallygenerate the formulae to find the means of the first 20 values of columns B, C & D.Although the formulas could be entered separately in each case, this facility allows anefficient means of doing the same thing.
These two capabilities (formulae and filling) together allow a spreadsheet to bereadily used to study recursive situations in mathematics. The most obvious examplesare those concerned with recursively defined sequences, which can be representedeasily in a spreadsheet. The recurrence relation can be defined in terms of a formula (avery simple case is the one described at the start of this section, using the formula,=A1+1), and then filling this formula down a column . This process effectively repeatsthe same relationship in successive cells. For this case, the filling down process willdefine an arithmetic sequence with common difference of 3.
While the spreadsheet itself comprises an array of cells with text, formulae ornumbers in them, spreadsheets generally have mechansims for representing theinformation in more helpful ways, especially graphical ways. These essentially allowthe user to define a graphical representation (such as a scatter plot or a histogram) ofselected data from the spreadsheet itself.
Advanced features
The features described above as essential have been built into spreadsheets for manyyears. Later versions of spreadsheets have included extra features that make them more
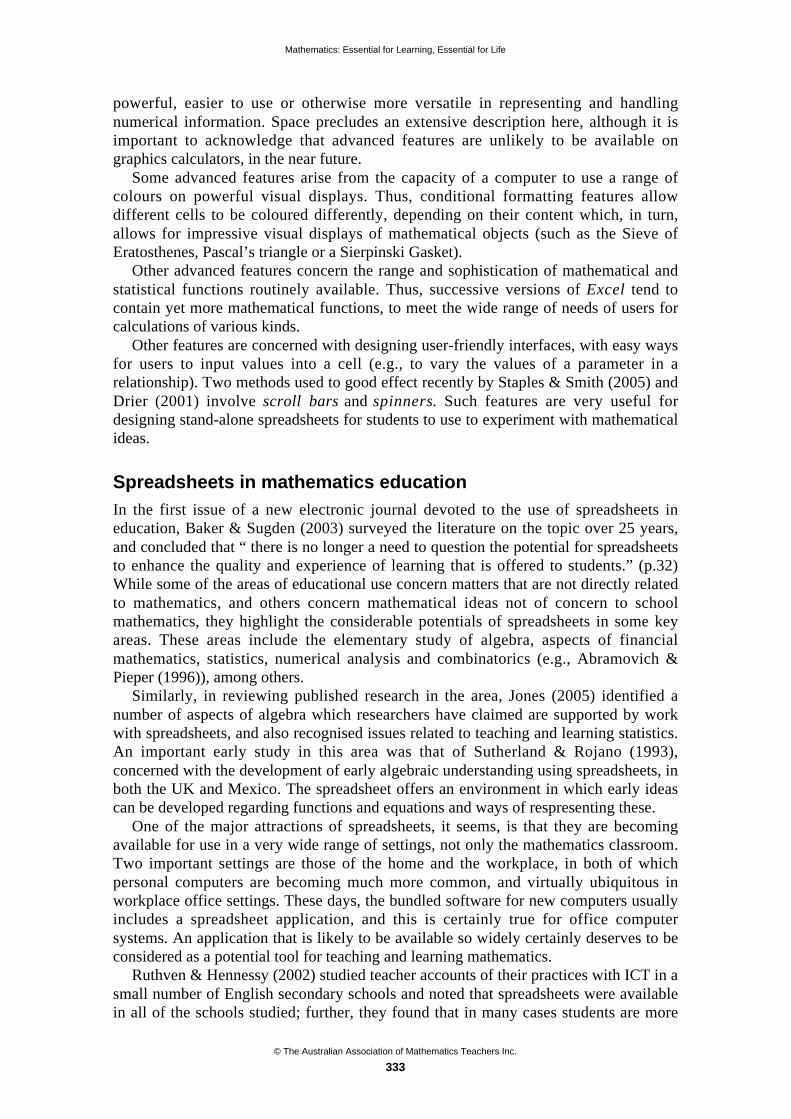
Mathematics: Essential for Learning, Essential for Life
© The Australian Association of Mathematics Teachers Inc.
333
powerful, easier to use or otherwise more versatile in representing and handlingnumerical information. Space precludes an extensive description here, although it isimportant to acknowledge that advanced features are unlikely to be available ongraphics calculators, in the near future.
Some advanced features arise from the capacity of a computer to use a range ofcolours on powerful visual displays. Thus, conditional formatting features allowdifferent cells to be coloured differently, depending on their content which, in turn,allows for impressive visual displays of mathematical objects (such as the Sieve ofEratosthenes, Pascal’s triangle or a Sierpinski Gasket).
Other advanced features concern the range and sophistication of mathematical andstatistical functions routinely available. Thus, successive versions of Excel tend tocontain yet more mathematical functions, to meet the wide range of needs of users forcalculations of various kinds.
Other features are concerned with designing user-friendly interfaces, with easy waysfor users to input values into a cell (e.g., to vary the values of a parameter in arelationship). Two methods used to good effect recently by Staples & Smith (2005) andDrier (2001) involve scroll bars and spinners. Such features are very useful fordesigning stand-alone spreadsheets for students to use to experiment with mathematicalideas.
Spreadsheets in mathematics education
In the first issue of a new electronic journal devoted to the use of spreadsheets ineducation, Baker & Sugden (2003) surveyed the literature on the topic over 25 years,and concluded that “ there is no longer a need to question the potential for spreadsheetsto enhance the quality and experience of learning that is offered to students.” (p.32)While some of the areas of educational use concern matters that are not directly relatedto mathematics, and others concern mathematical ideas not of concern to schoolmathematics, they highlight the considerable potentials of spreadsheets in some keyareas. These areas include the elementary study of algebra, aspects of financialmathematics, statistics, numerical analysis and combinatorics (e.g., Abramovich &Pieper (1996)), among others.
Similarly, in reviewing published research in the area, Jones (2005) identified anumber of aspects of algebra which researchers have claimed are supported by workwith spreadsheets, and also recognised issues related to teaching and learning statistics.An important early study in this area was that of Sutherland & Rojano (1993),concerned with the development of early algebraic understanding using spreadsheets, inboth the UK and Mexico. The spreadsheet offers an environment in which early ideascan be developed regarding functions and equations and ways of respresenting these.
One of the major attractions of spreadsheets, it seems, is that they are becomingavailable for use in a very wide range of settings, not only the mathematics classroom.Two important settings are those of the home and the workplace, in both of whichpersonal computers are becoming much more common, and virtually ubiquitous inworkplace office settings. These days, the bundled software for new computers usuallyincludes a spreadsheet application, and this is certainly true for office computersystems. An application that is likely to be available so widely certainly deserves to beconsidered as a potential tool for teaching and learning mathematics.
Ruthven & Hennessy (2002) studied teacher accounts of their practices with ICT in asmall number of English secondary schools and noted that spreadsheets were availablein all of the schools studied; further, they found that in many cases students are more
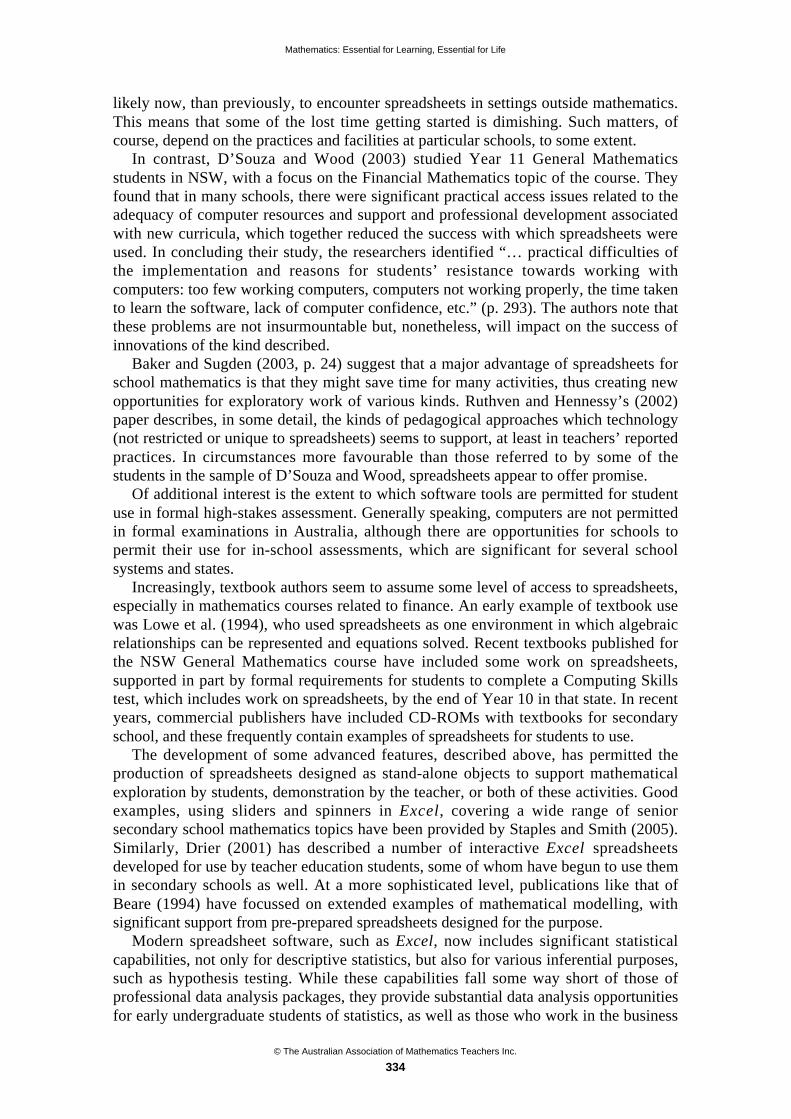
Mathematics: Essential for Learning, Essential for Life
© The Australian Association of Mathematics Teachers Inc.
334
likely now, than previously, to encounter spreadsheets in settings outside mathematics.This means that some of the lost time getting started is dimishing. Such matters, ofcourse, depend on the practices and facilities at particular schools, to some extent.
In contrast, D’Souza and Wood (2003) studied Year 11 General Mathematicsstudents in NSW, with a focus on the Financial Mathematics topic of the course. Theyfound that in many schools, there were significant practical access issues related to theadequacy of computer resources and support and professional development associatedwith new curricula, which together reduced the success with which spreadsheets wereused. In concluding their study, the researchers identified “… practical difficulties ofthe implementation and reasons for students’ resistance towards working withcomputers: too few working computers, computers not working properly, the time takento learn the software, lack of computer confidence, etc.” (p. 293). The authors note thatthese problems are not insurmountable but, nonetheless, will impact on the success ofinnovations of the kind described.
Baker and Sugden (2003, p. 24) suggest that a major advantage of spreadsheets forschool mathematics is that they might save time for many activities, thus creating newopportunities for exploratory work of various kinds. Ruthven and Hennessy’s (2002)paper describes, in some detail, the kinds of pedagogical approaches which technology(not restricted or unique to spreadsheets) seems to support, at least in teachers’ reportedpractices. In circumstances more favourable than those referred to by some of thestudents in the sample of D’Souza and Wood, spreadsheets appear to offer promise.
Of additional interest is the extent to which software tools are permitted for studentuse in formal high-stakes assessment. Generally speaking, computers are not permittedin formal examinations in Australia, although there are opportunities for schools topermit their use for in-school assessments, which are significant for several schoolsystems and states.
Increasingly, textbook authors seem to assume some level of access to spreadsheets,especially in mathematics courses related to finance. An early example of textbook usewas Lowe et al. (1994), who used spreadsheets as one environment in which algebraicrelationships can be represented and equations solved. Recent textbooks published forthe NSW General Mathematics course have included some work on spreadsheets,supported in part by formal requirements for students to complete a Computing Skillstest, which includes work on spreadsheets, by the end of Year 10 in that state. In recentyears, commercial publishers have included CD-ROMs with textbooks for secondaryschool, and these frequently contain examples of spreadsheets for students to use.
The development of some advanced features, described above, has permitted theproduction of spreadsheets designed as stand-alone objects to support mathematicalexploration by students, demonstration by the teacher, or both of these activities. Goodexamples, using sliders and spinners in Excel, covering a wide range of seniorsecondary school mathematics topics have been provided by Staples and Smith (2005).Similarly, Drier (2001) has described a number of interactive Excel spreadsheetsdeveloped for use by teacher education students, some of whom have begun to use themin secondary schools as well. At a more sophisticated level, publications like that ofBeare (1994) have focussed on extended examples of mathematical modelling, withsignificant support from pre-prepared spreadsheets designed for the purpose.
Modern spreadsheet software, such as Excel, now includes significant statisticalcapabilities, not only for descriptive statistics, but also for various inferential purposes,such as hypothesis testing. While these capabilities fall some way short of those ofprofessional data analysis packages, they provide substantial data analysis opportunitiesfor early undergraduate students of statistics, as well as those who work in the business
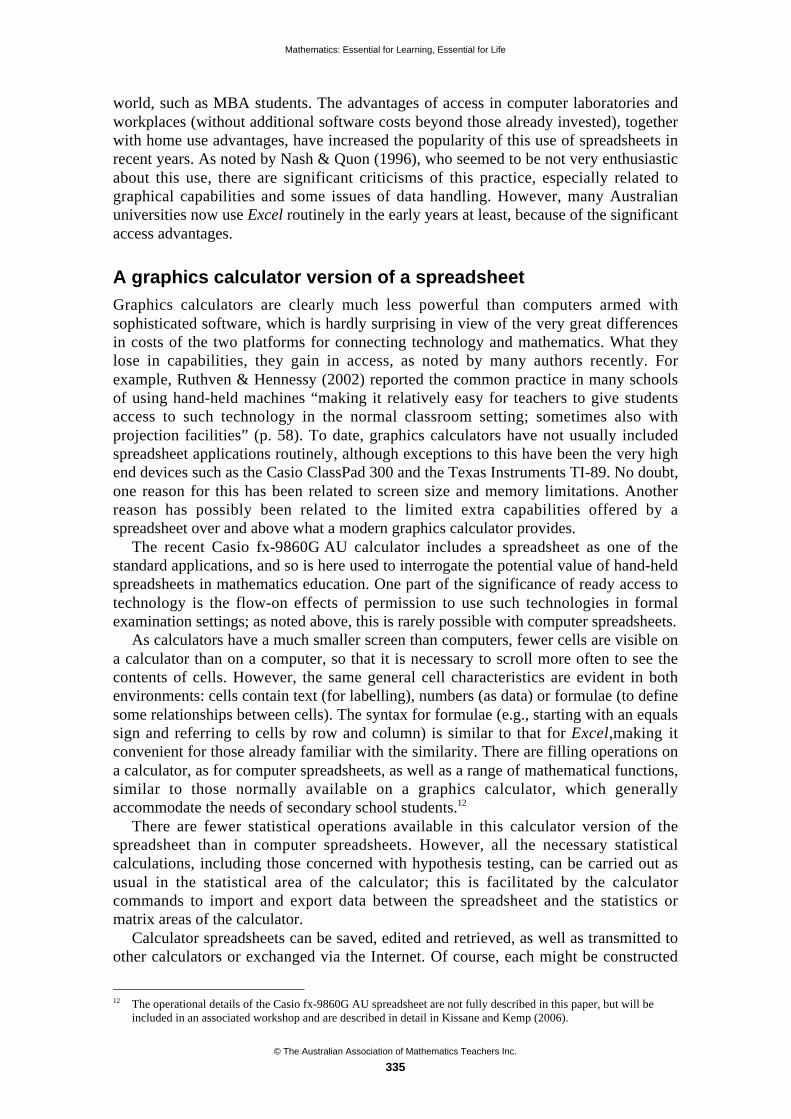
Mathematics: Essential for Learning, Essential for Life
© The Australian Association of Mathematics Teachers Inc.
335
world, such as MBA students. The advantages of access in computer laboratories andworkplaces (without additional software costs beyond those already invested), togetherwith home use advantages, have increased the popularity of this use of spreadsheets inrecent years. As noted by Nash & Quon (1996), who seemed to be not very enthusiasticabout this use, there are significant criticisms of this practice, especially related tographical capabilities and some issues of data handling. However, many Australianuniversities now use Excel routinely in the early years at least, because of the significantaccess advantages.
A graphics calculator version of a spreadsheet
Graphics calculators are clearly much less powerful than computers armed withsophisticated software, which is hardly surprising in view of the very great differencesin costs of the two platforms for connecting technology and mathematics. What theylose in capabilities, they gain in access, as noted by many authors recently. Forexample, Ruthven & Hennessy (2002) reported the common practice in many schoolsof using hand-held machines “making it relatively easy for teachers to give studentsaccess to such technology in the normal classroom setting; sometimes also withprojection facilities” (p. 58). To date, graphics calculators have not usually includedspreadsheet applications routinely, although exceptions to this have been the very highend devices such as the Casio ClassPad 300 and the Texas Instruments TI-89. No doubt,one reason for this has been related to screen size and memory limitations. Anotherreason has possibly been related to the limited extra capabilities offered by aspreadsheet over and above what a modern graphics calculator provides.
The recent Casio fx-9860G AU calculator includes a spreadsheet as one of thestandard applications, and so is here used to interrogate the potential value of hand-heldspreadsheets in mathematics education. One part of the significance of ready access totechnology is the flow-on effects of permission to use such technologies in formalexamination settings; as noted above, this is rarely possible with computer spreadsheets.
As calculators have a much smaller screen than computers, fewer cells are visible ona calculator than on a computer, so that it is necessary to scroll more often to see thecontents of cells. However, the same general cell characteristics are evident in bothenvironments: cells contain text (for labelling), numbers (as data) or formulae (to definesome relationships between cells). The syntax for formulae (e.g., starting with an equalssign and referring to cells by row and column) is similar to that for Excel,making itconvenient for those already familiar with the similarity. There are filling operations ona calculator, as for computer spreadsheets, as well as a range of mathematical functions,similar to those normally available on a graphics calculator, which generallyaccommodate the needs of secondary school students.12
There are fewer statistical operations available in this calculator version of thespreadsheet than in computer spreadsheets. However, all the necessary statisticalcalculations, including those concerned with hypothesis testing, can be carried out asusual in the statistical area of the calculator; this is facilitated by the calculatorcommands to import and export data between the spreadsheet and the statistics ormatrix areas of the calculator.
Calculator spreadsheets can be saved, edited and retrieved, as well as transmitted toother calculators or exchanged via the Internet. Of course, each might be constructed
12 The operational details of the Casio fx-9860G AU spreadsheet are not fully described in this paper, but will be
included in an associated workshop and are described in detail in Kissane and Kemp (2006).
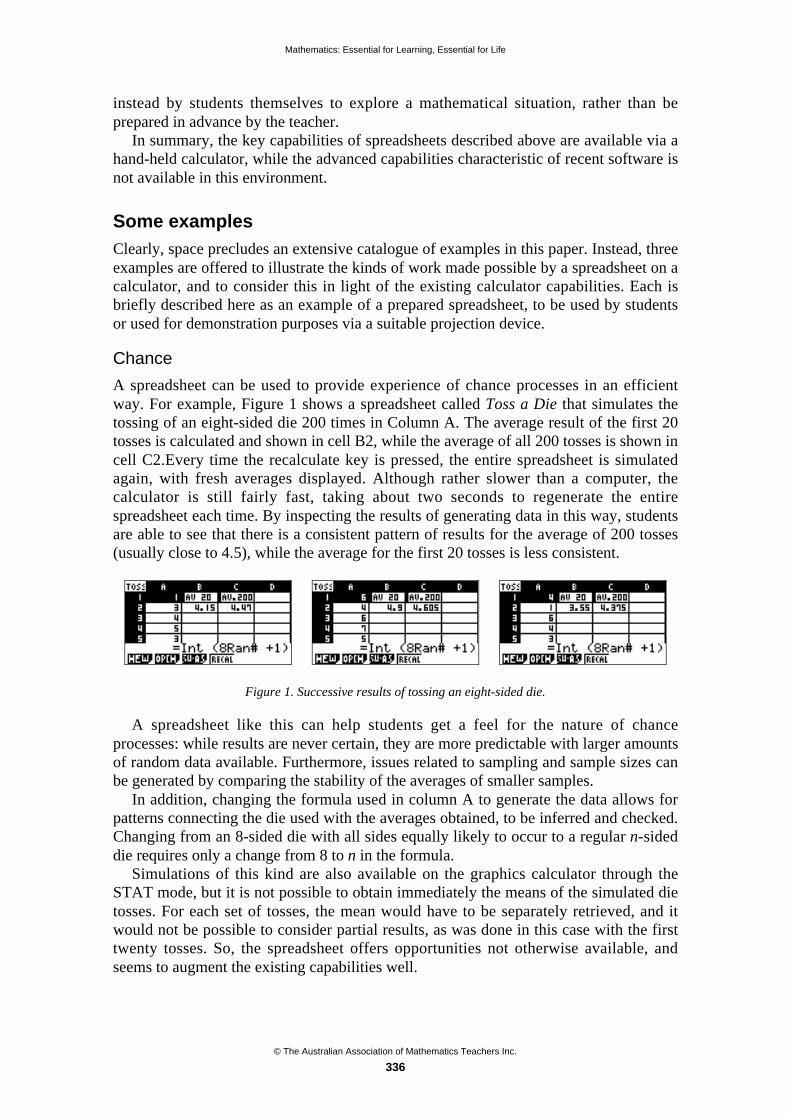
Mathematics: Essential for Learning, Essential for Life
© The Australian Association of Mathematics Teachers Inc.
336
instead by students themselves to explore a mathematical situation, rather than beprepared in advance by the teacher.
In summary, the key capabilities of spreadsheets described above are available via ahand-held calculator, while the advanced capabilities characteristic of recent software isnot available in this environment.
Some examples
Clearly, space precludes an extensive catalogue of examples in this paper. Instead, threeexamples are offered to illustrate the kinds of work made possible by a spreadsheet on acalculator, and to consider this in light of the existing calculator capabilities. Each isbriefly described here as an example of a prepared spreadsheet, to be used by studentsor used for demonstration purposes via a suitable projection device.
Chance
A spreadsheet can be used to provide experience of chance processes in an efficientway. For example, Figure 1 shows a spreadsheet called Toss a Die that simulates thetossing of an eight-sided die 200 times in Column A. The average result of the first 20tosses is calculated and shown in cell B2, while the average of all 200 tosses is shown incell C2.Every time the recalculate key is pressed, the entire spreadsheet is simulatedagain, with fresh averages displayed. Although rather slower than a computer, thecalculator is still fairly fast, taking about two seconds to regenerate the entirespreadsheet each time. By inspecting the results of generating data in this way, studentsare able to see that there is a consistent pattern of results for the average of 200 tosses(usually close to 4.5), while the average for the first 20 tosses is less consistent.
Figure 1. Successive results of tossing an eight-sided die.
A spreadsheet like this can help students get a feel for the nature of chanceprocesses: while results are never certain, they are more predictable with larger amountsof random data available. Furthermore, issues related to sampling and sample sizes canbe generated by comparing the stability of the averages of smaller samples.
In addition, changing the formula used in column A to generate the data allows forpatterns connecting the die used with the averages obtained, to be inferred and checked.Changing from an 8-sided die with all sides equally likely to occur to a regular n-sideddie requires only a change from 8 to n in the formula.
Simulations of this kind are also available on the graphics calculator through theSTAT mode, but it is not possible to obtain immediately the means of the simulated dietosses. For each set of tosses, the mean would have to be separately retrieved, and itwould not be possible to consider partial results, as was done in this case with the firsttwenty tosses. So, the spreadsheet offers opportunities not otherwise available, andseems to augment the existing capabilities well.
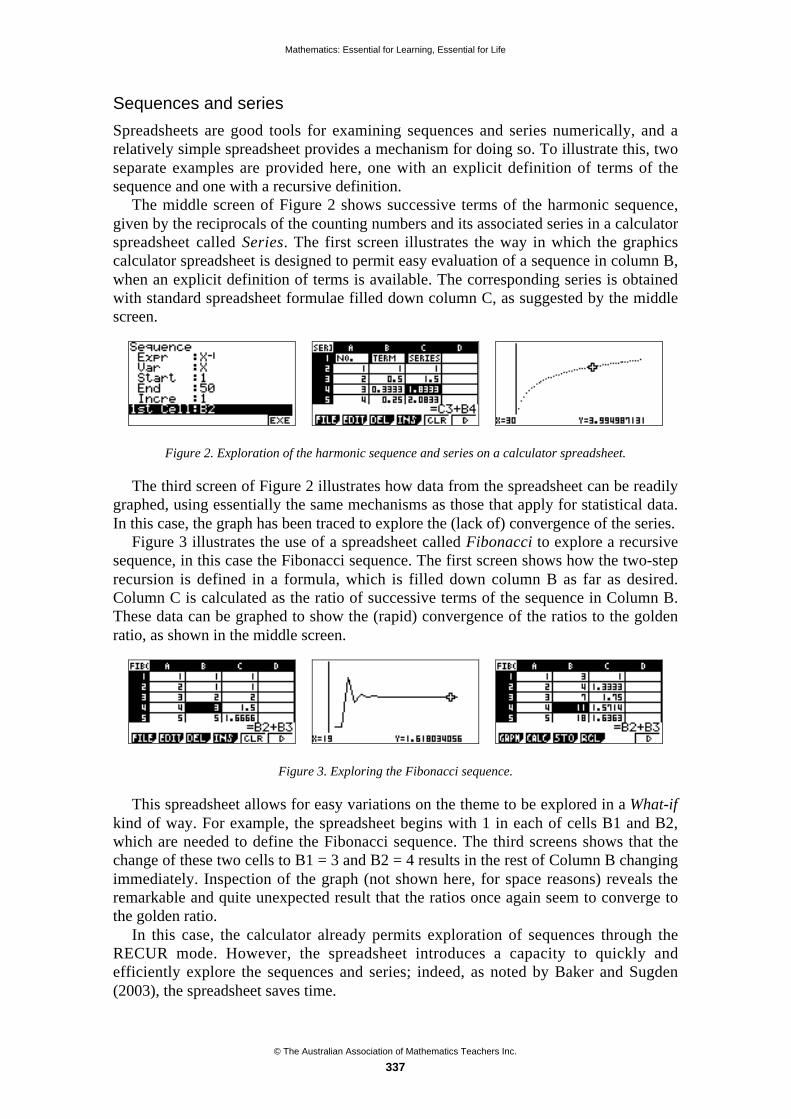
Mathematics: Essential for Learning, Essential for Life
© The Australian Association of Mathematics Teachers Inc.
337
Sequences and series
Spreadsheets are good tools for examining sequences and series numerically, and arelatively simple spreadsheet provides a mechanism for doing so. To illustrate this, twoseparate examples are provided here, one with an explicit definition of terms of thesequence and one with a recursive definition.
The middle screen of Figure 2 shows successive terms of the harmonic sequence,given by the reciprocals of the counting numbers and its associated series in a calculatorspreadsheet called Series. The first screen illustrates the way in which the graphicscalculator spreadsheet is designed to permit easy evaluation of a sequence in column B,when an explicit definition of terms is available. The corresponding series is obtainedwith standard spreadsheet formulae filled down column C, as suggested by the middlescreen.
Figure 2. Exploration of the harmonic sequence and series on a calculator spreadsheet.
The third screen of Figure 2 illustrates how data from the spreadsheet can be readilygraphed, using essentially the same mechanisms as those that apply for statistical data.In this case, the graph has been traced to explore the (lack of) convergence of the series.
Figure 3 illustrates the use of a spreadsheet called Fibonacci to explore a recursivesequence, in this case the Fibonacci sequence. The first screen shows how the two-steprecursion is defined in a formula, which is filled down column B as far as desired.Column C is calculated as the ratio of successive terms of the sequence in Column B.These data can be graphed to show the (rapid) convergence of the ratios to the goldenratio, as shown in the middle screen.
Figure 3. Exploring the Fibonacci sequence.
This spreadsheet allows for easy variations on the theme to be explored in a What-ifkind of way. For example, the spreadsheet begins with 1 in each of cells B1 and B2,which are needed to define the Fibonacci sequence. The third screens shows that thechange of these two cells to B1 = 3 and B2 = 4 results in the rest of Column B changingimmediately. Inspection of the graph (not shown here, for space reasons) reveals theremarkable and quite unexpected result that the ratios once again seem to converge tothe golden ratio.
In this case, the calculator already permits exploration of sequences through theRECUR mode. However, the spreadsheet introduces a capacity to quickly andefficiently explore the sequences and series; indeed, as noted by Baker and Sugden(2003), the spreadsheet saves time.
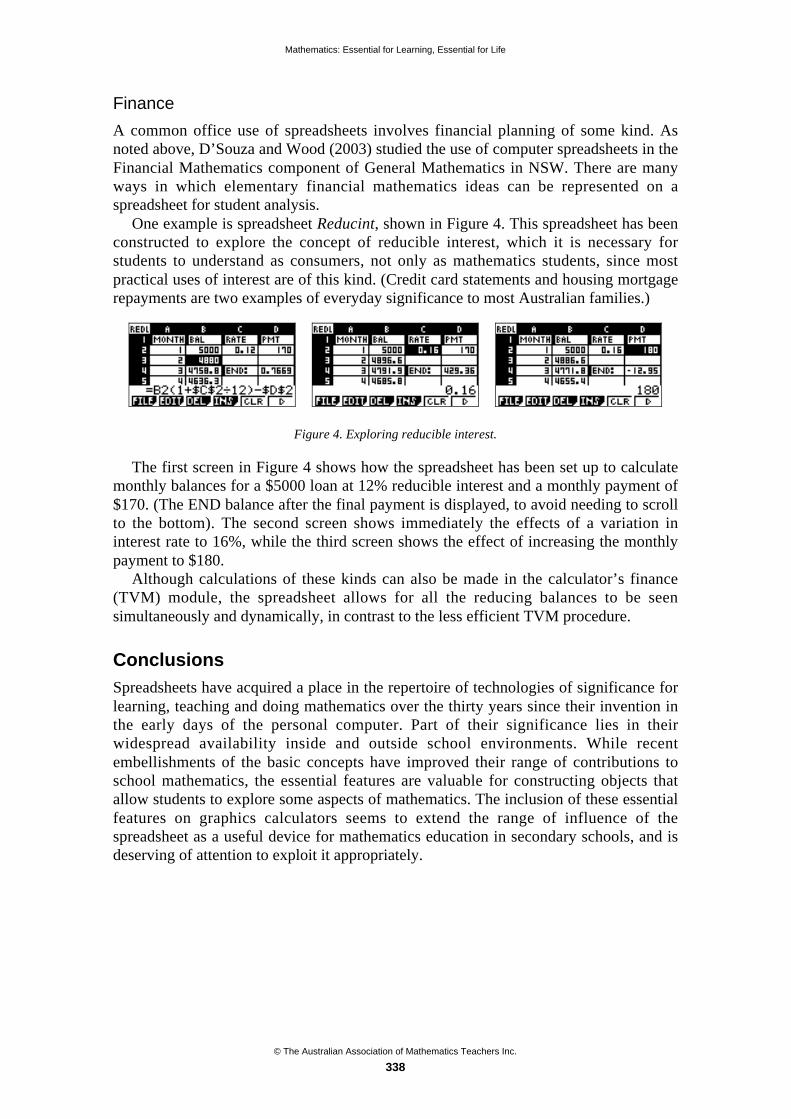
Mathematics: Essential for Learning, Essential for Life
© The Australian Association of Mathematics Teachers Inc.
338
Finance
A common office use of spreadsheets involves financial planning of some kind. Asnoted above, D’Souza and Wood (2003) studied the use of computer spreadsheets in theFinancial Mathematics component of General Mathematics in NSW. There are manyways in which elementary financial mathematics ideas can be represented on aspreadsheet for student analysis.
One example is spreadsheet Reducint, shown in Figure 4. This spreadsheet has beenconstructed to explore the concept of reducible interest, which it is necessary forstudents to understand as consumers, not only as mathematics students, since mostpractical uses of interest are of this kind. (Credit card statements and housing mortgagerepayments are two examples of everyday significance to most Australian families.)
Figure 4. Exploring reducible interest.
The first screen in Figure 4 shows how the spreadsheet has been set up to calculatemonthly balances for a $5000 loan at 12% reducible interest and a monthly payment of$170. (The END balance after the final payment is displayed, to avoid needing to scrollto the bottom). The second screen shows immediately the effects of a variation ininterest rate to 16%, while the third screen shows the effect of increasing the monthlypayment to $180.
Although calculations of these kinds can also be made in the calculator’s finance(TVM) module, the spreadsheet allows for all the reducing balances to be seensimultaneously and dynamically, in contrast to the less efficient TVM procedure.
Conclusions
Spreadsheets have acquired a place in the repertoire of technologies of significance forlearning, teaching and doing mathematics over the thirty years since their invention inthe early days of the personal computer. Part of their significance lies in theirwidespread availability inside and outside school environments. While recentembellishments of the basic concepts have improved their range of contributions toschool mathematics, the essential features are valuable for constructing objects thatallow students to explore some aspects of mathematics. The inclusion of these essentialfeatures on graphics calculators seems to extend the range of influence of thespreadsheet as a useful device for mathematics education in secondary schools, and isdeserving of attention to exploit it appropriately.
Mathematics: Essential for Learning, Essential for Life
© The Australian Association of Mathematics Teachers Inc.
339
References
Abramovich, S. & Pieper, A. (1996) Fostering recursive thinking in combinatorics through the use ofmanipulatives and computing technology. The Mathematics Educator, 7(1), 1–12. (Available athttp://math.coe.uga.edu/tme/tmeonline.html accessed 1 March 2007.)
Baker, J. E. & Sugden, S. J. (2003). Spreadsheets in education The first 25 years. eJournal ofSpreadsheets in Education, 1(1), 18–43. (Available at http://www.sie.bond.edu.au/ accessed 1 March2007.)
Beare, R. (1994). Mathematics in Action Modelling the Real World Using Mathematics, Bromley, Kent:Chartwell-Yorke.
Drier, H. S. (2001). Teaching and learning mathematics with interactive spreadsheets. School Science andMathematics 101(4), 170–179.
D’Souza, S. M. & Wood, L. N. (2003). Secondary students’ resistance toward incorporating computertechnology into mathematics learning. Mathematics and Computer Education, 37(3), 284–295.
Jones, K. (2005). Using spreadsheets in the teaching and learning of mathematics: A researchbibliography. Micromath 21(1), 30–31.
Kissane, B. (2007) Spreadsheets and Mathematics Education (Available at:http://wwwstaff.murdoch.edu.au/~kissane/spreadsheets.htm, accessed 1 March 2007.)
Kissane, B. & Kemp, M. (2006). Mathematics With a Graphics Calculator: Casio fx-9860G AU. Perth:Mathematical Association of Western Australia.
Lowe, I., Willis, S., Grace, N. & Kissane, B. (1994) Access to Algebra Book 3. Carlton: CurriculumCorporation.
Nash, J.C. & Quon, T.K. (1996). Issues in teaching statistical thinking with spreadsheets. Journal ofStatistics Education, 4(1). (online)
Ruthven, K. & Hennessy, S. (2002). A practitioner model of the use of computer-based tools andresources to support mathematics teaching and learning. Educational Studies in Mathematics, 49(1),47–88.
Staples, E. & Smith, M. (2005). Spinnamaths. Canberra: Spinnamaths (Australia).
Sutherland, R. & Rojano, T. (1993) A spreadsheet approach to solving algebra problems. Journal ofMathematical Behavior 12(4), 353–383.

© The Australian Association of Mathematics Teachers Inc.
340
Mathematics websites
David Leigh-Lancaster
Victorian Curriculum and
Assessmentt Authority (VCAA)
Antje Leigh-Lancaster
Teaching Teachers
with Technology (T3)
The world-wide-web provides teachers and mathematics educators with access toan extensive selection of papers, references, activities and information. Theseinclude materials and activities for topics in the curriculum, mathematicalbackground and content for teachers and students, pedagogical approaches,technology related resources, assessment, mathematics education research,teacher and student sites and authority and department websites. This paper givesa range of illustrative examples and outlines how teachers might use such materialto assist and inform their mathematics teaching their professional learning.
Introduction
The terms “internet” (a networking infrastructure that is a global network connectingcomputers), “world-wide web” (a system of internet servers that provides aninformation sharing model), “website” (a particular location or site on the world-wideweb), “URL” (a uniform resource locator which specifies the global address ofresources and documents on the world-wide web) and others, including the more recent“wiki” (a browser interface that enables an individual to edit material placed on acollaborative website) and “blog” (from web log is a web page that acts as a publiclyaccessible journal of an individual) are part of the evolving language associated withour use of a central aspect of information and communication technology (see, forexample, HREF1; HREF2).
There are many mathematics and mathematics education related websites thatcontain useful and interesting material. Websites are typically referenced in terms oftheir urls, the organisation or person to whom the website belongs, the date of accessand sometimes a brief summary description of the nature and/or purpose of the website.More broadly, websites can be characterised in terms of their nature (encyclopaedic,interactive, tutorial, diagnostic), scope (level, area, topic) purpose (describing disciplinecontent, curriculum structures, pedagogical approaches) and intended audience(students, teachers, parents, educators). The ephemeral nature of web-based materialmakes careful and ongoing scrutiny a critical and essential aspect of its use.
Over time, teachers will likely research, bookmark and systematically review variouswebsites as they find them to be of assistance to their teaching, student learning andassessment. In conjunction with colleagues, systematic cataloguing (for example, byreference to: level, standards, topic, use of technology) and periodic updating ofwebsites can be used to develop a good collection of resources. A selection of relevantwebsites can be incorporated into course outlines, planners, curriculum documentation,and the like, as applicable (these will, of course, need to be carefully checked forrelevance, suitability and currency). This process could be part of occasional facultystaff activity, perhaps following on from an initial detailed survey. A naïve search on

Mathematics: Essential for Learning, Essential for Life
© The Australian Association of Mathematics Teachers Inc.
341
almost any topic, for example, “Fibonacci sequences” using a search engine will yield adiversity of interesting materials (see, for example HREF3).
Types of websites
There are a range of different types of websites that teachers might access, both in termsof their daily work and also for planning purposes. These include:
Curriculum and Assessment Authority/Board/Counciland/or Department of Education websites
Teachers would be familiar with such sites in terms of information about curriculumand assessment and related resources, as well as a source of data about systems. Forexample, the Victorian and Curriculum Assessment Authority (VCAA) website(HREF4). includes the preparatory – Year 10 mathematics curriculum document,progression points and assessment maps, the state-wide tests for Years 3, 5, 7 and 9 aswell as Victorian Certificate of Education mathematics courses, past examinationpapers and assessors reports, and various data about schools and enrolments. This sitecontains links to Department of Education implementation materials and similarwebsites for the other Australian systems. Teachers will find that there is a wealth ofmaterial from across the states and territories system websites that can be used inimplementing curriculum and related assessment. The recently developed NationallyConsistent Curriculum Outcomes (NCCO) Statements of Learning for Mathematics andtheir Professional Elaborations can be accessed from the MCEETYA website(HREF5). The College Board US website contains some excellent materials for seniorsecondary mathematics courses as part of its Advanced Placement (AP) Calculus andStatistics Programs (HREF6).
Professional and subject associations
State, national and international professional and subject associations have websiteswith various information, forums and materials of interest to teachers. For example, theAustralian Association of Mathematics Teachers (AAMT) website contains informationabout resources (HREF7) while the Mathematical Association of Victoria (MAV)website (HREF8) outlines professional learning related to school based (coursework)assessment. The National Council of Teachers in Mathematics (NCTM) is well knowninternationally, and its website has a good collection of research and issues articles(HREF9).
Technology companies
Calculator company websites provide some good information and support about theirproducts and how to use them (Casio HREF10; Hewlett-Packard HREF11; SharpHREF12; Texas-Instruments HREF13). Common information on these companywebsites includes product specifications, where to buy them, guide books, software anddrivers to download, programs and applications, activities, forums and chat groups anda frequently asked question section. Some companies also provide free online tutorialsand/or videos via the net to help customers learn how to use their product. The ability toexpress interest for professional learning workshops, or actually book into them via theweb, is also becoming more frequent.
Some companies such as Texas Instruments (HREF14) have a large education sitebased in their country of origin, as well as additional regional websites with more
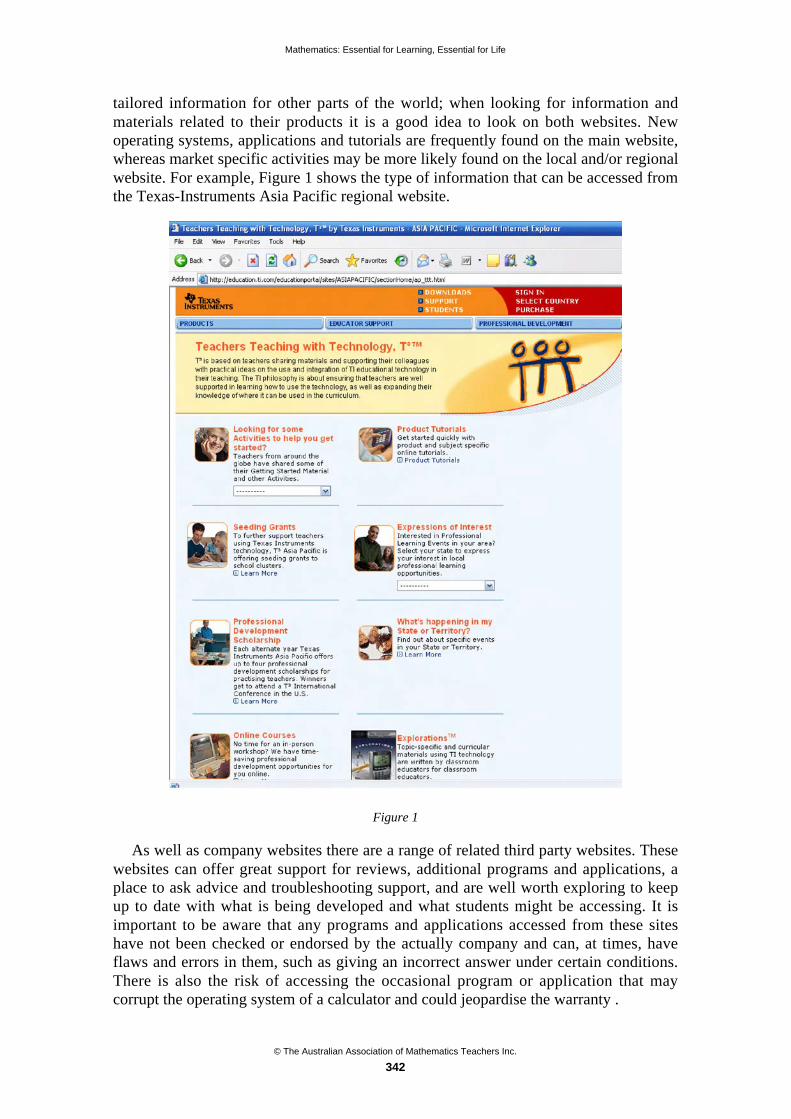
Mathematics: Essential for Learning, Essential for Life
© The Australian Association of Mathematics Teachers Inc.
342
tailored information for other parts of the world; when looking for information andmaterials related to their products it is a good idea to look on both websites. Newoperating systems, applications and tutorials are frequently found on the main website,whereas market specific activities may be more likely found on the local and/or regionalwebsite. For example, Figure 1 shows the type of information that can be accessed fromthe Texas-Instruments Asia Pacific regional website.
Figure 1
As well as company websites there are a range of related third party websites. Thesewebsites can offer great support for reviews, additional programs and applications, aplace to ask advice and troubleshooting support, and are well worth exploring to keepup to date with what is being developed and what students might be accessing. It isimportant to be aware that any programs and applications accessed from these siteshave not been checked or endorsed by the actually company and can, at times, haveflaws and errors in them, such as giving an incorrect answer under certain conditions.There is also the risk of accessing the occasional program or application that maycorrupt the operating system of a calculator and could jeopardise the warranty .
Mathematics: Essential for Learning, Essential for Life
© The Australian Association of Mathematics Teachers Inc.
343
The following are some third party sites: Casio (HREF15; HREF16), Hewlett-Packard (HREF17; HREF18), Sharp (HREF19), and Texas-Instruments (HREF20;HREF21). If one is looking for something specific, a Google search frequently producesa useful list of helpful sites from around the world.
Other institutions and organisations
In recent years international assessment programs, such as TIMMS (HREF22) andPISA (HREF23), have provided systems with data on the performance of students in abroader context, what is perhaps not so well known is that they also provide a wealth ofrelated materials and research findings that are of direct use in classroom teaching andlearning. Organisations such as the Australian Bureau of Statistics (HREF24) haveprovided both data sets for statistical analysis and statistics related curriculum materialson the education section of their website, of which the most recent is theCensusAtSchool project. The website of the School of Mathematics and Statistics atUniversity of St Andrews in Scotland (HREF25) is an excellent source of historicalmaterial on mathematicians and mathematical developments.
Individual and third party websites (wikis, bulletin boards and blogs)
The Wikipedia website contains a range of mathematics articles, which often provideuseful teacher reference material: for example, the discussion on the golden ratio (HREF26) is comprehensive and includes references to the literature and other relevantwebsites. However, as material on this site, while moderated, is available for “open-editing” it is important that teachers cross-reference to other sources as well. For aninsight into the views of (some) students on various aspects of senior secondarymathematics education around Australia, the BoredofStudies website (HREF27) is aninteresting student community Bulletin Board : for example, topics include within-stateand territory discussions on texts and the like, or the inter-state and territoryconversation on topics, techniques and questions from mathematics courses of a similarnature, such as the advanced mathematics courses.
There are many individual websites that provide material of interest to teachers andor students, such as the Library of Virtual Manipulatives (HREF28). While this sitedoes not replace students working with the actual tangible items themselves, it offers analternative by using a medium many students like to work with. The site offers activitiesfor the students to work through for each manipulative as well as a parent/teachersection to help explain the purpose and ideas behind the activities with themanipulative, and Frank Tapson’s Dictionary of Units (HREF29) which provides acomprehensive dictionary of measurement units, including historical references andlinks to related websites. For those interested in geometry, Paul Yiu’s website(HREF30), from the Department of Mathematics at Florida Atlantic University, gives arigorous but accessible treatment of a range of topics, including Euclidean geometrywith all diagrams constructed using dynamic geometry software.
Using the Internet and websites
The use of the Internet and websites can variously be incidental, tactical or strategic.The term “browsing” applies well to the Internet and websites; its use can often beincidental, just having a look and seeing what is there (many a good site, forum and/orresource is discovered this way). Sometimes its use will be tactical — targeted for aparticular purpose, such as finding a range of activities related to a particular topic in

Mathematics: Essential for Learning, Essential for Life
© The Australian Association of Mathematics Teachers Inc.
344
the curriculum to complement other materials. On other occasions its use will bestrategic, for example as part of a faculty or department project to gather web-basedinformation and resources related to a particular area of the curriculum, such as thedevelopment of rational numbers, within the broader context of Number, or the notionof “proof” in geometry/space. In such a context a team of teachers might systematicallycoordinate their efforts to gather:
• relevant curriculum documentation, materials and advice from a system(authority, board, council, department or region);
• mathematical background material;
• mathematics education research material on approaches to teaching and learning;
• resource materials including activities, presentations, use of technology;
• anecdotal material from teachers’ experience;
• information on opportunities for related professional learning;
• suitable assessment tasks; and
• other relevant information and materials.
Such an approach, supported by active use of a school intranet, would enable teachers todevelop a core set of key ideas, approaches and materials, which could be progressivelyenhanced, refined and periodically reviewed. In addition to this, individual teacherscould collect their own repertoire of web-based materials that they find particularlyinteresting or useful.
References
HREF1: http://www.webopedia.com/TERM/U/URL.html — Webopedia online encyclopedia, accessed8/03/07
HREF2: http://www.isoc.org/internet/history/brief.shtml — the Internet Society History of the Internet,accessed 8/03/07
HREF3: http://www.mcs.surrey.ac.uk/Personal/R.Knott/Fibonacci/fibnat.html — Dr Ron Knott,University of Surrey, accessed 8/03/07
HREF4: http://www.vcaa.vic.edu.au/ — Victorian Curriculum and Assessment Authority (VCAA),accessed 8/03/07
HREF5: http://www.mceetya.edu.au/verve/_resources/SOL_Mathematics_2006.pdf — MinisterialCouncil on Education, Employment, Training and Youth Affairs (MCEETYA), accessed 8/03/07
HREF6: http://www.collegeboard.com/student/testing/ap/subjects.html — College Board US, AdvancedPlacement subjects, accessed 13/05/07
HREF7: http://www.aamt.edu.au/resources/ — Australian Association of Mathematics Teachers(AAMT), accessed 8/03/07
HREF8: http://www.mav.vic.edu.au/activities/index.html — Mathematical Association of Victoria(MAV) accessed 8/03/07
HREF9: http://www.nctm.org/ National Council of Mathematics Teachers (US) accessed 8/03/07
HREF10: http://www.casio.edu.shriro.com.au/ — CasioEd Australia, 11/05/07
HREF11: http://www.hp.com/handheld/calculators/calculators.html — Hewlett-Packard, accessed11/05/07
HREF12: http://www.sharpusa.com/products/FunctionLanding/0,1050,4,00.html — Sharp Calculators,accessed 11/05/07
HREF13: http://education.ti.com — Texas-Instruments, accessed 11/05/07
HREF14: http://education.ti.com/asiapacific — Texas Instruments Asia Pacific Regional Page, accessed11/05/07
HREF15: http://www.casiocalc.org/ — Universal Casio Forum, accessed 11/05/07

Mathematics: Essential for Learning, Essential for Life
© The Australian Association of Mathematics Teachers Inc.
345
HREF16: http://www.brianhetrick.com/casio/hidetake/index.html — Casio Program Archive, accessed11/05/07
HREF17: http://www.hpcalc.org/ — hpcalc.org, accessed 11/05/07
HREF18: http://members.iinet.net.au/~ccroft/ — The HP Home View, accessed 11/05/07
HREF19: http://www.expansys.com/foc.aspx?m=807 — Expansys Sharp support and discussion forums,accessed 11/05/07
HREF20: http://www.ticalc.org/ — ticalc.org, accessed 11/05/07
HREF21: http://www.detachedsolutions.com — Detached Solutions, accessed 11/05/07
HREF22: http://nces.ed.gov/timss/, Trends in International Mathematics and Science Study (TIMSS), USDepartment of Education, accessed 11/05/07
HREF23: http://www.pisa.oecd.org/pages/0,2987,en_32252351_32235731_1_1_1_1_1,00.html, Programfor International Student Assessment (PISA), OECD, accessed 11/05/07
HREF24: http://www.abs.gov.au/websitedbs/d3310114.nsf/Home/Education+Resources , AustralianBureau of Statistics (ABS), accessed 11/05/07
HREF25: http://www-groups.dcs.st-and.ac.uk/~history/Mathematicians/Napier.html — Department ofMathematics and statistics, University of St Andrews, Scotland, accessed 11/05/07
HREF26: http://en.wikipedia.org/wiki/Golden_ratio, Wikimedia Foundation, accessed 11/05/07.
HREF27: http://community.boredofstudies.org/ — Bored of Studies, Student Community forum,accessed 11/05/07.
HREF28: http://nlvm.usu.edu/en/nav/vlibrary.html — National Library of Virtual Manipulatives, UtahState University, accessed 11/05/07
HREF29: http://www.ex.ac.uk/cimt/dictunit/dictunit.htm — A Dictionary of Units, Frank Tapson,accessed 11/05/07.
HREF30: http://www.math.fau.edu/yiu/geometry.html — Notes on Euclidean Geometry, Paul, Yiu,Department of Mathematics, Florida Atlantic University, accessed 11/05/07.
© The Australian Association of Mathematics Teachers Inc.
346
Mathematics in the primary years:Mechanisms of change
Diane Mellowship
Department of Education and Childrens Services, SA
Improving mathematics education in the primary years offers some particularchallenges. Primary teachers can have a view of mathematics, and themselves asmathematicians, that restricts the range of practices and the level of innovation inpractice in the classroom.Maths for Learning Inclusion is operating in 8 clusters of schools where locallybased specialist teachers support their colleagues to become more confident,engaging, and inclusive, teachers of mathematics. The program used the MostSignificant Change tool to collect qualitative data as part of its evaluationstrategy. From this process came teacher narrative writing identifying the keyfactors that prompted teachers to try new practices, develop mathematicalexpertise, rethink relationships with students not performing well in mathematics,and begin to see themselves as confident mathematicians. This workshop will workdirectly with the writing of the teachers to uncover what practices changed, howthey changed, and what were the critical program componants that supported thedevelopment of engaging pedagogies and improved student outcomes.
Introduction
This paper describes some of the mechanisms that have operated in changing bothteacher mathematics practice and students experience of mathematics learning withinMaths for Learning Inclusion (MLI), a South Australian Department of Education andChildrens Services initiative.
The data has been collected using a qualitative methodology called Most SignificantChange. This is one data set within an extensive programe evaluation plan developedwithin a realist evaluation framework. Realist Evaluation Theory recognises thatprograms are theories for action and change, and each requires the articulation of itstheory. Realist Evaluation also recognises that programs exist in contexts and that thesecontexts will interact with program inputs, in a variety of ways.
Maths for Learning Inclusion: What are its goals and structure?
Improving mathematics education in the primary years offers some particularchallenges. Primary teachers can have a view of mathematics, and themselves asmathematicians, that restricts the range of practices and the level of innovation inpractice in the classroom. Improving mathematics outcomes for students from low socioeconomic backgrounds and Aboriginal students continues to present a challenge foreducation systems.
Improvement in outcomes for these groups of learners was a particular goal of MLI.The program is operating in 44 schools working in 8 clusters where locally basedspecialist mathematics teachers support their colleagues to become more confident,
Mathematics: Essential for Learning, Essential for Life
© The Australian Association of Mathematics Teachers Inc.
347
engaging, and inclusive, teachers of mathematics. Known as Cluster Co-ordinators, theyoperate across a cluster of schools. They have no class teaching commitment, and eachone has developed a variety of ways of working with teachers, with some drawing onexisting mathematics programs, including First Steps and Maths 300.
Most Significant Change methodology was applied to collect samples of teachernarrative writing that helped identify the key factors which prompted teachers to trynew practices, develop mathematical expertise, rethink expectations of students notperforming well in mathematics, reshape learning relationships and conversations, usedata for learning, and begin to see themselves as confident mathematicians.
Maths for Learning Inclusion: What was the program theory?
The overaching program theory for MLI suggests that the path to improved studentoutcomes in mathematics lies in changed teacher thinking and practice. From thewriting of teachers, we hoped to uncover what practices changed, how they changed andwhat were the critical program components that supported the development ofengaging, inclusive pedagogies and improved student outcomes. The mechanisms ofchange that are captured, through the MSC narratives, give insights into teacherresponses to the program inputs and strategies. Teachers varied responses show not justif a program “works”, but how and for whom.
Changing mathematics teachers, changing mathematicspractice: which comes first?
There is much evidence that programs which attempt to change teacher practice havelimited impact on practice, as teachers have a high degree of both privacy and autonomyover what actually happens in a classroom. Equally, many programs find themselves ina position where program inputs are applied across a range of settings and find, at theconclusion that, for some participants, the experience has been significant while otherteachers barely show evidence that they have even been part of a program. For anyprogram to “work”, those involved must actually “participate”.
MLI applied a range of inputs including: practical support from a collegue; bothpractice and theory based professional learning; opportunities for teacher release;participation in teacher networks; and the construction of clusters to workcollaboratively on the program. The evaluation plan of MLI also included the collectionand analysis, of multiple sets of student outcomes data that teachers were asked to bothinterpret and act on. In this they were supported. A key issue for schools and systemsattempting to change teacher practice exists around a “chicken and egg” question:which comes first: a change in thinking and understanding or a change in practice?Most Significant Change offered a window into what were the significant activities,events, relationships and learning of the program and when, or how, did these happen.
Identifying changes in thinking and practice:How was this achieved?
Most Significant Change is a participatory evaluation process that has been developedby Jessica Dart and Rick Davies and adapted for use in educational settings by theUniversity of South Australia in collaboration with the South Australian Department ofEducation and Children’s Services.
MSC differs from other forms of evaluation in that it:

Mathematics: Essential for Learning, Essential for Life
© The Australian Association of Mathematics Teachers Inc.
348
• creates space for stakeholders to reflect and to make sense of complex changesthat occur as result of the application of a range of program inputs.
• provides opportunities for dialogue, between program participants, to help themmake sense of both the changes experienced by others and the value they place onthese changes.
• facilitates dynamic dialogue: “What do we really mean by learning inclusion andwhy do we teach mathematics in the way that we do?”
It is particularly useful for participatory programs, with diverse and complexoutcomes. It attempts to deal with the complexity of schools and the practices ofteaching and learning through both the writing and processing of teacher narrative. Itprovides a participant’s interpretation of the program they are involved in and, asparticipants can select any event, new learning or new thinking to write about, it canchallenge the view that program designers may have about how a program isexperienced by participants.
Most Significant Change: What does the process involve?
In brief the Most Significant Change Process involves a number of steps:
• determine sorts of change to monitor;
• collect narrative writing pieces;
• review and filter writing;
• collate selected narrative pieces for review;
• monitor the process and verify the writing;
• look for patterns, trends and next moves.
In MLI a professional learning session was held for teachers who would be writingnarratives, to help them become familiar the process, grapple with the idea of a“significant” change or insight and, also, to highlight the sorts of changes we weretrying to monitor. One strategy often used to collect data about topics of concern is toidentify domains of change and ask participants to write to these. In this case, thedomains were left open.
Within MLI, narratives were used with two particular purposes in mind. The firstwas for all stakeholders to understand the processes of change for individual teachers,as they themselves understand it. The second was to reinforce a sense of progress andlearning for teachers, through reflection and writing.
In analysing the narratives that were collected a number of domains were identifiedto assist with collation. These reflect the key areas of focus for the program and theareas that teachers had actually chosen to write about. The domains were old teacherbeliefs, old teacher skills, teacher mechanisms and new beliefs, changed teachingstrategies, issues, learning inclusion, teacher outcomes, student outcomes, and projectstrategies.
The Most Significant Change narratives: What did they tell us?
Within these domains a number of common mechanisms of change emerged as issuesfor primary teachers in teaching mathematics, and some insights into the program inputsand the way these inputs were configured, that supported teachers in improving bothpractice and student outcomes.
Mathematics: Essential for Learning, Essential for Life
© The Australian Association of Mathematics Teachers Inc.
349
For the purpose of MLI the term “program mechanisms” is used to describe theprocesses of change that have occurred when program strategies or resources are takenby teachers and, in responding to these strategies, changes in “reasoning” occur. Suchchanges might be in thinking, attitude or motivation that underpin changes in behaviour:“resources + reasoning = mechanism.”
A selection of these mechanisms that emerged through the MSC narratives have beenidentified and named by Gill Westhorpe, a evaluation consultant for MLI, and includewhat might be described as:
• the “changed purpose” mechanism, in which the teacher’s understanding of thegoal moves from “all students at same level” — an unachievable goal destined toreinforce a sense of failure — to a goal of “all students make progress.” In thequotation that follows, this is supported by an “appreciation” mechanism.
“I am constantly surprised by the difference in the level of thinking thatchildren exhibit and the different paths they take to arrive at an understanding ofthe concept… I have greater appreciation of the different levels that children arestarting from and a better understanding of the notion that they don’t all have toend up at the same point: as long as they have all made some measurable progressfrom where they were.” (MSC)
• the “optimism” mechanism, in which access to ideas and resources triggers abelief that change is possible (here, that positive teaching of mathematics ispossible and that all students can access mathematics curriculum and besuccessful). In the second quotation, this is supported by a “validation”mechanism.
“From scepticism to optimism — every now and again something comes alongto change your way of thinking… The richness of diversity, the wealth of ideasand abundant learning opportunities make this program work for me.” (MSC)
“What I think affects what I do! Attitudinal change. If I think I can do mathswith my class and that they will be engaged, enjoy what they are doing and learn,I will do it. My change in headset due to validation (demo lessons, T&D) andquality resources / lesson plans. And I have done it. Maths is integrated more intoother curriculum areas, just as Literacy has been in the past.” (MSC)
• the “seeing the maths” mechanism, in which recognising mathematics contentsupports integration across the curriculum.
“A change? Me realising how much maths was involved in this activity andfinding maths ideas for space in the other art ideas I used in this theme.” (MSC)
• the “reinforcement” mechanism, in which positive responses to early efforts fromstudents build confidence to progress further.
“I began small and found some quite immediate, positive changes in students’reaction to maths lessons… I felt more positive, more relaxed about how I wasteaching.” (MSC)
Mechanisms for change of levels of student achievement and engagement wereidentified through the MSC teacher narratives. Just as teacher level change incorporatesa change in thinking, so does student level change require a change in thinking aboutmathematics and themselves as mathematicians.
Teachers identified mechanisms for change, for students, that were operating inclassrooms. One might be described as “infectious enthusiasm.”
“Well, if my teacher’s happy about math it can’t be all bad”. (MSC)

Mathematics: Essential for Learning, Essential for Life
© The Australian Association of Mathematics Teachers Inc.
350
A second might be described as “mathematical self-efficacy” — the confidence to tryto work out mathematical problems.
“The attitude of the kids towards the testing and doing the maths. They’re not asfearful, not as worried, not as give-uppy, they’re quite resilient and… ‘I’m going towork this out.’” (MSC)
The third incorporates both self-respect and the desire for the teacher’s respect andapproval.
“He wants me to care, he wants me to like him and he thinks if he does this then I’llhonour him in some way… the difference between day one and now is that he caresenough, he has the respect of himself to want to finish the test… to try.”(MSC)
The fourth might be described as the “portable learning” mechanism or the“recognition of mathematics” mechanism.
“It used to be, ‘It’s maths time, this is when I learn maths.’ Like: ‘When do you learnabout literacy?’, ‘Oh, all the time, we see literacy everywhere, there’s this, that’. ‘Wheredo you do maths?’. ‘In maths time’. Whereas now, it’s ‘Well there’s maths here andthere’s maths there and you use it when you’re shopping and you use it when you’regetting up in the morning’ and all that sort of stuff, so it’s just a big change of thinkingin kids’ minds.” (MSC)
The MSC narratives highlight other — or perhaps associated — mechanisms. Two ofthe most commonly mentioned involve the use of concrete resources and the use ofmathematical games. These new resources were associated by teachers with increasedengagement in, and confidence in, mathematics:
“Each lesson (as my programming has evolved to) begins with a game. Everyone isalways keen to start maths as a result — motivation has increased.”
“We prepared coloured pencil cases containing materials including table cards,counters, a range of dice, numbers cards, playing cards and 100 and 200 numbercharts… This proved to be particularly successful for students requiring concretematerials.” (MSC)
A number of teachers particularly associated concrete materials and games withincreased engagement in problem-solving which, in turn, was associated with success inmathematics. Two changes in reasoning for students were described here:
• one was a change from seeing the “goal” as “right answers” to the goal being“reasoning through a problem”;
• the other, a change from seeing mistakes as “failure” to seeing mistakes as anormal part of the learning process.
“My methodology now encompasses a wider use of concrete materials, more open-ended and fun activities, and more discussion about the outcomes/results… Childrenwho previously probably rarely enjoyed ‘success’ in maths now know that their answersdon’t have to be ‘right’ in the traditional sense; as long as they show evidence of havingthought about the problem and represent their understanding. (This has involved achange in mind-set for the teacher too!)” (MSC)
“The Aboriginal students have often been reluctant to try new tasks. They now lovethe contextualised activities; accept the making of mistakes as a natural learning processinstead of as a failing. These students are volunteering information, opinions andanswers, whereas before they would have been ‘too shamed’.” (MSC)

Mathematics: Essential for Learning, Essential for Life
© The Australian Association of Mathematics Teachers Inc.
351
Concrete materials and games based approaches were also commonly associatedwith increased group-based learning and increased discussion. This, in itself, providesnew resources for students — access to a range of different ways of thinking aboutproblem solving, and peer support for learning:
“Problem solving was done as a group effort which led to more open discussion andexperimentation. Students began to see more than one way to ‘solve’ a problem throughour sharing.” (MSC)
“The talk around the computers and between students who are playing games is nowmaths talk and you can hear them teaching each other concepts as they come up in agame.” (MSC)
As well as highlighting the underlying mechanisms that led to changes for teachersand students, the use of MSC also gave teachers a chance to comment on a wide varietyof aspects of both the program design and the program implementation. Some of theseincluded the model itself, the impact of mentoring and modelling, the impact ofparticular professional learning sessions and the importance of leadership involvementand support. These comments have been used to inform the ongoing planning andimplementation of the program, as well as providing useful feedback about howteachers are experiencing their participation in MLI.
It would appear that some similar mechanisms of change operate for teachers andstudents, as well as some different ones. “More hands on” teaching and learningstrategies, in group settings, provide access to new resources (concrete materials, ideas,information, ways of thinking), encourage problem solving and experimentation, andprovide peer support for learning. These build motivation and engagement which:
• provide experiences of success;
• reinforce changed behaviours;
• over time, contribute to improved learning outcomes.
References
Dart, J. & Davies, R. (2003). A dialogical, story-based evaluation tool: The most significant changetechnique. The American Journal of Evaluation, 2 (2), 137–155.
Dart, J. & Davies, R. (2005). The “Most Significant Change” (MSC) Technique, A Guide to Its Use.http://www.mande.co.uk/docs/MSCGuide.htm
Westhorpe. G. (2007). Mathematics for Learning Inclusion, Interim Project Report April 2007 (Draft).
Pawson, R. & Tilley, N. (1997). Realistic Evaluation. Sage.
LeCornu, R., Peters, J., Foster, M., Barratt, R. & Mellowship, D. (2003). Exploring Perceptions of“Significant Change” in Reforming Schools. NZARE/AARE Joint Conference, Auckland, 2003.
© The Australian Association of Mathematics Teachers Inc.
352
Using Dimensions of Learningto increase student autonomy*
Lyn Nothdurft
St Patrick’s College – Gympie
The Dimensions of Learning framework has been used to create an environment inwhich students can develop as autonomous learners, aware and in control of theirlearning.
The essential goal of education is to transfer responsibility for learning to the students,so that they can act in an autonomous and self-directed manner. Thus, they need to learnhow to develop knowledge and skills to reach deep understanding. Yet, according to theliterature, the typical behaviours of high school students indicate a lack of involvementin, and commitment to, learning (Boaler, 1998). Too often, they are unaware of howthey learn and their learning is mechanical and instrumental, based on memorising roteprocedures, working and reworking de-contextualised examples, and recallinginformation only for assessment purposes.
To make a positive difference to learning outcomes, teachers should establish anenvironment that maximises learning opportunities through responding to students’individual needs; empowering students to become independent learners; motivatingstudents to improve their understanding and become enthusiastic about, and interestedin, mathematics; valuing active engagement; and encouraging collaborative learning(Standards for Excellence, AAMT, 2006). The goal of the Mathematics B syllabus(QBSSSS, 2000, p. 2) is for students to reach the level of competence required forinformed citizenship and life-long learning, to have confidence in using mathematics tosolve problems, and to develop a basis for a wide range of further studies.
Dimensions of Learning
This paper discusses using the Dimensions of Learning framework (Mid-continentRegional Education Laboratory [McREL], 2005) to work towards the goal of creating alearning environment in which the students are engaged in, and in control of, theirlearning. They should “know why they do what they do and can do it without theteacher”, as stated by Jane Doty at a Dimensions of Learning training workshop on 9November 2005.
There are five dimensions (McREL, 2005).
• Dimension 1: Attitudes and perceptionsTo learn effectively, students need to feel accepted by teachers and peers andexperience a sense of comfort and order. For them to realise that they have theability and resources to be successful, the learning tasks should be related to their
* Paper accepted by peer review
Mathematics: Essential for Learning, Essential for Life
© The Australian Association of Mathematics Teachers Inc.
353
needs and goals and be of appropriate difficulty. The students should be activelyengaged in their learning and have the opportunity to exercise some personalchoice about how they learn.
• Dimension 2: Acquire and integrate knowledgeTo recall and use results and procedures, students need both declarative andprocedural knowledge, as well as ways of organising and storing this knowledge.Tasks should elicit thinking and meaningful discussion so that studentscommunicate mathematically, construct reasonable solutions to complexproblems, and find and describe patterns. Students need to value understandingwhy a particular approach would be appropriate to solve a problem, not justmemorise rules and procedures.
• Dimension 3: Extend and refine knowledgeTo see the “big picture” and achieve conceptual understanding, students need todevelop complex reasoning processes including comparing, abstracting, inductiveand deductive reasoning, constructing support, and analysing errors andperspectives. By focusing on understanding, rather than content and correctanswers, students become more confident and more competent, and thus betterable to transfer their knowledge to unfamiliar situations.
• Dimension 4: Using knowledge meaningfullyStudents should have opportunities to apply their knowledge for a purpose, usingthe processes of decision making, problem solving, experimental inquiry andinvestigation. Thus, the teacher needs to provide authentic tasks that emphasisereasoning and higher order thinking skills, allow a range of solution strategies andresults, and require the construction and justification of mathematical arguments.
• Dimension 5: Habits of the MindThe Habits of the Mind can be classified into critical thinking, creative thinkingand self-regulated thinking. To work autonomously, students need knowledgeabout themselves as learners, as well as about effective learning strategies.Otherwise, they remain dependent on the teacher to tell them what to learn andhow to do it. Too often, their only learning strategy is memorisation by doing anexample over and over again, without understanding why they are using thealgorithm and so being unable to apply this knowledge in another context. Therequirement is to have students who can reflect on and analyse their thinking, anddevelop as independent and self-directed learners.
This paper argues that the value of the Dimensions of Learning framework is inincreasing teachers’ awareness of their knowledge so that they incorporate this into theirplanning.
When one has been teaching the same subject, to the same year level, for aconsiderable time, much becomes automatic. Work plans, and resources and assessmenttasks, have been developed over time. If these seem effective, they are re-used,generally without any explicit consideration as to why the particular strategy or resourcewas originally used. A focus on each dimension causes the teacher to reflect on whatstudent outcomes are sought through the teaching of the unit, why these are important,and how these might be achieved. Thus, there is increased teacher awareness of thecontent to be covered, often through referring to the syllabus to see exactly what it isexpected that the students experience in the unit, not just recall of what has beenhabitually covered. Planning includes ensuring what students should master. By listing
Mathematics: Essential for Learning, Essential for Life
© The Australian Association of Mathematics Teachers Inc.
354
what it is assumed that the students already know and have experienced, the teacherensures discussion takes place with the students to confirm the accuracy of theseassumptions. It also allows the students to connect the new knowledge to their previouslearning. This planning about content also helps the teacher situate the particular unit inrelation to the whole course. Subsequent sharing of this with the students helps themdevelop a sense of the”big picture” of their mathematics learning, and why the unit is ofvalue.
The second aspect of teacher awareness relates to the teaching strategies to be used.Instead of teaching in an automatic way, the teacher considers the strategies available.The Dimensions of Learning manual describes a wide range of strategies that canremind teachers of approaches that they seldom use, or suggest new ideas to try.Approaches include didactic whole class teaching, inquiry-based learning, studentcontracts in which the students are required to complete a set amount of work, andcombinations and modifications of these. Problems might be solved individually, indifferent sized groups, or as a whole class enterprise. By using the framework toconsider how the different options will contribute to student learning in each dimension,the teacher is more likely to implement a greater variety of teaching approaches.
The third aspect of the unit planning involves determining the appropriate cognitiveand metacognitive strategies. By reflection on personal strategies, for recalling thecontent and solving the problems related to the unit, the teacher can develop a list ofcognitive strategies that can then be given to the students. Having such a list can assistless confident students start solving a problem, instead of initially assuming they areunable to do it. The explicit focus on the cognitive learning strategies reinforces thestudents’ use of existing strategies and may enable their adoption of new strategies.Students may initially be unfamiliar with metacognitive learning strategies. The teacherneeds to plan their development throughout the year. Thus, planning for an early unitmay centre on introducing the concept of thinking about one’s thinking, and starting tobecome aware of how one goes about learning.
The use of the framework for teacher planning can also directly affect the students’learning. Sharing the outcomes of the planning with them allows discussion aboutlearning itself and about the Dimensions of Learning, as a framework for consideringthe different aspects of learning. This impacts on their learning in three ways:
Firstly, learning can be viewed as a joint enterprise involving a community oflearners (Brown, 1994). The teacher and students are active participants in developingknowledge, rather than the students being passive recipients of whatever it seems theteacher has decided they need to know. They realise that the teacher cares about what,and how, they learn and has put considerable thought into the planning. However, it isthen their responsibility to ensure that they achieve the outcomes listed on the plan.They become aware of what the teacher assumes they already know. If there are gaps inthis knowledge, it is their responsibility to let the teacher know so that this can be dealtwith. As there are explicit statements about what they need to be able to do, they canexercise more control over their learning and continually check whether they areachieving these outcomes.
Secondly, the students are encouraged to become more aware of themselves aslearners, not just to learn without considering how this is done. They are told about thelearning strategies that they will be encouraged to use. Instead of trying to improvethrough “working harder”, they have a range of strategies that they can implement and,so, can exercise greater control over their own learning.

Mathematics: Essential for Learning, Essential for Life
© The Australian Association of Mathematics Teachers Inc.
355
Thirdly, effective learning and understanding, rather than content knowledge andcorrect answers, are seen as the main objectives of the course. The framework providesways of talking about learning.
Thus, sharing the planning with the students contributes to the development of a“community of learning” in which learning, not course coverage, is the focus. Thestudents are able to exercise greater control over their learning as they know specificallywhat they need to be able to do, have a list of learning strategies to use to achieve this,and know how they will be expected to demonstrate their understanding.
How this approach contributes tothe growth of student autonomy
This approach is being used with a Year 12 Mathematics B class in a Catholiccoeducational college in a regional Queensland city. Mathematics B is an academicallyrigorous subject that is a prerequisite for many university courses.
The introductory lessons and unit of work, covered during the first five weeks of theschool year, are discussed. This unit involves functions. The focus is the developmentof an understanding and appreciation of relationships between variables; algebraic,graphical and numerical representation of these relationships; and application offunctions to solve problems in life-related situations (QBSSSS, 2000, p.12, p. 17).
The students receive handouts on the content and strategies and the associatedDimensions of Learning (see Appendix).
The contribution to the growth of student autonomy is considered through threeareas: the explicit focus on learning, the increased student control over learning, and thedevelopment of a community of learning. However, these aspects are connected, ratherthan discrete.
Explicit focus on learning
The first two lessons of the year focus on awareness of learning. The students reflect onattitudes and strategies that they have found to contribute to effective learning byresponding individually to the following stems:
• I learn well when I…
• I learn well when the teacher…
• I learn well when the other students…
The responses are shared in small groups and, then, with the whole class. Theyrepeat the process considering what causes them to have difficulty learning. Thestudents also write about their goals for the year, and how they plan to achieve them.
The discussion in response to the students’ reflection on learning makes thinkingmore visible than it usually is in classrooms, giving the students more to build on andlearn from (Perkins, 2003, p. 1).
The students receive the handout that lists the assumed knowledge and skills, theconcepts to be developed and assessed, and related cognitive and metacognitivelearning strategies. They are also given notebooks to use as journals to encouragereflection on both what they are learning and how they are doing this.
Reflection on understanding occurs as the students write, in their own words, aboutwhat they are doing and why, and why they have chosen particular strategies to solveproblems. This gives them a valuable resource for later study. At the end of somelessons, they are asked to list what they have learnt in the lesson, what they do not yet

Mathematics: Essential for Learning, Essential for Life
© The Australian Association of Mathematics Teachers Inc.
356
fully understand, and what they plan to do about this. Some students use the journals asa medium to ask the teacher about a particular type of problem with which they arehaving difficulty.
Reflection on how they are learning occurs through both class discussions andindividual journal writing. Students are asked to consider how effectively they are usingboth class and home time, whether they learn better working with others or individually,and what they are doing to get the best value from the time they spend doingmathematics. In their journals, they can admit their difficulties and concerns, set goalsand later determine the extent to which these have been achieved, acknowledge theirsuccesses or failures, and consider why these have occurred.
The goal is to make the students aware of their learning, realise their strengths andweaknesses, and have some control over their learning environment through their inputinto how the class is run. As students realise that they are the ones who achieve theresults, they can “own” their behaviours and the resulting outcomes.
Increase of control over one’s own learning
The importance of exercising control over learning is discussed in the initial lessons.The students are told that the beginning of a new year provides an opportunity for a newstart. Keeping up with the work from the very beginning, ensuring that they are usingtime effectively, asking questions when they did not understand, and contributingunderstandings and strategies to the class, are all stressed.
There is also a discussion on what it means to “know” and to “be able to do”mathematics. Generally, the class consensus is that it means knowing what to do andwhy it might be done that way, and being able to explain this to another person.
As the plan lists previous knowledge required for the unit, students can prepare byreviewing that work and so connect the new and old knowledge. By referring to theconcepts to be covered in the unit, they know what they need to be able to master.
Students are also told, at the beginning of each lesson, what will be covered duringthe lesson. This is then summarised at the end of the lesson and, generally, reviewed atthe beginning of the next lesson. Providing questions, cues and advanced organisers sothat students realise the objectives or purpose of new concepts, and what knowledgethey will need to acquire, has been found to enhance achievement (Marzano, Pickering& Pollock, 2001).
It is emphasised that it is not sufficient just to find a correct answer: they shouldunderstand why they are using a particular procedure of approach. Students areencouraged to write, in their own words, the steps that they are taking when workingthrough new types of questions. They can then construct their own algorithm, orprocedure, to use in similar questions, rather than learning it as steps of a recipe. Theycan also develop rules, instead of just memorising a rule given in the textbook. Theycan then use their own instructions when solving similar questions.
They are thus able to access knowledge from their own sources, without needing torely on the teacher as much. Similarly, if the teacher’s response to students’ questions isquestions that lead the students to solve the problem themselves, the students becomemore independent.
Community of learning
The third aspect of developing student autonomy is the move towards being activelyengaged with the teacher in “constructing knowledge.”
Mathematics: Essential for Learning, Essential for Life
© The Australian Association of Mathematics Teachers Inc.
357
In a community of learners, the students engage in thinking, reasoning, analysing andtheorising; learn the content and strategies for using that content simultaneously;assume responsibility for their learning; and learn collaboratively in a sociallysupportive learning environment. The teacher facilitates learning through selecting andposing appropriate work, sharing information, when necessary, and developing aclassroom culture in which students work on problems and discuss and reflect onanswers and methods (Hiebert et al., 1997). The teacher guides the students towardsforms of disciplined inquiry that would not be reached without expert guidance, butdoes not constantly monitor, direct and supervise students’ learning and behaviour. Achanged understanding of the roles of teacher and students occurs, as teacher andlearners work together.
Sharing the plan with the students, and explaining its different aspects, make thispartnership between teacher and students explicit.
Because of the focus on a community learning together, students are encouraged towork together and learn collaboratively. They extend their knowledge as, together, theyrelate new and old knowledge, analyse problem contexts, acknowledge what is notknown and then seek to find this out. Thinking is clarified and understandingconsolidated by explaining ideas to others. They are exposed to different approachesand modes of thinking. They mostly enjoy this more social type of learning and aremore motivated to learn, but must be willing to verbalise the processes and learningstrategies being used. Whole class problem-solving also allows a supportiveenvironment for the students to use problem-solving strategies.
Results
After a term with a focus on a community in which everyone was expected to beactively involved in learning and accept responsibility for their own learning, thestudents were asked to reflect on the value of the approach. They did so through bothindividual journal writing and whole class discussion. Aspects that they were asked toconsider included strategies used to improve learning, understandings of themselves aslearners, and how mathematics had been taught in this period. Their responses havebeen considered as related to achievement, awareness of learning, and classroomclimate.
Although the results of only one term have been considered, 19 of the 25 students inthe class improved compared with their results at the end of the previous year. Most ofthe students believed that they achieved at a higher level. Comments from the studentsincluded the following:
“I am actually understanding what we are learning”.“It really satisfies you to know what you can accomplish when you try”.Many students indicated that they have become more aware of how they learn. They
found having the plan helped as they know what they would expect during the unit andbe required to do for assessment.
“I learn best when I know exactly what I will need to learn”.“This subject needs time and effort. You need to know how to use the work and ask
lots of questions. You need to be motivated”.“I go home and practise after learning something new and make sure I understand it
before moving on”.The responses also indicated a positive classroom climate in which students thought
that they were learning work which was “challenging and interesting” in an “enjoyableenvironment”. Many students commented on the importance of the teacher listening to

Mathematics: Essential for Learning, Essential for Life
© The Australian Association of Mathematics Teachers Inc.
358
them and answering their questions. However, there were no comments stating that theteacher should have been telling them more. Many also found it valuable working withother students, with individual students noting the sense of teamwork and their freedomto choose how they learned.
In conclusion, the Dimensions of Learning framework enables the teacher toexplicitly plan pedagogy that emphasises making sense of the concepts, using a range oflearning strategies, and encouraging the students to accept the responsibility for theirown learning. As the resulting plan, and the reasoning behind it, is shared with thestudents, they have the opportunity to exercise greater control over their learning anddevelop a sense of working together to achieve to their potential.
References
Australian Association of Mathematics Teachers. (2006). Standards for Excellence in TeachingMathematics in Australian Schools . Adelaide: Author.
Boaler, J. (1998). Open and closed mathematics: Student experiences and understandings. Journal forResearch in Mathematics Education, 29(1), 41–62.
Brown, A. L. (1994). The advancement of learning. Educational Researcher, 23(8), 4–12.Hiebert, J., Carpenter, T. P., Fennema, E., Fuson, K., Wearne, D., Murray, H., Olivier, A. & Human, P.
(1997). Making sense: Teaching and Learning Mathematics with Understanding. Portsmouth, NH:Heinemann.
Marzano, R.J., Pickering, D.J. & Pollock, J.E. (2001). Classroom Instruction that Works: Research-basedStrategies for Increasing Student Achievement. Alexandria, VA: Association for Supervision andCurriculum Development.
Mid-continent Regional Education Laboratory. (2005). Dimensions of Learning Basics 2005. Aurora,CO: Author.
Perkins, D. (2003). Making Thinking Visible. Boston: Harvard Graduate School of Education.Queensland Board of Senior Secondary School Studies. (2000). Mathematics B Senior Syllabus 2001.
Spring Hill, Q: Author.
Appendix: Unit on functions
Time: 15 periodsTerminology:
polynomial, turning point, point of inflection, intercepts, exponential, logarithmPrevious knowledge (to be reviewed):
• curve sketching
o basic functions x2, x3, 1/xo effect of constants on a general curve y = f(x), af(x), f(bx), f(x + c), f(x) + do use of graphics calculators — entering function, expected result, suitable
windows
• index laws — simplifying exponential expressions and solving equations
• logarithms — change to exponential form and back, log rules, change of base rule
• finding equation of a line given points and/or gradient
New knowledge to be developed (extension of previous knowledge):
• process to sketch y = af(bx + c ) + d, starting from y = f(x) — emphasis oncommunicating reasoning
• sketching factorised polynomials y=a(x+b)(x+c)…
• attributes to consider when curve sketching: behaviour approaching ± , x and yintercepts, TPs, PIs, discontinuities
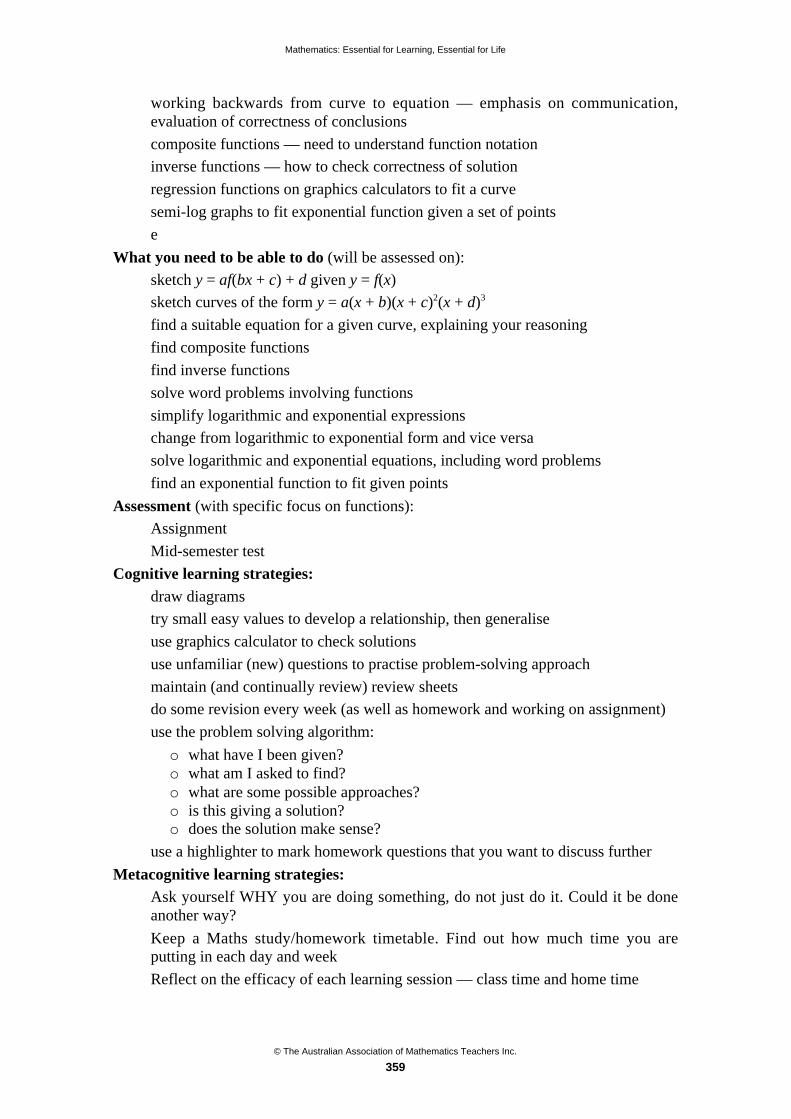
Mathematics: Essential for Learning, Essential for Life
© The Australian Association of Mathematics Teachers Inc.
359
• working backwards from curve to equation — emphasis on communication,evaluation of correctness of conclusions
• composite functions — need to understand function notation
• inverse functions — how to check correctness of solution
• regression functions on graphics calculators to fit a curve
• semi-log graphs to fit exponential function given a set of points
• e
What you need to be able to do (will be assessed on):
• sketch y = af(bx + c) + d given y = f(x)
• sketch curves of the form y = a(x + b)(x + c)2(x + d)3
• find a suitable equation for a given curve, explaining your reasoning
• find composite functions
• find inverse functions
• solve word problems involving functions
• simplify logarithmic and exponential expressions
• change from logarithmic to exponential form and vice versa
• solve logarithmic and exponential equations, including word problems
• find an exponential function to fit given points
Assessment (with specific focus on functions):
• Assignment
• Mid-semester test
Cognitive learning strategies:• draw diagrams
• try small easy values to develop a relationship, then generalise
• use graphics calculator to check solutions
• use unfamiliar (new) questions to practise problem-solving approach
• maintain (and continually review) review sheets
• do some revision every week (as well as homework and working on assignment)
• use the problem solving algorithm:
o what have I been given?o what am I asked to find?o what are some possible approaches?o is this giving a solution?o does the solution make sense?
• use a highlighter to mark homework questions that you want to discuss further
Metacognitive learning strategies:• Ask yourself WHY you are doing something, do not just do it. Could it be done
another way?
• Keep a Maths study/homework timetable. Find out how much time you areputting in each day and week
• Reflect on the efficacy of each learning session — class time and home time
Mathematics: Essential for Learning, Essential for Life
© The Australian Association of Mathematics Teachers Inc.
360
Dimensions of learning associated with unit
Attitudes and perceptions:• A new year and a new start — keep in control from the beginning
• Control your learning, input into whole class processes/approaches — speak up,ask questions
• Use your problem-solving strategies and algorithms — you should have theknowledge and resources to complete tasks
• Focus on understanding (making sense of what you are doing)
• Collaborative learning (“I know that I understand when I can explain it tosomeone else”)
• Your own learning — be aware of this!
• Tutor sessions
Acquire and integrate knowledge:• Review sheets — new rules, algorithms, “handy hints”
• Organise maths pads — course outline, page numbers, exercises done, correctionsin red ink, instructions to self
• Develop own revision sheets — what should be reviewed again at weekend
• “Think aloud” problem solving — in whole class situation and in pair work
Extend, refine, and use knowledge meaningfully:• Problem solving approach to learning
• Evaluation and monitoring of solutions (are they meaningful?)
• Develop arguments (communication and justification)
• Authentic assignment task
Habits of the mind:• Self-regulation — time management, monitoring effectiveness of learning —
work smart!
• Goal setting — big goals (hopes for the year) and small goals (plans for individuallesson)
© The Australian Association of Mathematics Teachers Inc.
361
Mathematics curriculum in the age of moderntechnology: Changes and challenges*
Karim Noura
Bayside Secondary College (Williamston), Vic.
This paper draws upon practical classroom experience as well as recent studies todiscuss the changes and challenges associated with the integration of technologyinto the mathematics classroom.
Introduction
In the age of modern technology, digital equipment and Information CommunicationTechnology (ICT) have become widely accessible and inexpensive. Many social andeducational researchers are, therefore, naturally concerned about the effect of thesetechnologies on school performance and curriculum reform. In response to suchconcerns, educational authorities, and other stakeholders in the wider community, areattempting to educate and equip students with necessary skills by utilising existingtechnology and encouraging, and assisting, students and teachers to appropriately usethese technologies to enhance the teaching and learning of mathematics, science, andinformation technology. This paper will use practical classroom activities and review anumber of studies in order to highlight the problems and challenges of integratingtechnology into the mathematics curriculum. In particular, the following questions willaddressed:
• How does modern technology affect the teaching and learning of mathematics?
• What kinds of changes are being made to mathematics curriculum?
• What is the role of the teacher in such unavoidable changes?
• How are authorities orchestrating the changes in the mathematics curriculum inthe age of modern technology?
• How does the mathematics department-school participate in the ongoing processof preparing students for the next decades in the light of modern technology and,also, in responding to modern cultural, social and economical needs?
How does modern technology affect theteaching and learning of mathematics?
The availability of various kinds of technologies, such as calculators (including graphicsand CAS calculators), computer programmes (e.g., Excel and geometric software) andother ICT naturally leads to a discussion of the ways in which parts of mathematicscurriculum, classroom practice, and student learning will be affected and may differfrom the traditional approach (Arcavi & Hadas, 2000).
* Paper accepted by peer review

Mathematics: Essential for Learning, Essential for Life
© The Australian Association of Mathematics Teachers Inc.
362
Calculator activities
During the last 25 years, handheld calculators became a powerful instrument inmathematics classes, especially because students in most schools had limited access tocomputers and to computer software (Waits & Demana, 2000). Graphing and CAScalculators became very inexpensive, handheld, and very computer-like. However, theexistence of such technology raised the importance of certain ideas, made someproblems and topics more accessible, provided new ways to present and handlemathematical information, and provided choices about content and pedagogy that wehave never had before (Goldenberg, 2000). However, as mathematics teachers we needto consider the type of technology and the needs of students when preparingmathematics activities, taking into consideration that calculators can cause greatchanges in the mathematics that we teach. For example, in the presence of calculators,some pen-and-paper applications became obsolete. This can be seen in the followingscenarios:
• Calculating a number such as 1250_(1.04125)12 or Solving an equation like3x3 +2x2 – 7x + 9 = 0 by pen-and-paper is very laborious and is not necessary ifthe lesson is not about the calculation process but it is about finding and usingresults.
• Sketching the graph of f (x) =x 3 17x + 7
x 2+1
may take 10 minutes of class time,
but graphics or CAS calculators can create a graph in just a few seconds. Incontrast, the traditional method for graphing included finding derivative f’(x),solving f’(x) = 0 and completing a table of values. Ideally, students will use theircalculus skills to confirm analytically that the graph they see is accurate.
Even for junior students who work with simple arithmetic calculators, teachers candesign activities (such as the “Broken Calculator” activities) to help them focus on andanalyse the structure and elements of arithmetic and, also, to gain skills along withunderstanding, rather than letting the calculator replace their thinking. For example,students can be asked to solve the following problems:
• How can you multiply 20 by 50 if the “0” key is broken?
• Calculate 35 _12 by using the “5” and the “7” keys only.
• Calculate 4039 – 49 if the “4” key is broken.
Thus, while calculators are useful when computational labour can get in the way ofthe purpose of a lesson, calculator use can be a bad idea when the purpose of the lessonis to learn how to perform the computation (Goldenberg, 2000).
Dynamic computerised environments
Dynamic computerised environments enable learners to visualise mathematicalsituations, see various sides of a problem and make connections between presentations.Working in such environments also allows students to experiment with: measuring,comparing, changing figures, and making supporting figures easily. This can nurturetheir need to re-inspect their knowledge and assumptions and, thereby, establishopportunities for meaningful learning.
The problem presented in Figure 1 provides a good example. It was presented toYear 9 students as a practical application of Pythagoras’ formula (Nelson Maths 9,2001, p. 163) but can also be presented to more senior classes.

Mathematics: Essential for Learning, Essential for Life
© The Australian Association of Mathematics Teachers Inc.
363
With Year 9 and Year 10 groups, I open the discussion in class by encouraging thestudents to brainstorm solutions to this problem. Common answers from students, basedmainly on guessing, include that: the exit should be in the middle; closer to the rightside; and closer to the left. Next, I asked the students to calculate the length of the road“MEC” according to their choice of exit and then to compare their results with those ofother students in the class. A few students in the group suggested gathering thecollected data into a table of values, so that it would be easier to compare the results andmake a decision. Students applied the formula of Pythagoras to calculate the lengths ofME and EC. Normally it is laborious to add any bit of data that comes from a student(to insert new data we need to create a new table or delete all the data we had and startagain from the beginning); also, it is a big job which requires many calculations tocover all possible positions of the exit (using values between 0 and 4, as the length ofthe freeway section is 4 km).
Figure 1
One mathematics teacher in the school suggested giving this problem solvingexercise as an assignment for a week, letting students find all possible positions of theexit using 10m elements between 0 and 4 km and presenting data in a table of values tofind the best position, or use 1km element to get a rough idea for the best position andthen create a new tables to include smaller and smaller values around the suspectedposition to be more precise. I suggested using an Excel spreadsheet to solve thisproblem; so that students can save time and pay attention to the problem itself ratherthan suffer the long and boring calculations. My suggestion did not receive a positiveresponse from other mathematics teachers, possibly because they were not comfortableor familiar with Excel, or possibly because of the challenges associated with having agroup of 20–25 students in a computer laboratory or problems with getting access to acomputer laboratory in the first place.
However, there was a computer station (two computers) in the classroom, so I put theidea to the class and a few students with prior Excel skills volunteered to attempt the

Mathematics: Essential for Learning, Essential for Life
© The Australian Association of Mathematics Teachers Inc.
364
task, with me assisting them to set up the spreadsheet and write the correct formulas, asin Figure 2.
A B C
1 x ME (a) EC (b) Y= a + b
2 0 =SQRT((a2)^
2+1)
=SQRT((4-
a2)^2+4)
=b2 + c2
3
4
5
Figure 2
I later retold this experience to the school principal and the head of the mathematicsdepartment who encouraged me to speak with other mathematics teachers about it andto organise a Professional Development session for the department (which I did later).Both Year 9 and Year 10 groups had the opportunity later on to experiment with thisactivity in a computer lab. They were able to calculate the length of each part of theroad ME and EC add them and compare measurements and make a decision.
Where is the best exit on the freeway?x a b y=a + b
0.2 1.01980 4.29418 5.31399
0.4 1.07703 4.11825 5.19529
0.6 1.16619 3.94462 5.11081
0.8 1.28062 3.77359 5.05422
1 1.41421 3.60555 5.01976
1.2 1.56205 3.44093 5.00298
1.3 1.64012 3.36006 5.00018
1.31 1.64806 3.35203 5.00009
1.32 1.65602 3.34401 5.00003
1.33 1.66400 3.33600 5.00000
1.34 1.67200 3.32800 5.00001
1.35 1.68003 3.32002 5.00004
1.4 1.72047 3.28024 5.00071
1.6 1.88680 3.12410 5.01090
1.8 2.05913 2.97321 5.03234
2 2.23607 2.82843 5.06450
2.2 2.41661 2.69072 5.10733
2.4 2.60000 2.56125 5.16125
2.6 2.78568 2.44131 5.22699
2.8 2.97321 2.33238 5.30559
3 3.16228 2.23607 5.39835
3.2 3.35261 2.15407 5.50668
3.4 3.54401 2.08806 5.63207
3.6 3.73631 2.03961 5.77592
3.8 3.92938 2.00998 5.93935
4 4.12311 2.00000 6.12311
y=a+b
0.00000
1.00000
2.00000
3.00000
4.00000
5.00000
6.00000
7.00000
0 1 2 3 4 5
Figure 3
Then by completing this spreadsheet, students were able to graph their data, makingconnection between presentations, visualise the situation, and make a decision ( seeFigure 3).

Mathematics: Essential for Learning, Essential for Life
© The Australian Association of Mathematics Teachers Inc.
365
My students also had the opportunity to use one of the dynamic geometry program(Geometer’s Sketch Pad or GSP) which enables them to experiment and comparevarious exit positions. Further, by using another feature of the application called“animation and tracing,” they were able to make their decision based on concreteobservations and results (see Figure 4).
The availability of different kinds of technology enables teachers to pose advancedquestions such as using “calculus” to solve the “Freeway Exit” problem.
Year 12 students in Mathematical Methods, where CAS calculators and GSP areavailable, were easi ly able to f ind the derivative of the
function f (x) = x 2+1 + (4 x)2
+ 4 , that represented the length of the road and tosolve the equation f’(x) = 0 without wasting their time doing such long and hardcalculations. By saving this time, they had more time to analyse and understand themathematics of the problem, and were also able to discuss the coordination of differentprocedures that were available to them.
Reflecting upon the above problem, it was clear that middle school students enjoyedusing technology in mathematics. It was a different and interesting tool which allowedthem to solve difficult questions or questions that required long and laborious processesand complex calculations. In particular, they found GSP — with its animations andquick calculations — to be an exciting application.
For senior students, technology saves time and they can attempt more problems andproduce more work, with less effort. They can use the spare time to concentrate on, andunderstand, the mathematical sides of problems. Mathematics teachers in my school, aswell as other teachers who attended my workshops on various occasions, found thatwith modern technology they had an opportunity to ask students to check differentaspects of the problem and to design tasks and activities which take advantage offeatures and potential of the available technology. This enhanced and supported newways of learning mathematics (Arcavi and Hadas 2000).
Figure 4

Mathematics: Essential for Learning, Essential for Life
© The Australian Association of Mathematics Teachers Inc.
366
In such a learning environment, the teacher is able to develop different teachingmethods that enable students to make good use of modern technology, developmathematical ideas, produce results and carry out analysis, in a problem solvingsituation.
What kinds of changes are being madeto the mathematics curriculum?
As seen in the above examples, technology can lead to changes in teaching andlearning. In the presence of modern technology, some mathematics becomes lessimportant (e.g., some arithmetic and symbolic techniques) while other aspects becomemore important (e.g., discrete and nonlinear mathematics and data analysis).
“Before calculators we studied calculus (applications of the derivative) to learn howto obtain accurate graphs. Today we use accurate graphs produced by graphingcalculator to help us study the concept of calculus” (Waits and Demana, 2000, p57).
Thus, teachers should balance paper-and-pen approaches and technology whenpreparing their mathematics curriculum. Yet,traditional arithmetic and algebraic skillsare still very important as we move to more computer-intensive learning environments(Waits & Demana, 2000). For example, students need to know how to use the mainoperations, need to know how to simplify and factorise expressions, and should be ableto estimate answers before using technology or, even, before doing any computation. Acurriculum should provide sufficient time for appropriate practice of these skills. Toachieve a good balance, teachers are advised to have students, from time to time, useeach of the three strategies:
1. Solve problems using paper and pencil and then support the results usingtechnology
2. Solve problems using technology and then confirm the results using paper-and pen techniques
3. Solve problems for which they choose whether it is most appropriate to usepaper-and-pen techniques, calculator techniques, or a combination of both(Waits & Demana, 2000, p. 59).
Nevertheless, the mathematics curriculum, in both written documents and practice,needs to stress that students, in the technology environment, should develop a set ofskills, strategies, rules or guidelines for actions, routines and ways of doing things,together with tactics, methods and algorithms that can be used in various situations(Bosco, 2004). In the presence of technology, the mathematics class becomes different:students and teachers will have more time for discussions; students can work in groups,can do much more work than before, and work much faster than they could imagine(Connors and Snook, 2001).
Great changes have occurred in the mathematics curriculum through takingadvantage of technology such as CAS calculators. Here some topics have become moreaccessible, and new courses have been introduced, such as Mathematical Methods withCAS in Victoria, Australia (Stacey, 2003). Such curriculum change is influenced by theuse of education to improve the economy, the efforts of government initiatives, and theinfluence of commercial curriculum resource providers (Textbook and softwarepublishers, and calculators and computer manufacturers), and internationalorganisations (McCormick, 1999).
Mathematics: Essential for Learning, Essential for Life
© The Australian Association of Mathematics Teachers Inc.
367
What is the role of the teacher in such unavoidable changes?
In the environment of modern technology, authorities expect teachers to integrate theappropriate technology into their teaching. However, research show that new teachers,with shorter length of service and better qualifications, are more competent in usingtechnology then more experienced teachers (Andrews, 1997).
As schools plan their use of technology, not all teachers are both willing and able toalign their teaching with the new teaching strands, nor with the integration oftechnology. Teachers should be provided with sufficient time and opportunity tobecome fluent with the tools, so that they can be flexible and more confident in theirability to use them (Goldenberg, 2000). Teachers’ fears about technology need to beunderstood and addressed. Professional development in technology, especially aroundtools, can play a great role in the process of change. Teachers need to be updated as wellas be made keenly aware of the limitations of the technology, so that they are able tokeep the balance while they develop, in their students, the ability to appropriatelydecide when to pick up a pen, when to pick up a calculator, or when to go to a computerworkstation (Connors & Snook, 2001).
Educators need to avoid letting a powerful technology tool become a crutch to poorunderstanding. They need to develop teaching strategies which enable students to makesensible choices about when to use, and when not to use, technology and becomejudicious users of technology (Ball & Stacey, 2005). Ball and Stacey described thesestrategies in their Classroom Vignette:
1. Promote careful decision making about technology use, where teacher andclass discuss the nature of human and technology contributions.
2. Integrate technology into the curriculum, focusing on mathematics ratherthan on the calculator’s syntax and include examples that really requiretechnology use, and examples where technology use would be inefficient.
3. Tactically restrict the use of technology for a limited time.4. Promote habits of using algebraic insight for overview and monitoring
(model this routinely at the start of each problem and encourage thecontinual monitoring of technology outputs against expectations). However,when preparing a mathematics activity using technology (calculators orcomputer); teachers need to make sure that they have access to the rightequipment at the right time.
Nevertheless, more work is still needed to involve all teachers in the process ofchange, especially those who need to be convinced of the need to use technology intheir teaching (Andrews, 1997). To initiate change and achieve the full potentialprovided by technology, we need to put the potential for change in the hands ofeveryone, and provide additional teacher in-service training on the use of technology,particularly addressing conceptual and pedagogical issues. Having said that, change hasto come from within the teaching profession and be supported both from within andfrom without, as it is very hard to change the teaching practice from the outside alone.
How are authorities orchestrating the changes in themathematics curriculum in the age of modern technology?
On the international scene, educational authorities hold the responsibility of monitoringcurriculum developments and implementations. They work closely with otherorganisations to develop new teaching strategies and resources to cater for the needs of
Mathematics: Essential for Learning, Essential for Life
© The Australian Association of Mathematics Teachers Inc.
368
the wide range of student abilities. They orchestrate changes in the curriculum andorganise the entire assessment processes in each country. Authorities take the initiativeof setting the curriculum’s goals and the standards framework, provide schools with thenecessary resources and assist with the necessary support, monitor and assess teachers’performance, and assess the curriculum implementation (Prawat 1996).
In recent times, mathematics education has been directly affected by the wide-ranging availability of, and easy access to, new technology. As a result, educationalauthorities have needed to update school curriculum, structure and performance in orderto enhance the teaching and learning of mathematics and ensure that students are wellprepared and equipped for their future endeavours (Kilpatrick and Silver, 2000). Inmaking changes, authorities are faced with challenging decisions. Integratingtechnology into the mathematics curriculum requires particularly complex decisions(Connors & Snook, 2001).
In Victoria, the Victorian Curriculum and Assessment Authority (VCAA) holdsresponsibility for school curriculum and like other similar bodies around the world,VCAA has expended a great deal of energy in recent years to support schools inintegrating new technologies into their curriculum.
The mathematics CSF II (2000) and the VELS (2005) in Victoria, support thesedevelopments and encourage teachers to integrate technology into the mathematicsclassroom. The objective is to enable students, using ICT, to have access to resourcesand information to ensure that they are making sensible use of calculators andcomputers. Teachers are advised to use technology effectively and appropriately tosupport the student’s learning i.e. to help students think and work mathematically andcarry out mathematical activities and solve problems. The choice of technology, when itshould be used and to what extent, should be guided by the degree to which technologycan efficiently and effectively assist students in their learning. However, the ultimateobjective is to equip students with the mathematical and numerical skills for successfulemployment and prepare them for further studies, should they desire it.
The Victorian Certificate of Education (VCE) Study Design (2000; 2005) stipulatesthat: “The appropriate use of technology to support and develop the teaching andlearning of mathematics is to be incorporated throughout each VCE mathematics unitand course, and in related assessment. This will include the use of some of thefollowing technologies for various areas of study or topics: graphing and CAScalculators, spreadsheets, graphing and numerical analysis packages, dynamic geometrysystems, and computer algebra systems” (VCAA, Mathematics VCE Study Design2005, p. 14). Thus, teachers are required to develop courses that encourage students toappropriately select and use technology, where they are required to respond to outcome3 which is based on the appropriate use of technology: to develop mathematical ideas,produce results and carry out analysis in situations requiring problem-solving,modelling or investigative techniques or approaches in the area of study of each courseand unit.
School participation in the ongoing change
When schools plan to integrate technology into the curriculum, issues arise such as theinteraction of technology with different elements in the school (Bosco, 2004).
The school holds the main responsibility for creating and maintaining a healthy andeffective technological learning and teaching environment. The school is responsible forproviding the necessary resources to achieve curriculum goals and meet learning needsof students, and the teaching needs of teachers. Resources include: class sets of
Mathematics: Essential for Learning, Essential for Life
© The Australian Association of Mathematics Teachers Inc.
369
calculators; computer labs; computer pods; printers; data projectors; computer software;school networking and Internet connection; as well as necessary maintenance andupgrading of software or hardware. Also, to ensure that the technology is smoothly andeffectively integrated into the curriculum, the school administration needs to:
• allocate a sufficient budget to run the curriculum;
• provide teachers with necessary information on software and hardware;
• organise relevant and necessary workshops and encourage teachers to attend in-services courses;
• make official information available to students and teachers, especiallyinformation that relates to course design and exam regulations (e.g., VCE Mathsexams technology active or technology free); and
• provide flexible timetables that enable mathematics teachers to have access totechnology on a regular or temporary basis.
Decision makers and curriculum reformers need to be aware of the different roles fortechnology, to think clearly about classroom goals, about the particular needs ofstudents and to choose technologies expressly to further these goals, rather than merelyadding technology to the classroom in ways that may be attractive, but tangential oreven detrimental to set goals (Goldenberg, 2000). The responsibility on schools is agreat one given their key role in enabling students to respond to ongoing cultural, socialand economic changes.
Conclusion
Technology enhances the teaching and learning of mathematics. To be able to achievethis goal, however, teachers need sufficient training in using the available technology,and must possess sufficient knowledge of computer facilities that are provided by theirdepartment or by the school. Teachers should be able to prepare and deliver teachingmaterials and learning activities that are interesting and relevant to the topic students arelearning in ways that open new windows of opportunities for students to improve theirlearning and to build up new and additional skills and knowledge which are necessaryfor future work or further studies. Finally, the integration of technology into themathematics class should be part of the global curriculum which is fully supported bythe school community and also by the wider community.
References
Andrews, P. (1997). Information technology in the mathematics National Curriculum: policy begetspractice? British Journal of Educational Technology, 28 (4).
Arcavi, A. & Hadas, N. (2000). Computer mediated learning: An example of an approach. InternationalJournal of Computers for Mathematical Learning, 5, 25–45.
Bosco, A. (2004). ICT resources in the teaching of mathematics: Between computer and schooltechnologies. A case-study. The Curriculum Journal, 15 (3).
Burkitt, I. (2002). Technologies of the self: Habitus and capacities. Journal for the Theory of SocialBehaviour, 32 (2).
Connors, M. A. & Snook, K. (2001). A technology tale: Integrating hand-held CAS into a mathematicscurriculum. Teaching Mathematics and Its Applications 20 (4).
Forster, P. A. (2006). Assessing technology-based approaches for teaching and learning mathematics.International Journal of Mathematical Education in Science and Technology, 37 (2), 145–164.
Goldenberg, E. P. (2000). Thinking (and Talking) about Technology in Math Classrooms. Accessed athttp://www2.edc.org/mcc/iss_tech.pdf.

Mathematics: Essential for Learning, Essential for Life
© The Australian Association of Mathematics Teachers Inc.
370
Harré, R. (1999). The rediscovery of the human mind: the discursive approach. Asian Journal of SocialPsychology, 2, 43–62.
Heid, M. Kathleen (2005). Technology in mathematics education: Tapping into visions of the future.Technology-Supported Mathematics Learning Environment. Reston, VA: NCTM.
Kilpatrick, J. & Silver, E. A. (2000). Unfinished business: Challenges for mathematics educators in thenext decades. In Learning Mathematics for a New Century. Reston, VA: NCTM.
McCormick, R. (1999). Curriculum development and new information technology.IN B. Moon & P.Murphy (Eds), Curriculum in Context. The Open University.
Nelson Maths 9 for CSF II (2001). Thomson Learning, Nelson Australia.
Prawat, R. S. (1996). Learning community, commitment and school reform. Journal Curriculum Studies,28 (1), 91–110.
Stacey, K. (2003). Using computer algebra system in secondary school mathematics: Issues ofcurriculum, assessment and teaching. ATCM-2003: 8th Asian Technology Conference in Mathematics.www.atcminc.com/mPublications.
Victorian Curriculum and Assessment Authority. www.vcaa.vic.edu.au
Waits, B. K. & Demana, F. (2000). Calculators in mathematics teaching and learning: Past, present, andfuture. In Learning Mathematics for a New Century. Reston, VA: NCTM.

© The Australian Association of Mathematics Teachers Inc.
371
Mathematics through learning inclusion:Learning inclusion through mathematics
Barbara Reinfeld
Department of Education and Children’s Services, SA
If primary teachers see mathematics as content-driven and challenging to teach,they may take refuge in teacher-centred pedagogies that do not engage students ormake mathematics meaningful for them. The Maths for Learning InclusionProgram in South Australia seeks to address the achievement gap in schools bydeveloping teachers' capacity to teach mathematics in ways that are engaging,inclusive and make high intellectual demands on students. In doing this, theprogram draws on strategies that have proved successful in improvingdisadvantaged students’ literacy achievement, and applying them to mathematics.This workshop will examine how the program integrates mathematics content witha focus on learners and inclusive learning and discusses the tensions and issuesinvolved in this approach.
Introduction
The Maths for Learning Inclusion Program (MLI) was developed in South Australia bythe Learning Inclusion Team within Curriculum Services, in the Department ofEducation and Children’s Services (DECS). It seeks to address the achievement gap inschools by developing teachers' capacity to teach mathematics in ways that areengaging, inclusive and make high intellectual demands on all students, particularlystudents from low socio economic status (low SES) and Aboriginal (ATSI) students.
There are eight clusters with a total of 44 primary schools in the program, each onewith a full time cluster coordinator (CC).
In designing the program, the Learning Inclusion Team chose a three part approachwhich included mathematics curriculum, learning inclusion and students in the primaryyears.
Underpinning the design of the project was an assumption that teachers want all theirstudents to be successful in mathematics. However, data suggests that for many lowSES and Aboriginal students, success in mathematics seems a long way off. The logicfor the program was that by providing teachers with opportunities to develop theirexpertise in a high stakes subject like mathematics, teachers would not only increasetheir repetoire of successful practice, improve their confidence and understandings,skills and resources, but have the opportunity to focus on those learners who werecurrently not being successful in mathematics and ask themselves; Why? What was itabout the teacher’s own beliefs, assumptions and practices in mathematics teaching thatresulted in the largely predictable learning outcomes?
The plan was to support teachers,through programming and planning, with the statecurriculum framework, the critical analysis of data, teacher reflection and questioning asstrategies, to begin to address the issues of equity and inclusion and imbed these

Mathematics: Essential for Learning, Essential for Life
© The Australian Association of Mathematics Teachers Inc.
372
changed practices and beliefs into their pedagogy and, ultimately, into their identity asteachers of mathematics.
The focus on mathematics in 2006
Professional learning is a vital component of the program and has included conferences,workshops, network meetings, school team meetings, and one to one sessions withteachers and CCs. The professional learning program offered to address each of thethree focii, i.e., mathematics, primary years learners and learning inclusion, and hasincluded the following topics in one or more sessions:
• A focus on the students in the primary years, their changed/changing natureespecially in the area of digital technology (i.e., students as digital natives); theimportance of knowing your learners and engaging with their realities and worldviews as the starting point for engagement; questions raised about what a relevantmathematics curriculum for this group of learners might look like in the 21st
century.
• Data collection and analysis — has included topics which addressed issuesabout the importance of using multilple data sets to get a “truer” picture of what isworking for whom; questions to facilitate critical analysis; whole schoolapproaches; analysis of data to support teachers’ planning and programming,including for individual special focus students, e.g., the Low SES and Aboriginalstudent(s).
• Developing professional learning communities — has included input fromEtienne Wenger introducing the concept of Communities of Practice; promotingstructures to support learning communities and professional dialogue, e.g.,structured teachers dialogue, moderation of student evidence in schools andclusters, etc.
• Challenging and engaging mathematics curriculum has been adressed by a widevariety of key speakers and practisioners including Robyn Zevenbergen, ThelmaPerso, Doug Williams, Sandra Knox, George Booker, The First Steps program,etc.
What did we find?
While this broad range of professional learning was on offer throughout the program,the focus for the day to day work in the clusters was predominantly focussed onmathematics content, pedagogy, resources, etc. Teachers were eager to develop newunderstandings and skills and saw immediate rewards back in their classrooms.
Every data set including (the PAT Maths tests, LaN tests, SACSA achievement data)suggested that the urgency for explicit intervention for Low SES and Aboriginallearners had to become a priority for ACTION.
Educational rhetoric (“We need to close the achievemnt gap,” etc.), certainlysupports the need for action. Given that the vast majority of schools in the program hadhigh numbers of both ATSI and low SES students, it was surprising to us that thelearning inclusion focus had not become more central to the work of teachers andleaders. Even though there were high levels of goodwill and commitment to equity,there seemed to be general confusion and uncertainty about what learing inclusion was,and how you might do it in mathematics? CCs reported a general anxiety aboutstopping or interrupting the mathematics focus to “do” learning inclusion. This

Mathematics: Essential for Learning, Essential for Life
© The Australian Association of Mathematics Teachers Inc.
373
highlighted that, despite the professional learning program and 12 months in theprogram, for many, learnng inclusion was still seen as some optional extra and notintegral to the pedagogy of mathematics. The learning inclusion agenda was clearlymore problematic than the mathematics agenda for many teachers, CCs and someschool leaders, who struggled with the concepts and ways in which to integrate learninginclusion into mathematics teaching and learning.
How did we respond?
Clearly, we needed some mechanism to make explicit what we meant by learninginclusion. In professional learning sessions, we had previously worked with teachers toanalyse the work of Martin Haberman and his “Pedagogy of Poverty” article in whichhe describes what you see when you observe “good teaching.” The work of Phillip C.Schleckty, however, provided a framework for our thinking. The Learning InclusionIndicators were adapted from Schlechty’s work, Shaking up the Schoolhouse andWorking on the Work. Schlechty helped provide us with the concept of a frameworkthat would describe the various aspects of learning and teaching that contributed tomore equitable outcomes, particularly for Low SES and Aboriginal learners. It is anattempt to provide a framework to describe the inclusion work teachers and schoolsalready do, and also provide some direction and priority for future planning and actionsneeded to make outcomes less predictable and more evenly spread across race, genderand class.
The topics covered include, for example:
• student engagement
• student achievement
• curriculum content and substance.
There are 12 topics in total, and each has an introductory statement and a number ofindicators which describe in some detail, for example, student engagement.
Statement 1: Classes are generally engaged, and when they are not, teachers makeevery possible effort to redesign the pattern of activity in the classroom so that allstudents are authentically engaged1. Most students, most of the time are engaged in learning tasks.2. Teachers intentionally plan the work they provide to students in ways that
builds on those qualities that show the most promise of increasing authenticengagement.
3. When patterns of engagement differ from what teachers want or expect,teachers talk to and question students and analyse their work to discoverwhat might account for the difficulty.
4. Teachers commonly work together to analyse the work they are providingstudents and give each other help and advice to make the work moreengaging to students.
5. There is evidence that over time the level of engagement has increased andthe amount of rebellion, retreatism, and passive compliance have decreased.

Mathematics: Essential for Learning, Essential for Life
© The Australian Association of Mathematics Teachers Inc.
374
Working with the indicators in 2007
While still in draft, the Learning Inclusion Indicators are being used in clusters invarious ways including:
Teachers in the Beach Road Cluster have used the indicators to design inquiryquestions for classroom research. The central question of teacher inquiry is aligned toone or other aspects of the indicators; e.g., How can I improve my questioningtechniques/skills so that I am better able to find out what student x knows aboutmeasurement?
In the North Yorke Cluster, leaders worked with the Learning Inclusion statements tobrainstorm how they might support the development of the indicators in their schools.The results of the brainstorm helped leaders determine the actions necessary in order forthem to support teachers and help them to address inclusion issues in their classroomsand the school, as a whole.
The Torrens Cluster used a number of approaches including:
• As part of the induction for new staff;
• In network meetings teachers focused on Improved Student Engagement.Teachers shared how they have changed what they do to increase engagement oflow SES and Aboriginal students. Posters and bookmarks were produced in thesesessions, with key statements, and were distributed to all teachers to display in therooms to keep the focus on inclusion;
• One teacher used the “engagement “indicators to help her identify what to lookfor in observing a particular student. She developed a rubric to monitor a student’sengagement and asked the CC to observe, and help her observe, class interactions.
Beyond 2007
The Learning Inclusion Team is currently developing a number of ways in which towork with teachers, school leaders and CCs in implementing the indicators.
We have been encouraged by the level of enthusiasm with which the indicators arebeing used across the program. It is reflective of the level of commitment to takingaction, when clear direction and opportunities for input are provided. This hasencouraged us to continue and broaden our consultation and share the collectivelearning with colleagues across DECS and beyond.
References
Schlechty, P. C. (2001). Shaking Up the Schoolhouse: How to Support and Sustain EducationalInnovation and Working on the Work. New York: Jossey-Bass, Wiley Company.
© The Australian Association of Mathematics Teachers Inc.
375
Mathematics to motivate
Pauline Rogers
Monash University
This paper presents examples of mathematical activities as trialled and provensuccessful in an Australian Government Quality Teacher Programme projectaimed to motivate students and teachers in their interest and learning ofmathematics. The success of these activities in the development of studentmotivation was examined in various contexts and is presented for information inthe areas of Working Mathematically, Fractals and 3D Animation. An activitywhich has students writing their own lessons instead of a teacher “driving” theclass is also illustrated. The activities are not difficult for the teacher to conductnor are they equipment intensive. This sample of activities will be expanded onduring the presentation.
The activities presented in the session are ideas and lessons taught, shared or examinedduring an Australian Government Quality Teacher Programme (AGQTP) titled“Teachers as Learners.” This teacher professional learning project centred on in-situlearning using a “mathematics educator in residence” who conducted teacherprofessional learning, visited classes, observed specific lessons, taught model lessonsand was involved in team teaching with staff. The project involved six week-long visitsto a school in rural Victoria spaced across two years. A structured learning program wasdeveloped and teachers were paired with professional learning partners. The basis of theprofessional learning model being conducted was “learn – practice – review.” For eachteacher, half an hour was spent with the mathematics educator in residence prior to eachlesson to be observed. The lesson was discussed and any other concerns or interestsregarding the teaching of mathematics were addressed. Then a lesson of approximatelyone hour was taught, with the mathematics educator in residence and the teacher’sprofessional partner viewing and participating as appropriate. After the lesson, half anhour (or more) was spent reflecting on the lesson with the mathematics educator-in-residence and the professional partner. The aim of the model was to promote teacherlearning, with an individual focus on goal setting.
Student outcomes and student motivation were a major initiative of the project. Itwas felt that through examination and reflection, teachers were able to trial new ideas toimprove student outcomes. This outcome based reinforcement was expected to lead to achange in teachers’ practice (Rogers, 2007). Having students genuinely interested inmathematics became one of the key performance indicators across the school (P – Year6) and throughout the duration of the project. To measure this; problem solving, open-ended tasks and links to students’ worlds were examined. These links became importantas they illustrated to students the need for mathematical learning and its relevance aswell as importance in their lives.
Presented in this paper is a sample of the activities taught at the school. The focus ispredominately Geometry, although other areas will be explored during the presentation.While these activities were conducted within the P – Year 6 setting, many could easily
Mathematics: Essential for Learning, Essential for Life
© The Australian Association of Mathematics Teachers Inc.
376
be altered for use with secondary students, and suggestions have been included asappropriate. The presentation will include an expanded discussion focussed on thecomments resulting from the “review” of the lessons with the teacher, professionalpartner and the mathematics educator in residence.
Cut ups
Equipment:
• one large piece of paper
• three small pieces of paper
• tape
• scissors
• a ruler
• a piece of string
• a pencil
The aim of the activity was to make all of the objects below:
• an object that holds water
• an object that measures the height of a member of the group
• a waterproof name card for the group
• a party decoration
• a Christmas decoration.
Students worked in small groups of three or four and the activity was conducted as awhole lesson with a Year 3/4 class.
This activity resulted from the exploration of the area of problem solving at theschool which was the focus of one of the mathematics educator-in-residence week-longvisits. The lesson was taught by the classroom teacher. After the teaching of the lesson,both the teacher and the professional partner commented that it was an interestingactivity as all student groups produced quite different results. For example: with thewaterproof container a variety of shapes were produced such as an open box, a cone anda cup shape, and all of the groups tested the container with varying degrees of success.Teachers noted that the object for measuring the height of a member of the group easilyreflected students’ understanding of the concepts of measurement and equal divisions;which was a topic that had been explored recently in the teaching of formalmeasurement.
The discussion in the review after the lesson focussed on how the activity itselfrequired students to plan mathematically, work in groups and use existing knowledge.The professional partner commented that students were also encouraged to think morebroadly and challenge the limitations set by activity.
Fractals
Adapted from the Math Rice website http://math.rice.edu/~lanius/frac/, the followingtwo activities were conducted as model lessons by the mathematics educator-in-residence with Year 5/6 students producing and exploring fractals. The ideas were thenused by one of the teachers viewing the model lesson with their own Year 5/6 students.

Mathematics: Essential for Learning, Essential for Life
© The Australian Association of Mathematics Teachers Inc.
377
Drawing Sierpinski’s triangle
1. Draw an equilateral triangle of side length 20 cm. Connect the midpoints of eachside to create a triangle in the centre.
2. Shade the triangle in the centre.
3. Now connect the midpoints of the sides of the unshaded triangles to create smallertriangles and shade the triangle in the center as before. Continue the process.
Both the set of observing teachers and the teacher who later taught similar lessonsfound the activity valuable as it provided students with the opportunity to use geometricconstruction as well develop their use of mathematical terms such as equilateral,midpoint, etc. Students recorded in tables, information about the side lengths and theareas of the constructed triangles and looked for patterns. For example: for eachiteration students found the area not shaded as a fraction. This produced the pattern of3/4, 9/16, 27/64…which students attempted to generalise by identifying the relationship3/4, 32/42, 33/43… for each iteration.
Teachers found the activity also allowed students to be creative and students couldbe further challenged. As an extension, a comparison between Sierpinski’s Triangle andPascal’s Triangle was also made using a template on triangular paper from the website.Students completed Pascal’s Triangle, after examining and learning about the patterns,and then they shaded all of the triangles except for the odd numbered ones and an imagewas found that was the same as Sierpinski’s Triangle. Students appeared to like theexamination of the patterns of the fractals and participated enthusiastically in thediscussion, which required them to express their thinking and understanding in a logicalmanner.
In the review after the lessons — modeled and taught — teachers commented thatthey found students were inspired and motivated by the development of the fractals. Thestudents were actively engaged in the activity and the discussion throughout the session.In subsequent classes teachers later shared, students completed fractals in similarcolours and these were combined into one design for display purposes. Students alsolooked at different sized equilateral triangles for the starting point, creating both largeand small versions of Sierpinski’s Triangle.
A similar activity was also completed with students drawing the Koch Snowflake. Inthis case the drawing is completed on the outside of the equilateral triangle instead ofthe inside.
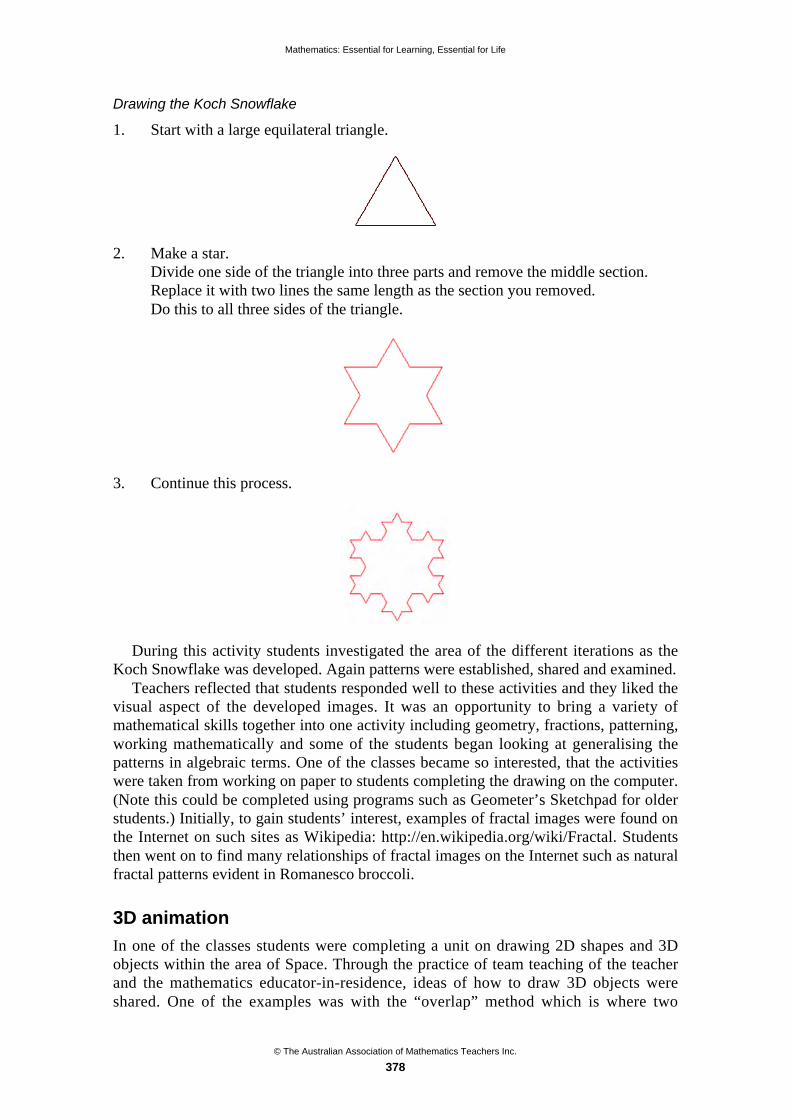
Mathematics: Essential for Learning, Essential for Life
© The Australian Association of Mathematics Teachers Inc.
378
Drawing the Koch Snowflake
1. Start with a large equilateral triangle.
2. Make a star.Divide one side of the triangle into three parts and remove the middle section.Replace it with two lines the same length as the section you removed.Do this to all three sides of the triangle.
3. Continue this process.
During this activity students investigated the area of the different iterations as theKoch Snowflake was developed. Again patterns were established, shared and examined.
Teachers reflected that students responded well to these activities and they liked thevisual aspect of the developed images. It was an opportunity to bring a variety ofmathematical skills together into one activity including geometry, fractions, patterning,working mathematically and some of the students began looking at generalising thepatterns in algebraic terms. One of the classes became so interested, that the activitieswere taken from working on paper to students completing the drawing on the computer.(Note this could be completed using programs such as Geometer’s Sketchpad for olderstudents.) Initially, to gain students’ interest, examples of fractal images were found onthe Internet on such sites as Wikipedia: http://en.wikipedia.org/wiki/Fractal. Studentsthen went on to find many relationships of fractal images on the Internet such as naturalfractal patterns evident in Romanesco broccoli.
3D animation
In one of the classes students were completing a unit on drawing 2D shapes and 3Dobjects within the area of Space. Through the practice of team teaching of the teacherand the mathematics educator-in-residence, ideas of how to draw 3D objects wereshared. One of the examples was with the “overlap” method which is where two

Mathematics: Essential for Learning, Essential for Life
© The Australian Association of Mathematics Teachers Inc.
379
congruent shapes are drawn slightly overlapping each other and then each of thecorresponding pairs of points are joined with straight lines to complete the prism as seenin Figure 1.
Figure 1. Congruent squares are overlapped and corresponding points are joined.
This activity led to students asking, “When are we ever going to use this?” Theapplication of 3D animation was explored. This idea immediately “grabbed” thestudents’ attention. Different web sites such as http://www.garyharbo.com/activity.htmland http://www.anim8or.com/main were presented which illustrated images for studentsto look at. There were also programs that students downloaded allowing them tocomplete the animation process.
Teachers involved reflected that it was terrific how students devised their ownimages on screen (computer) and animated them, so they could view the images fromany perspective. They found that this development from paper to computer allowedstudents to use their geometrical knowledge to apply it to a real situation which was ofinterest to them. Many elements of mathematics were brought together includingworking mathematically, two and three dimensional shapes, perspective, problemsolving and programming.
Writing your own activities
In many classes teachers set the questions and the activities. In this case students cameup with their own ideas. Students were randomly provided with elements of a topic onseparate pieces of card. For example: for a topic on measurement, the elements were:
• numbers, e.g.. 4, 0, 8
• equipment, e.g., Unifix
• context, e.g., area
• symbol, e.g.,
Students worked in small groups and used a large piece of paper to:
• discuss what each of the elements were
• link each of the elements (e.g., some groups used a concept map)
• develop their own activity / lesson that used all of their provided elements.
This activity proved exciting and interesting. The teachers involved felt the activityprovided students with ownership of their own learning. It allowed the teacher to seeany student misconceptions and it provided an insight into what students may like tolearn about. The completed ideas were collected together into a class book, but theycould also be run in the classroom. In the review time teachers felt that this activitycould also be modified for younger students by providing them with some numbers andhaving them write everything they know about the numbers on their piece of paper.

Mathematics: Essential for Learning, Essential for Life
© The Australian Association of Mathematics Teachers Inc.
380
Alternatively the activity could be extended for older students by including equipmentsuch as calculators, protractors and compasses.
Discussion
The “review” component of the “learn – practice – review” model allowed the teacher,the professional partner and the mathematics educator-in-residence to reflect on thetaught lesson, the impact of the learning and the students’ responses to the lessons. Asthe lessons were conducted during the week-long visits, between visits teachers couldtry further ideas resulting from the discussions, which were again shared and discussedduring the following visit. The model lessons, in this case the fractals activities, couldalso be tried by teachers viewing the lesson, and ideas could be developed and exploredif students displayed interest.
The use of the mathematics educator-in-residence provided teachers with support intheir use of lessons aiming to motivate students. This support was in the form offeedback, ideas, conducting model lessons and team teaching. The use of theprofessional partner again provided support for the teacher to attempt innovativelessons. It also aided in the rich discussion occurring after the lesson (review), as wellas creating the beginning of the on-going dialogue regarding mathematics teaching tocontinue between the visit weeks of the mathematics educator-in-residence.
The activities presented in this paper and during the presentation form part of a largerstudy of the effectiveness of the teacher professional development model “learn –practice – review” briefly explained in the paper. It appeared that the activities providedthe teachers with the opportunity to learn about a new idea, concept or take a differentperspective when looking at a topic. This motivated the teachers to try differentapproaches and activities in the classrooms with their students with the support of theirprofessional partner and the mathematics educator in residence. Finally it was throughthe review process that teachers could examine if the students were engaged, interestedand motivated. The concept of motivating students remained a focus during the twoyears of the project.
Conclusion
All of the activities presented in the paper used minimal and low cost equipmentmaking it easy to keep these ideas ready for an appropriate moment. All of the activitieshave been used in classrooms, with positive results. It appeared that both the studentsand the teachers became motivated in the learning and teaching of mathematics throughtrying new ideas that engaged the students. The “learn – practice – review” model wasutilised throughout the project with a range of teaching models including model lessonsand team teaching. The use of the model allowed teachers to explore new and/ordifferent ideas, to try them and then to reflect on the lessons and their own teaching.The use of the mathematics educator in residence and professional partners providedteachers with the support to try the new ideas with their own classes. It then allowedprofessional conversation to develop between teachers about mathematics and teachingin general.

Mathematics: Essential for Learning, Essential for Life
© The Australian Association of Mathematics Teachers Inc.
381
References
Anim8or: http://www.anim8or.com/main
A Fractals Unit for Elementary and Middle School Students: http://math.rice.edu/~lanius/frac/
Learn How To Draw With Gary Harbo! http://www.garyharbo.com/activity.html
Rogers, P. (2007). Teacher Professional Learning in Mathematics: An Example of a Change Process (tobe presented and published at the Mathematics Education Research Group of Australasia Annual 2007conference)
Wikipedia: http://en.wikipedia.org/wiki/Fractal
© The Australian Association of Mathematics Teachers Inc.
382
Incorporating dynamic geometry softwarewithin a teaching framework*
Penelope Serow
University of New England
There have been numerous studies that have characterised the nature of levels ofunderstandings in geometry. Some studies have extended this work and focusedupon developmental pathways and identified hurdles leading to higher orderthinking. There is an urgent need, however, to explore teaching/learning practicesthat facilitate student developmental progression. This paper considers previouswork by presenting dynamic geometry software as a teaching tool linked to the vanHiele teaching phases framework. Hence, the teaching sequence presented linkstheory and practice within a technological environment in the mathematicsclassroom.
Introduction
The philosophical stance taken by van Hiele in regards to teaching geometry isgrounded within the notion of insight. The opportunity to exhibit and develop insight isdescribed by van Hiele (1986) as the aim of teaching mathematics. Thus, for thepromotion of growth in understanding, learners require geometrical tasks that allowthem to control their individual problem-solving environment (Hoffer, 1983, p. 205).Essentially, dynamic geometry software (DGS) provides the potential for student-centred problem-solving tasks that remain in the control of the individual student. DGSallows the “continuous real-time transformation often called “dragging.” This featureallows users, after a construction is made, to move certain elements of a drawing freelyand to observe other elements respond dynamically to other altered conditions”(Goldenberg & Cuoco, 1998, p. 351).
Numerous studies have highlighted the difficulties associated with students’ attemptsto understand and utilise networks of relationships in geometry (Burger & Shaughnessy,1986; Fuys, Geddes & Tischler, 1985; Mayberry, 1981; Usiskin, 1982). The van HieleTheory (van Hiele, 1986) grew from a desire to address this need through the provisionof a five level framework of development in Geometry from which to view students’understandings. The level pertinent to this paper, is described as Level 3. This includes:
• the formation, and awareness, of a network of relations among properties andfigures;
• the ability to provide descriptions of figures and properties based upon knownrelationships; and
• the recognition of class inclusion concepts and their implications.
A typical example of a focus on the network of relationships among quadrilateralproperties is the relationship between parallelism of sides and equality of angles and
* Paper accepted by peer review
Mathematics: Essential for Learning, Essential for Life
© The Australian Association of Mathematics Teachers Inc.
383
sides. An example of class inclusion within the context of quadrilaterals is the ability toexplain and justify the square as a member of the class of rectangles in terms ofproperty relationships.
Background
In response to the recognised difficulties identified above, Serow (2002) highlighted thereasons students find class inclusion concepts in geometry difficult to grasp. Serow(2002) detailed the hurdles encountered by many students through the characterisationof the development of relationships among figures and relationships among properties.A natural progression would involve the presentation of suitable teaching strategies toassist students in meeting and rising above the identified cognitive hurdles.
The tools within The Geometer’s Sketchpad, Version 4.0 (an example of DGS),designed by Jackiw (2001), provide teachers with the opportunity to explore therelationships of quadrilateral figures and properties both intuitively and inductively.Goldenberg and Cuoco (1998, p. 396) found the “dynamic nature of these tools makesthem both exciting and accessible, even to elementary students” (p. 396). Dynamicinvestigations are possible when students have time to consider their mathematical ideasas opposed to “spending that time on the tedious effort required to perform numerousconstructions” (Tikoo, 1998, in Coffland & Strickland, 2004, p. 347).
It is evident that “few studies have been published on the effectiveness of technologywithin geometry classrooms” (Coffland & Strickland, 2004, p. 347). In light of this, thefollowing teaching sequence utilises technology as a facilitator of students’ growth inunderstanding geometrical concepts. This need in the mathematics classroom isemphasised by Fitzallen (2005, p. 253) through the recognition of “a need for teachersto gain an understanding of how Information and Communication Technology (ICT)can be used to extend students’ thinking and problem-solving skills, rather than just apublication and research tool”. Many classroom teachers confidently use technology asa presentation or display tool, but remain unaware of the potential for ICT to promoteconcept development in the mathematics classroom.
McGehen and Griffith (2004) in Fitzallen (2004, p. 360) “contend that is it importantthat teachers develop an understanding of how the technology promotes mathematicalthinking to ensure teaching and learning strategies promote a better understanding aboutmathematical concepts”. A teaching framework that suitably addressed this need is thebasis of the work of Dina van Hiele-Geldof. The five teaching phases represent aframework to facilitate the cognitive development of a student through the transitionbetween one level of understanding and the next. The phases originate from the ideathat “help from other people is necessary for so many learning processes” (van Hiele,1986, p. 181). This idea stems from the notion that students find it very difficult tomove unassisted from one thought level to the next.
The van Hiele model acknowledges that progress is easier for students with carefulteacher guidance, the opportunity to discuss relevant issues, and the gradualdevelopment of more technical language. The phases are organised in such a way thatthey acknowledge the assumptions underpinning the van Hiele levels, while providingstudents with the opportunity to exhibit insight. The van Hiele teaching phases addressthe concern that “teachers often feel reluctant or uncomfortable because theirpedagogical knowledge perhaps does not include a framework for conductingtechnology-based activities in their lessons” (Chua & Wu, 2005, p. 387).
The five phases of teaching assist in maintaining student ownership of ideasthroughout the learning process. During this process, students can seek clarification
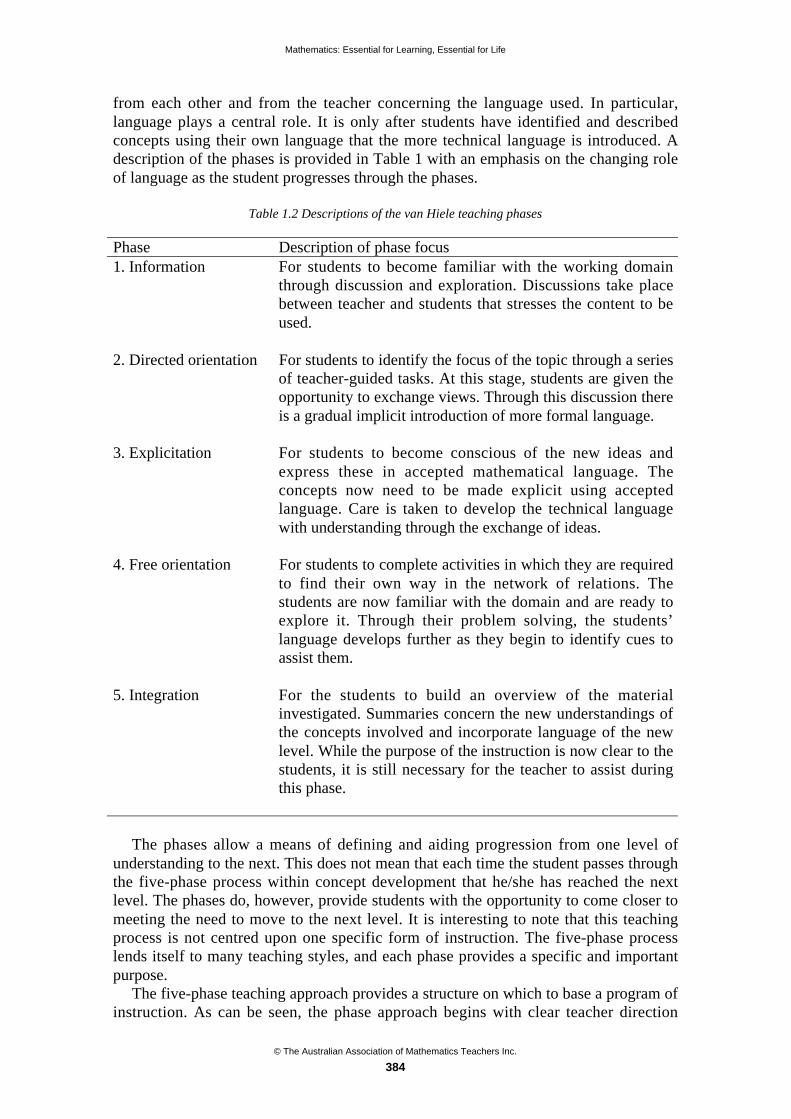
Mathematics: Essential for Learning, Essential for Life
© The Australian Association of Mathematics Teachers Inc.
384
from each other and from the teacher concerning the language used. In particular,language plays a central role. It is only after students have identified and describedconcepts using their own language that the more technical language is introduced. Adescription of the phases is provided in Table 1 with an emphasis on the changing roleof language as the student progresses through the phases.
Table 1.2 Descriptions of the van Hiele teaching phases
Phase Description of phase focus1. Information For students to become familiar with the working domain
through discussion and exploration. Discussions take placebetween teacher and students that stresses the content to beused.
2. Directed orientation For students to identify the focus of the topic through a seriesof teacher-guided tasks. At this stage, students are given theopportunity to exchange views. Through this discussion thereis a gradual implicit introduction of more formal language.
3. Explicitation For students to become conscious of the new ideas andexpress these in accepted mathematical language. Theconcepts now need to be made explicit using acceptedlanguage. Care is taken to develop the technical languagewith understanding through the exchange of ideas.
4. Free orientation For students to complete activities in which they are requiredto find their own way in the network of relations. Thestudents are now familiar with the domain and are ready toexplore it. Through their problem solving, the students’language develops further as they begin to identify cues toassist them.
5. Integration For the students to build an overview of the materialinvestigated. Summaries concern the new understandings ofthe concepts involved and incorporate language of the newlevel. While the purpose of the instruction is now clear to thestudents, it is still necessary for the teacher to assist duringthis phase.
The phases allow a means of defining and aiding progression from one level ofunderstanding to the next. This does not mean that each time the student passes throughthe five-phase process within concept development that he/she has reached the nextlevel. The phases do, however, provide students with the opportunity to come closer tomeeting the need to move to the next level. It is interesting to note that this teachingprocess is not centred upon one specific form of instruction. The five-phase processlends itself to many teaching styles, and each phase provides a specific and importantpurpose.
The five-phase teaching approach provides a structure on which to base a program ofinstruction. As can be seen, the phase approach begins with clear teacher direction
Mathematics: Essential for Learning, Essential for Life
© The Australian Association of Mathematics Teachers Inc.
385
involving exploration through simple tasks, and moves to activities that require studentinitiative in the form of problem solving. The phases are organised in such a way thatthey acknowledge the assumptions underpinning the van Hiele levels, while providingstudents with the opportunity to exhibit insight.
Teaching sequence
The teaching sequence was designed with two main elements; the developmentalframework, and the embedding of dynamic geometry software and other suitabletechnology. The two-week teaching sequence (eight sessions of 40 minutes duration)was delivered to a Year 9 (ages 14–15) secondary mathematics class. The focus contentstrand of the teaching sequence from the K–10 Mathematics Syllabus (Board of Studies,NSW, 2002) is Space and Geometry and the target outcomes to be addressed by theteaching sequence are “classify, construct, and determine properties of triangles andquadrilaterals” and “verify the properties of special quadrilaterals” (Board of Studies,2002, p.39). An outline of the teaching sequence and sample student responses to tasksare outlined below:
Activity 1: Information phase— Mechanics and recall
Students work through simple constructions in Sketchpad and brainstorm knownquadrilaterals. Instructions for individual students, with respect to the constructionsinvolve:a) Write your name using sketchpad.b) Create a person and reflect the person. Measure a selection of corresponding sidesand angles. What do you notice when you drag one of your people?c) Create a house design using the six quadrilaterals, namely, kite, trapezium, square,rectangle, rhombus, and parallelogram.At this stage, the students, in most cases, will construct their figures using the line tool.This will be extended in later phases. When the students are asked to drag (drag test) thequadrilaterals they have formed this way, they will notice that the constructions are notrobust (do not remain the intended figures). This becomes the motivation for thefollowing activity.
Activity 2: Explicatory phase— Robust templates and recording
Students create robust templates for each of the six quadrilaterals on separate Sketchpadpages. If the drag test allows the figure to remain as intended, the construction willinvolve known properties of each figure. Discussions will begin to occur concerningrelationships among figures. For example, comments such as “ this is really strange,when I drag the parallelogram it is sometimes a rectangle, square or rhombus”. Thisactivity will involve constructions such parallel lines, perpendicular lines, andtransformations. It is essential for the students at this phase to describe theirconstruction within a text box on Sketchpad and to record the properties for eachquadrilateral on a teacher-designed table.
Activity 3: Directed orientation phase— Irregular quadrilateral and midpoint construction
Students are instructed to:

Mathematics: Essential for Learning, Essential for Life
© The Australian Association of Mathematics Teachers Inc.
386
1. create any irregular quadrilateral using the line tool;2. construct the midpoints;3. join the midpoints to construct another quadrilateral;4. answer the question, What do you notice?; and,5. investigate the properties of this shape to justify what they have found, and record
their justification in a textbox.
Activity 4: Free orientation— Further exploration of properties and figures
Students design a spreadsheet where the six quadrilaterals are contained in the firstcolumn, and the first row contains all possible properties of quadrilaterals. Particularcare needs to be taken to include diagonal properties such as “diagonals meet at rightangles.” The students record the properties of each figure by ticking the appropriate cell.There is an element of surprise in the classroom when the students notice that the squarehas the maximum number of ticks.
Activity 5: Free orientation— Diagonal Starters Game Design
This activity is designed to reinforce diagonals as a property and not merely a feature ofthe quadrilaterals. Students are given the challenge to create the diagonal formationneeded for each of the quadrilaterals. The aim is for the students to construct templatesfor younger students to complete the figure and explore the properties. Figure 1 containsa student sample for the diagonal starters game.
All sides are equal, though
diagonals are not! Angles between
diagonals are right angles. The
shape has two axis of symmetry
at least. Join the dots to reveal a
- you guessed it, a ......
Figure 1. Sample of a student’s diagonal starters diagram.
Activity 6: Free orientation— Concept maps and flow charts
Students create concept maps and flow charts using suitable software. The chosensoftware will vary according to school accessibility. Figures 2 and 3 include studentsamples of a concept map and flow chart.

Mathematics: Essential for Learning, Essential for Life
© The Australian Association of Mathematics Teachers Inc.
387
Figure 2. Sample of a student’s concept map.
Figure 3. Sample of a student’s diagonal starters diagram.
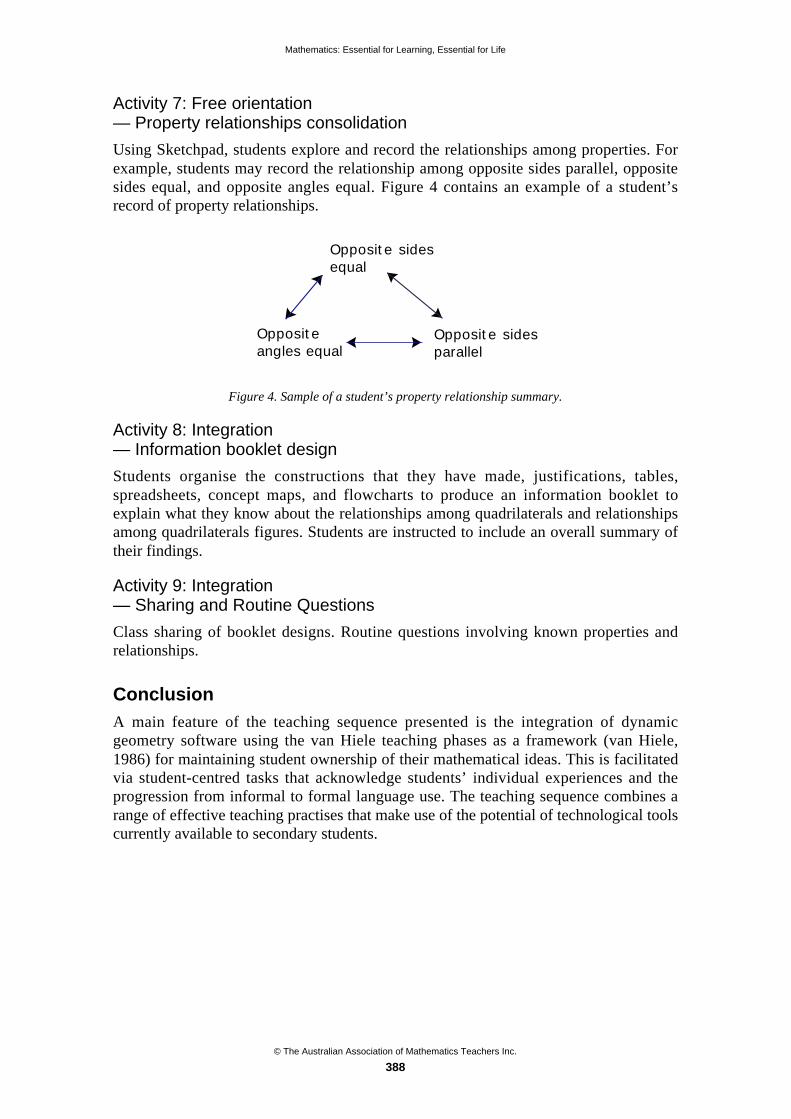
Mathematics: Essential for Learning, Essential for Life
© The Australian Association of Mathematics Teachers Inc.
388
Activity 7: Free orientation— Property relationships consolidation
Using Sketchpad, students explore and record the relationships among properties. Forexample, students may record the relationship among opposite sides parallel, oppositesides equal, and opposite angles equal. Figure 4 contains an example of a student’srecord of property relationships.
Opposite
angles equal
Opposite sides
parallel
Opposite sides
equal
Figure 4. Sample of a student’s property relationship summary.
Activity 8: Integration— Information booklet design
Students organise the constructions that they have made, justifications, tables,spreadsheets, concept maps, and flowcharts to produce an information booklet toexplain what they know about the relationships among quadrilaterals and relationshipsamong quadrilaterals figures. Students are instructed to include an overall summary oftheir findings.
Activity 9: Integration— Sharing and Routine Questions
Class sharing of booklet designs. Routine questions involving known properties andrelationships.
Conclusion
A main feature of the teaching sequence presented is the integration of dynamicgeometry software using the van Hiele teaching phases as a framework (van Hiele,1986) for maintaining student ownership of their mathematical ideas. This is facilitatedvia student-centred tasks that acknowledge students’ individual experiences and theprogression from informal to formal language use. The teaching sequence combines arange of effective teaching practises that make use of the potential of technological toolscurrently available to secondary students.
Mathematics: Essential for Learning, Essential for Life
© The Australian Association of Mathematics Teachers Inc.
389
References
Board of Studies, NSW (2002). Mathematics: Years 7–10 Syllabus. Sydney: Board of Studies NSW.
Burger, W. F. & Shaughnessy, J. M. (1986). Characterising the van Hiele levels of development inGeometry. Journal for Research in Mathematics Education, 17 (1), 31–48.
Chua, B. & Wu, Y. (2005). Designing technology-based mathematics lessons: a pedagogical framework.Journal of Computers in Mathematics and Science Teaching, 24 (4).
Coffland, D. A. & Strickland, A. W. (2004). Factors related to teacher use of technology in secondarygeometry instruction. Journal of Computers in Mathematics and Science Teaching, 23 (4), 347–366.
Fitzallen, N. (2005). Integrating ICT into professional practice: A case study of four mathematicsteachers, In P. Clarkson, D. Gronn, M. Horne, A. McDonough, R. Pierce & A. Roche (Eds),Proceedings of the 28th Mathematics Education Research Group of Australasia (pp. 353–360).Melbourne: RMIT.
Fuys, D., Geddes, D. & Tischler, R. (1985). An Investigation of the van Hiele Model of Thinking inGeometry Among Adolescents. New York: Brooklyn College.
Goldenberg, E. P. & Cuoco, A. A. (1988). What is dynamic geometry? In R. Lehrer & D. Chazen (Eds),Designing Learning Environments for Developing Understanding of Geometry and Space (pp.351–367). London: Lawrence Erlbaum Associates.
Hoffer, A. (1983). Van Hiele-based research. In R. Lesh & M. Landou (Eds), Acquisition of MathematicsConcepts and Processes (pp. 205–227). New York: Academic Press.
Jackiw, N. (2001). The Geometer’s Sketchpad: Dynamic Geometry Software for Exploring MathematicsVersion 4.0. Emeryville, CA USA: Key Curriculum Press.
Mayberry, J. (1981). An Investigation of the van Hiele Levels of Geometric Thought in UndergraduatePre-Service Teachers. Thesis, Ed. D. University of Georgia.
McGehee, J. & Griffith, L. K. (2004). Technology enhances student learning across the curriculum.Mathematics Teaching in the Middle School, 9 (6), 344–349.
Serow, P. A. (2002). An Investigation Into Students’ Understandings of Class Inclusion Concepts inGeometry. PhD Thesis: University of New England.
Tikoo, M. 1998. Integrating technology in a meaningful way (a point of view). International Journal ofMathematical Education in Science and Technology, 29, 663–675.
Usiskin, Z. (1982). Van Hiele Levels and Achievement in Secondary School Geometry (Final Report ofthe Cognitive Development and Achievement in Secondary School Geometry Project). Chicago, IL:University of Chicago, Department of Education.
van Hiele, P. M. (1986). Structure and Insight: A Theory of Mathematics Education. New York:Academic Press.

© The Australian Association of Mathematics Teachers Inc.
390
Magic maths moments: The power of dynamicand effective numeracy classrooms*
Jane Skalicky
University of Tasmania
Julie Mitchell
Brighton Primary School
Janet Boucher
Brighton Primary School
Encouraging students to think mathematically using open-ended questioning,investigation, reflection, and feedback is a key feature of effective numeracyclassrooms. This paper describes how open-ended tasks are being used to buildstudents’ mathematical knowledge and skills alongside their abilities to inquireand think reflectively. In Tasmania, curriculum reform that values the developmentof higher-order capacities and the connection of knowledge and skills, across thecurriculum, has enabled two teachers to work in a way that matches their ownpedagogical beliefs and practices with respect to planning, teaching, andassessment for student learning.
Introduction
Ron Ritchhart (2002) in his book, Intellectual Character: What it is, Why it Matters,and How to Get it challenges all teachers to consider their purpose for teaching. Is therole of teaching to fill students with knowledge, to help them succeed on nationalassessments, to prepare them for high school, or as Ritchhart would propose, areteachers “working to change who students are as thinkers and learners?” (p. 7).Developing classrooms as cultures of reasoning is critical in enabling students to buildthe intellectual capacities required of them in the twenty-first century.
Numeracy and the role of the teacher
Numeracy is an important aspect of the intellectual character of both students andadults. It has become an essential capability for any individual who wishes to participatefully in a democratic society, to apply not only knowledge and skills, but also criticalreasoning capabilities, to learning and to everyday life. In Australia, a view ofnumeracy, beyond the ability to handle number concepts in context, is reflected by theAustralian Association of Mathematics Teachers (AAMT) definition:
To be numerate is to use mathematics effectively to meet the general demands oflife at home, in paid work, and for participation in community and civic life.In school education, numeracy is a fundamental component of learning, discourseand critique across all areas of the curriculum. It involves the disposition to use, incontext, a combination of:• underpinning mathematical concepts and skills from across the discipline
(numerical, spatial, graphical, statistical and algebraic);• mathematical thinking and strategies;• general thinking skills; and• grounded appreciation of context. (AAMT, 1998)
* Paper accepted by peer review
Mathematics: Essential for Learning, Essential for Life
© The Australian Association of Mathematics Teachers Inc.
391
Numeracy is about making meaning of mathematics, at whatever level ofmathematical skill. It is about understanding and using mathematics, in all of itsrepresentations; for making sense of the world, for considering critically informationpresented, and for making informed decisions.
Researchers in both Australia and the United Kingdom have studied primary schoolmathematics with a view to identifying key practices that are indicative of highlyeffective teachers of numeracy. Askew, Rhodes, Johnson, and William (1997) described“connectionist” teachers as those who emphasised the connections between ideas andconcepts in mathematics and whose own beliefs and practices were based upon valuingstudents’ own methods. They encouraged students to describe their approaches and theirthinking in solving problems. Clarke and Clarke (2002) similarly found that effectiveteachers of early years’ numeracy exhibited specific characteristics. These included thestructuring of purposeful and open-ended tasks: tasks that focused on children’smathematical thinking. In addition, these teachers developed a culture of community inthe classroom where students were encouraged to question, explain and share theirthinking and evaluate others’ mathematical ideas. The teachers themselves reflectedupon students’ responses, recorded observations, and used a variety of assessmentmethods.
Striving for excellence in the teaching of mathematics is multifaceted and involvesongoing learning for teachers with respect to their own knowledge, beliefs, andpractices. In 2002, AAMT adopted a statement describing the knowledge, skills, andattributes considered to be important for excellence in the teaching of mathematics inAustralian schools. Excellent teachers of mathematics do not only have a thorough andrelevant knowledge of mathematics and of their students, and a commitment andenthusiasm for the profession, but they also make purposeful decisions that create forstudents a learning environment that maximises learning opportunities for each student.One aspect of the statement describes teaching, in action, as the capacity to “arousecuriosity, challenge students’ thinking, and engage them actively in learning” (AAMT,2002).
Learning context
The use of open-ended tasks is one way to successfully create a learning environmentthat supports students in their learning of mathematics. Sullivan and Lilburn (2004)describe three main features of “good” questions in the design of open-ended tasks:
1. They require more than remembering a fact or reproducing a skill.2. Students can learn by answering the questions, and the teacher learns about
each student from the attempt.3. There may be several acceptable answers. (p. 2)
These types of questions encourage high levels of thinking and emphasise the valueof students developing understanding of mathematical concepts, so they can apply theirknowledge and skills to new situations. Open-ended tasks also support learning thatassists students to follow arguments, evaluating them, and apply reasoned logic to anycritique.
Two Tasmanian Grade 6 teachers are using open-ended tasks to support theirstudents in the learning of mathematical concepts and skills. These teachers participatedin a research project investigating the positioning of numeracy by teachers, in reform-based learning environments, and the numeracy experiences of their students. Their
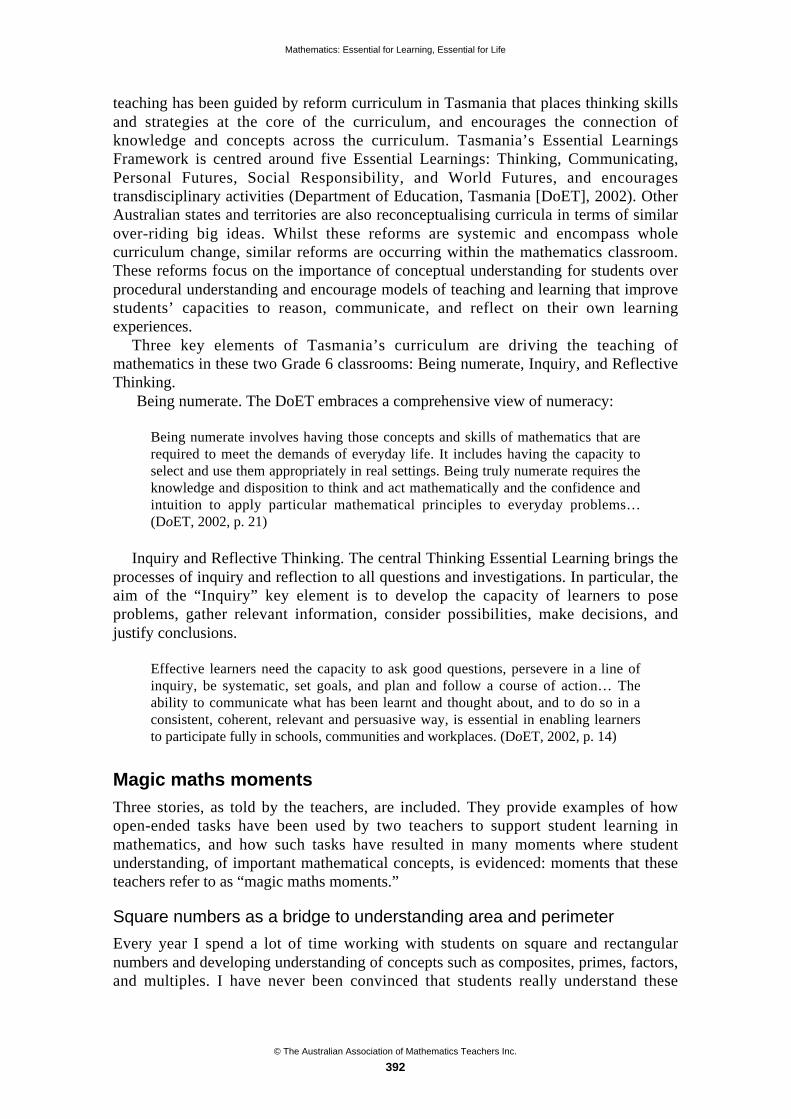
Mathematics: Essential for Learning, Essential for Life
© The Australian Association of Mathematics Teachers Inc.
392
teaching has been guided by reform curriculum in Tasmania that places thinking skillsand strategies at the core of the curriculum, and encourages the connection ofknowledge and concepts across the curriculum. Tasmania’s Essential LearningsFramework is centred around five Essential Learnings: Thinking, Communicating,Personal Futures, Social Responsibility, and World Futures, and encouragestransdisciplinary activities (Department of Education, Tasmania [DoET], 2002). OtherAustralian states and territories are also reconceptualising curricula in terms of similarover-riding big ideas. Whilst these reforms are systemic and encompass wholecurriculum change, similar reforms are occurring within the mathematics classroom.These reforms focus on the importance of conceptual understanding for students overprocedural understanding and encourage models of teaching and learning that improvestudents’ capacities to reason, communicate, and reflect on their own learningexperiences.
Three key elements of Tasmania’s curriculum are driving the teaching ofmathematics in these two Grade 6 classrooms: Being numerate, Inquiry, and ReflectiveThinking.
Being numerate. The DoET embraces a comprehensive view of numeracy:
Being numerate involves having those concepts and skills of mathematics that arerequired to meet the demands of everyday life. It includes having the capacity toselect and use them appropriately in real settings. Being truly numerate requires theknowledge and disposition to think and act mathematically and the confidence andintuition to apply particular mathematical principles to everyday problems…(DoET, 2002, p. 21)
Inquiry and Reflective Thinking. The central Thinking Essential Learning brings theprocesses of inquiry and reflection to all questions and investigations. In particular, theaim of the “Inquiry” key element is to develop the capacity of learners to poseproblems, gather relevant information, consider possibilities, make decisions, andjustify conclusions.
Effective learners need the capacity to ask good questions, persevere in a line ofinquiry, be systematic, set goals, and plan and follow a course of action… Theability to communicate what has been learnt and thought about, and to do so in aconsistent, coherent, relevant and persuasive way, is essential in enabling learnersto participate fully in schools, communities and workplaces. (DoET, 2002, p. 14)
Magic maths moments
Three stories, as told by the teachers, are included. They provide examples of howopen-ended tasks have been used by two teachers to support student learning inmathematics, and how such tasks have resulted in many moments where studentunderstanding, of important mathematical concepts, is evidenced: moments that theseteachers refer to as “magic maths moments.”
Square numbers as a bridge to understanding area and perimeter
Every year I spend a lot of time working with students on square and rectangularnumbers and developing understanding of concepts such as composites, primes, factors,and multiples. I have never been convinced that students really understand these
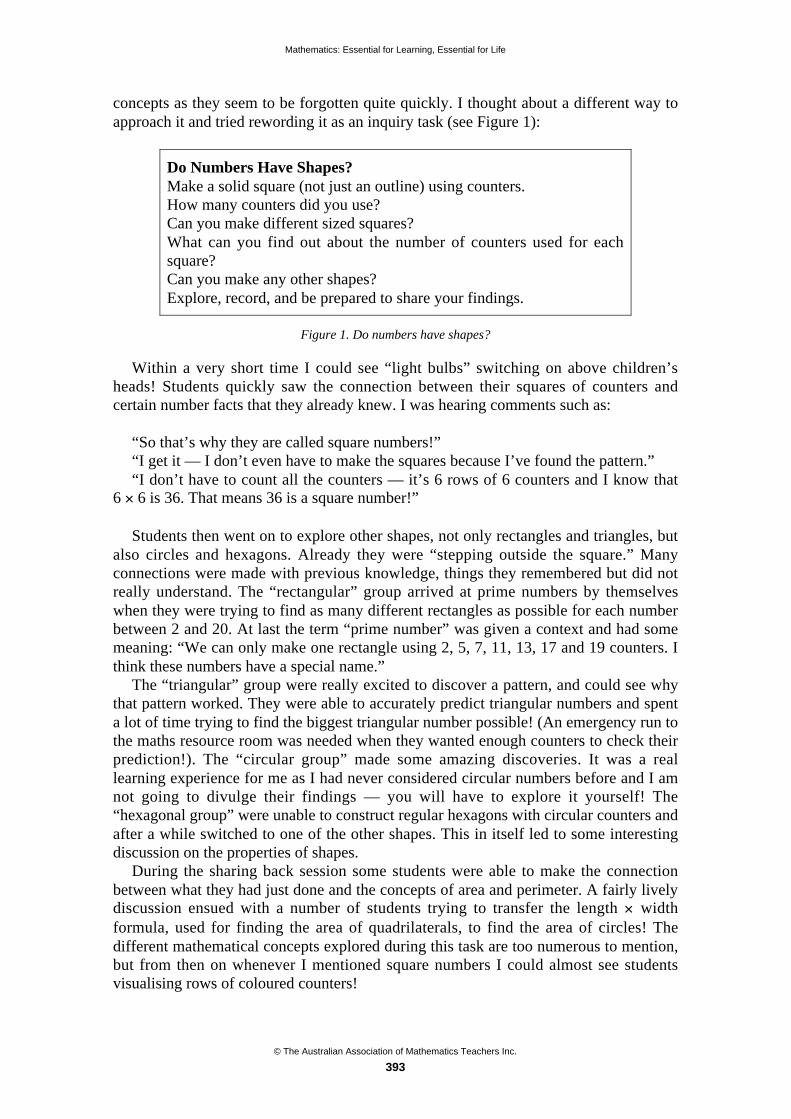
Mathematics: Essential for Learning, Essential for Life
© The Australian Association of Mathematics Teachers Inc.
393
concepts as they seem to be forgotten quite quickly. I thought about a different way toapproach it and tried rewording it as an inquiry task (see Figure 1):
Do Numbers Have Shapes?Make a solid square (not just an outline) using counters.How many counters did you use?Can you make different sized squares?What can you find out about the number of counters used for eachsquare?Can you make any other shapes?Explore, record, and be prepared to share your findings.
Figure 1. Do numbers have shapes?
Within a very short time I could see “light bulbs” switching on above children’sheads! Students quickly saw the connection between their squares of counters andcertain number facts that they already knew. I was hearing comments such as:
“So that’s why they are called square numbers!”“I get it — I don’t even have to make the squares because I’ve found the pattern.”“I don’t have to count all the counters — it’s 6 rows of 6 counters and I know that
6 6 is 36. That means 36 is a square number!”
Students then went on to explore other shapes, not only rectangles and triangles, butalso circles and hexagons. Already they were “stepping outside the square.” Manyconnections were made with previous knowledge, things they remembered but did notreally understand. The “rectangular” group arrived at prime numbers by themselveswhen they were trying to find as many different rectangles as possible for each numberbetween 2 and 20. At last the term “prime number” was given a context and had somemeaning: “We can only make one rectangle using 2, 5, 7, 11, 13, 17 and 19 counters. Ithink these numbers have a special name.”
The “triangular” group were really excited to discover a pattern, and could see whythat pattern worked. They were able to accurately predict triangular numbers and spenta lot of time trying to find the biggest triangular number possible! (An emergency run tothe maths resource room was needed when they wanted enough counters to check theirprediction!). The “circular group” made some amazing discoveries. It was a reallearning experience for me as I had never considered circular numbers before and I amnot going to divulge their findings — you will have to explore it yourself! The“hexagonal group” were unable to construct regular hexagons with circular counters andafter a while switched to one of the other shapes. This in itself led to some interestingdiscussion on the properties of shapes.
During the sharing back session some students were able to make the connectionbetween what they had just done and the concepts of area and perimeter. A fairly livelydiscussion ensued with a number of students trying to transfer the length widthformula, used for finding the area of quadrilaterals, to find the area of circles! Thedifferent mathematical concepts explored during this task are too numerous to mention,but from then on whenever I mentioned square numbers I could almost see studentsvisualising rows of coloured counters!
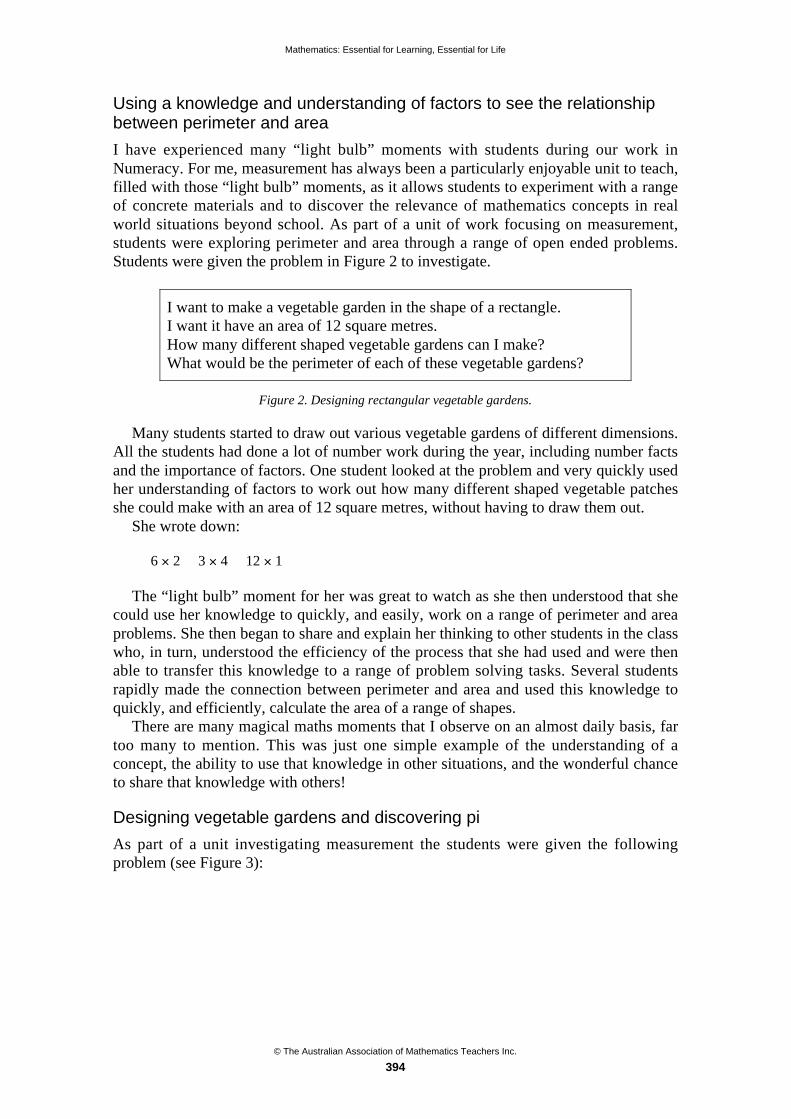
Mathematics: Essential for Learning, Essential for Life
© The Australian Association of Mathematics Teachers Inc.
394
Using a knowledge and understanding of factors to see the relationshipbetween perimeter and area
I have experienced many “light bulb” moments with students during our work inNumeracy. For me, measurement has always been a particularly enjoyable unit to teach,filled with those “light bulb” moments, as it allows students to experiment with a rangeof concrete materials and to discover the relevance of mathematics concepts in realworld situations beyond school. As part of a unit of work focusing on measurement,students were exploring perimeter and area through a range of open ended problems.Students were given the problem in Figure 2 to investigate.
I want to make a vegetable garden in the shape of a rectangle.I want it have an area of 12 square metres.How many different shaped vegetable gardens can I make?What would be the perimeter of each of these vegetable gardens?
Figure 2. Designing rectangular vegetable gardens.
Many students started to draw out various vegetable gardens of different dimensions.All the students had done a lot of number work during the year, including number factsand the importance of factors. One student looked at the problem and very quickly usedher understanding of factors to work out how many different shaped vegetable patchesshe could make with an area of 12 square metres, without having to draw them out.
She wrote down:
6 2 3 4 12 1
The “light bulb” moment for her was great to watch as she then understood that shecould use her knowledge to quickly, and easily, work on a range of perimeter and areaproblems. She then began to share and explain her thinking to other students in the classwho, in turn, understood the efficiency of the process that she had used and were thenable to transfer this knowledge to a range of problem solving tasks. Several studentsrapidly made the connection between perimeter and area and used this knowledge toquickly, and efficiently, calculate the area of a range of shapes.
There are many magical maths moments that I observe on an almost daily basis, fartoo many to mention. This was just one simple example of the understanding of aconcept, the ability to use that knowledge in other situations, and the wonderful chanceto share that knowledge with others!
Designing vegetable gardens and discovering pi
As part of a unit investigating measurement the students were given the followingproblem (see Figure 3):

Mathematics: Essential for Learning, Essential for Life
© The Australian Association of Mathematics Teachers Inc.
395
The Vegetable PatchTim wants to plant a vegetable garden but we have a lot of troublewith wallabies eating everything we plant.Tim bought a 60 m length of very expensive wallaby-proof fencingwire to fence in an area of land where he could grow vegetables. Hewanted to make his vegetable patch as big as possible.What is the largest possible area he can fence in with his 60 m ofwire?
Figure 3. The vegie patch.
Students tackled this problem in an amazing variety of ways. A large number ofstudents drew diagrams showing the possible dimensions of the vegetable patch. A lotof them started by setting out blocks in different arrays: 20 10, 15 15, etc. Somestudents were able to quickly identify a pattern and completed the calculations withoutthe use of blocks or diagrams: 1 29, 2 28, 3 27, etc. One group took a 60 m lengthof string out to the school oval and measured out vegetable patches of differentdimensions in order to see the relative sizes! Then there was Tom.
Tom immediately saw the pattern and completed the calculations accurately.However, he was not satisfied that a 15 15 square, with an area of 225 square metres,was going to give Tim, the vegeatbale garden owner, the greatest area because “Wehaven’t considered any different shapes: what about triangles and circles?” He decidedto see if he could work out the area of a 60 m circle. Tom began his investigation bymeasuring the circumference of a circular table we had in the classroom. Thecircumference of the table was 4 m. He covered the table in large sheets of paper andcut them to fit exactly. Figure 4 shows Tom and his friend ruling a 5 cm square grid onthe paper. Tom counted all the squares and then he estimated how many whole 5cmsquares could be made from the bits around the edge. He multiplied the total number ofsquares by 5 to get the area of the table.
Tom then considered the relationship between the table, with a 4 m circumference,and the original task where Tim had 60 m of fencing wire to build his vegetable garden.So Tom multiplied his result by 15 to get the area of a 60 m circle. This was all withoutany guidance from me and he was able to explain exactly what he was doing and whyevery step of the way!
Figure 4. Considering the area of a circle.

Mathematics: Essential for Learning, Essential for Life
© The Australian Association of Mathematics Teachers Inc.
396
However, Tom was not happy. He knew he did not have an accurate answer becauseof the bits of squares around the edge of the circle that he had had to estimate: “Ms M.,I’ve got as close as I can, but I suspect that you know an easier way to find the area of acircle!” I wrote the term pi on a piece of paper and suggested Tom might like to dosome finding out about it. He “googled” it and did a lot of reading. He discovered howto find the area of a circle given the diameter and/or radius and/or circumference. Hethen used compasses to construct circles of different sizes and test out his new foundformulae! Once he was convinced that all was legitimate, he applied his newly acquiredknowledge to his 60 m circle and concluded that a circle was going to give Tim, theowner of the vegetable garden, the biggest area for his vegetable patch: 286.62419square metres! Tom’s drawing and calculations for the vegetable garden are presentedin Figures 5 and 6.
Figure 5. A circular vegie garden.
Figure 6. Calculating the area of a circular vegie garden.
Mathematics: Essential for Learning, Essential for Life
© The Australian Association of Mathematics Teachers Inc.
397
Conclusion
The stories presented in this paper provide examples of the possibilities that open-endedtasks present, in relation to the learning outcomes of individual students. It has alsodemonstrated the power of such tasks to unlock student thinking. When students areencouraged to engage in a task, and to share their problem solving strategies andsolutions, it changes the nature of the classroom and student learning. Students becomeproblem solvers and strategists who are able to undertake meaningful mathematicsactivities, to suit their own level of understanding. They are also able to be stretched bythe discussions that occur, between teacher and student, and between studentsthemselves.
The use of open-ended tasks also has significant implications for assessment. Theuse of student work samples, and observational notes, to evidence studentunderstanding are important assessment tools. When students are provided with theopportunity to use their own methods and explain their own thinking, teachers areprovided with a depth of assessment opportunities. Students’ understanding ofimportant mathematical concepts is uncovered, misconceptions may be revealed, andopportunities for further teaching arise.
References
Askew, M., Brown, M., Rhodes, V., William, D. & Johnson, D. (1997). Effective Teachers of Numeracy.London: King’s College London.
Australian Association of Mathematics Teachers (1998). Policy on Numeracy Education in Schools.Retrieved 16 March 2004 from http://www.aamt.edu.au/about/policy/numpol.pdf
Australian Association of Mathematics Teachers (2002). Standards for Excellence in TeachingMathematics in Australian Schools. Adelaide: AAMT Inc.
Clarke, D. & Clarke, B. (2002). Challenging and effective teaching in junior primary mathematics: Whatdoes it look like? In M. Goos & T. Spencer (Eds), Mathematics: Making Waves (Proceedings of the19th Biennial Conference of the Australian Association of Mathematics, pp. 309–318). Adelaide:AAMT Inc.
Department of Education Tasmania (2002). Essential Learnings Framework 1. Hobart: Author.
Ritchhart, R. (2002). Intellectual Character: What It Is, Why It Matters, and How to Get It. SanFrancisco, CA: Jossey-Bass.
Sullivan, P. & Lilburn, P. (2004). Open-ended Maths Activities: Using ‘Good’ Questions to EnhanceLearning in Mathematics. Melbourne: Oxford University Press.
© The Australian Association of Mathematics Teachers Inc.
398
The Context Rich Integrated Mathematics andScience (CRIMS) projects*
Sue Wilson
ACU National
What activities can combine the thinking, reasoning and communicating aspects ofscience and mathematics with the development of essential skills? How can weadapt our existing lessons to generate richer approaches? How can we supportteacher professional learning integrating mathematics and science and addressingthe AAMT and ASTA professional standards? The CRIMS projects focuses onteacher professional learning, working with middle years teachers frommetropolitan and rural schools. The workshop will present the CRIMS model andCRIMS principles, which involve creative activities incorporating science as a wayto know and working mathematically.
The Context Rich Integrated Mathematics and Science (CRIMS)projects
The CRIMS projects began as an Australian School Innovation in Science andTechnology (ASISTM) Round 1 project. “The ASISTM Project aims to bring about realand permanent improvements to the ways in which science, technology andmathematics are taught in our schools… Project activities will enable schools to cometogether with industry, science organisations, universities and others to explore ways toencourage a culture of innovation, attract greater numbers of quality students intoteaching, improve coordination between primary and high school curricula and providepositive role models for students.” (Australian School Innovation in Science,Technology and Mathematics (ASISTM) Project, 2004). The ASISTM project has twomain components:
• funding of school cluster projects;
• teacher associates working in schools.
The CRIMS project addressed the ASISTM aims of:
• encouraging innovation in Australian schools;
• promoting world class teaching and learning, improvements in teachers'approaches and techniques and improved student learning outcomes;
• teacher attraction and retention.
The original CRIMS project was an ASISTM Round 1 project, in association withMerici College, St Clares College, St Francis Xavier College and Daramalan College inthe ACT. It aimed to produce well-developed and tested context-based teachingresources to promote innovation and student interest. CRIMS activities were developed,trialled and refined collaboratively by partner schools with assistance from non-schoolpartners, enhanced by the engagement of teacher associates who brought enthusiasm * Paper accepted by peer review
Mathematics: Essential for Learning, Essential for Life
© The Australian Association of Mathematics Teachers Inc.
399
and specialised knowledge into the classroom. Designed for Years 7 to 10, the resourceswere trialled at multiple partner schools and are available to other schools nationallythrough the CRIMS website.
The activities from the first CRIMS project are classroom resources for secondaryteachers. CRIMS tasks integrate mathematics and science, and are inquiry based andstudent-centred. CRIMS tasks aim to:
• cross mathematics, science and ICT curricula in Years 7 to 10;
• be practical resources for teachers which include feedback from other teachers;
• vary in length, from one to multiple lessons;
• be in context of the world outside the classroom;
• include elements of constructivism and meta-cognition; and
• promote higher order thinking and help develop problem solving skills.
CRIMS are inquiry based and focus on student-centred learning and problemsolving. They emphasise skill development, and thinking and reasoning. The centralfocus of the CRIMS project is open-ended investigation, scaffolded by the teacher. Theinterrelated disciplines of science and mathematics come together in the investigationprocess. CRIMS develop students’ understanding of how science and mathematics areused to describe, represent and explain their world. CRIMS assist students to formulatetheir ideas about the nature of science and mathematics and what it means to bescientifically and mathematically literate by examining the thinking within science andmathematics. Each investigation is accessible at a range of levels so each student canachieve some level of growth, hence there are different entry points and exit points.CRIMS use pedagogical tools which cater for differentiated instruction and contributeto a flexible and supportive classroom environment. Learning is social, and studentsmay work in collaborative groups carrying out investigations.
CRIMS principles
CRIMS aim to use rich contexts to create an environment whereby students canconstruct their own scientific and mathematical knowledge and develop understandingof scientific and mathematical processes. CRIMS are characterised by:
• interdisciplinary connections / linkages between mathematics and science;
• meaningful worthwhile contexts, e.g., a current event, a social issue relevant tostudents;
• an open-ended investigative approach, generating first hand data in cooperativegroups;
• kinesthetic and visual aspects;
• estimation , thinking, reasoning and communication;
• use of technology;
• multiple entry and exit points.
The main principles which underpin the CRIMS project are now identified andconsidered:
Linking science and mathematics
A major goal of science is to discover and use relationships between variables (usuallyexpressed mathematically) to understand and make predictions about the world.

Mathematics: Essential for Learning, Essential for Life
© The Australian Association of Mathematics Teachers Inc.
400
Problem solving connects mathematics and science, inquiry is a central activity of both,and they share common tools; for example, collection of data, spreadsheets, scales,instruments, graphs, data loggers, computer-based laboratories (CBLs). Students learnthat mathematical thinking, such as the identification of patterns and concepts ofprobability, underlies scientific investigations.
Constructivist learning theories
CRIMS are consistent with constructivist learning theories. They emphasiseunderstanding, with students actively building new knowledge.
Backward design
The three stages of the backward design planning process are:
• identify desired result
• determine acceptable evidence
• plan learning experiences and instruction (Wiggins & McTighe, 2005, p. 18).
Desired result: Scientific literacy and mathematical literacy
The CRIMS project aims to contribute to the lifelong learning of students, in that theymay learn:
to be mathematically and scientifically literate, to help empower [them] as citizensand skilled participants in a world increasingly dominated by technologicalinnovation. To achieve these outcomes, mathematics and science education mustbe engaging and contemporary. Mathematics and science education must also berelevant to student’s lives, promote deep conceptual understanding and embraceinvestigative inquiry and problem solving. (Herbert, 2006, p. v)
Acceptable evidence
CRIMS are consistent with constructivist learning theories. The stages of theinvestigation process can act as guidelines for assessment. Principles of sustainableassessment (Boud, 2000) are consistent with the emphasis on lifelong learning inherentin scientific and mathematical literacies.
Learning experiences
The 2006 Statements of Learning identify essential opportunities for Australian studentsto learn. The CRIMS project aims to produce tasks which make connections betweenScience as a Way to Know and Working Mathematically, from these Statements.Science as a way to know is:
about scientific investigation and the way in which scientific explanations areestablished. It includes posing questions, planning and conducting investigations,collecting and analysing evidence and communicating findings. It is concernedwith evaluating investigations and claims and making valid conclusions. It alsorecognises that scientific explanations change as new or different evidencebecomes available from investigations (MCEETYA, 2006a, p. 5).
Working mathematically involves:
Mathematics: Essential for Learning, Essential for Life
© The Australian Association of Mathematics Teachers Inc.
401
mathematical inquiry and its practical and theoretical application. This includesproblem posing and solving, representation and modelling, investigating,conjecturing, reasoning and proof and estimating and checking the reasonablenessof results or outcomes. Key aspects of working mathematically, individually andwith others, are formulation, solution, interpretation and communication(MCEETYA, 2006b, p. 3).
Inquiry and open ended investigations
CRIMS investigations are a vehicle for students to construct their own scientific andmathematical understandings, within the structure of a relevant and meaningful context.Investigations combine science and mathematics processes. Students may work at anyof the three levels of inquiry: structured, guided, or open while learning inquiry skills.As learning becomes more relevant for the student, they are encouraged to takeresponsibility for their own learning. They choose and use concepts and skills.
Planning and conducting investigations
The contexts chosen have genuine application and relevance to students. Students startwith a challenge, a dynamic opportunity to explore. They formulate questions and planinvestigations. They clarify what they already know or believe and conduct aninvestigation which will support or challenge these beliefs. They pose scientific andmathematical questions to guide the investigation and collect qualitative andquantitative information. Students are physically involved in the process which involvesvisual and kinaesthetic learning. Students understand that the information they obtaincan be used as a basis for extended investigations or analysis.
Collecting and processing data
Students make and test predictions, hypotheses and conjectures by designingexperiments or using problem solving strategies which model the situation —incorporating creative and imaginative aspects. Observations are made. They collectdata and identify patterns and groupings in the information. Science and mathematicsboth involve searching for patterns, and testing predictions and generalisations: theseare inherent parts of scientific and mathematical processes. Investigations and testingattributes lead to the development of generalisations. Abstraction may lead to thedevelopment of a formula or a model.
Representing and recording
The concrete materials are manipulated, students represent their observations asdiagrams, charts, tables and graphs. These representations are used to clarify thinkingand identify patterns. Students translate and move between representations. They usethem to model and interpret natural phenomena. They present information in ways thatclarify patterns and assist in making generalisations and drawing conclusions. They usemathematical terms to describe relationships.
Communicating
Students use talking and writing to clarify thinking and identify what they do, and donot, understand. They progress from everyday language to scientific and mathematicallanguage and symbols. The teacher models the use of scientific and mathematicallanguage. Students use scientific and mathematical language to give logical accounts oftheir work and their findings. They report the conclusions of the investigation clearlyand identify and communicate the implications of their findings.

Mathematics: Essential for Learning, Essential for Life
© The Australian Association of Mathematics Teachers Inc.
402
Making connections
The context provides a background and framework for exploring science concepts.Students work to develop rich conceptual lattices of understanding. They makeconnections with their own lives, with the result that concepts do not remain embeddedin a particular context. They are able to transfer knowledge and make new connectionsbeyond their current understanding.
Professional standards
The CRIMS projects refer to the ASTA professional standards and AAMT professionalstandards.
Building on the first CRIMS Project
CRIMS2 PL: An ASISTM Round 3 project
The CRIMS2 PL project focuses on teacher professional learning. Research indicates arelationship between student achievement and the quality of teachers. “This researchindicates that the effects of well-prepared teachers on student achievement can bestronger than the influences of student background factors, such as poverty, languagebackground, and minority status” (Darling-Hammond, 2000).
The CRIMS2 PL project involves teachers from 11 primary and secondary schools.Teachers involved in the project meet to reflect on their current practice and engage inprofessional dialogue. They share resources and information about their teaching andthe experiences of other teachers helps to inform their planning. The CRIMS PL projectprovides opportunities for teachers to share their practice and expertise to “enhancestudent achievement, teachers need to be supported with sustained and classroom-oriented professional development” (Goodrum, Hackling & Rennie, p. 174).
CRIMSRR: A SiMERR project
The National Centre of Science, Information and Communication Technology, andMathematics Education for Rural and Regional Australia (SiMERR):
works with rural and regional communities to achieve improved educationaloutcomes for all students in the areas of Science, ICT and Mathematics, so that:Parents can send their children to rural or regional schools knowing they willexperience equal opportunities for a quality education;• Students can attend rural or regional schools realising their academic potential
in Science, ICT and Mathematics; and• Teachers can work in rural or regional schools and be professionally connected
and supported. (SiMERR), 2005).
The SiMERR National Survey reported inequities in access to professionaldevelopment opportunities: “Primary teachers outside Metropolitan Areas indicted asubstantially greater unmet need for in-services in science and mathematics than didtheir metropolitan counterparts. Science Teachers in Provincial and Remote areasindicated a significantly higher unmet need for a broad range of professionaldevelopment opportunities than did those in Provincial Cities or Metropolitan Areas”(Lyons, Cooksey, Panizzon, Parnell & Pegg, 2006, p. vii).
Mathematics: Essential for Learning, Essential for Life
© The Australian Association of Mathematics Teachers Inc.
403
The CRIMSRR project involves teachers from four rural primary and secondaryschools, and focuses on ways of meeting the professional learning needs of teachers inrural schools.
Acknowledgments
The CRIMS project acknowledges the valuable contributions made by the teachers fromthe four schools in the original CRIMS project and the input from consultants, CharlesLovitt and Steve Thornton.
References
Australian School Innovation in Science, Technology and Mathematics (ASISTM) Project (2004).Retrieved 23 March 2007 from http://www.asistm.edu.au/asistm/
Boud, D. (2000). Sustainable Assessment: rethinking assessment for the learning society. Studies inContinuing Education, 22(2), 151–167.
Goodrum,D., Hackling, M. & Rennie, L. (2001). The Status and Quality of Teaching and Learning ofScience in Australian Schools: A Research Report. Canberra: Department of Education, Training andYouth Affairs.
Herbert, S. (2006). In Parliament of Victoria, Inquiry into the Promotion of Mathematics and ScienceEducation. Melbourne: Victorian Government Printer.
Lyons, T., Cooksey, R., Panizzon, D., Parnell, A. & Pegg, J. ( 2006). Science, ICT and MathematicsEducation in Rural and Regional Australia: The SiMERR National Survey. A Research ReportPrepared for the Department of Education, Science and Training. National Centre of Science, ICTand Mathematics Education for Rural and Regional Australia, University of New England.
Ministerial Council of Education, Employment, Training and Youth Affairs (2004). National Year 6Science Assessment Report. Melbourne: MCEETYA.
Ministerial Council of Education, Employment, Training and Youth Affairs (2006a). Statements ofLearning for Mathematics. Melbourne: Curriculum Corporation.
Ministerial Council of Education, Employment, Training and Youth Affairs (2006b). Statements ofLearning for Science. Melbourne: Curriculum Corporation.
Ostberg, M. (2004). Embedding the working mathematically outcomes — the Warnbro experience. In M.O’Brien (Ed.) Working Mathematically in the Middle Years (pp. 47–79). Retrieved 23 March 2007from http://www.une.edu.au/simerr/about/aims/aims.html
Thomson, S., Cresswell, J & De Bortoli, L. (2004). Facing the Future: A Focus on MathematicalLiteracy among Australian 15-year-old Students in PISA 2003. ACER.
Wiggins, G. & McTighe, J. (2005). Understanding by Design (Expanded 2nd Ed.). ASCD.

© The Australian Association of Mathematics Teachers Inc.
404
Mathematics through movement:An investigation of the links betweenkinaesthetic and conceptual learning*
Karen Wood
Mingenew Primary School, WA
Developing strategies for engaging mathematics activities is always a challenge.Teachers seek out new resources and online activities to excite students andsupport their learning. Mathematics through Movement offers an active learningstrategy requiring few resources, and a bit of imagination, to achieve a variety ofoutcomes across mathematics domains. It is based on sound educational theoryand a life time of experience in dance. This paper examines the beginnings ofresearch into this teaching strategy in a remote setting in Western Australia. Itshows that this teaching tool can motivate talk, deepen understandings, and engagestudents in mathematics tasks.
Background
As a dancer, teacher of dance and mother, I had often reflected upon the significant rolemovement had in my life and that of my daughters. Dancers, dance teachers and parentshad often commented that dance, callisthenics or movement of some sort, had supportedstudents in their school work. As a teacher I pondered on Gardner’s kinesthetic learnerand I am drawn to his statement:
Indeed participation in the arts is so natural and integral a part of human growththat an understanding of this process should provide important clues to manypivotal questions of human development. (Gardner, 1973, p. 23)
Observation of my classroom in northern Western Australia, in a small rural town,showed that students were more engaged with ideas and learning if there was anelement of movement involved. Many seemed to be kinaesthetic learners. Thisprompted the use of interactive technology but also a deeper investigation of how Icould use my understanding of movement to enhance some core mathematical concepts.The links seemed obvious in my mind but could I show a direct educational benefit forintegration of dance with specific mathematics foci?
Informal action research was undertaken in my classroom and anecdotal notes, videorecordings and reflective journal entries gathered. The data were showing that somecore mathematical concepts could be clarified and new ideas scaffolded usingmovement, especially in the Shape domain. This raised questions regarding howeffective dance might be in supporting learning in the other mathematics domains,(Number, Measurement, Chance and Data). A program of learning was devised with
* Paper accepted by peer review

Mathematics: Essential for Learning, Essential for Life
© The Australian Association of Mathematics Teachers Inc.
405
dance as the core strategy that addressed all mathematics domains and their links tomovement (see Figure 1)
Figure 1. Initial planning for Mathematics through Movement
This paper will discuss the findings of that informal research, the testing of the initialoutcomes in a new classroom with students with different learning styles and socio-economic backgrounds, and further developments that were derived from the programoutlined in Figure 1.
Findings
The following data were derived from observing students in a K–3 cohort ofpredominately indigenous Australian decent, around 25–27 students at any time, in asmall remote township in Western Australia. During 2006, mathematics concepts wereintegrated into the classroom program using the following outlined in Figure 2.
Mathematics through MovementT2-2006Outcomes Shape Measurement Number Chance and
DataLevel 1M11.1The student: Makes non-numerical estimates of sizeinvolving everyday activitiesand actions.C&D 12.1The student: Shows somerecognition of the element ofchance in familiar dailyactivities and uses andresponds to the familiareveryday language ofchance.S 15c.1Represent transformationsThe student: Repeats,reorients and turns overthings when matching shapesand making pictures andpatterns.S16.1The student: Talks aboutlikenesses and differencesbetween things that can beseen or handled and beginsto connect shape, movementand function.
Activity –ShapeBags/BodybagsExploringshape andmovement.
Activity – Spaceand MovementEstimating howmuch space thebody ormovements takeup.Activity – Sizewhen staging adance.
Activity –Counting thebeat.Activity –Rhythm andbeat –looking atfractionswhendancing.
Activity –Probability.Likelihood ofachieving thesame things inmovement –skills and abilityand chance.
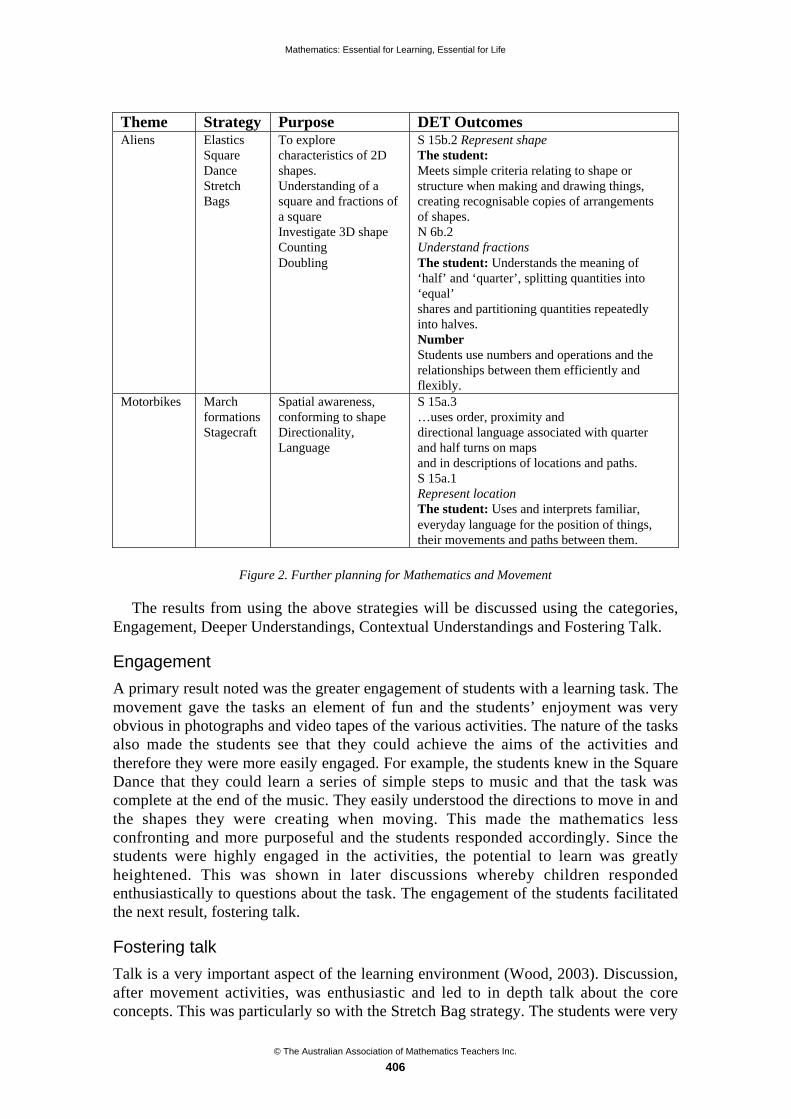
Mathematics: Essential for Learning, Essential for Life
© The Australian Association of Mathematics Teachers Inc.
406
Theme Strategy Purpose DET OutcomesAliens Elastics
SquareDanceStretchBags
To explorecharacteristics of 2Dshapes.Understanding of asquare and fractions ofa squareInvestigate 3D shapeCountingDoubling
S 15b.2 Represent shapeThe student:Meets simple criteria relating to shape orstructure when making and drawing things,creating recognisable copies of arrangementsof shapes.N 6b.2Understand fractionsThe student: Understands the meaning of‘half’ and ‘quarter’, splitting quantities into‘equal’shares and partitioning quantities repeatedlyinto halves.NumberStudents use numbers and operations and therelationships between them efficiently andflexibly.
Motorbikes MarchformationsStagecraft
Spatial awareness,conforming to shapeDirectionality,Language
S 15a.3…uses order, proximity anddirectional language associated with quarterand half turns on mapsand in descriptions of locations and paths.S 15a.1Represent locationThe student: Uses and interprets familiar,everyday language for the position of things,their movements and paths between them.
Figure 2. Further planning for Mathematics and Movement
The results from using the above strategies will be discussed using the categories,Engagement, Deeper Understandings, Contextual Understandings and Fostering Talk.
Engagement
A primary result noted was the greater engagement of students with a learning task. Themovement gave the tasks an element of fun and the students’ enjoyment was veryobvious in photographs and video tapes of the various activities. The nature of the tasksalso made the students see that they could achieve the aims of the activities andtherefore they were more easily engaged. For example, the students knew in the SquareDance that they could learn a series of simple steps to music and that the task wascomplete at the end of the music. They easily understood the directions to move in andthe shapes they were creating when moving. This made the mathematics lessconfronting and more purposeful and the students responded accordingly. Since thestudents were highly engaged in the activities, the potential to learn was greatlyheightened. This was shown in later discussions whereby children respondedenthusiastically to questions about the task. The engagement of the students facilitatedthe next result, fostering talk.
Fostering talk
Talk is a very important aspect of the learning environment (Wood, 2003). Discussion,after movement activities, was enthusiastic and led to in depth talk about the coreconcepts. This was particularly so with the Stretch Bag strategy. The students were very
Mathematics: Essential for Learning, Essential for Life
© The Australian Association of Mathematics Teachers Inc.
407
interested in the movements and the shapes created and it was a favourite “free time”activity for the students after it was introduced into the program. This activity led todiscussions regarding 2D and 3D shapes, including the characteristics of various regularand irregular polygons and how to transform shape. The use of this movement activityallowed for the demonstration all 3 aspects of Bruner’s levels of representation,Enactive, Iconic, and Symbolic (Frid, 2001). Bruner contends that by using these modesof knowledge the student is scaffolded to new understandings since the learner isengaged in all aspects of the cognitive system. In this case, the children were activelyinvolved with the concept of shape, making the shapes physically themselves (enactivemode). There were many opportunities to view shape both in a 3D contextual form andin visual representations (iconic) and, finally, due to the engaging discussion there werevery powerful language based representations (symbolic).
Contextual understandings
During the Square Dance activity the students were able to use counting and numbersense in a specific, purposeful context. The activity was designed to highlight theconcept of doubling numbers, in this case doubling 8. Counting was emphasised whilstdancing and later discussion centred on how many counts it took to complete sections ofthe dance. The correlation and comparison was then drawn to doubles. On this occasion,the understanding of the new concept was not immediate, however there was a veryuseful reference point created when the concept was discussed in later more explicitteaching regarding the idea of doubling. By placing the concept in a context, I was ableto scaffold the students’ learning towards new ideas.
A very useful investigation that evolved out of the square dance was thedirectionality of the dance. The students travelled around the square but also did sodiagonally across the square. By representing this diagrammatically the students wereled, very easily, into the concept of fractions. A natural progression to cutting halfsandwiches and quarters in fruit followed and the students were engaged with, andeasily stepped towards understanding, a new concept.
Deeper understandings
By using the above strategies, I was able to give purpose to the students’ learning. Theydid not learn a square had 4 sides by saying it over and over a gain. They knew becausethey moved around a square, they created one using the elastic (not as easy as it seems),and had to really think about a square and its attributes when doing so. I found this ledto deeper understandings and longer term retention of information. By learning throughdoing, the students gained a thorough grasp of the target understandings.
Summary
This research has shown me that there is an important link between constructivistlearning theory, the arts and human development, and learning by doing. Myinvestigation is continuing and I find new and exciting evidence for Mathematicsthrough Movement, with every session I conduct. Current work is showing that byallowing students to become the artistic critics (Gardner, 1973, p. 26) — that is,cultivating their ability to discern features and distinctions — they are able tocommunicate their understandings very effectively, thereby allowing a more accurateassessments of understandings to be made. The data above were a starting point for my

Mathematics: Essential for Learning, Essential for Life
© The Australian Association of Mathematics Teachers Inc.
408
research and, importantly, have led to reviewing literature, a greater attention totheoretical preface for chosen strategies, and more reliable data for future discussions.
There is, however, enough to suggest a few general applications for classroompractitioners. I should add, at this point, that a teacher need not have a huge knowledgeof dance and complicated dance routines to implement a program such as that which Ihave described. I have used very simple and accessible dances, such as the squaredance, to good effect. The challenge is to think laterally and find the place wheremovement fits in. For example, a new project in my classroom is “Happy Wheat” wherethe students are learning a simple tap dance routine to insert in their story about wheatin their home town of the wheat belt of WA. There are many forms of dance that can beinvestigated such as Aussie Bush dances, Social dances such as the “Nutbush” discoline dance, and creative movement with such things as the stretch bag. Finding links toyour context will make the strategy more effective and engaging.
Mathematics through Movement offers an interesting and engaging strategy toachieve the vast outcomes that make up Being Numerate. By integrating a well thoughtout movement strategy, a teacher can achieve many outcomes at once. Mathematicsthrough Movement provides rich tasks that, although seemingly closed in format, offervast flexibility via discussion as to where an investigation may lead. This importantreflective aspect of the process attends to the notion that “it is not sufficient simply tohave an experience to learn” (Gibbs, 1988, p. 9).
References
Curriculum Council of Western Australia (1998). Curriculum Framework for Kindergarten to Year 12Education in Western Australia. Osborne Park, WA: Author.
Frid, S. (2001). Making manipulatives meaningful. Cross Section, 13(2), 10–15.
Gardner, H. (1973). The Arts and Human Development. Canada: John Wiley & Sons Inc.
Gibbs, (1988). Learning by Doing: A Guide to Teaching and Learning Methods. London: FurtherEducation Unit.
Wood, K. (2003). Numeracy Education in a Multiage Setting: A Case Study. Unpublished Bachelor ofEducation Honours Thesis, Curtin University of Technology, Perth.