Mathematics Curriculum
288
6 GRADE New York State Common Core Mathematics Curriculum GRADE 6 • MODULE 1 Table of Contents 1 Ratios and Unit Rates Module Overview .................................................................................................................................................. 3 Topic A: Representing and Reasoning About Ratios (6.RP.A.1, 6.RP.A.3a) ........................................................ 12 Lessons 1–2: Ratios................................................................................................................................. 14 Lessons 3–4: Equivalent Ratios............................................................................................................... 28 Lessons 5–6: Solving Problems by Finding Equivalent Ratios................................................................. 41 Lesson 7: Associated Ratios and the Value of a Ratio ............................................................................ 51 Lesson 8: Equivalent Ratios Defined Through the Value of a Ratio ....................................................... 57 Topic B: Collections of Equivalent Ratios (6.RP.A.3a) ......................................................................................... 63 Lesson 9: Tables of Equivalent Ratios ..................................................................................................... 65 Lesson 10: The Structure of Ratio Tables—Additive and Multiplicative ................................................ 71 Lesson 11: Comparing Ratios Using Ratio Tables ................................................................................... 80 Lesson 12: From Ratio Tables to Double Number Line Diagrams .......................................................... 88 Lesson 13: From Ratio Tables to Equations Using the Value of a Ratio ................................................. 99 Lesson 14: From Ratio Tables, Equations, and Double Number Line Diagrams to Plots on the Coordinate Plane ................................................................................................................ 109 Lesson 15: A Synthesis of Representations of Equivalent Ratio Collections ........................................ 117 Mid-Module Assessment and Rubric ................................................................................................................ 126 Topics A through B (assessment 1 day, return 1 day, remediation or further applications 1 day) Topic C: Unit Rates (6.RP.A.2, 6.RP.A.3b, 6.RP.A.3d) ....................................................................................... 132 Lesson 16: From Ratios to Rates........................................................................................................... 134 Lesson 17: From Rates to Ratios........................................................................................................... 139 Lesson 18: Finding a Rate by Dividing Two Quantities ......................................................................... 145 Lessons 19–20: Comparison Shopping—Unit Price and Related Measurement Conversions ............. 150 Lessons 21–22: Getting the Job Done—Speed, Work, and Measurement Units ................................. 165 Lesson 23: Problem-Solving Using Rates, Unit Rates, and Conversions ............................................... 179 1 Each lesson is ONE day, and ONE day is considered a 45-minute period. Module 1: Ratios and Unit Rates 1 This work is licensed under a Creative Commons Attribution-NonCommercial-ShareAlike 3.0 Unported License. © 2015 Great Minds. eureka-math.org G6-M1-TE-1.3.0-06.2015
-
Upload
khangminh22 -
Category
Documents
-
view
3 -
download
0
Transcript of Mathematics Curriculum

6
G R A D E
New York State Common Core
Mathematics Curriculum GRADE 6 • MODULE 1
Table of Contents1
Ratios and Unit Rates Module Overview .................................................................................................................................................. 3
Topic A: Representing and Reasoning About Ratios (6.RP.A.1, 6.RP.A.3a) ........................................................ 12
Lessons 1–2: Ratios ................................................................................................................................. 14
Lessons 3–4: Equivalent Ratios ............................................................................................................... 28
Lessons 5–6: Solving Problems by Finding Equivalent Ratios ................................................................. 41
Lesson 7: Associated Ratios and the Value of a Ratio ............................................................................ 51
Lesson 8: Equivalent Ratios Defined Through the Value of a Ratio ....................................................... 57
Topic B: Collections of Equivalent Ratios (6.RP.A.3a) ......................................................................................... 63
Lesson 9: Tables of Equivalent Ratios ..................................................................................................... 65
Lesson 10: The Structure of Ratio Tables—Additive and Multiplicative ................................................ 71
Lesson 11: Comparing Ratios Using Ratio Tables ................................................................................... 80
Lesson 12: From Ratio Tables to Double Number Line Diagrams .......................................................... 88
Lesson 13: From Ratio Tables to Equations Using the Value of a Ratio ................................................. 99
Lesson 14: From Ratio Tables, Equations, and Double Number Line Diagrams to Plots on the Coordinate Plane ................................................................................................................ 109
Lesson 15: A Synthesis of Representations of Equivalent Ratio Collections ........................................ 117
Mid-Module Assessment and Rubric ................................................................................................................ 126 Topics A through B (assessment 1 day, return 1 day, remediation or further applications 1 day)
Topic C: Unit Rates (6.RP.A.2, 6.RP.A.3b, 6.RP.A.3d) ....................................................................................... 132
Lesson 16: From Ratios to Rates ........................................................................................................... 134
Lesson 17: From Rates to Ratios ........................................................................................................... 139
Lesson 18: Finding a Rate by Dividing Two Quantities ......................................................................... 145
Lessons 19–20: Comparison Shopping—Unit Price and Related Measurement Conversions ............. 150
Lessons 21–22: Getting the Job Done—Speed, Work, and Measurement Units ................................. 165
Lesson 23: Problem-Solving Using Rates, Unit Rates, and Conversions ............................................... 179
1Each lesson is ONE day, and ONE day is considered a 45-minute period.
Module 1: Ratios and Unit Rates
1
This work is licensed under a Creative Commons Attribution-NonCommercial-ShareAlike 3.0 Unported License.
© 2015 Great Minds. eureka-math.orgG6-M1-TE-1.3.0-06.2015
6•1 Module Overview NYS COMMON CORE MATHEMATICS CURRICULUM
Topic D: Percent (6.RP.A.3c) .............................................................................................................................. 187
Lesson 24: Percent and Rates per 100 ................................................................................................. 188
Lesson 25: A Fraction as a Percent ....................................................................................................... 197
Lesson 26: Percent of a Quantity .......................................................................................................... 208
Lessons 27–29: Solving Percent Problems ........................................................................................... 215
End-of-Module Assessment and Rubric ............................................................................................................ 229 Topics A through D (assessment 1 day, return 1 day, remediation or further applications 1 day)
Module 1: Ratios and Unit Rates
2
This work is licensed under a Creative Commons Attribution-NonCommercial-ShareAlike 3.0 Unported License. © 2015 Great Minds. eureka-math.org
G6-M1-TE-1.3.0-06.2015

6•1 Module Overview NYS COMMON CORE MATHEMATICS CURRICULUM
Grade 6 • Module 1
Ratios and Unit Rates
OVERVIEW In this module, students are introduced to the concepts of ratio and rate. Their previous experience solving problems involving multiplicative comparisons, such as Max has three times as many toy cars as Jack, (4.OA.A.2) serves as the conceptual foundation for understanding ratios as a multiplicative comparison of two or more numbers used in quantities or measurements (6.RP.A.1). Students develop fluidity in using multiple forms of ratio language and ratio notation. They construct viable arguments and communicate reasoning about ratio equivalence as they solve ratio problems in real-world contexts (6.RP.A.3). As the first topic comes to a close, students develop a precise definition of the value of a ratio 𝑎𝑎: 𝑏𝑏, where 𝑏𝑏 ≠ 0 as the value 𝑎𝑎𝑏𝑏
, applying previous understanding of fraction as division (5.NF.B.3). They can then formalize their understanding of equivalent ratios as ratios having the same value. With the concept of ratio equivalence formally defined, students explore collections of equivalent ratios in real-world contexts in Topic B. They build ratio tables and study their additive and multiplicative structure (6.RP.A.3a). Students continue to apply reasoning to solve ratio problems while they explore representations of collections of equivalent ratios and relate those representations to the ratio table (6.RP.A.3). Building on their experience with number lines, students represent collections of equivalent ratios with a double number line model. They relate ratio tables to equations using the value of a ratio defined in Topic A. Finally, students expand their experience with the coordinate plane (5.G.A.1, 5.G.A.2) as they represent collections of equivalent ratios by plotting the pairs of values on the coordinate plane. The Mid-Module Assessment follows Topic B. In Topic C, students build further on their understanding of ratios and the value of a ratio as they come to understand that a ratio of 5 miles to 2 hours corresponds to a rate of 2.5 miles per hour, where the unit rate is the numerical part of the rate, 2.5, and miles per hour is the newly formed unit of measurement of the rate (6.RP.A.2). Students solve unit rate problems involving unit pricing, constant speed, and constant rates of work (6.RP.A.3b). They apply their understanding of rates to situations in the real world. Students determine unit prices, use measurement conversions to comparison shop, and decontextualize constant speed and work situations to determine outcomes. Students combine their new understanding of rate to connect and revisit concepts of converting among different-sized standard measurement units (5.MD.A.1). They then expand upon this background as they learn to manipulate and transform units when multiplying and dividing quantities (6.RP.A.3d). Topic C culminates as students interpret and model real-world scenarios through the use of unit rates and conversions. In the final topic of the module, students are introduced to percent and find percent of a quantity as a rate
per 100. Students understand that 𝑁𝑁 percent of a quantity has the same value as 𝑁𝑁100
of that quantity. Students express a fraction as a percent and find a percent of a quantity in real-world contexts. Students learn to express a ratio using the language of percent and to solve percent problems by selecting from familiar representations, such as tape diagrams and double number lines or a combination of both (6.RP.A.3c). The End-of-Module Assessment follows Topic D.
Module 1: Ratios and Unit Rates
3
This work is licensed under a Creative Commons Attribution-NonCommercial-ShareAlike 3.0 Unported License. © 2015 Great Minds. eureka-math.org
G6-M1-TE-1.3.0-06.2015
6•1 Module Overview NYS COMMON CORE MATHEMATICS CURRICULUM
Focus Standards Understand ratio concepts and use ratio reasoning to solve problems.
6.RP.A.1 Understand the concept of a ratio and use ratio language to describe a ratio relationship between two quantities. For example, “The ratio of wings to beaks in the bird house at the zoo was 2: 1, because for every 2 wings there was 1 beak.” “For every vote candidate A received, candidate C received nearly three votes.”
6.RP.A.2 Understand the concept of a unit rate 𝑎𝑎/𝑏𝑏 associated with a ratio 𝑎𝑎: 𝑏𝑏 with 𝑏𝑏 ≠ 0, and use rate language in the context of a ratio relationship. For example, “This recipe has a ratio of 3 cups of flour to 4 cups of sugar, so there is 3/4 cup of flour for each cup of sugar.” “We paid $75 for 15 hamburgers, which is a rate of $5 per hamburger.”2
6.RP.A.3 Use ratio and rate reasoning to solve real-world and mathematical problems, e.g., by reasoning about tables of equivalent ratios, tape diagrams, double number line diagrams, or equations.
a. Make tables of equivalent ratios relating quantities with whole-number measurements, find missing values in the tables, and plot the pairs of values on the coordinate plane. Use tables to compare ratios.
b. Solve unit rate problems including those involving unit pricing and constant speed. For example, if it took 7 hours to mow 4 lawns, then at that rate, how many lawns could be mowed in 35 hours? At what rate were lawns being mowed?
c. Find a percent of a quantity as a rate per 100 (e.g., 30% of a quantity means 30/100 times the quantity); solve problems involving finding the whole, given a part and the percent.
d. Use ratio reasoning to convert measurement units; manipulate and transform units appropriately when multiplying or dividing quantities.
Foundational Standards Use the four operations with whole numbers to solve problems.
4.OA.A.2 Multiply or divide to solve word problems involving multiplicative comparison, e.g., by using drawings and equations with a symbol for the unknown number to represent the problem, distinguishing multiplicative comparison from additive comparison.3
2Expectations for unit rates in this grade are limited to non-complex fractions. 3See Glossary, Table 2.
Module 1: Ratios and Unit Rates
4
This work is licensed under a Creative Commons Attribution-NonCommercial-ShareAlike 3.0 Unported License.
© 2015 Great Minds. eureka-math.orgG6-M1-TE-1.3.0-06.2015

6•1 Module Overview NYS COMMON CORE MATHEMATICS CURRICULUM
Apply and extend previous understandings of multiplication and division to multiply and divide fractions.
5.NF.B.3 Interpret a fraction as division of the numerator by the denominator (𝑎𝑎/𝑏𝑏 = 𝑎𝑎 ÷ 𝑏𝑏). Solve word problems involving division of whole numbers leading to answers in the form of fractions or mixed numbers, e.g., by using visual fraction models or equations to represent the problem. For example, interpret 3/4 as the result of dividing 3 by 4, noting that 3/4 multiplied by 4 equals 3, and that when 3 wholes are shared equally among 4 people each person has a share of size 3/4. If 9 people want to share a 50-pound sack of rice equally by weight, how many pounds of rice should each person get? Between what two whole numbers does your answer lie?
Convert like measurement units within a given measurement system.
5.MD.A.1 Convert among different-sized standard measurement units within a given measurement system (e.g., convert 5 cm to 0.05 m), and use these conversions in solving multi-step, real world problems.
Graph points on the coordinate plane to solve real-world and mathematical problems.
5.G.A.1 Use a pair of perpendicular number lines, called axes, to define a coordinate system, with the intersection of the lines (the origin) arranged to coincide with the 0 on each line and a given point in the plane located by using an ordered pair of numbers, called its coordinates. Understand that the first number indicates how far to travel from the origin in the direction of one axis, and the second number indicates how far to travel in the direction of the second axis, with the convention that the names of the two axes and the coordinates correspond (e.g., 𝑥𝑥-axis and 𝑥𝑥-coordinate, 𝑦𝑦-axis and 𝑦𝑦-coordinate).
5.G.A.2 Represent real world and mathematical problems by graphing points in the first quadrant of the coordinate plane, and interpret coordinate values of points in the context of the situation.
Focus Standards for Mathematical Practice MP.1 Make sense of problems and persevere in solving them. Students make sense of and solve
real-world and mathematical ratio, rate, and percent problems using representations, such as tape diagrams, ratio tables, the coordinate plane, and double number line diagrams. They identify and explain the correspondences between the verbal descriptions and their representations and articulate how the representation depicts the relationship of the quantities in the problem. Problems include ratio problems involving the comparison of three quantities, multi-step changing ratio problems, using a given ratio to find associated ratios, and constant rate problems including two or more people or machines working together.
MP.2 Reason abstractly and quantitatively. Students solve problems by analyzing and comparing ratios and unit rates given in tables, equations, and graphs. Students decontextualize a given constant speed situation, representing symbolically the quantities involved with the formula, distance = rate × time.
Module 1: Ratios and Unit Rates
5
This work is licensed under a Creative Commons Attribution-NonCommercial-ShareAlike 3.0 Unported License. © 2015 Great Minds. eureka-math.org
G6-M1-TE-1.3.0-06.2015
6•1 Module Overview NYS COMMON CORE MATHEMATICS CURRICULUM
MP.5 Use appropriate tools strategically. Students become proficient using a variety of representations that are useful in reasoning with rate and ratio problems, such as tape diagrams, double line diagrams, ratio tables, a coordinate plane, and equations. They then use judgment in selecting appropriate tools as they solve ratio and rate problems.
MP.6 Attend to precision. Students define and distinguish between ratio, the value of a ratio, a unit rate, a rate unit, and a rate. Students use precise language and symbols to describe ratios and rates. Students learn and apply the precise definition of percent.
MP.7 Look for and make use of structure. Students recognize the structure of equivalent ratios in solving word problems using tape diagrams. Students identify the structure of a ratio table and use it to find missing values in the table. Students make use of the structure of division and ratios to model 5 miles/2 hours as a quantity 2.5 mph.
Terminology New or Recently Introduced Terms
Equivalent Ratios (Two ratios 𝐴𝐴:𝐵𝐵 and 𝐶𝐶:𝐷𝐷 are equivalent ratios if there is a nonzero number 𝑐𝑐 such that 𝐶𝐶 = 𝑐𝑐𝐴𝐴 and 𝐷𝐷 = 𝑐𝑐𝐵𝐵. For example, two ratios are equivalent if they both have values that are equal.)
Measurement of a Quantity (A measurement of a quantity is a representation of that quantity as a multiple of a unit of measurement. The multiple is a number called the measure of the quantity. Examples include 3 inches or 5 liters or 7 boys with measures 3, 5, and 7, respectively.)
Percent (One percent is the number 1100
and is written 1%. Percentages can be used as rates. For
example, 30% of a quantity means 30100
times the quantity.)
Quantity (illustration) (Examples of a quantity include a length, an area, a volume, a mass, a weight, a length of time, or a speed. It is an instance of a type of quantity.) All quantities of the same type have the properties that (1) two quantities can be compared, (2) two quantities can be combined to get a new quantity of that same type, and (3) there .always exists a quantity that is a multiple of any given quantity. These properties help define ways to measure quantities using a standard quantity called a unit of measurement.)
Rate (illustration) (A rate is a quantity that describes a ratio relationship between two types of quantities. For example, 1.25 miles
hour is a rate that describes a ratio relationship between hours and
miles: If an object is traveling at a constant 1.25 mileshour , then after 1 hour it has gone 1.25 miles, after
2 hours it has gone 2.50 miles, after 3 hours it has gone 3.75 miles, and so on. Rates differ from ratios in how they describe ratio relationships—rates are quantities and have the properties of quantities. For example, rates of the same type can be added together to get a new rate, as in 30 miles
hour + 20 mileshour = 50 miles
hour , whereas ratios cannot be added together.)
Module 1: Ratios and Unit Rates
6
This work is licensed under a Creative Commons Attribution-NonCommercial-ShareAlike 3.0 Unported License. © 2015 Great Minds. eureka-math.org
G6-M1-TE-1.3.0-06.2015

6•1 Module Overview NYS COMMON CORE MATHEMATICS CURRICULUM
Ratio (A ratio is an ordered pair of numbers which are not both zero. A ratio is denoted 𝐴𝐴:𝐵𝐵 to indicate the order of the numbers—the number 𝐴𝐴 is first and the number 𝐵𝐵 is second.)
Ratio Relationship (A ratio relationship is the set of all ratios that are equivalent ratios. A ratio such as 5: 4 can be used to describe the ratio relationship {1: 4
5 , 54 : 1, 5: 4, 10: 8, 15: 12, … }. Ratio
language such as “5 miles for every 4 hours” can also be used to describe a ratio relationship. Ratio relationships are often represented by ratio tables, double number lines diagrams, and by equations and their graphs.)
Type of Quantity (illustration) (Examples of types of quantities include lengths, areas, volumes, masses, weights, time, and (later) speeds.)
Unit of Measurement (A unit of measurement is a choice of a quantity for a given type of quantity. Examples include 1 cm, 1 m, or 1 in. for lengths, 1 liter or 1 cm3 for volumes, etc. But the choice could be arbitrary as well, such as the length between the vertical bars: |------------------|.)
Unit Rate (When a rate is written as a measurement (i.e., a number times a unit), the unit rate is the measure (i.e., the numerical part of the measurement). For example, when the rate of speed of an object is written as the measurement 1.25 mph, the number 1.25 is the unit rate.)
Value of a Ratio (The value of the ratio 𝐴𝐴:𝐵𝐵 is the quotient 𝐴𝐴𝐵𝐵
as long as 𝐵𝐵 is not zero.)
Familiar Terms and Symbols4
Convert Coordinate Plane Equation Tape Diagram
Suggested Tools and Representations Tape Diagrams (See example below.) Double Number Line Diagrams (See example below.) Ratio Tables (See example below.) Coordinate Plane (See example below.)
4These are terms and symbols students have seen previously.
Module 1: Ratios and Unit Rates
7
This work is licensed under a Creative Commons Attribution-NonCommercial-ShareAlike 3.0 Unported License.
© 2015 Great Minds. eureka-math.orgG6-M1-TE-1.3.0-06.2015

6•1 Module Overview NYS COMMON CORE MATHEMATICS CURRICULUM
Representing Equivalent Ratios for a Cake Recipe That Uses 2 Cups of Sugar for Every 3 Cups of Flour
Coordinate Plane
Flour Sugar
2
4
6
3
6
9
Ratio Table
Tape Diagram
0 2 4 6
0 3 6 9
Sugar
Flour
Double Number Line
2
Sugar
Flour
3
2: 3, 4: 6, 6: 9
Module 1: Ratios and Unit Rates
8
This work is licensed under a Creative Commons Attribution-NonCommercial-ShareAlike 3.0 Unported License. © 2015 Great Minds. eureka-math.org
G6-M1-TE-1.3.0-06.2015
6•1 Module Overview NYS COMMON CORE MATHEMATICS CURRICULUM
Preparing to Teach a Module Preparation of lessons will be more effective and efficient if there has been an adequate analysis of the module first. Each module in A Story of Ratios can be compared to a chapter in a book. How is the module moving the plot, the mathematics, forward? What new learning is taking place? How are the topics and objectives building on one another? The following is a suggested process for preparing to teach a module. Step 1: Get a preview of the plot.
A: Read the Table of Contents. At a high level, what is the plot of the module? How does the story develop across the topics?
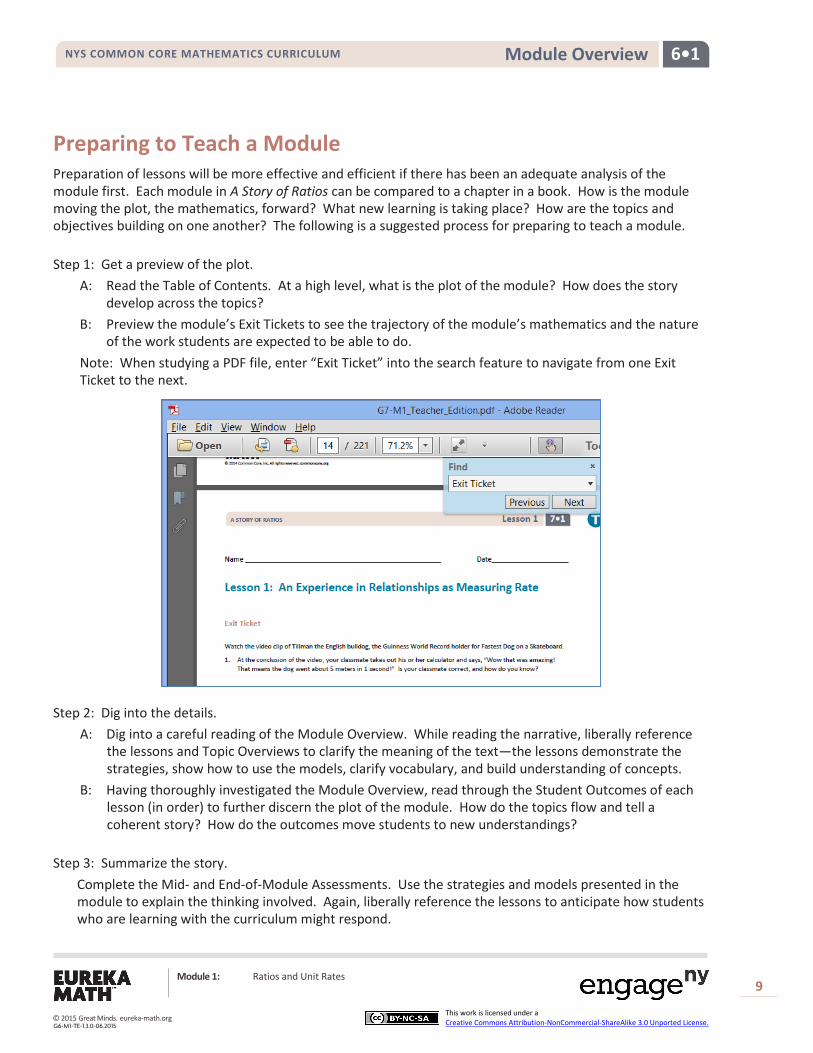
B: Preview the module’s Exit Tickets to see the trajectory of the module’s mathematics and the nature of the work students are expected to be able to do.
Note: When studying a PDF file, enter “Exit Ticket” into the search feature to navigate from one Exit Ticket to the next.
Step 2: Dig into the details.
A: Dig into a careful reading of the Module Overview. While reading the narrative, liberally reference the lessons and Topic Overviews to clarify the meaning of the text—the lessons demonstrate the strategies, show how to use the models, clarify vocabulary, and build understanding of concepts.
B: Having thoroughly investigated the Module Overview, read through the Student Outcomes of each lesson (in order) to further discern the plot of the module. How do the topics flow and tell a coherent story? How do the outcomes move students to new understandings?
Step 3: Summarize the story.
Complete the Mid- and End-of-Module Assessments. Use the strategies and models presented in the module to explain the thinking involved. Again, liberally reference the lessons to anticipate how students who are learning with the curriculum might respond.
Module 1: Ratios and Unit Rates
9
This work is licensed under a Creative Commons Attribution-NonCommercial-ShareAlike 3.0 Unported License. © 2015 Great Minds. eureka-math.org
G6-M1-TE-1.3.0-06.2015

6•1 Module Overview NYS COMMON CORE MATHEMATICS CURRICULUM
Preparing to Teach a Lesson A three-step process is suggested to prepare a lesson. It is understood that at times teachers may need to make adjustments (customizations) to lessons to fit the time constraints and unique needs of their students. The recommended planning process is outlined below. Note: The ladder of Step 2 is a metaphor for the teaching sequence. The sequence can be seen not only at the macro level in the role that this lesson plays in the overall story, but also at the lesson level, where each rung in the ladder represents the next step in understanding or the next skill needed to reach the objective. To reach the objective, or the top of the ladder, all students must be able to access the first rung and each successive rung. Step 1: Discern the plot.
A: Briefly review the module’s Table of Contents, recalling the overall story of the module and analyzing the role of this lesson in the module.
B: Read the Topic Overview related to the lesson, and then review the Student Outcome(s) and Exit Ticket of each lesson in the topic.
C: Review the assessment following the topic, keeping in mind that assessments can be found midway through the module and at the end of the module.
Step 2: Find the ladder.
A: Work through the lesson, answering and completing each question, example, exercise, and challenge.
B: Analyze and write notes on the new complexities or new concepts introduced with each question or problem posed; these notes on the sequence of new complexities and concepts are the rungs of the ladder.
C: Anticipate where students might struggle, and write a note about the potential cause of the struggle.
D: Answer the Closing questions, always anticipating how students will respond.
Step 3: Hone the lesson.
Lessons may need to be customized if the class period is not long enough to do all of what is presented and/or if students lack prerequisite skills and understanding to move through the entire lesson in the time allotted. A suggestion for customizing the lesson is to first decide upon and designate each question, example, exercise, or challenge as either “Must Do” or “Could Do.” A: Select “Must Do” dialogue, questions, and problems that meet the Student Outcome(s) while still
providing a coherent experience for students; reference the ladder. The expectation should be that the majority of the class will be able to complete the “Must Do” portions of the lesson within the allocated time. While choosing the “Must Do” portions of the lesson, keep in mind the need for a balance of dialogue and conceptual questioning, application problems, and abstract problems, and a balance between students using pictorial/graphical representations and abstract representations. Highlight dialogue to be included in the delivery of instruction so that students have a chance to articulate and consolidate understanding as they move through the lesson.
Module 1: Ratios and Unit Rates
10
This work is licensed under a Creative Commons Attribution-NonCommercial-ShareAlike 3.0 Unported License. © 2015 Great Minds. eureka-math.org
G6-M1-TE-1.3.0-06.2015

6•1 Module Overview NYS COMMON CORE MATHEMATICS CURRICULUM
B: “Must Do” portions might also include remedial work as necessary for the whole class, a small group, or individual students. Depending on the anticipated difficulties, the remedial work might take on different forms as suggested in the chart below.
Anticipated Difficulty “Must Do” Remedial Problem Suggestion
The first problem of the lesson is too challenging.
Write a short sequence of problems on the board that provides a ladder to Problem 1. Direct students to complete those first problems to empower them to begin the lesson.
There is too big of a jump in complexity between two problems.
Provide a problem or set of problems that bridge student understanding from one problem to the next.
Students lack fluency or foundational skills necessary for the lesson.
Before beginning the lesson, do a quick, engaging fluency exercise, such as a Rapid White Board Exchange or Sprint. Before beginning any fluency activity for the first time, assess that students have conceptual understanding of the problems in the set and that they are poised for success with the easiest problem in the set.
More work is needed at the concrete or pictorial level.
Provide manipulatives or the opportunity to draw solution strategies.
More work is needed at the abstract level.
Add a White Board Exchange of abstract problems to be completed toward the end of the lesson.
C: “Could Do” problems are for students who work with greater fluency and understanding and can, therefore, complete more work within a given time frame.
D: At times, a particularly complex problem might be designated as a “Challenge!” problem to provide to advanced students. Consider creating the opportunity for students to share their “Challenge!” solutions with the class at a weekly session or on video.
E: If the lesson is customized, be sure to carefully select Closing questions that reflect such decisions and adjust the Exit Ticket if necessary.
Assessment Summary Assessment Type Administered Format Standards Addressed
Mid-Module Assessment Task After Topic B Constructed response with rubric 6.RP.A.1, 6.RP.A.3 (Stem
Only), 6.RP.A.3a
End-of-Module Assessment Task After Topic D Constructed response with rubric 6.RP.A.1, 6.RP.A.2,
6.RP.A.3
Module 1: Ratios and Unit Rates
11
This work is licensed under a Creative Commons Attribution-NonCommercial-ShareAlike 3.0 Unported License. © 2015 Great Minds. eureka-math.org
G6-M1-TE-1.3.0-06.2015

New York State Common Core
Mathematics Curriculum GRADE 6 • MODULE 1
6 G R A D E
Topic A
Representing and Reasoning About Ratios
6.RP.A.1, 6.RP.A.3a
Focus Standards: 6.RP.A.1 Understand the concept of a ratio and use ratio language to describe a ratio relationship between two quantities. For example, “The ratio of wings to beaks in the bird house at the zoo was 2: 1, because for every 2 wings there was 1 beak.” “For every vote candidate A received, candidate C received nearly three votes.”
6.RP.A.3 Use ratio and rate reasoning to solve real-world and mathematical problems, e.g., by reasoning about tables of equivalent ratios, tape diagrams, double number line diagrams, or equations. a. Make tables of equivalent ratios relating quantities with whole-number
measurements, find missing values in the tables, and plot the pairs of values on the coordinate plane. Use tables to compare ratios.
Instructional Days: 8
Lessons 1–2: Ratios (S, E)1
Lessons 3–4: Equivalent Ratios (P, P)
Lessons 5–6: Solving Problems by Finding Equivalent Ratios (P, P)
Lesson 7: Associated Ratios and the Value of a Ratio (P)
Lesson 8: Equivalent Ratios Defined Through the Value of a Ratio (P) In Topic A, students are introduced to the concepts of ratios. Their previous experience solving problems involving multiplicative comparisons, such as Max has three times as many toy cars as Jack (4.OA.A.2), serves as the conceptual foundation for understanding ratios as a multiplicative comparison of two or more numbers used in quantities or measurements (6.RP.A.1). In the first two lessons, students develop fluidity in using multiple forms of ratio language and ratio notation as they read about or watch video clips about ratio relationships and then discuss and model the described relationships. Students are prompted to think of, describe, and model ratio relationships from their own experience. Similarly, Lessons 3 and 4 explore the idea of equivalent ratios. Students read about or watch video clips about situations that call for establishing an equivalent ratio. Students discuss and model the situations to solve simple problems of finding one or more equivalent ratios.
1Lesson Structure Key: P-Problem Set Lesson, M-Modeling Cycle Lesson, E-Exploration Lesson, S-Socratic Lesson
Topic A: Representing and Reasoning About Ratios
This work is licensed under a Creative Commons Attribution-NonCommercial-ShareAlike 3.0 Unported License.
12
© 2015 Great Minds. eureka-math.orgG6-M1-TE-1.3.0-06.2015
6•1 Topic A NYS COMMON CORE MATHEMATICS CURRICULUM
The complexity of problems increases as students are challenged to find values of quantities in a ratio given the total desired quantity or given the difference between the two quantities. For example, If the ratio of boys to girls in the school is 2: 3, find the number of girls if there are 300 more girls than boys. As the first topic comes to a close, students develop a precise definition of the value of a ratio 𝑎𝑎:𝑏𝑏, where 𝑏𝑏 ≠ 0, as the value
𝑎𝑎𝑏𝑏
, applying previous understanding of fraction as division (5.NF.B.3). Students are then challenged to express their understanding of ratio equivalence using the newly defined term, value of a ratio. They conclude that equivalent ratios are ratios having the same value.
Topic A: Representing and Reasoning About Ratios
This work is licensed under a Creative Commons Attribution-NonCommercial-ShareAlike 3.0 Unported License.
13
© 2015 Great Minds. eureka-math.orgG6-M1-TE-1.3.0-06.2015

NYS COMMON CORE MATHEMATICS CURRICULUM 6•1 Lesson 1
Lesson 1: Ratios
Student Outcomes
Students understand that a ratio is an ordered pair of numbers which are not both zero. Students understand that a ratio is often used instead of describing the first number as a multiple of the second.
Students use the precise language and notation of ratios (e.g., 3: 2, 3 to 2). Students understand that the order of the pair of numbers in a ratio matters and that the description of the ratio relationship determines the correct order of the numbers. Students conceive of real-world contextual situations to match a given ratio.
Lesson Notes The first two lessons of this module develop students’ understanding of the term ratio. A ratio is always a pair of numbers, such as 2: 3, and never a pair of quantities such as 2 cm: 3 sec. Keeping this straight for students requires teachers to use the term ratio correctly and consistently. Students are required to separately keep track of the units in a word problem. We refer to statements about quantities in word problems that define ratios as ratio language or ratio relationship descriptions. Typical examples of ratio relationship descriptions include 3 cups to 4 cups and 5 miles in 4 hours. The ratios for these ratio relationships are 3: 4 and 5: 4, respectively.
Tape diagrams may be unfamiliar to students. Making a clear connection between multiplicative comparisons and their representation with tape diagrams is essential to student understanding of ratios in this module. Creating and delivering brief opening exercises that demonstrate the use of tape diagrams, as well as providing fluency activities, such as Rapid Whiteboard Exchanges (RWBE), is highly suggested throughout the module. Students bridge their knowledge of multiplicative comparisons to ratio relationships in this lesson and through the rest of the module. An example of a connection between multiplicative comparisons and ratios is as follows:
Cameron has 5 shirts and 1 baseball cap. The multiplicative comparison is Cameron has 5 times as many shirts as he has baseball caps. This can be represented with a tape diagram:
Shirts
Baseball Caps
Students are asked to determine the ratio relationship of the number of shirts Cameron has to the number of baseball caps he has. Using the tape diagram above, students see that for every 5 shirts Cameron has, he has 1 baseball cap, or the ratio of the number of shirts Cameron has to the number of baseball caps he has is 5: 1.
Lesson 1: Ratios
14
This work is licensed under a Creative Commons Attribution-NonCommercial-ShareAlike 3.0 Unported License. © 2015 Great Minds. eureka-math.org
G6-M1-TE-1.3.0-06.2015

NYS COMMON CORE MATHEMATICS CURRICULUM 6•1 Lesson 1
Classwork
Example 1 (15 minutes)
Read the example aloud.
Example 1
The coed soccer team has four times as many boys on it as it has girls. We say the ratio of the number of boys to the number of girls on the team is 𝟒𝟒:𝟏𝟏. We read this as four to one.
Let’s create a table to show how many boys and how many girls could be on the team.
Create a table like the one shown below to show possibilities of the number of boys and girls on the soccer team. Have students copy the table into their student materials.
# of Boys # of Girls Total # of Players
4 1 5
So, we would have four boys and one girl on the team for a total of five players. Is this big enough for a team?
Adult teams require 11 players, but youth teams may have fewer. There is no right or wrong answer; just encourage reflection on the question, thereby having students connect their math work back to the context.
What are some other ratios that show four times as many boys as girls, or a ratio of boys to girls of 4 to 1?
Have students add each ratio to their table.
# of Boys # of Girls Total # of Players
4 1 5
8 2 10
12 3 15
From the table, we can see that there are four boys for every one girl on the team.
Read the example aloud.
Suppose the ratio of the number of boys to the number of girls on the team is 𝟑𝟑:𝟐𝟐.
Create a table like the one shown below to show possibilities of the number of boys and girls on the soccer team. Have students copy the table into their student materials.
# of Boys # of Girls Total # of Players 3 2 5
Lesson 1: Ratios
15
This work is licensed under a Creative Commons Attribution-NonCommercial-ShareAlike 3.0 Unported License. © 2015 Great Minds. eureka-math.org
G6-M1-TE-1.3.0-06.2015

NYS COMMON CORE MATHEMATICS CURRICULUM 6•1 Lesson 1
What are some other team compositions where there are three boys for every two girls on the team?
# of Boys # of Girls Total # of Players 3 2 5 6 4 10 9 6 15
I can’t say there are 3 times as many boys as girls. What would my multiplicative value have to be? There are as many boys as girls.
Encourage students to articulate their thoughts, guiding them to say there are 32 as many boys as girls.
Can you visualize 32
as many boys as girls?
Can we make a tape diagram (or bar model) that shows that there are 32
as many boys as girls?
Boys
Girls
Which description makes the relationship easier to visualize: saying the ratio is 3 to 2 or saying there are 3 halves as many boys as girls? There is no right or wrong answer. Have students explain why they picked their choices.
Example 2 (8 minutes): Class Ratios
Discussion
Direct students:
Find the ratio of boys to girls in our class.
Raise your hand when you know: What is the ratio of boys to girls in our class? How can we say this as a multiplicative comparison without using ratios? Raise your hand when you know.
Allow for choral response when all hands are raised.
Write the ratio of number of boys to number of girls in your student materials under Example 2.
Compare your answer with your neighbor’s answer. Does everyone’s ratio look exactly the same?
Allow for discussion of differences in what students wrote. Communicate the following in the discussions:
1. It is ok to use either the colon symbol or the word to between the two numbers of the ratio.
2. The ratio itself does not have units or descriptive words attached.
Raise your hand when you know: What is the ratio of number of girls to number of boys in our class?
Write the ratio in your student materials under Example 2.
Is the ratio of number of girls to number of boys the same as the ratio of number of boys to number of girls? Unless in this case there happens to be an equal number of boys and girls, then no, the ratios are not
the same. Indicate that order matters.
Lesson 1: Ratios
16
This work is licensed under a Creative Commons Attribution-NonCommercial-ShareAlike 3.0 Unported License. © 2015 Great Minds. eureka-math.org
G6-M1-TE-1.3.0-06.2015

NYS COMMON CORE MATHEMATICS CURRICULUM 6•1 Lesson 1
Is this an interesting multiplicative comparison for this class? Is it worth commenting on in our class? If our class had 15 boys and 5 girls, might it be a more interesting observation?
For the exercise below, choose a way for students to indicate that they identify with the first statement (e.g., standing up or raising a hand). After each pair of statements below, have students create a ratio of the number of students who answered yes to the first statement to the number of students who answered yes to the second statement verbally, in writing, or both. Consider following each pair of statements with a discussion of whether it seems like an interesting ratio to discuss. Or alternatively, when all of these examples are finished, ask students which ratio they found most interesting.
Students record a ratio for each of the following examples:
1. You traveled out of state this summer. 2. You did not travel out of state this summer.
3. You have at least one sibling.
4. You are an only child.
5. Your favorite class is math.
6. Your favorite class is not math.
Example 2: Class Ratios
Write the ratio of the number of boys to the number of girls in our class.
Write the ratio of the number of girls to the number of boys in our class.
Record a ratio for each of the examples the teacher provides.
1. Answers will vary. One example is 𝟏𝟏𝟐𝟐:𝟏𝟏𝟏𝟏.
3. Answers will vary. One example is 𝟕𝟕:𝟏𝟏𝟏𝟏.
5. Answers will vary. One example is 𝟏𝟏𝟏𝟏:𝟏𝟏𝟏𝟏.
2. Answers will vary. One example is 𝟏𝟏𝟏𝟏:𝟏𝟏𝟐𝟐.
4. Answers will vary. One example is 𝟏𝟏𝟏𝟏:𝟕𝟕.
6. Answers will vary. One example is 𝟏𝟏𝟏𝟏:𝟏𝟏𝟏𝟏.
Exercise 1 (2 minutes)
Have students look around the classroom to find quantities to compare. Have students create written ratio statements that represent their ratios in one of the summary forms.
Exercise 1
My own ratio compares the number of students wearing jeans to the number of students not wearing jeans.
My ratio is 𝟏𝟏𝟏𝟏:𝟏𝟏.
Exercise 2 (10 minutes)
With a partner, students use words to describe a context that could be represented by each ratio given. Encourage students to be precise about the order in which the quantities are stated (emphasizing that order matters) and about the quantities being compared. That is, instead of saying the ratio of boys to girls, encourage them to say the ratio of the number of boys to the number of girls. After students develop the capacity to be very precise about the quantities in the
MP.6
Lesson 1: Ratios
17
This work is licensed under a Creative Commons Attribution-NonCommercial-ShareAlike 3.0 Unported License. © 2015 Great Minds. eureka-math.org
G6-M1-TE-1.3.0-06.2015
NYS COMMON CORE MATHEMATICS CURRICULUM 6•1 Lesson 1
ratio, it is appropriate for them to abbreviate their communication in later lessons. Just be sure their abbreviations still accurately convey the meaning of the ratio in the correct order.
Exercise 2
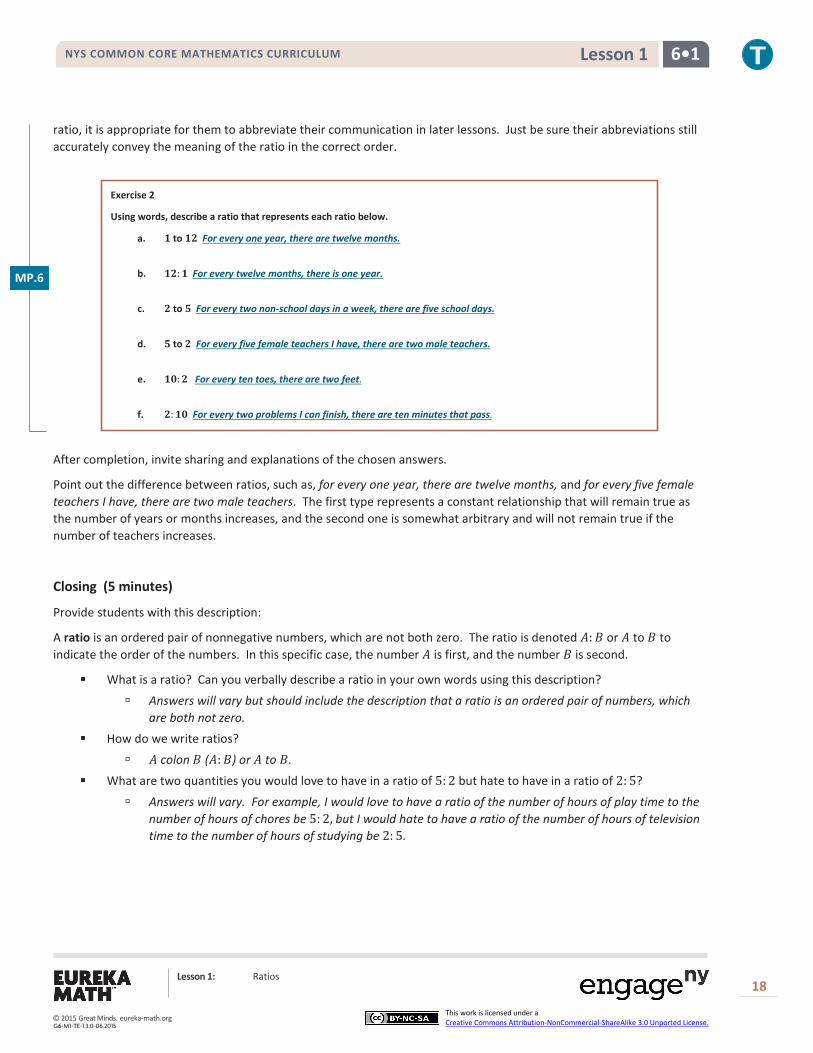
Using words, describe a ratio that represents each ratio below.
a. 𝟏𝟏 to 𝟏𝟏𝟐𝟐 For every one year, there are twelve months.
b. 𝟏𝟏𝟐𝟐:𝟏𝟏 For every twelve months, there is one year.
c. 𝟐𝟐 to 𝟏𝟏 For every two non-school days in a week, there are five school days.
d. 𝟏𝟏 to 𝟐𝟐 For every five female teachers I have, there are two male teachers.
e. 𝟏𝟏𝟏𝟏:𝟐𝟐 For every ten toes, there are two feet.
f. 𝟐𝟐:𝟏𝟏𝟏𝟏 For every two problems I can finish, there are ten minutes that pass.
After completion, invite sharing and explanations of the chosen answers.
Point out the difference between ratios, such as, for every one year, there are twelve months, and for every five female teachers I have, there are two male teachers. The first type represents a constant relationship that will remain true as the number of years or months increases, and the second one is somewhat arbitrary and will not remain true if the number of teachers increases.
Closing (5 minutes)
Provide students with this description:
A ratio is an ordered pair of nonnegative numbers, which are not both zero. The ratio is denoted 𝐴𝐴:𝐵𝐵 or 𝐴𝐴 to 𝐵𝐵 to indicate the order of the numbers. In this specific case, the number 𝐴𝐴 is first, and the number 𝐵𝐵 is second.
What is a ratio? Can you verbally describe a ratio in your own words using this description?
Answers will vary but should include the description that a ratio is an ordered pair of numbers, which are both not zero.
How do we write ratios?
𝐴𝐴 colon 𝐵𝐵 (𝐴𝐴:𝐵𝐵) or 𝐴𝐴 to 𝐵𝐵.
What are two quantities you would love to have in a ratio of 5: 2 but hate to have in a ratio of 2: 5?
Answers will vary. For example, I would love to have a ratio of the number of hours of play time to the number of hours of chores be 5: 2, but I would hate to have a ratio of the number of hours of television time to the number of hours of studying be 2: 5.
MP.6
Lesson 1: Ratios
18
This work is licensed under a Creative Commons Attribution-NonCommercial-ShareAlike 3.0 Unported License. © 2015 Great Minds. eureka-math.org
G6-M1-TE-1.3.0-06.2015

NYS COMMON CORE MATHEMATICS CURRICULUM 6•1 Lesson 1
Exit Ticket (5 minutes)
Lesson Summary
A ratio is an ordered pair of numbers, which are not both zero.
A ratio is denoted 𝑨𝑨:𝑩𝑩 to indicate the order of the numbers—the number 𝑨𝑨 is first and the number 𝑩𝑩 is second.
The order of the numbers is important to the meaning of the ratio. Switching the numbers changes the relationship. The description of the ratio relationship tells us the correct order for the numbers in the ratio.
Lesson 1: Ratios
19
This work is licensed under a Creative Commons Attribution-NonCommercial-ShareAlike 3.0 Unported License. © 2015 Great Minds. eureka-math.org
G6-M1-TE-1.3.0-06.2015
NYS COMMON CORE MATHEMATICS CURRICULUM 6•1 Lesson 1
Name Date
Lesson 1: Ratios
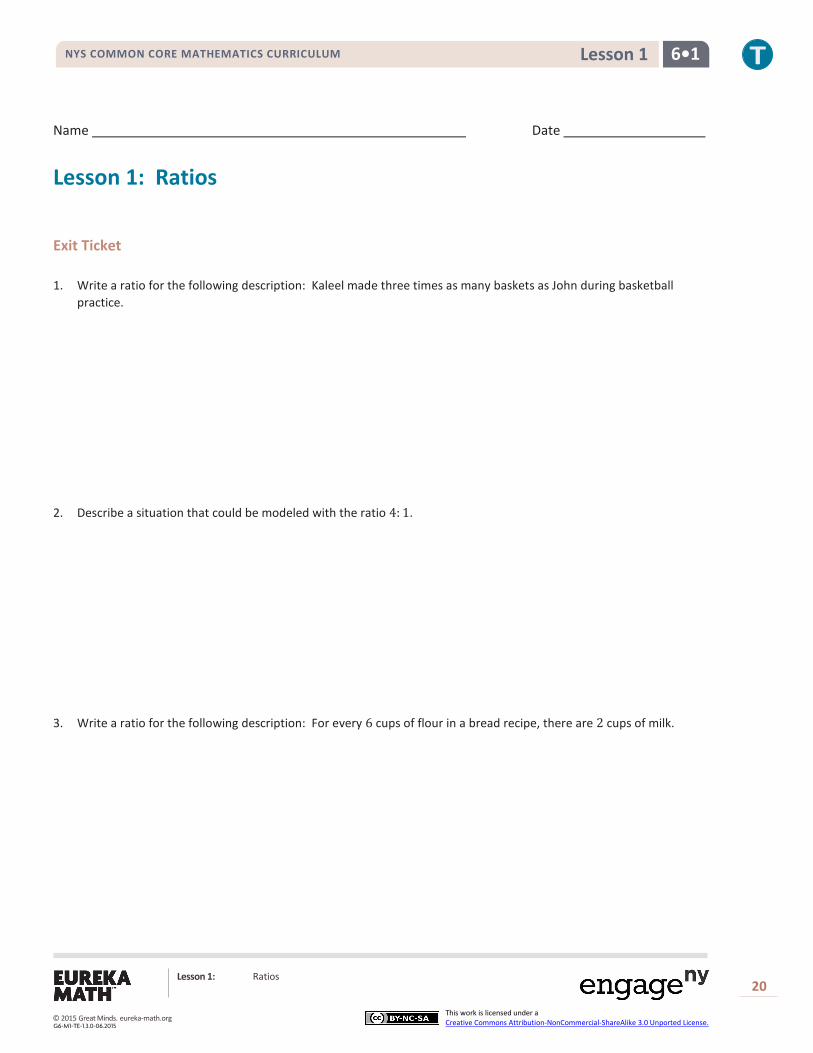
Exit Ticket 1. Write a ratio for the following description: Kaleel made three times as many baskets as John during basketball
practice.
2. Describe a situation that could be modeled with the ratio 4: 1.
3. Write a ratio for the following description: For every 6 cups of flour in a bread recipe, there are 2 cups of milk.
Lesson 1: Ratios
20
This work is licensed under a Creative Commons Attribution-NonCommercial-ShareAlike 3.0 Unported License. © 2015 Great Minds. eureka-math.org
G6-M1-TE-1.3.0-06.2015
NYS COMMON CORE MATHEMATICS CURRICULUM 6•1 Lesson 1
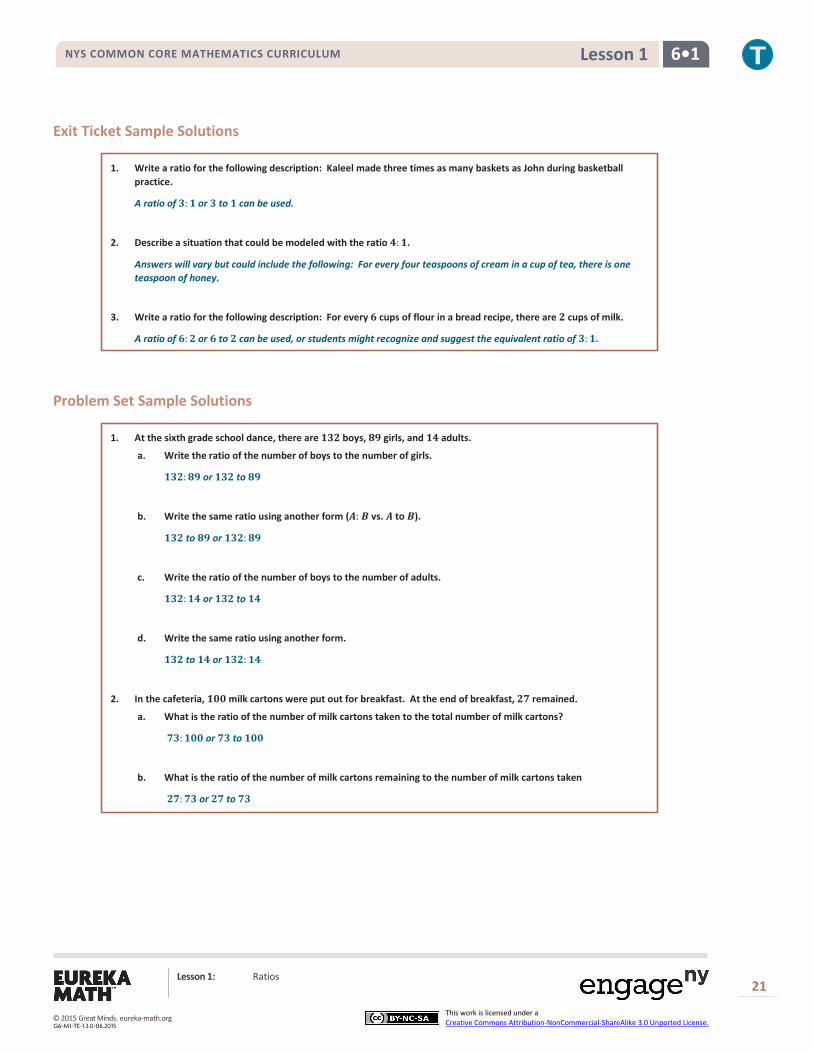
Exit Ticket Sample Solutions
1. Write a ratio for the following description: Kaleel made three times as many baskets as John during basketball practice.
A ratio of 𝟑𝟑:𝟏𝟏 or 𝟑𝟑 to 𝟏𝟏 can be used.
2. Describe a situation that could be modeled with the ratio 𝟒𝟒:𝟏𝟏.
Answers will vary but could include the following: For every four teaspoons of cream in a cup of tea, there is one teaspoon of honey.
3. Write a ratio for the following description: For every 𝟏𝟏 cups of flour in a bread recipe, there are 𝟐𝟐 cups of milk.
A ratio of 𝟏𝟏:𝟐𝟐 or 𝟏𝟏 to 𝟐𝟐 can be used, or students might recognize and suggest the equivalent ratio of 𝟑𝟑:𝟏𝟏.
Problem Set Sample Solutions
1. At the sixth grade school dance, there are 𝟏𝟏𝟑𝟑𝟐𝟐 boys, 𝟖𝟖𝟖𝟖 girls, and 𝟏𝟏𝟒𝟒 adults.
a. Write the ratio of the number of boys to the number of girls.
𝟏𝟏𝟑𝟑𝟐𝟐:𝟖𝟖𝟖𝟖 or 𝟏𝟏𝟑𝟑𝟐𝟐 to 𝟖𝟖𝟖𝟖
b. Write the same ratio using another form (𝑨𝑨: 𝑩𝑩 vs. 𝑨𝑨 to 𝑩𝑩).
𝟏𝟏𝟑𝟑𝟐𝟐 to 𝟖𝟖𝟖𝟖 or 𝟏𝟏𝟑𝟑𝟐𝟐:𝟖𝟖𝟖𝟖
c. Write the ratio of the number of boys to the number of adults.
𝟏𝟏𝟑𝟑𝟐𝟐:𝟏𝟏𝟒𝟒 or 𝟏𝟏𝟑𝟑𝟐𝟐 to 𝟏𝟏𝟒𝟒
d. Write the same ratio using another form.
𝟏𝟏𝟑𝟑𝟐𝟐 to 𝟏𝟏𝟒𝟒 or 𝟏𝟏𝟑𝟑𝟐𝟐:𝟏𝟏𝟒𝟒
2. In the cafeteria, 𝟏𝟏𝟏𝟏𝟏𝟏 milk cartons were put out for breakfast. At the end of breakfast, 𝟐𝟐𝟕𝟕 remained.
a. What is the ratio of the number of milk cartons taken to the total number of milk cartons?
𝟕𝟕𝟑𝟑:𝟏𝟏𝟏𝟏𝟏𝟏 or 𝟕𝟕𝟑𝟑 to 𝟏𝟏𝟏𝟏𝟏𝟏
b. What is the ratio of the number of milk cartons remaining to the number of milk cartons taken
𝟐𝟐𝟕𝟕:𝟕𝟕𝟑𝟑 or 𝟐𝟐𝟕𝟕 to 𝟕𝟕𝟑𝟑
Lesson 1: Ratios
21
This work is licensed under a Creative Commons Attribution-NonCommercial-ShareAlike 3.0 Unported License. © 2015 Great Minds. eureka-math.org
G6-M1-TE-1.3.0-06.2015
NYS COMMON CORE MATHEMATICS CURRICULUM 6•1 Lesson 1
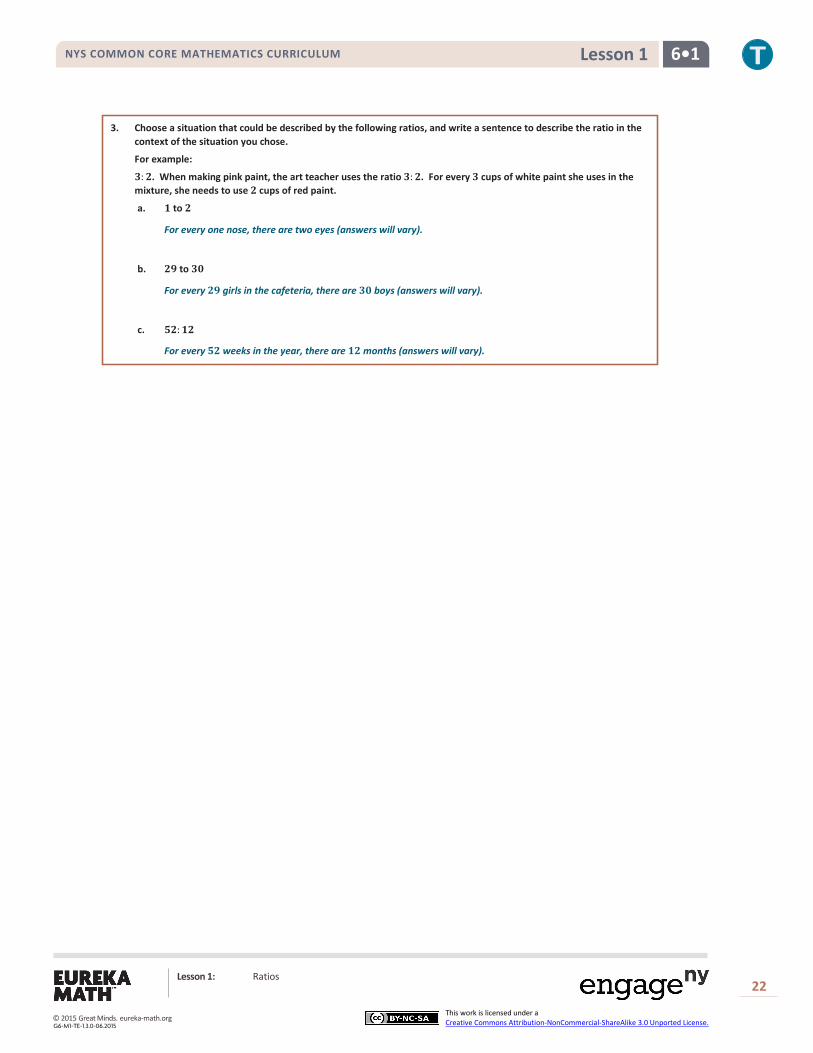
3. Choose a situation that could be described by the following ratios, and write a sentence to describe the ratio in the context of the situation you chose.
For example:
𝟑𝟑:𝟐𝟐. When making pink paint, the art teacher uses the ratio 𝟑𝟑:𝟐𝟐. For every 𝟑𝟑 cups of white paint she uses in the mixture, she needs to use 𝟐𝟐 cups of red paint.
a. 𝟏𝟏 to 𝟐𝟐
For every one nose, there are two eyes (answers will vary).
b. 𝟐𝟐𝟖𝟖 to 𝟑𝟑𝟏𝟏
For every 𝟐𝟐𝟖𝟖 girls in the cafeteria, there are 𝟑𝟑𝟏𝟏 boys (answers will vary).
c. 𝟏𝟏𝟐𝟐:𝟏𝟏𝟐𝟐
For every 𝟏𝟏𝟐𝟐 weeks in the year, there are 𝟏𝟏𝟐𝟐 months (answers will vary).
Lesson 1: Ratios
22
This work is licensed under a Creative Commons Attribution-NonCommercial-ShareAlike 3.0 Unported License. © 2015 Great Minds. eureka-math.org
G6-M1-TE-1.3.0-06.2015
NYS COMMON CORE MATHEMATICS CURRICULUM 6•1 Lesson 2
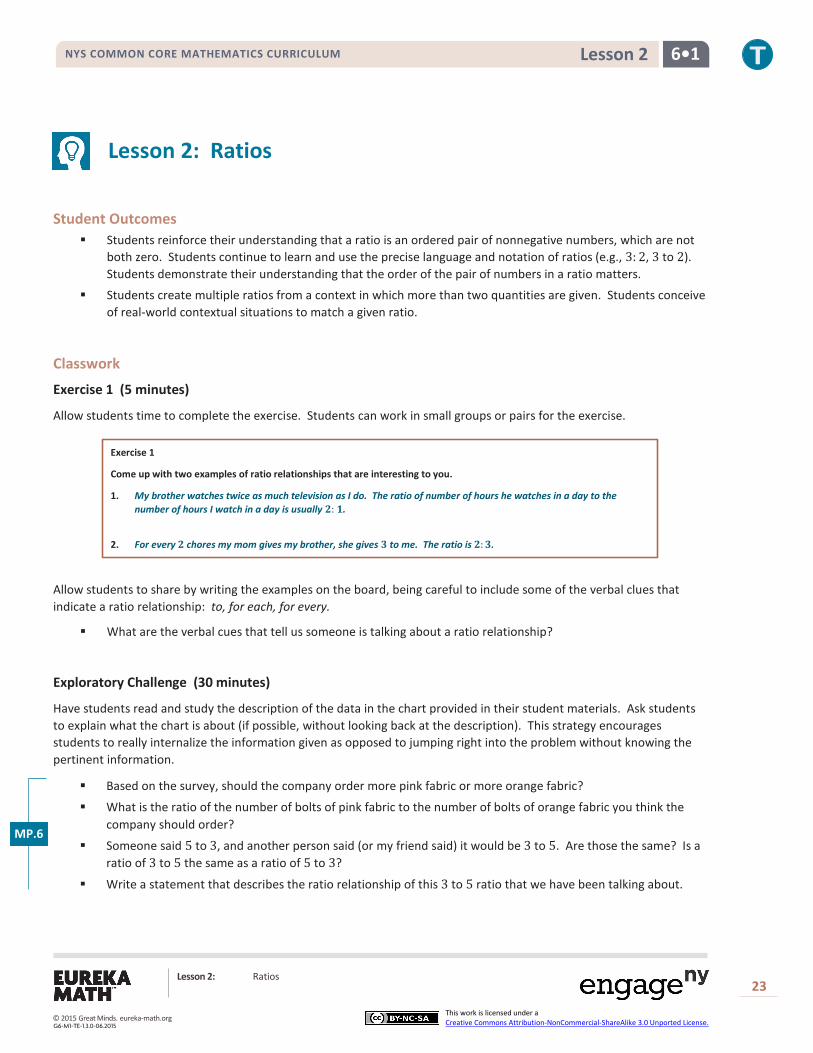
Lesson 2: Ratios
Student Outcomes
Students reinforce their understanding that a ratio is an ordered pair of nonnegative numbers, which are not both zero. Students continue to learn and use the precise language and notation of ratios (e.g., 3: 2, 3 to 2). Students demonstrate their understanding that the order of the pair of numbers in a ratio matters.
Students create multiple ratios from a context in which more than two quantities are given. Students conceive of real-world contextual situations to match a given ratio.
Classwork
Exercise 1 (5 minutes)
Allow students time to complete the exercise. Students can work in small groups or pairs for the exercise.
Exercise 1
Come up with two examples of ratio relationships that are interesting to you.
1. My brother watches twice as much television as I do. The ratio of number of hours he watches in a day to the number of hours I watch in a day is usually 𝟐𝟐: 𝟏𝟏.
2. For every 𝟐𝟐 chores my mom gives my brother, she gives 𝟑𝟑 to me. The ratio is 𝟐𝟐:𝟑𝟑.
Allow students to share by writing the examples on the board, being careful to include some of the verbal clues that indicate a ratio relationship: to, for each, for every.
What are the verbal cues that tell us someone is talking about a ratio relationship?
Exploratory Challenge (30 minutes)
Have students read and study the description of the data in the chart provided in their student materials. Ask students to explain what the chart is about (if possible, without looking back at the description). This strategy encourages students to really internalize the information given as opposed to jumping right into the problem without knowing the pertinent information.
Based on the survey, should the company order more pink fabric or more orange fabric?
What is the ratio of the number of bolts of pink fabric to the number of bolts of orange fabric you think the company should order?
Someone said 5 to 3, and another person said (or my friend said) it would be 3 to 5. Are those the same? Is a ratio of 3 to 5 the same as a ratio of 5 to 3?
Write a statement that describes the ratio relationship of this 3 to 5 ratio that we have been talking about.
MP.6
Lesson 2: Ratios
23
This work is licensed under a Creative Commons Attribution-NonCommercial-ShareAlike 3.0 Unported License. © 2015 Great Minds. eureka-math.org
G6-M1-TE-1.3.0-06.2015

NYS COMMON CORE MATHEMATICS CURRICULUM 6•1 Lesson 2
Review the statements written by students, checking and reinforcing their understanding that the ordering of the words in the description of the ratio relationship is what determines the order of the numbers in the ratio.
Allow students to work individually or in pairs to complete Exercises 2 and 3 for this Exploratory Challenge.
Exploratory Challenge
A T-shirt manufacturing company surveyed teenage girls on their favorite T-shirt color to guide the company’s decisions about how many of each color T-shirt they should design and manufacture. The results of the survey are shown here.
Favorite T-shirt Colors of Teenage Girls Surveyed
X X X X X X X X X X X X X X X X X X X
X X X X X X X Red Blue Green White Pink Orange Yellow
Exercises for Exploratory Challenge
1. Describe a ratio relationship, in the context of this survey, for which the ratio is 𝟑𝟑:𝟓𝟓.
The number of girls who answered orange to the number of girls who answered pink.
2. For each ratio relationship given, fill in the ratio it is describing.
Description of the Ratio Relationship (Underline or highlight the words or phrases that indicate the description is a ratio.) Ratio
For every 𝟕𝟕 white T-shirts they manufacture, they should manufacture 𝟒𝟒 yellow T-shirts. The ratio of the number of white T-shirts to the number of yellow T-shirts should be … 𝟕𝟕:𝟒𝟒
For every 𝟒𝟒 yellow T-shirts they manufacture, they should manufacture 𝟕𝟕 white T-shirts. The ratio of the number of yellow T-shirts to the number of white T-shirts should be … 𝟒𝟒:𝟕𝟕
The ratio of the number of girls who liked a white T-shirt best to the number of girls who liked a colored T-shirt best was … 𝟕𝟕:𝟏𝟏𝟏𝟏
For each red T-shirt they manufacture, they should manufacture 𝟒𝟒 blue T-shirts. The ratio of the number of red T-shirts to the number of blue T-shirts should be … 𝟏𝟏:𝟒𝟒
They should purchase 𝟒𝟒 bolts of yellow fabric for every 𝟑𝟑 bolts of orange fabric. The ratio of the number of bolts of yellow fabric to the number of bolts of orange fabric should be … 𝟒𝟒:𝟑𝟑
The ratio of the number of girls who chose blue or green as their favorite to the number of girls who chose pink or red as their favorite was …
𝟔𝟔:𝟔𝟔 or 𝟏𝟏:𝟏𝟏
Three out of every 𝟐𝟐𝟔𝟔 T-shirts they manufacture should be orange. The ratio of the number of orange T-shirts to the total number of T-shirts should be … 𝟑𝟑:𝟐𝟐𝟔𝟔
MP.6
Lesson 2: Ratios
24
This work is licensed under a Creative Commons Attribution-NonCommercial-ShareAlike 3.0 Unported License. © 2015 Great Minds. eureka-math.org
G6-M1-TE-1.3.0-06.2015

NYS COMMON CORE MATHEMATICS CURRICULUM 6•1 Lesson 2
Lesson Summary
Ratios can be written in two ways: 𝑨𝑨 to 𝑩𝑩 or 𝑨𝑨:𝑩𝑩.
We describe ratio relationships with words, such as to, for each, for every.
The ratio 𝑨𝑨:𝑩𝑩 is not the same as the ratio 𝑩𝑩:𝑨𝑨 (unless 𝑨𝑨 is equal to 𝑩𝑩).
3. For each ratio given, fill in a description of the ratio relationship it could describe, using the context of the survey.
Description of the Ratio Relationship (Underline or highlight the words or phrases that indicate your example is a ratio.)
Ratio
They should make 𝟒𝟒 yellow T-shirts for every 𝟑𝟑 orange T-shirts. The ratio of the number of yellow T-shirts to the number of orange T-shirts should be … 𝟒𝟒 to 𝟑𝟑
They should make 𝟑𝟑 orange T-shirts for every 𝟒𝟒 blue T-shirts. The ratio of the number of orange T-shirts to the number of blue T-shirts should be … 𝟑𝟑:𝟒𝟒
For every 𝟏𝟏𝟏𝟏 colored T-shirts, there should be 𝟕𝟕 white T-shirts. The ratio of the number of colored T-shirts to the number of white T-shirts should be … 𝟏𝟏𝟏𝟏:𝟕𝟕
𝟕𝟕 out of 𝟐𝟐𝟔𝟔 T-shirts should be white. The ratio of the number of white T-shirts to the number of total T-shirts should be … 𝟕𝟕 to 𝟐𝟐𝟔𝟔
If time permits, allow students to share some of their descriptions for the ratios in Exercise 3.
Closing (5 minutes)
Are the ratios 2: 5 and 5: 2 the same? Why or why not?
Exit Ticket (5 minutes)
Lesson 2: Ratios
25
This work is licensed under a Creative Commons Attribution-NonCommercial-ShareAlike 3.0 Unported License. © 2015 Great Minds. eureka-math.org
G6-M1-TE-1.3.0-06.2015
NYS COMMON CORE MATHEMATICS CURRICULUM 6•1 Lesson 2
Name Date
Lesson 2: Ratios
Exit Ticket Give two different ratios with a description of the ratio relationship using the following information:
There are 15 male teachers in the school. There are 35 female teachers in the school.
Lesson 2: Ratios
26
This work is licensed under a Creative Commons Attribution-NonCommercial-ShareAlike 3.0 Unported License. © 2015 Great Minds. eureka-math.org
G6-M1-TE-1.3.0-06.2015

NYS COMMON CORE MATHEMATICS CURRICULUM 6•1 Lesson 2
Exit Ticket Sample Solutions Give two different ratios with a description of the ratio relationship using the following information:
There are 𝟏𝟏𝟓𝟓 male teachers in the school. There are 𝟑𝟑𝟓𝟓 female teachers in the school.
Possible solutions:
The ratio of the number of male teachers to the number of female teachers is 𝟏𝟏𝟓𝟓:𝟑𝟑𝟓𝟓.
The ratio of the number of female teachers to the number of male teachers is 𝟑𝟑𝟓𝟓:𝟏𝟏𝟓𝟓.
The ratio of the number of female teachers to the total number of teachers in the school is 𝟑𝟑𝟓𝟓:𝟓𝟓𝟓𝟓.
The ratio of the number of male teachers to the total number of teachers in the school is 𝟏𝟏𝟓𝟓:𝟓𝟓𝟓𝟓.
*Please note that some students may write other equivalent ratios as answers. For example, 𝟑𝟑:𝟕𝟕 is equivalent to 𝟏𝟏𝟓𝟓:𝟑𝟑𝟓𝟓.
Problem Set Sample Solutions
1. Using the floor tiles design shown below, create 𝟒𝟒 different ratios related to the image. Describe the ratio relationship, and write the ratio in the form 𝑨𝑨:𝑩𝑩 or the form 𝑨𝑨 to 𝑩𝑩.
For every 𝟏𝟏𝟔𝟔 tiles, there are 𝟒𝟒 white tiles.
The ratio of the number of black tiles to the number of white tiles is 𝟐𝟐 to 𝟒𝟒.
(Answers will vary.)
2. Billy wanted to write a ratio of the number of apples to the number of peppers in his refrigerator. He wrote 𝟏𝟏: 𝟑𝟑. Did Billy write the ratio correctly? Explain your answer.
Billy is incorrect. There are 𝟑𝟑 apples and 𝟏𝟏 pepper in the picture. The ratio of the number of apples to the number of peppers is 𝟑𝟑:𝟏𝟏.
Lesson 2: Ratios
27
This work is licensed under a Creative Commons Attribution-NonCommercial-ShareAlike 3.0 Unported License. © 2015 Great Minds. eureka-math.org
G6-M1-TE-1.3.0-06.2015

NYS COMMON CORE MATHEMATICS CURRICULUM 6•1 Lesson 3
Lesson 3: Equivalent Ratios
Student Outcomes
Students develop an intuitive understanding of equivalent ratios by using tape diagrams to explore possible quantities of each part when given the part-to-part ratio. Students use tape diagrams to solve problems when the part-to-part ratio is given and the value of one of the quantities is given.
Students formalize a definition of equivalent ratios: Two ratios, 𝐴𝐴: 𝐵𝐵 and 𝐶𝐶: 𝐷𝐷, are equivalent ratios if there is a nonzero number 𝑐𝑐 such that 𝐶𝐶 = 𝑐𝑐𝐴𝐴 and 𝐷𝐷 = 𝑐𝑐𝐵𝐵.
Classwork
Exercise 1 (5 minutes)
This exercise continues to reinforce students’ ability to relate ratios to the real world, as practiced in Lessons 1 and 2. Provide students with time to think of a one-sentence story problem about a ratio.
Exercise 1
Write a one-sentence story problem about a ratio.
Answers will vary. The ratio of the number of sunny days to the number of cloudy days in this town is 𝟑𝟑: 𝟏𝟏.
Write the ratio in two different forms.
𝟑𝟑: 𝟏𝟏 and 𝟑𝟑 to 𝟏𝟏
Have students share their sentences with each other in pairs or trios. Ask a few students to share with the whole class.
Exercise 2 (15 minutes)
Ask students to read the problem and then describe in detail what the problem is about without looking back at the description, if possible. This strategy encourages students to really internalize the information given as opposed to jumping right into the problem without knowing the pertinent information.
Let’s represent this ratio in a table.
The Length of Shanni’s Ribbon
(in inches)
The Length of Mel’s Ribbon
(in inches) 7 3
14 6 21 9
We can use a tape diagram to represent the ratio of the lengths of ribbon. Let’s create one together.
Walk through the construction of the tape diagram with students as they record.
Lesson 3: Equivalent Ratios
28
This work is licensed under a Creative Commons Attribution-NonCommercial-ShareAlike 3.0 Unported License. © 2015 Great Minds. eureka-math.org
G6-M1-TE-1.3.0-06.2015

NYS COMMON CORE MATHEMATICS CURRICULUM 6•1 Lesson 3
How many units should we draw for Shanni’s portion of the ratio?
Seven
How many units should we draw for Mel’s portion of the ratio?
Three
Exercise 2
Shanni and Mel are using ribbon to decorate a project in their art class. The ratio of the length of Shanni’s ribbon to the length of Mel’s ribbon is 𝟕𝟕: 𝟑𝟑.
Draw a tape diagram to represent this ratio.
What does each unit on the tape diagram represent?
Allow students to discuss; they should conclude that they do not really know yet, but each unit represents some unit that is a length.
What if each unit on the tape diagrams represents 1 inch? What are the lengths of the ribbons? Shanni’s ribbon is 7 inches; Mel’s ribbon is 3 inches.
What is the ratio of the lengths of the ribbons?
7: 3 (Make sure that students feel comfortable expressing the ratio itself as simply the pair of numbers 7: 3 without having to add units.)
What if each unit on the tape diagrams represents 2 meters? What are the lengths of the ribbons? Shanni’s ribbon is 14 meters; Mel’s ribbon is 6 meters.
How did you find that?
Allow students to verbalize and record using a tape diagram.
What is the ratio of the length of Shanni’s ribbon to the length of Mel’s ribbon now? (Students may disagree; some may say it is 14: 6, and others may say it is still 7: 3.)
Allow them to debate and justify their answers. If there is no debate, initiate one: A friend of mine told me the ratio would be (provide the one that no one said, either 7: 3 or 14: 6). Is she right?
What if each unit represents 3 inches? What are the lengths of the ribbons? (Record. Shanni’s ribbon is 21 inches; Mel’s ribbon is 9 inches.) Why?
7 times 3 equals 21; 3 times 3 equals 9.
If each of the units represents 3 inches, what is the ratio of the length of Shanni’s ribbon to the length of Mel’s ribbon?
Allow for discussion as needed.
Shanni
Mel
Scaffolding: If students do not see that each unit represents a given length, write the length of each unit within the tape diagram units, and have students add them to find the total.
Lesson 3: Equivalent Ratios
29
This work is licensed under a Creative Commons Attribution-NonCommercial-ShareAlike 3.0 Unported License. © 2015 Great Minds. eureka-math.org
G6-M1-TE-1.3.0-06.2015

NYS COMMON CORE MATHEMATICS CURRICULUM 6•1 Lesson 3
We just explored three different possibilities for the length of the ribbon; did the number of units in our tape diagrams ever change?
No
What did these three ratios, 7: 3, 14: 6, 21: 9, all have in common?
Write the ratios on the board. Allow students to verbalize their thoughts without interjecting a definition. Encourage all to participate by asking questions of the class with respect to what each student says, such as, “Does that sound right to you?”
Mathematicians call these ratios equivalent. What ratios can we say are equivalent to 7: 3?
Shanni and Mel are using ribbon to decorate a project in their art class. The ratio of the length of Shanni’s ribbon to the length of Mel’s ribbon is 𝟕𝟕:𝟑𝟑.
Draw a tape diagram to represent this ratio.
Exercise 3 (8 minutes)
Work as a class or allow students to work independently first, and then go through as a class.
Exercise 3
Mason and Laney ran laps to train for the long-distance running team. The ratio of the number of laps Mason ran to the number of laps Laney ran was 𝟐𝟐 to 𝟑𝟑.
a. If Mason ran 𝟒𝟒 miles, how far did Laney run? Draw a tape diagram to demonstrate how you found the answer.
Shanni
Mel
𝟐𝟐 𝐦𝐦 𝟐𝟐 𝐦𝐦 𝟐𝟐 𝐦𝐦 𝟐𝟐 𝐦𝐦 𝟐𝟐 𝐦𝐦
𝟐𝟐 𝐦𝐦 𝟐𝟐 𝐦𝐦 𝟐𝟐 𝐦𝐦
𝟐𝟐 𝐦𝐦 𝟐𝟐 𝐦𝐦 Shanni
Mel
𝟑𝟑 𝐢𝐢𝐢𝐢. 𝟑𝟑 𝐢𝐢𝐢𝐢. 𝟑𝟑 𝐢𝐢𝐢𝐢. 𝟑𝟑 𝐢𝐢𝐢𝐢. 𝟑𝟑 𝐢𝐢𝐢𝐢.
𝟑𝟑 𝐢𝐢𝐢𝐢. 𝟑𝟑 𝐢𝐢𝐢𝐢. 𝟑𝟑 𝐢𝐢𝐢𝐢.
𝟑𝟑 𝐢𝐢𝐢𝐢. 𝟑𝟑 𝐢𝐢𝐢𝐢. Shanni
Mel
𝟐𝟐 𝐦𝐦𝐢𝐢. 𝟐𝟐 𝐦𝐦𝐢𝐢.
𝟐𝟐 𝐦𝐦𝐢𝐢. 𝟐𝟐 𝐦𝐦𝐢𝐢. 𝟐𝟐 𝐦𝐦𝐢𝐢.
𝟒𝟒 miles
𝟔𝟔 miles
Mason
Laney
𝟕𝟕 inches 𝟑𝟑 inches 𝟕𝟕:𝟑𝟑
𝟏𝟏𝟒𝟒 meters 𝟔𝟔 meters 𝟏𝟏𝟒𝟒:𝟔𝟔
𝟐𝟐𝟏𝟏 inches 𝟗𝟗 inches 𝟐𝟐𝟏𝟏:𝟗𝟗
Lesson 3: Equivalent Ratios
30
This work is licensed under a Creative Commons Attribution-NonCommercial-ShareAlike 3.0 Unported License. © 2015 Great Minds. eureka-math.org
G6-M1-TE-1.3.0-06.2015

NYS COMMON CORE MATHEMATICS CURRICULUM 6•1 Lesson 3
b. If Laney ran 𝟗𝟗𝟑𝟑𝟗𝟗 meters, how far did Mason run? Draw a tape diagram to determine how you found the answer.
c. What ratios can we say are equivalent to 𝟐𝟐:𝟑𝟑?
𝟒𝟒:𝟔𝟔 and 𝟔𝟔𝟐𝟐𝟗𝟗:𝟗𝟗𝟑𝟑𝟗𝟗
Exercise 4 (7 minutes)
Allow students to work the exercise independently and then compare their answers with a neighbor’s answer.
Exercise 4
Josie took a long multiple-choice, end-of-year vocabulary test. The ratio of the number of problems Josie got incorrect to the number of problems she got correct is 𝟐𝟐:𝟗𝟗.
a. If Josie missed 𝟖𝟖 questions, how many did she get correct? Draw a tape diagram to demonstrate how you found the answer.
b. If Josie missed 𝟐𝟐𝟗𝟗 questions, how many did she get correct? Draw a tape diagram to demonstrate how you found the answer.
𝟗𝟗𝟑𝟑𝟗𝟗 meters
𝟑𝟑𝟏𝟏𝟗𝟗 𝟑𝟑𝟏𝟏𝟗𝟗
𝟑𝟑𝟏𝟏𝟗𝟗 𝟑𝟑𝟏𝟏𝟗𝟗 𝟑𝟑𝟏𝟏𝟗𝟗
𝟔𝟔𝟐𝟐𝟗𝟗 meters Mason
Laney
𝟒𝟒 𝟒𝟒
𝟖𝟖
𝟒𝟒 × 𝟗𝟗
𝟑𝟑𝟔𝟔 correct
Incorrect
Correct
𝟏𝟏𝟗𝟗 𝟏𝟏𝟗𝟗
𝟐𝟐𝟗𝟗
𝟏𝟏𝟗𝟗 × 𝟗𝟗
𝟗𝟗𝟗𝟗 correct
Incorrect
Correct
Lesson 3: Equivalent Ratios
31
This work is licensed under a Creative Commons Attribution-NonCommercial-ShareAlike 3.0 Unported License. © 2015 Great Minds. eureka-math.org
G6-M1-TE-1.3.0-06.2015

NYS COMMON CORE MATHEMATICS CURRICULUM 6•1 Lesson 3
c. What ratios can we say are equivalent to 𝟐𝟐:𝟗𝟗?
𝟖𝟖:𝟑𝟑𝟔𝟔 and 𝟐𝟐𝟗𝟗:𝟗𝟗𝟗𝟗
d. Come up with another possible ratio of the number Josie got incorrect to the number she got correct.
𝟏𝟏𝟗𝟗:𝟒𝟒𝟒𝟒
e. How did you find the numbers?
Multiplied 𝟒𝟒 × 𝟐𝟐 and 𝟒𝟒 × 𝟗𝟗
f. Describe how to create equivalent ratios.
Multiply both numbers of the ratio by the same number (any number you choose).
Closing (5 minutes)
Ask students to share their answers to part (f); then, summarize by presenting the definition of equivalent ratios provided in the Lesson Summary below.
Note that if students do not have a sufficient grasp of algebra, they should not use the algebraic definition. It is acceptable to use only the second definition.
Exit Ticket (5 minutes)
𝟒𝟒 𝟒𝟒
𝟒𝟒 × 𝟗𝟗 = 𝟒𝟒𝟒𝟒
Lesson Summary
Two ratios 𝑨𝑨:𝑩𝑩 and 𝑪𝑪:𝑫𝑫 are equivalent ratios if there is a nonzero number 𝒄𝒄 such that 𝑪𝑪 = 𝒄𝒄𝑨𝑨 and 𝑫𝑫 = 𝒄𝒄𝑩𝑩. For example, two ratios are equivalent if they both have values that are equal.
Ratios are equivalent if there is a nonzero number that can be multiplied by both quantities in one ratio to equal the corresponding quantities in the second ratio.
Lesson 3: Equivalent Ratios
32
This work is licensed under a Creative Commons Attribution-NonCommercial-ShareAlike 3.0 Unported License. © 2015 Great Minds. eureka-math.org
G6-M1-TE-1.3.0-06.2015
NYS COMMON CORE MATHEMATICS CURRICULUM 6•1 Lesson 3
Name Date
Lesson 3: Equivalent Ratios
Exit Ticket Pam and her brother both open savings accounts. Each begin with a balance of zero dollars. For every two dollars that Pam saves in her account, her brother saves five dollars in his account.
1. Determine a ratio to describe the money in Pam’s account to the money in her brother’s account.
2. If Pam has 40 dollars in her account, how much money does her brother have in his account? Use a tape diagram to support your answer.
3. Record the equivalent ratio.
4. Create another possible ratio that describes the relationship between the amount of money in Pam’s account and the amount of money in her brother’s account.
Lesson 3: Equivalent Ratios
33
This work is licensed under a Creative Commons Attribution-NonCommercial-ShareAlike 3.0 Unported License. © 2015 Great Minds. eureka-math.org
G6-M1-TE-1.3.0-06.2015
NYS COMMON CORE MATHEMATICS CURRICULUM 6•1 Lesson 3
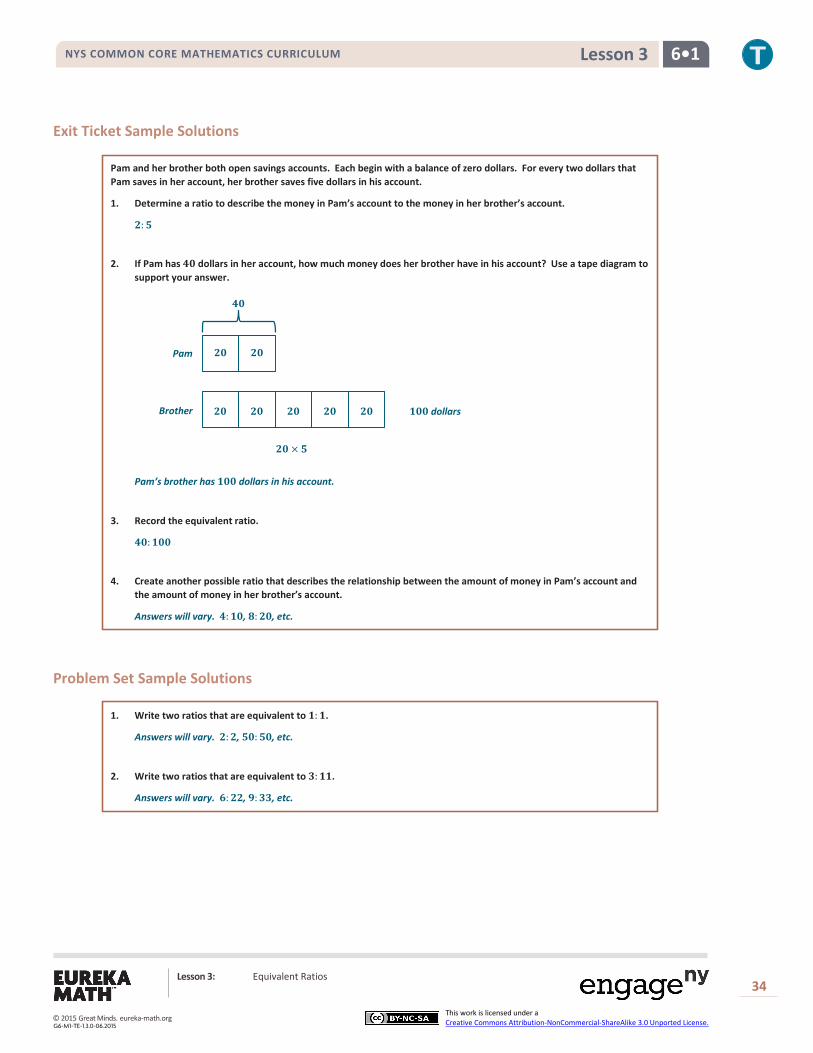
Exit Ticket Sample Solutions Pam and her brother both open savings accounts. Each begin with a balance of zero dollars. For every two dollars that Pam saves in her account, her brother saves five dollars in his account.
1. Determine a ratio to describe the money in Pam’s account to the money in her brother’s account.
𝟐𝟐:𝟒𝟒
2. If Pam has 𝟒𝟒𝟗𝟗 dollars in her account, how much money does her brother have in his account? Use a tape diagram to support your answer.
Pam’s brother has 𝟏𝟏𝟗𝟗𝟗𝟗 dollars in his account.
3. Record the equivalent ratio.
𝟒𝟒𝟗𝟗:𝟏𝟏𝟗𝟗𝟗𝟗
4. Create another possible ratio that describes the relationship between the amount of money in Pam’s account and the amount of money in her brother’s account.
Answers will vary. 𝟒𝟒:𝟏𝟏𝟗𝟗, 𝟖𝟖:𝟐𝟐𝟗𝟗, etc.
Problem Set Sample Solutions
1. Write two ratios that are equivalent to 𝟏𝟏:𝟏𝟏.
Answers will vary. 𝟐𝟐:𝟐𝟐, 𝟒𝟒𝟗𝟗:𝟒𝟒𝟗𝟗, etc.
2. Write two ratios that are equivalent to 𝟑𝟑:𝟏𝟏𝟏𝟏.
Answers will vary. 𝟔𝟔:𝟐𝟐𝟐𝟐, 𝟗𝟗:𝟑𝟑𝟑𝟑, etc.
𝟐𝟐𝟗𝟗 𝟐𝟐𝟗𝟗 𝟐𝟐𝟗𝟗 𝟐𝟐𝟗𝟗 𝟐𝟐𝟗𝟗
𝟐𝟐𝟗𝟗 × 𝟒𝟒
𝟐𝟐𝟗𝟗 𝟐𝟐𝟗𝟗
𝟒𝟒𝟗𝟗
𝟏𝟏𝟗𝟗𝟗𝟗 dollars
Pam
Brother
Lesson 3: Equivalent Ratios
34
This work is licensed under a Creative Commons Attribution-NonCommercial-ShareAlike 3.0 Unported License. © 2015 Great Minds. eureka-math.org
G6-M1-TE-1.3.0-06.2015
NYS COMMON CORE MATHEMATICS CURRICULUM 6•1 Lesson 3
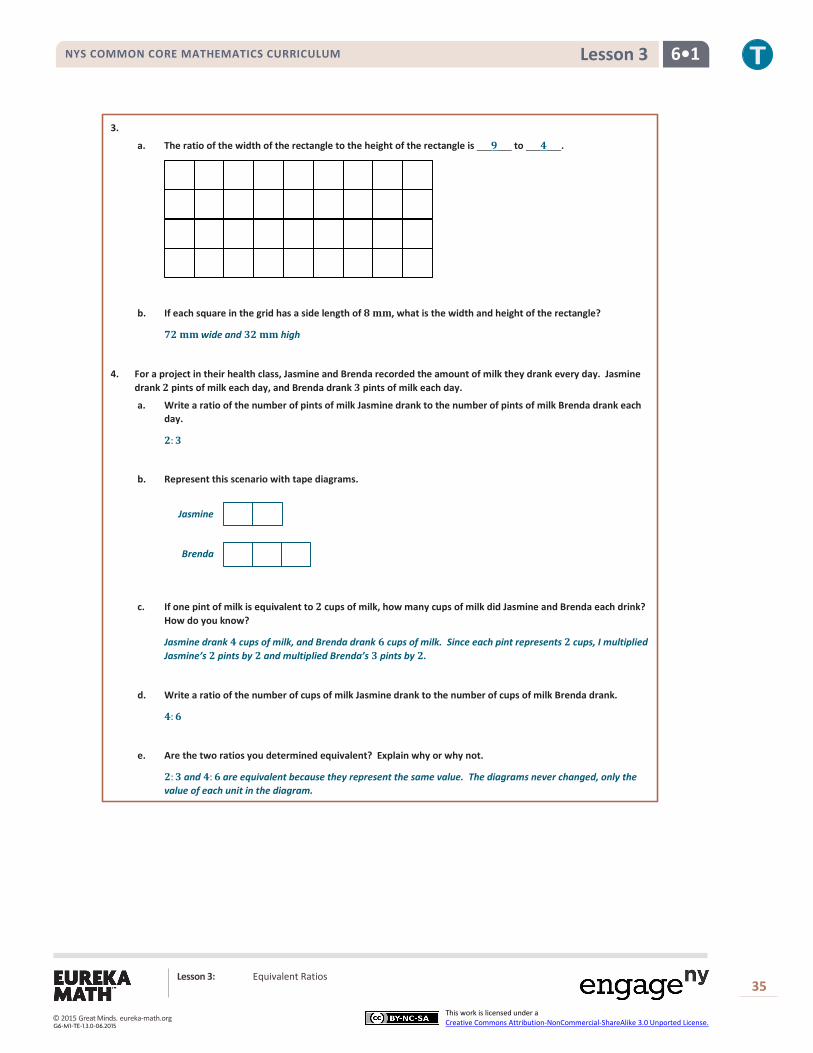
3.
a. The ratio of the width of the rectangle to the height of the rectangle is 𝟗𝟗 to 𝟒𝟒 .
b. If each square in the grid has a side length of 𝟖𝟖 𝐦𝐦𝐦𝐦, what is the width and height of the rectangle?
𝟕𝟕𝟐𝟐 𝐦𝐦𝐦𝐦 wide and 𝟑𝟑𝟐𝟐 𝐦𝐦𝐦𝐦 high
4. For a project in their health class, Jasmine and Brenda recorded the amount of milk they drank every day. Jasmine drank 𝟐𝟐 pints of milk each day, and Brenda drank 𝟑𝟑 pints of milk each day.
a. Write a ratio of the number of pints of milk Jasmine drank to the number of pints of milk Brenda drank each day.
𝟐𝟐:𝟑𝟑
b. Represent this scenario with tape diagrams.
c. If one pint of milk is equivalent to 𝟐𝟐 cups of milk, how many cups of milk did Jasmine and Brenda each drink? How do you know?
Jasmine drank 𝟒𝟒 cups of milk, and Brenda drank 𝟔𝟔 cups of milk. Since each pint represents 𝟐𝟐 cups, I multiplied Jasmine’s 𝟐𝟐 pints by 𝟐𝟐 and multiplied Brenda’s 𝟑𝟑 pints by 𝟐𝟐.
d. Write a ratio of the number of cups of milk Jasmine drank to the number of cups of milk Brenda drank.
𝟒𝟒:𝟔𝟔
e. Are the two ratios you determined equivalent? Explain why or why not.
𝟐𝟐:𝟑𝟑 and 𝟒𝟒:𝟔𝟔 are equivalent because they represent the same value. The diagrams never changed, only the value of each unit in the diagram.
Jasmine
Brenda
Lesson 3: Equivalent Ratios
35
This work is licensed under a Creative Commons Attribution-NonCommercial-ShareAlike 3.0 Unported License. © 2015 Great Minds. eureka-math.org
G6-M1-TE-1.3.0-06.2015

NYS COMMON CORE MATHEMATICS CURRICULUM 6•1 Lesson 4
Lesson 4: Equivalent Ratios
Student Outcomes
Given a ratio, students identify equivalent ratios. Students use tape diagrams and the description of equivalent ratios to determine if two ratios are equivalent.
Students relate the nonzero number 𝑐𝑐 in the description of equivalent ratios to the tape diagrams they have been using to find equivalent ratios.
Classwork
Example 1 (7 minutes)
Present Example 1 by reading it aloud or asking a student to read it aloud. Then encourage students to discuss what would need to be done. Guide students to a mathematically correct conclusion, and have them summarize their decisions.
Conclude by having students come up with the total number of students that would make Jasmine’s statement true.
Example 1
The morning announcements said that two out of every seven sixth-grade students in the school have an overdue library book. Jasmine said, “That would mean 𝟐𝟐𝟐𝟐 of us have overdue books!” Grace argued, “No way. That is way too high.” How can you determine who is right?
You would have to know the total number of sixth-grade students, and then see if the ratio 𝟐𝟐𝟐𝟐: total is equivalent to 𝟐𝟐:𝟕𝟕.
𝟐𝟐: 𝟕𝟕 𝟐𝟐𝟐𝟐: 𝟖𝟖𝟐𝟐
Let’s look at the ratios we determined in Example 1. We found the ratios 2: 7 and 24: 84. How have we previously determined two sets of ratios to be equivalent?
Each number in the first ratio must be multiplied by the same nonzero number in order to determine the corresponding numbers in the second ratio.
Let’s test these two ratios to see if they are equivalent. Since the corresponding number to 2 in the second ratio is 24, what must we multiply 2 by to find 24? 12
We can determine from this that 12 is the nonzero number 𝑐𝑐 that we will multiply each number in the first ratio by to determine the corresponding numbers in the second ratio.
If we multiply 2 by 12, then following the description, we must also multiply 7 by 12. What is the product of 7 × 12? 84
× 𝟏𝟏𝟐𝟐 × 𝟏𝟏𝟐𝟐
Lesson 4: Equivalent Ratios
36
This work is licensed under a Creative Commons Attribution-NonCommercial-ShareAlike 3.0 Unported License. © 2015 Great Minds. eureka-math.org
G6-M1-TE-1.3.0-06.2015

NYS COMMON CORE MATHEMATICS CURRICULUM 6•1 Lesson 4
Is 84 the number that corresponds to 7?
Yes
Allow students to finish the remaining problems independently.
Allow students to indicate their answers orally for each problem and debate with classmates when there are disagreements. If needed, step in and guide students to the correct reasoning process, ensuring all students come to understand how to use the description to determine equivalence.
Exercise 1 (20 minutes) Exercise 1
Decide whether or not each of the following pairs of ratios is equivalent.
If the ratios are not equivalent, find a ratio that is equivalent to the first ratio.
If the ratios are equivalent, identify the nonzero number, 𝒄𝒄, that could be used to multiply each number of the first ratio by in order to get the numbers for the second ratio.
a. 𝟔𝟔:𝟏𝟏𝟏𝟏 and 𝟐𝟐𝟐𝟐:𝟖𝟖𝟖𝟖 Yes, the value, 𝒄𝒄, is
X No, an equivalent ratio would be 𝟐𝟐𝟐𝟐:𝟕𝟕𝟕𝟕
b. 𝟎𝟎:𝟓𝟓 and 𝟎𝟎: 𝟐𝟐𝟎𝟎 X Yes, the value, 𝒄𝒄, is 𝟐𝟐
No, an equivalent ratio would be
Exercise 2 (8 minutes) Exercise 2
In a bag of mixed walnuts and cashews, the ratio of the number of walnuts to the number of cashews is 𝟓𝟓:𝟔𝟔. Determine the number of walnuts that are in the bag if there are 𝟓𝟓𝟐𝟐 cashews. Use a tape diagram to support your work. Justify your answer by showing that the new ratio you created of the number of walnuts to the number of cashews is equivalent to 𝟓𝟓:𝟔𝟔.
𝟓𝟓𝟐𝟐 divided by 𝟔𝟔 equals 𝟗𝟗. 𝟓𝟓 times 𝟗𝟗 equals 𝟐𝟐𝟓𝟓. There are 𝟐𝟐𝟓𝟓 walnuts in the bag. The ratio of the number of walnuts to the number of cashews is 𝟐𝟐𝟓𝟓:𝟓𝟓𝟐𝟐. That ratio is equivalent to 𝟓𝟓:𝟔𝟔.
𝟓𝟓:𝟔𝟔 and 𝟐𝟐𝟓𝟓:𝟓𝟓𝟐𝟐
𝟗𝟗 𝟗𝟗 𝟗𝟗 𝟗𝟗 𝟗𝟗
𝟗𝟗 𝟗𝟗 𝟗𝟗 𝟗𝟗 𝟗𝟗 𝟗𝟗
𝟓𝟓𝟐𝟐
Walnuts
Cashews
𝟎𝟎 × 𝟐𝟐 = 𝟎𝟎 𝟓𝟓 × 𝟐𝟐 = 𝟐𝟐𝟎𝟎
× 𝟕𝟕 × 𝟖𝟖
? × 𝟐𝟐
× 𝟗𝟗 × 𝟗𝟗
Lesson 4: Equivalent Ratios
37
This work is licensed under a Creative Commons Attribution-NonCommercial-ShareAlike 3.0 Unported License. © 2015 Great Minds. eureka-math.org
G6-M1-TE-1.3.0-06.2015

NYS COMMON CORE MATHEMATICS CURRICULUM 6•1 Lesson 4
Closing (5 minutes)
How can we use the description of equivalent ratios to find an equivalent ratio?
What do the numbers in the boxes of the tape diagram represent in terms of the ratios? Inside each of the boxes, the nonzero number 𝑐𝑐 comes from the value of one unit in the tape diagram.
We can determine that to find an equivalent ratio, the nonzero number 𝑐𝑐 must be the same in each box in the tape diagram. This can also be described as constant. If the number 𝑐𝑐 is constantly the same number, then the ratios are equivalent. As in Exercise 4, the value of each unit is 9. It is constantly nine. We multiplied 5 by the constant 9 and multiplied 6 by the constant 9 to determine the equivalent ratio.
Exit Ticket (5 minutes)
Lesson Summary
Recall the description:
Two ratios 𝑨𝑨:𝑩𝑩 and 𝑪𝑪:𝑫𝑫 are equivalent ratios if there is a nonzero number 𝒄𝒄 such that 𝑪𝑪 = 𝒄𝒄𝑨𝑨 and 𝑫𝑫 = 𝒄𝒄𝑩𝑩. For example, two ratios are equivalent if they both have values that are equal.
Ratios are equivalent if there is a nonzero number that can be multiplied by both quantities in one ratio to equal the corresponding quantities in the second ratio.
This description can be used to determine whether two ratios are equivalent.
Lesson 4: Equivalent Ratios
38
This work is licensed under a Creative Commons Attribution-NonCommercial-ShareAlike 3.0 Unported License. © 2015 Great Minds. eureka-math.org
G6-M1-TE-1.3.0-06.2015

NYS COMMON CORE MATHEMATICS CURRICULUM 6•1 Lesson 4
Name Date
Lesson 4: Equivalent Ratios
Exit Ticket There are 35 boys in the sixth grade. The number of girls in the sixth grade is 42. Lonnie says that means the ratio of the number of boys in the sixth grade to the number of girls in the sixth grade is 5: 7. Is Lonnie correct? Show why or why not.
Lesson 4: Equivalent Ratios
39
This work is licensed under a Creative Commons Attribution-NonCommercial-ShareAlike 3.0 Unported License. © 2015 Great Minds. eureka-math.org
G6-M1-TE-1.3.0-06.2015

NYS COMMON CORE MATHEMATICS CURRICULUM 6•1 Lesson 4
Exit Ticket Sample Solutions There are 𝟑𝟑𝟓𝟓 boys in the sixth grade. The number of girls in the sixth grade is 𝟐𝟐𝟐𝟐. Lonnie says that means the ratio of the number of boys in the sixth grade to the number of girls in sixth grade is 𝟓𝟓:𝟕𝟕. Is Lonnie correct? Show why or why not.
No, Lonnie is not correct. The ratios 𝟓𝟓:𝟕𝟕 and 𝟑𝟑𝟓𝟓:𝟐𝟐𝟐𝟐 are not equivalent. They are not equivalent because 𝟓𝟓 × 𝟕𝟕 = 𝟑𝟑𝟓𝟓, but 𝟕𝟕 × 𝟕𝟕 = 𝟐𝟐𝟗𝟗, not 𝟐𝟐𝟐𝟐.
Problem Set Sample Solutions
1. Use diagrams or the description of equivalent ratios to show that the ratios 𝟐𝟐:𝟑𝟑, 𝟐𝟐:𝟔𝟔, and 𝟖𝟖:𝟏𝟏𝟐𝟐 are equivalent.
2. Prove that 𝟑𝟑:𝟖𝟖 is equivalent to 𝟏𝟏𝟐𝟐:𝟑𝟑𝟐𝟐.
a. Use diagrams to support your answer.
𝟏𝟏𝟐𝟐 is 𝟑𝟑 times 𝟐𝟐; 𝟑𝟑𝟐𝟐 is 𝟖𝟖 times 𝟐𝟐.
b. Use the description of equivalent ratios to support your answer.
Answers will vary. Descriptions should include multiplicative comparisons, such as 𝟏𝟏𝟐𝟐 is 𝟑𝟑 times 𝟐𝟐 and 𝟑𝟑𝟐𝟐 is 𝟖𝟖 times 𝟐𝟐. The constant number, 𝒄𝒄, is 𝟐𝟐.
3. The ratio of Isabella’s money to Shane’s money is 𝟑𝟑:𝟏𝟏𝟏𝟏. If Isabella has $𝟑𝟑𝟑𝟑, how much money do Shane and Isabella have together? Use diagrams to illustrate your answer.
Isabella has $𝟑𝟑𝟑𝟑, and Shane has $𝟏𝟏𝟐𝟐𝟏𝟏. $𝟑𝟑𝟑𝟑+ $𝟏𝟏𝟐𝟐𝟏𝟏 = $𝟏𝟏𝟓𝟓𝟐𝟐. Together, Isabella and Shane have $𝟏𝟏𝟓𝟓𝟐𝟐.𝟎𝟎𝟎𝟎.
𝟖𝟖:𝟏𝟏𝟐𝟐
𝟖𝟖
𝟏𝟏𝟐𝟐 𝟖𝟖 is 𝟐𝟐 times 𝟐𝟐; 𝟏𝟏𝟐𝟐 is 𝟑𝟑 times 𝟐𝟐. The constant number, 𝒄𝒄, is 𝟐𝟐.
𝟐𝟐:𝟔𝟔
𝟐𝟐
𝟔𝟔 𝟐𝟐 is 𝟐𝟐 times 𝟐𝟐; 𝟔𝟔 is 𝟑𝟑 times 𝟐𝟐. The constant number, 𝒄𝒄, is 𝟐𝟐.
𝟑𝟑𝟐𝟐
𝟏𝟏𝟐𝟐
𝟑𝟑𝟑𝟑
Isabella
Shane
𝟑𝟑𝟑𝟑÷ 𝟑𝟑 = 𝟏𝟏𝟏𝟏
Each unit represents $𝟏𝟏𝟏𝟏.𝟎𝟎𝟎𝟎.
𝟏𝟏𝟏𝟏× 𝟏𝟏𝟏𝟏 = 𝟏𝟏𝟐𝟐𝟏𝟏.𝟎𝟎𝟎𝟎
Lesson 4: Equivalent Ratios
40
This work is licensed under a Creative Commons Attribution-NonCommercial-ShareAlike 3.0 Unported License. © 2015 Great Minds. eureka-math.org
G6-M1-TE-1.3.0-06.2015
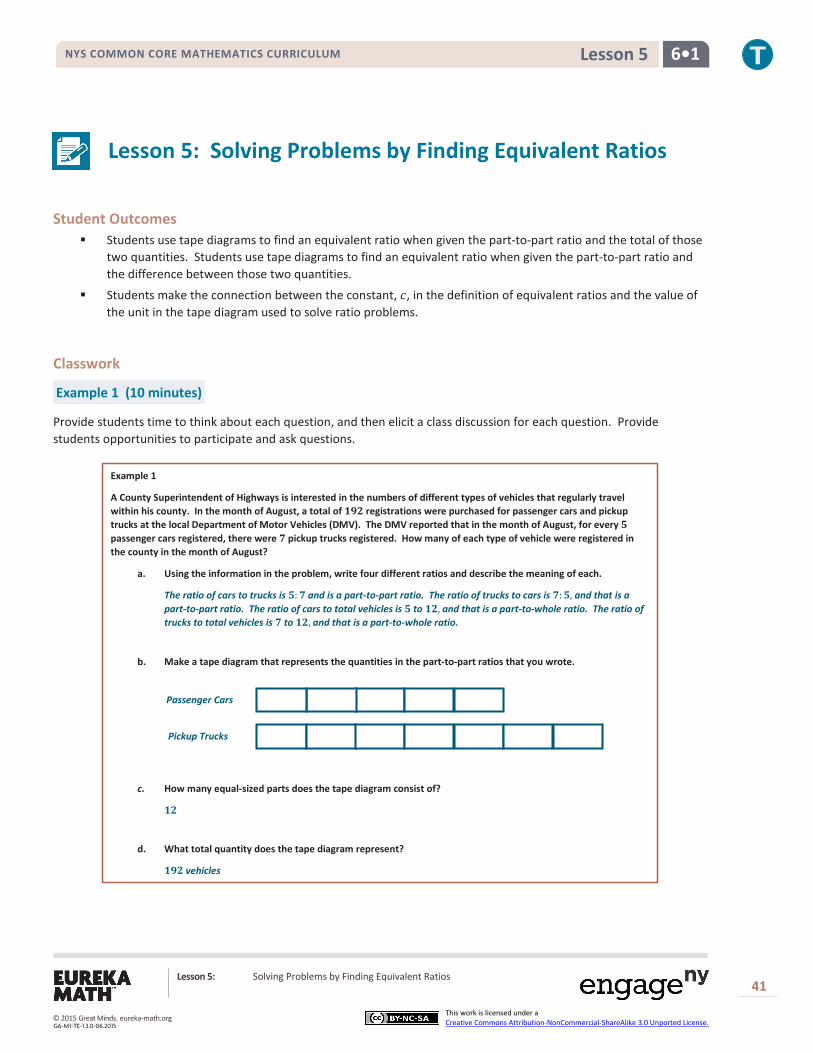
NYS COMMON CORE MATHEMATICS CURRICULUM 6•1 Lesson 5
Lesson 5: Solving Problems by Finding Equivalent Ratios
Student Outcomes
Students use tape diagrams to find an equivalent ratio when given the part-to-part ratio and the total of those two quantities. Students use tape diagrams to find an equivalent ratio when given the part-to-part ratio and the difference between those two quantities.
Students make the connection between the constant, 𝑐𝑐, in the definition of equivalent ratios and the value of the unit in the tape diagram used to solve ratio problems.
Classwork
Example 1 (10 minutes)
Provide students time to think about each question, and then elicit a class discussion for each question. Provide students opportunities to participate and ask questions.
Example 1
A County Superintendent of Highways is interested in the numbers of different types of vehicles that regularly travel within his county. In the month of August, a total of 𝟏𝟏𝟏𝟏𝟏𝟏 registrations were purchased for passenger cars and pickup trucks at the local Department of Motor Vehicles (DMV). The DMV reported that in the month of August, for every 𝟓𝟓 passenger cars registered, there were 𝟕𝟕 pickup trucks registered. How many of each type of vehicle were registered in the county in the month of August?
a. Using the information in the problem, write four different ratios and describe the meaning of each.
The ratio of cars to trucks is 𝟓𝟓:𝟕𝟕 and is a part-to-part ratio. The ratio of trucks to cars is 𝟕𝟕:𝟓𝟓, and that is a part-to-part ratio. The ratio of cars to total vehicles is 𝟓𝟓 to 𝟏𝟏𝟏𝟏, and that is a part-to-whole ratio. The ratio of trucks to total vehicles is 𝟕𝟕 to 𝟏𝟏𝟏𝟏, and that is a part-to-whole ratio.
b. Make a tape diagram that represents the quantities in the part-to-part ratios that you wrote.
c. How many equal-sized parts does the tape diagram consist of?
𝟏𝟏𝟏𝟏
d. What total quantity does the tape diagram represent?
𝟏𝟏𝟏𝟏𝟏𝟏 vehicles
Passenger Cars
Pickup Trucks
Lesson 5: Solving Problems by Finding Equivalent Ratios
41
This work is licensed under a Creative Commons Attribution-NonCommercial-ShareAlike 3.0 Unported License. © 2015 Great Minds. eureka-math.org
G6-M1-TE-1.3.0-06.2015

NYS COMMON CORE MATHEMATICS CURRICULUM 6•1 Lesson 5
Commercial Vehicles
e. What value does each individual part of the tape diagram represent?
Divide the total quantity into 𝟏𝟏𝟏𝟏 equal-sized parts:
𝟏𝟏𝟏𝟏𝟏𝟏𝟏𝟏𝟏𝟏
= 𝟏𝟏𝟏𝟏
f. How many of each type of vehicle were registered in August?
𝟓𝟓 ∙ 𝟏𝟏𝟏𝟏 = 𝟖𝟖𝟖𝟖 passenger cars
𝟕𝟕 ∙ 𝟏𝟏𝟏𝟏 = 𝟏𝟏𝟏𝟏𝟏𝟏 pickup trucks
Example 2 (10 minutes)
Find the values of the partial quantities in Example 2.
Example 2
The Superintendent of Highways is further interested in the numbers of commercial vehicles that frequently use the county’s highways. He obtains information from the Department of Motor Vehicles for the month of September and finds that for every 𝟏𝟏𝟏𝟏 non-commercial vehicles, there were 𝟓𝟓 commercial vehicles. If there were 𝟏𝟏𝟖𝟖𝟖𝟖 more non-commercial vehicles than commercial vehicles, how many of each type of vehicle frequently use the county’s highways during the month of September?
These 𝟏𝟏 sections represent the “more than commercial vehicles,” which is 𝟏𝟏𝟖𝟖𝟖𝟖.
To determine how many cars each section represents, divide 𝟏𝟏𝟖𝟖𝟖𝟖 by 𝟏𝟏 to get 𝟏𝟏𝟏𝟏. Therefore, each section of the tape diagram represents 𝟏𝟏𝟏𝟏 vehicles.
Since every section of the tape diagram represents 12 vehicles, demonstrate how to calculate the number of each type of vehicle.
168 non-commercial vehicles and 60 commercial vehicles
Exercises (16 minutes)
In pairs or small groups, students complete the following problems. After students are given time to work, have groups explain their answers.
Exercises
1. The ratio of the number of people who own a smartphone to the number of people who own a flip phone is 𝟏𝟏:𝟑𝟑. If 𝟓𝟓𝟖𝟖𝟖𝟖 more people own a smartphone than a flip phone, how many people own each type of phone?
𝟏𝟏,𝟖𝟖𝟖𝟖𝟖𝟖 people own a smartphone, and 𝟏𝟏,𝟓𝟓𝟖𝟖𝟖𝟖 people own a flip phone.
MP.5
Lesson 5: Solving Problems by Finding Equivalent Ratios
42
This work is licensed under a Creative Commons Attribution-NonCommercial-ShareAlike 3.0 Unported License.
Non-Commercial Vehicles
© 2015 Great Minds. eureka-math.orgG6-M1-TE-1.3.0-06.2015

NYS COMMON CORE MATHEMATICS CURRICULUM 6•1 Lesson 5
2. Sammy and David were selling water bottles to raise money for new football uniforms. Sammy sold 𝟓𝟓 water bottles for every 𝟑𝟑 water bottles David sold. Together they sold 𝟏𝟏𝟏𝟏𝟖𝟖 water bottles. How many did each boy sell?
Sammy sold 𝟏𝟏𝟖𝟖𝟖𝟖 water bottles, and David sold 𝟏𝟏𝟖𝟖 water bottles.
3. Ms. Johnson and Ms. Siple were folding report cards to send home to parents. The ratio of the number of report cards Ms. Johnson folded to the number of report cards Ms. Siple folded is 𝟏𝟏:𝟑𝟑. At the end of the day, Ms. Johnson and Ms. Siple folded a total of 𝟑𝟑𝟖𝟖𝟖𝟖 report cards. How many did each person fold?
Ms. Johnson folded 𝟏𝟏𝟏𝟏𝟖𝟖 report cards, and Ms. Siple folded 𝟏𝟏𝟖𝟖𝟖𝟖 report cards.
4. At a country concert, the ratio of the number of boys to the number of girls is 𝟏𝟏:𝟕𝟕. If there are 𝟏𝟏𝟓𝟓𝟖𝟖 more girls than boys, how many boys are at the concert?
There are 𝟏𝟏𝟖𝟖𝟖𝟖 boys at the country concert.
Closing (4 minutes)
Explain how tape diagrams can be helpful in solving ratio word problems.
Exit Ticket (5 minutes)
Lesson 5: Solving Problems by Finding Equivalent Ratios
43
This work is licensed under a Creative Commons Attribution-NonCommercial-ShareAlike 3.0 Unported License. © 2015 Great Minds. eureka-math.org
G6-M1-TE-1.3.0-06.2015

NYS COMMON CORE MATHEMATICS CURRICULUM 6•1 Lesson 5
Name Date
Lesson 5: Solving Problems by Finding Equivalent Ratios
Exit Ticket When Carla looked out at the school parking lot, she noticed that for every 2 minivans, there were 5 other types of vehicles. If there are 161 vehicles in the parking lot, how many of them are not minivans?
Lesson 5: Solving Problems by Finding Equivalent Ratios
44
This work is licensed under a Creative Commons Attribution-NonCommercial-ShareAlike 3.0 Unported License. © 2015 Great Minds. eureka-math.org
G6-M1-TE-1.3.0-06.2015

NYS COMMON CORE MATHEMATICS CURRICULUM 6•1 Lesson 5
Exit Ticket Sample Solution
When Carla looked out at the school parking lot, she noticed that for every 𝟏𝟏 minivans, there were 𝟓𝟓 other types of vehicles. If there are 𝟏𝟏𝟏𝟏𝟏𝟏 vehicles in the parking lot, how many of them are not minivans?
𝟓𝟓 out of 𝟕𝟕 vehicles are not minivans. 𝟕𝟕 × 𝟏𝟏𝟑𝟑 = 𝟏𝟏𝟏𝟏𝟏𝟏. So, 𝟓𝟓 × 𝟏𝟏𝟑𝟑 = 𝟏𝟏𝟏𝟏𝟓𝟓. 𝟏𝟏𝟏𝟏𝟓𝟓 of the vehicles are not minivans.
Problem Set Sample Solutions
1. Last summer, at Camp Okey-Fun-Okey, the ratio of the number of boy campers to the number of girl campers was 𝟖𝟖:𝟕𝟕. If there were a total of 𝟏𝟏𝟏𝟏𝟓𝟓 campers, how many boy campers were there? How many girl campers?
𝟏𝟏𝟖𝟖𝟏𝟏 boys and 𝟏𝟏𝟏𝟏 girls are at Camp Okey-Fun-Okey.
2. The student-to-faculty ratio at a small college is 𝟏𝟏𝟕𝟕:𝟑𝟑. The total number of students and faculty is 𝟕𝟕𝟏𝟏𝟖𝟖. How many faculty members are there at the college? How many students?
𝟏𝟏𝟏𝟏𝟏𝟏 faculty members and 𝟏𝟏𝟏𝟏𝟏𝟏 students are at the college.
3. The Speedy Fast Ski Resort has started to keep track of the number of skiers and snowboarders who bought season passes. The ratio of the number of skiers who bought season passes to the number of snowboarders who bought season passes is 𝟏𝟏:𝟏𝟏. If 𝟏𝟏,𝟏𝟏𝟓𝟓𝟖𝟖 more snowboarders bought season passes than skiers, how many snowboarders and how many skiers bought season passes?
𝟏𝟏,𝟏𝟏𝟓𝟓𝟖𝟖 skiers bought season passes, and 𝟏𝟏,𝟓𝟓𝟖𝟖𝟖𝟖 snowboarders bought season passes.
4. The ratio of the number of adults to the number of students at the prom has to be 𝟏𝟏:𝟏𝟏𝟖𝟖. Last year there were 𝟏𝟏𝟕𝟕𝟕𝟕 more students than adults at the prom. If the school is expecting the same attendance this year, how many adults have to attend the prom?
𝟓𝟓𝟑𝟑 adults have to be at the prom to keep the 𝟏𝟏:𝟏𝟏𝟖𝟖 ratio.
Lesson 5: Solving Problems by Finding Equivalent Ratios
45
This work is licensed under a Creative Commons Attribution-NonCommercial-ShareAlike 3.0 Unported License. © 2015 Great Minds. eureka-math.org
G6-M1-TE-1.3.0-06.2015

NYS COMMON CORE MATHEMATICS CURRICULUM 6•1 Lesson 6
Lesson 6: Solving Problems by Finding Equivalent Ratios
Student Outcomes
Students use tape diagrams to solve problems when given a ratio between two quantities and a change to those quantities that changes the ratio.
Classwork
Exercise 1 (10 minutes)
Lead the completion of Exercise 1, as outlined. Start by asking students to read the problem and then describe the problem in detail without having to look back at the problem. This technique helps students process what they have read before attempting to model the problem.
Any suggestions on how to start the problem? Answers will vary.
Use tape diagrams to model the occupied rooms and unoccupied rooms on Sunday night.
Provide students time to make their own tape diagrams.
The total number of occupied rooms is 432, and there are 6 sections on the tape diagram. So, each section represents 72 rooms.
How can we use this information to answer the question? Answers will vary.
After students share their thoughts, model how to solve the problem.
Exercises
1. The Business Direct Hotel caters to people who travel for different types of business trips. On Saturday night there is not a lot of business travel, so the ratio of the number of occupied rooms to the number of unoccupied rooms is 𝟐𝟐:𝟓𝟓. However, on Sunday night the ratio of the number of occupied rooms to the number of unoccupied rooms is 𝟔𝟔:𝟏𝟏 due to the number of business people attending a large conference in the area. If the Business Direct Hotel has 𝟒𝟒𝟒𝟒𝟐𝟐 occupied rooms on Sunday night, how many unoccupied rooms does it have on Saturday night?
There were 𝟒𝟒𝟔𝟔𝟑𝟑 unoccupied rooms on Saturday night.
Remind students that the total number of rooms in the hotel remains the same. Explain to students that there are still seven sections on the tape diagram, but they are just distributed between occupied and unoccupied rooms differently. Therefore, each section still represents 72 rooms.
Occupied Rooms
Unoccupied Rooms Unoccupied Rooms
Occupied Rooms
Sunday
Saturday
Lesson 6: Solving Problems by Finding Equivalent Ratios
46
This work is licensed under a Creative Commons Attribution-NonCommercial-ShareAlike 3.0 Unported License. © 2015 Great Minds. eureka-math.org
G6-M1-TE-1.3.0-06.2015

NYS COMMON CORE MATHEMATICS CURRICULUM 6•1 Lesson 6
Exercises 2–7 (25 minutes)
Have students work in small groups to solve each problem. Assign each group a problem to share with the class. Leave about 7−10 minutes to allow groups to present to the class.
2. Peter is trying to work out by completing sit-ups and push-ups in order to gain muscle mass. Originally, Peter was completing five sit-ups for every three push-ups, but then he injured his shoulder. After the injury, Peter completed the same number of repetitions as he did before his injury, but he completed seven sit-ups for every one push-up. During a training session after his injury, Peter completed eight push-ups. How many push-ups was Peter completing before his injury?
Peter was completing 𝟐𝟐𝟒𝟒 push-ups before his injury.
3. Tom and Rob are brothers who like to make bets about the outcomes of different contests between them. Before the last bet, the ratio of the amount of Tom’s money to the amount of Rob’s money was 𝟒𝟒:𝟕𝟕. Rob lost the latest competition, and now the ratio of the amount of Tom’s money to the amount of Rob’s money is 𝟖𝟖:𝟒𝟒. If Rob had $𝟐𝟐𝟖𝟖𝟑𝟑 before the last competition, how much does Rob have now that he lost the bet?
Rob has $𝟏𝟏𝟐𝟐𝟑𝟑.
4. A sporting goods store ordered new bikes and scooters. For every 𝟒𝟒 bikes ordered, 𝟒𝟒 scooters were ordered. However, bikes were way more popular than scooters, so the store changed its next order. The new ratio of the number of bikes ordered to the number of scooters ordered was 𝟓𝟓:𝟐𝟐. If the same amount of sporting equipment was ordered in both orders and 𝟔𝟔𝟒𝟒 scooters were ordered originally, how many bikes were ordered as part of the new order?
𝟖𝟖𝟑𝟑 bikes were ordered as part of the new order.
5. At the beginning of Grade 6, the ratio of the number of advanced math students to the number of regular math students was 𝟒𝟒:𝟖𝟖. However, after taking placement tests, students were moved around changing the ratio of the number of advanced math students to the number of regular math students to 𝟒𝟒:𝟕𝟕. How many students started in regular math and advanced math if there were 𝟗𝟗𝟐𝟐 students in advanced math after the placement tests?
There were 𝟔𝟔𝟗𝟗 students in advanced math and 𝟏𝟏𝟖𝟖𝟒𝟒 students in regular math before the placement tests.
6. During first semester, the ratio of the number of students in art class to the number of students in gym class was 𝟐𝟐:𝟕𝟕. However, the art classes were really small, and the gym classes were large, so the principal changed students’ classes for second semester. In second semester, the ratio of the number of students in art class to the number of students in gym class was 𝟓𝟓:𝟒𝟒. If 𝟕𝟕𝟓𝟓 students were in art class second semester, how many were in art class and gym class first semester?
There were 𝟒𝟒𝟑𝟑 students in art class and 𝟏𝟏𝟑𝟑𝟓𝟓 students in gym class during first semester.
7. Jeanette wants to save money, but she has not been good at it in the past. The ratio of the amount of money in Jeanette’s savings account to the amount of money in her checking account was 𝟏𝟏:𝟔𝟔. Because Jeanette is trying to get better at saving money, she moves some money out of her checking account and into her savings account. Now, the ratio of the amount of money in her savings account to the amount of money in her checking account is 𝟒𝟒:𝟒𝟒. If Jeanette had $𝟗𝟗𝟒𝟒𝟔𝟔 in her checking account before moving money, how much money does Jeanette have in each account after moving money?
Jeanette has $𝟔𝟔𝟐𝟐𝟒𝟒 in her savings account and $𝟒𝟒𝟔𝟔𝟖𝟖 in her checking account after moving money.
Lesson 6: Solving Problems by Finding Equivalent Ratios
47
This work is licensed under a Creative Commons Attribution-NonCommercial-ShareAlike 3.0 Unported License. © 2015 Great Minds. eureka-math.org
G6-M1-TE-1.3.0-06.2015
NYS COMMON CORE MATHEMATICS CURRICULUM 6•1 Lesson 6
Closing (5 minutes)
What advice would you have for a friend who missed class today and needed to do the Problem Set?
If a problem has a ratio that changes, it is best to do one tape diagram for the before and another for the after so you can visualize the change.
Exit Ticket (5 minutes)
Lesson Summary
When solving problems in which a ratio between two quantities changes, it is helpful to draw a before tape diagram and an after tape diagram.
Lesson 6: Solving Problems by Finding Equivalent Ratios
48
This work is licensed under a Creative Commons Attribution-NonCommercial-ShareAlike 3.0 Unported License. © 2015 Great Minds. eureka-math.org
G6-M1-TE-1.3.0-06.2015
NYS COMMON CORE MATHEMATICS CURRICULUM 6•1 Lesson 6
Name Date
Lesson 6: Solving Problems by Finding Equivalent Ratios
Exit Ticket Students surveyed boys and girls separately to determine which sport was enjoyed the most. After completing the boy survey, it was determined that for every 3 boys who enjoyed soccer, 5 boys enjoyed basketball. The girl survey had a ratio of the number of girls who enjoyed soccer to the number of girls who enjoyed basketball of 7: 1. If the same number of boys and girls were surveyed, and 90 boys enjoy soccer, how many girls enjoy each sport?
Lesson 6: Solving Problems by Finding Equivalent Ratios
49
This work is licensed under a Creative Commons Attribution-NonCommercial-ShareAlike 3.0 Unported License. © 2015 Great Minds. eureka-math.org
G6-M1-TE-1.3.0-06.2015

NYS COMMON CORE MATHEMATICS CURRICULUM 6•1 Lesson 6
Exit Ticket Sample Solutions
Students surveyed boys and girls separately to determine which sport was enjoyed the most. After completing the boy survey, it was determined that for every 𝟒𝟒 boys who enjoyed soccer, 𝟓𝟓 boys enjoyed basketball. The girl survey had a ratio of the number of girls who enjoyed soccer to the number of girls who enjoyed basketball of 𝟕𝟕:𝟏𝟏. If the same number of boys and girls were surveyed, and 𝟗𝟗𝟑𝟑 boys enjoy soccer, how many girls enjoy each sport?
The girl survey would show that 𝟐𝟐𝟏𝟏𝟑𝟑 girls enjoy soccer, and 𝟒𝟒𝟑𝟑 girls enjoy basketball.
Problem Set Sample Solutions
1. Shelley compared the number of oak trees to the number of maple trees as part of a study about hardwood trees in a woodlot. She counted 𝟗𝟗 maple trees to every 𝟓𝟓 oak trees. Later in the year there was a bug problem, and many trees died. New trees were planted to make sure there were the same number of trees as before the bug problem. The new ratio of the number of maple trees to the number of oak trees is 𝟒𝟒:𝟏𝟏𝟏𝟏. After planting new trees, there were 𝟏𝟏𝟒𝟒𝟐𝟐 oak trees. How many more maple trees were in the woodlot before the bug problem than after the bug problem? Explain.
There were 𝟕𝟕𝟐𝟐 more maple trees before the bug problem than after because there were 𝟏𝟏𝟑𝟑𝟖𝟖 maples trees before the bug problem and 𝟒𝟒𝟔𝟔 maple trees after the bug problem.
2. The school band is comprised of middle school students and high school students, but it always has the same maximum capacity. Last year the ratio of the number of middle school students to the number of high school students was 𝟏𝟏:𝟖𝟖. However, this year the ratio of the number of middle school students to the number of high school students changed to 𝟐𝟐:𝟕𝟕. If there are 𝟏𝟏𝟖𝟖 middle school students in the band this year, how many fewer high school students are in the band this year compared to last year? Explain.
There are 𝟗𝟗 fewer high school students in the band this year when compared to last year because last year there were 𝟕𝟕𝟐𝟐 high school students in the band, and this year there are only 𝟔𝟔𝟒𝟒 high school students in the band.
Lesson 6: Solving Problems by Finding Equivalent Ratios
50
This work is licensed under a Creative Commons Attribution-NonCommercial-ShareAlike 3.0 Unported License. © 2015 Great Minds. eureka-math.org
G6-M1-TE-1.3.0-06.2015
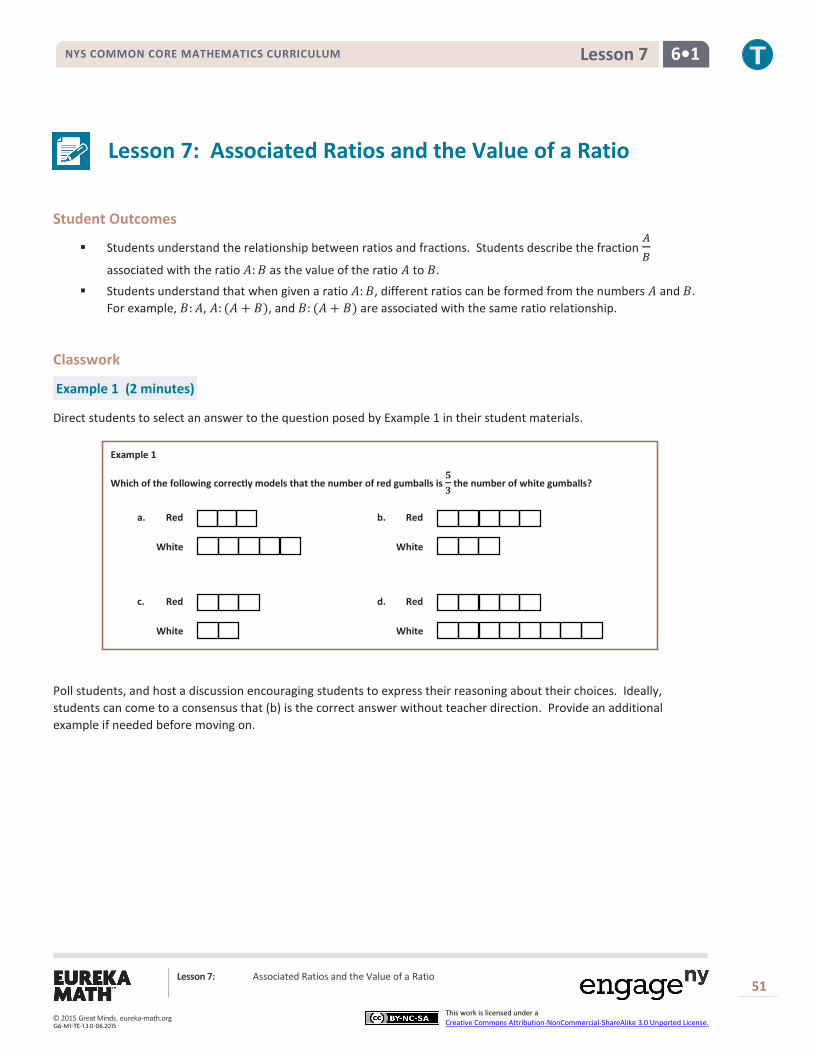
NYS COMMON CORE MATHEMATICS CURRICULUM 6•1 Lesson 7
Lesson 7: Associated Ratios and the Value of a Ratio
Student Outcomes
Students understand the relationship between ratios and fractions. Students describe the fraction 𝐴𝐴𝐵𝐵
associated with the ratio 𝐴𝐴:𝐵𝐵 as the value of the ratio 𝐴𝐴 to 𝐵𝐵.
Students understand that when given a ratio 𝐴𝐴:𝐵𝐵, different ratios can be formed from the numbers 𝐴𝐴 and 𝐵𝐵. For example, 𝐵𝐵:𝐴𝐴, 𝐴𝐴: (𝐴𝐴 + 𝐵𝐵), and 𝐵𝐵: (𝐴𝐴 + 𝐵𝐵) are associated with the same ratio relationship.
Classwork
Example 1 (2 minutes)
Direct students to select an answer to the question posed by Example 1 in their student materials.
Example 1
Which of the following correctly models that the number of red gumballs is 𝟓𝟓𝟑𝟑
the number of white gumballs?
a. Red
White
b. Red
White
c. Red
White
d. Red
White
Poll students, and host a discussion encouraging students to express their reasoning about their choices. Ideally, students can come to a consensus that (b) is the correct answer without teacher direction. Provide an additional example if needed before moving on.
Lesson 7: Associated Ratios and the Value of a Ratio
51
This work is licensed under a Creative Commons Attribution-NonCommercial-ShareAlike 3.0 Unported License. © 2015 Great Minds. eureka-math.org
G6-M1-TE-1.3.0-06.2015

NYS COMMON CORE MATHEMATICS CURRICULUM 6•1 Lesson 7
Example 2 (5 minutes)
Example 2
The duration of two films are modeled below.
a. The ratio of the length of Film A to the length of Film B is 𝟓𝟓:𝟕𝟕.
b. The length of Film A is of the length of Film B.
c. The length of Film B is of the length of Film A.
Exercise 1 (10 minutes)
Have students work the following problem independently and then compare their answers with a neighbor’s answer. Encourage discussion among pairs of students or among students who arrived at different answers.
Exercise 1
Sammy and Kaden went fishing using live shrimp as bait. Sammy brought 𝟖𝟖 more shrimp than Kaden brought. When they combined their shrimp they had 𝟑𝟑𝟑𝟑 shrimp altogether.
a. How many shrimp did each boy bring?
Kaden brought 𝟏𝟏𝟑𝟑 shrimp. Sammy brought 𝟑𝟑𝟐𝟐 shrimp.
b. What is the ratio of the number of shrimp Sammy brought to the number of shrimp Kaden brought?
𝟑𝟑𝟐𝟐:𝟏𝟏𝟑𝟑
c. Express the number of shrimp Sammy brought as a fraction of the number of shrimp Kaden brought.
𝟑𝟑𝟐𝟐𝟏𝟏𝟑𝟑
d. What is the ratio of the number of shrimp Sammy brought to the total number of shrimp?
𝟑𝟑𝟐𝟐:𝟑𝟑𝟑𝟑
e. What fraction of the total shrimp did Sammy bring?
𝟑𝟑𝟐𝟐𝟑𝟑𝟑𝟑
Film A
Film B
5 𝟓𝟓
𝟕𝟕
𝟕𝟕
𝟓𝟓
Lesson 7: Associated Ratios and the Value of a Ratio
52
This work is licensed under a Creative Commons Attribution-NonCommercial-ShareAlike 3.0 Unported License. © 2015 Great Minds. eureka-math.org
G6-M1-TE-1.3.0-06.2015

NYS COMMON CORE MATHEMATICS CURRICULUM 6•1 Lesson 7
Exercise 2 (20 minutes) Exercise 2
A food company that produces peanut butter decides to try out a new version of its peanut butter that is extra crunchy, using twice the number of peanut chunks as normal. The company hosts a sampling of its new product at grocery stores and finds that 𝟓𝟓 out of every 𝟗𝟗 customers prefer the new extra crunchy version.
a. Let’s make a list of ratios that might be relevant for this situation.
i. The ratio of number preferring new extra crunchy to total number surveyed is 𝟓𝟓 to 𝟗𝟗.
ii. The ratio of number preferring regular crunchy to the total number surveyed is 𝟒𝟒 to 𝟗𝟗.
iii. The ratio of number preferring regular crunchy to number preferring new extra crunchy is 𝟒𝟒 to 𝟓𝟓.
iv. The ratio of number preferring new extra crunchy to number preferring regular crunchy is 𝟓𝟓 to 𝟒𝟒.
b. Let’s use the value of each ratio to make multiplicative comparisons for each of the ratios we described here.
i. The number preferring new extra crunchy is_______of the total number surveyed.
ii. The number preferring regular crunchy is_______of the total number surveyed.
iii. The number preferring regular crunchy is_______of those preferring new extra crunchy.
iv. The number preferring new extra crunchy is_______of those preferring regular crunchy.
c. If the company is planning to produce 𝟗𝟗𝟐𝟐,𝟐𝟐𝟐𝟐𝟐𝟐 containers of crunchy peanut butter, how many of these containers should be the new extra crunchy variety, and how many of these containers should be the regular crunchy peanut butter? What would be helpful in solving this problem? Does one of our comparison statements above help us?
The company should produce 𝟓𝟓𝟐𝟐,𝟐𝟐𝟐𝟐𝟐𝟐 containers of new crunchy peanut butter and 𝟒𝟒𝟐𝟐,𝟐𝟐𝟐𝟐𝟐𝟐 containers of regular crunchy peanut butter.
Discuss whether it is appropriate to assume that the company will still sell the same amount of regular crunchy peanut butter or whether the 90,000 containers will simply be split between the two kinds of peanut butter.
What would be helpful in solving this problem? Does one of our comparison statements above help us?
Guide students to the recognition that if we assume 90,000 is the total number of containers sold for both types, then
the number of new extra crunchy containers should be 59
of that number.
Allow students to try solving the following three scenarios:
Try these next scenarios:
d. If the company decides to produce 𝟑𝟑,𝟐𝟐𝟐𝟐𝟐𝟐 containers of regular crunchy peanut butter, how many containers of new extra crunchy peanut butter would it produce?
𝟑𝟑,𝟓𝟓𝟐𝟐𝟐𝟐 new extra crunchy peanut butter containers
e. If the company decides to produce 𝟏𝟏𝟐𝟐,𝟐𝟐𝟐𝟐𝟐𝟐 containers of new extra crunchy peanut butter, how many containers of regular crunchy peanut butter would it produce?
𝟖𝟖,𝟐𝟐𝟐𝟐𝟐𝟐 regular crunchy peanut butter containers
𝟓𝟓𝟗𝟗
𝟒𝟒𝟗𝟗
𝟒𝟒𝟓𝟓
𝟓𝟓𝟒𝟒
Lesson 7: Associated Ratios and the Value of a Ratio
53
This work is licensed under a Creative Commons Attribution-NonCommercial-ShareAlike 3.0 Unported License. © 2015 Great Minds. eureka-math.org
G6-M1-TE-1.3.0-06.2015

NYS COMMON CORE MATHEMATICS CURRICULUM 6•1 Lesson 7
f. If the company decides to only produce 𝟑𝟑,𝟐𝟐𝟐𝟐𝟐𝟐 containers of new extra crunchy peanut butter, how many containers of regular crunchy peanut butter would it produce?
𝟑𝟑,𝟒𝟒𝟐𝟐𝟐𝟐 regular crunchy peanut butter containers
Closing (3 minutes)
Given the ratio 𝐴𝐴:𝐵𝐵, if 𝐵𝐵 ≠ 0, then the value of the ratio is the quotient 𝐴𝐴𝐵𝐵
.
Make up a ratio.
Find the value of that ratio.
Exit Ticket (5 minutes)
Lesson Summary
For a ratio 𝑨𝑨:𝑩𝑩, we are often interested in the associated ratio 𝑩𝑩:𝑨𝑨. Further, if 𝑨𝑨 and 𝑩𝑩 can both be measured in the same unit, we are often interested in the associated ratios 𝑨𝑨: (𝑨𝑨 +𝑩𝑩) and 𝑩𝑩: (𝑨𝑨+ 𝑩𝑩).
For example, if Tom caught 𝟑𝟑 fish and Kyle caught 𝟓𝟓 fish, we can say:
The ratio of the number of fish Tom caught to the number of fish Kyle caught is 𝟑𝟑:𝟓𝟓.
The ratio of the number of fish Kyle caught to the number of fish Tom caught is 𝟓𝟓:𝟑𝟑.
The ratio of the number of fish Tom caught to the total number of fish the two boys caught is 𝟑𝟑:𝟖𝟖.
The ratio of the number of fish Kyle caught to the total number of fish the two boys caught is 𝟓𝟓:𝟖𝟖.
For the ratio 𝑨𝑨:𝑩𝑩, where 𝑩𝑩 ≠ 𝟐𝟐, the value of the ratio is the quotient 𝑨𝑨𝑩𝑩
.
For example: For the ratio 𝟔𝟔:𝟖𝟖, the value of the ratio is 𝟔𝟔𝟖𝟖
or 𝟑𝟑𝟒𝟒.
Lesson 7: Associated Ratios and the Value of a Ratio
54
This work is licensed under a Creative Commons Attribution-NonCommercial-ShareAlike 3.0 Unported License. © 2015 Great Minds. eureka-math.org
G6-M1-TE-1.3.0-06.2015
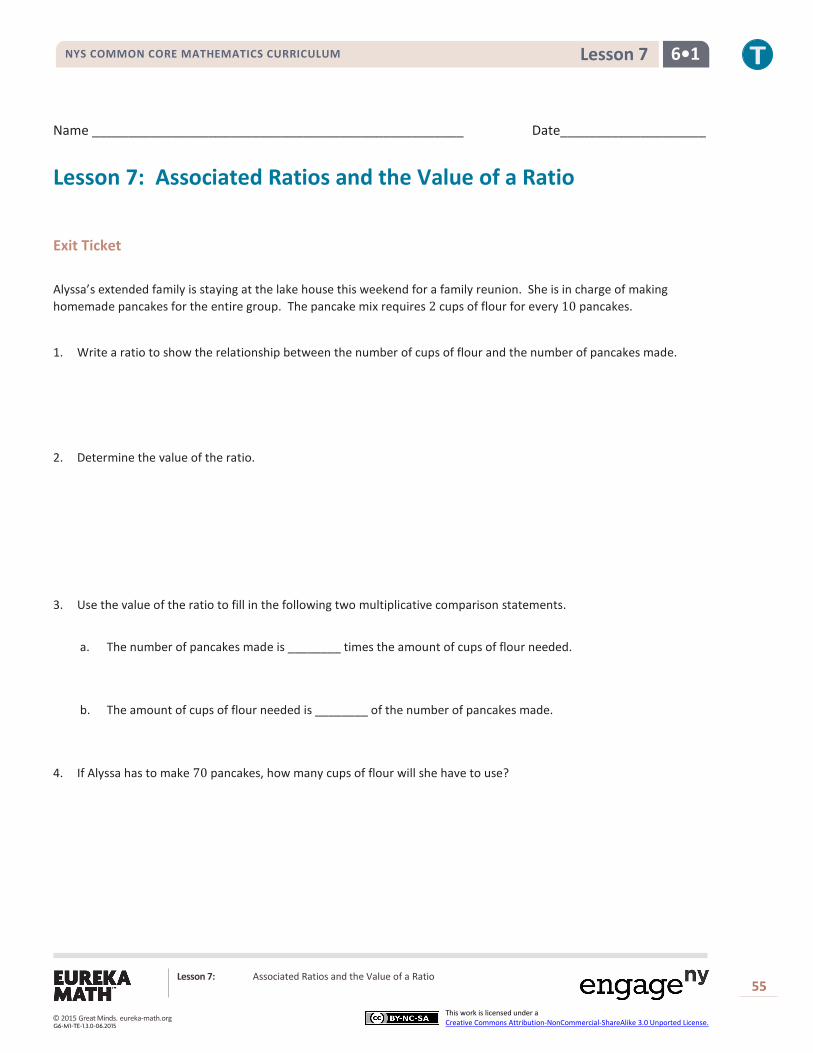
NYS COMMON CORE MATHEMATICS CURRICULUM 6•1 Lesson 7
Name ___________________________________________________ Date____________________
Lesson 7: Associated Ratios and the Value of a Ratio
Exit Ticket Alyssa’s extended family is staying at the lake house this weekend for a family reunion. She is in charge of making homemade pancakes for the entire group. The pancake mix requires 2 cups of flour for every 10 pancakes.
1. Write a ratio to show the relationship between the number of cups of flour and the number of pancakes made.
2. Determine the value of the ratio.
3. Use the value of the ratio to fill in the following two multiplicative comparison statements.
a. The number of pancakes made is ________ times the amount of cups of flour needed.
b. The amount of cups of flour needed is ________ of the number of pancakes made.
4. If Alyssa has to make 70 pancakes, how many cups of flour will she have to use?
Lesson 7: Associated Ratios and the Value of a Ratio
55
This work is licensed under a Creative Commons Attribution-NonCommercial-ShareAlike 3.0 Unported License. © 2015 Great Minds. eureka-math.org
G6-M1-TE-1.3.0-06.2015

NYS COMMON CORE MATHEMATICS CURRICULUM 6•1 Lesson 7
Exit Ticket Sample Solutions
Alyssa’s extended family is staying at the lake house this weekend for a family reunion. She is in charge of making homemade pancakes for the entire group. The pancake mix requires 𝟑𝟑 cups of flour for every 𝟏𝟏𝟐𝟐 pancakes.
1. Write a ratio to show the relationship between the number of cups of flour and the number of pancakes made.
𝟑𝟑:𝟏𝟏𝟐𝟐
2. Determine the value of the ratio.
𝟑𝟑𝟏𝟏𝟐𝟐
= 𝟏𝟏𝟓𝟓
3. Use the value of the ratio to make a multiplicative comparison statement.
a. The number of pancakes made is 𝟓𝟓 times the number of cups of flour needed.
b. The number of cups of flour needed is _______ of the number of pancakes made.
4. If Alyssa has to make 𝟕𝟕𝟐𝟐 pancakes, how many cups of flour will she have to use?
Alyssa will have to use 𝟏𝟏𝟒𝟒 cups of flour.
Problem Set Sample Solutions
1. Maritza is baking cookies to bring to school and share with her friends on her birthday. The recipe requires 𝟑𝟑 eggs for every 𝟑𝟑 cups of sugar. To have enough cookies for all of her friends, Maritza determined she would need 𝟏𝟏𝟑𝟑 eggs. If her mom bought 𝟔𝟔 cups of sugar, does Maritza have enough sugar to make the cookies? Why or why not?
Maritza will NOT have enough sugar to make all the cookies because she needs 𝟖𝟖 cups of sugar and only has 𝟔𝟔 cups of sugar.
2. Hamza bought 𝟖𝟖 gallons of brown paint to paint his kitchen and dining room. Unfortunately, when Hamza started painting, he thought the paint was too dark for his house, so he wanted to make it lighter. The store manager
would not let Hamza return the paint but did inform him that if he used 𝟏𝟏𝟒𝟒
of a gallon of white paint mixed with 𝟑𝟑
gallons of brown paint, he would get the shade of brown he desired. If Hamza decided to take this approach, how many gallons of white paint would Hamza have to buy to lighten the 𝟖𝟖 gallons of brown paint?
Hamza would need 𝟏𝟏 gallon of white paint to make the shade of brown he desires.
𝟏𝟏𝟓𝟓
Lesson 7: Associated Ratios and the Value of a Ratio
56
This work is licensed under a Creative Commons Attribution-NonCommercial-ShareAlike 3.0 Unported License. © 2015 Great Minds. eureka-math.org
G6-M1-TE-1.3.0-06.2015
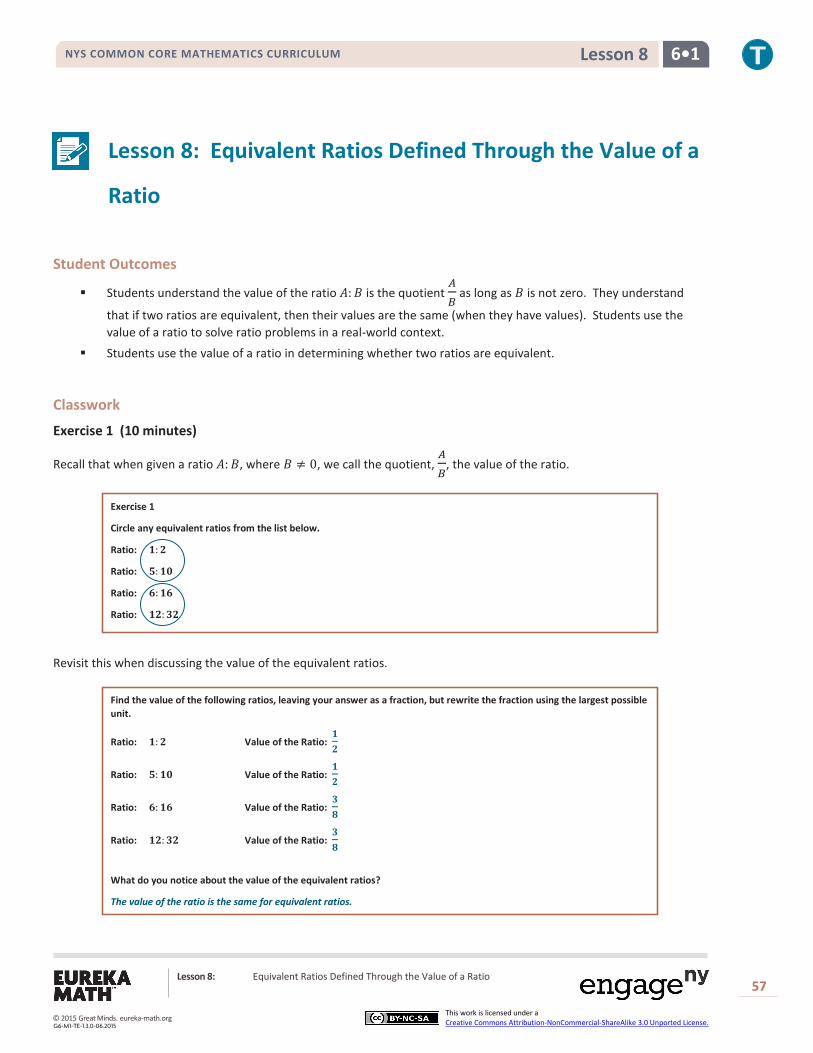
NYS COMMON CORE MATHEMATICS CURRICULUM 6•1 Lesson 8
Lesson 8: Equivalent Ratios Defined Through the Value of a
Ratio
Student Outcomes
Students understand the value of the ratio 𝐴𝐴:𝐵𝐵 is the quotient 𝐴𝐴𝐵𝐵
as long as 𝐵𝐵 is not zero. They understand
that if two ratios are equivalent, then their values are the same (when they have values). Students use the value of a ratio to solve ratio problems in a real-world context.
Students use the value of a ratio in determining whether two ratios are equivalent.
Classwork
Exercise 1 (10 minutes)
Recall that when given a ratio 𝐴𝐴:𝐵𝐵, where 𝐵𝐵 ≠ 0, we call the quotient, 𝐴𝐴𝐵𝐵
, the value of the ratio.
Exercise 1
Circle any equivalent ratios from the list below.
Ratio: 𝟏𝟏:𝟐𝟐
Ratio: 𝟓𝟓:𝟏𝟏𝟏𝟏
Ratio: 𝟔𝟔:𝟏𝟏𝟔𝟔
Ratio: 𝟏𝟏𝟐𝟐:𝟑𝟑𝟐𝟐
Revisit this when discussing the value of the equivalent ratios.
Find the value of the following ratios, leaving your answer as a fraction, but rewrite the fraction using the largest possible unit.
Ratio: 𝟏𝟏:𝟐𝟐 Value of the Ratio: 𝟏𝟏𝟐𝟐
Ratio: 𝟓𝟓:𝟏𝟏𝟏𝟏 Value of the Ratio: 𝟏𝟏𝟐𝟐
Ratio: 𝟔𝟔:𝟏𝟏𝟔𝟔 Value of the Ratio: 𝟑𝟑𝟖𝟖
Ratio: 𝟏𝟏𝟐𝟐:𝟑𝟑𝟐𝟐 Value of the Ratio: 𝟑𝟑𝟖𝟖
What do you notice about the value of the equivalent ratios?
The value of the ratio is the same for equivalent ratios.
Lesson 8: Equivalent Ratios Defined Through the Value of a Ratio
57
This work is licensed under a Creative Commons Attribution-NonCommercial-ShareAlike 3.0 Unported License. © 2015 Great Minds. eureka-math.org
G6-M1-TE-1.3.0-06.2015

NYS COMMON CORE MATHEMATICS CURRICULUM 6•1 Lesson 8
Note that 1: 2 is not the same ratio as 5: 10, so we do not say they are equal. The ratios are not the same, but their values are equal. Would this always be the case? Would the values of equivalent ratios always be equal?
Answers will vary. Some students may come to the conclusion that the values of equivalent ratios are always equal. However, some students may not be convinced at this point that all equivalent ratios will also have the same value of the ratio.
Exercise 2 (10 minutes) Exercise 2
Here is a theorem: If 𝑨𝑨:𝑩𝑩 with 𝑩𝑩 ≠ 𝟏𝟏 and 𝑪𝑪:𝑫𝑫 with 𝑫𝑫 ≠ 𝟏𝟏 are equivalent, then they have the same value: 𝑨𝑨𝑩𝑩
=𝑪𝑪𝑫𝑫
.
This is essentially stating that if two ratios are equivalent, then their values are the same (when they have values).
Can you provide any counterexamples to the theorem above?
Allow students to try this in pairs. Observe the progress of students and question students’ counterexamples. Ask for further clarification or proof that the two ratios are equivalent but do not have the same value. If students still think they have discovered a counterexample, share the example with the class and discuss why it is not a counterexample.
Ask entire class if anyone thought of a counterexample. If students share examples, have others explain why they are not counterexamples. Then discuss why there are no possible counterexamples to the given theorem. It is important for students to understand that the theorem is always true, so it is not possible to come up with a counterexample.
Exercise 3 (18 minutes)
Allow students 8 minutes to work on this exercise and 10 minutes to present and discuss.
Exercise 3
Taivon is training for a duathlon, which is a race that consists of running and cycling. The cycling leg is longer than the running leg of the race, so while Taivon trains, he rides his bike more than he runs. During training, Taivon runs 𝟒𝟒 miles for every 𝟏𝟏𝟒𝟒 miles he rides his bike.
a. Identify the ratio associated with this problem and find its value.
The ratio of the number of miles he ran to the number of miles he cycled is 𝟒𝟒:𝟏𝟏𝟒𝟒, and the value of the ratio is 𝟐𝟐𝟕𝟕
. The ratio of the number of miles he cycled to the number of miles he ran is 𝟏𝟏𝟒𝟒:𝟒𝟒, and the value of the ratio
is 𝟕𝟕𝟐𝟐
.
Use the value of each ratio to solve the following.
b. When Taivon completed all of his training for the duathlon, the ratio of total number of miles he ran to total number of miles he cycled was 𝟖𝟖𝟏𝟏:𝟐𝟐𝟖𝟖𝟏𝟏. Is this consistent with Taivon’s training schedule? Explain why or why not.
This is consistent because the ratio of the number of miles he ran to the number of miles he cycled, 𝟖𝟖𝟏𝟏:𝟐𝟐𝟖𝟖𝟏𝟏,
has the value of 𝟐𝟐𝟕𝟕
, which is the same value as the ratio 𝟒𝟒:𝟏𝟏𝟒𝟒.
Lesson 8: Equivalent Ratios Defined Through the Value of a Ratio
58
This work is licensed under a Creative Commons Attribution-NonCommercial-ShareAlike 3.0 Unported License. © 2015 Great Minds. eureka-math.org
G6-M1-TE-1.3.0-06.2015

NYS COMMON CORE MATHEMATICS CURRICULUM 6•1 Lesson 8
c. In one training session, Taivon ran 𝟒𝟒 miles and cycled 𝟕𝟕 miles. Did this training session represent an equivalent ratio of the distance he ran to the distance he cycled? Explain why or why not.
This training session does not represent an equivalent ratio of the distance he ran to the distance he cycled
because the value of the ratio in this instance is 𝟒𝟒
𝟕𝟕 , which is not equal to
𝟐𝟐𝟕𝟕
.
Select a couple of students, and allow them to present their solutions and explain their reasoning one at a time.
Closing (2 minutes)
How is the value of a ratio related to the ratio?
Exit Ticket (5 minutes)
MP.1
Lesson Summary
The value of the ratio 𝑨𝑨:𝑩𝑩 is the quotient 𝑨𝑨𝑩𝑩
as long as 𝑩𝑩 is not zero.
If two ratios are equivalent, then their values are the same (when they have values).
Lesson 8: Equivalent Ratios Defined Through the Value of a Ratio
59
This work is licensed under a Creative Commons Attribution-NonCommercial-ShareAlike 3.0 Unported License. © 2015 Great Minds. eureka-math.org
G6-M1-TE-1.3.0-06.2015

NYS COMMON CORE MATHEMATICS CURRICULUM 6•1 Lesson 8
Name ___________________________________________________ Date____________________
Lesson 8: Equivalent Ratios Defined Through the Value of a Ratio
Exit Ticket You created a new playlist, and 100 of your friends listened to it and shared if they liked the new playlist or not. Nadhii said the ratio of the number of people who liked the playlist to the number of people who did not like the playlist is 75: 25. Dylan said that for every three people who liked the playlist, one person did not.
Do Nadhii and Dylan agree? Prove your answer using the values of the ratios.
Lesson 8: Equivalent Ratios Defined Through the Value of a Ratio
60
This work is licensed under a Creative Commons Attribution-NonCommercial-ShareAlike 3.0 Unported License. © 2015 Great Minds. eureka-math.org
G6-M1-TE-1.3.0-06.2015
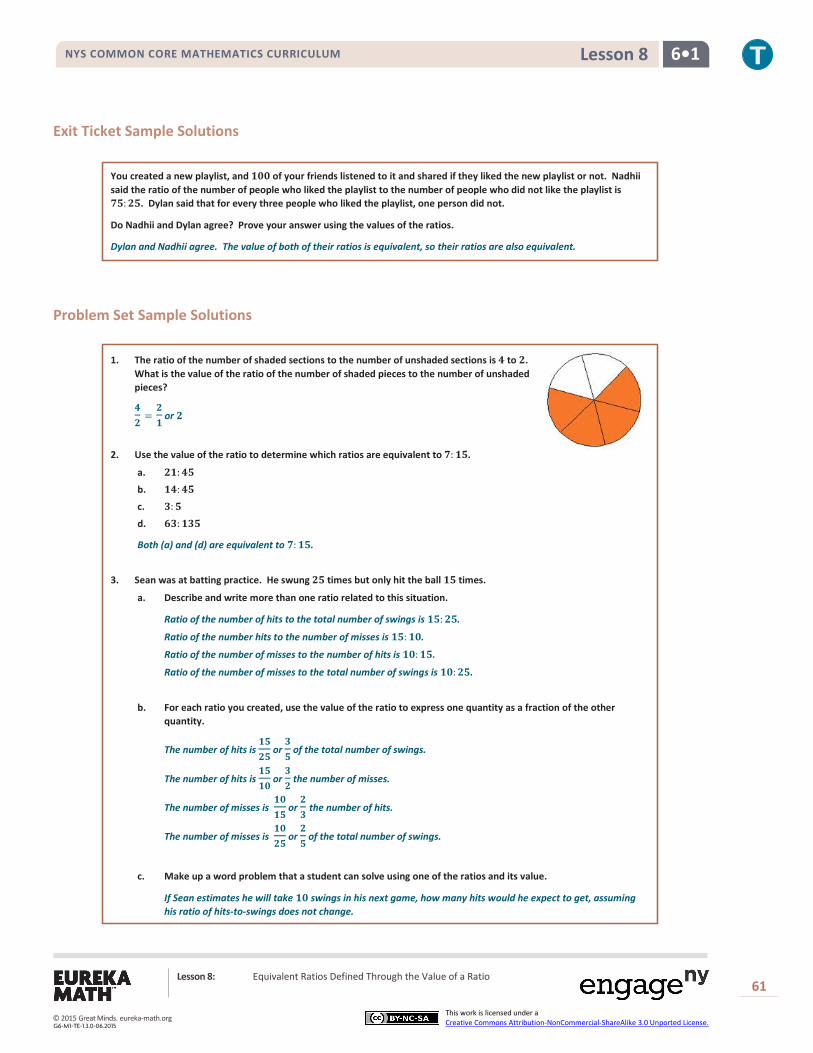
NYS COMMON CORE MATHEMATICS CURRICULUM 6•1 Lesson 8
Exit Ticket Sample Solutions
You created a new playlist, and 𝟏𝟏𝟏𝟏𝟏𝟏 of your friends listened to it and shared if they liked the new playlist or not. Nadhii said the ratio of the number of people who liked the playlist to the number of people who did not like the playlist is 𝟕𝟕𝟓𝟓:𝟐𝟐𝟓𝟓. Dylan said that for every three people who liked the playlist, one person did not.
Do Nadhii and Dylan agree? Prove your answer using the values of the ratios.
Dylan and Nadhii agree. The value of both of their ratios is equivalent, so their ratios are also equivalent.
Problem Set Sample Solutions
1. The ratio of the number of shaded sections to the number of unshaded sections is 𝟒𝟒 to 𝟐𝟐. What is the value of the ratio of the number of shaded pieces to the number of unshaded pieces?
𝟒𝟒𝟐𝟐
=𝟐𝟐𝟏𝟏
or 𝟐𝟐
2. Use the value of the ratio to determine which ratios are equivalent to 𝟕𝟕:𝟏𝟏𝟓𝟓.
a. 𝟐𝟐𝟏𝟏:𝟒𝟒𝟓𝟓 b. 𝟏𝟏𝟒𝟒:𝟒𝟒𝟓𝟓 c. 𝟑𝟑:𝟓𝟓 d. 𝟔𝟔𝟑𝟑:𝟏𝟏𝟑𝟑𝟓𝟓
Both (a) and (d) are equivalent to 𝟕𝟕:𝟏𝟏𝟓𝟓.
3. Sean was at batting practice. He swung 𝟐𝟐𝟓𝟓 times but only hit the ball 𝟏𝟏𝟓𝟓 times.
a. Describe and write more than one ratio related to this situation.
Ratio of the number of hits to the total number of swings is 𝟏𝟏𝟓𝟓:𝟐𝟐𝟓𝟓.
Ratio of the number hits to the number of misses is 𝟏𝟏𝟓𝟓:𝟏𝟏𝟏𝟏.
Ratio of the number of misses to the number of hits is 𝟏𝟏𝟏𝟏:𝟏𝟏𝟓𝟓.
Ratio of the number of misses to the total number of swings is 𝟏𝟏𝟏𝟏:𝟐𝟐𝟓𝟓.
b. For each ratio you created, use the value of the ratio to express one quantity as a fraction of the other quantity.
The number of hits is 𝟏𝟏𝟓𝟓𝟐𝟐𝟓𝟓
or 𝟑𝟑𝟓𝟓
of the total number of swings.
The number of hits is 𝟏𝟏𝟓𝟓𝟏𝟏𝟏𝟏
or 𝟑𝟑𝟐𝟐
the number of misses.
The number of misses is 𝟏𝟏𝟏𝟏𝟏𝟏𝟓𝟓
or 𝟐𝟐𝟑𝟑 the number of hits.
The number of misses is 𝟏𝟏𝟏𝟏𝟐𝟐𝟓𝟓
or 𝟐𝟐𝟓𝟓
of the total number of swings.
c. Make up a word problem that a student can solve using one of the ratios and its value.
If Sean estimates he will take 𝟏𝟏𝟏𝟏 swings in his next game, how many hits would he expect to get, assuming his ratio of hits-to-swings does not change.
Lesson 8: Equivalent Ratios Defined Through the Value of a Ratio
61
This work is licensed under a Creative Commons Attribution-NonCommercial-ShareAlike 3.0 Unported License. © 2015 Great Minds. eureka-math.org
G6-M1-TE-1.3.0-06.2015

NYS COMMON CORE MATHEMATICS CURRICULUM 6•1 Lesson 8
4. Your middle school has 𝟗𝟗𝟏𝟏𝟏𝟏 students. 𝟏𝟏𝟑𝟑
of students bring their lunch instead of buying lunch at school. What is the
value of the ratio of the number of students who do bring their lunch to the number of students who do not?
First, I created a tape diagram. In the tape diagram, 𝟏𝟏𝟑𝟑
of students bring their lunch instead of buying lunch at
school. I determined that 𝟑𝟑𝟏𝟏𝟏𝟏 students bring their lunch, leaving 𝟔𝟔𝟏𝟏𝟏𝟏 students who buy their lunch. One unit of the tape diagram represents 𝟑𝟑𝟏𝟏𝟏𝟏, and 𝟐𝟐 units of the tape diagram represent 𝟔𝟔𝟏𝟏𝟏𝟏. This creates a ratio of 𝟏𝟏:𝟐𝟐. As such, the value of the ratio of the number of students who bring their lunch to the number of students who buy their lunch
is 𝟏𝟏𝟐𝟐
.
𝟑𝟑𝟏𝟏𝟏𝟏 students bring lunch 𝟔𝟔𝟏𝟏𝟏𝟏 students buy lunch
Lesson 8: Equivalent Ratios Defined Through the Value of a Ratio
62
This work is licensed under a Creative Commons Attribution-NonCommercial-ShareAlike 3.0 Unported License. © 2015 Great Minds. eureka-math.org
G6-M1-TE-1.3.0-06.2015

New York State Common Core
Mathematics Curriculum GRADE 6 • MODULE 1
6 G R A D E
Topic B
Collections of Equivalent Ratios
6.RP.A.3a
Focus Standard: 6.RP.A.3 Use ratio and rate reasoning to solve real-world and mathematical problems, e.g., by reasoning about tables of equivalent ratios, tape diagrams, double number line diagrams, or equations. a. Make tables of equivalent ratios relating quantities with whole-number
measurements, find missing values in the tables, and plot the pairs of values on the coordinate plane. Use tables to compare ratios.
Instructional Days: 7
Lesson 9: Tables of Equivalent Ratios (P)1
Lesson 10: The Structure of Ratio Tables—Additive and Multiplicative (E)
Lesson 11: Comparing Ratios Using Ratio Tables (P)
Lesson 12: From Ratio Tables to Double Number Line Diagrams (P)
Lesson 13: From Ratio Tables to Equations Using the Value of the Ratio (P)
Lesson 14: From Ratio Tables, Equations, and Double Number Line Diagrams to Plots on the Coordinate Plane (S)
Lesson 15: A Synthesis of Representations of Equivalent Ratio Collections (E)
With the concept of ratio equivalence formally defined, students explore collections of equivalent ratios in real-world contexts in Topic B. In Lessons 9 and 10, students build ratio tables and study and articulate their additive and multiplicative structure (6.RP.A.3a). In Lesson 11, students answer comparative questions about two distinct ratios using reasoning with ratio tables. Students continue to apply reasoning to solve ratio problems while they explore other representations of collections of equivalent ratios and relate those representations to their experience working with the ratio table (6.RP.A.3).
1Lesson Structure Key: P-Problem Set Lesson, M-Modeling Cycle Lesson, E-Exploration Lesson, S-Socratic Lesson
Topic B: Collections of Equivalent Ratios 63
This work is licensed under a Creative Commons Attribution-NonCommercial-ShareAlike 3.0 Unported License.
© 2015 Great Minds. eureka-math.orgG6-M1-TE-1.3.0-06.2015
6•1 Topic B NYS COMMON CORE MATHEMATICS CURRICULUM
Building on their experience with number lines, students represent collections of equivalent ratios with a double number line model in Lesson 12. In Lesson 13, they relate ratio tables to equations using the value of a ratio defined in Topic A. Finally, students expand their experience with the coordinate plane (5.G.A.1, 5.G.A.2) as they represent collections of equivalent ratios by plotting the pairs of values on the coordinate plane in Lesson 14. In the final lesson of this topic, students begin to synthesize their experience of the various representations by working a variety of ratio problems and choosing the representation that best represents their thinking. They continue to apply their understanding of the representations as they apply them to rate and percent problems in Topics C and D.
Topic B: Collections of Equivalent Ratios
This work is licensed under a Creative Commons Attribution-NonCommercial-ShareAlike 3.0 Unported License.
64
© 2015 Great Minds. eureka-math.orgG6-M1-TE-1.3.0-06.2015

NYS COMMON CORE MATHEMATICS CURRICULUM 6•1 Lesson 9
Lesson 9: Tables of Equivalent Ratios
Student Outcomes
Students understand that a ratio is often used to describe the relationship between the amount of one quantity and the amount of another quantity as in the cases of mixtures or constant rates.
Students understand that a ratio table is a table of equivalent ratios. Students use ratio tables to solve problems.
Lesson Notes The approach of this lesson, and those that follow, is for the teacher to model the use of tables in problem solving. There is no need to engage in an explanation of why or how tables are useful; simply modeling their use in this lesson, examining their structure in the next lesson, and repeatedly using them for problem solving in the remaining lessons of the topic should sufficiently promote tables as a tool for problem solving with collections of equivalent ratios.
Classwork
Example 1 (10 minutes)
Example 1
To make paper mache, the art teacher mixes water and flour. For every two cups of water, she needs to mix in three cups of flour to make the paste.
Find equivalent ratios for the ratio relationship 𝟐𝟐 cups of water to 𝟑𝟑 cups of flour. Represent the equivalent ratios in the table below:
Cups of Water Cups of Flour
𝟐𝟐 𝟑𝟑 𝟐𝟐:𝟑𝟑
𝟒𝟒 𝟔𝟔 𝟐𝟐:𝟑𝟑
𝟔𝟔 𝟗𝟗 𝟐𝟐:𝟑𝟑
𝟖𝟖 𝟏𝟏𝟐𝟐 𝟐𝟐:𝟑𝟑
𝟏𝟏𝟏𝟏 𝟏𝟏𝟏𝟏 𝟐𝟐:𝟑𝟑
Lesson 9: Tables of Equivalent Ratios 65
This work is licensed under a Creative Commons Attribution-NonCommercial-ShareAlike 3.0 Unported License. © 2015 Great Minds. eureka-math.org
G6-M1-TE-1.3.0-06.2015

NYS COMMON CORE MATHEMATICS CURRICULUM 6•1 Lesson 9
What does this ratio mean? For every 2 cups of water, there are 3 cups of flour.
Every time we have a set of two cups of water, we need to have a set of three cups of flour.
Why is it worded, “for every 2 cups of water, there are 3 cups of flour”?
This suggests that we might be doing that action repeatedly, adding 2 cups of water and 3 cups of flour.
Why would I do it more than once?
There are times that batches need to be larger than using 2 cups of water and 3 cups of flour.
(Create a table on the board and label the columns.) Can we list all of the possible recipes for this mixture in order in a table? Let’s start with the ratio that uses the smallest whole numbers. Is there an equivalent ratio that uses smaller whole numbers than the ratio 2 to 3? No
Then let’s make 2 cups of water and 3 cups of flour our first entry.
What would the next possibility be if we were using only whole numbers? I don’t want to skip over any of my options here.
For every 4 cups of water, there are 6 cups of flour.
Continue to guide students to create the table shown.
What is the value of each ratio in the table?
23
Is that what we expected? Should the value of all of these ratios be equal to each other?
Yes
What we have created here is a ratio table, a table in which all of the values of the ratios are equivalent to one another.
What kinds of questions could we answer with the data in our table? Can anyone think of a question we might have had at the start of this problem that this table could help us answer?
Answers will vary, but students should include ratios and associated ratios in their answer.
Example 2 (5 minutes)
Example 2
Javier has a new job designing websites. He is paid at a rate of $𝟕𝟕𝟏𝟏𝟏𝟏 for every 𝟑𝟑 pages of web content that he builds. Create a ratio table to show the total amount of money Javier has earned in ratio to the number of pages he has built.
Javier is saving up to purchase a used car that costs $𝟒𝟒,𝟐𝟐𝟏𝟏𝟏𝟏. How many web pages will Javier need to build before he can pay for the car?
Javier will need to build 𝟏𝟏𝟖𝟖 web pages in order to pay for the car.
Total Pages Built 𝟑𝟑 𝟔𝟔 𝟗𝟗 𝟏𝟏𝟐𝟐 𝟏𝟏𝟏𝟏 𝟏𝟏𝟖𝟖 𝟐𝟐𝟏𝟏 𝟐𝟐𝟒𝟒
Total Money Earned 𝟕𝟕𝟏𝟏𝟏𝟏 𝟏𝟏,𝟒𝟒𝟏𝟏𝟏𝟏 𝟐𝟐,𝟏𝟏𝟏𝟏𝟏𝟏 𝟐𝟐,𝟖𝟖𝟏𝟏𝟏𝟏 𝟑𝟑,𝟏𝟏𝟏𝟏𝟏𝟏 𝟒𝟒,𝟐𝟐𝟏𝟏𝟏𝟏 𝟒𝟒,𝟗𝟗𝟏𝟏𝟏𝟏 𝟏𝟏,𝟔𝟔𝟏𝟏𝟏𝟏
MP.7
Lesson 9: Tables of Equivalent Ratios 66
This work is licensed under a Creative Commons Attribution-NonCommercial-ShareAlike 3.0 Unported License. © 2015 Great Minds. eureka-math.org
G6-M1-TE-1.3.0-06.2015
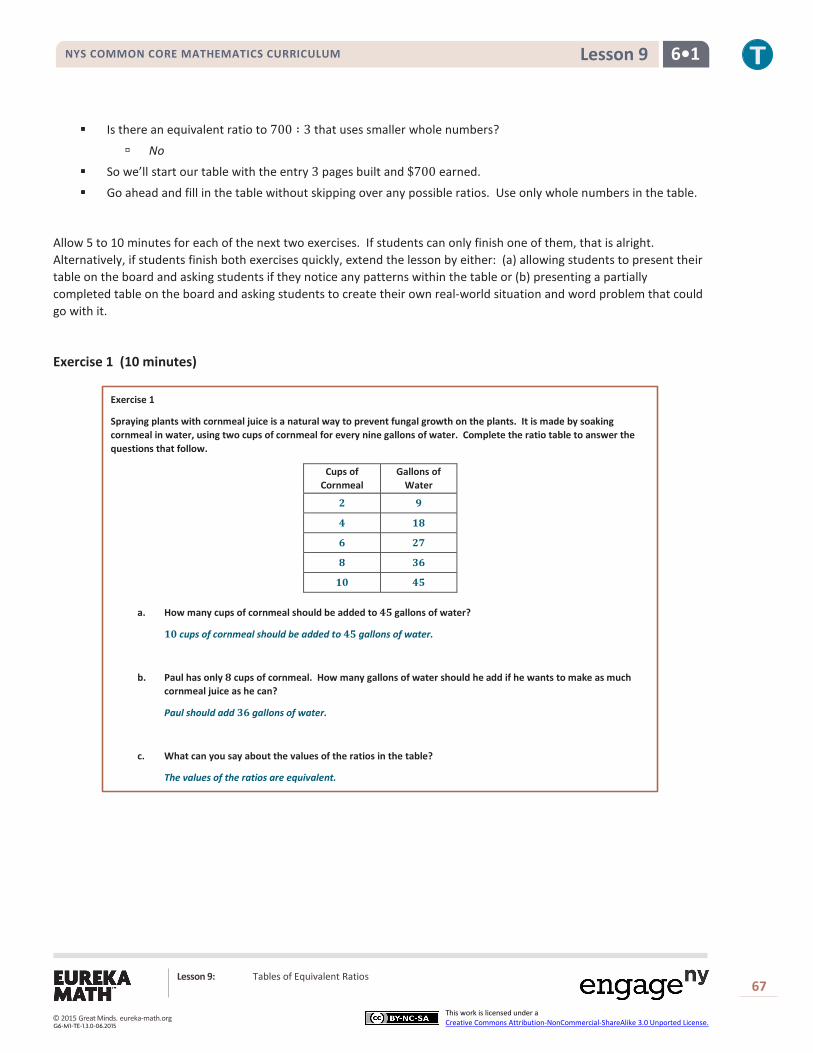
NYS COMMON CORE MATHEMATICS CURRICULUM 6•1 Lesson 9
Is there an equivalent ratio to 700 ∶ 3 that uses smaller whole numbers?
No
So we’ll start our table with the entry 3 pages built and $700 earned.
Go ahead and fill in the table without skipping over any possible ratios. Use only whole numbers in the table.
Allow 5 to 10 minutes for each of the next two exercises. If students can only finish one of them, that is alright. Alternatively, if students finish both exercises quickly, extend the lesson by either: (a) allowing students to present their table on the board and asking students if they notice any patterns within the table or (b) presenting a partially completed table on the board and asking students to create their own real-world situation and word problem that could go with it.
Exercise 1 (10 minutes) Exercise 1
Spraying plants with cornmeal juice is a natural way to prevent fungal growth on the plants. It is made by soaking cornmeal in water, using two cups of cornmeal for every nine gallons of water. Complete the ratio table to answer the questions that follow.
Cups of Cornmeal
Gallons of Water
𝟐𝟐 𝟗𝟗
𝟒𝟒 𝟏𝟏𝟖𝟖
𝟔𝟔 𝟐𝟐𝟕𝟕
𝟖𝟖 𝟑𝟑𝟔𝟔
𝟏𝟏𝟏𝟏 𝟒𝟒𝟏𝟏
a. How many cups of cornmeal should be added to 𝟒𝟒𝟏𝟏 gallons of water?
𝟏𝟏𝟏𝟏 cups of cornmeal should be added to 𝟒𝟒𝟏𝟏 gallons of water.
b. Paul has only 𝟖𝟖 cups of cornmeal. How many gallons of water should he add if he wants to make as much cornmeal juice as he can?
Paul should add 𝟑𝟑𝟔𝟔 gallons of water.
c. What can you say about the values of the ratios in the table?
The values of the ratios are equivalent.
Lesson 9: Tables of Equivalent Ratios 67
This work is licensed under a Creative Commons Attribution-NonCommercial-ShareAlike 3.0 Unported License. © 2015 Great Minds. eureka-math.org
G6-M1-TE-1.3.0-06.2015

NYS COMMON CORE MATHEMATICS CURRICULUM 6•1 Lesson 9
Exercise 2 (10 minutes) Exercise 2
James is setting up a fish tank. He is buying a breed of goldfish that typically grows to be 𝟏𝟏𝟐𝟐 inches long. It is recommended that there be 𝟏𝟏 gallon of water for every inch of fish length in the tank. What is the recommended ratio of gallons of water per full-grown goldfish in the tank?
Complete the ratio table to help answer the following questions:
Number of Fish
Gallons of Water
𝟏𝟏 𝟏𝟏𝟐𝟐
𝟐𝟐 𝟐𝟐𝟒𝟒
𝟑𝟑 𝟑𝟑𝟔𝟔
𝟒𝟒 𝟒𝟒𝟖𝟖
𝟏𝟏 𝟔𝟔𝟏𝟏
a. What size tank (in gallons) is needed for James to have 𝟏𝟏 full-grown goldfish?
James needs a tank that holds 𝟔𝟔𝟏𝟏 gallons of water in order to have 𝟏𝟏 full-grown goldfish.
b. How many full-grown goldfish can go in a 𝟒𝟒𝟏𝟏-gallon tank?
𝟑𝟑 full-grown goldfish can go in a 𝟒𝟒𝟏𝟏-gallon tank.
c. What can you say about the values of the ratios in the table?
The values of the ratios are equivalent.
Closing (5 minutes)
When creating a ratio table, what does each pair of values represent?
Each pair of values represents a ratio that is equivalent to all the other ratios in the table and describes the ratio relationship of two quantities.
Can anyone think of a situation where you have seen a ratio table other than here in class?
The back of a pancake mix box
Can you think of an example of a table of numbers you’ve seen that was not a ratio table? If you can’t think of one that you’ve seen, see if you can make one up to match a real-world situation.
Exit Ticket (5 minutes)
Lesson Summary
A ratio table is a table of pairs of numbers that form equivalent ratios.
Lesson 9: Tables of Equivalent Ratios 68
This work is licensed under a Creative Commons Attribution-NonCommercial-ShareAlike 3.0 Unported License. © 2015 Great Minds. eureka-math.org
G6-M1-TE-1.3.0-06.2015

NYS COMMON CORE MATHEMATICS CURRICULUM 6•1 Lesson 9
Name ___________________________________________________ Date____________________
Lesson 9: Tables of Equivalent Ratios
Exit Ticket A father and his young toddler are walking along the sidewalk. For every 3 steps the father takes, the son takes 5 steps just to keep up. What is the ratio of the number of steps the father takes to the number of steps the son takes? Add labels to the columns of the table, and place the ratio into the first row of data. Add equivalent ratios to build a ratio table.
What can you say about the values of the ratios in the table?
Lesson 9: Tables of Equivalent Ratios 69
This work is licensed under a Creative Commons Attribution-NonCommercial-ShareAlike 3.0 Unported License. © 2015 Great Minds. eureka-math.org
G6-M1-TE-1.3.0-06.2015

NYS COMMON CORE MATHEMATICS CURRICULUM 6•1 Lesson 9
Exit Ticket Sample Solutions
A father and his young toddler are walking along the sidewalk. For every 𝟑𝟑 steps the father takes, the son takes 𝟏𝟏 steps just to keep up. What is the ratio of the number of steps the father takes to the number of steps the son takes? Add labels to the columns of the table, and place the ratio into the first row of data. Add equivalent ratios to build a ratio table.
Number of Steps the Father Takes
Number of Steps the Son Takes
𝟑𝟑 𝟏𝟏
𝟔𝟔 𝟏𝟏𝟏𝟏
𝟗𝟗 𝟏𝟏𝟏𝟏
𝟏𝟏𝟐𝟐 𝟐𝟐𝟏𝟏
𝟏𝟏𝟏𝟏 𝟐𝟐𝟏𝟏
𝟏𝟏𝟖𝟖 𝟑𝟑𝟏𝟏
What can you say about the values of the ratios in the table?
The values of the ratios in the table should all be equal since the ratios in the table are equivalent.
Problem Set Sample Solutions
Assume each of the following represents a table of equivalent ratios. Fill in the missing values. Then choose one of the tables, and create a real-world context for the ratios shown in the table.
1. 𝟒𝟒 𝟏𝟏𝟏𝟏 2. 𝟏𝟏 𝟕𝟕 3. 𝟑𝟑 𝟏𝟏𝟕𝟕 𝟖𝟖 𝟐𝟐𝟐𝟐 𝟏𝟏𝟏𝟏 𝟏𝟏𝟒𝟒 𝟔𝟔 𝟑𝟑𝟒𝟒
𝟏𝟏𝟐𝟐 𝟑𝟑𝟑𝟑 𝟏𝟏𝟏𝟏 𝟐𝟐𝟏𝟏 𝟗𝟗 𝟏𝟏𝟏𝟏
𝟏𝟏𝟔𝟔 𝟒𝟒𝟒𝟒 𝟐𝟐𝟏𝟏 𝟐𝟐𝟖𝟖 𝟏𝟏𝟐𝟐 𝟔𝟔𝟖𝟖 𝟐𝟐𝟏𝟏 𝟏𝟏𝟏𝟏 𝟐𝟐𝟏𝟏 𝟑𝟑𝟏𝟏 𝟏𝟏𝟏𝟏 𝟖𝟖𝟏𝟏
𝟐𝟐𝟒𝟒 𝟔𝟔𝟔𝟔 𝟑𝟑𝟏𝟏 𝟒𝟒𝟐𝟐 𝟏𝟏𝟖𝟖 𝟏𝟏𝟏𝟏𝟐𝟐
Context provided will vary.
Lesson 9: Tables of Equivalent Ratios 70
This work is licensed under a Creative Commons Attribution-NonCommercial-ShareAlike 3.0 Unported License. © 2015 Great Minds. eureka-math.org
G6-M1-TE-1.3.0-06.2015
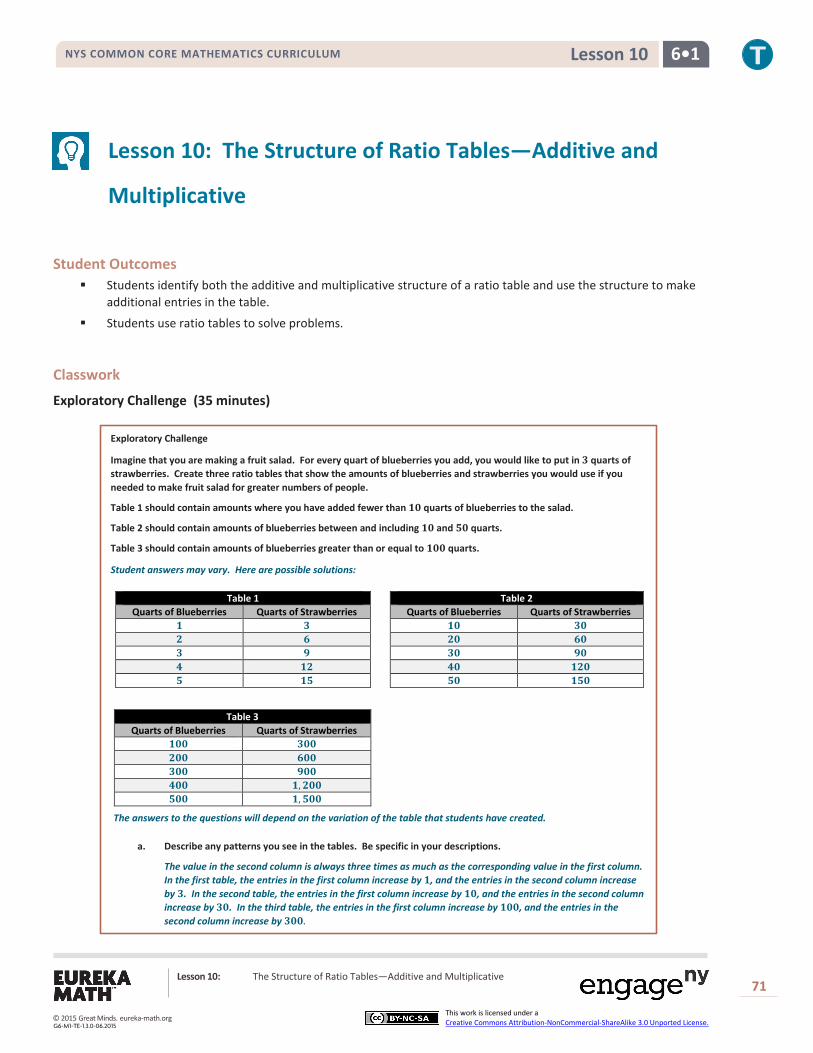
NYS COMMON CORE MATHEMATICS CURRICULUM 6•1 Lesson 10
Lesson 10: The Structure of Ratio Tables—Additive and
Multiplicative
Student Outcomes
Students identify both the additive and multiplicative structure of a ratio table and use the structure to make additional entries in the table.
Students use ratio tables to solve problems.
Classwork
Exploratory Challenge (35 minutes) Exploratory Challenge
Imagine that you are making a fruit salad. For every quart of blueberries you add, you would like to put in 𝟑𝟑 quarts of strawberries. Create three ratio tables that show the amounts of blueberries and strawberries you would use if you needed to make fruit salad for greater numbers of people.
Table 1 should contain amounts where you have added fewer than 𝟏𝟏𝟏𝟏 quarts of blueberries to the salad.
Table 2 should contain amounts of blueberries between and including 𝟏𝟏𝟏𝟏 and 𝟓𝟓𝟏𝟏 quarts.
Table 3 should contain amounts of blueberries greater than or equal to 𝟏𝟏𝟏𝟏𝟏𝟏 quarts.
Student answers may vary. Here are possible solutions:
The answers to the questions will depend on the variation of the table that students have created.
a. Describe any patterns you see in the tables. Be specific in your descriptions.
The value in the second column is always three times as much as the corresponding value in the first column. In the first table, the entries in the first column increase by 𝟏𝟏, and the entries in the second column increase by 𝟑𝟑. In the second table, the entries in the first column increase by 𝟏𝟏𝟏𝟏, and the entries in the second column increase by 𝟑𝟑𝟏𝟏. In the third table, the entries in the first column increase by 𝟏𝟏𝟏𝟏𝟏𝟏, and the entries in the second column increase by 𝟑𝟑𝟏𝟏𝟏𝟏.
Table 1 Quarts of Blueberries Quarts of Strawberries
𝟏𝟏 𝟑𝟑 𝟐𝟐 𝟔𝟔 𝟑𝟑 𝟗𝟗 𝟒𝟒 𝟏𝟏𝟐𝟐 𝟓𝟓 𝟏𝟏𝟓𝟓
Table 2 Quarts of Blueberries Quarts of Strawberries
𝟏𝟏𝟏𝟏 𝟑𝟑𝟏𝟏 𝟐𝟐𝟏𝟏 𝟔𝟔𝟏𝟏 𝟑𝟑𝟏𝟏 𝟗𝟗𝟏𝟏 𝟒𝟒𝟏𝟏 𝟏𝟏𝟐𝟐𝟏𝟏 𝟓𝟓𝟏𝟏 𝟏𝟏𝟓𝟓𝟏𝟏
Table 3 Quarts of Blueberries Quarts of Strawberries
𝟏𝟏𝟏𝟏𝟏𝟏 𝟑𝟑𝟏𝟏𝟏𝟏 𝟐𝟐𝟏𝟏𝟏𝟏 𝟔𝟔𝟏𝟏𝟏𝟏 𝟑𝟑𝟏𝟏𝟏𝟏 𝟗𝟗𝟏𝟏𝟏𝟏 𝟒𝟒𝟏𝟏𝟏𝟏 𝟏𝟏,𝟐𝟐𝟏𝟏𝟏𝟏 𝟓𝟓𝟏𝟏𝟏𝟏 𝟏𝟏,𝟓𝟓𝟏𝟏𝟏𝟏
Lesson 10: The Structure of Ratio Tables—Additive and Multiplicative 71
This work is licensed under a Creative Commons Attribution-NonCommercial-ShareAlike 3.0 Unported License. © 2015 Great Minds. eureka-math.org
G6-M1-TE-1.3.0-06.2015

NYS COMMON CORE MATHEMATICS CURRICULUM 6•1 Lesson 10
b. How are the amounts of blueberries and strawberries related to each other?
The amount of strawberries is always three times the amount of blueberries. Students could also respond that the ratio of the number of quarts of blueberries to the number of quarts of strawberries is always equivalent to 𝟏𝟏:𝟑𝟑.
c. How are the values in the Blueberries column related to each other?
Answers will vary. However, students could use the chart paper and write on the table to see the patterns. Most tables should have addition repeating throughout.
d. How are the values in the Strawberries column related to each other?
Answers will vary. However, students could use the chart paper and write on the table to see the patterns. Most tables should have addition repeating throughout.
e. If we know we want to add 𝟕𝟕 quarts of blueberries to the fruit salad in Table 1, how can we use the table to help us determine how many strawberries to add?
We could extend our table until we get to 𝟕𝟕 in the blueberry column.
f. If we know we used 𝟕𝟕𝟏𝟏 quarts of blueberries to make our salad, how can we use a ratio table to find out how many quarts of strawberries were used?
We could start with the ratio 𝟏𝟏:𝟑𝟑 that was given in the description and then multiply by ten to get 𝟏𝟏𝟏𝟏 and 𝟑𝟑𝟏𝟏. These would be the first values in our table. Then, we would count up by tens in the Blueberries column and count up by 𝟑𝟑𝟏𝟏′s in the Strawberries column.
Students create the three ratio tables on the student pages. Have index cards ready that say Table 1, Table 2, and Table 3 to hand out to students so that students can place the assigned table on chart paper (15 minutes). After the charts are created, have students focus on how they created the tables and discuss the structure of the tables with a partner or small group. After students have had a chance to work, pull the class together as a whole group for a discussion about the structure of the tables and how the tables are related. Use the questions below to guide the discussion.
How are all three of the tables related?
Each table represents the same ratio of the number of quarts of blueberries to the number of quarts of strawberries, which is 1: 3.
What operation(s) did you use to determine the values for quarts of blueberries and quarts of strawberries?
Adding or multiplying (Have students elaborate where they used each operation.)
How is the number of quarts of strawberries related to the number of quarts of blueberries?
The number of quarts of strawberries is always three times the number of quarts of blueberries, or the number of quarts of blueberries is one-third the number of quarts of strawberries. Students could also respond that the ratio of the number of quarts of blueberries to the number of quarts of strawberries is always equivalent to 1: 3.
MP.7
Lesson 10: The Structure of Ratio Tables—Additive and Multiplicative 72
This work is licensed under a Creative Commons Attribution-NonCommercial-ShareAlike 3.0 Unported License. © 2015 Great Minds. eureka-math.org
G6-M1-TE-1.3.0-06.2015

NYS COMMON CORE MATHEMATICS CURRICULUM 6•1 Lesson 10
Students write directly on the chart paper to check and see whether this is true for every entry in each table. Extend this question to ask students why the rows have the same ratio of the number of quarts of blueberries to the number of quarts of strawberries (or why the rows do not have the same ratio, if a mistake was made) or if the answer makes sense.
How are the amounts of blueberries related to each other in the table? Answers will vary. Students should notice that there is a pattern in the blueberries column. The paper
that each group of students made could be different so how they created the pattern will vary. However, students could use the chart paper and write on the table to see the patterns. Most tables should have addition repeating throughout.
How are the amounts of strawberries related to each other in the table?
Extend this question to further ask students how the two patterns are related to each other.
The change in the amount of blueberries compared to the change in the amount of strawberries is 10 to 30 or 1 to 3, the same ratio we started with.
If we know we want to add 7 quarts of blueberries in Table 1, how can we use the table to help us get the amount of strawberries needed? We could extend our table until we got to seven in the blueberries column.
MP.7
Lesson 10: The Structure of Ratio Tables—Additive and Multiplicative 73
This work is licensed under a Creative Commons Attribution-NonCommercial-ShareAlike 3.0 Unported License. © 2015 Great Minds. eureka-math.org
G6-M1-TE-1.3.0-06.2015

NYS COMMON CORE MATHEMATICS CURRICULUM 6•1 Lesson 10
What if we were making enough fruit salad to serve a large number of people and added 70 quarts of blueberries? How could we create a table to find the value for strawberries?
We could start with the ratio 1: 3 that was given in the description and then multiply by ten to get 10 and 30. These would be the first values in our table. Then, we would count up by tens in the Blueberries column and count up by 30′s in the Strawberries column.
Exercise 1
Students examine tables that were made incorrectly and make comments on what was done wrong when making the tables. Students also note the ratio that was used to create the ratio table and then create a correct table.
Exercise 1
The following tables were made incorrectly. Find the mistakes that were made, create the correct ratio table, and state the ratio that was used to make the correct ratio table.
a.
Hours Pay in Dollars
𝟑𝟑 𝟐𝟐𝟒𝟒
𝟓𝟓 𝟒𝟒𝟏𝟏
𝟕𝟕 𝟓𝟓𝟐𝟐
𝟗𝟗 𝟕𝟕𝟐𝟐
Ratio 𝟏𝟏:𝟖𝟖 (Solutions may vary.)
b.
Ratio 𝟏𝟏:𝟓𝟓 (Solutions may vary.)
Students should be able to note that the entry (7, 52) is incorrect. It should be (7, 56).
Students should also note that each entry should have a ratio of 1 to 8 showing that 1 hour pays $8.
Hours Pay in Dollars
3 24
5 40
7 52
9 72
Blue Yellow
𝟏𝟏 𝟓𝟓
𝟒𝟒 𝟐𝟐𝟏𝟏
𝟕𝟕 𝟑𝟑𝟓𝟓
𝟏𝟏𝟏𝟏 𝟓𝟓𝟏𝟏
MP.7
Hours Pay in Dollars
𝟑𝟑 𝟐𝟐𝟒𝟒
𝟓𝟓 𝟒𝟒𝟏𝟏
𝟕𝟕 𝟓𝟓𝟔𝟔
𝟗𝟗 𝟕𝟕𝟐𝟐
Blue Yellow
𝟏𝟏 𝟓𝟓
𝟒𝟒 𝟖𝟖
𝟕𝟕 𝟏𝟏𝟑𝟑
𝟏𝟏𝟏𝟏 𝟏𝟏𝟔𝟔
Lesson 10: The Structure of Ratio Tables—Additive and Multiplicative 74
This work is licensed under a Creative Commons Attribution-NonCommercial-ShareAlike 3.0 Unported License. © 2015 Great Minds. eureka-math.org
G6-M1-TE-1.3.0-06.2015

NYS COMMON CORE MATHEMATICS CURRICULUM 6•1 Lesson 10
Students may notice that each of the entries has a different ratio. The problem with this table is that the same amount was added repeatedly to both the Blue column and the Yellow column. Because the first ratio is 1: 5, to get a ratio of 4: 20, we would add three to the Blue column and fifteen to the Yellow column. Adding three to the Blue column and then adding fifteen to the Yellow column creates a ratio of 1: 5, just what we started with.
Closing (5 minutes)
Questions to Review:
In a vertically oriented ratio table, how are the values across the rows related?
The values across the rows form a ratio of 𝐴𝐴:𝐵𝐵. So, the value of the second column will be determined
by multiplying the value in the first column by 𝐵𝐵𝐴𝐴
, and the value of the first column will be determined by
multiplying the value in the second column by 𝐴𝐴𝐵𝐵
.
In a vertically oriented ratio table, how are the values related as we move down a column?
The values in the column depend on how the table was created, but they could be increasing by the same sum or by the same multiple. For example, the values in the first column could be increasing by 5 each time. So, the values could go from 6, 11, 16, 21, 26, etc. or the numbers could be formed by multiplying. In other words, the values could go from 6, 12, 24, 48, etc. if the values were multiplied by 2 each time.
Is there a way to use addition to figure out the next row in a ratio table?
I can use the ratio to help me use addition to get the next row. For example, if the ratio of 𝐴𝐴:𝐵𝐵 is 2: 5, I can add 2 to the value in the first column and add 5 to the value in the second column to get the next row in the table. I cannot just add the same thing to both the values in the first and second columns.
Is there a way to use multiplication to figure out the next row in a ratio table?
If I use multiplication to get the next row in the table, I need to multiply both the values in the first column and the values in the second column by the same number. So, if the original row is (4, 5), and I want to multiply by 3 to get the next row, I would multiply 4 × 3 and 5 × 3 to get a row that is (12, 15). Unlike the addition method, I would do the same thing to both the values in the first column and the values in the second column.
Blue Yellow
1 5
4 8
7 13
10 16
Lesson 10: The Structure of Ratio Tables—Additive and Multiplicative 75
This work is licensed under a Creative Commons Attribution-NonCommercial-ShareAlike 3.0 Unported License. © 2015 Great Minds. eureka-math.org
G6-M1-TE-1.3.0-06.2015

NYS COMMON CORE MATHEMATICS CURRICULUM 6•1 Lesson 10
Exit Ticket (5 minutes)
Lesson Summary
Ratio tables are constructed in a special way.
Each pair of values in the table will be equivalent to the same ratio.
Repeated addition or multiplication can be used to create a ratio table.
The values in the first column can be multiplied by a constant value to get the values in the second column.
red white 𝟑𝟑 × 𝟒𝟒 𝟏𝟏𝟐𝟐 𝟔𝟔 × 𝟒𝟒 𝟐𝟐𝟒𝟒 𝟏𝟏𝟐𝟐 × 𝟒𝟒 𝟒𝟒𝟖𝟖 𝟐𝟐𝟏𝟏 × 𝟒𝟒 𝟖𝟖𝟒𝟒
By just adding a certain number to the first entry of a ratio in the first column and adding the same number to the second entry in the second column, the new ratio formed is generally not equivalent to the original ratio. Instead, the numbers added to the entries must be related to the ratio used to make the table. However, if the entries in one column are multiplied by a certain number, multiplying the entries in the other column by the same number creates equivalent ratios.
Lesson 10: The Structure of Ratio Tables—Additive and Multiplicative 76
This work is licensed under a Creative Commons Attribution-NonCommercial-ShareAlike 3.0 Unported License. © 2015 Great Minds. eureka-math.org
G6-M1-TE-1.3.0-06.2015
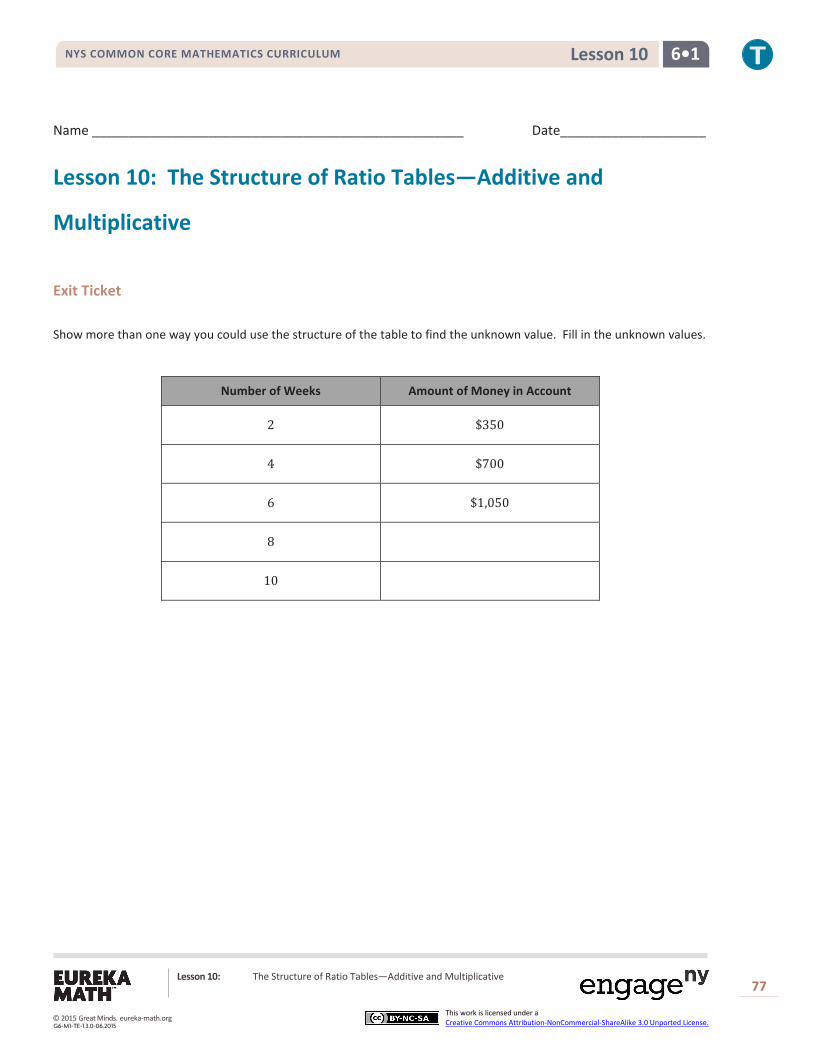
NYS COMMON CORE MATHEMATICS CURRICULUM 6•1 Lesson 10
Name ___________________________________________________ Date____________________
Lesson 10: The Structure of Ratio Tables—Additive and
Multiplicative
Exit Ticket Show more than one way you could use the structure of the table to find the unknown value. Fill in the unknown values.
Number of Weeks Amount of Money in Account
2 $350
4 $700
6 $1,050
8
10
Lesson 10: The Structure of Ratio Tables—Additive and Multiplicative 77
This work is licensed under a Creative Commons Attribution-NonCommercial-ShareAlike 3.0 Unported License. © 2015 Great Minds. eureka-math.org
G6-M1-TE-1.3.0-06.2015
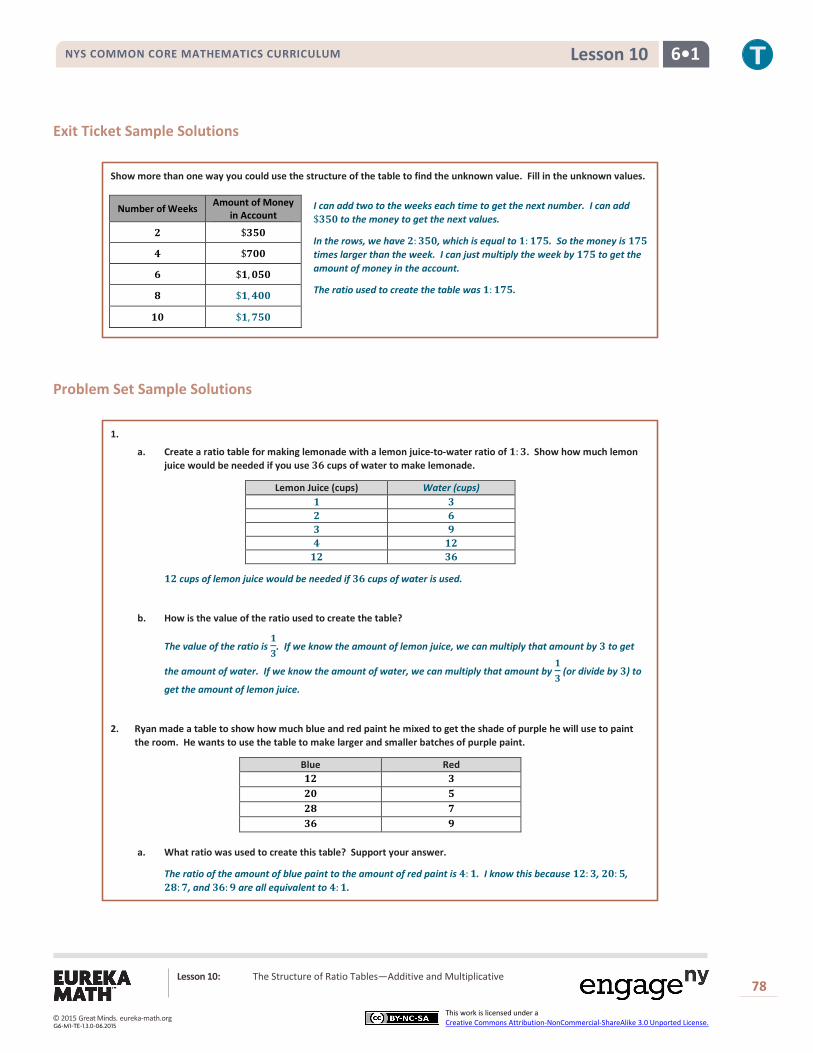
NYS COMMON CORE MATHEMATICS CURRICULUM 6•1 Lesson 10
Exit Ticket Sample Solutions
Show more than one way you could use the structure of the table to find the unknown value. Fill in the unknown values.
I can add two to the weeks each time to get the next number. I can add $𝟑𝟑𝟓𝟓𝟏𝟏 to the money to get the next values.
In the rows, we have 𝟐𝟐:𝟑𝟑𝟓𝟓𝟏𝟏, which is equal to 𝟏𝟏:𝟏𝟏𝟕𝟕𝟓𝟓. So the money is 𝟏𝟏𝟕𝟕𝟓𝟓 times larger than the week. I can just multiply the week by 𝟏𝟏𝟕𝟕𝟓𝟓 to get the amount of money in the account.
The ratio used to create the table was 𝟏𝟏:𝟏𝟏𝟕𝟕𝟓𝟓.
Problem Set Sample Solutions
1.
a. Create a ratio table for making lemonade with a lemon juice-to-water ratio of 𝟏𝟏:𝟑𝟑. Show how much lemon juice would be needed if you use 𝟑𝟑𝟔𝟔 cups of water to make lemonade.
Lemon Juice (cups) Water (cups) 𝟏𝟏 𝟑𝟑 𝟐𝟐 𝟔𝟔 𝟑𝟑 𝟗𝟗 𝟒𝟒 𝟏𝟏𝟐𝟐 𝟏𝟏𝟐𝟐 𝟑𝟑𝟔𝟔
𝟏𝟏𝟐𝟐 cups of lemon juice would be needed if 𝟑𝟑𝟔𝟔 cups of water is used.
b. How is the value of the ratio used to create the table?
The value of the ratio is 𝟏𝟏𝟑𝟑
. If we know the amount of lemon juice, we can multiply that amount by 𝟑𝟑 to get
the amount of water. If we know the amount of water, we can multiply that amount by 𝟏𝟏𝟑𝟑
(or divide by 𝟑𝟑) to
get the amount of lemon juice.
2. Ryan made a table to show how much blue and red paint he mixed to get the shade of purple he will use to paint the room. He wants to use the table to make larger and smaller batches of purple paint.
Blue Red 𝟏𝟏𝟐𝟐 𝟑𝟑 𝟐𝟐𝟏𝟏 𝟓𝟓 𝟐𝟐𝟖𝟖 𝟕𝟕 𝟑𝟑𝟔𝟔 𝟗𝟗
a. What ratio was used to create this table? Support your answer.
The ratio of the amount of blue paint to the amount of red paint is 𝟒𝟒:𝟏𝟏. I know this because 𝟏𝟏𝟐𝟐:𝟑𝟑, 𝟐𝟐𝟏𝟏:𝟓𝟓, 𝟐𝟐𝟖𝟖:𝟕𝟕, and 𝟑𝟑𝟔𝟔:𝟗𝟗 are all equivalent to 𝟒𝟒:𝟏𝟏.
Number of Weeks Amount of Money in Account
𝟐𝟐 $𝟑𝟑𝟓𝟓𝟏𝟏
𝟒𝟒 $𝟕𝟕𝟏𝟏𝟏𝟏
𝟔𝟔 $𝟏𝟏,𝟏𝟏𝟓𝟓𝟏𝟏
𝟖𝟖 $𝟏𝟏,𝟒𝟒𝟏𝟏𝟏𝟏
𝟏𝟏𝟏𝟏 $𝟏𝟏,𝟕𝟕𝟓𝟓𝟏𝟏
Lesson 10: The Structure of Ratio Tables—Additive and Multiplicative 78
This work is licensed under a Creative Commons Attribution-NonCommercial-ShareAlike 3.0 Unported License. © 2015 Great Minds. eureka-math.org
G6-M1-TE-1.3.0-06.2015

NYS COMMON CORE MATHEMATICS CURRICULUM 6•1 Lesson 10
b. How are the values in each row related to each other?
In each row, the amount of red paint is 𝟏𝟏𝟒𝟒
times the amount of blue paint, or the amount of blue paint is
𝟒𝟒 times the amount of red paint.
c. How are the values in each column related to each other?
The values in the columns are increasing using the ratio. Since the ratio of the amount of blue paint to the amount of red paint is 𝟒𝟒:𝟏𝟏, we have used 𝟒𝟒× 𝟐𝟐:𝟏𝟏 × 𝟐𝟐, or 𝟖𝟖:𝟐𝟐, and repeatedly added to form the table. 𝟖𝟖 was added to the entries in the blue column while 𝟐𝟐 was added to the entries in the red column.
Lesson 10: The Structure of Ratio Tables—Additive and Multiplicative 79
This work is licensed under a Creative Commons Attribution-NonCommercial-ShareAlike 3.0 Unported License. © 2015 Great Minds. eureka-math.org
G6-M1-TE-1.3.0-06.2015

NYS COMMON CORE MATHEMATICS CURRICULUM 6•1 Lesson 11
Lesson 11: Comparing Ratios Using Ratio Tables
Student Outcomes
Students solve problems by comparing different ratios using two or more ratio tables.
Classwork
Example 1 (10 minutes)
Allow students time to complete the example. If time permits, allow student volunteers to come to the board and explain their solutions. Students will be asked to complete two questions.
Example 1
Create four equivalent ratios (𝟐𝟐 by scaling up and 𝟐𝟐 by scaling down) using the ratio 𝟑𝟑𝟑𝟑 to 𝟖𝟖𝟑𝟑.
There are various possible answers.
Some examples of scaling down are 𝟑𝟑:𝟖𝟖, 𝟔𝟔:𝟏𝟏𝟔𝟔, 𝟗𝟗:𝟐𝟐𝟐𝟐, 𝟏𝟏𝟐𝟐:𝟑𝟑𝟐𝟐, 𝟏𝟏𝟏𝟏:𝟐𝟐𝟑𝟑, 𝟏𝟏𝟖𝟖:𝟐𝟐𝟖𝟖, 𝟐𝟐𝟏𝟏:𝟏𝟏𝟔𝟔, 𝟐𝟐𝟐𝟐:𝟔𝟔𝟐𝟐, and 𝟐𝟐𝟐𝟐:𝟐𝟐𝟐𝟐.
Some examples of scaling up are 𝟔𝟔𝟑𝟑:𝟏𝟏𝟔𝟔𝟑𝟑, 𝟗𝟗𝟑𝟑:𝟐𝟐𝟐𝟐𝟑𝟑, 𝟏𝟏𝟐𝟐𝟑𝟑:𝟑𝟑𝟐𝟐𝟑𝟑, etc.
Write a ratio to describe the relationship shown in the table.
Hours Number of Pizzas Sold 𝟐𝟐 𝟏𝟏𝟔𝟔 𝟏𝟏 𝟐𝟐𝟑𝟑 𝟔𝟔 𝟐𝟐𝟖𝟖 𝟏𝟏𝟑𝟑 𝟖𝟖𝟑𝟑
The ratio used to create the table is 𝟏𝟏:𝟖𝟖, which means that there are 𝟖𝟖 pizzas being sold every hour.
Exercise 1 (10 minutes)
Students work in small groups or with partners for the exercise. Show the examples of three students and their texting speeds. Tables are provided in the student materials showing different numbers of words being texted by different students at different times. Display these tables to have a visual representation to use during discussion. Have students discuss possible ways of using the tables to figure out who can text the fastest.
Exercise 1
The following tables show how many words each person can text in a given amount of time. Compare the rates of texting for each person using the ratio table.
Michaela
Minutes 𝟑𝟑 𝟏𝟏 𝟐𝟐 𝟗𝟗 Words 𝟏𝟏𝟏𝟏𝟑𝟑 𝟐𝟐𝟏𝟏𝟑𝟑 𝟑𝟑𝟏𝟏𝟑𝟑 𝟐𝟐𝟏𝟏𝟑𝟑
Lesson 11: Comparing Ratios Using Ratio Tables
80
This work is licensed under a Creative Commons Attribution-NonCommercial-ShareAlike 3.0 Unported License. © 2015 Great Minds. eureka-math.org
G6-M1-TE-1.3.0-06.2015
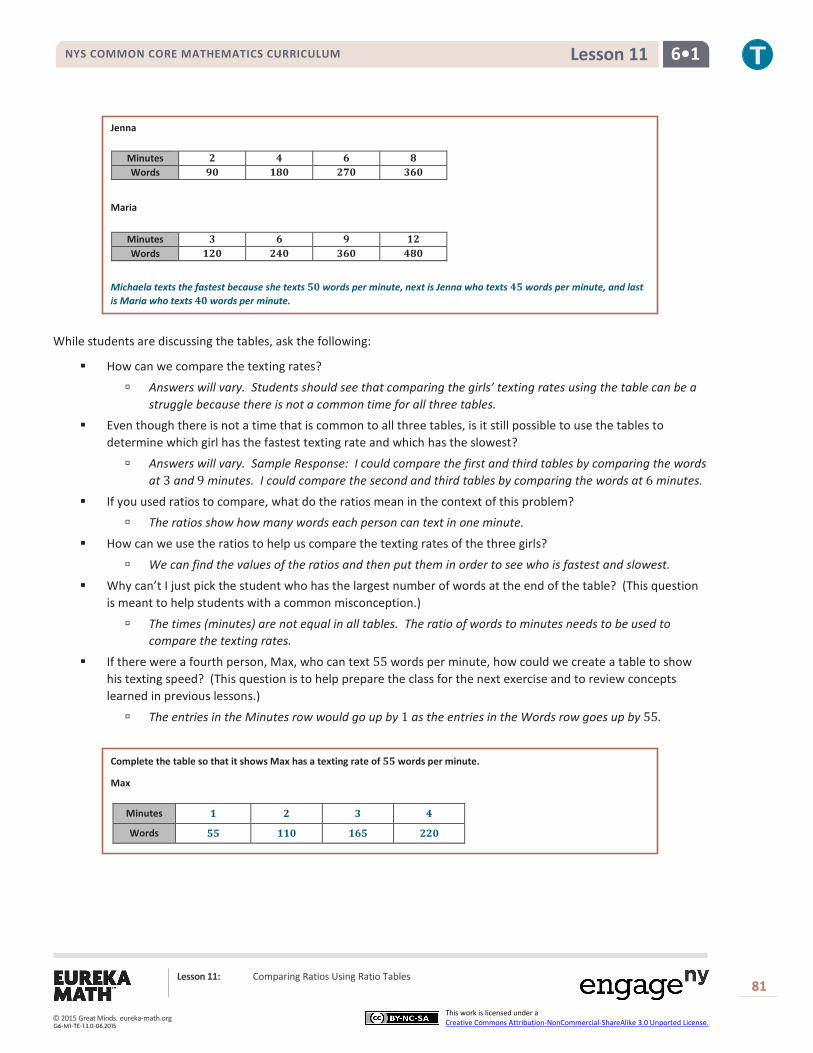
NYS COMMON CORE MATHEMATICS CURRICULUM 6•1 Lesson 11
Jenna
Maria
Michaela texts the fastest because she texts 𝟏𝟏𝟑𝟑 words per minute, next is Jenna who texts 𝟐𝟐𝟏𝟏 words per minute, and last is Maria who texts 𝟐𝟐𝟑𝟑 words per minute.
While students are discussing the tables, ask the following:
How can we compare the texting rates?
Answers will vary. Students should see that comparing the girls’ texting rates using the table can be a struggle because there is not a common time for all three tables.
Even though there is not a time that is common to all three tables, is it still possible to use the tables to determine which girl has the fastest texting rate and which has the slowest?
Answers will vary. Sample Response: I could compare the first and third tables by comparing the words at 3 and 9 minutes. I could compare the second and third tables by comparing the words at 6 minutes.
If you used ratios to compare, what do the ratios mean in the context of this problem? The ratios show how many words each person can text in one minute.
How can we use the ratios to help us compare the texting rates of the three girls?
We can find the values of the ratios and then put them in order to see who is fastest and slowest.
Why can’t I just pick the student who has the largest number of words at the end of the table? (This question is meant to help students with a common misconception.)
The times (minutes) are not equal in all tables. The ratio of words to minutes needs to be used to compare the texting rates.
If there were a fourth person, Max, who can text 55 words per minute, how could we create a table to show his texting speed? (This question is to help prepare the class for the next exercise and to review concepts learned in previous lessons.)
The entries in the Minutes row would go up by 1 as the entries in the Words row goes up by 55.
Complete the table so that it shows Max has a texting rate of 𝟏𝟏𝟏𝟏 words per minute.
Max
Minutes 𝟏𝟏 𝟐𝟐 𝟑𝟑 𝟐𝟐
Words 𝟏𝟏𝟏𝟏 𝟏𝟏𝟏𝟏𝟑𝟑 𝟏𝟏𝟔𝟔𝟏𝟏 𝟐𝟐𝟐𝟐𝟑𝟑
Minutes 𝟐𝟐 𝟐𝟐 𝟔𝟔 𝟖𝟖 Words 𝟗𝟗𝟑𝟑 𝟏𝟏𝟖𝟖𝟑𝟑 𝟐𝟐𝟐𝟐𝟑𝟑 𝟑𝟑𝟔𝟔𝟑𝟑
Minutes 𝟑𝟑 𝟔𝟔 𝟗𝟗 𝟏𝟏𝟐𝟐 Words 𝟏𝟏𝟐𝟐𝟑𝟑 𝟐𝟐𝟐𝟐𝟑𝟑 𝟑𝟑𝟔𝟔𝟑𝟑 𝟐𝟐𝟖𝟖𝟑𝟑
Lesson 11: Comparing Ratios Using Ratio Tables
81
This work is licensed under a Creative Commons Attribution-NonCommercial-ShareAlike 3.0 Unported License. © 2015 Great Minds. eureka-math.org
G6-M1-TE-1.3.0-06.2015

NYS COMMON CORE MATHEMATICS CURRICULUM 6•1 Lesson 11
Exercise 2 (10 minutes): Making Juice (Comparing Juice to Water)
Students work with a partner or in a small group. Students follow the set of instructions that leads them through examples and asks them questions to help them dig deeper. The questions ask students to compare the ratio of water to juice for a variety of beverages. Students can also find the value of the ratio in order to determine which juice has a higher water-to-juice ratio.
Exercise 2: Making Juice (Comparing Juice to Water)
a. The tables below show the comparison of the amount of water to the amount of juice concentrate (JC) in grape juice made by three different people. Whose juice has the greatest water-to-juice concentrate ratio, and whose juice would taste strongest? Be sure to justify your answer.
Franca’s juice has the greatest amount of water in comparison to juice concentrate, followed by Milton, and then Laredo. Because Laredo’s juice has the least amount of water in comparison to juice concentrate, his juice would taste the strongest.
Put the juices in order from the juice containing the most water to the juice containing the least water.
Franca, Milton, Laredo
Discussing what these ratios mean and what the values of the ratios look like will help give meaning to the problem for students who are struggling. Students should see that the value of the water-to-juice concentrate ratio for Franca’s juice is greater than the value of the water-to-juice concentrate ratio for Laredo’s and Milton’s juices.
Explain how you used the values in the table to determine the order.
Laredo makes his juice by combining three cups of water for every one cup of juice concentrate.
Franca makes her juice by combining five cups of water for every one cup of juice concentrate.
Milton makes his juice by combining four cups of water for every one cup of juice concentrate.
What ratio was used to create each table?
Laredo 𝟑𝟑:𝟏𝟏, Franca 𝟏𝟏:𝟏𝟏, Milton 𝟐𝟐:𝟏𝟏
Explain how the ratio could help you compare the juices.
Answers will vary.
As you visit the groups or partners as they are working, discuss the third column in the table. Some students may have compared using the total as well.
The next question does not have equal values in the columns for all three tables, so other reasoning will need to be used to solve the problems.
Lesson 11: Comparing Ratios Using Ratio Tables
82
This work is licensed under a Creative Commons Attribution-NonCommercial-ShareAlike 3.0 Unported License. © 2015 Great Minds. eureka-math.org
G6-M1-TE-1.3.0-06.2015

NYS COMMON CORE MATHEMATICS CURRICULUM 6•1 Lesson 11
Laredo’s Juice Franca’s Juice Milton’s Juice Water JC Total Water JC Total Water JC Total
12 2 14 15 6 21 16 6 22 18 3 21 20 8 28 24 9 33 30 5 35 35 14 49 40 15 55 42 7 49 50 20 70 64 24 88
Students may use the ratios to compare the data.
Struggling students, and even average students, may be challenged when comparing these ratios. By finding the value of the ratios, it will be easier for students to compare the data. It should be fairly obvious that Laredo has the juice with the most water compared to juice concentrate. If students use the tables to compare Franca’s ratio of the amount of water to the amount of juice concentrate with Milton’s ratio of the amount of water to the amount of juice concentrate, they can look for numbers the columns have in common.
b. The next day, each of the three people made juice again, but this time they were making apple juice. Whose juice has the greatest water-to-juice concentrate ratio, and whose juice would taste the strongest? Be sure to justify your answer.
Put the juices in order from the strongest apple taste to the weakest apple taste.
Franca, Milton, Laredo
Explain how you used the values in the table to determine the order.
Answers will vary.
Based on the data in the tables, Milton added more water to his juice than Franca added to her juice. So, the order of the juice with the strongest apple taste to the weakest apple taste is Franca, Milton, Laredo.
Students may use the ratios to get equal amounts of water and then compare the amounts of juice concentrate, or students may use the ratios to get equal amounts of juice concentrate and then compare the amounts of water.
𝟏𝟏:𝟐𝟐 -------- 𝟏𝟏 × 𝟖𝟖:𝟐𝟐 × 𝟖𝟖 ------- 𝟐𝟐𝟑𝟑:𝟏𝟏𝟔𝟔
𝟖𝟖:𝟑𝟑 -------- 𝟖𝟖 × 𝟏𝟏:𝟑𝟑 × 𝟏𝟏 ------- 𝟐𝟐𝟑𝟑:𝟏𝟏𝟏𝟏
Now we can compare and see that Franca’s juice has more juice concentrate compared to water than Milton’s juice.
Students also have the option of comparing the values of the ratios to see which value is greater. Then they can
compare 156
to 166
and see that the value of Milton’s ratio is larger than the value of Franca’s ratio.
MP.7
Lesson 11: Comparing Ratios Using Ratio Tables
83
This work is licensed under a Creative Commons Attribution-NonCommercial-ShareAlike 3.0 Unported License. © 2015 Great Minds. eureka-math.org
G6-M1-TE-1.3.0-06.2015

NYS COMMON CORE MATHEMATICS CURRICULUM 6•1 Lesson 11
What ratio was used to create each table?
Laredo: 𝟔𝟔:𝟏𝟏 Franca: 𝟏𝟏:𝟐𝟐
Milton: 𝟖𝟖:𝟑𝟑
Explain how the ratio could help you compare the juices.
Answers will vary.
How was this problem different than the grape juice questions in part (a)?
Answers will vary.
c. Max and Sheila are making orange juice. Max has mixed 𝟏𝟏𝟏𝟏 cups of water with 𝟐𝟐 cups of juice concentrate. Sheila has made her juice by mixing 𝟖𝟖 cups of water with 𝟑𝟑 cups of juice concentrate. Compare the ratios of juice concentrate to water using ratio tables. State which beverage has a higher juice concentrate-to-water ratio.
Max Sheila
Sheila has a higher juice concentrate-to-water ratio because she mixed 𝟏𝟏𝟐𝟐 cups of juice concentrate to only 𝟑𝟑𝟐𝟐 cups of water. Max’s juice would be more watery because he would have 𝟐𝟐𝟏𝟏 cups of water with the 𝟏𝟏𝟐𝟐 cups of juice concentrate.
d. Victor is making recipes for smoothies. His first recipe calls for 𝟐𝟐 cups of strawberries and 𝟐𝟐 cups of other ingredients. His second recipe says that 𝟑𝟑 cups of strawberries are combined with 𝟗𝟗 cups of other ingredients. Which smoothie recipe has more strawberries compared to other ingredients? Use ratio tables to justify your answer.
Recipe 2 has more strawberries compared to other ingredients.
Recipe 1 Recipe 2
Recipe 2 has more strawberries compared to the other ingredients. When comparing 𝟔𝟔 cups of strawberries, there were fewer other ingredients added in Recipe 2 than in Recipe 1.
Students who are struggling can use the value of the ratio to compare the data. However, in parts (c) and (d), struggling students may need to see the comparison of part to whole or get equal amounts of water in part (c) and other in part (d) to make sense of the problem. If students use this comparison, they may want to use multiplication instead of adding to make the table. For example, in part (d), students may want to see how many strawberries would be needed when 63 cups of other ingredients are added.
2: 7 becomes 18 to 63.
3: 9 becomes 21 to 63.
This might be an easier way for students to see that there are more strawberries in Recipe 2.
JC 𝟐𝟐 𝟖𝟖 𝟏𝟏𝟐𝟐 JC 𝟑𝟑 𝟔𝟔 𝟗𝟗 Water 𝟏𝟏𝟏𝟏 𝟑𝟑𝟑𝟑 𝟐𝟐𝟏𝟏 Water 𝟖𝟖 𝟏𝟏𝟔𝟔 𝟐𝟐𝟐𝟐
Strawberries 𝟐𝟐 𝟐𝟐 𝟔𝟔 Strawberries 𝟑𝟑 𝟔𝟔 𝟗𝟗 Other 𝟐𝟐 𝟏𝟏𝟐𝟐 𝟐𝟐𝟏𝟏 Other 𝟗𝟗 𝟏𝟏𝟖𝟖 𝟐𝟐𝟐𝟐
MP.7
Lesson 11: Comparing Ratios Using Ratio Tables
84
This work is licensed under a Creative Commons Attribution-NonCommercial-ShareAlike 3.0 Unported License. © 2015 Great Minds. eureka-math.org
G6-M1-TE-1.3.0-06.2015

NYS COMMON CORE MATHEMATICS CURRICULUM 6•1 Lesson 11
While students are working, circulate and ask students to share their solving strategies. It is important to also ask students to prove their claims. If a student has simply written that one beverage has a higher amount of water per juice than the other, ask the student to prove or explain how the answer was determined. Students share how they have compared the values in the table.
Closing (10 minutes)
Today we used ratio tables to compare two ratios that were not equivalent and answered questions about which situation would reach a given level first. Can anyone think of another way to compare two different ratios?
The value of a ratio might be useful because then we could determine which ratio had the larger or smaller value.
Exit Ticket (5 minutes)
Lesson Summary
Ratio tables can be used to compare two ratios.
Look for equal amounts in a row or column to compare the second amount associated with it.
𝟑𝟑 𝟔𝟔 𝟏𝟏𝟐𝟐 𝟑𝟑𝟑𝟑 𝟏𝟏𝟑𝟑 𝟐𝟐𝟏𝟏 𝟑𝟑𝟑𝟑 𝟐𝟐𝟏𝟏
𝟐𝟐 𝟏𝟏𝟐𝟐 𝟐𝟐𝟖𝟖 𝟐𝟐𝟑𝟑 𝟏𝟏𝟔𝟔 𝟐𝟐𝟑𝟑 𝟐𝟐𝟖𝟖 𝟐𝟐𝟐𝟐
The values of the tables can also be extended in order to get comparable amounts. Another method would be to compare the values of the ratios by writing the values of the ratios as fractions and then using knowledge of fractions to compare the ratios.
When ratios are given in words, creating a table of equivalent ratios helps in comparing the ratios.
𝟏𝟏𝟐𝟐:𝟑𝟑𝟏𝟏 compared to 𝟖𝟖:𝟐𝟐𝟑𝟑
Quantity 1 𝟏𝟏𝟐𝟐 𝟐𝟐𝟐𝟐 𝟑𝟑𝟔𝟔 𝟐𝟐𝟖𝟖 Quantity 1 𝟖𝟖 𝟏𝟏𝟔𝟔
Quantity 2 𝟑𝟑𝟏𝟏 𝟐𝟐𝟑𝟑 𝟏𝟏𝟑𝟑𝟏𝟏 𝟏𝟏𝟐𝟐𝟑𝟑 Quantity 2 𝟐𝟐𝟑𝟑 𝟏𝟏𝟐𝟐𝟑𝟑
Lesson 11: Comparing Ratios Using Ratio Tables
85
This work is licensed under a Creative Commons Attribution-NonCommercial-ShareAlike 3.0 Unported License. © 2015 Great Minds. eureka-math.org
G6-M1-TE-1.3.0-06.2015
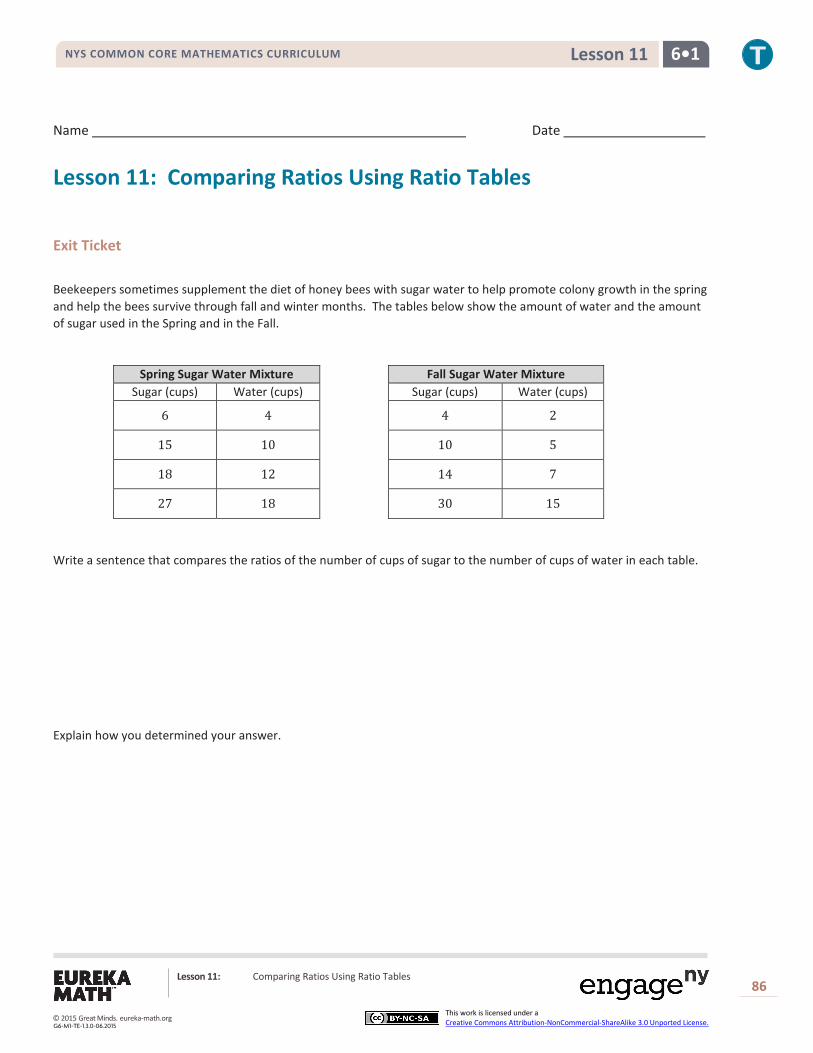
NYS COMMON CORE MATHEMATICS CURRICULUM 6•1 Lesson 11
Name Date
Lesson 11: Comparing Ratios Using Ratio Tables
Exit Ticket Beekeepers sometimes supplement the diet of honey bees with sugar water to help promote colony growth in the spring and help the bees survive through fall and winter months. The tables below show the amount of water and the amount of sugar used in the Spring and in the Fall.
Spring Sugar Water Mixture Fall Sugar Water Mixture Sugar (cups) Water (cups) Sugar (cups) Water (cups)
6 4 4 2
15 10 10 5
18 12 14 7
27 18 30 15
Write a sentence that compares the ratios of the number of cups of sugar to the number of cups of water in each table.
Explain how you determined your answer.
Lesson 11: Comparing Ratios Using Ratio Tables
86
This work is licensed under a Creative Commons Attribution-NonCommercial-ShareAlike 3.0 Unported License. © 2015 Great Minds. eureka-math.org
G6-M1-TE-1.3.0-06.2015

NYS COMMON CORE MATHEMATICS CURRICULUM 6•1 Lesson 11
Exit Ticket Sample Solutions
Beekeepers sometimes supplement the diet of honey bees with sugar water to help promote colony growth in the spring and help the bees survive through fall and winter months. The tables below show the amount of water and the amount of sugar used in the Spring and in the Fall.
Spring Sugar Water Mixture Fall Sugar Water Mixture Sugar (cups) Water (cups) Sugar (cups) Water (cups)
𝟔𝟔 𝟐𝟐 𝟐𝟐 𝟐𝟐 𝟏𝟏𝟏𝟏 𝟏𝟏𝟑𝟑 𝟏𝟏𝟑𝟑 𝟏𝟏 𝟏𝟏𝟖𝟖 𝟏𝟏𝟐𝟐 𝟏𝟏𝟐𝟐 𝟐𝟐 𝟐𝟐𝟐𝟐 𝟏𝟏𝟖𝟖 𝟑𝟑𝟑𝟑 𝟏𝟏𝟏𝟏
Write a sentence that compares the ratios of the number of cups of sugar to the number of cups of water in each table.
The value of the ratio for the Spring sugar water is 𝟏𝟏.𝟏𝟏𝟏𝟏
, while the value of the ratio of the Fall sugar water is 𝟐𝟐𝟏𝟏
. Therefore,
the Fall sugar water mixture has more sugar mixed in for every cup of water added to the mixture than the Spring sugar water mixture.
Explain how you determined your answer.
Spring: 𝟔𝟔𝟐𝟐
=𝟑𝟑𝟐𝟐
=𝟏𝟏.𝟏𝟏𝟏𝟏
Fall: 𝟐𝟐𝟐𝟐
=𝟐𝟐𝟏𝟏
Problem Set Sample Solutions
1. Sarah and Eva were swimming.
a. Use the ratio tables below to determine who the faster swimmer is.
Sarah
Time (min) 𝟑𝟑 𝟏𝟏 𝟏𝟏𝟐𝟐 𝟏𝟏𝟐𝟐 Distance (meters) 𝟐𝟐𝟏𝟏 𝟏𝟏𝟐𝟐𝟏𝟏 𝟑𝟑𝟑𝟑𝟑𝟑 𝟐𝟐𝟐𝟐𝟏𝟏
Eva
Time (min) 𝟐𝟐 𝟐𝟐 𝟏𝟏𝟑𝟑 𝟐𝟐𝟑𝟑 Distance (meters) 𝟏𝟏𝟐𝟐 𝟏𝟏𝟖𝟖𝟐𝟐 𝟐𝟐𝟔𝟔𝟑𝟑 𝟏𝟏𝟐𝟐𝟑𝟑
Eva is the faster swimmer because she swims 𝟐𝟐𝟔𝟔 meters in 𝟏𝟏 minute, which is faster than Sarah who swims 𝟐𝟐𝟏𝟏 meters in 𝟏𝟏 minute.
b. Explain the method that you used to determine your answer.
Answers will vary.
2. A 𝟏𝟏𝟐𝟐𝟑𝟑 𝐥𝐥𝐥𝐥. person would weigh about 𝟐𝟐𝟑𝟑 𝐥𝐥𝐥𝐥. on the earth’s moon. A 𝟏𝟏𝟏𝟏𝟑𝟑 𝐥𝐥𝐥𝐥. person would weigh about 𝟐𝟐𝟖𝟖 𝐥𝐥𝐥𝐥. on Io, a moon of Jupiter. Use ratio tables to determine which moon would make a person weigh the most.
Answers will vary. A person on Io will weigh more than a person on our moon.
Lesson 11: Comparing Ratios Using Ratio Tables
87
This work is licensed under a Creative Commons Attribution-NonCommercial-ShareAlike 3.0 Unported License. © 2015 Great Minds. eureka-math.org
G6-M1-TE-1.3.0-06.2015
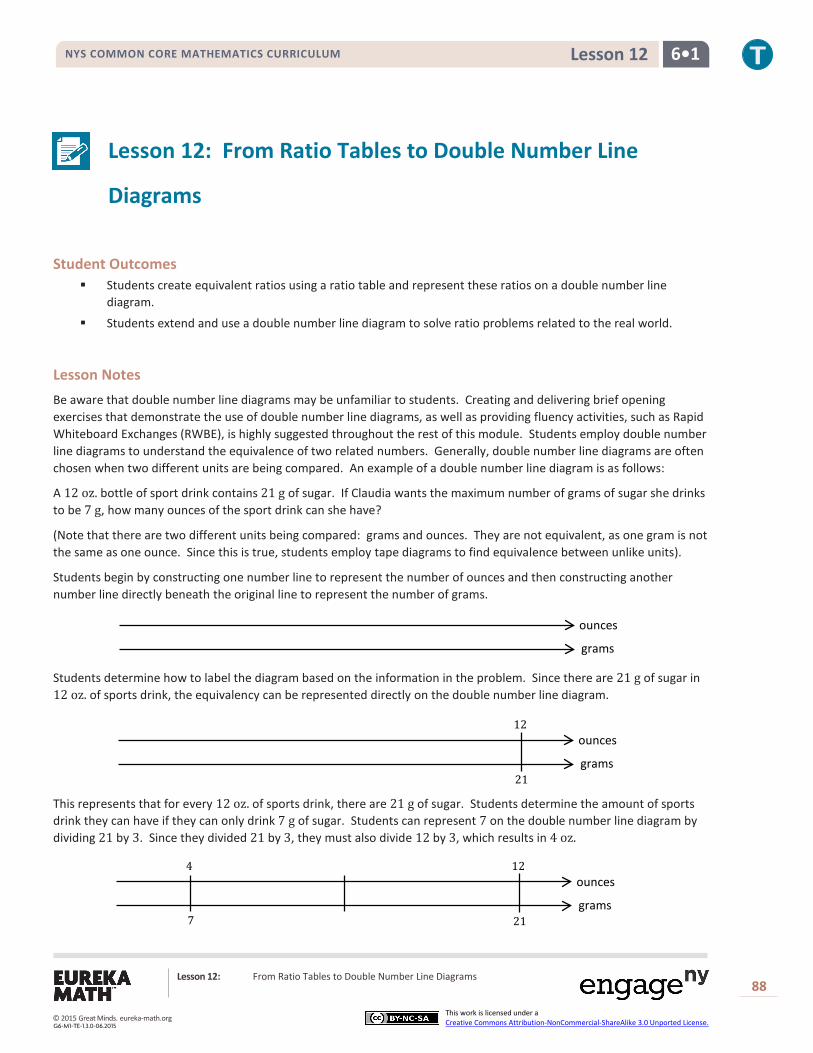
NYS COMMON CORE MATHEMATICS CURRICULUM 6•1 Lesson 12
Lesson 12: From Ratio Tables to Double Number Line
Diagrams
Student Outcomes
Students create equivalent ratios using a ratio table and represent these ratios on a double number line diagram.
Students extend and use a double number line diagram to solve ratio problems related to the real world.
Lesson Notes Be aware that double number line diagrams may be unfamiliar to students. Creating and delivering brief opening exercises that demonstrate the use of double number line diagrams, as well as providing fluency activities, such as Rapid Whiteboard Exchanges (RWBE), is highly suggested throughout the rest of this module. Students employ double number line diagrams to understand the equivalence of two related numbers. Generally, double number line diagrams are often chosen when two different units are being compared. An example of a double number line diagram is as follows:
A 12 oz. bottle of sport drink contains 21 g of sugar. If Claudia wants the maximum number of grams of sugar she drinks to be 7 g, how many ounces of the sport drink can she have?
(Note that there are two different units being compared: grams and ounces. They are not equivalent, as one gram is not the same as one ounce. Since this is true, students employ tape diagrams to find equivalence between unlike units).
Students begin by constructing one number line to represent the number of ounces and then constructing another number line directly beneath the original line to represent the number of grams.
Students determine how to label the diagram based on the information in the problem. Since there are 21 g of sugar in 12 oz. of sports drink, the equivalency can be represented directly on the double number line diagram.
This represents that for every 12 oz. of sports drink, there are 21 g of sugar. Students determine the amount of sports drink they can have if they can only drink 7 g of sugar. Students can represent 7 on the double number line diagram by dividing 21 by 3. Since they divided 21 by 3, they must also divide 12 by 3, which results in 4 oz.
ounces
grams
ounces
grams 21
12
ounces
grams 21
12 4
7
Lesson 12: From Ratio Tables to Double Number Line Diagrams 88
This work is licensed under a Creative Commons Attribution-NonCommercial-ShareAlike 3.0 Unported License. © 2015 Great Minds. eureka-math.org
G6-M1-TE-1.3.0-06.2015
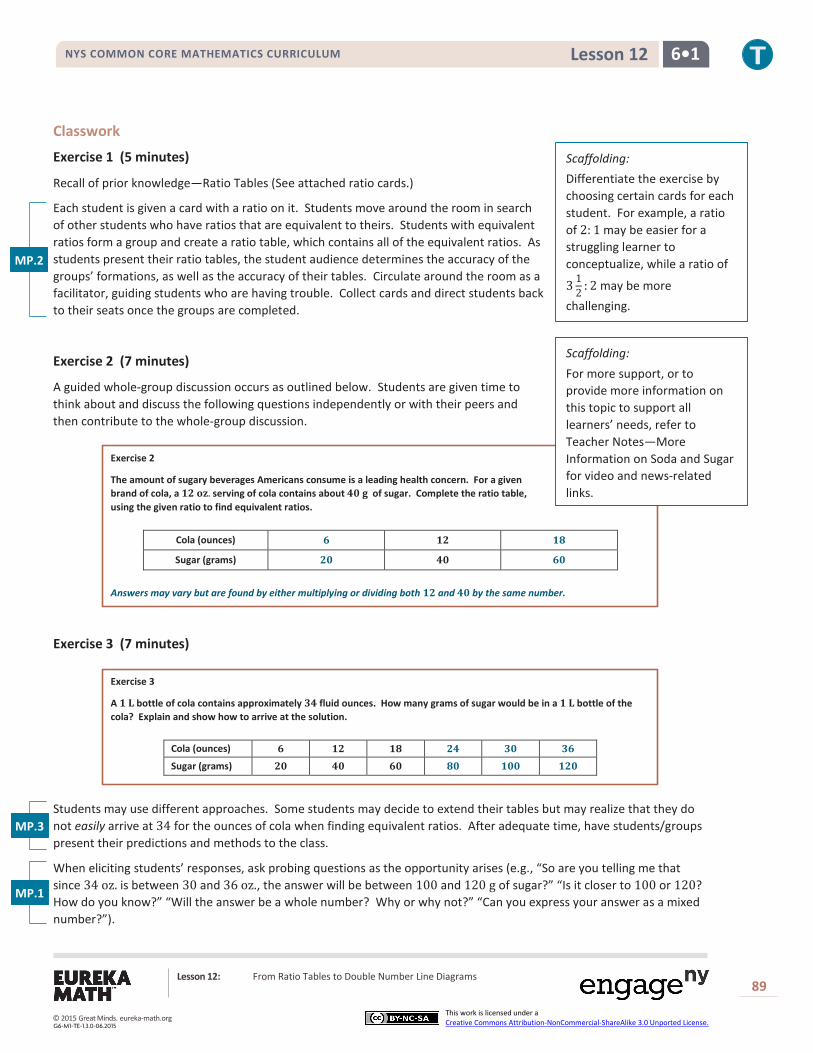
NYS COMMON CORE MATHEMATICS CURRICULUM 6•1 Lesson 12
Classwork
Exercise 1 (5 minutes)
Recall of prior knowledge—Ratio Tables (See attached ratio cards.)
Each student is given a card with a ratio on it. Students move around the room in search of other students who have ratios that are equivalent to theirs. Students with equivalent ratios form a group and create a ratio table, which contains all of the equivalent ratios. As students present their ratio tables, the student audience determines the accuracy of the groups’ formations, as well as the accuracy of their tables. Circulate around the room as a facilitator, guiding students who are having trouble. Collect cards and direct students back to their seats once the groups are completed.
Exercise 2 (7 minutes)
A guided whole-group discussion occurs as outlined below. Students are given time to think about and discuss the following questions independently or with their peers and then contribute to the whole-group discussion.
Exercise 2
The amount of sugary beverages Americans consume is a leading health concern. For a given brand of cola, a 𝟏𝟏𝟏𝟏 𝐨𝐨𝐨𝐨. serving of cola contains about 𝟒𝟒𝟒𝟒 𝐠𝐠 of sugar. Complete the ratio table, using the given ratio to find equivalent ratios.
Cola (ounces) 𝟔𝟔 𝟏𝟏𝟏𝟏 𝟏𝟏𝟏𝟏
Sugar (grams) 𝟏𝟏𝟒𝟒 𝟒𝟒𝟒𝟒 𝟔𝟔𝟒𝟒
Answers may vary but are found by either multiplying or dividing both 𝟏𝟏𝟏𝟏 and 𝟒𝟒𝟒𝟒 by the same number.
Exercise 3 (7 minutes)
Exercise 3
A 𝟏𝟏 𝐋𝐋 bottle of cola contains approximately 𝟑𝟑𝟒𝟒 fluid ounces. How many grams of sugar would be in a 𝟏𝟏 𝐋𝐋 bottle of the cola? Explain and show how to arrive at the solution.
Cola (ounces) 𝟔𝟔 𝟏𝟏𝟏𝟏 𝟏𝟏𝟏𝟏 𝟏𝟏𝟒𝟒 𝟑𝟑𝟒𝟒 𝟑𝟑𝟔𝟔 Sugar (grams) 𝟏𝟏𝟒𝟒 𝟒𝟒𝟒𝟒 𝟔𝟔𝟒𝟒 𝟏𝟏𝟒𝟒 𝟏𝟏𝟒𝟒𝟒𝟒 𝟏𝟏𝟏𝟏𝟒𝟒
Students may use different approaches. Some students may decide to extend their tables but may realize that they do not easily arrive at 34 for the ounces of cola when finding equivalent ratios. After adequate time, have students/groups present their predictions and methods to the class.
When eliciting students’ responses, ask probing questions as the opportunity arises (e.g., “So are you telling me that since 34 oz. is between 30 and 36 oz., the answer will be between 100 and 120 g of sugar?” “Is it closer to 100 or 120? How do you know?” “Will the answer be a whole number? Why or why not?” “Can you express your answer as a mixed number?”).
MP.2
MP.1
Scaffolding: Differentiate the exercise by choosing certain cards for each student. For example, a ratio of 2: 1 may be easier for a struggling learner to conceptualize, while a ratio of
3 12 : 2 may be more
challenging.
MP.3
Scaffolding: For more support, or to provide more information on this topic to support all learners’ needs, refer to Teacher Notes—More Information on Soda and Sugar for video and news-related links.
Lesson 12: From Ratio Tables to Double Number Line Diagrams 89
This work is licensed under a Creative Commons Attribution-NonCommercial-ShareAlike 3.0 Unported License. © 2015 Great Minds. eureka-math.org
G6-M1-TE-1.3.0-06.2015
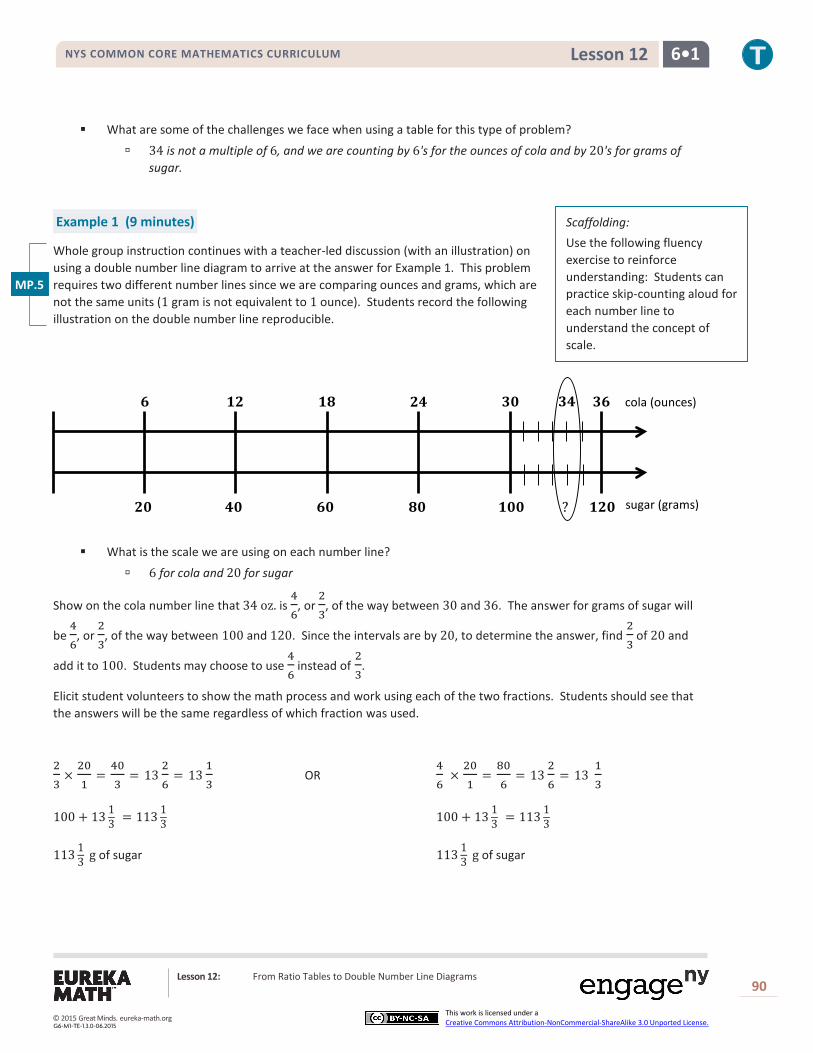
NYS COMMON CORE MATHEMATICS CURRICULUM 6•1 Lesson 12
What are some of the challenges we face when using a table for this type of problem?
34 is not a multiple of 6, and we are counting by 6's for the ounces of cola and by 20's for grams of sugar.
Example 1 (9 minutes)
Whole group instruction continues with a teacher-led discussion (with an illustration) on using a double number line diagram to arrive at the answer for Example 1. This problem requires two different number lines since we are comparing ounces and grams, which are not the same units (1 gram is not equivalent to 1 ounce). Students record the following illustration on the double number line reproducible.
What is the scale we are using on each number line?
6 for cola and 20 for sugar
Show on the cola number line that 34 oz. is 46
, or 23
, of the way between 30 and 36. The answer for grams of sugar will
be 46
, or 23
, of the way between 100 and 120. Since the intervals are by 20, to determine the answer, find 23
of 20 and
add it to 100. Students may choose to use 46
instead of 23
.
Elicit student volunteers to show the math process and work using each of the two fractions. Students should see that the answers will be the same regardless of which fraction was used.
23
×201
=403
= 1326
= 1313
OR 46
×201
=806
= 1326
= 13 13
100 + 13 13 = 113 1
3 100 + 13 13 = 113 1
3
113 13 g of sugar 113 1
3 g of sugar
cola (ounces) 𝟔𝟔 𝟏𝟏𝟏𝟏 𝟏𝟏𝟏𝟏 𝟏𝟏𝟒𝟒 𝟑𝟑𝟒𝟒 𝟑𝟑𝟔𝟔
𝟏𝟏𝟒𝟒 𝟒𝟒𝟒𝟒 𝟔𝟔𝟒𝟒 𝟏𝟏𝟒𝟒 𝟏𝟏𝟒𝟒𝟒𝟒 𝟏𝟏𝟏𝟏𝟒𝟒 ?
𝟑𝟑𝟒𝟒
sugar (grams)
MP.5
Lesson 12: From Ratio Tables to Double Number Line Diagrams 90
This work is licensed under a Creative Commons Attribution-NonCommercial-ShareAlike 3.0 Unported License.
Scaffolding: Use the following fluency exercise to reinforce understanding: Students can practice skip-counting aloud for each number line to understand the concept of scale.
© 2015 Great Minds. eureka-math.orgG6-M1-TE-1.3.0-06.2015

NYS COMMON CORE MATHEMATICS CURRICULUM 6•1 Lesson 12
Exercise 4 (7 minutes) Exercise 4
A school cafeteria has a restriction on the amount of sugary drinks available to students. Drinks may not have more than 𝟏𝟏𝟐𝟐 𝐠𝐠 of sugar. Based on this restriction, what is the largest size cola (in ounces) the cafeteria can offer to students?
My estimate is between 𝟔𝟔 and 𝟏𝟏𝟏𝟏 𝐨𝐨𝐨𝐨. but closer to 𝟔𝟔 ounces. I need to find 𝟏𝟏𝟒𝟒
of 𝟔𝟔 and add it to 𝟔𝟔.
𝟏𝟏𝟒𝟒
×𝟔𝟔𝟏𝟏
=𝟔𝟔𝟒𝟒
= 𝟏𝟏𝟏𝟏𝟏𝟏
𝟔𝟔 + 𝟏𝟏𝟏𝟏𝟏𝟏
= 𝟕𝟕 𝟏𝟏𝟏𝟏
A 𝟕𝟕𝟏𝟏𝟏𝟏 𝐨𝐨𝐨𝐨. cola is the largest size that the school cafeteria can offer to students.
After students have ample time to create their double number line diagram and answer the question, encourage students to present their thought process to the class.
Exercise 5 (time permitting) Exercise 5
Shontelle solves three math problems in four minutes.
a. Use this information to complete the table below.
Number of Questions 𝟑𝟑 𝟔𝟔 𝟗𝟗 𝟏𝟏𝟏𝟏 𝟏𝟏𝟐𝟐 𝟏𝟏𝟏𝟏 𝟏𝟏𝟏𝟏 𝟏𝟏𝟒𝟒 𝟏𝟏𝟕𝟕 𝟑𝟑𝟒𝟒
Number of Minutes 𝟒𝟒 𝟏𝟏 𝟏𝟏𝟏𝟏 𝟏𝟏𝟔𝟔 𝟏𝟏𝟒𝟒 𝟏𝟏𝟒𝟒 𝟏𝟏𝟏𝟏 𝟑𝟑𝟏𝟏 𝟑𝟑𝟔𝟔 𝟒𝟒𝟒𝟒
𝟒𝟒 𝟔𝟔 ? 𝟏𝟏𝟏𝟏 𝟏𝟏𝟏𝟏 cola (ounces)
𝟒𝟒 𝟏𝟏𝟒𝟒 𝟒𝟒𝟒𝟒 𝟔𝟔𝟒𝟒 sugar (grams) 𝟏𝟏𝟐𝟐 𝟑𝟑𝟒𝟒 𝟑𝟑𝟐𝟐
Lesson 12: From Ratio Tables to Double Number Line Diagrams 91
This work is licensed under a Creative Commons Attribution-NonCommercial-ShareAlike 3.0 Unported License. © 2015 Great Minds. eureka-math.org
G6-M1-TE-1.3.0-06.2015
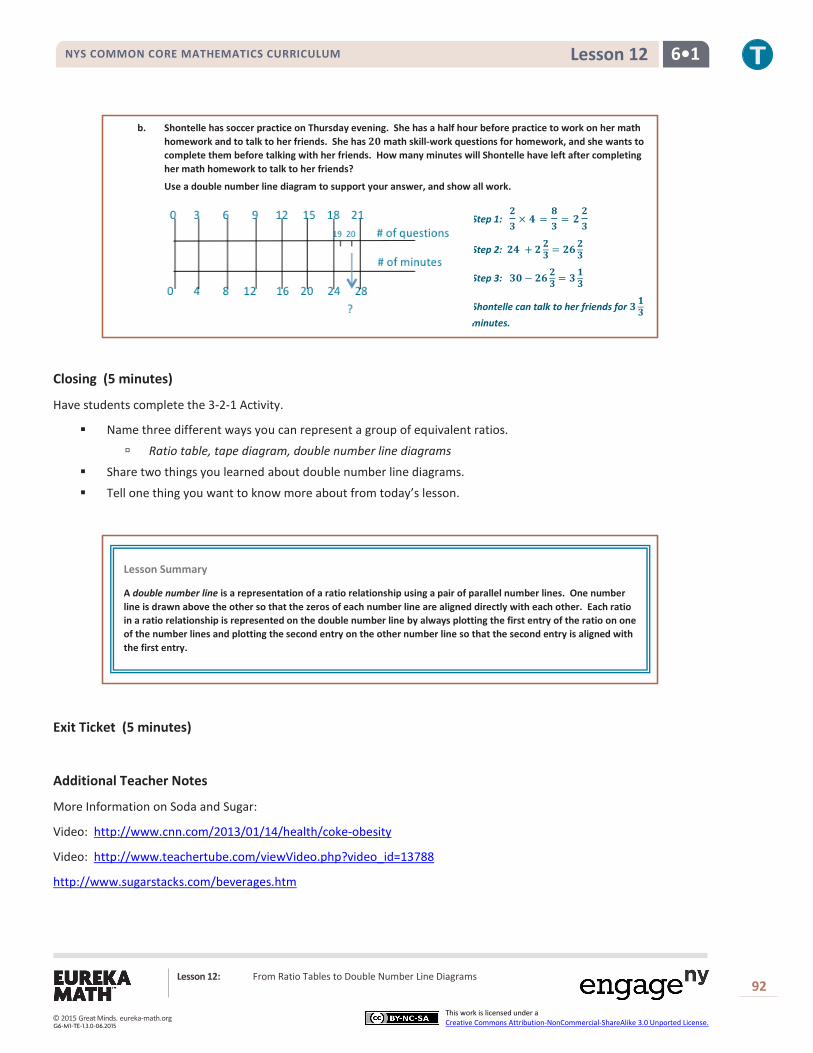
NYS COMMON CORE MATHEMATICS CURRICULUM 6•1 Lesson 12
b. Shontelle has soccer practice on Thursday evening. She has a half hour before practice to work on her math homework and to talk to her friends. She has 𝟏𝟏𝟒𝟒 math skill-work questions for homework, and she wants to complete them before talking with her friends. How many minutes will Shontelle have left after completing her math homework to talk to her friends?
Use a double number line diagram to support your answer, and show all work.
Closing (5 minutes)
Have students complete the 3-2-1 Activity.
Name three different ways you can represent a group of equivalent ratios.
Ratio table, tape diagram, double number line diagrams
Share two things you learned about double number line diagrams.
Tell one thing you want to know more about from today’s lesson.
Exit Ticket (5 minutes)
Additional Teacher Notes
More Information on Soda and Sugar:
Video: http://www.cnn.com/2013/01/14/health/coke-obesity
Video: http://www.teachertube.com/viewVideo.php?video_id=13788
http://www.sugarstacks.com/beverages.htm
Lesson Summary
A double number line is a representation of a ratio relationship using a pair of parallel number lines. One number line is drawn above the other so that the zeros of each number line are aligned directly with each other. Each ratio in a ratio relationship is represented on the double number line by always plotting the first entry of the ratio on one of the number lines and plotting the second entry on the other number line so that the second entry is aligned with the first entry.
Step 1: 𝟏𝟏𝟑𝟑
× 𝟒𝟒 =𝟏𝟏𝟑𝟑
= 𝟏𝟏𝟏𝟏𝟑𝟑
Step 2: 𝟏𝟏𝟒𝟒 + 𝟏𝟏𝟏𝟏𝟑𝟑 = 𝟏𝟏𝟔𝟔𝟏𝟏𝟑𝟑
Step 3: 𝟑𝟑𝟒𝟒 − 𝟏𝟏𝟔𝟔𝟏𝟏𝟑𝟑 = 𝟑𝟑𝟏𝟏𝟑𝟑
Shontelle can talk to her friends for 𝟑𝟑𝟏𝟏𝟑𝟑 minutes.
Lesson 12: From Ratio Tables to Double Number Line Diagrams 92
This work is licensed under a Creative Commons Attribution-NonCommercial-ShareAlike 3.0 Unported License. © 2015 Great Minds. eureka-math.org
G6-M1-TE-1.3.0-06.2015
NYS COMMON CORE MATHEMATICS CURRICULUM 6•1 Lesson 12
Name ___________________________________________________ Date____________________
Lesson 12: From Ratio Tables to Double Number Line Diagrams
Exit Ticket Kyra is participating in a fundraiser walk-a-thon. She walks 2 miles in 30 minutes. If she continues to walk at the same rate, determine how many minutes it will take her to walk 7 miles. Use a double number line diagram to support your answer.
Lesson 12: From Ratio Tables to Double Number Line Diagrams 93
This work is licensed under a Creative Commons Attribution-NonCommercial-ShareAlike 3.0 Unported License. © 2015 Great Minds. eureka-math.org
G6-M1-TE-1.3.0-06.2015

NYS COMMON CORE MATHEMATICS CURRICULUM 6•1 Lesson 12
Exit Ticket Sample Solution
Kyra is participating in a fundraiser walk-a-thon. She walks 𝟏𝟏 miles in 𝟑𝟑𝟒𝟒 minutes. If she continues to walk at the same rate, determine how many minutes it will take her to walk 𝟕𝟕 miles. Use a double number line diagram to support your answer.
Miles
Minutes
It will take Kyra 𝟏𝟏𝟒𝟒𝟐𝟐 minutes to walk 𝟕𝟕 miles.
Problem Set Sample Solutions
1. While shopping, Kyla found a dress that she would like to purchase, but it costs $𝟐𝟐𝟏𝟏.𝟏𝟏𝟐𝟐 more than she has. Kyla charges $𝟐𝟐.𝟐𝟐𝟒𝟒 an hour for babysitting. She wants to figure out how many hours she must babysit to earn $𝟐𝟐𝟏𝟏.𝟏𝟏𝟐𝟐 to buy the dress. Use a double number line to support your answer.
𝟗𝟗.𝟐𝟐 hours
2. Frank has been driving at a constant speed for 𝟑𝟑 hours, during which time he traveled 𝟏𝟏𝟗𝟗𝟐𝟐 miles. Frank would like to know how long it will take him to complete the remaining 𝟒𝟒𝟐𝟐𝟐𝟐 miles, assuming he maintains the same constant speed. Help Frank determine how long the remainder of the trip will take. Include a table or diagram to support your answer.
𝟕𝟕 hours
𝟏𝟏 𝟒𝟒 𝟔𝟔 𝟕𝟕 𝟏𝟏
𝟑𝟑𝟒𝟒 𝟔𝟔𝟒𝟒 𝟗𝟗𝟒𝟒 𝟏𝟏𝟒𝟒𝟐𝟐 𝟏𝟏𝟏𝟏𝟒𝟒
Lesson 12: From Ratio Tables to Double Number Line Diagrams 94
This work is licensed under a Creative Commons Attribution-NonCommercial-ShareAlike 3.0 Unported License. © 2015 Great Minds. eureka-math.org
G6-M1-TE-1.3.0-06.2015
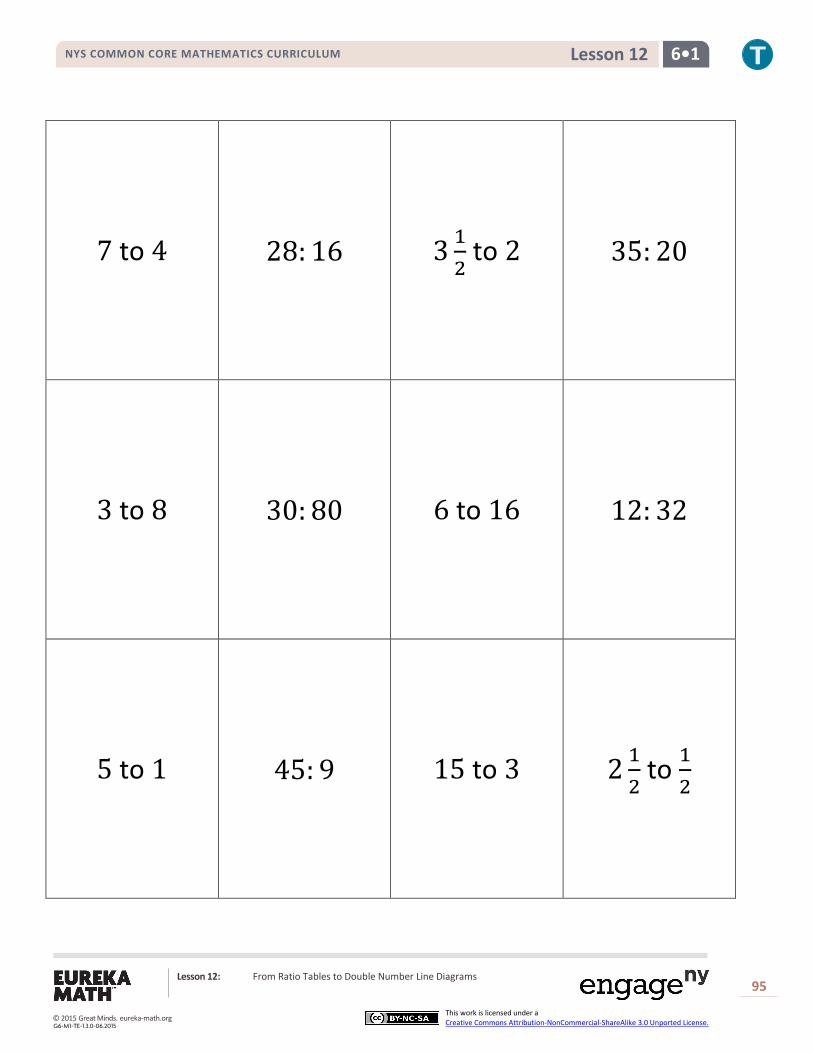
NYS COMMON CORE MATHEMATICS CURRICULUM 6•1 Lesson 12
7 to 4 28: 16 3 12 to 2 35: 20
3 to 8 30: 80 6 to 16 12: 32
5 to 1 45: 9 15 to 3 2 12 to 1
2
Lesson 12: From Ratio Tables to Double Number Line Diagrams 95
This work is licensed under a Creative Commons Attribution-NonCommercial-ShareAlike 3.0 Unported License. © 2015 Great Minds. eureka-math.org
G6-M1-TE-1.3.0-06.2015

NYS COMMON CORE MATHEMATICS CURRICULUM 6•1 Lesson 12
3 to 4 9: 16 1 12 to 2 15: 20
3 to 6 30: 60 1 to 2 4: 8
2 to 1 44: 22 18: 9 1 to 12
Lesson 12: From Ratio Tables to Double Number Line Diagrams 96
This work is licensed under a Creative Commons Attribution-NonCommercial-ShareAlike 3.0 Unported License. © 2015 Great Minds. eureka-math.org
G6-M1-TE-1.3.0-06.2015
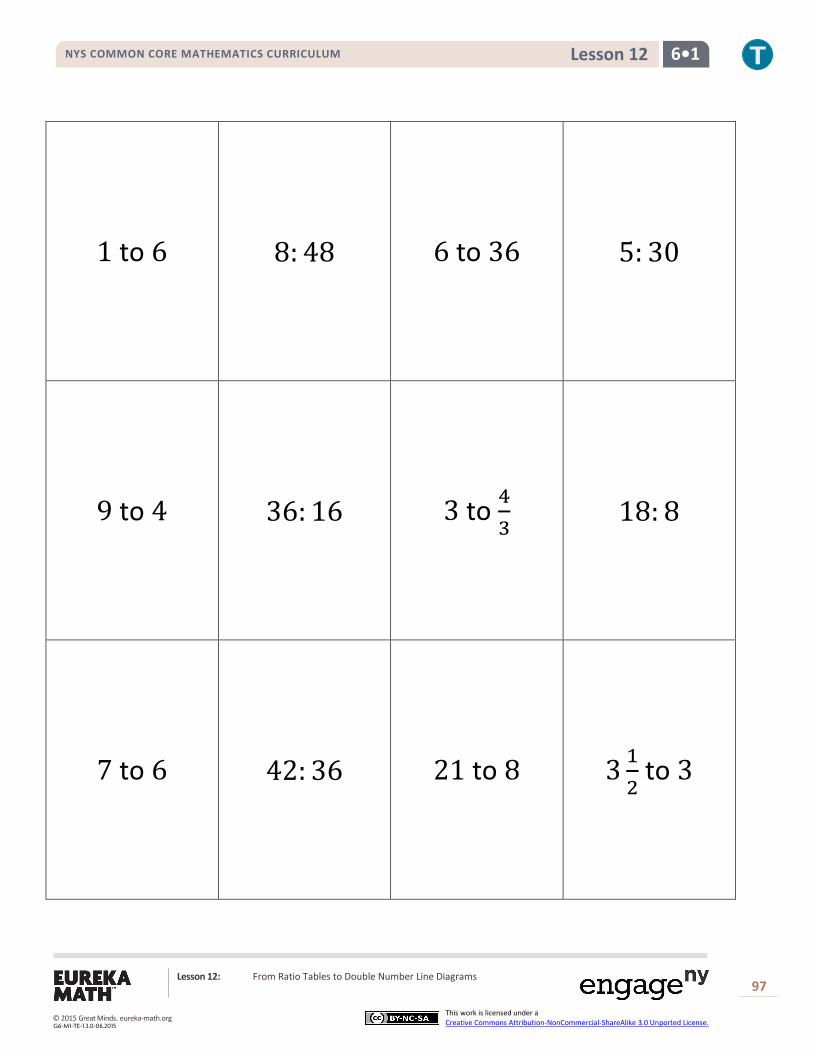
NYS COMMON CORE MATHEMATICS CURRICULUM 6•1 Lesson 12
1 to 6 8: 48 6 to 36 5: 30
9 to 4 36: 16 3 to 43 18: 8
7 to 6 42: 36 21 to 8 3 12 to 3
Lesson 12: From Ratio Tables to Double Number Line Diagrams 97
This work is licensed under a Creative Commons Attribution-NonCommercial-ShareAlike 3.0 Unported License. © 2015 Great Minds. eureka-math.org
G6-M1-TE-1.3.0-06.2015

NYS COMMON CORE MATHEMATICS CURRICULUM 6•1 Lesson 12
Double Number Line Reproducible
Lesson 12: From Ratio Tables to Double Number Line Diagrams 98
This work is licensed under a Creative Commons Attribution-NonCommercial-ShareAlike 3.0 Unported License. © 2015 Great Minds. eureka-math.org
G6-M1-TE-1.3.0-06.2015

NYS COMMON CORE MATHEMATICS CURRICULUM 6•1 Lesson 13
Lesson 13: From Ratio Tables to Equations Using the Value
of a Ratio
Student Outcomes
Students restate a ratio in terms of its value; for example, if the ratio of length 𝐴𝐴 to length 𝐵𝐵 is 3: 5 (in the
same units), students state that length 𝐴𝐴 is 35
of length 𝐵𝐵, length 𝐵𝐵 is 53
of length 𝐴𝐴, length 𝐴𝐴 is 38
of the total
length, and length 𝐵𝐵 is 58 of the total length.
Students use the value of the ratio to problem-solve by writing and solving equations.
Classwork
Exercise 1–3 (35 minutes)
Exercise 1
Each student is given a pre-made linking cube model consisting of one red cube and three yellow cubes to be used as a model for the scenario below.
Exercise 1
Jorge is mixing a special shade of orange paint. He mixed 𝟏𝟏 gallon of red paint with 𝟑𝟑 gallons of yellow paint.
Based on this ratio, which of the following statements are true?
𝟑𝟑𝟒𝟒
of a 𝟒𝟒-gallon mix would be yellow paint.
True
Every 𝟏𝟏 gallon of yellow paint requires 𝟏𝟏𝟑𝟑
gallon of red paint.
True
Every 𝟏𝟏 gallon of red paint requires 𝟑𝟑 gallons of yellow paint.
True
There is 𝟏𝟏 gallon of red paint in a 𝟒𝟒-gallon mix of orange paint.
True
There are 𝟐𝟐 gallons of yellow paint in an 𝟖𝟖-gallon mix of orange paint.
False
Use the space below to determine if each statement is true or false.
Scaffolding: Linking cubes should be available for each learner. They give a color-coded manipulative model that makes the abstract story problem tangible. The cubes can be combined to give a concrete model of the chart.
Lesson 13: From Ratio Tables to Equations Using the Value of a Ratio
99
This work is licensed under a Creative Commons Attribution-NonCommercial-ShareAlike 3.0 Unported License. © 2015 Great Minds. eureka-math.org
G6-M1-TE-1.3.0-06.2015

NYS COMMON CORE MATHEMATICS CURRICULUM 6•1 Lesson 13
Allow students to discuss each question with a partner or group. When the class comes back together as a whole group, each group is responsible for explaining to the class one of the statements and whether the group feels the statement is true or false and why. (The first four statements are true while the fifth statement is false. To be made true, the fifth statement should read “There are 6 gallons of yellow paint in an 8 gallon mix of orange paint.”)
Exercise 2
Exercise 2
Based on the information on red and yellow paint given in Exercise 1, complete the table below.
Red Paint (𝑹𝑹) Yellow Paint (𝒀𝒀)
𝟏𝟏 𝟑𝟑
𝟐𝟐 𝟔𝟔 𝟑𝟑 𝟗𝟗 𝟒𝟒 𝟏𝟏𝟐𝟐
𝟓𝟓 𝟏𝟏𝟓𝟓
Students should be encouraged to combine their linking cubes with those of a partner to model the ratio given in the second row of the table. Students should find a third partner to model the ratio given in the third row, etc.
Facilitate and lead the discussion (if necessary) to point out that we can extend the table to show total gallons.
Red Paint (𝑹𝑹) Yellow Paint (𝒀𝒀) Relationship
𝟏𝟏 𝟑𝟑 𝟑𝟑 = 𝟏𝟏 × 𝟑𝟑 𝟐𝟐 𝟔𝟔 𝟔𝟔 = 𝟐𝟐 × 𝟑𝟑 𝟑𝟑 𝟗𝟗 𝟗𝟗 = 𝟑𝟑 × 𝟑𝟑 𝟒𝟒 𝟏𝟏𝟐𝟐 𝟏𝟏𝟐𝟐 = 𝟒𝟒× 𝟑𝟑 𝟓𝟓 𝟏𝟏𝟓𝟓 𝟏𝟏𝟓𝟓 = 𝟓𝟓× 𝟑𝟑
Use the table to identify the relationship between two quantities as an intermediate step in creating an equation that models that relationship.
Here is a possible conversation that could be used to help students see the relationships:
What information is given in the table?
The table gives the number of gallons of red paint and the number of gallons of yellow paint.
In what context would someone use this information? This information would be useful to anyone who had a need to paint a surface and also had to mix his
own paint, such as a painting contractor who prefers to mix custom colors for high-end clients.
We need to interpret what this table means. If I use 5 gallons of red paint, how many gallons of yellow paint would I need?
I would need 15 gallons of yellow paint.
How is the amount of yellow paint related to the amount of red paint? The amount of yellow paint is always 3 times as much as the amount of red paint.
MP.7
Lesson 13: From Ratio Tables to Equations Using the Value of a Ratio
100
This work is licensed under a Creative Commons Attribution-NonCommercial-ShareAlike 3.0 Unported License. © 2015 Great Minds. eureka-math.org
G6-M1-TE-1.3.0-06.2015

NYS COMMON CORE MATHEMATICS CURRICULUM 6•1 Lesson 13
Is that true for all of the entries?
Yes
Now imagine that we want to make orange paint to cover an entire wing of our school, and we have 100 gallons of red paint. How could we figure out how many gallons of yellow paint to use?
We could multiply 100 by 3. Now we want to write this as an equation. You have told me that I can take all the values in the first column
and multiply by three to get the values in the second column. When we were given 4 gallons of red paint, we knew we would need 3 ∙ 4 gallons of yellow paint. What if we were given 𝑅𝑅 gallons of red paint, how many gallons of yellow paint would we need? So, 𝑌𝑌, the number of gallons of yellow paint, would equal…?
3 times 𝑅𝑅 How would we write this equation?
To get to these steps, students might need a little guidance. Help by pointing out the variables given in the table, and ask them to write what 𝑅𝑅 must be multiplied by to get 𝑌𝑌.
𝑌𝑌 = 3𝑅𝑅 We were trying to find out how much yellow paint we needed given the amount of red paint. Is the formula
related to the value of the ratio of the number of gallons of yellow paint to the number of gallons of red paint?
The ratio of the number of gallons of yellow paint to the number of gallons of red paint is 3: 1; the value
of the ratio is 31
.
What if we wanted an equation to tell us how much red paint to use if we are given the amount of yellow paint? How can we use the amount of yellow paint to determine the amount of red paint needed?
Divide by three or multiply by 13.
What is the ratio of the number of gallons of red paint to the number of gallons of yellow paint?
The ratio is 1: 3 or 1 to 3, and the value of the ratio is 13.
How can I use this information to write the equation?
We would take the 𝑌𝑌-value and divide by 3; in other words, multiply by 13
. So, the equation would be
𝑅𝑅 = 13𝑌𝑌.
Some suggestions for discussion questions:
In this case, the ratio of the number of gallons of red paint to the number of gallons of yellow paint is 1: 3. What if the ratio were changed to 1: 4? What would this mean in the context of our paint problem?
We would use one gallon of red paint for every four gallons of yellow paint.
Can we still use the equation we created earlier? What would the new equation be?
No. The new equation would be 𝑌𝑌 = 4 ∙ 𝑅𝑅
Scaffolding: The connection to the multiplication table should be elicited: rows 1 and 3 show the relationship in this ratio. Students might also find that equivalent fractions can be seen this way.
MP.2
Lesson 13: From Ratio Tables to Equations Using the Value of a Ratio
101
This work is licensed under a Creative Commons Attribution-NonCommercial-ShareAlike 3.0 Unported License. © 2015 Great Minds. eureka-math.org
G6-M1-TE-1.3.0-06.2015
NYS COMMON CORE MATHEMATICS CURRICULUM 6•1 Lesson 13
Scaffolding:
The connection to the multiplication table should be elicited: columns 1 and 4 show the relationship in this ratio.
How can we use the ratio to write the equation?
There will be 4 times as much yellow paint as there is red paint. The 4 tells us what to multiply the number of gallons of red paint by to find the number of gallons of yellow paint.
What if the ratio were 1: 7? What would the new equation be? 𝑌𝑌 = 7 ∙ 𝑅𝑅
Exercise 3
Students can try the first question on their own, or discuss the question if students need further instructions with the concept. Otherwise, students start the exercise on their own, in partners, or in small groups.
Jorge now plans to mix red paint and blue paint to create purple paint. The color of purple he has decided to make combines red paint and blue paint in the ratio 4: 1. If Jorge can only purchase paint in one gallon containers, construct a ratio table for all possible combinations for red and blue paint that will give Jorge no more than 25 gallons of purple paint.
Write an equation that will let Jorge calculate the amount of red paint he will need for any given amount of blue paint.
Write an equation that will let Jorge calculate the amount of blue paint he will need for any given amount of red paint.
If Jorge has 24 gallons of red paint, how much blue paint will he have to use to create the desired color of purple?
If Jorge has 24 gallons of blue paint, how much red paint will he have to use to create the desired color of purple?
Allow students to make a table or drawing.
Remember that we sometimes use variables to represent numbers. Let’s use 𝐵𝐵 and 𝑅𝑅 for the amounts of blue paint and red paint, respectively.
No matter how much blue paint I use, I need 4 times as much red paint. So, for one gallon of blue paint, I need (1 × 4) 4 gallons of red paint. That is a ratio of
1: 4. The value of the ratio is 14
.
Where do we see the ratio in the equations? We determine the amount of red paint by multiplying the unknown amount of blue paint by 4. So, for
every 1 gallon of blue paint, we need 4 gallons of red paint. To determine the amount of blue paint, we
need to find 14
of the amount of red paint.
MP.5
Lesson 13: From Ratio Tables to Equations Using the Value of a Ratio
102
This work is licensed under a Creative Commons Attribution-NonCommercial-ShareAlike 3.0 Unported License. © 2015 Great Minds. eureka-math.org
G6-M1-TE-1.3.0-06.2015

NYS COMMON CORE MATHEMATICS CURRICULUM 6•1 Lesson 13
Exercise 3
a. Jorge now plans to mix red paint and blue paint to create purple paint. The color of purple he has decided to make combines red paint and blue paint in the ratio 𝟒𝟒:𝟏𝟏. If Jorge can only purchase paint in one gallon containers, construct a ratio table for all possible combinations for red and blue paint that will give Jorge no more than 𝟐𝟐𝟓𝟓 gallons of purple paint.
Write an equation that will let Jorge calculate the amount of red paint he will need for any given amount of blue paint.
𝑹𝑹 = 𝟒𝟒𝟒𝟒
Write an equation that will let Jorge calculate the amount of blue paint he will need for any given amount of red paint.
𝟒𝟒 =𝟏𝟏𝟒𝟒𝑹𝑹
If Jorge has 𝟐𝟐𝟒𝟒 gallons of red paint, how much blue paint will he have to use to create the desired color of purple?
Jorge will have to use 𝟔𝟔 gallons of blue paint.
If Jorge has 𝟐𝟐𝟒𝟒 gallons of blue paint, how much red paint will he have to use to create the desired color of purple?
Jorge will have to use 𝟗𝟗𝟔𝟔 gallons of red paint.
b. Using the same relationship of red to blue from above, create a table that models the relationship of the three colors blue, red, and purple (total) paint. Let 𝟒𝟒 represent the number of gallons of blue paint, let 𝑹𝑹 represent the number of gallons of red paint, and let 𝑻𝑻 represent the total number of gallons of (purple) paint. Then write an equation that models the relationship between the blue paint and the total amount of paint, and answer the questions.
Equation: 𝑻𝑻 = 𝟓𝟓𝟒𝟒
Value of the ratio of total paint to blue paint: 𝟓𝟓𝟏𝟏
How is the value of the ratio related to the equation?
The value of the ratio is used to determine the total paint value by multiplying it with the blue paint value.
Continue to allow students time to work on the remainder of the problems. While working with students, be sure to remind them of the value of the ratio and how it is used to make the equation.
Blue (𝟒𝟒) Red (𝑹𝑹) Relationship 𝟏𝟏 𝟒𝟒 𝟒𝟒 = 𝟏𝟏 × 𝟒𝟒 𝟐𝟐 𝟖𝟖 𝟖𝟖 = 𝟐𝟐 × 𝟒𝟒 𝟑𝟑 𝟏𝟏𝟐𝟐 𝟏𝟏𝟐𝟐 = 𝟑𝟑 × 𝟒𝟒 𝟒𝟒 𝟏𝟏𝟔𝟔 𝟏𝟏𝟔𝟔 = 𝟒𝟒 × 𝟒𝟒 𝟓𝟓 𝟐𝟐𝟐𝟐 𝟐𝟐𝟐𝟐 = 𝟓𝟓 × 𝟒𝟒
Blue (𝟒𝟒) Red (𝑹𝑹) Total Paint (𝑻𝑻)
𝟏𝟏 𝟒𝟒 𝟓𝟓
𝟐𝟐 𝟖𝟖 𝟏𝟏𝟐𝟐
𝟑𝟑 𝟏𝟏𝟐𝟐 𝟏𝟏𝟓𝟓
𝟒𝟒 𝟏𝟏𝟔𝟔 𝟐𝟐𝟐𝟐
𝟓𝟓 𝟐𝟐𝟐𝟐 𝟐𝟐𝟓𝟓
𝑹𝑹 = 𝟒𝟒𝟒𝟒
𝟒𝟒 =𝟏𝟏𝟒𝟒𝑹𝑹
Lesson 13: From Ratio Tables to Equations Using the Value of a Ratio
103
This work is licensed under a Creative Commons Attribution-NonCommercial-ShareAlike 3.0 Unported License. © 2015 Great Minds. eureka-math.org
G6-M1-TE-1.3.0-06.2015

NYS COMMON CORE MATHEMATICS CURRICULUM 6•1 Lesson 13
Equations:
𝑴𝑴 = 𝟔𝟔𝟔𝟔
𝟔𝟔 = �𝟏𝟏𝟔𝟔�𝑴𝑴
𝑴𝑴𝟔𝟔
= 𝟔𝟔
𝟔𝟔𝑴𝑴
=𝟏𝟏𝟔𝟔
Exercise 4
During a particular U.S. Air Force training exercise, the ratio of the number of men to the number of women was 𝟔𝟔:𝟏𝟏. Use the ratio table provided below to create at least two equations that model the relationship between the number of men and the number of women participating in this training exercise.
If 𝟐𝟐𝟐𝟐𝟐𝟐 women participated in the training exercise, use one of your equations to calculate the number of men who participated.
I can substitute 𝟐𝟐𝟐𝟐𝟐𝟐 for the value of women and multiply by 𝟔𝟔, the value of the ratio, to get the number of men. There would be 𝟏𝟏,𝟐𝟐𝟐𝟐𝟐𝟐 men participating in the training exercise.
Exercise 5
Malia is on a road trip. During the first five minutes of Malia’s trip, she sees 𝟏𝟏𝟖𝟖 cars and 𝟔𝟔 trucks. Assuming this ratio of cars to trucks remains constant over the duration of the trip, complete the ratio table using this comparison. Let 𝑻𝑻 represent the number of trucks she sees, and let 𝑪𝑪 represent the number of cars she sees.
What is the value of the ratio of the number of cars to the number of trucks?
𝟑𝟑𝟏𝟏
What equation would model the relationship between cars and trucks?
𝑪𝑪 = 𝟑𝟑𝑻𝑻 and 𝑻𝑻 = �𝟏𝟏𝟑𝟑�𝑪𝑪
At the end of the trip, Malia had counted 𝟏𝟏,𝟐𝟐𝟓𝟓𝟒𝟒 trucks. How many cars did she see?
𝑪𝑪 = 𝟏𝟏,𝟐𝟐𝟓𝟓𝟒𝟒 ∙ 𝟑𝟑; 𝑪𝑪 = 𝟑𝟑,𝟕𝟕𝟔𝟔𝟐𝟐 cars
Exercise 6
Kevin is training to run a half-marathon. His training program recommends that he run for 𝟓𝟓 minutes and walk for 𝟏𝟏 minute. Let 𝑹𝑹 represent the number of minutes running, and let 𝟔𝟔 represent the number of minutes walking.
What is the value of the ratio of the number of minutes walking to the number of minutes running?
𝟏𝟏𝟓𝟓
Women (𝟔𝟔) Men (𝑴𝑴)
𝟏𝟏 𝟔𝟔
𝟐𝟐 𝟏𝟏𝟐𝟐
𝟑𝟑 𝟏𝟏𝟖𝟖
𝟒𝟒 𝟐𝟐𝟒𝟒
𝟓𝟓 𝟑𝟑𝟐𝟐
Trucks (𝑻𝑻) Cars (𝑪𝑪)
𝟏𝟏 𝟑𝟑
𝟑𝟑 𝟗𝟗
𝟔𝟔 𝟏𝟏𝟖𝟖
𝟏𝟏𝟐𝟐 𝟑𝟑𝟔𝟔
𝟐𝟐𝟐𝟐 𝟔𝟔𝟐𝟐
Minutes Running (𝑹𝑹) 𝟓𝟓 𝟏𝟏𝟐𝟐 𝟐𝟐𝟐𝟐 𝟒𝟒𝟐𝟐 𝟓𝟓𝟐𝟐 Minutes Walking (𝟔𝟔) 𝟏𝟏 𝟐𝟐 𝟒𝟒 𝟖𝟖 𝟏𝟏𝟐𝟐
Scaffolding: The connection to the multiplication table should be elicited: Columns 1 and 6 show the relationship in this ratio.
Lesson 13: From Ratio Tables to Equations Using the Value of a Ratio
104
This work is licensed under a Creative Commons Attribution-NonCommercial-ShareAlike 3.0 Unported License. © 2015 Great Minds. eureka-math.org
G6-M1-TE-1.3.0-06.2015

NYS COMMON CORE MATHEMATICS CURRICULUM 6•1 Lesson 13
What equation could you use to calculate the minutes spent walking if you know the minutes spent running?
𝟔𝟔 = 𝟏𝟏𝟓𝟓𝑹𝑹; Answers will vary.
Closing (5 minutes)
Have students explain the relationship between the ratio and the equation. Students can include examples, tables, equations, or other representations to justify their reasoning.
Exit Ticket (5 minutes)
Lesson Summary
The value of a ratio can be determined using a ratio table. This value can be used to write an equation that also represents the ratio.
Example:
𝟏𝟏 𝟒𝟒
𝟐𝟐 𝟖𝟖
𝟑𝟑 𝟏𝟏𝟐𝟐
𝟒𝟒 𝟏𝟏𝟔𝟔
The multiplication table can be a valuable resource to use in seeing ratios. Different rows can be used to find equivalent ratios.
MP.5
Lesson 13: From Ratio Tables to Equations Using the Value of a Ratio
105
This work is licensed under a Creative Commons Attribution-NonCommercial-ShareAlike 3.0 Unported License. © 2015 Great Minds. eureka-math.org
G6-M1-TE-1.3.0-06.2015

NYS COMMON CORE MATHEMATICS CURRICULUM 6•1 Lesson 13
Name ___________________________________________________ Date____________________
Lesson 13: From Ratio Tables to Equations Using the Value of a
Ratio
Exit Ticket A carpenter uses four nails to install each shelf. Complete the table to represent the relationship between the number of nails (𝑁𝑁) and the number of shelves (𝑆𝑆). Write the ratio that describes the number of nails per number of shelves. Write as many different equations as you can that describe the relationship between the two quantities.
Shelves
(𝑺𝑺)
Nails
(𝑵𝑵)
1 4
2
12
16
5
Lesson 13: From Ratio Tables to Equations Using the Value of a Ratio
106
This work is licensed under a Creative Commons Attribution-NonCommercial-ShareAlike 3.0 Unported License. © 2015 Great Minds. eureka-math.org
G6-M1-TE-1.3.0-06.2015
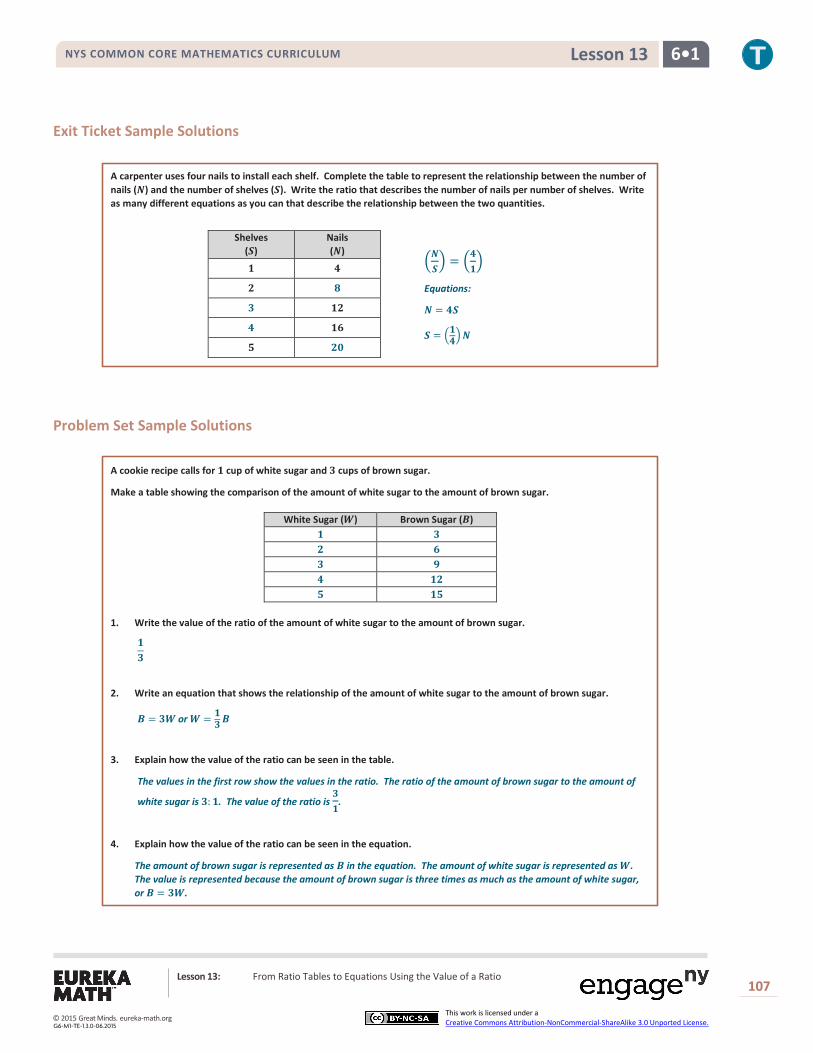
NYS COMMON CORE MATHEMATICS CURRICULUM 6•1 Lesson 13
Exit Ticket Sample Solutions
A carpenter uses four nails to install each shelf. Complete the table to represent the relationship between the number of nails (𝑵𝑵) and the number of shelves (𝑺𝑺). Write the ratio that describes the number of nails per number of shelves. Write as many different equations as you can that describe the relationship between the two quantities.
�𝑵𝑵𝑺𝑺� = �𝟒𝟒
𝟏𝟏�
Equations:
𝑵𝑵 = 𝟒𝟒𝑺𝑺
𝑺𝑺 = �𝟏𝟏𝟒𝟒�𝑵𝑵
Problem Set Sample Solutions
A cookie recipe calls for 𝟏𝟏 cup of white sugar and 𝟑𝟑 cups of brown sugar.
Make a table showing the comparison of the amount of white sugar to the amount of brown sugar.
White Sugar (𝟔𝟔) Brown Sugar (𝟒𝟒) 𝟏𝟏 𝟑𝟑 𝟐𝟐 𝟔𝟔 𝟑𝟑 𝟗𝟗 𝟒𝟒 𝟏𝟏𝟐𝟐 𝟓𝟓 𝟏𝟏𝟓𝟓
1. Write the value of the ratio of the amount of white sugar to the amount of brown sugar.
𝟏𝟏𝟑𝟑
2. Write an equation that shows the relationship of the amount of white sugar to the amount of brown sugar.
𝟒𝟒 = 𝟑𝟑𝟔𝟔 or 𝟔𝟔 = 𝟏𝟏𝟑𝟑𝟒𝟒
3. Explain how the value of the ratio can be seen in the table.
The values in the first row show the values in the ratio. The ratio of the amount of brown sugar to the amount of
white sugar is 𝟑𝟑:𝟏𝟏. The value of the ratio is 𝟑𝟑𝟏𝟏
.
4. Explain how the value of the ratio can be seen in the equation.
The amount of brown sugar is represented as 𝟒𝟒 in the equation. The amount of white sugar is represented as 𝟔𝟔. The value is represented because the amount of brown sugar is three times as much as the amount of white sugar, or 𝟒𝟒 = 𝟑𝟑𝟔𝟔.
Shelves (𝑺𝑺)
Nails (𝑵𝑵)
𝟏𝟏 𝟒𝟒 𝟐𝟐 𝟖𝟖 𝟑𝟑 𝟏𝟏𝟐𝟐 𝟒𝟒 𝟏𝟏𝟔𝟔 𝟓𝟓 𝟐𝟐𝟐𝟐
Lesson 13: From Ratio Tables to Equations Using the Value of a Ratio
107
This work is licensed under a Creative Commons Attribution-NonCommercial-ShareAlike 3.0 Unported License. © 2015 Great Minds. eureka-math.org
G6-M1-TE-1.3.0-06.2015

NYS COMMON CORE MATHEMATICS CURRICULUM 6•1 Lesson 13
Using the same recipe, compare the amount of white sugar to the amount of total sugars used in the recipe.
Make a table showing the comparison of the amount of white sugar to the amount of total sugar.
White Sugar (𝟔𝟔) Total Sugar (𝑻𝑻) 𝟏𝟏 𝟒𝟒 𝟐𝟐 𝟖𝟖 𝟑𝟑 𝟏𝟏𝟐𝟐 𝟒𝟒 𝟏𝟏𝟔𝟔 𝟓𝟓 𝟐𝟐𝟐𝟐
5. Write the value of the ratio of the amount of total sugar to the amount of white sugar.
𝟒𝟒𝟏𝟏
6. Write an equation that shows the relationship of total sugar to white sugar.
𝑻𝑻 = 𝟒𝟒𝟔𝟔
Lesson 13: From Ratio Tables to Equations Using the Value of a Ratio
108
This work is licensed under a Creative Commons Attribution-NonCommercial-ShareAlike 3.0 Unported License. © 2015 Great Minds. eureka-math.org
G6-M1-TE-1.3.0-06.2015

NYS COMMON CORE MATHEMATICS CURRICULUM 6•1 Lesson 14
Lesson 14: From Ratio Tables, Equations, and Double
Number Line Diagrams to Plots on the Coordinate Plane
Student Outcomes
Students associate with each ratio 𝐴𝐴:𝐵𝐵 the ordered pair (𝐴𝐴,𝐵𝐵) and plot it in the 𝑥𝑥–𝑦𝑦 coordinate plane. Students represent ratios in ratio tables, equations, and double number line diagrams and then represent
those ratios in the coordinate plane.
Lesson Notes This lesson serves as a means for students to associate ratios with ordered pairs and plot the ordered pairs in the 𝑥𝑥–𝑦𝑦 coordinate plane. Students graph collected data on the coordinate plane. Collected data falls within two categories: discrete data and continuous data. Discrete data is a set of data values with unconnected data points and often represents data that is countable and often finite. In this lesson, students represent non-integer data on the coordinate plane using points that are not connected with a ray. Continuous data can represent an unlimited selection of data and include integers. The lesson starts with an example that uses data that is continuous, allowing students to connect the data points with a ray. Students are able to navigate through the graph in order to analyze data, predict values, and find missing values based on the ratio relationship. A student is not required to know the vocabulary of collected data, nor is collected data part of the outcomes of the lesson. The information provided is for reference.
Classwork Representing ratios: Using knowledge from previous lessons in this module, students work together in predetermined groups to complete the table to satisfy the missing values, create a double number line diagram to support the values, and develop an equation to support the values. Pose the following scenario:
Kelli is traveling by train with her soccer team from Yonkers, NY to Morgantown, WV for a tournament. The distance between Yonkers and Morgantown is 𝟒𝟒𝟒𝟒𝟒𝟒 miles. The total trip will take 𝟖𝟖 hours. The train schedule is provided below:
Leaving Yonkers, NY Destination Distance
Allentown, PA 𝟏𝟏𝟒𝟒𝟒𝟒 miles
Carlisle, PA 𝟐𝟐𝟒𝟒𝟒𝟒 miles
Berkeley Springs, WV
𝟑𝟑𝟒𝟒𝟒𝟒 miles
Morgantown, WV
𝟒𝟒𝟒𝟒𝟒𝟒 miles
Leaving Morgantown, WV Destination Distance
Berkeley Springs, WV
𝟏𝟏𝟒𝟒𝟒𝟒 miles
Carlisle, PA 𝟐𝟐𝟒𝟒𝟒𝟒 miles
Allentown, PA 𝟑𝟑𝟒𝟒𝟒𝟒 miles
Yonkers, NY 𝟒𝟒𝟒𝟒𝟒𝟒 miles
Lesson 14: From Ratio Tables, Equations, and Double Number Line Diagrams to Plots on the Coordinate Plane
109
This work is licensed under a Creative Commons Attribution-NonCommercial-ShareAlike 3.0 Unported License. © 2015 Great Minds. eureka-math.org
G6-M1-TE-1.3.0-06.2015

NYS COMMON CORE MATHEMATICS CURRICULUM 6•1 Lesson 14
Exercises (10 minutes) Exercises
1. Create a table to show the time it will take Kelli and her team to travel from Yonkers to each town listed in the schedule assuming that the ratio of the amount of time traveled to the distance traveled is the same for each city. Then, extend the table to include the cumulative time it will take to reach each destination on the ride home.
Hours Miles
𝟐𝟐 𝟏𝟏𝟒𝟒𝟒𝟒
𝟒𝟒 𝟐𝟐𝟒𝟒𝟒𝟒
𝟔𝟔 𝟑𝟑𝟒𝟒𝟒𝟒
𝟖𝟖 𝟒𝟒𝟒𝟒𝟒𝟒
𝟏𝟏𝟒𝟒 𝟓𝟓𝟒𝟒𝟒𝟒
𝟏𝟏𝟐𝟐 𝟔𝟔𝟒𝟒𝟒𝟒
𝟏𝟏𝟒𝟒 𝟕𝟕𝟒𝟒𝟒𝟒
𝟏𝟏𝟔𝟔 𝟖𝟖𝟒𝟒𝟒𝟒
2. Create a double number line diagram to show the time it will take Kelli and her team to travel from Yonkers to each town listed in the schedule. Then, extend the double number line diagram to include the cumulative time it will take to reach each destination on the ride home. Represent the ratio of the distance traveled on the round trip to the amount of time taken with an equation.
Using the information from the double number line diagram, how many miles would be traveled in one hour?
𝟓𝟓𝟒𝟒
How do you know?
If the train is moving at a constant speed, half of 𝟐𝟐 hours is 𝟏𝟏 hour, and half of 𝟏𝟏𝟒𝟒𝟒𝟒 miles is 𝟓𝟓𝟒𝟒 miles.
𝟏𝟏𝟒𝟒𝟒𝟒 𝟐𝟐𝟒𝟒𝟒𝟒 𝟑𝟑𝟒𝟒𝟒𝟒 𝟓𝟓𝟒𝟒𝟒𝟒 𝟒𝟒𝟒𝟒𝟒𝟒 𝟔𝟔𝟒𝟒𝟒𝟒 𝟕𝟕𝟒𝟒𝟒𝟒 𝟖𝟖𝟒𝟒𝟒𝟒
Hours
Miles
𝟐𝟐 𝟒𝟒 𝟔𝟔 𝟖𝟖 𝟏𝟏𝟒𝟒 𝟏𝟏𝟐𝟐 𝟏𝟏𝟒𝟒 𝟏𝟏𝟔𝟔 𝟒𝟒
𝟒𝟒
Lesson 14: From Ratio Tables, Equations, and Double Number Line Diagrams to Plots on the Coordinate Plane
110
This work is licensed under a Creative Commons Attribution-NonCommercial-ShareAlike 3.0 Unported License. © 2015 Great Minds. eureka-math.org
G6-M1-TE-1.3.0-06.2015
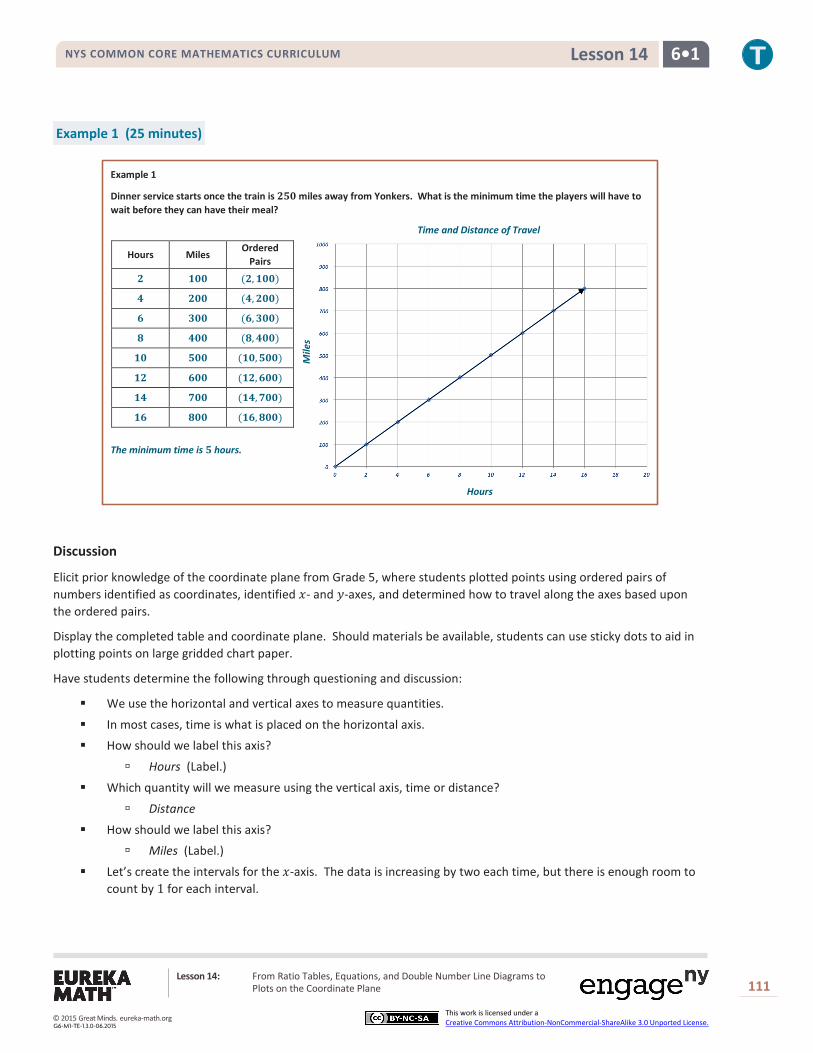
NYS COMMON CORE MATHEMATICS CURRICULUM 6•1 Lesson 14
Example 1 (25 minutes)
Example 1
Dinner service starts once the train is 𝟐𝟐𝟓𝟓𝟒𝟒 miles away from Yonkers. What is the minimum time the players will have to wait before they can have their meal?
The minimum time is 𝟓𝟓 hours.
Discussion
Elicit prior knowledge of the coordinate plane from Grade 5, where students plotted points using ordered pairs of numbers identified as coordinates, identified 𝑥𝑥- and 𝑦𝑦-axes, and determined how to travel along the axes based upon the ordered pairs.
Display the completed table and coordinate plane. Should materials be available, students can use sticky dots to aid in plotting points on large gridded chart paper.
Have students determine the following through questioning and discussion:
We use the horizontal and vertical axes to measure quantities.
In most cases, time is what is placed on the horizontal axis. How should we label this axis?
Hours (Label.)
Which quantity will we measure using the vertical axis, time or distance?
Distance
How should we label this axis? Miles (Label.)
Let’s create the intervals for the 𝑥𝑥-axis. The data is increasing by two each time, but there is enough room to count by 1 for each interval.
Hours Miles Ordered
Pairs
𝟐𝟐 𝟏𝟏𝟒𝟒𝟒𝟒 (𝟐𝟐,𝟏𝟏𝟒𝟒𝟒𝟒)
𝟒𝟒 𝟐𝟐𝟒𝟒𝟒𝟒 (𝟒𝟒,𝟐𝟐𝟒𝟒𝟒𝟒)
𝟔𝟔 𝟑𝟑𝟒𝟒𝟒𝟒 (𝟔𝟔,𝟑𝟑𝟒𝟒𝟒𝟒)
𝟖𝟖 𝟒𝟒𝟒𝟒𝟒𝟒 (𝟖𝟖,𝟒𝟒𝟒𝟒𝟒𝟒)
𝟏𝟏𝟒𝟒 𝟓𝟓𝟒𝟒𝟒𝟒 (𝟏𝟏𝟒𝟒,𝟓𝟓𝟒𝟒𝟒𝟒)
𝟏𝟏𝟐𝟐 𝟔𝟔𝟒𝟒𝟒𝟒 (𝟏𝟏𝟐𝟐,𝟔𝟔𝟒𝟒𝟒𝟒)
𝟏𝟏𝟒𝟒 𝟕𝟕𝟒𝟒𝟒𝟒 (𝟏𝟏𝟒𝟒,𝟕𝟕𝟒𝟒𝟒𝟒)
𝟏𝟏𝟔𝟔 𝟖𝟖𝟒𝟒𝟒𝟒 (𝟏𝟏𝟔𝟔,𝟖𝟖𝟒𝟒𝟒𝟒)
Hours
Time and Distance of Travel
Mile
s
Lesson 14: From Ratio Tables, Equations, and Double Number Line Diagrams to Plots on the Coordinate Plane
111
This work is licensed under a Creative Commons Attribution-NonCommercial-ShareAlike 3.0 Unported License. © 2015 Great Minds. eureka-math.org
G6-M1-TE-1.3.0-06.2015

NYS COMMON CORE MATHEMATICS CURRICULUM 6•1 Lesson 14
Create the intervals on the 𝑥𝑥-axis.
Now let’s look at the intervals for the 𝑦𝑦-axis. The data is increasing by 100, so we will use 100 as the interval on the 𝑦𝑦-axis.
Create the intervals on the 𝑦𝑦-axis.
How can I show the relationship between hours and distance on the coordinate plane? Travel first from the origin using the 𝑥𝑥-coordinate (the hours). Next, travel from the 𝑥𝑥-coordinate up
the 𝑦𝑦-axis the value of the 𝑦𝑦-coordinate (miles).
Guide students through the following activity to ensure students understand that an ordered pair can be graphed on a plane. Students should also understand how far the train traveled during a given time period and how long it took for the train to travel a given distance.
Have students locate the ordered pair (4, 600) on the coordinate plane.
What does this point represent in the context of distance and time?
The train traveled 600 miles in 4 hours.
Have students locate the ordered pair (7, 500) on the coordinate plane.
How far did the train travel in 7 hours?
The train traveled 500 miles in 7 hours.
Have students locate the ordered pair (15, 750) on the coordinate plane.
How many hours does it take the train to travel 750 miles?
The train has traveled 750 miles in 15 hours.
Elicit student responses to create and then place the ordered pairs from the table on the coordinate plane. Allow students to individually model placement of ordered pairs on the coordinate plane, coming to the instructional area and explaining in detail the reasoning behind their placement of the point.
What do you notice about the arrangement of the points on the coordinate plane?
They appear to be in a line.
Model how to connect the ordered pairs to the origin with a line and arrow.
What do you think having an ordered pair of (0,0) means since we drew the line to the origin? Zero hours after the trip began the train has traveled zero miles.
Using this graph, we can determine how many hours the team will have to wait before being served dinner.
What information do we know?
Dinner is served at mile 250.
Where can we find 250 miles on our graph?
Students take time to think and share their thoughts with a partner. One pair of students comes to the instructional area and shares their thoughts with the class.
Model how to draw a horizontal line from 100 miles on the 𝑦𝑦-axis to the line representing the relationship between hours and miles.
If I draw a vertical line down, at what hour will I intersect the 𝑥𝑥-axis?
2 hours
Lesson 14: From Ratio Tables, Equations, and Double Number Line Diagrams to Plots on the Coordinate Plane
112
This work is licensed under a Creative Commons Attribution-NonCommercial-ShareAlike 3.0 Unported License. © 2015 Great Minds. eureka-math.org
G6-M1-TE-1.3.0-06.2015
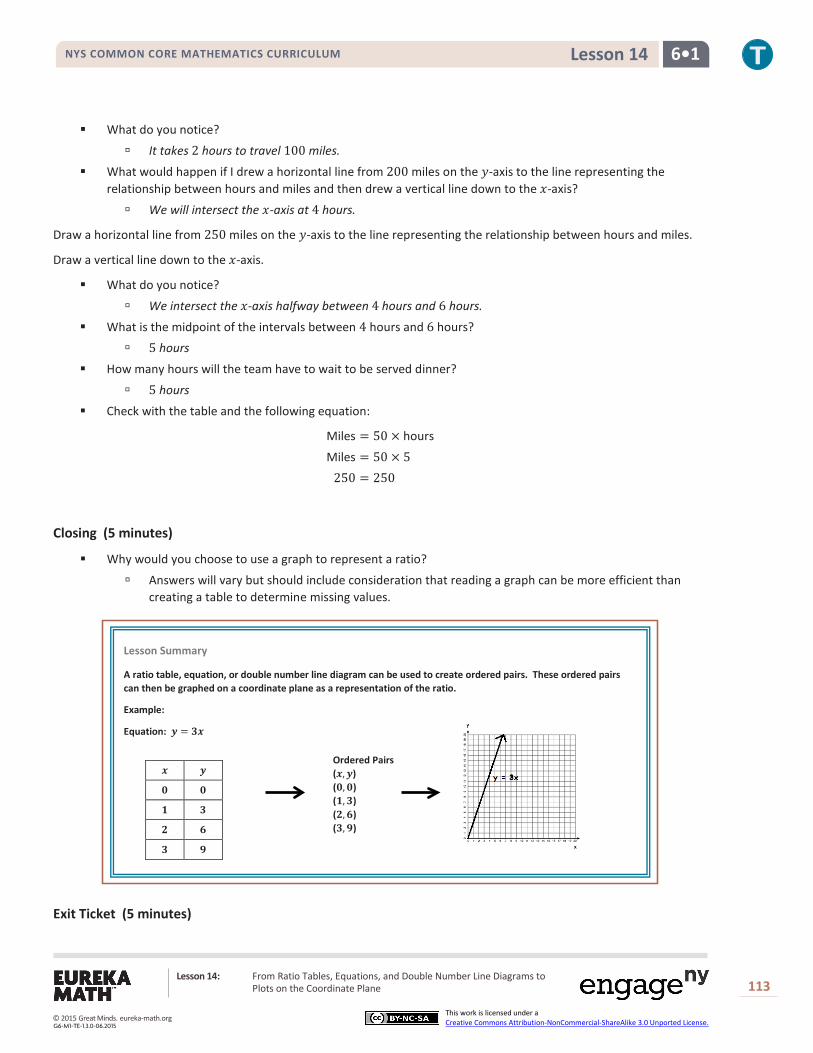
NYS COMMON CORE MATHEMATICS CURRICULUM 6•1 Lesson 14
What do you notice?
It takes 2 hours to travel 100 miles.
What would happen if I drew a horizontal line from 200 miles on the 𝑦𝑦-axis to the line representing the relationship between hours and miles and then drew a vertical line down to the 𝑥𝑥-axis?
We will intersect the 𝑥𝑥-axis at 4 hours.
Draw a horizontal line from 250 miles on the 𝑦𝑦-axis to the line representing the relationship between hours and miles.
Draw a vertical line down to the 𝑥𝑥-axis.
What do you notice?
We intersect the 𝑥𝑥-axis halfway between 4 hours and 6 hours.
What is the midpoint of the intervals between 4 hours and 6 hours? 5 hours
How many hours will the team have to wait to be served dinner?
5 hours
Check with the table and the following equation:
Miles = 50 × hours Miles = 50 × 5
250 = 250
Closing (5 minutes)
Why would you choose to use a graph to represent a ratio?
Answers will vary but should include consideration that reading a graph can be more efficient than creating a table to determine missing values.
Exit Ticket (5 minutes)
Lesson Summary
A ratio table, equation, or double number line diagram can be used to create ordered pairs. These ordered pairs can then be graphed on a coordinate plane as a representation of the ratio.
Example:
Equation: 𝒚𝒚 = 𝟑𝟑𝟑𝟑
𝟑𝟑 𝒚𝒚
𝟒𝟒 𝟒𝟒
𝟏𝟏 𝟑𝟑
𝟐𝟐 𝟔𝟔
𝟑𝟑 𝟗𝟗
` Ordered Pairs (𝟑𝟑,𝒚𝒚) (𝟒𝟒,𝟒𝟒) (𝟏𝟏,𝟑𝟑) (𝟐𝟐,𝟔𝟔) (𝟑𝟑,𝟗𝟗)
Lesson 14: From Ratio Tables, Equations, and Double Number Line Diagrams to Plots on the Coordinate Plane
113
This work is licensed under a Creative Commons Attribution-NonCommercial-ShareAlike 3.0 Unported License. © 2015 Great Minds. eureka-math.org
G6-M1-TE-1.3.0-06.2015
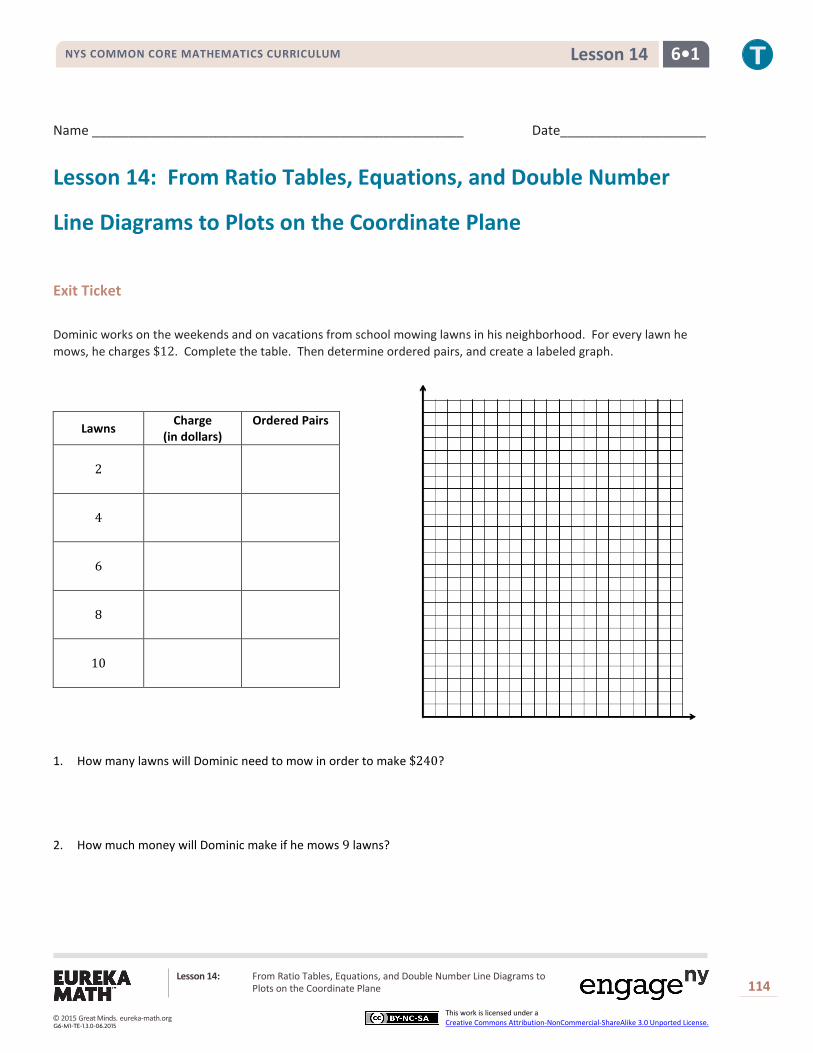
NYS COMMON CORE MATHEMATICS CURRICULUM 6•1 Lesson 14
Name ___________________________________________________ Date____________________
Lesson 14: From Ratio Tables, Equations, and Double Number
Line Diagrams to Plots on the Coordinate Plane
Exit Ticket Dominic works on the weekends and on vacations from school mowing lawns in his neighborhood. For every lawn he mows, he charges $12. Complete the table. Then determine ordered pairs, and create a labeled graph.
1. How many lawns will Dominic need to mow in order to make $240?
2. How much money will Dominic make if he mows 9 lawns?
Lawns Charge (in dollars)
Ordered Pairs
2
4
6
8
10
Lesson 14: From Ratio Tables, Equations, and Double Number Line Diagrams to Plots on the Coordinate Plane
114
This work is licensed under a Creative Commons Attribution-NonCommercial-ShareAlike 3.0 Unported License. © 2015 Great Minds. eureka-math.org
G6-M1-TE-1.3.0-06.2015
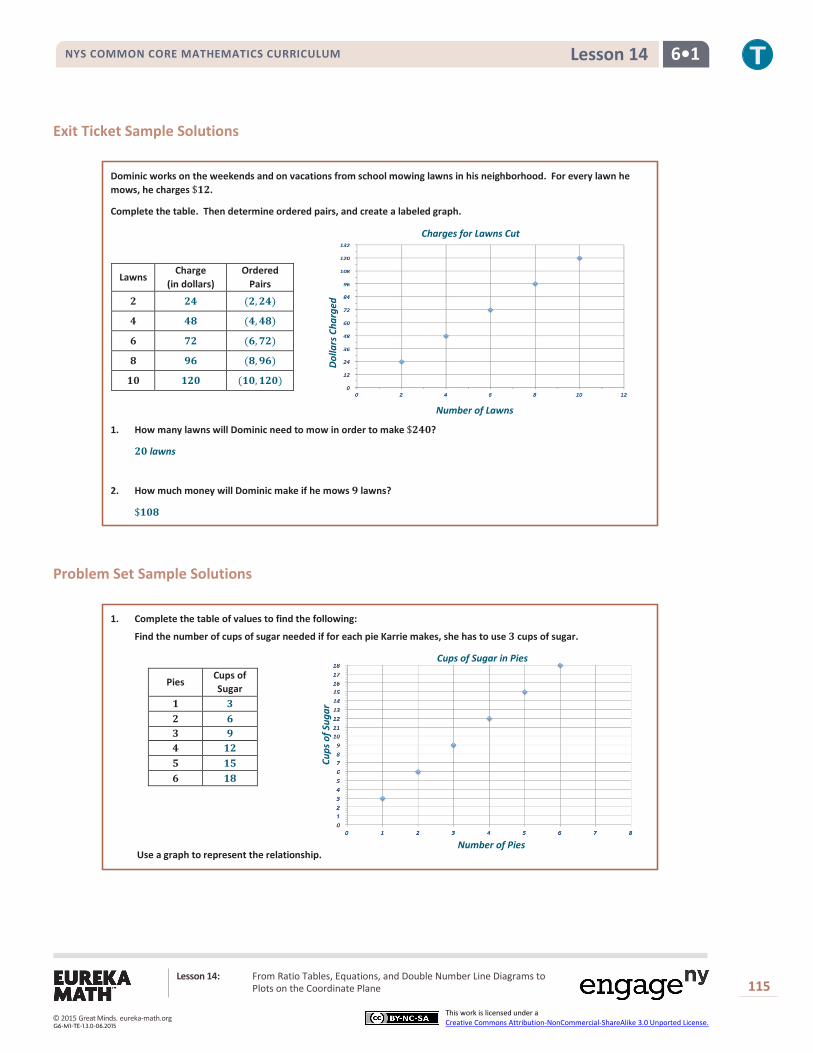
NYS COMMON CORE MATHEMATICS CURRICULUM 6•1 Lesson 14
Exit Ticket Sample Solutions
Dominic works on the weekends and on vacations from school mowing lawns in his neighborhood. For every lawn he mows, he charges $𝟏𝟏𝟐𝟐.
Complete the table. Then determine ordered pairs, and create a labeled graph.
1. How many lawns will Dominic need to mow in order to make $𝟐𝟐𝟒𝟒𝟒𝟒?
𝟐𝟐𝟒𝟒 lawns
2. How much money will Dominic make if he mows 𝟗𝟗 lawns?
$𝟏𝟏𝟒𝟒𝟖𝟖
Problem Set Sample Solutions
1. Complete the table of values to find the following:
Find the number of cups of sugar needed if for each pie Karrie makes, she has to use 𝟑𝟑 cups of sugar.
Use a graph to represent the relationship.
Lawns Charge (in dollars)
Ordered Pairs
𝟐𝟐 𝟐𝟐𝟒𝟒 (𝟐𝟐,𝟐𝟐𝟒𝟒)
𝟒𝟒 𝟒𝟒𝟖𝟖 (𝟒𝟒,𝟒𝟒𝟖𝟖)
𝟔𝟔 𝟕𝟕𝟐𝟐 (𝟔𝟔,𝟕𝟕𝟐𝟐)
𝟖𝟖 𝟗𝟗𝟔𝟔 (𝟖𝟖,𝟗𝟗𝟔𝟔)
𝟏𝟏𝟒𝟒 𝟏𝟏𝟐𝟐𝟒𝟒 (𝟏𝟏𝟒𝟒,𝟏𝟏𝟐𝟐𝟒𝟒)
Pies Cups of Sugar
𝟏𝟏 𝟑𝟑 𝟐𝟐 𝟔𝟔 𝟑𝟑 𝟗𝟗 𝟒𝟒 𝟏𝟏𝟐𝟐 𝟓𝟓 𝟏𝟏𝟓𝟓 𝟔𝟔 𝟏𝟏𝟖𝟖
Cups of Sugar in Pies
Number of Pies
Cups
of S
ugar
Charges for Lawns Cut
Number of Lawns
Dolla
rs C
harg
ed
Lesson 14: From Ratio Tables, Equations, and Double Number Line Diagrams to Plots on the Coordinate Plane
115
This work is licensed under a Creative Commons Attribution-NonCommercial-ShareAlike 3.0 Unported License. © 2015 Great Minds. eureka-math.org
G6-M1-TE-1.3.0-06.2015

NYS COMMON CORE MATHEMATICS CURRICULUM 6•1 Lesson 14
Create a double number line diagram to show the relationship.
2. Write a story context that would be represented by the ratio 𝟏𝟏:𝟒𝟒.
Answers will vary. Example: Kendra’s mom pays her four dollars for every load of laundry she washes and dries.
Complete a table of values for this equation and graph.
Loads of Laundry
Amount of Money She Earned in
Dollars 𝟏𝟏 𝟒𝟒 𝟐𝟐 𝟖𝟖 𝟑𝟑 𝟏𝟏𝟐𝟐 𝟒𝟒 𝟏𝟏𝟔𝟔 𝟓𝟓 𝟐𝟐𝟒𝟒
Pay for Laundry
Number of Loads of Laundry
Amou
nt o
f Mon
ey in
Dol
lars
Lesson 14: From Ratio Tables, Equations, and Double Number Line Diagrams to Plots on the Coordinate Plane
116
This work is licensed under a Creative Commons Attribution-NonCommercial-ShareAlike 3.0 Unported License. © 2015 Great Minds. eureka-math.org
G6-M1-TE-1.3.0-06.2015

NYS COMMON CORE MATHEMATICS CURRICULUM 6•1 Lesson 15
Lesson 15: A Synthesis of Representations of Equivalent
Ratio Collections
Student Outcomes
Students associate with each ratio 𝐴𝐴:𝐵𝐵 the ordered pair (𝐴𝐴,𝐵𝐵) and plot it in the 𝑥𝑥–𝑦𝑦 coordinate plane. Given a ratio table, students plot the ratios in the plane and observe that they lie on a line through the origin.
Students conclude that the coordinates in the line satisfy 𝑦𝑦 = 𝑘𝑘𝑥𝑥, where 𝑘𝑘 is the value of an associated ratio.
Classwork
Exploratory Challenge
Based on their previous knowledge from earlier lessons in this module, and working in predetermined groups, students complete Exercises 1–7 independently with ample time to share their collaboration with the entire class.
Exploratory Challenge
At the end of this morning’s news segment, the local television station highlighted area pets that need to be adopted. The station posted a specific website on the screen for viewers to find more information on the pets shown and the adoption process. The station producer checked the website two hours after the end of the broadcast and saw that the website had 𝟐𝟐𝟐𝟐 views. One hour after that, the website had 𝟑𝟑𝟑𝟑 views.
Exercise 1 (3 minutes) Exercise 1
Create a table to determine how many views the website probably had one hour after the end of the broadcast based on how many views it had two and three hours after the end of the broadcast. Using this relationship, predict how many views the website will have 𝟐𝟐, 𝟓𝟓, and 𝟑𝟑 hours after the end of the broadcast.
Hours Views
𝟏𝟏 𝟏𝟏𝟐𝟐
𝟐𝟐 𝟐𝟐𝟐𝟐
𝟑𝟑 𝟑𝟑𝟑𝟑
𝟐𝟐 𝟐𝟐𝟒𝟒
𝟓𝟓 𝟑𝟑𝟔𝟔
𝟑𝟑 𝟕𝟕𝟐𝟐
Lesson 15: A Synthesis of Representations of Equivalent Ratio Collections 117
This work is licensed under a Creative Commons Attribution-NonCommercial-ShareAlike 3.0 Unported License. © 2015 Great Minds. eureka-math.org
G6-M1-TE-1.3.0-06.2015

NYS COMMON CORE MATHEMATICS CURRICULUM 6•1 Lesson 15
Views per Hour
Number of Hours
Num
ber o
f Vie
ws
Exercise 2 (2 minutes)
Exercise 2
What is the constant number, 𝒄𝒄, that makes these ratios equivalent?
𝟏𝟏𝟐𝟐
Using an equation, represent the relationship between the number of views, 𝒗𝒗, the website received and the number of hours, 𝒉𝒉, after this morning's news broadcast.
𝒗𝒗 = 𝟏𝟏𝟐𝟐𝒉𝒉
Exercise 3 (2 minutes) Exercise 3
Use the table created in Exercise 1 to identify sets of ordered pairs that can be graphed.
(𝟏𝟏,𝟏𝟏𝟐𝟐), (𝟐𝟐,𝟐𝟐𝟐𝟐), (𝟑𝟑,𝟑𝟑𝟑𝟑), (𝟐𝟐,𝟐𝟐𝟒𝟒), (𝟓𝟓,𝟑𝟑𝟔𝟔), (𝟑𝟑,𝟕𝟕𝟐𝟐)
Exercise 4 (5 minutes) Exercise 4
Use the ordered pairs you created to depict the relationship between hours and number of views on a coordinate plane. Label your axes and create a title for the graph. Do the points you plotted lie on a line?
Lesson 15: A Synthesis of Representations of Equivalent Ratio Collections 118
This work is licensed under a Creative Commons Attribution-NonCommercial-ShareAlike 3.0 Unported License. © 2015 Great Minds. eureka-math.org
G6-M1-TE-1.3.0-06.2015

NYS COMMON CORE MATHEMATICS CURRICULUM 6•1 Lesson 15
Pasta Recipe
Tablespoons of Water
Num
ber o
f Egg
s
Exercise 5 (8 minutes) Exercise 5
Predict how many views the website will have after twelve hours. Use at least two representations (e.g., tape diagram, table, double number line diagram) to justify your answer.
Exercise 6 (10 minutes) Exercise 6
Also on the news broadcast, a chef from a local Italian restaurant demonstrated how he makes fresh pasta daily for his restaurant. The recipe for his pasta is below:
𝟑𝟑 eggs, beaten 𝟏𝟏 teaspoon salt
𝟐𝟐 cups all-purpose flour 𝟐𝟐 tablespoons water
𝟐𝟐 tablespoons vegetable oil
Determine the ratio of the number of tablespoons of water to the number of eggs.
𝟐𝟐:𝟑𝟑 Provided the information in the table below, complete the table to determine ordered pairs. Use the ordered pairs to graph the relationship of the number of tablespoons of water to the number of eggs.
Hours Views 𝟏𝟏 𝟏𝟏𝟐𝟐 𝟐𝟐 𝟐𝟐𝟐𝟐 𝟑𝟑 𝟑𝟑𝟑𝟑 𝟐𝟐 𝟐𝟐𝟒𝟒 𝟓𝟓 𝟑𝟑𝟔𝟔 𝟑𝟑 𝟕𝟕𝟐𝟐 𝟕𝟕 𝟒𝟒𝟐𝟐 𝟒𝟒 𝟗𝟗𝟑𝟑 𝟗𝟗 𝟏𝟏𝟔𝟔𝟒𝟒 𝟏𝟏𝟔𝟔 𝟏𝟏𝟐𝟐𝟔𝟔 𝟏𝟏𝟏𝟏 𝟏𝟏𝟑𝟑𝟐𝟐 𝟏𝟏𝟐𝟐 𝟏𝟏𝟐𝟐𝟐𝟐
Tablespoons of Water
Number of Eggs
𝟐𝟐 𝟑𝟑 (𝟐𝟐,𝟑𝟑)
𝟐𝟐 𝟑𝟑 (𝟐𝟐,𝟑𝟑)
𝟑𝟑 𝟗𝟗 (𝟑𝟑,𝟗𝟗)
𝟒𝟒 𝟏𝟏𝟐𝟐 (𝟒𝟒,𝟏𝟏𝟐𝟐)
𝟏𝟏𝟔𝟔 𝟏𝟏𝟓𝟓 (𝟏𝟏𝟔𝟔,𝟏𝟏𝟓𝟓)
𝟏𝟏𝟐𝟐 𝟏𝟏𝟒𝟒 (𝟏𝟏𝟐𝟐,𝟏𝟏𝟒𝟒)
Views
𝟏𝟏𝟐𝟐 × 𝟏𝟏𝟐𝟐 = 𝟏𝟏𝟐𝟐𝟐𝟐
𝟏𝟏𝟐𝟐 𝟏𝟏𝟐𝟐 𝟏𝟏𝟐𝟐 𝟏𝟏𝟐𝟐 𝟏𝟏𝟐𝟐 𝟏𝟏𝟐𝟐 𝟏𝟏𝟐𝟐 𝟏𝟏𝟐𝟐 𝟏𝟏𝟐𝟐 𝟏𝟏𝟐𝟐 𝟏𝟏𝟐𝟐 𝟏𝟏𝟐𝟐
𝟏𝟏𝟐𝟐
Hours
Hours
Views
𝟏𝟏
𝟐𝟐
𝟑𝟑
𝟐𝟐
𝟓𝟓
𝟑𝟑
𝟕𝟕
𝟒𝟒
𝟗𝟗
𝟏𝟏𝟔𝟔
𝟏𝟏𝟏𝟏
𝟏𝟏𝟐𝟐
𝟏𝟏𝟐𝟐𝟐𝟐
𝟏𝟏𝟑𝟑𝟐𝟐
𝟏𝟏𝟐𝟐𝟔𝟔
𝟏𝟏𝟔𝟔𝟒𝟒
𝟗𝟗𝟑𝟑
𝟏𝟏𝟐𝟐
𝟐𝟐𝟐𝟐
𝟑𝟑𝟑𝟑
𝟐𝟐𝟒𝟒
𝟑𝟑𝟔𝟔
𝟕𝟕𝟐𝟐
𝟒𝟒𝟐𝟐
Lesson 15: A Synthesis of Representations of Equivalent Ratio Collections 119
This work is licensed under a Creative Commons Attribution-NonCommercial-ShareAlike 3.0 Unported License. © 2015 Great Minds. eureka-math.org
G6-M1-TE-1.3.0-06.2015

NYS COMMON CORE MATHEMATICS CURRICULUM 6•1 Lesson 15
What would you have to do to the graph in order to find how many eggs would be needed if the recipe was larger and called for 𝟏𝟏𝟑𝟑 tablespoons of water?
Extend the graph.
Demonstrate on your graph.
How many eggs would be needed if the recipe called for 𝟏𝟏𝟑𝟑 tablespoons of water?
𝟐𝟐𝟐𝟐
Exercise 7 (5 minutes) Exercise 7
Determine how many tablespoons of water will be needed if the chef is making a large batch of pasta and the recipe increases to 𝟑𝟑𝟑𝟑 eggs. Support your reasoning using at least one diagram you find applies best to the situation, and explain why that tool is the best to use.
Answers may vary but should include reasoning for each tool. For example, extending the table/double number line diagram because values were already given to find the pattern or using a tape diagram to determine the equivalent ratios.
Tablespoons of Water
Number of Eggs
𝟐𝟐 𝟑𝟑
𝟐𝟐 𝟑𝟑
𝟑𝟑 𝟗𝟗
𝟒𝟒 𝟏𝟏𝟐𝟐
𝟏𝟏𝟔𝟔 𝟏𝟏𝟓𝟓
𝟏𝟏𝟐𝟐 𝟏𝟏𝟒𝟒
𝟏𝟏𝟐𝟐 𝟐𝟐𝟏𝟏
𝟏𝟏𝟑𝟑 𝟐𝟐𝟐𝟐
𝟏𝟏𝟒𝟒 𝟐𝟐𝟕𝟕
𝟐𝟐𝟔𝟔 𝟑𝟑𝟔𝟔
𝟐𝟐𝟐𝟐 𝟑𝟑𝟑𝟑
𝟐𝟐𝟐𝟐 𝟑𝟑𝟑𝟑
𝟐𝟐 × 𝟏𝟏𝟐𝟐 = 𝟐𝟐𝟐𝟐
Eggs
𝟏𝟏𝟐𝟐 𝟏𝟏𝟐𝟐
𝟑𝟑𝟑𝟑
Water
𝟑𝟑 × 𝟏𝟏𝟐𝟐 = 𝟑𝟑𝟑𝟑
𝟐𝟐 𝟐𝟐 𝟑𝟑 𝟒𝟒 𝟏𝟏𝟔𝟔 𝟏𝟏𝟐𝟐 𝟏𝟏𝟐𝟐 𝟏𝟏𝟑𝟑 𝟏𝟏𝟒𝟒 𝟐𝟐𝟔𝟔 𝟐𝟐𝟐𝟐 𝟐𝟐𝟐𝟐
𝟑𝟑 𝟑𝟑 𝟗𝟗 𝟏𝟏𝟐𝟐 𝟏𝟏𝟓𝟓 𝟏𝟏𝟒𝟒 𝟐𝟐𝟏𝟏 𝟐𝟐𝟐𝟐 𝟐𝟐𝟕𝟕 𝟑𝟑𝟔𝟔 𝟑𝟑𝟑𝟑 𝟑𝟑𝟑𝟑
Water
Eggs
Lesson 15: A Synthesis of Representations of Equivalent Ratio Collections 120
This work is licensed under a Creative Commons Attribution-NonCommercial-ShareAlike 3.0 Unported License. © 2015 Great Minds. eureka-math.org
G6-M1-TE-1.3.0-06.2015
NYS COMMON CORE MATHEMATICS CURRICULUM 6•1 Lesson 15
Lesson Summary
There are several ways to represent the same collection of equivalent ratios. These include ratio tables, tape diagrams, double number line diagrams, equations, and graphs on coordinate planes.
Closing (5 minutes)
Finish any leftover student discussion and presentation.
Describe the advantages and disadvantages of using each of the representations of equivalent ratios: table, double number line diagram, equation, and graph.
Answers will vary but should include the following: tables allow for organization and prediction of unknown values; double number line diagrams help make visible that there are many, even infinitely many, pairs of numbers in the same ratio; an equation is an efficient way to understand the relationship between the first value and the second value and allows us to simply multiply or divide to find any equivalent ratio; a graph is a visual way to immediately see the relationship between two values.
Exit Ticket (5 minutes)
Lesson 15: A Synthesis of Representations of Equivalent Ratio Collections 121
This work is licensed under a Creative Commons Attribution-NonCommercial-ShareAlike 3.0 Unported License. © 2015 Great Minds. eureka-math.org
G6-M1-TE-1.3.0-06.2015

NYS COMMON CORE MATHEMATICS CURRICULUM 6•1 Lesson 15
Name ___________________________________________________ Date____________________
Lesson 15: A Synthesis of Representations of Equivalent Ratio
Collections
Exit Ticket Jen and Nikki are making bracelets to sell at the local market. They determined that each bracelet would have eight beads and two charms.
Complete the table below to show the ratio of the number of charms to the number of beads.
Charms 2 4 6 8 10
Beads 8
Create ordered pairs from the table, and plot the pairs on the graph below. Label the axes of the graph, and provide a title.
Lesson 15: A Synthesis of Representations of Equivalent Ratio Collections 122
This work is licensed under a Creative Commons Attribution-NonCommercial-ShareAlike 3.0 Unported License. © 2015 Great Minds. eureka-math.org
G6-M1-TE-1.3.0-06.2015

NYS COMMON CORE MATHEMATICS CURRICULUM 6•1 Lesson 15
Number of Charms to Number of Beads
Number of Charms
Num
ber o
f Bea
ds
Exit Ticket Sample Solutions
Jen and Nikki are making bracelets to sell at the local market. They determined that each bracelet would have eight beads and two charms.
Complete the table below to show the ratio of the number of charms to the number of beads.
Create ordered pairs from the table, and plot the pairs on the graph below. Label the axes of the graph, and provide a title.
Problem Set Sample Solutions
1. The producer of the news station posted an article about the high school’s football championship ceremony on a new website. The website had 𝟓𝟓𝟔𝟔𝟔𝟔 views after four hours. Create a table to show how many views the website would have had after the first, second, and third hours after posting, if the website receives views at the same rate. How many views would the website receive after 𝟓𝟓 hours?
2. Write an equation that represents the relationship from Problem 1. Do you see any connections between the equations you wrote and the ratio of the number of views to the number of hours?
𝟏𝟏𝟐𝟐𝟓𝟓𝒉𝒉 = 𝒗𝒗
Charms 𝟐𝟐 𝟐𝟐 𝟑𝟑 𝟒𝟒 𝟏𝟏𝟔𝟔
Beads 𝟒𝟒 𝟏𝟏𝟑𝟑 𝟐𝟐𝟐𝟐 𝟑𝟑𝟐𝟐 𝟐𝟐𝟔𝟔
Hours Views
𝟏𝟏 𝟏𝟏𝟐𝟐𝟓𝟓
𝟐𝟐 𝟐𝟐𝟓𝟓𝟔𝟔
𝟑𝟑 𝟑𝟑𝟕𝟕𝟓𝟓
𝟐𝟐 𝟓𝟓𝟔𝟔𝟔𝟔
𝟓𝟓 𝟑𝟑𝟐𝟐𝟓𝟓
(𝟐𝟐,𝟒𝟒)
(𝟐𝟐,𝟏𝟏𝟑𝟑)
(𝟑𝟑,𝟐𝟐𝟐𝟐)
(𝟒𝟒,𝟑𝟑𝟐𝟐)
(𝟏𝟏𝟔𝟔,𝟐𝟐𝟔𝟔)
Lesson 15: A Synthesis of Representations of Equivalent Ratio Collections 123
This work is licensed under a Creative Commons Attribution-NonCommercial-ShareAlike 3.0 Unported License. © 2015 Great Minds. eureka-math.org
G6-M1-TE-1.3.0-06.2015
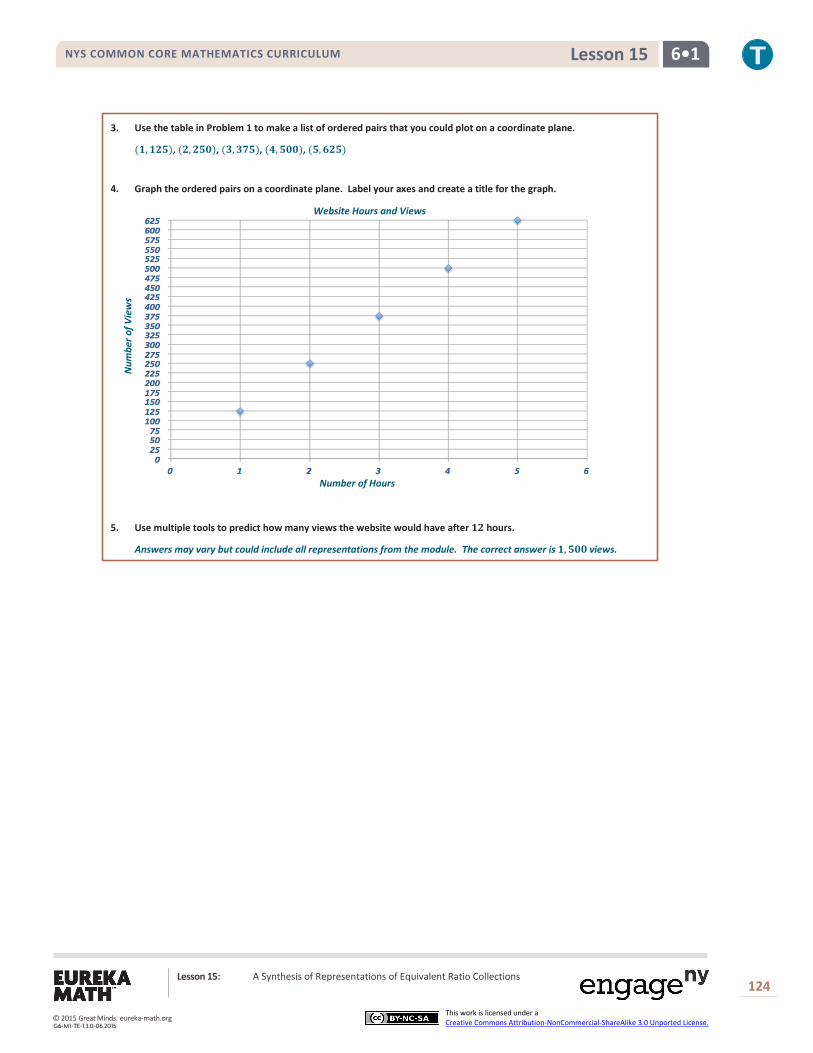
NYS COMMON CORE MATHEMATICS CURRICULUM 6•1 Lesson 15
3. Use the table in Problem 1 to make a list of ordered pairs that you could plot on a coordinate plane.
(𝟏𝟏,𝟏𝟏𝟐𝟐𝟓𝟓), (𝟐𝟐,𝟐𝟐𝟓𝟓𝟔𝟔), (𝟑𝟑,𝟑𝟑𝟕𝟕𝟓𝟓), (𝟐𝟐,𝟓𝟓𝟔𝟔𝟔𝟔), (𝟓𝟓,𝟑𝟑𝟐𝟐𝟓𝟓)
4. Graph the ordered pairs on a coordinate plane. Label your axes and create a title for the graph.
5. Use multiple tools to predict how many views the website would have after 𝟏𝟏𝟐𝟐 hours.
Answers may vary but could include all representations from the module. The correct answer is 𝟏𝟏,𝟓𝟓𝟔𝟔𝟔𝟔 views.
Website Hours and Views
Number of Hours
Num
ber o
f Vie
ws
Lesson 15: A Synthesis of Representations of Equivalent Ratio Collections 124
This work is licensed under a Creative Commons Attribution-NonCommercial-ShareAlike 3.0 Unported License. © 2015 Great Minds. eureka-math.org
G6-M1-TE-1.3.0-06.2015
NYS COMMON CORE MATHEMATICS CURRICULUM 6•1 Lesson 15
Graph Reproducible
Lesson 15: A Synthesis of Representations of Equivalent Ratio Collections 125
This work is licensed under a Creative Commons Attribution-NonCommercial-ShareAlike 3.0 Unported License. © 2015 Great Minds. eureka-math.org
G6-M1-TE-1.3.0-06.2015

6•1 Mid-Module Assessment Task NYS COMMON CORE MATHEMATICS CURRICULUM
Name Date
1. The most common women’s shoe size in the U.S. is reported to be an 8 12
. A shoe store uses a table like
the one below to decide how many pairs of size 8 12
shoes to buy when it places a shoe order from the shoe manufacturers.
Total Number of Pairs of Shoes Being Ordered
Number of Pairs of
Size 8 12
to Order
50 8 100 16 150 24 200 32
a. What is the ratio of the number of pairs of size 8 12
shoes the store orders to the total number of pairs of shoes being ordered?
b. Plot the values from the table on a coordinate plane. Label the axes. Then use the graph to find the
number of pairs of size 8 12 shoes the store orders for a total order of 125 pairs of shoes.
Module 1: Ratios and Unit Rates 126
This work is licensed under a Creative Commons Attribution-NonCommercial-ShareAlike 3.0 Unported License. © 2015 Great Minds. eureka-math.org
G6-M1-TE-1.3.0-06.2015
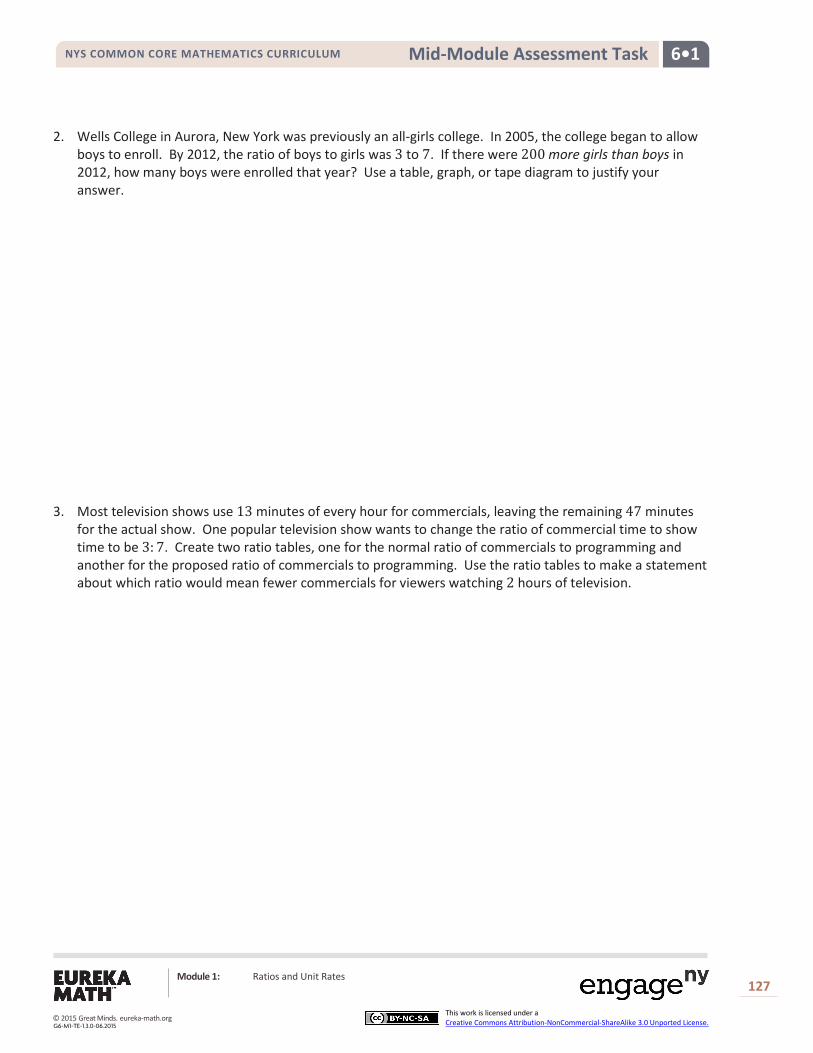
6•1 Mid-Module Assessment Task NYS COMMON CORE MATHEMATICS CURRICULUM
2. Wells College in Aurora, New York was previously an all-girls college. In 2005, the college began to allow boys to enroll. By 2012, the ratio of boys to girls was 3 to 7. If there were 200 more girls than boys in 2012, how many boys were enrolled that year? Use a table, graph, or tape diagram to justify your answer.
3. Most television shows use 13 minutes of every hour for commercials, leaving the remaining 47 minutes
for the actual show. One popular television show wants to change the ratio of commercial time to show time to be 3: 7. Create two ratio tables, one for the normal ratio of commercials to programming and another for the proposed ratio of commercials to programming. Use the ratio tables to make a statement about which ratio would mean fewer commercials for viewers watching 2 hours of television.
Module 1: Ratios and Unit Rates 127
This work is licensed under a Creative Commons Attribution-NonCommercial-ShareAlike 3.0 Unported License. © 2015 Great Minds. eureka-math.org
G6-M1-TE-1.3.0-06.2015

6•1 Mid-Module Assessment Task NYS COMMON CORE MATHEMATICS CURRICULUM
A Progression Toward Mastery
Assessment Task Item
STEP 1 Missing or incorrect answer and little evidence of reasoning or application of mathematics to solve the problem.
STEP 2 Missing or incorrect answer but evidence of some reasoning or application of mathematics to solve the problem.
STEP 3 A correct answer with some evidence of reasoning or application of mathematics to solve the problem, OR an incorrect answer with substantial evidence of solid reasoning or application of mathematics to solve the problem.
STEP 4 A correct answer supported by substantial evidence of solid reasoning or application of mathematics to solve the problem.
1
a
6.RP.A.1 6.RP.A.3a
Student provides an incorrect ratio and does not reflect an associated ratio. Student does not display an understanding of determining ratio using a ratio table.
Student provides an associated ratio, such as 25: 4. It may or may not be expressed in the smallest unit possible. Student shows evidence of understanding how to determine a ratio from a ratio table but lacks attentiveness to the precision for which the ratio is being asked.
Student provides the correct ratio, 4: 25, but has expressed using a larger unit, such as 8: 50. The notation or wording of the ratio statement may have minor errors.
Student provides the correct ratio, 4: 25. The notation and/or wording of the ratio statement are correct.
b
6.RP.A.1 6.RP.A.3a
Student does not produce a graph, or the graph does not accurately depict the pairs from the table. Student is unable to answer the question correctly.
Student depicts a graph, but the graph contains more than one error in its depiction, such as not going through the given points or not labeling the axes. Student may or may not answer the question correctly.
Student depicts a graph, but the graph contains a minor error in its depiction, such as not accurately plotting the given points or not labeling the axes. Student answers the question correctly or incorrectly, but the graph depicts the correct answer.
Student depicts the graph correctly, including plotting the given points and labeling the axes. Student answers the question correctly, and the answer is represented in the graph.
Module 1: Ratios and Unit Rates 128
This work is licensed under a Creative Commons Attribution-NonCommercial-ShareAlike 3.0 Unported License. © 2015 Great Minds. eureka-math.org
G6-M1-TE-1.3.0-06.2015

6•1 Mid-Module Assessment Task NYS COMMON CORE MATHEMATICS CURRICULUM
2 6.RP.A.3 (Stem Only)
Student is unable to answer the question. Student is not able to accurately depict the ratio of boys to girls or does not show evidence of moving beyond that basic depiction.
Student depicts the ratio of boys to girls and shows some evidence of using the depiction to solve the problem but is unable to come to a correct answer. The answer is either incomplete or incorrect.
Student is able to choose a depiction of the ratio and to incorporate the other information given into the depiction but makes an error in arriving at the answer.
Student is able to choose a depiction of the ratio of boys to girls and incorporate into the depiction the additional information of the difference between the number of girls and the number of boys. Student is able to use the depiction to arrive at the correct answer.
3
6.RP.A.3a
Student is unable to complete the two tables or is unable to fill in at least one row in each table. Student is unable to compose a reasonably accurate comparison of which option would be better for viewers.
Student constructs ratio tables with at least one entry in each table and demonstrates some reasoning in making a statement of comparison, even if the statement does not match the table entries.
Student makes two ratio tables with at least two entries in each table. There is one or more errors in the entries of the table. Student is able to make a statement of comparison of which option is better for viewers based on the entries provided in the table.
Student makes two ratio tables with at least two entries in each table. The student is able to make an accurate comparison of which option is better for viewers and relate the comparison to a 2-hour show using accurate grade-level language.
Module 1: Ratios and Unit Rates 129
This work is licensed under a Creative Commons Attribution-NonCommercial-ShareAlike 3.0 Unported License. © 2015 Great Minds. eureka-math.org
G6-M1-TE-1.3.0-06.2015
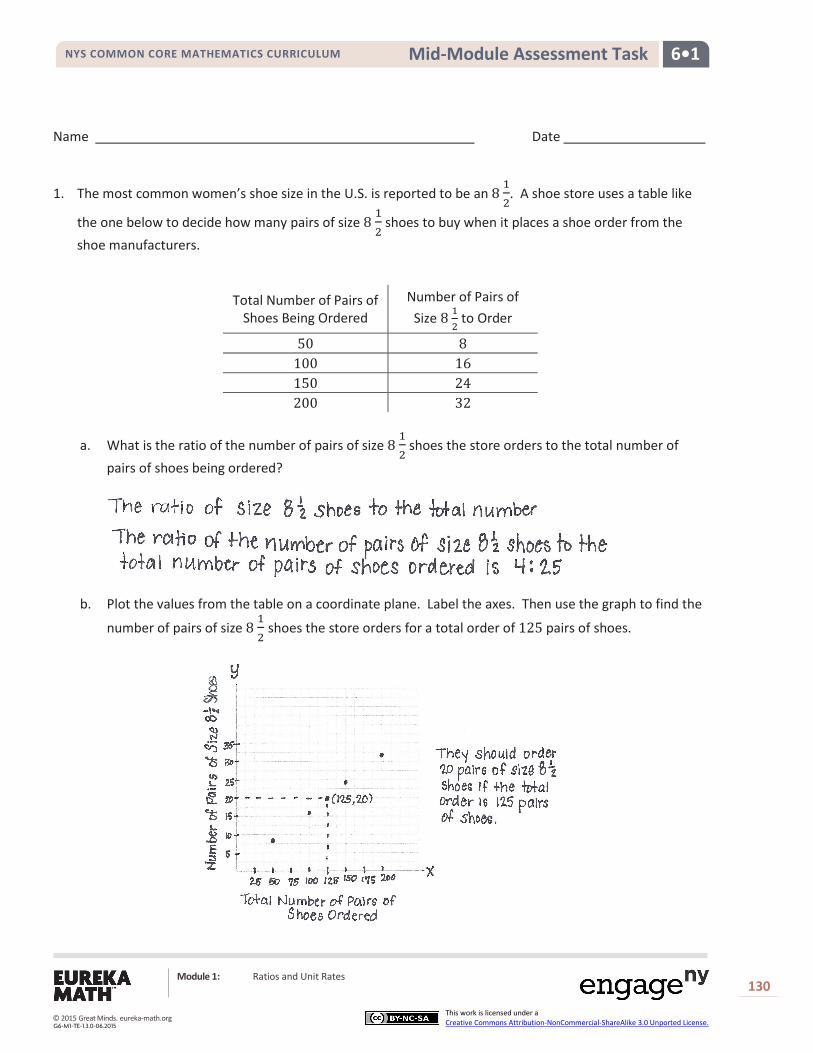
6•1 Mid-Module Assessment Task NYS COMMON CORE MATHEMATICS CURRICULUM
Name Date
1. The most common women’s shoe size in the U.S. is reported to be an 8 12
. A shoe store uses a table like
the one below to decide how many pairs of size 8 12
shoes to buy when it places a shoe order from the shoe manufacturers.
Total Number of Pairs of Shoes Being Ordered
Number of Pairs of Size 8 1
2 to Order
50 8 100 16 150 24 200 32
a. What is the ratio of the number of pairs of size 8 12
shoes the store orders to the total number of pairs of shoes being ordered?
b. Plot the values from the table on a coordinate plane. Label the axes. Then use the graph to find the
number of pairs of size 8 12 shoes the store orders for a total order of 125 pairs of shoes.
Module 1: Ratios and Unit Rates 130
This work is licensed under a Creative Commons Attribution-NonCommercial-ShareAlike 3.0 Unported License. © 2015 Great Minds. eureka-math.org
G6-M1-TE-1.3.0-06.2015

6•1 Mid-Module Assessment Task NYS COMMON CORE MATHEMATICS CURRICULUM
2. Wells College in Aurora, New York was previously an all-girls college. In 2005, the college began to allow boys to enroll. By 2012, the ratio of boys to girls was 3 to 7. If there were 200 more girls than boys in 2012, how many boys were enrolled that year? Use a table, graph, or tape diagram to justify your answer.
3. Most television shows use 13 minutes of every hour for commercials, leaving the remaining 47 minutes for the actual show. One popular television show wants to change the ratio of commercial time to show time to be 3: 7. Create two ratio tables, one for the normal ratio of commercials to programming and another for the proposed ratio of commercials to programming. Use the ratio tables to make a statement about which ratio would mean fewer commercials for viewers watching 2 hours of television.
Module 1: Ratios and Unit Rates 131
This work is licensed under a Creative Commons Attribution-NonCommercial-ShareAlike 3.0 Unported License. © 2015 Great Minds. eureka-math.org
G6-M1-TE-1.3.0-06.2015
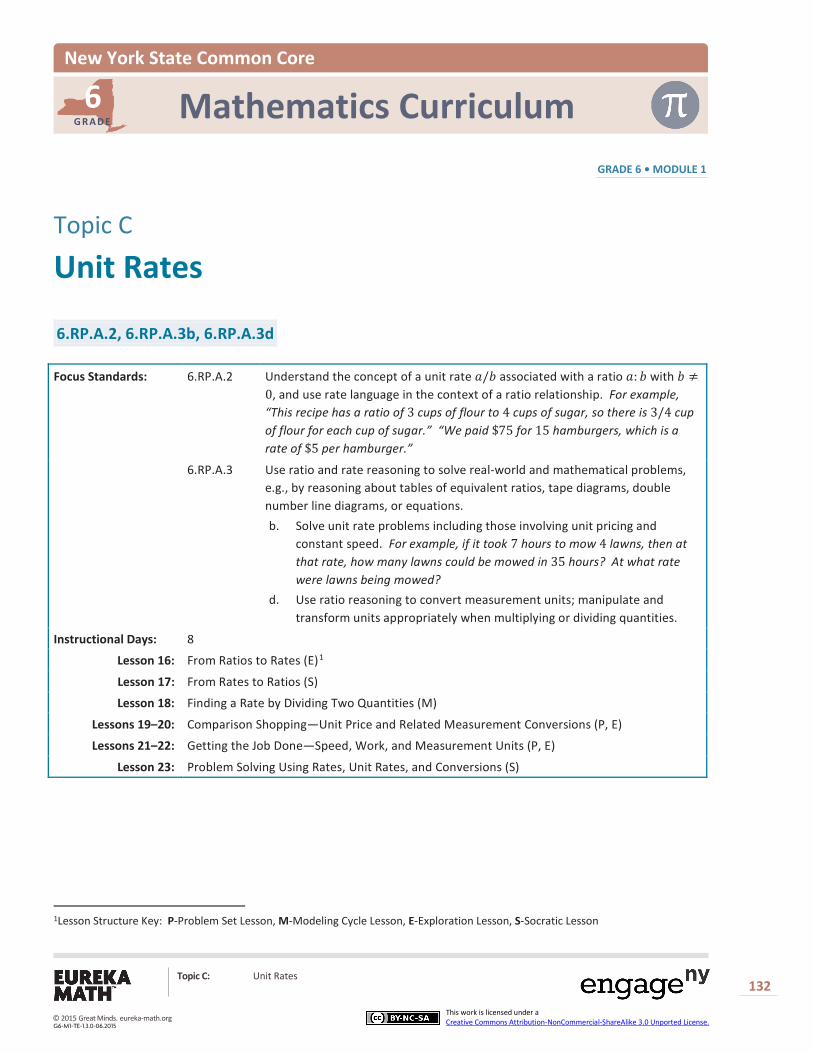
GRADE 6 • MODULE 1
Topic C: Unit Rates 132
This work is licensed under a Creative Commons Attribution-NonCommercial-ShareAlike 3.0 Unported License.
New York State Common Core
Topic C
Unit Rates
6.RP.A.2, 6.RP.A.3b, 6.RP.A.3d
Focus Standards: 6.RP.A.2 Understand the concept of a unit rate 𝑎𝑎/𝑏𝑏 associated with a ratio 𝑎𝑎: 𝑏𝑏 with 𝑏𝑏 ≠0, and use rate language in the context of a ratio relationship. For example, “This recipe has a ratio of 3 cups of flour to 4 cups of sugar, so there is 3/4 cup of flour for each cup of sugar.” “We paid $75 for 15 hamburgers, which is a rate of $5 per hamburger.”
6.RP.A.3 Use ratio and rate reasoning to solve real-world and mathematical problems, e.g., by reasoning about tables of equivalent ratios, tape diagrams, doublenumber line diagrams, or equations. b. Solve unit rate problems including those involving unit pricing and
constant speed. For example, if it took 7 hours to mow 4 lawns, then atthat rate, how many lawns could be mowed in 35 hours? At what ratewere lawns being mowed?
d. Use ratio reasoning to convert measurement units; manipulate andtransform units appropriately when multiplying or dividing quantities.
Instructional Days: 8
Lesson 16: From Ratios to Rates (E)1
Lesson 17: From Rates to Ratios (S)
Lesson 18: Finding a Rate by Dividing Two Quantities (M)
Lessons 19–20: Comparison Shopping—Unit Price and Related Measurement Conversions (P, E)
Lessons 21–22: Getting the Job Done—Speed, Work, and Measurement Units (P, E)
Lesson 23: Problem Solving Using Rates, Unit Rates, and Conversions (S)
1Lesson Structure Key: P-Problem Set Lesson, M-Modeling Cycle Lesson, E-Exploration Lesson, S-Socratic Lesson
Mathematics Curriculum G R A D E
6
© 2015 Great Minds. eureka-math.orgG6-M1-TE-1.3.0-06.2015

6•1 Topic C NYS COMMON CORE MATHEMATICS CURRICULUM
Topic C: Unit Rates
133
This work is licensed under a Creative Commons Attribution-NonCommercial-ShareAlike 3.0 Unported License.
In Topic C, students apply their understanding of ratios and the value of a ratio as they come to understand that a ratio relationship of 5 miles to 2 hours corresponds to a rate of 2.5 miles per hour, where the unit rate is the numerical part of the rate, 2.5, and miles per hour is the newly formed unit of measurement of the rate (6.RP.A.2). Throughout Topic C, students continue to make use of the representations and diagrams of Topics A and B as they investigate the concepts of this topic within the context of real-world rate problems. In Lesson 16, students develop their vocabulary and conceptual understanding of rate as they work through and discuss problems that require expressing simple ratios as rates using phrases such as ‘per’, ‘for each’ and ‘for every’. In Lesson 17, students reinforce their understanding as they see problems for the first time where the ratio relationship is expressed in rate form. Students are asked to verbalize and depict the underlying ratio relationship as a collection of equivalent ratios.
In Lesson 18, students generalize the process for finding a rate and define the term unit rate relating it to the value of a ratio. In the remaining lessons of Topic C, students solve unit rate problems involving unit pricing, constant speed, and constant rates of work (6.RP.A.3b). They combine their new understanding of rate to connect and revisit concepts of converting among different-sized standard measurement units (5.MD.A.1). They then expand upon this background as they learn to manipulate and transform units when multiplying and dividing quantities (6.RP.A.3d). In Lessons 19–20, students are conscientious consumers, and comparison shop by comparing unit prices and converting measurement units as needed. For instance, when comparing a 10-ounce bag of salad that sells for $2.25 to a 1-pound bag of salad that retails for $3.50, students recognize that in addition to finding a unit price, they must convert pounds to ounces for an accurate comparison.
In Lessons 21–22, students conduct real-world simulations that generate rates related to speed and work. In doing so, students begin to view math as a tool for solving real-life problems. Topic C concludes with Lesson 23, in which students draw upon their experiences in previous modeling lessons to demonstrate their ability to problem-solve using rates, unit rates, and conversions.
© 2015 Great Minds. eureka-math.orgG6-M1-TE-1.3.0-06.2015

NYS COMMON CORE MATHEMATICS CURRICULUM 6•1 Lesson 16
Lesson 16: From Ratios to Rates
134
This work is licensed under a Creative Commons Attribution-NonCommercial-ShareAlike 3.0 Unported License.
Lesson 16: From Ratios to Rates
Student Outcomes
Students associate a description of a ratio relationship, such as “5 miles for every 2 hours,” to a new quantity, “2.5 miles/hour,” called a rate.
Given a ratio, students precisely identify the associated rate. They identify the unit rate and the rate unit.
Classwork Ratios can be transformed to rates and unit rates.
Example (5 minutes): Introduction to Rates and Unit Rates
Students complete the problem individually. Encourage students to use prior knowledge of equivalent ratios. Discuss answers and methods after a few minutes of student work time.
Example: Introduction to Rates and Unit Rates
Diet cola was on sale last week; it cost $𝟏𝟏𝟏𝟏 for every 𝟒𝟒 packs of diet cola.
a. How much do 𝟐𝟐 packs of diet cola cost?
Packs of Diet Cola 𝟒𝟒 𝟐𝟐 Total Cost 𝟏𝟏𝟏𝟏 𝟓𝟓
𝟐𝟐 packs of diet cola cost $𝟓𝟓.𝟏𝟏𝟏𝟏.
b. How much does 𝟏𝟏 pack of diet cola cost?
Packs of Diet Cola 𝟐𝟐 𝟏𝟏 Total Cost 𝟓𝟓 𝟐𝟐.𝟓𝟓𝟏𝟏
𝟏𝟏 pack of diet cola costs $𝟐𝟐.𝟓𝟓𝟏𝟏.
After answers have been discussed, use this example to identify the new terms.
Rate: Ratio relationship given by “$10 for every 4 packs of diet cola” can be written as the rate “2.5 dollars/pack.”
Unit Rate: The unit rate is 2.5 because it is the value of the ratio.
Rate Unit: The rate unit is dollars/pack of diet cola because it costs 2.5 dollars for every 1 pack of diet cola.
Now that the new terms have been introduced, use these vocabulary words throughout the lesson.
© 2015 Great Minds. eureka-math.orgG6-M1-TE-1.3.0-06.2015
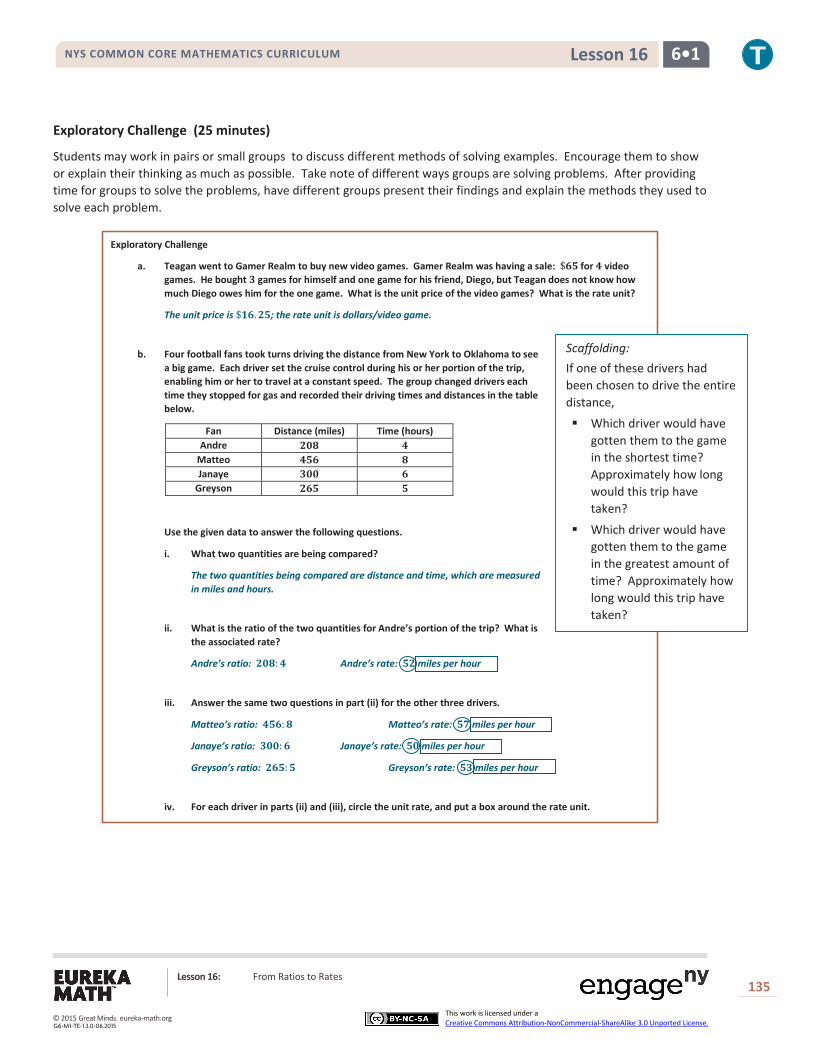
NYS COMMON CORE MATHEMATICS CURRICULUM 6•1 Lesson 16
Lesson 16: From Ratios to Rates
135
This work is licensed under a Creative Commons Attribution-NonCommercial-ShareAlike 3.0 Unported License.
Exploratory Challenge (25 minutes)
Students may work in pairs or small groups to discuss different methods of solving examples. Encourage them to show or explain their thinking as much as possible. Take note of different ways groups are solving problems. After providing time for groups to solve the problems, have different groups present their findings and explain the methods they used to solve each problem.
Exploratory Challenge
a. Teagan went to Gamer Realm to buy new video games. Gamer Realm was having a sale: $𝟔𝟔𝟓𝟓 for 𝟒𝟒 video games. He bought 𝟑𝟑 games for himself and one game for his friend, Diego, but Teagan does not know how much Diego owes him for the one game. What is the unit price of the video games? What is the rate unit?
The unit price is $𝟏𝟏𝟔𝟔.𝟐𝟐𝟓𝟓; the rate unit is dollars/video game.
b. Four football fans took turns driving the distance from New York to Oklahoma to see a big game. Each driver set the cruise control during his or her portion of the trip, enabling him or her to travel at a constant speed. The group changed drivers each time they stopped for gas and recorded their driving times and distances in the table below.
Fan Distance (miles) Time (hours) Andre 𝟐𝟐𝟏𝟏𝟐𝟐 𝟒𝟒
Matteo 𝟒𝟒𝟓𝟓𝟔𝟔 𝟐𝟐 Janaye 𝟑𝟑𝟏𝟏𝟏𝟏 𝟔𝟔
Greyson 𝟐𝟐𝟔𝟔𝟓𝟓 𝟓𝟓
Use the given data to answer the following questions.
i. What two quantities are being compared?
The two quantities being compared are distance and time, which are measured in miles and hours.
ii. What is the ratio of the two quantities for Andre’s portion of the trip? What is the associated rate?
Andre’s ratio: 𝟐𝟐𝟏𝟏𝟐𝟐:𝟒𝟒 Andre’s rate: 𝟓𝟓𝟐𝟐 miles per hour
iii. Answer the same two questions in part (ii) for the other three drivers.
Matteo’s ratio: 𝟒𝟒𝟓𝟓𝟔𝟔:𝟐𝟐 Matteo’s rate: 𝟓𝟓𝟓𝟓 miles per hour
Janaye’s ratio: 𝟑𝟑𝟏𝟏𝟏𝟏:𝟔𝟔 Janaye’s rate: 𝟓𝟓𝟏𝟏 miles per hour
Greyson’s ratio: 𝟐𝟐𝟔𝟔𝟓𝟓:𝟓𝟓 Greyson’s rate: 𝟓𝟓𝟑𝟑 miles per hour
iv. For each driver in parts (ii) and (iii), circle the unit rate, and put a box around the rate unit.
Scaffolding: If one of these drivers had been chosen to drive the entire distance,
Which driver would have gotten them to the game in the shortest time? Approximately how long would this trip have taken?
Which driver would have gotten them to the game in the greatest amount of time? Approximately how long would this trip have taken?
© 2015 Great Minds. eureka-math.orgG6-M1-TE-1.3.0-06.2015

NYS COMMON CORE MATHEMATICS CURRICULUM 6•1 Lesson 16
Lesson 16: From Ratios to Rates
136
This work is licensed under a Creative Commons Attribution-NonCommercial-ShareAlike 3.0 Unported License.
c. A publishing company is looking for new employees to type novels that will soon be published. The publishing company wants to find someone who can type at least 𝟒𝟒𝟓𝟓 words per minute. Dominique discovered she can type at a constant rate of 𝟓𝟓𝟏𝟏𝟒𝟒 words in 𝟏𝟏𝟔𝟔 minutes. Does Dominique type at a fast enough rate to qualify for the job? Explain why or why not.
Minutes 𝟏𝟏 𝟐𝟐 𝟒𝟒 𝟐𝟐 𝟏𝟏𝟔𝟔 Words 𝟒𝟒𝟒𝟒 𝟐𝟐𝟐𝟐 𝟏𝟏𝟓𝟓𝟔𝟔 𝟑𝟑𝟓𝟓𝟐𝟐 𝟓𝟓𝟏𝟏𝟒𝟒
Dominique does not type at a fast enough rate because she only types 𝟒𝟒𝟒𝟒 words per minute.
Closing (10 minutes)
Describe additional questions:
What are some examples of rates?
What are some examples of unit rates?
Exit Ticket (5 minutes)
Scaffolding:
Part (c) could be extended to ask students to figure out how many words Dominique needed to type in the 20 minutes to be able to qualify.
Lesson Summary
A rate is a quantity that describes a ratio relationship between two types of quantities.
For example, 𝟏𝟏𝟓𝟓 miles/hour is a rate that describes a ratio relationship between hours and miles: If an object is traveling at a constant 𝟏𝟏𝟓𝟓 miles/hour, then after 𝟏𝟏 hour it has gone 𝟏𝟏𝟓𝟓 miles, after 𝟐𝟐 hours it has gone 𝟑𝟑𝟏𝟏 miles, after 𝟑𝟑 hours it has gone 𝟒𝟒𝟓𝟓 miles, and so on.
When a rate is written as a measurement, the unit rate is the measure (i.e., the numerical part of the measurement). For example, when the rate of speed of an object is written as the measurement 𝟏𝟏𝟓𝟓 miles/hour, the number 𝟏𝟏𝟓𝟓 is the unit rate. The unit of measurement is miles/hour, which is read as “miles per hour.”
© 2015 Great Minds. eureka-math.orgG6-M1-TE-1.3.0-06.2015

NYS COMMON CORE MATHEMATICS CURRICULUM 6•1 Lesson 16
Lesson 16: From Ratios to Rates
137
This work is licensed under a Creative Commons Attribution-NonCommercial-ShareAlike 3.0 Unported License.
Name Date
Lesson 16: From Ratios to Rates
Exit Ticket Angela enjoys swimming and often swims at a steady pace to burn calories. At this pace, Angela can swim 1,700 meters in 40 minutes.
a. What is Angela’s unit rate?
b. What is the rate unit?
© 2015 Great Minds. eureka-math.orgG6-M1-TE-1.3.0-06.2015

NYS COMMON CORE MATHEMATICS CURRICULUM 6•1 Lesson 16
Lesson 16: From Ratios to Rates
138
This work is licensed under a Creative Commons Attribution-NonCommercial-ShareAlike 3.0 Unported License.
Exit Ticket Sample Solutions
Angela enjoys swimming and often swims at a steady pace to burn calories. At this pace, Angela can swim 𝟏𝟏,𝟓𝟓𝟏𝟏𝟏𝟏 meters in 𝟒𝟒𝟏𝟏 minutes.
a. What is Angela’s unit rate?
𝟒𝟒𝟐𝟐.𝟓𝟓
b. What is the rate unit?
Meters per minute
Problem Set Sample Solutions
The Scott family is trying to save as much money as possible. One way to cut back on the money they spend is by finding deals while grocery shopping; however, the Scott family needs help determining which stores have the better deals.
1. At Grocery Mart, strawberries cost $𝟐𝟐.𝟗𝟗𝟗𝟗 for 𝟐𝟐 𝐥𝐥𝐥𝐥., and at Baldwin Hills Market strawberries are $𝟑𝟑.𝟗𝟗𝟗𝟗 for 𝟑𝟑 𝐥𝐥𝐥𝐥.
a. What is the unit price of strawberries at each grocery store? If necessary, round to the nearest penny.
Grocery Mart: $𝟏𝟏.𝟓𝟓𝟏𝟏 per pound (𝟏𝟏.𝟒𝟒𝟗𝟗𝟓𝟓 rounded to the nearest penny)
Baldwin Hills Market: $𝟏𝟏.𝟑𝟑𝟑𝟑 per pound
b. If the Scott family wanted to save money, where should they go to buy strawberries? Why?
Possible Answer: The Scott family should go to Baldwin Hills Market because the strawberries cost less money there than at Grocery Mart.
2. Potatoes are on sale at both Grocery Mart and Baldwin Hills Market. At Grocery Mart, a 𝟓𝟓 𝐥𝐥𝐥𝐥. bag of potatoes cost $𝟐𝟐.𝟐𝟐𝟓𝟓, and at Baldwin Hills Market a 𝟓𝟓 𝐥𝐥𝐥𝐥. bag of potatoes costs $𝟒𝟒.𝟐𝟐𝟏𝟏. Which store offers the best deal on potatoes? How do you know? How much better is the deal?
Grocery Mart: $𝟏𝟏.𝟓𝟓𝟓𝟓 per pound
Baldwin Hills Market: $𝟏𝟏.𝟔𝟔𝟏𝟏 per pound
Grocery Mart offers the best deal on potatoes because potatoes cost $𝟏𝟏.𝟏𝟏𝟑𝟑 less per pound at Grocery Mart when compared to Baldwin Hills Market.
© 2015 Great Minds. eureka-math.orgG6-M1-TE-1.3.0-06.2015
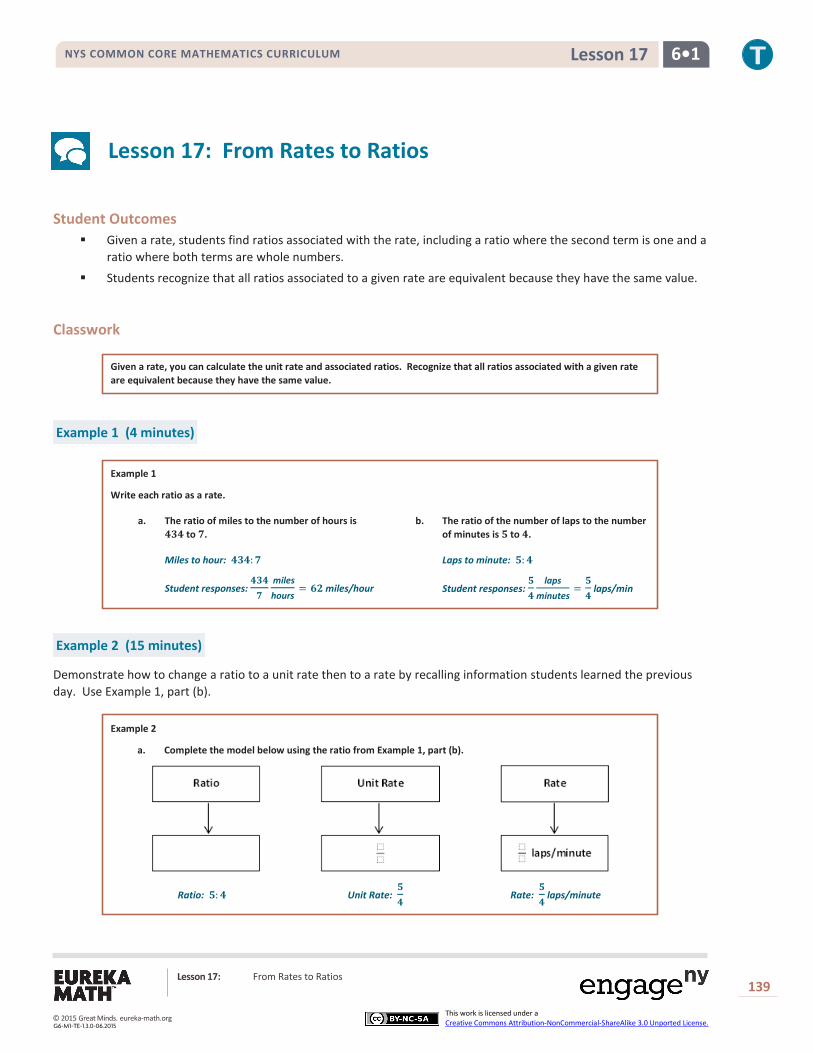
NYS COMMON CORE MATHEMATICS CURRICULUM 6•1 Lesson 17
Lesson 17: From Rates to Ratios
139
This work is licensed under a Creative Commons Attribution-NonCommercial-ShareAlike 3.0 Unported License.
Lesson 17: From Rates to Ratios
Student Outcomes
Given a rate, students find ratios associated with the rate, including a ratio where the second term is one and a ratio where both terms are whole numbers.
Students recognize that all ratios associated to a given rate are equivalent because they have the same value.
Classwork Given a rate, you can calculate the unit rate and associated ratios. Recognize that all ratios associated with a given rate are equivalent because they have the same value.
Example 1 (4 minutes)
Example 1
Write each ratio as a rate.
a. The ratio of miles to the number of hours is 𝟒𝟒𝟒𝟒𝟒𝟒 to 𝟕𝟕.
b. The ratio of the number of laps to the number of minutes is 𝟓𝟓 to 𝟒𝟒.
Miles to hour: 𝟒𝟒𝟒𝟒𝟒𝟒:𝟕𝟕
Student responses: 𝟒𝟒𝟒𝟒𝟒𝟒𝟕𝟕
mileshours
= 𝟔𝟔𝟔𝟔 miles/hour
Laps to minute: 𝟓𝟓:𝟒𝟒
Student responses: 𝟓𝟓𝟒𝟒
lapsminutes
=𝟓𝟓𝟒𝟒
laps/min
Example 2 (15 minutes)
Demonstrate how to change a ratio to a unit rate then to a rate by recalling information students learned the previous day. Use Example 1, part (b).
Example 2
a. Complete the model below using the ratio from Example 1, part (b).
Ratio: 𝟓𝟓:𝟒𝟒 Unit Rate: 𝟓𝟓𝟒𝟒
Rate: 𝟓𝟓𝟒𝟒
laps/minute
© 2015 Great Minds. eureka-math.orgG6-M1-TE-1.3.0-06.2015

NYS COMMON CORE MATHEMATICS CURRICULUM 6•1 Lesson 17
Lesson 17: From Rates to Ratios
140
This work is licensed under a Creative Commons Attribution-NonCommercial-ShareAlike 3.0 Unported License.
Rates to Ratios: Guide students to complete the next flow map where the rate is given. Students identify the unit rate and ratio.
b. Complete the model below now using the rate listed below.
Ratios: Answers may vary Unit Rate: 𝟔𝟔
𝟔𝟔:𝟏𝟏, 𝟔𝟔𝟔𝟔:𝟏𝟏𝟔𝟔, 𝟏𝟏𝟔𝟔:𝟔𝟔, etc.
Discussion
Will everyone have the same exact ratio to represent the given rate? Why or why not? Possible Answer: Not everyone’s ratios will be exactly the same because there are many different
equivalent ratios that could be used to represent the same rate.
What are some different examples that could be represented in the ratio box?
Answers will vary: All representations represent the same rate: 12: 2, 18: 3, 24: 4.
Will everyone have the same exact unit rate to represent the given rate? Why or why not?
Possible Answer: Everyone will have the same unit rate for two reasons. First, the unit rate is the value of the ratio, and each ratio only has one value. Second, the second quantity of the unit rate is always 1, so the rate will be the same for everyone.
Will everyone have the same exact rate when given a unit rate? Why or why not?
Possible Answer: No, a unit rate can represent more than one rate. A rate of 183
feet/second has a unit
rate of 6 feet/second.
Examples 3–6 (20 minutes)
Students work on one problem at a time. Have students share their reasoning. Provide opportunities for students to share different methods on how to solve each problem.
Examples 3–6
3. Dave can clean pools at a constant rate of 𝟒𝟒𝟓𝟓
pools/hour.
a. What is the ratio of the number of pools to the number of hours?
𝟒𝟒:𝟓𝟓
© 2015 Great Minds. eureka-math.orgG6-M1-TE-1.3.0-06.2015

NYS COMMON CORE MATHEMATICS CURRICULUM 6•1 Lesson 17
Lesson 17: From Rates to Ratios
141
This work is licensed under a Creative Commons Attribution-NonCommercial-ShareAlike 3.0 Unported License.
b. How many pools can Dave clean in 𝟏𝟏𝟔𝟔 hours?
Pools
= 𝟔𝟔 pools
Hours
= 𝟏𝟏𝟔𝟔 hours
Dave can clean 𝟔𝟔 pools in 𝟏𝟏𝟔𝟔 hours.
c. How long does it take Dave to clean 𝟏𝟏𝟓𝟓 pools?
Pools
= 𝟏𝟏𝟓𝟓 pools
Hours
= 𝟔𝟔𝟓𝟓 hours
It will take Dave 𝟔𝟔𝟓𝟓 hours to clean 𝟏𝟏𝟓𝟓 pools.
4. Emeline can type at a constant rate of 𝟏𝟏𝟒𝟒
pages/minute.
a. What is the ratio of the number of pages to the number of minutes?
𝟏𝟏:𝟒𝟒
b. Emeline has to type a 𝟓𝟓-page article but only has 𝟏𝟏𝟏𝟏 minutes until she reaches the deadline. Does Emeline have enough time to type the article? Why or why not?
Pages
Minutes
No, Emeline will not have enough time because it will take her 𝟔𝟔𝟔𝟔 minutes to type a 𝟓𝟓-page article.
c. Emeline has to type a 𝟕𝟕-page article. How much time will it take her?
Pages
Minutes
It will take Emeline 𝟔𝟔𝟏𝟏 minutes to type a 𝟕𝟕-page article.
5. Xavier can swim at a constant speed of 𝟓𝟓𝟒𝟒
meters/second.
a. What is the ratio of the number of meters to the number of seconds?
𝟓𝟓:𝟒𝟒
𝟔𝟔 𝟔𝟔 𝟔𝟔
𝟔𝟔 𝟔𝟔 𝟔𝟔 𝟔𝟔 𝟔𝟔
𝟓𝟓 𝟓𝟓 𝟓𝟓
𝟓𝟓 𝟓𝟓 𝟓𝟓 𝟓𝟓 𝟓𝟓
𝟓𝟓 𝟔𝟔 𝟕𝟕
𝟔𝟔𝟔𝟔 𝟔𝟔𝟒𝟒 𝟔𝟔𝟏𝟏
𝟏𝟏 𝟔𝟔 𝟒𝟒 𝟒𝟒 𝟓𝟓
𝟏𝟏𝟔𝟔 𝟔𝟔𝟔𝟔 𝟒𝟒 𝟏𝟏𝟔𝟔 𝟏𝟏
© 2015 Great Minds. eureka-math.orgG6-M1-TE-1.3.0-06.2015
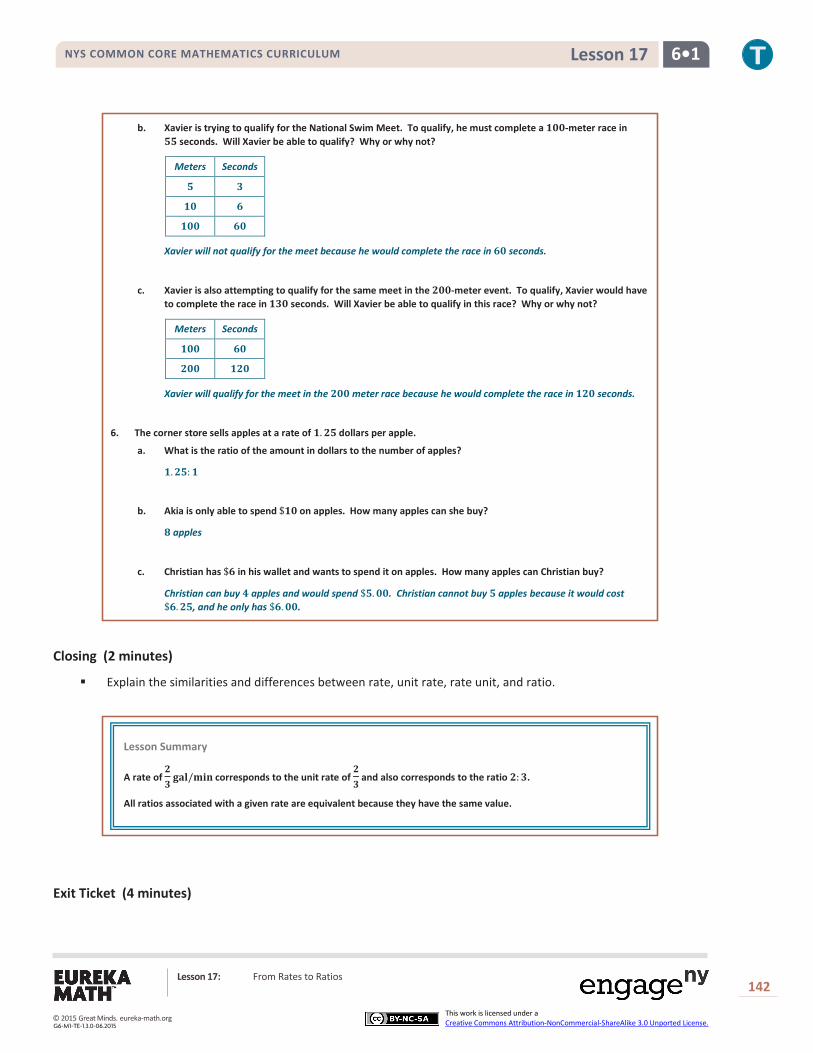
NYS COMMON CORE MATHEMATICS CURRICULUM 6•1 Lesson 17
Lesson 17: From Rates to Ratios
142
This work is licensed under a Creative Commons Attribution-NonCommercial-ShareAlike 3.0 Unported License.
b. Xavier is trying to qualify for the National Swim Meet. To qualify, he must complete a 𝟏𝟏𝟔𝟔𝟔𝟔-meter race in 𝟓𝟓𝟓𝟓 seconds. Will Xavier be able to qualify? Why or why not?
Meters Seconds
𝟓𝟓 𝟒𝟒
𝟏𝟏𝟔𝟔 𝟔𝟔
𝟏𝟏𝟔𝟔𝟔𝟔 𝟔𝟔𝟔𝟔
Xavier will not qualify for the meet because he would complete the race in 𝟔𝟔𝟔𝟔 seconds.
c. Xavier is also attempting to qualify for the same meet in the 𝟔𝟔𝟔𝟔𝟔𝟔-meter event. To qualify, Xavier would have to complete the race in 𝟏𝟏𝟒𝟒𝟔𝟔 seconds. Will Xavier be able to qualify in this race? Why or why not?
Meters Seconds
𝟏𝟏𝟔𝟔𝟔𝟔 𝟔𝟔𝟔𝟔
𝟔𝟔𝟔𝟔𝟔𝟔 𝟏𝟏𝟔𝟔𝟔𝟔
Xavier will qualify for the meet in the 𝟔𝟔𝟔𝟔𝟔𝟔 meter race because he would complete the race in 𝟏𝟏𝟔𝟔𝟔𝟔 seconds.
6. The corner store sells apples at a rate of 𝟏𝟏.𝟔𝟔𝟓𝟓 dollars per apple.
a. What is the ratio of the amount in dollars to the number of apples?
𝟏𝟏.𝟔𝟔𝟓𝟓:𝟏𝟏
b. Akia is only able to spend $𝟏𝟏𝟔𝟔 on apples. How many apples can she buy?
𝟏𝟏 apples
c. Christian has $𝟔𝟔 in his wallet and wants to spend it on apples. How many apples can Christian buy?
Christian can buy 𝟒𝟒 apples and would spend $𝟓𝟓.𝟔𝟔𝟔𝟔. Christian cannot buy 𝟓𝟓 apples because it would cost $𝟔𝟔.𝟔𝟔𝟓𝟓, and he only has $𝟔𝟔.𝟔𝟔𝟔𝟔.
Closing (2 minutes)
Explain the similarities and differences between rate, unit rate, rate unit, and ratio.
Exit Ticket (4 minutes)
Lesson Summary
A rate of 𝟔𝟔𝟒𝟒𝐠𝐠𝐠𝐠𝐠𝐠/𝐦𝐦𝐦𝐦𝐦𝐦 corresponds to the unit rate of
𝟔𝟔𝟒𝟒
and also corresponds to the ratio 𝟔𝟔:𝟒𝟒.
All ratios associated with a given rate are equivalent because they have the same value.
© 2015 Great Minds. eureka-math.orgG6-M1-TE-1.3.0-06.2015
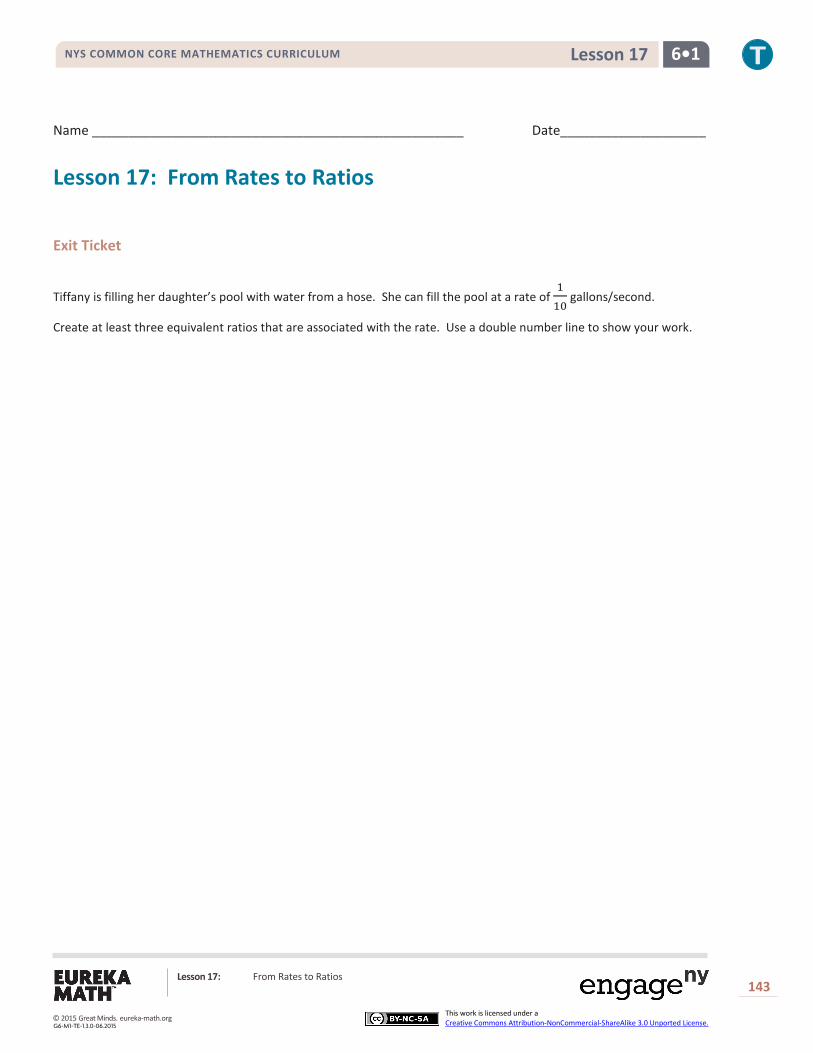
NYS COMMON CORE MATHEMATICS CURRICULUM 6•1 Lesson 17
Lesson 17: From Rates to Ratios
143
This work is licensed under a Creative Commons Attribution-NonCommercial-ShareAlike 3.0 Unported License.
Name ___________________________________________________ Date____________________
Lesson 17: From Rates to Ratios
Exit Ticket
Tiffany is filling her daughter’s pool with water from a hose. She can fill the pool at a rate of 110
gallons/second.
Create at least three equivalent ratios that are associated with the rate. Use a double number line to show your work.
© 2015 Great Minds. eureka-math.orgG6-M1-TE-1.3.0-06.2015
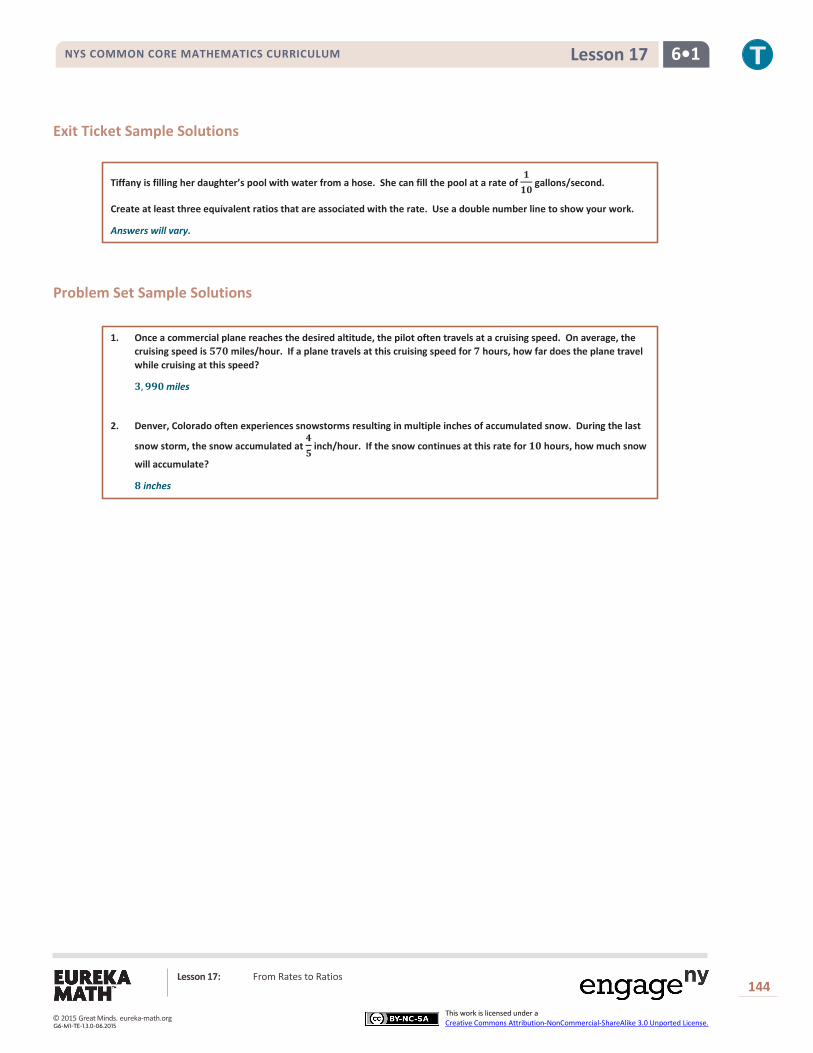
NYS COMMON CORE MATHEMATICS CURRICULUM 6•1 Lesson 17
Lesson 17: From Rates to Ratios
144
This work is licensed under a Creative Commons Attribution-NonCommercial-ShareAlike 3.0 Unported License.
Exit Ticket Sample Solutions
Tiffany is filling her daughter’s pool with water from a hose. She can fill the pool at a rate of 𝟏𝟏𝟏𝟏𝟔𝟔
gallons/second.
Create at least three equivalent ratios that are associated with the rate. Use a double number line to show your work.
Answers will vary.
Problem Set Sample Solutions
1. Once a commercial plane reaches the desired altitude, the pilot often travels at a cruising speed. On average, the cruising speed is 𝟓𝟓𝟕𝟕𝟔𝟔 miles/hour. If a plane travels at this cruising speed for 𝟕𝟕 hours, how far does the plane travel while cruising at this speed?
𝟒𝟒,𝟗𝟗𝟗𝟗𝟔𝟔 miles
2. Denver, Colorado often experiences snowstorms resulting in multiple inches of accumulated snow. During the last
snow storm, the snow accumulated at 𝟒𝟒𝟓𝟓
inch/hour. If the snow continues at this rate for 𝟏𝟏𝟔𝟔 hours, how much snow
will accumulate?
𝟏𝟏 inches
© 2015 Great Minds. eureka-math.orgG6-M1-TE-1.3.0-06.2015

NYS COMMON CORE MATHEMATICS CURRICULUM 6•1 Lesson 18
Lesson 18: Finding a Rate by Dividing Two Quantities
145
This work is licensed under a Creative Commons Attribution-NonCommercial-ShareAlike 3.0 Unported License.
Lesson 18: Finding a Rate by Dividing Two Quantities
Student Outcomes
While there is no physical way to divide two different quantities like (5 miles)/(2 hours), students make use of the structure of division and ratios to model (5 miles)/(2 hours) as a quantity 2.5 mph. Interpreting a rate as a division of two quantities, or better yet a fraction, is the first step toward converting measurement units using rates later in the module and dimensional analysis in high school. Students use this interpretation of a rate in
word problems when multiplying a rate by a quantity, as in �5 galmin� ∙ (10 min) = 5
1 gal
min ∙ 10 min = 50 gal.
Materials Stations—Set up six workstations around the classroom, identifying each with a number from 1 to 6.
Countdown timer
Classwork
Mathematical Modeling Exercises (12 minutes) Mathematical Modeling Exercises
1. At Fun Burger, the Burger Master can make hamburgers at a rate of 𝟒𝟒 burgers/minute. In order to address the heavy volume of customers, he needs to continue at this rate for 𝟑𝟑𝟑𝟑 minutes. If he continues to make hamburgers at this pace, how many hamburgers will the Burger Master make in 𝟑𝟑𝟑𝟑 minutes?
𝟒𝟒 burgers minute × 𝟑𝟑𝟑𝟑 minutes = 𝟏𝟏𝟏𝟏𝟑𝟑 burgers
If the Burger Master can make four burgers in one minute, he can make 𝟏𝟏𝟏𝟏𝟑𝟑 burgers in 𝟑𝟑𝟑𝟑 minutes.
Model how to solve the exercise as students take notes. Students can be part of the discussion on how to solve each problem, but the teacher should be modeling the process.
At what rate does the Burger Master make hamburgers?
How long does the Burger Master make hamburgers?
Multiply the rate by the amount of time the Burger Master works.
Answer the question asked in the problem.
2. Chandra is an editor at the New York Gazette. Her job is to read each article before it is printed in the newspaper. If Chandra can read 𝟏𝟏𝟑𝟑 words/second, how many words can she read in 𝟔𝟔𝟑𝟑 seconds?
𝟏𝟏𝟑𝟑 words second × 𝟔𝟔𝟑𝟑 seconds = 𝟔𝟔𝟑𝟑𝟑𝟑 words
If Chandra can read 𝟏𝟏𝟑𝟑 words in 𝟏𝟏 second, then she can read 𝟔𝟔𝟑𝟑𝟑𝟑 words in 𝟔𝟔𝟑𝟑 seconds.
© 2015 Great Minds. eureka-math.orgG6-M1-TE-1.3.0-06.2015
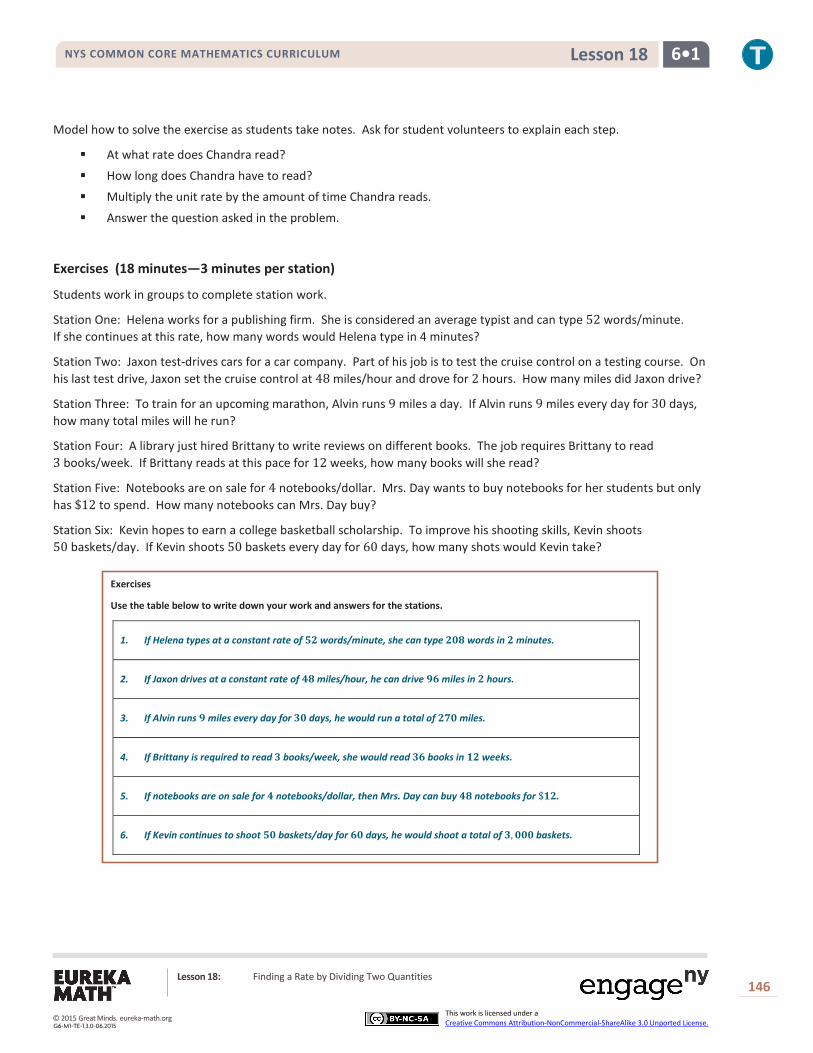
NYS COMMON CORE MATHEMATICS CURRICULUM 6•1 Lesson 18
Lesson 18: Finding a Rate by Dividing Two Quantities
146
This work is licensed under a Creative Commons Attribution-NonCommercial-ShareAlike 3.0 Unported License.
Model how to solve the exercise as students take notes. Ask for student volunteers to explain each step.
At what rate does Chandra read?
How long does Chandra have to read?
Multiply the unit rate by the amount of time Chandra reads.
Answer the question asked in the problem.
Exercises (18 minutes—3 minutes per station)
Students work in groups to complete station work.
Station One: Helena works for a publishing firm. She is considered an average typist and can type 52 words/minute. If she continues at this rate, how many words would Helena type in 4 minutes?
Station Two: Jaxon test-drives cars for a car company. Part of his job is to test the cruise control on a testing course. On his last test drive, Jaxon set the cruise control at 48 miles/hour and drove for 2 hours. How many miles did Jaxon drive?
Station Three: To train for an upcoming marathon, Alvin runs 9 miles a day. If Alvin runs 9 miles every day for 30 days, how many total miles will he run?
Station Four: A library just hired Brittany to write reviews on different books. The job requires Brittany to read 3 books/week. If Brittany reads at this pace for 12 weeks, how many books will she read?
Station Five: Notebooks are on sale for 4 notebooks/dollar. Mrs. Day wants to buy notebooks for her students but only has $12 to spend. How many notebooks can Mrs. Day buy?
Station Six: Kevin hopes to earn a college basketball scholarship. To improve his shooting skills, Kevin shoots 50 baskets/day. If Kevin shoots 50 baskets every day for 60 days, how many shots would Kevin take?
Exercises
Use the table below to write down your work and answers for the stations.
1. If Helena types at a constant rate of 𝟓𝟓𝟏𝟏 words/minute, she can type 𝟏𝟏𝟑𝟑𝟐𝟐 words in 𝟏𝟏 minutes.
2. If Jaxon drives at a constant rate of 𝟒𝟒𝟐𝟐 miles/hour, he can drive 𝟗𝟗𝟔𝟔 miles in 𝟏𝟏 hours.
3. If Alvin runs 𝟗𝟗 miles every day for 𝟑𝟑𝟑𝟑 days, he would run a total of 𝟏𝟏𝟐𝟐𝟑𝟑 miles.
4. If Brittany is required to read 𝟑𝟑 books/week, she would read 𝟑𝟑𝟔𝟔 books in 𝟏𝟏𝟏𝟏 weeks.
5. If notebooks are on sale for 𝟒𝟒 notebooks/dollar, then Mrs. Day can buy 𝟒𝟒𝟐𝟐 notebooks for $𝟏𝟏𝟏𝟏.
6. If Kevin continues to shoot 𝟓𝟓𝟑𝟑 baskets/day for 𝟔𝟔𝟑𝟑 days, he would shoot a total of 𝟑𝟑,𝟑𝟑𝟑𝟑𝟑𝟑 baskets.
© 2015 Great Minds. eureka-math.orgG6-M1-TE-1.3.0-06.2015
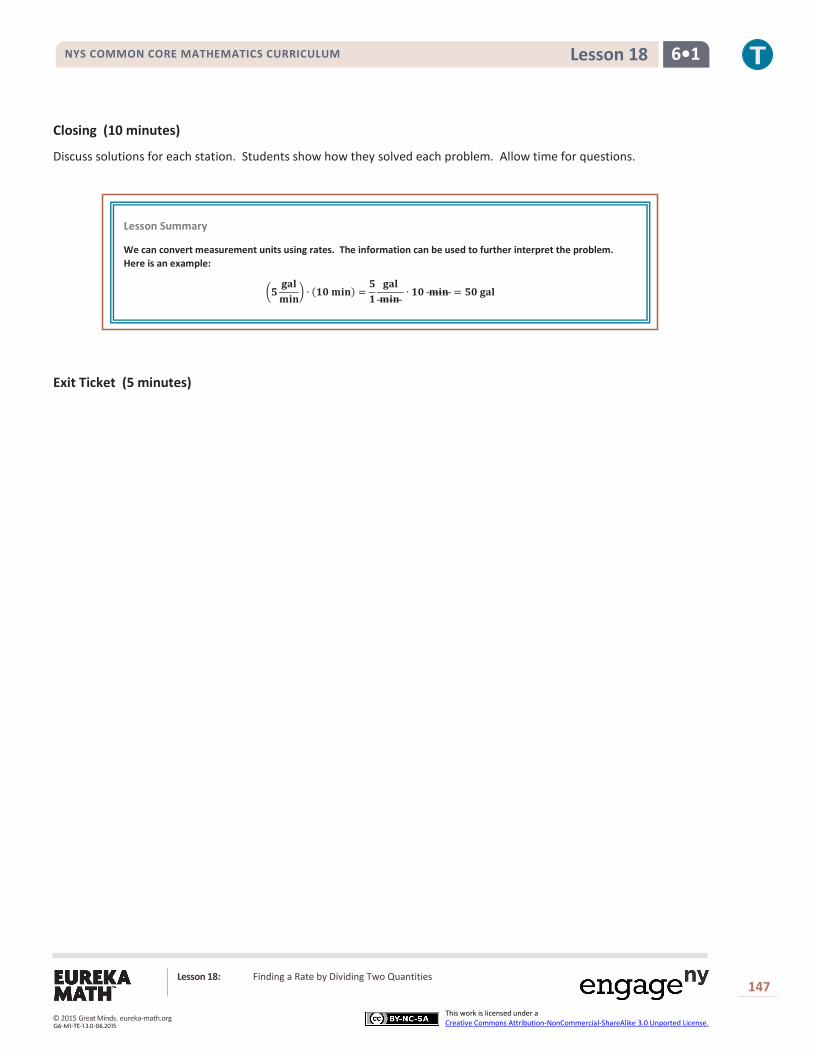
NYS COMMON CORE MATHEMATICS CURRICULUM 6•1 Lesson 18
Lesson 18: Finding a Rate by Dividing Two Quantities
147
This work is licensed under a Creative Commons Attribution-NonCommercial-ShareAlike 3.0 Unported License.
Closing (10 minutes)
Discuss solutions for each station. Students show how they solved each problem. Allow time for questions.
Exit Ticket (5 minutes)
Lesson Summary
We can convert measurement units using rates. The information can be used to further interpret the problem. Here is an example:
�𝟓𝟓𝐠𝐠𝐠𝐠𝐠𝐠𝐦𝐦𝐦𝐦𝐦𝐦
� ∙ (𝟏𝟏𝟑𝟑 𝐦𝐦𝐦𝐦𝐦𝐦) =𝟓𝟓𝟏𝟏
𝐠𝐠𝐠𝐠𝐠𝐠 𝐦𝐦𝐦𝐦𝐦𝐦
∙ 𝟏𝟏𝟑𝟑 𝐦𝐦𝐦𝐦𝐦𝐦 = 𝟓𝟓𝟑𝟑 𝐠𝐠𝐠𝐠𝐠𝐠
© 2015 Great Minds. eureka-math.orgG6-M1-TE-1.3.0-06.2015

NYS COMMON CORE MATHEMATICS CURRICULUM 6•1 Lesson 18
Lesson 18: Finding a Rate by Dividing Two Quantities
148
This work is licensed under a Creative Commons Attribution-NonCommercial-ShareAlike 3.0 Unported License.
Name ___________________________________________________ Date____________________
Lesson 18: Finding a Rate by Dividing Two Quantities
Exit Ticket Alejandra drove from Michigan to Colorado to visit her friend. The speed limit on the highway is 70 miles/hour. If Alejandra’s combined driving time for the trip was 14 hours, how many miles did Alejandra drive?
© 2015 Great Minds. eureka-math.orgG6-M1-TE-1.3.0-06.2015
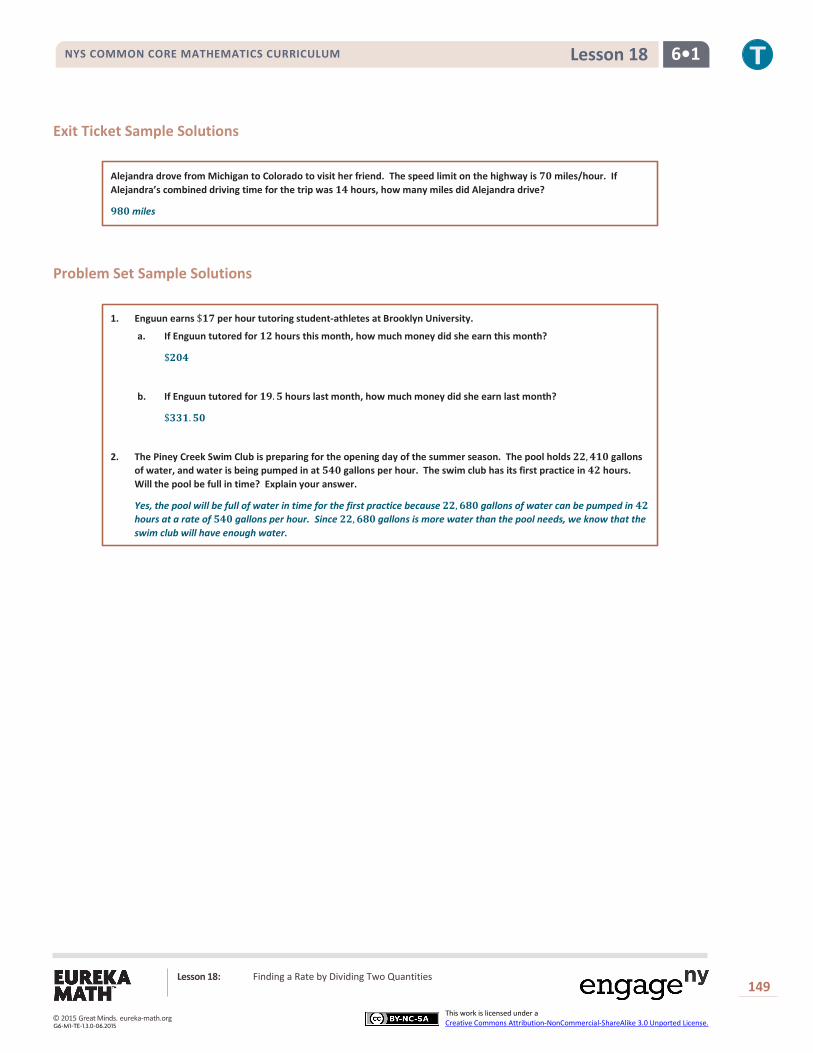
NYS COMMON CORE MATHEMATICS CURRICULUM 6•1 Lesson 18
Lesson 18: Finding a Rate by Dividing Two Quantities
149
This work is licensed under a Creative Commons Attribution-NonCommercial-ShareAlike 3.0 Unported License.
Exit Ticket Sample Solutions
Alejandra drove from Michigan to Colorado to visit her friend. The speed limit on the highway is 𝟐𝟐𝟑𝟑 miles/hour. If Alejandra’s combined driving time for the trip was 𝟏𝟏𝟒𝟒 hours, how many miles did Alejandra drive?
𝟗𝟗𝟐𝟐𝟑𝟑 miles
Problem Set Sample Solutions
1. Enguun earns $𝟏𝟏𝟐𝟐 per hour tutoring student-athletes at Brooklyn University.
a. If Enguun tutored for 𝟏𝟏𝟏𝟏 hours this month, how much money did she earn this month?
$𝟏𝟏𝟑𝟑𝟒𝟒
b. If Enguun tutored for 𝟏𝟏𝟗𝟗.𝟓𝟓 hours last month, how much money did she earn last month?
$𝟑𝟑𝟑𝟑𝟏𝟏.𝟓𝟓𝟑𝟑
2. The Piney Creek Swim Club is preparing for the opening day of the summer season. The pool holds 𝟏𝟏𝟏𝟏,𝟒𝟒𝟏𝟏𝟑𝟑 gallons of water, and water is being pumped in at 𝟓𝟓𝟒𝟒𝟑𝟑 gallons per hour. The swim club has its first practice in 𝟒𝟒𝟏𝟏 hours. Will the pool be full in time? Explain your answer.
Yes, the pool will be full of water in time for the first practice because 𝟏𝟏𝟏𝟏,𝟔𝟔𝟐𝟐𝟑𝟑 gallons of water can be pumped in 𝟒𝟒𝟏𝟏 hours at a rate of 𝟓𝟓𝟒𝟒𝟑𝟑 gallons per hour. Since 𝟏𝟏𝟏𝟏,𝟔𝟔𝟐𝟐𝟑𝟑 gallons is more water than the pool needs, we know that the swim club will have enough water.
© 2015 Great Minds. eureka-math.orgG6-M1-TE-1.3.0-06.2015

NYS COMMON CORE MATHEMATICS CURRICULUM 6•1 Lesson 19
Lesson 19: Comparison Shopping—Unit Price and Related
Measurement Conversions
Student Outcomes
Students solve problems by analyzing different unit rates given in tables, equations, and graphs.
Materials Matching activity cut and prepared for groups
Classwork Analyze tables, graphs, and equations in order to compare rates.
Examples 1–2 (10 minutes): Creating Tables from Equations
Let’s fill in the labels for each table as shown in the completed table below. If we have 1 cup of blue paint, how many cups of red paint would we have? (Model where these values go on
the table.)
If we have 2 cups of blue paint, how many cups of red paint would we have? (Model where these values go on the table.)
Examples 1–2: Creating Tables from Equations
1. The ratio of cups of blue paint to cups of red paint is 𝟏𝟏:𝟐𝟐, which means for every cup of blue paint, there are two cups of red paint. In this case, the equation would be red = 𝟐𝟐 × blue, or 𝒓𝒓 = 𝟐𝟐𝟐𝟐, where 𝟐𝟐 represents the amount of blue paint and 𝒓𝒓 represents the amount of red paint. Make a table of values.
Cups of Blue Paint 𝟏𝟏 𝟐𝟐 𝟑𝟑 𝟒𝟒
Cups of Red Paint 𝟐𝟐 𝟒𝟒 𝟔𝟔 𝟖𝟖
Follow this line of questioning for a few more values.
Examine the table, and identify the unit rate. 2
Where do you see this value in the equation?
The unit rate is represented in the equation as the value by which the cups of blue paint are being multiplied.
Lesson 19: Comparison Shopping—Unit Price and Related Measurement Conversions
150
This work is licensed under a Creative Commons Attribution-NonCommercial-ShareAlike 3.0 Unported License. © 2015 Great Minds. eureka-math.org
G6-M1-TE-1.3.0-06.2015

NYS COMMON CORE MATHEMATICS CURRICULUM 6•1 Lesson 19
2. Ms. Siple is a librarian who really enjoys reading. She can read 𝟑𝟑𝟒𝟒
of a book in one day. This relationship can be
represented by the equation days = 𝟑𝟑𝟒𝟒 books, which can be written as 𝒅𝒅 = 𝟑𝟑
𝟒𝟒𝟐𝟐, where 𝟐𝟐 is the number of books and 𝒅𝒅 is the number of days.
Number of Books 𝟏𝟏 𝟐𝟐 𝟑𝟑 𝟒𝟒
Number of Days 𝟑𝟑𝟒𝟒
𝟔𝟔𝟒𝟒
or 𝟏𝟏𝟏𝟏𝟐𝟐 𝟗𝟗𝟒𝟒
or 𝟐𝟐𝟏𝟏𝟒𝟒 𝟏𝟏𝟐𝟐𝟒𝟒
or 𝟑𝟑
Encourage students to fill in the table on their own. If students need more assistance, teachers can ask leading questions similar to those above.
Have students recognize the unit rate in the table and the equation, so they can later identify the unit rate in equations without creating a table.
Example 3 (13 minutes): Matching
Match an equation, table, and graph that represent the same unit rate. Students work individually or in pairs.
Cut apart the data representations at the end of the lesson and supply each student-pair with a set.
Exercises (12 minutes)
Students work on problems individually. Encourage students to explain their thinking.
Exercises
1. Bryan and ShaNiece are both training for a bike race and want to compare who rides his or her bike at a faster rate. Both bikers use apps on their phones to record the time and distance of their bike rides. Bryan’s app keeps track of his route on a table, and ShaNiece’s app presents the information on a graph. The information is shown below.
Bryan: ShaNiece:
Number of Hours 𝟎𝟎 𝟑𝟑 𝟔𝟔
Number of Miles 𝟎𝟎 𝟕𝟕𝟕𝟕 𝟏𝟏𝟕𝟕𝟎𝟎
MP.2
Lesson 19: Comparison Shopping—Unit Price and Related Measurement Conversions
151
This work is licensed under a Creative Commons Attribution-NonCommercial-ShareAlike 3.0 Unported License. © 2015 Great Minds. eureka-math.org
G6-M1-TE-1.3.0-06.2015
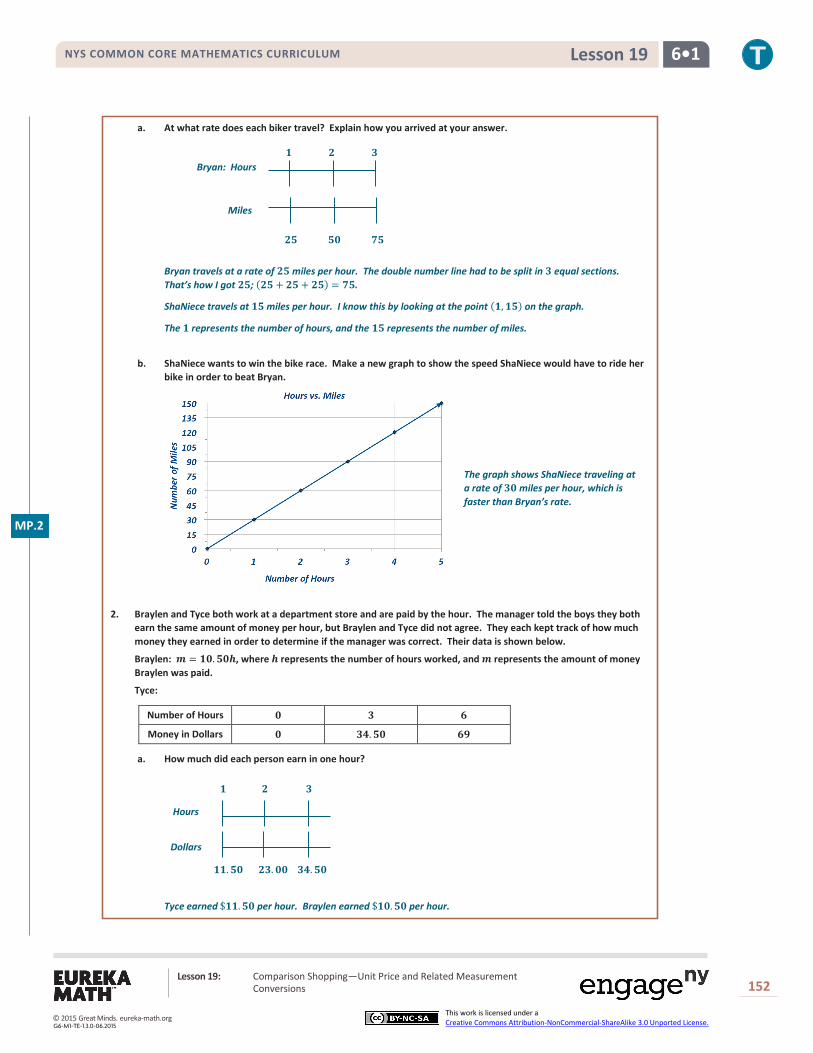
NYS COMMON CORE MATHEMATICS CURRICULUM 6•1 Lesson 19
a. At what rate does each biker travel? Explain how you arrived at your answer.
Bryan: Hours
Miles
Bryan travels at a rate of 𝟐𝟐𝟕𝟕 miles per hour. The double number line had to be split in 𝟑𝟑 equal sections. That’s how I got 𝟐𝟐𝟕𝟕; (𝟐𝟐𝟕𝟕 + 𝟐𝟐𝟕𝟕 + 𝟐𝟐𝟕𝟕) = 𝟕𝟕𝟕𝟕.
ShaNiece travels at 𝟏𝟏𝟕𝟕 miles per hour. I know this by looking at the point (𝟏𝟏,𝟏𝟏𝟕𝟕) on the graph.
The 𝟏𝟏 represents the number of hours, and the 𝟏𝟏𝟕𝟕 represents the number of miles.
b. ShaNiece wants to win the bike race. Make a new graph to show the speed ShaNiece would have to ride her bike in order to beat Bryan.
The graph shows ShaNiece traveling at a rate of 𝟑𝟑𝟎𝟎 miles per hour, which is faster than Bryan’s rate.
2. Braylen and Tyce both work at a department store and are paid by the hour. The manager told the boys they both earn the same amount of money per hour, but Braylen and Tyce did not agree. They each kept track of how much money they earned in order to determine if the manager was correct. Their data is shown below.
Braylen: 𝒎𝒎 = 𝟏𝟏𝟎𝟎.𝟕𝟕𝟎𝟎𝟓𝟓, where 𝟓𝟓 represents the number of hours worked, and 𝒎𝒎 represents the amount of money Braylen was paid.
Tyce:
Number of Hours 𝟎𝟎 𝟑𝟑 𝟔𝟔
Money in Dollars 𝟎𝟎 𝟑𝟑𝟒𝟒.𝟕𝟕𝟎𝟎 𝟔𝟔𝟗𝟗
a. How much did each person earn in one hour?
Hours
Dollars
Tyce earned $𝟏𝟏𝟏𝟏.𝟕𝟕𝟎𝟎 per hour. Braylen earned $𝟏𝟏𝟎𝟎.𝟕𝟕𝟎𝟎 per hour.
𝟏𝟏 𝟐𝟐 𝟑𝟑
𝟐𝟐𝟕𝟕 𝟕𝟕𝟎𝟎 𝟕𝟕𝟕𝟕
𝟏𝟏 𝟐𝟐 𝟑𝟑
𝟏𝟏𝟏𝟏.𝟕𝟕𝟎𝟎 𝟐𝟐𝟑𝟑.𝟎𝟎𝟎𝟎 𝟑𝟑𝟒𝟒.𝟕𝟕𝟎𝟎
MP.2
Lesson 19: Comparison Shopping—Unit Price and Related Measurement Conversions
152
This work is licensed under a Creative Commons Attribution-NonCommercial-ShareAlike 3.0 Unported License. © 2015 Great Minds. eureka-math.org
G6-M1-TE-1.3.0-06.2015
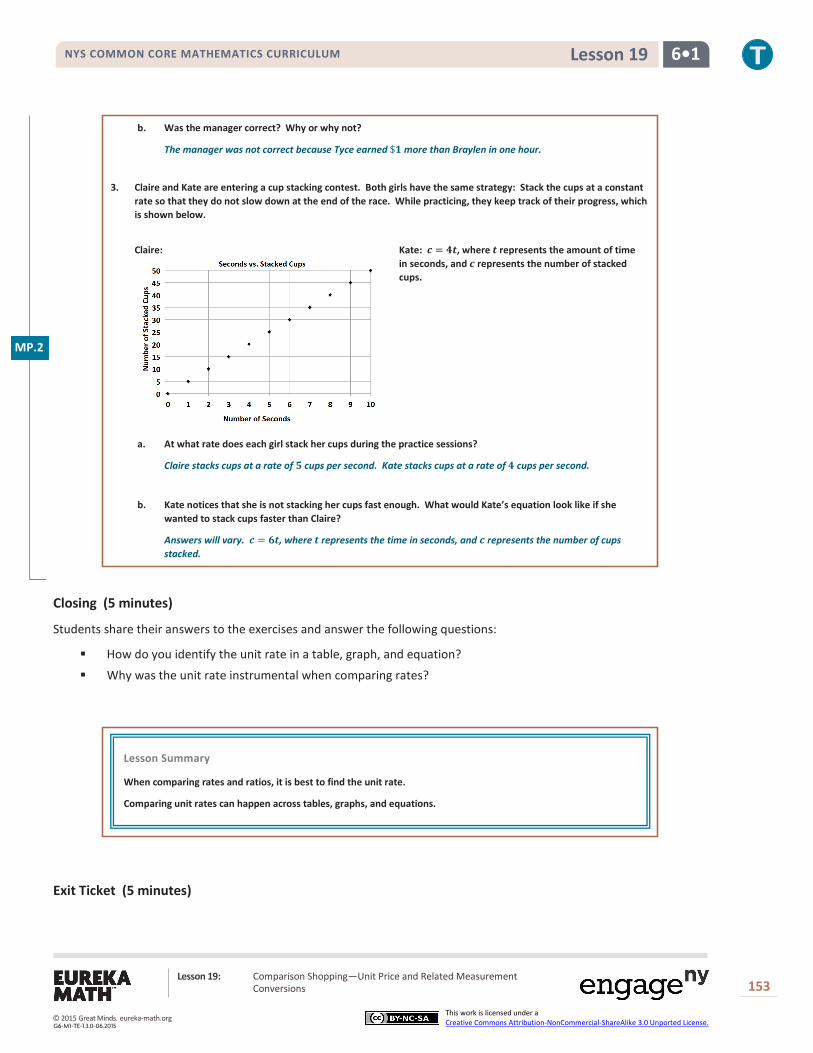
NYS COMMON CORE MATHEMATICS CURRICULUM 6•1 Lesson 19
b. Was the manager correct? Why or why not?
The manager was not correct because Tyce earned $𝟏𝟏 more than Braylen in one hour.
3. Claire and Kate are entering a cup stacking contest. Both girls have the same strategy: Stack the cups at a constant rate so that they do not slow down at the end of the race. While practicing, they keep track of their progress, which is shown below.
Claire: Kate: 𝒄𝒄 = 𝟒𝟒𝟒𝟒, where 𝟒𝟒 represents the amount of time in seconds, and 𝒄𝒄 represents the number of stacked cups.
a. At what rate does each girl stack her cups during the practice sessions?
Claire stacks cups at a rate of 𝟕𝟕 cups per second. Kate stacks cups at a rate of 𝟒𝟒 cups per second.
b. Kate notices that she is not stacking her cups fast enough. What would Kate’s equation look like if she wanted to stack cups faster than Claire?
Answers will vary. 𝒄𝒄 = 𝟔𝟔𝟒𝟒, where 𝟒𝟒 represents the time in seconds, and 𝒄𝒄 represents the number of cups stacked.
Closing (5 minutes)
Students share their answers to the exercises and answer the following questions:
How do you identify the unit rate in a table, graph, and equation?
Why was the unit rate instrumental when comparing rates?
Exit Ticket (5 minutes)
Lesson Summary
When comparing rates and ratios, it is best to find the unit rate.
Comparing unit rates can happen across tables, graphs, and equations.
MP.2
Lesson 19: Comparison Shopping—Unit Price and Related Measurement Conversions
153
This work is licensed under a Creative Commons Attribution-NonCommercial-ShareAlike 3.0 Unported License. © 2015 Great Minds. eureka-math.org
G6-M1-TE-1.3.0-06.2015

NYS COMMON CORE MATHEMATICS CURRICULUM 6•1 Lesson 19
Name ___________________________________________________ Date____________________
Lesson 19: Comparison Shopping—Unit Price and Related
Measurement Conversions
Exit Ticket Kiara, Giovanni, and Ebony are triplets and always argue over who can answer basic math facts the fastest. After completing a few different math fact activities, Kiara, Giovanni, and Ebony record their data, which is shown below.
Kiara: 𝑚𝑚 = 5𝑡𝑡, where 𝑡𝑡 represents the time in seconds, and 𝑚𝑚 represents the number of math facts completed.
Ebony:
Giovanni:
Seconds 5 10 15 Math Facts 20 40 60
1. What is the math fact completion rate for each student?
2. Who would win the argument? How do you know?
Lesson 19: Comparison Shopping—Unit Price and Related Measurement Conversions
154
This work is licensed under a Creative Commons Attribution-NonCommercial-ShareAlike 3.0 Unported License. © 2015 Great Minds. eureka-math.org
G6-M1-TE-1.3.0-06.2015
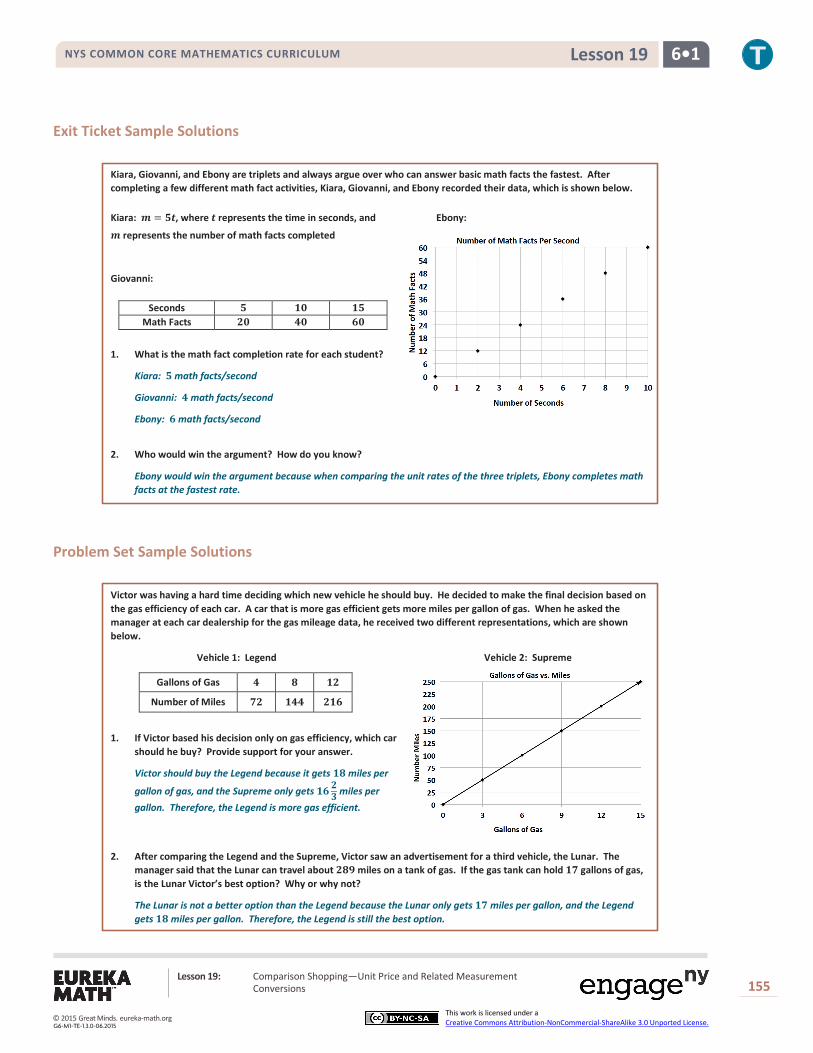
NYS COMMON CORE MATHEMATICS CURRICULUM 6•1 Lesson 19
Exit Ticket Sample Solutions
Kiara, Giovanni, and Ebony are triplets and always argue over who can answer basic math facts the fastest. After completing a few different math fact activities, Kiara, Giovanni, and Ebony recorded their data, which is shown below.
Kiara: 𝒎𝒎 = 𝟕𝟕𝟒𝟒, where 𝟒𝟒 represents the time in seconds, and Ebony:
𝒎𝒎 represents the number of math facts completed
Giovanni:
1. What is the math fact completion rate for each student?
Kiara: 𝟕𝟕 math facts/second
Giovanni: 𝟒𝟒 math facts/second
Ebony: 𝟔𝟔 math facts/second
2. Who would win the argument? How do you know?
Ebony would win the argument because when comparing the unit rates of the three triplets, Ebony completes math facts at the fastest rate.
Problem Set Sample Solutions
Victor was having a hard time deciding which new vehicle he should buy. He decided to make the final decision based on the gas efficiency of each car. A car that is more gas efficient gets more miles per gallon of gas. When he asked the manager at each car dealership for the gas mileage data, he received two different representations, which are shown below.
Vehicle 1: Legend Vehicle 2: Supreme
Gallons of Gas 𝟒𝟒 𝟖𝟖 𝟏𝟏𝟐𝟐
Number of Miles 𝟕𝟕𝟐𝟐 𝟏𝟏𝟒𝟒𝟒𝟒 𝟐𝟐𝟏𝟏𝟔𝟔
1. If Victor based his decision only on gas efficiency, which car should he buy? Provide support for your answer.
Victor should buy the Legend because it gets 𝟏𝟏𝟖𝟖 miles per
gallon of gas, and the Supreme only gets 𝟏𝟏𝟔𝟔𝟐𝟐𝟑𝟑 miles per gallon. Therefore, the Legend is more gas efficient.
2. After comparing the Legend and the Supreme, Victor saw an advertisement for a third vehicle, the Lunar. The manager said that the Lunar can travel about 𝟐𝟐𝟖𝟖𝟗𝟗 miles on a tank of gas. If the gas tank can hold 𝟏𝟏𝟕𝟕 gallons of gas, is the Lunar Victor’s best option? Why or why not?
The Lunar is not a better option than the Legend because the Lunar only gets 𝟏𝟏𝟕𝟕 miles per gallon, and the Legend gets 𝟏𝟏𝟖𝟖 miles per gallon. Therefore, the Legend is still the best option.
Seconds 𝟕𝟕 𝟏𝟏𝟎𝟎 𝟏𝟏𝟕𝟕 Math Facts 𝟐𝟐𝟎𝟎 𝟒𝟒𝟎𝟎 𝟔𝟔𝟎𝟎
Lesson 19: Comparison Shopping—Unit Price and Related Measurement Conversions
155
This work is licensed under a Creative Commons Attribution-NonCommercial-ShareAlike 3.0 Unported License. © 2015 Great Minds. eureka-math.org
G6-M1-TE-1.3.0-06.2015

NYS COMMON CORE MATHEMATICS CURRICULUM 6•1 Lesson 19
Example 3 Template
Lesson 19: Comparison Shopping—Unit Price and Related Measurement Conversions
156
This work is licensed under a Creative Commons Attribution-NonCommercial-ShareAlike 3.0 Unported License. © 2015 Great Minds. eureka-math.org
G6-M1-TE-1.3.0-06.2015

NYS COMMON CORE MATHEMATICS CURRICULUM 6•1 Lesson 19
𝑚𝑚 = 65ℎ 𝑚𝑚 = 45ℎ 𝑚𝑚 = 55ℎ
𝑚𝑚 = 70ℎ 𝑚𝑚 = 50ℎ 𝑚𝑚 = 60ℎ
ℎ 0 2 4 6 𝑚𝑚 0 130 260 390
ℎ 0 3 6 9 𝑚𝑚 0 135 270 405
ℎ 0 5 10 15 𝑚𝑚 0 275 550 825
ℎ 0 1 2 3 𝑚𝑚 0 60 120 180
ℎ 0 8 16 24 𝑚𝑚 0 400 800 1200
ℎ 0 6 12 18 𝑚𝑚 0 420 840 1260
Lesson 19: Comparison Shopping—Unit Price and Related Measurement Conversions
157
This work is licensed under a Creative Commons Attribution-NonCommercial-ShareAlike 3.0 Unported License. © 2015 Great Minds. eureka-math.org
G6-M1-TE-1.3.0-06.2015
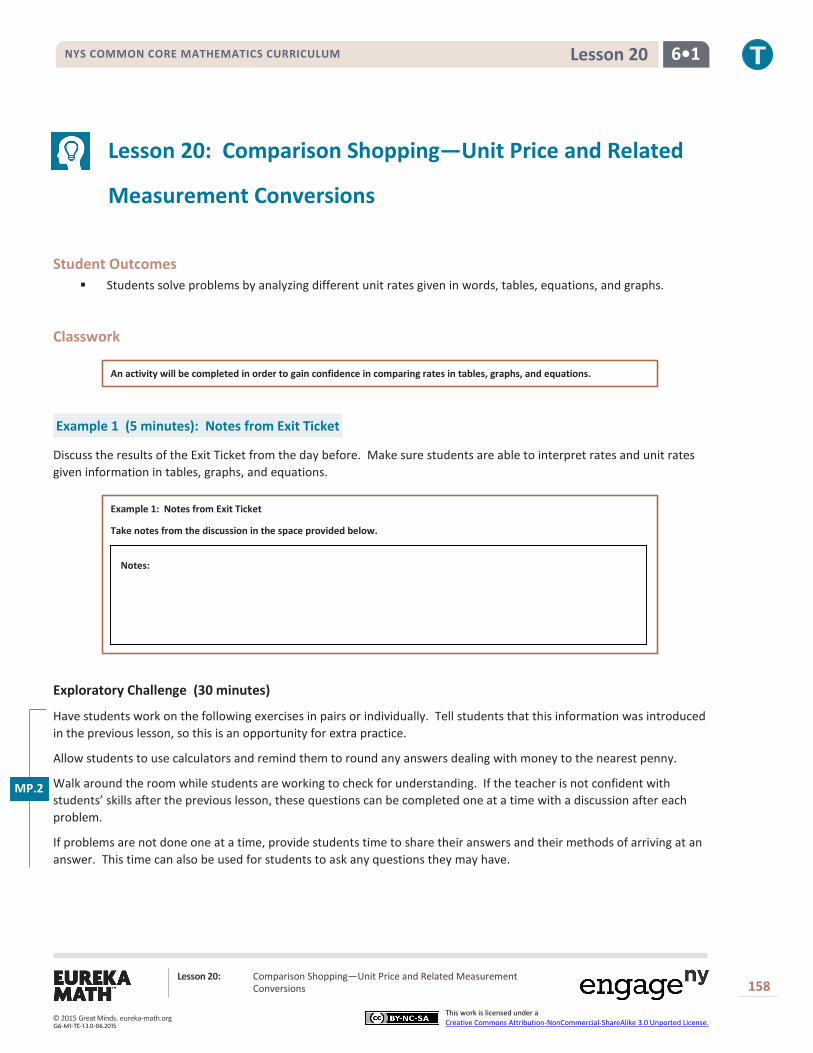
NYS COMMON CORE MATHEMATICS CURRICULUM 6•1 Lesson 20
Lesson 20: Comparison Shopping—Unit Price and Related
Measurement Conversions
Student Outcomes
Students solve problems by analyzing different unit rates given in words, tables, equations, and graphs.
Classwork An activity will be completed in order to gain confidence in comparing rates in tables, graphs, and equations.
Example 1 (5 minutes): Notes from Exit Ticket
Discuss the results of the Exit Ticket from the day before. Make sure students are able to interpret rates and unit rates given information in tables, graphs, and equations.
Example 1: Notes from Exit Ticket
Take notes from the discussion in the space provided below.
Exploratory Challenge (30 minutes)
Have students work on the following exercises in pairs or individually. Tell students that this information was introduced in the previous lesson, so this is an opportunity for extra practice.
Allow students to use calculators and remind them to round any answers dealing with money to the nearest penny.
Walk around the room while students are working to check for understanding. If the teacher is not confident with students’ skills after the previous lesson, these questions can be completed one at a time with a discussion after each problem.
If problems are not done one at a time, provide students time to share their answers and their methods of arriving at an answer. This time can also be used for students to ask any questions they may have.
Notes:
MP.2
Lesson 20: Comparison Shopping—Unit Price and Related Measurement Conversions
158
This work is licensed under a Creative Commons Attribution-NonCommercial-ShareAlike 3.0 Unported License. © 2015 Great Minds. eureka-math.org
G6-M1-TE-1.3.0-06.2015
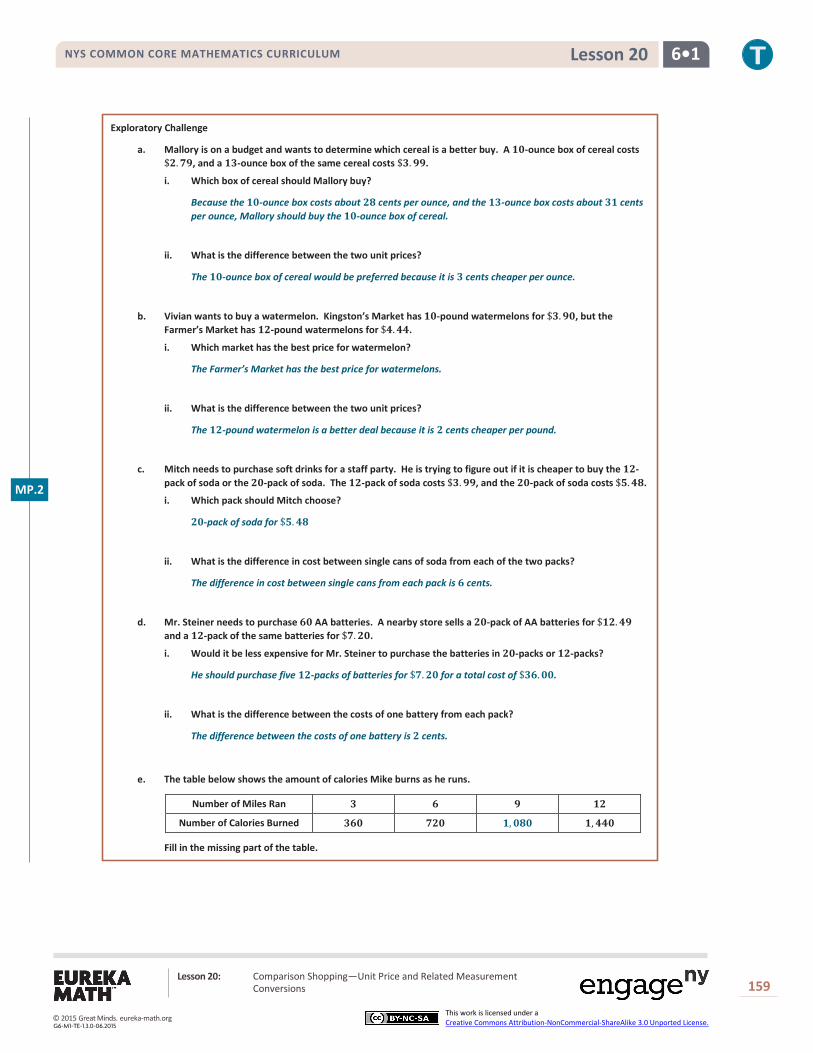
NYS COMMON CORE MATHEMATICS CURRICULUM 6•1 Lesson 20
Exploratory Challenge
a. Mallory is on a budget and wants to determine which cereal is a better buy. A 𝟏𝟏𝟏𝟏-ounce box of cereal costs $𝟐𝟐.𝟕𝟕𝟕𝟕, and a 𝟏𝟏𝟏𝟏-ounce box of the same cereal costs $𝟏𝟏.𝟕𝟕𝟕𝟕.
i. Which box of cereal should Mallory buy?
Because the 𝟏𝟏𝟏𝟏-ounce box costs about 𝟐𝟐𝟐𝟐 cents per ounce, and the 𝟏𝟏𝟏𝟏-ounce box costs about 𝟏𝟏𝟏𝟏 cents per ounce, Mallory should buy the 𝟏𝟏𝟏𝟏-ounce box of cereal.
ii. What is the difference between the two unit prices?
The 𝟏𝟏𝟏𝟏-ounce box of cereal would be preferred because it is 𝟏𝟏 cents cheaper per ounce.
b. Vivian wants to buy a watermelon. Kingston’s Market has 𝟏𝟏𝟏𝟏-pound watermelons for $𝟏𝟏.𝟕𝟕𝟏𝟏, but the Farmer’s Market has 𝟏𝟏𝟐𝟐-pound watermelons for $𝟒𝟒.𝟒𝟒𝟒𝟒.
i. Which market has the best price for watermelon?
The Farmer’s Market has the best price for watermelons.
ii. What is the difference between the two unit prices?
The 𝟏𝟏𝟐𝟐-pound watermelon is a better deal because it is 𝟐𝟐 cents cheaper per pound.
c. Mitch needs to purchase soft drinks for a staff party. He is trying to figure out if it is cheaper to buy the 𝟏𝟏𝟐𝟐-pack of soda or the 𝟐𝟐𝟏𝟏-pack of soda. The 𝟏𝟏𝟐𝟐-pack of soda costs $𝟏𝟏.𝟕𝟕𝟕𝟕, and the 𝟐𝟐𝟏𝟏-pack of soda costs $𝟓𝟓.𝟒𝟒𝟐𝟐.
i. Which pack should Mitch choose?
𝟐𝟐𝟏𝟏-pack of soda for $𝟓𝟓.𝟒𝟒𝟐𝟐
ii. What is the difference in cost between single cans of soda from each of the two packs?
The difference in cost between single cans from each pack is 𝟔𝟔 cents.
d. Mr. Steiner needs to purchase 𝟔𝟔𝟏𝟏 AA batteries. A nearby store sells a 𝟐𝟐𝟏𝟏-pack of AA batteries for $𝟏𝟏𝟐𝟐.𝟒𝟒𝟕𝟕 and a 𝟏𝟏𝟐𝟐-pack of the same batteries for $𝟕𝟕.𝟐𝟐𝟏𝟏.
i. Would it be less expensive for Mr. Steiner to purchase the batteries in 𝟐𝟐𝟏𝟏-packs or 𝟏𝟏𝟐𝟐-packs?
He should purchase five 𝟏𝟏𝟐𝟐-packs of batteries for $𝟕𝟕.𝟐𝟐𝟏𝟏 for a total cost of $𝟏𝟏𝟔𝟔.𝟏𝟏𝟏𝟏.
ii. What is the difference between the costs of one battery from each pack?
The difference between the costs of one battery is 𝟐𝟐 cents.
e. The table below shows the amount of calories Mike burns as he runs.
Number of Miles Ran 𝟏𝟏 𝟔𝟔 𝟕𝟕 𝟏𝟏𝟐𝟐
Number of Calories Burned 𝟏𝟏𝟔𝟔𝟏𝟏 𝟕𝟕𝟐𝟐𝟏𝟏 𝟏𝟏,𝟏𝟏𝟐𝟐𝟏𝟏 𝟏𝟏,𝟒𝟒𝟒𝟒𝟏𝟏
Fill in the missing part of the table.
MP.2
Lesson 20: Comparison Shopping—Unit Price and Related Measurement Conversions
159
This work is licensed under a Creative Commons Attribution-NonCommercial-ShareAlike 3.0 Unported License. © 2015 Great Minds. eureka-math.org
G6-M1-TE-1.3.0-06.2015
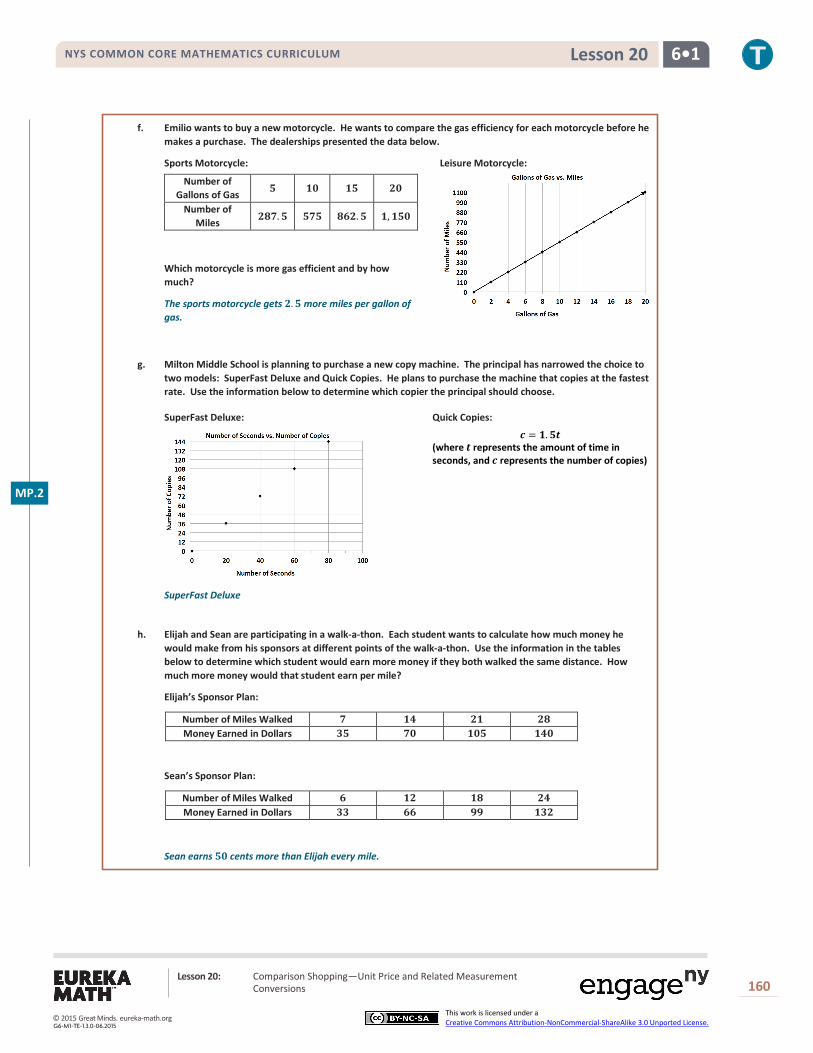
NYS COMMON CORE MATHEMATICS CURRICULUM 6•1 Lesson 20
f. Emilio wants to buy a new motorcycle. He wants to compare the gas efficiency for each motorcycle before he makes a purchase. The dealerships presented the data below.
Sports Motorcycle: Leisure Motorcycle:
Number of Gallons of Gas 𝟓𝟓 𝟏𝟏𝟏𝟏 𝟏𝟏𝟓𝟓 𝟐𝟐𝟏𝟏
Number of Miles 𝟐𝟐𝟐𝟐𝟕𝟕.𝟓𝟓 𝟓𝟓𝟕𝟕𝟓𝟓 𝟐𝟐𝟔𝟔𝟐𝟐.𝟓𝟓 𝟏𝟏,𝟏𝟏𝟓𝟓𝟏𝟏
Which motorcycle is more gas efficient and by how much?
The sports motorcycle gets 𝟐𝟐.𝟓𝟓 more miles per gallon of gas.
g. Milton Middle School is planning to purchase a new copy machine. The principal has narrowed the choice to two models: SuperFast Deluxe and Quick Copies. He plans to purchase the machine that copies at the fastest rate. Use the information below to determine which copier the principal should choose.
SuperFast Deluxe: Quick Copies:
𝒄𝒄 = 𝟏𝟏.𝟓𝟓𝟓𝟓 (where 𝟓𝟓 represents the amount of time in seconds, and 𝒄𝒄 represents the number of copies)
SuperFast Deluxe
h. Elijah and Sean are participating in a walk-a-thon. Each student wants to calculate how much money he would make from his sponsors at different points of the walk-a-thon. Use the information in the tables below to determine which student would earn more money if they both walked the same distance. How much more money would that student earn per mile?
Elijah’s Sponsor Plan:
Number of Miles Walked 𝟕𝟕 𝟏𝟏𝟒𝟒 𝟐𝟐𝟏𝟏 𝟐𝟐𝟐𝟐 Money Earned in Dollars 𝟏𝟏𝟓𝟓 𝟕𝟕𝟏𝟏 𝟏𝟏𝟏𝟏𝟓𝟓 𝟏𝟏𝟒𝟒𝟏𝟏
Sean’s Sponsor Plan:
Number of Miles Walked 𝟔𝟔 𝟏𝟏𝟐𝟐 𝟏𝟏𝟐𝟐 𝟐𝟐𝟒𝟒 Money Earned in Dollars 𝟏𝟏𝟏𝟏 𝟔𝟔𝟔𝟔 𝟕𝟕𝟕𝟕 𝟏𝟏𝟏𝟏𝟐𝟐
Sean earns 𝟓𝟓𝟏𝟏 cents more than Elijah every mile.
MP.2
Lesson 20: Comparison Shopping—Unit Price and Related Measurement Conversions
160
This work is licensed under a Creative Commons Attribution-NonCommercial-ShareAlike 3.0 Unported License. © 2015 Great Minds. eureka-math.org
G6-M1-TE-1.3.0-06.2015

NYS COMMON CORE MATHEMATICS CURRICULUM 6•1 Lesson 20
i. Gerson is going to buy a new computer to use for his new job and also to download movies. He has to decide between two different computers. How many more kilobytes does the faster computer download in one second?
Choice 1: The rate of download is represented by the following equation: 𝒌𝒌 = 𝟏𝟏𝟓𝟓𝟏𝟏𝟓𝟓, where 𝟓𝟓 represents the amount of time in seconds, and 𝒌𝒌 represents the number of kilobytes.
Choice 2: The rate of download is represented by the following equation: 𝒌𝒌 = 𝟏𝟏𝟓𝟓𝟏𝟏𝟓𝟓, where 𝟓𝟓 represents the amount of time in seconds, and 𝒌𝒌 represents the number of kilobytes.
Choice 1 downloads 𝟏𝟏 more kilobytes per second than Choice 2.
j. Zyearaye is trying to decide which security system company he will make more money working for. Use the graphs below that show Zyearaye’s potential commission rate to determine which company will pay Zyearaye more commission. How much more commission would Zyearaye earn by choosing the company with the better rate?
Superior Security: Top Notch Security:
Superior Security would pay $𝟓𝟓 more per security system sold than Top Notch Security.
k. Emilia and Miranda are sisters, and their mother just signed them up for a new cell phone plan because they send too many text messages. Using the information below, determine which sister sends the most text messages. How many more text messages does this sister send per week?
Emilia:
Number of Weeks 𝟏𝟏 𝟔𝟔 𝟕𝟕 𝟏𝟏𝟐𝟐 Number of Text
Messages 𝟏𝟏,𝟐𝟐𝟏𝟏𝟏𝟏 𝟐𝟐,𝟒𝟒𝟏𝟏𝟏𝟏 𝟏𝟏,𝟔𝟔𝟏𝟏𝟏𝟏 𝟒𝟒,𝟐𝟐𝟏𝟏𝟏𝟏
Miranda: 𝒎𝒎 = 𝟒𝟒𝟏𝟏𝟏𝟏𝟒𝟒, where 𝟒𝟒 represents the number of weeks, and 𝒎𝒎 represents the number of text messages.
Miranda sends 𝟏𝟏𝟏𝟏 more text messages per week than Emilia.
Closing (5 minutes)
What did all of the problems we solved today have in common?
Each involved using unit rates, although the information was provided in different forms.
MP.2
Lesson 20: Comparison Shopping—Unit Price and Related Measurement Conversions
161
This work is licensed under a Creative Commons Attribution-NonCommercial-ShareAlike 3.0 Unported License. © 2015 Great Minds. eureka-math.org
G6-M1-TE-1.3.0-06.2015

NYS COMMON CORE MATHEMATICS CURRICULUM 6•1 Lesson 20
Exit Ticket (5 minutes)
Lesson Summary
Unit Rate can be located in tables, graphs, and equations.
Table–the unit rate is the value of the first quantity when the second quantity is 𝟏𝟏.
Graphs–the unit rate is the value of 𝒓𝒓 at the point (𝟏𝟏,𝒓𝒓).
Equation–the unit rate is the constant number in the equation. For example, the unit rate in 𝒓𝒓 = 𝟏𝟏𝟑𝟑 is 𝟏𝟏.
Lesson 20: Comparison Shopping—Unit Price and Related Measurement Conversions
162
This work is licensed under a Creative Commons Attribution-NonCommercial-ShareAlike 3.0 Unported License. © 2015 Great Minds. eureka-math.org
G6-M1-TE-1.3.0-06.2015

NYS COMMON CORE MATHEMATICS CURRICULUM 6•1 Lesson 20
Name ___________________________________________________ Date____________________
Lesson 20: Comparison Shopping—Unit Price and Related
Measurement Conversions
Exit Ticket Value Grocery Mart and Market City are both having a sale on the same popular crackers. McKayla is trying to determine which sale is the better deal. Using the given table and equation, determine which store has the better deal on crackers? Explain your reasoning. (Remember to round your answers to the nearest penny.)
Value Grocery Mart:
Number of Boxes of Crackers 3 6 9 12 Cost (in dollars) 5 10 15 20
Market City:
𝑐𝑐 = 1.75𝑏𝑏, where 𝑐𝑐 represents the cost in dollars, and 𝑏𝑏 represents the number of boxes of crackers.
Lesson 20: Comparison Shopping—Unit Price and Related Measurement Conversions
163
This work is licensed under a Creative Commons Attribution-NonCommercial-ShareAlike 3.0 Unported License. © 2015 Great Minds. eureka-math.org
G6-M1-TE-1.3.0-06.2015

NYS COMMON CORE MATHEMATICS CURRICULUM 6•1 Lesson 20
Exit Ticket Sample Solutions
Value Grocery Mart and Market City are both having a sale on the same popular crackers. McKayla is trying to determine which sale is the better deal. Using the given table and equation, determine which store has the better deal on crackers. Explain your reasoning. (Remember to round your answers to the nearest penny.)
Value Grocery Mart:
Number of Boxes of Crackers 𝟏𝟏 𝟔𝟔 𝟕𝟕 𝟏𝟏𝟐𝟐
Cost (in dollars) 𝟓𝟓 𝟏𝟏𝟏𝟏 𝟏𝟏𝟓𝟓 𝟐𝟐𝟏𝟏
Market City:
𝒄𝒄 = 𝟏𝟏.𝟕𝟕𝟓𝟓𝟑𝟑, where 𝒄𝒄 represents the cost in dollars, and 𝟑𝟑 represents the number of boxes of crackers.
Value Grocery Mart is better because one box of crackers would cost $𝟏𝟏.𝟔𝟔𝟕𝟕. One box of crackers at Market City would cost $𝟏𝟏.𝟕𝟕𝟓𝟓, which is a little more expensive than Value Grocery Mart.
Problem Set Sample Solutions
The table below shows the amount of money Gabe earns working at a coffee shop.
Number of Hours Worked 𝟏𝟏 𝟔𝟔 𝟕𝟕 𝟏𝟏𝟐𝟐
Money Earned (in dollars) 𝟒𝟒𝟏𝟏.𝟓𝟓𝟏𝟏 𝟐𝟐𝟏𝟏.𝟏𝟏𝟏𝟏 𝟏𝟏𝟐𝟐𝟏𝟏.𝟓𝟓𝟏𝟏 𝟏𝟏𝟔𝟔𝟐𝟐.𝟏𝟏𝟏𝟏
1. How much does Gabe earn per hour?
Gabe earns $𝟏𝟏𝟏𝟏.𝟓𝟓𝟏𝟏 per hour.
2. Jordan is another employee at the same coffee shop. He has worked there longer than Gabe and earns $𝟏𝟏 more per hour than Gabe. Complete the table below to show how much Jordan earns.
Hours Worked 𝟒𝟒 𝟐𝟐 𝟏𝟏𝟐𝟐 𝟏𝟏𝟔𝟔
Money Earned (in dollars) 𝟔𝟔𝟔𝟔 𝟏𝟏𝟏𝟏𝟐𝟐 𝟏𝟏𝟕𝟕𝟐𝟐 𝟐𝟐𝟔𝟔𝟒𝟒
3. Serena is the manager of the coffee shop. The amount of money she earns is represented by the equation 𝒎𝒎 = 𝟐𝟐𝟏𝟏𝒉𝒉, where 𝒉𝒉 is the number of hours Serena works, and 𝒎𝒎 is the amount of money she earns. How much more money does Serena make an hour than Gabe? Explain your thinking.
𝟐𝟐𝟏𝟏 − 𝟏𝟏𝟏𝟏.𝟓𝟓 = 𝟕𝟕.𝟓𝟓𝟏𝟏, so Serena makes $𝟕𝟕.𝟓𝟓𝟏𝟏 per hour more than Gabe.
4. Last month, Jordan received a promotion and became a manager. He now earns the same amount as Serena. How much more money does he earn per hour now that he is a manager than he did before his promotion? Explain your thinking.
Jordan now makes the same amount as Serena, which is $𝟐𝟐𝟏𝟏 an hour. Jordan previously made $𝟏𝟏𝟔𝟔.𝟓𝟓𝟏𝟏 an hour, so 𝟐𝟐𝟏𝟏 − 𝟏𝟏𝟔𝟔.𝟓𝟓𝟏𝟏 = 𝟒𝟒.𝟓𝟓𝟏𝟏. Therefore, Jordan will make an additional $𝟒𝟒.𝟓𝟓𝟏𝟏 an hour now that he is a manager.
Lesson 20: Comparison Shopping—Unit Price and Related Measurement Conversions
164
This work is licensed under a Creative Commons Attribution-NonCommercial-ShareAlike 3.0 Unported License. © 2015 Great Minds. eureka-math.org
G6-M1-TE-1.3.0-06.2015
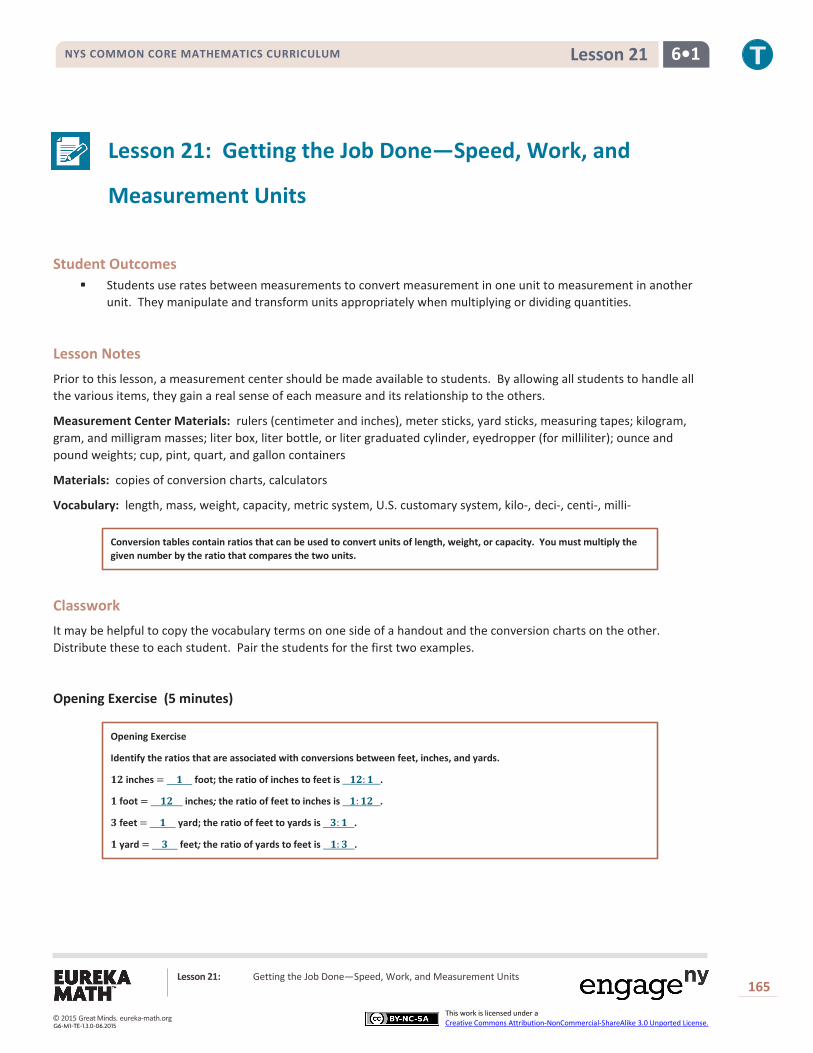
NYS COMMON CORE MATHEMATICS CURRICULUM 6•1 Lesson 21
Lesson 21: Getting the Job Done—Speed, Work, and Measurement Units
165
This work is licensed under a Creative Commons Attribution-NonCommercial-ShareAlike 3.0 Unported License.
Lesson 21: Getting the Job Done—Speed, Work, and
Measurement Units
Student Outcomes
Students use rates between measurements to convert measurement in one unit to measurement in another unit. They manipulate and transform units appropriately when multiplying or dividing quantities.
Lesson Notes Prior to this lesson, a measurement center should be made available to students. By allowing all students to handle all the various items, they gain a real sense of each measure and its relationship to the others.
Measurement Center Materials: rulers (centimeter and inches), meter sticks, yard sticks, measuring tapes; kilogram, gram, and milligram masses; liter box, liter bottle, or liter graduated cylinder, eyedropper (for milliliter); ounce and pound weights; cup, pint, quart, and gallon containers
Materials: copies of conversion charts, calculators
Vocabulary: length, mass, weight, capacity, metric system, U.S. customary system, kilo-, deci-, centi-, milli-
Conversion tables contain ratios that can be used to convert units of length, weight, or capacity. You must multiply the given number by the ratio that compares the two units.
Classwork It may be helpful to copy the vocabulary terms on one side of a handout and the conversion charts on the other. Distribute these to each student. Pair the students for the first two examples.
Opening Exercise (5 minutes) Opening Exercise
Identify the ratios that are associated with conversions between feet, inches, and yards.
𝟏𝟏𝟏𝟏 inches = 𝟏𝟏 foot; the ratio of inches to feet is 𝟏𝟏𝟏𝟏:𝟏𝟏 .
𝟏𝟏 foot = 𝟏𝟏𝟏𝟏 inches; the ratio of feet to inches is 𝟏𝟏:𝟏𝟏𝟏𝟏 .
𝟑𝟑 feet = 𝟏𝟏 yard; the ratio of feet to yards is 𝟑𝟑:𝟏𝟏 .
𝟏𝟏 yard = 𝟑𝟑 feet; the ratio of yards to feet is 𝟏𝟏:𝟑𝟑 .
© 2015 Great Minds. eureka-math.orgG6-M1-TE-1.3.0-06.2015

NYS COMMON CORE MATHEMATICS CURRICULUM 6•1 Lesson 21
Lesson 21: Getting the Job Done—Speed, Work, and Measurement Units
166
This work is licensed under a Creative Commons Attribution-NonCommercial-ShareAlike 3.0 Unported License.
Example 1 (10 minutes)
Conversion tables are really ratio tables that can be used to convert units of length, weight, or capacity (and other units, too). You must multiply the given number by the ratio that compares the two units.
Work with your partner to find out how many feet are in 48 inches. Make a ratio table that compares feet and
inches. Use the conversion rate of 12 inches per foot or 112
foot per inch.
Allow students to solve the problem using the conversion chart. When all groups finish, make clear that they can
multiply 48 by 112
or divide 48 by 12. The result is 4 feet either way.
Example 1
Work with your partner to find out how many feet are in 𝟒𝟒𝟒𝟒 inches. Make a ratio table that compares feet and inches.
Use the conversion rate of 𝟏𝟏𝟏𝟏 inches per foot or 𝟏𝟏𝟏𝟏𝟏𝟏
foot per inch.
𝟏𝟏𝟏𝟏𝟏𝟏
footinches
×𝟒𝟒𝟒𝟒𝟏𝟏
inches = 𝟏𝟏 × 𝟒𝟒𝟒𝟒𝟏𝟏𝟏𝟏 × 𝟏𝟏 feet = 𝟒𝟒𝟒𝟒
𝟏𝟏𝟏𝟏 feet = 𝟒𝟒 feet
𝟒𝟒𝟒𝟒 inches equals 𝟒𝟒 feet.
Example 2 (10 minutes)
Example 2
How many grams are in 𝟔𝟔 kilograms? Again, make a record of your work before using the calculator. The rate would be 𝟏𝟏,𝟎𝟎𝟎𝟎𝟎𝟎 grams per kg. The unit rate would be 𝟏𝟏,𝟎𝟎𝟎𝟎𝟎𝟎.
𝟔𝟔𝟏𝟏
×𝟏𝟏𝟎𝟎𝟎𝟎𝟎𝟎𝟏𝟏
=𝟔𝟔 × 𝟏𝟏𝟎𝟎𝟎𝟎𝟎𝟎𝟏𝟏 × 𝟏𝟏
= 𝟔𝟔𝟎𝟎𝟎𝟎𝟎𝟎
𝟔𝟔 𝟏𝟏
kilograms ×𝟏𝟏𝟎𝟎𝟎𝟎𝟎𝟎 𝟏𝟏
gramskilograms
=𝟔𝟔 × 𝟏𝟏𝟎𝟎𝟎𝟎𝟎𝟎 𝟏𝟏 × 𝟏𝟏
grams = 𝟔𝟔𝟎𝟎𝟎𝟎𝟎𝟎 grams
There are 𝟔𝟔,𝟎𝟎𝟎𝟎𝟎𝟎 grams in 𝟔𝟔 kilograms.
Exercises (10 minutes) Exercise 1
How many cups are in 𝟓𝟓 quarts? As always, make a record of your work before using the calculator. The rate would be 𝟒𝟒 cups per quart. The unit rate would be 𝟒𝟒.
𝟓𝟓𝟏𝟏
×𝟒𝟒𝟏𝟏
=𝟓𝟓 × 𝟒𝟒𝟏𝟏 × 𝟏𝟏
= 𝟏𝟏𝟎𝟎
𝟓𝟓 𝟏𝟏
quarts ×𝟒𝟒𝟏𝟏
cups quart
=𝟓𝟓 × 𝟒𝟒 𝟏𝟏 × 𝟏𝟏
cups = 𝟏𝟏𝟎𝟎 cups
There are 𝟏𝟏𝟎𝟎 cups in 𝟓𝟓 quarts.
© 2015 Great Minds. eureka-math.orgG6-M1-TE-1.3.0-06.2015

NYS COMMON CORE MATHEMATICS CURRICULUM 6•1 Lesson 21
Lesson 21: Getting the Job Done—Speed, Work, and Measurement Units
167
This work is licensed under a Creative Commons Attribution-NonCommercial-ShareAlike 3.0 Unported License.
Lesson Summary
Conversion tables contain ratios that can be used to convert units of length, weight, or capacity. You must multiply the given number by the ratio that compares the two units.
Exercise 2
How many quarts are in 𝟏𝟏𝟎𝟎 cups?
𝟏𝟏𝟎𝟎 cups ∙ 𝟏𝟏𝟒𝟒quartcups = 𝟏𝟏𝟎𝟎
𝟒𝟒 quarts = 𝟓𝟓𝟏𝟏 quarts = 𝟏𝟏𝟏𝟏𝟏𝟏 quarts
Closing (5 minutes)
In Exercise 2, what if the problem was set up this way: 10 cups × 41
cupsquart = 40 quarts. What is wrong with
that set up?
If the conversion factor is flipped upside down, the units will not cancel, and the number won’t make sense.
Exit Ticket (5 minutes)
© 2015 Great Minds. eureka-math.orgG6-M1-TE-1.3.0-06.2015
NYS COMMON CORE MATHEMATICS CURRICULUM 6•1 Lesson 21
Lesson 21: Getting the Job Done—Speed, Work, and Measurement Units
168
This work is licensed under a Creative Commons Attribution-NonCommercial-ShareAlike 3.0 Unported License.
Name ___________________________________________________ Date____________________
Lesson 21: Getting the Job Done—Speed, Work, and
Measurement Units
Exit Ticket Jill and Erika made 4 gallons of lemonade for their lemonade stand. How many quarts did they make? If they charge $2.00 per quart, how much money will they make if they sell it all?
© 2015 Great Minds. eureka-math.orgG6-M1-TE-1.3.0-06.2015

NYS COMMON CORE MATHEMATICS CURRICULUM 6•1 Lesson 21
Lesson 21: Getting the Job Done—Speed, Work, and Measurement Units
169
This work is licensed under a Creative Commons Attribution-NonCommercial-ShareAlike 3.0 Unported License.
Exit Ticket Sample Solutions
Jill and Erika made 𝟒𝟒 gallons of lemonade for their lemonade stand. How many quarts did they make? If they charge $𝟏𝟏.𝟎𝟎𝟎𝟎 per quart, how much money will they make if they sell it all?
The conversion rate is 𝟒𝟒 quarts per gallon.
𝟒𝟒𝟏𝟏
quartsgallon
∙ 𝟒𝟒 gallons = 𝟒𝟒 ∙ 𝟒𝟒𝟏𝟏 quarts= 𝟏𝟏𝟔𝟔 quarts
𝟏𝟏𝟔𝟔 quarts × 𝟏𝟏𝟏𝟏
dollarsquart = 𝟑𝟑𝟏𝟏 dollars in sales
Problem Set Sample Solutions
1. 𝟕𝟕 𝐟𝐟𝐟𝐟. = 𝟒𝟒𝟒𝟒 𝐢𝐢𝐢𝐢.
2. 𝟏𝟏𝟎𝟎𝟎𝟎 𝐲𝐲𝐲𝐲. = 𝟑𝟑𝟎𝟎𝟎𝟎 𝐟𝐟𝐟𝐟.
3. 𝟏𝟏𝟓𝟓 𝐦𝐦 = 𝟏𝟏,𝟓𝟓𝟎𝟎𝟎𝟎 𝐜𝐜𝐦𝐦
4. 𝟓𝟓 𝐤𝐤𝐦𝐦 = 𝟓𝟓,𝟎𝟎𝟎𝟎𝟎𝟎 𝐦𝐦
5. 𝟗𝟗𝟔𝟔 𝐨𝐨𝐨𝐨. = 𝟔𝟔 𝐥𝐥𝐥𝐥.
6. 𝟏𝟏 𝐦𝐦𝐢𝐢. = 𝟏𝟏𝟎𝟎,𝟓𝟓𝟔𝟔𝟎𝟎 𝐟𝐟𝐟𝐟.
7. 𝟏𝟏 𝐦𝐦𝐢𝐢. = 𝟑𝟑,𝟓𝟓𝟏𝟏𝟎𝟎 𝐲𝐲𝐲𝐲.
8. 𝟑𝟑𝟏𝟏 𝐟𝐟𝐥𝐥.𝐨𝐨𝐨𝐨. = 𝟒𝟒 𝐜𝐜.
9. 𝟏𝟏,𝟓𝟓𝟎𝟎𝟎𝟎 𝐦𝐦𝐦𝐦 = 𝟏𝟏.𝟓𝟓 𝐦𝐦
10. 𝟔𝟔 𝐠𝐠 = 𝟔𝟔,𝟎𝟎𝟎𝟎𝟎𝟎 𝐦𝐦𝐠𝐠
11. Beau buys a 𝟑𝟑-pound bag of trail mix for a hike. He wants to make one-ounce bags for his friends with whom he is hiking. How many one-ounce bags can he make?
𝟒𝟒𝟒𝟒 bags
12. The maximum weight for a truck on the New York State Thruway is 𝟒𝟒𝟎𝟎 tons. How many pounds is this?
𝟒𝟒𝟎𝟎,𝟎𝟎𝟎𝟎𝟎𝟎 𝐥𝐥𝐥𝐥.
13. Claudia’s skis are 𝟏𝟏𝟓𝟓𝟎𝟎 centimeters long. How many meters is this?
𝟏𝟏.𝟓𝟓 𝐦𝐦
© 2015 Great Minds. eureka-math.orgG6-M1-TE-1.3.0-06.2015

NYS COMMON CORE MATHEMATICS CURRICULUM 6•1 Lesson 21
Lesson 21: Getting the Job Done—Speed, Work, and Measurement Units
170
This work is licensed under a Creative Commons Attribution-NonCommercial-ShareAlike 3.0 Unported License.
14. Claudia’s skis are 𝟏𝟏𝟓𝟓𝟎𝟎 centimeters long. How many millimeters is this?
𝟏𝟏,𝟓𝟓𝟎𝟎𝟎𝟎 𝐦𝐦𝐦𝐦
15. Write your own problem, and solve it. Be ready to share the question tomorrow.
Answers will vary.
© 2015 Great Minds. eureka-math.orgG6-M1-TE-1.3.0-06.2015
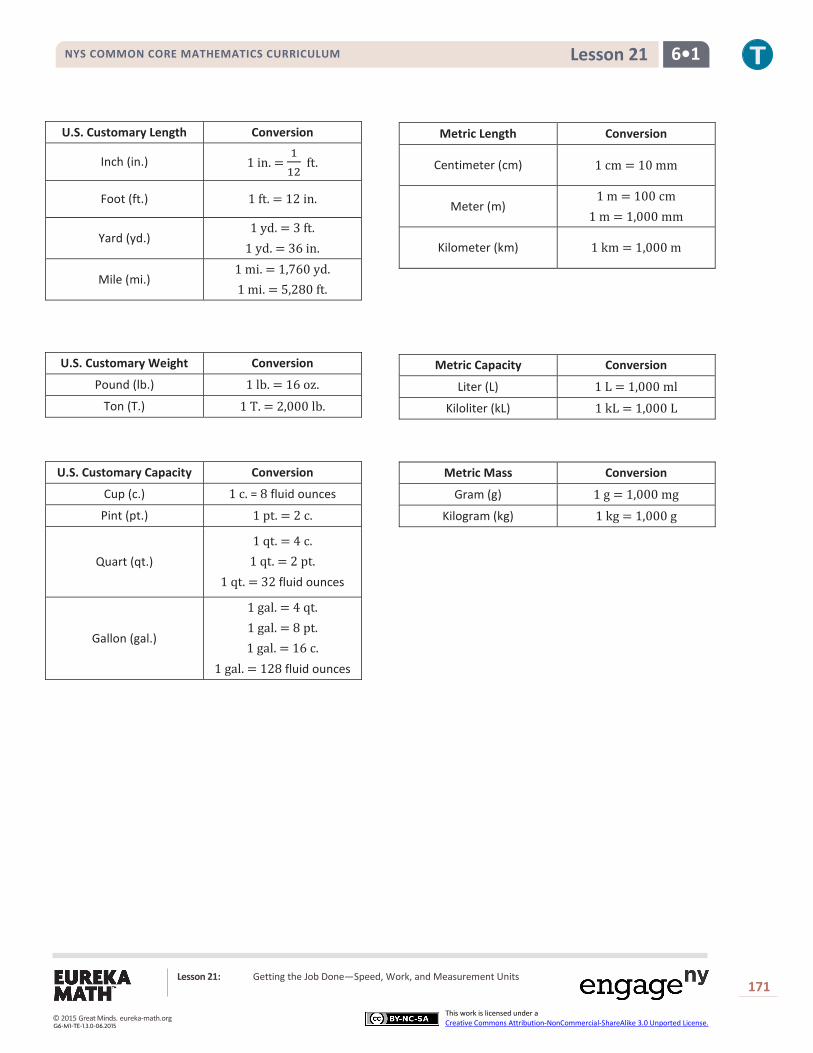
NYS COMMON CORE MATHEMATICS CURRICULUM 6•1 Lesson 21
Lesson 21: Getting the Job Done—Speed, Work, and Measurement Units
171
This work is licensed under a Creative Commons Attribution-NonCommercial-ShareAlike 3.0 Unported License.
U.S. Customary Length Conversion
Inch (in.) 1 in. = 112
ft.
Foot (ft.) 1 ft. = 12 in.
Yard (yd.) 1 yd. = 3 ft.
1 yd. = 36 in.
Mile (mi.) 1 mi. = 1,760 yd. 1 mi. = 5,280 ft.
U.S. Customary Weight Conversion
Pound (lb.) 1 lb. = 16 oz. Ton (T.) 1 T. = 2,000 lb.
Metric Length Conversion
Centimeter (cm) 1 cm = 10 mm
Meter (m) 1 m = 100 cm
1 m = 1,000 mm
Kilometer (km) 1 km = 1,000 m
Metric Capacity Conversion
Liter (L) 1 L = 1,000 ml Kiloliter (kL) 1 kL = 1,000 L
Metric Mass Conversion
Gram (g) 1 g = 1,000 mg
Kilogram (kg) 1 kg = 1,000 g
U.S. Customary Capacity Conversion
Cup (c.) 1 c. = 8 fluid ounces
Pint (pt.) 1 pt. = 2 c.
Quart (qt.) 1 qt. = 4 c.
1 qt. = 2 pt. 1 qt. = 32 fluid ounces
Gallon (gal.)
1 gal. = 4 qt. 1 gal. = 8 pt. 1 gal. = 16 c.
1 gal. = 128 fluid ounces
© 2015 Great Minds. eureka-math.orgG6-M1-TE-1.3.0-06.2015
NYS COMMON CORE MATHEMATICS CURRICULUM 6•1 Lesson 22
Lesson 22: Getting the Job Done—Speed, Work, and Measurement Units
172
This work is licensed under a Creative Commons Attribution-NonCommercial-ShareAlike 3.0 Unported License.
Lesson 22: Getting the Job Done—Speed, Work, and
Measurement Units
Student Outcomes
Students decontextualize a given speed situation, representing symbolically the quantities involved with the formula distance = rate ∙ time.
Materials Stopwatches 50-foot measured course Calculators
Lesson Notes
Vocabulary: distance, rate, time, 𝑑𝑑 = 𝑟𝑟 ∙ 𝑡𝑡, 𝑟𝑟 = 𝑑𝑑𝑡𝑡
Classwork If an object is moving at a constant rate of speed for a certain amount of time, it is possible to find how far the object went by multiplying the rate and the time. In mathematical language, we say, 𝐝𝐝𝐝𝐝𝐝𝐝𝐝𝐝𝐝𝐝𝐝𝐝𝐝𝐝𝐝𝐝 = 𝐫𝐫𝐝𝐝𝐝𝐝𝐝𝐝 ∙ 𝐝𝐝𝐝𝐝𝐭𝐭𝐝𝐝.
Exploratory Challenge
Students will make measurements of distance and time during this lesson and will calculate speed. When using a stopwatch, the teacher can decide whether to round to the nearest second or tenth of a second. If desired, multiple trials can be measured and results averaged.
Opening Exercise (2 minutes)
How many seconds are in 1 minute? 60 seconds
Can you verbalize this relationship?
For every 60 seconds, there is 1 minute.
Here are two different ways (display for students): 601
secondsminute
and 60secondsminute
.
© 2015 Great Minds. eureka-math.orgG6-M1-TE-1.3.0-06.2015

NYS COMMON CORE MATHEMATICS CURRICULUM 6•1 Lesson 22
Lesson 22: Getting the Job Done—Speed, Work, and Measurement Units
173
This work is licensed under a Creative Commons Attribution-NonCommercial-ShareAlike 3.0 Unported License.
Are these the same values?
Allow for discussion.
The first representation states that for every 60 seconds, there is 1 minute. Is that what the second representation states? I read this as “60 seconds per minute.” Knowing what we learned previously in Lessons 1 and 2, “per” and “for every” are verbal representations of a ratio, so they mean the same thing.
Example 1 (15 minutes)
Measure out a 50-foot course in the hallway (or shorter in the classroom). Have student volunteers use a stopwatch to measure the time it takes to have others walk the distance. Also, ask a fast runner to run the course as fast as he or she can.
I wonder how fast you were moving. In this exercise, we know the distance (in feet) and time (in seconds), and we must find the speed, which is the rate of distance traveled per unit of time. This will be expressed in feet per second for this activity.
Many people like to use the 𝑑𝑑 = 𝑟𝑟 ∙ 𝑡𝑡 formula, substitute in the values for rate and time, and then multiply.
Would you agree that 𝑟𝑟 = 𝑑𝑑𝑡𝑡?
Remind students that 12 = 3 ∙ 4, 3 = 124 , and 4 = 12
3 are all related and can be an anchor in relating 𝑑𝑑 = 𝑟𝑟 ∙ 𝑡𝑡 and
𝑟𝑟 = 𝑑𝑑𝑡𝑡 . Substitute the values to test if needed.
Ask students to substitute the runner’s distance and time into the equation and solve for the rate of speed. Also, substitute the runner’s time and distance into the equation to find his or her rate of speed.
Example 1
Walker: Substitute the walker’s distance and time into the equation and solve for the rate of speed.
𝐝𝐝𝐝𝐝𝐝𝐝𝐝𝐝𝐝𝐝𝐝𝐝𝐝𝐝𝐝𝐝 = 𝐫𝐫𝐝𝐝𝐝𝐝𝐝𝐝 ∙ 𝐝𝐝𝐝𝐝𝐭𝐭𝐝𝐝
𝒅𝒅 = 𝒓𝒓 ∙ 𝒕𝒕
Hint: Consider the units that you want to end up with. If you want to end up with the rate (feet/second), then divide the distance (feet) by time (seconds).
Runner: Substitute the runner’s time and distance into the equation to find the rate of speed.
𝐝𝐝𝐝𝐝𝐝𝐝𝐝𝐝𝐝𝐝𝐝𝐝𝐝𝐝𝐝𝐝 = 𝐫𝐫𝐝𝐝𝐝𝐝𝐝𝐝 ∙ 𝐝𝐝𝐝𝐝𝐭𝐭𝐝𝐝
𝒅𝒅 = 𝒓𝒓 ∙ 𝒕𝒕
Here is a sample of student work using 𝟖𝟖 seconds as an example:
𝒅𝒅 = 𝒓𝒓 ∙ 𝒕𝒕 and 𝒓𝒓 = 𝒅𝒅𝒕𝒕 ; Distance: 𝟓𝟓𝟓𝟓 feet; Time: 𝟖𝟖 seconds
𝒓𝒓 =𝟓𝟓𝟓𝟓𝟖𝟖
𝐟𝐟𝐝𝐝 𝐝𝐝𝐝𝐝𝐝𝐝
= 𝟔𝟔.𝟐𝟐𝟓𝟓 𝐟𝐟𝐝𝐝𝐝𝐝𝐝𝐝𝐝𝐝
MP.2
© 2015 Great Minds. eureka-math.orgG6-M1-TE-1.3.0-06.2015
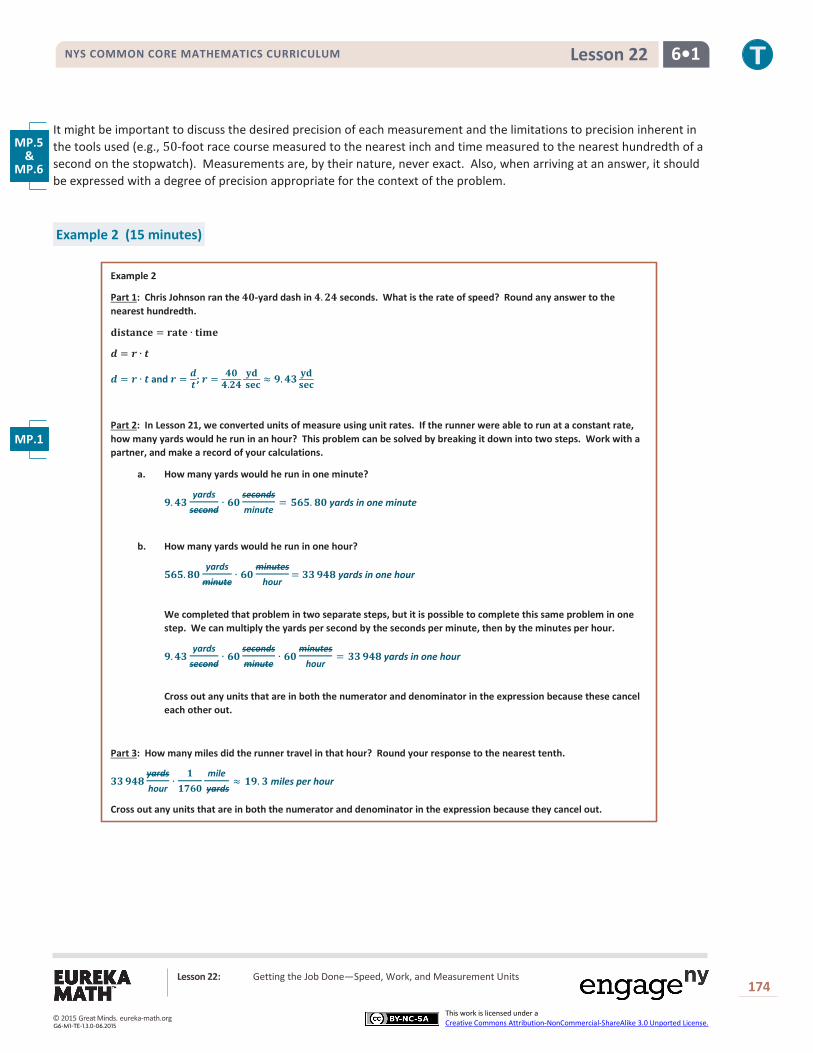
NYS COMMON CORE MATHEMATICS CURRICULUM 6•1 Lesson 22
Lesson 22: Getting the Job Done—Speed, Work, and Measurement Units
174
This work is licensed under a Creative Commons Attribution-NonCommercial-ShareAlike 3.0 Unported License.
It might be important to discuss the desired precision of each measurement and the limitations to precision inherent in the tools used (e.g., 50-foot race course measured to the nearest inch and time measured to the nearest hundredth of a second on the stopwatch). Measurements are, by their nature, never exact. Also, when arriving at an answer, it should be expressed with a degree of precision appropriate for the context of the problem.
Example 2 (15 minutes)
Example 2
Part 1: Chris Johnson ran the 𝟒𝟒𝟓𝟓-yard dash in 𝟒𝟒.𝟐𝟐𝟒𝟒 seconds. What is the rate of speed? Round any answer to the nearest hundredth.
𝐝𝐝𝐝𝐝𝐝𝐝𝐝𝐝𝐝𝐝𝐝𝐝𝐝𝐝𝐝𝐝 = 𝐫𝐫𝐝𝐝𝐝𝐝𝐝𝐝 ∙ 𝐝𝐝𝐝𝐝𝐭𝐭𝐝𝐝
𝒅𝒅 = 𝒓𝒓 ∙ 𝒕𝒕
𝒅𝒅 = 𝒓𝒓 ∙ 𝒕𝒕 and 𝒓𝒓 = 𝒅𝒅𝒕𝒕 ; 𝒓𝒓 = 𝟒𝟒𝟓𝟓
𝟒𝟒.𝟐𝟐𝟒𝟒 𝐲𝐲𝐝𝐝 𝐝𝐝𝐝𝐝𝐝𝐝 ≈ 𝟗𝟗.𝟒𝟒𝟒𝟒 𝐲𝐲𝐝𝐝
𝐝𝐝𝐝𝐝𝐝𝐝
Part 2: In Lesson 21, we converted units of measure using unit rates. If the runner were able to run at a constant rate, how many yards would he run in an hour? This problem can be solved by breaking it down into two steps. Work with a partner, and make a record of your calculations.
a. How many yards would he run in one minute?
𝟗𝟗.𝟒𝟒𝟒𝟒 yards
second∙ 𝟔𝟔𝟓𝟓
secondsminute
= 𝟓𝟓𝟔𝟔𝟓𝟓. 𝟖𝟖𝟓𝟓 yards in one minute
b. How many yards would he run in one hour?
𝟓𝟓𝟔𝟔𝟓𝟓.𝟖𝟖𝟓𝟓 yards
minute∙ 𝟔𝟔𝟓𝟓
minuteshour
= 𝟒𝟒𝟒𝟒 𝟗𝟗𝟒𝟒𝟖𝟖 yards in one hour
We completed that problem in two separate steps, but it is possible to complete this same problem in one step. We can multiply the yards per second by the seconds per minute, then by the minutes per hour.
𝟗𝟗.𝟒𝟒𝟒𝟒 yards
second∙ 𝟔𝟔𝟓𝟓
secondsminute
∙ 𝟔𝟔𝟓𝟓 minutes
hour= 𝟒𝟒𝟒𝟒 𝟗𝟗𝟒𝟒𝟖𝟖 yards in one hour
Cross out any units that are in both the numerator and denominator in the expression because these cancel each other out.
Part 3: How many miles did the runner travel in that hour? Round your response to the nearest tenth.
𝟒𝟒𝟒𝟒 𝟗𝟗𝟒𝟒𝟖𝟖 yardshour
∙𝟏𝟏
𝟏𝟏𝟏𝟏𝟔𝟔𝟓𝟓mile
yards≈ 𝟏𝟏𝟗𝟗. 𝟒𝟒 miles per hour
Cross out any units that are in both the numerator and denominator in the expression because they cancel out.
MP.1
MP.5 &
MP.6
© 2015 Great Minds. eureka-math.orgG6-M1-TE-1.3.0-06.2015
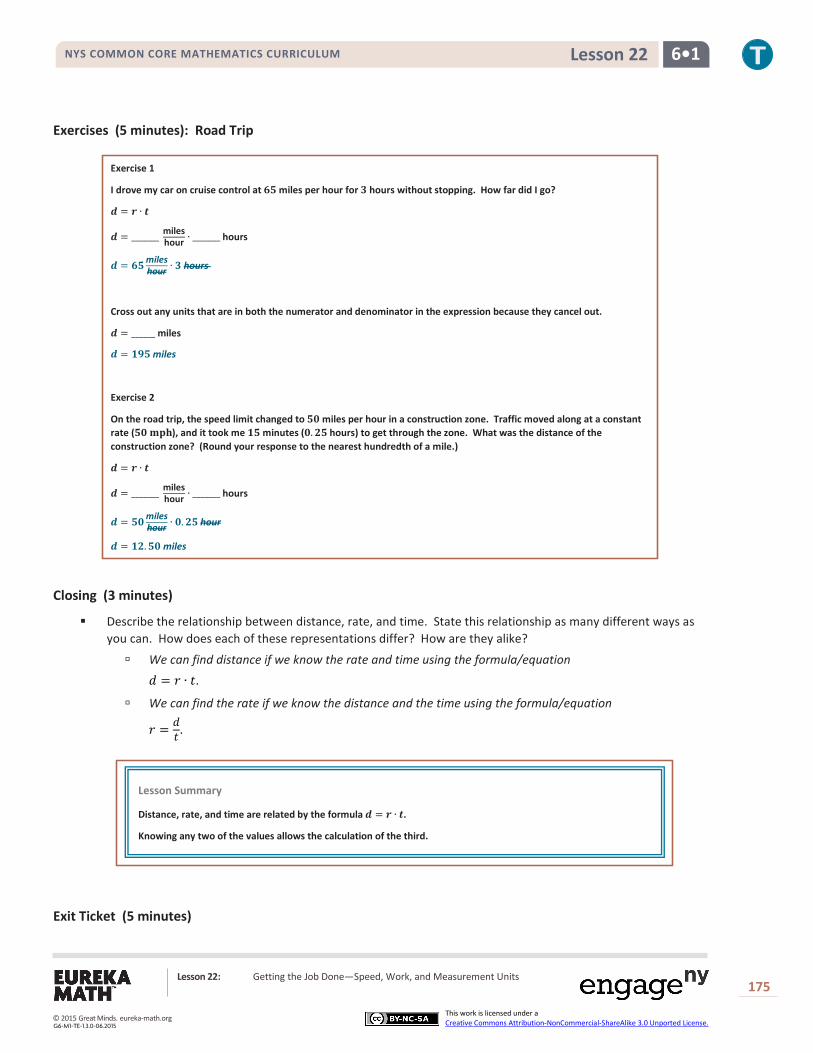
NYS COMMON CORE MATHEMATICS CURRICULUM 6•1 Lesson 22
Lesson 22: Getting the Job Done—Speed, Work, and Measurement Units
175
This work is licensed under a Creative Commons Attribution-NonCommercial-ShareAlike 3.0 Unported License.
Exercises (5 minutes): Road Trip Exercise 1
I drove my car on cruise control at 𝟔𝟔𝟓𝟓 miles per hour for 𝟒𝟒 hours without stopping. How far did I go?
𝒅𝒅 = 𝒓𝒓 ∙ 𝒕𝒕
𝒅𝒅 = _______ mileshour ∙ _______ hours
𝒅𝒅 = 𝟔𝟔𝟓𝟓mileshour ∙ 𝟒𝟒 hours
Cross out any units that are in both the numerator and denominator in the expression because they cancel out.
𝒅𝒅 = ______ miles
𝒅𝒅 = 𝟏𝟏𝟗𝟗𝟓𝟓 miles
Exercise 2
On the road trip, the speed limit changed to 𝟓𝟓𝟓𝟓 miles per hour in a construction zone. Traffic moved along at a constant rate (𝟓𝟓𝟓𝟓 𝐭𝐭𝐦𝐦𝐦𝐦), and it took me 𝟏𝟏𝟓𝟓 minutes (𝟓𝟓.𝟐𝟐𝟓𝟓 hours) to get through the zone. What was the distance of the construction zone? (Round your response to the nearest hundredth of a mile.)
𝒅𝒅 = 𝒓𝒓 ∙ 𝒕𝒕
𝒅𝒅 = _______ mileshour ∙ _______ hours
𝒅𝒅 = 𝟓𝟓𝟓𝟓mileshour ∙ 𝟓𝟓.𝟐𝟐𝟓𝟓 hour
𝒅𝒅 = 𝟏𝟏𝟐𝟐.𝟓𝟓𝟓𝟓 miles
Closing (3 minutes)
Describe the relationship between distance, rate, and time. State this relationship as many different ways as you can. How does each of these representations differ? How are they alike?
We can find distance if we know the rate and time using the formula/equation 𝑑𝑑 = 𝑟𝑟 ∙ 𝑡𝑡.
We can find the rate if we know the distance and the time using the formula/equation
𝑟𝑟 = 𝑑𝑑𝑡𝑡 .
Exit Ticket (5 minutes)
Lesson Summary
Distance, rate, and time are related by the formula 𝒅𝒅 = 𝒓𝒓 ∙ 𝒕𝒕.
Knowing any two of the values allows the calculation of the third.
© 2015 Great Minds. eureka-math.orgG6-M1-TE-1.3.0-06.2015

NYS COMMON CORE MATHEMATICS CURRICULUM 6•1 Lesson 22
Lesson 22: Getting the Job Done—Speed, Work, and Measurement Units
176
This work is licensed under a Creative Commons Attribution-NonCommercial-ShareAlike 3.0 Unported License.
Name ___________________________________________________ Date____________________
Lesson 22: Getting the Job Done—Speed, Work, and
Measurement Units
Exit Ticket Franny took a road trip to her grandmother’s house. She drove at a constant speed of 60 miles per hour for 2 hours. She took a break and then finished the rest of her trip driving at a constant speed of 50 miles per hour for 2 hours. What was the total distance of Franny’s trip?
© 2015 Great Minds. eureka-math.orgG6-M1-TE-1.3.0-06.2015
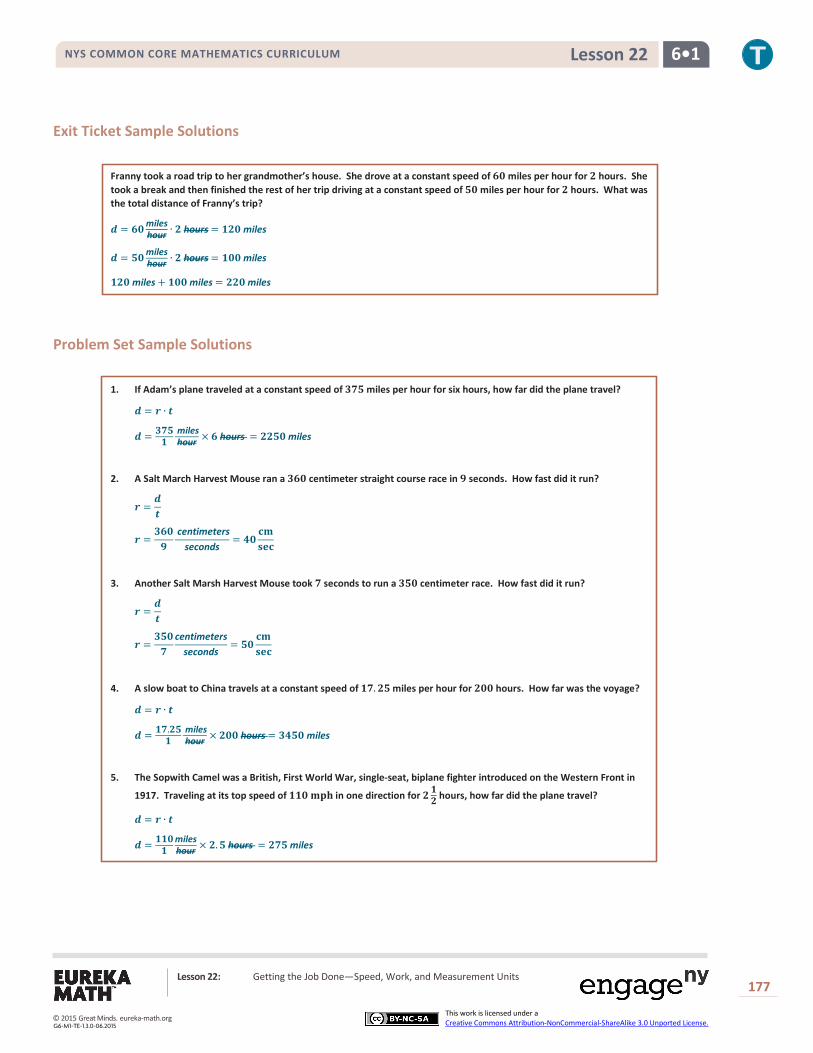
NYS COMMON CORE MATHEMATICS CURRICULUM 6•1 Lesson 22
Lesson 22: Getting the Job Done—Speed, Work, and Measurement Units
177
This work is licensed under a Creative Commons Attribution-NonCommercial-ShareAlike 3.0 Unported License.
Exit Ticket Sample Solutions
Franny took a road trip to her grandmother’s house. She drove at a constant speed of 𝟔𝟔𝟓𝟓 miles per hour for 𝟐𝟐 hours. She took a break and then finished the rest of her trip driving at a constant speed of 𝟓𝟓𝟓𝟓 miles per hour for 𝟐𝟐 hours. What was the total distance of Franny’s trip?
𝒅𝒅 = 𝟔𝟔𝟓𝟓mileshour ∙ 𝟐𝟐 hours = 𝟏𝟏𝟐𝟐𝟓𝟓 miles
𝒅𝒅 = 𝟓𝟓𝟓𝟓mileshour ∙ 𝟐𝟐 hours = 𝟏𝟏𝟓𝟓𝟓𝟓 miles
𝟏𝟏𝟐𝟐𝟓𝟓 miles + 𝟏𝟏𝟓𝟓𝟓𝟓 miles = 𝟐𝟐𝟐𝟐𝟓𝟓 miles
Problem Set Sample Solutions
1. If Adam’s plane traveled at a constant speed of 𝟒𝟒𝟏𝟏𝟓𝟓 miles per hour for six hours, how far did the plane travel?
𝒅𝒅 = 𝒓𝒓 ∙ 𝒕𝒕
𝒅𝒅 = 𝟒𝟒𝟏𝟏𝟓𝟓𝟏𝟏
mileshour × 𝟔𝟔 hours = 𝟐𝟐𝟐𝟐𝟓𝟓𝟓𝟓 miles
2. A Salt March Harvest Mouse ran a 𝟒𝟒𝟔𝟔𝟓𝟓 centimeter straight course race in 𝟗𝟗 seconds. How fast did it run?
𝒓𝒓 =𝒅𝒅𝒕𝒕
𝒓𝒓 =𝟒𝟒𝟔𝟔𝟓𝟓𝟗𝟗
centimetersseconds
= 𝟒𝟒𝟓𝟓𝐝𝐝𝐭𝐭𝐝𝐝𝐝𝐝𝐝𝐝
3. Another Salt Marsh Harvest Mouse took 𝟏𝟏 seconds to run a 𝟒𝟒𝟓𝟓𝟓𝟓 centimeter race. How fast did it run?
𝒓𝒓 =𝒅𝒅𝒕𝒕
𝒓𝒓 =𝟒𝟒𝟓𝟓𝟓𝟓𝟏𝟏
centimetersseconds
= 𝟓𝟓𝟓𝟓𝐝𝐝𝐭𝐭𝐝𝐝𝐝𝐝𝐝𝐝
4. A slow boat to China travels at a constant speed of 𝟏𝟏𝟏𝟏.𝟐𝟐𝟓𝟓 miles per hour for 𝟐𝟐𝟓𝟓𝟓𝟓 hours. How far was the voyage?
𝒅𝒅 = 𝒓𝒓 ∙ 𝒕𝒕
𝒅𝒅 = 𝟏𝟏𝟏𝟏.𝟐𝟐𝟓𝟓𝟏𝟏
mileshour × 𝟐𝟐𝟓𝟓𝟓𝟓 hours = 𝟒𝟒𝟒𝟒𝟓𝟓𝟓𝟓 miles
5. The Sopwith Camel was a British, First World War, single-seat, biplane fighter introduced on the Western Front in
1917. Traveling at its top speed of 𝟏𝟏𝟏𝟏𝟓𝟓 𝐭𝐭𝐦𝐦𝐦𝐦 in one direction for 𝟐𝟐𝟏𝟏𝟐𝟐 hours, how far did the plane travel?
𝒅𝒅 = 𝒓𝒓 ∙ 𝒕𝒕
𝒅𝒅 = 𝟏𝟏𝟏𝟏𝟓𝟓𝟏𝟏
mileshour × 𝟐𝟐.𝟓𝟓 hours = 𝟐𝟐𝟏𝟏𝟓𝟓 miles
© 2015 Great Minds. eureka-math.orgG6-M1-TE-1.3.0-06.2015

NYS COMMON CORE MATHEMATICS CURRICULUM 6•1 Lesson 22
Lesson 22: Getting the Job Done—Speed, Work, and Measurement Units
178
This work is licensed under a Creative Commons Attribution-NonCommercial-ShareAlike 3.0 Unported License.
6. A world-class marathon runner can finish 𝟐𝟐𝟔𝟔.𝟐𝟐 miles in 𝟐𝟐 hours. What is the rate of speed for the runner?
𝒓𝒓 =𝒅𝒅𝒕𝒕
𝒓𝒓 =𝟐𝟐𝟔𝟔.𝟐𝟐𝟐𝟐
mile𝒔𝒔 hours
= 𝟏𝟏𝟒𝟒.𝟏𝟏 𝐭𝐭𝐦𝐦𝐦𝐦 or 𝟏𝟏𝟒𝟒.𝟏𝟏𝐭𝐭𝐝𝐝𝐦𝐦
7. Banana slugs can move at 𝟏𝟏𝟏𝟏 𝐝𝐝𝐭𝐭 per minute. If a banana slug travels for 𝟓𝟓 hours, how far will it travel?
𝒅𝒅 = 𝒓𝒓 ∙ 𝒕𝒕
𝒅𝒅 =𝟏𝟏𝟏𝟏𝟏𝟏
𝐝𝐝𝐭𝐭𝐭𝐭𝐝𝐝𝐝𝐝
× 𝟒𝟒𝟓𝟓𝟓𝟓 𝐭𝐭𝐝𝐝𝐝𝐝 = 𝟓𝟓𝟏𝟏𝟓𝟓𝟓𝟓 𝐝𝐝𝐭𝐭
© 2015 Great Minds. eureka-math.orgG6-M1-TE-1.3.0-06.2015

NYS COMMON CORE MATHEMATICS CURRICULUM 6•1 Lesson 23
Lesson 23: Problem Solving Using Rates, Unit Rates, and Conversions
179
This work is licensed under a Creative Commons Attribution-NonCommercial-ShareAlike 3.0 Unported License.
Lesson 23: Problem Solving Using Rates, Unit Rates, and
Conversions
Student Outcomes
Students solve constant rate work problems by calculating and comparing unit rates.
Materials Calculators
Classwork
If work is being done at a constant rate by one person, and at a different constant rate by another person, both rates can be converted to their unit rates and then compared directly.
“Work” can include jobs done in a certain time period, rates of running or swimming, etc.
Example 1 (10 minutes): Fresh-Cut Grass
In the last lesson, we learned about constant speed problems. Today we will be learning about constant rate work problems. Think for a moment about what a constant rate work problem might be.
Allow time for speculation and sharing of possible interpretations of what the lesson title might mean. Student responses should be summarized by the following:
Constant rate work problems let us compare two unit rates to see which situation is faster or slower.
In Lesson 18, we found a rate by dividing two quantities. Recall how to do this. To find a unit rate, divide the numerator by the denominator.
Did it matter which quantity was in the numerator and which quantity was in the denominator?
Yes. To find the unit rate, it is important to have specific quantities in the numerator and denominator based on the rate unit.
Did the two quantities have to be two different units? Yes
Suppose that on a Saturday morning you can cut 3 lawns in 5 hours, and your friend can cut 5 lawns in 8 hours. Your friend claims he is working faster than you. Who is cutting lawns at a faster rate? How do you find out?
Divide the numerator by the denominator to find the unit rate.
© 2015 Great Minds. eureka-math.orgG6-M1-TE-1.3.0-06.2015
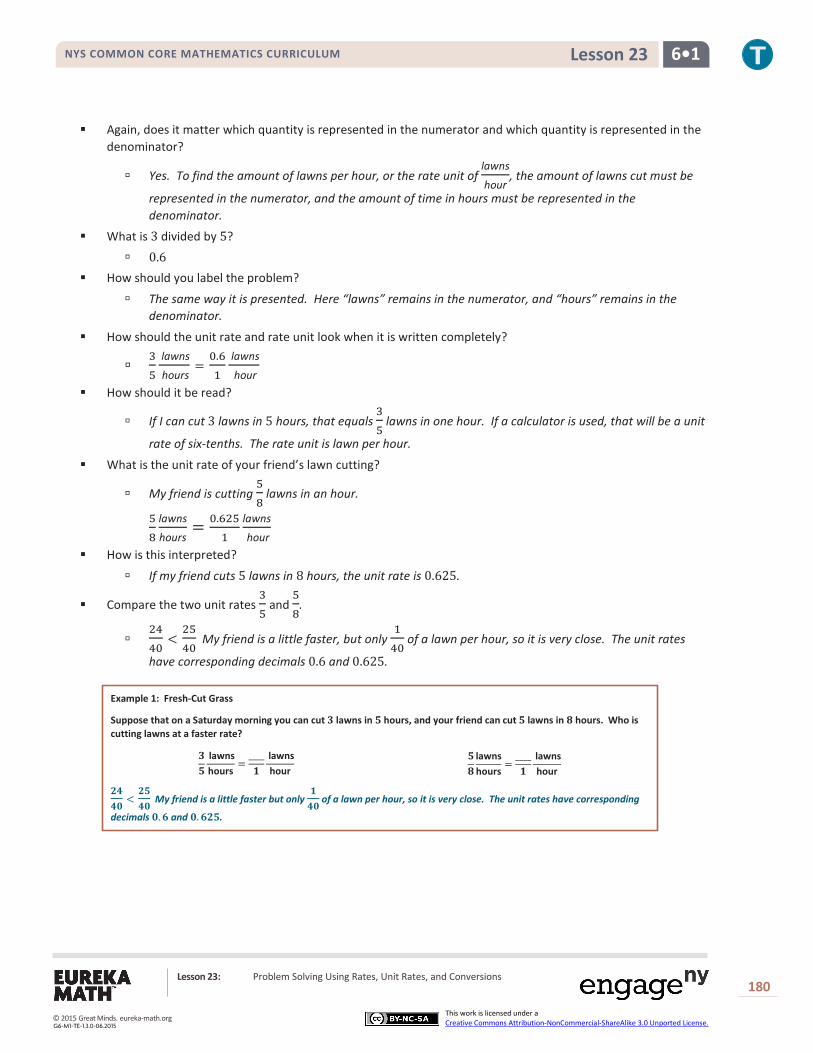
NYS COMMON CORE MATHEMATICS CURRICULUM 6•1 Lesson 23
Lesson 23: Problem Solving Using Rates, Unit Rates, and Conversions
180
This work is licensed under a Creative Commons Attribution-NonCommercial-ShareAlike 3.0 Unported License.
Again, does it matter which quantity is represented in the numerator and which quantity is represented in the denominator?
Yes. To find the amount of lawns per hour, or the rate unit of lawns
hour, the amount of lawns cut must be
represented in the numerator, and the amount of time in hours must be represented in the denominator.
What is 3 divided by 5? 0.6
How should you label the problem?
The same way it is presented. Here “lawns” remains in the numerator, and “hours” remains in the denominator.
How should the unit rate and rate unit look when it is written completely?
35
lawns
hours=0.61
lawns
hour
How should it be read?
If I can cut 3 lawns in 5 hours, that equals 35
lawns in one hour. If a calculator is used, that will be a unit
rate of six-tenths. The rate unit is lawn per hour.
What is the unit rate of your friend’s lawn cutting?
My friend is cutting 58
lawns in an hour.
58
lawns
hours= 0.625
1lawns
hour
How is this interpreted?
If my friend cuts 5 lawns in 8 hours, the unit rate is 0.625.
Compare the two unit rates 35
and 58
.
2440
<2540
My friend is a little faster, but only 140
of a lawn per hour, so it is very close. The unit rates
have corresponding decimals 0.6 and 0.625.
Example 1: Fresh-Cut Grass
Suppose that on a Saturday morning you can cut 𝟑𝟑 lawns in 𝟓𝟓 hours, and your friend can cut 𝟓𝟓 lawns in 𝟖𝟖 hours. Who is cutting lawns at a faster rate?
𝟑𝟑𝟓𝟓
lawnshours
=____𝟏𝟏
lawnshour
𝟓𝟓𝟖𝟖
lawnshours
=____𝟏𝟏
lawnshour
𝟐𝟐𝟐𝟐𝟐𝟐𝟒𝟒
<𝟐𝟐𝟓𝟓𝟐𝟐𝟒𝟒
My friend is a little faster but only 𝟏𝟏𝟐𝟐𝟒𝟒
of a lawn per hour, so it is very close. The unit rates have corresponding
decimals 𝟒𝟒.𝟔𝟔 and 𝟒𝟒.𝟔𝟔𝟐𝟐𝟓𝟓.
© 2015 Great Minds. eureka-math.orgG6-M1-TE-1.3.0-06.2015

NYS COMMON CORE MATHEMATICS CURRICULUM 6•1 Lesson 23
Lesson 23: Problem Solving Using Rates, Unit Rates, and Conversions
181
This work is licensed under a Creative Commons Attribution-NonCommercial-ShareAlike 3.0 Unported License.
Example 2 (9 minutes): Restaurant Advertising
Next, suppose you own a restaurant. You want to do some advertising, so you hire 2 students to deliver take-out menus around town. One student, Darla, delivers 350 menus in 2 hours, and another student, Drew, delivers 510 menus in 3 hours. You promise a $10 bonus to the fastest worker since time is money in the restaurant business. Who gets the bonus?
How should the unit rates and the rate units look when they are written completely?
3502
menus
hours=1751
menus
hour; 5103
menus
hours=1701
menus
hour
Compare the unit rates for each student. Who works faster at the task and gets the bonus cash?
Darla’s unit rate is 1751
menus
hour and Drew’s unit rate is
1701
menus
hour. Since Darla is able to deliver 5 more
menus an hour than Drew, she should get the bonus.
Will the unit labels in the numerator and denominator always match in the work rates we are comparing?
Yes.
Example 2: Restaurant Advertising
________
menushours
=____𝟏𝟏
menushour
________
menus hours
=____𝟏𝟏
menushour
𝟑𝟑𝟓𝟓𝟒𝟒𝟐𝟐
menushours
=𝟏𝟏𝟏𝟏𝟓𝟓𝟏𝟏
menushour
𝟓𝟓𝟏𝟏𝟒𝟒𝟑𝟑
menushours
=𝟏𝟏𝟏𝟏𝟒𝟒𝟏𝟏
menushour
Set up a problem for the student that does not keep the units in the same arrangement:
3502
menus
hours=1751
menus
hour
3510
hours
menus=
1170
hour
menus
What happens if they do not match and one is inverted?
It will be difficult to compare the rates. We would have to say 175 menus would be delivered per hour by Darla, and it would take an hour for Drew to deliver 170 menus. Mixing up the units makes the explanations awkward.
Will time always be in the denominator?
Yes
Do you always divide the numerator by the denominator to find the unit rate?
Yes
© 2015 Great Minds. eureka-math.orgG6-M1-TE-1.3.0-06.2015

NYS COMMON CORE MATHEMATICS CURRICULUM 6•1 Lesson 23
Lesson 23: Problem Solving Using Rates, Unit Rates, and Conversions
182
This work is licensed under a Creative Commons Attribution-NonCommercial-ShareAlike 3.0 Unported License.
Example 3 (9 minutes): Survival of the Fittest
Which runs faster: a cheetah that can run 60 feet in 4 seconds or gazelle that can run 100 feet in 8 seconds?
Example 3: Survival of the Fittest
_________ feet_________ seconds
=__________ feet
𝟏𝟏 second
_________ feet_________ seconds
=__________ feet
𝟏𝟏 second
𝟔𝟔𝟒𝟒𝟐𝟐
feetseconds
=𝟏𝟏𝟓𝟓𝟏𝟏
feetsecond
𝟏𝟏𝟒𝟒𝟒𝟒𝟖𝟖
feetseconds
=𝟏𝟏𝟐𝟐.𝟓𝟓𝟏𝟏
feetsecond
The cheetah runs faster.
Example 4 (7 minutes): Flying Fingers
What if the units of time are not the same in the two rates? What will this mean for the rate units? The secretary in the main office can type 225 words in 3 minutes, while the computer teacher can type 105 words in 90 seconds. Can we still compare the unit rates? Who types at a faster rate?
Ask half of the class to solve this problem using words per minute and the other half using words per second. Ask for a volunteer from each group to display and explain their solutions.
Example 4: Flying Fingers
=
=
𝟐𝟐𝟐𝟐𝟓𝟓𝟑𝟑
words minutes
=𝟏𝟏𝟓𝟓𝟏𝟏
wordsminute
𝟏𝟏𝟒𝟒𝟓𝟓𝟏𝟏.𝟓𝟓
wordsminutes
=𝟏𝟏𝟒𝟒𝟏𝟏
wordsminute
The secretary types faster.
𝟐𝟐𝟐𝟐𝟓𝟓𝟏𝟏𝟖𝟖𝟒𝟒
wordsseconds
=𝟏𝟏.𝟐𝟐𝟓𝟓𝟏𝟏
wordssecond
𝟏𝟏𝟒𝟒𝟓𝟓𝟗𝟗𝟒𝟒
wordsseconds
=𝟏𝟏.𝟏𝟏𝟔𝟔𝟔𝟔𝟔𝟔𝟔𝟔𝟏𝟏
𝟏𝟏 wordssecond
The secretary types faster.
Do we have to convert one time unit?
Yes What will happen if we do not convert one time unit so that they match?
We cannot compare the rates. It is not easy to tell which is faster: 70 words per minute or 1.25 words per second.
Does it matter which one you change?
No. Either change 90 seconds to 1.5 minutes or change 3 minutes to 180 seconds, as long as the rate units are the same when you are finished.
Can you choose the one that makes the problem easier for you?
Yes
Is there an advantage in choosing one method over the other?
Changing seconds to minutes avoids repeating decimals. Looking back on our work so far what is puzzling you? What questions do you have?
© 2015 Great Minds. eureka-math.orgG6-M1-TE-1.3.0-06.2015
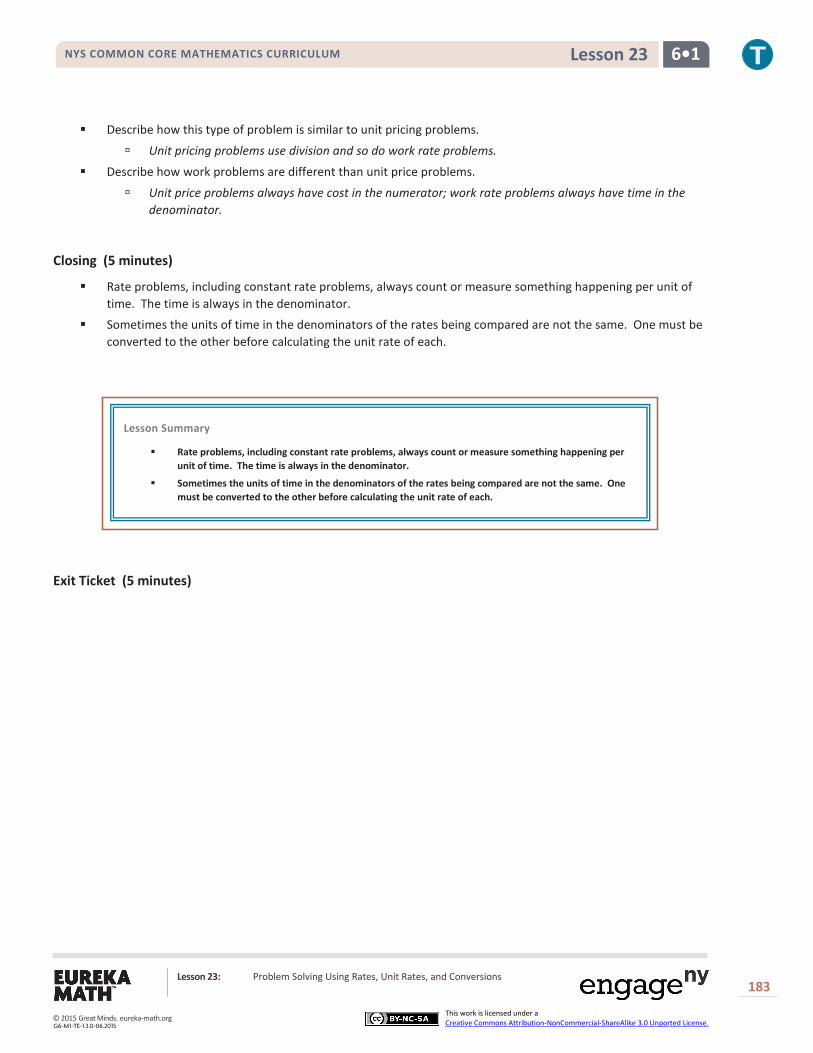
NYS COMMON CORE MATHEMATICS CURRICULUM 6•1 Lesson 23
Lesson 23: Problem Solving Using Rates, Unit Rates, and Conversions
183
This work is licensed under a Creative Commons Attribution-NonCommercial-ShareAlike 3.0 Unported License.
Describe how this type of problem is similar to unit pricing problems.
Unit pricing problems use division and so do work rate problems.
Describe how work problems are different than unit price problems.
Unit price problems always have cost in the numerator; work rate problems always have time in the denominator.
Closing (5 minutes)
Rate problems, including constant rate problems, always count or measure something happening per unit of time. The time is always in the denominator.
Sometimes the units of time in the denominators of the rates being compared are not the same. One must be converted to the other before calculating the unit rate of each.
Exit Ticket (5 minutes)
Lesson Summary
Rate problems, including constant rate problems, always count or measure something happening per unit of time. The time is always in the denominator.
Sometimes the units of time in the denominators of the rates being compared are not the same. One must be converted to the other before calculating the unit rate of each.
© 2015 Great Minds. eureka-math.orgG6-M1-TE-1.3.0-06.2015
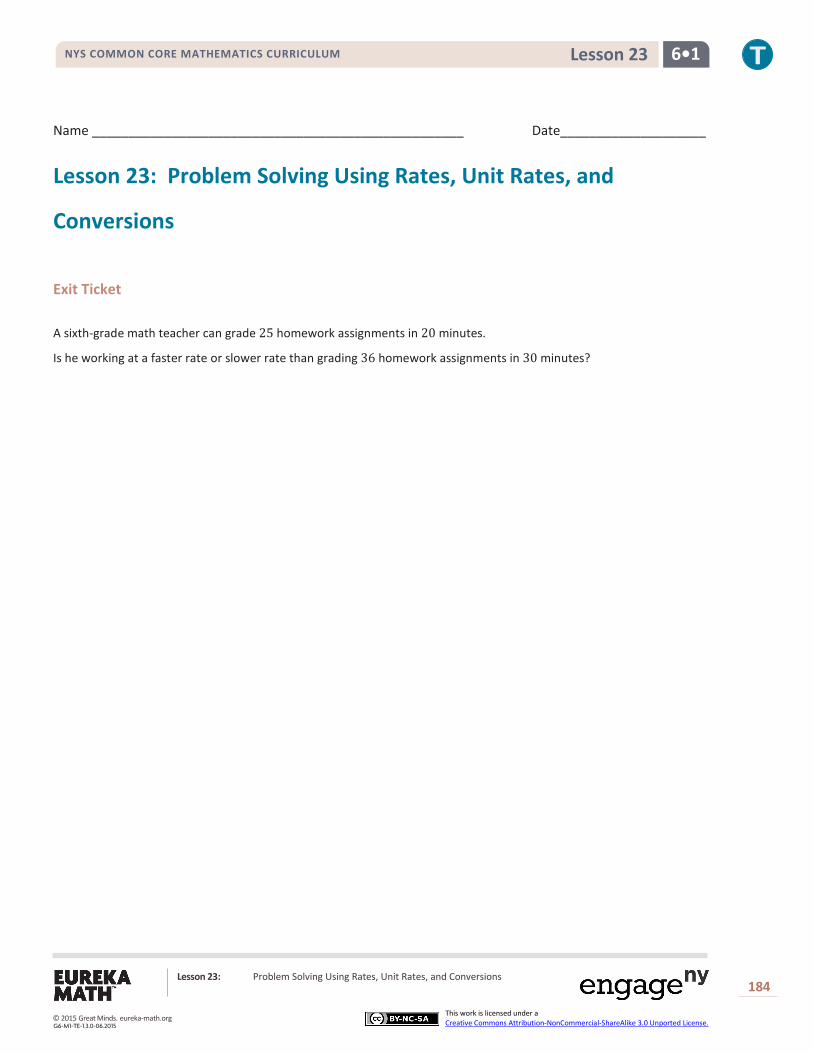
NYS COMMON CORE MATHEMATICS CURRICULUM 6•1 Lesson 23
Lesson 23: Problem Solving Using Rates, Unit Rates, and Conversions
184
This work is licensed under a Creative Commons Attribution-NonCommercial-ShareAlike 3.0 Unported License.
Name ___________________________________________________ Date____________________
Lesson 23: Problem Solving Using Rates, Unit Rates, and
Conversions
Exit Ticket A sixth-grade math teacher can grade 25 homework assignments in 20 minutes.
Is he working at a faster rate or slower rate than grading 36 homework assignments in 30 minutes?
© 2015 Great Minds. eureka-math.orgG6-M1-TE-1.3.0-06.2015
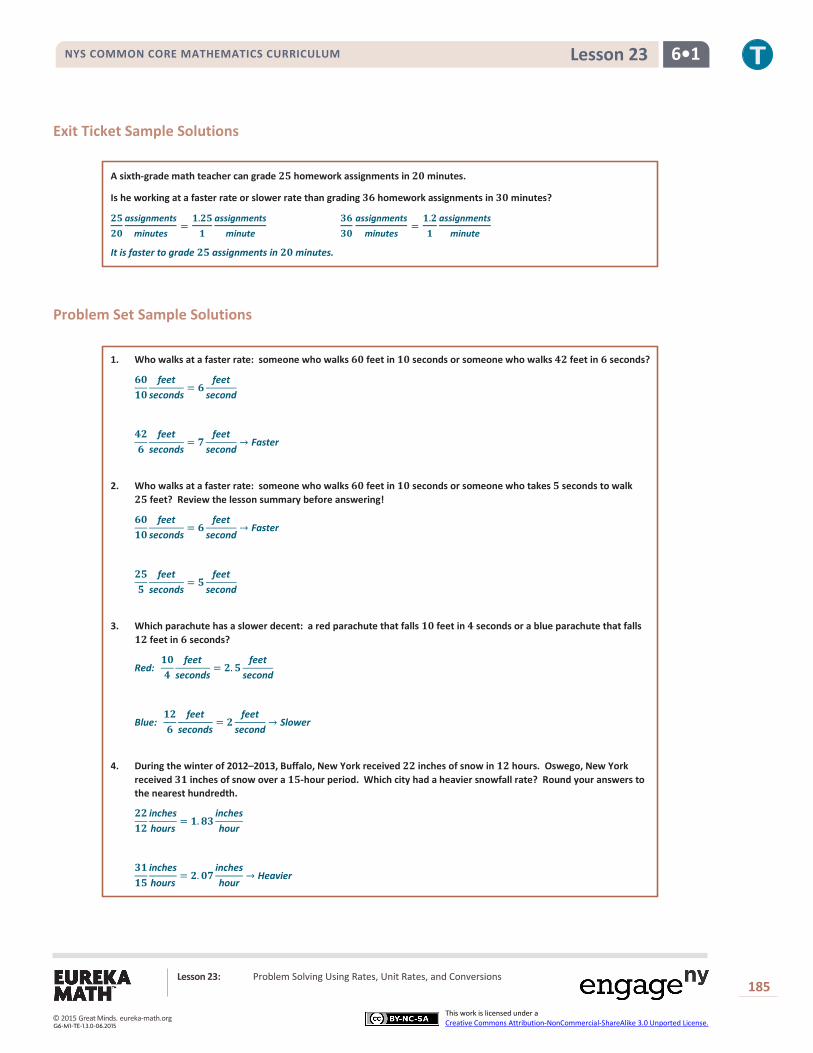
NYS COMMON CORE MATHEMATICS CURRICULUM 6•1 Lesson 23
Lesson 23: Problem Solving Using Rates, Unit Rates, and Conversions
185
This work is licensed under a Creative Commons Attribution-NonCommercial-ShareAlike 3.0 Unported License.
Exit Ticket Sample Solutions
A sixth-grade math teacher can grade 𝟐𝟐𝟓𝟓 homework assignments in 𝟐𝟐𝟒𝟒 minutes.
Is he working at a faster rate or slower rate than grading 𝟑𝟑𝟔𝟔 homework assignments in 𝟑𝟑𝟒𝟒 minutes?
𝟐𝟐𝟓𝟓𝟐𝟐𝟒𝟒
assignmentsminutes
=𝟏𝟏.𝟐𝟐𝟓𝟓𝟏𝟏
assignmentsminute
𝟑𝟑𝟔𝟔𝟑𝟑𝟒𝟒
assignmentsminutes
=𝟏𝟏.𝟐𝟐𝟏𝟏
assignmentsminute
It is faster to grade 𝟐𝟐𝟓𝟓 assignments in 𝟐𝟐𝟒𝟒 minutes.
Problem Set Sample Solutions
1. Who walks at a faster rate: someone who walks 𝟔𝟔𝟒𝟒 feet in 𝟏𝟏𝟒𝟒 seconds or someone who walks 𝟐𝟐𝟐𝟐 feet in 𝟔𝟔 seconds?
𝟔𝟔𝟒𝟒𝟏𝟏𝟒𝟒
feetseconds
= 𝟔𝟔feet
second
𝟐𝟐𝟐𝟐𝟔𝟔
feetseconds
= 𝟏𝟏feet
second→ Faster
2. Who walks at a faster rate: someone who walks 𝟔𝟔𝟒𝟒 feet in 𝟏𝟏𝟒𝟒 seconds or someone who takes 𝟓𝟓 seconds to walk 𝟐𝟐𝟓𝟓 feet? Review the lesson summary before answering!
𝟔𝟔𝟒𝟒𝟏𝟏𝟒𝟒
feetseconds
= 𝟔𝟔feet
second→ Faster
𝟐𝟐𝟓𝟓𝟓𝟓
feetseconds
= 𝟓𝟓feet
second
3. Which parachute has a slower decent: a red parachute that falls 𝟏𝟏𝟒𝟒 feet in 𝟐𝟐 seconds or a blue parachute that falls 𝟏𝟏𝟐𝟐 feet in 𝟔𝟔 seconds?
Red: 𝟏𝟏𝟒𝟒𝟐𝟐
feetseconds
= 𝟐𝟐.𝟓𝟓feet
second
Blue: 𝟏𝟏𝟐𝟐𝟔𝟔
feetseconds
= 𝟐𝟐feet
second→ Slower
4. During the winter of 2012–2013, Buffalo, New York received 𝟐𝟐𝟐𝟐 inches of snow in 𝟏𝟏𝟐𝟐 hours. Oswego, New York received 𝟑𝟑𝟏𝟏 inches of snow over a 𝟏𝟏𝟓𝟓-hour period. Which city had a heavier snowfall rate? Round your answers to the nearest hundredth.
𝟐𝟐𝟐𝟐𝟏𝟏𝟐𝟐
incheshours
= 𝟏𝟏.𝟖𝟖𝟑𝟑incheshour
𝟑𝟑𝟏𝟏𝟏𝟏𝟓𝟓
incheshours
= 𝟐𝟐.𝟒𝟒𝟏𝟏incheshour
→ Heavier
© 2015 Great Minds. eureka-math.orgG6-M1-TE-1.3.0-06.2015

NYS COMMON CORE MATHEMATICS CURRICULUM 6•1 Lesson 23
Lesson 23: Problem Solving Using Rates, Unit Rates, and Conversions
186
This work is licensed under a Creative Commons Attribution-NonCommercial-ShareAlike 3.0 Unported License.
5. A striped marlin can swim at a rate of 𝟏𝟏𝟒𝟒 miles per hour. Is this a faster or slower rate than a sailfish, which takes 𝟑𝟑𝟒𝟒 minutes to swim 𝟐𝟐𝟒𝟒 miles?
Marlin: 𝟏𝟏𝟒𝟒 𝐦𝐦𝐦𝐦𝐦𝐦 → Slower
Sailfish:
𝟐𝟐𝟒𝟒𝟑𝟑𝟒𝟒
milesminutes
×𝟔𝟔𝟒𝟒𝟏𝟏
minuteshour
=𝟐𝟐𝟐𝟐𝟒𝟒𝟒𝟒𝟑𝟑𝟒𝟒
mileshour
= 𝟖𝟖𝟒𝟒 𝐦𝐦𝐦𝐦𝐦𝐦
6. One math student, John, can solve 𝟔𝟔 math problems in 𝟐𝟐𝟒𝟒 minutes while another student, Juaquine, can solve the same 𝟔𝟔 math problems at a rate of 𝟏𝟏 problem per 𝟐𝟐 minutes. Who works faster?
𝟔𝟔𝟐𝟐𝟒𝟒
problemsminutes
= 𝟒𝟒.𝟑𝟑problems
minute → Faster
𝟏𝟏𝟐𝟐
problemminutes
= 𝟒𝟒.𝟐𝟐𝟓𝟓problems
minute
© 2015 Great Minds. eureka-math.orgG6-M1-TE-1.3.0-06.2015
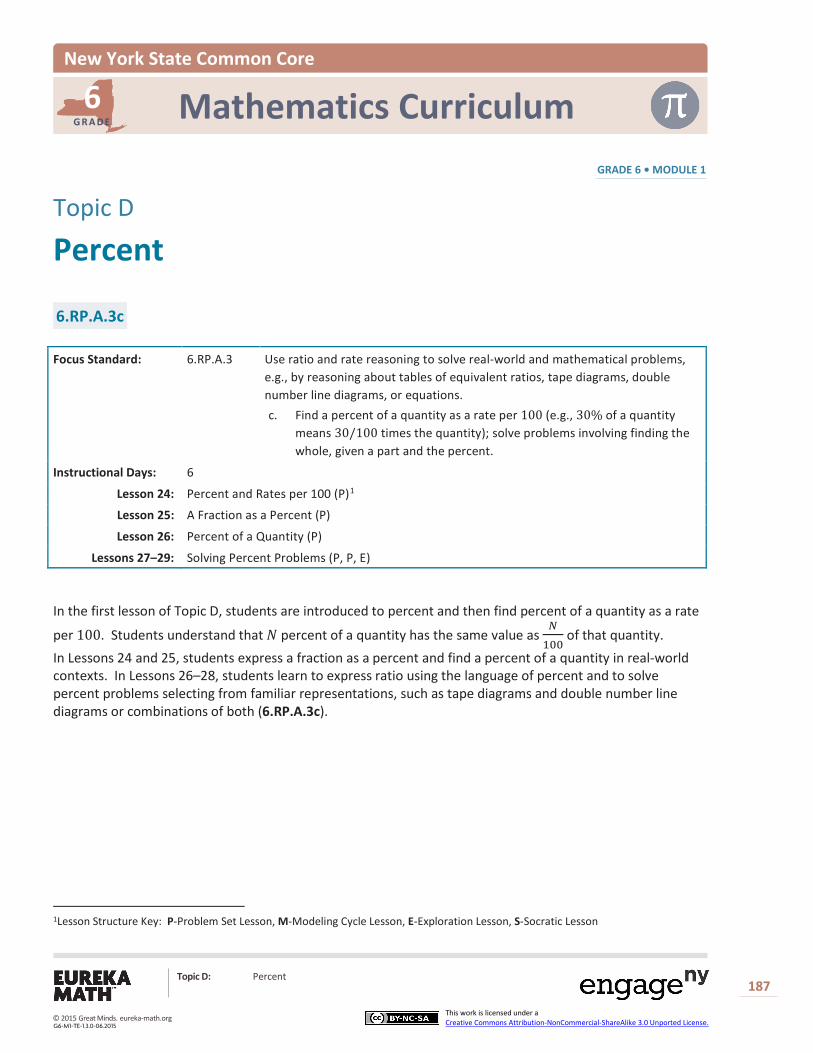
New York State Common Core
Mathematics Curriculum GRADE 6 • MODULE 1
6 G R A D E
Topic D
Percent
6.RP.A.3c
Focus Standard: 6.RP.A.3 Use ratio and rate reasoning to solve real-world and mathematical problems, e.g., by reasoning about tables of equivalent ratios, tape diagrams, double number line diagrams, or equations. c. Find a percent of a quantity as a rate per 100 (e.g., 30% of a quantity
means 30/100 times the quantity); solve problems involving finding the whole, given a part and the percent.
Instructional Days: 6
Lesson 24: Percent and Rates per 100 (P)1
Lesson 25: A Fraction as a Percent (P)
Lesson 26: Percent of a Quantity (P)
Lessons 27–29: Solving Percent Problems (P, P, E)
In the first lesson of Topic D, students are introduced to percent and then find percent of a quantity as a rate
per 100. Students understand that 𝑁𝑁 percent of a quantity has the same value as 𝑁𝑁100
of that quantity. In Lessons 24 and 25, students express a fraction as a percent and find a percent of a quantity in real-world contexts. In Lessons 26–28, students learn to express ratio using the language of percent and to solve percent problems selecting from familiar representations, such as tape diagrams and double number line diagrams or combinations of both (6.RP.A.3c).
1Lesson Structure Key: P-Problem Set Lesson, M-Modeling Cycle Lesson, E-Exploration Lesson, S-Socratic Lesson
Topic D: Percent
187
This work is licensed under a Creative Commons Attribution-NonCommercial-ShareAlike 3.0 Unported License.
© 2015 Great Minds. eureka-math.orgG6-M1-TE-1.3.0-06.2015

NYS COMMON CORE MATHEMATICS CURRICULUM 6•1 Lesson 24
Lesson 24: Percent and Rates per 100
Student Outcomes
Students understand that percents are related to part-to-whole ratios and rates where the whole is 100. Students model percents and write a percent as a fraction over 100 or a decimal to the hundredths place.
Classwork
Example 1 (5 minutes)
Begin class with a discussion to gather prior knowledge and to show a relationship to real-world applications.
Imagine that you are shopping. You want to purchase an item for $100, but today it is 20% off. What does this mean?
It means that $20 out of every $100 dollars will be subtracted from the total.
How can this situation be modeled?
We could use a tape diagram that represents $100 divided into ten sections of $10. Two of the sections represent the discount, and eight of the sections represent the amount paid for the item. It could also be shown on a 10 × 10 grid, where 20 of the squares represent the discount, and 80 squares represent the amount paid.
How are percent problems related to the types of problems we have been working with involving ratios and rates? Answers will vary depending on prior knowledge. Some students may see that 20% of $100 is $20 off.
Other students may see that we are trying to find part of a whole.
Use the following website on a projector to visually explore percents in a 10 × 10 grid model.
http://nlvm.usu.edu/en/nav/frames_asid_333_g_3_t_1.html?from category_g_3_t_1.html
Click the explore button on the website to be able to show 20%. This provides students with the visual for making the connection that 20% means 20 out of 100.
What does this grid show?
100 blocks
How many are shaded in?
20 blocks How many are not shaded in?
80 blocks
How can we use this model to help us think through 20% off of $100?
From the grid, I can see that when I save 20%, I am paying 80% of the original value.
Lesson 24: Percent and Rates per 100
188
This work is licensed under a Creative Commons Attribution-NonCommercial-ShareAlike 3.0 Unported License. © 2015 Great Minds. eureka-math.org
G6-M1-TE-1.3.0-06.2015
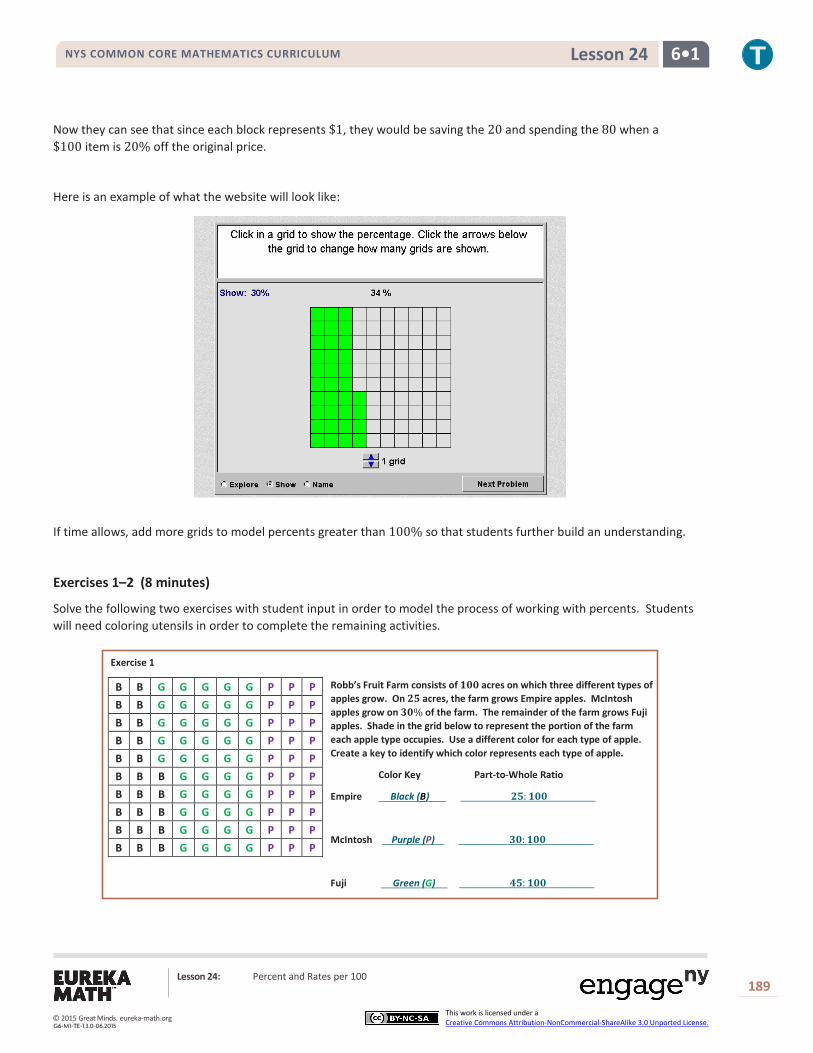
NYS COMMON CORE MATHEMATICS CURRICULUM 6•1 Lesson 24
Now they can see that since each block represents $1, they would be saving the 20 and spending the 80 when a $100 item is 20% off the original price.
Here is an example of what the website will look like:
If time allows, add more grids to model percents greater than 100% so that students further build an understanding.
Exercises 1–2 (8 minutes)
Solve the following two exercises with student input in order to model the process of working with percents. Students will need coloring utensils in order to complete the remaining activities.
Exercise 1
B B G G G G G P P P B B G G G G G P P P B B G G G G G P P P B B G G G G G P P P B B G G G G G P P P B B B G G G G P P P B B B G G G G P P P B B B G G G G P P P B B B G G G G P P P B B B G G G G P P P
Robb’s Fruit Farm consists of 𝟏𝟏𝟏𝟏𝟏𝟏 acres on which three different types of apples grow. On 𝟐𝟐𝟐𝟐 acres, the farm grows Empire apples. McIntosh apples grow on 𝟑𝟑𝟏𝟏% of the farm. The remainder of the farm grows Fuji apples. Shade in the grid below to represent the portion of the farm each apple type occupies. Use a different color for each type of apple. Create a key to identify which color represents each type of apple.
Color Key Part-to-Whole Ratio
Empire Black (B) 𝟐𝟐𝟐𝟐:𝟏𝟏𝟏𝟏𝟏𝟏
McIntosh Purple (P) 𝟑𝟑𝟏𝟏:𝟏𝟏𝟏𝟏𝟏𝟏
Fuji Green (G) 𝟒𝟒𝟐𝟐:𝟏𝟏𝟏𝟏𝟏𝟏
Lesson 24: Percent and Rates per 100
189
This work is licensed under a Creative Commons Attribution-NonCommercial-ShareAlike 3.0 Unported License. © 2015 Great Minds. eureka-math.org
G6-M1-TE-1.3.0-06.2015

NYS COMMON CORE MATHEMATICS CURRICULUM 6•1 Lesson 24
Exercise 2
The shaded portion of the grid below represents the portion of a granola bar remaining.
What percent does each block of granola bar represent?
𝟏𝟏% of the granola bar
What percent of the granola bar remains?
𝟖𝟖𝟏𝟏%
What other ways can we represent this percent?
𝟖𝟖𝟏𝟏𝟏𝟏𝟏𝟏𝟏𝟏
, 𝟖𝟖𝟏𝟏𝟏𝟏
, 𝟒𝟒𝟐𝟐
, 𝟏𝟏𝟏𝟏𝟐𝟐𝟏𝟏
,𝟑𝟑𝟐𝟐 𝟒𝟒𝟏𝟏
, 𝟏𝟏𝟒𝟒𝟖𝟖𝟏𝟏
,𝟏𝟏.𝟖𝟖
In this example, the teacher can discuss how 0.01 is related to 1100
and 1%. There are many examples that could be
used to represent this percent in the last question. Students should list several examples.
Exercises 3–6 (15 minutes)
In predetermined pairs or groups, students solve the remaining problems.
Circulate around the room. Students may have varying answers for several questions in the practice. There is more than one possible answer for several questions to spark conversation between pairs or small groups.
For example, the second 10 × 10 grid used two different colors, so students could compare colored to total: light gray to total, dark gray to total. In addition, when they are asked to describe the different scenarios, some may use part-to-part ratios while others may use part-to-whole. This is a good time for a discussion on how part-to-part can lead to part-to-whole. In addition, it is important to remember that percents are out of a total 100, so consider asking students which form of the ratio is most helpful for getting a percent.
A percent is just another way to show the part-to-whole ratio for each picture.
0.01 0.01 0.01 0.01 0.01 0.01 0.01 0.01 0.01 0.01
0.01 0.01 0.01 0.01 0.01 0.01 0.01 0.01 0.01 0.01
0.01 0.01 0.01 0.01 0.01 0.01 0.01 0.01 0.01 0.01
0.01 0.01 0.01 0.01 0.01 0.01 0.01 0.01 0.01 0.01
0.01 0.01 0.01 0.01 0.01 0.01 0.01 0.01 0.01 0.01
0.01 0.01 0.01 0.01 0.01 0.01 0.01 0.01 0.01 0.01
0.01 0.01 0.01 0.01 0.01 0.01 0.01 0.01 0.01 0.01
0.01 0.01 0.01 0.01 0.01 0.01 0.01 0.01 0.01 0.01
0.01 0.01 0.01 0.01 0.01 0.01 0.01 0.01 0.01 0.01
0.01 0.01 0.01 0.01 0.01 0.01 0.01 0.01 0.01 0.01
Lesson 24: Percent and Rates per 100
190
This work is licensed under a Creative Commons Attribution-NonCommercial-ShareAlike 3.0 Unported License. © 2015 Great Minds. eureka-math.org
G6-M1-TE-1.3.0-06.2015

NYS COMMON CORE MATHEMATICS CURRICULUM 6•1 Lesson 24
Exercise 3
a. For each figure shown, represent the gray shaded region as a percent of the whole figure. Write your answer as a decimal, fraction, and percent.
b. What ratio is being modeled in each picture?
Picture (a): Answers will vary. One example is the ratio of darker gray to the total is 𝟐𝟐𝟏𝟏 to 𝟏𝟏𝟏𝟏𝟏𝟏.
Picture (b): 𝟐𝟐𝟏𝟏 to 𝟏𝟏𝟏𝟏𝟏𝟏, or a correct answer for whichever description they chose.
Picture (c): The ratio of gray to the total is 𝟒𝟒𝟖𝟖 to 𝟏𝟏𝟏𝟏𝟏𝟏.
c. How are the ratios and percents related?
Answers will vary.
Exercise 4
Each relationship below compares the shaded portion (or part) to the entire figure (the whole). Complete the table.
Percentage Decimal Fraction Ratio Model
𝟏𝟏% 𝟏𝟏.𝟏𝟏𝟏𝟏 𝟏𝟏𝟏𝟏𝟏𝟏𝟏𝟏
𝟏𝟏:𝟏𝟏𝟏𝟏𝟏𝟏
Picture (a) Picture (b) Picture (c)
𝟐𝟐𝟏𝟏% is shaded darker than
the rest, 𝟏𝟏.𝟐𝟐𝟏𝟏, 𝟐𝟐𝟏𝟏𝟏𝟏𝟏𝟏𝟏𝟏
.
Answers will vary. Sample answer (colored compared
to total): 𝟐𝟐𝟏𝟏%, 𝟏𝟏.𝟐𝟐𝟏𝟏, 𝟐𝟐𝟏𝟏𝟏𝟏𝟏𝟏𝟏𝟏
(Students could also compare darker shading to total, lighter shading to total, light shading to darker shading, darker shading to lighter shading, etc.)
𝟒𝟒𝟖𝟖%, 𝟏𝟏.𝟒𝟒𝟖𝟖, 𝟒𝟒𝟖𝟖𝟏𝟏𝟏𝟏𝟏𝟏
Lesson 24: Percent and Rates per 100
191
This work is licensed under a Creative Commons Attribution-NonCommercial-ShareAlike 3.0 Unported License. © 2015 Great Minds. eureka-math.org
G6-M1-TE-1.3.0-06.2015

NYS COMMON CORE MATHEMATICS CURRICULUM 6•1 Lesson 24
𝟏𝟏𝟏𝟏%
𝟏𝟏.𝟏𝟏 𝟏𝟏𝟏𝟏𝟏𝟏𝟏𝟏𝟏𝟏
,𝟏𝟏𝟏𝟏𝟏𝟏
𝟏𝟏𝟏𝟏:𝟏𝟏𝟏𝟏𝟏𝟏
𝟏𝟏𝟏𝟏𝟏𝟏%
𝟏𝟏 𝟏𝟏𝟏𝟏𝟏𝟏𝟏𝟏𝟏𝟏𝟏𝟏
=𝟏𝟏𝟏𝟏
𝟏𝟏:𝟏𝟏
𝟏𝟏 wholes
𝟑𝟑𝟐𝟐% 𝟏𝟏.𝟑𝟑𝟐𝟐 𝟑𝟑𝟐𝟐𝟏𝟏𝟏𝟏𝟏𝟏
𝟑𝟑𝟐𝟐:𝟏𝟏𝟏𝟏𝟏𝟏
𝟐𝟐𝟐𝟐% 𝟏𝟏.𝟐𝟐𝟐𝟐 𝟐𝟐𝟐𝟐𝟏𝟏𝟏𝟏𝟏𝟏
,𝟏𝟏𝟏𝟏𝟐𝟐𝟏𝟏
𝟏𝟏𝟏𝟏:𝟐𝟐𝟏𝟏
𝟗𝟗𝟏𝟏% 𝟏𝟏.𝟗𝟗 𝟗𝟗𝟏𝟏𝟏𝟏
𝟗𝟗:𝟏𝟏𝟏𝟏
𝟕𝟕𝟏𝟏% 𝟏𝟏.𝟕𝟕 𝟕𝟕𝟏𝟏𝟏𝟏
,𝟕𝟕𝟏𝟏𝟏𝟏𝟏𝟏𝟏𝟏
𝟕𝟕:𝟏𝟏𝟏𝟏
Lesson 24: Percent and Rates per 100
192
This work is licensed under a Creative Commons Attribution-NonCommercial-ShareAlike 3.0 Unported License. © 2015 Great Minds. eureka-math.org
G6-M1-TE-1.3.0-06.2015

NYS COMMON CORE MATHEMATICS CURRICULUM 6•1 Lesson 24
Exercise 5
Mr. Brown shares with the class that 𝟕𝟕𝟏𝟏% of the students got an A on the English vocabulary quiz. If Mr. Brown has 𝟏𝟏𝟏𝟏𝟏𝟏 students, create a model to show how many of the students received an A on the quiz.
𝟕𝟕𝟏𝟏% →𝟕𝟕𝟏𝟏𝟏𝟏𝟏𝟏𝟏𝟏
=𝟕𝟕𝟏𝟏𝟏𝟏
What fraction of the students received an A on the quiz?
𝟕𝟕𝟏𝟏𝟏𝟏
or 𝟕𝟕𝟏𝟏𝟏𝟏𝟏𝟏𝟏𝟏
How could we represent this amount using a decimal?
𝟏𝟏.𝟕𝟕 or 𝟏𝟏.𝟕𝟕𝟏𝟏
How are the decimal, the fraction, and the percent all related?
The decimal, fraction, and percent all show 𝟕𝟕𝟏𝟏 out of 𝟏𝟏𝟏𝟏𝟏𝟏.
Exercise 6
Marty owns a lawn mowing service. His company, which consists of three employees, has 𝟏𝟏𝟏𝟏𝟏𝟏 lawns to mow this week. Use the 𝟏𝟏𝟏𝟏 × 𝟏𝟏𝟏𝟏 grid to model how the work could have been distributed between the three employees.
Students choose how they want to separate the workload. The answers will vary. Below is a sample response.
Closing (12 minutes)
Students present their work. Each group presents a problem or a part of a problem in order for all groups to respond.
Students complete this closing activity.
What are three things you learned about in this lesson?
Share two ways that you can write 2%. What is one thing that you still want to know about from the lesson?
G G G P P P P P B B
G G G P P P P P B B
G G G P P P P P B B
G G G P P P P P B B
G G G P P P P P B B
G G G P P P P P B B
G G G P P P P P B B
G G G P P P P P B B
G G G P P P P P B B
G G G P P P P P B B
Worker Percentage Fraction Decimal
Employee 1 (G) 𝟑𝟑𝟏𝟏%
𝟑𝟑𝟏𝟏𝟏𝟏𝟏𝟏𝟏𝟏
𝟏𝟏.𝟑𝟑𝟏𝟏
Employee 2 (P) 𝟐𝟐𝟏𝟏%
𝟐𝟐𝟏𝟏𝟏𝟏𝟏𝟏𝟏𝟏
𝟏𝟏.𝟐𝟐𝟏𝟏
Employee 3 (B) 𝟐𝟐𝟏𝟏%
𝟐𝟐𝟏𝟏𝟏𝟏𝟏𝟏𝟏𝟏
𝟏𝟏.𝟐𝟐𝟏𝟏
Lesson 24: Percent and Rates per 100
193
This work is licensed under a Creative Commons Attribution-NonCommercial-ShareAlike 3.0 Unported License. © 2015 Great Minds. eureka-math.org
G6-M1-TE-1.3.0-06.2015

NYS COMMON CORE MATHEMATICS CURRICULUM 6•1 Lesson 24
Exit Ticket (5 minutes)
Lesson Summary
One percent is the number 𝟏𝟏𝟏𝟏𝟏𝟏𝟏𝟏
and is written as 𝟏𝟏%.
Percentages can be used as rates. For example, 𝟑𝟑𝟏𝟏% of a quantity means 𝟑𝟑𝟏𝟏𝟏𝟏𝟏𝟏𝟏𝟏
times the quantity.
We can create models of percents. One example would be to shade a 𝟏𝟏𝟏𝟏 × 𝟏𝟏𝟏𝟏 grid. Each square in a 𝟏𝟏𝟏𝟏× 𝟏𝟏𝟏𝟏 grid represents 𝟏𝟏% or 𝟏𝟏.𝟏𝟏𝟏𝟏.
Lesson 24: Percent and Rates per 100
194
This work is licensed under a Creative Commons Attribution-NonCommercial-ShareAlike 3.0 Unported License. © 2015 Great Minds. eureka-math.org
G6-M1-TE-1.3.0-06.2015
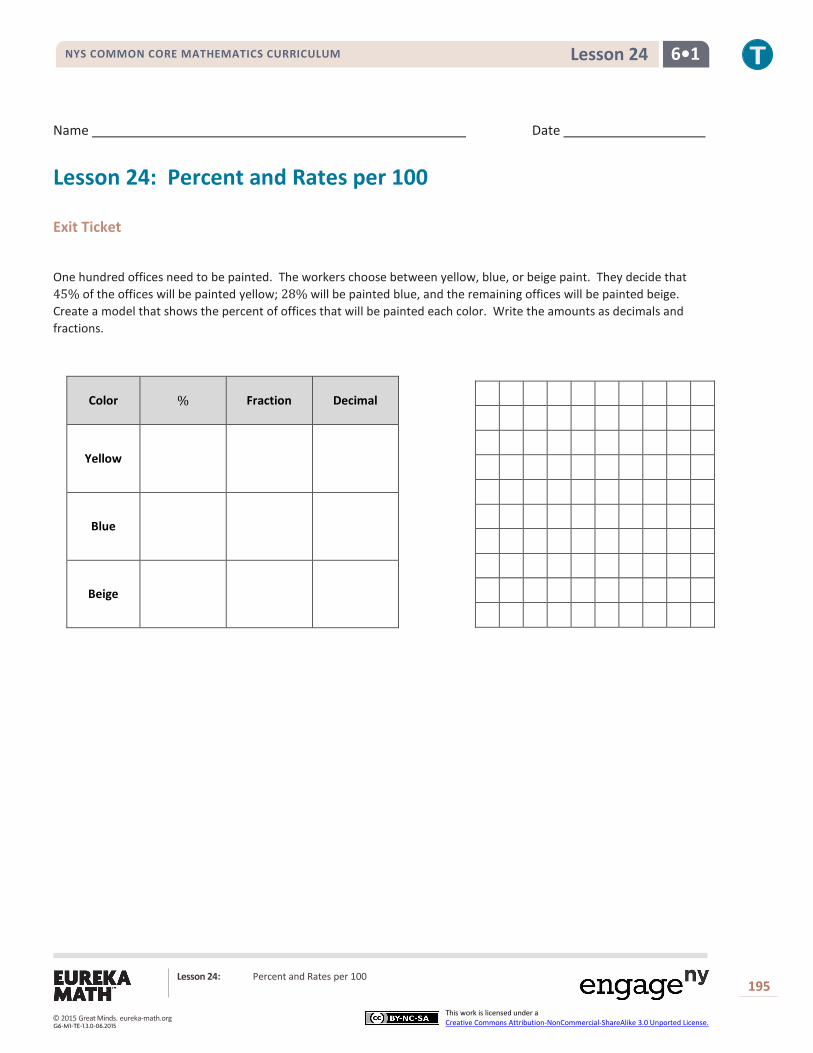
NYS COMMON CORE MATHEMATICS CURRICULUM 6•1 Lesson 24
Name Date
Lesson 24: Percent and Rates per 100
Exit Ticket
One hundred offices need to be painted. The workers choose between yellow, blue, or beige paint. They decide that 45% of the offices will be painted yellow; 28% will be painted blue, and the remaining offices will be painted beige. Create a model that shows the percent of offices that will be painted each color. Write the amounts as decimals and fractions.
Color % Fraction Decimal
Yellow
Blue
Beige
Lesson 24: Percent and Rates per 100
195
This work is licensed under a Creative Commons Attribution-NonCommercial-ShareAlike 3.0 Unported License. © 2015 Great Minds. eureka-math.org
G6-M1-TE-1.3.0-06.2015

NYS COMMON CORE MATHEMATICS CURRICULUM 6•1 Lesson 24
0.01 0.01 0.01 0.01 0.01 0.01 0.01 0.01 0.01 0.01
0.01 0.01 0.01 0.01 0.01 0.01 0.01 0.01 0.01 0.01
0.01 0.01 0.01 0.01 0.01 0.01 0.01 0.01 0.01 0.01
0.01 0.01 0.01 0.01 0.01 0.01 0.01 0.01 0.01 0.01
0.01 0.01 0.01 0.01 0.01 0.01 0.01 0.01 0.01 0.01
0.01 0.01 0.01 0.01 0.01 0.01 0.01 0.01 0.01 0.01
0.01 0.01 0.01 0.01 0.01 0.01 0.01 0.01 0.01 0.01
0.01 0.01 0.01 0.01 0.01 0.01 0.01 0.01 0.01 0.01
0.01 0.01 0.01 0.01 0.01 0.01 0.01 0.01 0.01 0.01
0.01 0.01 0.01 0.01 0.01 0.01 0.01 0.01 0.01 0.01
Exit Ticket Sample Solutions
One hundred offices need to be painted. The workers choose between yellow, blue, or beige paint. They decide that 𝟒𝟒𝟐𝟐% of the offices will be painted yellow; 𝟐𝟐𝟖𝟖% will be painted blue, and the remaining offices will be painted beige. Create a model that shows the percent of offices that will be painted each color. Write the amounts as decimals and fractions.
Problem Set Sample Solutions
1. Marissa just bought 𝟏𝟏𝟏𝟏𝟏𝟏 acres of land. She wants to grow apple, peach, and cherry trees on her land. Color the model to show how the acres could be distributed for each type of tree. Using your model, complete the table.
2. After renovations on Kim’s bedroom, only 𝟑𝟑𝟏𝟏 percent of one wall is left without any décor. Shade the grid below to represent the space that is left to decorate.
a. What does each block represent?
Each block represents 𝟏𝟏𝟏𝟏𝟏𝟏𝟏𝟏
of the total wall.
b. What percent of this wall has been decorated?
𝟑𝟑𝟏𝟏%
Color % Fraction Decimal
Yellow 𝟒𝟒𝟐𝟐 𝟒𝟒𝟐𝟐𝟏𝟏𝟏𝟏𝟏𝟏
𝟏𝟏.𝟒𝟒𝟐𝟐
Blue 𝟐𝟐𝟖𝟖 𝟐𝟐𝟖𝟖𝟏𝟏𝟏𝟏𝟏𝟏
𝟏𝟏.𝟐𝟐𝟖𝟖
Beige 𝟐𝟐𝟕𝟕 𝟐𝟐𝟕𝟕𝟏𝟏𝟏𝟏𝟏𝟏
𝟏𝟏.𝟐𝟐𝟕𝟕
Tree Percentage Fraction Decimal
Apple 𝟐𝟐𝟏𝟏% 𝟐𝟐𝟏𝟏𝟏𝟏𝟏𝟏𝟏𝟏
𝟏𝟏.𝟐𝟐𝟏𝟏
Peach 𝟒𝟒𝟐𝟐% 𝟒𝟒𝟐𝟐𝟏𝟏𝟏𝟏𝟏𝟏
𝟏𝟏.𝟒𝟒𝟐𝟐
Cherry 𝟐𝟐𝟗𝟗% 𝟐𝟐𝟗𝟗𝟏𝟏𝟏𝟏𝟏𝟏
𝟏𝟏.𝟐𝟐𝟗𝟗
Apple–Yellow, Peach– Green, Cherry–Blue
Lesson 24: Percent and Rates per 100
196
This work is licensed under a Creative Commons Attribution-NonCommercial-ShareAlike 3.0 Unported License. © 2015 Great Minds. eureka-math.org
G6-M1-TE-1.3.0-06.2015
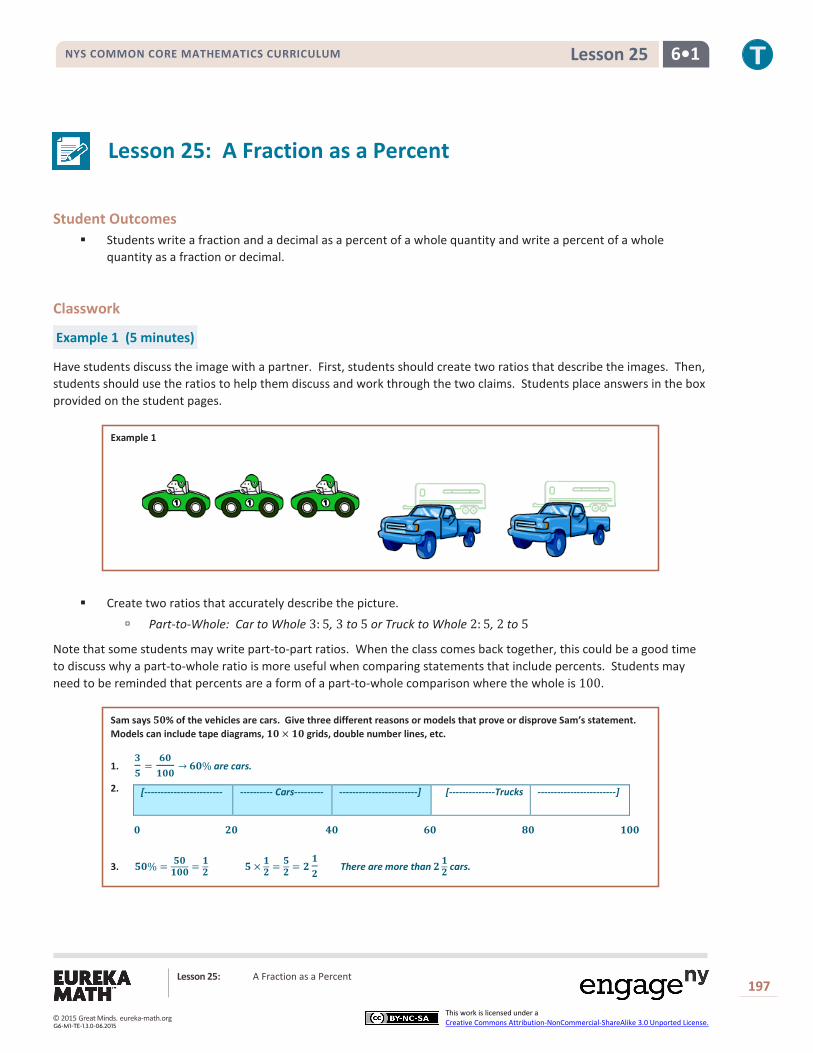
NYS COMMON CORE MATHEMATICS CURRICULUM 6•1 Lesson 25
Lesson 25: A Fraction as a Percent
Student Outcomes
Students write a fraction and a decimal as a percent of a whole quantity and write a percent of a whole quantity as a fraction or decimal.
Classwork
Example 1 (5 minutes)
Have students discuss the image with a partner. First, students should create two ratios that describe the images. Then, students should use the ratios to help them discuss and work through the two claims. Students place answers in the box provided on the student pages.
Example 1
Create two ratios that accurately describe the picture.
Part-to-Whole: Car to Whole 3: 5, 3 to 5 or Truck to Whole 2: 5, 2 to 5
Note that some students may write part-to-part ratios. When the class comes back together, this could be a good time to discuss why a part-to-whole ratio is more useful when comparing statements that include percents. Students may need to be reminded that percents are a form of a part-to-whole comparison where the whole is 100.
Sam says 𝟓𝟓𝟓𝟓% of the vehicles are cars. Give three different reasons or models that prove or disprove Sam’s statement. Models can include tape diagrams, 𝟏𝟏𝟓𝟓× 𝟏𝟏𝟓𝟓 grids, double number lines, etc.
1. 𝟑𝟑𝟓𝟓
=𝟔𝟔𝟓𝟓𝟏𝟏𝟓𝟓𝟓𝟓
→ 𝟔𝟔𝟓𝟓% are cars.
2.
3. 𝟓𝟓𝟓𝟓% = 𝟓𝟓𝟓𝟓𝟏𝟏𝟓𝟓𝟓𝟓 = 𝟏𝟏
𝟐𝟐 𝟓𝟓 × 𝟏𝟏𝟐𝟐 = 𝟓𝟓
𝟐𝟐 = 𝟐𝟐 𝟏𝟏𝟐𝟐
There are more than 𝟐𝟐𝟏𝟏𝟐𝟐 cars.
[------------------------ ---------- Cars--------- ------------------------] [--------------Trucks ------------------------]
𝟓𝟓 𝟐𝟐𝟓𝟓 𝟒𝟒𝟓𝟓 𝟔𝟔𝟓𝟓 𝟖𝟖𝟓𝟓 𝟏𝟏𝟓𝟓𝟓𝟓
Lesson 25: A Fraction as a Percent
197
This work is licensed under a Creative Commons Attribution-NonCommercial-ShareAlike 3.0 Unported License. © 2015 Great Minds. eureka-math.org
G6-M1-TE-1.3.0-06.2015
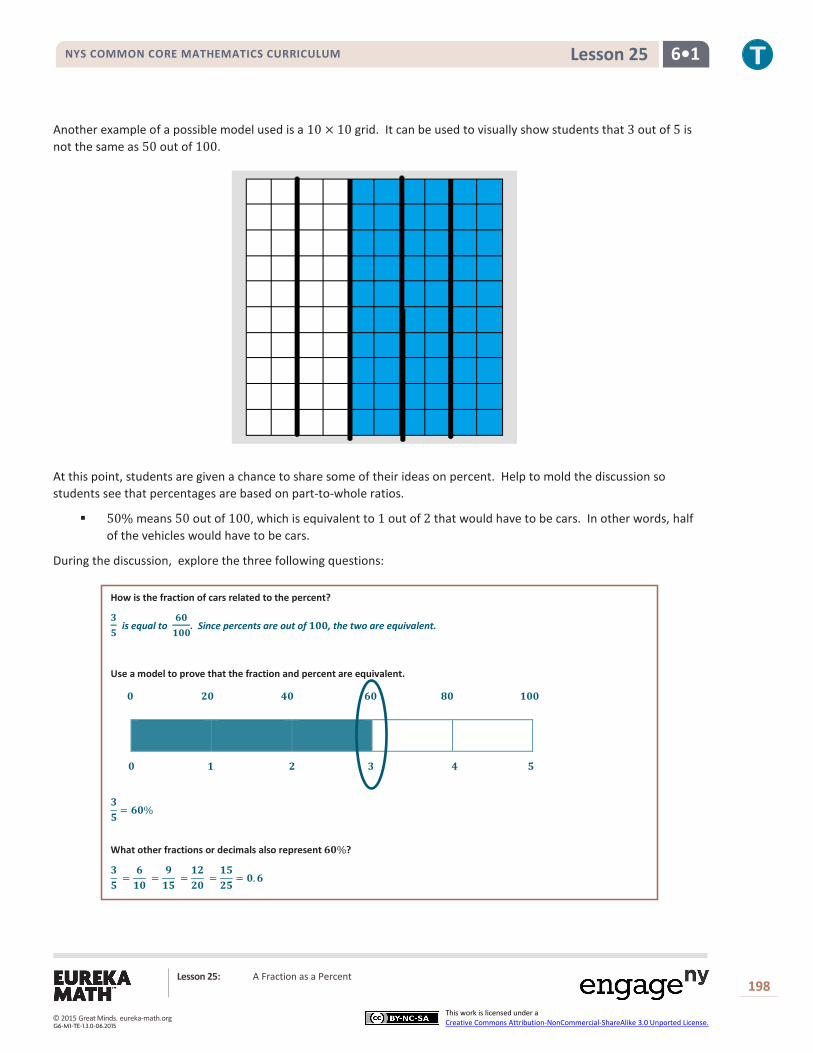
NYS COMMON CORE MATHEMATICS CURRICULUM 6•1 Lesson 25
Another example of a possible model used is a 10 × 10 grid. It can be used to visually show students that 3 out of 5 is not the same as 50 out of 100.
At this point, students are given a chance to share some of their ideas on percent. Help to mold the discussion so students see that percentages are based on part-to-whole ratios.
50% means 50 out of 100, which is equivalent to 1 out of 2 that would have to be cars. In other words, half of the vehicles would have to be cars.
During the discussion, explore the three following questions:
How is the fraction of cars related to the percent?
𝟑𝟑𝟓𝟓 is equal to
𝟔𝟔𝟓𝟓𝟏𝟏𝟓𝟓𝟓𝟓
. Since percents are out of 𝟏𝟏𝟓𝟓𝟓𝟓, the two are equivalent.
Use a model to prove that the fraction and percent are equivalent.
𝟑𝟑𝟓𝟓
= 𝟔𝟔𝟓𝟓%
What other fractions or decimals also represent 𝟔𝟔𝟓𝟓%?
𝟑𝟑𝟓𝟓
=𝟔𝟔𝟏𝟏𝟓𝟓
=𝟗𝟗𝟏𝟏𝟓𝟓
=𝟏𝟏𝟐𝟐𝟐𝟐𝟓𝟓
=𝟏𝟏𝟓𝟓𝟐𝟐𝟓𝟓
= 𝟓𝟓.𝟔𝟔
𝟓𝟓 𝟐𝟐𝟓𝟓 𝟒𝟒𝟓𝟓 𝟔𝟔𝟓𝟓 𝟖𝟖𝟓𝟓 𝟏𝟏𝟓𝟓𝟓𝟓
𝟓𝟓 𝟏𝟏 𝟐𝟐 𝟑𝟑 𝟒𝟒 𝟓𝟓
Lesson 25: A Fraction as a Percent
198
This work is licensed under a Creative Commons Attribution-NonCommercial-ShareAlike 3.0 Unported License. © 2015 Great Minds. eureka-math.org
G6-M1-TE-1.3.0-06.2015

NYS COMMON CORE MATHEMATICS CURRICULUM 6•1 Lesson 25
Example 2 (10 minutes)
Example 2
A survey was taken that asked participants whether or not they were happy with their job. An overall score was given. 𝟑𝟑𝟓𝟓𝟓𝟓 of the participants were unhappy while 𝟕𝟕𝟓𝟓𝟓𝟓 of the participants were happy with their job. Give a part-to-whole fraction for comparing happy participants to the whole. Then write a part-to-whole fraction of the unhappy participants to the whole. What percent were happy with their job, and what percent were unhappy with their job?
Create a model to justify your answer.
Have students write a fraction to represent the number of people that are happy with their job compared to the total.
number of people who said they were happy(part)total number of people questioned (whole)
=7001000
=70100
= 70%, Students should also see that 30% were unhappy.
Why is it helpful to write this fraction with a denominator of 100?
Percent refers to the number per 100.
How would we represent this as a decimal? 0.70 = 0.7
How can you model this question using a double number line?
Students can simply give a verbal description of the number line because it is so similar to the tape diagram.
The same reasoning could be used to create double number line graphs with percents on one line and the values being used on the other.
The two questions are meant to help show students that fractions with denominators other than 100 can also represent a percent. Before letting students work on the exercises, it is important to review how to identify the percent that a fraction represents.
We can scale up or scale down to get 100 as a denominator.
What if the denominator is not a multiple or a factor of 100? What would we do now? For example, what if I
ate 18
of a pizza and wanted to know what percent of the pizza I ate. How would I calculate this?
I can change a fraction to a decimal by dividing.
Happy 𝟕𝟕𝟓𝟓𝟓𝟓𝟏𝟏,𝟓𝟓𝟓𝟓𝟓𝟓
𝟕𝟕𝟓𝟓% Unhappy 𝟑𝟑𝟓𝟓𝟓𝟓𝟏𝟏,𝟓𝟓𝟓𝟓𝟓𝟓
𝟑𝟑𝟓𝟓%
Fraction Percent Fraction Percent
𝟓𝟓 𝟏𝟏𝟓𝟓% 𝟐𝟐𝟓𝟓% 𝟑𝟑𝟓𝟓% 𝟒𝟒𝟓𝟓% 𝟓𝟓𝟓𝟓% 𝟔𝟔𝟓𝟓% 𝟕𝟕𝟓𝟓% 𝟖𝟖𝟓𝟓% 𝟗𝟗𝟓𝟓% 𝟏𝟏𝟓𝟓𝟓𝟓%
𝟓𝟓 𝟏𝟏𝟓𝟓𝟓𝟓 𝟐𝟐𝟓𝟓𝟓𝟓 𝟑𝟑𝟓𝟓𝟓𝟓 𝟒𝟒𝟓𝟓𝟓𝟓 𝟓𝟓𝟓𝟓𝟓𝟓 𝟔𝟔𝟓𝟓𝟓𝟓 𝟕𝟕𝟓𝟓𝟓𝟓 𝟖𝟖𝟓𝟓𝟓𝟓 𝟗𝟗𝟓𝟓𝟓𝟓 𝟏𝟏𝟓𝟓𝟓𝟓𝟓𝟓
Lesson 25: A Fraction as a Percent
199
This work is licensed under a Creative Commons Attribution-NonCommercial-ShareAlike 3.0 Unported License. © 2015 Great Minds. eureka-math.org
G6-M1-TE-1.3.0-06.2015
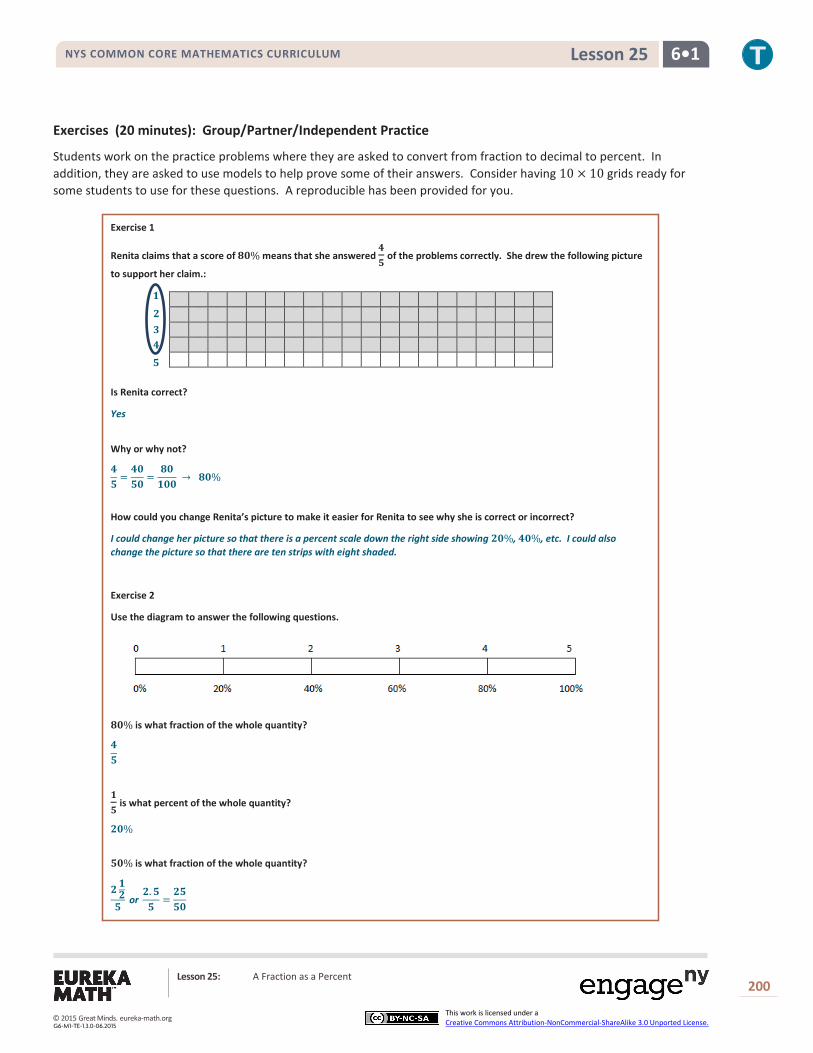
NYS COMMON CORE MATHEMATICS CURRICULUM 6•1 Lesson 25
Exercises (20 minutes): Group/Partner/Independent Practice
Students work on the practice problems where they are asked to convert from fraction to decimal to percent. In addition, they are asked to use models to help prove some of their answers. Consider having 10 × 10 grids ready for some students to use for these questions. A reproducible has been provided for you.
Exercise 1
Renita claims that a score of 𝟖𝟖𝟓𝟓% means that she answered 𝟒𝟒𝟓𝟓 of the problems correctly. She drew the following picture
to support her claim.:
Is Renita correct?
Yes
Why or why not?
𝟒𝟒𝟓𝟓
=𝟒𝟒𝟓𝟓𝟓𝟓𝟓𝟓
=𝟖𝟖𝟓𝟓𝟏𝟏𝟓𝟓𝟓𝟓
→ 𝟖𝟖𝟓𝟓%
How could you change Renita’s picture to make it easier for Renita to see why she is correct or incorrect?
I could change her picture so that there is a percent scale down the right side showing 𝟐𝟐𝟓𝟓%, 𝟒𝟒𝟓𝟓%, etc. I could also change the picture so that there are ten strips with eight shaded.
Exercise 2
Use the diagram to answer the following questions.
𝟖𝟖𝟓𝟓% is what fraction of the whole quantity?
𝟒𝟒𝟓𝟓
𝟏𝟏𝟓𝟓 is what percent of the whole quantity?
𝟐𝟐𝟓𝟓%
𝟓𝟓𝟓𝟓% is what fraction of the whole quantity?
𝟐𝟐𝟏𝟏𝟐𝟐𝟓𝟓
or 𝟐𝟐.𝟓𝟓𝟓𝟓
=𝟐𝟐𝟓𝟓𝟓𝟓𝟓𝟓
𝟏𝟏 𝟐𝟐 𝟑𝟑 𝟒𝟒 𝟓𝟓
Lesson 25: A Fraction as a Percent
200
This work is licensed under a Creative Commons Attribution-NonCommercial-ShareAlike 3.0 Unported License. © 2015 Great Minds. eureka-math.org
G6-M1-TE-1.3.0-06.2015

NYS COMMON CORE MATHEMATICS CURRICULUM 6•1 Lesson 25
𝟏𝟏 is what percent of the whole quantity?
𝟏𝟏 = 𝟓𝟓𝟓𝟓 This would be 𝟏𝟏𝟓𝟓𝟓𝟓%.
Exercise 3
Maria completed 𝟑𝟑𝟒𝟒 of her workday. Create a model that represents what percent of the workday Maria has worked.
She has completed 𝟕𝟕𝟓𝟓% of the workday.
What percent of her workday does she have left?
𝟐𝟐𝟓𝟓%
How does your model prove that your answer is correct?
My model shows that 𝟑𝟑𝟒𝟒
= 𝟕𝟕𝟓𝟓% and that the 𝟏𝟏𝟒𝟒 she has left is the same as 𝟐𝟐𝟓𝟓%.
Exercise 4
Matthew completed 𝟓𝟓𝟖𝟖
of his workday. What decimal would also describe the portion of the workday he has finished?
𝟓𝟓 ÷ 𝟖𝟖 = 𝟓𝟓.𝟔𝟔𝟐𝟐𝟓𝟓 or 𝟓𝟓𝟖𝟖
of 𝟏𝟏𝟓𝟓𝟓𝟓% = 𝟔𝟔𝟐𝟐.𝟓𝟓%
How can you use the decimal to get the percent of the workday Matthew has completed?
𝟓𝟓𝟖𝟖 is the same as 𝟓𝟓.𝟔𝟔𝟐𝟐𝟓𝟓. This is 𝟔𝟔𝟐𝟐𝟓𝟓 thousandths or
𝟔𝟔𝟐𝟐𝟓𝟓𝟏𝟏,𝟓𝟓𝟓𝟓𝟓𝟓
. If I divide both the numerator and denominator by ten, I can
see that 𝟔𝟔𝟐𝟐𝟓𝟓𝟏𝟏𝟓𝟓𝟓𝟓𝟓𝟓
=𝟔𝟔𝟐𝟐.𝟓𝟓𝟏𝟏𝟓𝟓𝟓𝟓
.
Before students solve Exercise 3, have students go back to the previous examples and write the percent and fraction as a
decimal. Then have them work with fractions, like 58
.
Some students may have difficulty writing a decimal given as thousandths as a fraction.
𝟓𝟓% 𝟐𝟐𝟓𝟓% 𝟓𝟓𝟓𝟓% 𝟕𝟕𝟓𝟓% 𝟏𝟏𝟓𝟓𝟓𝟓%
𝟓𝟓 𝟏𝟏 𝟐𝟐 𝟑𝟑 𝟒𝟒
Lesson 25: A Fraction as a Percent
201
This work is licensed under a Creative Commons Attribution-NonCommercial-ShareAlike 3.0 Unported License. © 2015 Great Minds. eureka-math.org
G6-M1-TE-1.3.0-06.2015

NYS COMMON CORE MATHEMATICS CURRICULUM 6•1 Lesson 25
Exercise 5
Complete the conversions from fraction to decimal to percent.
Fraction Decimal Percent
𝟏𝟏𝟖𝟖
𝟓𝟓.𝟏𝟏𝟐𝟐𝟓𝟓 𝟏𝟏𝟐𝟐.𝟓𝟓%
𝟕𝟕𝟐𝟐𝟓𝟓
𝟓𝟓.𝟑𝟑𝟓𝟓 𝟑𝟑𝟓𝟓%
𝟖𝟖𝟒𝟒.𝟓𝟓𝟏𝟏𝟓𝟓𝟓𝟓
=𝟖𝟖𝟒𝟒𝟓𝟓𝟏𝟏𝟓𝟓𝟓𝟓𝟓𝟓
𝟓𝟓.𝟖𝟖𝟒𝟒𝟓𝟓 𝟖𝟖𝟒𝟒.𝟓𝟓%
𝟑𝟑𝟐𝟐.𝟓𝟓𝟏𝟏𝟓𝟓𝟓𝟓
=𝟑𝟑𝟐𝟐𝟓𝟓𝟏𝟏𝟓𝟓𝟓𝟓𝟓𝟓
𝟓𝟓.𝟑𝟑𝟐𝟐𝟓𝟓 𝟑𝟑𝟐𝟐.𝟓𝟓%
𝟐𝟐𝟐𝟐𝟓𝟓
𝟓𝟓.𝟓𝟓𝟖𝟖 𝟖𝟖%
Exercise 6
Choose one of the rows from the conversion table in Exercise 5, and use models to prove your answers. (Models could include a 𝟏𝟏𝟓𝟓× 𝟏𝟏𝟓𝟓 grid, a tape diagram, a double number line, etc.)
Answers will vary. One possible solution is shown:
𝟕𝟕𝟐𝟐𝟓𝟓
𝟕𝟕𝟐𝟐𝟓𝟓
=𝟑𝟑𝟓𝟓𝟏𝟏𝟓𝟓𝟓𝟓
= 𝟓𝟓.𝟑𝟑𝟓𝟓 → 𝟑𝟑𝟓𝟓%
Closing (5 minutes)
Choose different pairs or small groups to post diagrams and explain how the diagram helped them to see the relationship between the fractions, percents, and decimals. If possible, it may be helpful to choose groups that have used two different models and compare the two. Students could draw on a blank overhead or have pre-made grids and tape diagrams that they can fill in on an interactive white board or a document camera.
5 7 10 15 20
25% 𝟑𝟑𝟓𝟓% 50% 75% 100%
Lesson 25: A Fraction as a Percent
202
This work is licensed under a Creative Commons Attribution-NonCommercial-ShareAlike 3.0 Unported License. © 2015 Great Minds. eureka-math.org
G6-M1-TE-1.3.0-06.2015
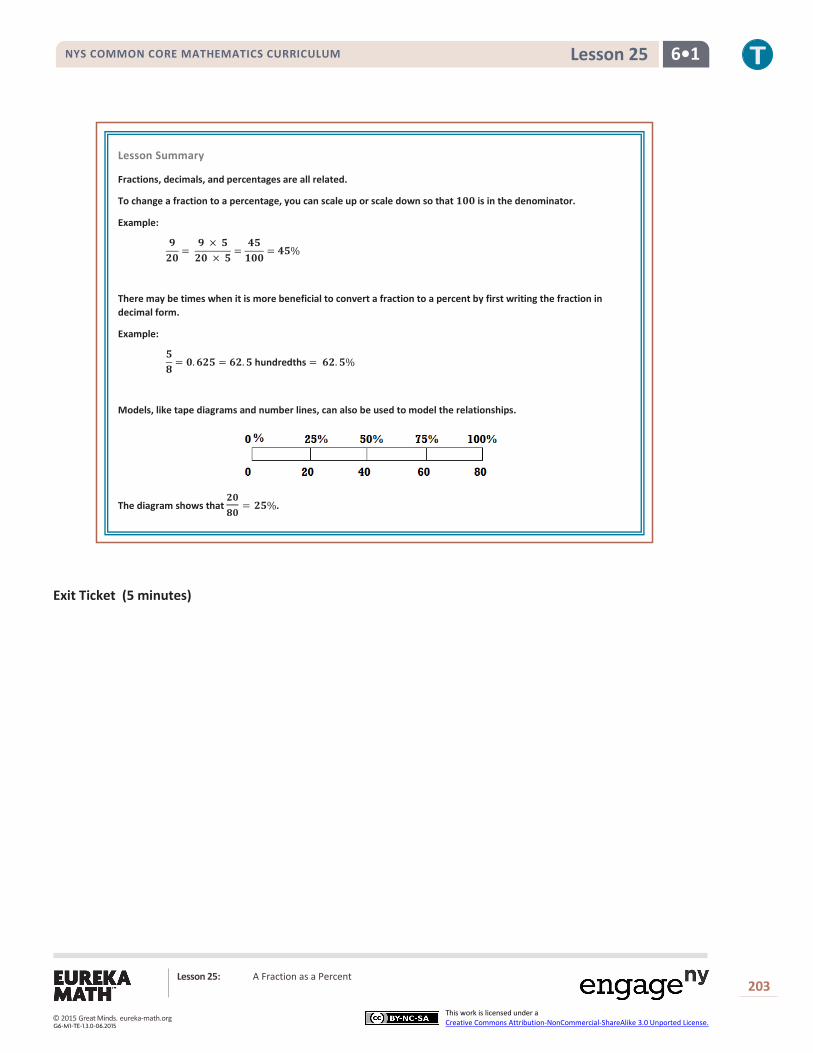
NYS COMMON CORE MATHEMATICS CURRICULUM 6•1 Lesson 25
Exit Ticket (5 minutes)
Lesson Summary
Fractions, decimals, and percentages are all related.
To change a fraction to a percentage, you can scale up or scale down so that 𝟏𝟏𝟓𝟓𝟓𝟓 is in the denominator.
Example:
𝟗𝟗𝟐𝟐𝟓𝟓
= 𝟗𝟗 × 𝟓𝟓𝟐𝟐𝟓𝟓 × 𝟓𝟓
=𝟒𝟒𝟓𝟓𝟏𝟏𝟓𝟓𝟓𝟓
= 𝟒𝟒𝟓𝟓%
There may be times when it is more beneficial to convert a fraction to a percent by first writing the fraction in decimal form.
Example:
𝟓𝟓𝟖𝟖
= 𝟓𝟓.𝟔𝟔𝟐𝟐𝟓𝟓 = 𝟔𝟔𝟐𝟐.𝟓𝟓 hundredths = 𝟔𝟔𝟐𝟐.𝟓𝟓%
Models, like tape diagrams and number lines, can also be used to model the relationships.
The diagram shows that 𝟐𝟐𝟓𝟓𝟖𝟖𝟓𝟓
= 𝟐𝟐𝟓𝟓%.
Lesson 25: A Fraction as a Percent
203
This work is licensed under a Creative Commons Attribution-NonCommercial-ShareAlike 3.0 Unported License. © 2015 Great Minds. eureka-math.org
G6-M1-TE-1.3.0-06.2015
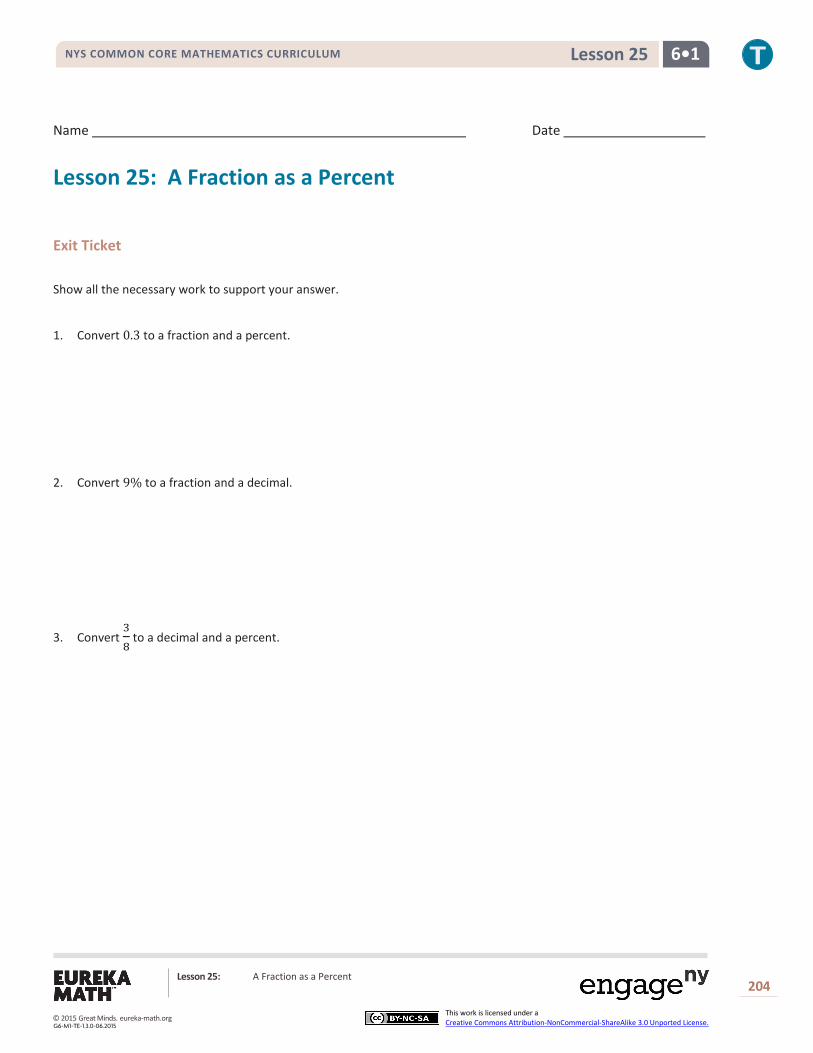
NYS COMMON CORE MATHEMATICS CURRICULUM 6•1 Lesson 25
Name Date
Lesson 25: A Fraction as a Percent
Exit Ticket Show all the necessary work to support your answer.
1. Convert 0.3 to a fraction and a percent.
2. Convert 9% to a fraction and a decimal.
3. Convert 38
to a decimal and a percent.
Lesson 25: A Fraction as a Percent
204
This work is licensed under a Creative Commons Attribution-NonCommercial-ShareAlike 3.0 Unported License. © 2015 Great Minds. eureka-math.org
G6-M1-TE-1.3.0-06.2015

NYS COMMON CORE MATHEMATICS CURRICULUM 6•1 Lesson 25
Exit Ticket Sample Solutions
Show all the necessary work to support your answer.
1. Convert 𝟓𝟓.𝟑𝟑 to a fraction and a percent.
𝟑𝟑𝟏𝟏𝟓𝟓
=𝟑𝟑𝟓𝟓𝟏𝟏𝟓𝟓𝟓𝟓
, 𝟑𝟑𝟓𝟓%
2. Convert 𝟗𝟗% to a fraction and a decimal.
𝟗𝟗𝟏𝟏𝟓𝟓𝟓𝟓
, 𝟓𝟓.𝟓𝟓𝟗𝟗
3. Convert 𝟑𝟑𝟖𝟖
to a decimal and a percent.
𝟓𝟓.𝟑𝟑𝟕𝟕𝟓𝟓 =𝟑𝟑𝟕𝟕𝟓𝟓𝟏𝟏𝟓𝟓𝟓𝟓𝟓𝟓
=𝟑𝟑𝟕𝟕.𝟓𝟓𝟏𝟏𝟓𝟓𝟓𝟓
= 𝟑𝟑𝟕𝟕.𝟓𝟓%
Problem Set Sample Solutions
1. Use the 𝟏𝟏𝟓𝟓 × 𝟏𝟏𝟓𝟓 grid to express the fraction 𝟏𝟏𝟏𝟏𝟐𝟐𝟓𝟓
as a percent.
Students should shade 𝟓𝟓𝟓𝟓 of the squares in the grid. They might divide it into 𝟓𝟓 sections of 𝟐𝟐𝟓𝟓 each and shade in 𝟏𝟏𝟏𝟏 of the 𝟐𝟐𝟓𝟓.
Lesson 25: A Fraction as a Percent
205
This work is licensed under a Creative Commons Attribution-NonCommercial-ShareAlike 3.0 Unported License. © 2015 Great Minds. eureka-math.org
G6-M1-TE-1.3.0-06.2015

NYS COMMON CORE MATHEMATICS CURRICULUM 6•1 Lesson 25
2. Use a tape diagram to relate the fraction 𝟏𝟏𝟏𝟏𝟐𝟐𝟓𝟓
to a percent.
Answers will vary.
𝟓𝟓 𝟏𝟏𝟏𝟏 𝟐𝟐𝟐𝟐 𝟑𝟑𝟑𝟑 𝟒𝟒𝟒𝟒 𝟓𝟓𝟓𝟓
3. How are the diagrams related?
Both show that 𝟏𝟏𝟏𝟏𝟐𝟐𝟓𝟓
is the same as 𝟓𝟓𝟓𝟓𝟏𝟏𝟓𝟓𝟓𝟓
.
4. What decimal is also related to the fraction?
𝟓𝟓.𝟓𝟓𝟓𝟓
5. Which diagram is the most helpful for converting the fraction to a decimal? _______________ Explain why.
Answers will vary according to student preferences.
𝟓𝟓 𝟐𝟐𝟓𝟓 𝟒𝟒𝟓𝟓 𝟔𝟔𝟓𝟓 𝟖𝟖𝟓𝟓 𝟏𝟏𝟓𝟓𝟓𝟓
Lesson 25: A Fraction as a Percent
206
This work is licensed under a Creative Commons Attribution-NonCommercial-ShareAlike 3.0 Unported License. © 2015 Great Minds. eureka-math.org
G6-M1-TE-1.3.0-06.2015
NYS COMMON CORE MATHEMATICS CURRICULUM 6•1 Lesson 25
𝟏𝟏𝟓𝟓 × 𝟏𝟏𝟓𝟓 Grid Reproducible
Lesson 25: A Fraction as a Percent
207
This work is licensed under a Creative Commons Attribution-NonCommercial-ShareAlike 3.0 Unported License. © 2015 Great Minds. eureka-math.org
G6-M1-TE-1.3.0-06.2015

NYS COMMON CORE MATHEMATICS CURRICULUM 6•1 Lesson 26
𝟎𝟎% 𝟐𝟐𝟎𝟎% 𝟒𝟒𝟎𝟎% 𝟔𝟔𝟎𝟎% 𝟖𝟖𝟎𝟎% 𝟏𝟏𝟎𝟎𝟎𝟎%
𝟎𝟎 𝟓𝟓 𝟏𝟏𝟎𝟎 𝟏𝟏𝟓𝟓 𝟐𝟐𝟎𝟎 𝟐𝟐𝟓𝟓
Lesson 26: Percent of a Quantity
Student Outcomes
Students find the percent of a quantity. Given a part and the percent, students solve problems involving finding the whole.
Classwork
Example 1 (5 minutes)
Example 1
Five of the 𝟐𝟐𝟓𝟓 girls on Alden Middle School’s soccer team are seventh-grade students. Find the percentage of seventh graders on the team. Show two different ways of solving for the answer. One of the methods must include a diagram or picture model.
Method 1:
Method 2:
𝟓𝟓𝟐𝟐𝟓𝟓
= 𝟏𝟏𝟓𝟓
= 𝟐𝟐𝟎𝟎𝟏𝟏𝟎𝟎𝟎𝟎
= 𝟐𝟐𝟎𝟎%
Students take time to make their own diagram or model and discuss with a partner. Students review the work they completed in Lesson 25. If they make a tape diagram, they begin by deciding to divide the tape diagram into 5 equal rectangles. Each rectangle represents 5 girls. From there they divide the 100% into 5 equal sections.
If time permits, students share the model they chose and explain why it did or did not help them solve the problem.
Students need to come to the conclusion that 525
=20100
, which is the same as 20%.
Note: Students who are struggling may need help figuring out which model to use and how to divide up the diagram. Help them think through the different options. Would it make sense to count by 5’s, 10’s, 20’s, 25’s, etc.?
Lesson 26 Percent of a Quantity
208
This work is licensed under a Creative Commons Attribution-NonCommercial-ShareAlike 3.0 Unported License. © 2015 Great Minds. eureka-math.org
G6-M1-TE-1.3.0-06.2015

NYS COMMON CORE MATHEMATICS CURRICULUM 6•1 Lesson 26
Example 2 (5 minutes)
Example 2
Of the 𝟐𝟐𝟓𝟓 girls on the Alden Middle School soccer team, 𝟒𝟒𝟎𝟎% also play on a travel team. How many of the girls on the middle school team also play on a travel team?
One method: 𝟒𝟒𝟎𝟎% = 𝟒𝟒𝟎𝟎𝟏𝟏𝟎𝟎𝟎𝟎 = 𝟏𝟏𝟎𝟎
𝟐𝟐𝟓𝟓. Therefore, 𝟏𝟏𝟎𝟎 of the 𝟐𝟐𝟓𝟓 girls are also on the travel team.
Another method: Use of tape diagram shown below.
𝟏𝟏𝟎𝟎 of the girls also play on a travel team.
Example 3 (5 minutes)
Example 3
The Alden Middle School girls’ soccer team won 𝟖𝟖𝟎𝟎% of its games this season. If the team won 𝟏𝟏𝟐𝟐 games, how many games did it play? Solve the problem using at least two different methods.
Method 1:
𝟖𝟖𝟎𝟎% =𝟖𝟖𝟎𝟎𝟏𝟏𝟎𝟎𝟎𝟎
=𝟖𝟖𝟏𝟏𝟎𝟎
=𝟒𝟒𝟓𝟓
𝟒𝟒 × 𝟑𝟑 →𝟓𝟓 × 𝟑𝟑 →
=𝟏𝟏𝟐𝟐𝟏𝟏𝟓𝟓
𝟏𝟏𝟓𝟓 total games
Method 2:
The girls played a total of 𝟏𝟏𝟓𝟓 games.
𝟎𝟎% 𝟐𝟐𝟎𝟎%
𝟒𝟒𝟎𝟎% 𝟔𝟔𝟎𝟎% 𝟖𝟖𝟎𝟎% 𝟏𝟏𝟎𝟎𝟎𝟎%
𝟎𝟎 𝟓𝟓 𝟏𝟏𝟎𝟎
𝟏𝟏𝟓𝟓 𝟐𝟐𝟎𝟎 𝟐𝟐𝟓𝟓
𝟎𝟎 𝟑𝟑
𝟔𝟔 𝟗𝟗 𝟏𝟏𝟐𝟐 𝟏𝟏𝟓𝟓
𝟎𝟎% 𝟐𝟐𝟎𝟎% 𝟒𝟒𝟎𝟎% 𝟔𝟔𝟎𝟎% 𝟖𝟖𝟎𝟎% 𝟏𝟏𝟎𝟎𝟎𝟎%
Lesson 26 Percent of a Quantity
209
This work is licensed under a Creative Commons Attribution-NonCommercial-ShareAlike 3.0 Unported License. © 2015 Great Minds. eureka-math.org
G6-M1-TE-1.3.0-06.2015
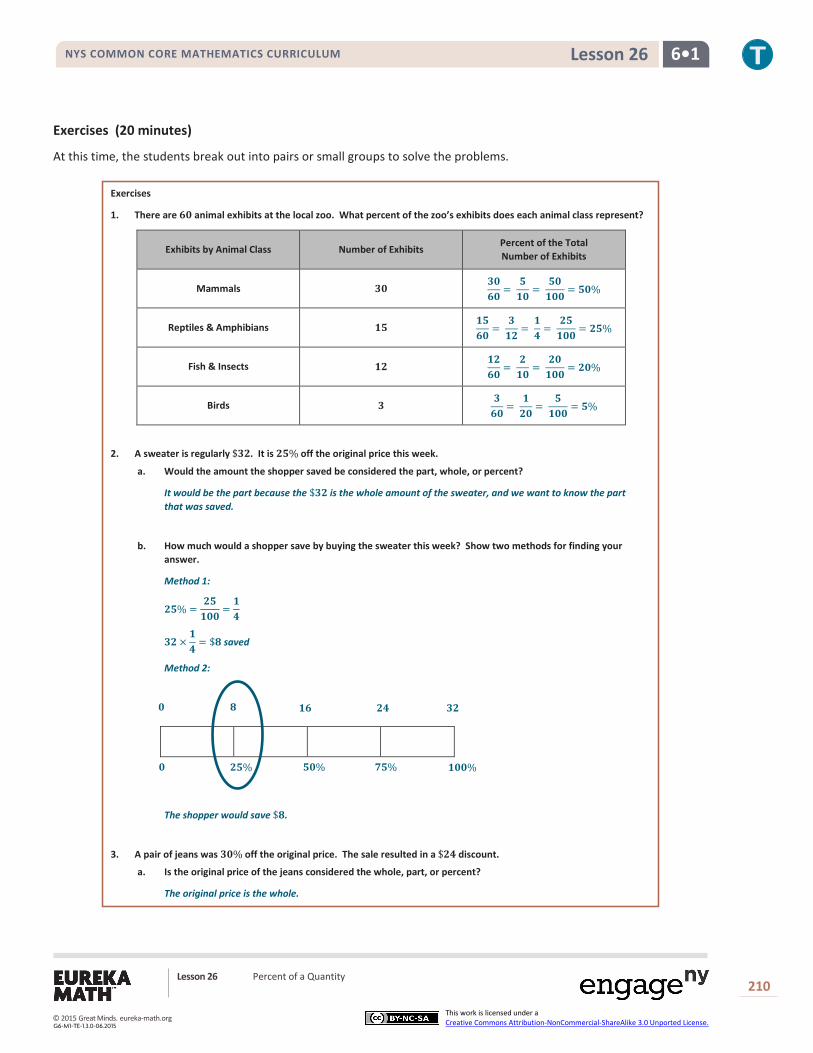
NYS COMMON CORE MATHEMATICS CURRICULUM 6•1 Lesson 26
Exercises (20 minutes)
At this time, the students break out into pairs or small groups to solve the problems.
Exercises
1. There are 𝟔𝟔𝟎𝟎 animal exhibits at the local zoo. What percent of the zoo’s exhibits does each animal class represent?
Exhibits by Animal Class Number of Exhibits Percent of the Total Number of Exhibits
Mammals 30 𝟑𝟑𝟎𝟎𝟔𝟔𝟎𝟎
= 𝟓𝟓𝟏𝟏𝟎𝟎
= 𝟓𝟓𝟎𝟎𝟏𝟏𝟎𝟎𝟎𝟎
= 𝟓𝟓𝟎𝟎%
Reptiles & Amphibians 15 𝟏𝟏𝟓𝟓𝟔𝟔𝟎𝟎
= 𝟑𝟑𝟏𝟏𝟐𝟐
= 𝟏𝟏𝟒𝟒
= 𝟐𝟐𝟓𝟓𝟏𝟏𝟎𝟎𝟎𝟎
= 𝟐𝟐𝟓𝟓%
Fish & Insects 12 𝟏𝟏𝟐𝟐𝟔𝟔𝟎𝟎
= 𝟐𝟐𝟏𝟏𝟎𝟎
= 𝟐𝟐𝟎𝟎𝟏𝟏𝟎𝟎𝟎𝟎
= 𝟐𝟐𝟎𝟎%
Birds 3 𝟑𝟑𝟔𝟔𝟎𝟎
= 𝟏𝟏𝟐𝟐𝟎𝟎
= 𝟓𝟓𝟏𝟏𝟎𝟎𝟎𝟎
= 𝟓𝟓%
2. A sweater is regularly $𝟑𝟑𝟐𝟐. It is 𝟐𝟐𝟓𝟓% off the original price this week.
a. Would the amount the shopper saved be considered the part, whole, or percent?
It would be the part because the $𝟑𝟑𝟐𝟐 is the whole amount of the sweater, and we want to know the part that was saved.
b. How much would a shopper save by buying the sweater this week? Show two methods for finding your answer.
Method 1:
𝟐𝟐𝟓𝟓% =𝟐𝟐𝟓𝟓𝟏𝟏𝟎𝟎𝟎𝟎
=𝟏𝟏𝟒𝟒
𝟑𝟑𝟐𝟐×𝟏𝟏𝟒𝟒
= $𝟖𝟖 saved
Method 2:
The shopper would save $𝟖𝟖.
3. A pair of jeans was 𝟑𝟑𝟎𝟎% off the original price. The sale resulted in a $𝟐𝟐𝟒𝟒 discount.
a. Is the original price of the jeans considered the whole, part, or percent?
The original price is the whole.
𝟎𝟎 𝟐𝟐𝟓𝟓%
𝟓𝟓𝟎𝟎% 𝟕𝟕𝟓𝟓% 𝟏𝟏𝟎𝟎𝟎𝟎%
𝟎𝟎 𝟖𝟖 𝟏𝟏𝟔𝟔 𝟐𝟐𝟒𝟒 𝟑𝟑𝟐𝟐
Lesson 26 Percent of a Quantity
210
This work is licensed under a Creative Commons Attribution-NonCommercial-ShareAlike 3.0 Unported License. © 2015 Great Minds. eureka-math.org
G6-M1-TE-1.3.0-06.2015
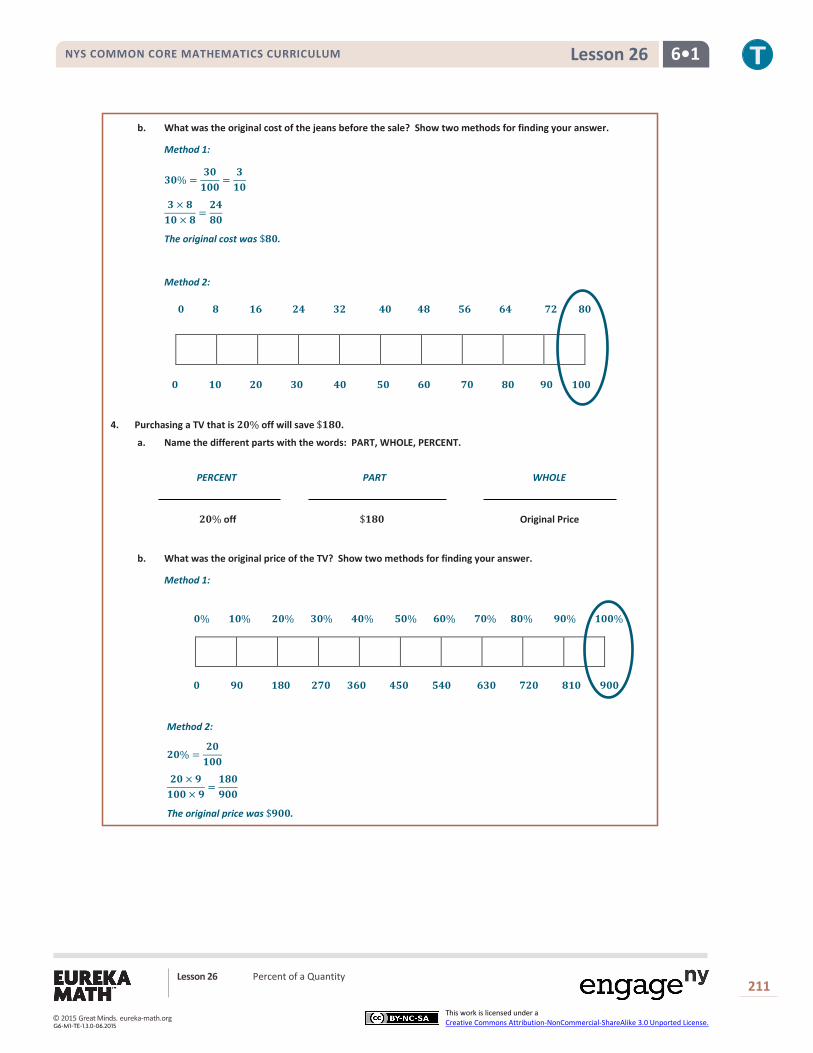
NYS COMMON CORE MATHEMATICS CURRICULUM 6•1 Lesson 26
b. What was the original cost of the jeans before the sale? Show two methods for finding your answer.
Method 1:
𝟑𝟑𝟎𝟎% =𝟑𝟑𝟎𝟎𝟏𝟏𝟎𝟎𝟎𝟎
=𝟑𝟑𝟏𝟏𝟎𝟎
𝟑𝟑× 𝟖𝟖𝟏𝟏𝟎𝟎× 𝟖𝟖
=𝟐𝟐𝟒𝟒𝟖𝟖𝟎𝟎
The original cost was $𝟖𝟖𝟎𝟎.
Method 2:
4. Purchasing a TV that is 𝟐𝟐𝟎𝟎% off will save $𝟏𝟏𝟖𝟖𝟎𝟎.
a. Name the different parts with the words: PART, WHOLE, PERCENT.
PERCENT PART WHOLE
𝟐𝟐𝟎𝟎% off $𝟏𝟏𝟖𝟖𝟎𝟎 Original Price
b. What was the original price of the TV? Show two methods for finding your answer.
Method 1:
Method 2:
𝟐𝟐𝟎𝟎% =𝟐𝟐𝟎𝟎𝟏𝟏𝟎𝟎𝟎𝟎
𝟐𝟐𝟎𝟎× 𝟗𝟗𝟏𝟏𝟎𝟎𝟎𝟎× 𝟗𝟗
=𝟏𝟏𝟖𝟖𝟎𝟎𝟗𝟗𝟎𝟎𝟎𝟎
The original price was $𝟗𝟗𝟎𝟎𝟎𝟎.
𝟎𝟎% 𝟏𝟏𝟎𝟎% 𝟐𝟐𝟎𝟎% 𝟑𝟑𝟎𝟎% 𝟒𝟒𝟎𝟎% 𝟓𝟓𝟎𝟎% 𝟔𝟔𝟎𝟎% 𝟕𝟕𝟎𝟎% 𝟖𝟖𝟎𝟎% 𝟗𝟗𝟎𝟎% 𝟏𝟏𝟎𝟎𝟎𝟎%
𝟎𝟎 𝟗𝟗𝟎𝟎 𝟏𝟏𝟖𝟖𝟎𝟎 𝟐𝟐𝟕𝟕𝟎𝟎 𝟑𝟑𝟔𝟔𝟎𝟎 𝟒𝟒𝟓𝟓𝟎𝟎 𝟓𝟓𝟒𝟒𝟎𝟎 𝟔𝟔𝟑𝟑𝟎𝟎 𝟕𝟕𝟐𝟐𝟎𝟎 𝟖𝟖𝟏𝟏𝟎𝟎 𝟗𝟗𝟎𝟎𝟎𝟎
𝟎𝟎 𝟏𝟏𝟎𝟎 𝟐𝟐𝟎𝟎 𝟑𝟑𝟎𝟎 𝟒𝟒𝟎𝟎 𝟓𝟓𝟎𝟎 𝟔𝟔𝟎𝟎 𝟕𝟕𝟎𝟎 𝟖𝟖𝟎𝟎 𝟗𝟗𝟎𝟎 𝟏𝟏𝟎𝟎𝟎𝟎
𝟎𝟎 𝟖𝟖 𝟏𝟏𝟔𝟔 𝟐𝟐𝟒𝟒 𝟑𝟑𝟐𝟐 𝟒𝟒𝟎𝟎 𝟒𝟒𝟖𝟖 𝟓𝟓𝟔𝟔 𝟔𝟔𝟒𝟒 𝟕𝟕𝟐𝟐 𝟖𝟖𝟎𝟎
Lesson 26 Percent of a Quantity
211
This work is licensed under a Creative Commons Attribution-NonCommercial-ShareAlike 3.0 Unported License. © 2015 Great Minds. eureka-math.org
G6-M1-TE-1.3.0-06.2015
NYS COMMON CORE MATHEMATICS CURRICULUM 6•1 Lesson 26
Closing (5 minutes)
Describe additional questions.
Discuss the main differences in solving strategies. Were there times when you preferred to use one method over another method?
How did the steps change when you were given the part instead of the total?
Exit Ticket (5 minutes)
Lesson Summary
Models and diagrams can be used to solve percent problems. Tape diagrams, 𝟏𝟏𝟎𝟎 × 𝟏𝟏𝟎𝟎 grids, double number line diagrams, and others can be used in a similar way to using them with ratios to find the percent, the part, or the whole.
Lesson 26 Percent of a Quantity
212
This work is licensed under a Creative Commons Attribution-NonCommercial-ShareAlike 3.0 Unported License. © 2015 Great Minds. eureka-math.org
G6-M1-TE-1.3.0-06.2015
NYS COMMON CORE MATHEMATICS CURRICULUM 6•1 Lesson 26
Name Date
Lesson 26: Percent of a Quantity
Exit Ticket 1. Find 40% of 60 using two different strategies, one of which must include a pictorial model or diagram.
2. 15% of an amount is 30. Calculate the whole amount using two different strategies, one of which must include a pictorial model.
Lesson 26 Percent of a Quantity
213
This work is licensed under a Creative Commons Attribution-NonCommercial-ShareAlike 3.0 Unported License. © 2015 Great Minds. eureka-math.org
G6-M1-TE-1.3.0-06.2015

NYS COMMON CORE MATHEMATICS CURRICULUM 6•1 Lesson 26
Exit Ticket Sample Solutions
1. Find 𝟒𝟒𝟎𝟎% of 𝟔𝟔𝟎𝟎 using two different strategies, one of which must include a pictorial model or diagram.
𝟒𝟒𝟎𝟎% of 𝟔𝟔𝟎𝟎 𝟒𝟒𝟎𝟎% = 𝟒𝟒𝟎𝟎𝟏𝟏𝟎𝟎𝟎𝟎 = 𝟒𝟒
𝟏𝟏𝟎𝟎 = 𝟐𝟐𝟒𝟒𝟔𝟔𝟎𝟎 𝟒𝟒𝟎𝟎% of 𝟔𝟔𝟎𝟎 is 𝟐𝟐𝟒𝟒.
2. 𝟏𝟏𝟓𝟓% of an amount is 𝟑𝟑𝟎𝟎. Calculate the whole amount using two different strategies, one of which must include a pictorial model.
𝟏𝟏𝟓𝟓% =𝟏𝟏𝟓𝟓𝟏𝟏𝟎𝟎𝟎𝟎
=𝟑𝟑𝟎𝟎𝟐𝟐𝟎𝟎𝟎𝟎
The whole quantity is 𝟐𝟐𝟎𝟎𝟎𝟎.
Problem Set Sample Solutions
1. What is 𝟏𝟏𝟓𝟓% of 𝟔𝟔𝟎𝟎? Create a model to prove your answer.
𝟗𝟗
2. If 𝟒𝟒𝟎𝟎% of a number is 𝟓𝟓𝟔𝟔, what was the original number?
𝟏𝟏𝟒𝟒𝟎𝟎
3. In a 𝟏𝟏𝟎𝟎× 𝟏𝟏𝟎𝟎 grid that represents 𝟖𝟖𝟎𝟎𝟎𝟎, one square represents 𝟖𝟖 .
Use the grids below to represent 𝟏𝟏𝟕𝟕% and 𝟖𝟖𝟑𝟑% of 𝟖𝟖𝟎𝟎𝟎𝟎.
𝟏𝟏𝟕𝟕% of 𝟖𝟖𝟎𝟎𝟎𝟎 is 𝟏𝟏𝟑𝟑𝟔𝟔 . 𝟖𝟖𝟑𝟑% of 𝟖𝟖𝟎𝟎𝟎𝟎 is 𝟔𝟔𝟔𝟔𝟒𝟒 .
𝟏𝟏𝟕𝟕% 𝟖𝟖𝟑𝟑%
Lesson 26 Percent of a Quantity
214
This work is licensed under a Creative Commons Attribution-NonCommercial-ShareAlike 3.0 Unported License. © 2015 Great Minds. eureka-math.org
G6-M1-TE-1.3.0-06.2015

NYS COMMON CORE MATHEMATICS CURRICULUM 6•1 Lesson 27
Lesson 27: Solving Percent Problems
Student Outcomes
Students find the percent of a quantity. Given a part and the percent, students solve problems involving finding the whole.
Classwork
Example (10 minutes)
Example
Solve the following three problems.
Write the words PERCENT, WHOLE, or PART under each problem to show which piece you were solving for.
𝟔𝟔𝟔𝟔% of 𝟑𝟑𝟔𝟔𝟔𝟔 = 𝟏𝟏𝟏𝟏𝟔𝟔 𝟔𝟔𝟔𝟔% of 𝟓𝟓𝟔𝟔𝟔𝟔 = 𝟑𝟑𝟔𝟔𝟔𝟔 𝟔𝟔𝟔𝟔 out of 𝟑𝟑𝟔𝟔𝟔𝟔 = 𝟐𝟐𝟔𝟔 %
𝟔𝟔𝟔𝟔×𝟑𝟑𝟏𝟏𝟔𝟔𝟔𝟔×𝟑𝟑
=𝟏𝟏𝟏𝟏𝟔𝟔𝟑𝟑𝟔𝟔𝟔𝟔
𝟔𝟔𝟔𝟔×𝟓𝟓𝟏𝟏𝟔𝟔𝟔𝟔×𝟓𝟓
=𝟑𝟑𝟔𝟔𝟔𝟔𝟓𝟓𝟔𝟔𝟔𝟔
𝟔𝟔𝟔𝟔÷𝟑𝟑𝟑𝟑𝟔𝟔𝟔𝟔÷𝟑𝟑
=𝟐𝟐𝟔𝟔𝟏𝟏𝟔𝟔𝟔𝟔
PART WHOLE PERCENT
How did your solving method differ with each problem?
Solutions will vary. A possible answer may include: When solving for the part, I need to find the missing number in the numerator. When solving for the whole, I solve for the denominator. When I solve for the percent, I need to find the numerator when the denominator is 𝟏𝟏𝟔𝟔𝟔𝟔.
What are you trying to find in each example?
Part, whole, percent How are the problems different from each other?
Answers will vary.
How are the problems alike?
Answers will vary.
Take time to discuss the clues in each problem including the placement of the word “of.” The word “of” lets students know which piece of information is the whole amount compared to the part. In the first example, 60% of 300 tells us that we are looking for part of 300. Therefore, 300 is the whole. In the second example where 60% of 500 is 300, 300 is the part, and 500 is the whole. In the third example, 60 out of 300 tells us that now, 60 is the part, and 300 is the whole. Structure the conversation around the part-whole relationship.
Lesson 27 Solving Percent Problems
215
This work is licensed under a Creative Commons Attribution-NonCommercial-ShareAlike 3.0 Unported License. © 2015 Great Minds. eureka-math.org
G6-M1-TE-1.3.0-06.2015

NYS COMMON CORE MATHEMATICS CURRICULUM 6•1 Lesson 27
In the first question, what is 60% of 300?
Students should understand that 60100
is the same ratio as unknown number
300 to determine an answer of
180.
In this case, is 180 the part or the whole?
180 is the part. It is part of 300.
In the second question, we are given 60% of some value equals 300 → 60100
=300
?. What is that value?
500
In this case, is 500 the part or the whole? What about 300? Is that a part or the whole?
500 is the whole, and 300 is the part.
In the third question, we are asked, 60 out of 300 equals what percent → 60300 =
?100
. What percent is that?
The percent is 20%. In this case, is 300 the part or the whole?
300 is the whole.
Exercise (20 minutes)
At this time, students break out into pairs or small groups to solve the problem.
Exercise
Use models, such as 𝟏𝟏𝟔𝟔 × 𝟏𝟏𝟔𝟔 grids, ratio tables, tape diagrams, or double number line diagrams, to solve the following situation.
Priya is doing her back-to-school shopping. Calculate all of the missing values in the table below, rounding to the nearest penny, and calculate the total amount Priya will spend on her outfit after she receives the indicated discounts.
Shirt (𝟐𝟐𝟓𝟓% discount)
Pants (𝟑𝟑𝟔𝟔% discount)
Shoes (𝟏𝟏𝟓𝟓% discount)
Necklace (𝟏𝟏𝟔𝟔% discount)
Sweater (𝟐𝟐𝟔𝟔% discount)
Original Price $𝟒𝟒𝟒𝟒 $𝟓𝟓𝟔𝟔 $𝟔𝟔𝟔𝟔 $𝟐𝟐𝟔𝟔 $𝟑𝟑𝟓𝟓
Amount of Discount $𝟏𝟏𝟏𝟏 $𝟏𝟏𝟓𝟓 $𝟗𝟗 $𝟐𝟐 $𝟕𝟕
Lesson 27 Solving Percent Problems
216
This work is licensed under a Creative Commons Attribution-NonCommercial-ShareAlike 3.0 Unported License. © 2015 Great Minds. eureka-math.org
G6-M1-TE-1.3.0-06.2015

NYS COMMON CORE MATHEMATICS CURRICULUM 6•1 Lesson 27
What is the total cost of Priya’s outfit?
Shirt 𝟐𝟐𝟓𝟓% = 𝟐𝟐𝟓𝟓𝟏𝟏𝟔𝟔𝟔𝟔 = 𝟏𝟏
𝟒𝟒 = 𝟏𝟏𝟏𝟏𝟒𝟒𝟒𝟒 The discount is $𝟏𝟏𝟏𝟏. The cost of the shirt is $𝟑𝟑𝟑𝟑 because $𝟒𝟒𝟒𝟒 − $𝟏𝟏𝟏𝟏 = $𝟑𝟑𝟑𝟑.
Pants 𝟑𝟑𝟔𝟔% = 𝟑𝟑𝟔𝟔𝟏𝟏𝟔𝟔𝟔𝟔 = 𝟏𝟏𝟓𝟓
𝟓𝟓𝟔𝟔 The original price is $𝟓𝟓𝟔𝟔. The price of the pants is $𝟑𝟑𝟓𝟓 because $𝟓𝟓𝟔𝟔 − $𝟏𝟏𝟓𝟓 = $𝟑𝟑𝟓𝟓.
Shoes 𝟏𝟏𝟓𝟓% = 𝟏𝟏𝟓𝟓𝟏𝟏𝟔𝟔𝟔𝟔 = 𝟑𝟑
𝟐𝟐𝟔𝟔 = 𝟗𝟗𝟔𝟔𝟔𝟔 The original price is $𝟔𝟔𝟔𝟔. The cost of the shoes is $𝟓𝟓𝟏𝟏 because $𝟔𝟔𝟔𝟔 − $𝟗𝟗 = $𝟓𝟓𝟏𝟏.
Necklace 𝟏𝟏𝟔𝟔% = 𝟏𝟏𝟏𝟏𝟔𝟔 = 𝟐𝟐
𝟐𝟐𝟔𝟔 The discount is $𝟐𝟐. The cost of the necklace is $𝟏𝟏𝟏𝟏 because $𝟐𝟐𝟔𝟔 − $𝟐𝟐 = $𝟏𝟏𝟏𝟏.
Sweater 𝟐𝟐𝟔𝟔% = 𝟐𝟐𝟔𝟔𝟏𝟏𝟔𝟔𝟔𝟔 = 𝟏𝟏
𝟓𝟓 = 𝟕𝟕𝟑𝟑𝟓𝟓 The original price is $𝟑𝟑𝟓𝟓. The cost of the sweater is $𝟐𝟐𝟏𝟏 because $𝟑𝟑𝟓𝟓 − $𝟕𝟕 = $𝟐𝟐𝟏𝟏.
The total outfit would cost the following: $𝟑𝟑𝟑𝟑+ $𝟑𝟑𝟓𝟓+ $𝟓𝟓𝟏𝟏+ $𝟏𝟏𝟏𝟏+ $𝟐𝟐𝟏𝟏 = $𝟏𝟏𝟔𝟔𝟓𝟓.
Closing (10 minutes)
Give students time to share samples of how they solved the problem and describe the methods they chose to use when solving.
Exit Ticket (5 minutes)
Lesson Summary
Percent problems include the part, whole, and percent. When one of these values is missing, we can use tables, diagrams, and models to solve for the missing number.
Lesson 27 Solving Percent Problems
217
This work is licensed under a Creative Commons Attribution-NonCommercial-ShareAlike 3.0 Unported License. © 2015 Great Minds. eureka-math.org
G6-M1-TE-1.3.0-06.2015
NYS COMMON CORE MATHEMATICS CURRICULUM 6•1 Lesson 27
Name Date
Lesson 27: Solving Percent Problems
Exit Ticket Jane paid $40 for an item after she received a 20% discount. Jane’s friend says this means that the original price of the item was $48.
a. How do you think Jane’s friend arrived at this amount?
b. Is her friend correct? Why or why not?
Lesson 27 Solving Percent Problems
218
This work is licensed under a Creative Commons Attribution-NonCommercial-ShareAlike 3.0 Unported License. © 2015 Great Minds. eureka-math.org
G6-M1-TE-1.3.0-06.2015

NYS COMMON CORE MATHEMATICS CURRICULUM 6•1 Lesson 27
Exit Ticket Sample Solutions
Jane paid $𝟒𝟒𝟔𝟔 for an item after she received a 𝟐𝟐𝟔𝟔% discount. Jane’s friend says this means that the original price of the item was $𝟒𝟒𝟏𝟏.
a. How do you think Jane’s friend arrived at this amount?
Jane’s friend found that 𝟐𝟐𝟔𝟔% of 𝟒𝟒𝟔𝟔 is 𝟏𝟏. Then she added $𝟏𝟏 to the sale price: 𝟒𝟒𝟔𝟔 + 𝟏𝟏 = 𝟒𝟒𝟏𝟏. Then she determined that the original amount was $𝟒𝟒𝟏𝟏.
b. Is her friend correct? Why or why not?
Jane’s friend was incorrect. Because Jane saved 𝟐𝟐𝟔𝟔%, she paid 𝟏𝟏𝟔𝟔% of the original amount, so that means that 𝟒𝟒𝟔𝟔 is 𝟏𝟏𝟔𝟔% of the original amount.
Problem Set Sample Solutions
1. Mr. Yoshi has 𝟕𝟕𝟓𝟓 papers. He graded 𝟔𝟔𝟔𝟔 papers, and he had a student teacher grade the rest. What percent of the papers did each person grade?
Mr. Yoshi graded 𝟏𝟏𝟔𝟔% of the papers, and the student teacher graded 𝟐𝟐𝟔𝟔%.
2. Mrs. Bennett has graded 𝟐𝟐𝟔𝟔% of her 𝟏𝟏𝟓𝟓𝟔𝟔 students’ papers. How many papers does she still need to finish grading?
Mrs. Bennett has graded 𝟑𝟑𝟔𝟔 papers. 𝟏𝟏𝟓𝟓𝟔𝟔 − 𝟑𝟑𝟔𝟔 = 𝟏𝟏𝟐𝟐𝟔𝟔. Mrs. Bennett has 𝟏𝟏𝟐𝟐𝟔𝟔 papers left to grade.
𝟔𝟔 𝟐𝟐𝟔𝟔% 𝟒𝟒𝟔𝟔% 𝟔𝟔𝟔𝟔% 𝟏𝟏𝟔𝟔% 𝟏𝟏𝟔𝟔𝟔𝟔%
𝟔𝟔 𝟏𝟏𝟔𝟔 𝟐𝟐𝟔𝟔 𝟑𝟑𝟔𝟔 𝟒𝟒𝟔𝟔 𝟓𝟓𝟔𝟔
The original amount of the item was $𝟓𝟓𝟔𝟔.
Lesson 27 Solving Percent Problems
219
This work is licensed under a Creative Commons Attribution-NonCommercial-ShareAlike 3.0 Unported License. © 2015 Great Minds. eureka-math.org
G6-M1-TE-1.3.0-06.2015

NYS COMMON CORE MATHEMATICS CURRICULUM 6•1 Lesson 28
Lesson 28: Solving Percent Problems
Student Outcomes
Given a part and the percent, students find the percent of a quantity and solve problems involving finding the whole.
Classwork
Example (5 minutes)
Read the questions from the example one by one.
Example
If an item is discounted 𝟐𝟐𝟐𝟐%, the sale price is what percent of the original price?
𝟏𝟏𝟐𝟐𝟐𝟐 − 𝟐𝟐𝟐𝟐 = 𝟖𝟖𝟐𝟐
𝟖𝟖𝟐𝟐%
If the original price of the item is $𝟒𝟒𝟐𝟐𝟐𝟐, what is the dollar amount of the discount?
𝟐𝟐𝟐𝟐% =𝟐𝟐𝟐𝟐𝟏𝟏𝟐𝟐𝟐𝟐
=𝟐𝟐𝟏𝟏𝟐𝟐
𝟒𝟒𝟐𝟐𝟐𝟐×𝟐𝟐𝟏𝟏𝟐𝟐
=𝟖𝟖𝟐𝟐𝟐𝟐𝟏𝟏𝟐𝟐
= $𝟖𝟖𝟐𝟐
$𝟖𝟖𝟐𝟐 discount
How much is the sale price?
𝟖𝟖𝟐𝟐% =𝟖𝟖𝟐𝟐𝟏𝟏𝟐𝟐𝟐𝟐
=𝟖𝟖𝟏𝟏𝟐𝟐
𝟒𝟒𝟐𝟐𝟐𝟐×𝟖𝟖𝟏𝟏𝟐𝟐
=𝟑𝟑𝟐𝟐𝟐𝟐𝟐𝟐𝟏𝟏𝟐𝟐
= $𝟑𝟑𝟐𝟐𝟐𝟐, or 𝟒𝟒𝟐𝟐𝟐𝟐 − 𝟖𝟖𝟐𝟐 = $𝟑𝟑𝟐𝟐𝟐𝟐
$𝟑𝟑𝟐𝟐𝟐𝟐 sale price
What are some different ways that we can solve this question?
Answers will vary. Some students may draw diagrams that they can share with the class. Others may have found the value by finding equivalent fractions or by multiplying a quantity by the percent written as a fraction.
Be sure to discuss different models that could be used.
Lesson 28 Solving Percent Problems
220
This work is licensed under a Creative Commons Attribution-NonCommercial-ShareAlike 3.0 Unported License. © 2015 Great Minds. eureka-math.org
G6-M1-TE-1.3.0-06.2015

NYS COMMON CORE MATHEMATICS CURRICULUM 6•1 Lesson 28
Lesson Summary
Percent problems include the part, whole, and percent. When one of these values is missing, we can use tables, diagrams, and models to solve for the missing number.
Exercise (20 minutes)
Have students work in pairs or small groups to solve the problems. Students are given the sale price and the percent that was saved. They need to come up with the original price.
Students should create models in order to prove that their answers are correct.
Exercise
The following items were bought on sale. Complete the missing information in the table.
Item Original Price Sale Price Amount of Discount
Percent Saved
Percent Paid
Television $𝟏𝟏𝟐𝟐𝟐𝟐𝟐𝟐 $𝟖𝟖𝟐𝟐𝟐𝟐 $𝟐𝟐𝟐𝟐𝟐𝟐 𝟐𝟐𝟐𝟐% 𝟖𝟖𝟐𝟐%
Sneakers $𝟖𝟖𝟐𝟐 $𝟔𝟔𝟐𝟐 $𝟐𝟐𝟐𝟐 𝟐𝟐𝟐𝟐% 𝟕𝟕𝟐𝟐%
Video Games $𝟔𝟔𝟐𝟐 $𝟐𝟐𝟒𝟒 $𝟔𝟔 𝟏𝟏𝟐𝟐% 𝟗𝟗𝟐𝟐%
MP3 Player $𝟖𝟖𝟔𝟔 $𝟐𝟐𝟏𝟏.𝟔𝟔𝟐𝟐 $𝟑𝟑𝟒𝟒.𝟒𝟒𝟐𝟐 𝟒𝟒𝟐𝟐% 𝟔𝟔𝟐𝟐%
Book $𝟏𝟏𝟒𝟒.𝟐𝟐𝟐𝟐 $𝟏𝟏𝟏𝟏.𝟐𝟐𝟐𝟐 $𝟐𝟐.𝟖𝟖𝟐𝟐 𝟐𝟐𝟐𝟐% 𝟖𝟖𝟐𝟐%
Snack Bar $𝟐𝟐.𝟐𝟐𝟐𝟐 $𝟏𝟏.𝟕𝟕𝟐𝟐 $𝟐𝟐.𝟑𝟑𝟐𝟐 𝟏𝟏𝟐𝟐% 𝟖𝟖𝟐𝟐%
Closing (10 minutes)
Have students showcase some of the models used to solve the problems. One possible way to showcase the work, if time allows, would be to hang the work on the walls and have students do a gallery walk to view the diagrams. Ask students how they could check their work.
The answers may vary according to which values are given and which values are missing. Students may mention that the discount and the sale price should add to be the original amount. The percents should add to 100%. They could solve the problem using the answer to see if they can work back to a given amount.
Exit Ticket (10 minutes)
Lesson 28 Solving Percent Problems
221
This work is licensed under a Creative Commons Attribution-NonCommercial-ShareAlike 3.0 Unported License. © 2015 Great Minds. eureka-math.org
G6-M1-TE-1.3.0-06.2015
NYS COMMON CORE MATHEMATICS CURRICULUM 6•1 Lesson 28
Name Date
Lesson 28: Solving Percent Problems
Exit Ticket 1. Write one problem using a dollar amount of $420 and a percent of 40%. Provide the solution to your problem.
2. The sale price of an item is $160 after a 20% discount. What was the original price of the item?
Lesson 28 Solving Percent Problems
222
This work is licensed under a Creative Commons Attribution-NonCommercial-ShareAlike 3.0 Unported License. © 2015 Great Minds. eureka-math.org
G6-M1-TE-1.3.0-06.2015

NYS COMMON CORE MATHEMATICS CURRICULUM 6•1 Lesson 28
Exit Ticket Sample Solutions
1. Write one problem using a dollar amount of $𝟒𝟒𝟐𝟐𝟐𝟐 and a percent of 𝟒𝟒𝟐𝟐%. Provide the solution to your problem.
Answers will vary.
Problems that include $𝟒𝟒𝟐𝟐𝟐𝟐 as the sale price should include $𝟕𝟕𝟐𝟐𝟐𝟐 as the original. Because 𝟒𝟒𝟐𝟐% is saved, 𝟔𝟔𝟐𝟐% is paid of the original. Therefore, the original price is $𝟕𝟕𝟐𝟐𝟐𝟐.
Problems that include $𝟒𝟒𝟐𝟐𝟐𝟐 as the original price and a 𝟒𝟒𝟐𝟐% discount should include $𝟐𝟐𝟐𝟐𝟐𝟐 as a sale price. Below is an example of a tape diagram that could be included in the solution.
2. The sale price of an item is $𝟏𝟏𝟔𝟔𝟐𝟐 after a 𝟐𝟐𝟐𝟐% off discount. What was the original price of the item?
Because the discount was 𝟐𝟐𝟐𝟐%, the purchase price was 𝟖𝟖𝟐𝟐% of the original.
𝟖𝟖𝟐𝟐% =𝟖𝟖𝟐𝟐𝟏𝟏𝟐𝟐𝟐𝟐
=𝟏𝟏𝟔𝟔𝟐𝟐𝟐𝟐𝟐𝟐𝟐𝟐
The original price was $𝟐𝟐𝟐𝟐𝟐𝟐.
Problem Set Sample Solutions
1. The Sparkling House Cleaning Company has cleaned 𝟐𝟐𝟖𝟖 houses this week. If this number represents 𝟒𝟒𝟐𝟐% of the total number of houses the company is contracted to clean, how many total houses will the company clean by the end of the week?
𝟕𝟕𝟐𝟐 houses
2. Joshua delivered 𝟑𝟑𝟐𝟐 hives to the local fruit farm. If the farmer has paid to use 𝟐𝟐% of the total number of Joshua’s hives, how many hives does Joshua have in all?
𝟔𝟔𝟐𝟐𝟐𝟐 hives
𝟐𝟐 𝟏𝟏𝟐𝟐 𝟐𝟐𝟐𝟐 𝟑𝟑𝟐𝟐 𝟒𝟒𝟐𝟐 𝟐𝟐𝟐𝟐 𝟔𝟔𝟐𝟐 𝟕𝟕𝟐𝟐 𝟖𝟖𝟐𝟐 𝟗𝟗𝟐𝟐 𝟏𝟏𝟐𝟐𝟐𝟐
𝟐𝟐 𝟕𝟕𝟐𝟐 𝟏𝟏𝟒𝟒𝟐𝟐 𝟐𝟐𝟏𝟏𝟐𝟐 𝟐𝟐𝟖𝟖𝟐𝟐 𝟑𝟑𝟐𝟐𝟐𝟐 𝟒𝟒𝟐𝟐𝟐𝟐 𝟒𝟒𝟗𝟗𝟐𝟐 𝟐𝟐𝟔𝟔𝟐𝟐 𝟔𝟔𝟑𝟑𝟐𝟐 𝟕𝟕𝟐𝟐𝟐𝟐
Lesson 28 Solving Percent Problems
223
This work is licensed under a Creative Commons Attribution-NonCommercial-ShareAlike 3.0 Unported License. © 2015 Great Minds. eureka-math.org
G6-M1-TE-1.3.0-06.2015
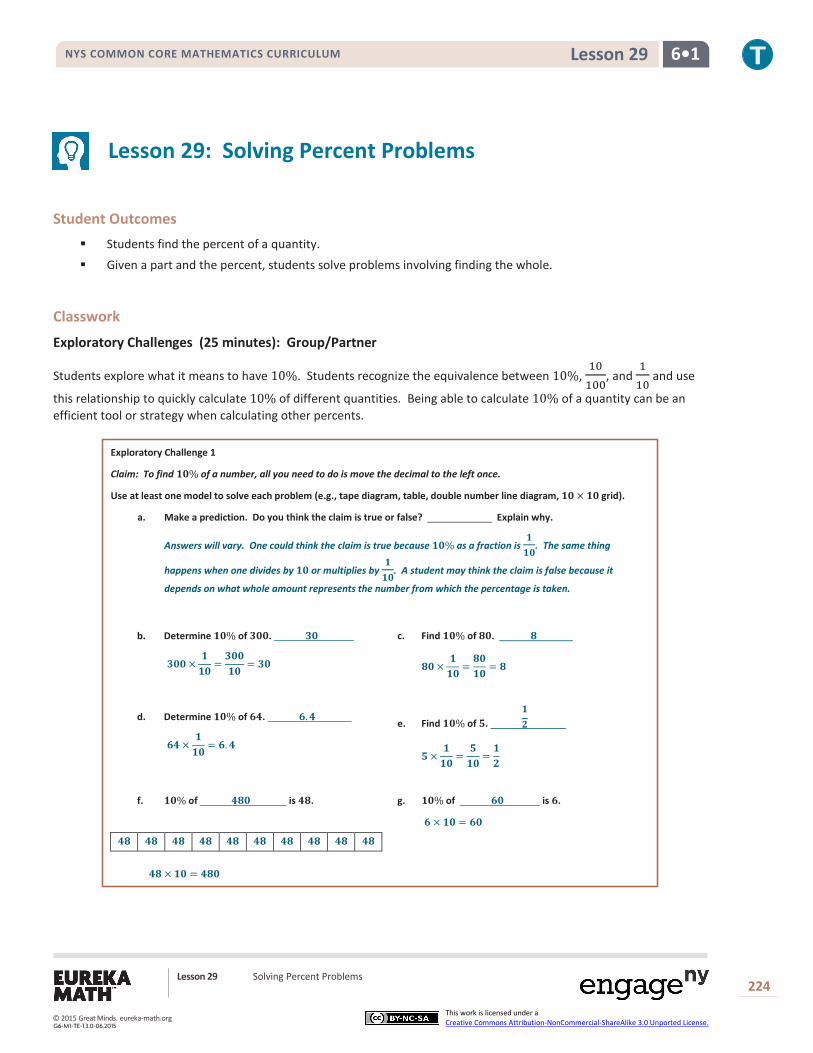
NYS COMMON CORE MATHEMATICS CURRICULUM 6•1 Lesson 29
Lesson 29: Solving Percent Problems
Student Outcomes
Students find the percent of a quantity. Given a part and the percent, students solve problems involving finding the whole.
Classwork
Exploratory Challenges (25 minutes): Group/Partner
Students explore what it means to have 10%. Students recognize the equivalence between 10%, 10100
, and 110
and use
this relationship to quickly calculate 10% of different quantities. Being able to calculate 10% of a quantity can be an efficient tool or strategy when calculating other percents.
Exploratory Challenge 1
Claim: To find 𝟏𝟏𝟏𝟏% of a number, all you need to do is move the decimal to the left once.
Use at least one model to solve each problem (e.g., tape diagram, table, double number line diagram, 𝟏𝟏𝟏𝟏 × 𝟏𝟏𝟏𝟏 grid).
a. Make a prediction. Do you think the claim is true or false? Explain why.
Answers will vary. One could think the claim is true because 𝟏𝟏𝟏𝟏% as a fraction is 𝟏𝟏𝟏𝟏𝟏𝟏
. The same thing
happens when one divides by 𝟏𝟏𝟏𝟏 or multiplies by 𝟏𝟏𝟏𝟏𝟏𝟏
. A student may think the claim is false because it
depends on what whole amount represents the number from which the percentage is taken.
b. Determine 𝟏𝟏𝟏𝟏% of 𝟑𝟑𝟏𝟏𝟏𝟏. 𝟑𝟑𝟏𝟏
𝟑𝟑𝟏𝟏𝟏𝟏×𝟏𝟏𝟏𝟏𝟏𝟏
=𝟑𝟑𝟏𝟏𝟏𝟏𝟏𝟏𝟏𝟏
= 𝟑𝟑𝟏𝟏
c. Find 𝟏𝟏𝟏𝟏% of 𝟖𝟖𝟏𝟏. 𝟖𝟖
𝟖𝟖𝟏𝟏×𝟏𝟏𝟏𝟏𝟏𝟏
=𝟖𝟖𝟏𝟏𝟏𝟏𝟏𝟏
= 𝟖𝟖
d. Determine 𝟏𝟏𝟏𝟏% of 𝟔𝟔𝟔𝟔. 𝟔𝟔.𝟔𝟔
𝟔𝟔𝟔𝟔×𝟏𝟏𝟏𝟏𝟏𝟏
= 𝟔𝟔.𝟔𝟔
e. Find 𝟏𝟏𝟏𝟏% of 𝟓𝟓. 𝟏𝟏𝟐𝟐
𝟓𝟓 ×𝟏𝟏𝟏𝟏𝟏𝟏
=𝟓𝟓𝟏𝟏𝟏𝟏
=𝟏𝟏𝟐𝟐
f. 𝟏𝟏𝟏𝟏% of 𝟔𝟔𝟖𝟖𝟏𝟏 is 𝟔𝟔𝟖𝟖.
𝟔𝟔𝟖𝟖 𝟔𝟔𝟖𝟖 𝟔𝟔𝟖𝟖 𝟔𝟔𝟖𝟖 𝟔𝟔𝟖𝟖 𝟔𝟔𝟖𝟖 𝟔𝟔𝟖𝟖 𝟔𝟔𝟖𝟖 𝟔𝟔𝟖𝟖 𝟔𝟔𝟖𝟖
g. 𝟏𝟏𝟏𝟏% of 𝟔𝟔𝟏𝟏 is 𝟔𝟔.
𝟔𝟔 × 𝟏𝟏𝟏𝟏 = 𝟔𝟔𝟏𝟏
𝟔𝟔𝟖𝟖 × 𝟏𝟏𝟏𝟏 = 𝟔𝟔𝟖𝟖𝟏𝟏
Lesson 29 Solving Percent Problems
224
This work is licensed under a Creative Commons Attribution-NonCommercial-ShareAlike 3.0 Unported License. © 2015 Great Minds. eureka-math.org
G6-M1-TE-1.3.0-06.2015

NYS COMMON CORE MATHEMATICS CURRICULUM 6•1 Lesson 29
h. Gary read 𝟑𝟑𝟔𝟔 pages of a 𝟑𝟑𝟔𝟔𝟏𝟏 pages book. What percent did he read?
𝟑𝟑𝟔𝟔÷ 𝟑𝟑𝟔𝟔𝟑𝟑𝟔𝟔𝟏𝟏÷ 𝟑𝟑𝟔𝟔
=𝟏𝟏𝟏𝟏𝟏𝟏
=𝟏𝟏𝟏𝟏𝟏𝟏𝟏𝟏𝟏𝟏
= 𝟏𝟏𝟏𝟏%
i. Micah read 𝟏𝟏𝟔𝟔 pages of his book. If this is 𝟏𝟏𝟏𝟏% of the book, how many pages are in the book?
𝟏𝟏𝟏𝟏𝟏𝟏𝟏𝟏𝟏𝟏
=𝟏𝟏 × 𝟏𝟏𝟔𝟔𝟏𝟏𝟏𝟏 × 𝟏𝟏𝟔𝟔
=𝟏𝟏𝟔𝟔𝟏𝟏𝟔𝟔𝟏𝟏
There are 𝟏𝟏𝟔𝟔𝟏𝟏 pages in the book.
j. Using the solutions to the problems above, what conclusions can you make about the claim?
The claim is true. When I find 𝟏𝟏𝟏𝟏% of a number, I am really finding 𝟏𝟏𝟏𝟏𝟏𝟏
of the amount or dividing by 𝟏𝟏𝟏𝟏,
which is the same as what occurred when I moved the decimal point in the number one place to the left.
Using the solutions to the problems above, what conclusions can you make about the claim? Answers will vary. However, students are required to share what is mathematically happening when
the decimal is moved over once to help make connections to why it works. Students may relate back to using place value and regrouping with the concept of decimals.
Students read a claim that two separate discounts give the same results as the sum of the two discounts taken off the original price at the same time. Students need to conclude that they are not the same because the second discount is being taken off a new amount not the original price.
Exploratory Challenge 2
Claim: If an item is already on sale, and then there is another discount taken off the sale price, this is the same as taking the sum of the two discounts off the original price.
Use at least one model to solve each problem (e.g., tape diagram, table, double number line diagram, 𝟏𝟏𝟏𝟏 × 𝟏𝟏𝟏𝟏 grid).
a. Make a prediction. Do you think the claim is true or false? _____________ Explain.
The answer is false. They will be different because when two discounts are taken off, the second discount is taken off a new amount.
b. Sam purchased 𝟑𝟑 games for $𝟏𝟏𝟔𝟔𝟏𝟏 after a discount of 𝟑𝟑𝟏𝟏%. What was the original price?
𝟐𝟐𝟏𝟏 𝟐𝟐𝟏𝟏 𝟐𝟐𝟏𝟏 𝟐𝟐𝟏𝟏 𝟐𝟐𝟏𝟏 𝟐𝟐𝟏𝟏 𝟐𝟐𝟏𝟏 𝟐𝟐𝟏𝟏 𝟐𝟐𝟏𝟏 𝟐𝟐𝟏𝟏
Sale price: $𝟏𝟏𝟔𝟔𝟏𝟏 Discount: $𝟔𝟔𝟏𝟏
$𝟐𝟐𝟏𝟏𝟏𝟏 is the original price.
c. If Sam had used a 𝟐𝟐𝟏𝟏% off coupon and opened a frequent shopper discount membership to save 𝟏𝟏𝟏𝟏%, would the games still have a total of $𝟏𝟏𝟔𝟔𝟏𝟏?
𝟐𝟐𝟏𝟏% = 𝟐𝟐𝟏𝟏𝟏𝟏𝟏𝟏𝟏𝟏 = 𝟐𝟐
𝟏𝟏𝟏𝟏 $𝟐𝟐𝟏𝟏𝟏𝟏× 𝟐𝟐𝟏𝟏𝟏𝟏
=$𝟔𝟔𝟏𝟏𝟏𝟏𝟏𝟏𝟏𝟏
= $𝟔𝟔𝟏𝟏 saved. The price after the coupon is $𝟏𝟏𝟔𝟔𝟏𝟏.
𝟏𝟏𝟏𝟏% = 𝟏𝟏𝟏𝟏𝟏𝟏𝟏𝟏𝟏𝟏 = 𝟏𝟏
𝟏𝟏𝟏𝟏 $𝟏𝟏𝟔𝟔𝟏𝟏× 𝟏𝟏𝟏𝟏𝟏𝟏 = $𝟏𝟏𝟔𝟔𝟏𝟏
𝟏𝟏𝟏𝟏 = $𝟏𝟏𝟔𝟔 saved. The price after the coupon and discount membership is $𝟏𝟏𝟔𝟔𝟔𝟔.
No, the games would now total $𝟏𝟏𝟔𝟔𝟔𝟔.
Lesson 29 Solving Percent Problems
225
This work is licensed under a Creative Commons Attribution-NonCommercial-ShareAlike 3.0 Unported License. © 2015 Great Minds. eureka-math.org
G6-M1-TE-1.3.0-06.2015
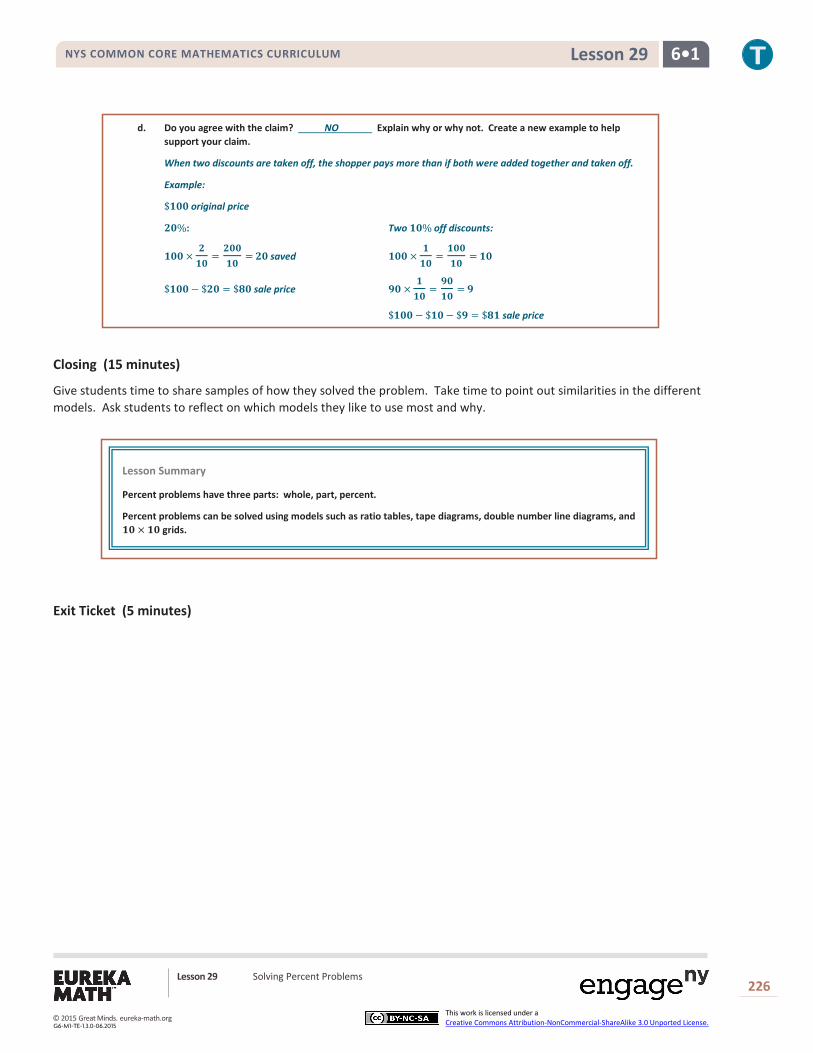
NYS COMMON CORE MATHEMATICS CURRICULUM 6•1 Lesson 29
d. Do you agree with the claim? NO Explain why or why not. Create a new example to help support your claim.
When two discounts are taken off, the shopper pays more than if both were added together and taken off.
Example:
$𝟏𝟏𝟏𝟏𝟏𝟏 original price
𝟐𝟐𝟏𝟏%: Two 𝟏𝟏𝟏𝟏% off discounts:
𝟏𝟏𝟏𝟏𝟏𝟏× 𝟐𝟐𝟏𝟏𝟏𝟏
=𝟐𝟐𝟏𝟏𝟏𝟏𝟏𝟏𝟏𝟏
= 𝟐𝟐𝟏𝟏 saved 𝟏𝟏𝟏𝟏𝟏𝟏× 𝟏𝟏𝟏𝟏𝟏𝟏
=𝟏𝟏𝟏𝟏𝟏𝟏𝟏𝟏𝟏𝟏
= 𝟏𝟏𝟏𝟏
$𝟏𝟏𝟏𝟏𝟏𝟏 − $𝟐𝟐𝟏𝟏 = $𝟖𝟖𝟏𝟏 sale price 𝟗𝟗𝟏𝟏 × 𝟏𝟏𝟏𝟏𝟏𝟏
=𝟗𝟗𝟏𝟏𝟏𝟏𝟏𝟏
= 𝟗𝟗
$𝟏𝟏𝟏𝟏𝟏𝟏 − $𝟏𝟏𝟏𝟏 − $𝟗𝟗 = $𝟖𝟖𝟏𝟏 sale price
Closing (15 minutes)
Give students time to share samples of how they solved the problem. Take time to point out similarities in the different models. Ask students to reflect on which models they like to use most and why.
Exit Ticket (5 minutes)
Lesson Summary
Percent problems have three parts: whole, part, percent.
Percent problems can be solved using models such as ratio tables, tape diagrams, double number line diagrams, and 𝟏𝟏𝟏𝟏 × 𝟏𝟏𝟏𝟏 grids.
Lesson 29 Solving Percent Problems
226
This work is licensed under a Creative Commons Attribution-NonCommercial-ShareAlike 3.0 Unported License. © 2015 Great Minds. eureka-math.org
G6-M1-TE-1.3.0-06.2015

NYS COMMON CORE MATHEMATICS CURRICULUM 6•1 Lesson 29
Name Date
Lesson 29: Solving Percent Problems
Exit Ticket Angelina received two discounts on a $50 pair of shoes. The discounts were taken off one after the other. If she paid $30 for the shoes, what was the percent discount for each coupon? Is there only one answer to this question?
Lesson 29 Solving Percent Problems
227
This work is licensed under a Creative Commons Attribution-NonCommercial-ShareAlike 3.0 Unported License. © 2015 Great Minds. eureka-math.org
G6-M1-TE-1.3.0-06.2015

NYS COMMON CORE MATHEMATICS CURRICULUM 6•1 Lesson 29
Exit Ticket Sample Solutions
Angelina received two discounts on a $𝟓𝟓𝟏𝟏 pair of shoes. The discounts were taken off one after the other. If she paid $𝟑𝟑𝟏𝟏 for the shoes, what was the percent discount for each coupon? Is there only one answer to this question?
Problem Set Sample Solutions
1. Henry has 𝟏𝟏𝟓𝟓 lawns mowed out of a total of 𝟔𝟔𝟏𝟏 lawns. What percent of the lawns does Henry still have to mow?
𝟕𝟕𝟓𝟓% of the lawns still need to be mowed.
2. Marissa got an 𝟖𝟖𝟓𝟓% on her math quiz. She had 𝟑𝟑𝟔𝟔 questions correct. How many questions were on the quiz?
There were 𝟔𝟔𝟏𝟏 questions on the quiz.
3. Lucas read 𝟑𝟑𝟏𝟏% of his book containing 𝟔𝟔𝟖𝟖𝟏𝟏 pages. What page is he going to read next?
𝟑𝟑𝟏𝟏% is 𝟏𝟏𝟔𝟔𝟔𝟔 pages, so he will read page 𝟏𝟏𝟔𝟔𝟓𝟓 next.
Original Price $𝟓𝟓𝟏𝟏
𝟏𝟏% 𝟐𝟐𝟏𝟏% 𝟔𝟔𝟏𝟏% 𝟔𝟔𝟏𝟏% 𝟖𝟖𝟏𝟏% 𝟏𝟏𝟏𝟏𝟏𝟏%
𝟏𝟏 𝟏𝟏𝟏𝟏 𝟐𝟐𝟏𝟏 𝟑𝟑𝟏𝟏 𝟔𝟔𝟏𝟏 𝟓𝟓𝟏𝟏
𝟐𝟐𝟏𝟏% off $𝟓𝟓𝟏𝟏 = $𝟏𝟏𝟏𝟏 discount. After a 𝟐𝟐𝟏𝟏% off discount, the new price would be $𝟔𝟔𝟏𝟏.
𝟐𝟐𝟓𝟓% off $𝟔𝟔𝟏𝟏 = $𝟏𝟏𝟏𝟏 discount. After a 𝟐𝟐𝟓𝟓% off discount, the new price would be $𝟑𝟑𝟏𝟏.
Therefore, the two discounts could be 𝟐𝟐𝟏𝟏% off and then 𝟐𝟐𝟓𝟓%.
This is not the only answer. She could have also saved 𝟐𝟐𝟓𝟓% and then 𝟐𝟐𝟏𝟏%.
Lesson 29 Solving Percent Problems
228
This work is licensed under a Creative Commons Attribution-NonCommercial-ShareAlike 3.0 Unported License. © 2015 Great Minds. eureka-math.org
G6-M1-TE-1.3.0-06.2015
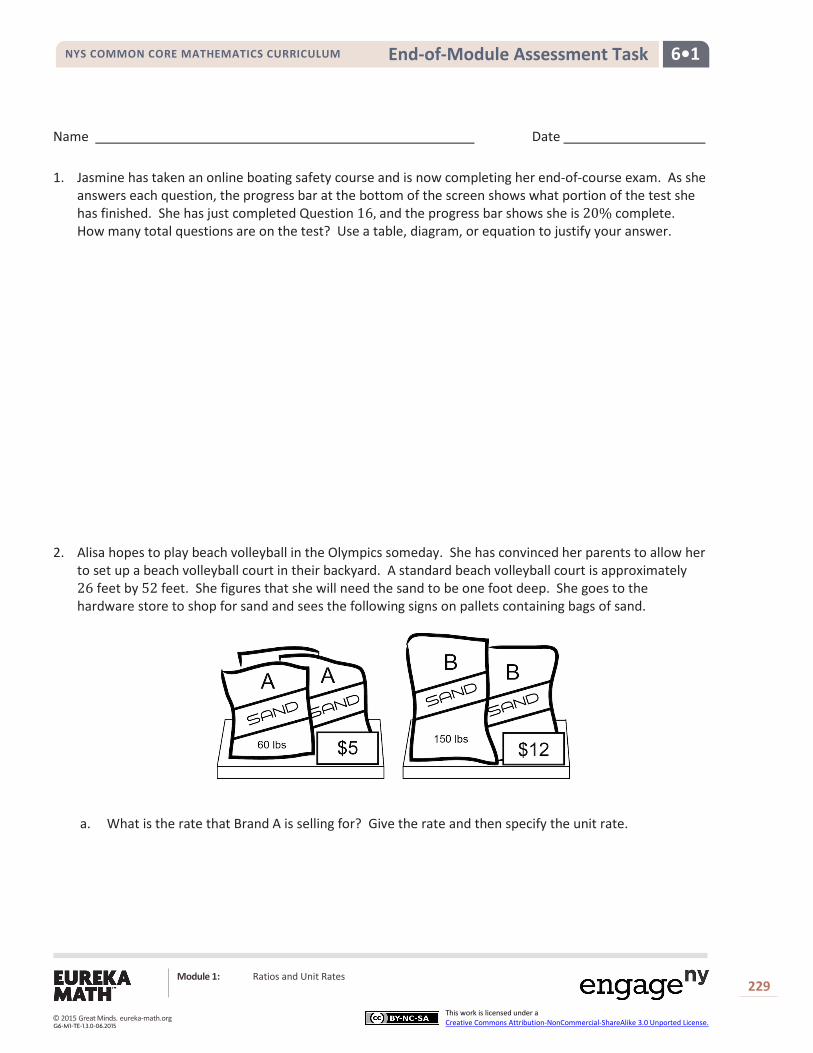
6•1 End-of-Module Assessment Task NYS COMMON CORE MATHEMATICS CURRICULUM
Name Date 1. Jasmine has taken an online boating safety course and is now completing her end-of-course exam. As she
answers each question, the progress bar at the bottom of the screen shows what portion of the test she has finished. She has just completed Question 16, and the progress bar shows she is 20% complete. How many total questions are on the test? Use a table, diagram, or equation to justify your answer.
2. Alisa hopes to play beach volleyball in the Olympics someday. She has convinced her parents to allow her to set up a beach volleyball court in their backyard. A standard beach volleyball court is approximately 26 feet by 52 feet. She figures that she will need the sand to be one foot deep. She goes to the hardware store to shop for sand and sees the following signs on pallets containing bags of sand.
a. What is the rate that Brand A is selling for? Give the rate and then specify the unit rate.
Module 1: Ratios and Unit Rates
229
This work is licensed under a Creative Commons Attribution-NonCommercial-ShareAlike 3.0 Unported License. © 2015 Great Minds. eureka-math.org
G6-M1-TE-1.3.0-06.2015

6•1 End-of-Module Assessment Task NYS COMMON CORE MATHEMATICS CURRICULUM
b. Which brand is offering the better value? Explain your answer. c. Alisa uses her cell phone to search how many pounds of sand is required to fill 1 cubic foot and finds
the answer is 100 pounds. Choose one of the brands and compute how much it will cost Alisa to purchase enough sand to fill the court. Identify which brand was chosen as part of your answer. Use the volume formula, 𝑉𝑉 = 𝑙𝑙 ×𝑤𝑤 × ℎ, to determine your answer.
Module 1: Ratios and Unit Rates
230
This work is licensed under a Creative Commons Attribution-NonCommercial-ShareAlike 3.0 Unported License. © 2015 Great Minds. eureka-math.org
G6-M1-TE-1.3.0-06.2015

6•1 End-of-Module Assessment Task NYS COMMON CORE MATHEMATICS CURRICULUM
3. Loren and Julie have different part-time jobs after school. They are both paid at a constant rate of dollars per hour. The tables below show Loren and Julie’s total income (amount earned) for working a given amount of time. Loren
Hours 2 4 6 8 10 12 14 16 18 Dollars 18 36 54 72 90 108 162
Julie
Hours 3 6 9 12 15 18 21 24 27 Dollars 36 108 144 180 216 288 324
a. Find the missing values in the two tables above. b. Who makes more per hour? Justify your answer. c. Write how much Julie makes as a rate. What is the unit rate?
Module 1: Ratios and Unit Rates
231
This work is licensed under a Creative Commons Attribution-NonCommercial-ShareAlike 3.0 Unported License. © 2015 Great Minds. eureka-math.org
G6-M1-TE-1.3.0-06.2015

6•1 End-of-Module Assessment Task NYS COMMON CORE MATHEMATICS CURRICULUM
d. How much money would Julie earn for working 16 hours? e. What is the ratio between how much Loren makes per hour and how much Julie makes per hour?
f. Julie works 112
hours/dollar. Write a one or two-sentence explanation of what this rate means. Use this rate to find how long it takes for Julie to earn $228.
Module 1: Ratios and Unit Rates
232
This work is licensed under a Creative Commons Attribution-NonCommercial-ShareAlike 3.0 Unported License. © 2015 Great Minds. eureka-math.org
G6-M1-TE-1.3.0-06.2015

6•1 End-of-Module Assessment Task NYS COMMON CORE MATHEMATICS CURRICULUM
4. Your mother takes you to your grandparents’ house for dinner. She drives 60 minutes at a constant speed of 40 miles per hour. She reaches the highway, quickly speeds up, and drives for another 30 minutes at constant speed of 70 miles per hour. a. How far did you and your mother travel altogether? b. How long did the trip take? c. Your older brother drove to your grandparents’ house in a different car but left from the same
location at the same time. If he traveled at a constant speed of 60 miles per hour, explain why he would reach your grandparents’ house first. Use words, diagrams, or numbers to explain your reasoning.
Module 1: Ratios and Unit Rates
233
This work is licensed under a Creative Commons Attribution-NonCommercial-ShareAlike 3.0 Unported License. © 2015 Great Minds. eureka-math.org
G6-M1-TE-1.3.0-06.2015
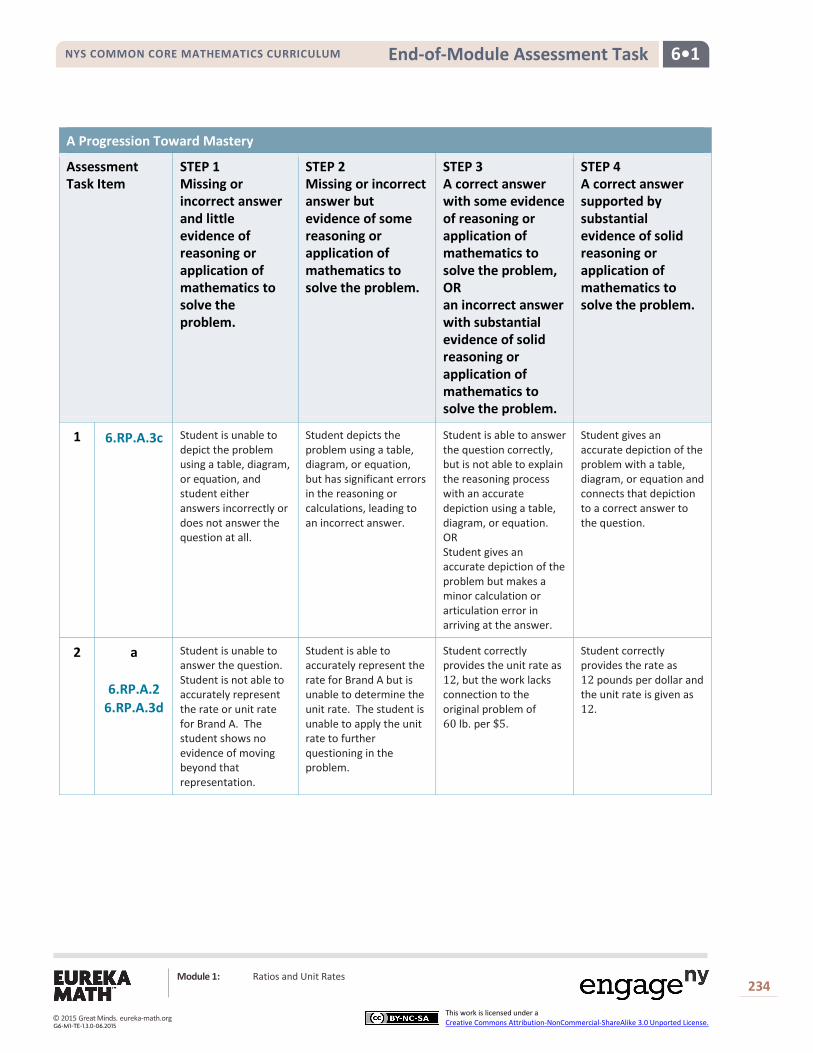
6•1 End-of-Module Assessment Task NYS COMMON CORE MATHEMATICS CURRICULUM
A Progression Toward Mastery
Assessment Task Item
STEP 1 Missing or incorrect answer and little evidence of reasoning or application of mathematics to solve the problem.
STEP 2 Missing or incorrect answer but evidence of some reasoning or application of mathematics to solve the problem.
STEP 3 A correct answer with some evidence of reasoning or application of mathematics to solve the problem, OR an incorrect answer with substantial evidence of solid reasoning or application of mathematics to solve the problem.
STEP 4 A correct answer supported by substantial evidence of solid reasoning or application of mathematics to solve the problem.
1
6.RP.A.3c Student is unable to depict the problem using a table, diagram, or equation, and student either answers incorrectly or does not answer the question at all.
Student depicts the problem using a table, diagram, or equation, but has significant errors in the reasoning or calculations, leading to an incorrect answer.
Student is able to answer the question correctly, but is not able to explain the reasoning process with an accurate depiction using a table, diagram, or equation. OR Student gives an accurate depiction of the problem but makes a minor calculation or articulation error in arriving at the answer.
Student gives an accurate depiction of the problem with a table, diagram, or equation and connects that depiction to a correct answer to the question.
2 a
6.RP.A.2 6.RP.A.3d
Student is unable to answer the question. Student is not able to accurately represent the rate or unit rate for Brand A. The student shows no evidence of moving beyond that representation.
Student is able to accurately represent the rate for Brand A but is unable to determine the unit rate. The student is unable to apply the unit rate to further questioning in the problem.
Student correctly provides the unit rate as 12, but the work lacks connection to the original problem of 60 lb. per $5.
Student correctly provides the rate as 12 pounds per dollar and the unit rate is given as 12.
Module 1: Ratios and Unit Rates
234
This work is licensed under a Creative Commons Attribution-NonCommercial-ShareAlike 3.0 Unported License. © 2015 Great Minds. eureka-math.org
G6-M1-TE-1.3.0-06.2015
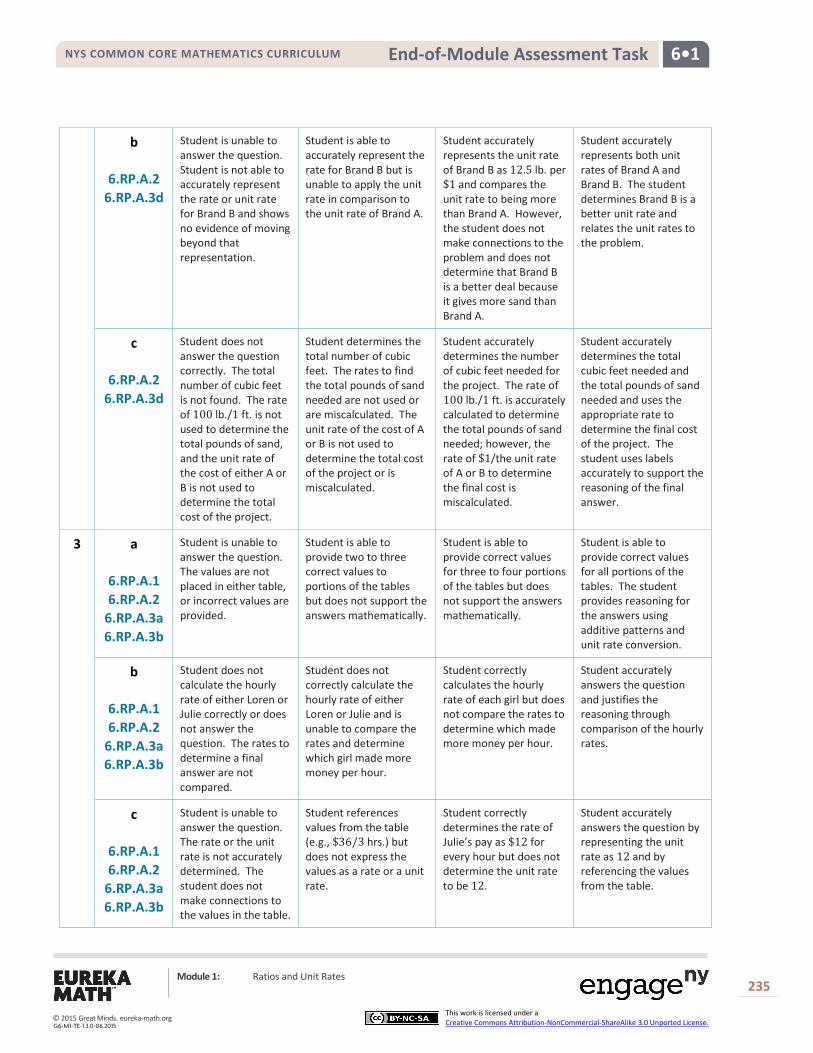
6•1 End-of-Module Assessment Task NYS COMMON CORE MATHEMATICS CURRICULUM
b
6.RP.A.2 6.RP.A.3d
Student is unable to answer the question. Student is not able to accurately represent the rate or unit rate for Brand B and shows no evidence of moving beyond that representation.
Student is able to accurately represent the rate for Brand B but is unable to apply the unit rate in comparison to the unit rate of Brand A.
Student accurately represents the unit rate of Brand B as 12.5 lb. per $1 and compares the unit rate to being more than Brand A. However, the student does not make connections to the problem and does not determine that Brand B is a better deal because it gives more sand than Brand A.
Student accurately represents both unit rates of Brand A and Brand B. The student determines Brand B is a better unit rate and relates the unit rates to the problem.
c
6.RP.A.2 6.RP.A.3d
Student does not answer the question correctly. The total number of cubic feet is not found. The rate of 100 lb./1 ft. is not used to determine the total pounds of sand, and the unit rate of the cost of either A or B is not used to determine the total cost of the project.
Student determines the total number of cubic feet. The rates to find the total pounds of sand needed are not used or are miscalculated. The unit rate of the cost of A or B is not used to determine the total cost of the project or is miscalculated.
Student accurately determines the number of cubic feet needed for the project. The rate of 100 lb./1 ft. is accurately calculated to determine the total pounds of sand needed; however, the rate of $1/the unit rate of A or B to determine the final cost is miscalculated.
Student accurately determines the total cubic feet needed and the total pounds of sand needed and uses the appropriate rate to determine the final cost of the project. The student uses labels accurately to support the reasoning of the final answer.
3
a
6.RP.A.1 6.RP.A.2
6.RP.A.3a 6.RP.A.3b
Student is unable to answer the question. The values are not placed in either table, or incorrect values are provided.
Student is able to provide two to three correct values to portions of the tables but does not support the answers mathematically.
Student is able to provide correct values for three to four portions of the tables but does not support the answers mathematically.
Student is able to provide correct values for all portions of the tables. The student provides reasoning for the answers using additive patterns and unit rate conversion.
b
6.RP.A.1 6.RP.A.2
6.RP.A.3a 6.RP.A.3b
Student does not calculate the hourly rate of either Loren or Julie correctly or does not answer the question. The rates to determine a final answer are not compared.
Student does not correctly calculate the hourly rate of either Loren or Julie and is unable to compare the rates and determine which girl made more money per hour.
Student correctly calculates the hourly rate of each girl but does not compare the rates to determine which made more money per hour.
Student accurately answers the question and justifies the reasoning through comparison of the hourly rates.
c
6.RP.A.1 6.RP.A.2
6.RP.A.3a 6.RP.A.3b
Student is unable to answer the question. The rate or the unit rate is not accurately determined. The student does not make connections to the values in the table.
Student references values from the table (e.g., $36/3 hrs.) but does not express the values as a rate or a unit rate.
Student correctly determines the rate of Julie’s pay as $12 for every hour but does not determine the unit rate to be 12.
Student accurately answers the question by representing the unit rate as 12 and by referencing the values from the table.
Module 1: Ratios and Unit Rates
235
This work is licensed under a Creative Commons Attribution-NonCommercial-ShareAlike 3.0 Unported License. © 2015 Great Minds. eureka-math.org
G6-M1-TE-1.3.0-06.2015

6•1 End-of-Module Assessment Task NYS COMMON CORE MATHEMATICS CURRICULUM
d
6.RP.A.1 6.RP.A.2
6.RP.A.3a 6.RP.A.3b
Student is unable to answer the question. The correct rate with the number of hours is not accurately computed. OR Student does not attempt the problem.
Student does not accurately compute the correct rate with the number of hours but is proficient in the process to find the correct answer.
Student computes the correct rate with the number of hours. The student finds the total amount of money Julie made in 16 hours. Student work lacks labeling and clear sequence in solving.
Student accurately derives the correct amount of money Julie made in 16 hours. Student uses the correct rate, and the work is labeled in order to justify the reasoning. Student’s work is in logical progression.
e
6.RP.A.1 6.RP.A.2
6.RP.A.3a 6.RP.A.3b
Student is unable to answer the question. The correct rate of pay for one or both of the girls is not found.
Student is able to compute the accurate rate of pay for the girls but does not compare to determine which girl made more money per hour.
Student accurately computes the rate of pay for each girl and accurately compares the pay in ratio form. Student does not derive a simplified ratio from the rates of pay.
Student answers the problem accurately, with labels, and simplifies the final answer.
f
6.RP.A.1 6.RP.A.2
6.RP.A.3a 6.RP.A.3b
Student explains what the rate means in the problem but does not accurately find the answer.
Student explains the meaning of the rate in detail using conversions but makes errors when deriving the plan to solve. Example: The answer is not indicative of understanding cancellation of units and finds $19 instead of 19 hours.
Student provides a lucid explanation with conversions and support. The student may multiply by minute conversion and find a final answer of 1,140 minutes instead of 19 hours.
Student answers the problem with precision and coherent explanation of what the rate means. Calculations are accurate, and the final answer is supported and justified through appropriate labeling.
4
a
6.RP.A.3b
Student is unable to answer the problem accurately. Student is not able to apply the rates to determine the number of miles.
Student is able to show intent to multiply the rate by the time to find the miles but computes incorrectly.
Student multiplies the rates appropriately to the time for each section of the trip. The number of separate miles is found, but student does not combine them for a total number of miles for the trip. OR Student shows understanding of the concept but makes computation errors.
Student completes the entire problem accurately with appropriate labels. Student is able to derive a total distance with no computation errors.
Module 1: Ratios and Unit Rates
236
This work is licensed under a Creative Commons Attribution-NonCommercial-ShareAlike 3.0 Unported License. © 2015 Great Minds. eureka-math.org
G6-M1-TE-1.3.0-06.2015

6•1 End-of-Module Assessment Task NYS COMMON CORE MATHEMATICS CURRICULUM
b
6.RP.A.3b
Student does not complete the problem or answers with an incorrect response.
Student uses information from the original problem to determine the addends but computes the total incorrectly.
Student uses information from the original problem to determine addends and computes the sum correctly but does not report the correct unit.
Student uses information from the original problem to determine addends and computes the sum correctly. Student labels work appropriately and converts the minutes into hours.
c
6.RP.A.3b
Student does not use a diagram, words, or numbers to support the answer or uses the diagram inappropriately. Student does not answer the problem with an accurate response.
Student provides an accurate response but does not utilize a diagram, words, or numbers to support the answer.
Student provides a correct answer and uses only words or numbers to support the answer.
Student uses appropriate diagrams, words, and numbers to support the accurate answer.
Module 1: Ratios and Unit Rates
237
This work is licensed under a Creative Commons Attribution-NonCommercial-ShareAlike 3.0 Unported License. © 2015 Great Minds. eureka-math.org
G6-M1-TE-1.3.0-06.2015

6•1 End-of-Module Assessment Task NYS COMMON CORE MATHEMATICS CURRICULUM
Name Date 1. Jasmine has taken an online boating safety course and is now completing her end-of-course exam. As she
answers each question, the progress bar at the bottom of the screen shows what portion of the test she has finished. She has just completed Question 16, and the progress bar shows she is 20% complete. How many total questions are on the test? Use a table, diagram, or equation to justify your answer.
2. Alisa hopes to play beach volleyball in the Olympics someday. She has convinced her parents to allow her to set up a beach volleyball court in their backyard. A standard beach volleyball court is approximately 26 feet by 52 feet. She figures that she will need the sand to be one foot deep. She goes to the hardware store to shop for sand and sees the following signs on pallets containing bags of sand.
a. What is the rate that Brand A is selling for? Give the rate and then specify the unit rate.
Module 1: Ratios and Unit Rates
238
This work is licensed under a Creative Commons Attribution-NonCommercial-ShareAlike 3.0 Unported License. © 2015 Great Minds. eureka-math.org
G6-M1-TE-1.3.0-06.2015

6•1 End-of-Module Assessment Task NYS COMMON CORE MATHEMATICS CURRICULUM
b. Which brand is offering the better value? Explain your answer.
c. Alisa uses her cell phone to search how many pounds of sand is required to fill 1 cubic foot and finds
the answer is 100 pounds. Choose one of the brands and compute how much it will cost Alisa to purchase enough sand to fill the court. Identify which brand was chosen as part of your answer. Use the volume formula, 𝑉𝑉 = 𝑙𝑙 ×𝑤𝑤 × ℎ, to determine your answer.
Module 1: Ratios and Unit Rates
239
This work is licensed under a Creative Commons Attribution-NonCommercial-ShareAlike 3.0 Unported License. © 2015 Great Minds. eureka-math.org
G6-M1-TE-1.3.0-06.2015

6•1 End-of-Module Assessment Task NYS COMMON CORE MATHEMATICS CURRICULUM
3. Loren and Julie have different part-time jobs after school. They are both paid at a constant rate of dollars per hour. The tables below show Loren and Julie’s total income (amount earned) for working a given amount of time.
a. Find the missing values in the two tables above. b. Who makes more per hour? Justify your answer.
c. Write how much Julie makes as a rate. What is the unit rate?
Module 1: Ratios and Unit Rates
240
This work is licensed under a Creative Commons Attribution-NonCommercial-ShareAlike 3.0 Unported License. © 2015 Great Minds. eureka-math.org
G6-M1-TE-1.3.0-06.2015
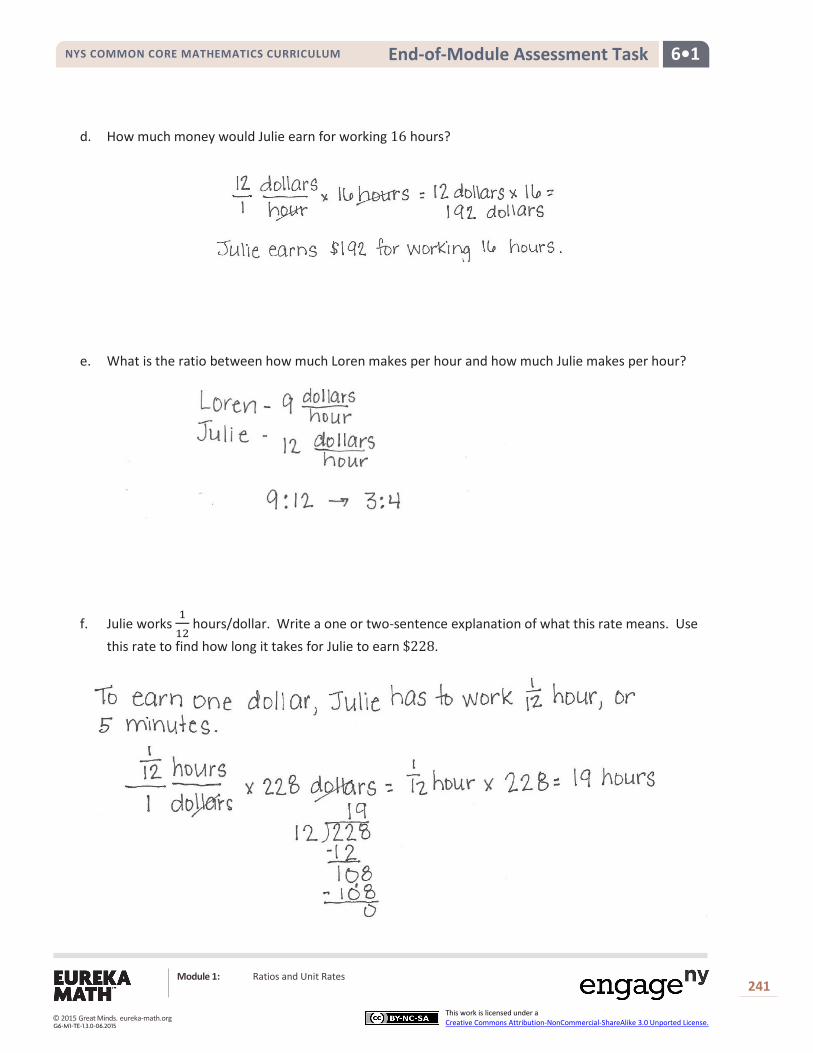
6•1 End-of-Module Assessment Task NYS COMMON CORE MATHEMATICS CURRICULUM
d. How much money would Julie earn for working 16 hours?
e. What is the ratio between how much Loren makes per hour and how much Julie makes per hour?
f. Julie works 112
hours/dollar. Write a one or two-sentence explanation of what this rate means. Use this rate to find how long it takes for Julie to earn $228.
Module 1: Ratios and Unit Rates
241
This work is licensed under a Creative Commons Attribution-NonCommercial-ShareAlike 3.0 Unported License. © 2015 Great Minds. eureka-math.org
G6-M1-TE-1.3.0-06.2015

6•1 End-of-Module Assessment Task NYS COMMON CORE MATHEMATICS CURRICULUM
4. Your mother takes you to your grandparents’ house for dinner. She drives 60 minutes at a constant speed of 40 miles per hour. She reaches the highway, quickly speeds up, and drives for another 30 minutes at constant speed of 70 miles per hour. a. How far did you and your mother travel altogether?
b. How long did the trip take?
c. Your older brother drove to your grandparents’ house in a different car but left from the same
location at the same time. If he traveled at a constant speed of 60 miles per hour, explain why he would reach your grandparents’ house first. Use words, diagrams, or numbers to explain your reasoning.
Module 1: Ratios and Unit Rates
242
This work is licensed under a Creative Commons Attribution-NonCommercial-ShareAlike 3.0 Unported License. © 2015 Great Minds. eureka-math.org
G6-M1-TE-1.3.0-06.2015

ALGEBRA I • MODULE 1
New York State Common Core
Mathematics Curriculum
Module 1: Relationships Between Quantities and Reasoning with Equations and Their Graphs
1
This work is derived from Eureka Math ™ and licensed by Great Minds. ©2015 Great Minds. eureka-math.org This file derived from ALG I-M1-TE-1.3.0-07.2015
This work is licensed under a Creative Commons Attribution-NonCommercial-ShareAlike 3.0 Unported License.
Table of Contents1
Relationships Between Quantities and
Reasoning with Equations and Their Graphs Module Overview .................................................................................................................................................. 3
Topic A: Introduction to Functions Studied this Year—Graphing Stories (N-Q.A.1, N-Q.A.2, N-Q.A.3, A-CED.A.2) ............................................................................................................................................. 15
Lesson 1: Graphs of Piecewise Linear Functions .................................................................................... 17
Lesson 2: Graphs of Quadratic Functions ............................................................................................... 24
Lesson 3: Graphs of Exponential Functions ............................................................................................ 35
Lesson 4: Analyzing Graphs—Water Usage During a Typical Day at School .......................................... 45
Lesson 5: Two Graphing Stories.............................................................................................................. 53
Topic B: The Structure of Expressions (A-SSE.A.2, A-APR.A.1) ........................................................................... 63
Lesson 6: Algebraic Expressions—The Distributive Property ................................................................. 65
Lesson 7: Algebraic Expressions—The Commutative and Associative Properties ................................. 76
Lesson 8: Adding and Subtracting Polynomials ...................................................................................... 89
Lesson 9: Multiplying Polynomials ......................................................................................................... 98
Mid-Module Assessment and Rubric ................................................................................................................ 106 Topics A through B (assessment 2 days, return and remediation or further applications 3 days)
Topic C: Solving Equations and Inequalities (A-CED.A.3, A-CED.A.4, A-REI.A.1, A-REI.B.3, A-REI.C.5, A-REI.C.6, A-REI.D.10, A-REI.D.12) ...................................................................................................... 133
Lesson 10: True and False Equations .................................................................................................... 135
Lesson 11: Solution Sets for Equations and Inequalities ...................................................................... 145
Lesson 12: Solving Equations ................................................................................................................ 160
Lesson 13: Some Potential Dangers when Solving Equations .............................................................. 170
Lesson 14: Solving Inequalities ............................................................................................................. 179
Lesson 15: Solution Sets of Two or More Equations (or Inequalities) Joined by “And” or “Or” .......... 188
Lesson 16: Solving and Graphing Inequalities Joined by “And” or “Or” ............................................... 198
1Each lesson is ONE day, and ONE day is considered a 45-minute period.

M1 ALGEBR
A I
Module Overview NYS COMMON CORE MATHEMATICS CURRICULUM
ALGEBRA I
Module 1: Relationships Between Quantities and Reasoning with Equations and Their Graphs
2
This work is derived from Eureka Math ™ and licensed by Great Minds. ©2015 Great Minds. eureka-math.org This file derived from ALG I-M1-TE-1.3.0-07.2015
This work is licensed under a Creative Commons Attribution-NonCommercial-ShareAlike 3.0 Unported License.
Lesson 17: Equations Involving Factored Expressions .......................................................................... 206
Lesson 18: Equations Involving a Variable Expression in the Denominator ......................................... 214
Lesson 19: Rearranging Formulas ......................................................................................................... 222
Lesson 20: Solution Sets to Equations with Two Variables .................................................................. 230
Lesson 21: Solution Sets to Inequalities with Two Variables ............................................................... 238
Lessons 22–23: Solution Sets to Simultaneous Equations ................................................................... 248
Lesson 24: Applications of Systems of Equations and Inequalities ...................................................... 266
Topic D: Creating Equations to Solve Problems (N-Q.A.1, A-SSE.A.1, A-CED.A.1, A-CED.A.2, A-REI.B.3) ........ 273
Lesson 25: Solving Problems in Two Ways—Rates and Algebra .......................................................... 275
Lessons 26–27: Recursive Challenge Problem—The Double and Add 5 Game .................................... 288
Lesson 28: Federal Income Tax ............................................................................................................. 304
End-of-Module Assessment and Rubric ............................................................................................................ 312 Topics A through D (assessment 2 days, return and remediation or further applications 3 days)

M1 ALGEBR
A I
Module Overview NYS COMMON CORE MATHEMATICS CURRICULUM
ALGEBRA I
Module 1: Relationships Between Quantities and Reasoning with Equations and Their Graphs
3
This work is derived from Eureka Math ™ and licensed by Great Minds. ©2015 Great Minds. eureka-math.org This file derived from ALG I-M1-TE-1.3.0-07.2015
This work is licensed under a Creative Commons Attribution-NonCommercial-ShareAlike 3.0 Unported License.
Algebra I • Module 1
Relationships Between Quantities and
Reasoning with Equations and Their Graphs
OVERVIEW By the end of Grade 8, students have learned to solve linear equations in one variable and have applied graphical and algebraic methods to analyze and solve systems of linear equations in two variables. Now, students are introduced to nonlinear equations and their graphs. Students formalize their understanding of equivalent algebraic expressions and begin their study of polynomial expressions. Further, they learn that there are some actions that, when applied to the expressions on both sides of an equal sign, will not result in an equation with the same solution set as the original equation. Finally, they encounter problems that induce the full modeling cycle, as it is described in the Common Core Learning Standards for Mathematics.
In Topic A, students explore the main functions that they will work with in Algebra I: linear, quadratic, and exponential. The goal is to introduce students to these functions by having them make graphs of situations (usually based upon time) in which the functions naturally arise (A-CED.A.2). As they graph, they reason abstractly and quantitatively as well as choose and interpret units to solve problems related to the graphs they create (N-Q.A.1, N-Q.A.2, N-Q.A.3).
In middle school, students applied the properties of operations to add, subtract, factor, and expand expressions (6.EE.A.3, 6.EE.A.4, 7.EE.A.1, 8.EE.A.1). Now, in Topic B, students use the structure of expressions to define what it means for two algebraic expressions to be equivalent. In doing so, they discern that the commutative, associative, and distributive properties help link each of the expressions in the collection together, even if the expressions look very different themselves (A-SSE.A.2). They learn the definition of a polynomial expression and build fluency in identifying and generating polynomial expressions as well as adding, subtracting, and multiplying polynomial expressions (A-APR.A.1). The Mid-Module Assessment follows Topic B.
Throughout middle school, students practice the process of solving linear equations (6.EE.B.5, 6.EE.B.7, 7.EE.B.4, 8.EE.C.7) and systems of linear equations (8.EE.C.8). Now, in Topic C, instead of just solving equations, they formalize descriptions of what they learned before (variable, solution sets, etc.) and are able to explain, justify, and evaluate their reasoning as they strategize methods for solving linear and nonlinear equations (A-REI.A.1, A-REI.B.3, A-CED.A.4). Students take their experience solving systems of linear equations further as they prove the validity of the addition method, learn a formal definition for the graph of an equation and use it to explain the reasoning of solving systems graphically, and represent the solution to systems of linear inequalities graphically (A-CED.A.3, A-REI.C.5, A-REI.C.6, A-REI.D.10, A-REI.D.12).
In Topic D, students are formally introduced to the modeling cycle (see page 61 of the CCLS) through problems that can be solved by creating equations and inequalities in one variable, systems of equations, and graphing (N-Q.A.1, A-SSE.A.1, A-CED.A.1, A-CED.A.2, A-REI.B.3). The End-of-Module Assessment follows Topic D.

NYS COMMON CORE MATHEMATICS CURRICULUM M1 Module Overview ALGEBRA I
Module 1: Relationships Between Quantities and Reasoning with Equations and Their Graphs
4
This work is derived from Eureka Math ™ and licensed by Great Minds. ©2015 Great Minds. eureka-math.org This file derived from ALG I-M1-TE-1.3.0-07.2015
This work is licensed under a Creative Commons Attribution-NonCommercial-ShareAlike 3.0 Unported License.
Focus Standards
Reason quantitatively and use units to solve problems.
N-Q.A.1 Use units as a way to understand problems and to guide the solution of multi-step problems; choose and interpret units consistently in formulas; choose and interpret the scale and the origin in graphs and data displays.
★
N-Q.A.22 Define appropriate quantities for the purpose of descriptive modeling.★
N-Q.A.3 Choose a level of accuracy appropriate to limitations on measurement when reporting quantities.
★
Interpret the structure of expressions.
A-SSE.A.1 Interpret expressions that represent a quantity in terms of its context.★
a. Interpret parts of an expression, such as terms, factors, and coefficients.
b. Interpret complicated expressions by viewing one or more of their parts as a single entity. For example, interpret 𝑃(1 + 𝑟)𝑛 as the product of 𝑃 and a factor not depending on 𝑃.
A-SSE.A.2 Use the structure of an expression to identify ways to rewrite it. For example, see 𝑥4 − 𝑦4 as (𝑥2)2 − (𝑦2)2, thus recognizing it as a difference of squares that can be factored as (𝑥2 − 𝑦2)(𝑥2 + 𝑦2).
Perform arithmetic operations on polynomials.
A-APR.A.1 Understand that polynomials form a system analogous to the integers, namely, they are closed under the operations of addition, subtraction, and multiplication; add, subtract, and multiply polynomials.
Create equations that describe numbers or relationships.
A-CED.A.13 Create equations and inequalities in one variable and use them to solve problems. Include equations arising from linear and quadratic functions, and simple rational and exponential functions.★
A-CED.A.2 Create equations in two or more variables to represent relationships between quantities; graph equations on coordinate axes with labels and scales.★
A-CED.A.3 Represent constraints by equations or inequalities, and by systems of equations and/or inequalities, and interpret solutions as viable or non-viable options in a modeling context. For example, represent inequalities describing nutritional and cost constraints on combinations of different foods.★
2This standard will be assessed in Algebra I by ensuring that some modeling tasks (involving Algebra I content or securely held content
from Grades 6-8) require the student to create a quantity of interest in the situation being described. 3In Algebra I, tasks are limited to linear, quadratic, or exponential equations with integer exponents.

NYS COMMON CORE MATHEMATICS CURRICULUM M1 Module Overview ALGEBRA I
Module 1: Relationships Between Quantities and Reasoning with Equations and Their Graphs
5
This work is derived from Eureka Math ™ and licensed by Great Minds. ©2015 Great Minds. eureka-math.org This file derived from ALG I-M1-TE-1.3.0-07.2015
This work is licensed under a Creative Commons Attribution-NonCommercial-ShareAlike 3.0 Unported License.
A-CED.A.4 Rearrange formulas to highlight a quantity of interest, using the same reasoning as in solving equations. For example, rearrange Ohm’s law 𝑉 = 𝐼𝑅 to highlight resistance 𝑅.★
Understand solving equations as a process of reasoning and explain the reasoning.
A-REI.A.1 Explain each step in solving a simple equation as following from the equality of numbers asserted at the previous step, starting from the assumption that the original equation has a solution. Construct a viable argument to justify a solution method.
Solve equations and inequalities in one variable.
A-REI.B.3 Solve linear equations and inequalities in one variable, including equations with coefficients represented by letters.
Solve systems of equations.
A-REI.C.5 Prove that, given a system of two equations in two variables, replacing one equation by the sum of that equation and a multiple of the other produces a system with the same solutions.
A-REI.C.64 Solve systems of linear equations exactly and approximately (e.g., with graphs), focusing on pairs of linear equations in two variables.
Represent and solve equations and inequalities graphically.
A-REI.D.10 Understand that the graph of an equation in two variables is the set of all its solutions plotted in the coordinate plane, often forming a curve (which could be a line).
A-REI.D.12 Graph the solutions to a linear inequality in two variables as a half-plane (excluding the boundary in the case of a strict inequality), and graph the solution set to a system of linear inequalities in two variables as the intersection of the corresponding half-planes.
4Tasks have a real-world context. In Algebra I, tasks have hallmarks of modeling as a mathematical practice (less defined tasks, more
of the modeling cycle, etc.).

NYS COMMON CORE MATHEMATICS CURRICULUM M1 Module Overview ALGEBRA I
Module 1: Relationships Between Quantities and Reasoning with Equations and Their Graphs
6
This work is derived from Eureka Math ™ and licensed by Great Minds. ©2015 Great Minds. eureka-math.org This file derived from ALG I-M1-TE-1.3.0-07.2015
This work is licensed under a Creative Commons Attribution-NonCommercial-ShareAlike 3.0 Unported License.
Foundational Standards
Apply and extend previous understandings of numbers to the system of rational numbers.
6.NS.C.7 Understand ordering and absolute value of rational numbers.
a. Interpret statements of inequality as statements about the relative position of two numbers on a number line diagram. For example, interpret −3 > −7 as a statement that −3 is located to the right of −7 on a number line oriented from left to right.
b. Write, interpret, and explain statements of order for rational numbers in real-world contexts. For example, write −3°𝐶 > −7°𝐶 to express the fact that −3°𝐶 is warmer than −7°𝐶.
Apply and extend previous understandings of arithmetic to algebraic expressions.
6.EE.A.3 Apply the properties of operations to generate equivalent expressions. For example, apply the distributive property to the expression 3(2 + 𝑥) to produce the equivalent expression 6 + 3𝑥; apply the distributive property to the expression 24𝑥 + 18𝑦 to produce the equivalent expression 6(4𝑥 + 3𝑦); apply properties of operations to 𝑦 + 𝑦 + 𝑦 to produce the equivalent expression 3𝑦.
6.EE.A.4 Identify when two expressions are equivalent (i.e., when the two expressions name the same number regardless of which value is substituted into them). For example, the expressions 𝑦 + 𝑦 + 𝑦 and 3𝑦 are equivalent because they name the same number regardless of which number 𝑦 stands for.
Reason about and solve one-variable equations and inequalities.
6.EE.B.5 Understand solving an equation or inequality as a process of answering a question: which values from a specified set, if any, make the equation or inequality true? Use substitution to determine whether a given number in a specified set makes an equation or inequality true.
6.EE.B.6 Use variables to represent numbers and write expressions when solving a real-world or mathematical problem; understand that a variable can represent an unknown number, or, depending on the purpose at hand, any number in a specified set.
6.EE.B.7 Solve real-world and mathematical problems by writing and solving equations of the form 𝑥 + 𝑝 = 𝑞 and 𝑝𝑥 = 𝑞 for cases in which 𝑝, 𝑞 and 𝑥 are all nonnegative rational numbers.
6.EE.B.8 Write an inequality of the form 𝑥 > 𝑐 or 𝑥 < 𝑐 to represent a constraint or condition in a real-world or mathematical problem. Recognize that inequalities of the form 𝑥 > 𝑐 or 𝑥 < 𝑐 have infinitely many solutions; represent solutions of such inequalities on number line diagrams.
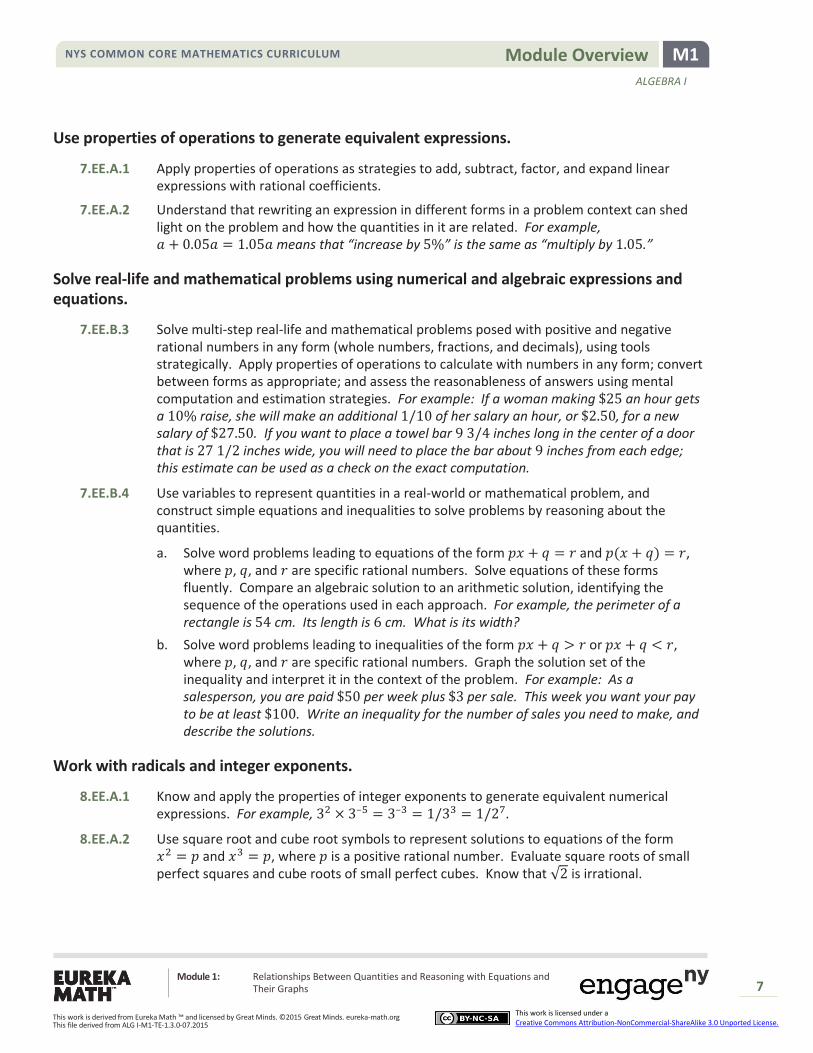
NYS COMMON CORE MATHEMATICS CURRICULUM M1 Module Overview ALGEBRA I
Module 1: Relationships Between Quantities and Reasoning with Equations and Their Graphs
7
This work is derived from Eureka Math ™ and licensed by Great Minds. ©2015 Great Minds. eureka-math.org This file derived from ALG I-M1-TE-1.3.0-07.2015
This work is licensed under a Creative Commons Attribution-NonCommercial-ShareAlike 3.0 Unported License.
Use properties of operations to generate equivalent expressions.
7.EE.A.1 Apply properties of operations as strategies to add, subtract, factor, and expand linear expressions with rational coefficients.
7.EE.A.2 Understand that rewriting an expression in different forms in a problem context can shed light on the problem and how the quantities in it are related. For example, 𝑎 + 0.05𝑎 = 1.05𝑎 means that “increase by 5%” is the same as “multiply by 1.05.”
Solve real-life and mathematical problems using numerical and algebraic expressions and equations.
7.EE.B.3 Solve multi-step real-life and mathematical problems posed with positive and negative rational numbers in any form (whole numbers, fractions, and decimals), using tools strategically. Apply properties of operations to calculate with numbers in any form; convert between forms as appropriate; and assess the reasonableness of answers using mental computation and estimation strategies. For example: If a woman making $25 an hour gets a 10% raise, she will make an additional 1/10 of her salary an hour, or $2.50, for a new salary of $27.50. If you want to place a towel bar 9 3/4 inches long in the center of a door that is 27 1/2 inches wide, you will need to place the bar about 9 inches from each edge; this estimate can be used as a check on the exact computation.
7.EE.B.4 Use variables to represent quantities in a real-world or mathematical problem, and construct simple equations and inequalities to solve problems by reasoning about the quantities.
a. Solve word problems leading to equations of the form 𝑝𝑥 + 𝑞 = 𝑟 and 𝑝(𝑥 + 𝑞) = 𝑟, where 𝑝, 𝑞, and 𝑟 are specific rational numbers. Solve equations of these forms fluently. Compare an algebraic solution to an arithmetic solution, identifying the sequence of the operations used in each approach. For example, the perimeter of a rectangle is 54 cm. Its length is 6 cm. What is its width?
b. Solve word problems leading to inequalities of the form 𝑝𝑥 + 𝑞 > 𝑟 or 𝑝𝑥 + 𝑞 < 𝑟, where 𝑝, 𝑞, and 𝑟 are specific rational numbers. Graph the solution set of the inequality and interpret it in the context of the problem. For example: As a salesperson, you are paid $50 per week plus $3 per sale. This week you want your pay to be at least $100. Write an inequality for the number of sales you need to make, and describe the solutions.
Work with radicals and integer exponents.
8.EE.A.1 Know and apply the properties of integer exponents to generate equivalent numerical expressions. For example, 32 × 3–5 = 3–3 = 1/33 = 1/27.
8.EE.A.2 Use square root and cube root symbols to represent solutions to equations of the form 𝑥2 = 𝑝 and 𝑥3 = 𝑝, where 𝑝 is a positive rational number. Evaluate square roots of small perfect squares and cube roots of small perfect cubes. Know that √2 is irrational.
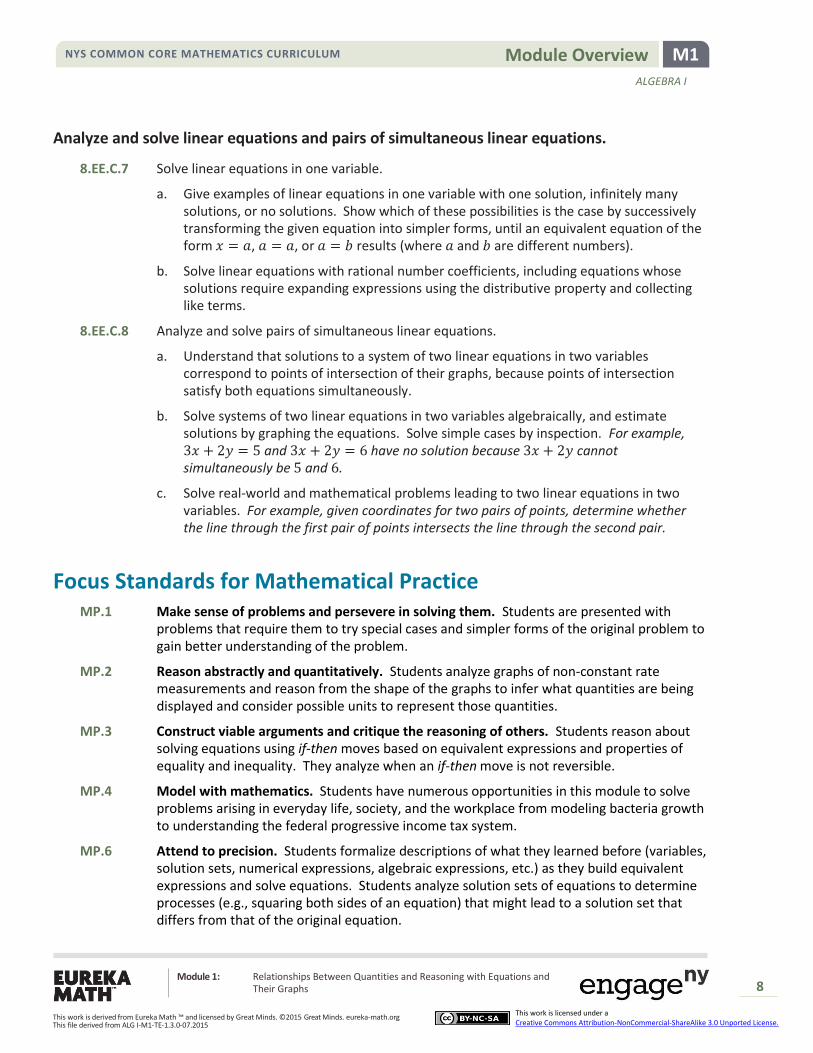
NYS COMMON CORE MATHEMATICS CURRICULUM M1 Module Overview ALGEBRA I
Module 1: Relationships Between Quantities and Reasoning with Equations and Their Graphs
8
This work is derived from Eureka Math ™ and licensed by Great Minds. ©2015 Great Minds. eureka-math.org This file derived from ALG I-M1-TE-1.3.0-07.2015
This work is licensed under a Creative Commons Attribution-NonCommercial-ShareAlike 3.0 Unported License.
Analyze and solve linear equations and pairs of simultaneous linear equations.
8.EE.C.7 Solve linear equations in one variable.
a. Give examples of linear equations in one variable with one solution, infinitely many solutions, or no solutions. Show which of these possibilities is the case by successively transforming the given equation into simpler forms, until an equivalent equation of the form 𝑥 = 𝑎, 𝑎 = 𝑎, or 𝑎 = 𝑏 results (where 𝑎 and 𝑏 are different numbers).
b. Solve linear equations with rational number coefficients, including equations whose solutions require expanding expressions using the distributive property and collecting like terms.
8.EE.C.8 Analyze and solve pairs of simultaneous linear equations.
a. Understand that solutions to a system of two linear equations in two variables correspond to points of intersection of their graphs, because points of intersection satisfy both equations simultaneously.
b. Solve systems of two linear equations in two variables algebraically, and estimate solutions by graphing the equations. Solve simple cases by inspection. For example, 3𝑥 + 2𝑦 = 5 and 3𝑥 + 2𝑦 = 6 have no solution because 3𝑥 + 2𝑦 cannot simultaneously be 5 and 6.
c. Solve real-world and mathematical problems leading to two linear equations in two variables. For example, given coordinates for two pairs of points, determine whether the line through the first pair of points intersects the line through the second pair.
Focus Standards for Mathematical Practice MP.1 Make sense of problems and persevere in solving them. Students are presented with
problems that require them to try special cases and simpler forms of the original problem to gain better understanding of the problem.
MP.2 Reason abstractly and quantitatively. Students analyze graphs of non-constant rate measurements and reason from the shape of the graphs to infer what quantities are being displayed and consider possible units to represent those quantities.
MP.3 Construct viable arguments and critique the reasoning of others. Students reason about solving equations using if-then moves based on equivalent expressions and properties of equality and inequality. They analyze when an if-then move is not reversible.
MP.4 Model with mathematics. Students have numerous opportunities in this module to solve problems arising in everyday life, society, and the workplace from modeling bacteria growth to understanding the federal progressive income tax system.
MP.6 Attend to precision. Students formalize descriptions of what they learned before (variables, solution sets, numerical expressions, algebraic expressions, etc.) as they build equivalent expressions and solve equations. Students analyze solution sets of equations to determine processes (e.g., squaring both sides of an equation) that might lead to a solution set that differs from that of the original equation.
NYS COMMON CORE MATHEMATICS CURRICULUM M1 Module Overview ALGEBRA I
Module 1: Relationships Between Quantities and Reasoning with Equations and Their Graphs
9
This work is derived from Eureka Math ™ and licensed by Great Minds. ©2015 Great Minds. eureka-math.org This file derived from ALG I-M1-TE-1.3.0-07.2015
This work is licensed under a Creative Commons Attribution-NonCommercial-ShareAlike 3.0 Unported License.
MP.7 Look for and make use of structure. Students reason with and about collections of equivalent expressions to see how all the expressions in the collection are linked together through the properties of operations. They discern patterns in sequences of solving equation problems that reveal structures in the equations themselves: 2𝑥 + 4 = 10, 2(𝑥 − 3) + 4 = 10, 2(3𝑥 − 4) + 4 = 10, etc.
MP.8 Look for and express regularity in repeated reasoning. After solving many linear equations in one variable (e.g., 3𝑥 + 5 = 8𝑥 − 17), students look for general methods for solving a generic linear equation in one variable by replacing the numbers with letters: 𝑎𝑥 + 𝑏 =𝑐𝑥 + 𝑑. They have opportunities to pay close attention to calculations involving the properties of operations, properties of equality, and properties of inequality as they find equivalent expressions and solve equations, noting common ways to solve different types of equations.
Terminology
New or Recently Introduced Terms
Algebraic Expression (An algebraic expression is either: (1) a numerical symbol or a variable symbol or (2) the result of placing previously generated algebraic expressions into the two blanks of one of the four operators ((__) + (__), (__) − (__), (__) × (__), (__) ÷ (__)) or into the base blank of an exponentiation with an exponent that is a rational number.)
Constant Term of a Polynomial in Standard Form (The constant term is the value of the numerical expression found by substituting 0 into all the variable symbols of the polynomial, namely 𝑎0.)
Degree of a Monomial (The degree of a nonzero monomial is the sum of the exponents of the variable symbols that appear in the monomial.)
Degree of a Polynomial in Standard Form (The degree of a polynomial in standard form is the highest degree of the terms in the polynomial, namely 𝑛.)
Equivalent Algebraic Expressions (Two algebraic expressions are equivalent if we can convert one expression into the other by repeatedly applying the commutative, associative, and distributive properties and the properties of rational exponents to components of the first expression.)
Equivalent Numerical Expressions (Two numerical expressions are equivalent if they evaluate to the same number.)
Graph of an Equation in Two Variables (The set of all points in the coordinate plane that are solutions to an equation in two variables is called the graph of the equation.)
Leading Term and Leading Coefficient of a Polynomial in Standard Form (The term 𝑎𝑛𝑥𝑛 is called the leading term, and 𝑎𝑛 is called the leading coefficient.)
Monomial (A monomial is a polynomial expression generated using only the multiplication operator (__ × __). Monomials are products whose factors are numerical expressions or variable symbols.)
Numerical Expression (A numerical expression is an algebraic expression that contains only numerical symbols (no variable symbols) and that evaluates to a single number.)
Numerical Symbol (A numerical symbol is a symbol that represents a specific number.)
NYS COMMON CORE MATHEMATICS CURRICULUM M1 Module Overview ALGEBRA I
Module 1: Relationships Between Quantities and Reasoning with Equations and Their Graphs
10
This work is derived from Eureka Math ™ and licensed by Great Minds. ©2015 Great Minds. eureka-math.org This file derived from ALG I-M1-TE-1.3.0-07.2015
This work is licensed under a Creative Commons Attribution-NonCommercial-ShareAlike 3.0 Unported License.
Piecewise Linear Function (Given a finite number of non-overlapping intervals on the real number line, a (real) piecewise linear function is a function from the union of the intervals to the set of real numbers such that the function is defined by (possibly different) linear functions on each interval.)
Polynomial Expression (A polynomial expression is either: (1) a numerical expression or a variable symbol or (2) the result of placing two previously generated polynomial expressions into the blanks of the addition operator (__ + __) or the multiplication operator (__ × __).)
Solution (A solution to an equation with one variable is a number in the domain of the variable that, when substituted for all instances of the variable in both expressions, makes the equation a true number sentence.)
Solution Set (The set of solutions of an equation is called its solution set.)
Standard Form of a Polynomial Expression in One Variable (A polynomial expression with one variable symbol 𝑥 is in standard form if it is expressed as 𝑎𝑛𝑥𝑛 + 𝑎𝑛−1𝑥𝑛−1 + ⋯ + 𝑎1𝑥 + 𝑎0, where 𝑛 is a nonnegative integer, and 𝑎0, 𝑎1, 𝑎2, … , 𝑎𝑛 are constant coefficients with 𝑎𝑛 ≠ 0. A polynomial expression in 𝑥 that is in standard form is often called a polynomial in 𝑥.)
Variable Symbol (A variable symbol is a symbol that is a placeholder for a number. It is possible that a question may restrict the type of number that a placeholder might permit, maybe integers only or a positive real number, for instance.)
Zero Product Property (The Zero Product Property states that given real numbers, 𝑎 and 𝑏, if 𝑎 ∙ 𝑏 = 0 then either 𝑎 = 0 or 𝑏 = 0, or both 𝑎 and 𝑏 = 0 .)
Familiar Terms and Symbols5
Equation
Formula
Identity
Inequality
Linear Function
Properties of Equality
Properties of Inequality
Solve
System of Equations
Term
Suggested Tools and Representations Coordinate Plane
Equations and Inequalities
5These are terms and symbols students have seen previously.
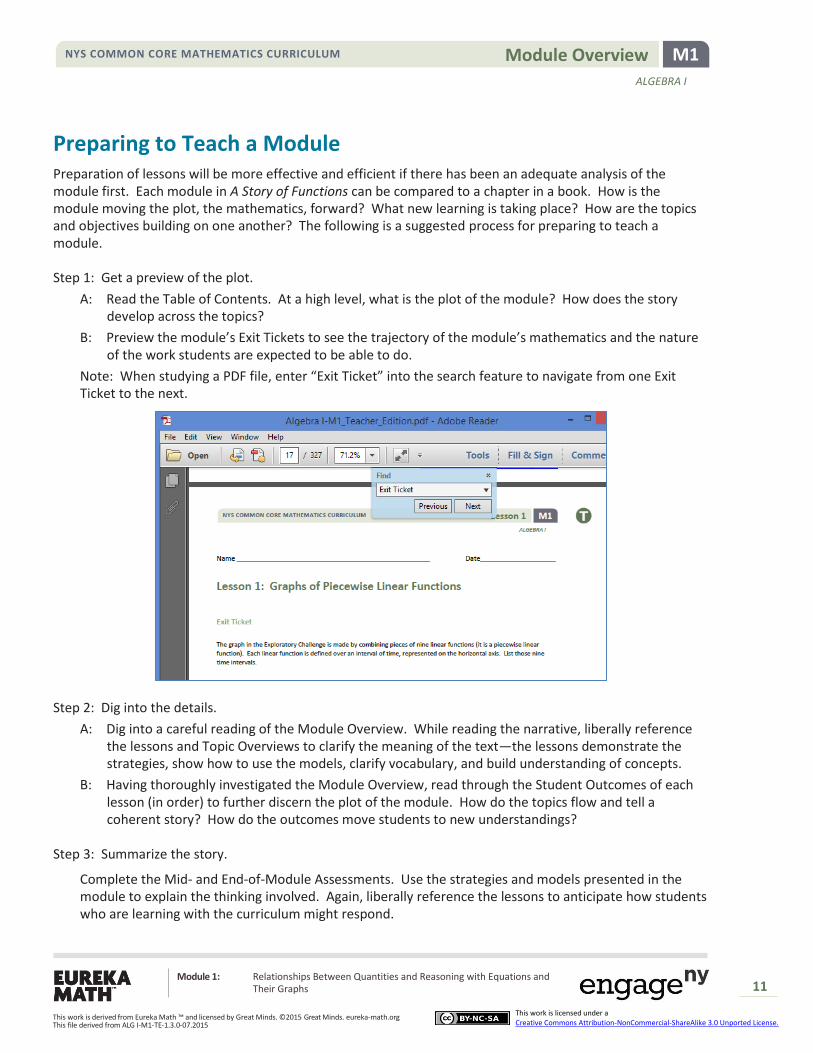
NYS COMMON CORE MATHEMATICS CURRICULUM M1 Module Overview ALGEBRA I
Module 1: Relationships Between Quantities and Reasoning with Equations and Their Graphs
11
This work is derived from Eureka Math ™ and licensed by Great Minds. ©2015 Great Minds. eureka-math.org This file derived from ALG I-M1-TE-1.3.0-07.2015
This work is licensed under a Creative Commons Attribution-NonCommercial-ShareAlike 3.0 Unported License.
Preparing to Teach a Module Preparation of lessons will be more effective and efficient if there has been an adequate analysis of the module first. Each module in A Story of Functions can be compared to a chapter in a book. How is the module moving the plot, the mathematics, forward? What new learning is taking place? How are the topics and objectives building on one another? The following is a suggested process for preparing to teach a module. Step 1: Get a preview of the plot.
A: Read the Table of Contents. At a high level, what is the plot of the module? How does the story develop across the topics?
B: Preview the module’s Exit Tickets to see the trajectory of the module’s mathematics and the nature of the work students are expected to be able to do.
Note: When studying a PDF file, enter “Exit Ticket” into the search feature to navigate from one Exit Ticket to the next.
Step 2: Dig into the details.
A: Dig into a careful reading of the Module Overview. While reading the narrative, liberally reference the lessons and Topic Overviews to clarify the meaning of the text—the lessons demonstrate the strategies, show how to use the models, clarify vocabulary, and build understanding of concepts.
B: Having thoroughly investigated the Module Overview, read through the Student Outcomes of each lesson (in order) to further discern the plot of the module. How do the topics flow and tell a coherent story? How do the outcomes move students to new understandings?
Step 3: Summarize the story.
Complete the Mid- and End-of-Module Assessments. Use the strategies and models presented in the module to explain the thinking involved. Again, liberally reference the lessons to anticipate how students who are learning with the curriculum might respond.

NYS COMMON CORE MATHEMATICS CURRICULUM M1 Module Overview ALGEBRA I
Module 1: Relationships Between Quantities and Reasoning with Equations and Their Graphs
12
This work is derived from Eureka Math ™ and licensed by Great Minds. ©2015 Great Minds. eureka-math.org This file derived from ALG I-M1-TE-1.3.0-07.2015
This work is licensed under a Creative Commons Attribution-NonCommercial-ShareAlike 3.0 Unported License.
Preparing to Teach a Lesson A three-step process is suggested to prepare a lesson. It is understood that at times teachers may need to make adjustments (customizations) to lessons to fit the time constraints and unique needs of their students. The recommended planning process is outlined below. Note: The ladder of Step 2 is a metaphor for the teaching sequence. The sequence can be seen not only at the macro level in the role that this lesson plays in the overall story, but also at the lesson level, where each rung in the ladder represents the next step in understanding or the next skill needed to reach the objective. To reach the objective, or the top of the ladder, all students must be able to access the first rung and each successive rung. Step 1: Discern the plot.
A: Briefly review the module’s Table of Contents, recalling the overall story of the module and analyzing the role of this lesson in the module.
B: Read the Topic Overview related to the lesson, and then review the Student Outcome(s) and Exit Ticket of each lesson in the topic.
C: Review the assessment following the topic, keeping in mind that assessments can be found midway through the module and at the end of the module.
Step 2: Find the ladder.
A: Work through the lesson, answering and completing each question, example, exercise, and challenge.
B: Analyze and write notes on the new complexities or new concepts introduced with each question or problem posed; these notes on the sequence of new complexities and concepts are the rungs of the ladder.
C: Anticipate where students might struggle, and write a note about the potential cause of the struggle.
D: Answer the Closing questions, always anticipating how students will respond.
Step 3: Hone the lesson.
Lessons may need to be customized if the class period is not long enough to do all of what is presented and/or if students lack prerequisite skills and understanding to move through the entire lesson in the time allotted. A suggestion for customizing the lesson is to first decide upon and designate each question, example, exercise, or challenge as either “Must Do” or “Could Do.”
A: Select “Must Do” dialogue, questions, and problems that meet the Student Outcome(s) while still providing a coherent experience for students; reference the ladder. The expectation should be that the majority of the class will be able to complete the “Must Do” portions of the lesson within the allocated time. While choosing the “Must Do” portions of the lesson, keep in mind the need for a balance of dialogue and conceptual questioning, application problems, and abstract problems, and a balance between students using pictorial/graphical representations and abstract representations. Highlight dialogue to be included in the delivery of instruction so that students have a chance to articulate and consolidate understanding as they move through the lesson.
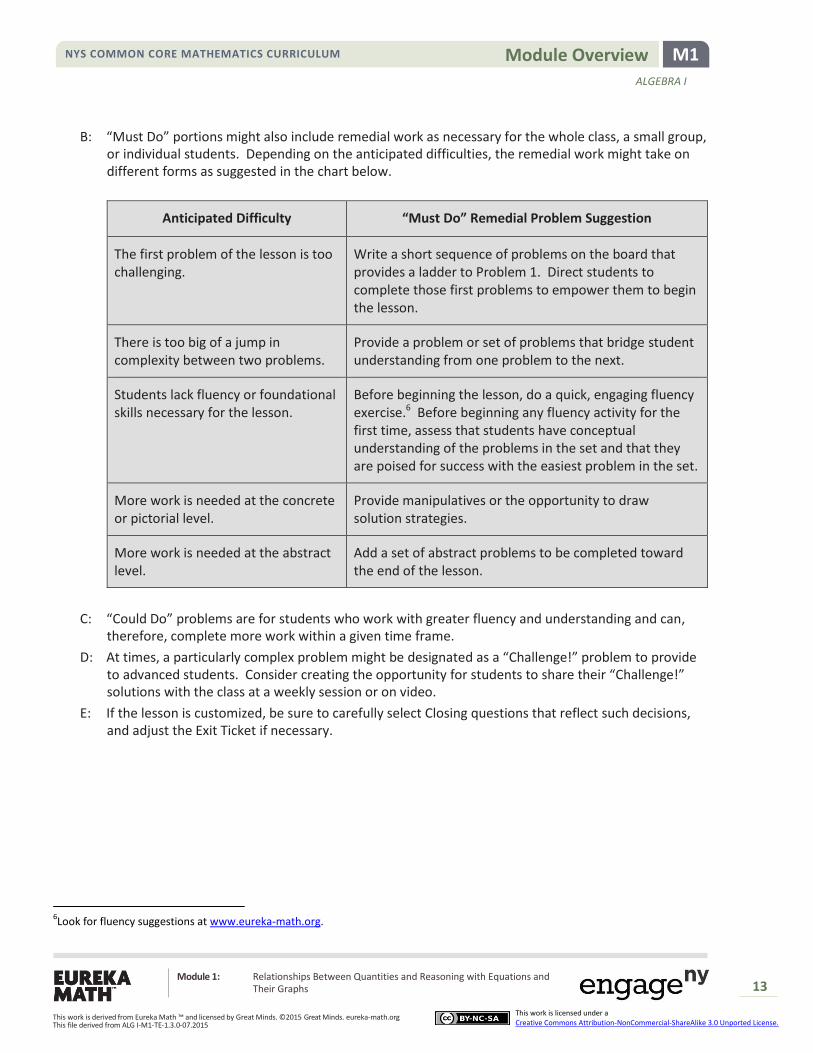
NYS COMMON CORE MATHEMATICS CURRICULUM M1 Module Overview ALGEBRA I
Module 1: Relationships Between Quantities and Reasoning with Equations and Their Graphs
13
This work is derived from Eureka Math ™ and licensed by Great Minds. ©2015 Great Minds. eureka-math.org This file derived from ALG I-M1-TE-1.3.0-07.2015
This work is licensed under a Creative Commons Attribution-NonCommercial-ShareAlike 3.0 Unported License.
B: “Must Do” portions might also include remedial work as necessary for the whole class, a small group, or individual students. Depending on the anticipated difficulties, the remedial work might take on different forms as suggested in the chart below.
Anticipated Difficulty “Must Do” Remedial Problem Suggestion
The first problem of the lesson is too challenging.
Write a short sequence of problems on the board that provides a ladder to Problem 1. Direct students to complete those first problems to empower them to begin the lesson.
There is too big of a jump in complexity between two problems.
Provide a problem or set of problems that bridge student understanding from one problem to the next.
Students lack fluency or foundational skills necessary for the lesson.
Before beginning the lesson, do a quick, engaging fluency exercise.6 Before beginning any fluency activity for the first time, assess that students have conceptual understanding of the problems in the set and that they are poised for success with the easiest problem in the set.
More work is needed at the concrete or pictorial level.
Provide manipulatives or the opportunity to draw solution strategies.
More work is needed at the abstract level.
Add a set of abstract problems to be completed toward the end of the lesson.
C: “Could Do” problems are for students who work with greater fluency and understanding and can, therefore, complete more work within a given time frame.
D: At times, a particularly complex problem might be designated as a “Challenge!” problem to provide to advanced students. Consider creating the opportunity for students to share their “Challenge!” solutions with the class at a weekly session or on video.
E: If the lesson is customized, be sure to carefully select Closing questions that reflect such decisions, and adjust the Exit Ticket if necessary.
6Look for fluency suggestions at www.eureka-math.org.

NYS COMMON CORE MATHEMATICS CURRICULUM M1 Module Overview ALGEBRA I
Module 1: Relationships Between Quantities and Reasoning with Equations and Their Graphs
14
This work is derived from Eureka Math ™ and licensed by Great Minds. ©2015 Great Minds. eureka-math.org This file derived from ALG I-M1-TE-1.3.0-07.2015
This work is licensed under a Creative Commons Attribution-NonCommercial-ShareAlike 3.0 Unported License.
Assessment Summary
Assessment Type Administered Format Standards Addressed
Mid-Module Assessment Task
After Topic B Constructed response with rubric N-Q.A.1, N-Q.A.2, N-Q.A.3, A-APR.A.1, A-SSE.A.2
End-of-Module Assessment Task
After Topic D Constructed response with rubric
N-Q.A.1, A-SSE.A.1, A-SSE.A.2, A-APR.A.1, A-CED.A.1, A-CED.A.2, A-CED.A.3, A-CED.A.4, A-REI.A.1, A-REI.C.5, A-REI.C.6, A-REI.D.10, A-REI.D.12

NYS COMMON CORE MATHEMATICS CURRICULUM M1 End-of-Module Assessment Task
ALGEBRA I
Module 1: Relationships Between Quantities and Reasoning with Equations and Their Graphs
312
This work is derived from Eureka Math ™ and licensed by Great Minds. ©2015 Great Minds. eureka-math.org This file derived from ALG I-M1-TE-1.3.0-07.2015
This work is licensed under a Creative Commons Attribution-NonCommercial-ShareAlike 3.0 Unported License.
Name Date
Solve the following equations for 𝑥. Write your answer in set notation. 1. a. 3𝑥 − 5 = 16
b. 3(𝑥 + 3) − 5 = 16
c. 3(2𝑥 − 3) − 5 = 16
d. 6(𝑥 + 3) − 10 = 32
e. Which two equations above have the same solution set? Write a sentence explaining how the properties of equality can be used to determine the pair without having to find the solution set for each.

NYS COMMON CORE MATHEMATICS CURRICULUM M1 End-of-Module Assessment Task
ALGEBRA I
Module 1: Relationships Between Quantities and Reasoning with Equations and Their Graphs
313
This work is derived from Eureka Math ™ and licensed by Great Minds. ©2015 Great Minds. eureka-math.org This file derived from ALG I-M1-TE-1.3.0-07.2015
This work is licensed under a Creative Commons Attribution-NonCommercial-ShareAlike 3.0 Unported License.
Let 𝑐 and 𝑑 be real numbers. 2.
a. If 𝑐 = 42 + 𝑑 is true, then which is greater: 𝑐 or 𝑑, or are you not able to tell? Explain how you know your choice is correct.
b. If 𝑐 = 42 − 𝑑 is true, then which is greater: 𝑐 or 𝑑, or are you not able to tell? Explain how you know your choice is correct.
If 𝑎 < 0 and 𝑐 > 𝑏, circle the expression that is greater: 3.
𝑎(𝑏 − 𝑐) or 𝑎(𝑐 − 𝑏)
Use the properties of inequalities to explain your choice.

NYS COMMON CORE MATHEMATICS CURRICULUM M1 End-of-Module Assessment Task
ALGEBRA I
Module 1: Relationships Between Quantities and Reasoning with Equations and Their Graphs
314
This work is derived from Eureka Math ™ and licensed by Great Minds. ©2015 Great Minds. eureka-math.org This file derived from ALG I-M1-TE-1.3.0-07.2015
This work is licensed under a Creative Commons Attribution-NonCommercial-ShareAlike 3.0 Unported License.
Solve for 𝑥 in each of the equations or inequalities below, and name the property and/or properties used: 4.
a. 3
4𝑥 = 9
b. 10 + 3𝑥 = 5𝑥
c. 𝑎 + 𝑥 = 𝑏
d. 𝑐𝑥 = 𝑑
e. 1
2𝑥 − 𝑔 < 𝑚
f. 𝑞 + 5𝑥 = 7𝑥 − 𝑟

NYS COMMON CORE MATHEMATICS CURRICULUM M1 End-of-Module Assessment Task
ALGEBRA I
Module 1: Relationships Between Quantities and Reasoning with Equations and Their Graphs
315
This work is derived from Eureka Math ™ and licensed by Great Minds. ©2015 Great Minds. eureka-math.org This file derived from ALG I-M1-TE-1.3.0-07.2015
This work is licensed under a Creative Commons Attribution-NonCommercial-ShareAlike 3.0 Unported License.
g. 3
4(𝑥 + 2) = 6(𝑥 + 12)
h. 3(5 − 5𝑥) > 5𝑥
The equation 3𝑥 + 4 = 5𝑥 − 4 has the solution set {4}. 5. a. Explain why the equation (3𝑥 + 4) + 4 = (5𝑥 − 4) + 4 also has the solution set {4}.
NYS COMMON CORE MATHEMATICS CURRICULUM M1 End-of-Module Assessment Task
ALGEBRA I
Module 1: Relationships Between Quantities and Reasoning with Equations and Their Graphs
316
This work is derived from Eureka Math ™ and licensed by Great Minds. ©2015 Great Minds. eureka-math.org This file derived from ALG I-M1-TE-1.3.0-07.2015
This work is licensed under a Creative Commons Attribution-NonCommercial-ShareAlike 3.0 Unported License.
b. In part (a), the expression (3𝑥 + 4) + 4 is equivalent to the expression 3𝑥 + 8. What is the definition of equivalent expressions? Why does changing an expression on one side of an equation to an equivalent expression leave the solution set unchanged?
c. When we square both sides of the original equation, we get the following new equation:
(3𝑥 + 4)2 = (5𝑥 − 4)2.
Show that 4 is still a solution to the new equation. Show that 0 is also a solution to the new equation but is not a solution to the original equation. Write a sentence that describes how the solution set to an equation may change when both sides of the equation are squared.

NYS COMMON CORE MATHEMATICS CURRICULUM M1 End-of-Module Assessment Task
ALGEBRA I
Module 1: Relationships Between Quantities and Reasoning with Equations and Their Graphs
317
This work is derived from Eureka Math ™ and licensed by Great Minds. ©2015 Great Minds. eureka-math.org This file derived from ALG I-M1-TE-1.3.0-07.2015
This work is licensed under a Creative Commons Attribution-NonCommercial-ShareAlike 3.0 Unported License.
d. When we replace 𝑥 by 𝑥2 in the original equation, we get the following new equation:
3𝑥2 + 4 = 5𝑥2 − 4.
Use the fact that the solution set to the original equation is {4} to find the solution set to this new equation.
The Zonda Information and Telephone Company (ZI&T) calculates a customer’s total monthly cell phone 6.charge using the formula,
𝐶 = (𝑏 + 𝑟𝑚)(1 + 𝑡),
where 𝐶 is the total cell phone charge, 𝑏 is a basic monthly fee, 𝑟 is the rate per minute, 𝑚 is the number of minutes used that month, and 𝑡 is the tax rate.
Solve for 𝑚, the number of minutes the customer used that month.

NYS COMMON CORE MATHEMATICS CURRICULUM M1 End-of-Module Assessment Task
ALGEBRA I
Module 1: Relationships Between Quantities and Reasoning with Equations and Their Graphs
318
This work is derived from Eureka Math ™ and licensed by Great Minds. ©2015 Great Minds. eureka-math.org This file derived from ALG I-M1-TE-1.3.0-07.2015
This work is licensed under a Creative Commons Attribution-NonCommercial-ShareAlike 3.0 Unported License.
Students and adults purchased tickets for a recent basketball playoff game. All tickets were sold at the 7.ticket booth—season passes, discounts, etc., were not allowed.
Student tickets cost $5 each, and adult tickets cost $10 each. A total of $4,500 was collected. 700 tickets were sold. a. Write a system of equations that can be used to find the number of student tickets, 𝑠, and the
number of adult tickets, 𝑎, that were sold at the playoff game.
b. Assuming that the number of students and adults attending would not change, how much more money could have been collected at the playoff game if the ticket booth charged students and adults the same price of $10 per ticket?
c. Assuming that the number of students and adults attending would not change, how much more money could have been collected at the playoff game if the student price was kept at $5 per ticket and adults were charged $15 per ticket instead of $10?

NYS COMMON CORE MATHEMATICS CURRICULUM M1 End-of-Module Assessment Task
ALGEBRA I
Module 1: Relationships Between Quantities and Reasoning with Equations and Their Graphs
319
This work is derived from Eureka Math ™ and licensed by Great Minds. ©2015 Great Minds. eureka-math.org This file derived from ALG I-M1-TE-1.3.0-07.2015
This work is licensed under a Creative Commons Attribution-NonCommercial-ShareAlike 3.0 Unported License.
Alexus is modeling the growth of bacteria for an experiment in science. She assumes that there are 8.𝐵 bacteria in a Petri dish at 12:00 noon. In reality, each bacterium in the Petri dish subdivides into two new bacteria approximately every 20 minutes. However, for the purposes of the model, Alexus assumes that each bacterium subdivides into two new bacteria exactly every 20 minutes.
a. Create a table that shows the total number of bacteria in the Petri dish at 1
3 hour intervals for 2
hours starting with time 0 to represent 12:00 noon.
b. Write an equation that describes the relationship between total number of bacteria 𝑇 and time ℎ in hours, assuming there are 𝐵 bacteria in the Petri dish at ℎ = 0.
c. If Alexus starts with 100 bacteria in the Petri dish, draw a graph that displays the total number of bacteria with respect to time from 12:00 noon (ℎ = 0) to 4:00 p.m. (ℎ = 4). Label points on your graph at time ℎ = 0, 1, 2, 3, 4.

NYS COMMON CORE MATHEMATICS CURRICULUM M1 End-of-Module Assessment Task
ALGEBRA I
Module 1: Relationships Between Quantities and Reasoning with Equations and Their Graphs
320
This work is derived from Eureka Math ™ and licensed by Great Minds. ©2015 Great Minds. eureka-math.org This file derived from ALG I-M1-TE-1.3.0-07.2015
This work is licensed under a Creative Commons Attribution-NonCommercial-ShareAlike 3.0 Unported License.
d. For her experiment, Alexus plans to add an anti-bacterial chemical to the Petri dish at 4:00 p.m. that is supposed to kill 99.9% of the bacteria instantaneously. If she started with 100 bacteria at 12:00 noon, how many live bacteria might Alexus expect to find in the Petri dish right after she adds the anti-bacterial chemical?
Jack is 27 years older than Susan. In 5 years, he will be 4 times as old as she is. 9. a. Find the present ages of Jack and Susan.
b. What calculations would you do to check if your answer is correct?

NYS COMMON CORE MATHEMATICS CURRICULUM M1 End-of-Module Assessment Task
ALGEBRA I
Module 1: Relationships Between Quantities and Reasoning with Equations and Their Graphs
321
This work is derived from Eureka Math ™ and licensed by Great Minds. ©2015 Great Minds. eureka-math.org This file derived from ALG I-M1-TE-1.3.0-07.2015
This work is licensed under a Creative Commons Attribution-NonCommercial-ShareAlike 3.0 Unported License.
10.
a. Find the product: (𝑥2 − 𝑥 + 1)(2𝑥2 + 3𝑥 + 2).
b. Use the results of part (a) to factor 21,112 as a product of a two-digit number and a three-digit number.
Consider the following system of equations with the solution 𝑥 = 3, 𝑦 = 4. 11. Equation A1: 𝑦 = 𝑥 + 1 Equation A2: 𝑦 = −2𝑥 + 10
a. Write a unique system of two linear equations with the same solution set. This time make both linear equations have positive slope.
Equation B1: ________________ Equation B2: ________________

NYS COMMON CORE MATHEMATICS CURRICULUM M1 End-of-Module Assessment Task
ALGEBRA I
Module 1: Relationships Between Quantities and Reasoning with Equations and Their Graphs
322
This work is derived from Eureka Math ™ and licensed by Great Minds. ©2015 Great Minds. eureka-math.org This file derived from ALG I-M1-TE-1.3.0-07.2015
This work is licensed under a Creative Commons Attribution-NonCommercial-ShareAlike 3.0 Unported License.
b. The following system of equations was obtained from the original system by adding a multiple of equation A2 to equation A1. Equation C1: 𝑦 = 𝑥 + 1 Equation C2: 3𝑦 = −3𝑥 + 21 What multiple of A2 was added to A1?
c. What is the solution to the system given in part (b)?
d. For any real number 𝑚, the line 𝑦 = 𝑚(𝑥 − 3) + 4 passes through the point (3,4). Is it certain, then, that the system of equations Equation D1: 𝑦 = 𝑥 + 1 Equation D2: 𝑦 = 𝑚(𝑥 − 3) + 4 has only the solution 𝑥 = 3, 𝑦 = 4? Explain.
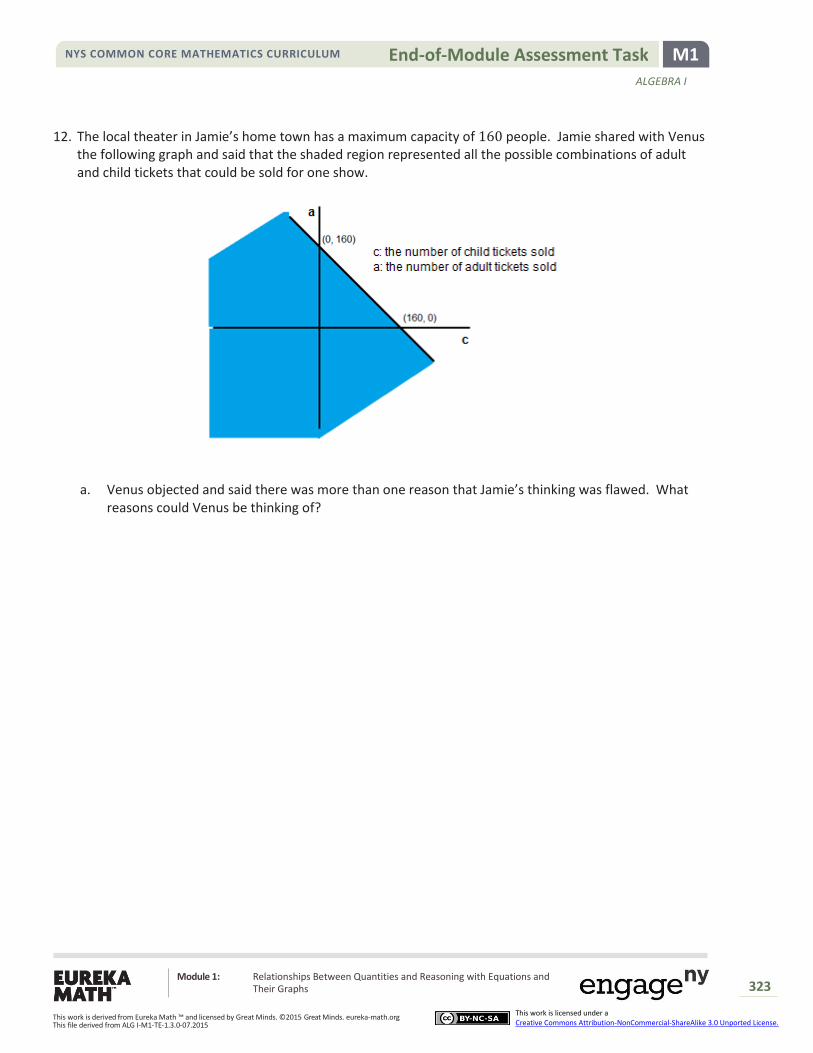
NYS COMMON CORE MATHEMATICS CURRICULUM M1 End-of-Module Assessment Task
ALGEBRA I
Module 1: Relationships Between Quantities and Reasoning with Equations and Their Graphs
323
This work is derived from Eureka Math ™ and licensed by Great Minds. ©2015 Great Minds. eureka-math.org This file derived from ALG I-M1-TE-1.3.0-07.2015
This work is licensed under a Creative Commons Attribution-NonCommercial-ShareAlike 3.0 Unported License.
The local theater in Jamie’s home town has a maximum capacity of 160 people. Jamie shared with Venus 12.the following graph and said that the shaded region represented all the possible combinations of adult and child tickets that could be sold for one show.
a. Venus objected and said there was more than one reason that Jamie’s thinking was flawed. What
reasons could Venus be thinking of?
NYS COMMON CORE MATHEMATICS CURRICULUM M1 End-of-Module Assessment Task
ALGEBRA I
Module 1: Relationships Between Quantities and Reasoning with Equations and Their Graphs
324
This work is derived from Eureka Math ™ and licensed by Great Minds. ©2015 Great Minds. eureka-math.org This file derived from ALG I-M1-TE-1.3.0-07.2015
This work is licensed under a Creative Commons Attribution-NonCommercial-ShareAlike 3.0 Unported License.
b. Use equations, inequalities, graphs, and/or words to describe for Jamie the set of all possible combinations of adult and child tickets that could be sold for one show.
c. The theater charges $9 for each adult ticket and $6 for each child ticket. The theater sold 144 tickets for the first showing of the new release. The total money collected from ticket sales for that show was $1,164. Write a system of equations that could be used to find the number of child tickets and the number of adult tickets sold, and solve the system algebraically. Summarize your findings using the context of the problem.
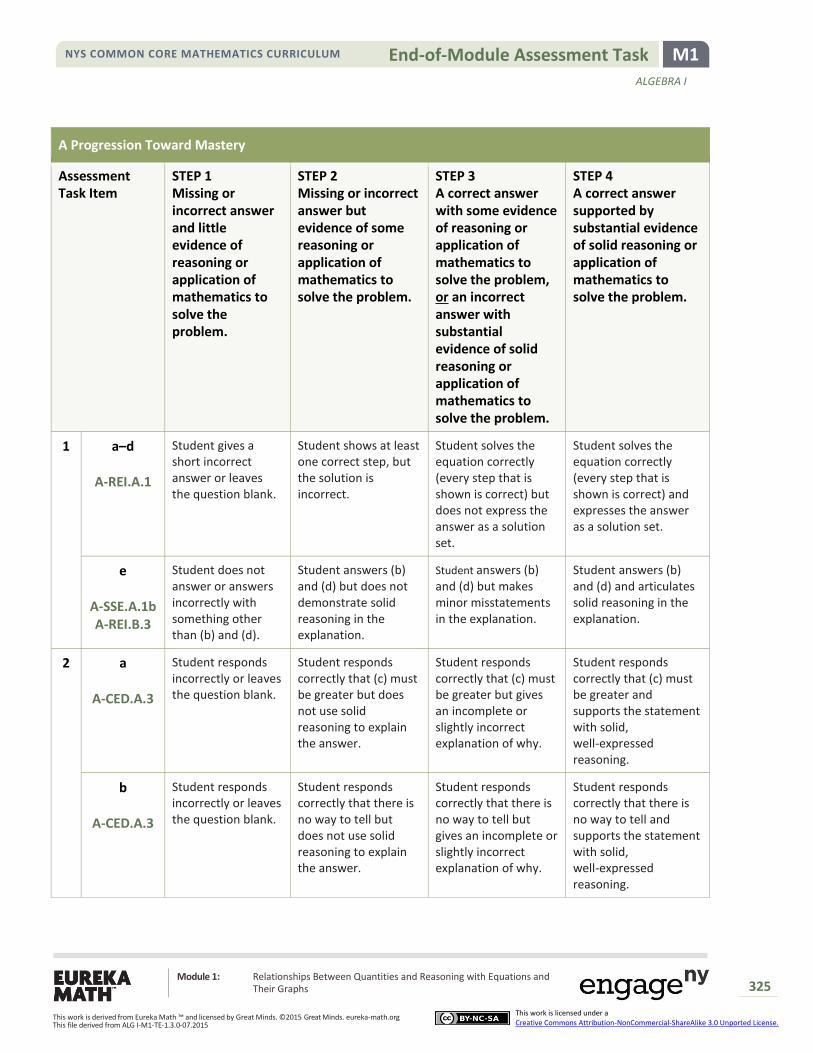
NYS COMMON CORE MATHEMATICS CURRICULUM M1 End-of-Module Assessment Task
ALGEBRA I
Module 1: Relationships Between Quantities and Reasoning with Equations and Their Graphs
325
This work is derived from Eureka Math ™ and licensed by Great Minds. ©2015 Great Minds. eureka-math.org This file derived from ALG I-M1-TE-1.3.0-07.2015
This work is licensed under a Creative Commons Attribution-NonCommercial-ShareAlike 3.0 Unported License.
A Progression Toward Mastery
Assessment Task Item
STEP 1 Missing or incorrect answer and little evidence of reasoning or application of mathematics to solve the problem.
STEP 2 Missing or incorrect answer but evidence of some reasoning or application of mathematics to solve the problem.
STEP 3 A correct answer with some evidence of reasoning or application of mathematics to solve the problem, or an incorrect answer with substantial evidence of solid reasoning or application of mathematics to solve the problem.
STEP 4 A correct answer supported by substantial evidence of solid reasoning or application of mathematics to solve the problem.
1
a–d
A-REI.A.1
Student gives a short incorrect answer or leaves the question blank.
Student shows at least one correct step, but the solution is incorrect.
Student solves the equation correctly (every step that is shown is correct) but does not express the answer as a solution set.
Student solves the equation correctly (every step that is shown is correct) and expresses the answer as a solution set.
e
A-SSE.A.1b A-REI.B.3
Student does not answer or answers incorrectly with something other than (b) and (d).
Student answers (b) and (d) but does not demonstrate solid reasoning in the explanation.
Student answers (b) and (d) but makes minor misstatements in the explanation.
Student answers (b) and (d) and articulates solid reasoning in the explanation.
2
a
A-CED.A.3
Student responds incorrectly or leaves the question blank.
Student responds correctly that (c) must be greater but does not use solid reasoning to explain the answer.
Student responds correctly that (c) must be greater but gives an incomplete or slightly incorrect explanation of why.
Student responds correctly that (c) must be greater and supports the statement with solid, well-expressed reasoning.
b
A-CED.A.3
Student responds incorrectly or leaves the question blank.
Student responds correctly that there is no way to tell but does not use solid reasoning to explain the answer.
Student responds correctly that there is no way to tell but gives an incomplete or slightly incorrect explanation of why.
Student responds correctly that there is no way to tell and supports the statement with solid, well-expressed reasoning.

NYS COMMON CORE MATHEMATICS CURRICULUM M1 End-of-Module Assessment Task
ALGEBRA I
Module 1: Relationships Between Quantities and Reasoning with Equations and Their Graphs
326
This work is derived from Eureka Math ™ and licensed by Great Minds. ©2015 Great Minds. eureka-math.org This file derived from ALG I-M1-TE-1.3.0-07.2015
This work is licensed under a Creative Commons Attribution-NonCommercial-ShareAlike 3.0 Unported License.
3
A-SSE.A.1b Student responds incorrectly or leaves the question blank.
Student responds correctly by circling the expression on the left but does not use solid reasoning to explain the answer.
Student responds correctly by circling the expression on the left but gives limited explanation or does not use the properties of inequality in the explanation.
Student responds correctly by circling the expression on the left and gives a complete explanation that uses the properties of inequality.
4
a–h
A-REI.A.1 A-REI.B.3
Student answers incorrectly with no correct steps shown.
Student answers incorrectly but has one or more correct steps.
Student answers correctly but does not correctly identify the property or properties used.
Student answers correctly and correctly identifies the property or properties used.
5
a
A-REI.A.1
Student does not answer or demonstrates incorrect reasoning throughout.
Student demonstrates only limited reasoning.
Student demonstrates solid reasoning but falls short of a complete answer or makes a minor misstatement in the answer.
Student answer is complete and demonstrates solid reasoning throughout.
b
A-REI.A.1
Student does not answer or does not demonstrate understanding of what the question is asking.
Student makes more than one misstatement in the definition.
Student provides a mostly correct definition with a minor misstatement.
Student answers completely and uses a correct definition without error or mis-statement.
c
A-REI.A.1
Student makes mistakes in both verifications and demonstrates incorrect reasoning or leaves the question blank.
Student conducts both verifications but falls short of articulating reasoning to answer the question.
Student conducts both verifications and articulates valid reasoning to answer the question but makes a minor error in the verification or a minor misstatement in the explanation.
Student conducts both verifications without error and articulates valid reasoning to answer the question.
d
A-REI.A.1
Student answers incorrectly or does not answer.
Student identifies one or both solutions but is unable to convey how the solutions could be found using the fact that 4 is a solution to the original equation.
Student identifies only one solution correctly but articulates the reasoning of using the solution to the original equation to find the solution to the new equation.
Student identifies both solutions correctly and articulates the reasoning of using the solution to the original equation to find the solution to the new equation.
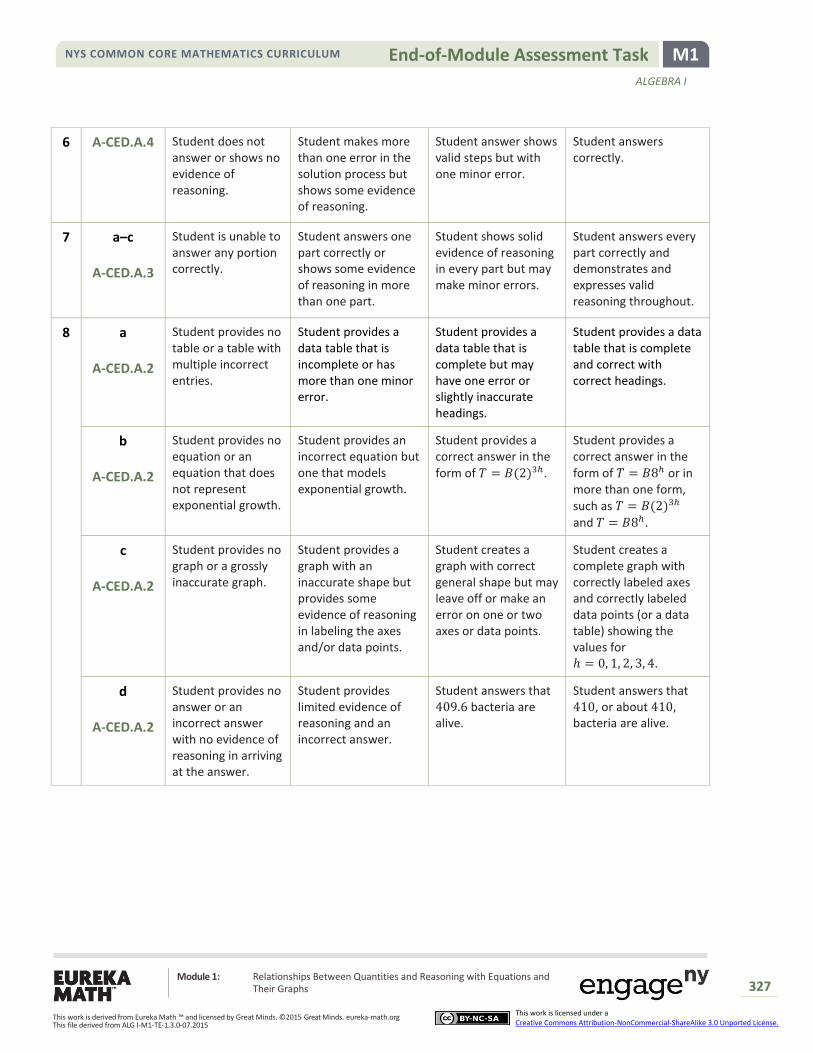
NYS COMMON CORE MATHEMATICS CURRICULUM M1 End-of-Module Assessment Task
ALGEBRA I
Module 1: Relationships Between Quantities and Reasoning with Equations and Their Graphs
327
This work is derived from Eureka Math ™ and licensed by Great Minds. ©2015 Great Minds. eureka-math.org This file derived from ALG I-M1-TE-1.3.0-07.2015
This work is licensed under a Creative Commons Attribution-NonCommercial-ShareAlike 3.0 Unported License.
6
A-CED.A.4 Student does not answer or shows no evidence of reasoning.
Student makes more than one error in the solution process but shows some evidence of reasoning.
Student answer shows valid steps but with one minor error.
Student answers correctly.
7
a–c
A-CED.A.3
Student is unable to answer any portion correctly.
Student answers one part correctly or shows some evidence of reasoning in more than one part.
Student shows solid evidence of reasoning in every part but may make minor errors.
Student answers every part correctly and demonstrates and expresses valid reasoning throughout.
8
a
A-CED.A.2
Student provides no table or a table with multiple incorrect entries.
Student provides a data table that is incomplete or has more than one minor error.
Student provides a data table that is complete but may have one error or slightly inaccurate headings.
Student provides a data table that is complete and correct with correct headings.
b
A-CED.A.2
Student provides no equation or an equation that does not represent exponential growth.
Student provides an incorrect equation but one that models exponential growth.
Student provides a correct answer in the
form of 𝑇 = 𝐵(2)3ℎ.
Student provides a correct answer in the
form of 𝑇 = 𝐵8ℎ or in more than one form,
such as 𝑇 = 𝐵(2)3ℎ
and 𝑇 = 𝐵8ℎ.
c
A-CED.A.2
Student provides no graph or a grossly inaccurate graph.
Student provides a graph with an inaccurate shape but provides some evidence of reasoning in labeling the axes and/or data points.
Student creates a graph with correct general shape but may leave off or make an error on one or two axes or data points.
Student creates a complete graph with correctly labeled axes and correctly labeled data points (or a data table) showing the values for ℎ = 0, 1, 2, 3, 4.
d
A-CED.A.2
Student provides no answer or an incorrect answer with no evidence of reasoning in arriving at the answer.
Student provides limited evidence of reasoning and an incorrect answer.
Student answers that 409.6 bacteria are alive.
Student answers that 410, or about 410, bacteria are alive.
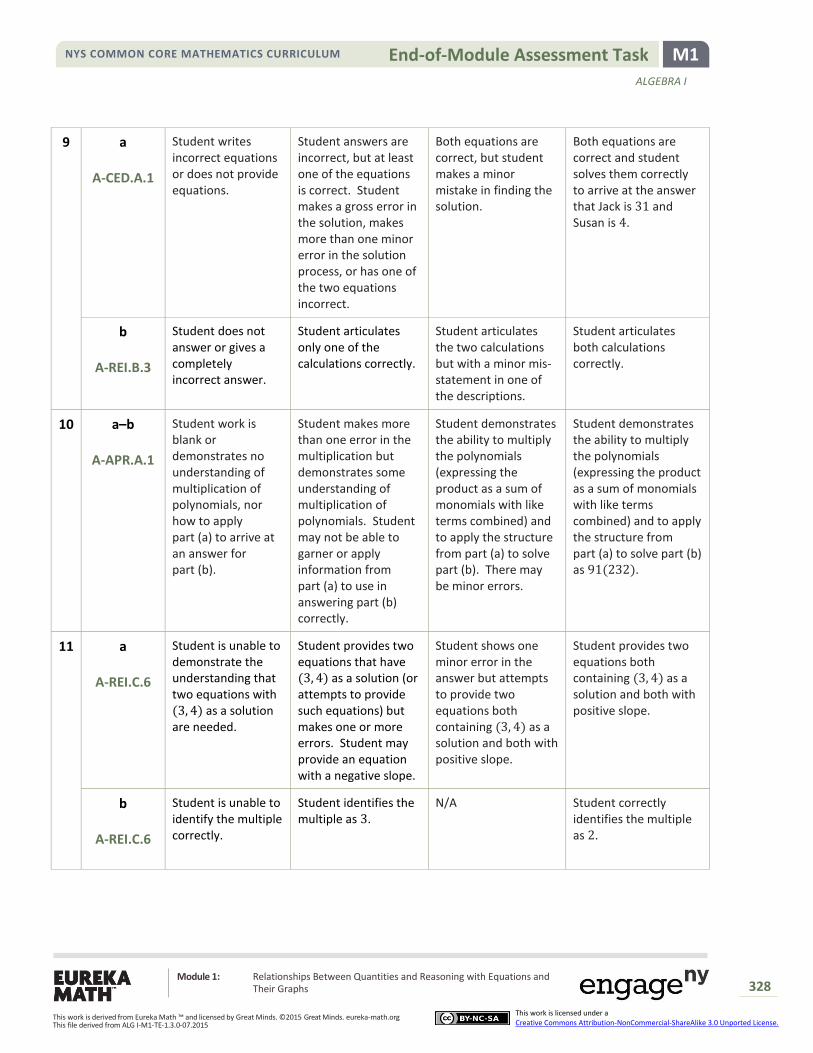
NYS COMMON CORE MATHEMATICS CURRICULUM M1 End-of-Module Assessment Task
ALGEBRA I
Module 1: Relationships Between Quantities and Reasoning with Equations and Their Graphs
328
This work is derived from Eureka Math ™ and licensed by Great Minds. ©2015 Great Minds. eureka-math.org This file derived from ALG I-M1-TE-1.3.0-07.2015
This work is licensed under a Creative Commons Attribution-NonCommercial-ShareAlike 3.0 Unported License.
9
a
A-CED.A.1
Student writes incorrect equations or does not provide equations.
Student answers are incorrect, but at least one of the equations is correct. Student makes a gross error in the solution, makes more than one minor error in the solution process, or has one of the two equations incorrect.
Both equations are correct, but student makes a minor mistake in finding the solution.
Both equations are correct and student solves them correctly to arrive at the answer that Jack is 31 and Susan is 4.
b
A-REI.B.3
Student does not answer or gives a completely incorrect answer.
Student articulates only one of the calculations correctly.
Student articulates the two calculations but with a minor mis-statement in one of the descriptions.
Student articulates both calculations correctly.
10
a–b
A-APR.A.1
Student work is blank or demonstrates no understanding of multiplication of polynomials, nor how to apply part (a) to arrive at an answer for part (b).
Student makes more than one error in the multiplication but demonstrates some understanding of multiplication of polynomials. Student may not be able to garner or apply information from part (a) to use in answering part (b) correctly.
Student demonstrates the ability to multiply the polynomials (expressing the product as a sum of monomials with like terms combined) and to apply the structure from part (a) to solve part (b). There may be minor errors.
Student demonstrates the ability to multiply the polynomials (expressing the product as a sum of monomials with like terms combined) and to apply the structure from part (a) to solve part (b) as 91(232).
11
a
A-REI.C.6
Student is unable to demonstrate the understanding that two equations with (3, 4) as a solution are needed.
Student provides two equations that have (3, 4) as a solution (or attempts to provide such equations) but makes one or more errors. Student may provide an equation with a negative slope.
Student shows one minor error in the answer but attempts to provide two equations both containing (3, 4) as a solution and both with positive slope.
Student provides two equations both containing (3, 4) as a solution and both with positive slope.
b
A-REI.C.6
Student is unable to identify the multiple correctly.
Student identifies the multiple as 3.
N/A Student correctly identifies the multiple as 2.

NYS COMMON CORE MATHEMATICS CURRICULUM M1 End-of-Module Assessment Task
ALGEBRA I
Module 1: Relationships Between Quantities and Reasoning with Equations and Their Graphs
329
This work is derived from Eureka Math ™ and licensed by Great Minds. ©2015 Great Minds. eureka-math.org This file derived from ALG I-M1-TE-1.3.0-07.2015
This work is licensed under a Creative Commons Attribution-NonCommercial-ShareAlike 3.0 Unported License.
c
A-REI.C.6
Student is unable to demonstrate even a partial understanding of how to find the solution to the system.
Student shows some reasoning required to find the solution but makes multiple errors.
Student makes a minor error in finding the solution point.
Student successfully identifies the solution point as (3, 4).
d
A-REI.C.5 A-REI.C.6
A-REI.D.10
Student is unable to answer or to support the answer with any solid reasoning.
Student concludes yes or no but is only able to express limited reasoning in support of the answer.
Student correctly explains that all the systems have the solution point (3, 4) but incorrectly assumes this is true for all cases of 𝑚.
Student correctly explains that while in most cases this is true, if 𝑚 = 1, the two lines are coinciding lines, resulting in a solution set consisting of all the points on the line.
12
a
MP.2 A-REI.D.12
Student is unable to articulate any sound reasons.
Student is only able to articulate one sound reason.
Student provides two sound reasons but makes minor errors in the expression of reasoning.
Student is able to articulate at least two valid reasons. Valid reasons include the following: the graph assumes 𝑥 could be less than zero, the graph assumes 𝑦 could be less than zero, the graph assumes 𝑎 and 𝑏 could be non-whole numbers, the graph assumes 160 children could attend with no adults.
b
A-CED.A.2 A-REI.D.10 A-REI.D.12
Student is unable to communicate a relevant requirement of the solution set.
Student provides a verbal description that lacks precision and accuracy but demonstrates some reasoning about the solution within the context of the problem.
Student makes minor errors in communicating the idea that both (a) and (b) must be whole numbers whose sum is less than or equal to 160.
Student communicates effectively that both (a) and (b) must be whole numbers whose sum is less than or equal to 160.
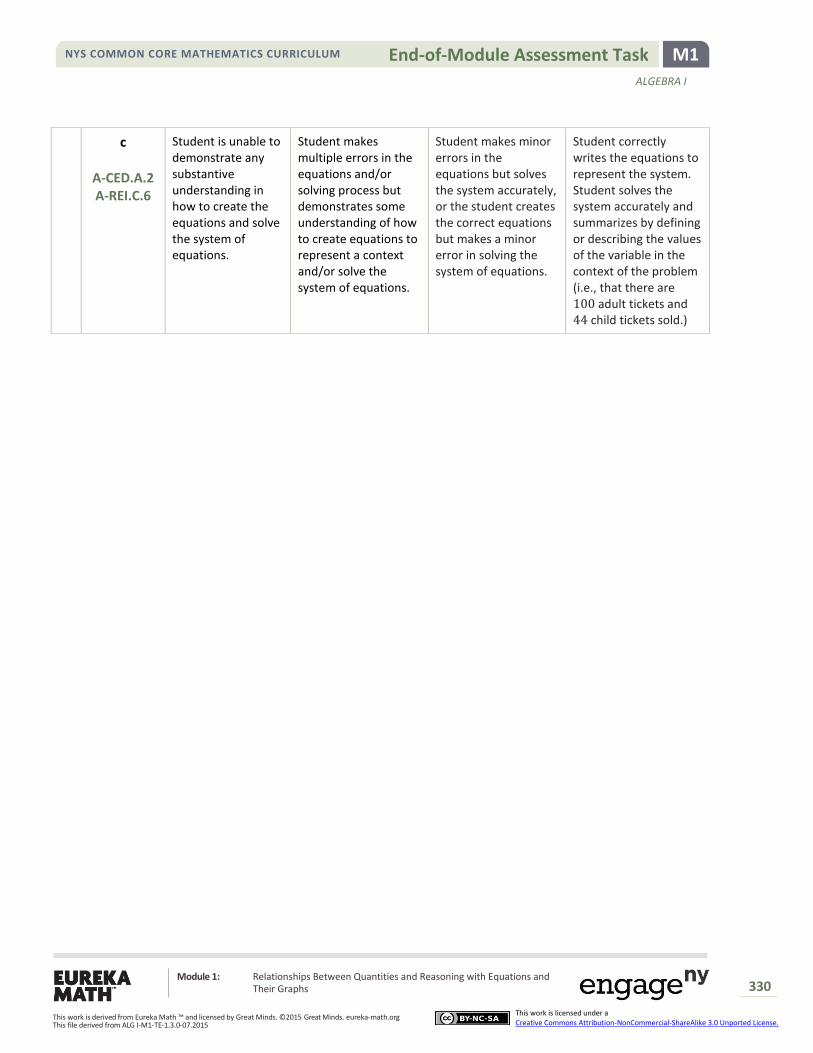
NYS COMMON CORE MATHEMATICS CURRICULUM M1 End-of-Module Assessment Task
ALGEBRA I
Module 1: Relationships Between Quantities and Reasoning with Equations and Their Graphs
330
This work is derived from Eureka Math ™ and licensed by Great Minds. ©2015 Great Minds. eureka-math.org This file derived from ALG I-M1-TE-1.3.0-07.2015
This work is licensed under a Creative Commons Attribution-NonCommercial-ShareAlike 3.0 Unported License.
c
A-CED.A.2 A-REI.C.6
Student is unable to demonstrate any substantive understanding in how to create the equations and solve the system of equations.
Student makes multiple errors in the equations and/or solving process but demonstrates some understanding of how to create equations to represent a context and/or solve the system of equations.
Student makes minor errors in the equations but solves the system accurately, or the student creates the correct equations but makes a minor error in solving the system of equations.
Student correctly writes the equations to represent the system. Student solves the system accurately and summarizes by defining or describing the values of the variable in the context of the problem (i.e., that there are 100 adult tickets and 44 child tickets sold.)

NYS COMMON CORE MATHEMATICS CURRICULUM M1 End-of-Module Assessment Task
ALGEBRA I
Module 1: Relationships Between Quantities and Reasoning with Equations and Their Graphs
331
This work is derived from Eureka Math ™ and licensed by Great Minds. ©2015 Great Minds. eureka-math.org This file derived from ALG I-M1-TE-1.3.0-07.2015
This work is licensed under a Creative Commons Attribution-NonCommercial-ShareAlike 3.0 Unported License.
Name Date
1. Solve the following equations for 𝑥. Write your answer in set notation. a. 3𝑥 − 5 = 16
3x = 21 Solution set: {7}
x = 7
b. 3(𝑥 + 3) − 5 = 16
3x + 9 - 5 = 16 Solution set: {4}
3x = 12
x = 4
c. 3(2𝑥 − 3) − 5 = 16
6x - 9 - 5 = 16 Solution set: {5}
6x - 14 = 16
6x = 30
x = 5
d. 6(𝑥 + 3) − 10 = 32
6x + 18 - 10 = 32 Solution set: {4}
6x = 24
x = 4
e. Which two equations above have the same solution set? Write a sentence explaining how the properties of equality can be used to determine the pair without having to find the solution set for each.
Problems (b) and (d) have the same solution set. The expressions on each side of the
equal sign for (d) are twice those for (b). So, if (left side) = (right side) is true for only
some x-values, then 2(left side) = 2(right side) will be true for exactly the same x-
values. Or simply, applying the multiplicative property of equality does not change the
solution set.
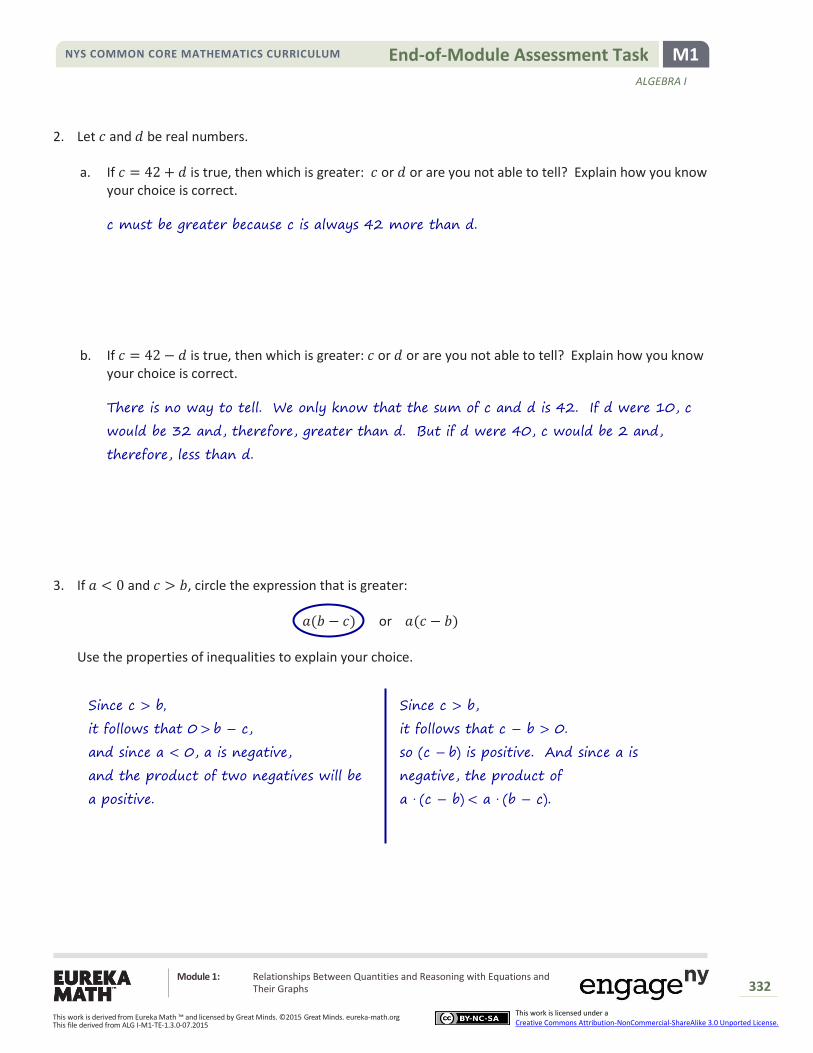
NYS COMMON CORE MATHEMATICS CURRICULUM M1 End-of-Module Assessment Task
ALGEBRA I
Module 1: Relationships Between Quantities and Reasoning with Equations and Their Graphs
332
This work is derived from Eureka Math ™ and licensed by Great Minds. ©2015 Great Minds. eureka-math.org This file derived from ALG I-M1-TE-1.3.0-07.2015
This work is licensed under a Creative Commons Attribution-NonCommercial-ShareAlike 3.0 Unported License.
Let 𝑐 and 𝑑 be real numbers. 2.
a. If 𝑐 = 42 + 𝑑 is true, then which is greater: 𝑐 or 𝑑 or are you not able to tell? Explain how you know your choice is correct.
c must be greater because c is always 42 more than d.
b. If 𝑐 = 42 − 𝑑 is true, then which is greater: 𝑐 or 𝑑 or are you not able to tell? Explain how you know your choice is correct.
There is no way to tell. We only know that the sum of c and d is 42. If d were 10, c
would be 32 and, therefore, greater than d. But if d were 40, c would be 2 and,
therefore, less than d.
If 𝑎 < 0 and 𝑐 > 𝑏, circle the expression that is greater: 3.
𝑎(𝑏 − 𝑐) or 𝑎(𝑐 − 𝑏)
Use the properties of inequalities to explain your choice.
Since c > b,
it follows that 0 > b − c,
and since a < 0, a is negative,
and the product of two negatives will be
a positive.
Since c > b,
it follows that c − b > 0.
so (c − b) is positive. And since a is
negative, the product of
a ∙ (c − b) < a ∙ (b − c).

NYS COMMON CORE MATHEMATICS CURRICULUM M1 End-of-Module Assessment Task
ALGEBRA I
Module 1: Relationships Between Quantities and Reasoning with Equations and Their Graphs
333
This work is derived from Eureka Math ™ and licensed by Great Minds. ©2015 Great Minds. eureka-math.org This file derived from ALG I-M1-TE-1.3.0-07.2015
This work is licensed under a Creative Commons Attribution-NonCommercial-ShareAlike 3.0 Unported License.
Solve for 𝑥 in each of the equations or inequalities below and name the property and/or properties used: 4.
a. 3
4𝑥 = 9
x = 9 ∙ (43
) Multiplication property of equality
x = 12
b. 10 + 3𝑥 = 5𝑥
10 = 2x Addition property of equality
5 = x Multiplication property of equality
c. 𝑎 + 𝑥 = 𝑏
x = b − a Addition property of equality
d. 𝑐𝑥 = 𝑑
x = dc, c ≠ 0 Multiplication property of equality
e. 1
2𝑥 − 𝑔 < 𝑚
12
x < m + g Addition property of equality
x < 2 ⋅ (m + g) Multiplication property of equality
f. 𝑞 + 5𝑥 = 7𝑥 − 𝑟
q + r = 2x Addition property of equality
(q+r)
2 = x Multiplication property of equality
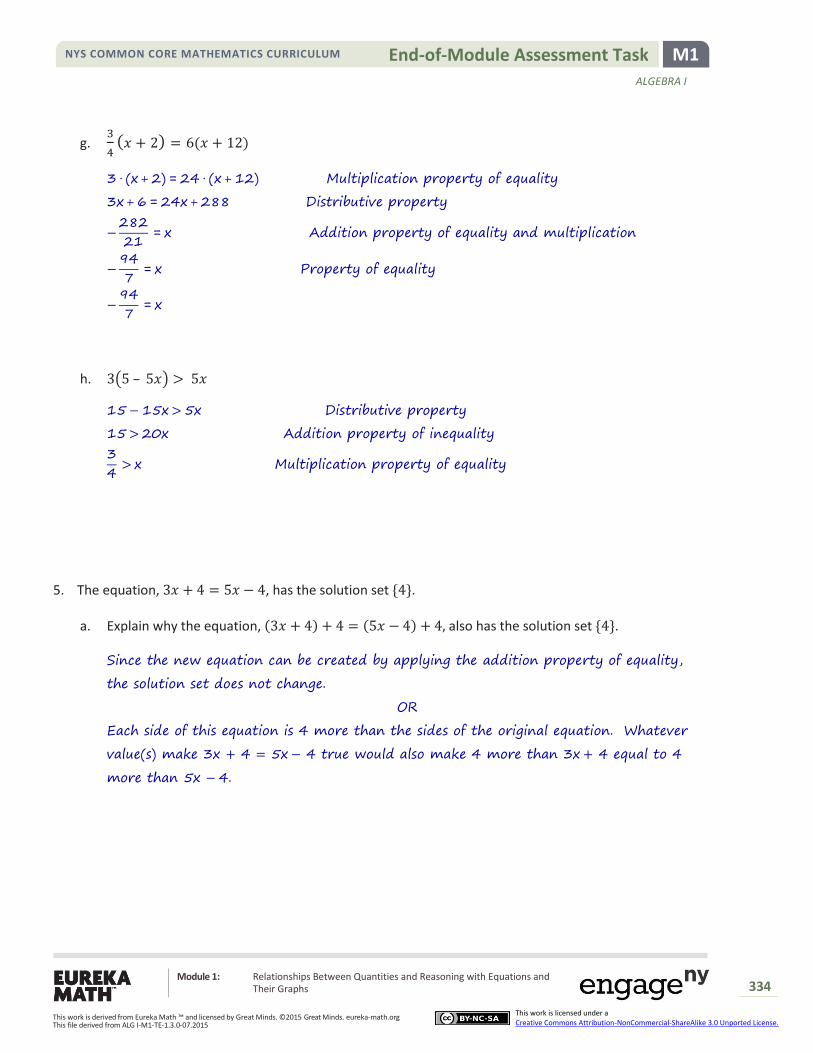
NYS COMMON CORE MATHEMATICS CURRICULUM M1 End-of-Module Assessment Task
ALGEBRA I
Module 1: Relationships Between Quantities and Reasoning with Equations and Their Graphs
334
This work is derived from Eureka Math ™ and licensed by Great Minds. ©2015 Great Minds. eureka-math.org This file derived from ALG I-M1-TE-1.3.0-07.2015
This work is licensed under a Creative Commons Attribution-NonCommercial-ShareAlike 3.0 Unported License.
g. 3
4(𝑥 + 2) = 6(𝑥 + 12)
3 ∙ (x + 2) = 24 ∙ (x + 12) Multiplication property of equality
3x + 6 = 24x + 288 Distributive property
−28221
= x Addition property of equality and multiplication
−947
= x Property of equality
−947
= x
h. 3(5 – 5𝑥) > 5𝑥
15 − 15x > 5x Distributive property
15 > 20x Addition property of inequality
34
> x Multiplication property of equality
The equation, 3𝑥 + 4 = 5𝑥 − 4, has the solution set {4}. 5. a. Explain why the equation, (3𝑥 + 4) + 4 = (5𝑥 − 4) + 4, also has the solution set {4}.
Since the new equation can be created by applying the addition property of equality,
the solution set does not change.
OR
Each side of this equation is 4 more than the sides of the original equation. Whatever
value(s) make 3x + 4 = 5x − 4 true would also make 4 more than 3x + 4 equal to 4
more than 5x − 4.

NYS COMMON CORE MATHEMATICS CURRICULUM M1 End-of-Module Assessment Task
ALGEBRA I
Module 1: Relationships Between Quantities and Reasoning with Equations and Their Graphs
335
This work is derived from Eureka Math ™ and licensed by Great Minds. ©2015 Great Minds. eureka-math.org This file derived from ALG I-M1-TE-1.3.0-07.2015
This work is licensed under a Creative Commons Attribution-NonCommercial-ShareAlike 3.0 Unported License.
b. In part (a), the expression (3𝑥 + 4) + 4 is equivalent to the expression 3𝑥 + 8. What is the definition of equivalent algebraic expressions? Describe why changing an expression on one side of an equation to an equivalent expression leaves the solution set unchanged?
Algebraic expressions are equivalent if (possibly repeated) use of the distributive,
associative, and commutative properties and/or the properties of rational exponents can
be applied to one expression to convert it to the other expression.
When two expressions are equivalent, assigning the same value to x in both expressions
will give an equivalent numerical expression, which then evaluates to the same number.
Therefore, changing the expression to something equivalent will not change the truth
value of the equation once values are assigned to x.
c. When we square both sides of the original equation, we get the following new equation:
(3𝑥 + 4)2 = (5𝑥 − 4)2. Show that 4 is still a solution to the new equation. Show that 0 is also a solution to the new equation but is not a solution to the original equation. Write a sentence that describes how the solution set to an equation may change when both sides of the equation are squared.
(3 ∙ 4 + 4)2 = (5 ∙ 4 − 4)2 gives 162 = 166, which is true.
(3 ∙ 0 + 4)2 =(5 ∙ 0 − 4)2 gives 42=(−4)2, which is true.
But, (3 ∙ 0 + 4) = (5 ∙ 0 − 4) gives 4 = − 4, which is false.
When both sides are squared, you might introduce new numbers to the solution set
because statements like 4 = − 4 are false, but statements like 42 = (−4)2 are true.
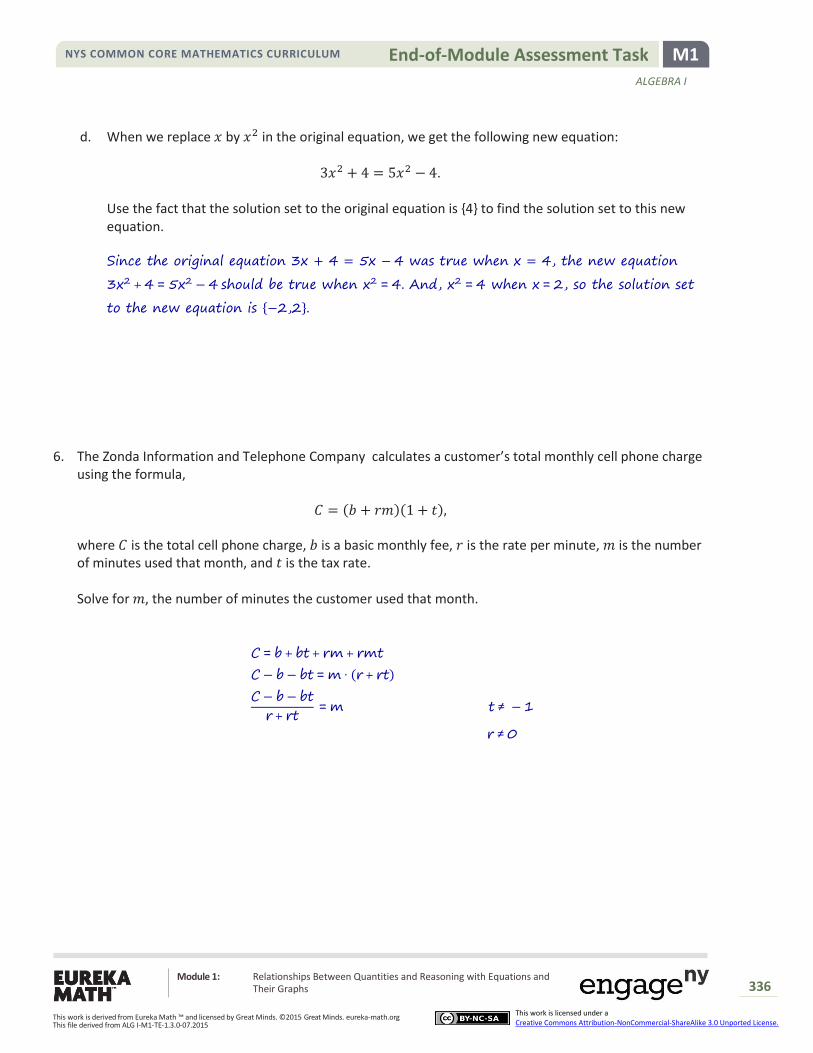
NYS COMMON CORE MATHEMATICS CURRICULUM M1 End-of-Module Assessment Task
ALGEBRA I
Module 1: Relationships Between Quantities and Reasoning with Equations and Their Graphs
336
This work is derived from Eureka Math ™ and licensed by Great Minds. ©2015 Great Minds. eureka-math.org This file derived from ALG I-M1-TE-1.3.0-07.2015
This work is licensed under a Creative Commons Attribution-NonCommercial-ShareAlike 3.0 Unported License.
d. When we replace 𝑥 by 𝑥2 in the original equation, we get the following new equation:
3𝑥2 + 4 = 5𝑥2 − 4.
Use the fact that the solution set to the original equation is {4} to find the solution set to this new equation.
Since the original equation 3x + 4 = 5x − 4 was true when x = 4, the new equation
3x2 + 4 = 5x2 − 4 should be true when x2 = 4. And, x2 = 4 when x = 2, so the solution set
to the new equation is {−2,2}.
The Zonda Information and Telephone Company calculates a customer’s total monthly cell phone charge 6.using the formula,
𝐶 = (𝑏 + 𝑟𝑚)(1 + 𝑡),
where 𝐶 is the total cell phone charge, 𝑏 is a basic monthly fee, 𝑟 is the rate per minute, 𝑚 is the number of minutes used that month, and 𝑡 is the tax rate. Solve for 𝑚, the number of minutes the customer used that month.
C = b + bt + rm + rmt
C − b − bt = m ∙ (r + rt)
C − b − btr + rt
= m t ≠ − 1
r ≠ 0
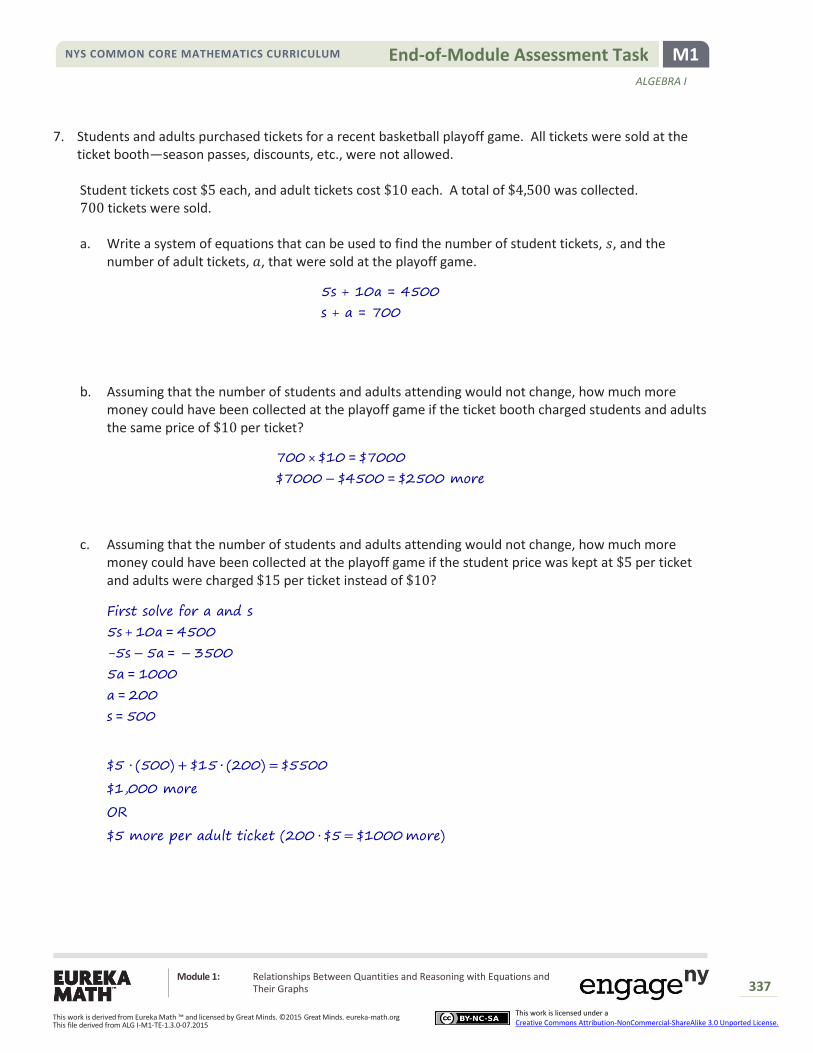
NYS COMMON CORE MATHEMATICS CURRICULUM M1 End-of-Module Assessment Task
ALGEBRA I
Module 1: Relationships Between Quantities and Reasoning with Equations and Their Graphs
337
This work is derived from Eureka Math ™ and licensed by Great Minds. ©2015 Great Minds. eureka-math.org This file derived from ALG I-M1-TE-1.3.0-07.2015
This work is licensed under a Creative Commons Attribution-NonCommercial-ShareAlike 3.0 Unported License.
Students and adults purchased tickets for a recent basketball playoff game. All tickets were sold at the 7.ticket booth—season passes, discounts, etc., were not allowed.
Student tickets cost $5 each, and adult tickets cost $10 each. A total of $4,500 was collected. 700 tickets were sold. a. Write a system of equations that can be used to find the number of student tickets, 𝑠, and the
number of adult tickets, 𝑎, that were sold at the playoff game.
5s + 10a = 4500
s + a = 700
b. Assuming that the number of students and adults attending would not change, how much more money could have been collected at the playoff game if the ticket booth charged students and adults the same price of $10 per ticket?
700 × $10 = $7000
$7000 − $4500 = $2500 more
c. Assuming that the number of students and adults attending would not change, how much more money could have been collected at the playoff game if the student price was kept at $5 per ticket and adults were charged $15 per ticket instead of $10?
First solve for a and s
5s + 10a = 4500
-5s − 5a = − 3500
5a = 1000
a = 200
s = 500
$5 ∙ (500) + $15 ∙ (200) = $5500
$1,000 more
OR
$5 more per adult ticket (200 ∙ $5 = $1000 more)

NYS COMMON CORE MATHEMATICS CURRICULUM M1 End-of-Module Assessment Task
ALGEBRA I
Module 1: Relationships Between Quantities and Reasoning with Equations and Their Graphs
338
This work is derived from Eureka Math ™ and licensed by Great Minds. ©2015 Great Minds. eureka-math.org This file derived from ALG I-M1-TE-1.3.0-07.2015
This work is licensed under a Creative Commons Attribution-NonCommercial-ShareAlike 3.0 Unported License.
Alexus is modeling the growth of bacteria for an experiment in science. She assumes that there are 𝐵 8.bacteria in a Petri dish at 12:00 noon. In reality, each bacterium in the Petri dish subdivides into two new bacteria approximately every 20 minutes. However, for the purposes of the model, Alexus assumes that each bacterium subdivides into two new bacteria exactly every 20 minutes.
a. Create a table that shows the total number of bacteria in the Petri dish at 1
3 hour intervals for
2 hours starting with time 0 to represent 12:00 noon.
Time Number of Bacteria
0 B
1/3 hour 2B
2/3 hour 4B
1 hour 8B
1 1/3 hour 16B
1 2/3 hour 32B
2 hour 64B
b. Write an equation that describes the relationship between total number of bacteria T and time h in hours, assuming there are 𝐵 bacteria in the Petri dish at ℎ = 0.
T = B ∙ (2)3h or T = B ∙ 8h
c. If Alexus starts with 100 bacteria in the Petri dish, draw a graph that displays the total number of bacteria with respect to time from 12:00 noon (ℎ = 0) to 4:00 p.m. (ℎ = 4). Label points on your graph at time ℎ = 0, 1, 2, 3, 4.

NYS COMMON CORE MATHEMATICS CURRICULUM M1 End-of-Module Assessment Task
ALGEBRA I
Module 1: Relationships Between Quantities and Reasoning with Equations and Their Graphs
339
This work is derived from Eureka Math ™ and licensed by Great Minds. ©2015 Great Minds. eureka-math.org This file derived from ALG I-M1-TE-1.3.0-07.2015
This work is licensed under a Creative Commons Attribution-NonCommercial-ShareAlike 3.0 Unported License.
d. For her experiment, Alexus plans to add an anti-bacterial chemical to the Petri dish at 4:00 p.m. that is supposed to kill 99.9% of the bacteria instantaneously. If she started with 100 bacteria at 12:00 noon, how many live bacteria might Alexus expect to find in the Petri dish right after she adds the anti-bacterial chemical?
(1 − 0.999) ∙ 409 600 = 409.6
about 410 live bacteria
Jack is 27 years older than Susan. In 5 years time, he will be 4 times as old as she is. 9.
a. Find the present ages of Jack and Susan.
J = S + 27
J + 5 = 4 ∙ (S + 5)
S + 27 + 5 = 4S + 20
S + 32 = 4S + 20
12 = 3S
S = 4
J = 4 + 27
J = 31
Jack is 31 and Susan is 4.
b. What calculations would you do to check if your answer is correct?
Is Jack’s age – Susan’s age = 27?
Add 5 years to Jack’s and Susan’s ages, and see if that makes Jack 4 times as old as
Susan.
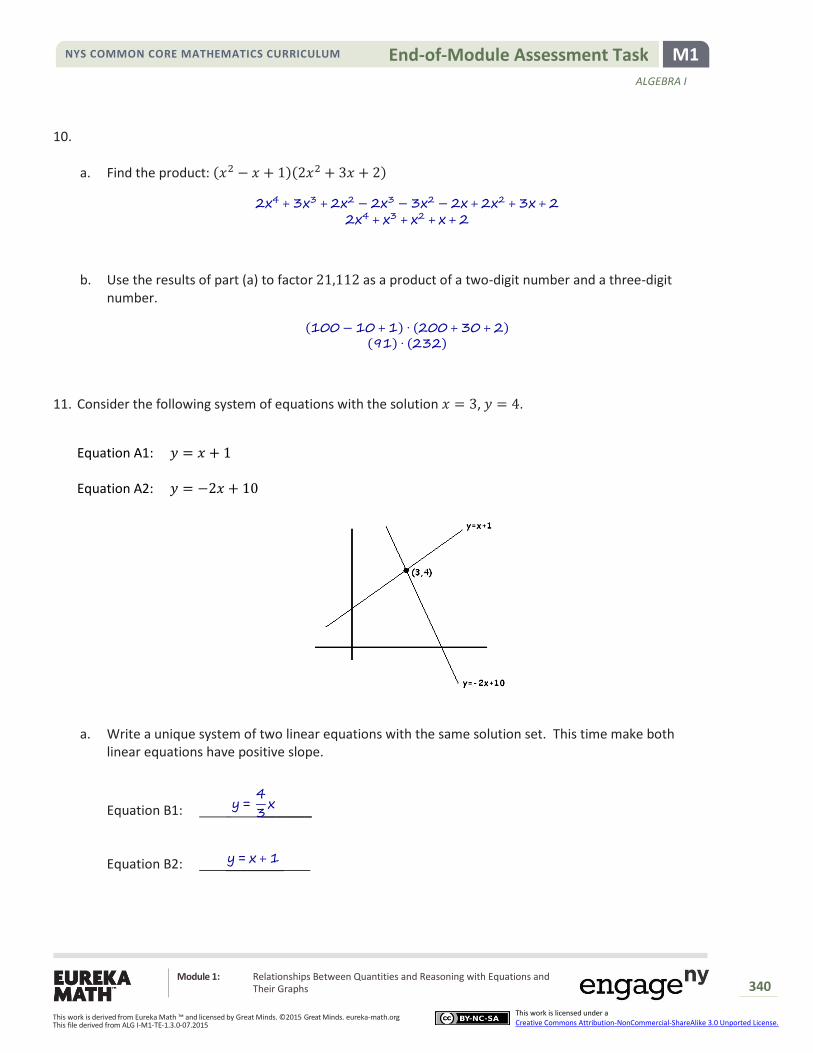
NYS COMMON CORE MATHEMATICS CURRICULUM M1 End-of-Module Assessment Task
ALGEBRA I
Module 1: Relationships Between Quantities and Reasoning with Equations and Their Graphs
340
This work is derived from Eureka Math ™ and licensed by Great Minds. ©2015 Great Minds. eureka-math.org This file derived from ALG I-M1-TE-1.3.0-07.2015
This work is licensed under a Creative Commons Attribution-NonCommercial-ShareAlike 3.0 Unported License.
10.
a. Find the product: (𝑥2 − 𝑥 + 1)(2𝑥2 + 3𝑥 + 2)
2x4 + 3x3 + 2x2 − 2x3 − 3x2 − 2x + 2x2 + 3x + 2 2x4 + x3 + x2 + x + 2
b. Use the results of part (a) to factor 21,112 as a product of a two-digit number and a three-digit number.
(100 − 10 + 1) ∙ (200 + 30 + 2) (91) ∙ (232)
Consider the following system of equations with the solution 𝑥 = 3, 𝑦 = 4. 11.
Equation A1: 𝑦 = 𝑥 + 1 Equation A2: 𝑦 = −2𝑥 + 10
a. Write a unique system of two linear equations with the same solution set. This time make both linear equations have positive slope.
Equation B1: _______
Equation B2: ________
y = 43
x
y = x + 1
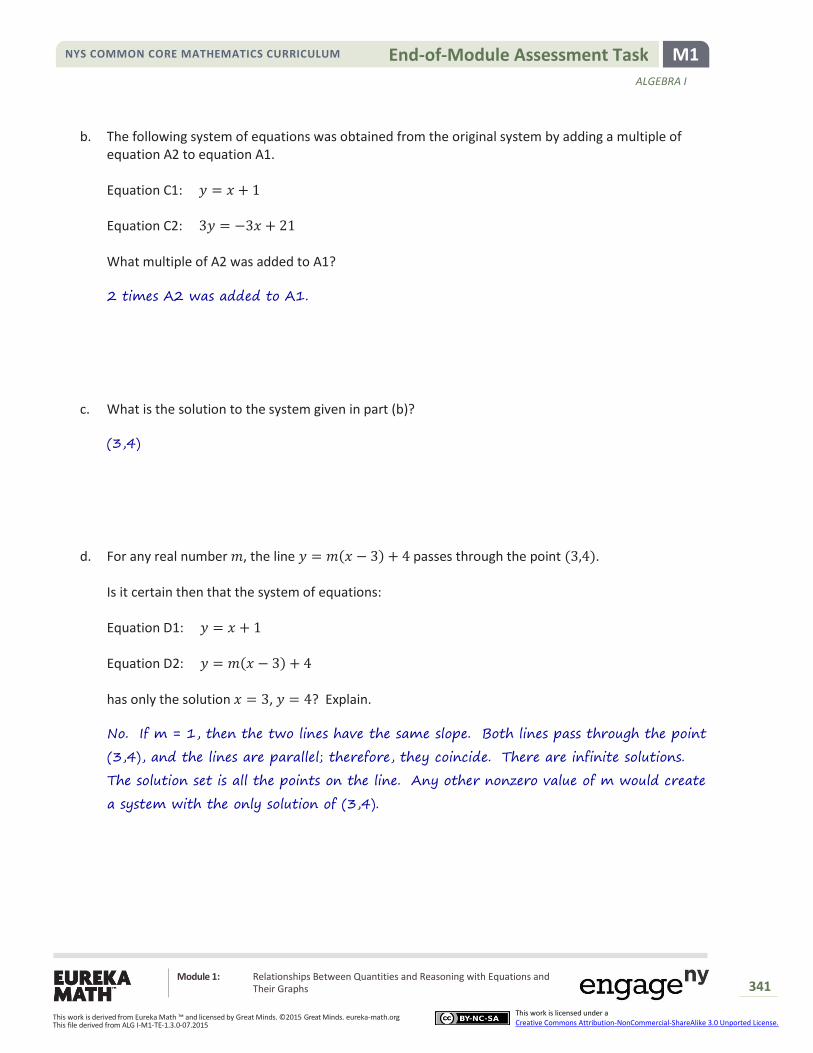
NYS COMMON CORE MATHEMATICS CURRICULUM M1 End-of-Module Assessment Task
ALGEBRA I
Module 1: Relationships Between Quantities and Reasoning with Equations and Their Graphs
341
This work is derived from Eureka Math ™ and licensed by Great Minds. ©2015 Great Minds. eureka-math.org This file derived from ALG I-M1-TE-1.3.0-07.2015
This work is licensed under a Creative Commons Attribution-NonCommercial-ShareAlike 3.0 Unported License.
b. The following system of equations was obtained from the original system by adding a multiple of equation A2 to equation A1. Equation C1: 𝑦 = 𝑥 + 1 Equation C2: 3𝑦 = −3𝑥 + 21 What multiple of A2 was added to A1?
2 times A2 was added to A1.
c. What is the solution to the system given in part (b)?
(3,4)
d. For any real number 𝑚, the line 𝑦 = 𝑚(𝑥 − 3) + 4 passes through the point (3,4). Is it certain then that the system of equations: Equation D1: 𝑦 = 𝑥 + 1 Equation D2: 𝑦 = 𝑚(𝑥 − 3) + 4 has only the solution 𝑥 = 3, 𝑦 = 4? Explain.
No. If m = 1, then the two lines have the same slope. Both lines pass through the point
(3,4), and the lines are parallel; therefore, they coincide. There are infinite solutions.
The solution set is all the points on the line. Any other nonzero value of m would create
a system with the only solution of (3,4).

NYS COMMON CORE MATHEMATICS CURRICULUM M1 End-of-Module Assessment Task
ALGEBRA I
Module 1: Relationships Between Quantities and Reasoning with Equations and Their Graphs
342
This work is derived from Eureka Math ™ and licensed by Great Minds. ©2015 Great Minds. eureka-math.org This file derived from ALG I-M1-TE-1.3.0-07.2015
This work is licensed under a Creative Commons Attribution-NonCommercial-ShareAlike 3.0 Unported License.
The local theater in Jamie’s home town has a maximum capacity of 160 people. Jamie shared with Venus 12.the following graph and said that the shaded region represented all the possible combinations of adult and child tickets that could be sold for one show.
a. Venus objected and said there was more than one reason that Jamie’s thinking was flawed. What
reasons could Venus be thinking of?
1. The graph implies that the number of tickets sold could be a fractional amount, but
really it only makes sense to sell whole number tickets. x and y must be whole
numbers.
2. The graph also shows that negative ticket amounts could be sold, which does not
make sense.
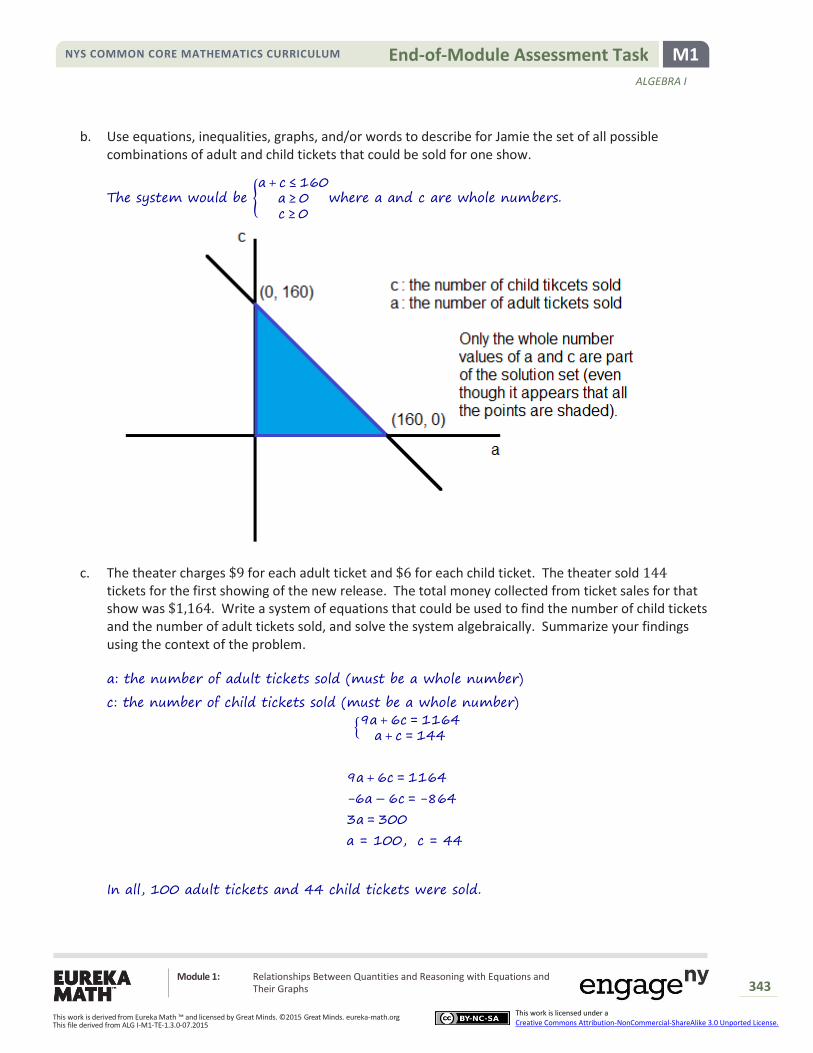
NYS COMMON CORE MATHEMATICS CURRICULUM M1 End-of-Module Assessment Task
ALGEBRA I
Module 1: Relationships Between Quantities and Reasoning with Equations and Their Graphs
343
This work is derived from Eureka Math ™ and licensed by Great Minds. ©2015 Great Minds. eureka-math.org This file derived from ALG I-M1-TE-1.3.0-07.2015
This work is licensed under a Creative Commons Attribution-NonCommercial-ShareAlike 3.0 Unported License.
b. Use equations, inequalities, graphs, and/or words to describe for Jamie the set of all possible combinations of adult and child tickets that could be sold for one show.
The system would be {a + c ≤ 160
a ≥ 0c ≥ 0
where a and c are whole numbers.
c. The theater charges $9 for each adult ticket and $6 for each child ticket. The theater sold 144 tickets for the first showing of the new release. The total money collected from ticket sales for that show was $1,164. Write a system of equations that could be used to find the number of child tickets and the number of adult tickets sold, and solve the system algebraically. Summarize your findings using the context of the problem.
a: the number of adult tickets sold (must be a whole number)
c: the number of child tickets sold (must be a whole number)
{9a + 6c = 1164
a + c = 144
9a + 6c = 1164
-6a − 6c = -864
3a = 300
a = 100, c = 44
In all, 100 adult tickets and 44 child tickets were sold.